
Electrocatalysis: Fundamentals and Applications - Hindawi.com
Upload
khangminh22Category
view
6download
0
Regulatory RNomics and Gene Expression
Guest Editors: Zhumur Ghosh, Bibekanand Mallick, Daniel Gautheret, Pawan Malhotra, and Ravi Sachidanandam
Journal of Biomedicine and Biotechnology

Regulatory RNomics and Gene Expression

Journal of Biomedicine and Biotechnology
Regulatory RNomics and Gene Expression
Guest Editors: Zhumur Ghosh, Bibekanand Mallick,Daniel Gautheret, Pawan Malhotra,and Ravi Sachidanandam

Copyright © 2009 Hindawi Publishing Corporation. All rights reserved.
This is a special issue published in volume 2009 of “Journal of Biomedicine and Biotechnology.” All articles are open access articlesdistributed under the Creative Commons Attribution License, which permits unrestricted use, distribution, and reproduction in anymedium, provided the original work is properly cited.

Editorial BoardThe editorial board of the journal is organized into sections that correspond to
the subject areas covered by the journal.
Agricultural Biotechnology
Guihua Bai, USAChristopher P. Chanway, CanadaRavindra N. Chibbar, CanadaSilvia R. Cianzio, USAIan Godwin, Australia
Hari B. Krishnan, USACarol A. Mallory-Smith, USADennis P. Murr, CanadaHenry T. Nguyen, USARodomiro Ortiz, Mexico
Badal C. Saha, USAMariam B. Sticklen, USAChiu-Chung Young, Taiwan
Animal Biotechnology
Ernest S. Chang, USAHans H. Cheng, USABhanu P. Chowdhary, USANoelle E. Cockett, USAPeter Dovc, SloveniaScott C. Fahrenkrug, USADorian J. Garrick, USAThomas A. Hoagland, USA
Tosso Leeb, SwitzerlandJames D. Murray, USAAnita M. Oberbauer, USAJorge A. Piedrahita, USADaniel Pomp, USAKent M. Reed, USALawrence Reynolds, USASheila M. Schmutz, Canada
Lawrence B. Schook, USAMari A. Smits, The NetherlandsLeon Spicer, USAJohn P. Verstegen, USAMatthew B. Wheeler, USAKenneth L. White, USA
Biochemistry
Robert Blumenthal, USADavid R. Brown, UKSaulius Butenas, USAVittorio Calabrese, ItalyFrancis J. Castellino, USARoberta Chiaraluce, ItalyDavid M. Clarke, CanadaFrancesca Cutruzzola, ItalyPaul W. Doetsch, USA
Hicham Fenniri, CanadaNick Grishin, USAJ. Guy Guillemette, CanadaYusuf A. Hannun, USAPaul W. Huber, USAChen-Hsiung Hung, TaiwanMichael Kalafatis, USABruce Kemp, AustraliaPhillip E. Klebba, USA
Wen-Hwa Lee, USARichard D. Ludescher, USAGeorge Makhatadze, USALeonid Medved, USASusan A. Rotenberg, USAJason Shearer, USAMark A. Smith, USAJohn B. Vincent, USAYujun George Zheng, USA
Bioinformatics
Tatsuya Akutsu, JapanMiguel A. Andrade, GermanyMark Borodovsky, USARita Casadio, ItalyArtem Cherkasov, CanadaDavid Wolfe Corne, UKSorin Draghici, USA
Stavros J. Hamodrakas, GreecePaul Harrison, CanadaGeorge Karypis, USAJack Leunissen, The NetherlandsGuohui Lin, CanadaSatoru Miyano, JapanZoran Obradovic, USA
Florencio Pazos, SpainZhirong Sun, ChinaYing Xu, USAAlexander Zelikovsky, USAAlbert Zomaya, Australia

Biophysics
Miguel Castanho, PortugalP. Bryant Chase, USAKuo-Chen Chou, USARizwan Khan, India
Ali A. Khraibi, Saudi ArabiaRumiana Koynova, USASerdar Kuyucak, AustraliaJianjie Ma, USA
S. B. Petersen, DenmarkPeter Schuck, USAClaudio M. Soares, Portugal
Cell Biology
Ricardo Benavente, GermanyOmar Benzakour, FranceSanford I. Bernstein, USAPhillip I. Bird, AustraliaEric Bouhassira, USAMohamed Boutjdir, USAChung-Liang Chien, TaiwanRichard Gomer, USAPaul J. Higgins, USAPavel Hozak, Czech Republic
Xudong Huang, USAAnton M. Jetten, USASeamus J. Martin, IrelandManuela Martins-Green, USAShoichiro Ono, USAGeorge Perry, USAMauro Piacentini, ItalyGeorge E. Plopper, USALawrence Rothblum, USAUlrich Scheer, Germany
Michael Sheetz, USAJames L. Sherley, USAClaudio A. Soto, USAGary S. Stein, USARichard Tucker, USAThomas van Groen, USAAndre Van Wijnen, USASteve Winder, UKChuanyue Wu, USABin-Xian Zhang, USA
Genetics
Adewale Adeyinka, USAClaude Bagnis, FranceJames Birchler, USASusan Blanton, USABarry J. Byrne, USARanajit Chakraborty, USASarah H. Elsea, USACelina Janion, Poland
J. Spencer Johnston, USAM. Ilyas Kamboh, USAManfred Kayser, The NetherlandsBrynn Levy, USAXiao Jiang Li, USAThomas Liehr, GermanyJames M. Mason, USARaj S. Ramesar, South Africa
Elliot D. Rosen, USAMichael Schmid, GermanyMarkus Schuelke, GermanyWolfgang A. Schulz, GermanyJorge Sequeiros, PortugalMouldy Sioud, NorwayMeena Upadhyaya, UKRongjia Zhou, China
Genomics
Vladimir Bajic, Saudi ArabiaMargit Burmeister, USASettara Chandrasekharappa, USAYataro Daigo, JapanSean Grimmond, AustraliaJ. Spencer Johnston, USAVladimir Larionov, USA
Hans Lehrach, GermanyThomas Lufkin, SingaporeJoakim Lundeberg, SwedenJohn L McGregor, FranceJohn V. Moran, USAHenry T. Nguyen, USAYasushi Okazaki, Japan
Gopi K. Podila, USAMariano Rocchi, ItalyPaul B. Samollow, USAMomiao Xiong, USA

Immunology
Hassan Alizadeh, USAPeter Bretscher, CanadaRobert E. Cone, USATerry Delovitch, CanadaAnthony L. DeVico, USANick Di Girolamo, AustraliaDon Mark Estes, USASoldano Ferrone, USAJeffrey A. Frelinger, USAJohn Gordon, UKJohn Robert Gordon, Canada
James D. Gorham, USASilvia Gregori, ItalyThomas Griffith, USAYoung S. Hahn, USAStella C. Knight, UKDorothy E. Lewis, USABradley W. McIntyre, USAR. Lee Mosley, USAMarija Mostarica-Stojkovic, SerbiaHans Konrad Muller, AustraliaAli Ouaissi, France
Kanury V. S. Rao, IndiaYair Reisner, IsraelHarry W. Schroeder, USAWilhelm Schwaeble, UKNilabh Shastri, USAYufang Shi, ChinaPiet Stinissen, BelgiumHannes Stockinger, AustriaJan Willem Tervaert, The NetherlandsVincent K. Tuohy, USAGraham R. Wallace, UK
Microbial Biotechnology
Jozef Anne, BelgiumYoav Bashan, MexicoMarco Bazzicalupo, ItalyNico Boon, BelgiumLuca Simone Cocolin, Italy
Peter Coloe, AustraliaDaniele Daffonchio, ItalyHan de Winde, The NetherlandsYanhe Ma, ChinaBernd Rehm, New Zealand
Angela Sessitsch, AustriaEffie Tsakalidou, GreeceJuergen Wiegel, USA
Microbiology
David Beighton, UKSteven R. Blanke, USAStanley Brul, The NetherlandsH. J. Busscher, The NetherlandsIsaac K. O. Cann, USAJohn E. Degener, The NetherlandsPeter Dimroth, SwitzerlandStephen K. Farrand, USA
Alain Filloux, UKGad Frankel, UKNancy Freitag, USARoy Gross, GermanyHans-Peter Klenk, GermanyTanya Parish, UKGopi K. Podila, USAFrederick D. Quinn, USA
Didier Raoult, FranceIsabel Sa-Correia, PortugalPamela L. C. Small, USALori Snyder, UKVanessa Sperandio, USAMichael Thomm, GermanyHenny van der Mei, The NetherlandsSchwan William, USA
Molecular Biology
Rudi Beyaert, BelgiumMichael Bustin, USADouglas Cyr, USAKostas Iatrou, GreeceLokesh Joshi, IrelandDavid W. Litchfield, Canada
Noel F. Lowndes, IrelandWuyuan Lu, USAPatrick Matthias, SwitzerlandJohn L McGregor, FranceSherry Mowbray, SwedenElena Orlova, UK
Yeon-Kyun Shin, USAWilliam S. Trimble, CanadaLisa Wiesmuller, GermanyMasamitsu Yamaguchi, Japan

Oncology
Ronald E. Cannon, USAColin Cooper, UKF. M. J. Debruyne, The NetherlandsMichael Eccles, New ZealandNathan Ames Ellis, USADominic Fan, USAMauro Ferrari, USAGary E. Gallick, USADaila S. Gridley, USAXin-yuan Guan, Hong KongAnne Hamburger, USAManoor Prakash Hande, Singapore
Beric Henderson, AustraliaSteve B. Jiang, USADaehee Kang, South KoreaAbdul R. Khokhar, USARakesh Kumar, USAMacus Tien Kuo, USAEric W Lam, UKSue-Hwa Lin, USAKapil Mehta, USAOrhan Nalcioglu, USAVincent C. O. Njar, USAPeter J. Oefner, Germany
Allal Ouhtit, USAFrank Pajonk, USAWaldemar Priebe, USAAnnie J. Sasco, FranceFernando Carlos Schmitt, PortugalSonshin Takao, JapanAna M. Tari, USAHenk G. Van Der Poel, The NetherlandsHaodong Xu, USADavid J. Yang, USA
Pharmacology
Abdel A. Abdel-Rahman, USAKrishna C. Agrawal, USARene Anand, USAMostafa Z. Badr, USAStelvio M. Bandiera, CanadaRonald E. Baynes, USAR. Keith Campbell, USAHak-Kim Chan, AustraliaMichael D. Coleman, UKJacques Descotes, France
Dobromir Dobrev, GermanyAyman El-Kadi, CanadaZuleica Bruno Fortes, BrazilJeffrey Hughes, USAKazim Husain, USAFarhad Kamali, UKMichael Kassiou, AustraliaJoseph J. McArdle, USAMark McKeage, New ZealandDaniel T. Monaghan, USA
Toshio Narahashi, USAKennerly S. Patrick, USAVickram Ramkumar, USAMichael J. Spinella, USAQuadiri Timour, FranceTodd W. Vanderah, USAVal J. Watts, USADavid J. Waxman, USA
Plant Biotechnology
Prem L. Bhalla, AustraliaJose Botella, AustraliaElvira Gonzalez De Mejia, USAH. M. Haggman, Finland
Liwen Jiang, Hong KongPulugurtha B. Kirti, IndiaYong Pyo Lim, South KoreaGopi K. Podila, USA
Ralf Reski, GermanySudhir Kumar Sopory, IndiaNeal Stewart, USA
Toxicology
Michael Aschner, USADouglas Bristol, USAMichael L. Cunningham, USALaurence D. Fechter, USA
Hartmut Jaeschke, USAYoumin James Kang, USAM. Firoze Khan, USAPascal Kintz, France
Ronald Tjeerdema, USAKenneth Turteltaub, USABrad Upham, USA

Virology
Nafees Ahmad, USAEdouard Cantin, USAEllen Collisson, USAKevin M. Coombs, CanadaNorbert K. Herzog, USATom Hobman, CanadaShahid Jameel, India
Fred Kibenge, CanadaFenyong Liu, USAEric Rassart, CanadaGerald G. Schumann, GermanyYoung-Chul Sung, South KoreaGregory Tannock, Australia
Ralf Wagner, GermanyJianguo Wu, ChinaDecheng Yang, CanadaJiing-Kuan Yee, USAXueping Zhou, ChinaWen-Quan Zou, USA

Contents
Regulatory RNomics and Gene Expression, Zhumur Ghosh, Bibekanand Mallick, Daniel Gautheret,Pawan Malhotra, and Ravi SachidanandamVolume 2009, Article ID 691286, 2 pages
MicroRNA-Biogenesis and Pre-mRNA Splicing Crosstalk, Noam Shomron and Carmit LevyVolume 2009, Article ID 594678, 6 pages
Computational Challenges in miRNA Target Predictions: To Be or Not to Be a True Target?,Christian Barbato, Ivan Arisi, Marcos E. Frizzo, Rossella Brandi, Letizia Da Sacco, and Andrea MasottiVolume 2009, Article ID 803069, 9 pages
Novel miR390-Dependent Transacting siRNA Precursors in Plants Revealed by a PCR-BasedExperimental Approach and Database Analysis, M. S. Krasnikova, I. A. Milyutina, V. K. Bobrova,L. V. Ozerova, A. V. Troitsky, A. G. Solovyev, and S. Y. MorozovVolume 2009, Article ID 952304, 9 pages
Efficient siRNA Delivery by the Cationic Liposome DOTAP in Human Hematopoietic Stem CellsDifferentiating into Dendritic Cells, Sabata Martino, Ilaria di Girolamo, Roberto Tiribuzi,Francesco D’Angelo, Alessandro Datti, and Aldo OrlacchioVolume 2009, Article ID 410260, 7 pages
Searching for MIND: MicroRNAs in Neurodegenerative Diseases, Christian Barbato, Francesca Ruberti,and Carlo CogoniVolume 2009, Article ID 871313, 8 pages
MicroRNA Implications across Neurodevelopment and Neuropathology, Sabata Martino,Ilaria di Girolamo, Antonio Orlacchio, Alessandro Datti, and Aldo OrlacchioVolume 2009, Article ID 654346, 13 pages
Quantification of Small Non-Coding RNAs Allows an Accurate Comparison of miRNA ExpressionProfiles, Andrea Masotti, Viviana Caputo, Letizia Da Sacco, Antonio Pizzuti, Bruno Dallapiccola,and Gian Franco BottazzoVolume 2009, Article ID 659028, 9 pages
Silencing Viral MicroRNA as a Novel Antiviral Therapy?, Ugo MoensVolume 2009, Article ID 419539, 18 pages
Gene Expression Analysis of an EGFR Indirectly Related Pathway Identified PTEN and MMP9 as ReliableDiagnostic Markers for Human Glial Tumor Specimens, Sergio Comincini, Mayra Paolillo,Giulia Barbieri, Silvia Palumbo, Elena Sbalchiero, Alberto Azzalin, Marika A. Russo, and Sergio SchinelliVolume 2009, Article ID 924565, 12 pages
An Evolutionary Perspective of Animal MicroRNAs and Their Targets, Noam Shomron, David Golan,and Eran HornsteinVolume 2009, Article ID 594738, 9 pages
Interaction Map and Selection of microRNA Targets in Parkinson’s Disease-Related Genes,Shinde Santosh P., Neelima Arora, Pranjal Sarma, Manika Pal-Bhadra, and Utpal BhadraVolume 2009, Article ID 363145, 11 pages

TIS11 Family Proteins and Their Roles in Posttranscriptional Gene Regulation, Maria Baou,Andrew Jewell, and John J. MurphyVolume 2009, Article ID 634520, 11 pages

Hindawi Publishing CorporationJournal of Biomedicine and BiotechnologyVolume 2009, Article ID 691286, 2 pagesdoi:10.1155/2009/691286
Editorial
Regulatory RNomics and Gene Expression
Zhumur Ghosh,1 Bibekanand Mallick,2 Daniel Gautheret,3 Pawan Malhotra,4
and Ravi Sachidanandam5
1 Department of Medicine, School of Medicine, Stanford University, Grant Building S140, Stanford, CA 94305, USA2 Wadsworth Center, New York State Department of Health, New York, NY 12208, USA3 CNRS Institut de Genetique et Microbiologie, Universite Paris Sud, Orsay, France4 International Centre for Genetic Engineering and Biotechnology, Aruna Asaf Ali Marg, New Delhi 110 067, India5 Department of Genetics and Genomic Sciences, Mount Sinai School of Medicine, New York University, NY 10029, USA
Correspondence should be addressed to Zhumur Ghosh, [email protected]
Received 11 October 2009; Accepted 11 October 2009
Copyright © 2009 Zhumur Ghosh et al. This is an open access article distributed under the Creative Commons AttributionLicense, which permits unrestricted use, distribution, and reproduction in any medium, provided the original work is properlycited.
Regulatory RNA research has marked a new paradigmof RNA-directed gene expression regulation and the mostpromising voice of the post-genomic era in developing newdrugs and therapeutics for various diseases. It helps todetermine what genes are accessible to each type of cell,a crucial choice for multicellular animals that require, forexample, a liver cell to read off one set of genes and a braincell to be governed by a different set. And it coordinatessuites of genes that may be under different control systemsbut need to act together in response to sudden stresses.The generation of a huge amount of sequences from anumber of key organisms and complementary developmentof computational bio-tools for regulatory RNA annotationand analysis, have accelerated this field of research. The smallRNAs have been a boon to scientists bringing reverse geneticsto assess the function of a gene. The new regulatory roleof RNA began to emerge in the last 10 years as researchersdiscovered a class of short RNA molecules known as silencingRNAs and a second class called micro-RNAs. And theseprobably constitute the tip of the iceberg. The opportunityto harness the tantalizing field of regulatory RNA mediatedRNA interference (RNAi) pathway in silencing disease-causing genes hold great promise for the development oftherapeutics directed against targets that are not addressablewith current medicines. Bioinformatics as well plays a majorrole and aids in analyzing, interpreting and screening of suchRNA sequences and their targets.
MicroRNAs are only the best studied members of theexpanding family of regulatory non-coding RNAs that
populates all domains of life. MicroRNAs tell us manystories like stories of evolution, with their quickly evolvingand adaptable structures that exploded in animal and plantgenomes through duplication of existing microRNAs andexaptation of elements that served other functions such assnoRNAs. They tell us stories of development, with theirintricate role in the differentiation of so many tissues,including animal brain, immune cells and muscle, as well asplant organs. They are also closely involved in human disease.An astounding 1700 papers have been published about RNAand cancer since the first report of downregulated miRNAsin cancer cells in 2002.
With the revelation that most intergenic and junk DNAin eukaryotic genomes was actually transcribed, a wholenew understanding of the non-messenger transcriptome isemerging, where transcripts produced during RNA poly-merase initiation or as the result of cleavage by a variety ofDicer-like enzyme are acting in regulating gene expressionat many different levels. Regulatory RNAs are also gainingimportance in the prokaryotic world in the form of trans-acting small RNAs and cis-acting riboswitches which, justas their eukaryotic counterparts, are able to switch geneson and off with exquisite accuracy in response to variousenvironmental challenges, triggering deep changes in cellularfunctions that are reminiscent of the developmental eventstriggered by miRNAs in multi-cellular organisms. There isa long way ahead in introducing this huge diversity of RNAmolecules into our global picture of cell regulatory networks.As our understanding of the functions of small RNAs and

2 Journal of Biomedicine and Biotechnology
their mode of regulation continues to increase, we will beable to translate these regulatory RNAs from lab-to-clinic fortherapeutic applications.
This area of research has attracted some of the mostinnovative research groups in the molecular biology andbioinformatics field and as Editors, we are truly privilegedthat many of these investigators have contributed to thisissue. We express our sincere gratitude to the contributingauthors as well as to the vision of the Founder Editor,Dr Abdelali Haoudi, for this opportunity provided by theJournal of Biomedicine and Biotechnology.
Zhumur GhoshBibekanand Mallick
Daniel GautheretPawan Malhotra
Ravi Sachidanandam

Hindawi Publishing CorporationJournal of Biomedicine and BiotechnologyVolume 2009, Article ID 594678, 6 pagesdoi:10.1155/2009/594678
Review Article
MicroRNA-Biogenesis and Pre-mRNA Splicing Crosstalk
Noam Shomron1 and Carmit Levy2
1 Department of Cell and Developmental Biology, Sackler Faculty of Medicine, Tel Aviv University, 69978 Tel Aviv, Israel2 Massachusetts General Hospital, Harvard Medical School, Charlestown, MA 02129, USA
Correspondence should be addressed to Noam Shomron, [email protected]
Received 27 March 2009; Accepted 18 May 2009
Recommended by Zhumur Ghosh
MicroRNAs (miRNAs) are often hosted in introns of protein-coding genes. Given that the same transcriptional unit can potentiallygive rise to both miRNA and mRNA transcripts raises the intriguing question of the level of interaction between these processes.Recent studies from transcription, pre-mRNA splicing, and miRNA-processing perspectives have investigated these relationshipsand yielded interesting, yet somewhat controversial findings. Here we discuss major studies in the field.
Copyright © 2009 N. Shomron and C. Levy. This is an open access article distributed under the Creative Commons AttributionLicense, which permits unrestricted use, distribution, and reproduction in any medium, provided the original work is properlycited.
1. Transcription, Pre-mRNA Splicing, andmiRNA Biogenesis
The gene expression pathway initiates at nuclear transcrip-tion generating a pre-mRNA, which very often undergoessplicing, post-transcriptional regulation, and then transla-tion into a protein. During the pre-mRNA splicing process,introns are removed and exons are joined in order to generatethe mature mRNA [1–3]. The highly coordinated splicingevent takes place in a large complex called the Spliceosome.The formation of this functional megacomplex is an orches-trated assembly of proteins and RNA that requires identi-fication of exon-intron boundaries [4]. Exons are regularlyalternatively spliced, meaning that they are either includedor excluded from the final mature mRNA transcript. Arecent comprehensive sequencing study observed that morethan 90% of the genes undergo alternative splicing [5]. Thisvastly increases the transcriptome repertoire, and emphasizesboth the significance of splicing and the requirement for itsaccurate execution.
In addition to protein coding genes, noncoding genes aretranscribed. microRNAs (miRNA), the most comprehensivenoncoding group, are a class of ∼22 nt noncoding RNAsthat inhibit gene expression through binding to the 3′
UnTranslated Region (UTR) of target mRNA transcripts[6, 7]. There are hundreds of unique miRNAs in a givenspecies [8], each predicted to regulate a plethora of targetgenes [9–13]. In fact, computational predictions indicate that
miRNAs may regulate 60% of all human protein codinggenes [14]. Therefore, it came as no surprise that miRNAswere linked to many cellular processes such as differentiation,growth, and apoptosis [15], while miRNA perturbationswere associated with numerous diseases, including cancer[16, 17]. In the past few years, the pivotal role playedby miRNAs in gene regulation has been recognized [18–20].
miRNAs are processed through a series of post-transcriptional biogenesis steps. The canonical maturationpathway, similar to protein-coding genes, initiates at tran-scription (mostly by RNA polymerase II) generating aprimary (pri-) miRNA. The pri-miRNA is characterized bya hairpin RNA structure recognized by the nuclear RNAse-III enzyme Drosha, and its cofactor DGCR8 [21]. Theseproteins work in a complex of several proteins, known asthe Microprocessor. The Microprocessor cleaves the pri-miRNA to generate a shorter hairpin of about 70 nt length—the pre-miRNA. This intermediate miRNA is exported fromthe nucleus to the cytoplasm via Exportin-5 where theRNase III endonuclease Dicer generates the final maturemiRNA. This short RNA loses one of its strands (the com-plementary miRNA∗ strand) while the other is loaded ontoan Argonaute-containing RNA-induced silencing complex(RISC) which mediates gene silencing. Once the miRNAbinds to its target gene, regulation takes place mainly throughmRNA degradation or translation inhibition [22, 23] (seeFigure 1). For simplicity, the widely used term “miRNA

2 Journal of Biomedicine and Biotechnology
biogenesis” hereafter refers to the initial step of miRNAexcision from its RNA transcript.
miRNAs can be located inter- or intragenically. Whenintergenic, their expression is coordinated with other miR-NAs as a cluster [25, 26]. When intragenic, namely, posi-tioned within a protein-coding gene (almost exclusively inintrons), they are often expressed from the same strand astheir host-gene [27–30] and at correlated levels [31]. Giventhat both coding mRNAs and miRNAs are generated fromthe same transcriptional unit, and that they cooccur inclose cellular proximity, it would be puzzling if these eventsexhibited total independence. Recent studies, from transcrip-tion, miRNA-processing, and splicing oriented perspectives,have investigated these fascinating interactions and yieldedinteresting, yet somewhat controversial findings.
2. Intronic miRNA Biogenesis in Light ofPre-mRNA Splicing
Relationships between intronic miRNAs and the processingevents of their host mRNA, namely, transcription andsplicing have been addressed. Here we outline the majorstudies in the field.
Expressed Sequence Tag (EST) libraries of expressedmRNAs are derived from various cells and tissues. The ESTsrepresent a snapshot of cellular transcripts at a particulartime point and thus display the given mRNA plethora andits variety at a particular cellular state. Analysis of this datarevealed several chimeric transcripts containing miRNA andpart of the adjacent mRNA sequences [32]. At an earlystage of miRNA research this indicated the existence of ashared RNA transcript. Notably, at a later stage, some ofthese EST fragments were shown to be partially spliced, witheither 5′ or 3′ ends matching putative Drosha cleavage sites[30]. These results strengthened the possibility that miRNAsand mRNAs are processed from the same RNA substrate.In addition, the correlated expression pattern of host-genetranscripts and their miRNAs [31] suggested that miRNAshave coevolved to use the same promoter for transcription[26]. Along with this work, by comparing miRNA processingin a construct containing only the intronic sequence versusone that also includes the flanking exons, Pawlicki and Steitz[33] found that the levels of pri-miRNA transcribed fromintrons are increased in the presence of flanking exons, dueto prolonged retention at the site of transcription. Thissupported the notion that flanking exons may facilitatemiRNA processing by increasing the time pri-miRNAs spendtethered to the DNA template [33, 34]. Altogether, the dataindicates that intronic miRNA processing is enhanced byphysical proximity to the site of transcription, and possiblyalso by splicing of the host gene. Several groups have isolatedand identified various proteins associated with the humanMicroprocessor complex [35–37]. In these studies, numerousMicroprocessor-associated proteins were identified as splic-ing factors (e.g., hnRNPH1; [37]) or involved in pre-mRNAprocessing (e.g., DHX15; [38]).
Taken together, based on miRNA-mRNA transcriptional(EST) evidence; shared promoters; facilitated biogenesis
when flanked by exons; and overlapping proteins betweenthe functional complexes, the data suggests that the Micro-processor is potentially enhanced and present during tran-scription and most likely also during splicing. If the sameRNA substrate is subjected to both host-gene and intronicmiRNA maturation, the intriguing question raised is how doall these processes—transcription, pre-mRNA splicing, andmiRNA processing—crosstalk?
The complexity of the miRNA-host-gene interactionmodel has increased recently when studies from the Proud-foot Laboratory demonstrated that pre-miRNAs are gen-erated through cotranscriptional cleavage by Drosha. Mor-lando et al. [39] suggested that efficient clearance of intronicsequences following Microprocessor (Drosha) cleavage mayact to enhance the splicing efficiency. This occurs both inintergenic miRNAs and intronic miRNA genes [39]. Theseresearchers showed that the Microprocessor complex, aswell as 5′-3′ and 3′-5′ RNA exonucleases, are recruitedto chromatin associated with intronic miRNAs duringtranscription of the host primary transcript, and that Droshacleavage occurs before host intron splicing. They found thatmiRNA-harboring transcripts preferentially associated withchromatin fractions, from which they concluded that bothpre-miRNA cleavage and intronic splicing must occur on thesame nascent transcripts. The rapid exonucleolytic removalof intronic sequences may clear the proximal vicinity of RNAprocessing for the purpose of efficiently completing the pre-mRNA splicing task. The enhancement of splicing by theMicroprocessor does not agree with other studies [30, 40](discussed below) and does not concur with experiments inyeast that showed enhanced processing for siRNA flankedexons in splicing mutants [41].
A crosstalk between two physically overlapping RNAtranscripts is not unheard of. Dependencies are seen, forexample, during the biogenesis process of small nucleolarRNA (snoRNA) [42–44]. In the process of snoRNA matu-ration, functional links between intronic snoRNP assembly,pre-mRNA synthesis and processing have been described[45–47]. An antithesis to this dependency is the alternativemiRNA biogenesis pathway that bypasses the Microprocessorvia generation of “Mirtrons” [48, 49]. This mechanisticallydistinct class of intronic miRNAs stem from very shortintrons where splicing substitutes the first step of miRNAbiogenesis. In this case, splicing activities replace the require-ments for a Microprocessor.
However, not all roads lead to the observed dependencybetween microprocessing and splicing. Ying and Lin [50]have designed an artificial intron containing a pre-miRNAsecondary structure. They used this construct to show thatthe mature miRNA was released only from the spliced intron.This suggested that spliced introns are subsequently usedby Drosha and argued against any physical link betweenthe Microprocessor and the transcriptional unit or betweenthe Microprocessor and the Spliceosome [50]. Dye et al.[40] showed that exons of pre-mRNA are tethered to theelongating RNA polymerase II either directly or indirectlywithout affecting processing, indicating that cotranscrip-tional cleavage of nascent intronic miRNA transcripts doesnot affect splicing efficiency [40, 51]. Supporting the same

Journal of Biomedicine and Biotechnology 3
Gene expression inhibition by miRNA
Protein coding geneNon-coding miRNA gene
RISC
Pre-mRNA
Mature-miRNA
CytoplasmN
ucleus
Pre-miRNA
Pri-miRNA
Mature-mRNA
Export
Dicer
Microprocessor
Microprocessor
Spliceosome
ExonExon
ExonExon Exon
Exon
ExonExonExon
Figure 1: The canonical miRNA biogenesis pathway and its affect on gene expression. Elaborated mechanisms and exceptions to this pathwayare reviewed in [24].
Microprocessor
Microprocessor
SpliceosomeSpliceosome
Pre-mRNA
Mature-mRNAPre-miRNA
ExonExon Exon
ExonExonExon
ExonExonExon
ExonExon Exon
ExonExonExonExonExonExon
Figure 2: Possible models for intronic miRNA biogenesis. Either both miRNA and mRNA are generated from one RNA transcript (leftscheme), or each is generated from an individual transcript (right scheme).
view, Kim and Kim [30] addressed miRNA biogenesis inlight of the splicing mechanism. They demonstrated thatcleavage of an intronic miRNA did not significantly affect theproduction of mature mRNA and, conversely, the productionof mature miRNA was not significantly affected by splicing.In their experiments, knockdown of Drosha, or mutations inthe miRNA hairpin, eliminated miRNA generation withoutdramatically affecting mRNA splicing. This suggested thatmiRNA biogenesis and splicing are coordinated but notfunctionally linked or interdependent. Taking a closer look,
however, they also mention that Drosha knockdown ledto a modest increase in spliced mRNA production and sodid mutations in the miRNA hairpin. Their work showedthat the adjacent introns were spliced more rapidly thanmiRNA-encoding introns, suggesting that binding of theMicroprocessor may eventually interfere with the splicingto some extent. Taken together, Kim and Kim’s data [30]imply mostly independent activities but cannot exclude thepossibility that the Microprocessor interferes, to some level,with splicing.

4 Journal of Biomedicine and Biotechnology
Microprocessor Microprocessor
Spliceosome
Microprocessor Microprocessor
Spliceosome Spliceosome
Spliceosome
(a)
(b)
(c)
(d)
Figure 3: Possible crosstalk models between the miRNA biogenesisprocess, carried out by the Microprocessor, and the pre-mRNAsplicing reaction, carried out by the Spliceosome.
Attempting to explain how both miRNA and mRNAare generated from the same DNA locus, reconciling withthe studies described here, we come up with two distinctmodels. The first envisions a single miRNA and mRNAarising from the same RNA precursor. The second predictsgeneration of an miRNA and mRNA products arising fromtwo independent RNA transcripts (see Figure 2). If the latterscenario was true, microprocessing and splicing would beindependent of each other. The outcome would be eitherno functional hindrance between the Microprocessor andSpliceosome activities or a competition for available pre-mRNA substrates. In the event that both RNA productsoriginate from the same precursor, it is conceivable that thetwo processes happen consecutively. This would imply thatexecution of one process would be a prerequisite for theother to occur. Alternatively, miRNA processing and mRNAsplicing may be coordinated so that the Microprocessorand Spliceosome interact with each other. This interactionmay be minimal, without affecting the amounts of miRNAand mRNA produced—as was suggested recently [30], orit may constitute a level of regulation. We note that theseevents should always be looked at in the spatial-temporalcontext meaning that the Microprocessor might act at anindependent rate prior to the Spliceosome assembly, and thustheir direct interaction would be prevented. Due to accu-mulating evidence, both in favor and against dependenciesbetween splicing and microprocessing, further investigationis necessary in order to uncover the full complexity of theseprocesses.
3. Coordinated Crosstalk
Cellular regulatory events are commonly embedded incomplex networks of interactions. The potential coor-
dinated activity between the Microprocessor and theSpliceosome can be stratified into four possible relation-ships. The Microprocessor can inhibit or activate theSpliceosome, and the Spliceosome can inhibit or acti-vate the Microprocessor (Figure 3). These relationships arenot mutually exclusive. For example, the Microprocessorcould activate the Spliceosome by recruiting splicing fac-tors to intronic miRNAs, while at the same time theSpliceosome could inhibit microprocessing. We cannotrule out, however, that these relationships occur in onelarge complex depending on the presence of particularRNA processing proteins within the Microprocessor [37].Many complex regulatory loops, both positive and neg-ative, were seen in other cellular systems (e.g., see [52,53]).
The Spliceosome is a mega complex of hundreds of pro-teins and snRNPs [54]. Its assembly and dynamic structurehave been extensively studied [55, 56]. The Microprocessor,on the other hand, is composed of a handful of proteins[21, 36], minimally described as a two-protein complex[24, 35] (alternatively, see [37]). It is hard to visualize thesetwo very differently-sized complexes aligned at the sameposition, competing for the same substrate. Thus, a coor-dinated processing and crosstalk seems necessary for thesecomplexes—the Microprocessor and the Spliceosome—tobe able to process the same transcript with intricate accu-racy.
During the mRNA splicing process, the rate at whichtranscription takes place may affect the transcripts’ patternof splicing [57]. Thus, kinetics of intron removal and exonligation may play a role in selecting particular splicedisoforms. Given that some introns undergo miRNA excision,unless the removal is extremely rapid, one can imaginea possible effect on splicing outcome. Thus, from anevolutionary perspective, an intronic miRNA might evolveto participate in determining splicing kinetics. Consequently,an evolutionary driving force may direct miRNA positioningwithin the intron to prevent disruption of relevant splicesignals (also see [39]).
In summary, growing evidence indicates a complexcrosstalk between transcription and splicing. It is notsurprising then that microprocessing is also linked to theseevents. Many questions still remained unanswered. Are theseprocesses coordinated by cis regulatory sequences or transacting factors? Does one process dominate over the other?How widespread is the mechanism and does it governall intronic miRNAs? To date, not all Microprocessor andSpliceosome crosstalk scenarios (as described in Figure 3)have been identified. Yet, given the complexity of cellularpathways, it is probably only a matter of time before theirelucidation.
Acknowledgments
The authors would like to thank Kathleen Robinson, Adri-enne Yanez, Steffen Schubert, Eyal Mor, Shira Modai, NaamaHazan, Yakir Vaknin, and Carl Novina for commenting onthe manuscript.

Journal of Biomedicine and Biotechnology 5
References
[1] T. Maniatis and R. Reed, “An extensive network of couplingamong gene expression machines,” Nature, vol. 416, no. 6880,pp. 499–506, 2002.
[2] T. W. Nilsen, “The spliceosome: the most complex macro-molecular machine in the cell?” BioEssays, vol. 25, no. 12, pp.1147–1149, 2003.
[3] M. J. Moore and N. J. Proudfoot, “Pre-mRNA processingreaches back to transcription and ahead to translation,” Cell,vol. 136, no. 4, pp. 688–700, 2009.
[4] E. Kim, A. Goren, and G. Ast, “Alternative splicing: currentperspectives,” BioEssays, vol. 30, no. 1, pp. 38–47, 2008.
[5] E. T. Wang, R. Sandberg, S. Luo, et al., “Alternative isoformregulation in human tissue transcriptomes,” Nature, vol. 456,no. 7221, pp. 470–476, 2008.
[6] E. C. Lai, “Micro RNAs are complementary to 3′ UTRsequence motifs that mediate negative post-transcriptionalregulation,” Nature Genetics, vol. 30, no. 4, pp. 363–364, 2002.
[7] D. P. Bartel, “MicroRNAs: target recognition and regulatoryfunctions,” Cell, vol. 136, no. 2, pp. 215–233, 2009.
[8] S. Griffiths-Jones, H. K. Saini, S. van Dongen, and A. J.Enright, “miRBase: tools for microRNA genomics,” NucleicAcids Research, vol. 36, database issue, pp. D154–D158, 2008.
[9] B. P. Lewis, I.-H. Shih, M. W. Jones-Rhoades, D. P. Bartel, andC. B. Burge, “Prediction of mammalian microRNA targets,”Cell, vol. 115, no. 7, pp. 787–798, 2003.
[10] A. Krek, D. Grun, M. N. Poy, et al., “Combinatorial microRNAtarget predictions,” Nature Genetics, vol. 37, no. 5, pp. 495–500, 2005.
[11] C. B. Nielsen, N. Shomron, R. Sandberg, E. Hornstein, J.Kitzman, and C. B. Burge, “Determinants of targeting byendogenous and exogenous microRNAs and siRNAs,” RNA,vol. 13, no. 11, pp. 1894–1910, 2007.
[12] A. Grimson, K. K.-H. Farh, W. K. Johnston, P. Garrett-Engele,L. P. Lim, and D. P. Bartel, “MicroRNA targeting specificity inmammals: determinants beyond seed pairing,” Molecular Cell,vol. 27, no. 1, pp. 91–105, 2007.
[13] J. Brennecke, A. Stark, R. B. Russell, and S. M. Cohen,“Principles of microRNA-target recognition,” PLoS Biology,vol. 3, no. 3, p. e85, 2005.
[14] R. C. Friedman, K. K.-H. Farh, C. B. Burge, and D. P.Bartel, “Most mammalian mRNAs are conserved targets ofmicroRNAs,” Genome Research, vol. 19, no. 1, pp. 92–105,2009.
[15] R. W. Carthew, “Gene regulation by microRNAs,” CurrentOpinion in Genetics and Development, vol. 16, no. 2, pp. 203–208, 2006.
[16] R. Garzon, M. Fabbri, A. Cimmino, G. A. Calin, and C. M.Croce, “MicroRNA expression and function in cancer,” Trendsin Molecular Medicine, vol. 12, no. 12, pp. 580–587, 2006.
[17] R. Schickel, B. Boyerinas, S.-M. Park, and M. E. Peter,“MicroRNAs: key players in the immune system, differentia-tion, tumorigenesis and cell death,” Oncogene, vol. 27, no. 45,pp. 5959–5974, 2008.
[18] V. Ambros, “The functions of animal microRNAs,” Nature,vol. 431, no. 7006, pp. 350–355, 2004.
[19] L. P. Lim, N. C. Lau, P. Garrett-Engele, et al., “Microarrayanalysis shows that some microRNAs downregulate largenumbers of-target mRNAs,” Nature, vol. 433, no. 7027, pp.769–773, 2005.
[20] W. Filipowicz, S. N. Bhattacharyya, and N. Sonenberg, “Mech-anisms of post-transcriptional regulation by microRNAs: are
the answers in sight?” Nature Reviews Genetics, vol. 9, no. 2,pp. 102–114, 2008.
[21] H. Seitz and P. D. Zamore, “Rethinking the microprocessor,”Cell, vol. 125, no. 5, pp. 827–829, 2006.
[22] N. Bushati and S. M. Cohen, “MicroRNA functions,” AnnualReview of Cell and Developmental Biology, vol. 23, pp. 175–205,2007.
[23] N. Shomron, D. Golan, and E. Horstein, “An evolutionaryperspective of animal microRNAs and their targets,” Journalof Biomedicine and Biotechnology. In press.
[24] J. Winter, S. Jung, S. Keller, R. I. Gregory, and S. Diederichs,“Many roads to maturity: microRNA biogenesis pathways andtheir regulation,” Nature Cell Biology, vol. 11, no. 3, pp. 228–234, 2009.
[25] Y. Altuvia, P. Landgraf, G. Lithwick, et al., “Clustering andconservation patterns of human microRNAs,” Nucleic AcidsResearch, vol. 33, no. 8, pp. 2697–2706, 2005.
[26] F. Ozsolak, L. L. Poling, Z. Wang, et al., “Chromatin structureanalyses identify miRNA promoters,” Genes and Development,vol. 22, no. 22, pp. 3172–3183, 2008.
[27] A. Rodriguez, S. Griffiths-Jones, J. L. Ashurst, and A. Bradley,“Identification of mammalian microRNA host genes andtranscription units,” Genome Research, vol. 14, no. 10A, pp.1902–1910, 2004.
[28] N. Liu, K. Okamura, D. M. Tyler, M. D. Phillips, W.-J. Chung,and E. C. Lai, “The evolution and functional diversificationof animal microRNA genes,” Cell Research, vol. 18, no. 10, pp.985–996, 2008.
[29] K. Okamura, W.-J. Chung, and E. C. Lai, “The long and shortof inverted repeat genes in animals: microRNAs, mirtrons andhairpin RNAs,” Cell Cycle, vol. 7, no. 18, pp. 2840–2845, 2008.
[30] Y.-K. Kim and V. N. Kim, “Processing of intronic microRNAs,”EMBO Journal, vol. 26, no. 3, pp. 775–783, 2007.
[31] S. Baskerville and D. P. Bartel, “Microarray profiling ofmicroRNAs reveals frequent coexpression with neighboringmiRNAs and host genes,” RNA, vol. 11, no. 3, pp. 241–247,2005.
[32] N. R. Smalheiser, “EST analyses predict the existence of a pop-ulation of chimeric microRNA precursor-mRNA transcriptsexpressed in normal human and mouse tissues,” GenomeBiology, vol. 4, no. 7, article 403, 2003.
[33] J. M. Pawlicki and J. A. Steitz, “Primary microRNA transcriptretention at sites of transcription leads to enhanced microRNAproduction,” Journal of Cell Biology, vol. 182, no. 1, pp. 61–76,2008.
[34] J. M. Pawlicki and J. A. Steitz, “Subnuclear compartmentaliza-tion of transiently expressed polyadenylated pri-microRNAs:processing at transcription sites or accumulation in SC35 foci,”Cell Cycle, vol. 8, no. 3, pp. 345–356, 2009.
[35] R. I. Gregory, K.-P. Yan, G. Amuthan, et al., “The Micropro-cessor complex mediates the genesis of microRNAs,” Nature,vol. 432, no. 7014, pp. 235–240, 2004.
[36] R. I. Gregory, T. P. Chendrimada, and R. Shiekhattar,“MicroRNA biogenesis: isolation and characterization of themicroprocessor complex,” Methods in Molecular Biology, vol.342, pp. 33–47, 2006.
[37] A. Shiohama, T. Sasaki, S. Noda, S. Minoshima, and N.Shimizu, “Nucleolar localization of DGCR8 and identificationof eleven DGCR8-associated proteins,” Experimental CellResearch, vol. 313, no. 20, pp. 4196–4207, 2007.
[38] X. Wen, S. Tannukit, and M. L. Paine, “TFIP11 interactswith mDEAH9, an RNA helicase involved in spliceosome
6 Journal of Biomedicine and Biotechnology
disassembly,” International Journal of Molecular Sciences, vol.9, no. 11, pp. 2105–2113, 2008.
[39] M. Morlando, M. Ballarino, N. Gromak, F. Pagano, I. Bozzoni,and N. J. Proudfoot, “Primary microRNA transcripts are pro-cessed co-transcriptionally,” Nature Structural and MolecularBiology, vol. 15, no. 9, pp. 902–909, 2008.
[40] M. J. Dye, N. Gromak, and N. J. Proudfoot, “Exon tethering intranscription by RNA polymerase II,” Molecular Cell, vol. 21,no. 6, pp. 849–859, 2006.
[41] E. H. Bayne, M. Portoso, A. Kagansky, et al., “Splicing factorsfacilitate RNAi-directed silencing in fission yeast,” Science, vol.322, no. 5901, pp. 602–606, 2008.
[42] L.-H. Qu, Y. Henry, M. Nicoloso, et al., “U24, a novelintron-encoded small nucleolar RNA with two 12 nt long,phylogenetically conserved complementarities to 28S rRNA,”Nucleic Acids Research, vol. 23, no. 14, pp. 2669–2676, 1995.
[43] W. Filipowicz and V. Pogacic, “Biogenesis of small nucleolarribonucleoproteins,” Current Opinion in Cell Biology, vol. 14,no. 3, pp. 319–327, 2002.
[44] V. De Turris, G. Di Leva, S. Caldarola, F. Loreni, F. Amaldi, andI. Bozzoni, “TOP promoter elements control the relative ratioof intron-encoded snoRNA versus spliced mRNA biosynthe-sis,” Journal of Molecular Biology, vol. 344, no. 2, pp. 383–394,2004.
[45] T. Hirose, M.-D. Shu, and J. A. Steitz, “Splicing-dependent and-independent modes of assembly for intron-encoded box C/DsnoRNPs in mammalian cells,” Molecular Cell, vol. 12, no. 1,pp. 113–123, 2003.
[46] P. K. Yang, C. Hoareau, C. Froment, B. Monsarrat, Y.Henry, and G. Chanfreau, “Cotranscriptional recruitment ofthe pseudouridylsynthetase Cbf5p and of the RNA bindingprotein Naf1p during H/ACA snoRNP assembly,” Molecularand Cellular Biology, vol. 25, no. 8, pp. 3295–3304, 2005.
[47] P. Richard, A. M. Kiss, X. Darzacq, and T. Kiss, “Cotranscrip-tional recognition of human intronic box H/ACA snoRNAsoccurs in a splicing-independent manner,” Molecular andCellular Biology, vol. 26, no. 7, pp. 2540–2549, 2006.
[48] E. Berezikov, W.-J. Chung, J. Willis, E. Cuppen, and E. C. Lai,“Mammalian mirtron genes,” Molecular Cell, vol. 28, no. 2, pp.328–336, 2007.
[49] J. G. Ruby, C. H. Jan, and D. P. Bartel, “Intronic microRNAprecursors that bypass Drosha processing,” Nature, vol. 448,no. 7149, pp. 83–86, 2007.
[50] S.-Y. Ying and S.-L. Lin, “Current perspectives in intronicmicro RNAs (miRNAs),” Journal of Biomedical Science, vol. 13,no. 1, pp. 5–15, 2006.
[51] N. Gromak, G. Talotti, N. J. Proudfoot, and F. Pagani,“Modulating alternative splicing by cotranscriptional cleavageof nascent intronic RNA,” RNA, vol. 14, no. 2, pp. 359–366,2008.
[52] J. Y. Leung, F. T. Kolligs, R. Wu, et al., “Activation of AXIN2expression by beta-catenin-T cell factor: a feedback repressorpathway regulating Wnt signaling,” Journal of BiologicalChemistry, vol. 277, no. 24, pp. 21657–21665, 2002.
[53] O. Brandman and T. Meyer, “Feedback loops shape cellularsignals in space and time,” Science, vol. 322, no. 5900, pp. 390–395, 2008.
[54] Z. Zhou, L. J. Licklider, S. P. Gygi, and R. Reed, “Comprehen-sive proteomic analysis of the human spliceosome,” Nature,vol. 419, no. 6903, pp. 182–185, 2002.
[55] J. Sperling, M. Azubel, and R. Sperling, “Structure andfunction of the pre-mRNA splicing machine,” Structure, vol.16, no. 11, pp. 1605–1615, 2008.
[56] M. C. Wahl, C. L. Will, and R. Luhrmann, “The spliceosome:design principles of a dynamic RNP machine,” Cell, vol. 136,no. 4, pp. 701–718, 2009.
[57] M. de la Mata, C. R. Alonso, S. Kadener, et al., “A slow RNApolymerase II affects alternative splicing in vivo,” MolecularCell, vol. 12, no. 2, pp. 525–532, 2003.

Hindawi Publishing CorporationJournal of Biomedicine and BiotechnologyVolume 2009, Article ID 803069, 9 pagesdoi:10.1155/2009/803069
Review Article
Computational Challenges in miRNA Target Predictions:To Be or Not to Be a True Target?
Christian Barbato,1 Ivan Arisi,2 Marcos E. Frizzo,3 Rossella Brandi,2
Letizia Da Sacco,4 and Andrea Masotti4
1 European Brain Research Institute-Fondazione EBRI-Rita Levi-Montalcini, Via del Fosso di Fiorano, 64/65, 00143 Roma, Italy2 Neurogenomics Facility, European Brain Research Institute-Fondazione EBRI-Rita Levi-Montalcini, Via del Fosso di Fiorano,64/65, 00143 Roma, Italy
3 Departamento de Ciencias Morfologicas, ICBS, UFRGS, Rua Sarmento Leite 500, Porto Alegre, RS, CEP 90050-170, Brazil4 Gene Expression - Microarrays Laboratory, Bambino Gesu Children’s Hospital, P.za S.Onofrio 4, 00165 Roma, Italy
Correspondence should be addressed to Andrea Masotti, [email protected]
Received 2 January 2009; Accepted 20 March 2009
Recommended by Zhumur Ghosh
All microRNA (miRNA) target—finder algorithms return lists of candidate target genes. How valid is that output in a biologicalsetting? Transcriptome analysis has proven to be a useful approach to determine mRNA targets. Time course mRNA microarrayexperiments may reliably identify downregulated genes in response to overexpression of specific miRNA. The approach may misssome miRNA targets that are principally downregulated at the protein level. However, the high-throughput capacity of the assaymakes it an effective tool to rapidly identify a large number of promising miRNA targets. Finally, loss and gain of function miRNAgenetics have the clear potential of being critical in evaluating the biological relevance of thousands of target genes predicted bybioinformatic studies and to test the degree to which miRNA-mediated regulation of any “validated” target functionally mattersto the animal or plant.
Copyright © 2009 Christian Barbato et al. This is an open access article distributed under the Creative Commons AttributionLicense, which permits unrestricted use, distribution, and reproduction in any medium, provided the original work is properlycited.
1. Introduction
The microRNA- (miRNA-) guided “RNA” silencing pathwayis a recently discovered process that is able to regulategene expression by acting on messenger RNA (mRNA) atposttranscriptional level. miRNA biogenesis is mediated byDicer which catalyzes the processing of double-strandedRNAs (dsRNAs) into ≈22 nt-long small miRNAs. Theinitial transcript, or “primary miRNA” (pri-miRNA), can behundreds to thousands nucleotides long and, like any otherPol II transcript, undergoes capping and polyadenylation.The mature miRNA is part of a 60 to 80-nucleotide stem-loop structure contained within the pri-miRNA. The firststep in miRNA biogenesis occurs in the nucleus and requiresthe excision of this hairpin structure. The excised hairpin,called pre-miRNA, is exported to the cytoplasm, and thepre-miRNA is then processed by another RNase III enzymecalled Dicer. This endonuclease removes the loop region of
the hairpin, releasing the mature miRNA:miRNA∗ duplex.During the assembly of the RNA-induced silencing complex(RISC) with the miRNA, only one strand of the duplexis loaded, whereas the complementary miRNA∗ strand isremoved and degraded. The mature miRNA is now readyto direct its activity on a target mRNA by binding miRNAresponsive elements usually located in the 3’untranslatedregion (3’UTR) of the transcript. This association may resultin either cleavage or translational repression of the targetmRNA, depending on the degree of base-pairing betweenthe miRNA and the responsive element. Perfect complemen-tarity generally results in cleavage, whereas imperfect base-pairing leads to translational repression. These alternativeeffects might also reflect differences in the biochemicalcomposition of the RISC complex associated to each specificmiRNA:mRNA duplex. The proteins in the Argonaute(AGO) family are very tightly bound to small single-strandedRNAs within RISC, as the RNA-protein interaction persists

2 Journal of Biomedicine and Biotechnology
even under high-salt conditions. The PAZ domain of Agohas been implicated in RNA binding, and the PIWI domainseems to furnish RISC with effector-nuclease function [1].The wide range of molecular weights reported for RISCcomplex (between 140 and 500 kDa) represents severaldifferent versions of the complex that contain other factorsin addition to AGO. Because the other components of RISCare not required for slicing, they may have a role in otheraspects of RISC activity, for example, substrate turnoverand/or RISC subcellular localization. This variation may alsorepresent species differences or may reflect developmental-or tissue-specific variations in RISC composition. The exactcomposition of the RISC complex is currently unknown[2].
miRNA genes represent about 1%-2% of the knowneukaryotic genomes and constitute an important classof fine-tuning regulators that are involved in severalphysiological or disease-associated cellular processes. miR-NAs are conserved throughout the evolution, and theirexpression may be constitutive or spatially and tempo-rally regulated. Even in viral infections these small non-coding RNAs can contribute to the repertoire of host-pathogen interactions. The resources needed to study indetails such interactions or to investigate their therapeuticimplications have been recently reviewed [3]. Increasingefforts have been made to identify the specific targetsof miRNAs, leading to speculation that miRNAs mayregulate at least 30% of human genes. Computationalpredictions suggest that each miRNA can target morethan 200 transcripts and that a single mRNA may beregulated by multiple miRNAs [4]. This entails that miRNAsand their targets are part of complex regulatory net-work and outline the widespread impact of miRNAs onboth the expression and evolution of protein-coding genes[5].
The mechanism of miRNA-mediated gene regulationremains controversial. However, artificial tethering of AGOproteins to the 3’UTR of a reporter mRNA is sufficient toinduce its translational repression. This evidence suggeststhat miRNAs may act to guide the deposition of the RISCcomplex onto a specific site of the target mRNA [6].
To date, the computational identification of miRNAtargets and the validation of miRNA-target interactionsrepresent fundamental steps in disclosing the contribu-tion of miRNAs toward cell functions. The predictionof miRNA targets by computational approaches is basedmainly on miRNAs complementarity to their target mRNAs,and several web-based or stand-alone computer soft-wares are used to predict miRNA targets [4]. Amongthem, TargetScanS, PicTar, and miRanda are the mostcommon target prediction programs while miRBase, Arg-onaute, miRNAMap, and miRGen are databases combiningthe compilation of miRNAs with target prediction mod-ules.
Here, we summarize and discuss the most recent insilico and biological approaches aimed to unravelling thefunctional interactions between miRNAs and their targetswith a special emphasis to combined methods for moreaccurate miRNA target gene prediction.
2. Combining mRNA and miRNA ExpressionProfiles for an Accurate Target Prediction
It is now well established that the formation of a double-stranded RNA duplex through the binding of miRNAto mRNA in the RNA-induced silencing complex (RISC)triggers either the degradation of the mRNA transcript orthe inhibition of protein translation. However, experimentalidentification of miRNA targets is not straightforward,and in the last few years, many computational methodsand algorithms have been developed to predict miRNAtargets [7]. Even though target prediction criteria may varywidely, most often they include: (1) strong Watson-Crickbasepairing of the 5′ seed (i.e., positions 2–8) of the miRNAto a complementary site in the 3’UTR of the mRNA,(2) conservation of the miRNA binding site, and (3) alocal miRNA-mRNA interaction with a positive balance ofminimum free energy (MFE). These requirements shouldbe accompanied by a good structural accessibility of thesurrounding mRNA sequence. However, it is likely thatother important parameters for functional miRNA-targetinteractions remain to be identified.
The first step in the prediction procedure requiresthe identification of potential miRNA binding sites in themRNA 3’UTR according to specific base-pairing rules. Thesecond step involves the implementation of cross-speciesconservation requirements [8]. Among the most popularprediction algorithms, we recall PicTar [9], TargetScan [10],and miRanda [11]. Each algorithm has a definite rate ofboth false positive and false negative predictions [7]. Incommon practice, more than one algorithm is used to makereliable predictions about a particular gene or a specificmiRNA.
Surprisingly, different algorithms provide different pre-dictions, and the degree of overlap between different lists ofpredicted targets is sometimes poor or null [8].
It has been predicted that up to 30% of mammaliangenes are regulated by miRNAs [11–13], and many reg-ulatory patterns are likely to be regulated by them [14].However, when the number of genes under study is on theorder of several hundreds or thousands (like in microarrayexperiments), a gene-by-gene search of miRNA targets ofinterest becomes impractical. Furthermore, when dealingwith such a number of genes that may be coregulated,the evaluation of groups of genes with common bindingsites for one or specific miRNAs or families of miRNAs issurely more informative. This goal may be reached usingclassical enrichment statistics, testing over-representation ofthe miRNA target predictions within the selected set ofgenes (see also next paragraph): the statistical methods aresimilar to those used for the Gene Ontology annotation(http://www.geneontology.org/GO.tools.html).
However, few prediction algorithms able to clarifymiRNA function or integrate data coming from differ-ent experimental high-throughput techniques are currentlyavailable. Therefore, there is the need to develop accuratecomputational methods for the identification of functionalmiRNA-target interactions. Undoubtedly, a computationalmethod able to efficiently combine gene expression studies

Journal of Biomedicine and Biotechnology 3
Table 1: Common softwares for “–omics” data analysis allowing in-depth analysis of high-throughput data.
Method name Reference Brief descriptionComputerplatform
Webinterface
Availability URL
Babelomics
Al-Shahrouret al.2006
Web-based tools for genomicdata analysis. Gene annotationsinclude predicted microRNA
Any platform,web browser
yes Free access http://www.babelomics.org/
M@ia
LeBechecet al.2008
Modular tools for genomic dataanalysis. Gene annotationsinclude predicted microRNA
Linux, MacOs,Windows. PHPlanguage, Apacheweb server andMySQL databaserequired
no Open-source http://maia.genouest.org/
TIGR Multiex-perimentViewer (MeV)
Integrated environment for-omics data analysis. Geneannotations include predictedmicroRNA
Windows,MacOs; Javarequired.
noFreeexecutable
http://www.tm4.org/mev.html
BRB-ArrayTools
Tools for -omics data analysis.The working environment isMicrosoft Excel, an R engine isproviding to Excel through andadd-in module. Geneannotations include predictedmicroRNA
Windows. Java,Excel and Rlanguagerequired
noFreeexecutable
http://linus.nci.nih.gov/∼brb/download.html
GeneSpringGX
Integrated environment for-omics data analysis. Geneannotations include predictedmicroRNA
Windows, Javarequired
no
Commercialfrom AgilentTechnologies,free trial
http://www.silicongenetics.com/
IngenuityPathwayAnalysis
Integrated environment for-omics data analysis. Geneannotations include predictedmicroRNA. Functionalannotation and analysis ofbiological networks.
Windows, Javarequired
no
CommercialfromIngenuitySystems Inc.,free trial
http://www.ingenuity.com/index.html
RBionconductor
A common open sourceenvironment for -omics dataanalysis and statistics. Itincludes tools for microRNAanalysis and annotation.
Linux, MacOs,Windows.
no Open Source http://www.bioconductor.org/
(mRNA profiles) with miRNAs expression profiles for areliable prediction of miRNA target is essential. In fact, usingthe results of both miRNA and gene expression profiling,the prediction of miRNA-mRNA associations through theidentification of anticorrelated pairs should be refined; basedon the well-established knowledge of miRNA function,an upregulation of a specific miRNA will lead to lowerexpression of its mRNA targets, and a downregulation of aspecific miRNA will lead to higher levels of its target genes.This effect is more clearly visible from in vitro studies wherethe system is perturbed either by the over-expression orby the silencing of a specific miRNA [15, 16]. Therefore, aranking of downregulated (or upregulated) genes coupledto several mRNA predictions should allow the researcher toobtain a more reliable estimate of the “real” miRNA targetsand finally their function [12, 13].
Unfortunately, so far this approach led to few examples,and the available software and algorithms will be brieflycommented here. In contrast, a biological approach has led
to the development of several techniques that appear tobe efficient alternatives to computational methods. Theseapplications, briefly reviewed in this paper, are able to solve,at least in part, the problem of high-throughput validation ofmiRNA targets in vivo.
2.1. Gene Expression Analysis. Several software for the anal-ysis of “-omics” data are commercially available or free fornonprofit organizations (Table 1). These systems are usuallygeneral purpose environments in which small databasesof experimental samples can be built; the data can befiltered and normalized and also analyzed in depth using anumber of statistical techniques such as analysis of variance(ANOVA), hierarchical clustering, Principal ComponentAnalysis (PCA), among others. The same systems also offerannotation instruments such as enrichment statistics for a setof reference databases, including lists of miRNAs targetingall the known genes. The predictions come usually from

4 Journal of Biomedicine and Biotechnology
Table 2: Algorithms and software tools specifically developed for functional interpretation of miRNA expression data, inference of miRNAgene regulation from mRNA trascriptomic profiles, combination of parallel mRNA and miRNA expression data.
Methodname
Reference Brief descriptionComputerplatform
Webinterface
Availability URL
miRGatorNamet al. [17]
A web-based system to analyzemicroRNA expression data and tointegrate parallel microRNA, mRNA,and protein profiles
Any platform,web browser
yes Free accesshttp://genome.ewha.ac.kr/miRGator/
SigTermsCreightonet al. [18]
Series of Microsoft Excel macros thatcompute an enrichment statistic forover-representation of predictedmicroRNA targets within the analyzedgene set. The software supports PicTar,TargetScan, and miRanda predictionalgorithms.
Windows,Excelrequired
nofree sourcecode
http://sigterms.sourceforge.net/
TopKCEMCLin andDing [19]
Integration of different analysis resultsof the same data, each represented by aranked list of entities. The algorithmfinds the optimal list combining all theinput ones. This system can be appliedto the output lists of differentmicroRNA target predictors as well as todifferent differentially expressed genelists.
Linux,MacOs,Windows. Rlanguage
noOpenSource
http://www.stat.osu.edu/∼statgen/SOFTWARE/TopKCEMC/
GenMIR++Huanget al. [20]
Using a Bayesian learning network, thealgorithm accounts for patterns ofmRNA gene expression using miRNAexpression data and a set of predictedmiRNA targets. A smaller set ofhigh-confidence functional miRNAtargets then obtained from the datausing the algorithm.
Any platform,Matlablanguage
noFreesourcecode
http://www.psi.toronto.edu/genmir/
MIRChengand Li[21]
This method infers the level ofmicroRNA expression starting from thegene expression profile and a gene targetprediction. It is similar to GSEA for theanalysis of gene expression. EverymicroRNA has an enrichment scorebased on the differential expression ofits targets, weighted by a binding energymatrix.
Windows,Linux
noFreeexecutable
http://leili-lab.cmb.usc.edu/yeastaging/projects/microrna
the most popular computational predictors (TargetScan,PicTar, Miranda) and are not validated by databases ofexperimental miRNA-mRNA interactions. Given any mRNAexpression profile and a selected gene list, this approachallows a first investigation of the miRNAs likely to directlymodulate, at least partially, the mRNA degradation rate orindirectly modulate the mRNA transcription and translationrates. These techniques are not specifically tailored tothe problem of integrating parallel miRNA and mRNAgene profiles obtained within the same experiment butare useful in combining data within the same analyticalenvironment.
Of these tools, only Babelomics is available via web.Algorithms for functional annotation, such as FatiGO, havebeen integrated into a single and user friendly interface.The software GeneSpring is a commercial package thatoffers, together with a wide range of standard and advanced
statistical analysis methods, other enrichment statistics forfunctional annotations. This last feature is further devel-oped in the Ingenuity Pathway Analysis system, specificallydesigned for functional and pathway analysis. Other analysissoftware such as the popular Bioconductor package and theMeV from the TIGR institute, are open source projects thatundergo constant updates. Bionconductor works within theR language environment, which enables it to be directly inte-grated with several other R libraries such as the TopKCEMCreported in Table 2.
2.2. Integration and Analysis of mRNA and miRNA Data.The usefulness of bioinformatic integration of mRNA andmiRNA expression data into an interaction database (Tran-scriptome Interaction Database) [22] was emphasized byChen et al. [23]. However, the functional significance of
Journal of Biomedicine and Biotechnology 5
many miRNAs is still largely unknown due to the difficultyin identifying target genes and the lack of genome wideexpression data combining miRNA results.
In Table 2 there is a list of some recent algorithms ortools developed to investigate the effect of miRNAs on mRNAexpression profiles, to better predict miRNA targets and tointegrate different data sources.
SigTerms is a novel software package (a set of MicrosoftExcel macros) that has been recently developed: for a giventarget prediction database, it retrieves all miRNA-mRNAfunctional pairs represented by an input set of genes [18]. Foreach miRNA, the software computes an enrichment statisticfor over-representation of predicted targets within the geneset. This could help to define roles of specific miRNAsand miRNA-regulated genes in the system under study. Inthe hands of researchers, SigTerms is a powerful tool thatallows rates of false positive and false negative responsesto be minimized. One method to decrease the incidence offalse positive predictions and to narrow down the list ofputative miRNA targets is to compare the in silico targetpredictions to the genes that are differentially expressed inthe biological system of interest. SigTerms can support thistype of analytical approach allowing the user to manipulate,filter, and extract different output from miRNA-mRNA sets.
Another recently reported application is miRGator [17]that integrates target predictions, functional analyses, geneexpression data and genome annotations. Since the functionof miRNA is mostly unknown, diverse experimental andcomputational approaches have been applied to elucidatetheir role [24, 25]. In this context, miRGator provides a util-ity for statistical enrichment tests of target genes, performedfor gene ontology (GO) function, GenMAPP and KEGGpathways, and for various diseases. Expression correlationbetween miRNA and target mRNA/proteins is evaluated, andtheir expression patterns can be readily compared with auser friendly interface. At present, miRGator supports onlyhuman and mouse genomes.
Another major task facing researchers studying com-plex biological systems is the integration of data fromhigh-throughput “-omics” platforms such as DNA vari-ations, transcriptome profiles, and RNAomics. Recently,some miRNA-bioinformatic aspects like the biological andtherapeutic repertoire of miRNAs, the in silico predictionof miRNA genes and their targets, and the bioinformaticchallenges lying ahead have been reviewed [26]. Combinedmodeling of multiple raw datasets can be extremely challeng-ing due to their enormous differences, while rankings fromeach dataset might provide a common base for integration.Aggregation of miRNA targets, predicted from differentcomputational algorithms is one of these problems. Anotherchallenging issue is the integration of results from multiplemRNA studies based on different platforms. However, oneof the methods recently proposed in the literature makesuse of a global optimization technique, the so-called CrossEntropy Monte Carlo (CEMC) [19]. This algorithm, calledTopKCEMC, searches iteratively for the optimal list thatminimizes the sum of weighted distances between thecandidate (aggregate) list and each of the input-rankedlists. The distance between two ranked lists is measured
using both the modified Kendall’s tau measure and theSpearman’s footrule [27]. The application of this techniquein the field of miRNA seems appropriate when the diversepredicted targets from different computational algorithmsare combined together to give an aggregate list that ismore informative for downstream experiments [12, 13]. Thisalgorithm is a clear example of what we think may be wellsuited for combining mRNA and miRNA data to furnish alist of more reliable miRNA targets. In fact, the comparisonshould be made combining the “classical” list of miRNAtargets (obtained from different prediction softwares) and alist of ranked downregulated (or upregulated) mRNAs.
Another proposed method of inferring the effectiveregulatory activities of miRNAs requires integrating microar-ray expression data with miRNA target predictions. Aspreviously mentioned, the method is based on the idea thatregulatory activity changes of miRNAs could be reflected bythe expression changes of their target transcripts (measuredby microarray techniques) [21]. To verify the hypothesis,this method has been applied to selected microarray datasets measuring gene expression changes in cell lines aftertransfection or inhibition of specific miRNAs. Results indi-cate that this method can detect activity enhancement ofthe transfected miRNAs as well as activity reduction ofthe inhibited miRNAs with high sensitivity and specificity.Furthermore, this inference is robust with respect to falsepositive predictions (i.e., nonspecific interactions whensilencing a miRNA or when the gene downregulation iserroneously associated to a direct miRNA targeting) [15].This method is a generalization of the gene set enrichmentanalysis (GSEA), which was proposed to identify gene setsassociated with expression change profiles [28].
The first example of a direct correlation between mRNAexpression levels and the 3’UTR motif composition has beenrecently reported [29]. This algorithm, a novel applicationof REDUCE [30], has also led to the hypothesis thatthe number of vertebrate miRNA could be larger thanpreviously estimated. The algorithm’s rationale is based onthe assumption that motifs within 3’UTRs make a linearcontribution to enhancing or inhibiting mRNA levels. Thesignificant motifs are chosen by iteratively looking at theindividual contribution that brings the greatest reduction inthe difference between the model and the expression data.Motifs with a P-value lower than a defined threshold areretained and listed. This method was ultimately demon-strated to be more sensitive than the current target predictionalgorithms not relying on cross-species comparisons.
The same approach has been followed in another recentpaper [31]. Here, the authors demonstrated that the effect ofa miRNA on its target mRNA levels can be measured withina single gene expression profile. This method, however, useda known public dataset of expression both for miRNA andmRNA, limiting the usefulness of the conclusions. However,the success of this approach has revealed the vast potential forextracting information about miRNA function from othergene expression profiles.
A novel Bayesian model and learning algorithm, Gen-MiR++ (Generative model for miRNA regulation), hasalso been proposed. GenMiR++ accounts for patterns of

6 Journal of Biomedicine and Biotechnology
Table 3: Other computational and experimental approaches capable of performing more reliable analysis by combining miRNA and mRNAexpression data.
Reference Brief description Computer platform
Kort et al. [32]Two signatures of differentially expressed mRNAs and microRNAsare used to cluster the data. Qualitative combination of mRNA andmicroRNA expression data.
Any platform, web browser, Rlanguage
Lanza et al. [33]One signature of differentially expressed mRNAs and microRNAs incombination is used to correctly cluster the data. Qualitativecombination of mRNA and microRNA expression data.
Any platform, GeneSpring software
Salter et al. [34]Qualitative combining of mRNA profiling and microRNA expression,by clustering separately the data and analyzing differentiallymodulated pathways.
Any platform, GeneSpring software, RLanguage, GenePattern software
Nicolas et al. [15] Experimental identification of real microRNA targets byoverexpression or silencing of miR-140.
Any platform, web browser
Sood et al. [29] A computational tool to directly correlate 3’UTR motifs with changesin mRNA levels upon miRNA overexpression or knockdown.
Linux, Cygwin (Windows), Mac OS X,SunOS platform. A web version is alsoavailable
gene expression using miRNA expression data and a setof candidate miRNA targets [20]. A set of high-confidencefunctional miRNA targets is obtained from the data using aBayesian learning algorithm. With this model, the expressionof a targeted mRNA transcript can be explained through theregulatory action of multiple miRNAs. GenMiR++ allowsaccurate identification of miRNA targets from both sequenceand expression data and allows the recovery of a significantnumber of experimentally verified targets, many of whichprovide insight into miRNA regulation.
In Table 3 we summarize some research articles wherethe authors have combined expression data for miRNA andmRNA, using standard analytical techniques but without theuse of specifically designed algorithms.
In a recent approach aimed at identifying miRNA targets,an experimental and analysis workflow was used to finda set of genes whose expression is modulated by miR-140 [15]. This method is based on the manipulation ofa miRNA activity in mouse cell lines, where miR-140is expressed at a moderate level, thus making it easierboth to repress or enhance its activity. Expression ofmRNAs repressed or enhanced upon miRNA overexpressionand silencing, respectively, was profiled. Within the setobtained by the intersection of the up- and down regulatedmRNAs measured by microarrays, the authors searchedfor complementary seed sequences in the 3’UTR sectionof transcripts: 21 out of 49 mRNAs were identified ascandidate direct targets, while the others as potential indirectones. Interestingly, none of the 21 identified candidateswere computed by popular predictors such as TargetScan,MiRBase, and PiCTar, though one of these targets, Cxcl12,was validated by Northern Blot and Luciferase assay. Thismethod suggests that the use of more cell lines wouldcertainly increase the set of experimentally identified targets.In fact, since some of them were already found to haveescaped the analysis, they were unaffected by the type ofcell manipulation chosen in this approach. This methodappears to be conservative and tends to find false negative
targets especially if they are not affected at the mRNAlevel.
A different type of combined analysis of mRNA andmiRNA profiles is often used in the field of tumors:cancers may be classified into various subclasses or mayrespond differently to various chemotherapeutic procedures.To correctly distinguish two subtypes of carcinomas (i.e., thecolorectal cancer that can be characterized by microsatellitepathway either stability or instability), the authors haveidentified two different gene signatures from the mRNA andmiRNA expression profiles [33]. The two signatures wereextracted by standard statistical techniques such as correctT-test, PAM (Prediction Analysis of Microarray) and SVM(support vector machine, provided by Gene Spring software,see Table 1). Then, their ability to classify the samples wastested through a hierarchical clustering, both separately andtogether. Results showed that the better performance wasobtained when the two signatures were combined togetherin a single clustering tree, proving once more the well-assessed crucial role played by miRNAs in the genesis ofcancers. Both mRNA and miRNA gene profiles coupledto hierarchical clustering techniques were recently used inobtaining a deeper understanding of the cancer biology ofthe Wilm’s tumor [32].
A serious problem that affects the results of antineo-plastic treatments is, together with a correct diagnosis andclassification, the choice of the right chemotherapeutic agent[34]. Again, both mRNA and miRNA expression signaturesof sensitive and resistant cell lines were used to predictpatient response to a panel of commonly used chemotherapyagents. The signatures were first used to cluster analyzesamples from real breast cancer patients, then also as pre-dictors to separate patients into nonresponders/respondersto each treatment. The miRNA profiles were also finallyanalyzed to investigate the biological mechanisms underlyingthe resistance/response to the agents used in the study,making use of the prior knowledge about the experimentallyvalidated targets of the selected miRNAs.

Journal of Biomedicine and Biotechnology 7
3. Novel Biochemical Approaches formiRNA Target Characterization.
Finally, we would like to report a few examples that showhow a biochemical approach may overcome all the difficultiesencountered with the computational approach.
So far, the small number of available validated miRNAtargets has hindered the evaluation of the accuracy ofmiRNA-target prediction software. Recently, the “mirWIP”method has been proposed for the capture of all knownconserved miRNA-mRNA target relationships in Caenorhab-ditis elegans, with a lower false positive rate than otherstandard methods [35]. This quantitative miRNA targetprediction method allows an accurate weighting of someimmunoprecipitation-enriched parameters, finally optimiz-ing sensitivity to verified miRNA-target interactions andspecificity.
As indicative examples, two recent studies on C. elegansused immunoprecipitation of miRNA-containing ribonucle-oprotein complexes and evaluated that only 30%–45% ofmiRNAs associated with these complexes contain perfectlymatched, conserved seed elements in their 3’UTRs [36, 37].Although these datasets have provided important insightsinto parameters associated with functional interactions,this approach is limited to the detection of miRNA-targetinteractions that result in transcript destabilization anddoes not identify stable, translationally repressed targetmRNAs. Recently, immunoprecipitation of the RISC hasbeen used to identify mRNAs that stably associate with theendogenous RISC [38]. This study recovered 3404 mRNAtranscripts that specifically coprecipitate with the miRNA-induced silencing complex (miRISC) proteins AIN-1 andAIN-2. This “AIN-IP” set of mRNA transcripts provideda biologically derived estimate of how many genes aretargeted by miRNAs: in this case, at least one-sixth of C.elegans genes. The authors used these features to developthe prediction algorithm mirWIP, which scores miRNAtarget sites by weighting site characteristics in proportion totheir enrichment in the experimental AIN-IP set. MirWIPhas improved overall performance compared to previousalgorithms, in both recovery of the AIN-IP transcripts andcorrect identification of genetically verified miRNA-targetrelationships without a requirement for alignment of targetsequences. MirWIP in its current form is supported byimmunoprecipitation experiments that identify transcriptsby their probable association with miRNAs, even if theseexperiments do not directly provide information about whatparticular miRNA (or set of miRNAs) is responsible formiRISC association.
Finally, because the miRISC immunoprecipitation ap-proach may be biased toward the identification of stablemiRNA-target complexes, miRNA-induced target destabi-lization can be screened using complementary datasets, suchas microarray assays to identify mRNA transcripts thatchange in response to miRNA activity.
To overcome the above mentioned difficulties and sincethe identification of the downstream targets of miRNAs isessential to understand cellular regulatory networks, a directbiochemical method for miRNA target discovery has been
proposed that combines RISC purification with microarrayanalysis of bound mRNAs [39]. A biochemical method ofidentifying miRNA targets holds the promise of deepeningthe understanding of the determinants of miRNA-mediatedregulation, particularly by revealing targets that are repressedwithout changes in mRNA levels. Identification of this classof targets will provide an opportunity to study sequencesor structural features determining miRNAs regulatory fate.As a model, miR-124a has been used because its targetsare well known and studied. This method consisted in theAgo2 co-immunoprecipitation of mRNA targets followedby microarray profiling of mRNAs. As a result, it hasbeen proven that not only most of the immunoprecipitatedmRNAs analyzed were direct miR-124a targets but also asignificant subset was downregulated.
4. Conclusions
A novel sequencing era is going to dramatically changeour view of studying gene expression, posttranscriptionalmodifications, DNA copy number variations, and SNPs.Novel high-throughput sequencing techniques are emergingat an impressive speed on the market and on the scientificcommunity. In the near future, these novel approaches willsurely help to elucidate the function of miRNAs and theirrole as fine regulators. One of the most important recentlyreported work is based on this approach [40]. Whereasconventional methods rely on computational predictionand subsequent experimental validation of target RNAs,the proposed method consists in the direct sequencingof more than 28 000 000 signatures from the 5′ ends ofpolyadenylated products of miRNA-mediated mRNA decay.Briefly, by matching millions of 5′ end sequences of RNAcleavage products back to their corresponding sequencesin the genome, additional sequences flanking the potentialcleavage sites were identified. These were used to identifymatches to known or new potential miRNAs that could directtheir cleavage. Even though this study was conducted onArabidopsis thaliana, we expect that the proposed methodwill also be rapidly applied to other genomes for theunderstanding of the role and functions of miRNAs.
In summary, we have addressed the issue of combiningmRNA and miRNA expression data from different pointsof view. While biological validation of a predicted targetis critical, failure to biologically validate the expressionof a certain miRNA does not necessarily imply that thebioinformatic approach is incorrect. It is possible thatthe miRNA is not expressed in the examined tissues, themiRNA is expressed only in specific phase of cell cycle,or that the miRNA is expressed in low abundance, whichescapes detection by the technique used. This latter cause isespecially problematic for miRNA that shares a high degreeof sequence homology with another miRNA. Expression ofan abundant miRNA may therefore mask the expression ofa rare one that is very similar in sequence, especially whenusing polymerase chain reaction amplification. While severalmethods already exist to predict miRNA targets, albeit witha heterogeneous and wide range of results, there are few

8 Journal of Biomedicine and Biotechnology
tools and algorithms or even only analysis workflow capableof elucidating the functional role of miRNAs. The wideravailability of experimentally validated miRNA targets andtheir action mechanisms will certainly permit in the nearfuture more reliable computational predictions.
Acknowledgment
The authors thank editors and reviewers for their usefulsuggestions and comments to improve the manuscript.This work was supported by grants of the Italian Min-istry of Health (to A.M and L.D.S), partially funded by“Project EBRI-IIT” of the Italian Institute of Technology(IIT) and supported by “Fondazione Alazio Award 2007”(http://www.fondazionealazio.org/ - Via Torquato Tasso 22,90144 Palermo) (to C.B).
References
[1] J.-J. Song, S. K. Smith, G. J. Hannon, and L. Joshua-Tor,“Crystal structure of argonaute and its implications for RISCslicer activity,” Science, vol. 305, no. 5689, pp. 1434–1437,2004.
[2] V. N. Kim, J. Han, and M. C. Siomi, “Biogenesis of small RNAsin animals,” Nature Reviews Molecular Cell Biology, vol. 10, no.2, pp. 126–139, 2009.
[3] Z. Ghosh, B. Mallick, and J. Chakrabarti, “Cellular versus viralmicroRNAs in host-virus interaction,” Nucleic Acids Research,vol. 37, no. 4, pp. 1035–1048, 2009.
[4] M. Lindow and J. Gorodkin, “Principles and limitations ofcomputational microRNA gene and target finding,” DNA andCell Biology, vol. 26, no. 5, pp. 339–351, 2007.
[5] D. P. Bartel, “MicroRNAs: target recognition and regulatoryfunctions,” Cell, vol. 136, no. 2, pp. 215–233, 2009.
[6] R. S. Pillai, C. G. Artus, and W. Filipowicz, “Tethering ofhuman Ago proteins to mRNA mimics the miRNA-mediatedrepression of protein synthesis,” RNA, vol. 10, no. 10, pp.1518–1525, 2004.
[7] N. Rajewsky, “microRNA target predictions in animals,”Nature Genetics, vol. 38, supplement 1, pp. S8–S13, 2006.
[8] P. Sethupathy, M. Megraw, and A. G. Hatzigeorgiou, “A guidethrough present computational approaches for the identifica-tion of mammalian microRNA targets,” Nature Methods, vol.3, no. 11, pp. 881–886, 2006.
[9] A. Krek, D. Grun, M. N. Poy, et al., “Combinatorial microRNAtarget predictions,” Nature Genetics, vol. 37, no. 5, pp. 495–500, 2005.
[10] B. P. Lewis, C. B. Burge, and D. P. Bartel, “Conserved seedpairing, often flanked by adenosines, indicates that thousandsof human genes are microRNA targets,” Cell, vol. 120, no. 1,pp. 15–20, 2005.
[11] B. John, A. J. Enright, A. Aravin, T. Tuschl, C. Sander, and D. S.Marks, “Human microRNA targets,” PLoS Biology, vol. 2, no.11, article e363, pp. 1–18, 2004.
[12] B. P. Lewis, I.-H. Shih, M. W. Jones-Rhoades, D. P. Bartel, andC. B. Burge, “Prediction of mammalian microRNA targets,”Cell, vol. 115, no. 7, pp. 787–798, 2003.
[13] X. Xie, J. Lu, E. J. Kulbokas, et al., “Systematic discoveryof regulatory motifs in human promoters and 3′ UTRs bycomparison of several mammals,” Nature, vol. 434, no. 7031,pp. 338–345, 2005.
[14] J. Li, G. Musso, and Z. Zhang, “Preferential regulationof duplicated genes by microRNAs in mammals,” GenomeBiology, vol. 9, no. 8, article R132, pp. 1–10, 2008.
[15] F. E. Nicolas, H. Pais, F. Schwach, et al., “Experimentalidentification of microRNA-140 targets by silencing andoverexpressing miR-140,” RNA, vol. 14, no. 12, pp. 2513–2520,2008.
[16] S. S. Li, S. L. Yu, L. P. Kao, et al., “Target identification ofmicroRNAs expressed highly in human embryonic stem cells,”Journal of Cellular Biochemistry, vol. 106, no. 6, pp. 1020–1030,2009.
[17] S. Nam, B. Kim, S. Shin, and S. Lee, “miRGator: an integratedsystem for functional annotation of microRNAs,” NucleicAcids Research, vol. 36, database issue, pp. D159–D164, 2008.
[18] C. J. Creighton, A. K. Nagaraja, S. M. Hanash, M. M. Matzuk,and P. H. Gunaratne, “A bioinformatics tool for linkinggene expression profiling results with public databases ofmicroRNA target predictions,” RNA, vol. 14, no. 11, pp. 2290–2296, 2008.
[19] S. Lin and J. Ding, “Integration of ranked lists via cross entropyMonte Carlo with applications to mRNA and microRNAstudies,” Biometrics, vol. 65, no. 1, pp. 9–18, 2009.
[20] J. C. Huang, Q. D. Morris, and B. J. Frey, “Bayesian inferenceof microRNA targets from sequence and expression data,”Journal of Computational Biology, vol. 14, no. 5, pp. 550–563,2007.
[21] C. Cheng and L. M. Li, “Inferring microRNA activities bycombining gene expression with microRNA target prediction,”PLoS ONE, vol. 3, no. 4, article e1989, pp. 1–9, 2008.
[22] R. W. Georgantas III, R. Hildreth, S. Morisot, et al., “CD34+
hematopoietic stem-progenitor cell microRNA expressionand function: a circuit diagram of differentiation control,”Proceedings of the National Academy of Sciences of the UnitedStates of America, vol. 104, no. 8, pp. 2750–2755, 2007.
[23] A. Chen, M. Luo, G. Yuan, et al., “Complementary analysisof microRNA and mRNA expression during phorbol 12-myristate 13-acetate (TPA)-induced differentiation of HL-60cells,” Biotechnology Letters, vol. 30, no. 12, pp. 2045–2052,2008.
[24] T. W. Nilsen, “Mechanisms of microRNA-mediated generegulation in animal cells,” Trends in Genetics, vol. 23, no. 5,pp. 243–249, 2007.
[25] A. Rodriguez, E. Vigorito, S. Clare, et al., “Requirement ofbic/microRNA-155 for normal immune function,” Science, vol.316, no. 5824, pp. 608–611, 2007.
[26] Z. Ghosh, J. Chakrabarti, and B. Mallick, “miRNomics—the bioinformatics of microRNA genes,” Biochemical andBiophysical Research Communications, vol. 363, no. 1, pp. 6–11, 2007.
[27] R. Fagin, R. Kumar, and D. Sivakumar, “Comparing top klists,” SIAM Journal on Discrete Mathematics, vol. 17, no. 1, pp.134–160, 2003.
[28] A. Subramanian, P. Tamayo, V. K. Mootha, et al., “Geneset enrichment analysis: a knowledge-based approach forinterpreting genome-wide expression profiles,” Proceedingsof the National Academy of Sciences of the United States ofAmerica, vol. 102, no. 43, pp. 15545–15550, 2005.
[29] P. Sood, A. Krek, M. Zavolan, G. Macino, and N. Rajewsky,“Cell-type-specific signatures of microRNAs on target mRNAexpression,” Proceedings of the National Academy of Sciences ofthe United States of America, vol. 103, no. 8, pp. 2746–2751,2006.

Journal of Biomedicine and Biotechnology 9
[30] H. J. Bussemaker, H. Li, and E. D. Siggia, “Regulatory elementdetection using correlation with expression,” Nature Genetics,vol. 27, no. 2, pp. 167–171, 2001.
[31] A. Arora and D. A. C. Simpson, “Individual mRNA expressionprofiles reveal the effects of specific microRNAs,” GenomeBiology, vol. 9, no. 5, article R82, pp. 1–16, 2008.
[32] E. J. Kort, L. Farber, M. Tretiakova, et al., “The E2F3-oncomir-1 axis is activated in Wilms’ tumor,” Cancer Research, vol. 68,no. 11, pp. 4034–4038, 2008.
[33] G. Lanza, M. Ferracin, R. Gafa, et al., “mRNA/microRNA geneexpression profile in microsatellite unstable colorectal cancer,”Molecular Cancer, vol. 6, article 54, pp. 1–11, 2007.
[34] K. H. Salter, C. R. Acharya, K. S. Walters, et al., “An integratedapproach to the prediction of chemotherapeutic response inpatients with breast cancer,” PLoS ONE, vol. 3, no. 4, articlee1908, pp. 1–8, 2008.
[35] M. Hammell, D. Long, L. Zhang, et al., “mirWIP:microRNA target prediction based on microRNA-containingribonucleoprotein-enriched transcripts,” Nature Methods, vol.5, no. 9, pp. 813–819, 2008.
[36] G. Easow, A. A. Teleman, and S. M. Cohen, “Isolation ofmicroRNA targets by miRNP immunopurification,” RNA, vol.13, no. 8, pp. 1198–1204, 2007.
[37] M. Beitzinger, L. Peters, J. Y. Zhu, E. Kremmer, and G. Meister,“Identification of human microRNA targets from isolatedargonaute protein complexes,” RNA Biology, vol. 4, no. 2, pp.76–84, 2007.
[38] L. Zhang, L. Ding, T. H. Cheung, et al., “Systematic identi-fication of C. elegans miRISC proteins, miRNAs, and mRNAtargets by their interactions with GW182 proteins AIN-1 andAIN-2,” Molecular Cell, vol. 28, no. 4, pp. 598–613, 2007.
[39] F. V. Karginov, C. Conaco, Z. Xuan, et al., “A biochemicalapproach to identifying microRNA targets,” Proceedings of theNational Academy of Sciences of the United States of America,vol. 104, no. 49, pp. 19291–19296, 2007.
[40] M. A. German, M. Pillay, D.-H. Jeong, et al., “Global identi-fication of microRNA-target RNA pairs by parallel analysis ofRNA ends,” Nature Biotechnology, vol. 26, no. 8, pp. 941–946,2008.
Hindawi Publishing CorporationJournal of Biomedicine and BiotechnologyVolume 2009, Article ID 952304, 9 pagesdoi:10.1155/2009/952304
Research Article
Novel miR390-Dependent Transacting siRNA Precursors inPlants Revealed by a PCR-Based Experimental Approach andDatabase Analysis
M. S. Krasnikova,1 I. A. Milyutina,2 V. K. Bobrova,2 L. V. Ozerova,3 A. V. Troitsky,2
A. G. Solovyev,1, 2 and S. Y. Morozov2
1 Institute of Agricultural Biotechnology, Russian Academy of Agricultural Sciences, Timiryazevskaya 42, 127550 Moscow, Russia2 A.N. Belozersky Institute of Physico-Chemical Biology, Moscow State University, 119992 Moscow, Russia3 Main Botanic Garden Russian Academy of Sciences, Botanicheskaya 4, 127276 Moscow, Russia
Correspondence should be addressed to S. Y. Morozov, [email protected]
Received 28 February 2009; Accepted 31 July 2009
Recommended by Zhumur Ghosh
TAS loci in plant genomes encode transacting small interfering RNAs (ta-siRNAs) that regulate expression of a number of genes.The function of TAS3 precursor in Arabidopsis thaliana is controlled by two miR390 target sites flanking two ta-siARF sequencestargeting mRNAs of ARF transcription factors. Cleavage of the 3′-miR390-site initiates ta-siRNAs biogenesis. Here we describethe new method for identification of plant ta-siRNA precursors based on PCR with oligodeoxyribonucleotide primers mimickingmiR390. The method was found to be efficient for dicotiledonous plants, cycads, and mosses. Based on sequences of amplified lociand a database analysis, a novel type of miR390-dependent TAS sequences was identified in dicots. These TAS loci are characterizedby a smaller distance between miR390 sites compared to TAS3, a single copy of ta-siARF, and a sequence conservation patternpointing to the possibility that processing of novel TAS-like locus is initiated by cleavage of the 5′-terminal miR390 target site.
Copyright © 2009 M. S. Krasnikova et al. This is an open access article distributed under the Creative Commons AttributionLicense, which permits unrestricted use, distribution, and reproduction in any medium, provided the original work is properlycited.
1. Introduction
Small RNA-mediated gene silencing plays important rolesin many cellular processes, including development, genomemaintenance and integrity, and adaptive responses to bioticand abiotic stress in most eukaryotes. Small RNAs, usually20–25 nucleotides (nt) in length, guide heterochromatinformation, mRNA degradation, translational inhibition, andDNA elimination. In plants, small RNAs are highly diverseand significant progress has been achieved in unraveling thecomponents and mechanisms involved in their biogenesisand function [1–8]. MicroRNAs (miRNAs) are a class ofsmall noncoding RNAs (21-22-nt long) transcribed from thegenomes of all multicellular organisms and some viruses[5, 9–13]. Plant miRNA biogenesis starts with the transcrip-tion of miRNA precursors by RNA polymerase II. Theseprecursors contain the mature miRNA sequence within thestem of a long imperfect RNA hairpin which is processed
in the nucleus by RNaseIII-like protein DCL1 to give animperfect RNA duplex with 2 nt 3′ overhangs on each strand[5, 14, 15]. In total, several dozens of plant miRNA fami-lies (hundreds of individual miRNA species) are currentlyidentified and found to target mainly protein-coding mRNAs[7, 12, 13, 15, 16]. However, some microRNAs guide thecleavage of the non-protein-coding primary transcripts ofTAS genes directing the formation of trans-acting siRNAs(ta-siRNAs). In this case, miRNAs represent a cleavage guiderfor ARGONAUTE (AGO) proteins with RNaseH-like activitythat cleaves TAS single-stranded RNA transcript in the regioncomplementary to small RNA [4]. TAS cleavage product(s)is converted by cooperative action of RNA-binding proteinSGS3 and RNA-polymerase RDR6 to double-stranded formand subsequently processed by DCL4 to produce a clusterof ta-siRNAs that are phased in 21 nt increment relative tothe original cleavage site on both strands [4, 5, 13, 17, 18].The generated 21 nt ta-siRNAs further work as components

2 Journal of Biomedicine and Biotechnology
of RISC complex to guide AGO-dependent cleavage of theirtarget mRNAs. Recent studies have reported that some ta-siRNAs also work as cleavage guiders to cut other TASRNA precursors similarly to microRNA and thus generatesecondary ta-siRNAs with new specificity [19]. Most TASRNA precursors have only single miRNA target motif (e.g.,miR173) positioned 5′ to ta-siRNA-producing site, and thetarget motif is cleaved by AGO1 guided by the respectivemiRNA. However, two miR390 target sites (5′ and 3′ to ta-siRNA site) were shown to be necessary for TAS3 precursorRNA cleavage that appeared to be dependent on specificinteraction between AGO7 and miR390 [4, 18, 20].
In this study, we analyzed TAS3-related sequencesencoded by genomes of different land plants. Using multiplealignments of TAS3-like RNAs in dicotyledonous plants [17,18], we synthesized oligonucleotide primers complementaryto miR390 target sites positioned 5′ and 3′ to ta-siRNAsite. In a control PCR reaction with Arabidopsis thalianachromosomal DNA, we obtained a PCR product of expectedsize. However, in Nicotiana benthamiana and tobacco, inaddition to the PCR products corresponding to TAS3-likeRNAs, we found smaller PCR fragments. Sequencing of thesefragments and further database analysis revealed that theyrepresent a new, previously undescribed, type of miR390-mediated TAS genes producing potential precursors of ta-siARF RNA in different dicotyledonous plants.
2. Materials and Methods
2.1. Plant Material. Plants were taken from collections ofMain Botanic Garden of the Russian Academy of Sciencesand Department of Virology, Moscow State University.Solanaceous plants were germinated in standard growthchamber conditions for several weeks until stage of 6–8leaves.
2.2. Analysis of Nucleic Acids. Genomic plant DNA wasisolated from 200 mg of plant material by DNA extractionkit (Macherey-Nagel) according to the protocol of themanufacturer. Total RNA was isolated from young tobaccoleaves with the Trizol reagent according to the manufacturer’sinstructions (Invitrogen). Digestion of any contaminatingDNA was achieved by treatment of samples with RQIRNase-free DNase (Promega). Reverse transcription wasperformed with 1 µg of total RNA and oligo (dT)-primerusing the RT system (Invitrogen) according to the protocolof the manufacturer. Primers for dicotiledonous plantsand Cycas revoluta were: forward primer: TAS-P 5′-GGT-GCTATCCTATCTGAGCTT-3′ and reverse primers TAS-Mcaa 5′-AGCTCAGGAGGGATAGCAA-3′ and TAS-Maca5′-AGCTCAGGAGGGATAGACA-3′.
The primers for mosses (Physcomitrella-specific) were:forward primers: Bryo TAS-P1 5′-GGCGCTATCCCTCCT-GAGCT-3′ and Bryo TAS-P3 5′-GACGCTACCCTTCCT-GAGCT-3′, reverse primer: Bryo TAS-M 5′-TAGCTCAGG-AGTGATA(G/T)A(C/A)AA-3′. For PCR, 25–35 cycles wereused for amplification with a melting temperature of 95◦C,an annealing temperature of 58◦C (for seed plants) or 60◦C
(for mosses), and an extending temperature of 72◦C, eachfor 30 seconds, followed by a final extension at 72◦C for 3minutes. PCR products were visualized by electrophoresis ofsamples in 1% agarose gel. For cloning, the PCR-amplifiedDNA bands were isolated from gel and ligated into pGEM-T (Promega). In each case, 7–18 independent clones weresequenced. Sequences of 20–50% of clones depending onparticular plant species showed no presence of tasi-ARF RNAsequences and these clones were regarded as false ones. Insome cases (less than 10% of clones), nucleotide sequencesof tasi-ARF precursor genes have the ends (primer sites)which are different by single nucleotide substitutions ordeletions from the primer sequences. We propose that thisdiscrepancy may result from rare mutations after cloning ofPCR products in Escherichia coli.
2.3. GeneBank Accession Numbers. DNA sequences weredeposited at NCBI databank under the following acces-sion numbers: Nicotiana benthamiana—FJ804742; Nicotianatabacum—FJ804743 (“short” TAS) and FJ804751 (classicalTAS); Datura stramonium—FJ804744; Solanum demissum—FJ804745; Physalis longifolia—FJ804746; Brachythecium lat-ifolium (clone 50 Br)—FJ804747; Brachythecium latifolium(clone 47 Br)—FJ804748; Hookeria lucens—FJ804749; Cycasrevolute—FJ804750.
3. Results
To design primers for PCR and cloning of TAS3-like genesfrom Nicotiana benthamiana and Nicotiana tabacum, weused a multiple alignment of TAS3-like RNA precursorsfrom flowering plants published by Axtell and others [18].PCR analysis was performed with two pairs of primers: P-Tas3 corresponded to the 5′ miR390 target site and eitherM-Tas3/caa or M-Tas3/aca, both complementary to the 3′
miR390 target/cleavage site [18, 20]. Control PCR reactionusing chromosomal Arabidopsis thaliana DNA as templateand both paires of primers resulted in efficient synthesisof a single PCR-fragments with expected size of 260 bp(Figure 1(a)) that was in agreement with calculated distancebetween 5′ and 3′ miR390 target sites in Arabidopsis ta-siARFprecursor RNAs [17, 18]. Sequencing of these PCR-amplifiedand cloned DNA fragments confirmed specific amplificationof at least two of three known A. thaliana TAS3 chromosomalloci (data not shown) [17, 21].
PCR amplification of chromosomal DNA from Nicotianabenthamiana and Nicotiana tabacum (cv. Samsun) alsoresulted in synthesis of one major band of 250 bp and 280 bp,respectively (Figure 1(a) and data not shown). Cloning andsequencing of the obtained DNA bands revealed that theamplified sequences contained putative ta-siARF site com-posed of two tandem copies of ARF-specific ta-siRNAs andlocated between miR390 target sites corresponding to PCRprimers. Moreover, amplified sequences showed obvioussimilarity to TAS3-like genes from other dicotyledonousplants (Figure 2) [17, 18]. Bioinformatic analysis of theputative TAS3-like sequences from Nicotiana benthamianaand Nicotiana tabacum using NCBI Blast revealed closely

Journal of Biomedicine and Biotechnology 3
1 2 3 4500400
300
200
100
M
(a)
1 2 3
500400300200
100
M
(b)
Figure 1: Agarose gel analysis of PCR products. (a) Amplification of genomic DNA sequences flanked by miR390 sites. PCR products wereobtained on Nicotiana tabacum genomic DNA with primers P-Tas3 and M-Tas3/caa (Lane 1), on N. tabacum genomic DNA with primersP-Tas3 and M-Tas3/aca (Lane 2), on Arabidopsis thaliana genomic DNA with primers P-Tas3 and M-Tas3/caa (Lane 3), and on A. thalianagenomic DNA with primers P-Tas3 and M-Tas3/aca (Lane 4). Arrow points to the 170-nt PCR product. M is DNA size markers. Markerfragment sizes in base pairs are indicated on the left. (b) Amplification of N. tabacum genomic DNA and cDNA preparation. PCR productswere obtained on N. tabacum genomic DNA with primers P-Tas3 and M-Tas3/caa (Lane 1), on N. tabacum cDNA with primers P-Tas3 andM-Tas3/caa (Lane 2), and on N. tabacum cDNA with primers P-Tas3 and M-Tas3/aca (Lane 3). M is DNA size markers. Marker fragmentsizes in base pairs are indicated on the left.
TCTTATGTTTTGTGTTTTTATATTGTGTCTTGTGCCCCAGAATGTTCCAGTTCTTTTCCAGAATGTTCCAGTTCTTT.88 nts.CTTTCGAGTCTATCCTATCGTGG
CAACCTGAATATTGCTCTTCCAATCCTTTGTATAGTCCAGAATGTTCCGGTTATTTTCCGGAATGTTCCAGTTCTTG.45 nts.ATTTCGAGTCTATCCTATCGTGG
TTTGCTCTTTTATTATTTTGCAAATCTTTCTCTACCCCAGAATGTTCCAGTTCTTTTCCGGAATGTTCCAGTTCTTT.60 nts.TTTTCGAGTCTATCCTATTGTGG
TGTTTTCGTTTTTGTTTCTCTTCTCTATCCCACACTCCAGAATGTTCCAGTTCTTTTCCAGAATGTTCCAGTTCTTC.75 nts.TTTTCGAGTCTATCCTATCGTGG
TGTTATGTTTTTAATTCTATTTATTTGTATTTTTCCCCAGAATGTTCCAGTTCTTTTCCAGAATGTTCCAGTTCTTC.45 nts.TTTTCGAGTCCATCCTATCGTGGCGCTTTACGTTTTGTTTCTGTTGTCTGGACCGTACTGTAGAATGTTCCAGTTCTTTTCCAGAATGTTCCAGTTCTTT.70 nts.TTTTCGAGTCGATCCTATCGTGG
TGTTCTACCTTTTGCTTCTTCTTTACGCGTGTTGTCCCAGAATGTTCCAGTTCTTTTCCAGAATGTTCCAGTTCTTC.56 nts.
.
TTTTCGAGTCCATCCTATCGTGG
TATTATGTTTTTTATCTTTGTTTCTTGTTTTTTACCCCAGAATGTTCCAGTTCTTTTCCAGAATGTTCCAGTTCTTT.33 ntsTTTTCGAGTCCATCCTATCGTGG
TTTTTTGCTTTGTATTTCTGCATTCTCTATTGTGCCCCAGAATGTTCCAGTTCTTTTCCAGAATGTTCCAGTTCTTC.75 nts.TTTTCGAGTCCATCCTATCGTGG
TCGAGTCCTCCCTATCTGTTCCTTCCTCTTGCACTCAACATGCTCTTGATTTTACCTGTGATTCGTTTAGAATGTAGCTTTTTAGTACTAAATTCTAGATGG
TCGAGTCCTCCCTATCTGTTCCTTCCTCTTCTACTCAACCCGTCTGTGTTCTTTCCTCTTATATATCTTGTACTGGGATGTGAGGAACAATGCTACAGGTAC
ATCGAGTCCTCCCTATCTGTTCCATCCTCTTTTACTGAGCTTGCTTAATCTCCATCTCTATCTATAGATAAGATATAACTCTTCTCTATCTTATCTTAGACAT
GTCGAGTCCTCCCTATCTGTTCCTTCCTTTCATACTCAACCCACCATTGCCCCTTTCTTCCTCTAGTTTGAGATATAGTCACCTATCACTATGTCCCAGAAGG
ATCGAGTCCTCCCTATCTGTTCCTTCCTCTTATACTCAACCCGTTTTTGTCTTTTTTTATTTGTACTTTAAGATATAGTTTTTTAAAACTATATCTTAAATACGTCGAGTCCTCCCTATCTGTTCCTTCCTCTTCTACTTAACCCGCCATTGCTACTCCTTGTTTCCGGTTCGACATATAGTCAATTAAGGCTACGTTTTGAACCC
ATCGAGTCCTCCCTATCTGTTCCTTCCTCTTGTACTCAACCCGCCTTTGCCCCT-TGTGCTACCGGCTCGAGATACAGTCAGCCACGACCATATCTCAAGTAC
ATCGAGTCCTCCCTATCTGTTCCTTCCTCTTCTACTCAACCTGCCTTTGCCCCTTTTTTAATCAGTTTTGAGATGTAGTTCTGTAAAACTACATTTCAACTAC
GTCGAGTCCTCCCTATCTGTTCCTTCCTCCTGCTCTCAACTCATCCTTTCTTCTTCCTCTGGTTTGTTTCGAATGTACTTCTTCAGTACTGCATTCTAAACGT
miR390 ta-siARF ta-siARF
miR390
Nicotiana tabacumNicotiana benthamianaArabidopsis thalianaGlycine maxManihot esculentaMalus domesticaVitis viniferaPopulus trichocarpaLycopersicon esculentum
Nicotiana tabacumNicotiana benthamianaArabidopsis thalianaGlycine maxManihot esculentaMalus domesticaVitis viniferaPopulus trichocarpaLycopersicon esculentum
Figure 2: Nucleotide sequence alignment of “280-nt-long” ta-siARF loci of dicot plants. Sequences of Nicotiana tabacum and Nicotianabenthamiana (undelined) were determined in this study, the others were from GeneBank. Boxes indicate miR390 complementary sitesand ta-siARF-encoding sequence regions. The length of nonconserved sequence between the 5′-miR390 complementary site and ta-siARFsequence not included in the alignment is indicated. Shading shows residues identical for the given position in most sequences. Sequences ofN. tabacum and N. benthamiana miR390 complementary sites originate from primers used for the amplification of ta-siARF loci. GeneBankaccession numbers of the sequences included in the alignment are as follows: Nicotiana tabacum, FJ804751; Nicotiana benthamiana,FJ804742; Arabidopsis thaliana, BX838290; Glycine max, BE330988; Manihot esculenta, CK652751; Malus domestica, CN490861; Vitis vinifera,DT025007; Populus trichocarpa, DT498974; Lycopersicon esculentum, DV105041.
related sequences in representatives of the family Solanaceae.For example, Nicotiana tabacum (cv. Samsun) TAS3-likesequence showed almost 100% identity to the Nicotianatabacum (cv. Hicks Broadleaf) genomic sequence obtainedin the frame of Tobacco Genome Initiative (GenBankaccession no. FH434354) and 78% identity to the Solanumlycopersicum (cv. Heinz 1706) chromosome 11 BAC clone(GenBank accession no. DU917444) (Figure 2).
Unlike Arabidopsis thaliana DNA showing only one vis-ible DNA band after PCR amplification, Nicotiana tabacumDNA consistently produced a second minor PCR product ofabout 170 bp in length (Figure 1(a)). Since no indicationson existence of miR390-dependent TAS3-like genes withso closely arranged miRNA target sites were found in theliterature and sequence databases, cloning and sequencing of
the minor PCR fragment was carried out. The 170 bp DNAsequence was found to contain the putative ta-siARF sitecomposed of one copy of ARF-specific ta-siRNAs (Figure 3).To rule out the possibility of PCR/cloning artifact wecompared this sequence to the available nucleotide sequencedatabases. As it was found for the 280-nucleotide-long Nico-tiana tabacum (cv. Samsun) PCR product, 170 bp fragmentcontained sequence closely related to some yet uncharacter-ized database entries (Figure 3). Particularly, it showed 96%identity to Nicotiana tabacum (cv. Hicks Broadleaf) genomicsurvey sequences (GSS) obtained in the frame of TobaccoGenome Initiative (GenBank accessions nos. FH734100,FH203124 and FH011695), 91% identity to EST sequenceof Nicotiana tabacum (cv. SNN) (GenBank accession nos.AM791738), 79% identity to the Solanum tuberosum EST

4 Journal of Biomedicine and Biotechnology
miR390 ta-siARFGGTGCTATCCTATCTGAGCTT ATTCT TCTTACATTT GTTTCTCATCTCTTAGAAAACTGGAGAAATGGCT CGAGT TTTCT TGACCTTGCAAGTCCGAAAC . 46 nts .
GGTGCTATCCTATCTGAGCTT ATTCT TCTTACATCCTCTCCTCGTCTTTTCTAACT TTAGAGGGACGGTT CGAGCTTTCT TGACCTTGCAAGTCCGAGGT . 46 nts .
GGTGCTATCCTATCTGAGCTT GTTCT TCTTACATTATTTTCTCATCTTTTAAAACT CTTGAACGATTGTT CGAGT TTTCT TGACCTTGCAAGTCCGTAAC . 47 nts .
ATAGCTATCCTATCTGAGCTT ATTCT TCTTACATCT TCTTCTCTTCTTTTCTAACT TTAGAGGGACGATT TGAGT TTTCT TGACCTTGCAAGTCCGAGGT . 45 nts .
GGTGTTATCCTT CCTGAGCTT ATTCT TCTTACATTT GTTTCTCGTCTCTTAGAAAACTGGAGAAATGGCT CGAGT TTTCT TGACCTTGCAAGTCCGAGAC . 46 nts .
GACGTTATCCTT TCTGAGCTT GTTCT TCTTACGTTATTTTCTCATCTTTTAGAATT CTTGAACTATTGTT CGAGT TTTCT TGACCTTGCAAGTCCGTAAC . 47 nts .GGCGATATCTCT CCTGAGCTT AGTCT TCTTACATTCGTTTT TTCTT TCTTT GAACT CCACGAAGGCCGTT CAAGT TTTCT TGACCTTGCAAGTCCGAGGA . 74 nts .
GGCGATATCTCT CCTGAGCTT GTTCT TCTTACATCATATCT TTTCCGTTTCTAACT CCACGAACATCACT TGACT TTTCT TGACCTTGCAAGTCCATGGA . 88 nts .
GGCGATATCTCT CCTGAGCTT ATCCT TCTTATATCT CCTTT CTTCT TCTTCGAACT CCACAAAGGCAGCT CGAGT TTTCT TGACCTTGCAAGTCCGAGGA 88 nts .
GGCAATATCTCT CCTGAGCTT ATTCT TCTTATATCT TTTCT TCTAT TCTCGAAATT CTTTGATGATTATT CGAGT TTTCT TGACCTTGCAAGTCCGTAAG 88 nts .
GGCGGTACCCCT CCTGAGCTT ATTCT TCTTACATTT TCTAT TTATATTTCCTAACT TCATAAAGGTTGTT CGAGT TTTCT TGACCTTGCAAGCCCGTGAT . 70 nts .
GGCGCTATCCCT CCTGAGCTT ATTCT TCTTATGCTGTTTAT TCCTAGTGTCCAACT TCATAAAGGTTGTT CGAGT TTTCT TGACCTTGCAAGCCCGTTGA . 67 nts .
GGCGGTACCCCT CCTGAGCTT ATTCT TCTTACGTTT CTTTT TTCTATTTTCTAACT TCATAAAGGTTGTT CGAGT TTTCT TGACCCTGCAAGCCCGTCCA . 67 nts .GGCGATATCTCT CCTGAGCTT ATTCT TCTTATATTT TTATT TTATT TTTGAAAACT TTATGAATAATGTT CAAGT TTTCT TGACCTTGCAAGTCCAAAAA . 92 nts .
GGCGGTATCTCT CCTGAGCTT ATTCT TCTTACGTTT TTCAT TTCGT TTCTCTATCT TTATGAATAATGTCCAAGT TTTCT TGACCTTGCAAGTCCAAAAA . 88 nts .
GGCCCTACCCCT CCTGAGCTT ATTCT TCTTATGTTT CTTTAATCTGTTCTCTAACT TCATAAAGGTTGTT CGAGT TTTCT TGACCTTGCAAGCCCGTCTA- - - - - - -
GGCGATATCTCT CCTGAGCTT ATTCT TCTTGCGTCT CCTCCCTTCT TCTTT GAACCTTACGAAGGTCGTT CGAGT TTTCT TGAACTTGCGAGTCCAAAGA- - - - - - -
GGCGATATCTCT CCTGAGCTT ATTCT TCTTGCGTCT CCTCCCTTCT TCTTT GAACCTTACGAAGGTCGTT CGAGT TTTCT TGACCTTGCAAGTCCAAAGA- - - - - - -
GGCTATATCTCT CCTGAGCTT ATCCT TCTTATATAT CCTTT CTTCT TTTTT CAAGCCTGTAAAGATGGCT TGAGT TTTCT TGACCTTGCAAGTCCAAGAA- - - - - - -
miR390TCGTTGCTATCCCTCCT - GAGCT
TCTTGTCTATCCCTCCT - GAGCT
TCTTGTCTATCCCTCCT - GAGCTTCTTGTCTATCCCTCCT - GAGCT
TCTTTTCTATCCCTCCT - GAGCTT
TCTTTCCTATCCCTTCT - GAGCTT
TCTTTCT CATCCCTCCT - GAGCTG
CCGTGTCTATCCCTCTT - GAGCTT
CCCTCTCTATCCCTCCT - GAGCTT
TATCTTCTATCCCTCCT - GAGCTGTAACAGCTATCCCTCCC- GAGCTA
ATATTTCTATCCCTCTT - GAGCTA
GTTTTTCTATCCCTCAT - GAGCTA
ATGCTAT CCCTCCTTCT TGAGCTT
TTGACGCTATCCCTCCT TGAGCTT
- - - - - - - - - - - - - - - - - - - - - - - -
- - - - - - - - - - - - - - - - - - - - - - - -- - - - - - - - - - - - - - - - - - - - - - - -
- - - - - - - - - - - - - - - - - - - - - - - -
Nicotiana tabacumDatura stramoniumSolanum demissum
Nicotiana tabacumSolanum lycopersicumVitis viniferaBeta vulgarisManihot esculentaGossypium hirsutumHelianthus exilis 1Helianthus exilis 2Cynara scolymusCyamopsis tetragonolobaVigna unguiculataCichorium endiviaCitrus aurantiumCitrus sinensisPopulus tremula
Nicotiana tabacumDatura stramoniumSolanum demissumPhysalis longifoliaNicotiana tabacumSolanum lycopersicumVitis viniferaBeta vulgarisManihot esculentaGossypium hirsutumHelianthus exilis 1Helianthus exilis 2Cynara scolymusCyamopsis tetragonolobaVigna unguiculataCichorium endiviaCitrus aurantiumCitrus sinensisPopulus tremula
Physalis longifolia
Figure 3: Nucleotide sequence alignment of “170-nt-long” ta-siARF loci of dicot plants. Sequences of Nicotiana tabacum, Daturastramonium, Solanum demissum, and Physalis longifolia (undelined) were determined in this study the others were from GeneBank. Boxesindicate miR390 complementary sites and ta-siARF-encoding sequence regions. The length of nonconserved sequence between the ta-siARFsequence and 3′-miR390 complementary site not included in the alignment is indicated. Dashes in the sequences of Cichorium endivia,Citrus aurantium, Citrus sinensis, and Populus tremula indicate the sequence region lacking the 3′-miR390 complementary site that couldnot be aligned with other sequences. Shading shows residues identical for the given position in most sequences. Sequences of N. tabacum, D.stramonium, S. demissum, and P. longifolia miR390 complementary sites originate from primers used for the amplification of ta-siARF loci.GeneBank accession numbers of the sequences included in the alignment are as follows: Nicotiana tabacum, FJ804743; Datura stramonium,FJ804744; Solanum demissum, FJ804745; Physalis longifolia, FJ804746; Nicotiana tabacum, AM791738; Solanum lycopersicum, BE459870;Vitis vinifera, CU775162; Beta vulgaris, CV301446; Manihot esculenta, DV447689; Gossypium hirsutum, DW502659; Helianthus exilis 1,EE630512; Helianthus exilis 2, EE657417; Cyamopsis tetragonoloba, EG977206; Vigna unguiculata, FG922881; Cynara scolymus, GE588140;Cichorium endivia, EL348656; Citrus aurantium, EY848024; Citrus sinensis, CK935773; Populus tremula, DN500355.
sequence (GenBank accession no. FG548921), 78% iden-tity to the Solanum lycopersicum chromosome 12 cloneLE HBa-26C13 (GenBank accession nos. AC209585) andthe Solanum lycopersicum EST sequence (GenBank accessionnos. BE459870). Somewhat lesser identity (73-74%) was alsorevealed for EST sequences from Solanum phureja (GenBankaccession nos. FG647537) and Solanum tuberosum (GenBankaccessions nos. BQ514736 and BI431636) (Figure 3 and datanot shown). These data indicated that 170 bp-long PCR-amplified fragments corresponded to the genuine Nico-tiana tabacum (cv. Samsun) genome fragment potentiallyencoding a new type of ta-siARF RNA precursors. Sequenceanalysis revealed that, except their length, the 170-nt-longta-siARF RNA differ from well-characterized 280-nt-longprecursors in the structure of ta-siARF-encoding region:while the longer precursors contain two tandem copies of ta-siARF arranged as the conserved 42-nt region, the smaller
precursors described in this paper have only one monomeric21-nt ta-siARF copy (Figures 2 and 3).
We further experimentally analyzed the occurrence ofsuch putative TAS precursor RNAs in other Solanaceae repre-sentatives. Genomic DNAs of Datura stramonium, Solanumdemissum and Physalis longifolia were taken as templatesfor PCR with primers P-Tas3 and either M-Tas3/caa or M-Tas3/aca. In all cases, major 280-nucleotide-long and minor170 bp amplified fragments were easily detected similarlyto Nicotiana tabacum (data not shown). Sequencing of thesmaller DNA band confirmed the occurrence of novel puta-tive monomeric ta-siARF precursor sequences in differentSolanaceae representatives (order Solanales) (Figure 3).
The TAS3 loci and miR390 are known to be wellconserved among diverse flowering plants [18, 21, 22]. Toexplore the possibility that the novel monomeric ta-siARFprecursor sequences might have emerged in plant evolution

Journal of Biomedicine and Biotechnology 5
miR390 Cycas revoluta Zamia fischeri Cryptomeria japonica Pinus pinaster Picea sitchensis Pinus taeda Picea sitchensis
ta-siARF Cycas revoluta Zamia fischeri Cryptomeria japonica Pinus pinaster Picea sitchensis Pinus taeda Picea sitchensis
miR390 Cycas revoluta Zamia fischeri Cryptomeria japonica Pinus pinaster Picea sitchensis Pinus taeda Picea sitchensis
G G T G C T A T C C T A T C T G A G C T T T A T C T - - - - - T A G T T G G C G - - - - - - - - - - - - - - - - - - - - - - - - - - - - - - - C C C C C A G G G A C G G A G - - - - - - - - - - - - T A A T T T
G G C G T T A T C C T G C C T G A G C T T T G A A T A C A A - G G A C T G C C A T G A G C T G A T G A T T A T C C T G C - - - A G C T T T C T C A G C T A T C T G A G G A G A G A T A T G A A T G C T G A T T T
G G T G C T A T C C T G C C T G A G C T T G T G G A A A A A T G A A G - G C C A C C A A T C T G G G C A T A T C A T C T C C C A T G C C T G T G A T G T A A C A G G G A T G T - - - - - - - - G G G A T G A C A
G G C G C T A T C C T G A C T G A G C T T A A T C C - - A T T G A G A T G T C A - - - - - - A G T G A G T G A T G - - - - - - - - - - - - - C C G A G C A A C T T G C T T G - - - - - - - - - G C T T C G T C T
G A C G C T A T C C T A C C T G A G C T T A A T A C T T G T T G A A A T G G A A T T - - - - A G T G A G T A A A G T G T G T - G T A T A T T C G A A G A A A T T T C C A T G - - - - - - - - - G C C G C C T C -
G G C G C T A T C C T G A C T G A G C T T A A T C C - - A T T G A G A T G T C A - - - - - - A G T A A G T G T T G - - - - - - - - - - - - - C C A A G C A A C T T A C T T G - - - - - - - - - G C T T C G T A G
G G C G C T A T C C T G A C T G A G C T T A T T C T - - - - - - - - - - - - - - - - - - - - A G G G A G T G A T G - - - - - - - - - - - - - C C A A G C A A G T T G C T T G - - - - - - - - - G C T G C C T T T
T C T T G A C C T T G C A A G T C C A - G G G T G C G A G G G C T T A T T C A T G T G G C C G C T C T C T A T A - - - - - - - C C G T T G G T C T G C T G C T T C C T C A A G A A C A G C G C T T G C G T C C T
T C T T G A C C T T G C A A G T C C T C G G A G G T G G G G T T T T C C T C A C A T G G C C G T C C T C T A C A - - - - - - - C C G T C G A T T G A A T T C T C T G A G A A C A A A A A T A C C A A C G T G C T
T C T T G A C C T T G C A A G A C C C A G A G G G T G G T G C G G C T A A T C T G C G - - - - - - - A T T C G T - - - - - - - - - - - - - - - - - G C G A T A T C T - - - - - - - - - - - - - - - - - - - - - -
T C T T G A C C T T G C A A G A C C C A G A G G G T G C T G C C G C T A A T C T G C G T G G G G G - A C T C C A T T G G C T T C A C A A G G A T C G C A C T A T C C T - - - - - - - - - - - - - - - - - - - - -
T C T T G A C C T T G C A A G A C C A A A A G G G T G C T A C T G C C A A T C T G C A G G G G A G - A G T G T A T T G G C C T C A C A A G G A T G G C A G T A T C C T - - - - - - - - - - - - - - - - - - - - -
T C T T G A C C T T G C A A G A C C C A G A G G G T G C T G C T G C T A A T C T G C G T G G G G G - A C T C C A T T G G C T T C A C A A G G A T C G C A C T A T C C T - - - - - - - - - - - - - - - - - - - - -
T C T T G A C C T T G C A A G A C C C A G A G G G T G C T G C C G C T A A T C T G C G T G G G A G - A C T C C A T - - - - - - - - - - - - - - - - - - - - - A T C C T - - - - - - - - - - - - - - - - - - - - -
G T T G A G G C T G C T C G T A T T T G T C T A T C C C T C C T G A G C T
G T G G A T G G T G T T C C - - T C T G T C T A T C C C T C - T G A G C T C
- - - - - G T C T C T T A A C T A T C G C C G T T T C C T C C - - - G C T G
- - - - - T G G T C T C A G T T A T A G T C T A T C C C T C C T G A G C T T
- - - - - T G A T C T G A C A A A T A G T T T A T C C C T C C T G A G C T T
- - - - - T G G T C T C A G T T A T A G T C T A T C C C T C C T G A G C T T
- - - - - T G G T C T C A T A T A T A G T C T A T C C C T C C T G A G C T T
Figure 4: Nucleotide sequence alignment of “short” ta-siARF loci of cycad and conifer plants. The sequence of Cycas revoluta (undelined) wasdetermined in this study, the others were taken from GeneBank. Boxes indicate miR390 complementary sites and ta-siARF sequence regions.Shading shows residues identical for the given position in most sequences. Sequences of C. revoluta miR390 complementary sites originatefrom primers used for the amplification of ta-siARF loci. GeneBank accession numbers of the sequences included in the alignment are asfollows: Cycas revoluta, FJ804750; Picea sitchensis, EF086492; Pinus pinaster, BX682439; Pinus taeda, CV034496; Picea sitchensis, CO220369;Zamia fischeri, DY034932; Cryptomeria japonica, DC432705.
earlier than the appearance of family Solanaceae, we searchedEST database at NCBI. We found that many dicot plantscode for putative monomeric ta-siARF loci surrounded inmost cases by complementary sites for miR390 positioned160–190 bp from each other, thus confirming that target-ing of ta-siRNA precursors is an evolutionarily conservedfunction of miR390. These plants include representativesof eurosids—orders Malpighiales, Fabales, Malvales, andSapindales, asterids—orders Asterales and Solanales, as wellas orders Caryophyllales and Vitales (Figure 3). Analysisof all identified monomeric ta-siARF precursor sequencesrevealed, in addition to the only copy of ta-siARF sequence,one more characteristic feature. The region between the5′-miR390 target site and the ta-siARF sequence appearedto be well conserved in length and, to some extent, insequence, whereas the region between the ta-siARF sequenceand the 3′-miR390 target site was found to be variableboth in length and sequence (Figure 3). This arrangementof the novel 170 bp-TAS loci differed considerably fromthat of the well characterized 280 bp-TAS loci, where thesequence and distance conservation was observed for theregion between the tandem ta-siARF sequence and the3′-miR390 target site and not for the sequence betweenthe 5′-miR390 target site and the ta-siARF sequence(Figure 2).
To verify expression of novel putative monomeric ta-siARF precursor RNAs in plant leaves, total RNA was isolatedfrom tobacco plants at 6-8-leaf stage and used as a templatefor cDNA synthesis with oligo(dT)-primer. It was foundthat PCR with primers P-Tas3, and either M-Tas3/caa or M-Tas3/aca carried out on this cDNA preparation gave rise only
to 280-nucleotide-long DNA fragment but not detectable170 bp-fragment (Figure 1(b)).
Conifers (Pinus taeda) TAS-like locus, like that of higherplants, was shown to contain the 42-nt ta-siARF regionflanked by two miR390 complementary sites. However,unlike TAS3 of flowering plants, only the 5′ miR390-targetsite is cleaved in conifer TAS3-like RNA precursor [18]. Toreveal the possible conservation of TAS3-like loci in lowerseed plants, we performed PCR amplification of total DNAfrom Cycads (Cycas revoluta) using dicot-specific primersP-Tas3, M-Tas3/caa and M-Tas3/aca. As it was found fortobacco, PCR on Cycas revoluta DNA gave rise to one majorDNA fragment of 250 bp and, in addition, several largerand smaller minor bands including those of 170–190 bp inlength (data not shown). Sequencing and BLAST analysisof the latter sort of bands revealed that they correspondedto the monomeric ta-siARF precursors of flowering plants(Figure 4). Analysis of databases revealed conifers-encodedsequences showing similarity to the sequenced Cycas revolutaputative ta-siARF precursor (Figure 4), showing thereforethat this type of regulatory element might have emerged earlyin seed plant evolution.
Previously, four ta-siRNA loci targeted by miR390were found in moss Physcomitrella patens and referred toas PpTAS3a-d. All four loci contain 5′ and 3′ miR390-target sites, and ta-siRNAs derived from these moss lociregulate, similarly to those encoded by the angiospermTAS3 loci, ARF genes and, additionally, AP2 transcriptionfactor genes [18, 23, 24]. To confirm applicability of theapproach based on PCR amplification of TAS3-like locito lower plants, we designed new primers BryoTAS-P1,

6 Journal of Biomedicine and Biotechnology
CCCATCGCAG AAGAGTCGAGTCCT GGGAACGGAAG -- GG AGGGA TGCG CG GG GTCG GGCCG TGTTCCGCGGC GCAACCACGAATTGTGGGGCAA CG
ATCGC TCGAGTCCTCCC GAAGAAAGA CCTCCGGGAAC TT GG CGA GACCGAAA GGGT GCAG AATGTTCCGC ATTGTGGGGC CACG GTT CGC TT
ta-siAP2 ta-siARF
GCCC TG TCC AGA CTG TAT CCTCG GTAGTGTGGGAT TTCGT CACAACCCA AC CATCTCC CGGGTACAGTGTTCCCATCCACCCGAC AC
CAG AGCC TCGACTGCAGAATC TACCTCGAT ATTCGTCAGTAGTGTGGG CCC GG CACACAC TCTC CCC AGTGTTCCCATCCACCCG GGGTA CG
miR390
CG CTAT GCG ATCGAGTCCTCACTATATGTTAACTGTACCCGA
CG GT TA AGCGC TTC CTGTACC GG TT ATCGAGTCCTCACTATAT
miR390Brachythecium latifolium 50Br T T T GG T G T G
Physcomitrella patens TAS3d GG T T T G G TC- T G T
Brachythecium latifolium 50Br GC GG C T TGT G G AG T T T G G
Physcomitrella patens TAS3d GCT T G G G T G G G TA
Brachythecium latifolium 50Br GT T G C
Physcomitrella patens TAS3d TTG T
(a)
miR390
CCCATCGCAG AAATCGAGTCCT ---------- AGA TGCGGA --- ------------ ----------------------------------- CTG AG
ATCGC TAAATCGAGTCCTCCC ----------- AC GAGACAGA TGC --------------- -------------------------------------- --
GC AT TCCC AAATCGAGTC ---------- AGA GT GGAGAC CT GAT ------------ -------------------------------------- --
CCCATCGCAG AATCGAGTCCT AT CGGTGCACGG GAG GAGAC TC GA GTCTCACTAACGT TGAATTCCGTCCCTGCTCAAAGTTACGTGAGAGTAAAA TC
ta-siAP2 ta-siARF
TGT TGCGGG AG ACGATTTCGTGAGTAGTGTGGAATCGAG CTCTAC TAT CG CATGCACCAAC GTCTGCCCAGAACAGAGA CACAGTAC CGGGA
---- TGCGG ACGATTTCGTGAGTAGTGTGGAATCG TAG CTCTAC GC CCCGAGC CACCA GA CA GT GAT CT ACA TCTGCCC TT CGGGAACACAGTA
--- GGG GT ATCG TTCGTGAGTAGTGTGG CC GAA AC ACTC GT CGAGC TCCCATGCACCAAC TACCGTCTGCCCAGAACAGAG GC CGGGAACAC
GAA GATAA TA GA AT GTGG AG AG TTCGT GAACGA AC TG ACT AT TTT ACCAACCCG CG TCCCAT AGAG GAAC TT TG CCGT GGGT CGGGAAC
miR390
TT GCTTCCACG TTGTTCCCGAATG ATCGAGTCCTCACTATCTGTTTTG
ACGCTT GCTTC TTGTTCCCGAATG ATCGAGTCCTCACTATCTGTTTTG
AA CCACGC TGCG TTGTTCCCGA CTCACTATCTGTTTTG ATCGAGT
TT GAT AG TTA TTGTTCCCGAAT CTCACTATCTGTTTTG ATCGAGT
Brachythecium latifolium 47Br T CA GAT GAA
Hookeria lucens GG T C T
Physcomitrella patens TAS3b GG G ACCCTT GA A -
Physcomitrella patens TAS3c T G CC G GC
Brachythecium latifolium 47Br TGA TCT- T TCC T C
Hookeria lucens GTGG CC G CGG G
Physcomitrella patens TAS3b AGAAC G CCGT - A - T T
Physcomitrella patens TAS3c G T G G AC T A A - T GC T TT
Brachythecium latifolium 47Br T T
Hookeria lucens G T
Physcomitrella patens TAS3b ATT G T
Physcomitrella patens TAS3c A T CC T
(b)
Figure 5: Nucleotide sequence alignment of ta-siARF loci of mosses. (a) Alignment of Brachythecium latifolium clone 50 Br sequence andPhyscomitrella patens TAS3d. (b) Alignment of B. latifolium clone 47 Br sequence and Hookeria lucens with P. patens TAS3b and TAS3c.Sequences of B. latifolium and H. lucens (undelined) were determined in this study, the others were from GeneBank. Boxes indicate miR390complementary sites, ta-siARF sequence regions and ta-siAP2 regions. Shading shows residues identical for the given position in mostsequences. Sequences of B. latifolium and H. lucens miR390 complementary sites originate from primers used for the amplification of ta-siARF loci. GeneBank accession numbers of the sequences included in the alignment are as follows: Brachythecium latifolium clone 50 Br,FJ804747; Brachythecium latifolium clone 47 Br, FJ804748; Hookeria lucens, FJ804749; Physcomitrella patens TAS3d, BK005828; P. patensTAS3b, BK005826; P. patens TAS3c, BK005827.
Bryo TAS-P3, and Bryo TAS-M complementary to miR390-target sites of PpTAS3a-d. These primers were used forPCR on total DNA isolated from Brachythecium latifoliumand Hookeria lucens. Sequencing of major amplified DNAbands showed that Brachythecium latifolium encodes atleast two types of miR390-dependent AP2/ARF-targetingTAS loci demonstrating sequence similarity to differentelements of this kind characterized for Physcomitrellapatens, namely, PpTAS3d (Figure 5(a)) and PpTAS3b/3c(Figure 5(b)), whereas Hookeria lucens, despite its distanttaxonomic relation to Physcomitrella patens, code for a ratherclose homolog of PpTAS3b/3c (Figure 5(b)).
4. Discussion
MicroRNAs and ta-siRNAs are small RNAs around 21 ntin length and have widespread roles as posttranscriptionalregulators of plant physiology and development [25]. Theycan affect target genes through a variety of mechanisms,including transcript cleavage and translational repression.The mature miRNAs and ta-siRNAs are derived from largerprecursor transcripts that are a few hundred base pairs insize. These precursor RNAs are capped and polyadenylatedand can be spliced, in agreement with them being transcribed
by RNA polymerase II [12, 26, 27]. Many plant miRNAs andta-siRNAs are encoded by gene families. For example, fourta-siRNA loci targeted by miR390 were found in P. patensand three miR390-dependent TAS loci were identified in A.thaliana [17, 18, 21, 23]. Given their similar complementarityto miR390, it was reasoned that multiple TAS3-like locimight be paralogs derived from duplication and divergenceof an ancestral locus, and perhaps the areas producingbiologically relevant ta-siRNAs may have been preferentiallyconserved [18, 23]. However, despite obvious progress instudies of miRNA precursor evolution in plants [12, 28, 29],little is known about TAS gene molecular evolution.
Comparing sequences of ta-siRNA precursors withinplant genera and between distantly related species shouldhelp to determine patterns of molecular evolution that issubject to different evolutionary constraints in comparisonwith patterns of protein-coding gene evolution. However,the discovery of ta-siRNA genes in plants is still an ongoingprocess. Although much effort has been directed towardta-siRNA identification in Arabidopsis, poplar and mossPhyscomitrella patens, many economically or evolutionarilyimportant species have yet to be examined, and more ta-siRNAs likely remain to be discovered even in the speciesthat have been extensively studied. One limiting factor in theta-siRNA discovery process is the availability of a sequenced

Journal of Biomedicine and Biotechnology 7
genome, without which a comprehensive analysis of thepotential precursor structures of cloned small RNAs is notpossible. In Arabidopsis, three major methods have been usedfor ta-siRNA discovery: forward genetics, direct cloning andsequencing, and bioinformatic prediction. Although forwardgenetic studies have only resulted in the identification of afew ta-siRNAs, this method provides hints to the functionsof these miRNAs in addition to their isolation [3]. A secondapproach to miRNA discovery was bioinformatic prediction.While a number of published studies employed severaldifferent algorithms to predict ta-siRNAs, the features thatthe algorithms search for in the genomic sequences are basedon our current knowledge of plant miRNAs and are largelysimilar among the studies [19]. A third, and perhaps themost effective, method for ta-siRNA discovery was directcloning and sequencing. In particular, deep sequencingof cloned small RNA libraries using massively parallelsignature sequencing (MPSS) or pyrosequencing allowed theidentification of numerous small RNAs from Arabidopsisand provided a picture of the genomic landscape of smallRNAs [18, 23]. One added advantage of this approach is thatmost small RNA species from a particular genomic loci areexhibited, which helps discern whether the locus gives rise toa single or multiple siRNAs. If multiple small RNAs mappingto both strands of a locus are present, these small RNAs aremost likely siRNAs.
Here, we describe a new method for identificationof plant miR390-flanked ta-siRNAs precursors based onPCR on the template of genomic DNA or cDNA usingoligodeoxyribonucleotide primers mimicking in their speci-ficity miR390. General idea of this experimental approachwas suggested by the recently published paper on cloning ofanimal miRNA-regulated target genes by reverse transcrip-tion with direct use of miRNA as a primer [30]. Importantly,the recognition of ta-siRNA precursor by miR390 occursin most cases by forming imperfect base pairs with 5′
and 3′ target sites [18, 23]. Assuming that imperfect base-pairing is tolerated by Taq polymerase, there is a highchance that designed miR390-related oligodeoxyribonu-cleotides will recognize both target sites in phylogeneti-cally distant species. To investigate functional constraintson sequence evolution of ta-siARF precursor genes, wehave studied sequence variation in the putative precursorsof miR390-dependent TAS-like genetic elements betweenspecies from the Solanaceae. The application of the novelPCR-based method to Nicotiana tabacum showed obviousdifference from A. thaliana: N. tabacum DNA directed amajor 280-nucleotide-long PCR product and the secondminor PCR product of about 170 bp in length (Figure 1).When the method was also applied to Datura stramonium,Solanum demissum, and Physalis longifolia, the minor PCRshort product was again identified. Sequencing of 280-nucleotide-long PCR product in the Solanaceae and Ara-bidopsis as a control showed that we amplified and clonedthe chromosomal region closely related to typical TAS3-related precursor sequences found in diverse dicot plants[17, 18]. This region included 42-nt region from AtTAS3tasiRNAs that target ARF3 and ARF4 (tasiARFs) and 5′-and 3′- terminal 21-nt regions corresponding to the miR390
complementary sites (PCR primer sites) (Figure 2). Theseresults demonstrate that the PCR-based method is a usefulway to clone and identify targets on the basis of basepairing with individual miRNAs. Nucleotide sequence ofthe minor 170-nucleotide-long product of four selectedsolanaceous plants revealed the putative 21-nt ta-siARFsite composed of one copy of ARF-specific ta-siRNAs andpositioned between the miR390 complementary sites (PCRprimer sites) (Figure 3). We searched publicly availablenucleotide databases of genome survey sequences (GSSs),high-throughput genomics sequences (HTGSs), expressedsequenced tags (ESTs), and nonredundant (NR) nucleotidesand identified 16 putative “short” miR390-dependent TASsequences in 15 diverse plant species (Figure 3 and data notshown).
Using this PCR approach, ta-siARF precursors char-acterized by the monomeric ta-siARF were found in thecycad Cycas revolute. Database search confirmed this exper-imental finding and revealed novel miR390-dependent TASsequences in one more cycad (Zamia fischeri) and fourconifer species (Figure 4). The experimental approach usedin this paper was further verified by the analysis of mosseswith primers based on Physcomitrella patens miR390 com-plementary; the PCR products obtained on Brachytheciumlatifolium and Hookeria lucens DNA represented ta-siRNAprecursor sequences that were not known before for thesespecies and related to the previously characterized P. patensta-siRNA loci (Figures 5(a) and 5(b)).
To analyze expression of the novel putative ta-siARFprecursor RNAs in plants, total RNA was isolated fromtobacco plants at 6-8-leaf stage and used as template forcDNA synthesis with oligo(dT)-primer. PCR analysis of leafcDNA revealed only 280-nucleotide-long DNA fragmentwhich sequence corresponded to classical tobacco TAS3-likeelement (Figure 1(b)). On the other hand, RNA templatefor the EST sequence of Nicotiana tabacum (cv. SNN)(GenBank accession no. AM791738) with 91% identity toour “short” TAS sequence from Nicotiana tabacum (cv.Samsun) (Figure 3) was isolated from 5-day seedlings. Thesedata suggest that the novel type of miR390-dependent TASelements might be expressed in tobacco only at early stagesof ontogenesis.
Importantly, alignment of the putative novel TAS ele-ments revealed that the length of a region between ta-siARFsite and 5′ miR390-target site is highly preserved in contrastto classical TAS3-like genes in which perfect size conservationwas revealed between ta-siARF site and 3′ miR390-target site(Figures 2 and 3). In addition, “core consensus” in classicalta-siARF site was found to represent sequence: TCTTGA-CCTTGTAAGACCPy, whereas consensus in “short” TAS isdifferent: TCTTGACCTTGCAAGPyCCPu. Significance ofthis variation remains obscure.
Strikingly, in four cases we failed to reveal the 3′ miR390-target site in “short” miR390-dependent TAS sequences(Figure 3). This type of organization of ta-siRNA precursorsis common for the other, except TAS3, TAS genes inArabidopsis, and other plants [4, 12] in which miRNA-dependent cleavage occurs 5′ to ta-siRNA sites. There-fore, we speculate that in “short” miR390-dependent TAS

8 Journal of Biomedicine and Biotechnology
sequences miRNA-dependent cleavage also can occur 5′
to ta-siRNA sites. This hypothesis requires experimentalverification. In addition to identification of the precursorcleavage site, the role of AGO1 and AGO7 in the “short”miR390-dependent ta-siARF precursor processing should beinvestigated in comparison to classical TAS3-like precursors[4, 20].
Recently a novel silencing method utilizing artificial ta-siRNAs was proved to be efficient for the chimeric Arabidop-sis thaliana TAS1 and TAS3 genes [31, 32]. This methodprovides an excellent tool not only for silencing of genes-of-interest but also for investigating functionality of TAS genesand their specific sequence modifications. Application of thismethod to “short” TAS3-like genes identified in this papermay result in a identification of their possible functions andmapping of cleavage sites in RNA precursors.
Acknowledgments
The authors thank A. C. Timonin for stimulating discus-sions. This work was supported by Grants 08-04-00846and 09-04-00707 from the Russian Foundation for BasicResearch.
References
[1] D. Baulcombe, “RNA silencing in plants,” Nature, vol. 431, no.7006, pp. 356–363, 2004.
[2] F. Vazquez, “Arabidopsis endogenous small RNAs: highwaysand byways,” Trends in Plant Science, vol. 11, no. 9, pp. 460–468, 2006.
[3] H. Vaucheret, “Post-transcriptional small RNA pathways inplants: mechanisms and regulations,” Genes & Development,vol. 20, no. 7, pp. 759–771, 2006.
[4] H. Vaucheret, “Plant ARGONAUTES,” Trends in Plant Science,vol. 13, no. 7, pp. 350–358, 2008.
[5] E. Bonnet, Y. van de Peer, and P. Rouze, “The small RNA worldof plants,” New Phytologist, vol. 171, no. 3, pp. 451–468, 2006.
[6] P. Laporte, F. Merchan, B. B. Amor, et al., “Riboregulators inplant development,” Biochemical Society Transactions, vol. 35,no. 6, pp. 1638–1642, 2007.
[7] C. Y. Chu and T. M. Rana, “Small RNAs: regulators andguardians of the genome,” Journal of Cellular Physiology, vol.213, no. 2, pp. 412–419, 2007.
[8] B. Liu, Z. Chen, X. Song, et al., “Oryza sativa Dicer-like4reveals a key role for small interfering RNA silencing in plantdevelopment,” The Plant Cell, vol. 19, no. 9, pp. 2705–2718,2007.
[9] X. Chen, “MicroRNA metabolism in plants,” Current Topics inMicrobiology and Immunology, vol. 320, pp. 117–136, 2008.
[10] S. Griffiths-Jones, H. K. Saini, S. van Dongen, and A. J.Enright, “miRBase: tools for microRNA genomics,” NucleicAcids Research, vol. 36, pp. D154–D158, 2008.
[11] E. Gottwein and B. R. Cullen, “Viral and cellular microRNAsas determinants of viral pathogenesis and immunity,” Cell Hostand Microbe, vol. 3, no. 6, pp. 375–387, 2008.
[12] M. J. Axtell and J. L. Bowman, “Evolution of plant microRNAsand their targets,” Trends in Plant Science, vol. 13, no. 7, pp.343–349, 2008.
[13] A. C. Mallory and N. Bouche, “MicroRNA-directed regula-tion: to cleave or not to cleave,” Trends in Plant Science, vol.13, no. 7, pp. 359–367, 2008.
[14] V. Ambros and X. Chen, “The regulation of genes andgenomes by small RNAs,” Development, vol. 134, no. 9, pp.1635–1641, 2007.
[15] B. Liu, P. Li, X. Li, et al., “Loss of function of OsDCL1 affectsmicroRNA accumulation and causes developmental defects inrice,” Plant Physiology, vol. 139, no. 1, pp. 296–305, 2005.
[16] A. Takeda, S. Iwasaki, T. Watanabe, et al., “The mechanismselecting the guide strand from small RNA duplexes isdifferent among Argonaute proteins,” Plant & Cell Physiology,vol. 49, no. 4, pp. 493–500, 2008.
[17] E. Allen, Z. Xie, A. M. Gustafson, and J. C. Carrington,“microRNA-directed phasing during trans-acting siRNA bio-genesis in plants,” Cell, vol. 121, no. 2, pp. 207–221, 2005.
[18] M. J. Axtell, C. Jan, R. Rajagopalan, and D. P. Bartel, “A two-hit trigger for siRNA biogenesis in plants,” Cell, vol. 127, no. 3,pp. 565–577, 2006.
[19] H. M. Chen, Y. H. Li, and S. H. Wu, “Bioinformatic predictionand experimental validation of a microRNA-directed tandemtrans-acting siRNA cascade in Arabidopsis,” Proceedings of theNational Academy of Sciences of the United States of America,vol. 104, no. 9, pp. 3318–3323, 2007.
[20] T. A. Montgomery, M. D. Howell, J. T. Cuperus, et al.,“Specificity of ARGONAUTE7-miR390 interaction and dualfunctionality in TAS3 trans-acting siRNA formation,” Cell, vol.133, no. 1, pp. 128–141, 2008.
[21] L. Williams, C. C. Carles, K. S. Osmont, and J. C. Fletcher,“A database analysis method identifies an endogenous trans-acting short-interfering RNA that targets the ArabidopsisARF2, ARF3, and ARF4 genes,” Proceedings of the NationalAcademy of Sciences of the United States of America, vol. 102,no. 27, pp. 9703–9708, 2005.
[22] M. J. Axtell and D. P. Bartel, “Antiquity of microRNAs andtheir targets in land plants,” Plant Cell, vol. 17, no. 6, pp. 1658–1673, 2005.
[23] M. J. Axtell, J. A. Snyder, and D. P. Bartel, “Common functionsfor diverse small RNAs of land plants,” Plant Cell, vol. 19, no.6, pp. 1750–1769, 2007.
[24] M. D. Howell, N. Fahlgren, E. J. Chapman, J. S. Cumbie,et al., “Genome-wide analysis of the RNA-DEPENDENTRNA POLYMERASE6/DICER-LIKE4 pathway in Arabidopsisreveals dependency on miRNA- and tasiRNA-directed target-ing,” Plant Cell, vol. 19, no. 3, pp. 926–942, 2007.
[25] G. Chuck, H. Candela, and S. Hake, “Big impacts by smallRNAs in plant development,” Current Opinion in PlantBiology, vol. 12, no. 1, pp. 81–86, 2009.
[26] M. Ha, M. Pang, V. Agarwal, and Z. J. Chen, “Interspeciesregulation of microRNAs and their targets,” Biochimica etBiophysica Acta, vol. 1779, no. 11, pp. 735–742, 2008.
[27] M. W. Jones-Rhoades, D. P. Bartel, and B. Bartel, “MicroRNAsand their regulatory roles in plants,” Annual Review of PlantBiology, vol. 57, pp. 19–53, 2006.
[28] A. Li and L. Mao, “Evolution of plant microRNA genefamilies,” Cell Research, vol. 17, no. 3, pp. 212–218, 2007.
[29] N. Warthmann, S. Das, C. Lanz, and D. Weigel, “Comparativeanalysis of the MIR319a microRNA locus in Arabidopsis andrelated Brassicaceae,” Molecular Biology and Evolution, vol. 25,no. 5, pp. 892–902, 2008.
[30] Y. Andachi, “A novel biochemical method to identify targetgenes of individual microRNAs: identification of a newCaenorhabditis elegans let-7 target,” RNA, vol. 14, no. 11, pp.2440–2451, 2008.

Journal of Biomedicine and Biotechnology 9
[31] T. A. Montgomery, M. D. Howell, J. T. Cuperus, et al.,“Specificity of ARGONAUTE7-miR390 interaction and dualfunctionality in TAS3 trans-acting siRNA formation,” Cell, vol.133, no. 1, pp. 128–141, 2008.
[32] M. de la Luz Gutierrez-Nava, M. J. Aukerman, H. Sakai,S. V. Tingey, and R. W. Williams, “Artificial trans-actingsiRNAs confer consistent and effective gene silencing,” PlantPhysiology, vol. 147, no. 2, pp. 543–551, 2008.

Hindawi Publishing CorporationJournal of Biomedicine and BiotechnologyVolume 2009, Article ID 410260, 7 pagesdoi:10.1155/2009/410260
Methodology Report
Efficient siRNA Delivery by the Cationic LiposomeDOTAP in Human Hematopoietic Stem Cells Differentiatinginto Dendritic Cells
Sabata Martino, Ilaria di Girolamo, Roberto Tiribuzi, Francesco D’Angelo, Alessandro Datti,and Aldo Orlacchio
Dipartimento di Medicina Sperimentale e Scienze Biochimiche, Sezione di Biochimica e Biologia Molecolare, Universita di Perugia,Via del Giochetto, 06100 Perugia, Italy
Correspondence should be addressed to Aldo Orlacchio, [email protected]
Received 11 December 2008; Accepted 20 March 2009
Recommended by Bibekanand Mallick
RNA interference technology is an ideal strategy to elucidate the mechanisms associated with human CD34+ hematopoieticstem cell differentiation into dendritic cells. Simple manipulations in vitro can unequivocally yield alloreactive or tolerogenicpopulations, suggesting key implications of biochemical players that might emerge as therapeutic targets for cancer or graft-versus-host disease. To knockdown proteins typically involved in the biology of dendritic cells, we employed an siRNA delivery systembased on the cationic liposome DOTAP as the carrier. Freshly-isolated CD34+ cells were transfected with siRNA for cathepsinS with negligible cytotoxicity and transfection rates (>60%) comparable to the efficiency shown by lentiviral vectors. Further,cathepsin S knockdown was performed during both cell commitment and through the entire 14-day differentiation processwith repeated transfection rounds that had no effect per se on cell development. Tested in parallel, other commercially-availablechemical reagents failed to meet acceptable standards. In addition to safe and practical handling, a direct advantage of DOTAPover viral-mediated techniques is that transient silencing effects can be dynamically appraised through the recovery of targetedproteins. Thus, our findings identify DOTAP as an excellent reagent for gene silencing in resting and differentiating CD34+ cells,suggesting a potential for applications in related preclinical models.
Copyright © 2009 Sabata Martino et al. This is an open access article distributed under the Creative Commons AttributionLicense, which permits unrestricted use, distribution, and reproduction in any medium, provided the original work is properlycited.
1. Introduction
The discovery of siRNAs and subsequent advances inRNA interference (RNAi) technology has contributed toa major methodological shift in functional genomics [1].Gene silencing, that can be successfully extended to high-throughput screening formats [2, 3], is a procedure thatdirectly accelerates biological and biomedical researchthrough the identification of molecular players involvedin development, homeostasis, and disease. In the newmillennium, the explosive growth of this field has also raisedthe prospect of RNAi as a therapeutic to treat a wide rangeof pathologies, in particular viral infections, cancer, andneurodegenerative disorders [4–7].
Synthetic siRNAs have emerged as a widespread meansfor gene silencing in mammalian cells [8], notwithstand-
ing limitations associated with a nonrenewable supply,temporary silencing effect, and occurrence of off-targetactivity [9, 10]. Next-generation synthetic products wererecently introduced to ensure the highest silencing powerunder a minimal occurrence of false positives (e.g., ON-TARGETplus [Dharmacon] and Silencer Select validatedsiRNAs [Ambion]), and provide the opportunity to transfectvirtually any cell type in the absence of a carrier (AccellsiRNAs [Dharmacon]). Further, shRNA expression vectorscoupled to lentiviral transduction systems were developedto obtain unlimited resources, achieve stable integrationinto the genome in a widest variety of both dividing andnondividing cells, produce sustained transgene expression,and comply with in vivo applications (e.g., MISSION[Sigma-Aldrich], BLOCK-iT [Invitrogen], SMARTvector[Dharmacon], GeneNet [System Biosciences], and Lenti-X

2 Journal of Biomedicine and Biotechnology
[Clontech]) [11–13]. Finally, access to mimic and inhibitormiRNA libraries for use in either gain- or loss-of-functionanalyses, respectively, have enhanced scope and flexibility ofstudies intended to unravel the involvement of miRNAs (e.g.,PremiR [Ambion], miRIDIAN [Dharmacon], and miScript[Qiagen]) in cytoplasmic posttranscriptional gene silencing[14], translational activation [15] and transcriptional controlof gene expression in the nucleus [16].
However, the extraordinary benefits of these break-throughs in RNAi technology may imply significant researchinvestments and special requirements, such as biocontain-ment facilities dedicated to viral work. Chemical agents,instead, are relatively inexpensive, easy to handle andgenerally already optimized by the vendor for use with spe-cific cell lines. Nonetheless, chemical transfections in finitecultures or freshly-isolated primary cells usually raise majorchallenges due to a combination of cytotoxic effects andpoor transfection efficiencies. These problems become moreobvious in dynamic systems such as stem cells subjected todifferentiation.
Lentiviral vectors can successfully transduce hematopoi-etic stem cells (HSCs) [12, 17], but integrate stably inthe genome and preclude the recovery of knocked-downproteins. Within nonviral transfection methods for HSCs,electroporation raises major survival issues due to apoptoticcell death [18], while nucleofactor technology was shownto deliver mRNA and plasmid DNA with inconsistenttransfection and cell survival rates [19].
Lipofection has typically been considered inefficientfor use with HSCs [20]. Nonetheless, based on the largenumber of products currently available from vendors andthe advantages offered by a transient gene knockdown,we screened a variety of agents with different chemicalformulations and found that the liposomal version of themonocationic lipid DOTAP is an excellent vector for thetreatment of freshly isolated HSCs. Further, we observed thatDOTAP is an efficient vehicle for gene knockdown in HSCsinduced to differentiate into immunogenic dendritic cells invitro through a conventional treatment based on Flt3L, GM-CSF, IL-4 and TNF-α [21–23].
2. Materials and Methods
2.1. Isolation of Human HSCs. Blood samples were collectedfrom healthy volunteers who provided informed consent.Human peripheral blood mononuclear cells were isolatedby density gradient centrifugation over Ficoll-Paque PLUS(GE Healthcare), after which CD34+cells were purifiedby immunomagnetic selection using the minimagnetic-activated cell sorter (MACS) system (Miltenyi Biotec). Meanpurity of CD34-enriched cells, determined by flow cytometryusing a FACScan (BD Biosciences), was 94.8%, with amedian value of 92 throughout an 86–98.5 range.
2.2. Differentiation of HSCs into Dendritic Cells. To generateimmunogenic dendritic cells, CD34-enriched cells weretransferred to 25 cm2 flasks at a density of 105 cells/mL andcultured for 14 days in RPMI-1640 medium (Euroclone)
containing 10% fetal calf serum (FCS) (Euroclone) and acytokine cocktail composed of human recombinant, Flt3L(50 ng/mL), GM-CSF (50 ng/mL), IL-4 (10 ng/mL), andTNF-α (2.5 ng/mL) (PeproTech EC). Every third day, halfof the culture medium was replaced by fresh mediumsupplemented with the same cocktail. Cells were analyzed atday 3, 7, and 14 to evaluate the expression of specific markersof differentiation [23].
2.3. Evaluation of Different Reagents for siRNA Transfectionof Untreated CD34+ Stem Cells. The following, commerciallyavailable reagents were tested to determine transfection ratesand cytotoxicity effects: TransPass R1 and TransPass R2 (NewEngland Biolabs), Lipofectamine 2000 and LipofectamineLTX (Invitrogen), siPORT NeoFX and siPORT Amine(Ambion), and DOTAP (Roche). Tests were performed usinga 96-well plate format. Freshly prepared CD34+ cells wereseeded at a density of 2×10⁴/well. Fluorescein-labeled siRNAcontrol (New England Biolabs), in a final concentration of15 nM, was used to monitor the transfection procedures.Fluorescein-labeled siRNA was regularly diluted with RPMI-1640 without serum, except for the experiment performedwith DOTAP, in which the diluent was HBS (Hepes-bufferedsaline: 20 mM HEPES, pH 7.4, containing 150 mM NaCl).
The transfection reagents were essentially employed asper each vendor’s recommendations. TransPass R1 andTransPass R2 (0.2 μL) were diluted directly in the fluorescein-labeled siRNA solution (10 μL), incubated 30 minutes atroom temperature and then added to the cultures (90 μL).Lipofectamine 2000 and Lipofectamine LTX (0.25 μL) werefirst diluted in 12.5 μL RPMI-1640 without serum and, after5 minutes incubation, mixed with 12.5 μL of fluorescein-labeled siRNA. After 30 minutes incubation, the transfectioncomplexes were added to the cells (75 μL).
siPORT NeoFX and siPORT Amine were first diluted(0.5 and 0.3 μL, resp.) in 10 μL RPMI-1640 without serum.After 10 minutes at room temperature, each carrier wasmixed with 10 μL of fluorescein-labeled siRNA. The mixtures(20 μL) were incubated 10 minutes, then spotted in the assaywells. Within 5 minutes, cells were dispensed in a volume of80 μL.
DOTAP (1.4 μL) was diluted in 7 μL HBS and thenmixed, very slowly, with the same volume of fluorescein-labeled siRNA. After 30 minutes at room temperature, themixture was added to cells (186 μL) resuspended in RPMI-1640 containing 20% FCS.
Except for the experiment performed with DOTAP, freshmedium was added to the assay wells 4 hours after eachtransfection process in order to achieve a final volume anda concentration of FCS of 200 μL and 10%, respectively.
In all instances, transfection and cell survival wereevaluated 24 hours after the transfection method.
Transfection rates were expressed as the ratio betweentransfected (fluorescein-labeled) and total number of viablecells measured via DAPI nuclear staining and trypan blueexclusion test. Signals were captured by a Nikon EclipseTE2000-S fluorescence microscope equipped with a Cell-F video camera (Olympus) and processed via the Cell-Fsoftware.

Journal of Biomedicine and Biotechnology 3
DO
TAP
Tran
sPas
sR
2
Tran
sPas
sR
1
siP
OR
Tam
ine
siP
OR
TN
eoFX
Lip
ofec
tam
ine
LTX
Lip
ofec
tam
ine
2000
Con
trol
0
20
40
60
80
100C
ytot
oxic
ity
(%)
(a)
DO
TAP
Tran
sPas
sR
2
Tran
sPas
sR
1
siP
OR
Tam
ine
siP
OR
TN
eoFX
Lip
ofec
tam
ine
LTX
Lip
ofec
tam
ine
2000
Con
trol
0
20
40
60
80
100
Tran
sfec
tion
effici
ency
(%)
(b)
Figure 1: Effects of siRNA delivery agents on cytotoxicity and transfection rates. Freshly isolated HSCs were subjected to agent-specifictransfection protocols using a fluorescein-labeled, nontargeting siRNA control as described in the Materials and Methods. After 24 hoursincubation, cytotoxicity was assessed through the trypan blue dye exclusion test (a), while transfection rates were calculated from the ratiobetween fluorescein-labeled and total number of DAPI-stained cells (b). Data shown are representative of triplicate determinations.
2.4. Silencing of Cathepsin S Gene via the DOTAP Reagentin HSCs Subjected to Differentiation. Freshly isolated CD34+
cells were resuspended in RPMI-1640 supplemented with theagents used to generate immunogenic dendritic cells. Imme-diately after treatment, cells were subjected to transfectionusing a predesigned siRNA targeting the CatS gene (CTSS:ID-113084-113085, Ambion).
Cells subjected to mock- and scrambled-siRNA trans-fection (ID-46183G, Ambion) under the same experimentalconditions were employed for control purposes. The pro-cedure, run in a 24-well plate format via triplicate tests,was implemented using a 25 nM final siRNA concentration.Each well-contained 2 × 10⁵ cells in a volume of 500 μL.The siRNAs were combined with DOTAP and maintainedfor 30 minutes at room temperature to form complexes.The mixture (50 μL) was then overlaid dropwise on the cellcultures. Following 4-hour incubation, 1.2 mL of RPMI-1640containing 10% FCS and differentiating agents was added toeach well. To ensure silencing of genes for the entire 14-daydifferentiation process, cells were centrifuged, resuspendedin 500 μL of cytokine-enriched culture medium and exposedto a second (day 3) and third (day 9) transfection roundunder the same experimental conditions.
2.5. Western Blotting. Preparation of cell extracts, elec-trophoresis (12% gel) under reducing conditions andWestern blotting procedures were performed as previouslydescribed [24].
Precursors and mature forms of cathepsin S were ana-lyzed using polyclonal antibodies from Santa Cruz Biotech-
nology as the primary antibodies. Immunodetection wascarried out by employing the enhanced, chemiluminescentAmersham ECL Plus kit. For each blot, several time expo-sures were performed to confirm that the results were withinthe linear response range of the film. Densitometric scansvia an MCID system (InterFocus Imaging) were used todemonstrate that the intensity of the bands was proportionalto protein content.
3. Results and Discussion
Several transfection reagents were employed to evaluatecytotoxic effects and the capacity to deliver a fluorescein-labeled siRNA control in freshly isolated, untreated HSCs.Commercially-available agents were chosen to explore avariety of structural diversities and chemical formulationsas per each vendor’s product description. The screenincluded a cationic lipid (TransPass R1), a nonlipidcationic polymer (TransPass R2), a lipid-based formula-tion designed for reverse transfection protocols (siPORTNeoFX), a polyamine mixture (siPORT Amine), anddifferent versions of cationic liposomes (Lipofectamine2000, Lipofectamine LTX), an animal origin-free product,and DOTAP, obtained from N-[1-(2,3-Dioleoyloxy)propyl]-N,N,N-trimethylammonium methylsulfate.
Four chemicals (i.e., Lipofectamine LTX, siPORT NeoFX,siPORT Amine, and DOTAP) were relatively well tolerated byHSCs (≥85% viability) (Figure 1(a)), however only DOTAPwas found to combine a lack of cell cytotoxicity with efficient(60%) siRNA transfer (Figure 1(b)). TransPass R2 showed

4 Journal of Biomedicine and Biotechnology
14730
(days)
0
50
100
150
200
250
300
350
400
450
Via
ble
cells
(103
)
Figure 2: Cell viability during repeated, DOTAP-mediated trans-fection rounds in differentiating HSCs. Freshly isolated HSCswere induced to differentiate into immunogenic dendritic cellsas described in the Materials and Methods. Immediately aftertreatment, cultures were split into two cell populations, of whichone, used as the control, was grown in absence of manipulations(white bars), while the other was subjected to two and threeDOTAP-based, scrambled siRNA transfection rounds performed atday 0 and day 3 (black bars), and day 0, day 3 and day 9 (grey bars).Cell viability was monitored by trypan blue staining at differenttime points as indicated.
a transfection capacity similar to DOTAP, but significantcytotoxicity. Thus, DOTAP emerged as the chemical withsuitable attributes for use in gene knockdown studies ofdifferentiating HSCs.
We have previously shown that changes in cathepsinS expression correlate with the differentiation of HSCsinto immunogenic dendritic cells in vitro. In this regard,cathepsin S shows a precursor form of 66 KDa in freshlyisolated HSCs, while the conventional, mature protein of26 KDa appears following a 7-day treatment with a cytokinecocktail [22]. Based on the physiological role of cathepsinS in the biology of dendritic cells [25, 26], we employed agene knockdown strategy to investigate the involvement ofthe enzyme during the entire 14-day differentiation process.
In light of the transient nature of siRNA-mediatedsilencing, we implemented the DOTAP protocol for threerounds of transfection performed in untreated HSCs (day0) and, following cocktail treatment, in cells subjected todifferentiation for 3 and 9 days. Trypan blue exclusion testsperformed at different time points showed that multipleknockdowns did not affect cell viability (Figure 2). Further-more, overall metabolic activity and cell proliferation werealso unchanged, measured through reduction rates of thetetrazolium salt XTT (not shown) [27]. We also observed thatrepeated transfections of a scrambled siRNA had no impacton the temporal expression of antigens typically modulatedduring the differentiation of HSCs into phenotypically and
functionally mature dendritic cells, namely CD34, CD1a,CD80, CD86, CD83, and CD11c (Figure 3). Similarly, theexpression of additional immunophenotypic markers such asCD40 (10.04%±0.5), CD4 (59.02%±0.3), CD123 (46.08%±0.6) HLA-ABC (94.10% ± 0.7) in fully differentiated den-dritic cells was found to compare well with previous data[23], suggesting that the differentiation process advancednormally within expected temporal timeframes. Further,mixed lymphocyte reaction tests (not shown) did not revealany discrepancy in the functional properties of alloreactivedendritic cells [23]. On day 14, the reduction of cathepsinS expression exceeded 95% in the differentiation model, asindicated by Western blotting analysis (Figure 4(a)). Instead,gene silencing performed only twice at day 0 and, again,at day 3 caused more than 80% enzyme reduction duringthe cell commitment stage (day 7), followed by increasingcathepsin levels that resulted in a fully restored expressionafter two weeks (Figure 4(b)). Interestingly, no differences onthe CD34, CD1a, CD80, CD86, CD83, and CD11c markerswere measured during HSCs differentiation subjected to twoand three transfection rounds compared to untrasfected cells(Figure 3).
These results were found to be consistent throughoutthe screen of >20 different populations of freshly isolatedHSCs and therefore demonstrate a reliable and flexibleexperimental approach. This system was therefore exploredto study the biochemical implication of cathepsin S in themolecular mechanisms associated with HSC differentiationinto dendritic cells along the immunogenic or immunosup-pressive pathway (Martino et al., submitted manuscript).
Together, our findings point to DOTAP as a chemicalsuitable for siRNA delivery into HSCs, in light of a trans-fection efficiency (∼60%) comparable to the transductionrate recently achieved in the same human cells throughlentiviral vectors [17], and the excellent tolerance to repeatedexposures. The ability to dramatically enhance antisenseoligodeoxyribonucleotide uptake had, in previous studies,been taken as evidence for DOTAP’s biocompatibility withHSCs [28]. However, absence of any disruption during HSCdifferentiation further suggests that the DOTAP protocolherein described may be successfully extended to other HSC-related systems, including models aimed at addressing exist-ing controversial perspectives on HSC transdifferentiationand overall plasticity [29, 30].
It is possible that other chemical agents, not includedin our screen, may exhibit a performance comparable, ifnot better, to that produced by DOTAP. In this regard,the cationic lipophosphoramide KLN-5 was shown to bea nontoxic, highly efficient vehicle for transgene deliveryinto HSCs [31]; however, this chemical has not yet beentested in repeated siRNA transfection procedures and, toour knowledge, is not widely available through vendors.It must be noted that while a large number of lipidformulations could be designed to introduce nucleic acidsin cells, a complex combination of chemical-physical andbiological factors may severely limit the selection of chem-icals capable of transfecting synthetic siRNAs with hightransfection scores in HSCs. Indeed, cationic liposomes suchas DOTAP, Lipofectamine 2000 and Lipofectamine LTX

Journal of Biomedicine and Biotechnology 5
Untransfected Transfected
14301430
CD34 (days)
0
20
40
60
80
100
Posi
tive
cells
(%)
Untransfected Transfected
14301430
CD1a (days)
0
20
40
60
80
100
Posi
tive
cells
(%)
<0.2 <0.2
Untransfected Transfected
14301430
CD80 (days)
0
20
40
60
80
100
Posi
tive
cells
(%)
<0.2 <0.2 <0.2 <0.2
Untransfected Transfected
14301430
CD86 (days)
0
20
40
60
80
100
Posi
tive
cells
(%)
0.1 1 0.1 1.1
Untransfected Transfected
14301430
CD83 (days)
0
20
40
60
80
100
Posi
tive
cells
(%)
Untransfected Transfected
14301430
CD11c (days)
0
20
40
60
80
100
Posi
tive
cells
(%)
<0.5 1 <0.5 1.1
Figure 3: Expression of phenotypic markers throughout HSC differentiation into immunogenic dendritic cells in presence of multiple, DOTAP-mediated transfection rounds. HSCs were subjected to differentiation agents, and then immediately split into two parallel cultures, one ofwhich was maintained in the absence of manipulations, while the other was subjected to DOTAP-based, scrambled siRNA transfectionrounds. Phenotypic antigens typically modulated during HSC differentiation into immunogenic dendritic cells were analyzed in HSCs at day0 (white bars), day 3 (grey bars), and day 14 (black bars). In all instances, analyses were performed through a FACScan flow cytometer usingmonoclonal antibodies labeled with fluorescein isothiocyanate or phycoerythrin. Data shown are representative of triplicate determinations.
siR
NA
D14
siR
NA
D7
Scra
mbl
edsi
RN
AD
14
Un
trea
ted
D14
Cat S
β-actin
66 KDa
26 KDa
(a)
siR
NA
D14
siR
NA
D7
Scra
mbl
edsi
RN
AD
14
Un
trea
ted
D14
Cat S
β-actin
66 KDa
26 KDa
(b)
Figure 4: Silencing of cathepsin S during HSC differentiation. (a) Levels of cathepsin S were assessed by Western blotting in dendriticcells generated from the differentiation in vitroof HSCs. During the 14-day differentiation process, cells were subjected to DOTAP-basedtransfection rounds on day 0, 3, and 9 using a CTSS-targeting siRNA as described in the Materials and Methods. Untreated and scrambledsiRNA-transfected cells were employed for control purposes. Levels of precursor (66 KDa) and mature (26 KDa) forms of cathepsin S atdifferent time points (i.e., days 7 and 14) are indicated. β-actin was used to normalize the signals. (b) Shown is the same analysis as in panelA, except for the number of transfections, that were performed on day 0 and 3 only. Graphs are representative of experiments consistentlyreproduced using at least 20 different populations of HSCs.

6 Journal of Biomedicine and Biotechnology
display a positively-charged headgroup that engages elec-trostatic interactions with the sugar-phosphate backbone, aspacer that may or may not be designed to facilitate suchinteractions, and 1–3 hydrocarbon chains that may vary inlength, extent of saturation and distribution of cis and transconfigurations [32]. Thus, cationic liposomes can be subjectto a high degree of structural permutations, likely correlatedwith a capacity to transfer nucleic acids in specific celltypes. Despite structural similarities and a shared clathrin-mediated endocytosis process for DNA delivery [33, 34],these reagents exhibited a very wide performance rangewhen tested in the HSC system. Marked differences in vectorefficiencies may also arise from different mechanisms ofinternalization linked to subsequent, intracellular traffickingroutes associated with macromolecular fates [33].
4. Conclusions
Our findings clearly point to DOTAP as an ideal vehicle forin vitro studies that require gene expression modulation inHSCs. It will, therefore, be intriguing to investigate whetherthis reagent can also be adapted to in vivo applications,for example, through combination with low-molecular-weight polyethylenimines. These may indeed synergize withliposomes for DNA uptake [35] and have already beenproven to be effective in preclinical models [36, 37]. Thisapproach, if successful, would obviate the safety concernsassociated with viral-mediated insertional mutagenesis.
Acknowledgments
The authors would like to thank Anna C. Berardi fromIRCCS-Bambino Gesu Roma, Italy, for useful discussionsand comments on the manuscript. This work was sup-ported by Grants from MIUR (FIRB- Idea Progettualen.RBIP06FH7J 002), Fondazione Cassa Risparmio di Peru-gia (Project 2007.0149.02), Ministero della Salute (Project n,RF-UMB-2006-339457), and Consorzio INNB to A.O.
References
[1] S. E. Martin and N. J. Caplen, “Applications of RNA interfer-ence in mammalian systems,” Annual Review of Genomics andHuman Genetics, vol. 8, pp. 81–108, 2007.
[2] D. E. Root, N. Hacohen, W. C. Hahn, E. S. Lander, and D.M. Sabatini, “Genome-scale loss-of-function screening with alentiviral RNAi library,” Nature Methods, vol. 3, no. 9, pp. 715–719, 2006.
[3] M. Boutros and J. Ahringer, “The art and design of geneticscreens: RNA interference,” Nature Reviews Genetics, vol. 9, no.7, pp. 554–566, 2008.
[4] D. Bumcrot, M. Manoharan, V. Koteliansky, and D. W. Y. Sah,“RNAi therapeutics: a potential new class of pharmaceuticaldrugs,” Nature Chemical Biology, vol. 2, no. 12, pp. 711–719,2006.
[5] A. Orlacchio, G. Bernardi, A. Orlacchio, and S. Martino, “RNAinterference as a tool for Alzheimer’s disease therapy,” Mini-Reviews in Medicinal Chemistry, vol. 7, no. 11, pp. 1166–1176,2007.
[6] A. Orlacchio, G. Bernardi, A. Orlacchio, and S. Martino,“Patented therapeutic RNAi strategies for neurodegenerativediseases of the CNS,” Expert Opinion on Therapeutic Patents,vol. 18, no. 10, pp. 1161–1174, 2008.
[7] D. H. Kim and J. J. Rossi, “Strategies for silencing humandisease using RNA interference,” Nature Reviews Genetics, vol.8, no. 3, pp. 173–184, 2007.
[8] S. M. Elbashir, J. Harborth, W. Lendeckel, A. Yalcin, K. Weber,and T. Tuschl, “Duplexes of 21-nucleotide RNAs mediate RNAinterference in cultured mammalian cells,” Nature, vol. 411,no. 6836, pp. 494–498, 2001.
[9] D.-H. Kim, M. A. Behlke, S. D. Rose, M.-S. Chang, S. Choi, andJ. J. Rossi, “Synthetic dsRNA Dicer substrates enhance RNAipotency and efficacy,” Nature Biotechnology, vol. 23, no. 2, pp.222–226, 2005.
[10] J. Moffat, J. H. Reiling, and D. M. Sabatini, “Off-target effectsassociated with long dsRNAs in Drosophila RNAi screens,”Trends in Pharmacological Sciences, vol. 28, no. 4, pp. 149–151,2007.
[11] S. A. Stewart, D. M. Dykxhoorn, D. Palliser, et al., “Lentivirus-delivered stable gene silencing by RNAi in primary cells,” RNA,vol. 9, no. 4, pp. 493–501, 2003.
[12] M. Li and J. J. Rossi, “Lentiviral vector delivery of siRNA andshRNA encoding genes into cultured and primary hematopoi-etic cells,” Methods in Molecular Biology, vol. 433, pp. 287–299,2008.
[13] O. ter Brake, K. ’t Hooft, Y. P. Liu, M. Centlivre, K. J. von Eije,and B. Berkhout, “Lentiviral vector design for multiple shRNAexpression and durable HIV-1 inhibition,” Molecular Therapy,vol. 16, no. 3, pp. 557–564, 2008.
[14] R. S. Pillai, S. N. Bhattacharyya, and W. Filipowicz, “Repres-sion of protein synthesis by miRNAs: how many mecha-nisms?” Trends in Cell Biology, vol. 17, no. 3, pp. 118–126,2007.
[15] S. Vasudevan, Y. Tong, and J. A. Steitz, “Switching from repres-sion to activation: microRNAs can up-regulate translation,”Science, vol. 318, no. 5858, pp. 1931–1934, 2007.
[16] D. H. Kim, P. Sætrom, O. Snøve Jr., and J. J. Rossi, “MicroRNA-directed transcriptional gene silencing in mammalian cells,”Proceedings of the National Academy of Sciences of the UnitedStates of America, vol. 105, no. 42, pp. 16230–16235, 2008.
[17] F. Di Nunzio, B. Piovani, F.-L. Cosset, F. Mavilio, and A.Stornaiuolo, “Transduction of human hematopoietic stemcells by lentiviral vectors pseudotyped with the RD114-TRchimeric envelope glycoprotein,” Human Gene Therapy, vol.18, no. 9, pp. 811–820, 2007.
[18] L. H. Li, P. McCarthy, and S. W. Hui, “High-efficiencyelectrotransfection of human primary hematopoietic stemcells,” The FASEB Journal, vol. 15, no. 3, pp. 586–588, 2001.
[19] J. M. Wiehe, P. Ponsaerts, M. T. Rojewski, et al., “mRNA-mediated gene delivery into human progenitor cells promoteshighly efficient protein expression,” Journal of Cellular andMolecular Medicine, vol. 11, no. 3, pp. 521–530, 2007.
[20] V. F. I. Van Tendeloo, H.-W. Snoeck, F. Lardon, et al., “Nonviraltransfection of distinct types of human dendritic cells: high-efficiency gene transfer by electroporation into hematopoieticprogenitor- but not monocyte-derived dendritic cells,” GeneTherapy, vol. 5, no. 5, pp. 700–707, 1998.
[21] G. Ferlazzo, J. Klein, X. Paliard, W.-Z. Wei, and A. Galy, “Den-dritic cells generated from CD34+ progenitor cells with flt3ligand, c-Kit ligand, GM-CSF, IL-4, and TNF-α are functionalantigen-presenting cells resembling mature monocyte-deriveddendritic cells,” Journal of Immunotherapy, vol. 23, no. 1, pp.48–58, 2000.

Journal of Biomedicine and Biotechnology 7
[22] R. Tiribuzi, S. Martino, E. Ciraci, et al., “Non-redundantroles of cathepsins L, B and S in CD1a+ dendritic cellsknocked-down for cathepsin S by RNA interference,” MinervaBiotecnologica, vol. 20, no. 2, pp. 59–67, 2008.
[23] S. Della Bella, S. Nicola, I. Timofeeva, M. L. Villa, A. Santoro,and A. C. Berardi, “Are interleukin-16 and thrombopoietinnew tools for the in vitro generation of dendritic cells?” Blood,vol. 104, no. 13, pp. 4020–4028, 2004.
[24] S. Martino, C. Emiliani, A. Orlacchio, R. Hosseini, andJ. L. Stirling, “β-N-acetylhexosaminidases A and S havesimilar sub-cellular distributions in HL-60 cells,” Biochimicaet Biophysica Acta, vol. 1243, no. 3, pp. 489–495, 1995.
[25] K. Honey and A. Y. Rudensky, “Lysosomal cysteine proteasesregulate antigen presentation,” Nature Reviews Immunology,vol. 3, no. 6, pp. 472–482, 2003.
[26] L. Delamarre, M. Pack, H. Chang, I. Mellman, and E. S.Trombetta, “Differential lysosomal proteolysis in antigen-presenting cells determines antigen fate,” Science, vol. 307, no.5715, pp. 1630–1634, 2005.
[27] D. A. Scudiero, R. H. Shoemaker, K. D. Paull, et al., “Evalu-ation of a soluble tetrazolium/formazan assay for cell growthand drug sensitivity in culture using human and other tumorcell lines,” Cancer Research, vol. 48, no. 17, pp. 4827–4833,1988.
[28] R. Kronenwett, U. Steidl, M. Kirsch, G. Sczakiel, and R.Haas, “Oligodeoxyribonucleotide uptake in primary humanhematopoietic cells is enhanced by cationic lipids and dependson the hematopoietic cell subset,” Blood, vol. 91, no. 3, pp.852–862, 1998.
[29] D. Orlic, J. Kajstura, S. Chimenti, et al., “Bone marrow cellsregenerate infarcted myocardium,” Nature, vol. 410, no. 6829,pp. 701–705, 2001.
[30] C. E. Murry, M. H. Soonpaa, H. Reinecke, et al., “Haematopoi-etic stem cells do not transdifferentiate into cardiac myocytesin myocardial infarcts,” Nature, vol. 428, no. 6983, pp. 664–668, 2004.
[31] T. Montier, P. Delepine, K. Le Ny, et al., “KLN-5: asafe monocationic lipophosphoramide to transfect efficientlyhaematopoietic cell lines and human CD34+ cells,” Biochimicaet Biophysica Acta, vol. 1665, no. 1-2, pp. 118–133, 2004.
[32] X. Gao and L. Huang, “Cationic liposome-mediated genetransfer,” Gene Therapy, vol. 2, no. 10, pp. 710–722, 1995.
[33] A. W. Wong, S. J. Scales, and D. E. Reilly, “DNA internalized viacaveolae requires microtubule-dependent, Rab7-independenttransport to the late endocytic pathway for delivery to thenucleus,” The Journal of Biological Chemistry, vol. 282, no. 31,pp. 22953–22963, 2007.
[34] J. Rejman, A. Bragonzi, and M. Conese, “Role of clathrin- andcaveolae-mediated endocytosis in gene transfer mediated bylipo- and polyplexes,” Molecular Therapy, vol. 12, no. 3, pp.468–474, 2005.
[35] P. Lampela, P. Soininen, A. Urtti, P. T. Mannisto, and A.Raasmaja, “Synergism in gene delivery by small PEIs andthree different nonviral vectors,” International Journal ofPharmaceutics, vol. 270, no. 1-2, pp. 175–184, 2004.
[36] A. Bragonzi, G. Dina, A. Villa, et al., “Biodistribution andtransgene expression with nonviral cationic vector/DNA com-plexes in the lungs,” Gene Therapy, vol. 7, no. 20, pp. 1753–1760, 2000.
[37] H.-W. Liao and K.-W. Yau, “In vivo gene delivery in the retinausing polyethylenimine,” BioTechniques, vol. 42, no. 3, pp.285–288, 2007.

Hindawi Publishing CorporationJournal of Biomedicine and BiotechnologyVolume 2009, Article ID 871313, 8 pagesdoi:10.1155/2009/871313
Review Article
Searching for MIND: MicroRNAs in Neurodegenerative Diseases
Christian Barbato,1, 2 Francesca Ruberti,2 and Carlo Cogoni1, 3
1 European Brain Research Institute (EBRI), Fondazione EBRI- Rita Levi-Montalcini, Via del Fosso di Fiorano 64/65,00143 Roma, Italy
2 Istituto di Neurobiologia e Medicina Molecolare (INMM), CNR, Via del Fosso di Fiorano 64/65, 00143 Roma, Italy3 Dipartimento di Biotecnologie Cellulari ed Ematologia, Sezione di Genetica Molecolare, Universita di Roma “La Sapienza”,Viale Regina Elena 324, 00161 Roma, Italy
Correspondence should be addressed to Christian Barbato, [email protected]
Received 9 January 2009; Accepted 12 June 2009
Recommended by Pawan Malhotra
In few years our understanding of microRNA (miRNA) biogenesis, molecular mechanisms by which miRNAs regulate geneexpression, and the functional roles of miRNAs has been expanded. Interestingly, numerous miRNAs are expressed in a spatiallyand temporally controlled manner in the nervous system, suggesting that their posttrascriptional regulation may be particularlyrelevant in neural development and function. MiRNA studies in neurobiology showed their involvement in synaptic plasticityand brain diseases. In this review ,correlations between miRNA-mediated gene silencing and Alzheimer’s, Parkinson’s, and otherneurodegenerative diseases will be discussed. Molecular and cellular neurobiological studies of the miRNAs in neurodegenerationrepresent the exploration of a new Frontier of miRNAs biology and the potential development of new diagnostic tests and genetictherapies for neurodegenerative diseases.
Copyright © 2009 Christian Barbato et al. This is an open access article distributed under the Creative Commons AttributionLicense, which permits unrestricted use, distribution, and reproduction in any medium, provided the original work is properlycited.
1. Introduction
Neurodegenerative diseases represent a large group of neu-rological disorders with heterogeneous clinical and patho-logical expressions, affecting specific groups of neurons,in specialized functional anatomic systems. A mixtureof environmental and genetic factors seems to engenderneurodegenerative diseases, and aging has been found acommon risk factor. Neurodegenerative diseases result fromthe gradual and progressive loss of neuronal cells, leadingto nervous system dysfunction. They are characterized bythe formation of distinct pathological changes in the brain,including extracellular protein deposits, cellular inclusions,and remodelling of cell morphology. However, while manydifferent forms of neurodegenerative disease are recognized,the lines that separate one from another are often unclear.For instance, symptoms such as motor impairment andmemory loss may occur in many different types of neu-rodegenerative disease. Alzheimer’s disease, Parkinson’s dis-ease, prion diseases, and polyglutamine disorders, includingHuntington’s disease and various spinocerebellar ataxias, are
well-known neurodegenerative disorders [1]. To date, withfew exceptions, no diagnostic laboratory tools exist thatcan clearly indicate the presence, absence, or category of aneurodegenerative disease. Diagnoses are usually based onclinical evaluation of the symptoms.
The microRNA-(miRNA-) guided RNA silencing path-way is a recently discovered process found to regulate geneexpression acting on messenger RNA (mRNA). MiRNA bio-genesis is mediated by Dicer which catalyzes the processingof double-stranded RNAs (dsRNAs) into ≈22 nt-long smallmiRNAs. These small noncoding RNA molecules operateas guides for RISC (RNA Induced Silencing Complex) tocleave a target mRNA in case of a perfect complementarity(siRNA) or to block the target mRNA translation (miRNA)when there is an imperfect pairing between miRNAs and thetargets. In mammalian cells the repression of translation bymiRNA is mediated by an imperfect pairing with 3′UTR ofthe mRNA target [2]. MiRNAs are conserved throughoutthe evolution, and their expression may be constitutiveor spatially and temporally regulated. Increasing efforts toidentify the specific targets of miRNAs lead to speculate

2 Journal of Biomedicine and Biotechnology
that miRNAs can regulate more than 90% of human genes.Specific miRNA subsets were expressed in specific brain areaand in neuronal and glial cell subtypes [3]. The studies ofmicroRNAs expression profiles in nervous system representthe first step in understanding how, where, and whenmiRNAs are involved in the regulation of neurodevelopment,differentiation, dendritic spine development, local proteinsynthesis, and synaptic plasticity [4]. Several works haveshown spatially and/or temporally restricted distribution ofmiRNAs, suggesting that they might regulate neuronal geneexpression. By comparative analysis of miRNA expression inthe normal and pathologic brain, the microRNA signaturesin several neurodegenerative diseases, including polyglu-tamine expansions, Parkinson’s and Alzheimer’s diseases arecoming up. To date we have few pieces of information aboutthe expression profiles, and the complex composition ofthe brain, containing several neuronal and glial istotypes,while representing its main biological characteristic, is alsothe principal obstacle for an accurate analysis. Furthermorein order to interpretate miRNA expression data from post-mortem human brains affected by neurodegenerative dis-eases, the source of neural tissues, together with the RNAisolation techniques used, need to be carefully considered.Overall, the identification of miRNA’s physiological targetgenes should be a primary approach to reveal the specificcontribution of microRNAs to neural function. Recentstudies of microRNA in nonneuronal cellular systems coulddrive future research in primary neuronal cells. In fact,prediction of microRNA targets utilizing different algorithmsbased on the general rule of the seed region has beencomplemented by an elegant proteomic approach whichuses a mass spectrometric method called stable-isotopelabelling with aminoacid in cell culture (SILAC) to measurechanges in protein levels in response to miRNA inductionor knockdown. SILAC approach showed that individualmicroRNA can reduce the production of hundred proteins[5, 6]. Many targets are repressed at both mRNA and proteinlevel and others are predominantly regulated at protein level.Although several miRNA-induced changes in the proteomecorrelate with the presence of seeds in the mRNA of theaffected proteins, some changes remain to be explained. Theymight be due both to indirect effects and/or to miRNAdirect targeting mediated by still unknown rules. Remarkablyan increasing level of complexity of species-specific miRNAexpression during evolution emerged. However, 447 newmiRNA genes expressed in human fetal and chimpanzeeadult brains were identified. Many of them are not conservedbeyond primates, indicating a recent evolutionary origin.Since 8% of miRNA were found to be human-specific,they might play a role in the human brain evolution.However, expression levels of miRNAs common to humanand chimpanzee were not determined, because differentregions were analyzed at various ages. Several features incognitive functions of humans and chimpanzees are probablyelucidated by variations in cortical structures. Therefore, thediversity of miRNA repertoire in the brain likely contributesto the dissimilarities between human and chimpanzee,arguing for a role of miRNA in brain evolution and function[7].
In this review we discuss the recent studies on theinvolvement of miRNA-mediated gene silencing in neurode-generative diseases.
2. MicroRNAs in Neurodegenerative Diseases
2.1. MicroRNAs in Alzheimer’s Disease. Alzheimer’s Disease(AD) is the best known degenerative disease affecting thecentral nervous system [8]. AD is a chronic progressivedisease characterized by early memory impairments followedby these cognitive deficits: aphasia (language disturbances),agnosia (failure to recognize people or objects in presence ofintact sensory function), apraxia (inability to perform motoracts in presence of intact motor system). Neuropathologicallythe areas of brain most affected are the hippocampusfollowed by association cortices and subcortical structures.The neurodegeneration is characterised by synapse andcellular loss, β-amyloid plaques, and neurofibrillary lesions.The major component of plaques is the Aβ peptide whichderives from the proteolytic processing of its precursorprotein (APP). The neurofibrillary lesions contain aggre-gates of hyperphosphorylated microtubule-associated pro-tein tau. This histopathological hallmark is used in Braak’sAlzheimer’s system [9] to describe postmortem AD brainsamples in six stages: in the transentorhinal stage (Stages Iand II), the neurofibrillary pathology is essentially confinedto the transentorhinal and entorhinal cortex and slightlyto the CA1/CA2 sections of the hippocampus; the limbicstage (Stages III and IV) frames a severe involvement ofthe entorhinal areas and a moderate engagement of thehippocampus; the hallmark of the neocortical stage (StagesV and VI) was the dismantlement of the neocortex. AD is themost common cause of dementia in aged populations. About1% early onset familial form of the disease (onset before 60to 65 years of age) is due to mutations in three genes, APP,presenilin 1 (PSEN1), and presenilin 2 (PSEN2) all ofwhich cause Aβ overproduction. Aβ production is initiatedby the processing of APP by the β-amyloid cleavage enzyme1 (BACE1) which generated a C-terminal fragment ofAPP, labelled as C99. This fragment is further cleaved byγ-secretase complex, which includes the presenilins, andgenerates the more abundant Aβ40 and the less abundant,but more pathogenic, Aβ42 [8]. Aβ load in AD brain wassuggested to trigger neuronal dysfunctions. For the majorityof AD cases, which shows less obvious familial aggregation(hence they are also called sporadic AD), the molecular basesof the disease are matter of intensive research.
A discrete number of studies has suggested that a dys-regulated microRNA expression could be aging-associatedand could contribute to AD. miRNA expression profiles arechanged in pathological conditions in all studies publisheduntil now. Lukiw’s laboratory evaluated the expression of12 miRNAs in hippocampal region of fetal, adult, andAD brain [10]. They found that miR-9 was upregulatedin both fetal and AD hippocampus, and miR-128 wasincreased specifically in AD hippocampus. However, thetranslational changes induced by these specific miRNAs inAD hippocampus remain to be investigated. More recently

Journal of Biomedicine and Biotechnology 3
espression profiles of 328 microRNAs in anterior temporalcortex from five sporadic AD patients and five age-mathcedcontrols showed 13 microRNAs significantly downregulatedin cortex of sporadic AD [11]. Using various predictionalgorithms to identify AD-related potential target genes, 7 ofthe 13 microRNAs had candidate binding sites in the 3′UTRof BACE (miR-15a, -29b-1, -9, and -19b) or APP (let-7, miR-101, miR-15a, and miR-106b,) or in the 3′UTR of PSEN1(miR-9). On the other hand, 6 microRNAs do not seem tobe related to obvious targets (miR-210, -181c, -22, -26b, -363,-93). In particular the relationship between BACE1 and miR-29 was deeply investigated (mentioned in what follows). Thechanges of miRNA profiles might be specific for sporadicAD and might cause or exacerbate the neuropathology.Furthermore, linking microRNA expression to their specifictargets could suggest novel pathways of the disease.
A recent study evaluated the importance of deregulationof miRNA expression in brains and cerebrospinal fluid(CSF) of Alzheimer’s patients [12]. Over 300 microRNAswere determined in the hippocampus, medial frontal gyrus,and cerebellum from early and late stage AD comparedto age-matched control. Deregulated microRNAs have beenassociated to known and novel molecular pathways inAD pathogenesis such as neurogenesis, oxidative stress,insulin resistance, and innate immunity. For example, miR-9 and miR-132 downregulation was correlated to impairedneurogenesis and neuronal differentiation. The finding thatmiR-423 was upregulated in hippocampus while miR-98 wasdecreased in cerebellum was appealing. In fact both miRNAsmodulate IDH2 (isocitrate dehydrogenase 2) expression andIDH2 reduction was described to be involved in oxidativestress in AD prefrontal cortex. These observations suggesta mechanism for the specific susceptibility of particular ADbrain areas such as the hippocampus and the relative sparingof others such as the cerebellum.
Sixty miRNAs were differentially expressed in the CSFof patients between Braak stage 5 and stage 1. Amongthese miRNAs few were brain enriched while several werenot correlated to the miRNAs changes observed in ADbrain regions. Therefore, CSF microRNAs were suggested toderive from T lymphocytes present in the CSF. The alteredexpression of miRNA in the CSF of patients affected byAlzheimer’s disease, opens a new scenario on the use ofthese expression profiles as putative AD biomarkers. To date,CSF analysis from AD patients produced some of the mostreproducible biomarkers, such as decreased Aβ42, increasedtotal tau (ttau), and increased phosphorylated tau (p-tau)[13]. Combinations of these CSF markers have been alsoproposed to diagnosticate AD. Future work might be toevaluate if the CSF miRNAs profile correlates with Aβ, totaland phosphorylated tau protein presently carried out in theCSF of AD patients.
Specific molecular mechanisms involving microRNAsand expression of BACE1 and APP are emerging in the ADfield. By microarray and in situ hybridization of superior-medial frontal cortex of AD, Nelson’s laboratory showedthat the expression of miR-107 decreased during progressionof the disease in parallel to BACE1 mRNA increase. Inaddition cell culture experiments showed that the expression
of a luciferase reporter gene fused to a 3′UTR containingBACE1 microRNA 107 binding site is modulated by miR-107 [14]. Another study, investigating changes in microRNAexpression profiles of anterior temporal cortex from sporadicAD patients found that the expression of the cluster miR-29a/b-1 was significantly decreased in a subgroup of ADpatients in which BACE 1 protein was abnormally upreg-ulated while BACE 1 mRNA levels were unchanged [11].Consistently, during mouse brain development from E17to 1 year, BACE1 protein level decrease was correlated tomiR-29a/b-1 upregulation while BACE1 mRNA level wasstable. In cell culture experiments, BACE1 target validationwas demonstrated by monitoring the effects of miR-29a/b-1 on the translation of a BACE1 3′UTR luciferase reportercarrying wilde-type or mutated miR29a/b-1 responsive site.Finally, upon either overexpression or downregulation ofmiR-29a/b-1 in human cell culture both BACE1 proteinlevels and APP cleavage product Aβ were, respectively,reduced and increased.
In both previous studies [11–14], the loss of microRNAin AD is not specific for a certain brain area more susceptibleto the disease, that is, miR-107 is also downregulated inmotor cortex of AD patients and miR-29a/b-1 expressionalso decreases in AD cerebellum. Therefore, altered BACEexpression due to microRNA deregulation is not responsiblefor increased sensitivity of particular brain regions. Howeveralso in the AD familial cases, mutations of APP and PSENare present in all cells of the brain and only specific regionsare affected from AD.
Interestingly other two microRNAs, miR-298 and miR-328, regulate BACE 1 protein expression in cultured neuronalcells [15]. It is relevant that in APPswe/Psen1 transgenicmice, an AD mouse model which recapitulates some featuresof the disease, it was observed that BACE1 mRNA decreasedand protein levels increased in the hippocampus at 19months of age. In transgenic mice, the expression of miR-298 and miR-328 decreased in the granular neurons of thehippocampus during aging. However, while the miR-328sequence is perfectly conserved between mouse and human,that of miR-298 is only 72% identical. Clearly, additionalwork will be needed to determine whether all of thesemicroRNAs are really active in human brain and their relativecontribution to BACE expression in physiological and patho-logical conditions and in different neuronal populations.
It has been shown that AD can be caused by increasedexpression of the APP gene due to either genomic duplica-tion or regulatory sequence alterations. In C. elegans, APPorthologue APL-1 is regulated by developmentally timedmicroRNA [16]. In particular, apl-1 expression in seamcells is indirectly repressed by let-7 family microRNA, andapl-1 transcription is regulated by downstream targets oflet-7 microRNA. This study opens new insights into thetime-dependent progression of AD. The 3′UTR of APPmRNA is a potential target for several microRNAs. Recently,utilizing human HEK-293 cells, it has been demonstratedthat miR106a and miR-520c negatively regulate expressionof reporter genes containing their predicted target sequencespresent in the APP 3′UTR [17]. In addition, overexpressionof miR-106a or miR-520c (which is not expressed in brain)

4 Journal of Biomedicine and Biotechnology
miR-107miR-29a/b-1miR-298 & miR-328
miR-106amiR-520cmiR-106bmiR-101miR-15alet-7
APP C99
BACE1 mRNA APP protein
APP mRNA
BACE1 enzyme
Neurofibrillary tanglesfeatures of Alzheimer’sdisease
Enviromental andgenetic factors
Cytoplasm
Extracellular space
γ-secretase
complex
Aβaggregates
Aβ
Aβ plaques
Figure 1: APP or BACE1 upregulation might lead to Aβ overproduction in Alzheimer’s Disease. The picture shows molecular pathwaysmodulating APP and BACE1 expression and amyloidogenic processing of APP by BACE1 and the γ-secretase complex leading to Aβproduction. Reduction of miRNA/RISC posttranscriptional regulation of APP and/or BACE1 mRNA induces the increase of the relativeproteins, which drive to Aβ accumulation. Changes of miRNA expression might trigger molecular events inducing AD pathology or generatea feed-forward mechanism during AD progression (as suggested for miR-298 and miR-328).
reduces APP levels by 50%. It will be important to translatethese results in a cellular context relevant for AD pathology.Interestingly, miR-106b is one of the four microRNA thathave been predicted to target the 3′UTR of APP (let-7,miR-101, miR-15a, and miR-106b) and that were foundto be downregulated in anterior temporal cortex from fivesporadic AD patients [11]. All these investigations suggestthat dysregulation of miRNAs, by modulation of APP andBACE1 expression, might be a cause or a consequence of AD(Figure 1).
2.2. MicroRNAs in Parkinson’s Disease. Parkinson’s disease(PD) is associated with progressive neurodegenerationof dopaminergic neurons (DNs) in the substantia nigraand leads to tremor, rigidity, and bradykinesia. Futrher-more, widespread neuronal modifications lead to complexand variable non-motor symptoms. Lewy bodies are aneropathological feature of PD and are cellular inclusionscomprising a dense core of filamentous material surroundedby a halo of fibrils, which mainly consists of a-synuclein.Mutations in genes coding for synuclein (SNCA), parkin,pink1, DJ-I, Lrrk2, can explain only a limited number offamilial PD cases, while the molecular bases of vast numbersof non familial cases are not yet understood [18]. A recentstudy shed some light on the role of microRNA in DNsdifferentiation and raises the question whether microRNA
are involved in etiology of PD. Deletion of Dicer impairsthe ability of ES cells to differentiate into DNs. SinceDicer deletion was partially rescued by transfection of smallRNA derived from embryonic mouse midbrain, it is likelythat microRNAs are involved in DNs differentiation andsurvival [19]. In addition, specific deletion of Dicer invivo, in mouse midbrain dopaminergic neurons, leads tocell death in the substantia nigra. Behavioural studies ofthe animals revealed reduced locomotion in an-open-fieldassay, reminiscent of the phenotype of human patients withPD. MiRNA expression profiles of normal adult midbraincompared with the profiles of midbrain depleted of DNsfrom PD patients revealed alterations of certain midbrain-enriched miRNA, in PD brain [19]. The role of miR-133b,enriched in midbrain and absent in the brains of PD patients,was further investigated. It was demonstrated that miR-133bconstitutes a negative feedback loop with the transcriptionfactor Ptx-3: Ptx-3 transcribes miR-133b which in turnrepresses Ptx-3 translation. In vitro experiments showedthat depletion of miR-133b increases the expression of DNmarkers and depolarization-induced dopamine release whilemiR-133b overexpression suppresses the full differentiationof DN neurons and produces a significant decrease indopamine release [19]. Thus, although miR-133b is involvedin differentiation and function of DN neurons, additionalmicroRNAs should be responsible for Dicer deletion pheno-type in DN.

Journal of Biomedicine and Biotechnology 5
Polymorphisms affecting the interactions betweenmicroRNAs and their targets are emerging in various studieson neurodegenerative disease. Genetic analyses showed thatrelevant polymorphic variations in the fibroblast growthfactor 20 gene (FGF20) are associated with the risk ofdeveloping PD. FGF20 is preferentially expressed in thesubstantia nigra and promotes survival of dopaminergicneurons. More recently, one SNP (rs 127202208), locatedwithin the FGF20 3′UTR, was strongly associated withPD. SNP rs 127202208 lies within a predicted bindingsite for microRNA 433 which is highly expressed in thebrain [20]. Through several functional assays, it wasdemonstrated that the risk allele rs 127202208 damped abinding site for microRNA 433 and increased translationof FGF20. In cell culture experiments and in PD brains, theincreased FGF20 translation was correlated with increasedsynuclein expression. Synuclein is included into the genesresponsible for familial cases of PD and althought thefunction of this protein is not yet defined, it has beendemonstrated that overexpression and point mutations cancause PD.
2.3. MicroRNAs in Polyglutamine Diseases. Polyglutamine(polyQ) disorders constitute a family of dominantly inher-ited neurodegenerative diseases caused by the expansionof CAG triplet repeats in a specific gene. A commonsignature is the accumulation of the mutant protein inlarge intranuclear inclusions. The clinical features includespasticity and cognitive impairments. To date, ten such neu-rodegenerative disorders known to be caused by expansionof the CAG repeat in the coding region of the respectivegenes have been identified [21]. These prototypical proteinmisfolding disorders include Huntington disease (HD), sixdistinct forms of spinocerebellar ataxia (SCA-1, 2, 3, 6, 7and 17), dentatorubropallidoluysian atrophy (DRPLA), andspinobulbar muscular atrophy (SBMA).
2.3.1. Huntington Disease. Huntington’s disease (HD) is themost common and well-studied polyglutamine neurodegen-erative disorder [22]. It is an hereditary autosomal dominantdisease characterized by motor, cognitive, and psychiatricsymptoms. It affects about 3 in 100 000 individuals. Theonset of symptoms typically occurs between the ages 35 and50 years, though it may appear at any age. The molecularbasis of the disease is the expansion of the trinucleotideCAG in the first exon of a gene on chromosome four (4p16.3). This gene encodes the protein huntingtin (Htt) of3136 amino acids. The mutation of huntingtin producesan expanded stretch of glutamine (Gln) residues. ThisCAG/polyGln expansion has 6–39 units in normal individ-uals and 36 to 180 units in HD patients. Huntingtin appearsto be associated to protein trafficking, transcriptional regu-lation, synaptic signalling, vesicle transport, and apoptosis.HD patients show progressive loss of cortical and striatalneurons associated with choreic movement and dementia.The neuropathological hallmark is the gradual atrophy of thestriatum (caudate nucleus and putamen), observed in 95%
of the HD brains. Mechanisms of neurodegeneration impli-cated in HD pathology are excitotoxicity, dopamine toxicity,mithocondrial dysfunction, oxidative stress, apoptosis, andautophagy.
Several observations suggested microRNAs dysregulationin HD. Interaction between wild type Htt and Repres-sor Element1 Silencing Transcription (REST) factor wasdescribed. In pathological conditions Htt mutation inhibitsits interaction with REST and provokes REST build-upin the nucleus of HD neurons, decreasing neuronal geneexpression. REST is a transcriptional repressor of neuralgenes, including several microRNAs [23].
Recently, Johnson et al. [24] identified miRNA regulatedby REST in neurons, and measured the expression ofthese miRNAs in the brains of HD mouse models andin postmortem tissue of HD patients. Several changes inmicroRNAs expression profile were allocated to species-specific differences, and others to the comparative analysisof a specific human cortex, area versus whole mouse cortex.Both in HD mouse model and in human HD cortex, miR-132was downregulated, and its mRNA target p250 GAP, whichmodulates dendritic plasticity, was increased. Since RESTis highly involved in HD, microRNAs are likely expectedto play an important role in the disease pathogenesis. Inaddition, it was demonstrated that huntingtin protein co-purified with Argonaute proteins, fundamental componentsof RISC complex. Argonaute proteins have been shown tolocalize to cytoplasmic foci, named P bodies. Htt, colocalizedwith Argonaute2 in P bodies, and depletion of Htt showedcompromised RNA-mediated gene silencing. Thereafter, inmouse striatal neurons expressing Htt mutation, P bodiesformation and translation miRNA-mediated repression wereimpaired. These data suggest that Htt play a role in miRNAprocesses [25].
2.3.2. Spinocerebellar Ataxia Type 3. The polyglutamine(polyQ) protein Ataxin-3 is mutated in the human polyg-lutamine disease spinocerebellar ataxia type 3 (SCA3),resulting in a progressive dysfunction of the cerebellum.SCA3 is typically a late-onset fatal autsosomal dominantneurodegenerative disease that, like all ataxias, is character-ized by loss of motor coordination and balance. In SCA-3 Drosophila model, the suppression of miRNA processingby dicer mutation increases ataxin-3 toxicity, inducing aneurodegenerative phenotype. Moreover, depletion of R3D1,a dsRNA-binding protein, that forms a stable complexwith Dicer-1, causes accumulation of precursor miRNA,increasing ataxin-3-induced toxicity [26, 27]. In HeLa cellline, dicer reduction by RNAi enhances polyQ proteintoxicity only in cells expressing pathogenic Ataxin-3, causingloss of 70% of the cultured cells. These findings suggest aneuroprotective role of miRNAs in these neurodegenerativediseases [27].
2.3.3. Spinocerebellar Ataxia Type 1. Spinocerebellar ataxiatype 1 (SCA1) is a dominant inherited disease caused byexpanded trinucleotide repeats resulting in an increased

6 Journal of Biomedicine and Biotechnology
polyglutamine tract in the gene product ataxin-1 (ATXN-1).SCA1 patients loose motor coordination and develop slurredspeech, spasticity, and cognitive impairments. A typicalfeature of SCA1 pathology is the atrophy and loss of Purkinjecells from the cerebellar cortex. Purkinje cells are the majorintegrative neurons of the cerebellar cortex, projecting theiraxons onto the deep cerebellar nuclei. A recent study showedthat a conditional Purkinje (PK) cell-specific ablation ofDicer leads to PK cell death, cerebellar dysfunction, andataxia indicating an involvement of miRNAs in cerebellarneurodegeneration [28].
Another line of evidence suggesting a role of miRNAs inSCA1 pathogenesis comes from the observation that miR-19,miR-101, and miR-130 cooperatively regulate ATXN1 levels[29]. When miR-19, miR-101 and miR-130 were inhibited by2′-O-methyl oligonucleotides, an increase of ATXN1 proteinlevel was observed. Moreover, it was demonstrated thatmiR-19, miR-101, and miR-130 were expressed in mousecerebellum and Purkinje cells by Northern blot analysis andin situ hybridization. These miRNAs regulate the cell toxicityof the polyQ-expanded ATXN1, suggesting to investigatemiRNAs-mediated regulation in SCA1 neurodegenerativedisorder.
2.4. MicroRNAs in Frontotemporal Dementia. Frontotempo-ral dementia (FTD) is a neurodegenerative disease repre-senting ∼5% of all dementia patients, characterized by theprogressive degeneration of the frontal and anterior temporalcortex. Considering the involvement of the frontal lobe,the clinical picture is cognitive and memory impairment,language dysfunction, and/or changes in personality orbehavioural disorders. FTD can be divided into two mainneuropathological subtypes: frontotemporal lobar degen-eration (FTLD) with neuronal and glial tau inclusions(FTLD-tau), and FTLD with neuronal cytoplasmic inclu-sions (NCIs) that are positive for ubiquitin and TAR DNA-binding protein (TDP-43) (FTLD-U). However, 20%–30%of cases of FTD follow an autosomal dominant patternof inheritance, and half of them are caused by defects inmicrotubule-associated protein tau (MAPT), multi-vesicularbody protein 2B (CHMP2B), and valosin-containing protein(VCP) [30].
Mutations in the progranulin gene (GRN), encoding asecreted growth factor, on chromosome 17q21, have recentlybeen identified as a major cause of familial FTLD-U. Thesecases have a characteristic pattern of neuropathology thatis a distinct subtype of frontotemporal lobar degenerationwith ubiquitinated inclusions (FTLD-U), with NCIs inlayer II of the cortex and lentiform neuronal intranuclearinclusions (NIIs). To date, more than 60 different mutationsin GRN were mapped, and a recent breakthrough wasthe identification of a genetic variant (rs5848), located inthe 3′UTR of GRN mRNA, in a binding site for miR-659 [32]. This research showed that miR-659 targets GRNsuppressing its translation, and demonstrated a decrease ofGRN protein levels of∼30% in FTLD-U rs5848 homozygousTT carriers compared to CC carriers. Consistently, in FTLD-U patients heterozygous for rs5848, an intermediate dosage
of GRN protein was determined. miR-659 seems to bea specie-specific human microRNA, which expressed inbrain, including frontal and temporal neocortex. In addition“seed” sequence for miR-659 in the GRN 3′UTR is onlypresent in humans, and is not found in other mammals.Although a small number of FTLD-U patients were exam-ined, the enhanced binding of miR-659 to the 3′UTR ofthe GRN gene is an important risk for TDP-43-positiveFTLD-U. Future studies on specific human cortical miRNAsmight be relevant to decrypt human neurodegenerativedisease.
2.5. MicroRNAs in Prion Disease. Prion diseases or trans-missible spongiform encephalopathies (TSEs) are a familyof rare progressive neurodegenerative disorders that affectboth humans and animals. They are distinguished bylong incubation periods, characteristic spongiform changesassociated with neuronal loss, and a failure to induceinflammatory response. The causative agent of TSEs isbelieved to be a prion, a transmissible agent, which isable to induce abnormal folding of normal cellular prionproteins in the brain [33]. According to the protein-onlyhypothesis, the central event in the pathogenesis of priondiseases is the conversion of a normal cellular protein termedPrP(C) to PrP(Sc), a conformational isoform. Prion dis-eases impair brain function, causing memory impairment,personality changes, dementia, and movement disordersand the characteristic signs and symptoms of the disease.TSEs begin in adulthood are rapidly progressive and leadto death within a few months to several years. Familialprion diseases of humans include classic Creutzfeldt-Jakobdisease (CJD), Gerstmann-Straussler-Scheinker syndrome(GSS), and fatal insomnia (FI). To explain TSE pathogenesis,it is important to identify disease-associated alterations ingene expression. Recently, by microarrays and RT-PCR, theanalysis of miRNA expression was made [31]. Brain miRNAsexpression of mice infected with mouse-adapted scrapieshowed changes of 15 miRNAs. Among these, only two,miR-338-3p and miR337-3p, were downregulated, whereasthe others were up-regulated. Several predictions of thetheoretical mRNA targets of changed miRNAs during priondisease were performed, using web-based computationalalgorithms. From this in silico analysis, genes involved bothin transcription, cell cycle, ubiquitin-proteasome pathway,and in normal functioning of synapses, neuronal activity,neurogenesis, and neurites growth were identified. Lastly,only one target, the transcriptional regulator EGR1, wasexperimentally validated by luciferase assay in vitro. Inparticular, the authors suggested that the prion diseaseupregulates miR-191 which represses the EGR1 mRNAtranslation. The transcriptional regulators EGR1 and CREB1were already identified as downregulated prion-related geneswith a central role in biologically relevant networks inprion infection [34]. As a consequence, miRNAs mediatedregulation of these prion-related genes could contribute toneuronal death and neurodegeneration. Finally, the miRNAexpression profile was proposed as potential biomarker ofprion diseases.

Journal of Biomedicine and Biotechnology 7
Table 1: MIND: MicroRNAs in neurodegenerative diseases.
miRNA Neurodegenerative disease mRNA target Reference
miR-298; miR328 ↓ Alzheimer’s Disease mouse model BACE1 [15]
miR-107 ↓ Alzheimer’s Disease BACE1 [14]
miR-29a/b-1 ↓ Alzheimer’s Disease BACE1 [11]
miR-133b ↓ Parkinson’s disease Pitx3 [19]
miR-433 Parkinson’s disease FGF20 (SNP rs127202208) ↑ [20]
miR-191 ↑ Prion disease EGR1 [31]
miR-132 ↓ Huntington disease P250GAP [24]
miR-659 Frontotemporal dementia GRN (SNP s5848) ↓ [32]
3. Concluding Remarks
The studies on miRNA in neurodegenerative diseases(Table 1) are only now coming to light. Until now, bothchanges of several miRNA expression profiles and polymor-phisms affecting the interactions between miRNAs and theirtargets are emerging in various studies on neurodegenerativedisease. It is difficult to determine if the changes in miRNAexpression detected in the brains or CSF of patients areprimary or secondary events, or both. Nevertheless early orlate in the evolution of the disease, they could contribute tothe pathogenesis of the observed lesions and neuronal loss.Unique patterns of miRNA expression profile in the CSFof particular neurodegenerative disease could be useful asmolecular biomarkers for disease diagnosis and eventuallyprediction of therapeutic responses. The identification ofmiRNA causing a specific pathology could open new ther-apeutic perspectives to block endogenous miRNAs or deliverexogenous miRNAs. Until now either antisense oligonu-cleotides chemically modified [35] or expressed sequencescorresponding to multiple miRNA seed target (miRNAsponge) [36] have been used as microRNA inhibitors.Delivery of these molecules to the CNS, avoiding toxicities,could be the challenge of future research. Furthermoresince in several neurodegenerative disorders specific nuclearor cytoplasmic protein accumulation is causative of theneuropathological picture, the identification of microRNAsregulating the translation of these targets could representthe first step aimed to therapeutic applications. The secondstep might be to evaluate the quantitative effects on theproteome of specific amounts of the “therapeutic” microR-NAs.
Acknowledgments
This work was supported by Italian Institute of Tech-nology (IIT), REGIONE LAZIO grant—‘Studio delle basimolecolari della neurodegenerazione nella malattia diAlzheimer’s—(to C. Cogoni), National Research Council(CNR) grant DG.RSTL.059.012 (to F. Ruberti), and by “Fon-dazione Alazio Award 2007” (to C. Barbato) (http://www.fondazionealazio.org/). The first and second author con-tributed equally to the preparation of this manuscript.
References
[1] D. M. Skovronsky, V. M.-Y. Lee, and J. Q. Trojanowski, “Neu-rodegenerative diseases: new concepts of pathogenesis andtheir therapeutic implications,” Annual Review of Pathology,vol. 1, pp. 151–170, 2006.
[2] D. P. Bartel, “MicroRNAs: genomics, biogenesis, mechanism,and function,” Cell, vol. 116, no. 2, pp. 281–297, 2004.
[3] K. S. Kosik, “The neuronal microRNA system,” Nature ReviewsNeuroscience, vol. 7, no. 12, pp. 911–920, 2006.
[4] C. Barbato, C. Giorgi, C. Catalanotto, and C. Cogoni,“Thinking about RNA? MicroRNAs in the brain,” MammalianGenome, vol. 19, no. 7-8, pp. 541–551, 2008.
[5] M. Selbach, B. Schwanhausser, N. Thierfelder, Z. Fang, R.Khanin, and N. Rajewsky, “Widespread changes in proteinsynthesis induced by microRNAs,” Nature, vol. 455, no. 7209,pp. 58–63, 2008.
[6] D. Baek, J. Villen, C. Shin, F. D. Camargo, S. P. Gygi, and D. P.Bartel, “The impact of microRNAs on protein output,” Nature,vol. 455, no. 7209, pp. 64–71, 2008.
[7] E. Berezikov, F. Thuemmler, L. W. van Laake, et al., “Diversityof microRNAs in human and chimpanzee brain,” NatureGenetics, vol. 38, no. 12, pp. 1375–1377, 2006.
[8] C. Haass and D. J. Selkoe, “Soluble protein oligomers inneurodegeneration: lessons from the Alzheimer’s amyloid β-peptide,” Nature Reviews Molecular Cell Biology, vol. 8, no. 2,pp. 101–112, 2007.
[9] H. Braak and E. Braak, “Neuropathological staging ofAlzheimer-related changes,” Acta Neuropathologica, no. 82, pp.239–259, 1991.
[10] W. J. Lukiw, “Micro-RNA speciation in fetal, adult andAlzheimer’s disease hippocampus,” NeuroReport, vol. 18, no.3, pp. 297–300, 2007.
[11] S. S. Hebert, K. Horre, L. Nicolaı, et al., “Loss of microRNAcluster miR-29a/b-1 in sporadic Alzheimer’s disease correlateswith increased BACE1/β-secretase expression,” Proceedingsof the National Academy of Sciences of the United States ofAmerica, vol. 105, no. 17, pp. 6415–6420, 2008.
[12] J. P. Cogswell, J. Ward, I. A. Taylor, et al., “Identificationof miRNA changes in Alzheimer’s disease brain and CSFyields putative biomarkers and insights into disease pathways,”Journal of Alzheimer’s Disease, vol. 14, no. 1, pp. 27–41, 2008.
[13] P. Formichi, C. Battisti, E. Radi, and A. Federico, “Cere-brospinal fluid tau, Aβ, and phosphorylated tau proteinfor the diagnosis of Alzheimer’s disease,” Journal of CellularPhysiology, vol. 208, no. 1, pp. 39–46, 2006.
8 Journal of Biomedicine and Biotechnology
[14] W.-X. Wang, B. W. Rajeev, A. J. Stromberg, et al., “The expres-sion of microRNA miR-107 decreases early in Alzheimer’sdisease and may accelerate disease progression through reg-ulation of β-site amyloid precursor protein-cleaving enzyme1,” Journal of Neuroscience, vol. 28, no. 5, pp. 1213–1223, 2008.
[15] V. Boissonneault, I. Plante, S. Rivest, and P. Provost,“MicroRNA-298 and microRNA-328 regulate expression ofmouse β-amyloid precursor protein-converting enzyme 1,”Journal of Biological Chemistry, vol. 284, no. 4, pp. 1971–1981,2009.
[16] R. Niwa, F. Zhou, C. Li, and F. J. Slack, “The expression of theAlzheimer’s amyloid precursor protein-like gene is regulatedby developmental timing microRNAs and their targets inCaenorhabditis elegans,” Developmental Biology, vol. 315, no.2, pp. 418–425, 2008.
[17] N. Patel, D. Hoang, N. Miller, et al., “MicroRNAs can regulatehuman APP levels,” Molecular Neurodegeneration, vol. 3, no. 1,p. 10, 2008.
[18] W. Mandemakers, V. A. Morais, and B. De Strooper, “Acell biological perspective on mitochondrial dysfunction inParkinson disease and other neurodegenerative diseases,”Journal of Cell Science, vol. 120, no. 10, pp. 1707–1716, 2007.
[19] J. Kim, K. Inoue, J. Ishii, et al., “A microRNA feedback circuitin midbrain dopamine neurons,” Science, vol. 317, no. 5842,pp. 1220–1224, 2007.
[20] G. Wang, J. M. van der Walt, G. Mayhew, et al., “Variationin the miRNA-433 binding site of FGF20 confers risk forParkinson disease by overexpression of α-Synuclein,” Ameri-can Journal of Human Genetics, vol. 82, no. 2, pp. 283–289,2008.
[21] P. Siwach and S. Ganesh, “Tandem repeats in human disorders:mechanisms and evolution,” Frontiers in Bioscience, vol. 13, no.12, pp. 4467–4484, 2008.
[22] J. M. Gil and A. C. Rego, “Mechanisms of neurodegenerationin Huntington’s disease,” European Journal of Neuroscience,vol. 27, no. 11, pp. 2803–2820, 2008.
[23] C. Conaco, S. Otto, J.-J. Han, and G. Mandel, “Reciprocalactions of REST and a microRNA promote neuronal identity,”Proceedings of the National Academy of Sciences of the UnitedStates of America, vol. 103, no. 7, pp. 2422–2427, 2006.
[24] R. Johnson, C. Zuccato, N. D. Belyaev, D. J. Guest, E. Cattaneo,and N. J. Buckley, “A microRNA-based gene dysregulationpathway in Huntington’s disease,” Neurobiology of Disease, vol.29, no. 3, pp. 438–445, 2008.
[25] J. N. Savas, A. Makusky, S. Ottosen, et al., “Huntington’sdisease protein contributes to RNA-mediated gene silencingthrough association with Argonaute and P bodies,” Proceed-ings of the National Academy of Sciences of the United States ofAmerica, vol. 105, no. 31, pp. 10820–10825, 2008.
[26] F. Jiang, X. Ye, X. Liu, L. Fincher, D. McKearin, and Q.Liu, “Dicer-1 and R3D1-L catalyze microRNA maturation inDrosophila,” Genes and Development, vol. 19, no. 14, pp. 1674–1679, 2005.
[27] J. Bilen, N. Liu, B. G. Burnett, R. N. Pittman, and N.M. Bonini, “MicroRNA pathways modulate polyglutamine-induced neurodegeneration,” Molecular Cell, vol. 24, no. 1, pp.157–163, 2006.
[28] A. Schaefer, D. O’Carroll, C. L. Tan, et al., “Cerebellarneurodegeneration in the absence of microRNAs,” Journal ofExperimental Medicine, vol. 204, no. 7, pp. 1553–1558, 2007.
[29] Y. Lee, R. C. Samaco, J. R. Gatchel, C. Thaller, H. T. Orr,and H. Y. Zoghbi, “miR-19, miR-101 and miR-130 co-regulateATXN1 levels to potentially modulate SCA1 pathogenesis,”Nature Neuroscience, vol. 11, no. 10, pp. 1137–1139, 2008.
[30] N. J. Cairns, E. H. Bigio, I. R. A. Mackenzie, et al., “Neu-ropathologic diagnostic and nosologic criteria for frontotem-poral lobar degeneration: consensus of the Consortium forFrontotemporal Lobar Degeneration,” Acta Neuropathologica,vol. 114, no. 1, pp. 5–22, 2007.
[31] R. Saba, C. D. Goodman, R. L. C. H. Huzarewich, C.Robertson, and S. A. Booth, “A miRNA signature of prioninduced neurodegeneration,” PLoS ONE, vol. 3, no. 11, p.e3652, 2008.
[32] R. Rademakers, J. L. Eriksen, M. Baker, et al., “Commonvariation in the miR-659 binding-site of GRN is a major riskfactor for TDP43-positive frontotemporal dementia,” HumanMolecular Genetics, vol. 17, no. 23, pp. 3631–3642, 2008.
[33] A. Aguzzi, F. Baumann, and J. Bremer, “The prion’s elusivereason for being,” Annual Review of Neuroscience, vol. 31, pp.439–477, 2008.
[34] G. Sorensen, S. Medina, D. Parchaliuk, C. Phillipson, C.Robertson, and S. A. Booth, “Comprehensive transcriptionalprofiling of prion infection in mouse models reveals networksof responsive genes,” BMC Genomics, vol. 9, article 114, 2008.
[35] G. Meister, M. Landthaler, Y. Dorsett, and T. Tuschl,“Sequence-specific inhibition of microRNA- and siRNA-induced RNA silencing,” RNA, vol. 10, no. 3, pp. 544–550,2004.
[36] M. S. Ebert, J. R. Neilson, and P. A. Sharp, “MicroRNAsponges: competitive inhibitors of small RNAs in mammaliancells,” Nature Methods, vol. 4, no. 9, pp. 721–726, 2007.

Hindawi Publishing CorporationJournal of Biomedicine and BiotechnologyVolume 2009, Article ID 654346, 13 pagesdoi:10.1155/2009/654346
Review Article
MicroRNA Implications across Neurodevelopment andNeuropathology
Sabata Martino,1 Ilaria di Girolamo,1 Antonio Orlacchio,2, 3 Alessandro Datti,1
and Aldo Orlacchio1
1 Dipartimento di Medicina Sperimentale e Scienze Biochimiche, Sezione di Biochimica e Biologia Molecolare,Universita di Perugia, Via del Giochetto, 06126 Perugia, Italy
2 Laboratorio di Neurogenetica, CERC-IRCCS Santa Lucia, Via del Fosso di Fiorano 64, 00143 Rome, Italy3 Dipartimento di Neuroscienze, Universita di Roma “Tor Vergata”, Viale Oxford 81, 00133 Rome, Italy
Correspondence should be addressed to Aldo Orlacchio, [email protected]
Received 2 February 2009; Revised 11 May 2009; Accepted 20 July 2009
Recommended by Ravi Sachidanandam
MicroRNAs (miRNAs) have rapidly emerged as biologically important mediators of posttranscriptional and epigenetic regulationin both plants and animals. miRNAs function through a variety of mechanisms including mRNA degradation and translationalrepression; additionally, miRNAs may guide gene expression by serving as transcription factors. miRNAs are highly expressedin human brain. Tissue and cell type-specific enrichments of certain miRNAs within the nervous system argue for a biologicalsignificance during neurodevelopmental stages. On the other hand, a large number of studies have reported links betweenalterations of miRNA homeostasis and pathologic conditions such as cancer, heart diseases, and neurodegeneration. Thus, profilesof distinct or aberrant miRNA signatures have most recently surged as one of the most fascinating interests in current biology.Here, the most recent insights into the involvement of miRNAs in the biology of the nervous system and the occurrence ofneuropathological disorders are reviewed and discussed.
Copyright © 2009 Sabata Martino et al. This is an open access article distributed under the Creative Commons AttributionLicense, which permits unrestricted use, distribution, and reproduction in any medium, provided the original work is properlycited.
1. Introduction
microRNAs (miRNAs) are small, noncoding oligoribonu-cleotides of ∼21-22 nt which regulate gene expressionthrough the assembly of an RNA-induced silencing complex(RISC). In particular, the downstream effects of miRNAsrelate to the fate of target mRNA, which may be subjected toendonucleolytic cleavage, enrolled into a faulty translationalprocess or, as surprisingly shown in most recent studies,translationally enhanced [1–12]. Each of the hundreds ofmiRNAs present in mammalian genomes can potentiallymodulate an impressively large number of target genes,thereby depicting a highly versatile network with the capacityto effectively control and modify the biochemical wiring and,in turn, the phenotypic outcome of a cell [1, 8].
It is now well established that miRNAs are involvedin disparate physiological functions, such as developmen-tal transitions and neuronal patterning, apoptosis, fat
metabolism, and regulation of hematopoietic lineage dif-ferentiation. For example, miRNAs are key regulators ofthe nervous system in the worm and brain morphogenesisin the fish and show distinct expression patterns duringmammalian brain development [13].
A clear understanding of the functional impact ofmiRNAs on brain neurodegeneration is an intriguing, yetrather elusive, matter of study. However, the current liter-ature shows clear evidence that tightly controlled miRNAexpression is required for proper neurodevelopment and,conversely, that specific miRNA dysregulation is likely linkedto the pathogenesis of neurodisorders.
2. miRNA Biogenesis
Biogenesis and silencing mechanisms of miRNAs wererecently revisited by Carthew and Sontheimer, who havehighlighted common themes and unique features of both

2 Journal of Biomedicine and Biotechnology
microRNA gene
Pri-microRNAPre-microRNA
Drosha
DGCR8
Nucleus
Cytoplasm
microRNA duplex
Dicer
RAN-GTP
Exportin 5
Risc complex
Risc complex
Translational repression RNA degradation
mRNA mRNA
3�5�
5�
5�5�
5�
5� 5�5� 5�
5� 5�
3�5�
3�
3�
3�
3�
3�
3�
3�
3�3�
3�
Figure 1: The biogenesis of miRNAs. Shown are the key steps of miRNA biogenesis in mammalian cells (reviewed in [14, 15]).
miRNA- and siRNA-related pathways (see Figure 1 and[14]). In either context, the molecular events that span frommiRNA transcription towards RNA degradation are complexand imply an intricate interplay of molecular events to ensureaccurate and efficient regulation of gene expression [16].
In mammals, 80% of miRNA genes are located withinintrons of longer primary transcripts that can be eitherprotein-coding or mRNA-like transcripts; the majority ofthese are produced by RNA polymerase II [17–20], whilea minor group of genes, characterized by Alu sequences, isinstead transcribed by Pol III [21]. Thus, Pol II-associatedtranscription factors may regulate the expression of themajority of miRNA genes in a tissue- and/or cell-specificfashion [22].
While transcription of intergenic miRNA genes impliesusage of own promoters, intronic miRNAs are transcribedwith their host genes and seem to be cotranscriptionally pro-cessed prior to the removal of the host intron [18]. Typically,primary miRNA transcripts or pri-miRNAs are composedof a double-stranded stem of 33 base pairs, a terminal loop,and two flanking, single-stranded segments which are subjectto cleavage, in the nucleus, by a protein complex calledMicroprocessor. This is composed of a nuclear memberof the RNA III family (Drosha) associated with a cofactor(DGCR8) for efficient and precise processing of pri-miRNAs
into 60–70 nt, hairpin-like precursor miRNAs (pre-miRNAs)[23–27].
Interestingly, several pre-miRNAs, known as mirtrons,originate directly from the splicing of pri-miRNAs and aresubsequently processed without a requirement for Micropro-cessor activity. Evidence suggests that this alternative path-way, although rather uncommon, has emerged throughoutmetazoans prior to the advent of Drosha [28–30].
Through the exportin-5 pathway, pre-miRNAs are thentransferred to the cytoplasm where they are further pro-cessed by Dicer, a second RNase III complexed with thehuman immunodeficiency virus transactivating responseRNA-binding protein, TRBP [31, 32]. Dicer binds the 3′
overhang of the dsRNA and then excises the terminal loopto produce a mature, single-stranded miRNA duplex ofapproximately 22 bp. This duplex is ephemeral, in that it israpidly unwound as soon as it associates with an Argonauteprotein (Ago). Only one strand of the original dsRNAmolecules is incorporated into RISC while the ejected strand,unlike during the siRNA unwinding mechanism, is notdegraded by the associated Ago [7, 14–32]. Finally, miRNAstrigger gene silencing through partial base-pairing withthe 3′-UTRs of protein-coding mRNAs, thereby preventingtranslation of targeted mRNAs and/or accelerating theirdegradation [15, 33].

Journal of Biomedicine and Biotechnology 3
Table 1: miRNAs involved in neurodevelopment.
miRNA Species Target Function Reference number
miR-iab-4-5p Drosophila UBX Regulation of Hox gene involved in the development of halters [34]
miR10a Human HOXA1 Downregulation of HOXA1 geneExpression [35]
lsy-6 C. elegans Cog-1 Required to specify ASEL sensory neuron identity [36, 37]
miR-273 C. elegans Die-1 Expressed in ASER; suppresses ASEL identity [36, 38]
miR-196 Rodents HOXB8 Downregulation of HOXC8, HOXD8 and HOXA7 [39]
miR-124 Rodents SCP1 Neural induction in the spinal cord of developing embryos [40]
miR-124 Rodents SOX9 Regulation of the neurogenesis in the SVZ stem cell niche andneurite outgrowth in neuronal differentiation
[41]
miR-132 Rodents P250GAP Regulation of the neuronal morphogenesis and circadian clock [42, 43]
miR-219 Rodents SCOP Regulation of the circadian period length [36, 43]
miR-133b Rodents Pitx3 Regulation of the maturation of midbrain dopaminergicneurons
[44]
miR-134 Rodents LimK1 Modulation of the size of dendritic spines [45]
The existence of stringent regulatory mechanisms affect-ing the biogenesis of miRNAs suggests that this pathway playsa crucial role in the control of gene expression and, furtherdownstream, the definition of biological outcomes. In thisregard, several examples of double-negative feedback loopshave been described, showing that the expression of miRNAgenes can be controlled by their own targets [14].
3. miRNAs Play Major PhysiologicalRoles in Neural Development
In Drosophila, multiple miRNAs interact with different 3′
UTR binding sites to play a cooperative role in the post-transcriptional regulation of nerfin-1, a nuclear regulator ofaxon guidance, within both the developing central nervoussystem (CNS) and peripheral nervous system. In species ofthis organism, the high degree of evolutionary conservationof miRNA-binding sites provides evidence that regulation ofthe onset and extinction dynamics of nerfin-1 expression iscommon to all members of the Drosophila genus [46].
As shown in Table 1, the effects of miRNA-mediatedmodulation of gene expression during multiple steps ofneuronal development, from early neurogenesis to synap-togenesis, have been well documented across the animalkingdom [34–45, 47–61].
Strong evidence for a biological role of miRNAs in neuraldevelopment emerged from their identification within theHOX gene clusters [49]. When ectopically expressed, thesemiRNAs induce a homeotic mutant phenotype, as shownin Drosophila for miR-iab-4-5p, which reduces endogenousUbx protein levels, causing halteres to be transformed intowings [34]. In addition, miR-10a targets HOXA1 [35] whilemiR-196, encoded at three paralogous locations in the A,B, and C mammalian HOX clusters, directs the cleavageof HOXB8 mRNA and, apparently, downregulates HOXC8,HOXD8, and HOXA7 [39].
The capacity of miRNAs to directly control cell fatedecisions and, in turn, specify neuron identity was alsoshown in Caenorhabditis elegans [37, 38]. In developing
axons, miRNAs may regulate pathfinding, the process bywhich the circuitry of the nervous system is built. Inzebrafish, normal brain morphogenesis is disrupted in theabsence of the miRNA-processing enzyme Dicer [50], whilethe observation that functional RISC complexes can beassembled in rat DRG axons and growth cones is indicativeof important roles played by miRNAs in the regulation ofaxonal mRNA translation [51].
Indeed, the CNS displays a substantial enrichment ofmiRNA species, of which a considerable number is expressedin a temporally- and/or spatially-controlled fashion, therebysuggesting biological implications for specific developmentalstages [52, 53]. Expression profiling revealed that severalspecies of miRNAs, such as miR-9, miR-124, miR-124a, miR-125b, miR-127, miR-128, miR-132, miR-219, and membersof the let-7 family, are especially localized in the mousebrain [40–45, 54–61], while the expression of 63 additionalmiRNAs appears to be widely distributed, although dif-ferentially, throughout the CNS [62]. Of these, some areprimarily present in the cerebellum (miR-195, miR-497, andmiR-30b), others in the medulla oblongata (miR-34a, miR-451, miR-219, miR-338, miR-10a, and miR-10b), while athird group (miR-7, miR-7b miR-218, miR-221, miR-222,miR-26a, miR-128a/b, miR-138, and let-7c) appears to berestricted to the hypothalamus [63–66]. In general, region-specific enrichments reflect expression rates threefold highercompared to average miRNA levels displayed throughout theCNS [67–70].
Conceivably, miRNAs affect patterning mechanisms thatspecify the fate of neural cells at specific times and withinproper locations. For example, an investigation of the expres-sion of 104 miRNAs during murine brain developmentshowed that these were distributed according to specifictemporal expression patterns; in particular, the expression of12 miRNAs was significantly upregulated during embryonicstages while markedly decreased during brain development.The involvement of modulated miRNAs was recapitulated bycomputational screens aimed at target identification, whichrevealed that 10 of 12 miRNAs are likely associated withneurogenesis [70].
4 Journal of Biomedicine and Biotechnology
In some instances, the physiological role of a numberof miRNAs in neurodevelopment is well-documented. Forexample, miR-124 controls neurite outgrowth in differ-entiating mouse P19 cells [71] and stimulates neuronaldifferentiation in the developing chick spinal cord bycounteracting the antineural activity of one of its targets,namely, the small C-terminal domain phosphatase 1 (SCP1)[40]. Furthermore, functional studies in vivo have recentlydemonstrated that miR-124 controls adult neurogenesis inthe mouse subventricular zone via a time-regulated controlof neuroblast generation from transit-amplifying precursors.In particular, neuronal differentiation is promoted throughdownregulation of the transcription factor Sox9, shown tobe one of the targets of miR-124 [41, 72]. A second examplerelates to miR-132, which oversees dendritic morphogenesisby inhibiting translation of the synaptic protein p250GAP,suggesting a key role of miR132 p250GAP pathway insynapse growth and plasticty [42, 43, 73]. Additionally,miR-133b regulates maturation and function of midbraindopaminergic neurons through a negative feedback affectingthe paired-like homeodomain transcription factor Pitx3[44], while miR-134 activity leads to dendritic spine devel-opment through downregulation of the Lim domain kinase-1 [45].
miRNAs may also play significant roles in apoptosis,which is crucial in neurogenesis and during the subsequent,continued expansion of the brain size following a massiveloss of neurons (i.e., 20%–80%) typical of embryonicdevelopment [74]. It was proposed that several aspects ofneuronal function, for example, the control of plasticity, aredirectly mediated by miRNAs [75].
Instead, not much evidence has yet become available todefine the impact of miRNAs on neural induction, namely,the stage when embryonic cells assume a neuronal identity.However, in light of a specific expression in stem cells, itis possible that miRNAs play a role in self-renewal anddifferentiation events through the regulation of key genes[76], as suggested by the ability of embryonic stem cell-specific miRNAs to enhance murine stem cell reprogram-ming [77, 78].
As regards human miRNAs, the miRBase SequenceDatabase of the Sanger Center (Release 14.0, datedSeptember 2009) contains 706 sequences (http://microrna.sanger.ac.uk/sequences/). It was estimated, based on high-throughput sequencing data, that the number of miRNAsexpressed in the human brain may well exceed one-thousand[68]. Interestingly, many miRNAs expressed in the humanbrain are not conserved beyond primates, suggesting a recentevolutionary origin [68]. Although functions have beenassigned to only very few brain-specific miRNAs, increasingevidence suggests key roles in normal development, dif-ferentiation events, and homeostasis, as well as in relatedpathological conditions [11, 13, 33, 36, 46, 47, 52, 100].
4. miRNA and Neurodegenerative Diseases
Neurodegenerative diseases result from dysfunction, pro-gressive deterioration, and extensive loss of neurons in
the central and/or peripheral nervous system [10, 100]. Inthis regard, Alzheimer’s disease (AD)[101–104], Parkinson’sdisease (PD) [105–107], prion diseases [108], amyotrophiclateral sclerosis (ALS) [109, 110], and hereditary spasticparaplegia [111, 112] may have a genetic or sporadicetiology. Instead, Huntington’s disease (HD) [113, 114] andmetabolic disorders with neurological involvement, such asthe GM2-gangliosidoses [115–119], can only be geneticallytransmitted.
There is now compelling evidence that dysregulationof miRNA networks is implicated in the development andonset of human neurodegenerative diseases (see Table 2 and[12, 120]). This, in turn, may provide the opportunity toelucidate underlying disease mechanisms and open up novelstrategies for therapeutic applications.
4.1. Alzheimer’s Disease. AD is the most common form ofdementia. While several hypotheses have been proposed toexplain the disease’s etiology, the causes of AD and meansof stopping its progression are still elusive matters [101–104, 121–125]. Features of the disease encompass neuronalloss, intraneuronal neurofibrillary tangles (i.e., aggregates ofthe microtubule-associated protein tau following hyperphos-phorylation), and extracellular deposits of amyloid plaques(i.e., deposits of Aβ-peptide) [102, 121–125].
Only 10%–15% of AD cases represent an inheritabledisease which follows an autosomal dominant Mendelianpattern, while the majority arise sporadically. Apparently,the disease may be caused by a genetic predisposition, asshown by the identification of specific DNA mutationsin a large number of families [101, 122–125]. Despite avariable etiology, a common pathogenetic cascade resultingfrom distinct gene defects and/or unknown environmentalfactors cannot be ruled out. For example, accumulationof the Aβ peptide, the cause of which is unknown, isconsistently observed. In approximately 30% of sporadic ADpatient samples, the expression of BACE1 protein, a secretaseassociated with the formation of Aβ-peptide, is significantlyincreased [126].
In AD, several miRNAs exhibit abnormal expressionlevels, suggesting a dysfunctional orchestration of geneexpression [79, 80, 127, 128].
Interestingly, Boissonneault et al. have recently foundthat miR-298 and miR-328 bind to the 3′-UTR of BACE1mRNA, thereby producing a regulatory effect on enzymeexpression in cultured neuronal (N2a) cells. Presence of bothmiR-298 and miR-328 in the hippocampus of APPSwe/PS1mice, a well-documented model for AD, and the observationthat their levels of expression decrease with aging suggest thataltered levels of these miRNAs may deregulate BACE1 and, inturn, lead to increased Aβ formation and disease progression[81].
Moreover, BACE1 can be controlled by the miR-29a/b-1 cluster, consistent with their inverse pattern of expressionobserved in sporadic AD patients; in addition, a causalcorrelation was shown in vitro between this cluster and theappearance of the Aβ peptide [12, 79, 80]. miRNAs mayalso be involved in the neuroinflammatory process associated

Journal of Biomedicine and Biotechnology 5
Table 2: miRNAs involved in neurological diseases.
microRNA Neurological disease Effect Reference number
miR-29a/b-1 Alzheimer’s disease downregulation [79]
miR-128a Alzheimer’s disease upregulation [80]
miR-298 Alzheimer’s disease downregulation [81]
miR-328 Alzheimer’s disease downregulation [81]
miR-146a Alzheimer’s disease upregulation [82]
miR-133b Parkinson’s disease downregulation [83]
miR-19 Spinocerebellar ataxia type 1 downregulation [84]
miR-101 Spinocerebellar ataxia type 1 downregulation [84]
miR-130 Spinocerebellar ataxia type 1 downregulation [84]
miR-9 Hungtington’s disease downregulation [85, 86]
miR-1 Tourette syndrome deregulation [87]
miR-206 Tourette syndrome deregulation [87]
miR-21 Glioblastoma upregulation [88]
miR-124 Glioblastoma downregulation [89]
miR-137 Glioblastoma downregulation [89]
miR-124a Medulloblastoma downregulation [90]
miR-34a Neuroblastoma downregulation [91]
miR-184 Neuroblastoma downregulation [92]
miR-15a Pituitary adenoma downregulation [93–95]
miR-16 Pituitary adenoma downregulation [93–95]
miR-221 Glioblastoma upregulation [88, 96–98]
miR-128 Glioblastoma upregulation [88, 96–98]
miR-181a Glioblastoma upregulation [88, 96–98]
miR-181b Glioblastoma upregulation [88, 96–98]
miR-181c Glioblastoma downregulation [88, 96–98]
miR-9 Medulloblastoma downregulation [99]
miR-125a Medulloblastoma downregulation [99]
with deposition of the Aβ-peptide. In this regard, the NF-kB-sensitive miRNA-146a, which targets complement factorH, an important repressor of inflammatory responses in thebrain, was found to be up-regulated in AD [82].
Finally, a recent work from Carrettiero et al. shows thatmiR-128a regulates the cochaperone BAG2 and, in turn,a pathway of degradation for microtubule-associated tauproteins with a propensity for misfolding. BAG2 wouldnormally direct tau toward an ubiquitin-independent path-way and selectively reduce the levels of sarkosyl-insolubleprotein [129]. Thus, the observation that miR-128a is upreg-ulated in AD [80] may highlight a molecular mechanismthat underlies tau inclusions in neurodegeneration. Takentogether, these findings suggest a mechanistic involvementof miRNAs in both the amyloid and tau hypotheses for ADpathogenesis.
4.2. Parkinson’s Disease (PD). PD is the second most com-mon neurodegenerative disorder, characterized by restingtremor, muscular rigidity, bradykinesia, and impaired bal-ance and coordination [105–107, 130–132]. Other symptomsinclude dysautonomia, dystonic cramps, and dementia. Typ-ical pathological features are loss of dopaminergic neuronsin the substantia nigra (SN) and presence of Lewy bodies,
which consist of intracellular inclusions affecting survivingneurons in various areas of the brain [130–132]. Several geneloci have been implicated in autosomal, dominant forms ofPD. These include PARK1 and PARK4 (due to a mutation ora triplication of the α-synuclein gene [SNCA] on 4q21 and4p15, resp.), PARK3 on 2p13, PARK5 (due to a mutation inthe UCHL1 gene) on 4p14, PARK8 (due to a mutation in theLRRK2 gene) on 12q12, PARK10 on 1p, PARK11 on 2q, andPARK13 (due to a mutation in the HTRA2 gene) on 2p12[105–107, 133, 134].
The implication of miRNAs in PD is intriguing. Inmurine models, the competence of embryonic stem cells todifferentiate into midbrain dopamine neurons in vitro wasshown to be disrupted by Dicer deletion and subsequentsuppression of miRNA biogenesis, suggesting a physiologicalrole for miRNAs in cell differentiation and/or survival. Theseresults were confirmed in vivo, using mice conditional forDicer, which exhibited impaired locomotor activity thatrecapitulated motility problems observed in PD patients.Through a subtractive approach, performed by comparingmiRNA expression profiles in normal human adult versusPD patients midbrains, it was shown that miR-133b isspecifically missing in PD and that, based on both over-expression and inhibitory tests in vitro, is likely implicated

6 Journal of Biomedicine and Biotechnology
in the maturation and function of dopaminergic neurons[44, 83]. A markedly reduced expression of miR-133bwas found in Aphakia mice [44], a dopaminergic neurondeficiency model, which lack Pitx3 [135], a homeoboxtranscription factor required for neuron survival and normalmotor activity susceptible to polymorphisms associated withsporadic PD [136]. Together, these observations suggest arelationship between miR-133b and Pitx3, which operatethrough a negative feedback loop, wherein Pitx3 promotesthe expression of miR-133b that, in turn, downregulatesPitx3 [83]. While these results point to a functional role ofthe miR-133b/Pitx3 system in ensuring correct dopaminergicfunction, miR-133b knock-out mice, which are currentlyunavailable, would establish the extent of miR-133b impacton PD etiology.
On the other hand, a more recent study showed thatdeletion of Dicer in dopaminoceptive neurons of the murinestriatum led to aberrant anatomical features (smaller brain,reduced neuron size, astrogliosis) and motor impairments(clasping and ataxia) but, surprisingly, not neurodegen-eration [137]. As dysfunction, but not necessarily loss,of dopaminoceptive neurons was previously implicated inPD [138], these observations, taken together, suggest thatthe link between Dicer, miRNAs, and neurodegenerationis restricted to dopaminergic neurons, thereby pointing todistinct functional roles in dopaminoceptive cells.
Finally, Wang et al. found that in PD brains and invitro cell models disruption of the binding site for miRNA-433 led to increased translation of fibroblast growth factor-20 (FGF20). Notably, an FGF20 polymorphism at 8p21.3–22 was previously identified as a PD risk factor correlatedwith increased α-synuclein expression, and consequently PDonset [139].
4.3. Spinocerebellar Ataxia. Spinocerebellar ataxia type 1(SCA1), which is caused by the expansion of a CAG repeatencoding glutamine within the gene ATXN1, is characterizedby the death of cerebellar Purkinje cells [140]. In eight-weekold mice, depletion of Dicer from murine Purkinje neuronsis irrelevant to cell function and survival, whereas 13-week-old animals are affected by a progressive degeneration ofPurkinje neurons leading to cell death. Further, these oldermice develop a slight tremor and mild ataxia, both of whichworsen with advancing age [141].
In 2008, Lee et al. found that miR-19, miR-101, andmiR-130 coregulate Ataxin-1 protein levels and that theirinhibition enhance the cytotoxic effects of polyglutamine(PolyQ)-expanded Ataxin-1 in human cells. Thus, mutationsin the miRNA binding sites or the miRNA genes themselvesmight be linked to neurodegenerative phenotypes as a resultof Ataxin-1 accumulation [84]. Consistent with this possibil-ity are earlier results showing that, in both Drosophila andhuman cells, the elimination of miRNAs via Dicer mutationwas followed by enhanced pathogenic polyQ protein toxicity.Altogether, these observations point to a neuroprotectivefunction of miRNAs [142].
4.4. Huntington’s Disease (HD). HD is a fatal, hereditaryneurodegenerative disorder characterized by involuntary
ballistic movements, depression, and dementia [113, 114,143]. Hallmarks of HD are progressive chorea, rigidity, andfrequent accurrence of seizures, emotional problems, lossof cognition, as well as atrophy of the caudate nucleus.The causal factor of HD is a gene mutation consisting ofabnormally extended repeats of the CAG sequence withinthe HTT gene, which translates into a huntingtin proteincontaining an excessively increased glutamine segment [113,114, 143].
Disruption of miRNA homeostasis, most likely in con-nection with an aberrant functionality of the transcriptionalrepressor REST, was recently shown to play a dynamic rolein HD. In fact, levels of several miRNAs with upstream RE1sites are decreased in HD patient cortices relative to healthycontrols. Interestingly, one of these, the bifunctional, brain-enriched miR-9/miR-9∗ targets two components of the RESTcomplex: miR-9 targets REST and miR-9∗ targets CoREST[85, 86]. As a consequence of a markedly altered miRNAexpression, target mRNAs are subject to dysregulated levelswhich, in turn, affect the physiological status of forebrainneurons [85, 86].
In 2005, RNA interference was shown to producetherapeutically-relevant effects in HD mouse models [144,145]. Moreover, McBride et al. reported that RNA inter-ference through miRNA technology, as compared to theshRNA-based approach, is a more appropriate strategyfor HD treatment. In particular, shRNAs targeting mutanthuman HD transgenes were found to cause overt toxicityin the mouse striatum, whereas the same sequences intro-duced into artificial miRNA expression constructs markedlyalleviated the neurotoxic profile without compromisingachievement of an efficient silencing effect on the murine HDgene homolog [146].
5. Other Neurological Diseases
5.1. Fragile X Mental Retardation. The Fragile X syndromeis one of the most common forms of inherited, X-linkeddominant mental retardation affecting approximately onein every 4000 males and 8000 females [147, 148] withreduced penetrance of 80% and 30%, respectively [148, 149].The clinical presentations of Fragile X syndrome includemild to severe mental retardation, that is reflected by IQvalues ranging between 20 and 70, some abnormal facialfeatures affecting jaw and ears as well as macroorchidism inpostpubescent males [149].
The gene responsible for the Fragile X syndrome, FMR1,encodes a protein, FMRP, that interacts with target RNAs[150] and is implicated in mRNA transport and translationalcontrol [148]. In particular, FMRP is linked to the miRNApathway in light of its association with RISC, as shownin Drosophila [151, 152], and with Argonaute proteins,Dicer and miRNAs, as shown in mammals [153–158].Indeed, FMRP can act as a miRNA acceptor for Dicer andfacilitate the assembly of miRNAs [154, 159, 160]. Thus, theneurodegenerative outcome caused by mutations in FMR1may give rise to a host of secondary effects mediated by theaction of FMRP on associated RNA targets.

Journal of Biomedicine and Biotechnology 7
The molecular mechanisms which underlie the patho-genesis of this disorder have yet to be elucidated. However,Xu et al. reported that miR-124a, a nervous-system-specificmiRNA, is modulated, at least partially, by the Drosophilahomolog of mammalian FMRP (dFMR1), which was foundto associate with miR-124 in vivo [161]. That FMRPcould utilize specific miRNAs to regulate the translation oftarget mRNAs was also confirmed by a recent Drosophilastudy, in which the bantam miRNA was shown to interactwith dFMR1 to regulate the fate of germline stem cells[162].
Further, miR-184 was found to be repressed by MeCP2,a protein that binds to methylated DNA forms and plays animportant role in synaptic plasticity [163]. This observationpoints to a link between miRNA and DNA methylationpathways in the dysregulation of synaptic plasticity, a featurefor which there is growing evidence of an important roleplayed by miRNAs [164] and that is observed in the FragileX syndrome.
5.2. Tourette Syndrome. The paradigm for a disease causedby a specific miRNA is the G to A transition in the 3′ UTRof the myostatin/growth differentiation factor 8 gene in Texelsheep [87]. This mutation creates a target site for miR-1 andmiR-206, which are highly expressed in the skeletal muscle.The downstream effect is the translational inhibition of themyostatin gene, which normally limits muscle growth but inthe sheep contributes to muscular hypertrophy. Based on thisfinding, it may be postulated that a search of human SNPdatabases will reveal mutations that are potentially able tocreate or destroy putative miRNA target sites and therebycontribute to phenotypic variation.
Conceivably, some of these mutations may affect neu-ronal miRNAs. One such example is a rare sequence variantof SLIT and Trk-like 1 (SLITRK1), a candidate gene forTourette syndrome located on chromosome 13q31.1 whichis involved in neural development [165]. Two independentinstances of the same mutation in the binding site for themiRNA hsa-miR-189 were detected among a populationof unrelated individuals with Tourette syndrome, whileabsent in 3600 control chromosomes. That this mutationmay be implicated in Tourette’s syndrome is supported bycircumstantial evidence showing an overlapping expressionpattern of SLITRK1 mRNA and hsa-miR-189 in several brainregions implicated in the disease [165].
5.3. miRNAs and Tumours of the Nervous System. Severalstudies found that a high proportion of genomic loci con-taining miRNA genes exhibit DNA copy number alterationsin common cancers [166] and miRNA misexpression has alsobeen described in tumours of the nervous system (see Table 2and [88–92, 96, 167–170]). miRNAs have been shown to acteither as tumor suppressors or oncogenes and, dependingon the mRNA target, may accelerate the oncogenic process[167]. A suppressor effect was observed in pituitary ade-nomas, the most common tumors of the central nervoussystem, in which down-regulation of miR-15a and miR-16correlates with tumor size [93–95]. Other miRNAs, such
as the miR-155 and miR17-92 cluster, have an oncogeniceffect [171, 172]. The consequence of an upregulation ofmiR-21 has been characterised in glioblastoma tumor cells[88], wherein the knockdown of miR-21 led to increasedapoptotic cell death, suggesting that this miRNA may act asan antiapoptotic player [88, 96, 173]. In addition, miRNAprofiling in glioblastoma cells has shown high levels of miR-221, miR-128, miR-181a, and miR-181b and low levels ofmiR-181c [88, 97, 98].
miRNA expression analysis may also be used for medul-loblastoma prognosis. Down-regulation of miR-9 and miR-125a was observed in aggressive brain malignancy, whichresults in the activation of medulloblastoma cell growthand arrest of apoptosis by activation of the proproliferativetruncated TrkC isoform [99].
Based on these findings, the potential to modulatemultiple messages at the same time via miRNA technologywould therefore represent an intriguing prospect for cancertreatment.
6. Concluding Remarks and Prospects
Contemporary science has embraced RNA as a centralelement of cellular biology. In addition to the canonical roleas an intermediate carrier of information, this molecule mayin fact perform catalytic, structural, and regulatory tasks.Hence, over the last decade, unravelling the unique versatilityof RNA has renewed impetus towards the concept of an“RNA world”, which refers to a self-sustaining replicationsystem, antecedent to DNA and proteins, that was engagedduring a hypothetical stage at the origin of life [174–177].Along with the most recent, stunning advances in RNAbiology on several fronts, the discovery of gene expressionregulators has opened up a large window into the RNAworld. Three main categories of small RNAs, namely, short-interfering, micro- and piwi-interacting RNAs, have emergedas regulatory players within a structurally and functionallysophisticated, and to some extent overlapping, context [14,178].
Unlike most of the siRNAs, which silence the samelocus from which they derive, the effect of miRNAs is torepress genes unrelated to their own loci. Thus, miRNas aresubject to precise sequence requirements for the necessaryinteraction with heterologous targets. Several approachesexist that can be employed to obtain comprehensive miRNAprofiling in cells or tissues [179]; however, the significanceof a specific profile may be difficult to interpret, in lightof the hundreds of target sequences in the human genomethat may be associated with any particular miRNAs. Inthis regard, computational predictions and simulations havea fundamental impact on experimental miRNA research,considering that the downstream effect of a given miRNAwill result from the complex modulation of multiple targetsalong different pathways prone to cross-talk. Conceivably,experimental and bioinformatic models will continue toevolve to offer large-scale screenings for the identificationof the most likely miRNA target(s) under a specific devel-opmental, physiological, environmental, or pathologicalstatus.

8 Journal of Biomedicine and Biotechnology
Currently, functional characterization of specific miR-NAs is facilitated by the existence of first-class reagentssuch as miRNA mimics and inhibitors, available throughseveral specialized vendors. These reagents, appropriatelymodified to optimize correct strand utilization by RISC(mimics) and ensure tight binding (inhibitors), can be usedto either increase or decrease the activity of specific miRNAs.Corresponding applications can be exceptionally informativewith respect to studies on gain (loss)-of-function effects,development of high-throughput screens to select speciesinvolved in normal and pathological cellular pathways, andthe identification of targets.
However, despite the significant progress in miRNAresearch in the field of neurodevelopment and neurologicaldiseases, it is still elusive as to whether any of the miRNAsimplicated in a neuropathological process is directly involvedin the etiology or progression of the disorder. Indeed, aber-rant expression of a miRNA could simply be circumstantial.This causality issue can be addressed, for example, throughan accurate determination of the frequency of specificmiRNA mutations, the definition of temporal and spatialmiRNA profiles within multiple pathways in vitro, and thedevelopment of appropriate in vivo models.
Based on their functional role in fine-tuning metabolicpathways and genetic networks, miRNAs appear to besuitable tools for use in diagnosis, prognosis, and therapy.The problem is to demonstrate which miRNA sequencesshould be considered drug discovery targets.
Systemic delivery is another hurdle that must be dealtwith. Initially, this problem was common to all RNA-based therapeutics, including antisense oligos and siRNAs(reviewed in [180]). However, second-generation antisensetechnologies have shown that drug delivery issues can beovercome, as shown by systemic drug distribution followingsubcutaneous administration.
Specific antisense oligos called antagomirs could be usedto affect the activity of miRNA. In this regard, treatment ofa mouse model of heart disease with an antagomir againstmiR-21 prevented heart failure [181], and antagomirs totarget glioma angiogenesis has recently been proposed [182].miRNA-based therapeutics have great potential becauseof their capability to efficiently silence multiple messagesconcurrently within an entire disease pathway. Instead,conventional therapies directed at single targets requireadministration of a plurality of drugs giving rise to complexdrug interaction and patient compliance issues.
Acknowledgments
The authors thank members of the Neurogenetics Labora-tory of the Santa Lucia Foundation (Rome, Italy) for criticalreading of the manuscript. This work was supported bythe Italian Ministero della Salute (Grant no. RF-UMB-2006-339457 to Al.O. and An.O.; Grants nos. EBRI.1O, PS05.11,and PS05.21 to An.O.), the Consorzio INBB to Al.O., and theComitato Telethon Fondazione Onlus, the AmministrazioneAutonoma dei Monopoli di Stato (AAMS), and the City ofGubbio, Italy (Grant no. GGP06209 to An. O.).
References
[1] D. P. Bartel, “microRNAs: genomics, biogenesis, mechanism,and function,” Cell, vol. 116, no. 2, pp. 281–297, 2004.
[2] G. Meister, “miRNAs get an early start on translationalsilencing,” Cell, vol. 131, no. 1, pp. 25–28, 2007.
[3] M. Kiriakidou, G. S. Tan, S. Lamprinaki, M. De Planell-Saguer, P. T. Nelson, and Z. Mourelatos, “An mRNA m7Gcap binding-like motif within human Ago2 represses trans-lation,” Cell, vol. 129, no. 6, pp. 1141–1151, 2007.
[4] G. Mathonnet, M. R. Fabian, Y. V. Svitkin, et al., “microRNAinhibition of translation initiation in vitro by targeting thecap-binding complex eIF4F,” Science, vol. 317, no. 5845, pp.1764–1767, 2007.
[5] R. Thermann and M. W. Hentze, “Drosophila miR2induces pseudo-polysomes and inhibits translation initia-tion,” Nature, vol. 447, no. 7146, pp. 875–878, 2007.
[6] M. Wakiyama, K. Takimoto, O. Ohara, and S. Yokoyama,“Let-7 microRNA-mediated mRNA deadenylation and trans-lational repression in a mammalian cell-free system,” Genesand Development, vol. 21, no. 15, pp. 1857–1862, 2007.
[7] X. C. Ding, J. Weiler, and H. Grosshans, “Regulatingthe regulators: mechanisms controlling the maturation ofmicroRNAs,” Trends in Biotechnology, vol. 27, no. 1, pp. 27–36, 2009.
[8] D. J. Guarnieri and R. J. DiLeone, “microRNAs: a new class ofgene regulators,” Annals of Medicine, vol. 40, no. 3, pp. 197–208, 2008.
[9] A. Kohler and E. Hurt, “Exporting RNA from the nucleus tothe cytoplasm,” Nature Reviews Molecular Cell Biology, vol. 8,no. 10, pp. 761–773, 2007.
[10] A. Orlacchio, G. Bernardi, A. Orlacchio, and S. Martino,“Patented therapeutic RNAi strategies for neurodegenerativediseases of the CNS,” Expert Opinion on Therapeutic Patents,vol. 18, no. 10, pp. 1161–1174, 2008.
[11] S. S. Hebert and B. De Strooper, “Molecular biology: miRNAsin neurodegeneration,” Science, vol. 317, no. 5842, pp. 1179–1180, 2007.
[12] S. S. Hebert and B. De Strooper, “Alterations of themicroRNA network cause neurodegenerative disease,” Trendsin Neurosciences, vol. 32, no. 4, pp. 199–206, 2009.
[13] S. K. Singh, “miRNAs: from neurogeneration to neurodegen-eration,” Pharmacogenomics, vol. 8, no. 8, pp. 971–978, 2007.
[14] R. W. Carthew and E. J. Sontheimer, “Origins and mecha-nisms of miRNAs and siRNAs,” Cell, vol. 136, no. 4, pp. 642–655, 2009.
[15] V. N. Kim, J. Han, and M. C. Siomi, “Biogenesis of smallRNAs in animals,” Nature Reviews Molecular Cell Biology, vol.10, no. 2, pp. 126–139, 2009.
[16] M. J. Moore and N. J. Proudfoot, “Pre-mRNA processingreaches back to transcription and ahead to translation,” Cell,vol. 136, no. 4, pp. 688–700, 2009.
[17] A. Rodriguez, S. Griffiths-Jones, J. L. Ashurst, and A. Bradley,“Identification of mammalian microRNA host genes andtranscription units,” Genome Research, vol. 14, no. 10A, pp.1902–1910, 2004.
[18] Y.-K. Kim and V. N. Kim, “Processing of intronic microR-NAs,” EMBO Journal, vol. 26, no. 3, pp. 775–783, 2007.
[19] X. Cai, C. H. Hagedorn, and B. R. Cullen, “Human microR-NAs are processed from capped, polyadenylated transcriptsthat can also function as mRNAs,” RNA, vol. 10, no. 12, pp.1957–1966, 2004.

Journal of Biomedicine and Biotechnology 9
[20] Y. Lee, M. Kim, J. Han, et al., “microRNA genes aretranscribed by RNA polymerase II,” EMBO Journal, vol. 23,no. 20, pp. 4051–4060, 2004.
[21] U. Ohler, S. Yekta, L. P. Lim, D. P. Bartel, and C. B. Burge,“Patterns of flanking sequence conservation and a charac-teristic upstream motif for microRNA gene identification,”RNA, vol. 10, no. 9, pp. 1309–1322, 2004.
[22] X. Liu, K. Fortin, and Z. Mourelatos, “microRNAs: biogenesisand molecular functions,” Brain Pathology, vol. 18, no. 1, pp.113–121, 2008.
[23] Y. Lee, K. Jeon, J.-T. Lee, S. Kim, and V. N. Kim, “microRNAmaturation: stepwise processing and subcellular localiza-tion,” EMBO Journal, vol. 21, no. 17, pp. 4663–4670, 2002.
[24] A. M. Denli, B. B. J. Tops, R. H. A. Plasterk, R. F. Ketting,and G. J. Hannon, “Processing of primary microRNAs bythe microprocessor complex,” Nature, vol. 432, no. 7014, pp.231–235, 2004.
[25] R. I. Gregory, K.-P. Yan, G. Amuthan, et al., “The micropro-cessor complex mediates the genesis of microRNAs,” Nature,vol. 432, no. 7014, pp. 235–240, 2004.
[26] J. Han, Y. Lee, K.-H. Yeom, Y.-K. Kim, H. Jin, and V. N.Kim, “The Drosha-DGCR8 complex in primary microRNAprocessing,” Genes and Development, vol. 18, no. 24, pp.3016–3027, 2004.
[27] M. Landthaler, A. Yalcin, and T. Tuschl, “The humanDiGeorge syndrome critical region gene 8 and its D.melanogaster homolog are required for miRNA biogenesis,”Current Biology, vol. 14, no. 23, pp. 2162–2167, 2004.
[28] E. Berezikov, W.-J. Chung, J. Willis, E. Cuppen, and E. C. Lai,“Mammalian mirtron genes,” Molecular Cell, vol. 28, no. 2,pp. 328–336, 2007.
[29] K. Okamura, J. W. Hagen, H. Duan, D. M. Tyler, and E. C. Lai,“The mirtron pathway generates microRNA-class regulatoryRNAs in Drosophila,” Cell, vol. 130, no. 1, pp. 89–100, 2007.
[30] J. G. Ruby, C. H. Jan, and D. P. Bartel, “Intronic microRNAprecursors that bypass Drosha processing,” Nature, vol. 448,no. 7149, pp. 83–86, 2007.
[31] M. T. Bohnsack, K. Czaplinski, and D. Gorlich, “Exportin 5 isa RanGTP-dependent dsRNA-binding protein that mediatesnuclear export of pre-miRNAs,” RNA, vol. 10, no. 2, pp. 185–191, 2004.
[32] E. Lund, S. Guttinger, A. Calado, J. E. Dahlberg, and U. Kutay,“Nuclear export of microRNA precursors,” Science, vol. 303,no. 5654, pp. 95–98, 2004.
[33] W. Filipowicz, S. N. Bhattacharyya, and N. Sonenberg,“Mechanisms of post-transcriptional regulation by microR-NAs: are the answers in sight?” Nature Reviews Genetics, vol.9, no. 2, pp. 102–114, 2008.
[34] M. Ronshaugen, F. Biemar, J. Piel, M. Levine, and E. C.Lai, “The Drosophila microRNA iab-4 causes a dominanthomeotic transformation of halteres to wings,” Genes andDevelopment, vol. 19, no. 24, pp. 2947–2952, 2005.
[35] R. Garzon, F. Pichiorri, T. Palumbo, et al., “microRNA fin-gerprints during human megakaryocytopoiesis,” Proceedingsof the National Academy of Sciences of the United States ofAmerica, vol. 103, no. 13, pp. 5078–5083, 2006.
[36] F.-B. Gao, “Posttranscriptional control of neuronal develop-ment by microRNA networks,” Trends in Neurosciences, vol.31, no. 1, pp. 20–26, 2008.
[37] R. J. Johnston Jr. and O. Hobert, “A microRNA controllingleft/right neuronal asymmetry in Caenorhabditis elegans,”Nature, vol. 426, no. 6968, pp. 845–849, 2003.
[38] R. J. Johnston Jr., S. Chang, J. F. Etchberger, C. O. Ortiz, andO. Hobert, “microRNAs acting in a double-negative feedbackloop to control a neuronal cell fate decision,” Proceedingsof the National Academy of Sciences of the United States ofAmerica, vol. 102, no. 35, pp. 12449–12454, 2005.
[39] S. Yekta, I.-H. Shih, and D. P. Bartel, “microRNA-directedcleavage of HOXB8 mRNA,” Science, vol. 304, no. 5670, pp.594–596, 2004.
[40] J. Visvanathan, S. Lee, B. Lee, J. W. Lee, and S.-K. Lee, “ThemicroRNA miR-124 antagonizes the anti-neural REST/SCP1pathway during embryonic CNS development,” Genes andDevelopment, vol. 21, no. 7, pp. 744–749, 2007.
[41] L.-C. Cheng, E. Pastrana, M. Tavazoie, and F. Doetsch, “MiR-124 regulates adult neurogenesis in the subventricular zonestem cell niche,” Nature Neuroscience, vol. 12, no. 4, pp. 399–408, 2009.
[42] N. Vo, M. E. Klein, O. Varlamova, et al., “A cAMP-responseelement binding protein-induced microRNA regulates neu-ronal morphogenesis,” Proceedings of the National Academyof Sciences of the United States of America, vol. 102, no. 45, pp.16426–16431, 2005.
[43] H.-Y. M. Cheng, J. W. Papp, O. Varlamova, et al., “microRNAmodulation of circadian-clock period and entrainment,”Neuron, vol. 54, no. 5, pp. 813–829, 2007.
[44] J. Kim, K. Inoue, J. Ishii, et al., “A microRNA feedback circuitin midbrain dopamine neurons,” Science, vol. 317, no. 5842,pp. 1220–1224, 2007.
[45] G. M. Schratt, F. Tuebing, E. A. Nigh, et al., “A brain-specificmicroRNA regulates dendritic spine development,” Nature,vol. 439, no. 7074, pp. 283–289, 2006.
[46] A. Kuzin, M. Kundu, T. Brody, and W. F. Odenwald, “TheDrosophila nerfin-1 mRNA requires multiple microRNAs toregulate its spatial and temporal translation dynamics in thedeveloping nervous system,” Developmental Biology, vol. 310,no. 1, pp. 35–43, 2007.
[47] X. Cao, G. Yeo, A. R. Muotri, T. Kuwabara, and F. H.Gage, “Noncoding RNAs in the mammalian central nervoussystem,” Annual Review of Neuroscience, vol. 29, pp. 77–103,2006.
[48] B. L. Davidson and R. L. Boudreau, “RNA interference: atool for querying nervous system function and an emergingtherapy,” Neuron, vol. 53, no. 6, pp. 781–788, 2007.
[49] J. C. Pearson, D. Lemons, and W. McGinnis, “ModulatingHox gene functions during animal body patterning,” NatureReviews Genetics, vol. 6, no. 12, pp. 893–904, 2005.
[50] A. J. Giraldez, R. M. Cinalli, M. E. Glasner, et al., “microRNAsregulate brain morphogenesis in zebrafish,” Science, vol. 308,no. 5723, pp. 833–838, 2005.
[51] U. Hengst, L. J. Cox, E. Z. Macosko, and S. R. Jaffrey,“Functional and selective RNA interference in developingaxons and growth cones,” Journal of Neuroscience, vol. 26, no.21, pp. 5727–5732, 2006.
[52] K. S. Kosik, “The neuronal microRNA system,” NatureReviews Neuroscience, vol. 7, no. 12, pp. 911–920, 2006.
[53] L. Smirnova, A. Grafe, A. Seiler, S. Schumacher, R. Nitsch,and F. G. Wulczyn, “Regulation of miRNA expression duringneural cell specification,” European Journal of Neuroscience,vol. 21, no. 6, pp. 1469–1477, 2005.
[54] M. Castoldi, S. Schmidt, V. Benes, et al., “A sensitive array formicroRNA expression profiling (miChip) based on lockednucleic acids (LNA),” RNA, vol. 12, no. 5, pp. 913–920, 2006.
[55] S. Griffiths-Jones, “miRBase: the microRNA sequencedatabase,” Methods in Molecular Biology, vol. 342, pp. 129–138, 2006.

10 Journal of Biomedicine and Biotechnology
[56] T. Babak, W. Zhang, Q. Morris, B. J. Blencowe, and T.R. Hughes, “Probing microRNAs with microarrays: tissuespecificity and functional inference,” RNA, vol. 10, no. 11, pp.1813–1819, 2004.
[57] O. Barad, E. Meiri, A. Avniel, et al., “microRNA expressiondetected by oligonucleotide microarrays: system establish-ment and expression profiling in human tissues,” GenomeResearch, vol. 14, no. 12, pp. 2486–2494, 2004.
[58] E. A. Miska, E. Alvarez-Saavedra, M. Townsend, et al.,“Microarray analysis of microRNA expression in the devel-oping mammalian brain,” Genome Biology, vol. 5, no. 9,article R68, 2004.
[59] L. F. Sempere, S. Freemantle, I. Pitha-Rowe, E. Moss, E.Dmitrovsky, and V. Ambros, “Expression profiling of mam-malian microRNAs uncovers a subset of brain-expressedmicroRNAs with possible roles in murine and humanneuronal differentiation,” Genome Biology, vol. 5, no. 3,article R13, 2004.
[60] J. Shingara, K. Keiger, J. Shelton, et al., “An optimizedisolation and labeling platform for accurate microRNAexpression profiling,” RNA, vol. 11, no. 9, pp. 1461–1470,2005.
[61] J. M. Thomson, J. Parker, C. M. Perou, and S. M. Hammond,“A custom microarray platform for analysis of microRNAgene expression,” Nature Methods, vol. 1, no. 1, pp. 47–53,2004.
[62] V. G. Tusher, R. Tibshirani, and G. Chu, “Significanceanalysis of microarrays applied to the ionizing radiationresponse,” Proceedings of the National Academy of Sciences ofthe United States of America, vol. 98, no. 9, pp. 5116–5121,2001.
[63] K. K.-H. Farh, A. Grimson, C. Jan, et al., “The widespreadimpact of mammalian microRNAs on mRNA repression andevolution,” Science, vol. 310, no. 5755, pp. 1817–1821, 2005.
[64] H. Hohjoh and T. Fukushima, “Expression profile analysis ofmicroRNA (miRNA) in mouse central nervous system usinga new miRNA detection system that examines hybridizationsignals at every step of washing,” Gene, vol. 391, no. 1-2, pp.39–44, 2007.
[65] P. Landgraf, M. Rusu, R. Sheridan, et al., “A mammalianmicroRNA expression atlas based on small RNA librarysequencing,” Cell, vol. 129, no. 7, pp. 1401–1414, 2007.
[66] W. P. Kloosterman and R. H. A. Plasterk, “The diversefunctions of microRNAs in animal development and disease,”Developmental Cell, vol. 11, no. 4, pp. 441–450, 2006.
[67] Y. Zeng and B. R. Cullen, “Recognition and cleavage of pri-mary microRNA transcripts,” Methods in Molecular Biology,vol. 342, pp. 49–56, 2006.
[68] E. Berezikov, F. Thuemmler, L. W. van Laake, et al., “Diversityof microRNAs in human and chimpanzee brain,” NatureGenetics, vol. 38, no. 12, pp. 1375–1377, 2006.
[69] S. Griffiths-Jones, “The microRNA registry,” Nucleic AcidsResearch, vol. 32, pp. D109–D111, 2004.
[70] D. B. Dogini, P. A. O. Ribeiro, C. Rocha, T. C. Pereira, andI. Lopes-Cendes, “microRNA expression profile in murinecentral nervous system development,” Journal of MolecularNeuroscience, vol. 35, no. 3, pp. 331–337, 2008.
[71] J.-Y. Yu, K.-H. Chung, M. Deo, R. C. Thompson, and D.L. Turner, “microRNA miR-124 regulates neurite outgrowthduring neuronal differentiation,” Experimental Cell Research,vol. 314, no. 14, pp. 2618–2633, 2008.
[72] Q. Shen and S. Temple, “Fine control: microRNA regulationof adult neurogenesis,” Nature Neuroscience, vol. 12, no. 4, pp.369–370, 2009.
[73] G. A. Wayman, M. Davare, H. Ando, et al., “An activity-regulated microRNA controls dendritic plasticity by down-regulating p250GAP,” Proceedings of the National Academy ofSciences of the United States of America, vol. 105, no. 26, pp.9093–9098, 2008.
[74] R. R. Buss and R. W. Oppenheim, “Role of programmedcell death in normal neuronal development and function,”Anatomical Science International, vol. 79, no. 4, pp. 191–197,2004.
[75] K. C. Martin and K. S. Kosik, “Synaptic tagging—who’s it?”Nature Reviews Neuroscience, vol. 3, no. 10, pp. 813–820,2002.
[76] L. Smirnova, A. Grafe, A. Seiler, S. Schumacher, R. Nitsch,and F. G. Wulczyn, “Regulation of miRNA expression duringneural cell specification,” European Journal of Neuroscience,vol. 21, no. 6, pp. 1469–1477, 2005.
[77] R. L. Judson, J. E. Babiarz, M. Venere, and R. Blelloch,“Embryonic stem cell-specific microRNAs promote inducedpluripotency,” Nature Biotechnology, vol. 27, no. 5, pp. 459–461, 2009.
[78] K. D. Wilson, S. Venkatasubrahmanyam, F. Jia, N. Sun, A. J.Butte, and J. C. Wu, “microRNA profiling of human-inducedpluripotent stem cells,” Stem Cells and Development, vol. 18,no. 5, pp. 749–757, 2009.
[79] S. S. Hebert, K. Horre, L. Nicolaı, et al., “Loss of microRNAcluster miR-29a/b-1 in sporadic Alzheimer’s disease corre-lates with increased BACE1/β-secretase expression,” Proceed-ings of the National Academy of Sciences of the United States ofAmerica, vol. 105, no. 17, pp. 6415–6420, 2008.
[80] W. J. Lukiw, “Micro-RNA speciation in fetal, adult andAlzheimer’s disease hippocampus,” NeuroReport, vol. 18, no.3, pp. 297–300, 2007.
[81] V. Boissonneault, I. Plante, S. Rivest, and P. Provost,“microRNA-298 and microRNA-328 regulate expression ofmouse β-amyloid precursor protein-converting enzyme 1,”Journal of Biological Chemistry, vol. 284, no. 4, pp. 1971–1981, 2009.
[82] W. J. Lukiw, Y. Zhao, and J. G. Cui, “An NF-κB-sensitive micro RNA-146a-mediated inflammatory circuit inalzheimer disease and in stressed human brain cells,” Journalof Biological Chemistry, vol. 283, no. 46, pp. 31315–31322,2008.
[83] S.-L. Ang, “Transcriptional control of midbrain dopaminer-gic neuron development,” Development, vol. 133, no. 18, pp.3499–3506, 2006.
[84] Y. Lee, R. C. Samaco, J. R. Gatchel, C. Thaller, H. T. Orr, andH. Y. Zoghbi, “miR-19, miR-101 and miR-130 co-regulateATXN1 levels to potentially modulate SCA1 pathogenesis,”Nature Neuroscience, vol. 11, no. 10, pp. 1137–1139, 2008.
[85] A. N. Packer, Y. Xing, S. Q. Harper, L. Jones, and B. L. David-son, “The bifunctional microRNA miR-9/miR-9∗ regulatesREST and CoREST and is downregulated in Huntington’sdisease,” Journal of Neuroscience, vol. 28, no. 53, pp. 14341–14346, 2008.
[86] R. Johnson, C. Zuccato, N. D. Belyaev, D. J. Guest, E.Cattaneo, and N. J. Buckley, “A microRNA-based gene dys-regulation pathway in Huntington’s disease,” Neurobiology ofDisease, vol. 29, no. 3, pp. 438–445, 2008.
[87] A. Clop, F. Marcq, H. Takeda, et al., “A mutation creating apotential illegitimate microRNA target site in the myostatingene affects muscularity in sheep,” Nature Genetics, vol. 38,no. 7, pp. 813–818, 2006.

Journal of Biomedicine and Biotechnology 11
[88] J. A. Chan, A. M. Krichevsky, and K. S. Kosik, “microRNA-21 is an antiapoptotic factor in human glioblastoma cells,”Cancer Research, vol. 65, no. 14, pp. 6029–6033, 2005.
[89] J. Silber, D. A. Lim, C. Petritsch, et al., “miR-124 and miR-137 inhibit proliferation of glioblastoma multiforme cellsand induce differentiation of brain tumor stem cells,” BMCMedicine, vol. 6, article 14, 2008.
[90] J. Pierson, B. Hostager, R. Fan, and R. Vibhakar, “Regulationof cyclin dependent kinase 6 by microRNA 124 in medul-loblastoma,” Journal of Neuro-Oncology, vol. 90, no. 1, pp. 1–7, 2008.
[91] J. S. Wei, Y. K. Song, S. Durinck, et al., “The MYCN oncogeneis a direct target of miR-34a,” Oncogene, vol. 27, no. 39, pp.5204–5213, 2008.
[92] Y. Chen and R. L. Stallings, “Differential patterns ofmicroRNA expression in neuroblastoma are correlated withprognosis, differentiation, and apoptosis,” Cancer Research,vol. 67, no. 3, pp. 976–983, 2007.
[93] A. Bottoni, D. Piccin, F. Tagliati, A. Luchin, M. C. Zatelli, andE. C. D. Uberti, “miR-15a and miR-16-1 down-regulation inpituitary adenomas,” Journal of Cellular Physiology, vol. 204,no. 1, pp. 280–285, 2005.
[94] A. P. Heaney, “Pituitary tumour pathogenesis,” British Medi-cal Bulletin, vol. 75-76, no. 1, pp. 81–97, 2005.
[95] A. Cimmino, G. A. Calin, M. Fabbri, et al., “miR-15 and miR-16 induce apoptosis by targeting BCL2,” Proceedings of theNational Academy of Sciences of the United States of America,vol. 102, no. 39, pp. 13944–13949, 2005.
[96] S. A. Ciafre, S. Galardi, A. Mangiola, et al., “Extensivemodulation of a set of microRNAs in primary glioblastoma,”Biochemical and Biophysical Research Communications, vol.334, no. 4, pp. 1351–1358, 2005.
[97] T. Papagiannakopoulos and K. S. Kosik, “microRNAs: regu-lators of oncogenesis and stemness,” BMC Medicine, vol. 6,article 15, 2008.
[98] S. Lawler and E. A. Chiocca, “Emerging functions ofmicroRNAs in glioblastoma,” Journal of Neuro-Oncology, vol.92, no. 3, pp. 297–306, 2009.
[99] E. Ferretti, E. De Smaele, A. Po, et al., “microRNA profilingin human medulloblastoma,” International Journal of Cancer,vol. 124, no. 3, pp. 568–577, 2009.
[100] N. Bushati and S. M. Cohen, “microRNAs in neurodegener-ation,” Current Opinion in Neurobiology, vol. 18, no. 3, pp.292–296, 2008.
[101] C. Patterson, J. W. Feightner, A. Garcia, G.-Y. R. Hsiung, C.MacKnight, and A. D. Sadovnick, “Diagnosis and treatmentof dementia: 1. Risk assessment and primary prevention ofAlzheimer disease,” Canadian Medical Association Journal,vol. 178, no. 5, pp. 548–556, 2008.
[102] A. Orlacchio, G. Bernardi, A. Orlacchio, and S. Martino,“RNA interference as a tool for Alzheimer’s disease therapy,”Mini-Reviews in Medicinal Chemistry, vol. 7, no. 11, pp.1166–1176, 2007.
[103] E. Costanzi, S. Martino, E. Persichetti, et al., “Effects ofvitamin C on fibroblasts from sporadic Alzheimer’s diseasepatients,” Neurochemical Research, vol. 33, no. 12, pp. 2510–2515, 2008.
[104] E. A. Rogaeva, S. Premkumar, J. Grubber, et al., “Anα-2-macroglobulin insertion-deletion polymorphism inAlzheimer disease,” Nature Genetics, vol. 22, no. 1, pp. 19–22,1999.
[105] J. W. Freeman, M. Simmons, and E. Matos, “Parkinsondisease: an incremental challenge,” South Dakota Medicine,vol. 60, no. 12, pp. 481–484, 2007.
[106] C. Balducci, L. Pierguidi, E. Persichetti, et al., “Lysosomalhydrolases in cerebrospinal fluid from subjects with Parkin-son’s disease,” Movement Disorders, vol. 22, no. 10, pp. 1481–1484, 2007.
[107] W. Stamey and J. Jankovic, “Impulse control disorders andpathological gambling in patients with parkinson disease,”Neurologist, vol. 14, no. 2, pp. 89–99, 2008.
[108] G. G. Kovacs and H. Budka, “Prion diseases: from protein tocell pathology,” American Journal of Pathology, vol. 172, no. 3,pp. 555–565, 2008.
[109] V. B. Tripathi and A. Al-Chalabi, “Molecular insights andtherapeutic targets in amyotrophic lateral sclerosis,” CNS andNeurological Disorders—Drug Targets, vol. 7, no. 1, pp. 11–19,2008.
[110] A. Orlacchio, G. Bernardi, A. Orlacchio, and S. Martino,“Genetics of amyotrophic lateral sclerosis,” Recent Researchin Developmental Neuroscience, pp. 17–54, 2007.
[111] A. Orlacchio, T. Kawarai, A. Totaro, et al., “Hereditary spasticparaplegia: clinical genetic study of 15 families,” Archives ofNeurology, vol. 61, no. 6, pp. 849–855, 2004.
[112] A. Orlacchio, T. Kawarai, F. Gaudiello, P. H. St. George-Hyslop, R. Floris, and G. Bernardi, “New locus for hereditaryspastic paraplegia maps to chromosome 1p31.1–1p21.1,”Annals of Neurology, vol. 58, no. 3, pp. 423–429, 2005.
[113] E. C. Stack and R. J. Ferrante, “Huntington’s disease: progressand potential in the field,” Expert Opinion on InvestigationalDrugs, vol. 16, no. 12, pp. 1933–1953, 2007.
[114] E. J. Wild and S. J. Tabrizi, “Huntington’s disease phenocopysyndromes,” Current Opinion in Neurology, vol. 20, no. 6, pp.681–687, 2007.
[115] S. Martino, C. Emiliani, B. Tancini, et al., “Absence ofmetabolic cross-correction in Tay-Sachs cells: implicationsfor gene therapy,” Journal of Biological Chemistry, vol. 277,no. 23, pp. 20177–20184, 2002.
[116] S. Martino, C. Cavalieri, C. Emiliani, et al., “Restorationof the GM2 ganglioside metabolism in bone marrow-derived stromal cells from Tay-Sachs disease animal model,”Neurochemical Research, vol. 27, no. 7-8, pp. 793–800, 2002.
[117] S. Martino, P. Marconi, B. Tancini, et al., “A direct genetransfer strategy via brain internal capsule reverses thebiochemical defect in Tay-Sachs disease,” Human MolecularGenetics, vol. 14, no. 15, pp. 2113–2123, 2005.
[118] S. Martino and A. Orlacchio, “Cellule staminali e GM2gangliosidosi,” Annali dell’Istituto Superiore di Sanita, pp. 27–28, 2005.
[119] S. Martino, I. di Girolamo, C. Cavazzin, et al., “Neural pre-cursor cell cultures from GM2 gangliosidosis animal modelsrecapitulate the biochemical and molecular hallmarks of thebrain pathology,” Journal of Neurochemistry, vol. 109, no. 1,pp. 135–147, 2009.
[120] M. S. Weinberg and M. J. A. Wood, “Short non-codingRNA biology and neurodegenerative disorders: novel diseasetargets and therapeutics,” Human Molecular Genetics, vol. 18,no. R1, pp. R27–R39, 2009.
[121] M. Goedert and M. G. Spillantini, “A century of Alzheimer’sdisease,” Science, vol. 314, no. 5800, pp. 777–781, 2006.
[122] P. T. Lansbury and H. A. Lashuel, “A century-old debate onprotein aggregation and neurodegeneration enters the clinic,”Nature, vol. 443, no. 7113, pp. 774–779, 2006.
[123] R. S. Turner, “Alzheimer’s disease,” Seminars in Neurology,vol. 26, no. 5, pp. 499–506, 2006.
[124] Y. Ohyagi and T. Tabira, “Intracellular amyloid β-protein andits associated molecules in the pathogenesis of Alzheimer’s

12 Journal of Biomedicine and Biotechnology
disease,” Mini-Reviews in Medicinal Chemistry, vol. 6, no. 10,pp. 1075–1080, 2006.
[125] D. Goldgaber, M. I. Lerman, and O. W. McBride, “Character-ization and chromosomal localization of a cDNA encoding-brain amyloid of Alzheimer’s disease,” Science, vol. 235, no.4791, pp. 877–880, 1987.
[126] C. E. Hunt and A. J. Turner, “Cell biology, regulation andinhibition of β-secretase (BACE-1),” FEBS Journal, vol. 276,no. 7, pp. 1845–1859, 2009.
[127] W.-X. Wang, B. W. Rajeev, A. J. Stromberg, et al.,“The expression of microRNA miR-107 decreases early inAlzheimer’s disease and may accelerate disease progressionthrough regulation of β-site amyloid precursor protein-cleaving enzyme 1,” Journal of Neuroscience, vol. 28, no. 5, pp.1213–1223, 2008.
[128] S. Bicker and G. Schratt, “microRNAs: tiny regulators ofsynapse function in development and disease,” Journal ofCellular and Molecular Medicine, vol. 12, no. 5A, pp. 1466–1476, 2008.
[129] D. C. Carrettiero, I. Hernandez, P. Neveu, T. Papagian-nakopoulos, and K. S. Kosik, “The cochaperone BAG2 sweepspaired helical filament-insoluble tau from the microtubule,”Journal of Neuroscience, vol. 29, no. 7, pp. 2151–2161, 2009.
[130] M. M. Hoehn and M. D. Yahr, “Parkinsonism: onset,progression, and mortality,” Neurology, vol. 57, no. 10, pp.S11–S26, 2001.
[131] R. L. Nussbaum and M. H. Polymeropoulos, “Genetics ofParkinson’s disease,” Human Molecular Genetics, vol. 6, no.10, pp. 1687–1691, 1997.
[132] M. H. Polymeropoulos, C. Lavedan, E. Leroy, et al., “Muta-tion in the α-synuclein gene identified in families withParkinson’s disease,” Science, vol. 276, no. 5321, pp. 2045–2047, 1997.
[133] V. M. Miller, H. Xia, G. L. Marrs, et al., “Allele-specificsilencing of dominant disease genes,” Proceedings of theNational Academy of Sciences of the United States of America,vol. 100, no. 12, pp. 7195–7200, 2003.
[134] P. Gonzalez-Alegre, V. M. Miller, B. L. Davidson, and H. L.Paulson, “Toward therapy for DYT1 dystonia: allele-specificsilencing of mutant Torsin A,” Annals of Neurology, vol. 53,no. 6, pp. 781–787, 2003.
[135] P. van den Munckhof, K. C. Luk, L. Ste-Marie, et al., “Pitx3is required for motor activity and for survival of a subset ofmidbrain dopaminergic neurons,” Development, vol. 130, no.11, pp. 2535–2542, 2003.
[136] J. Fuchs, J. C. Mueller, P. Lichtner, et al., “The transcriptionfactor PITX3 is associated with sporadic Parkinson’s disease,”Neurobiology of Aging, vol. 30, no. 5, pp. 731–738, 2009.
[137] T. L. Cuellar, T. H. Davis, P. T. Nelson, et al., “Dicer loss instriatal neurons produces behavioral and neuroanatomicalphenotypes in the absence of neurodegeneration,” Proceed-ings of the National Academy of Sciences of the United States ofAmerica, vol. 105, no. 14, pp. 5614–5619, 2008.
[138] A. H. Evans and A. J. Lees, “Dopamine dysregulation syn-drome in Parkinson’s disease,” Current Opinion in Neurology,vol. 17, no. 4, pp. 393–398, 2004.
[139] G. Wang, J. M. van der Walt, G. Mayhew, et al., “Variationin the miRNA-433 binding site of FGF20 confers Riskfor Parkinson disease by overexpression of α-synuclein,”American Journal of Human Genetics, vol. 82, no. 2, pp. 283–289, 2008.
[140] H. T. Orr and H. Y. Zoghbi, “Trinucleotide repeat disorders,”Annual Review of Neuroscience, vol. 30, pp. 575–621, 2007.
[141] A. Schaefer, D. O’Carroll, L. T. Chan, et al., “Cerebellarneurodegeneration in the absence of microRNAs,” Journal ofExperimental Medicine, vol. 204, no. 7, pp. 1553–1558, 2007.
[142] J. Bilen, N. Liu, and N. M. Bonini, “A new role formicroRNA pathways: modulation of degeneration inducedby pathogenic human disease proteins,” Cell Cycle, vol. 5, no.24, pp. 2835–2838, 2006.
[143] K. Nakamura and M. J. Aminoff, “Huntington’s disease:clinical characteristics, pathogenesis and therapies,” Drugs ofToday, vol. 43, no. 2, pp. 97–116, 2007.
[144] S. Q. Harper, P. D. Staber, X. He, et al., “RNA interferenceimproves motor and neuropathological abnormalities ina Huntington’s disease mouse model,” Proceedings of theNational Academy of Sciences of the United States of America,vol. 102, no. 16, pp. 5820–5825, 2005.
[145] E. Rodriguez-Lebron, E. M. Denovan-Wright, K. Nash, A. S.Lewin, and R. J. Mandel, “Intrastriatal rAAV-mediated deliv-ery of anti-huntingtin shRNAs induces partial reversal ofdisease progression in R6/1 Huntington’s disease transgenicmice,” Molecular Therapy, vol. 12, no. 4, pp. 618–633, 2005.
[146] J. L. McBride, R. L. Boudreau, S. Q. Harper, et al., “ArtificialmiRNAs mitigate shRNA-mediated toxicity in the brain:implications for the therapeutic development of RNAi,”Proceedings of the National Academy of Sciences of the UnitedStates of America, vol. 105, no. 15, pp. 5868–5873, 2008.
[147] Y. Li, L. Lin, and P. Jin, “The microRNA pathway and fragileX mental retardation protein,” Biochimica et Biophysica Acta,vol. 1779, no. 11, pp. 702–705, 2008.
[148] S. T. Warren and S. L. Sherman, “The fragile X syndrome,” inThe Metabolic and Molecular Bases of Inherited Disease, vol. 1,pp. 1257–1290, McGraw-Hill, New York, NY, USA, 2001.
[149] S. T. Warren and D. L. Nelson, “Advances in molecularanalysis of fragile X syndrome,” Journal of the AmericanMedical Association, vol. 271, no. 7, pp. 536–542, 1994.
[150] G. J. Bassell and S. T. Warren, “Fragile X syndrome: lossof local mRNA regulation alters synaptic development andfunction,” Neuron, vol. 60, no. 2, pp. 201–214, 2008.
[151] A. A. Caudy, M. Myers, G. J. Hannon, and S. M. Hammond,“Fragile X-related protein and VIG associate with the RNAinterference machinery,” Genes and Development, vol. 16, no.19, pp. 2491–2496, 2002.
[152] A. Ishizuka, M. C. Siomi, and H. Siomi, “A Drosophila fragileX protein interacts with components of RNAi and ribosomalproteins,” Genes and Development, vol. 16, no. 19, pp. 2497–2508, 2002.
[153] P. Jin, D. C. Zarnescu, S. Ceman, et al., “Biochemical andgenetic interaction between the fragile X mental retardationprotein 3nd the microRNA pathway,” Nature Neuroscience,vol. 7, no. 2, pp. 113–117, 2004.
[154] I. Plante, L. Davidovic, D. L. Ouellet, et al., “Dicer-derivedmicroRNAs are utilized by the fragile X mental retardationprotein for assembly on target RNAs,” Journal of Biomedicineand Biotechnology, vol. 2006, Article ID 64347, 12 pages,2006.
[155] P. Jin, R. S. Alisch, and S. T. Warren, “RNA and microRNAsin fragile X mental retardation,” Nature Cell Biology, vol. 6,no. 11, pp. 1048–1053, 2004.
[156] M. P. Perron and P. Provost, “Protein components ofthe microRNA pathway and human diseases,” Methods inMolecular Biology, vol. 487, pp. 369–385, 2009.
[157] A. Cheever and S. Ceman, “Translation regulation of mRNAsby the fragile X family of proteins through the microRNApathway,” RNA Biology, vol. 6, no. 2, pp. 175–178, 2009.

Journal of Biomedicine and Biotechnology 13
[158] M. Costa-Mattioli, W. S. Sossin, E. Klann, and N. Sonenberg,“Translational control of long-lasting synaptic plasticity andmemory,” Neuron, vol. 61, no. 1, pp. 10–26, 2009.
[159] R. Duan and P. Jin, “Identification of messenger RNAs andmicroRNAs associated with fragile X mental retardationprotein,” Methods in Molecular Biology, vol. 342, pp. 267–276,2006.
[160] A. Cheever and S. Ceman, “Phosphorylation of FMRPinhibits association with Dicer,” RNA, vol. 15, no. 3, pp. 362–366, 2009.
[161] X.-L. Xu, Y. Li, F. Wang, and F.-B. Gao, “The steady-state levelof the nervous-system-specific microRNA-124a is regulatedby dFMR1 in Drosophila,” Journal of Neuroscience, vol. 28, no.46, pp. 11883–11889, 2008.
[162] Y. Yang, S. Xu, L. Xia, et al., “The bantam microRNAis associated with Drosophila fragile X mental retardationprotein and regulates the fate of germline stem cells,” PLoSGenetics, vol. 5, no. 4, article e1000444, 2009.
[163] T. Nomura, M. Kimura, T. Horii, et al., “MeCP2-dependentrepression of an imprinted miR-184 released by depolariza-tion,” Human Molecular Genetics, vol. 17, no. 8, pp. 1192–1199, 2008.
[164] N. R. Smalheiser and G. Lugli, “microRNA Regulation ofSynaptic Plasticity,” NeuroMolecular Medicine, vol. 11, no. 3,pp. 133–140, 2009.
[165] J. F. Abelson, K. Y. Kwan, B. J. O’Roak, et al., “Sequence vari-ants in SLITRK1 are associated with Tourette’s syndrome,”Science, vol. 310, no. 5746, pp. 317–320, 2005.
[166] L. Zhang, J. Huang, N. Yang, et al., “microRNAs exhibit highfrequency genomic alterations in human cancer,” Proceedingsof the National Academy of Sciences of the United States ofAmerica, vol. 103, no. 24, pp. 9136–9141, 2006.
[167] A. Esquela-Kerscher and F. J. Slack, “Oncomirs—microRNAswith a role in cancer,” Nature Reviews Cancer, vol. 6, no. 4,pp. 259–269, 2006.
[168] T. Papagiannakopoulos, A. Shapiro, and K. S. Kosik,“microRNA-21 targets a network of key tumor-suppressivepathways in glioblastoma cells,” Cancer Research, vol. 68, no.19, pp. 8164–8172, 2008.
[169] M. S. Nicoloso and G. A. Calin, “microRNA involvement inbrain tumors: from bench to bedside,” Brain Pathology, vol.18, no. 1, pp. 122–129, 2008.
[170] G. A. Calin, C. Sevignani, C. D. Dumitru, et al., “HumanmicroRNA genes are frequently located at fragile sites andgenomic regions involved in cancers,” Proceedings of theNational Academy of Sciences of the United States of America,vol. 101, no. 9, pp. 2999–3004, 2004.
[171] S. Volinia, G. A. Calin, C.-G. Liu, et al., “A microRNAexpression signature of human solid tumors defines cancergene targets,” Proceedings of the National Academy of Sciencesof the United States of America, vol. 103, no. 7, pp. 2257–2261,2006.
[172] L. He, J. M. Thomson, M. T. Hemann, et al., “A microRNApolycistron as a potential human oncogene,” Nature, vol. 435,no. 7043, pp. 828–833, 2005.
[173] G. A. Calin and C. M. Croce, “microRNA signatures inhuman cancers,” Nature Reviews Cancer, vol. 6, no. 11, pp.857–866, 2006.
[174] C. R. Woese, The Genetic Code, Harper and Row, New York,NY, USA, 1968.
[175] T. A. Lincoln and G. F. Joyce, “Self-sustained replication ofan RNA enzyme,” Science, vol. 323, no. 5918, pp. 1229–1232,2009.
[176] P. A. Sharp, “The Centrality of RNA,” Cell, vol. 136, no. 4, pp.577–580, 2009.
[177] T. R. Cech, “Crawling out of the RNA world,” Cell, vol. 136,no. 4, pp. 599–602, 2009.
[178] C. D. Malone and G. J. Hannon, “Small RNAs as guardians ofthe genome,” Cell, vol. 136, no. 4, pp. 656–668, 2009.
[179] W. Kong, J.-J. Zhao, L. He, and J. Q. Cheng, “Strategiesfor profiling microRNA expression,” Journal of CellularPhysiology, vol. 218, no. 1, pp. 22–25, 2009.
[180] L. Bonetta, “RNA-based therapeutics: ready for delivery?”Cell, vol. 136, no. 4, pp. 581–584, 2009.
[181] T. Thum, C. Gross, J. Fiedler, et al., “microRNA-21 con-tributes to myocardial disease by stimulating MAP kinasesignalling in fibroblasts,” Nature, vol. 456, no. 7224, pp. 980–984, 2008.
[182] T. Wurdinger and B. A. Tannous, “Glioma angiogenesis:towards novel RNA therapeutics,” Cell Adhesion and Migra-tion, vol. 3, no. 2, pp. 230–235, 2009.
Hindawi Publishing CorporationJournal of Biomedicine and BiotechnologyVolume 2009, Article ID 659028, 9 pagesdoi:10.1155/2009/659028
Methodology Report
Quantification of Small Non-Coding RNAs Allows an AccurateComparison of miRNA Expression Profiles
Andrea Masotti,1 Viviana Caputo,2, 3 Letizia Da Sacco,1 Antonio Pizzuti,2, 3
Bruno Dallapiccola,2, 3 and Gian Franco Bottazzo4
1 Gene Expression and Microarrays Laboratory, Bambino Gesu Children’s Hospital, P. za S. Onofrio 4, 00165 Rome, Italy2 IRCCS-CSS, San Giovanni Rotondo and CSS-Mendel Institute, Viale Regina Margherita 261, 00198 Rome, Italy3 Department of Experimental Medicine and Pathology, University La Sapienza, Viale Regina Elena 324, 00161 Rome, Italy4 Scientific Directorate, Bambino Gesu Children’s Hospital, P. za S. Onofrio 4, 00165 Rome, Italy
Correspondence should be addressed to Andrea Masotti, [email protected]
Received 1 January 2009; Revised 17 April 2009; Accepted 4 June 2009
Recommended by Daniel Gautheret
MicroRNAs (miRNAs) are highly conserved ∼22-mer RNA molecules, encoded by plants and animals that regulate the expressionof genes binding to the 3′-UTR of specific target mRNAs. The amount of miRNAs in a total RNA sample depends on therecovery efficiency that may be significantly affected by the different purification methods employed. Traditional approaches maybe inefficient at recovering small RNAs, and common spectrophotometric determination is not adequate to quantify selectivelythese low molecular weight (LMW) species from total RNA samples. Here, we describe the use of qualitative and quantitativelab-on-a-chip tools for the analysis of these LMW RNA species. Our data emphasize the close correlation of LMW RNAs withthe expression levels of some miRNAs. We therefore applied our result to the comparison of some miRNA expression profiles indifferent tissues. Finally, the methods we used in this paper allowed us to analyze the efficiency of extraction protocols, to studythe small (but significant) differences among various preparations and to allow a proper comparison of some miRNA expressionprofiles in various tissues.
Copyright © 2009 Andrea Masotti et al. This is an open access article distributed under the Creative Commons AttributionLicense, which permits unrestricted use, distribution, and reproduction in any medium, provided the original work is properlycited.
1. Introduction
In the last few years, a new class of highly conserved∼21-mernon-coding RNAs, microRNAs (miRNAs), has emerged asan important player in post-transcriptional gene expressioncontrol in different physiological and pathological condi-tions: metabolism, proliferation, cell death, differentiationand development, viral infection, and cancer [1–3]. Theyspecifically bind the 3′-untranslated regions (3′-UTR) oftarget mRNAs, promoting either mRNA degradation ortranslation arrest [4–6]. Each miRNA may control theactivity of many genes, and almost 30% of the genomecould be regulated in such a way, which renders these smallmolecules as important as the transcription factors [7, 8].
Owing to their extreme importance as regulators, the iso-lation and the precise quantification of these tiny moleculesare therefore fundamental. As purity and integrity areessential requirements not only for total RNA but also
for these small species, RNA extraction protocols mustalso account for the maximizing of their recovery. Some-times, the handling and recovery of small RNAs are notstraightforward. Nowadays, it is well established that thetraditional glass-fiber total RNA extraction protocol maybe inefficient at recovering small RNAs. In addition, thecommon spectrophotometric determination of total RNAis not adequate to quantify low molecular weight (LMW)species selectively.
We and other authors found previously that the recoveryof LMW RNA species is significantly affected by the specificpurification process [3, 9]. Our results showed that differentextraction strategies lead to significantly different recovery ofLMW species including miRNAs. We also demonstrated thatusing the same amount of total RNA (from different tissues),different amounts of miRNAs may be obtained. Moreover,the amount of LMW RNA species does not perfectly parallelthat of miRNAs: even with the same extraction protocol,
2 Journal of Biomedicine and Biotechnology
the concentration of miRNAs may differ significantly amongvarious tissues. Nevertheless, this may also be because of adifferent global expression of miRNA by different tissues.All of these considerations are extremely important whenone compares the relative expression of many miRNAs indifferent tissues. Commonly, some small non-coding RNAs(i.e., U6, snoZ30, and others) are used as normalizationcontrols to compare miRNAs expression in different tissues.The choice of a proper control should be conditioned toits real “endogenous behavior”, that is, it should have aconstant and equal expression in all tissues. If the amountof that control small non-coding RNA is different, a relativequantification is not feasible. In this latter case, only thecomparison between various miRNAs and the control genein the same specimen (tissue) is methodologically acceptable.Therefore, a method allowing a reliable estimation of thegoodness of an endogenous control is highly desirable.
In order to address all of these issues we used alab-on-a-chip technology to characterize the LMW RNAfractions obtained with different RNA extraction protocolsand evaluated miRNAs recovery with specific quantitativereal-time PCR (qRT-PCR).
In this paper we report and discuss the methods thatallowed us to analyze the efficiency of extraction protocols, tostudy the small (but significant) differences between variouspreparations and to obtain a correct comparison of somemiRNA expression profiles in various tissues.
2. Materials and Methods
2.1. Total RNA Extraction and Small RNAs EnrichmentProtocols. Total RNA was extracted using three differentmethods: an acid phenol/guanidine isothiocyanate solution(TRIzol Reagent, Invitrogen), a glass-fiber filtration protocol(MirVana miRNA Isolation Kit, Ambion) that providesalso a procedure to isolate and enrich low molecularweight (LMW) RNAs from higher molecular weight (HMW)RNAs, and another common glass-fiber purification protocol(RNEasy Mini Kit, Qiagen). All extractions were performedaccording to manufacturer’s instructions.
2.2. Cell Lines. Three different cell lines (HeLa, COS-1and a lymphoblastoid cell line (LCL) obtained followingan already reported method [10]) were cultured usingstandard procedures, trypsinized (if necessary), and pel-leted by centrifugation. Approximately 107 cells for eachextraction were resuspended in the appropriate lysis solutioncontained in the RNA extraction kit and treated according tomanufacturer’s instructions.
2.3. Electrophoresis and RNA Elution from Gel. The integrityof RNA samples was checked by gel electrophoresis (agarose1%) stained with ethidium bromide. Gel images wereacquired and analyzed with the Quantity One (softwareVer.2.0, Biorad). Two micrograms of each RNA samples wereresolved into a 15% polyacrylamide TBE-Urea gel and theimage acquired. A second polyacrylamide gel, performedwith the same experimental conditions, was used for RNA
bands extraction. The visible bands were separately excisedusing a modified “crush-and-soak” method [11]. Briefly, eachband was gently disrupted with a pin and incubated in asoaking solution (0.5 M ammonium acetate, 2 mM EDTA,0.1% SDS) for 3 hours at 37◦C. The mixture was centrifugedat 14000 g for 5 minutes, and the supernatant was collectedin a new tube. The solution was centrifuged at 12000 gfor 10 minutes through a YM-50 spin column, washedwith water (3 × 300 μl), and centrifuged at 12000 g for 5minutes. Purified fractions were collected in new tubes byinverting the columns and spinning at 1000 g for 3 minutes.These RNA samples were then separately run on the AgilentBioanalyzer.
2.4. Agilent 2100 Bioanalyzer Chip Preparation. Total RNAsamples were analyzed with the Total RNA 6000 NanoKit (Vers. II), specifically optimized for total RNA analysiswith the Agilent 2100 Bioanalyzer. RNA samples obtainedafter extraction from polyacrylamide gel were run with thesame kit. For miRNA quantification we used the dedicatedSmall RNA kit. The instrument uses fluorescence detection,monitoring the emission between 670 nm and 700 nm. Therun was performed according to manufacturer’s instructions.Electropherograms were analyzed using the Agilent 2100Expert B.02.06 software that includes data collection, presen-tation, and interpretation functions.
2.5. Real-Time PCR. For the small RNAs recovery efficiencyevaluation of different extraction procedures, hsa-miR-21and small nucleolar Z30 (snoZ30) were assayed by Real-Time PCR (TaqMan, Applied Biosystems), according tomanufacturer’s instructions [12]. For the analysis of miRNAexpression in different tissues, three miRNAs (hsa-miR-26a,hsa-miR-26b, and hsa-miR-134) and two controls (U6 andsnoZ30) were arbitrarily chosen as model miRNAs. A panelof five tissues (brain, skeletal muscle, heart, liver, and uterus)was chosen for evaluation, and the corresponding total RNA(Clontech, BD Biosciences) was analyzed with Agilent 2100Bioanalyzer. Briefly, from five to ten nanograms of eachRNA samples were retrotranscribed to cDNA using theHigh-Capacity cDNA Archive Kit (Applied Biosystems) withspecific primers. The principle of TaqMan MicroRNA Assaysis a specific stem-loop reverse transcription (RT) primer.The short length of mature miRNAs (∼22 nt) prohibitsconventional design of a random-primed RT step followedby a specific real-time assay. In the former case, the resultingRT amplicon is a suitable template for standard real-time PCR with TaqMan assays. Reactions were performedincubating samples for 30 minutes at 16◦C, 30 minutes at42◦C, 5 minutes at 85◦C, and finally cooled on ice. PCRproducts were assayed with specific probes using the TaqManUniversal PCR Master Mix, No AmpErase UNG (AppliedBiosystems) following the manufacturer’s protocol. PCRreactions were performed incubating samples for 10 minutesat 95◦C, then for 15 seconds at 95◦C and 60 seconds at 60◦Cfor 45 cycles by means of ABI PRISM 7900HT SequenceDetection System. Data were analyzed using the SDS software(Ver. 2.1).

Journal of Biomedicine and Biotechnology 3
1
TR
Izol
Mir
Van
a
RN
Eas
y
En
rich
ed
Ladder(kb)
LMW RNAs
HMW RNAs
28S
18S
2 3 4
9
4
2
0.5
Figure 1: Gel electrophoresis (agarose 1% stained with ethidiumbromide) of RNA samples (from COS-1) extracted with TRIzolreagent (lane 1), MirVana kit (lane 2), RNEasy kit (lane 3), andLMW RNA fraction enriched with MirVana kit (lane 4).
2.6. Deconvolution with PeakFit Software. The early elec-tropherogram region (from 23 to 29 seconds), obtainedfrom LCL RNA sample extracted with TRIzol reagent, wasexported in ASCII format with the Agilent 2100 ExpertB.02.06 and imported in PeakFit V.4.12. The curve wasautomatically fitted using the least-squares method. Datawere further adjusted using the Savitzky-Golay smoothingalgorithm. The overall model was fitted with chromato-graphic Gaussian curves of variable amplitudes. The fittingprocedure was iterated until a constant r2 value (r2 =0.998693) was obtained.
3. Results
3.1. The Recovery of Low Molecular Weight (LMW) RNAsIs Affected by Different Extraction Protocols. RNA samplesextracted from HeLa, COS-1, and LCL were run on agarosegel to visualize the differences between various extractionmethods. COS-1 RNA samples, extracted with TRIzolreagent and MirVana kit, clearly showed the High MolecularWeight (HMW) 28S and 18S rRNA bands, while LMW RNAsare visualized as faint, smeary bands (Figure 1, lanes 1 and 2,resp.). COS-1 extracted with RNeasy kit displayed only theHMW RNA bands (28S and 18S) (Figure 1, lane 3), whilethe enriched LMW fraction obtained with MirVana kit isclearly displayed in the lowest part of the gel (Figure 1, lane4). Similar results (not shown) were also obtained with theother cell lines.
The same samples were also checked with Agilent 2100Bioanalyzer which is one of the most versatile microfluidics-based platforms for the analysis of DNA, RNA, proteins andcells. In all electropherograms the 28S and 18S RNAs arerepresented on the right side (Figure 2), and the smallerspecies (LMW RNAs) are present at a very low concentration
a
MirVana
TRIzol
RNEasy
18S
LMW RNAs
28S
0
20
40
60
80
100
120
140
160
[FU
](a
.u.)
23 24 25 26 27 28 29
(s)
20 30 40 50 60
(s)
0
500
1000
[FU
](a
.u.)
Figure 2: Agilent 2100 Bioanalyzer electropherogram profiles oftotal RNA samples (HeLa cells) extracted with TRIzol reagent(green), MirVana kit (blue), and RNEasy kit (red). Inbox: magni-fication of small RNA profiles for the three samples (between 23and 29 seconds).
and distinguishable on the left side of the profile (see themagnification of the LMW RNAs region in Figure 2). Inthe electropherogram, all samples present a similar HMWprofile region, but the major differences are recognizable inthe LMW region. While total RNA recovery is quite good,and similar for the three protocols (> 1.2μg/μl), the LMWfractions are substantially different (Table 1). In particular,TRIzol reagent allowed the highest LMW RNA recovery(22%–34% of total RNA), while RNEasy Mini Kit thelowest (2.5%–3%). MirVana miRNA Isolation Kit gives goodyields for LMW RNA species (16%–19%) even before theenrichment step. While LMW RNA species extracted withTRIzol and MirVana have comparable profiles (Figure 2);RNEasy kit retains only one RNA peak in comparableconcentrations to the others (peak a in the magnificationof Figure 2). Therefore, the lab-on-a-chip analysis is a usefultool to quantify precisely the amount of LMW RNAs ofsamples extracted with different protocols.
3.2. Low Molecular Weight (LMW) RNAs Characterization.Total RNAs from LCL extracted with TRIzol reagent, andRNEasy kit and enriched with MirVana kit were loaded on

4 Journal of Biomedicine and Biotechnology
1
tRNAs
1505.8S
5S 10090
8070
60
50
TR
Izol
RN
Eas
y
En
rich
ed
Ladder(nt) 2 3
(a)
0
2
4
6
8
10
12
Flu
ores
cen
ce(a
.u.)
23 24 25 26 27 28 29
Time (s)
LMW RNAs5.8S
5StRNA
(b)
(a)
(b)
64.8 bp24.306
89.4 bp24.836
103.7 bp25.243
114.1 bp25.827
131.4 bp26.327
145.4 bp26.887
171.3 bp27.784
0
2
4
6
8
2.2
4.4
6.6
8.8
11
Flu
ores
cen
ceu
nit
s(a
.u.)
23 24.5 26 27.5 29
Time (s)
r2 = 0.998693
(c)
Figure 3: (a) Gel electrophoresis (polyacrylamide 15% stained with ethidium bromide) of LMW RNA samples (LCL) extracted withTRIzol reagent (lane 1), RNEasy kit (lane 2), and small RNA fraction enriched with MirVana kit (lane 3). LMW profile obtained withMirVana kit extraction is similar to that obtained with TRIzol reagent which is not shown for clarity. (b) Agilent 2100 Bioanalyzerelectropherogram profile of LMW RNAs (LCL) extracted with TRIzol (black) superimposed on 5.8S (red), 5S (green), and tRNA (blue)bands eluted from polyacrylamide gel. (c) Lymphoblastoid (LCL) LMW RNA profile obtained after plotting the exported raw data fromAgilent electropherogram ( ) together with the PeakFit fitted curve (solid line) and the component peak functions. Seven peaks below theLMW RNA profile were fitted by the software (r2 = 0.998693).
a polyacrylamide gel (Figure 3(a)) to analyze the differencesbetween various extraction protocols. All the RNA bandswere cut out from the gel, and the RNA was extractedas described. Each species coming from excised bands wasrun on Bioanalyzer, and the corresponding electrophero-grams (Figure 3(b)) were superimposed on the large andunresolved LMW RNA profile (black line). This allowed usto localize unambiguously and identify precisely each RNAspecies previously identified on polyacrylamide gel.
The electropherogram profile in the LMW RNAs regionis made of several peaks (Figure 3(b)), the greatest partbelonging to the 5.8S rRNA (red line), the 5S rRNA (green
line), and the tRNAs fractions (blue line). In order to obtainthe principal number of peaks under the curve, PeakFitsoftware was used for the deconvolution of the LMW RNAregion. Seven peaks underlying the LMW RNA profile wereobtained with a good fit (r2 = 0.998693). The upperpart of Figure 3(c) reports raw data ( ) together with thefitted curve (solid line) and the calculated baseline, whilethe lower part of Figure 3(c) shows the component peakfunctions. Calculated peak-peaking (expressed in bp) isalso reported (Figure 3(c)). Three of the calculated peakscentered at 145 bp (26.89 seconds), 131 bp (26.33 seconds),and 104 bp (25.24 seconds) are located in the correspondence

Journal of Biomedicine and Biotechnology 5
Table 1: Low molecular weight (LMW) RNA mean concentration (% with respect to total RNA) for HeLa, COS-1 and LCL extracted withdifferent RNA extraction protocols evaluated with Agilent 2100 Bioanalyzer. Standard deviations of at least three independent extractionsare reported in parentheses.
LMW RNA Mean concentration (%)
Extraction method (total RNA) HeLa COS-1 LCL
TRIzol reagent (acid phenol/guanidine isothiocyanate) 24 (±3) 34 (±2) 22 (±3)
MirVana kit 16 (±1.5) 19 (±1) 19 (±1)
RNEasy kit 2.5 (±0.5) 3 (±0.5) 3 (±0.5)
MirVana
TRIzol
RNEasy
0.001
0.01
0.1
1
10
100
ΔRn
20 25 30 35 40 45 50
PCR cycle
(a)
MirVana
TRIzolRNEasy
0.001
0.01
0.1
1
10
100
ΔRn
20 25 30 35 40 45 50
PCR cycle
(b)
Figure 4: Small nucleolar Z30 real-time PCR assay (two replicas) of RNA samples (LCL) obtained starting from 10 ng of total RNA samples(a) and from 10 ng of LMW RNA (b) extracted with different protocols. In the latter case Ct values of samples from different extractions aremore reproducible, indicating a strict correlation between the amount of miRNAs and the LMW RNA fraction.
of 5.8S, 5S, and tRNA peaks, respectively. Another lessintense peak is located at 114 bp (25.83 seconds) and maybe described as a further tRNA peak. Other peaks foundat 171 bp (27.78 seconds), 89 bp (24.84 seconds) and 65 bp(24.31 seconds) might belong to other LMW RNA species,such as smaller tRNAs, pre-miRNAs, and small nuclear ornucleolar RNAs. These small peaks are difficult to extractfrom polyacrylamide gel owing to their low abundance, andtherefore it was not possible to run them on the chip.
Therefore, determination of small RNA species by Bio-analyzer (Table 1) and by polyacrylamide gel electrophoresis(Figure 3(a)) showed that the LMW RNA samples signifi-cantly differ from each other. This could reasonably pertainalso to the miRNAs fraction.
3.3. MicroRNAs Amount Correlates with the LMW RNA Frac-tion. In order to quantify miRNAs extracted with different
protocols and to study the correlation between LMW RNAsand miRNAs, we carried out a TaqMan quantitative assayfor two representative small RNAs: a control non-codingRNA (snoZ30) and a miRNA (hsa-miR-21). A target-specificstem-loop adapter technology was employed to obtain thecorresponding cDNA [12].
We started the RT reaction with 10 ng of total RNA fromeach sample and quantified the absolute expression level ofeach miRNAs through the analysis of cycle threshold (Ct)values. Ct is the PCR cycle at which the sample reaches thelevel of detection above the background. LCL RNA samplesextracted with different protocols showed different Ct valuesfor snoZ30 (Figure 4(a)) and for miR-21. A similar behaviorwas also obtained by using HeLa and COS-1 cell lines withboth probes (data not shown).
Then, we repeated the RT reaction using 10 ng of LMWRNA calculated from the Bioanalyzer electropherogram. As

6 Journal of Biomedicine and Biotechnology
Table 2: Real-time PCR data obtained for HeLa and LCL were compared calculating the ΔCt differences between Ct (10 ng of total RNA) andCt (10 ng of LMW RNA) values for miR-21 and snoZ30. Standard deviations of at least three independent assays are reported in parentheses.LMW RNA concentrations (%) calculated using the formula 2−ΔCt·100 are also reported where ΔCt are referred to snoZ30 values. Standarddeviations of at least three independent assays are reported in parentheses.
ΔCt (total RNA-LMW RNA) Calculated LMW RNA (%) (2−ΔCt(snoZ30) · 100)
Cell Type Extraction Method miR-21 snoZ30
HeLa TRIzol reagent 1.8 (2) 2.1 (1) 23 (±2)
MirVana kit 2.5 (1) 2.9 (1) 13 (±1)
RNEasy kit 3.5 (4) 5.1 (3) 3 (±0.5)
LCL TRIzol reagent 2.3 (1) 2.4 (1) 19 (±1)
MirVana kit 2.2 (1) 2.1 (4) 23 (±5)
RNEasy kit 4.2 (2) 4.6 (4) 4 (±1)
expected, using the same LMW RNA amount similar Ctvalues both for miR-21 and snoZ30 between the varioussamples were obtained (Figure 4(b)). This demonstrates thatthe amount of miR-21 and snoZ30 correlates only to theLMW RNA fraction and not to total RNA amount. In fact,Figure 4(a) clearly shows that using the same amount of totalRNA different Ct values may be obtained.
Ct differences (ΔCt) between total RNA and LMWRNA Ct values for each extraction protocol and for eachcell line are very similar both for hsa-miR-21 and snoZ30(Table 2). This demonstrates that ΔCt differences parallelthe amount of input RNA that is ultimately linked to theamount extracted by various protocols. Table 2 reports alsothe calculated LMW RNA concentration (expressed in %)calculated from ΔCt values applying the formula 2−ΔCt.MiRNA concentrations calculated from real-time assaysare, as expected, in perfect agreement with LMW RNAsconcentrations evaluated with the lab-on-a-chip technology.
3.4. Different Tissues Express Different Amounts of Small- andMicroRNAs. Here, we showed that LMW RNAs and miRNAsamount are closely correlated. Then, we asked if differenttissues might also express different amounts of LMW andmiRNAs and if it might be possible to quantify them indi-vidually with lab-on-a-chip technology. For this reason weselected five commercial RNA samples from different tissuesextracted with the same protocol (according to manufacturerinformation). Total RNAs from brain, skeletal muscle, heart,liver, and uterus were run on RNA 6000 Nano kit toquantify the total and the LMW RNA fractions. Total RNAconcentrations were quite homogeneous and resulted: brain(1159 ng/μL) > heart (1106 ng/μL) > uterus (1080 ng/μL) >liver (963 ng/μL) > skeletal muscle (890 ng/μL). These valuesare in good agreement with the nominal manufacturer’s con-centration of 1000 ng/μL. For all samples the concentrationof LMW RNA fraction was quite homogeneous and variedin the order: liver (43 ng/μL) > brain (29 ng/μL) > heart(26 ng/μL) > uterus (25 ng/μL) > skeletal muscle (23 ng/μL).Electropherograms of LMW RNAs of different tissues aredisplayed in Figure 5(a). Calculating the percentage of LMWRNAs with respect to the whole total RNA amount we foundthe following: liver (4.4%) > skeletal muscle (2.6%) > brain
(2.5%) > heart (2.3%) > uterus (2.3%). Only some minordifferences may be observed among various tissues. Giventhat the extraction protocol employed by the manufacturerwas the same for all samples, we could hypothesize thatthe only observed difference for liver might depend on thedifferent global expression of small RNAs in this tissue.
To evaluate if the difference in LMW RNA amount mayalso pertain to the miRNA fraction, we ran the total RNAsamples on Agilent Small RNA kit, specifically designed forthe evaluation of miRNAs. Figure 5(b) shows a magnificationof the electropherogram profile obtained by running totalRNA samples from different tissues. The displayed region(from 35 to 45 seconds) is specific to the miRNA region (asindicated by the manufacturer). MiRNA concentrations wereliver (700 pg/μL) > brain (510 pg/μL) > uterus (404 pg/μL) >heart (226 pg/μL) > skeletal muscle (71 pg/μL). The miRNAconcentration, expressed in percentage, respect to LMWRNAs resulted brain (1.7%) > liver (1.6%) = uterus (1.6%)> heart (0.9%) > skeletal muscle (0.3%). From this lab-on-a-chip quantification it was possible to conclude that themiRNAs amount does not parallel that of LMW RNAs inthe same tissue. Moreover, the variation is greater than thatdisplayed by LMW RNAs among different tissues. Again,assuming that the extraction efficiency is the same for allsamples, the observed differences are only due to the differentglobal expression of miRNAs in these tissues.
3.5. Evaluation of Endogenous Controls’ Reliability and TheirUse for Expression Profile Comparison. The Small RNA kit,specifically designed for the identification and quantificationof miRNA species, allowed us to know the exact amount ofmiRNAs present in the samples used for retrotranscription(RT) reactions. This information is useful, since the Ct valuesobtained from real-time assays are directly proportionalto the amount of miRNAs. In fact, the Ct differencesobserved for the same miRNA in different tissues may be dueessentially (1) to a real difference between different samplesand/or (2) to a different sample dilution that generates ashift in Ct absolute values. To eliminate the dilution problem,that occurs when absolute quantification is performed, arelative quantification with respect to an endogenous controlis commonly followed. In fact, the endogenous control must

Journal of Biomedicine and Biotechnology 7
0
10
20
30
40
[FU
](a
.u.)
23 24 25 26 27 28
Migration time (s)
Brain (29 ng/μl)Sk. muscle (23 ng/μl)Heart (26 ng/μl)
Liver (43 ng/μl)Uterus (25 ng/μl)
(a)
0
5
10
15
20
25
30
[FU
](a
.u.)
36 38 40 42 44
Migration time (s)
Brain (510 pg/μl)Sk. muscle (71 pg/μl)Heart (226 pg/μl)
Liver (700 pg/μl)Uterus (404 pg/μl)
(b)
Figure 5: (a) Electropherogram profile of LMW RNA species of five different tissues (brain, skeletal muscle, heart, liver, and uterus). (b)Electropherogram profile of miRNA species of the same tissues.
have a constant expression in all samples, and hence it may beused to normalize the expression of the other miRNAs. Fora methodologically correct comparison, however, one mustbe confident that the control (i.e., nuclear and/or nucleolarsmall RNAs) really does have a constant expression in consid-ered samples. The lab-on-a-chip technology that we used isable to give an estimate of this variation and let the researcherchoose the right endogenous control (the one that does notsignificantly vary) from an adequate selection. Therefore, thisvalidation ensures that the miRNA expression comparisonamong considered samples is methodologically correct.
The expression of three miRNAs (hsa-miR-26a, hsa-miR-26b, and hsa-miR-134) and two small RNAs (U6 andsnoZ30) from the same five tissues analyzed before, wasassayed with real-time PCR. According to the manufacturer’ssuggestion, we started the RT reactions with 5 ng of totalRNA. Cycle threshold values for all tissues are reported inTable 3. As expected, different Ct values for endogenousand other miRNAs were obtained. These values reflect theabsolute concentrations of these miRNAs in various samples.Since most studies aim to discover differences in expressionlevels of miRNAs and not absolute levels of expression, theuse of an endogenous control is needed. In order to assess ifthe differences in Ct values of the controls we used (U6 andsnoZ30) are because of a different starting concentration or areal differential expression, we corrected the obtained valuesby taking into account the concentration of miRNAs previ-ously obtained with the lab-on-a-chip technology. Hence, weconsidered that for double the concentration a correction ofone Ct value should be applied. This preliminary correctioneliminated the intrinsic variability owing to different sampleconcentrations and allowed us to estimate the reliabilityof the selected endogenous controls. We observed slightvariation for Ct values of U6 (Average Ct = 33.5± 0.8) while
0
1
2
3
4
510
15
20
25
30
Rel
ativ
equ
anti
ty(r
espe
ctto
U6)
U6 Z30 miR-26a miR-26b miR-134
BrainSk. muscleHeart
LiverUterus
Figure 6: Corrected comparison of the relative expression of amiRNA selection in five different tissues (brain, skeletal muscle,heart, liver, and uterus) with respect to the U6 endogenous control.
snoZ30 displayed a higher variability (Average Ct = 34.1 ±1.1) even after the applied correction. This means that U6is constitutively expressed, at least in these tissues. Certainly,the lower the Ct difference is, the more reliable are the results.To facilitate this, more lab-on-a-chip quantifications and realtime assays are needed.
Therefore, we concluded that U6 is a more reliableendogenous control than snoZ30 for miRNA expressionprofile comparison in the analyzed tissues. The miRNAexpression profile comparison is reported in Figure 6.

8 Journal of Biomedicine and Biotechnology
Table 3: List of miRNAs expressed in different tissues with theiraverage Ct values. Corrected Ct values represent the correctionmade after the precise quantification of miRNA species with the lab-on-a-chiptechnology.
MicroRNA Average Ct Corrected Ct
Brain
U6 34.16 33.70
snoZ30 35.98 35.52
miR-26a 29.77 29.31
miR-26b 33.45 32.99
miR-134 33.67 33.21
Liver
U6 32.37 32.37
snoZ30 32.85 32.85
miR-26a 28.90 28.90
miR-26b 30.70 30.70
miR-134 37.30 37.30
Muscle
U6 36.55 33.24
snoZ30 37.35 34.04
miR-26a 31.74 28.43
miR-26b 34.40 31.09
miR-134 38.23 34.92
Uterus
U6 34.61 33.81
snoZ30 34.12 33.32
miR-26a 30.67 29.87
miR-26b 33.28 32.48
miR-134 38.77 37.97
Heart
U6 36.15 34.52
snoZ30 36.28 34.65
miR-26a 32.60 30.97
miR-26b 36.21 34.58
miR-134 37.93 36.30
We then compared our data with those reported inliterature [13]. Figure 7 shows the expression values of hsa-miR-26a, hsa-miR-26b and hsa-miR-134 compared with theexpression values of some tissue-specific miRNAs (miR-1 forheart and muscle, miR-122a for liver, miR-124a for brain).Expression values of miRNAs are expressed as copies per ngof RNA.
4. Discussion
One of the most difficult problems with miRNAs experi-mental studies concerns the efficiency of their quantitativeand qualitative recovery after total RNA extraction from cellsor tissues. In some cases, traditional total RNA extractionprotocols are not efficient methods for extracting both highmolecular weight (HMW) and low molecular weight (LMW)
0
1.0e + 4
2.0e + 4
3.0e + 4
5.0e + 61.0e + 72.0e + 72.5e + 73.0e + 73.5e + 7
Cop
ies
per
ng
RN
A
miR-26a miR-26b miR-134 Controls
BrainMuscleHeartLiver
hsa-miR-1 (heart)hsa-miR-1 (muscle)hsa-miR-122a (liver)hsa-miR-124a (brain)
Figure 7: Expression values of hsa-miR-26a, hsa-miR-26b, and hsa-miR-134 reported in literature [13] compared with the expressionvalues of tissue-specific miRNAs.
RNAs. Moreover, conventional quantification methods (i.e.,spectrophotometric measurements) giving an overall quan-tification of total RNA concentration are therefore inad-equate for these small RNA species. Northern blotting isthe only current viable technique to visualize and evaluatesmall RNA molecules, particularly miRNAs. However, theirlow abundance sometimes prevents the use of such tech-niques. On the other hand, the lab-on-a-chip technology weemployed is an alternative and valuable tool for the precisequantification of small RNAs and miRNAs present in totalRNA samples.
In this work, to characterize in detail all the LMW RNAspecies visible in the Bioanalyzer electropherogram (5.8S, 5S,tRNAs, etc.), we ran RNA samples on polyacrylamide gelsto clearly separate each of the predominant species presentin the small RNA region (Figure 3(a)). We also optimizedan elution protocol from excised polyacrylamide bands aftergel electrophoresis. Then, we monitored the eluted fractionsby means of a lab-on-a-chip technology that is, at present,the only technique that allows for the comparison of smallRNA profiles and the exact quantification of these species(Figure 3(b)). Several other species were present under thepeak of LMW RNAs, even if it was not possible to distinguisheach of them. For these reasons, we applied a mathematicalalgorithm (the Fourier transform) for the deconvolutionof the profile coming from the Bioanalyzer into differentGaussian peaks. After the fitting procedure, we obtaineda mathematical model comprising seven peaks that definethe overall profile (Figure 3(c)) . These peaks range froma minimum of 65 bp to a maximum of 171 bp, which iswell in agreement with the results obtained with Agilentautomatic peak-peaking that relies on the comparison ofRNA species with an RNA ladder included in the runningbuffer. Interestingly, after this procedure was performed

Journal of Biomedicine and Biotechnology 9
some other non-assigned bands remained undetermined.These species may belong to smaller RNA species likemiRNAs. To clarify this, the Small RNA kit, specificallydesigned for the analysis of miRNA species, was used to studythese unidentified species in more detail.
We initially compared the three commonest RNA extrac-tion protocols, the classic acid phenol/guanidine isothio-cyanate solution, and two glass fiber filtration protocols toexamine and quantify the recovery of HMW and LMW RNAspecies. The acid phenol/guanidine isothiocyanate solution(Table 1) maximized not only the recovery of HMW RNAfractions but also the LMW RNAs (from 22% to 36%), aspreviously observed [3]. Then, we assessed by real-time PCRhow significantly affected the recovery of miRNA species wasas a function of the total RNA extraction protocol used.The expression levels of a miRNA (hsa-miR-21) and a smallnucleolar RNA (snoZ30) were evaluated by real-time PCRspecific assays [12]. This technique represents an effectivealternative to Northern blotting for miRNA detection andquantification. Real-time quantification results (Table 2)demonstrated that the amount of miRNAs correlates betterwith the amount of LMW RNAs than with total RNA.
Another aspect that we critically analyzed concerned thecorrelation between LMW RNA species and miRNAs. Thepresence of LMW RNAs is not always directly correlated withthat of miRNAs. In fact, we proved that even with the sameextraction protocol the concentration of miRNAs may differconsiderably between various preparations (i.e., extractionfrom different tissues).
As a potential application of our results, we applied ourfindings to the comparison of some miRNA expression indifferent tissues. We assessed the expression of hsa-miR-26a,hsa-miR-26b, and has-miR-134 as model miRNAs and twosmall RNAs (U6 and snoZ30) as controls. The expressionprofile comparison is correct only if we assume that theendogenous control (U6 or others) has a constant andequal expression in all the considered tissues. The lab-on-a-chip technology we used allowed precise quantification ofinput miRNAs, ultimately leading to a fine correction ofreal-time PCR Ct data for eventual variations. Therefore,we obtained a reliable and correct estimate of the relativequantities of miRNAs present in various tissues. Surprisingly,the expression of miR-26a was the highest of all the miRNAsin all the tissues considered (fold change > 10 with respect toU6). Although our data are in good agreement with thosereported in literature [13] (Figure 7), the high expressionvalues found for miR-26a will deserve future investigations.However, the expression values of miR-26a reported inliterature [13] are also very high (and higher than thoseof miR-26b) and above the values of those tissue-specificmiRNAs considered as highly expressed (i.e., miR-1 formuscle, miR-124a for brain, and miR-122a for liver) (seeFigure 7).
In conclusion, all the methods we used in this paperallowed us to study accurately the efficiency of extractionprotocols, analyze the small (but significant) differencesbetween various preparations, and suggest a methodologi-cally correct method for the comparison of miRNA expres-sion profiles in various tissues.
Acknowledgments
The authors thank editors and reviewers for their usefulsuggestions and comments to improve the manuscript. Thiswork was supported by Grants of the Italian Ministry ofHealth. The first and the second authors equally contributedto the work.
References
[1] J. S. Mattick and I. V. Makunin, “Non-coding RNA,” HumanMolecular Genetics, vol. 15, no. 1, pp. R17–R29, 2006.
[2] J. S. Mattick and I. V. Makunin, “Small regulatory RNAs inmammals,” Human Molecular Genetics, vol. 14, no. 1, pp.R121–R132, 2005.
[3] A. Masotti and T. Preckel, “Analysis of small RNAs with theAgilent 2100 bioanalyzer,” Nature Methods, vol. 3, no. 8, pp.3–4, 2006.
[4] T. W. Nilsen, “Mechanisms of microRNA-mediated generegulation in animal cells,” Trends in Genetics, vol. 23, no. 5,pp. 243–249, 2007.
[5] R. S. Pillai, S. N. Bhattacharyya, and W. Filipowicz, “Repres-sion of protein synthesis by miRNAs: how many mecha-nisms?” Trends in Cell Biology, vol. 17, no. 3, pp. 118–126,2007.
[6] A. Eulalio, E. Huntzinger, and E. Izaurralde, “Getting to theroot of miRNA-mediated gene silencing,” Cell, vol. 132, no. 1,pp. 9–14, 2008.
[7] B. P. Lewis, I.-H. Shih, M. W. Jones-Rhoades, D. P. Bartel, andC. B. Burge, “Prediction of mammalian microRNA targets,”Cell, vol. 115, no. 7, pp. 787–798, 2003.
[8] B. John, A. J. Enright, A. Aravin, T. Tuschl, C. Sander, and D. S.Marks, “Human microRNA targets,” PLoS Biology, vol. 2, no.11, article e363, 2004.
[9] R. A. Ach, H. Wang, and B. Curry, “Measuring microRNAs:comparisons of microarray and quantitative PCR measure-ments, and of different total RNA prep methods,” BMCBiotechnology, vol. 8, article 69, 2008.
[10] P. D. Ling and H. M. Huls, “Isolation and immortalizationof lymphocytes,” in Current Protocols in Molecular Biology,chapter 28, Unit 28.2, 2005.
[11] Z. Chen and D. E. Ruffner, “Modified crush-and-soak methodfor recovering oligodeoxynucleotides from polyacrylamidegel,” BioTechniques, vol. 21, no. 5, pp. 820–822, 1996.
[12] C. Chen, D. A. Ridzon, A. J. Broomer, et al., “Real-timequantification of microRNAs by stem-loop RT-PCR,” NucleicAcids Research, vol. 33, no. 20, article e179, 2005.
[13] P. W. Hsu, H. D. Huang, S. D. Hsu, et al., “miRNAMap:genomic maps of microRNA genes and their target genes inmammalian genomes,” Nucleic Acids Research, vol. 34, pp.D135–D139, 2006.

Hindawi Publishing CorporationJournal of Biomedicine and BiotechnologyVolume 2009, Article ID 419539, 18 pagesdoi:10.1155/2009/419539
Review Article
Silencing Viral MicroRNA as a Novel Antiviral Therapy?
Ugo Moens
Department of Microbiology and Virology, University of Tromsø, N-9037 Tromsø, Norway
Correspondence should be addressed to Ugo Moens, [email protected]
Received 28 December 2008; Accepted 20 March 2009
Recommended by Bibekanand Mallick
Viruses are intracellular parasites that ensure their existence by converting host cells into viral particle producing entities or intohiding places rendering the virus invisible to the host immune system. Some viruses may also survive by transforming the infectedcell into an immortal tumour cell. MicroRNAs are small non-coding transcripts that function as posttranscriptional regulatorsof gene expression. Viruses encode miRNAs that regulate expression of both cellular and viral genes, and contribute to thepathogenic properties of viruses. Hence, neutralizing the action of viral miRNAs expression by complementary single-strandedoligonucleotides or so-called anti-miRNAs may represent a strategy to combat viral infections and viral-induced pathogenesis.This review describes the miRNAs encoded by human viruses, and discusses the possible therapeutic applications of anti-miRNAsagainst viral diseases.
Copyright © 2009 Ugo Moens. This is an open access article distributed under the Creative Commons Attribution License, whichpermits unrestricted use, distribution, and reproduction in any medium, provided the original work is properly cited.
1. Introduction
Viruses are common habitants of the human population,where they establish different forms of infection, includingan acute, a chronic, or a persistent infection with productionof low levels of virions. Some viruses can exist in a truelatent state in which infectious particles are only producedupon reactivation stimuli. Viruses that reside harmlessly intheir host can under certain conditions or in immunocom-promised persons be responsible for malignant and non-malignant diseases, which may even lead to the death ofthe host. A causal role for human polyomaviruses (HPyV),papillomaviruses (HPV), herpesviruses (HHV), hepatitis Bvirus (HBV), hepatitis C virus (HCV), and human T-celllymphotropic virus type-I (HTLV-I) and cancer is accepted(for recent reviews see [1–7]). It is estimated that oncovirusesare associated with 15% of the human cancers [8], while non-malignant infections from human immunodeficiency virus(HIV), HBV and HCV alone cause more than 3 milliondeaths annually worldwide [9]. Other viral infections (HIVno included) were responsible for the death of more than6000 patients in Japan in 2006, ∼7000 individuals in theUSA in 2005, and 555 people in United Kingdom in 2006according the statistics of the World Health Organization
[10]. Thus the pathogenic properties of viruses necessitatethe development of efficient antiviral therapies.
Viruses attempt to create a favorable cellular environ-ment allowing viral replication or survival by establishinga lifelong latent infection through evading the immunesystem of their hosts. Viruses can hide within a cell byrestricting their activity to a minimum so as not to concealtheir presence to the immune system and at the same timethey will also try to avoid apoptosis. For these purposes,viruses have developed different strategies, one of whichincludes the posttranscriptional regulation of both cellularand viral gene expressions through modulating the host’sRNA-interference (RNAi) machinery. Viruses can suppressthe RNAi pathway by viral microRNA (vmiRNA) targetingcellular or viral transcripts, or by viral proteins (e.g.,human immunodeficiency virus Tat protein, influenza virusNS1/NS2 protein, Ebola VP35 protein, and vaccinia virusE3L protein) or viral RNA (Adenovirus VA transcripts)that counteract the host’s RNAi machinery (for recentreviews see [11–17]). This review summarizes the recentfindings on virus-encoded miRNAs and their describedfunctions and briefly discusses the potential of antiviralmiRNA as a novel therapeutic strategy in combating virusinfections.

2 Journal of Biomedicine and Biotechnology
2. MicroRNA (miRNA)
MiRNAs are noncoding small RNA molecules that act asposttranscriptional regulators. They seem to be an inherentpart of the genomes of most living organisms as they havebeen described in plants, unicellular and lower inverte-brates, all vertebrates, and in viruses. Their exact functionsstart to emerge and include control of cellular processessuch as differentiation, morphogenesis, organogenesis, andmetabolism [18–22]. MiRNAs are typically generated byRNA polymerase II. The primary transcript (pri-miRNA)is processed by the RNase III enzyme Drosha, in concertwith double-stranded (ds) RNA-binding protein DGCR8into a ∼60 pre-miRNA hairpin. This nuclear pre-miRNAis then transported into the cytoplasma by exportin 5/Ran-GTP and cleaved by the cytoplasmic RNase III Dicer togenerate an imperfect ds RNA of 21–25 nucleotides. Oneof the strands, the mature miRNA strand or guide strand,is loaded in the RNA induced silencing complex (RISC),and directs RISC to the target mRNA, where the complexhybridizes to (partially) complementary sequences resultingin cleavage or translational inhibition of the target mRNA.The unincorporated strand, called the passenger strand, isdegraded. The seed region, which encompasses nucleotides2 to 8 of the 5’ ends of miRNA, plays a pivotal role intarget selection by RISC-bound miRNA (for recent reviewssee [23–25]). In animals, mature miRNAs do not requirecomplete complementarity to their target mRNAs, enablingthem to bind to and prevent translation of several mRNAs.Experimental evidence suggests that a single miRNA canpotentially target as many as 200 different mRNAs [26–28].As such, miRNAs have merged as pivotal posttranscriptionalregulators of gene expression in multicellular eukaryotes andaberrant expression can contribute to diseases ([28] andreferences therein).
3. Silencing of miRNA byAnti-miRNA Oligonucleotides
Anti-miRNA oligonucleotides (AMOs) are chemically mod-ified synthetic oligonucleotides that are complementary totheir target sequence and this will silence the action ofthe target. AMOs are modified with the dual purposeto stabilize them and to improve their affinity for theirtargets. One modification is the 2’ sugar modificationwhich implies a chemical modification of the 2’-O ofthe ribose residue (Figure 1(a)). The 2’-O -methyl AMOshave a methyl group linked to the 2’-O of the riboseresidue, while the 2’-O - methoxyethyl AMOs contain amethoxygroup. This modification provides improved RNaseresistance and binding affinity to RNA compared to unmod-ified antioligonucleotides. However, 2’-O -methoxyethylAMOs possess a higher affinity and specificity to RNA thantheir 2’-O -methyl AMOs. Other 2’ sugar modificationsthat have been used include 2’-fluor and locked nucleicacid (LNA). In LNA-modified oligonucleotides, the 2’-O -oxygen is bridged to the 4’-position via a methylene linkerto form a rigid bicycle, locked into a C3’-end (RNA)sugar conformation (Figure 1(a)). LNAs give very strong
duplex formation with their target sequences and theydisplay excellent mismatch discrimination, hence avoidingoff-target effects (for recent reviews see [28] and [29]).LNA injections against miR-122, a cellular miRNA involvedin lipid metabolism, resulted in efficient and long-lastingdecrease in plasma cholesterol in African green monkeyswithout any evidence for toxicities [30]. A second typeof modification is the phosphorothioate backbone whichreduces the affinity to the target somewhat, but it conferssignificant stability to nuclease degradation (Figure 1(b)). Athird generation of antisense oligonucleotides are phospho-diamidate morpholino oligomers (PMO) in which the ribosering is replaced with a morpholine ring. Adding an arginine-rich peptide (RXR)4 further increased the stability and tissueretention of the PMO (reviewed in [31]). An additionalmodification can be made to improve the cellular uptake ofthe AMO. Krutzfeldt et al. linked a cholesterol moiety to theirAMOs and referred to these anti-miRNAs as antagomirs.Antagomirs should be >19 nucleotides in length to providehighest efficiency in silencing target miRNA [32–34]. Theputative therapeutic potentials of antagomirs were recentlydemonstrated in treatment of lipid metabolic disease inanimals [35]. An alternative class of AMOs is peptide nucleicacids (PNA), which are synthetic oligonucleotides with N-(2-aminoethyl)-glycine replacing the deoxyribose or ribosebackbone [36]. A study published in 2008 reported that PNAcan efficiently block the action of cellular miRNAs [37].Finally, another approach in silencing miRNA is the use ofso-called microRNA sponge, a synthetic mRNA that containsmultiple binding sites for a particular miRNA and that istranscribed from a plasmid containing a strong promoter(reviewed in [28]). In conclusion, different classes of AMOhave been shown to be efficient in silencing miRNA and maybe useful therapeutic tools (reviewed in [29, 32–34, 38]).
4. Viral miRNAs Encoded by Human Viruses
4.1. Human polyomaviruses. (HPyV) are nonenvelopedviruses with a circular ds DNA genome of approximately5000 base-pairs. The members BK virus and JC virus werefirst isolated in 1971 from the urine of a renal transplantpatient with the initials B.K., and from the brain of aHodgkin’s lymphoma patient with initials J.C. who sufferedfrom progressive multifocal leukoencephalopathy (PML),respectively. Human infections with the rhesus macaque(Macaca mulatta) Simian vacuolating virus 40 (SV40) wereconsidered as accidental transmission of the virus frommonkeys to people living in close contact with these animalsor through vaccination with the contaminated poliovirusvaccines. However, recent observations support the possibil-ity that SV40 can spread in humans by horizontal infectionand even vertical transmission, suggesting that man may bea natural host for this virus. The human polyomavirusesseem to be implicated in tumours of the brain, bone,colon, mesothelium, pancreas, stomach, urogenital tract, andlymphomas and leukaemias (reviewed in [39, 40]). In 2007,two independent research groups reported the isolationof two new human polyomaviruses from nasopharyngeal
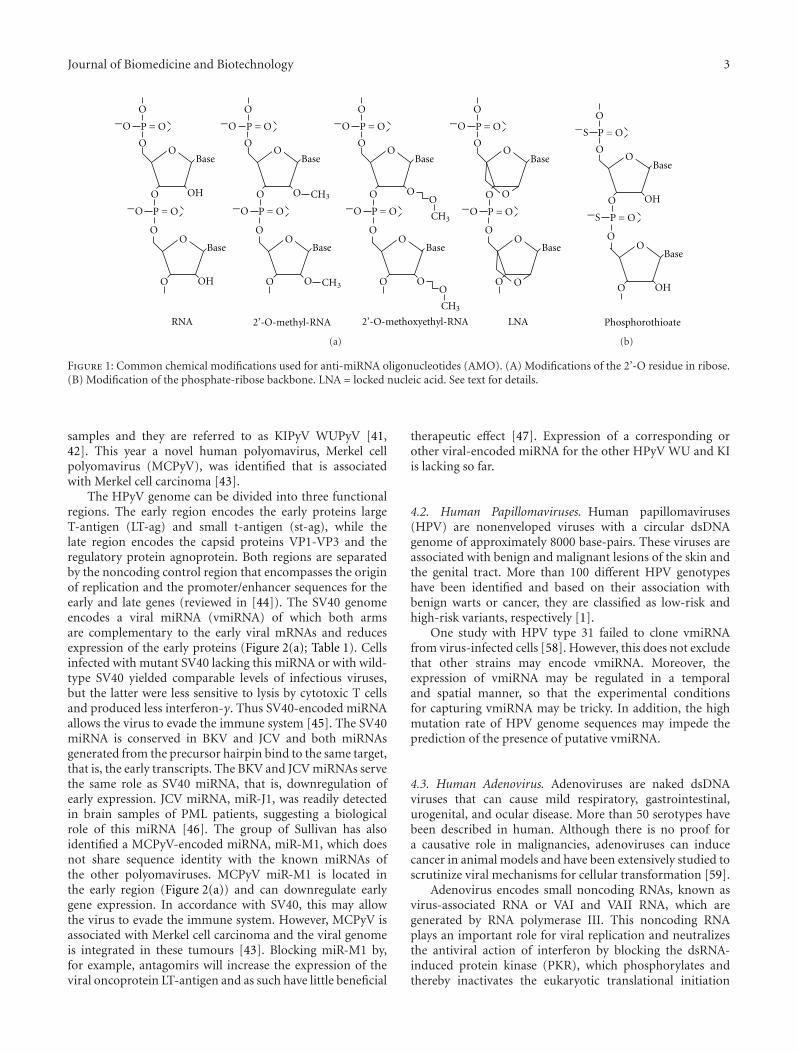
Journal of Biomedicine and Biotechnology 3
OO
OH
Base
OO
OH
Base
O
OO
CH
Base
OO
Base
O
OO
O
Base
OO
Base
O
O
CH
OO
CH
RNA 2’-O-methyl-RNA 2’-O-methoxyethyl-RNA LNA
OO
O
Base
OO
O
Base
O
3
3
3
3
P = O
O-O P = O
O-O P = O
O-O P = O
O-O
P = O
O-OP = O
O-OP = O
O O
-OP = O
O-O
CHO
(a)
Phosphorothioate
OO
OH
Base
OO
OH
Base
O
P = O
O-S
P = O
O-S
(b)
Figure 1: Common chemical modifications used for anti-miRNA oligonucleotides (AMO). (A) Modifications of the 2’-O residue in ribose.(B) Modification of the phosphate-ribose backbone. LNA = locked nucleic acid. See text for details.
samples and they are referred to as KIPyV WUPyV [41,42]. This year a novel human polyomavirus, Merkel cellpolyomavirus (MCPyV), was identified that is associatedwith Merkel cell carcinoma [43].
The HPyV genome can be divided into three functionalregions. The early region encodes the early proteins largeT-antigen (LT-ag) and small t-antigen (st-ag), while thelate region encodes the capsid proteins VP1-VP3 and theregulatory protein agnoprotein. Both regions are separatedby the noncoding control region that encompasses the originof replication and the promoter/enhancer sequences for theearly and late genes (reviewed in [44]). The SV40 genomeencodes a viral miRNA (vmiRNA) of which both armsare complementary to the early viral mRNAs and reducesexpression of the early proteins (Figure 2(a); Table 1). Cellsinfected with mutant SV40 lacking this miRNA or with wild-type SV40 yielded comparable levels of infectious viruses,but the latter were less sensitive to lysis by cytotoxic T cellsand produced less interferon-γ. Thus SV40-encoded miRNAallows the virus to evade the immune system [45]. The SV40miRNA is conserved in BKV and JCV and both miRNAsgenerated from the precursor hairpin bind to the same target,that is, the early transcripts. The BKV and JCV miRNAs servethe same role as SV40 miRNA, that is, downregulation ofearly expression. JCV miRNA, miR-J1, was readily detectedin brain samples of PML patients, suggesting a biologicalrole of this miRNA [46]. The group of Sullivan has alsoidentified a MCPyV-encoded miRNA, miR-M1, which doesnot share sequence identity with the known miRNAs ofthe other polyomaviruses. MCPyV miR-M1 is located inthe early region (Figure 2(a)) and can downregulate earlygene expression. In accordance with SV40, this may allowthe virus to evade the immune system. However, MCPyV isassociated with Merkel cell carcinoma and the viral genomeis integrated in these tumours [43]. Blocking miR-M1 by,for example, antagomirs will increase the expression of theviral oncoprotein LT-antigen and as such have little beneficial
therapeutic effect [47]. Expression of a corresponding orother viral-encoded miRNA for the other HPyV WU and KIis lacking so far.
4.2. Human Papillomaviruses. Human papillomaviruses(HPV) are nonenveloped viruses with a circular dsDNAgenome of approximately 8000 base-pairs. These viruses areassociated with benign and malignant lesions of the skin andthe genital tract. More than 100 different HPV genotypeshave been identified and based on their association withbenign warts or cancer, they are classified as low-risk andhigh-risk variants, respectively [1].
One study with HPV type 31 failed to clone vmiRNAfrom virus-infected cells [58]. However, this does not excludethat other strains may encode vmiRNA. Moreover, theexpression of vmiRNA may be regulated in a temporaland spatial manner, so that the experimental conditionsfor capturing vmiRNA may be tricky. In addition, the highmutation rate of HPV genome sequences may impede theprediction of the presence of putative vmiRNA.
4.3. Human Adenovirus. Adenoviruses are naked dsDNAviruses that can cause mild respiratory, gastrointestinal,urogenital, and ocular disease. More than 50 serotypes havebeen described in human. Although there is no proof fora causative role in malignancies, adenoviruses can inducecancer in animal models and have been extensively studied toscrutinize viral mechanisms for cellular transformation [59].
Adenovirus encodes small noncoding RNAs, known asvirus-associated RNA or VAI and VAII RNA, which aregenerated by RNA polymerase III. This noncoding RNAplays an important role for viral replication and neutralizesthe antiviral action of interferon by blocking the dsRNA-induced protein kinase (PKR), which phosphorylates andthereby inactivates the eukaryotic translational initiation
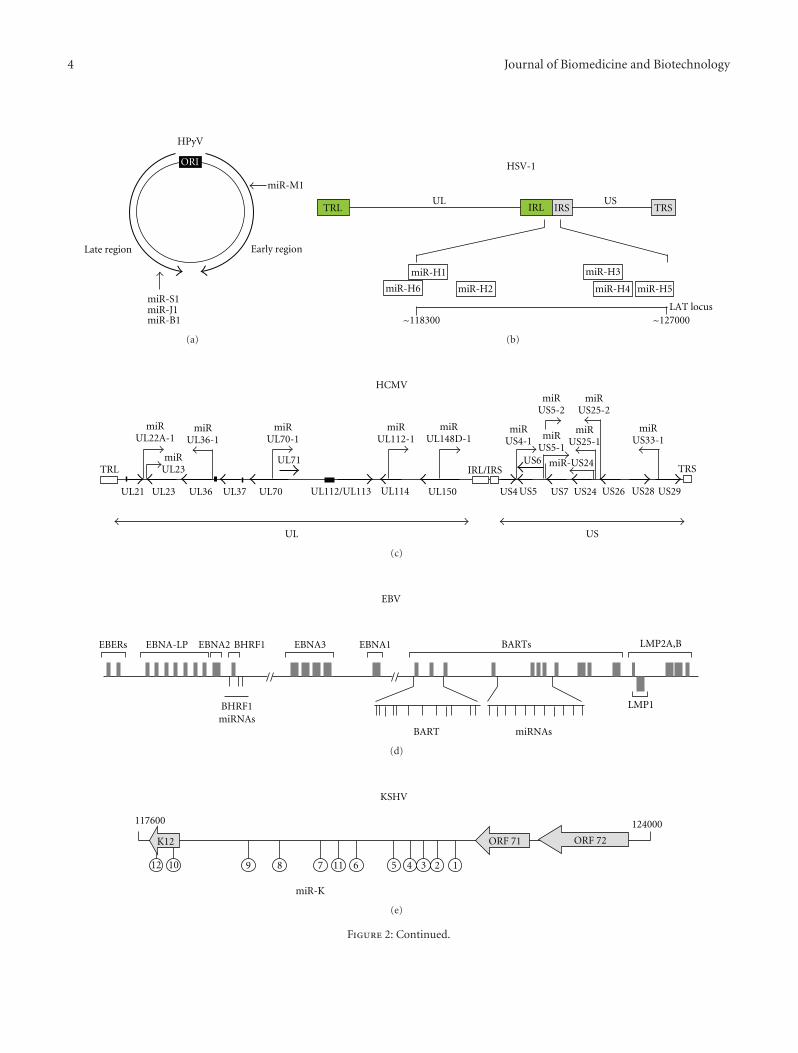
4 Journal of Biomedicine and Biotechnology
ORI
Late region Early region
miR-M1
HPyV
miR-S1miR-J1miR-B1
(a)
miR-H3
miR-H4 miR-H5miR-H6 miR-H2
UL USTRL TRSIRL IRS
miR-H1
LAT locus~118300 ~127000
HSV-1
(b)
HCMV
UL21 UL23 UL36 UL37 UL70
UL71
UL112/UL113 UL114 UL150 US4 US5
US6
US7 US24 US26 US28 US29
miRUL22A-1
miRUL148D-1
miRUS4-1 miR
US5-1
miRUS5-2
miRUL36-1
miRUL70-1
miRUL112-1
miRUS33-1
miRUS25-2
miRUS25-1
miRUL23
miR-US24
UL US
TRL TRSIRL/IRS
(c)
EBERs EBNA3 EBNA1EBNA2 BHRF1EBNA-LP
EBV
BHRF1miRNAs
LMP1
BARTs LMP2A,B
BART miRNAs
(d)
K12 ORF 71 ORF 72
124000117600
miR-K
KSHV
112 10 9 8 7 11 6 5 4 3 2
(e)
Figure 2: Continued.

Journal of Biomedicine and Biotechnology 5
HIV
gag
pol vpr
vif
env
nefvpu
tat
rev #4 #1 #5
miR-N367
#1 #2 #3mi-TARHAAmiR
U3 R U5 U3 R U5
(f)
Figure 2: Schematic representation of the genomes of different human viruses and location of viral-encoded miRNAs. (A) The humanpolyomavirus (HPyV) BK virus, JC virus, SV40, and Merkel Cell polyomavirus encode the viral miRNAs miR-B1, miR-J1, miR-S1, and miR-M1, respectively [45–47]. (B) Herpes simplex virus-1 genome with detail of the LATlocus. The numbers refer to the approximate sequencecoordinates of the LAT locus. L= long, S= short, U= unique, TR= terminal repeat, and IR= internal repeat. The figure is modified after [48].(C) Genomic map of HCMV with relative position of some of the genes. The open reading frames are depicted by thick arrows, while theposition of the viral miRNAs are indicated by narrow arrows. L= long, S= short, U= unique, TR= terminal repeat, and IR= internal repeat.Modified after [49] and [50]. (D) Location of the miRNAs in the EBV genome. The latency genes are shown as grey boxes, while the miRNAsare indicated by vertical lines. (E) Kaposi’s sarcoma-associated herpes virus (KSHV or HHV-8). Most KSHV miRNAs are clustered betweenthe kaposin(K12) gene and the v-FLIP(ORF71) gene, while two are located within the K12 open reading frame (ORF). Adapted from [51].(F) The HIV-1 genome and location of the viral-encoded miRNAs. The figure is based on a compilation of the studies by [52–57].
factor 2 [60]. A recent study showed that a minor frac-tion of VAI RNA is processed by Dicer into functionalRISC-associated ssRNA which can act as miRNA (Table 1).Blocking of VAI-derived small RNA by 2’-O -methyl AMOcomplementary to VAI decreased virion production [61–63].In an attempt to identify potential targets for VAI-derivedmiRNA, computational analysis was used. Putative targetsinclude genes encoding apoptosis-related protein NAPORand PKR-activating protein PACT. Therefore VAI RNA-derived miRNA may help adenovirus to escape the actionsof the host defense mechanisms [64].
4.4. Human Herpesviruses. Herpesviruses are envelopeddsDNA viruses with a genome size ranging between ∼130 to∼250 kilobase-pairs. They are divided into three subfamiliesdenoted α, β, and γ. Approximately 130 different her-pesviruses have been identified to date, including the humanα-herpesviruses herpes simplex virus 1 (HSV-1 or HHV-1),herpes simplex virus 2 (HSV-2 or HHV-2), Varicella-zostervirus (VZV or HHV-3), the β-herpesviruses cytomegalovirus(HCMV or HHV-5), HHV-6A, HHV-6B, and HHV-7, theγ-herpesviruses Epstein-Barr virus (EBV or HHV-4), andKaposi’s sarcoma-associated virus (KSHV or HHV-8). Allhuman herpesviruses are able to establish latent infectionswith only a small subset of viral genes expressed (reviewedin [64]). As will be discussed in the next section, among theviral transcripts that can be detected in latently infected cellsare viral-encoded miRNAs, which seem to be required tomaintain a latent state of infecton, but may also contributeto the pathogenic properties of the virus.
4.4.1. HSV-1. Herpes simplex virus-1 (HSV-1 or humanherpes virus 1; HHV1) infects the majority of the humanpopulation, but remains a latent cohabitant in most people.Reactivation of the viruses usually results in cold sores,
but it can also cause a spectrum of diseases from sight-threatening ocular infections in immunocompetent adults tomore severe infections in newborns and immunosuppressedpatients (reviewed in [89]).
An important gene in HSV latency is the LAT gene.This gene encodes the latency-associated transcript (LAT),which does not code for a protein. LAT seems to promotecell survival of the infected cells [90]. Gupta and cowork-ers proposed that the antiapoptotic activity of LAT wasachieved by an miRNA-entrapped in the LAT (miR-LAT),which downregulates the expression of transforming growthfactor-β (TGF-β) and SMAD3. The latter is a mediatorof the signalling pathway induced by TGF-β, while TGF-β can prevent cell proliferation and induce cell death [67].However, a later study revealed that the described miR-LATwas not viral encoded, but in fact a cellular miRNA expressedin SH-SY-5Y cells [67] and the report describing miR-LATwas retracted [91]. Work by Umbach et al. could also notconfirm the existence of this miRNA in HSV-1 infected SH-SY-5Y cells [48]. Later, it was shown that the HSV-1 LAT exonencodes HSV-1 miR-LAT-ICP34.5, which can be detected inHSV-1 infected cells [89]. Circa 120 base-pairs upstream inthis region, a sequence with 77% homology to the HSV-2miRNA miR-I (see further) is present, but no mature miRNAwas detected in HSV-1 infected cells. However, the existenceof this miRNA during HSV-1 latency in vivo remains to beconfirmed [68].
Computational analysis predicted 24-miRNA candidatesin the HSV-1 genome, 8 of which were conserved in HSV-2, suggesting they may be functional miRNAs [69]. Theauthors confirmed the expression of one mature miRNA,designated miR-H1, in HSV-1 infected Vero cells, where itwas expressed late in productive replication. This miRNA isencoded approximately 450 bp upstream of the transcriptionstart site of the LAT transcript, but a corresponding sequenceis not conserved in the HSV-2. The function of miR-H1

6 Journal of Biomedicine and Biotechnology
Table 1: MicroRNAs encoded by human viruses and their targets. See text for details.
Virus miRNA Target/function Reference
Human polyomaviruses
SV40 miR-S1Downregulation earlyexpression; Immunomodulating
[45]
BKV miR-B1 Downregulation early expression [46]
JCV miR-J1 Downregulation early expression [46]
MCPyV miR-M1 Downregulation early expression [47]
Human papillomavirus not predicted [65]
not detected [66]
Human adenovirus unnamed [61–63]
Human parvovirus not predicted [65]
HSV-1 (HHV1) miR-LAT(within exon 1)
Prevents apoptosis by targetingtranslation of the genes encodingTGF-β1 and SMAD3
[67](retracted),[48, 68,69],[70]
miR-LAT-ICP34.5
miR-H1Repression of the expression ofthe viral protein ICP0, whichpromotes viral replication
miR-H2Downregulation of ICP34.5, akey viral neurovirulence factor
miR-H3Downregulation of ICP34.5, akey viral neurovirulence factor
miR-H4
miR-H5Downregulation of ICP4, a viraltranscriptional activator
miR-H6Reduced expression of ICP34.5, akey viral neurovirulence factor
HSV-2 (HHV2) miR-I
miR-II
miR-III
VZV (HHV3) not predicted [65, 71]
HCMV (HHV5) miR-UL23 Immunomodulating [12, 49, 65, 72–74]
miR-UL36-1
miR-UL54-1
miR-UL70-1
miR-UL22A-1
miR-UL112-1
Downregulates the expression ofCMV genes involved in its ownreplication process, for example,transactivators IE72 and IE86;UL120/121; UL114MHC classI-related chain B (MICB), acellular ligand for the activatingreceptor NKG2D;downregulation of IE-1
miR-UL148D-1
miR-US4-1
miR-US5-1
miR-US5-2
miR-US24

Journal of Biomedicine and Biotechnology 7
Table 1: Continued.
Virus miRNA Target/function Reference
miR-US25-1
miR-US25-2
miR-US33-1
RNAβ2.7
Bnds components of themitochondrial respiratory chaincomplex I and thus preventingapoptosis
EBV (HHV4) miR-BART1-1to -3
Inhibition LMP1 expression [24], [51, 75–79]
Inhibit EBV DNA polymeraseBALF5
miR-BART2 Inhibition LMP1 expression
miR-BART3
miR-BART4Antiapoptotic bydownregulation of PUMA
miR-BART5
miR-BART6 Inhibition LMP1 expression
miR-BART7
miR-BART8
miR-BART9
miR-BART10
miR-BART11
miR-BART12
miR-BART13
miR-BART14 Inhibition LMP1 expression
miR-BART15 Inhibition LMP1 expression
miR-BART16
miR-BART17
miR-BART18
miR-BART19
miR-BART20Downregulation chemokineCXCL-11
miR-BHFR-1
miR-BHFR-2
miR-BHFR-3
KSHV (HHV-8) miR-K12-1Downregulation ofthrombospondin 1 and BACH
[51, 66, 75, 80–82]
miR-K12-2Downregulation ofthrombospondin 1
miR-K12-3
miR-K12-4
miR-K12-5Downregulation ofthrombospondin 1 and BACH
miR-K12-6
miR-K12-7
miR-K12-8
miR-K12-9
miR-K12-10a
miR-K12-10bDownregulation ofthrombospondin 1 and BACH-1;
miR-K12-11 Identical to miR-155

8 Journal of Biomedicine and Biotechnology
Table 1: Continued.
Virus miRNA Target/function Reference
miR-K12-12
Poxvirus vaccinia virus 3 predicted [65]
Poxvirus variola virus 1 predicted [65]
Hepatitis B virus [54]
Hepatitis C virus
Human immunodeficiency virus miR-H1
Type 1 (HIV-1) miR-TARHDAC-1-mediated repression ofviral gene expression
[83]
miR-TAR-5p [84]
miR-TAR-p
HAAmiRNADownregulation IL-15, IL-2receptor γ chain, IRAK1, andFMRP
[56]
VmiRNA#1-5
Proteins involved in, forexample, signal transduction,protein synthesis, anddegradation, DNA methylation
[85]
miR-N367 HIV promoter interference [86]
HIV-2 miR-TAR2-5p [87]
miR-TAR2-3p
HTLV-I not detected [88]
Paramyxoviridae (measles virus) 1 predicted [65]
remains to be established and no cellular target mRNAswere identified [69]. Umbach and coworkers detected inaddition to miR-H1 five novel viral miRNAs in trigeminalganglia of mice latently infected by HSV-1, as well as inHSV-1-infected Vero cells. These miRNAs, that is, miR-H1to miR-H6, are encompassed in the LAT locus (Figure 2(b)).By quantitative RT-PCR, the authors were able to roughlyestimate the number of copies of each miRNA duringproductive infection of Vero cells. MiR-H1 and miR-H6 wereexpressed at ∼1200 and 300 copies, respectively, while theother miR-Hs were present at less than 40 copies per infectedcell. In latently infected trigeminal ganglia, much higherlevels were monitored with 63 000 copies of miR-H2, 8000copies of miR-H3, 800 000 copies of miR-H4, 80 000 copies ofmiR-H5, and 40 000 copies of miR-H6. The large differencein numbers of miRNA transcripts in latently infected cellscompared to cells with productive HSV-1 infection indicatesthat miR-Hs play an important role in establishing latentHSV-1 infection. Indeed, miR-H2 expression diminished theprotein levels of ICP0, a viral transcriptional activator thatpromotes viral replication, while miR-H6 inhibits expressionof ICP4, which is required for expression of most HSV-1genes during reproductive infection [48].
4.4.2. HSV-2. HSV-2 typically infects the genital region andestablishes a lifelong latent infection. The prevalence of latent
HSV-2 infection varies between 10–60%. Reactivation cancause oro-facial and genital herpes, but HSV-2 infection canalso cause encephalitis and neonatal herpes, and forms a riskfactor for HIV acquisition [89]. The only detectable viraltranscript during HSV-2 latency is the LAT, but the molecularfunction of this transcript remains largely unknown [92].HSV-2 LAT exon encodes an miRNA, referred to as miR-I, which is expressed during latent, as well as during acuteinfection. Remarkably, several promoters regulate miR-Iexpression in different stages of the viral life cycle. ThisHSV-2 miRNA efficiently diminishes the expression ofthe viral neurovirulence factor ICP34.5, a multifunctionalprotein required for viral replication in neuronal cells invivo, and with intrinsic neurovirulent properties [93]. Thus,miR-I may affect the outcome of infection (latent versusproductive) by modulating the protein levels of ICP34.5.Whether miR-I has other targets remains to be investigated,but an miR-I analogue is also expressed by HSV-1, indicatingthe importance of this miRNA for these viruses [68]. Tangand colleagues identified two new HSV-2 miRNAs, miR-II, which includes miR-II-5p and miR-II-3p, and miR-III,both encoded by exon 2 of LAT. The expression of miR-I, -II, and –III increased during infection of cells, but miR-IIIdisplayed slower kinetics than the two other miRNAs. Similarto miR-I, miR-II silences the expression of ICP34.5,while

Journal of Biomedicine and Biotechnology 9
miR-III functionally resembles HSV-I miR-H2 in that it candownregulate the expression of ICP0 [70].
4.4.3. Varicella-Zoster Virus (VZV). VZV is a common virusthat causes chickenpox or varicella during primary infection.The virus establishes a latent infection, but reactivation leadsto herpes zoster, commonly referred to as shingles. AcuteVZV reactivation may lead to post-herpetic neuralgia [94].No putative miRNAs could be predicted in the VZV genome[65, 71], but experimental studies to unambiguously proofthe existence of VZV miRNA are lacking.
4.4.4. Human Cytomegalovirus (HCMV). HCMV causesmild or subclinical diseases in immunocompetent adults,but can lead to life-threatening complications in immuno-compromised patients such as organ transplant recipientsand AIDS patients. In addition, HCMV is one of theleading viral causes of birth defects and has been implicatedin the acceleration of long-term vascular diseases suchas atherosclerosis. Depending on the tissue type and thehost’s immune state, HCMV can establish acute, persistent,or latent infections characterized by different viral geneexpression [95, 96]. Because other herpesviruses encodemiRNAs, it was assumed that HCMV may encode miRNAswhich could be involved in determining the type of infection.To date, 15 HCMV vmiRNAs, scattered throughout the viralgenome, have been identified (see Table 1 and Figure 2(c)).Three viral miRNAs, designated as UL23-5p, miR-UL23-3p,and miR-US24, were identified that are expressed duringproductive HCMV infection of permissive cells (human fore-skin fibroblasts, astrocytoma U373MG cells, retinal pigmentepithelial cells, and human microvascular endothelial cells).Their putative cellular target genes include genes encodingtranscription factors (e.g., HNF3 and TGIF2), receptors (e.g.,IL-18 receptor 1 precursor; CD206), proteins implicated inT-cell activation (AHNAK1), in signal transduction (e.g.,RAB2L), and in biosynthesis of leukotrienes that sustaininflammatory reactions (coactosin-like protein). Whetherthese genes represent bona fide targets as well as the biologicalrelevance of HCMV miRNA-mediated silencing of thesegenes remains elusive [49].
HCMV usually establishes a lifelong persistent or latentstate in healthy individuals by ensuring that infected cellsavoid immune recognition. The HCMV-encoded miRNAmiR-UL112-1 seems to play a central role in helping the virusto hide from the host’s immune system. This viral miRNAtargets mRNA for MHC class I-related chain B (MICB), andto a lesser extend MICA. These proteins are cellular ligandsfor the activating receptor NKG2D, which is expressed onsome natural killer (NK) cells, γ/δ T cells, and CD8+ Tcells. During cellular stress (such as viral infection) MICB isinduced, thus activating NK-cells and T cells that can lead tothe killing of infected cells. Cells infected with mutant viruslacking this miRNA were more susceptible to being killed inan NKG2D-dependent manner by NK cells [72].
The miR-UL112-1 also represses the expression ofHCMV genes involved in its own replication process, in partby targeting mRNA encoding immediate early proteins. One
of them is the viral transactivator protein called immediateearly 72 (IE72) that regulates the transcription of viral genesrequired for acute replication [50]. IE72 plays a pivotal role incontrolling latency and reactivation. miR-UL-112-1 can thusrestrict reactivation of the virus through negative regulationof IE72 expression [50, 95]. Two separate studies showed thatmiR-UL112-1 also inhibited expression of the immediateearly protein IE1. Murphy et al. detected increased IE1 levelsin cells infected with either a virus lacking miR-UL112-1 or with mutations in the seed sequence of the ie1 genecompared to cells infected with wild-type HCMV [73]. Greyand coworkers demonstrated that addition of miR-UL112-1 RNA prior to infection reduced IE1 protein levels andblocked viral replication [74]. IE1 is a crucial protein toascertain lytic replication of HCMV, thus downregulation ofIE1 may help the virus to establish latency. This strategy maybe a common feature for herpesviruses because immediate-early genes may be putative targets for HSV-1 miR-LAT,EBV miR-BART15 and miR-BHRF1-3, and KSHV miR-K12-6-3p [73]. Yet another target for miR-UL112-1 is theviral protein UL114, a homologue of the mammalian DNArepair enzyme uracyl-DNA glycosylase. UL114 is requiredfor efficient viral DNA replication. Hence, miR-UL112-1-mediated downregulation of UL114 may prevent viral DNAreplication and favor a latent infection state [65]. Takentogether, the actions of miR-UL112-1 seem to be associatedwith latent viral infection, a state which allows the virus tohide from the immune system. Ablating expression of thisviral-encoded miRNAs by AMOs may therefore force thevirus into a lytic cycle and provide the immune system theopportunity to get ride of the viral infection.
4.4.5. EBV. Epstein-Barr virus (EBV) or human herpses-virus-4 (HHV-4) is a γ-herpesvirus that establishes a lifelonglatent infection in B-lymphocytes in more than 90% ofthe human population. EBV is associated with infectiousmononucleosis and has been implicated in the pathogenesisof several malignancies including Burkitt’s and Hodgkin’slymphomas, posttransplant and T-cell lymphomas, X-linkedlymphoproliferative syndrome, nasopharyngeal, and gastriccarcinomas [97]. Latently EBV-infected cells are classifiedin stage I, II, or III, each of them characterized by distinctEBV gene expression [98]. Among the latency stage-specificEBV transcripts are miRNAs. More than 20 different EBVmiRNAs have been identified that are transcribed duringlatent infection (Table 1; [25, 51, 75–79]). The EBV miRNAsare organized in two major clusters within the EBV genome(Figure 2(d)). One cluster resides in the BART (abbreviationfor BamHI-A rightward transcripts) region. The BARTregion gives rise to multispliced transcripts and is highlyexpressed in EBV-positive cancers and in epithelial tissues,while there is low BART expression in B lymphocytes. Theexact function of BART mRNAs remains obscure [76]. Theintronic region of BART also encodes the miRNAs miR-BART1 to miR-BART20. The second region that encodesmultiple miRNAs is the untranslated region of the geneencoding BHRF1 (BamHI fragment H rightward openreading frame 1), a viral Bcl-2 homologue that prevents

10 Journal of Biomedicine and Biotechnology
apoptosis. BHRF1 encompasses the miRNAs miR-BHRF-1-1 to miR-BHRF-1-3 [51, 75].
The expressions of EBV-encoded miRNAs in clinicalsamples and computational analysis to predict putativetargets were applied to unravel the biological functions ofEBV miRNAs. These approaches showed that the miR-BARTsare abundantly expressed in latently infected epithelial cells,nasopharyngeal carcinomas, EBV-associated gastric carci-noma cell lines and tissues, Burkitt’s lymphomas latency typeI, EBV positive primary effusion lymphomas, and diffuselarge B-cell lymphomas, but at a significantly lower level inB cells. This corresponds well with the expression patternof BART multispliced transcripts (see above). Higher levelsof BHRF1-3 were measured in latency type III Burkitt’slymphomas and in diffuse large B-cell lymphomas [66, 79,98–100]. Another study demonstrated that induction ofEBV replication in latency I-infected cells was associatedwith increased expression of miR-BHRF1-1, -2, and -3, butexpression levels of miR-BART-1 and -2 did not change.On the other hand, induction of EBV replication in latencyIII-infected cells did hardly change the expression levelsof BHRF1-1, -2, and -3 [98]. These observations suggestthat EBV miRNAs may be implicated in the oncogenicproperties of the virus, but also in regulating its replication.Moreover, a precise knowledge of the latency state of EBVand the expression pattern of viral miRNAs may improve thesuccessful treatment of EBV infection with AMOs.
The function of most EBV vmiRNA remains poorlyunderstood, but some targets of EBV miRNAs have beenrecently identified. Several mi-BARTs prevent expressionof viral latent infection membrane protein 1 (LMP1)protein (see Table 1). LMP1 functions as a constitutivelyactive tumour necrosis receptor [101], and can activateseveral signalling pathways including NFκB, AP1, JAK/STAT,MEK/ERK, and PKC. LMP1 can also interact with p53and affects cyclins, cyclin-dependent protein kinases (CDK),and the CDK inhibitors p16 and p27 (reviewed in [102]).Furthermore, LMP1 is expressed in all the EBV related malig-nancies and promotes cellular transformation. Its oncogenicproperty makes LMP1 an attractive target for EBV therapy.Interestingly, overexpression of LMP1 results in growth-inhibitory and sensitization to apoptosis induced by stress orchemotherapeutic agents ([76] and references therein). ThusAMO-mediated neutralization of mi-BARTs may lead to ele-vated LMP1 protein levels and render EBV-positive tumourcells more susceptible to chemotherapy. The viral miRNAmiR-BART2 can inhibit expression of viral DNA polymeraseBALF5 and may thus interfere with viral replication andprevent lytic infection [51, 77]. Silencing miR-BART2 couldthus allow the virus the complete its life cycle and producenew infectious virus particles, which then could offer theimmune system the opportunity to detect and eliminate EBV.Using computational prediction programs such as miRandaand RNAhybrid (reviewed in [103]) allowed Choy andcoworkers to envisage the cellular protein p53 up-regulatorof apoptosis (PUMA) as a target for miR-BART5 [78]. Theauthors demonstrated that PUMA levels were decreased incells expressing miR-BART5 compared to cells lacking miR-BART5. In accordance, when miR-BART5 was specifically
inhibited with an anti-miR-BART5 oligonucleotide, PUMAprotein levels decreased and apoptosis was triggered. Thus,EBV may promote survival of infected epithelial cells bymodulating the expression of an apoptotic protein throughan miRNA-mediated mechanism. This finding may haveimportant implications in the development of anti-EBVagents such as AMOs directed against miR-BART5.
Fewer studies have been directed to determine the targetsof miR-BHRF1s. miR-BHRF1-2 is involved in the cleavage ofBHRF1 RNA in the cytoplasm, but the biological relevanceremains to be determined [98]. In another study, Xia et al.observed that high levels of miR-BHRF1-3 were correlatedwith low levels CXCL-11, a potent interferon-inducible T-cell attracting chemokine. MiRNA-mediated suppression ofCXCL-11 may serve as an immunomodulating mechanismallowing the virus to survive in the host [79]. On theother hand, enhancing CXCL-11 expression in EBV-positivetumours by AMOs against miR-BHRF1-3 may increasesusceptibility of the tumour cells to the immune system. Inagreement with this, two recent studies reported antitumouractivity for CXCL-11 in animal models [104, 105].
4.4.6. Kaposi’s Sarcoma Virus (KSHV or Human HerpesVirus Type 8; HHV-8). Kaposi’s sarcoma-associated virus,so named because it was detected in Kaposi’s sarcoma,belongs to the γ-herpesviruses and is also known as humanherpesvirus-8 or HHV-8. HHV-8 is associated with Kaposi’ssarcoma, as well as with two rare forms of B-cell malig-nancy: primary effusion lymphoma (PEL) and the plasmacell variant of multicentric Castleman’s disease. Like otherherpesviruses, KSHV can establish a lifelong latent infectioncharacterized by a limited viral gene expression [106].
A total of 17 KSHV miRNAs encoded by 12 distinctmiRNA genes have been reported and their sequencesare highly conserved between different KSHV genomesin PEL cell lines and in clinical samples. However, somepolymorphism was observed, particularly in miR-K12-5 andmiR-K12-9 [80, 107, 108]. The entire KSHV miRNA clusterresides within an approximately 4 kilobase-pairs regionbetween open reading frames ORF K12 (kaposin) and ORF71 (Figure 2(e)).
To elucidate the functions of the KSHV miRNAs,transcriptome analysis was performed from cells stablyexpressing the miR-K12 cluster. Among the differentiallyexpressed genes were genes encoding proteins implicatedin proliferation, immune modulation, angiogenesis, andapoptosis. The gene encoding thrombospondin-1 was tar-geted by all ten KSHV miRNAs, but especially by miR-K12-1, miR-K12-3-3p, miR-K12-6-3p, and miR-K12-11.Thrombospondin-1 possesses antiproliferative and anti-angiogenic properties. Other transcripts that were reducedcorresponded to the genes for osteopontin, S100 calciumbinding protein, plasticity related gene 1 product, andintegral membrane protein 2A [80, 81]. The mRNA for theBcl-2 interacting protein BCLAF1 was identified as a targetfor miR-K12-5. Additional inhibition of BCLAF1 expressionwas obtained in the presence of miR-K9, -10a, and -10b. The

Journal of Biomedicine and Biotechnology 11
exact biological relevance is not yet understood, but siRNA-mediated depletion of BCLAF1 enhanced the frequency ofspontaneous lytic reactivation of KSHV. MiRNA-mediatedreduction of BCLAF1 expression would prevent permanentlatency of the virus, a type of infection that represents a dead-end pathway of viral spreading [108, 109].
A KSHV miRNA that has gained special interest is miR-K12-11 because its seed sequence, known to be criticallyimportant for mRNA target recognition is 100% conservedwith the cellular miR-155, suggesting that these miRNAsmay regulate common targets. The exact role of miR-155remains unclear, but a number of B-cell lymphomas andsolid organ tumors overexpress miR-155, while miR-155transgenic mice develop B lymphomas [110, 111]. Workby the groups of Skalsky and Cullen confirmed that miR-K12-11 indeed is an orthologue of miR-155, and that theytarget common transcripts [81, 82]. Comparing the geneexpression profiles in cells stably expressing either miR-155or miR-K12-11 revealed that they regulate an analogous setof mRNAs. The products of these transcripts include proteinsinvolved in B-cell function (e.g., Src-like adaptor or SLA),innate immunity (e.g., IκB kinase and phosphoinositide-3-kinase), apoptosis (XIAP associated factor-1; LDOC1),cell cycle regulation (e.g., FOS), and gene expression (e.g.,FOS and BACH1). BACH-1 (Btb and CNC homolog 1)is a bZip protein that can repress transcription throughheterodimerization with the small Maf proteins [112], whilec-Fos can heterodimerize with the JUN proteins to form theAP-1 complex. AP-1 is a multifunctional protein involved incellular proliferation, transformation, and apoptosis [113].For a complete list of miR-155/miR-K12-11 regulated genes,the reader is referred to the work of Skalsky et al., andof Gottwein et al. [81, 82]. Treatment of latently-infectedKSHV with an antagomir against miR-K12-11 enhanced Fosprotein levels about 2.5-fold compared to untreated cells[81]. Computational analyses further revealed seed sequencehomology between the viral miRNAs KSHV miR-K12-6-5p,EBV-BART5, and HCMV UL70-5p with human miRNAsmiR-15a plus 16, miR-18a/b, and miR-340, respectively [82].Both miR-15a and miR-16 are believed to possess tumoursuppressor activity and to induce apoptosis by silencing Bcl2expression, while miR-18 was demonstrated to be oncogenic[52, 114]. KSHV-encoded miRNAs seem to be crucial bothin survival of the virus in its host, but also to play acausal role in viral-associated pathologies. AMO-mediatedsilencing of KSHV-encoded miRNAs may thus be a strategyto counteract viral infection, but may also undesirably targetcellular miRNAs with identical seed sequences as the viralmiRNAs.
4.5. Poxvirus. Poxviruses are dsDNA viruses that replicatein the cytoplasm and have as such no access to the nuclearproteins involved in the biogenesis of miRNA. Nevertheless,miRNA precursor sequences have been predicted in thegenomes of the human poxviruses vaccinia virus and variolavirus, but their existence has not been validated [25, 65].Whether the other human poxvirus, molluscum contagio-sum virus, encodes miRNA remains to be established.
4.6. Hepatitis B Virus. Hepatitis B Virus (HBV), anenveloped virus with a circular partial dsDNA genome,persistently infects more than 300 million people worldwide.HBV can cause a spectrum of liver diseases ranging frommild liver dysfunctions to chronic hepatitis, cirrhosis, andhepatocellular carcinoma [53]. This makes efficient anti-HBV therapy highly vital. AMO-based vmiRNA silencingis probably no option since no miRNAs could be detectedby computational analysis [65], and expression of HBVmiRNAs has not been reported so far. One study identifieda putative HBV-encoded miRNA, but in vivo expression ofthis HBV miRNA was not tested. Computational screeningfor complementary sequences in the 3’ untranslated regionsof cellular mRNA to this HBV miRNA did not reveal putativetarget transcripts [54]. It therefore seems unlike that this is abona fide viral miRNA.
4.7. Human Immunodeficiency Virus (HIV). HIV is thecausative agent of acquired immune deficiency syndrome(AIDS), and it is estimated that >30 million people world-wide are infected with this virus. Two species, HIV-1 andHIV-2, infect humans (for a recent review see [55]).
HIV utilizes reverse transcriptase to convert its ssRNAgenome into a dsDNA provirus. During this process, the5’ and 3’ ends of the viral RNA genome are convertedinto long terminal repeats (LTRs). The LTRs play a pivotalregulatory role in establishing, maintaining, and overridingthe latent state of the virus [115]. The central domain ofthe LTR is referred to the R region, which encompassesthe (transactivation-response region) TAR. TAR binds theviral protein Tat, a transactivator that plays an importantrole in the transcriptional activation of the provirus genome(reviewed in [116]). The TAR encodes proven and putativemiRNAs (Figure 2(f)). Klase and coworkers described anmiRNA encoded by the HIV-1 TAR element. This miRNAcauses HDAC-1 to associate with the viral LTR, resultingin diminished viral gene expression. This suggests a rolefor HIV-1 miRNA in maintaining viral latency [83]. Inanother report, Ouellet and colleagues demonstrated theexpression of two TAR element-derived miRNAs by North-ern blotting, primer extension, and RNase protection assay.The miRNA derived from the left arm of the TAR stemhas been named miR-TAR-5p, while the miRNA originatingfrom the right arm was designated miR-TAR-3p. The latterappears to preferentially accumulate in HIV-positive cells[84]. The biological role of these miRNAs remains to beelucidated, but they may contribute to modulating viraland/or cellular gene expression, with a potential impacton viral replication and/or host antiviral defense efficiency.The miR-TAR-5p described by Ouellet overlaps with thevmiRNA no. 1, while miR-TAR-3p partially overlaps withvmiRNA no. 5 described by Bennasser and coworkers [85].They predicted by computer-directed analyses 5 pre-miRNAsin the HIV-1 genome, which in principle could yield 10mature miRNAs. Their expression has not been validated,nor has their biological role been addressed, but deductionof potential target transcripts resulted in the indentificationof cellular genes encoding protein kinases, ion channels,

12 Journal of Biomedicine and Biotechnology
proteins involved in protein synthesis and degradation,growth factors, and DNA methylation [85]. TAR DNA ofthe long terminal repeat of HIV-1 encompasses an antisenseRNA (HIVaINR), which encodes HIV proteins, but thatcan also form a duplex with the 5’ end of all sense HIVmRNA, enabling the virus to control the expression ofits gene [117]. HIVaINR can potentially code for severalmiRNAs, referred to as HAAmiRNAs. Putative targets forthese miRNAs are the mRNAs for interleukin (IL)-15, IL-2receptor γ chain, human fragile X mental retardation protein(FMRP), and IL-1 receptor-associated kinase 1 (IRAK1).IL-15 is important in the regulation of T-cell maturation,development and survival of natural killer cells, and survivalof long-lived memory T cells, while the IL-2 receptor γ chainis a common component of the receptors for IL-2, -4, -7,-9, -15, and -21. Aberant expression of this receptor leadsto severe T-cell and NK-cell deficiencies. IRAK1 is a criticalsignalling mediator of innate immunity. Downregulation theexpression of IL-15, IL-2 receptor γ chain, and IRAK1 byHIV miRNA would impair the immune system and favorsurvival of the virus in the host. FMRP is an RNA-bindingprotein that is implicated in protein synthesis and miRNAprocessing. Thus HIV could use HAAmiRNA to deregulatethe host miRNA mechanism to dispose the virus by depletingFMRP ([56] and references therein.) Although the existenceof these HAAmiRNAs has not been proven, it is tempting tospeculate that, in accordance with other viruses, HIV encodesmiRNAs allowing HIV to survive in the host. A recent studyexamined the possibility of HIV-2 TAR to encode miRNAs.Two putative miRNAs, miR-TAR2-5p and miR-TAR-3p wereidentified, but their expression awaits validation [87].
Besides TAR, other regions of the HIV genome have beenshown to contain miRNA sequences. The nef gene of HIV-1 is located at the 3’ end of the viral genome and is highlyexpressed during the early stages of virus replication. Nefis a multifunctional accessory protein that is important forviral replication, but that also plays a key role in pathogenesisas Nef can downmodulate CD4, CD28, and the class Imajor histocompatibility complex [86]. HIV-1 encodes anef -derived miRNA referred to as miR-N367 (Figure 2(f)).Unlike classical miRNA, this miRNA does not affect geneexpression at the post-transcription level, but rather atthe transcription level by promoter interference. MiR-N367suppresses HIV-1 promoter activity via a negative responsiveelement in the 5’-long terminal region and via Nef sequencesin the 3’ untranslated region [57, 118]. Future studies arerequired to elucidate the precise mechanism by which miR-N3667 represses HIV-1 promoter activity. Downregulationof Nef expression may suppress HIV-1 replication and allowpersistently low pathogenic or latent viral infection [57]. Asthe nef gene is conserved in HIV-2, HIV-2 may also apply asimilar mechanism to maintain a low profile in the host.
The identity and action of HIV miRNAs remains to bescrutinized before AMOs-based therapy can be consideredas anti-HIV drugs. However, computational alignment ofthe potential HIV-1 miRNAs with specific human T-cellmRNAs identified potential cellular targets including genesencoding CD4, CD28 and interleukin-2, IL-3, and IL-12[119]. Viral miRNA-caused inhibition of the expression
of these proteins seems advantageous for the virus, andtherefore counteracting vmiRNA by AMO may help the hostto clear HIV infection.
4.8. Human T-cell leukaemia virus type 1 (HTLV-I). HTLV-I persistently infects 10–20 million humans worldwide andis the etiological agent for adult T-cell leukaemia [5]. Onestudy reported that T cells persistently infected with HTLV-1did not express viral microRNAs [88], but meticulous studiesshould be performed to rule out the existence of HTLV-ImiRNA.
4.9. RNA Viruses. Pfeffer et al. tried to identify miRNAin the genomes of human RNA viruses like Marburg andEbola virus (Filoviridae), measles virus (Paramyxoviridae),poliovirus (Picornaviridae), yellow fever virus and hepatitisC virus (HCV; Flaviviridae), and Sindbis virus (Togaviridae).None of these viral genomes seem to contain putative miRNAsequences, except for measles virus and yellow fever virus,which each possesses a single putative miRNA. However,the miRNA in yellow fever virus could not be validated,while the existence of miRNA in measles virus was not tested[25, 65]. Intriguingly, the liver-specific miR-122 facilitatesthe replication of the oncovirus HCV, but the mechanism forthis function of miR-122 in HCV replication is still unknown[120, 121].
5. Conclusions
Numerous human diseases are caused by viral infections, butthe intimate relation with the host makes the developmentof antiviral drugs difficult. Vaccination has been proven to bevery succesful to combat some viral infections, but mutationsand diversity of virus strains has hampered the developmentof efficient vaccines against other viruses. New antiviral treat-ments are based on drugs that inhibit specific viral activitiessuch as viral proteases or polymerases (for recent reviews see[122, 123]). Viral-encoded miRNA that may be implicated inthe viral life cycle and the pathogenic properties of the virusoffers a novel attractive target for antiviral therapy. Silencingthe action of viral miRNAs may enable the host cell or theimmune system to gain control over the virus and even toeliminate the virus. The idea of targeting viral transcriptsis not new, and RNA interference has been demonstratedto efficiently mediate inhibition of replication of humanpathogenic viruses such as HIV-1, HCV, dengue virus, severeacute respiratory syndrome (SARS) coronavirus, poliovirus,human rhinovirus, influenza A virus, hepatitis D virus, HBV,HSV-1, HPV, JCV, EBV, and CMV in cell culture (reviewedin [12]). Besides recent studies have proven the potentialof this RNA interference as antiviral therapy in animalmodels [124, 125], and even in clinical trials such as Alnylamagainst respiratory syncytial virus and NUC B1000 againstHBV (reviewed in [126, 127]). However, anti-HIV RNAinterference studies revealed that escape virus variants couldappear which could evade the inhibitory action of siRNA[128, 129].

Journal of Biomedicine and Biotechnology 13
The use of AMO to neutralize viral miRNA adds anew twist to RNA interference. AMOs are easy to produceand relatively cheap, and easy to administer locally (butnot systemically). Moreover, they possess low toxicity andare highly specific. Most viral miRNAs identified so farhave little homology to each other and to known host cellmiRNAs (reviewed in [130]). This reduces the risk of off-target effects of anti-miRNA oligonucleotides and increasesthe therapeutic potentials of miRNA silencing. The miRNAsilencing action of both LNA and antagomirs is sensitive tosingle nucleotide exchanges. For antagomirs, it was shownthat this effect depends on the position of the mismatch.Nucleotide substitutions at the very 5’ end or in the centredid not prevent downregulation of miR-122 [33]. These dataindicate that changes in the 3’ end of the antagomir mayabrogate its ability to destroy target miRNA and should betaken into account when designing and testing antagomirs.Another advantage of AMOs is that they probably canbe used against all serotypes of a specific virus. Althoughnot meticulously investigated, miRNA sequences betweendifferent viral strains seem to be conserved because of theirimportance for the viral life-cycle (see e.g., KSHV-encodedmiRNAs; [80, 107, 108]). However, polymorphism in viralmiRNAs has also been observed (see next paragraph).
Although AMOs may provide an attractive novel antivi-ral therapy, practical problems and other pitfalls mayhamper the use of them. For example, antagomirs directedagainst miR-UL-112-1 could drive the virus towards acutereplication and disrupted the inhibition of MCIB expres-sion, resulting in possible clearance of the virus by theimmune system. However, there is a potential risk of severepathological effects caused by acutely replicating HCMV,especially in immunocompromised patients [50]. Anotherdisadvantage of AMOs may be off-target effects. As miRNAdo not require full complimentarity to bind their targetsequence, it can be imagined that an AMO not only bindsto its predicted miRNA but also to other miRNAs and evenmRNAs. In addition, ssRNA oligonucleotides may interactwith Toll-like receptors 7 and 8 thereby stimulating theimmune system. Similar side effects have been reported forsiRNA (reviewed in [126]). Polymorphism in viral-encodedmiRNAs has been described in viral-infected cell lines and inclinical samples. For instance, miR-K12-5 of different KSHVisolates contains mutations, which can affect maturation andbiological activity of this miRNA [25, 100, 107]. Thus themiRNA may not be expressed, in which case the AMO willhave no effect or the AMO may not bind because of themutations in its target miRNA. Another problem facing theuse of AMOs in antiviral therapy is that the expression ofa specific gene may be regulated by several viral miRNAs.For example, translation of the transcript of theBACHgeneis prevented by three KSHV viral miRNAS: miR-K12-11,miRNA-K12-1, and miR-K12-6. Thus the effectiveness of anAMO against, for example, miR-12-11 can be compromised.Indeed, treatment of latently infected KSHV virus with aspecific antagomir against miR-K12-12 alone only modestlyincreased the amount of BACH protein [81]. A cocktailof different AMOs directed against distinct viral miRNAmay help to overcome this problem. So far, such studies
are lacking, but a recent study successfully applied spongemiRNA to silence HBV transcripts. An expression vectorencoding multiple miRNAs targeting HBV HBsAg mRNAstrongly reduced the expression of this protein [131].Another challenge is to improve in vivo delivery of the AMOsto viral infected cells and obtain long-lasting action of theantagomirs. Aerosol delivery devices similar to the ones usedfor delivery of asthma therapeutics could be used for respira-tory viruses [15]. Other delivery strategies include intravenalor systemic injection, viral vectors, and lipid- and polymer-based vehicles [131–134]. Recently, sustained inhibition ofHCV replication in cell-culture was obtained when cell-degradable multilayered polyelectrolyte film (MPF) coatedwith siRNA was delivered to infected cells. By this approach,a single regime of MPF-mediated siRNA treatment wassufficient to inhibit HCV replication for 12 days. Moreover,MPF-mediated delivery of siRNA also protected uninfectedcells from HCV infection. Another advantage is the verylow toxicity of MPF [135]. These promising observations incell culture put MPF-based delivery of AMOs forward as anefficient antiviral tool. Another limitation of anti-miRNAsis the site of application. Studies with antagomirs againstmiR-16 in mice revealed that when injected into tail veins,antagomirs were incapable of silencing miR-16, whereaslocal injection into the mouse cortex efficiently induceddegradation of the target miRNA [33]. Another drawbackof the use of AMOs is that the chemical modification canexert antiproliferative or other off-target effects such as beendemonstrated for the phosphorothioate backbone, whichcan associate with cellular proteins [29].
Antisense oligonucleotides such as LNA and PMO haveproven to efficiently inhibit RNA and DNA virus replicationin cell culture and animal models, without toxicity for the cellor animal. However, these PMO were directed against viralprotein-encoding mRNA, and studies of PMO-mediatedsilencing of viral miRNA have not been reported so far(see e.g., [31, 136–138]). Future viral miRNA research isfaced with important challenges before AMOs may enterthe clinic. Our comprehension on the functions of viralmiRNA and the interplay between viral infection and cellularmiRNA expression is just beginning to emerge. Studiesaimed at the identification of viral miRNA and elucidationof their functions should be pursued. Difficulties facingcomputational-based prediction are false positives, but alsothe shortcoming to detect genuine miRNAs. Moreoverconfirmation of expression of miRNA by, for example,Northern blot may fail to monitor miRNA. Expression levelsof vmiRNA may be cell-specific, for example, EBV miR-BHFR1-2 had considerably lower expression levels in Jijoyecells than in B95-8 cells [7]. Dose- and time-dependent stud-ies are required to determine the optimal therapeutic regime.Such pharmacokinetics and pharmacodynamic studies arelargely lacking [133], but recent in studies in mice revealedthat a single cerebral or tail-vein injection of 240 mg/kg bodymass anti-miR122 had a silencing effect for at least 8 daysand as long as 23 days in the tissues examined [32, 33]. Inanother study, a five-week regime of two intraperitonal orsubcutaneous injection a week with different concentrationsof anti-miR-122 clearly silenced miR-122 and no untoward

14 Journal of Biomedicine and Biotechnology
effects were observed [35]. Despite the obstacles facingantiviral miRNA silencing as viral therapy, the coming yearswill certainly see the daylight of intensified research and eventhe initiation of clinical trials.
References
[1] H. zur Hausen, “Papillomaviruses and cancer: from basicstudies to clinical application,” Nature Reviews Cancer, vol.2, no. 5, pp. 342–350, 2002.
[2] L. Coscoy, “Immune evasion by Kaposi’s sarcoma-associatedherpesvirus,” Nature Reviews Immunology, vol. 7, no. 5, pp.391–401, 2007.
[3] B. Damania, “DNA tumor viruses and human cancer,” Trendsin Microbiology, vol. 15, no. 1, pp. 38–44, 2007.
[4] E. Klein, L. L. Kis, and G. Klein, “Epstein-Barr virusinfection in humans: from harmless to life endangeringvirus-lymphocyte interactions,” Oncogene, vol. 26, no. 9, pp.1297–1305, 2007.
[5] M. Matsuoka and K.-T. Jeang, “Human T-cell leukaemiavirus type 1 (HTLV-1) infectivity and cellular transforma-tion,” Nature Reviews Cancer, vol. 7, no. 4, pp. 270–280, 2007.
[6] V. E. Gurtsevitch, “Human oncogenic viruses: hepatitis B andhepatitis C viruses and their role in hepatocarcinogenesis,”Biochemistry, vol. 73, no. 5, pp. 504–513, 2008.
[7] U. Moens and M. Johannessen, “Human polyomaviruses andcancer: expanding repertoire,” Journal of the German Societyof Dermatology, vol. 6, no. 9, pp. 704–708, 2008.
[8] V. Brower, “Connecting viruses to cancer: how researchmoves from association to causation,” Journal of the NationalCancer Institute, vol. 96, no. 4, pp. 256–257, 2004.
[9] D. M. Morens, G. K. Folkers, and A. S. Fauci, “The challengeof emerging and re-emerging infectious diseases,” Nature,vol. 430, no. 6996, pp. 242–249, 2004.
[10] World Health Organization, 2008, http://www.who.int/healthinfo/morttables/en/index.html.
[11] B. R. Cullen, “Viruses and microRNAs,” Nature Genetics, vol.38, supplement 6, pp. S25–S30, 2006.
[12] B. Berkhout and J. Haasnoot, “The interplay between virusinfection and the cellular RNA interference machinery,” FEBSLetters, vol. 580, no. 12, pp. 2896–2902, 2006.
[13] B. Berkhout and K.-T. Jeang, “RISCy business: microRNAs,pathogenesis, and viruses,” Journal of Biological Chemistry,vol. 282, no. 37, pp. 26641–26645, 2007.
[14] J. Haasnoot, E. M. Westerhout, and B. Berkhout, “RNAinterference against viruses: strike and counterstrike,” NatureBiotechnology, vol. 25, no. 12, pp. 1435–1443, 2007.
[15] W. de Vries and B. Berkhout, “RNAi suppressors encodedby pathogenic human viruses,” International Journal ofBiochemistry & Cell Biology, vol. 40, no. 10, pp. 2007–2012,2008.
[16] B. R. Cullen, “Viral and cellular messenger RNA targets ofviral microRNAs,” Nature, vol. 457, no. 7228, pp. 421–425,2009.
[17] Z. Ghosh, B. Mallick, and J. Chakrabarti, “Cellular versusviral microRNAs in host-virus interaction,” Nucleic AcidResearch, vol. 37, no. 4, pp. 1035–1048, 2009.
[18] M. N. Poy, M. Spranger, and M. Stoffel, “MicroRNAs andthe regulation of glucose and lipid metabolism,” Diabetes,Obesity and Metabolism, vol. 9, supplement 2, pp. 67–73,2007.
[19] Y. Zhao and D. Srivastava, “A developmental view ofmicroRNA function,” Trends in Biochemical Sciences, vol. 32,no. 4, pp. 189–197, 2007.
[20] D. Baltimore, M. P. Boldin, R. M. O’Connell, D. S. Rao, andK. D. Taganov, “MicroRNAs: new regulators of immune celldevelopment and function,” Nature Immunology, vol. 9, no.8, pp. 839–845, 2008.
[21] F.-B. Gao, “Posttranscriptional control of neuronal develop-ment by microRNA networks,” Trends in Neurosciences, vol.31, no. 1, pp. 20–26, 2008.
[22] S. Griffiths-Jones, H. K. Saini, S. van Dongen, and A. J.Enright, “miRBase: tools for microRNA genomics,” NucleicAcids Research, vol. 36, database issue, pp. D154–D158, 2008.
[23] V. Ambros, “The functions of animal microRNAs,” Nature,vol. 431, no. 7006, pp. 350–355, 2004.
[24] D. P. Bartel, “MicroRNAs: genomics, biogenesis, mechanism,and function,” Cell, vol. 116, no. 2, pp. 281–297, 2004.
[25] E. Gottwein and B. R. Cullen, “Viral and cellular microRNAsas determinants of viral pathogenesis and immunity,” CellHost & Microbe, vol. 3, no. 6, pp. 375–387, 2008.
[26] J. Brennecke, A. Stark, R. B. Russell, and S. M. Cohen,“Principles of microRNA-target recognition,” PLoS Biology,vol. 3, no. 3, article e85, pp. 1–15, 2005.
[27] A. Krek, D. Grun, M. N. Poy, et al., “CombinatorialmicroRNA target predictions,” Nature Genetics, vol. 37, no.5, pp. 495–500, 2005.
[28] J. Mattes, A. Collison, and P. S. Foster, “Emerging roleof microRNAs in disease pathogenesis and strategies fortherapeutic modulation,” Current Opinion in Molecular Ther-apeutics, vol. 10, no. 2, pp. 150–157, 2008.
[29] C. C. Esau, “Inhibition of microRNA with antisense oligonu-cleotides,” Methods, vol. 44, no. 1, pp. 55–60, 2008.
[30] J. Elmen, M. Lindow, S. Schutz, et al., “LNA-mediatedmicroRNA silencing in non-human primates,” Nature, vol.452, no. 7189, pp. 896–899, 2008.
[31] K. B. Spurgers, C. M. Sharkey, K. L. Warfield, and S. Bavari,“Oligonucleotide antiviral therapeutics: antisense and RNAinterference for highly pathogenic RNA viruses,” AntiviralResearch, vol. 78, no. 1, pp. 26–36, 2008.
[32] J. Krutzfeldt, N. Rajewsky, R. Braich, et al., “Silencing ofmicroRNAs in vivo with ‘antagomirs’,” Nature, vol. 438, no.7068, pp. 685–689, 2005.
[33] J. Krutzfeldt, S. Kuwajima, R. Braich, et al., “Speci-ficity, duplex degradation and subcellular localization ofantagomirs,” Nucleic Acids Research, vol. 35, no. 9, pp. 2885–2892, 2007.
[34] J. Mattes, M. Yang, and P. S. Foster, “Regulation of microRNAby antagomirs: a new class of pharmacological antagonists forthe specific regulation of gene function?” American Journal ofRespiratory Cell and Molecular Biology, vol. 36, no. 1, pp. 8–12, 2007.
[35] C. Esau, S. Davis, S. F. Murray, et al., “miR-122 regulation oflipid metabolism revealed by in vivo antisense targeting,” CellMetabolism, vol. 3, no. 2, pp. 87–98, 2006.
[36] M. Egholm, O. Buchardt, L. Christensen, et al., “PNAhybridizes to complementary oligonucleotides obeying theWatson-Crick hydrogen-bonding rules,” Nature, vol. 365, no.6446, pp. 566–568, 1993.
[37] M. M. Fabani and M. J. Gait, “miR-122 targeting withLNA/2′-O-methyl oligonucleotide mixmers, peptide nucleicacids (PNA), and PNA-peptide conjugates,” RNA, vol. 14, no.2, pp. 336–346, 2008.

Journal of Biomedicine and Biotechnology 15
[38] J. Weiler, J. Hunziker, and J. Hall, “Anti-miRNA oligonu-cleotides (AMOs): ammunition to target miRNAs implicatedin human disease?” Gene Therapy, vol. 13, no. 6, pp. 496–502,2006.
[39] U. Moens, M. Van Ghelue, and M. Johannessen, “Humanpolyomaviruses: molecular mechanisms for transformationand their association with cancers,” in New Research onOncogenic Viruses, E. I. Tuneley, Ed., pp. 1–63, Nova Science,New York, NY, USA, 2008.
[40] M. Jiang, J. R. Abend, S. F. Johnson, and M. J. Imperiale, “Therole of polyomaviruses in human disease,” Virology, vol. 384,no. 2, pp. 266–273, 2009.
[41] T. Allander, K. Andreasson, S. Gupta, et al., “Identification ofa third human polyomavirus,” Journal of Virology, vol. 81, no.8, pp. 4130–4136, 2007.
[42] A. M. Gaynor, M. D. Nissen, D. M. Whiley, et al., “Identi-fication of a novel polyomavirus from patients with acuterespiratory tract infections,” PLoS Pathogens, vol. 3, no. 5,article e64, pp. 1–10, 2007.
[43] H. Feng, M. Shuda, Y. Chang, and P. S. Moore, “Clonal inte-gration of a polyomavirus in human Merkel cell carcinoma,”Science, vol. 319, no. 5866, pp. 1096–1100, 2008.
[44] U. Moens and O. P. Rekvig, “Molecular biology of BK virusand clinical aspects of BK virus renal infection,” in HumanPolyomaviruses: Molecular and Clinical Perspectives, K. Khaliliand G. L. Stoner, Eds., pp. 359–408, Wiley Liss, New York,NY, USA, 2001.
[45] C. S. Sullivan, A. T. Grundhoff, S. Tevethia, J. M. Pipas, andD. Ganem, “SV40-encoded microRNAs regulate viral geneexpression and reduce susceptibility to cytotoxic T cells,”Nature, vol. 435, no. 7042, pp. 682–686, 2005.
[46] G. J. Seo, L. H. L. Fink, B. O’Hara, W. J. Atwood, and C.S. Sullivan, “Evolutionarily conserved function of a viralmicroRNA,” Journal of Virology, vol. 82, no. 20, pp. 9823–9828, 2008.
[47] G. J. Seo, C. J. Chen, and C. S. Sullivan, “Merkel cellpolyomavirus encodes a microRNA with the ability toautoregulate viral gene expression,” Virology, vol. 383, no. 2,pp. 183–187, 2009.
[48] J. L. Umbach, M. F. Kramer, I. Jurak, H. W. Karnowski,D. M. Coen, and B. R. Cullen, “MicroRNAs expressed byherpes simplex virus 1 during latent infection regulate viralmRNAs,” Nature, vol. 454, no. 7205, pp. 780–783, 2008.
[49] W. Dunn, P. Trang, Q. Zhong, E. Yang, C. van Belle, and F.Liu, “Human cytomegalovirus expresses novel microRNAsduring productive viral infection,” Cellular Microbiology, vol.7, no. 11, pp. 1684–1695, 2005.
[50] F. Grey and J. Nelson, “Identification and function of humancytomegalovirus microRNAs,” Journal of Clinical Virology,vol. 41, no. 3, pp. 186–191, 2008.
[51] S. Pfeffer, M. Zavolan, F. A. Grasser, et al., “Identification ofvirus-encoded microRNAs,” Science, vol. 304, no. 5671, pp.734–736, 2004.
[52] L. He, J. M. Thomson, M. T. Hemann, et al., “A microRNApolycistron as a potential human oncogene,” Nature, vol. 435,no. 7043, pp. 828–833, 2005.
[53] C. Seeger, F. Zoulin, and W. S. Mason, “Hepadnaviruses,” inFields’ Virology, D. M. Knipe and P. M. Howeley, Eds., pp.2847–2888, Lippincott Williams and Wilkins, Philadelphia,Pa, USA, 2007.
[54] W.-B. Jin, F.-L. Wu, D. Kong, and A.-G. Guo, “HBV-encodedmicroRNA candidate and its target,” Computational Biologyand Chemistry, vol. 31, no. 2, pp. 124–126, 2007.
[55] M. A. Wainberg and K.-T. Jeang, “25 years of HIV-1research—progress and perspectives,” BMC Medicine, vol. 6,article 31, pp. 1–7, 2008.
[56] L. B. Ludwig, “RNA silencing and HIV: a hypothesis for theetiology of the severe combined immunodeficiency inducedby the virus,” Retrovirology, vol. 5, article 79, pp. 1–13, 2008.
[57] S. Omoto, M. Ito, Y. Tsutsumi, et al., “HIV-1 nef suppressionby virally encoded microRNA,” Retrovirology, vol. 1, p. 44,2004.
[58] X. Cai, G. Li, L. A. Laimins, and B. R. Cullen, “Humanpapillomavirus genotype 31 does not express detectablemicroRNA levels during latent or productive virus replica-tion,” Journal of Virology, vol. 80, no. 21, pp. 10890–10893,2006.
[59] W. S. M. Wold and M. S. Horowitz, “Adenoviruses,” in Fields’Virology, D. M. Knipe and P. M. Howeley, Eds., pp. 2395–2436, Lippincott Williams and Wilkins, Philadelphia, Pa,USA, 2007.
[60] M. B. Mathews, “Structure, function and evolution ofadenovirus virus-associated RNAs,” Current Topics in Micro-biology and Immunology, vol. 199, part 2, pp. 173–187, 1995.
[61] M. G. Andersson, P. C. J. Haasnoot, N. Xu, S. Beren-jian, B. Berkhout, and G. Akusjarvi, “Suppression of RNAinterference by adenovirus virus-associated RNA,” Journal ofVirology, vol. 79, no. 15, pp. 9556–9565, 2005.
[62] O. Aparicio, N. Razquin, M. Zaratiegui, I. Narvaiza, andP. Fortes, “Adenovirus virus-associated RNA is processed tofunctional interfering RNAs involved in virus production,”Journal of Virology, vol. 80, no. 3, pp. 1376–1384, 2006.
[63] M. Sano, Y. Kato, and K. Taira, “Sequence-specific interfer-ence by small RNAs derived from adenovirus VAI RNA,”FEBS Letters, vol. 580, no. 6, pp. 1553–1564, 2006.
[64] P. E. Pellet and B. Roizman, “The family Herpesviridae: abrief introduction,” in Fields’ Virology, D. M. Knipe and P.M. Howeley, Eds., pp. 2479–2500, Lippincott Williams andWilkins, Philadelphia, Pa, USA, 2007.
[65] S. Pfeffer, A. Sewer, M. Lagos-Quintana, et al., “Identificationof microRNAs of the herpesvirus family,” Nature Methods,vol. 2, no. 4, pp. 269–276, 2005.
[66] X. Cai, A. Schafer, S. Lu, et al., “Epstein-Barr virusmicroRNAs are evolutionarily conserved and differentiallyexpressed,” PLoS Pathogens, vol. 2, no. 3, article e23, pp. 1–12, 2006.
[67] A. Gupta, J. J. Gartner, P. Sethupathy, A. G. Hatzigeorgiou,and N. W. Fraser, “Anti-apoptotic function of a microRNAencoded by the HSV-1 latency-associated transcript,” Nature,vol. 442, no. 7098, pp. 82–85, 2006.
[68] S. Tang, A. S. Bertke, A. Patel, K. Wang, J. I. Cohen, and P.R. Krause, “An acutely and latently expressed herpes simplexvirus 2 viral microRNA inhibits expression of ICP34.5, a viralneurovirulence factor,” Proceedings of the National Academyof Sciences of the United States of America, vol. 105, no. 31, pp.10931–10936, 2008.
[69] C. Cui, A. Griffiths, G. Li, et al., “Prediction and identifica-tion of herpes simplex virus 1-encoded microRNAs,” Journalof Virology, vol. 80, no. 11, pp. 5499–5508, 2006.
[70] S. Tang, A. Patel, and P. R. Krause, “Novel less-abundantviral miRNAs encoded by herpes simplex virus 2 latency-associated transcript and their roles in regulating ICP34.5and ICP0 mRNAs,” Journal of Virology, vol. 83, no. 3, pp.1433–1442, 2009.
16 Journal of Biomedicine and Biotechnology
[71] R. Grassmann and K.-T. Jeang, “The roles of microRNAs inmammalian virus infection,” Biochimica et Biophysica Acta,vol. 1779, no. 11, pp. 706–711, 2008.
[72] N. Stern-Ginossar, N. Elefant, A. Zimmermann, et al., “Hostimmune system gene targeting by a viral miRNA,” Science,vol. 317, no. 5836, pp. 376–381, 2007.
[73] E. Murphy, J. Vanıcek, H. Robins, T. Shenk, and A. J. Levine,“Suppression of immediate-early viral gene expression byherpesvirus-coded microRNAs: implications for latency,”Proceedings of the National Academy of Sciences of the UnitedStates of America, vol. 105, no. 14, pp. 5453–5458, 2008.
[74] F. Grey, H. Meyers, E. A. White, D. H. Spector, and J. Nelson,“A human cytomegalovirus-encoded microRNA regulatesexpression of multiple viral genes involved in replication,”PloS Pathogens, vol. 3, article e163, no. 11, pp. 1–10, 2007.
[75] A. Grundhoff, C. S. Sullivan, and D. Ganem, “A com-bined computational and microarray-based approach iden-tifies novel microRNAs encoded by human gamma-herpesviruses,” RNA, vol. 12, no. 5, pp. 733–750, 2006.
[76] A. K. F. Lo, K. F. To, K. W. Lo, et al., “Modulation ofLMP1 protein expression by EBV-encoded microRNAs,”Proceedings of the National Academy of Sciences of the UnitedStates of America, vol. 104, no. 41, pp. 16164–16169, 2007.
[77] S. Barth, T. Pfuhl, A. Mamiani, et al., “Epstein-Barr virus-encoded microRNA miR-BART2 down-regulates the viralDNA polymerase BALF5,” Nucleic Acids Research, vol. 36, no.2, pp. 666–675, 2008.
[78] E. Y. Choy, K. L. Siu, K. H. Kok, et al., “An Epstein-Barrvirus-encoded microRNA targets PUMA to promote host cellsurvival,” The Journal of Experimental Medicine, vol. 205, no.11, pp. 2551–2560, 2008.
[79] T. Xia, A. O’Hara, I. Araujo, et al., “EBV microRNAs inprimary lymphomas and targeting of CXCL-11 by ebv-mir-BHRF1-3,” Cancer Research, vol. 68, no. 5, pp. 1436–1442,2008.
[80] M. A. Samols, R. L. Skalsky, A. M. Maldonado, et al.,“Identification of cellular genes targeted by KSHV-encodedmicroRNA,” PLoS Pathogens, vol. 3, no. 5, article e65, pp. 1–8, 2007.
[81] E. Gottwein, N. Mukherjee, C. Sachse, et al., “A viralmicroRNA functions as an orthologue of cellular miR-155,”Nature, vol. 450, no. 7172, pp. 1096–1099, 2007.
[82] R. L. Skalsky, M. A. Samols, K. B. Plaisance, et al., “Kaposi’ssarcoma-associated herpesvirus encodes an ortholog of miR-155,” Journal of Virology, vol. 81, no. 23, pp. 12836–12845,2007.
[83] Z. Klase, P. Kale, R. Winograd, et al., “HIV-1 TAR elementis processed by Dicer to yield a viral micro-RNA involvedin chromatin remodeling of the viral LTR,” BMC MolecularBiology, vol. 8, article 63, pp. 1–19, 2007.
[84] D. L. Ouellet, I. Plante, P. Landry, et al., “Identificationof functional microRNAs released through asymmetricalprocessing of HIV-1 TAR element,” Nucleic Acids Research,vol. 36, no. 7, pp. 2353–2365, 2008.
[85] Y. Bennasser, S.-Y. Le, M. L. Yeung, and K.-T. Jeang, “HIV-1 encoded candidate micro-RNAs and their cellular targets,”Retrovirology, vol. 1, article 43, pp. 1–5, 2004.
[86] J. L. Foster and J. V. Garcia, “HIV-1 Nef: at the crossroads,”Retrovirology, vol. 5, article 84, pp. 1–13, 2008.
[87] K. J. Purzycka and R. W. Adamiak, “The HIV-2 TAR RNAdomain as a potential source of viral-encoded miRNA. Areconnaissance study,” Nucleic Acids Symposium Series, vol.52, no. 1, pp. 511–512, 2008.
[88] J. Lin and B. R. Cullen, “Analysis of the interaction of primateretroviruses with the human RNA interference machinery,”Journal of Virology, vol. 81, no. 22, pp. 12218–12226, 2007.
[89] B. Roizman, D. M. Knipe, and R. J. Whitley, “Herpessimplex viruses,” in Fields’ Virology, D. M. Knipe and P.M. Howeley, Eds., pp. 2501–2602, Lippincott Williams andWilkins, Philadelphia, Pa, USA, 2007.
[90] B. Sugden, “Virology: micro mystery solution,” Nature, vol.442, no. 7098, pp. 33–34, 2006.
[91] A. Gupta, J. J. Gartner, P. Sethupathy, A. G. Hatzigeorgiou,and N. W. Fraser, “Anti-apoptotic function of a microRNAencoded by the HSV-1 latency-associated transcript,” Nature,vol. 451, no. 7178, p. 600, 2008.
[92] R. Gupta, T. Warren, and A. Wald, “Genital herpes,” TheLancet, vol. 370, no. 9605, pp. 2127–2137, 2007.
[93] A. Orvedahl, D. Alexander, Z. Talloczy, et al., “HSV-1 ICP34.5confers neurovirulence by targeting the beclin 1 autophagyprotein,” Cell Host & Microbe, vol. 1, no. 1, pp. 23–35, 2007.
[94] J. I. Cohen, S. E. Straus, and A. M. Arvin, “Varicella-zoster virus,” in Fields’ Virology, D. M. Knipe and P. M.Howeley, Eds., pp. 2733–2818, Lippincott Williams andWilkins, Philadelphia, Pa, USA, 2007.
[95] F. Grey, L. Hook, and J. Nelson, “The functions ofherpesvirus-encoded microRNAs,” Medical Microbiology andImmunology, vol. 197, no. 2, pp. 261–267, 2008.
[96] J. A. Nelson, “Small RNAs and large DNA viruses,” The NewEngland Journal of Medicine, vol. 357, no. 25, pp. 2630–2632,2007.
[97] L. S. Young and A. B. Rickinson, “Epstein-Barr virus: 40 yearson,” Nature Reviews Cancer, vol. 4, no. 10, pp. 757–768, 2004.
[98] L. Xing and E. Kieff, “Epstein-Barr virus BHRF1 micro-and stable RNAs during latency III and after induction ofreplication,” Journal of Virology, vol. 81, no. 18, pp. 9967–9975, 2007.
[99] D. N. Kim, H.-S. Chae, S. T. Oh, et al., “Expression ofviral microRNAs in Epstein-Barr virus-associated gastriccarcinoma,” Journal of Virology, vol. 81, no. 2, pp. 1033–1036,2007.
[100] R. H. Edwards, A. R. Marquitz, and N. Raab-Traub, “Epstein-Barr virus BART microRNAs are produced from a largeintron prior to splicing,” Journal of Virology, vol. 82, no. 18,pp. 9094–9106, 2008.
[101] M. M. Brinkmann and T. F. Schulz, “Regulation of intracellu-lar signalling by the terminal membrane proteins of membersof the Gammaherpesvirinae,” Journal of General Virology, vol.87, no. 5, pp. 1047–1074, 2006.
[102] U. Moens and M. Johannessen, “Mechanisms by which viralproteins of human DNA tumor viruses hijack the cell cycle,”in DNA Tumor Viruses, H. E. Tao, Ed., pp. 1–48, NovaScience, New York, NY, USA, 2008.
[103] P. Sethupathy, M. Megraw, and A. G. Hatzigeorgiou, “Aguide through present computational approaches for theidentification of mammalian microRNA targets,” NatureMethods, vol. 3, no. 11, pp. 881–886, 2006.
[104] X. Yang, Y. Chu, Y. Wang, Q. Guo, and S. Xiong, “Vaccinationwith IFN-inducible T cell α chemoattractant (ITAC) gene-modified tumor cell attenuates disseminated metastases ofcirculating tumor cells,” Vaccine, vol. 24, no. 15, pp. 2966–2974, 2006.
[105] P. J. Hensbergen, P. G. Wijnands, M. W. J. Schreurs, R.J. Scheper, R. Willemze, and C. P. Tensen, “The CXCR3targeting chemokine CXCL11 has potent antitumor activityin vivo involving attraction of CD8+ T lymphocytes but not
Journal of Biomedicine and Biotechnology 17
inhibition of angiogenesis,” Journal of Immunotherapy, vol.28, no. 4, pp. 343–351, 2005.
[106] D. Ganem, “Kaposi’s sarcoma-associated virus,” in Fields’Virology, D. M. Knipe and P. M. Howeley, Eds., pp. 2847–2888, Lippincott Williams and Wilkins, Philadelphia, Pa,USA, 2007.
[107] V. Marshall, T. Parks, R. Bagni, et al., “Conservation ofviraly encoded microRNAs in Kaposi sarcoma-associatedherpesvirus in primary effusion lymphoma cell lines andin patients with Kaposi sarcoma or multicentric Castlemandisease,” The Journal of Infectious Diseases, vol. 195, no. 5, pp.645–659, 2007.
[108] D. Ganem and J. Ziegelbauer, “MicroRNAs of Kaposi’ssarcoma-associated herpes virus,” Seminars in Cancer Biol-ogy, vol. 18, no. 6, pp. 437–440, 2008.
[109] J. M. Ziegelbauer, C. S. Sullivan, and D. Ganem, “Tandemarray-based expression screens identify host mRNA targetsof virus-encoded microRNAs,” Nature Genetics, vol. 41, no.1, pp. 130–134, 2009.
[110] G. A. Calin and C. M. Croce, “MicroRNA signatures inhuman cancers,” Nature Reviews Cancer, vol. 6, no. 11, pp.857–866, 2006.
[111] S. Costinean, N. Zanesi, Y. Pekarsky, et al., “Pre-B cell prolif-eration and lymphoblastic leukemia/high-grade lymphomain Eμ-miR155 transgenic mice,” Proceedings of the NationalAcademy of Sciences of the United States of America, vol. 103,no. 18, pp. 7024–7029, 2006.
[112] J. Sun, M. Brand, Y. Zenke, S. Tashiro, M. Groudine, and K.Igarashi, “Heme regulates the dynamic exchange of Bach1and NF-E2-related factors in the Maf transcription factornetwork,” Proceedings of the National Academy of Sciences ofthe United States of America, vol. 101, no. 6, pp. 1461–1466,2004.
[113] E. Shaulian and M. Karin, “AP-1 as a regulator of cell lifeand death,” Nature Cell Biology, vol. 4, no. 5, pp. E131–E136,2002.
[114] A. Cimmino, G. A. Calin, M. Fabbri, et al., “miR-15 and miR-16 induce apoptosis by targeting BCL2,” Proceedings of theNational Academy of Sciences of the United States of America,vol. 102, no. 39, pp. 13944–13949, 2005.
[115] M. S. Weinberg and K. V. Morris, “Are viral-encodedmicroRNAs mediating latent HIV-1 infection?” DNA andCell Biology, vol. 25, no. 4, pp. 223–231, 2006.
[116] M. Barboric and B. M. Peterlin, “A new paradigm in eukary-otic biology: HIV Tat and the control of transcriptionalelongation,” PLoS Biology, vol. 3, no. 2, article e76, pp. 200–203, 2005.
[117] L. B. Ludwig, J. L. Ambrus Jr., K. A. Krawczyk, etal., “Human Immunodeficiency Virus-Type 1 LTR DNAcontains an intrinsic gene producing antisense RNA andprotein products,” Retrovirology, vol. 3, article 80, pp. 1–20,2006.
[118] S. Omoto and Y. R. Fujii, “Regulation of human immunod-eficiency virus 1 transcription by nef microRNA,” Journal ofGeneral Virology, vol. 86, no. 3, pp. 751–755, 2005.
[119] J. P. Couturier and R. S. Root-Bernstein, “HIV may produceinhibitory microRNAs (miRNAs) that block production ofCD28, CD4 and some interleukins,” Journal of TheoreticalBiology, vol. 235, no. 2, pp. 169–184, 2005.
[120] C. L. Jopling, M. Yi, A. M. Lancaster, S. M. Lemon, and P.Sarnow, “Molecular biology: modulation of hepatitis C virus
RNA abundance by a liver-specific microRNA,” Science, vol.309, no. 5740, pp. 1577–1581, 2005.
[121] G. Randall, M. Panis, J. D. Cooper, et al., “Cellular cofactorsaffecting hepatitis C virus infection and replication,” Proceed-ings of the National Academy of Sciences of the United States ofAmerica, vol. 104, no. 31, pp. 12884–12889, 2007.
[122] J. Anderson, C. Schiffer, S. K. Lee, and R. Swanstrom, “Viralprotease inhibitors,” Handbook of Experimental Pharmacol-ogy, vol. 189, pp. 85–110, 2009.
[123] E. De Clercq and J. Neyts, “Antiviral agents acting asDNA or RNA chain terminators,” Handbook of ExperimentalPharmacology, vol. 189, pp. 53–84, 2009.
[124] P. Kumar, H.-S. Ban, S.-S. Kim, et al., “T cell-specific siRNAdelivery suppresses HIV-1 infection in humanized mice,”Cell, vol. 134, no. 4, pp. 577–586, 2008.
[125] C. Rauschhuber, H. Xu, F. H. Salazar, P. L. Marion, andA. Ehrhardt, “Exploring gene-deleted adenoviral vectors fordelivery of short hairpin RNAs and reduction of hepatitis Bvirus infection in mice,” The Journal of Gene Medicine, vol.10, no. 8, pp. 878–889, 2008.
[126] F. Eckstein, “The versatility of oligonucleotides as potentialtherapeutics,” Expert Opinion on Biological Therapy, vol. 7,no. 7, pp. 1021–1034, 2007.
[127] D. H. Le, “RNA-interference therapy for HBV infectionenters Phase I clinical trial,” Expert Review of Anti-InfectiveTherapy, vol. 6, no. 1, pp. 5–8, 2008.
[128] E. M. Westerhout, M. Ooms, M. Vink, A. T. Das, and B.Berkhout, “HIV-1 can escape from RNA interference byevolving an alternative structure in its RNA genome,” NucleicAcids Research, vol. 33, no. 2, pp. 796–804, 2005.
[129] D. Boden, O. Pusch, and B. Ramratnam, “Overcoming HIV-1 resistance to RNA interference,” Frontiers in Bioscience, vol.12, pp. 3104–3116, 2007.
[130] S. He, Z. Yang, G. Skogerbo, et al., “The properties andfunctions of virus encoded microRNA, siRNA, and othersmall noncoding RNAs,” Critical Reviews in Microbiology, vol.34, no. 3-4, pp. 175–188, 2008.
[131] N. Blow, “Small RNAs: delivering the future,” Nature, vol.450, no. 7172, pp. 1117–1120, 2007.
[132] M. Scherr, L. Venturini, K. Battmer, et al., “Lentivirus-mediated antagomir expression for specific inhibition ofmiRNA function,” Nucleic Acids Research, vol. 35, no. 22,article e149, pp. 1–9, 2007.
[133] E. R. Rayburn and R. Zhang, “Antisense, RNAi, and genesilencing strategies for therapy: mission possible or impos-sible?” Drug Discovery Today, vol. 13, no. 11-12, pp. 513–521,2008.
[134] L. L. Snyder, J. M. Esser, C. J. Pachuk, and L. F. Steel, “Vectordesign for liver-specific expression of multiple interferingRNAs that target hepatitis B virus transcripts,” AntiviralResearch, vol. 80, no. 1, pp. 36–44, 2008.
[135] M. Dimitrova, C. Affolter, F. Meyer, et al., “Sustained deliveryof siRNAs targeting viral infection by cell-degradable mul-tilayered polyelectrolyte films,” Proceedings of the NationalAcademy of Sciences of the United States of America, vol. 105,no. 42, pp. 16320–16325, 2008.
[136] Y.-J. Zhang, K.-Y. Wang, D. A. Stein, et al., “Inhibitionof replication and transcription activator and latency-associated nuclear antigen of Kaposi’s sarcoma-associatedherpesvirus by morpholino oligomers,” Antiviral Research,vol. 73, no. 1, pp. 12–23, 2007.

18 Journal of Biomedicine and Biotechnology
[137] I. Lebars, T. Richard, C. Di Primo, and J.-J. Toulme, “LNAderivatives of a kissing aptamer targeted to the trans-activating responsive RNA element of HIV-1,” Blood Cells,Molecules, and Diseases, vol. 38, no. 3, pp. 204–209, 2007.
[138] J. S. Eisen and J. C. Smith, “Controlling morpholinoexperiments: don’t stop making antisense,” Development, vol.135, no. 10, pp. 1735–1743, 2008.

Hindawi Publishing CorporationJournal of Biomedicine and BiotechnologyVolume 2009, Article ID 924565, 12 pagesdoi:10.1155/2009/924565
Methodology Report
Gene Expression Analysis of an EGFR Indirectly RelatedPathway Identified PTEN and MMP9 as Reliable DiagnosticMarkers for Human Glial Tumor Specimens
Sergio Comincini,1 Mayra Paolillo,2 Giulia Barbieri,1 Silvia Palumbo,1 Elena Sbalchiero,1
Alberto Azzalin,1 Marika A. Russo,2 and Sergio Schinelli2
1 Dipartimento di Genetica e Microbiologia, Universita di Pavia, Via Ferrata 1, 27100 Pavia, Italy2 Dipartimento di Farmacologia Sperimentale ed Applicata, Universita di Pavia, Viale Taramelli 14, 27100 Pavia, Italy
Correspondence should be addressed to Sergio Comincini, [email protected]
Received 9 February 2009; Revised 23 April 2009; Accepted 18 May 2009
Recommended by Zhumur Ghosh
In this study the mRNA levels of five EGFR indirectly related genes, EGFR, HB-EGF, ADAM17, PTEN, and MMP9, have beenassessed by Real-time PCR in a panel of 37 glioblastoma multiforme specimens and in 5 normal brain samples; as a result, inglioblastoma, ADAM17 and PTEN expression was significantly lower than in normal brain samples, and, in particular, a statisticallysignificant inverse correlation was found between PTEN and MMP9 mRNA levels. To verify if this correlation was conserved ingliomas, PTEN and MMP9 expression was further investigated in an additional panel of 16 anaplastic astrocytoma specimens and,in parallel, in different human normal and astrocytic tumor cell lines. In anaplastic astrocytomas PTEN expression was significantlyhigher than in glioblastoma multiforme, but no significant correlation was found between PTEN and MMP9 expression. PTENand MMP9 mRNA levels were also employed to identify subgroups of specimens within the different glioma malignancy gradesand to define a gene expression-based diagnostic classification scheme. In conclusion, this gene expression survey highlighted thatthe combined measurement of PTEN and MMP9 transcripts might represent a novel reliable tool for the differential diagnosis ofhigh-grade gliomas, and it also suggested a functional link involving these genes in glial tumors.
Copyright © 2009 Sergio Comincini et al. This is an open access article distributed under the Creative Commons AttributionLicense, which permits unrestricted use, distribution, and reproduction in any medium, provided the original work is properlycited.
1. Introduction
Glioblastoma multiforme is the most malignant brain tumoramong astrocytic gliomas with a typical prognosis of about12 months in spite of current therapeutic approaches thatinclude neurosurgery followed by combined chemotherapyand radiotherapy [1]. Recently, the development of massivescreening genome technologies, such as gene expressionprofiling, has prompted new attempts to the classificationof glioblastoma subgroups on molecular basis in order toidentify new diagnostic or prognostic tools. At present thesearch for potential molecular markers among aberrantsignal transduction pathways in glioblastoma is activelyexploited for the optimization of existing therapies orthe development of innovative drugs [2]. However, theaccomplishment of this ambitious task is severely hindered
by the extreme heterogeneity of glioblastoma tumor samplesand by the subsequent variability of possibly identifiedmolecular markers. One way to overcome this limit couldbe represented by the concomitant analysis of the mRNAexpression of several selected genes, already known to befunctionally involved in the cellular malignant transfor-mation. This analysis could highlight differences in geneexpression levels among high-grade gliomas, or at the sametime it could reveal relationships within glioma subtypesbetween the genes analyzed in order to improve theirreliability as prognostic or diagnostic markers.
The epidermal growth factor (EGF) receptor (EGFR orErbB1) plays a pivotal role in cancer physiology becauseits activation, elicited by at least six different endoge-nous peptidergic EGF-like ligands, leads to the activa-tion of intracellular signalling pathways that modulate cell

2 Journal of Biomedicine and Biotechnology
Table 1: Age, gender, mRNA expression values (in femptograms), and anatomical location of glioblasytoma multiforme samples.
Age Sex EGFR ADAM17 HB-EGF PTEN MMP9 Location
68 M 2.78 0.31 0.69 1.85 6.39 Parietal
84 F 155.97 0.31 4.43 6.81 31.13 Parietal
23 M 95.25 3.54 19.01 5.15 0.04 Cerebellum
50 M 579.69 0.87 9.28 8.97 43.32 Frontal dx
71 F 7.11 0.08 0.82 2.27 0.21 Frontal dx
58 M 236.18 0.91 8.98 15.05 183.29 Parietal dx
66 M 12.85 0.13 1.38 0.41 0.04 Temporal sx
50 M 150.97 3.08 4.87 1.65 3.09 Temporal dx
38 F 60.10 2.23 9.23 7.01 30.41 Occipital dx
61 F 2.88 0.41 1.75 1.96 0.72 Frontal sx
68 F 4.87 0.63 8.71 0.82 0.82 Occipital dx
70 M 23.38 2.13 2.82 3.92 3.51 Frontal dx
59 M 425.51 1.28 4.32 4.84 8.04 Frontal sx
67 F 1268.24 2.99 13.92 12.68 32.58 Temporal dx
31 M 13.33 1.87 52.08 6.66 13.33 Frontal sx
68 F 0.77 0.59 12.85 0.62 1.04 Parietal dx
39 F 6.87 13.33 0.21 3.14 0.16 Frontoinsular
39 M 2.37 0.42 3.96 4.79 0.21 Parietal sx
45 F 274.74 0.66 7.14 1.25 2.52 Frontal dx
63 M 1284.37 13.33 0.21 3.12 10.62 Temporal dx
71 M 30.11 5.42 10.62 2.92 2.08 Frontal sx
60 M 73.96 17.71 7.54 3.33 4.37 Temporal sx
44 F 2562.92 6.87 18.96 3.33 8.33 Thalamus sx
73 F 38.75 13.12 7.53 3.33 1.04 Paratrigonal sx
47 F 16.88 4.79 7.29 3.13 1.04 Frontal sx
63 M 12.01 12.31 28.22 3.85 3.28 Occipital dx
77 F 239.85 8.72 22.56 2.92 6.31 Cortical anterior
55 F 22.36 2.51 5.38 1.54 0.05 Parietal dx
70 F 13.18 9.18 12.31 3.08 0.16 Parietal dx
60 F 8.92 7.95 16.56 1.54 0.23 Temporal sx
54 M 1071.43 15.49 16.56 2.56 1.64 Temporal sx
55 M 371.49 9.54 19.49 1.54 1.85 Temporal sx
55 F 27.54 9.23 5.13 1.54 0.15 Temporal sx
58 M 21.38 20.87 17.38 3.08 1.23 Temporal sx
53 F 8.1 7.23 9.74 2.05 0.15 Occipital sx
69 F 4.66 12.56 26.69 3.08 1.69 Frontal sx
70 F 29.49 5.23 7.08 7.23 0.61 Parietal dx
proliferation, metastasis, and angiogenesis [3]. About 40%–50% of glioblastoma cases are characterized by EGFR geneamplification or overexpression, together with the expressionof the mutated and constitutively active EGFR isoformEGFRvIII [3]. Upregulation of the EGFR pathway could alsoresult from an increased availability of EGFR endogenousagonists belonging to the family of EGF-like growth factors.
Heparin-binding epidermal growth factor (HB-EGF)acts as a potent proliferative agent in many different cell typesvia the activation of EGFR or the other EGF-like receptorErbB4 [4]. HB-EGF is initially synthesized as the membrane-spanning protein proHB-EGF and then is proteolyticallycleaved by “A Disintegrin And Metalloproteinase” (ADAM)
family members that release the soluble form (sHB-EGF)in the extracellular space. The ADAM isoform responsiblefor this process appears to be cell type dependent, since indifferent experimental models ADAM 10, 12, and 17 havebeen involved in proHB-EGF shedding [3]. The overex-pression of ADAM17, also named “tumor necrosis factor-alpha-converting enzyme” (TACE), seems to be involved inthe malignant potential of cancer cells [5], and, notably,this metalloprotease modulates HB-EGF shedding and cellproliferation in U373-MG glioblastoma cell line [5].
In the clinical practice only 10%–20% of glioblastomapatients respond to EGFR kinase inhibitors, and this poorresponse has been ascribed to a combination of EGFR

Journal of Biomedicine and Biotechnology 3
Table 2: Age, gender, PTEN, and MMP9 expression values (in femtograms), and anatomical location of anaplastic astrocytoma samples.
Age Sex PTEN MMP9 Location
44 M 1.72 1.25 Temporal sx
68 F 7.66 0.57 Thalamus sx
67 F 2.25 37.06 Frontal dx
60 F 2.44 1.62 Frontal sx
50 M 92.46 0.79 Temporal dx
39 M 79.25 32.92 Parietal dx
64 F 33.82 43.21 Parietal dx
28 F 25.64 26.24 Temporal sx
55 F 12.47 0.32 Temporal sx
31 M 19.81 1.95 Temporal sx
52 F 50.12 4.37 Temporal sx
71 F 17.98 0.28 Frontal cortex
62 M 20.41 0.03 Total cortex
50 M 60.72 0.76 Occipital cortex
52 M 45.11 0.45 Total cortex
68 F 25.30 0.23 Frontal cortex
Table 3: Age, gender, mRNA expression values (in femtograms), and anatomical location of normal brain specimens.
Age Sex EGFR ADAM17 HB-EGF PTEN MMP9 Location
71 F 32.58 10.74 14.84 17.98 0.28 Frontal cortex
62 M 16.70 12.76 10.41 20.41 0.03 Total cortex
50 M 57.94 18.35 30.41 60.72 0.76 Occipital cortex
52 M 25.74 13.87 28.55 45.11 0.45 Total cortex
68 F 46.98 17.20 7.60 25.30 0.23 Frontal cortex
Table 4: MMP9 and PTEN absolute quantitative expression indifferent human normal (NHA) and glioma (PRT-HU2 and U138-MG) cell lines. Expression is indicated in femptograms.
Cell line MMP9 PTEN
NHA 0.59 117.97
PRT-HU2 0.56 45.62
U138-MG 3.09 4.08
overexpression and loss or mutation of the Phosphatase andTEN sin homolog deleted from chromosome 10 (PTEN)tumor suppressor protein [6]. The PTEN phosphatasereduces the levels of the second messenger phosphatidyli-nositol 3,4,5-triphosphate (PI3K) and regulates the activityof the downstream PI-3K/AKT- and mammalian target ofrapamacyn- (mTOR-) dependent pathways [7]. Notably,PTEN functional loss or mutation is present in 60%–70%of high-grade gliomas and is associated with malignantphenotypic changes such as migration capability, probablyby modulation of FAK activity [8]. Moreover, since PTENloss appears to accelerate the formation of high-gradegliomas [6], it could potentially represent a valid candidategene to discriminate between high- and low-grade gliomas.
One typical feature of glioblastoma is its high abilityto disseminate and spread to distant brain areas. Proteasesexpressed by glioma cells appear to play a significant role inthese processes because selective matrix metalloproteinases
like MMP2 or MMP9 degrade the extracellular environmentin order to facilitate tumor cell growth and migration.Expression of these proteases appears to increase with gliomagrade and in vitro studies showed that modifications of theirexpression levels resulted in altered migratory properties[9]. Although some previous reports have examined theexpression of EGFR [3], PTEN [10], HB-EGF [9], ADAM17[11], and MMP9 [12] in astrocytoma samples, at presentthe transcriptional expression of these five EGFR pathway-related genes has not yet been simultaneously investigated inglioma.
Therefore, in this study we have evaluated by quantitativeReal-time PCR the expression of ADAM17, EGFR, HB-EGF,PTEN, and MMP9 mRNAs in a panel of glioblastoma andanaplastic astrocytomas specimens and cell lines, and wehave finally compared them to normal control samples toascertain whether these expression profiles might provideadditional tools in glioma diagnosis and in tumor subtypesidentification.
2. Materials and Methods
2.1. Human Biopsy Samples. Biopsy samples, obtained fromAzienda Ospedaliera Universitaria di Parma (Parma, Italy)after informed consent of the patients, were placed in ice-cold Trizol reagent (Invitrogen, Paisley, UK) and immedi-ately processed for RNA extraction. Sections of samples were

4 Journal of Biomedicine and Biotechnology
Table 5: GeneBank accession numbers, PCR primer sequences, and products.
Gene Accession number PCR primer sequences (5′-3′) PCR product (bp)
EGFR NM 005228AGGAAGAAGCTTGCTGGTAGC
88CTCTGGAAGACTTGTGGCTTG
ADAM17 NM 003183CAAGTCATTTGAGGATCTCACG
96TCTTTGCTGTCAACACGATTCT
HB-EGF NM 001945GCCTAGGCGATTTTGTCTACC
119GCCCAACCTCTTCTGAGACTT
PTEN NM 000314CAGCAGTGGCTCTGTGTGTAA
98ATGGACATCTGATTGGGATGA
MMP9 NM 004994AAAGCCTATTTCTGCCAGGAC
105GCACTGCAGGATGTCATAGGT
independently histologically and morphologically evaluatedby different neuropathologists and classified as grade IV(glioblastoma multiforme) or grade III (anaplastic astro-cytoma), according to WHO guidelines [13]. Clinical dataof glioblastoma patients are reported in Table 1, and theyincluded 19 females and 18 males (age range 23–84 years,mean 57.8 ± 13.3). The anaplastic astrocytoma patients(Table 2) included 7 males and 9 females (age 28–68, mean50.7 ± 13.9). Total RNA samples extracted from humanpostmortem normal brain (NB) cortical regions, as reportedin Table 3, were purchased from Ambion (Foster City, Calif,USA): these included 2 females and 3 males (age range 50–71years, mean 60.6± 9.3).
2.2. Cell Lines. Normal human astrocytes (NHAs) werepurchased from Cambrex (East Rutherford, NJ, USA) andcultivated in the specific astrocyte AGM medium (Cam-brex) according to the manufacturer’s specifications. Humanglioma cell line U138-MG, derived from a glioblastomamultiforme patient and widely employed, was purchasedfrom ATCC (Rockville, Md, USA); PRT-HU2 cells, pre-viously described [14], were analogously derived from aglioblastoma multiforme patient. U138-MG and PRT-HU2cells were cultivated in D-MEM medium supplemented with10% FBS, 100 units/mL penicillin, 0.1 mg/mL streptomycin,and 1% L-glutamine (Invitrogen, Paisley, UK).
2.3. Real Time Quantitative PCR. Total RNA wasextracted as previously described [14] and accuratelyquantified using spectrophotometric and fluorimetric(Quant-it RNA Assay, Invitrogen) approaches. Thegene-specific primers were designed using the “Primer3input” software (http://frodo.wi.mit.edu/primer3/), andtheir specificity was verified using the Primer-BLASTsoftware (http://www.ncbi.nlm.nih.gov/tools/primer-blast/index.cgi?LINK LOC=BlastHome/). GeneBank accessionnumbers of the five genes examined, their respective primerpairs sequences, and PCR products lengths were reported inTable 5. Quantitative Real-time PCR analysis was performedas previously described [14]. For the absolute quantificationof specific cDNA, standard curves were derived usingdifferent concentrations of EGFR, ADAM17, MMP9, HB-EGF, and PTEN DNA-sequenced templates, prepared by
reamplifying the PCR purified products obtained from Real-time PCR. The second derivative maximum method in theLight Cycler software was used to calculate the crossing point(Cp) value, and the concentrations of each specific cDNAwere determined. All results were quantitative expressed infemtograms (fg) of cDNA, normalized to a total RNA inputof 1 microgram.
2.4. Statistical and Bioinformatics Analysis. All results wereexpressed as mean ± standard deviation of each biopsyspecimens, assayed in duplicate. The Instat v.3 software(GraphPad Software Inc., Mass, USA) was used for thestatistical analysis of differences in gene expression betweengroups by one-way ANOVA and for the analysis of corre-lations among gene expression profiles, using the Pearsoncoefficient r. A P-value less than .05 was considered sta-tistically significant. The dendrogram and the classificationtree analysis were performed using the Orange data miningsoftware (http://www.ailab.si/orange/). In particular, for thehierarchical clustering analysis, an Euclidean distance matrixwas adopted. Statistical trends were obtained from thePTEN and MMP9 average quantitative expression withinnormal control, anaplastic astrocytoma, and glioblastomamultiforme diagnostic classes, using the Excel softwarewith an exponential setting (Microsoft Word Package 2003,Redmond, Wash, USA).
3. Results
The mRNA expression of the investigated genes of glioblas-toma multiforme and normal brain specimens were analyti-cally reported in Tables 1 and 2 and depicted in Figures 1 and2. On the basis of their expression patterns in glioblastomaand using the mean values of normal samples as cut-off, the investigated genes were roughly classified in threedifferent subgroups, the first including ADAM17, HB-EGF,and PTEN, whose average levels in glioblastoma were belowthe controls, the second comprising MMP9, whose majorityof values in glioblastoma specimens were higher than incontrols and, finally, the last one constituted by the EGFRgene, displaying the widest variation and data dispersion(Figure 1).

Journal of Biomedicine and Biotechnology 5
30
20
10
0
NB GBM
∗
(a)
60
40
20
0
NB GBM
(b)
75
50
25
0
NB GBM
∗∗
(c)
50
25
0
NB GBM
(d)
2900
1500
100
100
50
0
NB GBM
(e)
Figure 1: The mRNA expression levels of (a) ADAM17, (b) HB-EGF, (c) PTEN, (d) MMP9, and (e) EGFR in 37 human glioblastoma samples(GBM) and in five normal brain cortex samples (NB). Horizontal lines represent the mean values. ∗P < .002, ∗∗P < .0001.
100
75
50
25
0
PTEN MMP9
Figure 2: The mRNA expression levels of PTEN and MMP9 in 16human grade III astrocytoma samples (AA). Bold horizontal linesrepresent the mean values, and thin lines represent the mean normalbrain cortex samples (NB) values.
The mRNA levels of ADAM17 metallo-protease inglioblastoma (mean 5.88 fg ± 5.71) were significantly lower(P < .002) than in controls (14.51 fg ± 3.15). In particular,in 33 out of 37 cases (89.19%), ADAM17 expression waslower than in control samples. For HB-EGF gene, although31 out of 37 (83.78%) glioblastoma samples displayedmRNA levels lower than controls, statistical analysis revealedthat the difference between controls (18.36 fg ± 10.52) andglioblastoma specimens (10.96 fg±10.13) was not statisticallysignificant (P < .434).
PTEN expression pattern showed statistically lowermRNA levels in all glioblastoma samples compared tocontrols. Notably, the highest PTEN expression level amongall glioblastoma had a quantitative expression (15.05 fg) thatwas less than 50% of the mean controls values (33.91 fg),with a control normalized ratio ranging from 2.25 to 82.72 fg.As expected, there was a very high statistically significantdifference (P < .0001) of PTEN mRNA expression betweenglioblastoma (3.86 fg± 3.15) and controls (33.91 fg± 18.44).
MMP9 was overexpressed in the majority of glioblas-toma specimens (72.22%) and, furthermore, in a subgroupof 24 cases (64.86%) the expression level was at least
twofold higher than in controls, with a control normalizedratio within this subgroup ranging from 1.74 to 123.71 fg.However, the mean expression level of MMP9 mRNA inglioblastoma (5.11 fg ± 8.78) was not significantly different(P = .238) from control samples (0.35 fg± 0.27).
EGFR mRNA transcript levels, due to their amplitude inexpression, were arbitrarily divided into two glioblastomasubgroups. The former, ranging from 0.77 to 95.25 fg,included 25 samples (67.63%); the latter, had EGRF absolutequantitative values ranging from 150.97 to 2562.92 fg. Allcontrol samples showed EGFR expression values below100 fg, with a mean value of 35.98 fg ± 16.51. It was evidentthat for EGFR there was no statistically significant difference(P < .371) between glioblastoma (247.60 fg ± 517.45) andcontrol samples (35.98 fg± 16.52).
Within glioblastoma samples, a highly statistically sig-nificant negative correlation (P < .0001; Person coefficientr = −0.776) was related to the expression of PTEN andMMP9; in a different manner, a statistically significantpositive correlation (P < .05; Pearson coefficient, r = 0.9221)was scored for the same genes within the control samples.The inverse correlation found between PTEN and MMP9mRNA expression in glioblastoma compared to controlsamples, prompted us to investigate whether this correlationwas also detectable in other glioma grades of malignancy.Therefore, PTEN and MMP9 expression, reported in Table 2and illustrated in Figure 2, was investigated in 16 histologicalconfirmed anaplastic astrocytoma specimens, previouslyclassified as WHO grade III. In these samples, PTENmRNA normalized quantitation (29.72 fg ± 31.62) was notsignificantly different from control (P = .792), but thisvalue was significantly higher compared to glioblastoma(P < .0001). MMP9 expression (13.60 fg ± 17.28) wasneither significantly different from the control (0.35 fg ±0.27, P = .113) nor from glioblastoma specimens (P =.103). Notably, no statistically significant correlation (P =.709) was found between the mRNA levels of these twogenes in anaplastic astrocytoma samples. Differently fromglioblastoma, no inverse correlation in PTEN and MMP9expression was found comparing anaplastic astrocytoma andcontrol samples (Pearson coefficient, r = 0.127).

6 Journal of Biomedicine and Biotechnology
IV 6.39–1.85IV 0.04–5.15IV 0.21–2.27IV 0.04–0.41IV 3.09–1.65IV 0.72–1.96IV 0.82–0.82IV 3.5–3.92IV 1.04–0.62IV 0.16–3.14IV 0.21–4.79IV 2.5–1.25IV 2.08–2.92IV 4.37–3.33IV 8.33–3.33IV 1.04–3.33IV 1.04–3.12IV 3.28–3.85IV 6.31–2.92IV 0.05–1.54IV 0.1–3.08IV 0.2–1.54IV 1.64–2.56IV 1.85–1.54IV 0.15–1.54IV 1.23–3.08IV 0.15–2.05IV 1.69–3.08IV 0.61–7.23IV 0.28–17.98C 0.03–20.14C 0.23–25.3III 0.57–15.2C 1.25–3.45III 1.62–4.89IV 8.04–4.84C 0.76–60.72C 0.45–45.11IV 13.33–6.66IV 10.62–3.12III 0.32–24.94III 1.95–39.63IV 15.78–15.05III 4.37–100IV 31.13–6.8IV 30.41–7.01IV 32.58–12.68IV 43.3–8.97III 0.79–184.93III 37.06–4.57III 43.21–67.6III 32.92–158.49III 26.24–51.29
C III IVWHO grading0.75 0.5 0.25 0
Similarity
∗
IV-aAge: 21/30 patients
(70%) class III(> 61 years)
IV-bAge: 2/7 patients
(29%) class III(> 61 years)
Figure 3: Dendrogram comparing PTEN and MMP9 absolute quantitative expression. Absolute quantifications are expressed infemtograms, as reported in Materials and Methods. WHO grades of malignancy (III, IV) and healthy brain control (C) specimens areindicated. Glioblastoma multiforme subgroups IV-a, including the majority of glioblastoma specimens, and IV-b, described in Results, arehighlighted. The box (∗) indicates subgrouping of patients sharing similar tumor anatomical localization (i.e., temporal). Subgroups IV-aand IV-b have a different and significant distribution of age-class III patients (>61 years, P < .01 Anova-one way).
Then, PTEN and MMP9 mRNA levels were compara-tively examined in two different human established glioblas-toma cell lines (PRT-HU2 and U138-MG) and in a primaryculture of embryonic normal human astrocytes (NHA), asshown in Table 4. In these cells, PTEN mRNA levels weremuch variable comparing to MMP9 expression; similarlyto the above examined control samples, normal astrocytesexhibited the highest PTEN expression.
We next exploited if PTEN and MMP9 expression mightbe more tightly related to the glioma tumor progression.To this purpose, different bioinformatics analyses wereperformed using the experimental data set reported in Tables1, 2, 3, and 4 and considering the WHO grading of thespecimens. We therefore performed hierarchical clustering,a standard unsupervised learning method [10] of the tumorspecimens. The WHO grading was simultaneously comparedto PTEN and MMP9 expression values, to identify homoge-neous clusters. As reported in the dendrogram of Figure 3,different groups of samples were created, according to the
above mentioned criteria. Using Euclidean distances, WHOgrades IV and III and normal control samples were roughlyclassified into different clusters. Of note, a major subset of theglioblastoma specimens was identified (Figure 3, subgroupIV-a), showing the lowest and almost similar levels of bothPTEN and MMP9 transcripts; the remaining glioblastomasamples clustered within subgroup IV-b. The associationof tumor anatomical localization and age of the patientswith the levels of PTEN and MMP9 expression was alsoinvestigated. According to the clinical data (Tables 1–3), agesof the patients were divided into three classes (i.e., I, 20–40;II, 41–60; III, >61 years): as reported in the dendrogram,the age-class III patients exhibited a statistically significantdifference in distribution between subgroups IV-a and IV-b(P < .01, Anova one-way). Differently, no clear associationsbetween levels of PTEN and MMP9 expression and tumorlocalization were highlighted, with the exception of a singlecluster of four class-III patients with a temporal tumorlocalization within subgroup IV-a.

Journal of Biomedicine and Biotechnology 7
100
75
50
25
IV C IIIInstances = 53 (91.3%) IV = 37/37 (100%); C = 5/5 (100%); III = 10/16 (63.2%)
100
75
50
25
If PTEN < 19.195 then IVinstances = 41 (79.2%)
IV = 37/37 (100%); C = 1/5 (20%); III = 3/10 (30%)
P(grade IV) = .905
100
75
50
25
If PTEN > 19.195 then IIIinstances = 11 (20.8%)
C = 4/5 (80%); III = 7/10 (70%)
P(grade III) = .636
100
75
50
25
If MMP9 < 0.775 and PTEN > 19.195 then Cinstances = 5 (45.5%)
C = 4/4 (100%); III = 1/7 (14.3%)
P(control) = 1
100
75
50
25
If MMP9 > 0.775 and PTEN > 19.195 then IIIinstances = 6 (55.5%)
III = 6/7 (85.7%)
P(grade III) = .805
Figure 4: Classification tree derived from the combined measurement of PTEN and MMP9 quantitative expression. At each root, diagnosticclasses are divided following the absolute quantification and expressed in femtograms. Probabilities values (P) for the different classes arereported.
Then, a classification tree was produced, evaluating theperformance of PTEN and MMP9 expression in predictingroots characterized by different WHO malignant grades; asreported in Figure 4, 53 out of 58 total samples, correspond-ing to 53 instances (i.e., 91.3%) fitted with the classificationtree; in detail, all grade IV samples had PTEN normalizedexpression values below a quantity of 19.195 fg (37/37instances, P = .905), while the large majority of control(80% of the total C instances) and anaplastic astrocytomassamples (70%, P = .636) were grouped with PTEN >19.195 fg; in this subgroup, to further differentiate controland anaplastic astrocytomas, MMP9 < 0.775 fg clustered allcontrol instances (P = 1.000).
Nomogram analysis, performed within the same data setand reported in Figure 5 confirmed that PTEN and MMP9expression analysis might be particularly helpful in theidentification of anaplastic astrocytoma specimens having a95% of probability (P(grade III) = .95) to correctly classify thesesamples, in correspondence of MMP9-normalized expres-sion value of 19.195 fg, independently of PTEN expressionlevel. Nomograms analysis with control and glioblastomaas target diagnostic classes showed less statistical significantprobabilities (P(control) = .60 and P(grade IV) = .55).
To further elucidated if PTEN and MMP9 expressionhad an expression trend that reflected the malignant gradeof the specimens (i.e., normal, anaplastic astrocytomas,

8 Journal of Biomedicine and Biotechnology
PTEN
MMP9
300
200
100
0
60
40
20
0
Total points
20 40 60 80 100 120 140 160
P(gradeIII)
0.05 0.1 0.2 0.3 0.4 0.5 0.6 0.7 0.8 0.9 0.95
(a)
PTEN
MMP9
300
200
100
0
60
40
20
0
Total points
140 150 160 170 180 190 200 210
P(gradeIV)
0.05 0.1 0.2 0.3 0.4 0.5 0.6 0.7 0.8 0.9 0.95
(b)
Figure 5: Nomogram analysis of PTEN and MMP9 expression within the different WHO grades of malignancy (III, IV) of the astrocytomasspecimens. Points and total points axes indicate the points attributed to each variable value and the sum of the points for each variable,respectively. P axes indicate the predicted probability that relates PTEN or MMP9 quantitative expression to each WHO tumor malignancygrade.
×102
100
10
1
0.1
0.01C III IV
MMP9PTEN
Espo. (PTEN)Espo. (MMP9)
(a)
×103
100
10
1
0.1
0.01
0.001NHA HU2 U138
MMP9PTEN
Espo. (PTEN)Espo. (MMP9)
(b)
Figure 6: Statistical trends of PTEN (black dotted line) and MMP9 (grey dotted line) expression in control (C), anaplastic astrocytomas (III)and glioblastoma multiforme (IV) specimens (Panel A), and in normal human astrocytes (NHA), glioma PRT-HU2 (HU2), and U138-MG(U138) cells (Panel B). Trends are calculated using average quantitative expression of PTEN and MMP9, and adopting exponential (Espo)models of prediction as follows: PTEN (C, III, IV average expression samples), y = 2148e−1.29x; MMP9 (C, III, IV), y = 83716e0.50x; PTEN(NHA, HU2, U138), y = 118596e−1.82x; MMP9 (NHA, HU2, U138), y = 42439e1.40x.
and glioblastoma multiforme), a statistical trend analysiswas performed (Figure 6); the analysis reported in Panel Ashowed that PTEN and MMP9 differences in their normal-ized expression clearly decreased following the malignantglioma grading, with the lowest values corresponding to
glioblastoma multiforme specimens; similarly, the trendanalysis, reported in Figure 6 Panel B, highlighted that,within the investigated cell lines, normal human astrocytesexhibited the largest differences in PTEN and MMP9expression levels, while, on the contrary, U138-MG cells,

Journal of Biomedicine and Biotechnology 9
isolated from a glioblastoma multiforme patient, showednearly coincident PTEN and MMP9 expression values; theglioblastoma derived PRT-HU2 cell line showed values ofPTEN and MMP9 expression trends, intermediate betweenNHA and U138-MG.
4. Discussion
The new challenge in cancer biology is to move from onepurely morphological classification of cancer to one thatis based on the integration of histological and molecularcriteria [15]. Among several cancer specific investigatedgenes, the epidermal growth factor receptor (EGFR) playsa pivotal pathological role through the activation of down-stream intracellular signalling pathways that can directlymodulate cell proliferation, metastasis, and angiogenesis[8]. Glial tumors, in particular, due to processes of gene-amplification or mutation, showed altered EGFR-relatedfunctional pathways [3]. Within this context, in order to findclinically relevant correlations between gene expression andtumor malignant progression, a cohort of glioma specimenswas analyzed for the expression of several genes, that is,ADAM-17, PTEN, MMP9, EGFR, and HB-EGF, indirectlyinvolved in the EGFR-dependent signaling pathway, In fact,the concurrent measurement of the transcript levels of thedifferent genes could potentially represent a useful tool toidentify a dysregulation of receptor activation or of down-stream signaling pathways or might also suggest functionallinks between these genes in pathological conditions [16].
Comparing a cohort of glioblastoma specimens and con-trols, only two genes, ADAM-17 and PTEN, had expressionlevels that significantly changed between the two WHOclasses; on the contrary, considering the expression of eachtranscript separately, we did not elucidate any associationbetween clinical status and EGFR, HB-EGF, and MMP9expression profiles. In particular, the wide range of variationfor the EGFR gene, found in glioblastoma specimens, was inpartial agreement with previous studies carried out in glialtumor samples [8]. In general, nearly 50% of glioblastomamultiforme cases express amplified EGFR, and about 40%of them also express the constitutively activated mutatedEGFRvIII isoform [11]. Since the primers we used inour experiments did not discriminate between EGFR andEGFRvIII, it is very likely that the EGFR mRNA levels foundin our samples reflected the combined contribution of boththe transcripts.
Since chemotherapic treatments enhance the EGFR-mediated proliferative responses via an increased HB-EGFexpression and shedding [17], previous studies have sug-gested a prominent role for HB-EGF in tumorigenic pro-cesses. In fact, in glioma cell lines, the inducible expression ofEGFRvIII can enhance HB-EGF expression and can activateEGFR-dependent pathways via a positive feedback autocrineloop [18]. The only previous published study, based ona semiquantitative assessment by Northern blot analysis,found an increased expression of HB-EGF in glioblastomacompared to control samples [9]. On the opposite, ourdata seemed to suggest that HB-EGF is not upregulated inglioblastoma; however, our results agreed with microarray
gene expression profiles studies that showed no significantdifferences in HB-EGF expression between glioblastoma andcontrol samples [19].
Recent mounting evidence showed that the expressionof MMP9 might play a critical role in brain neoplastictissue invasion, metastasis, and angiogenesis [12]. Even if notcompletely statistically supported, our findings were in goodagreement with a previous work showing an upregulation ofMMP9 mRNA levels in glioblastoma compared to controlsand suggesting a close relationship between MMP9 expres-sion and tumor malignant progression [12].
Although ADAM17 expression has been reported innormal human brain tissue and in cell lines [5], its expressionat mRNA level has been poorly investigated in brain tumors.Functional studies in U373-MG glioma cells have demon-strated that cannabinoids induced cell proliferation througha two-step mechanism involving ADAM17-mediated shed-ding of proHB-EGF and subsequent EGFR stimulation [5].Our finding that ADAM17 mRNA levels in glioblastoma arestatistically lower compared to controls is in contrast witha previous work that reported an increased expression ofADAM17 in glioblastoma specimens [20]. This might reflectdifferences in tumor sampling or a consequence of glioblas-toma multiforme cellular and molecular heterogeneity.
Our finding showing that glioblastoma expressed statisti-cally significant lower PTEN mRNA levels compared to con-trol samples confirmed previous reports [21], showing thatPTEN expression variations were detectable only in a lowfraction of anaplastic astrocytoma and were almost absent inlow-grade brain tumors and controls. Taken together, theseobservations strengthen the hypothesis that an impairmentof PTEN expression, together with a consequent aberrantactivity of the PI3K-dependent pathway, might represent atypical hallmark of glioblastoma multiforme. A functionalconfirmation of this hypothesis was that, in a mouseastrocytoma model with genetic inactivation of the Nf1 andp53 tumor suppressor genes, the loss of PTEN heterozygosityand the Akt activation contributed to the brain tumormalignant progression [6].
Differently from the above mentioned investigated genes,the analysis of PTEN and MMP9 expression, using a combi-nation of unsupervised and supervised algorithms, providedinteresting results: firstly, as reported in the dendrogramanalysis, the expression profiling derived novel subsets ofastrocytomas. This hierarchically clustering analysis clarifiedthat tumor classification based even on a quantization oftwo genes could generate a patient stratification, clinicallyrelevant and more informative than a single conventionalhistological classification. The PTEN and MMP9 expression-generated subgroups produced also a different distributionof the patients according to their age: in particular subgroupIV-a, differently from IV-b, was enriched in age-class IIIpatients (i.e., >61 years); this result might suggest thatin glioblastoma multiforme tumor specimens PTEN andMMP9 expression levels might be partly related with theelderly of the patients. On the contrary, in anaplasticastrocytoma and in control patients no association betweenage-related classes and PTEN/MMP9 expression levels wasevidenced. Furthermore, the originated dendrogram does

10 Journal of Biomedicine and Biotechnology
not reflect a classification of samples according to theiranatomical tumor localization. However, in the light ofthe development of new pharmacological treatments, theidentification of patient subsets with specific molecularsignatures within tumor malignancy grades is becomingmore and more relevant [22]. A finer analysis of PTENand MMP9 expression was also employed to derive a par-simonious classification tree of the investigated samples intotheir tumor malignancy grades. Specific PTEN and MMP9expression values significantly addressed the specimens intoa specific diagnostic class, that is, glioblastoma or anaplasticastrocytomas. However, the significance and the sensitivityof this classification might be further refined with theincreasing of specimens and through the identification ofnovel tumor-diagnostic markers. Basing on the averageexpression of PTEN and MMP9, the observed statisticaltrends clearly differentiate the control, anaplastic astrocy-tomas, and glioblastoma multiforme diagnostic classes; asimilar expression trend for PTEN and MMP9 genes wasdocumented comparing normal versus astrocytic tumor celllines. These results, in particular, reinforced the concept thatanaplastic astrocytomas were intermediate-grade tumors,showing detectable mitotic activity, absent in low-gradeastrocytomas, but not necrosis and prominent vascularproliferation, characteristic of glioblastoma multiforme [23,24].
An additional interesting finding emerging from ourstudy was the significant negative correlation between PTENand MMP9 mRNA expression in glioblastoma multiforme.Notably, not only was this negative correlation absent inanaplastic astrocytoma samples, but it was reversed incontrol samples. It was evident that differences in PTEN geneexpression mainly account for these correlations becauseits levels in glioblastoma were significant higher comparedto anaplastic astrocytoma samples, whilst no statisticaldifference was found for MMP9 mRNA levels. The positivecorrelation between PTEN and MMP9 in controls is derivedessentially from an overexpression of PTEN rather than alow expression of MMP9 compared to glioblastoma. Thefunctional significance of these correlations is currentlyunknown, and future functional studies aimed at elucidatingpossible interplays of these genes in glioblastoma are clearlywarranted. The negative correlation in glioblastoma betweenMMP9 and PTEN could imply a functional interplaysbetween these two genes, as already documented. It hasbeen reported that PTEN modulates the expression andsecretion of MMP2 and MMP9, thereby modifying tumorcell invasiveness [9, 25]. Notably, recent reports have clearlydemonstrated that, in glioblastoma, PTEN may regulatemigration via a PI3K-independent pathway [26]. In thismodel, the lack or functional loss of PTEN not only poten-tiates the migration induced by EGFR- and beta-integrin-dependent pathways but also enhances cell migration viaa still largely unclear mechanism. On this regard, a recentreport suggested that integrins could be a converging pointin the mechanism supporting tumor invasion and migrationof cancer cells with PTEN loss and MMP9 overexpression.
The intrinsic genetic heterogeneity and redundant over-lapping aberrant signalling transduction pathways underlie
the failure of monotherapies in glioblastoma [8]. Thereforea sensitive and reliable method to measure gene expression,such as Real-time PCR, may greatly ameliorate diagnostictools and eventually address the pharmacological approachusing multitarget kinase inhibitors or combination of ther-apies based on multiple single-targeted receptor or intracel-lular kinase inhibitors. Some researchers have proposed thatthe combination of PTEN loss and EGFR hyperfunctionalitycould be predictive of the ineffectiveness of therapies withEGFR inhibitors [4] because these two pathways might syn-ergize to enhance glioblastoma malignancy. This hypothesishas been elegantly supported by the recent observation thatthe pharmacological inhibition of PI3K-alpha and mTORaugments the antiproliferative activity of the EGFR inhibitorerlotinib in glioblastoma cell lines [7]. The inverse corre-lation between PTEN and MMP9 expression reported hereraised the issue whether the concomitant hyperactivation ofthe PI3K-alpha and MMP9-dependent pathways might beinstrumental in devising or refining combined pharmacolog-ical therapies in glioblastoma. The modest efficacy of mTORinhibitors alone in clinical trials was greatly enhanced whenthese compounds were administered in combination withthe EGFR inhibitor Gefitinib [27]. Although monotherapyregimens with MMPs inhibitors in clinical trials have beenquite disappointing, the relevance of MMPs as valid targethas been reevaluated by the recent finding that the combineduse of MMPs, COX2, and EGFR inhibitors reduced humanbreast cancer tumor growth [11]. We therefore speculate thatthe pivotal role of MMPs in glioma invasion and angiogenesisdeserves future in vitro and in vivo experiments using MMPinhibitors in combination with PI3K inhibitors alone or withthese latter compounds plus EGFR inhibitors.
The analyses of gene expression at transcriptional levelin biopsy tissue samples are instrumental in delineatingabnormal gene expression signature of brain tumors, butit should be mentioned that these studies suffer somepitfalls and limitations: in particular, the use of supervisedapproaches, based on the assumption that the grouping(i.e., the histological tumor diagnoses) is correct, may notbe a valid assumption for all the clinical cases examined;additionally, the intrinsic heterogeneity of glioblastoma,together with the presence of nontumor cells in the samples,probably accounts for the variability found in transcriptslevels and may represent a critical factor and a limitationin the interpretation of our results. From a technical pointof view, a main difference of our contribution, comparedto other reports, deals with the criteria adopted to expresstranscript levels in the investigated specimens. The majorityof clinical gene expression profile studies performed by Real-time PCR normalized data using an internal housekeepinggene as a reference, but great caution in choosing thisnormalization method is necessary especially when analyzingtumor biopsy samples [28]. The tumorigenic process itself,via genomic mutations or amplifications, could inducemodifications of housekeeping genes levels [29], and hencethe choice of unreliable housekeeping genes may lead tointerpretation errors and bias in experimental results [30].Our attempts to use GAPDH, ACTB, and HPRT as referencegenes were unsuccessful due to the great variations among

Journal of Biomedicine and Biotechnology 11
all the samples (data not shown); therefore, we decided toexpress gene expression as absolute amount of femtograms(fg) of transcripts, normalized to the total amount of RNAemployed, through accurate quantification using the combi-nation of spectrofotometric and fluorimetric approaches.
In conclusion, the combined analysis of the transcriptsof PTEN and MMP9 genes in biopsy specimens couldrepresent a reliable diagnostic and prognostic marker ofhuman glial tumor. Further epidemiological and functionalin vitro studies are required to establish the reliability ofPTEN and MMP9 genes as possible valid molecular targets inthe pharmacological strategies aimed at controlling humanglioma malignant progression.
Acknowledgments
This study was supported by grants from the Italian MIUR,“Progetti di Ricerca di Rilevante Interesse Nazionale (2005).”A. A. is granted by Fondo Sociale Europeo (F.S.E.). Theauthors are particularly grateful to Dr. Eugenio Benericetti(Azienda Ospedaliera di Parma, Italy) for providing WHOgraded glioma specimens. Orange Software is released underGeneral Programming License (GPL). The authors aretherefore particularly grateful to Orange Program’s authors,Demsar J, Zupan B, Leban G: (2004) Orange: From Experi-mental Machine Learning to Interactive Data Mining, WhitePaper (http://www.ailab.si/orange/), Faculty of Computerand Information Science, University of Ljubljana (Slovenia).
References
[1] D. N. Louis, “Molecular pathology of malignant gliomas,”Annual Review of Pathology, vol. 1, pp. 97–117, 2006.
[2] H. Ohgaki and P. Kleihues, “Genetic pathways to primary andsecondary glioblastoma,” American Journal of Pathology, vol.170, no. 5, pp. 1445–1453, 2007.
[3] S. Higashiyama and D. Nanba, “ADAM-mediated ectodomainshedding of HB-EGF in receptor cross-talk,” Biochimica etBiophysica Acta, vol. 1751, no. 1, pp. 110–117, 2005.
[4] S. Miyamoto, H. Yagi, F. Yotsumoto, T. Kawarabayashi, andE. Mekada, “Heparin-binding epidermal growth factor-likegrowth factor as a novel targeting molecule for cancertherapy,” Cancer Science, vol. 97, no. 5, pp. 341–347, 2006.
[5] S. Hart, O. M. Fischer, and A. Ullrich, “Cannabinoidsinduce cancer cell proliferation via tumor necrosis factor α-converting enzyme (TACE/ADAM17)-mediated transactiva-tion of the epidermal growth factor receptor,” Cancer Research,vol. 64, no. 6, pp. 1943–1950, 2004.
[6] C.-H. Kwon, D. Zhao, J. Chen, et al., “Pten haploinsufficiencyaccelerates formation of high-grade astrocytomas,” CancerResearch, vol. 68, no. 9, pp. 3286–3294, 2008.
[7] Q.-W. Fan, C. K. Cheng, T. P. Nicolaides, et al., “Adual phosphoinositide-3-kinase α/mTOR inhibitor cooperateswith blockade of epidermal growth factor receptor in PTEN-mutant glioma,” Cancer Research, vol. 67, no. 17, pp. 7960–7965, 2007.
[8] J. B. Johnston, S. Navaratnam, M. W. Pitz, et al., “Targetingthe EGFR pathway for cancer therapy,” Current MedicinalChemistry, vol. 13, no. 29, pp. 3483–3492, 2006.
[9] M.-S. Kim, M.-J. Park, E.-J. Moon, S.-J. Kim, C.-H. Lee,and H. Yoo, “Hyaluronic acid induces osteopontin via the
phosphatidylinositol 3-kinase/Akt pathway to enhance themotility of human glioma cells,” Cancer Research, vol. 65, no.3, pp. 686–691, 2005.
[10] T. Hastie, R. Tibshirani, D. Botstein, and P. Brown, “Super-vised harvesting of expression trees,” Genome Biology, vol. 2,no. 1, article research0003.1-0003.12, 2001.
[11] I. K. Mellinghoff, M. Y. Wang, I. Vivanco, et al., “Moleculardeterminants of the response of glioblastomas to EGFR kinaseinhibitors,” The New England Journal of Medicine, vol. 353, no.19, pp. 2012–2024, 2005.
[12] K. Komatsu, Y. Nakanishi, N. Nemoto, T. Hori, T. Sawada, andM. Kobayashi, “Expression and quantitative analysis of matrixmetalloproteinase-2 and -9 in human gliomas,” Brain TumorPathology, vol. 21, no. 3, pp. 105–112, 2004.
[13] P. Kleihues and W. K. Cavenee, World Health OrganizationClassification of Tumors of the Nervous System, Lyon, France,2000.
[14] M. Paolillo, A. Barbieri, P. Zanassi, and S. Schinelli, “Expres-sion of endothelins and their receptors in glioblastoma celllines,” Journal of Neuro-Oncology, vol. 79, no. 1, pp. 1–7, 2006.
[15] D. N. Louis, E. C. Holland, and J. G. Cairncross, “Gliomaclassification: a molecular reappraisal,” American Journal ofPathology, vol. 159, no. 3, pp. 779–786, 2001.
[16] Y. Liang, M. Diehn, N. Watson, et al., “Gene expressionprofiling reveals molecularly and clinically distinct subtypesof glioblastoma multiforme,” Proceedings of the NationalAcademy of Sciences of the United States of America, vol. 102,no. 16, pp. 5814–5819, 2005.
[17] F. Wang, R. Liu, S. W. Lee, C. M. Sloss, J. Couget, andJ. C. Cusack, “Heparin-binding EGF-like growth factor isan early response gene to chemotherapy and contributes tochemotherapy resistance,” Oncogene, vol. 26, no. 14, pp. 2006–2016, 2007.
[18] D. B. Ramnarain, S. Park, D. Y. Lee, et al., “Differential geneexpression analysis reveals generation of an autocrine loop bya mutant epidermal growth factor receptor in glioma cells,”Cancer Research, vol. 66, no. 2, pp. 867–874, 2006.
[19] D. S. Rickman, M. P. Bobek, D. E. Misek, et al., “Distinctivemolecular profiles of high-grade and low-grade gliomas basedon oligonucleotide microarray analysis,” Cancer Research, vol.61, no. 18, pp. 6885–6891, 2001.
[20] D. Wildeboer, S. Naus, Q.-X. A. Sang, J. W. Bartsch, andA. Pagenstecher, “Metalloproteinase disintegrins ADAM8 andADAM19 are highly regulated in human primary braintumors and their expression levels and activities are associatedwith invasiveness,” Journal of Neuropathology and Experimen-tal Neurology, vol. 65, no. 5, pp. 516–527, 2006.
[21] C. B. Knobbe, A. Merlo, and G. Reifenberger, “Pten signallingin gliomas,” Neuro-Oncology, vol. 4, no. 3, pp. 196–211, 2002.
[22] G. N. Fuller, K. R. Hess, C. H. Rhee, et al., “Molecular classifi-cation of human diffuse gliomas by multidimensional scalinganalysis of gene expression profiles parallels morphology-based classification, correlates with survival, and revealsclinically-relevant novel glioma subsets,” Brain Pathology, vol.12, no. 1, pp. 108–116, 2002.
[23] K. Ichimura, H. Ohgaki, P. Kleihues, and V. P. Collins,“Molecular pathogenesis of astrocytic tumours,” Journal ofNeuro-Oncology, vol. 70, no. 2, pp. 137–160, 2004.
[24] B. K. Ahmed Rasheed, R. N. Wiltshire, S. H. Bigner, and D.D. Bigner, “Molecular pathogenesis of malignant gliomas,”Current Opinion in Oncology, vol. 11, no. 3, pp. 162–167, 1999.
[25] K. Furukawa, Y. Kumon, H. Harada, et al., “PTEN genetransfer suppresses the invasive potential of human malignant

12 Journal of Biomedicine and Biotechnology
gliomas by regulating cell invasion-related molecules,” Inter-national Journal of Oncology, vol. 29, no. 1, pp. 73–81, 2006.
[26] M. Raftopoulou, S. Etienne-Manneville, A. Self, S. Nicholls,and A. Hall, “Regulation of cell migration by the C2 domainof the tumor suppressor PTEN,” Science, vol. 303, no. 5661,pp. 1179–1181, 2004.
[27] S. Sathornsumetee, D. A. Reardon, A. Desjardins, J. A. Quinn,J. J. Vredenburgh, and J. N. Rich, “Molecularly targetedtherapy for malignant glioma,” Cancer, vol. 110, no. 1, pp. 12–24, 2007.
[28] C. Tricarico, P. Pinzani, S. Bianchi, et al., “Quantitative real-time reverse transcription polymerase chain reaction: normal-ization to rRNA or single housekeeping genes is inappropriatefor human tissue biopsies,” Analytical Biochemistry, vol. 309,no. 2, pp. 293–300, 2002.
[29] S. Waxman and E. Wurmbach, “De-regulation of com-mon housekeeping genes in hepatocellular carcinoma,” BMCGenomics, vol. 8, pp. 243–250, 2007.
[30] J. L. Aerts, M. I. Gonzales, and S. L. Topalian, “Selectionof appropriate control genes to assess expression of tumorantigens using real-time RT-PCR,” BioTechniques, vol. 36, no.1, pp. 84–91, 2004.

Hindawi Publishing CorporationJournal of Biomedicine and BiotechnologyVolume 2009, Article ID 594738, 9 pagesdoi:10.1155/2009/594738
Review Article
An Evolutionary Perspective of Animal MicroRNAs andTheir Targets
Noam Shomron,1 David Golan,1 and Eran Hornstein2
1 Department of Cell & Developmental Biology, Sackler Faculty of Medicine, Tel Aviv University, Tel Aviv 69978, Israel2 Department of Molecular Genetics, Weizmann Institute of Science, Rehovot 76100, Israel
Correspondence should be addressed to Noam Shomron, [email protected]
Received 27 March 2009; Accepted 17 June 2009
Recommended by Bibekanand Mallick
MicroRNAs (miRNAs) are short noncoding RNAs that regulate gene expression through translational inhibition or mRNAdegradation by binding to sequences on the target mRNA. miRNA regulation appears to be the most abundant mode ofposttranscriptional regulation affecting ∼50% of the transcriptome. miRNA genes are often clustered and/or located in introns,and each targets a variable and often large number of mRNAs. Here we discuss the genomic architecture of animal miRNA genesand their evolving interaction with their target mRNAs.
Copyright © 2009 Noam Shomron et al. This is an open access article distributed under the Creative Commons AttributionLicense, which permits unrestricted use, distribution, and reproduction in any medium, provided the original work is properlycited.
1. Introduction
MicroRNAs (miRNAs) are short noncoding RNAs that reg-ulate gene expression by binding to sequences on the targetmRNA (reviewed by [1–7]. Gene silencing initiates when themiRNA, located within an RNA-Induced Silencing Complex(RISC), directs binding to complementary sequences on themRNA’s 3′ untranslated region (UTR). The miRNA-mRNArecognition binding sequences are short, usually 6–8 nt [8–11]. Inhibition of gene expression takes place via facilitatedmRNA degradation, mRNA cleavage, or interference withtranslation.
2. Generation of miRNA Genes
2.1. miRNA Gene Origins. During animal evolution therewere distinct, characterized phases of large scale genomeduplications [12–14]. miRNA origin, as well, is traced backto genomic episodes dominated by large duplication eventswhich coincide with the advent of bilaterians, vertebrates,and (placental) mammals [15]. The current wealth ofmiRNA genes results, additionally, from specific duplicationevents of miRNA clusters [16, 17] and from mechanismssuch as the integration of repetitive genetic elements [18].
2.2. The Gatekeeper of the miRNA Biogenesis. The transcrip-tion of miRNA genes is controlled by enhancer-promoterelements comparable with those of protein-coding genes[19]. Additional regulation of miRNA expression is obtainedthrough posttranscriptional processing [20], RNA A-to-Iediting [21, 22], selective export into the cytoplasm [23, 24],and subcellular localization [25] (Figure 1 (see [2, 26–43])also see review by [44]).
While several mechanisms control miRNA’s expressionalong its biogenesis pathway, it seems that the rate limitingstep in acquiring a novel miRNA is the recognition of theRNA secondary structure by Drosha. This stems from the factthat mammals express only several hundred miRNAs frommyriad amounts of expressed RNA secondary structures[16, 45–47]. Thus, processing of miRNA precursor by themicroprocessor is probably the gatekeeper of the miRNAbiogenesis pathway, which allows for only a portion of thetranscribed RNA hairpins to be further processed down themiRNA biosynthetic pathway. Analysis of miR-220 recentevolution provides an intriguing example for a gene thatapparently did not encode for a miRNA but became compe-tent for Drosha-dependent microprocessing. miR-220, whichcontains sequences of a tubulin gene, was probably originallyprocessed from an antisense strand (see [48, 49]) of tubulin,

2 Journal of Biomedicine and Biotechnology
Non-coding looped RNA [46]Intronic miRNAsSpliceosome/microprocessor segregation [27]
Intron retention or overlapwith coding region
[30]
Postprocessing[20]
A-to-I editing[34]
Export to the cytoplasm[24]
Selection of hairpin arm[37]
Subcellular localization[25]
RISC assembly
Promoter methylation[29]
Alternative transcriptionstart and termination sites
Clustered or stand-alone miRNAs[2, 26]
Potential conservedRNA folded structures
Processed byDrosha
Functional expressedmiRNAs in a given
adult tissue
10 s
100 s
10000
Protein coding exon
Dicer processing
Microprocessor (Drosha) processing
miRNA genes
Pri-miRNA
Pre-miRNA
[31, 32]
[40-43]
Mature-miRNA
Translation attenuation, mRNA cleavage, or reduced mRNA stability
ExonExonExon
CH3CH3
s
Figure 1: Several layers of regulation control canonical miRNA gene biogenesis: transcription activation, splicing, recognition by Drosha,postprocessing, RNA editing, subcellular localization, nuclear export, and hairpin arm selection. Selected examples are referenced within.
which folds back into a proper stem-loop structure in humanbut not in other vertebrates [15]. Comparative studies ofthe tubulin antisense strand sequence may shed light on thereasons for which human Drosha enables microprocessingwhile in other species it is skipped. Though canonicalmiRNA bioprocessing is Drosha-dependent, a novel splicing-dependent [33] mechanism was suggested recently to bypassinitial steps of microprocessing [33, 50, 51]. Despite thefunctional robustness of miRNA secondary structures inlight of accumulating mutations it is still not clear what theprecise requirements for passing the gatekeeper of miRNAbiogenesis are.
3. The Genomic Architecture ofmiRNA Genes and Their Expression
Two characteristics of miRNA genes stand out in regardto genomic organization of protein-coding genes. First,miRNA genes are often found in clusters (30%–42%) [52–54]. Additionally, miRNA genes are often embedded withinintrons (25% or more) [27, 55–59].
3.1. Chromosomal Organization of miRNA Genes. In accor-dance with genomic duplication events that accompanyevolution of species, we see a correlation between thenumber of miRNA genes and chromosome length. miRNAgene number per chromosome also correlates with theprotein-coding gene density (Figure 2(a) and 2(b)). Thisindicates that integration and/or maintenance of miRNAgenes roughly follows protein-coding genes.
However, Homo Sapiens chromosomes 14, 19, and X areexceptionally enriched for miRNA genes. Chromosomes 14and 19 both possess a single miRNA cluster, accounting for93% and 80% of the total number of miRNA genes on eachchromosome, respectively [16, 61]. The cluster on chromo-some 14 is located in the human imprinted domain (14 q32)where only maternally inherited miRNAs are expressed [62].Chromosome 19 hosts the primate-specific “500” cluster[16], a recently emerging, placental-specific cluster [16]. TheX chromosome, on the other hand, does not have one largecluster, but it exhibits rapid emergence of smaller miRNAclusters due to frequent tandem duplications and nucleotidesubstitutions [17]. We note that despite the parallel evolution

Journal of Biomedicine and Biotechnology 3
19
14
X
0 20 40 60 80
Number of miRNA genes
0
50
100
150
200
250
300
Len
gth
(nt×1
06)
R2 = 0.34
(a)
19
14
X
0 20 40 60 80
Number of miRNA genes
0
500
1000
1500
2000
2500
Nu
mbe
rof
prot
ein
-cod
ing
gen
es R2 = 0.63
(b)
Stand-aloneClustered
7%6%5%
40%43% 25% 25% = 100%
= 100%= 100%
28%42%
26%27%26%
IntronicNon-clusteredand intergenicIntergenic
50 kb10 kb
1 kbDis
tan
ce
(c)
0 1 2 3 4 5 6 7 8
miRNA copy number
0
0.2
0.4
0.6
0.8
1
1.2
Exp
ress
ion
leve
l(lo
g(x
+1)
)
Ave of 40 tissues
(d)
Figure 2: Genomic organization of miRNA genes and their expression. The number of miRNA genes correlates with chromosome length (a)and the number of protein-coding genes (b). Outliers chromosomes 14, 19, and X are indicated. When removing these three chromosomesthe number of miRNA genes aligns well on the regression line (R2 indicated). (c) Proportion of miRNA genes hosted in Introns—Intronic(based on Refseq genes), Clustered on the same genomic strand, or Stand-alone miRNAs. Overlapping intronic and clustered miRNAs arealso indicated. Each row refers to 50 kb, 10 kb, and 1 kb distance between paired genes on the same strand. It was shown that clusters of size3 kb give a large proportion of clusters (27%) with little change when increasing pairwise distance to 10 kb [54]. Diagrams are based on datafrom Refseq. (d) Human miRNA copy number was plotted against the average miRNA expression level of 40 Human tissues [60]. A similarplot of another dataset [55] gave comparable results (data not shown).
of miRNAs in animals and plants, miRNA clusters wereobserved in both kingdoms [63].
3.2. Clusters of miRNA Genes. Plausibly, employment of analready existing functional promoter by new miRNA genesis an efficient way to express new miRNAs, eliminatingthe need for de novo establishment of promoter-enhancersequences upstream of the miRNA gene (such as in [64–66]).This may be the rational underlying miRNA aggregationinto polycistronic miRNA clusters and for their genomicpreference for introns of transcribed genes (see Figure 2(c)).The consequence on the genomic level is that many miRNAswithin up to 50 kb DNA fragment tend to be coexpressed[54, 55]. Amplification of an ancestral miRNA inside acluster [54, 56] could contribute to the effective dosage ofa given expressed miRNA homolog. However, at lower copynumber gene dose does not seem to be a powerful predictorof expression levels (Figure 2(d)). The most likely interpre-tation is that the magnitude of promoter activity probably
dominates regulation of miRNA expression. The correlationbetween miRNA gene copy number and expression level thatwas noted in some cases [67] may nonetheless suggest thatwhen miRNA copy number is high (>3; Figure 2(d)), it mayalso serve to impact the expression level.
3.3. Intronic miRNA Genes. At least 25% of miRNA genesare hosted in introns of both protein-coding and noncodingRNAs (Figure 2(c) also see [27, 56, 59]). This is a strikingfeature of noncoding RNAs (reviewed by [68]), plausiblyimplying that some noncoding RNAs have developed afunctional relationship with their host genes [38, 69]. Theuse of the same promoter-enhancer system enables couplingof miRNA expression with its host gene, therefore notsurprisingly frequently seen [27, 55, 70]. When derived fromthe same primary transcript, it appears that pri-miRNAmaturation by the microprocessor and pre-mRNA editingby the Spliceosome can either coexist independently orinterconnect. While some studies imply that these processes

4 Journal of Biomedicine and Biotechnology
hardly interact [59], others have shown strong interactionsinitiating at transcription [71–73]. Overall, given the tightproximity of these cellular events in time and space it ishard to imagine how these functional complexes avoid eachother. Further analysis would be required to determine theextent of this interaction and whether this is true for all giventranscripts [74].
3.4. Functional Expression of miRNAs and Their Host Genes.While mRNA/miRNA derived from the same transcriptmay simply reflect an efficient use of a promoter-enhancercassette [59], in a subset of cases a coordinated expressionof an miRNA-protein pair from the same genomic locusmay reflect a genetic interaction. For example, plateletscontain two cAMP phosphodiesterases (PDEs)—PDE2A andPDE3A—each regulating a specific intracellular pool ofcAMP [75]. miR-139 that is hosted in an intron of thePDE2A targets PDE3A (TargetScanS, see [76]), implying thatthe miRNA expression from PDE2A regulates the balancebetween the two isoforms. Similarly, miR-208 is encodedby an intron of the cardiac-specific alpha myosin heavychain (MHC) gene, a major cardiac contractile protein.Alpha MHC responses to stress and hypothyroidism [35,77] partially by coexpressing miR-208. The miRNA targetsand downregulates beta MHC expression [70]. Thus, theprecision in regulating an miRNA and a gene product may behardwired into the genomic organization, to promise properbalance in their opposing or collaborating functions.
4. Generation of miRNA Targets andTheir Interaction with miRNAs
4.1. Reciprocal Evolutionary Interaction between miRNAs andTheir Targets. Our current understanding of miRNA bindingsites suggests that a stretch of 6 nucleotide “seed” region,matching between the 5′ end of the miRNA and the mRNA3′ UTR, may suffice for regulation by miRNAs [9, 10, 76, 78].Because changes in cis sequences often dominates rewiringof genetic networks, [79] it is likely that the 3′ UTR ofmRNA targets change their repertoire of seed matches fasterthan the highly conserved transacting miRNAs. This canbe intuitively explained merely because the large numberof targets affected by mutations in any given miRNA geneacts as a stabilizing element on the miRNA itself. So given avirtually fixed population of miRNAs, targets gain and losebinding sites in a way that supports their controlled miRNAexpression. This can be viewed as an evolutionary reciprocalinteraction between the miRNA and its accumulating targets.After miRNA emergence, once a critical number of targetsare functionally regulated by the miRNA, stabilization of itsprimary sequence is gained [80], while at the same time,stabilizing selection decreases variation in target seed match[28, 81, 82].
The target set size is also dramatically affected by thenucleotide composition of the new miRNA, and, as men-tioned above, this characteristic affects the average selectivepressure on the miRNA itself [78]. Given a set of 17 0003′ UTRs (“Known Genes” in the UCSC genome browser
0 200 400 600 800 1000
Number of miRNA targets
0
10
20
30
40
50
60
70
80
Nu
mbe
rof
miR
NA
fam
ilies
Conserved targetsConserved sitesPoorly conserved sites
(a)
H/P
HP
M/R
HP
MR
D/C
HP
MR
DC
1
200
400
600
800
1000
1200
1400
Nu
mbe
rof
con
serv
edta
rget
s
(b)
Figure 3: The number of predicted conserved miRNA targetsites. (a) Predicted number of conserved targets, conserved targetsites and poorly conserved sites of human miRNAs (based onTargetScanS). (b) The number of predicted conserved miRNAtargets was divided according to the conservation level of themiRNA itself (H, Human; P, Chimp; M, Mouse; R, Rat; D, Dog;C, Chicken; based on TargetScanS). Shaded in red/green are theregions with the largest/least number of targets (resp.). Extremenumbers of targets are boxed and are discussed in the text.
database), some ∼2000 UTRs would randomly have a singlebinding site for a heptamer seed composed of A/U residues.This number falls to only ∼200 seed matches with a G/C-only seed content and is somewhere in between (∼800)for a mixed nucleotide composition (equal number of A/Uand G/C). Once emerged, the set of targets affected by anovel miRNA is subject to selective pressure which moldsthe transcriptome such that binding sites would either beacquired or lost. In fact, selective loss of seed matches, to alevel below the randomly predicted baseline, dubbed “anti-targets” [9, 83], provides strong support for the evolutionarypower underlying the structure of miRNA binding sites (alsosee [84]).
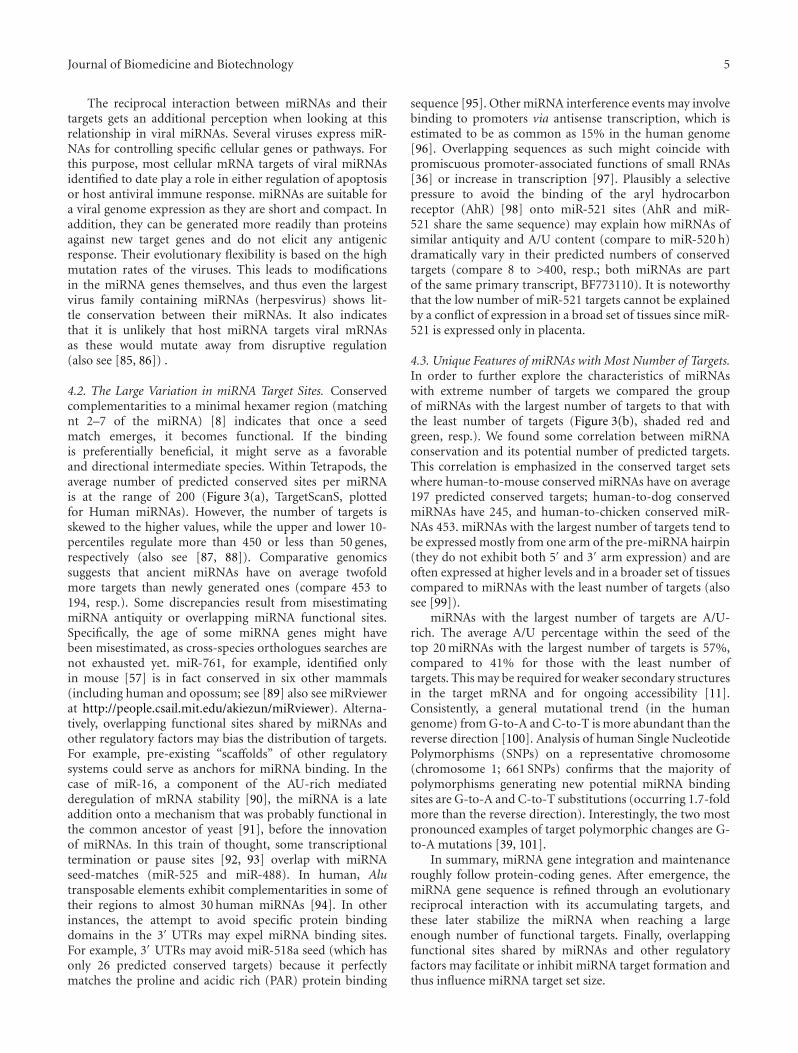
Journal of Biomedicine and Biotechnology 5
The reciprocal interaction between miRNAs and theirtargets gets an additional perception when looking at thisrelationship in viral miRNAs. Several viruses express miR-NAs for controlling specific cellular genes or pathways. Forthis purpose, most cellular mRNA targets of viral miRNAsidentified to date play a role in either regulation of apoptosisor host antiviral immune response. miRNAs are suitable fora viral genome expression as they are short and compact. Inaddition, they can be generated more readily than proteinsagainst new target genes and do not elicit any antigenicresponse. Their evolutionary flexibility is based on the highmutation rates of the viruses. This leads to modificationsin the miRNA genes themselves, and thus even the largestvirus family containing miRNAs (herpesvirus) shows lit-tle conservation between their miRNAs. It also indicatesthat it is unlikely that host miRNA targets viral mRNAsas these would mutate away from disruptive regulation(also see [85, 86]) .
4.2. The Large Variation in miRNA Target Sites. Conservedcomplementarities to a minimal hexamer region (matchingnt 2–7 of the miRNA) [8] indicates that once a seedmatch emerges, it becomes functional. If the bindingis preferentially beneficial, it might serve as a favorableand directional intermediate species. Within Tetrapods, theaverage number of predicted conserved sites per miRNAis at the range of 200 (Figure 3(a), TargetScanS, plottedfor Human miRNAs). However, the number of targets isskewed to the higher values, while the upper and lower 10-percentiles regulate more than 450 or less than 50 genes,respectively (also see [87, 88]). Comparative genomicssuggests that ancient miRNAs have on average twofoldmore targets than newly generated ones (compare 453 to194, resp.). Some discrepancies result from misestimatingmiRNA antiquity or overlapping miRNA functional sites.Specifically, the age of some miRNA genes might havebeen misestimated, as cross-species orthologues searches arenot exhausted yet. miR-761, for example, identified onlyin mouse [57] is in fact conserved in six other mammals(including human and opossum; see [89] also see miRviewerat http://people.csail.mit.edu/akiezun/miRviewer). Alterna-tively, overlapping functional sites shared by miRNAs andother regulatory factors may bias the distribution of targets.For example, pre-existing “scaffolds” of other regulatorysystems could serve as anchors for miRNA binding. In thecase of miR-16, a component of the AU-rich mediatedderegulation of mRNA stability [90], the miRNA is a lateaddition onto a mechanism that was probably functional inthe common ancestor of yeast [91], before the innovationof miRNAs. In this train of thought, some transcriptionaltermination or pause sites [92, 93] overlap with miRNAseed-matches (miR-525 and miR-488). In human, Alutransposable elements exhibit complementarities in some oftheir regions to almost 30 human miRNAs [94]. In otherinstances, the attempt to avoid specific protein bindingdomains in the 3′ UTRs may expel miRNA binding sites.For example, 3′ UTRs may avoid miR-518a seed (which hasonly 26 predicted conserved targets) because it perfectlymatches the proline and acidic rich (PAR) protein binding
sequence [95]. Other miRNA interference events may involvebinding to promoters via antisense transcription, which isestimated to be as common as 15% in the human genome[96]. Overlapping sequences as such might coincide withpromiscuous promoter-associated functions of small RNAs[36] or increase in transcription [97]. Plausibly a selectivepressure to avoid the binding of the aryl hydrocarbonreceptor (AhR) [98] onto miR-521 sites (AhR and miR-521 share the same sequence) may explain how miRNAs ofsimilar antiquity and A/U content (compare to miR-520 h)dramatically vary in their predicted numbers of conservedtargets (compare 8 to >400, resp.; both miRNAs are partof the same primary transcript, BF773110). It is noteworthythat the low number of miR-521 targets cannot be explainedby a conflict of expression in a broad set of tissues since miR-521 is expressed only in placenta.
4.3. Unique Features of miRNAs with Most Number of Targets.In order to further explore the characteristics of miRNAswith extreme number of targets we compared the groupof miRNAs with the largest number of targets to that withthe least number of targets (Figure 3(b), shaded red andgreen, resp.). We found some correlation between miRNAconservation and its potential number of predicted targets.This correlation is emphasized in the conserved target setswhere human-to-mouse conserved miRNAs have on average197 predicted conserved targets; human-to-dog conservedmiRNAs have 245, and human-to-chicken conserved miR-NAs 453. miRNAs with the largest number of targets tend tobe expressed mostly from one arm of the pre-miRNA hairpin(they do not exhibit both 5′ and 3′ arm expression) and areoften expressed at higher levels and in a broader set of tissuescompared to miRNAs with the least number of targets (alsosee [99]).
miRNAs with the largest number of targets are A/U-rich. The average A/U percentage within the seed of thetop 20 miRNAs with the largest number of targets is 57%,compared to 41% for those with the least number oftargets. This may be required for weaker secondary structuresin the target mRNA and for ongoing accessibility [11].Consistently, a general mutational trend (in the humangenome) from G-to-A and C-to-T is more abundant than thereverse direction [100]. Analysis of human Single NucleotidePolymorphisms (SNPs) on a representative chromosome(chromosome 1; 661 SNPs) confirms that the majority ofpolymorphisms generating new potential miRNA bindingsites are G-to-A and C-to-T substitutions (occurring 1.7-foldmore than the reverse direction). Interestingly, the two mostpronounced examples of target polymorphic changes are G-to-A mutations [39, 101].
In summary, miRNA gene integration and maintenanceroughly follow protein-coding genes. After emergence, themiRNA gene sequence is refined through an evolutionaryreciprocal interaction with its accumulating targets, andthese later stabilize the miRNA when reaching a largeenough number of functional targets. Finally, overlappingfunctional sites shared by miRNAs and other regulatoryfactors may facilitate or inhibit miRNA target formation andthus influence miRNA target set size.

6 Journal of Biomedicine and Biotechnology
Any 5-mer in a 7 nt region has a greater chance of evolving (×20);Possible combinations, for example:
1 nt mutation generates a 6-mer potential binding site which is an evolutionary intermediate favoring a relatively rapid change to a stronger binding 7-mer site
Theoretically, every 5-mer combination appears in1024 nt (4^5)
If 7-mer site exerts a favorable and desired regulation,mutation will be maintained through positive selection
8-mer site confers stronger regulation; similarlytwo 7-mer sites for the same miRNA
Regulation by a miRNA
NNCCUCA
NANCUCA
NACNUCA
NACCNCA
NACCUNA
UACCU
UACCUNN
NNNNN
3 UTR (1 kb)
Rapid
Let-7 miRNAs
8-m
er o
r do
ubl
e-st
ron
ger
site
s6-
to 7
-mer
fun
ctio
nal
sit
e5-
mer
pre
-see
d si
te
GAUGGAGU GAUGGAGU
UACCUC
UACCUCA
UACCUCA
UACCUCA
CUACCUCA
CUACCUCA
′
Figure 4: A possible scenario for acquiring a functional miRNA binding site.
5. A Timescale for miRNA Target-Site Evolution
It would take several million years for a specific 7-merbinding site to evolve from a complete null binding sequence[102]. However, miRNA binding sites evolve from existingsequences, and based on these partial binding sequences,(“almost-binding” sites or “pre-seed” sites), a correctedestimated time for a miRNA binding site to emerge is0.2 million years (Durrett R., personal communications).For example, a 5 nt pre-seed site will appear every 1024 nt(4∧5) or even 20 times more often since the position of the5 nt within the 7 nt is not restricted and may also includeinserts. Thus, a 1 kb 3′ UTR will contain several potentialpre-seed sequences. A human specific miRNA that is absenteven from the chimp genome should be roughly 6 millionyears old (last estimated split between human and chimp).Given 0.2 million years required for a 7-mer binding site toevolve, around 30 perfect 7-mer binding sites are expected.For an miRNA that is traced back to mouse (split more than100 million years ago from human), about 500 conservedtargets per miRNA are reasonable. This simplified calculationmight indicate that, given a spontaneous mutation rate,there should be a direct correlation between the age of anmiRNA and the number of targets it possesses and also tothe number of duplicated events of the same miRNA site onone transcript. Eventually, it is not enough for the mutationto occur—it should also be maintained in the populationafter exhibiting a strong selective pressure towards a favorableregulation which can only take place when an miRNA andits targets are spatially and temporally coexpressed [83, 103].This calculation allows us to set the general time line of
events for miRNA formation. Nevertheless there are manyoutstanding exceptions of small and large miRNA targetrepertoires (also see Figure 4 ).
Websites Used
Ensembl: http://www.ensembl.orgGenBank: http://www.ncbi.nlm.nih.govmiRBase: http://microrna.sanger.ac.uk/miRNAminer: http://groups.csail.mit.edu/pag/mirnaminermiRviewer: http://people.csail.mit.edu/akiezun/miRviewerPatrocles: http://www.patrocles.org/TargetRank: http://hollywood.mit.edu/targetrankTargetScanS: http://www.targetscan.orgUCSC genome browser: http://genome.ucsc.edu.
Acknowledgments
The authors thank the following people for commentingon their manuscript: Brad Friedman, Alex Stark, IftachNachman, Robin Friedman, Eric Wang, Rickard Sandberg,Etgar Levy-Nissenbaum, and the Shomron lab members.They thank Rick Durrett and Deena Schmidt for assistancein statistical calculations. Work at the NS lab is supported bythe Israeli Ministry of Health and the Kunz-Lion Foundation.EH is the incumbent of the Helen and Milton A. KimmelmanCareer Development Chair. Work at the EH lab is supportedby grants from the JDRF, ISF, ISf-Legacy, GIF, the BenoziyoCenter for Neurological Disease, the Estate of Flourence Blauand the Wolfson Family Charitable trust for miRNA.
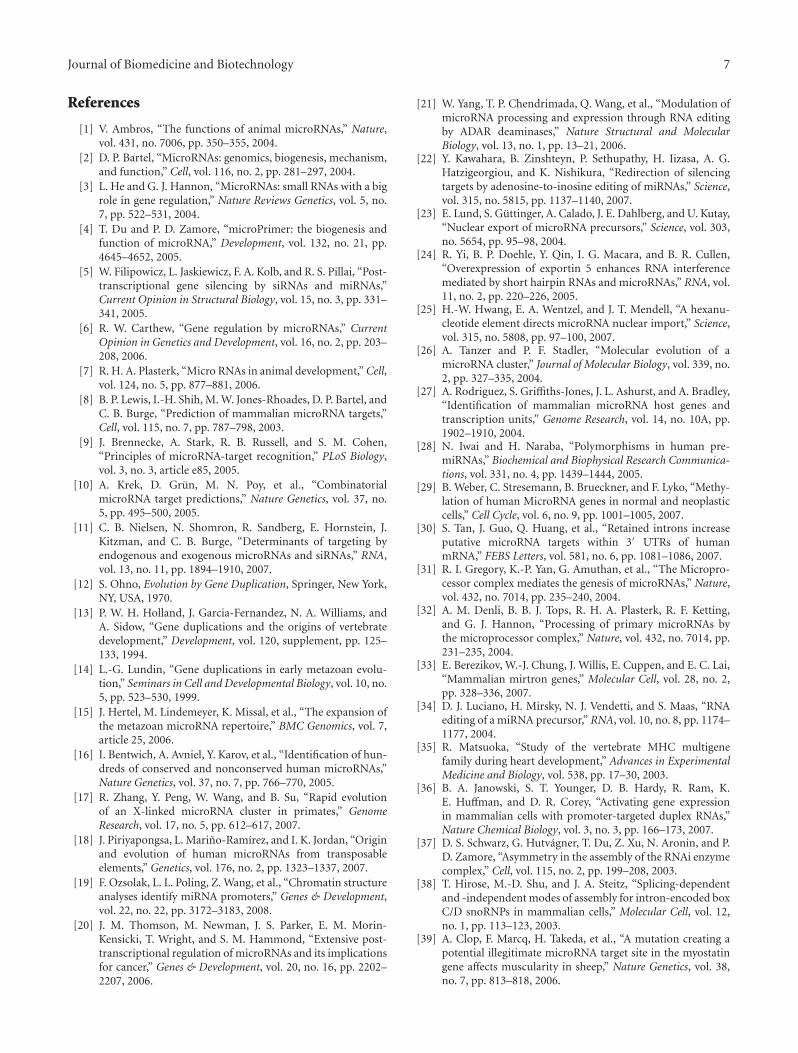
Journal of Biomedicine and Biotechnology 7
References
[1] V. Ambros, “The functions of animal microRNAs,” Nature,vol. 431, no. 7006, pp. 350–355, 2004.
[2] D. P. Bartel, “MicroRNAs: genomics, biogenesis, mechanism,and function,” Cell, vol. 116, no. 2, pp. 281–297, 2004.
[3] L. He and G. J. Hannon, “MicroRNAs: small RNAs with a bigrole in gene regulation,” Nature Reviews Genetics, vol. 5, no.7, pp. 522–531, 2004.
[4] T. Du and P. D. Zamore, “microPrimer: the biogenesis andfunction of microRNA,” Development, vol. 132, no. 21, pp.4645–4652, 2005.
[5] W. Filipowicz, L. Jaskiewicz, F. A. Kolb, and R. S. Pillai, “Post-transcriptional gene silencing by siRNAs and miRNAs,”Current Opinion in Structural Biology, vol. 15, no. 3, pp. 331–341, 2005.
[6] R. W. Carthew, “Gene regulation by microRNAs,” CurrentOpinion in Genetics and Development, vol. 16, no. 2, pp. 203–208, 2006.
[7] R. H. A. Plasterk, “Micro RNAs in animal development,” Cell,vol. 124, no. 5, pp. 877–881, 2006.
[8] B. P. Lewis, I.-H. Shih, M. W. Jones-Rhoades, D. P. Bartel, andC. B. Burge, “Prediction of mammalian microRNA targets,”Cell, vol. 115, no. 7, pp. 787–798, 2003.
[9] J. Brennecke, A. Stark, R. B. Russell, and S. M. Cohen,“Principles of microRNA-target recognition,” PLoS Biology,vol. 3, no. 3, article e85, 2005.
[10] A. Krek, D. Grun, M. N. Poy, et al., “CombinatorialmicroRNA target predictions,” Nature Genetics, vol. 37, no.5, pp. 495–500, 2005.
[11] C. B. Nielsen, N. Shomron, R. Sandberg, E. Hornstein, J.Kitzman, and C. B. Burge, “Determinants of targeting byendogenous and exogenous microRNAs and siRNAs,” RNA,vol. 13, no. 11, pp. 1894–1910, 2007.
[12] S. Ohno, Evolution by Gene Duplication, Springer, New York,NY, USA, 1970.
[13] P. W. H. Holland, J. Garcia-Fernandez, N. A. Williams, andA. Sidow, “Gene duplications and the origins of vertebratedevelopment,” Development, vol. 120, supplement, pp. 125–133, 1994.
[14] L.-G. Lundin, “Gene duplications in early metazoan evolu-tion,” Seminars in Cell and Developmental Biology, vol. 10, no.5, pp. 523–530, 1999.
[15] J. Hertel, M. Lindemeyer, K. Missal, et al., “The expansion ofthe metazoan microRNA repertoire,” BMC Genomics, vol. 7,article 25, 2006.
[16] I. Bentwich, A. Avniel, Y. Karov, et al., “Identification of hun-dreds of conserved and nonconserved human microRNAs,”Nature Genetics, vol. 37, no. 7, pp. 766–770, 2005.
[17] R. Zhang, Y. Peng, W. Wang, and B. Su, “Rapid evolutionof an X-linked microRNA cluster in primates,” GenomeResearch, vol. 17, no. 5, pp. 612–617, 2007.
[18] J. Piriyapongsa, L. Marino-Ramırez, and I. K. Jordan, “Originand evolution of human microRNAs from transposableelements,” Genetics, vol. 176, no. 2, pp. 1323–1337, 2007.
[19] F. Ozsolak, L. L. Poling, Z. Wang, et al., “Chromatin structureanalyses identify miRNA promoters,” Genes & Development,vol. 22, no. 22, pp. 3172–3183, 2008.
[20] J. M. Thomson, M. Newman, J. S. Parker, E. M. Morin-Kensicki, T. Wright, and S. M. Hammond, “Extensive post-transcriptional regulation of microRNAs and its implicationsfor cancer,” Genes & Development, vol. 20, no. 16, pp. 2202–2207, 2006.
[21] W. Yang, T. P. Chendrimada, Q. Wang, et al., “Modulation ofmicroRNA processing and expression through RNA editingby ADAR deaminases,” Nature Structural and MolecularBiology, vol. 13, no. 1, pp. 13–21, 2006.
[22] Y. Kawahara, B. Zinshteyn, P. Sethupathy, H. Iizasa, A. G.Hatzigeorgiou, and K. Nishikura, “Redirection of silencingtargets by adenosine-to-inosine editing of miRNAs,” Science,vol. 315, no. 5815, pp. 1137–1140, 2007.
[23] E. Lund, S. Guttinger, A. Calado, J. E. Dahlberg, and U. Kutay,“Nuclear export of microRNA precursors,” Science, vol. 303,no. 5654, pp. 95–98, 2004.
[24] R. Yi, B. P. Doehle, Y. Qin, I. G. Macara, and B. R. Cullen,“Overexpression of exportin 5 enhances RNA interferencemediated by short hairpin RNAs and microRNAs,” RNA, vol.11, no. 2, pp. 220–226, 2005.
[25] H.-W. Hwang, E. A. Wentzel, and J. T. Mendell, “A hexanu-cleotide element directs microRNA nuclear import,” Science,vol. 315, no. 5808, pp. 97–100, 2007.
[26] A. Tanzer and P. F. Stadler, “Molecular evolution of amicroRNA cluster,” Journal of Molecular Biology, vol. 339, no.2, pp. 327–335, 2004.
[27] A. Rodriguez, S. Griffiths-Jones, J. L. Ashurst, and A. Bradley,“Identification of mammalian microRNA host genes andtranscription units,” Genome Research, vol. 14, no. 10A, pp.1902–1910, 2004.
[28] N. Iwai and H. Naraba, “Polymorphisms in human pre-miRNAs,” Biochemical and Biophysical Research Communica-tions, vol. 331, no. 4, pp. 1439–1444, 2005.
[29] B. Weber, C. Stresemann, B. Brueckner, and F. Lyko, “Methy-lation of human MicroRNA genes in normal and neoplasticcells,” Cell Cycle, vol. 6, no. 9, pp. 1001–1005, 2007.
[30] S. Tan, J. Guo, Q. Huang, et al., “Retained introns increaseputative microRNA targets within 3′ UTRs of humanmRNA,” FEBS Letters, vol. 581, no. 6, pp. 1081–1086, 2007.
[31] R. I. Gregory, K.-P. Yan, G. Amuthan, et al., “The Micropro-cessor complex mediates the genesis of microRNAs,” Nature,vol. 432, no. 7014, pp. 235–240, 2004.
[32] A. M. Denli, B. B. J. Tops, R. H. A. Plasterk, R. F. Ketting,and G. J. Hannon, “Processing of primary microRNAs bythe microprocessor complex,” Nature, vol. 432, no. 7014, pp.231–235, 2004.
[33] E. Berezikov, W.-J. Chung, J. Willis, E. Cuppen, and E. C. Lai,“Mammalian mirtron genes,” Molecular Cell, vol. 28, no. 2,pp. 328–336, 2007.
[34] D. J. Luciano, H. Mirsky, N. J. Vendetti, and S. Maas, “RNAediting of a miRNA precursor,” RNA, vol. 10, no. 8, pp. 1174–1177, 2004.
[35] R. Matsuoka, “Study of the vertebrate MHC multigenefamily during heart development,” Advances in ExperimentalMedicine and Biology, vol. 538, pp. 17–30, 2003.
[36] B. A. Janowski, S. T. Younger, D. B. Hardy, R. Ram, K.E. Huffman, and D. R. Corey, “Activating gene expressionin mammalian cells with promoter-targeted duplex RNAs,”Nature Chemical Biology, vol. 3, no. 3, pp. 166–173, 2007.
[37] D. S. Schwarz, G. Hutvagner, T. Du, Z. Xu, N. Aronin, and P.D. Zamore, “Asymmetry in the assembly of the RNAi enzymecomplex,” Cell, vol. 115, no. 2, pp. 199–208, 2003.
[38] T. Hirose, M.-D. Shu, and J. A. Steitz, “Splicing-dependentand -independent modes of assembly for intron-encoded boxC/D snoRNPs in mammalian cells,” Molecular Cell, vol. 12,no. 1, pp. 113–123, 2003.
[39] A. Clop, F. Marcq, H. Takeda, et al., “A mutation creating apotential illegitimate microRNA target site in the myostatingene affects muscularity in sheep,” Nature Genetics, vol. 38,no. 7, pp. 813–818, 2006.

8 Journal of Biomedicine and Biotechnology
[40] A. Grishok, A. E. Pasquinelli, D. Conte, et al., “Genes andmechanisms related to RNA interference regulate expressionof the small temporal RNAs that control C. elegans develop-mental timing,” Cell, vol. 106, no. 1, pp. 23–34, 2001.
[41] G. Hutvagner, J. McLachlan, A. E. Pasquinelli, E. Balint, T.Tuschl, and P. D. Zamore, “A cellular function for the RNA-interference enzyme dicer in the maturation of the let-7 smalltemporal RNA,” Science, vol. 293, no. 5531, pp. 834–838,2001.
[42] R. C. Lee and V. Ambros, “An extensive class of small RNAsin Caenorhabditis elegans,” Science, vol. 294, no. 5543, pp.862–864, 2001.
[43] J. W. Pham, J. L. Pellino, Y. S. Lee, R. W. Carthew, and E.J. Sontheimer, “A Dicer-2-dependent 80S complex cleavestargeted mRNAs during RNAi in Drosophila,” Cell, vol. 117,no. 1, pp. 83–94, 2004.
[44] J. Winter, S. Jung, S. Keller, R. I. Gregory, and S. Diederichs,“Many roads to maturity: microRNA biogenesis pathwaysand their regulation,” Nature Cell Biology, vol. 11, no. 3, pp.228–234, 2009.
[45] P. Bertone, V. Stolc, T. E. Royce, et al., “Global identificationof human transcribed sequences with genome tiling arrays,”Science, vol. 306, no. 5705, pp. 2242–2246, 2004.
[46] J. S. Pedersen, G. Bejerano, A. Siepel, et al., “Identificationand classification of conserved RNA secondary structures inthe human genome,” PLoS Computational Biology, vol. 2, no.4, article e33, 2006.
[47] P. Landgraf, M. Rusu, R. Sheridan, et al., “A mammalianmicroRNA expression atlas based on small RNA librarysequencing,” Cell, vol. 129, no. 7, pp. 1401–1414, 2007.
[48] R. Yelin, D. Dahary, R. Sorek, et al., “Widespread occurrenceof antisense transcription in the human genome,” NatureBiotechnology, vol. 21, no. 4, pp. 379–386, 2003.
[49] G. Lavorgna, D. Dahary, B. Lehner, R. Sorek, C. M.Sanderson, and G. Casari, “In search of antisense,” Trends inBiochemical Sciences, vol. 29, no. 2, pp. 88–94, 2004.
[50] K. Okamura, J. W. Hagen, H. Duan, D. M. Tyler, and E. C. Lai,“The mirtron pathway generates microRNA-class regulatoryRNAs in Drosophila,” Cell, vol. 130, no. 1, pp. 89–100, 2007.
[51] J. G. Ruby, C. H. Jan, and D. P. Bartel, “Intronic microRNAprecursors that bypass Drosha processing,” Nature, vol. 448,no. 7149, pp. 83–86, 2007.
[52] M. Lagos-Quintana, R. Rauhut, W. Lendeckel, and T. Tuschl,“Identification of novel genes coding for small expressedRNAs,” Science, vol. 294, no. 5543, pp. 853–858, 2001.
[53] E. C. Lai, P. Tomancak, R. W. Williams, and G. M. Rubin,“Computational identification of Drosophila microRNAgenes,” Genome Biology, vol. 4, no. 7, article R42, 2003.
[54] Y. Altuvia, P. Landgraf, G. Lithwick, et al., “Clustering andconservation patterns of human microRNAs,” Nucleic AcidsResearch, vol. 33, no. 8, pp. 2697–2706, 2005.
[55] S. Baskerville and D. P. Bartel, “Microarray profiling ofmicroRNAs reveals frequent coexpression with neighboringmiRNAs and host genes,” RNA, vol. 11, no. 3, pp. 241–247,2005.
[56] M. J. Weber, “New human and mouse microRNA genesfound by homology search,” FEBS Journal, vol. 272, no. 1,pp. 59–73, 2005.
[57] E. Berezikov, G. van Tetering, M. Verheul, et al., “Many novelmammalian microRNA candidates identified by extensivecloning and RAKE analysis,” Genome Research, vol. 16, no.10, pp. 1289–1298, 2006.
[58] S.-L. Lin, J. D. Miller, and S.-Y. Ying, “Intronic microRNA(miRNA),” Journal of Biomedicine and Biotechnology, vol.2006, no. 4, p. 26818, 2006.
[59] Y.-K. Kim and V. N. Kim, “Processing of intronic microR-NAs,” The EMBO Journal, vol. 26, no. 3, pp. 775–783, 2007.
[60] Y. Liang, D. Ridzon, L. Wong, and C. Chen, “Characterizationof microRNA expression profiles in normal human tissues,”BMC Genomics, vol. 8, article 166, 2007.
[61] A. Sewer, N. Paul, P. Landgraf, et al., “Identification ofclustered microRNAs using an ab initio prediction method,”BMC Bioinformatics, vol. 6, article 267, 2005.
[62] H. Seitz, H. Royo, M.-L. Bortolin, S.-P. Lin, A. C. Ferguson-Smith, and J. Cavaille, “A large imprinted microRNA genecluster at the mouse Dlk1-Gtl2 domain,” Genome Research,vol. 14, no. 9, pp. 1741–1748, 2004.
[63] B. Zhang, X. Pan, C. H. Cannon, G. P. Cobb, and T. A.Anderson, “Conservation and divergence of plant microRNAgenes,” Plant Journal, vol. 46, no. 2, pp. 243–259, 2006.
[64] U. Ohler, S. Yekta, L. P. Lim, D. P. Bartel, and C. B. Burge,“Patterns of flanking sequence conservation and a charac-teristic upstream motif for microRNA gene identification,”RNA, vol. 10, no. 9, pp. 1309–1322, 2004.
[65] J. Lee, Z. Li, R. Brower-Sinning, and B. John, “Regulatory cir-cuit of human microRNA biogenesis,” PLoS ComputationalBiology, vol. 3, no. 4, article e67, 2007.
[66] X. Zhou, J. Ruan, G. Wang, and W. Zhang, “Characterizationand identification of microRNA core promoters in fourmodel species,” PLoS Computational Biology, vol. 3, no. 3,article e37, 2007.
[67] B. Ason, D. K. Darnell, B. Wittbrodt, et al., “Differences invertebrate microRNA expression,” Proceedings of the NationalAcademy of Sciences of the United States of America, vol. 103,no. 39, pp. 14385–14389, 2006.
[68] W. Filipowicz and V. Pogacic, “Biogenesis of small nucleolarribonucleoproteins,” Current Opinion in Cell Biology, vol. 14,no. 3, pp. 319–327, 2002.
[69] S. Vincenti, V. de Chiara, I. Bozzoni, and C. Presutti, “Theposition of yeast snoRNA-coding regions within host intronsis essential for their biosynthesis and for efficient splicing ofthe host pre-mRNA,” RNA, vol. 13, no. 1, pp. 138–150, 2007.
[70] E. van Rooij, L. B. Sutherland, X. Qi, J. A. Richardson, J.Hill, and E. N. Olson, “Control of stress-dependent cardiacgrowth and gene expression by a microRNA,” Science, vol.316, no. 5824, pp. 575–579, 2007.
[71] J. M. Pawlicki and J. A. Steitz, “Primary microRNA tran-script retention at sites of transcription leads to enhancedmicroRNA production,” Journal of Cell Biology, vol. 182, no.1, pp. 61–76, 2008.
[72] J. M. Pawlicki and J. A. Steitz, “Subnuclear compart-mentalization of transiently expressed polyadenylated pri-microRNAs: processing at transcription sites or accumula-tion in SC35 foci,” Cell Cycle, vol. 8, no. 3, pp. 345–356, 2009.
[73] M. Morlando, M. Ballarino, N. Gromak, F. Pagano, I. Boz-zoni, and N. J. Proudfoot, “Primary microRNA transcriptsare processed co-transcriptionally,” Nature Structural andMolecular Biology, vol. 15, no. 9, pp. 902–909, 2008.
[74] N. Shomron and C. Levy, “MicroRNA-biogenesis andpre-mRNA splicing crosstalk,” Journal of Biomedicine andBiotechnology, vol. 2009, Article ID 594678, 6 pages, 2009.
[75] S. Butenas, R. F. Branda, C. Van’t Veer, K. M. Cawthern, andK. G. Mann, “Platelets and phospholipids in tissue factor-initiated thrombin generation,” Thrombosis and Haemostasis,vol. 86, no. 2, pp. 660–667, 2001.
[76] B. P. Lewis, C. B. Burge, and D. P. Bartel, “Conservedseed pairing, often flanked by adenosines, indicates thatthousands of human genes are microRNA targets,” Cell, vol.120, no. 1, pp. 15–20, 2005.

Journal of Biomedicine and Biotechnology 9
[77] E. Morkin, “Control of cardiac myosin heavy chain geneexpression,” Microscopy Research and Technique, vol. 50, no.6, pp. 522–531, 2000.
[78] D. Gaidatzis, E. van Nimwegen, J. Hausser, and M. Zavolan,“Inference of miRNA targets using evolutionary conservationand pathway analysis,” BMC Bioinformatics, vol. 8, article 69,2007.
[79] R. Revilla-i-Domingo and E. H. Davidson, “Developmentalgene network analysis,” International Journal of Developmen-tal Biology, vol. 47, no. 7-8, pp. 695–703, 2003.
[80] L. F. Sempere, C. N. Cole, M. A. Mcpeek, and K. J. Peterson,“The phylogenetic distribution of metazoan microRNAs:insights into evolutionary complexity and constraint,” Jour-nal of Experimental Zoology Part B, vol. 306, no. 6, pp. 575–588, 2006.
[81] K. Chen and N. Rajewsky, “Natural selection on humanmicroRNA binding sites inferred from SNP data,” NatureGenetics, vol. 38, no. 12, pp. 1452–1456, 2006.
[82] M. A. Saunders, H. Liang, and W.-H. Li, “Human polymor-phism at microRNAs and microRNA target sites,” Proceedingsof the National Academy of Sciences of the United States ofAmerica, vol. 104, no. 9, pp. 3300–3305, 2007.
[83] K. K.-H. Farh, A. Grimson, C. Jan, et al., “The widespreadimpact of mammalian microRNAs on mRNA repression andevolution,” Science, vol. 310, no. 5755, pp. 1817–1821, 2005.
[84] R. C. Friedman, K. K.-H. Farh, C. B. Burge, and D. P.Bartel, “Most mammalian mRNAs are conserved targets ofmicroRNAs,” Genome Research, vol. 19, no. 1, pp. 92–105,2009.
[85] J. L. Umbach and B. R. Cullen, “The role of RNAi andmicroRNAs in animal virus replication and antiviral immu-nity,” Genes & Development, vol. 23, no. 10, pp. 1151–1164,2009.
[86] B. R. Cullen, “Viral and cellular messenger RNA targets ofviral microRNAs,” Nature, vol. 457, no. 7228, pp. 421–425,2009.
[87] B. John, A. J. Enright, A. Aravin, T. Tuschl, C. Sander, and D.S. Marks, “Human microRNA targets,” PLoS Biology, vol. 2,no. 11, article e363, 2004.
[88] R. Shalgi, D. Lieber, M. Oren, and Y. Pilpel, “Global and localarchitecture of the mammalian microRNA-transcriptionfactor regulatory network,” PLoS Computational Biology, vol.3, no. 7, article e131, 2007.
[89] S. Artzi, A. Kiezun, and N. Shomron, “miRNAminer: a toolfor homologous microRNA gene search,” BMC Bioinformat-ics, vol. 9, article 39, 2008.
[90] Q. Jing, S. Huang, S. Guth, et al., “Involvement of microRNAin AU-rich element-mediated mRNA instability,” Cell, vol.120, no. 5, pp. 623–634, 2005.
[91] C. A. Beelman and R. Parker, “Degradation of mRNA ineukaryotes,” Cell, vol. 81, no. 2, pp. 179–183, 1995.
[92] R. Ashfield, P. Enriquez-Harris, and N. J. Proudfoot, “Tran-scriptional termination between the closely linked humancomplement genes C2 and factor B: common terminationfactor for C2 and c-myc?” The EMBO Journal, vol. 10, no.13, pp. 4197–4207, 1991.
[93] M. Yonaha and N. J. Proudfoot, “Transcriptional terminationand coupled polyadenylation in vitro,” The EMBO Journal,vol. 19, no. 14, pp. 3770–3777, 2000.
[94] N. R. Smalheiser and V. I. Torvik, “Alu elements withinhuman mRNAs are probable microRNA targets,” Trends inGenetics, vol. 22, no. 10, pp. 532–536, 2006.
[95] K. Newcombe, T. Glassco, and C. Mueller, “Regulation of theDBP promoter by PAR proteins and in leukemic cells bearing
an E2A/HLF translocation,” Biochemical and BiophysicalResearch Communications, vol. 245, no. 2, pp. 633–639, 1998.
[96] M. Lapidot and Y. Pilpel, “Genome-wide natural antisensetranscription: coupling its regulation to its different regula-tory mechanisms,” EMBO Reports, vol. 7, no. 12, pp. 1216–1222, 2006.
[97] L.-C. Li, S. T. Okino, H. Zhao, et al., “Small dsRNAs inducetranscriptional activation in human cells,” Proceedings of theNational Academy of Sciences of the United States of America,vol. 103, no. 46, pp. 17337–17342, 2006.
[98] F. Saatcioglu, D. J. Perry, D. S. Pasco, and J. B. Fagan,“Multiple DNA-binding factors interact with overlappingspecificities at the aryl hydrocarbon response element of thecytochrome P450IA1 gene,” Molecular and Cellular Biology,vol. 10, no. 12, pp. 6408–6416, 1990.
[99] K. Chen and N. Rajewsky, “The evolution of gene regulationby transcription factors and microRNAs,” Nature ReviewsGenetics, vol. 8, no. 2, pp. 93–103, 2007.
[100] E. S. Lander, L. M. Linton, B. Birren, et al., “Initial sequencingand analysis of the human genome,” Nature, vol. 409, no.6822, pp. 860–921, 2001.
[101] J. F. Abelson, K. Y. Kwan, B. J. O’Roak, et al., “Sequence vari-ants in SLITRK1 are associated with Tourette’s syndrome,”Science, vol. 310, no. 5746, pp. 317–320, 2005.
[102] R. Durrett and D. Schmidt, “Waiting for regulatory sequencesto appear,” Annals of Applied Probability, vol. 17, no. 1, pp. 1–32, 2007.
[103] A. Stark, J. Brennecke, N. Bushati, R. B. Russell, andS. M. Cohen, “Animal microRNAs confer robustness togene expression and have a significant impact on 3′ UTRevolution,” Cell, vol. 123, no. 6, pp. 1133–1146, 2005.

Hindawi Publishing CorporationJournal of Biomedicine and BiotechnologyVolume 2009, Article ID 363145, 11 pagesdoi:10.1155/2009/363145
Research Article
Interaction Map and Selection of microRNA Targets inParkinson’s Disease-Related Genes
Shinde Santosh P.,1 Neelima Arora,1 Pranjal Sarma,2 Manika Pal-Bhadra,2
and Utpal Bhadra1
1 Functional Genomics and Gene Silencing Group, Centre for Cellular and Molecular Biology, Hyderabad 500007, AP, India2 Centre for Chemical Biology, Indian Institute of Chemical Technology, Tarnaka, Hyderabad 500007, AP, India
Correspondence should be addressed to Utpal Bhadra, [email protected]
Received 31 March 2009; Revised 31 July 2009; Accepted 11 August 2009
Recommended by Zhumur Ghosh
Parkinson’s disease (PD) is a complex multigenic neurodisorder frequently occurring in elderly persons. To investigate noncodingtiny microRNA mediated gene regulation, miRanda (version 1.0b) was used to predict human miRNA target sites on selected 29genes related to PD. To verify output generated from miRanda, a similar analysis was performed only for microRNA target sites in3′UTR using TargetScan (version 5.1). Data extracted by miRanda elucidates the mode of microRNA action based on the locationof target sites in the Parkinson genes. Sites prone to action of multiple miRNAs were identified as “hot spots.” Important propertiesof each miRNA including multiplicity and cooperativity appear to contribute towards a complex interplay between miRNAs andtheir targets. Two sets of predicted results were explored for the occurrence of target sites of 112 miRNAs expressed in midbrain.Overall, convergence of results predicted by two algorithms revealed that 48 target sites for midbrain-specific miRNA occur inclose proximity in 9 genes. This study will pave a way for selection of potential miRNA candidates for Parkinson’s disease-relatedgenes for quick therapeutic applications and diagnosis.
Copyright © 2009 Shinde Santosh P. et al. This is an open access article distributed under the Creative Commons AttributionLicense, which permits unrestricted use, distribution, and reproduction in any medium, provided the original work is properlycited.
1. Introduction
Mysteries underlying the neurological disorders are as com-plex and bewildering as human mind itself. Aging relateddisorders such as Alzheimer and Parkinson’s diseases aremajor culprits behind poor memory in elderly persons.Parkinson’s disease has emerged as the second most commonneurodegenerative disorder afflicting about 4 million peopleacross the globe [1]. Steep rise in PD cases in agedpopulation is quite distressing [2]. Though sporadic casesare more common yet in a significant fraction of westernpopulation, it can be attributed to delicate and fine tuningof gene regulation profile related to disorders [3]. PD ismanifested as an outcome of interaction of copious geneticand environmental factors [4].
Parkinson’s disease is characterized by motor impair-ments such as tremor of a limb usually restricted to oneside of body. Concomitant symptoms including rigidity orstiffness of the limbs and trunk, akinesia, and impaired
balance and postural instability [5–8] are often accompaniedwith depression to complete the clinical picture of PD. Onsetof symptoms is the result of loss of neurons substantia nigrapars compacta causing a considerable decline in levels ofDopamine, a neurotransmitter. The hallmarks essential forPD diagnosis is the occurrence of eosinophilic proteinaceousinclusions, Lewy bodies in extant dopaminergic neurons. PDis incurable and various drugs prescribed for PD treatmentoffer merely symptomatic relief and contribute little to thehalt of disease progression.
Since its description in 1817, very little was known aboutits etiology until recent days. The discovery of a series ofgenes involved in rare familial PD has instilled immenseexhilaration and provided much needed impetus to researchin this arena. There is mounting evidence that severalgenes like a-synuclein, Parkin, PTEN induced putative kinase1 (PINK1), DJ-1, leucine-rich repeat kinase 2 (LRRK2),and ATP13A2 are misregulated in PD [9]. But whetherthese genes contribute in a common regulatory pathway or

2 Journal of Biomedicine and Biotechnology
multiple parallel subpathways converging to same sequencein molecular pathogenesis of PD is yet to be resolved.microRNAs, generally known as negative regulators of geneexpression, have attracted a lot of attention in recent timesfor their possible role on fine tuning of disease relatedgenes. miRNAs are known to regulate approximately 30% ofgenes in human genome [10]. There is escalating evidenceregarding the involvement of the abundant and endogenous21–23 nt long RNA in various neurodegenerative disorders.Elucidation of precise biological function of these miRNAshas been the subject of many studies. miRNAs are involved incell differentiation, development, apoptosis [11], stress resis-tance [12], tumor formation [13], and more importantly inneurodegenerative disorders [11, 14–16]. The establishmentof role of miR-133b in mammalian midbrain dopaminergicneurons (DNs) has spurred a new interest in studies ofthe prospective function of these miRNAs in Parkinson’sdisease [17]. It appears that level of several miRNAs (miR-10a, miR-10b, miR-212, miR-132, and 495) modulates genesrelated to PD considerably [18]. Earlier studies provide someevidences about the involvement of miRNAs in Parkinsondisease [19] but do not offer a full comprehensive view ofmicroRNA dependent regulation of PD genes. Availabilityof simple, rapid, and accurate computer-based methodsand development of efficient algorithms for micro RNAprediction have generated a great deal of interest [20, 21].Here, our analysis reveals a complex interplay betweenmicroRNA and Parkinson genes for understanding themechanism of PD pathogenesis. In practice, conventionalbiochemical miRNA profile is often encountered with severalproblems including transient, and low level of microRNAexpression, tissue specificity and complex interaction withtargets [20, 22]. Computational prediction of miRNA targetsites can readily predict the role of miRNAs in the regulatorypathways.
The multifarious relationships shared by genes relatedto PD pathway, regulation of various miRNAs by othermiRNAs in response to indefinite cues impose the needof an interaction map. This study aims at developing acomplex interaction map between genes and microRNAs inthe PD pathways, which will provide readymade clues forselection of miRNA using a comprehensive view of overallinterplay between genes and microRNAs. This interactionmap unravels some unexpected complexity in searching ofmicroRNA target selection.
2. Methods
In the current study, we emphasized on identification offraction of miRNA specific to the PD genetic pathwayand propose an interaction network between these genesand targeted miRNA. Figure 1 represents stepwise workflowundertaken for the study.
2.1. Selection of Genes. Parkinson’s disease pathway(Figure 2) in Kyoto Encyclopedia of genes and Genomes(KEGG) available at http://www.genome.jp/kegg/ consistsof 27 genes. Among them, genetic studies have identified
few candidates such as parkin (PARK5, PARK6, PARK7,PARK8), alpha-syncline, NR4A2, synphilin-1, GBA, SNCAwhich, once mutated, can result Parkinson’s disease likesymptoms. Here, 2 more genes were also added to the PDnetwork based on literature survey.
Genes selected are CASP3, CASP9, COX6B2, CYCS,GPR37, HTRA2, APAF1, UQCRFSL1, LOC100133737,LRRK2, NDUFS7, PARK2, PARK7, PTEN induced puta-tive kinase1 (PINK1), SDHA, SEPT5, SLC6A3, SLC18A1,SLC25A4, SNCA, SNCAIP, TH, UBE1, UBE2J2, UBE2L3,ubiquitinB, UCHL1, GBA [23–25], NR4A2 [26]. Out of the29 genes selected for this study, PINK1, PARK7, UBE2J2,GBA, and CASP9 are located on chromosome 1 whileUCHL1, SNCA, CASP3, SLC25A4 are located on chromo-some 4. Genes SDHA, SLC6A3, SNCAIP are present on chro-mosome 5. The position and location of each gene on thechromosomes is summarized (see Table S1 in Supplemen-tary Material available online at doi:10.1155/2009/363145).Sequences for the selected genes were collected in Fastaformat from NCBI.
Total 866 human miRNA were downloaded in Fasta for-mat from miRBASE (http://microrna.sanger.ac.uk/sequen-ces/).
For prediction of miRNA targets, miRanda (version 1.0b)employs dynamic programming based on sequence comple-mentarity, allotting higher weights to matches at the 5′ endof the mature miRNA while considering the free energy ofthe RNA-RNA duplex (calculated using RNAFold) [27] andthe extent of conservation of the miRNA target across relatedgenomes. miRanda [28, 29] software version 1.0b available athttp://www.microrna.org/miranda was employed to predicttarget sites for these miRNAs. Cut-off values for predictionof target sites selected in analysis were Gap Open Penalty:2.0, Gap Extend: 8.00 match score (S) ≥150.00, duplexfree energy (ΔG) = −25.00 kcal/mol, Scaling Parameter (w)= 3.00. The selected gene sequences and human miRNAsequences were used as reference and query sequences,respectively, as input to miRanda. Conservation criterion wasnot used as it is reported that the nonconserved target sitesmay also play a part in repression.
Output generated from miRanda was used for target siteidentification and subsequent analysis. Top 10 microRNAswere selected based on the highest threshold match scores.Multiplicity and cooperativity were determined for all themiRNAs. Positions of the target sites for these miRNAs on29 genes were explored and sites prone to multiple miRNAswere identified. After assembling the data for all genes, top10 miRNAs were selected based on high multiplicity andClustalW provided in miRBase was employed to investigatethe conservation pattern in these microRNAs. A complexinteraction map of interplay among 29 genes and top 10miRNAs which showed maximum number of interactionwith Parkinson disease associated genes was constructed.
2.2. Physico-Chemical Properties of Top 10 miRNAs. Impor-tant physico-chemical properties of 10 miRNAs (based onmultiplicity) such as molecular weight (Kilo Dalton), freeenergy (δG in Kcal/mol), and composition were calculated by

Journal of Biomedicine and Biotechnology 3
27 genes from KEGG pathway and 2 genes from literature were selected
Sequences of 29 genes collected fromNCBI in Fasta format
Human miRNA (866) sequences collectedfrom miRbase
miRanda
Extraction of potential target sites
Selection of top 10 miRNAs
Finding miRNA clusters on each Parkinson candidate genes
Construction of an interaction map between potent miRNAs and key genes
Comparison of results with TargetScan
Figure 1: Schematic representation of the workflow.
employing Oligo Calc: Oligonucleotide Properties Calculator[30].
Molecular weight and free energy were calculated by thefollowing formulae:
Molecular weight (Mw) = (Anx 329.21) + (Un x 306.17)
+ (Cn x 305.18) + (Gn x 329.21)
+ 159.0,(1)
where An, Un, Cn and Gn are the number of each respectivenucleotide of the RNA molecule under consideration. Addi-tionally, weight 159.0 gm/mole was added that accounts to5′triphosphat.
Free energy (δG) : δG = RT ln
[(RNA · template
)(RNA)
(template
)]. (2)
Both (1) and (2) assume that the annealing occurs under thestandard conditions of 50 nM primer, 50 mM Na+, and pH7.0.
2.3. Validation of miRNA Target Prediction Using MultipleProgrammes. In order to verify target sites of microRNApredicted solely by miRanda, TargetScan (Release 5.1) (31)was employed for prediction of target sites. miRNA targetsin 3′UTR that are common in two miRNA predictionalgorithms and their comparative analysis was provided.
Information regarding specific microRNAs thatare expressed in midbrain was collected from WALKdatabase (http://web.bioinformatics.ic.ac.uk/MSc07/WALK/mirna.html) and whole data was screened for target sites ofmidbrain-specific miRNAs.
3. Results and Discussion
Complex interplay of genes and miRNA appears to be akey factor in determining the delicate balance of diseasecontrolling genes expression. Prediction of miRNAs usingcomputer-based methods serves many advantages and aid inrecognition of molecular hallmarks of the disease that canlead to development of effective screens for miRNA targets.
However, prediction of microRNA targets might sufferfrom numerous problems including tissue specific expressionand lack of validation. Such weakness of in silico studiescan be partially compensated by predicting targets usingmultiple programmes. The outputs can be effectively utilizedfor development of a molecular marker in diagnosis andprognosis.
3.1. miRNA Target Sites in Parkinson’s Disease. Total 5501miRNA binding target sites were predicted for 29 genesselected and the dataset of 866 human miRNA used for theanalysis.
Initially, top 20 miRNA targets were selected on basisof top scores and stringent parameters for each gene. Thesesites were distributed diversely in 5′untranslated regions;coding region and 3′untranslated regions (UTR) (Figure 3,Figure SF1-29, and Table S2 in Supplementary Material).Surprisingly, more target sites were predicted in CDS regionas compared to 3′UTR and 5′UTR. It was found thattarget sites predicted for CASP3, COX6B2, CYCS, SEPT5,SLC6A3, UBE2J2, UBE2L3 genes were more in 3′UTR. Incontrast, no target was predicted in 3′UTR for GPR37,PINK1, SLC25A4, UQCRFSL1, LOC100133737 genes. Tillrecently it was believed that microRNA can target all theregions including 5′UTR, CDS, and 3′ UTR in plants andare restricted to 3′UTR in animals. But there is growing

4 Journal of Biomedicine and Biotechnology
Apoptosis
Oxidative stress Cell death
Lewy body
Peptides
FibrilsProtofibrils
Parkin-substratesaccumulation
Disrupts dopaminerelease?
Endoplasmic reticulum stress
Ubiquitin proteasome system(UPS) disruption
ROS
Dopamine
Disrupted synapticvesicle function
Tyrosinemetabolism
L-DOPA
O
O
O
OTyr
Substrate
Parkin
PaelR
SNCA
CDCrell
Synphilin-1
E3
E2E1UBA1 UbcH7/8
Ubc6/7
UCHL1
UB
UB
DAT
DAT
Cx I
LRRK2
DJ-1
HTRA2
mPTP
CytC
Apaf-1
CASP9
CASP3PINK1
Cx II
Cx III
Cx IV
Cx V
UB
UB
UB
UB
TH
UB
UB
UB
UB
UB
The ubiquitin pathway
Dopaminergic neuron
Parkinson’s disease
ATP depletionATP ADP
O O + OPi
Proteasome
Mitochondrialdysfunction
Polyubiquitination
Ubiquitin mediated proteolysis
Endoplasmic-reticulum-associated E2
Ubiquitin monomers
Dopaminerelease
Environmental toxins
The mitochondrial pathway
Electrontransport chain
Complex Ideficiency
Abnormalphosphorylation
Increased ROSATP depletion
Fall in mitochondrialmembrane potential
Mitochondria
VMAT
Mitochondrial dysfunction
O + OADP
OATP
Pi
Oxidativephosphorylation
MPTP
Rotenone
O
O
OMPP+
Polyubiquitin chain
Synaptic vesicle
O + OAMP
ATPO
PPi α-Sp22(α-synuclein aggregation)
Interacts withα-synuclein
Figure 2: Pathway showing genes involved in Parkinson’s disease (Courtesy: KEGG pathway).
0
500
1000
1500
2000
2500
3000
5′ CDS 3′
1015
2898
1588
Figure 3: Distribution of predicted target sites in 5′UTR, CDS and3′UTR as predicted using miRanda.
evidence that micro RNA can target the CDS [31–35] aswell as 5′region [35, 36]. Location of target sites in aspecified region also provides clues about mode of actionof microRNAs, whether they are involved in transcriptional,posttranscriptional, and translational inhibition. Figure 4
shows the distribution pattern of miRNA target sites on theNDUFS7 genes.
3.2. Identification of Hotspots. Many microRNAs share eithersame target sites or sites located in vicinity of othermicroRNAs. Gathering of many miRNAs in the same siteor vicinity area is commonly known as “hotspot.” Usually,miRNAs that occupy the same spot are coregulated andcoexpressed [37, 38] and are involved in important biologicalfunctions [39–41]. In contrast, it is reasonable to anticipatethat sequences in hotspot region might be occupied onlyby a predominant microRNA among the cluster membersand a microRNA having affinity towards such sites mayoutcast other microRNAs by competitive selection. Buthow such selection of single microRNA occurs is stillunknown. This may provide a reasonable clue regardingthe variable effectiveness of microRNA pools. Researchersemploy different criteria for defining cluster, mostly rangingfrom the presence of more than two miRNAs in a samechromosomal sites [36] occurrence in same orientation,

Journal of Biomedicine and Biotechnology 5
Chromosome: 19; location: 19p13.3
hsa-miR-1908
hsa-miR-612
hsa-miR-1469
hsa-miR-663
hsa-miR-484
hsa-miR-1236
hsa-miR-1183
hsa-miR-612
hsa-miR-760
hsa-miR-663
hsa-miR-1469
hsa-miR-675
hsa-miR-490-5p
hsa-miR-638
hsa-miR-760
hsa-miR-744
hsa-miR-25
hsa-miR-638
hsa-miR-33b∗
hsa-miR-92b∗
0 bp 100 200 300 400 500 600 700 800
0 bp 787 bp
Figure 4: Schematic representation of miRNA targets on NDUFS7.
CASP9 COX6B2CYCS
GPR37
HTRA2
APA
F1
LOC
25LO
C37
LRR
K2
ND
UFS
7
PARK2
PARK7
PINK1
SDHASEPT5SLC6A3
SLC18A1
SLC25A4
SNCA
SNCAIP
TH
UB
E1
UB
E2J
2U
BE2L
3
UbiquitinB
UCHL1GBA
NR4A2 CASP3
1: 2: miR-638 3: miR-608 4: miR-1469 5: miR-658
6: miR-939 7: miR-1301 8: miR-1207-5p9: miR-118310: miR-612
1
2
3
4
56
7
8
9
10
miR-1226∗
Figure 5: Interaction map of miRNA and selected 29 genes. Interactions among genes and miRNAs are depicted with arrows.

6 Journal of Biomedicine and Biotechnology
miRanda1588
TargetScan1974
142
Figure 6: Intersection of miRanda and TargetScan.
1 7
8
13
8
8
4
8
CASP9COX6B2CYCSAPAF1PARK2
SEPT fiveSLC6A3THGBA
Figure 7: Common target sites predicted using miRanda andTargetscan, where datalabels show the number of target sitespredicted for each gene.
absence of interfering transcription unit [42] or in somecases on the basis of phylogenetic relationships [37]. Keepingin view, the coannotation of these spots in importantbiological processes, 5501 miRNA targets were then furtheranalyzed for identifying target prone regions in all Parkinsonassociated genes.
In the present study, we employed some preset criteria,which define a region as a hotspot if the region showedminimum 10 nucleotide overlap at starting position andpossesses minimum overlapping five miRNA targets (seeSupplementary Material). Total 288 regions were identifiedon all 29 genes spanned across 5′UTR, 3′UTR, and codingregions of the genes (Figure SF30-57 in supplement). Amongall miRNA hotspots, 81, 77, and 130 regions were foundin 5′UTR, 3′UTR, and coding region, respectively. Anyregion prone to multiple microRNA targeting could not beidentified on CYCS and LOC100133737 genes. For all othergenes, the number of hotspots varies between 1 and 26. Itis anticipated that the genes that show the highest numberof hotspots possibly undergo highest sensitivity in miRNAmediated regulation at transcriptional level because mostof the sensitive sites reside in the 5′ regulatory domainsof the genes. Genes such as PINK1, UBE2J2, SEPT5, andTH carried 26, 24, 23, 20 hotspots for miRNA action,respectively. The details of miRNA target prone sites againsteach gene are shown in Table S3. For example, in PINK1,23 of the 26 sensitive target sites were found in the 5′UTRregion, 3 regions are found in CDS only. Surprisingly, nohotspots could be identified in 3′UTR for PINK1. This
revealed that PINK1 is not prone to translational inhibition.In reality, microRNA mediated transcriptional regulation islacking broadly in animals, but frequent is plants. Abun-dance of predicted miRNA targets in the PINK1 regulatoryregions depicts complexity of microRNA mediated targetselection.
Conversely in UBE2J2, majority of such hotspots (19)were identified in 3′UTR while CDS region and 5′UTRshowed only 1 and 4 hotspots, respectively. Depending onlocation of target sites, most likely UBE2J2 was regulated bythe translational initiation. These results show that miRNAscan functionally target endogenous mRNAs in any regionincluding coding region and 5′UTR and not restricted tothe 3′UTR as described earlier. However, such disperseddistribution of miRNA target can generate more complexityin the nature of interaction, which counteracts the possibilityof selection of most efficient miRNA required for functionalknockdown of the PD genes.
3.3. Multiplicity and Cooperativity. In general term, onemiRNA can target more than one gene (multiplicity), andone gene can be controlled by more than one miRNA(cooperativity) [29]. As reported earlier single miRNA cancontrol hundreds of genes [43, 44]. Here, top 20 miRNAsdisplaying high scores were initially selected. After assem-bling all data, multiplicity and cooperativity were calculated.From the dataset, miRNAs that displayed maximum numberof interactions with PD related genes were selected andused for constructing an interaction map. miRNAs showingmaximum number of targets in PD related genes wereselected as top 10 miRNA. Maximum interactions werefound in 6 miRNAs, that is, hsa-miR-638, hsa-miR-1226∗,hsa-miR-612, hsa-miR-612, hsa-miR1469, hsa-miR-608 andhsa-miR-939 that show high value of multiplicity. Forinstance, hsa-miR-638 exhibited high multiplicity show-ing total 119 interactions with 26 genes while no hsa-miR-638 target sites were found on three genes, namely,CASP3, PARK7, and SNCA. Defects in SNCA have beenimplicated in the pathogenesis of Parkinson’s disease whileautosomal recessive mutations in PARK7 cause early onsetof Parkinson disease. CASP3 gene encodes a predominantcaspase involved in cleavage of amyloid-beta 4A precursorprotein, belonging to cysteine-aspartic acid protease (cas-pase) family which is associated with neuronal death inother neurological disorders. hsa-miR-1226∗ displayed 107interactions with 25 genes but no complementary targetsites could be identified for LOC100133737, PARK7, SNCA,ubiquitinB. Therefore, it can be inferred that these miRNAsmay not be involved in regulation of activity of thesegenes.
Similarly, we analyzed the same dataset for estimatingcooperativity. It was found that PINK1, SEPT5, TH exhibitedhigh cooperativity towards top 10 miRNAs. All top 10miRNA displayed 974 targets on the selected genes. It pro-vides a complex picture which is difficult to comprehend theinteractions. For example, PINK1 is regulated by 10 miRNAsat 81 positions, so these top 10 miRNAs demonstrate highcooperativity towards PINK1. Similarly, top 10 miRNAsexhibited 79, 78 targets in SEPT5 and TH genes. In contrast,
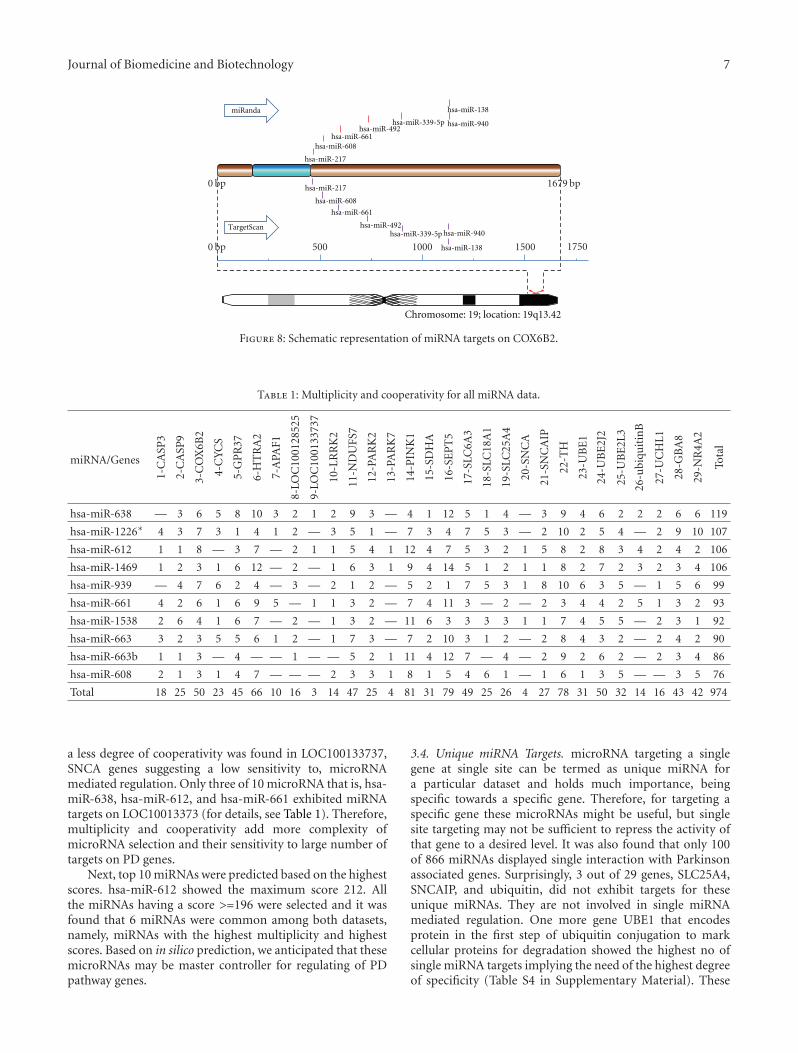
Journal of Biomedicine and Biotechnology 7
Chromosome: 19; location: 19q13.42
hsa-miR-217
hsa-miR-217
hsa-miR-608
hsa-miR-608
hsa-miR-661
hsa-miR-661
hsa-miR-492
hsa-miR-492
hsa-miR-339-5p
hsa-miR-339-5p
hsa-miR-940
hsa-miR-138
hsa-miR-940
hsa-miR-138
miRanda
TargetScan
0 bp 500 1000 1500 1750
0 bp 1679 bp
Figure 8: Schematic representation of miRNA targets on COX6B2.
Table 1: Multiplicity and cooperativity for all miRNA data.
miRNA/Genes
1-C
ASP
3
2-C
ASP
9
3-C
OX
6B2
4-C
YC
S
5-G
PR
37
6-H
TR
A2
7-A
PAF1
8-LO
C10
0128
525
9-LO
C10
0133
737
10-L
RR
K2
11-N
DU
FS7
12-P
AR
K2
13-P
AR
K7
14-P
INK
1
15-S
DH
A
16-S
EP
T5
17-S
LC6A
3
18-S
LC18
A1
19-S
LC25
A4
20-S
NC
A
21-S
NC
AIP
22-T
H
23-U
BE
1
24-U
BE
2J2
25-U
BE
2L3
26-u
biqu
itin
B
27-U
CH
L1
28-G
BA
8
29-N
R4A
2
Tota
l
hsa-miR-638 — 3 6 5 8 10 3 2 1 2 9 3 — 4 1 12 5 1 4 — 3 9 4 6 2 2 2 6 6 119
hsa-miR-1226∗ 4 3 7 3 1 4 1 2 — 3 5 1 — 7 3 4 7 5 3 — 2 10 2 5 4 — 2 9 10 107
hsa-miR-612 1 1 8 — 3 7 — 2 1 1 5 4 1 12 4 7 5 3 2 1 5 8 2 8 3 4 2 4 2 106
hsa-miR-1469 1 2 3 1 6 12 — 2 — 1 6 3 1 9 4 14 5 1 2 1 1 8 2 7 2 3 2 3 4 106
hsa-miR-939 — 4 7 6 2 4 — 3 — 2 1 2 — 5 2 1 7 5 3 1 8 10 6 3 5 — 1 5 6 99
hsa-miR-661 4 2 6 1 6 9 5 — 1 1 3 2 — 7 4 11 3 — 2 — 2 3 4 4 2 5 1 3 2 93
hsa-miR-1538 2 6 4 1 6 7 — 2 — 1 3 2 — 11 6 3 3 3 3 1 1 7 4 5 5 — 2 3 1 92
hsa-miR-663 3 2 3 5 5 6 1 2 — 1 7 3 — 7 2 10 3 1 2 — 2 8 4 3 2 — 2 4 2 90
hsa-miR-663b 1 1 3 — 4 — — 1 — — 5 2 1 11 4 12 7 — 4 — 2 9 2 6 2 — 2 3 4 86
hsa-miR-608 2 1 3 1 4 7 — — — 2 3 3 1 8 1 5 4 6 1 — 1 6 1 3 5 — — 3 5 76
Total 18 25 50 23 45 66 10 16 3 14 47 25 4 81 31 79 49 25 26 4 27 78 31 50 32 14 16 43 42 974
a less degree of cooperativity was found in LOC100133737,SNCA genes suggesting a low sensitivity to, microRNAmediated regulation. Only three of 10 microRNA that is, hsa-miR-638, hsa-miR-612, and hsa-miR-661 exhibited miRNAtargets on LOC10013373 (for details, see Table 1). Therefore,multiplicity and cooperativity add more complexity ofmicroRNA selection and their sensitivity to large number oftargets on PD genes.
Next, top 10 miRNAs were predicted based on the highestscores. hsa-miR-612 showed the maximum score 212. Allthe miRNAs having a score >=196 were selected and it wasfound that 6 miRNAs were common among both datasets,namely, miRNAs with the highest multiplicity and highestscores. Based on in silico prediction, we anticipated that thesemicroRNAs may be master controller for regulating of PDpathway genes.
3.4. Unique miRNA Targets. microRNA targeting a singlegene at single site can be termed as unique miRNA fora particular dataset and holds much importance, beingspecific towards a specific gene. Therefore, for targeting aspecific gene these microRNAs might be useful, but singlesite targeting may not be sufficient to repress the activity ofthat gene to a desired level. It was also found that only 100of 866 miRNAs displayed single interaction with Parkinsonassociated genes. Surprisingly, 3 out of 29 genes, SLC25A4,SNCAIP, and ubiquitin, did not exhibit targets for theseunique miRNAs. They are not involved in single miRNAmediated regulation. One more gene UBE1 that encodesprotein in the first step of ubiquitin conjugation to markcellular proteins for degradation showed the highest no ofsingle miRNA targets implying the need of the highest degreeof specificity (Table S4 in Supplementary Material). These

8 Journal of Biomedicine and Biotechnology
Table 2: Common microRNA target sites for various genes predicted using miRanda and TargetScan.
Gene microRNA
Start positionof target sitespredicted by
miRanda
End positionof target sitespredicted by
miRanda
Start positionof target sitespredicted byTargetScan
End positionof target sitespredicted byTargetScan
CASP9 hsa-miR-224 240 264 255 261
COX6B2
hsa-miR-138 676 701 693 699
hsa-miR-217 6 36 26 32
hsa-miR-339-5p 454 479 471 477
hsa-miR-492 274 293 285 291
hsa-miR-608 55 86 77 83
hsa-miR-661 163 187 180 186
hsa-miR-940 672 688 681 687
CYCS
hsa-miR-1301 1812 1840 1830 1836
hsa-miR-25 2191 2214 2204 2210
hsa-miR-510 2244 2273 2262 2268
hsa-miR-591 1332 1352 1341 1347
hsa-miR-658 2198 2232 2221 2227
hsa-miR-663 2283 2304 2286 2292
hsa-miR-769-5p 1943 1974 1964 1970
hsa-miR-939 1990 2018 2007 2013
APAF1 hsa-miR-650 639 662 654 660
PARK2hsa-miR-361-3p 21 40 31 37
hsa-miR-574-5p 96 118 110 116
hsa-miR-614 263 291 282 288
SEPT 5
hsa-miR-1207-5p 643 664 657 663
hsa-miR-1250 671 696 687 693
hsa-miR-1825 600 622 614 620
hsa-miR-484 871 894 887 893
hsa-miR-572 877 899 880 886
hsa-miR-637 81 104 95 101
hsa-miR-663 160 183 176 182
hsa-miR-663b 74 93 86 92
SLC6A3
hsa-miR-1301 1613 1635 1626 1632
hsa-miR-193b 1518 1541 1533 1539
hsa-miR-331-3p 331 351 342 348
hsa-miR-34a 684 706 698 704
hsa-miR-449a 686 706 698 704
hsa-miR-486-3p 324 347 337 343
hsa-miR-601 406 432 423 429
hsa-miR-637 883 912 883 889
TH
hsa-miR-34c-5p 211 240 230 236
hsa-miR-658 217 245 236 242
hsa-miR-885-3p 96 115 108 114
hsa-miR-920 107 125 116 122
GBA
hsa-miR-1233 12 33 25 31
hsa-miR-212 363 386 376 382
hsa-miR-331-3p 109 133 124 130
hsa-miR-331-3p 159 178 169 175
hsa-miR-519e 4 26 18 24
hsa-miR-637 197 223 215 221
hsa-miR-661 452 476 467 473
hsa-miR-766 160 183 175 181

Journal of Biomedicine and Biotechnology 9
results predict a coherent interplay between variation ofmicroRNA target and functional efficacy of PD genes. It ispossible that simple computational prediction of microRNAtargets may shed some light on the behavior of target genesinvolved in Parkinson disease.
3.5. Deciphering Complexity through miRNA and Gene Inter-actions Map. To envisage the interrelationship of multiplic-ity of top 10 miRNA and their association with selected29 genes, a gene-miRNA interaction map for Parkinsondisease was constructed (Figure 5). Hsa-miR-612 showedhighest number of interactions against 19 genes whilefour miRNAs hsa-miR-939, hsa-miR-1301, hsa-miR-1207-5p, hsa-miR-1183 showed interactions with only 9 genes. Incontrast, counting the miRNA hits for individual gene, itwas found that UBE2L3 exhibited 9 interactions with topscoring miRNAs whereas APAF1 and SNCA did not showany interaction with these miRNAs. These genes might notbe under miRNA-based control. These findings suggest thatcomputer-based prediction of microRNA target selectionundoubtedly reduces the noise but is not sufficient toestimate efficiency of each microRNA on the multiple targets.
Next, several important physico-chemical propertiessuch as molecular weight (MW), free energy (δG inKcal/mole), and the sequence composition features for thetop ten miRNAs (based on multiplicity) were calculatedemploying Oligo Calc: Oligonucleotide tool to identify anypotential specificity related to Parkinson’s disease. The size ofthe miRNAs varied between 22 and 26 nucleotides. A narrowrange of difference in properties was found among top 10miRNAs. All microRNAs displayed a high GC content with 2miRNAs, namely, hsa-miR-1469 and hsa-miR-663 showingexceptionally high GC composition of 91% (Table S5 insupplement). GC and AU content % of the human miRNomeas taken from sequence feature statistics of 782 microRNAsfrom Argonaute database [45] ranges from 19.05% to 95%and 5 to 80.95%, respectively. The difference in properties isnot enough for preferential selection of one miRNA from theothers.
Finally, to investigate the sequence conservation ofmicroRNA, Multiple Sequence Alignment (MSA) availableat miRBase (http://microrna.sanger.ac.uk/) was used. A clearpredominance of G-nucleotide site at 20th position wasobserved in all the top 10 miRNAs and a strong bias towardsG was also found at 8th, 12th, and 15th positions.
Intersection of miRanda and TargetScan prediction. In orderto verify our above-mentioned findings depicted exclusivelyby miRanda, we have predicted only 3′UTR target sites usingTargetScan [46] since prediction of TargetScan is limited totarget sites only in 3′UTR. TargetScan relies on perfect seedcomplementarity and thus reduces false positive rate. Targetsites predicted using miRanda and TargetScan were matchedand compared (Figure 6 and Table S6).
Two genes LOC100128525 and LOC100133737 inParkinson pathways were devoid of any predicted target sitesin the 3′UTR regions as predicted using both the algorithms.Moreover, miRanda failed to predict target sites in PINK1
and SLC25A4 and resulted in prediction of target sites foronly 25 genes while TargetScan predicted target sites for allremaining 27 genes. The number of targets sites predictedby two separate programmes is quite large as compared tocommon microRNA targets envisaged by both programmes.Target sites predicted based on only seed sequence similarityin TargetScan are greater than the 1588 sites predicted bymiRanda. However, intersection includes a small number(142) of common target sites which is limited to only 12genes (Table S7).
Using both algorithms, 7 microRNAs were predicted tohave target sites in vicinity. Target sites for 7 microRNAs,namely, hsa-mir-138 (miRanda: 676–701, TargetScan: 693–699), hsa-miR-217 (miRanda: 6–36, TargetScan: 26–32), hsa-miR-339-5p (miRanda: 454–479,TargetScan: 471–477), hsa-miR-492 (miRanda: 274–293, TargetScan: 285–291), hsa-miR-608 (miRanda: 55–86, TargetScan: 77–83), hsa-miR-661 (miRanda: 163–187, TargetScan: 180–186), hsa-miR-940(miRanda: 672–688, TargetScan: 681–687) were found inspecified region. Similar results were found for other 8 genesand are summarized in Table 2.
Midbrain Specific microRNAs. The predicted microRNAtargets were also screened for a subset of microRNAexpressed in the midbrain. It comprises of 112 microRNAs.In all, 378 target sites were predicted for 60 midbrain-specific miRNAs for miRanda across the entire length of gene(Table S8). Among them, 343 target sites were predictedfor 99 midbrain-specific microRNAs using TargetScan whileonly 115 target sites were identified for 43 midbrain-specificmicroRNAs using miRanda for 3′UTR (Tables S9 and S10in Supplementary Material). Only 39 miRNAs were foundto be common in both algorithms for which 105 and 136target sites were predicted by miRanda and TargetScan,respectively. Only target sites for hsa-miR-138 in COX6B2(miRanda: 676–701, TargetScan: 693–699) and hsa-miR-25 in CYCS (miRanda: 2191–2214, TargetScan: 2204–2210)were predicted to occur in close proximity. The variation inresults can be attributed to difference in set parameters in twoindependent algorithms.
4. Conclusion
Neurological disorders are complex diseases in which awealth of information remains hidden owing to a varietyof regulatory complexity. Despite of numerous studies onParkinson diseases, existence of multiple parallel pathwaysor their convergence at a point is still a puzzle. The previousstudies have pointed out the role of miRNAs in the etiologyof PD. Absence of efficient treatment methods tends us tobroaden our understanding of the candidate genes involvedin disease pathway. Knowledge of putative miRNA targets onthese genes achieved using fast computer-based assays will bea reasonable and powerful advancement for understandingPD. Repression of candidate genes involved in pathogenesisby a single miRNA or a group of miRNAs may aid in combat-ing this disease. In order to offer a simplistic view of perplex-ing relationship of gene and miRNAs, we propose an intricateand comprehensive microRNA-gene interaction map in the

10 Journal of Biomedicine and Biotechnology
PD pathway. For gaining an insight about the mechanismof these miRNA actions, distribution of these target sites atdifferent regions was explored. Importantly, it was foundthat miRNA target sites are not restricted only to 3′UTRbut are distributed across the entire length of gene. Thesehotspots may be representing favored sites for miRNA-basedregulation. The miRNA and gene networks of a particulartrait are poorly understood. Interaction map also providesa way for selecting important miRNAs markers required fordiagnosis and therapeutics. Finally, though physiochemicalproperties of microRNA narrate some indicative parametersyet it is not enough to understand the complex relationshipof Parkinson’s disease genes and microRNAs. The weaknessof the work is that as most of the computational miRNAprediction algorithms focus on 3′UTR and a number ofmiRNA in these search algorithms represent only a fractionof total miRNA available in microRNA repositories likemiRBase, it is difficult to validate the target sites forthose miRNAs and also in 5′UTR and CDS. Therefore,computational prediction may not guide optimize selectionof any single microRNA for efficient knock down and levelof action and further validation of these findings usingexperimental approaches is required. Further analysis andexperimental validation of these results is mandatory forresolving complexity for the selection of microRNA targets infuture.
Acknowledgments
This work was funded by grants from DBT and WellcomeTrust Senior International Fellowship to M. Pal-Bhadra andU. Bhadra, Human Frontier Science Program and DST CSIRNetwork (NWP 34, NWP35) projects to U. Bhadra. Theauthors thank anonymous reviewers for their critical anduseful comments for improvement of manuscript.
References
[1] J. C. Fitzgerald and H. Plun-Favreau, “Emerging pathwaysin genetic Parkinson’s disease: autosomal-recessive genes inParkinson’s disease—a common pathway?” FEBS Journal, vol.275, no. 23, pp. 5758–5766, 2008.
[2] A. Wood-Kaczmar, S. Gandhi, and N. W. Wood, “Understand-ing the molecular causes of Parkinson’s disease,” Trends inMolecular Medicine, vol. 12, no. 11, pp. 521–528, 2006.
[3] C. A. Davie, “A review of Parkinson’s disease,” British MedicalBulletin, vol. 86, no. 1, pp. 109–127, 2008.
[4] B. Thomas and M. F. Beal, “Parkinson’s disease,” HumanMolecular Genetics, vol. 16, no. 2, pp. 183–194, 2007.
[5] T. Gasser, “Genetics of Parkinson’s disease,” Journal of Neurol-ogy, vol. 248, no. 10, pp. 833–840, 2001.
[6] A. H. V. Schapira, E. Bezard, J. Brotchie, et al., “Novelpharmacological targets for the treatment of Parkinson’sdisease,” Nature Reviews Drug Discovery, vol. 5, no. 10, pp.845–854, 2006.
[7] M. R. Cookson, “The biochemistry of Parkinson’s disease,”Annual Review of Biochemistry, vol. 74, pp. 29–52, 2005.
[8] J. Jankovic, “Parkinson’s disease: clinical features and diagno-sis,” Journal of Neurology, Neurosurgery and Psychiatry, vol. 79,no. 4, pp. 368–376, 2008.
[9] D. J. Moore, A. B. West, V. L. Dawson, and T. M. Dawson,“Molecular pathophysiology of Parkinson’s disease,” AnnualReview of Neuroscience, vol. 28, pp. 57–87, 2005.
[10] N. Rajewsky, “microRNA target predictions in animals,”Nature Genetics, vol. 38, supplement 1, pp. S8–S13, 2006.
[11] M. Garofalo, C. Quintavalle, G. Di Leva, et al., “MicroRNAsignatures of TRAIL resistance in human non-small cell lungcancer,” Oncogene, vol. 27, no. 27, pp. 3845–3855, 2008.
[12] S. N. Bhattacharyya, R. Habermacher, U. Martine, E. I.Closs, and W. Filipowicz, “Relief of microRNA-mediatedtranslational repression in human cells subjected to stress,”Cell, vol. 125, no. 6, pp. 1111–1124, 2006.
[13] G. A. Calin, C. D. Dumitru, M. Shimizu, et al., “Frequentdeletions and downregulation of micro-RNA genes miR15 andmiR16 at 13q14 in chronic lymphocytic leukemia,” Proceedingsof the National Academy of Sciences, vol. 99, pp. 15524–15529,2002.
[14] W. J. Lukiw, “Micro-RNA speciation in fetal, adult andAlzheimer’s disease hippocampus,” NeuroReport, vol. 18, no.3, pp. 297–300, 2007.
[15] R. Saba, C. D. Goodman, R. L. C. H. Huzarewich, C.Robertson, and S. A. Booth, “A miRNA signature of prioninduced neurodegeneration,” PLoS ONE, vol. 3, no. 11, articlee3652, 2008.
[16] N. Bushati and S. M. Cohen, “microRNAs in neurodegenera-tion,” Current Opinion in Neurobiology, vol. 18, no. 3, pp. 292–296, 2008.
[17] J. Kim, K. Inoue, J. Ishii, et al., “A microRNA feedback circuitin midbrain dopamine neurons,” Science, vol. 317, no. 5842,pp. 1220–1224, 2007.
[18] F. Gillardon, M. Mack, W. Rist, et al., “MicroRNA andproteome expression profiling in early-symptomatic α-synuclein(A30P)-transgenic mice,” Proteomics-Clinical Appli-cations, vol. 2, no. 5, pp. 697–705, 2008.
[19] P. T. Nelson, W.-X. Wang, and B. W. Rajeev, “MicroRNAs(miRNAs) in neurodegenerative diseases,” Brain Pathology,vol. 18, no. 1, pp. 130–138, 2008.
[20] I. Bentwich, “Prediction and validation of microRNAs andtheir targets,” FEBS Letters, vol. 579, no. 26, pp. 5904–5910,2005.
[21] J. R. Brown and P. Sanseau, “A computational view ofmicroRNAs and their targets,” Drug Discovery Today, vol. 10,no. 8, pp. 595–601, 2005.
[22] E. Berezikov, V. Guryev, J. van de Belt, E. Wienholds, R. H.A. Plasterk, and E. Cuppen, “Phylogenetic shadowing andcomputational identification of human microRNA genes,”Cell, vol. 120, no. 1, pp. 21–24, 2005.
[23] J. Aharon-Peretz, H. Rosenbaum, and R. Gershoni-Baruch,“Mutations in the glucocerebrosidase gene and Parkinson’sdisease in Ashkenazi Jews,” The New England Journal ofMedicine, vol. 351, no. 19, pp. 1972–1977, 2004.
[24] Z. Gan-Or, N. Giladi, U. Rozovski, et al., “Genotype-phenotype correlations between GBA mutations and Parkin-son’s disease risk and onset,” Neurology, vol. 70, no. 24, pp.2277–2283, 2008.
[25] E.-K. Tan, J. Tong, S. Fook-Chong, et al., “Glucocerebrosidasemutations and risk of Parkinson’s disease in Chinese patients,”Archives of Neurology, vol. 64, no. 7, pp. 1056–1058, 2007.
[26] D. G. Healy, P. M. Abou-Sleiman, K. R. Ahmadi, et al., “NR4A2genetic variation in sporadic Parkinson’s disease: a gene wideapproach,” Movement Disorders, vol. 21, pp. 1960–1963, 2006.
[27] S. Wuchty, W. Fontana, I. L. Hofacker, and P. Schuster,“Complete suboptimal folding of RNA and the stability of

Journal of Biomedicine and Biotechnology 11
secondary structures,” Biopolymers, vol. 49, no. 2, pp. 145–165,1999.
[28] A. J. Enright, B. John, U. Gaul, T. Tuschl, C. Sander, and D.S. Marks, “MicroRNA targets in Drosophila,” Genome Biology,vol. 5, no. 1, pp. R1–R12, 2003.
[29] B. John, A. J. Enright, A. Aravin, T. Tuschl, C. Sander, and D. S.Marks, “Human microRNA targets,” PLoS Biology, vol. 2, no.11, article e363, 2004.
[30] W. A. Kibbe, “OligoCalc: an online oligonucleotide propertiescalculator,” Nucleic Acids Research, vol. 35, no. 2, pp. W43–W46, 2007.
[31] X. Zhou, X. Duan, J. Qian, and F. Li, “Abundant conservedmicroRNA target sites in the 5′-untranslated region andcoding sequence,” Genetica, vol. 137, no. 2, pp. 159–164, 2009.
[32] A. M. Duursma, M. Kedde, M. Schrier, C. le Sage, and R.Agami, “miR-148 targets human DNMT3b protein codingregion,” RNA, vol. 14, no. 5, pp. 872–877, 2008.
[33] J. J. Forman, A. Legesse-Miller, and H. A. Coller, “A searchfor conserved sequences in coding regions reveals that thelet-7 microRNA targets Dicer within its coding sequence,”Proceedings of the National Academy of Sciences of the UnitedStates of America, vol. 105, no. 39, pp. 14879–14884, 2008.
[34] A. Lal, H. H. Kim, K. Abdelmohsen, et al., “p16INK4a transla-tion suppressed by miR-24,” PLoS ONE, vol. 3, no. 3, articlee1864, 2008.
[35] Y. Tay, J. Zhang, A. M. Thomson, B. Lim, and I. Rigoutsos,“MicroRNAs to Nanog, Oct4 and Sox2 coding regions modu-late embryonic stem cell differentiation,” Nature, vol. 455, no.7216, pp. 1124–1128, 2008.
[36] C. L. Jopling, M. Yi, A. M. Lancaster, S. M. Lemon, and P.Sarnow, “Modulation of hepatitis C virus RNA abundanceby a liver-specific MicroRNA,” Science, vol. 309, no. 5740, pp.1577–1581, 2005.
[37] A. Tanzer and P. F. Stadler, “Molecular evolution of amicroRNA cluster,” Journal of Molecular Biology, vol. 339, no.2, pp. 327–335, 2004.
[38] A. Tanzer and P. F. Stadler, “Evolution of microRNAs,”Methods in Molecular Biology, vol. 342, pp. 35–350, 2006.
[39] Y. Hayashita, H. Osada, Y. Tatematsu, et al., “A polycistronicMicroRNA cluster, miR-17-92, is overexpressed in humanlung cancers and enhances cell proliferation,” Cancer Research,vol. 65, no. 21, pp. 9628–9632, 2005.
[40] M. A. Samols, J. Hu, R. L. Skalsky, and R. Renne, “Cloningand identification of a MicroRNA cluster within the latency-associated region of Kaposi’s sarcoma-associated herpesvirus,”Journal of Virology, vol. 79, no. 14, pp. 9301–9305, 2005.
[41] R. Zhang, Y.-Q. Wang, and B. Su, “Molecular evolution ofa primate-specific microRNA family,” Molecular Biology andEvolution, vol. 25, no. 7, pp. 1493–1502, 2008.
[42] J. R. Lytle, T. A. Yario, and J. A. Steitz, “Target mRNAs arerepressed as efficiently by microRNA-binding sites in the 5′
UTR as in the 3′ UTR,” Proceedings of the National Academyof Sciences of the United States of America, vol. 104, no. 23, pp.9667–9672, 2007.
[43] J. Brennecke, A. Stark, R. B. Russell, and S. M. Cohen,“Principles of microRNA-target recognition,” PLoS Biology,vol. 3, no. 3, article e85, 2005.
[44] A. Krek, D. Grun, M. N. Poy, et al., “Combinatorial microRNAtarget predictions,” Nature Genetics, vol. 37, no. 5, pp. 495–500, 2005.
[45] P. Shahi, S. Loukianiouk, A. Bohne-Lang, et al., “Argonaute—a database for gene regulation by mammalian microRNAs,”Nucleic Acids Research, vol. 34, pp. D115–D118, 2006.
[46] B. P. Lewis, C. B. Burge, and D. P. Bartel, “Conserved seedpairing, often flanked by adenosines, indicates that thousandsof human genes are microRNA targets,” Cell, vol. 120, no. 1,pp. 15–20, 2005.

Hindawi Publishing CorporationJournal of Biomedicine and BiotechnologyVolume 2009, Article ID 634520, 11 pagesdoi:10.1155/2009/634520
Review Article
TIS11 Family Proteins and Their Roles in PosttranscriptionalGene Regulation
Maria Baou,1, 2 Andrew Jewell,3 and John J. Murphy1
1 Division of Immunology Infection and Inflammatory Disease, King’s College London, London WC2R 2LS, UK2 MRC Toxicology Unit, University of Leicester, Leicester LE1 7RH, UK3 Faculty of Health and Social Care Sciences, Kingston University and St George’s Hospital Medical School, London SW17 ORE, UK
Correspondence should be addressed to John J. Murphy, [email protected]
Received 25 February 2009; Accepted 18 May 2009
Recommended by Bibekanand Mallick
Posttranscriptional regulation of gene expression of mRNAs containing adenine-uridine rich elements (AREs) in their 3′
untranslated regions is mediated by a number of different proteins that interact with these elements to either stabilise or destabilisethem. The present review concerns the TPA-inducible sequence 11 (TIS11) protein family, a small family of proteins, that appearsto interact with ARE-containing mRNAs and promote their degradation. This family of proteins has been extensively studied in thepast decade. Studies have focussed on determining their biochemical functions, identifying their target mRNAs, and determiningtheir roles in cell functions and diseases.
Copyright © 2009 Maria Baou et al. This is an open access article distributed under the Creative Commons Attribution License,which permits unrestricted use, distribution, and reproduction in any medium, provided the original work is properly cited.
1. Introduction
Mechanisms of posttranscriptional gene regulation bymicro-RNA (miRNA) and short interfering RNA (siRNA)have been highlighted in recent years as having importantroles in control of a variety of developmental and functionalprocesses. The present review concerns a small family ofproteins, the 12-O-tetradecanoylphorbol-13-acetate (TPA)inducible sequence 11 (TIS11) family, which also functionin posttranscriptional gene regulation and whose func-tions may overlap and interact with miRNA and siRNAcontrol mechanisms. The TIS11 family consists of fourmammalian members and include TIS11 (ZFP36, TTP,Nup475, GOS24), TIS11b (Berg36, ERF-1, ZFP36L1, BRF-1), and TIS11d (ZFP36L2, ERF-2, BRF-2). The fourth familymember described in rodents, Zfp36l3, was expressed inmouse placenta, but was not detected in human placentaor other human tissues [1]. TIS11-like proteins have alsobeen identified in drosophila and yeast [2–4]. These proteinscontain two tandemly repeated zinc finger motifs throughwhich they bind to adenine uridine (AU) rich elements(AREs) in mRNA and mediate ARE-mediated mRNA decay[5]. Table 1 lists the three human TIS11 family members,their chromosomal locations as well as reported mRNAtargets. This family of proteins have been reported to
promote deadenylation, decapping, and finally degradationof mRNAs by either exosome (3′-5′ degradation) or XRN1exonuclease (5′-3′ degradation) [6].
AREs are found mostly at the 3′ end of many mRNAsencoding cytokines, transcription factors, cell cycle regula-tors, and apoptosis regulators. It is estimated that up to8% of mRNAs may contain AREs [7]. AREs are subdividedinto three classes: Class I, Class II, and Class III. Class IIis further subdivided into Class IIA, IIB, IIC, IID, IIE [6].Class I is characterised by the AUUUA motif and a U-richregion. Class III is characterised by a U-rich sequence foundin, for example, the mRNA of c-jun. Class IIA contains fiveconsecutive AUUUA pentamer sequences; Class IIB containsfour consecutive AUUUA pentamers; Class IIC containsthree consecutive AUUUA pentamers; Class IID containstwo consecutive AUUUA pentamers, and finally Class IIEcontains one AUUUA motif [6].
2. The TIS11 Family in PosttranscriptionalGene Regulation
One of the first indications that the prototype TIS11 proteinfunctions as an AU binding protein came from workwhich showed that TIS11 inhibited TNFα production from

2 Journal of Biomedicine and Biotechnology
macrophages by destabilising its messenger RNA (mRNA)and this appeared to be due to direct binding of TIS11 tothe TNFα ARE [8]. It was later shown that the optimaland minimally required RNA sequence for TIS11 binding isUUAUUUAUU [9–12]. The adenine residues and the spacingbetween them are critical in ensuring a stable associationbetween the TIS11 peptide and RNA, even though TIS11was still able to strongly bind to an AUUUUA peptide, andintermediately to AUUA and AUUUUUA peptides [9, 10].TIS11 interaction with the RNA sequence is of relatively highaffinity [10]. It should be noted that AREs are found at the 3′
end of each of the TIS11 family mRNAs suggesting that theymay regulate themselves by a negative feedback loop [13, 14].
Overexpression of human TIS11 in HEK293 cells causedsignificant reduction in the levels of an artificial reportermRNA containing part of the TNF-α 3′ untranslated region(3′ UTR), and this was dependent on the amount ofTIS11 plasmid transfected [32]. Similar effects were seenfor rat TIS11b or Xenopus TIS11d, although TIS11d wasless efficient in inducing TNF-α reporter mRNA decay thanTIS11 and TIS11b [32]. Two zinc finger motifs in TIS11 arenecessary and sufficient for binding to the AREs, and alsomediate TNF-α mRNA decay [32]. Similarly, other studiesreported that TIS11 and other members of the TIS11 familycan also mediate decay of mRNA for GM-CSF and IL-3[15, 33]. Critical residues in the human TIS11 family zincfinger domains for binding to the TNF-α ARE probe orGM-CSF ARE probes were Cys124, Cys147, His128, Cys162,and His166, and mutations of these residues to other aminoacids completely abolished TIS11 binding [39]. In the samestudy it was shown that coexpression of wild type TIS11and a Cys124R nonbinding mutant resulted in stabilisationof artificial reporter TNF-α mRNA, even though wild typeTIS11 was able to bind reporter TNF-α mRNA [39]. Thisfinding suggested that the presence of a nonbinding mutantacts as a dominant negative over TIS11 destabilising activity,possibly by interacting with proteins that regulate TIS11destabilising function [39].
TIS11-dependent degradation of mRNA requires dead-enylation [40]. Deadenylation is strongly induced by TIS11when two nonamers (UUAUUUAUU) are present in asequence, whereas deadenylation and mRNA degradationby TIS11 in probes containing only one nonamer is muchweaker [12]. The ability of TIS11 to promote deadenylationwas dependent on the presence of Mg+2 and it was suggestedthat there is involvement of PolyA specific ribonuclease(PARN) in the process. It was shown that TIS11 requiresPARN to promote deadenylation of an ARE containingmRNA probe [40]. Association between TIS11 and PARNis indirect rather than direct and other proteins may formthe bridge between them. Alternatively, the presence ofTIS11 may displace an ARE stabilising factor that inhibitsdeadenylation caused by PARN [40]. Another study usingimmunoprecipitation demonstrated that TIS11 does notassociate directly with PARN [41]. It was also shownthat TIS11 co-immunoprecipitates with hDcp1 and hDcp2(decapping enzymes), hXrn1 (5′-3′ exonuclease), hCcr4(deadenylase), hRrp4 (a component of the exosome), orhEdc3 (enhances the activity of the decapping enzymes)
through the N-terminal domain, whereas the zinc fingers andthe C-terminal domain are not involved in these interactions[41, 42]. Additionally, deletion of the N-terminal domainof TIS11 partially abrogated induction of mRNA decay byTIS11. It was therefore proposed that TIS11 is involvedin deadenylation and degradation of mRNA by recruitingenzymes such as hDcp1, hDcp2 and hCcr4 through theN-terminal domain [41]. Other transacting elements mayalso be involved in TIS11 function recruited through theC-terminal domain, since deletion of this domain in bothTIS11 and TIS11b resulted in stabilisation of a β-globinmRNA containing AREs [41]. One such element may be theexosome, a multicomponent complex with 3′-5′ exonucleaseactivity, and it was reported that TIS11 requires and recruitsthe exosome specifically in ARE containing mRNA probes,to mediate degradation of a deadenylated mRNA [43]. Itwas also shown that the exosome consists of 14 differentcomponents, among which are hRrp4, hRrp40, hRrp41,hRrp42, hRrp43, hRrp46, hCsl4, and hMtr3 [43]. It seemslikely that TIS11 mediated mRNA degradation involvesmultiple enzymes including PARN, decapping enzymes suchas hDcp1, hDcp2, hEdc3, exonucleases including the exo-some, and Xrn1 (5′-3′ exonuclease) as well, to preferentiallydegrade ARE containing mRNAs [42, 43]. Figure 1 shows thepathways and major components of ARE mediated mRNAdecay.
Reported mRNA targets of the TIS11 family includeTNF-α in many cell types [14, 24, 44–47], GM-CSF [15], IL-3[16], IL-2 [21], IL-6 [17], IL-10 [30], Ccl2 and Ccl3 [24], 1,4-galactosyltransferase [22], vascular endothelial growth factor(VEGF) [29], cyclooxygenase-2 [18], plasminogen activatorinhibitor type 2 [19], paired-like homeodomain 2 (Pitx2)[20], E47 [28], polo-like kinase 3 [31], and TIS11 itself [14].VEGF mRNA was also reported to be a target of TIS11b[35] although in TIS11b deficient fibroblasts VEGF levelswere shown to be elevated as a consequence of increasedtranslation rather than an effect on VEGF mRNA [37]. Morerecently, TIS11b has been reported to target and degradesteroid acute regulatory (STAR) protein mRNA [38]. Utili-sation of siRNA inhibition for TIS11 revealed that it targetsFOS and p21 in the THP-1 cell line and primary humanmonocytes [26] and IL-12 and MIP-2 in macrophages [23].Similarly, TIS11 is involved in the regulation of c-myc andcyclin-D following treatment of glioblastoma and prostatecancer cell lines with rapamycin [25]. This suggests thatTIS11 also regulates certain transcription factors and cellcycle regulators. A global search for novel mRNA targetsof TIS11 identified 250 potential targets and characterisedimmediate early response gene 3 (Ier3) mRNA as a noveltarget [27]. Notably, in this study Ier3 was clearly shown notto be a target for TIS11b [27] and in a later study polo-like kinase 3 was shown also to be a target for TIS11 butnot TIS11b or TIS11d [31]. These examples illustrate thatmRNA targets of TIS11 family members may be different fordifferent family members. In fact, there is growing awarenessin the field that many in vitro assays designed to measuremRNA interaction and decay may identify “nonphysiologicaltargets” and that “physiological targets” of TTP familymembers can best be determined by analysis of mRNA

Journal of Biomedicine and Biotechnology 3
PARN
Rrp41Rrp40Rrp4
PM-Sc175
AUUUAUUUA
AAAA
AAAA
A
m7G
mRNA
3’ UTR
3’ UTR
3’ UTR
3’ UTR
3’ UTR
Tis11
DeadenylationCcr4
m7G
m7G
5’
AUUUAUUUA
AAAA
AAAA
A
Tis11
AUUUAUUUA
m7G
Tis11
hEdc3
5’
AAAA
AUUUAUUUA
5’
Tis11
AAAA
5’
AUUUAUUUA
AA
AA
Xrn1
Tis11
Degraded mRNA
5’
3’
3’–5’ mRNA decay
5’–3’ mRNA decay
Exosome recruitmentDecapping
Exosome
hDcp
1
hD
cp2
Figure 1: Pathways and major components of ARE-mediated mRNA decay by TIS11 proteins. TIS11 protein binds to the ARE sequence inthe 3′ UTR and recruits deadenylases either directly (hCcr4) or indirectly (PARN). Deadenylated mRNA can be recruited by the exosome,a multiprotein structure containing proteins such as Rrp4, Rrp40, Rrp41, and PM-Scl75 that form the 3′ to 5′ exoribonuclease complex.Decapping of mRNA can follow deadenylation mediated by decapping enzymes such as Dcp1 and Dcp2 and degradation of mRNA can thenbe mediated by the 5′ to 3′ Xrn1 exonuclease.
degradation kinetics in knockout mice or cells derived fromknockout mice [27]. Another more recent global analysis ofTIS11 targets identified 137 potential TIS11 mRNA targets[30]. Interestingly, only a subset of the putative TIS11 targetscontained the UUAUUUAUU sequence. This implies thateither the RNA binding specificity of TIS11 proteins is notfully understood or that TIS11 proteins can be indirectlyrecruited to mRNA targets via other RNA-binding proteins,or that many false positives have been indentified in targetscreens. Table 1 summarises the reported mRNA targets forTIS11 family proteins and reported mechanisms.
A number of recent studies have reported links betweenTIS11 and miRNA functions and processes. Dicer, an enzymerequired in the processing of miRNAs, was needed for TIS11mediated degradation of TNFα ARE [48]. Furthermore,these studies revealed that miRNA16 can pair with eightbases in the TNFα ARE and this pairing is required forTIS11 mediated degradation of TNFα ARE [48]. TIS11and miR16 do not bind directly to each other but interactthrough association with Argonaute/eiF2C family members[48]. Thus, TIS11 mediated mRNA degradation may requirecomponents of the miRNA processing pathway and indeedmiRNA and TIS11 proteins may act codependently in medi-
ating degradation. TIS11 was also identified as a componentof the RNAi pathway by a genome wide screen in drosophilamelanogaster [49]. TIS11 genes contain many predictedtargets for miRNA suggesting another level of complexityin the interrelationship between TIS11 family members andmiRNAs [50]. A picture is therefore emerging of potentiallycomplex interplay of different mechanisms of posttranscrip-tional gene regulation which include the TIS11 family.
3. Identification of Human TIS11Family Members
Human TIS11 is located on chromosome 19q13.1, and wasisolated and cloned by several groups after stimulation ofcells with serum, TPA, or insulin [51–53]. Human TIS11bis located on chromosome 14q22-24 and was isolated fromchronic lymphocytic leukemia cells (CLL) after stimulationwith TPA [54, 55], from human cDNA libraries probed withthe rat cMG1 [13] or as a gene that reversed the phenotypeof mutant H1080 cells which were unable to degrade IL-3mRNA [34]. Finally human TIS11d is located on 2p22.3-p21 and was isolated from human cDNA libraries probedwith the mouse TIS11d mRNA [56]. The sequence of each

4 Journal of Biomedicine and Biotechnology
Table 1: Human TIS11 family members and reported mRNA targets of the TIS11 family.
Gene Alternative names Chromosomal location Reported mRNA targets reference mechanism
TIS11 ZFP36, TTP, Nup475, GOS24 19q13.1 TNF∗ [8] mRNA stability
GM-CSF [15] mRNA stability
IL-3 [16] mRNA stability
IL-6 [17] mRNA stability
cyclooxygenase [18] mRNA stability
PAI type 2 [19] mRNA stability
Pitx2 [20] mRNA stability
TIS11 [14] mRNA stability
IL-2 [21] mRNA stability
1,4galactosyltransferase [22] mRNA stability
IL-12 [23] ?
Ccl2 [24] mRNA stability
Ccl3 [24] mRNA stability
c-myc [25] mRNA stability
cyclin D1 [25] mRNA stability
Fos [26] mRNA stability
Ier3 [27] mRNA stability
Genome analysis 250 mRNAs [27] mRNA stability
MIP-2 [23] ?
p21 [26] mRNA stability
E47 [28] mRNA stability
VEGF [29] mRNA stability
IL-10 [30] mRNA stability
Genome analysis 137 mRNAs [30] mRNA stability
polo-like kinase 3 [31] mRNA stability
TIS11b ZFP36L1, Berg36, ERF-1, BRF-1 14q22-24 TNF [32] mRNA stability
GMCSF [33] mRNA stability
IL-3 [34] mRNA stability
VEGF [35] mRNA stability
c-IAP2 [36] mRNA stability
VEGF [37] translation
STAR [38] mRNA stability
TIS11d ZFP36L2, ERF-2, BRF-2 2p22.3-p21 TNF [32] mRNA stability
GM-CSF [33] mRNA stability
IL-3 [33] mRNA stability∗
Targets in bold confirmed in cells derived from knockout animals are so-called “physiological” targets.
of the three human genes shows little variation betweenindividuals, and most polymorphisms are detected in theintrons, promoter, and 3′ UTR regions [57]. Thirteen poly-morphisms were detected in the protein-coding regions ofthe three TIS11 family genes and six of these would result inamino acid changes. In TIS11b a polymorphism generatinga dinucleotide substitution was detected that would preventsplicing of the single intron of TIS11b but to date thesignificance of this is unknown [57]. Further polymorphismsof TIS11 were identified in a more recent study and one, anC to T transition in the protein coding domain of TIS11, wassignificantly associated with rheumatoid arthritis in African-Americans [58].
TIS11, TIS11b, and TIS11d have all been associated withinduction of mRNA decay (see Table 1), and even though
redundancy in their function has been suggested, studieswith knock-out mice and analysis of tissue distributionsuggest that they may have cell specific regulation andfunctions. TIS11 knock-out mice appear normal at birth butlater develop severe cachexia, autoimmunity, patchy alopecia,arthritis, and conjunctivitis, which can be reversed byadministration of anti-TNF-α antibody [44]. TIS11b knock-out mice do not survive to birth but die in utero between daysE8 and E13, due either to failure in chorioallontoic fusion[59], or to defective extraembryonic vasculogenesis [37].Mice in which a truncated form of TIS11d was generated,which left the RNA binding domain and the nuclear exportsignal intact [60], appeared normal at birth, but females wereinfertile. Expression of the TIS11 family in mouse tissues hasshown that the TIS11 protein is highly expressed in spleen,

Journal of Biomedicine and Biotechnology 5
thymus, lung, large intestine, and liver, weakly expressed inbrain and pancreas but is not expressed at all in the testis anduterus [61]. TIS11b is highly expressed in kidneys, liver, lung,pancreas, and heart, and weakly in skeletal muscle, colon,thymus, spleen, small intestine, brain, and peripheral bloodleukocytes [62]. TIS11d is highly expressed in lung, liver,skeletal muscle, kidneys, pancreas, placenta, and less stronglyin heart and brain [63].
4. Structure of TIS11 Family Members
The structures of the first zinc finger motif of TIS11 [64]and human TIS11d before and after binding to an AREprobe have been reported [65]. The spacing between thecysteines and histidine in the zinc fingers (CX8CX5CX3H)and the length of the linker between the zinc finger motifsare conserved between TIS11, TIS11b, and TIS11d. Becauseof the similarity of the zinc finger motifs between the threefamily members, it is expected that the model of mRNAbinding to TIS11d will apply to all family members. The firstzinc finger motif of TIS11 was found to be very different incomparison with other metal and zinc binding core domains,in terms of diameter and thickness [64]. For human TIS11deach of the two zinc fingers is folded independently into acompact domain connected by a linker sequence [65]. Thestructure is stabilised by binding of zinc to side chains ofCys159, Cys168, Cys174, His178 for the first zinc finger (ZF1)motif and Cys197, Cys206, Cys212, His216 for the second zincfinger (ZF2). Hydrogen bonds and van der Waals forces areinvolved in further stabilisation of this structure [65]. Theorientation of the fingers is fixed, because the linker regionhas a relatively rigid structure stabilised by hydrogen bondsat each end and has little flexibility apart from the centralregion (residues 186-189) [65]. TNF-α ARE was used as aprobe in this study, with the sequence 5′-UUAUUUAUU-3′.Zinc finger 1 (Arg153-Phe180) interacted with a single UAUUsubsite on the 3′ end while zinc finger 2 (Lys191-Ala218)interacted with the same subsite on the 5′ end.
5. Regulation of the TIS11 Family atthe mRNA Level
TIS11 family mRNAs are induced by TPA in a wide varietyof cells including CLL cells, mouse fibroblasts, humanepithelial cells, and PC phaeochromocytoma cells [53, 54].Insulin can induce TIS11 in NIH3T3 mouse fibroblasts [66]but in RIE-1 cells only TIS11b is up regulated by insulinwhile the other two family members remain unaffected[67]. Lipopolysaccharide (LPS) induces TIS11 as early as 30minutes poststimulation in murine macrophage RAW264.7cells or human macrophages (THP-1) [14, 68, 69]. TIS11was also induced by LPS in primary human white blood cellsincluding lymphocytes, monocytes, and neutrophils [70].TIS11 can be induced by GM-CSF in myeloid cells [71] andby TGF-β in a T-cell line [72] or a combination of TPA andionomycin in T lymphocytes [73]. TIS11 can be inducedby anisomycin (a p38 activator) and further induced by acombination of anisomycin plus IFN-γ or IFN-β as early as1 hour poststimulation in mouse embryonic fibroblasts [24].
In the same study it was shown that addition of IFN-γ to LPStreated primary mouse bone marrow macrophages furtherincreased induction of TIS11 mRNA in comparison with LPStreated cells [24]. Glucocorticoids have also been reportedto induce TIS11 mRNA and protein in lung epithelial cellsand this induction may well be important for glucocorticoidmediated control of inflammatory gene expression [74, 75].The second family member, TIS11b, has been shown to beinduced by TPA, bryostatin, and rituximab in CLL cells[54, 76, 77], calcium ionophore, anti-IgM and anti-CD20 inBurkitt’s lymphoma cell lines [55, 78], insulin in RIE-1 cells[67] parathyroid hormone in human primary osteoblasts[79] or adrenocorticotropic hormone (ACTH) hormone inadrenocortical cells [80].
An important consideration is that the kinetics ofinduction of the mRNA for TIS11 genes appears to bedependent on the type of stimulus and cell type. For example,TIS11 mRNA is evident at 15 minutes after insulin or serumstimulation in mouse fibroblasts returning to almost baselinelevels at two hours [66, 81]. In RAW264.7 cells, TIS11 mRNAinduction by LPS is biphasic with the first peak at onehour and the second peak at five hours poststimulation[69]. It has been shown that both phases of the biphasicTIS11 mRNA induction after LPS treatment in RAW264.7are regulated through the p38 pathway at the mRNA level[69] and p38 and ERK pathway at the protein level [82].Similarly TIS11b peaks at two hours poststimulation and isclearly above basal levels at four hours after stimulation ininsulin treated RIE-1 cells [67] but in ACTH treated humanadrenocortical cells, peak induction of the gene occurs atthree hours poststimulation and is above the basal levelsfor up to 24 hours poststimulation [80]. TPA stimulationof CLL cells induced TIS11b more strongly and earlier thanbryostatin [76] and in the BL60-2 Burkitts lymphoma cellline, anti-IgM induced TIS11b more strongly than anti-CD20 stimulation [78]. H7 (a broad specificity inhibitor forthe PKC and PKA pathways) did not have any effect oninduction of TIS11b mRNA by TPA or bryostatin in CLLcells [76]. Similarly, induction of TIS11b in RIE-1 cell line byinsulin was unaffected by PKC inhibition, but inhibition ofPI3K pathway by wortmannin partially abrogated induction,whereas the same PI3K inhibitor had no effect on inductionof TIS11b by TPA [67].
6. Regulation of the TIS11 Family atthe Protein Level
The TIS11 family is also regulated at the protein level througheither phosphorylation and/or localisation in different cellu-lar compartments.
6.1. Phosphorylation. The TIS11 protein was suggested to bephosphorylated since it was noticed that stimulation of theNIH3T3 cell line with various stimuli such as serum, TPA,platelet-derived growth factor (PDGF), fibroblast growthfactor (FGF) for 2 hours, induced TIS11 protein detected as45 kDa protein and not as the predicted 33 kDa protein [83].In this particular study, phosphorylation of TIS11 was shownto be partially regulated by the p42 mitogen activated protein

6 Journal of Biomedicine and Biotechnology
kinase (MAPK) pathway, which phosphorylates Ser220 inmouse TIS11 [83]. In another study in LPS stimulatedmurine macrophages, TIS11 protein was evident at 75minutes poststimulation as a 36 kDa protein, and increasedin size over time up to 45 kDa at 240 minutes poststimulation[84]. TIS11 protein is a substrate for MAPK p38α and p38βisoforms which probably control multiple phosphorylationevents [84]. TIS11 phosphorylation was also reported tobe mediated by the p38-regulated MAPK activated proteinkinase 2 (MK2) [68]. Ser52, Ser178, Thr249, Thr250, Ser264,Ser80/82 were suggested to be the sites of phosphorylation byMK2 in murine TIS11 and Ser264 and Thr250 were suggestedto be regulated by the p38a pathway [85]. Addition of ap38 inhibitor to RAW 264.7 cells previously stimulated byLPS for 2 hours resulted in rapid TIS11 dephosphorylationand degradation [82]. TIS11 phosphorylation is therefore inequilibrium with dephosphorylation probably mediated byprotein phosphatase 2A [86]. Major phosphorylation sitesresponsible for murine TIS11 stabilisation were found to beSer52 and Ser178 which were phosphorylated by MK2 [82, 87].
The importance of Ser52 phosphorylation for the cyto-plasmic localisation of murine TIS11 was demonstrated ina study which also suggested that Ser178 is important forthis localisation [82]. Interestingly, Ser178 is also present inmurine TIS11b and phosphorylation of this site creates abinding site for the 14-3-3 β isoform [85]. This is not theonly isoform of 14-3-3 that the TIS11 family can bind toand it has been shown by a yeast two hybrid system thatall TIS11 family members bind equally well to 14-3-3 ηand β isoforms [88]. A study using MudPIT or MALDI/MSmethods showed that the major phosphorylation sites inhuman TIS11 when purified from HEK293 cells were Ser66,Ser88, Thr92, Ser169, Ser186, Ser197, Ser218, Ser228, Ser276,Ser296 [89]. Ser197, Ser218, and Ser228 were predicted to bepotential sites for protein kinase A, glycogen synthase kinase-3, and extracellular-signal-regulated kinase 1 (both Ser218
and Ser228), respectively [89].Phosphorylation of TIS11 may alter its function as a
destabilizing AU binding protein. One study showed thattransfection of cells with TIS11 and MKK6, which activatesp38, resulted in phosphorylation of TIS11 protein but thisdid not affect TIS11 ability to induce mRNA decay [69].Another study using a series of serine or threonine mutants,alone or in combination, showed that these phosphorylationevents did not alter the function of TIS11 in terms of TNF-αinduced destabilisation or mRNA binding and deadenylation[47]. A further study showed that cotransfection of HEK293cells with TIS11 and MKK6(E) dominant active MKK6resulted in a slight increase in the half life of a TNF-αconstruct in comparison with cells transfected with TIS11alone, suggesting some deactivation or inhibition of TIS11function following phosphorylation [84]. Furthermore, itwas reported that phosphorylation of murine TIS11 espe-cially at Ser178 inhibited its binding ability to TNF-α AREand thus that the unphosphorylated TIS11 is active inmRNA degradation [87]. It was proposed that reducedbinding activity of phosphorylated murine TIS11 could bedue to competitive binding with 14-3-3 proteins becausephosphorylation of Ser52 and Ser178 has been reported to
induce binding to 14-3-3 proteins [87]. More recently, itwas reported that phosphorylation of human TIS11b didnot affect its ability to bind to AREs and recruit RNAdegradation enzymes but did nonetheless inhibit its ability todegrade ARE-containing mRNA [90]. Finally, another studyinvolving human TIS11b, showed that phosphorylation ofTIS11b by protein kinase B at Ser92 abrogated mRNA decayof an IL-3 ARE containing probe induced by overexpressionof TIS11b [91].
6.2. Subcellular Localisation of TIS11 Family Members. Inmany cell types, TIS11 is expressed at very low/undetectablelevels in the nucleus and cytoplasm of unstimulated cells andis almost entirely expressed in the cytoplasm of stimulatedcells [82]. However, there was one early report showingthat TIS11 is nuclear and remains nuclear after stimulationwith serum [51]. Another exception appears to be humanumbilical vein endothelial cells (HUVEC) in which TIS11is cytoplasmic in resting HUVEC and becomes nuclearafter stimulation with TNF-α [22]. Nuclear to cytoplasmicshuttling of murine Tis11 has been shown to be regulatedthrough induction of phosphorylation at Ser52 and Ser178,primarily by the p38 pathway [82]. Hypophosphorylatedforms of TIS11 were found to be nuclear and highlysusceptible to proteasomal degradation [82].
Murine TIS11 has a nuclear export signal (NES) betweenamino acids 1–15 [92]. For murine TIS11b B the NES hasbeen mapped between amino acids 305–313 and for murineTIS11d between amino acids 471–479 [92]. In a separatestudy, the rat TIS11 nuclear localisation signal (NLS) wasmapped to the region containing the tandem repeats of thezinc finger motif (amino acids 88–161), and Arg127 andArg131, which are located in the linker region between the twozinc finger motifs, were shown to be critical residues whereasLeu3, Isol16 and Leu10 were critical for nuclear export [93].It has been shown by a yeast two hybrid system that TIS11specifically associates with nucleoporin/Nup214 which ispart of the nuclear pore on the cytoplasmic face of thepore complex [94] and this protein probably associates withthe linker region between the zinc finger motifs to mediatenuclear localisation of TIS11. On the other hand nuclearexport seems to be regulated through CRM1 since inhibitionof CRM1 resulted in nuclear accumulation of TIS11 [93].
When cells are stimulated with a strong stress signal suchas heat shock, TIS11 co-localises with TIA-1 in stress granules[95]. Localisation of TIS11 in stress granules also occurswhen cells are treated with FCCP (p-trifluoromethoxy car-bonyl cyanide phenyl hydrazone, a mitochondrial inhibitor),and oxidative stress but MK2 phosphorylation of TIS11promotes its complex formation with 14-3-3 protein andexcludes it from stress granules [96, 97]. Both zinc fingersof rat TIS11 are absolutely necessary for localisation in stressgranules, especially amino acids Tyr105, Tyr113, Phe119, Gly109,and Gly114 [95]. On the contrary it was shown that arsenitetreatment excludes TIS11 from stress granules throughMK2 mediated or p38 and c-jun N-terminal kinase (JNK)mediated phosphorylation [47, 96]. TIS11 and TIS11b alsolocalise to processing bodies (P-bodies), which are cytoplas-mic foci of mRNAs and enzymes that have been proposed as

Journal of Biomedicine and Biotechnology 7
sites of mRNA decay and translational silencing [42, 97, 98].TIS11 and TIS11b appear to deliver ARE containing mRNAsto processing bodies for translational silencing and mRNAdecay [98]. Overexpression of TIS11 and TIS11b resultedin stable association between stress granules and processingbodies suggesting that the TIS11 family plays an active rolein tethering stress granules to processing bodies [97]. Stressgranules are considered sites where mRNA is sorted forstorage, reinitiation of translation or degradation [97, 99].Interestingly, formation of processing bodies is absolutelynecessary for RNA interference activity and translationarrest or mRNA degradation through siRNA and miRNA[100]. Thus, TIS11 family and miRNA posttranscriptionalfunctions take place in the same subcellular location aswell as possibly being interdependent and sharing mRNAdegradation machinery [48].
7. TIS11 Family in Cell Functions and Disease
Overexpression of TIS11 family members induces apoptosisin a variety of cell lines including HeLa, U20S, SAOS2,and 3T3 [101, 102] and B-cell lymphoma cells [77] cells.Induction of apoptosis by all three TIS11 family memberswas completely abrogated in the presence of Bcl-2 or CrmA[101]. TIS11 synergistically induced apoptosis with TNF-α in 3T3 cells and the zinc fingers and the N-terminaldomain of TIS11 are absolutely critical for this effect [102].Mutant TIS11 lacking the zinc finger motifs failed to induceapoptosis and localised in the nucleus, whereas the wild typeTIS11 localised in the cytoplasm [102]. The TIS11 familymay regulate degradation of cell survival proteins such as,Bcl-2, directly. Bcl-2 mRNA contains a Class II ARE motif inthe 3′UTR with at least one UUAUUUAUU nonamer whichis conserved between different species and this sequencecontrols the stability of Bcl-2 [103]. RNA electrophoreticshift assays have confirmed an interaction between TIS11band the Bcl-2 ARE (Murphy et al., unpublished observa-tions). Because TIS11 also destabilises several mRNAs whoseoverexpression is related to malignant change, it has beensuggested that they may form a class of tumour suppressorgenes. In support of this hypothesis, it has been reported thatinjection of mast cells transformed with v-H-Ras resulted intumour formation in mice as early as 6 weeks after injectiondue to production of autocrine IL-3 [104]. Transfectionwith v-H-Ras clones overexpressing TIS11 delayed tumourformation by at least 4 weeks [104]. Another study correlatedresponse to cisplatin in head and neck squamous cell car-cinoma cell lines with levels of TIS11b expression. Tumourcells expressing TIS11b underwent apoptosis following drugexposure, while tumour cells with low/absent levels ofTIS11b were resistant to apoptosis, but became sensitiveafter transfection of cells with a TIS11b expressing plasmid[36]. Interestingly, significant downregulation of inhibitor ofapoptosis protein 2 (cIAP2) but not Bcl-2 mRNA was seenin these cells even though both these mRNAs contain class IIAREs [36].
TIS11 (but not TIS11b) specifically interacts with theTax protein from either bovine leukaemia virus or humanT lymphotropic virus 1 (HTLV-1) through the C-terminal
domain [46]. In the presence of TIS11, Tax was lessoncogenic probably due to inhibition of Tax transactivationactivity [46]. Interestingly TIS11 was able to abrogate TNF-α induction by Tax in unstimulated RAW264.7 cells [46].TIS11b expression is upregulated in human HTLV-1-infectedcells by Tax transactivator protein which binds to two TIS11bupstream control elements [105].
TIS11b was found to be one of the genes that are overexpressed in cell lines and primary cells expressing theAML1-ETO fusion protein, that is, found in 40% of AcuteMyeloid Leukaemia subtype M2 [62]. When ectopicallyexpressed TIS11b promoted myeloid progenitor L-G cellproliferation and inhibited differentiation [62]. Intriguingly,siRNA mediated TIS11b knockdown in murine embryonicstem cells promoted their differentiation to cardiomyocytes[106]. Increased expression of TIS11b was reported inprimary breast tumours [107] and hepatocellular carcinomas[108]. In addition, TIS11, TIS11b, and TIS11d have beenreported to be over-expressed in a variety of the NCI 60 panelof human cancer cell lines [109].
The involvement of the TIS11 family in inflammatorydisease was one of the earliest reported disease associationsof this family. TIS11 knockout mice developed a generalisedautoimmune-like disease that was largely controlled by theaddition of neutralising anti-TNF antibodies [44]. TIS11,in particular, has been reported to mediate degradation ofinflammatory cytokine mRNAs (see Table 1 and referencestherein). Recently, targeting TIS11 has been shown to havetherapeutic potential in an animal model of inflammatorybone loss [110].
8. Conclusion
The TIS11 family of proteins mediate posttranscriptionalgene regulation, which appears to be important in a rangeof physiological and pathological processes. A number ofimportant gaps in our knowledge still exist and requirefurther study. We have limited knowledge of mRNA targets ofTIS11 family members and whether individual TIS11 familymembers target distinct, overlapping, or identical targetsto other family members. A few studies have suggestedinhibition of translation may also be mediated by the TIS11family as well as mRNA degradation and this requires furtherelucidation. A most interesting line of enquiry concerns therelationship of TIS11 family mediated posttranscriptionalregulation to miRNA and siRNA mediated posttranscrip-tional regulation. Finally, their role in cell functions anddisease have already provided evidence that they may beuseful therapeutic targets in inflammatory diseases andcancer. Further studies are likely to identify other importantregulatory mechanisms for this family in health and disease.
Abbreviations
ARE: Adenine uridine rich elementsAU: Adenine uridineCLL: Chronic lymphocytic leukemiaLPS: LipopolysaccharideMAPK: Mitogen activated protein kinase

8 Journal of Biomedicine and Biotechnology
miRNA: Micro RNAMK2: p38-regulated MAPK activated protein kinase 2PARN: PolyA specific ribonucleasesiRNA: Short interfering RNATPA: 12-O-tetradecanoylphorbol-13-acetate.
References
[1] P. J. Blackshear, R. S. Phillips, S. Ghosh, S. V. B. Ramos,E. K. Richfield, and W. S. Lai, “Zfp36l3, a rodent X chro-mosome gene encoding a placenta-specific member of thetristetraprolin family of CCCH tandem zinc finger proteins,”Biology of Reproduction, vol. 73, no. 2, pp. 297–307, 2005.
[2] Q. Ma, D. Wadleigh, T. Chi, and H. Herschman, “TheDrosophila TIS11 homologue encodes a developmentallycontrolled gene,” Oncogene, vol. 9, no. 11, pp. 3329–3334,1994.
[3] Q. Ma and H. R. Herschman, “The yeast homologue YTIS11,of the mammalian TIS11 gene family is a non-essential,glucose repressible gene,” Oncogene, vol. 10, no. 3, pp. 487–494, 1995.
[4] M. J. Thompson, W. S. Lai, G. A. Taylor, and P. J. Blackshear,“Cloning and characterization of two yeast genes encodingmembers of the CCCH class of zinc finger proteins: zincfinger-mediated impairment of cell growth,” Gene, vol. 174,no. 2, pp. 225–233, 1996.
[5] P. J. Blackshear, “Tristetraprolin and other CCCH tandemzinc-finger proteins in the regulation of mRNA turnover,”Biochemical Society Transactions, vol. 30, no. 6, pp. 945–952,2002.
[6] C. J. Wilusz, M. Wormington, and S. W. Peltz, “The cap-to-tail guide to mRNA turnover,” Nature Reviews Molecular CellBiology, vol. 2, no. 4, pp. 237–246, 2001.
[7] T. Bakheet, B. R. G. Williams, and K. S. A. Khabar, “ARED2.0: an update of AU-rich element mRNA database,” NucleicAcids Research, vol. 31, no. 1, pp. 421–423, 2003.
[8] E. Carballo, W. S. Lai, and P. J. Blackshear, “Feedback inhi-bition of macrophage tumor necrosis factor-α production bytristetraprolin,” Science, vol. 281, no. 5379, pp. 1001–1005,1998.
[9] M. T. Worthington, J. W. Pelo, M. A. Sachedina, J. L.Applegate, K. O. Arseneau, and T. T. Pizarro, “RNA bindingproperties of the AU-rich element-binding recombinantNup475/TIS11/tristetraprolin protein,” The Journal of Biolog-ical Chemistry, vol. 277, no. 50, pp. 48558–48564, 2002.
[10] P. J. Blackshear, W. S. Lai, E. A. Kennington, et al., “Character-istics of the interaction of a synthetic human tristetraprolintandem zinc finger peptide with AU-rich element-containingRNA substrates,” The Journal of Biological Chemistry, vol.278, no. 22, pp. 19947–19955, 2003.
[11] B. Y. Brewer, J. Malicka, P. J. Blackshear, and G. M. Wilson,“RNA sequence elements required for high affinity bindingby the zinc finger domain of tristetraprolin: conformationalchanges coupled to the bipartite nature of AU-rich mRNA-destabilizing motifs,” The Journal of Biological Chemistry, vol.279, no. 27, pp. 27870–27877, 2004.
[12] W. S. Lai, D. M. Carrick, and P. J. Blackshear, “Influence ofnonameric AU-rich tristetraprolin-binding sites on mRNAdeadenylation and turnover,” The Journal of Biological Chem-istry, vol. 280, no. 40, pp. 34365–34377, 2005.
[13] S. A. Bustin, X.-F. Nie, R. C. Barnard, et al., “Cloning andcharacterization of ERF-1, a human member of the Tis11family of early-response genes,” DNA and Cell Biology, vol.13, no. 5, pp. 449–459, 1994.
[14] S. A. Brooks, J. E. Connoly, and W. F. C. Rigby, “Therole of mRNA turnover in the regulation of tritetraprolinexpression: evidence for an extracellular signal-regulatedkinase-specific, AU-rich element-dependent, autoregulatorypathway,” The Journal of Immunology, vol. 172, no. 12, pp.7263–7271, 2004.
[15] E. Carballo, W. S. Lai, and P. J. Blackshear, “Evidence thattristetraprolin is a physiological regulator of granulocyte-macrophage colony-stimulating factor messenger RNA dead-enylation and stability,” Blood, vol. 95, no. 6, pp. 1891–1899,2000.
[16] G. Stoecklin, X.-F. Ming, R. Looser, and C. Moroni, “SomaticmRNA turnover mutants implicate tristetraprolin in theinterleukin-3 mRNA degradation pathway,” Molecular andCellular Biology, vol. 20, no. 11, pp. 3753–3763, 2000.
[17] G. Stoecklin, P. Stoeckle, M. Lu, O. Muehlemann, andC. Moroni, “Cellular mutants define a common mRNAdegradation pathway targeting cytokine AU-rich elements,”RNA, vol. 7, no. 11, pp. 1578–1588, 2001.
[18] H. Sawaoka, D. A. Dixon, J. A. Oates, and O. Boutaud,“Tristetraprolin binds to the 3′-untranslated region ofcyclooxygenase-2 mRNA: a polyadenylation variant in acancer cell line lacks the binding site,” The Journal ofBiological Chemistry, vol. 278, no. 16, pp. 13928–13935, 2003.
[19] H. Yu, S. Stasinopoulos, P. Leedman, and R. L. Medcalf,“Inherent instability of plasminogen activator inhibitor type2 mRNA is regulated by tristetraprolin,” The Journal ofBiological Chemistry, vol. 278, no. 16, pp. 13912–13918, 2003.
[20] P. Briata, C. Ilengo, G. Corte, et al., “The Wnt/β-catenin→Pitx2 pathway controls the turnover of Pitx2 and otherunstable mRNAs,” Molecular Cell, vol. 12, no. 5, pp. 1201–1211, 2003.
[21] R. L. Ogilvie, M. Abelson, H. H. Hau, I. Vlasova, P. J.Blackshear, and P. R. Bohjanen, “Tristetraprolin down-regulates IL-2 gene expression through AU-rich element-mediated mRNA decay,” The Journal of Immunology, vol. 174,no. 2, pp. 953–961, 2005.
[22] S. I. Gringhuis, J. J. Garcıa-Vallejo, B. van Het Hof, and W.van Dijk, “Convergent actions of IκB kinase β and proteinkinase C δ modulate mRNA stability through phosphoryla-tion of 14-3-3 β complexed with tristetraprolin,” Molecularand Cellular Biology, vol. 25, no. 15, pp. 6454–6463, 2005.
[23] U. Jalonen, R. Nieminen, K. Vuolteenaho, H. Kankaan-ranta, and E. Moilanen, “Down-regulation of tristetraprolinexpression results in enhanced IL-12 and MIP-2 productionand reduced MIP-3α synthesis in activated macrophages,”Mediators of Inflammation, vol. 2006, Article ID 40691, 8pages, 2006.
[24] I. Sauer, B. Schaljo, C. Vogl, et al., “Interferons limitinflammatory responses by induction of tristetraprolin,”Blood, vol. 107, no. 12, pp. 4790–4797, 2006.
[25] M. Marderosian, A. Sharma, A. P. Funk, et al., “Tristetrapro-lin regulates cyclin D1 and c-Myc mRNA stability in responseto rapamycin in an Akt-dependent manner via p38 MAPKsignaling,” Oncogene, vol. 25, no. 47, pp. 6277–6290, 2006.
[26] W. D. Patino, J.-G. Kang, S. Matoba, O. Y. Mian, B.R. Gochuico, and P. M. Hwang, “Atherosclerotic plaquemacrophage transcriptional regulators are expressed in bloodand modulated by tristetraprolin,” Circulation Research, vol.98, no. 10, pp. 1282–1289, 2006.
[27] W. S. Lai, J. S. Parker, S. F. Grissom, D. J. Stumpo, and P. J.Blackshear, “Novel mRNA targets for tristetraprolin (TTP)

Journal of Biomedicine and Biotechnology 9
identified by global analysis of stabilized transcripts in TTP-deficient fibroblasts,” Molecular and Cellular Biology, vol. 26,no. 24, pp. 9196–9208, 2006.
[28] D. Frasca, A. M. Landin, J. P. Alvarez, P. J. Blackshear, R.L. Riley, and B. B. Blomberg, “Tristetraprolin, a negativeregulator of mRNA stability, is increased in old B cells andis involved in the degradation of E47 mRNA,” The Journal ofImmunology, vol. 179, no. 2, pp. 918–927, 2007.
[29] K. Essafi-Benkhadir, C. Onesto, E. Stebe, C. Moroni, andG. Pages, “Tristetraprolin inhibits ras-dependent tumor vas-cularization by inducing vascular endothelial growth factormRNA degradation,” Molecular Biology of the Cell, vol. 18,no. 11, pp. 4648–4658, 2007.
[30] G. Stoecklin, S. A. Tenenbaum, T. Mayo, et al., “Genome-wide analysis identifies interleukin-10 mRNA as target oftristetraprolin,” The Journal of Biological Chemistry, vol. 283,no. 17, pp. 11689–11699, 2008.
[31] T. J. Horner, W. S. Lai, D. J. Stumpo, and P. J. Blackshear,“Stimulation of polo-like kinase 3 mRNA decay by triste-traprolin,” Molecular and Cellular Biology, vol. 29, no. 8, pp.1999–2010, 2009.
[32] W. S. Lai, E. Carballo, J. M. Thorn, E. A. Kennington, andP. J. Blackshear, “Interactions of CCCH zinc finger proteinswith mRNA. Binding of tristetraprolin-related zinc fingerproteins to AU-rich elements and destabilization of mRNA,”The Journal of Biological Chemistry, vol. 275, no. 23, pp.17827–17837, 2000.
[33] W. S. Lai and P. J. Blackshear, “Interactions of CCCH zincfinger proteins with mRNA. Tristetraprolin-mediated AU-rich element-dependent mRNA degradation can occur in theabsence of a poly(A) tail,” The Journal of Biological Chemistry,vol. 276, no. 25, pp. 23144–23154, 2001.
[34] G. Stoecklin, M. Colombi, I. Raineri, et al., “Functionalcloning of BRF1, a regulator of ARE-dependent mRNAturnover,” The EMBO Journal, vol. 21, no. 17, pp. 4709–4718,2002.
[35] D. Ciais, N. Cherradi, S. Bailly, et al., “Destabilization ofvascular endothelial growth factor mRNA by the zinc-fingerprotein TIS11b,” Oncogene, vol. 23, no. 53, pp. 8673–8680,2004.
[36] S. K. Lee, S. B. Kim, J. S. Kim, et al., “Butyrate response factor1 enhances cisplatin sensitivity in human head and necksquamous cell carcinoma cell lines,” International Journal ofCancer, vol. 117, no. 1, pp. 32–40, 2005.
[37] S. E. Bell, M. J. Sanchez, O. Spasic-Boskovic, et al., “The RNAbinding protein Zfp36l1 is required for normal vascularisa-tion and post-transcriptionally regulates VEGF expression,”Developmental Dynamics, vol. 235, no. 11, pp. 3144–3155,2006.
[38] H. Duan, N. Cherradi, J.-J. Feige, and C. Jefcoate, “cAMP-dependent posttranscriptional regulation of steroidogenicacute regulatory (STAR) protein by the zinc finger proteinZFP36L1/TIS11b,” Molecular Endocrinology, vol. 23, no. 4,pp. 497–509, 2009.
[39] W. S. Lai, E. A. Kennington, and P. J. Blackshear, “Interactionsof CCCH zinc finger proteins with mRNA: non-bindingtristetraprolin mutants exert an inhibitory effect on degra-dation of AU-rich element-containing mRNAs,” The Journalof Biological Chemistry, vol. 277, no. 11, pp. 9606–9613, 2002.
[40] W. S. Lai, E. A. Kennington, and P. J. Blackshear, “Tris-tetraprolin and its family members can promote the cell-free deadenylation of AU-rich element-containing mRNAs
by poly(A) ribonuclease,” Molecular and Cellular Biology, vol.23, no. 11, pp. 3798–3812, 2003.
[41] J. Lykke-Andersen and E. Wagner, “Recruitment and activa-tion of mRNA decay enzymes by two ARE-mediated decayactivation domains in the proteins TTP and BRF-1,” Genesand Development, vol. 19, no. 3, pp. 351–361, 2005.
[42] M. Fenger-Grøn, C. Fillman, B. Norrild, and J. Lykke-Andersen, “Multiple processing body factors and the AREbinding protein TTP activate mRNA decapping,” MolecularCell, vol. 20, no. 6, pp. 905–915, 2005.
[43] C.-Y. Chen, R. Gherzi, S.-E. Ong, et al., “AU binding proteinsrecruit the exosome to degrade ARE-containing mRNAs,”Cell, vol. 107, no. 4, pp. 451–464, 2001.
[44] G. A. Taylor, E. Carballo, D. M. Lee, et al., “A pathogeneticrole for TNFα in the syndrome of cachexia, arthritis, andautoimmunity resulting from tristetraprolin (TTP) defi-ciency,” Immunity, vol. 4, no. 5, pp. 445–454, 1996.
[45] K. Suzuki, H. Nakajima, K. Ikeda, et al., “IL-4-Stat6 signalinginduces tristetraprolin expression and inhibits TNF-α pro-duction in mast cells,” Journal of Experimental Medicine, vol.198, no. 11, pp. 1717–1727, 2003.
[46] J.-C. Twizere, V. Kruys, L. Lefebvre, et al., “Interaction ofretroviral tax oncoproteins with tristetraprolin and regula-tion of tumor necrosis factor-α expression,” Journal of theNational Cancer Institute, vol. 95, no. 24, pp. 1846–1859,2003.
[47] W. F. C. Rigby, K. Roy, J. Collins, et al., “Structure/functionanalysis of tristetraprolin (TTP): p38 stress-activated proteinkinase and lipopolysaccharide stimulation do not alter TTPfunction,” The Journal of Immunology, vol. 174, no. 12, pp.7883–7893, 2005.
[48] Q. Jing, S. Huang, S. Guth, et al., “Involvement of microRNAin AU-Rich element-mediated mRNA instability,” Cell, vol.120, no. 5, pp. 623–634, 2005.
[49] S. Dorner, L. Lum, M. Kim, R. Paro, P. A. Beachy, andR. Green, “A genomewide screen for components of theRNAi pathway in Drosophila cultured cells,” Proceedings of theNational Academy of Sciences of the United States of America,vol. 103, no. 32, pp. 11880–11885, 2006.
[50] A. J. Asirvatham, C. J. Gregorie, Z. Hu, W. J. Magner,and T. B. Tomasi, “MicroRNA targets in immune genesand the Dicer/Argonaute and ARE machinery components,”Molecular Immunology, vol. 45, no. 7, pp. 1995–2006, 2008.
[51] R. N. DuBois, M. W. McLane, K. Ryder, L. F. Lau, and D.Nathans, “A growth factor-inducible nuclear protein with anovel cysteine/histidine repetitive sequence,” The Journal ofBiological Chemistry, vol. 265, no. 31, pp. 19185–19191, 1990.
[52] G. A. Taylor, W. S. Lai, R. J. Oakey, et al., “The humanTTP protein: sequence, alignment with related proteins, andchromosomal localization of the mouse and human genes,”Nucleic Acids Research, vol. 19, no. 12, p. 3454, 1991.
[53] B. C. Varnum, R. W. Lim, V. P. Sukhatme, and H. R.Herschman, “Nucleotide sequence of a cDNA encodingTIS11, a message induced in Swiss 3T3 cells by the tumorpromoter tetradecanoyl phorbol acetate,” Oncogene, vol. 4,no. 1, pp. 119–120, 1989.
[54] J. J. Murphy and J. D. Norton, “Cell-type-specific earlyresponse gene expression during plasmacytoid differentia-tion of human B lymphocytic leukemia cells,” Biochimica etBiophysica Acta, vol. 1049, no. 3, pp. 261–271, 1990.
[55] Z.-Q. Ning, J. D. Norton, J. Li, and J. J. Murphy, “Distinctmechanisms for rescue from apoptosis in Ramos human Bcells by signaling through CD40 and interleukin-4 receptor:role for inhibition of an early response gene, Berg36,”

10 Journal of Biomedicine and Biotechnology
European Journal of Immunology, vol. 26, no. 10, pp. 2356–2363, 1996.
[56] X.-F. Nie, K. N. Maclean, V. Kumar, I. A. McKay, and S. A.Bustin, “ERF-2, the human homologue of the murine TIS11dearly response gene,” Gene, vol. 152, no. 2, pp. 285–286, 1995.
[57] P. J. Blackshear, R. S. Phillips, J. Vazquez-Matias, andH. Mohrenweiser, “Polymorphisms in the genes encodingmembers of the tristetraprolin family of human tandemCCCH zinc finger proteins,” Progress in Nucleic Acid Researchand Molecular Biology, vol. 75, pp. 43–68, 2003.
[58] D. M. Carrick, P. Chulada, R. Donn, et al., “Genetic variationsin ZFP36 and their possible relationship to autoimmunediseases,” Journal of Autoimmunity, vol. 26, no. 3, pp. 182–196, 2006.
[59] D. J. Stumpo, N. A. Byrd, R. S. Phillips, et al., “Chorioal-lantoic fusion defects and embryonic lethality resulting fromdisruption of Zfp36L1, a gene encoding a CCCH tandem zincfinger protein of the tristetraprolin family,” Molecular andCellular Biology, vol. 24, no. 14, pp. 6445–6455, 2004.
[60] S. B. V. Ramos, D. J. Stumpo, E. A. Kennington, et al.,“The CCCH tandem zinc-finger protein Zfp36l2 is crucialfor female fertility and early embryonic development,”Development, vol. 131, no. 19, pp. 4883–4893, 2004.
[61] H. Cao, J. S. Tuttle, and P. J. Blackshear, “Immunologi-cal characterization of tristetraprolin as a low abundance,inducible, stable cytosolic protein,” The Journal of BiologicalChemistry, vol. 279, no. 20, pp. 21489–21499, 2004.
[62] H. Shimada, H. Ichikawa, S. Nakamura, et al., “Analysis ofgenes under the downstream control of the t(8;21) fusionprotein AML1-MTG8: overexpression of the TIS11b (ERF-1, cMG1) gene induces myeloid cell proliferation in responseto G-CSF,” Blood, vol. 96, no. 2, pp. 655–663, 2000.
[63] T. Ino, H. Yasui, M. Hirano, and Y. Kurosawa, “Identificationof a member of the TIS11 early response gene family atthe insertion point of a DNA fragment containing a genefor the T-cell receptor β chain in an acute T-cell leukemia,”Oncogene, vol. 11, no. 12, pp. 2705–2710, 1995.
[64] B. T. Amann, M. T. Worthington, and J. M. Berg, “A Cys3Hiszinc-binding domain from Nup475/tristetraprolin: a novelfold with a disklike structure,” Biochemistry, vol. 42, no. 1,pp. 217–221, 2003.
[65] B. P. Hudson, M. A. Martinez-Yamout, H. J. Dyson, and P.E. Wright, “Recognition of the mRNA AU-rich element bythe zinc finger domain of TIS11d,” Nature Structural andMolecular Biology, vol. 11, no. 3, pp. 257–264, 2004.
[66] W. S. Lai, D. J. Stumpo, and P. J. Blackshear, “Rapid insulin-stimulated accumulation of an mRNA encoding a proline-rich protein,” The Journal of Biological Chemistry, vol. 265,no. 27, pp. 16556–16563, 1990.
[67] A. N. Corps and K. D. Brown, “Insulin and insulin-likegrowth factor I stimulate expression of the primary responsegene cMG1/TIS11b by a wortmannin-sensitive pathway inRIE-1 cells,” FEBS Letters, vol. 368, no. 1, pp. 160–164, 1995.
[68] K. R. Mahtani, M. Brook, J. L. E. Dean, G. Sully, J. Saklatvala,and A. R. Clark, “Mitogen-activated protein kinase p38controls the expression and posttranslational modificationof tristetraprolin, a regulator of tumor necrosis factor alphamRNA stability,” Molecular and Cellular Biology, vol. 21, no.19, pp. 6461–6469, 2001.
[69] C. R. Tchen, M. Brook, J. Saklatvala, and A. R. Clark, “Thestability of tristetraprolin mRNA is regulated by mitogen-activated protein kinase p38 and by tristetraprolin itself,” TheJournal of Biological Chemistry, vol. 279, no. 31, pp. 32393–32400, 2004.
[70] A. M. Fairhurst, J. E. Connolly, K. A. Hintz, et al., “Regula-tion and localization of endogenous human tristetraprolin,”Arthritis Research & Therapy, vol. 5, no. 4, pp. R214–R225,2003.
[71] B. C. Varnum, R. W. Lim, D. A. Kujubu, et al., “Granulocyte-macrophage colony-stimulating factor and tetradecanoylphorbol acetate induce a distinct, restricted subset ofprimary-response TIS genes in both proliferating and ter-minally differentiated myeloid cells,” Molecular and CellularBiology, vol. 9, no. 8, pp. 3580–3583, 1989.
[72] K. Ogawa, F. Chen, Y.-J. Kim, and Y. Chen, “Transcriptionalregulation of tristetraprolin by transforming growth factor-β in human T cells,” The Journal of Biological Chemistry, vol.278, no. 32, pp. 30373–30381, 2003.
[73] A. Raghavan, R. L. Robison, J. McNabb, C. R. Miller, D.A. Williams, and P. R. Bohjanen, “HuA and tristetraprolinare induced following T cell activation and display distinctbut overlapping RNA binding specificities,” The Journal ofBiological Chemistry, vol. 276, no. 51, pp. 47958–47965, 2001.
[74] K. Smoak and J. A. Cidlowski, “Glucocorticoids regulatetristetraprolin synthesis and posttranscriptionally regulatetumor necrosis factor alpha inflammatory signaling,” Molec-ular and Cellular Biology, vol. 26, no. 23, pp. 9126–9135,2006.
[75] F. T. Ishmael, X. Fang, M. R. Galdiero, et al., “Role ofthe RNA-binding protein tristetraprolin in glucocorticoid-mediated gene regulation,” The Journal of Immunology, vol.180, no. 12, pp. 8342–8353, 2008.
[76] Z.-Q. Ning, T. Hirose, R. Deed, J. Newton, J. J. Murphy, andJ. D. Norton, “Early response gene signalling in bryostatin-stimulated primary B chronic lymphocytic leukaemia cells invitro,” Biochemical Journal, vol. 319, part 1, pp. 59–65, 1996.
[77] M. Baou, A. Jewell, A. Muthurania, et al., “Involvement ofTIS11b, an AU-rich binding protein, in induction of apopto-sis by rituximab in B cell chronic lymphocytic leukemia cells,”Leukemia, vol. 23, pp. 986–989, 2009.
[78] S. Mathas, A. Rickers, K. Bommert, B. Dorken, and M. Y.Mapara, “Anti-CD20-and B-cell receptor-mediated apopto-sis: evidence for shared intracellular signaling pathways,”Cancer Research, vol. 60, no. 24, pp. 7170–7176, 2000.
[79] S. Reppe, O. K. Olstad, E. Rian, V. T. Gautvik, K. M. Gautvik,and R. Jemtland, “Butyrate response factor 1 is regulatedby parathyroid hormone and bone morphogenetic protein-2 in osteoblastic cells,” Biochemical and Biophysical ResearchCommunications, vol. 324, no. 1, pp. 218–223, 2004.
[80] A. M. Chinn, D. Ciais, S. Bailly, E. Chambaz, J. LaMarre,and J.-J. Feige, “Identification of two novel ACTH-responsivegenes encoding manganese-dependent superoxide dismutase(SOD2) and the zinc finger protein TIS11b [tetradecanoylphorbol acetate (TPA)-inducible sequence 11b],” MolecularEndocrinology, vol. 16, no. 6, pp. 1417–1427, 2002.
[81] G. A. Taylor, M. J. Thompson, W. S. Lai, and P. J. Blackshear,“Mitogens stimulate the rapid nuclear to cytosolic translo-cation of tristetraprolin, a potential zinc-finger transcriptionfactor,” Molecular Endocrinology, vol. 10, no. 2, pp. 140–146,1996.
[82] M. Brook, C. R. Tchen, T. Santalucia, et al., “Posttranslationalregulation of tristetraprolin subcellular localization andprotein stability by p38 mitogen-activated protein kinase andextracellular signal-regulated kinase pathways,” Molecularand Cellular Biology, vol. 26, no. 6, pp. 2408–2418, 2006.
[83] G. A. Taylor, M. J. Thompson, W. S. Lai, and P. J. Blackshear,“Phosphorylation of tristetraprolin, a potential zinc fingertranscription factor, by mitogen stimulation in intact cells

Journal of Biomedicine and Biotechnology 11
and by mitogen-activated protein kinase in vitro,” TheJournal of Biological Chemistry, vol. 270, no. 22, pp. 13341–13347, 1995.
[84] W. Zhu, M. A. Brauchle, F. Di Padova, et al., “Gene sup-pression by tristetraprolin and release by the p38 pathway,”American Journal of Physiology, vol. 281, no. 2, pp. L499–L508, 2001.
[85] C. A. Chrestensen, M. J. Schroeder, J. Shabanowitz, et al.,“MAPKAP kinase 2 phosphorylates tristetraprolin on in vivosites including Ser178, a site required for 14-3-3 binding,”The Journal of Biological Chemistry, vol. 279, no. 11, pp.10176–10184, 2004.
[86] L. Sun, G. Stoecklin, S. Van Way, et al., “Tristetrapro-lin (TTP)-14-3-3 complex formation protects TTP fromdephosphorylation by protein phosphatase 2a and stabilizestumor necrosis factor-α mRNA,” The Journal of BiologicalChemistry, vol. 282, no. 6, pp. 3766–3777, 2007.
[87] E. Hitti, T. Iakovleva, M. Brook, et al., “Mitogen-activatedprotein kinase-activated protein kinase 2 regulates tumornecrosis factor mRNA stability and translation mainly byaltering tristetraprolin expression, stability, and bindingto adenine/uridine-rich element,” Molecular and CellularBiology, vol. 26, no. 6, pp. 2399–2407, 2006.
[88] B. A. Johnson, J. R. Stehn, M. B. Yaffe, and T. K. Blackwell,“Cytoplasmic localization of tristetraprolin involves 14-3-3-dependent and -independent mechanisms,” The Journal ofBiological Chemistry, vol. 277, no. 20, pp. 18029–18036, 2002.
[89] H. Cao, L. J. Deterding, J. D. Venable, et al., “Identification ofthe anti-inflammatory protein tristetraprolin as a hyperphos-phorylated protein by mass spectrometry and site-directedmutagenesis,” Biochemical Journal, vol. 394, no. 1, pp. 285–297, 2006.
[90] S. Maitra, C.-F. Chou, C. A. Luber, K.-Y. Lee, M. Mann, andC.-Y. Chen, “The AU-rich element mRNA decay-promotingactivity of BRF1 is regulated by mitogen-activated proteinkinase-activated protein kinase 2,” RNA, vol. 14, no. 5, pp.950–959, 2008.
[91] M. Schmidlin, M. Lu, S. A. Leuenberger, et al., “The ARE-dependent mRNA-destabilizing activity of BRF1 is regulatedby protein kinase B,” The EMBO Journal, vol. 23, no. 24, pp.4760–4769, 2004.
[92] R. S. Phillips, S. B. V. Ramos, and P. J. Blackshear, “Membersof the tristetraprolin family of tandem CCCH zinc fingerproteins exhibit CRM1-dependent nucleocytoplasmic shut-tling,” The Journal of Biological Chemistry, vol. 277, no. 13,pp. 11606–11613, 2002.
[93] T. Murata, Y. Yoshino, N. Morita, and N. Kaneda, “Identifica-tion of nuclear import and export signals within the structureof the zinc finger protein TIS11,” Biochemical and BiophysicalResearch Communications, vol. 293, no. 4, pp. 1242–1247,2002.
[94] J. A. Carman and S. G. Nadler, “Direct association of triste-traprolin with the nucleoporin CAN/Nup214,” Biochemicaland Biophysical Research Communications, vol. 315, no. 2, pp.445–449, 2004.
[95] T. Murata, N. Morita, K. Hikita, K. Kiuchi, K. Kiuchi, and N.Kaneda, “Recruitment of mRNA-destabilizing protein TIS11to stress granules is mediated by its zinc finger domain,”Experimental Cell Research, vol. 303, no. 2, pp. 287–299, 2005.
[96] G. Stoecklin, T. Stubbs, N. Kedersha, et al., “MK2-inducedtristetraprolin:14-3-3 complexes prevent stress granule asso-ciation and ARE-mRNA decay,” The EMBO Journal, vol. 23,no. 6, pp. 1313–1324, 2004.
[97] N. Kedersha, G. Stoecklin, M. Ayodele, et al., “Stress granulesand processing bodies are dynamically linked sites of mRNPremodeling,” Journal of Cell Biology, vol. 169, no. 6, pp. 871–884, 2005.
[98] T. M. Franks and J. Lykke-Andersen, “TTP and BRF proteinsnucleate processing body formation to silence mRNAs withAU-rich elements,” Genes and Development, vol. 21, no. 6, pp.719–735, 2007.
[99] N. Cougot, S. Babajko, and B. Seraphin, “Cytoplasmic fociare sites of mRNA decay in human cells,” Journal of CellBiology, vol. 165, no. 1, pp. 31–40, 2004.
[100] A. Jakymiw, S. Lian, T. Eystathioy, et al., “Disruption of GWbodies impairs mammalian RNA interference,” Nature CellBiology, vol. 7, no. 12, pp. 1267–1274, 2005.
[101] B. A. Johnson, M. Geha, and K. T. Blackwell, “Similar butdistinct effects of the tristetraprolin/TIS11 immediate-earlyproteins on cell survival,” Oncogene, vol. 19, no. 13, pp. 1657–1664, 2000.
[102] B. A. Johnson and T. K. Blackwell, “Multiple tristetrapro-lin sequence domains required to induce apoptosis andmodulate responses to TNFα through distinct pathways,”Oncogene, vol. 21, no. 27, pp. 4237–4246, 2002.
[103] N. Schiavone, P. Rosini, A. Quattrone, et al., “A conservedAU-rich element in the 3′ untranslated region of bcl-2 mRNAis endowed with a destabilizing function that is involvedin bcl-2 down-regulation during apoptosis,” The FASEBJournal, vol. 14, no. 1, pp. 174–184, 2000.
[104] G. Stoecklin, B. Gross, X.-F. Ming, and C. Moroni, “A novelmechanism of tumor suppression by destabilizing AU-richgrowth factor mRNA,” Oncogene, vol. 22, no. 23, pp. 3554–3561, 2003.
[105] B. Li, T. Fink, P. Ebbesen, X. D. Liu, and V. Zachar, “Expres-sion of butyrate response factor 1 in HTLV-1-transformedcells and its transactivation by tax protein,” Archives ofVirology, vol. 148, no. 9, pp. 1787–1804, 2003.
[106] D. Wegmuller, I. Raineri, B. Gross, E. J. Oakeley, and C.Moroni, “A cassette system to study embryonic stem celldifferentiation by inducible RNA interference,” Stem Cells,vol. 25, no. 5, pp. 1178–1185, 2007.
[107] M. C. Abba, H. Sun, K. A. Hawkins, et al., “Breast cancermolecular signatures as determined by SAGE: correlationwith lymph node status,” Molecular Cancer Research, vol. 5,no. 9, pp. 881–890, 2007.
[108] P. J. Zindy, A. L’Helgoualc’h, D. Bonnier, et al., “Upregulationof the tumor suppressor gene menin in hepatocellularcarcinomas and its significance in fibrogenesis,” Hepatology,vol. 44, no. 5, pp. 1296–1307, 2006.
[109] D. M. Carrick and P. J. Blackshear, “Comparative expressionof tristetraprolin (TTP) family member transcripts in normalhuman tissues and cancer cell lines,” Archives of Biochemistryand Biophysics, vol. 462, no. 2, pp. 278–285, 2007.
[110] C. S. Patil, M. Liu, W. Zhao, et al., “Targeting mRNA stabilityarrests inflammatory bone loss,” Molecular Therapy, vol. 16,no. 10, pp. 1657–1664, 2008.
Copyright © 2022 FDOKUMEN