Efficient computation of minimal perturbation sets in gene regulatory networks
10
ORIGINAL RESEARCH ARTICLE published: 17 December 2013 doi: 10.3389/fphys.2013.00361 Efficient computation of minimal perturbation sets in gene regulatory networks Abhishek Garg 1 , Kartik Mohanram 2 , Alessandro Di Cara 3 , Gwendoline Degueurce 4 , Mark Ibberson 1 , Julien Dorier 1 and Ioannis Xenarios 1,4,5 * 1 Vital-IT Systems Biology Division, SIB Swiss Institute of Bioinformatics, Lausanne, Switzerland 2 Electrical and Computer Engineering, University of Pittsburgh, Pittsburgh, PA, USA 3 Quartz Bio, Plan-Les-Ouates, Switzerland 4 Center for Integrative Genomics, University of Lausanne, Lausanne, Switzerland 5 Swiss-Prot group, SIB Swiss Institute of Bioinformatics, Lausanne, Switzerland Research Topic: From structural to molecular systems biology: experimental and computaonal approaches to unravel mechanisms of kinase acvity regulaon in cancer and neurodegeneraon Edited by: Matteo Barberis, Humboldt University Berlin, Germany; Max Planck Institute for Molecular Genetics, Berlin, Germany Reviewed by: Marco Scutari, University College London, UK Tomᢠs Helikar, University of Nebraska at Lincoln, USA *Correspondence: Ioannis Xenarios, Department Head, Vital-IT Systems Medecine/Biology Department, SIB Swiss Institute of Bioinformatics, Quartier Genopode, 1005 Lausanne, Switzerland e-mail: [email protected] In the last few decades, technological and experimental advancements have enabled a more precise understanding of the mode of action of drugs with respect to human cell signaling pathways and have positively influenced the design of new drug compounds. However, as the design of compounds has become increasingly target-specific, the overall effects of a drug on adjacent cellular signaling pathways remain difficult to predict because of the complexity of the interactions involved. Off-target effects of drugs are known to influence their efficacy and safety. Similarly, drugs which are more target-specific also suffer from lack of efficacy because their scope might be too limited in the context of cellular signaling. Even in situations where the signaling pathways targeted by a drug are known, the presence of point mutations in some of the components of the pathways can render a therapy ineffective in a considerable target subpopulation. Some of these issues can be addressed by predicting Minimal Intervention Sets (MIS) of elements of the signaling pathways that when perturbed give rise to a pre-defined cellular phenotype. These minimal gene perturbation sets can then be further used to screen a library of drug compounds in order to discover effective drug therapies. This manuscript describes algorithms that can be used to discover MIS in a gene regulatory network that can lead to a defined cellular phenotype. Algorithms are implemented in our Boolean modeling toolbox, GenYsis. The software binaries of GenYsis are available for download from http://www.vital- it.ch/software/genYsis/. Keywords: boolean modeling, GRN, MIS, miRNA, algorithms, qualitative modeling, T-Helper, cancer pathways 1. INTRODUCTION Advancements in high-throughput technologies have enabled biologists to measure the expression (or activity) of many genes simultaneously. By measuring and comparing the expression of genes in a normal vs. diseased cell phenotypes, biologists have been able to identify various key genes involved in disease path- ways. However, predicting a set of genes in a disease is often not sufficient as it may not be possible to directly manipulate the expression of those genes using available drug compounds. This necessitates studying the interactions of genes that are known drug targets with respect to the genes (or proteins) that are impli- cated in high-throughput analysis of specific disease phenotypes. This observation has shifted the focus of computational and experimental tools from studying individual genes to understand- ing the underlying gene regulatory networks (GRNs) of biological processes. By modeling GRNs, one would like to gain a deeper understanding of how different cellular phenotypes arise from the same set of underlying genes and how a biological system can be forced to differentiate into a specific phenotype by manipulating the expression of a small set of genes/proteins in the underlying GRN. Even with an improved understanding of the working of cellular signaling components and technological advancements in designing new drug compounds, it is often not possible to design drug compounds that specifically target only the desired genes/proteins with desired effectiveness. Some of these issues can also be addressed by predicting which elements of the GRNs have to be targeted in order to attain a pre-defined phenotype. The lat- ter problem is formally referred to as Minimal Intervention Sets (MIS) problem in the literature (Karlebach and Shamir, 2010; Samaga et al., 2010). In an MIS problem, one would like to enumerate a list of possible sets of genes/proteins from a given GRN, which when perturbed, can give rise to the desired cellular phenotypes. A GRN, such as the one in Figure 1A, can be modeled as a Boolean network using the mapping we have introduced earlier in Garg et al. (2009). In the Boolean modeling of a GRN, a node can exist in two expression states: low and high. These two expres- sion states are represented by logic 0 and 1, respectively. A state of the network at a given time instant t is defined by the expression state of all the nodes at that instant of time. A state of the net- work evolves over time as defined by the underlying interactions www.frontiersin.org December 2013 | Volume 4 | Article 361 | 1
-
Upload
independent -
Category
Documents
-
view
1 -
download
0
Transcript of Efficient computation of minimal perturbation sets in gene regulatory networks
ORIGINAL RESEARCH ARTICLEpublished: 17 December 2013
doi: 10.3389/fphys.2013.00361
Efficient computation of minimal perturbation sets in generegulatory networksAbhishek Garg1, Kartik Mohanram2, Alessandro Di Cara3, Gwendoline Degueurce4, Mark Ibberson1,
Julien Dorier1 and Ioannis Xenarios1,4,5*
1 Vital-IT Systems Biology Division, SIB Swiss Institute of Bioinformatics, Lausanne, Switzerland2 Electrical and Computer Engineering, University of Pittsburgh, Pittsburgh, PA, USA3 Quartz Bio, Plan-Les-Ouates, Switzerland4 Center for Integrative Genomics, University of Lausanne, Lausanne, Switzerland5 Swiss-Prot group, SIB Swiss Institute of Bioinformatics, Lausanne, Switzerland
Research Topic: From structural to molecular systems biology: experimental and computa�onal approaches to unravel mechanisms of kinase ac�vityregula�on in cancer and neurodegenera�on
Edited by:
Matteo Barberis, HumboldtUniversity Berlin, Germany;Max Planck Institute for MolecularGenetics, Berlin, Germany
Reviewed by:
Marco Scutari, University CollegeLondon, UKTomás Helikar, University ofNebraska at Lincoln, USA
*Correspondence:
Ioannis Xenarios, Department Head,Vital-IT Systems Medecine/BiologyDepartment, SIB Swiss Institute ofBioinformatics, Quartier Genopode,1005 Lausanne, Switzerlande-mail: [email protected]
In the last few decades, technological and experimental advancements have enabled amore precise understanding of the mode of action of drugs with respect to human cellsignaling pathways and have positively influenced the design of new drug compounds.However, as the design of compounds has become increasingly target-specific, the overalleffects of a drug on adjacent cellular signaling pathways remain difficult to predict becauseof the complexity of the interactions involved. Off-target effects of drugs are known toinfluence their efficacy and safety. Similarly, drugs which are more target-specific alsosuffer from lack of efficacy because their scope might be too limited in the context ofcellular signaling. Even in situations where the signaling pathways targeted by a drug areknown, the presence of point mutations in some of the components of the pathwayscan render a therapy ineffective in a considerable target subpopulation. Some of theseissues can be addressed by predicting Minimal Intervention Sets (MIS) of elements ofthe signaling pathways that when perturbed give rise to a pre-defined cellular phenotype.These minimal gene perturbation sets can then be further used to screen a library ofdrug compounds in order to discover effective drug therapies. This manuscript describesalgorithms that can be used to discover MIS in a gene regulatory network that can lead to adefined cellular phenotype. Algorithms are implemented in our Boolean modeling toolbox,GenYsis. The software binaries of GenYsis are available for download from http://www.vital-it.ch/software/genYsis/.
Keywords: boolean modeling, GRN, MIS, miRNA, algorithms, qualitative modeling, T-Helper, cancer pathways
1. INTRODUCTIONAdvancements in high-throughput technologies have enabledbiologists to measure the expression (or activity) of many genessimultaneously. By measuring and comparing the expression ofgenes in a normal vs. diseased cell phenotypes, biologists havebeen able to identify various key genes involved in disease path-ways. However, predicting a set of genes in a disease is often notsufficient as it may not be possible to directly manipulate theexpression of those genes using available drug compounds. Thisnecessitates studying the interactions of genes that are knowndrug targets with respect to the genes (or proteins) that are impli-cated in high-throughput analysis of specific disease phenotypes.This observation has shifted the focus of computational andexperimental tools from studying individual genes to understand-ing the underlying gene regulatory networks (GRNs) of biologicalprocesses. By modeling GRNs, one would like to gain a deeperunderstanding of how different cellular phenotypes arise from thesame set of underlying genes and how a biological system can beforced to differentiate into a specific phenotype by manipulatingthe expression of a small set of genes/proteins in the underlyingGRN.
Even with an improved understanding of the working ofcellular signaling components and technological advancementsin designing new drug compounds, it is often not possible todesign drug compounds that specifically target only the desiredgenes/proteins with desired effectiveness. Some of these issues canalso be addressed by predicting which elements of the GRNs haveto be targeted in order to attain a pre-defined phenotype. The lat-ter problem is formally referred to as Minimal Intervention Sets(MIS) problem in the literature (Karlebach and Shamir, 2010;Samaga et al., 2010). In an MIS problem, one would like toenumerate a list of possible sets of genes/proteins from a givenGRN, which when perturbed, can give rise to the desired cellularphenotypes.
A GRN, such as the one in Figure 1A, can be modeled as aBoolean network using the mapping we have introduced earlierin Garg et al. (2009). In the Boolean modeling of a GRN, a nodecan exist in two expression states: low and high. These two expres-sion states are represented by logic 0 and 1, respectively. A state ofthe network at a given time instant t is defined by the expressionstate of all the nodes at that instant of time. A state of the net-work evolves over time as defined by the underlying interactions
www.frontiersin.org December 2013 | Volume 4 | Article 361 | 1
Garg et al. Computing MIS in GRNs
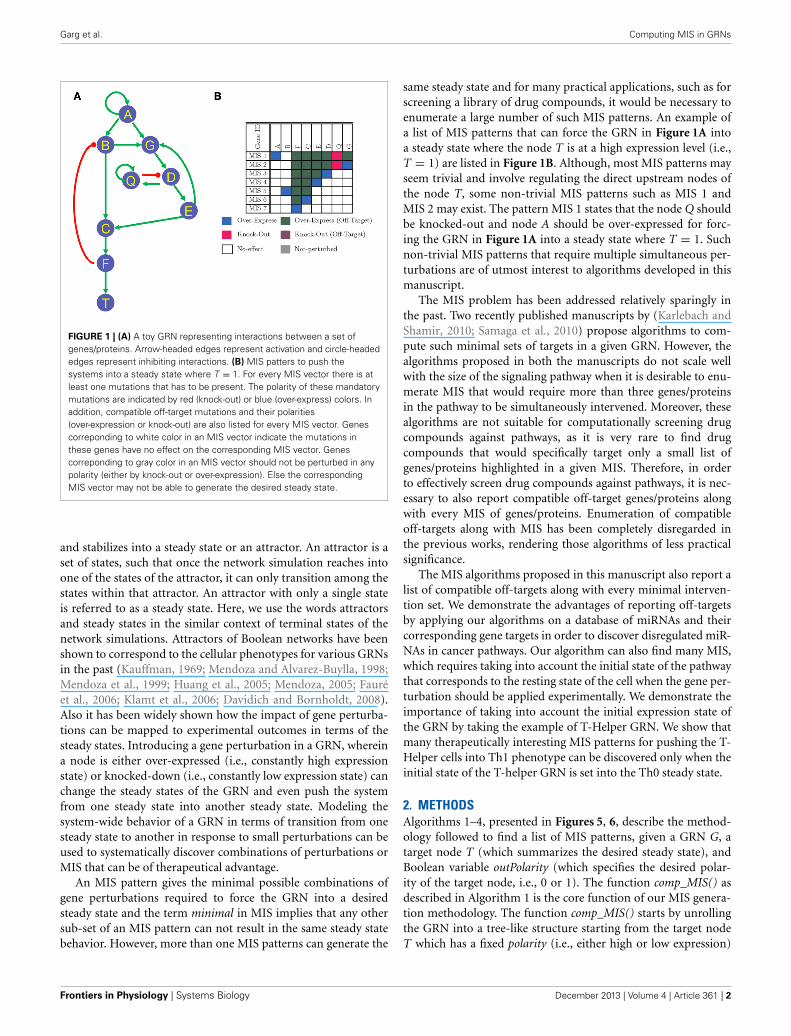
FIGURE 1 | (A) A toy GRN representing interactions between a set ofgenes/proteins. Arrow-headed edges represent activation and circle-headededges represent inhibiting interactions. (B) MIS patters to push thesystems into a steady state where T = 1. For every MIS vector there is atleast one mutations that has to be present. The polarity of these mandatorymutations are indicated by red (knock-out) or blue (over-express) colors. Inaddition, compatible off-target mutations and their polarities(over-expression or knock-out) are also listed for every MIS vector. Genescorreponding to white color in an MIS vector indicate the mutations inthese genes have no effect on the corresponding MIS vector. Genescorreponding to gray color in an MIS vector should not be perturbed in anypolarity (either by knock-out or over-expression). Else the correspondingMIS vector may not be able to generate the desired steady state.
and stabilizes into a steady state or an attractor. An attractor is aset of states, such that once the network simulation reaches intoone of the states of the attractor, it can only transition among thestates within that attractor. An attractor with only a single stateis referred to as a steady state. Here, we use the words attractorsand steady states in the similar context of terminal states of thenetwork simulations. Attractors of Boolean networks have beenshown to correspond to the cellular phenotypes for various GRNsin the past (Kauffman, 1969; Mendoza and Alvarez-Buylla, 1998;Mendoza et al., 1999; Huang et al., 2005; Mendoza, 2005; Fauréet al., 2006; Klamt et al., 2006; Davidich and Bornholdt, 2008).Also it has been widely shown how the impact of gene perturba-tions can be mapped to experimental outcomes in terms of thesteady states. Introducing a gene perturbation in a GRN, whereina node is either over-expressed (i.e., constantly high expressionstate) or knocked-down (i.e., constantly low expression state) canchange the steady states of the GRN and even push the systemfrom one steady state into another steady state. Modeling thesystem-wide behavior of a GRN in terms of transition from onesteady state to another in response to small perturbations can beused to systematically discover combinations of perturbations orMIS that can be of therapeutical advantage.
An MIS pattern gives the minimal possible combinations ofgene perturbations required to force the GRN into a desiredsteady state and the term minimal in MIS implies that any othersub-set of an MIS pattern can not result in the same steady statebehavior. However, more than one MIS patterns can generate the
same steady state and for many practical applications, such as forscreening a library of drug compounds, it would be necessary toenumerate a large number of such MIS patterns. An example ofa list of MIS patterns that can force the GRN in Figure 1A intoa steady state where the node T is at a high expression level (i.e.,T = 1) are listed in Figure 1B. Although, most MIS patterns mayseem trivial and involve regulating the direct upstream nodes ofthe node T, some non-trivial MIS patterns such as MIS 1 andMIS 2 may exist. The pattern MIS 1 states that the node Q shouldbe knocked-out and node A should be over-expressed for forc-ing the GRN in Figure 1A into a steady state where T = 1. Suchnon-trivial MIS patterns that require multiple simultaneous per-turbations are of utmost interest to algorithms developed in thismanuscript.
The MIS problem has been addressed relatively sparingly inthe past. Two recently published manuscripts by (Karlebach andShamir, 2010; Samaga et al., 2010) propose algorithms to com-pute such minimal sets of targets in a given GRN. However, thealgorithms proposed in both the manuscripts do not scale wellwith the size of the signaling pathway when it is desirable to enu-merate MIS that would require more than three genes/proteinsin the pathway to be simultaneously intervened. Moreover, thesealgorithms are not suitable for computationally screening drugcompounds against pathways, as it is very rare to find drugcompounds that would specifically target only a small list ofgenes/proteins highlighted in a given MIS. Therefore, in orderto effectively screen drug compounds against pathways, it is nec-essary to also report compatible off-target genes/proteins alongwith every MIS of genes/proteins. Enumeration of compatibleoff-targets along with MIS has been completely disregarded inthe previous works, rendering those algorithms of less practicalsignificance.
The MIS algorithms proposed in this manuscript also report alist of compatible off-targets along with every minimal interven-tion set. We demonstrate the advantages of reporting off-targetsby applying our algorithms on a database of miRNAs and theircorresponding gene targets in order to discover disregulated miR-NAs in cancer pathways. Our algorithm can also find many MIS,which requires taking into account the initial state of the pathwaythat corresponds to the resting state of the cell when the gene per-turbation should be applied experimentally. We demonstrate theimportance of taking into account the initial expression state ofthe GRN by taking the example of T-Helper GRN. We show thatmany therapeutically interesting MIS patterns for pushing the T-Helper cells into Th1 phenotype can be discovered only when theinitial state of the T-helper GRN is set into the Th0 steady state.
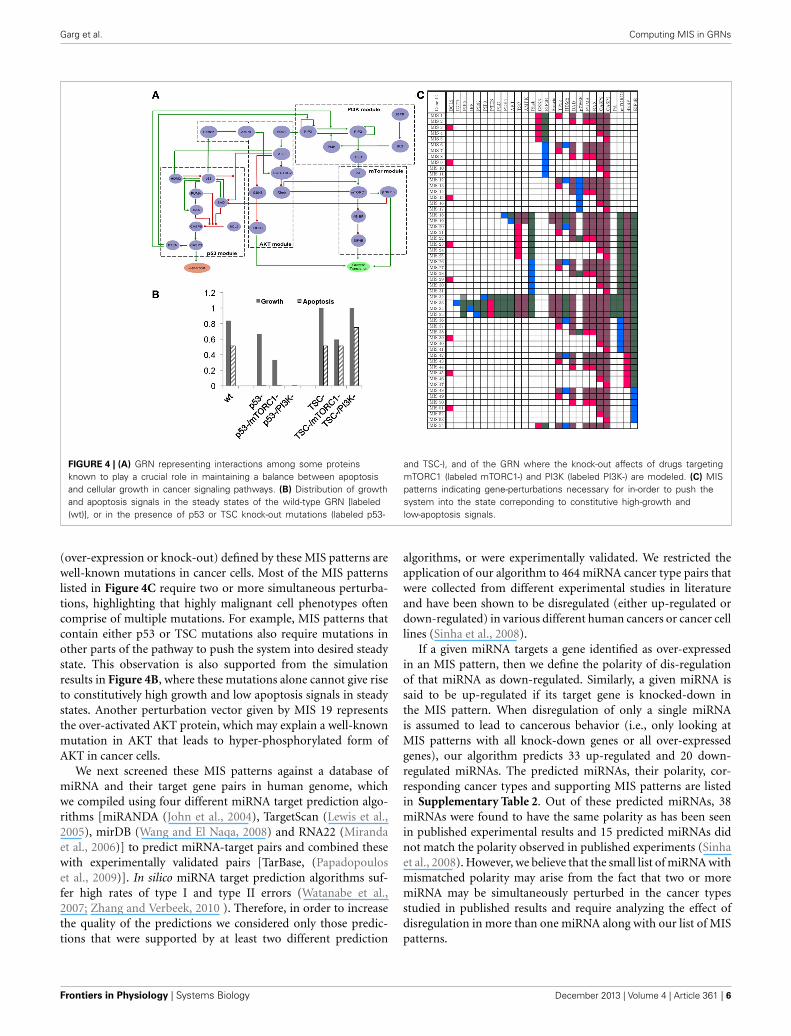
2. METHODSAlgorithms 1–4, presented in Figures 5, 6, describe the method-ology followed to find a list of MIS patterns, given a GRN G, atarget node T (which summarizes the desired steady state), andBoolean variable outPolarity (which specifies the desired polar-ity of the target node, i.e., 0 or 1). The function comp_MIS() asdescribed in Algorithm 1 is the core function of our MIS genera-tion methodology. The function comp_MIS() starts by unrollingthe GRN into a tree-like structure starting from the target nodeT which has a fixed polarity (i.e., either high or low expression)
Frontiers in Physiology | Systems Biology December 2013 | Volume 4 | Article 361 | 2
Garg et al. Computing MIS in GRNs
in the desired final steady state (Line 3 of Algorithm 1). Thesenodes with fixed polarities are referred to as the root nodes of thenetwork.
Algorithm 2 describes the GRN unrolling functionUnrollGRN(). The function UnrollGRN() is called recur-sively starting from the root node (or target node) T. The GRNis unrolled along a path until a duplicate node is found. At thatinstance, if all the input nodes to the duplicate node already existon the unrolled path, then the duplicate node is assigned a newname (with the symbol “∼” over the original node name) andthe unrolling process is terminated along this path. Otherwise,the duplicate node is further unrolled until the criteria forterminating the unrolling process is met. In each recursion, a setof nodes on the current path is maintained in the set of alreadyunrolled nodes (labeled as aN). The current node being unrolledis added to set aN in Line 5 of Algorithm 2 and the input nodes(labeled as g) to the current node being unrolled (labeled as Sn)are checked for duplicacy in Line 7. If the input node g does notexist in the set aN, then the UnrollGRN() process is repeated forthat input node. In Lines 11–13, we check if any of the inputnodes g to the node g does not belong to the set of duplicatenodes aN, in which case the node g is further unrolled (Line15). Otherwise the unrolling process is terminated along thecurrent path by assigning the node ID corresponding to initialstate nodes. The orgIndex vector maintains the index ID of all thenodes in the input GRN. The UnrollGRN() process returns a newnode ID corresponding to unrolled node counterpart of originalnode Sn. The new node IDs are generated by incrementingthe counter corresponding to original set of nodes in the GRNin the vector indexCount (Line 18 of Algorithm 2). VectorindexCount maintains a count of the number of times a givennode in the GRN is duplicated in the unrolling process, and
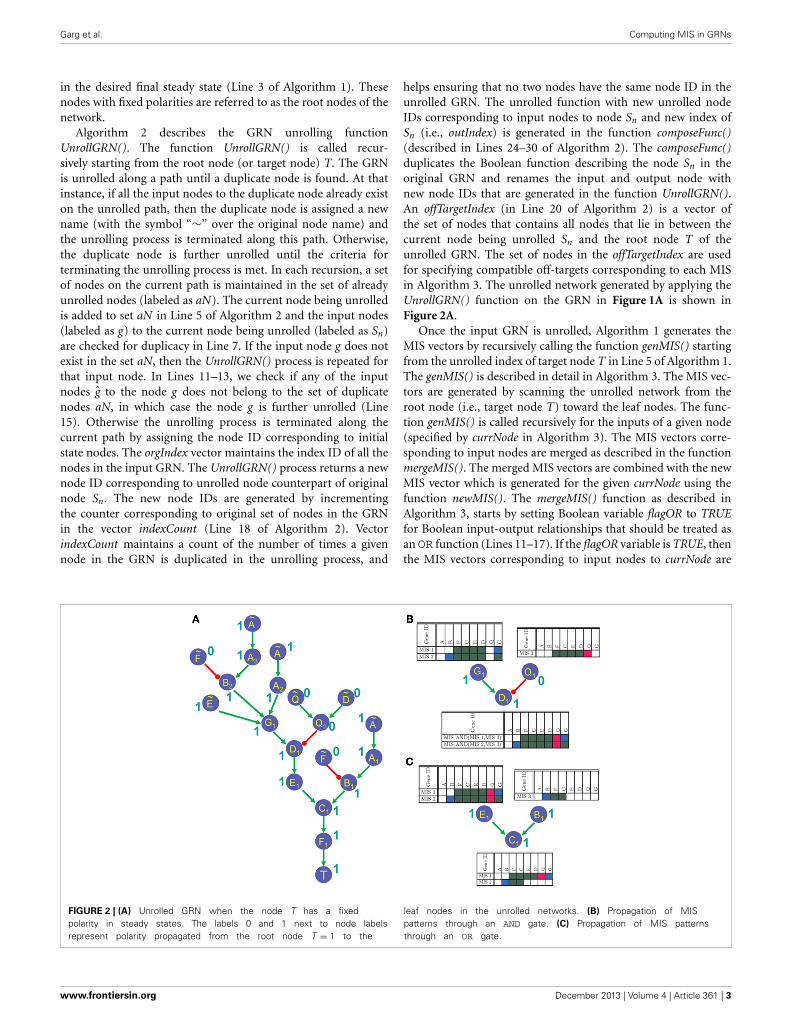
helps ensuring that no two nodes have the same node ID in theunrolled GRN. The unrolled function with new unrolled nodeIDs corresponding to input nodes to node Sn and new index ofSn (i.e., outIndex) is generated in the function composeFunc()(described in Lines 24–30 of Algorithm 2). The composeFunc()duplicates the Boolean function describing the node Sn in theoriginal GRN and renames the input and output node withnew node IDs that are generated in the function UnrollGRN().An offTargetIndex (in Line 20 of Algorithm 2) is a vector ofthe set of nodes that contains all nodes that lie in between thecurrent node being unrolled Sn and the root node T of theunrolled GRN. The set of nodes in the offTargetIndex are usedfor specifying compatible off-targets corresponding to each MISin Algorithm 3. The unrolled network generated by applying theUnrollGRN() function on the GRN in Figure 1A is shown inFigure 2A.
Once the input GRN is unrolled, Algorithm 1 generates theMIS vectors by recursively calling the function genMIS() startingfrom the unrolled index of target node T in Line 5 of Algorithm 1.The genMIS() is described in detail in Algorithm 3. The MIS vec-tors are generated by scanning the unrolled network from theroot node (i.e., target node T) toward the leaf nodes. The func-tion genMIS() is called recursively for the inputs of a given node(specified by currNode in Algorithm 3). The MIS vectors corre-sponding to input nodes are merged as described in the functionmergeMIS(). The merged MIS vectors are combined with the newMIS vector which is generated for the given currNode using thefunction newMIS(). The mergeMIS() function as described inAlgorithm 3, starts by setting Boolean variable flagOR to TRUEfor Boolean input-output relationships that should be treated asanOR function (Lines 11–17). If the flagOR variable is TRUE, thenthe MIS vectors corresponding to input nodes to currNode are
FIGURE 2 | (A) Unrolled GRN when the node T has a fixedpolarity in steady states. The labels 0 and 1 next to node labelsrepresent polarity propagated from the root node T = 1 to the
leaf nodes in the unrolled networks. (B) Propagation of MISpatterns through an AND gate. (C) Propagation of MIS patternsthrough an OR gate.
www.frontiersin.org December 2013 | Volume 4 | Article 361 | 3
Garg et al. Computing MIS in GRNs
merged using the MIS_OR function (as decribed in Algorithm 4).Otherwise the input MIS vectors are merged using the MIS_ANDfunction. The newMIS() function, generates a new MIS vector forthe currNode. It returns a Boolean vector of length six times thenumber of number of nodes in the original GRN. The Booleanvector can be divided into three fragments of equal number ofbits. The first fragment stores the information corresponding tooffTargetIndex nodes, the second fragment stores the informationof nodes that should have a specific initial state (i.e., nodes withthe symbol “∼”), and the last fragment stores the informationregarding the nodes that should be perturbed (i.e., over-expressedor knocked-out). Figure 2A shows the polarity of each node inthe unrolled GRN as a result of applying the genMIS() functionon the unrolled network.
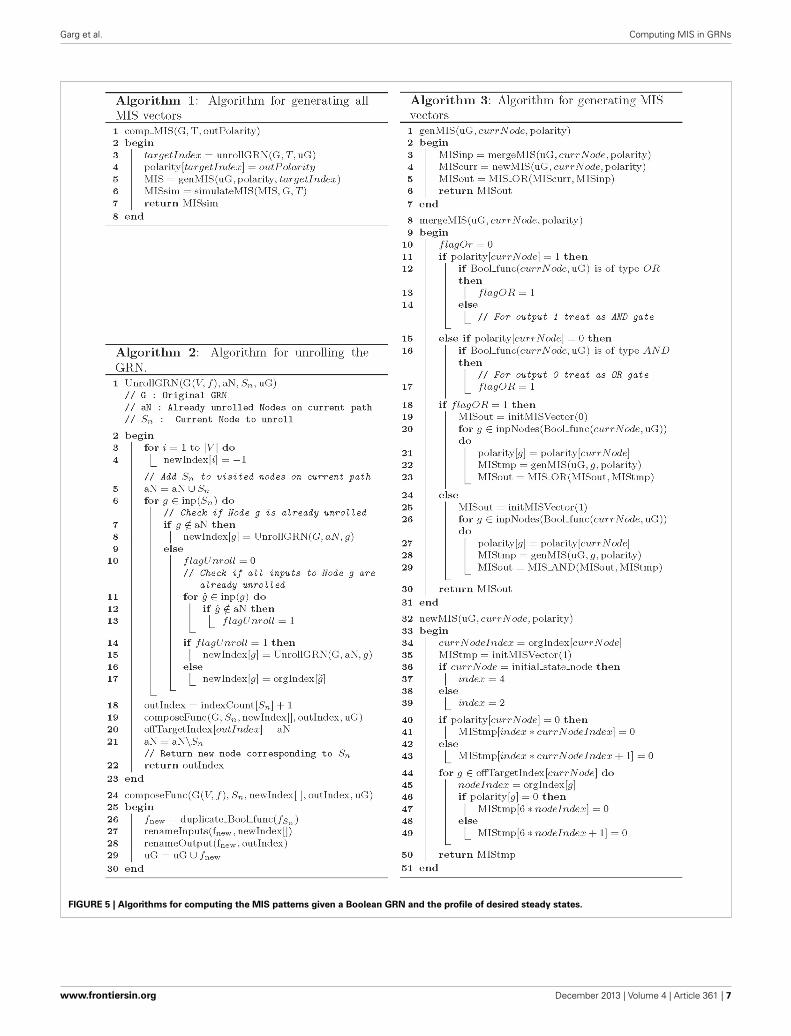
The MIS_OR() and MIS_AND() are the core functions of ourMIS algorithm and ensure minimal and non-conflict propertiesof generated MIS vectors. Functions MIS_OR() and MIS_AND()merge the list of MIS vectors in a Boolean OR or AND man-ner as described in Algorithm 4. The MIS_OR() function checksfor setwise containment of an MIS vector from one input listin another input list (Lines 5 and 7) and maintains the mini-mal property of generated MIS vectors by dropping MIS patternsthat are not minimal in Lines 6 and 8 of Algorithm 4. TheMIS_AND() function, checks for conflict between the MIS vec-tors in two input lists (Lines 23–25). Before merging any two MISvectors, it checks if the resulting MIS vector would give rise toa conflicting perturbations (i.e., the same node over-expressedin one input MIS and knocked-out in the other MIS). Any suchMIS vectors are dropped from the merged list of two input MISvectors. Small examples further demonstrating the MIS_AND()and MIS_OR() functions are described in Figures 2B,C, respec-tively. In Figure 2B, the MIS pattern at the input node E1, whichrequires two perturbations involving over-expression of node Band knock-down of node Q is dropped from the merged MIS list
at the output, as it is not a minimal pattern and can be replacedby the minimal MIS at the input node B1, which only requires oneperturbation involving over-expression of node B.
Function genMIS() in Line 5 of Algorithm 1 returns mini-mal perturbation sets obtained by traversing the unrolled GRN.However, presence of feedback loops may prevent some of theseMIS patterns from generating the desired steady state in actualsimulations. Therefore, in order to ensure that the generated MIScan indeed give rise to desired steady state, we simulate the gen-erated MIS patterns using the the function simulateMIS(), whichessentially uses the Algorithm we developed in Garg et al. (2008)to model gene perturbations and checks if the resulting steadystate are indeed the ones that are expected from the comp_MIS()function. The simulateMIS() function also checks for minimalityof generated MIS patterns. These two additional steps, ensure thatthe list of MIS patterns resulting from comp_MIS() are indeed aminimal list of perturbed genes that can push the system into adesired cellular phenotype.
3. RESULTSWe show the application of our algorithms on T-Helper cell andGrowth vs. Apoptosis gene regulatory networks.
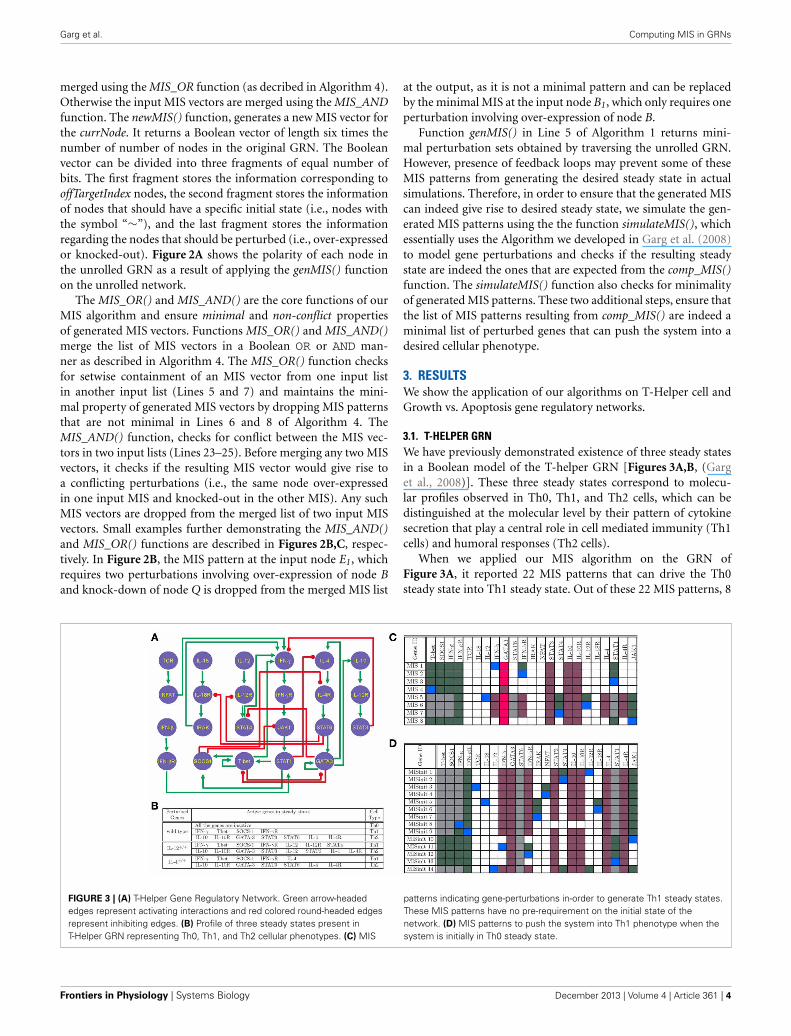
3.1. T-HELPER GRNWe have previously demonstrated existence of three steady statesin a Boolean model of the T-helper GRN [Figures 3A,B, (Garget al., 2008)]. These three steady states correspond to molecu-lar profiles observed in Th0, Th1, and Th2 cells, which can bedistinguished at the molecular level by their pattern of cytokinesecretion that play a central role in cell mediated immunity (Th1cells) and humoral responses (Th2 cells).
When we applied our MIS algorithm on the GRN ofFigure 3A, it reported 22 MIS patterns that can drive the Th0steady state into Th1 steady state. Out of these 22 MIS patterns, 8
FIGURE 3 | (A) T-Helper Gene Regulatory Network. Green arrow-headededges represent activating interactions and red colored round-headed edgesrepresent inhibiting edges. (B) Profile of three steady states present inT-Helper GRN representing Th0, Th1, and Th2 cellular phenotypes. (C) MIS
patterns indicating gene-perturbations in-order to generate Th1 steady states.These MIS patterns have no pre-requirement on the initial state of thenetwork. (D) MIS patterns to push the system into Th1 phenotype when thesystem is initially in Th0 steady state.
Frontiers in Physiology | Systems Biology December 2013 | Volume 4 | Article 361 | 4
Garg et al. Computing MIS in GRNs
patterns (Figure 3C) do not have any pre-requirement on initialstate of the network and can lead to Th1 steady state indepen-dent of the initial state of the network. The remaining 14 MIS(Figure 3D) would lead to Th1 steady state only if the network isinitially in the Th0 state. It is interesting to note that all the MISpatterns are composed of either a single or at most two simultae-nous perturbations. Most of the gene perturbation combinationsamong the 14 MIS patterns in Figure 3D are well-known geneperturbations for biasing the T-Helper cellular differentiationtoward Th1 cell types and have been used as target for well-knowndrug molecules to enhance immune response. The existing meth-ods to find MIS patterns, which do not take into account initialstate of the network, will only be able to identify 8 MIS patternslisted in Figure 3C. All these 8 MIS patterns require either T-bet over-expression or GATA3 knock-down in combination withfew other perturbations. However, both T-bet and GATA3 areknown to be difficult to target using drug compounds and canonly be supressed or activated by using siRNAs or through indi-rect stimulation of upstream cytokines (Weigmann and Neurath,2002; Usui et al., 2003; Liberman et al., 2009, 2012; Chou et al.,2010). More interesting perturbations identified by the remaining14 MIS patterns in Figure 3D highlight the importance of consid-ering initial state of the GRN in the algorithms presented in thismanuscript.
The Th1 cells produce IFNg as their signature cytokine secre-tion profile. Secreted IFNg can bind to its receptor IFNgR presenton the Th1 cell surface leading to activation of signaling pathwaysinvolved in Th1 cell differentiation and maintenance of Th1 state(Novelli et al., 1997; Murphy and Reiner, 2002). The MIS pat-terns, MISInit 8 and 9, in Figure 3D represent over-expression ofIFNg or IFNgR, respectively, that are required for differentiationof Th0 cells to Th1 phenotype. The MIS pattern MISInit 3 repre-sents activation of T cell receptor (TCR) through external ligands,which can lead to transcriptional expression of various cytokinesinvolved in T cell differentiation. The remaining MIS patternsrepresent other well-known modes of differentiating Th0 to Th1cell types either through production of IFNg in T helper cells orby activating proteins downstream of IFNg signaling (Mendoza,2005; Mendoza and Xenarios, 2006 ). These modes of activationinclude expression of external ligands such as IL-18, IL-12, andIFN-b (MISInit 5, 11 and 14), or by directly stimulating theirtarget receptors IL-18R, IL-12R, and IFN-bR (MISInit 6, 1 and12), increased expression of intermediate Kinases IRAK and JAK1(MISInit 7 and 10), or by expressing transcription factors STAT1,STAT4, or NFAT (MISInit 13, 2 and 4). The compatible off-targetperturbations in the MIS patterns listed in Figure 3D, are mostlyrelated to down-regulating the expression of ligands and otherproteins involved in maintenance of Th2 cell type, and differen-tiation of Th0 to Th2 cell types (Mendoza, 2005; Mendoza andXenarios, 2006 ).
3.2. GROWTH vs. APOPTOSIS GRNWe identified key proteins that are known to play a crucial role inmaintaining the balance between growth and apoptosis signals inthe cancer pathways. We then constructed the GRN representinginteractions between these proteins by identifying experimentallyvalidated functions defining these interactions from the literature.
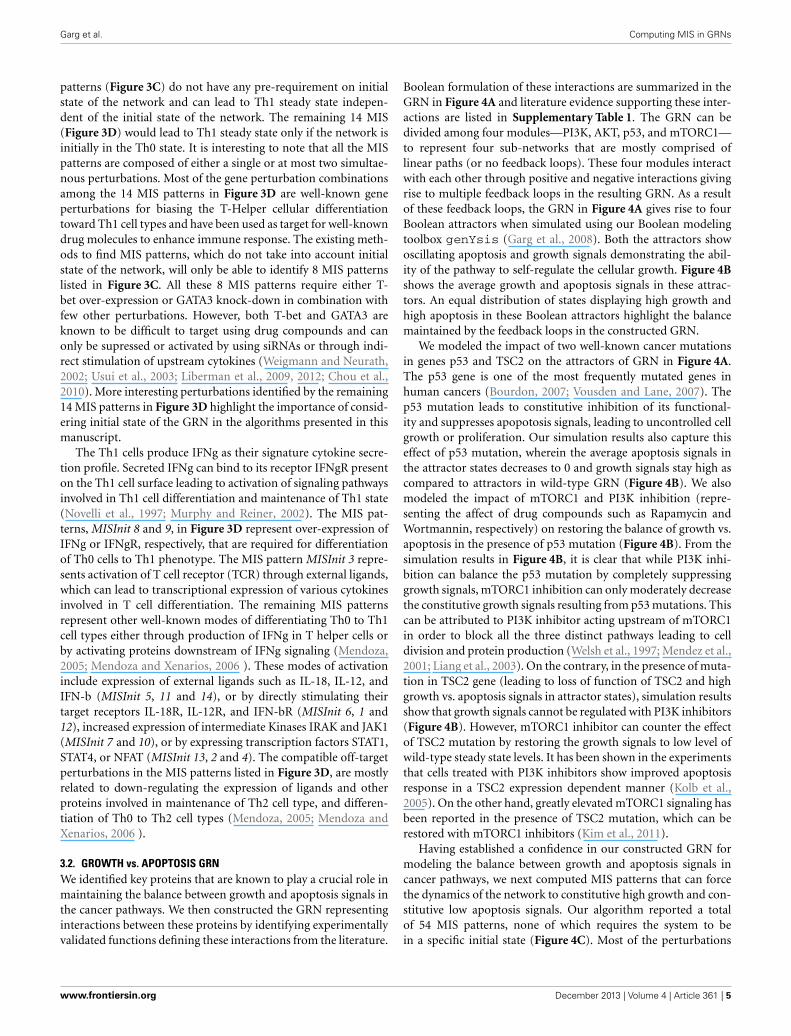
Boolean formulation of these interactions are summarized in theGRN in Figure 4A and literature evidence supporting these inter-actions are listed in Supplementary Table 1. The GRN can bedivided among four modules—PI3K, AKT, p53, and mTORC1—to represent four sub-networks that are mostly comprised oflinear paths (or no feedback loops). These four modules interactwith each other through positive and negative interactions givingrise to multiple feedback loops in the resulting GRN. As a resultof these feedback loops, the GRN in Figure 4A gives rise to fourBoolean attractors when simulated using our Boolean modelingtoolbox genYsis (Garg et al., 2008). Both the attractors showoscillating apoptosis and growth signals demonstrating the abil-ity of the pathway to self-regulate the cellular growth. Figure 4Bshows the average growth and apoptosis signals in these attrac-tors. An equal distribution of states displaying high growth andhigh apoptosis in these Boolean attractors highlight the balancemaintained by the feedback loops in the constructed GRN.
We modeled the impact of two well-known cancer mutationsin genes p53 and TSC2 on the attractors of GRN in Figure 4A.The p53 gene is one of the most frequently mutated genes inhuman cancers (Bourdon, 2007; Vousden and Lane, 2007). Thep53 mutation leads to constitutive inhibition of its functional-ity and suppresses apopotosis signals, leading to uncontrolled cellgrowth or proliferation. Our simulation results also capture thiseffect of p53 mutation, wherein the average apoptosis signals inthe attractor states decreases to 0 and growth signals stay high ascompared to attractors in wild-type GRN (Figure 4B). We alsomodeled the impact of mTORC1 and PI3K inhibition (repre-senting the affect of drug compounds such as Rapamycin andWortmannin, respectively) on restoring the balance of growth vs.apoptosis in the presence of p53 mutation (Figure 4B). From thesimulation results in Figure 4B, it is clear that while PI3K inhi-bition can balance the p53 mutation by completely suppressinggrowth signals, mTORC1 inhibition can only moderately decreasethe constitutive growth signals resulting from p53 mutations. Thiscan be attributed to PI3K inhibitor acting upstream of mTORC1in order to block all the three distinct pathways leading to celldivision and protein production (Welsh et al., 1997; Mendez et al.,2001; Liang et al., 2003). On the contrary, in the presence of muta-tion in TSC2 gene (leading to loss of function of TSC2 and highgrowth vs. apoptosis signals in attractor states), simulation resultsshow that growth signals cannot be regulated with PI3K inhibitors(Figure 4B). However, mTORC1 inhibitor can counter the effectof TSC2 mutation by restoring the growth signals to low level ofwild-type steady state levels. It has been shown in the experimentsthat cells treated with PI3K inhibitors show improved apoptosisresponse in a TSC2 expression dependent manner (Kolb et al.,2005). On the other hand, greatly elevated mTORC1 signaling hasbeen reported in the presence of TSC2 mutation, which can berestored with mTORC1 inhibitors (Kim et al., 2011).
Having established a confidence in our constructed GRN formodeling the balance between growth and apoptosis signals incancer pathways, we next computed MIS patterns that can forcethe dynamics of the network to constitutive high growth and con-stitutive low apoptosis signals. Our algorithm reported a totalof 54 MIS patterns, none of which requires the system to bein a specific initial state (Figure 4C). Most of the perturbations
www.frontiersin.org December 2013 | Volume 4 | Article 361 | 5
Garg et al. Computing MIS in GRNs
FIGURE 4 | (A) GRN representing interactions among some proteinsknown to play a crucial role in maintaining a balance between apoptosisand cellular growth in cancer signaling pathways. (B) Distribution of growthand apoptosis signals in the steady states of the wild-type GRN [labeled(wt)], or in the presence of p53 or TSC knock-out mutations (labeled p53-
and TSC-), and of the GRN where the knock-out affects of drugs targetingmTORC1 (labeled mTORC1-) and PI3K (labeled PI3K-) are modeled. (C) MISpatterns indicating gene-perturbations necessary for in-order to push thesystem into the state correponding to constitutive high-growth andlow-apoptosis signals.
(over-expression or knock-out) defined by these MIS patterns arewell-known mutations in cancer cells. Most of the MIS patternslisted in Figure 4C require two or more simultaneous perturba-tions, highlighting that highly malignant cell phenotypes oftencomprise of multiple mutations. For example, MIS patterns thatcontain either p53 or TSC mutations also require mutations inother parts of the pathway to push the system into desired steadystate. This observation is also supported from the simulationresults in Figure 4B, where these mutations alone cannot give riseto constitutively high growth and low apoptosis signals in steadystates. Another perturbation vector given by MIS 19 representsthe over-activated AKT protein, which may explain a well-knownmutation in AKT that leads to hyper-phosphorylated form ofAKT in cancer cells.
We next screened these MIS patterns against a database ofmiRNA and their target gene pairs in human genome, whichwe compiled using four different miRNA target prediction algo-rithms [miRANDA (John et al., 2004), TargetScan (Lewis et al.,2005), mirDB (Wang and El Naqa, 2008) and RNA22 (Mirandaet al., 2006)] to predict miRNA-target pairs and combined thesewith experimentally validated pairs [TarBase, (Papadopouloset al., 2009)]. In silico miRNA target prediction algorithms suf-fer high rates of type I and type II errors (Watanabe et al.,2007; Zhang and Verbeek, 2010 ). Therefore, in order to increasethe quality of the predictions we considered only those predic-tions that were supported by at least two different prediction
algorithms, or were experimentally validated. We restricted theapplication of our algorithm to 464 miRNA cancer type pairs thatwere collected from different experimental studies in literatureand have been shown to be disregulated (either up-regulated ordown-regulated) in various different human cancers or cancer celllines (Sinha et al., 2008).
If a given miRNA targets a gene identified as over-expressedin an MIS pattern, then we define the polarity of dis-regulationof that miRNA as down-regulated. Similarly, a given miRNA issaid to be up-regulated if its target gene is knocked-down inthe MIS pattern. When disregulation of only a single miRNAis assumed to lead to cancerous behavior (i.e., only looking atMIS patterns with all knock-down genes or all over-expressedgenes), our algorithm predicts 33 up-regulated and 20 down-regulated miRNAs. The predicted miRNAs, their polarity, cor-responding cancer types and supporting MIS patterns are listedin Supplementary Table 2. Out of these predicted miRNAs, 38miRNAs were found to have the same polarity as has been seenin published experimental results and 15 predicted miRNAs didnot match the polarity observed in published experiments (Sinhaet al., 2008). However, we believe that the small list of miRNA withmismatched polarity may arise from the fact that two or moremiRNA may be simultaneously perturbed in the cancer typesstudied in published results and require analyzing the effect ofdisregulation in more than one miRNA along with our list of MISpatterns.
Frontiers in Physiology | Systems Biology December 2013 | Volume 4 | Article 361 | 6
Garg et al. Computing MIS in GRNs
FIGURE 5 | Algorithms for computing the MIS patterns given a Boolean GRN and the profile of desired steady states.
www.frontiersin.org December 2013 | Volume 4 | Article 361 | 7
Garg et al. Computing MIS in GRNs
FIGURE 6 | Algorithms for merging MIS patterns.
4. DISCUSSIONIn this manuscript, we have presented an efficient approach togenerate a list of minimal sets of gene perturbations that canpush the dynamics of GRN into a specific steady state (represent-ing a given cellular phenotype). Our algorithm for computingMIS patterns follows a branch and bound approach, where theunrolled network is scanned for MIS patterns in a depth-firstmanner. If the network being simulated has many feedback loops,then the current implementation of Algorithms proposed in thismanuscript may be inefficient due to the large size of the unrollednetwork (Supplementary Table 3). However, the unrolled net-work can be scanned for MIS patterns in an efficient mannerby a parallel implementation of the function genMIS() describedin Algorithm 3. The efficiency of MIS computation can be fur-ther enhanced by parallelizing the function simulateMIS(), which
simulates and tests the minimality of the MIS patterns generatedby the function genMIS().
The algorithms proposed here can be useful in various exper-imental settings where one would like to enumerate multipleoptions to regulate the dynamics of GRNs. We demonstrate onesuch application of our algorithm with respect to T-Helper GRN.The T-helper GRN shown in Figure 3A has been previouslyshown to effectively model the precursor Th0 cells and effectorTh1 and Th2 cells (Mendoza and Xenarios, 2006 ). Understandingthe molecular mechanisms that regulate the differentiation pro-cess from Th0 toward either Th1 or Th2 is very important, sincean immune response biased toward the Th1 phenotype result inthe appearance of autoimmune diseases, and an enhanced Th2response can originate allergic reactions (Murphy and Reiner,2002; Agnello et al., 2003). We previously demonstrated how onecan efficiently simulate the effect of gene perturbations in the T-Helper GRN (Garg et al., 2008, 2009). However, it would be ofutmost interest to generate a list of possible perturbations thatcan transition a cell from one steady state to another. For exam-ple, MIS patterns required to transition a cell from Th0 to Th1 cellstate would indicate different possible treatments to stimulate theauto-immune response of the body. The MIS patterns generatedby our algorithm captures some of the well-known perturbationsthat have been experimentally validated to differentiate T-Helpercells into Th1 phenotype. Gene expression levels can often exist atmore than two expression states. The algorithms proposed herecan be extended to multiple expression levels of nodes (such asLow/Medium/High) by encoding them into Boolean rules (Garget al., 2007).
The GRN presented here for modeling the growth vs. apop-tosis signals in cancer pathways, consists of various feedbackloops that ensures the balance between the growth and apop-tosis pathways. It is a well-accepted fact that mutations leadingto permanent loss or gain of function of genes in the feedbackloops of signaling pathways can disregulate the delicate balancebetween pro-growth and pro-apoptopic cellular signals. If thesemutations are in a favor of pro-growth or anti-apoptosis signals,then a cell is said to have a pre-disposition toward uncontrolledgrowth (and hence proliferation). In such a scenario, a cell (car-rying mutations) undergoes uncontrolled proliferation and cansubsequently lead to the formation of tumors. Most cancer thera-pies either try to restore the normal expression of mutated genesdirectly or counteract the impact of mutated genes by targetingother genes (or proteins) in the pathway. Understanding how dif-ferent genes (and proteins) regulate each other in these pathwaysis therefore of major interest in the development of treatments forvarious cancers. Here, we show how the impact of such mutationscan be studied with respect to our proposed GRN by modelingp53 and TSC mutations. In Figure 4B, differential response oftherapies targeting PI3K and mTORC1 nodes in the presence ofp53 and TSC mutations indicate the importance of taking intoaccount gene mutations when deciding upon the drug therapies.Whereas, only single mutations are simulated in Figure 4B, in areal world scenario, multiple mutations can be present simulta-neously. In such a scenario, activity of multiple genes/proteinsmay have to be targeted for the drug therapy to be effective. Suchcompatible sets of genes/proteins which would be suitable for
Frontiers in Physiology | Systems Biology December 2013 | Volume 4 | Article 361 | 8
Garg et al. Computing MIS in GRNs
manipulation by one or more drug compounds can be quicklydiscovered by enumerating all MIS vectors of a GRN. Here, wedemonstrate one such application by listing MIS vectors that canlead to high growth and low apoptosis signals in steady state ofGRN of Figure 4A.
We also demonstrate an example of how the MIS patterns gen-erated by our algorithm could be used to predict miRNAs which,when over or under-expressed, could lead to a cancerous pheno-type of cells. Aberrant expression of miRNAs is known to playa major role in the development of cancers due to their impor-tance in various biological processes such as cellular proliferationand apoptosis (Subramanian and Steer, 2010; Yu et al., 2010).However, despite much interest in this area, the mechanism ofaction of miRNAs in disease remains largely unknown. The cur-rent view is that miRNAs have evolved to coordinately regulatecellular processes; thus, whilst the number of miRNAs is rela-tively small compared to the number of genes [<1000 in humans,(Griffiths-Jones et al., 2008)], complex regulation mechanismscan be achieved through the combined actions of multiple miR-NAs acting in a temporal and spatial manner. In our analysis, of53 miRNAs predicted to influence the cancerous phenotype, 38(∼71%) show the same polarity as published data, demonstratingthe potential of this approach. It remains to be seen whether theremaining 15 predicted miRNAs that do not show the same polar-ity as published data, have an impact on defining the cancerousphenotype.
In addition to applications shown in this manuscript, such asdiscovering minimal functional mutations in a disease phenotypeand screening drug compound library, one can use the MISvectors to guide experimental setups. Normally, in the absence ofinformation of MIS patterns, one would have to try all possiblecombinations (3N) of N different perturbations (compounds ortreatments) of genes/proteins in a given signaling pathway, whichcan quickly lead to a large number of experiments for even amodestly large GRN. Even when number of simultaneous per-turbations to test are restricted to two, it becomes unfeasible toperform all possible two-combinations of available compounds.In such a scenario, MIS patterns generated by our algorithmcan be very useful. The number of MIS patterns that can leadto a desired steady state can be significantly smaller than thenumber of all possible perturbations as has been seen from theapplication of our algorithm on the T-Helper and Apoptosisvs. Growth GRNs (Figures 3, 4 and Supplementary Table 3).Generating such MIS patterns algorithmically using an approachpresented here can therefore reduce both the number ofsimulations and experiments required, and can providemodel-driven insight into which subsets of genes should beknocked-down and over-expressed to obtain a desired cellularphenotype.
ACKNOWLEDGMENTSAbhishek Garg and Kartik Mohanram developed the algorithmto compute MIS patterns, Abhishek Garg and Julien Dorier per-formed simulations, Abhishek Garg and Alessandro Di Cara per-formed the literature survey and compiled the GRN for growthvs. apoptosis model, Gwendoline Degueurce, and Mark Ibbersonwrote the code and compiled the list of miRNAs and their target
genes, Abhishek Garg and Ioannis Xenarios wrote the manuscriptand designed the study.
FUNDINGEuropean Commission FP6 project ENFIN (ExperimentalNetwork for Functional INtegration -LSHG-CT-2005-518254).Computations were performed at the Vital-IT Center of the SwissInstitute of Bioinformatics. Swiss Federal Government throughthe Federal Office of Education Science and Innovation (SERI)Postdoc Fellowship (RPF) Program for Julien Dorier.
SUPPLEMENTAL MATERIALThe Supplementary Material for this article can be found onlineat: http://www.frontiersin.org/journal/10.3389/fphys.2013.
00361/abstract
Supplementary Table 1 | List of Boolean interactions in the Growth vs.
Apoptosis GRN along with supporting references.
Supplementary Table 2 | List of predicted miRNA with matching (and
mis-matching) polarity, Cancer types, and supporting MIS IDs.
Supplementary Table 3 | Simulation results of computing MIS patterns on
Random Networks of varying complexities.
REFERENCESAgnello, D., Lankford, C. S., Bream, J., Morinobu, A., Gadina, M., O’Shea, J. J.,
et al. (2003). Cytokines and transcription factors that regulate T helper cell dif-ferentiation: new players and new insights. J. Clin. Immunol. 23, 147–162. doi:10.1023/A:1023381027062
Bourdon, J. C. (2007). p53 and its isoforms in cancer. Br. J. Cancer 97, 277–282.doi: 10.1038/sj.bjc.6603886
Chou, J., Provot, S., and Werb, Z. (2010). GATA3 in development and cancer differ-entiation: cells GATA have it! J. Cell Physiol. 222, 42–49. doi: 10.1002/jcp.21943
Davidich, M. I., and Bornholdt, S. (2008). Boolean network model predictscell cycle sequence of fission yeast. PLoS ONE 3:e1672. doi: 10.1371/jour-nal.pone.0001672
Fauré, A., Naldi, A., Chaouiya, C., and Thieffry, D. (2006). Dynamical analy-sis of a generic Boolean model for the control of the mammalian cell cycle.Bioinformatics 22, e124–e131. doi: 10.1093/bioinformatics/btl210
Garg, A., Di Cara, A., Xenarios, I., Mendoza, L., and De Micheli, G. (2008).Synchronous versus asynchronous modeling of gene regulatory networks.Bioinformatics 24, 1917–1925. doi: 10.1093/bioinformatics/btn336
Garg, A., Mendoza, L., Xenarios, I., and Micheli, G. D. (2007). Modeling of multiplevalued gene regulatory networks. Conf. Proc. IEEE Eng. Med. Biol. Soc. 2007,1398–1404. doi: 10.1109/IEMBS.2007.4352560
Garg, A., Mohanram, K., Di Cara, A., De Micheli, G., and Xenarios, I.(2009). Modeling stochasticity and robustness in gene regulatory networks.Bioinformatics 25, i101–i109. doi: 10.1093/bioinformatics/btp214
Griffiths-Jones, S., Saini, H. K., Van Dongen, S., and Enright, A. J. (2008). mir-base: tools for microrna genomics. Nucleic Acids Res. 36, D154–D158. doi:10.1093/nar/gkm952
Huang, S., Eichler, G., Bar-Yam, Y., and Ingber, D. E. (2005). Cell fates as high-dimensional attractor states of a complex gene regulatory network. Phys. Rev.Lett. 94:128701. doi: 10.1103/PhysRevLett.94.128701
John, B., Enright, A. J., Aravin, A., Tuschl, T., Sander, C., and Marks, D. S. (2004).Human microrna targets. PLoS Biol. 2:e363. doi: 10.1371/journal.pbio.0020363
Karlebach, G., and Shamir, R. (2010). Minimally perturbing a gene regulatory net-work to avoid a disease phenotype: the glioma network as a test case. BMC Syst.Biol. 4:15. doi: 10.1186/1752-0509-4-15
Kauffman, S. A. (1969). Metabolic stability and epigenesis in randomly constructedgenetic nets. J. Theor. Biol. 22, 437–467. doi: 10.1016/0022-5193(69)90015-0
Kim, S. H., Speirs, C. K., Solnica-Krezel, L., and Ess, K. C. (2011). Zebrafishmodel of tuberous sclerosis complex reveals cell-autonomous and non-cell-autonomous functions of mutant tuberin. Dis. Model Mech. 4, 255–267. doi:10.1242/dmm.005587
www.frontiersin.org December 2013 | Volume 4 | Article 361 | 9
Garg et al. Computing MIS in GRNs
Klamt, S., Saez-Rodriguez, J., Lindquist, J. A., Simeoni, L., and Gilles, E. D. (2006).A methodology for the structural and functional analysis of signaling andregulatory networks. BMC Bioinformatics 7:56. doi: 10.1186/1471-2105-7-56
Kolb, T. M., Duan, L., and Davis, M. A. (2005). Tsc2 expression increases thesusceptibility of renal tumor cells to apoptosis. Toxicol. Sci. 88, 331–339. doi:10.1093/toxsci/kfi310
Lewis, B. P., Burge, C. B., and Bartel, D. P. (2005). Conserved seed pairing, oftenflanked by adenosines, indicates that thousands of human genes are micrornatargets. Cell 120, 15–20. doi: 10.1016/j.cell.2004.12.035
Liang, K., Jin, W., Knuefermann, C., Schmidt, M., Mills, G. B., Ang, K. K.,et al. (2003). Targeting the phosphatidylinositol 3-kinase/Akt pathwayfor enhancing breast cancer cells to radiotherapy. Mol. Cancer Ther. 2,353–360.
Liberman, A. C., Antunica-Noguerol, M., de Paula, V. F., Palermo-Neto, J., Castro,C. N., Druker, J., et al. (2012). Compound A, a dissociated glucocorticoid recep-tor modulator, inhibits T-bet (Th1) and induces GATA-3 (Th2) activity inimmune cells. PLoS ONE 7:e35155. doi: 10.1371/journal.pone.0035155
Liberman, A. C., Druker, J., Refojo, D., Holsboer, F., and Arzt, E. (2009).Glucocorticoids inhibit GATA-3 phosphorylation and activity in T cells. FASEBJ. 23, 1558–1571. doi: 10.1096/fj.08-121236
Mendez, R., Welsh, G., Kleijn, M., Myers, M. G., White, M. F., Proud, C. G., et al.(2001). Regulation of protein synthesis by insulin through IRS-1. Prog. Mol.Subcell Biol. 26, 49–93. doi: 10.1007/978-3-642-56688-2_3
Mendoza, L. (2005). A network model for the control of the differentiation processin Th cells. Biosystems 84, 101–114. doi: 10.1016/j.biosystems.2005.10.004
Mendoza, L., and Alvarez-Buylla, E. R. (1998). Dynamics of the genetic regula-tory network for Arabidopsis thaliana flower morphogenesis. J. Theor. Biol. 193,307–319. doi: 10.1006/jtbi.1998.0701
Mendoza, L., Thieffry, D., and Alvarez-Buylla, E. R. (1999). Genetic control offlower morphogenesis in Arabidopsis thaliana: a logical analysis. Bioinformatics15, 593–606. doi: 10.1093/bioinformatics/15.7.593
Mendoza, L., and Xenarios, I. (2006). A method for the generation of standard-ized qualitative dynamical systems of regulatory networks. Theor. Biol. Med.Model. 3. doi: 10.1186/1742-4682-3-13
Miranda, K. C., Huynh, T., Tay, Y., Ang, Y. S., Tam, W. L., Thomson, A. M.,et al. (2006). A pattern-based method for the identification of microrna bind-ing sites and their corresponding heteroduplexes. Cell 126, 1203–1217. doi:10.1016/j.cell.2006.07.031
Murphy, K. M., and Reiner, S. L. (2002). The lineage decisions on helper T cells.Nat. Rev. Immunol. 2, 933–944. doi: 10.1038/nri954
Novelli, F., D’Elios, M. M., Bernabei, P., Ozmen, L., Rigamonti, L., Almerigogna,F., et al. (1997). Expression and role in apoptosis of the Îs- and Κ-chains of theIFN-Îs receptor in human Th1 and Th2 clones. J. Immunol. 159, 206–213.
Papadopoulos, G. L., Reczko, M., Simossis, V. A., Sethupathy, P., and Hatzigeorgiou,A. G. (2009). The database of experimentally supported targets: a functionalupdate of tarbase. Nucleic Acids Res. 37, D155–D158. doi: 10.1093/nar/gkn809
Samaga, R., Von Kamp, A., and Klamt, S. (2010). Computing combinatorial inter-vention strategies and failure modes in signaling networks. J. Comput. Biol. 17,39–53. doi: 10.1089/cmb.2009.0121
Sinha, A. U., Kaimal, V., Chen, J., and Jegga, A. G. (2008). Dissecting microregu-lation of a master regulatory network. BMC Genomics 9:88. doi: 10.1186/1471-2164-9-88
Subramanian, S., and Steer, C. J. (2010). Micrornas as gatekeepers of apoptosis. J.Cell Physiol. 223, 289–298. doi: 10.1002/jcp.22066
Usui, T., Nishikomori, R., Kitani, A., and Strober, W. (2003). GATA-3 sup-presses Th1 development by downregulation of stat4 and not through effectson IL-12Rbeta2 chain or T-bet. Immunity 18, 415–428. doi: 10.1016/S1074-7613(03)00057-8
Vousden, K. H., and Lane, D. P. (2007). p53 in health and disease. Nat. Rev. Mol.Cell Biol. 8, 275–283. doi: 10.1038/nrm2147
Wang, X., and El Naqa, I. M. (2008). Prediction of both conserved and non-conserved microrna targets in animals. Bioinformatics 24, 325–332. doi:10.1093/bioinformatics/btm595
Watanabe, Y., Tomita, M., and Kanai, A. (2007). Computational methods formicroRNA target prediction. Methods Enzymol. 427, 65–86. doi: 10.1016/S0076-6879(07)27004-1
Weigmann, B., and Neurath, M. F. (2002). T-bet as a possible therapeutic tar-get in autoimmune disease. Expert Opin. Ther. Target 6, 619–622. doi:10.1517/14728222.6.6.619
Welsh, G. I., Stokes, C. M., Wang, X., Sakaue, H., Ogawa, W., Kasuga, M., et al.(1997). Activation of translation initiation factor eIF2B by insulin requiresphosphatidyl inositol 3-kinase. FEBS Lett. 410, 418–422. doi: 10.1016/S0014-5793(97)00579-6
Yu, Z., Baserga, R., Chen, L., Wang, C., Lisanti, M. P., and Pestell, R. G. (2010).microrna, cell cycle, and human breast cancer. Am. J. Pathol. 176, 1058–1064.doi: 10.2353/ajpath.2010.090664
Zhang, Y., and Verbeek, F. J. (2010). Comparison and integration of targetprediction algorithms for microRNA studies. J. Integr. Bioinform. 7. doi:10.2390/biecoll-jib-2010-127
Conflict of Interest Statement: The authors declare that the research was con-ducted in the absence of any commercial or financial relationships that could beconstrued as a potential conflict of interest.
Received: 14 August 2013; paper pending published: 31 August 2013; accepted: 22November 2013; published online: 17 December 2013.Citation: Garg A, Mohanram K, Di Cara A, Degueurce G, Ibberson M, Dorier Jand Xenarios I (2013) Efficient computation of minimal perturbation sets in generegulatory networks. Front. Physiol. 4:361. doi: 10.3389/fphys.2013.00361This article was submitted to Systems Biology, a section of the journal Frontiers inPhysiology.Copyright © 2013 Garg, Mohanram, Di Cara, Degueurce, Ibberson, Dorier andXenarios. This is an open-access article distributed under the terms of the CreativeCommons Attribution License (CC BY). The use, distribution or reproduction in otherforums is permitted, provided the original author(s) or licensor are credited and thatthe original publication in this journal is cited, in accordance with accepted academicpractice. No use, distribution or reproduction is permitted which does not comply withthese terms.
Research Topic: Topic Editor:From structural to molecular systems biology: experimental and Ma�eo Barberis,computa�onal approaches to unravel mechanisms of kinase ac�vity Humboldt University Berlin, Germany;regula�on in cancer and neurodegenera�on Max Planck Ins�tute for Molecular Gene�cs, Berlin, Germany
Frontiers in Physiology | Systems Biology December 2013 | Volume 4 | Article 361 | 10