Mitochondrial perturbation negatively affects auxin signaling
41
1 Mitochondrial Perturbation Negatively Affects Auxin Signaling Pavel Ivanov Kerchev a,b,2 , Inge De Clercq a,b,2 , Jordi Denecker a,b,3 ,Per Mühlenbock a,b,3,4 , Robert Kumpf a,b , Long Nguyen c , Dominique Audenaert a,b,c , Wim Dejonghe a,b & Frank Van Breusegem a,b,1 a Department of Plant Systems Biology, VIB, Ghent University, B–9052 Gent, Belgium b Department of Plant Biotechnology and Bioinformatics, Ghent University, B–9052 Gent, Belgium c VIB Compound Screening Facility, B–9052 Gent, Belgium 1 To whom correspondence should be addressed. E-mail [email protected] ugent.be, tel. 32 9 331 39 20, fax 32 9 331 38 09. 2,3 These authors contributed equally to this work. 4 Current address: Department of Plant Protection Biology, Swedish University of Agricultural Sciences, SE-230 53 Alnarp, Sweden Running title: Impact of mitochondria on auxin signaling Short Summary Mitochondria play a crucial role in stress signaling upon perturbation of there function. Here, we show the negative regulatory role of auxin in the process of mitochondria-to-nucleus signaling of stress responses. Molecular Plant Advance Access published June 5, 2014 at Rijksuniversiteit Gent on June 13, 2014 http://mplant.oxfordjournals.org/ Downloaded from
-
Upload
independent -
Category
Documents
-
view
0 -
download
0
Transcript of Mitochondrial perturbation negatively affects auxin signaling

1
Mitochondrial Perturbation Negatively Affects Auxin Signaling
Pavel Ivanov Kercheva,b,2
, Inge De Clercq a,b,2
, Jordi Deneckera,b,3
,Per Mühlenbocka,b,3,4
, Robert
Kumpfa,b
,
Long Nguyenc, Dominique Audenaert
a,b,c, Wim Dejonghe
a,b & Frank Van
Breusegema,b,1
a Department of Plant Systems Biology, VIB, Ghent University, B–9052 Gent, Belgium
b Department of Plant Biotechnology and Bioinformatics, Ghent University, B–9052 Gent,
Belgium
c VIB Compound Screening Facility, B–9052 Gent, Belgium
1 To whom correspondence should be addressed. E-mail [email protected]
ugent.be, tel. 32 9 331 39 20, fax 32 9 331 38 09.
2,3 These authors contributed equally to this work.
4 Current address: Department of Plant Protection Biology, Swedish University of Agricultural
Sciences, SE-230 53 Alnarp, Sweden
Running title: Impact of mitochondria on auxin signaling
Short Summary
Mitochondria play a crucial role in stress signaling upon perturbation of there function. Here,
we show the negative regulatory role of auxin in the process of mitochondria-to-nucleus
signaling of stress responses.
Molecular Plant Advance Access published June 5, 2014 at R
ijksuniversiteit Gent on June 13, 2014
http://mplant.oxfordjournals.org/
Dow
nloaded from

2
ABSTRACT
Mitochondria are crucial players in the signaling and metabolic homeostasis of the plant
cell. The molecular components that orchestrate the underlying processes, however, are
largely unknown. Using a chemical biology approach, we exploited the responsiveness of
Arabidopsis UDP-glucosyltransferase-encoding UGT74E2 towards mitochondrial
perturbation in order to look for novel mechanisms regulating mitochondria-to-nucleus
communication. The most potent inducers of UGT74E2 shared a (2-furyl)acrylate (FAA)
substructure that negatively affected mitochondrial function and was identified before
as an auxin transcriptional inhibitor. Based on these premises, we demonstrated that
perturbed mitochondria negatively affect the auxin signaling machinery. Moreover,
chemical perturbation of polar auxin transport and auxin biosynthesis was sufficient to
induce mitochondrial retrograde markers and their transcript abundance was
constitutively elevated in the absence of the auxin transcriptional activators ARF7 and
ARF19.
Keywords: mitochondrial perturbation; auxin signaling; retrograde communication
at Rijksuniversiteit G
ent on June 13, 2014http://m
plant.oxfordjournals.org/D
ownloaded from

3
INTRODUCTION
Mitochondria play a crucial role in maintaining cellular homeostasis by integrating a plethora
of signaling and metabolic pathways that operate between different cellular compartments
(Dutilleul et al., 2003; Noctor et al., 2007; Sweetlove et al., 2007). Apart from the production
of energy-rich adenosine triphosphate (ATP) coupled to the mitochondrial electron transport
chain (mETC), numerous mitochondrial biosynthetic reactions deliver metabolic
intermediates that are transported and utilized throughout the cell to sustain plant metabolism
(Day, 2004; Millar et al., 2011). The flux via the photorespiratory pathway, for example,
depends on mitochondrial glycine decarboxylase and serine hydroxymethyltransferase
activities and thus couples mitochondrial function to carbon assimilation (Foyer et al., 2009).
Moreover, the terminal step in the synthesis of ascorbic acid, the most abundant cellular redox
buffer, is coupled to the mETC (Bartoli et al., 2000). This diverse array of mitochondrial
functions underlies their high functional and morphological plasticity which is required to
execute specific developmental and stress programs.
Despite the fact that plant mitochondria contain their own genome, over 90% of the
mitochondrial proteins are encoded in the nucleus. Therefore, the synthesis and import of
nuclear-encoded mitochondrial proteins have to be tightly coordinated with the metabolic and
signaling requirements of the cell and further subjected to feedback regulatory mechanisms
reflecting the functional state of mitochondria (Woodson and Chory, 2008). The
communication between mitochondria and the nuclear transcription machinery, often referred
to as mitochondrial retrograde regulation (MRR), ensures adequate gene expression at the
mitochondrial and nuclear levels to maintain organellar as well as whole-cellular function. In
particular, a function has been attributed to MRR during plants responses to stresses that alter
or perturb the functioning of mitochondria (Rhoads and Subbaiah, 2007). The precise
molecular mechanism by which plant mitochondria signal to the nucleus are far from
elucidated but reactive oxygen species (ROS), calcium, and changes of energy and redox
status are likely to be involved in initiating and/or transmitting mitochondrial signals to the
nucleus (Rhoads and Subbaiah, 2007; Rhoads et al., 2006; Schwarzlander and Finkemeier,
2013; Subbaiah et al., 1998; Vanlerberghe et al., 2002).
Chemical and genetic perturbation of mitochondrial function has been extensively
exploited as a model system to study MRR (Dojcinovic et al., 2005; Schwarzlander et al.,
2012; Zarkovic et al., 2005) and led to the identification of a set of genes commonly referred
at Rijksuniversiteit G
ent on June 13, 2014http://m
plant.oxfordjournals.org/D
ownloaded from

4
to as Mitochondrial Dysfunction Stimulon (MDS) that are consistently and reproducibly
induced under such conditions (De Clercq et al., 2013; Van Aken et al., 2007; Van Aken and
Whelan, 2012). Perhaps the best characterized of these transcripts is ALTERNATVE OXIDASE
1a (AOX1a) encoding a cyanide-insensitive terminal oxidase that functions alongside
cytochrome c oxidase (Moller, 2001). Together with the alternative NADH dehydrogenases,
AOX forms a complete respiratory chain that does not generate a proton gradient across the
inner mitochondrial membrane and subsequently does not contribute to ATP production.
Similar to AOX1a, transcripts encoding alternative NAD dehydrogenases (NDB4) are also
part of the MDS. Redirection of electron flow via the alternative respiratory pathway
minimizes ROS accumulation by preventing the overreduction of the mETC (Cvetkovska and
Vanlerberghe, 2012; Maxwell et al., 1999). This can be crucial when the cytochrome pathway
is impaired or overreduced by adverse environmental conditions (Hernández et al., 1993;
Parsons et al., 1999; Prasad et al., 1994). The functions of other MDS genes extend beyond
mitochondrial homeostasis and comprise, amongst others, N-acetyltransferases, cytochrome
P450 enzymes, transmembrane transporters, etc. UGT74E2, for example, encodes a UDP-
glycosyltransferase and is one of the most strongly induced MDS genes. In vitro enzymatic
assays with recombinant UGT74E2 identified the auxin indole-3-butyric acid (IBA) as its
favored substrate. In vivo perturbation of auxin homeostasis through overexpression of
UGTE74E2 was associated with distinct morphological changes (increased shoot branching
and compact rosette) and enhanced survival under drought and salt stress (Tognetti et al.,
2010).
Various signaling components required for the information flow from mitochondria to
the nucleus have been identified in yeast and animal systems. Apart from the evolutionary
conserved RTG and NF-κB pathways that activate among others glycolysis upon impaired
respiration, other retrograde pathways that trigger various responses to specific mitochondrial
defects have been reported (Butow and Avadhani, 2004; Jazwinski and Kriete, 2012; Liu and
Butow, 2006; Srinivasan et al., 2010). In contrast, protein components playing a role in plant
MRR are largely unknown. The only identified players so far are cyclin-dependent kinase E1
(CDKE1), and the transcription factors ABSCISIC ACID INSENSITIVE 4 (ABI4),
WRKY40, and NO APICAL MERISTEM/ARABIDOPSIS TRANSCRIPTION
ACTIVATION FACTOR/CUP-SHAPED COTYLEDON 13 and 17 (ANAC013 and
ANAC017) (De Clercq et al., 2013; Giraud et al., 2009; Ng et al., 2013a; Ng et al., 2013b;
Van Aken et al., 2013). ANAC013 and ANAC017 target a conserved cis-regulatory element
at Rijksuniversiteit G
ent on June 13, 2014http://m
plant.oxfordjournals.org/D
ownloaded from

5
commonly found in the promoter regions of the MDS genes which is necessary and sufficient
for gene expression upon mitochondrial perturbation. ANAC013 and ANAC017 contain
transmembrane domains required for their anchoring to the endoplasmic reticulum (ER) and
ANAC017 localizes at the junctions of ER and F-actin. Upon proteolytic cleavage, likely
mediated by rhomboid proteases, ANAC017 migrates into the nucleus to activate gene
expression. Intimate contacts between mitochondria and ER have been documented in yeast
and animal systems and are required for interorganellar Ca2+
exchange. The link between
mitochondria and ER in the activation of the MRR has recently emerged in Arabidopsis.
Under salt stress, the induction of AOX1a is dependent on the Ca2+
-mediated communication
between ER and mitochondria (Vanderauwera et al., 2012). The involvement of the ER during
stress response is dependent on the unfolded protein response (UPR), which is evolutionary
conserved and maintains cellular function upon accumulation of misfolded proteins (Urade,
2007). UPR activation, for example, negatively impacts the auxin signaling machinery and its
severity is reduced in mutants affected in ER-localized auxin transporters (Chen et al., 2014).
The signaling pathways of plant MRR have been extensively studied using AOX1a as
a model system (Dojcinovic et al., 2005; Zarkovic et al., 2005; Giraud et al., 2009). However,
mitochondrial perturbation induces several other genes, among which one of the most
strongly induced is UGT74E2. Using the distinct advantages offered by small molecule
approaches, we performed a chemical screen looking for activators of UGT74E2. The two
most potent hit compounds shared a common 3-(2-furyl) acrylate substructure and
surprisingly inhibited auxin signaling, implying a mechanistic link between mitochondrial
function and auxin signaling pathways.
at Rijksuniversiteit G
ent on June 13, 2014http://m
plant.oxfordjournals.org/D
ownloaded from

6
RESULTS
Chemical Screen to Identify Compounds Activating Mitochondrial Retrograde Signaling
Pathways
We have previously shown that a set of nuclear-encoded genes which we referred to as
Mitochondrial Dysfunction Stimulon (MDS), are strongly induced upon mitochondrial
perturbation caused by chemical or genetic factors (De Clercq et al., 2013). The MDS is co-
regulated by NAC transcription factors (ANAC013 and ANAC017) targeting the conserved
Mitochondrial Dysfunction Motif (MDM) cis-regulatory element present in their promoter
regions (De Clercq et al., 2013; Ng et al., 2013b). To further explore the molecular
mechanism by which perturbed mitochondria signal to the nucleus, we designed a high-
throughput chemical screen based on the luciferase (LUC) reporter gene driven by the
UGT74E2 promoter (pUGT74E2:LUC). UGT74E2, being part of the MDS, is strongly
responsive to mitochondrial perturbations and contains the MDM cis-regulatory element in its
promoter region, making it a good marker to identify novel players in mitochondrial
retrograde signaling. To counterselect for chemicals that trigger a general stress response and
thus unspecifically induce UGT74E2 expression (Tognetti et al., 2010), we used the
chlorophyll fluorescence parameter photosystem II (PSII) maximum efficiency (Fv'/Fm') that is
a stable and sensitive stress marker (Baker, 2008; Mishra et al., 2011). Chemicals that
negatively affected photosynthetic performance, reflected by a Fv'/Fm' drop, were not retained
as potential hits (Supplemental Figure 1). Following a primary screen and two validation
rounds, we isolated seventeen hit compounds that induced the luciferase signal in
pUGT74E2:LUC lines above the control threshold without impairing PSII maximum
efficiency (Figure 1A, Supplemental Figure 1).
The two most potent hit compounds shared a characteristic (2-furyl)acrylate moiety
fused via an amide linkage to the rest of the molecule (Figure 1B). Both chemicals acted in a
dose-dependent manner and their ability to enhance UGT74E2 transcript abundances was
confirmed in a wild-type (Col-0) background by quantitative real-time (qRT)-PCR analysis
(Supplemental Figure 2). We then tested whether 3-(2-furyl) acrylic acid (FAA), which is
present as a substructure in both hit compounds, is sufficient to activate pUGT74E2. FAA
(20 µM) also strongly induced the luciferase signal in pUGT74E2:LUC seedlings without a
negative impact on the the Fv'/Fm' ratio (Figure 1C, Figure 1D).
FAA Treatment Activates the Mitochondrial Dysfunction Stimulon
at Rijksuniversiteit G
ent on June 13, 2014http://m
plant.oxfordjournals.org/D
ownloaded from

7
We then tested whether FAA activates other genes belonging to the MDS apart from
UGT74E2 by analyzing their transcript abundance in chemically treated seedlings using qRT-
PCR analysis. Treatment of Arabidopsis seedlings with 20 µM FAA induced the majority of
the tested MDS genes; the most strongly up-regulated transcripts were UGT74E2, UPOX,
AOX1a and sHsp23.5 (Figure 2A), suggesting that FAA activates mitochondrial retrograde
signaling pathways. To further corroborate these findings, we mined the publicly available
microarray data for perturbation experiments that had used structurally similar chemicals. We
identified an experiment in which global gene expression changes were analyzed upon
treatment of seven-day-old Arabidopsis seedlings with 10 µM furyl acrylate ester of a
thiadiazole heterocycle (Armstrong et al., 2004). The FAA part of the molecule was shown to
render its bioactivity (Sungur et al., 2007). Comparing the expression of the MDS genes after
treatment with the furyl acrylate ester and after treatment with chemicals perturbing
mitochondrial functions (rotenone, Antimycin A, and oligomycin) revealed a similar
transcriptional pattern (Figure 2B). Taken together, these results suggest that FAA-dependent
transcriptional activation is not restricted to the induction of UGT74E2, but rather mimics the
responses provoked by disturbance of mitochondrial function.
We further tested this hypothesis by using the fluorescent dye MitoTracker Red CM-H2XRos
which stains actively respiring mitochondria. Mitochondrial staining in root tip cells was
severely decreased upon pretreatment with 50 µM Antimycin A (AA) (Figure 2C). AA inhibits
the mitochondrial respiratory chain by binding to the quinone reduction site of Complex III.
Similarly, pretreatment with 20 µM FAA strongly decreased the fluorescent signal, pointing
toward a negative impact of FAA on mitochondrial function (Figure 2C).
FAA Activates the Mitochondrial Dysfunction Motif cis-Regulatory Element
The presence of the Mitochondrial Dysfunction Motif (MDM) cis-regulatory element was
shown to be necessary and sufficient for full induction of the MDS genes upon various
mitochondrial perturbations. The MDM consensus (CTTGNNNNNCA[AC]G) is present
twice in the AOX1a promoter and once in the UGT74E2 promoter (De Clercq et al., 2013). To
test whether FAA mediates promoter activation through this sequence, we used luciferase
reporter lines harboring either a hexamer of the MDM sequence from the UGT74E2 promoter
(6xMDM[UGT74E2]) or one of the MDM sequences from the AOX1a promoter
(6xMDM1[AOX1a]). The luminescent signal detected upon exposure of seedlings carrying either
of the promoter constructs to FAA was strongly induced in comparison to mock-treated
at Rijksuniversiteit G
ent on June 13, 2014http://m
plant.oxfordjournals.org/D
ownloaded from
8
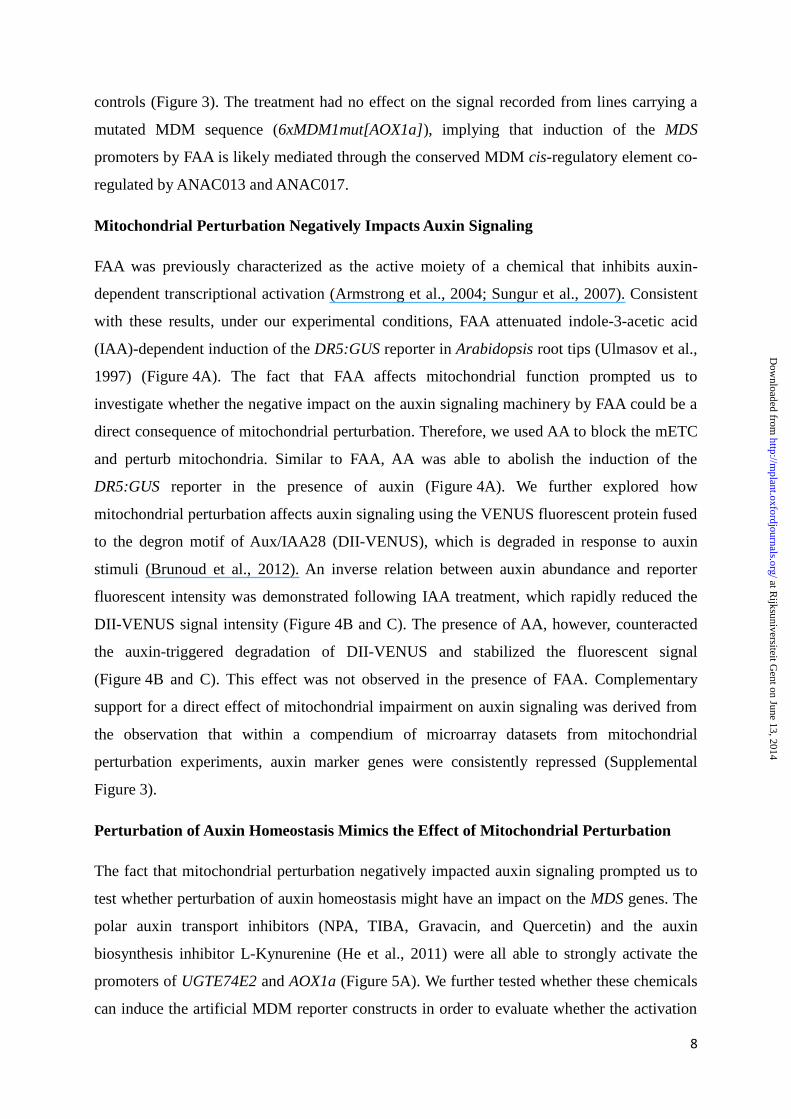
controls (Figure 3). The treatment had no effect on the signal recorded from lines carrying a
mutated MDM sequence (6xMDM1mut[AOX1a]), implying that induction of the MDS
promoters by FAA is likely mediated through the conserved MDM cis-regulatory element co-
regulated by ANAC013 and ANAC017.
Mitochondrial Perturbation Negatively Impacts Auxin Signaling
FAA was previously characterized as the active moiety of a chemical that inhibits auxin-
dependent transcriptional activation (Armstrong et al., 2004; Sungur et al., 2007). Consistent
with these results, under our experimental conditions, FAA attenuated indole-3-acetic acid
(IAA)-dependent induction of the DR5:GUS reporter in Arabidopsis root tips (Ulmasov et al.,
1997) (Figure 4A). The fact that FAA affects mitochondrial function prompted us to
investigate whether the negative impact on the auxin signaling machinery by FAA could be a
direct consequence of mitochondrial perturbation. Therefore, we used AA to block the mETC
and perturb mitochondria. Similar to FAA, AA was able to abolish the induction of the
DR5:GUS reporter in the presence of auxin (Figure 4A). We further explored how
mitochondrial perturbation affects auxin signaling using the VENUS fluorescent protein fused
to the degron motif of Aux/IAA28 (DII-VENUS), which is degraded in response to auxin
stimuli (Brunoud et al., 2012). An inverse relation between auxin abundance and reporter
fluorescent intensity was demonstrated following IAA treatment, which rapidly reduced the
DII-VENUS signal intensity (Figure 4B and C). The presence of AA, however, counteracted
the auxin-triggered degradation of DII-VENUS and stabilized the fluorescent signal
(Figure 4B and C). This effect was not observed in the presence of FAA. Complementary
support for a direct effect of mitochondrial impairment on auxin signaling was derived from
the observation that within a compendium of microarray datasets from mitochondrial
perturbation experiments, auxin marker genes were consistently repressed (Supplemental
Figure 3).
Perturbation of Auxin Homeostasis Mimics the Effect of Mitochondrial Perturbation
The fact that mitochondrial perturbation negatively impacted auxin signaling prompted us to
test whether perturbation of auxin homeostasis might have an impact on the MDS genes. The
polar auxin transport inhibitors (NPA, TIBA, Gravacin, and Quercetin) and the auxin
biosynthesis inhibitor L-Kynurenine (He et al., 2011) were all able to strongly activate the
promoters of UGTE74E2 and AOX1a (Figure 5A). We further tested whether these chemicals
can induce the artificial MDM reporter constructs in order to evaluate whether the activation
at Rijksuniversiteit G
ent on June 13, 2014http://m
plant.oxfordjournals.org/D
ownloaded from

9
of the full promoters might be mediated through the MDM cis-regulatory element. A
significant induction of the 6xMDM[UGT74E2] promoter was recorded only upon treatment
with TIBA (Figure 5B) like this activation was modest in comparison to the effect of FAA.
The 6xMDM1[AOX1a] reporter was similarly induced by TIBA, but also by Gravacin and
Quercetin (Figure 5B). Again the induction was less pronounced compared to FAA
treatments.
To test whether genetic perturbation of auxin signaling induces MDS genes, we
quantified their transcript levels by qRT-PCR in a range of auxin-related mutants. No
consistent effects were observed in mutants impaired in components required for auxin
perception (tir1), Aux/IAA transcriptional repression (axr3), polar auxin transport (pin2 and
pin3 pin7), regulation of polar auxin transport (pid wag1 wag2), and intercellular trafficking
(gnom) (Supplemental Figure 4). Interestingly, however, the absence of auxin-regulated
transcriptional activators AUXIN RESPONSE FACTOR 7 and 19 (ARF7 and ARF19) in the
double mutant arf7 arf19 led to strong constitutive expression of the majority of MDS genes
(Figure 6).
Activation of Auxin Signaling Modulates the Effects of Mitochondrial Perturbation
To further investigate the interplay between mitochondrial function and auxin homeostasis,
we pretreated Arabidopsis seedlings carrying pUGT74E2 and pAOX1a luciferase constructs
with 5 µM IAA before disrupting mitochondrial function with 50 µM AA. Regardless of the
presence of exogenous auxin, AA activated both promoters to fully induced levels
(Supplemental Figure 5). However, when seedlings harboring the artificial MDM reporter
constructs were treated in a similar way, the induction of both 6xMDM[UGT74E2] and
6xMDM1[AOX1a] was alleviated by auxin (Supplemental Figure 5), suggesting that the
signaling cascades activated upon mitochondrial perturbation could be fine-tuned by auxin.
Several high-flux metabolic pathways operate in mitochondria and some of them are
intimately linked with the respiratory activity that partly regulates mitochondria-to-nucleus
communication. To assess how auxin could affect mitochondrial function and subsequently
modify AA-triggered stress responses, we profiled polar metabolites (by GC-MS) in
Arabidopsis seedlings treated with AA only, or pretreated with auxin before AA treatment.
The abundance of the majority of the measured metabolites induced by AA was not affected
by IAA pretreatment (Supplemental Figure 5). Nevertheless, a small number of metabolites
were differentially regulated. The AA-induced increase of serine and glycine content was
at Rijksuniversiteit G
ent on June 13, 2014http://m
plant.oxfordjournals.org/D
ownloaded from

10
significantly alleviated in the presence of auxin (Supplemental Figure 5). Similarly, elevated
glycine and serine levels were also detected in mitochondrial prohibitin 3 mutants (Van Aken
et al., 2007) (Supplemental Figure 6). Taken together, these results suggest that serine and
glycine accumulation might be a general consequence of mitochondrial perturbation, which
can be fine-tuned by auxin.
DISCUSSION
We have used a small molecule approach to identify novel plant mitochondrial retrograde
signaling components. In contrast to the majority of previous studies which used AOX1a as a
marker for MRR (Giraud et al., 2009; Ng et al., 2013a; Ng et al., 2013b), we exploited the
responsiveness of UGT74E2 towards mitochondrial perturbation and selected for compounds
that activate the UGT74E2 promoter without negatively impacting the chlorophyll fluorescent
parameter Fv’/Fm’ which is widely used as an indicator of stress response (Baker, 2008;
Mishra et al., 2011). UGT74E2 is induced by a variety of abiotic and biotic stress conditions
(Tognetti et al., 2010) and by monitoring Fv’/Fm’ values we aimed to discard cytotoxic
chemicals.
FAA has been previously shown to impair auxin-triggered Aux/IAA protein degradation and
subsequent auxin-dependent gene expression without interfering with the interaction between
IAA7/AXR2 and the SCFTIR1
complex, leaving the cellular targets and the mode of action of
FAA enigmatic (Sungur et al., 2007). Here, we further revealed that FAA induces the MDS
genes among which is the well-characterized MRR marker AOX1a; implying that FAA
treatment might directly or indirectly affect mitochondrial function. To unequivocally test
whether mitochondrial perturbation directly negatively affects auxin signaling, we used AA, a
specific inhibitor of mitochondrial Complex III, and demonstrated that auxin signaling is
attenuated upon AA treatment through a stabilization of Aux/IAA repressors (Figure 4). Thus,
even though we cannot exclude the possibility that FAA is not targeting mitochondria directly,
its ultimate impact on mitochondria is most probably linked to the observed attenuation of
auxin signaling. Intriguingly, under our experimental conditions, FAA failed to stabilize the
DII-VENUS reporter. This is at first sight in conflict with the previously reported FAA-
triggered stabilization of the IAA17/AXR3-GUS fusion protein in the presence of exogenous
auxin (Sungur et al., 2007). The heat shock-inducible production of the reporter protein in the
HS:AXR3NT-GUS lines (Sungur et al., 2007), the different degron motifs used in both
at Rijksuniversiteit G
ent on June 13, 2014http://m
plant.oxfordjournals.org/D
ownloaded from

11
constructs and the higher sensitivity of DII-VENUS could explain the different responses of
both reporters.
Perturbation of mitochondrial function (e.g. by AA) has previously been associated with
enhanced mitochondrial ROS levels (Maxwell et al., 1999). The interaction between oxidative
stress signaling and auxin has surfaced in the last years, but the molecular knowledge is
limited and mainly based on circumstantial evidence. The perturbed redox homeostasis in the
triple glutathione-deficient mutant (cad2 ntra ntrb) leads to developmental defects
reminiscent of the phenotype of several mutants affected in auxin transport or biosynthesis
(Bashandy et al., 2010). Moreover, apoplastic ROS negatively affect the abundance of several
transcripts encoding auxin receptors, Aux/IAA transcriptional repressors, and auxin efflux and
influx carriers without noticeable changes in IAA levels (Blomster et al., 2011). The widely
used auxin transport inhibitor TIBA mimics the negative effect of apoplastic ROS on auxin-
responsive gene expression (Blomster et al., 2011). Our analysis displayed that conditions
perturbing mitochondrial function provoke similar auxin-related transcriptional changes
(Supplemental Figure 3). Similar repression of auxin signaling was observed in meristematic
tissues under mild osmotic stress (Skirycz et al., 2010). Meristems are crucial in determining
plant growth with auxin orchestrating many of the underlying processes and bear
mitochondria with altered shapes (Skirycz et al., 2010). Moreover, the global transcriptional
pattern of the proliferating leaves under mild osmotic stress conditions displayed a
characteristic ethylene signature, pointing towards an auxin-ethylene crosstalk. An intriguing
aspect in this context is the tissue-specific regulation of UGT74E2 and other MDS genes.
During adverse environmental conditions, they are specifically induced in proliferating
tissues, which potentially implies a mechanistic link to the maintenance of mitochondrial
function and cell proliferation. In this respect, the fact that UGT74E2 glycosylates IBA and its
overexpression perturbs auxin homeostasis implies that induction of UGT74E2 might be
instrumental to rearrange auxin pools in the meristematic tissues during stress response.
Interestingly, prohibitin mutants which also have abnormally shaped mitochondria
specifically induce the MDS genes, show lower meristematic activity and display
developmental defects (Van Aken et al., 2007). A common theme between various adverse
conditions is a general growth retardation (Potters et al., 2007; Pasternak et al., 2005) and
UGT74E2 and the other MDS (e.g. ABCB4 is known as an auxin transporter, Terasaka et al.,
2005)) genes might be involved in this response. Recently, it was also found that auxins
counteract photorespiration-dependent cell death, indicating that auxin plays a role in
at Rijksuniversiteit G
ent on June 13, 2014http://m
plant.oxfordjournals.org/D
ownloaded from

12
adapting tissues to ROS challenge (Kerchev et al., 2014). It is tempting to speculate that this
adaptation occurs through the fine tuning of mitochondrial function through regulation of the
MDS genes. The constitutive induction of the MDS genes in the arf7arf19 knock-out mutant is
highly intriguing and deserves further attention in the future. ARF7 and ARF19 function
together not only in regulating auxin signaling, but also participate in ethylene responses and
the coordination of lipid remodeling during phosphate starvation (Li et al., 2006; Narise et al.,
2010). The attenuated accumulation of nonphosphorous glycolipids under limited phosphate
conditions in arf7arf19 hints towards a role in stress response which is further supported by
our observations.
The role of auxin homeostasis during stress responses has recently emerged in the light
of the ROS-auxin crosstalk (Tognetti et al., 2012). Auxin depends on a complex signaling and
transport machinery distributing it differentially within plant tissues (Vanneste and Friml,
2009). The way plants perceive stress responses is equally modulated by tissue-specific
mechanisms, that are likely to be co-orchestrated by mitochondria. The fact that
mitochondrial perturbation negatively impacts auxin signaling will for sure have implications
for our understanding how growth is rearranged during adverse environmental conditions.
METHODS
Plant Material and Growth Conditions
Promoter:LUC (pAOX1a:LUC, pUGT74E2:LUC, 6xMDM1[AOX1a]:LUC and
6xMDM1mut[AOX1a]:LUC) Arabidopsis lines were described in De Clercq et al. (2013).
Unless otherwise stated, seeds were surface-sterilized with chlorine gas, stratified at 4 ºC for
3-4 days, germinated on half-strength Murashige and Skoog (½MS ) medium containing 1%
(w/v) sucrose solidified with 0.8% (w/v) agar and grown for 14 days until stage 1.04 (Boyes
et al., 2001). Plants were grown under long-day conditions (16h/8h light/dark photoperiod, 21
ºC, 150 µE m-2
s-1
) and treated as described for the individual experiments.
Generation of Transgenic Arabidopsis Plants
The artificial promoter construct (6xMDM[UGT74E2]) was synthesized as an oligonucleotide
(Invitrogen), annealed by heating followed by gradual cooling, and subsequently, cloned into
pDONRP4-P1r. The 6xMDM[UGT74E2] consists of a six-tandem repeat of the MDM cis-
regulatory element from the UGT74E2 promoter with 5-bp flanking sequences at each end
(ACAACTTTGTATAGAAAAGTTGcacatCTTGGTCGCCACGgaacacacatCTTGGTCGCCA
at Rijksuniversiteit G
ent on June 13, 2014http://m
plant.oxfordjournals.org/D
ownloaded from

13
CGgaacacacatCTTGGTCGCCACGgaacacacatCTTGGTCGCCACGgaacacacatCTTGGTCG
CCACGgaacacacatCTTGGTCGCCACGgaacaCAAGTTTGTACAAAAAAGCAGT). The
fusion of this construct upstream of the minimal Cauliflower mosaic virus 35S promoter and
the LUC reporter gene, and its subsequent transformation in Arabidopsis Col-0 was performed
as described in De Clercq et al. (2013). The pUGT74E2:LUC line used in this screen, was
described in Tognetti et al., 2010.
Chemical Screen
Surface-sterilized pUGT74E2:LUC seeds were distributed in 96-well white CulturePlate-96
(Perkin-Elmer) (5-10 seeds/well) containing 150 µL ½MS medium (0.5% w/v sucrose) per
well. Following a cold treatment (3-4 days at 4ºC), parafilm®-sealed plates were transferred
to a growth chamber with controlled environmental conditions (16h/8h light/dark
photoperiod, 100 μmol m−2
s−1 light intensity, 21ºC, 50% relative humidity). Nine days post
germination 12,000 chemicals from the DIVERSet screening library (ChemBridge
Corporation, USA) were added to individual wells to a final concentration of 50 µM (1%
(v/v) DMSO). A treatment with 1% (v/v) DMSO and 10 mM H2O2 (1% (v/v) DMSO) were
used as a negative and positive control, respectively. Twenty four hours following chemical
addition, the PSII maximum efficiency (Fv'/Fm') was recorded. Subsequently, 100 µl luciferin
(Promega ONE-Glo™ Luciferase Assay System) was added to individual wells and after 8-
min dark-incubation, luminescence was acquired with a LUMIstar Galaxy luminometer
(BMG labtechnologies, Offenburg, Germany).
Chlorophyll fluorescence imaging
Chlorophyll fluorescence measurements were performed using an Imaging-PAM M-Series
chlorophyll fluorometer (Heinz Walz, Germany) on light-adapted plants. In the absence of
actinic illumination the minimal fluorescence level of light-adapted plants (F'o) was
determined. For assessment of the maximum fluorescence yield of light-adapted plants (F'm) a
saturation pulse of blue light (450 nm) with an intensity of ca. 2800 µmol m-2
s-1
was applied
for 1 second. Both fluorescence parameters were used to calculate the PSII maximum
efficiency (F'v/F'm=(F'm-F'o)/F'm) (Baker, 2008).
Chemical Treatments
3-(2-furyl)acrylic acid (FAA), indole-3-acetic acid (IAA), 2,3,5-triiodobenzoic acid (TIBA),
1-N-naphthylphthalamic acid (NPA), L-kynurenine, antimycin A (AA), and quercetin were
at Rijksuniversiteit G
ent on June 13, 2014http://m
plant.oxfordjournals.org/D
ownloaded from

14
purchased from Sigma-Aldrich. Gravacin (3-[5-(3,4-dichlorophenyl)-2-furyl]acrylic acid) was
obtained from ChemBridge Corporation (USA). Chemicals were applied from 50 mM stock
solutions in DMSO to final concentrations described in the text. Mock treatments of 0.1%
[v/v] DMSO were used as a control.
GC-MS Profiling
For metabolite profiling, 15 Arabidopsis Col-0 seeds were germinated in 24-well plates
containing 2 ml ½MS medium (0.5 % w/v sucrose) and grown for 14 days. Whole seedlings
(~60 mg fresh weight) were homogenized with a retsch mill and processed as described
before (Desbrosses et al., 2005; Kaplan et al., 2004). Subsequently, dried aliquots from the
extracted samples were incubated with 40 µl methylhydroxylamine hydrochloride (20 mg/ml
in pyridine) for 1.5h at 30°C. The samples were further incubated with 70 µl N-methyl-N-
(trimethylsilyl)trifluoroacetamide (MSTFA) and 10 µl alkane retention mixture for 30 min at
37°C. HP6890 gas chromatograph coupled to HP5973 quadrupole mass detector was used to
analyze the samples. Following a splitless injection (1 µl) at 230°C, constant helium flow (1
ml/min) was used to introduce the vaporized sample to a 30 m capillary column (FactorFour
VF-5ms column, Varian). The oven temperature was maintained constant at 70°C for 5 min,
and then ramped to 325°C at a rate of 5°C/min. The detector was operating in a scanning
mode (60 to 600 atomic mass units; 7.8 to 68.8 min).
Peak alignment and integration were performed using the functions implemented in
the xcms package with the following parameters: fwhm=3, max=300, snthresh=2, step=0.1,
steps=2, mzdiff=0.5. The peaks of interest were annotated with the AMDIS software using a
mass spectra library (Q_MSRI_ID) from the Golm Metabolome Database (Schauer et al.,
2005).
Luciferase Analysis
Luciferase measurements were performed as described before (De Clercq et al., 2013).
Quantitative RT-PCR
Total RNA was prepared with TRIzol reagent (Invitrogen) and total RNA concentrations were
determined with an ND-1000 spectrophotometer (Nanodrop Technologies, Wilmington, DE).
First-strand cDNA was prepared from 2 µg of total RNA with the cDNA synthesis kit (Bio-
rad) according to the manufacturer’s instructions. Half a microliter of a 1:8 diluted first-strand
at Rijksuniversiteit G
ent on June 13, 2014http://m
plant.oxfordjournals.org/D
ownloaded from

15
cDNA was used as a template in the subsequent PCR, which was performed on the iCycler iQ
(BioRad, Hercules, CA) or on the LightCycler 480 (Roche Diagnostics) in 384-well plates
with the SYBR Green I Master kit (Roche Diagnostics), according to the manufacturer’s
instructions. All individual reactions were done in triplicate. Primers were designed with the
Universal ProbeLibrary Assay Design center ProbeFinder software (Roche; http://www.roche-
applied-science.com/). Primers used to amplify the MDS genes are shown in Supplemental
Table 1. The Δ cycle treshold was applied for relative expression analysis using three
reference genes (ACTIN-RELATED PROTEIN7 [ARP7], UBIQUITIN-CONJUGATING
ENZYME 21 [UBC21] (At5g25760), and At2g28390) for normalization.
Histological Analysis
To analyze DR5:GUS activity 5-day-old DR5:GUS seedlings were transferred from vertical
½MS (0.8 % agar) plates to liquid ½MS medium supplemented with 5 µM IAA, 20 µM FAA
or 50 µM AA or combinations of 5 µM IAA plus either 20 µM FAA or 50 µM AA in a 6-well
plate format. Following a 4 h incubation, GUS assays were performed as described previously
(Beeckman and Engler, 1994). Images were acquired at a 20-fold magnification (Zeiss,
AxioImager).
Five-day-old Arabidopsis seedlings grown on vertical ½MS (0.8 % agar) plates were
used to analyze the effect of FAA and AA on the DII VENUS reporter. For FAA and AA
treatment, seedlings were incubated for 5 min with 20 µM FAA or 50 µM AA before being
subjected to the following treatments. The seedlings were further placed in glass bottomed
dishes and covered with media containing 50 nM IAA, 20 µM FAA or 50 µM AA or
combinations of 50 nM IAA plus either 20 µM or 50 µM AA. The time series started 5 min
after the seedlings had been placed in contact with the media and captured over 35 min (every
5min) with a Zeiss 710 confocal microscope (20x objective). ZEN2009 software was used to
process the images.
For mitochondrial staining 6-day-old Arabidopsis Col0 seedlings grown vertically
were transferred to liquid ½MS media containing 0.1% (v/v) DMSO, 50 µM AA (0.1% [v/v]
DMSO) and 20 µM FAA (0.1% [v/v] DMSO). Following 1h incubation, seedlings were
transferred to equivalent solutions containing Mito Tracker Red CMH2Xros (M-7513,
Molecular Probes) in a final concentration of 250 nM and further incubated for an additional
hour. Fluorescence from five to ten seedlings was detected using a Zeiss confocal microscope.
at Rijksuniversiteit G
ent on June 13, 2014http://m
plant.oxfordjournals.org/D
ownloaded from
16
Meta-analysis of Transcriptome Data
For meta-analyses of public microarray data, normalized expression values were obtained
from Genevestigator (Zimmermann et al., 2008): AA treatment, AT-00561, GSE41136, Ng et
al. (2013a); FAA – ester treatment, AT-00167, GSE1491, Armstrong et al. (2004); rotenone
and Oligomycin treatment, AT-00522, GSE3709, Clifton et al. (2005). The exported data were
clustered based on Pearson correlation using the TMEV4 software.
SUPPLEMENTARY DATA
Supplementary Data are available at Molecular Plant Online.
FUNDING
This work was supported by Ghent University (Multidisciplinary Research Partnership
“Biotechnology for a Sustainable Economy”, Grant 01MRB510W), the Agency for Innovation
by Science and Technology (IWT; Phoenix project 070347), VIB and Marie Curie
(OMICS@VIB PCOFUND-GA-2010-267139), and the Interuniversity Attraction Poles
Programme (IUAP P7/29 “MARS”), initiated by the Belgian Science Policy Office. This
work was also supported by a Marie Currie fellowship to P.M., by FWO (Fonds
Wetenschappelijk Onderzoek – Vlaanderen) through a Pegasus postdoctoral grant funded to
P.K and by IWT through a predoctoral fellowship to I.D.C.
ACKNOWLEDGEMENTS
We thank Kristof Verleye for fruitful discussions and technical assistance. We also thank
Steffen Vanneste and Michael Metzlaff for discussions and suggestions, Wei Xuan for seed
material, and Annick Bleys for help in preparing the manuscript. No conflict of interest
declared.
FIGURE LEGENDS
at Rijksuniversiteit G
ent on June 13, 2014http://m
plant.oxfordjournals.org/D
ownloaded from

17
Figure 1. Chemical Screen to Identify Compounds Activating Mitochondrial Retrograde
Signalling Pathways.
(A) A schematic representation of the chemical screen.
(B) Chemical formulas of the two most potent hit compounds identified in the screen
(Compound 2 and Compound 3) and the shared substructure (3-(2-Furyl)acrylic acid (FAA)).
(C) Induction of pUGT74E2 by Compound 2, Compound 3, and FAA. 10 mM H202 was used
as a positive control. The 1,5-kb upstream sequences of UGT74E2 was fused upstream of the
luciferase gene and stably transformed in Arabidopsis plants. Luciferase activity following
chemical (20 µM) and mock (DMSO) treatment is shown (±SD; n=8 biological replicates).
Different letters represent statistically significant differences according to one-way ANOVA
with Tukey’s post hoc test (p<0.05). RLU, relative luminescence units.
(D) Photosystem II maximum efficiency (Fv'/Fm') of seedlings treated with chemicals (20
µM), 10 mM H202 or DMSO for 24 h (left panel). Fv'/Fm' levels are depicted by color codes;
blue represents high values and yellow-green corresponds to low values. Quantification of
Fv'/Fm' values in chemically treated seedlings (right panel). Bars represent means of 8
replicates ± SD. Different letters represent statistically significant differences according to
one-way ANOVA with Tukey’s post hoc test (p<0.05).
Figure 2. FAA Negatively Impacts Mitochondria.
(A) Induction of MDS genes following FAA treatment. Transcript levels of fourteen of the
MDS genes were analyzed by qRT-PCR in 10-day-old wild-type Arabidopsis plants grown as
liquid cultures and treated with 20 µM FAA or DMSO for 24 h. Bars represent average fold
changes relative to the mock treatment from four biological replicates (± SE). Asterisks
indicate significant differences to the mock (Student’s t test; * p<0.05, ** p<0.01, and ***
p<0.001).
at Rijksuniversiteit G
ent on June 13, 2014http://m
plant.oxfordjournals.org/D
ownloaded from

18
(B) Comparison of publicly available expression profiles of the MDS genes between FAA
ester treatment and treatments with mitochondrial blockers. Color codes represent linear fold
changes relative to control extracted from Genevestigator and hierarchically clustered using
Pearson correlation as a distance measure in the TMEV4 software. Antimycin A: GSE41136
(Ng et al., 2013b); oligomycin and rotenone: GSE3709 (Clifton et al., 2005); FAA ester:
GSE1491 (Armstrong et al., 2004).
(C) Mitochondrial staining of Arabidopsis root tips with MitoTracker Red CM-H2XRos
fluorescent dye (left panel). Six-old-day Arabidopsis Col0 seedlings were pretreated with
20 µM FAA, 50 µM AA and DMSO in liquids ½MS media for 1 h before transferring to
identical solutions containing additional 250 nM Mito Tracker Red CMH2XRos for an
additional 1 h. Bright field images (right panel). Scale bars equal 5 µM.
Figure 3. Induction of the MDM Cis-Regulatory Elements by FAA. Regulatory activity of the
synthetic sequence containing six consecutive repeats of the MDM sequence from the
UGT74E2 promoter (6xMDM[UGT74E2]) and from the AOX1a promoter
(6xMDM1[AOX1a]) in transgenic Arabidopsis plants treated with 20 µM FAA or DMSO for
24 h. The construct mutated in the MDM sequence (6xMDM1mut[AOX1a]) was included as a
negative control. Bars represent averages ±SE of 8 biological replicates. RLU, relative
luminescence units.
Figure 4. Inhibition of Auxin Signaling by Mitochondrial Dysfunction.
(A) Effect of AA and FAA on the auxin-responsive reporter line DR5:GUS. Five-day-old
DR5:GUS seedlings were treated for 4 h with 5 µM IAA alone or with combinations of 5µM
IAA and either 50 µM AA or 20 µM FAA. DMSO was used as a mock treatment.
(B) Quantification of the DII-Venus fluorescent signal intensity in the median section of the
root tip. Data points represent averages based on quantification of three independent roots
at Rijksuniversiteit G
ent on June 13, 2014http://m
plant.oxfordjournals.org/D
ownloaded from

19
relative to the first time point (5 min = 1) ± SD. The roots were pre-incubated for 5 min with
either 50 µM AA or 20 µM FAA before being placed in contact with agar-solidified ½MS
media containing combinations of auxin (50 nM) and either 50 µM AA or 20 µM FAA and
imaged for 35 min. For IAA and mock (DMSO) treatments, roots were placed in contact with
the media without a prior incubation.
(C) DII-Venus fluorescence signal (range indicator: blue to green) in propodium iodid (red)
stained Arabidopsis root tips at 5 min and 25 min after exposure to exogenous IAA (50 nM);
IAA + FAA (50 nM and 20 µM), IAA + AA (50 nM and 50 µM), and DMSO as described
above.
Figure 5. Effect of Polar Auxin Transport Inhibitors on Mitochondrial Retrograde Markers.
(A) The UGT74E2 and AOX1a promoters are activated by polar auxin transport inhibitors and
an inhibitor of auxin biosynthesis. The 1,5-kb upstream sequences of UGT74E2 and AOX1a
were fused upstream of the luciferase gene and stably transformed in Arabidopsis plants.
Mean luciferase activities after 24 h treatment of UGT74E2:LUC and AOX1a:LUC lines with
20 µM NPA, 20 µM TIBA, 20 µM gravacin, 500 µM quercetin, 20 µM L-kynurerine, and
DMSO are shown ±SE (n = 8 biological replicates). RLU, relative luminescence units.
(B) The MDM cis-regulatory element is sufficient for promoter activation by polar auxin
transport inhibitors and an inhibitor of auxin biosynthesis. Regulatory activity of the synthetic
sequence containing six consecutive repeats of the MDM sequence from the UGT74E2
promoter (6xMDM[UGT74E2]) and from the AOX1a promoter (6xMDM1[AOX1a]) in
transgenic Arabidopsis plants treated with NPA, TIBA, gravacin, quercetin, L-kynerine and
DMSO in concentrations described above. The construct mutated in the MDM sequence
(6xMDM1mut[AOX1a]) was included as a negative control. Bars represent average luciferase
at Rijksuniversiteit G
ent on June 13, 2014http://m
plant.oxfordjournals.org/D
ownloaded from

20
activity ± SE (n = 8 biological replicates). Asterisks indicate significant differences to the
mock treatment (Student’s t test; *p < 0.05, **p < 0.01, and ***p < 0.001).
Figure 6. Constitutive Activation of MDS Gene Expression in the arf7arf19 Mutant
Background. Transcript abundances of fourteen of the MDS genes were quantified by qRT-
PCR analysis in two-week-old arf7arf19 plants relative to the wild type. Bars represent
average linear fold changes from four biological replicates (± SE). Asterisks indicate
significant differences to the wild type (Student’s t test; * p<0.05, ** p<0.01, and ***
p<0.001).
at Rijksuniversiteit G
ent on June 13, 2014http://m
plant.oxfordjournals.org/D
ownloaded from

21
REFERENCES
Armstrong, J.I., Yuan, S., Dale, J.M., Tanner, V.N., and Theologis, A. (2004). Identification of
inhibitors of auxin transcriptional activation by means of chemical genetics in Arabidopsis.
Proc. Natl. Acad. Sci. USA 101:14978-14983.
Baker, N.R. (2008). Chlorophyll fluorescence: a probe of photosynthesis in vivo. Annu. Rev.
Plant Biol. 59:89-113.
Bartoli, C.G., Pastori, G.M., and Foyer, C.H. (2000). Ascorbate biosynthesis in mitochondria
is linked to the electron transport chain between complexes III and IV. Plant Physiol.
123:335-343.
Bashandy, T., Guilleminot, J., Vernoux, T., Caparros-Ruiz, D., Ljung, K., Meyer, Y., and
Reichheld, J.-P. (2010). Interplay between the NADP-linked thioredoxin and glutathione
systems in Arabidopsis auxin signaling. Plant Cell 22:376-391.
Beeckman, T., and Engler, G. (1994). An easy technique for the clearing of histochemically
stained plant tissue. Plant Mol. Biol. Rep. 12:37-42.
Blomster, T., Salojärvi, J., Sipari, N., Brosché, M., Ahlfors, R., Keinänen, M., Overmyer, K.,
and Kangasjärvi, J. (2011). Apoplastic reactive oxygen species transiently decrease auxin
signaling and cause stress-induced morphogenic response in Arabidopsis. Plant Physiol.
157:1866-1883.
Boyes, D.C., Zayed, A.M., Ascenzi, R., McCaskill, A.J., Hoffman, N.E., Davis, K.R., and
Görlach, J. (2001). Growth stage-based phenotypic analysis of Arabidopsis: a model for
high throughput functional genomics in plants. Plant Cell 13:1499-1510.
Brunoud, G., Wells, D.M., Oliva, M., Larrieu, A., Mirabet, V., Burrow, A.H., Beeckman, T.,
Kepinski, S., Traas, J., Bennett, M.J., et al. (2012). A novel sensor to map auxin response
and distribution at high spatio-temporal resolution. Nature 482:103-106.
Butow, R.A., and Avadhani, N.G. (2004). Mitochondrial signaling: The retrograde response.
Mol. Cell 14:1-15.
Chen, Y.N., Aung, K., Rolcik, J., Walicki, K., Friml, J., and Brandizzi, F. (2014). Inter-
regulation of the unfolded protein response and auxin signaling. Plant J. 77:97-107.
Clifton, R., Lister, R., Parker, K.L., Sappl, P.G., Elhafez, D., Millar, A.H., Day, D.A., and
Whelan, J. (2005). Stress-induced co-expression of alternative respiratory chain
components in Arabidopsis thaliana. Plant Mol. Biol. 58:193-212.
Cvetkovska, M., and Vanlerberghe, G.C. (2012). Alternative oxidase modulates leaf
mitochondrial concentrations of superoxide and nitric oxide. New Phytol. 195:32-39.
at Rijksuniversiteit G
ent on June 13, 2014http://m
plant.oxfordjournals.org/D
ownloaded from

22
Day, D.A. (2004). Mitochondrial structure and function in plants. In: Plant Mitochondria:
From Genome to Function--Day, D.A., Millar, A.H., and Whelan, J., eds. Great Britain:
Kluwer Academic Publishers. 1-12.
De Clercq, I., Vermeirssen, V., Van Aken, O., Vandepoele, K., Murcha, M.W., Law, S.R., Inzé,
A., Ng, S., Ivanova, A., Rombaut, D., et al. (2013). The membrane-bound NAC
transcription factor ANAC013 functions in mitochondrial retrograde regulation of the
oxidative stress response in Arabidopsis. Plant Cell 25:3472-3490.
Desbrosses, G.G., Kopka, J., and Udvardi, M.K. (2005). Lotus japonicus metabolic profiling.
Development of gas chromatography-mass spectrometry resources for the study of plant-
microbe interactions. Plant Physiol. 137:1302-1318.
Dojcinovic, D., Krosting, J., Harris, A.J., Wagner, D.J., and Rhoads, D.M. (2005).
Identification of a region of the Arabidopsis AtAOX1a promoter necessary for
mitochondrial retrograde regulation of expression. Plant Mol. Biol. 58:159-175.
Dutilleul, C., Garmier, M., Noctor, G., Mathieu, C., Chetrit, P., Foyer, C.H., and de Paepe, R.
(2003). Leaf mitochondria modulate whole cell redox homeostasis, set antioxidant
capacity, and determine stress resistance through altered signaling and diurnal regulation.
The Plant cell 15:1212-1226.
Foyer, C.H., Bloom, A.J., Queval, G., and Noctor, G. (2009). Photorespiratory metabolism:
genes, mutants, energetics, and redox signaling. Annu. Rev. Plant Biol. 60:455-484.
Giraud, E., Van Aken, O., Ho, L.H.M., and Whelan, J. (2009). The transcription factor ABI4 is
a regulator of mitochondrial retrograde expression of ALTERNATIVE OXIDASE1a. Plant
Physiol. 150:1286-1296.
He, W., Brumos, J., Li, H., Ji, Y., Ke, M., Gong, X., Zeng, Q., Li, W., Zhang, X., An, F., et al.
(2011). A small-molecule screen identifies L-kynurenine as a competitive inhibitor of
TAA1/TAR activity in ethylene-directed auxin biosynthesis and root growth in
Arabidopsis. Plant Cell 23:3944-3960.
Hernández, J.A., Corpas, F.J., Gómez, M., Del Río, L.A., and Sevilla, F. (1993). Salt-induced
oxidative stress mediated by activated oxygen species in pea leaf mitochondria. Physiol.
Plant. 89:103-110.
Jazwinski, S.M., and Kriete, A. (2012). The yeast retrograde response as a model of
intracellular signaling of mitochondrial dysfunction. Front. Physiol. 3.
Kaplan, F., Kopka, J., Haskell, D.W., Zhao, W., Schiller, K.C., Gatzke, N., Sung, D.Y., and
Guy, C.L. (2004). Exploring the temperature-stress metabolome of Arabidopsis. Plant
Physiol. 136:4159-4168.
at Rijksuniversiteit G
ent on June 13, 2014http://m
plant.oxfordjournals.org/D
ownloaded from

23
Li, J., Dai, X., and Zhao, Y. (2006). A role for auxin response factor 19 in auxin and ethylene
signaling in Arabidopsis. Plant Physiol. 140:899-908.
Liu, Z.C., and Butow, R.A. (2006). Mitochondrial retrograde signaling. Annu. Rev. Genet.
40:159-185.
Maxwell, D.P., Wang, Y., and McIntosh, L. (1999). The alternative oxidase lowers
mitochondrial reactive oxygen production in plant cells. Proc. Natl. Acad. Sci. USA
96:8271-8276.
Millar, A.H., Whelan, J., Soole, K.L., and Day, D.A. (2011). Organization and regulation of
mitochondrial respiration in plants. Annu. Rev. Plant Biol. 62:79-104.
Mishra, A., Mishra, K.B., Höermiller, I.I., Heyer, A.G., and Nedbal, L. (2011). Chlorophyll
fluorescence emission as a reporter on cold tolerance in Arabidopsis thaliana accessions.
Plant signaling & behavior 6:301-310.
Moller, I.M. (2001). Plant mitochondria and oxidative stress: Electron transport, NADPH
turnover, and metabolism of reactive oxygen species. Annu. Rev. Plant Physiol. Plant Mol.
Biol. 52:561-591.
Narise, T., Kobayashi, K., Baba, S., Shimojima, M., Masuda, S., Fukaki, H., and Ohta, H.
(2010). Involvement of auxin signaling mediated by IAA14 and ARF7/19 in membrane
lipid remodeling during phosphate starvation. Plant Mol. Biol. 72:533-544.
Ng, S., Giraud, E., Duncan, O., Law, S.R., Wang, Y., Xu, L., Narsai, R., Carrie, C., Walker,
H., Day, D.A., et al. (2013a). Cyclin-dependent kinase E1 (CDKE1) provides a cellular
switch in plants between growth and stress responses. J. Biol. Chem. 288:3449-3459.
Ng, S., Ivanova, A., Duncan, O., Law, S.R., Van Aken, O., De Clercq, I., Wang, Y., Carrie, C.,
Xu, L., Kmiec, B., et al. (2013b). A Membrane-Bound NAC Transcription Factor,
ANAC017, Mediates Mitochondrial Retrograde Signaling in Arabidopsis. The Plant cell
25:3450-3471.
Noctor, G., De Paepe, R., and Foyer, C.H. (2007). Mitochondrial redox biology and
homeostasis in plants. Trends Plant Sci. 12:125-134.
Paponov, I.A., Paponov, M., Teale, W., Menges, M., Chakrabortee, S., Murray, J.A.H., and
Palme, K. (2008). Comprehensive transcriptome analysis of auxin responses in
Arabidopsis. Mol. Plant 1:321-337.
Parsons, H.L., Yip, J.Y.H., and Vanlerberghe, G.C. (1999). Increased respiratory restriction
during phosphate-limited growth in transgenic tobacco cells lacking alternative oxidase.
Plant Physiol. 121:1309-1320.
at Rijksuniversiteit G
ent on June 13, 2014http://m
plant.oxfordjournals.org/D
ownloaded from

24
Prasad, T.K., Anderson, M.D., and Stewart, C.R. (1994). Acclimation, hydrogen peroxide, and
abscisic acid protect mitochondria against irreversible chilling injury in maize seedlings.
Plant Physiol. 105:619-627.
Rhoads, D.M., and Subbaiah, C.C. (2007). Mitochondrial retrograde regulation in plants.
Mitochondrion 7:177-194.
Rhoads, D.M., Umbach, A.L., Subbaiah, C.C., and Siedow, J.N. (2006). Mitochondrial
reactive oxygen species. Contribution to oxidative stress and interorganellar signaling.
Plant Physiol. 141:357-366.
Schauer, N., Steinhauser, D., Strelkov, S., Schomburg, D., Allison, G., Moritz, T., Lundgren,
K., Roessner-Tunali, U., Forbes, M.G., Willmitzer, L., et al. (2005). GC-MS libraries for
the rapid identification of metabolites in complex biological samples. FEBS Lett.
579:1332-1337.
Schwarzlander, M., and Finkemeier, I. (2013). Mitochondrial Energy and Redox Signaling in
Plants. Antioxid. Redox Signaling 18:2122-2144.
Schwarzlander, M., Konig, A.C., Sweetlove, L.J., and Finkemeier, I. (2012). The impact of
impaired mitochondrial function on retrograde signalling: a meta-analysis of transcriptomic
responses. J. Exp. Bot. 63:1735-1750.
Srinivasan, V., Kriete, A., Sacan, A., and Jazwinski, S.M. (2010). Comparing the yeast
retrograde response and NF‐κB stress responses: implications for aging. Aging Cell 9:933-
941.
Subbaiah, C.C., Bush, D.S., and Sachs, M.M. (1998). Mitochondrial contribution to the
anoxic Ca2+
signal in maize suspension-cultured cells. Plant Physiol. 118:759-771.
Sungur, C., Miller, S., Bergholz, J., Hoye, R.C., Brisbois, R.G., and Overvoorde, P. (2007).
The small molecule 2-furylacrylic acid inhibits auxin-mediated responses in Arabidopsis
thaliana. Plant Cell Physiol. 48:1693-1701.
Sweetlove, L.J., Fait, A., Nunes-Nesi, A., Williams, T., and Fernie, A.R. (2007). The
mitochondrion: An integration point of cellular metabolism and signalling. Crit. Rev. Plant
Sci. 26:17-43.
Tognetti, V.B., Mühlenbock, P., and Van Breusegem, F. (2012). Stress homeostasis - the redox
and auxin perspective. Plant Cell Environ. 35:321-333.
Tognetti, V.B., Van Aken, O., Morreel, K., Vandenbroucke, K., van de Cotte, B., De Clercq, I.,
Chiwocha, S., Fenske, R., Prinsen, E., Boerjan, W., et al. (2010). Perturbation of indole-3-
butyric acid homeostasis by the UDP-glucosyltransferase UGT74E2 modulates
Arabidopsis architecture and water stress tolerance. Plant Cell 22:2660-2679.
at Rijksuniversiteit G
ent on June 13, 2014http://m
plant.oxfordjournals.org/D
ownloaded from

25
Ulmasov, T., Murfett, J., Hagen, G., and Guilfoyle, T.J. (1997). Aux/IAA proteins repress
expression of reporter genes containing natural and highly active synthetic auxin response
elements. The Plant cell 9:1963-1971.
Urade, R. (2007). Cellular response to unfolded proteins in the endoplasmic reticulum of
plants. FEBS J. 274:1152-1171.
Van Aken, O., Pecenkova, T., van de Cotte, B., De Rycke, R., Eeckhout, D., Fromm, H., De
Jaeger, G., Witters, E., Beemster, G.T.S., Inze, D., et al. (2007). Mitochondrial type-I
prohibitins of Arabidopsis thaliana are required for supporting proficient meristem
development. Plant Journal 52:850-864.
Van Aken, O., and Whelan, J. (2012). Comparison of transcriptional changes to chloroplast
and mitochondrial perturbations reveals common and specific responses in Arabidopsis.
Front Plant Sci 3:281.
Van Aken, O., Zhang, B., Law, S., Narsai, R., and Whelan, J. (2013). AtWRKY40 and
AtWRKY63 modulate the expression of stress-responsive nuclear genes encoding
mitochondrial and chloroplast proteins. Plant Physiol 162:254-271.
Vanderauwera, S., Vandenbroucke, K., Inzé, A., van de Cotte, B., Mühlenbock, P., De Rycke,
R., Naouar, N., Van Gaever, T., Van Montagu, M.C.E., and Van Breusegem, F. (2012).
AtWRKY15 perturbation abolishes the mitochondrial stress response that steers osmotic
stress tolerance in Arabidopsis. Proc. Natl. Acad. Sci. USA 109:20113-20118.
Vanlerberghe, G.C., Robson, C.A., and Yip, J.Y.H. (2002). Induction of mitochondrial
alternative oxidase in response to a cell signal pathway down-regulating the cytochrome
pathway prevents programmed cell death. Plant Physiol. 129:1829-1842.
Vanneste, S., and Friml, J. (2009). Auxin: a trigger for change in plant development. Cell
136:1005-1016.
Woodson, J.D., and Chory, J. (2008). Coordination of gene expression between organellar and
nuclear genomes. Nat. Rev. Genet. 9:383-395.
Zarkovic, J., Anderson, S.L., and Rhoads, D.M. (2005). A reporter gene system used to study
developmental expressionof alternative oxidase and isolate mitochondrial retrograde
regulationmutants in Arabidopsis. Plant Mol. Biol. 57:871-888.
Zimmermann, P., Laule, O., Schmitz, J., Hruz, T., Bleuler, S., and Gruissem, W. (2008).
Genevestigator transcriptome meta-analysis and biomarker search using rice and barley
gene expression databases. Mol. Plant 1:851-857.
at Rijksuniversiteit G
ent on June 13, 2014http://m
plant.oxfordjournals.org/D
ownloaded from

26
SUPPLEMENTARY DATA
Supplemental Figure 1. High-throughput screen for chemicals inducing pUGT74E2 without
causing a general stress response. A) Normalized luminescence data for 12,000 compounds
from a DIVERSet library screened in the primary screen. Luminescence values are indicated
in percent activity, calculated by normalizing the relative luminescence units (RLU) induced
by each compound to the mean of the signals of the negative controls. The arbitrary chosen
700% activity threshold is indicated by the dashed line. Encircled data points show
compounds that have a percent activity equal or above 700 but decrease the F’v/F’m value
below a threshold of 0.677. B). Photosystem II maximum efficiency (F’v/F’m) values of the
12,000 compounds screened in the primary screen. A threshold value of 0.677 was set
(indicated by the dashed line) to retain compounds for further analysis. This threshold
corresponds to the mean of all F’v/F’m values from all negative controls (DMSO treated)
included in primary screen minus three times the standard deviation of these negative controls
(μc - 3σc, with μc = mean F’v/F’m of all negative controls; σc = standard deviation of the
F’v/F’m values of all negative controls) . Encircled data points indicate compounds inducing
the luciferase signal above the 700% activity threshold but decreasing F’v/F’m below the 0.677
threshold.
Supplemental Figure 2. Dose-responsiveness and UGT74E2 transcript abundancies induced
by compounds 2 and 3. A). Dose-response of compound 2. Induction of pUGT74E2:LUC by
different concetrations of compound 2. Data points represent means of 8 biological replicates
± SD. RLU, relative luminescence units. B) Dose-response of compound 3. Induction of
pUGT74E2:LUC by different concentrations of compound 3. Data points represent means of
8 biological replicates ± SD. RLU, relative luminescence units. C) Transcript abundance of
UGT74E2 quantified by qRT-PCR in 10-day-old seedlings treated with either 20 µM
at Rijksuniversiteit G
ent on June 13, 2014http://m
plant.oxfordjournals.org/D
ownloaded from

27
compound 2 or 20 µM compound 3 for 24 h. Bars represent average fold changes relative to
the mock treatment from four biological replicates ± SE.
Supplemental Figure 3. Expression profile of auxin response marker genes during
mitochondrial perturbation conditions. Auxin response marker genes were obtained from
Paponov et al. (2008). Expression data were obtained from publicly available microarray data
sets: Antimycin A, GSE41136 (Ng et al., 2013b); oligomycin and rotenone, GSE3709 (Clifton
et al., 2005); FAA-ester, GSE1491(Armstrong et al., 2004) . Color codes represent linear fold
changes relative to control extracted from Genevestigator and hierarchically clustered using
Pearson correlation as a distance measure in the TMEV4 software.
Supplemental Figure 4. Expression profiles of MDS genes in different auxin mutant
backgrounds. MDS transcript abundances in transport inhibitor response 1 (tir1), auxin
resistant 3 (axr3), pin-formed 2 (pin2), pin-formed 3 and 7 (pin3 pin7), gnom and pid wag1
wag2 triple mutant backgrounds grown in vitro under long day conditions. Expression was
analyzed by qRT-PCR and bars represent average fold changes relative to wild-type (Col-0)
plants from three biological replicates ± SE.
Supplemental Figure 5. Activation of Auxin Signaling Modulates the Effects of
Mitochondrial Dysfunction. A) Auxin alleviates antimycin-mediated promoter activation.
Average fold changes of luciferase activity relative to the mock following treatments with
50 µM AA for 24 h alone or after pretreatment with 5 µM IAA for 24 h and subsequent
exposure to a combination of 50 µM AA and 5 µM IAA for additional 24 h. Asterisks indicate
significant differences according to Student’s t test; *p < 0.05. Arabidopsis lines carrying the
synthetic promoter sequences consisting of a six-tandem repeat of the MDM from the
at Rijksuniversiteit G
ent on June 13, 2014http://m
plant.oxfordjournals.org/D
ownloaded from

28
UGT74E2 promoter (6xMDM[UGT74E2]) and the MDM from the AOX1a promoter
(6xMDM1[AOX1a]), and the 1.5-kb upstream sequences of the UGT74E2 and the AOX1a
genes were used in the experiments. B) Auxin alleviates antimycin-mediated accumulation of
glycine and serine. Wild type Arabidopsis plants grown in liquid MS media were treated as
described above and subjected to metabolite profiling by GC-MS. Bars represent means of six
biological replicates ± SD. Different letters indicate significant differences according to one-
way ANOVA with Tukey’s post hoc test (p<0.05). C) GC-MS metabolite profiling of
Arabidopsis plants grown in liquid MS media and treated with 50 µM AA for 24 h alone or
pretreated with 5 µM IAA for 24 h and subsequently exposed to a combination of 50 µM AA
and 5 µM IAA for additional 24 h. Control plants were treated similarly with DMSO. Colors
bars represent log transformed (glog) and Pareto scaled values cluster hierarchically clustered
using Pearson correlation as a distance measure. Color codes represent log transformed (glog)
and Pareto scaled values hierarchically clustered using Pearson correlation as a distance
measure.
Supplemental Figure 6. GC-MS metabolite profiling of prohibitin3 mutant plants in
comparison to the wild type (Col-0). Metabolites were extracted from shoots of two-week-old
plants grown in vitro on horizontal plants under long-day conditions. Per treatment, results
from three biological replicates are shown. Colors codes represent log transformed (glog) and
Pareto scaled values hierarchically clustered using Pearson correlation as a distance measure.
Supplemental Table 1. Primers used for quantitative RT-PCR analysis.
at Rijksuniversiteit G
ent on June 13, 2014http://m
plant.oxfordjournals.org/D
ownloaded from

a)
Chemical
treatment
Control Fv'/Fm' Decreased Fv'/Fm'
9-day-old pUGT74E2:LUC seedlings
Induced
luminescence
Fv'/F
m'
0
0.2
0.4
0.6
0.8 a a a a
b
high
low
Fv'/F
m'
DM
SO
20
µM
Com
p 2
20
µM
Com
p 3
20
µM
FA
A
10
mM
H2 O
2
Compound 2
3-(2-Furyl)acrylic acid (FAA)
Compound 3
b)
Hit compound c)
0
5000
10000
15000
20000
25000
b b
c
a
d
DMSO 20 µM
Comp 2
20 µM
Comp 3
20 µM
FAA
10 mM
H2O2 d)
RL
U
Figure 1. Chemical Screen to Identify Compounds Activating Mitochondrial Retrograde Signalling
Pathways.
(A) A schematic representation of the chemical screen.
(B) Chemical formulas of the two most potent hit compounds identified in the screen (Compound 2
and Compound 3) and the shared substructure (3-(2-Furyl)acrylic acid (FAA)).
(C) Induction of pUGT74E2 by Compound 2, Compound 3, and FAA. 10 mM H202 was used as a
positive control. The 1,5-kb upstream sequences of UGT74E2 was fused upstream of the luciferase
gene and stably transformed in Arabidopsis plants. Luciferase activity following chemical (20 µM)
and mock (DMSO) treatment is shown (±SD; n=8 biological replicates). Different letters represent
statistically significant differences according to one-way ANOVA with Tukey’s post hoc test
(p<0.05). RLU, relative luminescence units.
(D) Photosystem II maximum efficiency (Fv'/Fm') of seedlings treated with chemicals (20 µM), 10 mM
H202 or DMSO for 24 h (left panel). Fv'/Fm' levels are depicted by color codes; blue represents high
values and yellow-green corresponds to low values. Quantification of Fv'/Fm' values in chemically
treated seedlings (right panel). Bars represent means of 8 replicates ± SD. Different letters
represent statistically significant differences according to one-way ANOVA with Tukey’s post hoc
test (p<0.05).
at Rijksuniversiteit G
ent on June 13, 2014http://m
plant.oxfordjournals.org/D
ownloaded from

DM
SO
20 µ
M F
AA
50 µ
M A
A
oligomycin (4h)
antimycin A
rotenone (3h) oligomycin (1h)
rotenone (12h)
furyl acrylate ester
3.0 -3.0
At2
g0
31
30
At3
g2
72
80
A
t2g2
16
40
AB
CB
4
HR
E2
A
t2g3
20
20
A
t2g4
17
30
A
t3g2
52
50
U
GT
74
E2
A
t2g0
37
60
A
t3g5
09
30
A
NA
C0
13
A
t2g0
40
50
C
RF
6
At5
g1
47
30
sH
sp2
3.5
A
OX
1a
At4
g3
73
70
A
t5g0
95
70
A
t1g0
50
60
A
t5g4
34
50
A
t2g0
40
70
N
DB
4
At5
g5
52
00
c) C *
***
***
*
***
***
**
*
***
b)
a)
Figure 2. FAA Negatively Impacts Mitochondria.
(A) Induction of MDS genes following FAA treatment. Transcript levels of fourteen of the MDS
genes were analyzed by qRT-PCR in 10-day-old wild-type Arabidopsis plants grown as liquid
cultures and treated with 20 µM FAA or DMSO for 24 h. Bars represent average fold changes
relative to the mock treatment from four biological replicates (± SE). Asterisks indicate
significant differences to the mock (Student’s t test; * p<0.05, ** p<0.01, and *** p<0.001).
(B) Comparison of publicly available expression profiles of the MDS genes between FAA
ester treatment and treatments with mitochondrial blockers. Color codes represent linear fold
changes relative to control extracted from Genevestigator and hierarchically clustered using
Pearson correlation as a distance measure in the TMEV4 software. Antimycin A: GSE41136
(Ng et al., 2013b); oligomycin and rotenone: GSE3709 (Clifton et al., 2005); FAA ester:
GSE1491 (Armstrong et al., 2004).
(C) Mitochondrial staining of Arabidopsis root tips with MitoTracker Red CM-H2XRos
fluorescent dye (left panel). Six-old-day Arabidopsis Col0 seedlings were pretreated with
20 µM FAA, 50 µM AA and DMSO in liquids ½MS media for 1 h before transferring to identical
solutions containing additional 250 nM Mito Tracker Red CMH2XRos for an additional 1 h.
Bright field images (right panel). Scale bars equal 5 µM.
at Rijksuniversiteit G
ent on June 13, 2014http://m
plant.oxfordjournals.org/D
ownloaded from

Figure 3. Induction of the MDM Cis-Regulatory Elements by FAA. Regulatory activity of the
synthetic sequence containing six consecutive repeats of the MDM sequence from the
UGT74E2 promoter (6xMDM[UGT74E2]) and from the AOX1a promoter (6xMDM1[AOX1a])
in transgenic Arabidopsis plants treated with 20 µM FAA or DMSO for 24 h. The construct
mutated in the MDM sequence (6xMDM1mut[AOX1a]) was included as a negative control.
Bars represent averages ±SE of 8 biological replicates. RLU, relative luminescence units.
at Rijksuniversiteit G
ent on June 13, 2014http://m
plant.oxfordjournals.org/D
ownloaded from

IAA IAA + FAA IAA + AA DMSO
a)
5 m
in
25
min
IAA IAA + FAA IAA + AA DMSO
IAA IAA + FAA IAA +AA DMSO
c)
0
0.5
1
1.5
5 10 15 20 25 30 35
No
rmal
ized
sig
nal
inte
sity
b)
min IAA + AA DMSO
IAA + FAA IAA
Figure 4. Inhibition of Auxin Signaling by Mitochondrial Dysfunction.
(A) Effect of AA and FAA on the auxin-responsive reporter line DR5:GUS. Five-day-old DR5:GUS
seedlings were treated for 4 h with 5 µM IAA alone or with combinations of 5µM IAA and either 50
µM AA or 20 µM FAA. DMSO was used as a mock treatment.
(B) Quantification of the DII-Venus fluorescent signal intensity in the median section of the root tip.
Data points represent averages based on quantification of three independent roots relative to the
first time point (5 min = 1) ± SD. The roots were pre-incubated for 5 min with either 50 µM AA or
20 µM FAA before being placed in contact with agar-solidified ½MS media containing
combinations of auxin (50 nM) and either 50 µM AA or 20 µM FAA and imaged for 35 min. For
IAA and mock (DMSO) treatments, roots were placed in contact with the media without a prior
incubation.
(C) DII-Venus fluorescence signal (range indicator: blue to green) in propodium iodid (red)
stained Arabidopsis root tips at 5 min and 25 min after exposure to exogenous IAA (50 nM); IAA +
FAA (50 nM and 20 µM), IAA + AA (50 nM and 50 µM), and DMSO as described above.
at Rijksuniversiteit G
ent on June 13, 2014http://m
plant.oxfordjournals.org/D
ownloaded from

a)
**
**
***
*
b) a)
Figure 5. Effect of Polar Auxin Transport Inhibitors on Mitochondrial Retrograde Markers.
(A) The UGT74E2 and AOX1a promoters are activated by polar auxin transport inhibitors and
an inhibitor of auxin biosynthesis. The 1,5-kb upstream sequences of UGT74E2 and AOX1a
were fused upstream of the luciferase gene and stably transformed in Arabidopsis plants.
Mean luciferase activities after 24 h treatment of UGT74E2:LUC and AOX1a:LUC lines with
20 µM NPA, 20 µM TIBA, 20 µM gravacin, 500 µM quercetin, 20 µM L-kynurerine, and DMSO
are shown ±SE (n = 8 biological replicates). RLU, relative luminescence units.
(B) The MDM cis-regulatory element is sufficient for promoter activation by polar auxin
transport inhibitors and an inhibitor of auxin biosynthesis. Regulatory activity of the synthetic
sequence containing six consecutive repeats of the MDM sequence from the UGT74E2
promoter (6xMDM[UGT74E2]) and from the AOX1a promoter (6xMDM1[AOX1a]) in transgenic
Arabidopsis plants treated with NPA, TIBA, gravacin, quercetin, L-kynerine and DMSO in
concentrations described above. The construct mutated in the MDM sequence
(6xMDM1mut[AOX1a]) was included as a negative control. Bars represent average luciferase
activity ± SE (n = 8 biological replicates). Asterisks indicate significant differences to the mock
treatment (Student’s t test; *p < 0.05, **p < 0.01, and ***p < 0.001).
at Rijksuniversiteit G
ent on June 13, 2014http://m
plant.oxfordjournals.org/D
ownloaded from

**
*
*
***
**
***
*
**
*
*
*
*
Figure 6. Constitutive Activation of MDS Gene Expression in the arf7arf19 Mutant
Background. Transcript abundances of fourteen of the MDS genes were quantified by qRT-
PCR analysis in two-week-old arf7arf19 plants relative to the wild type. Bars represent
average linear fold changes from four biological replicates (± SE). Asterisks indicate
significant differences to the wild type (Student’s t test; * p<0.05, ** p<0.01, and *** p<0.001).
at Rijksuniversiteit G
ent on June 13, 2014http://m
plant.oxfordjournals.org/D
ownloaded from

a) b)
Supplemental Figure 1. High-throughput screen for chemicals inducing pUGT74E2 without
causing a general stress response. A) Normalized luminescence data for 12,000 compounds
from a DIVERSet library screened in the primary screen. Luminescence values are indicated in
percent activity, calculated by normalizing the relative luminescence units (RLU) induced by each
compound to the mean of the signals of the negative controls. The arbitrary chosen 700% activity
threshold is indicated by the dashed line. Encircled data points show compounds that have a
percent activity equal or above 700 but decrease the F’v/F’m value below a threshold of 0.677. B).
Photosystem II maximum efficiency (F’v/F’m) values of the 12,000 compounds screened in the
primary screen. A threshold value of 0.677 was set (indicated by the dashed line) to retain
compounds for further analysis. This threshold corresponds to the mean of all F’v/F’m values from
all negative controls (DMSO treated) included in primary screen minus three times the standard
deviation of these negative controls (μc - 3σc, with μc = mean F’v/F’m of all negative controls; σc =
standard deviation of the F’v/F’m values of all negative controls) . Encircled data points indicate
compounds inducing the luciferase signal above the 700% activity threshold but decreasing
F’v/F’m below the 0.677 threshold.
at Rijksuniversiteit G
ent on June 13, 2014http://m
plant.oxfordjournals.org/D
ownloaded from

0
10000
20000
30000
40000
50000
60000
0 2.5 5 10 15 20 25
Compound 2 [µM]
RL
U
0
10000
20000
30000
40000
50000
60000
0 2.5 5 10 15 20 25
Compound 3 [µM]
RL
U
0.0
2.0
4.0
6.0
8.0
10.0
12.0
14.0
16.0
Fold
chan
ge
(rel
ativ
e to
mock
)
a)
b)
c)
Supplemental Figure 2. Dose-responsiveness and UGT74E2 transcript abundancies induced by
compounds 2 and 3. A). Dose-response of compound 2. Induction of pUGT74E2:LUC by different
concentrations of compound 2. Data points represent means of 8 biological replicates ± SD. RLU,
relative luminescence units. B) Dose-response of compound 3. Induction of pUGT74E2:LUC by
different concentrations of compound 3. Data points represent means of 8 biological replicates ±
SD. RLU, relative luminescence units. C) Transcript abundance of UGT74E2 quantified by qRT-
PCR in 10-day-old seedlings treated with either 20 µM compound 2 or 20 µM compound 3 for 24
h. Bars represent average fold changes relative to the mock treatment from four biological
replicates ± SE.
at Rijksuniversiteit G
ent on June 13, 2014http://m
plant.oxfordjournals.org/D
ownloaded from

AUX1
LAX2
LBD41
ARF19
GH3.6
PIN1
SAUR36
SAUR66
SAUR72
GH3.1
LAX3
IAA3
LBD16
LBD25
ARF4
IAA29
LBD33
IAA30
IAA13
LBD15
PIN3
IAA19
IAA5
PIN7
SAUR15
SAUR59
IAA4
IAA27
SAUR62
ARF16
SAUR37
AMI1
SAUR64
GH3.5
IAA2
IAA28
LBD17
IAA1
IAA11
SAUR67
LBD29
LBD4
CYP79B2
GH3.4
FH3.3
LBD40
LBD18
SAUR32
GH3.17
CYP79B3
SAUR31
SAUR9
rote
no
ne
(12
h)
oli
go
myci
n (
1h)
rote
no
ne
(3h)
anti
myci
n A
oli
go
myci
n 4
h)
fury
l ac
ryla
te e
ster
-4.0 1.0 4.0
Supplemental Figure 3. Expression profile of auxin response marker genes during mitochondrial
perturbation conditions. Auxin response marker genes were obtained from Paponov et al. (2008).
Expression data were obtained from publicly available microarray data sets: Antimycin A,
GSE41136 (Ng et al., 2013b); oligomycin and rotenone, GSE3709 (Clifton et al., 2005); FAA-
ester, GSE1491 (Armstrong et al., 2004). Color codes represent linear fold changes relative to
control extracted from Genevestigator and hierarchically clustered using Pearson correlation as a
distance measure in the TMEV4 software.
at Rijksuniversiteit G
ent on June 13, 2014http://m
plant.oxfordjournals.org/D
ownloaded from

0
0.5
1
1.5
2
2.5
3
3.5
tir1
0
0.5
1
1.5
2
2.5
3
3.5
4
axr3 Fo
ld c
han
ge (
rela
tive
to
wild
typ
e)
0
0.5
1
1.5
2
2.5
3
3.5
4
4.5
5
pin3 pin7
0
0.5
1
1.5
2
2.5
3
3.5pid wag1 wag2
Fold
ch
ange
(re
lati
ve t
o w
ild t
ype)
-2
0
2
4
6
8
10
12
14
gnom
0
0.5
1
1.5
2
2.5
3
3.5
4
4.5
5
Fold
ch
ange
(re
lati
ve t
o w
ild t
ype)
pin2
Supplemental Figure 4. Expression profiles of MDS genes in different auxin mutant
backgrounds. MDS transcript abundances in transport inhibitor response 1 (tir1), auxin resistant
3 (axr3), pin-formed 2 (pin2), pin-formed 3 and 7 (pin3 pin7), gnom and pid wag1 wag2 triple
mutant backgrounds grown in vitro under long day conditions. Expression was analyzed by qRT-
PCR and bars represent average fold changes relative to wild-type (Col-0) plants from three
biological replicates ± SE.
at Rijksuniversiteit G
ent on June 13, 2014http://m
plant.oxfordjournals.org/D
ownloaded from

0
1
2
3
-1
-2
-3
-4
Nicotinic acid
Pyroglutamic acid
Serine
ß-Alanine
Homoserine
Sucrose
Valine
Phosphate
Glucose-6-phosphate
Glucose
Alanine
Succinic acid
Glycine
Glutamine
Arginine
Lysine
Tyrosine
Glycerol
Lactic acid
Threonic acid
Phenylalanine
Malic acid
Fructose
Tryptophan
Fumaric acid
Threonic acid
Glyceric acid
Putrescine
Ornithine/Arginine
Aspartic acid
Myo-Inositol
Citric acid
Galactonic acid
Ribonic acid
2-Keto-L-gluconic acid
Gluconic acid
ɣ-aminobutyric acid
Isoleucine
Threonine
Asparagine
Proline
Glutamic acid
Mock IAA AA IAA+AA
b)
c)
* *
a)
a a a b
a
a
b
c
Supplemental Figure 5. Activation of Auxin Signaling Modulates the Effects of Mitochondrial
Dysfunction. A) Auxin alleviates antimycin-mediated promoter activation. Average fold changes of
luciferase activity relative to the mock following treatments with 50 µM AA for 24 h alone or after
pretreatment with 5 µM IAA for 24 h and subsequent exposure to a combination of 50 µM AA and
5 µM IAA for additional 24 h. Asterisks indicate significant differences according to Student’s t test;
*p < 0.05. Arabidopsis lines carrying the synthetic promoter sequences consisting of a six-tandem
repeat of the MDM from the UGT74E2 promoter (6xMDM[UGT74E2]) and the MDM from the AOX1a
promoter (6xMDM1[AOX1a]), and the 1.5-kb upstream sequences of the UGT74E2 and the AOX1a
genes were used in the experiments. B) Auxin alleviates antimycin-mediated accumulation of glycine
and serine. Wild type Arabidopsis plants grown in liquid MS media were treated as described above
and subjected to metabolite profiling by GC-MS. Bars represent means of six biological replicates ±
SD. Different letters indicate significant differences according to one-way ANOVA with Tukey’s post
hoc test (p<0.05). C) GC-MS metabolite profiling of Arabidopsis plants grown in liquid MS media and
treated with 50 µM AA for 24 h alone or pretreated with 5 µM IAA for 24 h and subsequently exposed
to a combination of 50 µM AA and 5 µM IAA for additional 24 h. Control plants were treated similarly
with DMSO. Colors bars represent log transformed (glog) and Pareto scaled values cluster
hierarchically clustered using Pearson correlation as a distance measure. Color codes represent log
transformed (glog) and Pareto scaled values hierarchically clustered using Pearson correlation as a
distance measure.
at Rijksuniversiteit G
ent on June 13, 2014http://m
plant.oxfordjournals.org/D
ownloaded from

Aspartic acid
Threonine
Maleic acid
Proline
Ornithine/Arginine
Threonic acid
Valine
Phenylalanine
Xylose
Isoleucine
Lactic acid
Phosphate
Glutamic acid
Ribonic acid
Putrescine
Serine
Myo-inositol
Glucose-6-phosphate
Fumaric acid
Threonic acid
Glyceric acid
Glyceric acid-3-phosphate
2-Keto-L-gluconic acid
Citric acid
Sucrose
Glucose
Succinic acid
Pyroglutamic acid
Fructose
Shikimic acid
ɣ-aminobutyric acid
Glycine
Alanine 2TMS
Alanine 3TMS
Malic acid
Wild type (Col0) prohibitin3
0
1
2
-1
-2
Supplemental Figure 6. GC-MS metabolite profiling of prohibitin3 mutant plants in comparison
to the wild type (Col-0). Metabolites were extracted from shoots of two-week-old plants grown in
vitro on horizontal plants under long-day conditions. Per treatment, results from three biological
replicates are shown. Colors codes represent log transformed (glog) and Pareto scaled values
hierarchically clustered using Pearson correlation as a distance measure.
at Rijksuniversiteit G
ent on June 13, 2014http://m
plant.oxfordjournals.org/D
ownloaded from

Supplemental Table 1. Primers used for quantitative RT-PCR analysis.
Primer Sequence
ANAC013_RT_FWD ACCAGACAGATAAACAATGGATCA
ANAC013_RT_REV CAGAAGGAACAGGGTTTAGGAA
ABCB4_RT_FWD CAAAGTCTCCAAAGTTGCTCTG
ABCB4_RT_REV CTCGCTGCTTGTCTCTCTCC
AOX1a_RT_FWD TGGTTGTTCGTGCTGACG
AOX1a_RT_REV CACGACCTTGGTAGTGAATATCAG
ARP7_RT_FWD ACTCTTCCTGATGGACAGGTG
ARP7_RT_REV CTCAACGATTCCATGCTCCT
at2g04050_RT_FWD CCACAATGGTGAGCTCCAG
at2g04050_RT_REV CACCCGCTAACCCAAACA
at2g04070_RT_FWD CTCCAGCTCTCCGGTGTC
at2g04070_RT_REV GTGAACCCACTAACCCAAACA
AT2G28390_FWD AACTCTATGCAGCATTTGATCCACT
AT2G28390_REV TGATTGCATATCTTTATCGCCATC
at2g41730_RT_FWD GTCACCAAGGCATCGTAAGG
at2g41730_RT_REV AAAGCTGGTGGTGAATCGAG
at5g09570_RT_FWD GAAACCGTTGTTTCTCAGGTTC
at5g09570_RT_REV CCAAAATGGTTGACGCAAT
CRF6_RT_FWD TGGCTTGGGACTTTTGTCA
CRF6_RT_REV GAGATGAATCGCGGCTCTA
CYP81D8_RT_L CGTCTTTCTCGGAACTTTTCA
CYP81D8_RT_R AACACCGTCTCCGTAGTAACG
HRE2_RT_FWD GAAGCGTAAACCCGTCTCAGT
HRE2_RT_REV AATCTCCGCTGCCCATTT
HSP23.5_RT_FWD TCAAACCGACATGTTTCTCG
HSP23.5_RT_REV AAGCTTCTCGTTGGAGTAAACG
ST_RT_FWD GGTCACCAATCCACACCTTC
ST_RT_REV CGAAATCTGGGGACTCGTAG
UBC21_RT_FWD TCCTCTTAACTGCGACTCAGG
UBC21_RT_REV GCGAGGCGTGTATACATTTG
UGT74E2_RT_FWD TAACTTCTTCCACACTTCTCATAATCT
UGT74E2_RT_REV ACAACAAAAACTAGAGTCAGTAACAAC
UPOX_RT_FWD TTCAAAAACACCATGGACAAGA
UPOX_RT_REV GCCTCAATTTGCTTCTCTGC
at Rijksuniversiteit G
ent on June 13, 2014http://m
plant.oxfordjournals.org/D
ownloaded from