8810029.pdf - Hindawi.com
6
Research Article Physicochemical Quality Characteristics of Southeastern Anatolia Honey, Turkey Semra G¨ urb¨ uz , 1 Neslihan Çakıcı, 2 Serdar Mehmeto˘ glu, 2 Hilal Atmaca, 2 Tahsin Demir, 2 Mukaddes Arıg¨ ul Apan, 2 ¨ Omer Faruk Atmaca, 2 and Fazıl G¨ uney 2 1 Gastronomy and Culinary Arts, Faculty of Tourism, Mardin Artuklu University, Mardin 47080, Turkey 2 Ministry of Agriculture and Forestry, Directorate of Beekeeping Research Institute, Ordu 52850, Turkey Correspondence should be addressed to Semra G¨ urb¨ uz; [email protected] Received 3 June 2020; Revised 8 August 2020; Accepted 21 August 2020; Published 1 September 2020 Academic Editor: Valentina Venuti Copyright©2020SemraG¨ urb¨ uzetal.isisanopenaccessarticledistributedundertheCreativeCommonsAttributionLicense, which permits unrestricted use, distribution, and reproduction in any medium, provided the original work is properly cited. is study was performed to investigate the physicochemical quality characteristics of honey produced in Southeastern Anatolia of Turkey. A total of 68 honey samples collected from different beekeepers were analyzed for sugar components, moisture, pH, HMF, electrical conductivity, free acidity, proline values, and diastase number using the methods recommended by the International Honey Commission. e color value was determined by the Hanna HI 96785 color identification device using the Pfund scale. e mean values of fructose + glucose, fructose/glucose ratio, sucrose, and maltose were 70.97 ± 3.27%, 1.21 ± 0.15, 0.90 ± 1.35%, and 2.88 ± 1.42%, respectively. e moisture, pH, electrical conductivity, free acidity, diastase number, proline, and HMF values were 15.91 ± 1.05%, 4.10 ± 0.73, 0.21 ± 0.04 mS/cm, 14.94 ± 6.81meq/kg, 10.68 ± 4.61, 420±, 174 mg/kg, and 18.5 ± 31.43mg/kg, respectively. All of the samples met the international standards and legal limits set in Turkey for fructose+glucose, sucrose, moisture, electrical conductivity, and free acidity, whereas 20.58%, 25%, 10.29%, and 8.82% of the samples did not meet the standards and legal limits for the diastase number, proline value, HMF value, and fructose/glucose ratio, respectively. It has been considered to be important to raise awareness of the producer about good production practices and to ensure continuity of inspections for high-quality honey production. 1. Introduction Honey, which has antibacterial, antioxidant, and anti-in- flammatory properties, special taste, and aroma, is highly nutritious natural food [1–3]. e content of honey consists of 70–80% carbohydrates, 10–20% water, and small amounts of enzymes, proteins, hormones, vitamins, amino acids, phenolic compounds, pollen particles, essential oils, and sterols [3, 4]. e composition of honey varies depending on the plant source, bee type, geographical origin, climatic conditions, seasons, harvest, processing, and storage con- ditions [5]. Honey quality is determined by chemical, physical, microbiological, and sensory characteristics [6]. e limits for honey composition and quality factors were determined by the Codex Alimentarius Commission (CAC) Honey Standard for the quality and safety of honey, as well as fair international honey trade [7]. Regulations are available in the European Union (EU) and in Turkey [8, 9]. In the Turkish Food Codex (TFC) Honey Communiqu´ e, flower honey is defined as honey obtained from plant nectars. Moisture up to 20%, free acidity up to 50 meq/kg, electrical conductivity up to 0.8mS/cm, hydrox- ymethylfurfural (HMF) up to 40 mg/kg, sucrose up to 5 g/ 100g, diastase number at least 8, proline value at least 300 mg/kg, total fructose and glucose at least 60 g in 100 g honey, and fructose/glucose ratio as 0.9–1.4 were the limits for flower honey [9]. Turkey is among the largest honey-producing countries in the world because of its suitable geographical conditions and climate for beekeeping. Honey production of Turkey was 114,471 tons in 2017 [10]. ere is an increasing trend in the Southeastern Anatolia Region to beekeeping, which is an important source of income in the rural areas, where plant flora is rich [11, 12]. Geographical Sign Registration Cer- tificate was received from Turkish Patent Institute in 2003 for Pervari honey, which is produced in this region [13]. Hindawi International Journal of Analytical Chemistry Volume 2020, Article ID 8810029, 6 pages https://doi.org/10.1155/2020/8810029
-
Upload
khangminh22 -
Category
Documents
-
view
0 -
download
0
Transcript of 8810029.pdf - Hindawi.com

Research ArticlePhysicochemical Quality Characteristics of SoutheasternAnatolia Honey, Turkey
Semra Gurbuz ,1 Neslihan Çakıcı,2 Serdar Mehmetoglu,2 Hilal Atmaca,2 Tahsin Demir,2
Mukaddes Arıgul Apan,2 Omer Faruk Atmaca,2 and Fazıl Guney2
1Gastronomy and Culinary Arts, Faculty of Tourism, Mardin Artuklu University, Mardin 47080, Turkey2Ministry of Agriculture and Forestry, Directorate of Beekeeping Research Institute, Ordu 52850, Turkey
Correspondence should be addressed to Semra Gurbuz; [email protected]
Received 3 June 2020; Revised 8 August 2020; Accepted 21 August 2020; Published 1 September 2020
Academic Editor: Valentina Venuti
Copyright © 2020 Semra Gurbuz et al.(is is an open access article distributed under the Creative Commons Attribution License,which permits unrestricted use, distribution, and reproduction in any medium, provided the original work is properly cited.
(is study was performed to investigate the physicochemical quality characteristics of honey produced in SoutheasternAnatolia of Turkey. A total of 68 honey samples collected from different beekeepers were analyzed for sugar components,moisture, pH, HMF, electrical conductivity, free acidity, proline values, and diastase number using the methods recommendedby the International Honey Commission. (e color value was determined by the Hanna HI 96785 color identification deviceusing the Pfund scale. (e mean values of fructose + glucose, fructose/glucose ratio, sucrose, and maltose were 70.97 ± 3.27%,1.21 ± 0.15, 0.90 ± 1.35%, and 2.88 ± 1.42%, respectively. (e moisture, pH, electrical conductivity, free acidity, diastasenumber, proline, and HMF values were 15.91 ± 1.05%, 4.10 ± 0.73, 0.21 ± 0.04mS/cm, 14.94 ± 6.81meq/kg, 10.68 ± 4.61, 420±,174mg/kg, and 18.5 ± 31.43mg/kg, respectively. All of the samples met the international standards and legal limits set inTurkey for fructose + glucose, sucrose, moisture, electrical conductivity, and free acidity, whereas 20.58%, 25%, 10.29%, and8.82% of the samples did not meet the standards and legal limits for the diastase number, proline value, HMF value, andfructose/glucose ratio, respectively. It has been considered to be important to raise awareness of the producer about goodproduction practices and to ensure continuity of inspections for high-quality honey production.
1. Introduction
Honey, which has antibacterial, antioxidant, and anti-in-flammatory properties, special taste, and aroma, is highlynutritious natural food [1–3]. (e content of honey consistsof 70–80% carbohydrates, 10–20% water, and small amountsof enzymes, proteins, hormones, vitamins, amino acids,phenolic compounds, pollen particles, essential oils, andsterols [3, 4]. (e composition of honey varies depending onthe plant source, bee type, geographical origin, climaticconditions, seasons, harvest, processing, and storage con-ditions [5]. Honey quality is determined by chemical,physical, microbiological, and sensory characteristics [6].(e limits for honey composition and quality factors weredetermined by the Codex Alimentarius Commission (CAC)Honey Standard for the quality and safety of honey, as wellas fair international honey trade [7]. Regulations areavailable in the European Union (EU) and in Turkey [8, 9].
In the Turkish Food Codex (TFC) Honey Communique,flower honey is defined as honey obtained from plantnectars. Moisture up to 20%, free acidity up to 50meq/kg,electrical conductivity up to 0.8mS/cm, hydrox-ymethylfurfural (HMF) up to 40mg/kg, sucrose up to 5 g/100 g, diastase number at least 8, proline value at least300mg/kg, total fructose and glucose at least 60 g in 100 ghoney, and fructose/glucose ratio as 0.9–1.4 were the limitsfor flower honey [9].
Turkey is among the largest honey-producing countriesin the world because of its suitable geographical conditionsand climate for beekeeping. Honey production of Turkeywas 114,471 tons in 2017 [10]. (ere is an increasing trend inthe Southeastern Anatolia Region to beekeeping, which is animportant source of income in the rural areas, where plantflora is rich [11, 12]. Geographical Sign Registration Cer-tificate was received from Turkish Patent Institute in 2003for Pervari honey, which is produced in this region [13].
HindawiInternational Journal of Analytical ChemistryVolume 2020, Article ID 8810029, 6 pageshttps://doi.org/10.1155/2020/8810029

(is study was aimed to determine the physicochemicalquality characteristics such as moisture, pH, free acidity,diastase activity, proline, HMF, electrical conductivity, andcolor values and fructose, glucose, sucrose, and maltoseamount of honey produced in 9 regions located in South-eastern Anatolia of Turkey and to evaluate their compliancewith legal regulations and standards.
2. Materials and Methods
2.1. Honey Samples. In this study, a total of 68 floral honeysamples were used. (e samples were collected from Farasin(19), Uludere (5), Idil (3), Besta (3), Silopi (1), Pervari (17),Siirt Center (13), Tillo (5), and Sirvan (2) regions located inSoutheastern Anatolia of Turkey. Honey samples werecollected directly from beekeepers in 2018. Approximately350 g of filtered honey samples was taken from each pro-ducer in glass cobs and stored at room temperature untilanalysis.
3. Methods
To determine the sugar composition, 5 g of the honey samplewas weighed and dissolved in some distilled water. 25ml ofmethanol was added, and the flask was made up to 100mL.(e solution was filtered through a 0.45 syringe filter andread on the high-performance liquid chromatography(HPLC) instrument ((ermo Scientific UltiMate 3000;(ermo Scientific Amino Gold column) with the RID de-tector. Fructose, glucose, sucrose, and maltose (Sigma-Aldrich) standards were used for the calibration curve. (emobile phase was acetonitrile:distilled water (80:20, v/v)with 1.3mL/min flow rate. Column temperature was 30°C.(e moisture value was determined by a refractometer(Atago RX5000α). pH of honey was determined by a pHmeter (Hanna/HI2030-02). Electrical conductivity of honeywas measured by a conductimeter (Hanna/HI2030-02). Freeacidity was determined by the titrimetric method. To de-termine the HMF value, 10 g of the honey sample wasweighed and dissolved in some distilled water. 25ml ofmethanol was added, and the flask was made up to 50mL.(e solution was filtered through a 0.45 syringe filter andread on the HPLC instrument (with (ermo ScientificUltiMate 3000;(ermo Scientific Amino Gold column) withthe DAD detector. Fructose, glucose, sucrose, andmaltose (Dr. Ehrenstorfer) standards were used for thecalibration curve. (e mobile phase was methanol:distillatedwater (10:90, v/v) with 1.0mL/min flow rate. Columntemperature was 30°C. Diastase activity and proline analysiswere determined by a spectrophotometer (PerkinElmerLambda 25). All the analyses mentioned above were realizedaccording to the methods recommended by the Interna-tional Honey Commission (IHC) [14]. Color was deter-mined using the Pfund scale with the Hanna HI 96785 colordetermination device [15]. All analyses were performedduplicate, and mean of the duplicate data was used instatistical analyses. Silopi was not included in the statisticalanalysis due to the number of samples.
3.1. StatisticalAnalysis. Statistical analysis was performed bySPSS ver. 21 package program. (e differences between thesampling regions for the physicochemical values obtainedfrom the analyzed samples were determined by one-wayANOVA, Tukey, and Games–Howell tests. In the analyses,P< 0.05 was considered statistically significant.
4. Results and Discussion
(emean, standard deviation, and minimum andmaximumvalues of fructose, glucose, fructose + glucose, fructose/glucose, sucrose, and maltose in honey samples according tosampling regions are shown in Table 1. (e moisture, pH,electrical conductivity, number of diastase, HMF, andproline values are given in Table 2, and the results of coloranalysis are given in Figure 1.
Fructose and glucose are the main sugars in honey.Although the composition of the sugars in honey depends onthe plant flora, it is also affected by the geographical con-ditions and climate [5, 16, 17]. In this study, the meanfructose + glucose value of honey samples was determined as70.97± 3.27%, which was ranging from 62.55 to 77.25%.(isvalue was higher than 60/100 g, which is indicated as theminimum value by the CAC Honey Standard, TFC HoneyCommunique, and EU directive of 2001/110/EC [7–9]. Ourresult was lower than the result of Vit et al. [18] and close tothe result reported by Kahraman et al. [19], whereas it waspartly higher than that reported by some other researchers[6, 20, 21]. Statistically significant differences for the glucoseratio were found in some sampling locations. (e glucosevalue in the samples taken from Farasin was higher than thesamples collected from Siirt Center and Tillo. (e glucosevalue in the samples taken from Idil was higher than SiirtCenter and Tillo (Table 1). Differences between locationscould possibly be due to nectar content and environmentalconditions.
It has been stated that the ratio of fructose/glucose,which is used in the evaluation of the crystallization degreeof honey, is related to nectar used in the production of honey[4, 16]. In our study, the mean fructose/glucose ratio was1.21± 0.15 (1.03–1.67). Six (8.82%) of the analyzed sampleswere found to be above the legally determined maximumvalue of 1.4. Improper values were found in honey samplescollected from Pervari (2), Siirt Center (3), and Tillo (1).Concerning the ratio of fructose/glucose values, it was foundthat there was a statistically significant difference betweenFarasin and Siirt Center sampling locations (Table 1). (eratio of the fructose/glucose value in Siirt Center was high.
Sucrose and maltose are sugars found in small amountsin honey. High sucrose in honey is seen when honey isharvested before sugar is completely transformed intoglucose and fructose by the effect of the invertase enzyme[1, 22] or is seen in the case of overfeeding of bees with sugarin spring [16, 23]. In this study, sucrose was not detected in38 (55.88%) of the samples.(e sucrose contents of the othersamples were less than the legally permissible maximumvalue of 5%. (e mean value of 0.90± 1.35% (nd-4.10%) forthe sucrose content, which was found in the present study,was lower than the sucrose content found by some other
2 International Journal of Analytical Chemistry

researchers [6, 24]. However, the mean sucrose content ofhoney in our study was close to the results of Can et al. [17]and Kuçuk et al. [1].
Statistically significant differences for the maltose valuewere found in some sampling locations, and the differencesare indicated in Table 1. (e mean maltose value of
2.88± 1.42% that was determined in this study was higherthan the maltose values of 1.05± 0.87% and 0.31± 0.02%reported by Can et al. [17] and Habib et al. [25], respectively.On the contrary, our result was lower than the finding ofManzanares et al. [26] who found maltose value as5.31± 0.97%.
Table 1: Results of sugar contents of the honey samples according to sampling locations, mean± std (min-max), and sugar values (%).
Locations (n) Fructose Glucose Fructose + glucose Fructose/glucose Sucrose Maltose
Farasin (19) 37.76± 1.54(35.05–40.65)
34.05± 2.35ab(29.40–37.35)
71.82± 3.19(65.60–75.95)
1.11± 0.08e(1.03–1.28)
1.59± 1.72(nd-4.10)
3.51± 1.69f(nd-5.50)
Uludere (5) 38.52± 2.20(36.05–41.35)
33.31± 2.07(30.40–35.50)
71.83± 2.73(68.05–75.35)
1.16± 0.11(1.07–1.36)
1.79± 2.04(nd-4.10)
4.34± 0.47ghij(3.65–4.75)
Idil (3) 38.77± 1.02(37.60–39.50)
35.17± 2.20cd(32.80–37.15)
73.93± 3.13(70.40–76.35)
1.11± 0.05(1.06–1.15)
0.73± 1.27(nd-2.20)
4.18± 0.34klmn
(3.80–4.45)
Besta (3) 40.05± 2.18(37.65–41.90)
33.30± 3.48(29.70–36.65)
73.35± 3.38(71.20–77.25)
1.21± 0.17(1.11–1.41)
0.73± 1.27(nd-2.20)
3.60± 0.83(2.65–4.15)
Silopi (1) 40.15± 0.07(40.10–40.20)
32.75± 0.78(32.20–33.30)
72.90± 3.71(72.40-73-40)
1.23± 0.03(1.20–1.24)
ndnd
4.10± 0.00(4.10–4.10)
Pervari (17) 39.39± 2.79(34.35–45.51)
31.92± 2.00(27.55–35.70)
71.31± 3.04(63.33–76.21)
1.24± 0.14(1.12–1.65)
0.52± 1.00(nd-3.20)
2.48± 1.28gk(0.80–4.80)
SiirtCenter (13)
38.89± 3.36(33.89–46.47)
30.39± 2.04ac(27.86–34.41)
69.28± 2.93(62.55–74.32)
1.29± 0.18 e
(1.06–1.67)0.39± 0.59(nd-1.89)
1.78± 0.66fhl(0.70–2.84)
Tillo (5) 38.39± 3.20(34.43–43.37)
29.22± 2.12bd(26.78–31.43)
67.61± 2.99(63.06–70.15)
1.32± 0.18(1.20–1.62)
0.70± 0.90(nd-2.20)
2.12± 0.50im(1.38–2.70)
Sirvan (2) 37.87± 0.31(37.65–38.09)
30.52± 1.02(29.80–31.24)
68.39± 1.33(67.45–69.33)
1.24± 0.03(1.22–1.26)
ndnd
2.21± 0.15jn(2.10–2.32)
Total, n (68) 38.67± 2.47(33.89–46.47)
32.30± 2.67(26.78–37.35)
70.97± 3.27(62.55–77.25)
1.21± 0.15(1.03–1.67)
0.90± 1.35(nd-4.10)
2.88± 1.42(nd-5.50)
P value 0.645 0.000 0.020 0.009 0.110 0.000∗nd: not detected. (e values with the same superscript in the same column differ significantly. P values: (a) Farasin-Siirt Center (0.000), (b) Farasin-Tillo(0.001), (c) Idil-Siirt Center (0.025), (d) Idil-Tillo (0.010), (e) Farasin-Siirt Center (0.014), (f ): Farasin-Siirt Center (0.009), (g) Uludere-Pervari (0.002), (h)Uludere-Siirt Center (0.000), (i) Uludere-Tillo (0.001), (j) Uludere-Sirvan (0.003), (k) Idil-Pervari (0.007), (l) Idil-Siirt Center (0.001), (m) Idil-Tillo (0.006),and (n) Idil-Sirvan (0.022).
Table 2: Results of physicochemical analysis of honey according to the sampling locations and mean± std (min-max).
Locations (n) Moisture (%) pHElectrical
conductivity(mS/cm)
Free acidity(meq/kg)
Diastaseactivity(⁰ Gothe)
Proline (mg/kg) HMF (mg/kg)
Farasin (19) 15.63± 1.03(14.32–18.02)
3.88± 0.11(3.69–4.11)
0.19± 0.02(0.14–0.231)
16.29± 7.79(9.50–44.00)
8.13± 3.68(0.00–13.15)
367.79± 88.23(198.36–496.28)
23.68± 44.16(3.80–166.25)
Uludere (5) 15.12± 0.81(14.58–16.48)
3.97± 0.05(3.91–4.04)
0.20± 0.05(0.14–0.26)
15.00± 3.39(11.50–20.50)
11.32± 6.14(5.60–19.45)
381.67± 177.68(193.12–645.24)
4.56± 2.39(1.30–7.30)
Idil (3) 15.84± 0.33(15.59–16.22)
3.84± 0.05(3.81–3.90)
0.20± 0.06(0.16–0.27)
16.17± 5.69(11.50–22.50)
9.08± 5.85(3.10–14.80)
444.41± 190.43(303.76–661.12)
61.27± 80.02(9.70–153.45)
Besta (3) 16.10± 1.09(15.16–17.30)
3.82± 0.10(3.73–3.92)
0.21± 0.02(0.18–0.24)
18.67± 8.28(10.00–26.50)
11.20± 0.71(10.45–11.85)
447.91± 118.20(321.62–555.90)
34.35± 31.03(9.00–68.95)
Silopi (1) 16.68± 0.14(16.58–16.78)
3.84± 0.00(3.84–3.84)
0.22± 0.07(0.22–0.23)
18.50± 0.71(18.00–19.00)
10.75± 0.07(10.70–10.80)
528.73± 3.45(526.29–531.17)
22.15± 0.07(22.10–22.20)
Pervari (17) 16.11± 1.05(14.04–17.80)
4.09± 0.86(3.70–6.45)
0.21± 0.041(0.16–0.03)
13.82± 6.47(2.00–25.50)
12.26± 4.75(3.60–20.55)
456.98± 208.86(117.15–933.49)
12.88± 15.71(1.10–54.40)
Siirt Center (13) 16.31± 1.16(14.36–17.76)
4.49± 1.08(3.67–6.34)
0.21± 0.05(0.25–0.29)
12.12± 6.09(2.50–21.50)
11.66± 4.58(4.30–20.40)
363.25± 172.70(136.88–736.18)
9.14± 7.50(1.20–24.60)
Tillo (5) 15.86± 1.41(14.20–17.88)
4.37± 1.11(3.72–6.33)
0.23± 0.06(0.18–0.30)
15.50± 9.85(2.50–27.50)
10.88± 3.77(5.70–14.80)
617.61± 231.78(403.24–918.69)
21.89± 23.59(1.40–61.15)
Sirvan (2) 15.91± 0.07(15.87–15.96)
4.22± 0.71(3.71–4.72)
0.25± 0.02(0.23–0.26)
19.25± 3.18(17.00–21.50)
14.65± 8.41(8.70–20.60)
449.55± 241.39(278.86–620.24)
15.08± 0.46(14.75–15.40)
Total (68) 15.91± 1.05(14.04–18.02)
4.10± 0.73(3.67–6.45)
0.21± 0.04(0.15–0.31)
14.94± 6.81(2.00–44.00)
10.68± 4.61(0.00–20.60)
420± 174(117.15–933.49)
18.50± 31.43(1.10–166.25)
P value 0.522 0.510 0.701 0.720 0.238 0.189 0.295
International Journal of Analytical Chemistry 3

(e moisture content, which is the water amount ofhoney, is a component of honey that affects viscosity andcrystallization properties, as well as honey’s flavor, color,and shelf life [5]. Moisture in honey can vary according tothe moisture content of the plant used in the productionof honey, the harvest season, and climatic conditions[17, 27, 28]. (e high water content of honey increases thepossibility of fermentation as a result of osmophilic yeastdevelopment [2]. Large number of dead yeasts, glycerol,ethanol, and butanediol due to fermentation of honeyresult in deterioration of its taste [29]. Shelf life of honeywith low moisture content is longer. A value above thevalues determined for moisture in honey on the market israre. It is reported that water content of less than 20 g/100 g was determined in 91–95% of 30,000 honey samplesanalyzed between 1989 and 97 [30]. Similarly, all samplesanalyzed in our study were found to comply with the legalmaximum limit of 20% moisture content. (e meanmoisture content of 15.91 ± 1.05% (ranging from 14.04 to18.02%) that was determined in our study was consistentwith the results of the previous studies [17, 31, 32]. In astudy by Erez et al. [33], the moisture value of honeysamples taken from three different locations in thePervari region was determined as 12.58–15.99%. How-ever, in our study, the mean moisture value of honeycollected from 17 different producers in the same regionwas higher than the value found by Erez et al. [33]. (isdifference may be due to the number of samples andclimatic conditions.
(e electrical conductivity is related to the concentrationof organic acids, proteins, and mineral salts in honey [25].Since the electrical conductivity of honey depends on theflower, in which the bee receives nectar, it is an importantparameter for the determination of flower honey obtainedfrom different flowers [4, 21, 30]. Honeydew honey hashigher electrical conductivity than flower honey [17]. In this
study, determination of the mean value of 0.21± 0.04mS/cmwas found to be compatible with the results of some otherresearchers [6, 17, 20, 21]. In this study, the value of0.16–0.03mS/cm in the Pervari sampling location wasconsistent with the value detected in honey taken from thePervari location by Erez et al. [33]. (e electrical conduc-tivity values determined in this study were below the legallypermitted maximum value of 0.8mS/cm.
Although there is no legal limit for the pH value ofhoney, it is desirable to have low pH of honey to avoidmicrobial contamination [25]. (e pH value that variesdepending on factors such as processing and storage con-ditions can affect honey’s structure, durability, and shelf life.Because honeydew honey shows higher pH and electricalconductivity compared to flower honey, the pH and elec-trical conductivity values of honey help to differentiatehoneydew and flower honey from each other [34]. Additionof sugar syrup to honey significantly increases pH of honey;thus, pH of honey is an indicator of fraud [4]. In this study,the pH value of analyzed honey samples was found to beacidic (mean 4.10± 0.73, ranging from 3.67 to 6.45). Ourfinding was consistent with the values determined by someother researchers [6, 21, 25].
Free acidity depends on the flower type used by thehoney bee for nectar [27]. In the present study, free aciditywas found between 14.94± 6.81meq/kg (2.00–44.00). Noneof the samples exceeded 50meq/kg, the legal maximumpermissible value. In previous studies, Derebası et al. [6] andEstevinho et al. [20] reported free acidity values as24.97± 027 and 40.3meq/kg, respectively, which werehigher than the value determined in this study. (is dif-ference may be due to the type of flower that the bee receivesnectar. In the study by Erez et al. [33], who analyzed honeycollected from Pervari, the free acidity value(16.41–26.20meq/kg) determined in the samples was partlydifferent from the value of 2.00–25.50meq/kg that wasdetermined in our study in the same location. (e differencemay be due to the larger sample size in our study.
Hydroxymethylfurfural, which occurs as a decompositionproduct of monosaccharides found in honey, is not found infresh honey. It is an important indicator in determining thefreshness of honey due to its increased concentration duringstorage [28, 30]. (e HMF value is the main indicator of fraudpractices associated with high heating [23]. High diastase ac-tivity but lowHMF content are expected in high-quality honey.In this study, the mean HMF value was found as18.50± 31.43mg/kg (1.10–166.25), and this value was lowerthan the values determined by Vit et al. [18], who found162.71± 184.94mg/kg HMF values. On the contrary, ourfinding was consistent with the value of 19.2± 2.0mg/kg de-termined by Kuçuk et al. [1] and was higher than the8.86± 0.38mg/kg value that was determined by Derebası et al.[6]. In this study, it was determined that 7 (10.29%) honeysamples had higher HMF content than the legally permittedmaximum level which is 40mg/kg. However, the diastasenumber in the 3 honey samples with high HMF values wasbelow 8, and no negative correlation was found in the others.
Diastase, a heat-sensitive enzyme found in honey, is aparameter that shows freshness of honey and
Fara
şin
Ulu
dere İdil
Besta
Silo
pi
Perv
ari
Siirt
cent
er
Tillo
Şirv
an
0
10
20
30
40
50
60
70
80
90
100
(%)
Dark amberAmberLight amber
Extra light amberWhiteExtra white
Figure 1: Color distribution of honey according to samplinglocations.
4 International Journal of Analytical Chemistry
inappropriate heat treatment and storage conditions[4, 16]. A low level of diastase enzyme in honey is anindication that honeybees are fed with glucose [4]. In thisstudy, diastase activity was determined as 10.68 ± 4.61(0.00–20.60). (e value of 17.9 ± 1.3 that was detected inmultifloral honey by Kuçuk et al. [1] was higher than thevalue we found. (e diastase numbers in 14 (20.58%)samples were found to be less than 8, which was deter-mined as the legal limit. (e diastase number detected inthis study was consistent with the result of Derebası et al.[6] but lower than the value of 21.46 determined by Kıvraket al. [21] in multifloral honey. Detection of the value lessthan the legal limits may be related to improper heattreatment, storage conditions, and fraud practices withindustrial sugar. In this study, the lowest diastase activityvalue was found in Farasin and the highest in honey takenfrom Sirvan. (e difference between the results may bedue to the number of samples, unsuitable heat treatment,and storage conditions, as well as fraud.
Proline is the most abundant free amino acid in honeydue to salivary secretions of honeybees in the process ofconverting nectar into honey [5]. (e proline content ofhoney is an indicator for determining the quality and an-tioxidant activity of honey, and it is also used to determinethe source of the plant origin of honey [34]. Proline contentshows honey ripening status and sometimes sugar fraudapplications [30, 35]. Since proline is reduced in fraudulenthoney, it is an indicator of honey purity. (e amount ofproline, which may vary depending on the flora of honey, isalso closely related to the working performance of the bee[35]. In this study, the mean of the proline value determinedas 420± 174mg/kg (117.15–933.49) was lower than the value482± 160 found by Can et al. [17] in multifloral honey. Inthis study, proline amount was found less than 300mg/kg,which was the legal minimum limit, in 17 (25%) of theinvestigated honey samples. (e lowest proline value wasdetermined in Pervari, whereas the highest proline value wasfound in Tillo.
In this study, no statistically significant difference wasfound between locations in terms of moisture, pH, electricalconductivity, free acidity, diastase, proline, and HMF valuesof the analyzed samples (Table 2).
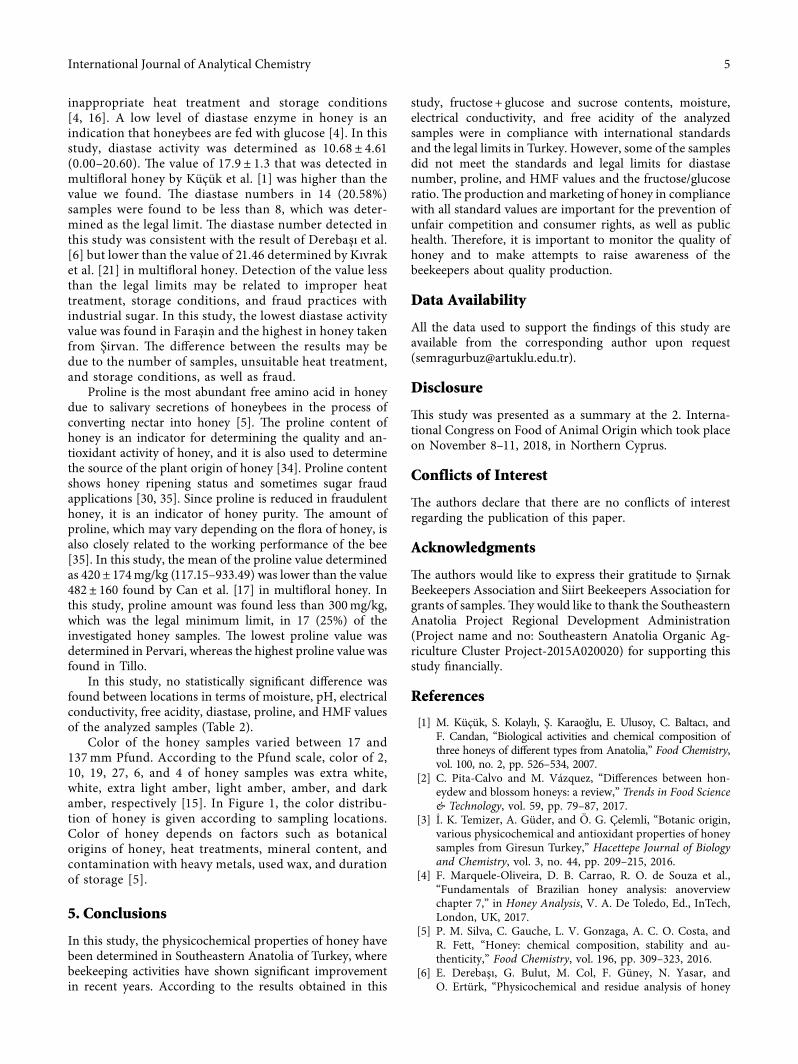
Color of the honey samples varied between 17 and137mm Pfund. According to the Pfund scale, color of 2,10, 19, 27, 6, and 4 of honey samples was extra white,white, extra light amber, light amber, amber, and darkamber, respectively [15]. In Figure 1, the color distribu-tion of honey is given according to sampling locations.Color of honey depends on factors such as botanicalorigins of honey, heat treatments, mineral content, andcontamination with heavy metals, used wax, and durationof storage [5].
5. Conclusions
In this study, the physicochemical properties of honey havebeen determined in Southeastern Anatolia of Turkey, wherebeekeeping activities have shown significant improvementin recent years. According to the results obtained in this
study, fructose + glucose and sucrose contents, moisture,electrical conductivity, and free acidity of the analyzedsamples were in compliance with international standardsand the legal limits in Turkey. However, some of the samplesdid not meet the standards and legal limits for diastasenumber, proline, and HMF values and the fructose/glucoseratio.(e production andmarketing of honey in compliancewith all standard values are important for the prevention ofunfair competition and consumer rights, as well as publichealth. (erefore, it is important to monitor the quality ofhoney and to make attempts to raise awareness of thebeekeepers about quality production.
Data Availability
All the data used to support the findings of this study areavailable from the corresponding author upon request([email protected]).
Disclosure
(is study was presented as a summary at the 2. Interna-tional Congress on Food of Animal Origin which took placeon November 8–11, 2018, in Northern Cyprus.
Conflicts of Interest
(e authors declare that there are no conflicts of interestregarding the publication of this paper.
Acknowledgments
(e authors would like to express their gratitude to SırnakBeekeepers Association and Siirt Beekeepers Association forgrants of samples. (ey would like to thank the SoutheasternAnatolia Project Regional Development Administration(Project name and no: Southeastern Anatolia Organic Ag-riculture Cluster Project-2015A020020) for supporting thisstudy financially.
References
[1] M. Kuçuk, S. Kolaylı, S. Karaoglu, E. Ulusoy, C. Baltacı, andF. Candan, “Biological activities and chemical composition ofthree honeys of different types from Anatolia,” Food Chemistry,vol. 100, no. 2, pp. 526–534, 2007.
[2] C. Pita-Calvo and M. Vazquez, “Differences between hon-eydew and blossom honeys: a review,” Trends in Food Science& Technology, vol. 59, pp. 79–87, 2017.
[3] I. K. Temizer, A. Guder, and O. G. Çelemli, “Botanic origin,various physicochemical and antioxidant properties of honeysamples from Giresun Turkey,” Hacettepe Journal of Biologyand Chemistry, vol. 3, no. 44, pp. 209–215, 2016.
[4] F. Marquele-Oliveira, D. B. Carrao, R. O. de Souza et al.,“Fundamentals of Brazilian honey analysis: anoverviewchapter 7,” in Honey Analysis, V. A. De Toledo, Ed., InTech,London, UK, 2017.
[5] P. M. Silva, C. Gauche, L. V. Gonzaga, A. C. O. Costa, andR. Fett, “Honey: chemical composition, stability and au-thenticity,” Food Chemistry, vol. 196, pp. 309–323, 2016.
[6] E. Derebası, G. Bulut, M. Col, F. Guney, N. Yasar, andO. Erturk, “Physicochemical and residue analysis of honey
International Journal of Analytical Chemistry 5

from black sea region of Turkey,” Fresen Environ. Bull, vol. 23,pp. 10–17, 2014.
[7] Codex Alimentarius Commission (CAC), “Revised codexstandard for honey codex standard 12-1981,” Codex Standard,vol. 12, pp. 1–7, 2001.
[8] European Union (EU), “Council directive 2001/110/EC of 20December 2001 relating to honey,” Official Journal of theEuropean Communities, vol. 12, pp. L10/47–L10/52, 2001.
[9] Turkish Food Codex (TFC), “Communique on honey (no:2012/58),” 2012.
[10] Turkish Statistical Institute,Animal Production Statistics, http://www.tuik.gov.tr/PreHaberBultenleri.do?id�27704#, 2018.
[11] S. S. Gurbuz and O Gençay Çelemli, “Melissopalnologicalanalysis of honey samples collected from sirnak city,” UludagBee Journal, vol. 19, no. 2, pp. 126–135, 2019.
[12] S. Gurbuz, Ç. Ozenirler, N. Mayda, O Gençay Çelemli, andA. Ozkok, “Pollen spectrum of some honey samples producedin Siirt-Turkey,” Hacettepe Journal of Biology and Chemistry,vol. 47, p. 295, 2019.
[13] T. Patent and Trademark Office, Geographical Sign RegistrationCertificate, http://www.turkpatent.gov.tr/TURKPATENT/resources/temp/47506828-7173-41AD-936C-374E2787E7E1.pdf, 2018.
[14] International Honey Commission (IHC), HarmonisedMethods of the International Honey Commission, http://www.ihc-platform.net/ihcmethods2009.pdf, 2009.
[15] G. F. Townsend, “Optical Density as a means of colourclassification of honey,” Journal of Apicultural Research, vol. 8,no. 1, pp. 29–36, 1969.
[16] E. Anklam, “A review of the analytical methods to determinethe geographical and botanical origin of honey,” FoodChemistry, vol. 63, no. 4, pp. 549–562, 1998.
[17] Z. Can, O. Yildiz, H. Sahin, E. Akyuz Turumtay, S. Silici, andS. Kolayli, “An investigation of Turkish honeys: their physico-chemical properties, antioxidant capacities and phenolicprofiles,” Food Chemistry, vol. 180, pp. 133–141, 2015.
[18] P. Vit, A. Rodrıguez-Malaver, D. W. Roubik et al., “Expandedparameters to assess the quality of honey from Venezuelanbees (Apis melllifera),” Journal of ApiProduct and ApiMedicalScience, vol. 1, no. 3, pp. 72–81, 2009.
[19] T. Kahraman, S. K. Buyukunal, A. Vural, andS. S. Altunatmaz, “Physico-chemical properties in honey fromdifferent regions of Turkey,” Food Chemistry, vol. 123, no. 1,pp. 41–44, 2010.
[20] L. M. Estevinho, X. Feas, J. A. Seijas, and M. Pilar Vazquez-Tato, “Organic honey from Tras-Os-Montes region (Portu-gal): chemical, palynological, microbiological and bioactivecompounds characterization,” Food and Chemical Toxicology,vol. 50, no. 2, pp. 258–264, 2012.
[21] S. Kivrak, I. Kivrak, and E. Karababa, “Characterization ofTurkish honeys regarding of physicochemical properties, andtheir adulteration analysis,” Food Science and Technology,vol. 37, no. 1, pp. 80–89, 2017.
[22] L. d. C. Azeredo, M. A. A. Azeredo, S. R. de Souza, andV. M. L. Dutra, “Protein contents and physicochemicalproperties in honey samples ofApis mellifera of different floralorigins,” Food Chemistry, vol. 80, no. 2, pp. 249–254, 2003.
[23] T. Gebremariam and G. Brhane, “Determination of qualityand adulteration effects of honey from Adigrat and its sur-rounding areas,” International Journal of Technology En-hancements And Emerging Engineering Research, vol. 2,pp. 2347–4289, 2014.
[24] C. Unal and O. Kuplulu, “Chemical quality of strained honeyconsumed in Ankara,” Ankara Universitesi Veteriner Fakul-tesi Dergisi, vol. 50, no. 1, pp. 1–4, 2006.
[25] H. M. Habib, F. T. Al Meqbali, H. Kamal, U. D. Souka, andW. H. Ibrahim, “Physicochemical and biochemical propertiesof honeys from Arid regions,” Food Chemistry, vol. 153,pp. 35–43, 2014.
[26] A. B. Manzanares, Z. H. Garcia, B. R. Galdon,E. M. Rodriguez-Rodriguez, and C. D. Romero, “Physico-chemical charecteritics and pollen spectrum of monofloralhoneys from Tenerife, Spain,” Food Chemistry, vol. 228,pp. 441–446, 2017.
[27] V. Nanda, B. C. Sarkar, H. K. Sharma, and A. S. Bawa,“Physico-chemical properties and estimation of mineralcontent in honey produced from different plants in NorthernIndia,” Journal of Food Composition and Analysis, vol. 16,no. 5, pp. 613–619, 2003.
[28] M. Juan-Borras, E. Domenech, A. Conchado, and I. Escriche,“Physicochemical quality parameters at the reception of thehoney packaging process: influence of type of honey, year ofharvest, and beekeeper,” Journal of Chemistry, vol. 2015,Article ID 929658, 6 pages, 2015.
[29] S. Bogdanov and P. Martin, “Honey authenticity: a review,”Mitteilungen aus Lebensmitteluntersuchung und Hygiene,vol. 93, pp. 232–254, 2002.
[30] S. Bogdanov, C. Cord Lullmann, P. Martin et al., “Honeyquality, methods of analysis and international regulatorystandards: review of the work of the International HoneyCommission,” Mitteilungen aus Lebensmitteluntersuchungund Hygiene, vol. 90, pp. 108–125, 1999.
[31] P. V. Aloisi, “Determination of quality chemical parameters ofhoney from Chubut (Argentinean Patagonia),” ChileanJournal of Agricultural Research, vol. 70, no. 4, pp. 640–645,2010.
[32] G. Saric, D. Matkoviç, M. Hruskar, and N. Vahcic, “Char-acterisation and classification of Croation honey by physi-cochemical paramaters,” Food Technology and Biotechnology,vol. 46, no. 4, pp. 355–367, 2008.
[33] M. E. Erez, O. Karabacak, L. Kayci, M. Fidan, and Y. Kaya,“Characterization of multifloral honeys of Pervari region withdifferent properties,” Turkiye Tarımsal Arastırmalar Dergisi,vol. 2, no. 1, pp. 40–46, 2015.
[34] R. Halouzka, P. Tarkowski, and S. Cavar Zeljkovic, “Char-acterisation of phenolics and other quality parameters ofdifferent types of honey,” Czech Journal of Food Sciences,vol. 34, no. 3, pp. 244–253, 2016.
[35] S. Cavrar, O. Yıldız, H. Sahin, F. Karahalil, and S. Kolaylı,“Comparison of physical and biochemical characteristics ofdifferent quality of Turkish honey,” Uludag Bee Journal,vol. 13, pp. 55–62, 2013.
6 International Journal of Analytical Chemistry