Aging, Metabolic, and Degenerative Disorders - Hindawi.com
145
Oxidative Medicine and Cellular Longevity Aging, Metabolic, and Degenerative Disorders: Biomedical Value of Antioxidants Lead Guest Editor: Mohamed M. Abdel-Daim Guest Editors: Nadia I. Zakhary, Lotfi Aleya, Simona G. Bungǎu, Raghvendra A. Bohara, and Nikhat J. Siddiqi
-
Upload
khangminh22 -
Category
Documents
-
view
2 -
download
0
Transcript of Aging, Metabolic, and Degenerative Disorders - Hindawi.com

Oxidative Medicine and Cellular Longevity
Aging, Metabolic, and Degenerative Disorders: Biomedical Value of Antioxidants
Lead Guest Editor: Mohamed M. Abdel-DaimGuest Editors: Nadia I. Zakhary, Lotfi Aleya, Simona G. Bungǎu, Raghvendra A. Bohara, and Nikhat J. Siddiqi

Aging, Metabolic, and Degenerative Disorders:Biomedical Value of Antioxidants

Oxidative Medicine and Cellular Longevity
Aging, Metabolic, and Degenerative Disorders:Biomedical Value of Antioxidants
Lead Guest Editor: Mohamed M. Abdel-DaimGuest Editors: Nadia I. Zakhary, Lotfi Aleya, Simona G. Bungau,and Raghvendra A. Bohara

Copyright © 2018 Hindawi. All rights reserved.
This is a special issue published in “OxidativeMedicine and Cellular Longevity.” All articles are open access articles distributed under theCreative Commons Attribution License, which permits unrestricted use, distribution, and reproduction in any medium, provided theoriginal work is properly cited.

Editorial Board
Darío Acuña-Castroviejo, SpainFabio Altieri, ItalyFernanda Amicarelli, ItalyJosé P. Andrade, PortugalCristina Angeloni, ItalyAntonio Ayala, SpainElena Azzini, ItalyPeter Backx, CanadaDamian Bailey, UKGrzegorz Bartosz, PolandSander Bekeschus, GermanyJi C. Bihl, USAConsuelo Borrás, SpainNady Braidy, AustraliaDarrell W. Brann, USARalf Braun, GermanyLaura Bravo, SpainVittorio Calabrese, ItalyAmadou Camara, USAGianluca Carnevale, ItalyRoberto Carnevale, ItalyAngel Catalá, ArgentinaGiulio Ceolotto, ItalyShao-Yu Chen, USAFerdinando Chiaradonna, ItalyZhao Zhong Chong, USAAlin Ciobica, RomaniaAna Cipak Gasparovic, CroatiaGiuseppe Cirillo, ItalyMaria R. Ciriolo, ItalyMassimo Collino, ItalyManuela Corte-Real, PortugalMark Crabtree, UKManuela Curcio, ItalyAndreas Daiber, GermanyFelipe Dal Pizzol, BrazilFrancesca Danesi, ItalyDomenico D’Arca, ItalyClaudio De Lucia, ItalyYolanda de Pablo, SwedenSonia de Pascual-Teresa, SpainCinzia Domenicotti, ItalyJoël R. Drevet, FranceGrégory Durand, France
Javier Egea, SpainErsin Fadillioglu, TurkeyIoannis G. Fatouros, GreeceQingping Feng, CanadaGianna Ferretti, ItalyGiuseppe Filomeni, ItalySwaran J. S. Flora, IndiaTeresa I. Fortoul, MexicoJeferson L. Franco, BrazilRodrigo Franco, USAJoaquin Gadea, SpainJosé Luís García-Giménez, SpainGerardo García-Rivas, MexicoJanusz Gebicki, AustraliaAlexandros Georgakilas, GreeceHusam Ghanim, USAEloisa Gitto, ItalyDaniela Giustarini, ItalySaeid Golbidi, CanadaAldrin V. Gomes, USATilman Grune, GermanyNicoletta Guaragnella, ItalySolomon Habtemariam, UKEva-Maria Hanschmann, GermanyTim Hofer, NorwayJohn D. Horowitz, AustraliaSilvana Hrelia, ItalyStephan Immenschuh, GermanyMaria G. Isaguliants, SwedenLuigi Iuliano, ItalyVladimir Jakovljevic, SerbiaMarianna Jung, USAPeeter Karihtala, FinlandEric E. Kelley, USAKum Kum Khanna, AustraliaNeelam Khaper, CanadaThomas Kietzmann, FinlandDemetrios Kouretas, GreeceAndrey V. Kozlov, AustriaJean-Claude Lavoie, CanadaSimon Lees, CanadaChristopher Horst Lillig, GermanyPaloma B. Liton, USAAna Lloret, Spain
Lorenzo Loffredo, ItalyDaniel Lopez-Malo, SpainAntonello Lorenzini, ItalyNageswara Madamanchi, USAKenneth Maiese, USAMarco Malaguti, ItalyTullia Maraldi, ItalyReiko Matsui, USAJuan C. Mayo, SpainSteven McAnulty, USAAntonio Desmond McCarthy, ArgentinaBruno Meloni, AustraliaPedro Mena, ItalyVíctor Manuel Mendoza-Núñez, MexicoMaria U Moreno, SpainTrevor A. Mori, AustraliaRyuichi Morishita, JapanFabiana Morroni, ItalyLuciana Mosca, ItalyAnge Mouithys-Mickalad, BelgiumDanina Muntean, RomaniaColin Murdoch, UKPablo Muriel, MexicoRyoji Nagai, JapanDavid Nieman, USAHassan Obied, AustraliaJulio J. Ochoa, SpainPál Pacher, USAPasquale Pagliaro, ItalyValentina Pallottini, ItalyRosalba Parenti, ItalyVassilis Paschalis, GreeceDaniela Pellegrino, ItalyIlaria Peluso, ItalyClaudia Penna, ItalySerafina Perrone, ItalyTiziana Persichini, ItalyShazib Pervaiz, SingaporeVincent Pialoux, FranceAda Popolo, ItalyJosé L. Quiles, SpainWalid Rachidi, FranceZsolt Radak, HungaryNamakkal S. Rajasekaran, USA

Kota V. Ramana, USASid D. Ray, USAHamid Reza Rezvani, FranceAlessandra Ricelli, ItalyPaola Rizzo, ItalyFrancisco J. Romero, SpainJoan Roselló-Catafau, SpainH. P. V. Rupasinghe, CanadaGabriele Saretzki, UKNadja Schroder, BrazilSebastiano Sciarretta, ItalyHonglian Shi, USA
Cinzia Signorini, ItalyMithun Sinha, USACarla Tatone, ItalyFrank Thévenod, GermanyShaneThomas, AustraliaCarlo Tocchetti, ItalyAngela Trovato Salinaro, JamaicaPaolo Tucci, ItalyRosa Tundis, ItalyGiuseppe Valacchi, ItalyJeannette Vasquez-Vivar, USADaniele Vergara, Italy
Victor M. Victor, SpainLászló Virág, HungaryNatalie Ward, AustraliaPhilip Wenzel, GermanyAnthony R. White, AustraliaMichal Wozniak, PolandSho-ichi Yamagishi, JapanLiang-Jun Yan, USAGuillermo Zalba, SpainJacek Zielonka, USAMario Zoratti, Italy

Contents
Aging, Metabolic, and Degenerative Disorders: Biomedical Value of AntioxidantsMohamed M. Abdel-Daim , Nadia I. Zakhary, Lotfi Aleya, Simona G. Bungau , Raghvendra A. Bohara,and Nikhat J. SiddiqiEditorial (2 pages), Article ID 2098123, Volume 2018 (2018)
Longevity-Related Gene Transcriptomic Signature in Glioblastoma MultiformeManal S. Fawzy , Dahlia I. Badran , Essam Al Ageeli, Saeed Awad M. Al-Qahtani, Saleh Ali Alghamdi,Ghada M. Helal, and Eman A. ToraihResearch Article (12 pages), Article ID 8753063, Volume 2018 (2018)
Mesenchymal Stromal Cell Therapy for Pancreatitis: A Systematic ReviewSara M. Ahmed, Mahmoud Morsi , Nehal I. Ghoneim, Mohamed M. Abdel-Daim ,and Nagwa El-BadriReview Article (14 pages), Article ID 3250864, Volume 2018 (2018)
Black SeedThymoquinone Improved Insulin Secretion, Hepatic Glycogen Storage, and Oxidative Stressin Streptozotocin-Induced Diabetic Male Wistar RatsHeba M. A. Abdelrazek , Omnia E. Kilany, Muhammad A. A. Muhammad , Hend M. Tag ,and Aaser M. AbdelazimResearch Article (10 pages), Article ID 8104165, Volume 2018 (2018)
Rutin Isolated from Chrozophora tinctoria Enhances Bone Cell Proliferation and Ossification MarkersAshraf B. Abdel-Naim , Abdullah A. Alghamdi, Mardi M. Algandaby, Fahad A. Al-Abbasi,Ahmed M. Al-Abd, Basma G. Eid , Hossam M. Abdallah, and Ali M. El-HalawanyResearch Article (10 pages), Article ID 5106469, Volume 2018 (2018)
Comparison of Selected Parameters of Redox Homeostasis in Patients with Ataxia-Telangiectasia andNijmegen Breakage SyndromeBarbara Pietrucha, Edyta Heropolitanska-Pliszka, Mateusz Maciejczyk, Halina Car,Jolanta Sawicka-Powierza, Radosław Motkowski, Joanna Karpinska, Marta Hryniewicka,Anna Zalewska, Malgorzata Pac, Beata Wolska-Kusnierz, Ewa Bernatowska, and Bozena MikolucResearch Article (8 pages), Article ID 6745840, Volume 2017 (2018)
Insulin-Like Growth Factor (IGF) Binding Protein-2, Independently of IGF-1, Induces GLUT-4Translocation and Glucose Uptake in 3T3-L1 AdipocytesBiruhalem Assefa, Ayman M. Mahmoud, Andreas F. H. Pfeiffer, Andreas L. Birkenfeld, Joachim Spranger,and Ayman M. ArafatResearch Article (13 pages), Article ID 3035184, Volume 2017 (2018)
Modulatory Effect of Fermented Papaya Extracts on Mammary Gland Hyperplasia Induced by Estrogenand Progestin in Female RatsZhenqiang You, Junying Sun, Feng Xie, Zhiqin Chen, Sheng Zhang, Hao Chen, Fang Liu, Lili Li,Guocan Chen, Yisheng Song, Yaoxian Xuan, Gaoli Zheng, and Yanfei XinResearch Article (11 pages), Article ID 8235069, Volume 2017 (2018)

Protective Effects and Possible Mechanisms of Ergothioneine and Hispidin againstMethylglyoxal-Induced Injuries in Rat Pheochromocytoma CellsTuzz-Ying Song, Nae-Cherng Yang, Chien-Lin Chen, and Thuy Lan VoThiResearch Article (10 pages), Article ID 4824371, Volume 2017 (2018)
MicroRNA-34a: A Key Regulator in the Hallmarks of Renal Cell CarcinomaEman A. Toraih, Afaf T. Ibrahiem, Manal S. Fawzy, Mohammad H. Hussein, Saeed Awad M. Al-Qahtani,and Aly A. M. ShaalanResearch Article (21 pages), Article ID 3269379, Volume 2017 (2018)
Simvastatin Ameliorates Diabetic Cardiomyopathy by Attenuating Oxidative Stress and Inflammationin RatsNawal M. Al-Rasheed, Nouf M. Al-Rasheed, Iman H. Hasan, Maha A. Al-Amin, Hanaa N. Al-Ajmi,Raeesa A. Mohamad, and Ayman M. MahmoudResearch Article (13 pages), Article ID 1092015, Volume 2017 (2018)
Febuxostat Modulates MAPK/NF-𝜅Bp65/TNF-𝛼 Signaling in Cardiac Ischemia-Reperfusion InjurySana Irfan Khan, Rajiv Kumar Malhotra, Neha Rani, Anil Kumar Sahu, Ameesha Tomar, Shanky Garg,Tapas Chandra Nag, Ruma Ray, Shreesh Ojha, Dharamvir Singh Arya, and Jagriti BhatiaResearch Article (13 pages), Article ID 8095825, Volume 2017 (2018)

EditorialAging, Metabolic, and Degenerative Disorders: BiomedicalValue of Antioxidants
Mohamed M. Abdel-Daim ,1,2 Nadia I. Zakhary,3 Lotfi Aleya,4 Simona G. Bungǎu ,5
Raghvendra A. Bohara,6 and Nikhat J. Siddiqi 7
1Pharmacology Department, Faculty of Veterinary Medicine, Suez Canal University, Ismailia 41522, Egypt2Department of Ophthalmology and Micro-Technology, Yokohama City University, Yokohama, Japan3Cancer Biology Department, National Cancer Institute, Cairo University, Cairo 11796, Egypt4Chrono-Environment Laboratory, Bourgogne Franche-Comté University, UMR CNRS 6249, 25030 Besançon Cedex, France5Pharmacy Department, Faculty of Medicine and Pharmacy, University of Oradea, Oradea, Romania6Centre for Interdisciplinary Research, D. Y. Patil University, Kolhapur 416006, India7Department of Biochemistry, College of Science, King Saud University, Riyadh 11495, Saudi Arabia
Correspondence should be addressed to Mohamed M. Abdel-Daim; [email protected]
Received 7 March 2018; Accepted 7 March 2018; Published 10 April 2018
Copyright © 2018 Mohamed M. Abdel-Daim et al. This is an open access article distributed under the Creative CommonsAttribution License, which permits unrestricted use, distribution, and reproduction in any medium, provided the original workis properly cited.
Oxidative stress is a common aetiological factor in aging,metabolic diseases, and degenerative disorders. The bodycontains an endogenous antioxidant system to help neutral-ize reactive oxygen species and mitigate oxidative damage.Every living cell survives when there is a balance betweenthe oxidative stress generated and the counter antioxidantsystem present. Once this harmony is disrupted, the gener-ated stress loads on the cell and starts to exert pathological,metabolic, and degenerative effects. Antioxidants have beenproven to ameliorate drug toxicity [1], carcinogenesis [2],and neurodegenerative processes [3, 4]. In this special issue,several articles have proposed different molecular mecha-nisms to mitigate oxidative stress and prevent aging, meta-bolic, and degenerative disorders.
For example, S. M. Ahmed et al. searched and analyzedprevious animal studies to develop a conclusive systematicreview discussing the use of different types of mesenchymalstromal cells (MSCs) for the treatment of acute and chronicpancreatitis and pancreatic fibrosis. They concluded thatbone marrow and umbilical cord MSCs were the most fre-quently administered cell types. In addition, they did notrecommend clinical trials to investigate the use of MSCs
as therapy for pancreatitis due to the insufficiency of pub-lished data.
In cardiovascular research, S. I. Khan et al. evaluatedthe effects of febuxostat and allopurinol on a rat modelof ischemia-reperfusion (IR) injury and concluded thatfebuxostat had more potent protective activities than allo-purinol against IR injury by inhibiting apoptosis (MAPK)and inflammation (NF-κBp65/TNF-α) pathways. In anotherstudy, N. M. Al-Rasheed et al. investigated the potentialcardioprotective effect of simvastatin on a diabetic cardio-myopathy (DCM) rat model and suggested that simva-statin ameliorates DCM by attenuating inflammation,oxidative stress, and apoptosis, induced by hyperglycemiaand hyperlipidemia.
In the field of diabetes research, B. Assefa et al. inves-tigated the mechanisms underlying insulin-like growth fac-tor binding protein-2- (IGFBP-2-) stimulated glucose uptakein adipocytes and concluded that the potentiating effects ofIGFBP-2 on 3T3-L1 adipocyte GU are independent of itsbinding to IGF-1 and might occur, which was mediatedthrough the activation of PI3K/Akt, AMPK/TBC1D1, andPI3K/PKCζ/λ/GLUT-4 signaling. In addition, H. M. A.
HindawiOxidative Medicine and Cellular LongevityVolume 2018, Article ID 2098123, 2 pageshttps://doi.org/10.1155/2018/2098123

Abdelrazek et al. evaluated the protective role of black seedoil (NSO) active constituent in streptozotocin-induceddiabetic rats and showed that NSO improved oxidativestress, hepatic glycogen storage, and pancreatic islet insu-lin secretion.
Another study in oncology, performed by E. A. Toraihet al., examined the expression of miR-34a and miR-11 ofits bioinformatically selected target genes and proteins to testtheir potential dysregulation in renal cell carcinoma tumori-genesis and cancer progression. Moreover, Z. You et al.evaluated the alleviating role of fermented papaya extracts(FPEs) in estrogen- and progestogen-induced mammarygland hyperplasia via their antioxidant activities and inhi-bition of DNA damage.
T.-Y. Song et al. showed the possible protective effects ofergothioneine and hispidin on methylglyoxal-induced neu-ronal cell hyperglycemic damage in rat pheochromocytomacells through inhibition of oxidative stress and the NF-κBtranscription pathway, which adds to the rich neuroscienceliterature. Further, B. Pietrucha et al. compared the antioxi-dant status and major lipophilic antioxidants in patients withataxia-telangiectasia (AT) and Nijmegen breakage syndrome(NBS) and confirmed the irregularities in redox homeostasis,and reduction of coenzyme Q10 in AT and NBS patientscould be used as potential diagnostic tools in these diseases.In addition, M. S. Fawzy et al. examined the expression oflongevity-related transcriptional factors (SOX2, OCT3/4,and NANOG) to evaluate them as diagnostic tools as wellas to treat glioblastoma multiforme.
Finally, A. B. Abdel-Naim et al. isolated rutin isolatedfrom Chrozophora tinctoria along with other five flavonoidsand found that rutin enhanced bone cell proliferation andossification markers using human osteosarcoma cell lines(SAOS-2 and MG-63). We hope that the readers of this spe-cial issue will find it enlightening about the potential benefitsof antioxidants, which may help them fill the knowledge gapsin the prevention and treatment of aging, metabolic, anddegenerative disorders.
Mohamed M. Abdel-DaimNadia I. Zakhary
Lotfi AleyaSimona G. Bungǎu
Raghvendra A. BoharaNikhat J. Siddiqi
References
[1] K. I. Block, A. C. Koch, M. N.Mead, P. K. Tothy, R. A. Newman,and C. Gyllenhaal, “Impact of antioxidant supplementation onchemotherapeutic toxicity: a systematic review of the evidencefrom randomized controlled trials,” International Journal ofCancer, vol. 123, no. 6, pp. 1227–1239, 2008.
[2] L. Milkovic, W. Siems, R. Siems, and N. Zarkovic, “Oxidativestress and antioxidants in carcinogenesis and integrative ther-apy of cancer,” Current Pharmaceutical Design, vol. 20, no. 42,pp. 6529–6542, 2014.
[3] M. S. Uddin, A. Stachowiak, A. A. Mamun et al., “Autophagyand Alzheimer’s disease: from molecular mechanisms to thera-peutic implications,” Frontiers in Aging Neuroscience, vol. 10,p. 4, 2018.
[4] J. K. Candlish and N. P. Das, “Antioxidants in food and chronicdegenerative diseases,” Biomedical and Environmental Sciences,vol. 9, no. 2-3, pp. 117–123, 1996.
2 Oxidative Medicine and Cellular Longevity

Research ArticleLongevity-Related Gene Transcriptomic Signature inGlioblastoma Multiforme
Manal S. Fawzy ,1,2 Dahlia I. Badran ,1,3 Essam Al Ageeli,4 Saeed Awad M. Al-Qahtani,5
Saleh Ali Alghamdi,6 Ghada M. Helal,7 and Eman A. Toraih 3,8
1Department of Medical Biochemistry, Faculty of Medicine, Suez Canal University, Ismailia 41522, Egypt2Department of Medical Biochemistry, Faculty of Medicine, Northern Border University, Arar, Saudi Arabia3Center of excellence in Molecular and Cellular Medicine, Faculty of Medicine, Suez Canal University, Ismailia, Egypt4Department of Clinical Biochemistry (Medical Genetics), Faculty of Medicine, Jazan University, Jazan, Saudi Arabia5Department of Physiology, Faculty of Medicine, Taibah University, Almadinah Almunawwarah, Saudi Arabia6Medical Genetics, Clinical Laboratory Department, College of Applied Medical Sciences, Taif University, Taif, Saudi Arabia7Department of Medical Biochemistry, Faculty of Medicine, Mansoura University, Mansoura, Egypt8Genetics Unit, Histology and Cell Biology Department, Faculty of Medicine, Suez Canal University, Ismailia, Egypt
Correspondence should be addressed to Manal S. Fawzy; [email protected] Eman A. Toraih; [email protected]
Received 2 October 2017; Accepted 11 December 2017; Published 21 March 2018
Academic Editor: Simona G. Bungǎu
Copyright © 2018 Manal S. Fawzy et al. This is an open access article distributed under the Creative Commons AttributionLicense, which permits unrestricted use, distribution, and reproduction in any medium, provided the original work isproperly cited.
Glioblastoma multiforme (GBM) (grade IV astrocytoma) has been assumed to be the most fatal type of glioma with low survivaland high recurrence rates, even after prompt surgical removal and aggressive courses of treatment. Transcriptionalreprogramming to stem cell-like state could explain some of the deregulated molecular signatures in GBM disease. The presentstudy aimed to quantify the expression profiling of longevity-related transcriptional factors SOX2, OCT3/4, and NANOG toevaluate their diagnostic and performance values in high-grade gliomas. Forty-four specimens were obtained from glioblastomapatients (10 females and 34 males). Quantitative real-time polymerase chain reaction was applied for relative gene expressionquantification. In silico network analysis was executed. NANOG and OCT3/4 mRNA expression levels were significantlydownregulated while that of SOX2 was upregulated in cancer compared to noncancer tissues. Receiver operating characteristiccurve analysis showed high diagnostic performance of NANOG and OCT3/4 than SOX2. However, the aberrant expressions ofthe genes studied were not associated with the prognostic variables in the current population. In conclusion, the current studyhighlighted the aberrant expression of certain longevity-associated transcription factors in glioblastoma multiforme which maydirect the attention towards new strategies in the treatment of such lethal disease.
1. Introduction
Tumors of the brain were considered one of the ten mostcommon causes of cancer-related mortality [1]. Accordingto the World Health Organization (WHO) classification,the primary brain tumors are categorized into glial tumors(e.g., glioblastoma, astrocytomas, oligodendroglial tumors,and ependymal tumors), embryonic tumors (e.g., medullo-blastomas), tumors of the meninges, tumors of the hemato-poietic system, and tumors of the sellar region [2]. The
most fatal type of glioma has been reported to be the glioblas-toma multiforme (GBM) [3] which represents up to 50% ofalmost all primary brain gliomas [4] with poor prognosis[5] and median survival rate of nearly 25 months after treat-ment [6]. The recurrence of the tumor after prompt surgicalremoval despite the aggressive courses of radio- and chemo-therapy denotes the limited understanding of the diseasebiology [7]. Dell’Albani has stated that “new insights intothe causes and the potential treatment of CNS tumors havecome from disclosing relations with genes that regulate cell
HindawiOxidative Medicine and Cellular LongevityVolume 2018, Article ID 8753063, 12 pageshttps://doi.org/10.1155/2018/8753063
growth, proliferation, differentiation, and death during nor-mal development” [7]. These genes may represent a new tar-get for GBM treatment by ameliorating the survival rate andpreventing or minimizing disease recurrence.
Several emerging evidences support the reactivation ofpluripotent transcription factors in many types of cancer[8–12]. As a normal biological phenomenon, these factorsare expressed in embryonic stem cells (ESCs) and somaticcells where they imply the self-renewal [13] and the pluripo-tency characteristics [14]. As cancer development is a multi-step process in which differentiated cells transform intoimmature ones, these factors could participate in cancerbiogenesis and/or progress.
Among these pluripotent transcription factors overex-pressed in high-grade gliomas are “sex-determining regionY-Box (SOX2), octamer-binding transcription factor 4(OCT 4), and Nanog homeobox (NANOG)” [13, 15].
SOX2 gene encodes a transcriptional factor (TF) of 317amino acids which contains a high-mobility group DNA-binding domain (Figure 1(a)) [16]. It implicated in embry-onic development regulation, cell fate determination, andembryonic stem cell pluripotency. More specifically, it wasreported to control the neural stem cell proliferation anddifferentiation into neurons, astrocytes, or oligodendrocytes[17]. SOX2 is expressed in stem cells of endoderm-derivedorgans such as the liver, pancreas, and stomach [18], andits aberrant expression has been found to support self-renewal and inhibit neuronal differentiation [19]. Addition-ally, SOX2 knockout in glioblastoma stem cells isolated fromhuman glioma tumor inhibits cell proliferation and tumori-genicity in immunodeficient mice [20].
OCT3/4 is a member of a transcription POU family(Figure 1(b)) which has to react with other TFs in orderto stimulate or inhibit gene expression [21] in ESCsthrough heterodimerization with SOX2. It was implicatedin embryonic development regulation, cell fate determina-tion, and embryonic stem cell pluripotency [22]. Finally,NANOG (Figure 1(c)) is involved in gene regulation withthe aforementioned two transcription factors through theirbinding to the promoters of several genes which mediatesthe pluripotency, inhibits embryonic stem cell differentia-tion, and autorepresses its own expression in differentiatingcells [22]. It has been found to be localized mainly in thenuclei of high-grade glioma cells than lower grades [15].Despite the fact that OCT3/4 and NANOG have shown adirect relationship with the tumor grade, their oncogenicnature in brain tumorigenesis has not been establishedyet [23].
Up to our knowledge, there were no previous studiesthat relate the expression of the aforementioned longevity-related transcription factors in GBM patients among theArab population. Hence, the present study for the first timeaimed to quantify the expression levels of these markers inGBM sample of Egyptian patients and to correlate theirexpressions with the available clincopathological features.A thorough understanding of the relevance of each bio-marker in GBM will be in need not only for reliable diagno-sis of the disease but also to participate in future drug designfor this fetal tumor.
2. Materials and Methods
2.1. Study Participants and Tissue Samples. The current studyincluded 44 glioblastoma patients (10 females and 34 males,aged 38 to 62 years) assessed retrospectively from archivedformalin-fixed paraffin-embedded section (FFPE) specimensof the Pathology Department, Mansoura University Hospi-tals, Egypt, from 2010 to 2013. They had glioblastomamultiforme grade 4, subjected to surgical removal and post-operative irradiation, and followed up for more than 36months. Specimens were collected before receiving chemo-therapy or radiotherapy prior to surgery. They were com-pared to 10 FFPE noncancerous brain specimens obtainedfrom patients undergoing brain tissue resection for otherreasons collected from the same hospital. Guidelines in theDeclaration of Helsinki were followed, and an approval bythe Medical Research Ethics Committee of Faculty of Medi-cine, Suez Canal University, was obtained before taking part.Written informed consent was obtained from all participantsbefore providing the archived tissue samples as part of theirroutine register in our University Teaching Hospitals.
2.2. RNA Extraction. Extraction of total RNA from FFPEspecimens was done using RNeasy FFPE Kit (Qiagen,52304) according to the protocol of the manufacturer.RNA concentration and purity were assessed with Nano-Drop ND-1000 spectrophotometer (NanoDrop Tech. Inc.,Wilmington, DE, USA), followed by agarose gel electropho-resis (1%) check for RNA integrity.
2.3. Reverse Transcription (RT). Complementary DNA(cDNA) was obtained by total RNA conversion using theHigh-Capacity cDNA Reverse Transcription Kit (AppliedBiosystems, P/N 4368814) with RT random primers onT-Professional Basic, Biometra PCR System (Biometra,Goettingen, Germany), as previously described [12]. Appro-priate negative and positive controls were included ineach experiment.
2.4. Gene Expression Profiling. The Minimum Informationfor Publication of Quantitative Real-Time PCR Experi-ments (MIQE) guidelines were followed for the real-timePCR reactions. Pluripotent gene relative expressions wereassessed using “Universal PCR master mix II, No UNG(2×)” (TaqMan®, Applied Biosystems, P/N 4440043), Taq-Man assay (Applied Biosystems, assay ID Hs02387400_g1for NANOG, Hs01053049_s1 for SOX2, and Hs03005111_gfor OCT3/4) and compared to the endogenous controlTATA box binding protein (TBP) (Hs00427620_m1) whichhas been proved in our previous work [24] to be uniformlyand stably expressed with no significant difference betweenGBM and noncancer tissues for gene expression normaliza-tion. PCRs were done in 20μl total volume using “StepOne™Real-Time PCR System (Applied Biosystems)” as previouslydescribed in details [25].
2.5. Statistical Analysis. Data analysis was done using PC-ORD ver. 5 software package and Statistical Package for theSocial Sciences (SPSS) for windows software (version 22.0).Two-tailed statistical tests were used for continuous and
2 Oxidative Medicine and Cellular Longevity

Chr
181.711 Mb
UniProtKB P48431 M.W 34310 KDaHigh mobility group box domain
181711924 181714436Forward strand
3q26.3-q27
2513 bp 317 aa181.713 Mb181.712 Mb 181.714 Mb 181.715 Mb
3
p26.
1p2
5.3
p25.
1p2
4.3
p24.
1p2
2.3
p22.
2p2
2.1
p14.
3p1
4.2
p14.
1p1
3p1
2.3
p12.
2p1
2.1
p11.
1q1
1.1
q11.
2
q13.
11q1
3.13
q13.
31q1
3.33
q21.
3q2
2.1
q22.
3q2
3q2
4
q28
q29
q25.
1q2
5.2
q26.
1q2
6.2
q26.
31
q26.
33q2
6.32
p21.
31
1 MYNMMETELK PPGPQQTSGG GGGNSTAAAA GGNQKNSPDR VKRPMNAFMV
AHMNGWSNGSAGVNQRMDSYSGVGVGAGLGLLAPGGNSMAKKDKYTLPGG
PQHPGLNAHG AAQMQPMHRY
HMKEHPDYKYIDEAKRLRALLLSETEKRPFISKRLGAEWKQENPKMHNSE
GSVVKSEASS SPPVVTSSSH
DVSALQYNSM TSSQTYMNGS
RDMISMYLPG
PTYSMSYSQQ
AEVPEPAAPS
GTPGMALGSM
RLHMSQHYQS
Transcription factor SOX
SRAPCQAGDL
TLPLSHMGPVPGTAING
61
121
181
241
301
Transcript
Protein
SOX2
Gene SOX2
WSRGQRRKMA
RPRRKTKTLM
YSMMQDQLGY
(a)
31.162 Mb 31.164 Mb 31.166 Mb1420 bp 360 aa
31.168 Mb 31.170 Mb 31.172 Mb
Chr 6
p25.
1p2
4.3
p22.
3
p22.
1
p21.
31p2
1.2
p21.
1
p12.
3
q11.
1q1
2
q13
q14.
1
q14.
3q1
5
q16.
1
q16.
3
q21
q22.
1
q22.
31
q22.
33q2
3.2
q23.
3q2
4.1
q24.
2q2
4.3
q25.
1q2
5.2
q25.
3q2
6
q27
p12.
1
6p21.33
31164337 31170693
Reverse strandTranscript
Gene
OCT3/4
OCT3/4
UniProtKB Q01860 MW 38,571 Da
POU-specific domain138-212Protein
DNA-binding domain230-289
1 MAGHLASDFA FSPPPGGGGD GPGGPEPGWV DPRTWLSFQG VGPGSEVWGIPPGGPGIGPG
SPEPCTVTPG
DYAQREDFEA
LGVLFGKVFSGYTQADVGLTKLLKQKRITL
ADNNENLQEI
ALQKELEQFA
RPLLQKWVEE
SHIAQQLGLE
GTPGYGSPHF
KDVVRVWFCN
TALYSSVPFP
CKAETLVQAR
RRQKGKRSSS
EGEAFPPVSV
KRKRTSIENR
TTLGSPMHSN
VGVESNSDGAETSQPEGEAGGVGLVPQGGLGGMAYCGPQV
QNPEESQDIK
QLSFKNMCKL
QCPKPTLQQI
SFPLAPGPHF
PPCPPPYEFC
AVKLEKEKLE
QTTICRFEAL
VRGNLENLFL
AGSPFSGGPV
61
121
181
241
301
(b)
Figure 1: Continued.
3Oxidative Medicine and Cellular Longevity
categorical variables. Correlation analysis between the vari-ables was performed via Pearson’s correlation coefficient.p value< 0.05 was considered significant. The fold changeof mRNA expression in each patient cancer tissue relativeto the mean of controls was calculated using Livak methodthat depends on the quantitation cycle (Cq) value with thefollowing equation: relative quantity = 2−ΔΔCq [26]. The diag-nostic performance of pluripotent genes was evaluated byreceiver operating characteristic (ROC) analysis. Kaplan–Meier estimator was generated for survival analysis, andlog-rank test was applied for different Kaplan–Meier curve(stratified by clinicopathological features) comparisons.Linear regression analysis using ENTER method was per-formed to evaluate potential factors affecting the overallsurvival of patients. Two-way Hierarchical cluster analysiswas run for exploratory multivariate analysis. Ward’smethod and Euclidean (Pythagorean) were adjusted for
linkage method and distance measure, respectively, with abeta value of −0.75 to reach the minimum % of chaining.Principal Component Ordination analysis was used to visual-ize clustering of patients according to their clinicopathologi-cal characteristics [27].
3. Results
3.1. Expression Profile of Pluripotent Genes. Baseline clin-ical features of the study participants are illustrated inTable 1. Relative expression analyses of pluripotent genesin brain cancer specimens were compared to TBP. Ourresults revealed that the expression levels of NANOGand OCT3/4 were significantly downregulated (p < 0 001and = 0.001, resp.) while that of SOX2 was significantlyupregulated (p = 0 0027) in tumor specimens compared tononcancer tissues (Figures 2(a) and 2(b)). Both NANOG
p13.
33p1
3.32
p13.
31p1
3.2
p13.
1p1
2.3
p12.
1
p11.
22p1
1.21
p11.
1q1
1
q12
q13.
11q1
3.12
q13.
13
q14.
1q1
4.2
q14.
3
q21.
1
q15
q21.
31
q21.
32q2
1.33
q22
q23.
1q2
3.2
q23.
3q2
4.11
q24.
13q2
4.21
q24.
23q2
4.31
q24.
32
q21.
2
77991417787794
12p13.31
Chr 12
7785.0 Mb 7787.5 Mb 7790.0 Mb 7792.5 Mb 7795.0 Mb 7797.5 Mb 7800.0 Mb
Forward strand
11348 bp 305 aaNANOG
Transcript
Gene
ProteinUniProtKB Q9H9S0 MW 34,620 KDa
DNA binding domain97-154
Strong transativation activity241-305
Transactivation196-240
NANOG
161
121
181241
301
MSVDPACPQS LPCFEASDCK ESSPMPVICG PEENYPSLQM SSAEMPHTET VSPLPSSMDLNDRFQRQKYL
APTYPSLYSS
WNNQAWNSPFDLFLNYSMNM
VFSSTQLCVL
NSNGVTQKAS
WNTQTWCTQSTRYFSTPQTM
VPVKKQKTRT
KRWQKNNWPK
GEGLNVIQQT
EKSVAKKEDK
TWFQNQRMKS
WNNSTWSNQTSDLEAALEAA
SPKGKQPTSA
ILNLSYKQVK
GNLPMWSNQTCMQFQPNSPA
SLQQMQELSN
YHQGCLVNPTYNCGEESLQS
QPEDV
LIQDSPDSST
QNIQSWSNHS
(c)
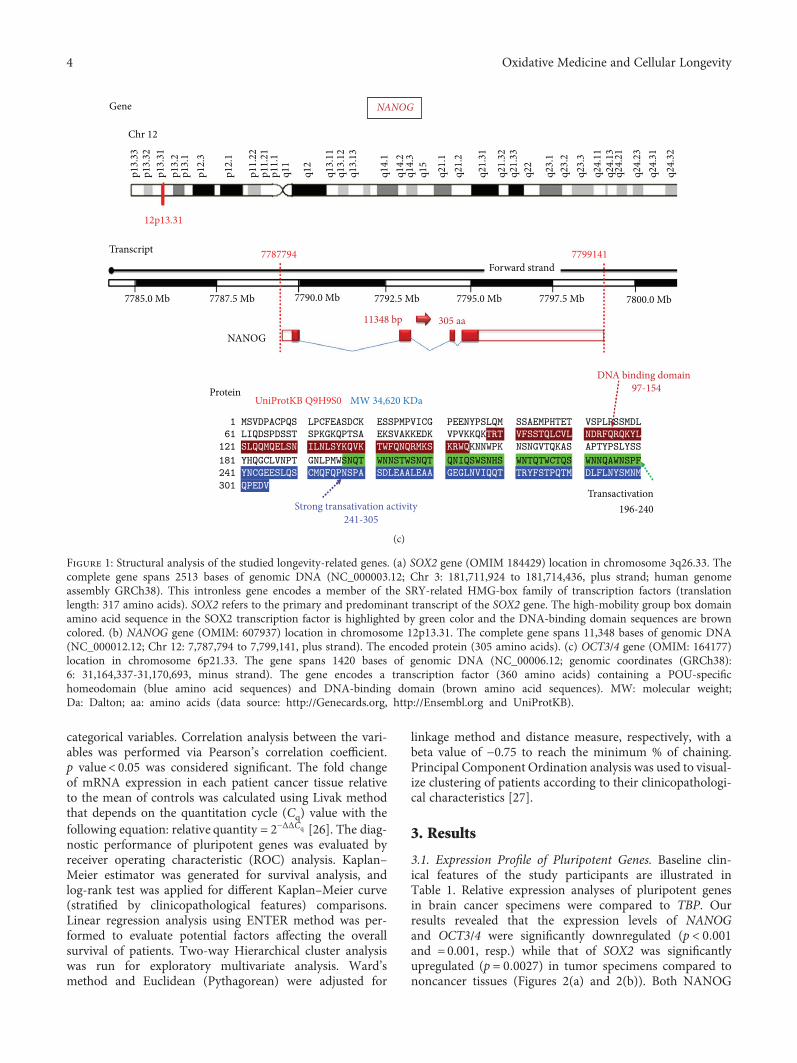
Figure 1: Structural analysis of the studied longevity-related genes. (a) SOX2 gene (OMIM 184429) location in chromosome 3q26.33. Thecomplete gene spans 2513 bases of genomic DNA (NC_000003.12; Chr 3: 181,711,924 to 181,714,436, plus strand; human genomeassembly GRCh38). This intronless gene encodes a member of the SRY-related HMG-box family of transcription factors (translationlength: 317 amino acids). SOX2 refers to the primary and predominant transcript of the SOX2 gene. The high-mobility group box domainamino acid sequence in the SOX2 transcription factor is highlighted by green color and the DNA-binding domain sequences are browncolored. (b) NANOG gene (OMIM: 607937) location in chromosome 12p13.31. The complete gene spans 11,348 bases of genomic DNA(NC_000012.12; Chr 12: 7,787,794 to 7,799,141, plus strand). The encoded protein (305 amino acids). (c) OCT3/4 gene (OMIM: 164177)location in chromosome 6p21.33. The gene spans 1420 bases of genomic DNA (NC_00006.12; genomic coordinates (GRCh38):6: 31,164,337-31,170,693, minus strand). The gene encodes a transcription factor (360 amino acids) containing a POU-specifichomeodomain (blue amino acid sequences) and DNA-binding domain (brown amino acid sequences). MW: molecular weight;Da: Dalton; aa: amino acids (data source: http://Genecards.org, http://Ensembl.org and UniProtKB).
4 Oxidative Medicine and Cellular Longevity

and OCT3/4 mRNAs showed high diagnostic values asbiomarkers for GBM (AUC=0.886± 0.054 and 0.736± 0.078, resp.) (Figure 3).
3.2. Association with Clinicopathological Characteristics andSurvival Analysis. Higher OCT3/4 gene expression was notedin elder GBM patients (p = 0 036). No statistically significantassociation was found with any other parameters (Figure 4).Correlation analysis revealed moderate correlation betweenNANOG and SOX2 gene expression profile (r = 0 484, p =0 023). In addition, elder age of patients was associatedwith poor overall survival (OS) (r = −0 479, p = 0 024) anddisease-free survival (DFS) (r = −0 481, p = 0 023) (Figure 5).
Linear regression analysis was performed to evaluatepotential factors affecting overall survival of patients. Noneof the genes or clinicopathological variables was determinedas a good prognostic marker for patients’ survival in thestudy population (Table 2). However, survival analysis inGBM by log-rank and Tarone-Ware tests showed poor OSamong elder patients (Figure 6 and Table S1).
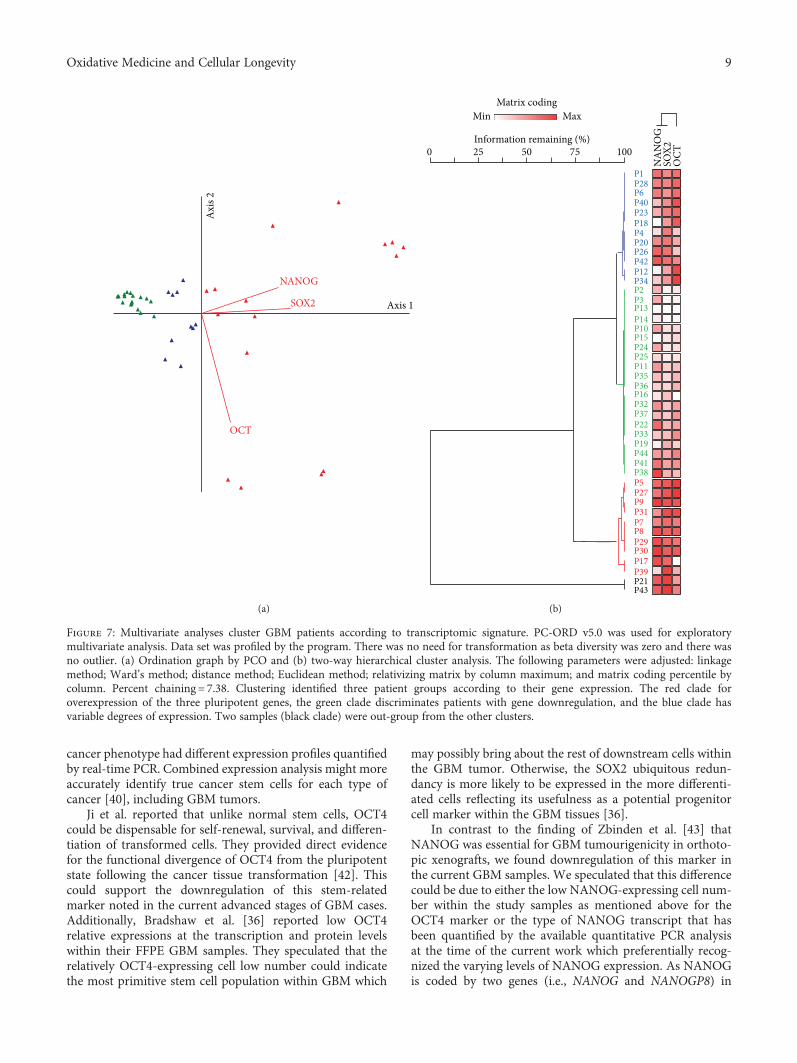
3.3. Multivariate Analysis. Exploratory multivariate analysisby principle component and hierarchical cluster analysesclassified patients into 3 groups based on the relative expres-sion of the combined genes (Figure 7). However, there was no
clear demarcation found between patients according to age,gender, tumor site, and recurrence (Figure S1).
4. Discussion
The presence of a significant heterogeneity in certain types ofsolid tumors including GBM is becoming obvious. Hence, itwill be rational to search for and evaluate specific molecularmarkers that could assist in diagnosis and/or prognosis ofthese tumors and could act as targeted molecular markersfor personalized therapy [7]. Here, we attempted to investi-gate the presence of a molecular signature of longevity-related genes (SOX2, NANOG, and OCT3/4) by examiningtheir mRNA expression in GBM tissues relative to noncancertissues. Our analyses revealed that the expression level ofSOX2 was significantly upregulated. This finding was consis-tent with several independent cohorts [28–30] and in partwith Guo et al., [13] who detected an overexpression of
Table 1: Characteristics of GBM patients.
Variables Number (%) or mean± SEAge
Mean± SE 51.4± 0.97Age categories
35–50 y 18 (40.9)
>50 y 26 (59.1)
Gender
Female 10 (22.7)
Male 34 (77.3)
Tumor site
Frontal 22 (50)
Frontotemporal 4 (9.1)
Temporoparietal 18 (40.9)
Recurrence
Nonrecurrent 36 (81.8)
Recurrent 8 (18.2)
Disease-free survival (months)
Mean± SE 15.1± 0.85Range 6–27
Prolonged DFS (>1 y) 28 (63.6)
Short DFS (≤1 y) 16 (36.4)
Overall survival (months)
Mean± SE 15.6± 0.86Range 8–27
High survival (>1 y) 30 (68.2)
Low survival (≤1 y) 14 (31.8)
NANOG OCT3/4 SOX2
P < 0.001 P = 0.001 P = 0.027
Relat
ive e
xpre
ssio
n le
vels
25
20
15
10
5
0
(a)
NANOG OCT3/4 SOX2
100
80
60
40
20
0
Fequ
ency
of p
atie
nts (
%)
UpregulatedDownregulated
(b)
Figure 2: Expression profile of pluripotent genes in GBM patientscompared to controls. (a) Values are presented as medians andquartiles of fold change relative to controls. The box defines upperand lower quartiles (25% and 75%, resp.) and the Whisker barsindicate upper and lower adjacent limits. TBP was used as aninternal control. Noncancer tissues was set to have a relativeexpression value of 1.0. Mann–Whitney U test was used forcomparison. p value< 0.05 was considered statistically significant.(b) Frequency of patients with up- and downregulated genes.
5Oxidative Medicine and Cellular Longevity

SOX2 mRNA in grade IV gliomas compared to grade II. Ofthe three longevity-related factors, SOX2 seems to be theplaymaker in the development of brain tumors [18]. Whenoverexpressed, it promotes cell cycle progression into Sphase and proliferation [3, 20, 28, 31], which were attenu-ated by application of SOX2-RNAi (RNA interference)
therapy [32]. At the cellular level, Garros-Regulez et al.[33] proposed SOX2 upregulation via activation of GBM-specific signaling pathways that maintain the overexpres-sion of SOX2 via transforming growth factor-beta (TGF-β),Sonic Hedgehog (SHH), epidermal growth factor receptor(EGFR), and fibroblast growth factor receptor (FGFR)
1.0
0.8
0.6
0.4
0.2
0.2 0.6 0.8 1.00.40.0
0.0
Sens
itivi
ty
NANOG
1 − specificity
1.0
0.8
0.6
0.4
0.2
0.00.2 0.6 0.8 1.00.40.0
Sens
itivi
ty
OCT3/4
1 − specificity
1.0
0.8
0.6
0.4
0.2
0.2 0.6
(c) (d)
(a) (b)
0.8 1.00.40.0
0.0
Sens
itivi
ty
1 − specificity
SOX21.0
0.8
0.6
0.4
0.2
0.00.2 0.6 0.8 1.00.40.0
Sens
itivi
ty
1 − specificity
Combined markers
Area under the curve
Markers
NANOG
OCT3/4SOX2Combined
AUC
0.8860.7360.3350.631
0.0540.0780.0870.051
0.0000.0070.0600.009
0.7800.5820.1640.531
0.9920.8890.5050.731
SE P values Lower bound Upper bound95% confidence internal
Figure 3: Diagnostic performance of pluripotent genes to discriminate between GBM and noncancer samples. NANOG and OCT3/4 showedhigh diagnostic values as biomarkers for GBM.
6 Oxidative Medicine and Cellular Longevity

pathways. In addition, SOX2 gene amplification and DNApromoter hypomethylation have been reported in a groupof GBM patients to expand the mechanism responsible forSOX2 upregulation [34].
Despite that our in silico analysis revealed that theexpression of the studied stem-related factors has similarcolocalization and physical interactions with each other[12], they seem to be differentially expressed independentlyin the current samples. We found that NANOG and OCT3/4 were significantly downregulated in GBM tissues. Ourfinding might seem contradictory to the stemness role thesepluripotent transcription factors play; however, it is worthto emphasize that the mechanistic functions of SOX2,OCT4, and NANOG in cancer cells are a little different ineach stage of tumor progress. Kallas et al. reported high levelsof SOX2, OCT4, and NANOG transcription factor expres-sions at the beginning of their tested human embryonic stemcell differentiation. However, on progress of the differentia-tion process, a decline in OCT4 and NANOG expressionlevels was observed, while expression of SOX2 was kept at ahigh level [35]. They suggested that the pluripotency ismaintained by a transcriptional network that is harmonizedby the aforementioned core transcription factors. Duringdifferentiation, the epigenetic modifications could play a rolein level modulation of these factors.
The other possible reasons for inconsistency of geneexpression for the three stem cell marker studies could besampling bias and/or relatively low expression levels of these
2.0
1.5
1.0
0.5
0.0
2.0
1.5
1.0
0.5
0.0
2.0
1.5
1.0
0.5
0.0
2.0
1.5
1.0
0.5
0.0
2.0
1.5
1.0
0.5
0.0
2.0
1.5
1.0
0.5
0.0NA
NO
G re
lativ
e exp
ress
ion
NA
NO
G re
lativ
e exp
ress
ion
NA
NO
G re
lativ
e exp
ress
ion
NA
NO
G re
lativ
e exp
ress
ion
NA
NO
G re
lativ
e exp
ress
ion
NA
NO
G re
lativ
e exp
ress
ion
p = 0.431
<50 y ≥50 yAge groups
Female MaleGender
F FT TPSite
NR RRecurrence
High LowOverall survival
ProlongedDisease-free survival
p = 0.595 p = 0.842 p = 0.774 p = 0.368 p = 0.815
Short
(a)
OCT
3/4
relat
ive e
xpre
ssio
n
<50 y ≥50 yAge groups
Female MaleGender
F FT TPSite
NR RRecurrence
High LowOverall survival
Prolonged ShortDisease-free survival
4
3
2
1
0 OCT
3/4
relat
ive e
xpre
ssio
n 4
3
2
1
0 OCT
3/4
relat
ive e
xpre
ssio
n 4
3
2
1
0 OCT
3/4
relat
ive e
xpre
ssio
n 4
3
2
1
0 OCT
3/4
relat
ive e
xpre
ssio
n 4
3
2
1
0 OCT
3/4
relat
ive e
xpre
ssio
n 4
3
2
1
0
p = 0.036 p = 0.085 p = 0.891 p = 1.000 p = 0.332 p = 0.485
(b)
SOX2
relat
ive e
xpre
ssio
n
<50 y ≥50 yAge groups
Female MaleGender
F FT TPSite
NR RRecurrence
High LowOverall survival
Prolonged ShortDisease-free survival
60
40
20
0 SOX2
relat
ive e
xpre
ssio
n
60
40
20
0 SOX2
relat
ive e
xpre
ssio
n
60
40
20
0 SOX2
relat
ive e
xpre
ssio
n60
40
20
0 SOX2
relat
ive e
xpre
ssio
n
60
40
20
0 SOX2
relat
ive e
xpre
ssio
n
60
40
20
0
p = 0.695 p = 0.401 p = 0.764 p = 1.000 p = 0.162 p = 0.365
(c)
Figure 4: Association between gene expression and the clinicopathological features. Values are presented as medians and quartiles of foldchange relative to controls. The box defines upper and lower quartiles (25% and 75%, resp.) and the whisker bars indicate upper andlower adjacent limits. TBP was used as an internal control. Noncancer tissues were set to have a relative expression value of 1.0.Mann–Whitney U and Kruskal-Wallis tests were used for comparison. p value< 0.05 was considered statistically significant. F: frontaltumor site; FT: frontotemporal; TP: temporoparietal; R: recurrent; NR: nonrecurrent.
Nanog
OCT3/4
SOX2
Age
OS
DFS
Gender
Tumor site
Recurrence
Nan
og
OCT
3/4
SOX2
Age
OS
DFS
Gen
der
Tum
or si
te
Recu
rren
ce
−1.0−0.8−0.6−0.4−0.200.20.40.60.81.0
Figure 5: Correlation matrix between transcriptomic signature andthe clinicopathological features. Pearson’s correlation analysis wasperformed and represented as color gradient.
7Oxidative Medicine and Cellular Longevity

factors within the individual GBM tissue examined in thecurrent study [36]. This could be explained by the uniquestem cell signature that has been implied by each tumordue to the inherent intratumor heterogeneity within GBMtissues [37–39]. Our multivariate analysis and the hierarchi-cal cluster analysis confirmed the previous suggestions by
revealing classification of the study population into 3 groupsbased on the combined gene expression that confirm aspecific protumorigenic profile. Similar to other combina-tions of cancer stem cell markers in other types of cancer[40, 41], previous studies revealed that cancer stem cellswhich were isolated using different markers in the same
Table 2: Linear regression analysis to determine predictors for survival.
Unstandardized coefficients Standardized coefficients 95% confidence interval for BB Std. error Beta t Sig. Lower bound Upper bound
(Constant) 34.675 10.593 3.273 0.006 11.955 57.395
Age −0.318 0.220 −0.363 −1.448 0.170 −0.790 0.153
Gender −2.142 3.510 −0.170 −0.610 0.551 −9.671 5.387
Tumor site 0.079 1.498 0.014 0.053 0.959 −3.134 3.292
Recurrence 0.501 3.635 0.036 0.138 0.892 −7.295 8.296
NANOG 0.374 3.095 0.033 0.121 0.905 −6.263 7.011
OCT3/4 −0.943 1.339 −0.173 −0.705 0.493 −3.815 1.928
SOX2 −0.085 0.123 −0.214 −0.691 0.501 −0.348 0.178
0 5 10 15 20 25 30
1.0
0.8
0.6
0.4
0.2
0.0
Cum
surv
ival
Overall survival (mo)
p = 0.001
<50 y
≥50 y
(a)
0 5 10 15 20 25 30
1.0
0.8
0.6
0.4
0.2
0.0
Cum
surv
ival
Overall survival (mo)
p = 0.063
Females
Males
(b)
1.0
0.8
0.6
0.4
0.2
0.0
Cum
surv
ival
0 5 10 15 20 25 30Overall survival (mo)
p = 0.751
Frontotemporal
Frontal
Temporoparietal
(c)
1.0
0.8
0.6
0.4
0.2
0.0
Cum
surv
ival
0 5 10 15 20 25 30Overall survival (mo)
p = 0.320
Nonrecurrent
Recurrent
(d)
Figure 6: Kaplan–Meier survival curve in GBM patients. Log-rank (Mantel-Cox) test was used for comparison. Statistical significanceat p < 0 05.
8 Oxidative Medicine and Cellular Longevity
cancer phenotype had different expression profiles quantifiedby real-time PCR. Combined expression analysis might moreaccurately identify true cancer stem cells for each type ofcancer [40], including GBM tumors.
Ji et al. reported that unlike normal stem cells, OCT4could be dispensable for self-renewal, survival, and differen-tiation of transformed cells. They provided direct evidencefor the functional divergence of OCT4 from the pluripotentstate following the cancer tissue transformation [42]. Thiscould support the downregulation of this stem-relatedmarker noted in the current advanced stages of GBM cases.Additionally, Bradshaw et al. [36] reported low OCT4relative expressions at the transcription and protein levelswithin their FFPE GBM samples. They speculated that therelatively OCT4-expressing cell low number could indicatethe most primitive stem cell population within GBM which
may possibly bring about the rest of downstream cells withinthe GBM tumor. Otherwise, the SOX2 ubiquitous redun-dancy is more likely to be expressed in the more differenti-ated cells reflecting its usefulness as a potential progenitorcell marker within the GBM tissues [36].
In contrast to the finding of Zbinden et al. [43] thatNANOG was essential for GBM tumourigenicity in orthoto-pic xenografts, we found downregulation of this marker inthe current GBM samples. We speculated that this differencecould be due to either the low NANOG-expressing cell num-ber within the study samples as mentioned above for theOCT4 marker or the type of NANOG transcript that hasbeen quantified by the available quantitative PCR analysisat the time of the current work which preferentially recog-nized the varying levels of NANOG expression. As NANOGis coded by two genes (i.e., NANOG and NANOGP8) in
Axi
s 2
Axis 1
OCT
NANOG
SOX2
(a)
Matrix codingMin
0 25 50Information remaining (%)
75 100
P1P28P6P40P23P18P4P20P26P42P12P34P2P3P13P14P10P15P24P25P11P35P36P16P32P37P22P33P19P44P41P38P5P27P9P31P7P8P29P30P17P39P21P43
Max
OCT
NA
NO
GSO
X2
(b)
Figure 7: Multivariate analyses cluster GBM patients according to transcriptomic signature. PC-ORD v5.0 was used for exploratorymultivariate analysis. Data set was profiled by the program. There was no need for transformation as beta diversity was zero and there wasno outlier. (a) Ordination graph by PCO and (b) two-way hierarchical cluster analysis. The following parameters were adjusted: linkagemethod; Ward’s method; distance method; Euclidean method; relativizing matrix by column maximum; and matrix coding percentile bycolumn. Percent chaining = 7.38. Clustering identified three patient groups according to their gene expression. The red clade foroverexpression of the three pluripotent genes, the green clade discriminates patients with gene downregulation, and the blue clade hasvariable degrees of expression. Two samples (black clade) were out-group from the other clusters.
9Oxidative Medicine and Cellular Longevity
human, it has been found that NANOGP8 is the mostabundantly expressed of the two NANOG-encoding genesin GBMs, accounting for more than ninety percent of allNANOG-encoding mRNAs in a number of previously testedcases [43]. However, future lineage analyses will be requiredfor unravelling the high NANOG-expressing cell natureand NANOG expression stability as recommended by thelatter researchers.
Correlating the available clincopathological featuresincluding the survival data of GBM cases with the geneexpression results revealed that poor overall survival anddisease-free survival were found significantly among patientsas reported by previous studies [44, 45]. Despite that GBMcan occur in individuals of any age according to the previouspopulation-based studies, the median age is nearly above 60years. Additionally, primary GBMs have been reported todevelop commonly in older individuals (mean, 55 years),whereas secondary ones were found in middle-aged subjects(39 year olds) [4].
5. Conclusion
The current study findings highlighted the dysregulatedlongevity-related gene expression in GBM Egyptian casesthat could have a potential role in carcinogenesis andprocuration of stemness-like properties in this type oftumors. The current study could be limited by the rela-tively small sample size and the fact that all patients havegrade IV gliomas, although this last issue increases thespecificity of the study results that confined to one stageof GBM. Additional large-scale studies including differentglioma grades are recommended to evaluate the relationof the studied longevity-related gene expression with differ-ent WHO grades as well as to confirm their putative role asdiagnostic and/or prognostic biomarkers. These could be aninteresting era for future individualized molecular-targetedtherapy for GBM patients.
Abbreviations
Cq: Quantitation cycleDFS: Disease-free survivalESCs: Embryonic stem cellsGBM: Glioblastoma multiformeMIQE: Minimum Information for Publication of
Quantitative Real-Time PCR ExperimentsNANOG: Nanog homeoboxOCT: Octamer-binding transcription factorOS: Overall survivalROC: Receiver-operating characteristicRT: Reverse transcriptionSOX2: Sex-determining region Y-Box.
Conflicts of Interest
The authors declare that they have no competing of interests.
Acknowledgments
The authors thank the Oncology Diagnostic Unit and theCenter of Excellence in Molecular and Cellular Medicine,Suez Canal University, Ismailia, Egypt, for providing thefacilities for performing the research work.
Supplementary Materials
Table S1: Kaplan–Meier curves comparing survival ofpatients with different clinical variables. Figure S1: multi-variate analysis stratified by clinicopathological features.(Supplementary Materials)
References
[1] American Cancer Society, Cancer Facts & Figures 2015,American Cancer Society, Atlanta, 2015.
[2] D. N. Louis, A. Perry, G. Reifenberger et al., “The 2016World Health Organization classification of tumors of thecentral nervous system: a summary,” Acta Neuropathologica,vol. 131, no. 6, pp. 803–820, 2016.
[3] M. Schmitz, A. Temme, V. Senner et al., “Identification ofSOX2 as a novel glioma-associated antigen and potential targetfor T cell-based immunotherapy,” British Journal of Cancer,vol. 96, no. 8, pp. 1293–1301, 2007.
[4] X. Zhang, W. Zhang, W.-D. Cao, G. Cheng, and Y.-Q. Zhang,“Glioblastoma multiforme: molecular characterization andcurrent treatment strategy (review),” Experimental and Thera-peutic Medicine, vol. 3, no. 1, pp. 9–14, 2012.
[5] R. Stupp,W. P. Mason, M. J. van den Bent et al., “Radiotherapyplus concomitant and adjuvant temozolomide for glioblas-toma,” The New England Journal of Medicine, vol. 352,no. 10, pp. 987–996, 2005.
[6] R. R. Lonser, S. Walbridge, A. O. Vortmeyer et al., “Inductionof glioblastoma multiforme in nonhuman primates after ther-apeutic doses of fractionated whole-brain radiation therapy,”Journal of Neurosurgery, vol. 97, no. 6, pp. 1378–1389, 2002.
[7] P. Dell’Albani, “Stem cell markers in gliomas,” NeurochemicalResearch, vol. 33, no. 12, pp. 2407–2415, 2008.
[8] I. Ben-Porath, M. W. Thomson, V. J. Carey et al., “Anembryonic stem cell-like gene expression signature in poorlydifferentiated aggressive human tumors,” Nature Genetics,vol. 40, no. 5, pp. 499–507, 2008.
[9] M. Schoenhals, A. Kassambara, J. De Vos, D. Hose,J. Moreaux, and B. Klein, “Embryonic stem cell markersexpression in cancers,” Biochemical and Biophysical ResearchCommunications, vol. 383, no. 2, pp. 157–162, 2009.
[10] J. Matsuoka, M. Yashiro, K. Sakurai et al., “Role of the stem-ness factors Sox2, Oct3/4, and Nanog in gastric carcinoma,”Journal of Surgical Research, vol. 174, no. 1, pp. 130–135, 2012.
[11] W. Luo, S. Li, B. Peng, Y. Ye, X. Deng, and K. Yao, “Embryonicstem cells markers SOX2, OCT4 and Nanog expression andtheir correlations with epithelial-mesenchymal transition innasopharyngeal carcinoma,” PLoS One, vol. 8, no. 2, articlee56324, 2013.
[12] E. A. Toraih, M. S. Fawzy, A. I. El-Falouji et al., “Stemness-related transcriptional factors and homing gene expressionprofiles in hepatic differentiation and cancer,” MolecularMedicine, vol. 22, no. 1, pp. 653–663, 2016.
10 Oxidative Medicine and Cellular Longevity

[13] Y. Guo, S. Liu, P. Wang, S. Zhao, F. Wang, and L. Bing,“Expression profile of embryonic stem cell-associated genesOct4, Sox2 and Nanog in human gliomas,” Histopathology,vol. 59, no. 4, pp. 763–775, 2011.
[14] T. Seymour, A. J. Twigger, and F. Kakulas, “Pluripotency genesand their functions in the normal and aberrant breast andbrain,” International Journal of Molecular Sciences, vol. 16,no. 11, pp. 27288–27301, 2015.
[15] C. S. Niu, D. X. Li, Y. H. Liu, X. M. Fu, S. F. Tang, and J. Li,“Expression of NANOG in human gliomas and its relationshipwith undifferentiated glioma cells,” Oncology Reports, vol. 26,no. 3, pp. 593–601, 2011.
[16] F. Doetsch, L. Petreanu, I. Caille, J. M. Garcia-Verdugo, andA. Alvarez-Buylla, “EGF converts transit-amplifying neuro-genic precursors in the adult brain into multipotent stemcells,” Neuron, vol. 36, no. 6, pp. 1021–1034, 2002.
[17] D. Maric, A. Fiorio Pla, Y. H. Chang, and J. L. Barker, “Self-renewing and differentiating properties of cortical neural stemcells are selectively regulated by basic fibroblast growth factor(FGF) signaling via specific fgf receptors,” The Journal ofNeuroscience, vol. 27, no. 8, pp. 1836–1852, 2007.
[18] R. Favaro, I. Appolloni, S. Pellegatta, A. B. Sanga, P. Pagella,and E. Gambini, “Sox2 is required to maintain cancer stemcells in a mouse model of high-grade oligodendroglioma,”Cancer Research, vol. 74, no. 6, pp. 1833–1844, 2014.
[19] G. Thiel, “How Sox2 maintains neural stem cell identity,”Biochemical Journal, vol. 450, no. 3, pp. e1–e2, 2013.
[20] R. M. Gangemi, F. Griffero, D. Marubbi et al., “SOX2 silencingin glioblastoma tumor-initiating cells causes stop of prolifera-tion and loss of tumorigenicity,” Stem Cells, vol. 27, no. 1,pp. 40–48, 2009.
[21] M. Pesce and H. R. Scholer, “Oct-4: gatekeeper in the begin-nings of mammalian development,” Stem Cells, vol. 19, no. 4,pp. 271–278, 2001.
[22] L. A. Boyer, T. I. Lee, M. F. Cole, S. E. Johnstone, S. S. Levine,and J. P. Zucker, “Core transcriptional regulatory circuitry inhuman embryonic stem cells,” Cell, vol. 122, no. 6, pp. 947–956, 2005.
[23] T. Seymour, A. Nowak, and F. Kakulas, “Targeting aggressivecancer stem cells in glioblastoma,” Frontiers in Oncology,vol. 5, no. 159, 2015.
[24] M. S. Fawzy, E. A. Toraih, and H. Y. Abdallah, “Long noncod-ing RNA metastasis-associated lung adenocarcinoma tran-script 1 (MALAT1): a molecular predictor of poor survival inglioblastoma multiforme in Egyptian patients,” EgyptianJournal of Medical Human Genetics, vol. 18, no. 3, pp. 231–239, 2017.
[25] E. A. Toraih, M. S. Fawzy, E. A. Mohammed, M. H. Hussein,and M. M. EL-Labban, “MicroRNA-196a2 biomarker and tar-getome network analysis in solid tumors,”Molecular Diagnosis& Therapy, vol. 20, no. 6, pp. 559–577, 2016.
[26] K. J. Livak and T. D. Schmittgen, “Analysis of relative geneexpression data using real-time quantitative PCR and the2−ΔΔCT method,” Methods, vol. 25, no. 4, pp. 402–408, 2001.
[27] M. S. Fawzy, E. A. Toraih, N. M. Aly, A. Fakhr-Eldeen, D. I.Badran, and M. H. Hussein, “Atherosclerotic and thromboticgenetic and environmental determinants in Egyptian coronaryartery disease patients: a pilot study,” BMC CardiovascularDisorders, vol. 17, no. 1, p. 26, 2017.
[28] L. Annovazzi, M. Mellai, V. Caldera, G. Valente, andD. Schiffer, “SOX2 expression and amplification in gliomas
and glioma cell lines,” Cancer Genomics & Proteomics, vol. 8,no. 3, pp. 139–147, 2011.
[29] C. W. Brennan, R. G. Verhaak, A. McKenna et al., “Thesomatic genomic landscape of glioblastoma,” Cell, vol. 155,no. 2, pp. 462–477, 2013.
[30] A. M. de la Rocha, N. Sampron, M. M. Alonso, and A. Matheu,“Role of SOX family of transcription factors in central nervoussystem tumors,” American Journal of Cancer Research, vol. 4,no. 4, pp. 312–324, 2014.
[31] K. Weina and J. Utikal, “SOX2 and cancer: current researchand its implications in the clinic,” Clinical and TranslationalMedicine, vol. 3, no. 1, p. 19, 2014.
[32] F. Oppel, N. Müller, G. Schackert et al., “SOX2-RNAi attenu-ates S-phase entry and induces RhoA-dependent switch toprotease-independent amoeboid migration in human gliomacells,” Molecular Cancer, vol. 10, no. 1, p. 137, 2011.
[33] L. Garros-Regulez, I. Garcia, E. Carrasco-Garcia et al., “Target-ing SOX2 as a therapeutic strategy in glioblastoma,” Frontiersin Oncology, vol. 6, no. 222, 2016.
[34] M. M. Alonso, R. Diez-Valle, L. Manterola et al., “Genetic andepigenetic modifications of Sox2 contribute to the invasivephenotype of malignant gliomas,” PLoS One, vol. 6, no. 11,article e26740, 2011.
[35] A. Kallas, M. Pook, A. Trei, and T. Maimets, “SOX2 isregulated differently from NANOG and OCT4 in humanembryonic stem cells during early differentiation initiated withsodium butyrate,” Stem Cells International, vol. 2014, ArticleID 298163, 12 pages, 2014.
[36] A. Bradshaw, A. Wickremsekera, S. T. Tan, L. Peng, P. F.Davis, and T. Itinteang, “Cancer stem cell hierarchy in glio-blastoma multiforme,” Frontiers in Surgery, vol. 3, 2016.
[37] D. Stieber, A. Golebiewska, L. Evers et al., “Glioblastomasare composed of genetically divergent clones with distincttumourigenic potential and variable stem cell-associatedphenotypes,” Acta Neuropathologica, vol. 127, no. 2, pp. 203–219, 2014.
[38] A. Morokoff, W. Ng, A. Gogos, and A. H. Kaye, “Molecularsubtypes, stem cells and heterogeneity: implications for perso-nalised therapy in glioma,” Journal of Clinical Neuroscience,vol. 22, no. 8, pp. 1219–1226, 2015.
[39] A. R. Safa, M. R. Saadatzadeh, A. A. Cohen-Gadol, K. E. Pollok,and K. Bijangi-Vishehsaraei, “Glioblastoma stem cells (GSCs)epigenetic plasticity and interconversion between differenti-ated non-GSCs and GSCs,” Genes & Diseases, vol. 2, no. 2,pp. 152–163, 2015.
[40] J. Skoda, M. Hermanova, T. Loja, P. Nemec, J. Neradil, andP. Karasek, “Co-expression of cancer stem cell markerscorresponds to a pro-tumorigenic expression profile in pan-creatic adenocarcinoma,” PLoS One, vol. 11, no. 7, articlee0159255, 2016.
[41] G. S. Wilson, Z. Hu, W. Duan et al., “Efficacy of using cancerstem cell markers in isolating and characterizing liver cancerstem cells,” Stem Cells and Development, vol. 22, no. 19,pp. 2655–2664, 2013.
[42] J. Ji, T. E. Werbowetski-Ogilvie, B. Zhong, S.-H. Hong, andM. Bhatia, “Pluripotent transcription factors possess distinctroles in normal versus transformed human stem cells,” PLoSOne, vol. 4, no. 11, article e8065, 2009.
[43] M. Zbinden, A. Duquet, A. Lorente-Trigos, S.-N. Ngwabyt,I. Borges, and A. Ruiz i Altaba, “NANOG regulates gliomastem cells and is essential in vivo acting in a cross-functional
11Oxidative Medicine and Cellular Longevity

network with GLI1 and p53,” The EMBO Journal, vol. 29,no. 15, pp. 2659–2674, 2010.
[44] D. Xie, Y. X. Zeng, H. J. Wang et al., “Amplification andoverexpression of epidermal growth factor receptor gene inglioblastomas of Chinese patients correlates with patient’sage but not with tumor’s clinicopathological pathway,” ActaNeuropathologica, vol. 110, no. 5, pp. 481–489, 2005.
[45] M. Vand Rajabpour, H. Yahyazadeh, and M. Beheshti,“Prognostic factors and survival of glioblastoma multiform(GBM) in Iranian patients,” International Journal of CancerManagement, vol. 10, article e6260, 2017.
12 Oxidative Medicine and Cellular Longevity

Review ArticleMesenchymal Stromal Cell Therapy for Pancreatitis: ASystematic Review
Sara M. Ahmed,1 Mahmoud Morsi ,2 Nehal I. Ghoneim,1 Mohamed M. Abdel-Daim ,3,4
and Nagwa El-Badri 1
1Center of Excellence for Stem Cells and Regenerative Medicine, Zewail City of Science and Technology, 6th of October, Giza, Egypt2Faculty of Medicine, Menoufia University, Shebin El Kom, Menoufia, Egypt3Pharmacology Department, Faculty of Veterinary Medicine, Suez Canal University, Ismailia 41522, Egypt4Department of Ophthalmology and Micro-Technology, Yokohama City University, Yokohama, Japan
Correspondence should be addressed to Nagwa El-Badri; [email protected]
Received 26 October 2017; Accepted 31 December 2017; Published 18 March 2018
Academic Editor: Tullia Maraldi
Copyright © 2018 Sara M. Ahmed et al. This is an open access article distributed under the Creative Commons AttributionLicense, which permits unrestricted use, distribution, and reproduction in any medium, provided the original work isproperly cited.
Background. Based on animal studies, adult mesenchymal stromal cells (MSCs) are promising for the treatment of pancreatitis.However, the best type of this form of cell therapy and its mechanism of action remain unclear. Methods. We searched thePubMed, Web of Science, Scopus, Google Scholar, and Clinical Trials.gov websites for studies using MSCs as a therapy for bothacute and chronic pancreatitis published until September 2017. Results. We identified 276 publications; of these publications, 18met our inclusion criteria. In animal studies, stem cell therapy was applied more frequently for acute pancreatitis than forchronic pancreatitis. No clinical trials were identified. MSC therapy ameliorated pancreatic inflammation in acute pancreatitisand pancreatic fibrosis in chronic pancreatitis. Bone marrow and umbilical cord MSCs were the most frequently administeredcell types. Due to the substantial heterogeneity among the studies regarding the type, source, and dose of MSCs used,conducting a meta-analysis was not feasible to determine the best type of MSCs. Conclusion. The available data were insufficientfor determining the best type of MSCs for the treatment of acute or chronic pancreatitis; therefore, clinical trials investigatingthe use of MSCs as therapy for pancreatitis are not warranted.
1. Background
Pancreatitis is characterized by the release of pancreaticdigestive enzymes from damaged exocrine cells and presentsclinically in the following two forms: acute and chronic.Acute pancreatitis is a common cause of acute abdomen,which is self-limited in most cases; only 10–15% of patientswith acute abdomen present with severe acute pancreatitis[1, 2]. Severe acute pancreatitis causes pancreatic tissuenecrosis and organ failure with a mortality rate of up to30–47% [1, 2]. Acute pancreatitis is induced by the acuteactivation of proenzymes in the pancreatic acinar cellsleading to the lysis of the pancreatic tissue [3]. Inflammatorypancreatitis is associated with the local production of inflam-matory cytokines, such as interleukin (IL)-1, IL-6, tumour
necrosis factor-α (TNF-α), and interferon-γ (IFN-γ) [4, 5].Remote organ failure results from the production of certaininflammatory chemokines, such as monocyte chemoattrac-tant protein-1 (MCP-1) and fractalkine (FKN) [4, 6, 7].Treatment strategies for acute pancreatitis remain lackingand are mainly conservative; in most cases, treatment islimited to fluid therapy and antibiotics in cases of infection.Nutritional support and prophylactic therapy are adminis-tered to prevent further pancreatic damage by inhibitingpancreatic enzyme synthesis and secretion [8, 9].
Chronic pancreatitis is a progressive condition that leadsto damage in both the endocrine and exocrine pancreatictissues and is complicated by diabetes (Type III) and exo-crine pancreatic insufficiency. Alcohol consumption, geneticmutations, and pancreatic duct obstruction are the most
HindawiOxidative Medicine and Cellular LongevityVolume 2018, Article ID 3250864, 14 pageshttps://doi.org/10.1155/2018/3250864

common risk factors for chronic pancreatitis [10]. Chronicpancreatitis is associated with chronic inflammation, lead-ing to pancreatic fibrosis, acinar gland atrophy, and pan-creatic duct obstruction [11]. Because pancreatic damagecannot be reversed, the treatment of chronic pancreatitisis mainly conservative.
Stem cell therapy has been considered for the treatmentof many intractable diseases. MSCs are adult stem cellsprimarily isolated from bone marrow [12]. MSCs canself-renew and undergo multilineage differentiation [12].According to the definition provided by the InternationalSociety for Cell Therapy, MSCs are characterized asplastic-adherent in standard culture conditions and canbe differentiated in vitro into osteoblasts, chondroblasts,and adipocytes [13–15]. MSCs express specific surfacemarkers, such as CD105, CD90, and CD73, but do notexpress CD45, CD34, CD14, CD11b, CD79 alpha, CD19, orHLA-DR. MSC-like cells have been isolated from othertissues, including the human placenta [16], peripheralblood [17], umbilical cord [18], adipose tissue [19], endome-trium [20], and pancreas [12, 21, 22]. MSCs have been usedfor the treatment of wound injury and acute inflammationbecause they engraft into wounds and contribute to theremodelling of injured tissues [12, 15]. MSCs reduce theacute inflammatory response via their immunomodulatoryeffect by secreting anti-inflammatory cytokines, suppressingproinflammatory cytokines, and regulating immune cellactivation [23–25]. MSCs suppress T cell proliferation andB cell maturation and activate regulatory T cells to furthersuppress the immune response in vitro [26, 27]. MSCsdecrease chronic inflammation and subsequent fibrosis viamultiple mechanisms, including the downregulation of theexpression of TGF-β1, which is a major regulator of chronicinflammation and fibrosis [28, 29]. MSCs also attenuate localhypoxia and oxidative stress [30, 31]. MSCs decrease thesecretion of collagen, which is the main constituent of theextracellular matrix (ECM), to ameliorate the excessive secre-tion of the ECM and its degradation during fibrosis [32, 33].MSCs exert their immunosuppressive effect by decreasingthe levels of anti-inflammatory cytokines and inhibiting theproduction of immunoglobulins and active immune cells[34, 35]. Furthermore, MSCs have been shown to specificallytranslocate to injured tissues and induce angiogenesis inischaemic tissues [36–38]. Given these advantages, MSCsare promising candidates for cell replacement therapy fortissue inflammation. Due to the lack of effective therapiesfor both acute and chronic pancreatitis and the highmortality rate associated with severe acute pancreatitis, anew therapeutic approach is highly desirable. Due to theiraccessibility, relative safety, and lack of ethical consider-ations, MSC therapy is the most common approach used inexperimental stem cell therapy. Here, we review studies thatinvestigated the effects of MSC transplantation in acute andchronic pancreatitis.
2. Method
2.1. Eligibility Criteria for Systematic Search. The eligibility ofthe studies was assessed by two independent reviewers in
duplicate. We included all studies describing in vivo exper-iments in which MSC transplantation was performed asthe therapeutic approach for either acute or chronic pan-creatitis. Review articles, hypotheses, conference abstracts,editorials, and studies describing only in vitro data wereexcluded. We also excluded in vitro studies using MSCtherapy in an in vitro model of pancreatitis, studies usingcell-free MSC derivatives, and articles written in languagesother than English.
2.2. Search Strategy and Study Selection. A systematic searchwas conducted following the recommendations by thePreferred Reporting Items for Systematic Reviews andMeta-Analyses (PRISMA) [39]. We searched PubMed, Sco-pus, Google Scholar, Web of Science, and Clinical trials.govfor articles published until September 2017. In addition, wemanually searched the reference lists of relevant reviewarticles for any study that may have been missed during thedatabase search. The following keywords were used: pan-creatitis, mesenchymal stromal cells, mesenchymal stemcells, acute pancreatitis, chronic pancreatitis, bone marrowmesenchymal stromal cells, umbilical cord mesenchymalcells, pancreatitis therapy, and stem cells. Three investigatorsindependently screened the titles and abstracts of thestudies identified in the systematic search to determinetheir relevance. After the initial screening, we retrievedthe relevant articles and assessed the articles according tothe eligibility criteria.
2.3. Data Extraction, Synthesis, and Analysis. Tworesearchers independently extracted the data using astandardized Excel sheet. Discrepancies were resolved byconsensus. We classified the studies according to the typeof pancreatitis, that is, acute or chronic. The primary out-come measures included signs of pancreatic damage afterthe infusion of MSCs, changes in the serum amylase andlipase levels, and histological changes in the pancreatic tissue.Pancreatic tissue fibrosis was the primary outcome assessedin chronic pancreatitis studies using MSC therapy. Thesecondary outcome measures included the type of MSCsused, the mechanism by which the MSC therapy was effectivein treating pancreatitis, and the effect of the cell infusion onmortality following acute pancreatitis. The extracted dataincluded the inclusion criteria; exclusion criteria; MSC type;route, source and dose of therapy; and outcome measures.Due to the heterogeneity of the data, conducting a meta-analysis was not feasible.
2.4. Risk of Bias Assessment. Two investigators assessed therisk of bias in individual studies using the Cochrane Risk ofBias tool [40]. The risk of bias was assessed as “low risk,”“high risk,” or “unclear risk.” The main items of bias wereas follows: (1) sequence generation, (2) allocation conceal-ment, (3) blinding of participants and personnel, (4) blindingof outcome assessors, (5) incomplete outcome data, (6) selec-tive outcome reporting, (7) source of funding, (8) conflicts ofinterest, and (9) sample size calculations. We used additionaldomains from the SYRCLE Risk of Bias Tool, which is atool used to assess the risk of bias in preclinical animal
2 Oxidative Medicine and Cellular Longevity

studies [41]. These domains included the following: (1)similarity of experimental groups, (2) random housing ofanimals, and (3) random animal selection for outcomeassessment. Disagreements between the investigators wereresolved by consensus.
3. Results
We identified 276 publications; of these publications, 122were duplicates and were removed. After reviewing the titlesand abstracts, we excluded 121 unrelated studies. Thirty-twopapers were eligible for a full-text review. We furtherexcluded 15 studies as follows: one study involved anin vitro experiment, one study used MSC microvesicles totreat pancreatitis, 6 publications were review articles, onearticle was a hypothesis paper, 5 papers were written in alanguage other than English, and one publication was a bookchapter. After the full-text review, only 18 studies met ourinclusion criteria (flow chart: Figure 1).
Of the 18 included studies, 16 studies used MSCs foracute pancreatitis, while only 3 eligible studies used MSCsas a therapy for chronic pancreatitis (one study used MSCsfor both acute and chronic pancreatitis) [42]. No previouslypublished or currently ongoing clinical trials investigatingMSC therapy for pancreatitis were identified. All includedstudies involved experimental animals. The most commonly
used types of MSC in the included studies were bone marrowand umbilical cord MSCs. Bone marrow MSCs (BM-MSCs)were administered to animals in 12 studies; of these studies,11 studies used BM-MSCs for the treatment of acutepancreatitis, and only one study used BM-MSCs for thetreatment of chronic pancreatitis. Umbilical cord MSCs(UCMSCs) were examined in four studies; of these studies,3 applied UCMSCs for the treatment of acute pancreatitis,and one applied UCMSCs for the treatment of chronicpancreatitis (Figure 2). The included studies used eitherrat or human MSCs, while one study used canine MSCs[43]. MSCs from rats were the most commonly used to treatpancreatitis (N = 11 studies; 8 investigating acute pancreatitisand 2 investigating chronic pancreatitis). Only 7 studies usedhuman MSC for pancreatitis therapy (6 studies investigat-ing acute pancreatitis and one study investigating chronicpancreatitis) (Figure 3). Among the 7 studies using humanMSCs, 3 studies administered BM-MSCs to investigate acutepancreatitis, 3 other studies administered UCMSCs toinvestigate acute pancreatitis, and 1 study administered foetalmembrane MSCs to investigate chronic pancreatitis.
3.1. MSC Therapy for Acute Pancreatitis. In 16 studies, MSCswere administered for the treatment of acute pancreatitis.Eleven studies used BM-MSCs [44–54], while 3 studies usedUCMSCs [55–57]. Of the 11 studies, one study administered
Studies included inqualitative synthesis(n = 18)
Full-text articles assessedfor eligibility(n = 33)
Records screened(n = 154)
Records a�er duplicates were removed(n = 154)
Records identified throughdatabase searching:(n = 276)
Unrelated studiesexcluded (n = 121)
Excluded papers: 1 in vitroexperiment, 1 study thatused MSC microvesicle totreatpancreatitis, 6 reviewarticles,1 hypothesis, 5 non-English, and 1 book chapter(n = 15)
Iden
tifica
tion
Scre
enin
gEl
igib
ility
Inclu
ded
Figure 1: A flow chart to show the eligible studies for inclusion in the review.
3Oxidative Medicine and Cellular Longevity

adipose-derived MSCs [43], and one study administeredfoetal membrane MSCs [42] (Table 1). Since acute pancreati-tis is a self-limited condition and pancreatic tissue damageoccurs only following severe acute pancreatitis, all includedstudies investigated the effect of MSC therapy in severe acutepancreatitis. Multiple methods of inducing severe acutepancreatitis were used: injection of Na-taurocholate (7studies) [44, 46, 47, 49, 50, 52], intraperitoneal injectionsof caerulein (2 studies) [29, 30], L-arginine-induced acutepancreatitis (one study) [33], and deoxy-STC injectionunder the pancreatic capsule (1 study) [51]. All 16 studiesshowed a reduction in pancreatic tissue damage, necrosis,inflammation, and oedema compared to those of the
untreated groups. In all 16 studies, the serum amylase andlipase levels were lower than those in the control groups.Fourteen of the 16 studies investigated the mechanismof action of the MSCs in alleviating the acute inflamma-tion and tissue damage following acute pancreatitis. Thestudies evaluated the effect of MSC transplantation onimmunomodulation, angiogenesis, and apoptosis as wellas the antioxidant effect and the homing of infused cells(Figure 4).
Eleven of the 16 studies used BM-MSCs as therapy forsevere acute pancreatitis [44–52]. Except for two studies[51, 52], well-characterized MSCs were infused into animalsusing defined surface markers and mesodermal differentia-tion according to the criteria of the International Society forCell Therapy. Nine of the 11 studies further evaluated themechanism of action of BM-MSCs following severe acutepancreatitis [44–49, 52]. Eight of the nine studies exam-ined the immunomodulatory mechanism of the infusedBM-MSCs. In 2 of the 8 studies, the infused BM-MSCsdownregulated the expression of proinflammatory markers,including nuclear transcription factor kappa B p65 (NF-κBp65), IL-1β, IL-6, TNF-α, TGF-β, NOS2, COX2, SPHK1IL-15, and IL-17 [44, 49]. One study showed that humanclonal BM-MSCs suppressed T cell proliferation andincreased the expression of Foxp3 regulatory T cells in pan-creatic tissue with mild or severe acute pancreatitis [44].One study showed that the infusion of rat BM-MSCsincreased the expression of anti-inflammatory cytokines,such as IL-10, following acute pancreatitis [48]. Anotherstudy demonstrated that microRNA-9-modified BM-MSCs(pri-miR-9-BM-MSCs) could further ameliorate pancreaticdamage in severe acute pancreatitis [54]. The pri-miR-9-BM-MSCs decreased the local and serum proinflammatoryresponse (TNF-α, IL-1β, IL-6, HMGB1, MPO, and CD68),increased the levels of anti-inflammatory cytokines (IL-4,IL-10, and TGF-β), and enhanced the regeneration of thedamaged pancreas. Furthermore, these pri-miR-9-BM-MSCscould deliver miR-9 to the damaged pancreas and peripheralblood mononuclear cells (PBMCs) and inhibit the NF-κBsignalling pathway [54]. Three of the eleven studies adminis-tered BM-MSCs as therapy for severe acute pancreatitis, andthe BM-MSCs increased antioxidant activities, such assuperoxide dismutase (SOD) and glutathione peroxidase(GPx) [45, 51, 54]. In one study, human clonal BM-MSCs decreased the levels of malondialdehyde (MDA),which is a product of lipid peroxidation that increasesduring acute pancreatitis [45]. Two of the eleven studiesadministered BM-MSCs as a therapy for severe acute pan-creatitis and showed that human BM-MSCs used as atherapy for acute pancreatitis enhance neovascularizationand angiogenesis [46, 47]. After the administration ofBM-MSCs pretreated with stromal-cell-derived factor 1α(SDF-1α), the expression of angiogenesis markers (CD31,VEGF, and vWF) was increased in the pancreatic tissue[46]. Compared with untreated BM-MSCs, the supernatantfrom human BM-MSCs pretreated with SDF-1α signifi-cantly promoted angiogenesis in vitro [46]. In one study,human BM-MSCs transfected with TSG-6 were infusedto treat severe acute pancreatitis based on the premise that
Acute pancreatitisChronic pancreatitis
Type of MSCs
Bone marrowMSCs
Umbilical cordMSCs
AdiposeMSCs
Fetal membraneMSCs
0
2
4
6
8
10
12
14
16
18
Num
ber o
f stu
dies
Figure 2: Number of studies according to the type of MSCs used totreat pancreatitis.
Canine adiposeMSCs
Human MSCs
Source of MSCs
Rat MSCs
Num
ber o
f stu
dies
02468
1012141618
Acute pancreatitisChronic pancreatitis
Figure 3: Number of studies according to the source of MSCs usedto treat pancreatitis.
4 Oxidative Medicine and Cellular Longevity
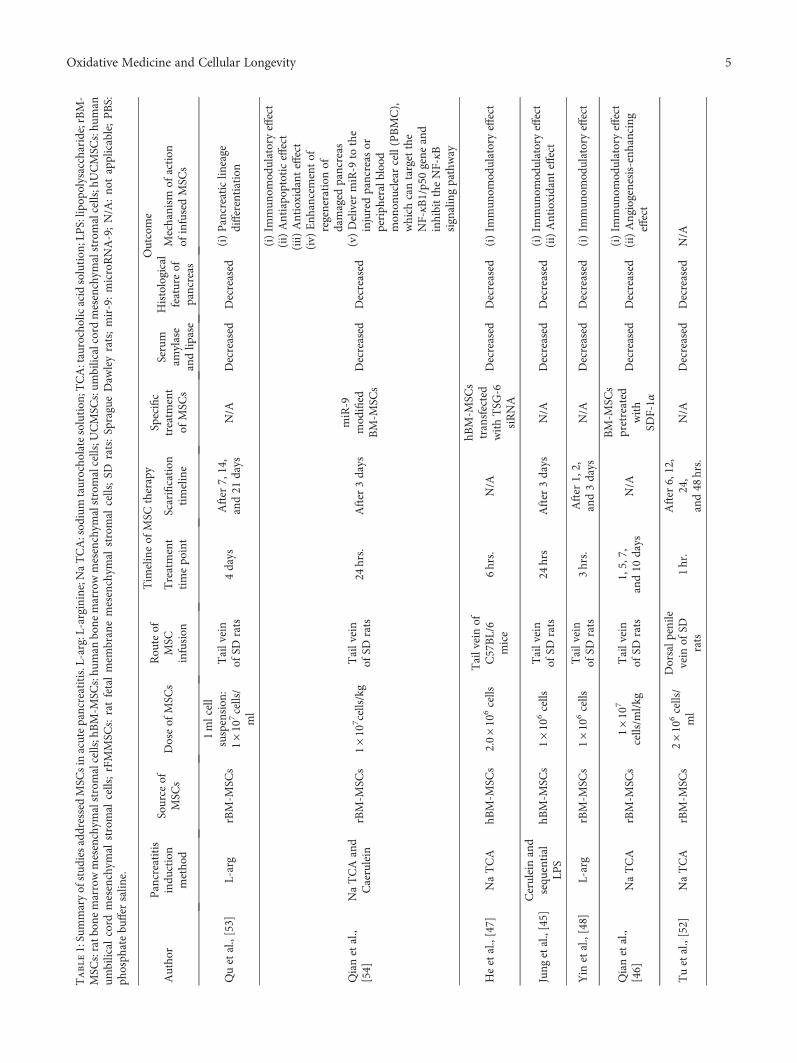
Table1:Summaryofstud
iesaddressedMSC
sin
acutepancreatitis.L-arg:L-arginine;NaTCA:sod
ium
taurocho
latesolution
;TCA:taurocholicacidsolution
;LPS:lip
opolysaccharide;rBM-
MSC
s:ratb
onemarrowmesenchym
alstromalcells;hBM-M
SCs:hu
man
bone
marrowmesenchym
alstromalcells;U
CMSC
s:um
bilicalcord
mesenchym
alstromalcells;hUCMSC
s:hu
man
umbilical
cord
mesenchym
alstromal
cells;rFMMSC
s:ratfetalmem
branemesenchym
alstromal
cells;SD
rats:SpragueDaw
leyrats;mir-9:microRNA-9;N/A
:no
tapplicable;PBS:
phosph
atebu
ffer
salin
e.
Autho
rPancreatitis
indu
ction
metho
d
Source
ofMSC
sDoseof
MSC
sRou
teof
MSC
infusion
Tim
elineof
MSC
therapy
Specific
treatm
ent
ofMSC
s
Outcome
Treatment
timepo
int
Scarification
timeline
Serum
amylase
andlip
ase
Histological
featureof
pancreas
Mechanism
ofaction
ofinfusedMSC
s
Quetal.,[53]
L-arg
rBM-M
SCs
1mlcell
suspension
:1×10
7cells/
ml
Tailvein
ofSD
rats
4days
After
7,14,
and21
days
N/A
Decreased
Decreased
(i)Pancreaticlin
eage
differentiation
Qianetal.,
[54]
NaTCAand
Caerulein
rBM-M
SCs
1×10
7 cells/kg
Tailvein
ofSD
rats
24hrs.
After
3days
miR-9
mod
ified
BM-M
SCs
Decreased
Decreased
(i)Im
mun
omod
ulatoryeffect
(ii)Antiapo
ptoticeffect
(iii)
Antioxidant
effect
(iv)
Enh
ancementof
regeneration
ofdamaged
pancreas
(v)Deliver
miR-9
tothe
injuredpancreas
orperiph
eralblood
mon
onuclear
cell(PBMC),
which
cantargetthe
NF-κB
1/p50gene
and
inhibittheNF-κB
signalingpathway
Heetal.,[47]
NaTCA
hBM-M
SCs
2.0×10
6cells
Tailveinof
C57BL/6
mice
6hrs.
N/A
hBM-M
SCs
transfected
withTSG
-6siRNA
Decreased
Decreased
(i)Im
mun
omod
ulatoryeffect
Jung
etal.,[45]
Ceruleinand
sequ
ential
LPS
hBM-M
SCs
1×10
6cells
Tailvein
ofSD
rats
24hrs
After
3days
N/A
Decreased
Decreased
(i)Im
mun
omod
ulatoryeffect
(ii)Antioxidant
effect
Yin
etal.,[48]
L-arg
rBM-M
SCs
1×10
6cells
Tailvein
ofSD
rats
3hrs.
After
1,2,
and3days
N/A
Decreased
Decreased
(i)Im
mun
omod
ulatoryeffect
Qianetal.,
[46]
NaTCA
rBM-M
SCs
1×10
7
cells/m
l/kg
Tailvein
ofSD
rats
1,5,7,
and10
days
N/A
BM-M
SCs
pretreated
with
SDF-1α
Decreased
Decreased
(i)Im
mun
omod
ulatoryeffect
(ii)Angiogenesis-enhancing
effect
Tuetal.,[52]
NaTCA
rBM-M
SCs
2×10
6cells/
ml
Dorsalp
enile
vein
ofSD
rats
1hr.
After
6,12,
24,
and48
hrs.
N/A
Decreased
Decreased
N/A
5Oxidative Medicine and Cellular Longevity

Table1:Con
tinu
ed.
Autho
rPancreatitis
indu
ction
metho
d
Source
ofMSC
sDoseof
MSC
sRou
teof
MSC
infusion
Tim
elineof
MSC
therapy
Specific
treatm
ent
ofMSC
s
Outcome
Treatment
timepo
int
Scarification
timeline
Serum
amylase
andlip
ase
Histological
featureof
pancreas
Mechanism
ofaction
ofinfusedMSC
s
Chenetal.,
[50]
NaTCA
BM-M
SCs
(sou
rceno
tspecified)
1×10
6cells
Tailvein
ofSD
rats
0hr.
After
6hrs.
N/A
Decreased
Decreased
N/A
0,6hrs.
After
12hrs.
0,6,and12
hrs.
After
24hrs.
Tuetal.,[51]
Deoxy-STC
rBM-M
SCs
2mlcell
suspension
:1×10
6cells/
ml
Tailvein
ofSD
rats
N/A
After
6,24,
and72
hrs.
N/A
Decreased
Decreased
(i)Im
mun
omod
ulatoryeffect
(ii)Antioxidant
effect
Zhaoetal.,
[49]
TCA
rBM-M
SCs
5–7×10
7cells
Tailvein
ofSD
rats
24hrs.
After
72hrs.
N/A
Decreased
Decreased
(i)Im
mun
omod
ulatoryeffect
Jung
etal.,[44]
Mild
acute
pancreatitis:
cerulein
Severe
acute
pancreatitis:
NaTCA
hBM-M
SCs
N/A
Tailvein
ofSD
rats
N/A
After
3days
N/A
Decreased
Decreased
(i)Im
mun
omod
ulatoryeffect
(ii)Antiapo
ptoticeffect
(apo
ptosisof
acinar
cells
was
redu
cedin
severe
acutepancreatitisthan
inmild
acutepancreatitis)
Hua
etal.,[57]
NaTCA
hUCMSC
s1×10
6cells
in200μlsaline
Tailvein
ofSD
rats
12hrs
After
3days
ANGPT1-
transfected
hUCMSC
sDecreased
Decreased
(i)Im
mun
omod
ulatoryeffect
(ii)Angiogenesis-enhancing
effect
Yangetal.,
[56]
NaTCA
hUCMSC
s
5×10
6cells/kg
Tailvein
ofSD
rats
0,1,6,and
12hrs
After
48hrs.
N/A
Decreased
Decreased
(i)Im
mun
omod
ulatoryeffect
5×10
4 ,5×10
6 ,and
1×10
7cells/kg
1hr
5×10
66hrs
Mengetal.,
[55]
NaTCA
hUSM
SCs
1×10
7cells/kg
Tailvein
ofSD
rats
12hrs
After
1,3,
and5days
N/A
Decreased
Decreased
(i)Antiapo
ptoticeffect
(reduceacinar
cell
apop
tosis)
(ii)Im
mun
omod
ulatoryeffect
Kim
etal.,[43]
NaTCA
Canine
adipose
tissue-derived
MSC
s
2×10
6cells/kg
in200μlP
BS
Tailvein
ofSD
rats
N/A
After
3days
N/A
Decreased
Decreased
(i)Im
mun
omod
ulatoryeffect
Ketal.,2016
TCA
rFMMSC
s1×10
6cells
in200ul
PBS
Penile
vein
ofAugust
Cop
enhagen
Irishrats
N/A
After
4days
N/A
Decreased
Decreased
(i)Im
mun
omod
ulatoryeffect
6 Oxidative Medicine and Cellular Longevity
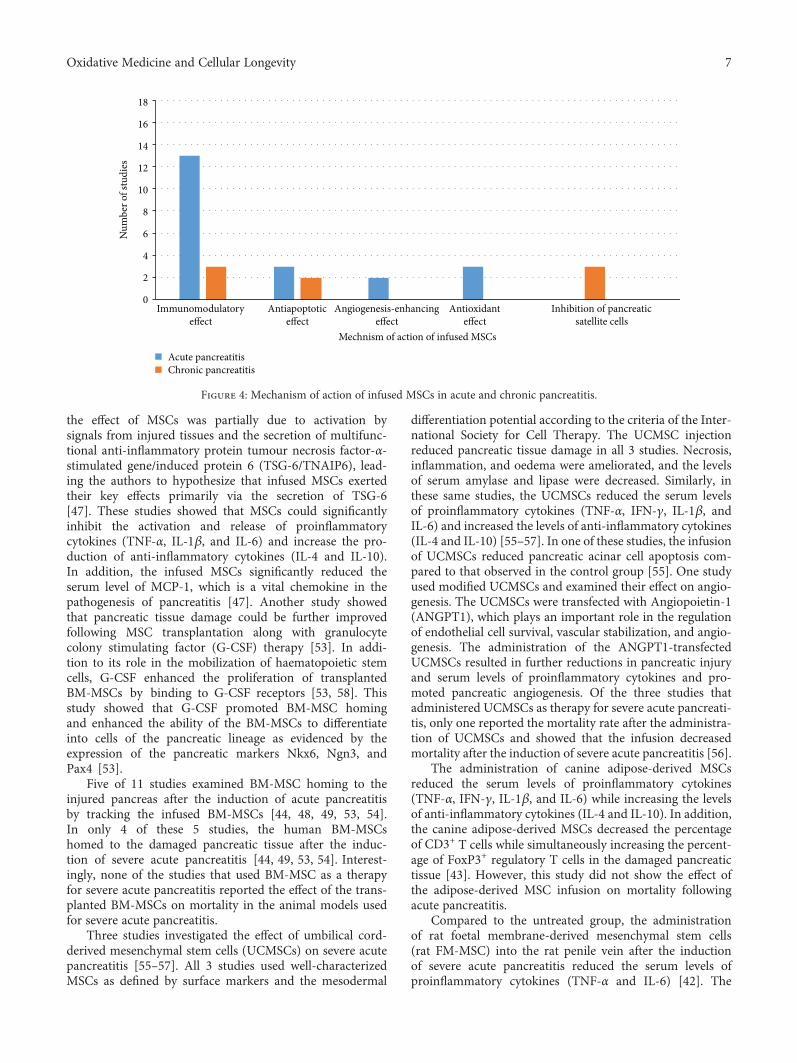
the effect of MSCs was partially due to activation bysignals from injured tissues and the secretion of multifunc-tional anti-inflammatory protein tumour necrosis factor-α-stimulated gene/induced protein 6 (TSG-6/TNAIP6), lead-ing the authors to hypothesize that infused MSCs exertedtheir key effects primarily via the secretion of TSG-6[47]. These studies showed that MSCs could significantlyinhibit the activation and release of proinflammatorycytokines (TNF-α, IL-1β, and IL-6) and increase the pro-duction of anti-inflammatory cytokines (IL-4 and IL-10).In addition, the infused MSCs significantly reduced theserum level of MCP-1, which is a vital chemokine in thepathogenesis of pancreatitis [47]. Another study showedthat pancreatic tissue damage could be further improvedfollowing MSC transplantation along with granulocytecolony stimulating factor (G-CSF) therapy [53]. In addi-tion to its role in the mobilization of haematopoietic stemcells, G-CSF enhanced the proliferation of transplantedBM-MSCs by binding to G-CSF receptors [53, 58]. Thisstudy showed that G-CSF promoted BM-MSC homingand enhanced the ability of the BM-MSCs to differentiateinto cells of the pancreatic lineage as evidenced by theexpression of the pancreatic markers Nkx6, Ngn3, andPax4 [53].
Five of 11 studies examined BM-MSC homing to theinjured pancreas after the induction of acute pancreatitisby tracking the infused BM-MSCs [44, 48, 49, 53, 54].In only 4 of these 5 studies, the human BM-MSCshomed to the damaged pancreatic tissue after the induc-tion of severe acute pancreatitis [44, 49, 53, 54]. Interest-ingly, none of the studies that used BM-MSC as a therapyfor severe acute pancreatitis reported the effect of the trans-planted BM-MSCs on mortality in the animal models usedfor severe acute pancreatitis.
Three studies investigated the effect of umbilical cord-derived mesenchymal stem cells (UCMSCs) on severe acutepancreatitis [55–57]. All 3 studies used well-characterizedMSCs as defined by surface markers and the mesodermal
differentiation potential according to the criteria of the Inter-national Society for Cell Therapy. The UCMSC injectionreduced pancreatic tissue damage in all 3 studies. Necrosis,inflammation, and oedema were ameliorated, and the levelsof serum amylase and lipase were decreased. Similarly, inthese same studies, the UCMSCs reduced the serum levelsof proinflammatory cytokines (TNF-α, IFN-γ, IL-1β, andIL-6) and increased the levels of anti-inflammatory cytokines(IL-4 and IL-10) [55–57]. In one of these studies, the infusionof UCMSCs reduced pancreatic acinar cell apoptosis com-pared to that observed in the control group [55]. One studyused modified UCMSCs and examined their effect on angio-genesis. The UCMSCs were transfected with Angiopoietin-1(ANGPT1), which plays an important role in the regulationof endothelial cell survival, vascular stabilization, and angio-genesis. The administration of the ANGPT1-transfectedUCMSCs resulted in further reductions in pancreatic injuryand serum levels of proinflammatory cytokines and pro-moted pancreatic angiogenesis. Of the three studies thatadministered UCMSCs as therapy for severe acute pancreati-tis, only one reported the mortality rate after the administra-tion of UCMSCs and showed that the infusion decreasedmortality after the induction of severe acute pancreatitis [56].
The administration of canine adipose-derived MSCsreduced the serum levels of proinflammatory cytokines(TNF-α, IFN-γ, IL-1β, and IL-6) while increasing the levelsof anti-inflammatory cytokines (IL-4 and IL-10). In addition,the canine adipose-derived MSCs decreased the percentageof CD3+ T cells while simultaneously increasing the percent-age of FoxP3+ regulatory T cells in the damaged pancreatictissue [43]. However, this study did not show the effect ofthe adipose-derived MSC infusion on mortality followingacute pancreatitis.
Compared to the untreated group, the administrationof rat foetal membrane-derived mesenchymal stem cells(rat FM-MSC) into the rat penile vein after the inductionof severe acute pancreatitis reduced the serum levels ofproinflammatory cytokines (TNF-α and IL-6) [42]. The
Immunomodulatoryeffect
Angiogenesis-enhancingeffect
Antiapoptoticeffect
Antioxidanteffect
Mechnism of action of infused MSCs
Acute pancreatitisChronic pancreatitis
Inhibition of pancreaticsatellite cells
0
2
4
6
8
10
12
14
16
18
Num
ber o
f stu
dies
Figure 4: Mechanism of action of infused MSCs in acute and chronic pancreatitis.
7Oxidative Medicine and Cellular Longevity

rat FM-MSCs also reduced the number of CD68+ cells [42].However, this study did not show the effect of MSC infusionon mortality following acute pancreatitis.
Due to heterogeneity in the administered MSCs, theirdose, the frequency of administration, the sources and typesof MSCs, and the method of the induction of pancreatitis, avalid comparison among the different protocols is challeng-ing. We could not statistically compare the different typesof MSCs to determine the superiority of any one type ofMSCs in achieving a favourable therapeutic outcome inacute pancreatitis.
3.2. MSC Therapy for Chronic Pancreatitis. The literaturesearch resulted in only 3 studies in which MSCs were admin-istered for the treatment of chronic pancreatitis. In the threestudies, chronic pancreatitis was induced in Sprague Dawleyrats by an intravenous injection of dibutyltin dichloride viathe penile vein [42, 59, 60]. The sources of the MSCsincluded rat umbilical cord MSCs [60], human amnion-derived MSCs (hAMSCs) [42], and rat BM-MSCs [59](Table 2). All three studies showed reduced pancreaticdamage and decreased fibrosis after the administration ofthe stem cells [42, 59, 60]. In all studies, this effect wasconsidered a result of the inhibition of the pancreatic satellitecells. The injection of rat UCMSCs lowered the expression ofmonocyte chemoattractant protein 1 (MCP-1), vascularcell adhesion molecule 1 (VCAM-1), intercellular adhesionmolecule 1 (ICAM-1), IL-6, and TNF-α [60]. The trackingof the infused rat UCMSCs using carboxyfluorescein succi-nimidyl ester (CFSE) dye revealed that these cells homedto and engrafted the damaged pancreatic tissue [60]. Inanother study, nuclear factor kappa Β (NF-kΒ), which isan important regulator of the inflammatory response andapoptosis, was inactivated in rat UCMSCs using the inhib-itor IκBαM. The modified UCMSCs, called IκBαM-MSCs,were then infused to treat chronic pancreatitis in a ratmodel. IκBαM-MSCs reduced the levels of proinflamma-tory cytokines, such as IL-1, IL-6, IL-8, FN, TIMP-1,TIMP-2, TNF-α, CTGF, ICAM-1, and TGF-β1; increasedthe levels of anti-inflammatory cytokines, such as IL-10;and promoted apoptosis in pancreatic stellate cells [59].This effect was greater than that achieved by injection of ratUCMSCs alone [59].
3.3. Assessment of Risk of Bias and Methodological Quality.By assessing the methodological quality and risk of bias ineach included study (Figure 5), we found that allocationconcealment was not performed in any of the reported stud-ies. In addition, a description of the blinding of the personnelwho conducted the animal experiments was not included inany of the studies. Seven of the 18 studies (38.9%) blindedthe assessors of the outcome (27.8% of the studies investi-gating acute pancreatitis, N = 5 and 11.1% of the studiesinvestigating chronic pancreatitis, N = 2). The remainingstudies were evaluated in an unclear manner due to thelack of data regarding their method of blinding. Only 2of the 18 studies (11.1%) (both were used for the treat-ment of acute pancreatitis) were assessed as having a lowrisk for bias for incomplete outcome data, since the number
of animals reported was consistent between the methods andresults. The studies addressing chronic pancreatitis were eval-uated as unclear for the risk of bias since the number of ani-mals was not reported in either Method or Results; thus,sufficient data were not available to assess this feature. Sixteenof the 18 studies (88.9%) (72.2%, N = 13 in which MSC ther-apy was applied for acute pancreatitis and 2 studies, 11.1%in which MSC therapy was applied for chronic pancreati-tis) were assessed as having a low risk of bias for selectivereporting of the data. In Method, the serum amylase andlipase levels along with the histological scoring or pancre-atic fibrosis (in case of chronic pancreatitis) as the prespe-cified outcome measure were reported. In only one study(using MSCs as a therapy for chronic pancreatitis), theserum amylase and lipase levels, along with the histologicalscoring, were presented in Results but unmentioned as anoutcome in Method.
Only 5 of the 18 studies (27.7%) reported that thebaseline severity of the disease was equal between the testand control groups (16.7%, N = 3 for MSC therapy for acutepancreatitis, and 11.1%, N = 2 using MSC therapy forchronic pancreatitis). Fourteen of the 18 studies (77.8%)had nonindustry sources of funding (61.1%, N = 11 fortherapy for acute pancreatitis, 16.7%, N = 3 for chronicpancreatitis). Eleven of the 18 studies (61.1%) reported noconflicts of interest (50%, N = 9 for therapy for acutepancreatitis, and 11.1%, N = 2 for chronic pancreatitis),while 6 of the 18 studies reported a potential conflict ofinterest (all 6 were studies investigating acute pancreatitis,N = 4 BM-MSC therapy for acute pancreatitis, and N = 2UCMSC therapy for acute pancreatitis). Only 6 studies(33.3%) (22.2%, N = 4 for acute pancreatitis, and 11.1%,N = 2 for chronic pancreatitis) reported a justification fortheir sample size selection (22.2%, N = 4 for acute pancre-atitis, and 11.1%, N = 2 for chronic pancreatitis), while inthe remaining studies, no calculation of sample size wasperformed. Only 2 studies (11.1%) reported that the ani-mals used in the study were randomized (N = 2 for MSCtherapy for acute pancreatitis). Due to the limited numberof studies that reported internal validity practices, wecould not proceed with an analysis to identify the effectsof high versus low risks of bias on the effect size.
4. Discussion and Conclusion
In this study, we systematically reviewed studies investigatingthe effect of MSC therapy on acute and chronic pancreatitis.The impetus of this study was the absence of therapeuticstrategies for pancreatitis and the promising therapeuticeffect of MSCs. The current conservative therapy used forpancreatitis is effective in relieving the acute process ofthe disease and reducing patient mortality. However, thisconservative therapy does not ensure a complete cure.Indeed, resistant chronic pancreatitis is often a sequela ofthe disease. The benefits of MSC therapy for pancreatitisinclude the amelioration of the local inflammatory processand damage to acinar cells in acute pancreatitis, and henceMSC therapy may limit the extent of fibrosis in chronic
8 Oxidative Medicine and Cellular Longevity

Table2:Summaryof
stud
iesaddressedMSC
sin
chronicpancreatitis.hFM
MSC
s:hu
man
fetalm
embranemesenchym
alstromalcells;rBM-M
SCs:ratb
onemarrowmesenchym
alstromal
cell;rU
CMSC
s:ratum
bilicalcord
mesenchym
alstromalcells;P
BS:ph
osph
atebu
ffer
salin
e;SD
rats:Sprague
Daw
leyrats;N
/A:n
otapplicable
Autho
rMetho
dof
indu
ction
ofpancreatitis
Source
ofMSC
sDoseof
infusedMSC
s
Rou
teof
MSC
infusion
Tim
elineof
MSC
therapy
Specifictreatm
ent
ofMSC
s
Outcome
Infusion
timepo
int
Scarification
timepo
int
Pancreatic
fibrosis
Mechanism
ofaction
ofinfusedMSC
s
Ketal.,
2016
Dibutyltin
dichloride
hFMMSC
s1×10
6cells
in200μlP
BS
Penile
vein
ofSD
rats
Onday5
Day
14N/A
Decreased
(i)Im
mun
omod
ulatoryeffect
(ii)Inhibition
ofactivation
ofpancreaticsatellitecells
Qin
etal.,
[59]
N/A
rBM-
MSC
sN/A
N/A
Group
1:4hrs.before
chronicpancreatitis
Group
2:du
ring
chronicpancreatitis
Group
3:4hrs.after
chronicpancreatitis
N/A
BM-M
SCswere
transfectedwith
IkBαM
(i)Im
mun
omod
ulatoryeffect
(ii)Antiapo
ptoticeffect:
redu
cedacinar
cell
apop
tosis
(iii)
Inhibition
ofactivation
ofpancreaticsatellitecells
Zho
uetal.,[60]
Dibutyltin
dichloride
rUCMSC
s1×10
6
cells/m
lJugularvein
ofSD
rats
Onday5
Ondays
14and28
rUCMSC
sinjected
throughjugularvein
(i)Im
mun
omod
ulatoryeffect
(ii)Antiapo
ptoticeffect:
redu
cedacinar
cell
apop
tosis
(iii)
Inhibition
ofactivation
ofpancreaticsatellitecells
9Oxidative Medicine and Cellular Longevity

pancreatitis. Recently, MSCs have been shown to be capableof replacing damaged pancreatic cells [53].
All studies were performed in rodents and showedpronounced heterogeneity in the outcome assessment; hence,conducting a meta-analysis was not feasible. Heterogeneitywas observed in the technique used to induce pancreatitis,the type of MSCs used, the time of therapy after the diseaseonset, the source of the MSCs (human or murine), and thedose of the MSCs. Due to the lack of consistency, deter-mining the most effective form of MSC therapy for pan-creatitis is challenging. Similarly, none of the studiesinvestigating chronic pancreatitis evaluated the efficacy ofMSC therapy in a dose-dependent manner or followedup on the disease progression.
The included studies failed to address selection bias anddetection bias using techniques such as randomization,blinding, and sample size calculations. These limitations inthe study methodologies may have led to an exaggerationof the reported therapeutic effect [61–65]. Thus, thesefactors should be evaluated in future preclinical studiesto ensure the validity of these studies because the currentlyavailable data do not sufficiently warrant the use of MSCsin clinical trials.
The mechanism of action of MSC therapy in both typesof pancreatitis was confined to immunomodulatory effectsmediated by the secretion of pro- and anti-inflammatorycytokines (Figure 4). No sufficient data were availableregarding the interaction between MSCs and local immunecells. CD4+ T cells have been found to play a critical rolein the development of tissue injury during acute pancreatitisin mice since the severity of pancreatitis is ameliorated byCD4+ T cell depletion [66]. MSCs have indeed beenshown to suppress CD4+ T cell proliferation via multiplesoluble factors or in a cell contact-dependent manner[67]. The favourable role of MSCs in the suppression ofCD4+ T cell proliferation in acute pancreatitis warrantsfurther investigation.
Necrosis of acinar cells, which is accompanied by therelease of digestive enzymes, is the basic mechanism underly-ing the pathology of severe acute pancreatitis. In total, 3studies showed that MSCs reduce oxidative stress, account-ing for most of the damage to acinar cells [45, 51, 68]. Intwo other studies, the antiapoptotic effect of MSCs on acinar
cells was documented [44, 55]. However, the mechanismby which MSCs exert this effect on acinar cells duringacute pancreatitis remains unknown. Recent reports sug-gest that MSCs exert their antiapoptotic effect by secretingthe antiapoptotic chemokine XCL1 [69]. Mouse skeletalmyoblasts cocultured with MSCs showed very high resis-tance to apoptosis. This mechanism was mediated by thesecretion of XCL1 by MSCs [69].
The tracking of the infused MSCs was important fordetermining their possible mechanism of action, particularlysince numerous reports suggest that MSCs exert theirregenerative effect via a paracrine, immunosuppressive effectrather than by directly differentiating into tissue-specific cells(in this case, pancreatic cells) [70]. A substantial body ofliterature reports that most intravenously infused MSCsbecome trapped in the lungs, raising many questions regard-ing their direct role in tissue regeneration [25, 44, 46, 47]. Astudy by Gong et al. showed that SDF-1, a critical regulatorfor MSC migration, is upregulated in injured pancreasfollowing acute pancreatitis. SDF-1 enhanced BM-MSCmigration in vitro as well as in vivo to injured pancreasduring acute pancreatitis through their receptor: CXCchemokine receptor-4 (CXCR-4). BM-MSCs treated withanti CXCR-4 antibody showed less migration in vitro andless capability to migrate and to heal injured pancreas incomparison to untreated group, suggesting that SDF/CXCR4axis may be important in regulation of MSC migration fol-lowing acute pancreatitis [71].
Both marrow MSCs and UCMSCs lead to reduction ininflammation associated with acute pancreatitis along withenhanced angiogenesis when administered intravenously toaffected rats. These MSCs ameliorate inflammation, whichis likely one of the most obvious applications of MSCtherapy in pancreatitis. In He et al. study, BM-MSCs weretransfected with TSG-6 resulting in a significantly enhancedimmunomodulatory function and improved effectiveness intreating severe acute pancreatitis [47]. TSG-6 has a potentanti-inflammatory effect with no apparent toxicity [72–74]and is thus a potentially effective therapy for severe acutepancreatitis. Human adipose-derived stem cells (HADSCs)may have potential to reduce inflammation through theirimmunomodulatory [75–77] and angiogenesis-enhancingeffect [78] in addition to the secretion of growth factors
Random sequence generation (selection bias)Allocation concealment (selection bias)
Blinding of personnelBlinding of outcome assessment
Incomplete outcome dataSelective reporting
Baseline characteristicsRandom housing
Source of fundingConflict of interest
Sample size calculation
0%
Low risk of biasUnclear risk of biasHigh risk of bias
25% 50% 75% 100%
Figure 5: Risk of bias assessment for included studies.
10 Oxidative Medicine and Cellular Longevity

that promote repair [79]. Although these data suggest thatHADSCs have a therapeutic potential in acute pancreatitis[80], no sufficient studies investigating the effect of HADSCtherapy in acute pancreatitis have been reported.
In addition to morbidity, mortality is an importantparameter in evaluating new therapies, particularly in a debil-itating diagnosis, such as severe acute pancreatitis. Mortalityis a frequent sequela (may reach up to 30–47%) of acutepancreatitis due to the complications of organ failure andtissue necrosis [1, 2]. Most evaluated studies did not assessmortality after the MSC infusion. Because the first 24 hoursafter the onset of acute pancreatitis are critical for prognosis[81], the therapeutic effect of the injected MSCs should beevaluated within this time frame. Studies investigating MSCtherapy have shown that the time frame for the maximumtherapeutic effect is an important determining factor, andearly intervention is almost always necessary [82]. Indeed,only a few studies evaluated the outcome of MSC admin-istration within 24 hours of the induction of severe acutepancreatitis [47, 50, 52, 55–57].
Unlike acute pancreatitis, very few (only 3) studiesevaluated MSC therapy in chronic pancreatitis [42, 59, 60].Interestingly, all 3 studies showed the promising potentialof MSCs in decreasing the fibrosis that complicated chronicinflammation. MSCs appeared to exert their immunomod-ulatory effect on profibrotic factors, such as oxidativestress, hypoxia, and the transforming growth factor-β1pathway [83].
Due to the significant therapeutic effect of MSCs andthe lack of treatments for pancreatitis, the currently availabledata suggest that MSCs may be an attractive source of celltherapy for both acute and chronic pancreatitis. The rela-tive safety of the protocol, particularly using autologousstem cells, coupled with the lack of effective traditionaltherapeutic approaches, merit clinical trials. However, thestandardization of the therapy in the experimental settingis clearly lacking.
Disclosure
This work was presented as an oral presentation at 21st PanArab Conference on Diabetes, March 21–24, 2017.
Conflicts of Interest
Authors declare no competing financial interests.
Authors’ Contributions
Sara M. Ahmed and Nagwa El-Badri conceived the idea;determined the inclusion and exclusion criteria, systematicsearch plan, and literature screening for eligibility; preparedthe data extraction excel sheet and data extraction; and wroteand revised the whole paper. Mohamed M. Abdel-Daimcritically revised the paper. Mahmoud Morsi helped in dataextraction and literature screening for eligibility, preparedgraphs, prepared risk assessment graph, revised the paper,and shared in writing Results and tables. Nehal I. Ghoneim
helped in literature screening for eligibility, prepared risk ofassessment graph, and revised the paper.
Acknowledgments
This work has been supported by Grant no. 5300 from theScience and Technology Development Fund.
References
[1] M. S. Petrov, S. Shanbhag, M. Chakraborty, A. R. J. Phillips,and J. A. Windsor, “Organ failure and infection of pancreaticnecrosis as determinants of mortality in patients with acutepancreatitis,” Gastroenterology, vol. 139, no. 3, pp. 813–820,2010.
[2] C. E. Forsmark and J. Baillie, “AGA Institute technical reviewon acute pancreatitis,” Revista de Gastroenterología de México,vol. 72, no. 3, pp. 257–285, 2007.
[3] Y. C. Chan and P. S. Leung, “Acute pancreatitis: animal modelsand recent advances in basic research,” Pancreas, vol. 34, no. 1,pp. 1–14, 2007.
[4] T. Ishibashi, H. Zhao, K. Kawabe et al., “Blocking of monocytechemoattractant protein-1 (MCP-1) activity attenuates theseverity of acute pancreatitis in rats,” Journal of Gastroenterol-ogy, vol. 43, no. 1, pp. 79–85, 2008.
[5] J. L. Frossard, M. L. Steer, and C. M. Pastor, “Acute pancreati-tis,” Lancet, vol. 371, no. 9607, pp. 143–152, 2008.
[6] L. Huang, P. Chen, L. Xu, Y. Zhou, Y. Zhang, and Y. Yuan,“Fractalkine upregulates inflammation through CX3CR1 andthe Jak–Stat pathway in severe acute pancreatitis rat model,”Inflammation, vol. 35, no. 3, pp. 1023–1030, 2012.
[7] L. Huang, J. Ma, Y. Tang et al., “siRNA-based targeting of frac-talkine overexpression suppresses inflammation developmentin a severe acute pancreatitis rat model,” International Journalof Molecular Medicine, vol. 30, no. 3, pp. 514–520, 2012.
[8] J. Baillie, “AGA Institute medical position statement on acutepancreatitis,” Gastroenterology, vol. 132, no. 5, pp. 2019–2021, 2007.
[9] C. Y. Wang and Y. P. Zhao, “The guidelines interpretationfor diagnosis and treatment of severe acute pancreatitis,”Zhonghua Wai Ke Za Zhi, vol. 51, no. 3, pp. 198–200, 2013.
[10] E. Afghani, “Introduction to pancreatic disease: chronicpancreatitis,” in Pancreapedia: Exocrine Pancreas KnowledgeBase, The Exocrine Pancreas Knowledge Base, USA, 2015.
[11] M. W. Büchler, H. Freiss, and W. Uhl, Chronic Pancreatitis:Novel Concepts in Biology and Therapy, Blackwell Publishing,Oxford, UK, 2002.
[12] K. L. Seeberger, J. M. Dufour, A. M. J. Shapiro, J. R. T. Lakey,R. V. Rajotte, and G. S. Korbutt, “Expansion of mesenchymalstem cells from human pancreatic ductal epithelium,” Labora-tory Investigation, vol. 86, no. 2, pp. 141–153, 2006.
[13] M. Dominici, K. Le Blanc, I. Mueller et al., “Minimal criteriafor defining multipotent mesenchymal stromal cells. TheInternational Society for Cellular Therapy position statement,”Cytotherapy, vol. 8, no. 4, pp. 315–317, 2006.
[14] B. J. Herdrich, R. C. Lind, and K. W. Liechty, “Multipotentadult progenitor cells: their role in wound healing and thetreatment of dermal wounds,” Cytotherapy, vol. 10, no. 6,pp. 543–550, 2008.
[15] J. L. Spees, M. J. Whitney, D. E. Sullivan et al., “Bone marrowprogenitor cells contribute to repair and remodeling of the
11Oxidative Medicine and Cellular Longevity
lung and heart in a rat model of progressive pulmonary hyper-tension,” The FASEB Journal, vol. 22, no. 4, pp. 1226–1236,2008.
[16] V. L. Battula, P. M. Bareiss, S. Treml et al., “Human placentaand bone marrow derived MSC cultured in serum-free,b-FGF-containing medium express cell surface frizzled-9and SSEA-4 and give rise to multilineage differentiation,”Differentiation, vol. 75, no. 4, pp. 279–291, 2007.
[17] N. J. Zvaifler, L. Marinova-Mutafchieva, G. Adams et al.,“Mesenchymal precursor cells in the blood of normal individ-uals,” Arthritis Research & Therapy, vol. 2, no. 6, pp. 477–488,2000.
[18] A. Erices, P. Conget, and J. J. Minguell, “Mesenchymalprogenitor cells in human umbilical cord blood,” BritishJournal of Haematology, vol. 109, no. 1, pp. 235–242, 2000.
[19] K. Morizono, D. A. De Ugarte, M. Zhu et al., “Multilineagecells from adipose tissue as gene delivery vehicles,” HumanGene Therapy, vol. 14, no. 1, pp. 59–66, 2003.
[20] R. Dimitrov, T. Timeva, D. Kyurkchiev et al., “Characteri-zation of clonogenic stromal cells isolated from humanendometrium,” Reproduction, vol. 135, no. 4, pp. 551–558,2008.
[21] R. M. Baertschiger, D. Bosco, P. Morel et al., “Mesenchymalstem cells derived from human exocrine pancreas expresstranscription factors implicated in beta-cell development,”Pancreas, vol. 37, no. 1, pp. 75–84, 2008.
[22] J. Kim, M. J. Breunig, L. E. Escalante et al., “Biologic andimmunomodulatory properties of mesenchymal stromal cellsderived from human pancreatic islets,” Cytotherapy, vol. 14,no. 8, pp. 925–935, 2012.
[23] K. Sato, K. Ozaki, I. Oh et al., “Nitric oxide plays a critical rolein suppression of T-cell proliferation by mesenchymal stemcells,” Blood, vol. 109, no. 1, pp. 228–234, 2007.
[24] L. A. Ortiz, M. DuTreil, C. Fattman et al., “Interleukin 1receptor antagonist mediates the antiinflammatory and anti-fibrotic effect of mesenchymal stem cells during lunginjury,” Proceedings of the National Academy of Sciences ofthe United States of America, vol. 104, no. 26, pp. 11002–11007, 2007.
[25] R. H. Lee, A. A. Pulin, M. J. Seo et al., “Intravenous hMSCsimprove myocardial infarction in mice because cells embolizedin lung are activated to secrete the anti-inflammatory proteinTSG-6,” Cell Stem Cell, vol. 5, no. 1, pp. 54–63, 2009.
[26] I. Rasmusson, O. Ringden, B. Sundberg, and K. Le Blanc,“Mesenchymal stem cells inhibit lymphocyte proliferation bymitogens and alloantigens by different mechanisms,” Experi-mental Cell Research, vol. 305, no. 1, pp. 33–41, 2005.
[27] S. Aggarwal and M. F. Pittenger, “Human mesenchymal stemcells modulate allogeneic immune cell responses,” Blood,vol. 105, no. 4, pp. 1815–1822, 2005.
[28] C. Linard, E. Busson, V. Holler et al., “Repeated autologousbone marrow-derived mesenchymal stem cell injectionsimprove radiation-induced proctitis in pigs,” Stem CellsTranslational Medicine, vol. 2, no. 11, pp. 916–927, 2013.
[29] P. C. Tsai, T. W. Fu, Y. M. A. Chen et al., “The therapeuticpotential of human umbilical mesenchymal stem cells fromWharton’s jelly in the treatment of rat liver fibrosis,” LiverTransplantation, vol. 15, no. 5, pp. 484–495, 2009.
[30] C. K. Sun, C. H. Yen, Y. C. Lin et al., “Autologous transplanta-tion of adipose-derived mesenchymal stem cells markedlyreduced acute ischemia-reperfusion lung injury in a rodent
model,” Journal of Translational Medicine, vol. 9, no. 1,p. 118, 2011.
[31] J. Niu, A. Azfer, O. Zhelyabovska, S. Fatma, and P. E. Kolattu-kudy, “Monocyte chemotactic protein (MCP)-1 promotesangiogenesis via a novel transcription factor, MCP-1-inducedprotein (MCPIP),” The Journal of Biological Chemistry,vol. 283, no. 21, pp. 14542–14551, 2008.
[32] L. Song, Y. J. Yang, Q. T. Dong et al., “Atorvastatin enhanceefficacy of mesenchymal stem cells treatment for swinemyocardial infarction via activation of nitric oxide synthase,”PLoS One, vol. 8, no. 5, article e65702, 2013.
[33] L. Li, Y. Zhang, Y. Li et al., “Mesenchymal stem cell transplan-tation attenuates cardiac fibrosis associated with isoproterenol-induced global heart failure,” Transplant International, vol. 21,no. 12, pp. 1181–1189, 2008.
[34] A. Corcione, F. Benvenuto, E. Ferretti et al., “Human mesen-chymal stem cells modulate B-cell functions,” Blood, vol. 107,no. 1, pp. 367–372, 2006.
[35] P. A. Sotiropoulou, S. A. Perez, A. D. Gritzapis, C. N.Baxevanis, and M. Papamichail, “Interactions between humanmesenchymal stem cells and natural killer cells,” Stem Cells,vol. 24, no. 1, pp. 74–85, 2006.
[36] J. Wu, Z. Sun, H. S. Sun et al., “Intravenously administeredbone marrow cells migrate to damaged brain tissue andimprove neural function in ischemic rats,” Cell Transplanta-tion, vol. 16, no. 10, pp. 993–1005, 2008.
[37] Z. Cheng, L. Ou, X. Zhou et al., “Targeted migration ofmesenchymal stem cells modified with CXCR4 gene toinfarcted myocardium improves cardiac performance,”Molec-ular Therapy, vol. 16, no. 3, pp. 571–579, 2008.
[38] J. Xu, J. Qu, L. Cao et al., “Mesenchymal stem cell-basedangiopoietin-1 gene therapy for acute lung injury inducedby lipopolysaccharide in mice,” The Journal of Pathology,vol. 214, no. 4, pp. 472–481, 2008.
[39] D. Moher, L. Shamseer, M. Clarke et al., “Preferred reportingitems for systematic review and meta-analysis protocols(PRISMA-P) 2015 statement,” Systematic Reviews, vol. 4,no. 1, 2015.
[40] J. P. Higgins and S. Green, Eds., Cochrane Handbook for Sys-tematic Reviews of Interventions, John Wiley & Sons, New Jer-sey, USA, 2011, The Cochrane Collaboration.
[41] C. R. Hooijmans, M.M. Rovers, R. B. M. de Vries, M. Leenaars,M. Ritskes-Hoitinga, and M. W. Langendam, “SYRCLE’s riskof bias tool for animal studies,” BMC Medical ResearchMethodology, vol. 14, no. 1, p. 43, 2014.
[42] K. Kawakubo, S. Ohnishi, H. Fujita et al., “Effect of fetalmembrane-derived mesenchymal stem cell transplantation inrats with acute and chronic pancreatitis,” Pancreas, vol. 45,no. 5, pp. 707–713, 2016.
[43] H. W. Kim, W. J. Song, Q. Li et al., “Canine adipose tissue-derived mesenchymal stem cells ameliorate severe acutepancreatitis by regulating T cells in rats,” Journal of VeterinaryScience, vol. 17, no. 4, pp. 539–548, 2016.
[44] K. H. Jung, S. U. Song, T. Yi et al., “Human bone marrow–derived clonal mesenchymal stem cells inhibit inflammationand reduce acute pancreatitis in rats,” Gastroenterology,vol. 140, no. 3, pp. 998–1008.e4, 2011.
[45] K. H. Jung, T. G. Yi, M. K. Son, S. U. Song, and S. S. Hong,“Therapeutic effect of human clonal bone marrow-derivedmesenchymal stem cells in severe acute pancreatitis,” Archivesof Pharmacal Research, vol. 38, no. 5, pp. 742–751, 2015.
12 Oxidative Medicine and Cellular Longevity

[46] D. Qian, J. Gong, Z. He et al., “Bone marrow-derivedmesenchymal stem cells repair necrotic pancreatic tissueand promote angiogenesis by secreting cellular growthfactors involved in the SDF-1α/CXCR4 Axis in rats,” StemCells International, vol. 2015, Article ID 306836, 20 pages,2015.
[47] Z. He, J. Hua, D. Qian et al., “Intravenous hMSCs ameliorateacute pancreatitis in mice via secretion of tumor necrosisfactor-α stimulated gene/protein 6,” Scientific Reports, vol. 6,no. 1, article 38438, 2016.
[48] G. Yin, G. Hu, R. Wan et al., “Role of bone marrow mesenchy-mal stem cells in L-arg-induced acute pancreatitis: effects andpossible mechanisms,” International Journal of Clinical andExperimental Pathology, vol. 8, no. 5, pp. 4457–4468, 2015.
[49] H. Zhao, Z. He, D. Huang et al., “Infusion of bone marrowmesenchymal stem cells attenuates experimental severe acutepancreatitis in rats,” Stem Cells International, vol. 2016,Article ID 7174319, 10 pages, 2016.
[50] Z. Chen, F. Lu, H. Fang, and H. Huang, “Effect of mesen-chymal stem cells on renal injury in rats with severe acutepancreatitis,” Experimental Biology and Medicine, vol. 238,no. 6, pp. 687–695, 2013.
[51] X. H. Tu, J. X. Song, X. J. Xue et al., “Role of bone marrow-derived mesenchymal stem cells in a rat model of severe acutepancreatitis,” World Journal of Gastroenterology, vol. 18,no. 18, pp. 2270–2279, 2012.
[52] X.-H. Tu, S.-X. Huang, W.-S. Li, J.-X. Song, and X.-L. Yang,“Mesenchymal stem cells improve intestinal integrity duringsevere acute pancreatitis,” Molecular Medicine Reports,vol. 10, no. 4, pp. 1813–1820, 2014.
[53] B. Qu, Y. Chu, F. Zhu et al., “Granulocyte colony-stimulatingfactor enhances the therapeutic efficacy of bone marrowmesenchymal stem cell transplantation in rats with experi-mental acute pancreatitis,” Oncotarget, vol. 8, no. 13,pp. 21305–21314, 2017.
[54] D. Qian, G. Wei, C. Xu et al., “Bone marrow-derivedmesenchymal stem cells (BMSCs) repair acute necrotizedpancreatitis by secreting microRNA-9 to target the NF-κB1/p50 gene in rats,” Scientific Reports, vol. 7, no. 1, p. 581, 2017.
[55] H. B. Meng, J. Gong, B. Zhou, J. Hua, L. Yao, and Z. S.Song, “Therapeutic effect of human umbilical cord-derivedmesenchymal stem cells in rat severe acute pancreatitis,”International Journal of Clinical and Experimental Pathology,vol. 6, no. 12, pp. 2703–12, 2013.
[56] B. Yang, B. Bai, C. X. Liu et al., “Effect of umbilical cordmesenchymal stem cells on treatment of severe acute pancrea-titis in rats,” Cytotherapy, vol. 15, no. 2, pp. 154–162, 2013.
[57] J. Hua, Z. G. He, D. H. Qian et al., “Angiopoietin-1 gene-modified human mesenchymal stem cells promote angiogene-sis and reduce acute pancreatitis in rats,” International Journalof Clinical and Experimental Pathology, vol. 7, no. 7, pp. 3580–3595, 2014.
[58] S. A. Wexler, C. Donaldson, P. Denning-Kendall, C. Rice,B. Bradley, and J. M. Hows, “Adult bone marrow is a richsource of human mesenchymal “stem” cells but umbilicalcord and mobilized adult blood are not,” British Journal ofHaematology, vol. 121, no. 2, pp. 368–374, 2003.
[59] T. Qin, C. J. Liu, H. W. Zhang et al., “Effect of the IkBαmutantgene delivery to mesenchymal stem cells on rat chronicpancreatitis,” Genetics and Molecular Research, vol. 13, no. 1,pp. 371–385, 2014.
[60] C. H. Zhou, M. L. Li, A. L. Qin et al., “Reduction of fibrosis indibutyltin dichloride–induced chronic pancreatitis using ratumbilical mesenchymal stem cells from Wharton’s jelly,”Pancreas, vol. 42, no. 8, pp. 1291–1302, 2013.
[61] J. A. Hirst, J. Howick, J. K. Aronson et al., “The need forrandomization in animal trials: an overview of systematicreviews,” PLoS One, vol. 9, no. 6, article e98856, 2014.
[62] S. C. Landis, S. G. Amara, K. Asadullah et al., “A call for trans-parent reporting to optimize the predictive value of preclinicalresearch,” Nature, vol. 490, no. 7419, pp. 187–191, 2012.
[63] N. A. Crossley, E. Sena, J. Goehler et al., “Empirical evidence ofbias in the design of experimental stroke studies: a metaepide-miologic approach,” Stroke, vol. 39, no. 3, pp. 929–934, 2008.
[64] E. D. M. Rooke, H. M. Vesterinen, E. S. Sena, K. J. Egan, andM. R. Macleod, “Dopamine agonists in animal models ofParkinson’s disease: a systematic review and meta-analysis,”Parkinsonism & Related Disorders, vol. 17, no. 5, pp. 313–320, 2011.
[65] National Institutes of Health, Principles and Guidelines forReporting Preclinical Research, National Institutes of Health,Bethesda, Maryland, USA, 2015.
[66] A. Demols, O. Le Moine, F. Desalle, E. Quertinmont, J. L. vanLaethem, and J. Devière, “CD4+ T cells play an important rolein acute experimental pancreatitis in mice,” Gastroenterology,vol. 118, no. 3, pp. 582–590, 2000.
[67] M. M. Duffy, T. Ritter, R. Ceredig, and M. D. Griffin, “Mesen-chymal stem cell effects on T-cell effector pathways,” Stem CellResearch & Therapy, vol. 2, no. 4, p. 34, 2011.
[68] A. S. Gukovskaya, I. Gukovsky, Y. Jung, M. Mouria, andS. J. Pandol, “Cholecystokinin induces caspase activationand mitochondrial dysfunction in pancreatic acinar cells.Roles in cell injury processes of pancreatitis,” Journal of Biolog-ical Chemistry, vol. 277, no. 25, pp. 22595–22604, 2002.
[69] S. J. Kwon, S. M. Ki, S. E. Park et al., “Anti-apoptotic effects ofhuman Wharton’s jelly-derived mesenchymal stem cells onskeletal muscle cells mediated via secretion of XCL1,”Molecu-lar Therapy, vol. 24, no. 9, pp. 1550–1560, 2016.
[70] S. Chiesa, S. Morbelli, S. Morando et al., “Mesenchymalstem cells impair in vivo T-cell priming by dendritic cells,”Proceedings of the National Academy of Sciences of the UnitedStates of America, vol. 108, no. 42, pp. 17384–17389, 2011.
[71] J. Gong, H.-B. Meng, J. Hua et al., “The SDF-1/CXCR4 axisregulates migration of transplanted bone marrow mesenchy-mal stem cells towards the pancreas in rats with acutepancreatitis,” Molecular Medicine Reports, vol. 9, no. 5,pp. 1575–1582, 2014.
[72] D. J. Prockop and J. Youn Oh, “Mesenchymal stem/stromalcells (MSCs): role as guardians of inflammation,” MolecularTherapy, vol. 20, no. 1, pp. 14–20, 2012.
[73] H. Choi, R. H. Lee, N. Bazhanov, J. Y. Oh, and D. J. Prockop,“Anti-inflammatory protein TSG-6 secreted by activatedMSCs attenuates zymosan-induced mouse peritonitis bydecreasing TLR2/NF-κB signaling in resident macrophages,”Blood, vol. 118, no. 2, pp. 330–338, 2011.
[74] H. G. Wisniewski and J. Vilcek, “Cytokine-induced geneexpression at the crossroads of innate immunity, inflammationand fertility: TSG-6 and PTX3/TSG-14,” Cytokine & GrowthFactor Reviews, vol. 15, no. 2-3, pp. 129–146, 2004.
[75] E. W. Choi, I. S. Shin, H. W. Lee et al., “Transplantation ofCTLA4Ig gene-transduced adipose tissue-derived mesenchy-mal stem cells reduces inflammatory immune response and
13Oxidative Medicine and Cellular Longevity

improves Th1/Th2 balance in experimental autoimmunethyroiditis,” The Journal of Gene Medicine, vol. 13, no. 1,pp. 3–16, 2011.
[76] G. M. Spaggiari, A. Capobianco, H. Abdelrazik, F. Becchetti,M. C. Mingari, and L. Moretta, “Mesenchymal stem cellsinhibit natural killer–cell proliferation, cytotoxicity, andcytokine production: role of indoleamine 2,3-dioxygenaseand prostaglandin E2,” Blood, vol. 111, no. 3, pp. 1327–1333, 2008.
[77] X. X. Jiang, Y. Zhang, B. Liu et al., “Human mesenchymalstem cells inhibit differentiation and function ofmonocyte-derived dendritic cells,” Blood, vol. 105, no. 10,pp. 4120–4126, 2005.
[78] L. Cai, B. H. Johnstone, T. G. Cook et al., “IFATS collection:human adipose tissue-derived stem cells induce angiogenesisand nerve sprouting following myocardial infarction, inconjunction with potent preservation of cardiac function,”Stem Cells, vol. 27, no. 1, pp. 230–237, 2009.
[79] A. Banas, T. Teratani, Y. Yamamoto et al., “IFATS collection:in vivo therapeutic potential of human adipose tissue mesen-chymal stem cells after transplantation into mice with liverinjury,” Stem Cells, vol. 26, no. 10, pp. 2705–2712, 2008.
[80] Z. Wen, Q. Liao, Y. Hu, S. Liu, L. You, and Y. Zhao, “Humanadipose-derived stromal/stem cells: a novel approach toinhibiting acute pancreatitis,” Medical Hypotheses, vol. 80,no. 5, pp. 598–600, 2013.
[81] B. U. Wu, “Prognosis in acute pancreatitis,” Canadian MedicalAssociation Journal, vol. 183, no. 6, pp. 673–677, 2011.
[82] S. Li, X. Wang, J. Li et al., “Advances in the treatment ofischemic diseases by mesenchymal stem cells,” Stem CellsInternational, vol. 2016, Article ID 5896061, 11 pages, 2016.
[83] B. Usunier, M. Benderitter, R. Tamarat, and A. Chapel,“Management of fibrosis: the mesenchymal stromal cellsbreakthrough,” Stem Cells International, vol. 2014, Article ID340257, 26 pages, 2014.
14 Oxidative Medicine and Cellular Longevity

Research ArticleBlack Seed Thymoquinone Improved Insulin Secretion, HepaticGlycogen Storage, and Oxidative Stress in Streptozotocin-InducedDiabetic Male Wistar Rats
Heba M. A. Abdelrazek ,1 Omnia E. Kilany,2 Muhammad A. A. Muhammad ,3
Hend M. Tag ,4 and Aaser M. Abdelazim 5,6
1Department of Physiology, Faculty of Veterinary Medicine, Suez Canal University, Ismailia, Egypt2Department of Clinical Pathology, Faculty of Veterinary Medicine, Suez Canal University, Ismailia, Egypt3Department of Pathology, Faculty of Medicine, Suez Canal University, Ismailia, Egypt4Zoology Department, Faculty of Sciences, Suez Canal University, Ismailia, Egypt5Department of Biochemistry, Faculty of Veterinary Medicine, Zagazig University, Zagazig, Egypt6Department of Basic Medical Sciences, College of Applied Medical Sciences, University of Bisha, Bisha, Saudi Arabia
Correspondence should be addressed to Heba M. A. Abdelrazek; [email protected]
Received 28 October 2017; Accepted 19 December 2017; Published 4 March 2018
Academic Editor: Lotfi Aleya
Copyright © 2018 Heba M. A. Abdelrazek et al. This is an open access article distributed under the Creative CommonsAttribution License, which permits unrestricted use, distribution, and reproduction in any medium, provided the originalwork is properly cited.
Diabetes mellitus is one of the metabolic diseases having several complications.Nigella sativa oil (NSO)might have beneficial effectsin the treatment of diabetic complications. Thirty-two mature male Wistar rats were equally divided into four experimental groups:control, control NSO 2mL/kg, streptozotocin- (STZ-) induced diabetic, and diabetic (STZ-induced) treated with oral NSO 2mg/kgfor 30 days. Fasting blood glucose (FBG), insulin, and lipid profile levels were determined. Pancreatic and hepatic tissues were usedfor catalase and GSH. Histopathology, hepatic glycogen contents, insulin immunohistochemistry, and pancreatic isletmorphometry were performed. NSO 2mL/kg was noticed to decrease (P < 0 05) FBG and increase (P < 0 05) insulin levels indiabetic rats than in diabetic nontreated animals. Lipid profile showed significant (P < 0 5) improvement in diabetic rats thatreceived NSO 2mL/kg than in the diabetic group. Both pancreatic and hepatic catalase and GSH activities revealed a significant(P < 0 05) increment in the diabetic group treated with NSO than in the diabetic animals. NSO improved the histopathologicalpicture and hepatic glycogen contents of the diabetic group as well as increased (P < 0 05) insulin immunoreactive parts % andmean pancreatic islet diameter. NSO exerts ameliorative and therapeutic effects on the STZ-induced diabetic male Wistar rats.
1. Introduction
Diabetes mellitus (DM) is considered as one of the mostcommon chronic metabolic diseases characterized byincreased blood glucose due to insulin resistance, insulindeficiency, or both [1]. Mostly, DM is associated with vascu-lar, metabolic, neuropathic, and nephropathic disorders.Hyperglycemia and lipid profile abnormalities are the mainclues for diagnosis of DM metabolic disorders [2]. Hypergly-cemia is a consequence of the inability of the cells to utilize
glucose and/or skeletal muscles and liver are not capable ofglycogen storage [3]. Moreover, the persistent hyperglycemiain DM promoted oxidative stress through the formation orrelease of reactive oxygen species (ROS) and depletion ofantioxidant reserve. Oxidative stress is the main cause of car-diovascular disease that results in mortalities [4, 5].
Insulin is the primary hormone which is involved inblood glucose control. Once insulin is released into the blood,it stimulates the entrance of glucose into skeletal musclesand, to a lesser extent, liver and adipose tissue via special
HindawiOxidative Medicine and Cellular LongevityVolume 2018, Article ID 8104165, 10 pageshttps://doi.org/10.1155/2018/8104165

transporters, thus controlling glucose homeostasis [6]. Insu-lin binding mediates much action through interaction withinsulin receptors (IR) [7].
The efficient management of diabetes requires continu-ous control to blood sugar level to minimize the risks of dia-betic complications [8]. Thus, natural and therapeuticantioxidants are one of the strategies for diabetic remedy.Although there are various categories of antidiabetic drugs,these drugs possibly possess significant side effects or are veryexpensive [9, 10]. In comparison to the synthetic drug, natu-ral plants have lesser toxicity and are devoid of any sideeffects [11].
Nigella sativa (NS), a dicotyledon plant species of thefamily Ranunculaceae, has been used since long eras in med-ical and culinary fields [12]. Its plant seeds are called blackcumin or black seeds [13]. Thymoquinone (2-isopropyl-5-methyl-1,4-benzoquinone) is considered the chief activeprinciple in the NS seeds and its volatile oily extract [14].NS has several physiological and pharmacological propertiessuch as hepatoprotective [15, 16], immunomodulatory [17],nephroprotective [18, 19], neuroprotective [20], antimuta-genic, anticancer [21], and anticonvulsant [22] effects. More-over, it is known for its hypotensive [23] properties.
The current study aimed to investigate the potential pro-tective actions of NSO in streptozotocin- (STZ-) induced dia-betic male Wistar rats. This was done via the manipulation ofblood biochemical parameters, oxidative stress, histopathol-ogy, and pancreatic insulin immunoreactive parts.
2. Material and Methods
2.1. Experimental Rats. Thirty-two adult male Wistar rats,weighing 195–205 g, were kept in metallic cages (4/cage) atLaboratory Animal House, Faculty of Veterinary Medicine,Suez Canal University, Egypt. They were kept under standardnatural day-light rhythm with a temperature of 25°C (±1°C)and allowed to ad libitum diet and water supply. Theanimals were handled and cared according to the ethicalguidelines described by Faculty of Veterinary Medicine, SuezCanal University.
2.2. Experiment Design. After 14 days of acclimatization,animals were divided into four equal groups:
(i) Control group (n = 8): They were normal nondia-betic rats and gavaged daily with distilled water forone month.
(ii) Nigella group (n = 8): They were normal nondiabeticrats that were gavaged with 2mL/kg cold-pressedNSO (Amazing Herbs Co., Turkey) containing0.95% thymoquinone, as determined via HPLC, bygavage tube for one month.
(iii) Diabetic group: They were STZ-induced diabeticrats and given daily oral dose of distilled water bygavage tube for one month.
(iv) Diabetic Nigella-treated group: They were STZ-induced diabetic rats that were given a daily oral
dose of 2mL/kg cold-pressed NSO (Amazing HerbsCo., Turkey) containing 0.95% thymoquinone, asdetermined via HPLC, by gavage tube for onemonth.
2.3. Induction of Diabetes. Experimental rats from diabeticand diabetic treated with NSO groups were induced to diabe-tes after 16 h fasting by a sole STZ (TUKU-E Company,USA), intraperitoneal (i.p.) injection, in a dose of 45mg/kg.STZ was freshly prepared in 0.1M citrate buffer (pH4.5).The STZ-inoculated rats were allowed ad libitum 20% glu-cose solution for a duration of 24 h to avoid the occurrenceof hypoglycemia. Rats of the control and NSO groups wereinjected with citrate buffer only [24]. The occurrence of dia-betes was ascertained after 48 h post-STZ injection by deter-mination of blood glucose level. The animals that possessedblood glucose values of over 250mg/dL were supposed tobe diabetic [25].
2.4. Sampling. After 30 days of treatments, overnight fastedrats were decapitated under effect of anesthesia, and bloodsamples were obtained in sterile plain tubes. The sera werestored at −20°C. Pancreas and liver of each experimentalanimal were excised, rinsed in cold phosphate bufferedsaline, and dried with filter paper. Pancreas and liver of eachrat was divided into 2 parts: one part was kept at −80°C untilpreparation of pancreatic homogenate for reduced glutathi-one (GSH) and catalase assay. The remaining part of pan-creas and liver was immersed in 10% neutral bufferedformalin for histopathological and immunohistochemicalexamination.
2.5. Body Weight. Experimental rats were weighed weeklyduring the experimental period.
2.6. Blood Glucose Value and Insulin Level. Fasting blood glu-cose level was estimated using reagent strips (Accu-Chek®,Roche). The levels of insulin in serum were estimatedby commercial rat enzyme-linked immunosorbent assay(ELISA) kit (Abnova, Germany) according to enclosed man-ufacturer’s protocol.
2.7. Lipid Profile. The high-density lipoprotein cholesterol(HDL-c), low-density lipoprotein cholesterol (LDL-c), totalcholesterol (TC), and triglycerides (TG) were measured insera using enzymatic colorimetric kits (Stanbio Laboratory,USA, and ELITechGroup, France) according to Tietz [26].
2.8. Catalase and Reduced Glutathione Activity (GSH).Catalase and GSH activities in pancreatic and hepatichomogenates were determined using colorimetric kits fromBiodiagnostic (Egypt) and BioVision (USA), respectively,according to methods of Aebi [27] and Tietez [28],respectively.
2.9. Histopathology. Formalin-fixed pancreases and liverswere put in paraffin wax, and several 5 μm sections weresliced and then subjected to hematoxylin and eosin (H&E)stain according to Bancroft and Gamble [29]. Livers of5 μm sections were subjected to periodic acid Schiff (PAS)stain for glycogen demonstration [30].
2 Oxidative Medicine and Cellular Longevity

2.10. Immunohistochemistry. Paraffin-embedded pancreaseswere sliced into 4 μm sections on the positively chargedslides. Sections were subjected to xylene deparaffinizationand then rehydrated with descending series of ethanol,followed by water. The sections were incubated with pri-mary monoclonal anti-insulin antibody (catalog no. 13-9769-80, Thermo Fisher Scientific, Canada) at a rate of0.5 μg/mL for 2 h at 25°C in a humidified chamber. Thenthe steps according to the method of Adewole and Ojewole[31] were followed.
2.11. Image Analysis and Islet Size.Measurements of pancre-atic islet size were performed via ImageJ program. Insulin-positive islet immunostaining intensity and area % weredetermined from each slide of each experimental group usingImageJ program after subtracting light background. Sevenfields of pancreatic islets were randomly chosen. The inten-sity of immunohistochemistry (IHC) staining and the per-centages of IHC stained regions were obtained by ImageJprogram and calculated according to Elgawish et al. [32].The diameters of the pancreatic islet were measured byselecting seven of pancreatic islets/animal in all groups usingImageJ program by the aid of a calibrated micrometer.
2.12. Statistical Analysis. The data were presented as themean± standard error of mean (SEM). Statistically signifi-cant differences between groups were calculated using one-way analysis of variance (ANOVA) followed by Duncan’spost hoc multiple comparison test (SPSS software, version16.0; SPSS Inc., Chicago, IL, USA). The criterion for signifi-cance was set at P < 0 05.
3. Results
3.1. Body Weight. The body weights of the STZ-induced dia-betic group rats reduced significantly (P < 0 05) than didthose of the control nondiabetic rats at the 3rd and 4th weeks
of the experiment. However, NSO 2mL/kg treatment of dia-betic rats increased their body weights (P < 0 05) comparedto those of diabetic nontreated rats at the 4th week of theexperimental period (Table 1).
3.2. Fasting Blood Glucose Value and Insulin Level. The injec-tion of experimental rats with single i.p. dose of STZ induceda significant (P < 0 05) elevation in FBG levels compared tothose of the control rats. Administration of NSO 2mL/kgto the diabetic rats, for one month, induced a significant(P < 0 05) reduction in the levels of FBG compared to thoseof the diabetic group. Insulin level revealed a significant(P < 0 05) decrement in the STZ diabetic group than in thecontrol one. Meanwhile treatment of the diabetic rats withNSO 2mL/kg, for 1 month, significantly (P < 0 05) improvedinsulin to a level comparable to that of the control group(Table 2).
3.3. Lipid Profile. Oral administration of NSO 2mL/kg tothe nondiabetic rats for one month induced a significant(P < 0 05) increment in HDL-c level compared to that ofthe control group. However, HDL-c level revealed a signifi-cant (P < 0 05) decrement in the diabetic group than in thecontrol. Meanwhile, administration of 2mL/kg NSO to thediabetic rats increased HDL-c significantly (P < 0 05) com-pared to that of diabetic nontreated rats. Treatment of thecontrol rats with NSO 2mL/kg for one month induced a sig-nificant (P < 0 05) decrement in TC and LDL-c levels com-pared to those in the control. The diabetic rats revealedelevation in TC, TG, and LDL-c (P < 0 05) than did the con-trol group. However, 30 days’ treatment with NSO 2mL/kgof the diabetic rats induced a significant (P < 0 05) decrementin TC, TG, and LDL-c values compared to those of the dia-betic group (Table 2).
3.4. Pancreatic and Hepatic Oxidative Stress. Current datarevealed that both hepatic and pancreatic catalase as well
Table 1: The effect of NSO 2mL/kg on weekly body weight (g) of STZ-induced diabetic rats.
Groups Control Nigella Diabetic Diabetic Nigella treated
Body weight (g)
Week 1 200.50± 1.48a 200.33± 1.60a 201.17± 1.72a 201.50± 2.08a
Week 2 212.50± 3.23a 211.25± 2.46a 205.50± 2.10a 203.25± 4.59a
Week 3 220.00± 4.56a 228.75± 4.92a 195.00± 3.19b 200.75± 4.91b
Week 4 226.75± 5.27a 239.00± 3.56a 160.00± 4.c 188.50± 3.12b
Values are presented as mean ± SE. abcDifferent letters on numbers in each row represent a significant difference at P < 0 05.
Table 2: Effect of NSO 2mL/kg on FBG (mg/dL), insulin (pmol/L), HDL-c (mg/dL), LDL-c (mg/dL), TG (mg/dL), and TC (mg/dL) in STZ-induced diabetic rats.
Groups Control Nigella Diabetic Diabetic Nigella treated
FBG (mg/dL) 98.40± 7.00c 93.60± 3.80c 313.00± 5.19b 187.40± 19.91a
Insulin (pmol/L) 5.78± 0.49a 6.25± 0.47a 3.41± 0.29b 5.36± 0.27a
HDL-c (mg/dL) 44.73± 1.82b 53.37± 2.02a 22.31± 2.45d 33.60± 2.26c
LDL-c (mg/dL) 56.91± 2.86c 47.09± 2.60d 109.28± 4.18a 84.52± 2.99b
TG (mg/dL) 58.28± 3.47c 52.07± 4.14c 105.92± 3.19a 84.25± 2.81b
TC (mg/dL) 109.96± 4.08c 89.84± 4.77d 161.28± 8.54a 139.54± 3.92b
Values are presented as mean ± SE. abcdDifferent letters on numbers in each row represent a significant difference at P < 0 05.
3Oxidative Medicine and Cellular Longevity

as GSH activities were decreased significantly (P < 0 05) inthe STZ-induced diabetic rats than in the control. Adminis-tration of NSO 2mL/kg, for one month, to the diabetic ratssignificantly (P < 0 05) elevated hepatic and pancreatic cata-lase and GSH activities compared to those in the diabeticgroup (Table 3).
3.5. Histopathology and Islet Size. Examination of pancreaticsections from the control group and the Nigella-treatedgroup showed abundant and scattered pancreatic islets ofLangerhans between the exocrine parenchyma throughoutthe pancreas. The islets were large, well defined, and com-posed of groups of compact cells arranged in branching,irregular, and anastomosing cords separated by blood capil-laries (Figures 1(a) and 1(b)).
On the other hand, examination of pancreases of the dia-betic rats yielded an observable decrement in the number ofislets. They were shrunken and irregular, and some of the
islet cells showed hydropic degeneration while others werenecrotized with deeply stained pyknotic nuclei. Few lympho-cytes were seen attacking the islet cells (Figure 1(c)).
The diabetic group treated with oral NSO 2mL/kgshowed marked increase in number of islets throughout thepancreas, and most of them demonstrated recovery of theirnormal morphologic features comparable to those of theislets of the control group (Figure 1(d)).
Analysis of the mean diameter of pancreatic Langer-hans islets among the studied groups showed a significant(P < 0 05) reduction in the mean diameter in the diabeticrats. Oral treatment with NSO (2mL/kg), for one month,significantly (P < 0 05) increased the mean diameter ofLangerhans islets compared to that in the diabetic nontreatedgroup (Table 4).
The results obtained from histological sections oflivers with hematoxylin and eosin staining for the controland Nigella-treated rats were similar. Liver histological
Table 3: Effect of NSO 2mL/kg on catalase (U/g) and GSH (mg/g) in pancreas and liver of STZ-induced diabetic rats.
Groups Control Nigella Diabetic Diabetic Nigella treated
Pancreatic catalase (U/g) 84.27± 5.56a 86.66± 4.91a 38.25± 2.30c 69.00± 1.22b
Hepatic catalase (U/g) 27.49± 2.26b 34.73± 2.09 a 10.51± 1.31d 18.19± 1.09c
Pancreatic GSH (mg/g) 36.45± 2.80a 42.71± 4.49a 13.49± 3.12c 23.00± 0.95b
Hepatic GSH (mg/g) 85.71± 9.57a 84.92± 6.33a 35.95± 6.32b 62.89± 6.63a
Values are presented as mean ± SE. abcdDifferent letters on numbers in each row represent a significant difference at P < 0 05.
Control50 �휇m
(a)
Nigella50 �휇m
(b)
Diabetic
50 �휇m
(c)
Nigella + Diabetic50 �휇m
(d)
Figure 1: Nigella seed oil extract effect on pancreatic histopathology in normal and STZ-induced diabetic rats. (a and b) Control- and NSO-(2mL/kg) treated control groups: normal control rat displayed healthy islets of Langerhans. (c) Diabetic control: arrow displays the atrophiedislets of Langerhans. (d) NSO- (2mL/kg) treated diabetic rats display bigger islets of Langerhans than do diabetic untreated group(arrowhead). Scale bar represents 50 μm.
4 Oxidative Medicine and Cellular Longevity

observations of the control and Nigella-treated rats showednormal hepatic architecture showing the classic lobulewith the central vein as its center and portal tracts at theperiphery. Embedded in the portal tract were portalvenule, hepatic arteriole, and interlobular bile ductule(Figures 2(a) and 2(b)). The livers of the diabetic animalsshowed ballooning degeneration, mild portal inflamma-tion, and interface hepatitis (Figure 2(c)). Sections of livertissues from diabetic animals treated with Nigella showedrestoration of the normal hepatic architecture with markedreduction of portal inflammation and absence of interfacehepatitis (Figure 2(d)).
The PAS-stained liver sections demonstrated abundantcytoplasmic contents of glycogen in the control and NSO-treated control (Figure 3(a) and (b)). The diabetic groupshowed marked depletion of glycogen contents in hepato-cytes cytoplasm than did the control ones (Figure 3(c)).Treatment of diabetic rats with 2mL/kg NSO improved
glycogen contents in hepatocytes cytoplasm compared tothose in the diabetic rats (Figure 3(d)).
3.6. Immunohistochemistry. Positive insulin expression wasvisualized as dark-brown cytoplasmic granules in the pan-creatic islets’ β cells. The quantitative analysis of insulinimmunoreaction in the pancreatic islets showed significant(P < 0 05) variations among the study groups. Regarding thepercentage of insulin-positive islet area, the analysis showed asignificant (P < 0 05) decrement in the percentage of insulin-positive area in the diabetic group than in the control group.However, NSO treatment of the diabetic rats significantly(P < 0 05) improved positive islet area % compared to that ofthe diabetic ones (Table 4).
The immunostaining intensity of pancreatic islets’ insu-lin was assessed in a quantitative fashion according to themicrodensitometric method. The staining intensities of insu-lin in the pancreatic islets among different study groups are
Table 4: The effect of NSO 2mL/kg on mean pancreatic islet size (μm), insulin-positive islet area %, and insulin immunostaining intensity(integrated density) in STZ-induced diabetic rats.
Groups Control Nigella Diabetic Diabetic Nigella treated
Mean islet size (μm) 233.90± 24.71a 247.52± 35.27a 29.83.36± 83.17b 170.61± 26.63a
Insulin-positive islet area (%) 65.79± 9.81a 68.52± 9.58a 18.01± 3.42c 43.05± 5.57b
Insulin immunostaining intensity (integrated density) 92.50± 3.05a 99.34± 2.23a 60.93± 4.31c 76.15± 1.92b
Values are presented as mean ± SE. abcDifferent letters on numbers in each row represent a significant difference at P < 0 05.
Control100 �휇m
(a)
Nigella100 �휇m
(b)
Diabetic
⁎
⁎
100 �휇m
(c)
Nigella + Diabetic
100 �휇m
(d)
Figure 2: H&E stain of liver: (a) control group and (b)Nigella-treated rats demonstrate normal hepatic architecture showing the classic lobulewith the central vein at the center and portal tracts at the periphery; each one is separated from the others by a similar distance, 100x. (c)Diabetic group showing ballooning degeneration of the hepatocyte (∗, 40x), and interface hepatitis (arrow), 100x. (d) NSO-treated diabeticgroup showing restoration of normal architecture, 100x. Scale bar represents 100μm.
5Oxidative Medicine and Cellular Longevity

shown in Figure 4 and Table 4. The Nigella-treated groupexhibited pancreatic islets with the highest insulin stainingintensity followed by the control with no significancebetween both of them compared to the diabetic group treatedwith NSO. On the other hand, the diabetic untreated animalsshowed the lowest (P < 0 05) insulin staining intensity.
4. Discussion
Diabetes mellitus is considered as one of the systemic,endocrine, and metabolic diseases, which is diagnosed byhyperglycemia. This could be considered with alterationsin carbohydrate, lipid, and protein metabolism. This isconsidered to be due to reduction and/or impairment inantioxidant mechanisms inside the body leading to weightloss [33, 34].
Therefore the usage of antioxidants is considered as oneof the strategies used for resetting the normal homeostasis indiabetic patients [35, 36]. Numerous plant extracts and com-pounds from these extracts are known to possess antidia-betic properties that could be used in the remedy ofdiabetes mellitus [11, 37]. Nigella sativa thymoquinone isconsidered as an antioxidant and hypoglycemic compoundthat could counteract the high cost and the adverse effectsof pharmacological drugs [38], which confirms the antidia-betic effects of NSO.
The current study demonstrated that STZ produced asignificant (P < 0 05) decrement in body weights at the 3rdand 4th weeks of experiment. These results are consideredto be consistent with Wong and Tzeng [39] and Doğan andÇelik [40]. This could be due to reduction in glucose avail-ability as well as amino acids to the body cells, which createsa lack in the substrates that are necessary for cellular biosyn-thesis and can affect linked cellular metabolism that causesmuscle wasting [39]. Oral administration of NSO (2mL/kg)containing 5% thymoquinone to the diabetic rats led to amarked increment in the body weights of these animals com-pared to diabetic nontreated rats. The current results were inaccordance with those of Kanter et al. [41] and Kaleem et al.[42]. This may confirm the effect of NSO on diabetes-induced muscle wasting due to carbohydrate inaccessibility,which confirms the antidiabetic effect of NSO [42].
The serum level of insulin was reduced in the diabetic ratsthan in the control, while FBG level was increased (P < 0 05)in the diabetic group than in the control one. These resultsare considered to be consistent with those of Houcher et al.[43] and Mahmoud et al. [24]. This effect is due to the alky-lating toxic action of STZ on β cells of pancreatic islets, whichblocks insulin secretion leading to hyperglycemia [44]. NSOthymoquinone induced a marked decrease and a markedincrease at P < 0 05 in both FBG and insulin levels, respec-tively, than in those in the diabetic group. These results wereconsistent with those of Fararh et al. [45], Rchid et al. [46],
Control50 �휇m
(a)
Nigella50 �휇m
(b)
Diabetic50 �휇m
(c)
Nigella + Diabetic50 �휇m
(d)
Figure 3: PAS stain of liver: (a) control group and (b) NSO- (2mL/kg) treated control rats demonstrate abundant glycogen, which is presentwithin the cytoplasm of the hepatocytes (magenta-colour granules), 400x. (c) Diabetic group demonstrates marked reduction in PASpositivity (few scattered glycogen granules), 400x. (d) NSO- (2mL/kg) treated diabetic group demonstrates restoration of PAS positivity,400x. Scale bar represents 50μm.
6 Oxidative Medicine and Cellular Longevity
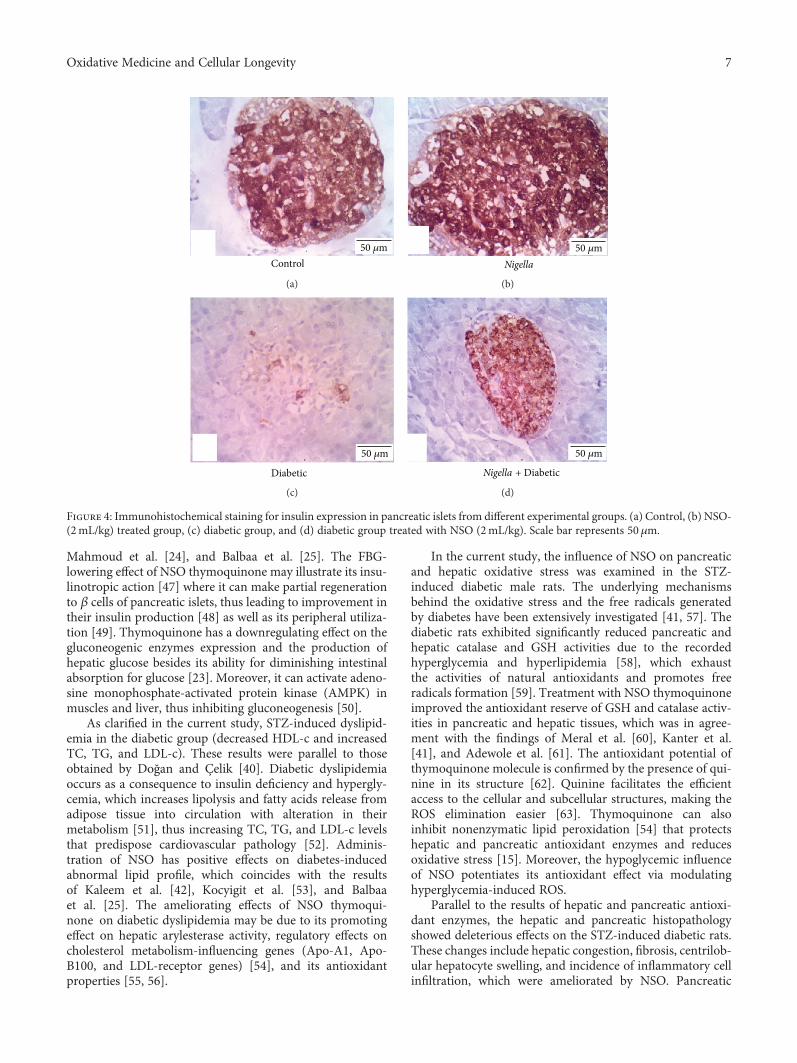
Mahmoud et al. [24], and Balbaa et al. [25]. The FBG-lowering effect of NSO thymoquinone may illustrate its insu-linotropic action [47] where it can make partial regenerationto β cells of pancreatic islets, thus leading to improvement intheir insulin production [48] as well as its peripheral utiliza-tion [49]. Thymoquinone has a downregulating effect on thegluconeogenic enzymes expression and the production ofhepatic glucose besides its ability for diminishing intestinalabsorption for glucose [23]. Moreover, it can activate adeno-sine monophosphate-activated protein kinase (AMPK) inmuscles and liver, thus inhibiting gluconeogenesis [50].
As clarified in the current study, STZ-induced dyslipid-emia in the diabetic group (decreased HDL-c and increasedTC, TG, and LDL-c). These results were parallel to thoseobtained by Doğan and Çelik [40]. Diabetic dyslipidemiaoccurs as a consequence to insulin deficiency and hypergly-cemia, which increases lipolysis and fatty acids release fromadipose tissue into circulation with alteration in theirmetabolism [51], thus increasing TC, TG, and LDL-c levelsthat predispose cardiovascular pathology [52]. Adminis-tration of NSO has positive effects on diabetes-inducedabnormal lipid profile, which coincides with the resultsof Kaleem et al. [42], Kocyigit et al. [53], and Balbaaet al. [25]. The ameliorating effects of NSO thymoqui-none on diabetic dyslipidemia may be due to its promotingeffect on hepatic arylesterase activity, regulatory effects oncholesterol metabolism-influencing genes (Apo-A1, Apo-B100, and LDL-receptor genes) [54], and its antioxidantproperties [55, 56].
In the current study, the influence of NSO on pancreaticand hepatic oxidative stress was examined in the STZ-induced diabetic male rats. The underlying mechanismsbehind the oxidative stress and the free radicals generatedby diabetes have been extensively investigated [41, 57]. Thediabetic rats exhibited significantly reduced pancreatic andhepatic catalase and GSH activities due to the recordedhyperglycemia and hyperlipidemia [58], which exhaustthe activities of natural antioxidants and promotes freeradicals formation [59]. Treatment with NSO thymoquinoneimproved the antioxidant reserve of GSH and catalase activ-ities in pancreatic and hepatic tissues, which was in agree-ment with the findings of Meral et al. [60], Kanter et al.[41], and Adewole et al. [61]. The antioxidant potential ofthymoquinone molecule is confirmed by the presence of qui-nine in its structure [62]. Quinine facilitates the efficientaccess to the cellular and subcellular structures, making theROS elimination easier [63]. Thymoquinone can alsoinhibit nonenzymatic lipid peroxidation [54] that protectshepatic and pancreatic antioxidant enzymes and reducesoxidative stress [15]. Moreover, the hypoglycemic influenceof NSO potentiates its antioxidant effect via modulatinghyperglycemia-induced ROS.
Parallel to the results of hepatic and pancreatic antioxi-dant enzymes, the hepatic and pancreatic histopathologyshowed deleterious effects on the STZ-induced diabetic rats.These changes include hepatic congestion, fibrosis, centrilob-ular hepatocyte swelling, and incidence of inflammatory cellinfiltration, which were ameliorated by NSO. Pancreatic
Control50 �휇m
(a)
Nigella50 �휇m
(b)
Diabetic
50 �휇m
(c)
Nigella + Diabetic
50 �휇m
(d)
Figure 4: Immunohistochemical staining for insulin expression in pancreatic islets from different experimental groups. (a) Control, (b) NSO-(2mL/kg) treated group, (c) diabetic group, and (d) diabetic group treated with NSO (2mL/kg). Scale bar represents 50μm.
7Oxidative Medicine and Cellular Longevity

pathology revealed severe atrophy, necrosis of acinar cells,and severe reduction in islet area %, which were greatlyimproved by NSO administration. The present results werein accordance with those of Kanter et al. [41], Widodo et al.[64], and Tuhin et al. [65]. The improvement in both pancre-atic and hepatic histopathology could be attributed to theantioxidant potential of thymoquinone in NSO. Thymoqui-none improves diabetic depletion of antioxidant reserves ofcatalase and GSH, thus keeping the integrity of both hepaticand pancreatic cells.
The depletion of hepatic glycogen contents in the diabeticrats was due to depletion of insulin that led to increased glu-coneogenesis rather than glycogenesis [66]. Administrationof NSO 2mL/kg to the diabetic rats markedly improvedhepatic glycogen contents due to the promotion of pancreaticinsulin secretion, which activates glycogen synthase enzyme,thus reducing circulating glucose level [67].
The increment in pancreatic islet immunostained area %by NSO treatment in the diabetic rats, as a result of its antiox-idant effect, was in agreement with the findings of Omar andAtia [38] andWidodo et al. [64]. The improvement of insulinimmunoreactivity as well as pancreatic islet morphology anddiameter could elucidate the upregulation of serum insulinlevel and the decrease in FBG, thus improving hyperlipid-emia in diabetic rats.
5. Conclusion
Based on the current results, NSO was found to be aneffective protection against the adverse consequences ofSTZ-induced diabetes in Wistar rats. NSO exerts itseffect through thymoquinone antioxidant potential, whichimproved pancreatic and hepatic integrity, thus increasingpancreatic islet immunoreactivity, therefore increasing theserum insulin level, increasing hepatic glycogen content,reducing the elevated blood glucose level, and counteractingdiabetic dyslipidemia.
Conflicts of Interest
The authors declare that there are no conflicts of interestto disclose.
References
[1] P. Kumar andM. Clark, “Diabetes mellitus and other disordersof metabolism,” Clinical Medicine, vol. 2, pp. 1069–1071, 2002.
[2] American Diabetes Association, “Economic costs of diabetesin the U.S. in 2012,” Diabetes Care, vol. 36, no. 4, pp. 1033–1046, 2013.
[3] D. Luis-Rodríguez, A. Martínez-Castelao, J. L. Górriz, F. De-Álvaro, and J. F. Navarro-González, “Pathophysiological roleand therapeutic implications of inflammation in diabeticnephropathy,” World Journal of Diabetes, vol. 3, no. 1, pp. 7–18, 2012.
[4] A. Sturza, O. M. Duicu, A. Vaduva et al., “Monoamineoxidases are novel sources of cardiovascular oxidative stressin experimental diabetes,” Canadian Journal of Physiologyand Pharmacology, vol. 93, no. 7, pp. 555–561, 2015.
[5] B. S. Karam, A. Chavez-Moreno, W. Koh, J. G. Akar, and F. G.Akar, “Oxidative stress and inflammation as central mediatorsof atrial fibrillation in obesity and diabetes,” CardiovascularDiabetology, vol. 16, no. 1, p. 120, 2017.
[6] A. Zorzano, W. Wilkinson, N. Kotliar et al., “Insulin-regulatedglucose uptake in rat adipocytes is mediated by two trans-porter isoforms present in at least two vesicle populations,”Journal of Biological Chemistry, vol. 264, no. 21, pp. 12358–12363, 1989.
[7] A. Belfiore, F. Frasca, G. Pandini, L. Sciacca, and R. Vigneri,“Insulin receptor isoforms and insulin receptor/insulin-likegrowth factor receptor hybrids in physiology and disease,”Endocrine Reviews, vol. 30, no. 6, pp. 586–623, 2009.
[8] S. S. Schwartz, “Optimizing glycemic control and minimizingthe risk of hypoglycemia in patients with type 2 diabetes,”Drugs in Context, vol. 2013, article 212255, 8 pages, 2013.
[9] H. Nasri, H. Shirzad, A. Baradaran, and M. Rafieian-kopaei,“Antioxidant plants and diabetes mellitus,” Journal of Researchin Medical Sciences, vol. 20, no. 5, pp. 491–502, 2015.
[10] S. K. Basha, G. Sudarsanam, M. S. Mohammad, andN. Parveen, “Investigations on anti-diabetic medicinal plantsused by Sugali tribal inhabitants of Yerramalais of Kurnooldistrict, Andhra Pradesh India,” Stamford Journal of Pharma-ceutical Sciences, vol. 4, no. 2, 2012.
[11] R. B. Kasetti, M. D. Rajasekhar, V. K. Kondeti et al., “Antihy-perglycemic and antihyperlipidemic activities of methanol:water (4, 1) fraction isolated from aqueous extract of Syzygiumalternifolium seeds in streptozotocin induced diabetic rats,”Food and Chemical Toxicology, vol. 48, no. 4, pp. 1078–1084,2010.
[12] W. Goreja, Black Seed: Nature's Miracle Remedy, AmazingHerbs Press, New York, NY, USA, 2003.
[13] H. Ijaz, U. R. Tulain, J. Qureshi et al., “Nigella sativa (propheticmedicine): a review,” Pakistan Journal of Pharmaceutical Sci-ences, vol. 30, no. 1, 2017.
[14] L. Canonica, G. Jommi, C. Scolastico, and A. Bonati, “Thepharmacologically active principle in Nigella sativa,” GazzettaChimica Italiana, vol. 93, pp. 1404–1407, 1963.
[15] J. Danladi, A. Abdusalam, J. Timbuak, A. Miriga, andA. Dahiru, “Hepatoprotective effect of black seed (Nigellasativa) oil on carbon tetrachloride (CCl4) induced liver toxicityin adult Wistar rats,” IOSR Journal of Dental and MedicalSciences, vol. 4, no. 3, pp. 56–62, 2013.
[16] M. M. Abdel-Daim and E. W. Ghazy, “Effects of Nigella sativaoil and ascorbic acid against oxytetracycline-induced hepato-renal toxicity in rabbits,” Iranian Journal of Basic Medical Sci-ences, vol. 18, no. 3, pp. 221–227, 2015.
[17] Z. Gholamnezhad, H. Rafatpanah, H. R. Sadeghnia, andM. H. Boskabady, “Immunomodulatory and cytotoxic effectsof Nigella sativa and thymoquinone on rat splenocytes,”Food and Chemical Toxicology, vol. 86, Supplement C,pp. 72–80, 2015.
[18] A. M. S. Gani and S. A. John, “Effect ofNigella sativa L. on liverenzymes and kidney morphology on D-GalN induced toxicityin rats,” World Journal of Pharmacy and PhamaceuticalSciences, vol. 5, no. 12, pp. 1193–1200, 2016.
[19] H. A. El Rabey, M. N. Al-Seeni, and A. S. Bakhashwain, “Theantidiabetic activity of Nigella sativa and propolis onstreptozotocin-induced diabetes and diabetic nephropathy inmale rats,” Evidence-based Complementary and AlternativeMedicine, vol. 2017, Article ID 5439645, 14 pages, 2017.
8 Oxidative Medicine and Cellular Longevity

[20] F. Beheshti, M. Khazaei, and M. Hosseini, “Neuropharmaco-logical effects of Nigella sativa,” Avicenna Journal of Phytome-dicine, vol. 6, no. 1, pp. 104–116, 2016.
[21] A. F. Majdalawieh and M. W. Fayyad, “Recent advances onthe anti-cancer properties of Nigella sativa, a widely used foodadditive,” Journal of Ayurveda and Integrative Medicine, vol. 7,no. 3, pp. 173–180, 2016.
[22] H. Hosseinzadeh and S. Parvardeh, “Anticonvulsant effects ofthymoquinone, the major constituent of Nigella sativa seeds,in mice,” Phytomedicine, vol. 11, no. 1, pp. 56–64, 2004.
[23] B. Meddah, R. Ducroc, M. El Abbes Faouzi et al., “Nigellasativa inhibits intestinal glucose absorption and improves glu-cose tolerance in rats,” Journal of Ethnopharmacology, vol. 121,no. 3, pp. 419–424, 2009.
[24] Y. K. Mahmoud, S. Y. Saleh, A. Abd El Rehim, and I. A. Ibra-him, “Biochemical efficacy of Nigella sativa oil and metforminon induced diabetic male rats,” American Journal of Animaland Veterinary Sciences, vol. 9, no. 4, pp. 277–284, 2014.
[25] M. Balbaa, M. El-Zeftawy, D. Ghareeb, N. Taha, and A. W.Mandour, “Nigella sativa relieves the altered insulin receptorsignaling in streptozotocin-induced diabetic rats fed with ahigh-fat diet,” Oxidative Medicine and Cellular Longevity,vol. 2016, Article ID 2492107, 16 pages, 2016.
[26] N. W. Tietz, Tietz Clinical Guide to Laboratory Tests, WBSaunders Company, Philadelphia, PA, USA, 1990.
[27] H. Aebi, “Catalase in vitro,” Methods in Enzymology, vol. 105,pp. 121–126, 1984.
[28] F. Tietze, “Enzymic method for quantitative determination ofnanogram amounts of total and oxidized glutathione: applica-tions to mammalian blood and other tissues,” Analytical Bio-chemistry, vol. 27, no. 3, pp. 502–522, 1969.
[29] J. Bancroft and M. Gamble, “Hematoxylin and eosin, connec-tive tissue and stain, carbohydrates,” in Theory and Practice inHistological Techniques, p. pp. 121–186, Churchill-Living-stone, Edinburgh, 2008.
[30] A. G. E. Pearse, “Histochemistry,” Theoretical and Applied,vol. 1, pp. 1–759, 1968.
[31] S. O. Adewole and J. A. O. Ojewole, “Insulin-induced immu-nohistochemical and morphological changes in pancreaticbeta-cells of streptozotocin-treated diabetic rats,” Methodsand Findings in Experimental and Clinical Pharmacology,vol. 29, no. 7, pp. 447–455, 2007.
[32] R. A. R. Elgawish, H. G. A. Rahman, and H. M. A. Abdelrazek,“Green tea extract attenuates CCl4-induced hepatic injury inmale hamsters via inhibition of lipid peroxidation and p53-mediated apoptosis,” Toxicology Reports, vol. 2, SupplementC, pp. 1149–1156, 2015.
[33] V. Ramakrishna and R. Jailkhani, “Evaluation of oxidativestress in insulin dependent diabetes mellitus (IDDM)patients,” Diagnostic Pathology, vol. 2, no. 1, p. 22, 2007.
[34] T. van Bremen, D. Drömann, K. Luitjens et al., “Triggeringreceptor expressed on myeloid cells-1 (Trem-1) on blood neu-trophils is associated with cytokine inducibility in human E.coli sepsis,” Diagnostic Pathology, vol. 8, no. 1, p. 24, 2013.
[35] J. M. Forbes, M. T. Coughlan, and M. E. Cooper, “Oxidativestress as a major culprit in kidney disease in diabetes,” Diabe-tes, vol. 57, no. 6, pp. 1446–1454, 2008.
[36] K. Huynh, B. C. Bernardo, J. R. McMullen, and R. H. Ritchie,“Diabetic cardiomyopathy: mechanisms and new treatmentstrategies targeting antioxidant signaling pathways,” Pharma-cology & Therapeutics, vol. 142, no. 3, pp. 375–415, 2014.
[37] M. Tag Hend, M. A. Abdelazek Heba, S. Mahoud Yasmen,and S. el Shenawy Nahla, “Efficacy of Tribulus terrestris extractand metformin on fertility indices and oxidative stress of tes-ticular tissue in streptozotocin-induced diabetic male rats,”African Journal of Pharmacy and Pharmacology, vol. 9,no. 48, pp. 1088–1098, 2015.
[38] N. M. Omar and G. M. Atia, “Effect of Nigella sativa onpancreatic β-cell damage in streptozotocin-induced diabeticrats,” The Egyptian Journal of Histology, vol. 35, no. 1,pp. 106–116, 2012.
[39] K. K. Wong and E. S. Tzeng, “Appearance of different diabeticsymptoms after streptozotocin administration: a comparisonstudy,” Biochemistry and Molecular Biology International,vol. 30, no. 6, pp. 1035–1041, 1993.
[40] A. Doğan and İ. Çelik, “Healing effects of sumac (Rhus cor-iaria) in streptozotocin-induced diabetic rats,” PharmaceuticalBiology, vol. 54, no. 10, pp. 2092–2102, 2016.
[41] M. Kanter, O. Coskun, A. Korkmaz, and S. Oter, “Effects ofNigella sativa on oxidative stress and β-cell damage instreptozotocin-induced diabetic rats,” The Anatomical Record,vol. 279, no. 1, pp. 685–691, 2004.
[42] M. Kaleem, D. Kirmani, M. Asif, Q. Ahmed, and B. Bano,Biochemical Effects of Nigella sativa L Seeds in Diabetic Rats,2006.
[43] Z. Houcher, K. Boudiaf, M. Benboubetra, and B. Houcher,“Effects of methanolic extract and commercial oil of Nigellasativa L. on blood glucose and antioxidant capacity inalloxan-induced diabetic rats,” Pteridines, vol. 18, no. 1, 2007.
[44] T. Szkudelski, “The mechanism of alloxan and streptozotocinaction in B cells of the rat pancreas,” Physiological Research,vol. 50, no. 6, pp. 537–546, 2001.
[45] K. M. Fararh, Y. Atoji, Y. Shimizu, T. Shiina, H. Nikami, andT. Takewaki, “Mechanisms of the hypoglycaemic and immu-nopotentiating effects of Nigella sativa L. oil instreptozotocin-induced diabetic hamsters,” Research in Veter-inary Science, vol. 77, no. 2, pp. 123–129, 2004.
[46] H. Rchid, H. Chevassus, R. Nmila et al., “Nigella sativa seedextracts enhance glucose-induced insulin release from rat-isolated Langerhans islets,” Fundamental & Clinical Pharma-cology, vol. 18, no. 5, pp. 525–529, 2004.
[47] K. M. Fararh, Y. Atoji, Y. Shimizu, and T. Takewaki, “Isulino-tropic properties of Nigella sativa oil in streptozotocin plusnicotinamide diabetic hamster,” Research in Veterinary Sci-ence, vol. 73, no. 3, pp. 279–282, 2002.
[48] K. M. S. Mansi, “Effects of oral administration of water extractofNigella sativa on serum concentrations of insulin and testos-terone in alloxan-induced diabetic rats,” Pakistan Journal ofBiological Sciences, vol. 8, no. 8, pp. 1152–1156, 2005.
[49] B. Krishnamurthy, J. Chee, G. Jhala et al., “Complete diabe-tes protection despite delayed thymic tolerance in NOD8.3TCR transgenic mice due to antigen-induced extrathymicdeletion of T cells,” Diabetes, vol. 61, no. 2, pp. 425–435,2012.
[50] K. A. Coughlan, R. J. Valentine, N. B. Ruderman, andA. K. Saha, “AMPK activation: a therapeutic target for type2 diabetes?,” Diabetes, Metabolic Syndrome and Obesity:Targets and Therapy, vol. 7, p. 241, 2014.
[51] D. F. Horrobin, “The roles of essential fatty acids in the devel-opment of diabetic neuropathy and other complications ofdiabetes mellitus,” Prostaglandins, Leukotrienes, and EssentialFatty Acids, vol. 31, no. 3, pp. 181–197, 1988.
9Oxidative Medicine and Cellular Longevity

[52] I. J. Goldberg, “Diabetic dyslipidemia: causes and conse-quences,” The Journal of Clinical Endocrinology &Metabolism,vol. 86, no. 3, pp. 965–971, 2001.
[53] Y. Kocyigit, Y. Atamer, and E. Uysal, “The effect of dietarysupplementation of Nigella sativa L. on serum lipid profile inrats,” Saudi Medical Journal, vol. 30, no. 7, pp. 893–896, 2009.
[54] M. Ismail, G. Al-Naqeep, and K. W. Chan, “Nigella sativathymoquinone-rich fraction greatly improves plasma antioxi-dant capacity and expression of antioxidant genes in hyper-cholesterolemic rats,” Free Radical Biology and Medicine,vol. 48, no. 5, pp. 664–672, 2010.
[55] G. Al-Naqeeb and M. Ismail, “Regulation of apolipoproteinA-1 and apolipoprotein B100 genes by thymoquinone richfraction and thymoquinone in HEPG2 cells,” Journal ofFood Lipids, vol. 16, no. 2, pp. 245–258, 2009.
[56] S. Ahmad and Z. H. Beg, “Hypolipidemic and antioxidantactivities of thymoquinone and limonene in atherogenicsuspension fed rats,” Food Chemistry, vol. 138, no. 2-3,pp. 1116–1124, 2013.
[57] J. W. Baynes, “Role of oxidative stress in development of com-plications in diabetes,” Diabetes, vol. 40, no. 4, pp. 405–412,1991.
[58] S. Tsimikas and Y. I. Miller, “Oxidative modification oflipoproteins: mechanisms, role in inflammation and poten-tial clinical applications in cardiovascular disease,” CurrentPharmaceutical Design, vol. 17, no. 1, pp. 27–37, 2011.
[59] O. E. Kelany, H. E. Khaled, M. Amal, H. M. Abdelrazek, andM. M. Abdel-Daim, “Hepatoprotective and metabolic effectsof dietary soy phytoestrogens against hyper caloric diet incyclic female albino rats is mediated through estradiol recep-tors beta,” Biomedical and Pharmacology Journal, vol. 10,no. 3, pp. 1061–1069, 2017.
[60] I. Meral, Z. Yener, T. Kahraman, and N. Mert, “Effect ofNigella sativa on glucose concentration, lipid peroxidation,anti-oxidant defence system and liver damage inexperimentally-induced diabetic rabbits,” Journal of Veteri-nary Medicine Series A, vol. 48, no. 10, pp. 593–599, 2001.
[61] S. O. Adewole, E. A. Caxton-Martins, and J. A. Ojewole, “Pro-tective effect of quercetin on the morphology of pancreatic β-cells of streptozotocin-treated diabetic rats,” African Journal ofTraditional, Complementary and Alternative Medicines, vol. 4,no. 1, pp. 64–74, 2007.
[62] A. Gökçe, S. Oktar, A. Koc, and Z. Yonden, “Protective effectsof thymoquinone against methotrexate-induced testicularinjury,” Human & Experimental Toxicology, vol. 30, no. 8,pp. 897–903, 2010.
[63] O. A. Badary, A. B. Abdel-Naim, M. H. Abdel-Wahab,and F. M. Hamada, “The influence of thymoquinone ondoxorubicin-induced hyperlipidemic nephropathy in rats,”Toxicology, vol. 143, no. 3, pp. 219–226, 2000.
[64] G. P. Widodo, R. Herowati, J. M. Perangin-Angin, and J. E.Kamlasi, “Antihyperglycemic, antioxidant, and pancreasregeneration activities of black cumin (Nigella sativa L.) seedsethanol extract in alloxan-induced diabetic rats,” InternationalJournal of Pharmacy and Pharmaceutical Sciences, vol. 8, no. 5,pp. 37–40, 2016.
[65] R. H. Tuhin, M. M. Begum, M. S. Rahman et al., “Wound heal-ing effect of Euphorbia hirta Linn. (Euphorbiaceae) in alloxaninduced diabetic rats,” BMC Complementary and AlternativeMedicine, vol. 17, no. 1, p. 423, 2017.
[66] M. G. Bischof, E. Bernroider, M. Krssak et al., “Hepatic glyco-genmetabolism in type 1 diabetes after long-term near normo-glycemia,” Diabetes, vol. 51, no. 1, pp. 49–54, 2002.
[67] A. R. Saltiel and C. R. Kahn, “Insulin signalling and the regu-lation of glucose and lipid metabolism,” Nature, vol. 414,no. 6865, pp. 799–806, 2001.
10 Oxidative Medicine and Cellular Longevity
Research ArticleRutin Isolated from Chrozophora tinctoria Enhances Bone CellProliferation and Ossification Markers
Ashraf B. Abdel-Naim ,1,2 Abdullah A. Alghamdi,3 Mardi M. Algandaby,1,4
Fahad A. Al-Abbasi,1,3 Ahmed M. Al-Abd,2,5 Basma G. Eid ,2 Hossam M. Abdallah,6,7
and Ali M. El-Halawany7
1Medicinal Plants Research Group, Deanship of Scientific Research, King Abdulaziz University, Jeddah, Saudi Arabia2Department of Pharmacology and Toxicology, Faculty of Pharmacy, King Abdulaziz University, Jeddah, Saudi Arabia3Department of Biochemistry, Faculty of Science, King Abdulaziz University, Jeddah, Saudi Arabia4Department of Biological Sciences, Faculty of Science, King Abdulaziz University, Jeddah, Saudi Arabia5Pharmacology Department, Medical Division, National Research Centre, Giza, Egypt6Department of Natural Products, Faculty of Pharmacy, King Abdulaziz University, Jeddah, Saudi Arabia7Department of Pharmacognosy, Faculty of Pharmacy, Cairo University, Cairo, Egypt
Correspondence should be addressed to Ashraf B. Abdel-Naim; [email protected]
Received 12 October 2017; Revised 25 November 2017; Accepted 17 December 2017; Published 13 February 2018
Academic Editor: Lotfi Aleya
Copyright © 2018 Ashraf B. Abdel-Naim et al. This is an open access article distributed under the Creative Commons AttributionLicense, which permits unrestricted use, distribution, and reproduction in any medium, provided the original work isproperly cited.
Osteoporosis is a chronic disease in which the skeleton loses a weighty proportion of its mineralized mass and mechanical pliability.Currently available antiosteoporotic agents suffer adverse effects that include elevated risk of thrombosis and cancer.Phytochemicals may constitute a safer and effective option. In the current work, six flavonoids were obtained fromChrozophora tinctoria and identified as amentoflavone (1), apigenin-7-O-β-D-glucopyranoside (2), apigenin-7-O-6′′-E-p-coumaroyl-β-D-glucopyranoside (3), acacetin-7-O-β-D-[α-L-rhamnosyl(1→6)]3′′-E-p-coumaroyl glucopyranoside (4), apigenin-7-O-(6′′-Z-p-coumaroyl)-β-D-glucopyranoside (5), and rutin (6). An extensive review of the literature as well as NMR and massspectral techniques was employed in order to elucidate the compound structures. Proliferation was enhanced in MCF7, MG-63,and SAOS-2 cells after exposure to subcytotoxic levels of the tested flavonoids. Rutin was chosen for subsequent studies inSAOS-2 cells. Rutin was not found to cause any alteration in the index of proliferation of these cells, when examining the cellcycle distribution by DNA flowcytometric analysis. Rutin was, however, found to increase osteocyte and osteoblast-related geneexpression and lower the expression of RUNX suppressor and osteoclast genes. When examining the influence of rutin onvitamin D levels and the activity of alkaline phosphatase enzyme, it was found to enhance both, while decreasing acidphosphatase which is a marker of osteoporosis. Thus, rutin enhances proliferation and ossification markers in bone cells.
1. Introduction
Osteoporosis is a chronic disease in which the skeleton loses aweighty proportion of its mineralized mass and mechanicalpliability [1]. It occurs when bone resorption surpasses boneformation, causing an imbalance [2]. As a result, the bonestend to become more fragile and more susceptible to frac-tures [3]. Studies have shown that 50% of women and 20%of men are likely to have a fracture resulting from
osteoporosis during their lifetime [4]. Such fractures imposea heavy health and economic burden worldwide [5, 6]. Therisk of developing osteoporosis has been shown to be directlylinked to diet. Studies have reported that people eatinghealthy diets with a high fruit and vegetable content tend tohave lower bone resorption than their counterparts eatingpoor diets rich in processed foods [7]. Pharmacologicalmanagement of osteoporosis involves the use of bisphospho-nates and estrogen replacement therapy. However, these
HindawiOxidative Medicine and Cellular LongevityVolume 2018, Article ID 5106469, 10 pageshttps://doi.org/10.1155/2018/5106469
medicines suffer adverse effects that may range from gas-tric irritation to increased thromboembolic and cancerrisks [8–10]. Therefore, it is imperative that we look for saferand effective alternatives. In this regard, medicinal herbs andplant-derived molecules have gained wide acceptance by thepublic and scientific communities [11].
Flavonoids, which are widely found in fruit and vegeta-bles, are bioactive polyphenols with anti-inflammatory andantioxidant properties. Bone health has been associated withthe intake of flavonoids. Intake of flavonoids increases bonemass density (BMD) in the neck and spine and decreasesbone resorption in perimenopausal women [12]. Moreover,catechins and flavanones were found to associate withmarkers of bone resorption negatively. At the hip and spine,anthocyanins were found to be strongly linked with BMD[13]. It has been postulated that the reduction of low-gradeinflammation and oxidative stress by flavonoids is thehallmark of protecting bone loss. In addition, flavonoids arethought to promote the upregulation of signaling pathwaysthat increase the activity of osteoblasts [14].
Chrozophora tinctoria (L.)A. Juss. has several other namesincluding turnsole, Dyer’s croton or giradol. It is an annualplant that belongs to the Euphorbiaceae family [15]. Experi-mentally, it exhibited antioxidant and wound healing effects[16, 17]. It exerts pronounced anti-inflammatory activitieswhich involve inhibition of TNF-α, PGE2, IL-1β, and IL-6[18]. Phytochemically, this plant is rich in biflavones, such asamentoflavone in addition to many flavonoids includingapigenin, rutin, quercetin, and acacetin [15, 18–20]. The cur-rent work aimed at isolating, identifying, and assessing theactivity of major flavonoids isolated from C. tinctoria onmarkers of ossification and proliferation of bone cells.
2. Materials and Methods
2.1. Material for Phytochemical Studies. UV IKON 940 spec-trophotometer was used to measure UV spectra. A BrukerApex III Fourier-transform ion cyclotron resonance (FTICR)mass spectrometer (Bruker Daltonics, Billerica, USA) includ-ing an Infinity™ cell and a 7.0 Tesla superconducting magnet(Bruker, Karlsruhe, Germany) was used to perform massspectrometric studies. A Bruker DRX-600MHz Ultrashieldspectrometer (Bruker BioSpin, Billerica, MA, USA) wasutilized to measure NMR spectra. Chromatographic separa-tion of the active compounds was performed on Silica gel60 (70-230 mesh, Merck, Darmstadt, Germany), Silica gel100 C18-Reversed phase (0.04–0.063mm, Merck, Darmstadt,Germany), and Sephadex LH-20 (Pharmacia Fine ChemicalsInc., Uppsala, Sweden). Monitoring of the isolation processwas carried out on TLC plates with Silica gel 60 F254 (Merck,Darmstadt, Germany).
2.2. Plants Utilized in the Study. Chrozophora tinctoria (L.)A. Juss., Euphorbiaceae aerial parts were obtained from Al-Hadda road, Kingdom of Saudi Arabia (April 2015). Thesespecimens were authenticated by Dr. Emad Al-Sharif,Department of Biology, King Abdulaziz University, SaudiArabia. A specimen (reg. number CO-1080) was retained in
the herbarium of the Department of Natural Products andAlternative Medicine, Saudi Arabia.
2.3. Phenolic Compound Extraction. The isolation processwas performed as previously reported [18]. In brief, twokilograms of the aerial parts of C. tinctoria were dried andmethanol was used as an extraction solvent till exhaustionto give a 150 g residue. The total extract was suspended inthe least amount of water and extracted with chloroformleaving flavonoid-rich mother liquor that was separatedusing a Diaion HP-20 column starting with water up to100% methanol to give three fractions (A–C). Fraction Awas free from any phenolic compounds. Silica gel columnchromatography was employed to separate fraction B(50× 5 cm, 180 g). CHCl3 :MeOH was employed with gradi-ent elution resulting in three fractions, I, II, and III. The firstfraction (0.5 g) was separated on CC Sephadex LH-20 usingthe eluent MeOH to give compound 1 (50mg). The secondfraction (1.5 g) was subjected to chromatography withreversed phase Silica gel 100 C18–column and MeOH :H2O,3 : 7 as an eluent to give compound 2 (40mg). The thirdfraction (2 g) was repeatedly fractionated on Sephadex LH-20 using MeOH as an eluent; followed by CC on reversedphase Silica gel 100 C18 using a system of MeOH : water,3 : 7; and finally purification was performed on HPLCusing a Zorbax SB-C18 column (9.4× 250mm), flow rate5ml/min to give to compounds 3 (20mg), 4 (35mg),and 5 (45mg). Fraction C was chromatographed onSephadex LH-20 using MeOH as an eluent to give com-pound 6 (20mg).
2.4. Chemical Compounds and Media. Sulfarhodamine B(SRB), RNAse-A enzyme, 17β-hydroxyestradiol, and propi-dium iodide (PI) were obtained from Sigma-Aldrich (St.Louis, MO, USA). Cell culture materials such as DMEMmedia, fetal bovine serum (FBS), McCoy’s-5A media, andMEM media were obtained from Gibco™, Thermo FisherScientific (Waltham, MA, USA). The chemicals utilized inthis study were of the highest available analytical grade.
2.5. Cell Culture. The cell lines used in this study were humanbreast adenocarcinoma cells (MCF-7 cell line), in addition tohuman osteosarcoma cell lines (SAOS-2 and MG-63). Theseestrogen-dependent cell lines were purchased from the VAC-CERA(Giza, Egypt). The cellswere kept inDMEM,MEM,andMcCoy’s-5A media, respectively. Streptomycin (100μg/ml),penicillin (100 units/ml), and heat-inactivated FBS (10% v/v)were added to the media. Cells were kept in at 37°C and inhumid conditions 5% (v/v) CO2 atmosphere.
2.6. Assessment of Cytotoxicity. The cytotoxic effects of thecompounds obtained from C. tincturia were examined inMCF-7, SAOS-2, and MG-63 cells using SRB assay asdescribed in the previous work [21]. Trypsin-EDTA (0.25%w/v) was utilized to briefly detach exponentially growingcells. Subsequently, cells were transferred to 96-well plates(103 cells per well). The test compounds were applied for72 h to the cells. The cells were then fixed using TCA (10%w/v) at 4°C for 1 h. Subsequently, the cells were washed threetimes and SRB solution (0.4% w/v) was added in a dark room
2 Oxidative Medicine and Cellular Longevity

for 10min after which glacial acetic acid (1% v/v) was appliedfor a final wash. Cells were dried and the SRB-stained cellswere dissolved by Tris-HCl (0.1M). A microplate readerwas utilized to record the color intensity at 540nm.
2.7. Determination of Doubling Time Using the ProliferationAssay. SRB assay was employed to calculate the doublingtime (as a measure for the proliferative effect) of MCF-7,SAOS-2, and MG-63 cells in the presence of and absence ofincubation with the compounds isolated from C. tincturia.A subcytotoxic concentration (1μM) of the flavonoidsobtained from C. tincturia was shortly applied to cellsgrowing exponentially in media free of phenol red for 96h.SRB solution was used to stain cells in order to carry out theirquantification and to calculate doubling time using the bestfit linear regression analysis curve [22].
2.8. Cell Cycle Distribution Study. In order to determine theeffects of rutin on the cell cycle distribution, 1μM rutin wasapplied to SAOS-2 cells for 48 h and a comparison was maderelative to 0.1μM estradiol. Trypsin was used to detach andcollect the cells, after which PBS was added to wash the cellstwice at 4°C. The cells were then resuspended in PBS (0.5ml).Ethanol (ice-cold 70% v/v) (2ml) was applied while shaking.This was followed by an incubation of the cells for 1 h at 4°Cto allow fixation to occur. Cells were then analyzed, washed,and resuspended in PBS (1ml) containing 50μg/ml ofRNAase-A and 10μg/ml of PI. The cells were kept in the dark(20°C) for 20 minutes and the DNA contents were deter-mined. After being passed into an ACEA Novocyte™ flowcytometer (ACEA Biosciences Inc., San Diego, CA, USA),the cells were analyzed using a FL2 signal detector (λex/em535/617 nm) for PI positive events. Phases of the cell cyclewere determined by ACEA NovoExpress™ software (ACEABiosciences Inc., San Diego, CA, USA) for every sample(12,000 events per sample) subsequent to defining cellfragment-free fluorescent gate. Cells in the supra-G2/Mphase were identified using ungated events. Total cells inS- and G2/M phases were divided by cells in G0/G1 phasesin order to calculate the proliferation index.
2.9. Gene Array Studies. Expression of osteogenic- andosteolytic-related genes was studied by exposing the cells(1× 10⁶) to either 1μM rutin or 0.1μM estradiol for 48h.The latter served as a positive control. RNeasy Mini Kit®(Qiagen Inc., Valencia, CA, USA) was used for RNA extrac-tion. cDNA was obtained by reverse transcription with acDNA Reverse Transcription Kit (Applied Biosystems, Fos-ter City, CA). PCR was performed in real time on the cDNAvia GeneQuery™ Human Osteogenic Differentiation qPCRArray (Science Cell Research Laboratories Inc., Carlsbad,CA, USA) according to the manufacturer’s instructions[23]; β-actin was selected as the housekeeping gene. Theformula: 2−ΔΔCq was employed to detect the normalizedchange in the gene expression of the studied genes after treat-ment with rutin and estradiol.
2.10. Osteoporosis Marker Assessment. The effects of rutin onossification markers in the SAOS-2 cell line were determinedby the application of 1μM rutin or 0.1μM estradiol to 1× 10⁶
cells for 48 h. The latter served as a positive control. Aftercollecting the media, assays of vitamin D, alkaline phospha-tase (ALP), osteocalcin (OC), and acid phosphatase (ACP)were performed. A direct HTS-ready colorimetric kit(Abcam, Cambridge, UK) was used to determine ALP as wellas tartrate-resistant ACP [24]. Uscan® immunoassay ELISAKit (Life Science Inc., Wuhan, China) was utilized to detectosteocalcin [25]. Human Total 25-OH Vitamin D IVDELISA Kit (R&D Systems, Inc., Minneapolis, MN, USA)was used to detect vitamin D in its active form.
2.11. Statistical Analysis. Data are presented as mean± SD.Analysis of variance (ANOVA) and Tukey’s post hoc testwere used to calculate statistical significance by SPSS® forWindows, version 17.0.0. p < 0 05 was regarded as being sta-tistically significant.
3. Results and Discussion
There is an immense need for the development of noveldrugs to treat osteoporosis which are devoid of potentiallylife-threatening side effects, namely, stroke and carcinogene-sis [8, 26]. We have previously found that the phenolic com-pound paradol, isolated from Aframomum meleguea seeds,showed proliferative effects in bone cells [27]. Flavonoidshave been shown by numerous studies to prevent bone loss[12, 28–31]. Since C. tinctoria is rich in flavonoids as api-genin, rutin, quercetin, and acacetin [18, 20], we examinedthe effects of these compounds on proliferation and ossifica-tion markers. Mechanistically, the plant has been shown toimpede several pathologic processes leading to osteoporosisas oxidative stress and inflammation [18]. Our study focusedon isolating and determining the activity of its flavonoids onbone cell proliferation and ossification markers. Six metabo-lites were isolated from the C. tinctoria after phytochemicalanalysis (Figure 1). Cochromatography with authentic sam-pleswasused to identify these compounds, in addition to refer-ring to spectral data from the literature. The identifiedcompounds were amentoflavone (1) [32, 33], apigenin-7-O-β-D-glucopyranoside (2) [34], apigenin-7-O-6′′-E-p-coumar-oyl-β-D-glucopyranoside (3) [35], acacetin-7-O- β-D-[α-L-rhamnosyl(1→6)]3′′-E-p-coumaroyl glucopyranoside (4)[18], apigenin-7-O-(6′′-Z-p-coumaroyl)-β-D-glucopyrano-side (5) [18], and rutin (6) [34].
The cytotoxicity of these compounds was studied usingthe SRB viability assay in various estrogenic cell lines,namely, MCF-7, SAOS-2, and MG-63 cells. We have previ-ously used these cell lines to study the effects of paradol onA. meleguea seeds, where we noted an accelerated prolifera-tion [27]. In the present study, when looking at the effectson MCF-7 cells, the compounds showed a maximum of20% alteration in the viability of cells, after being applied tothe compounds for 72h in 10μM concentrations. Exposingthe cells to a higher concentration (100μM) of amentofla-vone for 72h (1) lead to a 78.8% viability of the controluntreated cells (Table 1). As in the MCF-7 cells, exposureof SAOS-2 cells to the compounds at 10μM concentrationfor 72 h showed amaximum of 20% change in viability. How-ever, increasing the concentration of the compounds 1, 3, 5,
3Oxidative Medicine and Cellular Longevity

and 6 to 100μM induced a viability drop down to 70.1%,66.2%, 77.1%, and 76.2% of the untreated control cells,respectively (Table 1). Interestingly, MG-63 cells were themost affected by the compounds under investigation. Theaddition of the compounds under investigation (0.1μM) toMG-63 cells for 72 h had no more than a 20% change in theviability of the cells. However, exposure to 1μM of 1 and 5
reduced cell viability to 74.9% and 78.1% of the controlcells, respectively. The addition of a greater concentration(10μM) of all flavonoids under investigation induced 20–40% killing effect at 72 h of exposure. Further exposureto 100μM of all compounds under investigation droppedcell viability of MG-63 cells to 40–70% of the controluntreated cells (Table 1).
HO
HO
HOOH
OH
OH
HO
O
O O
O
HO
HO
OHOH
OH
OH
(1)
(3)
(4)
(6)(5)
(2)
OH
OH
OH
OH
OH
OH
OH
OH
OH OH
OHOHOH
OHHO
OH
OH
OH
OH
OCH3
OH
OO
OO O
O
O
O
OO O
O
O
O
O
O
OO O
OO
O
O
O
O
O
HO
HO
HO
HO
HO
HOHO
HO
O
O
O
O
Figure 1: Isolated compounds from Chrozophora tincturia.
4 Oxidative Medicine and Cellular Longevity
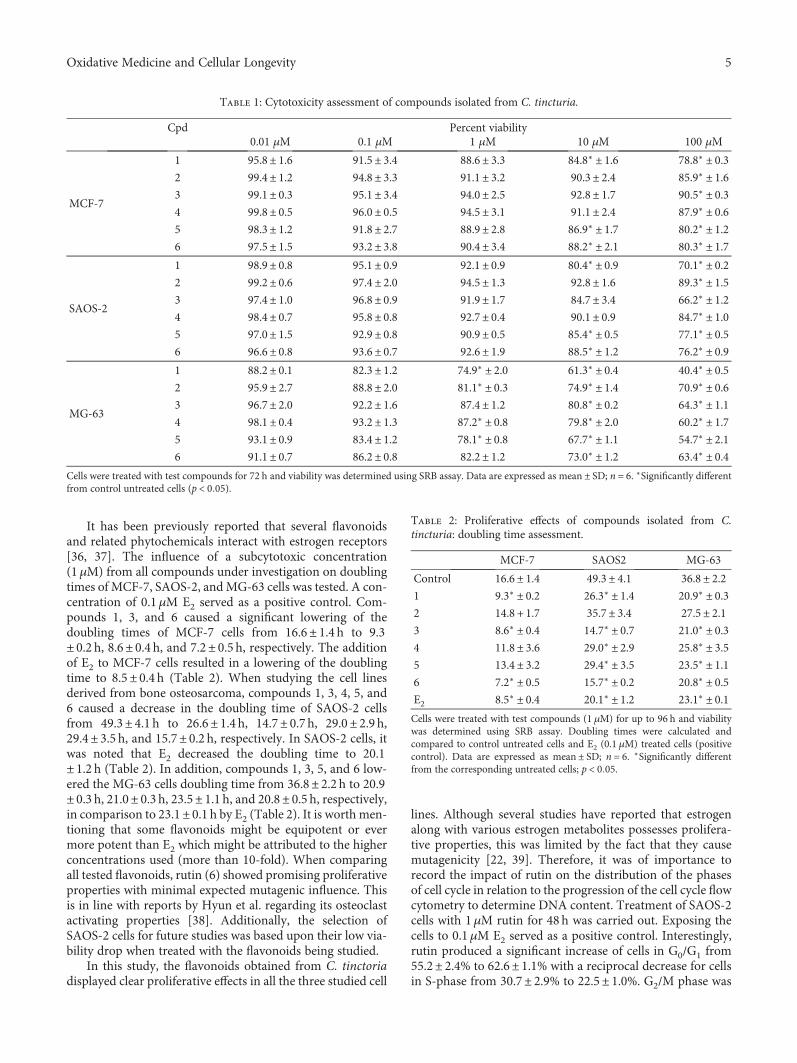
It has been previously reported that several flavonoidsand related phytochemicals interact with estrogen receptors[36, 37]. The influence of a subcytotoxic concentration(1μM) from all compounds under investigation on doublingtimes of MCF-7, SAOS-2, andMG-63 cells was tested. A con-centration of 0.1μM E2 served as a positive control. Com-pounds 1, 3, and 6 caused a significant lowering of thedoubling times of MCF-7 cells from 16.6± 1.4 h to 9.3± 0.2 h, 8.6± 0.4 h, and 7.2± 0.5 h, respectively. The additionof E2 to MCF-7 cells resulted in a lowering of the doublingtime to 8.5± 0.4 h (Table 2). When studying the cell linesderived from bone osteosarcoma, compounds 1, 3, 4, 5, and6 caused a decrease in the doubling time of SAOS-2 cellsfrom 49.3± 4.1 h to 26.6± 1.4 h, 14.7± 0.7 h, 29.0± 2.9 h,29.4± 3.5 h, and 15.7± 0.2 h, respectively. In SAOS-2 cells, itwas noted that E2 decreased the doubling time to 20.1± 1.2 h (Table 2). In addition, compounds 1, 3, 5, and 6 low-ered the MG-63 cells doubling time from 36.8± 2.2 h to 20.9± 0.3 h, 21.0± 0.3 h, 23.5± 1.1 h, and 20.8± 0.5 h, respectively,in comparison to 23.1± 0.1 h by E2 (Table 2). It is worth men-tioning that some flavonoids might be equipotent or evermore potent than E2 which might be attributed to the higherconcentrations used (more than 10-fold). When comparingall tested flavonoids, rutin (6) showed promising proliferativeproperties with minimal expected mutagenic influence. Thisis in line with reports by Hyun et al. regarding its osteoclastactivating properties [38]. Additionally, the selection ofSAOS-2 cells for future studies was based upon their low via-bility drop when treated with the flavonoids being studied.
In this study, the flavonoids obtained from C. tinctoriadisplayed clear proliferative effects in all the three studied cell
lines. Although several studies have reported that estrogenalong with various estrogen metabolites possesses prolifera-tive properties, this was limited by the fact that they causemutagenicity [22, 39]. Therefore, it was of importance torecord the impact of rutin on the distribution of the phasesof cell cycle in relation to the progression of the cell cycle flowcytometry to determine DNA content. Treatment of SAOS-2cells with 1μM rutin for 48 h was carried out. Exposing thecells to 0.1μM E2 served as a positive control. Interestingly,rutin produced a significant increase of cells in G0/G1 from55.2± 2.4% to 62.6± 1.1% with a reciprocal decrease for cellsin S-phase from 30.7± 2.9% to 22.5± 1.0%. G2/M phase was
Table 1: Cytotoxicity assessment of compounds isolated from C. tincturia.
Cpd Percent viability0.01 μM 0.1 μM 1 μM 10 μM 100 μM
MCF-7
1 95.8± 1.6 91.5± 3.4 88.6± 3.3 84.8∗ ± 1.6 78.8∗ ± 0.32 99.4± 1.2 94.8± 3.3 91.1± 3.2 90.3± 2.4 85.9∗ ± 1.63 99.1± 0.3 95.1± 3.4 94.0± 2.5 92.8± 1.7 90.5∗ ± 0.34 99.8± 0.5 96.0± 0.5 94.5± 3.1 91.1± 2.4 87.9∗ ± 0.65 98.3± 1.2 91.8± 2.7 88.9± 2.8 86.9∗ ± 1.7 80.2∗ ± 1.26 97.5± 1.5 93.2± 3.8 90.4± 3.4 88.2∗ ± 2.1 80.3∗ ± 1.7
SAOS-2
1 98.9± 0.8 95.1± 0.9 92.1± 0.9 80.4∗ ± 0.9 70.1∗ ± 0.22 99.2± 0.6 97.4± 2.0 94.5± 1.3 92.8± 1.6 89.3∗ ± 1.53 97.4± 1.0 96.8± 0.9 91.9± 1.7 84.7± 3.4 66.2∗ ± 1.24 98.4± 0.7 95.8± 0.8 92.7± 0.4 90.1± 0.9 84.7∗ ± 1.05 97.0± 1.5 92.9± 0.8 90.9± 0.5 85.4∗ ± 0.5 77.1∗ ± 0.56 96.6± 0.8 93.6± 0.7 92.6± 1.9 88.5∗ ± 1.2 76.2∗ ± 0.9
MG-63
1 88.2± 0.1 82.3± 1.2 74.9∗ ± 2.0 61.3∗ ± 0.4 40.4∗ ± 0.52 95.9± 2.7 88.8± 2.0 81.1∗ ± 0.3 74.9∗ ± 1.4 70.9∗ ± 0.63 96.7± 2.0 92.2± 1.6 87.4± 1.2 80.8∗ ± 0.2 64.3∗ ± 1.14 98.1± 0.4 93.2± 1.3 87.2∗ ± 0.8 79.8∗ ± 2.0 60.2∗ ± 1.75 93.1± 0.9 83.4± 1.2 78.1∗ ± 0.8 67.7∗ ± 1.1 54.7∗ ± 2.16 91.1± 0.7 86.2± 0.8 82.2± 1.2 73.0∗ ± 1.2 63.4∗ ± 0.4
Cells were treated with test compounds for 72 h and viability was determined using SRB assay. Data are expressed as mean ± SD; n = 6. ∗Significantly differentfrom control untreated cells (p < 0 05).
Table 2: Proliferative effects of compounds isolated from C.tincturia: doubling time assessment.
MCF-7 SAOS2 MG-63
Control 16.6± 1.4 49.3± 4.1 36.8± 2.21 9.3∗ ± 0.2 26.3∗ ± 1.4 20.9∗ ± 0.32 14.8 + 1.7 35.7± 3.4 27.5± 2.13 8.6∗ ± 0.4 14.7∗ ± 0.7 21.0∗ ± 0.34 11.8± 3.6 29.0∗ ± 2.9 25.8∗ ± 3.55 13.4± 3.2 29.4∗ ± 3.5 23.5∗ ± 1.16 7.2∗ ± 0.5 15.7∗ ± 0.2 20.8∗ ± 0.5E2 8.5∗ ± 0.4 20.1∗ ± 1.2 23.1∗ ± 0.1Cells were treated with test compounds (1 μM) for up to 96 h and viabilitywas determined using SRB assay. Doubling times were calculated andcompared to control untreated cells and E2 (0.1 μM) treated cells (positivecontrol). Data are expressed as mean ± SD; n = 6. ∗Significantly differentfrom the corresponding untreated cells; p < 0 05.
5Oxidative Medicine and Cellular Longevity

not affected by treatment with rutin (Figures 2(a), 2(c),and 2 (d)). However, 0.1μM E2 produced a significant dropof cells in the S-phase (30.7± 2.9% to 26.5± 0.9%). TreatingSAOS-2 cells with E2 caused no significant changes of cellsin G0/G1 or S-phases (Figures 2(a), 2(b), and 2(d)). Whenstudying the proliferating cell fraction balance in SAOS-2cells, rutin significantly decreased the proliferation index;on the other hand, treatment with E2 did not alter theirproliferation index (Figure 2(e)). In a previous study in ourlaboratory, paradol showed no influence on the proliferationindex of SAOS-2 cells [27]. Our current data are in alignmentwith our studies on SAOS-2 cells where 1μM rutin was foundto decrease the doubling time. Yet, we tested the nature of therutin proliferative effect in SAOS-2; accumulation of cells inthe supra-G2 compartment (multiploidy phase) mightindicate uncontrolled cell proliferation. Interestingly, afterSAOS-2 exposure to rutin, cells in supra-G2 phase were muchlower than control cells (Figure 2(f)). This indicates a punc-tuated cell division without cell accumulation in multiploidyphase [40]. This gains support by the known chemopreven-tive and anticarcinogenic properties of rutin [41–43].
Several studies have reported that targeting ossification isa more fruitful approach than targeting proliferation, whenlooking at developing new drug targets to treat osteoporosis.[44, 45]. The effects of rutin on osteogenic marker geneexpression were quantitatively studied using RT-PCR genearray battery kit that comprises various osteogenic gene fam-ilies. These include osteocyte, osteoclast, and osteoblast activ-ity markers, as well as RUNX suppressor genes. Whenstudying the osteocyte activity markers (BGN, FGF23, PDPN,HYOU1, and SOST), rutin and E2 caused an increase inexpression of all the tested osteocyte activity gene markersby 1.9- to 2.9-folds and 2.7- to 3.5-folds, respectively(Figure 3(a)). The role of osteocytes in calcium and phos-phate homeostasis has been previously reported. Osteocytescloned with BGN caused acceleration of osteoblast differenti-ation in vitro and an increase in the area of lamellar bone-likematrices in vivo [46]. Phosphate levels are known to declinedue to the presence of the FGF23 protein [47]. Dividing oste-ocytes are known to express PDPN, which is regarded as amarker of activity [48]. They also secrete SOST causing anegative effect on the formation of bones [49]. Also, rutin
G1 G2
(b)
G1 G2
(a)
G1 G2
(c)
0
50
100
G0/G1SG2/M
Perc
enta
ge o
f cel
ls (%
)
Control E2 Rutin
(d)
0.0
0.2
0.4
0.6
0.8
1.0Pr
olife
ratio
n in
dex
Control E2 Rutin
⁎
(e)
0Control E2 Rutin
5
10
15
Perc
ent (
%)
⁎
(f)
Figure 2: Effect of rutin on the cell cycle distribution of SAOS-2 cells. Cells were exposed to rutin (1 μM) for 48 h (b) and compared to controluntreated cells (a) and E2- (0.1μM) treated cells (c). Cell cycle distribution was determined using DNA cytometry analysis and differentcell phases were plotted (d) as percentage of total events. Proliferation index was calculated and plotted (e). Supra-G2/M cell populationwas plotted as percent of total events (f). Data are presented as mean± SD; n = 3. ∗Significantly different from the control untreatedcells; p < 0 05.
6 Oxidative Medicine and Cellular Longevity
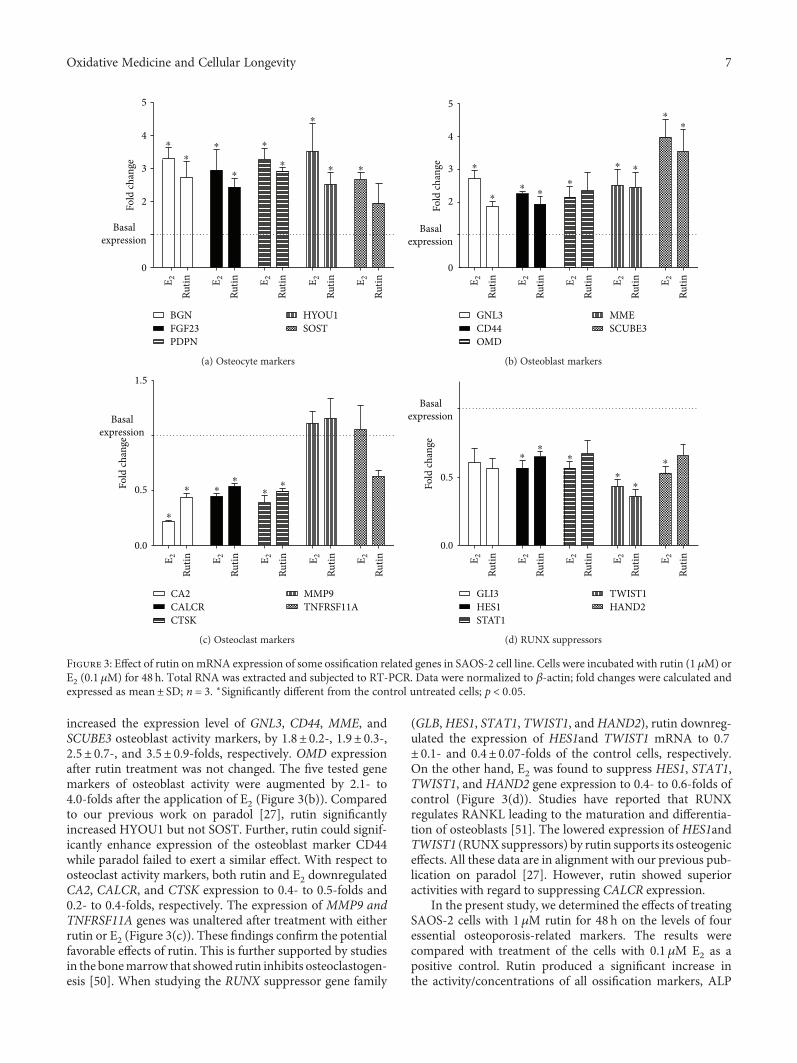
increased the expression level of GNL3, CD44, MME, andSCUBE3 osteoblast activity markers, by 1.8± 0.2-, 1.9± 0.3-,2.5± 0.7-, and 3.5± 0.9-folds, respectively. OMD expressionafter rutin treatment was not changed. The five tested genemarkers of osteoblast activity were augmented by 2.1- to4.0-folds after the application of E2 (Figure 3(b)). Comparedto our previous work on paradol [27], rutin significantlyincreased HYOU1 but not SOST. Further, rutin could signif-icantly enhance expression of the osteoblast marker CD44while paradol failed to exert a similar effect. With respect toosteoclast activity markers, both rutin and E2 downregulatedCA2, CALCR, and CTSK expression to 0.4- to 0.5-folds and0.2- to 0.4-folds, respectively. The expression of MMP9 andTNFRSF11A genes was unaltered after treatment with eitherrutin or E2 (Figure 3(c)). These findings confirm the potentialfavorable effects of rutin. This is further supported by studiesin the bonemarrow that showed rutin inhibits osteoclastogen-esis [50]. When studying the RUNX suppressor gene family
(GLB,HES1, STAT1, TWIST1, andHAND2), rutin downreg-ulated the expression of HES1and TWIST1 mRNA to 0.7± 0.1- and 0.4± 0.07-folds of the control cells, respectively.On the other hand, E2 was found to suppress HES1, STAT1,TWIST1, and HAND2 gene expression to 0.4- to 0.6-folds ofcontrol (Figure 3(d)). Studies have reported that RUNXregulates RANKL leading to the maturation and differentia-tion of osteoblasts [51]. The lowered expression of HES1andTWIST1 (RUNX suppressors) by rutin supports its osteogeniceffects. All these data are in alignment with our previous pub-lication on paradol [27]. However, rutin showed superioractivities with regard to suppressing CALCR expression.
In the present study, we determined the effects of treatingSAOS-2 cells with 1μM rutin for 48 h on the levels of fouressential osteoporosis-related markers. The results werecompared with treatment of the cells with 0.1μM E2 as apositive control. Rutin produced a significant increase inthe activity/concentrations of all ossification markers, ALP
0
2
3
4
5
Basalexpression
E 2Ru
tin E 2Ru
tin E 2Ru
tin E 2Ru
tin E 2Ru
tin
Fold
chan
ge
FGF23BGN
PDPNSOSTHYOU1
⁎⁎
⁎
⁎
⁎
⁎
⁎
⁎
⁎
(a) Osteocyte markers
Basalexpression
E 2Ru
tin E 2Ru
tin E 2Ru
tin E 2Ru
tin E 2Ru
tin
0
2
3
4
5
Fold
chan
ge
CD44GNL3
OMDSCUBE3MME
⁎
⁎⁎
⁎
⁎ ⁎⁎
⁎
⁎
(b) Osteoblast markers
Basalexpression
E 2Ru
tin E 2Ru
tin E 2Ru
tin E 2Ru
tin E 2Ru
tin
0.0
0.5
1.5
Fold
chan
ge
CALCRCA2
CTSKTNFRSF11AMMP9
⁎
⁎
⁎
⁎⁎
⁎
(c) Osteoclast markers
Basalexpression
E 2Ru
tin E 2Ru
tin E 2Ru
tin E 2Ru
tin E 2Ru
tin
0.0
0.5
Fold
chan
ge
HES1GLI3
STAT1HAND2TWIST1
⁎
⁎
⁎
⁎
⁎
⁎
(d) RUNX suppressors
Figure 3: Effect of rutin onmRNA expression of some ossification related genes in SAOS-2 cell line. Cells were incubated with rutin (1 μM) orE2 (0.1 μM) for 48 h. Total RNA was extracted and subjected to RT-PCR. Data were normalized to β-actin; fold changes were calculated andexpressed as mean± SD; n = 3. ∗Significantly different from the control untreated cells; p < 0 05.
7Oxidative Medicine and Cellular Longevity

enzyme, OCN hormone, and active Vit-D3 concentration, by7.1-, 3.4-, and 1.1-folds, respectively. Similarly, E2 increasedthe activity/concentrations of ALP enzyme, OCN hormone,and active Vit-D3 concentration, by 6.9-, 3.9-, and 1.2-folds,respectively (Figures 4(a)–4(c)). On the other hand, rutinproduced a statistically significant drop in ACP enzymeactivity (bone resorption marker) from 4.7± 0.4 IU/ml to1.6± 0.4 IU/ml compared to 1.5± 0.4 IU/ml for E2-treatedcells (Figure 4(d)). The biochemical markers chosen in thisstudy are well documented in the literature as reliablemarkers having antiosteoporotic properties. [52]. In conclu-sion, the analysis of C. tinctoria extract led to the isolationof various flavonoids showing antiosteoporosis influence.Rutin was especially promising as it showed ossificationin bone cells as well as possessing punctuate proliferativeactivity with minimal influence to cell cycle distribution.
In other words, rutin might be further studied as a poten-tial antiosteoprotic agent with minimal expected muta-genic effects.
Conflicts of Interest
The authors declare no conflicts of interest.
Acknowledgments
This project was funded by the Deanship of ScientificResearch (DSR), King Abdulaziz University, Jeddah, SaudiArabia, under Grant no. (1-166-35 RG). The authors,therefore, acknowledge with thanks DSR for technical andfinancial support.
0Normal E2 Rutin
2
4
6
8
1040
45
50
55
60
ALP
(IU
/ml)
⁎
⁎
(a)
0
2
4
6
8
10
OC
(ng/
ml)
Normal E2 Rutin
⁎
⁎
(b)
Normal E2 Rutin0
5
10
15
Vit-D
3 (I
U/m
l)
⁎
⁎
(c)
Normal E2 Rutin0
2
4
6
ACP
(mU
/dl)
⁎⁎
(d)
Figure 4: Biochemical assessment for antiosteoporosis effect of rutin in vitro. SAOS-2 cells were treated with rutin (1 μM) and E2 (0.1 μM) for48 h and compared to the control untreated cells. Biochemical assessment of osteoporosis was evaluated by measuring alkaline phosphatase(a), osteocalcin (b), vitamin D3 (c), and acid phosphatase (d). Data are presented as mean± SD; n = 3. ∗Significantly different from the controluntreated cells; p < 0 05.
8 Oxidative Medicine and Cellular Longevity

References
[1] R. M. Martin and P. H. S. Correa, “Bone quality and osteopo-rosis therapy,” Arquivos Brasileiros de Endocrinologia &Meta-bologia, vol. 54, no. 2, pp. 186–199, 2010.
[2] K. Akesson, “New approaches to pharmacological treatment ofosteoporosis,” Bulletin of the World Health Organization,vol. 81, no. 9, pp. 657–664, 2003.
[3] K. E. Ensrud and C. J. Crandall, “Osteoporosis,” Annals ofInternal Medicine, vol. 167, no. 3, pp. ITC17–ITC32, 2017.
[4] T. P. van Staa, E. M. Dennison, H. G. Leufkens, and C. Cooper,“Epidemiology of fractures in England and Wales,” Bone,vol. 29, no. 6, pp. 517–522, 2001.
[5] W. D. Leslie, C. J. Metge, M. Azimaee et al., “Direct costs offractures in Canada and trends 1996–2006: a population-based cost-of-illness analysis,” Journal of Bone and MineralResearch, vol. 26, no. 10, pp. 2419–2429, 2011.
[6] J. P. van den Bergh, T. A. van Geel, and P. P. Geusens, “Oste-oporosis, frailty and fracture: implications for case finding andtherapy,” Nature Reviews Rheumatology, vol. 8, no. 3, pp. 163–172, 2012.
[7] A. C. Hardcastle, L. Aucott, W. D. Fraser, D. M. Reid, andH. M. Macdonald, “Dietary patterns, bone resorption andbone mineral density in early post-menopausal Scottishwomen,” European Journal of Clinical Nutrition, vol. 65,no. 3, pp. 378–385, 2011.
[8] L. M. Brass, “Estrogens and stroke: use of oral contraceptivesand postmenopausal use of estrogen: current recommenda-tions,” Current Treatment Options in Neurology, vol. 6, no. 6,pp. 459–467, 2004.
[9] W. Strampel, R. Emkey, and R. Civitelli, “Safety considerationswith bisphosphonates for the treatment of osteoporosis,” DrugSafety, vol. 30, no. 9, pp. 755–763, 2007.
[10] D. A. Yardley, “Pharmacologic management of bone-relatedcomplications and bonemetastases in postmenopausal womenwith hormone receptor-positive breast cancer,” Breast Cancer:Targets and Therapy, vol. 8, pp. 73–82, 2016.
[11] L. Wu, Z. Ling, X. Feng, C. Mao, and Z. Xu, “Herb medicinesagainst osteoporosis: active compounds & relevant biologicalmechanisms,” Current Topics in Medicinal Chemistry,vol. 17, no. 15, pp. 1670–1691, 2017.
[12] A. C. Hardcastle, L. Aucott, D. M. Reid, and H. M. Mac-donald, “Associations between dietary flavonoid intakesand bone health in a Scottish population,” Journal ofBone and Mineral Research, vol. 26, no. 5, pp. 941–947,2011.
[13] A. Welch, A. MacGregor, A. Jennings, S. Fairweather-Tait,T. Spector, and A. Cassidy, “Habitual flavonoid intakes arepositively associated with bone mineral density in women,”Journal of Bone and Mineral Research, vol. 27, no. 9,pp. 1872–1878, 2012.
[14] A. A.Welch and A. C. Hardcastle, “The effects of flavonoids onbone,” Current Osteoporosis Reports, vol. 12, no. 2, pp. 205–210, 2014.
[15] R. Gibbs, Chemotaxonomy of Flowering Plants, McGill-Queen’s University Press, Montreal, 1974.
[16] F. Oke-Altuntas, S. Ipekcioglu, A. Sahin Yaglioglu, L. Behcet,and I. Demirtas, “Phytochemical analysis, antiproliferativeand antioxidant activities of Chrozophora tinctoria: a naturaldye plant,” Pharmaceutical Biology, vol. 55, no. 1, pp. 966–973, 2017.
[17] H. Maurya, M. Semwal, and S. K. Dubey, “Pharmacologicalevaluation of Chrozophora tinctoria as wound healing poten-tial in diabetic rat’s model,” BioMed Research International,vol. 2016, Article ID 7475124, 7 pages, 2016.
[18] H. M. Abdallah, F. M. Almowallad, A. Esmat, I. A. Shehata,and E. A. Abdel-Sattar, “Anti-inflammatory activity of flavo-noids from Chrozophora tinctoria,” Phytochemistry Letters,vol. 13, pp. 74–80, 2015.
[19] E. Hecker, “Cocarcinogenic principles from the seed oil of Cro-ton tiglium and from other Euphorbiaceae,” Cancer Research,vol. 28, no. 11, pp. 2338–2349, 1968.
[20] U. W. Hawas, “Antioxidant activity of brocchlin carbox-ylic acid and its methyl ester from Chrozophora brocchi-ana,” Natural Product Research, vol. 21, no. 7, pp. 632–640,2007.
[21] P. Skehan, R. Storeng, D. Scudiero et al., “New colorimetriccytotoxicity assay for anticancer-drug screening,” JNCIJournal of the National Cancer Institute, vol. 82, no. 13,pp. 1107–1112, 1990.
[22] H. A. Mosli, M. F. Tolba, A. M. Al-Abd, and A. B. Abdel-Naim,“Catechol estrogens induce proliferation and malignant trans-formation in prostate epithelial cells,” Toxicology Letters,vol. 220, no. 3, pp. 247–258, 2013.
[23] J. Vandesompele, K. De Preter, F. Pattyn et al., “Accuratenormalization of real-time quantitative RT-PCR data by geo-metric averaging of multiple internal control genes,” GenomeBiology, vol. 3, article RESEARCH0034, 2002.
[24] W. Gerhardt, M. L. Nielsen, O. V. Nielsen, J. S. Olsen, and B. E.Statland, “Clinical evaluation of routine measurement of liverand bone alkaline phosphatases in human serum: differentialinhibition by L-phenylalanine and carbamide (urea) on theLKB 8600 reaction rate analyzer,” Clinica Chimica Acta,vol. 53, no. 3, pp. 291–297, 1974.
[25] J. Y. Fu and D. Muller, “Simple, rapid enzyme-linkedimmunosorbent assay (ELISA) for the determination of ratosteocalcin,” Calcified Tissue International, vol. 64, no. 3,pp. 229–233, 1999.
[26] P. D. Papapetrou, “Bisphosphonate-associated adverseevents,” Hormones, vol. 8, no. 2, pp. 96–110.
[27] A. B. Abdel-Naim, A. A. Alghamdi, M. M. Algandaby et al.,“Phenolics isolated from Aframomum meleguta enhance pro-liferation and ossification markers in bone cells,” Molecules,vol. 22, no. 9, 2017.
[28] I. Fernandes, R. Pérez-Gregorio, S. Soares, N. Mateus, andV. de Freitas, “Wine flavonoids in health and disease preven-tion,” Molecules, vol. 22, no. 4, p. 292, 2017.
[29] C.-L. Shen and M.-C. Chyu, “Tea flavonoids for bone health:from animals to humans,” Journal of Investigative Medicine,vol. 64, no. 7, pp. 1151–1157, 2016.
[30] Y. Gao, F. Yang, H. Xi, W. Li, P. Zhen, and K. Chen, “Effects oficariin total flavonoids capsule on bone mineral density andbone histomorphometry in growing rats,” Zhejiang Da XueXue Bao. Yi Xue Ban, vol. 45, no. 6, pp. 581–586, 2016.
[31] Y.-L. Huang, C.-C. Shen, Y.-C. Shen, W.-F. Chiou, andC.-C. Chen, “Anti-inflammatory and Antiosteoporosis flavo-noids from the rhizomes ofHelminthostachys zeylanica,” Jour-nal of Natural Products, vol. 80, no. 2, pp. 246–253, 2017.
[32] C. A. Carbonezi, L. Hamerski, A. A. L. Gunatilaka et al., “Bio-active flavone dimers from Ouratea multiflora (Ochnaceae),”Revista Brasileira de Farmacognosia, vol. 17, no. 3, pp. 319–324, 2007.
9Oxidative Medicine and Cellular Longevity
[33] Y.-M. Zhang, R. Zhan, Y.-G. Chen, and Z.-X. Huang, “Twonew flavones from the twigs and leaves of Cephalotaxus lan-ceolata,” Phytochemistry Letters, vol. 9, pp. 82–85, 2014.
[34] M. Shabana, M. El-Sherei, M. Moussa, A. Sleem, andH. Abdallah, “Investigation of phenolic constituents of Car-duncellus eriocephalus Boiss. Var. albiflora Gauba and theirbiological activities,” Natural Product Communications,vol. 2, pp. 823–828, 2007.
[35] M. Plioukas, A. Termentzi, C. Gabrieli, M. Zervou, P. Kefalas,and E. Kokkalou, “Novel acylflavones from Sideritis syriacassp. syriaca,” Food Chemistry, vol. 123, no. 4, pp. 1136–1141,2010.
[36] S. Lecomte, M. Lelong, G. Bourgine, T. Efstathiou, C. Saligaut,and F. Pakdel, “Assessment of the potential activity of majordietary compounds as selective estrogen receptor modulatorsin two distinct cell models for proliferation and differentia-tion,” Toxicology and Applied Pharmacology, vol. 325,pp. 61–70, 2017.
[37] X. Wang, N. Zheng, J. Dong, X. Wang, L. Liu, and J. Huang,“Estrogen receptor-α36 is involved in icaritin induced growthinhibition of triple-negative breast cancer cells,” The Journalof Steroid Biochemistry and Molecular Biology, vol. 171,pp. 318–327, 2017.
[38] H. Hyun, H. Park, J. Jeong et al., “Effects of watercress contain-ing rutin and rutin alone on the proliferation and osteogenicdifferentiation of human osteoblast-like MG-63 cells,” TheKorean Journal of Physiology & Pharmacology, vol. 18, no. 4,pp. 347–352, 2014.
[39] A. M. Soto and C. Sonnenschein, “The role of estrogens on theproliferation of human breast tumor cells (MCF-7),” Journal ofSteroid Biochemistry, vol. 23, no. 1, pp. 87–94, 1985.
[40] J. M. Mitchison and B. L. A. Carter, “Chapter 11 cell cycleanalysis,” Methods in Cell Biology, vol. 11, pp. 201–219,1975.
[41] M. G. Hertog, P. C. Hollman, M. B. Katan, and D. Kromhout,“Intake of potentially anticarcinogenic flavonoids and theirdeterminants in adults in The Netherlands,” Nutrition andCancer, vol. 20, no. 1, pp. 21–29, 1993.
[42] C. Chaumontet, M. Suschetet, E. Honikman-Leban et al.,“Lack of tumor-promoting effects of flavonoids: studies onrat liver preneoplastic foci and on in vivo and in vitro gap junc-tional intercellular communication,” Nutrition and Cancer,vol. 26, no. 3, pp. 251–263, 1996.
[43] S. Sharma, A. Ali, J. Ali, J. K. Sahni, and S. Baboota, “Rutin:therapeutic potential and recent advances in drug delivery,”Expert Opinion on Investigational Drugs, vol. 22, no. 8,pp. 1063–1079, 2013.
[44] J. A. Kanis and C. C. Glüer, “An update on the diagnosis andassessment of osteoporosis with densitometry,” OsteoporosisInternational, vol. 11, no. 3, pp. 192–202, 2000.
[45] T. D. Rachner, S. Khosla, and L. C. Hofbauer, “Osteoporosis:now and the future,” The Lancet, vol. 377, no. 9773,pp. 1276–1287, 2011.
[46] D. Parisuthiman, Y. Mochida, W. R. Duarte, andM. Yamauchi, “Biglycan modulates osteoblast differentiationand matrix mineralization,” Journal of Bone and MineralResearch, vol. 20, no. 10, pp. 1878–1886, 2005.
[47] R. Sapir-Koren and G. Livshits, “Osteocyte control of boneremodeling: is sclerostin a key molecular coordinator of thebalanced bone resorption–formation cycles?,” OsteoporosisInternational, vol. 25, no. 12, pp. 2685–2700, 2014.
[48] D. Dayong Guo and L. F. Bonewald, “Advancing our under-standing of osteocyte cell biology,” Therapeutic Advances inMusculoskeletal Disease, vol. 1, no. 2, pp. 87–96, 2009.
[49] X. Li, M. S. Ominsky, Q.-T. Niu et al., “Targeted deletion of thesclerostin gene inmice results in increased bone formation andbone strength,” Journal of Bone and Mineral Research, vol. 23,no. 6, pp. 860–869, 2008.
[50] C. M. Rassi, M. Lieberherr, G. Chaumaz, A. Pointillart, andG. Cournot, “Modulation of osteoclastogenesis in porcinebone marrow cultures by quercetin and rutin,” Cell and TissueResearch, vol. 319, no. 3, pp. 383–393, 2005.
[51] T. Komori, “Roles of runx2 in skeletal development,” Advancesin Experimental Medicine and Biology, vol. 962, pp. 83–93,2017.
[52] H. M. Abdallah, A. M. Al-Abd, G. F. Asaad, A. B. Abdel-Naim,and A. M. El-halawany, “Isolation of antiosteoporotic com-pounds from seeds of Sophora japonica,” PLoS One, vol. 9,no. 6, article e98559, 2014.
10 Oxidative Medicine and Cellular Longevity

Research ArticleComparison of Selected Parameters of RedoxHomeostasis in Patients with Ataxia-Telangiectasia andNijmegen Breakage Syndrome
Barbara Pietrucha,1 Edyta Heropolitanska-Pliszka,1 Mateusz Maciejczyk,2 Halina Car,2
Jolanta Sawicka-Powierza,3 RadosławMotkowski,4 Joanna Karpinska,5Marta Hryniewicka,5
Anna Zalewska,6 Malgorzata Pac,1 Beata Wolska-Kusnierz,1 Ewa Bernatowska,1
and Bozena Mikoluc4
1Clinical Immunology, The Children’s Memorial Health Institute, Av. Dzieci Polskich 20, 04-730 Warsaw, Poland2Department of Experimental Pharmacology, Medical University of Bialystok, Szpitalna 37 Str., 15-295 Bialystok, Poland3Department of Family Medicine, Medical University of Bialystok, Bialystok, Poland4Department of Pediatrics Rheumatology, Immunology, and Metabolic Bone Diseases, Medical University of Bialystok,Waszyngtona 17 Str., 15-274 Bialystok, Poland5Institute of Chemistry, University of Bialystok, Bialystok, Poland6Department of Conservative Dentistry, Medical University of Bialystok, Bialystok, Poland
Correspondence should be addressed to Bozena Mikoluc; [email protected]
Received 25 August 2017; Revised 21 November 2017; Accepted 3 December 2017; Published 31 December 2017
Academic Editor: Mohamed M. Abdel-Daim
Copyright © 2017 Barbara Pietrucha et al. This is an open access article distributed under the Creative Commons AttributionLicense, which permits unrestricted use, distribution, and reproduction in any medium, provided the original work isproperly cited.
This study compared the antioxidant status and major lipophilic antioxidants in patients with ataxia-telangiectasia (AT) andNijmegen breakage syndrome (NBS). Total antioxidant status (TAS), total oxidant status (TOS), oxidative stress index (OSI),and concentrations of coenzyme Q10 (CoQ10) and vitamins A and E were estimated in the plasma of 22 patients with AT,12 children with NBS, and the healthy controls. In AT patients, TAS (median 261.7μmol/L) was statistically lower but TOS(496.8 μmol/L) was significantly elevated in comparison with the healthy group (312.7 μmol/L and 311.2μmol/L, resp.).Tocopherol (0.8μg/mL) and CoQ10 (0.1μg/mL) were reduced in AT patients versus control (1.4μg/mL and 0.3μg/mL, resp.).NBS patients also displayed statistically lower TAS levels (290.3 μmol/L), while TOS (404.8 μmol/L) was comparable to thecontrols. We found that in NBS patients retinol concentration (0.1 μg/mL) was highly elevated and CoQ10 (0.1 μg/mL) wassignificantly lower in comparison with those in the healthy group. Our study confirms disturbances in redox homeostasis in ATand NBS patients and indicates a need for diagnosing oxidative stress in those cases as a potential disease biomarker. DecreasedCoQ10 concentration found in NBS and AT indicates a need for possible supplementation.
1. Introduction
Ataxia-telangiectasia (AT; OMIM #208900) and Nijmegenbreakage syndrome (NBS; OMIM #251260) belong to agroup of genetically determined primary immunodeficiencydisorders (PID) whose course involves defects in DNA repairprocesses [1]. AT is caused by null mutations in the ATM(ataxia-telangiectasia mutated) gene located on chromosome
11q.26 which encodes a protein of the same name. The mainrole of ATM protein is the coordination of cellular responseto DNA double strand breaks, oxidative stress, signal trans-duction, and cell-cycle control. The clinical picture of thedisease is characterised by cerebellar degeneration, telangiec-tasia, immunodeficiency, cancer susceptibility, and radiationsensitivity. Experimental studies have provided direct evi-dence for the presence of mitochondrial dysfunctions in AT
HindawiOxidative Medicine and Cellular LongevityVolume 2017, Article ID 6745840, 8 pageshttps://doi.org/10.1155/2017/6745840

cells. They have demonstrated that the structural organisa-tion of mitochondria in AT cells is abnormal compared towild-type cells [2, 3].
NBS, similarly to AT, belongs to a group of the XCINDsyndrome. The XCIND syndrome is named after Eatonet al. who found distinct hypersensitivity to ionizing(X-ray) irradiation, cancer susceptibility, immunodeficiency,neurological abnormality, and double-strand DNA breakagein these cases [4]. Mutations causative of NBS occur in theNBS1 gene, located on human chromosome 8q21. NBS1encodes for nibrin, the key regulatory protein of the R/M/N(RAD50/MRE11/NBS1) protein complex which senses andmediates cellular response to DNA damage caused by ioniz-ing radiation [5, 6]. The chromosome instability in AT andNBS patients results from a defective response to DNAdouble-strand breaks. In addition, AT and NBS patientsdisplay a few common characteristics such as growth retarda-tion, premature aging, and neurodegeneration. It is believedthat these symptoms can be caused not only by chromosomalinstability and aberrant DNA damage response but also byoxidative stress and mitochondrial abnormalities [1, 2].
Recent studies indicate new, alternative sources of ROSand oxidative stress in AT and NBS cells, including NADPHoxidase 4, oxidised low-density lipoprotein (ox-LDL), or poly(ADP-ribose) polymerases (PARP-1, PARP-2, and PARP-3)[1, 7–10]. Mitochondrial dysfunction such as aberrant struc-tural organisation of mitochondria, excess mitochondrialROS (mROS) production and mitochondrial injury have alsobeen reported in AT and NBS cells [1, 3, 11]. Valentin-Vegaet al. [11] showed increased mROS production in AT cells,which resulted from a decline in the activity of complex I ofthe electron transport chain in mitochondria. Noteworthyis a study conducted by Weyemi et al. [9] who stressed thatNADPH oxidase 4 (the main source of free radicals in thecell) was highly upregulated in AT cells and correlated withhigher oxidative damage and apoptosis. To date, however,little is still known about the oxidant/antioxidant abnormal-ities in AT and NBS patients. Therefore, the purpose of ourstudy was to measure selected parameters of redox homeo-stasis in patients with AT and NBS. Both disorders arecharacterised by symptoms typical of the XCIND syndrome,and therefore we intended to evaluate total antioxidant status(TAS), total oxidant status (TOS), and oxidative stress index(OSI) as well as concentrations of the most common lipo-philic antioxidants, CoQ10, and vitamins A and E. It appearsthat the thorough understanding of disturbances in thebody’s antioxidant defense mechanisms could lead to newtherapeutic strategies in AT and NBS, similarly as in otheroxidative stress-related genetic disorders.
2. Materials and Methods
2.1. Patients. The study included 12 Caucasian children withNBS (5 females, 7 males) whose average age was 12 years and1 month with a confirmed mutation in the NBS1 gene and22 patients with AT (9 females, 13 males) whose average agewas 13 years and 7 months with a confirmed mutation inATM gene. All study participants were under the medicalcare of the Department of Immunology at the Children’s
Memorial Health Institute in Warsaw, Poland. The patientswere included in the study on the basis of their medicalhistory and physical examination, and they were found tobe in good health at the time of enrollment (normal biochem-ical and morphological blood parameters, negative markersof inflammation). Diagnosis was based on clinical symptomsand genetic and biochemical tests according to ESID(European Society for Immunodeficiencies) criteria. Noneof the patients enrolled in the study were diagnosed withcancer, diabetes, hypertension, and HIV infection. Thecontrol group consisted of, respectively, 12 and 22 healthyindividuals matched for age and sex. Plasma samples of thestudy and the control group were collected between February2016 and January 2017.
The study was approved by the Bioethical Committee atthe Medical University, Bialystok, Poland. Parents of allrespondents gave informed written consent for theirchildren’s participation in the study.
2.2. Determination of Plasma Total Antioxidant Status (TAS),Total Oxidant Status (TOS), and Oxidative Stress Index (OSI).Total antioxidant status (TAS) and total oxidant status(TOS) were determined using commercial colorimetric kits(ImAnOx (TAS/TAC) Kit, Immundiagnostik, Bensheim,Germany and PerOx (TOS/TOC) Kit, Immundiagnostik,Bensheim, Germany, resp.) in accordance with the manufac-turer’s instructions. The determination of TAS was based ona reaction between antioxidants contained in the sample withexogenous hydrogen peroxide, while the determination ofTOS was performed by the reaction of peroxidase with totallipid peroxides in the sample. The resulting coloured prod-ucts were measured colorimetrically at a wavelength of450 nm using Mindray MR-96 Microplate Reader, China.All assays were performed in duplicate samples. To assessthe redox balance disorders, we have also used the oxidativestress index (OSI), which may be considered as a gold indica-tor of oxidative stress in biological systems. OSI was calcu-lated according to the formula OSI=TOS/TAS× 100 [12].
2.3. Determination of Plasma Vitamin A (All-Trans-Retinol),Vitamin E (L-Tocopherol), and Coenzyme Q10. Analyseswere performed using high performance liquid chromato-graph coupled with MS detector equipped with triplequadrupole (Shimadzu LCMS/MS-8040). Ionization wasconducted using APCI (atmospheric pressure chemicalionization) mode. Data acquisition and processing wereperformed using Shimadzu LabSolutions LCMS Software.
The compounds were separated with a Kinetex XB-C18100A analytical column (50mm× 3.0mm, 1.7μm). Themobile phase consisted of an isocratic solvent A (methanol)0.01-2min and then isocratic solvent B (methanol-n-hexan,72 : 28, v/v) 2.5–6min. The flow rate was 0.4mL/min, andthe temperature of the analytical column was 400°C. Theinjection volumes of standard and sample solutions were10μL. Acquisition settings and method were optimized bythe infusion of a 10μg/mL solution of each fixed compound.The mass spectrometer was operated in the positive ionatmospheric pressure chemical ionization mode. The APCItemperature was set at 350°C and the ion current 4.5μA.
2 Oxidative Medicine and Cellular Longevity

The flow of the drying gas (N2) and the flow of the nebulizinggas were 10L/min and 3L/min, respectively. The desolvationline (DL) and heat block temperature was 230°C.
All analytes were detected in the MS/MS multiple reac-tion monitoring (MRM) with unit resolution at both Q1and Q3. The MS conditions for generation of the positiveions are presented in Table 1. The described above chromato-graphic conditions were used for quantification of targetanalytes in plasma samples. The chromatogram of real sam-ple is visualized in Figure 1. Plasma samples were preparedaccording to the procedure published previously [13].
2.4. Statistical Analysis. The examined variable distributionwas assessed by means of the Kolmogoroff-Smirnow test.Due to the fact that the tested variables were inconsistentwith normal distribution, the Mann–Whitney U test wasused. Results are expressed as median, minimum, and maxi-mum. The Spearman’s method was applied in assessingcorrelations between variables. In calculations, the relevancelevel of p < 0 05 was accepted as statistically significant,authorising the rejection of individual zero hypotheses. Thedata were processed using the Polish version of Statistica12.0 statistical software for PC with Windows.
3. Results
Our study demonstrated that in patients with AT plasmaTAS levels were statistically lower (p = 0 002) and plasmaTOS was statistically significantly elevated (p = 0 001) incomparison with the control group. Similarly to TOS, OSIwas elevated in AT patients (p = 0 001) (Figure 2).
Tocopherol plasma concentrations were significantlyreduced in AT patients as compared to the control group(p = 0 021). The concentrations of endogenous free radicalscavenger coenzyme Q10 were statistically decreased inthe plasma of AT patients versus the healthy controls(p = 0 001). There were no significant differences in theconcentrations of plasma retinol between both groups(p = 0 076) (Figure 2).
Similarly to the AT group, NBS patients displayedstatistically lower plasma TAS levels in comparison withthe control group (p = 0 044). In contrast to AT, plasmaTOS in NBS was not significantly different in comparisonwith the healthy controls (p = 0 102). The OSI value, sim-ilarly to AT, was higher in comparison with the controls(p = 0 004) (Figure 3).
We demonstrated that in patients with NBS the concen-tration of vitamin A precursor, beta carotene, was signifi-cantly elevated in comparison with that in the controlgroup (p = 0 011). The difference in CoQ10 concentrationin NBS patients and healthy controls points to a significantlylower level in NBS patients (p = 0 001). The concentrations ofplasma vitamin E were similar in the control group and NBSpatients (p = 0 582) (Figure 3).
It is worth noting that we did not observe statisticallysignificant differences between the evaluated parameters inpatients with AT and those with NBS (Table 2). In addition,we did not find significant correlations in the assessed
markers of oxidative stress between the study groupsand controls.
4. Discussion
This study compared the redox balance as well as majorlipophilic antioxidants in patients with AT and NBS diseases.We have shown that AT and NBS are associated withimpaired redox homeostasis including disturbances in lipo-philic free radical scavengers such as coenzyme Q10 andalpha-tocopherol (Figure 4).
We aimed to investigate the oxidant/antioxidant statusvia the measurement of plasma TAS and TOS, which couldprovide a systemic reflection of redox homeostasis in biolog-ical systems. Concentration of TAS was significantly reducedin AT and NBS patients, which suggests the exhaustion orinefficiency of protective antioxidant systems resulting fromthe overproduction or enhanced activity of reactive oxygenspecies (ROS). It is believed that oxidative stress plays a keyrole in the development of many systemic complicationsincluding growth retardation, endocrine abnormalities, neu-rodegeneration, and premature aging as well as immunodefi-ciency [14–16], which are the major phenotypic hallmarks inAT and NBS diseases [1]. Our study did not directly demon-strate oxidative stress in patients with AT and NBS, sinceit would have been necessary to measure oxidative modifi-cation products. Nevertheless, we showed the existence ofcellular redox abnormalities in the AT (↓ TAS, ↑ OSI,and ↑ TOS) and NBS groups (↓ TAS and ↑ OSI), whichcan constitute the basis for the development of oxidativestress leading to DNA mutations and protein oxidationas well as lipid peroxidation. We would like to emphasisethat we did not find significant differences between theresearched parameters of redox balance when we comparedAT with NBS. A lack of correlation may indicate a similarityof redox imbalance in AT and NBS disorders, although thesechanges tend to be more severe in patients with AT.However, we recorded significantly elevated TOS levels onlyin patients with AT and therefore, TOS may be subtledistinguishing between AT and NBS diseases.
There is a consensus in the literature regarding enhancedoxidative stress in neurodegenerative disorders such asAlzheimer’s or Parkinson’s disease (PD) [17, 18]. Clinicalstudies have confirmed increased oxidant status and com-parable, decreased antioxidant status in patients with PD[19–21]. It is probable that similar changes occur in the
Table 1: The MS conditions for generation of positive ions ofthe analytes.
CompoundPrecursor ion
(m/z)Product ions
(m/z)Collision energy
[eV]
Retinol 269.10213.2093.10
−12−23
α-Tocopherol 429.30165.10137.05
−25−48
Coenzyme Q10 863.60197.15109.10
−45−47
m/z: mass-to-charge ratio.
3Oxidative Medicine and Cellular Longevity
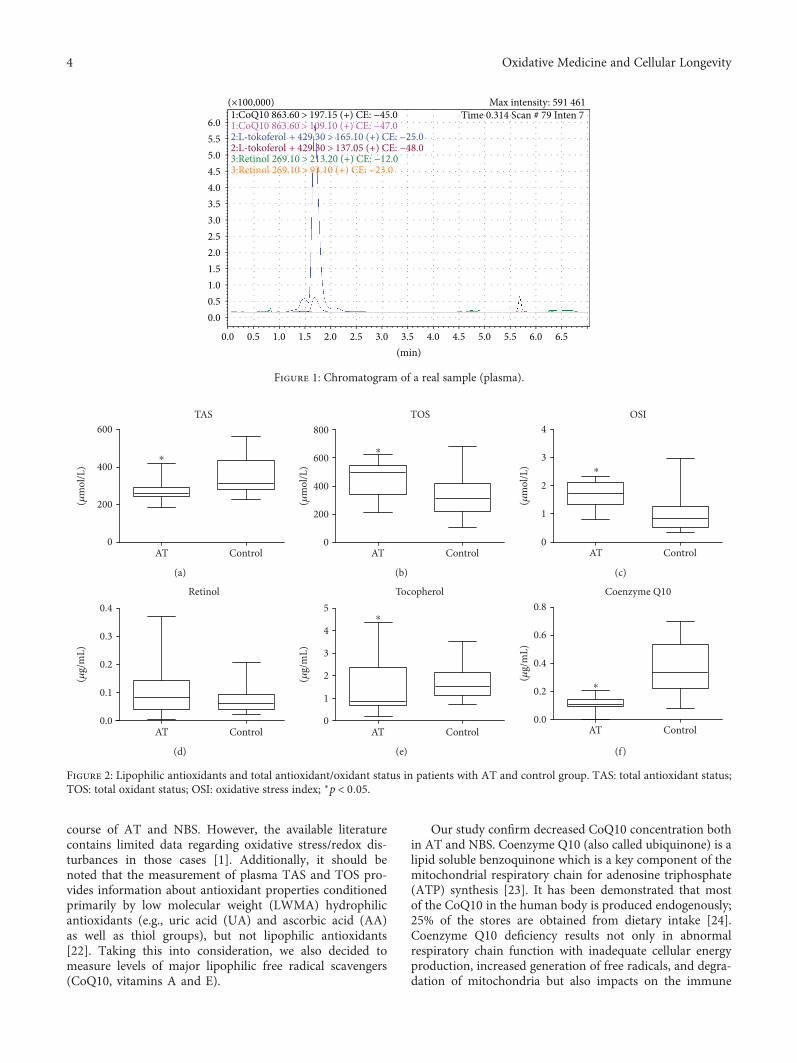
course of AT and NBS. However, the available literaturecontains limited data regarding oxidative stress/redox dis-turbances in those cases [1]. Additionally, it should benoted that the measurement of plasma TAS and TOS pro-vides information about antioxidant properties conditionedprimarily by low molecular weight (LWMA) hydrophilicantioxidants (e.g., uric acid (UA) and ascorbic acid (AA)as well as thiol groups), but not lipophilic antioxidants[22]. Taking this into consideration, we also decided tomeasure levels of major lipophilic free radical scavengers(CoQ10, vitamins A and E).
Our study confirm decreased CoQ10 concentration bothin AT and NBS. Coenzyme Q10 (also called ubiquinone) is alipid soluble benzoquinone which is a key component of themitochondrial respiratory chain for adenosine triphosphate(ATP) synthesis [23]. It has been demonstrated that mostof the CoQ10 in the human body is produced endogenously;25% of the stores are obtained from dietary intake [24].Coenzyme Q10 deficiency results not only in abnormalrespiratory chain function with inadequate cellular energyproduction, increased generation of free radicals, and degra-dation of mitochondria but also impacts on the immune
6.01:CoQ10 863.60 > 197.15 (+) CE: −45.01:CoQ10 863.60 > 109.10 (+) CE: −47.0
Time 0.314 Scan # 79 Inten 7Max intensity: 591 461
2:L-tokoferol + 429.30 > 165.10 (+) CE: −25.02:L-tokoferol + 429.30 > 137.05 (+) CE: −48.03:Retinol 269.10 > 213.20 (+) CE: −12.03:Retinol 269.10 > 93.10 (+) CE: −23.0
(×100,000)
5.55.04.54.03.53.02.52.01.51.00.50.0
0.0 0.5 1.0 1.5 2.0 2.5 3.0 3.5 4.0 4.5 5.0 5.5 6.0 6.5(min)
Figure 1: Chromatogram of a real sample (plasma).
600
400
200
0AT Control
TAS
⁎
(�휇m
ol/L
)
(a)
800
600
400
200
0AT
TOS
Control
⁎
(�휇m
ol/L
)
(b)
4
3
2
1
0
(�휇m
ol/L
)
AT
OSI
Control
⁎
(c)
0.3
0.4
0.2
0.1
0.0AT Control
Retinol
(�휇g/
mL)
(d)
5
4
3
2
1
0AT Control
Tocopherol
⁎
(�휇g/
mL)
(e)
0.8
0.6
0.4
0.2
0.0
(�휇g/
mL)
AT Control
Coenzyme Q10
⁎
(f)
Figure 2: Lipophilic antioxidants and total antioxidant/oxidant status in patients with AT and control group. TAS: total antioxidant status;TOS: total oxidant status; OSI: oxidative stress index; ∗p < 0 05.
4 Oxidative Medicine and Cellular Longevity

system [25]. Literature reports demonstrate that CoQ10supplementation has improved CD4 T cell counts in patientswith AIDS and outcomes in herpes and HPV infections.Furthermore, leukocyte activity is conditioned, inter alia, byproper CoQ10 activity [25]. CoQ10 deficiency may contrib-ute to the abnormal function of mitochondria in the courseof diseases such as AIDS, Alzheimer’s disease, Parkinson’sdisease, and cancer [26, 27]. Similar disturbances have beenobserved in AT and NBS cells, which may suggest a potentialinvolvement of CoQ10 in the pathogenesis of these disorders[1]. Considering the protective action of CoQ10 in neurode-generative processes and its role in the immune system,decreased CoQ10 concentration in AT and NBS patientsindicates a need for monitoring its concentration and poten-tial supplementation. At this stage, we are unable to answerthe question to what degree clinical symptoms observed inAT, such as cerebellar degeneration, immunodeficiency,cancer susceptibility, and radiation sensitivity, result fromoxidative stress disturbances observed in our study. Are these
disturbances primary or secondary? However, they undeni-ably confirm CoQ10 involvement in the pathomechanismof the observed changes. It should be also emphasised thatrare autosomal recessive disorder, CoQ10 deficiency (muta-tion in CABC1; COQ2; COQ9; PDSS1; PDSS2 genes), isfrequently associated with seizures, cognitive decline, pyra-midal track signs, myopathy, and prominent cerebellar ataxia[28, 29]. Some of these symptoms occur in both AT and NBS.Additionally, it is very likely that, in AT and NBS patients, adecrease in CoQ10 levels may be associated with impairedDNA repair mechanisms, similarly as in other bioenergeticsdisorders such as xeroderma pigmentosum (XP), CockayneSyndrome (CS), Fanconi anaemia (FA), and Hutchinson-Gilford syndrome (HGS) [1].
Deficiency in lipid soluble antioxidants has been demon-strated in various conditions such as eating disorders,nicotine addiction, chronic diseases, and aging. Antioxidantvitamins and trace elements contribute to maintaining aneffective immune response [30–33]. Treatments are also
600
400
200
0NBS Control
TAS
⁎
(�휇m
ol/L
)
(a)
800
600
400
200
0NBS Control
TOS
(�휇m
ol/L
)
(b)
4
3
2
1
0
(�휇m
ol/L
)
NBS Control
OSI
⁎
(c)
0.4
0.6
0.2
0.0NBS Control
Retinol
⁎
(�휇g/
mL)
(d)
4
3
2
1
0NBS Control
Tocopherol
(�휇g/
mL)
(e)
0.8
0.6
0.4
0.2
0.0
(�휇g/
mL)
NBS Control
Coenzyme Q10
⁎
(f)
Figure 3: Lipophilic antioxidants and total antioxidant/oxidant status in patients with NBS and control group. TAS: total antioxidant status;TOS: total oxidant status; OSI: oxidative stress index; ∗p < 0 05.
Table 2: Differences between lipophilic antioxidants and total antioxidant/oxidant status in patients with AT and NBS.
Parameters examinedAT group NBS group
pMedian Min–max Median Min–max
Retinol (μg/mL) 0.083 0.003–0.371 0.140 0.009–0.498 0.109
α-Tocopherol (μg/mL) 0.847 0.213–4.371 1.361 0.032–3.003 0.929
Coenzyme Q10 (μg/mL) 0.108 0.085–0.206 0.098 0.077–0.183 0.290
TAS (μmol/L) 261.745 186.852–422.515 290.288 223.966–389.895 0.327
TOS (μmol/L) 496.839 209.803–621.354 404.795 204.741–548.632 0.094
OSI 1.730 0.790–2.320 1.543 0.615–1.915 0.157
TAS: total antioxidant status; TOS: total oxidant status; OSI: oxidative stress index.
5Oxidative Medicine and Cellular Longevity

available for a few autosomal recessive ataxias: vitamin Etherapy for ataxia with vitamin E deficiency (AVED),chenodeoxycholic acid for cerebrotendinous xanthomatosis,CoQ10 for CoQ10 deficiency, and dietary restriction ofphytanic acid for Refsum disease. Idebenone may amelioratethe cardiac and neurological manifestations of Friedreichataxia (FRDA). No other specific treatments exist for hered-itary ataxias [34]. Unfortunately, no sufficiently effectivecausal therapy is available for AT and NBS patients atpresent. Our results indicate a need for introducing CoQ10and tocopherol into AT and NBS treatment, taking intoconsideration their plasma levels.
Alpha-tocopherol primarily inhibits the production ofnew free radicals and thus might help in preventing ordelaying chronic diseases associated with reactive oxygenspecies molecules [35]. Decreased vitamin E concentrationin AT may result in a decline in the body’s antioxidant activ-ity and anti-inflammatory as well as cell-mediated andhumoral immune functions. In AT cases, we found decreasedconcentrations of both CoQ10 and vitamin E, which enhancedisturbances in the redox balance and may increase ROSproduction, accumulation of damaged mitochondrial DNA(mDNA), and progressive respiratory chain dysfunction.The few experimental studies found in the available literaturereport that disturbances in redox processes also occur in NBS[1]. Our study of NBS cases demonstrated decreased TASand enhanced OSI on the one hand and a reduced concentra-tion of CoQ10 and increased concentration of vitamin A, onthe other hand. Despite the fact that the interpretation ofobtained results is difficult at this stage of research advance-ment due to a lack of comparable studies, we would like toemphasise that we did not find any differences in the testedparameters between AT and NBS.
To date, only few studies have evaluated the antioxidantdefenses in AT and NBS patients [1, 36]. In one of the firstreports on the subject, Reichenbach et al. showed a decreasein the levels of total antioxidant capacity, vitamin A, andvitamin E in AT patients. In contrast to our study, CoQ10levels in AT were not significantly reduced [37]. In our studypatients with AT, we found not only significantly reducedlevels of CoQ10 but also of α-tocopherol. However, retinolconcentration, in line with studies by Da Silva et al., wassimilar to the control group [38]. It is probable that theaforementioned dissimilarities result from differences in thesize of study groups and research methodologies. At thispoint, it should be emphasized that our study is the first inwhich the largest group of AT and NBS patients took part.
In summary, we demonstrated a significant decrease inthe level of plasma TAS in AT and NBS patients as well asan increase in the oxidative stress index. It appears thatdisturbances in the body’s antioxidant defense mechanismsmay lead to oxidative damage and altered cellular redoxhomeostasis and thus affect clinical manifestations of ATand NBS phenotypes. Redox imbalance in patients with ATand NBS appears to exist at a comparable level. However, asignificant increase in total oxidant status (TOS) was demon-strated only in patients with AT in whom plasma TOS maybe a subtle distinguishing feature of AT and NBS disorders.We are considering the theory that antioxidant supplementa-tion with tocopherol and CoQ10 may be one of the factorsenhancing treatment efficacy in AT and NBS diseases andimproving patients’ clinical status. Further studies regardingCoQ10 in AT and NBS are needed in order to assess itsconcentration not only in the blood but also in selectedtissues and to evaluate the dynamics of change in relationto disease duration. The issue of a possible link between
1.61.41.2
10.80.60.40.2
0
2000
16001800
140012001000
800600400200
0TAS TOS OSI
Retinol Tocopherol Coenzyme Q10
ATNBS
Control
ATNBS
Control
Plasmasamples
22 AT patients12 NBS patients22 healthy controls
Vitamin A (all-trans-retinol)Vitamim E (L-tocopherol)Coenzyme Q10
Total antioxidant status (TAS)Total oxidant status (TOS)Oxidative stress index (OSI)
Colorimetric methods
LC-MS/MS
⁎⁎
⁎
⁎
⁎
⁎⁎
⁎
⁎
Figure 4: Graphical presentation of the study. ∗p < 0 05 versus control.
6 Oxidative Medicine and Cellular Longevity

CoQ10 deficiency and the occurrence of mutations responsi-ble for CoQ10 deficiency remains open.
When analyzing the results of our research, one mustbear in mind its limitations. We evaluated only selectedparameters of redox balance in patients with AT and NBS,so determination of other markers may lead to other conclu-sions and clinical applications. Additionally, blood oxidativestress biomarkers cannot be mechanistically informative forsome reasons. Firstly, blood and the respective tissue understudy do not share common redox components and/or path-ways (e.g., lack of mitochondria in erythrocytes and plasma).Secondly, both plasma and blood cells can autonomouslyproduce significant amounts of ROS [15, 16]. However, itshould be also emphasized that extremely strong point ofour study is the large number of patients in the study groupscompared to previously published works. Our research mayalso provide a new practical aspects for clinicians.
5. Conclusions
(1) Our study confirms disturbances in redox homeosta-sis in AT and NBS patients and indicates a need fordiagnosing oxidative stress in those cases as a poten-tial disease biomarker.
(2) The statistically significantly decreased coenzymeQ10 concentration found in NBS and AT indicates aneed for possible supplementation aimed at remedy-ing the diagnosed deficiencies in those individuals.
Abbreviations
APCI: Atmospheric pressure chemicalionization
AT: Ataxia-telangiectasiaATM: Ataxia-telangiectasia mutatedCoQ10: Coenzyme Q10ESID: European Society for
ImmunodeficienciesLWMA: Low molecular weight hydrophilic
antioxidantsMRM: MS/MS multiple reaction monitoringNBS: Nijmegen breakage syndromeOSI: Oxidative stress indexPARP: Poly (ADP-ribose) polymerasePID: Primary immunodeficiency disorderROS: Reactive oxygen speciesTAS: Total antioxidant statusTOS: Total oxidant statusXCIND syndrome: Hypersensitivity to ionizing (X-ray)
irradiation, cancer susceptibility,immunodeficiency, neurologicalabnormality, and double-strandDNA breakage.
Conflicts of Interest
The authors declare that they have no conflicts of interest.
Authors’ Contributions
Barbara Pietrucha, Edyta Heropolitanska-Pliszka, andMateusz Maciejczyk had equal participation.
Acknowledgments
The investigation was supported by Grant nos. 143-26591Land N/ST/ZB/16/001/1126 from the Medical Universityin Bialystok.
References
[1] M. Maciejczyk, B. Mikoluc, B. Pietrucha et al., “Oxidativestress, mitochondrial abnormalities and antioxidant defensein ataxia-telangiectasia, bloom syndrome and Nijmegenbreakage syndrome,” Redox Biology, vol. 11, pp. 375–383, 2017.
[2] F. V. Pallardó, A. Lloret, M. Lebel et al., “Mitochondrialdysfunction in some oxidative stress-related genetic diseases:ataxia-telangiectasia, down syndrome, Fanconi anaemia andWerner syndrome,” Biogerontology, vol. 11, no. 4, pp. 401–419, 2010.
[3] M. Ambrose, J. V. Goldstine, and R. A. Gatti, “Intrinsicmitochondrial dysfunction in ATM-deficient lymphoblastoidcells,” Human Molecular Genetics, vol. 16, no. 18, pp. 2154–2164, 2007.
[4] J. S. Eaton, Z. P. Lin, A. C. Sartorelli, N. D. Bonawitz, and G. S.Shadel, “Ataxia-telangiectasia mutated kinase regulates ribo-nucleotide reductase and mitochondrial homeostasis,” TheJournal of Clinical Investigation, vol. 117, no. 9, pp. 2723–2734, 2007.
[5] K. H. Chrzanowska, W. J. Kleijer, M. Krajewska-Walasek et al.,“Eleven Polish patients with microcephaly, immunodeficiency,and chromosomal instability: the Nijmegen breakage syn-drome,” American Journal of Medical Genetics, vol. 57, no. 3,pp. 462–471, 1995.
[6] S. Mizutani and M. Takagi, “XCIND as a genetic disease ofX-irradiation hypersensitivity and cancer susceptibility,”International Journal of Hematology, vol. 97, no. 1, pp. 37–42, 2013.
[7] S. Squadrone, P. Brizio, C. Mancini et al., “Blood metallevels and related antioxidant enzyme activities in patientswith ataxia telangiectasia,” Neurobiology of Disease, vol. 81,pp. 162–167, 2015.
[8] M. Semlitsch, R. E. Shackelford, S. Zirkl, W. Sattler, andE. Malle, “ATM protects against oxidative stress induced byoxidized low-density lipoprotein,” DNA Repair, vol. 10, no. 8,pp. 848–860, 2011.
[9] U. Weyemi, C. E. Redon, T. Aziz et al., “NADPH oxidase 4 is acritical mediator in ataxia telangiectasia disease,” Proceedingsof the National Academy of Sciences of the United States ofAmerica, vol. 112, no. 7, pp. 2121–2126, 2015.
[10] H. Krenzlin, I. Demuth, B. Salewsky et al., “DNA damage inNijmegen breakage syndrome cells leads to PARP hyperactiva-tion and increased oxidative stress,” PLoS Genetics, vol. 8,no. 3, article e1002557, 2012.
[11] Y. A. Valentin-Vega, K. H. MacLean, J. Tait-Mulder et al.,“Mitochondrial dysfunction in ataxia-telangiectasia,” Blood,vol. 119, no. 6, pp. 1490–1500, 2012.
[12] J. Borys, M. Maciejczyk, A. J. Krȩtowski et al., “The redoxbalance in erythrocytes, plasma, and periosteum of patients
7Oxidative Medicine and Cellular Longevity

with titanium fixation of the jaw,” Frontiers in Physiology,vol. 8, 2017.
[13] J. Karpińska, B. Mikołuć, R. Motkowski, and J. Piotrowska-Jastrzebska, “HPLC method for simultaneous determinationof retinol, α-tocopherol and coenzyme Q10 in human plasma,”Journal of Pharmaceutical and Biomedical Analysis, vol. 42,no. 2, pp. 232–236, 2006.
[14] O. I. Aruoma, “Free radicals, oxidative stress, and antioxidantsin human health and disease,” Journal of the American OilChemists' Society, vol. 75, no. 2, pp. 199–212, 1998.
[15] M. Valko, D. Leibfritz, J. Moncol, M. T. D. Cronin, M. Mazur,and J. Telser, “Free radicals and antioxidants in normalphysiological functions and human disease,” The InternationalJournal of Biochemistry & Cell Biology, vol. 39, no. 1,pp. 44–84, 2007.
[16] B. Uttara, A. V. Singh, P. Zamboni, and R. T. Mahajan,“Oxidative stress and neurodegenerative diseases: a review ofupstream and downstream antioxidant therapeutic options,”Current Neuropharmacology, vol. 7, no. 1, pp. 65–74, 2009.
[17] A. Arikanoglu, E. Akil, S. Varol et al., “Relationship ofcognitive performance with prolidase and oxidative stress inAlzheimer disease,” Neurological Sciences, vol. 34, no. 12,pp. 2117–2121, 2013.
[18] A. Kirbas, S. Kirbas, M. C. Cure, and A. Tufekci, “Paraoxonaseand arylesterase activity and total oxidative/anti-oxidativestatus in patients with idiopathic Parkinson’s disease,” Journalof Clinical Neuroscience, vol. 21, no. 3, pp. 451–455, 2014.
[19] M. Y. Sherman and A. L. Goldberg, “Cellular defenses againstunfolded proteins: a cell biologist thinks about neurodegener-ative diseases,” Neuron, vol. 29, no. 1, pp. 15–32, 2001.
[20] T. B. Shea, Y. L. Zheng, D. Ortiz, and H. C. Pant, “Cyclin-dependent kinase 5 increases perikaryal neurofilament phos-phorylation and inhibits neurofilament axonal transport inresponse to oxidative stress,” Journal of Neuroscience Research,vol. 76, no. 6, pp. 795–800, 2004.
[21] A. K. Verma, J. Raj, V. Sharma, T. B. Singh, S. Srivastava, andR. Srivastava, “Plasma Prolidase activity and oxidative stressin patients with Parkinson’s disease,” Parkinson's Disease,vol. 2015, Article ID 598028, 6 pages, 2015.
[22] C. Rice-Evans and N. J. Miller, “Total antioxidant status inplasma and body fluids,” Methods in Enzymology, vol. 234,pp. 279–293, 1994.
[23] L. Ernster and G. Dallner, “Biochemical, physiological andmedical aspects of ubiquinone function,” Biochimica et Bio-physica Acta (BBA) - Molecular Basis of Disease, vol. 1271,no. 1, pp. 195–204, 1995.
[24] H. N. Bhagavan and R. K. Chopra, “Coenzyme Q10:absorption, tissue uptake, metabolism and pharmacokinetics,”Free Radical Research, vol. 40, no. 5, pp. 445–453, 2006.
[25] S. Farough, A. Karaa, M. A. Walker et al., “Coenzyme Q10 andimmunity: a case report and new implications for treatment ofrecurrent infections in metabolic diseases,” Clinical Immunol-ogy, vol. 155, no. 2, pp. 209–212, 2014.
[26] J. Garrido-Maraver, M. D. Cordero, M. Oropesa-Ávila et al.,“Coenzyme Q10 therapy,” Molecular Syndromology, vol. 5,no. 3-4, pp. 187–197, 2014.
[27] I. P. Hargreaves, “Coenzyme Q10 as a therapy for mitochon-drial disease,” The International Journal of Biochemistry & CellBiology, vol. 49, pp. 105–111, 2014.
[28] C. Lamperti, M. H. a Naini, D. C. De Vivo et al., “Cerebellarataxia and coenzyme Q10 deficiency,” Neurology, vol. 60,no. 7, pp. 1206–1208, 2003.
[29] R. Montero, M. Pineda, A. Aracil et al., “Clinical, biochemicaland molecular aspects of cerebellar ataxia and coenzyme Q10deficiency,” Cerebellum, vol. 6, no. 2, pp. 118–122, 2007.
[30] J. A. Drisko, “The use of antioxidants in transmissible spongi-form encephalopathies: a case report,” Journal of the AmericanCollege of Nutrition, vol. 21, no. 1, pp. 22–25, 2002.
[31] D. Q. Pham and R. Plakogiannis, “Vitamin E supplementationin Alzheimer’s disease, Parkinson’s disease, tardive dyskinesia,and cataract: part 2,” The Annals of Pharmacotherapy, vol. 39,no. 12, pp. 2065–2072, 2005.
[32] C. Ramassamy, “Emerging role of polyphenolic compounds inthe treatment of neurodegenerative diseases: a review of theirintracellular targets,” European Journal of Pharmacology,vol. 545, no. 1, pp. 51–64, 2006.
[33] D. Brambilla, C. Mancuso, M. R. Scuderi et al., “The role ofantioxidant supplement in immune system, neoplastic, andneurodegenerative disorders: a point of view for an assessmentof the risk/benefit profile,” Nutrition Journal, vol. 7, no. 1,p. 29, 2008.
[34] S. Jayadev and T. D. Bird, “Hereditary ataxias: overview,”Genetics in Medicine, vol. 15, no. 9, pp. 673–683, 2013.
[35] S. Rizvi, S. T. Raza, F. Ahmed, A. Ahmad, S. Abbas, andF. Mahdi, “The role of vitamin E in human health and somediseases,” Sultan Qaboos University Medical Journal, vol. 14,no. 2, pp. 157–165, 2014.
[36] A. Lloret, R. Calzone, C. Dunster et al., “Different patterns ofin vivo pro-oxidant states in a set of cancer- or aging-relatedgenetic diseases,” Free Radical Biology & Medicine, vol. 44,no. 4, pp. 495–503, 2008.
[37] J. Reichenbach, R. Schubert, C. Schwan, K. Müller, H. J.Böhles, and S. Zielen, “Anti-oxidative capacity in patients withataxia telangiectasia,” Clinical and Experimental Immunology,vol. 117, no. 3, pp. 535–539, 1999.
[38] R. da Silva, E. C. dos Santos-Valente, F. Burim Scomparini,R. O. Saccardo Sarni, and B. T. Costa-Carvalho, “The relation-ship between nutritional status, vitamin a and zinc levels andoxidative stress in patients with ataxia-telangiectasia,” Allergo-logia et Immunopathologia, vol. 42, no. 4, pp. 329–335, 2014.
8 Oxidative Medicine and Cellular Longevity

Research ArticleInsulin-Like Growth Factor (IGF) Binding Protein-2,Independently of IGF-1, Induces GLUT-4 Translocation andGlucose Uptake in 3T3-L1 Adipocytes
Biruhalem Assefa,1,2 Ayman M. Mahmoud,1,2,3 Andreas F. H. Pfeiffer,1,4
Andreas L. Birkenfeld,5,6 Joachim Spranger,1,2,7 and Ayman M. Arafat1,2,4
1Department of Endocrinology, Diabetes and Nutrition, Charité-University Medicine Berlin, Berlin, Germany2Department of Endocrinology, Diabetes and Nutrition at the Center for Cardiovascular Research (CCR),Charité-University Medicine Berlin, Berlin, Germany3Division of Physiology, Department of Zoology, Faculty of Science, Beni-Suef University, Beni-Suef, Egypt4Department of Clinical Nutrition, German Institute of Human Nutrition Potsdam-Rehbrücke, Nuthetal, Germany5Section of Metabolic Vascular Medicine, Medical Clinic III, and Paul Langerhans Institute Dresden (PLID),Dresden University of Technology, Dresden, Germany6Division of Diabetes & Nutritional Sciences, Faculty of Life Sciences & Medicine, King’s College London, London, UK7Department of Endocrinology, Diabetes and Nutrition at the Experimental and Clinical Research Centre (ECRC),Charité-University Medicine Berlin and Max-Delbrück Center Berlin-Buch, Berlin, Germany
Correspondence should be addressed to Ayman M. Arafat; [email protected]
Received 13 September 2017; Accepted 23 October 2017; Published 20 December 2017
Academic Editor: Mohamed M. Abdel-Daim
Copyright © 2017 Biruhalem Assefa et al. This is an open access article distributed under the Creative Commons AttributionLicense, which permits unrestricted use, distribution, and reproduction in any medium, provided the original work isproperly cited.
Insulin-like growth factor binding protein-2 (IGFBP-2) is the predominant IGF binding protein produced during adipogenesis andis known to increase the insulin-stimulated glucose uptake (GU) in myotubes. We investigated the IGFBP-2-induced changes inbasal and insulin-stimulated GU in adipocytes and the underlying mechanisms. We further determined the role of insulin andIGF-1 receptors in mediating the IGFBP-2 and the impact of IGFBP-2 on the IGF-1-induced GU. Fully differentiated 3T3-L1adipocytes were treated with IGFBP-2 in the presence and absence of insulin and IGF-1. Insulin, IGF-1, and IGFBP-2 induced adose-dependent increase in GU. IGFBP-2 increased the insulin-induced GU after long-term incubation. The IGFBP-2-inducedimpact on GU was neither affected by insulin or IGF-1 receptor blockage nor by insulin receptor knockdown. IGFBP-2significantly increased the phosphorylation of PI3K, Akt, AMPK, TBC1D1, and PKCζ/λ and induced GLUT-4 translocation.Moreover, inhibition of PI3K and AMPK significantly reduced IGFBP-2-stimulated GU. In conclusion, IGFBP-2 stimulates GUin 3T3-L1 adipocytes through activation of PI3K/Akt, AMPK/TBC1D1, and PI3K/PKCζ/λ/GLUT-4 signaling. The stimulatoryeffect of IGFBP-2 on GU is independent of its binding to IGF-1 and is possibly not mediated through the insulin or IGF-1receptor. This study highlights the potential role of IGFBP-2 in glucose metabolism.
1. Introduction
Insulin-like growth factor-1 (IGF-1) bears structural homol-ogy with proinsulin [1] and plays a key role in the prolifera-tion and differentiation of adipocytes [2]. In vitro, it is knownto exert mitogenic effects at nanomolar concentrations [3]
and to induce insulin-like metabolic effects in both muscleand adipose tissues [4]. The production and secretion ofIGF-1 is affected by age, nutritional status, and otherhormones [5]. Because of the ability of insulin to inducehepatic growth hormone (GH) receptor gene expression [6]and protein abundance [7], the GH-induced synthesis and
HindawiOxidative Medicine and Cellular LongevityVolume 2017, Article ID 3035184, 13 pageshttps://doi.org/10.1155/2017/3035184

release of IGF-1 is highly dependent on the hepatic insulinsensitivity. This interplay among GH, insulin, and IGF-1 isof key importance for metabolic and growth regulation [8].
The bioavailability of IGFs is regulated by a family ofseven structurally conserved binding proteins (IGFBPs)[9–11]. These IGFBPs bind IGF-1 and IGF-2 but not insu-lin [12]. The IGF-1 independent role of IGFBPs in growthand metabolism has also been reported at least in vitro[13, 14]. IGFBP-2 is the predominant binding protein pro-duced during adipogenesis of white preadipocytes [15]. Bothinhibitory and stimulatory effects of IGFBP-2 on the cellularactions of IGF-1 and IGF-2 have been reported [16, 17].IGFBP-2 is reported to be a key regulator of metabolicdiseases, such as diabetes and obesity. Low IGFBP-2 has beenshown to be associated with higher fasting glucose levels andreduced insulin sensitivity suggesting it as a biomarker foridentification of insulin-resistant individuals [18]. Moreover,IGFBP-2 gene expression was downregulated in visceralwhite adipose tissue of mice and its circulating levels werereduced in obese ob/ob, db/db, and high fat-fed mice [19].Low levels of circulating IGFBP-2 have also been reportedin obese adults [20] and children [21].
Wheatcroft and colleagues demonstrated that IGFBP-2overexpression conferring protection against age-associateddecline in insulin sensitivity in mice [22]. Moreover, theleptin-induced overexpression of IGFBP-2 has been shownto reverse diabetes in insulin-resistant obese mice and hyper-insulinemic clamp studies showed a threefold improvementin hepatic insulin sensitivity following IGFBP-2 treatmentof ob/ob mice [23]. However, only few information exists todate regarding the mechanisms underlying the positiveIGFBP-2-induced impact on glucose metabolism. Indeed,IGFBP-2 has been shown to increase the insulin-stimulatedglucose uptake in myotubes [24] but nothing is known aboutits impact on glucose uptake in adipocytes with respect to theinsulin or IGF-1-induced effects. We, therefore, aimed toinvestigate the IGFBP-2-induced changes in both basal andinsulin-stimulated glucose uptake in 3T3-L1 adipocytes andthe underlying mechanisms. We further investigated the roleof insulin and IGF-1 receptors in mediating the IGFBP-2and even the impact of IGFBP-2 on the IGF-1-inducedimprovement in glucose uptake.
2. Materials and Methods
2.1. Reagents, Hormones, and Antibodies. IGF-1 and IGF-1Long R3 (IGF-1 LR3) were purchased from BioVisionInc. (Milpitas, CA, USA). IGFBP-2, Dulbecco’s ModifiedEagle Medium (DMEM), penicillin/streptomycin, and fetalbovine serum (FBS) were purchased from Biochrom AG(Berlin, Germany). Insulin, dexamethasone, LY294002, andpicropodophyllin (PPP) were supplied by Sigma-Aldrich(Darmstadt, Germany). 3-Isobutyl-1-methylxanthine (IBMX),S961, wortmannin, and Compound C were purchased fromBiomol GmbH (Hamburg, Germany), Phoenix Biotech(Beijing, China), Merck Chemicals (Darmstadt, Germany),and BIOZOL Diagnostica Vertrieb (Eching, Germany),respectively. RevertAid First Strand cDNA Synthesis Kit,SYBR Green master mix, Bicinchoninic Acid (BCA) protein
assay kit, and ECL reagent were supplied by ThermoFisher Scientific (Dreieich, Germany). DNA primers werepurchased from Eurogentec Deutschland GmbH (Köln,Germany). All other chemicals were supplied by Sigma-Aldrich (Darmstadt, Germany).
2.2. Cell Culture. The murine fibroblast cell line 3T3-L1(ATCC, Manassas, VA, USA) was cultured in DMEMsupplemented with 4.5 g/L glucose, 10% fetal bovine serum(FBS), 4mM glutamine, 50U/ml penicillin, and 50μg/mlstreptomycin until confluence. The cells were incubated todifferentiate into adipocytes following the method of Woodyet al. [25] with slight modifications. Briefly, 2 days post-confluence, cells were treated with 0.5mM IBMX, 1μMdexamethasone, and 1μM insulin supplemented DMEMfor 2 days. The cells were then maintained in 1μM insulin-supplemented growth medium for 3 days and in growthmedium for 4 days prior to experiments.
2.3. Transfection of Insulin Receptor (INSR) siRNAs.Differen-tiated 3T3-L1 adipocytes were transfected with control orINSR specific siRNA (validated siRNA from Dharmacon)using Lipofectamine RNAiMAX (Invitrogen) for 72 h. Theefficiency of transfection was assessed by using qPCR andWestern blot.
2.4. Measurement of Glucose Uptake. Glucose uptake wasassayed using the method described by Yamamoto et al.[26]. Briefly, differentiated 3T3-L1 adipocytes were serumstarved for 4 h followed by incubation in D-glucose freeDMEM for 1 h. The adipocytes were washed with PBS(pH 7.4) and then incubated for 30 min in Krebs-Ringerbicarbonate buffer (KRBP) with different concentrationsof insulin, IGF-1, IGF-1 LR3 and/or IGFBP-2. IGF1 LR3is an analogue of IGF-1 in which the glutamic acid at carbon3 (Glu3) is replaced by arginine and contains 13 extra aminoacids to the N-terminus. It has a very low affinity towardsIGFBPs as compared to IGF-1 [27]. The rationale for usingIGF1-LR3 was to investigate whether IGFBP-2 is able toimpact the IGF-1-induced increase in glucose uptake regard-less of its binding to IGF-1 itself. Had IGFBP-2 exertedadditive effect on the IGF-1-induced glucose uptake, itwould be imperative to scrutinize the observed effect asdue to binding or other means. In some experiments, theadipocytes were incubated with 100nM S961 (INSR blocker)for 2 h, 60nM PPP (IGF-1 receptor blocker) for 4 h, 100μMLY294002 (PI3K inhibitor) for 1 h, 200nM wortmannin(PI3K inhibitor) for 30min, or 200μM Compound C(AMPK inhibitor) for 20min before the treatment. Theadipocytes were treated with [3H] 2-Deoxy-D-glucose(0.5μCi/ml in HEPES) for 10min at room temperature(RT) and then washed with PBS. Thereafter, the cells werelysed in 50mM NaOH/1% Triton X-100 for scintillationcounting using a liquid scintillation counter (PerkinElmerWallac GmbH, Freiburg, Germany). Each experiment wasperformed with three technical replicates and total numberof experiments was three.
2.5. Quantitative Reverse Transcriptase-Polymerase ChainReaction (qRT-PCR) Analysis. Total RNA was isolated from
2 Oxidative Medicine and Cellular Longevity

3T3-L1 adipocytes using TRizol reagent and was treated withDNase I. RNA was quantified at 260nm using a NanoDrop(Peqlab Biotechnologie, Erlangen, Germany) and sampleswith A260/A280 ratios< 1.8 were discarded. 1μg RNA wasreverse transcribed into cDNA using RevertAid First StrandcDNA Synthesis Kit (Thermo Fisher Scientific, Dreieich,Germany). cDNA was amplified using SYBR Green mastermix (Thermo Fisher Scientific, Dreieich, Germany) with theprimers set outlined in Table 1 and with the following condi-tions: initial denaturation step at 95°C for 10min, followed by40 cycles of 15 sec at 95°C, 60 sec at annealing temperature ofrespective primer, and 60 sec at 72°C for extension. Meltingcurve analysis was used to assess the quality of PCR productsand the cycle threshold (CT) values were analyzed using the2−ΔΔCt method. Data were normalized to 36B4 and presentedas % of control.
2.6. Preparation of a Plasma Membrane Fraction for GlucoseTransporter (GLUT)-4 Translocation Assay. The amount ofGLUT-4 in the cell membranes was determined using sub-cellular fractionation [28] followed by Western blottinganalysis. Adipocytes were washed 3 times with ice-coldHEPES-EDTA-sucrose (HES) buffer (pH7.4) containingproteinase inhibitors. The cell suspension was homogenizedby passing through 22-gauge needles 10 times on ice. Thehomogenate was centrifuged at 16000g for 30min at 4°C,and the pellet was suspended in HES buffer followed bycentrifugation at 16000g for 30min at 4°C. The pellet wasresuspended in HES buffer, layered on the top of sucrosecushion (38.5% sucrose, 20mM HEPES and 1mM EDTA,pH7) in 1 : 1 volume ratio, and centrifuged at 100000g for1 h at 4°C. The plasma membrane fraction (middle layer)was carefully collected and centrifuged at 40000g for 20minat 4°C. The pellet was used to determine the amount ofGLUT-4 using Western blotting.
2.7. Western Blot Analysis. Treated 3T3-L1 adipocytes werelysed in RIPA buffer supplemented with inhibitors forproteinases and phosphatases. For the GLUT-4 translocationexperiments, the samples were lysed in a specific buffer(10mM Tris-HCl [pH7.2], 150mM NaCl, 5mM EDTA,1% Triton X-100, 1% sodium deoxycholate, and 0.1% SDS)supplemented with proteinase and phosphatase inhibitors.The protein content in the samples was measured by BCAassay kit. Proteins (30–50μg) were denatured and resolvedin 10% SDS/PAGE and transferred to nitrocellulose mem-branes. For GLUT-4, 8% SDS/PAGE was used. Blots wereblocked for 1 h and probed with 1 : 1000 diluted primaryantibodies for phosphoinositide 3-kinase (PI3K) p85, phos-pho-(Tyr) PI3K p85, protein kinase B (Akt), phospho-Akt(Ser473), AMP-activated protein kinase alpha (AMPKα),phospho-AMPKα (Thr172), atypical protein kinase (PKCζ),phospho-PKCζ/λ (Thr410/403), TBC1D1 (tre-2/USP6, BUB2,cdc16 domain family member 1), phospho-TBC1D1 (Ser237),and GAPDH overnight at 4°C and with GLUT-4 antibodyand Na+/K+-ATPase for 1 h at RT. The blots were washedand incubated with 1 : 2000 diluted corresponding horse-radish peroxidase- (HRP-) labeled secondary antibodies.Details of the used antibodies are listed in Table 2. After
washing, the membranes were developed with an ECLreagent and visualized and densitometry analysis usingImage Lab™ Software (Bio-Rad Laboratories GmbH,Munich, Germany) was used to quantify protein signal.
2.8. Statistical Analysis. Data were analyzed for statisticalsignificance by one-way analysis of variance (ANOVA) withTukey’s post hoc test using GraphPad Prism 5 (La Jolla,CA, USA). The results were presented as means± standarderror of the mean (SEM) with values of P < 0 05 wereconsidered significant.
3. Results
3.1. Effect of IGFBP-2 on Basal as well as Insulin and IGF-1-Induced Increase in Glucose Uptake in 3T3-L1 Adipocytes.To study the effect of insulin, IGF-1, IGF-1 LR3, andIGFBP-2 on glucose uptake in 3T3-L1 adipocytes, thecells were incubated with different concentrations of alltested agents for 30min and [3H] 2-Deoxy-D-glucoseuptake was assayed. Insulin and IGF-1 were able to exertstatistically significant effects on glucose uptake. As repre-sented in Figure 1(a), different concentrations of insulin(10, 20, 50, and 100nM) were able to exert a significant(P < 0 001) increase in glucose uptake. IGF-1 as well pro-duced a significant increase in glucose uptake at either10 nM (P < 0 05) or higher concentrations (P < 0 001) asdepicted in Figure 1(b).
Treatment of the cells with the lengthened analogueof IGF-1, IGF-1 LR3, induced significant increase in glu-cose uptake first at higher concentrations (20, 50, and100 nM) (Figure 1(c)). Similarly, IGFBP-2 was able to sig-nificantly (P < 0 01) increase glucose uptake in adipocytesfirst at a concentration of 100nM as compared to controlcells (Figure 1(d)).
Next, we determined both the short- and long-termimpact of IGFBP-2 on insulin, IGF-1, and IGF-1 LR3-induced glucose uptake in adipocytes.
Short-term incubation of the cells with 1 : 1 stoichio-metric ratio of IGFBP-2 and either insulin, IGF-1, orIGF-1 LR3 for 30min resulted in no additive increase inglucose uptake when compared to insulin, IGF-1, or IGF-1LR3 alone (Figure 1(e)).
Long-term incubation (24 h) of the cells with IGFBP-2significantly (P < 0 05) increased basal glucose uptake andexerted an additive effect (P < 0 01) on insulin-stimulatedglucose uptake. However, adipocytes treated with IGFBP-2for 24 h showed nonsignificant changes in either IGF-1 orIGF-1 LR3-induced glucose uptake (Figure 1(f)).
Table 1: Primers used for qRT-PCR.
Gene Sequence (5′-3′)
INSRF: GTACTGGGAGAGGCAAGCAG
R: ACTGGCCGAGTCGTCATACT
36B4F: TCATCCAGCAGGTGTTTGACA
R: GGCACCGAGGCAACAGTT
3Oxidative Medicine and Cellular Longevity

3.2. The IGFBP-2-Induced Impact on Glucose Uptake Is NotMediated through the Activation of Insulin or IGF-1Receptor. To investigate whether the stimulatory effect ofIGFBP-2 on glucose uptake is mediated through its bindingto insulin or IGF-1 receptors, we incubated 3T3-L1 adipo-cytes with either insulin receptor blocker (S961) or IGF-1receptor blocker (PPP).
3T3-L1 adipocytes incubated for 2 h with S961 showeda significant (P < 0 05) decrease in basal glucose uptakewhen compared with the control cells (Figure 2(a)). Theinsulin receptor blocker S961 significantly reduced insulin(P < 0 001), IGF-1 (P < 0 001), and IGF-1 LR3 (P < 0 01)and stimulated glucose uptake, whereas no impact (P > 0 05)of such treatment on IGFBP-2-stimulated glucose uptakewas seen.
When compared with S961, the IGF-1 receptor blockerPPP was not able to induce any significant (P > 0 05) effecton glucose uptake in adipocytes neither under basal condi-tions nor following stimulation with IGF-1, IGF-1 LR3, orIGFBP-2 (Figure 2(b)).
In 3T3-L1 adipocytes transfected with control or INSR-specific siRNA (Figures 2(c) and 2(d)), insulin (Figure 2(e))and IGF-1-stimulated glucose uptake (Figure 2(f)) weresignificantly (P < 0 05) reduced, whereas INSR knockdownpotentiated the effect of IGFBP-2 on glucose uptake whencompared with the control cells (P < 0 01) (Figure 2(g)).
3.3. IGFBP-2 Stimulates Glucose Uptake in a PI3K-DependentManner. Adipocytes treated with insulin and IGF-1 for30min exhibited significant (P < 0 001) increase in PI3Kphosphorylation when compared with the control cells.Similarly, IGFBP-2 induced a significant increase in PI3Kphosphorylation in 3T3-L1 adipocytes treated for either30min (P < 0 01) or 24hr (P < 0 001) (Figure 3(a)).
The effect of PI3K inhibitors (LY294002 and wortman-nin) on glucose uptake was investigated to further determinethe role of PI3K in mediating the IGFBP-2-stimulated
glucose uptake in 3T3-L1 adipocytes. Treatment of theadipocytes with either LY294002 (Figure 3(b)) or wortman-nin (Figure 3(c)) induced a significant decline in basal aswell as insulin-, IGF-1-, and IGFBP-2-stimulated glucoseuptake (P < 0 001).
3.4. IGFBP-2 Induces Akt and AMPK Phosphorylation andthe Subsequent Increase in GLUT-4 Translocation in aPI3K-Dependent Manner.We further investigated the impactof IGFBP-2 on Akt and AMPK phosphorylation as well ason GLUT-4 translocation. As expected, insulin and IGF-1significantly (P < 0 001) upregulated Akt phosphorylationin treated 3T3-L1 adipocytes. Similarly, IGFBP-2 induceda noticeable increase in Akt phosphorylation in 3T3-L1adipocytes treated for either 30min (P < 0 05) or 24 h(P < 0 01) (Figure 4(a)).
IGF-1 significantly (P < 0 001) increased, whereas insulinfailed to induce (P > 0 05) AMPK phosphorylation in 3T3-L1adipocytes (Figure 4(b)). Similarly, treatment of adipocyteswith IGFBP-2 for either 30min or 24 h induced a significant(P < 0 001) increase in AMPK phosphorylation.
To further confirm the involvement of AMPK phos-phorylation in IGFBP-2-stimulated glucose uptake, adi-pocytes were treated with IGFBP-2 with or withoutprevious incubation with the AMPK inhibitor CompoundC. Treatment of the 3T3-L1 adipocytes with IGFBP-2 sig-nificantly (P < 0 01) increased glucose uptake, an effectthat was significantly (P < 0 001) abolished by CompoundC (Figure 3(c)).
Insulin and IGF-1 stimulation increased TBC1D1 phos-phorylation significantly (P < 0 05) when compared withthe control adipocytes (Figure 4(d)). Similarly, treatment ofthe 3T3-L1 adipocytes with IGFBP-2 for either 30min or24 h induced a significant (P < 0 05) increase in TBC1D1phosphorylation (Figure 4(d)).
GLUT-4 translocation was assessed by subcellularfractionation followed by Western blotting. Treatment of
Table 2: List of antibodies used.
Antibody Species Supplier Catalog number
Anti-Phospho-AMPKα (Thr172) Rabbit Cell Signaling Technology 2535
Anti-AMPKα Rabbit Cell Signaling Technology 2532
Anti-Phospho-Akt (Ser473) Rabbit Cell Signaling Technology 9271
Anti-Akt Rabbit Cell Signaling Technology 9272
Anti-Phospho-(Tyr) p85 PI3K Rabbit Cell Signaling Technology 3821
Anti-PI3K p85 Rabbit Cell Signaling Technology 4292
Anti-Phospho-TBC1D1 (Ser237) Rabbit Millipore 07–2268
Anti-TBC1D1 Rabbit Cell Signaling Technology 5929
Anti-Phospho-PKCζ/λ (Thr410/403) Rabbit Cell Signaling Technology 9378
Anti-PKCζ Mouse Santa Cruz Biotechnology SC-17781
Anti-GLUT-4 Rabbit Sigma G4173
Anti-Na+, K+-ATPase Rabbit Cell Signaling Technology 3010
Anti-GAPDH Rabbit Cell Signaling Technology 2118
Goat anti-rabbit IgG HRP-linked Goat Cell Signaling Technology 4074
Horse anti-mouse IgG HRP-linked Horse Cell Signaling Technology 4076
4 Oxidative Medicine and Cellular Longevity

350
300
250
200
150
100
[3 H] 2
-DG
upt
ake (
%)
50
0Insulin
(nM) 0 10
⁎⁎⁎
⁎⁎⁎ ⁎⁎⁎
⁎⁎⁎
20 50 100
(a)
IGF-1(nM)
350
300
250
200
150
100
[3 H] 2
-DG
upt
ake (
%)
50
0
⁎⁎⁎
⁎⁎⁎
⁎⁎⁎
0 10 20 50 100
⁎
(b)
350
300
250
200
150
100[3 H] 2
-DG
upt
ake (
%)
50
0IGF-1 LR3
(nM)0 10 20 50 100
⁎ ⁎
⁎⁎
(c)
350
300
250
200
150
100
[3 H] 2
-DG
upt
ake (
%)
50
0IGFBP-2
(nM)0 25
nsns
50 100
⁎⁎
(d)
500
400
300
ns
ns
ns
200
100
Insulin − − + +
+ ++ +
− −− − − −
− −
− −
− −− −
− −
IGF-1IGF-1 LR3
0
[3 H] 2
-DG
upt
ake (
%)
⁎⁎
+ IGFBP-2
(e)
Insulin ‒ ‒ + +
+ ++ +
‒ ‒
‒ ‒ ‒ ‒
‒ ‒
‒ ‒
‒ ‒
‒ ‒
‒ ‒
IGF-1IGF-1 LR3
500
400
300
200
100
0
[3 H] 2
-DG
upt
ake (
%)
ns
ns
⁎⁎
⁎
+ IGFBP-2
(f)
Figure 1: Effects of IGFBP-2 on insulin and IGF-1-stimulated glucose uptake in 3T3-L1 adipocytes. (a–d) Dose-dependent effects ofinsulin, IGF-1, IGF-1 LR3, and IGFBP-2 on glucose uptake in 3T3-L1 adipocytes. ∗P < 0 05, ∗∗P < 0 01, and ∗∗∗P < 0 001 versuscontrol. (e and f) Effect of IGFBP-2 (100 nM) (black bars) on basal and insulin (20 nM), IGF-1 (20 nM), and IGF-1 LR3 (20 nM)-inducedglucose uptake (white bars) after short- and long-term incubations. ∗P < 0 05 and ∗∗P < 0 01. Each experiment was performed with threetechnical replicates and total number of experiments was three. The glucose uptake values are percentage of the controls. The results arepresented as mean± SEM.
5Oxidative Medicine and Cellular Longevity

the adipocytes with insulin significantly (P < 0 01) stimulatedGLUT-4 translocation from the cytoplasm to the plasmamembrane. IGF-1 was also able to significantly (P < 0 05)
stimulate GLUT-4 translocation. Similarly, IGFBP-2 induceda significant (P < 0 05) increase in GLUT-4 translocation intreated 3T3-L1 adipocytes (Figure 4(e)).
+ S961
ns
250
200
150
[3 H] 2
-DG
upt
ake (
%)
100
50
0InsulinIGF-1
IGF-1 LR3IGFBP-2
⁎
⁎⁎⁎
⁎⁎⁎⁎⁎
‒ ‒ + ++ +
+ ++ +
‒ ‒
‒ ‒
‒ ‒ ‒ ‒ ‒ ‒ ‒ ‒
‒ ‒
‒ ‒
‒ ‒‒ ‒
‒ ‒
‒ ‒
‒ ‒
‒ ‒
‒ ‒
(a)
ns
nsns
ns
ns
250
+ PPP
200
150
[3 H] 2
-DG
upt
ake (
%)
100
50
0InsulinIGF-1
IGF-1 LR3IGFBP-2
‒ ‒ + ++ +
+ ++ +
‒ ‒
‒ ‒
‒ ‒ ‒ ‒ ‒ ‒ ‒ ‒
‒ ‒
‒ ‒
‒ ‒‒ ‒
‒ ‒
‒ ‒
‒ ‒
‒ ‒
‒ ‒
(b)
1.5
1.0
INSR
fold
chan
ge(r
elat
ive t
o co
ntro
l)
0.5
0.0Control siRNA INSR siRNA
⁎⁎⁎
(c)
INSR
(rel
ativ
e to
cont
rol)
1.5
1.0
0.5
0.0Control siRNA INSR siRNA
⁎⁎
INSR
GAPDH
(d)
[3 H] 2
-DG
upt
ake (
%)
0
50
100
150
Control siRNA INSR siRNA
Insulin
⁎
(e)
[3 H] 2
-DG
upt
ake (
%)
0
50
100
150
Control siRNA INSR siRNA
IGF-1
⁎
(f)
[3 H] 2
-DG
upt
ake (
%)
0
50
100
150
Control siRNA INSR siRNA
IGFBP-2
⁎⁎
(g)
Figure 2: IGFBP-2 stimulates glucose uptake in insulin receptor and IGF-1 receptor-independent mechanism. (a) Effect of the insulinreceptor (INSR) blocker S961 (black bars) on basal and insulin, IGF-1, IGF-1 LR3, and IGFBP-2-induced glucose uptake (white bars).(b) Effect of the IGF-1 receptor blocker PPP (black bars) on basal and insulin, IGF-1, IGF-1 LR3, and IGFBP-2 induced glucose uptake(white bars). Differentiated 3T3-L1 adipocytes were incubated with 100 nM S961 for 2 h or 60 nM PPP for 4 h before treatment withinsulin, IGF-1, IGF-1 LR3, or IGFBP-2 for 30min. (c and d) Relative mRNA expression, normalized to 36B4, and Western blot analysisof INSR following siRNA transfection, respectively. (e, f, and g) Effect of 30min treatment with insulin, IGF-1, and IGFBP-2 on glucoseuptake in control siRNA and INSR siRNA transfected 3T3-L1 adipocytes. Each experiment was performed with three technical replicatesand total number of experiments was three. The glucose uptake values are percentage of the controls. The results are presented asmean± SEM. ∗P < 0 05, ∗∗P < 0 01, and ∗∗∗P < 0 001.
6 Oxidative Medicine and Cellular Longevity
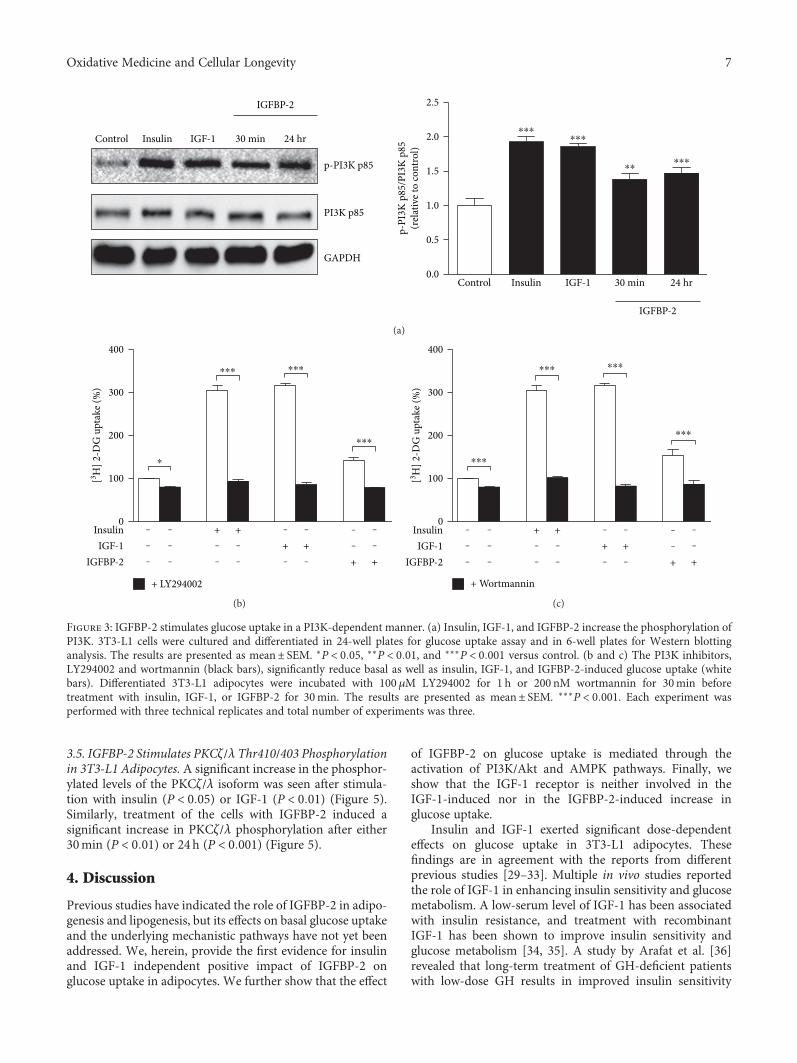
3.5. IGFBP-2 Stimulates PKCζ/λ Thr410/403 Phosphorylationin 3T3-L1 Adipocytes. A significant increase in the phosphor-ylated levels of the PKCζ/λ isoform was seen after stimula-tion with insulin (P < 0 05) or IGF-1 (P < 0 01) (Figure 5).Similarly, treatment of the cells with IGFBP-2 induced asignificant increase in PKCζ/λ phosphorylation after either30min (P < 0 01) or 24h (P < 0 001) (Figure 5).
4. Discussion
Previous studies have indicated the role of IGFBP-2 in adipo-genesis and lipogenesis, but its effects on basal glucose uptakeand the underlying mechanistic pathways have not yet beenaddressed. We, herein, provide the first evidence for insulinand IGF-1 independent positive impact of IGFBP-2 onglucose uptake in adipocytes. We further show that the effect
of IGFBP-2 on glucose uptake is mediated through theactivation of PI3K/Akt and AMPK pathways. Finally, weshow that the IGF-1 receptor is neither involved in theIGF-1-induced nor in the IGFBP-2-induced increase inglucose uptake.
Insulin and IGF-1 exerted significant dose-dependenteffects on glucose uptake in 3T3-L1 adipocytes. Thesefindings are in agreement with the reports from differentprevious studies [29–33]. Multiple in vivo studies reportedthe role of IGF-1 in enhancing insulin sensitivity and glucosemetabolism. A low-serum level of IGF-1 has been associatedwith insulin resistance, and treatment with recombinantIGF-1 has been shown to improve insulin sensitivity andglucose metabolism [34, 35]. A study by Arafat et al. [36]revealed that long-term treatment of GH-deficient patientswith low-dose GH results in improved insulin sensitivity
IGFBP-2
Control Insulin IGF-1 30 min 24 hr
2.5
2.0
1.5
1.0
0.5
0.0Control Insulin IGF-1 30 min 24 hr
IGFBP-2
p-PI3K p85
p-PI
3K p
85/P
I3K
p85
(rel
ativ
e to
cont
rol)
PI3K p85
GAPDH
⁎⁎⁎⁎⁎⁎
⁎⁎⁎⁎⁎
(a)
400
+ LY294002
300
200
100[3 H] 2
-DG
upt
ake (
%)
0InsulinIGF-1
IGFBP-2
‒ ‒ + ++ +
+ +‒ ‒
‒ ‒ ‒ ‒
‒ ‒
‒ ‒
‒ ‒
‒ ‒
‒ ‒
⁎
⁎⁎⁎ ⁎⁎⁎
⁎⁎⁎
(b)
+ Wortmannin
400
300
200
100[3 H] 2
-DG
upt
ake (
%)
0InsulinIGF-1
IGFBP-2
‒ ‒ + ++ +
+ +‒ ‒
‒ ‒ ‒ ‒
‒ ‒
‒ ‒
‒ ‒
‒ ‒
‒ ‒
⁎⁎⁎
⁎⁎⁎ ⁎⁎⁎
⁎⁎⁎
(c)
Figure 3: IGFBP-2 stimulates glucose uptake in a PI3K-dependent manner. (a) Insulin, IGF-1, and IGFBP-2 increase the phosphorylation ofPI3K. 3T3-L1 cells were cultured and differentiated in 24-well plates for glucose uptake assay and in 6-well plates for Western blottinganalysis. The results are presented as mean± SEM. ∗P < 0 05, ∗∗P < 0 01, and ∗∗∗P < 0 001 versus control. (b and c) The PI3K inhibitors,LY294002 and wortmannin (black bars), significantly reduce basal as well as insulin, IGF-1, and IGFBP-2-induced glucose uptake (whitebars). Differentiated 3T3-L1 adipocytes were incubated with 100 μM LY294002 for 1 h or 200 nM wortmannin for 30min beforetreatment with insulin, IGF-1, or IGFBP-2 for 30min. The results are presented as mean± SEM. ∗∗∗P < 0 001. Each experiment wasperformed with three technical replicates and total number of experiments was three.
7Oxidative Medicine and Cellular Longevity

IGFBP-2
IGFBP-2
Con
trol
Insu
lin
IGF-
1
30 m
in
24 h
r
Control Insulin IGF-1 30 min 24 hr
20⁎⁎⁎
⁎⁎⁎
⁎⁎
15
10
3
2
1
0
p-Akt(Ser473)
p-A
kt/A
kt(r
elat
ive t
o co
ntro
l)
Akt
GAPDH
⁎
(a)
IGFBP-2
Control Insulin IGF-1 30 min 24 hr
⁎⁎⁎⁎⁎⁎
⁎⁎⁎2.5
2.5
1.5
1.0
0.5
0.0GAPDH
p-AMPK�훼(Thr172)
p-A
MPK
/AM
PK(r
elat
ive t
o co
ntro
l)
AMPK�훼
IGFBP-2
Con
trol
Insu
lin
IGF-
1
30 m
in
24 h
r
(b)
IGFBP-2 IGFBP-2 + Compound C
Control
⁎⁎⁎⁎⁎
200
150
100
50
0
[3 H] 2
-DG
upt
ake (
%)
(c)
IGFBP-2
Control Insulin IGF-1 30 min 24 hr
p-TBC1D1(Ser237)
p-TB
C1D
1/TB
C1D
1(r
elat
ive t
o co
ntro
l)
TBC1D1
GAPDH
2.0
1.5
1.0
0.5
0.0
⁎⁎
⁎⁎
IGFBP-2
Con
trol
Insu
lin
IGF-
1
30 m
in
24 h
r
(d)
Figure 4: Continued.
8 Oxidative Medicine and Cellular Longevity
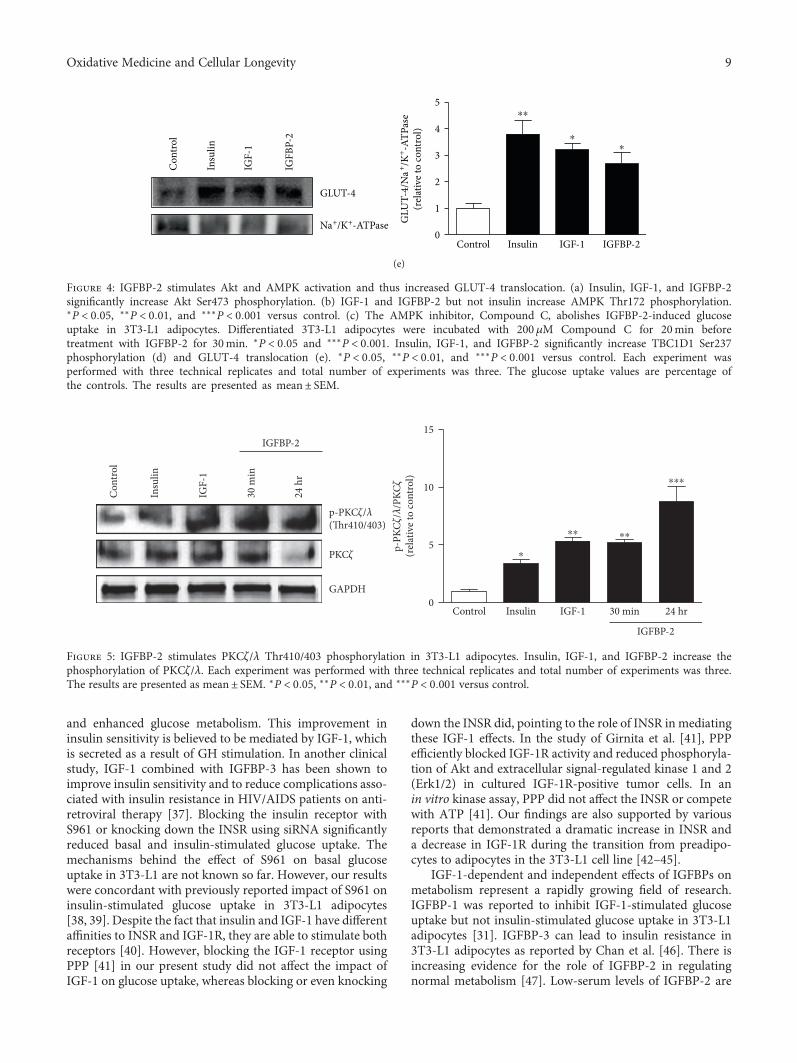
and enhanced glucose metabolism. This improvement ininsulin sensitivity is believed to be mediated by IGF-1, whichis secreted as a result of GH stimulation. In another clinicalstudy, IGF-1 combined with IGFBP-3 has been shown toimprove insulin sensitivity and to reduce complications asso-ciated with insulin resistance in HIV/AIDS patients on anti-retroviral therapy [37]. Blocking the insulin receptor withS961 or knocking down the INSR using siRNA significantlyreduced basal and insulin-stimulated glucose uptake. Themechanisms behind the effect of S961 on basal glucoseuptake in 3T3-L1 are not known so far. However, our resultswere concordant with previously reported impact of S961 oninsulin-stimulated glucose uptake in 3T3-L1 adipocytes[38, 39]. Despite the fact that insulin and IGF-1 have differentaffinities to INSR and IGF-1R, they are able to stimulate bothreceptors [40]. However, blocking the IGF-1 receptor usingPPP [41] in our present study did not affect the impact ofIGF-1 on glucose uptake, whereas blocking or even knocking
down the INSR did, pointing to the role of INSR in mediatingthese IGF-1 effects. In the study of Girnita et al. [41], PPPefficiently blocked IGF-1R activity and reduced phosphoryla-tion of Akt and extracellular signal-regulated kinase 1 and 2(Erk1/2) in cultured IGF-1R-positive tumor cells. In anin vitro kinase assay, PPP did not affect the INSR or competewith ATP [41]. Our findings are also supported by variousreports that demonstrated a dramatic increase in INSR anda decrease in IGF-1R during the transition from preadipo-cytes to adipocytes in the 3T3-L1 cell line [42–45].
IGF-1-dependent and independent effects of IGFBPs onmetabolism represent a rapidly growing field of research.IGFBP-1 was reported to inhibit IGF-1-stimulated glucoseuptake but not insulin-stimulated glucose uptake in 3T3-L1adipocytes [31]. IGFBP-3 can lead to insulin resistance in3T3-L1 adipocytes as reported by Chan et al. [46]. There isincreasing evidence for the role of IGFBP-2 in regulatingnormal metabolism [47]. Low-serum levels of IGFBP-2 are
IGFBP-2Control Insulin IGF-10
1
2
3
4
5
GLUT-4
GLU
T-4/
Na+ /K
+ -ATP
ase
(rel
ativ
e to
cont
rol)
Na+/K+-ATPase
⁎⁎
⁎⁎
IGFB
P-2
Con
trol
Insu
lin
IGF-
1(e)
Figure 4: IGFBP-2 stimulates Akt and AMPK activation and thus increased GLUT-4 translocation. (a) Insulin, IGF-1, and IGFBP-2significantly increase Akt Ser473 phosphorylation. (b) IGF-1 and IGFBP-2 but not insulin increase AMPK Thr172 phosphorylation.∗P < 0 05, ∗∗P < 0 01, and ∗∗∗P < 0 001 versus control. (c) The AMPK inhibitor, Compound C, abolishes IGFBP-2-induced glucoseuptake in 3T3-L1 adipocytes. Differentiated 3T3-L1 adipocytes were incubated with 200μM Compound C for 20min beforetreatment with IGFBP-2 for 30min. ∗P < 0 05 and ∗∗∗P < 0 001. Insulin, IGF-1, and IGFBP-2 significantly increase TBC1D1 Ser237phosphorylation (d) and GLUT-4 translocation (e). ∗P < 0 05, ∗∗P < 0 01, and ∗∗∗P < 0 001 versus control. Each experiment wasperformed with three technical replicates and total number of experiments was three. The glucose uptake values are percentage ofthe controls. The results are presented as mean± SEM.
p-PKC�휁/�휆(Thr410/403)
p-PK
C�휁/�휆
/PKC
�휁
(rel
ativ
e to
cont
rol)
PKC�휁
GAPDH
15
10
5
0
IGFBP-2
Control Insulin IGF-1 30 min 24 hr
IGFBP-2
Con
trol
Insu
lin
IGF-
1
30 m
in
24 h
r
⁎⁎ ⁎⁎
⁎⁎⁎
⁎
Figure 5: IGFBP-2 stimulates PKCζ/λ Thr410/403 phosphorylation in 3T3-L1 adipocytes. Insulin, IGF-1, and IGFBP-2 increase thephosphorylation of PKCζ/λ. Each experiment was performed with three technical replicates and total number of experiments was three.The results are presented as mean± SEM. ∗P < 0 05, ∗∗P < 0 01, and ∗∗∗P < 0 001 versus control.
9Oxidative Medicine and Cellular Longevity

correlated with obesity [22], metabolic syndrome [18], andtype 2 diabetes [48], whereas overexpression of IGFBP-2protects against diabetes and obesity [22, 23]. Roles ofIGFBP-2 on metabolism such as inhibition of adipogenesisand lipogenesis [49], enhancing insulin-stimulated glucoseuptake in skeletal myotubes [50], and inhibition of preadi-pocyte differentiation in vitro [14] have been reported.However, the effects of IGFBP-2 on basal glucose uptakeand the mechanisms underlying its IGF-1-independentrole on glucose uptake are not well studied. Here, wereported significantly increased glucose uptake in 3T3-L1adipocytes treated with 100nM IGFBP-2. To our knowledge,this is the first report to show the stimulatory effects ofIGFBP-2 on basal glucose uptake in adipocytes. In addition,our data showed a nonsignificant effect for short- andlong-term treatment with IGFBP-2 on IGF-1 and IGF-1LR3-stimulated glucose uptake. Adipocytes treated withIGFBP-2 for 24h followed by 30min stimulation withIGF-1 showed a trend increase in glucose uptake. Increasedbasal glucose uptake in control cells incubated withIGFBP-2 for 24h may explain this increase. However,incubation with IGFBP-2 for 24h exerted a significantadditive effect on the insulin-stimulated glucose uptakewhich coincides with the study of Yau et al. [50] whoreported similar effect for IGFBP-2 in human skeletalmuscle cells in vitro. It can be postulated that the additiveincrease in the acute insulin-induced stimulation of glucoseuptake after long-term treatment with IGFBP-2 is due tothe impact of IGFBP-2 on basal glucose uptake that is likelyalso mediated through different signaling pathways otherthan the PI3K/Akt pathway. Moreover, these findings pro-vide a notion that IGFBP-2 binding to IGF-1 does not inhibitIGF-1 from exerting its biological role, at least on glucoseuptake in vitro.
In addition to its ability to bind and modulate theactivity of IGFs, IGFBP-2 can bind to proteoglycans [51]through two heparin-binding domains (HBDs) as well asto integrins through its integrin-binding motif, Gly-Arg-Asp (RGD) [51, 52]. This may explain, at least in part,the IGFR-independent IGFBP-2 activities [49].
Interestingly, neither S961 nor PPP blocked the stimula-tory effect of IGFBP-2 on glucose uptake. Moreover, INSRknockdown even increased IGFBP-2-induced increase inglucose uptake. These findings indicate the involvement ofother receptors or pathways in IGFBP-2-stimulated glucoseuptake in 3T3-L1 adipocytes. This is concordant with thefindings of Xi et al. [53], who reported that IGFBP-2stimulates AMPK via its own receptor.
Signaling via INSR and IGF-1R shares many commonsignaling pathways at target cells. One of the commonpathways in mediating glucose uptake and metabolism isthe PI3K pathway [40, 54]. Insulin and IGF-1 are known tostimulate the activity of PI3K by triggering its phosphoryla-tion at specific tyrosine residues by upstream componentsof the INSR and IGF-1R signaling pathways [55]. In thepresent study, the PI3K inhibitors, LY294002 and wortman-nin, reduced basal and insulin, IGF-1, and even IGFBP-2-stimulated glucose uptake in adipocytes, pointing to the roleof PI3K pathway in mediating the IGFBP-2 effect on glucose
uptake. We, therefore, investigated the impact of short- andlong-term treatment with IGFBP-2 on PI3K phosphorylationin 3T3-L1 adipocytes, using insulin and IGF-1 as controls.As expected, treatment of the adipocytes with either insu-lin or IGF-1 significantly increased PI3K phosphorylation.Similarly, IGFBP-2 induced marked increase in PI3K phos-phorylation after both short- and long-term treatment, con-firming the involvement of PI3K activation in mediatingIGFBP-2 effects.
Given that IGFBP-2 activates PI3K, we tested its effect onthe downstream signaling molecules Akt and AMPK andGLUT-4 translocation. As a result of PI3K activation, insulinand IGF-1 stimulated the phosphorylation of Akt. Thesefindings are in agreement with the studies of Karlsson et al.[56] and Zhang et al. [57]. Moreover, IGF-1 significantlyincreased AMPK phosphorylation. IGF-1 has been previ-ously shown to stimulate the phosphorylation of AMPK atits alpha subunit [58]. On the other hand, insulin did notaffect the level of p-AMPK indicating that insulin mainlyuses the PI3K pathway to exert its effects on glucose metabo-lism. Our findings are in agreement with Shen et al. [59] whoclearly showed that insulin does not stimulate AMPK. In thesame context, pharmacological activation of AMPK increasesglucose uptake in skeletal muscles of subjects with type 2diabetes [60] by an insulin-independent mechanism [61].
Similarly, IGFBP-2 produced a significant increase in Aktphosphorylation which is attributed to its stimulatory effecton PI3K. Concordant data were reported by Yau et al. [50]in human skeletal muscle cells. The surface proteoglycanreceptor-type protein tyrosine phosphatase β (RPTPβ) hasbeen identified as a functionally active cell surface receptorthat links IGFBP-2 and the activation of Akt [62]. IGFBP-2binds RPTPβ through its HBD, resulting in inhibition ofRPTPβ phosphatase activity and subsequently phosphataseand tensin homolog (PTEN) suppression [62]. PTEN isknown to prevent Akt activation by dephosphorylatingphosphatidylinositol-3,4,5-triphosphate (PIP3). The studyof Shen et al. [62] showed that IGFBP-2−/− mice hadincreased RPTPβ activity and impaired Akt activation,changes that were reversed by administration of IGFBP-2.
In addition, both short- and long-term treatment of theadipocytes with IGFBP-2 induced a significant increase inAMPK phosphorylation. IGFBP-2 and IGF-1 have beenrecently reported by Xi et al. [53] to induce stimulatoryeffects on AMPK in osteoblasts. Our results were furtherconfirmed through testing the effect of AMPK inhibitor,Compound C, on IGFBP-2-stimulated glucose uptake. Incu-bation of the adipocytes with Compound C significantlyabolished IGFBP-2-induced glucose uptake. Taken together,AMPK activation plays a potential role in mediatingIGFBP-2-stimulated glucose uptake in 3T3-L1 adipocytes.
One of the major metabolic changes elicited by AMPKactivation is the promotion of glucose uptake [63]. AMPKinduces glucose uptake either acutely through GLUT-4 trans-location or in the longer term via upregulation of GLUT-4expression [63]. Here, we show that treatment of the3T3-L1 adipocytes with IGFBP-2 for 30min stimulatesGLUT-4 translocation to the plasma membrane. This effectis attributed to the ability of IGFBP-2 to activate AMPK. In
10 Oxidative Medicine and Cellular Longevity

addition, we show a significant increase in the phosphoryla-tion of the Rab-GAP protein TBC1D1 by IGFBP-2. There-fore, the mechanism underlying the IGFBP-2 impact onGLUT-4 translocation and the subsequent promotion ofglucose uptake involves the phosphorylation of TBC1D1 atleast partly through AMPK-pathway activation. This effectis similar to the complementary regulation of TBC1D1 byinsulin and AMPK activators [64, 65]. Increased TBC1D1phosphorylation and GLUT-4 translocation by IGFBP-2could also be directly mediated by Akt activation. In theskeletal muscle of rodents, Akt phosphorylates TBC1D1[66] which promotes the hydrolysis of guanosine-5′-tri-phosphate on GLUT-4-containing vesicles [67].
The atypical protein kinase PKCζ/λ/GLUT-4 is anothersignaling pathway we thought to have a role in mediatingthe positive effect of IGFBP-2 on glucose uptake in adipo-cytes. In our study, insulin, IGF-1, and IGFBP-2 induceda significant increase in PKCζ/λ phosphorylation. Since,PKCζ/λ is dependent on PI3K activation [29, 68], it wasexpected to be activated in adipocytes treated with insulin,IGF-1, and IGFBP-2 because of their ability to activatePI3K. Following activation, PI3K signaling diverges intoAkt-dependent and PKCζ/λ-mediated pathways [69].PKCζ/λ is known to play little or no role in mediatinginsulin effects on glucose uptake in 3T3-L1 adipocytes[70], which may explain the IGFBP-2-induced additiveincrease in the insulin-induced glucose uptake after long-term treatment in our present study. However, furtherstudies using inhibitors or gene silencing are needed toexplore the precise involvement of PKCζ/λ in mediatingthe IGFBP-2-induced increase in glucose uptake andGLUT-4 translocation. One of the limitations of our studywas the IGFBP-2 concentrations used to elicit a significantimpact on glucose uptake. IGFBP-2 increased glucose uptakeat concentrations 7–10-fold higher than those described inhumans. Therefore, further in vivo studies are needed toexplore the precise impact of physiological concentrationsof IGFBP-2 on glucose utilization in humans.
In summary, this study shows that IGFBP-2 stimulatesglucose uptake in 3T3-L1 adipocytes and that synergisticactivation of Akt and AMPK mediates the modulatory effectof IGFBP-2. The PI3K/PKCζ/λ/GLUT-4 signaling is hereshown to mediate the IGFBP-2-induced increase in glucoseuptake. Furthermore, we showed that IGFBP-2-inducedglucose uptake is independent of its binding to IGF-1, INSR,and IGF-1R. Our findings highly strengthen the potentialand novel role for IGFBP-2 in glucose metabolism.
Conflicts of Interest
The authors have declared that no competing interests exist.
Authors’ Contributions
Ayman M. Arafat conceived the study and acquired fundingfor the experiment. Biruhalem Assefa and Ayman M.Mahmoud performed the experiments and analyzed theresults. Biruhalem Assefa, AymanM. Mahmoud, and AymanM. Arafat wrote the manuscript. Andreas F. H. Pfeiffer,
Andreas L. Birkenfeld, and Joachim Spranger revised andcommented on the manuscript. All authors read andapproved the final manuscript.
Acknowledgments
The authors would like to thank Dr. Michael Laue andLars Möller from the Robert Koch Institute (Berlin) fortheir technical support during subcellular fractionationprocedures. Biruhalem Assefa and Ayman M. Arafat werefunded by the graduate school Grant no. 1208/2 from theGerman Research Foundation (DFG). Ayman M. Mahmoudis funded by a postdoctoral fellowship (ID 1158232)from the Alexander Von Humboldt Foundation.
References
[1] E. Rinderknecht and R. E. Humbel, “The amino acid sequenceof human insulin-like growth factor I and its structural homol-ogy with proinsulin,” Journal of Biological Chemistry, vol. 253,no. 8, pp. 2769–2776, 1978.
[2] P. J. Smith, L. S. Wise, R. Berkowitz, C. Wan, and C. S. Rubin,“Insulin-like growth factor-I is an essential regulator of thedifferentiation of 3T3-L1 adipocytes,” Journal of BiologicalChemistry, vol. 263, no. 19, pp. 9402–9408, 1988.
[3] S. D. O’Dell and I. N. M. Day, “Insulin-like growth factor II(IGF-II),” International Journal of Biochemistry & Cell Biology,vol. 30, no. 7, pp. 767–771, 1998.
[4] R. Monzavi and P. Cohen, “IGFs and IGFBPs: role in healthand disease,” Best Practice & Research Clinical Endocrinology& Metabolism, vol. 16, no. 3, pp. 433–447, 2002.
[5] A. Skottner, “Biosynthesis of growth hormone and insulin-likegrowth factor-I and the regulation of their secretion,” TheOpen Endocrinology Journal, vol. 6, no. 1, pp. 3–12, 2012.
[6] S. T. Butler, A. L. Marr, S. H. Pelton, R. P. Radcliff, M. C. Lucy,and W. R. Butler, “Insulin restores GH responsiveness duringlactation-induced negative energy balance in dairy cattle:effects on expression of IGF-I and GH receptor 1A,” Journalof Endocrinology, vol. 176, no. 2, pp. 205–217, 2003.
[7] R. P. Rhoads, J. W. Kim, B. J. Leury et al., “Insulin increases theabundance of the growth hormone receptor in liver andadipose tissue of periparturient dairy cows,” The Journal ofNutrition, vol. 134, no. 5, pp. 1020–1027, 2004.
[8] D. R. Clemmons, “The relative roles of growth hormoneand IGF-1 in controlling insulin sensitivity,” The Journalof Clinical Investigation, vol. 113, no. 1, pp. 25–27, 2004.
[9] L. A. Bach, S. J. Headey, and R. S. Norton, “IGF-bindingproteins – the pieces are falling into place,” Trends in Endocri-nology & Metabolism, vol. 16, no. 5, pp. 228–234, 2005.
[10] M. Kutsukake, R. Ishihara, K. Momose et al., “CirculatingIGF-binding protein 7 (IGFBP7) levels are elevated in patientswith endometriosis or undergoing diabetic hemodialysis,”Reproductive Biology and Endocrinology, vol. 6, p. 54, 2008.
[11] D. R. Clemmons, “Role of IGF binding proteins in regulatingmetabolism,” Trends in Endocrinology & Metabolism, vol. 27,no. 6, pp. 375–391, 2016.
[12] V. C. Russo, P. D. Gluckman, E. L. Feldman, and G. A.Werther, “The insulin-like growth factor system and itspleiotropic functions in brain,” Endocrine Reviews, vol. 26,no. 7, pp. 916–943, 2005.
11Oxidative Medicine and Cellular Longevity
[13] S. Mohan and D. J. Baylink, “IGF-binding proteins aremultifunctional and act via IGF-dependent and -independentmechanisms,” Journal of Endocrinology, vol. 175, no. 1,pp. 19–31, 2002.
[14] S. B. Wheatcroft and M. T. Kearney, “IGF-dependent andIGF-independent actions of IGF-binding protein-1 and -2:implications for metabolic homeostasis,” Trends in Endocri-nology & Metabolism, vol. 20, no. 4, pp. 153–162, 2009.
[15] C. M. Boney, B. M. Moats-Staats, A. D. Stiles, and A. J.D’Ercole, “Expression of insulin-like growth factor-I (IGF-I)and IGF-binding proteins during adipogenesis,” Endocrinol-ogy, vol. 135, no. 5, pp. 1863–1868, 1994.
[16] A. Hoeflich, R. Reisinger, H. Lahm et al., “Insulin-like growthfactor-binding protein 2 in tumorigenesis: protector or pro-moter?,” Cancer Research, vol. 61, no. 24, pp. 8601–8610, 2001.
[17] T. Fukushima and H. Kataoka, “Roles of insulin-like growthfactor binding protein-2 (IGFBP-2) in glioblastoma,” Antican-cer Research, vol. 27, no. 6A, pp. 3685–3692, 2007.
[18] A. H. Heald, K. Kaushal, K. W. Siddals, A. S. Rudenski, S. G.Anderson, and J. M. Gibson, “Insulin-like growth factorbinding protein-2 (IGFBP-2) is a marker for the metabolicsyndrome,” Experimental and Clinical Endocrinology & Dia-betes, vol. 114, no. 07, pp. 371–376, 2006.
[19] Z. Li and F. Picard, “Modulation of IGFBP2 mRNA expressionin white adipose tissue upon aging and obesity,” Hormone andMetabolic Research, vol. 42, no. 11, pp. 787–791, 2010.
[20] S. Y. Nam, E. J. Lee, K. R. Kim et al., “Effect of obesity on totaland free insulin-like growth factor (IGF)-1, and their relation-ship to IGF-binding protein (BP)-1, IGFBP-2, IGFBP-3, insu-lin, and growth hormone,” International Journal of Obesity,vol. 21, no. 5, pp. 355–359, 1997.
[21] M. Claudio, F. Benjamim, B. Riccardo, C. Massimiliano,B. Francesco, and C. Luciano, “Adipocytes IGFBP-2 expres-sion in prepubertal obese children,” Obesity, vol. 18, no. 10,pp. 2055–2057, 2010.
[22] S. B. Wheatcroft, M. T. Kearney, A. M. Shah et al., “IGF-binding protein-2 protects against the development ofobesity and insulin resistance,” Diabetes, vol. 56, no. 2,pp. 285–294, 2007.
[23] K. Hedbacker, K. Birsoy, R. W. Wysocki et al., “Antidiabeticeffects of IGFBP2, a leptin-regulated gene,” Cell Metabolism,vol. 11, no. 1, pp. 11–22, 2010.
[24] S. W. Yau, V. C. Russo, I. J. Clarke, G. A. Werther, and M. A.Sabin, “IGFBP-2 enhances insulin signalling and glucoseuptake in human skeletal myotubes,” Obesity Research &Clinical Practice, vol. 7, pp. e44–e45, 2013.
[25] S. Woody, R. Stall, J. Ramos, and Y. M. Patel, “Regulation ofmyosin light chain kinase during insulin-stimulated glucoseuptake in 3T3-L1 adipocytes,” PLoS One, vol. 8, no. 10, articlee77248, 2013.
[26] N. Yamamoto, M. Ueda, T. Sato et al., “Measurement ofglucose uptake in cultured cells,” Current Protocols in Pharma-cology, vol. 12, pp. 12.14 11–12.14.22, 2011.
[27] L. G. Laajoki, G. L. Francis, J. C. Wallace, J. A. Carver, andM. A. Keniry, “Solution structure and backbone dynamics oflong-[Arg3]insulin-like growth factor-I,” Journal of BiologicalChemistry, vol. 275, no. 14, pp. 10009–10015, 2000.
[28] T. Ramlal, V. Sarabia, P. J. Bilan, and A. Klip, “Insulin-mediated translocation of glucose transporters from intra-cellular membranes to plasma membranes: sole mechanismof stimulation of glucose transport in L6 muscle cells,”
Biochemical and Biophysical Research Communications,vol. 157, no. 3, pp. 1329–1335, 1988.
[29] K. Kotani, W. Ogawa, M. Matsumoto et al., “Requirement ofatypical protein kinase Cλ for insulin stimulation of glucoseuptake but not for Akt activation in 3T3-L1 adipocytes,”Molecular and Cellular Biology, vol. 18, no. 12, pp. 6971–6982, 1998.
[30] K. M. Rice and C. W. Garner, “IGF-I regulates IRS-1 expres-sion in 3T3-L1 adipocytes,” Biochemical and BiophysicalResearch Communications, vol. 255, no. 3, pp. 614–617, 1999.
[31] K. W. Siddals, M. Westwood, J. M. Gibson, and A. White,“IGF-binding protein-1 inhibits IGF effects on adipocyte func-tion: implications for insulin-like actions at the adipocyte,”Journal of Endocrinology, vol. 174, no. 2, pp. 289–297, 2002.
[32] M. Takahashi, Y. Takahashi, K. Takahashi et al., “Chemerinenhances insulin signaling and potentiates insulin-stimulatedglucose uptake in 3T3-L1 adipocytes,” FEBS Letters, vol. 582,no. 5, pp. 573–578, 2008.
[33] M. Berenguer, J. Zhang, M. C. Bruce et al., “Dimethyl sulfoxideenhances GLUT4 translocation through a reduction in GLUT4endocytosis in insulin-stimulated 3T3-L1 adipocytes,” Biochi-mie, vol. 93, no. 4, pp. 697–709, 2011.
[34] K. C. Yuen and D. B. Dunger, “Impact of treatment withrecombinant human GH and IGF-I on visceral adipose tissueand glucose homeostasis in adults,” Growth Hormone & IGFResearch, vol. 16, Supplement A, pp. S55–S61, 2006.
[35] K. C. Yuen and D. B. Dunger, “Therapeutic aspects of growthhormone and insulin-like growth factor-I treatment onvisceral fat and insulin sensitivity in adults,” Diabetes, Obesityand Metabolism, vol. 9, no. 1, pp. 11–22, 2007.
[36] A. M. Arafat, M. Möhlig, M. O. Weickert, C. Schöfl,J. Spranger, and A. F. Pfeiffer, “Improved insulin sensitivity,preserved beta cell function and improved whole-body glucosemetabolism after low-dose growth hormone replacementtherapy in adults with severe growth hormone deficiency: apilot study,” Diabetologia, vol. 53, no. 7, pp. 1304–1313, 2010.
[37] M. N. Rao, K. Mulligan, V. Tai et al., “Effects of insulin-likegrowth factor (IGF)-I/IGF-binding protein-3 treatment onglucose metabolism and fat distribution in human immunode-ficiency virus-infected patients with abdominal obesity andinsulin resistance,” The Journal of Clinical Endocrinology &Metabolism, vol. 95, no. 9, pp. 4361–4366, 2010.
[38] L. Schäffer, C. L. Brand, B. F. Hansen et al., “A novel high-affinity peptide antagonist to the insulin receptor,” Biochemi-cal and Biophysical Research Communications, vol. 376,no. 2, pp. 380–383, 2008.
[39] L. Knudsen, B. F. Hansen, P. Jensen et al., “Agonism andantagonism at the insulin receptor,” PLoS One, vol. 7, no. 12,article e51972, 2012.
[40] K. Siddle, “Molecular basis of signaling specificity of insulinand IGF receptors: neglected corners and recent advances,”Frontiers in Endocrinology, vol. 3, p. 34, 2012.
[41] A. Girnita, L. Girnita, F. del Prete, A. Bartolazzi, O. Larsson,and M. Axelson, “Cyclolignans as inhibitors of the insulin-like growth factor-1 receptor and malignant cell growth,”Cancer Research, vol. 64, no. 1, pp. 236–242, 2004.
[42] B. C. Reed, S. H. Kaufmann, J. C. Mackall, A. K. Student, andM. D. Lane, “Alterations in insulin binding accompanyingdifferentiation of 3T3-L1 preadipocytes,” Proceedings of theNational Academy of Sciences of the United States of America,vol. 74, no. 11, pp. 4876–4880, 1977.
12 Oxidative Medicine and Cellular Longevity
[43] C. M. Boney, R. M. Smith, and P. A. Gruppuso, “Modulationof insulin-like growth factor I mitogenic signaling in 3T3-L1preadipocyte differentiation,” Endocrinology, vol. 139, no. 4,pp. 1638–1644, 1998.
[44] S. Hong, H. Huo, J. Xu, and K. Liao, “Insulin-like growthfactor-1 receptor signaling in 3T3-L1 adipocyte differentiationrequires lipid rafts but not caveolae,” Cell Death and Differen-tiation, vol. 11, no. 7, pp. 714–723, 2004.
[45] J. Boucher, Y. H. Tseng, and C. R. Kahn, “Insulin and insulin-like growth factor-1 receptors act as ligand-specific amplitudemodulators of a common pathway regulating gene transcrip-tion,” Journal of Biological Chemistry, vol. 285, no. 22,pp. 17235–17245, 2010.
[46] S. S. Chan, S. M. Twigg, S. M. Firth, and R. C. Baxter, “Insulin-like growth factor binding protein-3 leads to insulin resistancein adipocytes,” The Journal of Clinical Endocrinology &Metab-olism, vol. 90, no. 12, pp. 6588–6595, 2005.
[47] M. A. Sabin, V. C. Russo, W. J. Azar, S. W. Yau, W. Kiess,and G. A. Werther, “IGFBP-2 at the interface of growth andmetabolism–implications for childhood obesity,” PediatricEndocrinology Reviews, vol. 8, no. 4, pp. 382–393, 2011.
[48] J. Frystyk, C. Skjaerbaek, E. Vestbo, S. Fisker, andH. Orskov, “Circulating levels of free insulin-like growthfactors in obese subjects: the impact of type 2 diabetes,”Diabetes/Metabolism Research and Reviews, vol. 15, no. 5,pp. 314–322, 1999.
[49] S. W. Yau, V. C. Russo, I. J. Clarke, F. R. Dunshea, G. A.Werther, and M. A. Sabin, “IGFBP-2 inhibits adipogenesisand lipogenesis in human visceral, but not subcutaneous,adipocytes,” International Journal of Obesity, vol. 39, no. 5,pp. 770–781, 2015.
[50] S. W. Yau, V. C. Russo, G. A. Werther, and M. A. Sabin,“IGFBP-2 enhances insulin signalling pathways in humanskeletal muscle by cell surface binding – an IGF-independentprocess?,” in Endocrine Society’s 96th Annual Meeting andExpo, Endocrine Society, Chicago, IL, USA, 2014, SAT-1072.
[51] V. C. Russo, B. S. Schütt, E. Andaloro et al., “Insulin-likegrowth factor binding protein-2 binding to extracellularmatrix plays a critical role in neuroblastoma cell proliferation,migration, and invasion,” Endocrinology, vol. 146, no. 10,pp. 4445–4455, 2005.
[52] B. S. Schutt, M. Langkamp, U. Rauschnabel, M. B. Ranke, andM. W. Elmlinger, “Integrin-mediated action of insulin-likegrowth factor binding protein-2 in tumor cells,” Journal ofMolecular Endocrinology, vol. 32, no. 3, pp. 859–868, 2004.
[53] G. Xi, C. J. Rosen, and D. R. Clemmons, “IGF-I and IGFBP-2stimulate AMPK activation and autophagy, which are requiredfor osteoblast differentiation,” Endocrinology, vol. 157, no. 1,pp. 268–281, 2016.
[54] K. Siddle, “Signalling by insulin and IGF receptors: supportingacts and new players,” Journal of Molecular Endocrinology,vol. 47, no. 1, pp. R1–R10, 2011.
[55] J. Dupont and D. LeRoith, “Insulin and insulin-like growthfactor I receptors: similarities and differences in signaltransduction,” Hormone Research in Pædiatrics, vol. 55,Supplement 2, pp. 22–26, 2001.
[56] H. K. Karlsson, J. R. Zierath, S. Kane, A. Krook, G. E. Lienhard,and H. Wallberg-Henriksson, “Insulin-stimulated phosphory-lation of the Akt substrate AS160 is impaired in skeletal muscleof type 2 diabetic subjects,” Diabetes, vol. 54, no. 6, pp. 1692–1697, 2005.
[57] Y. Zhang, Y. Liu, X. Li et al., “Effects of insulin and IGF-Ion growth hormone- induced STAT5 activation in 3T3-F442A adipocytes,” Lipids in Health and Disease, vol. 12,p. 56, 2013.
[58] A. Suzuki, G. Kusakai, A. Kishimoto et al., “IGF-1 phosphory-lates AMPK-α subunit in ATM-dependent and LKB1-independent manner,” Biochemical and Biophysical ResearchCommunications, vol. 324, no. 3, pp. 986–992, 2004.
[59] Y. Shen, N. Honma, K. Kobayashi et al., “Cinnamon extractenhances glucose uptake in 3T3-L1 adipocytes and C2C12myocytes by inducing LKB1-AMP-activated protein kinasesignaling,” PLoS One, vol. 9, no. 2, article e87894, 2014.
[60] H. A. Koistinen, D. Galuska, A. V. Chibalin et al., “5-amino-imidazole carboxamide riboside increases glucose transportand cell-surface GLUT4 content in skeletal muscle fromsubjects with type 2 diabetes,” Diabetes, vol. 52, no. 5,pp. 1066–1072, 2003.
[61] T. Hayashi, M. F. Hirshman, E. J. Kurth, W. W. Winder, andL. J. Goodyear, “Evidence for 5′ AMP-activated protein kinasemediation of the effect of muscle contraction on glucose trans-port,” Diabetes, vol. 47, no. 8, pp. 1369–1373, 1998.
[62] X. Shen, G. Xi, L. A. Maile, C. Wai, C. J. Rosen, and D. R.Clemmons, “Insulin-like growth factor (IGF) binding protein2 functions coordinately with receptor protein tyrosinephosphatase β and the IGF-I receptor to regulate IGF-I-stimulated signaling,” Molecular and Cellular Biology, vol. 32,no. 20, pp. 4116–4130, 2012.
[63] S. L. McGee, B. J. van Denderen, K. F. Howlett et al., “AMP-activated protein kinase regulates GLUT4 transcription byphosphorylating histone deacetylase 5,” Diabetes, vol. 57,no. 4, pp. 860–867, 2008.
[64] S. Chen, J. Murphy, R. Toth, D. G. Campbell, N. A. Morrice,and C. Mackintosh, “Complementary regulation of TBC1D1and AS160 by growth factors, insulin and AMPK activators,”Biochemical Journal, vol. 409, no. 2, pp. 449–459, 2008.
[65] C. Pehmoller, J. T. Treebak, J. B. Birk et al., “Genetic disruptionof AMPK signaling abolishes both contraction- and insulin-stimulated TBC1D1 phosphorylation and 14-3-3 binding inmouse skeletal muscle,” American Journal of Physiology -Endocrinology and Metabolism, vol. 297, no. 3, pp. E665–E675, 2009.
[66] E. B. Taylor, D. An, H. F. Kramer et al., “Discovery of TBC1D1as an insulin-, AICAR-, and contraction-stimulated signalingnexus in mouse skeletal muscle,” Journal of Biological Chemis-try, vol. 283, no. 15, pp. 9787–9796, 2008.
[67] H. Sano, S. Kane, E. Sano et al., “Insulin-stimulated phosphor-ylation of a Rab GTPase-activating protein regulates GLUT4translocation,” Journal of Biological Chemistry, vol. 278,no. 17, pp. 14599–14602, 2003.
[68] M. Ishiki and A. Klip, “Minireview: recent developments inthe regulation of glucose transporter-4 traffic: new signals,locations, and partners,” Endocrinology, vol. 146, no. 12,pp. 5071–5078, 2005.
[69] G. Bandyopadhyay, M. L. Standaert, M. P. Sajan et al., “Depen-dence of insulin-stimulated glucose transporter 4 translocationon 3-phosphoinositide-dependent protein kinase-1 and its tar-get threonine-410 in the activation loop of protein kinase C-ζ,”Molecular Endocrinology, vol. 13, no. 10, pp. 1766–1772, 1999.
[70] M. Tsuru, H. Katagiri, T. Asano et al., “Role of PKC isoformsin glucose transport in 3T3-L1 adipocytes: insignificance ofatypical PKC,” American Journal of Physiology - Endocrinologyand Metabolism, vol. 283, no. 2, pp. E338–E345, 2002.
13Oxidative Medicine and Cellular Longevity

Research ArticleModulatory Effect of Fermented Papaya Extracts onMammary Gland Hyperplasia Induced by Estrogen andProgestin in Female Rats
Zhenqiang You,1 Junying Sun,2 Feng Xie,1 Zhiqin Chen,1 Sheng Zhang,1 Hao Chen,1
Fang Liu,1 Lili Li,3 Guocan Chen,1 Yisheng Song,1 Yaoxian Xuan,1 Gaoli Zheng,1
and Yanfei Xin1
1State Key Laboratory of Safety Evaluation for New Drugs, Zhejiang Academy of Medical Sciences, Hangzhou, Zhejiang, China2Institute of Animal Health, Guangdong Academy of Agricultural Sciences, Guangzhou, Guangdong, China3Collaborative Innovation Center of Yangtze River Delta Region Green Pharmaceuticals, Zhejiang University of Technology,Hangzhou, Zhejiang, China
Correspondence should be addressed to Yanfei Xin; [email protected]
Received 21 June 2017; Revised 24 August 2017; Accepted 25 September 2017; Published 20 November 2017
Academic Editor: Nadia I. Zakhary
Copyright © 2017 Zhenqiang You et al. This is an open access article distributed under the Creative Commons Attribution License,which permits unrestricted use, distribution, and reproduction in any medium, provided the original work is properly cited.
Fermented papaya extracts (FPEs) are obtained by fermentation of papaya by Aspergillus oryzae and yeasts. In this study, weinvestigated the protective effects of FPEs on mammary gland hyperplasia induced by estrogen and progestogen. Rats wererandomly divided into 6 groups, including a control group, an FPE-alone group, a model group, and three FPE treatmentgroups (each receiving 30, 15, or 5ml/kg FPEs). Severe mammary gland hyperplasia was induced upon estradiol benzoate andprogestin administration. FPEs could improve the pathological features of the animal model and reduce estrogen levels in theserum. Analysis of oxidant indices revealed that FPEs could increase superoxide dismutase (SOD) and glutathione peroxidase(GSH-Px) activities, decrease malondialdehyde (MDA) level in the mammary glands and serum of the animal models, anddecrease the proportion of cells positive for the oxidative DNA damage marker 8-oxo-dG in the mammary glands. Additionally,estradiol benzoate and progestin altered the levels of serum biochemical compounds such as aspartate transaminase (AST),total bilirubin (TBIL), and alanine transaminase (ALT), as well as hepatic oxidant indices such as SOD, GSH-Px, MDA, and8-oxo-2′-deoxyguanosine (8-oxo-dG). These indices reverted to normal levels upon oral administration of a high dose of FPEs.Taken together, our results indicate that FPEs can protect the mammary glands and other visceral organs from oxidative damage.
1. Introduction
Fermented fruit and vegetable juices are popular functionalfoods in China. They contain large amounts of probiotics,amino acids, carbohydrates, and functional enzymes, whichcan be easily digested. In addition, fermented fruit and vege-table juice exhibits antioxidant, antitumor, antidiabetic, andanti-inflammatory activities [1, 2]. Papaya is used in tradi-tional medicine because of its antioxidant, antitumor, andimmune regulatory effects [3–6]; these effects could be dueto the high content of α-tocopherol, flavonoid, benzyl isothio-cyanate, lycopene, and papain in papaya [7–10]. Fermented
papaya is used in medical treatment and has been developedas a commercial functional food in Japan, United States, andseveral European countries [11]. Studies have shown thatfermented papaya products (FPP) protect hemocytes fromoxidative damage, prevent complications of aging, and cureAlzheimer’s disease (AD) [12–14]. Due to its antioxidantactivity, FPP exhibits potential for tumor treatment, immuneregulation, and wound healing in diabetics [4, 6, 15]. Fermen-ted papaya extracts (FPEs) are the fermentation liquorextracted from papaya through long-term fermentation byAspergillus and yeast; they are commercially available inthe form of tablets and powder. Clinically, FPEs are applied
HindawiOxidative Medicine and Cellular LongevityVolume 2017, Article ID 8235069, 11 pageshttps://doi.org/10.1155/2017/8235069

as functional food to regulate endocrine disorders andantioxidant activity, as well as to improve immune andanti-inflammatory responses.
Mammary gland hyperplasia is a common noninflam-matory and nontumor disease that occurs in women ofchild-bearing age. This condition accounts for 75% of allbreast diseases [16, 17]. Women suffering from mammarygland hyperplasia exhibits two to three times higher risk ofbreast cancer than the general population. The risk is fiveto eight times higher among patients with atypical hyperpla-sia [18, 19]. The occurrence of mammary gland hyperplasiais directly related to endocrine disorders, which are mainlycaused by imbalance of estrogen and progestin [20]. Hyper-plasia ofmammary epithelial cells can also be induced by cho-lesterol and its oxidative product cholesterol epoxide [21, 22].In the present study, animal models of mammary glandhyperplasia were established using estradiol benzoate andprogestin based on the underlying mechanism of mammarygland hyperplasia. Using these models, the protective effect,functions, and mechanism of FPEs in estrogen-inducedmammary gland hyperplasia were investigated.
2. Materials and Methods
2.1. FPEs and Drugs. Immature papaya (half a month frommaturity) were peeled and cut into 2mm slices after remov-ing the seeds. The prepared papaya was fermented for 3months through Aspergillus oryzae (isolated from millet cat-sup and stored at our laboratory), and then fermented for 3months using yeasts (Saccharomyces cerevisiae, provided byDesheng Biotechnology Co. Ltd., Zhejiang, China) with 5%glucose at 24–28°C. The FPEs were obtained by squeezingand filtering after fermentation. Total flavonoids, one of theimportant functional constituents in FPEs, were nearly11.65mg/ml detected by UV method. Estradiol (2mg/ml)and progestin (10mg/ml) were purchased from HangzhouAnimal Pharmaceutical Factory, China.
2.2. Animals and Treatments. Thirty-six female SPF Sprague-Dawley (SD) rats (180–200 g, 7-8 weeks old, and at sexualmaturity) were purchased from the Shanghai Slack Labora-tory Animal Co. Ltd. All animals were groomed in thebarrier system with a clean environment at 20°C–25°Cunder 50–60% humidity and with a 12h light and 12h darkcycle. Animal experiments were conducted in laboratoriesthat passed the AAALAC (Association for Assessment andAccreditation of Laboratory Animal Care International)authentication. The rats were randomly divided into sixgroups, with each group containing six rats.
Group 1, the blank control group, received daily intra-muscular injection of 0.5ml/kg saline and were orallyadministered 30ml distilled water/kg weight. Group 2, theFPE control group, was orally administered 30ml of FPEs/kgweight at the beginning of the experiment. Group 3, themodelgroup, received intramuscular injection of 0.5mg (0.5ml)/kgestradiol benzoate from day 1 to day 25 and 4mg (0.5ml)/kgprogestin from day 26 to day 30. As treatment groups,group 4, group 5, and group 6 received estradiol benzoateand progestin the same as the model group and were orally
treated with FPEs from day 1 to day 30. Group 4, treatmentgroup I, was administered an oral dose of 30ml of FPEs/kg.Group 5, treatment group II, was administered an oral doseof 15ml of FPEs plus 15ml of distilled water/kg. Group 6,treatment group III, was administered an oral dose of 5mlof FPEs plus 25ml of distilled water/kg.
2.3. Nipple Measurement.On the 31st day, the third nipple onthe right side of the rats in each group was shaved. The diam-eter and height of the shaved nipple were measured using aVernier caliper.
2.4. Sample Collection. On the 31st day, all experimental ratswere anesthetized with 2.5% pentobarbital solution andkilled humanely. Blood and tissue samples were collectedfrom the mammary glands, heart, liver, spleen, lung, kidney,ovary, and uterus. To avoid interference from blood cells, theblood in the liver was cleared by injecting saline through theportal vein. Once blood clotted at room temperature, theserum was separated within 10min by centrifugation at3000×g. Aportion of the serumwas immediately used for bio-chemical detection, and the remainder was stored at −70°Cfor analysis of hormones and oxidant indices. Half of thecollected tissue samples were stored in 10% formaldehydefor pathological and immunohistochemical (IHC) tests,and the remaining half was stored at −70°C for testingoxidant indices and 8-oxo-2′-deoxyguanosine (8-oxo-dG).
2.5. Sex Hormone Concentrations. The concentration ofeach sex hormone in the serum was tested as per standardspecifications using estradiol (E2), progesterone (P), luteiniz-ing hormone (LH), and follicle-stimulating hormone (FSH)detection kits (Beijing Kemei Biological Technology Co. Ltd.).
2.6. Oxidative Index Detection. Malondialdehyde (MDA)level, superoxide dismutase (SOD), and glutathione perox-idase (GSH-Px) activities in the serum, mammary glands,and livers were detected using commercially availabledetection kits following the manufacturer’s instructions(Sigma-Aldrich).
2.7. Blood Biochemistry. Serum biochemical parametersincluding aspartate transaminase (AST), alanine transami-nase (ALT), total bilirubin (TBIL), alkaline phosphatase(ALP), creatine kinase (CK), blood urea nitrogen (BUN),creatinine (Crea), total protein (TP), albumin (ALB), glucose(GLU), total cholesterol (T-CHO), triglyceride (TG), potas-sium (K+), serum sodium (Na+), chloride (Cl−), and totalcalcium (TCa) were analyzed using a Hitachi 7020 automaticbiochemical analyzer.
2.8. Detection of 8-Oxo-2′-deoxyguanosine (8-oxo-dG) throughEnzyme-Linked Immunosorbent Assay (ELISA) and IHC. Thebiomarker 8-oxo-dG was detected in the mammary glandsand liver tissues through ELISA and IHC analyses. For ELISA,50mg of the tissues was collected. Total DNA was extractedusing a genome extraction kit (Sigma-Aldrich) and quantifiedby colorimetric method. Approximately 300 ng of DNA wasextracted from each sample. The content of 8-oxo-dG in thetotal DNA was determined using the EpiQuik™ 8-OHdG
2 Oxidative Medicine and Cellular Longevity
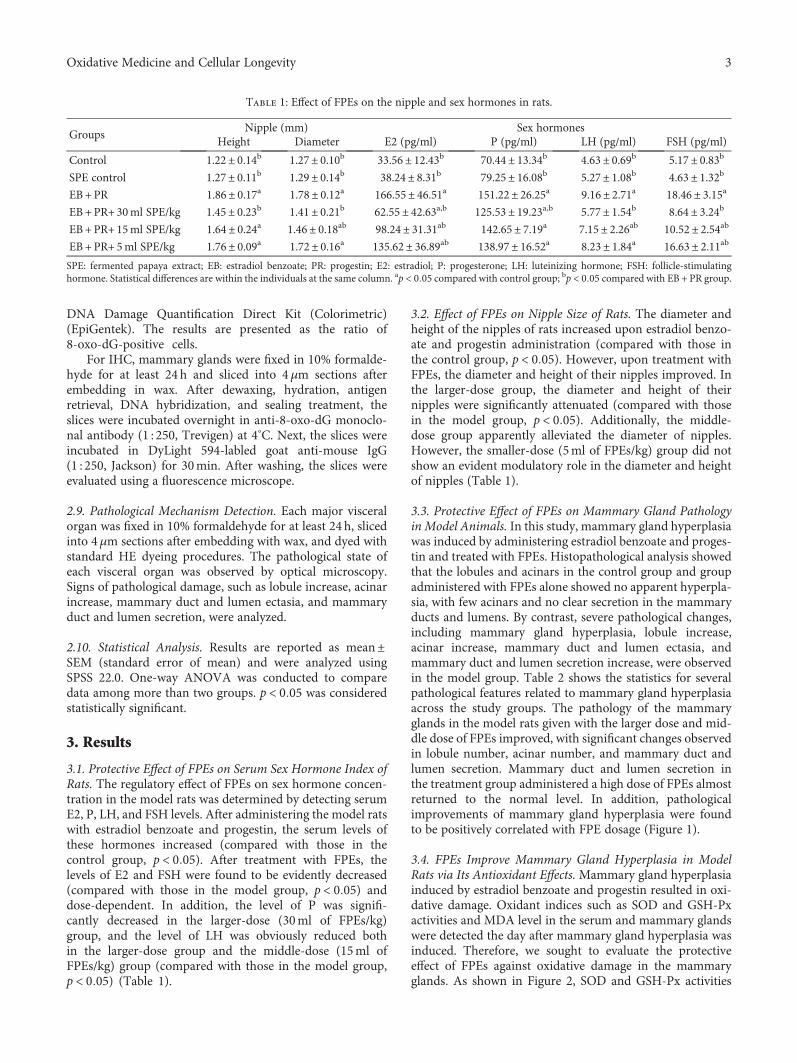
DNA Damage Quantification Direct Kit (Colorimetric)(EpiGentek). The results are presented as the ratio of8-oxo-dG-positive cells.
For IHC, mammary glands were fixed in 10% formalde-hyde for at least 24 h and sliced into 4μm sections afterembedding in wax. After dewaxing, hydration, antigenretrieval, DNA hybridization, and sealing treatment, theslices were incubated overnight in anti-8-oxo-dG monoclo-nal antibody (1 : 250, Trevigen) at 4°C. Next, the slices wereincubated in DyLight 594-labled goat anti-mouse IgG(1 : 250, Jackson) for 30min. After washing, the slices wereevaluated using a fluorescence microscope.
2.9. Pathological Mechanism Detection. Each major visceralorgan was fixed in 10% formaldehyde for at least 24 h, slicedinto 4μm sections after embedding with wax, and dyed withstandard HE dyeing procedures. The pathological state ofeach visceral organ was observed by optical microscopy.Signs of pathological damage, such as lobule increase, acinarincrease, mammary duct and lumen ectasia, and mammaryduct and lumen secretion, were analyzed.
2.10. Statistical Analysis. Results are reported as mean±SEM (standard error of mean) and were analyzed usingSPSS 22.0. One-way ANOVA was conducted to comparedata among more than two groups. p < 0 05 was consideredstatistically significant.
3. Results
3.1. Protective Effect of FPEs on Serum Sex Hormone Index ofRats. The regulatory effect of FPEs on sex hormone concen-tration in the model rats was determined by detecting serumE2, P, LH, and FSH levels. After administering the model ratswith estradiol benzoate and progestin, the serum levels ofthese hormones increased (compared with those in thecontrol group, p < 0 05). After treatment with FPEs, thelevels of E2 and FSH were found to be evidently decreased(compared with those in the model group, p < 0 05) anddose-dependent. In addition, the level of P was signifi-cantly decreased in the larger-dose (30ml of FPEs/kg)group, and the level of LH was obviously reduced bothin the larger-dose group and the middle-dose (15ml ofFPEs/kg) group (compared with those in the model group,p < 0 05) (Table 1).
3.2. Effect of FPEs on Nipple Size of Rats. The diameter andheight of the nipples of rats increased upon estradiol benzo-ate and progestin administration (compared with those inthe control group, p < 0 05). However, upon treatment withFPEs, the diameter and height of their nipples improved. Inthe larger-dose group, the diameter and height of theirnipples were significantly attenuated (compared with thosein the model group, p < 0 05). Additionally, the middle-dose group apparently alleviated the diameter of nipples.However, the smaller-dose (5ml of FPEs/kg) group did notshow an evident modulatory role in the diameter and heightof nipples (Table 1).
3.3. Protective Effect of FPEs on Mammary Gland Pathologyin Model Animals. In this study, mammary gland hyperplasiawas induced by administering estradiol benzoate and proges-tin and treated with FPEs. Histopathological analysis showedthat the lobules and acinars in the control group and groupadministered with FPEs alone showed no apparent hyperpla-sia, with few acinars and no clear secretion in the mammaryducts and lumens. By contrast, severe pathological changes,including mammary gland hyperplasia, lobule increase,acinar increase, mammary duct and lumen ectasia, andmammary duct and lumen secretion increase, were observedin the model group. Table 2 shows the statistics for severalpathological features related to mammary gland hyperplasiaacross the study groups. The pathology of the mammaryglands in the model rats given with the larger dose and mid-dle dose of FPEs improved, with significant changes observedin lobule number, acinar number, and mammary duct andlumen secretion. Mammary duct and lumen secretion inthe treatment group administered a high dose of FPEs almostreturned to the normal level. In addition, pathologicalimprovements of mammary gland hyperplasia were foundto be positively correlated with FPE dosage (Figure 1).
3.4. FPEs Improve Mammary Gland Hyperplasia in ModelRats via Its Antioxidant Effects.Mammary gland hyperplasiainduced by estradiol benzoate and progestin resulted in oxi-dative damage. Oxidant indices such as SOD and GSH-Pxactivities and MDA level in the serum and mammary glandswere detected the day after mammary gland hyperplasia wasinduced. Therefore, we sought to evaluate the protectiveeffect of FPEs against oxidative damage in the mammaryglands. As shown in Figure 2, SOD and GSH-Px activities
Table 1: Effect of FPEs on the nipple and sex hormones in rats.
GroupsNipple (mm) Sex hormones
Height Diameter E2 (pg/ml) P (pg/ml) LH (pg/ml) FSH (pg/ml)
Control 1.22± 0.14b 1.27± 0.10b 33.56± 12.43b 70.44± 13.34b 4.63± 0.69b 5.17± 0.83b
SPE control 1.27± 0.11b 1.29± 0.14b 38.24± 8.31b 79.25± 16.08b 5.27± 1.08b 4.63± 1.32b
EB+ PR 1.86± 0.17a 1.78± 0.12a 166.55± 46.51a 151.22± 26.25a 9.16± 2.71a 18.46± 3.15a
EB + PR+ 30ml SPE/kg 1.45± 0.23b 1.41± 0.21b 62.55± 42.63a,b 125.53± 19.23a,b 5.77± 1.54b 8.64± 3.24b
EB+ PR+ 15ml SPE/kg 1.64± 0.24a 1.46± 0.18ab 98.24± 31.31ab 142.65± 7.19a 7.15± 2.26ab 10.52± 2.54ab
EB + PR+ 5ml SPE/kg 1.76± 0.09a 1.72± 0.16a 135.62± 36.89ab 138.97± 16.52a 8.23± 1.84a 16.63± 2.11ab
SPE: fermented papaya extract; EB: estradiol benzoate; PR: progestin; E2: estradiol; P: progesterone; LH: luteinizing hormone; FSH: follicle-stimulatinghormone. Statistical differences are within the individuals at the same column. ap < 0 05 compared with control group; bp < 0 05 compared with EB + PR group.
3Oxidative Medicine and Cellular Longevity

Table 2: Effect of SM on estradiol benzoate and progestin induced mammary gland changes on histopathology.
GroupsMammary gland
hyperplasiaLobule increase Acinar increase
Mammary duct andlumen ectasia
Mammary duct andlumen secretion
Control − − − − −FPEs control − − − − −EB+ PR +++ +++ +++ +++ +++
EB+ PR+ 30ml FPEs/kg + + + ++ +/−EB+ PR+ 15ml FPEs/kg ++ ++ ++ +++ +
EB+ PR+ 5ml FPEs/kg +++ +++ +++ +++ ++
FPEs: fermented papaya extracts; EB: estradiol benzoate; PR: progestin. The histopathology changes were determined at the end of experiment. −: none;+/−: some have and some not; +: mild; ++: moderate; +++: severe.
MA
MD
(a)
MAMD
(b)
MGH
LI
MAMD
(c)
MGH
LI
MAMD
(d)
MGH
LI MA
MD
(e)
MA
MD
MGH
LI
(f)
Figure 1: Photomicrographs showing mammary gland of rats in the control and treatment groups (200x). There was no apparent hyperplasiaand no clear secretion in the mammary ducts and lumens in the control group (a) and the FPE-treatment-alone group (b). However, severemammary gland hyperplasia (MGH), lobule increase (LI), acinar (MA) increase, mammary duct (MD) and lumen ectasia, and mammaryduct and lumen secretion were observed in the estradiol benzoate and progestin treatment group (c). The pathology of the mammaryglands of the model rats improved upon treatment with FPEs at 30ml/kg (d), 15ml/kg (e) and 5ml/kg (f). Scale bar, 100 μm.
4 Oxidative Medicine and Cellular Longevity
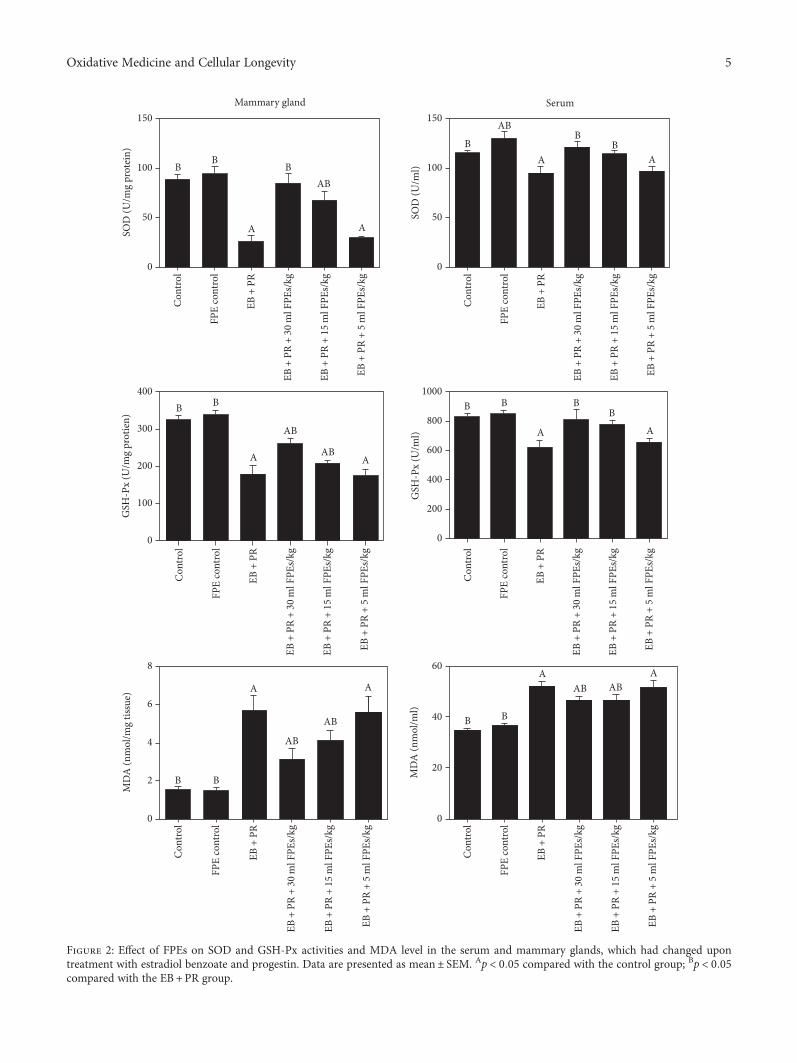
150Mammary gland
50
0
100
150Serum
50
0
100
SOD
(U/m
g pr
otei
n)
BB
B
A
Con
trol
FPE
cont
rol
EB +
PR
EB +
PR
+ 30
ml F
PEs/
kg
EB +
PR
+ 15
ml F
PEs/
kg
EB +
PR
+ 5
ml F
PEs/
kg
Con
trol
FPE
cont
rol
EB +
PR
EB +
PR
+ 30
ml F
PEs/
kg
EB +
PR
+ 15
ml F
PEs/
kg
EB +
PR
+ 5
ml F
PEs/
kg
Con
trol
FPE
cont
rol
EB +
PR
EB +
PR
+ 30
ml F
PEs/
kg
EB +
PR
+ 15
ml F
PEs/
kg
EB +
PR
+ 5
ml F
PEs/
kg
Con
trol
FPE
cont
rol
EB +
PR
EB +
PR
+ 30
ml F
PEs/
kg
EB +
PR
+ 15
ml F
PEs/
kg
EB +
PR
+ 5
ml F
PEs/
kg
Con
trol
FPE
cont
rol
EB +
PR
EB +
PR
+ 30
ml F
PEs/
kg
EB +
PR
+ 15
ml F
PEs/
kg
EB +
PR
+ 5
ml F
PEs/
kg
Con
trol
FPE
cont
rol
EB +
PR
EB +
PR
+ 30
ml F
PEs/
kg
EB +
PR
+ 15
ml F
PEs/
kg
EB +
PR
+ 5
ml F
PEs/
kg
AB
A
A AB
BAB
B
SOD
(U/m
l)
AAB
AB
A
BB B B BB
AA
400
300
200
100
0
1000
800
600
400
200
0
GSH
-Px
(U/m
l)
GSH
-Px
(U/m
g pr
otie
n)
A
AB
AB
A
B B
AABAB
A
BB
8
6
4
2
0 0
20
40
60
MD
A (n
mol
/ml)
MD
A (n
mol
/mg
tissu
e)
Figure 2: Effect of FPEs on SOD and GSH-Px activities and MDA level in the serum and mammary glands, which had changed upontreatment with estradiol benzoate and progestin. Data are presented as mean± SEM. Ap < 0 05 compared with the control group; Bp < 0 05compared with the EB +PR group.
5Oxidative Medicine and Cellular Longevity

and MDA level in the mammary glands and serum of themodel rats obviously changed compared with that in thecontrol group (p < 0 05). These oxidative indices in the mam-mary glands and serum of the model rats also significantlyimproved after treatment with FPEs both in the larger-dosegroup and the middle-dose group (compared with those inthe model group, p < 0 05). SOD and GSH-Px activitiesin the serum of model rats treated with high doses ofFPEs recovered to levels observed in the control group.Moreover, SOD activity in the serum of rats treated withFPEs alone (group 2) was higher than that in the controlgroup (p < 0 05). Although the smaller-dose group did notshow an apparent antioxidant effect, these results indicatethat FPEs can increase the antioxidant levels and inhibit thehyperplasia of mammary glands by antioxidants.
3.5. Blood Biochemistry. Each serum biochemical index wasdetermined to investigate the damage induced by estradiolbenzoate and progestin in the body and the protective effectof FPEs. The AST and TBIL indices in the model rats obvi-ously increased, and the ALT index obviously decreased inthe model rats (compared with those in the control group,p < 0 05). Compared with those in the model group, theAST, TBIL, and ALT indices in the larger-dose FPE
treatment group were obviously improved and recovered tothe levels of the control group (p < 0 05). Furthermore, FPEsshowed a dose-dependent effect on AST index. The TBILindex was also evidently reduced in the middle-dose group.However, the TBIL and ALT indices in the smaller-dosegroup were not significantly changed (compared with thosein the model group, p > 0 05) (Figure 3).
3.6. FPEs Inhibit Liver Damage in Model Rats via TheirAntioxidant Effects. Estradiol benzoate and progestin caninduce mammary gland hyperplasia and change AST, TBIL,and ALT, which suggested that estradiol benzoate andprogestin could induce damage to other visceral organs.Pathological examination of the major visceral organs didnot reveal any obvious pathological change in the visceralorgans, except for the liver, which underwent inflammatoryinfiltration. Mammary gland hyperplasia is inhibited by FPEsmainly via antioxidants. The SOD and GSH-Px activities andMDA levels in the liver were examined to determine whetherliver damage induced by estradiol benzoate and progestinwas caused by oxidative stress and whether the liver was pro-tected by FPEs via antioxidants. The liver was completelycleaned with saline to avoid interference from blood. Resultsshowed that SOD and GSH-Px activities were obviously
0
50
100
150
200
250A
ST (I
U/l) B B
A
BAB
AB
0
10
20
30
40
50
ALT
(IU
/l) AB B
AB
A
0.0
0.5
1.0
1.5
2.0
TBIL
(�휇m
ol/l)
B B
A
B
ABA
0
100
200
300
SOD
(U/m
g pr
otei
n) B
AB
AB A
0
200
400
600
800
GSH
-Px
(U/m
g pr
otei
n)
A
B BAB
B
A
0
2
4
6
8
MD
A (n
mol
/mg
tissu
e)
B B
A
ABAB
AAB
Con
trol
FPE
cont
rol
EB +
PR
EB +
PR
+ 30
ml F
PEs/
kg
EB +
PR
+ 15
ml F
PEs/
kg
EB +
PR
+ 5
ml F
PEs/
kg
Con
trol
FPE
cont
rol
EB +
PR
EB +
PR
+ 30
ml F
PEs/
kg
EB +
PR
+ 15
ml F
PEs/
kg
EB +
PR
+ 5
ml F
PEs/
kg
Con
trol
FPE
cont
rol
EB +
PR
EB +
PR
+ 30
ml F
PEs/
kg
EB +
PR
+ 15
ml F
PEs/
kg
EB +
PR
+ 5
ml F
PEs/
kg
Con
trol
FPE
cont
rol
EB +
PR
EB +
PR
+ 30
ml F
PEs/
kg
EB +
PR
+ 15
ml F
PEs/
kg
EB +
PR
+ 5
ml F
PEs/
kg
Con
trol
FPE
cont
rol
EB +
PR
EB +
PR
+ 30
ml F
PEs/
kg
EB +
PR
+ 15
ml F
PEs/
kg
EB +
PR
+ 5
ml F
PEs/
kg
Con
trol
FPE
cont
rol
EB +
PR
EB +
PR
+ 30
ml F
PEs/
kg
EB +
PR
+ 15
ml F
PEs/
kg
EB +
PR
+ 5
ml F
PEs/
kg
Figure 3: Effect of FPEs on AST, ALT, and TBIL biochemistry indices and SOD, GSH-Px, and MDA oxidative indices in the livers, whichchanged upon treatment with estradiol benzoate and progestin administration. Data are presented as mean± SEM. Ap < 0 05 comparedwith the control group; Bp < 0 05 compared with the EB+ PR group.
6 Oxidative Medicine and Cellular Longevity
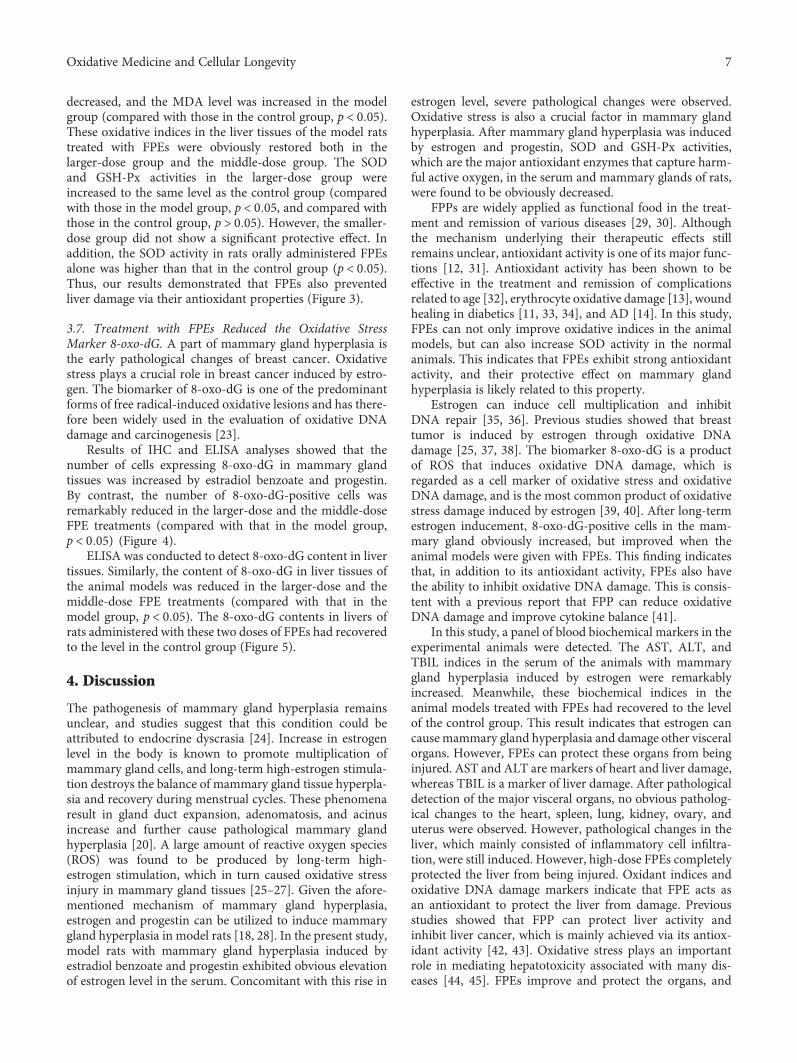
decreased, and the MDA level was increased in the modelgroup (compared with those in the control group, p < 0 05).These oxidative indices in the liver tissues of the model ratstreated with FPEs were obviously restored both in thelarger-dose group and the middle-dose group. The SODand GSH-Px activities in the larger-dose group wereincreased to the same level as the control group (comparedwith those in the model group, p < 0 05, and compared withthose in the control group, p > 0 05). However, the smaller-dose group did not show a significant protective effect. Inaddition, the SOD activity in rats orally administered FPEsalone was higher than that in the control group (p < 0 05).Thus, our results demonstrated that FPEs also preventedliver damage via their antioxidant properties (Figure 3).
3.7. Treatment with FPEs Reduced the Oxidative StressMarker 8-oxo-dG. A part of mammary gland hyperplasia isthe early pathological changes of breast cancer. Oxidativestress plays a crucial role in breast cancer induced by estro-gen. The biomarker of 8-oxo-dG is one of the predominantforms of free radical-induced oxidative lesions and has there-fore been widely used in the evaluation of oxidative DNAdamage and carcinogenesis [23].
Results of IHC and ELISA analyses showed that thenumber of cells expressing 8-oxo-dG in mammary glandtissues was increased by estradiol benzoate and progestin.By contrast, the number of 8-oxo-dG-positive cells wasremarkably reduced in the larger-dose and the middle-doseFPE treatments (compared with that in the model group,p < 0 05) (Figure 4).
ELISA was conducted to detect 8-oxo-dG content in livertissues. Similarly, the content of 8-oxo-dG in liver tissues ofthe animal models was reduced in the larger-dose and themiddle-dose FPE treatments (compared with that in themodel group, p < 0 05). The 8-oxo-dG contents in livers ofrats administered with these two doses of FPEs had recoveredto the level in the control group (Figure 5).
4. Discussion
The pathogenesis of mammary gland hyperplasia remainsunclear, and studies suggest that this condition could beattributed to endocrine dyscrasia [24]. Increase in estrogenlevel in the body is known to promote multiplication ofmammary gland cells, and long-term high-estrogen stimula-tion destroys the balance of mammary gland tissue hyperpla-sia and recovery during menstrual cycles. These phenomenaresult in gland duct expansion, adenomatosis, and acinusincrease and further cause pathological mammary glandhyperplasia [20]. A large amount of reactive oxygen species(ROS) was found to be produced by long-term high-estrogen stimulation, which in turn caused oxidative stressinjury in mammary gland tissues [25–27]. Given the afore-mentioned mechanism of mammary gland hyperplasia,estrogen and progestin can be utilized to induce mammarygland hyperplasia in model rats [18, 28]. In the present study,model rats with mammary gland hyperplasia induced byestradiol benzoate and progestin exhibited obvious elevationof estrogen level in the serum. Concomitant with this rise in
estrogen level, severe pathological changes were observed.Oxidative stress is also a crucial factor in mammary glandhyperplasia. After mammary gland hyperplasia was inducedby estrogen and progestin, SOD and GSH-Px activities,which are the major antioxidant enzymes that capture harm-ful active oxygen, in the serum and mammary glands of rats,were found to be obviously decreased.
FPPs are widely applied as functional food in the treat-ment and remission of various diseases [29, 30]. Althoughthe mechanism underlying their therapeutic effects stillremains unclear, antioxidant activity is one of its major func-tions [12, 31]. Antioxidant activity has been shown to beeffective in the treatment and remission of complicationsrelated to age [32], erythrocyte oxidative damage [13], woundhealing in diabetics [11, 33, 34], and AD [14]. In this study,FPEs can not only improve oxidative indices in the animalmodels, but can also increase SOD activity in the normalanimals. This indicates that FPEs exhibit strong antioxidantactivity, and their protective effect on mammary glandhyperplasia is likely related to this property.
Estrogen can induce cell multiplication and inhibitDNA repair [35, 36]. Previous studies showed that breasttumor is induced by estrogen through oxidative DNAdamage [25, 37, 38]. The biomarker 8-oxo-dG is a productof ROS that induces oxidative DNA damage, which isregarded as a cell marker of oxidative stress and oxidativeDNA damage, and is the most common product of oxidativestress damage induced by estrogen [39, 40]. After long-termestrogen inducement, 8-oxo-dG-positive cells in the mam-mary gland obviously increased, but improved when theanimal models were given with FPEs. This finding indicatesthat, in addition to its antioxidant activity, FPEs also havethe ability to inhibit oxidative DNA damage. This is consis-tent with a previous report that FPP can reduce oxidativeDNA damage and improve cytokine balance [41].
In this study, a panel of blood biochemical markers in theexperimental animals were detected. The AST, ALT, andTBIL indices in the serum of the animals with mammarygland hyperplasia induced by estrogen were remarkablyincreased. Meanwhile, these biochemical indices in theanimal models treated with FPEs had recovered to the levelof the control group. This result indicates that estrogen cancause mammary gland hyperplasia and damage other visceralorgans. However, FPEs can protect these organs from beinginjured. AST and ALT are markers of heart and liver damage,whereas TBIL is a marker of liver damage. After pathologicaldetection of the major visceral organs, no obvious patholog-ical changes to the heart, spleen, lung, kidney, ovary, anduterus were observed. However, pathological changes in theliver, which mainly consisted of inflammatory cell infiltra-tion, were still induced. However, high-dose FPEs completelyprotected the liver from being injured. Oxidant indices andoxidative DNA damage markers indicate that FPE acts asan antioxidant to protect the liver from damage. Previousstudies showed that FPP can protect liver activity andinhibit liver cancer, which is mainly achieved via its antiox-idant activity [42, 43]. Oxidative stress plays an importantrole in mediating hepatotoxicity associated with many dis-eases [44, 45]. FPEs improve and protect the organs, and
7Oxidative Medicine and Cellular Longevity

in turn improve blood biochemical indexes, through theirantioxidative effects.
FPP is available in the market in powdered form afterpapaya fermentation with edible fungi. FPEs, the extractingsolution fermented by papaya through the collaborationof A. oryzae and yeasts for six months, can be easily pre-pared and consumed. Clinically, FPEs are mainly used for
improving digestion and immune regulation, endocrinedyscrasia improvement, and weight reduction. In thisstudy, three FPE treatment groups (each receiving 30, 15,or 5ml/kg FPEs) was used for evaluating the protectiveeffect on mammary gland hyperplasia. The results provideconvincing evidence that FPEs with higher and middledoses could obviously improve hormone levels, clinical
100 �휇m
(a)
100 �휇m
(b)
100 �휇m
(c)
100 �휇m
(d)
100 �휇m
(e)
100 �휇m
(f)
0
10
20
30
40
50
A
B B
AB
AB
A
Perc
ent o
f 8-o
xo-d
G-p
ositi
ve ce
lls (‰
)
Con
trol
FPE
cont
rol
EB +
PR
EB +
PR
+ 30
ml F
PEs/
kg
EB +
PR
+ 15
ml F
PEs/
kg
EB +
PR
+ 5
ml F
PEs/
kg
(g)
Figure 4: Effect of SPE supplementation on oxidative stress in mammary gland hyperplasia of rats induced by estradiol benzoateand progestin administration. (a–f) Representative images of 8-oxo-dG immunostaining in the mammary glands (200x). No apparent8-oxo-dG-positive cells were observed in the control group (a) and the FPE-treatment-alone group (b). A high percentage of 8-oxo-dG-positive cells were observed in the estradiol benzoate and progestin treatment group (c). Scale bar, 100μm. However, the percentage of 8-oxo-dG-positive cells decreased upon treatment with FPEs at 30ml/kg (d), 15ml/kg (e) and 5ml/kg (f). (g) Quantification of 8-oxo-dG-positivecells in the mammary glands by ELISA. Data are presented as mean± SEM. Ap < 0 05 compared with the control group; Bp < 0 05 comparedwith the EB+PR group.
8 Oxidative Medicine and Cellular Longevity

signs, oxidative indices, biochemical index, and pathologicalchanges in model animals of mammary gland hyperplasia,and with smaller dose had no significant modulatory role.Moreover, the higher dose is the optimal dose, which wasconverted into an adult dose 70ml/kg approximatelyaccording to body surface area. In general, the clinical doseof adult women is 100ml/d. A 1-month safety evaluation ofFPEs for SD rats was conducted. The results showed thatblood biochemistry, hematology, histopathology, ingestion,and water intake of the rats administered the recommendedclinical dose of FPEs four times did not obviously change.However, an obvious decrease in body weight was docu-mented, which is also a possible reason for the observedchange in body shape.
Studies have shown that mammary gland hyperplasiainduced by estrogen can be effectively inhibited by FPEs viatheir antioxidant effects. In addition, FPEs can also improveand repair oxidative damage in the liver. FPEs contain abun-dant nutrients, such as alpha-tocopherol [8], flavonoid [9],glutamic acid, cystine, cytosine, nicotinic acid, pipecolic acid,homoserine, quinic acid, and glucuronic acid, which possessantioxidant and antitumor functions. In recent years, liquorobtained via fruit fermentation has become popular in Chinaand is commonly sold as commercial food. Each activeelement in FPEs should be further analyzed. Future studiesshould focus on the functions and mechanism of FPEs invarious diseases and in developing FPEs as functional food.
Conflicts of Interest
The authors declare that there is no conflict of interestregarding the publication of this article.
Acknowledgments
The project was supported by the Science and Technol-ogy Department of Zhejiang Province (2016F30009) andthe Natural Science Foundation of Zhejiang Province(LQY18H160001, LY17H310009).
References
[1] M. Lu, Y. Toshima, X. Wu, X. Zhang, and Y. Q. Cai, “Inhibi-tory effects of vegetable and fruit ferment liquid on tumorgrowth in Hepatoma-22 inoculation model,” Asia PacificJournal of Clinical Nutrition, vol. 16, no. S1, pp. 443–446, 2007.
[2] H. Y. Huang, M. Korivi, C. H. Tsai, J. H. Yang, and Y. C. Tsai,“Supplementation of lactobacillus plantarum K68 and fruit-vegetable ferment along with high fat-fructose diet attenuatesmetabolic syndrome in rats with insulin resistance,” Evidence-based Complementary and Alternative Medicine, vol. 2013,Article ID 943020, 12 pages, 2013.
[3] S. Mehdipour, N. Yasa, G. Dehghan et al., “Antioxidant poten-tials of Iranian Carica papaya juice in vitro and in vivo arecomparable to α-tocopherol,” Phytotherapy Research, vol. 20,no. 7, pp. 591–594, 2006.
[4] K. M. Sadek, “Antioxidant and immunostimulant effect ofCarica papaya Linn. aqueous extract in acrylamide intoxicatedrats,” Acta Informatica Medica, vol. 20, no. 3, pp. 180–185,2012.
[5] J. A. Osato, L. A. Santiago, G. M. Remo, M. S. Cuadra, andA. Mori, “Antimicrobial and antioxidant activities of unripepapaya,” Life Sciences, vol. 53, no. 17, pp. 1383–1389, 1993.
[6] N. Otsuki, N. H. Dang, E. Kumagai, A. Kondo, S. Iwata, andC.Morimoto, “Aqueous extract ofCarica papaya leaves exhibitsanti-tumor activity and immunomodulatory effects,” Journalof Ethnopharmacology, vol. 127, no. 3, pp. 760–767, 2010.
[7] A. Basu and S. Haldar, “Dietary isothiocyanate mediatedapoptosis of human cancer cells is associated with Bcl-xLphosphorylation,” International Journal of Oncology, vol. 33,no. 4, pp. 657–663, 2008.
[8] L. S. Ching and S. Mohamed, “Alpha-tocopherol content in 62edible tropical plants,” Journal of Agricultural and FoodChemistry, vol. 49, no. 6, pp. 3101–3105, 2001.
[9] K. H. Miean and S. Mohamed, “Flavonoid (myricetin,quercetin, kaempferol, luteolin, and apigenin) content ofedible tropical plants,” Journal of Agricultural and FoodChemistry, vol. 49, no. 6, pp. 3106–3112, 2001.
[10] D. Telgenhoff, K. Lam, S. Ramsay et al., “Influence of papainurea copper chlorophyllin on wound matrix remodeling,”Wound Repair and Regeneration, vol. 15, no. 5, pp. 727–735,2007.
[11] E. Collard and S. Roy, “Improved function of diabetic wound-site macrophages and accelerated wound closure in responseto oral supplementation of a fermented papaya preparation,”Antioxidants and Redox Signaling, vol. 13, no. 5, pp. 599–606, 2010.
[12] O. I. Aruoma, R. Colognato, I. Fontana et al., “Moleculareffects of fermented papaya preparation on oxidative damage,MAP kinase activation and modulation of the benzo [a]pyrene mediated genotoxicity,” BioFactors, vol. 26, no. 2,pp. 147–159, 2006.
[13] F. Marotta, M. Weksler, Y. Naito, C. Yoshida, M. Yoshioka,and P. Marandola, “Nutraceutical supplementation: effect ofa fermented papaya preparation on redox status and DNA
0
2
4
6
8Pe
rcen
t of 8
-oxo
-dG
-pos
itive
cells
(‰)
A
BB B
B
B
Con
trol
FPE
cont
rol
EB +
PR
EB +
PR
+ 30
ml F
PEs/
kg
EB +
PR
+ 15
ml F
PEs/
kg
EB +
PR
+ 5
ml F
PEs/
kg
Figure 5: Quantification of 8-oxo-dG-positive cells in the liver byELISA. Data are presented as mean± SEM. Ap < 0 05 comparedwith the control group; Bp < 0 05 compared with the EB+PR group.
9Oxidative Medicine and Cellular Longevity

damage in healthy elderly individuals and relationship withGSTM1 genotype,” Annals of the New York Academy ofSciences, vol. 1067, no. 1, pp. 400–407, 2006.
[14] M. Barbagallo, F. Marotta, and L. J. Dominguez, “Oxidativestress in patients with Alzheimer’s disease: effect of extractsof fermented papaya powder,” Mediators of Inflammation,vol. 2015, Article ID 624801, 6 pages, 2015.
[15] B. S. Nayak, R. Ramdeen, A. Adogwa, A. Ramsubhag, andJ. R. Marshall, “Wound-healing potential of an ethanolextract of Carica papaya (Caricaceae) seeds,” InternationalWound Journal, vol. 9, no. 6, pp. 650–655, 2012.
[16] K. H. Allison, P. R. Eby, J. Kohr, W. B. DeMartini, and C. D.Lehman, “Atypical ductal hyperplasia on vacuum-assistedbreast biopsy: suspicion for ductal carcinoma in situ can strat-ify patients at high risk for upgrade,” Human Pathology,vol. 42, no. 1, pp. 41–50, 2011.
[17] D. J. Marchant, “Benign breast disease,” Obstetrics and Gyne-cology Clinics of North America, vol. 29, no. 1, pp. 1–20, 2002.
[18] L. Wang, D. Zhao, L. Di et al., “The anti-hyperplasia ofmammary gland effect of Thladiantha dubia root ethanolextract in rats reduced by estrogen and progestogen,” Journalof Ethnopharmacology, vol. 134, no. 1, pp. 136–140, 2011.
[19] D. Medina, “Biological and molecular characteristics ofthe premalignant mouse mammary gland,” Biochimica et Bio-physica Acta (BBA)-Reviews on Cancer, vol. 1603, no. 1,pp. 1–9, 2002.
[20] J. L. Yang, Y. Ren, L. Wang et al., “PTENmutation spectrum inbreast cancers and breast hyperplasia,” Journal of CancerResearch and Clinical Oncology, vol. 136, no. 9, pp. 1303–1311, 2010.
[21] E. C. Ontsouka and C. Albrecht, “Cholesterol transport andregulation in the mammary gland,” Journal of MammaryGland Biology and Neoplasia, vol. 19, no. 1, pp. 43–58, 2014.
[22] C. E. Ontsouka, X. Huang, E. Aliyev, and C. Albrecht, “Invitro characterization and endocrine regulation of choles-terol and phospholipid transport in the mammary gland,”Molecular and Cellular Endocrinology, vol. 5, no. 439,pp. 35–45, 2017.
[23] A. Valavanidis, T. Vlachogianni, and C. Fiotakis, “8-hydroxy-2′ -deoxyguanosine (8-OHdG): a critical biomarker ofoxidative stress and carcinogenesis,” Journal of EnvironmentalScience and Health, Part C: Environmental Carcinogenesis &Ecotoxicology Reviews, vol. 27, no. 2, pp. 120–139, 2009.
[24] N. L. Henry, “Endocrine therapy toxicity: managementoptions,” American Society of Clinical Oncology EducationalBook, vol. 34, pp. e25–e30, 2014.
[25] S. D. Gupta, J. Y. So, J. Wahler et al., “Tocopherols inhibitoxidative and nitrosative stress in estrogen-induced earlymammary hyperplasia in ACI rats,”Molecular Carcinogenesis,vol. 54, no. 9, pp. 916–925, 2015.
[26] L. Marinelli, G. Gabai, J. Wolfswinkel, and J. A. Mol,“Mammary steroid metabolizing enzymes in relation to hyper-plasia and tumorigenesis in the dog,” The Journal of SteroidBiochemistry and Molecular Biology, vol. 92, no. 3, pp. 167–173, 2004.
[27] S. M. Mense, F. Remotti, A. Bhan et al., “Estrogen-inducedbreast cancer: alterations in breast morphology and oxidativestress as a function of estrogen exposure,” Toxicology andApplied Pharmacology, vol. 232, no. 1, pp. 78–85, 2008.
[28] T. Chen, J. Li, J. Chen, H. Song, and C. Yang, “Anti-hyperpla-sia effects of Rosa rugosa polyphenols in rats with hyperplasia
of mammary gland,” Environmental Toxicology and Pharma-cology, vol. 39, no. 2, pp. 990–996, 2015.
[29] S. Murakami, S. Eikawa, S. Kaya, M. Imao, and T. Aji, “Anti-tumor and immunoregulatory effects of fermented papayapreparation (FPP: SAIDO-PS501),” Asian Pacific Journal ofCancer Prevention, vol. 17, no. 7, pp. 3077–3084, 2016.
[30] Z. F. Kharaeva, L. R. Zhanimova, M. S. Mustafaev et al.,“Effects of standardised fermented papaya gel on clinical symp-toms, inflammatory cytokines, and nitric oxide metabolites inpatients with chronic periodontitis: an open randomisedclinical study,” Mediators of Inflammation, vol. 2016, ArticleID 9379840, 12 pages, 2016.
[31] I. Calzuola, G. L. Gianfranceschi, and V. Marsili, “Compara-tive activity of antioxidants from wheat sprouts, Morindacitrifolia, fermented papaya and white tea,” InternationalJournal of Food Sciences and Nutrition, vol. 57, no. 3-4,pp. 168–177, 2006.
[32] F. Marotta, K. Pavasuthipaisit, C. Yoshida, F. Albergati, andP. Marandola, “Relationship between aging and susceptibilityof erythrocytes to oxidative damage: in view of nutraceuticalinterventions,” Rejuvenation Research, vol. 9, no. 2, pp. 227–230, 2006.
[33] R. Dickerson, B. Deshpande, U. Gnyawali et al., “Correction ofaberrant NADPH oxidase activity in blood-derived mononu-clear cells from type II diabetes mellitus patients by a naturallyfermented papaya preparation,” Antioxidants and RedoxSignaling, vol. 17, no. 3, pp. 485–491, 2012.
[34] S. Gurung and N. Skalko-Basnet, “Wound healing propertiesof Carica papaya latex: in vivo evaluation in mice burn model,”Journal of Ethnopharmacology, vol. 121, no. 2, pp. 338–341,2009.
[35] S. J. Weroha, S. A. Li, O. Tawfik, and J. J. Li, “Overexpression ofcyclins D1 and D3 during estrogen-induced breast oncogene-sis in female ACI rats,” Carcinogenesis, vol. 27, no. 3,pp. 491–498, 2006.
[36] K. P. Singh, J. Treas, T. Tyagi, and W. Gao, “DNA demethyla-tion by 5-aza-2-deoxycytidine treatment abrogates 17 beta-estradiol-induced cell growth and restores expression ofDNA repair genes in human breast cancer cells,” CancerLetters, vol. 316, no. 1, pp. 62–69, 2012.
[37] B. Singh, A. Chatterjee, A. M. Ronghe, N. K. Bhat, and H. K.Bhat, “Antioxidant-mediated up-regulation of OGG1 viaNRF2 induction is associated with inhibition of oxidativeDNA damage in estrogen-induced breast cancer,” BMCCancer, vol. 13, no. 1, p. 253, 2013.
[38] S. M. Mense, B. Singh, F. Remotti, X. Liu, and H. K. Bhat,“Vitamin C and α-naphthoflavone prevent estrogen-inducedmammary tumors and decrease oxidative stress in femaleACI rats,” Carcinogenesis, vol. 30, no. 7, pp. 1202–1208, 2009.
[39] M. M. Montano, L. J. Chaplin, H. Deng et al., “Protective rolesof quinone reductase and tamoxifen against estrogen-inducedmammary tumorigenesis,”Oncogene, vol. 26, no. 24, pp. 3587–3590, 2007.
[40] B. Singh, N. K. Bhat, and H. K. Bhat, “Induction of NAD (P)H-quinone oxidoreductase 1 by antioxidants in female ACIrats is associated with decrease in oxidative DNA damageand inhibition of estrogen-induced breast cancer,” Carcino-genesis, vol. 33, no. 1, pp. 156–163, 2012.
[41] F. Marotta, C. Yoshida, R. Barreto, Y. Naito, and L. Packer,“Oxidative-inflammatory damage in cirrhosis: effect ofvitamin E and a fermented papaya preparation,” Journal of
10 Oxidative Medicine and Cellular Longevity

Gastroenterology and Hepatology, vol. 22, no. 5, pp. 697–703,2007.
[42] J. Somanah, S. Ramsaha, S. Verma et al., “Fermented papayapreparation modulates the progression of N-methyl-N-nitrosourea induced hepatocellular carcinoma in Balb/c mice,”Life Sciences, vol. 151, pp. 330–338, 2016.
[43] B. Rajkapoor, B. Jayakar, S. Kavimani, and N. Murugesh,“Effect of dried fruits of Carica papaya Linn on hepatotoxic-ity,” Biological and Pharmaceutical Bulletin, vol. 25, no. 12,pp. 1645-1646, 2002.
[44] N. Houstis, E. D. Rosen, and E. S. Lander, “Reactive oxygenspecies have a causal role in multiple forms of insulin resis-tance,” Nature, vol. 440, no. 7086, pp. 944–948, 2006.
[45] S. C. Gupta, D. Hevia, S. Patchva, B. Park, W. Koh, and B. B.Aggarwal, “Upsides and downsides of reactive oxygen speciesfor cancer: the roles of reactive oxygen species in tumorigene-sis, prevention, and therapy,” Antioxidants Redox Signaling,vol. 16, no. 11, pp. 1295–1322, 2012.
11Oxidative Medicine and Cellular Longevity

Research ArticleProtective Effects and Possible Mechanisms of Ergothioneine andHispidin against Methylglyoxal-Induced Injuries in RatPheochromocytoma Cells
Tuzz-Ying Song,1 Nae-Cherng Yang,2 Chien-Lin Chen,1 and Thuy Lan Vo Thi1
1Department of Bioindustry Technology, Da-Yeh University, Dacun, Taiwan2Department of Nutrition, Chung Shan Medical University Hospital, Taichung, Taiwan
Correspondence should be addressed to Tuzz-Ying Song; [email protected]
Received 6 June 2017; Revised 8 August 2017; Accepted 23 August 2017; Published 17 October 2017
Academic Editor: Mohamed M. Abdel-Daim
Copyright © 2017 Tuzz-Ying Song et al. This is an open access article distributed under the Creative Commons Attribution License,which permits unrestricted use, distribution, and reproduction in any medium, provided the original work is properly cited.
Diabetic encephalopathy (DE) is often a complication in patients with Alzheimer’s disease due to high blood sugar induced bydiabetic mellitus. Ergothioneine (EGT) and hispidin (HIP) are antioxidants present in Phellinus linteus. Methylglyoxal (MGO), atoxic precursor of advanced glycated end products (AGEs), is responsible for protein glycation. We investigated whether acombination EGT and HIP (EGT+HIP) protects against MGO-induced neuronal cell damage. Rat pheochromocytoma (PC12)cells were preincubated with EGT (2 μM), HIP (2 μM), or EGT+HIP, then challenged with MGO under high-glucose condition(30 μM MGO+30mM glucose; GLU+MGO) for 24–96 h. GLU+MGO markedly increased protein carbonyls and reactiveoxygen species in PC12 cells; both of these levels were strongly reduced by EGT or HIP with effects comparable to those of100 nM aminoguanidine (an AGE inhibitor) but stronger than those of 10μM epalrestat (an aldose reductase inhibitor).GLU+MGO significantly increased the levels of AGE and AGE receptor (RAGE) protein expression of nuclear factorkappa-B (NF-κB) in the cytosol, but treatment with EGT, HIP, or EGT+HIP significantly attenuated these levels. These resultssuggest that EGT and HIP protect against hyperglycemic damage in PC12 cells by inhibiting the NF-κB transcription pathwaythrough antioxidant activities.
1. Introduction
In general, there is a higher prevalence of diabetes amongpatients suffering from various neurodegenerative disorders,such as Alzheimer’s disease (AD) [1]. Recently, severalreports revealed an epidemiological association betweendiabetes mellitus (DM) and cognitive impairment known asdiabetic encephalopathy (DE), which has been recognizedas an important CNS complication of diabetes [2]. Accumu-lating data indicate that DE results from neuronal cellapoptosis in the hippocampal region due to brain insulindeficiency [3], impaired brain insulin signaling [4], andhyperglycemia-induced oxidative stress in the brain [5].
Glucose and other reducing sugars are important gly-cating agents; however, the most reactive and physiologicallyrelevant glycating agents are the dicarbonyls, in particular
methylglyoxal (MGO). Excessive glucose causes the accu-mulation of MGO and advanced glycation end products(AGE). MGO can react with amino acids to induce proteinglycation and consequently form AGE [6]. Many studieshave revealed an association between MGO and AGEs inthe pathogenesis of cognitive disorders such as DE and AD[7, 8]. In addition, the importance of the receptor foradvanced glycation end products (RAGE), which functionas signal-transducing cell surface accepters for AGE in DEand for β-amyloid in AD, was recently highlighted [9].MGO is more toxic and reactive than glucose and formsadducts with proteins, phospholipids, and nucleic acids.MGO exposure itself, without hyperglycemia, can inducediabetes-like complications [10]. Hyperglycemic conditionis known to activate both oxidative stress and inflammatorypathways. The interaction of these two pathways complicates
HindawiOxidative Medicine and Cellular LongevityVolume 2017, Article ID 4824371, 10 pageshttps://doi.org/10.1155/2017/4824371

the hyperglycemia-mediated neuronal damage. Oxidativestress-mediated inflammation is known to execute NF-κB,activator protein-1 (AP-1), and MAPK pathways [11].
Ergothioneine (2-mercaptohistidine trimethylbetaine;EGT), which is formed in some bacteria and fungi but notin animals [12], is known to be present in the mammalianbrain at 0.2–1.0mg per 100 g tissue [13]. In humans, EGTis derived from a plant-based diet, primarily from ediblemushrooms. In vitro studies have shown that EGT possessesantioxidant, antiradiation, and anti-inflammatory activities[14, 15], and sufficient evidence suggests that EGT functionsas a physiological antioxidant [15]. EGT also protects neu-rons from cytotoxicity induced by various neurotoxins,including N-methyl-D-aspartate, β-amyloid, and cisplatin[16–18]. In our previous study, we demonstrated that EGTprotects against learning and memory deficits in aging micetreated with Aβ [19] or D-galactose [20] by improvingparameters related to oxidative stress. However, little isknown about the effects of EGT on MGO-induced injuriesin neurons.
Hispidin (HIP), 6-(3,4-dihydroxystyryl)-4-hydroxy-2-pyrone, is a phenolic compound first purified from Inonotushispidus [21]. Later, it was found in medicinal mushrooms,particularly the genus Phellinus (a traditional medicinalmushroom used in Asian countries for the treatment ofvarious diseases). HIP has garnered significant attentiondue to its antioxidant [22], anti-inflammatory [23], antipro-liferative, and antimetastatic effects [24]. HIP also protectsagainst peroxynitrite-mediated DNA damage and preventshydroxyl radical generation [25, 26]. In addition, HIP pos-sesses potent aldose reductase and protein glycation inhibi-tory activity [27, 28] and acts as an antidiabetic agent bypreventing beta cells from the damage by reactive oxygen spe-cies (ROS) in diabetes [29, 30]. Importantly, protein kinaseCβ (PKCβ) expression in humans is activated during highblood sugar or diabetic conditions, whereas HIP can inhibitPKC expression and prevent diabetic complications [26].
Liu et al. [31] used high-glucose concentration (35mM)rather than normal-glucose concentration (5.5mM) toinduce AGE formation. Miller et al. [32] indicated that ahigh-glucose environment (30mM D-glucose) alone doesnot induce apoptosis within 7 days of incubation and that acombination of high glucose with glyoxalase I (an MGO-metabolizing enzyme) inhibitor can maintain cells underhyperglycemic conditions. To reduce reaction time, we useMGO and high-glucose concentration as a high-sugar con-centration. Few studies have explored the ameliorative effectsof EGT, HIP, or a combination EGT and HIP on MGO-induced injuries in neuronal cells. In this study, we thereforeemployed rat pheochromocytoma (PC12) cells to investigatethe cytoprotective effect and possible mechanistic actionsof HIP, EGT, and their combination against neurotoxicityinduced by MGO and a high-glucose concentration.
2. Materials and Methods
2.1. Chemical Reagents. PC12 cells (BCRC 60048) werepurchased from the Food Industry Research & Develop-ment Institute (Hsinchu, Taiwan). EGT, HIP, L-glutamine,
sodium bicarbonate (NaHCO3), horse serum (HS), fetalbovine serum (FBS), penicillin, streptomycin, MTT: (3-(4,5-dimethylthiazol-2-yl)-2,5-diphenyltetrazolium bromide)tetrazolium, and all other reagents were purchased fromSigma Chemical Company (St. Louis, MO, USA). 2′,7′-Dichlorofluorescein diacetate (H2DCFDA) was purchasedfrom Molecular Probes Inc. (Eugene, OR, USA). Well plateswere bought from FALCON (Becton Dickinson, NJ, USA).
2.2. Preparation of PC12 Culture. Rat pheochromocytoma(PC12 cells (BCRC 60048)) was obtained from the FoodIndustry Research & Development Institute (Hsinchu,Taiwan) and maintained in 5% FBS, 10% HS, 84% RPMI,1% NEAA with 2mM L-glutamine containing 1.5 g/Lsodium bicarbonate, and antibiotics (100U/mL penicillinand 100μg/mL streptomycin) at 37°C in a humidifiedatmosphere with 5% CO2. The medium was replaced every2 days. Cells were seeded at a density of 1× 10⁵ cells/well ontoa 24-well plate for 24h before sample treatment.
2.3. Cell Viability Assay. Cells were seeded at a density of1× 105 cells/well onto a 24-well plate (FALCON, BectonDickinson, NJ, USA) 24 h before the treatment. The cellswere divided in eight groups: (A) control (CON), (B) hyper-glycemic conditions (30μM MGO+30mM D-glucose(GLU+MGO group)), (C) 30mM mannitol group (exclud-ing the impact of glucose osmosis), (D) epalrestat (EPA,10μM, aldose reductase inhibitor), (E) 100nM aminoguani-dine (AMG, AGE inhibitor), (F) 2μM EGT, (G) 2μM HIP,and (H) EGT+HIP (2μM+2μM). Groups B and C wereonly treated with GLU+MGO or mannitol for 24–96 h.PC12 cells were added to groups D, E, F, G, and H andallowed to stand for 2 h. Then, GLU+MGO was added tothe five groups and the cells were incubated for 24–96 h.Using 0.4% trypan blue dye, cell viability was calculated witha hemocytometer in an inverted microscope (BestScopeInternational Limited, Beijing, China) at 100x magnification.The percentage of cell viability was calculated as follows: cellviability on treatment/cell viability in control× 100%. Alltests were performed at least in triplicate, and graphs wereplotted using an average of three measurements.
2.4. Measurement of Intracellular ROS. Intracellular ROSlevels were measured using the fluorogenic probe 2′,7′-dichlorodihydrofluorescein diacetate (H2DCFDA) to detectH2O2 levels, as previously described [33]. Cells were seededat 1× 10⁶ cells/mL in a 10 cm dish and incubated for 24 h.Cells in the D, E, F, G, and H groups were incubated for2 h, then GLU+MGO was added and incubated for 24,48, and 72h. Then, H2DCFDA (5μM) was added at37°C for 30min, and the cells were centrifuged at 4°C,900g for 5min. The cell pellet was collected, and 1mLof 1×PBS was added and mixed before being transferredto a flow cytometer tube for measurement of ROS levelusing flow cytometry.
2.5. Measurement of Protein Carbonyl. Protein carbonylcontent was measured as described by Reznick and Packer[34] with minor modifications. Cells (2× 10⁶ cells/mL) wereseeded in a 6-well plate and incubated for 24 h. Groups D,
2 Oxidative Medicine and Cellular Longevity

E, F, G, and H were pretreated with GLU+MGO for 2 hand incubated with GLU+MGO for 24, 48, and 72 h. Then,the cells were centrifuged at 1500 rpm for 5min, collected,and mixed to 1.5-fold with Triton X-100 (0.5%/PBS). Thesecells were frozen in liquid nitrogen for 1min and placed ina water bath at 37°C for 5min. Next, the cells were centri-fuged at 4°C, 12,000×g for 10min. To collect protein,100μL of supernatant and 0.5mL of 10mM DNPH/2NHCl were mixed in the dark at room temperature and keptfor 1 h with shaking every 15min. The protein was precipi-tated by adding 0.6mL of 20% TCA and centrifugation at10000 rpm for 10min. The supernatant was removed, andthe precipitate was washed thrice with ethanol/ethyl acetate(1 : 1, v/v) to remove residual DNPH. The precipitate wasdissolved using 1mL of 6M guanidine-HCl (pH2.3) andincubated at 37°C for 1 h. Then, the sample was centrifugedat 12000 rpm for 15min. The absorption of protein car-bonyl was measured at 370nm using a spectrophotometer(E370= 2.2× 10³M−1 cm−1 terms of protein carbonyl).
2.6. Determination of AGE and RAGE. The levels of AGEand RAGE were assessed using ELISA kit (Cell BiolabsInc. CA, USA) according to the manufacturer’s instructions.We detected AGE content by carboxymethyllysine (CML).CML, also known as N(epsilon)-(carboxymethyl) lysine, isan advanced glycation end product (AGE) found on proteinsand lipids as a result of oxidative stress and chemical glyca-tion. The quantity of AGE adduct in protein samples isdetermined by comparing its absorbance (450 nm) with thatof a known AGE-BSA standard curve. The minimum detect-able concentration was 0.39μg/mL for AGEs and 0.41 ng/mLfor RAGE.
2.7. Measurement of Protein Expression of NF-κB withWestern Blotting. After incubation with GLU+MGO, cellswere collected and resuspended in radio immunoprecipita-tion assay (RIPA) buffer (Millipore, Bedford, MA, USA)containing inhibitor cocktail (protease and phosphataseinhibitor) to obtain whole cell lysates. Cytoplasmic andnuclear lysates were isolated by NE-PER nuclear and cyto-plasmic extraction reagents (Thermo Scientific, Rockford,IL, USA) according to manufacturer’s protocol. Total proteincontents of whole cell lysates or cytoplasmic and nuclearextracts were assayed using Bradford’s reagent (Bio-RadHercules, CA, USA). Then, a portion of the protein (50μg)was subjected to 10% SDS-PAGE and transferred onto thePVDF membranes. After blocking with 5% skimmed milkfor 2 h at 37°C, the membranes were incubated with primaryantibodies (IκBα (Santa Cruz Biotechnology) at 1 : 500dilution, nuclear factor-kappa B (NF-κB) p65 (Santa CruzBiotechnology) at 1 : 200 dilution, and β-actin (Santa CruzBiotechnology) at 1 : 500 dilution). After being washedwith Tris-buffered saline with Tween 20 (TBS-T), the mem-branes were then incubated with goat anti-rabbit horse-radish peroxidase-conjugated secondary antibodies (Sigma,St. Louis, MO) for 1 h at 1 : 2000 dilution at room tem-perature. The immunoreactive bands were visualized usingan enhanced chemiluminescence kits (Amersham; ECL kits)
and quantified with densitometry analysis—AmershamImager 600 (GE, USA). β-Actin was used as a loading control.
2.8. Statistical Analysis. Data are expressed as means± SDand analyzed using one-way ANOVA followed by Fisher’sprotected LSD test for multiple comparisons of groupmeans. All statistical analyses were performed using SPSSfor Windows, version 10 (SPSS, Inc.); a P value< 0.05 isconsidered statistically significant [35].
3. Results
3.1. Effects of High-Glucose Concentration on PC12 CellViability. As shown in Figure 1, after treatment withGLU+MGO for 24, 48, and 72 h, the viability of PC12 cellssignificantly decreased with time compared with treatmentwith GLU or MGO only (P < 0 05). After treatment ofPC12 cells with GLU+MGO for 72 h, the cell viabilitydecreased to about 45%, which was lower than that aftertreatment with GLU (78%) or MGO (75%). Therefore, wechose 30mM GLU and 30μM MGO for the hyperglycemiccondition for PC12 cells.
3.2. Effects of EGT, HIP, and EGT+HIP on PC12 CellViability at High-Glucose Concentration. Figure 2 shows thatthe viability of cells treated with GLU+MGO was signifi-cantly decreased with increasing culture time (70%, 50%,and 45% at 24, 48, and 72h, resp.). On the contrary, the cellviability of the group treated with mannitol to induce highosmotic pressure was above 80% even after 72 h of incuba-tion, indicating that GLU+MGO decreases cell viability byother actions such as glycation besides high osmotic pressure.However, both EGT (2μM) and HIP (2μM) alone signifi-cantly attenuated cytotoxicity induced by GLU+MGO.
Incubation time (h)24 48 72
0
20
40
60
80
100
120
AA
AB
C
ABB
C
A
BB
C
CON GLU
MGO GLU + MGO
Cel
l via
bilit
y (%
of c
ontro
l)
Figure 1: Effects of glucose (GLU), methylglyoxal (MGO), andGLU+MGO on viability of PC12 cells. Cell viability was estimatedby trypan blue dye exclusion method. Values (means± SD oftriplicate tests) without a superscript letter are significantlydifferent (P < 0 05).
3Oxidative Medicine and Cellular Longevity

EGT and HIP were significantly more effective than 10μMEPA and 100nM AMG (55% and 72% at 72 h of incubation)(P < 0 05). The cell viability of the EGT+HIP groupincreased to 82–90% after 24, 48, and 72 h of incubation,and the viability was not significantly different (P > 0 05)from that in the EGT or HIP group.
3.3. Effects of EGT, HIP, and EGT+HIP on Protein CarbonylLevels in PC12 Cells under Hyperglycemic Condition. Asshown in Figure 3, treatment with GLU+MGO significantlyincreased protein carbonyl levels in PC12 cells at each incu-bation time (24, 48, and 72h), and the highest level wasdetected at 48 h of incubation. Treatment with EGT alonesignificantly decreased protein carbonyl, and the effect ofEGT was roughly comparable to those of 10μM EPA and100nM AMG. HIP alone significantly decreased proteincarbonyls at 48 and 72 h, but not at 24 h, of incubation, andEGT+HIP produced no synergistic inhibition on proteincarbonyls, as compared with the GLU+MGO group.
3.4. Effects of EGT, HIP, and EGT+HIP on ROS in PC12 Cellsunder Hyperglycemic Condition. As shown in Figure 4(a),after 48 and 72 h of incubation, the ROS levels in PC12 cellsinduced by GLU+MGO (36% and 43.6%) were significantlyincreased, as compared with that in the control group (12.7%and 15.3%, at 48 and 72 h, resp.). In the mannitol group,the ROS levels (12.1% at 48 h and 18.5% at 72 h) were notsignificantly different from those of the control. The resultrevealed that the intracellular ROS production induced byGLU+MGO was not due to the osmotic effect. In addition,
intracellular ROS levels in the EGT, HIP, and EGT+HIPgroups were significantly decreased (to 28.1%, 25.2%, and23.4% after 72 h of incubation, resp.), as compared withthat in the GLU+MGO group (Figure 4(b)). Treatmentwith EGT, HIP, or EGT+HIP inhibited ROS by 54.8%,65.0%, and 71.4%, respectively, but no synergistic effectof EGT and HIP was observed. The inhibitory effect ofEGT+HIP on ROS (71.4% at 72h) in PC12 cells underhigh-glucose concentration was stronger than that of EPA(21.6%) and AMG (61.1%).
3.5. Effects of EGT, HIP, and EGT+HIP on AGE and RAGELevels in PC12 Cells under Hyperglycemic Condition.Table 1 shows that the AGE and RAGE levels were sig-nificantly increased in the GLU+MGO group, as com-pared with those in the control group (P < 0 05) duringincubation of PC12 cells for 72 and 96h. AGE levels weresignificantly higher (at 72 h) in cells treated with EGT, HIP,or EGT+HIP than in their absence (control), because afteradding the EGT, HIP, or EGT+HIP for 2 h, the cells wereadded with GLU+MGO. After PC12 cells were treated withGLU+MGO for 72h, AGE levels in cells treated with EGT,HIP, or EGT+HIP were significantly lower (at 72 h) thanthose of the GLU+MGO-treated group but were signifi-cantly higher than those of the control group. AGE andRAGE levels in the group treated with mannitol (to inducehigh osmotic pressure) were significantly higher than thosein the control group (P < 0 05) but were significantly lowerthan those in the GLU+MGO group after 72 h of incubation(P < 0 05). AGE level of the mannitol-treated group was not
Incubation time (h)24 48 72
Cell n
umbe
r (%
of c
ontro
l)
40
60
80
100
120
A
CD
C
BBC
BCBC
BCE
BCBC
C
D
B
D
BC
AB
C
D
CBC BC
AA
AMG EGT HIP EGT + HIP
CON GLU + MGO Mannitol EPA
Figure 2: Effects of ergothioneine (EGT), hispidin (HIP), andEGT+HIP on viability of PC12 cells treated with 30mMglucose and 30μM methylglyoxal (GLU+MGO). PC12 cells werepretreated with epalrestat (EPA), aminoguanidine (AMG), ETG,HIP, and EGT+HIP for 2 h and incubated with GLU+MGO ormannitol for 24, 48, and 72 h. Cell viability was estimated bythe trypan blue dye exclusion method. Values (means± SD oftriplicate tests) without a superscript letter are significantlydifferent (P < 0 05).
Incubation time (h)24 48 72
Prot
ein
carb
onyl
(�휇m
ol/m
g pr
otei
n)
0
500
1000
1500
2000
2500
A
CB B
BCB
CC B
A
E E DCCD
F
A
D
BCB
CB
CB
CON GLU + MGO Mannitol EPA
AMG EGT HIP EGT + HIP
Figure 3: Effects of ergothioneine (EGT), hispidin (HIP), andEGT+HIP on protein carbonyl levels in PC12 cells treated with30mM glucose and 30 μM methylglyoxal (GLU+MGO). PC12cells were pretreated with epalrestat (EPA), aminoguanidine(AMG), ETG, HIP, and EGT+HIP for 2 h and incubated withGLU+MGO or mannitol for 24, 48, and 72 h. Values (means± SDof triplicate tests) without a superscript letter are significantlydifferent (P < 0 05).
4 Oxidative Medicine and Cellular Longevity
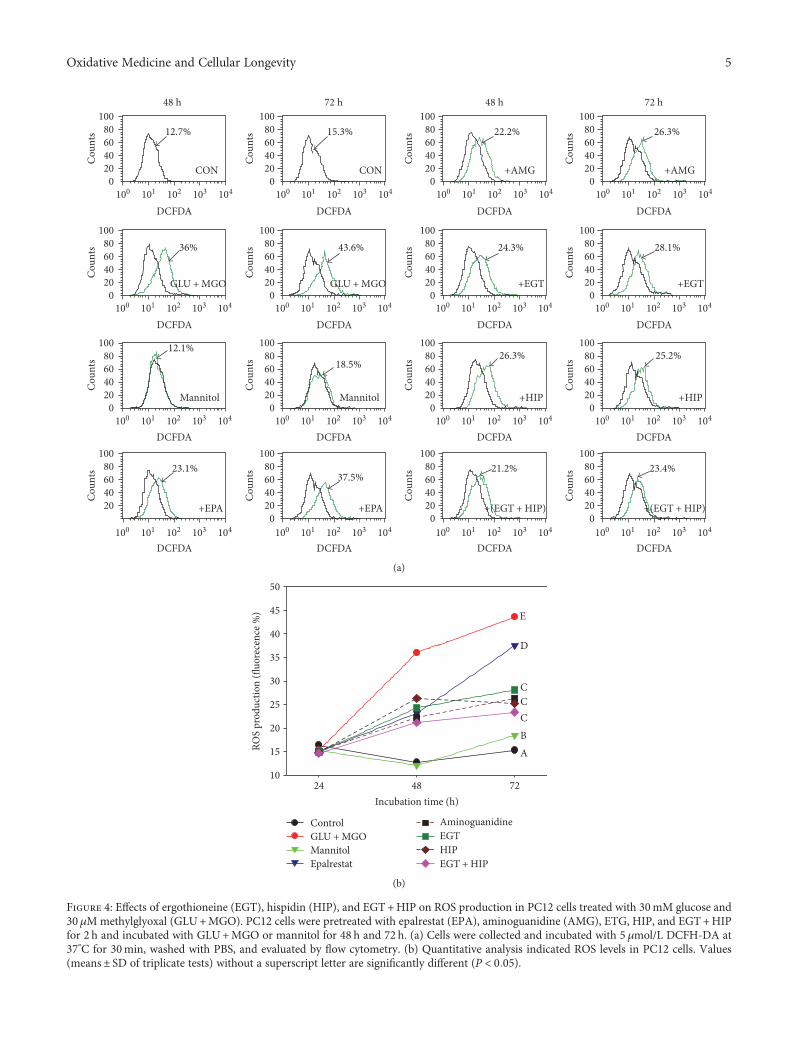
1000
20406080
100
101 102 103 104
Cou
nts
DCFDA100
020406080
100
101 102 103 104
Cou
nts
DCFDA100
020406080
100
101 102 103 104
Cou
nts
DCFDA100
020406080
100
101 102 103 104
100 101 102 103 104 100 101 102 103 104 100 101 102 103 104 100 101 102 103 104
100 101 102 103 104 100 101 102 103 104 100 101 102 103 104 100 101 102 103 104
100 101 102 103 104 100 101 102 103 104 100 101 102 103 104 100 101 102 103 104
Cou
nts
DCFDA
020406080
100
Cou
nts
020406080
100
Cou
nts
020406080
100
Cou
nts
020406080
100
Cou
nts
020406080
100
Cou
nts
020406080
100
Cou
nts
020406080
100
Cou
nts
020406080
100
Cou
nts
20406080
100
Cou
nts
020406080
100
Cou
nts
020406080
100
Cou
nts
020406080
100
Cou
nts
48 h 72 h 48 h 72 h
CON CON
12.7% 15.3% 22.2% 26.3%
+AMG +AMG
36% 43.6% 24.3% 28.1%
12.1%18.5%
26.3% 25.2%
Mannitol Mannitol +HIP
+(EGT + HIP) +(EGT + HIP)
+EGT +EGT
+HIP
GLU + MGO GLU + MGO
+EPA +EPA
23.1%37.5%
21.2% 23.4%
DCFDA DCFDA DCFDA DCFDA
DCFDA DCFDA DCFDA DCFDA
DCFDA DCFDA DCFDA DCFDA
(a)
Incubation time (h)24 48 72
ROS
prod
uctio
n (fl
uore
cenc
e %)
10
15
20
25
30
35
40
45
50
ABCCC
D
E
Control GLU + MGO Mannitol Epalrestat
Aminoguanidine EGT HIP EGT + HIP
(b)
Figure 4: Effects of ergothioneine (EGT), hispidin (HIP), and EGT+HIP on ROS production in PC12 cells treated with 30mM glucose and30μMmethylglyoxal (GLU+MGO). PC12 cells were pretreated with epalrestat (EPA), aminoguanidine (AMG), ETG, HIP, and EGT+HIPfor 2 h and incubated with GLU+MGO or mannitol for 48 h and 72 h. (a) Cells were collected and incubated with 5 μmol/L DCFH-DA at37°C for 30min, washed with PBS, and evaluated by flow cytometry. (b) Quantitative analysis indicated ROS levels in PC12 cells. Values(means± SD of triplicate tests) without a superscript letter are significantly different (P < 0 05).
5Oxidative Medicine and Cellular Longevity

significantly different from that of the control group after96 h incubation (P > 0 05), and RAGE level did not increaseafter 72–96 h of incubation. These results indicate thatGLU+MGO increases AGE and RAGE levels by glycationbesides high osmotic pressure.
Treatment of EGT alone significantly decreased AGE andRAGE levels, as compared with that of GLU+MGO, and theeffect was comparable to that of EPA and AMG treatmentalone. However, treatment of HIP alone only significantlydecreased AGE or RAGE levels at 96 h (but not at 72 h)of incubation, as compared with that of GLU+MGO.EGT+HIP significantly inhibited AGE and RAGE levelsinduced by GLU+MGO, but the combined treatment onlysignificantly decreased AGE levels at 96 h of incubation, ascompared with the EGT treatment alone. The combinedtreatment did not significantly decrease RAGE levels, ascompared with that of EGT alone at either 72 or 96 hof incubation.
3.6. Effects of EGT, HIP, and EGT+HIP on NF-κB-AssociatedPathways in PC12 Cells under Hyperglycemic Condition.As shown in Figure 5, after exposure of PC12 cells toGLU+MGO for 72h, the cytoplasmic NF-κB was signifi-cantly decreased (P < 0 05) and the nuclear NF-κB wassignificantly increased (P < 0 05). However, no difference incytoplasmic IκB was observed between the GLU+MGOand control groups (P > 0 05). In contrast, when PC12 cellswere pretreated with EPA, AMG, HIP, or EGT, nuclearNF-κB activation induced by GLU+MGO was markedlyinhibited (P < 0 05). We also found that EGT+HIP increasesthe regulation of cytoplasmic NF-κB expression and decreasenuclear NF-κB expression compared with EGT or HIP alone.The expression of cyt-IκB in cells treated with EGT+HIPwas somewhat decreased, but not significantly decreased,as compared with that of the control. The quantifiedresults of cytoplasmic IκB and NF-κB and nuclear NF-κBprotein levels are presented in Figures 5(b), 5(c), and5(d), respectively. These results suggest that EGT, HIP,and EGT+HIP inhibit GLU+MGO-mediated inflammatoryresponses through NF-κB cleavage from IκB.
4. Discussion
The aim of this study was to evaluate the neuroprotectiveeffect of EGT, HIP, and EGT+HIP on hyperglycemiccondition-mediated cytotoxicity and the possible pathwaysin PC12 cells for gaining insights to prevent cognitiveimpairment induced by DM. In Figure 1, we provide theevidence that GLU+MGO more strongly decreased thecell viability in PC12 cells than did GLU or MGO alone.Thus, GLU+MGO was used as a glycemic-inducing agentin the following experiment. In our study, we found thatcytotoxicity, protein carbonyl levels, and ROS levels weresignificantly increased under hyperglycemic condition. BothEGT and HIP alone can increase cell viability, amelioratethe antioxidant status, and reduce glycation levels in PC12cells. Though EGT+HIP demonstrated higher cell viability,ROS production, and cytoplasmic NF-κB expression thanEGT or HIP alone, no synergistic effect was observed.
Numerous studies have reported the role of EGT indiseases and its physiological antioxidant activities underexperimental conditions involving oxidative stress [15].Cheah et al. [36] demonstrated that declining EGT levelsin elderly subjects are associated with age and incidence ofmild cognitive impairment. EGT ameliorates the responseto acetylcholine in the arteries of rats with streptozotocin-induced diabetes and reduces diabetic embryopathy in preg-nant rats with diabetes, probably through the modulation ofhyperglycemia-mediated oxidative stress [37]. Servillo et al.[38] indicated that the antioxidant mechanisms of EGTmay provide new perspectives in targeted therapies againstthe production of ROS in diabetes. Our results also revealedthat EGT significantly decreased ROS and protein carbonyllevels induced by GLU+MGO in PC12 cells. In addition,EGT supplementation decreased the secretion of AGE andRAGE in PC12 cells and inhibited the expression of theNF-κB transcription factor in the nucleus. These resultsdemonstrate that EGT, through its antioxidant activities,can mitigate the damage caused by DE.
HIP, a PKC inhibitor, possesses strong antioxidant, anti-cancer, and antidiabetic activities [26, 29, 39]. HIP exhibits
Table 1: Effects of ergothioneine, hispidin, and ergothioneine + hispidin on production of advanced glycated end products and receptor foradvanced glycated end products in PC12 cells induced by glucose +methylglyoxal.
TreatmentsAGE (ng/mL) RAGE (ng/mL)
72 h IP %3 96 h IP % 72 h IP % 96 h IP %
CON 191± 10a4 302± 13bc 2.8± 0.5a 11.4± 1.0a
Mannitol 230± 6bc 308± 10bc 24.9± 1.2b 24.1± 0.5c
GLU+MGO1 294± 18d 411± 11d 32.0± 1.6c 43.0± 1.1e
+EPA 235± 11bc 20.07 299± 9bc 27.25 32.6± 1.3c −1.88 25.1± 0.6c 41.63
+AMG 202± 9a 31.29 269± 8b 34.55 29.9± 1.0c 6.56 20.7± 1.7b 51.86
+EGT 264± 14c 10.20 275± 8b 33.09 26.9± 1.2b 15.94 20.3± 0.7b 52.79
+HIP 296± 14d −0.68 296± 10bc 27.98 31.7± 2.4c 0.94 28.6± 0.9d 33.49
+(EGT+HIP) 231± 10bc 21.43 233± 14a 43.31 24.5± 2.6b 23.44 22.9± 1.5bc 46.741GLU+MGO: 30mM glucose (GLU) and 30 μMmethylglyoxal (MGO); EPA: epalrestat; AMG: aminoguanidine. 2PC12 cells were pretreated with EPA, AMG,ETG, HIP, and EGT+HIP for 2 h and incubated with GLU+MGO for 72 h and 96 h. 3IP% = 1 − sample/ GLU +MGO × 100. 4Values (means ± SD oftriplicate tests) without a superscript letter are significantly different (P < 0 05).
6 Oxidative Medicine and Cellular Longevity

potent α-glucosidase inhibitor activity, with IC50 value of297μg/mL, and aldose reductase inhibitor activity, withIC50 value of 48μg/mL [39]. These findings suggest thatHIP may be an effective antidiabetic agent. However, to thebest of our knowledge, no study has examined the action ofHIP against oxidative stress or the detailed molecular mech-anism underlying its preventive effect against DE. Ourpresent results indicated that HIP significantly decreasedAGE and RAGE levels induced by GLU+MGO at 96 h ofincubation. In addition, HIP inhibited the levels of ROSand protein carbonyl as well as the activation of NF-κB tran-scription factor to obstruct mitochondria-associated apopto-sis pathways, leading to an increase in cell viability. Epalrestatis an aldose reductase inhibitor that is used for the improve-ment of subjective neuropathy symptoms [40]. Recently,hispidin was shown to exhibit potent aldose reductase inhib-itory activity. Thus, we used epalrestat as a positive control tounderstand whether hispidin has protective effects on PC12cells in addition to aldose reductase inhibitory effect.
NF-κB is a pleiotropic regulator of many cellular sig-naling pathways, providing a mechanism for the cells inresponse to various stimuli associated with inflammationand oxidative stress. IκB degradation triggers NF-κB release,and the nuclear-translocated heterodimer (or homodimer)can associate with the κB sites of promoter to regulate thegene transcription [41]. NF-κB can regulate the transcriptionof genes such as chemokines, cytokines, proinflammatoryenzymes, adhesion molecules, and other factors to modulatethe neuronal survival [41]. Both high glucose and ROS acti-vate signal transduction cascade (PKC, mitogen-activatedprotein kinases, and janus kinase/signal transducers andactivators of transcription) and transcription factors (NF-κB, activated protein-1, and specificity protein 1) furtherpromote the formation of AGEs [42]. Morgan and Liu [43]pointed out that ROS interacts with NF-κB signaling path-ways in many ways. The transcription of NF-κB-dependentgenes influences the levels of ROS in the cell, and in turn,the levels of NF-κB activity are regulated by the levels of ROS.
Cyt-I�휅B
Cyt-NF�휅B
Nu-NF�휅B
�훽-Actin
A B C D E F G H
(a)
A B C D E F G H0
1
2
3
4
5
ABABABABABABAB
B
Cyt-l�휅
B/�훽
-act
in
(b)
A B C D E F G H0.0
0.2
0.4
0.6
0.8
1.0
1.2
1.4
A A
B B
C
C
CD
E
Cyt-N
F�휅B/�훽
-act
in
(c)
A B C D E F G H0.0
0.1
0.2
0.3
0.4
0.5
A
B
C
CD
E
CDCD
D
Nu-
NF�휅
B/�훽
-act
in (f
olds
)
(d)
Figure 5: Effects of ergothioneine (EGT), hispidin (HIP), and EGT+HIP on cytoplasm IκB (Cyt-IκB), cytoplasm NF-κB (Cyt-NF-κB), andnuclear NF-κB (Nu-NFκB) protein expression in PC12 cells treated with 30mM glucose and 30μM methylglyoxal GLU+MGO) or 30mMmannitol (to exclude the impact of glucose osmosis). β-Actin serves as an internal control. PC12 cells were pretreated with epalrestat (EPA),aminoguanidine (AMG), ETG, HIP, and EGT+HIP for 2 h and incubated with GLU+MGO for 72 h. A: control; B: GLU+MGO; C: 30mMmannitol; D: 10 μM EPA; E: 100 nM AMG; F: 2μM EGT; G: 2μM HIP; H: 2 μM EGT+ 2 μM HIP. (b–d) Quantitative data for Cyt-IκB,Cyt-NF-κB, and Nu-NF-κB expression. A portion of the protein (50 μg) was loaded to 10% SDS-PAGE. Values (means± SD of triplicate tests)without a superscript letter are significantly different (P < 0 05).
7Oxidative Medicine and Cellular Longevity

It is true that blots of cyt-NFκB had higher density thanthose of Nu-NFκB, but this only occurred in the controlgroup. In contrast, in GLU+MGO-treated PC12 cells, Nu-NFκB expression was significantly increased, and cyt-NFκBexpression was decreased. Besides, ROS, protein carbonyl,and AGE levels were significantly induced by GLU+MGO.Thus, our data suggested that GLU+MGO increased NF-κB translocation. The present study showed that EGT andHIP protect PC12 cell damage under high-glucose conditionby inhibiting NF-κB transcription cascade to inhibit ROSproduction and AGE formation.
A previous study reported that the binding of AGE toRAGE induces pathophysiological cascades linked to thedownstream activation of NF-κB, which in turn leads toROS generation [11] and inflammatory processes [44].Haslbeck et al. [45] reported that the AGE/RAGE/NF-κBpathway may contribute to the pathogenesis of polyneuropa-thy in impaired glucose tolerance. NF-κB is a transcriptionfactor that upregulates the gene expression of proinflamma-tory cytokines and also is responsible for the induction ofneuronal apoptosis. Activation of NF-κB also suppressesthe expression of antioxidant genes by downregulating theNrf-2 pathway and thus indirectly weakening the innate anti-oxidant defense [46]. Several natural inhibitors of NF-κBsuch as curcumin, resveratrol, and melatonin have beenused in experimental diabetic animals. The use of NF-κBinhibitors can prevent the AGE-mediated proinflammatorycytokine production and thus halts the events associatedwith neuroinflammation [11].
Our results showed that the AGE/RAGE/NF-κB systemwas significantly activated in the GLU+MGO-treated
cells but was markedly inhibited by EGT+HIP. Theseresults suggest that EGT+HIP protects PC12 cells againstGLU+MGO-induced cytotoxicity by inhibiting the AGE/RAGE/NF-κB pathway. We hypothesize that EGT+HIPinvolved two quite different pathways in synergistic effectsof glycation; one was the inhibition of aldose reductaseactivity (HIP) [39], and the other was the inhibition ofthe production of reactive oxygen species in the AGE/RAGE/NF-κB pathway (EGT) [38]. Thus, we speculate thatEGT, HIP, and EGT+HIP have the potential to improveDE induced by DM and that their effects are comparable tothose of AMG (an AGE inhibitor) added at 100 nM andbetter than those of EPA (an aldose reductase inhibitor)added at 10μM.
Combination of EGT and HIP had the ability of thesynergistic effects of inhibition of the formation of AGEto inhibit the AGE/RAGE/NF-κB pathway; however, EGTand HIP did not exhibit a synergistic effect in increasingcell viability and decreasing protein carbonyl and ROSlevels. However, EGT and HIP did not exhibit a synergisticeffect in increasing cell viability and decreasing protein car-bonyl and ROS levels. Intriguingly, our results displayedthat the treatment with EGT in combination with HIP(EGT+HIP) was more effective than that with EGT or HIPalone in inhibiting the AGE/RAGE/NF-κB pathway inducedby GLU+MGO in PC12 cells. Thus, we speculated thatEGT+HIP plays synergistic role in antiglycation activity,but not antioxidant activity.
Evidence shows that tea polyphenols have strong MGO-trapping abilities to form mono- and di-MGO adducts underphysiological conditions (pH7.4, 37°C) [47, 48]. Shao et al.
AGE/RAGE-related signal pathway
Fructose
AGEformation
NF-�휅B active of transcription factor
Related mitochondrialapoptotic pathway
ROS
Cell death
Aldose reductase [27]
HIP traps MGO [47–49]
HIP
EGT + HIP
Antiglycation [28]
Antioxidation [14‑15]
Anti-in�ammation
GLU + MGO
EGT
Figure 6: Proposed protective pathways of ergothioneine and hispidin against glycation induced by glucose +methylglyoxal in PC12 cells.
8 Oxidative Medicine and Cellular Longevity

[49] also reported that apple polyphenol-phloretin trapsmore than 80% MGO within 10min, and phloridzin trapsmore than 70% MGO within 24 h under physiologicalconditions. Thus, HIP could trap MGO and lead to decreasedAGE formation. In addition, S-cysteinyl compounds couldreact with polyphenol (catechin, chlorogenic acid, dihydro-caffeic acid, hydroxytyrosol, nordihydroguaiaretic acid, androsmarinic acid) to form S-cysteinyl polyphenols underperoxidase-catalyzed oxidation [50]. Thus, we speculatedthat EGT could react with HIP to decrease the MGO-trapping ability of HIP. Therefore, this may explain why nosynergistic effect in antioxidant activity of EGT+HIP inprotecting PC12 cells.
5. Conclusion
In conclusion, the present study shows that HIP inhibitsaldose reductase activity and reduces AGE/RAGE levels(i.e., the antiglycation pathway). HIP may also trap MGOdirectly [47–49]. HIP+EGT further reduces the activationof NF-κB leading to reduced inflammation and oxidativeresponse in PC12 cells (Figure 6). In contrast, EGT canreduce AGE formation primarily through its antioxidantcapacity. EGT and HIP do not show a synergistic protectiveeffect in PC12 cells, possibly because EGT may react withHIP in vitro. In vivo studies are required to elucidatewhether EGT and HIP exert a synergistic effect on protectionagainst DE.
Conflicts of Interest
The authors declare that there are no conflicts of interest.
Acknowledgments
This study was supported by a grant from the NationalScience Council, ROC. (NSC 100-2313-B-235-001-MY3).
References
[1] M. Ristow, “Neurodegenerative disorders associated withdiabetes mellitus,” Journal of Molecular Medicine, vol. 82,pp. 510–529, 2004.
[2] Z. Arvanitakis, R. S. Wilson, J. L. Bienias, D. A. Evans, andD. A. Bennett, “Diabetes mellitus and risk of Alzheimer diseaseand decline in cognitive function,” Archives of Neurology,vol. 61, pp. 661–666, 2004.
[3] Z. G. Li, W. Zhang, G. Grunberger, and A. A. Sima, “Hippo-campal neuronal apoptosis in type 1 diabetes,” Brain Research,vol. 946, pp. 221–231, 2002.
[4] A. A. Sima and Z. G. Li, “The effect of C-peptide on cognitivedysfunction and hippocampal apoptosis in type 1 diabeticrats,” Diabetes, vol. 54, pp. 1497–1505, 2005.
[5] C. A. Grillo, G. G. Piroli, D. R. Rosell, E. K. Hoskin, B. S.McEwen, and L. P. Reagan, “Region specific increases inoxidative stress and superoxide dismutase in the hippocampusof diabetic rats subjected to stress,” Neuroscience, vol. 121,pp. 133–140, 2003.
[6] T. H. Fleming, P. M. Humpert, P. P. Nawroth, and A. Bierhaus,“Reactive metabolites and AGE/RAGE-mediated cellular
dysfunction affect the aging process - a mini-review,” Geron-tology, vol. 57, pp. 435–443, 2011.
[7] C. Toth, J. Martinez, and D. W. Zochodne, “RAGE, diabetes,and the nervous system,” Current Molecular Medicine, vol. 7,pp. 766–776, 2007.
[8] S. Di Loreto, V. Zimmitti, P. Sebastiani, C. Cervelli, S. Falone,and F. Amicarelli, “Methylglyoxal causes strong weakening ofdetoxifying capacity and apoptotic cell death in rat hippocam-pal neurons,” The International Journal of Biochemistry andCell Biology, vol. 40, pp. 245–257, 2008.
[9] O. Arancio, H. P. Zhang, X. Chen et al., “RAGE potentiatesAβ-induced perturbation of neuronal function in transgenicmice,” The EMBO Journal, vol. 23, pp. 4096–4105, 2004.
[10] J. Berlanga, D. Cibrian, I. Guillen et al., “Methylglyoxal admin-istration induces diabetes-like microvascular changes andperturbs the healing process of cutaneous wounds,” ClinicalScience, vol. 109, pp. 83–95, 2005.
[11] R. Sandireddy, V. G. Yerra, A. Areti, P. Komirishetty, andA. Kumar, “Neuroinflammation and oxidative stress in dia-betic neuropathy: futuristic strategies based on these targets,”International Journal of Endocrinology, vol. 2014, Article ID674987, 10 pages, 2014.
[12] D. B. Melville, W. H. Horner, C. C. Otken, and M. L. Ludwig,“Studies on the origin of ergothioneine in animals,” TheJournal of Biological Chemistry, vol. 213, pp. 61–68, 1955.
[13] N. Nakamichi, T. Taguchi, H. Hosotani et al., “Functionalexpression of carnitine/organic cation transporter OCTN1 inmouse brain neurons: possible involvement in neuronal differ-entiation,” Neurochemistry International, vol. 61, pp. 1121–1132, 2012.
[14] O. I. Aruoma, M. Whiteman, T. G. England, and B. Halliwell,“Antioxidant action of ergothioneine: assessment of its abil-ity to scavenge peroxynitrite,” Biochemical and BiophysicalResearch Communications, vol. 231, pp. 389–391, 1997.
[15] I. K. Cheah and B. Halliwell, “Ergothioneine; antioxidantpotential, physiological function and role in disease,” Biochi-mica et Biophysica Acta (BBA) - Molecular Basis of Disease,vol. 1822, pp. 784–793, 2012.
[16] J. A. Moncaster, D. T. Walsh, S. M. Gentleman, L. S.Jen, and O. I. Aruoma, “Ergothioneine treatment protectsneurons against N-methyl-D-aspartate excitotoxicity in anin vivo rat retinal model,” Neuroscience Letters, vol. 328,pp. 55–59, 2002.
[17] J. H. Jang, O. I. Aruoma, L. S. Jen, H. Y. Chung, and Y. J. Surh,“Ergothioneine rescues PC12 cells from β-amyloid-inducedapoptotic death,” Free Radical Biology and Medicine, vol. 36,pp. 288–299, 2004.
[18] T. Y. Song, C. L. Chen, J. W. Liao, O. HC, and M. S. Tsai,“Ergothioneine protects against neuronal injury induced bycisplatin both in vitro and in vivo,” Food and Chemical Toxi-cology, vol. 48, pp. 3492–3499, 2010.
[19] N. C. Yang, H. C. Lin, W. JH et al., “Ergothioneine protectsagainst neuronal injury induced by β-amyloid in mice,” Foodand Chemical Toxicology, vol. 50, pp. 3902–3911, 2012.
[20] T. Y. Song, H. C. Lin, C. L. Chen, W. JH, J. W. Liao, and M. L.Hu, “Ergothioneine and melatonin attenuate oxidative stressand protect against learning and memory deficits in C57BL/6J mice treated with D-galactose,” Free Radical Research,vol. 48, pp. 1049–1060, 2014.
[21] N. A. Ali, J. Lüdtke, H. Pilgrim, and U. Lindequist, “Inhibitionof chemiluminescence response of human mononuclear cells
9Oxidative Medicine and Cellular Longevity
and suppression of mitogen-induced proliferation of spleenlymphocytes of mice by hispolon and hispidin,” Pharmazie,vol. 51, pp. 667–670, 1996.
[22] I. H. Park, S. K. Chung, K. B. Lee et al., “An antioxidanthispidin from the mycelial cultures of Phellinus linteus,”Archives of Pharmacal Research, vol. 27, pp. 615–618, 2004.
[23] H. G. Kim, D. H. Yoon, W. H. Lee et al., “Phellinus linteusinhibits inflammatory mediators by suppressing redox-basedNF-κB and MAPKs activation in lipopolysaccharide-inducedRAW 264.7 macrophage,” Journal of Ethnopharmacology,vol. 114, pp. 307–315, 2007.
[24] T. Y. Song, H. G. Lin, N. C. Yang, and M. L. Hu, “Antipro-liferative and antimetastatic effects of the ethanolic extractof Phellinus igniarius (Linnearus: Fries) Quelet,” Journal ofEthnopharmacology, vol. 115, pp. 50–56, 2008.
[25] W. Chen, L. Feng, Z. Huang, and H. Su, “Hispidin producedfrom Phellinus linteus protects against peroxynitrite- mediatedDNA damage and hydroxyl radical generation,” Chemico-Biological Interactions, vol. 199, pp. 137–142, 2012.
[26] C. Gonindard, C. Bergonzi, C. Denier et al., “Synthetic hispi-din, a PKC inhibitor, is more cytotoxic toward cancer cellsthan normal cells in vitro,” Cell Biology and Toxicology,vol. 13, pp. 141–153, 1997.
[27] Y. S. Lee, Y. H. Kang, J. Y. Jung et al., “Inhibitory constituentsof aldose reductase in the fruiting body of Phellinus linteus,”Biological and Pharmaceutical Bulletin, vol. 31, pp. 765–768, 2008.
[28] Y. S. Lee, Y. H. Kang, J. Y. Jung et al., “Protein glycation inhib-itors from the fruiting body of Phellinus linteus,” Biological andPharmaceutical Bulletin, vol. 31, pp. 1968–1972, 2008.
[29] J. S. Jang, J. S. Lee, J. H. Lee et al., “Hispidin produced fromPhellinus linteus protects pancreatic β-cells from damage byhydrogen peroxide,” Archives of Pharmacal Research, vol. 33,pp. 853–861, 2010.
[30] J. H. Lee, J. S. Lee, Y. R. Kim et al., “Hispidin isolated fromPhellinus linteus protects against hydrogen peroxide-inducedoxidative stress in pancreatic MIN6N β-cells,” Journal ofMedicinal Food, vol. 14, pp. 1431–1438, 2011.
[31] J. Liu, J. Mao, Y. Jiang et al., “AGEs induce apoptosis in ratosteoblast cells by activating the caspase-3 signaling pathwayunder a high-glucose environment in vitro,” Applied Bio-chemistry and Biotechnology, vol. 178, pp. 1015–1027, 2016.
[32] A. G. Miller, D. G. Smith, M. Bhat, and R. H. Nagaraj, “Glyox-alase I is critical for human retinal capillary pericyte survivalunder hyperglycemic conditions,” The Journal of BiologicalChemistry, vol. 281, pp. 11864–11871, 2006.
[33] C. S. Yang, H. M. Lee, J. Y. Lee et al., “Reactive oxygenspecies and p47phox activation are essential for the Myco-bacterium tuberculosis-induced pro-inflammatory responsein murine microglia,” Journal of Neuroinflammation,vol. 4, p. 27, 2007.
[34] A. Z. Reznick and L. Packer, “Oxidative damage to proteins:spectrophotometric method for carbonyl assay,” Methods inEnzymology, vol. 233, pp. 357–363, 1994.
[35] M. A. Seaman, J. R. Levin, and R. C. Serlin, “Newdevelopments in pairwise multiple comparisons: some pow-erful and practicable procedures,” Psychological Bulletin,vol. 110, pp. 577–586, 1991.
[36] I. K. Cheah, L. Feng, R. M. Tang, K. H. Lim, and B. Halliwell,“Ergothioneine levels in an elderly population decrease withage and incidence of cognitive decline; a risk factor for
neurodegeneration?,” Biochemical and Biophysical ResearchCommunications, vol. 478, pp. 162–167, 2016.
[37] R. W. Li, C. Yang, A. S. Sit et al., “Uptake and protective effectsof ergothioneine in human endothelial cells,” The Journal ofPharmacology and Experimental Therapeutics, vol. 350,pp. 691–700, 2014.
[38] L. Servillo, N. D'Onofrio, R. Casale et al., “Ergothioneineproducts derived by superoxide oxidation in endothelial cellsexposed to high-glucose,” Free Radical Biology and Medicine,vol. 108, pp. 8–18, 2017.
[39] G. J. Huang, W. T. Hsieh, H. Y. Chang, S. S. Huang, Y. C.Lin, and Y. H. Kuo, “α-Glucosidase and aldose reductaseinhibitory activities from the fruiting body of Phellinus mer-rillii,” Journal of Agricultural and Food Chemistry, vol. 59,pp. 5702–5706, 2011.
[40] M. A. Ramirez and N. L. Borja, “Epalrestat: an aldose reductaseinhibitor for the treatment of diabetic neuropathy,” Pharmaco-therapy, vol. 28, pp. 646–655, 2008.
[41] R. H. Shih, C. Y.Wang, and C.M. Yang, “NF-kappaB signalingpathways in neurological inflammation: a mini review,” Fron-tiers in Molecular Neuroscience, vol. 8, p. 77, 2015.
[42] H. B. Lee, M. R. Yu, Y. Yang, Z. Jiang, and H. Ha, “Reactiveoxygen species-regulated signaling pathways in diabeticnephropathy,” Journal of the American Society of Nephrology,vol. 14, no. 8, Supplement 3, pp. S241–S245, 2003.
[43] M. J. Morgan and Z. G. Liu, “Crosstalk of reactive oxygenspecies and NF-κB signaling,” Cell Research, vol. 21, pp. 103–115, 2011.
[44] S. D. Yan, A. M. Schmidt, G. M. Anderson et al., “Enhancedcellular oxidant stress by the interaction of advanced glycationend products with their receptors/binding proteins,” The Jour-nal of Biological Chemistry, vol. 269, pp. 9889–9897, 1994.
[45] K. M. Haslbeck, E. Schleicher, A. Bierhaus et al., “The AGE/RAGE/NF-κB pathway may contribute to the pathogenesis ofpolyneuropathy in impaired glucose tolerance (IGT),” Experi-mental and Clinical Endocrinology and Diabetes, vol. 113,pp. 288–291, 2005.
[46] V. Ganesh Yerra, G. Negi, S. S. Sharma, and A. Kumar, “Poten-tial therapeutic effects of the simultaneous targeting of theNrf2 and NF-κB pathways in diabetic neuropathy,” RedoxBiology, vol. 1, pp. 394–397, 2013.
[47] S. Sang, X. Shao, N. Bai, C. Y. Lo, C. S. Yang, and C. T. Ho,“Tea polyphenol (−)-epigallocatechin-3-gallate: a new trap-ping agent of reactive dicarbonyl species,” Chemical Researchin Toxicology, vol. 20, pp. 1862–1870, 2007.
[48] D. Tan, Y. Wang, C. Y. Lo, and C. T. Ho, “Methylglyoxal: itspresence and potential scavengers,” Asia Pacific Journal ofClinical Nutrition, vol. 17, Supplement 1, pp. 261–264, 2008.
[49] X. Shao, N. Bai, K. He, C. T. Ho, C. S. Yang, and S. Sang,“Apple polyphenols, phloretin and phloridzin: new trappingagents of reactive dicarbonyl species,” Chemical Research inToxicology, vol. 21, pp. 2042–2050, 2008.
[50] S. Honda, Y. Miura, T. Masuda, and A. Masuda, “Effectiveconversion of metmyoglobin to oxymyoglobin by cysteine-substituted polyphenols,” Journal of Agricultural and FoodChemistry, vol. 64, pp. 806–811, 2016.
10 Oxidative Medicine and Cellular Longevity

Research ArticleMicroRNA-34a: A Key Regulator in the Hallmarks of RenalCell Carcinoma
Eman A. Toraih,1 Afaf T. Ibrahiem,2 Manal S. Fawzy,3,4 Mohammad H. Hussein,5
Saeed Awad M. Al-Qahtani,6 and Aly A. M. Shaalan7,8
1Faculty of Medicine, Genetics Unit, Department of Histology and Cell Biology, Suez Canal University, P.O. 41522, Ismailia, Egypt2Faculty of Medicine, Department of Pathology, Mansoura University, Mansoura, Egypt3Faculty of Medicine, Department of Medical Biochemistry, Suez Canal University, P.O. 41522, Ismailia, Egypt4Faculty of Medicine, Department of Medical Biochemistry, Northern Border University, Arar, Saudi Arabia5Ministry of Health, Cairo, Egypt6Faculty of Medicine, Department of Physiology, Jazan University, Jazan, Saudi Arabia7Faculty of Medicine, Department of Histology and Cell Biology, Suez Canal University, Ismailia, Egypt8Faculty of Medicine, Department of Anatomy and Histology, Jazan University, Jazan, Saudi Arabia
Correspondence should be addressed to Eman A. Toraih; [email protected] Manal S. Fawzy; [email protected]
Received 29 April 2017; Revised 7 August 2017; Accepted 20 August 2017; Published 20 September 2017
Academic Editor: Simona G. Bungǎu
Copyright © 2017 Eman A. Toraih et al. This is an open access article distributed under the Creative Commons AttributionLicense, which permits unrestricted use, distribution, and reproduction in any medium, provided the original work isproperly cited.
Renal cell carcinoma (RCC) incidence has increased over the past two decades. Recent studies reported microRNAs as promisingbiomarkers for early cancer detection, accurate prognosis, and molecular targets for future treatment. This study aimed to evaluatethe expression levels of miR-34a and 11 of its bioinformatically selected target genes and proteins to test their potentialdysregulation in RCC. Quantitative real-time PCR for miR-34a and its targets; MET oncogene; gene-regulating apoptosis(TP53INP2 and DFFA); cell proliferation (E2F3); and cell differentiation (SOX2 and TGFB3) as well as immunohistochemicalassay for VEGFA, TP53, Bcl2, TGFB1, and Ki67 protein expression have been performed in 85 FFPE RCC tumor specimens.Clinicopathological parameter correlation and in silico network analysis have also implicated. We found RCC tissues displayedsignificantly higher miR-34a expression level than their corresponding noncancerous tissues, particularly in chromophobicsubtype. MET and E2F3 were significantly upregulated, while TP53INP2 and SOX2 were downregulated. ROC analysis showedhigh diagnostic performance of miR-34a (AUC= 0.854), MET (AUC= 0.765), and E2F3 (AUC= 0.761). The advancedpathological grade was associated with strong TGFB1, VEGFA, and Ki67 protein expression and absent Tp53 staining. Thesefindings indicate miR-34a along with its putative target genes could play a role in RCC tumorigenesis and progression.
1. Introduction
Renal cell carcinoma (RCC) accounts for approximately 3%of human malignancies, and its incidence appears to beincreasing globally [1]. RCC is not a single disease; althoughit is derived from cells of the renal tubular epithelium, it hasseveral histological subtypes which differ in their clinical out-come and biological features. It is classified into clear cellRCC accounting for (75%) of cases, papillary RCC (10–15%), chromophobe RCC (5%), collecting duct RCC (<1%),
and unclassified subtype [2]. For the refinement of RCC ther-apeutic strategies, a better realization of the RCC-underlyingmolecular mechanisms will be mandatory [3].
Over the past few years, emerging numerous bioinfor-matic tools have been developed to identify candidatedisease-causing genes [4], including microRNA (miRNA)genes. This class of noncoding RNAs is small, singlestranded, and 19–25 nucleotide long that act as negativeregulators involved in posttranscriptional silencing of thegene expression [5]. An aberrant miRNA expression could
HindawiOxidative Medicine and Cellular LongevityVolume 2017, Article ID 3269379, 21 pageshttps://doi.org/10.1155/2017/3269379

contribute to cancer development and progression [6, 7] andcould affect their target genes that are involved in many bio-logical processes, such as cell differentiation, proliferation,apoptosis, metabolism, and development [8]. Recently, thepotential therapeutic use of miRNAs has been evaluateddue to their dynamic and reversible properties. This mayinclude oncomir (oncogenic miRNA) inhibition, or tumorsuppressor-miRNA replacement therapies [6, 9].
MicroRNA-34a gene (MIR-34A) that is located on chro-mosome 1p36 belongs to one of evolutionary-conservedmiRNA families (MIR-34 family) that consists of three mem-bers: MIR-34A, MIR-34B, and MIR-34C [10]. MIR-34A hasits own transcript and is expressed at higher levels than MIR-34B/C in most tissues, and this expression could be dysregu-lated in multiple diseases, especially in cancers [11]. It isinvolved in p53 pathways and is implicated in cell death/sur-vival signaling, the cell cycle, and differentiation, therebyplaying a regulatory role in carcinogenesis [12]. Previousstudies have reported that several key molecules were identi-fied as targets of miR-34a, including Bcl-2 (B-cell lymphoma2) [13], TGFB (transforming growth factor-beta) [14], thetranscription inducer of cell cycle progression E2F3a [15],MET oncogene [16, 17], and vascular endothelial growthfactor (VEGF) [18]. In addition, our bioinformatic analysisthat has been discussed in details in Materials and Methodssection of the current work has revealed other miRNA-34a-predicted target genes that could be involved in cancer-related biology, including genes for apoptosis [TP53INP(tumor protein p53 inducible nuclear protein), Tp53, andDFFA (DNA fragmentation factor subunit alpha)], cell prolif-eration (Ki67), and cell differentiation SOX2 (sex-determiningregion Y-box 2). As miR-34a has many different targets inregulating different kinds of human cancer, Yu et al. [18]suggested the role of miR-34a is possibly tumor-specific andhighly dependent on its targets in different cancer cells.
Whether miR-34a or any one of its selected aforemen-tioned 11 putative target genes or proteins could be relatedto RCC pathogenesis and/or progression in our populationstill lacks of solid evidence. Therefore, we aimed to investi-gate the expression level of miR-34a and a panel of selectedputative targets in an attempt to better understand themolecular mechanisms that underlie the tumorigenesis andprogression of RCC. This could represent potential futuretherapeutic targets in renal cell carcinoma.
2. Materials and Methods
2.1. Study Population. Eighty-five archived formalin-fixedparaffin-embedded (FFPE) renal samples that have beentaken from patients who underwent radical nephrectomyfor a primary RCC and dating back for 3 years were collectedfrom Pathology laboratory of Mansoura Oncology Center,Mansoura and Pathology laboratory of the Suez Canal Uni-versity Hospital, Ismailia, Egypt. None of the patientsreceived any neoadjuvant chemotherapy or radiotherapy.Complete clinicopathological data, including (patients’ age,sex, and tumor’s site and size), were obtained from patientmedical records. Sections of cancer-free tissues adjacent tothe tumor were cut, examined, and collected to serve as
controls during the genetic profiling. Samples that were nothomogeneous, histologically well-characterized primaryrenal cancer, nor had cancer-free adjacent tissues determinedby an experienced pathologist have been excluded. The studywas conducted in accordance with the guidelines in theDeclaration of Helsinki and approved by the MedicalResearch Ethics Committee of Faculty of Medicine, SuezCanal University. Written informed consent was obtainedfrom all participants before providing the archived tissuesamples as part of their routine register in our UniversityTeaching Hospitals.
2.2. Bioinformatic Selection of miRNA-34a and the StudyMolecular Targets. Predicted and experimentally validatedmiRNAs that significantly target renal cell carcinoma KEGGpathway (hsa05211) were identified by DIANA-mirPath v3.0web server via Reverse Search module and TarBase v7.0 pipe-line [19]. The most top and highly significant miRNAinvolved in this pathway was hsa-miR-34a-5p (p = 1 275767e − 88) with 28 target genes, including MET oncogene andthree angiogenesis-related genes (VEGFA, TGFB1, TGFB3).Assessment of miR-34a regulatory roles in cancer biologywas performed by DIANA-mirPath v3.0 online software(Figure 1).
The list of all experimentally validated target genes formiR-34a-5p was retrieved from miRTarBase v20 (http://mirtarbase.mbc.nctu.edu.tw/) [20] and DIANA-TarBasev7.0 (http://diana.imis.athena-innovation.gr/) [21]. A panelof other targets involved in cancer-related biology was cho-sen. It included genes for apoptosis (Tp53, TP53INP2, andDFFA), antiapoptosis (BCL2), cell proliferation (E2F3 andKi67), and cell differentiation (SOX2) (Figure 2). Structuralanalysis of MIR-34A gene and transcripts were retrievedfrom http://Ensembl.org. Gene expression of MIR-34A acrossnormal human tissues was obtained from http://BioGPS.organd Expression Atlas. Complementary base pairing ofmiR-34a-5p seed region with the selected mRNA targetswas confirmed by both http://microRNA.org resource [22]and miRTarBase v20. Prior publications demonstratingfunctional experimental validation of miRNA-target interac-tions by different methods (as luciferase reporter assay, west-ern blot, microarray, qRT-PCR, and immunocytochemistry)are listed in Supplementary Table S1 available online athttps://doi.org/10.1155/2017/3269379. A functional interac-tion network of selected target proteins was implementedusing STRING v10 program (http://string-db.org), inferringprotein-protein associations from coexpression data [23].
2.3. MicroRNA-34a and Gene Expression Analysis. TotalRNA, including the small RNAs, was isolated from FFPE tis-sue sections (5 to 8μm thick) using miRNeasy FFPE Kit(Qiagen, 217504) following the protocol supplied by themanufacturer. Briefly, after the removal of paraffin by xyleneand washing the sample with ethanol several times, proteinswere degraded by incubation with proteinase K solution at45°C for a few hours and later incubation with DNAses forDNA digestion. Total RNA quantity and quality were mea-sured by Nanodrop ND-1000 (NanoDrop Technologies,Wilmington, DE). Samples with a 260/280 nm absorbance
2 Oxidative Medicine and Cellular Longevity

ratio less than 1.8 were discarded, and new sections of thecorresponding tissue block were cut and purified, if possible.Subsequent reverse transcription (RT) and amplification ofcDNA by real-time PCR using StepOne™ Real-Time PCRSystem (Applied Biosystems) were done as described indetails previously [8, 24]. As the quantitation cycle (Cq)values of RNU6B small RNA and GAPDH were uniformlyand stably expressed with no significant difference betweencancer and noncancer tissues, they have been run for normal-ization of miRNA-34a and target gene mRNA expressionanalysis, respectively. All the PCR reactions were carriedout in accordance with the Minimum Information for Publi-cation of Quantitative Real-Time PCR Experiments guide-lines [25]. Ten percent randomly selected study sampleswere reevaluated in separate runs for the study gene expres-sions to test the reproducibility of the qPCR which showedvery close Cq value results and low standard deviations.
2.4. Histopathological Examination. Sections of 4μm thick-ness have been cut from FFPE blocks of RCC tissues for
routine H&E examination, and other sections were preparedon charged slides for immunohistochemistry. Examinationof three tumor slides from each specimen was done with anOlympus CX31 light microscope. Photos were obtained bya PC-driven digital camera (Olympus E-620). Cases werereviewed to determine the histological type according to theInternational Society of Urological Pathology (ISUP) Van-couver Modification of WHO (2004) Histologic Classifica-tion of Kidney Tumors [26]. Nuclear grade is assessedaccording to Fuhrman et al. [27]. Tumors were stagedaccording to the International Union Against Cancer [28].
2.5. Immunohistochemistry Examination and Analysis.Immunohistochemical analysis for p53 protein, Bcl2 protein,Ki67, TGFb, and VEGF with a labelled streptavidin-biotin-peroxidase complex technique was performed on tumorsections. The primary antibodies were mouse monoclonalantibodies against p53 (clone BP-53-12, monoclonal mouseanti-human p53, c-Kit, Genemed, California, USA, diluted1 : 50), Bcl2 (code 226M98, monoclonal mouse anti-human
Papi
llary
RCC
(I)
Cell proliferationCell cycle progression
HGF
GAB1
GRB2 SOS2 Ras
MAPK1
ARAF
MAPK signalingpathway
MET
PIK3CG AKT2 Survival
Cell junctionMigration/invasion
crk
ERKMEK
Cell polarityActin cytoskeletonMotility
BHD ????
Intercalated cell of renal collecting duct epithelium
Onc
ocyt
oma
Chro
mop
hobe
HIF1A
EGLN3
Proximal renal tubular epitheliumCl
ear c
ell R
CC
DegradationNormoxin
HypoxiaCREBBP VEGFA
TGFB3
TGFA Growthstimulation
Angiogenesis
Cell proliferation
↑ Nutrientsand O2
VHLTGF-�훽 signaling
pathway
VEGF signalingpathway
Papi
llary
RCC
(II)
HIF-�훽
HIF-1 signalingpathway
GlucosetransportSLC2A1EP300
PTPN11
Rap-1
PAK4
JUN
JUN
c3 5
Renal cell carcinoma
Figure 1: Predicted target genes of miRNA-34a in renal cell carcinoma pathway [KEGG hsa05211]. Disease pathways for each pathologicalsubtype are shown. Hsa-miR-34a-5p can target several genes in RCC pathway. They have complementary regions at their 3′UTR, 5′UTR, orcoding sequence (CDS): HIF-1, VEGF, and TGF-β signaling pathways in clear cell and papillary type II RCC (eosinophilic), as well as MAPKsignaling pathway in papillary RCC type I (basophilic). However, candidate genes and the role of miR-34a in oncocytoma and chromophobicRCC pathways are still undetermined. Colored box: miRNA-34a target gene; green color: target on 3′UTR sequence; blue color: target on5′UTR sequence; pink color: target on CDS; white box: not predicted target.
3Oxidative Medicine and Cellular Longevity
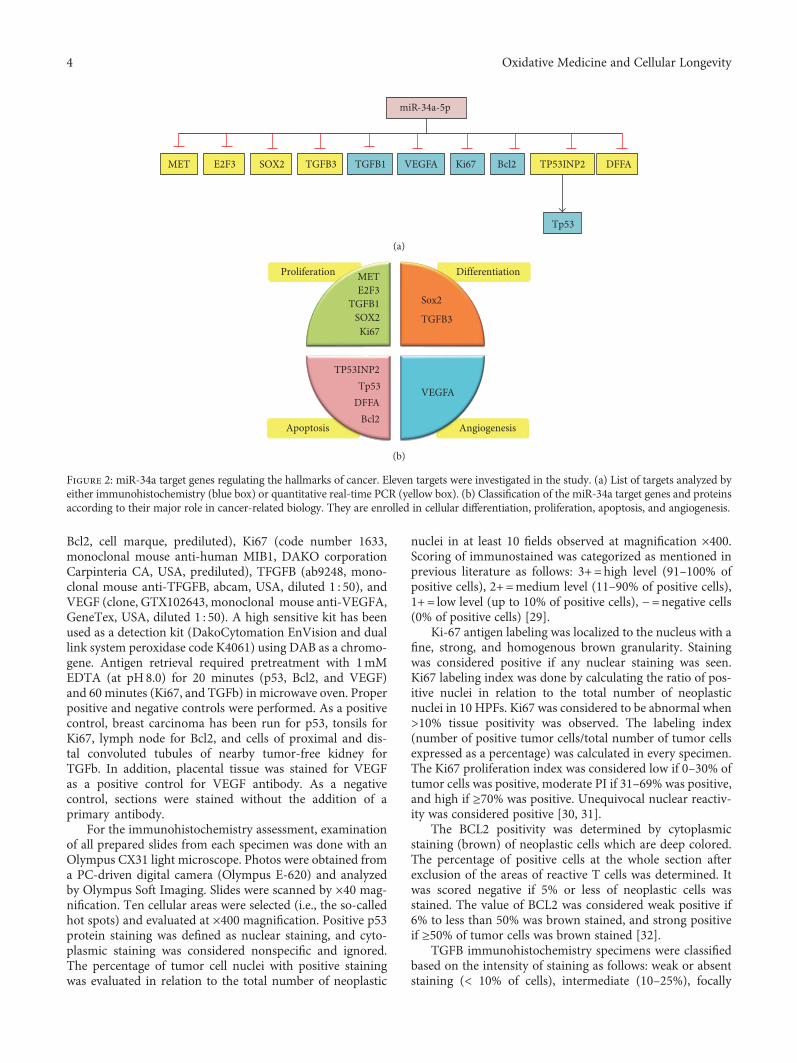
Bcl2, cell marque, prediluted), Ki67 (code number 1633,monoclonal mouse anti-human MIB1, DAKO corporationCarpinteria CA, USA, prediluted), TFGFB (ab9248, mono-clonal mouse anti-TFGFB, abcam, USA, diluted 1 : 50), andVEGF (clone, GTX102643, monoclonal mouse anti-VEGFA,GeneTex, USA, diluted 1 : 50). A high sensitive kit has beenused as a detection kit (DakoCytomation EnVision and duallink system peroxidase code K4061) using DAB as a chromo-gene. Antigen retrieval required pretreatment with 1mMEDTA (at pH8.0) for 20 minutes (p53, Bcl2, and VEGF)and 60 minutes (Ki67, and TGFb) in microwave oven. Properpositive and negative controls were performed. As a positivecontrol, breast carcinoma has been run for p53, tonsils forKi67, lymph node for Bcl2, and cells of proximal and dis-tal convoluted tubules of nearby tumor-free kidney forTGFb. In addition, placental tissue was stained for VEGFas a positive control for VEGF antibody. As a negativecontrol, sections were stained without the addition of aprimary antibody.
For the immunohistochemistry assessment, examinationof all prepared slides from each specimen was done with anOlympus CX31 light microscope. Photos were obtained froma PC-driven digital camera (Olympus E-620) and analyzedby Olympus Soft Imaging. Slides were scanned by ×40 mag-nification. Ten cellular areas were selected (i.e., the so-calledhot spots) and evaluated at ×400 magnification. Positive p53protein staining was defined as nuclear staining, and cyto-plasmic staining was considered nonspecific and ignored.The percentage of tumor cell nuclei with positive stainingwas evaluated in relation to the total number of neoplastic
nuclei in at least 10 fields observed at magnification ×400.Scoring of immunostained was categorized as mentioned inprevious literature as follows: 3+=high level (91–100% ofpositive cells), 2+=medium level (11–90% of positive cells),1+= low level (up to 10% of positive cells), −=negative cells(0% of positive cells) [29].
Ki-67 antigen labeling was localized to the nucleus with afine, strong, and homogenous brown granularity. Stainingwas considered positive if any nuclear staining was seen.Ki67 labeling index was done by calculating the ratio of pos-itive nuclei in relation to the total number of neoplasticnuclei in 10 HPFs. Ki67 was considered to be abnormal when>10% tissue positivity was observed. The labeling index(number of positive tumor cells/total number of tumor cellsexpressed as a percentage) was calculated in every specimen.The Ki67 proliferation index was considered low if 0–30% oftumor cells was positive, moderate PI if 31–69% was positive,and high if ≥70% was positive. Unequivocal nuclear reactiv-ity was considered positive [30, 31].
The BCL2 positivity was determined by cytoplasmicstaining (brown) of neoplastic cells which are deep colored.The percentage of positive cells at the whole section afterexclusion of the areas of reactive T cells was determined. Itwas scored negative if 5% or less of neoplastic cells wasstained. The value of BCL2 was considered weak positive if6% to less than 50% was brown stained, and strong positiveif ≥50% of tumor cells was brown stained [32].
TGFB immunohistochemistry specimens were classifiedbased on the intensity of staining as follows: weak or absentstaining (< 10% of cells), intermediate (10–25%), focally
TGFB1E2F3 TGFB3
miR-34a-5p
SOX2 VEGFA Bcl2 TP53INP2 DFFA
Tp53
MET Ki67
(a)
Proliferation Differentiation
Apoptosis Angiogenesis
TGFB3
VEGFA
METE2F3
Sox2TGFB1
Bcl2
TP53INP2
DFFATp53
SOX2Ki67
(b)
Figure 2: miR-34a target genes regulating the hallmarks of cancer. Eleven targets were investigated in the study. (a) List of targets analyzed byeither immunohistochemistry (blue box) or quantitative real-time PCR (yellow box). (b) Classification of the miR-34a target genes and proteinsaccording to their major role in cancer-related biology. They are enrolled in cellular differentiation, proliferation, apoptosis, and angiogenesis.
4 Oxidative Medicine and Cellular Longevity

strong (25–50%), and strong (> 50% of cells) [33]. VEGF sec-tions were considered positive for VEGF if the membranes orcytoplasm of more than 10% of tumor cells was stained [34].
2.6. Statistical Analysis. Data were managed using the Rpackage (version 3.3.2). Categorical variables were comparedusing the chi-square (χ2) or Fisher’s exact tests where appro-priate, while Mann–Whitney U (MW) and Kruskal-Wallis(KW) tests were used to compare continuous variables. Thecorrelation between miR-34a level and mRNAs and proteinexpression was calculated by Spearman’s rank correlationanalysis. A two-tailed p value of< 0.05 was considered statis-tically significant. The receiver operating characteristic(ROC) curves were performed to get the best cutoff valuesof either miR-34a or mRNAs for discriminating RCC fromnoncancer tissues. The fold change of miRNA and mRNAexpressions in each patient cancer tissue relative to thecorresponding cancer-free tissue was calculated via Livakmethod based on the quantitative cycle (Cq) valueswith the following equation: relative quantity = 2−ΔΔCq,where ΔΔCq= (Cq miRNA–Cq NBU6)RCC− (Cq miRNA–CqNBU6)NAT in case of miR-34a analysis and where ΔΔCq=(Cq mRNA–Cq GAPDH)RCC− (Cq mRNA–Cq GAPDH)NATin case of study gene target analysis [35].
3. Results
3.1. Baseline Characteristics of the Study Population. In thecurrent study, 85 patients (32 females and 53 males) wereenrolled in the study. Their age ranged from 20 to 79 yearsold with mean± SD of 52.23± 11.12. Renal cancer sampleswere compared to normal tissues. There was no significantdifference in age and gender between FFPE tumor samplesand normal renal tissues (p = 0 087 and p = 0 214, resp.).The clinicopathological characteristics of renal cell carci-noma patients are demonstrated in Table 1. According tothe 2004 WHO classification, several histological RCCsubtypes were recognized in the study population. Themost frequent histological subtypes included clear cellrenal cell carcinomas (ccRCC), papillary renal cell carcino-mas (pRCC), and chromophobe renal cell carcinomas(crRCC). Most cancer specimens were moderately or poorlydifferentiated; nevertheless, low proportions of tumors hadhigh tumor size (T3), positive lymph node involvement,capsular and pelvic infiltration, and vascular invasion.
3.2. Gene and Protein Expression Analysis. Using qRT-PCRtechnology and immunohistochemistry, gene and proteinexpression analyses were used to identify differential molecu-lar changes between tumor and normal renal tissues. Geneexpression profiling revealed a significant overexpression ofmiR-34a in almost all RCC patients (91.7%) with an overallmedian and quartile values of 7.97 (2.37–29.54). In addition,among the 6 genes that have been predicted to be targeted bymiR-34a via the in silico computational tools, two genes weresignificantly upregulated (MET and E2F3) in 87.1% of FFPEsamples, while two others were downregulated (TP53INP2and SOX2) in almost all RCC patients compared to noncan-cer tissues (Figure 3). However, correlation analysis revealed
no significant relationship of miR-34a with the tested targetgenes (Supplementary Table S2 and Figure S1).
Immunohistochemistry of renal tissue samples demon-strated variable staining patterns (Figure 4). Ki-67 expres-sion, a cell proliferation marker, was detected in all cases ofRCC but with variable level of expression. Low level ofexpression (<10%) was detected in 28 cases (70%), while highexpression (≥10%) was noted in 12 cases (30%). Similarly, theangiogenesis-mediated protein (VEGFA) and the antiapop-totic marker (Bcl2) were expressed in all cancer tissues.Eighty percent of patients had high expression of VEGFA,while only 20% demonstrated weak staining. Antihuman
Table 1: Clinicopathological characteristics of renal cell carcinomapatients (n = 85).
Variables N %
Age
20 y 5 5.9
40 y 47 55.3
60 y 33 38.8
Gender
Females 34 40.0
Males 51 60.0
Affected side
Right 47 44.7
Left 38 55.3
Histological type
Clear cell RCC 47 55.3
Papillary RCC 15 17.6
Chromophobic RCC 13 15.3
Unclassified 10 11.8
Pathological grade
Grade 1 11 12.9
Grade 2 51 60.0
Grade 3 23 27.1
Tumor size
T1 25 29.4
T2 42 49.4
T3 18 21.2
LN involvement
Negative 77 90.6
Positive 8 9.4
Capsular infiltration
Negative 60 70.6
Positive 25 29.4
Vascular infiltration
Negative 71 83.5
Positive 14 16.5
Renal pelvis infiltration
Negative 79 92.9
Positive 6 7.1
Data are presented as N (number) and % (percentage); RCC: renal cellcarcinoma; T: tumor size; LN: lymph node.
5Oxidative Medicine and Cellular Longevity

Bcl2 antibody was widely distributed all over the renal cancertissues. Strong expression was noted in 75% of samples. ForTGFB1 protein, most of cancer tissue attained moderate tostrong expression in the cytoplasm, but the protein was lessintense in approximately one-fifth of patients and absentin three samples only. In contrast, expression of the tumorsuppressor protein (Tp53) was not detected by immuno-histochemistry in less than half of tumor specimens.Unlike tumor cells, which had nuclear staining, lining cellsof the proximal tubules stained the cytoplasm only.
ROC curve analysis of all genes and proteins showedsignificant high diagnostic performance of miR-34a(AUC=0.854), MET (AUC=0.765), and E2F3 (AUC=0.761) in differentiating between cancer specimens andnoncancer tissues (Table 2).
3.3. Association of Gene and Protein Signature withClinicopathological Features. The expression of miR-34awas markedly higher in RCC samples with chromophobicrenal cell carcinoma and lower in clear cell type (p = 0 039)
(Figure 5(a)). In addition, its level was inversely correlatedwith the tumor pathological grade (r = −0 301, p = 0 037).Among the target genes, lower levels of three genes E2F3,SOX2, and DFFA were significantly associated with capsular,pelvic, and vascular invasion, respectively (Figures 5(b), 5(c),and 5(d)). These findings were consistent with Spearman’scorrelation analysis (Supplementary Table S3).
Immunohistochemistry photos of the target proteins inrenal tissues in relation with pathological parameters areillustrated in Figure 6. The advanced pathological gradewas significantly associated with strong expression of Ki67(p = 0 001), TGFB1 (p = 0 034), VEGFA proteins (p = 0 001),and absent Tp53 staining (p = 0 029) (Figures 7(a), 7(b), 7(c),and 7(d)). Larger tumor size and capsular infiltration alsoshowed higher Ki67 expression (p = 0 027 and p = 0 014,resp.) (Figures 7(e) and 7(f)). Additionally, there was dif-ferential expression of TGFB1 and Tp53 proteins accordingto the specimen histopathological diagnosis, with stron-ger staining in chromophobic renal cell carcinoma type(Figures 7(g) and 7(h)). Similarly, correlation analysis
80
100
60
40
20
0
p = <0.001
Controls Patients
7.97 (2.37–29.54)
miR
-34a
fold
chan
ge
(a)
p = 0.004
Controls Patients
16.91 (1.32–60.66)150
100
50
0
MET
fold
chan
ge
(b)
p = 0.005
Controls Patients
14.62 (1.39–39.39)
E2F3
fold
chan
ge
80
60
40
20
0
(c)SO
X2 fo
ld ch
ange
p = 0.493
Controls Patients
3.97 (0.25–5.41)20
15
10
5
0
(d)
p = 0.583
Controls Patients
1.49 (0.13–11.25)20
25
15
10
5
0
TGFB
3 fo
ld ch
ange
(e)
p = <0.001
Controls Patients
0.42 (0.07 – 0.65)2.0
1.5
1.0
.5
.0
DFF
A fo
ld c
hang
e
(f)
p = <0.001
Controls Patients
0.0001 (0.0001–0.024) .8
1.0
.6
.4
.2
.0TP53
INP2
fold
chan
ge
(g)
Figure 3: Gene expression profiling in cancer and normal renal tissues. Data are represented as medians. The box defines upper and lowerquartiles (25% and 75%, resp.), and the error bars indicate upper and lower adjacent limits. Expression levels of miR-34a and targets in cancerand normal tissues were normalized to RNU6B and GAPDH, respectively. Fold change was calculated using the delta-delta CT method(2−ΔΔCT) in comparison to normal renal tissues. The gray dash line represents the expression level of normal renal tissues (equivalent to1.0). p values< 0.05 were considered statistical significant. Mann–Whitney U test was used for comparison. Median and quartile values ofpatients are noted in red.
6 Oxidative Medicine and Cellular Longevity

between proteins and clinicopathological characteristicsdemonstrated moderate correlation of Ki67 with histopatho-logical diagnosis (r = −0 419, p = 0 007), grade (r = 0 690,p < 0 001), tumor size (r = 0 389, p ≤ 0 001), LN invasion(r = 0 351, p = 0 026), and capsular infiltration (r = 0 431,p = 0 006). TGFB1 protein showed moderate correlationwith histopathological diagnosis (r = 0 427, p = 0 006) andtumor grade (r = 0 441, p = 0 004). VEGFA protein alsoshowed a significant positive correlation with pathologicalgrade (r = 0 563, p < 0 001). In contrast, there was a negative
correlation between Tp53 and grade (r = −0 403, p = 0 010)(Supplementary Table S3).
3.4. In Silico Data Analysis. Hsa-miR-34a is encoded byMIR-34A gene (ENSG00000284357), mapped at 1p36.22.The gene has a single exon which contains a p53-binding sitewithin a CpG island about 30 kb upstream of the matureMIR-34A sequence and encodes for a transcript of 110 bpin length. The precursor miRNA stem-loop is processed inthe cytoplasm of the cell, with the predominant miR-34a
0
20
40
60
80
Weak Strong
Freq
uenc
y (%
)
Bcl2 expression
(a)
Freq
uenc
y (%
)
0
20
40
60
Negative PositiveTp53 expression
(b)
Freq
uenc
y (%
)
0
10
20
30
40
Negative Weak Mod StrongTGFB1 expression
(c)
0
20
40
60
Weak Mod Strong
Freq
uenc
y (%
)
VEGFA expression
(d)
0
20
40
60
Weak Mod Strong
Freq
uenc
y (%
)
Ki67 expression
(e)
Figure 4: Frequency of Immunohistochemistry markers of miR-34a putative target proteins in RCC specimens. Five protein markers wereexamined, Bcl2, Tp53, TGFB1, VEGFA, and Ki67.
Table 2: ROC curve of miRNA-34a and target genes in renal cancer and normal tissues.
Variable(s) Area Standard error p value95% confidence interval
Lower bound Upper bound
miR-34a 0.854 0.051 <0.001 0.754 0.954
MET 0.765 0.059 0.005 0.648 0.881
E2F3 0.761 0.063 0.006 0.638 0.884
SOX2 0.571 0.094 0.479 0.388 0.755
TGFB3 0.553 0.081 0.586 0.395 0.711
DFFA 0.118 0.053 0.068 0.014 0.222
TP53INP2 0.587 0.062 0.173 0.466 0.709
Combined first three markers 0.793 0.034 <0.001 0.727 0.859
All combined markers 0.589 0.030 0.014 0.530 0.648
Bold values are statistically significant at p < 0 05.
7Oxidative Medicine and Cellular Longevity

mature sequence excised from the 5′ arm of the hairpin. Sec-ondary structure of hsa-miR-34a stem-loop predicted bycomputational programs is illustrated in Figure 8(a). Func-tional characterization of miR-34a based on differentialexpression experiments revealed its control on numerouscancer-related molecular pathways and cellular processes. Itcan control up to 115 genes involved in pathways in cancer(hsa05200), in addition to dozens of genes in particulartumor types (Figure 8(b)). As shown in the heat map, themost top five significant pathways targeted by miR-34a weremicroRNAs in cancer, fatty acid biosynthesis, proteoglycansin cancer, adherence junction, and cell cycle (Figure 8(b)and Supplementary Table S4).
Interaction of mature miR-34a-5p with complementarysites of selected experimentally validated targets is shownin Supplementary Figure S2. Protein-protein interactionbetween the targets is shown in Supplementary Figure S3.Enrichment analysis of the target panel elucidated their func-tional impact on numerous biological processes and cancerKEGG pathways (Supplementary Table S5 and S6).
4. Discussion
A key goal in clinical oncology is the development of thera-peutic strategies that impede specific deregulated biological
pathways in cancer. Understanding these pathways whichinvolve candidate disease-causing genes will provide newtherapeutic modalities for renal cancer.
In the current study, upregulation of miR-34a wasobserved in more than 90% of RCC patients, with medianfold change of 7.97 in RCC FFPE tissues compared to non-cancer tissues. ROC analysis revealed a high diagnostic per-formance of miR-34a in discriminating between cancer andnoncancer tissues. However, higher levels showed a betterprognosis (i.e., it was moderately correlated with well differ-entiated tumors). In addition, expression profiles in chromo-phobic RCC samples were markedly greater than that of clearcell and papillary subtypes.
According to a survey across diverse normal human tis-sues, miR-34a was downregulated in most human normal tis-sues, including renal cortex and medulla (data source:U133plus2 Affymetrix microarray from http://BioGPS.org).Consistent with our findings in renal cancer tissues,miRNA-34a has been reported to support cell proliferationin oxidative stress-induced renal carcinogenesis rat model[36] and it has been found to be overexpressed in varioustypes of human cancer [37–40]. As one of the upregulatedmiRNAs in RCC, it has been speculated to function by down-regulating tumor suppressor genes including secretedfrizzled-related protein 1 (SFRP1) [41]. In addition, miR-
p = 0.039
ccRCCHistopathological type
pRCC crRCC Unclassified
miR
-34a
fold
chan
ge
0
100
200
300
400
(a)
p = 0.028
Negative PositiveCapsular infiltration
E2F3
fold
chan
ge
0
20
40
60
80
(b)
p = 0.021
Negative PositivePelvic infiltration
0
5
10
15
20
SOX2
fold
chan
ge
(c)
p = 0.013
Negative PositiveVascular infiltration
.0
.5
1.0
1.5
2.0
DFF
A fo
ld ch
ange
(d)
Figure 5: Association of miR-34a and target genes with the clinicopathological features in RCC patients. (a) Higher expression of miR-34awas significantly associated with chromophobic RCC subtype. (b) Lower levels of E2F3 were associated with capsular infiltration. (c)Lower levels of SOX2 had higher frequency of pelvic infiltration in RCC tumor tissues. (d) DFFA downregulation was associated withvascular infiltration.
8 Oxidative Medicine and Cellular Longevity

34a was identified to be a direct target of the tumor suppres-sor Tp53 protein in human and mouse cells and mediatessome of its proapoptotic biological functions [42, 43]. Simi-larly, He et al. found that deregulation of miR-34a onresponse to DNA damage and oncogenic stress depends onp53 in vitro and in vivo [13].
In vitro, miR-34a was coexpressed with Tp53 at highlevels in colorectal cancer cell lines and in irradiated micebut was not expressed in Tp53-knockout mice [44]. Thesefindings could explain the good prognosis that is implied byhigher levels of miR-34a in the current samples with low
pathological grade and in chromophobic RCC subtype. Ithas been found that miR-34a expression could suppressthe cell proliferation [38, 44], promote apoptosis throughthe induction of caspase-dependent apoptotic pathways[42, 45] in several cancer cell lines [46–48], and cause dra-matic reprogramming of gene targets that regulate apoptosis,DNA repair, cell cycle progression, epithelial-mesenchymaltransition, and angiogenesis [42, 49]. In addition, miR-34arestoration in cancer cells was shown to induce cell cyclearrest at G1 and G2/M phases and sensitized the cells tochemo- and radiotherapy [16, 50]. However, low expression
(1) (2) (3) (4)
Bcl2
(5) (6) (7) (8)Tp
53
(9) (10) (11) (12)
TGFB
1
(13) (14) (15) (16)
VEG
FAKi
67
(17) (18) (19) (20)
Figure 6: Immunohistochemistry images according to type and grade of RCC. Clear cell RCC (Ng1) weakly expresses bcl2 (x100), (photo 1),clear cell RCC (Ng2) with focal strong cytoplasmic bcl2 (x100) (photo 2), chromophobe RCC (Ng2) with diffuse moderate expression of bcl2(x400) (photo 3), and papillary RCC (Ng2) with diffuse strong expression of bcl2 (x200) (photo 4). Clear cell RCC (Ng1/2) with diffuse strongnuclear expression of P53 (x100) (photo 5), clear cell RCC clear cell RCC (Ng3) showed scarce cell nuclei express P53 (X200) (photo 6),chromophobe RCC (Ng2) diffusely and strongly express P53 (X100) (photo 7), and papillary RCC do not express p53 (x100) (photo 8).Clear cell RCC (Ng2) with weak expression of TGFB1 (x100) (photo 9), RCC (Ng3) with strong expression of TGFB1 (x200) (photo 10),chromophobe RCC with focal strong expression of TGFB1 (X200) (photo 11), and papillary with focal strong expression of TGFB1(X200) (photo 12). Clear cell RCC (Ng1) with diffuse weak expression of VEGFR (X100) (photo 13), clear RCC (Ng3) with diffusemoderate expression of VEGFR (X200) (photo 14), chromophobe RCC with weak expression of VEGF (X100) (photo 15), papillary RCCwith intermediate expression of VEGFR (X200) (photo 16). RCC (Ng2) with low expression of Ki67 (X100) (photo 17), RCC (Ng3) withhigh expression of Ki67 (X200) (photo 18), and papillary RCC does not express Ki 67 (x100) (photo 19), and chromophobe RCC do notexpress Ki67 (x200) (photo 20).
9Oxidative Medicine and Cellular Longevity

of miR-34a was noted in other types of cancer [46, 51–54], inglioblastoma and glioma with mutant Tp53 [55], in chroniclymphocytic lymphoma with Tp53 deletion [56], and in met-astatic hepatocellular carcinoma [57], reflecting that miRNA-34a can work in a cell type-specific manner with a differentialp53 pathway inactivation [36].
Taken our results with the findings of prior studies, wecould support the hypothesis that miR-34a overexpressionin the current study is a secondary consequence in cancercells elucidated to compete the DNA damage and uncon-trolled growth proliferation. Accumulation of further muta-tions in higher pathological grade tumors, especially those
related to Tp53 gene activity or 1p36 locus itself, couldaccount for the fall of miR-34a expression profile in thosepatients. Further functional studies are recommended tounravel the molecular mechanisms underlying the chromo-phobic RCC which has the best prognosis among all othersubtypes in our cases [58–60].
In silico analysis of miR-34a targets in databasesrevealed numerous candidate gene targets. Functionalannotation and enrichment analysis showed high linkageof miR-34a with cancer-related pathways. It can influenceseveral pathways involved in all cancer hallmarks acquiredduring the multistep development of human tumors, by
0%
20%
40%
60%
80%
100%
Grade 1/2 Grade 3
Freq
uenc
y (%
)
Ki67 expression
WeakMod
Strong
p = <0.001
(a)
Grade 1/2 Grade 3
TGFB1 expression
NegativeWeak
ModStrong
p = 0.034
0%
20%
40%
60%
80%
100%
Freq
uenc
y (%
)(b)
0%
20%
40%
60%
80%
100%
Freq
uenc
y (%
)
WeakMod
Strong
Grade 1/2 Grade 3
VEGFA expression
p = 0.001
(c)
0%
20%
40%
60%
80%
100%
Freq
uenc
y (%
)
Grade 1/2 Grade 3
Tp53 expression
NegativePositive
p = 0.029
(d)
0%
20%
40%
60%
80%
100%
Freq
uenc
y (%
)
WeakMod
Strong
p = 0.027
T1 T2 T3
Ki67 expression
(e)
0%
20%
40%
60%
80%
100%
Freq
uenc
y (%
)
WeakMod
Strong
p = 0.014
Negative Positive
Ki67 expression
(f)
0%
20%
40%
60%
80%
100%
Freq
uenc
y (%
)
NegativePositive
Clear cell Papillary ChromophobicTp53 expression
p = 0.035
(g)
NegativeWeak
ModStrong
0%
20%
40%
60%
80%
100%
Freq
uenc
y (%
)
Clear cell Papillary ChromophobicTGFB1 expression
p = 0.001
(h)
Figure 7: Association of immunohistochemistry markers with the clinicopathological features in RCC patients. The figures illustrated higherintensity of Ki67, TGFB1, VEGFA, and Tp53 in RCC tumors with advanced pathological grade (a–d), extensive staining of Ki67 antibodies inT3 samples and capsular infiltration (e-f), and differential expression of Tp53 and TGFB1 in various histopathological subtypes (g-h).
10 Oxidative Medicine and Cellular Longevity

sustaining proliferative cell signaling, evading growth sup-pressors, resisting apoptosis, inducing angiogenesis, and acti-vating invasion and metastasis. In the current study, weidentified predicted putative miR-34a binding sites withinthe 3′ UTR, 5′UTR, or coding regions of eleven mRNAs.These selected genes were functionally validated in priorexperiments listed in Supplementary Table S1. Nevertheless,our data did not reveal inverse correlations of these targetswith miR-34a. This could be explained by the fact that theirgene expressions result from several integrated cell responsesand cross talk between signaling pathways. Additionally,according to miRNA databases, there are multiple-to-multiple relationships between microRNAs and target genes;one miRNA may regulate transcription of many genes,and a single gene could be targeted by multiple miRNAs
simultaneously, thus forming complex genetic circuits inhuman cancer [61, 62]. Liu et al., in addition, speculatedthe identified putative targets of miRNA could be regulatedby translation inhibition rather than degradation. Subse-quently, this would leave mRNA levels unaffected but reducethe protein levels. This speculation warrants the need of pro-tein level measurement in tumor/normal samples along withthe miRNA and mRNA levels for the same gene to identifysuch type of regulation [41].
Of the deregulated target genes expressed significantlyin the current renal cancer specimens, MET and E2F3were significantly upregulated in RCC compared to non-cancer tissues with high diagnostic performance. The Metprotooncogene, mapped at 7q31.2, has two alternativespliced isoforms (http://genecards.org). We identified two
2ry structure ofpre-miR-34a
(a)
miR-34a
Parkinson’s disease
Hepatitis BEndocytosisProstate cancer
Viral carcinogenesisThyroid hormone signaling pathway
Pancreatic cancerChronic myeloid leukemia
HTLV-1 infectionRegulation in actin cytoskeletonMelanomaBladder cancer
Glioma
Glycosphingolipid biosynthesisEndometrial cancerDNA replicationMetabolism in cancerAlcoholoismColor keyThyroid cancerColorectal cancerOther types O-glycan biosynthesisLog (p value)
–15 –10 –5 0
Non-small cell lung cancer
Renal cell carcinomaProgesterone-mediated ma
Fatty acid biosynthesisFatty acid metabolism
P53 signaling pathwayTranscriptional misregulation in cancer
Adherens junctionCell cycle
Pathways in cancer
Proteoglycans in cancer
MicroRNAs in cancer
3p 5p
(b)
Figure 8: Structural analysis of MIR-34A gene locus and transcripts. (a) Homo sapiens hairpin secondary structure of pre-miR-34a stem-loop. Mature miR-34a-5p highlighted in red [data source: miRTarBase v20]. (b) Enrichment pathway analysis for miR-34a. Heat mapshowing targeted pathways, diseases, and cancers for both hsa-miR-34a-5p and hsa-miR-34a-3p with p values< 0.05 and microT-CDSthreshold 0.4. A total of 33 pathways have target genes (in CDS or 3′ UTR regions) for miR-34a. The enrichment results of validatedtarget genes showed that most pathways were related to cancer and cancer-related pathways. KEGG pathway annotations relatedspecifically to current RCC work had been labeled (red). Degree of color is based on the significant p values of the predicted algorithm byDIANA tools; the red has the top significance estimated by false discovery rate (data source: DIANA-miRPath v2.0 web server).
11Oxidative Medicine and Cellular Longevity

putative miR-34a binding sites within the 3′ UTR and 5′UTR of the human c-Met mRNA. Similarly, Li et al.[16] and Hu et al. [17] reported that c-Met is directlytargeted by miR-34a. The MET gene encodes a receptortyrosine kinase that is activated by hepatocyte growth fac-tor (HGF) [16]. Ligand binding at the cell surface inducesautophosphorylation of carboxyl terminus of MET on itsintracellular domain that generates docking sites for secondmessengers, which activate several signaling pathwaysinvolving RAS-ERK, mitogen-activated protein kinase(MAPK), phosphatidylinositol 3-kinase- (PI3K-) AKT, sig-nal transducer and activator of transcription (STAT), andphospholipase C [63]. Such downstream signaling pathwaysevoke a variety of pleiotropic physiological processes, includ-ing survival, morphogenesis, differentiation, epithelial-mesenchymal transition, and regulation of cell migration[64]. However, improper activation of c-MET may conferproliferative and invasive/metastatic abilities of cancer cells[65]. Similar to our findings in RCC patients, MET over-expression was associated with multiple human cancers[63, 66–71]. Its aberrant expression by different mecha-nisms, including point mutations [72], gene amplification[73], and oncogenic deletion [74, 75, 76], may lead to amore aggressive cancer phenotype and may be a prognos-tic indicator of poor overall survival and resistance totherapy [74–76].
The second upregulated gene in most of the current RCCsamples was the transcription factor E2F3. ROC analysisshowed its high discrimination accuracy in RCC diagnosis.In addition, its expression profile was associated with capsu-lar infiltration. E2F3 gene lies on chromosome 6p22.3 andhas 3 transcript variants encoding 3 proteins of 465, 334,and 128 amino acids long. In contrast to full-length E2F3protein, which is expressed only at the G1/S boundary,truncated isoforms are expressed throughout the cell cycle[77, 78]. E2F3 recognizes a specific sequence motif in DNAand interacts directly with the tumor suppressor retinoblas-toma protein (pRB) to regulate the expression of genesinvolved in the G1/S boundary of the cell cycle and DNA rep-lication; hence, E2F3 has a critical role in the control of cellu-lar proliferation [79]. Acute loss of E2F3 activity affected theexpression of genes encoding DNA replication and mitoticactivities [80]. In vitro and in vivo studies showed a failureof division and proliferation in E2F3-null retinal progenitorcells [81] and early embryonic death in E2F3-null mice[82, 83]. Dysregulation of E2F3 and altered copy numberand activity of this gene have been observed in a numberof malignant tumors [84–92] and correlated with severalpathological features of cancer like the pathological gradeand tumor cell proliferation rate [91], as well as tumoraggressiveness and poor overall survival [91, 92]. However,transgenic mice expressing inducible E2F3 resulted inhyperplasia, but not tumor development [93], supportingits role in tumor progression rather than initiation.
As an excellent marker to determine the growth fractionof a given cell population, the expression of proliferation-related Ki67 antigen was investigated in the current study.The fraction of Ki67 positive cells is often correlated withthe clinical course of the tumors. Currently, this marker of
proliferation was detected in all cases of RCC, but with vari-able levels of expression. High expression of Ki67 was associ-ated with advanced pathological grade, large tumor size,lymphatic invasion, and capsular infiltration. In addition,strong staining was correlated with chromophobic RCC sub-type. Antigen Ki67 is a nuclear protein, encoded by MKI67gene that is mapped at 10q26.2. It has five splice variants;only two of them are translated to synthesize a long form(3256 aa/ 395 kDa) and a short form (2896 aa/345 kDa) pro-teins that differ only by the presence or absence of exon 7[94]. Antigen Ki67 is associated with cellular proliferation[95]. During interphase, the Ki67 protein can be exclusivelydetected within the cell nucleus, whereas in mitosis, most ofthe protein is relocated to the surface of the chromosomes[96]. Ki67 protein is present during all active phases of thecell cycle (G1, S, G2, and mitosis) but is absent from restingcells (G0) [95, 97]. GO annotation identified the gene toplay vital roles in chromosomal segregation regulationand organization, nuclear division, cell cycle, organ regen-eration, and stress response (http://genecards.org). It isalso associated with ribosomal RNA transcription and syn-thesis [98, 99]. Several lines of evidence have implicated theimportance of Ki67 index in multiple cancers [100–106]and reported its prognostic value for survival and tumorrecurrence [107–114].
Regarding the TGFB superfamily proteins, they wereknown to be implicated in cell growth and differentiation.These growth factors bind various TGF-beta receptors, lead-ing to recruitment and activation of SMAD family transcrip-tion factors which regulate the expression of the downstreamgenes, including interferon gamma and tumor necrosis factoralpha [115]. We examined the expression profile of TGFB1protein and TGFB3 gene. In RCC samples, TGFB3 mRNAdid not show differential expression compared to noncancertissues. However, TGFB1 protein showed moderate to strongcytoplasmic staining in most samples. Higher protein levelexpression was associated with poor tumor differentiationand chromophobic subtype. This protein is involved inembryogenesis and cell differentiation and may play animportant role in apoptosis, immune defense, inflammation,and tissue repair [115, 116]. Overexpression or alterations ofits active protein induced by gene somatic mutations werefrequently observed in several tumor cells [117–121] andwere correlated with tumor aggressiveness, invasion, angio-genesis, metastasis, immune surveillance inhibition [122],and epithelial-mesenchymal transformation [117].
SOX2 is a critical transcription factor for self-renewal andmaintenance of undifferentiated embryonic stem cells [123].SOX2 gene is mapped at 3q26.33, consisting of a singleexon that encodes a protein of 318 amino acid residues(http://genecards.org). It was reported to be involved inembryonic development regulation and in the cell fate deter-mination, and its over expression can induce reprogrammingof somatic cells to acquire pluripotency characteristics[124, 125]. SOX2 was identified as an oncogenic factor andwas reported to be overexpressed in certain types of cancer[123, 126–129]. Knockdown of SOX2 could inhibit cell via-bility and tumorigenesis in vitro and in vivo [123, 126] bypotentiating cell cycle arrest associated with decreased levels
12 Oxidative Medicine and Cellular Longevity
of CCND1 and phosphorylated Rb and/or by upregulating ofp27Kip1 level [130]. In our samples, no differential expres-sion was observed between cancer and noncancer tissues;nevertheless, lower expression of SOX2 mRNA was corre-lated with cancer infiltration of renal pelvic tissues.
In the current study, one antiapoptotic and three proa-poptotic miR-34a targets regulating essential cancer-relatedpathways were examined. The apoptotic regulator BCL2gene, mapped at 18q21.33, has 2 alternative transcripts andencodes an integral outer mitochondrial membrane protein[131]. It has two protein isoforms, Bcl2a (5.5-Kb mRNA/239 aa) and Bcl2b (3.5-Kb/205 aa), which are identical exceptfor the C-terminal portion. The former contains a hydropho-bic tail for membrane anchorage which seems to be necessaryfor antiapoptotic ability [132]. Bcl2 is found on the outermembrane of mitochondria. It functions as an apoptosisinhibitor by forming complexes with caspase-9 and APAF1,thus prevent them to initiate the protease cascade and apo-ptosis through caspase-3 cytochrome C-dependent activa-tion [133]. In 2002, Marsden et al. [134] discovered thatBcl2 can also function independently via other pathways.Bcl2 constitutively blocks p53-induced apoptosis and enablesthe survival of colorectal cancer cells [135]. Overexpressionof Bcl2 blocks TNF-related apoptosis-inducing ligand-(TRAIL-) induced apoptosis in human lung cancer cells[136]. In addition to the antiapoptotic function, Bcl2 isknown to regulate mitochondrial fusion and fission dynam-ics [137]. Bcl2 acts as a potent regulator of cell survival inneurons both during development and throughout adult life[138]. In cancer, overexpression of the antiapoptotic Bcl2can result in a distinct cellular growth advantage due to lackof cell death, a hallmark of cancer. In the present study, Bcl2protein was expressed in all cancer tissues. Similarly, in pre-vious studies, Bcl2 upregulation has been reported in manytypes of cancer [139–142]. Moreover, it has also been associ-ated with poor clinical outcome and shorter overall survivalin cancer patients [143]. It can confer resistance to chemo-therapy and radiotherapy in some types of cancer [144,145]. In addition, targeting Bcl2 by miR-125a, miR-206,and miR-34a was reported to inhibit the cell proliferationand induce apoptosis in multiple cancer cells [146–148].
The tumor suppressor protein Tp53, the guardian of thegenome, is essential for the carcinogenesis prevention. Inthe current study, it was not detected by immunohistochem-istry in less than one half of the specimens. Absent staining ofTp53 protein in tumor cell nuclei was significantly associatedwith advanced pathological grade, while positive staining wasobserved in the chromophobic RCC, known to have the bestprognosis. The transcription factor Tp53 is encoded by TP53gene mapped at 17p13.1. This gene has a complex transcrip-tional expression pattern encoding 28 different mRNA vari-ants through the use of an internal promoter in intron 4and alternative splicing machinery. All variants could bedetected in all tissues, and only 5 is exclusively transcribedin tissue-specific manner [149]; each isoform has distinctbiological activity and subcellular localizations [150]. Nor-mally, Tp53 is expressed at low levels and kept inactivethrough the action of MDM2 (mouse double minute 2homolog) which promotes its degradation [150]. However,
during cellular stresses or DNA damage, activated Tp53induces cell cycle arrest for DNA repair or force apoptosis.It binds to DNA and regulates transcription of target genesthat induce cell cycle arrest, apoptosis, and DNA repair[150–152]. It can trigger cell death independently of its tran-scriptional activity through subcellular translocation andactivation of proapoptotic Bcl-2 family members [153].Attenuation of Tp53 activity would render the cells more sus-ceptible to further genetic damage and therefore to neoplastictransformation and tumor progression.
Another apoptotic gene, Tp53INP2, is located at20q11.22 with 4 transcripts and encodes for 3 putative pro-tein variants of 220, 88, and 77 amino acid long. It is thoughtto be a scaffold protein that is normally expressed uponinduction by the Tp53 protein [154]. The protein encodedby this gene has two distinct functions depending on its cel-lular localization [155]. It is essential for proper autophagy,a self-degradative process that occurs at critical times indevelopment to recycle unnecessary intracellular compo-nents and damaged organelles [156]. Tp53INP2 proteinshuttles between the nucleus and the cytoplasm, dependingon cellular stress conditions, and relocates in the autophago-somes during autophagy activation. It recruits Atg8-like pro-teins to the autophagosome membrane by interacting withthe transmembrane protein VMP1 (vacuole membrane pro-tein 1) [154]. Failure of autophagy is thought to be one of themain reasons for the accumulation of cell damage and aging[157]. In addition to its role in autophagy, it serves as atranscriptional coactivator for several nuclear receptors,such as the glucocorticoid receptor, vitamin D receptor(VDR), and peroxisome proliferator-activated receptorgamma [155], thus possess a tumor suppressor-like function-ality similar to Tp53 [158, 159]. Dysregulation of Tp53INP2expression was found differently in several types of cancertissues [160–164]. Therefore, our results along with previousdata highlight its putative role in cancer developmentand progression.
Low levels of the apoptotic gene, DFFA, were observed inalmost all RCC samples. Lower expression was associatedwith vascular infiltration. DFFA gene is located in the sameregion of miR-34a at 1p36.22 which is commonly deleted inhuman tumors. DFFA plays an essential role in apoptosis.When cleaved by caspase-3, it induces the release of its part-ner DFFB, which in turn triggers DNA fragmentation by itsnuclease activity [165]. Hence, absence of this protein couldresult in aberrant apoptosis, invasive growth, and metastasis[166]. Similar to our findings, downregulated DFFA expres-sion was observed during the exponential phase of growthin several human colonic cancer cell lines [167]. DFFA(−/−) mice exerted severe genomic instability and tumor pro-gression in colon epithelial cells [168]. Moreover, low DFFAexpression was associated with poor prognosis in esophagealcancer [169] and neuroblastoma tumors [170].
As angiogenesis is of central importance in the growthand metastasis of tumors [171], we investigated theexpression of the angiogenesis-mediated protein, VEGFAin RCC compared to noncancer tissues. VEGFA proteinexpression was detected in all RCC tissues, with 80% ofsamples showing strong staining. Elevated levels were
13Oxidative Medicine and Cellular Longevity
associated with advanced tumor grade. VEGFA protein isencoded by the VEGFA gene, mapped at 6p21.1, a highlypolymorphic region that showed association with cancersusceptibility, aggressiveness, and therapeutic response invarious tumor types [172, 173]. Alternative exon splicingcan generate up to 29 transcript variants with different iso-forms (http://Ensembl.org). There was also evidence foralternative translation initiation codons resulting in addi-tional isoforms. VEGFA promotes proliferation and migra-tion of vascular endothelial cells both in vitro and in vivoand is essential for both physiological and pathologicalangiogenesis [172]. This prosurvival effect is mediated viaPI3-kinase/Akt signal transduction pathway [174]. In addi-tion, it induces permeabilization of blood vessels, thus knownas a vascular permeability factor [175]. It induces endothelialfenestration in vascular beds [176] and enhances vasodilata-tion in vitro in a dose-dependent manner [177]. In addition,VEGFA promotes apoptosis and induces expression of theantiapoptotic protein Bcl-2 [178]. In vivo, VEGFA inhibitionresults in abnormal embryonic blood vessel formation andextensive apoptotic changes in the vasculature of neonatalmice [179, 180]. Within tumors, cancer cells and cancer-associated stroma are the major source of VEGFA [173]. Itinfluences the newly formed blood vessels, but not the estab-lished ones. In agreement with our findings, VEGFA wasreported to be overexpressed in several different tumor types[171, 181–183]. Anti-VEGF antibodies were implicated aspotent inhibitory effectors [184, 185]. Furthermore, VEGFAexpression is correlated with tumor stage and progression.It was found to be associated with high pathological grade,tumor size, lymph node metastasis, poor prognosis, resis-tance to chemotherapy, and poor overall survival and out-comes in several types of cancer [171, 172, 186–189].
5. Conclusions
The current study does confirm the association of miR-34aoverexpression with RCC in our population, suggesting itspotential role in pathogenesis and progression of this typeof cancer. Furthermore, chromophobic RCC subtype hasbeen postulated to attain different transcriptomics and prote-omics characteristics compared to other subtypes. It has beenfound to have higher MIR-34A, Tp53, Ki67, and TGFBexpressions. Hence, the molecular mechanism and genesinvolved in this particular type need to be validated in largescale multicenter study for better disease outcome andresponse to treatment predictions. In addition, the exactmolecular interplay between the potential miR-34a targetgenes is still unclear and will warrant further detailed studies.One of the limitations that need to be considered is that theprotein levels of the selected target genes in tumor/normalsamples were not measured along with the mRNA levels.Hence, we could not suggest if the selected potential targetscould be affected by translation inhibition rather than degra-dation in light of absence of miRNA34a-selected targetsanticorrelation. Another limitation is the lack of the func-tional analysis either on tumor cell lines or on RCC ratmodels to validate the current findings and explore thedetailed biological mechanisms and the potential therapeutic
roles of miR-34a in RCC. This will be considered the logicnext step in our ongoing research.
Abbreviations
AUC: Area under curveBcl-2: B-cell lymphoma 2CDKN1A: Cyclin dependent kinase inhibitor 1AcrRCC: Chromophobe renal cell carcinomasccRCC: Clear cell renal cell carcinomasDFFA: DNA fragmentation factor subunit alphaFFPE: Formalin-fixed paraffin embeddedHGF: Hepatocyte growth factorISUP: International society of urological pathologyKEGG: Kyoto encyclopedia of genes and genomesMDM2: Mouse double minute 2 homologmiR-34a: MicroRNA-34amiRNAs: MicroRNAsNg: Nuclear gradeNSCLC: Non-small-cell lung cancerpRCC: Papillary renal cell carcinomasPI3K: Phosphatidylinositol 3-kinaseqPCR: Quantitative polymerase chain reactionCq: Quantitative cycleROC: Receiver operating characteristicRCC: Renal cell carcinomapRB: Retinoblastoma proteinRT: Reverse transcriptionSFRP1: Secreted frizzled-related protein 1STAT: Signal transducer and activator of transcriptionSOX2: Sex-determining region Y-box 2TGFB: Transforming growth factor-betaTP53INP: Tumor protein p53 inducible nuclear proteinUTR: Untranslated regionVEGF: Vascular endothelial growth factorVDR: Vitamin D receptorVMP1: Vacuole membrane protein 1.
Conflicts of Interest
The authors declare that they have no competing interests.
Acknowledgments
The authors thank the Oncology Diagnostic Unit and theCenter of Excellence in Molecular and Cellular Medicine,Suez Canal University, Ismailia, Egypt for providing thefacilities for performing the research work.
References
[1] K. Tang and H. Xu, “Prognostic value of meta-signaturemiRNAs in renal cell carcinoma: an integrated miRNAexpression profiling analysis,” Scientific Reports, vol. 5,article 10272, 2015.
[2] P. Cairns, “Renal Cell Carcinoma,” Cancer Biomarkers, vol. 9,pp. 461–473, 2011.
[3] D. L. Lim, R. Ko, and S. E. Pautler, “Current understanding ofthe molecular mechanisms of kidney cancer: a primer for
14 Oxidative Medicine and Cellular Longevity

urologists,” Canadian Urological Association Journal, vol. 1,pp. S13–S20, 2007.
[4] Y. Moreau and L. C. Tranchevent, “Computational tools forprioritizing candidate genes: boosting disease gene discov-ery,” Nature Reviews. Genetics, vol. 13, pp. 523–536, 2012.
[5] A. Valinezhad Orang, R. Safaralizadeh, and M. Kazemza-deh-Bavili, “Mechanisms of mirna-mediated gene regula-tion from common downregulation to mRNA-specificupregulation,” International Journal of Genomics, vol. 2014,Article ID 970607, 15 pages, 2014.
[6] C. Baer, R. Claus, and C. Plass, “Genome-wide epigeneticregulation of miRNAs in cancer,” Cancer Research, vol. 73,pp. 473–477, 2013.
[7] E. A. Toraih, M. S. Fawz, M. G. Elgazzaz, M. H. Hussein,R. H. Shehata, and H. G. Daoud, “Combined genotypeanalyses of precursor miRNA196a2 and 499a variants withhepatic and renal cancer susceptibility a preliminary study,”Asian Pacific Journal of Cancer Prevention, vol. 17,pp. 3369–3375, 2016.
[8] E. A. Toraih, M. S. Fawzy, E. A. Mohammed, M. H. Hussein,and M. M. El-Labban, “MicroRNA-196a2 biomarker andtargetome network analysis in solid tumors,”Molecular Diag-nosis & Therapy, vol. 20, pp. 559–577, 2016.
[9] C. Grange, F. Collino, M. Tapparo, and G. Camussi, “Onco-genic micro-RNAs and renal cell carcinoma,” Frontiers inOncology, vol. 4, p. 49, 2014.
[10] H. Hermeking, “The miR-34 family in cancer and apoptosis,”Cell Death and Differentiation, vol. 17, pp. 193–199, 2010.
[11] L. Li, “Regulatory mechanisms and clinical perspectives ofmiR-34a in cancer,” Journal of Cancer Research and Thera-peutics, vol. 10, pp. 805–810, 2014.
[12] M. Ghandadi and A. Sahebkar, “MicroRNA-34a and itstarget genes: key factors in cancer multidrug resistance,”Current Pharmaceutical Design, vol. 22, pp. 933–939, 2016.
[13] L. He, X. He, L. P. Lim et al., “A microRNA component ofthe p53 tumour suppressor network,” Nature, vol. 447,pp. 1130–1134, 2007.
[14] G. Genovese, A. Ergun, S. A. Shukla et al., “microRNAregulatory network inference identifies miR-34a as a novelregulator of TGF-β signaling in glioblastoma,” Cancer Dis-covery, vol. 2, pp. 736–749, 2012.
[15] D. Reimer, M. Hubalek, H. Kiefel et al., “Regulation of tran-scription factor E2F3a and its clinical relevance in ovariancancer,” Oncogene, vol. 30, pp. 4038–4049, 2011.
[16] N. Li, H. Fu, Y. Tie et al., “miR-34a inhibits migration andinvasion by down-regulation of c-Met expression in humanhepatocellular carcinoma cells,” Cancer Letters, vol. 275,pp. 44–53, 2009.
[17] Y. Hu, A. M. Correa, A. Hoque et al., “Prognostic signifi-cance of differentially expressed miRNAs in esophagealcancer,” International Journal of Cancer, vol. 128, pp. 132–143, 2011.
[18] G. Yu, W. Yao, W. Xiao, H. Li, H. Xu, and B. Lang, “Micro-RNA-34a functions as an anti-metastatic microRNA andsuppresses angiogenesis in bladder cancer by directly target-ing CD44,” Journal of Experimental & Clinical CancerResearch, vol. 33, p. 779, 2014.
[19] I. S. Vlachos, K. Zagganas, M. D. Paraskevopoulou et al.,“DIANA-miRPath v3.0: deciphering microRNA functionwith experimental support,” Nucleic Acids Research, vol. 43,pp. W460–W466, 2015.
[20] C. H. Chou, N. W. Chang, S. Shrestha et al., “miRTarBase2016: updates to the experimentally validated miRNA-targetinteractions database,” Nucleic Acids Research, vol. 44,pp. D239–D247, 2016.
[21] I. S. Vlachos, M. D. Paraskevopoulou, D. Karagkouni et al.,“DIANA-TarBase v7.0: indexing more than half a millionexperimentally supported miRNA:mRNA interactions,”Nucleic Acids Research, vol. 43, pp. D153–D159, 2015.
[22] D. Betel, M. Wilson, A. Gabow, D. S. Marks, and C. Sander,“The microRNA.org resource: targets and expression,”Nucleic Acids Research, vol. 36, pp. D149–D153, 2008.
[23] D. Szklarczyk, A. Franceschini, S. Wyder et al., “STRINGv10: protein-protein interaction networks, integrated overthe tree of life,” Nucleic Acids Research, vol. 43, pp. D447–D452, 2015.
[24] E. M. Wagner, “Monitoring gene expression: quantitativereal-time RT–PCR,” Methods in Molecular Biology, vol. 1027,pp. 19–45, 2013.
[25] S. A. Bustin, V. Benes, J. A. Garson et al., “The MIQE guide-lines: minimum information for publication of quantitativereal-time PCR experiments,” Clinical Chemistry, vol. 55,pp. 611–622, 2009.
[26] J. Srigley, B. Delahunt, J. Eble et al., “The InternationalSociety of Urological Pathology (ISUP) Vancouver classifi-cation of renal neoplasia,” The American Journal of Surgi-cal Pathology, vol. 37, pp. 1469–1489, 2013.
[27] S. Fuhrman, L. C. Lasky, and L. Limas, “Prognostic signifi-cance of morphologic parameters in renal cell carcinoma,”The American Journal of Surgical Pathology, vol. 6, pp. 655–663, 1982.
[28] L. H. Sobin, C. Wittekind, and International Union AgainstCancer (UICC), TNM Classification of Malignant Tumors,New York, 1997.
[29] D. L. Uhlman, P. L. Nguyen, J. C. Manivel et al., “Associationof immunohistochemical staining for p53 with metastaticprogression and poor survival in patients with renal cell car-cinoma,” Journal of the National Cancer Institute, vol. 86,pp. 1470–1475, 1994.
[30] A. F. Olumi, N. Weidner, and J. C. Presti, “P53 immunoreac-tivity correlates with Ki-67 and bcl-2 expression in renal cellcarcinoma,” Urologic Oncology, vol. 6, pp. 63–67, 2001.
[31] A. Bishoy, B. Gayed, R. Youssef et al., “Ki67 is an independentpredictor of oncological outcomes in patients with localizedclear-cell renal cell carcinoma,” BJU International, vol. 113,pp. 668–673, 2014.
[32] J. P. Kallio, P. Hirvikoski, H. Helin et al., “Renal cellcarcinoma MIB-1, Bax and Bcl-2 expression and prognosis,”The Journal of Urology, vol. 172, pp. 2158–2161, 2004.
[33] D. Mitropoulos, A. Kiroudi, E. Christelli et al., “Expression oftransforming growth factor β in renal cell carcinoma andmatched non-involved renal tissue,” Urological Research,vol. 32, pp. 317–322, 2004.
[34] S. Ambs, W. P. Bennett, W. G. Merriam et al., “Vascularendothelial growth factor and nitric oxide synthase expres-sion in human lung cancer and the relation to p53,” BritishJournal of Cancer, vol. 78, pp. 233–239, 1998.
[35] K. J. Livak and T. D. Schmittgen, “Analysis of relative geneexpression data using real-time quantitative PCR and the2−ΔΔCT method,” Methods, vol. 25, pp. 402–408, 2001.
[36] K. K. Dutta, Y. Zhong, Y. T. Liu et al., “Association ofmicroRNA-34a overexpression with proliferation is cell
15Oxidative Medicine and Cellular Longevity

type-dependent,” Cancer Science, vol. 98, pp. 1845–1852,2007.
[37] H. He, K. Jazdzewski, W. Li et al., “The role of microRNAgenes in papillary thyroid carcinoma,” Proceedings of theNational Academy of Sciences of the United States of America,vol. 102, pp. 19075–19080, 2005.
[38] H. Tazawa, N. Tsuchiya, M. Izumiya, and H. Nakagama,“Tumor-suppressive miR-34a induces senescence-likegrowth arrest through modulation of the E2F pathway inhuman colon cancer cells,” Proceedings of the National Acad-emy of Sciences of the United States of America, vol. 104,pp. 15472–15477, 2007.
[39] E. E. Marsh, Z. Lin, P. Yin, M. Milad, D. Chakravarti, andS. E. Bulun, “Differential expression of microRNA speciesin human uterine leiomyoma versus normal myometrium,”Fertility and Sterility, vol. 89, pp. 1771–1776, 2008.
[40] D. Asslaber, J. D. Pión, I. Seyfried et al., “microRNA-34aexpression correlates with MDM2 SNP309 polymorphismand treatment-free survival in chronic lymphocytic leuke-mia,” Blood, vol. 115, pp. 4191–4197, 2010.
[41] H. Liu, A. R. Brannon, A. R. Reddy et al., “Identifying mRNAtargets of microRNA dysregulated in cancer: with applicationto clear cell renal cell carcinoma,” BMC Systems Biology,vol. 4, p. 51, 2010.
[42] T.-C. Chang, E. A. Wentzel, O. A. Kent et al., “Transactiva-tion of miR-34a by p53 broadly influences gene expressionand promotes apoptosis,” Molecular Cell, vol. 26, pp. 745–752, 2007.
[43] V. Tarasov, P. Jung, B. Verdoodt et al., “Differentialregulation of microRNAs by p53 revealed by massivelyparallel sequencing: miR-34a is a p53 target that inducesapoptosis and G1-arrest,” Cell Cycle, vol. 6, pp. 86–1593,2007.
[44] C. Welch, Y. Chen, and R. L. Stallings, “MicroRNA-34a func-tions as a potential tumor suppressor by inducing apoptosisin neuroblastoma cells,” Oncogene, vol. 26, pp. 5017–5022,2007.
[45] N. Raver-Shapira, E. Marciano, E. Meiri et al., “Transcrip-tional activation of miR-34a contributes to p53-mediatedapoptosis,” Molecular Cell, vol. 26, pp. 731–743, 2007.
[46] C. L. Dalgard, M. Gonzalez, J. E. Deniro, and J. M. O'Brien,“Differential microRNA-34a expression and tumor sup-pressor function in retinoblastoma cells,” InvestigativeOphthalmology & Visual Science, vol. 50, pp. 4542–4551,2009.
[47] Z. L. Ma, P. P. Hou, Y. L. Li et al., “MicroRNA-34a inhibitsthe proliferation and promotes the apoptosis of non-smallcell lung cancer H1299 cell line by targeting TGFβR2,”Tumour Biology, vol. 36, pp. 2481–2490, 2015.
[48] Y. Fujita, K. Kojima, N. Hamada et al., “Effects of miR-34aon cell growth and chemoresistance in prostate cancer PC3cells,” Biochemical and Biophysical Research Communica-tions, vol. 377, pp. 114–119, 2008.
[49] Q. Ji, X. Hao, M. Zhang et al., “MicroRNA miR-34 inhibitshuman pancreatic cancer tumor-initiating cells,” PLoS One,vol. 4, no. 8, article e6816, 2009.
[50] V. P. Tryndyak, S. A. Ross, F. A. Beland, and I. P. Pogribny,“Down-regulation of the microRNAs miR-34a, miR-127,and miR-200b in rat liver during hepatocarcinogenesisinduced by a methyl-deficient diet,” Molecular Carcinogene-sis, vol. 48, pp. 479–487, 2008.
[51] M. Guled, L. Lahti, P. M. Lindholm et al., “CDKN2A,NF2, and JUN are dysregulated among other genes bymiRNAs in malignant mesothelioma—a miRNA microarrayanalysis,” Genes, Chromosomes & Cancer, vol. 48, pp. 615–623, 2009.
[52] D. Yan, X. Zhou, X. Chen et al., “MicroRNA-34a inhibitsuveal melanoma cell proliferation and migration throughdownregulation of c-Met,” Investigative Ophthalmology &Visual Science, vol. 50, pp. 1559–1565, 2009.
[53] I. Satzger, A. Mattern, U. Kuettler et al., “MicroRNA-15brepresents an independent prognostic parameter and iscorrelated with tumor cell proliferation and apoptosis inmalignant melanoma,” International Journal of Cancer,vol. 126, pp. 2553–2562, 2010.
[54] K. Kozaki, I. Imoto, S. Mogi, K. Omura, and J. Inazawa,“Exploration of tumor-suppressive microRNAs silenced byDNA hypermethylation in oral cancer,” Cancer Research,vol. 68, pp. 2094–2105, 2008.
[55] Y. Li, F. Guessous, Y. Zhang et al., “MicroRNA-34a inhibitsglioblastoma growth by targeting multiple oncogenes,” Can-cer Research, vol. 69, pp. 7569–7576, 2009.
[56] M. K. Dijkstra, K. Lomvan, D. Tielemans et al., “17p13/TP53deletion in B-CLL patients is associated with microRNA-34adownregulation,” Leukemia, vol. 23, pp. 625–627, 2009.
[57] A. Budhu, H. L. Jia, M. Forgues et al., “Identification ofmetastasis-related microRNAs in hepatocellular carcinoma,”Hepatology, vol. 47, pp. 897–907, 2008.
[58] M. W. Kattan, V. Reuter, R. J. Motzer, J. Katz, and P.Russo, “A postoperative prognostic nomogram for renalcell carcinoma,” The Journal of Urology, vol. 166, pp. 63–67, 2001.
[59] M. F. Dall'Oglio, A. A. Antunes, A. C. Pompeo, A. Mosconi,K. R. Leite, and M. Srougi, “Prognostic relevance of the histo-logical subtype of renal cell carcinoma,” International Braz JUrol, vol. 34, pp. 3–8, 2008.
[60] V. F. Muglia and A. Prando, “Renal cell carcinoma: histolog-ical classification and correlation with imaging findings,”Radiologia Brasileira, vol. 48, pp. 166–174, 2015.
[61] Y. Hashimoto, Y. Akiyama, and Y. Yuasa, “Multiple-to-multiple relationships between microRNAs and targetgenes in gastric cancer,” PLoS One, vol. 8, article e62589,2013.
[62] T. Kunej, I. Godnic, S. Horvat, M. Zorc, and G. A. Calin,“Cross talk between microRNA and coding cancer genes,”Cancer Journal (Sudbury Mass), vol. 18, pp. 223–231, 2012.
[63] J. R. Sierra and M.-S. Tsao, “c-MET as a potential therapeutictarget and biomarker in cancer,” Therapeutic Advances inMedical Oncology, vol. 3, pp. S21–S35, 2011.
[64] J. R. Sierra, S. Corso, L. Caione et al., “Tumor angiogenesisand progression are enhanced by Sema4D produced bytumor-associated macrophages,” The Journal of ExperimentalMedicine, vol. 205, pp. 1673–1685, 2008.
[65] S. Benvenuti and P. M. Comoglio, “The MET receptor tyro-sine kinase in invasion and metastasis,” Journal of CellularPhysiology, vol. 213, pp. 316–325, 2007.
[66] M. Tokunou, T. Niki, K. Eguchi et al., “c-MET expression inmyofibroblasts: role in autocrine activation and prognosticsignificance in lung adenocarcinoma,” The American Journalof Pathology, vol. 158, pp. 1451–1463, 2001.
[67] E. Lengyel, D. Prechtel, J. H. Resau et al., “C-Met overexpres-sion in node-positive breast cancer identifies patients with
16 Oxidative Medicine and Cellular Longevity
poor clinical outcome independent of Her2/neu,” Interna-tional Journal of Cancer, vol. 113, pp. 678–682, 2005.
[68] S. Koochekpour, M. Jeffers, S. Rulong et al., “Met andhepatocyte growth factor/scatter factor expression inhuman gliomas,” Cancer Research, vol. 57, pp. 5391–5398,1997.
[69] C. Liu, M. Park, and M. S. Tsao, “Overexpression of c-metproto-oncogene but not epidermal growth factor receptoror c-erbB-2 in primary human colorectal carcinomas,” Onco-gene, vol. 7, pp. 181–185, 1992.
[70] T. Furukawa, W. P. Duguid, M. Kobari, S. Matsuno, andM. S.Tsao, “Hepatocyte growth factor andMet receptor expressionin human pancreatic carcinogenesis,” The American Journalof Pathology, vol. 147, pp. 889–895, 1995.
[71] R. Ramirez, D. Hsu, A. Patel et al., “Over-expression ofhepatocyte growth factor/scatter factor (HGF/SF) and theHGF/SF receptor (cMET) are associated with a high riskof metastasis and recurrence for children and young adultswith papillary thyroid carcinoma,” Clinical Endocrinology,vol. 53, pp. 635–644, 2000.
[72] M. Olivero, G. Valente, A. Bardelli et al., “Novel mutationin the ATP-binding site of the MET oncogene tyrosinekinase in a HPRCC family,” International Journal of Cancer,vol. 82, pp. 640–643, 1999.
[73] Y. Kwak, S.-I. Kim, C.-K. Park, S. H. Paek, S.-T. Lee, and S.-H.Park, “C-MET overexpression and amplification in gliomas,”International Journal of Clinical and Experimental Pathology,vol. 8, pp. 14932–14938, 2015.
[74] F. BaccoDe, P. Luraghi, E. Medico et al., “Induction ofMET by ionizing radiation and its role in radioresistanceand invasive growth of cancer,” Journal of the NationalCancer Institute, vol. 103, pp. 645–661, 2011.
[75] E. C. Smyth, F. Sclafani, and D. Cunningham, “Emergingmolecular targets in oncology: clinical potential of MET/hepatocyte growth-factor inhibitors,” OncoTargets and Ther-apy, vol. 7, pp. 1001–1014, 2014.
[76] Z. S. Zeng, M. R. Weiser, E. Kuntz et al., “c-Met gene ampli-fication is associated with advanced stage colorectal cancerand liver metastases,” Cancer Letters, vol. 265, pp. 258–269,2008.
[77] M. R. Adams, R. Sears, F. Nuckolls, G. Leone, and J. R.Nevins, “Complex transcriptional regulatory mechanismscontrol expression of the E2F3 locus,”Molecular and CellularBiology, vol. 20, pp. 3633–3639, 2000.
[78] Y. He, M. K. Armanious, M. J. Thomas, and W. D. Cress,“Identification of E2F-3B, an alternative form of E2F-3 lack-ing a conserved N-terminal region,” Oncogene, vol. 19,pp. 3422–3433, 2000.
[79] G. Leone, J. DeGregori, Z. Yan et al., “E2F3 activity isregulated during the cell cycle and is required for the induc-tion of S phase,” Genes & Development, vol. 12, pp. 2120–2130, 1998.
[80] L. J. Kong, J. T. Chang, A. H. Bild, and J. R. Nevins, “Compen-sation and specificity of function within the E2F family,”Oncogene, vol. 26, pp. 321–327, 2007.
[81] D. Chen, M. Pacal, P. Wenzel, P. S. Knoepfler, G. Leone,and R. Bremner, “Division and apoptosis of E2f-deficientretinal progenitors,” Nature, vol. 462, pp. 925–929, 2009.
[82] L. Wu, C. Timmers, B. Maiti et al., “The E2F1-3 transcriptionfactors are essential for cellular proliferation,” Nature,vol. 414, pp. 457–462, 2001.
[83] S.-Y. Tsai, R. Opavsky, N. Sharma et al., “Mouse developmentwith a single E2F activator,” Nature, vol. 454, pp. 1137–1141,2008.
[84] M. Y. Lee, C. S. Moreno, and H. Saavedra, “E2F activatorssignal and maintain centrosome amplification in breast can-cer cells,” Molecular and Cellular Biology, vol. 34, pp. 2581–2599, 2014.
[85] Q. An, Y. Wang, R. An et al., “Association of E2F3 expressionwith clinicopathological features of Wilms’ tumors,” Journalof Pediatric Surgery, vol. 48, pp. 2187–2193, 2013.
[86] C. S. Cooper, A. G. Nicholson, C. Foster et al., “Nuclear over-expression of the E2F3 transcription factor in human lungcancer,” Lung Cancer, vol. 54, pp. 155–162, 2006.
[87] X. Zeng, F. Yin, X. Liu et al., “Upregulation of E2F transcrip-tion factor 3 is associated with poor prognosis in hepatocel-lular carcinoma,” Oncology Reports, vol. 31, pp. 1139–1146,2014.
[88] L. Huang, J. Luo, Q. Cai et al., “MicroRNA-125b sup-presses the development of bladder cancer by targetingE2F3,” International Journal of Cancer, vol. 128, pp. 1758–1769, 2011.
[89] M. Oeggerli, P. Schraml, C. Ruiz et al., “E2F3 is the maintarget gene of the 6p22 amplicon with high specificity forhuman bladder cancer,” Oncogene, vol. 25, pp. 6538–6543, 2006.
[90] A. Feber, J. Clark, G. Goodwin et al., “Amplification andoverexpression of E2F3 in human bladder cancer,” Oncogene,vol. 23, pp. 1627–1630, 2004.
[91] A. Y. Olsson, A. Feber, S. R. Edwards et al., “Role of E2F3expression in modulating cellular proliferation rate in humanbladder and prostate cancer cells,” Oncogene, vol. 26,pp. 1028–1037, 2007.
[92] C. S. Foster, A. Falconer, A. R. Dodson et al., “Transcriptionfactor E2F3 overexpressed in prostate cancer independentlypredicts clinical outcome,” Oncogene, vol. 23, pp. 5871–5879, 2004.
[93] E. Lazzerini Denchi, C. Attwooll, D. Pasini, and K. Helin,“Deregulated E2F activity induces hyperplasia andsenescence-like features in the mouse pituitary gland,”Molec-ular and Cellular Biology, vol. 25, pp. 2660–2672, 2005.
[94] C. Schluter, M. Duchrow, C. Wohlenberg et al., “The cellproliferation-associated antigen of antibody Ki-67: a verylarge, ubiquitous nuclear protein with numerous repeatedelements, representing a new kind of cell cycle-maintainingproteins,” The Journal of Cell Biology, vol. 123, pp. 513–522,1993.
[95] T. Scholzen and J. Gerdes, “The Ki-67 protein: from theknown and the unknown,” Journal of Cellular Physiology,vol. 182, pp. 311–322, 2000.
[96] J. Gerdes, U. Schwab, H. Lemke, and H. Stein, “Production ofa mouse monoclonal antibody reactive with a human nuclearantigen associated with cell proliferation,” International Jour-nal of Cancer, vol. 31, pp. 13–20, 1983.
[97] J. Gerdes, H. Lemke, H. Baisch, H. H. Wacker, U. Schwab,and H. Stein, “Cell cycle analysis of a cell proliferation-associated human nuclear antigen defined by the monoclonalantibody Ki-67,” Journal of Immunology, vol. 133, no. 4,pp. 1710–1715, 1984.
[98] J. Bullwinkel, B. Baron-Lühr, A. Lüdemann, C. Wohlenberg,J. Gerdes, and T. Scholzen, “Ki-67 protein is associatedwith ribosomal RNA transcription in quiescent and
17Oxidative Medicine and Cellular Longevity

proliferating cells,” Journal of Cellular Physiology, vol. 206,pp. 624–635, 2006.
[99] R. Rahmanzadeh, G. Hüttmann, J. Gerdes, and T. Scholzen,“Chromophore-assisted light inactivation of pKi-67 leads toinhibition of ribosomal RNA synthesis,” Cell Proliferation,vol. 40, pp. 422–430, 2007.
[100] R. J. Bryant, P. M. Banks, and D. P. O'Malley, “Ki67 stain-ing pattern as a diagnostic tool in the evaluation of lympho-proliferative disorders,” Histopathology, vol. 48, pp. 505–515,2006.
[101] Y. L. Ma, J. Y. Peng, P. Zhang, W. J. Liu, L. Huang, and H. L.Qin, “Immunohistochemical analysis revealed CD34 andKi67 protein expression as significant prognostic factors incolorectal cancer,” Medical Oncology, vol. 27, pp. 304–309,2010.
[102] R. N. Das, U. Chatterjee, S. K. Sinha, A. K. Ray, K. Saha, andS. Banerjee, “Study of histopathological features and prolifer-ation markers in cases of Wilms’ tumor,” Indian Journal ofMedical and Paediatric Oncology: Official Journal of IndianSociety of Medical & Paediatric Oncology, vol. 33, pp. 102–106, 2012.
[103] G. Fisher, Z. H. Yang, S. Kudahetti et al., “Prognostic value ofKi-67 for prostate cancer death in a conservatively managedcohort,” British Journal of Cancer, vol. 108, pp. 271–277,2013.
[104] N. V. Shivaprasad, S. Satish, S. Ravishankar, and M. G.Vimalambike, “Ki-67 immunostaining in astrocytomas:association with histopathological grade - a South Indianstudy,” Journal of Neurosciences in Rural Practice, vol. 7,pp. 510–514, 2016.
[105] I. Markova, M. Duskova, M. Lubusky et al., “Selected immu-nohistochemical prognostic factors in endometrial cancer,”International Journal of Gynecological Cancer, vol. 20,pp. 576–582, 2010.
[106] K. Kontzoglou, V. Palla, G. Karaolanis et al., “Correlationbetween Ki67 and breast cancer prognosis,” Oncology,vol. 84, pp. 219–225, 2013.
[107] E. C. Inwald, M. Klinkhammer-Schalke, F. Hofstadter et al.,“Ki-67 is a prognostic parameter in breast cancer patients:results of a large population-based cohort of a cancer regis-try,” Breast Cancer Research and Treatment, vol. 139,pp. 539–552, 2013.
[108] M. Ishihara, H. Mukai, S. Nagai et al., “Retrospective analysisof risk factors for central nervous system metastases in oper-able breast cancer: effects of biologic subtype and Ki67 over-expression on survival,” Oncology, vol. 84, pp. 135–140, 2013.
[109] U. Kucuk, U. Bayol, E. E. Pala, and S. Cumurcu, “Importanceof P53, Ki-67 expression in the differential diagnosis ofbenign/malignant phyllodes tumors of the breast,” IndianJournal of Pathology & Microbiology, vol. 56, pp. 129–134,2013.
[110] S. C. Stoian, C. Simionescu, C. Margaritescu, A. Stepan, andM. Nurciu, “Endometrial carcinomas: correlation betweenER, PR, Ki67 status and histopathological prognostic param-eters,” Romanian Journal of Morphology and Embryology,vol. 52, pp. 631–636, 2011.
[111] A. Mourtzikou, K. Kosmas, A. Marouga, M. Stamouli, A.Pouliakis, and P. Karakitsos, “The use of an immunocyto-chemical double-labeling staining can display the distribu-tion of Bcl-2/Ki-67 cells in endometrial adenocarcinomas aswell as in normal endometrium,” Clinical Laboratory,vol. 58, pp. 133–144, 2012.
[112] U. Kucukgoz Gulec, D. Gumurdulu, A. B. Guzel et al., “Prog-nostic importance of survivin, Ki-67, and topoisomerase IIαin ovarian carcinoma,” Archives of Gynecology and Obstetrics,vol. 289, pp. 393–398, 2014.
[113] B. Belev, I. Brcic, J. Prejac et al., “Role of Ki-67 as a prognosticfactor in gastrointestinal stromal tumors,” World Journal ofGastroenterology, vol. 19, pp. 523–527, 2013.
[114] M. Preusser, R. Hoeftberger, A. Woehrer et al., “Prognosticvalue of Ki67 index in anaplastic oligodendroglial tumours -a translational study of the European Organization forResearch and Treatment of Cancer Brain Tumor Group,”Histopathology, vol. 60, pp. 885–894, 2012.
[115] K. A. Harradine and R. J. Akhurst, “Mutations of TGFβ sig-naling molecules in human disease,” Annals of Medicine,vol. 38, pp. 403–414, 2006.
[116] A. B. Roberts, “Molecular and cell biology of TGF-β,” Min-eral and Electrolyte Metabolism, vol. 24, pp. 111–119, 1998.
[117] J. Seoane, “Escaping from the TGFβ anti-proliferative con-trol,” Carcinogenesis, vol. 27, pp. 2148–2156, 2006.
[118] H. G. Kang, M. H. Chae, J. M. Park et al., “Polymorphisms inTGF-β1 gene and the risk of lung cancer,” Lung Cancer,vol. 52, pp. 1–7, 2006.
[119] A. Helmy, O. A. Hammam, T. R. LithyEl, and M. M. DeenWishahiEl, “The role of TGF-beta-1 protein and TGF-beta-R-1 receptor in immune escape mechanism in bladder can-cer,” MedGenMed, vol. 9, p. 34, 2007.
[120] V. Ivanovic, M. Demajo, K. Krtolica et al., “Elevated plasmaTGF-β1 levels correlate with decreased survival of metastaticbreast cancer patients,” Clinica Chimica Acta, vol. 371,pp. 191–193, 2006.
[121] X. Sun, S. A. Robertson, and W. V. Ingman, “Regulation ofepithelial cell turnover andmacrophage phenotype by epithe-lial cell-derived transforming growth factor beta1 in themammary gland,” Cytokine, vol. 61, pp. 377–388, 2013.
[122] W. Wick, M. Platten, and M. Weller, “Glioma cell invasion:regulation of metalloproteinase activity by TGF-β,” Journalof Neuro-Oncology, vol. 53, pp. 177–185, 2001.
[123] C. Ren, T. Ren, K. Yang et al., “Inhibition of SOX2 inducescell apoptosis and G1/S arrest in Ewing’s sarcoma throughthe PI3K/Akt pathway,” Journal of Experimental & ClinicalCancer Research, vol. 35, p. 44, 2016.
[124] K. Takahashi, K. Tanabe, M. Ohnuki et al., “Induction of plu-ripotent stem cells from adult human fibroblasts by definedfactors,” Cell, vol. 131, pp. 861–872, 2007.
[125] J. Yu, M. A. Vodyanik, K. Smuga-Otto et al., “Inducedpluripotent stem cell lines derived from human somaticcells,” Science, vol. 318, pp. 1917–1920, 2007.
[126] Y. Chen, L. Shi, L. Zhang et al., “The molecular mechanismgoverning the oncogenic potential of SOX2 in breast cancer,”The Journal of Biological Chemistry, vol. 283, pp. 17969–17978, 2008.
[127] X. Fang, W. Yu, L. Li et al., “ChIP-seq and functional analysisof the SOX2 gene in colorectal cancers,” OMICS, vol. 14,pp. 369–384, 2010.
[128] E. A. Toraih, M. S. Fawzy, A. I. El-Falouji et al., “Stemness-related transcriptional factors and homing gene expressionprofiles in hepatic differentiation and cancer,” MolecularMedicine, vol. 22, pp. 653–663, 2016.
[129] L. Annovazzi, M. Mellai, V. Caldera, G. Valente, and D.Schiffer, “SOX2 expression and amplification in gliomas
18 Oxidative Medicine and Cellular Longevity
and glioma cell lines,” Cancer Genomics & Proteomics,vol. 8, pp. 139–147, 2011.
[130] T. Otsubo, Y. Akiyama, K. Yanagihara, and Y. Yuasa,“SOX2 is frequently downregulated in gastric cancers andinhibits cell growth through cell-cycle arrest and apopto-sis,” British Journal of Cancer, vol. 98, pp. 824–831, 2008.
[131] D. Hockenbery, G. Nunez, C. Milliman, R. D. Schreiber, andS. J. Korsmeyer, “Bcl-2 is an inner mitochondrial membraneprotein that blocks programmed cell death,” Nature, vol. 348,pp. 334–336, 1990.
[132] Y. Tsujimoto and C. M. Croce, “Analysis of the structure,transcripts, and protein products of bcl-2, the gene involvedin human follicular lymphoma,” Proceedings of the NationalAcademy of Sciences of the United States of America, vol. 83,pp. 5214–5218, 1986.
[133] A. M. Kabel, A. A. Adwas, A. A. Elkhoely, M. N. Abdel-Rah-man, and A. A. Eissa, “Apoptosis: insights into pathways androle of p53, Bcl-2 and sphingosine kinases,” Journal of CancerResearch and Treatment, vol. 4, pp. 69–72, 2016.
[134] V. S. Marsden, L. O'Connor, L. A. O'Reilly et al., “Apoptosisinitiated by Bcl-2-regulated caspase activation independentlyof the cytochrome c/Apaf-1/caspase-9 apoptosome,” Nature,vol. 419, pp. 634–637, 2002.
[135] M. Jiang and J. Milner, “Bcl-2 constitutively suppressesp53-dependent apoptosis in colorectal cancer cells,” Genes& Development, vol. 17, pp. 832–837, 2003.
[136] S. Y. Sun, P. Yue, J. Y. Zhou et al., “Overexpression of BCL2blocks TNF-related apoptosis-inducing ligand (TRAIL)-induced apoptosis in human lung cancer cells,” Biochemicaland Biophysical Research Communications, vol. 280,pp. 788–797, 2001.
[137] A. Autret and S. J. Martin, “Bcl-2 family proteins and mito-chondrial fission/fusion dynamics,” Cellular and MolecularLife Sciences, vol. 67, pp. 1599–1606, 2010.
[138] J. Chen, J. G. Flannery, M. M. LaVail, R. H. Steinberg, J.Xu, and M. I. Simon, “Bcl-2 overexpression reduces apo-ptotic photoreceptor cell death in three different retinaldegenerations,” Proceedings of the National Academy ofSciences of the United States of America, vol. 93, pp. 7042–7047, 1996.
[139] A. Majid, O. Tsoulakis, R. Walewska et al., “BCL2 expressionin chronic lymphocytic leukemia: lack of association with theBCL2 938A>C promoter single nucleotide polymorphism,”Blood, vol. 111, pp. 874–877, 2008.
[140] J. Iqbal, V. T. Neppalli, G. Wright et al., “BCL2 expression is aprognostic marker for the activated B-cell-like type of diffuselarge B-cell lymphoma,” Journal of Clinical Oncology, vol. 24,pp. 961–968, 2006.
[141] I. Skirnisdottir, T. Seidal, E. Gerdin, and B. Sorbe, “Theprognostic importance of p53, bcl-2, and bax in early stageepithelial ovarian carcinoma treated with adjuvant chemo-therapy,” International Journal of Gynecological Cancer,vol. 12, pp. 265–276, 2002.
[142] C. Wei, Q. Luo, X. Sun et al., “microRNA-497 induces cellapoptosis by negatively regulating Bcl-2 protein expressionat the posttranscriptional level in human breast cancer,”International Journal of Clinical and Experimental Pathology,vol. 8, pp. 7729–7739, 2015.
[143] D. F. Mühlbeier, V. A. Saddi, É. C. Paulade et al., “Prog-nostic significance of apoptosis-related markers inpatients with soft-tissue sarcomas of extremities,” Applied
Immunohistochemistry & Molecular Morphology, vol. 24,pp. 268–274, 2016.
[144] M. Abou El Hassan, D. C. J. Mastenbroek, W. R. Gerritsen,G. Giaccone, and F. A. E. Kruyt, “Overexpression of Bcl2abrogates chemo- and radiotherapy-induced sensitisation ofNCI-H460 non-small-cell lung cancer cells to adenovirus-mediated expression of full-length TRAIL,” British Journalof Cancer, vol. 91, pp. 171–177, 2004.
[145] S. H. Kim, J. N. Ho, H. Jin et al., “Upregulated expression ofBCL2, MCM7, and CCNE1 indicate cisplatin-resistance inthe set of two human bladder cancer cell lines: T24 cisplatinsensitive and T24R2 cisplatin resistant bladder cancer celllines,” Investigative and Clinical Urology, vol. 57, pp. 63–72,2016.
[146] Z. Tong, N. Liu, L. Lin, X. Guo, D. Yang, and Q. Zhang,“miR-125a-5p inhibits cell proliferation and induces apo-ptosis in colon cancer via targeting BCL2, BCL2L12 andMCL1,” Biomedicine & Pharmacotherapy, vol. 75, pp. 129–136, 2015.
[147] C. Sun, Z. Liu, S. Li et al., “Down-regulation of c-Met andBcl2 by microRNA-206, activates apoptosis, and inhibitstumor cell proliferation, migration and colony formation,”Oncotarget, vol. 6, pp. 25533–25574, 2015.
[148] L. Li, L. Yuan, J. Luo, J. Gao, J. Guo, and X. Xie, “MiR-34ainhibits proliferation and migration of breast cancer throughdown-regulation of Bcl-2 and SIRT1,” Clinical and Experi-mental Medicine, vol. 13, pp. 109–117, 2013.
[149] J.-C. Bourdon, K. Fernandes, F. Murray-Zmijewski et al.,“p53 isoforms can regulate p53 transcriptional activity,”Genes & Development, vol. 19, pp. 2122–2137, 2005.
[150] J.-C. Bourdon, “p53 and its isoforms in cancer,” British Jour-nal of Cancer, vol. 97, pp. 277–282, 2007.
[151] J. E. Chipuk and D. R. Green, “Dissecting p53-dependentapoptosis,” Cell Death and Differentiation, vol. 13, pp. 994–1002, 2006.
[152] K. H. Vousden and D. P. Lane, “p53 in health and disease,”Nature Reviews. Molecular Cell Biology, vol. 8, pp. 275–283,2007.
[153] U. M. Moll, S. Wolff, D. Speidel, andW. Deppert, “Transcrip-tion-independent pro-apoptotic functions of p53,” CurrentOpinion in Cell Biology, vol. 17, pp. 631–636, 2005.
[154] J. Nowak and J. L. Iovanna, “TP53INP2 is the new guest at thetable of self-eating,” Autophagy, vol. 5, pp. 383-384, 2009.
[155] D. Sala and A. Zorzano, “Is TP53INP2 a critical regulator ofmuscle mass?,” Current Opinion in Clinical Nutrition andMetabolic Care, vol. 18, pp. 234–239, 2015.
[156] J. Nowak, C. Archange, J. Tardivel-Lacombe et al., “TheTP53INP2 protein is required for autophagy in mammaliancells,” Molecular Biology of the Cell, vol. 20, pp. 870–881,2009.
[157] A. M. Cuervo, E. Bergamini, U. T. Brunk, W. Dröge, M.Ffrench, and A. Terman, “Autophagy and aging: the impor-tance of maintaining “clean” cells,” Autophagy, vol. 1,pp. 131–140, 2005.
[158] R. Mirzayans, B. Andrais, A. Scott, and D. Murray, “Newinsights into p53 signaling and cancer cell response toDNA damage: implications for cancer therapy,” Journal ofBiomedicine and Biotechnology, vol. 2012, Article ID170325, 16 pages, 2012.
[159] T. A. Haj-Ahmad, M. A. Abdalla, and Y. Haj-Ahmad,“Potential urinary protein biomarker candidates for the
19Oxidative Medicine and Cellular Longevity

accurate detection of prostate cancer among benign prostatichyperplasia patients,” Journal of Cancer, vol. 5, pp. 103–114,2014.
[160] M. He, Y. Zhao, H. Yi, H. Sun, X. Liu, and S. Ma, “The com-bination of TP53INP1, TP53INP2 and AXIN2: potential bio-markers in papillary thyroid carcinoma,” Endocrine, vol. 48,pp. 712–717, 2015.
[161] T. Schlomm, E. Näkel, A. Lübke et al., “Marked gene tran-script level alterations occur early during radical prostatec-tomy,” European Urology, vol. 53, pp. 333–344, 2008.
[162] E. Staub, J. Gröne, D. Mennerich et al., “A genome-wide mapof aberrantly expressed chromosomal islands in colorectalcancer,” Molecular Cancer, vol. 5, p. 37, 2006.
[163] A. Nordgren, M. Corcoran, A. Sääf et al., “Characterisationof hairy cell leukaemia by tiling resolution array-basedcomparative genome hybridisation: a series of 13 cases andreview of the literature,” European Journal of Haematology,vol. 84, pp. 17–25, 2010.
[164] K. Moran-Jones, J. Grindlay, M. Jones, R. Smith, and J. C.Norman, “hnRNP A2 regulates alternative mRNA splicingof TP53INP2 to control invasive cell migration,” CancerResearch, vol. 69, pp. 9219–9227, 2009.
[165] S. S. Boon and S. P. Sim, “Inhibitor of caspase-activatedDNase expression enhances caspase-activated DNase expres-sion and inhibits oxidative stress-induced chromosomebreaks at the mixed lineage leukaemia gene in nasopharyn-geal carcinoma cells,” Cancer Cell International, vol. 15,p. 54, 2015.
[166] J. Zhang, H. Guo, G. Qian et al., “MiR-145, a new regulator ofthe DNA fragmentation factor-45 (DFF45)-mediated apo-ptotic network,” Molecular Cancer, vol. 9, p. 211, 2010.
[167] L. Charrier, A. Jarry, C. Toquet et al., “Growth phase-dependent expression of ICADL/DFF45 modulates the pat-tern of apoptosis in human colonic cancer cells,” CancerResearch, vol. 62, pp. 2169–2174, 2002.
[168] Y. Errami, H. Brim, K. Oumouna-Benachour et al., “ICADdeficiency in human colon cancer and predisposition to colontumorigenesis: linkage to apoptosis resistance and genomicinstability,” PLoS One, vol. 8, article e57871, 2013.
[169] S. Konishi, H. Ishiguro, Y. Shibata et al., “Decreased expres-sion of DFF45/ICAD is correlated with a poor prognosis inpatients with esophageal carcinoma,” Cancer, vol. 95,pp. 2473–2478, 2002.
[170] F. Abel, R. M. Sjöberg, C. Krona, S. Nilsson, and T. Martins-son, “Mutations in the N-terminal domain of DFF45 in a pri-mary germ cell tumor and in neuroblastoma tumors,”International Journal of Oncology, vol. 25, pp. 1297–1302,2004.
[171] H. Linardou, K. T. Kalogeras, R. Kronenwett et al., “The prog-nostic and predictive value of mRNA expression of vascularendothelial growth factor family members in breast cancer:a study in primary tumors of high-risk early breast cancerpatients participating in a randomized Hellenic Coopera-tive Oncology Group trial,” Breast Cancer Research, vol. 14,article R145, 2012.
[172] D. Sa-Nguanraksa and P. O-Charoenrat, “The role of vascu-lar endothelial growth factor a polymorphisms in breast can-cer,” International Journal of Molecular Sciences, vol. 13,pp. 14845–14864, 2012.
[173] D. Della-Morte, S. Riondino, P. Ferroni et al., “Impact ofVEGF gene polymorphisms in elderly cancer patients:
clinical outcome and toxicity,” Pharmacogenomics, vol. 16,pp. 61–78, 2015.
[174] H. P. Gerber, A. McMurtrey, J. Kowalski et al., “Vascularendothelial growth factor regulates endothelial cell survivalthrough the phosphatidylinositol 3′-kinase/Akt signal trans-duction pathway. Requirement for Flk-1/KDR activation,”The Journal of Biological Chemistry, vol. 273, pp. 30336–30343, 1998.
[175] H. F. Dvorak, “Vascular permeability factor/vascular endo-thelial growth factor: a critical cytokine in tumor angiogene-sis and a potential target for diagnosis and therapy,” Journalof Clinical Oncology, vol. 20, pp. 4368–4380, 2002.
[176] W. G. Roberts and G. E. Palade, “Increased microvascularpermeability and endothelial fenestration induced by vascu-lar endothelial growth factor,” Journal of Cell Science,vol. 108, pp. 2369–2379, 1995.
[177] K. DD, J. K. Zaleski, S. Liu, and T. A. Brock, “Vascular endo-thelial growth factor induces EDRF-dependent relaxation incoronary arteries,” The American Journal of Physiology,vol. 265, pp. H586–H592, 1993.
[178] H. P. Gerber, V. Dixit, and N. Ferrara, “Vascular endothelialgrowth factor induces expression of the antiapoptotic pro-teins Bcl-2 and A1 in vascular endothelial cells,” The Journalof Biological Chemistry, vol. 273, pp. 13313–13316, 1998.
[179] L. E. Benjamin, D. Golijanin, A. Itin, D. Pode, and E. Keshet,“Selective ablation of immature blood vessels in establishedhuman tumors follows vascular endothelial growth factorwithdrawal,” The Journal of Clinical Investigation, vol. 103,pp. 159–165, 1999.
[180] H. P. Gerber, K. J. Hillan, A. M. Ryan et al., “VEGF is requiredfor growth and survival in neonatal mice,” Development,vol. 126, pp. 1149–1159, 1999.
[181] P. Delmotte, B. Martin, M. Paesmans et al., “VEGF and sur-vival of patients with lung cancer: a systematic literaturereview and meta-analysis,” Revue des Maladies Respiratoires,vol. 19, pp. 577–584, 2002.
[182] P. A. Kyzas, I. W. Cunha, and J. P. Ioannidis, “Prognostic sig-nificance of vascular endothelial growth factor immunohisto-chemical expression in head and neck squamous cellcarcinoma: a meta-analysis,” Clinical Cancer Research,vol. 11, pp. 1434–1434, 2005.
[183] G. Des Guetz, B. Uzzan, P. Nicolas et al., “Microvessel densityand VEGF expression are prognostic factors in colorectalcancer. Meta-analysis of the literature,” British Journal ofCancer, vol. 94, pp. 1823–1832, 2006.
[184] P. Borgström, M. A. Bourdon, K. J. Hillan, P. Sriramarao,and N. Ferrara, “Neutralizing anti-vascular endothelialgrowth factor antibody completely inhibits angiogenesisand growth of human prostate carcinoma micro tumorsin vivo,” The Prostate, vol. 1, no. 35, pp. 1–10, 1998.
[185] K. J. Kim, B. Li, J. Winer et al., “Inhibition of vascular endo-thelial growth factor-induced angiogenesis suppressestumour growth in vivo,” Nature, vol. 362, pp. 841–844, 1993.
[186] S. P. Balasubramanian, A. Cox, S. S. Cross, S. E. Higham,N. J. Brown, and M. W. Reed, “Influence of VEGF-A genevariation and protein levels in breast cancer susceptibilityand severity,” International Journal of Cancer, vol. 121,pp. 1009–1016, 2007.
[187] L. Rydén, M. Stendahl, H. Jonsson, S. Emdin, N. O. Bengts-son, and G. Landberg, “Tumor-specific VEGF-A andVEGFR2 in postmenopausal breast cancer patients with
20 Oxidative Medicine and Cellular Longevity

long-term follow-up. Implication of a link between VEGFpathway and tamoxifen response,” Breast Cancer Researchand Treatment, vol. 89, pp. 135–143, 2005.
[188] H. Han, J. F. Silverman, T. S. Santucci et al., “Vascularendothelial growth factor expression in stage I non-smallcell lung cancer correlates with neoangiogenesis and a poorprognosis,” Annals of Surgical Oncology, vol. 8, pp. 72–79,2001.
[189] G. Cao, X. Li, C. Qin, and J. Li, “Prognostic value of VEGF inhepatocellular carcinoma patients treated with sorafenib: ameta-analysis,” Medical Science Monitor, vol. 21, pp. 3144–3151, 2015.
21Oxidative Medicine and Cellular Longevity

Research ArticleSimvastatin Ameliorates Diabetic Cardiomyopathy by AttenuatingOxidative Stress and Inflammation in Rats
Nawal M. Al-Rasheed,1,2 Nouf M. Al-Rasheed,1 Iman H. Hasan,1 Maha A. Al-Amin,1
Hanaa N. Al-Ajmi,1 Raeesa A. Mohamad,3 and Ayman M. Mahmoud4,5,6
1Department of Pharmacology and Toxicology, College of Pharmacy, King Saud University, Riyadh, Saudi Arabia2Department of Pharmaceutical Sciences, College of Pharmacy, Princess Nourah bint Abdulrahman University, Riyadh, Saudi Arabia3Department of Anatomy, College of Medicine, King Saud University, Riyadh, Saudi Arabia4Physiology Division, Department of Zoology, Faculty of Science, Beni-Suef University, Beni Suef, Egypt5Department of Endocrinology, Diabetes and Nutrition, Charité-University Medicine Berlin, Berlin, Germany6Department of Endocrinology, Diabetes and Nutrition at the Center for Cardiovascular Research (CCR), Charité-UniversityMedicine Berlin, Berlin, Germany
Correspondence should be addressed to Ayman M. Mahmoud; [email protected]
Received 19 June 2017; Accepted 6 August 2017; Published 12 September 2017
Academic Editor: Simona G. Bungǎu
Copyright © 2017 Nawal M. Al-Rasheed et al. This is an open access article distributed under the Creative CommonsAttribution License, which permits unrestricted use, distribution, and reproduction in any medium, provided the originalwork is properly cited.
Simvastatin is a lipid-lowering agent used to treat hypercholesterolemia and to reduce the risk of heart disease. This studyscrutinized the beneficial effects of simvastatin on experimental diabetic cardiomyopathy (DCM), pointing to the role ofhyperglycemia-induced oxidative stress and inflammation. Diabetes was induced by intraperitoneal injection of streptozotocinand both control and diabetic rats received simvastatin for 90 days. Diabetic rats showed significant cardiac hypertrophy, bodyweight loss, hyperglycemia, and hyperlipidemia. Serum creatine kinase MB (CK-MB) and troponin I showed a significantincrease in diabetic rats. Simvastatin significantly improved body weight, attenuated hyperglycemia and hyperlipidemia, andameliorated CK-MB and troponin I. Simvastatin prevented histological alterations and deposition of collagen in the heart ofdiabetic animals. Lipid peroxidation and nitric oxide were increased in the heart of diabetic rats whereas antioxidant defenseswere decreased. These alterations were significantly reversed by simvastatin. In addition, simvastatin decreased seruminflammatory mediators and expression of NF-κB in the diabetic heart. Cardiac caspase-3 was increased in the diabetic heartand decreased following treatment with simvastatin. In conclusion, our results suggest that simvastatin alleviates DCM byattenuating hyperglycemia/hyperlipidemia-induced oxidative stress, inflammation, and apoptosis.
1. Introduction
Cardiovascular disease (CVD) is the leading cause ofmorbidity and mortality in the world. Diabetes mellitus(DM) is a major contributing factor to CVD and heart failure[1]. A causative relationship between myocardial abnormali-ties and diabetes has been well demonstrated [2]. Diabeticcardiomyopathy (DCM) is the clinical condition associatedwith cardiac abnormalities provoked by diabetes [2]. It hasbeen estimated that DCM affects approximately 12% of thediabetic patients and may lead to heart failure and death
[3]. Cardiac hypertrophy, oxidative stress, inflammation,apoptosis, and myocardial interstitial fibrosis are the majorfeatures of DCM [4].
Persistent hyperglycemia in diabetes provokes excessiveproduction of reactive oxygen species (ROS) and inflamma-tion which play a key role in DCM [5, 6]. Hyperglycemiainduces glucose auto-oxidation and surplus generation ofROS. Hyperlipidemia can also increase ROS productionthrough stimulating nicotinamide adenine dinucleotidephosphate (NADPH) oxidases and inducing leakage of themitochondrial electron transport chain [7]. Excess ROS
HindawiOxidative Medicine and Cellular LongevityVolume 2017, Article ID 1092015, 13 pageshttps://doi.org/10.1155/2017/1092015

activates protein kinase C and subsequently nuclear factor-κB (NF-κB), leading to myocardial injury [5, 6]. NF-κB isa redox-sensitive protein complexes with a central role ininflammation [8]. Activated NF-κB promotes the tran-scription and release of inflammatory mediators such astumor necrosis factor-α (TNF-α) and thereby provokesmyocardial inflammation [8].
Statins are hydroxymethylglutaryl coenzyme A (HMG-CoA) reductase inhibitors with lipid-lowering effect. Statinsare the first-line treatment for coronary artery disease andare widely prescribed to prevent hypercholesterolemia [9].Studies have shown the beneficial outcomes of statins onthe cardiovascular system. In this context, Liu et al. [10]have recently reported that rosuvastatin postconditioningcan protect isolated hearts against ischemia-reperfusioninjury. Independently of their lipid-lowering effects, chronicpretreatment with statins preserved the integrity of micro-vasculature after acute myocardial infarction [11]. Improvedmyocardial perfusion and decreased infarction areas afterischemic reperfusion have been associated with early andchronic pretreatment with statins [11, 12]. The beneficialtherapeutic outcomes of statins have been attributed to theirability to activate protein kinase B and endothelial nitricoxide synthase (eNOS) [13] and to attenuate oxidative stress[14, 15]. Previous studies have shown that simvastatininhibits hypertrophy of cultured cardiomyocytes [16, 17]and in isoproterenol-induced rats [15]. In addition, simva-statin exerted protective effect against cardiac hypertrophyin a rat model of abdominal aortic constriction [18].Recently, González-Herrera et al. [19] demonstrated thatsimvastatin can improve the pathophysiological conditionin chronic Chagas cardiomyopathy experimental animalmodel. However, the protective effect of simvastatin againstDCM has not yet been reported. Therefore, this study scruti-nized the possible cardioprotective effect of simvastatin in arat model of DCM.
2. Materials and Methods
2.1. Chemicals and Reagents. Simvastatin, streptozotocin(STZ), pyrogallol, reduced glutathione (GSH), malondialde-hyde (MDA), thiobarbituric acid, and Griess reagent weresupplied by Sigma-Aldrich (USA). Cholesterol, high-densitylipoprotein (HDL) cholesterol, and triglyceride assay kitswere supplied by Accurex (Mumbai, India). Antibodies forNF-κB p65 (Cat. number sc-372), caspase-3 (Cat. numbersc-7148), and β-actin (Cat. number sc-47778) were pur-chased from Santa Cruz Biotechnology (USA). Other che-micals and reagents were supplied by Sigma-Aldrich orother standard suppliers.
2.2. Experimental Animals. Ten-week old male Wistar ratsweighing 160–180 g were included in this investigation.The animals were supplied by the College of Pharmacyat King Saud University (Riyadh, Saudi Arabia) and wereprovided free access to standard laboratory diet of knowncomposition and water ad libitum. The rats were main-tained at normal atmospheric temperature (23± 2°C) ona 12h light/dark cycle. The experimental protocol and all
animal procedures were approved by the InstitutionalResearch Ethics Committee, College of Pharmacy at KingSaud University (Riyadh, Saudi Arabia).
2.3. Experimental Design and Treatments. Type 1 DM wasinduced by a single intraperitoneal (i.p.) injection of55mg/kg body weight STZ to overnight fasted rats. STZ solu-tion was freshly prepared by dissolving in 0.1M cold citratebuffer (pH 4.5). Diabetes was confirmed through thedetermination of blood glucose levels at 72 hr using MED-ISAFE MINI blood glucose reader (TERUMO Corporation,Tokyo, Japan). Rats with blood glucose levels higher than200mg/dl were considered diabetic and selected for furtherexperiments. Diabetes was further verified by measuringblood glucose levels 7 days after STZ injection. Normal con-trol rats received a single i.p. dose of physiological saline.
Thirty-two rats (16 diabetic and 16 normal) were dividedinto 4 groups (N = 8) as follows:
Group I (control): Nondiabetic rats received physiologi-cal saline orally for 90 days.
Group II (SIM): Nondiabetic rats received simvastatin(10mg/kg) [15] dissolved in saline by oral gavage for 90 days.
Group III (diabetic): Diabetic rats received physiologicalsaline by oral gavage for 90 days.
Group IV (diabetic + SIM): Diabetic rats received simva-statin (10mg/kg) for 90 days.
2.4. Sample Collection and Preparation. Twenty-four hoursafter the last treatment, overnight fasted rats were sacrificedby cervical dislocation. Blood was collected and processedto separate serum. Hearts were excised, washed, and weighed.Samples from the heart were homogenized in coldphosphate-buffered saline (10% w/v), and clear homogenatewas collected to assay MDA, nitric oxide (NO), GSH, andsuperoxide dismutase (SOD). Other samples were collectedon neutral buffered formalin for histological and immuno-histochemical processing while others were kept at −80°Cfor Western blotting.
2.5. Biochemical Assays
2.5.1. Assay of Creatine Kinase MB (CK-MB) and Troponin I.Serum CK-MB and troponin I were determined using spe-cific ELISA kits supplied by EIAab (Wuhan, China).
2.5.2. Assay of Serum Lipids and Cardiovascular Risk Indices.Total cholesterol [20], triglycerides [21], and HDL choles-terol [22] were assayed in serum of normal and diabetic ratsusing reagent kits purchased from Accurex (Mumbai, India).Low-density lipoprotein (LDL) cholesterol level was deter-mined using the formula
LDL cholesterol
= total cholesterol − triglycerides5 + HDL cholesterol
1
Very low-density lipoprotein (vLDL) cholesterol wascalculated using the formula
2 Oxidative Medicine and Cellular Longevity
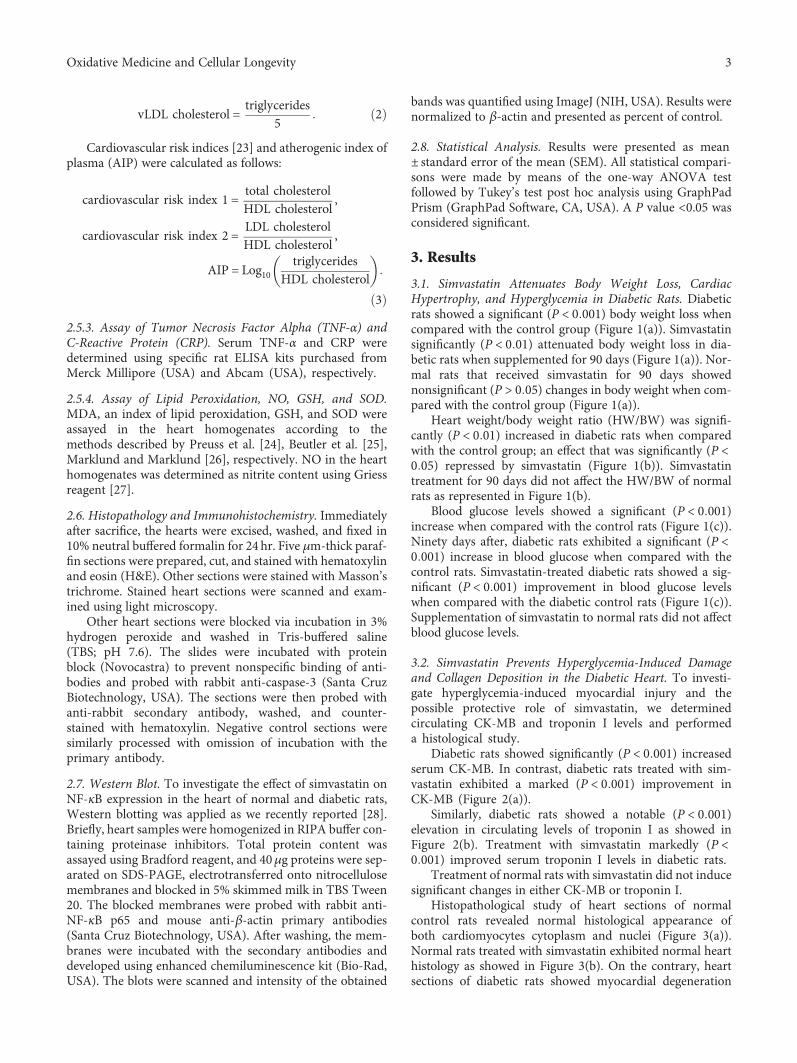
vLDL cholesterol = triglycerides5 2
Cardiovascular risk indices [23] and atherogenic index ofplasma (AIP) were calculated as follows:
cardiovascular risk index 1 = total cholesterolHDL cholesterol ,
cardiovascular risk index 2 = LDL cholesterolHDL cholesterol ,
AIP = Log10triglycerides
HDL cholesterol3
2.5.3. Assay of Tumor Necrosis Factor Alpha (TNF-α) andC-Reactive Protein (CRP). Serum TNF-α and CRP weredetermined using specific rat ELISA kits purchased fromMerck Millipore (USA) and Abcam (USA), respectively.
2.5.4. Assay of Lipid Peroxidation, NO, GSH, and SOD.MDA, an index of lipid peroxidation, GSH, and SOD wereassayed in the heart homogenates according to themethods described by Preuss et al. [24], Beutler et al. [25],Marklund and Marklund [26], respectively. NO in the hearthomogenates was determined as nitrite content using Griessreagent [27].
2.6. Histopathology and Immunohistochemistry. Immediatelyafter sacrifice, the hearts were excised, washed, and fixed in10% neutral buffered formalin for 24 hr. Five μm-thick paraf-fin sections were prepared, cut, and stained with hematoxylinand eosin (H&E). Other sections were stained with Masson’strichrome. Stained heart sections were scanned and exam-ined using light microscopy.
Other heart sections were blocked via incubation in 3%hydrogen peroxide and washed in Tris-buffered saline(TBS; pH 7.6). The slides were incubated with proteinblock (Novocastra) to prevent nonspecific binding of anti-bodies and probed with rabbit anti-caspase-3 (Santa CruzBiotechnology, USA). The sections were then probed withanti-rabbit secondary antibody, washed, and counter-stained with hematoxylin. Negative control sections weresimilarly processed with omission of incubation with theprimary antibody.
2.7. Western Blot. To investigate the effect of simvastatin onNF-κB expression in the heart of normal and diabetic rats,Western blotting was applied as we recently reported [28].Briefly, heart samples were homogenized in RIPA buffer con-taining proteinase inhibitors. Total protein content wasassayed using Bradford reagent, and 40μg proteins were sep-arated on SDS-PAGE, electrotransferred onto nitrocellulosemembranes and blocked in 5% skimmed milk in TBS Tween20. The blocked membranes were probed with rabbit anti-NF-κB p65 and mouse anti-β-actin primary antibodies(Santa Cruz Biotechnology, USA). After washing, the mem-branes were incubated with the secondary antibodies anddeveloped using enhanced chemiluminescence kit (Bio-Rad,USA). The blots were scanned and intensity of the obtained
bands was quantified using ImageJ (NIH, USA). Results werenormalized to β-actin and presented as percent of control.
2.8. Statistical Analysis. Results were presented as mean± standard error of the mean (SEM). All statistical compari-sons were made by means of the one-way ANOVA testfollowed by Tukey’s test post hoc analysis using GraphPadPrism (GraphPad Software, CA, USA). A P value <0.05 wasconsidered significant.
3. Results
3.1. Simvastatin Attenuates Body Weight Loss, CardiacHypertrophy, and Hyperglycemia in Diabetic Rats. Diabeticrats showed a significant (P < 0 001) body weight loss whencompared with the control group (Figure 1(a)). Simvastatinsignificantly (P < 0 01) attenuated body weight loss in dia-betic rats when supplemented for 90 days (Figure 1(a)). Nor-mal rats that received simvastatin for 90 days showednonsignificant (P > 0 05) changes in body weight when com-pared with the control group (Figure 1(a)).
Heart weight/body weight ratio (HW/BW) was signifi-cantly (P < 0 01) increased in diabetic rats when comparedwith the control group; an effect that was significantly (P <0 05) repressed by simvastatin (Figure 1(b)). Simvastatintreatment for 90 days did not affect the HW/BW of normalrats as represented in Figure 1(b).
Blood glucose levels showed a significant (P < 0 001)increase when compared with the control rats (Figure 1(c)).Ninety days after, diabetic rats exhibited a significant (P <0 001) increase in blood glucose when compared with thecontrol rats. Simvastatin-treated diabetic rats showed a sig-nificant (P < 0 001) improvement in blood glucose levelswhen compared with the diabetic control rats (Figure 1(c)).Supplementation of simvastatin to normal rats did not affectblood glucose levels.
3.2. Simvastatin Prevents Hyperglycemia-Induced Damageand Collagen Deposition in the Diabetic Heart. To investi-gate hyperglycemia-induced myocardial injury and thepossible protective role of simvastatin, we determinedcirculating CK-MB and troponin I levels and performeda histological study.
Diabetic rats showed significantly (P < 0 001) increasedserum CK-MB. In contrast, diabetic rats treated with sim-vastatin exhibited a marked (P < 0 001) improvement inCK-MB (Figure 2(a)).
Similarly, diabetic rats showed a notable (P < 0 001)elevation in circulating levels of troponin I as showed inFigure 2(b). Treatment with simvastatin markedly (P <0 001) improved serum troponin I levels in diabetic rats.
Treatment of normal rats with simvastatin did not inducesignificant changes in either CK-MB or troponin I.
Histopathological study of heart sections of normalcontrol rats revealed normal histological appearance ofboth cardiomyocytes cytoplasm and nuclei (Figure 3(a)).Normal rats treated with simvastatin exhibited normal hearthistology as showed in Figure 3(b). On the contrary, heartsections of diabetic rats showed myocardial degeneration
3Oxidative Medicine and Cellular Longevity

60ns
‒60
40
‒40
20
‒20
0
ΔBo
dy w
eigh
t (g)
STZSIM
− −− +
+
⁎⁎
+
+−
⁎⁎⁎
(a)
1.5
1.0
0.5
0.0
HW
/BW
ratio
ns
STZSIM
⁎⁎⁎
− −− +
+ +
+−
(b)
ns
ns
Initial Final
nsBloo
d gl
ucos
e (m
g/dl
)
500
400
300
200
100
0STZSIM
− −− +
+ +
+−− −− +
+ +
+−
⁎⁎⁎⁎⁎⁎
⁎⁎⁎
(c)
Figure 1: Simvastatin attenuates body weight loss (a), cardiac hypertrophy (b), and hyperglycemia (c) in STZ-induced diabetic rats. Data areM± SEM (N = 8). ∗P < 05, ∗∗P < 0 01, and ∗∗∗P < 0 001. STZ: streptozotocin; SIM: simvastatin; HW: heart weight; BW: body weight;ns: nonsignificant.
⁎⁎⁎⁎⁎⁎
ns
2500
2000
1500
1000200
150CK-M
B (U
/l)
100
50
0STZSIM
− −− +
+ ++−
(a)
⁎⁎⁎⁎⁎⁎
ns
500
400
300
200
Trop
onin
I (n
g/m
l)
100
0STZSIM
− −− +
+ ++−
(b)
Figure 2: Simvastatin decreases serum CK-MB (a) and troponin I (b) levels in STZ-induced diabetic rats. Data are M± SEM (N = 8).∗∗∗P < 0 001. STZ: streptozotocin; SIM: simvastatin; CK-MB: creatine kinase MB; ns: nonsignificant.
4 Oxidative Medicine and Cellular Longevity
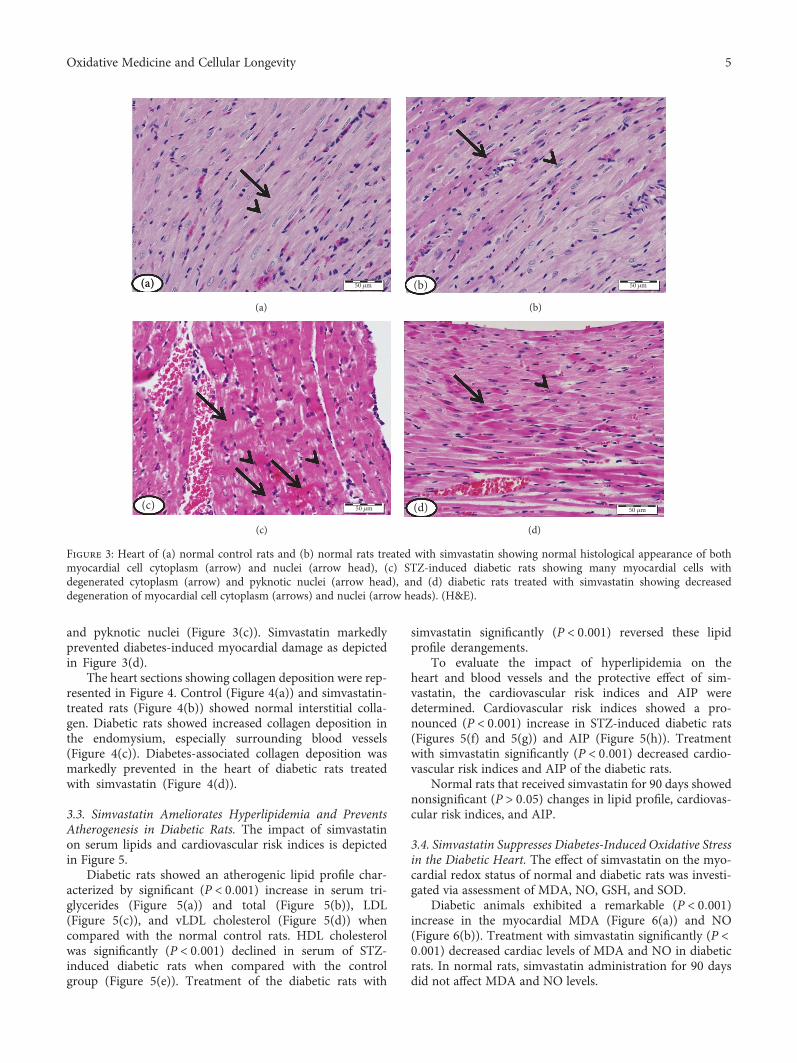
and pyknotic nuclei (Figure 3(c)). Simvastatin markedlyprevented diabetes-induced myocardial damage as depictedin Figure 3(d).
The heart sections showing collagen deposition were rep-resented in Figure 4. Control (Figure 4(a)) and simvastatin-treated rats (Figure 4(b)) showed normal interstitial colla-gen. Diabetic rats showed increased collagen deposition inthe endomysium, especially surrounding blood vessels(Figure 4(c)). Diabetes-associated collagen deposition wasmarkedly prevented in the heart of diabetic rats treatedwith simvastatin (Figure 4(d)).
3.3. Simvastatin Ameliorates Hyperlipidemia and PreventsAtherogenesis in Diabetic Rats. The impact of simvastatinon serum lipids and cardiovascular risk indices is depictedin Figure 5.
Diabetic rats showed an atherogenic lipid profile char-acterized by significant (P < 0 001) increase in serum tri-glycerides (Figure 5(a)) and total (Figure 5(b)), LDL(Figure 5(c)), and vLDL cholesterol (Figure 5(d)) whencompared with the normal control rats. HDL cholesterolwas significantly (P < 0 001) declined in serum of STZ-induced diabetic rats when compared with the controlgroup (Figure 5(e)). Treatment of the diabetic rats with
simvastatin significantly (P < 0 001) reversed these lipidprofile derangements.
To evaluate the impact of hyperlipidemia on theheart and blood vessels and the protective effect of sim-vastatin, the cardiovascular risk indices and AIP weredetermined. Cardiovascular risk indices showed a pro-nounced (P < 0 001) increase in STZ-induced diabetic rats(Figures 5(f) and 5(g)) and AIP (Figure 5(h)). Treatmentwith simvastatin significantly (P < 0 001) decreased cardio-vascular risk indices and AIP of the diabetic rats.
Normal rats that received simvastatin for 90 days showednonsignificant (P > 0 05) changes in lipid profile, cardiovas-cular risk indices, and AIP.
3.4. Simvastatin Suppresses Diabetes-Induced Oxidative Stressin the Diabetic Heart. The effect of simvastatin on the myo-cardial redox status of normal and diabetic rats was investi-gated via assessment of MDA, NO, GSH, and SOD.
Diabetic animals exhibited a remarkable (P < 0 001)increase in the myocardial MDA (Figure 6(a)) and NO(Figure 6(b)). Treatment with simvastatin significantly (P <0 001) decreased cardiac levels of MDA and NO in diabeticrats. In normal rats, simvastatin administration for 90 daysdid not affect MDA and NO levels.
50 �휇m(a)(a)
(a)
50 �휇m(b)
(b)
50 �휇m(c)
(c)
50 �휇m(d)
(d)
Figure 3: Heart of (a) normal control rats and (b) normal rats treated with simvastatin showing normal histological appearance of bothmyocardial cell cytoplasm (arrow) and nuclei (arrow head), (c) STZ-induced diabetic rats showing many myocardial cells withdegenerated cytoplasm (arrow) and pyknotic nuclei (arrow head), and (d) diabetic rats treated with simvastatin showing decreaseddegeneration of myocardial cell cytoplasm (arrows) and nuclei (arrow heads). (H&E).
5Oxidative Medicine and Cellular Longevity

The antioxidant GSH was significantly (P < 0 001)declined in the heart of STZ-induced diabetic rats when com-pared with the control group (Figure 6(c)). In addition, dia-betic rats showed a significant (P < 0 01) decrease in cardiacSOD activity (Figure 6(d)). Simvastatin, supplemented for90 days, significantly ameliorated GSH content (P < 0 001)and SOD (P < 0 05) activity in the heart of diabetic rats whileexerted nonsignificant (P > 0 05) effect in normal rats.
3.5. Simvastatin Inhibits Inflammation and MyocardialApoptosis in Diabetic Rats. The ameliorative effect of sim-vastatin on diabetes-associated inflammation was exploredvia determination of serum TNF-α and CRP levels andcardiac NF-κB expression. TNF-α (Figure 7(a)) and CRP(Figure 7(a)) were significantly (P < 0 001) increased indiabetic rats. Simvastatin significantly decreased TNF-αand CRP in serum of the STZ-induced diabetic rats. Oraladministration of simvastatin to control rats exerted non-significant (P > 0 05) effects on serum TNF-α and CRP.
Protein expression of NF-κB was significantly (P < 0 001)upregulated in the heart of STZ-induced diabetic rats(Figure 7(c)). Diabetic rats treated with simvastatin showeda significant (P < 0 001) downregulation of cardiac NF-κBexpression. Simvastatin did not affect NF-κB expressionlevels in the heart of control rats (Figure 7(c)).
To investigate the protective effect of simvastatin onmyocardial apoptosis in diabetes, the expression of caspase-3 was assessed by immunohistochemistry (Figure 7(d)).Heart sections of normal (Figure 7(d)-A) and simvastatinsupplemented rats (Figure 7(d)-B) did not show caspase-3immunopositive reaction of cardiomyocytes. STZ-induceddiabetic rats showed marked increase in caspase-3 immuno-positive stained cardiomyocytes (Figure 7(d)-C), an effectthat was prevented by simvastatin (Figure 7(d)-D).
4. Discussion
Cardiomyopathy is an independent complication of DMwhich occurs in the absence of other heart diseases [29].Hyperglycemia/hyperlipidemia-induced oxidative stress,inflammation, and apoptosis are probably involved in thepathogenesis of DCM [30, 31]. Here, we demonstrated theameliorative potential of simvastatin on DCM in a rat modelof STZ-induced diabetes. We provide the evidence thatsimvastatin ameliorates DCM via its ability to mitigatehyperglycemia, hyperlipidemia, oxidative stress, inflamma-tion, and apoptosis.
The principal approach to control DM is loweringblood glucose levels. Here, STZ-induced diabetic ratsexhibited a significant increase in blood glucose levels with
100 �휇m(a)(a)
(a)
100 �휇m(b)
(b)
100 �휇m(c)
(c)
100 �휇m(d)
(d)
Figure 4: Heart of (a) control rats, (b) simvastatin-supplemented rats revealing normal amount and distribution of interstitial collagen(arrow), (c) STZ-induced diabetic rats with marked increase in the amount of collagen tissue in the endomysium especially surroundingblood vessels (arrows), and (d) diabetic rats treated with simvastatin showing decreased collagen deposition (arrow). (Masson’s trichrome).
6 Oxidative Medicine and Cellular Longevity

200
150
100
50
0
⁎⁎⁎ ⁎⁎⁎
ns
Trig
lyce
ride (
mg/
dl)
− −− −+
+ +
+
STZSIM
(a)
250
200
150
100
0
50
⁎⁎⁎⁎⁎⁎
ns
T ch
oles
tero
l (m
g/dl
)
− −− −+
+ +
+
STZSIM
(b)
nsLDL
chol
este
rol (
mg/
dl)
200
150
100
50
0
⁎⁎⁎⁎⁎⁎
− −− −+
+ +
+
STZSIM
(c)
0
40
30
20
10
ns
vLD
L ch
oles
tero
l (m
g/dl
)
⁎⁎⁎⁎⁎⁎
− −− −+
+ +
+
STZSIM
(d)
0
40
30
20
10
ns
HD
L ch
oles
tero
l (m
g/dl
)
⁎⁎⁎
⁎⁎⁎
− −− −+
+ +
+
STZSIM
(e)
0
5
10
15
ns
T ch
oles
tero
l/H
DL
chol
este
rol
⁎⁎⁎ ⁎⁎⁎
− −− −+
+ +
+
STZSIM
(f)
0
2
4
6
8
10
ns
LDL
chol
este
rol/
HD
L ch
oles
tero
l
⁎⁎⁎⁎⁎⁎
− −− −+
+ +
+
STZSIM
(g)
0.0
0.5
1.0
1.5
ns
Athe
roge
nic i
ndex
of p
lasm
a
⁎⁎⁎⁎⁎⁎
− −− −+
+ +
+
STZSIM
(h)
Figure 5: Simvastatin ameliorates hyperlipidemia and prevents atherogenesis in STZ-induced diabetic rats. Data are M± SEM (N = 8).∗∗∗P < 0 001. STZ: streptozotocin; SIM: simvastatin; T cholesterol: total cholesterol; LDL: low-density lipoprotein; HDL: high-densitylipoprotein; vLDL: very low density lipoprotein; ns: nonsignificant.
7Oxidative Medicine and Cellular Longevity

concomitantly declined body weight as we previouslyreported [32]. Treatment with simvastatin significantlyimproved blood glucose levels in diabetic rats. Similarfindings have been described in type 1 [14] and type 2diabetic rodent models [33]. The antihyperglycemic effectof statins may be attributed to their pleotropic effects,including increased insulin release and improved insulinsignaling and protection of pancreatic β-cells from ROS[34, 35]. Additionally, statins have been proven to inhibitthe activity of dipeptidyl peptidase IV (DPP-IV) [36]. Inthe same context, we have recently reported attenuatedhyperglycemia and DCM in diabetic rats treated with theDPP-IV inhibitor sitagliptin [32]. The improved glycemicstatus following simvastatin treatment may have contrib-uted to the alleviated body weight.
Oxidative stress and inflammation are known to promotecardiomyocyte hypertrophy in hyperglycemic conditions[37]. Here, diabetic rats exhibited cardiac hypertrophy evi-denced by the increased HW/BW ratio. Similar findings havebeen reported in our recent study [32]. In our study, cardiachypertrophy was associated with increased TNF-α and car-diac NF-κB expression. TNF-α has been reported to reducedegradation and increase synthesis of proteins in feline
cardiomyocytes. These derangements occur through a mech-anism involving preserved interaction between the extracel-lular matrix and cell integrins [38] and activation of NF-κB[39]. Increased rate of fatty acid (FA) oxidation in thediabetic myocardium results in lipid accumulation andsubsequently cardiac hypertrophy [40]. Myocardial hyper-trophy has also been reported to occur after 8 weeks ofdiabetes [41]. Simvastatin treatment prevented cardiachypertrophy in the diabetic rats. This effect might be attrib-uted to the attenuated inflammation and oxidative stress. Inconsistent with our findings, simvastatin has preventedisoproterenol-induced cardiac hypertrophy in rats as wepreviously reported [15]. In addition, Liu et al. [18] showedthe capacity of simvastatin to prevent in vitro and in vivomyocardial hypertrophy.
Hyperglycemia provoked cardiomyocyte damage asevidenced by the myocardium degeneration and pyknoticnuclei and elevated serum CK-MB and troponin I. Thesederangements are direct consequences of hyperglycemia-induced oxidative stress, inflammation, and other alterations.Elevated serum level of CK-MB is a powerful and sensitivetool to predict the risk of cardiac complications [42]. Theonset of myofibrillar disintegration and inflammation-
80
60
MD
A (n
mol
/100
mg)
40
ns
⁎⁎⁎⁎⁎⁎
20
0STZ − −
−−SIM ++
++
(a)
NO
(nm
ol/1
00 m
g)
ns
⁎⁎⁎⁎⁎⁎60
40
20
0
−−
−STZSIM +
+ ++
−
(b)
GSH
(nm
ol/1
00 m
g)
ns
⁎⁎⁎
⁎⁎⁎
20
10
30
0
−−− −STZ
SIM ++ +
+
(c)
SOD
(U/g
)
ns
⁎⁎
⁎
20
10
15
5
0− −
−−STZSIM +
+ ++
(d)
Figure 6: Simvastatin suppresses hyperglycemia-induced oxidative stress in the heart of STZ-induced diabetic rats. Data are M± SEM(N = 8). ∗P < 0 05, ∗∗P < 0 01, and ∗∗∗P < 0 001. STZ: streptozotocin; SIM: simvastatin; MDA: malondialdehyde; NO: nitric oxide; GSH:reduced glutathione; SOD: superoxide dismutase; ns: nonsignificant.
8 Oxidative Medicine and Cellular Longevity
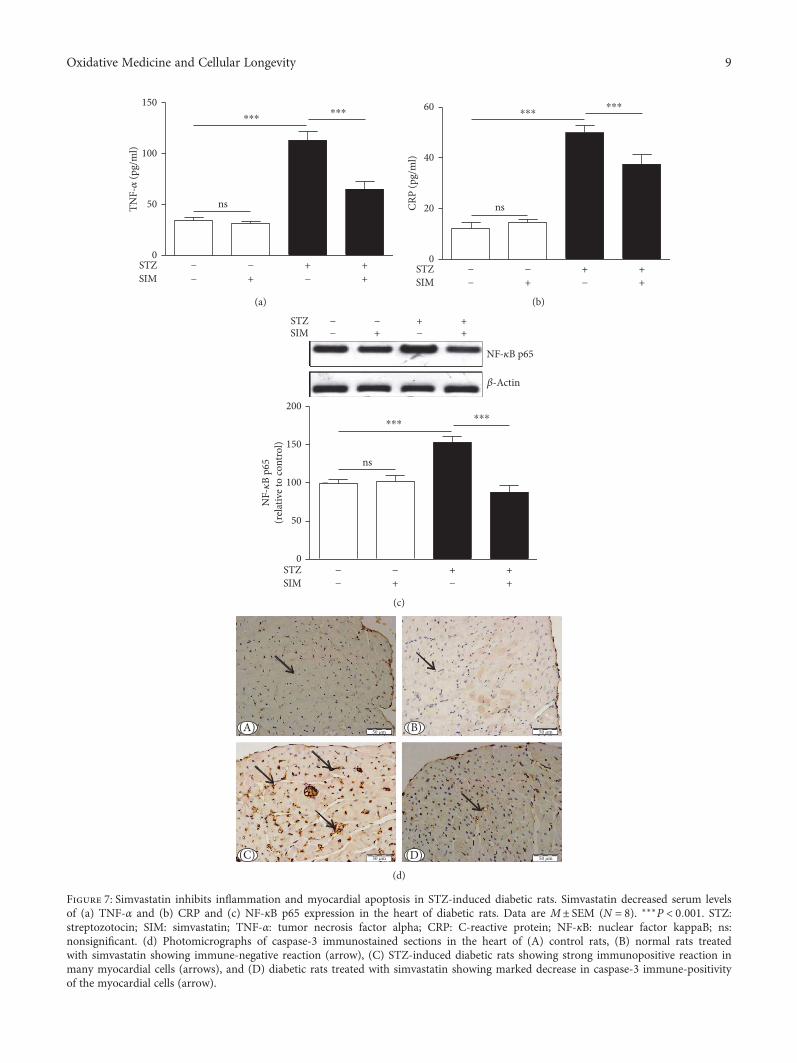
150
100
⁎⁎⁎⁎⁎⁎
TNF-�훼
(pg/
ml)
50 ns
0STZ − −
−−SIM ++ +
+
(a)
60
40
20
0
⁎⁎⁎⁎⁎⁎
CRP
(pg/
ml)
ns
STZ − −−−SIM ++ +
+
(b)
150
100
50
0
200⁎⁎⁎
⁎⁎⁎
NF-�휅
B p6
5(r
elat
ive t
o co
ntro
l)
NF-�휅B p65
�훽-Actin
ns
STZSIM
− −−− ++ +
+
STZSIM
−
− −−− ++ +
+
(c)
50 �휇m
50 �휇m50 �휇m
50 �휇m(A) (B)
(C) (D)(d)
Figure 7: Simvastatin inhibits inflammation and myocardial apoptosis in STZ-induced diabetic rats. Simvastatin decreased serum levelsof (a) TNF-α and (b) CRP and (c) NF-κB p65 expression in the heart of diabetic rats. Data are M± SEM (N = 8). ∗∗∗P < 0 001. STZ:streptozotocin; SIM: simvastatin; TNF-α: tumor necrosis factor alpha; CRP: C-reactive protein; NF-κB: nuclear factor kappaB; ns:nonsignificant. (d) Photomicrographs of caspase-3 immunostained sections in the heart of (A) control rats, (B) normal rats treatedwith simvastatin showing immune-negative reaction (arrow), (C) STZ-induced diabetic rats showing strong immunopositive reaction inmany myocardial cells (arrows), and (D) diabetic rats treated with simvastatin showing marked decrease in caspase-3 immune-positivityof the myocardial cells (arrow).
9Oxidative Medicine and Cellular Longevity

induced increase in permeability are associated with elevatedcirculating CK-MB and troponin I [43]. Previous researchfrom our lab showed increased CK-MB and troponin Iin serum of rat models of myocardial hypertrophy [15]and DCM [32]. Hyperlipidemia is another factor that con-tributes to cell death and cardiac dysfunctions in diabetes.Hyperlipidemia promotes the deposition of triglyceridesand cholesterol in the myocardium and influences cardiactoxicological consequences [44]. Simvastatin significantlyameliorated indices of myocardial damage in diabeticanimals. Therefore, reduced CK-MB and troponin I insimvastatin-treated diabetic rats supports the role of lipid-lowering agents in reducing hyperglycemia/hyperlipidemia-induced myocardial damage.
Given its role in inducing the production of ROS [45] anddeposition of lipids in the myocardium [44], hyperlipidemiaexerts a direct impact on the myocardium and increases therisk of coronary heart disease [46]. Here, STZ-induceddiabetic rats exhibited an atherogenic lipid profile character-ized by significant increases in serum cholesterol, triglycer-ides, LDL cholesterol, and vLDL cholesterol. In contrast,the cardioprotective HDL cholesterol [47] was significantlydeclined in the diabetic rats. Moreover, diabetic ratsshowed significantly increased values of the cardiovascularrisk indices and AIP which is a frequently used predictorof atherosclerosis [48]. Simvastatin significantly reducedhyperlipidemia, cardiovascular risk indices, and atherogenicindex in diabetic rats, indicating its potent lipid-lowering,antiatherogenic, and cardioprotective effects.
Counteracting oxidative stress is another mechanism weassumed have mediated the protective effect of simvastatinon DCM. Hyperglycemia/hyperlipidemia-induced produc-tion of ROS and reactive nitrogen species (RNS) constitutesa major contributing factor in the development of DCM.Hyperglycemia promotes generation of ROS and RNS inthe mitochondria [49], and increased cardiac FAs activateNADPH oxidases and induce leakage of the mitochondrialelectron transport chain [7]. Excess ROS promote upsurgesin lipid peroxidation and consequently alter membranestructure and enzyme activity [50]. In the present study,diabetic rats exhibited significantly elevated lipid peroxida-tion and NO in the myocardium. NO and superoxide rad-icals can react and produce peroxynitrite, leading to DNAfragmentation and protein damage [51]. Diabetic ratsexhibited reduced cardiac GSH, indicating its overutiliza-tion in the redox-challenged cellular microenvironment.GSH depletion induces further oxidative damage andnecrotic cell death [52, 53]. SOD, an enzyme catalyzingthe dismutation of superoxide, showed declined activity inthe diabetic heart. Simvastatin reduced lipid peroxidationand NO and alleviated antioxidants in the diabetic heart.Accordingly, simvastatin decreased lipid peroxidation andincreased hepatic and renal GSH levels in diabetic rats[14]. We have previously demonstrated the ability of simva-statin to decrease ROS generation and enhance antioxidantdefenses in a rodent model of cardiac hypertrophy [15].Therefore, the efficacy of simvastatin to attenuate oxidativestress may mediate, at least in part, its protective effectagainst DCM.
Cardiac inflammation, apoptosis, and fibrosis have beendefined in the diabetic heart [31]. Seddon et al. [54] reportedthat cardiac inflammation occurs as a consequence ofhyperglycemia-induced excessive ROS generation in diabe-tes. In our study, diabetic rats showed a significant increasein circulating TNF-α and CRP. Previous experimental stud-ies demonstrated the contributing role of chronic inflamma-tory status in DCM [55–57]. TNF-α has been reported toexert a crucial role in the development of myocardial hyper-trophy and dysfunction [55–57]. In the study of Bozkurtet al. [58], exogenous administration of TNF-α inducedin vivo cardiac inflammation and dysfunction. The role ofTNF-α in DCM has been further supported through observ-ing similar effects in a mouse model with cardiomyocyte-specific TNF-α overexpression [59]. Additionally, in amurine model of pressure overload, genetic disruption ofTNF-α hampered cardiac hypertrophy, dysfunction, andfibrosis [60]. In STZ-induced DCM, TNF-α antagonism pro-tected against myocardial inflammation, leukocyte infiltra-tion, and fibrosis [61].
Elevated CRP in STZ-induced diabetic rats in the pres-ent investigation was in agreement with the findings of pre-vious studies showing increased serum CRP levels indiabetic patients [62] and STZ-induced type 1 diabetic ani-mals [63]. Interestingly, diabetic rats treated with simva-statin showed significantly reduced serum TNF-α andCRP levels. Therefore, the beneficial effect of simvastatinis connected to its ability to reduce inflammation. In accor-dance, we have previously reported attenuated inflammationin a rat model of cardiac hypertrophy following simvastatinadministration [15].
Next, we demonstrated the effect of simvastatin on NF-κB expression in the diabetic heart. In consistent with theincreased serum levels of TNF-α and CRP, cardiac NF-κBwas upregulated in the diabetic rats. Different mechanismsimplicated in the establishment of inflammation in the dia-betic myocardium were reported to converge towards NF-κB activation. Hyperglycemia promotes NF-κB transcriptionthrough activation of NADPH oxidase and production ofROS [64], degradation of IκB [8], and activation of Erk1/2[65] and mitogen-activated protein kinase (MAPK) [66].Activated NF-κB induces the upregulation of TNF-α andother molecules contributing to cardiovascular damage [8].Increased circulating lipids may also contribute to NF-κBactivation in diabetes [67]. Treatment of the diabetic ratswith simvastatin prevented NF-κB activation in the myocar-dium, confirming its anti-inflammatory efficacy. In an exper-imental model of cardiac hypertrophy, we have reported theability of simvastatin to reduce NF-κB expression in theheart. This anti-inflammatory effect could be directly con-nected to its lipid-lowering mechanism.
Hyperglycemia-induced ROS generation can inducemyocardial apoptosis and fibrosis [32, 54]. Myocardialinflammation promotes cardiomyocyte death and thereforecontributes to cardiac remodeling [37]. Here, diabetic ratsshowed increased expression of the apoptosis markercaspase-3 in the myocardium. Apoptosis in the diabetic heartoccurs as a direct result of sustained ROS production andinflammation. In this context, Haudek et al. [68] reported
10 Oxidative Medicine and Cellular Longevity

that sustained TNF-α signaling provokes both intrinsic andextrinsic cell death pathways, increases caspase-3 activation,and promotes cardiomyocyte apoptosis. The proapoptoticeffects of TNF-α are likely mediated via NF-κB activation[69]. Simvastatin markedly prevented hyperglycemia-induced cardiomyocyte apoptosis in STZ-induced diabeticrats via attenuating inflammation and ROS production.
Histological examination of the diabetic heart revealedmyocardium degeneration and increased collagen deposi-tion as we recently reported [32]. Oxidative stress, inflamma-tion and cell injury are well-known causes of the cardiacfibrosis [61]. Cytokines and profibrotic factors released bycardiomyocytes and inflammatory cells stimulate fibrosis inthe diabetic heart. Through its ability to activate WNT1inducible-signaling pathway protein 1 (WISP1), TNF-αdirectly induces proliferation of cardiac fibroblast andproduction of collagen [70]. In addition, the profibroticeffects of cytokines have been shown to be boosted by ROS[55, 57]. Treatment with simvastatin markedly reduced colla-gen production and fibrosis, probably through its dual abilityto enhance the antioxidant defenses and to reduce chronicinflammation in the heart of diabetic rats. Accordingly,statins have reduced cardiovascular events and mortalityin diabetic patients [71]. Atorvastatin reduced myocardialinflammation and fibrosis in a diabetic rat model [72].This effect was believed to be independent of atorvastatin’sLDL cholesterol-lowering capacity [72]. Fluvastatin has alsobeen reported to attenuate cardiac dysfunction and myocar-dial interstitial fibrosis in diabetes [73]. Therefore, lipid-lowering treatments seem to be effective in the attenuationof diabetes-associated cardiac fibrosis and cell injury togetherwith a role in the primary prevention of the disease.
In conclusion, simvastatin has a protective effect onDCM. Simvastatin attenuated hyperglycemia/hyperlipid-emia-induced oxidative stress and enhanced antioxidantdefenses in the myocardium of diabetic rats. Simvastatinshowed a strong modulatory effect against cardiac hypertro-phy, inflammation, apoptosis, and fibrosis. Therefore, simva-statin and possibly other lipid-lowering agents can protectagainst DCM.
Conflicts of Interest
The authors declare that they have no conflicts of interest.
Acknowledgments
The authors extend their appreciation to the Deanship ofScientific Research at King Saud University for fundingthis work through research group no. RGP-1438-005.
References
[1] A. G. Bertoni, W. G. Hundley, M. W. Massing, D. E. Bonds,G. L. Burke, and D. C. Goff Jr, “Heart failure prevalence,incidence, and mortality in the elderly with diabetes,” DiabetesCare, vol. 27, no. 3, p. 699, 2004.
[2] S. Boudina and E. D. Abel, “Diabetic cardiomyopathy revis-ited,” Circulation, vol. 115, no. 25, pp. 3213–3223, 2007.
[3] A. Lorenzo-Almoros, J. Tunon, M. Orejas, M. Cortés, J. Egido,and Ó. Lorenzo, “Diagnostic approaches for diabetic cardio-myopathy,” Cardiovascular Diabetology, vol. 16, no. 1, p. 28,2017.
[4] Y. Saisho, “Glycemic variability and oxidative stress: a linkbetween diabetes and cardiovascular disease?,” InternationalJournal of Molecular Sciences, vol. 15, no. 10, pp. 18381–18406, 2014.
[5] R. Khanra, S. Dewanjee, T. K Dua et al., “Abroma augustaL. (Malvaceae) leaf extract attenuates diabetes inducednephropathy and cardiomyopathy via inhibition of oxidativestress and inflammatory response,” Journal of TranslationalMedicine, vol. 13, p. 6, 2015.
[6] N. Bhattacharjee, S. Barma, N. Konwar, S. Dewanjee, andP. Manna, “Mechanistic insight of diabetic nephropathy andits pharmacotherapeutic targets: an update,” European Journalof Pharmacology, vol. 791, pp. 8–24, 2016.
[7] H. O. Steinberg, G. Paradisi, G. Hook, K. Crowder, J. Cronin,and A. D. Baron, “Free fatty acid elevation impairs insulin-mediated vasodilation and nitric oxide production,” Diabetes,vol. 49, no. 7, pp. 1231–1238, 2000.
[8] M. S. Shah and M. Brownlee, “Molecular and cellular mecha-nisms of cardiovascular disorders in diabetes,” CirculationResearch, vol. 118, no. 11, pp. 1808–1829, 2016.
[9] N. K. Kapur and K. Musunuru, “Clinical efficacy and safety ofstatins in managing cardiovascular risk,” Vascular Health andRisk Management, vol. 4, no. 2, pp. 341–353, 2008.
[10] C. W. Liu, F. Yang, S. Z. Cheng, Y. Liu, L. H. Wan, and H. L.Cong, “Rosuvastatin postconditioning protects isolated heartsagainst ischemia-reperfusion injury: the role of radical oxygenspecies, PI3K-Akt-GSK-3β pathway, and mitochondrialpermeability transition pore,” Cardiovascular Therapeutics,vol. 35, no. 1, pp. 3–9, 2017.
[11] K. Iwakura, H. Ito, S. Kawano et al., “Chronic pre-treatmentof statins is associated with the reduction of the no-reflowphenomenon in the patients with reperfused acute myocardialinfarction,” European Heart Journal, vol. 27, no. 5, pp. 534–539, 2006.
[12] J. L. Zhao, Y. J. Yang, C. J. Cui, S. J. You, and R. L. Gao,“Pretreatment with simvastatin reduces myocardial no-reflow by opening mitochondrial KATP channel,” BritishJournal of Pharmacology, vol. 149, no. 3, pp. 243–249, 2006.
[13] S. Manickavasagam, Y. Ye, Y. Lin et al., “The cardioprotec-tive effect of a statin and cilostazol combination: relation-ship to Akt and endothelial nitric oxide synthase activation,”Cardiovascular Drugs and Therapy, vol. 21, no. 5, pp. 321–330, 2007.
[14] A. M. Mohamadin, A. A. Elberry, H. S. Abdel Gawad,G. M. Morsy, and F. A. Al-Abbasi, “Protective effects of sim-vastatin, a lipid lowering agent, against oxidative damage inexperimental diabetic rats,” Journal of Lipids, vol. 2011,Article ID 167958, 13 pages, 2011.
[15] N. M. Al-Rasheed, M. M. Al-Oteibi, R. Z. Al-Maneeet al., “Simvastatin prevents isoproterenol-induced cardiachypertrophy through modulation of the JAK/STAT path-way,” Drug Design, Development and Therapy, vol. 9,pp. 3217–3229, 2015.
[16] J. D. Luo, F. Xie, W. W. Zhang, X. D. Ma, J. X. Guan, andX. Chen, “Simvastatin inhibits noradrenaline-induced hyper-trophy of cultured neonatal rat cardiomyocytes,” British Jour-nal of Pharmacology, vol. 132, no. 1, pp. 159–164, 2001.
11Oxidative Medicine and Cellular Longevity

[17] L. Wu, L. Zhao, Q. Zheng et al., “Simvastatin attenuates hyper-trophic responses induced by cardiotrophin-1 via JAK-STATpathway in cultured cardiomyocytes,” Molecular and CellularBiochemistry, vol. 284, no. 1-2, pp. 65–71, 2006.
[18] J. Liu, Q. Shen, and Y. Wu, “Simvastatin prevents cardiachypertrophy in vitro and in vivo via JAK/STAT pathway,” LifeSciences, vol. 82, no. 19-20, pp. 991–996, 2008.
[19] F. Gonzalez-Herrera, A. Cramer, P. Pimentel et al.,“Simvastatin attenuates endothelial activation through15-epi-lipoxin A4 production in murine chronic Chagascardiomyopathy,” Antimicrobial Agents and Chemotherapy,vol. 61, no. 3, 2017.
[20] C. C. Allain, L. S. Poon, C. S. Chan, W. Richmond, and P. C.Fu, “Enzymatic determination of total serum cholesterol,”Clinical Chemistry, vol. 20, no. 4, pp. 470–475, 1974.
[21] P. Fossati and L. Prencipe, “Serum triglycerides determinedcolorimetrically with an enzyme that produces hydrogen per-oxide,” Clinical Chemistry, vol. 28, no. 10, pp. 2077–2080,1982.
[22] M. Burstein, H. R. Scholnick, and R. Morfin, “Rapid methodfor the isolation of lipoproteins from human serum by precip-itation with polyanions,” Journal of Lipid Research, vol. 11,no. 6, pp. 583–595, 1970.
[23] R. Ross, “The pathogenesis of atherosclerosis,” in Heart Dis-ease: A Textbook of Cardiovascular Medicine, E. Braunwald,Ed., pp. 1106–1124, WB Saunders, Philadelphia, PA, 1992.
[24] H. G. Preuss, S. T. Jarrell, R. Scheckenbach, S. Lieberman, andR. A. Anderson, “Comparative effects of chromium, vanadiumand Gymnema sylvestre on sugar-induced blood pressureelevations in SHR,” Journal of the American College of Nutri-tion, vol. 17, no. 2, pp. 116–123, 1998.
[25] E. Beutler, O. Duron, and B. M. Kelly, “Improved methodfor the determination of blood glutathione,” The Journal ofLaboratory and Clinical Medicine, vol. 61, pp. 882–888, 1963.
[26] S. Marklund and G. Marklund, “Involvement of the superox-ide anion radical in the autoxidation of pyrogallol and a conve-nient assay for superoxide dismutase,” European Journal ofBiochemistry, vol. 47, no. 3, pp. 469–474, 1974.
[27] M. B. Grisham, G. G. Johnson, and J. R. Lancaster Jr., “Quan-titation of nitrate and nitrite in extracellular fluids,” Methodsin Enzymology, vol. 268, pp. 237–246, 1996.
[28] A. M. Mahmoud, M. O. Germoush, M. F. Alotaibi, and O. E.Hussein, “Possible involvement of Nrf2 and PPARγ up-regulation in the protective effect of umbelliferone againstcyclophosphamide-induced hepatotoxicity,” Biomedicine &Pharmacotherapy, vol. 86, pp. 297–306, 2017.
[29] K. Huynh, B. C. Bernardo, J. R. McMullen, and R. H. Ritchie,“Diabetic cardiomyopathy: mechanisms and new treatmentstrategies targeting antioxidant signaling pathways,” Pharma-cology & Therapeutics, vol. 142, no. 3, pp. 375–415, 2014.
[30] I. Falcao-Pires and A. F. Leite-Moreira, “Diabetic cardiomyop-athy: understanding the molecular and cellular basis to prog-ress in diagnosis and treatment,” Heart Failure Reviews,vol. 17, no. 3, pp. 325–344, 2012.
[31] H. Suzuki, Y. Kayama, M. Sakamoto et al., “Arachidonate12/15-lipoxygenase-induced inflammation and oxidativestress are involved in the development of diabetic cardiomyop-athy,” Diabetes, vol. 64, no. 2, pp. 618–630, 2015.
[32] N. M. Al-Rasheed, N. M. Al-Rasheed, I. H. Hasan, M. A.Al-Amin, H. N. Al-Ajmi, and A. M. Mahmoud, “Sitagliptinattenuates cardiomyopathy by modulating the JAK/STAT
signaling pathway in experimental diabetic rats,” Drug Design,Development and Therapy, vol. 10, pp. 2095–2107, 2016.
[33] S. Zhang, H. Xu, X. Yu, Y. Wang, F. Sun, and D. Sui, “Sim-vastatin ameliorates low-dose streptozotocin-induced type 2diabetic nephropathy in an experimental rat model,” Inter-national Journal of Clinical and Experimental Medicine,vol. 8, no. 4, pp. 6388–6396, 2015.
[34] S. I. McFarlane, R. Muniyappa, R. Francisco, and J. R. Sowers,“Clinical review 145: pleiotropic effects of statins: lipid reduc-tion and beyond,” The Journal of Clinical Endocrinology andMetabolism, vol. 87, no. 4, pp. 1451–1458, 2002.
[35] K. K. Ray and C. P. Cannon, “The potential relevance of themultiple lipid-independent (pleiotropic) effects of statins inthe management of acute coronary syndromes,” Journal ofthe American College of Cardiology, vol. 46, no. 8, pp. 1425–1433, 2005.
[36] T. Taldone, S. W. Zito, and T. T. Talele, “Inhibition of dipep-tidyl peptidase-IV (DPP-IV) by atorvastatin,” Bioorganic &Medicinal Chemistry Letters, vol. 18, no. 2, pp. 479–484, 2008.
[37] G. Frati, L. Schirone, I. Chimenti et al., “An overview of theinflammatory signalling mechanisms in the myocardiumunderlying the development of diabetic cardiomyopathy,”Cardiovascular Research, vol. 113, no. 4, pp. 378–388, 2017.
[38] T. Yokoyama, M. Nakano, J. L. Bednarczyk, B. W. McIntyre,M. Entman, and D. L. Mann, “Tumor necrosis factor-αprovokes a hypertrophic growth response in adult cardiacmyocytes,” Circulation, vol. 95, no. 5, pp. 1247–1252, 1997.
[39] G. Condorelli, C. Morisco, M. V. Latronico et al., “TNF-α sig-nal transduction in rat neonatal cardiac myocytes: definition ofpathways generating from the TNF-α receptor,” The FASEBJournal, vol. 16, no. 13, pp. 1732–1737, 2002.
[40] T. Nishikawa, D. Edelstein, X. L. Du et al., “Normalizingmitochondrial superoxide production blocks three pathwaysof hyperglycaemic damage,” Nature, vol. 404, no. 6779,pp. 787–790, 2000.
[41] G.-G. Wang, W. Li, X.-H. Lu, X. Zhao, and L. Xu, “Taurineattenuates oxidative stress and alleviates cardiac failure in typeI diabetic rats,” Croatian Medical Journal, vol. 54, no. 2,pp. 171–179, 2013.
[42] P. B. Taylor and Q. Tang, “Development of isoproterenol-induced cardiac hypertrophy,” Canadian Journal of Physiologyand Pharmacology, vol. 62, no. 4, pp. 384–389, 1984.
[43] A. Upaganlawar and R. Balaraman, “Protective effects ofLagenaria siceraria (Molina) fruit juice in isoproterenolinduced myocardial infarction,” International Journal ofPharmacology, vol. 6, no. 5, pp. 645–651, 2010.
[44] S. Boudina and E. D. Abel, “Diabetic cardiomyopathy, causesand effects,” Reviews in Endocrine & Metabolic Disorders,vol. 11, no. 1, pp. 31–39, 2010.
[45] T. Inoguchi, P. Li, F. Umeda et al., “High glucose level and freefatty acid stimulate reactive oxygen species productionthrough protein kinase C–dependent activation of NAD(P)Hoxidase in cultured vascular cells,” Diabetes, vol. 49, no. 11,pp. 1939–1945, 2000.
[46] A. C. Leite, T. G. Araujo, B.M. Carvalho, N. H. Silva, V. L. Lima,and M. B. Maia, “Parkinsonia aculeata aqueous extract fraction:biochemical studies in alloxan-induced diabetic rats,” Journal ofEthnopharmacology, vol. 111, no. 3, pp. 547–552, 2007.
[47] P. Keul, K. Sattler, and B. Levkau, “HDL and its sphingosine-1-phosphate content in cardioprotection,” Heart FailureReviews, vol. 12, no. 3-4, pp. 301–306, 2007.
12 Oxidative Medicine and Cellular Longevity
[48] M. Hemmati, E. Zohoori, O. Mehrpour et al., “Anti-athero-genic potential of jujube, saffron and barberry: anti-diabeticand antioxidant actions,” EXCLI Journal, vol. 14, pp. 908–915, 2015.
[49] S. Boudina, S. Sena, B. T. O'Neill, P. Tathireddy, M. E. Young,and E. D. Abel, “Reduced mitochondrial oxidative capacityand increased mitochondrial uncoupling impair myocardialenergetics in obesity,” Circulation, vol. 112, no. 17, pp. 2686–2695, 2005.
[50] T. Silambarasan and B. Raja, “Diosmin, a bioflavonoid reversesalterations in blood pressure, nitric oxide, lipid peroxides andantioxidant status in DOCA-salt induced hypertensive rats,”European Journal of Pharmacology, vol. 679, no. 1–3, pp. 81–89, 2012.
[51] S. E. McKim, E. Gäbele, F. Isayama et al., “Inducible nitricoxide synthase is required in alcohol-induced liver injury:studies with knockout mice,” Gastroenterology, vol. 125,no. 6, pp. 1834–1844, 2003.
[52] A. M. Mahmoud, M. B. Ashour, A. Abdel-Moneim, and O. M.Ahmed, “Hesperidin and naringin attenuate hyperglycemia-mediated oxidative stress and proinflammatory cytokineproduction in high fat fed/streptozotocin-induced type 2diabetic rats,” Journal of Diabetes and its ComplicationsJournal of Diabetes and its Complications, vol. 26, no. 6,pp. 483–490, 2012.
[53] A. M. Mahmoud and H. S. A. Dera, “18β-Glycyrrhetinic acidexerts protective effects against cyclophosphamide-inducedhepatotoxicity: potential role of PPARγ and Nrf2 upregula-tion,” Genes & Nutrition, vol. 10, no. 6, pp. 1–13, 2015.
[54] M. Seddon, Y. H. Looi, and A. M. Shah, “Oxidative stress andredox signalling in cardiac hypertrophy and heart failure,”Heart, vol. 93, no. 8, pp. 903–907, 2007.
[55] R. A. Frieler and R. M. Mortensen, “Immune cell andother noncardiomyocyte regulation of cardiac hypertrophyand remodeling,” Circulation, vol. 131, no. 11, pp. 1019–1030, 2015.
[56] D. L. Mann, “Innate immunity and the failing heart: thecytokine hypothesis revisited,” Circulation Research, vol. 116,no. 7, pp. 1254–1268, 2015.
[57] S. D. Prabhu and N. G. Frangogiannis, “The biological basisfor cardiac repair after myocardial infarction: from inflam-mation to fibrosis,” Circulation Research, vol. 119, no. 1,pp. 91–112, 2016.
[58] B. Bozkurt, S. B. Kribbs, F. J. Clubb Jr et al., “Pathophysiologi-cally relevant concentrations of tumor necrosis factor-α pro-mote progressive left ventricular dysfunction and remodelingin rats,” Circulation, vol. 97, no. 14, pp. 1382–1391, 1998.
[59] T. Kubota, C. F. McTiernan, C. S. Frye et al., “Dilated cardio-myopathy in transgenic mice with cardiac-specific overexpres-sion of tumor necrosis factor-α,” Circulation Research, vol. 81,no. 4, pp. 627–635, 1997.
[60] M. Sun, M. Chen, F. Dawood et al., “Tumor necrosisfactor-α mediates cardiac remodeling and ventricular dys-function after pressure overload state,” Circulation, vol. 115,no. 11, pp. 1398–1407, 2007.
[61] D. Westermann, S. V. Linthout, S. Dhayat et al., “Tumornecrosis factor-alpha antagonism protects from myocardialinflammation and fibrosis in experimental diabetic cardiomy-opathy,” Basic Research in Cardiology, vol. 102, no. 6, pp. 500–507, 2007.
[62] M. K. Rutter, J. B. Meigs, L. M. Sullivan, R. B. D'Agostino Sr.,and P. W. Wilson, “C-reactive protein, the metabolicsyndrome, and prediction of cardiovascular events in theFramingham offspring study,” Circulation, vol. 110, no. 4,pp. 380–385, 2004.
[63] S. K. Gupta, S. Dongare, R. Mathur et al., “Genisteinameliorates cardiac inflammation and oxidative stress instreptozotocin-induced diabetic cardiomyopathy in rats,”Molecular and Cellular Biochemistry, vol. 408, no. 1-2,pp. 63–72, 2015.
[64] T. J. Guzik, S. Mussa, D. Gastaldi et al., “Mechanisms ofincreased vascular superoxide production in human diabetesmellitus: role of NAD(P)H oxidase and endothelial nitric oxidesynthase,” Circulation, vol. 105, no. 14, pp. 1656–1662, 2002.
[65] Y. Tan, T. Ichikawa, J. Li et al., “Diabetic downregulation ofNrf2 activity via ERK contributes to oxidative stress-inducedinsulin resistance in cardiac cells in vitro and in vivo,” Diabe-tes, vol. 60, no. 2, pp. 625–633, 2011.
[66] H. C. Volz, C. Seidel, D. Laohachewin et al., “HMGB1: themissing link between diabetes mellitus and heart failure,” BasicResearch in Cardiology, vol. 105, no. 6, pp. 805–820, 2010.
[67] F. Kim, M. Pham, I. Luttrell et al., “Toll-like receptor-4mediates vascular inflammation and insulin resistance indiet-induced obesity,” Circulation Research, vol. 100, no. 11,pp. 1589–1596, 2007.
[68] S. B. Haudek, G. E. Taffet, M. D. Schneider, and D. L. Mann,“TNF provokes cardiomyocyte apoptosis and cardiacremodeling through activation of multiple cell death path-ways,” The Journal of Clinical Investigation, vol. 117, no. 9,pp. 2692–2701, 2007.
[69] R. G. Baker, M. S. Hayden, and S. Ghosh, “NF-kappaB, inflam-mation, and metabolic disease,” Cell Metabolism, vol. 13, no. 1,pp. 11–22, 2011.
[70] K. Venkatachalam, B. Venkatesan, A. J. Valente et al., “WISP1,a pro-mitogenic, pro-survival factor, mediates tumor necrosisfactor-α (TNF-α)-stimulated cardiac fibroblast proliferationbut inhibits TNF-α-induced cardiomyocyte death,” TheJournal of Biological Chemistry, vol. 284, no. 21, pp. 14414–14427, 2009.
[71] Y. H. Chen, B. Feng, and Z. W. Chen, “Statins for primaryprevention of cardiovascular and cerebrovascular events indiabetic patients without established cardiovascular diseases:a meta-analysis,” Experimental and Clinical Endocrinology &Diabetes, vol. 120, no. 2, pp. 116–120, 2012.
[72] S. V. Linthout, A. Riad, N. Dhayat et al., “Anti-inflammatoryeffects of atorvastatin improve left ventricular function inexperimental diabetic cardiomyopathy,” Diabetologia, vol. 50,no. 9, pp. 1977–1986, 2007.
[73] Q. M. Dai, J. Lu, and N. F. Liu, “Fluvastatin attenuatesmyocardial interstitial fibrosis and cardiac dysfunction indiabetic rats by inhibiting over-expression of connectivetissue growth factor,” Chinese Medical Journal, vol. 124,no. 1, pp. 89–94, 2011.
13Oxidative Medicine and Cellular Longevity

Research ArticleFebuxostat Modulates MAPK/NF-κBp65/TNF-α Signaling inCardiac Ischemia-Reperfusion Injury
Sana Irfan Khan,1 Rajiv Kumar Malhotra,1 Neha Rani,1 Anil Kumar Sahu,1
Ameesha Tomar,1 Shanky Garg,1 Tapas Chandra Nag,2 Ruma Ray,3 Shreesh Ojha,4
Dharamvir Singh Arya,1 and Jagriti Bhatia1
1Department of Pharmacology, Cardiovascular Research Laboratory, All India Institute of Medical Sciences, New Delhi, India2Department of Anatomy, All India Institute of Medical Sciences, New Delhi, India3Department of Pathology, All India Institute of Medical Sciences, New Delhi, India4Department of Pharmacology and Therapeutics, College of Medicine and Health Sciences, United Arab Emirates University,Abu Dhabi, UAE
Correspondence should be addressed to Shreesh Ojha; [email protected] and Jagriti Bhatia; [email protected]
Received 12 May 2017; Accepted 2 July 2017; Published 24 August 2017
Academic Editor: Mohamed M. Abdel-Daim
Copyright © 2017 Sana Irfan Khan et al. This is an open access article distributed under the Creative Commons AttributionLicense, which permits unrestricted use, distribution, and reproduction in any medium, provided the original work isproperly cited.
Xanthine oxidase and xanthine dehydrogenase have been implicated in producing myocardial damage following reperfusion of anoccluded coronary artery. We investigated and compared the effect of febuxostat and allopurinol in an experimental model ofischemia-reperfusion (IR) injury with a focus on the signaling pathways involved. Male Wistar rats were orally administeredvehicle (CMC) once daily (sham and IR + control), febuxostat (10mg/kg/day; FEB10 + IR), or allopurinol (100mg/kg/day;ALL100 + IR) for 14 days. On the 15th day, the IR-control and treatment groups were subjected to one-stage left anteriordescending (LAD) coronary artery ligation for 45 minutes followed by a 60-minute reperfusion. Febuxostat and allopurinolpretreatment significantly improved cardiac function and maintained morphological alterations. They also attenuated oxidativestress and apoptosis by suppressing the expression of proapoptotic proteins (Bax and caspase-3), reducing TUNEL-positive cells,and increasing the level of antiapoptotic proteins (Bcl-2). The MAPK-based molecular mechanism revealed suppression ofactive JNK and p38 proteins concomitant with the rise in ERK1/ERK2, a prosurvival kinase. Additionally, a reduction in thelevel of inflammatory markers (TNF-α, IL-6, and NF-κB) was also observed. The changes observed with febuxostat wereremarkable in comparison with those observed with allopurinol. Febuxostat protects relatively better against IR injury thanallopurinol by suppressing inflammation and apoptosis mediating the MAPK/NF-κBp65/TNF-α pathway.
1. Introduction
Ischemic heart disease is the major cause of morbidity andmortality worldwide. Ischemia stimulates metabolic andionic disturbance in the myocardium and leads to rapiddeterioration of cardiac function. Hence, thrombolytic ther-apy or primary percutaneous coronary intervention is imper-ative for salvaging the myocardium and improving clinicaloutcome [1]. However, restoration of blood flow to theischemic myocardium termed reperfusion unavoidably leadsto a number of complications such as stunning (diminished
contractile function), rhythm abnormalities, and sequentiallyheart failure. Paradoxically, reperfusion may also inducedeath of cardiomyocytes which were viable prior to therapeu-tic procedure and can worsen infarct size, an entity termedmyocardial ischemia-reperfusion (IR) injury [2]. Therefore,developments of effective therapeutic strategies are necessaryto protect heart against the inimical consequences of reperfu-sion injury.
There are substantial evidences that oxidative stressplays a crucial role in IR injury [3]. Oxidative stress in turnproduces mitochondrial impairment which leads to the
HindawiOxidative Medicine and Cellular LongevityVolume 2017, Article ID 8095825, 13 pageshttps://doi.org/10.1155/2017/8095825

release of inflammatory cytokines and subsequent cell death[4, 5]. Subsequently, there is stimulation of intracellular sig-naling pathways such as mitogen-activated protein kinases(MAPKs) [6]. The subfamilies of MAPKs identified in thecardiomyocyte are c-Jun NH-terminal kinases (JNKs), extra-cellular signal-regulated kinase-1/2 (ERK1/2, also known asp42/p44 MAPK), and p38 MAPKs [7]. The activation ofMAPKs may further activate transcription factors, inducingexaggerated synthesis of proinflammatory cytokines, subse-quently triggering inflammatory responses and institutionof the apoptotic cascade [8]. NF-κB is a nuclear transcriptionfactor which regulates gene expression critical to inflamma-tion and apoptosis during various pathologies including IRinjury [9–11]. NF-κB, when inactive, is sequestered in thecytoplasm, where it is bound by the IκB family proteinsincluding IκB-α. Upon stimulation, NF-κB gets phosphory-lated and IκB-α is degraded by IKK. The NF-κB subunitstranslocate from the cytoplasm to the nucleus where theyinduce gene expression of inflammatory cytokines [11].The role of NF-κB subunit p65 has been demonstrated indifferent ischemic reperfusion injuries including cardiacinjury [12–14].
Xanthine oxidase (XO) is involved in free radical genera-tion following hypoxia as well as during reperfusion [15, 16].Under normal physiological conditions, XO occurs mainly inthe dehydrogenase form (XDH), while during reperfusion,the dehydrogenase form is converted to XO by posttransla-tional modifications [17]. Both XDH and XO are importantenzymes that produce oxidative stress during reperfusioninjury [18]. Allopurinol and its metabolites are structuralanalogues of both purines and pyrimidines, whereas febuxo-stat is a nonpurine inhibitor of XO. In contrast to allopurinol,febuxostat suppresses both oxidized and reduced forms ofXO which may contribute to its superiority in limitingoxidative stress [17, 18]. Xanthine oxidase inhibitors (XOI)have demonstrated beneficial effects on myocardial IR injury[19]. The mitigation of oxidative stress, apoptosis, andinflammation by febuxostat has been extensively studiedand documented [18, 19]. Febuxostat has also been shownto affect the MAPK pathway by inhibiting JNK phosphoryla-tion in macrophages [20]. Since febuxostat has also demon-strated favorable outcomes in heart failure patients andischemia-reperfusion injury is one of the precursors of heartfailure, we proposed a hypothesis of the utility of febuxostatin reducing ischemia-reperfusion injury; thereby, febuxostatcan be clinically translated as a preventive measure in heartfailure. We have focused on the molecular pathways becauseto the best of our knowledge, there is no study depicting therole of XOI on MAPK modulation in the heart. Therefore,this study was conducted in order to investigate and delineatethe downstream and upstream components of febuxostat-and allopurinol-mediated MAPK modulation in cardiac IRinjury in rats.
2. Materials and Methods
2.1. Animals. Healthy adult male Wistar albino rats, 10 to 12weeks old, weighing 150 to 200 g were used in the presentstudy. The rats were maintained at standard laboratory
conditions and provided food and water ad libitum. Theexperiments were conducted following the animal ethicsapproval from the Institutional Animal Ethics Committeeof the All India Institute of Medical Sciences, New Delhi,India, with reference number IAEC No. 893/IAEC/15. Thehandling of the animals during experiments was carried outin accordance with the Indian National Science AcademyGuidelines for the use and care of experimental animals.
2.2. Chemicals. Febuxostat (Febutaz) was purchased fromSun Pharma, Sikkim, India, and allopurinol (Zyloric) waspurchased fromGlaxoSmithKline, Mumbai, India. The drugswere suspended in carboxymethyl cellulose (0.5% CMC).The kits for TNF-α and IL-6 were purchased from RayBio-tech Inc., Norcross, GA. The CK-MB kit was purchased fromLogotech Private Limited, India.
The primary antibodies for caspase-3 (#9662S), Bcl-2(#2876S), and β-actin (#4967S) were procured from Cell Sig-naling Technology, MA, USA, and those for Bax (#7480),NF-κBp65 (#109), p-NF-κBp65 (Ser536) (#101752), JNK(#572), p-JNK (#6254) (Thr 183/Tyr 185), ERK1/2(#135900), p-ERK1/2 (#16982) (Thr 202/Tyr 204), andp-p38 (#17852) (Thr 180/Tyr 182) as well as anti-rabbit (#2004) and anti-goat (#2020) secondary antibod-ies were procured from Santa Cruz, California, USA.Antibody for p38 (#197348) was purchased from AbcamTechnologies, USA.
2.3. Experimental Protocol. A total of 38 rats were randomlydistributed into 4 groups. The doses of febuxostat andallopurinol were chosen based on a dose-response studyin our laboratory [21] and previous studies [22]:
Group 1 (sham; n = 8): administered 0.5% CMC (2mL/kg/day; p.o.) for 14 days. On day 15, IR surgerywas performed and thread was passed beneaththe left anterior descending (LAD) coronaryartery but the coronary artery was not occluded.
Group 2 (IR-control; n = 10): administered 0.5% CMC(2mL/kg/day; p.o.) for 14 days. On day 15,surgery was performed for LAD coronaryartery ligation for 45min following reperfusionfor 60min.
Group 3 (FEB10+ IR; n = 10): administered febuxostat(10mg/kg/day; p.o.) for 14 days. On day 15,surgery was performed for LAD coronaryartery ligation for 45min following reperfusionfor 60min.
Group 4 (ALL100+ IR; n = 10): administered allopurinol(100mg/kg/day; p.o.) for 14 days. On day 15,surgery was performed for LAD coronary arteryligation for 45min following reperfusion for60min. There was no effect of febuxostat andallopurinol on normal heart (per se) in ourpreliminary morphological assessment (datanot shown) which is in keeping with previousstudies [19, 23].
2 Oxidative Medicine and Cellular Longevity

2.4. Experimental Procedure for Myocardial Injury Inductionand Hemodynamic Parameter Measurement. The experi-mental procedure followed for induction of ischemia andreperfusion and assessment of hemodynamic and ventricularfunction has been described by Agrawal et al. [24]. Briefly,following anesthesia with intraperitoneal injection of pento-barbitone sodium (60mg/kg), monitoring and maintenanceof body temperature were carried out at 37°C throughoutthe experiment. A ventral midline incision was made afteropening the neck, a tracheostomy was performed, and therats were ventilated with room air from a positive pressurerespirator (TSE animal respirator, Germany) using com-pressed air at the rate of 70 strokes per minute and a tidal vol-ume of 10mL/kg. 0.9% saline was infused continuouslythrough a polyethylene tube with which the left jugular veinwas cannulated. After that, the right carotid artery was can-nulated, and the cannula filled with heparinised saline wasconnected to a pressure transducer (Gould Statham P231D,USA) for the assessment of blood pressure (mean arterialpressure (MAP) and heart rate (HR)). A left thoracotomywas then performed at the fifth intercostal space, and theheart was exposed after opening the pericardium. After that,the LAD coronary artery was ligated using a 5-0 silk suture 4-5mm from its origin with an atraumatic needle, and ends ofthis ligature were passed through a small vinyl tube to form asnare. Upon completion of this step, the heart was thenreturned back into the thorax. After stabilization of the ani-mals for 15 minutes, LAD coronary artery ligation was car-ried out and myocardial ischemia was induced by one-stageocclusion of the LAD coronary artery by pressing the poly-ethylene tubing against the ventricular wall and then fixingit in place by clamping it with a hemostat (except in IR-sham rats). In addition to the above parameters, the maxi-mum rates of rise and fall of left ventricular pressure (peak+LVdP/dt and peak −LVdP/dt) as well as of preload, thatis, left ventricular end-diastolic pressure (LVEDP), wererecorded using Biopac system software BSL 4.0 MP36 byintroducing a sterile metal cannula into the cavity of the leftventricle. The ischemic region appeared grossly as an areaof epicardial cyanosis. After 45 minutes, the snare wasreleased gently thereby allowing reperfusion to commencewhich was evident from an area of hyperaemia in the previ-ously cyanosed region. After 60 minutes of reperfusion,blood was drawn from the heart and rats were sacrificed withan overdose of pentobarbitone sodium (150mg/kg; i.p.).Blood was withdrawn from the heart and centrifuged at5000 rpm (Heraeus Biofuge, Germany) for 10min to obtainserum for biochemical analysis. Hearts were then excised,rinsed in ice-cold saline, and stored for biochemical, histo-pathological, and ultrastructural evaluation; terminal deoxy-nucleotide transferase dUTP nick end labeling (TUNEL)assay; immunohistochemistry (IHC); and Western blot anal-ysis. For biochemical estimations, hearts were stored in liquidnitrogen, whereas for immunohistochemistry, hearts werefixed in 10% buffer formalin.
2.5. Assessment of Biochemical Parameters. A 10% homoge-nate of the heart was prepared in ice-cold phosphate buffer(0.1M, pH7.4), and an aliquot was used to estimate
thiobarbituric acid reactive substance (TBARS) and reducedglutathione (GSH). The supernatant obtained following thecentrifugation of homogenate at 4930g for 15 minutes wasused for the estimation of catalase and superoxide dismutase(SOD) activities. Serum samples were used for the estimationof lactate dehydrogenase (LDH) and creatine kinase-MB(CK-MB) isoenzyme activities and interleukin-6 (IL-6) andtumor necrosis factor-α (TNF-α) levels.
2.6. Measurement of MDA Level and Reduced GSH Content.Tissue MDA level was measured by the method publishedby Ohkawa et al. [25]. This method assesses the ability ofMDA to react with thiobarbituric acid in acidic conditionsleading to the development of pink color adducts whoseabsorbance was read at 532nm.
Reduced GSH level was assessed by the method describedby Moron et al. [26]. This method is based on the generationof yellow color when 5,5′-dithiobis(2-nitrobenzoic acid)(DTNB) is added to compounds containing sulfhydryl grouplike glutathione. The homogenate was centrifuged with equalparts of 10% tricarboxylic acid (TCA) at 5000 rpm for10min. The supernatant containing glutathione (which hasa thiol (-SH) group) reacted with DTNB at pH8.0 to producea yellow-colored ion whose concentration was measured at412 nm.
2.7. Measurement of Activities of Enzymes SOD and CAT.The activity of SOD was determined by the method describedby Marklund S and Marklund G [27] measuring the extent ofinhibition of pyrogallol autoxidation at pH8.4. The activityof CAT was determined by the method described by Aebimeasuring difference in H2O2 extinction per unit time [28].
2.8. CK-MB and LDH Enzyme Activities. The activities ofmyocardial enzymes, CK-MB isoenzyme and LDH, weredetermined in serum according to the manufacturer’sinstructions which have been extensively described previ-ously [29].
2.9. Estimation of Serum TNF-α and IL-6 Levels. The levels ofproinflammatory cytokines, TNF-α and IL-6, were estimatedin serum following the manufacturer’s instructions as previ-ously described [29].
2.10. Histopathological Evaluation. The protocol followed forhistopathological studies was described previously [30]. Theformalin-fixed and paraffin-embedded heart tissues werecut to get cross sections of 5 μm thick. The sections werestained with hematoxylin and eosin (H&E) and examinedby a pathologist using a light microscope (DeWinter Tech-nologies, Italy). The pathologist was unaware of the experi-mental groups and treatments. Three hearts from eachgroup were examined for histological examination andgraded for the severity of changes using a score on a scaleof severe (+++), moderate (++), mild (+), and nil (−).
2.11. Ultrastructural Evaluation. The protocol followed forultrastructural studies was described previously [30]. Kar-novsky’s fixed heart tissues were processed and embeddedin araldite CY212 to cut thin sections (70–80 nm) using an
3Oxidative Medicine and Cellular Longevity

ultracut microtome (Reichert, Australia) and stained withuranyl acetate and lead acetate. The visualization was per-formed using a transmission electron microscope (Morgagni268D, Fei Company, the Netherlands) operated at 80 kV andevaluated by a cytologist masked to the experimental groupsand treatments.
2.12. Immunostaining for Myocardial Apoptosis Markers. Theprotocol followed for immunostaining for detection of apo-ptosis markers in the heart was described previously [30].The sections after deparaffinization were processed forimmunostaining using primary rabbit monoclonal antibod-ies (mAb) against Bax, Bcl-2, and caspase-3 for 48 h followedby incubation with horse radish peroxidase- (HRP-) conju-gated secondary antibodies. 3,3-Diaminobenzidine (DAB)was added for the initiation of colorimetric reaction andassessment under the light microscope (DeWinter Technolo-gies, Italy) following the methods described [30].
2.13. Terminal Deoxynucleotidyl Transferase dUTP Nick EndLabeling. The TUNEL assay for analysis of apoptosis in heartsections was performed using the ApoBrdUDNA fragmenta-tion assay kit (Biovision, USA; #K403-50), and the steps forthe assessment are described previously [9]. The sectionswere deparaffinized and processed to visualize the antigen-antibody interaction, and the counterstaining was then donewith hematoxylin visualized under a light microscope. Atleast 5 fields in each slide were examined for any TUNEL-positive cells in each group by the pathologist unaware ofthe experimental groups and treatments.
2.14. Assessment by Western Blot. The heart tissue homoge-nate was prepared using RIPA buffer supplemented withprotease inhibitor cocktail. The protein concentration wasmeasured by the method described by Bradford [31]. Theprotocol followed for Western blotting has been describedpreviously [32]. Briefly, each well was loaded with equalamounts of proteins (40 μg) in 10% sodium dodecyl sulfatepolyacrylamide gel electrophoresis (SDS-PAGE) and thentransferred to the nitrocellulose transfer membrane (Bio-Trace™ NT, Pall Corporation, USA) which was blockedfor 1 h with 3% bovine serum albumin or 5% nonfat driedmilk and incubated for 12h at 4°C with primary antibodies.The primary antibodies used were against β-actin, total andphosphorylated IKK-β, total and phosphorylated NF-κBp65, total and phosphorylated p38, total and phosphory-lated JNK, and total and phosphorylated ERK1/2 whichwere detected with HRP-conjugated anti-rabbit/anti-goatsecondary antibodies. The antibody-antigen complexes werevisualizedusing anenhanced chemiluminescence kit (ThermoFischer Scientific Inc., USA) under the FluorChemMProteinImaging System (ProteinSimple, USA) and were quantifiedusing ImageJ software.
2.15. Statistical Analysis. The data were expressed asmean± SEM. Statistical analysis was performed by ANOVAfollowed by the multiple comparison post hoc Bonferroni testwhich was done using GraphPad InStat 3 software (Graph-Pad Software Inc., San Diego, USA). The value of p < 0 05was considered statistically significant.
3. Results
3.1. Mortality.During the course of this study, 4 out of 38 rats(translating to a mortality of 11%) died; one rat died in theIR-control group, two died in the FEB10+ IR group, andone died in ALL100+ IR group. The rats that died were notconsidered during statistical analysis, and the reason of thedeath was excessive bleeding during either carotid arterycannulation or coronary artery ligation.
3.2. XOI Improved Hemodynamic and VentricularDysfunction after IR. Reperfusion following cardiac ischemiain rats led to a significant fall in heart rate and mean arterialpressure (MAP) as compared to the sham group at all timepoints. Pretreatment with febuxostat (10mg/kg) or allopuri-nol (100mg/kg) significantly improved heart rate and MAPas compared to IR-control rats during reperfusion (Figure 1).The induction of IR also significantly depressed ventricularfunction as depicted by elevated LVEDP and reduced+LVdP/dtmax as well as −LVdP/dtmax as compared to thesham group at all time points (Figure 2). This was amelioratedby febuxostat and allopurinol during reperfusion. There wasno significant difference between the improvements by allo-purinol and febuxostat.
3.3. XOI Augmented Antioxidants, Improved Cardiac Injury,and Reduced Inflammatory Markers after IR. As depicted inFigure 3, there was a significant (p < 0 001) rise in oxidativestress as evidenced by an increase in the lipid peroxidationproduct, MDA, with a significant (p < 0 001) fall in the anti-oxidant system, that is, GSH, SOD, and catalase levels in theIR-control group when compared to the sham group.Febuxostat and allopurinol pretreatment in IR-injured ratssignificantly (p < 0 001, p < 0 01) reduced the level of MDAconcomitant with the significant (p < 0 001, p < 0 01) risein GSH level and also increased the activities of theendogenous antioxidants SOD and catalase in comparisonto the IR-control group. Improvement by febuxostatwasmoresignificant (p < 0 05) when compared to that by allopurinol.
As illustrated inFigure4, therewasa significant (p < 0 001)increase in the CK-MB isoenzyme and LDH in the IR-controlgroup when compared to the sham group. The XOIs alsosignificantly (p < 0 01, p < 0 05) preserved the level of theCK-MB isoenzyme and LDH, respectively. Improvement byfebuxostat was more significant (p < 0 05) when comparedto that by allopurinol. Since inflammation is a critical pointin IR injury, we assessed TNF-α and IL-6 in the serum asthese are usually low in normal heart. As anticipated, weobserved a significant (p < 0 001) increase in cytokinesTNF-α and IL-6 in the IR-control group when compared tothe sham group, while febuxostat and allopurinol treatmentsignificantly downregulated TNF-α (p < 0 001 and p < 0 05)and IL-6 (p < 0 001 and p < 0 05) (Figure 4). Improvementby febuxostat was more significant (p < 0 05) when com-pared to that by allopurinol with TNF-α but not with IL-6.
3.4. XOI Preserved Myocardial Architecture Histologicallyand Ultrastructurally after IR. The light microscopicexamination of heart sections from the myocardial IR groupshowed myofibrillar membrane damage with extensive
4 Oxidative Medicine and Cellular Longevity
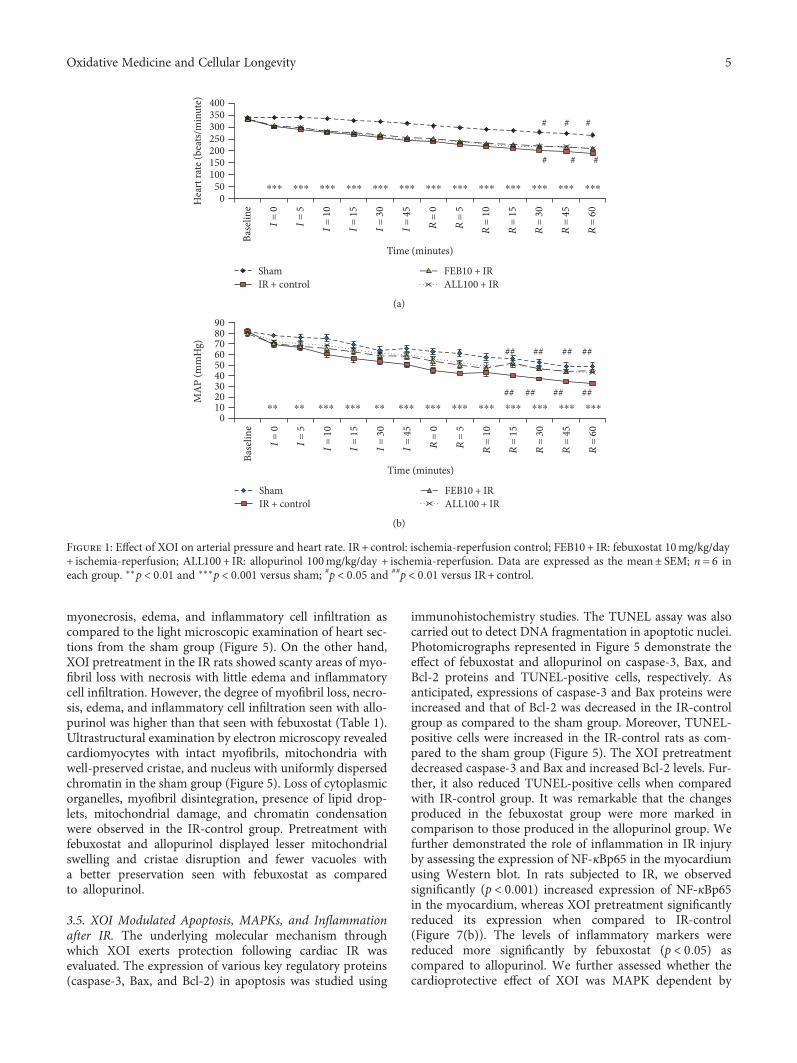
myonecrosis, edema, and inflammatory cell infiltration ascompared to the light microscopic examination of heart sec-tions from the sham group (Figure 5). On the other hand,XOI pretreatment in the IR rats showed scanty areas of myo-fibril loss with necrosis with little edema and inflammatorycell infiltration. However, the degree of myofibril loss, necro-sis, edema, and inflammatory cell infiltration seen with allo-purinol was higher than that seen with febuxostat (Table 1).Ultrastructural examination by electron microscopy revealedcardiomyocytes with intact myofibrils, mitochondria withwell-preserved cristae, and nucleus with uniformly dispersedchromatin in the sham group (Figure 5). Loss of cytoplasmicorganelles, myofibril disintegration, presence of lipid drop-lets, mitochondrial damage, and chromatin condensationwere observed in the IR-control group. Pretreatment withfebuxostat and allopurinol displayed lesser mitochondrialswelling and cristae disruption and fewer vacuoles witha better preservation seen with febuxostat as comparedto allopurinol.
3.5. XOI Modulated Apoptosis, MAPKs, and Inflammationafter IR. The underlying molecular mechanism throughwhich XOI exerts protection following cardiac IR wasevaluated. The expression of various key regulatory proteins(caspase-3, Bax, and Bcl-2) in apoptosis was studied using
immunohistochemistry studies. The TUNEL assay was alsocarried out to detect DNA fragmentation in apoptotic nuclei.Photomicrographs represented in Figure 5 demonstrate theeffect of febuxostat and allopurinol on caspase-3, Bax, andBcl-2 proteins and TUNEL-positive cells, respectively. Asanticipated, expressions of caspase-3 and Bax proteins wereincreased and that of Bcl-2 was decreased in the IR-controlgroup as compared to the sham group. Moreover, TUNEL-positive cells were increased in the IR-control rats as com-pared to the sham group (Figure 5). The XOI pretreatmentdecreased caspase-3 and Bax and increased Bcl-2 levels. Fur-ther, it also reduced TUNEL-positive cells when comparedwith IR-control group. It was remarkable that the changesproduced in the febuxostat group were more marked incomparison to those produced in the allopurinol group. Wefurther demonstrated the role of inflammation in IR injuryby assessing the expression of NF-κBp65 in the myocardiumusing Western blot. In rats subjected to IR, we observedsignificantly (p < 0 001) increased expression of NF-κBp65in the myocardium, whereas XOI pretreatment significantlyreduced its expression when compared to IR-control(Figure 7(b)). The levels of inflammatory markers werereduced more significantly by febuxostat (p < 0 05) ascompared to allopurinol. We further assessed whether thecardioprotective effect of XOI was MAPK dependent by
⁎⁎⁎ ⁎⁎⁎ ⁎⁎⁎ ⁎⁎⁎ ⁎⁎⁎ ⁎⁎⁎ ⁎⁎⁎ ⁎⁎⁎ ⁎⁎⁎ ⁎⁎⁎ ⁎⁎⁎ ⁎⁎⁎ ⁎⁎⁎
# # #
###
400350300250200150100
500H
eart
rate
(bea
ts/m
inut
e)
ShamIR + control
FEB10 + IRALL100 + IR
Time (minutes)Ba
selin
e
I = 0
I = 5
I = 1
0
I = 1
5
I = 3
0
I = 4
5
R =
0
R =
5
R =
10
R =
15
R =
30
R =
45
R =
60
(a)
⁎⁎ ⁎⁎ ⁎⁎⁎ ⁎⁎⁎ ⁎⁎⁎ ⁎⁎⁎ ⁎⁎⁎ ⁎⁎⁎ ⁎⁎⁎ ⁎⁎⁎ ⁎⁎⁎ ⁎⁎⁎⁎⁎## ## ## ##
########
908070605040302010
0
MA
P (m
mH
g)
ShamIR + control
FEB10 + IRALL100 + IR
Time (minutes)
Base
line
I = 0
I = 5
I = 1
0
I = 1
5
I = 3
0
I = 4
5
R =
0
R =
5
R =
10
R =
15
R =
30
R =
45
R =
60
(b)
Figure 1: Effect of XOI on arterial pressure and heart rate. IR + control: ischemia-reperfusion control; FEB10 + IR: febuxostat 10mg/kg/day+ ischemia-reperfusion; ALL100 + IR: allopurinol 100mg/kg/day + ischemia-reperfusion. Data are expressed as the mean± SEM; n = 6 ineach group. ∗∗p < 0 01 and ∗∗∗p < 0 001 versus sham; #p < 0 05 and ##p < 0 01 versus IR + control.
5Oxidative Medicine and Cellular Longevity

investigating their effect on phosphorylation of MAPK pro-teins. We did not observe any significant change in totalp38, JNK, and ERK protein expressions in any of the groups.Though there was a significant (p < 0 001) decrease inexpression of p-ERK and increase in expressions of p-p38 and p-JNK in the IR-control group as compared to thesham group. These findings were normalized by febuxostat(p-ERK: p < 0 01, p-JNK: p < 0 001, and p-p38: p < 0 001)and allopurinol (p < 0 05) pretreatment. Interestingly,
febuxostat increased p-ERK and decreased p-p38 and JNKmore significantly (p < 0 05) as compared to allopurinol(Figures 7(a) and 7(b)).
4. Discussion
Although numerous studies have described the fundamentalrole of XO in IR injury, however, the molecular mechanismsunderlying the inhibition of XO in cardiac IR injury are not
89
10
76543210
LVED
P (m
mH
g)⁎⁎ ⁎⁎ ⁎⁎ ⁎⁎ ⁎⁎ ⁎⁎ ⁎⁎⁎ ⁎⁎⁎ ⁎⁎⁎ ⁎⁎⁎ ⁎⁎⁎ ⁎⁎⁎ ⁎⁎⁎
# ## ## ## ###
# # ## ## ###
ShamIR + control
FEB10 + IRALL100 + IR
Time (minutes)Ba
selin
e
I = 0
I = 5
I = 1
0
I = 1
5
I = 3
0
I = 4
5
R =
0
R =
5
R =
10
R =
15
R =
30
R =
45
R =
60
(a)
0500
10001500200025003000
+LVd
p/dt
(mm
Hg/
s)
⁎⁎⁎ ⁎⁎⁎ ⁎⁎⁎ ⁎⁎⁎ ⁎⁎⁎ ⁎⁎⁎ ⁎⁎⁎ ⁎⁎⁎ ⁎⁎⁎ ⁎⁎⁎ ⁎⁎⁎ ⁎⁎⁎⁎⁎⁎⁎
## ### ### ### ###
##############
ShamIR + control
FEB10 + IRALL100 + IR
Time (minutes)
Base
line
I = 0
I = 5
I = 1
0
I = 1
5
I = 3
0
I = 4
5
R =
0
R =
5
R =
10
R =
15
R =
30
R =
45
R =
60
(b)
ShamIR + control
FEB10 + IRALL100 + IR
Time (minutes)
Base
line
I = 0
I = 5
I = 1
0
I = 1
5
I = 3
0
I = 4
5
R =
0
R =
5
R =
10
R =
15
R =
30
R =
45
R =
60
0
500
1000
1500
2000
2500
‒LVd
p/dt
(mm
Hg/
s)
⁎⁎ ⁎⁎⁎ ⁎⁎⁎ ⁎⁎⁎ ⁎⁎⁎ ⁎⁎⁎ ⁎⁎⁎ ⁎⁎⁎ ⁎⁎⁎ ⁎⁎⁎ ⁎⁎⁎ ⁎⁎⁎ ⁎⁎⁎##
########
(c)
Figure 2: Effect of XOI on ventricular function. (a) LVEDP, (b) maximal positive rate of the left ventricular pressure (+LVdP/dtmax), and (c)maximal negative rate of the left ventricular pressure (−LVdP/dtmax). IR + control: ischemia-reperfusion control; FEB10 + IR: febuxostat10mg/kg/day + ischemia-reperfusion; ALL100 + IR: allopurinol 100mg/kg/day + ischemia-reperfusion. Data are expressed as the mean± SEM; n = 6 in each group. ∗∗p < 0 01 and ∗∗∗p < 0 001 versus sham; #p < 0 05, ##p < 0 01, and ###p < 0 001 versus IR + control.
6 Oxidative Medicine and Cellular Longevity

known. Thus, our study design attempted to examine theeffects of selective and potent inhibitor of XO, febuxostat,in comparison to the classical XOI, allopurinol, in a rat modelof myocardial infarction. In this study, we observed thatfebuxostat significantly diminished ischemia-reperfusion-
induced myocardial injury and the effect was superior to thatof allopurinol. This was evident from suppression ofoxidative stress and apoptosis in the febuxostat treatmentgroup. We further explored the effect of febuxostat pretreat-ment on MAPK-mediated inflammation and observed that
450400350300250200150100
500
(nm
ol/g
)
MDA
⁎⁎⁎, a
⁎⁎
###
Sham IR + control FEB10 + IR ALL100 + IR
(a)
⁎⁎⁎, a
⁎⁎
###
Sham IR + control FEB10 + IR ALL100 + IR
2.5
2
1.5
1
0.5
0
(�휇m
ol/g
)
GSH
(b)
⁎⁎, a
⁎⁎, a
Sham IR + control FEB10 + IR ALL100 + IR
⁎
⁎
###
###
4540353025201510
50
(U/m
g)
SODCatalase
(c)
Figure 3: Effect of XOI on oxidative stress markers. (a) GSH; (b) MDA; (c) SOD and catalase. IR + control: ischemia-reperfusion control;FEB10 + IR: febuxostat 10mg/kg/day + ischemia-reperfusion; ALL100 + IR: allopurinol 100mg/kg/day + ischemia-reperfusion. Data areexpressed as the mean± SEM; n = 6 in each group. ∗p < 0 05, ∗∗p < 0 01, and ∗∗∗p < 0 001 versus IR + control; ###p < 0 001 versus sham.ap < 0 05 versus ALL100 + IR.
450400350300250200150100
500
(U/L
)
Sham IR + control FEB10 + IR ALL100 + IR
###
###
⁎⁎, a
⁎⁎, a
⁎
⁎
CK-MBLDH
(a)
Sham IR + control FEB10 + IR ALL100 + IR
######
⁎⁎, a⁎⁎ ⁎⁎
⁎3025201510
5
0
(pg/
mL)
TNF-�훼IL-6
(b)
Figure 4: Effect of XOI on cardiac injury and inflammatory markers. (a) CK-MB and LDH; (b) TNF-α and IL-6. IR + control:ischemia-reperfusion control; FEB10 + IR: febuxostat 10mg/kg/day + ischemia-reperfusion; ALL100 + IR: allopurinol 100mg/kg/day+ ischemia-reperfusion. Data are expressed as the mean± SEM; n = 6 in each group. ∗p < 0 05 and ∗∗p < 0 01 versus IR + control;###p < 0 001 versus sham. ap < 0 05 versus ALL100 + IR.
7Oxidative Medicine and Cellular Longevity

febuxostat pretreatment ameliorated the cardiac dysfunctioninduced by reperfusion injury, primarily via the activation ofthe ERK1/2 pathway and suppression of the p38/JNK/NF-κBp65/TNF-α pathway. Further, febuxostat modulated theseregulatory proteins more markedly than allopurinol.
The rat model of myocardial IR injury is a clinically rele-vant model and mimics the human pathophysiological con-dition. This IR model has been standardized as ischemia for45min followed by reperfusion for 60min in our laboratory[9, 30, 33]. The occlusion of the LAD coronary artery resultsin myocardial ischemia which initiates complex cascade ofcellular events leading to myocardial cell death. Reperfusion(restoration of blood flow), on the other hand, aggravatesmyocardial injury, induces metabolic derangement, anddiminishes cardiac contractile function. In the present study,the IR group exhibited significant impairment of systolic anddiastolic function, depicted by a decrease in MAP, as well as
by impaired inotropic and lusitropic state, represented by afall in +LVdP/dtmax and −LVdP/dtmax, respectively, alongwith increased LVEDP which characterizes increased preloadon the compromised heart. These hemodynamic changeswere improved by pretreatment with febuxostat or allopuri-nol. A more pronounced and earlier onset of improvementwas observed in the febuxostat group. This improvementcould be attributed to the faster acting property of febuxostat.Additionally, the histological examination of heart sectionsin the IR group revealed inflammatory cells, necrosis, edema,and replacement of myofibrils by interfibrillar spaces. Thepretreatment with XOI mitigated these changes. Further,pretreatment with febuxostat showed more marked restora-tion as compared to that with allopurinol. In the IR group,ultrastructural findings further corroborated the myocardialinjury and swollen as well as irregular mitochondria with lossof cristae and chromatin condensation, whereas pretreat-ment with febuxostat showed only mild separation of themitochondrial cristae with negligible swelling and vacuola-tion. This cardioprotective effect was less pronounced inthe allopurinol group. The plausible reason for the cardio-protective effect of febuxostat is the inhibition of XO-mediated oxidative stress and inflammation and augmentedmitochondrial protection.
XO-mediated oxidative stress has been extensively dem-onstrated by numerous investigators [1, 15, 33]. Its levelshave also been found to increase in heart tissue during reper-fusion following myocardial ischemia [15, 17]. Ischemicinjury leads to energy charge depletion from the cell that sub-sequently results in accumulation of hypoxanthine from ATP
1
2
MF
MC
(a)
MC
MF
(b)
MF
MC
(c)
MC
MF
(d)
Figure 5: Effect of XOI on (a1–d1) histopathology (n = 3) (20x; scale bar 100 μm) and (a2–d2) ultrastructure (n = 3). (a) Sham; (b)IR + control: ischemia-reperfusion control; (c) FEB10 + IR: febuxostat 10mg/kg/day + ischemia-reperfusion; (d) ALL100 + IR: allopurinol100mg/kg/day + ischemia-reperfusion.
Table 1: Effect of XOI on histological scoring of cardiac tissue.
Myonecrosis Inflammatory cells Edema
Sham neg neg neg
IR-C 3+ 3+ 4+
FEB10 + IR 1+ 1+ 1+
ALL100 + IR 2+ 2+ 2+
(3+) severe; (2+) moderate; (+) mild; (neg) nil. IR-C: ischemia-reperfusioncontrol; FEB10 + IR: febuxostat 10mg/kg/day + ischemia-reperfusion;ALL100 + IR: allopurinol 100mg/kg/day + ischemia-reperfusion.
8 Oxidative Medicine and Cellular Longevity

breakdown as well as concomitant conversion of xanthinedehydrogenase (XDH) to its XO isoform, a reaction whichis mediated by sulfhydryl oxidation [17]. XDH exhibitsNADH oxidase activity under acidic conditions like ischemiaand XDH oxidizes NADH rather than xanthine, it has alsobeen shown that a tissue likely remains in a reductive state(low NAD+-to-NADH ratio) in the early reperfusion periodwhich favors oxidative stress in terms of ROS generation byXDH. Therefore, accumulated hypoxanthine as well as areductive state (higher NADH relative to NAD+) duringreperfusion produces a burst in superoxide production[17, 34]. Interestingly, while allopurinol can inhibit the gen-eration of superoxide by XO, the drug has no effect on theNADH oxidase activity of XDH. Therefore, we hypothesizedthat febuxostat should be superior to allopurinol in amelio-rating myocardial IR injury. Febuxostat has been shown toattenuate pressure overload in the left ventricle as well as itprotects the kidneys from IR injury via suppression of oxida-tive stress [19, 35]. From our study, it is evident that febuxo-stat alleviated oxidative stress by restoring the antioxidantenzymes SOD and catalase and preventing depletion ofGSH concomitant with the inhibition of lipid peroxidationas evidenced by decreased MDA formation. Febuxostatexerted a significantly better antioxidant effect than allopuri-nol. Oxidative stress-mediated lipid peroxidation also
denatures cellular proteins and DNA resulting in loss ofmembrane integrity. Consequently, cardiac enzymes suchas LDH and CK-MB are released from the intracellular com-partment to the extracellular fluid [36, 37]. In our study, weobserved that cardiac enzyme levels were raised in the IR-control group. However, febuxostat pretreatment reducedthe serum LDH and CK-MB levels more potently as com-pared to allopurinol pretreatment. This further validates thatfebuxostat has a superior antioxidant property. Studies haveproposed that MAPK pathway activation is mediated via oxi-dative stress by the inactivation of MAPK phosphatases(MKPs). It has been demonstrated that ERK is responsiblefor promoting cell survival, while p38 MAPKs/JNKs areinvolved in cell death and a tight regulation of these pathwaysis an important determinant of cell survival [37–39].
The free radicals generated from the mitochondriainduces DNA damage and membrane peroxidation that pro-motes outer membrane permeabilization and facilitatestranslocation of Bax and cytochrome C from the mitochon-dria to the cytosol with subsequent activation of caspases toinitiate and execute apoptosis [32, 40]. The antiapoptoticprotein, Bcl-2, maintains the external mitochondrial mem-brane integrity and thereby prevents the release of cyto-chrome C from the mitochondria. On the contrary, theproapoptotic protein, Bax, induces mitochondrial injury that
(a) (b) (c) (d)
Figure 6: Effect of XOI on (a1–d1) caspase-3 immunohistochemistry (n = 3) (20x; scale bar 100 μm), (a2–d2) Bax immunohistochemistry(n = 3) (20x; scale bar 100 μm), (a3–d3) Bcl-2 immunohistochemistry (n = 3) (20x; scale bar 100 μm), and (a4–d4) TUNEL positivity(20x; scale bar 100 μm). (a) Sham; (b) IR + control: ischemia-reperfusion control; (c) FEB10 + IR: febuxostat 10mg/kg/day + ischemia-reperfusion; (d) ALL100 + IR: allopurinol 100mg/kg/day + ischemia-reperfusion.
9Oxidative Medicine and Cellular Longevity

�훽-Actin �훽-Actinp-p38
p-JNK
t-JNK
t-p38 38 kDa
38 kDa
45 kDa
54 kDa46 kDa
54 kDa46 kDa
45 kDaSh
am
IR +
cont
rol
FEB1
0 +
IR
ALL
100
+ IR
Sham
IR +
cont
rol
FEB1
0 +
IR
ALL
100
+ IR
Rela
tive v
alue
norm
aliz
ed
Rela
tive v
alue
norm
aliz
ed
2
1.5
1
0.5
0
⁎⁎ ⁎⁎
###
⁎⁎⁎, a
###⁎
t-p38p-p38
(A) (B)
3
2.5
2
1.5
1
0.5
0
t-JNKp-JNK
(a)
�훽-Actin
p-NF�휅Bp65
t-NF�휅Bp65
�훽-Actin
p-ERK1/2
t-ERK1/2 44 kDa65 kDa
65 kDa
45 kDa
42 kDa
44 kDa
42 kDa
45 kDa
Sham
IR +
cont
rol
FEB1
0 +
IR
ALL
100
+ IR
Sham
IR +
cont
rol
FEB1
0 +
IR
ALL
100
+ IR
Rela
tive v
alue
norm
aliz
ed
Rela
tive v
alue
norm
aliz
ed
(A) (B)
2
1.5
1
0.5
0
1.2
1
0.8
0.6
0.4
0.2
0
⁎⁎⁎, a
⁎
⁎⁎, a
⁎###
###
t-NF�휅Bp-NF�휅B
t-ERKp-ERK
(b)
Figure 7: Effect of XOI on MAPK protein expressions. (a) (A) p38 and p-p38 and (B) JNK and p-JNK; (b) (A) NFκBp65 and p-NFκBp65and (B) ERK1/2 and p-ERK1/2. Protein expressions are normalized with β-actin. All the values are expressed as mean± SEM; n = 3 in eachgroup. ∗p < 0 05, ∗∗p < 0 01, and ∗∗∗p < 0 001 versus IR + control; ###p < 0 001 versus sham. ap < 0 05 versus ALL100 + IR.
10 Oxidative Medicine and Cellular Longevity

results in cell death [41, 42]. MAPK also arbitrates apoptosisdirectly by activating Bax during reperfusion. The apoptosis-induced cardiac damage following IR is halted by the activa-tion of ERK1/ERK2 [43]. There is substantial evidenceregarding improvement of cardiac function following IRinjury by suppressing cardiomyocyte apoptosis through tar-geted inhibition of p38 MAPK [36, 39, 44]. The present studyfindings reveal for the first time that febuxostat modulatestheMAPK in the heart tissue as evidenced by enhanced activ-ities of ERK1/ERK2, increased Bcl-2, decreased Bax, reducedcaspase-3, and fewer DNA fragments in febuxostat-treatedgroups relative to the untreated group. This observation isin affirmation with theMAPK-regulating property of febuxo-stat explored previously in the macrophages [20], whereasallopurinol, on the other hand, demonstrated a milder effectwhen compared to febuxostat. It appears from the presentstudy that MAPK is a downstream component of oxidativestress and an upstream component of apoptosis. Further-more, we can convincingly state that oxidative stress can acti-vate apoptosis directly as well as indirectly by modulation ofthe MAPK pathway.
The components of the MAPK pathway are known toinduce nuclear factor kappa-light-chain-enhancer of acti-vated B cells (NF-κB), an important inflammatory transcrip-tion factor [10, 17, 34]. NF-κB plays a key role in the processof inflammation and apoptosis induced by IR injury [10].Previous studies have shown that the NF-κB subunit p65 isactivated during IR injury in the rat steatotic liver [13]. Thishas been further supported by the suppression of NF-κBusing its inhibitor BAY 11-7802 or the inhibition of IκBphosphorylation which has been shown to reduce the inflam-mation and apoptosis induced by myocardial as well as cere-bral IR injury [12, 14]. Previous studies have also shown thatNF-κB activation is associated with the release of proinflam-matory cytokines such as TNF-α [9, 13, 18]. In addition, theTNF-α-induced secretion of IL-6 is mediated by NF-κB sig-naling as evidenced by reduced expression of IL-6 whenNF-κB is inhibited [45]. It was also evident from our studythat upon reperfusion, there was increased phosphorylationof NF-κB and IκB, along with increased expression of TNF-α and IL-6. This transcription factor phosphorylation andcytokine increase were significantly diminished by febuxostatpretreatment. This is in agreement with the previously docu-mented NF-κB inhibitory effect of febuxostat [34]. In thepresent study, however, a significantly lower protection wasobserved with allopurinol. These two drugs have been previ-ously compared in intestinal IR injury where febuxostatemerged superior to allopurinol in ameliorating the reperfu-sion injury [22]. Wang and colleagues have also demon-strated the antioxidant and antiapoptotic effect of XOI oncardiac ischemia-reperfusion injury in vitro and in vivo[19]. To our knowledge, the present study for the first timefocused on the signaling pathway through which XOI medi-ated their cardioprotective effect. A convincing reason forthe superior effect of febuxostat as a cardioprotective agentin IR injury is the ability of this drug to inhibit bothXDH and XO thereby abolishing the NADH-derived as wellas hypoxanthine-derived sources of free radical-mediatedcell damage.
To conclude, using an experimental model of cardiac IRinjury, our study provides convincing data on the improvedefficacy of febuxostat in ameliorating the cardiac damageinduced by IR injury following LAD coronary artery occlu-sion. The effect of febuxostat appears to be mediated byattenuation of XO-mediated oxidative stress as well as sup-pression of apoptosis and inflammation mediating theMAPK signaling pathway. In view of the favorable propertiesof febuxostat vis a vis allopurinol, the former may be furtherevaluated for its usefulness in halting the damage producedin the heart by revascularization procedures in humans.
Conflicts of Interest
The authors declare that they have no conflicts of interest.
Authors’ Contributions
Sana Irfan Khan and Rajiv Kumar Malhotra contributedequally to this work.
Acknowledgments
The authors are thankful toMr. B.M. Sharma andMr. DeepakSharma for their technical assistance. The research in thelaboratory of Shreesh Ojha is supported by the UniversityProgram for Advanced Research and Center-Based Inter-disciplinary grants from the Office of the Deputy ViceChancellor of Research and Graduate Studies of UnitedArab Emirates University, Al Ain, UAE.
References
[1] A. Frank, M. Bonney, S. Bonney, L. Weitzel, M. Koeppen, andT. Eckle, “Myocardial ischemia reperfusion injury: from basicscience to clinical bedside,” Seminars in Cardiothoracic andVascular Anesthesia, vol. 16, pp. 123–132, 2012.
[2] K. Raedschelders, D. M. Ansley, and D. D. Chen, “The cellularand molecular origin of reactive oxygen species generationduring myocardial ischemia and reperfusion,” Pharmacology& Therapeutics, vol. 133, pp. 230–255, 2012.
[3] Y. Li, D. Zhong, L. Lei, Y. Jia, H. Zhou, and B. Yang, “Propofolprevents renal ischemia-reperfusion injury via inhibiting theoxidative stress pathways,” Cellular Physiology and Biochemis-try, vol. 37, pp. 14–26, 2015.
[4] W.Du,Z. Pan,X.Chen et al., “By targeting Stat3microRNA-17-5p promotes cardiomyocyte apoptosis in response to ischemiafollowed by reperfusion,”Cellular Physiology and Biochemistry,vol. 34, pp. 955–965, 2014.
[5] T. Zhou, C. C.Chuang, and L. Zuo, “Molecular characterizationof reactive oxygen species in myocardial ischemia-reperfusioninjury,” BioMed Research International, vol. 2015, Article ID864946, 9 pages, 2015.
[6] G. Vassalli, G. Milano, and T. Moccetti, “Role of mitogen-activated protein kinases in myocardial ischemia-reperfusioninjury during heart transplantation,” Journal of Transplanta-tion, vol. 2012, Article ID 928954, 16 pages, 2012.
[7] C. M. Walshe, J. G. Laffey, L. Kevin, and D. O'Toole, “Sep-sis protects the myocardium and other organs from subse-quent ischaemic/reperfusion injury via a MAPK-dependent
11Oxidative Medicine and Cellular Longevity

mechanism,” Intensive Care Medicine Experimental, vol. 3,p. 35, 2015.
[8] X. Guo, J. Shang, Y. Deng, X. Yuan, D. Zhu, and H. Liu, “Alter-ations in left ventricular function during intermittent hypoxia:possible involvement of O-GlcNAc protein and MAPK signal-ing,” International Journal of Molecular Medicine, vol. 36,pp. 150–158, 2015.
[9] K. Suchal, S. Malik, N. Gamad et al., “Kaempferol attenuatesmyocardial ischemic injury via inhibition of MAPK signalingpathway in experimental model of myocardial ischemia-reperfusion injury,” Oxidative Medicine and Cellular Longev-ity, vol. 2016, Article ID 7580731, 10 pages, 2016.
[10] L. Ma, H. Liu, Z. Xie et al., “Ginsenoside Rb3 protects car-diomyocytes against ischemia-reperfusion injury via theinhibition of JNK-mediated NF-kappaB pathway: a mousecardiomyocyte model,” PloS One, vol. 9, article e103628,2014.
[11] S. E. Stokes and L. M. Winn, “NF-kappaB signaling isincreased in HD3 cells following exposure to 1,4-benzoqui-none: role of reactive oxygen species and p38-MAPK,” Toxico-logical Sciences, vol. 137, pp. 303–310, 2014.
[12] Y. S. Kim, J. S. Kim, J. S. Kwon et al., “BAY 11-7082, a nuclearfactor-kappaB inhibitor, reduces inflammation and apoptosisin a rat cardiac ischemia-reperfusion injury model,” Interna-tional Heart Journal, vol. 51, pp. 348–353, 2010.
[13] S. Ramachandran, J. M. Liaw, J. Jia et al., “Ischemia-reperfusioninjury in rat steatotic liver is dependent on NFkappaB P65activation,” Transplant Immunology, vol. 26, pp. 201–206,2012.
[14] J. H. Gu, J. B. Ge, M. Li, F. Wu, W. Zhang, and Z. H. Qin,“Inhibition of NF-kappaB activation is associated withanti-inflammatory and anti-apoptotic effects of ginkgolideB in a mouse model of cerebral ischemia/reperfusioninjury,” European Journal of Pharmaceutical Sciences, vol. 47,pp. 652–660, 2012.
[15] N. Ozbek, E. B. Bali, and C. Karasu, “Quercetin and hydroxy-tyrosol attenuates xanthine/xanthine oxidase-induced toxicityin H9c2 cardiomyocytes by regulation of oxidative stress andstress-sensitive signaling pathways,” General Physiology andBiophysics, vol. 34, pp. 407–414, 2015.
[16] Y. S. Zhang, B. Liu, X. J. Luo et al., “A novel function of nuclearnonmuscle myosin regulatory light chain in promotion ofxanthine oxidase transcription after myocardial ischemia/reperfusion,” Free Radical Biology & Medicine, vol. 83,pp. 115–128, 2015.
[17] D. N. Granger and P. R. Kvietys, “Reperfusion injury and reac-tive oxygen species: the evolution of a concept,” Redox Biology,vol. 6, pp. 524–551, 2015.
[18] J. Saban-Ruiz, A. Alonso-Pacho, M. Fabregate-Fuente, andG.-Q. C. Puertade la, “Xanthine oxidase inhibitor febuxostatas a novel agent postulated to act against vascular inflamma-tion,” Anti-Inflammatory & Anti-Allergy Agents in MedicinalChemistry, vol. 12, pp. 94–99, 2013.
[19] S. Wang, Y. Li, X. Song et al., “Febuxostat pretreatment attenu-ates myocardial ischemia/reperfusion injury via mitochondrialapoptosis,” Journal of Translational Medicine, vol. 13, p. 209,2015.
[20] J. Nomura, N. Busso, A. Ives et al., “Febuxostat, an inhibitorof xanthine oxidase, suppresses lipopolysaccharide-inducedMCP-1 production via MAPK phosphatase-1-mediatedinactivation of JNK,” PloS One, vol. 8, article e75527, 2013.
[21] B. Krishnamurthy, N. Rani, S. Bharti et al., “Febuxostatameliorates doxorubicin-induced cardiotoxicity in rats,”Chemico-Biological Interactions, vol. 237, pp. 96–103, 2015.
[22] A. N. Shafik, “Febuxostat improves the local and remote organchanges induced by intestinal ischemia/reperfusion in rats,”Digestive Diseases and Sciences, vol. 58, pp. 650–659, 2013.
[23] J. D. Gladden, B. R. Zelickson, J. L. Guichard et al., “Xanthineoxidase inhibition preserves left ventricular systolic but notdiastolic function in cardiac volume overload,” American Jour-nal of Physiology. Heart and Circulatory Physiology, vol. 305,pp. H1440–H1450, 2013.
[24] Y. O. Agrawal, P. K. Sharma, B. Shrivastava et al., “Hesperidinproduces cardioprotective activity via PPAR-gamma pathwayin ischemic heart disease model in diabetic rats,” PloS One,vol. 9, article e111212, 2014.
[25] H. Ohkawa, N. Ohishi, and K. Yagi, “Assay for lipid peroxidesin animal tissues by thiobarbituric acid reaction,” AnalyticalBiochemistry, vol. 95, pp. 351–358, 1979.
[26] M. S. Moron, J. W. Depierre, and B. Mannervik, “Levels of glu-tathione, glutathione reductase and glutathione S-transferaseactivities in rat lung and liver,” Biochimica et Biophysica Acta,vol. 582, pp. 67–78, 1979.
[27] S. Marklund and G. Marklund, “Involvement of the superox-ide anion radical in the autoxidation of pyrogallol and a conve-nient assay for superoxide dismutase,” European Journal ofBiochemistry / FEBS, vol. 47, pp. 469–474, 1974.
[28] H. Aebi, “Catalase in vitro,” Methods in Enzymology, vol. 105,pp. 121–126, 1984.
[29] K. Suchal, S. Malik, S. I. Khan et al., “Molecular pathwaysinvolved in the amelioration of myocardial injury in diabeticrats by kaempferol,” International Journal of MolecularSciences, L. Speranza, J. L. Quiles and S. Franceschelli, Eds.,vol. 18, no. 5, p. 1001, 2017.
[30] N. Rani, S. Bharti, M. Manchanda et al., “Regulation of heatshock proteins 27 and 70, p-Akt/p-eNOS and MAPKs by nar-ingin dampens myocardial injury and dysfunction in vivoafter ischemia/reperfusion,” PloS One, vol. 8, article e82577,2013.
[31] M. M. Bradford, “A rapid and sensitive method for the quan-titation of microgram quantities of protein utilizing the princi-ple of protein-dye binding,” Analytical Biochemistry, vol. 72,pp. 248–254, 1976.
[32] E. Hochhauser, E. Lahat, M. Sultan et al., “Ultra low dose delta9-tetrahydrocannabinol protects mouse liver from ischemiareperfusion injury,” Cellular Physiology and Biochemistry,vol. 36, pp. 1971–1981, 2015.
[33] S. Malik, A. K. Sharma, S. Bharti et al., “In vivo cardioprotec-tion by pitavastatin from ischemic-reperfusion injury throughsuppression of IKK/NF-kappaB and upregulation of pAkt-e-NOS,” Journal of Cardiovascular Pharmacology, vol. 58,pp. 199–206, 2011.
[34] H. J. Lee, K. H. Jeong, Y. G. Kim et al., “Febuxostat amelioratesdiabetic renal injury in a streptozotocin-induced diabetic ratmodel,” American Journal of Nephrology, vol. 40, pp. 56–63,2014.
[35] H. Tsuda, N. Kawada, J. Y. Kaimori et al., “Febuxostat sup-pressed renal ischemia-reperfusion injury via reduced oxidativestress,”Biochemical andBiophysicalResearchCommunications,vol. 427, pp. 266–272, 2012.
[36] L. T. Retamoso, M. E. J. Silveira, F. D. Lima et al., “Increasedxanthine oxidase-related ROS production and TRPV1
12 Oxidative Medicine and Cellular Longevity

synthesis preceding DOMS post-eccentric exercise in rats,”Life Sciences, vol. 152, pp. 52–59, 2016.
[37] D. Yu, M. Li, Y. Tian, J. Liu, and J. Shang, “Luteolininhibits ROS-activated MAPK pathway in myocardial ische-mia/ reperfusion injury,” Life Sciences, vol. 122, pp. 15–25,2015.
[38] C.Li, J.He,Y.Gao,Y.Xing, J.Hou, and J.Tian, “Preventive effectof total flavones of Choerospondias axillaries on ischemia/reperfusion-induced myocardial infarction-related MAPKsignaling pathway,” Cardiovascular Toxicology, vol. 14,pp. 145–152, 2014.
[39] X. F. Gao, Y. Zhou, D. Y. Wang, K. S. Lew, A. M. Richards, andP. Wang, “Urocortin-2 suppression of p38-MAPK signaling asan additional mechanism for ischemic cardioprotection,”Molecular and Cellular Biochemistry, vol. 398, pp. 135–146,2015.
[40] M. L. Circu and T. Y. Aw, “Reactive oxygen species, cellularredox systems, and apoptosis,” Free Radical Biology & Medi-cine, vol. 48, pp. 749–762, 2010.
[41] C. Y. Chien, C. T. Chien, and S. S. Wang, “Progressive thermo-preconditioning attenuates rat cardiac ischemia/ reperfusioninjury by mitochondria-mediated antioxidant and antiapopto-tic mechanisms,” The Journal of Thoracic and CardiovascularSurgery, vol. 148, pp. 705–713, 2014.
[42] J. Huang, X. Zhang, F. Qin et al., “Protective effects of Millettiapulchra flavonoids on myocardial ischemia in vitro andin vivo,” Cellular Physiology and Biochemistry, vol. 35,pp. 516–528, 2015.
[43] H. Wang, Q. W. Zhu, P. Ye et al., “Pioglitazone attenuatesmyocardial ischemia-reperfusion injury via up-regulation ofERK and COX-2,” Bioscience Trends, vol. 6, pp. 325–332, 2012.
[44] C. J. Thomas, D. C. Ng, N. Patsikatheodorou et al., “Cardio-protection from ischaemia-reperfusion injury by a novel flavo-nol that reduces activation of p38 MAPK,” European Journalof Pharmacology, vol. 658, pp. 160–167, 2011.
[45] C. Lee, J. I. Oh, J. Park et al., “TNF alpha mediated IL-6 secre-tion is regulated by JAK/STAT pathway but not by MEKphosphorylation and AKT phosphorylation in U266 multiplemyeloma cells,” BioMed Research International, vol. 2013,Article ID 580135, 8 pages, 2013.
13Oxidative Medicine and Cellular Longevity