Neural Plasticity and Functional Recovery 2018 - Hindawi.com
115
Neural Plasticity Neurorehabilitation: Neural Plasticity and Functional Recovery 2018 Lead Guest Editor: Toshiyuki Fujiwara Guest Editors: Junichi Ushiba and Surjo R. Soekadar
-
Upload
khangminh22 -
Category
Documents
-
view
1 -
download
0
Transcript of Neural Plasticity and Functional Recovery 2018 - Hindawi.com

Neural Plasticity
Neurorehabilitation: Neural Plasticity and Functional Recovery 2018
Lead Guest Editor: Toshiyuki FujiwaraGuest Editors: Junichi Ushiba and Surjo R. Soekadar

Neurorehabilitation: Neural Plasticityand Functional Recovery 2018
Neural Plasticity
Neurorehabilitation: Neural Plasticityand Functional Recovery 2018
Lead Guest Editor: Toshiyuki FujiwaraGuest Editors: Junichi Ushiba and Surjo R. Soekadar

Copyright © 2019 Hindawi. All rights reserved.
This is a special issue published in “Neural Plasticity.”All articles are open access articles distributedunder theCreative CommonsAttribu-tion License, which permits unrestricted use, distribution, and reproduction in any medium, provided the original work is properly cited.
Editorial Board
Eckart Altenmüller, GermanyShimon Amir, CanadaVictor Anggono, AustraliaSergio Bagnato, ItalyLaura Baroncelli, ItalyMichel Baudry, USAMichael S. Beattie, USAAlfredo Berardelli, ItalyNicoletta Berardi, ItalyMichael Borich, USADavide Bottari, ItalyClive R. Bramham, NorwayAnna K. Braun, GermanyKalina Burnat, PolandGaston Calfa, ArgentinaMartin Cammarota, BrazilCarlo Cavaliere, ItalySumantra Chattarji, IndiaRajnish Chaturvedi, IndiaGuy Cheron, BelgiumVincenzo De Paola, UKGabriela Delevati Colpo, USA
Michele Fornaro, USAFrancesca Foti, ItalyZygmunt Galdzicki, USAPreston E. Garraghty, USAPaolo Girlanda, ItalyMassimo Grilli, ItalyTakashi Hanakawa, JapanAnthony J. Hannan, AustraliaGrzegorz Hess, PolandGeorge W. Huntley, USAAlexandre H. Kihara, BrazilJeansok J. Kim, USAEric Klann, USAMalgorzata Kossut, PolandVolker Mall, GermanyStuart C. Mangel, USADiano Marrone, CanadaAage R. Møller, USAJean-Pierre Mothet, FranceXavier Navarro, SpainMartin Oudega, USAFernando Peña-Ortega, Mexico
Martin Pienkowski, USAMaurizio Popoli, ItalyBruno Poucet, FranceMojgan Rastegar, CanadaEmiliano Ricciardi, ItalyGernot Riedel, UKAlessandro Sale, ItalyMarco Sandrini, UKRoland Schaette, UKMenahem Segal, IsraelJerry Silver, USANaweed I. Syed, CanadaJosef Syka, Czech RepublicYasuo Terao, JapanDaniela Tropea, IrelandTara Walker, GermanyChristian Wozny, UKChun-Fang Wu, USALong-Jun Wu, USAJ. Michael Wyss, USALin Xu, China

Contents
Neurorehabilitation: Neural Plasticity and Functional Recovery 2018Toshiyuki Fujiwara , Junichi Ushiba, and Surjo R. SoekadarEditorial (3 pages), Article ID 7812148, Volume 2019 (2019)
Evidence Linking Brain Activity Modulation to Age and to Deductive TrainingP. Álvarez Merino , C. Requena , and F. SaltoResearch Article (10 pages), Article ID 1401579, Volume 2018 (2019)
Anatomical and Functional MRI Changes after One Year of Auditory Rehabilitation with Hearing AidsM. R. Pereira-Jorge, K. C. Andrade, F. X. Palhano-Fontes, P. R. B. Diniz, M. Sturzbecher, A. C. Santos,and D. B. AraujoResearch Article (13 pages), Article ID 9303674, Volume 2018 (2019)
Repetitive Transcranial Electrical Stimulation Induces Quantified Changes in Resting CerebralPerfusion Measured from Arterial Spin LabelingMatthew S. Sherwood , Aaron T. Madaris, Casserly R. Mullenger, and R. Andy McKinleyResearch Article (12 pages), Article ID 5769861, Volume 2018 (2019)
Green Tea and Red Tea from Camellia sinensis Partially Prevented the Motor Deficits and StriatalOxidative Damage Induced by Hemorrhagic Stroke in RatsPriscila Marques Sosa, Mauren Assis de Souza, and Pâmela B. Mello-CarpesResearch Article (8 pages), Article ID 5158724, Volume 2018 (2019)
Intraspinal Grafting of Serotonergic Neurons Modifies Expression of Genes Important for FunctionalRecovery in Paraplegic RatsKrzysztof Miazga , Hanna Fabczak, Ewa Joachimiak, Ma�gorzata Zawadzka, Łucja Krzemień-Ojak,Marek Bekisz , Anna Bejrowska, Larry M. Jordan, and Urszula S�awińskaResearch Article (15 pages), Article ID 4232706, Volume 2018 (2019)
Testing rTMS-Induced Neuroplasticity: A Single Case Study of Focal Hand DystoniaSonia Betti, Andrea Spoto, Umberto Castiello, and Luisa SartoriResearch Article (12 pages), Article ID 6464896, Volume 2018 (2019)
Laterality of Poststroke Cortical Motor Activity during Action Observation Is Related to HemisphericDominanceSook-Lei Liew , Kathleen A. Garrison, Kaori L. Ito , Panthea Heydari, Mona Sobhani ,Julie Werner , Hanna Damasio, Carolee J. Winstein, and Lisa Aziz-ZadehResearch Article (14 pages), Article ID 3524960, Volume 2018 (2019)
State-of-the-Art Techniques to Causally Link Neural Plasticity to Functional Recovery in ExperimentalStroke ResearchAnna-Sophia WahlReview Article (10 pages), Article ID 3846593, Volume 2018 (2019)
Neurorehabilitation in Parkinson’s Disease: A Critical Review of Cognitive Rehabilitation Effects onCognition and BrainMaría Díez-Cirarda, Naroa Ibarretxe-Bilbao , Javier Peña, and Natalia OjedaReview Article (12 pages), Article ID 2651918, Volume 2018 (2019)
EditorialNeurorehabilitation: Neural Plasticity and FunctionalRecovery 2018
Toshiyuki Fujiwara ,1 Junichi Ushiba,2,3,4 and Surjo R. Soekadar 5,6
1Department of Rehabilitation Medicine, Juntendo University Graduate School of Medicine, 2-1-1 Hongo, Bunkyo,Tokyo 113-8421, Japan2Faculty of Science and Technology, Keio University, 3-14-1 Hiyoshi, Kohoku-ku, Yokohama, Kanagawa 223-8522, Japan3Keio Institute of Pure and Applied Sciences (KiPAS), Keio University, 3-14-1 Hiyoshi, Kohoku-ku, Yokohama,Kanagawa 223-8522, Japan4Department of Biosciences and Informatics, Faculty of Science and Technology, Keio University, 3-14-1 Hiyoshi, Kohoku-ku,Yokohama, Kanagawa 223-8522, Japan5Clinical Neurotechnology Laboratory, Department of Psychiatry and Psychotherapy, Neuroscience Research Center (NWFZ),Charité-University Medicine Berlin, Germany6Department of Psychiatry and Psychotherapy, Eberhard-Karls-University Tübingen, Germany
Correspondence should be addressed to Surjo R. Soekadar; [email protected]
Received 15 November 2018; Accepted 6 December 2018; Published 21 January 2019
Copyright © 2019 Toshiyuki Fujiwara et al. This is an open access article distributed under the Creative Commons AttributionLicense, which permits unrestricted use, distribution, and reproduction in any medium, provided the original work isproperly cited.
Over the last decades, many axiomatic and dominating viewson the functional architecture and workings of the mamma-lian central nervous system (CNS) had to be fundamentallyreconsidered. Although the dominating view that the maturemammalian CNS is structurally immutable was repeatedlychallenged, e.g., by studies showing collateral axonal sprout-ing and intracortical synaptic plasticity after a spinal cordinjury (SCI) in cats [1, 2], the capacity of the lesioned CNSto reorganize was only fully appreciated after Merzenichand colleagues introduced their famous deafferentation stud-ies in the 1980s [3, 4]. Besides showing that topographic cor-tical representations are maintained dynamically throughoutlife, they also provided compelling evidence that thisself-organizing capacity of the CNS can relate to neurologicalrecovery [5–7].
Based on this new understanding of CNS plasticity andthe factors driving it, Taub et al. introduced a novel rehabil-itation procedure that now belongs to the established reper-toire of physiotherapists worldwide (Constraint-InducedMovement Therapy, CIMT) [7–9]. Being a good examplefor the successful translation of insights from basic researchfindings collected over several decades in animal studies into
a new treatment strategy used in hospitals all over the world,the development of CIMT also exemplifies the long, strenu-ous and often very difficult path from bench to bedside.
This special issue acknowledges this challenging path andprovides a forum for presenting the latest views and findingsin the field of neurorehabilitation. Besides featuring a com-prehensive review on the state-of-the-art in experimentalstroke research by A.-S. Wahl (“State-of-the-Art Techniquesto Causally Link Neural Plasticity to Functional Recovery inExperimental Stroke Research”) and cognitive rehabilitationin Parkinson’s disease by M. Díez-Cirarda et al. (“Neuroreh-abilitation in Parkinson’s Disease: A Critical Review of Cog-nitive Rehabilitation Effects on Cognition and Brain”), thisspecial issue includes a study by S.-L. Liew et al. that evalu-ated brain activity during action observation of 24 strokesurvivors and 12 age-matched healthy controls using func-tional magnetic resonance imaging (fMRI) (“Laterality ofPoststroke Cortical Motor Activity during Action Observa-tion Is Related to Hemispheric Dominance”). They foundthat action observation is lateralized to the dominant, ratherthan ipsilesional, hemisphere. As this may reflect an interac-tion between the lesioned hemisphere and the dominant
HindawiNeural PlasticityVolume 2019, Article ID 7812148, 3 pageshttps://doi.org/10.1155/2019/7812148

hemisphere in driving lateralization of brain activity afterstroke, they conclude that this finding should be carefullyconsidered when characterizing poststroke neural activity.
M. R. Pereira-Jorge et al. (“Anatomical and FunctionalMRI Changes after One Year of Auditory Rehabilitation withHearing Aids”) describe the anatomical and functional MRIchanges related to one year of auditory rehabilitation withhearing aids (HA) across 14 individuals diagnosed with bilat-eral hearing loss. While they found a reduction in activity inthe auditory and language systems and an increase in visualand frontal cortical areas, the use of HA over one yearincrease the activity in the auditory and language cortices aswell as multimodal integration areas. Moreover, they foundan increased cortical thickness in multimodal integrationareas, particularly the very caudal end of the superior tempo-ral sulcus, the angular gyrus, and the insula. P. ÁlvarezMerino et al. (“Evidence Linking Brain Activity Modulationto Age and to Deductive Training”) investigated the effectof deductive reasoning training on modulation of electricbrain activity and compared this modulation between youn-ger (mean age 21 ± 3 39 years) and older (mean age 68 92± 5 72 years) healthy adults. While younger adults showedsymmetric bilateral activity in anterior brain areas in theirstudy, older adults showed asymmetrical activity in anteriorand posterior brain areas. They conclude that bilateral brainactivity modulation may be an age-dependent mechanismsto maintain cognitive function under high demand.
To better understand the role of serotonergic receptorsfor functional recovery after SCI, K. Miazga et al. analyzedthe mRNA of serotonergic 5-HT2A and 5-HT7 receptors(encoded by Htr2a and Htr7 genes) in motoneurons of ratswith and without SCI (“Intraspinal Grafting of SerotonergicNeurons Modifies Expression of Genes Important for Func-tional Recovery in Paraplegic Rats”). They found thatintraspinal grafting of serotonergic neurons can modify theexpression of Htr2a and Htr7 genes suggesting that upregula-tion of these genes might account for the improved locomo-tion found after intraspinal grafting.
Based on a number of studies suggesting a neuroprotec-tive effect of green tea (Camellia sinensis), P. M. Sosa et al.investigated whether green tea and red tea have a compara-ble effect on motor deficits and striatum oxidative damagein rats with hemorrhagic stroke (“Green Tea and Red Teafrom Camellia sinensis Partially Prevented the Motor Deficitsand Striatal Oxidative Damage Induced by HemorrhagicStroke in Rats”). They found that the two teas seemedequally effective.
M S. Sherwood et al. evaluated resting cerebral perfusionbefore and after transcranial direct current stimulation(tDCS), a form of transcranial electric stimulation (tES),applied to the left prefrontal cortex to investigate theunderlying neural mechanisms of tDCS on cognitive brainfunctions (“Repetitive Transcranial Electrical StimulationInduces Quantified Changes in Resting Cerebral PerfusionMeasured from Arterial Spin Labeling”). They found thattDCS increased cerebral perfusion across many areas ofthe brain as compared to sham stimulation. As this effectoriginated in the locus coeruleus linked to the noradrener-gic system, the authors suggest that the broad behavioral
effects of frontal lobe tDCS might relate to a modulation ofthe locus coeruleus that excites the noradrenergic system.
S. Betti et al. (“Testing rTMS-Induced Neuroplasticity: ASingle Case Study of Focal Hand Dystonia”) used 1Hzrepetitive transcranial magnetic stimulation (rTMS) target-ing the left primary motor cortex (M1) of an individualdiagnosed with focal hand dystonia. rTMS was applied overfive daily thirty-minute sessions. Using a fine-grained kine-matic analysis, they found that rTMS resulted in improvedmotor coordination, a finding that underlines the impor-tance of adopting measures that are sufficiently sensitive todetect behavioral improvements.
Only recently, novel neurotechnological tools, suchas brain/neural-machine interfaces (B/NMI) [10–14] orclosed-loop brain and spinal cord stimulation [15], weredeveloped that provide promising means to modulate CNSplasticity triggering neural recovery. A remarkable demon-stration of these new targeted neurotechnologies was recentlyprovided by Wagner et al. [16] demonstrating restoration ofwalking in individuals who sustained a spinal cord injury sev-eral years ago with permanent motor deficits despite exten-sive rehabilitation efforts. A few months of individualizedspatiotemporal electrical stimulation of the lumbosacral spi-nal cord resulted in regained voluntary control over previ-ously paralyzed muscles, even in the absence of stimulation.
As our understanding of the underlying mechanisms ofneural recovery improves and neurotechnologies advance,more of such demonstrations will be ahead of us. We hopethat this special issue will contribute towards such improvedunderstanding of the relationship between neural plasticityand functional recovery and will give new impulses on howneurorehabilitation can be advanced through neurotechno-logical tools.
Conflicts of Interest
The guest editors declare that there is no conflict of interest.
Toshiyuki FujiwaraJunichi Ushiba
Surjo R. Soekadar
References
[1] C.-N. Liu and W. W. Chambers, “Intraspinal sprouting ofdorsal root axons; development of new collaterals and preter-minals following partial denervation of the spinal cord in thecat,” A.M.A. Archives of Neurology and Psychiatry, vol. 79,no. 1, pp. 46–61, 1958.
[2] F. H. Gage, A. Bjorklund, and U. Stenevi, “Local regulationof compensatory noradrenergic hyperactivity in the partiallydenervated hippocampus,” Nature, vol. 303, no. 5920,pp. 819–821, 1983.
[3] M. M. Merzenich, J. H. Kaas, J. Wall, R. J. Nelson, M. Sur, andD. Felleman, “Topographic reorganization of somatosensorycortical areas 3b and 1 in adult monkeys following restricteddeafferentation,” Neuroscience, vol. 8, no. 1, pp. 33–55, 1983.
[4] J. H. Kaas, M. M. Merzenich, and H. P. Killackey, “The reorga-nization of somatosensory cortex following peripheral nerve
2 Neural Plasticity

damage in adult and developing mammals,” Annual Review ofNeuroscience, vol. 6, no. 1, pp. 325–356, 1983.
[5] W. M. Jenkins, M. M. Merzenich, M. T. Ochs, T. Allard, andE. Guic-Robles, “Functional reorganization of primarysomatosensory cortex in adult owl monkeys after behaviorallycontrolled tactile stimulation,” Journal of Neurophysiology,vol. 63, no. 1, pp. 82–104, 1990.
[6] C. Xerri, M. M. Merzenich, B. E. Peterson, and W. Jenkins,“Plasticity of primary somatosensory cortex paralleling senso-rimotor skill recovery from stroke in adult monkeys,” Journalof Neurophysiology, vol. 79, no. 4, pp. 2119–2148, 1998.
[7] E. Taub, “Movement in nonhuman primates deprived ofsomatosensory feedback,” Exercise and Sport Sciences Reviews,vol. 4, pp. 335–374, 1976.
[8] E. Taub, G. Uswatte, and R. Pidikiti, “Constraint-inducedmovement therapy: a new family of techniques with broadapplication to physical rehabilitation–a clinical review,” Jour-nal of Rehabilitation Research and Development, vol. 36,no. 3, pp. 237–251, 1999.
[9] E. Taub, N. E. Miller, T. A. Novack et al., “Technique toimprove chronic motor deficit after stroke,” Archives of Physi-cal Medicine and Rehabilitation, vol. 74, no. 4, pp. 347–354,1993.
[10] J. Ushiba and S. R. Soekadar, “Brain-machine interfaces forrehabilitation of poststroke hemiplegia,” Progress in BrainResearch, vol. 228, pp. 163–183, 2016.
[11] S. R. Soekadar, N. Birbaumer, M. W. Slutzky, and L. G. Cohen,“Brain-machine interfaces in neurorehabilitation of stroke,”Neurobiology of Disease, vol. 83, pp. 172–179, 2015.
[12] S. R. Soekadar, M. Witkowski, C. Gómez et al., “HybridEEG/EOG-based brain/neural hand exoskeleton restores fullyindependent daily living activities after quadriplegia,” ScienceRobotics, vol. 1, no. 1, 2016.
[13] J. Clausen, E. Fetz, J. Donoghue et al., “Help, hope, and hype:ethical dimensions of neuroprosthetics,” Science, vol. 356,no. 6345, pp. 1338-1339, 2017.
[14] S. Crea, M. Nann, E. Trigili et al., “Feasibility and safety ofshared EEG/EOG and vision-guided autonomous whole-armexoskeleton control to perform activities of daily living,” Scien-tific Reports, vol. 8, no. 1, article 10823, 2018.
[15] A. Jackson and J. B. Zimmermann, “Neural interfaces for thebrain and spinal cord–restoring motor function,” NatureReviews. Neurology, vol. 8, no. 12, pp. 690–699, 2012.
[16] F. B. Wagner, J. B. Mignardot, C. G. le Goff-Mignardot et al.,“Targeted neurotechnology restores walking in humans withspinal cord injury,”Nature, vol. 563, no. 7729, pp. 65–71, 2018.
3Neural Plasticity
Research ArticleEvidence Linking Brain Activity Modulation to Age and toDeductive Training
P. Álvarez Merino , C. Requena , and F. Salto
Department of Psychology, Sociology and Philosophy, University of León, Campus de Vegazana, s/n, 24071 León, Spain
Correspondence should be addressed to P. Álvarez Merino; [email protected]
Received 22 February 2018; Revised 29 August 2018; Accepted 14 October 2018; Published 25 November 2018
Guest Editor: Junichi Ushiba
Copyright © 2018 P. Álvarez Merino et al. This is an open access article distributed under the Creative Commons AttributionLicense, which permits unrestricted use, distribution, and reproduction in any medium, provided the original work isproperly cited.
Electrical brain activity modulation in terms of changes in its intensity and spatial distribution is a function of age and task demand.However, the dynamics of brain modulation is unknown when it depends on external factors such as training. The aim of thisresearch is to verify the effect of deductive reasoning training on the modulation in the brain activity of healthy younger andolder adults (N = 47 (mean age of 21± 3.39) and N = 38 (mean age of 68.92± 5.72)). The analysis reveals the benefits of training,showing that it lowers cerebral activation while increasing the number of correct responses in the trained reasoning task(p < 0 001). The brain source generators were identified by time-averaging low-resolution brain electromagnetic tomography(sLORETA) current density images. In both groups, a bilateral overactivation associated with the task and not with age wasidentified. However, while the profile of bilateral activation in younger adults was symmetrical in anterior areas, in the olderones, the profile was located asymmetrically in anterior and posterior areas. Consequently, bilaterality may be a marker of howthe brain adapts to maintain cognitive function in demanding tasks in both age groups. However, the differential bilaterallocations across age groups indicate that the tendency to brain modulation is determined by age.
1. Introduction
Brain activity adapts in time to the cognitive needs of anorganism, altering its intensity and its distribution which canbe measured through modulations in electrical brain activity[1]. Scientific literature offers two different approaches to thecomplex phenomenon of the electrical brain signal’s modula-tion. One explicative strategy focuses on overactivation ofbrain activity as a function of the demand of tasks [2], whilea second perspective explains modulation in terms of age andfocuses on the idiosyncrasy of brain aging [3]. Many studieshave verified how brain overactivation correlates with betterperformance in cognitive tasks. For example, the perfor-mance of older people who participated in a digit span taskwas better if they exhibited a bilateral pattern of brain activitycompared to those who did not show such bilaterality [4].Another memory study involving older adults with highand low memory capacities and younger adults reported thatboth the older adults with low memory capacity and the
younger adults showed prefrontal asymmetry with greateractivity in the right hemisphere [3]. While the performanceof the younger adults was the most successful, that of theolder adults with low memory capacity was the least. In theolder adults with better memory, a pattern of bilateral activitywas evidenced with similar results to those of the youngeradults. When the task is more demanding for these olderadults, the left prefrontal cortex is also activated. That is, asupplementary activation reflects the additional effort thatthese older adults make in order to access information [5].On the other hand, the approach based on the difficulty gra-dient of the task describes the increment in brain activationand the involvement of wider brain areas as an adaptive strat-egy for functional performance both in older and in youngeradults [6]. In this regard, an investigation in which youngerand older adults had to resolve memory tasks of differentcomplexity levels found that the dorsolateral prefrontal cor-tex was overactivated in older adults in order to achieve aperformance similar to that of younger adults. In addition,
HindawiNeural PlasticityVolume 2018, Article ID 1401579, 10 pageshttps://doi.org/10.1155/2018/1401579
as the difficulty increased, the dorsolateral prefrontal cortexin younger adults activated as well [7].
The second perspective attributes brain activity modula-tion to age [8]. Namely, the cerebral plastic behavior in olderadults makes it possible for them to relearn a new activationmode which is manifested in a deactivation of posteriorregions along with a higher activation in previous regions[9]. For example, in tasks requiring the intervention of basiccognitive operations such as visual perception, the highestactivation is not located in the posterior cognitive regionsof older adults. This brain behavior is associated with age,but it does not necessarily involve cognitive decline [10]. Inthis regard, an extensive research study tested age-relatedcerebral changes using an episodic memory task (high com-plexity) as well as a visual perception one (low complexity)[11]. The results showed that regardless of the complexityof the task, a higher activation was localized in the prefrontalcortex. In addition, this activation correlates with bettercognitive function, as opposed to an inverse correlationbetween performance and activity in the occipital region.Other studies have also shown age-related changes in thebrain and cognitive strategies to solve executive control tasks[12]. In particular, the experiment was carried out with youn-ger and older adults who faced a task with consecutive pairswhereby the first one constituted a cue and the second onea target. Subjects were instructed to respond to the targetwhenever it was preceded by the same cue. Otherwise, theyshould omit or refrain from responding. The results showedthat, with age, the executive control strategies shifted in tem-poral distribution. That is, they were proactive in youngeradults during the presentation of the cue and reactive in olderadults in response to the target presentation. In addition, theneuroimaging analysis showed that only younger adults dis-played higher activation of the dorsolateral prefrontal cortexand left hippocampus when the cue appeared rather thanwhen the target was presented. On the other hand, it revealsan idiosyncratic behavior of cerebral aging in the amount ofcognitive resources that are activated by the demand of acognitive task. There seems to be a ceiling effect linked tohow high the difficulty of the demand is in older adults, sincebrain activity lessens if the task is too hard [13]. An investi-gation in which younger and older adults had to resolvememory tasks of different complexity levels found that theprefrontal cortex was overactivated in both younger andolder adults to achieve performance success [7]. However,beyond a certain level of demand, in older adults as opposedto younger adults, brain activity decreased, and so did theirperformance [14].
All in all, there is evidence of both task-dependent andage-dependent factors in brain activity modulation. Demand-ing tasks modulate brain activity both in younger and in olderadults. However, simultaneously beyond the task demand,there is also idiosyncratic aged brain behavior. The state ofthe art includes two basic results: (1) when older adults facea demanding task, they require more brain activation thanyounger adults to obtain a similar performance level [6] and(2) when the task is demanding for all age groups, youngeradult brains manifest an increased activation while older adultbrains tend to diminish their brain activity [15, 16]. However,
there are no known experimental studies that analyze theeffect of training on the modulation of brain activity whichin turn would help to clarify the relationship between thetwo explanatory approaches to brain modulation.
The current study is aimed at examining the modula-tion of EEG brain activity in a highly demanding cognitivetask in younger and older adults before and after a reason-ing training. In particular, the following hypotheses weretested experimentally: (a) baseline EEG activity will showa bilateral overactivation in younger adults rather than inolder ones, (b) the posttraining evaluation will show bilat-eral overactivation in the older adults while it will disap-pear in the younger ones, and (c) the effect of trainingimproves deductive reasoning performance by increasingthe number of valid responses and decreasing the reactiontime in both age groups.
2. Materials and Methods
2.1. Participants. Eighty-five subjects, divided into two agegroups, voluntarily participated in this study. The group ofyounger adults consisted of 47 subjects with an average ageof 24.21± 3.39 years. These subjects were students from theUniversity of León whose participation was rewarded with1 academic credit. On the other hand, the group of olderadults consisted of another 38 subjects with an average ageof 68.92± 5.72 years. These subjects were contacted throughthe senior center of León Council.
All participants were screened to be right-handed withnormal or corrected vision and not currently under any stress(i.e., exams, job interviews, and grief). Additionally, olderadults were screened to be cognitively intact (Mini-MentalStatus Exam≥ 28) [17]. This study was approved by theEthics Committee of the University of León in 2017, and itwas carried out following the deontological standards recog-nized by the Helsinki Declaration of 1975 (as revised in the52nd Annual General Assembly in Edinburgh, Scotland, inOctober 2000), the standards of Good Clinical Practice, andthe Spanish Legal Code regulating clinical research involvinghuman subjects (Royal Decree 223/2004 about regulation ofclinical trials).
2.2. Procedure. The experimental design consists of 99deductive reasoning tasks that are presented in a time win-dow of 3.5 seconds which includes the presentation of thetask and the response time. There was an interval of 200msbetween tasks. Tasks were presented through the MindTracer (Neuronic S.A., Havana) on a 23-inch NEC screen.Subjects were requested to minimize their blinking as wellas their postural movements. The program also providesconductual information about the number of correct andincorrect answers and reaction times.
For the basal evaluation and for posttraining evaluation,99 deductive tasks were designed corresponding to thethree types presented above. 33 items for each type of taskswere randomly distributed. In the basal evaluation, subjectswere instructed to mandatorily respond to this instruction:“If the item follows a rule based on properties regarding fig-ures, colors, number, shape, or shading, press the ‘Ctrl’ key;
2 Neural Plasticity

otherwise, press the ‘spacebar’ key.” Notice that in the basalevaluation, the subject had no information or hints aboutthe contents of the rules. The task was new and highlydemanding, since the subject lacked any hints and did notknow the rules of the task. For the posttraining, the subjectsfollowed this instruction: “If the three cards have two or moreproperties in common, then (and only then) they form a set.”In this case, subjects would respond by pressing the “Ctrl”key and otherwise by pressing the spacebar.
The initial registration lasted about 40 minutes: 20minutes to prepare the EEG system (cleaning, placementof the electrodes, etc.) using MEDICID (Neuronic S.A.,Havana) and another 20 minutes to run the test. Afterthe initial recording, subjects undertook behavioural trainingof reasoning in a single session followed by a posttrainingrecording, with an approximate duration of 70 minutes: 30minutes for the training itself and the remaining time forEEG data recording.
2.3. Stimuli. The paradigm used during the EEG acquisitionwas based on a subset of the cards that compose the deck ofthe card game set. The game was unknown to all participants,and it was instrumental in the training and evaluation ofelemental logical deductions. This kind of task was chosenbecause human deductive abilities are known to be, undercertain specific conditions, rather invariant with respectto age, culture, and education. In particular, the reductionof cognitive resources accompanying aging does not impedethe preservation of elementary deductive abilities [18],specifically if inferential conclusions are relevant to theirpremises [17, 19]. Even if the cultural context partially deter-mines reasoning, elementary deductive inference remainsinvariant across cultures [20] and education levels [21].Additionally, deductive inferences occur both in linguisticand in visual support [22]. That is, there are deductionswhich are not sentential sequences of premises and conclu-sions but logically valid visual inferences such as those pres-ent in diagrams or geometrical proofs. Finally, an interestingpeculiarity of deductive reasoning is its easiness to producenew tasks with simple instructions where it is easy to measureand control both the logical complexity (number of instancesof employed rules) and the relational complexity (number ofvariables). In this research, these measures offer an objectivedemand gradient.
The deductive tasks presented and evaluated in this studyare elementary logical (first order) inferences realized over asubset of the card game set. The cards presented items with
certain characteristics: shape, color, number, and shading.There are three shapes, two colors, two numbers, and twoshadings. Each item presents a trio of cards which shareszero, one, two, or three of these characteristics. By definition,any trio is a set if and only if the three cards share at least twoproperties. Determining whether an item (trio) is or is not aset is a purely deductive task, namely, a finite sequence ofinferences which can be developed in a logically valid wayand follows a recursive procedure which computes thetruth values of the premises. Given that the subject per-ceives the properties of each card, the exercise of comput-ing or deducing if the trio is a set is an elementary logicaltask. In the simplest scenario, it is enough to apply the defini-tion of a set to verify that in fact, the cards in the trio sharetwo properties. This situation automatically applies the ruleof modus ponens (deduce B from {A, if A then B}). In themore complex scenario, instead of directly applying the def-inition after positive cases, we have counterexamples. In thiscase, the rule of modus tollens (deduce notA from {notB, if Athen B}) can be used.
To elucidate the experimental design, we show an exam-ple of each of the three kinds of items presented to the sub-jects in the evaluation tests. Only in the first kind of case(see Figure 1) do the three cards share at least two properties,and consequently the trio satisfies the definition of a set.
The three cards in Figure 1 share the same shape andcolor; therefore, they are a set. From the only presenta-tion of the trio and the application of negationless deduc-tive rules, the reasoner may deduce that the item is a set.Observe how the reasoner may deduce the conclusion with-out going through all the properties of all objects in thecards: once form and color are shared, there is no needfor further verifications.
The second type of case is a trio which shares only oneproperty (see Figure 2).
The three cards share shape, but no other property.Therefore, this item is not a set. The inference behind thisconclusion contains an application of the modus tollens rule,since by this rule the subject can refute each of the otherproperties (color, number, and shading) one by one.
Finally, Figure 3 shows the example of the third type ofcase in which no properties are shared by any card of the trio.
The subject may easily verify property by property that acharacteristic is not shared in the trio, deducing by modustollens that the trio is not a set. Note that in the three typesof cases, the whole inference is elementary and deductivelyvalid. Moreover, it is remarkable that the second and third
Figure 1: Case 1 type.
3Neural Plasticity

types of cases have a slightly greater logical complexity thancase 1, but their relational complexity is identical.
2.4. Training. All subjects received a personalized one-on-one training, which took place in the same session as thepostevaluation. The point of the training was to producevalid deductive inferences by means of recursive or comput-able logical procedures which would prove whether a givenitem was (or was not) part of a set. In its first stage, thetraining focused on identifying sets and practicing at least15 exercises of type 1 tasks with items that were not pres-ent in the basal evaluation. In its second stage, the trainingmade the subject explain her deductive process out loud tothe researcher who then corrected her as necessary. Sinceseveral logically equivalent procedures are equally accept-able, the personalized training adapts to the heuristicalstrategies proposed by the subject in case they are logicallyvalid. Remarkably, the deductive training does not purportto teach the subject to reason logically but to bring intoexplicit conscience the logical properties of the inferencesshe already makes. For example, the conjunction operator(logical operator for “and”) allows the subject to go over sev-eral cards to accumulate available conclusions. This initialtraining phase ends when the subject says she understandsthe task of identifying positive cases of a set and does notcommit two consecutive errors in type 1 trials.
In the third training phase, the subject herself proposedexamples of items that would be a set and described her rea-soning out loud. Once her proposals were adequate, thetraining for types 2 and 3 began, which consisted of makingthe subject aware of the use of modus tollens to infer coun-terexamples to sets. For example, if one card did not share aproperty with another one in a given item, it was deduced tobe a counterexample to a set. The training finished when thesubject expressed her cognizance of the task and did not
commit any errors. The standard duration of the personal-ized training process was between 20 and 30 minutes foreach subject.
3. EEG Recording and Analysis
The EEG was recorded with a 64-channel amplifier (Neu-ronic System, Havana) and specific acquisition software(Neuronic EEG/Edition EEG Software). Reference electrodeswere placed on the earlobes. In addition, electrooculography(EOG) was registered using three pairs of external electrodesin order to record the horizontal and vertical movement ofthe eyes. Electrode impedance was set for each subject beforedata collection but always kept below 5kΩ. The recordingwas carried out using an Electrocap with Ag/AgCl electrodes,which made it possible to analyze the active scalp areas of thesubjects. ERP signals and stimulus markers were continu-ously recorded at a sampling frequency of 200Hz duringthe 20-minute presentation of the task. The signals werefiltered using a band-pass finite impulse response filter witha Hamming window between 1 and 70Hz. In addition, a50Hz notch filter was used in order to remove the power lineartifact. Finally, a three-step artifact rejection algorithm wasapplied to minimize oculographic and myographic artifacts[23]: (1) components related to eye blinks, according to avisual inspection of the scalp maps and their temporal activa-tions from independent component analysis (ICA), were dis-carded [24], (2) segmentation of each 3.5-second trial intoone 1.5 s length trial ranging from 200ms before stimulusonset to 1300ms after stimulus onset, and (3) the threshold-ing of amplitude in each trial was established in five standarddeviations of the signal. That is, trials in which at least fivechannels contained two samples that exceeded the thresholdwere taken out. Only correct answers were considered forfurther analysis. Next, a sliding window approach was used
Figure 2: Case 2 type.
Figure 3: Case type 3.
4 Neural Plasticity

for the localization of the major activation of each trial.Windows of 150ms with an overlap of 90% were selectedfor measures of brain activity before and after training. Peakamplitude measurement took into account the most negativepeak value within the temporal window of 400 to 550ms afterthe stimulus.
3.1. Source Localization. This technique has been widelyused to study the neural correlations of cognition, becauseit combines a high temporal resolution of the EEG techniquewith a reasonable spatial identification of the electrical signalof the cortical sources [25] (see http://www.uzh.ch/keyinst/NewLORETA/sLORETA/sLORETA.htm). The sLORETAsoftware divides the brain into a total of 6239 cubic voxelswith a resolution of 5mm and estimates the density of thecurrent sources [26].
In the current investigation, the source localization wasestimated with the analysis of 64 electrodes located in thefrontal, medial, temporal, and bilateral parietal regions.The subjects were registered using the International 10-20system. The sources were calculated for every subject andeach age group at the temporal window of 400 to 550mswith the Brain Cracker (Neuronic S.A., Havana) which usedthe low-resolution electromagnetic tomography (LORETAimplemented in sLORETA [26]). sLORETA source currentdensity is calculated from the scalp-recorded ERP using arealistic head model from the Montreal Neurological Institute
(MNI) [27], in which the 3-D solution space was restricted toonly the cortical gray matter [28]. The ERP voltage topo-graphic maps were made by plotting color-coded isopoten-tials obtained by interpolating the voltage values betweenthe scalp electrodes in specific latencies. Voxelwise nonpara-metrical statistics as implemented in sLORETA were used.
4. Results
EEG records were processed using the “EEG edition” soft-ware (Neuronic S.A., Havana). Descriptive analyses for eachgroup were calculated using a toolbox from MATLABR2015a, which was developed in the laboratory of theresearchers. Statistical analyses were performed using Statis-tica (Statistica 10). Brain Cracker and sLORETA softwarewere used to determine source localization [26].
4.1. Correct versus Incorrect Responses. In relation to thenumber of correct responses in the basal evaluation, theyounger adults obtained an average of 32.08± 12.29 whereasthe group of older adults obtained an average of 31.05±15.86. Regarding the number of correct response evalua-tions posttraining, the younger adults obtained an averageof 74.79± 14.45 whereas the older adults obtained an averageof 55.13± 16.94 (Figure 4).
To evaluate the effects of this training, a repeated mea-sures model was used. The difference in the number ofcorrect/incorrect responses between both age groups was sig-nificant (F1,84 = 24 186, p = 0 001), just like in postevaluation(F1,84 = 188 596, p = 0 001). It shows that the interactionbetween groups and postevaluation is significant (F1,84 =14 674, p = 0 001) and the level of confidence was 0.95.
Post hoc analysis using the Tukey test revealed significantdifferences in the pre-postevaluation, both in the group ofyounger adults (p < 0 001) and in the group of older adults(p < 0 001). The training had a greater effect on the groupof younger adults (Table 1 and Figure 5).
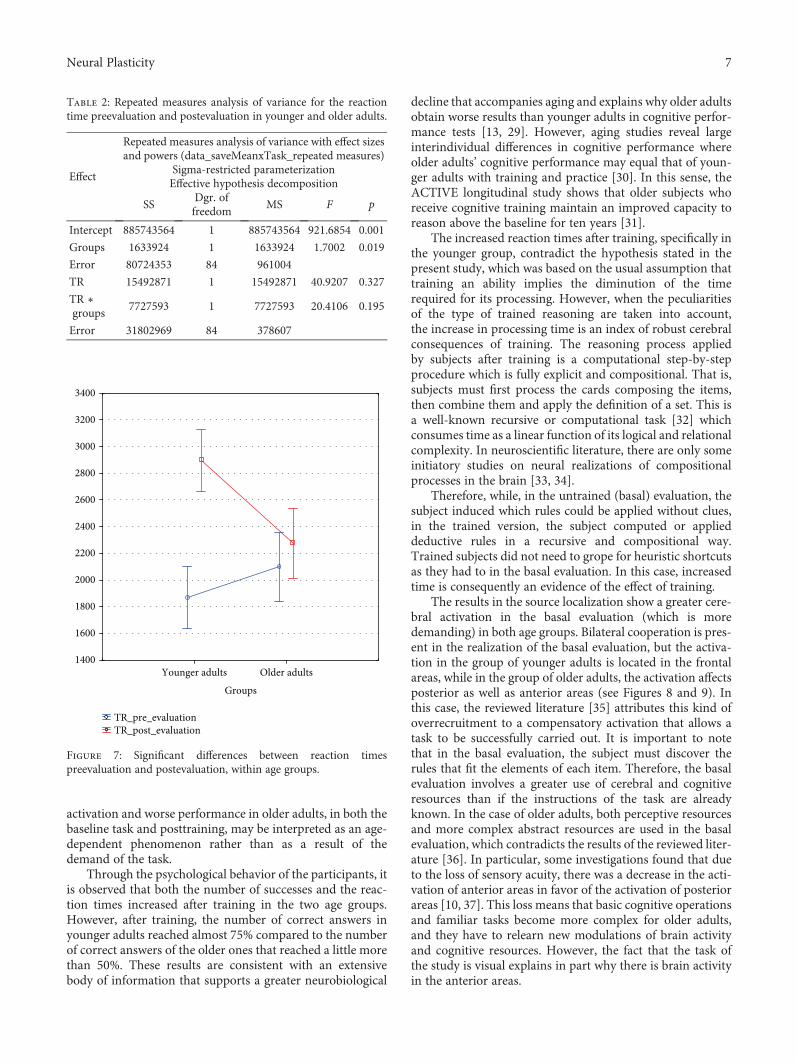
4.2. Reaction Times. The average reaction time in the basalevaluation was 1869.33± 608.79ms for younger adults and2097.89± 1046.77ms for the older ones. The same parameterposttraining was 2898.50± 917.93ms for younger adults and2275.42± 635.92ms for older adults (Figure 6).
To evaluate the effects of this training, a repeated mea-sures model was used. The difference in reaction timesbetween both age groups was not significant (F1,84 = 1 700,p = 0 195). However, the posttraining shows significant dif-ferences (F1,84 = 40 920, p = 0 001), especially in the groupof younger adults. This is verified in the effect of the interac-tion, which is also significant (F1,84 = 20 410, p = 0 001),because the level of confidence is 0.95.
Post hoc analysis using the Tukey test reveals significantdifferences in the pre-postevaluation in the group of youngeradults (p < 0 001) but not in the older adults (p < 0 780)(Table 2 and Figure 7).
4.3. Analysis of Source Localization with sLORETA. Thedescriptive analyses show that, in the basal evaluation ofyounger adults, there is activity in the right hemisphere
Correct vs incorrectresponses_pre ev.OutliersExtremes
Correct vs incorrect_post ev.OutliersExtremes
Younger adults Older adultsGroups
0
10
20
30
40
50
60
70
80
90
100
110
Figure 4: Mean and SD of correct and incorrect responses inyounger and older adults.
5Neural Plasticity

gyrus: orbitofrontal, superior temporal, and postcentral, aswell as in the insula; there is also activity in the left superior,middle, and inferior temporal gyri. After training, that is, inthe postevaluation of the group of younger adults, the activitywas observed in the left hemisphere gyrus: angular, middletemporal, superior, and middle frontal (Figure 8).
In older adults, the activity in the basal evaluation wasobserved in the left superior and middle frontal gyrus, rightparietal superior lobe, and right postcentral gyrus. In thegroup of older adults, the activity in the postevaluation wasobserved in the left postcentral gyrus and in the right lateralorbitofrontal gyrus (Figure 9).
5. Discussion
To the best of our knowledge, this is the first cerebral studyassessing a reasoning training task in younger and older
adults. The results confirm the effects of cognitive trainingon the brain and behavior, since the posttraining evaluationshowed less brain activity and a better performance in theproposed cognitive task in both younger and older adults.On the other hand, the results confirmed hypothesis (a) ofgreater activation in younger adults during the basal evalua-tion compared to older adults. However, the results do notconfirm hypothesis (b) since there were no increases in brainactivity in older adults after training. In addition, hypothesis(c) on the effects of training on psychological variables ispartially verified. The number of correct answers increasedin the posttraining tasks; at the same time, reaction timesgrew unexpectedly. Globally considered cerebral results showthat older adults may have less efficient cerebral resources forcognitive processing. Posttraining performance among oldersubjects is comparatively poor with respect to younger sub-jects, evidencing older adults’ reduced cognitive capacity tobuffer high demands. In addition, the trend of lower brain
Table 1: Repeated measures analysis of variance for the number of correct and incorrect responses preevaluation and postevaluation inyounger and older adults.
Effect
Repeated measures analysis of variance with effect sizes and powers(data_saveMeanxTask_repeated measures)
Sigma-restricted parameterizationEffective hypothesis decomposition
SS Dgr. of freedom MS F p
Intercept 395255.1 1 395255.1 2105.690 0.001
Groups 4539.9 1 4539.9 24.186 0.001
Error 15767.5 84 187.7
Correct vs. incorrect 47302.5 1 47302.5 188.596 0.001
Correct vs. incorrect ∗ groups 3680.4 1 3680.4 14.674 0.001
Error 21068.3 84 250.8
Younger adults Older adults
Groups
20
30
40
50
60
70
80
90
Pre_post correct vs incorrect_prePre_post correct vs incorrect_post
Figure 5: Significant differences between correct/incorrect responsespreevaluation and postevaluation, within age groups.
TR_pre_evaluationOutliersExtremes
TR_post_evaluationOutliersExtremes
Younger adults Older adultsGroups
500
1000
1500
2000
2500
3000
3500
4000
4500
5000
5500
6000
Figure 6: Mean and SD of reaction times in younger and olderadults.
6 Neural Plasticity
activation and worse performance in older adults, in both thebaseline task and posttraining, may be interpreted as an age-dependent phenomenon rather than as a result of thedemand of the task.
Through the psychological behavior of the participants, itis observed that both the number of successes and the reac-tion times increased after training in the two age groups.However, after training, the number of correct answers inyounger adults reached almost 75% compared to the numberof correct answers of the older ones that reached a little morethan 50%. These results are consistent with an extensivebody of information that supports a greater neurobiological
decline that accompanies aging and explains why older adultsobtain worse results than younger adults in cognitive perfor-mance tests [13, 29]. However, aging studies reveal largeinterindividual differences in cognitive performance whereolder adults’ cognitive performance may equal that of youn-ger adults with training and practice [30]. In this sense, theACTIVE longitudinal study shows that older subjects whoreceive cognitive training maintain an improved capacity toreason above the baseline for ten years [31].
The increased reaction times after training, specifically inthe younger group, contradict the hypothesis stated in thepresent study, which was based on the usual assumption thattraining an ability implies the diminution of the timerequired for its processing. However, when the peculiaritiesof the type of trained reasoning are taken into account,the increase in processing time is an index of robust cerebralconsequences of training. The reasoning process appliedby subjects after training is a computational step-by-stepprocedure which is fully explicit and compositional. That is,subjects must first process the cards composing the items,then combine them and apply the definition of a set. This isa well-known recursive or computational task [32] whichconsumes time as a linear function of its logical and relationalcomplexity. In neuroscientific literature, there are only someinitiatory studies on neural realizations of compositionalprocesses in the brain [33, 34].
Therefore, while, in the untrained (basal) evaluation, thesubject induced which rules could be applied without clues,in the trained version, the subject computed or applieddeductive rules in a recursive and compositional way.Trained subjects did not need to grope for heuristic shortcutsas they had to in the basal evaluation. In this case, increasedtime is consequently an evidence of the effect of training.
The results in the source localization show a greater cere-bral activation in the basal evaluation (which is moredemanding) in both age groups. Bilateral cooperation is pres-ent in the realization of the basal evaluation, but the activa-tion in the group of younger adults is located in the frontalareas, while in the group of older adults, the activation affectsposterior as well as anterior areas (see Figures 8 and 9). Inthis case, the reviewed literature [35] attributes this kind ofoverrecruitment to a compensatory activation that allows atask to be successfully carried out. It is important to notethat in the basal evaluation, the subject must discover therules that fit the elements of each item. Therefore, the basalevaluation involves a greater use of cerebral and cognitiveresources than if the instructions of the task are alreadyknown. In the case of older adults, both perceptive resourcesand more complex abstract resources are used in the basalevaluation, which contradicts the results of the reviewed liter-ature [36]. In particular, some investigations found that dueto the loss of sensory acuity, there was a decrease in the acti-vation of anterior areas in favor of the activation of posteriorareas [10, 37]. This loss means that basic cognitive operationsand familiar tasks become more complex for older adults,and they have to relearn new modulations of brain activityand cognitive resources. However, the fact that the task ofthe study is visual explains in part why there is brain activityin the anterior areas.
Table 2: Repeated measures analysis of variance for the reactiontime preevaluation and postevaluation in younger and older adults.
Effect
Repeated measures analysis of variance with effect sizesand powers (data_saveMeanxTask_repeated measures)
Sigma-restricted parameterizationEffective hypothesis decomposition
SSDgr. offreedom
MS F p
Intercept 885743564 1 885743564 921.6854 0.001
Groups 1633924 1 1633924 1.7002 0.019
Error 80724353 84 961004
TR 15492871 1 15492871 40.9207 0.327
TR ∗groups
7727593 1 7727593 20.4106 0.195
Error 31802969 84 378607
Younger adults Older adults
Groups
1400
1600
1800
2000
2200
2400
2600
2800
3000
3200
3400
TR_pre_evaluationTR_post_evaluation
Figure 7: Significant differences between reaction timespreevaluation and postevaluation, within age groups.
7Neural Plasticity

The localization of sources of brain activity after trainingin younger adults goes from being bilateral to focal. In partic-ular, activation is now focused on the left medial angulargyrus, the temporal and frontal areas, and the left superiorfrontal area. Other investigations also related these cerebralareas to deductive reasoning [38]. Therefore, the results showthat the estimate of the demand of the task posttraining inthis group has decreased with respect to the baseline task.In the case of older adults, the training does not causesuch remarkable brain activity changes, and the strategyof bilateral activation of anterior and posterior areas ismaintained. In particular, the parietal and fronto-orbitalareas are activated, which again produces a wide overlapbetween the perceptual and abstract resources also used inthe basal evaluation. The surprising lower brain activationposttraining with respect to the basal evaluation contradictshypothesis (b) about older adults. One explanation could bea ceiling effect linked to high levels of demand in older adults[1]. That is, when older adults face a demanding task that isbeyond their capacity, their performance level and brainactivity both decrease [13]. However, the better cognitiveresults and the fact that the activation in the two groups is
lower after training are proofs of the effect of training on cog-nitive and cerebral activity.
In summary, bilaterality may be a marker of how thebrain adapts to maintain cognitive function in demandingtasks in both age groups. However, the differential bilaterallocations across age groups indicate that the tendency ofthe brain to modulate is determined by age. One limitationof the study concerns the fact that all tasks are visual, thusrestricting the possibility of verifying if posterior activationin older adults is due to the visual tasks. The high demandof the tasks and the short training period of the study mayexplain why older subjects improved 20% less than youngeradults. Future research should replicate these results withnonvisual tasks and longer training periods to profoundlyunderstand the benefits obtained from practice and trainingat a neurological level.
Data Availability
The data used to support the findings of this study are avail-able from the corresponding author upon request.
Pre-evaluation. Younger adults
127,470
-51,124
127,470
-51,124
127,470
-51,124
52,685
-0,252
52,685
-0,252
52,685
-0,252
Post-evaluation. Younger adults
Figure 8: Analysis of source localization pre-postevaluation in younger adults.
Pre-evaluation. Older adults16,627
-41,184
16,627
-41,184
16,627
-41,184
68,650
-76,572
68,650
-76,572
68,650
-76,572
Pre-evaluation. Older adults
Figure 9: Analysis of source localization in basal and posttraining evaluation, within age groups.
8 Neural Plasticity
Conflicts of Interest
The authors declare that they have no conflicts of interest.
References
[1] J. R. Rieck, K. M. Rodrigue, M. A. Boylan, and K. M. Kennedy,“Age-related reduction of BOLD modulation to cognitivedifficulty predicts poorer task accuracy and poorer fluid rea-soning ability,”NeuroImage, vol. 147, no. 1, pp. 262–271, 2017.
[2] F. Grandi and J. Tirapu Ustárroz, “Neurociencia cognitiva delenvejecimiento: modelos explicativos,” Revista Española deGeriatría y Gerontología, vol. 52, no. 6, pp. 326–331, 2017.
[3] R. Cabeza, “Hemispheric asymmetry reduction in older adults:the HAROLD model,” Psychology and Aging, vol. 17, no. 1,pp. 85–100, 2002.
[4] P. A. Reuter-Lorenz, J. Jonides, E. E. Smith et al., “Age differ-ences in the frontal lateralization of verbal and spatial workingmemory revealed by PET,” Journal of Cognitive Neuroscience,vol. 12, no. 1, pp. 174–187, 2000.
[5] D. Barulli and Y. Stern, “Efficiency, capacity, compensa-tion, maintenance, plasticity: emerging concepts in cognitivereserve,” Trends in Cognitive Sciences, vol. 17, no. 10,pp. 502–509, 2013.
[6] G. T. Stebbins, M. C. Carrillo, J. Dorfman et al., “Aging effectson memory encoding in the frontal lobes,” Psychology andAging, vol. 17, no. 1, pp. 44–55, 2002.
[7] K. A. Cappell, L. Gmeindl, and P. A. Reuter-Lorenz, “Agedifferences in prefontal recruitment during verbal workingmemory maintenance depend on memory load,” Cortex,vol. 46, no. 4, pp. 462–473, 2010.
[8] A. Osorio, S. Fay, V. Pouthas, and S. Ballesteros, “Ageingaffects brain activity in highly educated older adults: an ERPstudy using a word-stem priming task,” Cortex, vol. 46, no. 4,pp. 522–534, 2010.
[9] D. Payer, C. Marshuetz, B. Sutton, A. Hebrank, R. C. Welsh,and D. C. Park, “Decreased neural specialization in old adultson a working memory task,” Neuroreport, vol. 17, no. 5,pp. 487–491, 2006.
[10] J. Ansado, O. Monchi, N. Ennabil, S. Faure, and Y. Joanette,“Load-dependent posterior–anterior shift in aging in complexvisual selective attention situations,” Brain Research, vol. 1454,pp. 14–22, 2012.
[11] A. H. Gutchess, R. C. Welsh, T. Hedden et al., “Aging and theneural correlates of successful picture encoding: frontal activa-tions compensate for decreased medial-temporal activity,”Journal of Cognitive Neuroscience, vol. 17, no. 1, pp. 84–96,2005.
[12] I. T. Z. Dew, N. Buchler, I. G. Dobbins, and R. Cabeza, “Whereis ELSA? The early to late shift in aging,” Cerebral Cortex,vol. 22, no. 11, pp. 2542–2553, 2012.
[13] J. R. Rieck, K. M. Rodrigue, M. A. Boylan, and K. M. Kennedy,“Age-related reduction of BOLD modulation to cognitive dif-ficulty predicts poorer task accuracy and poorer fluid reason-ing ability,” NeuroImage, vol. 147, pp. 262–271, 2017.
[14] N. J. Schneider-Garces, B. A. Gordon, C. R. Brumback-Peltzet al., “Span, CRUNCH, and beyond: working memory capac-ity and the aging brain,” Journal of Cognitive Neuroscience,vol. 22, no. 4, pp. 655–669, 2010.
[15] C. Opdebeeck, A. Martyr, and L. Clare, “Cognitive reserve andcognitive function in healthy older people: a meta-analysis,”
Aging, Neuropsychology, and Cognition, vol. 23, no. 1,pp. 40–60, 2016.
[16] M. F. Folstein, S. E. Folstein, and P. R. McHugh, ““Mini-men-tal state”: a practical method for grading the cognitive state ofpatients for the clinician,” Journal of Psychiatric Research,vol. 12, no. 3, pp. 189–198, 1975.
[17] E. L. Beatty and O. Vartanian, “The prospects of workingmemory training for improving deductive reasoning,” Fron-tiers in Human Neuroscience, vol. 9, p. 56, 2015.
[18] J. M. Tommerdahl, W. McKee, M. Nesbitt et al., “Do deductiveand probabilistic reasoning abilities decline in older adults?,”Journal of Applied Biobehavioral Research, vol. 21, no. 4,pp. 225–236, 2016.
[19] P. Álvarez Merino, C. Requena Hernández, and F. Salto Ale-many, “La integración más que la edad influye en el rendi-miento del razonamiento deductivo,” International Journal ofDevelopmental and Educational Psychology, vol. 1, no. 2,p. 221, 2016.
[20] H. Mercier, “The argumentative theory: predictions andempirical evidence,” Trends in Cognitive Sciences, vol. 20,no. 9, pp. 689–700, 2016.
[21] H. Markovits, J. Brisson, P. L. de Chantal, and C. M. St-Onge,“Elementary schoolchildren know a logical argument whenthey see one,” Journal of Cognitive Psychology, vol. 28, no. 7,pp. 877–883, 2016.
[22] G. Allwein and J. Barwise, Logical Reasoning with Diagrams,Oxford University Press, 1996.
[23] J. Gomez-Pilar, J. Poza, A. Bachiller, C. Gómez, V. Molina, andR. Hornero, “Neural network reorganization analysis duringan auditory oddball task in schizophrenia using waveletentropy,” Entropy, vol. 17, no. 12, pp. 5241–5256, 2015.
[24] S. Makeig, S. Debener, J. Onton, and A. Delorme, “Miningevent-related brain dynamics,” Trends in Cognitive Sciences,vol. 8, no. 5, pp. 204–210, 2004.
[25] R. Thatcher, D. North, and C. Biver, “LORETA EEG phasereset of the default mode network,” Frontiers in Human Neu-roscience, vol. 8, no. 1, p. 529, 2014.
[26] R. D. Pascual-Marqui, R. J. Biscay, J. Bosch-Bayard et al.,“Assessing direct paths of intracortical causal information flowof oscillatory activity with the isolated effective coherence(iCoh),” Frontiers in Human Neuroscience, vol. 8, p. 448, 2014.
[27] J. Mazziotta, A. Toga, A. Evans et al., “A probabilistic atlas andreference system for the human brain: International Consor-tium for Brain Mapping (ICBM),” Philosophical Transactionsof the Royal Society of London B: Biological Sciences, vol. 356,no. 1412, pp. 1293–1322, 2001.
[28] J. L. Lancaster, M. G. Woldorff, L. M. Parsons et al., “Auto-mated Talairach atlas labels for functional brain mapping,”Human Brain Mapping, vol. 10, no. 3, pp. 120–131, 2000.
[29] N. Raz and K. M. Rodrígue, “Differential aging of the brain:patterns, cognitive correlates and modifiers,” Neuroscience &Biobehavioral Reviews, vol. 30, no. 6, pp. 730–748, 2006.
[30] C. Requena, A. Turrero, and T. Ortiz, “Six-year trainingimproves everyday memory in healthy older people. Random-ized controlled trial,” Frontiers in Aging Neuroscience, vol. 8,no. 1, p. 135, 2016.
[31] G. W. Rebok, K. Ball, L. T. Guey et al., “Ten-year effects of theadvanced cognitive training for independent and vital elderlycognitive training trial on cognition and everyday functioningin older adults,” Journal of the American Geriatrics Society,vol. 62, no. 1, pp. 16–24, 2014.
9Neural Plasticity
[32] G. S. Boolos, J. P. Burgess, and R. C. Jeffrey, Computability andLogic, Cambridge University Press, 2002.
[33] N. T. Franklin and M. J. Frank, “Compositional clustering intask structure learning,” PLOS Computational Biology,vol. 14, no. 4, article e1006116, 2018.
[34] C. Reverberi, K. Görgen, and J. D. Haynes, “Compositionalityof rule representations in human prefrontal cortex,” CerebralCortex, vol. 22, no. 6, pp. 1237–1246, 2012.
[35] N. R. Lighthall, S. A. Huettel, and R. Cabeza, “Functional com-pensation in the ventromedial prefrontal cortex improvesmemory-dependent decisions in older adults,” The Journal ofNeuroscience, vol. 34, no. 47, pp. 15648–15657, 2014.
[36] C. L. Grady, J. M. Maisog, B. Horwitz et al., “Age-relatedchanges in cortical blood flow activation during visual process-ing of faces and location,” The Journal of Neuroscience, vol. 14,no. 3, pp. 1450–1462, 1994.
[37] S. W. Davis, N. A. Dennis, S. M. Daselaar, M. S. Fleck, andR. Cabeza, “Que PASA? The posterior-anterior shift in aging,”Cerebral Cortex, vol. 18, no. 5, pp. 1201–1209, 2008.
[38] G. Baggio, P. Cherubini, D. Pischedda, A. Blumenthal, J. D.Haynes, and C. Reverberi, “Multiple neural representationsof elementary logical connectives,” NeuroImage, vol. 135,pp. 300–310, 2016.
10 Neural Plasticity

Research ArticleAnatomical and Functional MRI Changes after One Year ofAuditory Rehabilitation with Hearing Aids
M. R. Pereira-Jorge,1 K. C. Andrade,2 F. X. Palhano-Fontes,2 P. R. B. Diniz,3M. Sturzbecher,1
A. C. Santos,1,4 and D. B. Araujo 2
1Department of Neuroscience and Behavior, University of São Paulo, Ribeirao Preto, SP, Brazil2Brain Institute/Onofre Lopes University Hospital, Federal University of Rio Grande do Norte (UFRN), Natal, RN, Brazil3Department of Internal Medicine, Federal University of Pernambuco, Recife, PE, Brazil4Department of Internal Medicine, University of São Paulo, Ribeirao Preto, SP, Brazil
Correspondence should be addressed to D. B. Araujo; [email protected]
Received 23 February 2018; Revised 8 July 2018; Accepted 8 August 2018; Published 10 September 2018
Academic Editor: Surjo R. Soekadar
Copyright © 2018 M. R. Pereira-Jorge et al. This is an open access article distributed under the Creative Commons AttributionLicense, which permits unrestricted use, distribution, and reproduction in anymedium, provided the original work is properly cited.
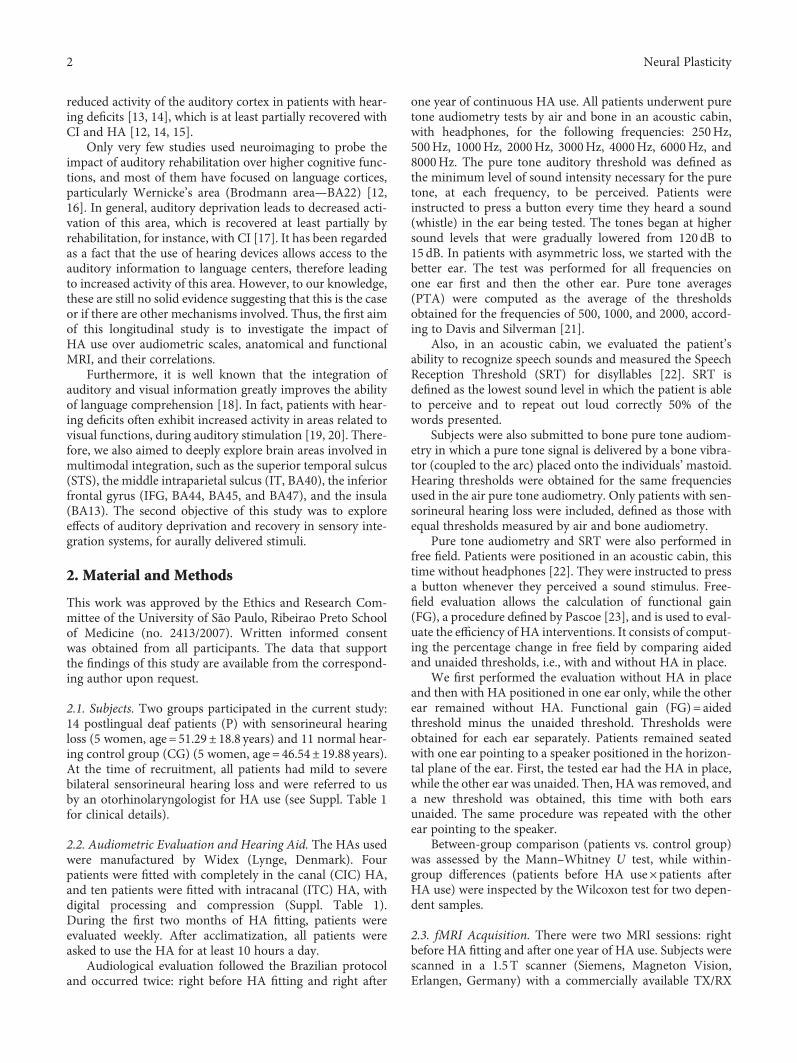
Hearing aids (HAs) are an effective strategy for auditory rehabilitation in patients with peripheral hearing deficits. Yet, theneurophysiological mechanisms behind HA use are still unclear. Thus far, most studies have focused on changes in the auditorysystem, although it is expected that hearing deficits affect a number of cognitive systems, notably speech. In the present study,we used audiometric evaluations in 14 patients with bilateral hearing loss before and after one year of continuous HA use andfunctional magnetic resonance imaging (fMRI) and cortical thickness analysis in 12 and 10 of them compared with a normalhearing control group. Prior to HA fitting, fMRI activity was found reduced in the auditory and language systems and increasedin visual and frontal areas, expanding to multimodal integration cortices, such as the superior temporal gyrus, intraparietalsulcus, and insula. One year after rehabilitation with HA, significant audiometric improvement was observed, especially in free-field Speech Reception Threshold (SRT) test and functional gain, a measure of HA efficiency. HA use increased fMRI activity inthe auditory and language cortices and multimodal integration areas. Individual fMRI signal changes from all these areas werepositively correlated with individual SRT changes. Before rehabilitation, cortical thickness was increased in parts of theprefrontal cortex, precuneus, fusiform gyrus, and middle temporal gyrus. It was reduced in the insula, supramarginal gyrus,medial temporal gyrus, occipital cortex, posterior cingulate cortex, and claustrum. After HA use, increased cortical thickness wasobserved in multimodal integration regions, particularly the very caudal end of the superior temporal sulcus, the angular gyrus,and the inferior parietal gyrus/superior temporal gyrus/insula. Our data provide the first evidence that one year of HA use isrelated to functional and anatomical brain changes, notably in auditory and language systems, extending to multimodal cortices.
1. Introduction
Peripheral hearing deficits have a profound impact on thecentral auditory system, hampering individual communi-cation and social interaction [1]. Individuals with hearingimpairment can benefit from rehabilitation with cochlearimplant (CI) and acoustic hearing aid (HA) devices. In bothcases, patients experience significant improvement in theirgeneral condition, including cognitive abilities such as mem-ory and language comprehension [2, 3].
Little is known, however, about neurophysiologicalmechanisms underlying these beneficial changes, and most
knowledge on the topic is still based on animal models.Lesions to different segments of the auditory system are asso-ciated with specific changes in the neuronal representation ofsound stimuli in cats [4], monkeys [5], mice [6], birds [7],and rabbits [8]. Furthermore, molecular and electrophysi-ological evidences show that rehabilitation with CI, forinstance, leads to changes in the auditory system [8, 9].
In humans, advances in neuroimaging have expandedconsiderably the exploration of the auditory system, both innormal hearing subjects [10] and in patients with hearingimpairment [11, 12]. Positron emission tomography (PET)and functional MRI (fMRI) have already found consistent
HindawiNeural PlasticityVolume 2018, Article ID 9303674, 13 pageshttps://doi.org/10.1155/2018/9303674
reduced activity of the auditory cortex in patients with hear-ing deficits [13, 14], which is at least partially recovered withCI and HA [12, 14, 15].
Only very few studies used neuroimaging to probe theimpact of auditory rehabilitation over higher cognitive func-tions, and most of them have focused on language cortices,particularly Wernicke’s area (Brodmann area—BA22) [12,16]. In general, auditory deprivation leads to decreased acti-vation of this area, which is recovered at least partially byrehabilitation, for instance, with CI [17]. It has been regardedas a fact that the use of hearing devices allows access to theauditory information to language centers, therefore leadingto increased activity of this area. However, to our knowledge,these are still no solid evidence suggesting that this is the caseor if there are other mechanisms involved. Thus, the first aimof this longitudinal study is to investigate the impact ofHA use over audiometric scales, anatomical and functionalMRI, and their correlations.
Furthermore, it is well known that the integration ofauditory and visual information greatly improves the abilityof language comprehension [18]. In fact, patients with hear-ing deficits often exhibit increased activity in areas related tovisual functions, during auditory stimulation [19, 20]. There-fore, we also aimed to deeply explore brain areas involved inmultimodal integration, such as the superior temporal sulcus(STS), the middle intraparietal sulcus (IT, BA40), the inferiorfrontal gyrus (IFG, BA44, BA45, and BA47), and the insula(BA13). The second objective of this study was to exploreeffects of auditory deprivation and recovery in sensory inte-gration systems, for aurally delivered stimuli.
2. Material and Methods
This work was approved by the Ethics and Research Com-mittee of the University of São Paulo, Ribeirao Preto Schoolof Medicine (no. 2413/2007). Written informed consentwas obtained from all participants. The data that supportthe findings of this study are available from the correspond-ing author upon request.
2.1. Subjects. Two groups participated in the current study:14 postlingual deaf patients (P) with sensorineural hearingloss (5 women, age = 51.29± 18.8 years) and 11 normal hear-ing control group (CG) (5 women, age = 46.54± 19.88 years).At the time of recruitment, all patients had mild to severebilateral sensorineural hearing loss and were referred to usby an otorhinolaryngologist for HA use (see Suppl. Table 1for clinical details).
2.2. Audiometric Evaluation and Hearing Aid. The HAs usedwere manufactured by Widex (Lynge, Denmark). Fourpatients were fitted with completely in the canal (CIC) HA,and ten patients were fitted with intracanal (ITC) HA, withdigital processing and compression (Suppl. Table 1).During the first two months of HA fitting, patients wereevaluated weekly. After acclimatization, all patients wereasked to use the HA for at least 10 hours a day.
Audiological evaluation followed the Brazilian protocoland occurred twice: right before HA fitting and right after
one year of continuous HA use. All patients underwent puretone audiometry tests by air and bone in an acoustic cabin,with headphones, for the following frequencies: 250Hz,500Hz, 1000Hz, 2000Hz, 3000Hz, 4000Hz, 6000Hz, and8000Hz. The pure tone auditory threshold was defined asthe minimum level of sound intensity necessary for the puretone, at each frequency, to be perceived. Patients wereinstructed to press a button every time they heard a sound(whistle) in the ear being tested. The tones began at highersound levels that were gradually lowered from 120 dB to15 dB. In patients with asymmetric loss, we started with thebetter ear. The test was performed for all frequencies onone ear first and then the other ear. Pure tone averages(PTA) were computed as the average of the thresholdsobtained for the frequencies of 500, 1000, and 2000, accord-ing to Davis and Silverman [21].
Also, in an acoustic cabin, we evaluated the patient’sability to recognize speech sounds and measured the SpeechReception Threshold (SRT) for disyllables [22]. SRT isdefined as the lowest sound level in which the patient is ableto perceive and to repeat out loud correctly 50% of thewords presented.
Subjects were also submitted to bone pure tone audiom-etry in which a pure tone signal is delivered by a bone vibra-tor (coupled to the arc) placed onto the individuals’mastoid.Hearing thresholds were obtained for the same frequenciesused in the air pure tone audiometry. Only patients with sen-sorineural hearing loss were included, defined as those withequal thresholds measured by air and bone audiometry.
Pure tone audiometry and SRT were also performed infree field. Patients were positioned in an acoustic cabin, thistime without headphones [22]. They were instructed to pressa button whenever they perceived a sound stimulus. Free-field evaluation allows the calculation of functional gain(FG), a procedure defined by Pascoe [23], and is used to eval-uate the efficiency of HA interventions. It consists of comput-ing the percentage change in free field by comparing aidedand unaided thresholds, i.e., with and without HA in place.
We first performed the evaluation without HA in placeand then with HA positioned in one ear only, while the otherear remained without HA. Functional gain (FG)= aidedthreshold minus the unaided threshold. Thresholds wereobtained for each ear separately. Patients remained seatedwith one ear pointing to a speaker positioned in the horizon-tal plane of the ear. First, the tested ear had the HA in place,while the other ear was unaided. Then, HA was removed, anda new threshold was obtained, this time with both earsunaided. The same procedure was repeated with the otherear pointing to the speaker.
Between-group comparison (patients vs. control group)was assessed by the Mann–Whitney U test, while within-group differences (patients before HA use×patients afterHA use) were inspected by the Wilcoxon test for two depen-dent samples.
2.3. fMRI Acquisition. There were two MRI sessions: rightbefore HA fitting and after one year of HA use. Subjects werescanned in a 1.5T scanner (Siemens, Magneton Vision,Erlangen, Germany) with a commercially available TX/RX
2 Neural Plasticity
head coil. fMRI acquisition used an echo-planar imaging(EPI) sequence, with the following parameters: 66 volumes,each one composed of 16 axial slices covering both hemi-spheres, TR=4600ms, TE=60ms, flip angle=90°, FOV=220mm, matrix = 128× 128, and slice thickness = 5mm.
Whole brain anatomical T1-weighted images were alsoacquired using a 3D gradient-recalled echo (GRE) sequence,with the following parameters: TR=9.7ms, TE=4.0ms,matrix size = 256× 256, flip angle=12°, FOV=256mm, slicenumber = 154, and slice thickness = 1mm.
2.4. Experimental Paradigm. fMRI auditory stimuli were deliv-ered by MRI compatible headphones (Siemens, Erlangen,Germany) maintaining the same sound level in both earsand for both sessions: before and after HA fitting. The taskconsisted of listening to a story, presented in a block design,with five blocks of the story (27.5 seconds each) interruptedwith five blocks of rest (27.5 seconds each) [24]. The samestory was used in both sessions, recorded by a male voice,and delivered to both ears, using the same sound level in bothsessions and for all patients (30 dB). Subjects were asked toreport the story’s content after each session, and story com-prehension was rated using a 0–5 Likert scale (0—did notunderstand at all, 1—understood isolated words, 2—under-stood 25% of the story, 3—understood 50% of the story,4—understood 75% of the story, and 5—understood theentire story). Prior to fMRI acquisition, subjects were care-fully instructed not to move while in the scanner and to payas much attention as possible to the story being told.
2.5. fMRI Analysis. fMRI data were processed using Brain-Voyager QX 1.86 (Brain Innovation, Maastricht, Netherlands)according to the same procedures described elsewhere[24, 25]. Preprocessing steps consisted of motion correc-tion, high pass temporal filter at 0.01Hz, spatial filtering(FWHM=4mm), and transformation into Talairach space.fMRI group differences were analyzed using a fixed-effectgeneral linear model (GLM) with separate subject predic-tors. Clusters were selected using a threshold corrected formultiple comparisons (q FDR < 0.05) and with an extensionof at least 50mm3. Group analysis included 2 orthogonalcontrasts: (i) controls (CG) vs. patients before intervention(PB) and (ii) patients before intervention (PB) vs. patientsafter intervention (PA).
2.6. Correlation Analysis. A Pearson correlation analysis wasused to assess whether individual fMRI β-values were corre-lated with individual changes in SRT with headphones, com-puted as a global difference between thresholds observedbefore and after intervention, according to [SRT (right earbefore) + SRT (left ear before)]− [SRT (right ear after) + SRT(left ear after)]. Correlation was computed in specific regionsof interest (ROI), involved in the auditory and Wernicke’sarea (BA22, BA41, and BA42), as well as in brain areasrelated to multimodal integration, such as the superior tem-poral sulcus (STS), the middle intraparietal sulcus (IT), andthe insula.
2.7. Cortical Thickness (CT). In order to evaluate whether theuse of the HA would also be associated with neuroanatomical
changes, we used FreeSurfer image analysis suite for corticalreconstruction and volumetric segmentation, which is docu-mented and freely available for download online (http://surfer.nmr.mgh.harvard.edu/). Processing was performedon a Mac-Pro OS X 10.8.2, 2× 2.26GHz Quad-Core IntelXeon. Preprocessing steps included grey/white segmentation,segmentation of the pial surface, for final computation of cor-tical thickness (CT) maps [26]. Statistical significance was setat p < 0 01.
3. Results
3.1. Audiometric Evaluation. Figure 1(a) shows the pure toneaverages (PTA) obtained with headphones for all groups.PTA with headphones in the control group (CG) revealed athreshold of 15.68± 8.34 dBHL for the right and 14.66±8.47 dBHL for the left ear, which are within the range ofnormality for adults (0–25dBHL). Supplementary Figure 1shows the CG thresholds with headphones for all testedfrequencies. Supplementary Table 2 shows individual CGPTA.
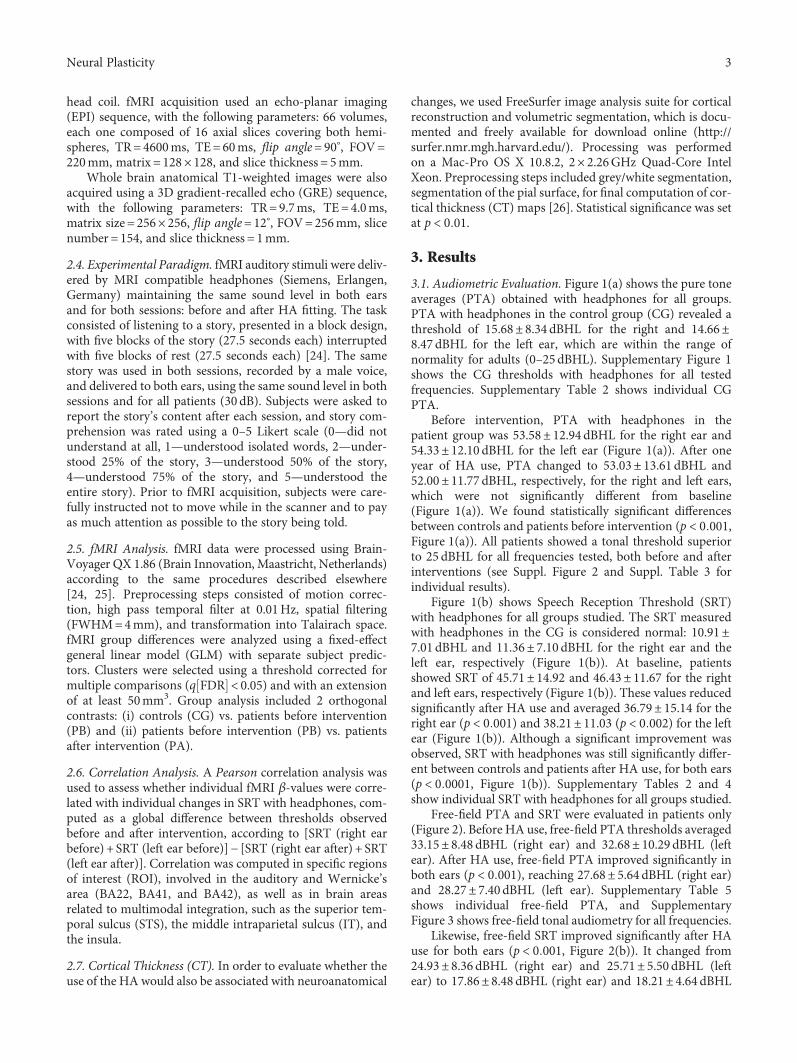
Before intervention, PTA with headphones in thepatient group was 53.58± 12.94 dBHL for the right ear and54.33± 12.10 dBHL for the left ear (Figure 1(a)). After oneyear of HA use, PTA changed to 53.03± 13.61 dBHL and52.00± 11.77 dBHL, respectively, for the right and left ears,which were not significantly different from baseline(Figure 1(a)). We found statistically significant differencesbetween controls and patients before intervention (p < 0 001,Figure 1(a)). All patients showed a tonal threshold superiorto 25 dBHL for all frequencies tested, both before and afterinterventions (see Suppl. Figure 2 and Suppl. Table 3 forindividual results).
Figure 1(b) shows Speech Reception Threshold (SRT)with headphones for all groups studied. The SRT measuredwith headphones in the CG is considered normal: 10.91±7.01 dBHL and 11.36± 7.10 dBHL for the right ear and theleft ear, respectively (Figure 1(b)). At baseline, patientsshowed SRT of 45.71± 14.92 and 46.43± 11.67 for the rightand left ears, respectively (Figure 1(b)). These values reducedsignificantly after HA use and averaged 36.79± 15.14 for theright ear (p < 0 001) and 38.21± 11.03 (p < 0 002) for the leftear (Figure 1(b)). Although a significant improvement wasobserved, SRT with headphones was still significantly differ-ent between controls and patients after HA use, for both ears(p < 0 0001, Figure 1(b)). Supplementary Tables 2 and 4show individual SRT with headphones for all groups studied.
Free-field PTA and SRT were evaluated in patients only(Figure 2). Before HA use, free-field PTA thresholds averaged33.15± 8.48 dBHL (right ear) and 32.68± 10.29 dBHL (leftear). After HA use, free-field PTA improved significantly inboth ears (p < 0 001), reaching 27.68± 5.64 dBHL (right ear)and 28.27± 7.40 dBHL (left ear). Supplementary Table 5shows individual free-field PTA, and SupplementaryFigure 3 shows free-field tonal audiometry for all frequencies.
Likewise, free-field SRT improved significantly after HAuse for both ears (p < 0 001, Figure 2(b)). It changed from24.93± 8.36 dBHL (right ear) and 25.71± 5.50 dBHL (leftear) to 17.86± 8.48 dBHL (right ear) and 18.21± 4.64 dBHL
3Neural Plasticity
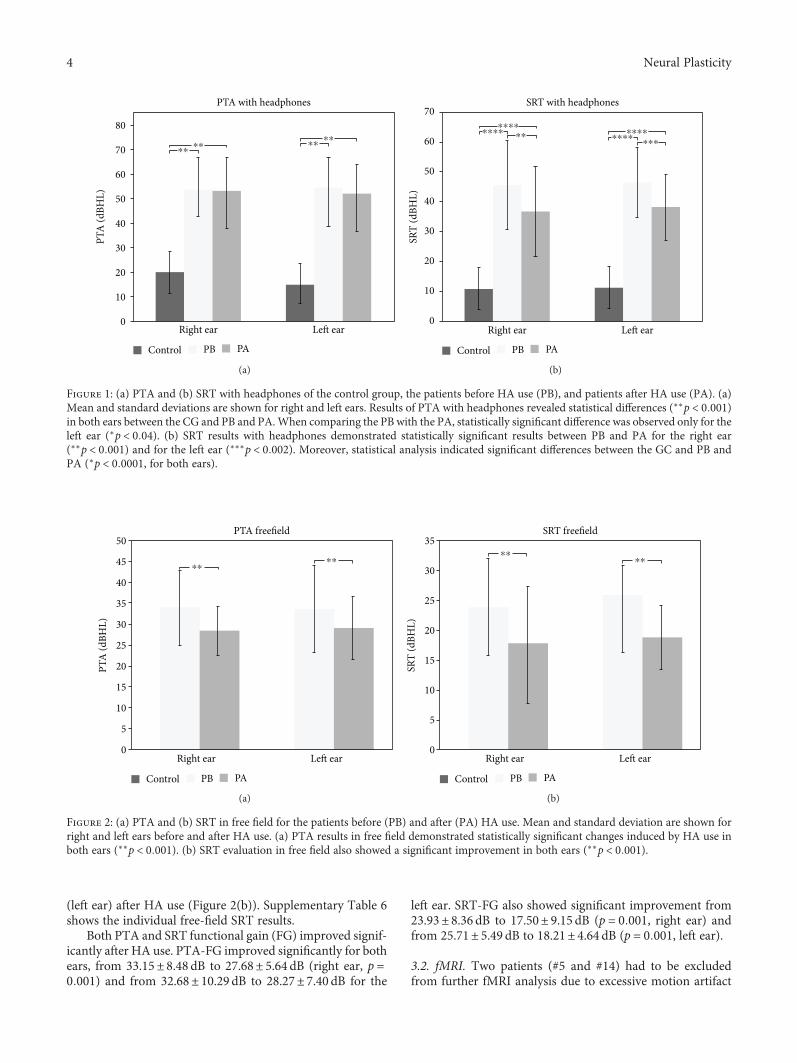
(left ear) after HA use (Figure 2(b)). Supplementary Table 6shows the individual free-field SRT results.
Both PTA and SRT functional gain (FG) improved signif-icantly after HA use. PTA-FG improved significantly for bothears, from 33.15± 8.48 dB to 27.68± 5.64 dB (right ear, p =0 001) and from 32.68± 10.29 dB to 28.27± 7.40 dB for the
left ear. SRT-FG also showed significant improvement from23.93± 8.36 dB to 17.50± 9.15 dB (p = 0 001, right ear) andfrom 25.71± 5.49 dB to 18.21± 4.64 dB (p = 0 001, left ear).
3.2. fMRI. Two patients (#5 and #14) had to be excludedfrom further fMRI analysis due to excessive motion artifact
Right ear
PTA with headphones
0
10
20
30
40
50
60
70
80
Le� ear
PTA
(dBH
L)
⁎⁎ ⁎⁎ ⁎⁎ ⁎⁎
Control PB PA
(a)
Right ear0
10
20
30
40
50
60
70
Le� ear
SRT
(dBH
L)
⁎⁎⁎⁎⁎⁎
⁎⁎⁎⁎⁎⁎⁎⁎
⁎⁎⁎⁎⁎⁎⁎
Control
SRT with headphones
PB PA
(b)
Figure 1: (a) PTA and (b) SRT with headphones of the control group, the patients before HA use (PB), and patients after HA use (PA). (a)Mean and standard deviations are shown for right and left ears. Results of PTA with headphones revealed statistical differences (∗∗p < 0 001)in both ears between the CG and PB and PA.When comparing the PB with the PA, statistically significant difference was observed only for theleft ear (∗p < 0 04). (b) SRT results with headphones demonstrated statistically significant results between PB and PA for the right ear(∗∗p < 0 001) and for the left ear (∗∗∗p < 0 002). Moreover, statistical analysis indicated significant differences between the GC and PB andPA (∗p < 0 0001, for both ears).
Right ear0
10
5
15
20
25
30
35
40
45
50
Left ear
PTA
(dBH
L)
⁎⁎
Control
PTA freefield
⁎⁎
PB PA
(a)
Right ear0
10
5
15
20
25
30
35
Left ear
SRT
(dBH
L)
⁎⁎
Control
SRT freefield
⁎⁎
PB PA
(b)
Figure 2: (a) PTA and (b) SRT in free field for the patients before (PB) and after (PA) HA use. Mean and standard deviation are shown forright and left ears before and after HA use. (a) PTA results in free field demonstrated statistically significant changes induced by HA use inboth ears (∗∗p < 0 001). (b) SRT evaluation in free field also showed a significant improvement in both ears (∗∗p < 0 001).
4 Neural Plasticity
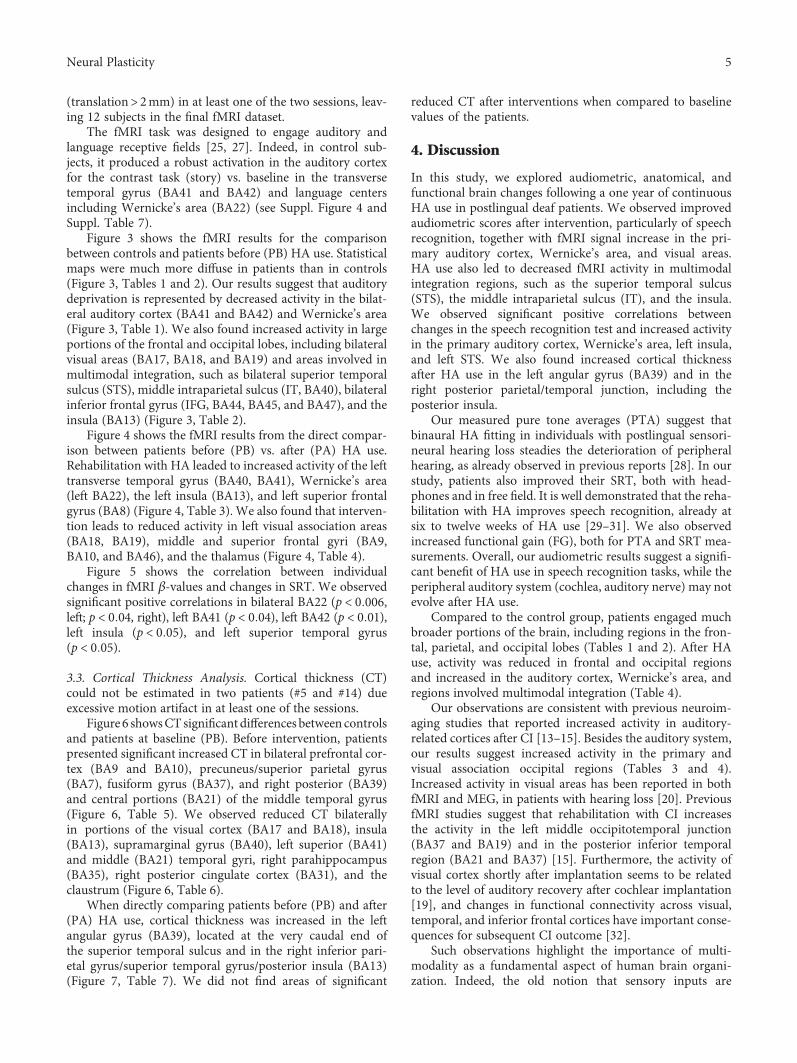
(translation> 2mm) in at least one of the two sessions, leav-ing 12 subjects in the final fMRI dataset.
The fMRI task was designed to engage auditory andlanguage receptive fields [25, 27]. Indeed, in control sub-jects, it produced a robust activation in the auditory cortexfor the contrast task (story) vs. baseline in the transversetemporal gyrus (BA41 and BA42) and language centersincluding Wernicke’s area (BA22) (see Suppl. Figure 4 andSuppl. Table 7).
Figure 3 shows the fMRI results for the comparisonbetween controls and patients before (PB) HA use. Statisticalmaps were much more diffuse in patients than in controls(Figure 3, Tables 1 and 2). Our results suggest that auditorydeprivation is represented by decreased activity in the bilat-eral auditory cortex (BA41 and BA42) and Wernicke’s area(Figure 3, Table 1). We also found increased activity in largeportions of the frontal and occipital lobes, including bilateralvisual areas (BA17, BA18, and BA19) and areas involved inmultimodal integration, such as bilateral superior temporalsulcus (STS), middle intraparietal sulcus (IT, BA40), bilateralinferior frontal gyrus (IFG, BA44, BA45, and BA47), and theinsula (BA13) (Figure 3, Table 2).
Figure 4 shows the fMRI results from the direct compar-ison between patients before (PB) vs. after (PA) HA use.Rehabilitation with HA leaded to increased activity of the lefttransverse temporal gyrus (BA40, BA41), Wernicke’s area(left BA22), the left insula (BA13), and left superior frontalgyrus (BA8) (Figure 4, Table 3). We also found that interven-tion leads to reduced activity in left visual association areas(BA18, BA19), middle and superior frontal gyri (BA9,BA10, and BA46), and the thalamus (Figure 4, Table 4).
Figure 5 shows the correlation between individualchanges in fMRI β-values and changes in SRT. We observedsignificant positive correlations in bilateral BA22 (p < 0 006,left; p < 0 04, right), left BA41 (p < 0 04), left BA42 (p < 0 01),left insula (p < 0 05), and left superior temporal gyrus(p < 0 05).
3.3. Cortical Thickness Analysis. Cortical thickness (CT)could not be estimated in two patients (#5 and #14) dueexcessive motion artifact in at least one of the sessions.
Figure 6 showsCTsignificant differences between controlsand patients at baseline (PB). Before intervention, patientspresented significant increased CT in bilateral prefrontal cor-tex (BA9 and BA10), precuneus/superior parietal gyrus(BA7), fusiform gyrus (BA37), and right posterior (BA39)and central portions (BA21) of the middle temporal gyrus(Figure 6, Table 5). We observed reduced CT bilaterallyin portions of the visual cortex (BA17 and BA18), insula(BA13), supramarginal gyrus (BA40), left superior (BA41)and middle (BA21) temporal gyri, right parahippocampus(BA35), right posterior cingulate cortex (BA31), and theclaustrum (Figure 6, Table 6).
When directly comparing patients before (PB) and after(PA) HA use, cortical thickness was increased in the leftangular gyrus (BA39), located at the very caudal end ofthe superior temporal sulcus and in the right inferior pari-etal gyrus/superior temporal gyrus/posterior insula (BA13)(Figure 7, Table 7). We did not find areas of significant
reduced CT after interventions when compared to baselinevalues of the patients.
4. Discussion
In this study, we explored audiometric, anatomical, andfunctional brain changes following a one year of continuousHA use in postlingual deaf patients. We observed improvedaudiometric scores after intervention, particularly of speechrecognition, together with fMRI signal increase in the pri-mary auditory cortex, Wernicke’s area, and visual areas.HA use also led to decreased fMRI activity in multimodalintegration regions, such as the superior temporal sulcus(STS), the middle intraparietal sulcus (IT), and the insula.We observed significant positive correlations betweenchanges in the speech recognition test and increased activityin the primary auditory cortex, Wernicke’s area, left insula,and left STS. We also found increased cortical thicknessafter HA use in the left angular gyrus (BA39) and in theright posterior parietal/temporal junction, including theposterior insula.
Our measured pure tone averages (PTA) suggest thatbinaural HA fitting in individuals with postlingual sensori-neural hearing loss steadies the deterioration of peripheralhearing, as already observed in previous reports [28]. In ourstudy, patients also improved their SRT, both with head-phones and in free field. It is well demonstrated that the reha-bilitation with HA improves speech recognition, already atsix to twelve weeks of HA use [29–31]. We also observedincreased functional gain (FG), both for PTA and SRT mea-surements. Overall, our audiometric results suggest a signifi-cant benefit of HA use in speech recognition tasks, while theperipheral auditory system (cochlea, auditory nerve) may notevolve after HA use.
Compared to the control group, patients engaged muchbroader portions of the brain, including regions in the fron-tal, parietal, and occipital lobes (Tables 1 and 2). After HAuse, activity was reduced in frontal and occipital regionsand increased in the auditory cortex, Wernicke’s area, andregions involved multimodal integration (Table 4).
Our observations are consistent with previous neuroim-aging studies that reported increased activity in auditory-related cortices after CI [13–15]. Besides the auditory system,our results suggest increased activity in the primary andvisual association occipital regions (Tables 3 and 4).Increased activity in visual areas has been reported in bothfMRI and MEG, in patients with hearing loss [20]. PreviousfMRI studies suggest that rehabilitation with CI increasesthe activity in the left middle occipitotemporal junction(BA37 and BA19) and in the posterior inferior temporalregion (BA21 and BA37) [15]. Furthermore, the activity ofvisual cortex shortly after implantation seems to be relatedto the level of auditory recovery after cochlear implantation[19], and changes in functional connectivity across visual,temporal, and inferior frontal cortices have important conse-quences for subsequent CI outcome [32].
Such observations highlight the importance of multi-modality as a fundamental aspect of human brain organi-zation. Indeed, the old notion that sensory inputs are
5Neural Plasticity
processed in specific and unimodal cortices is outdated [33].For instance, studies in congenitally blind subjects have con-sistently found increased activity in the primary visual cortexduring auditory stimulus processing [34, 35]. Moreover, sev-eral lines of evidence indicate that under certain circum-stances and for specific visual tasks, hearing impairmentleads to increased visual ability following congenital deafness[36]. In our study, we observed augmented fMRI activationof striate cortex (BA17) and extrastriate visual areas (BA18and BA19), before rehabilitation. Increased recruitment ofthe visual system of hearing-impaired individuals in responseto auditory stimuli has been reported in previous PET studies[37, 38]. Such findings have been interpreted as a result ofthe increased demand for visual cues during speech process-ing in individuals with hearing deficits [38]. Possibly as a
result of reduced demand, HA use was associated withreduced activity in the secondary and associative visual areas(BA18 and BA19).
Increased activity in frontal areas may reflect increasedeffort, inner speech with speech production, and/or increasedaudiovisual (AV) cooperation. In fact, after one year of HAuse, we observed significant increased activity in bilateralauditory cortices. Besides, we have found increased activityin Wernicke’s area (BA22) (Table 4) and reduced activityin visual areas, such as BA18 and BA19 (Table 3). Together,these results may show a different balance in AV interac-tion, with a reactivation of auditory speech areas and amore leftward lateralized network, i.e., a more physiologicalspeech processing, less demanding after HA use. The recentstudy suggests that hearing loss impacts audiovisual speech
−8.00
−2.45
2.45
8.00
t(2170)
(a)
−8.00
−2.45
2.45
8.00
t(2170)
(b)
Figure 3: fMRI group analysis: controls versus patients before HA use. (a) Left and (b) right hemispheres, respectively. Color code indicatesstatistical significance. Warm colors (red-yellowish) show regions where activity was greater in controls than in PB, and cool colors(blue-greenish) show the opposite contrast (PB>CG). Clusters were selected with a q FDR < 0.05 and size of at least 50mm3.
Table 1: Brain regions with increased fMRI activity in controls (CG) when compared to patients before HA use (PB). The center of the clusterfor each brain region is represented in Talairach coordinates (x, y, and z), followed by its respective standard deviations (in parentheses).Clusters were selected using a q FDR < 0.05 and a cluster size of at least 50mm3.
Brain region Hem Cluster sizeTalairach coordinates
BAx y z
Middle temporal gyrus L 2403 −60 (5) −33 (14) 0 (7) 21, 22, 37, 39
Middle temporal gyrus R 855 59 (4) −26 (15) −3 (6) 21, 22, 37, 39
Transverse temporal gyrus L 226 −53 (8) −20 (4) 11 (1) 41, 42
Superior temporal gyrus L 2893 −56 (6) −18 (21) 3 (9) 22, 39, 41, 42
Superior temporal gyrus R 1255 54 (6) −12 (19) 0 (8) 22, 39, 41, 42
Inferior frontal gyrus R 278 47 (2) 16 (4) 0 (14) 47
Inferior frontal gyrus L 107 −51 (3) 15 (5) 0 (12) 47
Middle frontal gyrus L 223 −2 (1) −2 (4) 50 (2) 6
Hem= hemisphere; L = left; R = right; and BA = Brodmann area.
6 Neural Plasticity
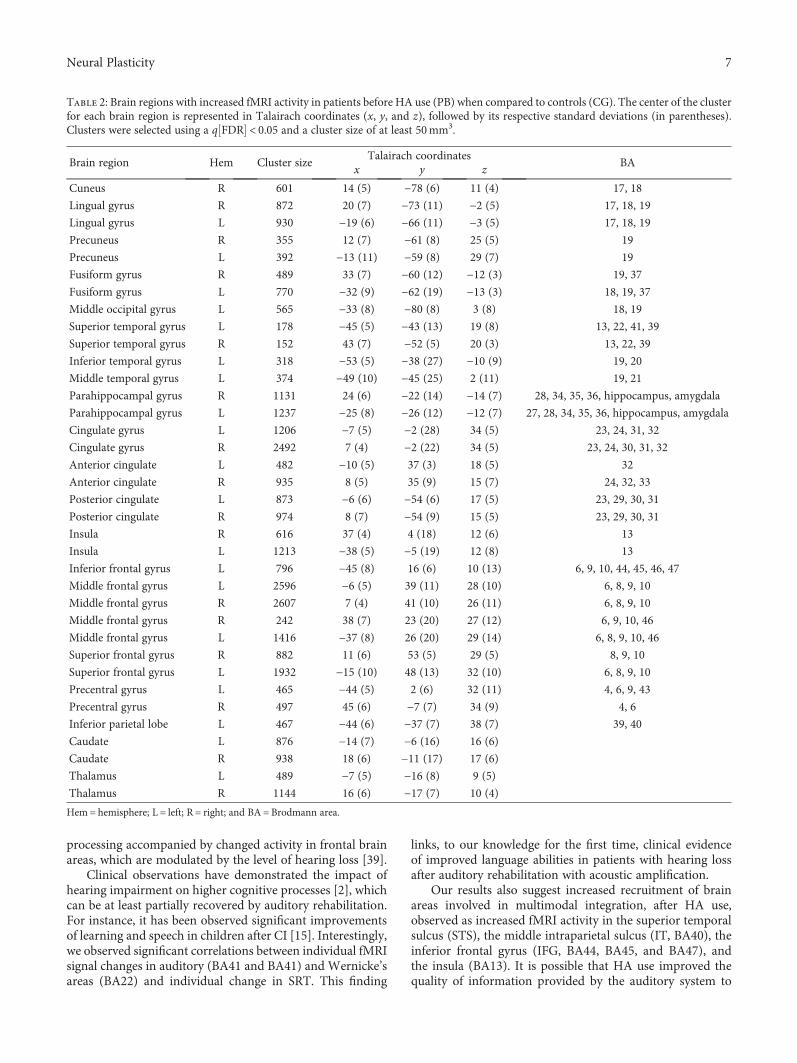
processing accompanied by changed activity in frontal brainareas, which are modulated by the level of hearing loss [39].
Clinical observations have demonstrated the impact ofhearing impairment on higher cognitive processes [2], whichcan be at least partially recovered by auditory rehabilitation.For instance, it has been observed significant improvementsof learning and speech in children after CI [15]. Interestingly,we observed significant correlations between individual fMRIsignal changes in auditory (BA41 and BA41) and Wernicke’sareas (BA22) and individual change in SRT. This finding
links, to our knowledge for the first time, clinical evidenceof improved language abilities in patients with hearing lossafter auditory rehabilitation with acoustic amplification.
Our results also suggest increased recruitment of brainareas involved in multimodal integration, after HA use,observed as increased fMRI activity in the superior temporalsulcus (STS), the middle intraparietal sulcus (IT, BA40), theinferior frontal gyrus (IFG, BA44, BA45, and BA47), andthe insula (BA13). It is possible that HA use improved thequality of information provided by the auditory system to
Table 2: Brain regions with increased fMRI activity in patients before HA use (PB) when compared to controls (CG). The center of the clusterfor each brain region is represented in Talairach coordinates (x, y, and z), followed by its respective standard deviations (in parentheses).Clusters were selected using a q FDR < 0.05 and a cluster size of at least 50mm3.
Brain region Hem Cluster sizeTalairach coordinates
BAx y z
Cuneus R 601 14 (5) −78 (6) 11 (4) 17, 18
Lingual gyrus R 872 20 (7) −73 (11) −2 (5) 17, 18, 19
Lingual gyrus L 930 −19 (6) −66 (11) −3 (5) 17, 18, 19
Precuneus R 355 12 (7) −61 (8) 25 (5) 19
Precuneus L 392 −13 (11) −59 (8) 29 (7) 19
Fusiform gyrus R 489 33 (7) −60 (12) −12 (3) 19, 37
Fusiform gyrus L 770 −32 (9) −62 (19) −13 (3) 18, 19, 37
Middle occipital gyrus L 565 −33 (8) −80 (8) 3 (8) 18, 19
Superior temporal gyrus L 178 −45 (5) −43 (13) 19 (8) 13, 22, 41, 39
Superior temporal gyrus R 152 43 (7) −52 (5) 20 (3) 13, 22, 39
Inferior temporal gyrus L 318 −53 (5) −38 (27) −10 (9) 19, 20
Middle temporal gyrus L 374 −49 (10) −45 (25) 2 (11) 19, 21
Parahippocampal gyrus R 1131 24 (6) −22 (14) −14 (7) 28, 34, 35, 36, hippocampus, amygdala
Parahippocampal gyrus L 1237 −25 (8) −26 (12) −12 (7) 27, 28, 34, 35, 36, hippocampus, amygdala
Cingulate gyrus L 1206 −7 (5) −2 (28) 34 (5) 23, 24, 31, 32
Cingulate gyrus R 2492 7 (4) −2 (22) 34 (5) 23, 24, 30, 31, 32
Anterior cingulate L 482 −10 (5) 37 (3) 18 (5) 32
Anterior cingulate R 935 8 (5) 35 (9) 15 (7) 24, 32, 33
Posterior cingulate L 873 −6 (6) −54 (6) 17 (5) 23, 29, 30, 31
Posterior cingulate R 974 8 (7) −54 (9) 15 (5) 23, 29, 30, 31
Insula R 616 37 (4) 4 (18) 12 (6) 13
Insula L 1213 −38 (5) −5 (19) 12 (8) 13
Inferior frontal gyrus L 796 −45 (8) 16 (6) 10 (13) 6, 9, 10, 44, 45, 46, 47
Middle frontal gyrus L 2596 −6 (5) 39 (11) 28 (10) 6, 8, 9, 10
Middle frontal gyrus R 2607 7 (4) 41 (10) 26 (11) 6, 8, 9, 10
Middle frontal gyrus R 242 38 (7) 23 (20) 27 (12) 6, 9, 10, 46
Middle frontal gyrus L 1416 −37 (8) 26 (20) 29 (14) 6, 8, 9, 10, 46
Superior frontal gyrus R 882 11 (6) 53 (5) 29 (5) 8, 9, 10
Superior frontal gyrus L 1932 −15 (10) 48 (13) 32 (10) 6, 8, 9, 10
Precentral gyrus L 465 −44 (5) 2 (6) 32 (11) 4, 6, 9, 43
Precentral gyrus R 497 45 (6) −7 (7) 34 (9) 4, 6
Inferior parietal lobe L 467 −44 (6) −37 (7) 38 (7) 39, 40
Caudate L 876 −14 (7) −6 (16) 16 (6)
Caudate R 938 18 (6) −11 (17) 17 (6)
Thalamus L 489 −7 (5) −16 (8) 9 (5)
Thalamus R 1144 16 (6) −17 (7) 10 (4)
Hem= hemisphere; L = left; R = right; and BA = Brodmann area.
7Neural Plasticity
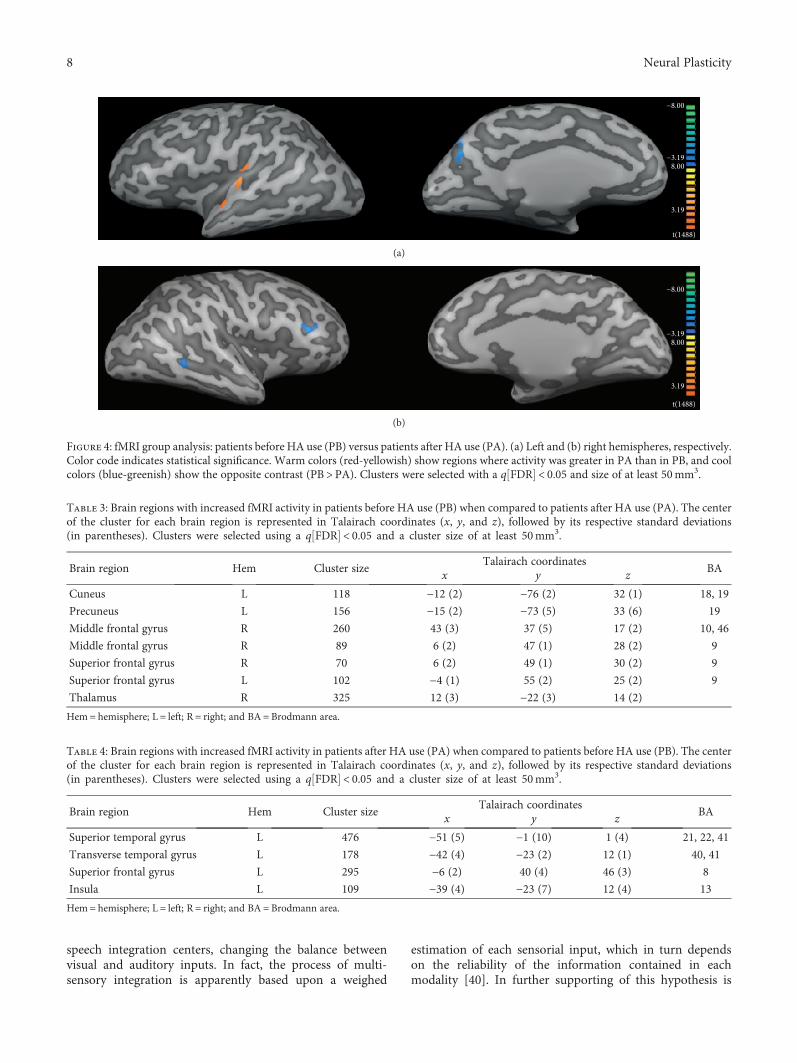
speech integration centers, changing the balance betweenvisual and auditory inputs. In fact, the process of multi-sensory integration is apparently based upon a weighed
estimation of each sensorial input, which in turn dependson the reliability of the information contained in eachmodality [40]. In further supporting of this hypothesis is
−8.00
−3.19
3.19
8.00
t(1488)
(a)
−8.00
−3.19
3.19
8.00
t(1488)
(b)
Figure 4: fMRI group analysis: patients before HA use (PB) versus patients after HA use (PA). (a) Left and (b) right hemispheres, respectively.Color code indicates statistical significance. Warm colors (red-yellowish) show regions where activity was greater in PA than in PB, and coolcolors (blue-greenish) show the opposite contrast (PB>PA). Clusters were selected with a q FDR < 0.05 and size of at least 50mm3.
Table 3: Brain regions with increased fMRI activity in patients before HA use (PB) when compared to patients after HA use (PA). The centerof the cluster for each brain region is represented in Talairach coordinates (x, y, and z), followed by its respective standard deviations(in parentheses). Clusters were selected using a q FDR < 0.05 and a cluster size of at least 50mm3.
Brain region Hem Cluster sizeTalairach coordinates
BAx y z
Cuneus L 118 −12 (2) −76 (2) 32 (1) 18, 19
Precuneus L 156 −15 (2) −73 (5) 33 (6) 19
Middle frontal gyrus R 260 43 (3) 37 (5) 17 (2) 10, 46
Middle frontal gyrus R 89 6 (2) 47 (1) 28 (2) 9
Superior frontal gyrus R 70 6 (2) 49 (1) 30 (2) 9
Superior frontal gyrus L 102 −4 (1) 55 (2) 25 (2) 9
Thalamus R 325 12 (3) −22 (3) 14 (2)
Hem= hemisphere; L = left; R = right; and BA = Brodmann area.
Table 4: Brain regions with increased fMRI activity in patients after HA use (PA) when compared to patients before HA use (PB). The centerof the cluster for each brain region is represented in Talairach coordinates (x, y, and z), followed by its respective standard deviations(in parentheses). Clusters were selected using a q FDR < 0.05 and a cluster size of at least 50mm3.
Brain region Hem Cluster sizeTalairach coordinates
BAx y z
Superior temporal gyrus L 476 −51 (5) −1 (10) 1 (4) 21, 22, 41
Transverse temporal gyrus L 178 −42 (4) −23 (2) 12 (1) 40, 41
Superior frontal gyrus L 295 −6 (2) 40 (4) 46 (3) 8
Insula L 109 −39 (4) −23 (7) 12 (4) 13
Hem= hemisphere; L = left; R = right; and BA = Brodmann area.
8 Neural Plasticity
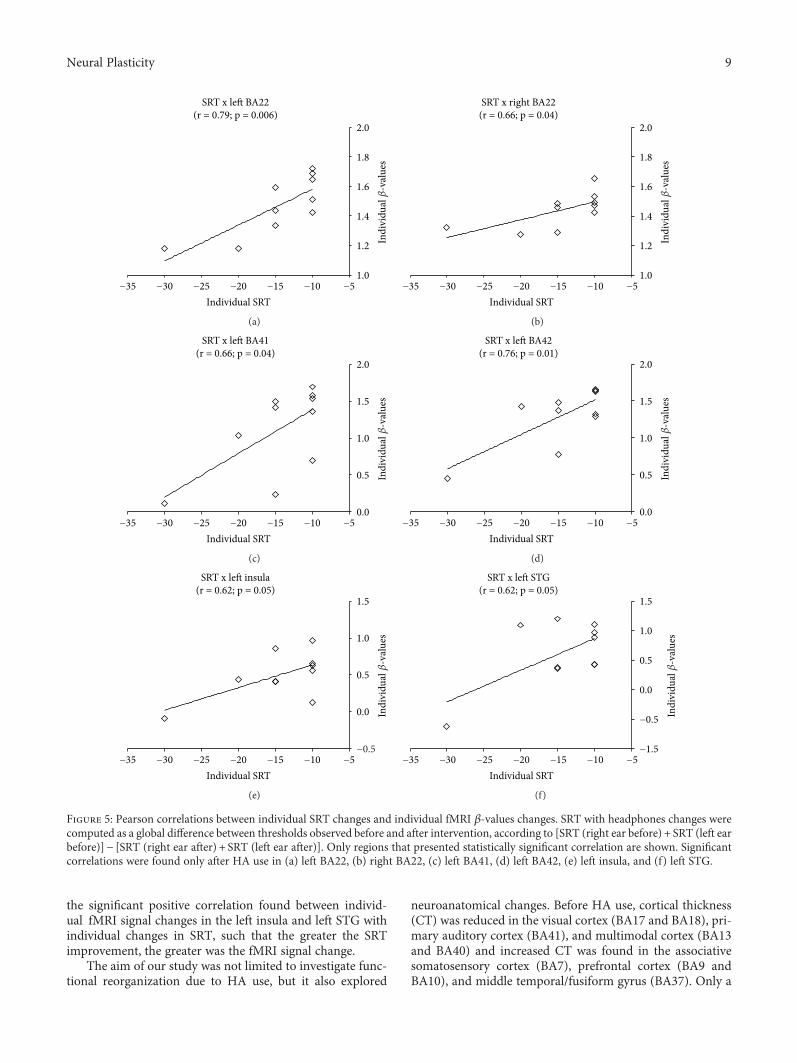
the significant positive correlation found between individ-ual fMRI signal changes in the left insula and left STG withindividual changes in SRT, such that the greater the SRTimprovement, the greater was the fMRI signal change.
The aim of our study was not limited to investigate func-tional reorganization due to HA use, but it also explored
neuroanatomical changes. Before HA use, cortical thickness(CT) was reduced in the visual cortex (BA17 and BA18), pri-mary auditory cortex (BA41), and multimodal cortex (BA13and BA40) and increased CT was found in the associativesomatosensory cortex (BA7), prefrontal cortex (BA9 andBA10), and middle temporal/fusiform gyrus (BA37). Only a
−35 −30 −25 −20 −15 −10 −51.0
1.2
1.4
1.6
1.8
2.0
Individual SRT
Indi
vidu
al �훽
-val
ues
SRT x le� BA22(r = 0.79; p = 0.006)
(a)
−35 −30 −25 −20 −15 −10 −51.0
1.2
1.4
1.6
1.8
2.0
Individual SRT
Indi
vidu
al �훽
-val
ues
SRT x right BA22(r = 0.66; p = 0.04)
(b)
−35 −30 −25 −20 −15 −10 −50.0
0.5
1.0
1.5
2.0
Individual SRT
Indi
vidu
al �훽
-val
ues
SRT x le� BA41(r = 0.66; p = 0.04)
(c)
−35 −30 −25 −20 −15 −10 −50.0
0.5
1.0
1.5
2.0
Individual SRT
Indi
vidu
al �훽
-val
ues
SRT x le� BA42(r = 0.76; p = 0.01)
(d)
−35 −30 −25 −20 −15 −10 −5−0.5
0.0
0.5
1.0
1.5
Individual SRT
Indi
vidu
al �훽
-val
ues
SRT x le� insula(r = 0.62; p = 0.05)
(e)
−35 −30 −25 −20 −15 −10 −5−1.5
−0.5
0.0
0.5
1.0
1.5
Individual SRT
Indi
vidu
al �훽
-val
ues
SRT x le� STG(r = 0.62; p = 0.05)
(f)
Figure 5: Pearson correlations between individual SRT changes and individual fMRI β-values changes. SRT with headphones changes werecomputed as a global difference between thresholds observed before and after intervention, according to [SRT (right ear before) + SRT (left earbefore)]− [SRT (right ear after) + SRT (left ear after)]. Only regions that presented statistically significant correlation are shown. Significantcorrelations were found only after HA use in (a) left BA22, (b) right BA22, (c) left BA41, (d) left BA42, (e) left insula, and (f) left STG.
9Neural Plasticity

few studies have used MRI to investigate neuroanatomicalchanges due to auditory deprivation, and the results are notconsistent. A seminal study used voxel-based morphometry(VBM) in prelingually deaf subjects and identified significantreduced volume only in the left posterior STG [41]. In a morerecent study, VBM and CT analysis were applied to evaluateindividuals with profound sensorineural hearing loss [42].No brain structure in the patient group presented increasedvolume or CT, but the cortical thickness of the primary visualarea (BA17) was significantly smaller in patients than in thecontrol group [42]. In another study, CT was investigatedin adolescents with prelingual deafness and significant CTdifferences were found in the right middle occipital gyrus,right precuneus, left gyrus rectus, and left posterior cingulategyrus [43, 44].
After HA use, our results indicate increased CT at thevery caudal end of the STS, including the left angular gyrus(BA39) and the inferior parietal gyrus/superior temporal
gyrus/posterior insula (BA13). All of these regions arerelated to multimodality, and it is tempting to associatethese anatomical changes to the functional ones detectedby fMRI. Although there are evidence giving support to apossible link between functional and anatomical changesobserved by MRI, this is still a matter of debate [45]. Indeed,in some brain areas, the observed increased fMRI activitywas related to a reduced CT, as for instance BA17 beforeHA use. On the other hand, sensory integration areas, suchas the left insula, showed increased CT and increased fMRIactivity after HA use.
This study has a number of caveats and limitations worthmentioning. First, our sample size was limited to 12 patientsin the final functional and anatomical datasets. Second, theabsence of a control group (patients without intervention),where patients would be placed on a waiting list for follow-up intervention. However, the nature of this 1-year longitudi-nal study hinders such design.During audiologic assessments,
p < 0.005Le� hemisphere
Right hemisphere
p < 0.05
p < 0.05
p < 0.005
Figure 6: Cortical thickness changes of the patients before HA use (PB) when compared to the control group (CG). Color code indicatesp values. Warm colors (red-yellowish) show regions where cortical thickness was greater in PB than in the controls, and cool colors(blue-greenish) show the opposite contrast (CG>PB).
Table 5: Regions of increased cortical thickness in patients at baseline (PB) when compared to controls (CG). Mean cortical thickness isexpressed in mm. The numbers in parentheses correspond to standard deviations. Statistical significance was based at p < 0 01.
Brain region Hem NvoxTalairach coordinates
BAPB CG
p valuex y z Mean (SD) Mean (SD)
Medial orbitofrontal gyrus L 176 −9.0 37.8 −13.5 10 3.12 (0.36) 2.54 (0.35) 0.001
Middle frontal gyrus L 111 −21.2 52.3 −9.7 10 2.83 (0.41) 2.45 (0.20) 0.010
Middle frontal gyrus R 226 38.9 20.0 25.7 9 2.89 (0.22) 2.59 (0.21) 0.005
Superior parietal gyrus L 209 −16.6 −70.1 37.3 7 2.35 (0.29) 2.00 (0.30) 0.010
Superior parietal gyrus R 55 22.6 −53.5 57.5 7 2.28 (0.16) 2.01 (0.28) 0.010
Precuneus L 58 −7.8 −52.7 37.5 7 2.96 (0.37) 2.50 (0.40) 0.010
Precuneus R 279 18.8 −66.1 34.2 7 2.49 (0.29) 2.21 (0.16) 0.010
Fusiform gyrus R 626 40.7 −48.7 −11.0 37 3.28 (0.16) 2.84 (0.25) 0.0002
Fusiform gyrus L 127 −50.9 −58.3 3.3 37 3.08 (0.21) 2.59 (0.29) 0.0003
Middle temporal gyrus R 281 54.5 −20.4 −18.6 21 3.34 (0.26) 2.95 (0.30) 0.005
Middle temporal gyrus R 56 49.4 −59.1 7.4 39 3.11 (0.21) 2.73 (0.38) 0.010
Entorhinal gyrus R 161 30.2 −3.5 −29.0 36 3.94 (0.50) 3.33 (0.31) 0.003
Hem= hemisphere; L = left; R = right; BA = Brodmann area; Nvox = number of voxels in the cluster; SD = standard deviation; PB = patients before HA use;CG = control group.
10 Neural Plasticity
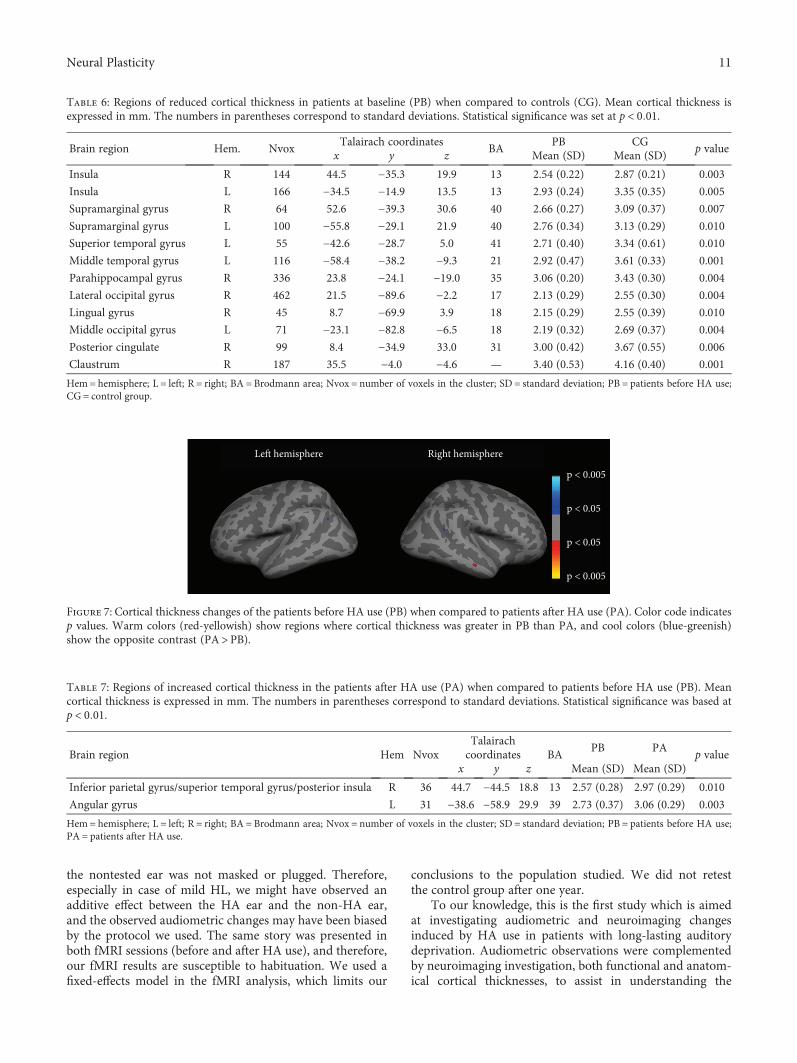
the nontested ear was not masked or plugged. Therefore,especially in case of mild HL, we might have observed anadditive effect between the HA ear and the non-HA ear,and the observed audiometric changes may have been biasedby the protocol we used. The same story was presented inboth fMRI sessions (before and after HA use), and therefore,our fMRI results are susceptible to habituation. We used afixed-effects model in the fMRI analysis, which limits our
conclusions to the population studied. We did not retestthe control group after one year.
To our knowledge, this is the first study which is aimedat investigating audiometric and neuroimaging changesinduced by HA use in patients with long-lasting auditorydeprivation. Audiometric observations were complementedby neuroimaging investigation, both functional and anatom-ical cortical thicknesses, to assist in understanding the
Table 7: Regions of increased cortical thickness in the patients after HA use (PA) when compared to patients before HA use (PB). Meancortical thickness is expressed in mm. The numbers in parentheses correspond to standard deviations. Statistical significance was based atp < 0 01.
Brain region Hem NvoxTalairachcoordinates BA
PB PAp value
x y z Mean (SD) Mean (SD)
Inferior parietal gyrus/superior temporal gyrus/posterior insula R 36 44.7 −44.5 18.8 13 2.57 (0.28) 2.97 (0.29) 0.010
Angular gyrus L 31 −38.6 −58.9 29.9 39 2.73 (0.37) 3.06 (0.29) 0.003
Hem= hemisphere; L = left; R = right; BA = Brodmann area; Nvox = number of voxels in the cluster; SD = standard deviation; PB = patients before HA use;PA = patients after HA use.
Le� hemisphere Right hemisphere
p < 0.005
p < 0.05
p < 0.05
p < 0.005
Figure 7: Cortical thickness changes of the patients before HA use (PB) when compared to patients after HA use (PA). Color code indicatesp values. Warm colors (red-yellowish) show regions where cortical thickness was greater in PB than PA, and cool colors (blue-greenish)show the opposite contrast (PA>PB).
Table 6: Regions of reduced cortical thickness in patients at baseline (PB) when compared to controls (CG). Mean cortical thickness isexpressed in mm. The numbers in parentheses correspond to standard deviations. Statistical significance was set at p < 0 01.
Brain region Hem. NvoxTalairach coordinates
BAPB CG
p valuex y z Mean (SD) Mean (SD)
Insula R 144 44.5 −35.3 19.9 13 2.54 (0.22) 2.87 (0.21) 0.003
Insula L 166 −34.5 −14.9 13.5 13 2.93 (0.24) 3.35 (0.35) 0.005
Supramarginal gyrus R 64 52.6 −39.3 30.6 40 2.66 (0.27) 3.09 (0.37) 0.007
Supramarginal gyrus L 100 −55.8 −29.1 21.9 40 2.76 (0.34) 3.13 (0.29) 0.010
Superior temporal gyrus L 55 −42.6 −28.7 5.0 41 2.71 (0.40) 3.34 (0.61) 0.010
Middle temporal gyrus L 116 −58.4 −38.2 −9.3 21 2.92 (0.47) 3.61 (0.33) 0.001
Parahippocampal gyrus R 336 23.8 −24.1 −19.0 35 3.06 (0.20) 3.43 (0.30) 0.004
Lateral occipital gyrus R 462 21.5 −89.6 −2.2 17 2.13 (0.29) 2.55 (0.30) 0.004
Lingual gyrus R 45 8.7 −69.9 3.9 18 2.15 (0.29) 2.55 (0.39) 0.010
Middle occipital gyrus L 71 −23.1 −82.8 −6.5 18 2.19 (0.32) 2.69 (0.37) 0.004
Posterior cingulate R 99 8.4 −34.9 33.0 31 3.00 (0.42) 3.67 (0.55) 0.006
Claustrum R 187 35.5 −4.0 −4.6 — 3.40 (0.53) 4.16 (0.40) 0.001
Hem= hemisphere; L = left; R = right; BA = Brodmann area; Nvox = number of voxels in the cluster; SD = standard deviation; PB = patients before HA use;CG = control group.
11Neural Plasticity

neurophysiological mechanisms behind hearing rehabilita-tion. Furthermore, the correlation found between individualfMRI and SRT further paves the perspective for the use offunctional neuroimaging as a clinical tool in audiology.
Data Availability
The data used to support the findings of this study are avail-able from the corresponding author upon request.
Conflicts of Interest
The authors declare that there is no conflict of interestregarding the publication of this paper.
Acknowledgments
This work was supported by the São Paulo Research Founda-tion (FAPESP), Brazilian National Council for Scientific andTechnological Development (CNPq), and CAPES, a founda-tion from the Ministry of Education, Brazil. Thanks are dueto Sandra Moroti for MRI scanning, to Dr. Elson Rodriguesfor helping with patient screening and for the diagnosishearing loss type, and to the patients.
Supplementary Materials
Supplementary Figure 1: pure tone audiometry for each fre-quency tested with headphones in the control group. Supple-mentary Figure 2: pure tone audiometry for each frequencytested with headphones for the group of patients before(PB) and after (PA) HA use. Supplementary Figure 3: puretone audiometry for each frequency tested in free field, forpatients before (PB) and after (PA) HA use. SupplementaryFigure 4: fMRI statistical maps of the control group. Supple-mentary Table 1: clinical and audiometric information of thepatients. Supplementary Table 2: individual PTA and SRTwith headphones for the control group (CG). SupplementaryTable 3: individual PTA with headphones for patients before(PB) and after (PA) HA use. Supplementary Table 4: individ-ual SRT with headphones of the group of patients before (PB)and after (PA) HA use. Supplementary Table 5: individualPTA in free field of the group of patients before (PB) andafter (PA) HA use. Supplementary Table 6: individual SRTin free field for patients before (PB) and after (PA) HA use.Supplementary Table 7: statistically significant fMRI responsein the control group. (Supplementary Materials)
References
[1] C. D. Mulrow, M. R. Tuley, and C. Aguilar, “Sustained benefitsof hearing-aids,” Clinical Research, vol. 39, pp. A593–A593,1991.
[2] M. K. Pichora-Fuller and G. Singh, “Effects of age on auditoryand cognitive processing: implications for hearing aid fittingand audiologic rehabilitation,” Trends in Amplification, vol. 10,no. 1, pp. 29–59, 2006.
[3] A. Y. Choi, H. J. Shim, S. H. Lee, S. W. Yoon, and E. J. Joo,“Is cognitive function in adults with hearing impairment
improved by the use of hearing aids?,” Clinical and Experimen-tal Otorhinolaryngology, vol. 4, no. 2, pp. 72–76, 2011.
[4] R. Rajan, D. R. F. Irvine, L. Z. Wise, and P. Heil, “Effect of uni-lateral partial cochlear lesions in adult cats on the representa-tion of lesioned and unlesioned cochleas in primary auditorycortex,” The Journal of Comparative Neurology, vol. 338,no. 1, pp. 17–49, 1993.
[5] M. K. Schwaber, P. E. Garraghty, and J. H. Kaas, “Neuroplasti-city of the adult primate auditory cortex following cochlearhearing loss,” The American Journal of Otology, vol. 14,no. 3, pp. 252–258, 1993.
[6] J. F. Willott, L. M. Aitkin, and S. L. McFadden, “Plasticity ofauditory cortex associated with sensorineural hearing loss inadult C57BL/6J mice,” The Journal of Comparative Neurology,vol. 329, no. 3, pp. 402–411, 1993.
[7] B. Ryals and E. Rubel, “Hair cell regeneration after acoustictrauma in adult Coturnix quail,” Science, vol. 240, no. 4860,pp. 1774–1776, 1988.
[8] Y. Chung, K. E. Hancock, S. I. Nam, and B. Delgutte, “Codingof electric pulse trains presented through cochlear implants inthe auditory midbrain of awake rabbit: comparison with anes-thetized preparations,” The Journal of Neuroscience, vol. 34,no. 1, pp. 218–231, 2014.
[9] J. B. Fallon, D. R. F. Irvine, and R. K. Shepherd, “Cochlearimplant use following neonatal deafness influences thecochleotopic organization of the primary auditory cortex incats,” Journal of Comparative Neurology, vol. 512, no. 1,pp. 101–114, 2009.
[10] E. Amaro, S. C. R. Williams, S. S. Shergill et al., “Acoustic noiseand functional magnetic resonance imaging: current strategiesand future prospects,” Journal of Magnetic Resonance Imaging,vol. 16, no. 5, pp. 497–510, 2002.
[11] D. Bilecen, E. Seifritz, E. W. Radu et al., “Cortical reorganiza-tion after acute unilateral hearing loss traced by fMRI,” Neu-rology, vol. 54, no. 3, pp. 765–767, 2000.
[12] D. S. Lazard, H. J. Lee, E. Truy, and A. L. Giraud, “Bilateralreorganization of posterior temporal cortices in post-lingualdeafness and its relation to cochlear implant outcome,”Human Brain Mapping, vol. 34, no. 5, pp. 1208–1219, 2013.
[13] J. S. Lee, D. S. Lee, S. H. Oh et al., “PET evidence of neuroplas-ticity in adult auditory cortex of postlingual deafness,” TheJournal of Nuclear Medicine, vol. 44, no. 9, pp. 1435–1439,2003.
[14] J. H. Hwang, C. W. Wu, J. H. Chen, and T. C. Liu, “Changes inactivation of the auditory cortex following long-term amplifi-cation: an fMRI study,” Acta Oto-Laryngologica, vol. 126,no. 12, pp. 1275–1280, 2006.
[15] E. Kang, D. S. Lee, H. Kang et al., “Neural changes associatedwith speech learning in deaf children following cochlearimplantation,” NeuroImage, vol. 22, no. 3, pp. 1173–1181,2004.
[16] A. L. Giraud, C. J. Price, J. M. Graham, and R. S. J. Frackowiak,“Functional plasticity of language-related brain areas aftercochlear implantation,” Brain, vol. 124, no. 7, pp. 1307–1316,2001.
[17] J. Rouger, S. Lagleyre, J. F. Démonet, B. Fraysse, O. Deguine,and P. Barone, “Evolution of crossmodal reorganization ofthe voice area in cochlear-implanted deaf patients,” HumanBrain Mapping, vol. 33, no. 8, pp. 1929–1940, 2012.
[18] G. A. Calvert, R. Campbell, and M. J. Brammer, “Evidencefrom functional magnetic resonance imaging of crossmodal
12 Neural Plasticity

binding in the human heteromodal cortex,” Current Biology,vol. 10, no. 11, pp. 649–657, 2000.
[19] K. Strelnikov, J. Rouger, J. F. Demonet et al., “Visual activitypredicts auditory recovery from deafness after adult cochlearimplantation,” Brain, vol. 136, no. 12, pp. 3682–3695, 2013.
[20] Y. T. Zhang, Z. J. Geng, Q. Zhang, W. Li, and J. Zhang, “Audi-tory cortical responses evoked by pure tones in healthy andsensorineural hearing loss subjects: functional MRI and mag-netoencephalography,” Chinese Medical Journal, vol. 119,no. 18, pp. 1548–1554, 2006.
[21] H. Davis and S. R. Silverman, Hearing and Deafness, Holt,Rinehart & Winston of Canada Ltd, 1970.
[22] A. W. Bronkhorst and R. Plomp, “Binaural speech-intelligibility in noise for hearing-impaired listeners,” TheJournal of the Acoustical Society of America, vol. 86, no. 4,pp. 1374–1383, 1989.
[23] D. P. Pascoe, “Frequency responses of hearing aids and theireffects on the speech perception of hearing-impaired subjects,”Annals of Otology, Rhinology & Laryngology, vol. 84, no. 5,Supplement, pp. 5–40, 1975.
[24] D. Araujo, D. B. De Araujo, O. M. Pontes-Neto et al., “Lan-guage and motor fMRI activation in polymicrogyric cortex,”Epilepsia, vol. 47, no. 3, pp. 589–592, 2006.
[25] C. A. Estombelo-Montesco, M. Sturzbecher Jr., A. K. D.Barros, and D. B. de Araujo, “Detection of auditory cortexactivity by fMRI using a dependent component analysis,” inAdvances in Experimental Medicine and Biology, vol. 657,pp. 135–145, Springer, 2010.
[26] B. Fischl, M. I. Sereno, and A. M. Dale, “Cortical surface-basedanalysis: II: inflation, flattening, and a surface-based coordi-nate system,” NeuroImage, vol. 9, no. 2, pp. 195–207, 1999.
[27] M. J. Sturzbecher, W. Tedeschi, B. C. T. Cabella, O. Baffa, U. P.C. Neves, and D. B. de Araujo, “Non-extensive entropy and theextraction of BOLD spatial information in event-relatedfunctional MRI,” Physics in Medicine & Biology, vol. 54,no. 1, pp. 161–174, 2009.
[28] R. M. Hurley, “Onset of auditory deprivation,” Journal of theAmerican Academy of Audiology, vol. 10, no. 10, pp. 529–534, 1999.
[29] B. C. J. Moore, J. I. Alcántara, and J. Marriage, “Comparisonof three procedures for initial fitting of compression hearingaids. I. Experienced users, fitted bilaterally,” British Journalof Audiology, vol. 35, no. 6, pp. 339–353, 2001.
[30] G. H. Saunders and J. M. Kates, “Speech intelligibilityenhancement using hearing-aid array processing,” The Journalof the Acoustical Society of America, vol. 102, no. 3, pp. 1827–1837, 1997.
[31] T. Wittkop and V. Hohmann, “Strategy-selective noise reduc-tion for binaural digital hearing aids,” Speech Communication,vol. 39, no. 1-2, pp. 111–138, 2003.
[32] D. S. Lazard and A. L. Giraud, “Faster phonological processingand right occipito-temporal coupling in deaf adults signal poorcochlear implant outcome,” Nature Communications, vol. 8,article 14872, 2017.
[33] A. Ghazanfar and C. Schroeder, “Is neocortex essentiallymultisensory?,” Trends in Cognitive Sciences, vol. 10, no. 6,pp. 278–285, 2006.
[34] L. B. Merabet and A. Pascual-Leone, “Neural reorganizationfollowing sensory loss: the opportunity of change,” NatureReviews Neuroscience, vol. 11, no. 1, pp. 44–52, 2010.
[35] O. Collignon, G. Vandewalle, P. Voss et al., “Functionalspecialization for auditory–spatial processing in the occipitalcortex of congenitally blind humans,” Proceedings of theNational Academy of Sciences of the United States of America,vol. 108, no. 11, pp. 4435–4440, 2011.
[36] D. Bavelier, M. W. G. Dye, and P. C. Hauser, “Do deaf individ-uals see better?,” Trends in Cognitive Sciences, vol. 10, no. 11,pp. 512–518, 2006.
[37] A. L. Giraud, C. J. Price, J. M. Graham, E. Truy, and R. S. J.Frackowiak, “Cross-modal plasticity underpins languagerecovery after cochlear implantation,” Neuron, vol. 30, no. 3,pp. 657–664, 2001.
[38] A. L. Giraud and E. Truy, “The contribution of visual areas tospeech comprehension: a PET study in cochlear implantspatients and normal-hearing subjects,” Neuropsychologia,vol. 40, no. 9, pp. 1562–1569, 2002.
[39] S. Rosemann and C. M. Thiel, “Audio-visual speech processingin age-related hearing loss: stronger integration and increasedfrontal lobe recruitment,” NeuroImage, vol. 175, pp. 425–437,2018.
[40] N. W. Roach, J. Heron, and P. V. McGraw, “Resolving multi-sensory conflict: a strategy for balancing the costs and benefitsof audio-visual integration,” Proceedings of the Royal Society B:Biological Sciences, vol. 273, no. 1598, pp. 2159–2168, 2006.
[41] D. K. Shibata, “Differences in brain structure in deaf personson MR imaging studied with voxel-based morphometry,”American Journal of Neuroradiology, vol. 28, no. 2, pp. 243–249, 2007.
[42] J. Li, W. Li, J. Xian et al., “Cortical thickness analysis and opti-mized voxel-based morphometry in children and adolescentswith prelingually profound sensorineural hearing loss,” BrainResearch, vol. 1430, pp. 35–42, 2012.
[43] W. Li, J. Li, J. Xian et al., “Alterations of grey matter asymme-tries in adolescents with prelingual deafness: a combined VBMand cortical thickness analysis,” Restorative Neurology andNeuroscience, vol. 31, no. 1, pp. 1–17, 2013.
[44] M. Yang, H. J. Chen, B. Liu et al., “Brain structural and func-tional alterations in patients with unilateral hearing loss,”Hearing Research, vol. 316, pp. 37–43, 2014.
[45] M. P. Harms, L. Wang, J. G. Csernansky, and D. M. Barch,“Structure–function relationship of working memory activitywith hippocampal and prefrontal cortex volumes,” BrainStructure and Function, vol. 218, no. 1, pp. 173–186, 2013.
13Neural Plasticity
Research ArticleRepetitive Transcranial Electrical Stimulation Induces QuantifiedChanges in Resting Cerebral Perfusion Measured from ArterialSpin Labeling
Matthew S. Sherwood ,1,2 Aaron T. Madaris,1,2 Casserly R. Mullenger,1
and R. Andy McKinley3
1Infoscitex, a DCS company, 4027 Colonel Glenn Hwy, Beavercreek, OH 45431, USA2Department of Biomedical, Industrial & Human Factors Engineering, Wright State University, 3640 Colonel Glenn Hwy, Dayton,OH 45435, USA3Air Force Research Laboratory, U.S. Air Force, 2510 Fifth Street, Bldg 840, Wright-Patterson AFB, OH 45433-7951, USA
Correspondence should be addressed to Matthew S. Sherwood; [email protected]
Received 23 March 2018; Revised 23 July 2018; Accepted 8 August 2018; Published 5 September 2018
Academic Editor: Junichi Ushiba
Copyright © 2018 Matthew S. Sherwood et al. This is an open access article distributed under the Creative CommonsAttribution License, which permits unrestricted use, distribution, and reproduction in any medium, provided the originalwork is properly cited.
The use of transcranial electrical stimulation (TES) as a method to augment neural activity has increased in popularity in the lastdecade and a half. The specific application of TES to the left prefrontal cortex has been shown to produce broad cognitive effects;however, the neural mechanisms underlying these effects remain unknown. In this work, we evaluated the effect of repetitive TESon cerebral perfusion. Stimulation was applied to the left prefrontal cortex on three consecutive days, and resting cerebral perfusionwas quantified before and after stimulation using arterial spin labeling. Perfusion was found to decrease significantly more in amatched sham stimulation group than in a group receiving active stimulation across many areas of the brain. These changeswere found to originate in the locus coeruleus and were broadly distributed in the neocortex. The changes in the neocortex maybe a direct result of the stimulation or an indirect result via the changes in the noradrenergic system produced from the alteredactivity of the locus coeruleus. These findings indicate that anodal left prefrontal stimulation alters the activity of the locuscoeruleus, and this altered activity may excite the noradrenergic system producing the broad behavioral effects that havebeen reported.
1. Introduction (AM)
Transcranial electrical stimulation (TES) has experiencedincreased interest over the last 15 years [1]. The applicationof TES using a weak, constant current delivered to the scalpis referred to as transcranial direct current stimulation(tDCS) [2]. This method has been presented by many groupsas a feasible process for stimulation of the brain to augmentneural activity [3–7]. The specific application of tDCS withthe anode placed over the left prefrontal cortex has beenroutinely applied in the literature with demonstrablebehavioral effects in combating performance decrementsassociated with vigilance [8], decreasing the effect of fatigueon cognitive performance [9, 10], accelerating learning
processes [2, 3, 11, 12], enhancing multitasking performance[13], and improving procedural memory [14].
Clark et al. [11] implemented 2mA anodal left prefrontaltDCS while performing a task involving the identification ofthreat-related objects in a naturalistic environment. Usingdynamic Bayesian network analysis, they indicated that theright frontal and parietal cortices were involved in thelearning processes of their identification task. Furthermore,they reported that the group receiving full-current (2mA)tDCS performed significantly better than the one thatreceived low-current (0.1mA) stimulation. McKinley et al.[12] provided support for the findings of Clark and col-leagues using a realistic visual search task implanted withsynthetic aperture radar images. They stated that participants
HindawiNeural PlasticityVolume 2018, Article ID 5769861, 12 pageshttps://doi.org/10.1155/2018/5769861
who received anodal left prefrontal tDCS attained enhancedvisual search accuracies compared to those supplied withsham or no stimulation. Effects of anodal left prefrontal tDCShave also been observed in decreasing the effects of fatigueon cognitive performance. Using a cohort of 30 partici-pants (10 placebo gum, 10 caffeine gum with sham tDCS,and 10 2mA anodal left prefrontal tDCS with placebogum), McIntire et al. [9] performed psychomotor vigilancetasks, delayed matching-to-sample working memory tasks,and the Mackworth clock test throughout 30 hours of con-tinuous wakefulness. They reported improved latencies inworking memory tasks and faster reaction times in psycho-motor tasks in the groups receiving active tDCS and caffeinegum compared to placebo throughout the sleep deprivationperiod. Altogether, these findings provide evidence for thecentral role of the prefrontal cortex in vigilance, acceleratedlearning, fatigue, and multitasking performance but indicatethat tDCS may be utilized to maintain performance levelsin environments requiring little to no rest or settings requiredsustained attentional focus.
Despite the broad applications of tDCS and thosespecific to anodal left prefrontal stimulation, the neuralmechanisms underlying tDCS are not well understood. Ithas been suggested that anodal tDCS increases excitabilityin the neocortex [6] by altering neuronal membrane poten-tials [15]. This theory is supported by findings of enhancedglutamatergic activity following the application of anodaltDCS [2]. Neuroplasticity, the ability of the brain to formand restructure synaptic connections [16], is thought tocoincide with increased glutamatergic activity [2] as evi-denced in the lasting behavioral effects from tDCS (e.g.,[9, 10]) and the acceleration of learning processes [3, 11, 12].However, recent evidence suggests that the neuroplasticeffects of tDCS have some dependence on synaptic activityduring stimulation [7].
A growing method for studying neural processes isthrough the measurement of cerebral perfusion. The in vivoquantification of cerebral perfusion (referred to as cerebralblood flow (CBF) mL/100mg/min) can be performed nonin-vasively using magnetic resonance imaging (MRI) throughan arterial spin labeling (ASL) pulse sequence [17, 18]. ASLis a clinical method that has been used to identify earlypathophysiological changes in Alzheimer’s disease and otherdisorders such as dementia [18, 19]. In comparison to signalsbased on blood oxygen, CBF has better reliability andintersubject variability [20]. Furthermore, CBF is directlyresponsible for the delivery of glucose and oxygen. Both oxy-gen and glucose are necessary to maintain adenosine triphos-phate (ATP) production and need to be replenished tosupport continued neural activity. Although CBF is not adirect measure of neural activity, it is a tightly coupled corre-late: CBF changes with neural activity such as that whichoccurs during task activation or with changing metabolism[21]. Evidence published just this year indicates that thiscoupling is electrical: extracellular K+ activates capillaryendothelial cells which then signal upstream arteriolar dila-tion [22]. The extracellular concentration of K+ increasesduring neural activity, thereby signaling enhanced vasodila-tion and increased blood flow to the supporting capillary bed.
The study of resting CBF in anodal left prefrontal tDCSmay provide critical insights as increased glutamatergicactivity associated with anodal tDCS would manifest asenhanced cerebral perfusion. Few previous studies haveutilized ASL to assess the neural effects of tDCS. In somestudies, anodal tDCS led increased regional CBF in the braintissue underneath the stimulation site, with reliable andreproducible results within and between subjects. Further-more, transfer effects were observed in brain regions func-tionally connected to the stimulation site [7]. Importantly,immediate and lasting changes in CBF have been associatedwith anodal left prefrontal tDCS [23]. The goal of this studyis to enhance our understanding of the underlying neuralmechanisms associated with repetitive anodal tDCS to theleft prefrontal cortex through the study of resting cerebralperfusion. The study consisted of anodal left prefrontal tDCSapplied on three consecutive days with the same proceduresperformed on each day to assess the additive effects of tDCS.In this work, we present preliminary findings of a larger,ongoing study.
2. Materials and Methods
2.1. Participants. A total of 28 healthy, active duty, Air Forcemilitary members recruited from Wright-Patterson AirForce Base volunteered to participate in this study. Partici-pants were excluded from participation if they had anyneurological or psychological diagnoses; vision, hearing, ormotor control impairments; or recent trauma or hospitaliza-tion. Participants were also excluded if they currently tookany medication which may affect cognitive function or if theywere dependent on alcohol, caffeine, or nicotine. Writteninformed consent was obtained from each participant priorto any experimental procedures which were approved bythe Air Force Research Laboratory Institutional ReviewBoard at Wright-Patterson Air Force Base under Protocolnumber FWR20130126H. Participants eligible for compen-sation (i.e., if participation occurred in an off-duty status)received equal remuneration. Of the 28 participantsrecruited, eight were excluded due to medical disqualifica-tion (n = 2), incomplete data or corrupted data (n = 2), orfailure to complete all three sessions in three consecutivedays (n = 4).
Participants were randomly assigned to one of twogroups. Both groups received the same instructions and per-formed the same tasks with the exception of the stimulationthat was received. In the experimental group (ACT, n = 11,mean age= 24.5± 2.6), 2mA stimulation was provided for30 minutes while in the control group (CON, n = 9, meanage =25.9± 3.2) sham stimulation consisting of 2mA stimu-lation for 30 s. Participants in each group were blinded to thevalidity of the simulation (i.e., not aware of the stimulationcondition) and naïve to TES (i.e., first time receiving TES).
All participants completed three experimental sessionson three consecutive days. Each session was separated by 24hours. The sessions were conducted in the evening so as tonot conflict with the working day but also due to the MRIavailability. Participants completed the experimental sessionsin groups of two with staggered start times (see Table 1). Start
2 Neural Plasticity

times were held consistent across the three sessions and werecounterbalanced across groups.
2.2. Transcranial DC Stimulation. On each of the threesessions, anodal stimulation was applied to the left prefrontalcortex (approximately F3) with the cathode placed on thecontralateral bicep. During stimulation, participants com-pleted a 30min laboratory vigilance task [24]. The electricstimulation (MagStim DC Stimulator, Magstim CompanyLimited, Whitland, UK) delivered a constant 2mA througha ring of five customNa/NaCl electrodes. The electrodes werearranged in a 1.6 cm radius circle and separated by 0.1 cm(outer edge to outer edge). The same ring configuration wasused at the cathode location. The 2mA stimulation wasdistributed evenly among the five electrodes. The stimulatoris battery-powered and utilizes multistage current monitor-ing to ensure constant current levels are delivered to theanode. Each electrode was placed in a small “cup” andsecured to the participant using medical bandages. The elec-trode cups were filled with highly conductive gel (SignaGel,Parker Laboratories, Fairfield, NJ) to ensure current transferto the scalp.
2.3. MRI Acquisition. At each session, MRI data was acquiredprior to and approximately 0.5 hours following the applica-tion of tDCS. The MRI acquisition consisted of the followingsequences: a 12min resting-state functional MRI (fMRI),three 10min task fMRIs, T1-weighted MRI, diffusion tensorimaging (DTI), magnetic resonance spectroscopy (MRS),and resting ASL. As this work is part of a larger, ongoingstudy, we will only be presenting the resting ASL data in thiswork. However, it is important to discuss the three taskfMRIs where participants completed a dual (verbal andspatial) n-back task. This task was conducted in a boxcardesign with 48 s control and task blocks, each with 16–3 strials. During each trial, a letter was displayed on a 3× 3 gridfor 500ms. Participants were asked to provide one response ifthe current letter was the same as the nth previous letter thatwas presented and another response if the current letter wasin the same position on a 3× 3 grid as the nth previous letter.For control blocks, the letter was replaced with a dot andparticipants were instructed to provide one response if thedot was on the right side of the grid and another for the left.For the first run, n was set to 2. n for the second run wasdetermined from the performance of the first run (if per-formance was 90 or above, n incremented; if less than70, n decremented; otherwise, n remained the same) andthe third run from the second.
Structural (T1-weighted) images were acquired using a3D brain volume imaging (BRAVO) pulse sequence which
uses an inversion recovery prepared fast spoiled gradientecho (FSPGR). The structural images were acquired usinga 256× 256 element matrix, 172 slices oriented to the ante-rior commissure- (AC-) posterior commissure (PC) plane,1mm3 isotropic voxels, 0.8 phase field of view factor,inversion time (TI) = 450ms, TE=3.224ms, a flip angleof 13°, and an autocalibrated reconstruction for Cartesiansampling with a phase acceleration factor of 1.0 for thefirst session and 2.0 for all remaining sessions. All MRIprocedures were conducted on a 3 Tesla (T) MRI (Discovery750w, GE Healthcare, Madison, WI) using a 24-channelhead coil.
Images of cerebral perfusion were acquired approxi-mately 20 minutes prior to the application of tDCS andapproximately 1.5 hours after the conclusion of stimulationusing a pseudocontinuous arterial spin labeling (pcASL)technique [25] with inversion (tagging) pulses administeredimmediately inferior to the imaging volume. All images wereacquired true axial (oriented perpendicular to the scannerbore) using a postlabel delay time (PLD) of 2025ms. Fivebackground suppression pulses were applied to reduce thesignal of stationary tissues [26–28] and improve signal-to-noise ratio (SNR) of arterial blood. A 3D fast spin echo (3DFSE) sequence was used for acquisition of the imagingvolume. To reduce motion sensitivity, improve acquisitiontime, and minimize susceptibility artifacts, a stack-of-spiralsreadout gradient starting at the center of the k-space wasused [29]. A total of 8 spiral arms were used for k-spacesampling. Echoes were rebinned to Cartesian space in a128× 128 matrix, with TR=4640ms, TE=10.7ms, voxelsize = 1.875× 1.875mm, slice thickness = 4mm, and flipangle = 111°. The sequence acquired a total of 3 tag/controlpairs. The total acquisition time was 4min 46 s. During thescan, participants were instructed to remain awake and focuson a fixation dot presented on the display. This condition hasdemonstrated significantly greater reliability in resting-statefunctional MRI across all within-network connections, aswell as within default-mode, attention, and auditory net-works when compared to eyes open (no specified fixation)and closed methods [30].
2.4. Data Processing and Analysis. Cerebral perfusion wasquantified from ASL. CBF maps were computed fromthe automated functions in the GE reconstruction soft-ware. First, the 3 tagged and 3 control volumes wereaveraged in place (without motion correction). Then, dif-ference images were calculated for all participants by sub-tracting the average tagged volume from the averagecontrol volume. Finally, quantitative CBF maps were gen-erated from the difference images, the associated proton
Table 1: Starting times for the experimental procedures. Participants completed the three sessions in groups of two with staggered start times.
ProcedureParticipant 1 Participant 2
Local start time ASL scan time Local end time Local start time ASL scan time Local end time
Prestimulation MRI 5:00 pm 6:10 pm 6:15 pm 6:15 pm 7:25 pm 7:30 pm
Transcranial DC stimulation 6:30 pm n/a 7:00 pm 7:55 pm n/a 8:25 pm
Poststimulation MRI 7:30 pm 8:40 pm 8:45 pm 8:45 pm 9:55 pm 10:00 pm
3Neural Plasticity

density- (PD-) weighted volumes, and a standard singlecompartment model [31–33].
The CBF maps from each day and session were exportedfrom the MRI scanner and processed using the FMRIB Soft-ware Library (FSL) [34, 35] on a 74-core Rocks Cluster Dis-tribution (http://www.rocksclusters.org) high-performance
computing system capable of running 120 threads in parallel(see Figure 1, e.g., CBF maps). First, the PD-weighted imagesacquired were registered to the individual’s high-resolutionstructural image by estimating motion from a boundary-based registration method which includes a fieldmap-baseddistortion correction [36]. Then, the individual’s high-
L
(a)
L
(b)
L
(c)
L
(d)
Figure 1: Raw CBF maps for (a) day 1 prestimulation and (b) day 3 poststimulation from a single CON participant and (c) day 1prestimulation and (d) day 3 poststimulation from a single ACT participant.
4 Neural Plasticity
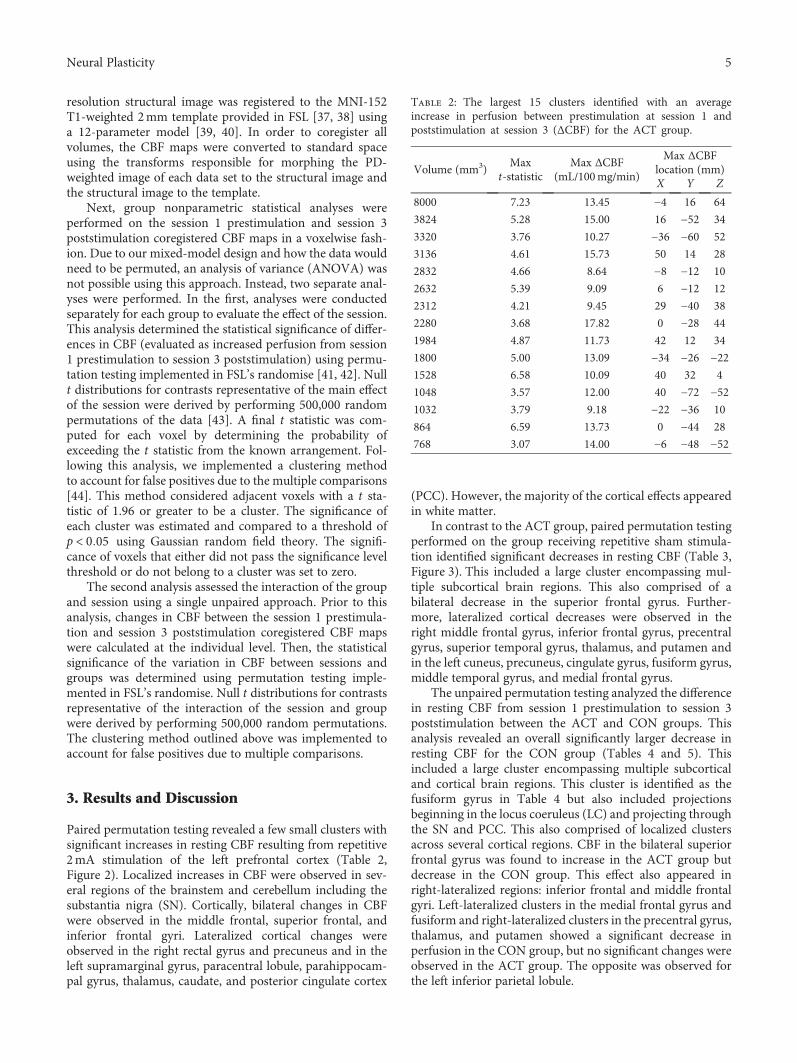
resolution structural image was registered to the MNI-152T1-weighted 2mm template provided in FSL [37, 38] usinga 12-parameter model [39, 40]. In order to coregister allvolumes, the CBF maps were converted to standard spaceusing the transforms responsible for morphing the PD-weighted image of each data set to the structural image andthe structural image to the template.
Next, group nonparametric statistical analyses wereperformed on the session 1 prestimulation and session 3poststimulation coregistered CBF maps in a voxelwise fash-ion. Due to our mixed-model design and how the data wouldneed to be permuted, an analysis of variance (ANOVA) wasnot possible using this approach. Instead, two separate anal-yses were performed. In the first, analyses were conductedseparately for each group to evaluate the effect of the session.This analysis determined the statistical significance of differ-ences in CBF (evaluated as increased perfusion from session1 prestimulation to session 3 poststimulation) using permu-tation testing implemented in FSL’s randomise [41, 42]. Nullt distributions for contrasts representative of the main effectof the session were derived by performing 500,000 randompermutations of the data [43]. A final t statistic was com-puted for each voxel by determining the probability ofexceeding the t statistic from the known arrangement. Fol-lowing this analysis, we implemented a clustering methodto account for false positives due to the multiple comparisons[44]. This method considered adjacent voxels with a t sta-tistic of 1.96 or greater to be a cluster. The significance ofeach cluster was estimated and compared to a threshold ofp < 0 05 using Gaussian random field theory. The signifi-cance of voxels that either did not pass the significance levelthreshold or do not belong to a cluster was set to zero.
The second analysis assessed the interaction of the groupand session using a single unpaired approach. Prior to thisanalysis, changes in CBF between the session 1 prestimula-tion and session 3 poststimulation coregistered CBF mapswere calculated at the individual level. Then, the statisticalsignificance of the variation in CBF between sessions andgroups was determined using permutation testing imple-mented in FSL’s randomise. Null t distributions for contrastsrepresentative of the interaction of the session and groupwere derived by performing 500,000 random permutations.The clustering method outlined above was implemented toaccount for false positives due to multiple comparisons.
3. Results and Discussion
Paired permutation testing revealed a few small clusters withsignificant increases in resting CBF resulting from repetitive2mA stimulation of the left prefrontal cortex (Table 2,Figure 2). Localized increases in CBF were observed in sev-eral regions of the brainstem and cerebellum including thesubstantia nigra (SN). Cortically, bilateral changes in CBFwere observed in the middle frontal, superior frontal, andinferior frontal gyri. Lateralized cortical changes wereobserved in the right rectal gyrus and precuneus and in theleft supramarginal gyrus, paracentral lobule, parahippocam-pal gyrus, thalamus, caudate, and posterior cingulate cortex
(PCC). However, the majority of the cortical effects appearedin white matter.
In contrast to the ACT group, paired permutation testingperformed on the group receiving repetitive sham stimula-tion identified significant decreases in resting CBF (Table 3,Figure 3). This included a large cluster encompassing mul-tiple subcortical brain regions. This also comprised of abilateral decrease in the superior frontal gyrus. Further-more, lateralized cortical decreases were observed in theright middle frontal gyrus, inferior frontal gyrus, precentralgyrus, superior temporal gyrus, thalamus, and putamen andin the left cuneus, precuneus, cingulate gyrus, fusiform gyrus,middle temporal gyrus, and medial frontal gyrus.
The unpaired permutation testing analyzed the differencein resting CBF from session 1 prestimulation to session 3poststimulation between the ACT and CON groups. Thisanalysis revealed an overall significantly larger decrease inresting CBF for the CON group (Tables 4 and 5). Thisincluded a large cluster encompassing multiple subcorticaland cortical brain regions. This cluster is identified as thefusiform gyrus in Table 4 but also included projectionsbeginning in the locus coeruleus (LC) and projecting throughthe SN and PCC. This also comprised of localized clustersacross several cortical regions. CBF in the bilateral superiorfrontal gyrus was found to increase in the ACT group butdecrease in the CON group. This effect also appeared inright-lateralized regions: inferior frontal and middle frontalgyri. Left-lateralized clusters in the medial frontal gyrus andfusiform and right-lateralized clusters in the precentral gyrus,thalamus, and putamen showed a significant decrease inperfusion in the CON group, but no significant changes wereobserved in the ACT group. The opposite was observed forthe left inferior parietal lobule.
Table 2: The largest 15 clusters identified with an averageincrease in perfusion between prestimulation at session 1 andpoststimulation at session 3 (ΔCBF) for the ACT group.
Volume (mm3)Max
t-statisticMax ΔCBF
(mL/100mg/min)
Max ΔCBFlocation (mm)X Y Z
8000 7.23 13.45 −4 16 64
3824 5.28 15.00 16 −52 34
3320 3.76 10.27 −36 −60 52
3136 4.61 15.73 50 14 28
2832 4.66 8.64 −8 −12 10
2632 5.39 9.09 6 −12 12
2312 4.21 9.45 29 −40 38
2280 3.68 17.82 0 −28 44
1984 4.87 11.73 42 12 34
1800 5.00 13.09 −34 −26 −221528 6.58 10.09 40 32 4
1048 3.57 12.00 40 −72 −521032 3.79 9.18 −22 −36 10
864 6.59 13.73 0 −44 28
768 3.07 14.00 −6 −48 −52
5Neural Plasticity
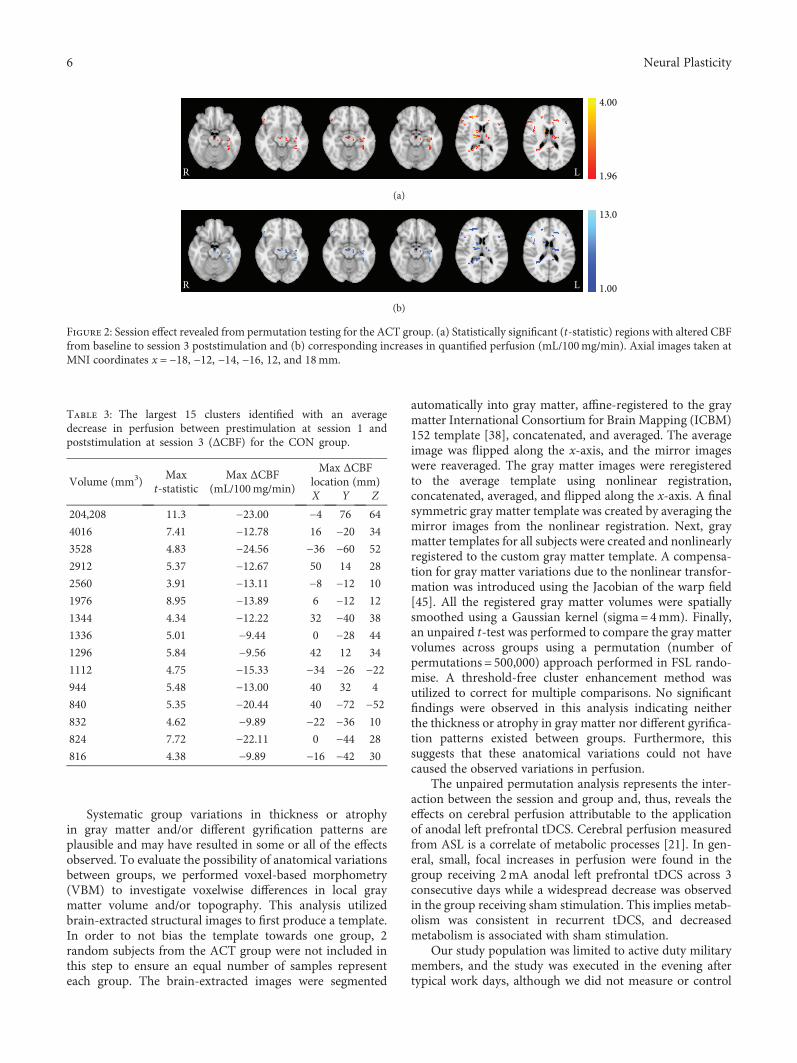
Systematic group variations in thickness or atrophyin gray matter and/or different gyrification patterns areplausible and may have resulted in some or all of the effectsobserved. To evaluate the possibility of anatomical variationsbetween groups, we performed voxel-based morphometry(VBM) to investigate voxelwise differences in local graymatter volume and/or topography. This analysis utilizedbrain-extracted structural images to first produce a template.In order to not bias the template towards one group, 2random subjects from the ACT group were not included inthis step to ensure an equal number of samples representeach group. The brain-extracted images were segmented
automatically into gray matter, affine-registered to the graymatter International Consortium for Brain Mapping (ICBM)152 template [38], concatenated, and averaged. The averageimage was flipped along the x-axis, and the mirror imageswere reaveraged. The gray matter images were reregisteredto the average template using nonlinear registration,concatenated, averaged, and flipped along the x-axis. A finalsymmetric gray matter template was created by averaging themirror images from the nonlinear registration. Next, graymatter templates for all subjects were created and nonlinearlyregistered to the custom gray matter template. A compensa-tion for gray matter variations due to the nonlinear transfor-mation was introduced using the Jacobian of the warp field[45]. All the registered gray matter volumes were spatiallysmoothed using a Gaussian kernel (sigma=4mm). Finally,an unpaired t-test was performed to compare the gray mattervolumes across groups using a permutation (number ofpermutations = 500,000) approach performed in FSL rando-mise. A threshold-free cluster enhancement method wasutilized to correct for multiple comparisons. No significantfindings were observed in this analysis indicating neitherthe thickness or atrophy in gray matter nor different gyrifica-tion patterns existed between groups. Furthermore, thissuggests that these anatomical variations could not havecaused the observed variations in perfusion.
The unpaired permutation analysis represents the inter-action between the session and group and, thus, reveals theeffects on cerebral perfusion attributable to the applicationof anodal left prefrontal tDCS. Cerebral perfusion measuredfrom ASL is a correlate of metabolic processes [21]. In gen-eral, small, focal increases in perfusion were found in thegroup receiving 2mA anodal left prefrontal tDCS across 3consecutive days while a widespread decrease was observedin the group receiving sham stimulation. This implies metab-olism was consistent in recurrent tDCS, and decreasedmetabolism is associated with sham stimulation.
Our study population was limited to active duty militarymembers, and the study was executed in the evening aftertypical work days, although we did not measure or control
4.00
1.96LR
(a)
13.0
1.00LR
(b)
Figure 2: Session effect revealed from permutation testing for the ACT group. (a) Statistically significant (t-statistic) regions with altered CBFfrom baseline to session 3 poststimulation and (b) corresponding increases in quantified perfusion (mL/100mg/min). Axial images taken atMNI coordinates x = −18, −12, −14, −16, 12, and 18mm.
Table 3: The largest 15 clusters identified with an averagedecrease in perfusion between prestimulation at session 1 andpoststimulation at session 3 (ΔCBF) for the CON group.
Volume (mm3)Max
t-statisticMax ΔCBF
(mL/100mg/min)
Max ΔCBFlocation (mm)X Y Z
204,208 11.3 −23.00 −4 76 64
4016 7.41 −12.78 16 −20 34
3528 4.83 −24.56 −36 −60 52
2912 5.37 −12.67 50 14 28
2560 3.91 −13.11 −8 −12 10
1976 8.95 −13.89 6 −12 12
1344 4.34 −12.22 32 −40 38
1336 5.01 −9.44 0 −28 44
1296 5.84 −9.56 42 12 34
1112 4.75 −15.33 −34 −26 −22944 5.48 −13.00 40 32 4
840 5.35 −20.44 40 −72 −52832 4.62 −9.89 −22 −36 10
824 7.72 −22.11 0 −44 28
816 4.38 −9.89 −16 −42 30
6 Neural Plasticity
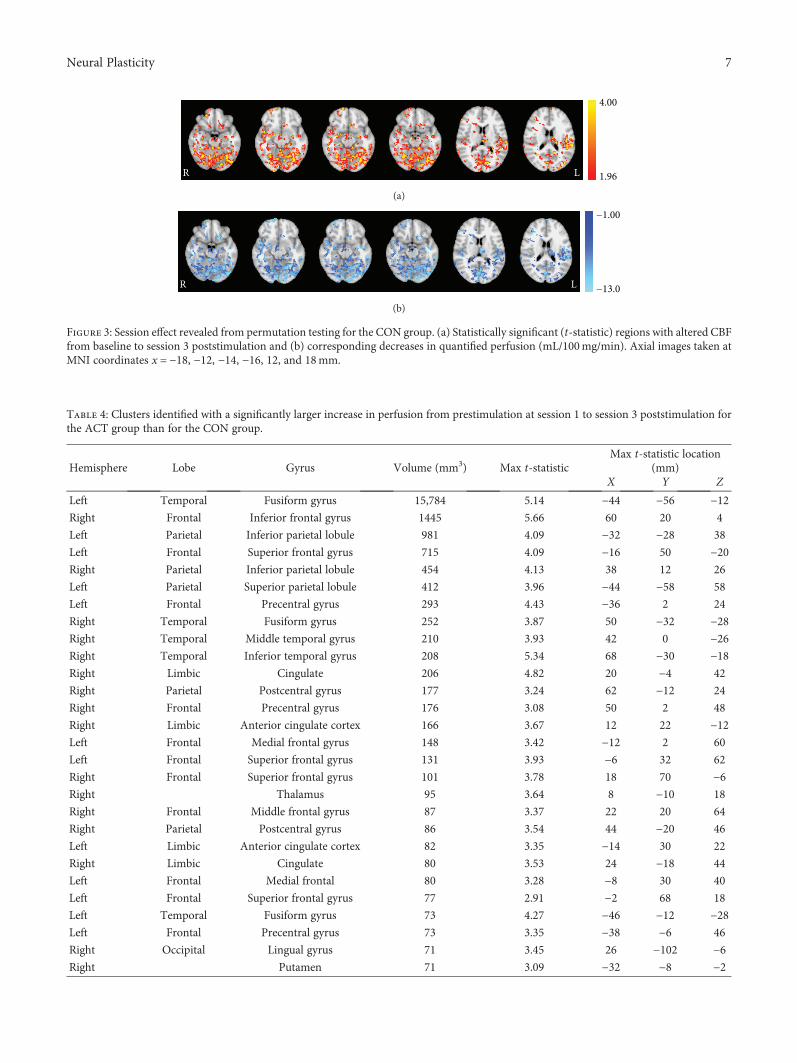
4.00
1.96LR
(a)
−1.00
−13.0LR
(b)
Figure 3: Session effect revealed from permutation testing for the CON group. (a) Statistically significant (t-statistic) regions with altered CBFfrom baseline to session 3 poststimulation and (b) corresponding decreases in quantified perfusion (mL/100mg/min). Axial images taken atMNI coordinates x = −18, −12, −14, −16, 12, and 18mm.
Table 4: Clusters identified with a significantly larger increase in perfusion from prestimulation at session 1 to session 3 poststimulation forthe ACT group than for the CON group.
Hemisphere Lobe Gyrus Volume (mm3) Max t-statisticMax t-statistic location
(mm)X Y Z
Left Temporal Fusiform gyrus 15,784 5.14 −44 −56 −12Right Frontal Inferior frontal gyrus 1445 5.66 60 20 4
Left Parietal Inferior parietal lobule 981 4.09 −32 −28 38
Left Frontal Superior frontal gyrus 715 4.09 −16 50 −20Right Parietal Inferior parietal lobule 454 4.13 38 12 26
Left Parietal Superior parietal lobule 412 3.96 −44 −58 58
Left Frontal Precentral gyrus 293 4.43 −36 2 24
Right Temporal Fusiform gyrus 252 3.87 50 −32 −28Right Temporal Middle temporal gyrus 210 3.93 42 0 −26Right Temporal Inferior temporal gyrus 208 5.34 68 −30 −18Right Limbic Cingulate 206 4.82 20 −4 42
Right Parietal Postcentral gyrus 177 3.24 62 −12 24
Right Frontal Precentral gyrus 176 3.08 50 2 48
Right Limbic Anterior cingulate cortex 166 3.67 12 22 −12Left Frontal Medial frontal gyrus 148 3.42 −12 2 60
Left Frontal Superior frontal gyrus 131 3.93 −6 32 62
Right Frontal Superior frontal gyrus 101 3.78 18 70 −6Right Thalamus 95 3.64 8 −10 18
Right Frontal Middle frontal gyrus 87 3.37 22 20 64
Right Parietal Postcentral gyrus 86 3.54 44 −20 46
Left Limbic Anterior cingulate cortex 82 3.35 −14 30 22
Right Limbic Cingulate 80 3.53 24 −18 44
Left Frontal Medial frontal 80 3.28 −8 30 40
Left Frontal Superior frontal gyrus 77 2.91 −2 68 18
Left Temporal Fusiform gyrus 73 4.27 −46 −12 −28Left Frontal Precentral gyrus 73 3.35 −38 −6 46
Right Occipital Lingual gyrus 71 3.45 26 −102 −6Right Putamen 71 3.09 −32 −8 −2
7Neural Plasticity

sleep/wake times. After three consecutive days of studyparticipation as outlined in Table 1, it is only reasonable thatthe participants would be experiencing symptoms of fatigue.Hypoperfusion measured from ASL has been observed anddetailed in patients with chronic fatigue syndrome [46–48]and associated with cognitive fatigue in healthy individuals[49]. Furthermore, hypometabolism has been observed inpatients with chronic fatigue syndrome [50] and multiplesclerosis with fatigue [51]. The results from our CON groupare consistent with this postulation and these previous find-ings; however, the findings from our ACT group are not.We theorize that left prefrontal tDCS provides some neuralmechanism that counteracts this neural effect of fatigue.Behaviorally, left prefrontal tDCS has been shown to reducethe cognitive decline associated with fatigue in a similargroup of active duty military members in an extended wake-fulness study [9]. Anodal tDCS applied to the motor cortexhas also been shown to have behavioral effects from fatiguein patients with multiple sclerosis [52]. However, there are
no studies to date that have evaluated the neural effects oftDCS on fatigue.
The altered perfusion observed in this work can betraced to the LC. The LC is well known as the largest nor-adrenergic nucleus in the brain. The noradrenergic systemis responsible for the synthesis, storage, and release of nor-epinephrine. Although the LC is relatively small, it is theprimary source of norepinephrine for the neocortex. Pro-jections from the LC are diverse, innervating most of thecentral nervous system [53]. Norepinephrine is a neuro-transmitter associated with increased arousal and alertness[46–48], enhances long-term and working memory pro-cesses [54], and promotes vigilance and sensory processing[55]. The evidence presented in this work suggests thatrepetitive 2mA tDCS applied to the left prefrontal cortexsustains the metabolic activity of the LC (Figure 4) whichmay result in an increased production of norepinephrineand a decreased effect of fatigue. In this work, measure-ments of resting perfusion were collected approximately
Table 5: Average CBF (±SEM) for each session/group from the clusters identified with a significantly larger increase in perfusion fromprestimulation at session 1 to session 3 poststimulation for the ACT group than for the CON group.
ClusterACT CON
Day 1 prestimulationCBF (mg/100mL/min)
Day 3 poststimulationCBF (mg/100mL/min)
Day 1 prestimulationCBF (mg/100mL/min)
Day 3 poststimulationCBF (mg/100mL/min)
L. fusiform gyr. 46.05 ± 1.67 49.12 ± 2.72 54.32 ± 2.95 44.92 ± 3.11
R. inf. front. gyr. 45.66 ± 1.74 51.35 ± 2.66 55.39 ± 2.14 48.77 ± 1.80
L. inf. par. lob. 41.91 ± 2.33 46.66 ± 2.85 53.84 ± 2.97 48.20 ± 2.31
L. sup. front. gyr. 43.85 ± 1.66 49.38 ± 2.28 54.18 ± 3.77 45.59 ± 2.08
R. inf. par. lob. 54.02 ± 2.71 60.72 ± 3.61 62.01 ± 2.61 56.53 ± 2.17
L. sup. par. lob. 46.36 ± 2.06 51.62 ± 2.46 57.50 ± 3.72 51.70 ± 2.37
L. precentral gyr. 47.67 ± 2.56 54.85 ± 3.32 60.10 ± 3.59 53.57 ± 2.24
R. fusiform gyr. 45.13 ± 1.75 49.94 ± 2.78 54.71 ± 2.83 47.77 ± 2.10
R. mid. temp. gyr. 35.97 ± 1.72 38.91 ± 2.66 44.12 ± 3.19 36.85 ± 2.29
R. inf. temp. gyr. 54.20 ± 2.66 60.18 ± 3.50 67.23 ± 3.00 59.48 ± 3.20
R. cingulate 26.44 ± 1.62 29.40 ± 1.67 31.46 ± 1.57 26.75 ± 1.24
R. postcentral gyr. 55.16 ± 2.92 58.52 ± 3.74 66.35 ± 2.57 58.83 ± 3.34
R. precentral gyr. 50.97 ± 2.50 55.60 ± 3.57 59.40 ± 2.75 52.78 ± 2.22
R. ant. cing. cort. 43.86 ± 2.98 47.93 ± 3.31 50.55 ± 1.89 43.44 ± 2.40
L. med. front. gyr. 38.35 ± 2.21 44.37 ± 2.64 50.01 ± 2.87 44.60 ± 1.31
L. sup. front. gyr. 45.39 ± 2.39 51.99 ± 1.73 58.87 ± 3.47 52.62 ± 2.46
R. sup. front. gyr. 55.52 ± 1.68 61.90 ± 3.42 70.82 ± 5.29 59.93 ± 2.77
R. thalamus 37.73 ± 2.26 43.27 ± 2.47 42.38 ± 1.91 39.36 ± 2.03
R. mid. front. gyr. 47.86 ± 3.26 54.08 ± 3.30 60.84 ± 2.89 52.83 ± 2.26
R. postcentral gyr. 44.32 ± 1.83 49.13 ± 2.65 51.83 ± 3.68 45.45 ± 3.21
L. ant. cing. cort. 26.56 ± 1.71 31.58 ± 1.28 38.40 ± 4.57 31.94 ± 1.78
R. cingulate 45.18 ± 3.25 49.41 ± 3.54 54.01 ± 2.76 46.79 ± 1.87
L. med. front. gyr. 21.89 ± 1.24 26.22 ± 1.71 27.54 ± 1.55 24.80 ± 1.47
L. sup. front. gyr. 48.97 ± 1.86 54.11 ± 4.37 60.99 ± 5.80 51.25 ± 3.37
L. fusiform gyr. 43.57 ± 2.65 49.91 ± 3.64 58.01 ± 2.42 52.00 ± 2.71
L. precentral gyr. 37.09 ± 1.91 40.43 ± 2.50 47.73 ± 3.50 39.29 ± 2.63
R. lingual gyr. 39.00 ± 1.94 41.87 ± 1.60 46.74 ± 3.45 40.15 ± 2.49
R. putamen 47.96 ± 3.36 48.57 ± 2.53 56.82 ± 4.07 46.27 ± 3.81
8 Neural Plasticity

1.5 hrs following the conclusion of stimulation. Therefore,this effect remains following stimulation; however, it isnot known how long this effect persists. Previous sleepdeprivation studies utilizing anodal left prefrontal tDCSobserved single-session behavioral effects that persistedfor many hours [9, 10]. Effects such as this and thecurrent findings could be derived from activation of thenoradrenergic system.
Attention involves both top-down and bottom-up modu-lation. In bottom-up modulation, salient stimuli captureattention involuntarily while top-down modulation candirect attention as well as inhibit bottom-up processes. Theability to voluntarily direct attention (i.e., attentional control)varies significantly and substantially across individuals [56].Top-downmodulation of attention involves a variety of brainregions including the middle frontal gyrus, ACC, andsuperior parietal lobule. Each of these regions were foundto have enhanced perfusion following repetitive 2mA anodaltDCS to the left prefrontal cortex (Figure 5), suggestive ofincreased attentional control.
Objects can be classified based upon the observation ofphysical properties such as shape, color, and texture. Seman-tic memory, general knowledge that has accumulatedthrough life, can aid the classification process. The fusiformgyrus is theorized to largely contribute to processes involvingsemantic memory [57]. The large increase in perfusion in theoccipital cortex, including the fusiform gyrus (Figure 6), issuggestive of enhanced utilization of semantic processes,increased semantic memory, and/or a heightened ability torecognize objects.
4. Conclusions
This study examined the effect of repetitive tDCS on cerebralperfusion. Anodal left prefrontal tDCS was used to apply2mA to the scalp for 30 minutes on three consecutive days.Measures of resting cerebral perfusion were acquired beforeand after stimulation on each day using ASL. Widespreadincreases in perfusion, indicative of increased metabolism,were observed; however, general decreases were observed ina matched group receiving sham tDCS. Furthermore,
perfusion increased significantly more in the active stimula-tion group across many areas of the brain. These increasesoriginated in the LC and spread extensively to regions inthe neocortex supporting functions such as object recogni-tion and top-down attentional modulation. The changes inthe neocortex may be a direct result of the stimulation oran indirect result via the changes in the noradrenergic systemproduced from the altered LC activity. These findings helpunderstand the broad behavioral effects that have beendemonstrated using anodal left prefrontal tDCS. Future workis necessary to identify if the observed changes in perfusioncorrelate with altered metabolism but should also addressthe transiency of these effects.
4.00
1.96R L
Figure 4: Session/group interaction effects (t-statistic) in the locus coeruleus revealed from permutation testing. The ACT group hadsignificantly larger perfusion increases in the locus coeruleus from baseline to session 3 poststimulation compared to the CONgroup. The axial (left), sagittal (middle), and coronal (right) images were taken from MNI coordinates z = −40 mm, y = −36 mm,and x = 0 mm, respectively.
4.00
1.96LR LRR LR
Figure 5: Session/group interaction effects (t-statistic) in the top-down attentional control network revealed from permutationtesting. The ACT group had significantly larger perfusionincreases in the right middle frontal gyrus, bilateral ACC, and leftsuperior lobule from baseline to session 3 poststimulationcompared to the CON group. The axial (left) images were takenfrom MNI coordinates z = −14 (top) and 56 (bottom) mm, sagittal(middle) images were taken from y = −58 (top) and 22 (bottom)mm, and coronal (right) images were taken from x = 35 (top),47 (center), and 61 (bottom) mm.
9Neural Plasticity
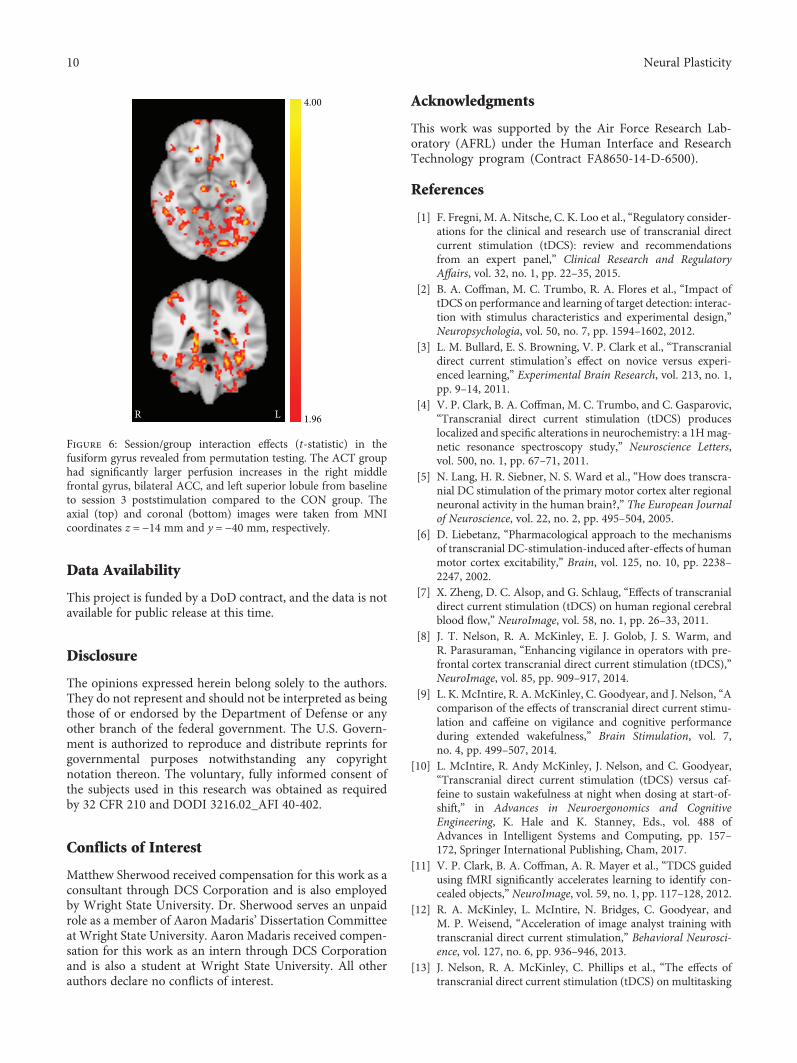
Data Availability
This project is funded by a DoD contract, and the data is notavailable for public release at this time.
Disclosure
The opinions expressed herein belong solely to the authors.They do not represent and should not be interpreted as beingthose of or endorsed by the Department of Defense or anyother branch of the federal government. The U.S. Govern-ment is authorized to reproduce and distribute reprints forgovernmental purposes notwithstanding any copyrightnotation thereon. The voluntary, fully informed consent ofthe subjects used in this research was obtained as requiredby 32 CFR 210 and DODI 3216.02_AFI 40-402.
Conflicts of Interest
Matthew Sherwood received compensation for this work as aconsultant through DCS Corporation and is also employedby Wright State University. Dr. Sherwood serves an unpaidrole as a member of Aaron Madaris’ Dissertation Committeeat Wright State University. Aaron Madaris received compen-sation for this work as an intern through DCS Corporationand is also a student at Wright State University. All otherauthors declare no conflicts of interest.
Acknowledgments
This work was supported by the Air Force Research Lab-oratory (AFRL) under the Human Interface and ResearchTechnology program (Contract FA8650-14-D-6500).
References
[1] F. Fregni, M. A. Nitsche, C. K. Loo et al., “Regulatory consider-ations for the clinical and research use of transcranial directcurrent stimulation (tDCS): review and recommendationsfrom an expert panel,” Clinical Research and RegulatoryAffairs, vol. 32, no. 1, pp. 22–35, 2015.
[2] B. A. Coffman, M. C. Trumbo, R. A. Flores et al., “Impact oftDCS on performance and learning of target detection: interac-tion with stimulus characteristics and experimental design,”Neuropsychologia, vol. 50, no. 7, pp. 1594–1602, 2012.
[3] L. M. Bullard, E. S. Browning, V. P. Clark et al., “Transcranialdirect current stimulation’s effect on novice versus experi-enced learning,” Experimental Brain Research, vol. 213, no. 1,pp. 9–14, 2011.
[4] V. P. Clark, B. A. Coffman, M. C. Trumbo, and C. Gasparovic,“Transcranial direct current stimulation (tDCS) produceslocalized and specific alterations in neurochemistry: a 1Hmag-netic resonance spectroscopy study,” Neuroscience Letters,vol. 500, no. 1, pp. 67–71, 2011.
[5] N. Lang, H. R. Siebner, N. S. Ward et al., “How does transcra-nial DC stimulation of the primary motor cortex alter regionalneuronal activity in the human brain?,” The European Journalof Neuroscience, vol. 22, no. 2, pp. 495–504, 2005.
[6] D. Liebetanz, “Pharmacological approach to the mechanismsof transcranial DC-stimulation-induced after-effects of humanmotor cortex excitability,” Brain, vol. 125, no. 10, pp. 2238–2247, 2002.
[7] X. Zheng, D. C. Alsop, and G. Schlaug, “Effects of transcranialdirect current stimulation (tDCS) on human regional cerebralblood flow,” NeuroImage, vol. 58, no. 1, pp. 26–33, 2011.
[8] J. T. Nelson, R. A. McKinley, E. J. Golob, J. S. Warm, andR. Parasuraman, “Enhancing vigilance in operators with pre-frontal cortex transcranial direct current stimulation (tDCS),”NeuroImage, vol. 85, pp. 909–917, 2014.
[9] L. K. McIntire, R. A. McKinley, C. Goodyear, and J. Nelson, “Acomparison of the effects of transcranial direct current stimu-lation and caffeine on vigilance and cognitive performanceduring extended wakefulness,” Brain Stimulation, vol. 7,no. 4, pp. 499–507, 2014.
[10] L. McIntire, R. Andy McKinley, J. Nelson, and C. Goodyear,“Transcranial direct current stimulation (tDCS) versus caf-feine to sustain wakefulness at night when dosing at start-of-shift,” in Advances in Neuroergonomics and CognitiveEngineering, K. Hale and K. Stanney, Eds., vol. 488 ofAdvances in Intelligent Systems and Computing, pp. 157–172, Springer International Publishing, Cham, 2017.
[11] V. P. Clark, B. A. Coffman, A. R. Mayer et al., “TDCS guidedusing fMRI significantly accelerates learning to identify con-cealed objects,” NeuroImage, vol. 59, no. 1, pp. 117–128, 2012.
[12] R. A. McKinley, L. McIntire, N. Bridges, C. Goodyear, andM. P. Weisend, “Acceleration of image analyst training withtranscranial direct current stimulation,” Behavioral Neurosci-ence, vol. 127, no. 6, pp. 936–946, 2013.
[13] J. Nelson, R. A. McKinley, C. Phillips et al., “The effects oftranscranial direct current stimulation (tDCS) on multitasking
4.00
1.96LR
Figure 6: Session/group interaction effects (t-statistic) in thefusiform gyrus revealed from permutation testing. The ACT grouphad significantly larger perfusion increases in the right middlefrontal gyrus, bilateral ACC, and left superior lobule from baselineto session 3 poststimulation compared to the CON group. Theaxial (top) and coronal (bottom) images were taken from MNIcoordinates z = −14 mm and y = −40 mm, respectively.
10 Neural Plasticity
throughput capacity,” Frontiers in Human Neuroscience,vol. 10, p. 589, 2016.
[14] R. Andy McKinley, L. McIntire, J. Nelson, J. Nelson, andC. Goodyear, “The effects of transcranial direct current stimu-lation (tDCS) on training during a complex procedural task,”in Advances in Neuroergonomics and Cognitive Engineering,K. Hale and K. Stanney, Eds., vol. 488 of Advances in Intelli-gent Systems and Computing, Springer, Cham, 2017.
[15] L. J. Bindman, O. C. J. Lippold, and J. W. T. Redfearn,“Long-lasting changes in the level of the electrical activityof the cerebral cortex produced by polarizing currents,”Nature, vol. 196, no. 4854, pp. 584-585, 1962.
[16] C. Pittenger and R. S. Duman, “Stress, depression, and neuro-plasticity: a convergence of mechanisms,” Neuropsychophar-macology, vol. 33, no. 1, pp. 88–109, 2008.
[17] D. S. Williams, D. J. Grandis, W. Zhang, and A. P.Koretsky, “Magnetic resonance imaging of perfusion inthe isolated rat heart using spin inversion of arterialwater,” Magnetic Resonance in Medicine, vol. 30, no. 3,pp. 361–365, 1993.
[18] G. Xu, H. A. Rowley, G. Wu et al., “Reliability and precision ofpseudo-continuous arterial spin labeling perfusion MRI on 3.0T and comparison with 15O-water PET in elderly subjects atrisk for Alzheimer’s disease,” NMR in Biomedicine, vol. 23,no. 3, pp. n/a–293, 2010.
[19] M. Grade, J. A. Hernandez Tamames, F. B. Pizzini, E. Achten,X. Golay, and M. Smits, “A neuroradiologist’s guide to arterialspin labeling MRI in clinical practice,” Neuroradiology, vol. 57,no. 12, pp. 1181–1202, 2015.
[20] M. J. Weber, J. A. Detre, S. L. Thompson-Schill, and B. B.Avants, “Reproducibility of functional network metrics andnetwork structure: a comparison of task-related BOLD, restingASL with BOLD contrast, and resting cerebral blood flow,”Cognitive, Affective, & Behavioral Neuroscience, vol. 13, no. 3,pp. 627–640, 2013.
[21] A. Borogovac and I. Asllani, “Arterial spin labeling (ASL)fMRI: advantages, theoretical constrains and experimentalchallenges in neurosciences,” International Journal of Biomed-ical Imaging, vol. 2012, Article ID 818456, 13 pages, 2012.
[22] T. A. Longden, F. Dabertrand, M. Koide et al., “Capillary K+-sensing initiates retrograde hyperpolarization to increaselocal cerebral blood flow,” Nature Neuroscience, vol. 20,no. 5, pp. 717–726, 2017.
[23] C. J. Stagg, R. L. Lin, M. Mezue et al., “Widespread modulationof cerebral perfusion induced during and after transcranialdirect current stimulation applied to the left dorsolateral pre-frontal cortex,” The Journal of Neuroscience, vol. 33, no. 28,pp. 11425–11431, 2013.
[24] N. H. Mackworth, “The breakdown of vigilance duringprolonged visual search,” Quarterly Journal of ExperimentalPsychology, vol. 1, no. 1, pp. 6–21, 1948.
[25] A. C. Silva and S.-G. Kim, “Pseudo-continuous arterial spinlabeling technique for measuring CBF dynamics with hightemporal resolution,” Magnetic Resonance in Medicine,vol. 42, no. 3, pp. 425–429, 1999.
[26] W. T. Dixon, M. Sardashti, M. Castillo, and G. P. Stomp,“Multiple inversion recovery reduces static tissue signal inangiograms,” Magnetic Resonance in Medicine, vol. 18, no. 2,pp. 257–268, 1991.
[27] S. Mani, J. Pauly, S. Conolly, C. Meyer, and D. Nishimura,“Background suppression with multiple inversion recovery
nulling: applications to projective angiography,” MagneticResonance in Medicine, vol. 37, no. 6, pp. 898–905, 1997.
[28] F. Q. Ye, J. A. Frank, D. R. Weinberger, and A. C. McLaughlin,“Noise reduction in 3D perfusion imaging by attenuatingthe static signal in arterial spin tagging (ASSIST),” MagneticResonance in Medicine, vol. 44, no. 1, pp. 92–100, 2000.
[29] G. H. Glover, “Spiral imaging in fMRI,” NeuroImage, vol. 62,no. 2, pp. 706–712, 2012.
[30] R. Patriat, E. K. Molloy, T. B. Meier et al., “The effect of restingcondition on resting-state fMRI reliability and consistency: acomparison between resting with eyes open, closed, andfixated,” NeuroImage, vol. 78, pp. 463–473, 2013.
[31] D. C. Alsop, J. A. Detre, X. Golay et al., “Recommended imple-mentation of arterial spin-labeled perfusion MRI for clinicalapplications: a consensus of the ISMRM perfusion study groupand the European consortium for ASL in dementia,”MagneticResonance in Medicine, vol. 73, no. 1, pp. 102–116, 2015.
[32] D. C. Alsop and J. A. Detre, “Reduced transit-time sensitivityin noninvasive magnetic resonance imaging of human cerebralblood flow,” Journal of Cerebral Blood Flow & Metabolism,vol. 16, no. 6, pp. 1236–1249, 1996.
[33] H. J. M. M. Mutsaerts, R. M. E. Steketee, D. F. R. Heijtel et al.,“Inter-vendor reproducibility of pseudo-continuous arterialspin labeling at 3 Tesla,” PLoS One, vol. 9, no. 8, articlee104108, 2014.
[34] S. M. Smith, M. Jenkinson, M. W. Woolrich et al., “Advancesin functional and structural MR image analysis and implemen-tation as FSL,” NeuroImage, vol. 23, Supplement 1, pp. S208–S219, 2004.
[35] M. W. Woolrich, S. Jbabdi, B. Patenaude et al., “Bayesiananalysis of neuroimaging data in FSL,” NeuroImage, vol. 45,no. 1, Supplement 1, pp. S173–S186, 2009.
[36] D. N. Greve and B. Fischl, “Accurate and robust brain imagealignment using boundary-based registration,” NeuroImage,vol. 48, no. 1, pp. 63–72, 2009.
[37] D. L. Collins, C. J. Holmes, T. M. Peters, and A. C. Evans,“Automatic 3-D model-based neuroanatomical segmenta-tion,” Human Brain Mapping, vol. 3, no. 3, pp. 190–208, 1995.
[38] J. Mazziotta, A. Toga, A. Evans et al., “A probabilistic atlas andreference system for the human brain: international consor-tium for brain mapping (ICBM),” Philosophical Transactionsof the Royal Society B: Biological Sciences, vol. 356, no. 1412,pp. 1293–1322, 2001.
[39] M. Jenkinson and S. Smith, “A global optimisation method forrobust affine registration of brain images,” Medical ImageAnalysis, vol. 5, no. 2, pp. 143–156, 2001.
[40] M. Jenkinson, P. Bannister, M. Brady, and S. Smith, “Improvedoptimization for the robust and accurate linear registrationand motion correction of brain images,” NeuroImage, vol. 17,no. 2, pp. 825–841, 2002.
[41] M. J. Anderson and J. Robinson, “Permutation tests for linearmodels,” Australian & New Zealand Journal of Statistics,vol. 43, no. 1, pp. 75–88, 2001.
[42] A. M. Winkler, G. R. Ridgway, M. A. Webster, S. M. Smith,and T. E. Nichols, “Permutation inference for the general lin-ear model,” NeuroImage, vol. 92, pp. 381–397, 2014.
[43] T. Nichols and A. Holmes, “Nonparametric permutation testsfor functional neuroimaging,” in Human Brain Function: Sec-ond Edition, pp. 887–910, Academic Press, 2004.
[44] K. J. Worsley, “Statistical analysis of activation images,” inFunctional MRI: An Introduction to Methods, P. M. Matthews,
11Neural Plasticity
P. Jezzard, and S. M. Smith, Eds., pp. 251–270, Oxford UP,London, 2001.
[45] C. D. Good, I. S. Johnsrude, J. Ashburner, R. N. A. Henson,K. J. Friston, and R. S. J. Frackowiak, “A voxel-based morpho-metric study of ageing in 465 normal adult human brains,”Neuroimage, vol. 14, no. 1, pp. 21–36, 2001.
[46] B. Biswal, P. Kunwar, and B. H. Natelson, “Cerebral blood flowis reduced in chronic fatigue syndrome as assessed by arterialspin labeling,” Journal of the Neurological Sciences, vol. 301,no. 1-2, pp. 9–11, 2011.
[47] S. M. MacHale, S. M. Lawrie, J. T. O. Cavanagh et al., “Cerebralperfusion in chronic fatigue syndrome and depression,” TheBritish Journal of Psychiatry, vol. 176, no. 6, pp. 550–556, 2000.
[48] D. C. Costa, C. Tannock, and J. Brostoff, “Brainstem perfusionis impaired in chronic fatigue syndrome,” QJM, vol. 88, no. 11,pp. 767–773, 1995.
[49] J. Lim, W.-C. Wu, J. Wang, J. A. Detre, D. F. Dinges, andH. Rao, “Imaging brain fatigue from sustained mentalworkload: an ASL perfusion study of the time-on-task effect,”NeuroImage, vol. 49, no. 4, pp. 3426–3435, 2010.
[50] U. Tirelli, F. Chierichetti, M. Tavio et al., “Brain positronemission tomography (PET) in chronic fatigue syndrome:preliminary data,” The American Journal of Medicine,vol. 105, no. 3, pp. 54S–58S, 1998.
[51] U. Roelcke, L. Kappos, J. Lechner-Scott et al., “Reduced glu-cose metabolism in the frontal cortex and basal ganglia of mul-tiple sclerosis patients with fatigue: a 18F-fluorodeoxyglucosepositron emission tomography study,” Neurology, vol. 48,no. 6, pp. 1566–1571, 1997.
[52] R. Ferrucci, M. Vergari, F. Cogiamanian et al., “Transcranialdirect current stimulation (tDCS) for fatigue in multiple scle-rosis,” NeuroRehabilitation, vol. 34, no. 1, pp. 121–127, 2014.
[53] D. J. Chandler, “Evidence for a specialized role of the locuscoeruleus noradrenergic system in cortical circuitries andbehavioral operations,” Brain Research, vol. 1641, Part B,pp. 197–206, 2016.
[54] V. Sterpenich, A. D'Argembeau, M. Desseilles et al., “The locusceruleus is involved in the successful retrieval of emotionalmemories in humans,” The Journal of Neuroscience, vol. 26,no. 28, pp. 7416–7423, 2006.
[55] C. W. Berridge, B. E. Schmeichel, and R. A. España, “Norad-renergic modulation of wakefulness/arousal,” Sleep MedicineReviews, vol. 16, no. 2, pp. 187–197, 2012.
[56] K. Fukuda and E. K. Vogel, “Human variation in overridingattentional capture,” The Journal of Neuroscience, vol. 29,no. 27, pp. 8726–8733, 2009.
[57] M. Mion, K. Patterson, J. Acosta-Cabronero et al., “What theleft and right anterior fusiform gyri tell us about semanticmemory,” Brain, vol. 133, no. 11, pp. 3256–3268, 2010.
12 Neural Plasticity

Research ArticleGreen Tea and Red Tea from Camellia sinensis PartiallyPrevented the Motor Deficits and Striatal Oxidative DamageInduced by Hemorrhagic Stroke in Rats
Priscila Marques Sosa,1,2,3 Mauren Assis de Souza,1,2 and Pâmela B. Mello-Carpes 1,2,3
1Physiology Research Group, Stress, Memory and Behavior Lab, Federal University of Pampa, Uruguaiana, RS, Brazil2Multicentric Graduate Program in Physiological Sciences, Federal University of Pampa, Uruguaiana, RS, Brazil3Biological Sciences: Physiology Graduate Program, Federal University of Rio Grande do Sul, Porto Alegre, RS, Brazil
Correspondence should be addressed to Pâmela B. Mello-Carpes; [email protected]
Received 27 January 2018; Revised 17 June 2018; Accepted 16 July 2018; Published 2 August 2018
Academic Editor: Junichi Ushiba
Copyright © 2018 Priscila Marques Sosa et al. This is an open access article distributed under the Creative CommonsAttribution License, which permits unrestricted use, distribution, and reproduction in any medium, provided the originalwork is properly cited.
Green tea from Camellia sinensis plays a well-established neuroprotective role in several neurodegenerative diseases, includingintracerebral hemorrhage (ICH). However, the other teas of the same plant do not have their properties well understood; butthey can be as effective as green tea as an alternative therapy. In this study, we investigated the effects of supplementationwith green tea and red tea from Camellia sinensis on motor deficits and striatum oxidative damage in rats submitted tohemorrhagic stroke (ICH). Male Wistar rats were supplemented with green tea, red tea, or vehicle for 10 days prior to ICHinduction. After injury, the rats were submitted to motor tests (open field for locomotion, rotarod for balance, andneurological deficit scale (NDS)) 1, 3, and 7 days after ICH induction, while the tea supplementation was maintained.Subsequently, the rats were euthanized to striatal tissue dissection for biochemical analyzes (lipid peroxidation, reactiveoxygen species, glutathione levels, and total antioxidant capacity). ICH caused locomotor and balance deficits, as well asincreased the neurological deficit (NDS). Only red tea prevented locomotor deficits after injury. Green tea and red teaprevented balance deficits on the seventh day after ICH. On NDS evaluation, green tea presented a better neuroprotectionthan red tea (until day 3 after ICH injury). In addition, ICH increased reactive oxygen species and lipid peroxidation levels,without altering antioxidant markers. Green and red teas were effective in decreasing the lipid peroxidation levels. Therefore,green and red teas partially prevented the motor deficits and striatal oxidative damage induced by ICH. Based on our results,we can consider that the two teas seem to be equally effective to prevent motor deficits and striatal oxidative damageinduced by hemorrhagic stroke in rats.
1. Introduction
Intracerebral hemorrhage (ICH) is a common type of strokeassociated with a considerable socioeconomic impact, dis-ability, and mortality [1] and represents 15 to 20% of allstroke cases [2].
Some regions of the brain are more susceptible to strokedamage, including striatum, which is one of the most impor-tant regions for voluntary motor control [3]. After ICH, thehematoma components initiate an inflammatory signalingthrough the activation of microglia, which culminates on
secondary damage [4, 5]. Progressive deterioration of braintissues is classified as ICH secondary damage and plays animportant role in neurological impairment [4]. These molec-ular events that occur during ICH increase the production ofhydroxyl radicals and oxidation of lipids [6], which exposethe brain to higher levels of reactive oxygen species (ROS).There is increasing evidence that oxidative stress contributesto ICH-induced secondary brain injury through the gen-eration of ROS [7]. The biochemical events involved insecondary damage are not well described but representan important therapeutic target after ICH [7].
HindawiNeural PlasticityVolume 2018, Article ID 5158724, 8 pageshttps://doi.org/10.1155/2018/5158724
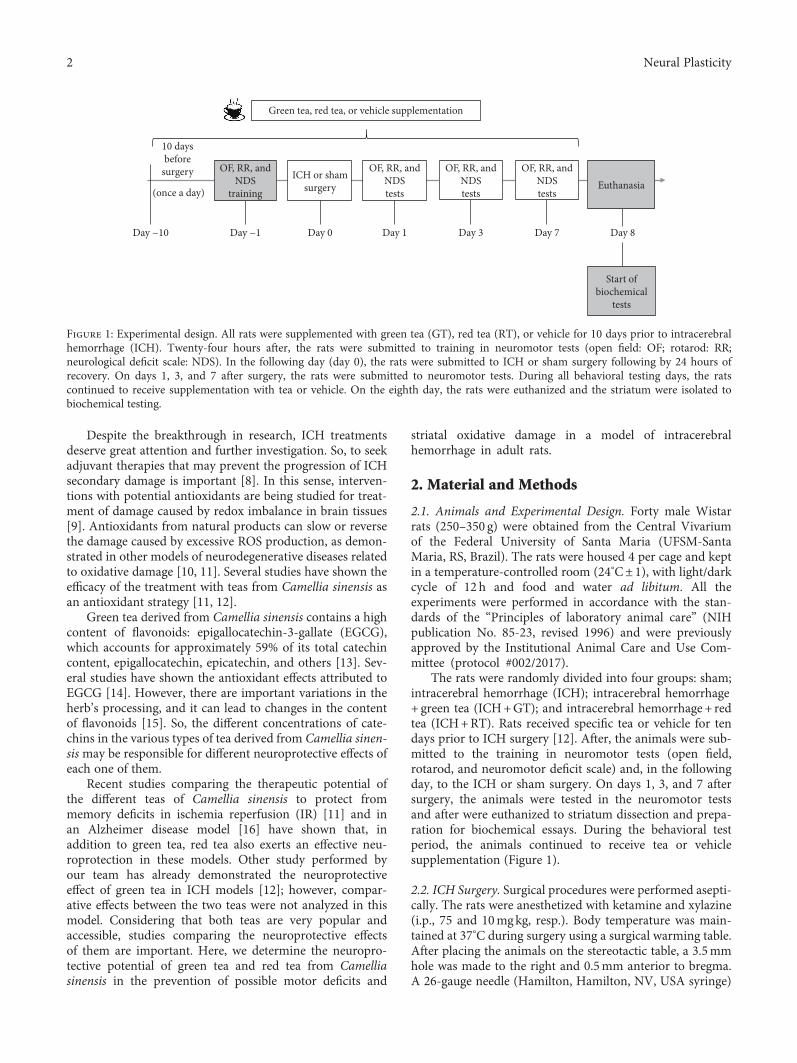
Despite the breakthrough in research, ICH treatmentsdeserve great attention and further investigation. So, to seekadjuvant therapies that may prevent the progression of ICHsecondary damage is important [8]. In this sense, interven-tions with potential antioxidants are being studied for treat-ment of damage caused by redox imbalance in brain tissues[9]. Antioxidants from natural products can slow or reversethe damage caused by excessive ROS production, as demon-strated in other models of neurodegenerative diseases relatedto oxidative damage [10, 11]. Several studies have shown theefficacy of the treatment with teas from Camellia sinensis asan antioxidant strategy [11, 12].
Green tea derived from Camellia sinensis contains a highcontent of flavonoids: epigallocatechin-3-gallate (EGCG),which accounts for approximately 59% of its total catechincontent, epigallocatechin, epicatechin, and others [13]. Sev-eral studies have shown the antioxidant effects attributed toEGCG [14]. However, there are important variations in theherb’s processing, and it can lead to changes in the contentof flavonoids [15]. So, the different concentrations of cate-chins in the various types of tea derived from Camellia sinen-sismay be responsible for different neuroprotective effects ofeach one of them.
Recent studies comparing the therapeutic potential ofthe different teas of Camellia sinensis to protect frommemory deficits in ischemia reperfusion (IR) [11] and inan Alzheimer disease model [16] have shown that, inaddition to green tea, red tea also exerts an effective neu-roprotection in these models. Other study performed byour team has already demonstrated the neuroprotectiveeffect of green tea in ICH models [12]; however, compar-ative effects between the two teas were not analyzed in thismodel. Considering that both teas are very popular andaccessible, studies comparing the neuroprotective effectsof them are important. Here, we determine the neuropro-tective potential of green tea and red tea from Camelliasinensis in the prevention of possible motor deficits and
striatal oxidative damage in a model of intracerebralhemorrhage in adult rats.
2. Material and Methods
2.1. Animals and Experimental Design. Forty male Wistarrats (250–350 g) were obtained from the Central Vivariumof the Federal University of Santa Maria (UFSM-SantaMaria, RS, Brazil). The rats were housed 4 per cage and keptin a temperature-controlled room (24°C± 1), with light/darkcycle of 12 h and food and water ad libitum. All theexperiments were performed in accordance with the stan-dards of the “Principles of laboratory animal care” (NIHpublication No. 85-23, revised 1996) and were previouslyapproved by the Institutional Animal Care and Use Com-mittee (protocol #002/2017).
The rats were randomly divided into four groups: sham;intracerebral hemorrhage (ICH); intracerebral hemorrhage+ green tea (ICH+GT); and intracerebral hemorrhage + redtea (ICH+RT). Rats received specific tea or vehicle for tendays prior to ICH surgery [12]. After, the animals were sub-mitted to the training in neuromotor tests (open field,rotarod, and neuromotor deficit scale) and, in the followingday, to the ICH or sham surgery. On days 1, 3, and 7 aftersurgery, the animals were tested in the neuromotor testsand after were euthanized to striatum dissection and prepa-ration for biochemical essays. During the behavioral testperiod, the animals continued to receive tea or vehiclesupplementation (Figure 1).
2.2. ICH Surgery. Surgical procedures were performed asepti-cally. The rats were anesthetized with ketamine and xylazine(i.p., 75 and 10mgkg, resp.). Body temperature was main-tained at 37°C during surgery using a surgical warming table.After placing the animals on the stereotactic table, a 3.5mmhole was made to the right and 0.5mm anterior to bregma.A 26-gauge needle (Hamilton, Hamilton, NV, USA syringe)
(once a day)
Day −10 Day −1
OF, RR, andNDS
training
ICH or shamsurgery
Day 0
OF, RR, andNDStests
Day 1
OF, RR, andNDStests
Day 3
OF, RR, andNDStests
Day 7
Euthanasia
Green tea, red tea, or vehicle supplementation
Day 8
Start ofbiochemical
tests
10 daysbefore
surgery
Figure 1: Experimental design. All rats were supplemented with green tea (GT), red tea (RT), or vehicle for 10 days prior to intracerebralhemorrhage (ICH). Twenty-four hours after, the rats were submitted to training in neuromotor tests (open field: OF; rotarod: RR;neurological deficit scale: NDS). In the following day (day 0), the rats were submitted to ICH or sham surgery following by 24 hours ofrecovery. On days 1, 3, and 7 after surgery, the rats were submitted to neuromotor tests. During all behavioral testing days, the ratscontinued to receive supplementation with tea or vehicle. On the eighth day, the rats were euthanized and the striatum were isolated tobiochemical testing.
2 Neural Plasticity

was inserted unilaterally into 6.5mm in the right striatum toinfuse 1μl of sterile saline containing 0.2U of bacterial colla-genase (type IV). The needle was left in place for 5min andthen slowly withdrawn. The hole was sealed with a metalscrew, suture threads were used to close the wound, andlidocaine was used at the suture site [17]. The sameprocedure was performed with the sham animals, exceptthat the infusion did not contain collagenase, only saline.
2.3. Tea Supplementation. The two types of Camellia sinensisteas (green and red) were purchased directly from the samecompany (Madrugada Alimentos Ltda., Venâncio Aires, RS,Brazil), and prepared daily in the same way.
The teas were prepared with distilled water (95°C± 5°C)and then the infusion was maintained rested and muffledfor approximately 3 minutes, and after was filtered. Teaswere administered via gavage (400mg/ml/day), at roomtemperature [9].
Tea samples used in this study were analyzed by high-performance liquid chromatography (HPLC) to analyzethe presence of epicatechin (EC), epigallocatechin (EGC),epigalocatechin gallate (EGCG), and epicatechin gallate(ECG) [18] (Table 1).
2.4. Behavioral Testing. To verify possible changes and/ordeficits in motor function, the rats were trained in OF, RR,and NDS tasks 24h prior to ICH or sham surgery. The testswere performed 24 h, 3 days and 7 days after the surgeries.
2.5. Open Field Test (OF). To evaluate the locomotor activityand the exploratory behavior of the rats, we used the openfield apparatus. The open field consists in a box (60 cm indiameter× 45 cm in height) divided into 12 quadrants ofthe same surface area. The animals were gently placed inthe open field arena (i.e., in the box), so that they could freelyexplore it for 5min. The number of crossed lines (crossings)was counted [19]. After each rat testing, the arena wascleaned with 70% ethanol.
2.6. Rotarod Test (RR). In order to evaluate the influence ofICH in rats’ motor coordination and balance, the RR testwas used. The apparatus consists of a rotating cylinder(5 cm diameter× 8 cm wide× 20 cm high), with an automaticfall register. On the training day, the animals were placed inthe static cylinder for 2 minutes for habituation. After thehabituation time, the cylinder rotation was set at 16 rpm for6 minutes, and the number of falls and latency for the first fallwere recorded. In the test sessions, the animals were sus-pended for 6 minutes in the cylinder at a speed set in20 rpm. The number of falls and latency for first fall wereagain recorded [20].
2.7. Neurological Deficit Scale (NDS). This test set is sensitiveto striatal/motor damage [21]. The rats were trained in NDSbefore surgery, for reference. On test days after surgery, theywere resubmitted to NDS. Briefly, the rats were evaluated forspontaneous movement, hind limb retraction, bilateral fore-foot grip, contralateral forearm flexion, and beam trajectory.A maximum score of 14 indicates greater neurologicalimpairment [22].
2.8. Biochemical Analyses
2.8.1. Tissue Preparation. Rats were sacrificed 24 hours afterthe last test day. Their brains were removed, and the striatumipsilateral to the lesion was quickly dissected and homoge-nized in 50mM Tris HCl, pH7.4 (1/10, w/v). The sampleswere centrifuged at 2400g for 10min, and the supernatants(S1) were used for assay.
2.8.2. Lipid Peroxidation. Lipid peroxidation was assessed bythe substances reactive to thiobarbituric acid (TBARS) test[23]. S1 aliquot was incubated with a solution of 0.8% thio-barbituric acid, acetic acid buffer (pH3.2), and sodiumdodecyl sulfate solution (8%) at 95°C for 2 h. The colorreaction was measured at 532 nm. Results were expressedas nmol of malondialdehyde (MDA) per mg protein.
2.8.3. Reactive Oxygen Species (ROS) Levels. ROS levels weredetermined indirectly by fluorimetric method spectrumusing 2′, 7′-dichlorofluorescein diacetate (DCFH-DA). Thesamples were incubated in the dark with 5μl of DCFH-DA(1mM). Oxidation monitoring was made of DCFH-DA todichlorofluorescein (DCF) fluorescence by reactive oxygenspecies. The fluorescence emission intensity was performedat 520nm (with excitation at 480nm) for 60 minutes afterthe addition of DCFH-DA in spectrofluorimeter (ShimadzuRF-5301PC Model).
2.8.4. Glutathione (GSH) Levels. GSH levels were fluorome-trically determined (Hissin and Hilf, 1976). An aliquot ofhomogenized sample was mixed (1 : 1) with perchloric acid(HClO4) and centrifuged at 3000g for 10min. This mixturewas centrifuged, the protein pellet was discarded, and freethiols (SH) groups were determined in the clear supernatant.An aliquot of supernatant was incubated with orthophthala-dehyde and fluorescence was measured at excitation of350 nm and emission of 420nm. Results were normalizedby mg of protein and expressed as percent of control.
2.8.5. Total Antioxidant Capacity. Total antioxidant capacitywas measure by ferric reducing/antioxidant power assay(FRAP). Working FRAP reagent was prepared by mixing25ml acetate buffer, 2.5ml TPTZ solution, and 2.5mlFeCl3.6H2O solution, and 10μl of homogenate was addedin the 300μl working FRAP reagent in a microplate (Benzieand Strain, 1996). A standard curve with 10μl trolox(concentrations of 15, 30, 60, 120, and 240mM) and 300μlworking FRAP reagent was used. The microplate was incu-bated at 37°C for 15min before reading in SpectraMax M5
Table 1: Concentration of catechins (mg/ml) found in samples ofthe two teas from Camellia sinensis.
Catechins Green tea Red tea
(−)-Epigallocatechin 6412.14 ND
(−)-Epicatechin 5736.00 5442.34
(−)-Epigallocatechin gallate 9405.42 ND
(−)-Epicatechin gallate 2609.19 ND
ND: not detected.
3Neural Plasticity

Microplate Reader at 593 nm. Each sample was analyzedin triplicate.
2.8.6. Protein Determination. Protein content was measuredcolorimetrically by the method of Bradford [24] using bovineserum albumin (1mg·ml−1) as standard.
2.9. Statistical Analysis. Data were checked for normality ofdistribution using Shapiro-Wilk test. Results are presentedas mean± standard error of the mean (SEM). Results wereanalyzed by one-way ANOVA followed by Tukey’s posthoc test, when appropriate. Significance level was set at 0.05for all analyses.
3. Results
3.1. Behavioral Assessment. The locomotor activity wasassessed using the OF test. The locomotor activity was differ-ent between the groups on days 1 (F(3, 36) = 4.621, P = 0 0078,
Figure 2(a)) and 3 (F(3, 36) = 4.771, P = 0 0067, Figure 2(a)).However, on day 7 there was no difference between thegroups (F(3, 36) = 1.563, P = 0 215, Figure 2(a)). The posthoc test showed that the rats in the ICH group had decreasedlocomotor activity compared to sham rats on day 1 (P < 0 05,Figure 2(a)) and day 3 (P < 0 05, Figure 2(a)). On day 7, therewas no difference in locomotor activity between the ICH andsham rats (P > 0 05). In addition, there are no differences oncrossings between ICH and ICH+green tea groups on days1 and 3 (P > 0 05, ICH versus ICH+ teas Figure 2(a)).Importantly, ICH+ red tea presented similar number ofcrossing to the control group on both days (D1: P =0 0078; D3: P = 0 0067), while green tea did not presentthe same effect.
In rotarod test, there was a difference between thegroups on days 1 (F(3, 36) = 5.264, P = 0 004, Figure 2(b)), 3(F(3, 36) = 2.925, P = 0 046, Figure 2(b)), and 7 (F(3, 36) = 6.352,P = 0 001, Figure 2(b)), considering the latency for the firstfall. The rats in the ICH group presented a deficit in the
80
60
40
20
0BL D1 D3 D7
ShamICH
Green teaRed tea
Cros
sing
(n°)
⁎
⁎
⁎ ⁎
(a)
400
300
200
100
0BL D1 D3 D7
ShamICH
Green teaRed tea
Late
ncy
of fi
rst f
all (
s)
⁎
⁎
⁎
⁎
# #
(b)
5
4
3
2
1
0BL D1 D3 D7
ShamICH
Green teaRed tea
Num
ber o
f fal
ls
⁎
⁎
⁎⁎
# # # #
(c)
6
4
2
0BL D1 D3 D7
ShamICH
Green teaRed tea
Neu
rolo
gic d
efici
t sca
le
⁎
⁎
⁎
⁎⁎
#
##
(d)
Figure 2: Effects of green and red tea administration on neuromotor function after ICH in rats. (a) Open field test: number ofcrossings; (b) rotarod test: latency to the first fall in seconds; (c) rotarod test: total number of falls; (d) neurological deficit scale:total score. Data are presented as the mean± S.E.M. One-way ANOVA ∗P < 0 05 in comparison to sham group, #P < 0 05 incomparison to the ICH group (n = 10/group).
4 Neural Plasticity

balance (shorter latency to the first fall than control animals)on days 1, 3, and 7 (P < 0 05, Figure 2(b)). GT and RT supple-mentation showed a neuroprotective effect on the seventhday (P < 0 05 for GT; P < 0 01 for RT; Figure 2(b)). Inaddition, there were no differences in the balance betweenICH+ ICH tea groups on days 1 and 3 (P > 0 05, ICHversus ICH+ teas; Figure 2(b)), but ICH+RT presented asimilar latency for the first fall than the control group onday 1 (P = 0 04, Figure 2(b)).
Considering the number of falls (rotarod test), weobserved difference between the groups on days 1 (F(3, 36) =5.698, P = 0 0027, Figure 2(c)), 3 (F(3, 36) = 4.832, P = 0 0063,Figure 2(c)), and 7 (F(3, 36) = 5.921, P = 0 002, Figure 2(c)).The ICH rats showed a higher number of falls than shamrats on days 1, 3, and 7 (P < 0 05, Figure 2(c)). The GTreversed this deficit at days 3 (P < 0 05, Figure 2(c)) and 7(P < 0 01, Figure 2(c)), as well as RT (D3: P < 0 05;D7: P < 0 01; Figure 2(c)), but only ICH+ red tea pre-sented similar number of falls to the control group onday 1 (P > 0 05, Figure 2(c)).
On neurological deficit (NDS) evaluation, we founddifferences between the groups on days 1 (F(3.36) = 20.47,P < 0 0001, Figure 2(d)), 3 (F(3.36) = 7.704, P = 0 0004,
Figure 2(d)), and 7 (F(3.36) = 4.21, P = 0 013, Figure 2(d)).ICH rats presented higher NDS score than sham rats ondays 1 (P < 0 0001, Figure 2(d)), 3 (P < 0 001, Figure 2(d)),and 7 (P < 0 05, Figure 2(d)). The GT and RT were able toreverse these deficits on day 1 (GT: P < 0 05, RT: P < 0 05,Figure 2(d)), but, on day 3, only GT reversed the neurologicaldeficit (P < 0 05, Figure 2(d)).
3.2. Biochemical Assays. Considering that the increase ofoxidative stress is one of the secondary damage characteris-tics of ICH affected tissues, we evaluated the levels of oxida-tive species, the oxidative damage, the levels of GSH (anantioxidant marker), and the total antioxidant capacity inthe striatum of rats.
A significant difference on the striatal level of oxidativespecies (DCFH) (F(3, 20) = 6.850, P = 0 0137, Figure 3(a))was observed. The post hoc showed that ICH rats presentedincreased ROS compared to the sham group (P < 0 01).Neither green tea (P > 0 05) nor red tea (P > 0 05) was ableto reverse striatal oxidative stress.
There was difference between the groups on lipoperoxi-dation (TBARS) (F(3, 20) = 7.144; P = 0 0019, Figure 3(b)).ICH rats showed an increase in lipoperoxidation compared
200
150
100
50
0
DCF
H-D
A o
xida
tion
% o
f con
trol
Sham ICH GT RT
⁎
(a)
3
2
1
0Sham ICH GT RT
TBA
Rs (n
mol
MD
A/g
)
⁎
# #
(b)
500
400
300
200
100
0Sham ICH GT RT
GSH
(mm
ol/m
g tis
sue)
(c)
400
300
200
100
0Sham ICH GT RT
FRA
P (n
mol
Fe+2
TPT
Z/g)
(d)
Figure 3: Effects of administration of green tea and red tea on oxidative stress, oxidative damage, and antioxidant markers on striatum afterICH in rats. (a) ROS levels by DCFHmethod; (b) lipid peroxidation by TBARS (thiobarbituric acid reactive substance); (c) glutathione levels(GSH); (d) total antioxidant capacity by FRAP method. Data are presented as the mean± S.E.M. One-way ANOVA ∗P < 0 05 in comparisonto sham group; #P < 0 05 in comparison to ICH group (n = 6/group).
5Neural Plasticity

to sham rats (P < 0 05). Both green tea and red tea avoidedthis increase (GT: P < 0 01 versus ICH; RT: P < 0 01 versusICH; Figure 3(b)).
Considering the antioxidant measures, we did not finddifferences between the groups in the GSH levels (F(3, 20) =0.4608, P = 0 7127, Figure 3(c)), as in the total antioxidantcapacity (FRAP; F(3, 20) = 0.2767, P = 0 8415, Figure 3(d)).
4. Discussion
In this study, we determined the neuroprotective potential ofgreen tea and red tea on the motor deficits and striataldamage caused by hemorrhagic stroke in rats. Our majorfindings demonstrate that the two teas studied partiallyprotect against neuromotor deficits and oxidative damagecaused by ICH, and appear to be promoters of neuroprotec-tion in this model. The different teas protect against neuro-logical deficits mainly on the first and third day after theinjury, avoiding locomotor (OF) and balance deficits (RR),general neuromotor function deficits (NDS), and contribut-ing to avoid the increase of lipid peroxidation (TBARS).
ICH is associated with motor damage [25, 26] and cogni-tive impairments [27] that may be closely related to oxidativestress [28]. Our current results show that ICH generateslocomotor and exploratory damage (OF), which is main-tained for up to 3 days after injury. However, in this case,only the red tea was able to protect against such damage. Asignificant finding is that on the seventh day after the injury,a spontaneous recovery was observed in relation to the loco-motor and exploratory activity, which is in agreement withLu et al. [29], but prevents us from evaluating whether theteas have a protective effect in this case. Additionally, theresults show that ICH rats presented a balance impairment(RR) until the seventh day after ICH, and that the greenand red teas were able to protect against such damages ondays 3 and 7 after the injury. The neuromotor deficit was alsoobserved from the first to the seventh day after ICH in NDStest [22]. Green tea was effective to protect the damage on testday 1 and 3 after injury, while red tea was effective only ontest day 1.
Strategies that propose the administration of antioxidantagents have been widely tested to prevent or treat hemor-rhagic stroke [30, 31]. Previous studies have already demon-strated the neuroprotective effects of green tea on balance inICH [12] and brain ischemia-reperfusion models [18, 32].It is known that ICH injury mechanisms are related toincreased free radical production and consequent oxidativestress [9, 28]. In this study, ICH induced an increase onstriatum ROS and on lipid peroxidation. Green tea andred tea were able to protect the striatum tissue againstlipid peroxidation. Any alteration on antioxidant markerswas detected.
The administration of tea from Camellia sinensis andEGCG (the main component of green tea) has already beendescribed as neuroprotective by its antioxidant effects indifferent models of brain injury [9, 28]. A recent study con-ducted in our laboratory that sought to evaluate the neuro-protective capacity of 4 teas from Camellia sinensis (green,red, white, and black) in an ischemic stroke model showed
that the greatest protective effect on memory and oxidativestress is from green tea and red tea, since the best effectsassociated with green tea [11]. In another study using green,red, and black teas from Camellia sinensis, Schimidt andcolleagues suggest that supplementation with green tea andred tea may avoid deficits in social and object recognitionmemories related to Alzheimer’s disease, but only green teaavoids the hippocampal oxidative stress and damage inducedin Alzheimer model [16]. These effects may be closely relatedto the greater amount of specific catechins present in greentea [33, 34], since some literature data suggest that the bene-ficial effects of teas are mainly related to catechins polyphenoland their derivatives [35]. However, this may not be the onlyexplanation for their ability to neuroprotection. In additionto the antioxidant capacity, we cannot disregard the anti-inflammatory potential and inhibition of acetylcholinesteraseaction [36] of the Camellia sinensis teas, although thesemechanisms are not completely clear.
The great amount of compounds in teas emphasizes thedifferences of mixture use or its isolated components. Here,considering that the neuroprotection effects could be relatedto the combined activity of the varios teas' compounds [37],we decided investigated the effects of the teas, and not ofthe isolated compounds, mainly because the teas mixtureare available to population.
5. Conclusions
Green and red teas have been shown to be effective strategies,with similar effectiveness, to prevent some motor deficits andthe striatal oxidative damage induced by ICH. The mecha-nisms involved in their protective role include the decreaseof oxidative damage, that is, lipid peroxidation.
Data Availability
The data can be made available through request by [email protected].
Additional Points
Highlights. Hemorrhagic stroke (ICH) causes motor deficitsand oxidative damage in the striatum. Green tea and redtea partially avoided the motor deficits caused by ICH. Greentea and red tea avoided the striatal oxidative damage causedby ICH.
Conflicts of Interest
The authors declare that there is no conflict of interestregarding the publication of this paper.
Acknowledgments
This work was supported by research grants and fellowshipfrom CAPES (Coordenação de Aperfeiçoamento de Pessoalde Nível Superior), Brazil; CNPq (Conselho Nacional dePesquisa), Brazil; and Federal University of Pampa, Brazil.Priscila Marques Sosa was supported by FAPERGS/CAPESfellowship. Mauren Assis de Souza was supported by CAPES.
6 Neural Plasticity

Pâmela B Mello-Carpes was supported by For Womenin Science Program, L’Oreal Foundation & UNESCO,and CNPq.
References
[1] B. Bakhshayesh, M. Hosseininezhad, S. M. Seyed Saadat,M. Hajmanuchehri, E. Kazemnezhad, and A. R. Ghayeghran,“Predicting in-hospital mortality in Iranian patients withspontaneous intracerebral hemorrhage,” Iranian Journal ofNeurology, vol. 13, no. 4, pp. 231–236, 2014.
[2] R. L. Macdonald, R. T. Higashida, E. Keller et al., “Preventingvasospasm improves outcome after aneurysmal subarachnoidhemorrhage: rationale and design of CONSCIOUS-2 andCONSCIOUS-3 trials,” Neurocritical Care, vol. 13, no. 3,pp. 416–424, 2010.
[3] R. Baez-Mendoza and W. Schultz, “The role of the striatum insocial behavior,” Frontiers in Neuroscience, vol. 7, p. 233, 2013.
[4] X. Lan, X. Han, Q. Li, Q. W. Yang, and J. Wang, “Modulatorsof microglial activation and polarization after intracerebralhaemorrhage,” Nature Reviews Neurology, vol. 13, no. 7,pp. 420–433, 2017.
[5] J. Shen, B. Chen, G. R. Zheng et al., “Detection of high serumconcentration of CXC chemokine ligand-12 in acute intra-cerebral hemorrhage,” Clinica Chimica Acta, vol. 471,pp. 55–61, 2017.
[6] S. M. Sadrzadeh and J. W. Eaton, “Hemoglobin-mediatedoxidant damage to the central nervous system requiresendogenous ascorbate,” The Journal of Clinical Investigation,vol. 82, no. 5, pp. 1510–1515, 1988.
[7] X. Hu, C. Tao, Q. Gan, J. Zheng, H. Li, and C. You, “Oxidativestress in intracerebral hemorrhage: sources, mechanisms, andtherapeutic targets,” Oxidative Medicine and Cellular Longev-ity, vol. 2016, Article ID 3215391, 12 pages, 2016.
[8] J. S. Knutson, D. D. Gunzler, R. D. Wilson, and J. Chae,“Contralaterally controlled functional electrical stimulationimproves hand dexterity in chronic hemiparesis: a randomizedtrial,” Stroke, vol. 47, no. 10, pp. 2596–2602, 2016.
[9] K. J. Wu, M. T. Hsieh, C. R. Wu, W. G. Wood, and Y. F. Chen,“Green tea extract ameliorates learning and memory deficitsin ischemic rats via its active component polyphenolepigallocatechin-3-gallate by modulation of oxidative stressand neuroinflammation,” Evidence-Based Complementaryand Alternative Medicine, vol. 2012, Article ID 163106,11 pages, 2012.
[10] F. Shaki, Y. Shayeste, M. Karami, E. Akbari, M. Rezaei, andR. Ataee, “The effect of epicatechin on oxidative stress andmitochondrial damage induced by homocycteine using iso-lated rat hippocampus mitochondria,” Research in Pharma-ceutical Sciences, vol. 12, no. 2, pp. 119–127, 2017.
[11] A. Martins, H. L. Schimidt, A. Garcia et al., “Supplementationwith different teas from Camellia sinensis prevents memorydeficits and hippocampus oxidative stress in ischemia-reperfusion,” Neurochemistry international, vol. 108, pp. 287–295, 2017.
[12] C. D. C. Altermann, M. A. Souza, H. L. Schimidt et al., “Short-term green tea supplementation prevents recognition memorydeficits and ameliorates hippocampal oxidative stress inducedby different stroke models in rats,” Brain Research Bulletin,vol. 131, pp. 78–84, 2017.
[13] M. Assuncao, M. J. Santos-Marques, F. Carvalho, and J. P.Andrade, “Green tea averts age-dependent decline of hippo-campal signaling systems related to antioxidant defenses andsurvival,” Free Radical Biology & Medicine, vol. 48, no. 6,pp. 831–838, 2010.
[14] P. Bogdanski, J. Suliburska, M. Szulinska, M. Stepien,D. Pupek-Musialik, and A. Jablecka, “Green tea extract reducesblood pressure, inflammatory biomarkers, and oxidative stressand improves parameters associated with insulin resistance inobese, hypertensive patients,” Nutrition Research, vol. 32,no. 6, pp. 421–427, 2012.
[15] M. B. Soares, A. P. Izaguirry, L. M. Vargas, A. S. L. Mendez,C. C. Spiazzi, and F. W. Santos, “Catechins are not major com-ponents responsible for the beneficial effect of Camellia sinen-sis on the ovarian δ-ALA-D activity inhibited by cadmium,”Food and Chemical Toxicology, vol. 55, pp. 463–469, 2013.
[16] H. L. Schimidt, A. Garcia, A. Martins, P. B. Mello-Carpes, andF. P. Carpes, “Green tea supplementation produces betterneuroprotective effects than red and black tea in Alzheimer-like rat model,” Food Research International, vol. 100, Part 1,pp. 442–448, 2017.
[17] J. Caliaperumal, Y. Ma, and F. Colbourne, “Intra-parenchymalferrous iron infusion causes neuronal atrophy, cell deathand progressive tissue loss: implications for intracerebralhemorrhage,” Experimental Neurology, vol. 237, no. 2,pp. 363–369, 2012.
[18] H. L. Schimidt, A. Vieira, C. Altermann et al., “Memorydeficits and oxidative stress in cerebral ischemia-reperfusion:neuroprotective role of physical exercise and green tea supple-mentation,” Neurobiology of Learning and Memory, vol. 114,pp. 242–250, 2014.
[19] J. S. Bonini, L. R. Bevilaqua, C. G. Zinn et al., “Angiotensin IIdisrupts inhibitory avoidance memory retrieval,” Hormonesand Behavior, vol. 50, no. 2, pp. 308–313, 2006.
[20] S. Stroobants, I. Gantois, T. Pooters, and R. D’Hooge,“Increased gait variability in mice with small cerebellar cortexlesions and normal rotarod performance,” Behavioural BrainResearch, vol. 241, pp. 32–37, 2013.
[21] M. R. D. Bigio, H. J. Yan, R. Buist, J. Peeling, and G. J. delZoppo, “Experimental intracerebral hemorrhage in rats. Mag-netic resonance imaging and histopathological correlates,”Stroke, vol. 27, no. 12, pp. 2312–2320, 1996.
[22] L. M. Warkentin, A. M. Auriat, S. Wowk, and F. Colbourne,“Failure of deferoxamine, an iron chelator, to improve out-come after collagenase-induced intracerebral hemorrhage inrats,” Brain Research, vol. 1309, pp. 95–103, 2010.
[23] H. Ohkawa, N. Ohishi, and K. Yagi, “Assay for lipid peroxidesin animal tissues by thiobarbituric acid reaction,” AnalyticalBiochemistry, vol. 95, no. 2, pp. 351–358, 1979.
[24] M. M. Bradford, “A rapid and sensitive method for thequantitation of microgram quantities of protein utilizing theprinciple of protein-dye binding,” Analytical Biochemistry,vol. 72, no. 1-2, pp. 248–254, 1976.
[25] K. P. Wadden, T. S. Woodward, P. D. Metzak et al., “Compen-satory motor network connectivity is associated with motorsequence learning after subcortical stroke,” Behavioural BrainResearch, vol. 286, pp. 136–145, 2015.
[26] A. M. Auriat, S. Wowk, and F. Colbourne, “Rehabilitationafter intracerebral hemorrhage in rats improves recoverywith enhanced dendritic complexity but no effect on cellproliferation,” Behavioural Brain Research, vol. 214, no. 1,pp. 42–47, 2010.
7Neural Plasticity

[27] M. Huijben-Schoenmakers, A. Rademaker, and E. Scherder,“Cognition in relation to independency in older, comorbidstroke patients in a stroke unit,” International Journal ofGeriatric Psychiatry, vol. 32, no. 7, pp. 761–768, 2017.
[28] C. F. Chang, S. Cho, and J. Wang, “(−)-Epicatechin protectshemorrhagic brain via synergistic Nrf2 pathways,” Annals ofClinical and Translational Neurology, vol. 1, no. 4, pp. 258–271, 2014.
[29] H. Lu, J. Shen, X. Song et al., “Protective effect of Pyrroloqui-noline Quinone (PQQ) in rat model of intracerebral hemor-rhage,” Cellular and Molecular Neurobiology, vol. 35, no. 7,pp. 921–930, 2015.
[30] H. Rojas, T. Lekic, W. Chen et al., “The antioxidant effects ofmelatonin after intracerebral hemorrhage in rats,” Acta Neuro-chirurgica Supplementum, vol. 105, pp. 19–21, 2008.
[31] E. Titova, R. P. Ostrowski, L. C. Sowers, J. H. Zhang, andJ. Tang, “Effects of apocynin and ethanol on intracerebralhaemorrhage-induced brain injury in rats,” Clinical andExperimental Pharmacology and Physiology, vol. 34, no. 9,pp. 845–850, 2007.
[32] P. M. Sosa, H. L. Schimidt, C. Altermann et al., “Physicalexercise prevents motor disorders and striatal oxidativeimbalance after cerebral ischemia-reperfusion,” BrazilianJournal of Medical and Biological Research, vol. 48, no. 9,pp. 798–804, 2015.
[33] H. F. Gu, Y. X. Nie, Q. Z. Tong et al., “Epigallocatechin-3-gallate attenuates impairment of learning and memory inchronic unpredictable mild stress-treated rats by restoringhippocampal autophagic flux,” PLoS One, vol. 9, no. 11,article e112683, 2014.
[34] Y. J. Lee, D. Y. Choi, Y. P. Yun, S. B. Han, K. W. Oh, andJ. T. Hong, “Epigallocatechin-3-gallate prevents systemicinflammation-induced memory deficiency and amyloidogen-esis via Its anti-neuroinflammatory properties,” The Journalof Nutritional Biochemistry, vol. 24, no. 1, pp. 298–310, 2013.
[35] S. Mandel, O. Weinreb, L. Reznichenko, L. Kalfon, andT. Amit, “Green tea catechins as brain-permeable, non toxiciron chelators to "iron out iron" from the brain,” Journal ofNeural Transmission, vol. 71, pp. 249–257, 2006.
[36] K. Ide, H. Yamada, N. Takuma et al., “Green tea consumptionaffects cognitive dysfunction in the elderly: a pilot study,”Nutrients, vol. 6, no. 10, pp. 4032–4042, 2014.
[37] Y. Yang, M. Zhang, X. Kang et al., “Thrombin-induced micro-glial activation impairs hippocampal neurogenesis and spatialmemory ability in mice,” Behavioral and Brain Functions,vol. 11, no. 1, p. 30, 2015.
8 Neural Plasticity

Research ArticleIntraspinal Grafting of Serotonergic Neurons ModifiesExpression of Genes Important for Functional Recovery inParaplegic Rats
Krzysztof Miazga ,1 Hanna Fabczak,1 Ewa Joachimiak,1 Małgorzata Zawadzka,1
Łucja Krzemień-Ojak,1 Marek Bekisz ,1 Anna Bejrowska,1 Larry M. Jordan,2
and Urszula Sławińska 1
1Nencki Institute of Experimental Biology, Polish Academy of Sciences, Warsaw, Poland2Department of Physiology and Phatophysiology, University of Manitoba, Winnipeg, MB, Canada
Correspondence should be addressed to Urszula Sławińska; [email protected]
Received 18 February 2018; Revised 23 May 2018; Accepted 4 June 2018; Published 25 July 2018
Academic Editor: Junichi Ushiba
Copyright © 2018 Krzysztof Miazga et al. This is an open access article distributed under the Creative Commons AttributionLicense, which permits unrestricted use, distribution, and reproduction in any medium, provided the original work isproperly cited.
Serotonin (5-hydroxytryptamine; 5-HT) plays an important role in control of locomotion, partly through direct effects onmotoneurons. Spinal cord complete transection (SCI) results in changes in 5-HT receptors on motoneurons that influencefunctional recovery. Activation of 5-HT2A and 5-HT7 receptors improves locomotor hindlimb movements in paraplegic rats.Here, we analyzed the mRNA of 5-HT2A and 5-HT7 receptors (encoded by Htr2a and Htr7 genes, resp.) in motoneuronsinnervating tibialis anterior (TA) and gastrocnemius lateralis (GM) hindlimb muscles and the tail extensor caudae medialis(ECM) muscle in intact as well as spinal rats. Moreover, the effect of intraspinal grafting of serotonergic neurons on Htr2a andHtr7 gene expression was examined to test the possibility that the graft origin 5-HT innervation in the spinal cord ofparaplegic rats could reverse changes in gene expression induced by SCI. Our results indicate that SCI at the thoracic levelleads to changes in Htr2a and Htr7 gene expression, whereas transplantation of embryonic serotonergic neurons modifies thesechanges in motoneurons innervating hindlimb muscles but not those innervating tail muscles. This suggests that theupregulation of genes critical for locomotor recovery, resulting in limb motoneuron plasticity, might account for the improvedlocomotion in grafted animals.
1. Introduction
Motoneurons (MNs) respond to 5-HT with an increase inexcitability [1–3]. We and others have previously argued that5-HT2A and 5-HT7 receptors are important in the initiationand control of locomotion [3–12], and that these receptorsmediate hindlimb locomotor recovery produced in paraple-gic animals after replacement of 5-HT neurons into the sub-lesional spinal cord by grafts of fetal brainstem [10, 13]. Oneof the effects of spinal cord transection, which interrupts the5-HT pathway from the brainstem to the spinal cord, is plas-ticity in 5-HT receptors of spinal MNs [14, 15]. The 5-HT7receptors have been implicated in control of MNs or reflexesinvolved in respiration, jaw movement, micturition, and
locomotion [16–21] as well as in the control of pain after spi-nal cord injury [22, 23], while the 5-HT2A receptor has beenimplicated in the control of respiration, development ofspasticity in tail and hindlimb digit MNs, and the recoveryof locomotor capability after spinal cord injury [24–27].Intraspinal grafting of serotonergic neurons leads to func-tional recovery and involves activation of 5-HT2A and 5-HT7 receptors [10]. We asked whether the facilitation oflocomotion by our grafts might be mediated by plasticity inthese key receptors that are necessary for locomotor recovery.
The 5-HT7 receptor protein is found in MNs of the spinalcord [28], with some MN populations (e.g., Onuf’s nucleus)more intensely labeled than others. MNs in the L4 spinalcord, where MNs to hindlimb muscles are located, displayed
HindawiNeural PlasticityVolume 2018, Article ID 4232706, 15 pageshttps://doi.org/10.1155/2018/4232706

a relatively low level of labeling. These receptors have beenshown to have excitatory effects on some MNs, includingphrenic MNs [29] and trigeminal MNs [19], but not hypo-glossal respiratory MNs [30, 31].
The afterhyperpolarization (AHP) in many types of neu-rons is reduced by 5-HT, and this effect may be mediated by5-HT7 receptors [19, 32]. MNs of limb muscles have reducedAHPs during locomotion [33, 34], and lamprey MNs havereduced AHP due to 5-HT [35, 36]. This effect serves as ameans of increasing MN spiking.
The 5-HT2A receptor is abundant in ventral horn MNs[37, 38], with variable expression levels depending upon thefunctional role of the cell. For example, 5-HT2A receptorsare differentially distributed on MNs to the physiologicalextensor soleus muscle and extensor digitorum longus, aphysiological flexor muscle [39]. Plasticity in the 5-HT2Areceptor protein has been examined after sacral spinal cordinjury, where the changes have been suggested to underliethe development of tail spasticity (reviewed in [14, 15]). Con-tusive spinal cord injury at the thoracic level resulted inupregulation of 5-HT2A receptor protein in MNs of therostral dorsolateral nucleus innervating the plantar musclesof the foot, with an associated increase in the H-reflexrecorded from the plantar muscles of the hindpaw [40].Cervical spinal cord hemisections give rise to increased5-HT2A receptor protein in phrenic MNs and their subse-quent increased excitability [27].
Chopek et al. [41] demonstrated that the extensor mono-synaptic reflex in hindlimb MNs of passively cycled spinalrats responded to quipazine (a 5-HT2 agonist). This plasticitycould be related to changes in 5-HT receptors in MNs; 5-HT2A receptor mRNA increased after injury and increasedfurther after passive cycling [42]. An increase in 5-HT2AmRNA after sacral SCI was observed in tail MNs [43].Chopek et al. [42] found no change in 5-HT7 receptorgene expression in lumbar MNs 3 months after spinal cordtransection, but passive cycling increased 5-HT7 receptormRNA. Giroux et al. [44] found spinal 5-HT receptorsincreased at 15 and 30 days after spinal cord injury, butreturned to baseline levels after 60 days or more. They used[3H]8-OH-DPAT to label 5-HT receptors, a ligand that canbind to 5-HT7 receptors.
There is increasing evidence that activation of specificserotonin receptors in the spinal cord is effective for enhanc-ing locomotor recovery in spinal rats [11, 45, 46]. Out ofmany serotonergic receptors present in the spinal cord, the5-HT2A and 5-HT7 receptors are the major ones implicatedin the control of locomotion [3, 6, 7, 12, 25, 47–49]. The mostcommonly used agonists that are effective in enhancing thelocomotor hindlimb movements when applied systemicallyare quipazine, which has high affinity for both 5-HT2A and5-HT2C receptors and 8-hydroxy-2-(di-n-propylamino)-tet-ralin (8-OH-DPAT), which binds selectively to 5-HT7and 5-HT1A receptors [46, 47, 50]. We previously demon-strated that intraspinal grafting of embryonic brainstemtissue containing serotonergic neurons below a thoracictotal transection enhances recovery of hindlimb locomotormovements [10, 13, 51]. We also demonstrated that graft-related recovery is mediated in part by 5-HT2A and 5-HT7
receptors because application of their antagonists diminishedthe restored hindlimb locomotor movements [10, 13]. Con-stitutive activity in 5-HT2 receptors is implicated in therecovery of locomotion after SCI [25, 52], and intrathecalapplication of a selective 5-HT7 receptor antagonist duringunrestrained locomotion in intact adult rats [4] blocks volun-tary locomotion. Similar effects were obtained with 5-HT2antagonists [53].
Here, we hypothesize that the plastic changes in thesereceptors that occur after spinal cord injury might be affectedby the restoration of 5-HT innervation from grafted 5-HTneurons so as to reverse or normalize these changes. Thishypothesis is consistent with the findings that the presenceof 5-HT or other ligands for these receptors can downregu-late, upregulate, or desensitize these 5-HT receptors [54,55]. We tested this hypothesis on identified MNs of the lum-bar enlargement that innervate muscles with known actionsduring locomotion (ankle flexor (TA), extensor (GM), andtail elevator (ECM)), and we attempted to induce plasticityin the receptors on these MNs using thoracic spinal cordtransection. We monitored the changes in receptor mRNAexpression produced in these identified lumbar MNs at 1month and 4 months after spinal cord transection, and wedetermined whether intraspinal grafting of embryonic sero-tonergic neurons in spinal rats reverses the effects of spinaltotal transection on expression of these genes. We show, forthe first time, that intraspinal grafting of embryonic seroto-nergic neurons reverses injury-evoked changes in 5-HT2Aand 5-HT7 receptor gene expression in the MN populationssupplying hindlimb but not tail muscles. We propose thatthese changes may account for the effects of the grafts onneural plasticity responsible for locomotor recoveryachieved by intraspinal grafting of embryonic raphe nucleiin paraplegic rats. A preliminary report of these findingshas been published [56].
2. Materials and Methods
Experiments were performed on WAG (Wistar AlbinoGlaxo) 3-month-old female rats (n = 35) at the time of spi-nal cord injury. All procedures were conducted with care tominimize pain and suffering of animals with the approvalof the First Local Ethics Committee in Poland, accordingto the principles of experimental conditions and laboratoryanimal care of European Union and the Polish Law onAnimal Protection.
2.1. Spinal Cord Transection. Complete spinal cord transec-tion (SCI) was performed (n = 23) at the Th9/10 level underdeep anesthesia (isoflurane: 5% to induce and then main-tained with 2% in oxygen 0.2–0.3 l/min and Butomidor:0.05mg/kg b.w.) as previously described [10]. To preventthe possibility of axonal regrowth through the cavity of thelesion, 1-2mm of spinal cord tissue was aspirated usinga glass pipette. Then, the muscles and fascia overlyingthe paravertebral muscles were closed in layers using sterilesutures, and the skin was closed with stainless steel surgicalclips. After surgery, the animals received a nonsteroidalanti-inflammatory and analgesic treatment (s.c., Tolfedine
2 Neural Plasticity
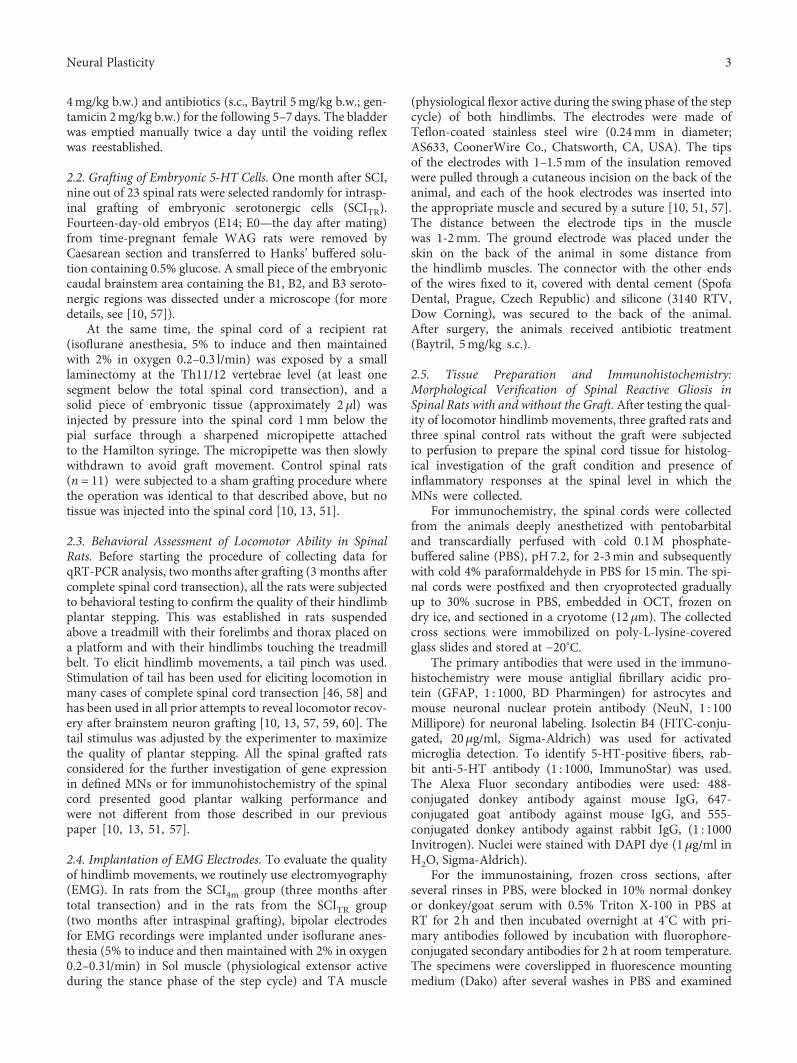
4mg/kg b.w.) and antibiotics (s.c., Baytril 5mg/kg b.w.; gen-tamicin 2mg/kg b.w.) for the following 5–7 days. The bladderwas emptied manually twice a day until the voiding reflexwas reestablished.
2.2. Grafting of Embryonic 5-HT Cells. One month after SCI,nine out of 23 spinal rats were selected randomly for intrasp-inal grafting of embryonic serotonergic cells (SCITR).Fourteen-day-old embryos (E14; E0—the day after mating)from time-pregnant female WAG rats were removed byCaesarean section and transferred to Hanks’ buffered solu-tion containing 0.5% glucose. A small piece of the embryoniccaudal brainstem area containing the B1, B2, and B3 seroto-nergic regions was dissected under a microscope (for moredetails, see [10, 57]).
At the same time, the spinal cord of a recipient rat(isoflurane anesthesia, 5% to induce and then maintainedwith 2% in oxygen 0.2–0.3 l/min) was exposed by a smalllaminectomy at the Th11/12 vertebrae level (at least onesegment below the total spinal cord transection), and asolid piece of embryonic tissue (approximately 2μl) wasinjected by pressure into the spinal cord 1mm below thepial surface through a sharpened micropipette attachedto the Hamilton syringe. The micropipette was then slowlywithdrawn to avoid graft movement. Control spinal rats(n = 11) were subjected to a sham grafting procedure wherethe operation was identical to that described above, but notissue was injected into the spinal cord [10, 13, 51].
2.3. Behavioral Assessment of Locomotor Ability in SpinalRats. Before starting the procedure of collecting data forqRT-PCR analysis, two months after grafting (3 months aftercomplete spinal cord transection), all the rats were subjectedto behavioral testing to confirm the quality of their hindlimbplantar stepping. This was established in rats suspendedabove a treadmill with their forelimbs and thorax placed ona platform and with their hindlimbs touching the treadmillbelt. To elicit hindlimb movements, a tail pinch was used.Stimulation of tail has been used for eliciting locomotion inmany cases of complete spinal cord transection [46, 58] andhas been used in all prior attempts to reveal locomotor recov-ery after brainstem neuron grafting [10, 13, 57, 59, 60]. Thetail stimulus was adjusted by the experimenter to maximizethe quality of plantar stepping. All the spinal grafted ratsconsidered for the further investigation of gene expressionin defined MNs or for immunohistochemistry of the spinalcord presented good plantar walking performance andwere not different from those described in our previouspaper [10, 13, 51, 57].
2.4. Implantation of EMG Electrodes. To evaluate the qualityof hindlimb movements, we routinely use electromyography(EMG). In rats from the SCI4m group (three months aftertotal transection) and in the rats from the SCITR group(two months after intraspinal grafting), bipolar electrodesfor EMG recordings were implanted under isoflurane anes-thesia (5% to induce and then maintained with 2% in oxygen0.2–0.3 l/min) in Sol muscle (physiological extensor activeduring the stance phase of the step cycle) and TA muscle
(physiological flexor active during the swing phase of the stepcycle) of both hindlimbs. The electrodes were made ofTeflon-coated stainless steel wire (0.24mm in diameter;AS633, CoonerWire Co., Chatsworth, CA, USA). The tipsof the electrodes with 1–1.5mm of the insulation removedwere pulled through a cutaneous incision on the back of theanimal, and each of the hook electrodes was inserted intothe appropriate muscle and secured by a suture [10, 51, 57].The distance between the electrode tips in the musclewas 1-2mm. The ground electrode was placed under theskin on the back of the animal in some distance fromthe hindlimb muscles. The connector with the other endsof the wires fixed to it, covered with dental cement (SpofaDental, Prague, Czech Republic) and silicone (3140 RTV,Dow Corning), was secured to the back of the animal.After surgery, the animals received antibiotic treatment(Baytril, 5mg/kg s.c.).
2.5. Tissue Preparation and Immunohistochemistry:Morphological Verification of Spinal Reactive Gliosis inSpinal Rats with and without the Graft.After testing the qual-ity of locomotor hindlimb movements, three grafted rats andthree spinal control rats without the graft were subjectedto perfusion to prepare the spinal cord tissue for histolog-ical investigation of the graft condition and presence ofinflammatory responses at the spinal level in which theMNs were collected.
For immunochemistry, the spinal cords were collectedfrom the animals deeply anesthetized with pentobarbitaland transcardially perfused with cold 0.1M phosphate-buffered saline (PBS), pH7.2, for 2-3min and subsequentlywith cold 4% paraformaldehyde in PBS for 15min. The spi-nal cords were postfixed and then cryoprotected graduallyup to 30% sucrose in PBS, embedded in OCT, frozen ondry ice, and sectioned in a cryotome (12μm). The collectedcross sections were immobilized on poly-L-lysine-coveredglass slides and stored at −20°C.
The primary antibodies that were used in the immuno-histochemistry were mouse antiglial fibrillary acidic pro-tein (GFAP, 1 : 1000, BD Pharmingen) for astrocytes andmouse neuronal nuclear protein antibody (NeuN, 1 : 100Millipore) for neuronal labeling. Isolectin B4 (FITC-conju-gated, 20μg/ml, Sigma-Aldrich) was used for activatedmicroglia detection. To identify 5-HT-positive fibers, rab-bit anti-5-HT antibody (1 : 1000, ImmunoStar) was used.The Alexa Fluor secondary antibodies were used: 488-conjugated donkey antibody against mouse IgG, 647-conjugated goat antibody against mouse IgG, and 555-conjugated donkey antibody against rabbit IgG, (1 : 1000Invitrogen). Nuclei were stained with DAPI dye (1μg/ml inH2O, Sigma-Aldrich).
For the immunostaining, frozen cross sections, afterseveral rinses in PBS, were blocked in 10% normal donkeyor donkey/goat serum with 0.5% Triton X-100 in PBS atRT for 2 h and then incubated overnight at 4°C with pri-mary antibodies followed by incubation with fluorophore-conjugated secondary antibodies for 2h at room temperature.The specimens were coverslipped in fluorescence mountingmedium (Dako) after several washes in PBS and examined
3Neural Plasticity

on either a Zeiss Fluorescence Microscope Axio Imager.M2 ora Leica SP5 Laser Scanning Confocal Microscope.
2.6. Motoneuron Labeling. One week before the animaleuthanasia, populations of MNs innervate the following mus-cles: TA of the right hindlimb, GM of the left hindlimb, andECM of the right side of the tail were labeled by intramuscu-lar injection by cholera toxin subunit B (CTB) coupled withAlexa Fluor 555 dye (see examples of CTB-labeled MNsinnervating TA, GM, and ECM muscles in Figure 1). TheTA and GM muscles were selected on the left and right sidesto provide easy differentiation between the two MN poolsinnervating these two muscles when the same type of labelingwas used in both of them. Also, the left ECM pool MN label-ing (the most caudally localized) is a marker of the left sidehelping in identification of the GM MN pool. At the sametime, the ECM and TAMN pools are separated with the mostrostrocaudal distance. The ECM muscle was also selectedbecause it plays a role in elevation of the tail, an indicatorof functional recovery after spinal cord injury, according tothe BBB score [61]. Animals were anesthetized using isoflur-ane (5% to induce and then maintained with 2% in oxygen0.2–0.3 l/min), and proper muscles were exposed by smallskin incisions enabling injection with 0.5% CTB using Ham-ilton syringe (TA and GMmuscles 3× 15μl of CTB and ECMmuscle 2× 20μl of CTB). The CTB injection was performedover a period of 2 minutes, the needle was slowly (2min)withdrawn, and the skin incision was closed.
2.7. Htr2a and Htr7 Gene Expression Analysis
2.7.1. Experiment Scheme. In order to examine the Htr2a andHtr7 gene expression in MNs innervating selected hindlimband tail muscles, we performed experiments on 29 WAGfemale rats, in which specific motoneuron pools were labeledby injection of retrograde tracer molecules into a target mus-cle. Our investigations were performed on rats from four
experimental groups: INT: intact (n = 12); SCITR: spinal cordinjury followed by intraspinal transplantation of embryonicbrainstem tissue containing serotonergic neurons (n = 6);SCI1m: 1 month after spinal cord injury (n = 5); SCI4m: 4months after spinal cord injury (n = 6)-the time matchedwith the time of euthanasia of rats from the SCITR group.
Animals from the SCI1m and SCI4m groups were sub-jected to a spinal cord total transection procedure performedat the thoracic level. Animals from the INT group were thecontrol animals that were not subjected to any procedure.Animals from the SCITR group received an intraspinal graftof 14-day-old rat embryonic brainstem one month after spi-nal cord total transection. Three months after intraspinalgrafting in SCITR group and four months after completetransection in rats of both groups, SCITR and SCI4m (sevendays after motoneuron tracer injection with cholera toxinsubunit B coupled with Alexa Fluor 555) rats were transcar-dially perfused with PBS solution to remove any blood-borne 5-HT receptors, and the spinal cord was dissectedand prepared for further analysis (animals from the SCI4mand SCITR groups were euthanized 4 months after spinalcord total transection).
2.7.2. Laser Capture Microdissection (LCM) of SelectedMotoneurons. Spinal cord tissue was collected from animalsthat were deeply anesthetized and transcardially perfusedwith PBS solution. Then, the spinal cords were immediatelydissected and frozen by fast immersion in isopentane(−80°C) and stored at −80°C until future processing. Hori-zontal sections (20μm) of the lumbar-sacral spinal cord frag-ment were cut on the cryostat in −20°C and mounted on PENMembrane Frame Slides (Applied Biosystems). Slides werestored at −80°C until future use.
Slides were dehydrated by immersion in increasingconcentrations (70%, 90%, and 100%) of ethyl alcohol(ETOH) followed by immersion in xylene. Motoneuroncollection was performed using an Arcturus Laser
GM
TA
ECM
(a)
ECM
(b)
GM
(c)
TA
(d)
Figure 1: (a) Examples of labeled motoneurons (cholera toxin subunit B coupled with Alexa Fluor 555) innervating selectedmuscles: extensorcaudae medialis (ECM) of the right side (b), gastrocnemius lateralis (GM) in the left hindlimb (c), and tibialis anterior (TA) in the righthindlimb (d). Scale bar: 50μm.
4 Neural Plasticity

Microdissection System (Applied Biosystems). Tissue sec-tions were photographed using a filter set for Alexa Fluor555 to identify CTB-labeled MNs. Individual MNs weredissected using UV laser and collected on Cap Sure MacroLCM Caps (Applied Biosystems). After incubation in lysisbuffer (Arcturus Pico Pure RNA Isolation Kit, Applied Bio-systems) for 30 minutes, the samples were stored at −80°Cuntil future processing.
2.7.3. RNA Isolation. RNA was isolated using an Arcturus PicoPure RNA Isolation Kit (Applied Biosystems) according to themanufacturer’s instructions. Any residual genomic DNA wasremoved using supplementary DNAse I (RQ1 RNase-FreeDNase, Promega) treatment. Three independent measure-ments of RNA concentration were obtained using NanoDrop(Thermo Scientific). RNA samples were pooled by mixing thesame RNA amount isolated from one motoneuron populationfrom all rats in a particular experimental group (i.e., equalamounts of RNA collected from the particular selected moto-neuron populations in different rats in the same experimentalgroup were pooled). RNA samples were stored at −80°C.
2.7.4. Reverse Transcription PCR and cDNA Preamplification.Reverse transcription PCR (RT-PCR) was performed in aMJMini Personal Thermal Cycler (Bio-Rad) using aHigh Capac-ity cDNA Reverse Transcription Kit (Applied Biosystems)according to the manufacturer’s instructions (10min, 25°C;120min, 37°C; 5min, 85°C; storage 4°C) with use of 31ngof purified RNA as a sample. Synthesized cDNA was storedat −20°C for future use.
Preamplification was performed to increase the numberof cDNA copies to the level necessary for accurate detectionin the real-time PCR reaction. cDNA was preamplified inMJ Mini Personal Thermal Cycler (Bio-Rad) using TaqManPreAmp Master Mix Kit (Applied Biosystems). Reactionswere conducted in standard conditions according to the pre-amplification kit manufacturer’s instructions: 95°C for10min; then 14 cycles: 95°C for 15 s; 60°C for 4min.
2.7.5. Real-Time PCR. Expression of the Htr2a and Htr7genes (encoding the 5-HT2A and 5-HT7 receptors, resp.) inthe selected MN populations was measured by semiquantita-tive real-time PCR (qRT-PCR) using a Step One Plus(Applied Biosystems) thermocycler and TaqMan gene-specific FAM/MGB assays (Applied Biosystems). Ppia geneencoding cyclophilin A was used as the housekeeping gene.The description of TaqMan assays used in the qRT-PCRreaction is shown in Table 1.
Reactions were run in triplicate for each sample and foreach assay in 20μl reaction mix prepared in accordance withTaqMan Gene Expression Master Mix (Applied Biosystems)
manufacturer recommendations. Reactions were run in stan-dard, recommended by TaqMan Gene Expression MasterMix manufacturer conditions (2min, 50°C; 10min, 95°C;then 40 cycles: 15 s, 95°C; 1min, 60°C). Relative expressionlevels of analyzed genes were then calculated using the com-parative CT method.
2.8. Statistical Analysis. For comparison of results from twoexperimental groups, Student’s t-test analysis was used afternormal distribution was confirmed using Shapiro-Wilk test(Prism, GraphPad Software, La Jolla, CA). For statisticalanalysis of the results collected from qRT-PCR of more thantwo experimental groups that were expressed in relation tothose established in INT rats, the nonparametric Kruskal-Wallis test for multiple independent sample comparisonfollowed by Conover post hoc (further adjusted by the Holmfamily-wise error rate (FWER) method and in one case themethod of Benjamini-Hochberg false discovery rate (FDR)when the FWER method just approached significance) wasused (http://astatsa.com/KruskalWallisTest/).
3. Results
3.1. Locomotor Ability in Spinal Rats. As we published before,the SCI rats (SCI1m and SCI4m) presented very limited hin-dlimb movements [10, 11, 13, 46, 51]. Usually, their hin-dlimbs were outstretched passively behind the hindquarterswithout any spontaneous hindlimb movement present andthere was hardly any EMG activity recorded in the hindlimbflexor (TA) and extensor (Sol) muscles (Figure 2(a)). In con-trast, the hindlimbs of the SCITR rats moving in the homecage were abducted with partial flexion in the ankle joint orflexed at all joints with the foot plantar surface touching theground, but without noticeable body weight support in spitepresence of some EMG activity in hindlimb Sol and TAmus-cles (Figure 2(c)). Tail pinching in SCI rats suspended over atreadmill induced only irregular, limited hindlimb move-ments characterized by obvious lack of body weight supportwith no plantar stepping. EMG activity of hindlimb flexorand extensor muscles was irregular with lack of the long burstof Sol EMG activity related to the stance phase of the stepcycle that is observed in normal locomotor activity of intactrats (Figure 2(b)). In SCITR rats suspended over the treadmill,tail pinch was effective to induce regular plantar hindlimbwalking with nice regular EMG muscle activity with typicalalternating pattern of EMG Sol versus TA bursts of activityand long burst of Sol related to the stance phase of step cyclein both hindlimbs (Figure 2(d)).
3.2. Morphological Verification of Reactive Gliosis in SpinalRats with and without the Graft. As we published before
Table 1: Description of assays used in real-time PCR.
Gene symbol Reference number Gene name Assay ID Amplicon length
Ppia NM_017101.1 Cyclophilin A Rn00690933_m1 149
Htr2a NM_017254.1 Receptor 5-HT2A Rn00568473_m1 71
Htr7 NM_022938.2 Receptor 5-HT7 Rn00576048_m1 85
5Neural Plasticity
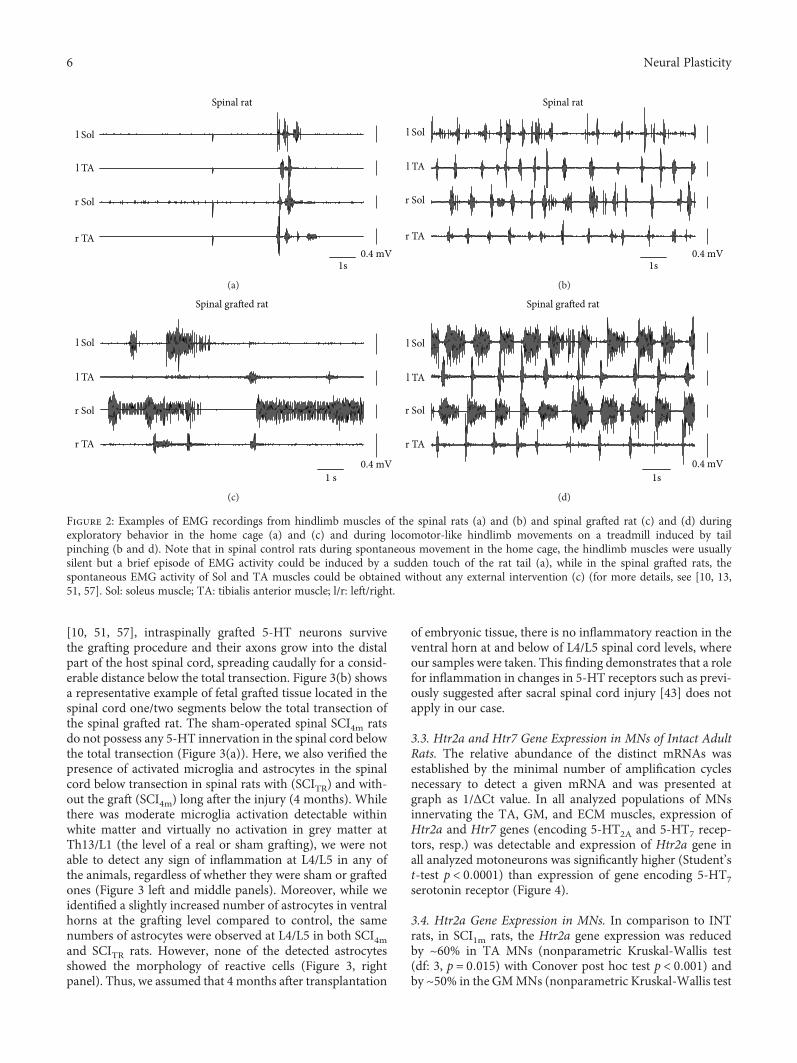
[10, 51, 57], intraspinally grafted 5-HT neurons survivethe grafting procedure and their axons grow into the distalpart of the host spinal cord, spreading caudally for a consid-erable distance below the total transection. Figure 3(b) showsa representative example of fetal grafted tissue located in thespinal cord one/two segments below the total transection ofthe spinal grafted rat. The sham-operated spinal SCI4m ratsdo not possess any 5-HT innervation in the spinal cord belowthe total transection (Figure 3(a)). Here, we also verified thepresence of activated microglia and astrocytes in the spinalcord below transection in spinal rats with (SCITR) and with-out the graft (SCI4m) long after the injury (4 months). Whilethere was moderate microglia activation detectable withinwhite matter and virtually no activation in grey matter atTh13/L1 (the level of a real or sham grafting), we were notable to detect any sign of inflammation at L4/L5 in any ofthe animals, regardless of whether they were sham or graftedones (Figure 3 left and middle panels). Moreover, while weidentified a slightly increased number of astrocytes in ventralhorns at the grafting level compared to control, the samenumbers of astrocytes were observed at L4/L5 in both SCI4mand SCITR rats. However, none of the detected astrocytesshowed the morphology of reactive cells (Figure 3, rightpanel). Thus, we assumed that 4 months after transplantation
of embryonic tissue, there is no inflammatory reaction in theventral horn at and below of L4/L5 spinal cord levels, whereour samples were taken. This finding demonstrates that a rolefor inflammation in changes in 5-HT receptors such as previ-ously suggested after sacral spinal cord injury [43] does notapply in our case.
3.3. Htr2a and Htr7 Gene Expression in MNs of Intact AdultRats. The relative abundance of the distinct mRNAs wasestablished by the minimal number of amplification cyclesnecessary to detect a given mRNA and was presented atgraph as 1/ΔCt value. In all analyzed populations of MNsinnervating the TA, GM, and ECM muscles, expression ofHtr2a and Htr7 genes (encoding 5-HT2A and 5-HT7 recep-tors, resp.) was detectable and expression of Htr2a gene inall analyzed motoneurons was significantly higher (Student’st-test p < 0 0001) than expression of gene encoding 5-HT7serotonin receptor (Figure 4).
3.4. Htr2a Gene Expression in MNs. In comparison to INTrats, in SCI1m rats, the Htr2a gene expression was reducedby ~60% in TA MNs (nonparametric Kruskal-Wallis test(df: 3, p = 0 015) with Conover post hoc test p < 0 001) andby ~50% in the GMMNs (nonparametric Kruskal-Wallis test
0.4 mV1s
l Sol
r TA
l TA
r Sol
Spinal rat
(a)
1s0.4 mV
l Sol
r TA
l TA
r Sol
Spinal rat
(b)
0.4 mV1 s
l Sol
r TA
l TA
r Sol
Spinal grafted rat
(c)
0.4 mV1s
l Sol
r TA
l TA
r Sol
Spinal grafted rat
(d)
Figure 2: Examples of EMG recordings from hindlimb muscles of the spinal rats (a) and (b) and spinal grafted rat (c) and (d) duringexploratory behavior in the home cage (a) and (c) and during locomotor-like hindlimb movements on a treadmill induced by tailpinching (b and d). Note that in spinal control rats during spontaneous movement in the home cage, the hindlimb muscles were usuallysilent but a brief episode of EMG activity could be induced by a sudden touch of the rat tail (a), while in the spinal grafted rats, thespontaneous EMG activity of Sol and TA muscles could be obtained without any external intervention (c) (for more details, see [10, 13,51, 57]. Sol: soleus muscle; TA: tibialis anterior muscle; l/r: left/right.
6 Neural Plasticity

(df: 3, p = 0 019) with Conover post hoc test p < 0 01) andincreased by 103% in ECM MNs (nonparametric Kruskal-Wallis test (df: 3, p = 0 015) with Conover post hoc p <0 0001) when normalized to the Htr2a gene expression inMNs of INT animals (Figure 5).
In SCI4m rats, the Htr2a gene expression was also lowerthan in INT rats (~45% of INT) in TA MNs (Conover posthoc test p < 0 001) and GM MNs (Conover post hoc test p <0 05). There was also a small difference in gene expression inSCI4m rats in comparison to SCI1m rats (Conover post hoc testp < 0 05) in MNs of both TA and GM muscles. In SCI4m, theHtr2a gene expression in the ECM MNs decreased by ~44%(Conover post hoc p < 0 001) in comparison to the geneexpression level measured in SCI1m rats. Expression of theHtr2a gene in TA and GM MNs of SCI4m rats was still muchlower than expression of this gene in INT rats (Figure 5).
Intraspinal grafting of embryonic brainstem serotonergicneurons reversed to some extent changes in the Htr2a geneexpression observed in the TA and GM MNs of SCI1m rats(Figure 5). Expression of the Htr2a gene in TA and in GMMNs in SCITR rats was significantly higher by 112% and110%, respectively, than that in SCI1m (Conover post hoctest p < 0 001 for both MN populations) and by 52% and93%, respectively, than that in SCI4m (Conover post hoc testp < 0 05 and p < 0 01, resp., for both MN populations).However, Htr2a gene expression remained ~14% lower incomparison to MNs of INT TA (Conover post hoc test p <0 05) but in the GM MNs was restored to the level of INT(Conover post hoc test p > 0 05). The expression of theHtr2a gene in ECM MNs of SCITR rats remained increasedby ~25% in comparison to that in MNs of INT rats (Conoverpost hoc test p < 0 001).
IB4 5-HT DAPI IB4 NeuN 5-HT DAPI GFAP 5-HT DAPI
SCI4
m (Th
13/L
1)SC
I 4m
(L4/
5)
(a)
IB4 5-HT DAPI IB4 NeuN 5-HT DAPI GFAP 5-HT DAPI
SCIT
R (Th
13/L
1)SC
I TR
(L4/
5)
(b)
Figure 3: Immunofluorescent detection of inflammatory response in control SCI4m (a) and transplanted SCITR (b) rats at 4 months after totalspinal transection and 3 months after transplantation (sham grafting in SCI4m). The first panel shows general view of spinal cord cross sectionlabeled with isolectin B4 (IB4) to visualize activated microglia in low power; the next two panels show boxed area labeled with IB4 (green; leftand middle panel) for microglia and GFAP (green; right panel) for astrocytes, reimaged using confocal microscope. Note grafted tissue atTh13/L1 and serotonin-positive fibers (5-HT, red) located closely to ventral horn motoneurons (NeuN; purple) at L4/L5. Representativeimages: scale bar: 500μm and 50 μm in low- and high-power images, respectively.
7Neural Plasticity

3.5. Htr7 Gene Expression in MNs. In SCI1m rats, the Htr7gene expression was reduced by ~22% in TAMNs (nonpara-metric Kruskal-Wallis test (df: 3, p = 0 015) with Conoverpost hoc test p < 0 001), by ~50% in GMMNs (nonparamet-ric Kruskal-Wallis test (df: 3, p = 0 022) with Conover posthoc test p < 0 05), and by ~20% in ECM MNs (nonparamet-ric Kruskal-Wallis test (df: 3, p = 0 025) with Conover posthoc test p < 0 001) when normalized to theHtr7 gene expres-sion in MNs of INT animals (Figure 6).
In SCI4m rats, the Htr7 gene expression was also lowerthan in INT rats in TA MNs (Conover post hoc test p <0 05) and in GM MNs (Conover post hoc test p < 0 01).There was also a small increase in gene expression in SCI4mrats in comparison to SCI1m rats (Conover post hoc testp < 0 05) in TA MNs but remained significantly lower incomparison to that of INT (p < 0 01). In MNs of GMmuscle,Htr7 gene expression was unchanged (Conover post hoc testp > 0 05) in comparison to that of SCI1m rats but remainedlower in comparison to that of INT (Conover post hoc testp < 0 01). In SCI4m, the Htr7 gene expression in the ECMMNs increased by ~12% (Conover post hoc test p < 0 05) incomparison to the gene expression level measured in SCI1mrats (Figure 6).
Intraspinal grafting of embryonic brainstem serotonergicneurons reversed changes in the Htr7 gene expressionobserved in the TA and GM MNs of SCI1m rats (Figure 6).Expression of the Htr7 gene in the TA MNs (nonparametricKruskal-Wallis test (df: 3, p = 0 015) with post hoc Conovermethod for multiple comparisons p < 0 001) and in the GMMNs (nonparametric Kruskal-Wallis test p = 0 022 and
Conover post hoc adjusted with FDR method for multiplecomparisons p < 0 05) in SCITR rats was higher than that inthe INT rats. Expression of the Htr7 gene in SCITR signifi-cantly increased by ~109% (Conover post hoc p < 0 01) and~215% (Conover post hoc test p < 0 001) in the TA andGM MNs, respectively, in comparison to the Htr7 geneexpression in the SCI1m and by ~86% (Conover post hocp < 0 001) and ~215% (Conover post hoc test p < 0 001)in the TA and GM MNs, respectively, in comparison to theHtr7 gene expression in SCI4m rats. On the other hand, inthe ECM MNs, expression of the Htr7 gene in the SCITR ratswas not different in comparison to theHtr7 expression in theSCI4m rats (nonparametric Kruskal-Wallis (df: 3, p = 0 025with Conover post hoc p = 0 81)).
4. Discussion
In our previous papers, we demonstrated that intraspinalgrafting of embryonic neurons destined to form the descend-ing 5-HT system of the rat brain stem effectively restorescoordinated plantar stepping in adult spinal rats [10, 13, 51,57]. We also demonstrated that such recovery is mediatedby 5-HT2A and 5-HT7 serotonergic receptors [10, 13].
In the present paper, we confirmed expression of theHtr2a and Htr7 genes in MN populations of intact and para-plegic rats. We showed for the first time that intraspinaltransplantation of rat E14 embryo brainstem containingserotonergic neurons increases expression of these genes inthe TA and GM hindlimb MNs in comparison to ungraftedspinal animals. We found that 5-HT7 receptor mRNA wasdecreased at 1 month and 4 months after spinal cord injuryin all 3 types of MNs. In the presence of the grafts, 5-HT7mRNA levels increased above those at 1 and 4 months andwere significantly different from the intact condition in TA,GM, and ECMMNs. The graft tended to reverse the decreasein 5-HT7 receptor mRNA in TA and GM MNs, with a sus-tained increase after 4 months in the grafted rats. The graftsdid not have such an effect in ECM (tail) MNs. One monthafter SCI, 5-HT2A receptor mRNA decreased in flexor andextensor MNs, while it increased in tail MNs. Flexor andextensor MNs had decreased 5-HT2A mRNA after 4 months,while 5-HT2A mRNA in the tail MNs decreased in compari-son to that observed one month after SCI but remainedslightly higher than that in INT. Grafting resulted in 5-HT2A mRNA levels that did not differ from the intact condi-tion in GM MNs, but 5-HT2A mRNA expression continuedto be slightly downregulated in TA MNs and upregulated inECM MNs. It is possible to conclude that the presence ofthe grafts tended to normalize the levels of 5-HT receptormRNA in limb muscle MNs, as predicted by our hypothesis,but not in MNs of tail muscle. A possible mechanism for theeffect of the grafts might be that increasedHtr2a gene expres-sion may be a consequence of the increased presence of 5-HTderived from the graft, which can occur in some cells [62].The mechanism for regulation of Htr2a gene expression inMNs of different types may vary. This is a suitable topic forfurther research.
Our data showing 5-HT2A mRNA upregulation in ECMis similar to findings on receptor protein upregulation in
Gen
e exp
ress
ion
(1/Δ
Ct)
Htr2aHtr7
ECM0
0.1
0.2
0.3
TA GM
⁎⁎⁎ ⁎⁎⁎ ⁎⁎⁎
Figure 4: Expression level of Htr2a and Htr7 genes (encoding 5-HT2A and 5-HT7 receptors, resp.) in motoneuron populationsinnervating TA, GM, and ECM muscles in intact adult rats.Expression levels of Htr2a and Htr7 genes were normalized to theexpression level of the constitutively active Ppia (cyclophyline A)gene and was presented as the 1/ΔCt value of the analyzed genes.Student’s t-test ∗∗∗p < 0 0001. Data are presented asmean ± standard deviation (mean ± SD). TA: tibialis anteriormuscle; GM: gastrocnemius muscle; ECM: extensor caudaemedialis muscle.
8 Neural Plasticity
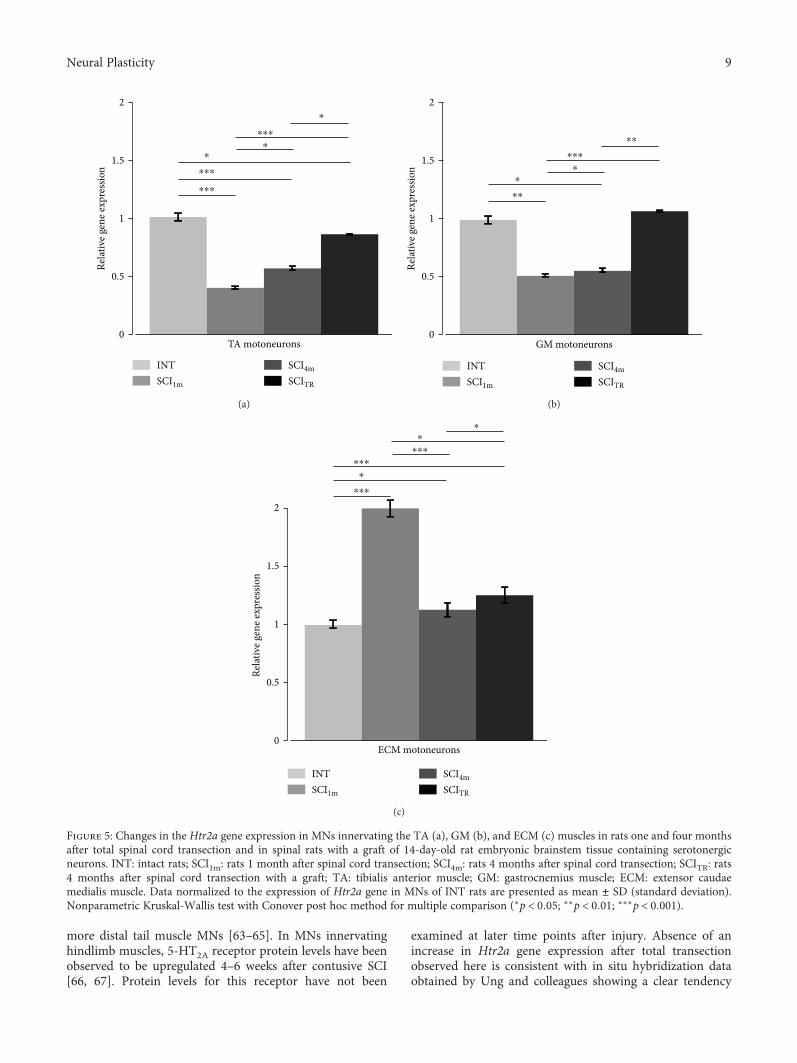
more distal tail muscle MNs [63–65]. In MNs innervatinghindlimb muscles, 5-HT2A receptor protein levels have beenobserved to be upregulated 4–6 weeks after contusive SCI[66, 67]. Protein levels for this receptor have not been
examined at later time points after injury. Absence of anincrease in Htr2a gene expression after total transectionobserved here is consistent with in situ hybridization dataobtained by Ung and colleagues showing a clear tendency
0
0.5
1
1.5
2Re
lativ
e gen
e exp
ress
ion
TA motoneurons
INTSCI1m
SCI4mSCITR
⁎
⁎
⁎
⁎⁎⁎
⁎⁎⁎
⁎⁎⁎
(a)
0
0.5
1
1.5
2
Relat
ive g
ene e
xpre
ssio
n
INTSCI1m
SCI4mSCITR
GM motoneurons
⁎
⁎
⁎⁎
⁎⁎⁎
⁎⁎
(b)
0
0.5
1
1.5
2
Relat
ive g
ene e
xpre
ssio
n
INTSCI1m
SCI4mSCITR
ECM motoneurons
⁎
⁎
⁎
⁎⁎⁎
⁎⁎⁎
⁎⁎⁎
(c)
Figure 5: Changes in the Htr2a gene expression in MNs innervating the TA (a), GM (b), and ECM (c) muscles in rats one and four monthsafter total spinal cord transection and in spinal rats with a graft of 14-day-old rat embryonic brainstem tissue containing serotonergicneurons. INT: intact rats; SCI1m: rats 1 month after spinal cord transection; SCI4m: rats 4 months after spinal cord transection; SCITR: rats4 months after spinal cord transection with a graft; TA: tibialis anterior muscle; GM: gastrocnemius muscle; ECM: extensor caudaemedialis muscle. Data normalized to the expression of Htr2a gene in MNs of INT rats are presented as mean ± SD (standard deviation).Nonparametric Kruskal-Wallis test with Conover post hoc method for multiple comparison (∗p < 0 05; ∗∗p < 0 01; ∗∗∗p < 0 001).
9Neural Plasticity
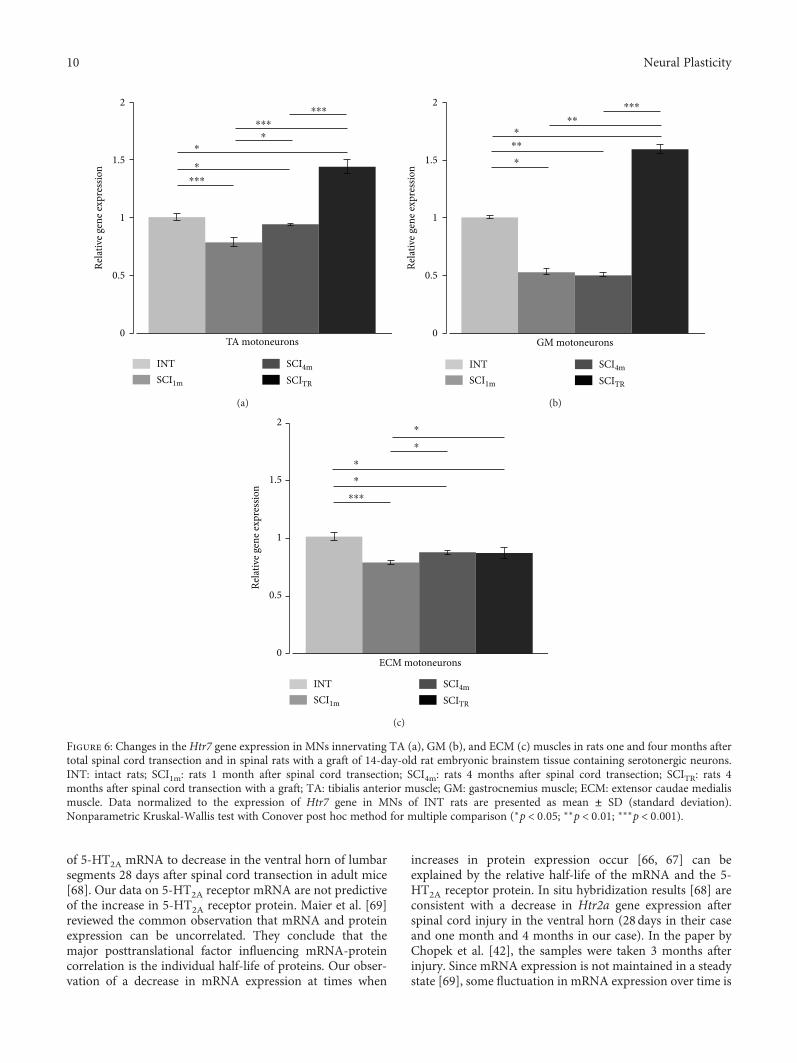
of 5-HT2A mRNA to decrease in the ventral horn of lumbarsegments 28 days after spinal cord transection in adult mice[68]. Our data on 5-HT2A receptor mRNA are not predictiveof the increase in 5-HT2A receptor protein. Maier et al. [69]reviewed the common observation that mRNA and proteinexpression can be uncorrelated. They conclude that themajor posttranslational factor influencing mRNA-proteincorrelation is the individual half-life of proteins. Our obser-vation of a decrease in mRNA expression at times when
increases in protein expression occur [66, 67] can beexplained by the relative half-life of the mRNA and the 5-HT2A receptor protein. In situ hybridization results [68] areconsistent with a decrease in Htr2a gene expression afterspinal cord injury in the ventral horn (28 days in their caseand one month and 4 months in our case). In the paper byChopek et al. [42], the samples were taken 3 months afterinjury. Since mRNA expression is not maintained in a steadystate [69], some fluctuation in mRNA expression over time is
Relat
ive g
ene e
xpre
ssio
n
TA motoneurons
INTSCI1m
SCI4m
SCITR
0
0.5
1
1.5
2⁎⁎⁎
⁎⁎⁎
⁎⁎⁎
⁎
⁎
⁎
(a)
INTSCI1m
SCI4m
SCITR
GM motoneurons
Relat
ive g
ene e
xpre
ssio
n
0
0.5
1
1.5
2 ⁎⁎⁎
⁎⁎
⁎⁎
⁎
⁎
(b)
INTSCI1m
SCI4m
SCITR
ECM motoneurons
Relat
ive g
ene e
xpre
ssio
n
0
0.5
1
1.5
2⁎
⁎
⁎
⁎
⁎⁎⁎
(c)
Figure 6: Changes in the Htr7 gene expression in MNs innervating TA (a), GM (b), and ECM (c) muscles in rats one and four months aftertotal spinal cord transection and in spinal rats with a graft of 14-day-old rat embryonic brainstem tissue containing serotonergic neurons.INT: intact rats; SCI1m: rats 1 month after spinal cord transection; SCI4m: rats 4 months after spinal cord transection; SCITR: rats 4months after spinal cord transection with a graft; TA: tibialis anterior muscle; GM: gastrocnemius muscle; ECM: extensor caudae medialismuscle. Data normalized to the expression of Htr7 gene in MNs of INT rats are presented as mean ± SD (standard deviation).Nonparametric Kruskal-Wallis test with Conover post hoc method for multiple comparison (∗p < 0 05; ∗∗p < 0 01; ∗∗∗p < 0 001).
10 Neural Plasticity

to be expected. For example, in laser-captured phrenic moto-neurons [70], mRNA for 5-HT2A receptors was upregulated14 days after cervical hemisection, but had returned to nor-mal or below at 21 days. Fuller et al. [27], in contrast, foundupregulation of 5-HT2A protein after 7–14 days in the samepreparation (cervical hemisection). The decrease in Htr2agene expression may be an autoregulatory response toincreased receptor density [71].
Chopek and others [42] found significant increases inHtr2a gene expression in motoneurons innervating hindlimbflexor and extensor muscles after spinal cord transection.This is not surprising given the frequent absence of correla-tion between gene and protein expression after injury. Whatmight account for the differences between our findings andthose of Chopek et al? They might be an effect of differentselection of motoneurons for analysis. We compared MNsinnervating TA with those innervating GM based upon thefact that these muscles have comparable composition of thethree types of motor units, but they are different in function(extensor versus flexor). Chopek and others collected MNsinnervating both soleus and gastrocnemius lateralis musclesto the extensor pool and MNs innervating extensor digi-torum longus and tibialis anterior muscles to the flexor pool.Soleus is a typical slow muscle, and extensor digitorumlongus is a typical fast muscle, so including these MNs intheir extensor and flexor pools, respectively, may have influ-enced the results. MNs of different sizes may express 5-HT2Areceptors differently, and they react differently to spinal cordinjury [72]. Moreover, Chopek and others [42] use SDHA asthe reference gene for qPCR analysis, which may have influ-enced the results, because expression of this gene may bealtered by spinal cord injury. This is the case after disuse inmicrogravity, and it appears to induce changes in SDHAexpression differently in motoneurons of different sizes [73,74]. We selected the Ppia gene after Navarrett and others[75], who verified it as suitable for use in spinal cord tissueafter injury. We also eliminated any effects of 5-HT receptorsin blood [76] by perfusing the rat with PBS before dissectingthe spinal cord and further preparation for laser capture ofthe motoneurons, whereas this was not done by others whoobserved an increase in 5-HT2A mRNA [42, 43]. In the DiNarzo et al. [43] study, the sample was taken from the sacralcord and was not limited to motoneurons. Another possibleexplanation for the differences between our observations on5-HT2A mRNA levels after injury and those of Chopeket al. [42] and Di Narzo et al. [43] is that they usedSprague-Dawley rats, while WAG (Wistar Albino Glaxo) ratswere used in our study.
Di Narzo et al. [43] described recently that in rat spinalcord, the mRNA expression of Htr2c gene is influenced byinflammation caused by total transection at the sacral level(0.6mm below and above the SCI). Our analysis of theinflammatory responses in the spinal cord of spinal ratswith and without a graft revealed that in the ventral hornof the lumbar segments (6mm below the graft site—theshortest distance below the graft that MNs of TA andGM muscles were collected), there was no increased levelof astrocytes and no presence of activated microglia. Thus,inflammation induced by intraspinal grafting is not likely to
be responsible for the observed changes in Htr2a and Htr7gene expression.
There is good evidence for constitutive activity in 5-HT2receptors in sacral MNs after S2 spinal cord injury (reviewedin [14]), but the evidence that this is true in MNs innervatinglimb muscles is less complete. The degree of constitutiveactivity of 5-HT2A receptors is thought to be dependent uponmRNA expression [75]. The reduction in mRNA after SCImay be interpreted as an indication of decreased constitutiveactivity in both 5-HT2A and 5-HT7 receptors. Our findingthat limb motoneuron 5-HT2A and 5-HT7 mRNA expressionis increased by the grafts could therefore reflect an increase inconstitutive activity in these receptors. Whether this canaccount for the efficacy of the grafts for improving locomotorrecovery in paraplegic rats will require further investigation.These results suggest that the mechanisms regulating 5-HTreceptor mRNA expression in limb and tail MNs after SCImight be different.
Our results showing 5-HT7 receptor mRNA upregulationafter grafting provides support for the suggestion that the graftimproves locomotion by increasing the role of this receptor intheseMNs. Both 5-HT2A and 5-HT7 receptors are expressed inphrenic MNs, and both receptors facilitate spinal motor plas-ticity [77, 78]. Their coexistence results in mutual crosstalkinhibition (Fuller and Mitchell respiratory neuroplasticity)due to the downstream effects induced by Gq (5-HT2A) andGs (5-HT7) activation. The details of this crosstalk inhibitionare not well defined, but this factor needs to be taken intoaccount if the function of neurons expressing both these Gprotein receptors is to be understood. In the case of limbmotoneurons, it is possible that such crosstalk inhibition couldresult in mutual downregulation of receptor expression. Fur-ther investigations of the effects of 5-HT7 receptors on limbmotoneurons are warranted. A description of the mechanismsinvolved in the increased expression of RNAs for both recep-tors induced by the grafts will require further investigation.
5-HT7 receptors appear to be expressed in limb MNs, buttheir role in controlling motoneuron function has not beenestablished. Zhang [79] found that a 5-HT7 receptor agonistproduced depolarization when applied iontophoreticallyonto lumbar MNs in cat spinal cord. MN excitability mightbe increased if 5-HT7 receptors mediated a reduction in theafterhyperpolarization in limb MNs, which appears to bethe case in trigeminal MNs [19]. LimbMNAHPs are reducedby iontophoretically applied 5-HT [80], but the receptorresponsible for this effect has not been determined. Theseissues need to be investigated, along with the possibility ofinhibitory crosstalk between 5-HT2A and 5-HT7 receptorswhich occurs in phrenic motoneurons [77, 78], when bothreceptors are present in the same cell.
5. Conclusion
Our results indicate that thoracic spinal cord transectionleads to changes in Htr2a and Htr7 gene expression, whereastransplantation of embryonic serotonergic neurons reversesthese changes in MNs innervating hindlimb muscles butnot those innervating the tail muscle. These differences inHtr2a and Htr7 gene expression between MNs innervating
11Neural Plasticity
hindlimb and tail muscles can be a result of the distance fromthe graft to the motoneurons. The fibers of grafted 5-HT neu-rons do not extend farther than to the level of L4-L5 lumbarsegments [10, 57], so motoneurons innervating the ECMmuscle may not be supplied by serotonergic innervation ofgraft origin. Alternatively, it may be that motoneurons thatinnervate tail muscles have unique adaptations to spinalinjury and the effects of intraspinal grafts of 5-HT neurons,such as reliance on constitutive activity of 5-HT2 receptorsafter spinal cord injury. Increased Htr2a and Htr7 geneexpression induced by the graft could restore motoneuronexcitability and lead to improved motor function, such aswe observed in the grafted rats [10, 57]. Here, we show forthe first time that changes in gene expression induced bythe graft may account for this recovery.
Data Availability
All data used in this study are included in the article. Anyadditional information required will be provided uponrequest to the corresponding author.
Conflicts of Interest
The authors declare that there is no conflict of interestregarding the publication of this paper.
Acknowledgments
This work was supported by grants from the Polish NationalScience Centre (UMO-2013/09/B/NZ4/02885) to UrszulaSławińska and the Operational Programme Human Capital– Priority 8.2.2, engaged in the innovative scientific researchin areas considered particularly important for the develop-ment of Masovian Voivodeship for Krzysztof Miazga.Research subject was carried out with the use of CePT infra-structure (the Arcturus Laser Microdissection System, Labo-ratory of Molecular Neurobiology, headed by Professor B.Kamińska) financed by the European Union – the EuropeanRegional Development Fund within the Operational Pro-gramme “Innovative Economy” for 2007–2013.
References
[1] J. Hounsgaard, “Motor neurons,” Comprehensive Physiology,vol. 7, no. 2, pp. 463–484, 2017.
[2] J. F. Perrier and F. Cotel, “Serotonergic modulation of spinalmotor control,” Current Opinion in Neurobiology, vol. 33,pp. 1–7, 2015.
[3] B. J. Schmidt and L. M. Jordan, “The role of serotonin in reflexmodulation and locomotor rhythm production in the mam-malian spinal cord,” Brain Research Bulletin, vol. 53, no. 5,pp. 689–710, 2000.
[4] A. M. Cabaj, H. Majczyński, E. Couto et al., “Serotonin con-trols initiation of locomotion and afferent modulation of coor-dination via 5-HT7 receptors in adult rats,” The Journal ofPhysiology, vol. 595, no. 1, pp. 301–320, 2017.
[5] F. Gackiere and L. Vinay, “Serotonergic modulation of post-synaptic inhibition and locomotor alternating pattern in thespinal cord,” Frontiers in Neural Circuits, vol. 8, 2014.
[6] J. Liu and L. M. Jordan, “Stimulation of the parapyramidalregion of the neonatal rat brain stem produces locomotor-like activity involving spinal 5-HT7 and 5-HT2A receptors,”Journal of Neurophysiology, vol. 94, no. 2, pp. 1392–1404, 2005.
[7] J. Liu, T. Akay, P. B. Hedlund, K. G. Pearson, and L. M. Jordan,“Spinal 5-HT7 receptors are critical for alternating activityduring locomotion: in vitro neonatal and in vivo adult studiesusing 5-HT7 receptor knockout mice,” Journal of Neurophysi-ology, vol. 102, no. 1, pp. 337–348, 2009.
[8] M. A. Madriaga, L. C. McPhee, T. Chersa, K. J. Christie, andP. J. Whelan, “Modulation of locomotor activity by multiple5-HT and dopaminergic receptor subtypes in the neonatalmouse spinal cord,” Journal of Neurophysiology, vol. 92,no. 3, pp. 1566–1576, 2004.
[9] E. Pearlstein, F. Ben Mabrouk, J. F. Pflieger, and L. Vinay,“Serotonin refines the locomotor-related alternations in thein vitro neonatal rat spinal cord,” European Journal of Neuro-science, vol. 21, no. 5, pp. 1338–1346, 2005.
[10] U. Sławińska, K. Miazga, A. M. Cabaj et al., “Grafting of fetalbrainstem 5-HT neurons into the sublesional spinal cord ofparaplegic rats restores coordinated hindlimb locomotion,”Experimental Neurology, vol. 247, pp. 572–581, 2013.
[11] U. Sławińska, K. Miazga, and L. M. Jordan, “5-HT2 and 5-HT7receptor agonists facilitate plantar stepping in chronic spinalrats through actions on different populations of spinal neu-rons,” Frontiers in Neural Circuits, vol. 8, 2014.
[12] S. Hochman, S. M. Garraway, D. W. Machacek, and B. L. Shay,“5-HT receptors and the neuromodualatory control of spinalcord function,” in Motor Neurobiology of the Spinal Cord, T.C. Cope, Ed., pp. 48–87, CRC Press, New York, 2001.
[13] H. Majczyński, K. Maleszak, A. Cabaj, and U. Sławińska,“Serotonin-related enhancement of recovery of hind limbmotor functions in spinal rats after grafting of embryonicraphe nuclei,” Journal of Neurotrauma, vol. 22, no. 5,pp. 590–604, 2005.
[14] J. M. D’Amico, E. G. Condliffe, K. J. B. Martins, D. J. Bennett,and M. A. Gorassini, “Recovery of neuronal and networkexcitability after spinal cord injury and implications for spas-ticity,” Frontiers in Integrative Neuroscience, vol. 8, 2014.
[15] M. Zhang, “Normal distribution and plasticity of serotoninreceptors after spinal cord injury and their impacts on motoroutputs,” in Recovery of Motor Function Following Spinal CordInjury, H. Fuller and M. Gates, Eds., InTech, 2016.
[16] M. S. Hoffman and G. S. Mitchell, “Spinal 5-HT7 receptorsand protein kinase A constrain intermittent hypoxia-induced phrenic long-term facilitation,” Neuroscience,vol. 250, pp. 632–643, 2013.
[17] M. S. Hoffman and G. S. Mitchell, “Spinal 5-HT7 receptor acti-vation induces long-lasting phrenic motor facilitation,” TheJournal of Physiology, vol. 589, no. 6, pp. 1397–1407, 2011.
[18] W. Gang, T. Hongjian, C. Jasheng et al., “The effect of the 5-HT7 serotonin receptor agonist, LP44, on micturition in ratswith chronic spinal cord injury,” Neurourology and Urody-namics, vol. 33, no. 7, pp. 1165–1170, 2014.
[19] T. Inoue, S. Itoh, S. Wakisaka, S. Ogawa, M. Saito, andT. Morimoto, “Involvement of 5-HT7 receptors in serotoner-gic effects on spike afterpotentials in presumed jaw-closingmotoneurons of rats,” Brain Research, vol. 954, no. 2,pp. 202–211, 2002.
[20] K. Matsumoto-Miyai, M. Yoshizumi, and M. Kawatani, “Reg-ulatory effects of 5-hydroxytryptamine receptors on voiding
12 Neural Plasticity

function,” Advances in Therapy, vol. 32, Supplement 1, pp. 3–15, 2015.
[21] J. Ogilvie, M. Wigglesworth, L. Appleby, T. O. W. Kingston,and R. W. Clarke, “On the role of 5-HT1B/1D receptors inmodulating transmission in a spinal reflex pathway in thedecerebrated rabbit,” British Journal of Pharmacology,vol. 128, no. 3, pp. 781–787, 1999.
[22] A. Dogrul, M. Seyrek, E. O. Akgul, T. Cayci, S. Kahraman, andH. Bolay, “Systemic paracetamol-induced analgesic and antihy-peralgesic effects through activation of descending serotonergicpathways involving spinal 5-HT7 receptors,” European Journalof Pharmacology, vol. 677, no. 1-3, pp. 93–101, 2012.
[23] F. Viguier, B. Michot, M. Hamon, and S. Bourgoin, “Multipleroles of serotonin in pain control mechanisms—implicationsof 5-HT7 and other 5-HT receptor types,” European Journalof Pharmacology, vol. 716, no. 1-3, pp. 8–16, 2013.
[24] N. Cao, J. Ni, X. Wang et al., “Chronic spinal cord injurycauses upregulation of serotonin (5-HT)2A and 5-HT2Creceptors in lumbosacral cord motoneurons,” BJU Interna-tional, vol. 121, no. 1, pp. 145–154, 2018.
[25] K. Fouad, M. M. Rank, R. Vavrek, K. C. Murray, L. Sanelli, andD. J. Bennett, “Locomotion after spinal cord injury depends onconstitutive activity in serotonin receptors,” Journal of Neuro-physiology, vol. 104, no. 6, pp. 2975–2984, 2010.
[26] P. J. Harvey, X. Li, Y. Li, and D. J. Bennett, “5-HT2 receptoractivation facilitates a persistent sodium current and repetitivefiring in spinal motoneurons of rats with and without chronicspinal cord injury,” Journal of Neurophysiology, vol. 96, no. 3,pp. 1158–1170, 2006.
[27] D. D. Fuller, T. L. Baker-Herman, F. J. Golder, N. J. Doperalski,J. J. Watters, and G. S. Mitchell, “Cervical spinal cord injuryupregulates ventral spinal 5-HT2A receptors,” Journal of Neu-rotrauma, vol. 22, no. 2, pp. 203–213, 2005.
[28] S. Doly, J. Fischer, M. J. Brisorgueil, D. Verge, and M. Conrath,“Pre- and postsynaptic localization of the 5-HT7 receptor inrat dorsal spinal cord: immunocytochemical evidence,” TheJournal of Comparative Neurology, vol. 490, no. 3, pp. 256–269, 2005.
[29] D. P. Fields, S. R. Springborn, and G. S. Mitchell, “Spinal 5-HT7 receptors induce phrenic motor facilitation via EPAC-mTORC1 signaling,” Journal of Neurophysiology, vol. 114,no. 3, pp. 2015–2022, 2015.
[30] P. Fenik and S. C. Veasey, “Pharmacological characterizationof serotonergic receptor activity in the hypoglossal nucleus,”American Journal of Respiratory and Critical Care Medicine,vol. 167, no. 4, pp. 563–569, 2003.
[31] S. Okabe, M. Mackiewicz, and L. Kubin, “Serotonin receptormRNA expression in the hypoglossal motor nucleus,” Respira-tion Physiology, vol. 110, no. 2-3, pp. 151–160, 1997.
[32] C. H. Gill, E. M. Soffin, J. J. Hagan, and C. H. Davies, “5-HT7receptors modulate synchronized network activity in rathippocampus,” Neuropharmacology, vol. 42, no. 1, pp. 82–92,2002.
[33] R. M. Brownstone, L. M. Jordan, D. J. Kriellaars, B. R. Noga,and S. J. Shefchyk, “On the regulation of repetitive firing inlumbar motoneurones during fictive locomotion in the cat,”Experimental Brain Research, vol. 90, no. 3, pp. 441–455, 1992.
[34] B. J. Schmidt, “Afterhyperpolarization modulation in lumbarmotoneurons during locomotor-like rhythmic activity in theneonatal rat spinal cord in vitro,” Experimental BrainResearch, vol. 99, no. 2, pp. 214–222, 1994.
[35] P. A. M. ban Dongen, S. Grillner, and T. Hökfelt, “5-Hydroxytryptamine (serotonin) causes a reduction in theafterhyperpolarization following the action potential in lam-prey motoneurons and premotor interneurons,” BrainResearch, vol. 366, no. 1-2, pp. 320–325, 1986.
[36] P. Wallén, J. Christenson, L. Brodin, R. Hill, A. Lansner, andS. Grillner, “Chapter 26 Mechanisms underlying the seroto-nergic modulation of the spinal circuitry for locomotion inlamprey,” Progress in Brain Research, vol. 80, pp. 321–327,1989.
[37] S. Doly, A. Madeira, J. Fischer et al., “The 5-HT2A receptor iswidely distributed in the rat spinal cord andmainly localized atthe plasma membrane of postsynaptic neurons,” The Journalof Comparative Neurology, vol. 472, no. 4, pp. 496–511, 2004.
[38] V. Cornea-Hebert, M. Riad, C. Wu, S. K. Singh, andL. Descarries, “Cellular and subcellular distribution of theserotonin 5-HT2A receptor in the central nervous system ofadult rat,” The Journal of Comparative Neurology, vol. 409,no. 2, pp. 187–209, 1999.
[39] F. Vult von Steyern and T. Lomo, “Postnatal appearance of 5-HT2A receptors on fast flexor and slow extensor rat motorneurons,” Neuroscience, vol. 136, no. 1, pp. 87–93, 2005.
[40] J. K. Lee, C. S. Johnson, and J. R. Wrathall, “Up-regulation of5-HT2 receptors is involved in the increased H-reflex ampli-tude after contusive spinal cord injury,” Experimental Neurol-ogy, vol. 203, no. 2, pp. 502–511, 2007.
[41] J. W. Chopek, C. W. MacDonell, K. Gardiner, and P. F. Gardi-ner, “Daily passive cycling attenuates the hyperexcitability andrestores the responsiveness of the extensor monosynapticreflex to quipazine in the chronic spinally transected rat,” Jour-nal of Neurotrauma, vol. 31, no. 12, pp. 1083–1087, 2014.
[42] J. W. Chopek, P. C. Sheppard, K. Gardiner, and P. F. Gardiner,“Serotonin receptor and KCC2 gene expression in lumbarflexor and extensor motoneurons posttransection with andwithout passive cycling,” Journal of Neurophysiology,vol. 113, no. 5, pp. 1369–1376, 2015.
[43] A. F. Di Narzo, A. Kozlenkov, Y. Ge et al., “Decrease of mRNAediting after spinal cord injury is caused by down-regulation ofADAR2 that is triggered by inflammatory response,” ScientificReports, vol. 5, no. 1, article 12615, 2015.
[44] I. Giroux, E. M. Kurowska, and K. K. Carroll, “Role of dietarylysine, methionine, and arginine in the regulation of hypercho-lesterolemia in rabbits,” The Journal of Nutritional Biochemis-try, vol. 10, no. 3, pp. 166–171, 1999.
[45] M. Antri, J. Y. Barthe, C. Mouffle, and D. Orsal, “Long-lastingrecovery of locomotor function in chronic spinal rat followingchronic combined pharmacological stimulation of serotoner-gic receptors with 8-OHDPAT and quipazine,” NeuroscienceLetters, vol. 384, no. 1-2, pp. 162–167, 2005.
[46] U. Sławińska, H. Majczyński, Y. Dai, and L. M. Jordan, “Theupright posture improves plantar stepping and altersresponses to serotonergic drugs in spinal rats,” The Journalof Physiology, vol. 590, no. 7, pp. 1721–1736, 2012.
[47] E. S. Landry, N. P. Lapointe, C. Rouillard, D. Levesque, P. B.Hedlund, and P. A. Guertin, “Contribution of spinal 5-HT1Aand 5-HT7 receptors to locomotor-like movement inducedby 8-OH-DPAT in spinal cord-transected mice,” The Euro-pean Journal of Neuroscience, vol. 24, no. 2, pp. 535–546, 2006.
[48] R. Bos, K. Sadlaoud, P. Boulenguez et al., “Activation of 5-HT2A receptors upregulates the function of the neuronalK-Cl cotransporter KCC2,” Proceedings of the National
13Neural Plasticity
Academy of Sciences of the United States of America, vol. 110,no. 1, pp. 348–353, 2013.
[49] M. J. Dunbar, M. A. Tran, and P. J. Whelan, “Endogenousextracellular serotonin modulates the spinal locomotor net-work of the neonatal mouse,” The Journal of Physiology,vol. 588, no. 1, pp. 139–156, 2010.
[50] M. Antri, C. Mouffle, D. Orsal, and J. Y. Barthe, “5-HT1Areceptors are involved in short- and long-term processesresponsible for 5-HT-induced locomotor function recoveryin chronic spinal rat,” The European Journal of Neuroscience,vol. 18, no. 7, pp. 1963–1972, 2003.
[51] U. Sławińska, H. Majczyński, and R. Djavadian, “Recovery ofhindlimb motor functions after spinal cord transection isenhanced by grafts of the embryonic raphe nuclei,” Experi-mental Brain Research, vol. 132, no. 1, pp. 27–38, 2000.
[52] K. C. Murray, A. Nakae, M. J. Stephens et al., “Recovery ofmotoneuron and locomotor function after spinal cord injurydepends on constitutive activity in 5-HT2C receptors,” NatureMedicine, vol. 16, no. 6, pp. 694–700, 2010.
[53] U. Sławińska, L. M. Jordan, B. Burger, H. Fabczak, andH. Majczyński, “Locomotion of intact adult rats is controlledby 5-HT2A and 5-HT7 but not 5-HT2C receptors; 2012,” inSociety of Neuroscience, Neuroscience Meeting Planner, NewOrleans, LA, USA, 2012, Program No. 85.09.
[54] K. L. Wohlpart and P. B. Molinoff, “Regulation of levels of 5-HT2A receptor mRNA,” Annals of the New York Academy ofSciences, vol. 861, no. 1 ADVANCES IN S, pp. 128–135, 1998.
[55] D. Van Oekelen, W. H. M. L. Luyten, and J. E. Leysen, “5-HT2A and 5-HT2C receptors and their atypical regulationproperties,” Life Sciences, vol. 72, no. 22, pp. 2429–2449, 2003.
[56] K. Miazga, E. Joachimiak, H. Fabczak, and U. Sławińska,“Grafted serotonergic neurons can reverse changes in geneexpression in motoneurons produced by spinal cord injuryin rats.; 2015. Programm: P9.6,” in 12th International Congressof the Polish Neuroscience Society, Gdańsk, Poland, September2015.
[57] U. Sławińska, K. Miazga, and L. M. Jordan, “The role ofserotonin in the control of locomotor movements and strat-egies for restoring locomotion after spinal cord injury,” ActaNeurobiologiae Experimentalis, vol. 74, no. 2, pp. 172–187,2014.
[58] A. Lev-Tov, A. Etlin, and D. Blivis, “Sensory-induced activa-tion of pattern generators in the absence of supraspinal con-trol,” Annals of the New York Academy of Sciences, vol. 1198,no. 1, pp. 54–62, 2010.
[59] D. Feraboli-Lohnherr, D. Orsal, A. Yakovleff, M. Gimenez yRibotta, and A. Privat, “Recovery of locomotor activity inthe adult chronic spinal rat after sublesional transplantationof embryonic nervous cells: specific role of serotonergic neu-rons,” Experimental Brain Research, vol. 113, no. 3, pp. 443–454, 1997.
[60] M. G. y Ribotta, J. Provencher, D. Feraboli-Lohnherr,S. Rossignol, A. Privat, and D. Orsal, “Activation of locomo-tion in adult chronic spinal rats is achieved by transplantationof embryonic raphe cells reinnervating a precise lumbar level,”The Journal of Neuroscience, vol. 20, no. 13, pp. 5144–5152,2000.
[61] D. M. Basso, M. S. Beattie, and J. C. Bresnahan, “Graded histo-logical and locomotor outcomes after spinal cord contusionusing the NYU weight-drop device versus transection,” Exper-imental Neurology, vol. 139, no. 2, pp. 244–256, 1996.
[62] R. C. Ferry, C. D. Unsworth, R. P. Artymyshyn, and P. B.Molinoff, “Regulation of mRNA encoding 5-HT2A receptorsin P11 cells through a post-transcriptional mechanism requir-ing activation of protein kinase C,” The Journal of BiologicalChemistry, vol. 269, no. 50, pp. 31850–31857, 1994.
[63] X. Y. Kong, J. Wienecke, M. Chen, H. Hultborn, andM. Zhang, “The time course of serotonin 2a receptor expres-sion after spinal transection of rats: an immunohistochemicalstudy,” Neuroscience, vol. 177, pp. 114–126, 2011.
[64] X.-Y. Kong, J. Wienecke, H. Hultborn, and M. Zhang, “Robustupregulation of serotonin 2A receptors after chronic spinaltransection of rats: an immunohistochemical study,” BrainResearch, vol. 1320, pp. 60–68, 2010.
[65] Y. Zhang, R. X. Zhang, M. Zhang et al., “Electroacupunctureinhibition of hyperalgesia in an inflammatory pain rat model:involvement of distinct spinal serotonin and norepinephrinereceptor subtypes,” British Journal of Anaesthesia, vol. 109,no. 2, pp. 245–252, 2012.
[66] Y. Ryu, T. Ogata, M. Nagao et al., “The swimming test is effec-tive for evaluating spasticity after contusive spinal cordinjury,” PLoS One, vol. 12, no. 2, article e0171937, 2017.
[67] Y. Ryu, T. Ogata, M. Nagao, Y. Sawada, R. Nishimura, andN. Fujita, “Effects of treadmill training combined with seroto-nergic interventions on spasticity after contusive spinal cordinjury,” Journal of Neurotrauma, vol. 35, no. 12, pp. 1358–1366, 2018.
[68] R. V. Ung, E. S. Landry, P. Rouleau, N. P. Lapointe,C. Rouillard, and P. A. Guertin, “Role of spinal 5-HT2 receptorsubtypes in quipazine-induced hindlimb movements after alow-thoracic spinal cord transection,” European Journal ofNeuroscience, vol. 28, no. 11, pp. 2231–2242, 2008.
[69] T. Maier, M. Guell, and L. Serrano, “Correlation of mRNA andprotein in complex biological samples,” FEBS Letters, vol. 583,no. 24, pp. 3966–3973, 2009.
[70] C. B.Mantilla, J. P. Bailey,W. Z. Zhan, and G. C. Sieck, “Phrenicmotoneuron expression of serotonergic and glutamatergicreceptors following upper cervical spinal cord injury,” Experi-mental Neurology, vol. 234, no. 1, pp. 191–199, 2012.
[71] M. Zaniewska, N. Alenina, K. Wydra et al., “Discovering themechanisms underlying serotonin (5-HT)2A and 5-HT2Creceptor regulation following nicotine withdrawal in rats,”Journal of Neurochemistry, vol. 134, no. 4, pp. 704–716,2015.
[72] J. Celichowski, W. Mrówczyński, P. Krutki, T. Górska,H. Majczyński, and U. Sławińska, “Changes in contractileproperties of motor units of the rat medial gastrocnemiusmuscle after spinal cord transection,” Experimental Physiology,vol. 91, no. 5, pp. 887–895, 2006.
[73] A. Ishihara, F. Nagatomo, H. Fujino, H. Kondo, and Y. Ohira,“Decreased succinate dehydrogenase activity of gamma andalpha motoneurons in mouse spinal cords following 13 weeksof exposure to microgravity,” Neurochemical Research, vol. 38,no. 10, pp. 2160–2167, 2013.
[74] A. Ishihara, R. R. Roy, and V. R. Edgerton, “Succinate dehy-drogenase activity and soma size of motoneurons innervatingdifferent portions of the rat tibialis anterior,” Neuroscience,vol. 68, no. 3, pp. 813–822, 1995.
[75] S. Navarrett, L. Collier, C. Cardozo, and S. Dracheva,“Alterations of serotonin 2C and 2A receptors in responseto T10 spinal cord transection in rats,” Neuroscience Letters,vol. 506, no. 1, pp. 74–78, 2012.
14 Neural Plasticity
[76] N. Herr, C. Bode, and D. Duerschmied, “The effects of seroto-nin in immune cells,” Frontiers in Cardiovascular Medicine,vol. 4, p. 48, 2017.
[77] D. P. Fields and G. S. Mitchell, “Divergent cAMP signaling dif-ferentially regulates serotonin-induced spinal motor plastic-ity,” Neuropharmacology, vol. 113, no. Part A, pp. 82–88, 2017.
[78] D. D. Fuller and G. S. Mitchell, “Respiratory neuroplasticity –overview, significance and future directions,” ExperimentalNeurology, vol. 287, Part 2, pp. 144–152, 2017.
[79] L. Zhang, “Effects of 5-hydroxytryptamine on cat spinal moto-neurons,” Canadian Journal of Physiology and Pharmacology,vol. 69, no. 2, pp. 154–163, 1991.
[80] S. R. White and S. J. Fung, “Serotonin depolarizes cat spinalmotoneurons in situ and decreases motoneuron afterhyperpo-larizing potentials,” Brain Research, vol. 502, no. 2, pp. 205–213, 1989.
15Neural Plasticity
Research ArticleTesting rTMS-Induced Neuroplasticity: A Single Case Study ofFocal Hand Dystonia
Sonia Betti,1 Andrea Spoto,1 Umberto Castiello,1,2 and Luisa Sartori 1,3
1Dipartimento di Psicologia Generale, Università di Padova, Padova, Italy2Centro Beniamino Segre, Accademia Nazionale dei Lincei, Roma, Italy3Centro di Neuroscienze Cognitive, Università di Padova, Padova, Italy
Correspondence should be addressed to Luisa Sartori; [email protected]
Received 6 January 2018; Accepted 30 April 2018; Published 30 May 2018
Academic Editor: Toshiyuki Fujiwara
Copyright © 2018 Sonia Betti et al. This is an open access article distributed under the Creative Commons Attribution License,which permits unrestricted use, distribution, and reproduction in any medium, provided the original work is properly cited.
Focal hand dystonia in musicians is a neurological motor disorder in which aberrant plasticity is caused by excessive repetitive use.This work’s purposes were to induce plasticity changes in a dystonic musician through five daily thirty-minute sessions of 1Hzrepetitive transcranial magnetic stimulation (rTMS) applied to the left M1 by using neuronavigated stimulation and to reliablymeasure the effect of these changes. To this aim, the relationship between neuroplasticity changes and motor recovery wasinvestigated using fine-grained kinematic analysis. Our results suggest a statistically significant improvement in motorcoordination both in a task resembling the dystonic-inducing symptoms and in a reach-to-grasp task. This single case studysupports the safe and effective use of noninvasive brain stimulation in neurologic patients and highlights the importance ofevaluating outcomes in measurable ways. This issue is a key aspect to focus on to classify the clinical expression of dystonia.These preliminary results promote the adoption of kinematic analysis as a valuable diagnostic tool.
1. Introduction
Dystonias are a group of disorders characterized by intermit-tent or sustained muscle contractions causing twisting andrepetitive movements (for a review, see [1, 2]). The crucialcatalyst behind dystonia is a multifactorial combination ofexcessive plasticity, intensive training, and failure of limitingplastic changes, as seen through noninvasive neurostimula-tion studies [3]. Once this abnormal plasticity process isbrought under control, it could ultimately result in a clinicalimprovement [4].
Dystonia may be task-specific producing abnormalmotor performance for only a specific task, such as in musi-cian’s dystonia (MD). MD affects isolated fingers that per-form complex and repetitive motor tasks during actionsassociated with musical play, but can also lead to impairedadjacent finger flexion [2]. This overflow into adjacent mus-cles not specifically involved in the particular motor task isdue to a loss of inhibition that manifests in the periphery withabnormally long muscle bursts [5]. In MD, abnormallyprolonged muscle firing due to selective overtraining of
an intended finger may prevent the ability to keep excitabilitywithin a useable range (i.e., homeostatic plasticity), a func-tion which is specifically impaired in dystonia [6].
Although its underlying pathophysiology remainsunclear, several studies in patients with MD have shown thatrepeated and prolonged hand use might result in abnormalactivity in the cortical representation of the hand [7, 8]. Infact, important neural correlates of task-specific dystoniaare the enlarged and partially overlapping fields revealed bybrain imaging and transcranial magnetic stimulation (TMS)studies targeting the somatosensory and the motor cortices[8–14]. Whereas a typical homuncular organization revealsa distance of about 2.5 cm between the representations ofthe thumb and the little finger, these boundaries seem to beblurred for the dystonic fingers [10]. This lack of clearlydefined somatosensory and motor cortical representationscan lead to involuntary motor control [15]. The loss of con-trol is particularly evident during fast passages, often leadingto involuntary flexion or extension of one or more fingers[16]. In particular, stringed instrument players exhibit ause-dependent alteration in the cortical representational
HindawiNeural PlasticityVolume 2018, Article ID 6464896, 12 pageshttps://doi.org/10.1155/2018/6464896

zones of the digits of the hand that engage in the dexterity-demanding task of fingering the strings [17]. While initialMD is only associated with impairment of highly practicedmotor tasks, it can subsequently lead to severe deficits, even-tually terminating a career for one percent of professionalmusicians [18].
Although prompt initiation of treatment could rescuesome patients, dystonia is often misdiagnosed or neglectedsince the lack of objective diagnostic criteria and reliable bio-markers prohibits early diagnostic recognition [19]. So far,the extent of motor symptoms has mainly been estimatedby means of visual inspection and rating procedures (e.g.,[20]), without providing fine resolution (but see [21] for anexample of kinematic analysis to assess a flautist perfor-mance). In addition, treatment responses are very patient-dependent. A precise quantification tool for objective andreliable diagnosis and for treatment evaluation is thereforeneeded to acquire highly precise data and to identify subtledifferences in the symptomatology.
Given the sparse literature on this topic, there are noclinical practice guidelines on how to recover voluntarymotor control. To date, the preferred treatment for dystoniais botulinum toxin injection, but it only transiently works in aminor fraction of patients and its application is limited by thespread of weakness to adjacent muscles, which causes furthermotor performance impairment [22].
Recently, motor training has been combined with neuro-stimulation methods in an attempt to normalize brain excit-ability and recover motor performance [23, 24]. Notably,since the effects of long-term treatment might differ fromthose of a single session [24], TMS is usually delivered inrepeated daily sessions to prolong after effects. Therapeuticprocedures with dystonic patients classically adopted dailysessions of low-frequency repetitive TMS (rTMS) over theprimary motor cortex (M1; [5, 25–28]) or the premotorcortex (PM; [24, 29, 30]). Siebner and colleagues [25, 26]evaluated the effect of low-frequency (1Hz) stimulation ofM1 to increase inhibition in the motor areas of the cerebralcortex. Low-frequency rTMS set to 10% below the restingmotor threshold of the target muscle restored intracorticalinhibition. Treatment output on handwriting was quantifiedby means of a pressure-sensitive digitizing tablet.
Needless to say, the principle of the measurement mustbe based on the phenomenology of each patient. Motorassessment must be specifically related to the compromisedmovement (i.e., the particular exercise that most consistentlyinduced the dystonic disorder), rather than to a more generalskill (e.g., [21, 31]). As Pujol and colleagues (2000) convinc-ingly demonstrated in an fMRI study, a tailored assessmentof patients in the dystonia-inducing situation is necessary [8].
The aim of the present study was to test a multimethodo-logical paradigm based on the combination of single-pulsetranscranial magnetic stimulation (spTMS), low-frequencyrTMS, and 3D motion analysis in a professional guitaristaffected by MD. Single pulses of TMS were used to assessthe excitability of synaptic connections within the motor cor-tex, providing indirect measures of changes produced byneural plasticity. In addition, TMS can also produce long-term changes in excitability if the TMS pulses are applied
repetitively [27]. In both cases, changes in excitability weremonitored by computing the amplitude of the motor-evoked potential (MEP) in response to a standard TMS pulse.In particular, resting motor threshold MEPs reflect thedegree of corticospinal system activation and potentially helpin diagnosing motor symptoms and in monitoring treatmentprogress (i.e., whether interventions are safe and effective inslowing symptoms). Fine-grained 3D movement analysishas been adopted to specifically evaluate the treatment bothin terms of improved motor coordination and cortical plas-ticity. The acquisition of MEPs induced by spTMS to the leftM1 and recorded from the contralateral second dorsal inter-osseous (SDI) muscle before and after five daily sessions ofrTMS protocol allowed to measure the variations on the rest-ing motor threshold to obtain a physiological index of neuralplasticity. Moreover, we considered two behavioral measuresof performance plasticity: (i) a repetitive sequence of fingers’movement (task 1) and (ii) a reach-to-grasp action (task 2).Since guitar arpeggios involve a rapid succession of fine andisolated finger movements, the finger flexion task was con-ceived as a realistic attempt to execute the affected flexionpattern. As concerns the grip task, it was specifically chosento investigate the distinct contribution of the two separatereaching and grasping components [32] on performedmovements: the timing dissociation between these twocomponents may in fact give useful hints to the underlyingpathological state [33, 34]. Notably, problems to grasp andmanipulate objects are frequent in movement disorders anda methodological approach providing highly standardizedmeasures of natural movements is needed [35]. The outputsof both tasks were compared at local and general levels:across daily sessions and throughout the intervention, to pro-vide a consistent measure of plasticity trend.
2. Method
2.1. Participants. A 55-year-old male right-handed classicalguitarist (M.C.) diagnosed as suffering from MD in his righthand was recruited at the Neuroscience of Movement(NEMO) Laboratory at the Department of General Psychol-ogy, University of Padua. He specifically presented a painlessand exaggerated involuntary flexion pattern in his right mid-dle finger’s metacarpophalangeal joint, which occurredexclusively in the task-specific context of playing the musicalinstrument (i.e., plucking the strings). The loss of synergisticmuscle control was also evident as a cocontraction of adja-cent muscles. The onset of the movement disorder hadbeen three years before this study and had forced him tointerrupt his career as a professional musician and especiallyas a concert performer. He reported no dystonic movementpatterns in other activities. There was no evidence of anyother neurologic disorder and he was not under medication.An additional guitarist served as control subject in this study.He was right-handed with comparable experience (40 yearsof practice) and age (50 years).
No adverse effects were reported during the experiment.Informed consent was obtained after they were fullyinformed, according to the Declaration of Helsinki, about
2 Neural Plasticity

the study’s nature. The experimental protocol was approvedby the University of Padua Ethics Review Board.
2.2. General Procedure. A daily protocol (Figure 1) entailingtwo evaluation sessions (prestimulation) of kinematic andresting motor threshold (rMT) baselines, followed by low-frequency rTMS (stimulation) and kinematic and rMT tests(poststimulation), was repeated for five consecutive daysand was designed as follows:
(1) Prestimulation kinematic baseline (KB). A series ofalternating finger flexion movements (i.e., the index,middle, and ring fingers, 15 movements per finger;task 1) with the palm upward and a sequence of 15reach-to-grasp movements (task 2) were performedto test independent movements of the dystonic fingerand motor coordination.
(2) Prestimulation neurophysiologic baseline (NB).TMS-induced motor-evoked potentials (MEPs) wererecorded from the right second dorsal interosseous(SDI) muscle to measure the rMT, thus assessing cor-ticospinal excitability before intervention.
(3) Stimulation. The participant underwent 30 minutesof rTMS (1Hz) over the SDI muscle representationon the left primary motor cortex, delivered withintensity of 90% with respect to the rMT.
(4) Poststimulation neurophysiologic test (NT). Thesame procedure adopted during the prestimulationNB session was implemented for comparison pur-poses. We performed a trend analysis to evaluatechanges in motor cortex plasticity.
(5) Poststimulation kinematic test (KT). The same pro-cedure adopted during preintervention KB sessionwas implemented for comparison purposes. We per-formed a day-by-day analysis and we compared thefirst and last day to evaluate both short- and long-term effects in motor coordination.
2.3. Kinematics Recording. A 3D optoelectronic SMART-Dsystem (Bioengineering Technology and Systems, BTS) was
used to track the kinematics of the participants’ righthand. During the KB and KT phases, the participants wereseated in a height-adjustable chair in front of a table(900mm× 900mm) with the right hand placed on a desig-nated position on the table surface so as to guarantee the con-sistency of the start position across participants. Threesemispherical infrared-reflective markers (5mm diameter)were attached to the right hand on the tip of the index,middle, and ring fingers, and one was attached to theradial aspect of the wrist. Six digital video cameras with a fre-quency of 140Hz were placed in a semicircle around the table(at 1–1.2m away) to detect the markers (see Figure 2(a)).Before the experimental sessions, cameras position, rollangle, focus, zoom, brightness, and threshold were adjustedto optimize markers’ tracking. Static and dynamic calibra-tions were then performed. For the static calibration, athree-axis frame of reference at known distance was placedon the center of the table. For the dynamic calibration, athree-marker wand was moved in all directions throughoutthe workspace of interest for approximately one minute.The spatial resolution of the recording system was 0.3mmover the field of view. The standard deviation (SD) ofthe reconstruction error was below 0.2mm for all the axes(x, y, and z).
During each daily session of the KB and KT phases, theparticipants took part in two tasks:
(i) Task 1: A series of 45 randomly alternating fingerflexion movements of the index, middle, and ringfingers (15 movements per finger) were performedto test independent movements of the dystonicand adjacent fingers. The participants’ right wristswere placed over a wooden cylinder (7.5mmdiameter; 11 cm high) with the palm of the handfacing upwards.
(ii) Task 2: In the prehension task, a sequence of 15reach-to-grasp movements was performed to testmotor coordination. At the beginning of each trial,the hand was pronated with the palm resting on astarting platform (60× 70mm; 5mm thick), whichwas shaped to allow for a comfortable and repeatableposture of all digits, that is, slightly flexed at the
Daily experimental design
Kinematic baseline(KB)
Neurophysiologicbaseline (NB)
Prestimulation Stimulation
Time
1 Hz rTMS(30 min)
Task 1 Task 2
Neurophysiologictest (NT)
Kinematic test(KT)
Poststimulation
Task 1 Task 2rMT rMT
Figure 1: Daily experimental design for both MD patient and control participant. The graph represents the three daily phases of theexperiment: behavioral and neurophysiological indexes were measured both before (prestimulation) and after (poststimulation) eachstimulation session with low-frequency rTMS (1Hz) on the left M1 (stimulation). The kinematic behavioral assessment (KB and KT)consisted of two tasks: finger abduction (task 1) and reach-to-grasp (task 2). In the neurophysiological assessment (NB and NT), theresting motor threshold was measured to assess corticospinal excitability variations. This protocol was repeated for five consecutive days.
3Neural Plasticity

metacarpal and proximal interphalangeal joints.Then, the participants were asked to reach and graspthe cylinder located frontally with a whole handgrasp (WHG). The starting platform was attached90mm away from the edge of the table surface50mm away from the midsection. The cylinder wasplaced on a target platform, located at a distance of350mm from the starting platform, for consistentreplacing (Figure 2(a)). An affixed colored dot onthe cylinder was signaling the required thumb’s con-tact point in order to perform stable and consistentgrasps across the experiment. An auditory signal(300Hz; 200ms) was adopted as the “go” signal.
2.4. Transcranial Magnetic Stimulation and ElectromyographicRecording. During both the MB and the MT phases, eachparticipant was comfortably seated in an armchair withthe right hand positioned on a pillow and the head keptstable by a neck pillow. The participant was asked to keephis muscles relaxed and to remain as still as possible duringthe delivery of the TMS pulses. While TMS pulses were deliv-ered, he was asked to observe a white fixation cross on blackbackground presented in the center of a monitor. TMS-induced MEPs were acquired from the participant’s SDImuscle of the right hand (Figure 2(c)). EMG activity wasrecorded through pairs of surface Ag-AgCl surface electrodes(9mm diameter) placed in a belly-tendon montage, with theactive electrodes over the SDI muscle and the reference elec-trodes over the corresponding metacarpophalangeal joint(Figure 2(d)). The ground electrode was placed over the dor-sal part of the right wrist. Electrodes were connected to an
isolable portable ExG input box linked to the main EMGamplifier for signal transmission via a twin fiber opticcable (Professional BrainAmp ExG MR, Munich, Germany).Single-pulse TMS was administered using a 70mm figure-of-eight coil connected to a Magstim Bistim2 stimulator(Magstim Co., Whitland, UK). Pulses were delivered to thehand region of the left M1. The coil was placed tangentiallyon the scalp, with the handle pointing laterally and caudally,so that the flow of induced electrical current in the brain trav-elled in a posterior-anterior direction [36, 37]. During thefirst session of the first day, the optimal cortical hotspot ofthe target muscle (OSP; i.e., the position at which largerand more stable MEPs are recorded from SDI with minimalstimulation intensity) was identified by delivering singleTMS pulses at fixed intensity while moving the coil of0.5 cm around the target area until the position was reached.To maintain an accurate and constant placement of thecoil throughout the experimental sessions, it was kept overthe OSP by a mechanical arm (Manfrotto, Italy) and itsposition and orientation were recorded and loaded into aneuronavigation system (SofTaxic Optic, EMS, Bologna,Italy; Figure 2(b)). Once the OSP was found, the individualresting motor threshold (rMT)—defined as the lowest stimu-lus intensity at which TMS is able to generate MEPs of at least50μV in relaxed muscles in 5 out of 10 consecutive pulses[38]—was determined. rMT was then measured every daybefore and after the rTMS protocol to test possible variationsof corticospinal excitability. Repetitive TMS pulses wereapplied using a Magstim Rapid2 stimulator (Magstim Co.,Whitland, UK) with a figure-of-eight coil (70mm outerdiameter). Each rTMS session consisted of the application
Startingplatform
Targetplatform
50 mm
350 m
m
Cylinder
TMS coil
1−1.2 m
(a)
Z+
X+
Y+
(b)
Motor-evoked potential(MEP)
(c)
SDI muscle
(d)
Figure 2: Experiment setup. A 3D optoelectronic SMART-D system was used to track the kinematics of the participant’s right hand by meansof six video cameras (a). TMS coil placement over the participant’s left M1 hand area (b). Example of a TMS-evoked MEP (c). The targetedsecond dorsal interosseous (SDI) muscle (d).
4 Neural Plasticity
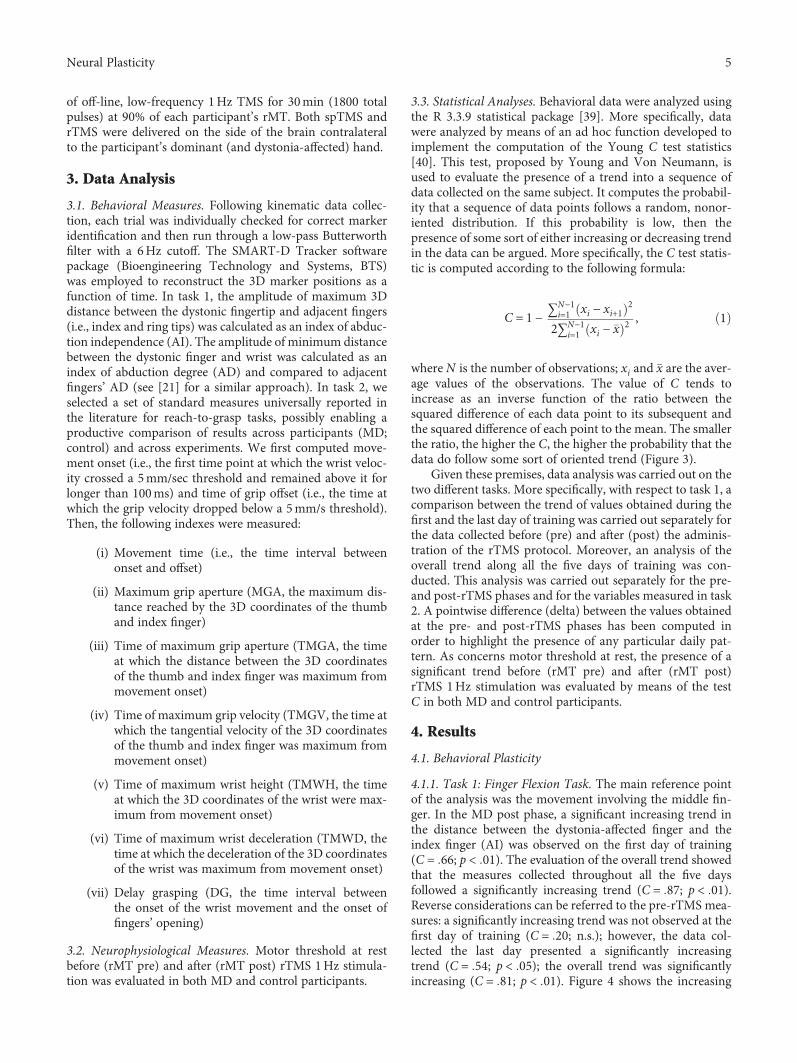
of off-line, low-frequency 1Hz TMS for 30min (1800 totalpulses) at 90% of each participant’s rMT. Both spTMS andrTMS were delivered on the side of the brain contralateralto the participant’s dominant (and dystonia-affected) hand.
3. Data Analysis
3.1. Behavioral Measures. Following kinematic data collec-tion, each trial was individually checked for correct markeridentification and then run through a low-pass Butterworthfilter with a 6Hz cutoff. The SMART-D Tracker softwarepackage (Bioengineering Technology and Systems, BTS)was employed to reconstruct the 3D marker positions as afunction of time. In task 1, the amplitude of maximum 3Ddistance between the dystonic fingertip and adjacent fingers(i.e., index and ring tips) was calculated as an index of abduc-tion independence (AI). The amplitude of minimum distancebetween the dystonic finger and wrist was calculated as anindex of abduction degree (AD) and compared to adjacentfingers’ AD (see [21] for a similar approach). In task 2, weselected a set of standard measures universally reported inthe literature for reach-to-grasp tasks, possibly enabling aproductive comparison of results across participants (MD;control) and across experiments. We first computed move-ment onset (i.e., the first time point at which the wrist veloc-ity crossed a 5mm/sec threshold and remained above it forlonger than 100ms) and time of grip offset (i.e., the time atwhich the grip velocity dropped below a 5mm/s threshold).Then, the following indexes were measured:
(i) Movement time (i.e., the time interval betweenonset and offset)
(ii) Maximum grip aperture (MGA, the maximum dis-tance reached by the 3D coordinates of the thumband index finger)
(iii) Time of maximum grip aperture (TMGA, the timeat which the distance between the 3D coordinatesof the thumb and index finger was maximum frommovement onset)
(iv) Time of maximum grip velocity (TMGV, the time atwhich the tangential velocity of the 3D coordinatesof the thumb and index finger was maximum frommovement onset)
(v) Time of maximum wrist height (TMWH, the timeat which the 3D coordinates of the wrist were max-imum from movement onset)
(vi) Time of maximum wrist deceleration (TMWD, thetime at which the deceleration of the 3D coordinatesof the wrist was maximum from movement onset)
(vii) Delay grasping (DG, the time interval betweenthe onset of the wrist movement and the onset offingers’ opening)
3.2. Neurophysiological Measures. Motor threshold at restbefore (rMT pre) and after (rMT post) rTMS 1Hz stimula-tion was evaluated in both MD and control participants.
3.3. Statistical Analyses. Behavioral data were analyzed usingthe R 3.3.9 statistical package [39]. More specifically, datawere analyzed by means of an ad hoc function developed toimplement the computation of the Young C test statistics[40]. This test, proposed by Young and Von Neumann, isused to evaluate the presence of a trend into a sequence ofdata collected on the same subject. It computes the probabil-ity that a sequence of data points follows a random, nonor-iented distribution. If this probability is low, then thepresence of some sort of either increasing or decreasing trendin the data can be argued. More specifically, the C test statis-tic is computed according to the following formula:
C = 1 − 〠N−1i=1 xi − xi+1
2
2〠N−1i=1 xi − x 2 , 1
where N is the number of observations; xi and x are the aver-age values of the observations. The value of C tends toincrease as an inverse function of the ratio between thesquared difference of each data point to its subsequent andthe squared difference of each point to the mean. The smallerthe ratio, the higher the C, the higher the probability that thedata do follow some sort of oriented trend (Figure 3).
Given these premises, data analysis was carried out on thetwo different tasks. More specifically, with respect to task 1, acomparison between the trend of values obtained during thefirst and the last day of training was carried out separately forthe data collected before (pre) and after (post) the adminis-tration of the rTMS protocol. Moreover, an analysis of theoverall trend along all the five days of training was con-ducted. This analysis was carried out separately for the pre-and post-rTMS phases and for the variables measured in task2. A pointwise difference (delta) between the values obtainedat the pre- and post-rTMS phases has been computed inorder to highlight the presence of any particular daily pat-tern. As concerns motor threshold at rest, the presence of asignificant trend before (rMT pre) and after (rMT post)rTMS 1Hz stimulation was evaluated by means of the testC in both MD and control participants.
4. Results
4.1. Behavioral Plasticity
4.1.1. Task 1: Finger Flexion Task. The main reference pointof the analysis was the movement involving the middle fin-ger. In the MD post phase, a significant increasing trend inthe distance between the dystonia-affected finger and theindex finger (AI) was observed on the first day of training(C = 66; p < 01). The evaluation of the overall trend showedthat the measures collected throughout all the five daysfollowed a significantly increasing trend (C = 87; p < 01).Reverse considerations can be referred to the pre-rTMS mea-sures: a significantly increasing trend was not observed at thefirst day of training (C = 20; n.s.); however, the data col-lected the last day presented a significantly increasingtrend (C = 54; p < 05); the overall trend was significantlyincreasing (C = 81; p < 01). Figure 4 shows the increasing
5Neural Plasticity
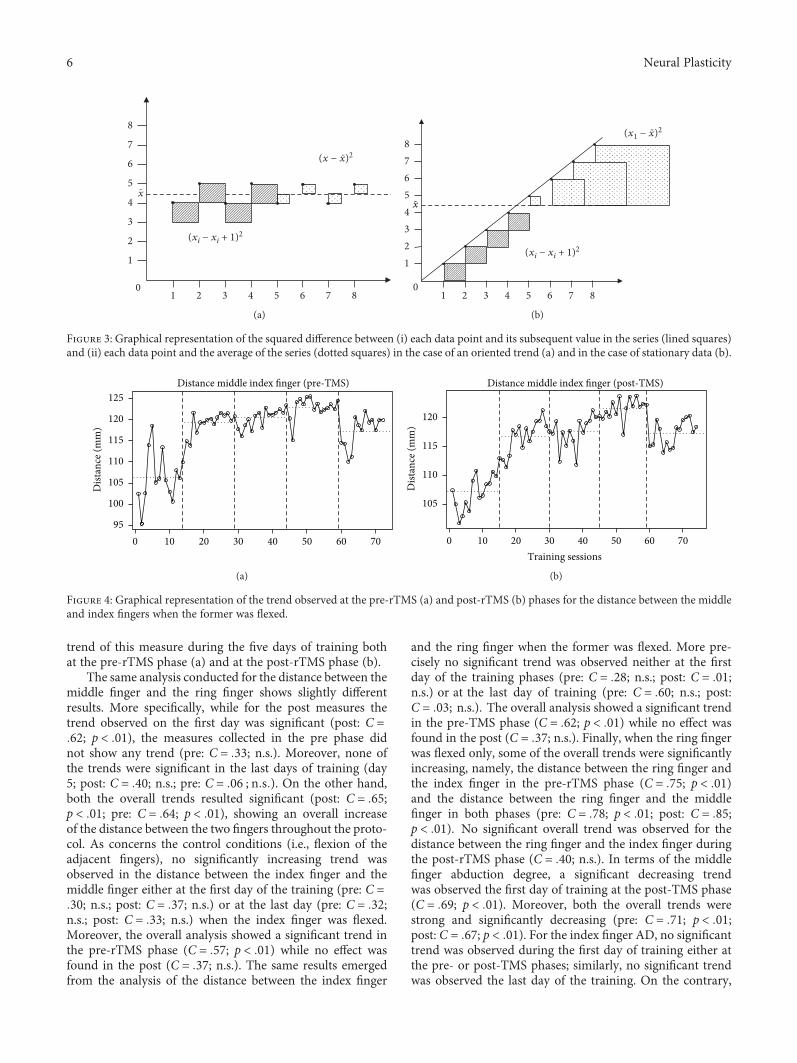
trend of this measure during the five days of training bothat the pre-rTMS phase (a) and at the post-rTMS phase (b).
The same analysis conducted for the distance between themiddle finger and the ring finger shows slightly differentresults. More specifically, while for the post measures thetrend observed on the first day was significant (post: C =62; p < 01), the measures collected in the pre phase didnot show any trend (pre: C = 33; n.s.). Moreover, none ofthe trends were significant in the last days of training (day5; post: C = 40; n.s.; pre: C = 06 ; n s ). On the other hand,both the overall trends resulted significant (post: C = 65;p < 01; pre: C = 64; p < 01), showing an overall increaseof the distance between the two fingers throughout the proto-col. As concerns the control conditions (i.e., flexion of theadjacent fingers), no significantly increasing trend wasobserved in the distance between the index finger and themiddle finger either at the first day of the training (pre: C =30; n.s.; post: C = 37; n.s.) or at the last day (pre: C = 32;n.s.; post: C = 33; n.s.) when the index finger was flexed.Moreover, the overall analysis showed a significant trend inthe pre-rTMS phase (C = 57; p < 01) while no effect wasfound in the post (C = 37; n.s.). The same results emergedfrom the analysis of the distance between the index finger
and the ring finger when the former was flexed. More pre-cisely no significant trend was observed neither at the firstday of the training phases (pre: C = 28; n.s.; post: C = 01;n.s.) or at the last day of training (pre: C = 60; n.s.; post:C = 03; n.s.). The overall analysis showed a significant trendin the pre-TMS phase (C = 62; p < 01) while no effect wasfound in the post (C = 37; n.s.). Finally, when the ring fingerwas flexed only, some of the overall trends were significantlyincreasing, namely, the distance between the ring finger andthe index finger in the pre-rTMS phase (C = 75; p < 01)and the distance between the ring finger and the middlefinger in both phases (pre: C = 78; p < 01; post: C = 85;p < 01). No significant overall trend was observed for thedistance between the ring finger and the index finger duringthe post-rTMS phase (C = 40; n.s.). In terms of the middlefinger abduction degree, a significant decreasing trendwas observed the first day of training at the post-TMS phase(C = 69; p < 01). Moreover, both the overall trends werestrong and significantly decreasing (pre: C = 71; p < 01;post: C = 67; p < 01). For the index finger AD, no significanttrend was observed during the first day of training either atthe pre- or post-TMS phases; similarly, no significant trendwas observed the last day of the training. On the contrary,
(xi − xi + 1)2
(x − x)2
0
-
x
1
2
3
4
5
6
7
8
2 3 41 6 7 85
-
(a)
-
0
(xi − xi + 1)2
(x1 − x)2-
12345678
2 3 41 6 7 85
x
(b)
Figure 3: Graphical representation of the squared difference between (i) each data point and its subsequent value in the series (lined squares)and (ii) each data point and the average of the series (dotted squares) in the case of an oriented trend (a) and in the case of stationary data (b).
Distance middle index finger (pre-TMS)
10 20 30 40 50 60 70095
100
105
110
115
120
125
Dist
ance
(mm
)
(a)
Distance middle index finger (post-TMS)
105
110
115
120D
istan
ce (m
m)
10 20 30 40 50 60 700Training sessions
(b)
Figure 4: Graphical representation of the trend observed at the pre-rTMS (a) and post-rTMS (b) phases for the distance between the middleand index fingers when the former was flexed.
6 Neural Plasticity

both the overall trends were significantly decreasing (pre:C = 68; p < 01; post: C = 58; p < 01). Finally, only theoverall trends were significantly decreasing when consider-ing the distance between the wrist and the ring finger (pre:C = 82; p < 01; post: C = 84; p < 01). When consideringthe control participant, data from day 1 were discardeddue to a technical problem. Results showed no significantoverall trend when the middle finger, the index finger,and the ring finger were moved. Such stable trends wereobserved in both the pre-TMS and post-TMS phases.
4.1.2. Task 2: Reach-to-Grasp Task. Several variables wereconsidered during task 2. For such variables, the analysis wasconducted by referring to the data collected throughout thefive days of training before (pre) and after (post) the TMSstimulation. The results obtained from the selected kine-matic variables in MD participant are reported as follows.
Movement time: A significantly decreasing trend wasobserved for the measures collected both pre-rTMS stimula-tion (C = 73; p < 01) and post-rTMS stimulation (C = 62;p < 01).
Maximum grip aperture: A significantly increasing trendwas observed for the measures collected before the stimula-tion (C = 64; p < 01). No significant trend was observedfor the measures collected after the rTMS (C = 30 ; n s ).
Time of maximum grip aperture: Two clearly and signif-icantly decreasing trends were observed for this variable. Thefirst one involved the measures collected before the rTMS(C = 79; p < 01), while the second one involved the mea-sures collected after the stimulation (C = 62; p < 01).
Time to maximum grip velocity: A clearly significantdecreasing trend was observed for the data series collectedbefore the TMS (C = 72; p < 01). The trend observed forthe data series collected after the stimulation was significant,although more noisy (C = 43; p < 01).
Time of maximum wrist height: A significantly decreas-ing trend was observed at both the pre-rTMS (C = 74; p <01) and the post-rTMS (C = 69; p < 01) phases.
Time of maximum wrist deceleration: With respect tothis variable, a significant although very noisy decreasingtrend was observed at both the pre-TMS measures (C = 49;p < 01) and the post-TMS ones (C = 50; p < 01).
Delay grasping: A significant decreasing trend wasobserved for this variable for the measures collected bothpre-rTMS stimulation (C = 57; p < 01) and post-rTMSstimulation (C = 57; p < 01).
Figure 5 displays the trend of the pointwise delta com-puted for the main variables measured in task 2. It is notice-able the increase of the negative difference between the preand the post measures during the first day of training, whilean increase in the positive difference between the same valuesis observed during the second day of training. After thesedays, the difference tends to remain stable.
As concerns the control participant, no trend resultedstatistically significant (ps > 0 05). Figure 6 displays togetherthe trends for the MD patient and the control participant.By the figure, it is clearly seen the difference of the two trendsin the movement time variable. Similar results were observedfor the remaining variables of task 2.
4.2. Neurophysiological Measures. No significant trend wasobserved in motor threshold at rest before (rMT pre) andafter (rMT post) rTMS 1Hz stimulation for either the MD(C = 07; n.s.; see Table 1) or the control (C = 17; n.s.; seeTable 1) participant.
5. Conclusions
We set out to investigate neural plasticity in a professionalguitarist affected by MD through a multimethodological par-adigm. To this end, we combined spTMS, low-frequencyrTMS, and 3Dmotion analysis. Results showed that althoughrTMS on M1 partially modulated resting motor threshold, asystematic normalization of various kinematic indexes dur-ing the 5-day treatment occurred for the MD participant.In particular, as concerns abduction independence, a signifi-cant increase in the distance between the dystonia-affectedfinger and the index and ring fingers was observed on the firstday of training during the post-TMS session. The trend sig-nificantly increased throughout the five days, showing anoverall increase of the distance between the fingers. Thesedata were further confirmed by the distance between theaffected finger and the wrist: a decreasing distance (abductiondegree) was observed both on the first day of training duringthe post-TMS session and throughout the treatment’s period.These results point to the presence of both a short-term and along-term trend in the affected finger and not to a generaleffect of practice.
As regards the reach-to-grasp task, an increase in generalmotor coordination was hypothesized for theMD participantthroughout the five days of training. No significant trend wasinstead expected for the control participant, since there wasno room for improvement (ceiling effect). Results showedan increase in motor coordination only for the MD partic-ipant, as indexed by a significant decrease in the movementtime. In terms of the reaching component, the time ofmaximum wrist height and the time of maximum wristdeceleration were anticipated, in line with previous studiesdemonstrating a significant anticipation when an object isapproached more carefully (e.g., [41, 42]). For the graspingcomponent, the amplitude of the maximum grip aperturerevealed an increasing pattern of accuracy—as indexedby an appropriate finger scaling—throughout the 5-daytraining. The time of maximum grip aperture, the timeof maximum grip velocity, and the delay grasping wereanticipated as well as for the reaching parameters, indicat-ing a temporal coupling between the reaching and thegrasping components. These results are consistent withhuman literature suggesting that task constraints can modu-late the proximal and distal components of a coordinatedaction. The failure to reduce variability as the target is beingapproached calls for coordination strategies amongst compo-nents, which might serve to partially dissipate errors [43].
An intriguing hypothesis points to a malfunctioning inthe parietal-premotor pathway of dystonic patients [44].Parietal-premotor connections are specialized for specifictasks, for example, reach-to-grasp movements, having sep-arate pathways for each of the two components (i.e.,reaching and grasping; [45]). Thus, a task-specific deficit
7Neural Plasticity

could arise from the combination of excessive motor repeti-tion of a particular task, together with disordered controlof neural plasticity in the pathway where that specific taskwas learned [2]. Based on this hypothesis, we might sug-gest that future behavioral interventions should be basedon restoring specific motor pathways through plasticityprocesses [22].
Notably, an initial positive outcome was observed duringthe post-TMS session of day 1, when all the parametersjointly showed a significant improvement. This effect, how-ever, was neutralized and reversed during the post-TMSsession of day 2, which was then followed by a stabiliza-tion phase for the remaining three days. The convergent
oscillation of all these parameters seems to indicate thatrTMS inhibitory stimulation might be beneficial in the veryshort term, but it provides a stable advantage only in thecourse of a 5-day training. This result might suggest that ittakes many days of intervention to rebalance motor activity.
Overall, these results suggest that kinematic assessmentsof abduction independence, abduction degree, and reachingand grasping components are useful parameters for objectivequantification of MD before and after training. Moreover, thereach-to-grasp task might allow studying situations similar tothose participants facing in their daily life motor activities.This points to the effectiveness of assessing kinematics inconjunction with individual clinical scores such as the Arm
1 4 7 11 16 21 26 31 36 41 46 51 56 61 66 71
Movement time
−400
−200
0
200
400
Del
ta (m
s)
(a)
1 4 7 11 16 21 26 31 36 41 46 51 56 61 66 71
Time of maximum wrist height
−200
−100
0
100
200
Del
ta (m
s)
(b)
1 4 7 11 16 21 26 31 36 41 46 51 56 61 66 71
Time of maximum wrist deceleration
Training sessions
−500
0
500
1000
Del
ta (m
m)
(c)
1 4 7 11 16 21 26 31 36 41 46 51 56 61 66 71
Time of maximum grip velocity
−400
−200
0
200
400
Del
ta (m
s)
(d)
1 4 7 11 16 21 26 31 36 41 46 51 56 61 66 71
Time of maximum grip aperture
−400
−200
0
200
400
Del
ta (m
s)
(e)
1 4 7 11 16 21 26 31 36 41 46 51 56 61 66 71
Maximum grip aperture
Training sessions
−10
−5
0
5
10
15
Del
ta (m
m)
(f)
Figure 5: Pointwise delta between the measures, for the main variables of task 2, obtained at pre- and post-rTMS phases by the MD patient.Parameters referring to the reaching component are listed on (a), (b), and (c), whereas parameters for the grasping component are displayedon (d), (e), and (f).
8 Neural Plasticity

Dystonia Disability Scale (ADDS). Although they probe dif-ferent aspects of motor impairment and might not correlatewith each other [46], they should both be used to supplementthe clinical diagnosis for monitoring the treatment and toassess the effectiveness of rehabilitation.
In neural terms, no trend was observed when consideringrMT. This is a counterintuitive—though not rare—output.Veugen and colleagues [47] recently found that inhibitionof the overactive dorsal premotor cortex partially recovereddystonic symptomatology despite having no influence onsurround inhibition (i.e., the mechanism in the motor systemwhich focuses neuronal activity to select the execution of thedesired movement; [48]), as indexed by MEP sizes. In partic-ular, stimulation improved writing performance in patients,
though there was no significant effect on rMT in either dys-tonic or control participants.
In this respect, the study described here highlights theimportance of evaluating brain stimulation outcomes in amoresystematic way, beyond classical measures of neural plasticitysuch as MEP size. The cause of MD is obscure, but a loss ofinhibition in the central nervous system and a loss of the nor-mal regulation of plasticity are classically reported [49–51].Plasticity generally refers to the ability of the nervous systemto change the effectiveness of transmission in neural circuits[3]. An increase of sensory and motor finger representationsin musicians is usually described as an adaptive plastic changeto conform to the new needs. However, when this changedevelops too far, brain plasticity might shift from a benefit toa maladaptive mechanism [52]. On the basis of this abnormalplasticity hypothesis, new treatment protocols have beendesigned aimed at the redifferentiation of the disturbed handrepresentations. Here, we propose a new procedure to investi-gate affected muscle activations in individuals with neurologicmotor disorders after plastic changes induced by rTMS.
This line of intervention holds several advantages overpharmacologic therapy (e.g., injections of botulinum toxininto the intrinsic arm/hand muscles): It is safe and effective,as demonstrated by kinematic analysis, and there is no riskof impairing movement in adjacent fingers. Moreover, it
MT_DIST
Movement time
500700900
110013001500170019002100
6 11 16 21 26 31 36 41 46 511
MT_CONT
(a)
MDControl
500
700
900
1100
1300
1500
1700
1900
2100
6 11 16 21 26 31 36 41 461
(b)
Figure 6: MD and control participant trends on the movement time (task 2).
Table 1: Resting motor threshold variations throughout the five-day protocol, before (rMT pre) and after (rMT post) the rTMS1Hz stimulation at the 90 percent of the rMT.
Day 1 Day 2 Day 3 Day 4 Day 5
MDrMT pre 43 43 43 44 44
rMT post 46 44 46 46 46
ControlrMT pre 43 50 44 52 42
rMT post 48 60 50 53 56
9Neural Plasticity

can be applied to patients unresponsive to a variety of com-monly used medical treatments. Noninvasive brain stimula-tion can transiently normalize corticospinal excitability tothe affected muscles and can improve the degree of motorcoordination over time. Objective quantifications of thistreatment can be experimentally obtained with EMG and3D movement analysis, paving the way for developingnovel evaluation tools to optimize therapeutic strategiesfor motor disorders.
As the rehabilitation research in limb dystonia develops,it will be relevant to investigate comparative effectivenessof interventions to understand which approach holds themost promise.
The present results could support three future researchaims:
(i) To develop an effective diagnostic tool based onneurophysiologic and behavioral measures forearly identification of patients and for quantifyingchanges in symptoms
(ii) To investigate how dystonia affects the parietal-premotor pathway (reaching and graspingcomponents)
(iii) To determine the best frequency and durationfor interventions and after effects followingrehabilitation.
A limit of the present study is the small sampleadopted. However, according to Kimberley and colleagues[23, 53], studies in this field should utilize robust smalln methodology such as single subject experimental designstudies with repeated measures that allows for detailedanalysis of within subject variability. Needless to say thatdefinitive statements cannot yet be made regarding efficacyof this paradigm. Randomized controlled measurements areessential for future studies to compare different outcomeswith similar frequency and duration.
Identifying the motor dynamics underlying this disorderwill be helpful for moving forward both in diagnosis andin treatment, to optimize therapeutic outcomes. Since theavailable medical approaches are only moderately effective,preventing dystonia is just as much important.
We argue that an enhanced understanding of how neuralplasticity can be assessed in FDH affected patients will pro-vide helpful insights for designing more effective patient-tailored therapies based on noninvasive brain stimulationand for evaluating different treatment approaches.
Data Availability
All related data are included within the article or will be madeavailable upon request.
Conflicts of Interest
The authors declare that there is no conflict of interestregarding the publication of this paper.
Acknowledgments
This work was supported by the Progetto Strategico, Univer-sità di Padova (N. 2010XPMFW4) to Umberto Castiello andby the SIR (Scientific Independence of Young Researchers)grant (N. RBSI141QKX) to Luisa Sartori. The authors wouldlike to thank Dr. Paolo Fuschi for his precious advice.
References
[1] E. Altenmüller and H.-C. Jabusch, “Focal dystonia in musi-cians: phenomenology, pathophysiology and triggering fac-tors,” European Journal of Neurology., vol. 17, pp. 31–36,2010.
[2] S. Pirio Richardson, E. Altenmüller, K. Alter et al., “Researchpriorities in limb and task-specific dystonias,” Frontiers inNeurology, vol. 8, p. 170, 2017.
[3] A. Quartarone, H. R. Siebner, and J. C. Rothwell, “Task-spe-cific hand dystonia: can too much plasticity be bad for you?,”Trends in Neurosciences., vol. 29, no. 4, pp. 192–199, 2006.
[4] D. Ruge, S. Tisch, M. I. Hariz et al., “Deep brain stimulationeffects in dystonia: time course of electrophysiological changesin early treatment,” Movement Disorders, vol. 26, no. 10,pp. 1913–1921, 2011.
[5] A. Quartarone, S. Bagnato, V. Rizzo et al., “Abnormal associa-tive plasticity of the human motor cortex in writer’s cramp,”Brain, vol. 126, no. 12, pp. 2586–2596, 2003.
[6] A. Quartarone, V. Rizzo, S. Bagnato et al., “Homeostatic-likeplasticity of the primary motor hand area is impaired in focalhand dystonia,” Brain, vol. 128, no. 8, pp. 1943–1950, 2005.
[7] A. Berardelli, J. C. Rothwell, M. Hallett, P. D. Thompson,M. Manfredi, and C. D. Marsden, “The pathophysiology ofprimary dystonia,” Brain, vol. 121, no. 7, pp. 1195–1212, 1998.
[8] J. Pujol, J. Roset-Llobet, D. Rosinés-Cubells et al., “Brain corti-cal activation during guitar-induced hand dystonia studied byfunctional MRI,” NeuroImage, vol. 12, no. 3, pp. 257–267,2000.
[9] W. Bara-Jimenez, M. J. Catalan, M. Hallett, and C. Gerloff,“Abnormal somatosensory homunculus in dystonia of thehand,” Annals of Neurology, vol. 44, no. 5, pp. 828–831, 1998.
[10] T. Elbert, V. Candia, E. Altenmüller et al., “Alteration of digitalrepresentations in somatosensory cortex in focal hand dysto-nia,” Neuroreport, vol. 9, no. 16, pp. 3571–3575, 1998.
[11] M. L. Byrnes, G. W. Thickbroom, S. A. Wilson et al., “The cor-ticomotor representation of upper limb muscles in writer’scramp and changes following botulinum toxin injection,”Brain, vol. 121, no. 5, pp. 977–988, 1998.
[12] M. Sommer, D. Ruge, F. Tergau, W. Beuche, E. Altenmüller,and W. Paulus, “Intracortical excitability in the hand motorrepresentation in hand dystonia and blepharospasm,” Move-ment Disorders, vol. 17, no. 5, pp. 1017–1025, 2002.
[13] C. Pantev, A. Engelien, V. Candia, and T. Elbert, “Representa-tional cortex in musicians,” Annals of the New York Academyof Sciences, vol. 930, no. 1, pp. 300–314, 2001.
[14] A. Pascual-Leone, “The brain that plays music and is changedby it,” Annals of the New York Academy of Sciences, vol. 930,no. 1, pp. 315–329, 2001.
[15] J. Konczak and G. Abbruzzese, “Focal dystonia in musicians:linking motor symptoms to somatosensory dysfunction,”Frontiers in Human Neuroscience, vol. 7, p. 297, 2013.
10 Neural Plasticity

[16] E. Altenmüller, “Focal dystonia: advances in brain imagingand understanding of fine motor control in musicians,” HandClinics, vol. 19, no. 3, pp. 523–538, 2003.
[17] T. Elbert, C. Pantev, C. Wienbruch, B. Rockstroh, and E. Taub,“Increased cortical representation of the fingers of the lefthand in string players,” Science, vol. 270, no. 5234, pp. 305–307, 1995.
[18] E. Altenmüller, V. Baur, A. Hofmann, V. K. Lim, and H.-C. Jabusch, “Musician’s cramp as manifestation of maladaptivebrain plasticity: arguments from instrumental differences,”Annals of the New York Academy of Sciences, vol. 1252, no. 1,pp. 259–265, 2012.
[19] S. J. Frucht, “Evaluating the musician with dystonia of theupper limb: a practical approach with video demonstration,”Journal of Clinical Movement Disorders, vol. 2, no. 1, p. 16,2015.
[20] N. N. Byl and A. McKenzie, “Treatment effectiveness forpatients with a history of repetitive hand use and focal handdystonia: a planned, prospective follow-up study,” Journal ofHand Therapy, vol. 13, no. 4, pp. 289–301, 2000.
[21] H.-C. Jabusch and E. Altenmüller, “Three-dimensionalmovement analysis as a promising tool for treatment evalua-tion of musicians’ dystonia,” Advances in Neurology, vol. 94,pp. 239–245, 2004.
[22] F. Cogiamanian, S. Barbieri, and A. Priori, “Novel nonphar-macologic perspectives for the treatment of task-specific focalhand dystonia,” Journal of Hand Therapy, vol. 22, no. 2,pp. 156–162, 2009.
[23] T. J. Kimberley, R. L. S. Schmidt, M. Chen, D. D. Dykstra, andC. M. Buetefisch, “Mixed effectiveness of rTMS and retrainingin the treatment of focal hand dystonia,” Frontiers in HumanNeuroscience, vol. 9, p. 385, 2015.
[24] Y.-Z. Huang, C.-S. Lu, J. C. Rothwell et al., “Modulation of thedisturbed motor network in dystonia by multisession suppres-sion of premotor cortex,” PLoS One, vol. 7, no. 10, articlee47574, 2012.
[25] H. R. Siebner, J. M. Tormos, A. O. Ceballos-Baumann et al.,“Low-frequency repetitive transcranial magnetic stimulationof the motor cortex in writer’s cramp,” Neurology, vol. 52,no. 3, pp. 529–537, 1999.
[26] H. R. Siebner, C. Auer, and B. Conrad, “Abnormal increase inthe corticomotor output to the affected hand during repetitivetranscranial magnetic stimulation of the primary motor cortexin patients with writer’s cramp,” Neuroscience Letters, vol. 262,no. 2, pp. 133–136, 1999.
[27] H. Siebner and J. Rothwell, “Transcranial magnetic stimu-lation: new insights into representational cortical plasticity,”Experimental Brain Research, vol. 148, no. 1, pp. 1–16,2003.
[28] H. R. Siebner, N. Lang, V. Rizzo et al., “Preconditioning of low-frequency repetitive transcranial magnetic stimulation withtranscranial direct current stimulation: evidence for homeo-static plasticity in the human motor cortex,” The Journal ofNeuroscience, vol. 24, no. 13, pp. 3379–3385, 2004.
[29] M. Borich, S. Arora, and T. J. Kimberley, “Lasting effects ofrepeated rTMS application in focal hand dystonia,” RestorativeNeurology and Neuroscience, vol. 27, no. 1, pp. 55–65, 2009.
[30] N. Murase, J. C. Rothwell, R. Kaji et al., “Subthresholdlow-frequency repetitive transcranial magnetic stimulationover the premotor cortex modulates writer’s cramp,” Brain,vol. 128, no. 1, pp. 104–115, 2005.
[31] A. S. Schneider, B. Baur, W. Fürholzer, I. Jasper, C. Marquardt,and J. Hermsdörfer, “Writing kinematics and pen forces inwriter’s cramp: effects of task and clinical subtype,” ClinicalNeurophysiology, vol. 121, no. 11, pp. 1898–1907, 2010.
[32] M. Jeannerod, “The timing of natural prehensionmovements,”Journal of Motor Behavior, vol. 16, no. 3, pp. 235–254, 1984.
[33] D. A. Nowak and J. Hermsdörfer, “Coordination of grip andload forces during vertical point-to-point movements with agrasped object in Parkinson’s disease,” Behavioral Neurosci-ence, vol. 116, no. 5, pp. 837–850, 2002.
[34] D. A. Nowak and J. Hermsdörfer, “Grip force behavior duringobject manipulation in neurological disorders: toward anobjective evaluation of manual performance deficits,” Move-ment Disorders, vol. 20, no. 1, pp. 11–25, 2005.
[35] D. A. Nowak and J. Hermsdörfer, “Objective evaluation ofmanual performance deficits in neurological movement disor-ders,” Brain Research Reviews, vol. 51, no. 1, pp. 108–124,2006.
[36] J. P. Basil-Neto, L. G. Cohen, M. Panizza, J. Nilsson, B. J. Roth,and M. Hallett, “Optimal focal transcranial magnetic activa-tion of the human motor cortex: effects of coil orientation,shape of the induced current pulse, and stimulus intensity,”Journal of Clinical Neurophysiology, vol. 9, no. 1, pp. 132–136, 1992.
[37] K. R. Mills, S. J. Boniface, and M. Schubert, “Magnetic brainstimulation with a double coil: the importance of coil orienta-tion,” Electroencephalography and Clinical Neurophysiology/Evoked Potentials Section, vol. 85, no. 1, pp. 17–21, 1992.
[38] P. M. Rossini, A. T. Barker, A. Berardelli et al., “Non-invasiveelectrical and magnetic stimulation of the brain, spinal cordand roots: basic principles and procedures for routine clinicalapplication. Report of an IFCN committee,” Electroencepha-lography and Clinical Neurophysiology, vol. 91, no. 2, pp. 79–92, 1994.
[39] R Core Team, R: A, Language and Environment for StatisticalComputing, R Foundation for Statistical Computing, Vienna,Austria, 2014.
[40] L. C. Young, “On randomness in ordered sequences,” TheAnnals of Mathematical Statistics, vol. 12, no. 3, pp. 293–300,1941.
[41] C. Armbrüster and W. Spijkers, “Movement planning in pre-hension: do intended actions influence the initial reach andgrasp movement?,” Motor Control, vol. 10, no. 4, pp. 311–329, 2006.
[42] A. Schuboe, A. Maldonado, S. Stork, and M. Beetz, “Subse-quent actions influence motor control parameters of a currentgrasping action,” in RO-MAN 2008 - The 17th IEEE Interna-tional Symposium on Robot and Human Interactive Communi-cation, pp. 389–394, Munich, Germany, August 2008.
[43] A. M. Wing, A. Turton, and C. Fraser, “Grasp size and accu-racy of approach in reaching,” Journal of Motor Behavior,vol. 18, no. 3, pp. 245–260, 1986.
[44] C. Gallea, S. G. Horovitz, M. ‘Ali Najee-Ullah, and M. Hallett,“Impairment of a parieto-premotor network specialized forhandwriting in writer’s cramp,” Human Brain Mapping,vol. 37, no. 12, pp. 4363–4375, 2016.
[45] C. Cavina-Pratesi, S. Monaco, P. Fattori et al., “Functionalmagnetic resonance imaging reveals the neural substrates ofarm transport and grip formation in reach-to-grasp actionsin humans,” The Journal of Neuroscience, vol. 30, no. 31,pp. 10306–10323, 2010.
11Neural Plasticity
[46] K. E. Zeuner, M. Peller, A. Knutzen et al., “How to assessmotor impairment in writer’s cramp,” Movement Disorders,vol. 22, no. 8, pp. 1102–1109, 2007.
[47] L. C. Veugen, B. S. Hoffland, D. F. Stegeman, and B. P. van deWarrenburg, “Inhibition of the dorsal premotor cortex doesnot repair surround inhibition in writer’s cramp patients,”Experimental Brain Research, vol. 225, no. 1, pp. 85–92, 2013.
[48] S. Beck, S. P. Richardson, E. A. Shamim, N. Dang, M. Schubert,and M. Hallett, “Short intracortical and surround inhibitionare selectively reduced during movement initiation in focalhand dystonia,” The Journal of Neuroscience, vol. 28, no. 41,pp. 10363–10369, 2008.
[49] A. Quartarone and M. Hallett, “Emerging concepts in thephysiological basis of dystonia,” Movement Disorders, vol. 28,no. 7, pp. 958–967, 2013.
[50] P. T. Lin and M. Hallett, “The pathophysiology of focal handdystonia,” Journal of Hand Therapy, vol. 22, no. 2, pp. 109–114, 2009.
[51] M. Herrojo Ruiz, P. Senghaas, M. Grossbach et al., “Defectiveinhibition and inter-regional phase synchronization in pianistswith musician’s dystonia: an EEG study,” Human Brain Map-ping, vol. 30, no. 8, pp. 2689–2700, 2009.
[52] T. F. Münte, E. Altenmüller, and L. Jäncke, “The musician’sbrain as a model of neuroplasticity,” Nature Reviews Neurosci-ence, vol. 3, no. 6, pp. 473–478, 2002.
[53] T. J. Kimberley and R. P. D. Fabio, “Visualizing the effects ofrTMS in a patient sample: small N vs. group level analysis,”PLoS One, vol. 5, no. 12, article e15155, 2010.
12 Neural Plasticity
Research ArticleLaterality of Poststroke Cortical Motor Activity during ActionObservation Is Related to Hemispheric Dominance
Sook-Lei Liew ,1 Kathleen A. Garrison,2 Kaori L. Ito ,1 Panthea Heydari,1
Mona Sobhani ,1 Julie Werner ,3,4 Hanna Damasio,1 Carolee J. Winstein,1
and Lisa Aziz-Zadeh1
1University of Southern California, Los Angeles, CA, USA2Yale University, New Haven, CT, USA3California State University, Dominguez Hills, Carson, CA, USA4Children’s Hospital Los Angeles, Los Angeles, CA, USA
Correspondence should be addressed to Sook-Lei Liew; [email protected]
Received 24 February 2018; Revised 5 April 2018; Accepted 19 April 2018; Published 28 May 2018
Academic Editor: Toshiyuki Fujiwara
Copyright © 2018 Sook-Lei Liew et al. This is an open access article distributed under the Creative Commons Attribution License,which permits unrestricted use, distribution, and reproduction in any medium, provided the original work is properly cited.
Background. Increased activity in the lesioned hemisphere has been related to improved poststroke motor recovery. However, therole of the dominant hemisphere—and its relationship to activity in the lesioned hemisphere—has not been widely explored.Objective. Here, we examined whether the dominant hemisphere drives the lateralization of brain activity after stroke andwhether this changes based on if the lesioned hemisphere is the dominant hemisphere or not. Methods. We used fMRI tocompare cortical motor activity in the action observation network (AON), motor-related regions that are active bothduring the observation and execution of an action, in 36 left hemisphere dominant individuals. Twelve individuals hadnondominant, right hemisphere stroke, twelve had dominant, left-hemisphere stroke, and twelve were healthy age-matchedcontrols. We previously found that individuals with left dominant stroke show greater ipsilesional activity during actionobservation. Here, we examined if individuals with nondominant, right hemisphere stroke also showed greater lateralizedactivity in the ipsilesional, right hemisphere or in the dominant, left hemisphere and compared these results with those ofindividuals with dominant, left hemisphere stroke. Results. We found that individuals with right hemisphere stroke showedgreater activity in the dominant, left hemisphere, rather than the ipsilesional, right hemisphere. This left-lateralized patternmatched that of individuals with left, dominant hemisphere stroke, and both stroke groups differed from the age-matchedcontrol group. Conclusions. These findings suggest that action observation is lateralized to the dominant, rather thanipsilesional, hemisphere, which may reflect an interaction between the lesioned hemisphere and the dominant hemispherein driving lateralization of brain activity after stroke. Hemispheric dominance and laterality should be carefully consideredwhen characterizing poststroke neural activity.
1. Introduction
Despite intensive research and clinical efforts, strokeremains a leading cause of physical disability worldwide[1], and there is an urgent need for improved poststrokerehabilitation strategies. Many studies have suggested thatincreased levels of activity in the ipsilesional hemisphereafter stroke are associated with enhanced recovery [2–4].Functional magnetic resonance imaging (fMRI) studies in
individuals with stroke suggest that greater blood oxygenlevel-dependent (BOLD) activity in the contralateral (ipsi-lesional) hemisphere during a task with the impairedupper limb—a pattern consistent with typical motorcontrol—is associated with better motor outcomes [4–6].Poststroke therapeutic techniques have therefore aimed atpromoting motor recovery by increasing activity in theipsilesional hemisphere and decreasing activity in the con-tralesional hemisphere [7–10]. However, poststroke motor
HindawiNeural PlasticityVolume 2018, Article ID 3524960, 14 pageshttps://doi.org/10.1155/2018/3524960

outcomes using such approaches remain variable, suggest-ing that other factors influence recovery beyond the levelof brain activity in the ipsilesional hemisphere.
One factor that has been largely overlooked in strokestudies is the role of motor dominance relative to the lesionedhemisphere. Studies often discuss findings related to the ipsi-lesional or contralesional hemisphere, without distinguishingwhether the ipsilesional hemisphere is the dominant or non-dominant hemisphere prior to stroke. However, whetherstroke occurs in the dominant or nondominant hemispherecan impact recovery in multiple ways, including impactingthe pattern of brain activity achieved in poststroke therapy[11–13]. Research has shown clear hemispheric differencesin the specialization of motor control, with differences inthe performance of motor actions after stroke related to thelesioned hemisphere. Winstein and Pohl (1995) reported thatindividuals with left hemisphere stroke showed deficits inopen-loop, motor planning aspects of movement, whereasindividuals with right hemisphere stroke showed deficits inclosed-loop, feedback-based aspects of movement [14].Another study showed that in an arm-reaching task, individ-uals with left hemisphere stroke had difficulty controlling thedirection of movement, whereas individuals with right hemi-sphere stroke had a tendency to overshoot their targets [11].These studies and others suggest that there is hemisphericspecialization in a distributed motor control scheme, wherethe left hemisphere is responsible for optimizing and predict-ing dynamic aspects of movement, and the right hemisphereis responsible for movement accuracy and stability [15].There are thus likely differences in task-related brain activitydepending on the dominance of the lesioned hemisphere.Better understanding the relationship between motor domi-nance, hemisphere of stroke, and brain activity is criticalbecause it could enable greater personalization of interven-tions in stroke neurorehabilitation and allow us to betterunderstand the neural mechanisms underlying deficitsfollowing stroke.
Here, we hypothesized that the motor dominant hemi-sphere might in fact drive poststroke brain activity duringaction observation more strongly than the side of the strokelesion. We specifically evaluated brain activity in the actionobservation network (AON), as it is a brain network typicallyengaged through both the observation and performance ofactions and is comprised of cortical motor regions in the pre-motor and parietal cortices [16]. Importantly, activity in theAON can be elicited simply through action observation, soeven individuals with moderate to severe upper arm paresiscan complete the task. Action observation therapy (AOT),in which individuals with stroke observe another person per-forming actions (e.g., through videos) before or during actualphysical practice of those actions, has been proposed as a wayto enhance the effects of occupational or physical therapy[17–20]. Behavioral studies examining outcomes of AOTwith occupational or physical therapy showmodest improve-ments in poststroke motor recovery when compared to tradi-tional therapy alone [17–19, 21, 22]. Researchers hypothesizethat action observation may enhance plasticity in the samemotor pathways responsible for action execution [23]. TheAON has also been shown to be active during action
observation in individuals after stroke [24]. In particular,activity in the AON was found to be lateralized to the ipsile-sional, dominant hemisphere in individuals with motordominant, left hemisphere stroke who observed actionsbeing performed by the counterpart to their own pareticright arm [24]. However, since the left hemisphere wasboth the ipsilesional and motor dominant hemisphere, itwas not possible to distinguish whether action observationdrives activity in the ipsilesional hemisphere or in the motordominant hemisphere.
The present study was designed with a primary aim ofimproving our understanding of the effects of motordominance versus side of lesion on AON activity in individ-uals after stroke. We recruited individuals who were lefthemisphere dominant (right handed) prior to stroke andhad nondominant, right hemisphere stroke. Using the samefMRI protocol as in the earlier AON stroke study [24], wetested whether individuals with nondominant right hemi-sphere stroke had greater AON activity during actionobservation in the ipsilesional (right) hemisphere or inthe dominant (left) hemisphere. We compared these datato the dominant left hemisphere stroke group and anage-matched control group from the earlier study [24].We predicted that if action observation drives activity inthe ipsilesional hemisphere, the right hemisphere strokegroup should show greater activity in the right hemisphere,whereas if action observation drives activity in the motordominant hemisphere, the right hemisphere stroke groupshould show greater activity in the left hemisphere.
2. Methods
2.1. Subjects. The current analysis included 36 individualswho were right-handed (left hemisphere motor dominant)as determined by the Edinburgh Handedness Inventory[25]. There were 24 participants with chronic stroke andmoderate-to-severe upper extremity motor impairmentsand 12 nondisabled, age-matched controls. Both the non-disabled controls and 12 individuals with dominant lefthemisphere stroke were included in an earlier study [24].In the current study, 12 additional individuals with non-dominant right hemisphere stroke were recruited fromcommunity centers. All participants gave informed consentin accordance with institutional guidelines approved bythe University of Southern California Institutional ReviewBoard. All individuals were right handed (prior to stroke),had normal or corrected-to-normal vision, and were safefor MRI. Additional inclusion criteria for individuals withstroke was chronic (>3 months since stroke onset), middlecerebral artery stroke, with no prior history of stroke,moderate-to-severe upper extremity impairment as deter-mined by a phone screening form in which participantsindicated difficulty moving their hand or arm for func-tional tasks, and no apraxia. For all participants, meanage (including nondisabled controls) was 63± 13 years anddid not differ between groups (F 2, 33 = 0 94, p = 0 40).For participants with stroke, average time since stroke was80± 58 months and did not differ between right and left
2 Neural Plasticity
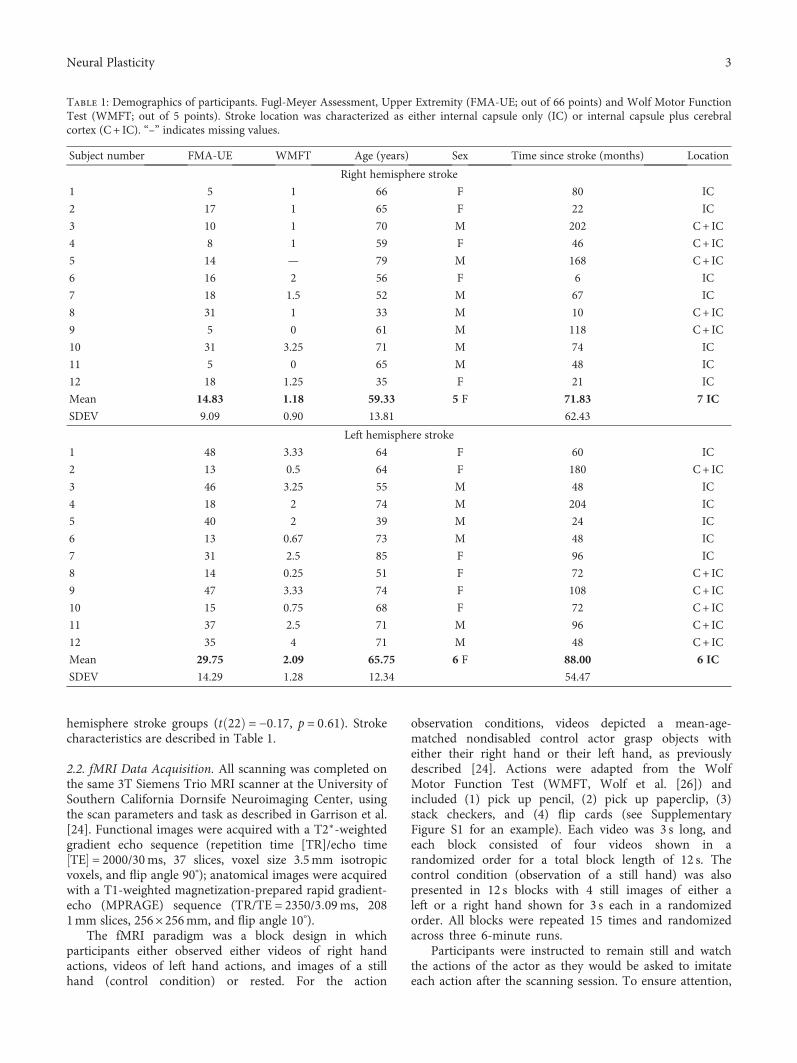
hemisphere stroke groups (t 22 = −0 17, p = 0 61). Strokecharacteristics are described in Table 1.
2.2. fMRI Data Acquisition. All scanning was completed onthe same 3T Siemens Trio MRI scanner at the University ofSouthern California Dornsife Neuroimaging Center, usingthe scan parameters and task as described in Garrison et al.[24]. Functional images were acquired with a T2∗-weightedgradient echo sequence (repetition time [TR]/echo timeTE = 2000/30ms, 37 slices, voxel size 3.5mm isotropicvoxels, and flip angle 90°); anatomical images were acquiredwith a T1-weighted magnetization-prepared rapid gradient-echo (MPRAGE) sequence (TR/TE = 2350/3 09ms, 2081mm slices, 256× 256mm, and flip angle 10°).
The fMRI paradigm was a block design in whichparticipants either observed either videos of right handactions, videos of left hand actions, and images of a stillhand (control condition) or rested. For the action
observation conditions, videos depicted a mean-age-matched nondisabled control actor grasp objects witheither their right hand or their left hand, as previouslydescribed [24]. Actions were adapted from the WolfMotor Function Test (WMFT, Wolf et al. [26]) andincluded (1) pick up pencil, (2) pick up paperclip, (3)stack checkers, and (4) flip cards (see SupplementaryFigure S1 for an example). Each video was 3 s long, andeach block consisted of four videos shown in arandomized order for a total block length of 12 s. Thecontrol condition (observation of a still hand) was alsopresented in 12 s blocks with 4 still images of either aleft or a right hand shown for 3 s each in a randomizedorder. All blocks were repeated 15 times and randomizedacross three 6-minute runs.
Participants were instructed to remain still and watchthe actions of the actor as they would be asked to imitateeach action after the scanning session. To ensure attention,
Table 1: Demographics of participants. Fugl-Meyer Assessment, Upper Extremity (FMA-UE; out of 66 points) and Wolf Motor FunctionTest (WMFT; out of 5 points). Stroke location was characterized as either internal capsule only (IC) or internal capsule plus cerebralcortex (C + IC). “–” indicates missing values.
Subject number FMA-UE WMFT Age (years) Sex Time since stroke (months) Location
Right hemisphere stroke
1 5 1 66 F 80 IC
2 17 1 65 F 22 IC
3 10 1 70 M 202 C+ IC
4 8 1 59 F 46 C+ IC
5 14 — 79 M 168 C+ IC
6 16 2 56 F 6 IC
7 18 1.5 52 M 67 IC
8 31 1 33 M 10 C+ IC
9 5 0 61 M 118 C+ IC
10 31 3.25 71 M 74 IC
11 5 0 65 M 48 IC
12 18 1.25 35 F 21 IC
Mean 14.83 1.18 59.33 5 F 71.83 7 IC
SDEV 9.09 0.90 13.81 62.43
Left hemisphere stroke
1 48 3.33 64 F 60 IC
2 13 0.5 64 F 180 C+ IC
3 46 3.25 55 M 48 IC
4 18 2 74 M 204 IC
5 40 2 39 M 24 IC
6 13 0.67 73 M 48 IC
7 31 2.5 85 F 96 IC
8 14 0.25 51 F 72 C+ IC
9 47 3.33 74 F 108 C+ IC
10 15 0.75 68 F 72 C+ IC
11 37 2.5 71 M 96 C+ IC
12 35 4 71 M 48 C+ IC
Mean 29.75 2.09 65.75 6 F 88.00 6 IC
SDEV 14.29 1.28 12.34 54.47
3Neural Plasticity

participants were asked questions about the videos at theend of each run (e.g., “In the last video you saw, which handdid the actor use?”).
2.3. fMRI Analysis
2.3.1. Preprocessing and Analyses. Functional neuroimagingdata analysis was carried out using FEAT (FMRI ExpertAnalysis Tool) Version 6, part of FSL (FMRIB’s SoftwareLibrary, http://www.fmrib.ox.ac.uk/fsl). Registration tohigh-resolution structural and standard space images wascarried out using FLIRT [27, 28]. The following preprocess-ing steps were applied: semimanual skull stripping of theanatomical image using BET [29], motion correction usingMCFLIRT [27], automated nonbrain removal of the fMRIdata using BET [29], spatial smoothing using a Gaussian ker-nel of FWHM 5mm, grand-mean intensity normalization ofthe entire 4D dataset by a single multiplicative factor, andhigh-pass temporal filtering (Gaussian-weighted least-squares straight line fitting, with sigma = 50 s). For each sub-ject, a time-series statistical analysis was carried out usingFILM GLM with local autocorrelation correction [30]. TheseZ (Gaussianized T/F) statistic images were then thresholdedusing clusters determined by Z > 3 1 and a (corrected) clustersignificance threshold of p < 0 05 [31]. A second-level analy-sis for each subject was conducted, averaged across the threeruns, and carried out using a fixed-effects model by forcingthe random-effects variance to zero in FLAME (FMRIB’sLocal Analysis of Mixed Effects) [32–34]. At the group level,analyses were completed using a mixed-effects model thatincluded both fixed effects and random effects from crosssession/subject variance in FLAME. Again, Z (GaussianizedT/F) statistic images were then thresholded using clustersdetermined by Z > 3 1 and a (corrected) cluster significancethreshold of p < 0 05. Whole brain analyses examined maineffects of right hand action observation, main effects of lefthand action observation, and contrasts of right hand actionobservation versus left hand action observation and left handaction observation versus right hand observation.
An additional aim of the current study was to directlycompare new data from the right hemisphere stroke groupto the data from the left hemisphere stroke group andnondisabled control group from the earlier study [24]. Inorder to do this, we reanalyzed all of the earlier data usingthe preprocessing steps described above to ensure that thesame, up-to-date analysis techniques were used in all cohorts.
2.3.2. Region of Interest Analyses. A priori regions of interest(ROIs) included regions of the human AON: inferior frontalgyrus pars opercularis (IFGop) and pars triangularis (IFGtri),the supramarginal gyrus (SMG), and the precentral gyrus(PC) [35]. ROIs were defined anatomically using theprobabilistic Harvard-Oxford Atlas included in FSL, with aprobability threshold of greater than 25% applied for eachROI. The percent signal change (% SC) within each ROIwas extracted for each task condition and each participantusing Featquery in FSL.
2.3.3. Laterality Index. A laterality index (LI) was calculatedto measure lateralization of brain activity during observation
of each hand (right, left) for each group (nondisabled control,right hemisphere stroke, and left hemisphere stroke). LI wascalculated as the proportion of active voxels in the left versusright ROI averaged across multiple thresholds [36, 37]. Wecalculated LI using the proportion of active voxels, ratherthan percent signal change, based on previous work suggest-ing that this approach is more robust for lesioned brains(Jansen et al. [37]). The cluster tool in FSL was used to setthe different threshold values (Z = 1 0, 1.5, 2.3); Fslstats wasused to determine the number of active voxels. LI wascalculated using the classic formula
LI =lef t − rightlef t + right
1
at each Z-threshold for each ROI [37], where LI is equal toleft hemisphere activity minus right hemisphere activitydivided by left hemisphere activity plus right hemisphereactivity. The average of the three LIs at different Z-valueswas then calculated. LI scores range from +1 (all left hemi-sphere activation only) to −1 (all right hemisphere activationonly) and were categorized as either bilateral (∣LI∣ ≤ 0 1),hemisphere dominant (0 1 < ∣LI∣ < 0 2), or hemisphere later-alized (∣LI∣ ≥ 0 2) [37]. Following previous work, the LI andstandard error of the mean (SEM) are reported [24]. Thecomplete LI values for each group at each threshold/ROIcan be found in Supplementary Table 5 and for each individualat each threshold/ROI in Supplementary Tables 6–9.
2.3.4. ROI-Based Task by Hemisphere by Group Interactions.A three-way ANOVAwas carried out in SPSS 22 (IBMCorp.,Armonk, NY, USA) to determine the effects of hand observed(right, left), hemisphere of activity (right, left), and group(nondisabled control, right hemisphere stroke, and lefthemisphere stroke) for each of our four regions of interest.We applied a Bonferroni correction for multiple compari-sons. We also report any significant two-way interactionswithin the ANOVAs and subsequently tested for simplemain effects where appropriate.
2.3.5. Lesion Analyses. Lesions were manually drawn by atrained research assistant following a detailed lesion tracingprotocol [38, 39] using MRIcron [40]. Lesion masks werethen smoothed using a 2mm Gaussian kernel. For eachsubject, a small mask was manually created in the healthywhite matter tissue of the contralesional hemisphere. Thewhite matter mask was used to determine the mean andstandard deviation of healthy white matter voxel intensitieswithin each subject’s anatomical image using fslstats. Eachsubject’s anatomical image was then thresholded at onestandard deviation away from the mean white matter inten-sity, such that voxels with a signal intensity within or abovethe normal range would be excluded from the final lesionmask. Finally, the volume of the lesion was calculated usingfslstats. An independent-sample t-test was conducted tocompare lesion size between the right hemisphere strokegroup and the left hemisphere stroke group. For each ROI,Pearson product-moment correlations were tested betweenlesion size and LI for that ROI, for each stroke group.
4 Neural Plasticity
2.3.6. Percent of Lesion Overlap with ROIs. To examine thepercent of lesion overlap with each ROI, each individual’sbinarized lesion mask was normalized to standard spaceand masked with each ROI using fslmaths. The number ofvoxels in the overlapping area was obtained using fslstats.The number of voxels in the overlapping area was thendivided by the total number of voxels within the ROI to cal-culate the percent of overlap between the lesion and the ROIfor each subject.
2.4. Behavioral Assessments. Immediately after the scanningsession, participants completed a series of behavioral assess-ments. Due to the small sample size, behavioral correlationswith fMRI data were used as secondary, exploratory analyses.Participants were administered the Wolf Motor FunctionTest (WMFT) to test the function of the upper extremity inthe motor domain [26]. Performance on the WMFT wasvideotaped and scored by a trained, blinded researchassistant for a Functional Ability Scale (FAS) score, rangingfrom 0 to 5, where 0=does not attempt movement and5=movement is normal. Individuals were also assessed withthe Fugl-Meyer Assessment, Upper Extremity (FMA-UE)[41], a measure of poststroke motor impairment. Behavioralassessments were performed by graduate research assistantswho were trained in the administration of both the WMFTand FMA-UE assessments.
For each ROI, Spearman’s rho correlations were testedbetween ROI activity and motor scores for the WMFT andFMA-UE (both categorical variables) in SPSS 22. We notethat these results are exploratory and report results, notingthat correcting for multiple comparisons across ROIs resultsin a corrected p value of p = 0 00625 (p = 0 05 divided by8 comparisons).
3. Results
In the current study, we aimed to understand whether indi-viduals with nondominant right hemisphere stroke showedgreater ipsilesional right hemisphere activity or greater motordominant left hemisphere activity during action observation.In order to better generalize our findings, we also comparedthe nondominant right hemisphere stroke group with adominant left hemisphere stroke group and a nondisabledcontrol group from our earlier study [24].
3.1. Between-Group Behavioral Comparisons. Individualswith right hemisphere stroke had significantly lower Fugl-Meyer scores than individuals with left hemisphere strokehad (t 22 = −0 67, p = 0 02), indicating greater poststrokemotor impairments of the upper extremity in the righthemisphere stroke group. Fugl-Meyer scores are reported inTable 1. Similarly, on the WMFT, individuals with righthemisphere stroke showed a trend towards lower FAS scores(t 21 = 1 94, p = 0 06) than did individuals with lefthemisphere stroke, again indicating poorer motor perfor-mance. WMFT scores are reported in Table 1, along withall participant demographics.
3.2. Whole-Brain fMRI Analyses.Notably, overall, patterns ofbrain activity during right and left hand action observation
were similar between right and left hemisphere strokegroups, despite the groups having motor impairments inopposite hands. Contrasts of right versus left hand actionobservation, and vice versa, showed similar patterns inthe stroke groups and a different pattern in the nondis-abled group.
3.2.1. Right Hemisphere Stroke Group. For the righthemisphere stroke group, during right (corresponding tononparetic) hand action observation, activity was found inthe left premotor cortex, bilateral precentral gyri, bilateralsuperior parietal lobules, and bilateral occipital cortices,among other areas (Figure 1; Supplementary Table 1).During left (corresponding to paretic) hand action observation,activity was again found in the left supramarginal gyrus,bilateral precentral gyri, bilateral superior parietal lobules,and bilateral occipital cortices (Figure 1; SupplementaryTable 2).
Comparing right and left hand action observationdirectly revealed the following: Right versus left hand actionobservation recruited greater activity in the left postcentralgyrus and superior parietal lobule and the right occipital pole.Left versus right hand action observation more stronglyactivated the right occipital pole and intracalcarine cortex(Figure 2; Supplementary Tables 3–4).
3.2.2. Left Hemisphere Stroke Group. Despite our reanalysisusing a more stringent threshold, for the left hemispherestroke group, we find results consistent with the findingsreported in Garrison et al. [24]. During right (correspondingto paretic) hand action observation, activity was found inthe left premotor cortex, bilateral precentral gyri, bilateralsupramarginal gyri, and bilateral occipital cortices, amongother areas, with greater activity in the left hemisphere(Figure 1; Supplementary Table 1).
During left (corresponding to nonparetic) hand actionobservation, a sparser pattern of activity was found in the leftsupramarginal gyrus, bilateral precentral gyri, bilateral supe-rior parietal lobules, and bilateral occipital cortices amongother areas (Figure 1; Supplementary Table 2).
Comparing right and left hand action observationdirectly revealed the following: Right versus left hand actionobservation recruited greater activity in left precentral gyrusand left postcentral gyrus. Left versus right hand actionobservation recruited greater activity in right occipital andoccipitotemporal regions (Figure 2; Supplementary Figure S2;Supplementary Tables 3–4).
3.2.3. Nondisabled Control Group. Again, consistent with thefindings reported in Garrison et al. [24] for the nondisabledcontrol group, during right (dominant) hand action observa-tion, activity was found in the right inferior frontal gyrus,right dorsal premotor cortex, right precentral gyrus, bilateralpostcentral gyri, bilateral parietal cortices, and bilateraloccipital cortices (Figure 3; Supplementary Table 1).
During left (nondominant) hand action observation, therewas a similar pattern of activity, with activation in the rightinferior frontal gyrus, right dorsal premotor cortex, bilateralprecentral gyri, bilateral postcentral gyri, bilateral parietal
5Neural Plasticity

cortices, and bilateral occipital cortices, as well as the rightposterior superior temporal sulcus at the temporoparietaljunction (Figure 3; Supplementary Table 2).
Comparing right and left hand action observationdirectly revealed the following: Right versus left handaction observation revealed no significant activity (Figure 4;Supplementary Table 3). In contrast, left versus right handaction observation recruited more activity in the righthemisphere, particularly in the right postcentral gyrus, rightsuperior parietal lobule, and right occipital cortex (Figure 4;Supplementary Table 4).
3.2.4. Interim Summary.Whole brain patterns in both strokegroups primarily showed greater left hemisphere activityduring right hand action observation, while whole brain pat-terns in nondisabled controls were largely right lateralizedduring left hand action observation. Results here werereported at a relatively stringent threshold of Z > 3 1, clustercorrected at p < 0 05. Given our smaller group sample sizesand heterogeneity of lesion locations, we also wished tovisualize this data at a more lenient threshold (Z > 2 3, clustercorrected at p < 0 05) to examine whether these lateralitytrends expanded. At this more lenient threshold, wefound the same laterality patterns reported above, butthey were extended to much wider regions of the AON (seeSupplementary Figure S2).
3.3. Laterality Index. LI scores range from +1 (all lefthemisphere activation only) to −1 (all right hemisphereactivation only) and are typically categorized as eitherbilateral (∣LI∣ ≤ 0 1), hemisphere dominant (0 1 < ∣LI∣ < 0 2),or hemisphere lateralized (∣LI∣ ≥ 0 2; Jansen et al. [37]). Par-ticipants in both the right and left hemisphere stroke groupsdemonstrated a left hemisphere dominant/lateralized patternof activation across ROIs during right hand action observa-tion, independently of which limb was affected by stroke(Figure 5; Supplementary Tables 5–9). For participants withright hemisphere stroke, LI values were as follows: inferiorfrontal gyrus pars opercularis (LI = 0 33, SEM = 0 17), parstriangularis (LI = 0 16, SEM = 0 19), precentral gyrus (LI =0 22, SEM = 0 09), and supramarginal gyrus (LI = 0 40, SEM = 0 08). For participants with left hemisphere stroke, LIvalues were as follows: inferior frontal gyrus parsopercularis (LI = 0 28, SEM = 0 17), pars triangularis (LI =0 24, SEM = 0 21), precentral gyrus (LI = 0 15, SEM = 0 08),and supramarginal gyrus (LI = 0 32, SEM = 0 12).
Participants in both the right and left hemispherestroke groups demonstrated a largely bilateral pattern ofactivation in most ROIs during left hand action observa-tion, independent of the limb that was affected by stroke(Figure 5; Supplementary Tables 5–9). Participants withright hemisphere stroke showed bilateral results in theinferior frontal gyrus pars opercularis (LI = −0 10, SEM =
RHAO
LHAO
Le� hemisphere strokeRight hemisphere stroke
L R
Figure 1: Whole brain activity during right and left action observation for individuals with stroke. While both stroke groups show bilateralactivity during right and left hand action observation, activity in the left hemisphere was more extensive regardless of hemisphere of lesion.Top: right hand action observation (RHAO), bottom: left hand action observation (LHAO). Participants with left hemisphere stroke arerepresented in blue; participants with right hemisphere stroke are represented in red. Overlap between stroke groups is represented inpurple. Thresholded at Z > 3 1, corrected for multiple comparisons at p < 0 05.
6 Neural Plasticity

0 19), inferior frontal gyrus pars triangularis (LI = −0 08,SEM = 0 22), right hemisphere lateralization in theprecentral gyrus (LI = −0 17, SEM = 0 10), and lefthemisphere dominant in the supramarginal gyrus (LI =0 21, SEM = 0 17). Participants with left hemispherestroke showed bilateral results in the inferior frontalgyrus pars opercularis (LI = −0 05, SEM = 0 18), parstriangularis (LI = 0 01, SEM = 0 22), and supramarginalgyrus (LI = 0 07, SEM = 0 14) and right hemispherelateralization in the precentral gyrus (LI = −0 23, SEM =0 10; Figure 5; Supplementary Tables 5–9). We note thatone difference in the LI pattern between stroke groupswas that for the right hemisphere stroke group, activityin the supramarginal gyrus was left hemispheredominant compared to bilateral in the left hemispherestroke group.
For the nondisabled control group, regions in the AONdemonstrated either right hemisphere dominant/lateralizedor bilateral activity during both right and left hand actionobservation (Figure 5; Supplementary Tables 5–9). For righthand action observation, LI values are as follows: inferiorfrontal gyrus pars opercularis (LI = −0 15, SEM = 0 17),pars triangularis (LI = −0 21, SEM = 0 18), precentral gyrus(LI = −0 08, SEM = 0 11), and supramarginal gyrus (LI =−0 07, SEM = 0 14). For left hand action observation, LIvalues are as follows: inferior frontal gyrus pars opercularis
(LI = −0 17, SEM = 0 14), pars triangularis (LI = −0 11, SEM = 0 12), precentral gyrus (LI = −0 15, SEM = 0 04), andsupramarginal gyrus (LI = 0 05, SEM = 0 09). Importantly,the laterality patterns seen in the nondisabled controlgroup, particularly for right hand action observation, differfrom those of the two stroke groups.
3.4. Task by Hemisphere by Group Interactions inROI Activity
3.4.1. Right Hemisphere Stroke Group versus NondisabledControls. No three-way interactions were found betweengroup (nondisabled control, right hemisphere stroke), handobserved (right, left), and hemisphere of activity (right, left)for any ROI. A significant two-way interaction was foundfor group (nondisabled control versus right hemispherestroke) and hemisphere of activity (right, left) in the supra-marginal gyrus (F 1, 22 = 7 17, p = 0 01, partial η2 = 0 25;Bonferroni-corrected p value: p = 0 04). We then tested forsimple main effects. For hemisphere of activity, there was astatistically significant difference between the left and rightSMG in the right hemisphere stroke group (F 1, 23 =13 14, p = 0 001, partial η2 = 0 36), with greater activity inthe left compared to right hemisphere (mean± standarddeviation reported for all analyses; left hemisphere: 0.20±0.16, right hemisphere: 0.10± 0.19). There were no
RHAO > LHAO
LHAO>RHAO
Le� hemisphere strokeRight hemisphere stroke
L R
Figure 2: Whole brain activity contrasted between right and left action observation for individuals with stroke. Top: right hand actionobservation (RHAO) compared to left hand action observation (LHAO), bottom: Left hand action observation (LHAO) compared to righthand action observation (RHAO). Participants with left hemisphere stroke are represented in cool colors (blue); participants with righthemisphere stroke are represented in warm colors (red). Overlap between stroke groups is represented in purple. Thresholded at Z > 3 1,corrected for multiple comparisons at p < 0 05.
7Neural Plasticity

L RRHAO
LHAO
3.5 4.0 4.5 5.0
Figure 3: Whole brain activity during right and left action observation for the nondisabled control group. Unlike the two stroke groups, thenondisabled group did not show greater activity on the left hemisphere during right and left hand action observation. Top: right hand actionobservation (RHAO), bottom: left hand action observation (LHAO). Thresholded at Z > 3 1, corrected for multiple comparisons at p < 0 05.
L RRHAO > LHAO
LHAO > RHAO
3.5 4.0 4.5 5.0
Figure 4: Whole brain activity contrasted between right and left action observation for the nondisabled control group. Top: right hand actionobservation (RHAO) compared to left hand action observation (LHAO), bottom: left hand action observation (LHAO) compared to righthand action observation (RHAO). Thresholded at Z > 3 1, corrected for multiple comparisons at p < 0 05.
8 Neural Plasticity

differences in left and right SMG activity in the ND group(F 1, 23 = 2 35, p = 0 14). For group, there was a statisti-cally significant difference between groups in the rightSMG (F 1, 46 = 6 60, p = 0 01, partial η2 = 0 13), withgreater activity for the nondisabled control group comparedto the right hemisphere stroke group (nondisabled controls:0.24± 0.19; right hemisphere stroke: 0.10± 0.19). No differ-ences in activity were found between ND and RHS groupsin the left SMG (F 1, 46 = 0 04, p = 0 85). Put together, thissuggests that the nondisabled control group had more activ-ity in the right compared left supramarginal gyrus, whereasthe right hemisphere stroke group had more activity in theleft compared to right supramarginal gyrus.
A significant two-way interaction was also found for thehemisphere of activity (right, left) and side of hand observed(right, left) in the precentral gyrus (F 1, 22 = 14 78, p =0 001, partial η2 = 0 40; Bonferroni-corrected p value: p =0 004). We then tested for simple main effects. We did notfind a simple main effect for hand observed (i.e., no differencein activity between right and left hand observation for eitherhemisphere (right hemisphere: F 1, 23 = 0 19, p = 0 67; lefthemisphere: F 1, 23 = 3 15, p = 0 09)). We found a simplemain effect of hemisphere of activity during right hand actionobservation, with greater activity in the left versus rightprecentral gyrus (F 1, 23 = 7 3, p = 0 01; left hemisphere:0.09± 1.5, right hemisphere: 0.04± 0.13). Put another way,for both groups, during right hand action observation,activity was greater in the left precentral gyrus.
3.4.2. Right versus Left Hemisphere Stroke Group. We thencompared the two stroke groups to one another directly.No three-way interactions were found between the sideof the stroke (right, left), hand observed (right, left), andhemisphere of activity (right, left) in any ROI. A significanttwo-way interaction was found between the hemisphere ofactivity (right, left) and hand observed (right, left) in the pre-central gyrus (F 1, 22 = 18 73, p < 0 001, partial η2 = 0 46;Bonferroni-corrected p value: p < 0 004); this same interac-tion was also marginally significant in the inferior frontalgyrus pars opercularis after correcting for multiple
comparisons (F 1 , 22 = 5 74, p = 0 025, partial η2 = 0 21;Bonferroni-corrected p value: p = 0 1). We then testedfor simple main effects for each interaction. In the precentralgyrus, for effect of hand observed, there was a statisticallysignificant difference in the left precentral gyrus, with greateractivity during right hand action observation than duringleft hand action observation (F 1, 23 = 13 78, p = 0 001;partial η2 = 0 38; left hand action observation: 0.01± 0.10,right hand action observation: 0.08± 0.11). There was nostatistically significant main effect in the right precentralgyrus (F 1, 23 = 0 37, p = 0 55). For simple main effectof hemisphere of activity, there was a statistically significantdifference during right hand action observation (F 1, 23 =11 27, p = 0 003, partial η2 = 0 33), with greater activity inthe left compared to right precentral gyrus (left hemisphere:0.08± 0.11, right hemisphere: 0.03± 0.13). There were nosignificant simple main effects for hemisphere during lefthand action observation (F 1, 23 = 3 14, p = 0 09).
For the inferior frontal gyrus pars opercularis, wefound a similar simple main effect for hand observed inthe left hemisphere with greater activity during right handaction observation compared to left hand action observa-tion (F 1, 23 = 8 1, p = 0 009, partial η2 = 0 26; right handaction observation: 0.08± 0.14, left hand action observa-tion: 0.02± 0.14). There were no simple main effects forhand observed in the right hemisphere (F 1, 23 = 0 002,p = 0 97) and no simple main effects for hemisphereduring either right hand action observation (F 1, 23 = 2 07,p = 0 16) or left hand action observation (F 1, 23 = 1 17,p = 0 29). Overall, these results suggest there was more lefthemisphere activity during right hand action observationfor both stroke groups. Both stroke groups showed similarhemispheres by hand observed interactions, with brainactivity lateralized toward the left motor dominant hemi-sphere, despite having lesions in different hemispheres.
3.5. Lesion Analyses
3.5.1. Lesion Volume Compared between Groups. Nosignificant difference in lesion size was found between the
0.60.50.40.30.40.1
0−0.1−0.2−0.3−0.4
0.60.50.40.30.40.1
0−0.1−0.2−0.3−0.4
0.60.50.40.30.40.1
0−0.1−0.2−0.3−0.4
Nondisabled Le� hemisphere stroke Right hemisphere stroke
Le� hand action observationRight hand action observation
IFG-Op IFG-Op SMG Precentral IFG-Op IFG-Op IFG-Tri SMG PrecentralIFG-Op SMG Precentral
p = 0.051
⁎⁎
Figure 5: Laterality index in regions of interest. Left: nondisabled participants, middle: participants with left hemisphere stroke, right:participants with right hemisphere stroke; each during left hand (blue) and right hand (red) action observation; in the inferior frontalgyrus pars opercularis (IFG-Op), inferior frontal gyrus pars triangularis (IFG-Tri), supramarginal gyrus (SMG), and precentral gyrus(Precentral). ∗p < 0 05. Positive values indicate left hemisphere laterality; negative values indicate right hemisphere laterality.
9Neural Plasticity

right hemisphere stroke group (M = 35593 08mm3, SD =55942 81) and the left hemisphere stroke group (M =23196 64mm3, SD = 33296 69; t 22 = −0 660, p = 0 52).This suggests that, despite varying lesion sizes acrossindividuals, reported results were not driven by a differencein overall lesion size between groups. Lesion overlap mapscan be found in Supplementary Material Figures S3–S7.
3.5.2. ROI-Lesion Overlap. Overlap between the individuallesions and the AON ROIs (measured as greater than 5%overlap) occurred in only 4 of the individuals in the lefthemisphere stroke group and 3 of the individuals in the righthemisphere stroke group. While we had considered alsoexamining the relationship between lesion overlap andlaterality index, to examine whether lesion overlap withcritical AON regions influenced laterality results, the result-ing sample of individuals with lesion overlap was too limitedto make an accurate calculation.
3.6. Brain Behavior Analyses. Finally, as an exploratoryanalysis, we examined correlations between ROI activityand motor scores.
3.6.1. Correlations between ROI Activity and WMFT FASScores. For participants with right hemisphere stroke, therewere no significant correlations between WMFT motorscores and ROI activity. For participants with left hemispherestroke, nonsignificant trends showing negative correlationsbetween WMFT scores and ROI activity during right handaction observation were found in the inferior frontal gyrus,pars opercularis (ρ = −0 51, p = 0 091), and pars triangularis(ρ = −0 534, p = 0 074). In addition, trends in negative corre-lations between WFMT scores and ROI activity during lefthand action observation were found in the right inferiorfrontal gyrus (ρ = −0 545, p = 0 067) and precentral gyrus(ρ = −0 517, p = 0 085). Notably, however, none of theserelationships meets the significance threshold after correctingfor multiple comparisons (p = 0 00625).
3.6.2. Correlations between ROI Activity and Fugl-MeyerScores. For participants with right hemisphere stroke, nosignificant correlations were found between Fugl-Meyerscores and ROI activity. For participants with left hemispherestroke, activity in the right precentral gyrus during right handaction observation demonstrated a trend towards a negativecorrelation with Fugl-Meyer scores (ρ = −0 53, p = 0 077),although this again was not significant.
4. Discussion
In this study, our primary aim was to examine whethercortical motor activity in the action observation networkwas lateralized more towards the ipsilesional hemisphere orthe motor dominant hemisphere during action observationafter a stroke. In both individuals with nondominant righthemisphere stroke and individuals with dominant lefthemisphere stroke, AON activity was lateralized toward theleft motor dominant hemisphere. There were no significantdifferences in the lateralization of AON activity between thetwo stroke groups, despite having lesions in different
hemispheres. These results suggest that action observationafter stroke may drive greater activity in the motor dominantrather than the ipsilesional hemisphere, at least in our sampleof individuals who were right-handed prior to stroke. Thesefindings also differed from our nondisabled control group,in which AON activity was either bilateral or slightlylateralized toward the right nondominant hemisphere.
As mentioned in the Introduction, hemispheric speciali-zation could be an underlying cause of these results in strokepatients. That is, greater AON activity in the dominant lefthemisphere may reflect hard-wired properties of the lefthemisphere for motor control such as left hemispherespecialization for motor planning, and by extension, actionobservation, compared to the right hemisphere, regardlessof which hemisphere is affected after stroke. This may meanthat the motor dominant hemisphere may also play a role inthe effectiveness of action observation therapy. While nottested here, it is possible that driving activity in the motordominant hemisphere via action observation could help topromote motor recovery after stroke. Future studies couldexamine whether dominant hemisphere activation duringaction observation relates to changes in motor recoveryfollowing poststroke action observation therapy.
In addition, previous work has shown that the motordominant hemisphere has greater descending motorpathways than the nondominant hemisphere has [42, 43].Additionally, the typically motor dominant left precentralgyrus receives inputs from both the contralateral and ipsilat-eral hand, whereas the nondominant right precentral gyrusreceives the majority of inputs solely from the contralateralleft hand [44]. After a stroke, this imbalance in motorpathways may be accentuated to more strongly engageleft-lateralized activity during right hand action observationand bilateral activity during left hand action observation.Likewise, individuals with dominant left hemisphere strokehave been shown to experience some motor deficits in bothhands, whereas those with right hemisphere stroke typicallyonly experience motor deficits in the contralateral left hand[45]. Again, while it remains to be tested in a future study,it is possible that individuals with nondominant righthemisphere stroke are able to continue to use their dominant(nonparetic) hand, and individuals with dominant lefthemisphere stroke may place more emphasis on using theirdominant (paretic) hand in spite of its impairments.Therefore, both groups may place greater emphasis on thedominant hand when asked to observe and later imitateactions, explaining the greater activation in the dominant lefthemisphere in both groups.
Based on this logic, we might expect individuals withnondominant hand paresis to experience poorer motorrecovery due to the ability to rely on the nonparetic dominanthand. Although results across studies vary, there is indeedevidence that individuals with right hemisphere stroke showpoorer motor recovery of the affected nondominant left handthan those with left hemisphere stroke and an affecteddominant right hand [46, 47]. Related, a limitation of the cur-rent study is the fact that the nondominant right hemispherestroke group also had greater motor impairments (lowerFugl-Meyer and Wolf Motor Function Test scores) of the
10 Neural Plasticity

affected hand than the dominant left hemisphere strokegroup, despite both groups falling within the eligibility rangeof moderate-to-severe motor impairments and having nodifferences in lesion volumes. While this may be reflectiveof trends in the general stroke population, this differencedoes introduce a potential confound, as the level of impair-ment could also drive patterns of cortical activity. However,importantly, there was no significant relationship betweenthe level of impairment and brain activity within the righthemisphere stroke group, suggesting that the level of impair-ment for individuals with right hemisphere stroke does notinfluence AON activity. Given the small sample size, wefurther visually inspected the subject-level correlation databetween brain activity and motor impairment, in case therewere potential trends that were not significant. However,there were no relationships or trends between level of motorimpairment and brain activity across this sample, such thatindividuals with less severe stroke did not show any differ-ences in laterality index than individuals with more severestroke. This suggests that between-group differences in levelof motor impairment did not drive these left-lateralizedresults. Regardless, further research with a larger sample ofnondominant, right hemisphere stroke patients, with a widerrange from mild to severe impairments, is needed to confirmthese findings.
In addition, although both right and left hemispherestroke groups had stronger activations in the left hemisphereduring action observation, it should be noted that there wasstill significant activity observed in the right hemisphere inall groups, including the two stroke groups (see Figure 1;Tables S1 and S2). General whole brain activity during actionobservation was bilateral for all groups, and the lateralizationresults emerged primarily when examining the lateralityindex, which calculates a ratio of left to right hemisphereactivity. Thus, while we emphasize the role of the dominantleft hemisphere because AON activity examined using thelaterality index calculation was lateralized to the dominantleft hemisphere more in both stroke groups compared to thecontrol group, there is likely also a role of right hemisphereactivity for all groups during action observation.
Finally, in line with this, we note that the healthy,age-matched control group showed bilateral or slightlyright-lateralized activity. Although this is in line with manyprevious studies showing that AON activity in healthyright-handed individuals is typically bilateral [35, 48, 49],a previous study specifically examining the laterality indexin healthy individuals showed left-lateralized AON pat-terns [50]. In reconciling our current findings with theprevious literature, we first note that in that study, thelaterality index was performed on entire lobes (e.g., LI ofthe frontal lobe was left-lateralized) whereas here wecalculated the LI within specific AON nodes. This specific-ity may have affected results. In addition, a primary factorthat may contribute to these disparate results is age. Theprevious study examining the laterality index of theAON in healthy individuals used healthy younger adults,while in our study, we used healthy older adults (age-matched to our stroke population). Research has shownthat older adults typically recruit additional and broader
regions of the AON compared to younger adults [51–54].While further research is needed to specifically examine thelaterality of the AON in healthy younger versus older adults,it is possible that our healthy older adult control group showsmore bilateral or slightly right-lateralized AON activity,instead of left-lateralized AON activity, due to age-relatedchanges in the AON.
4.1. Limitations and Future Directions. Our results supportthe idea that hemispheric dominance affects patterns ofneural activity induced by action observation after stroke.While the current sample size was small (12 participantsper group), both right and left hemisphere stroke groups(24 participants in total) showed similar patterns of left-lateralized AON activity during observation of right handactions and bilateral AON activity during observation of lefthand actions, which was different from nondisabled individ-uals. However, as noted in the Discussion, the functionalabilities of the two groups were significantly different.Notably, we did not find a relationship between the level ofimpairment and lateralization of AON activity within theright hemisphere group, suggesting that the differingfunctional levels were not associated with different brainactivation patterns. However, we acknowledge that thisgroup difference still provides a possible confounding factoras previous work has shown that degree of motor severityinfluences cortical recruitment [55]. In addition, previouswork has shown that patients with greater corticospinal tract(CST) damage also show greater recruitment of cortical areas[56, 57]. Although lesion volumes were similar betweengroups, the current study did not specifically examine over-lap of the lesion with the CST. Thus, a replication of thesepatterns in a larger, more diverse sample, with individualsacross a range of motor impairment levels (mild, moderate,severe), and examining the overlap of the lesion with theCST, would improve our understanding of how the currentfindings relate to a diverse population of individualsafter stroke.
Our findings support a possible specialization of themotor dominant hemisphere during action observationfollowing stroke. However, the functional implications of thisactivation are unclear. An important question is whether andhow these results, and recovery from nondominant (righthemisphere) stroke, may relate to real-world hand usage.Future studies might examine real-world hand usage duringdaily activities (e.g., using accelerometers [58, 59]), and relatethat to laterality patterns in brain activity following stroke.
In addition, here we showed that action observationengages the motor dominant hemisphere in individualswho are right hemisphere dominant (left-handed) prior tostroke. Right hemisphere dominance is less common, andtherefore, the population with stroke will be smaller and lessis known about motor control in this group. However, givenour findings’ interpretations, we might expect AON activityto be lateralized toward the dominant right hemisphere inthat group. A more complete understanding of the relation-ship between motor dominance, hemisphere of stroke, andAON activity should be studied to enable personalizedinterventions in stroke neurorehabilitation.
11Neural Plasticity

Finally, given the conventional wisdom that activity inthe ipsilesional hemisphere promotes recovery of motorfunction after stroke [2–4], a logical next step is to evaluatewhat our findings may mean for stroke rehabilitation. Ourfindings, and those of others, suggest that optimal recoveryof motor function may depend on the hemisphere of thelesion [20]. As such, parameters of AOT, such as whetherindividuals with stroke observe actions corresponding totheir paretic limb only, versus observation of bilateralmovements, may yield different results for different partic-ipants. While few stroke neuroimaging studies have beenadequately powered to compare between right and lefthemisphere stroke groups, it may be a critical differencethat affects stroke rehabilitation and motor recovery.Future large-scale studies should examine whether andhow the hemispheric dominance of the lesioned hemisphereaffects neural activity during different types of therapy andsubsequent motor recovery.
Data Availability
The authors are happy to share their data. However, due toIRB regulations, the authors may share only deidentified sub-sets of the data from this study upon request.
Disclosure
The contents of the study are solely the responsibility of theauthor and do not necessarily represent the official views ofthe NIH.
Conflicts of Interest
The authors have no conflicts of interest to declare.
Acknowledgments
The authors thank the research participants and Alicia John-son and Matthew Konersman, DPT, for their contributions.This work was supported by the American Heart Association(10SDG3510062, 14CRP18200010, and 16IRG26960017),the National Institute on Drug Abuse (K12DA00167), theNational Institutes of Health, Eunice Kennedy ShriverNational Institute of Child Health and Human Development(R03HD067475 and K01HD091283), the National Institutesof Health (NIH) National Institute of Neurological Disordersand Stroke (NINDS) Intramural Competitive FellowshipAward, and the NIH Rehabilitation Research CareerDevelopment Program Grant K12 (HD055929).
Supplementary Materials
Figure S1: Example from video stimuli during fMRI. FigureS2: Whole brain activity contrasted between right and leftaction observation compared between stroke and controlgroups at a more lenient threshold. Figure S3: Lesion overlapheat map (whole group). Figure S4: Lesion overlap heat mapfor cortical left hemisphere strokes (n = 6). Figure S5: Lesionoverlap heat map for subcortical left hemisphere strokes (n= 6). Figure S6: Lesion overlap heat map for cortical right
hemisphere stroke (n = 5). Figure S7: Lesion overlap heatmap for subcortical right hemisphere stroke (n = 7). TableS1: Main effect of right hand action observation. Table S2:Main effect of left hand action observation. Table S3: Brainactivity during right hand action observation versus left handaction observation (RHAO > LHAO). Table S4: Brain activ-ity during left hand action observation versus right handaction observation (LHAO > RHAO). Table S5: Group later-ality index values. Table S6: Individual laterality index value-s—inferior frontal gyrus and pars opercularis. Table S7:Individual laterality index values—inferior frontal gyrusand pars triangularis. Table S8: Individual laterality indexvalues—supramarginal gyrus. Table S9: Individual lateralityindex values—precentral gyrus. (Supplementary Materials)
References
[1] D. Mozaffarian, E. J. Benjamin, A. S. Go et al., “Heart diseaseand stroke statistics-2016 update a report from the AmericanHeart Association,” Circulation, vol. 133, no. 4, pp. e38–e360,2016.
[2] R. S. Marshall, G. M. Perera, R. M. Lazar, J. W. Krakauer, R. C.Constantine, and R. L. DeLaPaz, “Evolution of cortical activa-tion during recovery from corticospinal tract infarction,”Stroke, vol. 31, no. 3, pp. 656–661, 2000.
[3] R. J. Nudo, “Mechanisms for recovery of motor functionfollowing cortical damage,” Current Opinion in Neurobiology,vol. 16, no. 6, pp. 638–644, 2006.
[4] N. S. Ward and L. G. Cohen, “Mechanisms underlyingrecovery of motor function after stroke,” Archives of Neurol-ogy, vol. 61, no. 12, pp. 1844–1848, 2004.
[5] N. S. Ward, M. M. Brown, A. J. Thompson, and R. S. J. Frack-owiak, “Neural correlates of outcome after stroke: a cross-sectional fMRI study,” Brain, vol. 126, no. 6, pp. 1430–1448,2003.
[6] K. J. Werhahn, A. B. Conforto, N. Kadom, M. Hallett, andL. G. Cohen, “Contribution of the ipsilateral motor cortexto recovery after chronic stroke,” Annals of Neurology,vol. 54, no. 4, pp. 464–472, 2003.
[7] F. Fregni, P. S. Boggio, C. G. Mansur et al., “Transcranial directcurrent stimulation of the unaffected hemisphere in strokepatients,” Neuroreport, vol. 16, no. 14, pp. 1551–1555, 2005.
[8] S.-L. Liew, E. Santarnecchi, E. R. Buch, and L. G. Cohen, “Non-invasive brain stimulation in neurorehabilitation: local anddistant effects for motor recovery,” Frontiers in Human Neuro-science, vol. 8, p. 77, 2014.
[9] R. Lindenberg, V. Renga, L. L. Zhu, D. Nair, and G. Schlaug,“Bihemispheric brain stimulation facilitates motor recoveryin chronic stroke patients,” Neurology, vol. 75, no. 24,pp. 2176–2184, 2010.
[10] N. Takeuchi, T. Chuma, Y. Matsuo, I. Watanabe, andK. Ikoma, “Repetitive transcranial magnetic stimulation ofcontralesional primary motor cortex improves hand functionafter stroke,” Stroke, vol. 36, no. 12, pp. 2681–2686, 2005.
[11] S. Mani, P. K. Mutha, A. Przybyla, K. Y. Haaland, D. C. Good,and R. L. Sainburg, “Contralesional motor deficits after unilat-eral stroke reflect hemisphere-specific control mechanisms,”Brain, vol. 136, no. 4, pp. 1288–1303, 2013.
[12] R. L. Sainburg and S. V. Duff, “Does motor lateralization haveimplications for stroke rehabilitation?,” Journal of
12 Neural Plasticity

Rehabilitation Research and Development, vol. 43, no. 3,pp. 311–322, 2006.
[13] S. Y. Schaefer, K. Y. Haaland, and R. L. Sainburg, “Ipsilesionalmotor deficits following stroke reflect hemispheric specializa-tions for movement control,” Brain, vol. 130, no. 8,pp. 2146–2158, 2007.
[14] C. J.Winstein and P. S. Pohl, “Effects of unilateral brain damageon the control of goal-directed hand movements,” Experimen-tal Brain Research, vol. 105, no. 1, pp. 163–174, 1995.
[15] V. Yadav and R. L. Sainburg, “Limb dominance results fromasymmetries in predictive and impedance control mecha-nisms,” PLoS One, vol. 9, no. 4, article e93892, 2014.
[16] G. Rizzolatti and L. Craighero, “The mirror-neuron system,”Annual Review of Neuroscience, vol. 27, no. 1, pp. 169–192,2004.
[17] P. Celnik, B. Webster, D. M. Glasser, and L. G. Cohen, “Effectsof action observation on physical training after stroke,” Stroke,vol. 39, no. 6, pp. 1814–1820, 2008.
[18] D. Ertelt, S. Small, A. Solodkin et al., “Action observation has apositive impact on rehabilitation of motor deficits afterstroke,” NeuroImage, vol. 36, pp. T164–T173, 2007.
[19] M. Franceschini, M. G. Ceravolo, M. Agosti et al., “Clinicalrelevance of action observation in upper-limb stroke rehabili-tation: a possible role in recovery of functional dexterity. Arandomized clinical trial,” Neurorehabilitation and NeuralRepair, vol. 26, no. 5, pp. 456–462, 2012.
[20] P. Sale, M. G. Ceravolo, and M. Franceschini, “Action observa-tion therapy in the subacute phase promotes dexterity recoveryin right-hemisphere stroke patients,” BioMed Research Inter-national, vol. 2014, Article ID 457538, 7 pages, 2014.
[21] S. Sarasso, S. Määttä, F. Ferrarelli, R. Poryazova, G. Tononi,and S. L. Small, “Plastic changes following imitation-basedspeech and language therapy for aphasia: a high-density sleepEEG study,” Neurorehabilitation and Neural Repair, vol. 28,no. 2, pp. 129–138, 2014.
[22] K. Sugg, S. Müller, C. Winstein, D. Hathorn, and A. Dempsey,“Does Action Observation Training with Immediate PhysicalPractice Improve Hemiparetic Upper-Limb Function inChronic Stroke?,” Neurorehabilitation and Neural Repair,vol. 29, no. 9, pp. 807–817, 2015.
[23] K. A. Garrison, C. J. Winstein, and L. Aziz-Zadeh, “The mirrorneuron system: a neural substrate for methods in stroke reha-bilitation,” Neurorehabilitation and Neural Repair, vol. 24,no. 5, pp. 404–412, 2010.
[24] K. A. Garrison, L. Aziz-Zadeh, S.W.Wong, S. L. Liew, and C. J.Winstein, “Modulating the motor system by action observa-tion after stroke,” Stroke, vol. 44, no. 8, pp. 2247–2253, 2013.
[25] R. C. Oldfield, “The assessment and analysis of handedness:the Edinburgh inventory,” Neuropsychologia, vol. 9, no. 1,pp. 97–113, 1971.
[26] S. L. Wolf, P. A. Catlin, M. Ellis, A. L. Archer, B. Morgan, andA. Piacentino, “AssessingWolf motor function test as outcomemeasure for research in patients after stroke,” Stroke, vol. 32,no. 7, pp. 1635–1639, 2001.
[27] M. Jenkinson, P. Bannister, M. Brady, and S. Smith, “Improvedoptimization for the robust and accurate linear registrationand motion correction of brain images,” NeuroImage, vol. 17,no. 2, pp. 825–841, 2002.
[28] M. Jenkinson and S. Smith, “A global optimisation method forrobust affine registration of brain images,” Medical ImageAnalysis, vol. 5, no. 2, pp. 143–156, 2001.
[29] S. M. Smith, “Fast robust automated brain extraction,”HumanBrain Mapping, vol. 17, no. 3, pp. 143–155, 2002.
[30] M. W. Woolrich, B. D. Ripley, M. Brady, and S. M. Smith,“Temporal autocorrelation in univariate linear modeling ofFMRI data,” NeuroImage, vol. 14, no. 6, pp. 1370–1386,2001.
[31] K. J. Worsley, “Statistical analysis of activation images,”Functional Magnetic Resonance Imaging, vol. 14, pp. 251–270, 2001.
[32] C. F. Beckmann, M. Jenkinson, and S. M. Smith, “Generalmultilevel linear modeling for group analysis in FMRI,” Neu-roImage, vol. 20, no. 2, pp. 1052–1063, 2003.
[33] M. Woolrich, “Robust group analysis using outlier inference,”NeuroImage, vol. 41, no. 2, pp. 286–301, 2008.
[34] M. W. Woolrich, T. E. J. Behrens, C. F. Beckmann,M. Jenkinson, and S. M. Smith, “Multilevel linear modellingfor FMRI group analysis using Bayesian inference,” Neuro-Image, vol. 21, no. 4, pp. 1732–1747, 2004.
[35] S. Caspers, K. Zilles, A. R. Laird, and S. B. Eickhoff, “ALEmeta-analysis of action observation and imitation in the humanbrain,” NeuroImage, vol. 50, no. 3, pp. 1148–1167, 2010.
[36] K. L. Ito and S.-L. Liew, “Calculating the laterality indexusing FSL for stroke neuroimaging data,” GigaScience, vol. 5,Supplement 1, pp. 14-15, 2016.
[37] A. Jansen, R. Menke, J. Sommer et al., “The assessment ofhemispheric lateralization in functional MRI-robustness andreproducibility,” NeuroImage, vol. 33, no. 1, pp. 204–217,2006.
[38] J. D. Riley, V. le, L. der-Yeghiaian et al., “Anatomy of strokeinjury predicts gains from therapy,” Stroke, vol. 42, no. 2,pp. 421–426, 2011.
[39] S.-L. Liew, J. M. Anglin, N. W. Banks et al., “A large, opensource dataset of stroke anatomical brain images and manuallesion segmentations,” Scientific Data, vol. 5, article 180011,2018.
[40] C. Rorden and M. Brett, “Stereotaxic display of brain lesions,”Behavioural Neurology, vol. 12, no. 4, pp. 191–200, 2000.
[41] A. R. Fugl-Meyer, L. Jääskö, I. Leyman, S. Olsson, andS. Steglind, “The post-stroke hemiplegic patient. 1. A methodfor evaluation of physical performance,” Scandinavian Journalof Rehabilitation Medicine, vol. 7, no. 1, pp. 13–31, 1975.
[42] G. Hammond, “Correlates of human handedness in primarymotor cortex: a review and hypothesis,” Neuroscience &Biobehavioral Reviews, vol. 26, no. 3, pp. 285–292, 2002.
[43] J. Rademacher, U. Bürgel, S. Geyer et al., “Variability andasymmetry in the human precentral motor system: a cytoarch-itectonic and myeloarchitectonic brain mapping study,” Brain,vol. 124, no. 11, pp. 2232–2258, 2001.
[44] S. Kim, J. Ashe, K. Hendrich et al., “Functional magnetic reso-nance imaging of motor cortex: hemispheric asymmetry andhandedness,” Science, vol. 261, no. 5121, pp. 615–617, 1993.
[45] K. Y. Haaland and D. L. Harrington, “Hemispheric asymmetryof movement,” Current Opinion in Neurobiology, vol. 6, no. 6,pp. 796–800, 1996.
[46] J. E. Harris and J. J. Eng, “Individuals with the dominant handaffected following stroke demonstrate less impairment thanthose with the nondominant hand affected,” Neurorehabilita-tion and Neural Repair, vol. 20, no. 3, pp. 380–389, 2006.
[47] J. E. Ween, M. P. Alexander, M. D'Esposito, and M. Roberts,“Factors predictive of stroke outcome in a rehabilitationsetting,” Neurology, vol. 47, no. 2, pp. 388–392, 1996.
13Neural Plasticity
[48] L. Aziz-Zadeh, L. Koski, E. Zaidel, J. Mazziotta, andM. Iacoboni, “Lateralization of the human mirror neuron sys-tem,” Journal of Neuroscience, vol. 26, no. 11, pp. 2964–2970,2006.
[49] L. Aziz-Zadeh, F. Maeda, E. Zaidel, J. Mazziotta, andM. Iacoboni, “Lateralization in motor facilitation duringaction observation: a TMS study,” Experimental BrainResearch, vol. 144, no. 1, pp. 127–131, 2002.
[50] M. Cabinio, V. Blasi, P. Borroni et al., “The shape of motorresonance: right- or left-handed?,” NeuroImage, vol. 51,no. 1, pp. 313–323, 2010.
[51] M. C. Costello and E. K. Bloesch, “Are older adults lessembodied? A review of age effects through the lens of embod-ied cognition,” Frontiers in Psychology, vol. 8, p. 267, 2017.
[52] N. Diersch, K. Mueller, E. S. Cross, W. Stadler, M. Rieger, andS. Schütz-Bosbach, “Action prediction in younger versus olderadults: neural correlates of motor familiarity,” PLoS One,vol. 8, no. 5, article e64195, 2013.
[53] E. Kuehn, M. B. Perez-Lopez, N. Diersch, J. Döhler,T. Wolbers, and M. Riemer, “Embodiment in the aging mind,”Neuroscience & Biobehavioral Reviews, vol. 86, no. 4, pp. 207–225, 2017.
[54] G. Léonard and F. Tremblay, “Corticomotor facilitationassociated with observation, imagery and imitation of handactions: a comparative study in young and old adults,” Exper-imental Brain Research, vol. 177, no. 2, pp. 167–175, 2007.
[55] A. K. Rehme, G. R. Fink, D. Y. von Cramon, and C. Grefkes,“The role of the contralesional motor cortex for motor recov-ery in the early days after stroke assessed with longitudinalFMRI,” Cerebral Cortex, vol. 21, no. 4, pp. 756–768, 2010.
[56] N. S. Ward, J. M. Newton, O. B. C. Swayne et al., “The relation-ship between brain activity and peak grip force is modulatedby corticospinal system integrity after subcortical stroke,”European Journal of Neuroscience, vol. 25, no. 6, pp. 1865–1873, 2007.
[57] N. S.Ward, J. M. Newton, O. B. C. Swayne et al., “Motor systemactivation after subcortical stroke depends on corticospinalsystem integrity,” Brain, vol. 129, no. 3, pp. 809–819, 2006.
[58] R. R. Bailey, J. W. Klaesner, and C. E. Lang, “Anaccelerometry-based methodology for assessment of real-world bilateral upper extremity activity,” PLoS One, vol. 9,no. 7, article e103135, 2014.
[59] C. E. Lang, J. M.Wagner, D. F. Edwards, and A.W. Dromerick,“Upper extremity use in people with hemiparesis in the firstfew weeks after stroke,” Journal of Neurologic Physical Therapy,vol. 31, no. 2, pp. 56–63, 2007.
14 Neural Plasticity

Review ArticleState-of-the-Art Techniques to Causally Link Neural Plasticity toFunctional Recovery in Experimental Stroke Research
Anna-Sophia Wahl 1,2,3
1Brain Research Institute, University of Zurich, Winterthurerstr. 190, 8057 Zurich, Switzerland2Department of Health Sciences and Technology, ETH Zurich, Winterthurerstr. 190, 8057 Zurich, Switzerland3Central Institute of Mental Health, University of Heidelberg, J5, 68159 Mannheim, Germany
Correspondence should be addressed to Anna-Sophia Wahl; [email protected]
Received 23 January 2018; Revised 12 April 2018; Accepted 2 May 2018; Published 27 May 2018
Academic Editor: Surjo R. Soekadar
Copyright © 2018 Anna-Sophia Wahl. This is an open access article distributed under the Creative Commons Attribution License,which permits unrestricted use, distribution, and reproduction in any medium, provided the original work is properly cited.
Current experimental stroke research faces the same challenge as neuroscience: to transform correlative findings in causative ones.Research of recent years has shown the tremendous potential of the central nervous system to react to noxious stimuli such as astroke: Increased plastic changes leading to reorganization in form of neuronal rewiring, neurogenesis, and synaptogenesis,accompanied by transcriptional and translational turnover in the affected cells, have been described both clinically and inexperimental stroke research. However, only minor attempts have been made to connect distinct plastic remodeling processes ascausative features for specific behavioral phenotypes. Here, we review current state-of the art techniques for the examination ofcortical reorganization and for the manipulation of neuronal circuits as well as techniques which combine anatomical changeswith molecular profiling. We provide the principles of the techniques together with studies in experimental stroke researchwhich have already applied the described methodology. The tools discussed are useful to close the loop from our understandingof stroke pathology to the behavioral outcome and may allow discovering new targets for therapeutic approaches. The herepresented methods open up new possibilities to assess the efficiency of rehabilitative strategies by understanding their externalinfluence for intrinsic repair mechanisms on a neurobiological basis.
1. Introduction
Although huge efforts have been made in recent years,both by clinicians and basic researchers, we have stillgained limited insights into a neurological disease suchas stroke preventing us from developing specific curesand resulting in poor statistical numbers: Of 15 millionpeople suffering from an ischemic brain attack every year,a third dies, a third remains permanently disabled, and athird recovers as the stroke itself has not been too devas-tating. On the clinical side, stroke units have been created,which combine experts in intensive care medicine, neurol-ogy, physiotherapy, and speech therapy, to accelerate andcoordinate the diagnostic and therapeutical processes aim-ing at improving recovery rates for patients. According tothe neurologists’ saying “time is brain,” even mobile unitshave been established to bring the hospital to the patient[1]. These efforts aim at increasing the number of patients
being eligible for the only currently approved acute treat-ment—thrombolysis or thrombectomy—within a very earlytime window of 4.5 h after stroke [2, 3].
On the side of basic research, we study the neurobiologyof stroke, but seem to be stuck in a “black box” situation: Wehave accumulated data showing the tremendous capacities ofthe brain to reorganize by synaptogenesis and even neuro-genesis and by neuronal circuit rewiring and new circuitformation. We find cortical map shifts and hyperactive brainregions after stroke; we detect genetic and proteomic turn-over within a distinct spatiotemporal profile and sequenceof events [4]. However, only minor attempts have been madeto transform pure correlative data into causative ones, whichwould enable a causal connection of plastic remodeling pro-cesses in the brain with distinct behavioral outcomes. Notonly would this allow us to form a new understanding ofthe functional brain status after stroke, but also it opens uppossibilities to develop and test the efficiency of new
HindawiNeural PlasticityVolume 2018, Article ID 3846593, 10 pageshttps://doi.org/10.1155/2018/3846593

therapeutic approaches. Today’s basic stroke research is partof neuroscience that faces the challenges to first describe thebroad morphological features, then study fine cellular andmolecular events, find genes which are active in a specificneuron or cell type, and link it to the behavioral phenotype.But as the philosopher of science Karl Popper might haveargued: Before we can provide answers, we need the powerto ask new questions.
In recent years, new technology has been designedwhich is starting to fill the gap between correlative andcausative research.
The aim of this review is to first discuss current state-of-the-art technology of experimental stroke research whichenables a deeper understanding of neuronal reorganizationand circuit formation. In the second part, techniques fordistinct neuronal circuit manipulation are introduced whichhelp to reveal causal relationships between anatomy andbehavior. Finally, new approaches combining cytology withmolecular profiles are provided which elucidate the underly-ing molecular mechanisms of neuronal rewiring and repair.The principles of the techniques are explained together withexemplary studies in experimental stroke research whichhave already applied the described methodology. The herediscussed tools may not only enhance our understanding ofstroke pathology but also help to identify crucial anchorpoints for new therapeutic interventions.
2. State-of-the-Art Techniques to StudyNeuronal Reorganization and CircuitFormation after Experimental Stroke
2.1. Approaches to Examine Brain-Wide Remodeling. Aclassical approach to study reorganizational processes acrossthe whole brain is functional resonance imaging (fMRI),allowing the monitoring of neuronal rewiring processes ona macroanatomical level within the same animal. However,although significant contributions to the understanding ofthe interplay between altered functional status and structuralconnectivity have been made in stroke models [5, 6] usingthis technique, the spatial and temporal resolution levelremains low.
In contrast, intrinsic optical imaging sticks out by a highspatial resolution enabling the visualization of small domainswithin larger brain areas demonstrating the functional orga-nization and the spatial relationships among those smallerdomains, for example, in the barrel or visual cortex [7].Intrinsic optical imaging uses the effect that more activebrain tissue reflects less light than does less active tissue.Thus, the most active areas appear as the darkest ones. Opti-cal imaging has been used to show disrupted functionalconnectivity in rodent mouse models of stroke [8, 9].
Another technique to study in particular sensory mapshifts is millisecond-timescale voltage-sensitive dye (VSD)imaging which unlike functional fMRI and intrinsic opticalsignal imaging measures electrical activity with relativelyhigh spatial and temporal resolution [10]. VSD imaging hasrecently been applied to measure spontaneous activity overlarge regions of the mouse cortex to reveal fast, complex,
localized, and bilaterally synchronized patterns of depolari-zation [10]. In a study by Gosh et al. [11], VSD imagingwas used to show the expansion of the forelimb sensorymap towards parts of the hindlimb cortex after a largethoracic spinal cord injury, indicating incorporation of axo-tomized hindlimb neurons into sensory circuits of the fore-limb. In another study by Brown et al. [12], the function ofthe sensorimotor cortex was visualized with VSD imaging.The mouse forelimb sensory cortex was targeted by strokeleading to a new sensory representation in the territory previ-ously occupied by the forelimb motor cortex. VSD imagingrevealed slower kinetics in remapped sensory circuits accom-panied by high levels of dendritic spines as visualized withtwo-photon microscopy.
While VSD imaging was the first demonstration of wide-field optical imaging of neural activity [13], the necessity toapply VSDs prior to imaging, their very fast response time,and their very small signal ratios made them difficult to use.However, recent developments of exogenous and in particu-lar genetically encoded fluorescent indicators of neuronalactivity such as GCaMP and YC-Nano have revolutionizedthe targeted expression of fluorescence with much highersignal levels. And even transgenetic lines exist [14]. Further-more, recent work has shown that the dynamics of flavopro-tein fluorescence can be optically mapped in wild-type CNStissue as an indicator of oxidative metabolism [15, 16], whichmight be also a useful tool in experimental stroke research.As wide-field neuroimaging methods are also relatively easilycombined with optogenetics to modify brain activity in thebehaving animal, studies have been conducted usingcamera-based “mesoscopic” optical recording of neuronalactivity examining a large part of the cortical surface. Thesemesoscopic optical recordings became possible by extensivechronic window implantations [17] and improved high-speed sensitive camera technology. Vanni et al. [18] mea-sured cortical functional connectivity using wide-field imag-ing in lightly anesthetized GCaMP3 mice and correlatedcalcium signals recoded in the primary sensory cortex tothe other sensorimotor areas bilaterally. The coactivation ofareas was interpreted as an indication that areas might befunctionally connected. However, a final proof for a func-tional connection, shutting-off correlated areas, was missingin this study. Balbi et al. [19] used the same approach inawake GCaMP6 mice studying mososcopic functional con-nectivity longitudinally in a microinfarct model.
That wide-field calcium imaging might be also a pow-erful tool to study brain-wide cortical reorganization on ahigh-resolution level over time in animals monitoring theirrehabilitative courses or recording rehabilitative trainingafter stroke was demonstrated by Murphy et al. [20]. Hislab presented a home cage system, where mice could initi-ate mesoscopic functional imaging by themselves over daysbeing unsupervised.
2.2. Methods to Understand Regional Reorganization. Intra-cortical microstimulation (ICMS) and surface stimulationwith electrode arrays have been used for many years to mapcortical regions, to study cortical reorganization, and to findfirst hints if projections in the motor cortex are functionally
2 Neural Plasticity

relevant. This technique applies electrical stimulation of cor-tical sites to induce, for example, stimulus-evoked movementresponses, which can be detected visually, by EMG responsesor by the usage of accelerometers. Several studies have usedthis technique to either examine cortical map shifts insensorimotor areas after spontaneous recovery or differenttherapeutical applications [21–24] or used the stimulationitself as a method to increase plastic processes [25]. However,ICMS has its disadvantages such as the inability to selectivelytarget neuronal subtypes as well as the indiscriminate activa-tion of axons of passage. Furthermore, due to electrodepenetration, intracortical electric stimulation remains aninvasive procedure causing tissue damage [26]. ICMS is alsolimited to perform cortical representation of body function ata distinct time point after stroke constraining longitudinalexperiments within the same animal.
A new noninvasive strategy to study the reorganization ofthe motor cortex after stroke in the same animal over time islight-based motor mapping: This technique makes usage ofthe possibility to stimulate neurons by light, either byuncaging neurotransmitters [27, 28] or by directly activatinglight-sensitive channels, such as channelrhodopsin-2 (ChR-2). Ayling et al. [26] used transgenic channelrhodopsin-2mice which express ChR-2 in layer 5B pyramidal neurons ofthe motor cortex. Thus, light-based stimulation directlytargets corticofugal cells, enabling the analysis of their contri-bution to motor cortex topography. Light-based motor map-ping has the advantage of sampling stimulus-evokedmovements at hundreds of cortical locations in mere minutesobjectively and in a reproducible manner [29]. It is faster andless invasive than electrode-based mapping and can be com-bined with intrinsic signal imaging in animals with cranialwindow preparations [30]. In addition, it enables repeatedmapping of the motor cortex over a timescale of minutes tomonths, opening up possibilities to examine the dynamicsof movement representations at distinct conditions such aslearning over time, pharmacological intervention or reorgani-zation before, during, and after cortical damage. In a firststudy by Harrison et al. [29] light-based motor mappingrevealed a functional subdivision of the forelimbmotor cortexbased on the direction of movements evoked by brief lightpulses (10ms), while prolonged stimulation (100–500ms)resulted in complex movements of the forelimb to specificpositions in space. In a follow-up study [30], light-basedmap-ping was for the first time used to perform a longitudinalexperiment studying the reorganization of the sensorimotorcortex after a focal sensory stroke. The sensory stroke causedthe establishment of a new sensory map in prior parts of theforelimb motor cortex, which preserved its center positionbut became more dispersed.
2.3. Studying Poststroke Neuronal Circuit Formation andNetwork Activity. However, although all described mappingapproaches are powerful tools, they can only provide infor-mation about map shifts and representation of general move-ment dynamics. They stay far beyond cellular resolution anddo not allow studying local neuronal circuitry or singleneuron contribution to neuronal networks. In particular afterstroke, it is not clear how activity in single neurons changes
in relation to cortical map shifts. The analysis of single neu-rons in relation to the neuronal circuit in which they areembedded may elucidate whether stroke-induced plasticityis a result of the capacity of surviving neurons to processmultiple functional streams. In vivo two-photon calciumimaging is a potent method which not only allows studyingactivity of a single neuron or ensembles of neurons in a net-work but also enables cell type and neuronal subtype-specificanalysis. Only a few in vivo two-photon calcium imagingstudies focusing on neuronal reorganization and circuitrewiring after stroke have been conducted so far. In an acutein vivo calcium imaging experiment during the induction of atransient global ischemia model in mice, Murphy et al. [31]saw a widespread loss of mouse somatosensory cortex apicaldendritic structure during the phase of ischemic depolariza-tion. This was accompanied by increased intracellular cal-cium levels which coincidently occurred with the loss ofdendritic structure. In a second study [32], in vivo two-photon calcium imaging was used to examine how responseproperties of individual neurons and glial cells in reorganizedforelimb and hindlimb functional somatosensory maps mod-ified during the recovery period from ischemic damage in thesensory cortex. However, all studies have been conducted inanimals under anesthesia which itself influences neuronalactivity. An experiment which examines single neuron activ-ity in the behaving animal before stroke and during therecovery phase after insult is lacking so far.
Two-photon calcium imaging enables recordings ofindividual neuronal activity within a neuronal networkand allows subtype-specific functional analysis of brain tis-sue. However, neuronal activity with cellular resolution levelcan only be examined in small (<1 millimeter) fields ofview. Collective dynamics across different brain regionsare inaccessible. Recent advances in two-photon micros-copy allow the simultaneous imaging of neuronal networkswith cellular resolution level in the active animal in multi-ple areas, which are even not directly connected [33–35].This technological progress also provides new promisesfor experimental stroke research.
3. State-of-the-Art Techniques for ManipulatingNeuronal Circuits
In a 1979 Scientific American article, Nobel laureate FrancisCrick stated that the major challenge facing neurosciencewas the need to control one type of cell in the brain whileleaving others unaltered. In a lecture from 1999, he furtherconfined: “One of the next requirements is to be able toturn the firing of one or more types of neuron on andoff in the alert animal in a rapid manner. The ideal signalwould be light, probably at an infrared wavelength toallow the light to penetrate far enough. This seems ratherfarfetched but it is conceivable that molecular biologistscould engineer a particular cell type to be sensitive to lightin this way” [36].
Manipulation of neuronal circuits or single neuronshas two prerequisites: Manipulation has to be quick andvery specific. Over the years, a very diverse set of toolshas been developed to manipulate whole brain regions as
3Neural Plasticity

well as the activity of individual cells and subtypes in thealert behaving animal.
3.1. Manipulating with Specific Spatial Control. The firstconstraint for specific manipulation implies a high spatialcontrol allowing the selective modulation of a whole brainarea, a distinct anatomical sub region (e.g., layer 5 pyramidalcells in the sensorimotor cortex) or a particular cell type (e.g.,a parvalbumin-positive interneuron).
For inhibiting neuronal activity in whole brain regions,agents such as the GABA agonist muscimol have been used[37, 38] resulting in a loss of motor function, indicating acausal relationship between anatomy and behavior. Otherapproaches block synapse remodeling through protein syn-thesis inhibitors such as anisomycin, for example, inducingthe disruption of synapses and motor maps in a rat fore-limb stroke model [39]. However, for a better spatial con-trol to target distinct circuits and individual cell types,researchers have either created transgenic mouse lines orlocally injected viruses with cell-type specific promotors[40]. These promotors induce gene expression directly—asin the case of transgenic mice—or indirectly via, for example,Tet- (tetracycline-controlled transcriptional activation-) on/off or Cre-flox systems.
The Tet system uses at least two viral vectors plus an anti-biotic drug which in a sequential way activate each other toinduce the transcription and translation of the gene of inter-est: A tissue-specific promoter initiates the expression of atranscription factor, either the tetracycline transactivator(tTA) or the reverse tetracycline transactivator (rtTA). ThetTA or rtTA then becomes the key player for the transcrip-tion of a tetracycline response element (TRE) promotor,which in dependence of the presence of tetracycline or doxy-cycline drives the expression of the gene of interest. Expres-sion of the gene of interest is fully reversible asadministration or removal of tetracycline or doxycycline willturn its expression on or off. In a study by Kinoshita et al.[41] a Tet-on system was used to selectively express thesynaptotoxin tetanus toxin in propriospinal (PN) neuronsinnervated by the motor cortex. The researchers could showthat upon doxycycline administration in the drinking waterreaching performance of monkeys significantly declineddue to temporal blockade of the motor cortex–PN–motorneuron pathway. The same Tet-on system was used by Wahlet al. [42] in a rat stroke model to selectively shut off rewiredcorticospinal fibers originating in the contralesional pre- andmotor cortex and targeting the stroke-denervated hemi-spinal cord: When doxycycline was administered to the ratsin the drinking water after the rehabilitative treatment forimpaired skilled motor function, the recovered grasping skillsof the impaired paw decreased again over time. The effect wasreversible, when doxycycline was removed from the drinkingwater. This study showed for the first time the specific andreversible inactivating of newly out-sprouting corticospinalfibers after stroke. In another study by Ishida et al. [43] ipsi-lesional corticorubral fibers were shut off after forced rehabil-itation in a rat stroke model revealing the functionalimportance of the red nucleus for the recovery of impairedmotor function.
Similar to the Tet system, the Cre-flox system alsorequires two transgenes: A tissue-specific promotor regu-lates the expression of Cre recombinase, a bacteriophageenzyme which recombines DNA at specific recognitionsequences called loxP sites. Cre recombinase then excisesDNA within two loxP sites (“floxed”). As in most cases,floxed-stop constructs are knocked in by homologousrecombination to a gene of interest [40]; the stop signalis excised in the presence of Cre and the transgene expres-sion can be initiated. Cre-mediated expression only occursin cells expressing Cre, which are also those cells in whichthe tissue-specific promotor is active, indicating the highcell-type specificity of this technique.
3.2. Manipulating with High Spatial and Temporal Control
3.2.1. DREADDs. As the second prerequisite for specificneuronal manipulation in addition to a high degree of spatialresolution, temporal resolution and directional modulationof signaling are required for remotely controlling neuronalfiring. Temporal resolution implies the precise control whena receptor or pathway is active or inactive and for how long itshould be in a specific active status. Temporal resolution canvary from milliseconds (see “opsins” described below) tohours (e.g., designer receptors exclusively activated bydesigner drugs, DREADDs). Important are also “onset”kinetics (the time between the experimental manipulationand the modulation of the receptor or signaling pathway)and “offset” kinetics (the time between the initiation of thesignaling modulation and the termination of the modulation[40]). Directional regulation describes the effect of the tool onneuronal activity (either activating or inhibiting), while bidi-rectional control would be the optimal case: Turning on andoff the same cell population would elucidate the full spectrumof function that a cell provides within a particular networkfor perception or execution of a distinct behavior.
For manipulation of neuronal networks for minutes tohours, designer G protein-coupled receptors have beendeveloped. G protein-coupled receptor pathways areinvolved in a multitude of cellular functions. Unlike opsins,which are functionally silent without excitation in vivo asthey are not directly activated by endogenous compounds,G protein-coupled receptors (GCPRs) are constantly modu-lated by endogenous ligands in vivo or reveal ligand-independent activity [44, 45]. In vitro and in vivo pharmaco-logical studies have described GPCRs as the most importantclass of druggable targets in the human genome [46], throughwhich 50% of prescribed therapeutics act [47]. These factsmade the development of highly selective orthologousligand-receptor pairs, which would enable a high spatiotem-poral control over GPCR signaling pathways in vivochallenging [48]. In recent years, mutations to more than adozen native GPCRs have opened the field for the develop-ment of selectively activated designer receptors. Most of thesereceptors are divided in two classes: the first-generationRASSLs (receptors activated solely by synthetic ligands) andthe second-generation DREADDs (designer receptors exclu-sively activated by designer drugs), which were evolvedthrough directed molecular evolution in yeast [40]. RASSLs
4 Neural Plasticity
were first engineered on the basis of serotonin receptors [49],histamine receptors [50], and melanocortin-4 receptors [51].However, the first generation of orthologous ligand-GPCRpairs revealed potential shortcomings: Although the recep-tors were activated solely by the synthetic ligands, the ligandsthemselves did not solely activate the designer receptors (asreviewed by Rogan and Roth [40]). Thus, for the develop-ment of second-generation DREADDs, Armbruster et al.took a designer ligand, clozapine n-oxide (CNO), whichwas known to be inert at endogenous targets and highly bio-available and blood-brain barrier-permeant in both humansand mice [52, 53]. As CNO had a modified structure of cloza-pine, which is known to be a weak partial agonist at musca-rinic receptors, [54] mutations were induced in the fivemembers of the muscarinic cholinergic receptor familyand tested upon their selective responsiveness to theCNO application. Introducing two mutations transformedthe hM3 receptor into a designer receptor which wasinsensitive to its native ligands, but highly sensitive tothe designer ligand CNO. In smooth muscles cells theGq-coupled hM3 DREADD receptor stimulated a cascadeof inositol phosphate hydrolysis, calcium release andERK1/2 activation, while the hM4Di DREADD receptor,derived from the Gi-coupled human muscarinic M4 recep-tor, inhibited forskolin-induced cAMP formation and acti-vation of GIRK causing hyperpolarization and inhibitionof neuronal firing [54].
Since the first development of DREADD receptors,reports of their usage in vivo are now appearing: Thepharmacokinetic properties of the DREADD ligands andthe particular route of administration (oral administration,subcutaneous, intraperitoneal, or even local stereotaxicinfusion) determine how quickly neurons response to exper-imental manipulation by ligand application. Responsestypically emerge 5 to 15min after systematic application,for example, of CNO and usually last for 2 h—but this timeperiod can be further enlarged upon dose-dependentincrease of CNO [55]. When Ferguson et al. [56] usedvirus-mediated expression of the hM4Di receptor in thedirect and indirect pathway neurons of the striatum, theyfound altered behavioral plasticity associated with repeateddrug treatment. In particular, decreasing striatopallidal neu-ronal activity facilitated behavioral sensitization to drugtreatment. Expression of the hM4Di receptor in rewired cor-ticospinal projecting neurons was recently used to shut offregained grasping function in rats which had gained nearlyfull recovery of impaired skilled forelimb function due to alarge stroke after the sequential application of a growth-promoting therapy and intense rehabilitative training [42].
3.2.2. Optogenetics. Although manipulation of GPCR signal-ing pathways by DREADD receptor induction and activationis highly efficient and shows a very specific spatial resolution(depending on the constructs or transgenic mouse linesused), the temporal resolution remains limited to an activa-tion within minutes—due to the slower nature of GPCRsignaling—and the necessary ligand delivery to the locationof neuronal manipulation. In contrast, high-temporal (milli-seconds) and cellular precision within intact mammalian
neural tissue for fast, specific excitation or inhibition evenwithin a freely moving animal can only be achieved withoptogenetics [57].
Early approaches to use light to stimulate neuron activityincluded the selective photostimulation of neurons in Dro-sophila by coexpression of the drosophila photoreceptorgenes encoding arrestin-2, rhodopsin, and the alpha subunitof the cognate heterotrimeric G protein which enabled thesensitization of neurons to light [58]. In a second approach,action potentials in hippocampal neurons were induced ina reliable and temporarily precise manner by uncaging acaged capsaicin derivate by light [59]. However, depolariza-tion occurred within 5 s after a 1 s light pulse, lasting for 2–3 s and did not attenuate with multiple light pulses. Otherapproaches such as UV light-isomerizable chemicals linkedto genetically encoded channels [60, 61] had also shownlimitations due to reduced speed, targeting, tissue penetra-tion, or applicability because of their multicomponent nature[57]. In 2003, Nagel et al. [62] cloned channelrhodopsin-2(ChR2), a cation channel from the green alga Chlamydomo-nas reinhardtii which depicted similarities to the vertebraterhodopsin which opens in response to blue light allowingpotassium ions to enter the cell. Two years later, the firstoptogenetic experiment in neuroscience was conducted byexpressing ChR2 using a lentiviral vector in cultured rat hip-pocampal neurons [63]. Illumination of these cultures withshorter wavelength blue light (450–490nm) initiated largeand rapid depolarization, while light with longer wavelengths(490–510nm) induced smaller currents. Light stimulationof neurons was selective to those neurons expressingChR2. Since then, neuroscientists rapidly adapted the pos-sibilities of this new technology to in vivo experiments. Inaddition, the palette of available light-sensitive channelsand ion pumps for neuronal inhibition and activation,for fast- and slow-acting opsins, and for opsins activatedat distinct wavelengths has been extensively augmentedin recent years [64–68].
However, although the numerous advantages of optoge-netics are evident—such as the highest specificity, the ultra-fast millisecond time scale dissection, and basically noadverse effects due to the light (unless the light source isnot too strong or applied too long)—optogenetics stays aninvasive procedure for many in vivo experiments: As the lightsource has to be brought close to the neuronal tissue, target-ing deep brain areas or diffuse neuronal populations remainschallenging. New development of step function or bistableopsins and opsins such as Jaws—an inhibitory opsin, whichis activated by light of infrared wavelength [66]—opens upnew possibilities for noninvasive manipulation in-vivo.
Only very few studies have applied optogenetics in exper-imental stroke research so far: Optogenetics was mainly usedin the context of light-based motor mapping as describedabove [30]. Other studies used optogenetics as a therapeuticapproach to increase neuronal activity aiming at enhancingfunctional recovery: In a first study by Cheng et al. [69], opto-genetic stimulation of the ipsilateral primary motor cortex inChR2 transgenic mice promoted functional recovery and theinduction of growth-promoting genes after stroke inductionin the striatum and somatosensory cortex. Shah et al. [70]
5Neural Plasticity
could furthermore show that selectively stimulating neuronsin the lateral cerebellar nucleus (LCN), a deep cerebellarnucleus that sends major excitatory output to multiple motorand sensory areas in the forebrain, results in persistent recov-ery on the rotating beam after stroke in a transgenic mouseline (Thy1-ChR2-YFP-channelrhodopsin fused to yellowfluorescent protein under the Thy1 pan-neuronal promoter).Tennant et al. [71] revealed that optogenetic stimulation ofthalamocortical axons could facilitate recovery. In anotherstudy [72], optogenetic stimulation of the intact corticospinaltract was sufficient to promote functional recovery after alarge photothrombotic stroke in rats. Optogenetics were alsoused to drive the excitatory outputs of the grafted neural stemcells and increase forelimb use on the stroke-affected side andmotor activity in a rat stroke model [73]. Reducing the inhib-itory striatal output by optogenetics enhanced neurogenesisin the subventribular zone and behavioral recovery in miceafter middle cerebral artery occlusion [74–76].
That optogenetics can also be used to demonstrate acausal relationship between a rewiring neuronal circuit andrecovery of a specific (sensorimotor) behavior was demon-strated by Wahl et al. [72]: The authors used the inhibitorylight-sensitive proton pump ArchT to reveal the functionalrelevance and regionalized organization of rewired corticosp-inal circuitry for the recovery of distinct grasping features.
New advanced technology in microscopy allows theprecise optogenetic stimulation of individual neurons [77]and even dendritic spines and nerve cell somata [78, 79]using holographic photostimulation. In addition, the devel-opment of parallel illumination methods [80] which com-bine the preservation of the spatial targeting capability ofbeam-scanning systems and the rapid stimulation of mul-tiple neurons now enable the simultaneous excitation ofneurons in selected target regions.
3.2.3. Magnetogenetics. Although optogenetics have revolu-tionized the field of neuroscience, the examination of deeper,subcortical brain regions remains a challenge, as the light hasto be somehow delivered to the tissue often requiring inva-sive implantation of fiber optics causing collateral damageof the surrounding brain tissue. A new emerging methodwhich overcomes the spatial limitations is magnetogenetics:It relies on a principle known as thermal relaxation [81],implying that an alternating magnetic field is able to heatup small magnetic nanoparticles. As key elements the specificfrequency of the magnetic field, the size and composition ofthe nanoparticles are required. Huang et al. [82] activated aheat-sensitive TRPV1 channel expressed in human embry-onic kidney (HEK) cells by induction of thermal relaxationof manganese oxide nanoparticles, which enhanced the tem-perature at the plasma membrane and initiated the calciuminflux through the heat-sensitive ion channels. Chen et al.[83] used this technique to stimulate a defined neuronal pop-ulation activity in the ventral tegmental area in behavingmice demonstrating the potential of magnetogenetics fordeep brain stimulation.
However, although individual neuron and specific neuro-nal circuit manipulation with high spatial and temporal con-trol is possible as discussed above, there still is a need for
good behavioral readouts: In particular, in experimentalstroke research studying, for example, motor impairmentand recovery, it is crucial to quantitatively understand truerecovery versus compensation of impaired function [84]:While analyzing video recordings of motor behavior usingscores is not only time consuming but also often very subjec-tive, even the analysis of movement trajectories might notprovide the full picture [72]: When manipulating with highprecision control on a cellular and even subcellular level onthe neurobiological side, there is a need for precise analysisof the behavioral phenotype. The dramatic development ofComputer Vision algorithms and artificial intelligence mayallow further steps beyond for a detailed analysis of kinemat-ics including the sequence of postures, shape and trajectories,which is missed by the human eye.
4. State-of-the-Art Techniques to CombineAnatomy and Molecular Biology
So far, we have discussed how stroke reorganization can beexamined on the macrolevel of map shifts or by studying sin-gle neurons in neuronal circuits using 2-photon calciumimaging approaches. We have reviewed how individual neu-rons and whole neuronal populations can be manipulatedwith high spatiotemporal resolution disclosing new possi-bilities of causally linking individual neuronal activity witha distinct behavioral phenotype. However, an understand-ing of the underlying molecular crosstalk which inducesanatomical and behavioral changes is still lacking. Classically,tracing techniques (e.g., dextran tracers) have been applied tovisualize cells involved in structural reorganization afterstroke [22, 23]. Li et al. [85] found a way to exclusively studymolecular changes in newly out-sprouting neurons (“thesprouting transcriptome”) in the peri-infarct cortex by inject-ing two different fluorescent conjugates of the tracer choleratoxin B (CTB) into forelimb sensorimotor cortex at differenttimes points: One CTB tracer was injected at the time ofstroke, the second differently labeled one either 7 or 21 daysafterwards. Neurons which expressed only the second tracerwere those which missed an axonal projection to the injec-tion site at the time of the injection of the first tracer and thusrepresented neurons which established a new projection pat-tern after stroke. Both neuron types (single- and double-labeled ones) were laser captured to identify the distincttranscriptional profile of an out-sprouting neuron in theperi-infarct cortex.
In addition, new constructs have been recently devel-oped for molecular profiling of projecting neurons andthus bridging the gap between anatomical modificationsand underlying molecular mechanisms. Using, for example,bacterial artificial chromosome (BAC) transgenic micewhich express EGFP-tagged ribosomal protein L10a indefined cell populations allowed purification of polysomalmRNAs from genetically defined cell populations in thebrain [86, 87]. In another study by Ekstrand et al. [88],ribosomes were tagged with a camelid nanobody raisedagainst GFP enabling the selective capture of translatingmRNAs in projecting neurons.
6 Neural Plasticity

5. Conclusion
Here, we have reviewed current and new promising state-of-the-art techniques for studying reorganization after stroke,for the identification and manipulation of distinct neuronalpopulations and approaches which allow examining molecu-lar profiles of neurons being part of the cortical reorganiza-tion process. While for decades studies in basic strokeresearch have only described and reported correlative find-ings, these techniques open up tremendous possibilities toanalyze plastic processes and identify and target key playersfor the development of new therapies in stroke.
Conflicts of Interest
The author excludes any competing interest.
Funding
This work was supported by the Swiss National ScienceFoundation Grant no. 31003A-149315-1.
References
[1] S. Walter, P. Kostopoulos, A. Haass et al., “Diagnosis and treat-ment of patients with stroke in a mobile stroke unit versus inhospital: a randomised controlled trial,” The Lancet Neurology,vol. 11, no. 5, pp. 397–404, 2012.
[2] O. A. Berkhemer, P. S. Fransen, D. Beumer et al., “A random-ized trial of intraarterial treatment for acute ischemic stroke,”The New England Journal of Medicine, vol. 372, no. 1,pp. 11–20, 2015.
[3] W. Hacke, M. Kaste, E. Bluhmki et al., “Thrombolysis withalteplase 3 to 4.5 hours after acute ischemic stroke,” The NewEngland Journal of Medicine, vol. 359, no. 13, pp. 1317–1329,2008.
[4] S. T. Carmichael, I. Archibeque, L. Luke, T. Nolan, J. Momiy,and S. Li, “Growth-associated gene expression after stroke: evi-dence for a growth-promoting region in peri-infarct cortex,”Experimental Neurology, vol. 193, no. 2, pp. 291–311, 2005.
[5] M. P. van Meer, K. van der Marel, W. M. Otte, J. W.Berkelbach van der Sprenkel, and R. M. Dijkhuizen, “Corre-spondence between altered functional and structuralconnectivity in the contralesional sensorimotor cortex afterunilateral stroke in rats: a combined resting-state functionalMRI and manganese-enhanced MRI study,” Journal ofCerebral Blood Flow & Metabolism, vol. 30, no. 10,pp. 1707–1711, 2010.
[6] M. P. A. van Meer, W. M. Otte, K. van der Marel et al., “Extentof bilateral neuronal network reorganization and functionalrecovery in relation to stroke severity,” The Journal of Neuro-science, vol. 32, no. 13, pp. 4495–4507, 2012.
[7] R. D. Frostig and C. H. Chen-Bee, “Visualizing adult corticalplasticity using intrinsic signal optical imaging,” in In VivoOptical Imaging of Brain Function, R. D. Frostig, Ed., CRCPress, Boca Raton, FL, USA, 2009.
[8] A. Q. Bauer, A. W. Kraft, P. W.Wright, A. Z. Snyder, J. M. Lee,and J. P. Culver, “Optical imaging of disrupted functional con-nectivity following ischemic stroke in mice,” NeuroImage,vol. 99, pp. 388–401, 2014.
[9] J. Hakon, M. J. Quattromani, C. Sjölund et al., “Multisensorystimulation improves functional recovery and resting-statefunctional connectivity in the mouse brain after stroke,”NeuroImage: Clinical, vol. 17, pp. 717–730, 2018.
[10] M. H. Mohajerani, A. W. Chan, M. Mohsenvand et al., “Spon-taneous cortical activity alternates between motifs defined byregional axonal projections,” Nature Neuroscience, vol. 16,no. 10, pp. 1426–1435, 2013.
[11] A. Ghosh, F. Haiss, E. Sydekum et al., “Rewiring of hindlimbcorticospinal neurons after spinal cord injury,” Nature Neuro-science, vol. 13, no. 1, pp. 97–104, 2010.
[12] C. E. Brown, K. Aminoltejari, H. Erb, I. R. Winship, and T. H.Murphy, “In vivo voltage-sensitive dye imaging in adult micereveals that somatosensory maps lost to stroke are replacedover weeks by new structural and functional circuits withprolonged modes of activation within both the peri-infarctzone and distant sites,” The Journal of Neuroscience, vol. 29,no. 6, pp. 1719–1734, 2009.
[13] Y. Ma, M. A. Shaik, S. H. Kim et al., “Wide-field opticalmapping of neural activity and brain haemodynamics: consid-erations and novel approaches,” Philosophical Transactions ofthe Royal Society of London Series B, Biological Sciences,vol. 371, no. 1705, p. 20150360, 2016.
[14] K. Horikawa, “Recent progress in the development of geneti-cally encoded Ca2+ indicators,” The Journal of Medical Investi-gation, vol. 62, no. 1.2, pp. 24–28, 2015.
[15] M. Kozberg and E. Hillman, “Chapter 10 - neurovascularcoupling and energy metabolism in the developing brain,”Progress in Brain Research, vol. 225, pp. 213–242, 2016.
[16] M. G. Kozberg, Y. Ma, M. A. Shaik, S. H. Kim, and E. M. C.Hillman, “Rapid postnatal expansion of neural networksoccurs in an environment of altered neurovascular and neuro-metabolic coupling,” The Journal of Neuroscience, vol. 36,no. 25, pp. 6704–6717, 2016.
[17] G. Silasi, D. Xiao, M. P. Vanni, A. C. N. Chen, and T. H.Murphy, “Intact skull chronic windows for mesoscopicwide-field imaging in awake mice,” Journal of NeuroscienceMethods, vol. 267, pp. 141–149, 2016.
[18] M. P. Vanni and T. H. Murphy, “Mesoscale transcranial spon-taneous activity mapping in GCaMP3 transgenic mice revealsextensive reciprocal connections between areas of somatomo-tor cortex,” The Journal of Neuroscience, vol. 34, no. 48,pp. 15931–15946, 2014.
[19] M. Balbi, M. P. Vanni, M. J. Vega et al., “Longitudinalmonitoring of mesoscopic cortical activity in a mousemodel of microinfarcts reveals dissociations with behavioraland motor function,” Journal of Cerebral Blood Flow &Metabolism, 2018.
[20] T. H. Murphy, J. D. Boyd, F. Bolaños et al., “High-throughputautomated home-cage mesoscopic functional imaging ofmouse cortex,” Nature Communications, vol. 7, article 11611,2016.
[21] A. J. Emerick, E. J. Neafsey, M. E. Schwab, and G. L. Kartje,“Functional reorganization of the motor cortex in adult ratsafter cortical lesion and treatment with monoclonal antibodyIN-1,” The Journal of Neuroscience, vol. 23, no. 12, pp. 4826–4830, 2003.
[22] N. T. Lindau, B. J. Bänninger, M. Gullo et al., “Rewiring of thecorticospinal tract in the adult rat after unilateral stroke andanti-Nogo-A therapy,” Brain, vol. 137, no. 3, pp. 739–756,2014.
7Neural Plasticity

[23] M. L. Starkey, C. Bleul, B. Zörner et al., “Back seat driving: hin-dlimb corticospinal neurons assume forelimb control follow-ing ischaemic stroke,” Brain, vol. 135, no. 11, pp. 3265–3281,2012.
[24] K. A. Tennant, D. A. L. Adkins, N. A. Donlan et al., “The orga-nization of the forelimb representation of the C57BL/6 mousemotor cortex as defined by intracortical microstimulation andcytoarchitecture,” Cerebral Cortex, vol. 21, no. 4, pp. 865–876,2011.
[25] M. Brus-Ramer, J. B. Carmel, S. Chakrabarty, and J. H. Martin,“Electrical stimulation of spared corticospinal axons augmentsconnections with ipsilateral spinal motor circuits after injury,”The Journal of Neuroscience, vol. 27, no. 50, pp. 13793–13801,2007.
[26] O. G. S. Ayling, T. C. Harrison, J. D. Boyd, A. Goroshkov, andT. H. Murphy, “Automated light-based mapping of motorcortex by photoactivation of channelrhodopsin-2 transgenicmice,” Nature Methods, vol. 6, no. 3, pp. 219–224, 2009.
[27] G. M. G. Shepherd, T. A. Pologruto, and K. Svoboda, “Circuitanalysis of experience-dependent plasticity in the developingrat barrel cortex,” Neuron, vol. 38, no. 2, pp. 277–289, 2003.
[28] L. Luo, E. M. Callaway, and K. Svoboda, “Genetic dissection ofneural circuits,” Neuron, vol. 57, no. 5, pp. 634–660, 2008.
[29] T. C. Harrison, O. G. S. Ayling, and T. H. Murphy, “Distinctcortical circuit mechanisms for complex forelimb movementand motor map topography,” Neuron, vol. 74, no. 2, pp. 397–409, 2012.
[30] T. C. Harrison, G. Silasi, J. D. Boyd, and T. H. Murphy, “Dis-placement of sensory maps and disorganization of motorcortex after targeted stroke in mice,” Stroke, vol. 44, no. 8,pp. 2300–2306, 2013.
[31] T. H. Murphy, P. Li, K. Betts, and R. Liu, “Two-photonimaging of stroke onset in vivo reveals that NMDA-receptorindependent ischemic depolarization is the major cause ofrapid reversible damage to dendrites and spines,” The Journalof Neuroscience, vol. 28, no. 7, pp. 1756–1772, 2008.
[32] I. R. Winship and T. H. Murphy, “In vivo calcium imagingreveals functional rewiring of single somatosensory neuronsafter stroke,” The Journal of Neuroscience, vol. 28, no. 26,pp. 6592–6606, 2008.
[33] N. J. Sofroniew, D. Flickinger, J. King, and K. Svoboda, “Alarge field of view two-photon mesoscope with subcellularresolution for in vivo imaging,” eLife, vol. 5, 2016.
[34] J. Lecoq, J. Savall, D. Vučinić et al., “Visualizing mammalianbrain area interactions by dual-axis two-photon calcium imag-ing,” Nature Neuroscience, vol. 17, no. 12, pp. 1825–1829,2014.
[35] J. L. Chen, F. F. Voigt, M. Javadzadeh, R. Krueppel, andF. Helmchen, “Long-range population dynamics of anatomi-cally defined neocortical networks,” eLife, vol. 5, 2016.
[36] F. Crick, “The impact of molecular biology on neurosci-ence,” Philosophical Transactions of the Royal Society ofLondon Series B, Biological Sciences, vol. 354, no. 1392,pp. 2021–2025, 1999.
[37] J. B. Carmel, H. Kimura, and J. H. Martin, “Electrical stimula-tion of motor cortex in the uninjured hemisphere after chronicunilateral injury promotes recovery of skilled locomotionthrough ipsilateral control,” The Journal of Neuroscience,vol. 34, no. 2, pp. 462–466, 2014.
[38] B. K. Mansoori, L. Jean-Charles, B. Touvykine, A. Liu,S. Quessy, and N. Dancause, “Acute inactivation of the
contralesional hemisphere for longer durations improvesrecovery after cortical injury,” Experimental Neurology,vol. 254, pp. 18–28, 2014.
[39] S. Y. Kim, J. E. Hsu, L. C. Husbands, J. A. Kleim, and T. A.Jones, “Coordinated plasticity of synapses and astrocytesunderlies practice-driven functional vicariation in peri-infarct motor cortex,” The Journal of Neuroscience, vol. 38,no. 1, pp. 93–107, 2018.
[40] S. C. Rogan and B. L. Roth, “Remote control of neuronal sig-naling,” Pharmacological Reviews, vol. 63, no. 2, pp. 291–315,2011.
[41] M. Kinoshita, R. Matsui, S. Kato et al., “Genetic dissection ofthe circuit for hand dexterity in primates,” Nature, vol. 487,no. 7406, pp. 235–238, 2012.
[42] A. S. Wahl, W. Omlor, J. C. Rubio et al., “Neuronal repair.Asynchronous therapy restores motor control by rewiring ofthe rat corticospinal tract after stroke,” Science, vol. 344,no. 6189, pp. 1250–1255, 2014.
[43] A. Ishida, K. Isa, T. Umeda et al., “Causal link between thecortico-rubral pathway and functional recovery throughforced impaired limb use in rats with stroke,” The Journal ofNeuroscience, vol. 36, no. 2, pp. 455–467, 2016.
[44] R. Seifert and K. Wenzel-Seifert, “Constitutive activity ofG-protein-coupled receptors: cause of disease and com-mon property of wild-type receptors,” Naunyn-Schmiede-berg’s Archives of Pharmacology, vol. 366, no. 5, pp. 381–416,2002.
[45] M. J. Smit, H. F. Vischer, R. A. Bakker et al., “Pharmacoge-nomic and structural analysis of constitutive G protein-coupled receptor activity,” Annual Review of Pharmacologyand Toxicology, vol. 47, no. 1, pp. 53–87, 2007.
[46] P. M. Giguere, W. K. Kroeze, and B. L. Roth, “Tuning up theright signal: chemical and genetic approaches to studyGPCR functions,” Current Opinion in Cell Biology, vol. 27,pp. 51–55, 2014.
[47] J. P. Overington, B. Al-Lazikani, and A. L. Hopkins, “Howmany drug targets are there?,” Nature Reviews Drug Discovery,vol. 5, no. 12, pp. 993–996, 2006.
[48] B. R. Conklin, E. C. Hsiao, S. Claeysen et al., “EngineeringGPCR signaling pathways with RASSLs,” Nature Methods,vol. 5, no. 8, pp. 673–8, 2008.
[49] K. Kristiansen, W. K. Kroeze, D. L. Willins et al., “A highlyconserved aspartic acid (Asp-155) anchors the terminal aminemoiety of tryptamines and is involved in membrane targetingof the 5-HT2A serotonin receptor but does not participate inactivation via a “salt-bridge disruption” mechanism,” TheJournal of Pharmacology and Experimental Therapeutics,vol. 293, no. 3, pp. 735–746, 2000.
[50] M. Bruysters, A. Jongejan, A. Akdemir, R. A. Bakker, andR. Leurs, “A Gq/11-coupled mutant histamine H1 receptorF435A activated solely by synthetic ligands (RASSL),” Journalof Biological Chemistry, vol. 280, no. 41, pp. 34741–34746,2005.
[51] S. Srinivasan, C. Vaisse, and B. R. Conklin, “Engineering themelanocortin-4 receptor to control Gs signaling in vivo,”Annals of the New York Academy of Sciences, vol. 994, no. 1,pp. 225–232, 2003.
[52] W. H. Chang, S. K. Lin, H. Y. Lane et al., “Reversible metabo-lism of clozapine and clozapine N-oxide in schizophrenicpatients,” Progress in Neuro-Psychopharmacology & BiologicalPsychiatry, vol. 22, no. 5, pp. 723–739, 1998.
8 Neural Plasticity
[53] D. M. Weiner, H. Y. Meltzer, I. Veinbergs et al., “The role ofM1 muscarinic receptor agonism of N-desmethylclozapine inthe unique clinical effects of clozapine,” Psychopharmacology,vol. 177, no. 1-2, pp. 207–216, 2004.
[54] B. N. Armbruster, X. Li, M. H. Pausch, S. Herlitze, and B. L.Roth, “Evolving the lock to fit the key to create a family of Gprotein-coupled receptors potently activated by an inertligand,” Proceedings of the National Academy of Sciences ofthe United States of America, vol. 104, no. 12, pp. 5163–5168,2007.
[55] J. M. Guettier, D. Gautam, M. Scarselli et al., “A chemical-genetic approach to study G protein regulation of β cellfunction in vivo,” Proceedings of the National Academy ofSciences of the United States of America, vol. 106, no. 45,pp. 19197–19202, 2009.
[56] S. M. Ferguson, D. Eskenazi, M. Ishikawa et al., “Transientneuronal inhibition reveals opposing roles of indirect anddirect pathways in sensitization,” Nature Neuroscience,vol. 14, no. 1, pp. 22–24, 2011.
[57] L. Fenno, O. Yizhar, and K. Deisseroth, “The development andapplication of optogenetics,” Annual Review of Neuroscience,vol. 34, no. 1, pp. 389–412, 2011.
[58] B. V. Zemelman, G. A. Lee, M. Ng, and G. Miesenböck,“Selective photostimulation of genetically chARGed neurons,”Neuron, vol. 33, no. 1, pp. 15–22, 2002.
[59] B. V. Zemelman, N. Nesnas, G. A. Lee, and G. Miesenbock,“Photochemical gating of heterologous ion channels: remotecontrol over genetically designated populations of neurons,”Proceedings of the National Academy of Sciences of theUnited States of America, vol. 100, no. 3, pp. 1352–1357,2003.
[60] S. Szobota, P. Gorostiza, F. del Bene et al., “Remote controlof neuronal activity with a light-gated glutamate receptor,”Neuron, vol. 54, no. 4, pp. 535–545, 2007.
[61] P. Gorostiza and E. Y. Isacoff, “Optical switches for remote andnoninvasive control of cell signaling,” Science, vol. 322,no. 5900, pp. 395–399, 2008.
[62] G. Nagel, T. Szellas, W. Huhn et al., “Channelrhodopsin-2,a directly light-gated cation-selective membrane channel,”Proceedings of the National Academy of Sciences of the UnitedStates of America, vol. 100, no. 24, pp. 13940–13945, 2003.
[63] E. S. Boyden, F. Zhang, E. Bamberg, G. Nagel, andK. Deisseroth, “Millisecond-timescale, genetically targetedoptical control of neural activity,” Nature Neuroscience,vol. 8, no. 9, pp. 1263–1268, 2005.
[64] O. Yizhar, L. Fenno, F. Zhang, P. Hegemann, andK. Diesseroth, “Microbial opsins: a family of single-component tools for optical control of neural activity,” ColdSpring Harbor Protocols, vol. 2011, no. 3, article top102, 2011.
[65] D. Schmidt, P. W. Tillberg, F. Chen, and E. S. Boyden, “A fullygenetically encoded protein architecture for optical control ofpeptide ligand concentration,” Nature Communications,vol. 5, p. 3019, 2014.
[66] A. S. Chuong, M. L. Miri, V. Busskamp et al., “Noninvasiveoptical inhibition with a red-shifted microbial rhodopsin,”Nature Neuroscience, vol. 17, no. 8, pp. 1123–1129, 2014.
[67] N. C. Klapoetke, Y. Murata, S. S. Kim et al., “Independent opti-cal excitation of distinct neural populations,” Nature Methods,vol. 11, no. 3, pp. 338–346, 2014.
[68] C. K. Kim, A. Adhikari, and K. Deisseroth, “Integration ofoptogenetics with complementary methodologies in systems
neuroscience,” Nature Reviews Neuroscience, vol. 18, no. 4,pp. 222–235, 2017.
[69] M. Y. Cheng, E. H. Wang, W. J. Woodson et al., “Optogeneticneuronal stimulation promotes functional recovery afterstroke,” Proceedings of the National Academy of Sciences ofthe United States of America, vol. 111, no. 35, pp. 12913–12918, 2014.
[70] A. M. Shah, S. Ishizaka, M. Y. Cheng et al., “Optogenetic neu-ronal stimulation of the lateral cerebellar nucleus promotespersistent functional recovery after stroke,” Scientific Reports,vol. 7, article 46612, 2017.
[71] K. A. Tennant, S. L. Taylor, E. R. White, and C. E. Brown,“Optogenetic rewiring of thalamocortical circuits to restorefunction in the stroke injured brain,” Nature Communications,vol. 8, article 15879, 2017.
[72] A. S. Wahl, U. Büchler, A. Brändli et al., “Optogenetically stim-ulating intact rat corticospinal tract post-stroke restores motorcontrol through regionalized functional circuit formation,”Nature Communications, vol. 8, no. 1, p. 1187, 2017.
[73] M. M. Daadi, J. Q. Klausner, B. Bajar et al., “Optogeneticstimulation of neural grafts enhances neurotransmissionand downregulates the inflammatory response in experi-mental stroke model,” Cell Transplantation, vol. 25, no. 7,pp. 1371–1380, 2016.
[74] L. Jiang, W. Li, M. Mamtilahun et al., “Optogenetic inhibi-tion of striatal GABAergic neuronal activity improves out-comes after ischemic brain injury,” Stroke, vol. 48, no. 12,pp. 3375–3383, 2017.
[75] Y. Lu, L. Jiang, W. Li et al., “Optogenetic inhibition of striatalneuronal activity improves the survival of transplanted neuralstem cells and neurological outcomes after ischemic stroke inmice,” Stem Cells International, vol. 2017, Article ID4364302, 11 pages, 2017.
[76] M. Song, S. P. Yu, O.Mohamad et al., “Optogenetic stimulationof glutamatergic neuronal activity in the striatum enhancesneurogenesis in the subventricular zone of normal and strokemice,” Neurobiology of Disease, vol. 98, pp. 9–24, 2017.
[77] O. A. Shemesh, D. Tanese, V. Zampini et al., “Temporally pre-cise single-cell-resolution optogenetics,” Nature Neuroscience,vol. 20, no. 12, pp. 1796–1806, 2017.
[78] A. M. Packer, D. S. Peterka, J. J. Hirtz, R. Prakash,K. Deisseroth, and R. Yuste, “Two-photon optogenetics ofdendritic spines and neural circuits,” Nature Methods, vol. 9,no. 12, pp. 1202–1205, 2012.
[79] A. M. Packer, L. E. Russell, H.W. P. Dalgleish, andM. Häusser,“Simultaneous all-optical manipulation and recording of neu-ral circuit activity with cellular resolution in vivo,” NatureMethods, vol. 12, no. 2, pp. 140–146, 2015.
[80] V. Emiliani, A. E. Cohen, K. Deisseroth, and M. Hausser,“All-optical interrogation of neural circuits,” The Journalof Neuroscience, vol. 35, no. 41, pp. 13917–13926, 2015.
[81] S. Nimpf and D. A. Keays, “Is magnetogenetics the new opto-genetics?,” The EMBO Journal, vol. 36, no. 12, pp. 1643–1646,2017.
[82] H. Huang, S. Delikanli, H. Zeng, D. M. Ferkey, and A. Pralle,“Remote control of ion channels and neurons throughmagnetic-field heating of nanoparticles,” Nature Nanotechnol-ogy, vol. 5, no. 8, pp. 602–606, 2010.
[83] R. Chen, G. Romero, M. G. Christiansen, A. Mohr, andP. Anikeeva, “Wireless magnetothermal deep brain stimula-tion,” Science, vol. 347, no. 6229, pp. 1477–1480, 2015.
9Neural Plasticity
[84] T. A. Jones, “Motor compensation and its effects on neuralreorganization after stroke,” Nature Reviews Neuroscience,vol. 18, no. 5, pp. 267–280, 2017.
[85] S. Li, J. J. Overman, D. Katsman et al., “An age-related sprout-ing transcriptome provides molecular control of axonalsprouting after stroke,” Nature Neuroscience, vol. 13, no. 12,pp. 1496–1504, 2010.
[86] J. P. Doyle, J. D. Dougherty, M. Heiman et al., “Application ofa translational profiling approach for the comparative analysisof CNS cell types,” Cell, vol. 135, no. 4, pp. 749–762, 2008.
[87] M. Heiman, A. Schaefer, S. Gong et al., “A translational profil-ing approach for the molecular characterization of CNS celltypes,” Cell, vol. 135, no. 4, pp. 738–748, 2008.
[88] M. I. Ekstrand, A. R. Nectow, Z. A. Knight, K. N. Latcha, L. E.Pomeranz, and J. M. Friedman, “Molecular profiling ofneurons based on connectivity,” Cell, vol. 157, no. 5,pp. 1230–1242, 2014.
10 Neural Plasticity

Review ArticleNeurorehabilitation in Parkinson’s Disease: A Critical Review ofCognitive Rehabilitation Effects on Cognition and Brain
María Díez-Cirarda, Naroa Ibarretxe-Bilbao , Javier Peña, and Natalia Ojeda
Department of Methods and Experimental Psychology, Faculty of Psychology and Education, University of Deusto, Bilbao, Spain
Correspondence should be addressed to Naroa Ibarretxe-Bilbao; [email protected]
Received 20 February 2018; Accepted 29 March 2018; Published 6 May 2018
Academic Editor: Toshiyuki Fujiwara
Copyright © 2018 María Díez-Cirarda et al. This is an open access article distributed under the Creative CommonsAttribution License, which permits unrestricted use, distribution, and reproduction in any medium, provided the originalwork is properly cited.
Background. Parkinson’s disease (PD) patients experience cognitive impairment which has been related to reduced quality of lifeand functional disability. These symptoms usually progress until dementia occurs. Some studies have been published assessingthe efficacy of cognitive treatments on improving cognition, functional outcome, and producing changes in brain activity.Objective. A critical review was performed to present up-to-date neurorehabilitation effects of cognitive rehabilitation in PD,with special emphasis on the efficacy on cognition, quality of life aspects, brain changes, and the longitudinal maintenance ofthese changes. Results. After exclusions, 13 studies were reviewed, including 6 randomized controlled trials for the efficacy oncognition, 2 randomized controlled trials regarding the brain changes after cognitive training, and 5 studies which evaluated thelong-term effects of cognitive treatments. Conclusions. Cognitive rehabilitation programs have demonstrated to be effective onimproving cognitive functions, but more research is needed focusing on the efficacy on improving behavioral aspects andproducing brain changes in patients with PD. Moreover, there is a need of randomized controlled trials with long-termfollow-up periods.
1. Introduction
Parkinson’s disease (PD) is a common neurodegenerative dis-ease, being most of the cases diagnosed at around 60 years [1].Traditionally, PD has been considered a motor disorder, andthe core motor symptoms are rigidity, tremor, bradykinesia(akinesia), and postural instability. In addition, freezing of gait(difficulty to initiate or continue walking) and flexed posturehave been included in the cardinalmotor symptomsof the dis-ease [2]. Nowadays, it is known that this neurodegenerativeprocess produces a wide range of motor and nonmotor symp-toms inPDpatients; hence, PD is considered amultiple systemneurodegenerative disorder [3]. Among these nonmotorsymptoms, cognitive impairment is an important nonmotorsymptom due to its prevalence among PD patients (20–50%)[4, 5]. In addition, PD patients might develop cognitiveimpairment from the early stages of the disease [4, 5]. Thesecognitive deficits may deteriorate with the progression of thedisease until dementia occurs [6, 7]. The analysis of cognitive
impairment and dementia in PD patients is relevant becauseboth have shown relationship with reduced quality of lifeand functional disability in PD patients [8, 9].
These cognitive impairments in PD have been related togrey matter (GM) atrophy, white matter (WM) alterations,brain functional connectivity (FC), and brain activation alter-ations. PD patients with Mild Cognitive Impairment (MCI)diagnosis have shown GM volume reduction in the frontal,temporal, and parietal lobes, but also in the hippocampus,amygdala, and putamen [10, 11]. Additionally, PD patientswith MCI have shown widespread cerebral WM deterioration[11–13]. Interestingly, WM alterations have been found toappear before GM volume reduction in PD patients, whichhighlights the importance to explore the relationship betweenWM indexes and cognitive impairment [14]. In addition,cognitive deficits have also been related to functional brainalterations, showing altered FC and brain activation valuesboth during resting state and during cognitive tasks insidethe scanner [15, 16].
HindawiNeural PlasticityVolume 2018, Article ID 2651918, 12 pageshttps://doi.org/10.1155/2018/2651918

With the progression of the disease, cognitive deficitsusually deteriorate until dementia occurs after 10 to 20 years[6, 17]. A study followed newly diagnosed PD patients overtime and found that after 20 years, dementia was present inup to 80% of PD patients [6]. In addition, recent studiesshowed that the presence of MCI diagnosis in PD patientscontributes to the development of dementia [7], and resultssupport that MCI could be considered as a prodromal stagefor dementia in PD [18]. Cognitive deterioration is accompa-nied by GM volume loss [19], WM alterations [20], and func-tional brain changes [21, 22]. When dementia occurs in PDpatients, cortical degeneration has been extended to frontal,temporal, parietal, and occipital areas [23].
Due to the relevance of cognitive deficits, therapeuticstrategies are needed to treat cognitive decline. A commoncognitive rehabilitation program could be described as abehavioral treatment for cognitive impairment which focusedon cognitive abilities and daily living activities, which is basedon the restoration, compensation, and optimization of thecognitive functions [24, 25]. Cognitive rehabilitation pro-grams have demonstrated their efficacy on improving cogni-tion in different studies in PD. Several reviews [26–28] andmeta-analyses [29, 30] have been published in the field. Theefficacy of cognitive rehabilitation on improving cognitionhas been shown, but these reviews and meta-analyses high-light the importance of continuing with research focused onthe efficacy of the cognitive rehabilitation approach in PD.
The main objective of the present study is to perform acritical review to present up-to-date neurorehabilitation effectsof cognitive rehabilitation in PD. The first objective was toexamine the efficacy of cognitive rehabilitation programs oncognition and behavioral aspects. The second objective wasto review the evidence of the brain changes found aftercognitive treatments. Finally, the present study analyzed thelong-term effects of cognitive rehabilitation in PD.
2. Methods
2.1. Review Strategy. Studies were included from inception toDecember 2017. Focusing on the first objective of this criticalreview, which was to analyze those randomized controlledtrials focused on the efficacy of cognitive rehabilitationprograms on cognition, we selected only those studies thatfulfilled the following criteria: (1) randomized controlledtrials; (2) PD patients underwent a cognitive rehabilitationprogram; (3) the main objective was to investigate the changein cognition; and (4) studies including a PD control group.Among the studies that fulfilled these specific criteria, we alsoreported (if included in the studies) the results of the efficacyon behavioral or mood aspects, such as depression, apathy,functional disability, and quality of life aspects.
Regarding the second objective of the present review, theefficacy of cognitive rehabilitation programs in producingbrain changes in PD was determined based on the followingcriteria: (1) randomized controlled trials; (2) PD patients under-went a cognitive rehabilitation program; (3) studies includinga PD control group; and (4) brain changes were evaluated.
Finally, focusing on the last objective of the presentstudy, the review about the long-term effects of cognitive
rehabilitation programs was based on the following criteria:(1) PD patients underwent a cognitive rehabilitation pro-gram; (2) a longitudinal follow-up evaluation was performed;and (3) the main objective was to investigate the change incognition at follow-up. In this specific section, we includedboth randomized controlled trials and nonrandomized trials,due to the scarce number of published studies and to have awider perspective.
Databases included were PubMed, Medline, and GoogleScholar. The search terms were specified to be found inthe title of the studies. The terms were (1) Parkinson’s dis-ease/Parkinson disease; (2) cognitive rehabilitation/cognitivetraining/cognitive remediation; (3) attention rehabilitation/attention training/attention remediation; (4) executive train-ing/executive rehabilitation/executive remediation; (5) mem-ory training/memory rehabilitation/memory remediation; (6)randomized controlled trial/randomized controlled trial; and(7) cognition. The search term combinations in the databaseswere (1)+ (2); (1) + (3); (1) + (4); (1) + (5); and (1)+ (6)+ (7).
A summary of study selection is shown in Figure 1. Theresults of the selected studies were divided into 3 differentsections. First, the studies evaluating the cognitive andbehavioral changes are shown in Table 1. Then, Table 2shows the studies that assessed the brain changes after cogni-tive rehabilitation in PD. In addition, the longitudinal effectsof cognitive rehabilitation programs are shown in Table 3. InTables 1 and 3, different characteristics of the studies areshown, such as the sample size, characteristics of the cogni-tive rehabilitation program used, cognitive domains ana-lyzed, significant results found, and limitations of eachstudy. In Table 2, MRI acquisition, preprocessing, and analy-sis specifications are included for each study, along with thebrain significant results and the study limitations.
3. Results
3.1. Efficacy on Improving Cognition and Behavioral Aspects.A summary of the included cognitive rehabilitation studies inPD is shown in Table 1. Studies were included if they followedguidelines for randomized controlled trials, the interventionwas a cognitive rehabilitationprogram, and themain objectiveof the study was to improve cognition. As previously reportedin other reviews and meta-analyses, cognitive rehabilitationimproves cognition inPD[27, 29, 30].However, there is aneedfor studies with larger samples and double-blind randomizedcontrolled trials to reach generalized conclusions in PD.
A less studied aspect of cognitive rehabilitation is itsefficacy on improving mood symptoms or functionaldisability related to the disease. Following the review-specific criteria, among the randomized controlled trialsin PD, only five studies have evaluated the change in func-tionality and mood aspects [31–35] and two of them foundpositive effects [31, 32] (Table 1). Petrelli et al. compared astructured and a nonstructured cognitive training programin PD patients and found that the symptoms of depressionwere reduced only in those PD patients that attended thenonstructured cognitive program [32]. Peña et al. found thatfunctional disability scores were reduced in the experimentalgroup (3 months of cognitive training) compared to the
2 Neural Plasticity
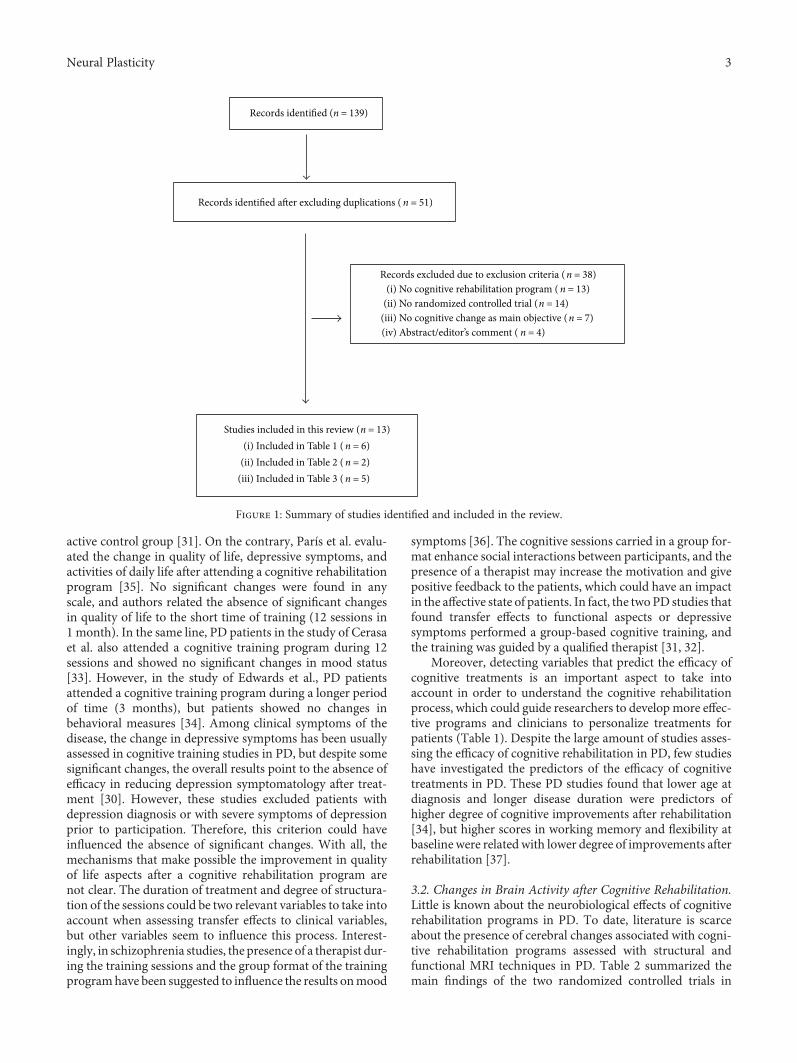
active control group [31]. On the contrary, París et al. evalu-ated the change in quality of life, depressive symptoms, andactivities of daily life after attending a cognitive rehabilitationprogram [35]. No significant changes were found in anyscale, and authors related the absence of significant changesin quality of life to the short time of training (12 sessions in1 month). In the same line, PD patients in the study of Cerasaet al. also attended a cognitive training program during 12sessions and showed no significant changes in mood status[33]. However, in the study of Edwards et al., PD patientsattended a cognitive training program during a longer periodof time (3 months), but patients showed no changes inbehavioral measures [34]. Among clinical symptoms of thedisease, the change in depressive symptoms has been usuallyassessed in cognitive training studies in PD, but despite somesignificant changes, the overall results point to the absence ofefficacy in reducing depression symptomatology after treat-ment [30]. However, these studies excluded patients withdepression diagnosis or with severe symptoms of depressionprior to participation. Therefore, this criterion could haveinfluenced the absence of significant changes. With all, themechanisms that make possible the improvement in qualityof life aspects after a cognitive rehabilitation program arenot clear. The duration of treatment and degree of structura-tion of the sessions could be two relevant variables to take intoaccount when assessing transfer effects to clinical variables,but other variables seem to influence this process. Interest-ingly, in schizophrenia studies, the presence of a therapist dur-ing the training sessions and the group format of the trainingprogramhave been suggested to influence the results onmood
symptoms [36]. The cognitive sessions carried in a group for-mat enhance social interactions between participants, and thepresence of a therapist may increase the motivation and givepositive feedback to the patients, which could have an impactin the affective state of patients. In fact, the twoPD studies thatfound transfer effects to functional aspects or depressivesymptoms performed a group-based cognitive training, andthe training was guided by a qualified therapist [31, 32].
Moreover, detecting variables that predict the efficacy ofcognitive treatments is an important aspect to take intoaccount in order to understand the cognitive rehabilitationprocess, which could guide researchers to develop more effec-tive programs and clinicians to personalize treatments forpatients (Table 1). Despite the large amount of studies asses-sing the efficacy of cognitive rehabilitation in PD, few studieshave investigated the predictors of the efficacy of cognitivetreatments in PD. These PD studies found that lower age atdiagnosis and longer disease duration were predictors ofhigher degree of cognitive improvements after rehabilitation[34], but higher scores in working memory and flexibility atbaseline were related with lower degree of improvements afterrehabilitation [37].
3.2. Changes in Brain Activity after Cognitive Rehabilitation.Little is known about the neurobiological effects of cognitiverehabilitation programs in PD. To date, literature is scarceabout the presence of cerebral changes associated with cogni-tive rehabilitation programs assessed with structural andfunctional MRI techniques in PD. Table 2 summarized themain findings of the two randomized controlled trials in
Records identified (n = 139)
Records excluded due to exclusion criteria (n = 38)(i) No cognitive rehabilitation program (n = 13)
(ii) No randomized controlled trial (n = 14)(iii) No cognitive change as main objective (n = 7)(iv) Abstract/editor’s comment ( n = 4)
Records identified a�er excluding duplications (n = 51)
Studies included in this review (n = 13)(i) Included in Table 1 (n = 6)
(ii) Included in Table 2 (n = 2)(iii) Included in Table 3 (n = 5)
Figure 1: Summary of studies identified and included in the review.
3Neural Plasticity

Table1:Summaryof
therand
omized
controlledtrialsin
assessingtheeffi
cacy
ofcognitiverehabilitationprogramsin
PD.
Autho
rsSample
H&Y
Cognitive
rehabilitationprogram
Tests1
Predictorsof
greater
improvem
ent
MRI
(Table2)
Results
Long-
term
follo
w-up
(Table3)
Limitations/
risk
ofbias
Duration
Paper-pencil—
PCom
puterized—
CCogn.
domains
trained
Form
at
Parísetal.
[35]
28PD
16CR
12ACG
1–3
12sessions
4weeks
3times/
week
45min/
session
CR—“SmartBrain
tool”(P
+C)
ACG—
speech
therapy
(i)Attention
(ii)WM
(iii)
Mem
ory
(iv)
Psychom
otor
speed
(v)EF
(vi)Visuo
spatial
ability
(vii)
Language
(viii)Calculation
skills
(ix)
Culture
Group
+ho
me
(i)Attention
(ii)WM
(iii)
EF
(iv)
Processingspeed
(v)Verbalm
emory
(vi)Visualm
emory
(vii)
Visuo
construction
(viii)Visuo
spatial
ability
(ix)
Verbalfl
uency
(x)Depression
(xi)Qua
lityof
life
(xii)
Dailyliving
activities
——
Improvem
ents
(i)Attention
/WM
(ii)Inform
ation
processing
speed
(iii)
Visualm
emory
(iv)
Visuo
spatial
ability
(v)Visuo
constructive
ability
(vi)Semantic
fluency
(vii)
EF
—Sm
allsam
ple
size
Edw
ards
etal.
[34]
74PD
32CR
42CG
1–3
36sessions
3mon
ths
3times/
week
1h/session
CR—“InS
ight
version
ofSO
PT”(C)
(i)Inform
ation
processing
speed
Hom
e
(i)Speedof
processing
(self-repo
rted)
(ii)Perceptionof
cognitiveandeveryday
function
ing
(self-repo
rted)
(iii)
Depression
<Age
atPD
diagno
sis
>Disease
duration
—Im
provem
ents
(i)S
peed
ofprocessing
—
NoACG
Only1
domain
trained
Self-repo
rted
testfor
cognition
and
function
ality
Cerasaetal.
[33]
15PD
8CR
7ACG
1–3
12sessions
6weeks
2times/
week
1h/session
CR—“R
ehaC
om”(C)
ACG—visuom
otor
coordination
tapp
ing
task.In-ho
use
software(C)
(i)Attention
(ii)Inform
ation
processing
Group
(i)Attention
/processing
speed
(ii)EF
(iii)
WM
(iv)
Spatialm
emory
(v)Verbalm
emory
(vi)Visuo
spatial
orientation
(vii)
Verbalfl
uency
(viii)Depression
(ix)
Anxiety
(x)Qua
lityof
life
—Yes
Improvem
ents
(i)Attention
/processing
speed
(ii)WM
—Sm
allsam
ple
size
Zim
mermann
etal.[37]
39PD
19CR
20ACG
2a
12sessions
4weeks
3times/
week
CR—“C
ogniPlus”
(C)
ACG—“N
intend
oWii”
(C)
(i)Attention
(ii)Working
mem
ory
(iii)
EF
Group
(i)Attention
(ii)WM
(iii)
EF
(iv)
Episodicmem
ory
(v)Visuo
construction
(i)WM
score
(ii)Flexibility
score
—(i)ACGim
proved
attentioncomparedto
CR
—
Smallsam
ple
size
Nochange
infunction
ality
evaluated
4 Neural Plasticity
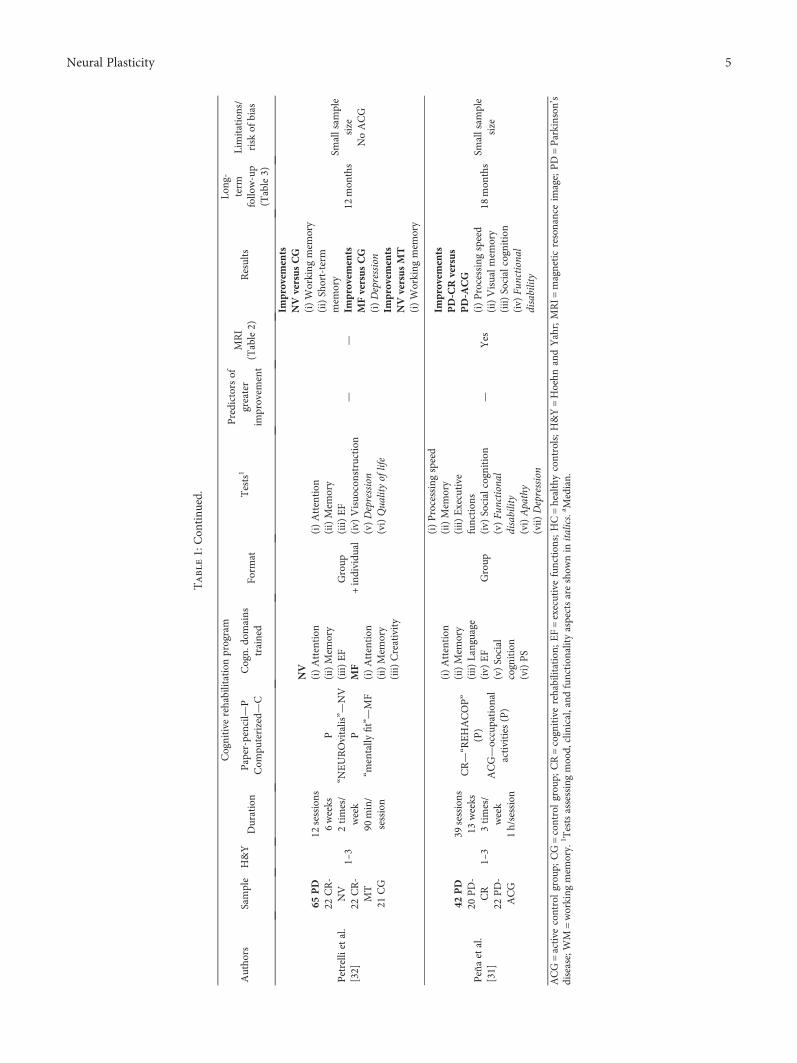
Table1:Con
tinu
ed.
Autho
rsSample
H&Y
Cognitive
rehabilitationprogram
Tests1
Predictorsof
greater
improvem
ent
MRI
(Table2)
Results
Long-
term
follo
w-up
(Table3)
Limitations/
risk
ofbias
Duration
Paper-pencil—
PCom
puterized—
CCogn.
domains
trained
Form
at
Petrelli
etal.
[32]
65PD
22CR-
NV
22CR-
MT
21CG
1–3
12sessions
6weeks
2times/
week
90min/
session
P“N
EUROvitalis”—
NV
P“m
entally
fit”—MF
NV
(i)Attention
(ii)Mem
ory
(iii)
EF
MF
(i)Attention
(ii)Mem
ory
(iii)
Creativity
Group
+individu
al
(i)Attention
(ii)Mem
ory
(iii)
EF
(iv)
Visuo
construction
(v)Depression
(vi)Qua
lityof
life
——
Improvem
ents
NVversusCG
(i)Working
mem
ory
(ii)Short-term
mem
ory
Improvem
ents
MFversusCG
(i)Depression
Improvem
ents
NVversusMT
(i)Working
mem
ory
12mon
ths
Smallsam
ple
size
NoACG
Peñaetal.
[31]
42PD
20PD-
CR
22PD-
ACG
1–3
39sessions
13weeks
3times/
week
1h/session
CR—“R
EHACOP”
(P)
ACG—occupation
alactivities
(P)
(i)Attention
(ii)Mem
ory
(iii)
Language
(iv)
EF
(v)Social
cognition
(vi)PS
Group
(i)Processingspeed
(ii)Mem
ory
(iii)
Executive
function
s(iv)
Socialcognition
(v)Fu
nctional
disability
(vi)Apathy
(vii)
Depression
—Yes
Improvem
ents
PD-CRversus
PD-A
CG
(i)Processingspeed
(ii)Visualm
emory
(iii)
Socialcognition
(iv)
Functional
disability
18mon
ths
Smallsam
ple
size
ACG=active
controlgrou
p;CG=controlgrou
p;CR=cognitiverehabilitation;
EF=executivefunction
s;HC=healthycontrols;H&Y=Hoehn
andYahr;MRI=
magneticresonanceim
age;PD=Parkinson
’sdisease;WM
=working
mem
ory.
1 Testsassessingmood,
clinical,and
function
alityaspectsareshow
nin
italics.
a Median.
5Neural Plasticity

Table2:Summaryof
rand
omized
controlledtrialsin
assessingbrainchangesrelatedto
cognitiverehabilitationprogramsin
PD.
Autho
rsMRI
sample
H&Y
Cognitive
rehabilitation
program
MRIacqu
isition/
preprocessing/analysis
MRIstatistical
analysis
MRIresults
Correlation
with
cognitive
measures
Limitations/riskof
bias
Cerasaetal.[33]
15PD
8CR
7ACG
1–3
RehaC
omcompu
ter
program
Training:
(i)Attention
(ii)Inform
ation
processing
Resting-statefM
RI/ICAin
FSL/FC
analysis
ANOVA
(group
×time)
Regionof
interests
Dorsolateral
PFC
Ventrolateral
PFC
ACC
Sup+inf
parietalleft
Caudate
Cerebellum
Increasedfunction
alactivity:
(i)Leftdo
rsolateralPFC
(executive
network)
(ii)Superior
parietalleft
(attention
network)
—Sm
allsam
plesize
Onlyon
etype
ofMRI
acqu
isition
Díez-Cirarda
etal.[38]
(cognitive
results
in[31])
30PD
15CR
15 ACG
1–3
“REHACOP”
program
Training:
(i)Attention
(ii)Mem
ory
(iii)
Language
(iv)
EF
(v)Social
cognition
Resting-statefM
RI/ROI-to-
ROIapproach
inCONN
toolbox
ANOVA
(group
×time)
Pairedt-test
Who
lebrain
IncreasedFC
between
BA9L
-BA20LandBA9R
-BA20L
Yes
Smallsam
plesize
and
redu
cedat
long-term
follow-up
Mem
oryfM
RIparadigm
results
atFW
Eun
corrected
Mem
oryfM
RIparadigm
/mod
el-based
approach
inSP
M
Increasedbrainactivation
Learning
task:leftfron
tal
inferior
lobe
Increasedbrainactivation
Mem
orytask:leftmiddle
tempo
rallobe
Diffusionweighted/TBSS
inFSL
—
T1weighted/VBM
inFSL
—
ACC=anterior
cingulatecortex;A
CG=active
controlg
roup
;BA=Brodm
annarea;C
R=cognitiverehabilitation;
EF=executivefunction
s;FC
=function
alconn
ectivity;fMRI=
function
almagneticresonance
imaging;
FSL=FM
RIB
SoftwareLibrary;
H&Y=Hoehn
andYahr;ICA=independ
entcompo
nent
analysis;MRI=
magneticresonanceim
age;PD=Parkinson
’sdisease;PFC
=prefrontal
cortex;TBSS
=tract-
basedspatialstatistics;VBM
=voxel-basedmorph
ometry.
6 Neural Plasticity
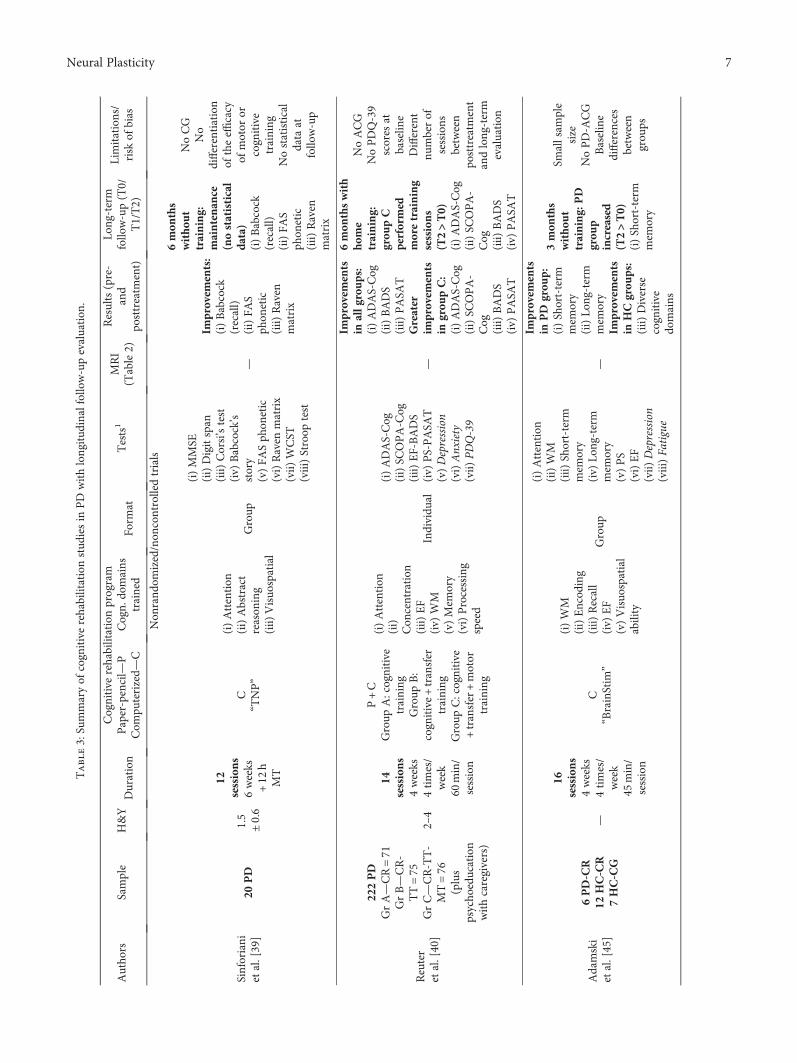
Table3:Summaryof
cognitiverehabilitationstud
iesin
PDwithlongitud
inalfollow-upevaluation
.
Autho
rsSample
H&Y
Cognitive
rehabilitationprogram
Tests1
MRI
(Table2)
Results(pre-
and
posttreatm
ent)
Long-term
follow-up(T0/
T1/T2)
Limitations/
risk
ofbias
Duration
Paper-pencil—
PCom
puterized—
CCogn.
domains
trained
Form
at
Non
rand
omized/non
controlledtrials
Sinforiani
etal.[39]
20PD
1.5
±0.6
12sessions
6weeks
+12
hMT
C“T
NP”
(i)Attention
(ii)Abstract
reason
ing
(iii)
Visuo
spatial
Group
(i)MMSE
(ii)Digitspan
(iii)
Corsi’stest
(iv)
Babcock’s
story
(v)FA
Sph
onetic
(vi)Raven
matrix
(vii)
WCST
(viii)Stroop
test
—
Improvem
ents:
(i)Babcock
(recall)
(ii)FA
Sph
onetic
(iii)
Raven
matrix
6mon
ths
witho
ut
training:
maintenan
ce(nostatistical
data)
(i)Babcock
(recall)
(ii)FA
Sph
onetic
(iii)
Raven
matrix
NoCG
No
differentiation
oftheeffi
cacy
ofmotor
orcognitive
training
Nostatistical
data
atfollow-up
Reuter
etal.[40]
222PD
GrA—CR=71
GrB—CR-
TT=75
GrC—CR-TT-
MT=76
(plus
psycho
education
withcaregivers)
2–4
14sessions
4weeks
4times/
week
60min/
session
P+C
Group
A:cognitive
training
Group
B:
cognitive+transfer
training
Group
C:cognitive
+transfer+motor
training
(i)Attention
(ii)
Con
centration
(iii)
EF
(iv)
WM
(v)Mem
ory
(vi)Processing
speed
Individu
al
(i)ADAS-Cog
(ii)SC
OPA-C
og(iii)
EF-BADS
(iv)
PS-PASA
T(v)Depression
(vi)Anxiety
(vii)
PDQ-39
—
Improvem
ents
inallg
roups:
(i)ADAS-Cog
(ii)BADS
(iii)
PASA
TGreater
improvem
ents
ingrou
pC:
(i)ADAS-Cog
(ii)SC
OPA-
Cog
(iii)
BADS
(iv)
PASA
T
6mon
thswith
home
training:
grou
pC
performed
moretraining
sessions
(T2>T0)
(i)ADAS-Cog
(ii)SC
OPA-
Cog
(iii)
BADS
(iv)
PASA
T
NoACG
NoPDQ-39
scores
atbaselin
eDifferent
numberof
sessions
between
posttreatm
ent
andlong-term
evaluation
Adamski
etal.[45]
6PD-CR
12HC-CR
7HC-CG
—
16sessions
4weeks
4times/
week
45min/
session
C“BrainStim
”
(i)WM
(ii)Encod
ing
(iii)
Recall
(iv)
EF
(v)Visuo
spatial
ability
Group
(i)Attention
(ii)WM
(iii)
Short-term
mem
ory
(iv)
Long-term
mem
ory
(v)PS
(vi)EF
(vii)
Depression
(viii)Fa
tigue
—
Improvem
ents
inPD
grou
p:(i)Short-term
mem
ory
(ii)Lo
ng-term
mem
ory
Improvem
ents
inHCgrou
ps:
(iii)
Diverse
cognitive
domains
3mon
ths
witho
ut
training:
PD
grou
pincreased
(T2>T0)
(i)Short-term
mem
ory
Smallsam
ple
size
NoPD-A
CG
Baseline
differences
between
grou
ps
7Neural Plasticity

Table3:Con
tinu
ed.
Autho
rsSample
H&Y
Cognitive
rehabilitationprogram
Tests1
MRI
(Table2)
Results(pre-
and
posttreatm
ent)
Long-term
follow-up(T0/
T1/T2)
Limitations/
risk
ofbias
Duration
Paper-pencil—
PCom
puterized—
CCogn.
domains
trained
Form
at
Rando
mized
controlledtrials
Petrelli
etal.[42]
65PD
22CR-N
V22
CR-M
F21
CG
1–3
12sessions
6weeks
2times/
week
90min/
session
P“N
EUROvitalis”—
NV
P“m
entally
fit”—MF
NV
(i)Attention
(ii)Mem
ory
(iii)
EF
MF
(i)Attention
(ii)Mem
ory
(iii)
Creativity
Group
+individu
al
(i)Attention
(ii)Mem
ory
(iii)
EF
(iv)
Visuo
construction
(v)Depression
(vi)Qua
lityof
life
—
Improvem
ents
inNVversus
CG:
(i)Working
mem
ory
(ii)Short-term
mem
ory
Improvem
ents
inMFversus
CG:
(i)Depression
Improvem
ents
inNVversus
MT:
(i)Working
mem
ory
12mon
ths
witho
ut
training:
NV
grou
pmaintenan
ce(T2=T0)
(i)MMSE
(ii)Dem
Tect
Smallsam
ple
size
NoACG
Long-term
evaluation
withscreening
tests
Díez-
Cirarda
etal.[41]
42PD
20PD-C
R22
PD-A
CG
1–3
39sessions
13weeks
3times/
week
60min/
session
CR—“R
EHACOP”
(P)
ACG—occupation
alactivities
(P)
(i)Attention
(ii)Mem
ory
(iii)
Language
(iv)
EF
(v)Social
cognition
(vi)PS
Group
(i)PS
(ii)Mem
ory
(iii)
Executive
function
s(iv)
Social
cognition
(v)Fu
nctional
disability
(vi)Apathy
(vii)
Depression
Yes
Improvem
ents
inPD-CR
versusPD-
ACG:
(i)PS
(ii)Visual
mem
ory
(iii)
Social
cognition
(iv)
Functional
disability
(v)Brain
function
alchanges
18mon
ths
witho
ut
training:
PD-
CRincreased
(T2>T0):
(i)Verbal
mem
ory
(ii)Visual
mem
ory
(iii)
EF
(iv)
ToM
(v)Fu
nctional
disability
(vi)Brain
function
alactivity
Smallsam
ple
size
Absence
ofCG
atfollow-up
ACG=active
controlgroup
;CG=controlgroup
;CR=cognitiverehabilitation;
EF=executivefunction
s;FA
S=ph
oneticfluencytest;H
C=healthycontrols;H
&Y=Hoehn
andYahr;MMSE
=minim
entalstate
exam
ination;
MRI=
magneticresonanceim
age;MT=motor
training;TT=transfer
training;PD=Parkinson
’sdisease;PS=processing
speed;
WCST
=Wisconsin
card
sortingtask;WM
=working
mem
ory.
1 Testsassessingmood,
clinical,and
function
alityaspectsareshow
nin
italics.
8 Neural Plasticity
evaluating brain changes after a cognitive rehabilitation pro-gram in PD.
One study evaluated the effects of group-based attentionrehabilitation on brain functional activity in PD patients[33]. PD patients were included in the trial if they had atten-tion impairment but no other cognitive domain impaired. Atpre- and post-treatment assessments, patients underwent anextensive neuropsychological assessment and resting-statefMRI were acquired. PD patients were randomly divided intoexperimental group and active control group. The experi-mental group received attention rehabilitation using “Reha-Com” computer program, while the control group attendedin-house software which focused on visuomotor coordina-tion. The attention rehabilitation consisted in computer-assisted tasks which trained attention and information pro-cessing during 6 weeks. Specifically, attention rehabilitationtasks were focused on concentration and attention tasksand vigilance program and divided attention from the Reha-Com software. After rehabilitation, PD patients showedimprovements in attention and processing speed tasks andincreased brain activation in the left dorsolateral prefrontalcortex (part of the executive resting-state network) and theleft superior parietal cortex (part of the attentional resting-state network) [33] (Table 2).
A later study in PDpatients evaluated the changes in brainactivity after a 3-month integrative cognitive rehabilitationprogram [38]. PD patients underwent an extensive neuropsy-chological assessment at pre- and post-treatment. RegardingMRI acquisition, GM andWM changes were analyzed as wellas brain activity changes during resting-state and during amemory paradigm. The cognitive rehabilitation programused was the REHACOP, a paper/pencil rehabilitation pro-gram, which trained attention, processing speed, memory,language, executive functions, and social cognition during 3months. PD patients after cognitive rehabilitation showedincreased brain FC between frontal and temporal lobes andincreased brain activation during the memory paradigm infrontal and temporal areas (see Table 2). No brain structuralchanges were found after rehabilitation. These brain FC andactivation values at post-treatment showed correlations withpost-treatment cognitive performance in PD patients fromthe experimental group. Specifically, during resting state, FCvalues between frontal and temporal lobes at post-treatmentcorrelated with executive function performance at post-treatment. Additionally, during the learning fMRI task, thebrain activation values after treatment correlated with thevisual memory performance at post-treatment [38].
These studies suggest that brain activity changes arepossible after a cognitive rehabilitation program in PD.Further studies are needed to replicate and complementthese findings.
3.3. Long-Term Effects of Cognitive Rehabilitation. Further-more, the ultimate goal of cognitive treatments is to ensurethat benefits are maintained over long periods of time, butlittle is known about the maintenance of cognitive improve-ments over time in PD patients, and a few studies haveevaluated it [39–42, 45]. A summary of these studies isshown in Table 3.
The first study to evaluate the long-term effects of cogni-tive rehabilitation was published in 2004 by Sinforiani et al.and showed that PD patients attending a cognitive trainingprogram combined with motor training during one monthshowed maintenance of the cognitive benefits after 6 months[39]. However, the study did not include statistical analysesfor the follow-up period. Moreover, this study did notinclude a control group; therefore, we cannot conclude thatthese possible benefits were related to the cognitive or motortraining or the combination of treatments.
Another study in PD compared three training groups:“group A” which attended cognitive training, “group B”which attended cognitive training and transfer training, and“group C” which attended cognitive, transfer, and motortraining [40] (Table 3). The authors found that the threegroups benefited from training, but those PD patients thatattended cognitive training combined with transfer trainingand physical activity benefited significantly more in the shortterm. Moreover, over the next 6 months, patients from“group C” were more motivated to spend more time trainingat home compared to the other groups and showed greatermaintenance of cognitive improvements after 6 months[40]. However, because patients from group C spent morehours in training at home over the next 6 months comparedto the other groups, these results may be influenced by thedifference of hours spent in training. Finally, this study alsoincluded an intervention therapy with caregivers focusingon psychoeducation, which helped the patients to continuethe training tasks at home [40] (Table 3).
A later study in PD assessed the long-term effects of cog-nitive rehabilitation for a longer period of time (12 months)[42]. At baseline, these PD patients were randomized to astructured cognitive rehabilitation program (NEUROvitalis),to a nonstructured cognitive rehabilitation program (men-tally fit), or to a control group. After 12 months from post-treatment, PD patients that attended NEUROvitalis trainingprogram showed reduced cognitive performance comparedto post-treatment, but scores were similar compared to base-line. Moreover, the risk of conversion to MCI was foundhigher in the control group than in any of the cognitive train-ing groups. Regarding depression, the “mentally fit” groupwas the only group that showed significant reduction indepressive symptoms after training, but these changes werenot maintained at follow-up (Table 3). With all, the authorsconcluded that a structured cognitive treatment could pre-vent cognitive decline [42].
Regarding the maintenance of neuroimaging changes, todate, only one study has been published assessing the longi-tudinal effects of cognitive rehabilitation [41]. PD patientsattended a 3-month cognitive rehabilitation program andshowed increased brain connectivity and activation in thefrontal and temporal lobes after treatment. These patientsunderwent a neuropsychological and neuroimaging assess-ment after 18 months from post-treatment. The resultsshowed that not only improvements in cognitive perfor-mance and functionality were maintained after 18 monthsbut also increased FC was found at follow-up [41]. In addi-tion, PD patients also showed maintenance of the increasedbrain activation during the memory paradigm at long-term
9Neural Plasticity

compared to baseline, but the level of activation at long-termwas reduced compared to post-treatment. This study showedpromising findings regarding the maintenance of brainchanges in a neurodegenerative disease; however, the samplesize was small, and the control group was not evaluated in thelong term. The results need to be replicated.
These few studies suggest the maintenance of cognitiveimprovements after attending a cognitive rehabilitation pro-gram in PD patients (Table 3). However, literature is scarcein this pathology and more research needs to be done, espe-cially including neuroimaging assessment at follow-up.
4. Discussion
The studies on the efficacy of cognitive rehabilitation pro-grams in PD suggest that cognitive rehabilitation programsare effective in improving cognition but further research isneeded in this field to clarify its efficacy on functional disabil-ity and brain activity changes. Also, very little is known aboutthe long-term maintenance of cognitive changes after reha-bilitation. There are few cognitive rehabilitation studies inPD which followed the Consolidated Standards of ReportingTrials (CONSORT) guidelines for randomized controlled tri-als. These make more difficult to find conclusive findings.Future studies should implement these guidelines in orderto improve the research quality and validity of findings.
All randomized controlled trials in PD for cognitive reha-bilitation programs point to the efficacy in improving cogni-tion. However, most of them highlighted the small samplesize as a limitation, which makes it difficult to generalizethe findings. Additionally, all of them used different typesof cognitive training programs, with different duration andtype of exercises. One of the future steps to be taken towardsunderstanding the efficacy of cognitive rehabilitation is iden-tifying the characteristics that make an integrative cognitiverehabilitation program effective against cognitive impair-ment. A review of cognitive rehabilitation concluded thatbetter results may be obtained in a group-based format com-pared to an individual format [28]. However, while most ofthe rehabilitation studies in PD are group-based, this ques-tion has not been directly addressed. In addition, a recentmeta-analysis compared the efficacy of standardized with tai-lored (individualized) cognitive interventions, but found thatthere were insufficient studies for a statistical comparison[29]. Furthermore, other variables are also to be defined, suchas the most appropriate number of sessions, their frequency,and the duration of the treatment. Also, the number of cog-nitive domains trained may also influence the results. More-over, predictors of the efficacy of cognitive treatments areuseful in the disease to adequate cognitive treatment to thepatient. Very few studies have evaluated this aspect, andresearch is needed in the field.
Regarding patients’ characteristics, most of the random-ized controlled trials in PD have been performed with PDpatients at the early Hoehn and Yahr stages of the disease.Future studies should also include PD patients at moreadvanced stages to evaluate whether cognitive treatmentscould also benefit these patients. Interestingly, a study proto-col was recently published addressing the efficacy of a
cognitive rehabilitation in PD patients with dementia, butresults are pending [43].
Moreover, transfer effects to clinical aspects have beenfound in some cognitive rehabilitation studies in PD; how-ever, other studies found no significant changes. The mecha-nisms that make possible to transfer benefits to clinicalvariables are unknown. There is an urgent need of studiesanalyzing this subject. The last goal of cognitive rehabilita-tion programs is to improve quality of life of patients. Futurestudies should also include clinical and functionality scales inpre- and post-treatment neuropsychological assessments.
On the other hand, promising findings have been foundregarding brain changes after treatment in PD, which supportthe efficacy of cognitive rehabilitation programs in the disease.Results showing brain connectivity and activation incrementsafter a cognitive treatment of less than 3 months in patientswith a neurodegenerative disease are relevant in the field ofneurorehabilitation. Future studies should include the MRIacquisition as part of the protocol assessment to evaluate brainchanges after treatment and replicate the findings.
All these changes have been analyzed at follow-up, andsome studies found maintenance of these improvements.Future randomized controlled trials should include follow-up periods in order to replicate previous findings and assesswhether the improvements after training could be main-tained over time. It would be also interesting to examinethe maintenance of these changes in PD patients with andwithout booster sessions.
Another aspect to be taken into account during therehabilitation process of the patient is the role of the care-giver. Some cognitive rehabilitation studies have includedan intervention which focused on psychoeducation withthe caregivers of the PD patients [40, 44]. The psychoedu-cation usually addresses aspects of the disease, patients’care management, information about help aids, and theimportance of the self-care [40, 44]. These studies foundthat the caregivers gain self-confidence and felt more con-fident to take care of the person with the disease.
In conclusion, cognitive rehabilitation programs havedemonstrated to be effective in improving cognitive func-tions andmay also improve functional disability and producebrain changes in patients with PD. In addition, to provide acomplete or integrative treatment, the combination of cogni-tive training with other types of trainings or the interventionwith the caregivers should be further analyzed. More researchshould be performed in the field, with a view to reaching gen-eralized conclusions and including cognitive rehabilitation inthe standard of care of PD patients.
Disclosure
This article is a contribution to the special issue entitledNeurorehabilitation: Neural Plasticity and FunctionalRecovery 2018.
Conflicts of Interest
Natalia Ojeda and Javier Peña are coauthors and copyrightholders of the REHACOP cognitive rehabilitation
10 Neural Plasticity

program, published by Parima Digital, S.L. (Bilbao, Spain).María Díez-Cirarda and Naroa Ibarretxe-Bilbao have noconflicts of interest to report.
Acknowledgments
The authors thank ASPARBI (Parkinson’s Disease Associ-ation in Biscay) and all the patients involved in the study.This study was supported by the Department of Health ofthe Basque Government (2011111117), the Ministerio deEconomía y Competitividad (PSI2012-32441), and theDepartment of Education and Science of the BasqueGovernment (Equipo A) (IT946-16).
References
[1] L. Hirsch, N. Jette, A. Frolkis, T. Steeves, and T. Pringsheim,“The incidence of Parkinson’s disease: a systematic reviewand meta-analysis,” Neuroepidemiology, vol. 46, no. 4,pp. 292–300, 2016.
[2] R. Xia and Z.-H. Mao, “Progression of motor symptoms inParkinson’s disease,” Neuroscience Bulletin, vol. 28, no. 1,pp. 39–48, 2012.
[3] E. Tolosa, C. Gaig, J. Santamaria, and Y. Compta, “Diagnosisand the premotor phase of Parkinson disease,” Neurology,vol. 72, no. 7, Supplement 2, pp. S12–S20, 2009.
[4] D. Muslimovic, B. Post, J. D. Speelman, and B. Schmand,“Cognitive profile of patients with newly diagnosed Parkinsondisease,” Neurology, vol. 65, no. 8, pp. 1239–1245, 2005.
[5] A. J. Yarnall, D. P. Breen, G. W. Duncan et al., “Characterizingmild cognitive impairment in incident Parkinson disease: theICICLE-PD study,” Neurology, vol. 82, no. 4, pp. 308–316,2014.
[6] M. A. Hely, W. G. J. Reid, M. A. Adena, G. M. Halliday, andJ. G. L. Morris, “The Sydney multicenter study of Parkinson’sdisease: the inevitability of dementia at 20 years,” MovementDisorders, vol. 23, no. 6, pp. 837–844, 2008.
[7] J. Hoogland, J. A. Boel, R. M. A. de Bie et al., “Mild cognitiveimpairment as a risk factor for Parkinson’s disease dementia,”Movement Disorders, vol. 32, no. 7, pp. 1056–1065, 2017.
[8] I. Leroi, K. McDonald, H. Pantula, and V. Harbishettar,“Cognitive impairment in Parkinson disease: impact onquality of life, disability, and caregiver burden,” Journal ofGeriatric Psychiatry and Neurology, vol. 25, no. 4,pp. 208–214, 2012.
[9] E. Rosenthal, L. Brennan, S. Xie et al., “Association betweencognition and function in patients with Parkinson disease withand without dementia,” Movement Disorders, vol. 25, no. 9,pp. 1170–1176, 2010.
[10] T. R. Melzer, R. Watts, M. R. MacAskill et al., “Grey matteratrophy in cognitively impaired Parkinson’s disease,” Journalof Neurology, Neurosurgery, & Psychiatry, vol. 83, no. 2,pp. 188–194, 2012.
[11] G. W. Duncan, M. J. Firbank, A. J. Yarnall et al., “Gray andwhite matter imaging: a biomarker for cognitive impairmentin early Parkinson’s disease?,” Movement Disorders, vol. 31,no. 1, pp. 103–110, 2016.
[12] Z. Zheng, S. Shemmassian, C. Wijekoon, W. Kim, S. Y.Bookheimer, and N. Pouratian, “DTI correlates of distinctcognitive impairments in Parkinson’s disease,” HumanBrain Mapping, vol. 35, no. 4, pp. 1325–1333, 2014.
[13] H. Matsui, K. Nishinaka, M. Oda, H. Niikawa, T. Kubori, andF. Udaka, “Dementia in Parkinson’s disease: diffusion tensorimaging,” Acta Neurologica Scandinavica, vol. 116, no. 3,pp. 177–181, 2007.
[14] I. Rektor, A. Svátková, L. Vojtíšek et al., “White matter alter-ations in Parkinson’s disease with normal cognition precedegrey matter atrophy,” PLoS One, vol. 13, no. 1, articlee0187939, 2018.
[15] R. Cabeza and L. Nyberg, “Imaging cognition II: an empiricalreview of 275 PET and fMRI studies,” Journal of CognitiveNeuroscience, vol. 12, no. 1, pp. 1–47, 2000.
[16] L. Christopher and A. P. Strafella, “Neuroimaging of brainchanges associated with cognitive impairment in Parkinson’sdisease,” Journal of Neuropsychology, vol. 7, no. 2, pp. 225–240, 2013.
[17] C. H. Williams-Gray, S. L. Mason, J. R. Evans et al., “TheCamPaIGN study of Parkinson’s disease: 10-year outlook inan incident population-based cohort,” Journal of Neurology,Neurosurgery, & Psychiatry, vol. 84, no. 11, pp. 1258–1264,2013.
[18] D. K. Johnson, Z. Langford, M. Garnier-Villarreal, J. C. Morris,and J. E. Galvin, “Onset of mild cognitive impairment inParkinson disease,” Alzheimer Disease & Associated Disorders,vol. 30, no. 2, pp. 127–133, 2016.
[19] B. Ramírez–Ruiz, M. J. Martí, E. Tolosa et al., “Longitudinalevaluation of cerebral morphological changes in Parkinson’sdisease with and without dementia,” Journal of Neurology,vol. 252, no. 11, pp. 1345–1352, 2005.
[20] Y. Zhang, I. W. Wu, D. Tosun, E. Foster, N. Schuff, and theParkinson’s Progression Markers Initiative, “Progression ofregional microstructural degeneration in Parkinson’s disease:a multicenter diffusion tensor imaging study,” PLoS One,vol. 11, no. 10, article e0165540, 2016.
[21] C. Huang, C. Tang, A. Feigin et al., “Changes in network activ-ity with the progression of Parkinson’s disease,” Brain,vol. 130, no. 7, pp. 1834–1846, 2007.
[22] B. Segura, N. Ibarretxe-Bilbao, R. Sala-Llonch et al., “Progres-sive changes in a recognition memory network in Parkinson’sdisease,” Journal of Neurology, Neurosurgery, & Psychiatry,vol. 84, no. 4, pp. 370–378, 2013.
[23] E. Mak, L. Su, G. B. Williams, and J. T. O'Brien, “Neuroimag-ing correlates of cognitive impairment and dementia in Par-kinson’s disease,” Parkinsonism & Related Disorders, vol. 21,no. 8, pp. 862–870, 2015.
[24] A. Bahar-Fuchs, L. Clare, and B. Woods, “Cognitive trainingand cognitive rehabilitation for persons with mild to moderatedementia of the Alzheimer’s or vascular type: a review,”Alzheimer's Research & Therapy, vol. 5, no. 4, p. 35, 2013.
[25] T. Wykes and W. D. Spaulding, “Thinking about the futurecognitive remediation therapy—what works and could we dobetter?,” Schizophrenia Bulletin, vol. 37, Supplement 2,pp. S80–S90, 2011.
[26] J. V. Hindle, A. Petrelli, L. Clare, and E. Kalbe, “Nonpharma-cological enhancement of cognitive function in Parkinson’sdisease: a systematic review,” Movement Disorders, vol. 28,no. 8, pp. 1034–1049, 2013.
[27] R. Biundo, L. Weis, E. Fiorenzato, and A. Antonini, “Cognitiverehabilitation in Parkinson’s disease: is it feasible?,” Archives ofClinical Neuropsychology, vol. 32, no. 7, pp. 840–860, 2017.
[28] C. C. Walton, S. L. Naismith, A. Lampit, L. Mowszowski, andS. J. G. Lewis, “Cognitive training in Parkinson’s disease: a
11Neural Plasticity

theoretical perspective,” Neurorehabilitation and NeuralRepair, vol. 31, no. 3, pp. 207–216, 2017.
[29] B. J. Lawrence, N. Gasson, R. S. Bucks, L. Troeung, and A. M.Loftus, “Cognitive training and noninvasive brain stimulationfor cognition in Parkinson’s disease: a meta-analysis,” Neuror-ehabilitation and Neural Repair, vol. 31, no. 7, pp. 597–608,2017.
[30] I. H. Leung, “Cognitive training in Parkinson disease,”Neurology, vol. 85, pp. 1–9, 2015.
[31] J. Peña, N. Ibarretxe-Bilbao, I. García-Gorostiaga, M. A.Gomez-Beldarrain, M. Díez-Cirarda, and N. Ojeda, “Improv-ing functional disability and cognition in Parkinson disease:randomized controlled trial,” Neurology, vol. 83, no. 23,pp. 2167–2174, 2014.
[32] A. Petrelli, S. Kaesberg, M. T. Barbe et al., “Effects of cognitivetraining in Parkinson’s disease: a randomized controlledtrial,” Parkinsonism & Related Disorders, vol. 20, no. 11,pp. 1196–1202, 2014.
[33] A. Cerasa, M. C. Gioia, M. Salsone et al., “Neurofunctionalcorrelates of attention rehabilitation in Parkinson’s disease:an explorative study,” Neurological Sciences, vol. 35, no. 8,pp. 1173–1180, 2014.
[34] J. D. Edwards, R. A. Hauser, M. L. O'Connor, E. G. Valdés,T. A. Zesiewicz, and E. Y. Uc, “Randomized trial of cognitivespeed of processing training in Parkinson disease,” Neurology,vol. 81, no. 15, pp. 1284–1290, 2013.
[35] A. P. París, H. G. Saleta, M. de la Cruz Crespo Maraver et al.,“Blind randomized controlled study of the efficacy of cognitivetraining in Parkinson’s disease,” Movement Disorders, vol. 26,no. 7, pp. 1251–1258, 2011.
[36] M. Cella, A. Preti, C. Edwards, T. Dow, and T. Wykes,“Cognitive remediation for negative symptoms of schizo-phrenia: a network meta-analysis,” Clinical PsychologyReview, vol. 52, pp. 43–51, 2017.
[37] R. Zimmermann, U. Gschwandtner, N. Benz et al., “Cognitivetraining in Parkinson disease: cognition-specific vs nonspecificcomputer training,” Neurology, vol. 82, no. 14, pp. 1219–1226,2014.
[38] M. Díez-Cirarda, N. Ojeda, J. Peña et al., “Increased brainconnectivity and activation after cognitive rehabilitation inParkinson’s disease: a randomized controlled trial,” BrainImaging and Behavior, vol. 11, no. 6, pp. 1640–1651, 2017.
[39] E. Sinforiani, L. Banchieri, C. Zucchella, C. Pacchetti, andG. Sandrini, “Cognitive rehabilitation in Parkinson’s disease,”Archives of Gerontology and Geriatrics, vol. 38, pp. 387–391,2004.
[40] I. Reuter, S. Mehnert, G. Sammer, M. Oechsner, andM. Engelhardt, “Efficacy of a multimodal cognitive rehabili-tation including psychomotor and endurance training inParkinson’s disease,” Journal of Aging Research, vol. 2012,Article ID 235765, 15 pages, 2012.
[41] M. Díez-Cirarda, N. Ojeda, J. Peña et al., “Long-term effects ofcognitive rehabilitation on brain, functional outcome and cog-nition in Parkinson’s disease,” European Journal of Neurology,vol. 25, no. 1, pp. 5–12, 2018.
[42] A. Petrelli, S. Kaesberg, M. T. Barbe et al., “Cognitive trainingin Parkinson’s disease reduces cognitive decline in the longterm,” European Journal of Neurology, vol. 22, no. 4,pp. 640–647, 2015.
[43] J. V. Hindle, T. J. Watermeyer, J. Roberts et al., “Cognitiverehabilitation for Parkinson’s disease dementia: a study
protocol for a pilot randomised controlled trial,” Trials,vol. 17, no. 1, p. 152, 2016.
[44] L. E. I. A’Campo, N. G. A. Spliethoff-Kamminga, M. Macht,R. A. C. Roos, and The EduPark Consortium, “Caregivereducation in Parkinson’s disease: formative evaluation of astandardized program in seven European countries,” Qualityof Life Research, vol. 19, no. 1, pp. 55–64, 2010.
[45] N. Adamski, M. Adler, K. Opwis, and I. K. Penner, “A pilotstudy on the benefit of cognitive rehabilitation in Parkinson’sdisease,” Therapeutic Advances in Neurological Disorders,vol. 9, no. 3, pp. 153–164, 2016.
12 Neural Plasticity