Electrocatalysis: Fundamentals and Applications - Hindawi.com
83
International Journal of Electrochemistry Guest Editors: Carlos F. Zinola, Maria E. Martins, Elena Pastor Tejera, and Newton Pimenta Neves Jr. Electrocatalysis: Fundamentals and Applications
-
Upload
khangminh22 -
Category
Documents
-
view
1 -
download
0
Transcript of Electrocatalysis: Fundamentals and Applications - Hindawi.com

International Journal of Electrochemistry
Guest Editors: Carlos F. Zinola, Maria E. Martins, Elena Pastor Tejera, and Newton Pimenta Neves Jr.
Electrocatalysis: Fundamentals and Applications

Electrocatalysis:Fundamentals and Applications
International Journal of Electrochemistry
Electrocatalysis:Fundamentals and Applications
Guest Editors: Carlos F. Zinola, Maria E. Martins,Elena Pastor Tejera, and Newton Pimenta Neves Jr.

Copyright © 2012 Hindawi Publishing Corporation. All rights reserved.
This is a special issue published in “International Journal of Electrochemistry.” All articles are open access articles distributed under theCreative Commons Attribution License, which permits unrestricted use, distribution, and reproduction in any medium, provided theoriginal work is properly cited.

Editorial Board
Maria Carmen Arevalo, SpainShen-Ming Chen, TaiwanAbel Cesar Chialvo, ArgentinaJean-Paul Chopart, FranceA. Rodrigues de Andrade, BrazilSergio Ferro, ItalyGerd-Uwe Flechsig, GermanyRubin Gulaboski, GermanyShengshui Hu, ChinaMehran Javanbakht, IranJiye Jin, Japan
Emilia Kirowa-Eisner, IsraelBoniface Kokoh, FranceEmmanuel Maisonhaute, FranceGrzegorz Milczarek, PolandValentin Mirceski, MacedoniaMohamed Mohamedi, CanadaAngela Molina, SpainDavood Nematollahi, IranK. I. Ozoemena, South AfricaMarıa Isabel Pividori, SpainMiloslav Pravda, Ireland
Manfred Rudolph, GermanyBenjamın R. Scharifker, VenezuelaAuro Atsushi Tanaka, BrazilGermano Tremiliosi-Filho, BrazilHamilton Varela, BrazilJay D. Wadhawan, UKJose H. Zagal, ChileSheng S. Zhang, USAJiujun Zhang, CanadaXueji Zhang, USA

Contents
Electrocatalysis: Fundamentals and Applications, Carlos F. Zinola, Maria E. Martins, Elena Pastor Tejera,and Newton Pimenta Neves Jr.Volume 2012, Article ID 874687, 2 pages
Ethanol Electrooxidation on Pt with Lanthanum Oxide as Cocatalyst in a DAFC, T. A. B. Santoro,A. Oliveira Neto, C. A. L. G. de O. Forbicini, M. Linardi, J. L. Rodrıguez, and E. PastorVolume 2012, Article ID 674150, 6 pages
Influence of Synthesis pH on Textural Properties of Carbon Xerogels as Supports for Pt/CXs Catalysts forDirect Methanol Fuel Cells, C. Alegre, M. E. Galvez, D. Sebastian, R. Moliner, and M. J. LazaroVolume 2012, Article ID 267893, 9 pages
Carbon-Supported Fe Catalysts for CO2 Electroreduction to High-Added Value Products: A DEMSStudy: Effect of the Functionalization of the Support, S. Perez-Rodrıguez, G. Garcıa, L. Calvillo,V. Celorrio, E. Pastor, and M. J. LazaroVolume 2011, Article ID 249804, 13 pages
Investigation of the Performance of Aucore-Pdshell/C as the Anode Catalyst of DirectBorohydride-Hydrogen Peroxide Fuel Cell, Hong Wang, Ying Wang, Xianyou Wang, Peiying He,Lanhua Yi, Wei Yi, and Xue LiuVolume 2011, Article ID 129182, 7 pages
Use of Dendrimers during the Synthesis of Pt-Ru Electrocatalysts for PEM Fuel Cells: Effects on thePhysical and Electrochemical Properties, J. C. Calderon, L. Calvillo, M. J. Lazaro, and E. PastorVolume 2011, Article ID 564828, 7 pages
Investigation of IrO2/Pt Electrocatalysts in Unitized Regenerative Fuel Cells, V. Baglio, C. D’Urso,A. Di Blasi, R. Ornelas, L. G. Arriaga, V. Antonucci, and A. S. AricoVolume 2011, Article ID 276205, 5 pages
Electrocatalytic Reduction of Hydrogen Peroxide on Palladium-Gold Codeposits on Glassy Carbon:Applications to the Design of Interference-Free Glucose Biosensor, Elena Horozova, Totka Dodevska,Nina Dimcheva, and Ruska MussarlievaVolume 2011, Article ID 697698, 8 pages
The Electrochemical Development of Pt(111) Stepped Surfaces and Its Influence on MethanolElectrooxidation, E. Teliz, V. Dıaz, R. Faccio, A. W. Mombru, and C. F. ZinolaVolume 2011, Article ID 289032, 9 pages
Some Applications of Bayes’ Rule in Probability Theory to Electrocatalytic Reaction Engineering,Thomas Z. FahidyVolume 2011, Article ID 404605, 5 pages
Chiral Recognition of Amino Acids by Magnetoelectrodeposited Cu Film Electrodes, Iwao Mogi andKazuo WatanabeVolume 2011, Article ID 239637, 6 pages
Hindawi Publishing CorporationInternational Journal of ElectrochemistryVolume 2012, Article ID 874687, 2 pagesdoi:10.1155/2012/874687
Editorial
Electrocatalysis: Fundamentals and Applications
Carlos F. Zinola,1 Maria E. Martins,2 Elena Pastor Tejera,3 and Newton Pimenta Neves Jr.4
1 Electrochemical Engineering Group, School of Sciences and School of Engineering, Fundamental Electrochemistry Laboratory,J. R. Rodo No. 1843, UDELAR, C.P.11100 Montevideo, Uruguay
2 Electrocatalysis Laboratory, INIFTA, UNLP, C.C. 16, Suc. 4, 1900 La Plata, Argentina3 Departemento de Quımica-Fısica, P.O. Box 38207 ULL, La Laguna, Spain4 Laboratorio de Hidrogenio, Instituto de Fısica “Gleb Wataghin”, Universidade Estadual de Campinas (UNICAMP),Campinas, SP, Brazil
Correspondence should be addressed to Carlos F. Zinola, [email protected]
Received 28 December 2011; Accepted 28 December 2011
Copyright © 2012 Carlos F. Zinola et al. This is an open access article distributed under the Creative Commons AttributionLicense, which permits unrestricted use, distribution, and reproduction in any medium, provided the original work is properlycited.
Electrocatalysis is a special field in Electrochemistry that hasgained a special growth after the late eighties due to theapplication of new hybrid techniques. However, most of theapplications have run for academic purposes but not fortechnical uses in the industry. Nowadays, the application ofnew concepts of electrocatalysis for industrial electrochemi-cal processes has appeared as a necessity and not only attract-ing attention for chemists but for engineers. Therefore,industrial electrocatalytic processes have only been presentedin the literature from the chemical engineering point of viewwith few further electrochemical explanations and mainlyduring the late seventies. The design and preparation of anelectrocatalyst (electrodes for technological uses) are basedon new concepts such as a controlled surface roughness,atomic topographic profiles, defined catalytic centre sites,atomic rearrangements, and phase transitions in the courseof the electrochemical reactions.
Maybe the best interpretation of electrocatalysis is due toA. J. Appleby as an electrochemical reaction with an adsorbedspecies, either as reactant and/or product, which can changethe kinetics of the reaction and in some cases also themechanism. Although the old conception of electrocatalysisis mainly related to an experimental field of electrochemistrywhen using platinum-type metals, the advances in theoryand modeling are main keys for a successful interpretationof the data.
The perspective and limitations of electrocatalysis inthe laboratory together with their theoretical implicationsare also presented to give the readers a clearer view of
the problems inside electrocatalytic reactions. This specialissue also gathers the experiences of different authors whohave worked on the principles of electrocatalysis with rel-evancy to experimental situations of particular importancein electrochemical engineering. This is the case of thework by T. Fahidy in the use of the Bayer’s rule for anelectrochemical reactor in order to avoid the possibilityof reactor breakdown, reactor’s safety, and environmentalconsiderations well beyond purely scientific quantities.
One of the most important features of electrocatalysisarises from the different electrode kinetics using differentcrystallographic orientations for the electrode surface. Acathodic treatment develops (111) stepped planes similarlyto the electrofacetting performed after applying the squarewave program shown with X-ray diffraction patterns. Thesearrangements are well explained in the paper by C. Zinola,using combined techniques and particularly studying themethanol electrooxidation reaction. In spite of being mostof the electrocatalytic reactions studied in the scientificcommunity only for rather simple species, some of theminvolve low-weight amino acids, showing changes in theadsorbed configurations and chiral responses when thenature of the electrode surface is changed, as shown byK. Watanabe. Chiral behavior was clearly observed as anoxidation current difference between the enantiomers ofalanine, aspartic acid, and glutamic acid.
The fast and contemporary advances in electrocatalysishave been already treated in other books but only consideringthe progress in the application of surface science and
2 International Journal of Electrochemistry
ultrahigh vacuum techniques to electrochemistry with noextrapolation to the possible industrial applications of thesefindings. Some combined techniques, such as differentialelectrochemical mass spectrometry, show the possibility ofthe continuous analysis of an electrode reaction with thedetection of volatile or gaseous products in the course of theelectrochemical reaction as shown by M. J. Lazaro for car-bon dioxide electroreduction. Differential electrochemicalmass spectrometry studies showed that the carbon supportdegradation, the distribution of products, and the catalyticactivity toward the carbon dioxide electroreduction dependsignificantly on the surface chemistry of the carbon support.
There are various applications of electrocatalysis fortechnological electrochemical reactions, organic electrosyn-thesis, galvanoplasty, electrode sensors, fuel cells, batteriespreparations, and so forth Some of them are presentedhere in order to give an insight into the possibilities ofthis science. Thus, the avoiding of interferences in thecase of hydrogen peroxide electroreduction has been gainedusing alloys such as palladium-gold electrodes as reportedby R. Mussarlieva with application for glucose biosensors.The surface topography of the electrode modified withPd + Au mixed in proportions 90 : 10, exhibiting optimalcombination of sensitivity and linear dynamic range towardshydrogen peroxide electrochemical reduction.
However, it seems that the main application is the caseof fuel cells and one of the scopes is the possibility of long-lasting experiments without contamination or poisoning ofthe electrode surfaces. A. S. Arico studied the continuous useof IrO2/Pt electrocatalysts in fuel cells with good results thatare also presented in this special issue. The IrO2/Pt compo-sition of 14/86 showed the highest performance for waterelectrolysis and the lowest one as fuel cell. Polymer electrolytefuel cells are one of the most used devices for low-to-mediumpower density sizes. However, platinum electrocatalysts areoften changed to platinum/ruthenium alloys because of theapplication of the electrocatalytic Langmuir-Hinshelwoodsurface mechanism. In this issue the use of dendrimersduring the synthesis of platinum/ruthenium electrocatalystsfor polymer electrolyte fuel cells shows interesting resultsthat are strongly dependent on the physical characteristicsof the alloy as presented by E. Pastor. After the activationof the catalysts by heating at 350◦C, the real importance ofthe use of these encapsulating molecules and the effect ofthe generation of the dendrimer become visible. Not onlythe use of alloys of combined electrodeposited species offerselectrocatalytic differences for fuel cell application, but alsothe preparation of Au core-Pd shell/C electrodes as shown byX. Liu for a direct borohydride-hydrogen peroxide fuel cell.The results show that the Au-Pd/C catalyst with core-shellstructure exhibits much higher catalytic activity for the directoxidation of NaBH4 than pure Au/C catalyst, i.e. a directborohydride-hydrogen peroxide fuel cell, in which the Au-Pd/C with core-shell structure is used as the anode catalystand the Au/C as the cathode catalyst.
New advances relevant to electrocatalysis such as spec-troscopic or hybrid techniques with new theoretical con-siderations act as a final point from them it is possible toevolve to a new projection of the electrocatalytic reaction
itself. One of the purposes of this special issue is to presentthe field of electrocatalysis as an interfacial approach toa dynamic and permanently changing electronic-to-ionicconductor interphase with real technical applications.
Carlos F. Zinola
Maria E. Martins
Elena Pastor Tejera
Newton Pimenta Neves Jr.
Hindawi Publishing CorporationInternational Journal of ElectrochemistryVolume 2012, Article ID 674150, 6 pagesdoi:10.1155/2012/674150
Research Article
Ethanol Electrooxidation on Pt with Lanthanum Oxide asCocatalyst in a DAFC
T. A. B. Santoro,1, 2 A. Oliveira Neto,2 C. A. L. G. de O. Forbicini,2 M. Linardi,2
J. L. Rodrıguez,1 and E. Pastor1
1 Departamento de Quımica Fısica, Instituto Universitario de Materiales y Nanotecnologıa, Universidad de La Laguna,C/Astrofısico Francisco Sanchez s/n, 38071 La Laguna, Spain
2 Instituto de Pesquisas Energeticas e Nucleares (IPEN), CNEN-SP, Avenida Professor Lineu Prestes 2242, Cidade Universitaria,05508-900 Sao Paulo, SP, Brazil
Correspondence should be addressed to T. A. B. Santoro, [email protected]
Received 1 May 2011; Revised 1 November 2011; Accepted 24 November 2011
Academic Editor: Newton Pimenta Neves Jr.
Copyright © 2012 T. A. B. Santoro et al. This is an open access article distributed under the Creative Commons AttributionLicense, which permits unrestricted use, distribution, and reproduction in any medium, provided the original work is properlycited.
Electrocatalytic activity toward ethanol electrooxidation of Pt particles in PtLa/C catalysts with different Pt : La ratios has beenstudied with different electrochemical and spectroscopic techniques, and the results were compared to those of Pt/C catalyst. Signi-ficant enhancement in the electrocatalytic activity has been achieved by depositing the Pt particles with lanthanum oxides/hydro-xides using an alcohol reduction method. Compared to Pt/C catalyst, PtLa/C materials exhibit a lower onset potential and a higherelectron-transfer rate constant for the investigated reaction. These studies illustrate the possibility of utilizing Pt/C with La oxides/hidroxides as electrocatalyst for direct alcohol fuel cells (DAFCs).
1. Introduction
In catalysis, numerous applications can be found for lantha-num oxide. It is used as support for metals that catalyze reac-tions such as methanol decomposition, ammonia oxidation,and methane dry reforming [1–4]. It is also recognized as anactive and selective catalyst for several processes [5–7]. It hasbeen shown that lanthanum oxides can substantially modifythe chemical behaviour of highly dispersed metal catalysts[6]. In this system, several chemical species are present suchas La2O3 or La(OH)3 [8], which could be implied in the elec-trooxidation of alcohols like methanol or ethanol, for exam-ple.
In the past decades, direct alcohol fuel cells (DAFCs) havereceived much attention due to their possible applications intransportation and portable electronic devices [9–15]. Meth-anol or ethanol can be directly used as fuel in DAFCs withoutexternal reformer. Ethanol has higher energy density com-pared with methanol [15, 16] and it is more attractive as fuelfor DAFCs: it is safer and can be produced in great quantitiesfrom biomass. However, the ethanol electrooxidation hasslow reaction kinetics that is still the main problem for its
direct application in an ethanol fuel cell (DEFC). A lot ofwork has been done with the purpose to prepare catalystswith sufficiently high catalytic activity and CO tolerance forethanol electrooxidation. It is accepted that the coexistence ofsome metal oxides with Pt can improve the catalytic activityof Pt-based catalysts for this reaction.
In the present work, the effect of the addition of Laoxides/hidroxides to Pt/C is investigated for ethanol electro-oxidation [16]. PtLa/C catalyst powders with different com-positions were prepared and compared to Pt/C. X-ray diffra-ction (XRD), cyclic voltammetry (CV), steady-state polariza-tion experiments, and Fourier transform IR spectroscopy(FTIRS) were employed as characterization techniques toprovide information on the physicochemical properties aswell as on the catalytic activity of these materials towards theelectrochemical reactions of ethanol.
2. Experimental
PtLa/C with different Pt : La atomic ratios and Pt/C catalystswere prepared by an alcohol reduction process in alkaline
2 International Journal of Electrochemistry
environment (KOH/Pt : La molar ratio of 8) using VulcanXC 72R as support. Metal precursors were H2PtCl6·6H2O(Aldrich) and LaCl3·xH2O (Aldrich), and ethylene glycol(Merck) was employed as solvent and reducing agent [17–19]. The reduction potential of La is about 3.5 V morenegative than that of Pt [20]. Therefore, it is not possibleto reduce La(III) ions to La0 in the conditions of the chosenmethodology. Thus, in alkaline medium La(III) ions are de-posited as lanthanum oxide and/or hydroxide. On the otherhand, Pt (IV) ions can be reduced by ethylene glycol to meta-llic Pt nanoparticles, which are placed on the carbon sup-port. Characterization of prepared materials by XRD andtransmission electron microscopy (TEM) has been describedin a previous work where it was proved that La is depositedin the form of oxides and hydroxides by this procedure [21].The diffractograms of PtLa/C electrocatalysts showed thepeaks characteristic of fcc Pt and the presence of the contri-butions of La2O3 at 26◦, 29◦, 34◦, and 56◦ (JPDF 000–83–1354) and those of La(OH)3 at 27◦, 31◦, and 43◦ (JPDF 000–75–1900) [21, 22].
Dispersive X-ray (EDX) analysis using a scanning elec-tron microscope Philips XL30 with a 20 keV electron beamand provided with EDAX DX-4 microanalyser was used toestablish the real composition of the materials investigated inthe present paper.
The electrochemical measurements for the ethanol oxi-dation reaction were carried out with a three-electrodeflow cell. A hydrogen electrode in the electrolyte solution(RHE) was used as reference and a glassy carbon as counterelectrode. The working electrode was prepared with 40 µL ofa homogeneous mixture of 4 mg of powder electrocatalyst,ultrasonically dispersed in 1 mL of Milli-Q ultrapure water,and 38 µL of Nafion (Aldrich, 5 wt.%) [23]. This ink was de-posited onto a glassy carbon polished surface disc, with geo-metric area of 0.28 cm2, and dried in N2 atmosphere beforeits utilization.
Electrochemical experiments were performed in a1 mol L−1 CH3CH2OH + 0.5 mol L−1 H2SO4 solution forboth PtLa/C and Pt/C electrocatalysts. Cyclic voltammo-grams (CVs) were recorded in the 0.05–0.90 V potentialrange at 0.01 Vs−1 and the current-time curves at a constantpotential of 0.55 V. Activation pretreatment by potential cycl-ing between 0.05 and 0.40 V in the base electrolyte (H2SO4
0.5 mol L−1) was applied until a stabilized CV was achieved(the upper potential was set to 0.40 V in order to avoid Ladissolution from the alloy). A potentiostat/galvanostat Auto-lab PGSTAT30 was used for these studies.
Electroactive area was calculated from the hydrogenadsorption/desorption region assuming 0.210 mC/cm2 forthe oxidation of an H adsorbed monolayer. Density currentvalues in the paper are calculated with respect to the electro-active areas.
Fourier transform IR spectroscopy (FTIRS) experimentswere carried out with a Bruker Vector 22 spectrometer equip-ped with an MCT (mercury cadmium telluride) detector. Asmall glass flow cell with a 60◦ CaF2 prism at its bottom wasemployed. For each spectrum, 128 interferograms were col-lected at selected potentials with a resolution of 8 cm−1, byapplying 0.05 V single potential steps from a reference
Table 1: Pt : La ratios from EDX analysis and current density fromchronoamperometric curves obtained at 0.55 V.
Electrocatalysts Atomic ratios (Pt : La) CV0.55 (mA cm−2)
PtLa 30 : 70 37 : 63 0.288
PtLa 50 : 50 57 : 43 0.213
Pt — 0.092
potential (0.05 V) in the positive going direction. Spectra arerepresented as the ratio R/R0, where R and R0 are the reflec-tance at the sample and reference spectra, respectively [11].In this way, positive bands represent the loss and negativebands the gain of species at the sampling potential.
The working electrodes for FTIRS consist of a thin layerof a certain amount of the metal/C catalysts deposited overa polycrystalline gold disk. The geometric area of the disk was0.85 cm2. 40 µL of the homogeneous mixture of powderelectrocatalyst was pipetted on the top of the gold disk anddried at ambient temperature. The electrolyte was0.1 mol L−1 HClO4 containing 1.0 mol L−1 of ethanol.
3. Results and Discussion
The real compositions of the catalysts were established fromEDX analysis and results are summarized in Table 1. Themeasured atomic ratios of PtLa/C were close to nominalones, so it can be deduced that Pt and La oxides/hydroxideswere successfully loaded on the carbon support withoutmetal loss.
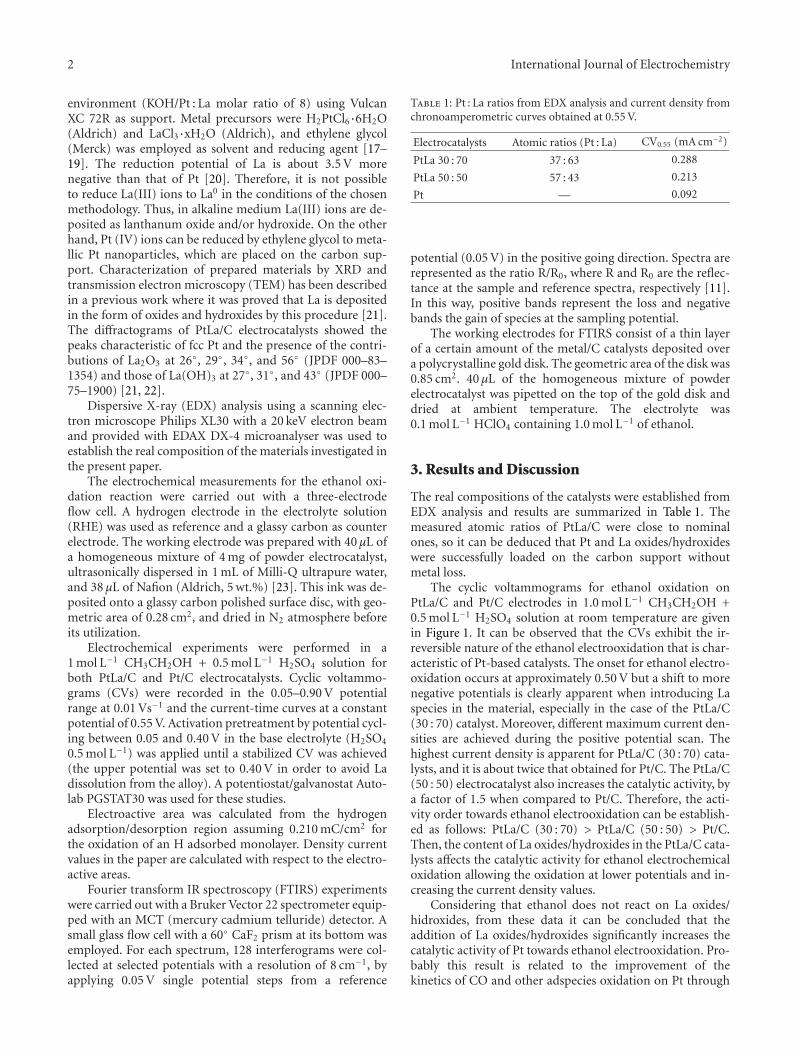
The cyclic voltammograms for ethanol oxidation onPtLa/C and Pt/C electrodes in 1.0 mol L−1 CH3CH2OH +0.5 mol L−1 H2SO4 solution at room temperature are givenin Figure 1. It can be observed that the CVs exhibit the ir-reversible nature of the ethanol electrooxidation that is char-acteristic of Pt-based catalysts. The onset for ethanol electro-oxidation occurs at approximately 0.50 V but a shift to morenegative potentials is clearly apparent when introducing Laspecies in the material, especially in the case of the PtLa/C(30 : 70) catalyst. Moreover, different maximum current den-sities are achieved during the positive potential scan. Thehighest current density is apparent for PtLa/C (30 : 70) cata-lysts, and it is about twice that obtained for Pt/C. The PtLa/C(50 : 50) electrocatalyst also increases the catalytic activity, bya factor of 1.5 when compared to Pt/C. Therefore, the acti-vity order towards ethanol electrooxidation can be establish-ed as follows: PtLa/C (30 : 70) > PtLa/C (50 : 50) > Pt/C.Then, the content of La oxides/hydroxides in the PtLa/C cata-lysts affects the catalytic activity for ethanol electrochemicaloxidation allowing the oxidation at lower potentials and in-creasing the current density values.
Considering that ethanol does not react on La oxides/hidroxides, from these data it can be concluded that theaddition of La oxides/hydroxides significantly increases thecatalytic activity of Pt towards ethanol electrooxidation. Pro-bably this result is related to the improvement of thekinetics of CO and other adspecies oxidation on Pt through
International Journal of Electrochemistry 3
0 0.1 0.2 0.3 0.4 0.5 0.6 0.7 0.8 0.9 1
−0.50
0.5
1
1.5
2
2.5
3
3.5
4
4.5
5
5.5
PtPtLa 5050
PtLa 3070
Cu
rren
t (m
A c
m−2
)
Potential (V) versus RHE
Figure 1: Cyclic voltammograms for ethanol electrooxidationon Pt/C, PtLa/C (50 : 50), and PtLa/C (30 : 70) electrocatalysts in1.0 mol L−1 CH3CH2OH + 0.5 mol L−1 H2SO4 in the 0.05 to 0.90 Vpotential range at room temperature. Scan rate: 0.010 Vs−1.
a bifunctional mechanism [24] (as no alloy is formed in thesematerials according to previous results in [21]).
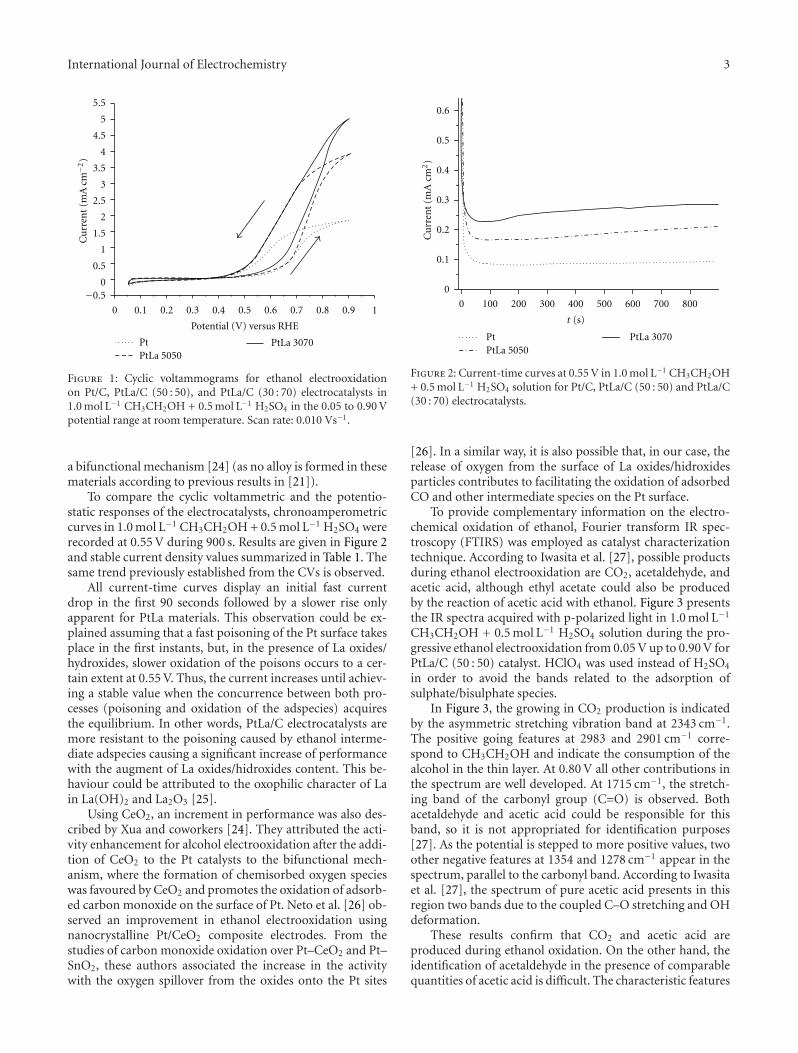
To compare the cyclic voltammetric and the potentio-static responses of the electrocatalysts, chronoamperometriccurves in 1.0 mol L−1 CH3CH2OH + 0.5 mol L−1 H2SO4 wererecorded at 0.55 V during 900 s. Results are given in Figure 2and stable current density values summarized in Table 1. Thesame trend previously established from the CVs is observed.
All current-time curves display an initial fast currentdrop in the first 90 seconds followed by a slower rise onlyapparent for PtLa materials. This observation could be ex-plained assuming that a fast poisoning of the Pt surface takesplace in the first instants, but, in the presence of La oxides/hydroxides, slower oxidation of the poisons occurs to a cer-tain extent at 0.55 V. Thus, the current increases until achiev-ing a stable value when the concurrence between both pro-cesses (poisoning and oxidation of the adspecies) acquiresthe equilibrium. In other words, PtLa/C electrocatalysts aremore resistant to the poisoning caused by ethanol interme-diate adspecies causing a significant increase of performancewith the augment of La oxides/hidroxides content. This be-haviour could be attributed to the oxophilic character of Lain La(OH)2 and La2O3 [25].
Using CeO2, an increment in performance was also des-cribed by Xua and coworkers [24]. They attributed the acti-vity enhancement for alcohol electrooxidation after the addi-tion of CeO2 to the Pt catalysts to the bifunctional mech-anism, where the formation of chemisorbed oxygen specieswas favoured by CeO2 and promotes the oxidation of adsorb-ed carbon monoxide on the surface of Pt. Neto et al. [26] ob-served an improvement in ethanol electrooxidation usingnanocrystalline Pt/CeO2 composite electrodes. From thestudies of carbon monoxide oxidation over Pt–CeO2 and Pt–SnO2, these authors associated the increase in the activitywith the oxygen spillover from the oxides onto the Pt sites
0
0 100 200 300 400 500 600 700 800
0.1
0.2
0.3
0.4
0.5
0.6
Pt PtLa 5050
PtLa 3070
t (s)
Cu
rren
t (m
Acm
2)
Figure 2: Current-time curves at 0.55 V in 1.0 mol L−1 CH3CH2OH+ 0.5 mol L−1 H2SO4 solution for Pt/C, PtLa/C (50 : 50) and PtLa/C(30 : 70) electrocatalysts.
[26]. In a similar way, it is also possible that, in our case, therelease of oxygen from the surface of La oxides/hidroxidesparticles contributes to facilitating the oxidation of adsorbedCO and other intermediate species on the Pt surface.
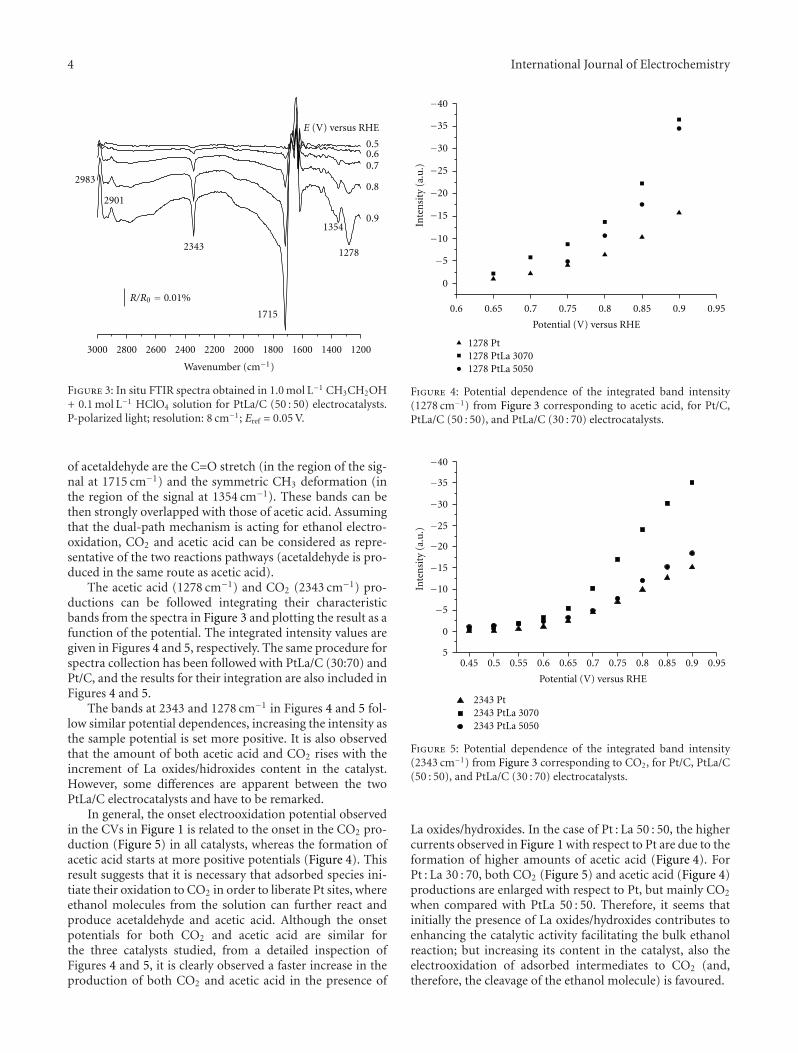
To provide complementary information on the electro-chemical oxidation of ethanol, Fourier transform IR spec-troscopy (FTIRS) was employed as catalyst characterizationtechnique. According to Iwasita et al. [27], possible productsduring ethanol electrooxidation are CO2, acetaldehyde, andacetic acid, although ethyl acetate could also be producedby the reaction of acetic acid with ethanol. Figure 3 presentsthe IR spectra acquired with p-polarized light in 1.0 mol L−1
CH3CH2OH + 0.5 mol L−1 H2SO4 solution during the pro-gressive ethanol electrooxidation from 0.05 V up to 0.90 V forPtLa/C (50 : 50) catalyst. HClO4 was used instead of H2SO4
in order to avoid the bands related to the adsorption ofsulphate/bisulphate species.
In Figure 3, the growing in CO2 production is indicatedby the asymmetric stretching vibration band at 2343 cm−1.The positive going features at 2983 and 2901 cm−1 corre-spond to CH3CH2OH and indicate the consumption of thealcohol in the thin layer. At 0.80 V all other contributions inthe spectrum are well developed. At 1715 cm−1, the stretch-ing band of the carbonyl group (C=O) is observed. Bothacetaldehyde and acetic acid could be responsible for thisband, so it is not appropriated for identification purposes[27]. As the potential is stepped to more positive values, twoother negative features at 1354 and 1278 cm−1 appear in thespectrum, parallel to the carbonyl band. According to Iwasitaet al. [27], the spectrum of pure acetic acid presents in thisregion two bands due to the coupled C–O stretching and OHdeformation.
These results confirm that CO2 and acetic acid areproduced during ethanol oxidation. On the other hand, theidentification of acetaldehyde in the presence of comparablequantities of acetic acid is difficult. The characteristic features
4 International Journal of Electrochemistry
3000 2800 2600 2400 2200 2000 1800 1600 1400 1200
2901
1354
1278
1715
2983
2343
0.50.60.7
0.8
0.9
Wavenumber (cm−1)
E (V) versus RHE
R/R0 = 0.01%
Figure 3: In situ FTIR spectra obtained in 1.0 mol L−1 CH3CH2OH+ 0.1 mol L−1 HClO4 solution for PtLa/C (50 : 50) electrocatalysts.P-polarized light; resolution: 8 cm−1; Eref = 0.05 V.
of acetaldehyde are the C=O stretch (in the region of the sig-nal at 1715 cm−1) and the symmetric CH3 deformation (inthe region of the signal at 1354 cm−1). These bands can bethen strongly overlapped with those of acetic acid. Assumingthat the dual-path mechanism is acting for ethanol electro-oxidation, CO2 and acetic acid can be considered as repre-sentative of the two reactions pathways (acetaldehyde is pro-duced in the same route as acetic acid).
The acetic acid (1278 cm−1) and CO2 (2343 cm−1) pro-ductions can be followed integrating their characteristicbands from the spectra in Figure 3 and plotting the result as afunction of the potential. The integrated intensity values aregiven in Figures 4 and 5, respectively. The same procedure forspectra collection has been followed with PtLa/C (30:70) andPt/C, and the results for their integration are also included inFigures 4 and 5.
The bands at 2343 and 1278 cm−1 in Figures 4 and 5 fol-low similar potential dependences, increasing the intensity asthe sample potential is set more positive. It is also observedthat the amount of both acetic acid and CO2 rises with theincrement of La oxides/hidroxides content in the catalyst.However, some differences are apparent between the twoPtLa/C electrocatalysts and have to be remarked.
In general, the onset electrooxidation potential observedin the CVs in Figure 1 is related to the onset in the CO2 pro-duction (Figure 5) in all catalysts, whereas the formation ofacetic acid starts at more positive potentials (Figure 4). Thisresult suggests that it is necessary that adsorbed species ini-tiate their oxidation to CO2 in order to liberate Pt sites, whereethanol molecules from the solution can further react andproduce acetaldehyde and acetic acid. Although the onsetpotentials for both CO2 and acetic acid are similar forthe three catalysts studied, from a detailed inspection ofFigures 4 and 5, it is clearly observed a faster increase in theproduction of both CO2 and acetic acid in the presence of
0.65 0.75 0.85 0.95
0
0.7 0.8 0.90.6
−15
−20
−25
−30
−35
−40
−10
−5
1278 Pt1278 PtLa 30701278 PtLa 5050
Inte
nsi
ty (
a.u
.)
Potential (V) versus RHE
Figure 4: Potential dependence of the integrated band intensity(1278 cm−1) from Figure 3 corresponding to acetic acid, for Pt/C,PtLa/C (50 : 50), and PtLa/C (30 : 70) electrocatalysts.
0.65 0.75 0.85 0.950.7 0.8 0.90.60.45 0.555
2343 Pt 2343 PtLa 3070 2343 PtLa 5050
0.5
−15
−20
−25
−30
−35
−40
−10
−5
0
Inte
nsi
ty (
a.u
.)
Potential (V) versus RHE
Figure 5: Potential dependence of the integrated band intensity(2343 cm−1) from Figure 3 corresponding to CO2, for Pt/C, PtLa/C(50 : 50), and PtLa/C (30 : 70) electrocatalysts.
La oxides/hydroxides. In the case of Pt : La 50 : 50, the highercurrents observed in Figure 1 with respect to Pt are due to theformation of higher amounts of acetic acid (Figure 4). ForPt : La 30 : 70, both CO2 (Figure 5) and acetic acid (Figure 4)productions are enlarged with respect to Pt, but mainly CO2
when compared with PtLa 50 : 50. Therefore, it seems thatinitially the presence of La oxides/hydroxides contributes toenhancing the catalytic activity facilitating the bulk ethanolreaction; but increasing its content in the catalyst, also theelectrooxidation of adsorbed intermediates to CO2 (and,therefore, the cleavage of the ethanol molecule) is favoured.

International Journal of Electrochemistry 5
To produce CO2 or CH3COOH, CH3CH2OH needs atleast a second oxygen atom. The reaction mechanism mustinvolve some form of adsorbed oxygen species, which pro-bably come from La oxides/hidroxides in addition to PtOHfrom water splitting. Although there is an evident rise in theperformance of the catalyst with the increment of La oxides/hidroxides content, this is mainly due to a faster oxidationof bulk ethanol to acetic acid, that is, without breaking theC–C bond. However, it is also shown that with appropriateamounts of La oxides/hydroxides also the efficiency to CO2
(and, therefore, the cleavage of the molecule) can be enhan-ced.
4. Conclusions
The combination of electrochemical and spectroscopic tech-niques has allowed a comparative analysis of the behaviourof Pt/C, PtLa/C (50 : 50) and PtLa/C (30 : 70) electrocatalyststowards ethanol electrooxidation. A significant increase ofperformance was observed with the increment of La oxides/hidroxides content, indicating that the addition of La speciesimproves the activity of Pt for this reaction. FTIR resultsshow that higher amounts of acetic acid are produced duringethanol oxidation at PtLa/C (50 : 50). Also the formation ofCO2 is favoured if the La oxides/hydroxides content is rais-ed to Pt : La 30 : 70, and, therefore, the presence of these com-pounds as oxygen source can favour both bulk alcohol re-actions (acetic acid formation) and adsorbed species oxida-tion (CO2 production).
The onset for ethanol oxidation is observed at 0.50 V, thatis, in the potential range used for a DAFC. The enhancementof activity towards alcohol electrooxidation in this potentialregion due to the addition of La oxides/hidroxides to Ptopens a possibility to utilize these materials as electrocatalystsfor these devices. However, the detection of representativeamounts of acetic acid clearly indicates that the C–C bond isnot completely broken and further optimization of the cata-lysts is needed to improve the energy efficiency of ethanolelectrooxidation.
Acknowledgments
The authors thank FAPESP (Process 03/03127-0), CNPq(CTENERG 504793/2004-0), CAPES (Process 3982-07-6),MICINN (MAT2008-06631-C03-02), and ACIISI (PI2007/023) for the financial support.
References
[1] G. Mul and A. S. Hirschon, “Effect of preparation procedureson the activity of supported palladium/lanthanum methanoldecomposition catalysts,” Catalysis Today, vol. 65, no. 1, pp.69–75, 2001.
[2] J. Petryk and E. Kolakowska, “Cobalt oxide catalysts for am-monia oxidation activated with cerium and lanthanum,” Appl-ied Catalysis B, vol. 24, no. 2, pp. 121–128, 2000.
[3] S. Irusta, L. M. Cornaglia, and E. A. Lombardo, “Hydrogenproduction using Ni-Rh on La,” Journal of Catalysis, vol. 210,no. 1, pp. 7–16, 2002.
[4] O. V. Manoilova, S. G. Podkolzin, B. Tope et al., “Surface aci-dity and basicity of La,” Journal of Physical Chemistry B, vol.108, no. 40, pp. 15770–15781, 2004.
[5] S. J. Huang, A. B. Walters, and M. A. Vannice, “Adsorption anddecomposition of NO on lanthanum oxide,” Journal of Cata-lysis, vol. 192, no. 1, pp. 29–47, 2000.
[6] M. Traykova, N. Davidova, J. S. Tsaih, and A. H. Weiss, “Oxi-dative coupling of methane—the transition from reaction totransport control over La,” Applied Catalysis A, vol. 169, no. 2,pp. 237–247, 1998.
[7] H. Vidal, S. Bernal, R. T. Baker, G. A. Cifredo, D. Finol, and J.M. Rodrıguez-Izquierdo, “Catalytic behavior of lanthana pro-moted Rh/SiO,” Applied Catalysis A, vol. 208, no. 1-2, pp. 111–123, 2001.
[8] L. M. Cornaglia, J. Munera, S. Irusta, and E. A. Lombardo,“Raman studies of Rh and Pt on La,” Applied Catalysis A, vol.263, no. 1, pp. 91–101, 2004.
[9] W. Zhou, Z. Zhou, S. Song et al., “Pt based anode catalysts fordirect ethanol fuel cells,” Applied Catalysis B, vol. 46, no. 2, pp.273–285, 2003.
[10] A. O. Neto, A. Y. Watanabe, M. Brandalise et al., “Preparationand characterization of Pt-Rare Earth/C electrocatalysts usingan alcohol reduction process for methanol electro-oxidation,”Journal of Alloys and Compounds, vol. 476, no. 1-2, pp. 288–291, 2009.
[11] G. Garcıa, J. A. Silva-Chong, O. Guillen-Villafuerte, J. L. Ro-drıguez, E. R. Gonzalez, and E. Pastor, “CO tolerant catalystsfor PEM fuel cells. Spectroelectrochemical studies,” CatalysisToday, vol. 116, no. 3, pp. 415–421, 2006.
[12] S. Song and P. Tsiakaras, “Recent progress in direct ethanolproton exchange membrane fuel cells (DE-PEMFCs),” AppliedCatalysis B, vol. 63, no. 3-4, pp. 187–193, 2006.
[13] A. O. Neto, R. R. Dias, M. M. Tusi, M. Linardi, and E. V.Spinace, “Electro-oxidation of methanol and ethanol usingPtRu/C, PtSn/C and PtSnRu/C electrocatalysts prepared by analcohol-reduction process,” Journal of Power Sources, vol. 166,no. 1, pp. 87–91, 2007.
[14] E. V. Spinace, L. A. Farias, M. Linardi, and A. O. Neto, “Pre-paration of PtSn/C and PtSnNi/C electrocatalysts using the al-cohol-reduction process,” Materials Letters, vol. 62, no. 14, pp.2103–2106, 2008.
[15] E. Antolini, J. R. C. Salgado, L. G. R. A. Santos et al., “Carbonsupported Pt-Cr alloys as oxygen-reduction catalysts for directmethanol fuel cells,” Journal of Applied Electrochemistry, vol.36, no. 3, pp. 355–362, 2006.
[16] Y. Bai, J. Wu, X. Qiu et al., “Electrochemical characterization ofPt-CeO2/C and Pt-CexZr1−xO2/C catalysts for ethanol electro-oxidation,” Applied Catalysis B, vol. 73, no. 1-2, pp. 144–149,2007.
[17] E. V. Spinace, A. O. Neto, T. R. R. Vasconcelos, and M. Linardi,“Electro-oxidation of ethanol using PtRu/C electrocatalystsprepared by alcohol-reduction process,” Journal of PowerSources, vol. 137, no. 1, pp. 17–23, 2004.
[18] E. V. Spinace, A. O. Neto, T. R. R. Vasconcelos, and M. Linardi,Brazilian Patent INPI-RJ, PI0304121-2, 2003.
[19] F. Colmati, W. H. Lizcano-Valbuena, G. A. Camara, E. A.Ticianelli, and E. R. Gonzalez, “Carbon monoxide oxidationon Pt-Ru electrocatalysts supported on high surface area car-bon,” Journal of the Brazilian Chemical Society, vol. 13, no. 4,pp. 474–482, 2002.
[20] K. W. Lux and E. J. Cairns, “Lanthanide-platinum intermetal-lic compounds as anode electrocatalysts for direct ethanolPEM fuel cells,” Journal of the Electrochemical Society, vol. 153,no. 6, pp. A1132–A1138, 2006.
6 International Journal of Electrochemistry
[21] T. A. B. Santoro, A. O. Neto, R. Chiba, E. S. M. Seo, and E. G.Franco, “Characterization of proton exchange membrane fuelcell cathode catalysts prepared by alcohol-reduction process,”Materials Science Forum, vol. 660-661, pp. 94–99, 2010.
[22] X. Wang, M. Wang, H. Song, and B. Ding, “A simple sol-geltechnique for preparing lanthanum oxide nanopowders,”Materials Letters, vol. 60, no. 17-18, pp. 2261–2265, 2006.
[23] T. A. B. Santoro, C. A. L. G. de O. Forbicini, A. O. Neto et al.,“Synthesis of PtLa/C catalysts for polymer electrolyte mem-brane fuel cells,” in Proceedings of the 1st Simposium Iberico deHidrogeno, Pilas de Combustible y Baterıas Avanzadas (HYCEL-TEC ’08), Bilbao, Spain, 2008.
[24] C. Xu, R. Zeng, P. K. Shen, and Z. Wei, “Synergistic effect ofCeO2 modified Pt/C catalysts on the alcohols oxidation,” Elec-trochimica Acta, vol. 51, no. 6, pp. 1031–1035, 2005.
[25] L. M. Cornaglia, J. Munera, S. Irusta, and E. A. Lombardo,“Raman studies of Rh and Pt on La2O3 catalysts used ina membrane reactor for hydrogen production,” Applied Catal-ysis A, vol. 263, no. 1, pp. 91–101, 2004.
[26] A. O. Neto, L. A. Farias, R. R. Dias, M. Brandalise, M. Linardi,and E. V. Spinace, “Enhanced electro-oxidation of ethanol us-ing PtSn/CeO2-C electrocatalyst prepared by an alcohol-re-duction process,” Electrochemistry Communications, vol. 10,no. 9, pp. 1315–1317, 2008.
[27] T. Iwasita, B. Rasch, E. Cattaneo, and W. Vielstich, “A sniftirsstudy of ethanol oxidation on platinum,” Electrochimica Acta,vol. 34, no. 8, pp. 1073–1079, 1989.
Hindawi Publishing CorporationInternational Journal of ElectrochemistryVolume 2012, Article ID 267893, 9 pagesdoi:10.1155/2012/267893
Research Article
Influence of Synthesis pH on Textural Properties ofCarbon Xerogels as Supports for Pt/CXs Catalysts forDirect Methanol Fuel Cells
C. Alegre, M. E. Galvez, D. Sebastian, R. Moliner, and M. J. Lazaro
Instituto de Carboquımica (CSIC), Miguel Luesma Castan 4, 50018 Zaragoza, Spain
Correspondence should be addressed to M. J. Lazaro, [email protected]
Received 1 May 2011; Revised 4 September 2011; Accepted 19 September 2011
Academic Editor: Elena Pastor Tejera
Copyright © 2012 C. Alegre et al. This is an open access article distributed under the Creative Commons Attribution License,which permits unrestricted use, distribution, and reproduction in any medium, provided the original work is properly cited.
Carbon xerogels (CXs) have been prepared by polycondensation of resorcinol and formaldehyde. Two synthesis pHs were studiedin order to evaluate its influence on the electrochemical behaviour of Pt catalysts supported on previous carbon xerogels,synthesized by conventional impregnation method. Catalysts were also synthesized over a commercial carbon black (Vulcan-XC-72R) for comparison purposes. Characterization techniques included nitrogen physisorption, scanning electron microscopy, andX-ray diffraction. Catalysts electrochemical activity towards the oxidation of carbon monoxide and methanol was studied by cyclicvoltammetry and chronoamperometry to establish the effect of the carbon support on the catalysts performance. CommercialPt/C catalyst (E-TEK) was analyzed for comparison purposes. It was observed that the more developed and mesopore-enrichedporous structure of the carbon xerogel synthesized at a higher initial pH resulted in an optimal utilization of the active phase andin an enhanced and promising catalytic activity in the electrooxidation of methanol, in comparison with commercial catalysts.
1. Introduction
One of the main challenges nowadays in polymer-electrolytefuel cell technology is the optimization of the catalytic sys-tems employed in anode (fuel oxidation) and cathode (oxy-gen reduction), towards the enhancement of their catalyticactivity and durability, at each time lower noble metal—normally Pt—loads. In the case of the anode of direct metha-nol fuel cells (DMFCs), the detailed mechanism of methanoloxidation has been elucidated during the last decades usinga variety of experimental procedures, and several reviewscan serve as a reference for the reader [1, 2]. Basically, theelectrochemical oxidation of methanol on Pt involves severalintermediate steps such as dehydrogenation, CO-like specieschemisorption, OH (or H2O) species adsorption, chemicalinteraction between adsorbed CO and OH compounds, andCO2 evolution. The catalytic activity strongly depends on themetallic composition (it is well known that the presence of asecond metal like Ru or Sn considerably enhances the OHadsorption and, consequently, the electrocatalytic activity),the particle size, the metallic surface structure, and the metal-support interaction [1–3].
Employing high-surface area carbon supports has beenregarded as one of the most plausible options for achievingan optimal utilization of the active phase. Thus, in the lastdecade, an increasing number of publications report thesynthesis and use of advanced carbon supports for fuel cellsystems, such as carbon nanotubes [4, 5], carbon nanofibers[6, 7], ordered mesoporous carbons [8], and carbon xerogelsand aerogels [4, 8–13], which can lead to more stable, highlyactive catalysts, at lower platinum loadings (<0.1 mg·cm−2)than in the case of using conventional carbon black supports,leading therefore to lower catalyst cost [14]. In the prepara-tion of carbon-supported catalysts, textural properties of thesupport can be properly adjusted in order to overcome masstransfer limitations while favouring an adequate dispersionof the active phase. This fact becomes especially significantin the case of the preparation of catalysts for electrochemicalapplications; their electrochemical properties may becomestrongly dependent on their final textural features, withadequate specific surface area and abundance of mesoporesin the pore size range of 20–40 nm, resulting fundamentalfor a highly accessible catalytic surface area [15].
2 International Journal of Electrochemistry
Since their introduction by Pekala in 1989 [16], resor-cinol-formaldehyde aqueous gels have received considerableattention, due to the possibility of fine-tuning their texturalproperties by adequately modifying different parametersinvolved in their preparation [17]. In this way, it is possibleto obtain a wide variety of materials with different propertieswhich can be used in a wide range of applications [18]. Apartfrom this fact, these synthetic carbon materials possess highpurity, and, moreover, whereas carbon blacks are constitutedof aggregates connected through van der Waals bonds, car-bon gels display monolithic structures at the micrometerscale, and, as a consequence, the pore texture of a carbon gelmicromonolith remains identical in the catalytic layer of amembrane-electrode assembly [14, 19]. In previous studies[14, 19], PEMFCs cathodes were prepared from Pt catalystsupported on carbon aerogels and xerogels. The results ob-tained clearly evidenced that an adequate choice of thecarbon pore texture can in fact lead to a significant decreaseof the diffusion-induced potential losses. Liu and Creager[20] have recently reported as well evidence of lower masstransfer resistance in Pt-loaded carbon xerogels vis-a-vis thesame electrocatalyst prepared using carbon black Vulcan XC-72 R as support.
Arbizzani et al. [15] studied the specific catalytic activityof DMFC anodes based on PtRu catalysts deposited bychemical and electrochemical route on mesoporous cryo-and xerogel carbons. Their results were compared with thoseobtained with PtRu supported on Vulcan, being the specificcatalytic activity more than double when Vulcan is substi-tuted by former carbons.
Job et al. [21] also synthesized highly mesoporous carbonvia sol-gel condensation of resorcinol and formaldehyde.Electrooxidation of methanol in alkaline electrolyte was car-ried out using Pt and PtNi catalysts supported on high-ly mesoporous carbon xerogels. The electrocatalytic testsshowed better performance of the catalysts when impreg-nated on this kind of carbon support.
In a more recent work [5], the same group prepared mul-tiwalled carbon nanotubes and high surface area mesoporouscarbon xerogel and used them as supports for monometallicPt and bimetallic PtRu catalysts. In order to assess theinfluence of the oxygen surface groups of the support, themesoporous carbon xerogel was also oxidized with dilutedoxygen before impregnation. A remarkable increase in theactivity was observed when the PtRu catalysts were supportedon the oxidized xerogel. This effect was explained in termsof the metal oxidation state. It was shown that the oxidizedsupport helps to maintain the metals in the metallic state, asrequired for the electrooxidation of methanol.
However, carbon gels have also been tested as carbonsupports in several applications different from the field ofelectrocatalysis. For example, Job et al. [9] prepared Pt/Ccatalysts by impregnation of three xerogels possessing vari-ous pore textures. They observed that the specific catalyticactivity measured towards benzene hydrogenation was 4–10 times higher in the presence of the carbon-xerogel-supported catalysts than the one determined for analogousactive charcoal-supported ones. This enhanced catalyticactivity was attributed to higher Pt dispersion on the carbon
surface, due to the abundant presence of large mesopores andwide mesopores in the carbon xerogel pore structure, whichin the end facilitated its impregnation with the precursor ofthe active phase.
Carbon gels preparation comprises several steps, basi-cally, (i) sol-gel synthesis and gel curing, (ii) drying, forremoving the excess solvent, and (iii) carbonization of theorganic gel. Carbon aerogels differ from carbon xerogels inthe drying procedure applied in each case. While supercrit-ical drying is used to synthesize carbon aerogels, carbonxerogels are prepared using conventional evaporative drying.This last option results in the shrinkage of the initial porousstructure of the gel [22, 23], but its consequences can bereally advantageous, depending on the final application ofthe carbon material. Furthermore, synthesis costs are alsosubstantially reduced by means of choosing evaporativedrying. Carbon xerogels possessing microporous, micro-mesoporous, to micro-macroporous structures can be pro-duced by varying the morphologies of the primary particlesthat compose them, the degree of interconnectivity amongprimary particles, and by means of controlling gel structureshrinkage during drying, which is as well determined bythe original structure of the organic gel. Resorcinol toformaldehyde molar ratio, kind and amount of catalystused, solvent, dilution, and pH have a decisive influencein final gel properties. With respect to pH effect on theporosity of carbon gels, Mahata et al. [24] prepared carbonxerogels at two different pH values, 5.5 and 6, observingthat the materials prepared at the lower pH values possessedconsiderably higher mesopore area but lower average porediameter. Lin and Ritter [25] previously reported similarobservations. They prepared carbon xerogels at pH valuesbetween 5.5 and 7.0, observing, that as the pH decreasedfrom 7.0 to 6.5, the surface area increased sharply from 0to 600 m2·g−1, then remained constant over the pH rangefrom 6.5 to 5.5. In contrast, the pore volume increased almostlinearly as the pH decreased between 7.0 and 5.7, and thenremained constant at around 0.8 cm3·g−1 over the pH rangefrom 5.7 to 5.5. These results indicate that the increase in thepore volume that occurred with a decrease in the pH from 6.5to 5.5 corresponded to the creation of larger pores which didnot contribute much to the surface area. They also observedthat higher pH values led to carbon gels with a weaker porestructure which collapsed easily after drying and pyrolysis.They stated that higher pH hindered the condensationreaction leading to less cross-linking of the structures andresulting in a much weaker gel structure than at lower pH.A few years later, Zanto et al. [23] claimed the opposite,comparing carbon aerogels and xerogels synthesized at pHvalues of 5.5 and 7.0. The highest pH corresponded to thehighest development of surface area and porosity. Theseauthors explained this fact by stating, that at their higherpH setting, cross-linking of the already formed clustersoccurred to a greater extent due to lower concentrationof protons in the media, what resulted in a more porouspolymeric structure. Zubizarreta et al. [26] noticed thatthe time required for gelation, curing, and drying of theirorganic gels depended on the pH of the initial solution.This parameter also influenced the structure of the materials
International Journal of Electrochemistry 3
after drying, being less compact at the lowest pH valuesemployed. In consequence, surface area and pore volume ofthe carbon gels decreased with increasing synthesis pH. Joband coworkers reported as well the strong influence that thepH of the solution in the synthesis of a carbon xerogel exertson the final properties of these carbon materials [27]. As pHwas increased from 5.45 to 7.35, carbon gels evolved frommicro-macroporous to exclusively microporous materials,that is, pore size distribution becoming narrower at higherpHs, whereas surface area passed through a maximum ata pH of 6.50. However, these series of published worksalso evidence that there is no general agreement on theinfluence of this parameter in controlling the carbon gel finalstructure and that this might depend as well on the rest ofthe parameters involved in the gel synthesis and, in general,on the experimental procedure and setup used in each case.
In the present paper, mesoporous carbon xerogels havebeen synthesized at two pH values: 5.5 and 5.8, with theaim of evaluating its influence on the carbonaceous texturalproperties and, in turn, on the electrochemical behaviourof Pt-supported electrocatalysts. Although in recent years,PtRu, PtSn, and other Pt alloys have replaced Pt for thepreparation of anodic catalysts, due to their enhancedperformance and resistance towards CO poisoning [25–28],Pt was exclusively used as active metal through the presentwork in order to simplify the catalytic system. In this sense,this is a preliminary study focused on the evaluation of theparticular influence of the carbon support in the catalystactivity, independently of the influence of other parameterssuch as Pt : M (Ru, Sn, etc.) atomic ratio, oxidation state, orthe interaction between the bimetallic sites. Future works willcomprise the introduction of bimetallic systems on the bestsupport. Commercial Pt-supported catalyst (E-TEK) has alsobeen studied for comparison. Moreover, in order to comparethe results obtained using the synthesised carbon xerogels assupports, a catalyst was prepared using a commercial carbonblack (Vulcan-XC-72 R) instead. Voltamperometric studiestowards carbon monoxide and methanol oxidation werecarried out in order to analyze the influence of the carbonsupport on the electrochemical behaviour of Pt catalysts[29].
2. Experimental
2.1. Synthesis of Carbon Xerogels. Resorcinol (1,3-dihydrox-ybenzoic acid)-formaldehyde organic gels were synthesizedfollowing the procedure described in detail in [27]. 9.91 gof resorcinol (99% Vol) were first mixed with 18.8 mL ofdeionised water under magnetic stirring and poured intosealable flasks. After dissolution, the pH value was generallyclose to 2 and was first increased close to the chosen value(5.5 and 5.8) by addition of concentrated sodium hydroxidesolution (5 and 2 N solutions were used). Afterwards 13.5 mLof formaldehyde solution (Aldrich, 37% wt. in water, stabi-lized by 10–15% wt. methanol) were added to the mixture(resorcinol/formaldehyde ratio was 0.5), and the pH valuewas then finally adjusted by addition of diluted sodiumhydroxide solution (0.5 N). The use of three different alkaline
solutions of various concentrations enabled us to minimizethe amount of water added during pH adjustment.
Gelation was performed at 85◦C in an oven. The obtainedaqueous gels were then dried without any pretreatment, at65◦C for 5 h, and then, temperature was risen up to 110◦Cand held for another 5 h, as described elsewhere [25]. Afterdrying, the gels were pyrolyzed at 800◦C under nitrogen flowin a tubular oven, following the heating pattern describedelsewhere [27]. Carbon xerogels obtained were named:CX 550, the one synthesized at pH = 5.5, and CX 580, in thecase of adjusting to pH = 5.8 during its synthesis.
2.2. Pt Catalysts Synthesis. Pt was deposited on carbonxerogels by impregnation and reduction with sodium boro-hydride [2]. The amount of metallic precursors was adjustedin order to obtain a final nominal metal loading of 20% w/w.An aqueous solution of H2PtCl6 (Sigma-Aldrich) was slowlyadded into a dispersion of carbon xerogel or carbon blackin ultrapure water under sonication. pH was adjusted to 5with a 5 N NaOH solution. The loaded metal was reduced byaddition of sodium borohydride, maintaining temperaturearound 18◦C. Subsequently, catalysts were filtered andthoroughly washed with ultrapure water and dried overnightat 60◦C.
2.3. Carbon Xerogels and Catalysts Textural and MorphologicalCharacterization. The textural and morphological featuresof the synthesized carbon xerogels were determined bymeans of nitrogen physisorption at −196◦C (Micromerit-ics ASAP 2020) and scanning electron microscopy (SEM,Hitachi S-3400 N). Textural properties such as specificsurface area, pore volume, and pore size distribution werecalculated from each corresponding nitrogen adsorption-desorption isotherms applying the Brunauer-Emmett-Teller(BET) equation, Barrett-Joyner-Halenda (BJH), and t-plotmethods.
SEM combined with energy dispersive X-ray spectro-scopy (SEM-EDX) was used to determine the amount ofmetal deposited. An analyzer EDX Rontec XFlash de Si(Li)was employed with this purpose. Catalysts were as wellcharacterized by X-ray diffraction (XRD), using a BrukerAXS D8 Advance diffractometer, with a θ-θ configurationand using Cu-Kα radiation.
2.4. Electrochemical Characterization. Electrochemical char-acterization has proven to be of key importance in deter-mining the electrocatalytic activity of these materials [29,30]. Catalysts electrochemical activity towards the oxidationof carbon monoxide and methanol was studied by cyclicvoltammetry and chronoamperometry at room temperatureas in previous works [6, 8, 31]. A cell with a three-elec-trode assembly at room temperature and an AUTOLABpotentiostat-galvanostat were used to carry out the electro-chemical characterization. The counter electrode consistedon a pyrolytic graphite rod, while the reference electrodewas a reversible hydrogen electrode (RHE). Therefore, allpotentials in the text are referred to the latter. The workingelectrode consisted of a pyrolytic graphite disk (7 mm) with
4 International Journal of Electrochemistry
a thin layer of the electrocatalyst under study deposited ontoit. For the preparation of this layer, an aqueous suspensionconsisting of 2 mg of Pt/C catalyst was obtained by ultra-sonically dispersing it in Nafion solution 10% wt. (15 μL)and ultrapure water (500 μL) (Millipore). Subsequently analiquot of 40 μL of the dispersed suspension was depositedon top of the graphite disk (7 mm) and dried under inertatmosphere prior to its use.
After preparation, the electrode was immersed into de-aerated 0.5 M H2SO4 electrolyte, prepared from high purityreagents (Merck) and ultrapure water (Milli-Q). The elec-trolyte was saturated with pure N2 or CO (99.997%, AirLiquide), depending on the experiments. Prior to the elec-trochemical characterization, the electrode was subjected topotential cycling between 0.05 and 1.10 V versus RHE at ascan rate of 500 mV·s−1 until a stable voltammogram in thebase electrolyte (0.5 M H2SO4) was obtained. CO strippingvoltammograms were obtained after bubbling this gas in thecell for 10 min at 0.20 V versus RHE, followed by nitrogenpurging to remove the excess of CO. The admission potentialwas selected considering that, for this value, maximumadsorbate coverage is achieved for CO adsorption on Pt.Afterwards, potential cycling between 0.05 V and 1.10 Vversus RHE at 20 mV·s−1 was carried out to follow COoxidation. Electrochemical Pt active areas were determinedfrom the integration of the current involved in the oxidationof a CO monolayer, taking into account that CO linearlyadsorbs on Pt and assuming 420 μC/cm2 involved in theoxidation process. Current values were normalized withrespect to the electroactive area.
Cyclic voltammograms for the electrooxidation ofmethanol were carried out in a 2 M CH3OH + 0.5 M H2SO4
solution, at scan rate of 20 mV·s−1, between 0.05 and 1.10 Vversus RHE, and current was normalized with respect to eachcatalyst electroactive area.
Chronoamperometries were performed at 0.60 V versusRHE in a 2 M CH3OH + 0.5 M H2SO4 solution, in orderto evaluate the evolution of the electrocatalytic activity withtime of the prepared catalysts in the electrooxidation ofmethanol. All the experiments were carried out at roomtemperature (25 ± 1◦C), and current was normalized withrespect to each catalyst electroactive area.
3. Results and Discussion
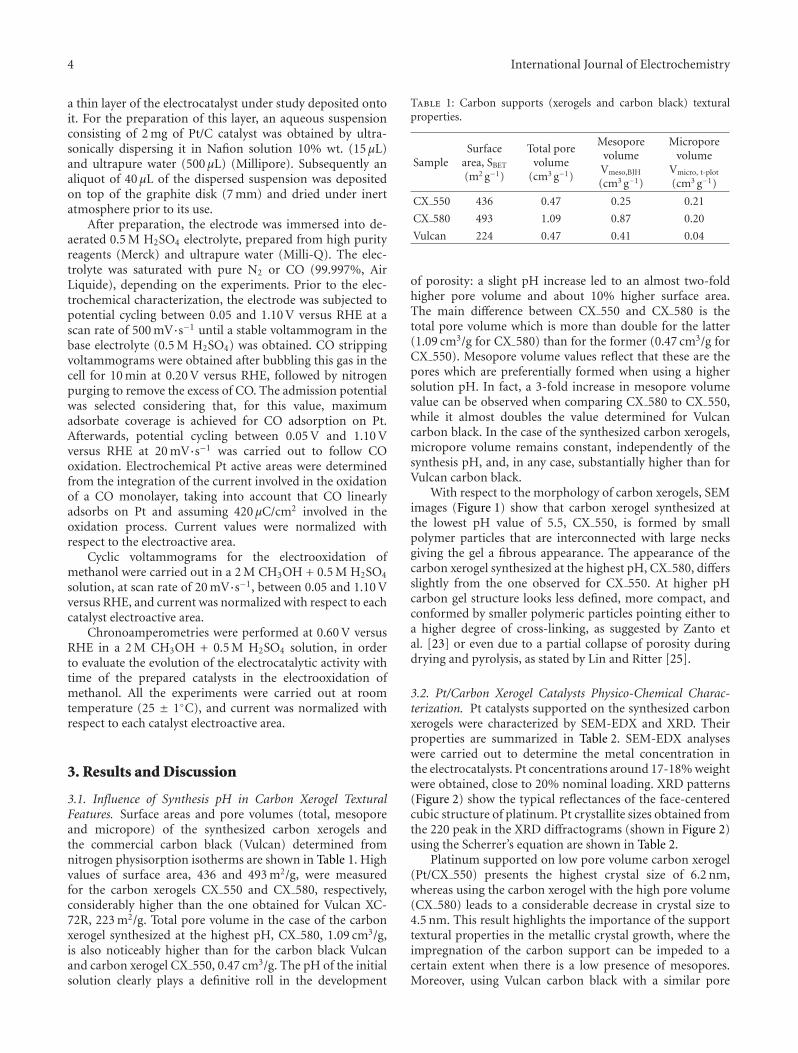
3.1. Influence of Synthesis pH in Carbon Xerogel TexturalFeatures. Surface areas and pore volumes (total, mesoporeand micropore) of the synthesized carbon xerogels andthe commercial carbon black (Vulcan) determined fromnitrogen physisorption isotherms are shown in Table 1. Highvalues of surface area, 436 and 493 m2/g, were measuredfor the carbon xerogels CX 550 and CX 580, respectively,considerably higher than the one obtained for Vulcan XC-72R, 223 m2/g. Total pore volume in the case of the carbonxerogel synthesized at the highest pH, CX 580, 1.09 cm3/g,is also noticeably higher than for the carbon black Vulcanand carbon xerogel CX 550, 0.47 cm3/g. The pH of the initialsolution clearly plays a definitive roll in the development
Table 1: Carbon supports (xerogels and carbon black) texturalproperties.
SampleSurface
area, SBET
(m2 g−1)
Total porevolume
(cm3 g−1)
MesoporevolumeVmeso,BJH
(cm3 g−1)
Microporevolume
Vmicro, t-plot
(cm3 g−1)
CX 550 436 0.47 0.25 0.21
CX 580 493 1.09 0.87 0.20
Vulcan 224 0.47 0.41 0.04
of porosity: a slight pH increase led to an almost two-foldhigher pore volume and about 10% higher surface area.The main difference between CX 550 and CX 580 is thetotal pore volume which is more than double for the latter(1.09 cm3/g for CX 580) than for the former (0.47 cm3/g forCX 550). Mesopore volume values reflect that these are thepores which are preferentially formed when using a highersolution pH. In fact, a 3-fold increase in mesopore volumevalue can be observed when comparing CX 580 to CX 550,while it almost doubles the value determined for Vulcancarbon black. In the case of the synthesized carbon xerogels,micropore volume remains constant, independently of thesynthesis pH, and, in any case, substantially higher than forVulcan carbon black.
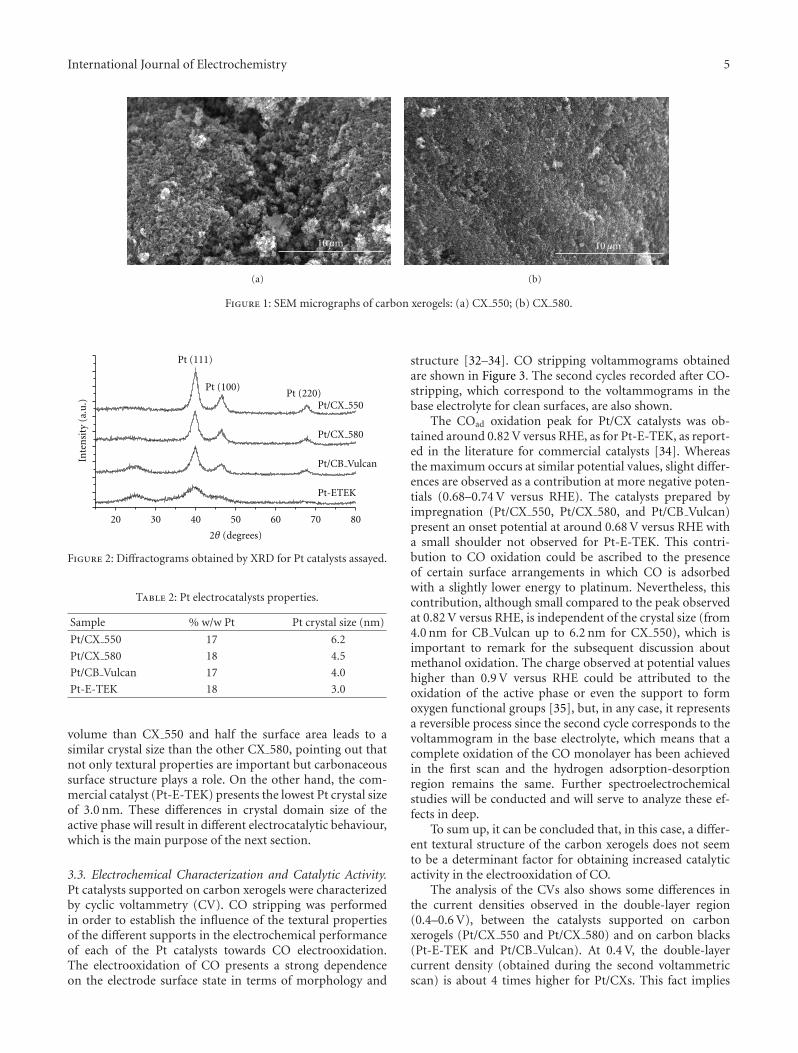
With respect to the morphology of carbon xerogels, SEMimages (Figure 1) show that carbon xerogel synthesized atthe lowest pH value of 5.5, CX 550, is formed by smallpolymer particles that are interconnected with large necksgiving the gel a fibrous appearance. The appearance of thecarbon xerogel synthesized at the highest pH, CX 580, differsslightly from the one observed for CX 550. At higher pHcarbon gel structure looks less defined, more compact, andconformed by smaller polymeric particles pointing either toa higher degree of cross-linking, as suggested by Zanto etal. [23] or even due to a partial collapse of porosity duringdrying and pyrolysis, as stated by Lin and Ritter [25].
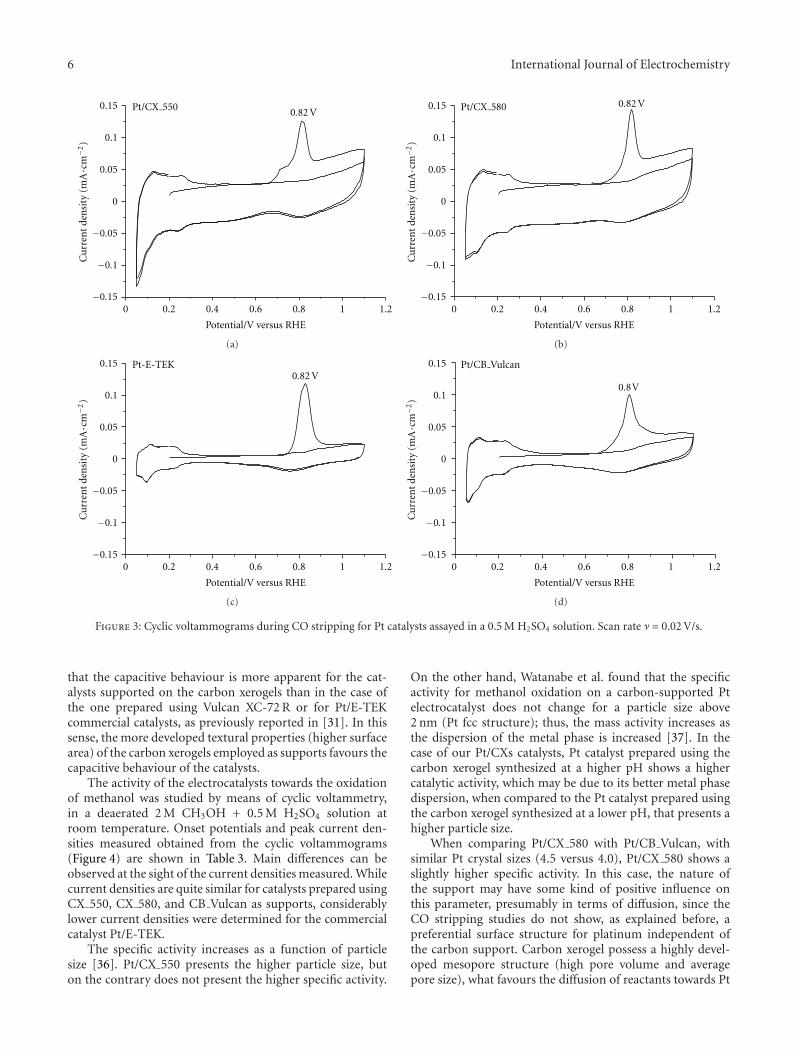
3.2. Pt/Carbon Xerogel Catalysts Physico-Chemical Charac-terization. Pt catalysts supported on the synthesized carbonxerogels were characterized by SEM-EDX and XRD. Theirproperties are summarized in Table 2. SEM-EDX analyseswere carried out to determine the metal concentration inthe electrocatalysts. Pt concentrations around 17-18% weightwere obtained, close to 20% nominal loading. XRD patterns(Figure 2) show the typical reflectances of the face-centeredcubic structure of platinum. Pt crystallite sizes obtained fromthe 220 peak in the XRD diffractograms (shown in Figure 2)using the Scherrer’s equation are shown in Table 2.
Platinum supported on low pore volume carbon xerogel(Pt/CX 550) presents the highest crystal size of 6.2 nm,whereas using the carbon xerogel with the high pore volume(CX 580) leads to a considerable decrease in crystal size to4.5 nm. This result highlights the importance of the supporttextural properties in the metallic crystal growth, where theimpregnation of the carbon support can be impeded to acertain extent when there is a low presence of mesopores.Moreover, using Vulcan carbon black with a similar pore
International Journal of Electrochemistry 5
10μm
(a)
10μm
(b)
Figure 1: SEM micrographs of carbon xerogels: (a) CX 550; (b) CX 580.
20 30 40 50 60 70 80
Pt-ETEK
Pt/CB Vulcan
Pt/CX 580
Pt/CX 550
Inte
nsi
ty(a
.u.)
2θ (degrees)
Pt (220)Pt (100)
Pt (111)
Figure 2: Diffractograms obtained by XRD for Pt catalysts assayed.
Table 2: Pt electrocatalysts properties.
Sample % w/w Pt Pt crystal size (nm)
Pt/CX 550 17 6.2
Pt/CX 580 18 4.5
Pt/CB Vulcan 17 4.0
Pt-E-TEK 18 3.0
volume than CX 550 and half the surface area leads to asimilar crystal size than the other CX 580, pointing out thatnot only textural properties are important but carbonaceoussurface structure plays a role. On the other hand, the com-mercial catalyst (Pt-E-TEK) presents the lowest Pt crystal sizeof 3.0 nm. These differences in crystal domain size of theactive phase will result in different electrocatalytic behaviour,which is the main purpose of the next section.
3.3. Electrochemical Characterization and Catalytic Activity.Pt catalysts supported on carbon xerogels were characterizedby cyclic voltammetry (CV). CO stripping was performedin order to establish the influence of the textural propertiesof the different supports in the electrochemical performanceof each of the Pt catalysts towards CO electrooxidation.The electrooxidation of CO presents a strong dependenceon the electrode surface state in terms of morphology and
structure [32–34]. CO stripping voltammograms obtainedare shown in Figure 3. The second cycles recorded after CO-stripping, which correspond to the voltammograms in thebase electrolyte for clean surfaces, are also shown.
The COad oxidation peak for Pt/CX catalysts was ob-tained around 0.82 V versus RHE, as for Pt-E-TEK, as report-ed in the literature for commercial catalysts [34]. Whereasthe maximum occurs at similar potential values, slight differ-ences are observed as a contribution at more negative poten-tials (0.68–0.74 V versus RHE). The catalysts prepared byimpregnation (Pt/CX 550, Pt/CX 580, and Pt/CB Vulcan)present an onset potential at around 0.68 V versus RHE witha small shoulder not observed for Pt-E-TEK. This contri-bution to CO oxidation could be ascribed to the presenceof certain surface arrangements in which CO is adsorbedwith a slightly lower energy to platinum. Nevertheless, thiscontribution, although small compared to the peak observedat 0.82 V versus RHE, is independent of the crystal size (from4.0 nm for CB Vulcan up to 6.2 nm for CX 550), which isimportant to remark for the subsequent discussion aboutmethanol oxidation. The charge observed at potential valueshigher than 0.9 V versus RHE could be attributed to theoxidation of the active phase or even the support to formoxygen functional groups [35], but, in any case, it representsa reversible process since the second cycle corresponds to thevoltammogram in the base electrolyte, which means that acomplete oxidation of the CO monolayer has been achievedin the first scan and the hydrogen adsorption-desorptionregion remains the same. Further spectroelectrochemicalstudies will be conducted and will serve to analyze these ef-fects in deep.
To sum up, it can be concluded that, in this case, a differ-ent textural structure of the carbon xerogels does not seemto be a determinant factor for obtaining increased catalyticactivity in the electrooxidation of CO.
The analysis of the CVs also shows some differences inthe current densities observed in the double-layer region(0.4–0.6 V), between the catalysts supported on carbonxerogels (Pt/CX 550 and Pt/CX 580) and on carbon blacks(Pt-E-TEK and Pt/CB Vulcan). At 0.4 V, the double-layercurrent density (obtained during the second voltammetricscan) is about 4 times higher for Pt/CXs. This fact implies
6 International Journal of Electrochemistry
0 0.2 0.4 0.6 0.8 1 1.2−0.15
−0.1
−0.05
0
0.05
0.1
0.150.82 V
Cu
rren
tde
nsi
ty(m
A·cm
−2)
Potential/V versus RHE
Pt/CX 550
(a)
0 0.2 0.4 0.6 0.8 1 1.2−0.15
−0.1
−0.05
0
0.05
0.1
0.15 0.82 V
Cu
rren
tde
nsi
ty(m
A·cm
−2)
Potential/V versus RHE
Pt/CX 580
(b)
0 0.2 0.4 0.6 0.8 1 1.2−0.15
−0.1
−0.05
0
0.05
0.1
0.150.82 V
Cu
rren
tde
nsi
ty(m
A·cm
−2)
Potential/V versus RHE
Pt-E-TEK
(c)
0 0.2 0.4 0.6 0.8 1 1.2−0.15
−0.1
−0.05
0
0.05
0.1
0.15
0.8V
Cu
rren
tde
nsi
ty(m
A·cm
−2)
Potential/V versus RHE
Pt/CB Vulcan
(d)
Figure 3: Cyclic voltammograms during CO stripping for Pt catalysts assayed in a 0.5 M H2SO4 solution. Scan rate ν = 0.02 V/s.
that the capacitive behaviour is more apparent for the cat-alysts supported on the carbon xerogels than in the case ofthe one prepared using Vulcan XC-72 R or for Pt/E-TEKcommercial catalysts, as previously reported in [31]. In thissense, the more developed textural properties (higher surfacearea) of the carbon xerogels employed as supports favours thecapacitive behaviour of the catalysts.
The activity of the electrocatalysts towards the oxidationof methanol was studied by means of cyclic voltammetry,in a deaerated 2 M CH3OH + 0.5 M H2SO4 solution atroom temperature. Onset potentials and peak current den-sities measured obtained from the cyclic voltammograms(Figure 4) are shown in Table 3. Main differences can beobserved at the sight of the current densities measured. Whilecurrent densities are quite similar for catalysts prepared usingCX 550, CX 580, and CB Vulcan as supports, considerablylower current densities were determined for the commercialcatalyst Pt/E-TEK.
The specific activity increases as a function of particlesize [36]. Pt/CX 550 presents the higher particle size, buton the contrary does not present the higher specific activity.
On the other hand, Watanabe et al. found that the specificactivity for methanol oxidation on a carbon-supported Ptelectrocatalyst does not change for a particle size above2 nm (Pt fcc structure); thus, the mass activity increases asthe dispersion of the metal phase is increased [37]. In thecase of our Pt/CXs catalysts, Pt catalyst prepared using thecarbon xerogel synthesized at a higher pH shows a highercatalytic activity, which may be due to its better metal phasedispersion, when compared to the Pt catalyst prepared usingthe carbon xerogel synthesized at a lower pH, that presents ahigher particle size.
When comparing Pt/CX 580 with Pt/CB Vulcan, withsimilar Pt crystal sizes (4.5 versus 4.0), Pt/CX 580 shows aslightly higher specific activity. In this case, the nature ofthe support may have some kind of positive influence onthis parameter, presumably in terms of diffusion, since theCO stripping studies do not show, as explained before, apreferential surface structure for platinum independent ofthe carbon support. Carbon xerogel possess a highly devel-oped mesopore structure (high pore volume and averagepore size), what favours the diffusion of reactants towards Pt

International Journal of Electrochemistry 7
0
0.25
0.5
0.75
1
1.25 Pt/CX 550
0 0.2 0.4 0.6 0.8 1 1.2
Potential/V versus RHE
Cu
rren
tde
nsi
ty(m
A·cm
−2)
(a)
0
0.25
0.5
0.75
1
1.25
0 0.2 0.4 0.6 0.8 1 1.2
Potential/V versus RHE
Cu
rren
tde
nsi
ty(m
A·cm
−2)
Pt/CX 580
(b)
0 0.2 0.4 0.6 0.8 1 1.2
Potential/V versus RHE
0
0.25
0.5
0.75
1
1.25
Cu
rren
tde
nsi
ty(m
A·cm
−2)
Pt-E-TEK
(c)
0 0.2 0.4 0.6 0.8 1 1.2
Potential/V versus RHE
0
0.25
0.5
0.75
1
1.25
Cu
rren
tde
nsi
ty(m
A·cm
−2)
Pt/CB Vulcan
(d)
Figure 4: Cyclic voltammograms for the electrooxidation of methanol in a 2 M CH3OH + 0.5 M H2SO4 solution at Pt catalysts and Pt-E-TEK. Scan rate ν = 0.02 V/s.
Table 3: Onset and peak potentials extracted from methanol oxi-dation cyclic voltammetries measured for both the synthesised andcommercial catalysts.
CatalystOnset
potential/Vversus RHE
Forwardanodic
peak/mA cm−2
Reverse anodicpeak/mA cm−2
Pt/CX 550 0.53 1.13 1.00
Pt/CX 580 0.51 1.24 1.21
Pt/CB Vulcan 0.49 0.86 1.23
Pt-E-TEK 0.48 0.43 0.42
particles. In fact, the most active catalyst towards methanoloxidation reaction is Pt/CX 580, which support presents thebest textural features among the studied materials in thiswork.
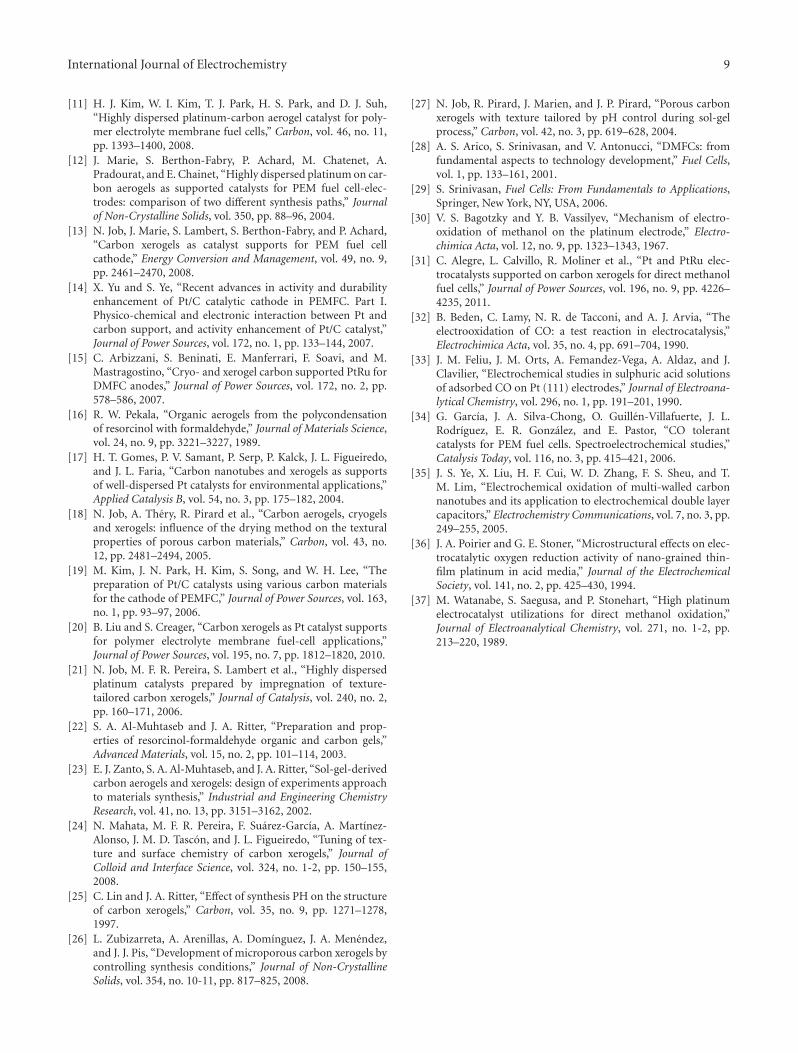
Methanol electrooxidation chronoamperometric meas-urements presented in Figure 5 show that Pt/CX 580 reachesinitially the highest current density, what it may be favoured
due to its enriched mesopore structure, favouring reactantsdiffusion. However, current density in the case of carbonxerogels supported catalysts decay uniformly with time,which is not the case of carbon-black-supported catalysts.This effect may be attributed to the accumulation of interme-diate products that will be clarified with further spectroelec-trochemical studies.
4. Conclusions
With the aim of analyzing the influence of the pH duringcarbon xerogel synthesis in their final textural propertiesand behaviour as supports in the preparation of Pt elec-trocatalysts, two different carbon xerogels were synthesizedadjusting each corresponding initial solution to differentpH values, namely, 5.5 and 5.8. The determination of theirtextural and morphological properties by means of nitro-gen physisorption evidenced notably higher developmentof mesoporosity and more compact structure (studiedby means of scanning electron microscopy) in the case of
8 International Journal of Electrochemistry
0 100 200 300 400 500 600 700 8000
0.02
0.04
0.06
0.08
0.1
Time (s)
Cu
rren
tde
nsi
ty(m
A·cm
−2)
Pt/CX 550Pt/CX 580
Pt/CB VulcanPt-E-TEK
Figure 5: Current density-time curves recorded in a 2 M CH3OH+ 0.5 M H2SO4 solution at E = 0.60 V versus RHE for Pt-supportedand Pt-E-TEK catalysts.
the carbon xerogel synthesized at the highest pH. Both mate-rials show higher surface areas than those measured forVulcan XC-72R; however, the carbon xerogel synthesizedat the lower pH showed an important contribution ofmicroporosity and lower amount of mesopores than thiscommercial carbon black. Pt catalysts were synthesizedusing the carbon xerogels prepared and Vulcan XC-72R assupports. XRD analysis showed smaller Pt crystallite size inthe case of the carbon xerogel possessing a more developedporous structure, that is, the one synthesized at higherinitial pH. More developed porosity, concretely abundanceof mesopores, resulted in an optimized impregnation of thecarbon surface, contributing to a more adequate active-phasedispersion.
Electrochemical characterization showed similar toler-ance towards CO poisoning for the catalysts prepared usingthe synthesized carbon xerogels and the analogous catalystsprepared using Vulcan XC-72R as supports. Among carbonxerogels, slight differences were observed with small contri-butions to CO oxidation at more negative potentials.
Methanol electrooxidation studied by voltamperometricanalyses showed that current densities obtained were consid-erably higher in the case of the carbon-xerogel-based cata-lysts and the Pt/CB Vulcan catalyst, compared to the com-mercial Pt/E-TEK. Pt/CX 580 showed the highest specificactivity which may be a combination of both adequate metaldispersion and a highly developed mesoporous structure,that may favour reactants diffusion towards reactive sites.
In fact, methanol chronoamperometry showed higherinitial current density in this case, although electrocatalyticactivity soon decreased with time reaching similar currentdensity values than CB Vulcan supported catalyst. At thebeginning of the curves, the higher catalytic activity of thePt/CX 580 catalyst may be due to diffusional effects thatare favoured for Pt/CX catalyst (given its higher mesoporestructure when compared to Vulcan).
Nevertheless, at the sight of the results obtained in thiswork, it can be concluded that the more developed and meso-pore-enriched porous structure of the carbon xerogel synthe-sized at a higher initial pH resulted in a more optimal utiliza-tion of the active phase and in an enhanced and promisingcatalytic activity in the electrooxidation of methanol, incomparison to analogous catalysts prepared using Vulcancarbon black as support and to commercially available Ptcatalysts.
Acknowledgments
The authors wish to thank “FEDER” and the SpanishMICINN for financial support MAT2008-06631-C03-01. M.E. Galvez is indebted to the Spanish Ministry of Science andInnovation for its “Juan de la Cierva” postdoctoral grant.
References
[1] S. Wasmus and A. Kuver, “Methanol oxidation and directmethanol fuel cells: a selective review,” Journal of Electroana-lytical Chemistry, vol. 461, no. 1-2, pp. 14–31, 1999.
[2] J. R. C. Salgado, E. Antolini, and E. R. Gonzalez, “Structureand activity of carbon-supported Pt-Co electrocatalysts foroxygen reduction,” Journal of Physical Chemistry B, vol. 108,no. 46, pp. 17767–17774, 2004.
[3] E. Teliz, V. Dıaz, R. Faccio, A. W. Mombru, and F. Zinola,“The electrochemical development of Pt(111)stepped surfacesand its influence on methanol electrooxidation,” InternationalJournal of Electrochemistry, vol. 2011, Article ID 289032, 9pages, 2011.
[4] Z. Cui, C. Liu, J. Liao, and W. Xing, “Highly active PtRucatalysts supported on carbon nanotubes prepared by mod-ified impregnation method for methanol electro-oxidation,”Electrochimica Acta, vol. 53, no. 27, pp. 7807–7811, 2008.
[5] J. L. Figueiredo, M. F. R. Pereira, P. Serp, P. Kalck, P. V. Samant,and J. B. Fernandes, “Development of carbon nanotube andcarbon xerogel supported catalysts for the electro-oxidation ofmethanol in fuel cells,” Carbon, vol. 44, no. 12, pp. 2516–2522,2006.
[6] D. Sebastian, J. C. Calderon, J. A. Gonzalez-Exposito et al.,“Influence of carbon nanofiber properties as electrocatalystsupport on the electrochemical performance for PEM fuelcells,” International Journal of Hydrogen Energy, vol. 35, no. 18,pp. 9934–9942, 2010.
[7] L. Calvillo, M. Gangeri, S. Perathoner, G. Centi, R. Moliner,and M. J. Lazaro, “Effect of the support properties on thepreparation and performance of platinum catalysts supportedon carbon nanofibers,” Journal of Power Sources, vol. 192, no.1, pp. 144–150, 2009.
[8] L. Calvillo, M. J. Lazaro, E. Garcıa-Bordeje et al., “Platinumsupported on functionalized ordered mesoporous carbon aselectrocatalyst for direct methanol fuel cells,” Journal of PowerSources, vol. 169, no. 1, pp. 59–64, 2007.
[9] N. Job, M. F. R. Pereira, S. Lambert et al., “Highly dispersedplatinum catalysts prepared by impregnation of texture-tailored carbon xerogels,” Journal of Catalysis, vol. 240, no. 2,pp. 160–171, 2006.
[10] P. V. Samant, J. B. Fernandes, C. M. Rangel, and J. L.Figueiredo, “Carbon xerogel supported Pt and Pt-Ni catalystsfor electro-oxidation of methanol in basic medium,” CatalysisToday, vol. 102-103, pp. 173–176, 2005.
International Journal of Electrochemistry 9
[11] H. J. Kim, W. I. Kim, T. J. Park, H. S. Park, and D. J. Suh,“Highly dispersed platinum-carbon aerogel catalyst for poly-mer electrolyte membrane fuel cells,” Carbon, vol. 46, no. 11,pp. 1393–1400, 2008.
[12] J. Marie, S. Berthon-Fabry, P. Achard, M. Chatenet, A.Pradourat, and E. Chainet, “Highly dispersed platinum on car-bon aerogels as supported catalysts for PEM fuel cell-elec-trodes: comparison of two different synthesis paths,” Journalof Non-Crystalline Solids, vol. 350, pp. 88–96, 2004.
[13] N. Job, J. Marie, S. Lambert, S. Berthon-Fabry, and P. Achard,“Carbon xerogels as catalyst supports for PEM fuel cellcathode,” Energy Conversion and Management, vol. 49, no. 9,pp. 2461–2470, 2008.
[14] X. Yu and S. Ye, “Recent advances in activity and durabilityenhancement of Pt/C catalytic cathode in PEMFC. Part I.Physico-chemical and electronic interaction between Pt andcarbon support, and activity enhancement of Pt/C catalyst,”Journal of Power Sources, vol. 172, no. 1, pp. 133–144, 2007.
[15] C. Arbizzani, S. Beninati, E. Manferrari, F. Soavi, and M.Mastragostino, “Cryo- and xerogel carbon supported PtRu forDMFC anodes,” Journal of Power Sources, vol. 172, no. 2, pp.578–586, 2007.
[16] R. W. Pekala, “Organic aerogels from the polycondensationof resorcinol with formaldehyde,” Journal of Materials Science,vol. 24, no. 9, pp. 3221–3227, 1989.
[17] H. T. Gomes, P. V. Samant, P. Serp, P. Kalck, J. L. Figueiredo,and J. L. Faria, “Carbon nanotubes and xerogels as supportsof well-dispersed Pt catalysts for environmental applications,”Applied Catalysis B, vol. 54, no. 3, pp. 175–182, 2004.
[18] N. Job, A. Thery, R. Pirard et al., “Carbon aerogels, cryogelsand xerogels: influence of the drying method on the texturalproperties of porous carbon materials,” Carbon, vol. 43, no.12, pp. 2481–2494, 2005.
[19] M. Kim, J. N. Park, H. Kim, S. Song, and W. H. Lee, “Thepreparation of Pt/C catalysts using various carbon materialsfor the cathode of PEMFC,” Journal of Power Sources, vol. 163,no. 1, pp. 93–97, 2006.
[20] B. Liu and S. Creager, “Carbon xerogels as Pt catalyst supportsfor polymer electrolyte membrane fuel-cell applications,”Journal of Power Sources, vol. 195, no. 7, pp. 1812–1820, 2010.
[21] N. Job, M. F. R. Pereira, S. Lambert et al., “Highly dispersedplatinum catalysts prepared by impregnation of texture-tailored carbon xerogels,” Journal of Catalysis, vol. 240, no. 2,pp. 160–171, 2006.
[22] S. A. Al-Muhtaseb and J. A. Ritter, “Preparation and prop-erties of resorcinol-formaldehyde organic and carbon gels,”Advanced Materials, vol. 15, no. 2, pp. 101–114, 2003.
[23] E. J. Zanto, S. A. Al-Muhtaseb, and J. A. Ritter, “Sol-gel-derivedcarbon aerogels and xerogels: design of experiments approachto materials synthesis,” Industrial and Engineering ChemistryResearch, vol. 41, no. 13, pp. 3151–3162, 2002.
[24] N. Mahata, M. F. R. Pereira, F. Suarez-Garcıa, A. Martınez-Alonso, J. M. D. Tascon, and J. L. Figueiredo, “Tuning of tex-ture and surface chemistry of carbon xerogels,” Journal ofColloid and Interface Science, vol. 324, no. 1-2, pp. 150–155,2008.
[25] C. Lin and J. A. Ritter, “Effect of synthesis PH on the structureof carbon xerogels,” Carbon, vol. 35, no. 9, pp. 1271–1278,1997.
[26] L. Zubizarreta, A. Arenillas, A. Domınguez, J. A. Menendez,and J. J. Pis, “Development of microporous carbon xerogels bycontrolling synthesis conditions,” Journal of Non-CrystallineSolids, vol. 354, no. 10-11, pp. 817–825, 2008.
[27] N. Job, R. Pirard, J. Marien, and J. P. Pirard, “Porous carbonxerogels with texture tailored by pH control during sol-gelprocess,” Carbon, vol. 42, no. 3, pp. 619–628, 2004.
[28] A. S. Arico, S. Srinivasan, and V. Antonucci, “DMFCs: fromfundamental aspects to technology development,” Fuel Cells,vol. 1, pp. 133–161, 2001.
[29] S. Srinivasan, Fuel Cells: From Fundamentals to Applications,Springer, New York, NY, USA, 2006.
[30] V. S. Bagotzky and Y. B. Vassilyev, “Mechanism of electro-oxidation of methanol on the platinum electrode,” Electro-chimica Acta, vol. 12, no. 9, pp. 1323–1343, 1967.
[31] C. Alegre, L. Calvillo, R. Moliner et al., “Pt and PtRu elec-trocatalysts supported on carbon xerogels for direct methanolfuel cells,” Journal of Power Sources, vol. 196, no. 9, pp. 4226–4235, 2011.
[32] B. Beden, C. Lamy, N. R. de Tacconi, and A. J. Arvia, “Theelectrooxidation of CO: a test reaction in electrocatalysis,”Electrochimica Acta, vol. 35, no. 4, pp. 691–704, 1990.
[33] J. M. Feliu, J. M. Orts, A. Femandez-Vega, A. Aldaz, and J.Clavilier, “Electrochemical studies in sulphuric acid solutionsof adsorbed CO on Pt (111) electrodes,” Journal of Electroana-lytical Chemistry, vol. 296, no. 1, pp. 191–201, 1990.
[34] G. Garcıa, J. A. Silva-Chong, O. Guillen-Villafuerte, J. L.Rodrıguez, E. R. Gonzalez, and E. Pastor, “CO tolerantcatalysts for PEM fuel cells. Spectroelectrochemical studies,”Catalysis Today, vol. 116, no. 3, pp. 415–421, 2006.
[35] J. S. Ye, X. Liu, H. F. Cui, W. D. Zhang, F. S. Sheu, and T.M. Lim, “Electrochemical oxidation of multi-walled carbonnanotubes and its application to electrochemical double layercapacitors,” Electrochemistry Communications, vol. 7, no. 3, pp.249–255, 2005.
[36] J. A. Poirier and G. E. Stoner, “Microstructural effects on elec-trocatalytic oxygen reduction activity of nano-grained thin-film platinum in acid media,” Journal of the ElectrochemicalSociety, vol. 141, no. 2, pp. 425–430, 1994.
[37] M. Watanabe, S. Saegusa, and P. Stonehart, “High platinumelectrocatalyst utilizations for direct methanol oxidation,”Journal of Electroanalytical Chemistry, vol. 271, no. 1-2, pp.213–220, 1989.
SAGE-Hindawi Access to ResearchInternational Journal of ElectrochemistryVolume 2011, Article ID 249804, 13 pagesdoi:10.4061/2011/249804
Research Article
Carbon-Supported Fe Catalysts for CO2 Electroreduction toHigh-Added Value Products: A DEMS Study:Effect of the Functionalization of the Support
S. Perez-Rodrıguez,1 G. Garcıa,2, 3 L. Calvillo,1 V. Celorrio,1 E. Pastor,2 and M. J. Lazaro1
1 Instituto de Carboquımica CSIC, Miguel Luesma Castan 4, 50018 Zaragoza, Spain2 Departmento de Quımica-Fısica, Instituto Universitario de Materiales y Nanotecnologıa, Universidad de La Laguna,Avenida Astrofısico F. Sanchez s/n, 38071 La Laguna, Spain
3 Instituto de Catalisis y Petroleoquımica, CSIC, c/Marie Curie 2, 2. 28049 Madrid, Spain
Correspondence should be addressed to G. Garcıa, [email protected] and M. J. Lazaro, [email protected]
Received 30 April 2011; Accepted 9 September 2011
Academic Editor: Maria E. Martins
Copyright © 2011 S. Perez-Rodrıguez et al. This is an open access article distributed under the Creative Commons AttributionLicense, which permits unrestricted use, distribution, and reproduction in any medium, provided the original work is properlycited.
Vulcan XC-72R-supported Fe catalysts have been synthesised for the electroreduction of CO2 to high-added value products.Catalysts were obtained by the polyol method, using ethylene glycol as solvent and reducing agent. Prior to the metal deposition,Vulcan was subjected to different oxidation treatments in order to modify its surface chemistry and study its influence on thephysicochemical and electrochemical properties of the catalysts, as well as on the product distribution. The oxidation treatmentsof the supports modify their textural properties, but do not affect significantly the physicochemical properties of catalysts. However,DEMS studies showed that the carbon support degradation, the distribution of products, and the catalytic activity toward the CO2
electroreduction reaction depend significantly on the surface chemistry of the carbon support.
1. Introduction
Carbon dioxide (CO2) emissions are the inevitable resultfrom the burning of fossil fuels for electricity and energy(80% anthropogenic CO2) [1]. During the last years, CO2
concentration in the atmosphere has been increasing, beingthe major responsible of global warming. Therefore, reduc-ing the CO2 concentration in the atmosphere has becomea critical issue. Different methods have been developed toreduce its emissions, such as chemical, thermochemical, pho-tochemical, electrochemical, and biochemical procedures[2–4]. Among them, the electrochemical reduction seemsto be of particular interest since it could both mitigate thegreenhouse gas emission and use CO2 as carbon source forproducing a variety of useful products like (e.g., formic acid,methanol, etc.) for energy source [1, 4–8]. CO2 reductionwould be carried out making use of renewable energy toresult in a net decrease of CO2 emissions [9, 10].
In recent years, different metallic electrodes have beenstudied for the electrochemical reduction of carbon dioxide,
since the product distribution strongly depends on the usedmaterial, surface metallic arrangement, and surface energy[11–17]. Copper has been found to be one of the mosteffective electrode materials for the CO2 reduction processat atmospheric pressure and room temperature in aqueoussolutions [11, 12, 16]. On the other hand, CO2 is hardlyreduced on group VIII-X metal electrodes such as Fe, Co, andNi, under similar conditions [15–17].
One of the main problems of this process is the lowsolubility of CO2 in water at atmospheric pressure androom temperature. For this reason, in the last years, theelectroreduction of CO2 has been studied at high pressure[18–21] or low temperatures [21–24] on different metalelectrodes. It has been reported that, at low temperatures(ca. 2◦C) or high pressures (ca. 30 atm), the catalytic activityof the electrodes toward the electrochemical CO2 reductionincreases and the selectivity of the resultant products canchange, even for metal catalysts of the group VIII-X [18–24]. In this context, Azuma et al. reported that the CO2
2 International Journal of Electrochemistry
reduction efficiency increased dramatically on some metalelectrodes, such as Ni, as the temperature decreased [24].Conversely, at high pressure, formic acid and/or carbonmonoxide are efficiently formed on metal electrodes of thegroup VIII-X. Moreover, the formation of short and longchain hydrocarbons such as methane, ethane, propane, andiso- and normal-butanes has also been observed on Fe, Co,and Ni electrodes [18–20].
Since the solubility of CO2 in aprotic solvents is high-er than in water, the electroreduction of CO2 has alsobeen studied using organic molecules (methanol, acetoni-trile, dimethyl formamide, propylene carbonate, etc.) asreaction medium [25–32]. Higher CO2 solubility increasesthe current density, however, the low electrolytic conduc-tivity gives high ohmic losses. For this reason, methanol isoften added into a supporting electrolyte in order to balancethese two aspects. For example, Kaneco et al. reported thatthe faradic efficiencies for CO2 reduction products using Cuelectrode in a methanol solution at low temperatures werebetter than those obtained without methanol at ambienttemperature [29, 30]. In addition, Ohta et al. reported theformation mainly of methane, carbon monoxide and ethane,on different metal electrodes (among them Fe, Co, and Ni)using methanol into the supporting electrolyte [27].
Therefore, the effective electrochemical reduction of CO2
on metal surfaces of the group VIII-X using high pressures,low temperatures, and/or nonaqueous solvents has beendemonstrated. Among these metals, Fe is well known ascatalyst for the hydrocarbon formation in the Fischer-Tropsch reaction. Therefore, its catalytic activity toward theelectrochemical CO2 reduction is expected to be interesting[33].
On the other hand, carbon materials have also beenused as electrodes for the electrochemical CO2 reduction.However, until now, the electrocatalytic activity of theseelectrodes is not clear. Christensen et al. reported that CO2
is reduced to CO and carbonate on a glassy carbon electrodein acetonitrile solution [32]. Moreover, Hara et al. reportedthe formation of hydrocarbons such as methane, ethane,ethylene, propane, and n-butane during the electrochemicalCO2 reduction on a glassy carbon electrode under 30 atm[34]. However, there are not many studies about the elec-troreduction of CO2 on metal catalysts supported on carbonmaterials in aqueous electrolytes. These electrodes couldhave different properties than those of the correspondingmetal or carbon material. The support could improve thedispersion of the metal and, therefore, the activity and/orselectivity could be changed. Nowadays, among all kindsof carbon supports, carbon blacks are the most commonlyused, especially for electrochemical applications (e.g., inthe fuel cells field), due to their mesoporous distributionand their graphite characteristics. Vulcan XC-72 is the mostfrequently used because of its good compromise betweenelectrical conductivity and high specific surface area [35, 36].The surface chemistry of carbon materials can be modifiedby oxidation treatments in gas or liquid phase in orderto create functional groups. These functional groups maysignificantly affect the dispersion and anchoring of the metalon the carbon materials and, therefore, may affect the
Table 1: Nomenclature of functionalizated Vulcan XC-72R.
Sample Oxidizing agentTemperature
(◦C)Time(h)
Vulcan — — —
Vulcan NSTa0.5 HNO3-H2SO4 1 : 1 (v/v) 25 0.5
Vulcan NcTb0.5Concentrated HNO3
(65%)115 0.5
Vulcan NcTb2Concentrated HNO3
(65%)115 2
performance of the electrocatalysts. In addition, it is wellknown that surface oxygen groups are the responsible forboth the acid-base and the redox properties of the carbonmaterials. It has been reported that the acidic groups on thecarbon surface decrease the hydrophobicity of the carbon,whereas the less acidic groups improve the interactionbetween metal particles and carbon materials [37]. However,the functionalization of Vulcan XC-72R has not been studiedfor the CO2 electroreduction reaction.
In this work, different Fe catalysts supported on VulcanXC-72R have been prepared for studying the electroreduc-tion of CO2 in aqueous solution under 1 atm and roomtemperature. Prior to the metal deposition, Vulcan was sub-jected to different oxidation treatments, using HNO3 orHNO3-H2SO4 1 : 1 (v/v) mixture as oxidizing agents, in orderto create functional groups. In this way, the influence ofthe surface chemistry of the carbon support on the physic-ochemical and electrochemical properties of the catalysts forthe CO2 electroreduction process can be studied.
In the present communication, the modified and un-modified carbon supports were characterized by X-raydiffraction (XRD), scanning electron microscopy (SEM),temperature programmed desorption (TPD), and N2-physisorption. On the other hand, carbon-supported cat-alysts (Fe/C) were characterized by energy dispersive X-ray analysis (EDX), XRD, SEM, and N2-physisorption. Inaddition, the electrochemical properties of the catalystsand the formation of gaseous and volatile products ofthe reduction of CO2 were followed by in-situ differentialelectrochemical mass spectrometry (DEMS).
2. Experimental
2.1. Functionalization of Vulcan XC-72R. In order to createfunctional groups, Vulcan XC-72R (Cabot) was modifiedwith different oxidation treatments in liquid phase, usingconcentrated HNO3 (65% wt.) (Nc) and an HNO3-H2SO4
1 : 1 (v/v) mixture (NS) as oxidizing agents [38]. Theoxidation treatments were carried out at room (Ta) andboiling temperature (Tb) for 0.5 or 2 h. The nomenclatureused for the different materials and the oxidation conditionsare summarized in Table 1.
2.2. Synthesis of the Carbon-Supported Fe Electrocatalysts.Fe electrocatalysts were prepared by polyol method, usingethylene glycol (EG) as solvent and reducing agent. The
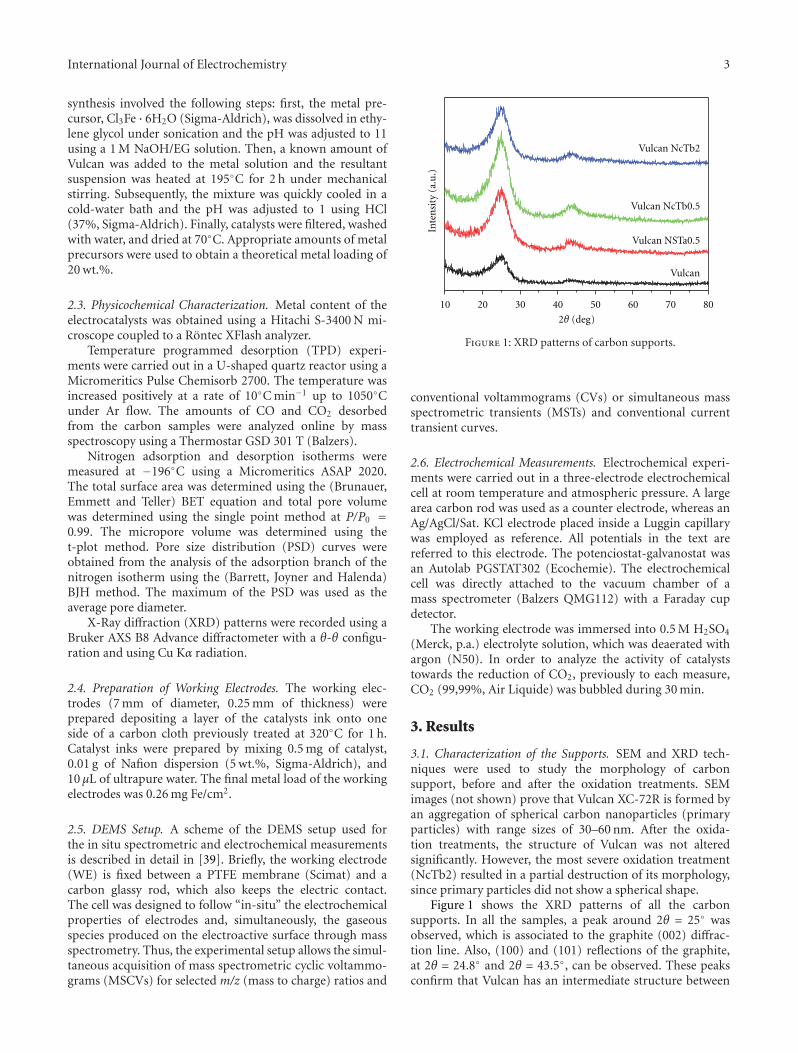
International Journal of Electrochemistry 3
synthesis involved the following steps: first, the metal pre-cursor, Cl3Fe · 6H2O (Sigma-Aldrich), was dissolved in ethy-lene glycol under sonication and the pH was adjusted to 11using a 1 M NaOH/EG solution. Then, a known amount ofVulcan was added to the metal solution and the resultantsuspension was heated at 195◦C for 2 h under mechanicalstirring. Subsequently, the mixture was quickly cooled in acold-water bath and the pH was adjusted to 1 using HCl(37%, Sigma-Aldrich). Finally, catalysts were filtered, washedwith water, and dried at 70◦C. Appropriate amounts of metalprecursors were used to obtain a theoretical metal loading of20 wt.%.
2.3. Physicochemical Characterization. Metal content of theelectrocatalysts was obtained using a Hitachi S-3400 N mi-croscope coupled to a Rontec XFlash analyzer.
Temperature programmed desorption (TPD) experi-ments were carried out in a U-shaped quartz reactor using aMicromeritics Pulse Chemisorb 2700. The temperature wasincreased positively at a rate of 10◦C min−1 up to 1050◦Cunder Ar flow. The amounts of CO and CO2 desorbedfrom the carbon samples were analyzed online by massspectroscopy using a Thermostar GSD 301 T (Balzers).
Nitrogen adsorption and desorption isotherms weremeasured at −196◦C using a Micromeritics ASAP 2020.The total surface area was determined using the (Brunauer,Emmett and Teller) BET equation and total pore volumewas determined using the single point method at P/P0 =0.99. The micropore volume was determined using thet-plot method. Pore size distribution (PSD) curves wereobtained from the analysis of the adsorption branch of thenitrogen isotherm using the (Barrett, Joyner and Halenda)BJH method. The maximum of the PSD was used as theaverage pore diameter.
X-Ray diffraction (XRD) patterns were recorded using aBruker AXS B8 Advance diffractometer with a θ-θ configu-ration and using Cu Kα radiation.
2.4. Preparation of Working Electrodes. The working elec-trodes (7 mm of diameter, 0.25 mm of thickness) wereprepared depositing a layer of the catalysts ink onto oneside of a carbon cloth previously treated at 320◦C for 1 h.Catalyst inks were prepared by mixing 0.5 mg of catalyst,0.01 g of Nafion dispersion (5 wt.%, Sigma-Aldrich), and10 μL of ultrapure water. The final metal load of the workingelectrodes was 0.26 mg Fe/cm2.
2.5. DEMS Setup. A scheme of the DEMS setup used forthe in situ spectrometric and electrochemical measurementsis described in detail in [39]. Briefly, the working electrode(WE) is fixed between a PTFE membrane (Scimat) and acarbon glassy rod, which also keeps the electric contact.The cell was designed to follow “in-situ” the electrochemicalproperties of electrodes and, simultaneously, the gaseousspecies produced on the electroactive surface through massspectrometry. Thus, the experimental setup allows the simul-taneous acquisition of mass spectrometric cyclic voltammo-grams (MSCVs) for selected m/z (mass to charge) ratios and
10 20 30 40 50 60 70 80
Inte
nsi
ty(a
.u.)
2θ (deg)
Vulcan
Vulcan NSTa0.5
Vulcan NcTb0.5
Vulcan NcTb2
Figure 1: XRD patterns of carbon supports.
conventional voltammograms (CVs) or simultaneous massspectrometric transients (MSTs) and conventional currenttransient curves.
2.6. Electrochemical Measurements. Electrochemical experi-ments were carried out in a three-electrode electrochemicalcell at room temperature and atmospheric pressure. A largearea carbon rod was used as a counter electrode, whereas anAg/AgCl/Sat. KCl electrode placed inside a Luggin capillarywas employed as reference. All potentials in the text arereferred to this electrode. The potenciostat-galvanostat wasan Autolab PGSTAT302 (Ecochemie). The electrochemicalcell was directly attached to the vacuum chamber of amass spectrometer (Balzers QMG112) with a Faraday cupdetector.
The working electrode was immersed into 0.5 M H2SO4
(Merck, p.a.) electrolyte solution, which was deaerated withargon (N50). In order to analyze the activity of catalyststowards the reduction of CO2, previously to each measure,CO2 (99,99%, Air Liquide) was bubbled during 30 min.
3. Results
3.1. Characterization of the Supports. SEM and XRD tech-niques were used to study the morphology of carbonsupport, before and after the oxidation treatments. SEMimages (not shown) prove that Vulcan XC-72R is formed byan aggregation of spherical carbon nanoparticles (primaryparticles) with range sizes of 30–60 nm. After the oxida-tion treatments, the structure of Vulcan was not alteredsignificantly. However, the most severe oxidation treatment(NcTb2) resulted in a partial destruction of its morphology,since primary particles did not show a spherical shape.
Figure 1 shows the XRD patterns of all the carbonsupports. In all the samples, a peak around 2θ = 25◦ wasobserved, which is associated to the graphite (002) diffrac-tion line. Also, (100) and (101) reflections of the graphite,at 2θ = 24.8◦ and 2θ = 43.5◦, can be observed. These peaksconfirm that Vulcan has an intermediate structure between

4 International Journal of Electrochemistry
Table 2: Quantification of surface oxygen groups as CO and CO2 amounts desorbed during the TPD experiments.
SampleCO2 and CO peak area (μmolg−1) CO + CO2
(μmolg−1)CO/CO2
Carboxylic Lactone Anhydride Phenol Quinone + carbonyl
Vulcan — — — — — — —
Vulcan NSTa0.5 545 256 65 412 881 2160 1.54
Vulcan NcTb0.5 556 243 58 480 699 2037 1.42
Vulcan NcTb2 799 362 63 632 963 2819 1.34
Table 3: Textural properties of the supports and Fe electrocatalysts.
SampleSBET
(m2/g)SMICRO
(m2/g)SMESO
(m2/g)VTOTAL
(cm3/g)VMICRO
(cm3/g)VMESO
(cm3/g)
Vulcan 210 102 108 0.38 0.06 0.32
Vulcan NSTa0.5 200 104 96 0.40 0.06 0.34
Vulcan NcTb0.5 181 91 90 0.38 0.05 0.33
Vulcan NcTb2 159 77 82 0.38 0.04 0.33
Fe/Vulcan 175 76 99 0.41 0.04 0.36
Fe/VulcanNSTa0.5
166 55 111 0.49 0.03 0.46
Fe/VulcanNcTb0.5
148 58 90 0.41 0.03 0.37
Fe/Vulcan NcTb2 139 54 85 0.42 0.03 0.38
amorphous and graphitic. After the oxidation treatments,the same peaks were observed, indicating that the originalstructure of Vulcan was maintained. However, the intensityof the peaks increased with the severity of the oxidationtreatment, except for the sample Vulcan NcTb2. This increaseis attributed to the removal of the more amorphous carbon.In other words, the structure ratio crystalline/amorphousincreases. On the other hand, the sample Vulcan NcTb2 didnot follow the same tendency, which is attributed to thepartial destruction of the original structure of Vulcan (i.e.,both amorphous and crystalline structures are damaged), asobserved by SEM.
The surface chemistry of the supports was studied byTPD experiments. These measurements give informationabout the surface oxygen groups created during the oxidationtreatments. Acidic groups (carboxylic groups, lactones, andanhydrides) are decomposed into CO2 at lower tempera-tures and basic and neutral groups (anhydrides, phenols,quinones and carbonyls) are decomposed into CO at highertemperatures during the TPD experiments [40]. In order toestimate the type and the amount of oxygen groups createdduring the oxidation treatments, CO2 and CO profiles canbe deconvoluted. Thus, the decomposition temperature canbe related to the type of the functional groups created [40].Deconvolution profiles were carried out with Excel software,using a Gaussian function to fit each functional groupcontribution and the corresponding addition of Gaussiancurves was fitted minimizing the square of the deviationsby a numerical routine (conjugate gradient method). Otherauthors have used this method [41].
As can be seen in Table 2, the original material had a neg-ligible amount of surface oxygen groups. After the oxidationtreatments, the number of surface oxygen groups increased,being the treatment with HNO3 at boiling temperatureduring 2 h (NcTb2) the most effective at creating functionalgroups. In addition, it is observed that the ratio CO/CO2,which can be taken as a measure of the surface acidity [42],decreased as the severity of the treatment increased.
Deconvolution of CO2 profiles showed that carboxylicgroups were mainly created. It is expected that these groupsdecrease the hydrophobic character of the carbon materials,improving their interaction with the metal. On the otherhand, deconvolution of CO profiles showed that phenols,quinones, and carbonyls were mainly created. It is expectedthat these groups, which are stable at higher temperatures,act as metal anchoring sites, hindering the agglomeration ofmetal particles [42].
In order to further investigate how the pore structure andtextural properties of the Vulcan XC-72R were changed dur-ing the oxidation treatments (see Section 2.1 for oxidationtreatments details), supports were characterized by means ofN2-physisorption. Table 3 contains the textural properties ofthe carbon materials obtained by N2-physisorption. VulcanXC-72R has a high specific surface area (210 m2 g −1) anda large total pore volume (0.38 cm3 g−1). Nevertheless, afterthe oxidation treatments, the specific surface area of allthe samples decreased indicating a partial destruction ofthe original morphology, being this effect more significantat the carbon material oxidized with the most severetreatment (Vulcan NcTb2). However, no significant change
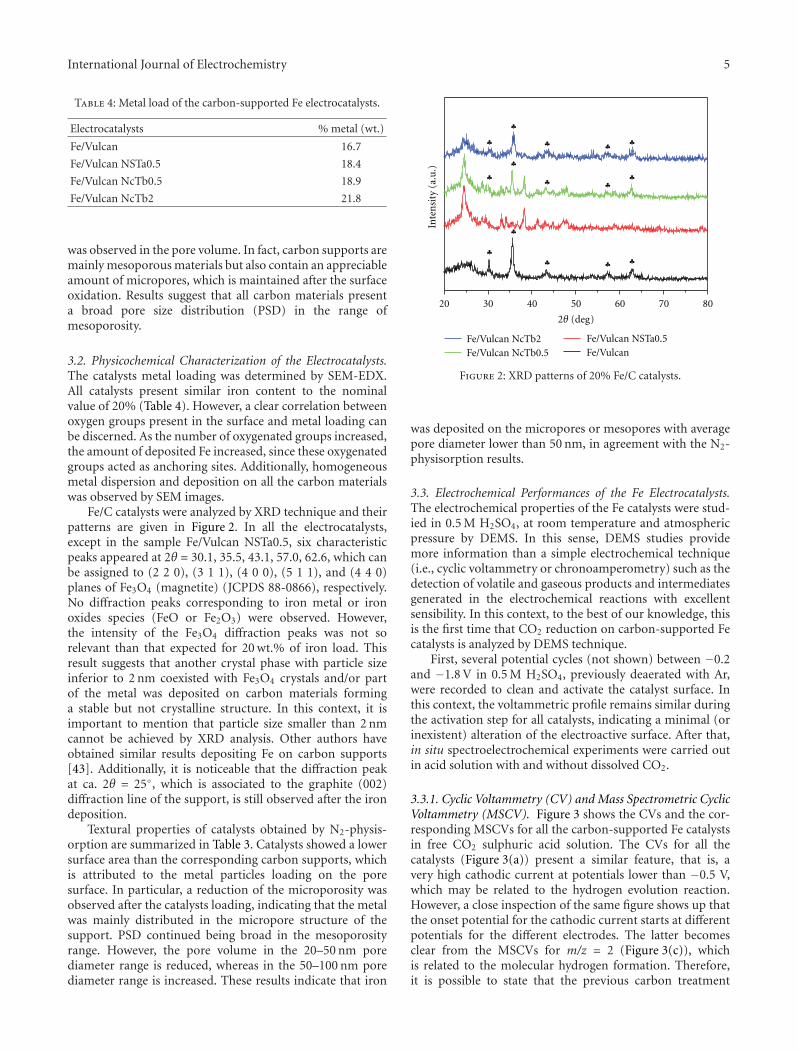
International Journal of Electrochemistry 5
Table 4: Metal load of the carbon-supported Fe electrocatalysts.
Electrocatalysts % metal (wt.)
Fe/Vulcan 16.7
Fe/Vulcan NSTa0.5 18.4
Fe/Vulcan NcTb0.5 18.9
Fe/Vulcan NcTb2 21.8
was observed in the pore volume. In fact, carbon supports aremainly mesoporous materials but also contain an appreciableamount of micropores, which is maintained after the surfaceoxidation. Results suggest that all carbon materials presenta broad pore size distribution (PSD) in the range ofmesoporosity.
3.2. Physicochemical Characterization of the Electrocatalysts.The catalysts metal loading was determined by SEM-EDX.All catalysts present similar iron content to the nominalvalue of 20% (Table 4). However, a clear correlation betweenoxygen groups present in the surface and metal loading canbe discerned. As the number of oxygenated groups increased,the amount of deposited Fe increased, since these oxygenatedgroups acted as anchoring sites. Additionally, homogeneousmetal dispersion and deposition on all the carbon materialswas observed by SEM images.
Fe/C catalysts were analyzed by XRD technique and theirpatterns are given in Figure 2. In all the electrocatalysts,except in the sample Fe/Vulcan NSTa0.5, six characteristicpeaks appeared at 2θ = 30.1, 35.5, 43.1, 57.0, 62.6, which canbe assigned to (2 2 0), (3 1 1), (4 0 0), (5 1 1), and (4 4 0)planes of Fe3O4 (magnetite) (JCPDS 88-0866), respectively.No diffraction peaks corresponding to iron metal or ironoxides species (FeO or Fe2O3) were observed. However,the intensity of the Fe3O4 diffraction peaks was not sorelevant than that expected for 20 wt.% of iron load. Thisresult suggests that another crystal phase with particle sizeinferior to 2 nm coexisted with Fe3O4 crystals and/or partof the metal was deposited on carbon materials forminga stable but not crystalline structure. In this context, it isimportant to mention that particle size smaller than 2 nmcannot be achieved by XRD analysis. Other authors haveobtained similar results depositing Fe on carbon supports[43]. Additionally, it is noticeable that the diffraction peakat ca. 2θ = 25◦, which is associated to the graphite (002)diffraction line of the support, is still observed after the irondeposition.
Textural properties of catalysts obtained by N2-physis-orption are summarized in Table 3. Catalysts showed a lowersurface area than the corresponding carbon supports, whichis attributed to the metal particles loading on the poresurface. In particular, a reduction of the microporosity wasobserved after the catalysts loading, indicating that the metalwas mainly distributed in the micropore structure of thesupport. PSD continued being broad in the mesoporosityrange. However, the pore volume in the 20–50 nm porediameter range is reduced, whereas in the 50–100 nm porediameter range is increased. These results indicate that iron
20 30 40 50 60 70 80
Inte
nsi
ty(a
.u.)
Fe/Vulcan NcTb2Fe/Vulcan NcTb0.5
Fe/Vulcan NSTa0.5Fe/Vulcan
2θ (deg)
Figure 2: XRD patterns of 20% Fe/C catalysts.
was deposited on the micropores or mesopores with averagepore diameter lower than 50 nm, in agreement with the N2-physisorption results.
3.3. Electrochemical Performances of the Fe Electrocatalysts.The electrochemical properties of the Fe catalysts were stud-ied in 0.5 M H2SO4, at room temperature and atmosphericpressure by DEMS. In this sense, DEMS studies providemore information than a simple electrochemical technique(i.e., cyclic voltammetry or chronoamperometry) such as thedetection of volatile and gaseous products and intermediatesgenerated in the electrochemical reactions with excellentsensibility. In this context, to the best of our knowledge, thisis the first time that CO2 reduction on carbon-supported Fecatalysts is analyzed by DEMS technique.
First, several potential cycles (not shown) between −0.2and −1.8 V in 0.5 M H2SO4, previously deaerated with Ar,were recorded to clean and activate the catalyst surface. Inthis context, the voltammetric profile remains similar duringthe activation step for all catalysts, indicating a minimal (orinexistent) alteration of the electroactive surface. After that,in situ spectroelectrochemical experiments were carried outin acid solution with and without dissolved CO2.
3.3.1. Cyclic Voltammetry (CV) and Mass Spectrometric CyclicVoltammetry (MSCV). Figure 3 shows the CVs and the cor-responding MSCVs for all the carbon-supported Fe catalystsin free CO2 sulphuric acid solution. The CVs for all thecatalysts (Figure 3(a)) present a similar feature, that is, avery high cathodic current at potentials lower than −0.5 V,which may be related to the hydrogen evolution reaction.However, a close inspection of the same figure shows up thatthe onset potential for the cathodic current starts at differentpotentials for the different electrodes. The latter becomesclear from the MSCVs for m/z = 2 (Figure 3(c)), whichis related to the molecular hydrogen formation. Therefore,it is possible to state that the previous carbon treatment
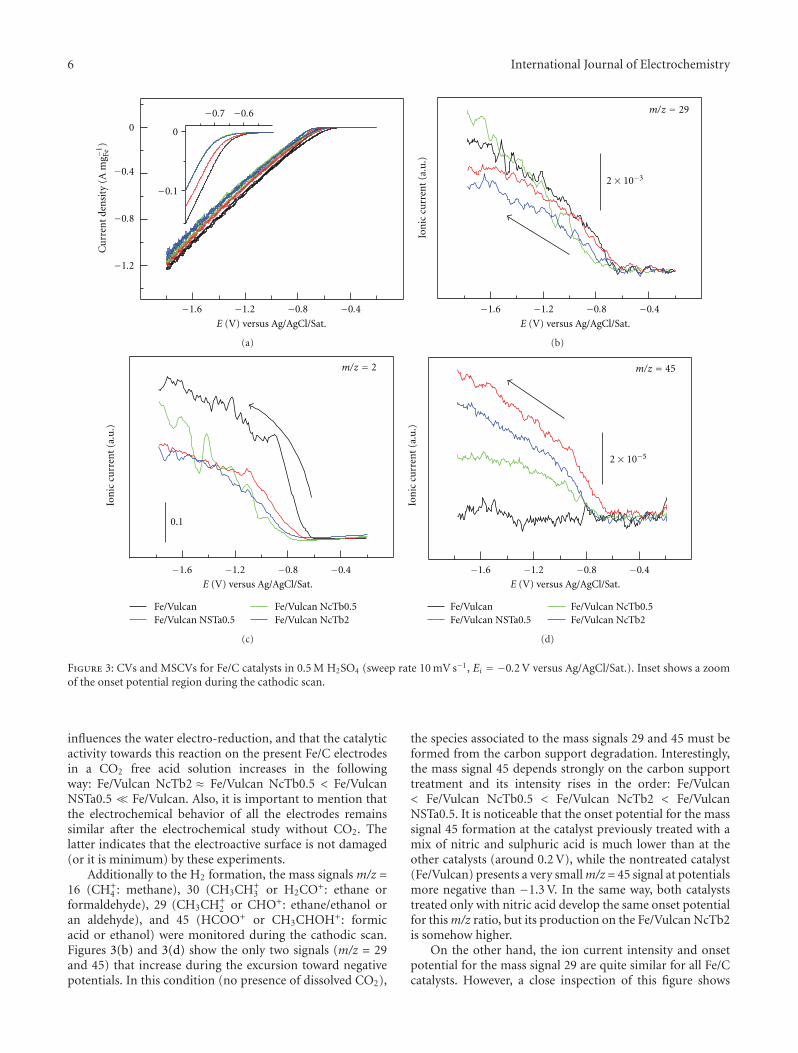
6 International Journal of Electrochemistry
−1.6 −1.2 −0.8 −0.4
−1.2
−0.8
−0.4
0
−0.7 −0.6
−0.1
0
Cu
rren
tde
nsi
ty(A
mg−
1Fe
)
E (V) versus Ag/AgCl/Sat.
(a)
−1.6 −1.2 −0.8 −0.4
Ion
iccu
rren
t(a
.u.)
m/z = 29
2× 10⁻³
E (V) versus Ag/AgCl/Sat.
(b)
−1.6 −1.2 −0.8 −0.4
Ion
iccu
rren
t(a
.u.)
m/z = 2
0.1
Fe/VulcanFe/Vulcan NSTa0.5
Fe/Vulcan NcTb0.5Fe/Vulcan NcTb2
E (V) versus Ag/AgCl/Sat.
(c)
−1.6 −1.2 −0.8 −0.4
Ion
iccu
rren
t(a
.u.)
m/z = 45
2× 10⁻⁵
Fe/VulcanFe/Vulcan NSTa0.5
Fe/Vulcan NcTb0.5Fe/Vulcan NcTb2
E (V) versus Ag/AgCl/Sat.
(d)
Figure 3: CVs and MSCVs for Fe/C catalysts in 0.5 M H2SO4 (sweep rate 10 mV s−1, Ei = −0.2 V versus Ag/AgCl/Sat.). Inset shows a zoomof the onset potential region during the cathodic scan.
influences the water electro-reduction, and that the catalyticactivity towards this reaction on the present Fe/C electrodesin a CO2 free acid solution increases in the followingway: Fe/Vulcan NcTb2 ≈ Fe/Vulcan NcTb0.5 < Fe/VulcanNSTa0.5� Fe/Vulcan. Also, it is important to mention thatthe electrochemical behavior of all the electrodes remainssimilar after the electrochemical study without CO2. Thelatter indicates that the electroactive surface is not damaged(or it is minimum) by these experiments.
Additionally to the H2 formation, the mass signals m/z =16 (CH+
4 : methane), 30 (CH3CH+3 or H2CO+: ethane or
formaldehyde), 29 (CH3CH+2 or CHO+: ethane/ethanol or
an aldehyde), and 45 (HCOO+ or CH3CHOH+: formicacid or ethanol) were monitored during the cathodic scan.Figures 3(b) and 3(d) show the only two signals (m/z = 29and 45) that increase during the excursion toward negativepotentials. In this condition (no presence of dissolved CO2),
the species associated to the mass signals 29 and 45 must beformed from the carbon support degradation. Interestingly,the mass signal 45 depends strongly on the carbon supporttreatment and its intensity rises in the order: Fe/Vulcan< Fe/Vulcan NcTb0.5 < Fe/Vulcan NcTb2 < Fe/VulcanNSTa0.5. It is noticeable that the onset potential for the masssignal 45 formation at the catalyst previously treated with amix of nitric and sulphuric acid is much lower than at theother catalysts (around 0.2 V), while the nontreated catalyst(Fe/Vulcan) presents a very small m/z = 45 signal at potentialsmore negative than −1.3 V. In the same way, both catalyststreated only with nitric acid develop the same onset potentialfor this m/z ratio, but its production on the Fe/Vulcan NcTb2is somehow higher.
On the other hand, the ion current intensity and onsetpotential for the mass signal 29 are quite similar for all Fe/Ccatalysts. However, a close inspection of this figure shows
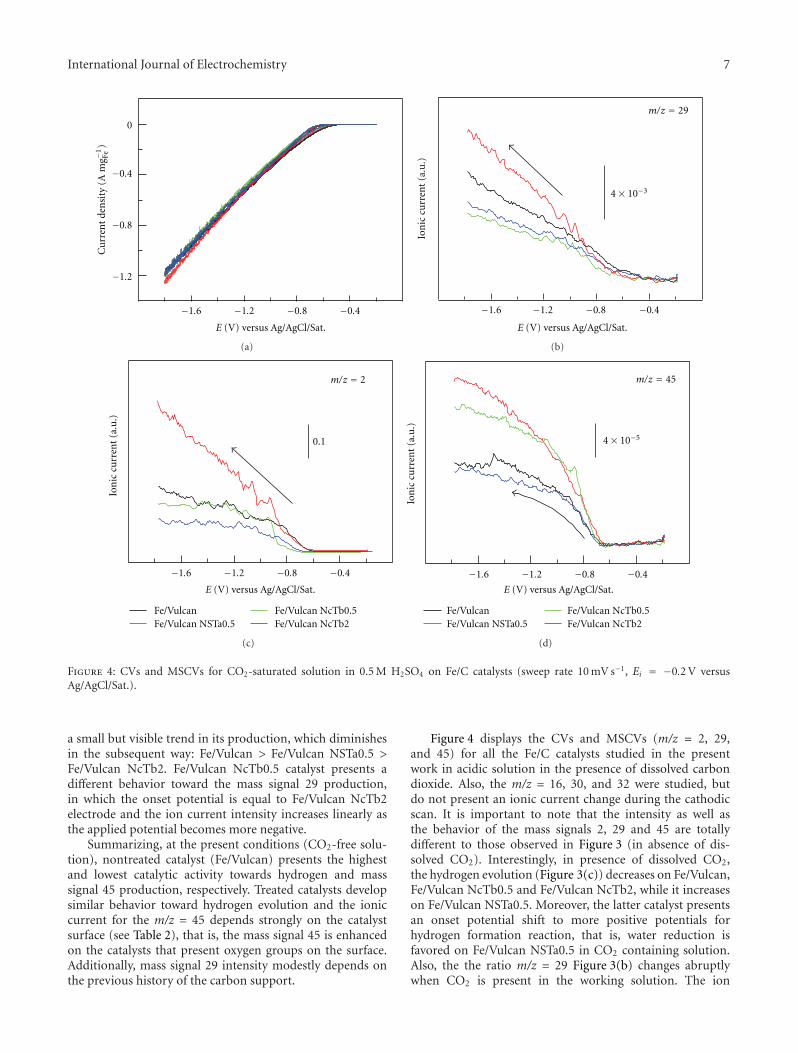
International Journal of Electrochemistry 7
−1.6 −1.2 −0.8 −0.4
−1.2
−0.8
−0.4
0
Cu
rren
tde
nsi
ty(A
mg−
1Fe
)
E (V) versus Ag/AgCl/Sat.
(a)
−1.6 −1.2 −0.8 −0.4
Ion
iccu
rren
t(a
.u.)
m/z = 29
4× 10⁻³
E (V) versus Ag/AgCl/Sat.
(b)
−1.6 −1.2 −0.8 −0.4
Ion
iccu
rren
t(a
.u.)
m/z = 2
0.1
Fe/VulcanFe/Vulcan NSTa0.5
Fe/Vulcan NcTb0.5Fe/Vulcan NcTb2
E (V) versus Ag/AgCl/Sat.
(c)
−1.6 −1.2 −0.8 −0.4
Ion
iccu
rren
t(a
.u.)
m/z = 45
4× 10⁻⁵
Fe/VulcanFe/Vulcan NSTa0.5
Fe/Vulcan NcTb0.5Fe/Vulcan NcTb2
E (V) versus Ag/AgCl/Sat.
(d)
Figure 4: CVs and MSCVs for CO2-saturated solution in 0.5 M H2SO4 on Fe/C catalysts (sweep rate 10 mV s−1, Ei = −0.2 V versusAg/AgCl/Sat.).
a small but visible trend in its production, which diminishesin the subsequent way: Fe/Vulcan > Fe/Vulcan NSTa0.5 >Fe/Vulcan NcTb2. Fe/Vulcan NcTb0.5 catalyst presents adifferent behavior toward the mass signal 29 production,in which the onset potential is equal to Fe/Vulcan NcTb2electrode and the ion current intensity increases linearly asthe applied potential becomes more negative.
Summarizing, at the present conditions (CO2-free solu-tion), nontreated catalyst (Fe/Vulcan) presents the highestand lowest catalytic activity towards hydrogen and masssignal 45 production, respectively. Treated catalysts developsimilar behavior toward hydrogen evolution and the ioniccurrent for the m/z = 45 depends strongly on the catalystsurface (see Table 2), that is, the mass signal 45 is enhancedon the catalysts that present oxygen groups on the surface.Additionally, mass signal 29 intensity modestly depends onthe previous history of the carbon support.
Figure 4 displays the CVs and MSCVs (m/z = 2, 29,and 45) for all the Fe/C catalysts studied in the presentwork in acidic solution in the presence of dissolved carbondioxide. Also, the m/z = 16, 30, and 32 were studied, butdo not present an ionic current change during the cathodicscan. It is important to note that the intensity as well asthe behavior of the mass signals 2, 29 and 45 are totallydifferent to those observed in Figure 3 (in absence of dis-solved CO2). Interestingly, in presence of dissolved CO2,the hydrogen evolution (Figure 3(c)) decreases on Fe/Vulcan,Fe/Vulcan NcTb0.5 and Fe/Vulcan NcTb2, while it increaseson Fe/Vulcan NSTa0.5. Moreover, the latter catalyst presentsan onset potential shift to more positive potentials forhydrogen formation reaction, that is, water reduction isfavored on Fe/Vulcan NSTa0.5 in CO2 containing solution.Also, the the ratio m/z = 29 Figure 3(b) changes abruptlywhen CO2 is present in the working solution. The ion

8 International Journal of Electrochemistry
current intensity for this mass signal in a CO2-containingsolution is higher than in a CO2-free one, and it drops off inthe sequence: Fe/Vulcan NSTa0.5 > Fe/Vulcan > Fe/VulcanNcTb2 ≈ Fe/Vulcan NcTa0.5, whereas the onset potential isquite similar for all the electrodes.
On the other hand, Figure 4(d) shows an importantenhancement of the mass signal 45 at all the catalysts whenCO2 is present in the solution. These experimental factsunequivocally indicate that carbon dioxide is reduced toform hydrocarbonated compounds such as formic acid. Theformation of acids, alcohols, or other molecules, whichcontain longer hydrocarbon chains, is not discarded but thischaracterization is not the principal purpose of the presentwork: the main reasons of the present study are to know if itis possible to electrochemically reduce CO2 on iron catalystsand to establish if the carbon support influences on thisparticular reaction. Therefore, only the mass signals 2 and45 are going to be followed along the present manuscript.
3.3.2. Current Transient (CT) and Mass Spectrometric Tran-sient (MST). Potentiostatic pulse experiments were per-formed from a potential where nonfaradaic reactions occur(Ei = −0.2 V) to a final potential (Ef = −1.8 V) wherethe CO2 reduction reaction is controlled by mass diffusion.Current transients for all the Fe/C catalysts used in thepresent work in absence (a) and presence (b) of dissolvedCO2 in sulphuric acid solution can be seen in Figure 5. Itis observed similar faradaic current intensities than thoseobtained during the potentiodymanic experiments (Figures3(a) and 4(a)), that is, Fe/Vulcan NcTb2 presents at bothmediums (in presence and absence of dissolved CO2) thelowest faradaic current, while the other catalysts developsimilar faradaic currents. Consistent with the results pre-sented above, molecular hydrogen production is significantlyinfluenced by the presence of CO2 (Figure 6). Fe/Vulcan andFe/Vulcan NSTa0.5 electrodes present the highest catalyticactivity toward H2 formation in absence and presence ofCO2, respectively. Also, it is noticeable that the signalfor m/z = 2 decreases abruptly on Fe/Vulcan, Fe/VulcanNcTb0.5, and Fe/Vulcan NcTb2 catalysts, while the samereaction is enhanced on the Fe/Vulcan NSTa0.5 when CO2
is present in solution.
Figure 7(a) shows the MSTs for the mass signal 45.Currents obtained are of the same order of magnitudethan in the voltammetric experiments. However, a closeinspection of the curves reveals that the m/z = 45 signalcontinuously increases on Fe/Vulcan catalyst along the time,while the other catalysts present a constant ionic current.The latter suggests that the support time degradation is moreimportant at this material. In this sense, it is important toremind that Fe/Vulcan electrode presents small quantity ofoxygenated species on the surface (see Table 2), that is, thiscatalyst suffers a dreadful condition at this potential. On theother hand, when CO2 is present in solution (Figure 7(b))the intensity of the mass signal 45 changes dramatically(about five fold times), as it was observed before theMSCV experiments (Section 3.3.1). In fact, the ionic currentintensities for the mass signal 45 grow up on the studied
50 100 150 200 250 300
−1
−0.5
0
Cu
rren
tde
nsi
ty(A
mg−
1Fe
)
t (s)
CO2-free
(a)
50 100 150 200 250 300
−1
−0.5
0
Fe/Vulcan Fe/Vulcan NcTb0.5Fe/Vulcan NcTb2
Cu
rren
tde
nsi
ty(A
mg−
1Fe
)
t (s)
CO2-saturated
Fe/Vulcan NSTa0.5
(b)
Figure 5: CTs for CO2-free (a) and CO2-saturated (b) solution in0.5 M H2SO4 on Fe/C catalysts (Ei = −0.2 V, Ef = −1.8 versusAg/AgCl/Sat.).
catalysts in the following way: Fe/Vulcan NcTb2 < Fe/Vulcan< Fe/Vulcan NcTb0.5 < Fe/Vulcan NSTa0.5.
In order to acquire a realistic result of hydrocarbonproduction from carbon dioxide reduction, the mass signal45 was subtracted from the ionic current signals obtainedwith dissolved CO2 in solution (Figure 7(b)) and thoseacquired in a CO2-free solution (Figure 7(a)) and repre-sented in Figure 8. In this context, it is really importantto know that this subtraction can be only done if allthe parameters concerning to the mass spectrometer areconstant [44], and because of this, our mass spectrometersetup was build up to make all this parameters accurate[39]. Therefore, Figure 8 shows a realistic catalytic activitytoward carbon dioxide reduction. In fact, it can be observedthat the typical features of a reaction controlled by massdiffusion, and even more important that the carbon dioxidereduction, or what is the same in this event, the hydrocarbonproduction depends strongly on the catalyst support andit increases as follows: Fe/Vulcan NcTb2 < Fe/Vulcan <Fe/Vulcan NSTa0.5 ≈ Fe/Vulcan NcTb0.5.
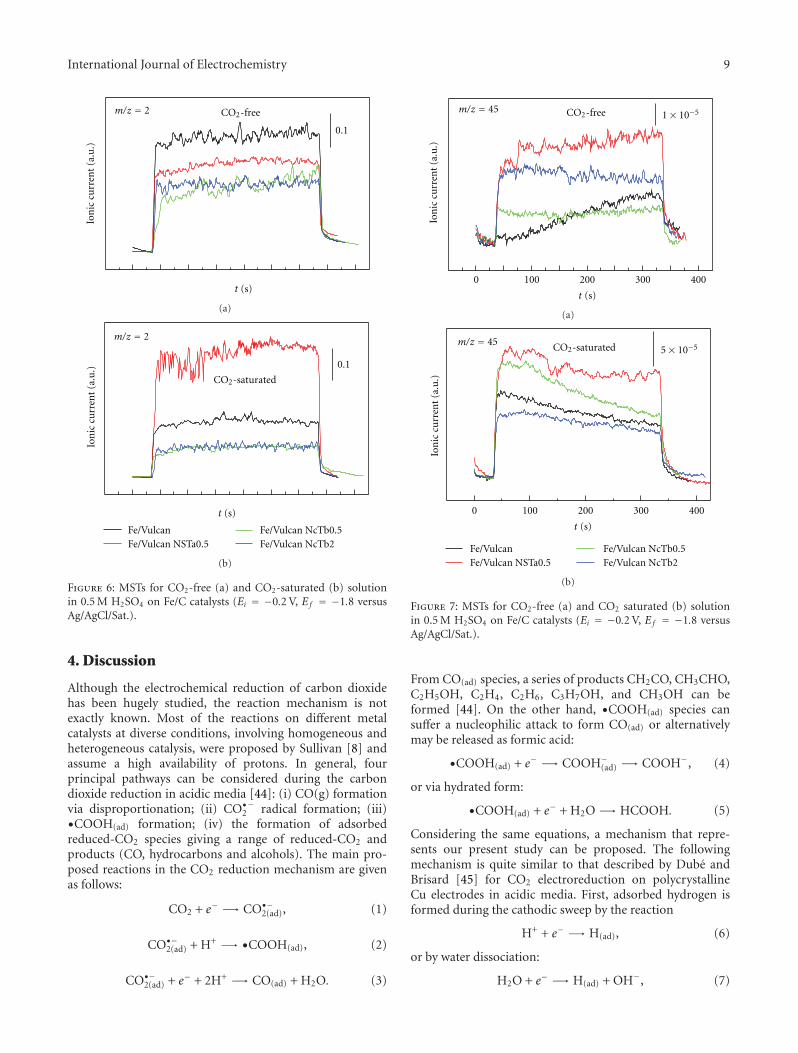
International Journal of Electrochemistry 9
Ion
iccu
rren
t(a
.u.)
m/z = 2
0.1
CO2-free
t (s)
(a)
m/z = 2
0.1
Ion
iccu
rren
t(a
.u.)
CO2-saturated
Fe/Vulcan Fe/Vulcan NcTb0.5Fe/Vulcan NcTb2Fe/Vulcan NSTa0.5
t (s)
(b)
Figure 6: MSTs for CO2-free (a) and CO2-saturated (b) solutionin 0.5 M H2SO4 on Fe/C catalysts (Ei = −0.2 V, Ef = −1.8 versusAg/AgCl/Sat.).
4. Discussion
Although the electrochemical reduction of carbon dioxidehas been hugely studied, the reaction mechanism is notexactly known. Most of the reactions on different metalcatalysts at diverse conditions, involving homogeneous andheterogeneous catalysis, were proposed by Sullivan [8] andassume a high availability of protons. In general, fourprincipal pathways can be considered during the carbondioxide reduction in acidic media [44]: (i) CO(g) formationvia disproportionation; (ii) CO•2
− radical formation; (iii)•COOH(ad) formation; (iv) the formation of adsorbedreduced-CO2 species giving a range of reduced-CO2 andproducts (CO, hydrocarbons and alcohols). The main pro-posed reactions in the CO2 reduction mechanism are givenas follows:
CO2 + e− −→ CO•−2(ad), (1)
CO•−2(ad) + H+ −→ •COOH(ad), (2)
CO•−2(ad) + e− + 2H+ −→ CO(ad) + H2O. (3)
0 100 200 300 400
t (s)
Ion
iccu
rren
t(a
.u.)
m/z = 451× 10−5CO2-free
(a)
0 100 200 300 400
t (s)
Ion
iccu
rren
t(a
.u.)
5× 10⁻⁵m/z = 45
Fe/Vulcan Fe/Vulcan NcTb0.5Fe/Vulcan NcTb2Fe/Vulcan NSTa0.5
CO2-saturated
(b)
Figure 7: MSTs for CO2-free (a) and CO2 saturated (b) solutionin 0.5 M H2SO4 on Fe/C catalysts (Ei = −0.2 V, Ef = −1.8 versusAg/AgCl/Sat.).
From CO(ad) species, a series of products CH2CO, CH3CHO,C2H5OH, C2H4, C2H6, C3H7OH, and CH3OH can beformed [44]. On the other hand, •COOH(ad) species cansuffer a nucleophilic attack to form CO(ad) or alternativelymay be released as formic acid:
•COOH(ad) + e− −→ COOH−(ad) −→ COOH−, (4)
or via hydrated form:
•COOH(ad) + e− + H2O −→ HCOOH. (5)
Considering the same equations, a mechanism that repre-sents our present study can be proposed. The followingmechanism is quite similar to that described by Dube andBrisard [45] for CO2 electroreduction on polycrystallineCu electrodes in acidic media. First, adsorbed hydrogen isformed during the cathodic sweep by the reaction
H+ + e− −→ H(ad), (6)
or by water dissociation:
H2O + e− −→ H(ad) + OH−, (7)

10 International Journal of Electrochemistry
0 100 200 300 400
m/z = 45
t (s)
Ion
iccu
rren
t(a
.u.)
1× 10⁻⁵
Fe/Vulcan NcTb2Fe/Vulcan NcTb0.5Fe/Vulcan NSTa0.5Fe/Vulcan
Figure 8: Corrected MSTs for CO2 electroreduction in 0.5 MH2SO4 on Fe/C catalysts (Ei = −0.2 V, Ef = −1.8 versus Ag/AgCl/Sat.).
followed by hydrogen evolution:
2H(ad) −→ H2. (8)
Then, carbon dioxide bubbled trough the solution mayadsorb and react on the iron-based catalysts in acidicsolution in the subsequent way:
CO2 ←→ CO2(ad), (9)
CO2(ad) + 2H(ad) −→ CO(ad) + H2O, (10)
CO2(ad) + H(ad) −→ COOH(ad), (11)
COOH(ad) + H(ad) −→ HCOOH, (12)
COOH(ad) + H(ad) −→ CO(ad) + H2O. (13)
The present mechanism is limited by the hydrogen (6)and carbon dioxide (9) adsorption reactions, which arenecessary steps to form hydrogenated molecules. In fact, theavailability of protons and the adsorbed hydrogen coverageon the surface have a strong influence on these reactions.Moreover, the metal surface must interact preferentially witha CO2 species than with adsorbed hydrogen, otherwise,
hydrogen evolution reaction will be predominant at theelectrode and carbon dioxide reduction reaction will behindered.
Accordingly, two main pathways are possible.
(i) CO(ad) formation (reaction (10)): the production ofthis species is favored when the metal surface is highlycovered by adsorbed hydrogen and prefer to reactwith adsorbed carbon dioxide instead of reactingwith each other. Therefore, the hydrogen evolutionreaction will be apparently inhibited in this event.It seems that this path is governing on Fe/VulcanNcTb2, Fe/Vulcan, Fe/Vulcan NcTb0.5 catalysts. Infact, it is clearly observed in the MSCVs and MSTsfor m/z = 2 of all catalysts (with the exceptionof Fe/Vulcan NSTa0.5) in absence and presence ofdissolved CO2 (Figures 3, 4, and 6), in which the masscurrent signal associated to H2 production decreasesin presence of dissolved carbon dioxide. So, theseiron catalysts have a preference to adsorb CO2 insteadof producing molecular hydrogen, and consequently,adsorbed hydrogen reacts with adsorbed carbondioxide to produce hydrogenated species mainlythrough reaction (10). As it was described before,from adsorbed carbon monoxide it is possible toform products such as HCOH, CH2CO, CH3CHO,C2H5OH, C2H4, C2H6, C3H7OH and CH3OH [45,46].
(ii) COOH(ad) production (reaction (11)): this pathwaygives mainly formic acid as a final product (reac-tion (12)). Reaction (11) is favoured on surfaceswith preference to produce molecular hydrogen, andtherefore, with a low H2 coverage. In other words,adsorbed hydrogen species prefer to react with eachother to form molecular hydrogen instead to reactwith adsorbed carbon dioxide. Therefore, hydrogenevolution reaction is usually favoured in parallel tothis reaction. Nevertheless, adsorbed carbon monox-ide formation (reaction (13)) cannot be discarded.Thus, if CO(ad) is produced, the operative mechanismwill be the same than that described above (reactionpath i). In this context, Fe/Vulcan NSTa0.5 catalystis the only one that does not follow the behaviorobserved for the other catalysts. In fact, this catalystenhances the hydrogen evolution (m/z = 2) and masssignal 45 in presence of CO2. The latter suggests thatFe/Vulcan NSTa0.5 catalyst follows principally thereaction path (ii).
Furthermore, the native oxygenated species on the car-bon support may follow the same reactions during the ca-thodic scan (at least in absence of dissolved CO2, see Figures3 and 7(a)).
In this context, the mass signal 29 can be attributedto the first reaction path (i), while m/z = 45 can beassociated with formic acid production (ii). Nevertheless,the last mass signal also could be linked to the reactionpath (i), that is, it could be related to a fragmentation of along hydrogenated species such as ethanol, which presents
International Journal of Electrochemistry 11
27, 29, 31, and 45 ion current signals. In this sense, in aforthcoming work, will be discussed in detail the speciesproduced during the carbon dioxide reduction on ironcatalysts.
Additionally, it is observed that all the present surfacereactions are strongly affected by the carbon support. Thisstatement is observed in the MSCVs for m/z = 2, 29, and45 in Figures 3 and 4, and strongly confirmed by the MSTsfor molecular hydrogen and formic acid production depictedin Figures 6 and 7, respectively. It seems that surface oxygengroups enhance the catalytic activity toward CO2 reduction.However, Fe/Vulcan NcTb2 presents the lowest ion currentintensities, suggesting that longer treatment times of carbonsupport in nitric acid destroy (at least partially) the supportstructure, and consequently, the catalytic activity towardsCO2 diminishes.
On the other hand, the surface chemistry of the carbonsupport could explain the different catalytic activity towardCO2 reduction recorded on Fe/Vulcan NSTa0.5. VulcanNSTa0.5 is the only support that suffered the oxidationtreatment at ambient temperature in the presence of nitricand sulphuric acid. A temperature effect must be discardedsince the material catalyst supported on untreated Vulcanfollows the same behavior than the other catalysts. Therefore,the presence of sulphuric acid in the treatment that provideshigh quantity of oxygenated species on the surface seems tobe the main responsible for the different behavior observedduring the carbon dioxide reduction on Fe/Vulcan NSTa0.5electrode.
5. Conclusions
Fe catalysts supported on Vulcan XC-72R were synthesizedby the polyol method, using ethylenglycol as solvent andreducing agent. Before the metal deposition, surface chem-istry of the Vulcan was modified by different oxidationtreatments in order to study the influence of the surfacechemistry of the support on the catalytic properties of thematerials. During these treatments surface oxygen groupswere created, being HNO3 treatment at boiling temperaturefor 2 h the most effective in creating functional groups, whileHNO3-H2SO4 treatment at room temperature produces thehighest CO/CO2 ratio of functional groups in the surface.These treatments strongly affect the behavior of the iron-based catalysts toward the carbon dioxide reduction. Infact, two main reaction paths were identified during thecarbon dioxide reduction, both influenced by the sur-face properties of the carbon support. Additionally, thesetreatments also modified the textural and morphologicalproperties of Vulcan. A decrease of the surface area, aswell as a partial destruction of its structure, was observedas the severity of oxidation treatments increased. Finally,Fe/Vulcan NSTa0.5 and Fe/Vulcan NcTb0.5 present thehighest and lowest catalytic activity toward the hydrogenevolution reaction, though both catalysts develop the highestproduction of the mass signal 45 (formic acid and/orhigher carbon-chain products) in presence of dissolvedCO2.
Acknowledgments
The authors gratefully acknowledge financial support givenby MICINN (MAT2008-06631-C03-01 and 02) and Gobier-no de Aragon and Obra Social La Caixa (GA-LC-008/2009).S. Perez-Rodrıguez acknowledges Gobierno de Aragon forthe DGA grant. G. Garcıa acknowledges to the JAE program(CSIC) for financial support.
References
[1] S. Ichikawa, “Chemical conversion of carbon dioxide by cata-lytic hydrogenation and room temperature photoelectrocatal-ysis,” Energy Conversion and Management, vol. 36, no. 6–9, pp.613–616, 1995.
[2] T. Inui, M. Anpo, K. Izui, S. Yanagida, and T. Yamaguchi,Advances in Chemical Conversions for Mitigating Carbon Di-oxide, Elsevier Science, Amsterdam, The Netherlands, 1998.
[3] M. M. Halmann, Greenhouse Gas Carbon Dioxide Mitigation,Lewis, Washington, DC, USA, 1999.
[4] Ch. Song, A. Gaffney, and K. Fujimoto, CO2 Conversion andUtilization, American Chemical Society, Washington, DC,USA, 2009.
[5] F. R. Keene and B. P. Sullivan, “Mechanisms of the electro-chemical reduction of carbon dioxide catalyzed by transitionmetal complexes,” in Electrochemical and Electrocatalytic Reac-tions of Carbon Dioxide, B. P. Sullivan, K. Krist, and H. E.Guard, Eds., Elsevier, Amsterdam, The Netherlands, 1993.
[6] M. Aulice Scibioh and V. R. Vijayaraghavan, “Electrocatalyticreduction of carbon dioxide : its relevance and importance,”Journal of Scientific and Industrial Research, vol. 57, no. 3, pp.111–123, 1998.
[7] M. M. Halmann, Chemical Fixation of Carbon Dioxide: Meth-ods for Recycling CO2 into Useful Products, CRC Press, BocaRaton, Fla, USA, 1993.
[8] B. P. Sullivan, Electrochemical and Electrocatalytic Reductionof Carbon Dioxide, Elsevier Press, Amsterdam, Netherlands,1993.
[9] T. Weimer, K. Schaber, M. Specht, and A. Bandi, “Methanolfrom atmospheric carbon dioxide: a liquid zero emission fuelfor the future,” Energy Conversion and Management, vol. 37,no. 6–8, pp. 1351–1356, 1996.
[10] D. Mignard, M. Sahibzada, J. M. Duthie, and H. W. Whitting-ton, “Methanol synthesis from flue-gas CO2 and renewableelectricity: a feasibility study,” International Journal of Hydro-gen Energy, vol. 28, no. 4, pp. 455–464, 2003.
[11] M. Jitaru, “Electrochemical carbon dioxide reduction—Fun-damental and applied topics (review),” Journal of the Univer-sity of Chemical Technology and Metallurgy, vol. 42, no. 4, pp.333–344, 2007.
[12] M. Gattrell, N. Gupta, and A. Co, “A review of the aqueouselectrochemical reduction of CO2 to hydrocarbons at copper,”Journal of Electroanalytical Chemistry, vol. 594, no. 1, pp. 1–19,2006.
[13] I. Taniguchi, “Electrochemical and photoelectrochemicalreduction of carbon dioxide,” in Modem Aspects of Electro-chemistry, J. O’M. Bockris, R. E. White, and B. E. Conway, Eds.,p. 327, Plenum, New York, NY, USA, 1989.
[14] D. L. DuBois, “Electrochemical reactions of carbon dioxide,”in Encyclopaedia of Electrochemistry, A. J. Bard and M. Strat-mann, Eds., pp. 202–225, Wiley-VCH, Weinheim, Germany,2006.
12 International Journal of Electrochemistry
[15] Y. Hori, H. Wakebe, T. Tsukamoto, and O. Koga, “Electrocat-alytic process of CO selectivity in electrochemical reductionof CO2 at metal electrodes in aqueous media,” ElectrochimicaActa, vol. 39, no. 11-12, pp. 1833–1839, 1994.
[16] Y. Hori, “CO2 reduction catalyzed by metal electrodes,”in Handbook of Fuel Cells—Fundamentals, Technology andApplications, W. Vielstich, H. A. Gasteiger, and A. Lamm, Eds.,vol. 2, pp. 720–733, John Wiley & Sons, New York, NY, USA,2003.
[17] M. Azuma, K. Hashimoto, M. Hiramoto, M. Watanabe, andT. Sakata, “Electrochemical reduction of carbon dioxide onvarious metal electrodes in low-temperature aqueous KHCO3
media,” Journal of the Electrochemical Society, vol. 137, no. 6,pp. 1772–1778, 1990.
[18] K. Hara, A. Kudo, and T. Sakata, “Electrochemical reductionof carbon dioxide under high pressure on various electrodes inan aqueous electrolyte,” Journal of Electroanalytical Chemistry,vol. 391, no. 1-2, pp. 141–147, 1995.
[19] S. Nakagawa, A. Kudo, M. Azuma, and T. Sakata, “Effect ofpressure on the electrochemical reduction of CO2 on GroupVIII metal electrodes,” Journal of Electroanalytical Chemistry,vol. 308, no. 1-2, pp. 339–343, 1991.
[20] K. Hara, A. Kudo, and T. Sakata, “Electrochemical reduction ofhigh pressure carbon dioxide on Fe electrodes at large currentdensity,” Journal of Electroanalytical Chemistry, vol. 386, no. 1-2, pp. 257–260, 1995.
[21] H. De Jesus-Cardona, C. Del Moral, and C. R. Cabrera, “Vol-tammetric study of CO2 reduction at Cu electrodes underdifferent KHCO3 concentrations, temperatures and CO2 pres-sures,” Journal of Electroanalytical Chemistry, vol. 513, no. 1,pp. 45–51, 2001.
[22] S. Kaneco, N. H. Hiei, Y. Xing et al., “High-efficiency electro-chemical CO2-to-methane reduction method using aqueousKHCO3 media at less than 273 K,” Journal of Solid StateElectrochemistry, vol. 7, no. 3, pp. 152–156, 2003.
[23] S. Kaneco, N. H. Hiei, Y. Xing et al., “Electrochemical con-version of carbon dioxide to methane in aqueous NaHCO3solution at less than 273 K,” Electrochimica Acta, vol. 48, no. 1,pp. 51–55, 2002.
[24] M. Azuma, K. Hashimoto, M. Hiramoto, M. Watanabe, and T.Sakata, “Carbon dioxide reduction at low temperature on var-ious metal electrodes,” Journal of Electroanalytical Chemistry,vol. 260, no. 2, pp. 441–445, 1989.
[25] T. Saeki, K. Hashimoto, N. Kimura, K. Omata, and A. Fujishi-ma, “Electrochemical reduction of CO2 with high current den-sity in a CO2 + methanol medium at various metal electrodes,”Journal of Electroanalytical Chemistry, vol. 404, no. 2, pp. 299–302, 1996.
[26] T. Saeki, K. Hashimoto, N. Kimura, K. Omata, and A. Fujishi-ma, “Electrochemical reduction of CO2 with high current den-sity in a CO2 + methanol medium II. CO formation promotedby tetrabutylammonium cation,” Journal of ElectroanalyticalChemistry, vol. 390, no. 1-2, pp. 77–82, 1995.
[27] K. Ohta, M. Kawamoto, T. Mizuno, and D. A. Lowy, “Electro-chemical reduction of carbon dioxide in methanol at ambienttemperature and pressure,” Journal of Applied Electrochemistry,vol. 28, no. 7, pp. 717–724, 1998.
[28] S. Ohya, S. Kaneco, H. Katsumata, T. Suzuki, and K. Ohta,“Electrochemical reduction of CO2 in methanol with aid ofCuO and Cu2O,” Catalysis Today, vol. 148, no. 3-4, pp. 329–334, 2009.
[29] S. Kaneco, K. Iiba, H. Katsumata, T. Suzuki, and K. Ohta,“Electrochemical reduction of high pressure CO2 at a Cu
electrode in cold methanol,” Electrochimica Acta, vol. 51, no.23, pp. 4880–4885, 2006.
[30] S. Kaneco, K. Iiba, K. Ohta, and T. Mizuno, “Electrochemicalreduction of carbon dioxide on copper in methanol with var-ious potassium supporting electrolytes at low temperature,”Journal of Solid State Electrochemistry, vol. 3, no. 7-8, pp. 424–428, 1999.
[31] T. Mizuno, A. Naitoh, and K. Ohta, “Electrochemical reduc-tion of CO2 in methanol at -30◦C,” Journal of ElectroanalyticalChemistry, vol. 391, no. 1-2, pp. 199–201, 1995.
[32] P. A. Christensen, A. Hamnett, A. V. G. Muir, and N. A.Freeman, “CO2 reduction at platinum, gold and glassy carbonelectrodes in acetonitrile. An in-situ FTIR study,” Journal ofElectroanalytical Chemistry, vol. 288, no. 1-2, pp. 197–215,1990.
[33] J. P. Hindermann, G. J. Hutchings, and A. Kiennemann,“Mechanistic aspects of the formation of hydrocarbons andalcohols from CO hydrogenation,” Catalysis Reviews, vol. 35,no. 1, pp. 1–127, 1993.
[34] K. Hara, A. Kudo, and T. Sakata, “Electrochemical CO2
reduction on a glassy carbon electrode under high pressure,”Journal of Electroanalytical Chemistry, vol. 421, no. 1-2, pp. 1–4, 1997.
[35] C. W. B. Bezerra, L. Zhang, H. Liu et al., “A review of heat-treatment effects on activity and stability of PEM fuel cellcatalysts for oxygen reduction reaction,” Journal of PowerSources, vol. 173, no. 2, pp. 891–908, 2007.
[36] Y. Shao, G. Yin, J. Zhang, and Y. Gao, “Comparative inves-tigation of the resistance to electrochemical oxidation ofcarbon black and carbon nanotubes in aqueous sulfuric acidsolution,” Electrochimica Acta, vol. 51, no. 26, pp. 5853–5857,2006.
[37] C. Prado-Burguete, A. Linares-Solano, F. Rodrıguez-Reinoso,and C. S. M. de Lecea, “The effect of oxygen surface groupsof the support on platinum dispersion in Pt/carbon catalysts,”Journal of Catalysis, vol. 115, no. 1, pp. 98–106, 1989.
[38] M. J. Lazaro, L. Calvillo, V. Celorrio, J. I. Pardo, S. Perathoner,and R. Moliner, “Study and application of carbon black VulcanXC-72R in polymeric electrolyte fuel cells,” in Carbon Black:Production, Properties and Uses, I. J. Sanders and T. L. Peeten,Eds., 2011.
[39] S. Perez Rodrıguez, M. Corengia, G. Garcıa, F. C. Zinola, M. J.Lazaro, and E. Pastor, “Gas diffusion electrodes for methanolelectro-oxidation studied by a new DEMS configuration:Influence of the diffusion layer,” accepted for publication inInternational Journal of Hydrogen Energy.
[40] J. L. Figueiredo, M. F. R. Pereira, M. M. A. Freitas, and J. J.M. Orfao, “Modification of the surface chemistry of activatedcarbons,” Carbon, vol. 37, no. 9, pp. 1379–1389, 1999.
[41] D. Sebastian, I. Suelves, R. Moliner, and M. J. Lazaro, “Theeffect of the functionalization of carbon nanofibers on theirelectronic conductivity,” Carbon, vol. 48, no. 15, pp. 4421–4431, 2010.
[42] C. Prado-Burguete, A. Linares-Solano, F. Rodrıguez-Reinoso,and C. S. M. de Lecea, “The effect of oxygen surface groupsof the support on platinum dispersion in Pt/carbon catalysts,”Journal of Catalysis, vol. 115, no. 1, pp. 98–106, 1989.
[43] X. Liu, R. Tang, Q. He, X. Liao, and B. Shi, “Fe(III)-loaded collagen fiber as a heterogeneous catalyst for thephoto-assisted decomposition of malachite green,” Journal ofHazardous Materials, vol. 174, no. 1–3, pp. 687–693, 2010.
[44] O. Wolter and J. Heitbaum, “Differential electrochemical massspectroscopy (dems)- a new method for the study of electrodeprocesses,” Physical Chemistry, vol. 88, no. 1, pp. 2–6, 1984.

International Journal of Electrochemistry 13
[45] P. Dube and G. M. Brisard, “Influence of adsorption processeson the CO2 electroreduction: an electrochemical mass spec-trometry study,” Journal of Electroanalytical Chemistry, vol.582, no. 1-2, pp. 230–240, 2005.
[46] R. P. S. Chaplin and A. A. Wragg, “Effects of process conditionsand electrode material on reaction pathways for carbondioxide electroreduction with particular reference to formateformation,” Journal of Applied Electrochemistry, vol. 33, no. 12,pp. 1107–1123, 2003.
SAGE-Hindawi Access to ResearchInternational Journal of ElectrochemistryVolume 2011, Article ID 129182, 7 pagesdoi:10.4061/2011/129182
Research Article
Investigation of the Performance of Aucore-Pdshell/C as the AnodeCatalyst of Direct Borohydride-Hydrogen Peroxide Fuel Cell
Hong Wang,1 Ying Wang,2 Xianyou Wang,1 Peiying He,1 Lanhua Yi,1 Wei Yi,1 and Xue Liu1
1 Key Laboratory of Environmentally Friendly Chemistry and Applications of Ministry of Education, School of Chemistry,Xiangtan University, Hunan 411105, China
2 School of Chemical Engineering and Pharmacy, Wuhan Institute of Technology, Hubei 430073, China
Correspondence should be addressed to Xianyou Wang, [email protected]
Received 26 April 2011; Accepted 7 September 2011
Academic Editor: Carlos F. Zinola
Copyright © 2011 Hong Wang et al. This is an open access article distributed under the Creative Commons Attribution License,which permits unrestricted use, distribution, and reproduction in any medium, provided the original work is properly cited.
The carbon-supported bimetallic Au-Pd catalyst with core-shell structure is prepared by successive reduction method. The core-shell structure, surface morphology, and electrochemical performances of the catalysts are characterized by X-ray diffraction(XRD), transmission electron microscopy (TEM), ultraviolet-visible absorption spectrometry, linear sweep voltammetry, andchronopotentiometry. The results show that the Au-Pd/C catalyst with core-shell structure exhibits much higher catalytic activityfor the direct oxidation of NaBH4 than pure Au/C catalyst. A direct borohydride-hydrogen peroxide fuel cell, in which the Au-Pd/C with core-shell structure is used as the anode catalyst and the Au/C as the cathode catalyst, shows as high as 68.215 mW cm−2
power density.
1. Introduction
Fuel cells constitute an attractive class of renewable andsustainable energy sources alternative to conventional energysources such as petroleum that has finite reserves. Amongall types of fuel cells, the direct borohydride-hydrogenperoxide fuel cell (DBHFC) has recently attracted increasingattentions because of some excellent features such as highopen circuit potential, low operation temperature, and highpower density [1–8]. The DBHFC is comprised of BH4
−
oxidation at the anode and H2O2 reduction at the cathode;thus, it can be used as a promising power source for space andunderwater applications. Generally, the key of developmentof DBHFC is anode electrocatalyst Cao et al. [9] haveprepared Au/Ni-foam electrode by spontaneous depositionof Au nanoparticles on nickel foam substrates and achievedan open-circuit voltage of about 1.07 V and a peak powerdensity of 100 mW cm−2 at 170 mA cm−2 and 0.6 V at 60◦C.Chatenet et al. [10] reported that electrooxidation of BH4
−
can exchange about 7.5 electrons on Au and Ag electrodesin contrast to about 4 electrons on Pt electrode. The highelectron utilization efficiencies of Au and Ag towards BH4
−
electrooxidation are attributed to their low activity towards
BH4− hydrolysis. However, the catalyst, which causes the low
activity towards BH4− hydrolysis, simultaneously has a low
catalytic activity towards BH4− electrochemical oxidation
reaction. Thus, it is very important for DBHFC applicationto develop high-activity electrocatalysts for the borohydrideoxidation reaction (BOR).
In our previous works, high-activity catalysts suchas carbon-supported hollow gold nanoparticles (HAu/C)[11, 12] and AuCo/C [13] have been studied. Usually, thecore-shell structure is an effective morphology to enhancecatalytic activity. The improvement of catalytic activity ofcore-shell bimetallic nanoparticles is attributed to the uniquestructure in electrocatalysis, which has gained much atten-tion in recent years [14]. Besides, the activity of core-shellstructure is related with the underlying interface betweenthe core and shell metals due to the bimetallic mechanism[15]. It is reported that the core-shell nanoparticle catalystssuch as Ni@Pd/MWCNTs [16] and Ptshell-Aucore/C [17] haveeffectively enhanced the catalytic activity for the electrooxi-dation of methanol. Palladium is an appropriate choice as theshell of the catalyst since it has the similar catalytic activityas platinum, which is more expensive than the former.In this paper, carbon-supported bimetallic Au-Pd catalyst
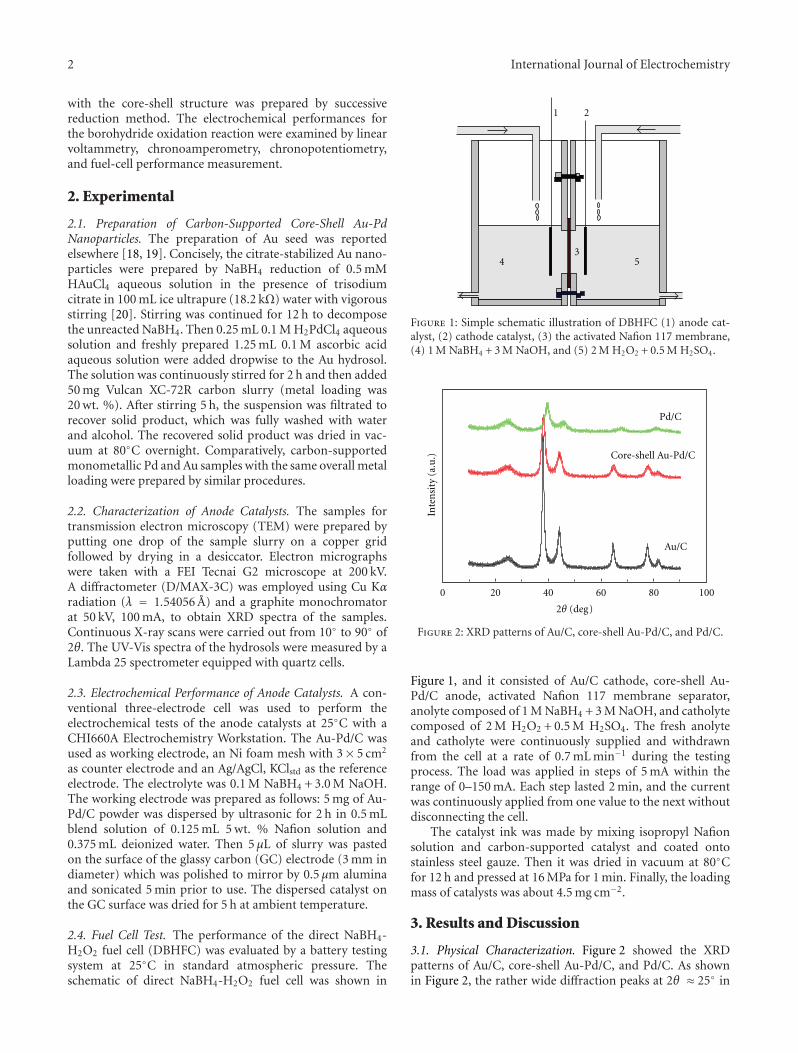
2 International Journal of Electrochemistry
with the core-shell structure was prepared by successivereduction method. The electrochemical performances forthe borohydride oxidation reaction were examined by linearvoltammetry, chronoamperometry, chronopotentiometry,and fuel-cell performance measurement.
2. Experimental
2.1. Preparation of Carbon-Supported Core-Shell Au-PdNanoparticles. The preparation of Au seed was reportedelsewhere [18, 19]. Concisely, the citrate-stabilized Au nano-particles were prepared by NaBH4 reduction of 0.5 mMHAuCl4 aqueous solution in the presence of trisodiumcitrate in 100 mL ice ultrapure (18.2 kΩ) water with vigorousstirring [20]. Stirring was continued for 12 h to decomposethe unreacted NaBH4. Then 0.25 mL 0.1 M H2PdCl4 aqueoussolution and freshly prepared 1.25 mL 0.1 M ascorbic acidaqueous solution were added dropwise to the Au hydrosol.The solution was continuously stirred for 2 h and then added50 mg Vulcan XC-72R carbon slurry (metal loading was20 wt. %). After stirring 5 h, the suspension was filtrated torecover solid product, which was fully washed with waterand alcohol. The recovered solid product was dried in vac-uum at 80◦C overnight. Comparatively, carbon-supportedmonometallic Pd and Au samples with the same overall metalloading were prepared by similar procedures.
2.2. Characterization of Anode Catalysts. The samples fortransmission electron microscopy (TEM) were prepared byputting one drop of the sample slurry on a copper gridfollowed by drying in a desiccator. Electron micrographswere taken with a FEI Tecnai G2 microscope at 200 kV.A diffractometer (D/MAX-3C) was employed using Cu Kαradiation (λ = 1.54056 A) and a graphite monochromatorat 50 kV, 100 mA, to obtain XRD spectra of the samples.Continuous X-ray scans were carried out from 10◦ to 90◦ of2θ. The UV-Vis spectra of the hydrosols were measured by aLambda 25 spectrometer equipped with quartz cells.
2.3. Electrochemical Performance of Anode Catalysts. A con-ventional three-electrode cell was used to perform theelectrochemical tests of the anode catalysts at 25◦C with aCHI660A Electrochemistry Workstation. The Au-Pd/C wasused as working electrode, an Ni foam mesh with 3× 5 cm2
as counter electrode and an Ag/AgCl, KClstd as the referenceelectrode. The electrolyte was 0.1 M NaBH4 + 3.0 M NaOH.The working electrode was prepared as follows: 5 mg of Au-Pd/C powder was dispersed by ultrasonic for 2 h in 0.5 mLblend solution of 0.125 mL 5 wt. % Nafion solution and0.375 mL deionized water. Then 5 μL of slurry was pastedon the surface of the glassy carbon (GC) electrode (3 mm indiameter) which was polished to mirror by 0.5 μm aluminaand sonicated 5 min prior to use. The dispersed catalyst onthe GC surface was dried for 5 h at ambient temperature.
2.4. Fuel Cell Test. The performance of the direct NaBH4-H2O2 fuel cell (DBHFC) was evaluated by a battery testingsystem at 25◦C in standard atmospheric pressure. Theschematic of direct NaBH4-H2O2 fuel cell was shown in
1 2
34 5
Figure 1: Simple schematic illustration of DBHFC (1) anode cat-alyst, (2) cathode catalyst, (3) the activated Nafion 117 membrane,(4) 1 M NaBH4 + 3 M NaOH, and (5) 2 M H2O2 + 0.5 M H2SO4.
0 20 40 60 80 100
Inte
nsi
ty(a
.u.)
Pd/C
Au/C
2θ (deg)
Core-shell Au-Pd/C
Figure 2: XRD patterns of Au/C, core-shell Au-Pd/C, and Pd/C.
Figure 1, and it consisted of Au/C cathode, core-shell Au-Pd/C anode, activated Nafion 117 membrane separator,anolyte composed of 1 M NaBH4 + 3 M NaOH, and catholytecomposed of 2 M H2O2 + 0.5 M H2SO4. The fresh anolyteand catholyte were continuously supplied and withdrawnfrom the cell at a rate of 0.7 mL min−1 during the testingprocess. The load was applied in steps of 5 mA within therange of 0–150 mA. Each step lasted 2 min, and the currentwas continuously applied from one value to the next withoutdisconnecting the cell.
The catalyst ink was made by mixing isopropyl Nafionsolution and carbon-supported catalyst and coated ontostainless steel gauze. Then it was dried in vacuum at 80◦Cfor 12 h and pressed at 16 MPa for 1 min. Finally, the loadingmass of catalysts was about 4.5 mg cm−2.
3. Results and Discussion
3.1. Physical Characterization. Figure 2 showed the XRDpatterns of Au/C, core-shell Au-Pd/C, and Pd/C. As shownin Figure 2, the rather wide diffraction peaks at 2θ ≈ 25◦ in
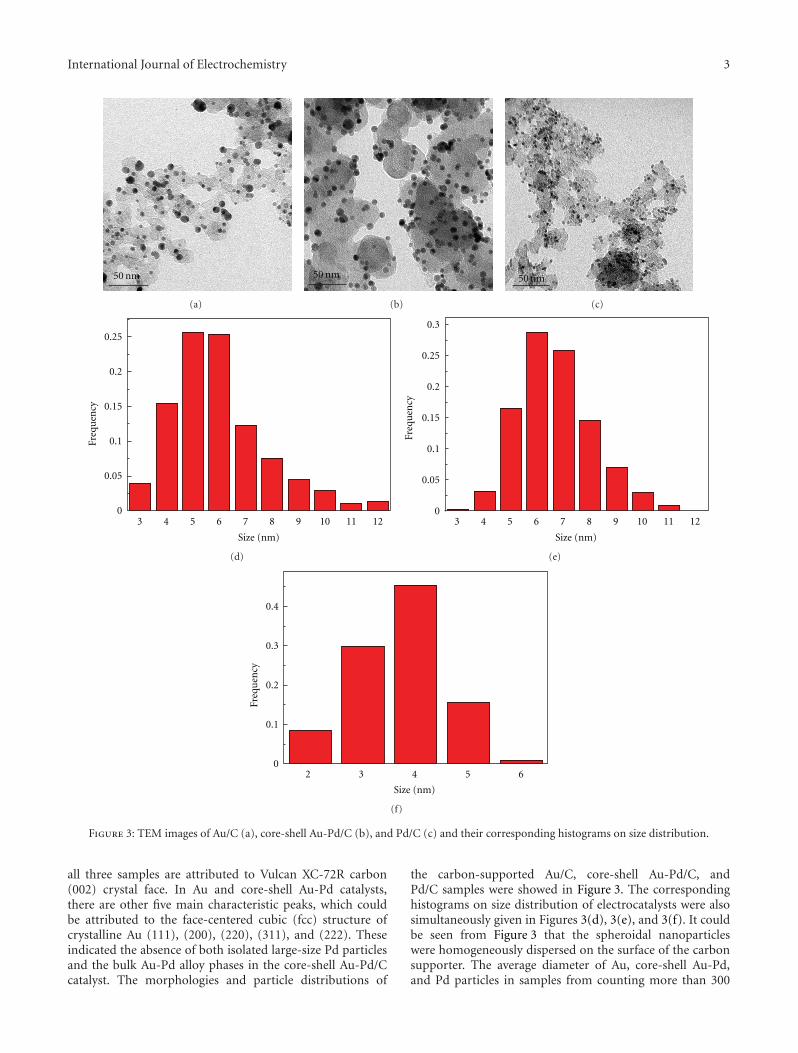
International Journal of Electrochemistry 3
50 nm
(a)
50 nm
(b)
50 nm
(c)
3 4 5 6 7 8 9 10 11 12
Size (nm)
Freq
uen
cy
0
0.05
0.1
0.15
0.2
0.25
(d)
3 4 5 6 7 8 9 10 11 12
Size (nm)
Freq
uen
cy
0
0.05
0.1
0.15
0.2
0.25
0.3
(e)
3 4 5 6
Size (nm)
20
0.1
0.2
0.3
0.4
Freq
uen
cy
(f)
Figure 3: TEM images of Au/C (a), core-shell Au-Pd/C (b), and Pd/C (c) and their corresponding histograms on size distribution.
all three samples are attributed to Vulcan XC-72R carbon(002) crystal face. In Au and core-shell Au-Pd catalysts,there are other five main characteristic peaks, which couldbe attributed to the face-centered cubic (fcc) structure ofcrystalline Au (111), (200), (220), (311), and (222). Theseindicated the absence of both isolated large-size Pd particlesand the bulk Au-Pd alloy phases in the core-shell Au-Pd/Ccatalyst. The morphologies and particle distributions of
the carbon-supported Au/C, core-shell Au-Pd/C, andPd/C samples were showed in Figure 3. The correspondinghistograms on size distribution of electrocatalysts were alsosimultaneously given in Figures 3(d), 3(e), and 3(f). It couldbe seen from Figure 3 that the spheroidal nanoparticleswere homogeneously dispersed on the surface of the carbonsupporter. The average diameter of Au, core-shell Au-Pd,and Pd particles in samples from counting more than 300

4 International Journal of Electrochemistry
300 400 500 600 700
0
0.05
0.1
0.15
0.2
0.25
0.3
0.35
0.4
0.45
Abs
orba
nce
(a.u
.)
Wavenumber (nm)
Au solCore shell Au-Pd solMixed Au and Pd sol
Figure 4: Absorption spectra of Au, core-shell Au-Pd, and mixedAu-Pd hydrosols before deposition on carbon.
particles were about 5.955 nm, 6.705 nm, and 3.613 nm,respectively. Usually, the size of the particle with core-shellstructure, D, can be calculated by [21]
D = Dcore
(1 +
VPd[Pd]VAu[Au]
)1/3
. (1)
Here, Dcore was the measured Au particles size; VPd and VAu
were the academic Pd and Au mole volume, respectively;[Pd] and [Au] were the overall concentrations of the twometals involved, respectively. It had been found from theabove formula that the calculated size of core-shell Au-Pdparticle was 6.719 nm, which is close to actually measuredparticle size (6.705 nm). Besides, the calculated Pd shellthickness was about 0.375 nm.
The absorption spectra of Au hydrosol, core-shellAu-Pd hydrosol, and mixed Au-Pd hydrosol were shownon Figure 4. The absorption peak positioned at 516 nm,which was ascribed to the surface plasmon resonance (SPR)of Au, could be clearly observed for Au hydrosol. For themixed Au-Pd hydrosol, the Au plasmon absorption peakdeclined slightly because of the decrease of the Au hydrosolconcentration. However, for the core-shell Au-Pd hydrosol,the remaining Au plasmon absorption peak indicatedthat the Pd shell was not too thick to overwhelm the SPRresponse of the Au nanoparticles [22].
3.2. Electrochemical Performance of Anode Catalysts. Figure 5showed the linear sweep voltammogram (LSV) of differentcatalysts in 0.1 M NaBH4 + 3.0 M NaOH solution at 25◦Cat a potential sweep rate of 20 mV s−1 in the potentialrange of −1.2 V to 0.6 V versus Ag/AgCl. The Au-Pd/C withcore-shell structure and Pd/C exhibited more negative initialreaction potentials than Au/C due to the BH4
− hydrolysis.The current densities of Au/C, core-shell Au-Pd/C, and Pd/Cwere 20.80 mA cm−2, 24.35 mA cm−2, and 27.89 mA cm−2
− 1.4 − 1.2 − 1 − 0.8 − 0.6 − 0.4 − 0.2
−5
0
5
5
53
Potential (V) versus Ag/AgCl
Au/CCore-shell Au-Pd/CPd/C
0.2 0.4 0.6 0.8
Cu
rren
tde
nsi
ty(m
Acm
−2)
0.0
1
10
20
30
40
25
Figure 5: Linear sweep voltammogram of Au/C, core-shell Au-Pd/C, and Pd/C electrodes.
at −0.2 V versus Ag/AgCl, respectively. The peak currentdensity of Au-Pd/C (34.65 mA cm−2) was nearly close toPd/C (35.44 mA cm−2), which was about 1.7 times higherthan that of Au/C (20.80 mA cm−2). Besides, the areaenclosed by LSV on core-shell Au-Pd/C electrode wasapparently bigger than that on Au/C and Pd/C electrodes.Obviously, the above results indicated that the core-shell Au-Pd/C catalyst had much better catalytic activity than pure Auand Pd catalysts. Moreover, the core-shell Au-Pd/C (4.25 wt.% Pd loading) was more economical than Pd/C (20 wt.% Pd loading). The reasons why the core-shell Au-Pd/Cenhanced the catalytic activity of the borohydride oxidationreaction could correlate with the long-range electromagneticenhancement between the Au core and the Pd shell [23].
Chronopotentiometry was a usefully qualitative screen-ing method for catalyst since it simulated the constant cur-rent operation of a fuel cell. Figure 6 showed the chronopo-tentiometry curves of BH4
− oxidation on the Au/C, core-shell Au-Pd/C, and Pd/C at a current density of 8.5 mA cm−2
in a solution of 0.1 M NaBH4 + 3 M NaOH, respectively.The open-circuit potentials (OCPs) were −0.953 V versusAg/AgCl for Au/C, −1.203 V versus Ag/AgCl for core-shellAu-Pd/C, and−1.188 V versus Ag/AgCl for Pd/C. After 120 s,the operating potential for Au/C, core-shell Au-Pd/C, andPd/C was −0.653 V, −0.920 V, and −0.800 V, respectively.Therefore, it can be expected that the core-shell Au-Pd/Ccatalyst had higher direct electrooxidation catalytic activityand power output than those of Au/C and Pd/C underthe same experimental condition, which also suggested thepossibility of potentially obtaining a higher power output.
In chronoamperometry experiments (Figure 7(a)), thepotential was stepped from −1.2 to −0.2 V versus Ag/AgClin 0.1 M NaBH4 + 3 M NaOH solution. At the beginningof the experiment, the initial current densities of threecarbon-supported catalysts corresponded mainly to double-layer charging. The core-shell Au-Pd/C and Pd/C showed
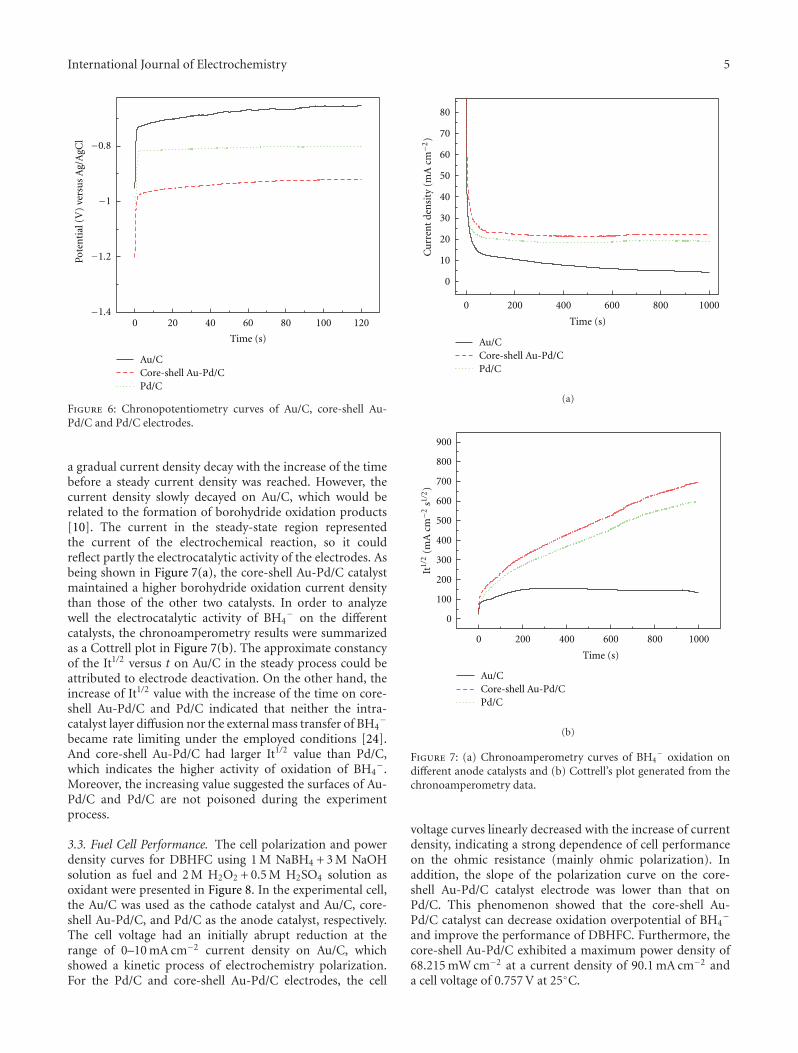
International Journal of Electrochemistry 5
0 20 40 60 80 100 120−1.4
−1.2
−1
−0.8
Pote
nti
al(V
)ve
rsu
sA
g/A
gCl
Time (s)
Au/CCore-shell Au-Pd/CPd/C
Figure 6: Chronopotentiometry curves of Au/C, core-shell Au-Pd/C and Pd/C electrodes.
a gradual current density decay with the increase of the timebefore a steady current density was reached. However, thecurrent density slowly decayed on Au/C, which would berelated to the formation of borohydride oxidation products[10]. The current in the steady-state region representedthe current of the electrochemical reaction, so it couldreflect partly the electrocatalytic activity of the electrodes. Asbeing shown in Figure 7(a), the core-shell Au-Pd/C catalystmaintained a higher borohydride oxidation current densitythan those of the other two catalysts. In order to analyzewell the electrocatalytic activity of BH4
− on the differentcatalysts, the chronoamperometry results were summarizedas a Cottrell plot in Figure 7(b). The approximate constancyof the It1/2 versus t on Au/C in the steady process could beattributed to electrode deactivation. On the other hand, theincrease of It1/2 value with the increase of the time on core-shell Au-Pd/C and Pd/C indicated that neither the intra-catalyst layer diffusion nor the external mass transfer of BH4
−
became rate limiting under the employed conditions [24].And core-shell Au-Pd/C had larger It1/2 value than Pd/C,which indicates the higher activity of oxidation of BH4
−.Moreover, the increasing value suggested the surfaces of Au-Pd/C and Pd/C are not poisoned during the experimentprocess.
3.3. Fuel Cell Performance. The cell polarization and powerdensity curves for DBHFC using 1 M NaBH4 + 3 M NaOHsolution as fuel and 2 M H2O2 + 0.5 M H2SO4 solution asoxidant were presented in Figure 8. In the experimental cell,the Au/C was used as the cathode catalyst and Au/C, core-shell Au-Pd/C, and Pd/C as the anode catalyst, respectively.The cell voltage had an initially abrupt reduction at therange of 0–10 mA cm−2 current density on Au/C, whichshowed a kinetic process of electrochemistry polarization.For the Pd/C and core-shell Au-Pd/C electrodes, the cell
0 200 400 600 800 1000
0
10
20
30
40
50
60
70
80
Cu
rren
tde
nsi
ty(m
Acm
−2)
Time (s)
Au/CCore-shell Au-Pd/CPd/C
(a)
0
100
200
300
400
500
600
700
800
900
It1/
2(m
Acm
−2s1/
2)
0 200 400 600 800 1000
Time (s)
Au/CCore-shell Au-Pd/CPd/C
(b)
Figure 7: (a) Chronoamperometry curves of BH4− oxidation on
different anode catalysts and (b) Cottrell’s plot generated from thechronoamperometry data.
voltage curves linearly decreased with the increase of currentdensity, indicating a strong dependence of cell performanceon the ohmic resistance (mainly ohmic polarization). Inaddition, the slope of the polarization curve on the core-shell Au-Pd/C catalyst electrode was lower than that onPd/C. This phenomenon showed that the core-shell Au-Pd/C catalyst can decrease oxidation overpotential of BH4
−
and improve the performance of DBHFC. Furthermore, thecore-shell Au-Pd/C exhibited a maximum power density of68.215 mW cm−2 at a current density of 90.1 mA cm−2 anda cell voltage of 0.757 V at 25◦C.
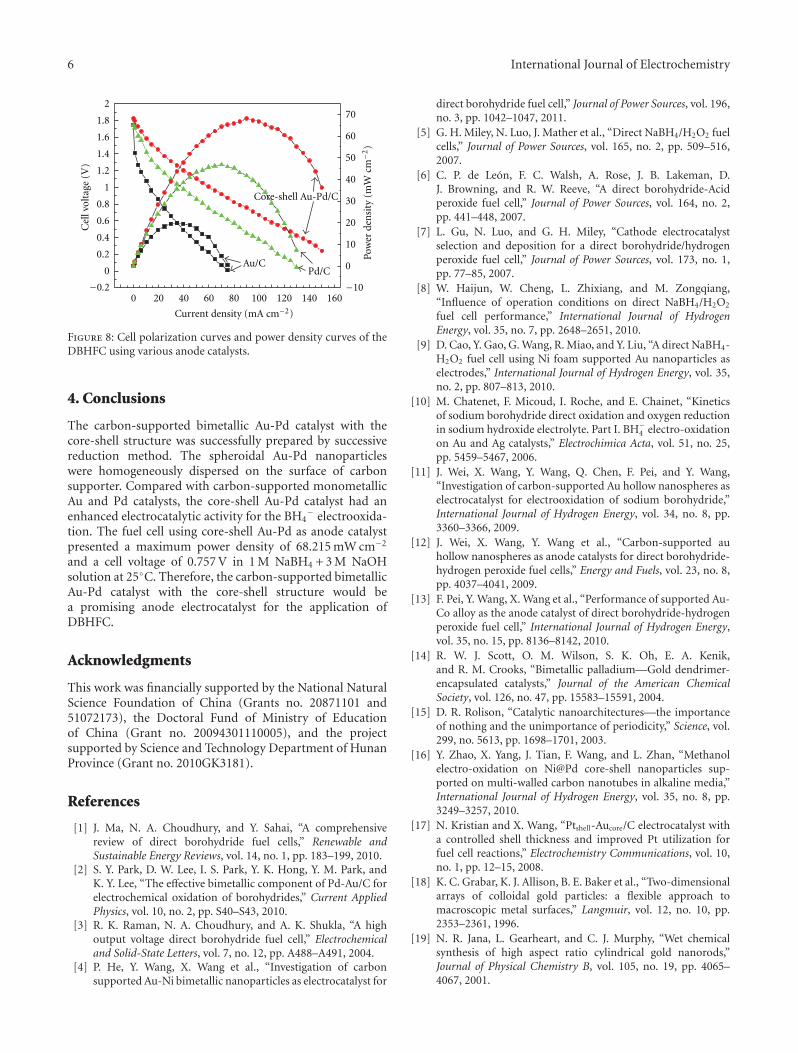
6 International Journal of Electrochemistry
20 40 60 80 100 120 140−0.2
0
0.2
0.4
0.6
0.8
1
1.2
1.4
1.6
1.8
2
Au/CPd/C
0 601
Current density (mA cm−2)
−10
10
20
30
40
50
60
70
0
Pow
erde
nsi
ty(m
Wcm
−2)
Core-shell Au-Pd/C
Cel
lvol
tage
(V)
Figure 8: Cell polarization curves and power density curves of theDBHFC using various anode catalysts.
4. Conclusions
The carbon-supported bimetallic Au-Pd catalyst with thecore-shell structure was successfully prepared by successivereduction method. The spheroidal Au-Pd nanoparticleswere homogeneously dispersed on the surface of carbonsupporter. Compared with carbon-supported monometallicAu and Pd catalysts, the core-shell Au-Pd catalyst had anenhanced electrocatalytic activity for the BH4
− electrooxida-tion. The fuel cell using core-shell Au-Pd as anode catalystpresented a maximum power density of 68.215 mW cm−2
and a cell voltage of 0.757 V in 1 M NaBH4 + 3 M NaOHsolution at 25◦C. Therefore, the carbon-supported bimetallicAu-Pd catalyst with the core-shell structure would bea promising anode electrocatalyst for the application ofDBHFC.
Acknowledgments
This work was financially supported by the National NaturalScience Foundation of China (Grants no. 20871101 and51072173), the Doctoral Fund of Ministry of Educationof China (Grant no. 20094301110005), and the projectsupported by Science and Technology Department of HunanProvince (Grant no. 2010GK3181).
References
[1] J. Ma, N. A. Choudhury, and Y. Sahai, “A comprehensivereview of direct borohydride fuel cells,” Renewable andSustainable Energy Reviews, vol. 14, no. 1, pp. 183–199, 2010.
[2] S. Y. Park, D. W. Lee, I. S. Park, Y. K. Hong, Y. M. Park, andK. Y. Lee, “The effective bimetallic component of Pd-Au/C forelectrochemical oxidation of borohydrides,” Current AppliedPhysics, vol. 10, no. 2, pp. S40–S43, 2010.
[3] R. K. Raman, N. A. Choudhury, and A. K. Shukla, “A highoutput voltage direct borohydride fuel cell,” Electrochemicaland Solid-State Letters, vol. 7, no. 12, pp. A488–A491, 2004.
[4] P. He, Y. Wang, X. Wang et al., “Investigation of carbonsupported Au-Ni bimetallic nanoparticles as electrocatalyst for
direct borohydride fuel cell,” Journal of Power Sources, vol. 196,no. 3, pp. 1042–1047, 2011.
[5] G. H. Miley, N. Luo, J. Mather et al., “Direct NaBH4/H2O2 fuelcells,” Journal of Power Sources, vol. 165, no. 2, pp. 509–516,2007.
[6] C. P. de Leon, F. C. Walsh, A. Rose, J. B. Lakeman, D.J. Browning, and R. W. Reeve, “A direct borohydride-Acidperoxide fuel cell,” Journal of Power Sources, vol. 164, no. 2,pp. 441–448, 2007.
[7] L. Gu, N. Luo, and G. H. Miley, “Cathode electrocatalystselection and deposition for a direct borohydride/hydrogenperoxide fuel cell,” Journal of Power Sources, vol. 173, no. 1,pp. 77–85, 2007.
[8] W. Haijun, W. Cheng, L. Zhixiang, and M. Zongqiang,“Influence of operation conditions on direct NaBH4/H2O2
fuel cell performance,” International Journal of HydrogenEnergy, vol. 35, no. 7, pp. 2648–2651, 2010.
[9] D. Cao, Y. Gao, G. Wang, R. Miao, and Y. Liu, “A direct NaBH4-H2O2 fuel cell using Ni foam supported Au nanoparticles aselectrodes,” International Journal of Hydrogen Energy, vol. 35,no. 2, pp. 807–813, 2010.
[10] M. Chatenet, F. Micoud, I. Roche, and E. Chainet, “Kineticsof sodium borohydride direct oxidation and oxygen reductionin sodium hydroxide electrolyte. Part I. BH−
4 electro-oxidationon Au and Ag catalysts,” Electrochimica Acta, vol. 51, no. 25,pp. 5459–5467, 2006.
[11] J. Wei, X. Wang, Y. Wang, Q. Chen, F. Pei, and Y. Wang,“Investigation of carbon-supported Au hollow nanospheres aselectrocatalyst for electrooxidation of sodium borohydride,”International Journal of Hydrogen Energy, vol. 34, no. 8, pp.3360–3366, 2009.
[12] J. Wei, X. Wang, Y. Wang et al., “Carbon-supported auhollow nanospheres as anode catalysts for direct borohydride-hydrogen peroxide fuel cells,” Energy and Fuels, vol. 23, no. 8,pp. 4037–4041, 2009.
[13] F. Pei, Y. Wang, X. Wang et al., “Performance of supported Au-Co alloy as the anode catalyst of direct borohydride-hydrogenperoxide fuel cell,” International Journal of Hydrogen Energy,vol. 35, no. 15, pp. 8136–8142, 2010.
[14] R. W. J. Scott, O. M. Wilson, S. K. Oh, E. A. Kenik,and R. M. Crooks, “Bimetallic palladium—Gold dendrimer-encapsulated catalysts,” Journal of the American ChemicalSociety, vol. 126, no. 47, pp. 15583–15591, 2004.
[15] D. R. Rolison, “Catalytic nanoarchitectures—the importanceof nothing and the unimportance of periodicity,” Science, vol.299, no. 5613, pp. 1698–1701, 2003.
[16] Y. Zhao, X. Yang, J. Tian, F. Wang, and L. Zhan, “Methanolelectro-oxidation on Ni@Pd core-shell nanoparticles sup-ported on multi-walled carbon nanotubes in alkaline media,”International Journal of Hydrogen Energy, vol. 35, no. 8, pp.3249–3257, 2010.
[17] N. Kristian and X. Wang, “Ptshell-Aucore/C electrocatalyst witha controlled shell thickness and improved Pt utilization forfuel cell reactions,” Electrochemistry Communications, vol. 10,no. 1, pp. 12–15, 2008.
[18] K. C. Grabar, K. J. Allison, B. E. Baker et al., “Two-dimensionalarrays of colloidal gold particles: a flexible approach tomacroscopic metal surfaces,” Langmuir, vol. 12, no. 10, pp.2353–2361, 1996.
[19] N. R. Jana, L. Gearheart, and C. J. Murphy, “Wet chemicalsynthesis of high aspect ratio cylindrical gold nanorods,”Journal of Physical Chemistry B, vol. 105, no. 19, pp. 4065–4067, 2001.
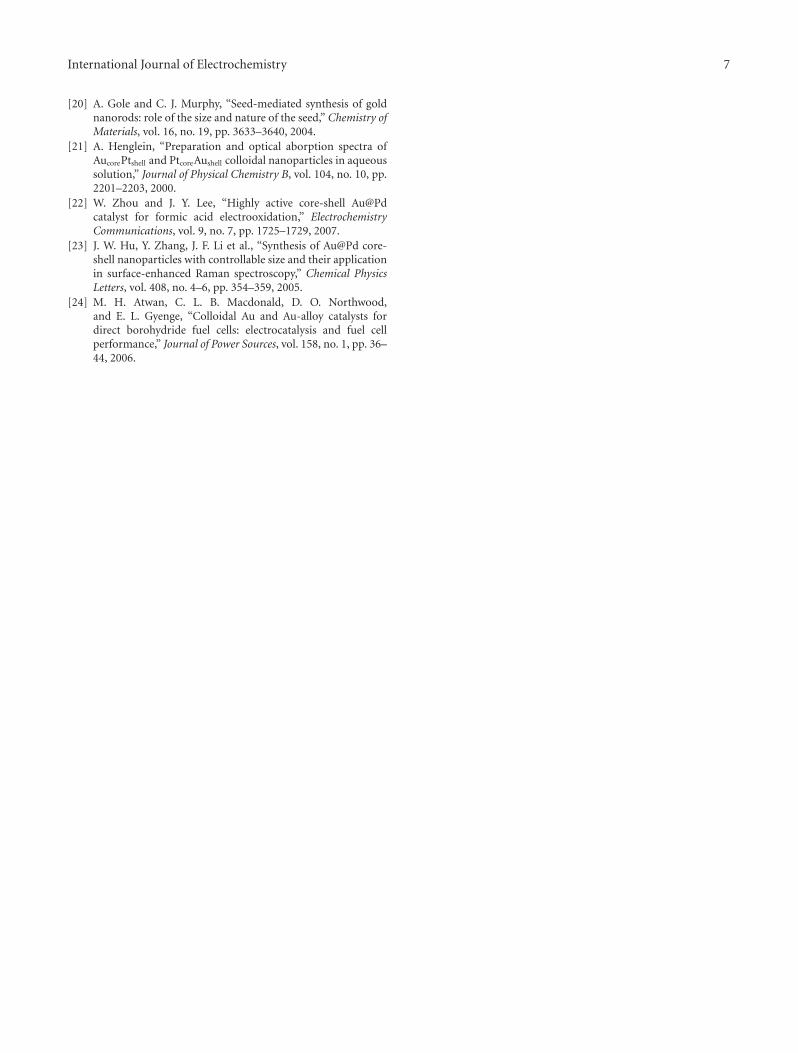
International Journal of Electrochemistry 7
[20] A. Gole and C. J. Murphy, “Seed-mediated synthesis of goldnanorods: role of the size and nature of the seed,” Chemistry ofMaterials, vol. 16, no. 19, pp. 3633–3640, 2004.
[21] A. Henglein, “Preparation and optical aborption spectra ofAucorePtshell and PtcoreAushell colloidal nanoparticles in aqueoussolution,” Journal of Physical Chemistry B, vol. 104, no. 10, pp.2201–2203, 2000.
[22] W. Zhou and J. Y. Lee, “Highly active core-shell Au@Pdcatalyst for formic acid electrooxidation,” ElectrochemistryCommunications, vol. 9, no. 7, pp. 1725–1729, 2007.
[23] J. W. Hu, Y. Zhang, J. F. Li et al., “Synthesis of Au@Pd core-shell nanoparticles with controllable size and their applicationin surface-enhanced Raman spectroscopy,” Chemical PhysicsLetters, vol. 408, no. 4–6, pp. 354–359, 2005.
[24] M. H. Atwan, C. L. B. Macdonald, D. O. Northwood,and E. L. Gyenge, “Colloidal Au and Au-alloy catalysts fordirect borohydride fuel cells: electrocatalysis and fuel cellperformance,” Journal of Power Sources, vol. 158, no. 1, pp. 36–44, 2006.
SAGE-Hindawi Access to ResearchInternational Journal of ElectrochemistryVolume 2011, Article ID 564828, 7 pagesdoi:10.4061/2011/564828
Research Article
Use of Dendrimers during the Synthesis of Pt-RuElectrocatalysts for PEM Fuel Cells: Effects on the Physical andElectrochemical Properties
J. C. Calderon,1 L. Calvillo,2 M. J. Lazaro,2 and E. Pastor1
1 Deparamento de Quımica-Fısica, Facultad de Quımica, Universidad de La Laguna, Avenida Astrofısico Francisco Sanchez s/n,38071 La Laguna (Tenerife), Spain
2 Instituto de Carboquımica (CSIC), Miguel Luesma Castan 4, 50018 Zaragoza, Spain
Correspondence should be addressed to E. Pastor, [email protected]
Received 3 May 2011; Accepted 28 July 2011
Academic Editor: Maria E. Martins
Copyright © 2011 J. C. Calderon et al. This is an open access article distributed under the Creative Commons Attribution License,which permits unrestricted use, distribution, and reproduction in any medium, provided the original work is properly cited.
In this work, Pt-Ru catalysts were synthesized by a novel methodology which includes the use as encapsulating molecules ofdendrimers of different generation: zero (DN-0), one (DN-1), two (DN-2), and three (DN-3). Synthesized catalysts were heat-treated at 350◦C, and the effects of this treatment was established from the physical (X-ray dispersive energy (XDE) and X-raydiffraction (XRD)) and electrochemical characterization (cyclic voltammetry and chronoamperometry). Results showed that theheat-treatment benefits the catalytic properties of synthesized materials in terms of CO and methanol electrochemical oxidation.The curves for CO stripping were more defined for heat-treated catalysts, and methanol oxidation current densities were higherfor these materials. These changes are principally explained from the removal of organic residues remaining on the surface of thePt-Ru nanoparticles after the synthesis procedure. After the activation of the catalysts by heating at 350◦C, the real importance ofthe use of these encapsulating molecules and the effect of the generation of the dendrimer become visible. From these results, itcan be concluded that synthesized catalysts are good catalytic anodes for direct methanol fuel cells (DMFCs).
1. Introduction
Direct methanol fuel cells (DMFCs) are a promising powersource for automotive and portable power applications. Thisversatility is related to ease in fuel handling, simple systemdesign, high efficiency, and low emissions [1, 2]. Neverthe-less, the use of DMFCs is limited by the reaction kinetics formethanol electro-oxidation on platinum, which possesses aslow rate and involves steps like methanol adsorption withtheir respective dissociation, water adsorption also with itsactivation, and CO oxidation as intermediate of this reaction[3]. In fact, the presence of CO and HCOO− intermediatesis determinant in slow reaction kinetics due to the strongadsorption of these species on Pt, blocking the electroactivesites. As an alternative for solving this problem, Pt-Ru alloyshave been suggested [4, 5] because of their higher activityfor methanol electro-oxidation, stability, and ability of Rufor providing OHads species, which are able to weaken andaccelerate CO adsorption and oxidation [3].
These reasons motivate the implementation of novelPt-Ru nanoparticles synthesis procedures, with controlledmetal loading, Pt : Ru atomic proportions, particle size, andhomogeneous dispersion on a determined support. Typicalwet impregnation and incipient wetness methods do notallow controlling these properties [6]. An alternative is theuse of dendrimers, which are three-dimensional and tree-like functional macromolecules, where branches are thespecific sites for nucleation process of metal precursors [7].Branches conform the so-called generations of a dendrimer;the first-generation dendrimer is constituted by a determinednumber of monomers linked to a central core. Subsequentunion between other monomers and the extreme of the firstlinked monomers generates a second generation and thus,next generations are formed until steric hindrance inhibitsformation of further shells [7]. Because of these structuralcharacteristics, they were successfully used as a templatefor metal nanoparticles formation, providing five principaladvantages [8]: (1) the possibility of obtaining well-defined

2 International Journal of Electrochemistry
size and shape nanoparticles due to their uniform structure[9], (2) avoid agglomeration of nanoparticles by stabilizationinto the dendrimer structure [10], (3) protection towardspassivation and enabling to catalytic activity by means ofsteric hindrance which surround the nanoparticles [11],(4) the selectivity towards access of small substrates tothe encapsulated catalytic nanoparticles, controlled by thedendrimer branches, and (5) terminal amino groups of themolecule could be modified for controlling the solubility ofdendrimer-nanoparticle composite, providing the possibilityof linkage to others polymers [12].
Synthesis of DENs (dendrimer encapsulated nanoparti-cles) is widely reported in the literature [13–19], and thisprocess usually initiates with the formation of intraden-drimer metal clusters, then chemically reduced with excessof NaBH4. Changes in solution colour and UV-visibleabsorbance bands are the evidences for this cluster formation[20] even giving some clue about their size [21, 22]. Inthe case of dendrimers with noncomplexing functionalgroups, such as hydroxyl groups, nanoparticle formation iscarried out into the dendrimer [23, 24]. However, dendrimertemplate formation of nanoparticles can be realized alsoin the external branches [23, 25], as is the case of amine-terminated poly(amidoamine) dendrimers, which couldpromote the formation of nanoparticles surrounded bycomplexation of metal ions with dendrimeric surface aminegroups [26]. The control of the pH of the dendrimericsolution could prevent the formation of metal complexeson the dendrimer periphery, by protonation of the surfaceprimary amine groups, which also be available to nucleatemetallic nanoparticles [27].
In this work, Pt-Ru catalysts supported on carbonnanofibers were synthesized, by reduction with sodium boro-hydride, making use of amino-terminal dendrimers, withzero, one, two, and three generation. Heat treatment at 350◦Cwas used in order to remove the encapsulating dendrimers.Physical characterization was carried out by means of EDX,XRD, and TEM, while electrochemical activity towards COand methanol electrochemical oxidation was studied bycyclic voltammetry and chronoamperometry, comparing theeffect of heat treatment in terms of metal loading, Pt : Ruproportion, particle size, and catalytic activity.
2. Experimental
2.1. Synthesis of Catalysts. Carbon nanofibers synthesized bycatalytic thermal decomposition of methane were used ascarbon support. For their synthesis, an Ni : Cu : Al catalystwith a weight proportion 78 : 6 : 16 was employed. After theactivation of this catalyst growth of CNFs was carried outpassing a methane flux at 700◦C for 10 h on the catalysts.Obtained carbon nanofibers were treated with an HNO3-H2SO4 1 : 1 (v/v) mixture for 0.5 h at room temperature.For the synthesis of catalysts, different generation PAMAMdendrimers (20% wt in methanol, Aldrich) were dissolved inultrapure water adding the appropriate volume to achievea 2.0 μM concentration. Solutions were vigorous magneticstirred during 30 min, and then, metal precursors solution(H2PtCl6, 8% wt solution, Aldrich; and RuCl3 99.999%,
Aldrich) was slowly added to the dendrimer one, maintain-ing the agitation during the addition and after for 3 days.Then, 20 mL of reducing agent solution (NaBH4, 26.4 mMin NaOH 7.0 M) were slowly added generating a dark colourbecause of the formation of Pt-Ru nanoparticles. After 24 hon the magnetic stirrer, carbon nanofibers was added to thereaction mixture in the presence of ultrasound agitation. Thereaction mixture was maintained under stirring for 2 days,and after being filtered, it was washed with ultrapure waterand dried at 60◦C during 2 h. Nomenclature used for thesecatalysts is PtRu/CNF-DN-X, being X the generation of thedendrimer used during the synthesis. Finally, catalysts wereheat treated at 350◦C in a furnace for 30 min. In this case, thenomenclature was PtRu/CNF-DN-X TT, with X meaning asbefore.
2.2. EDX, XRD, and TEM Characterization. Determinationof metal content and Pt-Ru atomic ratios for the synthesizedmaterials were made by energy dispersive X-ray (EDX)analysis, using a scanning electron microscope (LEO Mod.440) at 20 keV, with a Si detector and a Be window. X-ray diffraction (XRD) patterns were made by means of anuniversal diffractometer Panalytical X’Pert, operating withCu-Kα radiation, generated at 40 kV and 30 mA. Scan ratewas 3◦ min−1 with 2θ values between 10 and 100◦. Scherrer’sequation was used to calculate the metal crystallite size fromXRD, using the dimensions of (220) peak around 2θ = 70◦.
2.3. Electrochemical Characterization. Electrochemical activ-ity of Pt-Ru catalysts towards CO and methanol wasevaluated by cyclic voltammetry and chronoamperometry.It was compared to that of the commercial PtRu/C catalystfrom E-TEK. An electrochemical thermostatized cell wasused with a glassy carbon disk as working electrode, a glassycarbon bar as counter electrode and a reversible hydrogenelectrode (RHE), placed inside a Luggin capillary as referenceelectrode. All potentials in the text are referred to the RHEelectrode. A catalyst ink was prepared by mixing 2 mg of thecatalyst, 15 μL of Nafion (5 wt.%, Aldrich), and 500 μL ofultrapure water. An aliquot of this dispersion was depositedonto the glassy carbon disk. 0.5 M H2SO4 (95–97%, Merck)and 2.0 M methanol (98%, Merck) solutions were used inthese experiments. CO reactivity on the different catalystswas evaluated by bubbling it into the electrochemical cell,during 10 minutes, producing an adsorbed CO monolayeron the deposited catalyst. Then, nitrogen (MicroGeN2,GasLab) was bubbled during 10 minutes to remove CO fromthe solution. Finally, cyclic voltammetric and chronoam-perometric curves were recorded using an ElectrochemistryInstrument μAUTOLAB III modular equipment.
3. Results and Discussion
3.1. Physical Characterization of the Catalysts. EDX analysiswas used for determining the metal content and Pt : Ruatomic ratio, and the results are given in Table 1. All catalystspresent similar metal content and Pt : Ru atomic ratio, aprox.20% wt. and 1 : 1, respectively. These values were comparable
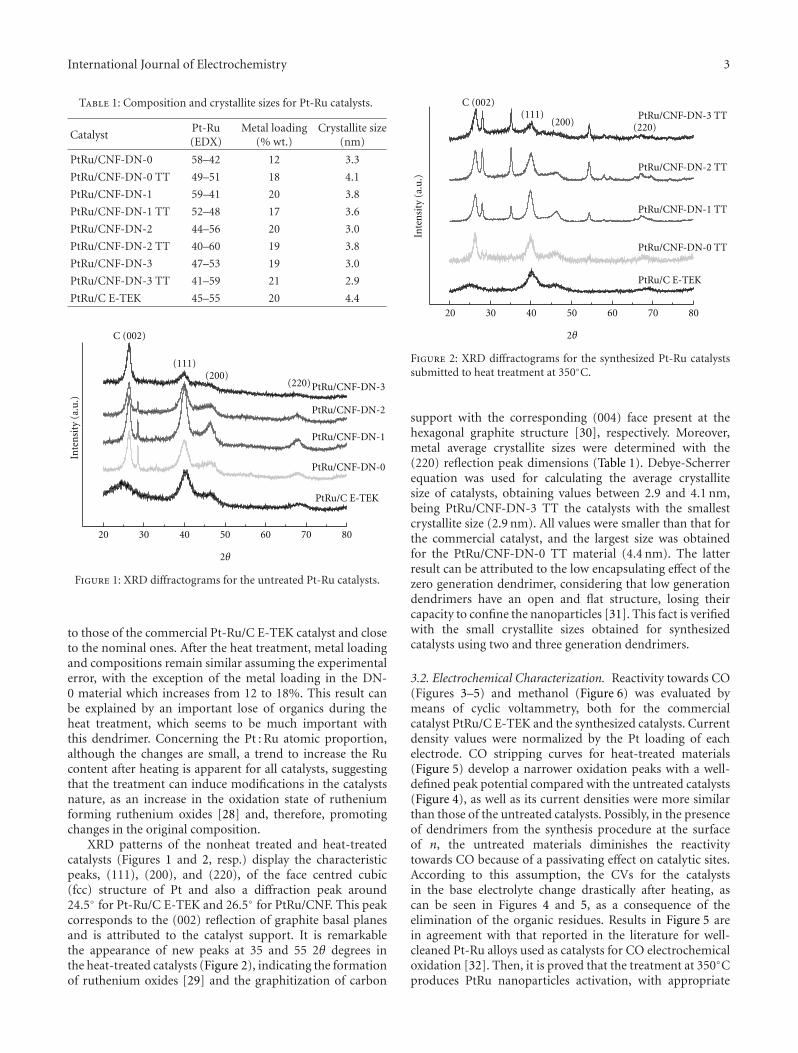
International Journal of Electrochemistry 3
Table 1: Composition and crystallite sizes for Pt-Ru catalysts.
CatalystPt-Ru(EDX)
Metal loading(% wt.)
Crystallite size(nm)
PtRu/CNF-DN-0 58–42 12 3.3
PtRu/CNF-DN-0 TT 49–51 18 4.1
PtRu/CNF-DN-1 59–41 20 3.8
PtRu/CNF-DN-1 TT 52–48 17 3.6
PtRu/CNF-DN-2 44–56 20 3.0
PtRu/CNF-DN-2 TT 40–60 19 3.8
PtRu/CNF-DN-3 47–53 19 3.0
PtRu/CNF-DN-3 TT 41–59 21 2.9
PtRu/C E-TEK 45–55 20 4.4
20 30 40 50 60 70 80
(220)(200)
(111)
C (002)
2θ
Inte
nsi
ty(a
.u.)
PtRu/C E-TEK
PtRu/CNF-DN-3
PtRu/CNF-DN-2
PtRu/CNF-DN-1
PtRu/CNF-DN-0
Figure 1: XRD diffractograms for the untreated Pt-Ru catalysts.
to those of the commercial Pt-Ru/C E-TEK catalyst and closeto the nominal ones. After the heat treatment, metal loadingand compositions remain similar assuming the experimentalerror, with the exception of the metal loading in the DN-0 material which increases from 12 to 18%. This result canbe explained by an important lose of organics during theheat treatment, which seems to be much important withthis dendrimer. Concerning the Pt : Ru atomic proportion,although the changes are small, a trend to increase the Rucontent after heating is apparent for all catalysts, suggestingthat the treatment can induce modifications in the catalystsnature, as an increase in the oxidation state of rutheniumforming ruthenium oxides [28] and, therefore, promotingchanges in the original composition.
XRD patterns of the nonheat treated and heat-treatedcatalysts (Figures 1 and 2, resp.) display the characteristicpeaks, (111), (200), and (220), of the face centred cubic(fcc) structure of Pt and also a diffraction peak around24.5◦ for Pt-Ru/C E-TEK and 26.5◦ for PtRu/CNF. This peakcorresponds to the (002) reflection of graphite basal planesand is attributed to the catalyst support. It is remarkablethe appearance of new peaks at 35 and 55 2θ degrees inthe heat-treated catalysts (Figure 2), indicating the formationof ruthenium oxides [29] and the graphitization of carbon
20 30 40 50 60 70 80
2θ
Inte
nsi
ty(a
.u.)
(220)(200)(111)
C (002)
PtRu/CNF-DN-1 TT
PtRu/CNF-DN-2 TT
PtRu/CNF-DN-3 TT
PtRu/C E-TEK
PtRu/CNF-DN-0 TT
Figure 2: XRD diffractograms for the synthesized Pt-Ru catalystssubmitted to heat treatment at 350◦C.
support with the corresponding (004) face present at thehexagonal graphite structure [30], respectively. Moreover,metal average crystallite sizes were determined with the(220) reflection peak dimensions (Table 1). Debye-Scherrerequation was used for calculating the average crystallitesize of catalysts, obtaining values between 2.9 and 4.1 nm,being PtRu/CNF-DN-3 TT the catalysts with the smallestcrystallite size (2.9 nm). All values were smaller than that forthe commercial catalyst, and the largest size was obtainedfor the PtRu/CNF-DN-0 TT material (4.4 nm). The latterresult can be attributed to the low encapsulating effect of thezero generation dendrimer, considering that low generationdendrimers have an open and flat structure, losing theircapacity to confine the nanoparticles [31]. This fact is verifiedwith the small crystallite sizes obtained for synthesizedcatalysts using two and three generation dendrimers.
3.2. Electrochemical Characterization. Reactivity towards CO(Figures 3–5) and methanol (Figure 6) was evaluated bymeans of cyclic voltammetry, both for the commercialcatalyst PtRu/C E-TEK and the synthesized catalysts. Currentdensity values were normalized by the Pt loading of eachelectrode. CO stripping curves for heat-treated materials(Figure 5) develop a narrower oxidation peaks with a well-defined peak potential compared with the untreated catalysts(Figure 4), as well as its current densities were more similarthan those of the untreated catalysts. Possibly, in the presenceof dendrimers from the synthesis procedure at the surfaceof n, the untreated materials diminishes the reactivitytowards CO because of a passivating effect on catalytic sites.According to this assumption, the CVs for the catalystsin the base electrolyte change drastically after heating, ascan be seen in Figures 4 and 5, as a consequence of theelimination of the organic residues. Results in Figure 5 arein agreement with that reported in the literature for well-cleaned Pt-Ru alloys used as catalysts for CO electrochemicaloxidation [32]. Then, it is proved that the treatment at 350◦Cproduces PtRu nanoparticles activation, with appropriate

4 International Journal of Electrochemistry
0 0.2 0.4 0.6 0.8 1
−25
0
25
50
75
Cu
rren
tde
nsi
ty/m
Am
g−1P
t
Potential/V versus RHE
Figure 3: Cyclic voltammograms for CO oxidation at roomtemperature on commercial catalysts PtRu/C E-TEK. Full line: firstscan. Dashed line: second scan. Scan rate: 20 mVs−1. Supportingelectrolyte: 0.5 M H2SO4. CO adsorption potential: 0.2 V versusRHE.
−25
0
25
50
−25
0
25
50
0 0.3 0.6 0 0.3 0.6 0.9
PtRu/CNF-DN-1PtRu/CNF-DN-0
PtRu/CNF-DN-2 PtRu/CNF-DN-3
Cu
rren
tde
nsi
ty/m
Am
g−1P
t
Potential/V versus RHE
Figure 4: Cyclic voltammograms for CO oxidation at roomtemperature on untreated synthesized catalysts. Full line: firstscan. Dashed line: second scan. Scan rate: 20 mVs−1. Supportingelectrolyte: 0.5 M H2SO4. CO adsorption potential: 0.2 V versusRHE.
surface activity towards CO electrooxidation, even betterthan the commercial PtRu/C E-TEK (which shows a broadercurve shifted to more positive potentials, Figure 3).
Methanol electrochemical oxidation (Figure 6) presentssignificant differences between the untreated catalysts andthose heat-treated catalysts. For the former (Figure 6(a)),commercial catalyst PtRu/C E-TEK shows a great activitywith respect to the synthesized catalyst. Possibly, den-drimers kept in the material, passivating metal nanoparticlesand inhibiting their catalytic activity towards methanol.However, the effect of dendrimer generation is clearlyobserved: the higher the generation of the dendrimer, lower
−25
0
25
50
−25
0
25
50
0 0.3 0.6 0 0.3 0.6 0.9
PtRu/CNF-DN-1 TTPtRu/CNF-DN-0 TT
PtRu/CNF-DN-2 TT PtRu/CNF-DN-3 TT
Cu
rren
tde
nsi
ty/m
Am
g−1P
t
Potential/V versus RHE
Figure 5: Cyclic voltammograms for CO oxidation at roomtemperature on the heat-treated synthesized catalysts. Full line: firstscan. Dashed line: second scan. Scan rate: 20 mVs−1. Supportingelectrolyte: 0.5 M H2SO4. CO adsorption potential: 0.2 V versusRHE.
the the methanol oxidation current densities recorded.The explanation is conducted through the dendrimer size:PtRu/CNF-DN-0 displays the better performance probablybecause of the relatively small size of zero generation den-drimer molecules, which did not produce a strong surfacepassivation. Opposite, DN-3 is the biggest molecule and,consequently, generates the highest passivation effect.
Nevertheless, heat treatment strongly promotes themethanol electrochemical oxidation on those materials pre-pared with dendrimers corresponding to generation higherthan zero (Figure 6(b)). In this case, the catalyst synthesizedin the presence of DN-0 (PtRu/CNF-DN-0 TT) shows thelowest current densities, and the activities increase with thegeneration of the dendrimer: PtRu/CNF-DN-3 TT displaysthe highest methanol oxidation current densities, followedby PtRu/CNF-DN-2 TT, PtRu/C E-TEK, PtRu/CNF-DN-1TT, and finally, PtRu/CNF-DN-0 TT. According to Table 1,the main difference between the PtRu/CNF-DN-3 TT andthe other catalysts is the small particle size, and therefore,it seems to be the main parameter conditioning the currentdensities attained. This fact leads us to conclude the roleplayed by dendrimer generation. Thus, it seems that thesize of dendrimer is a crucial factor for obtaining adequatecrystallite sizes. However, an effect associated to changesin the distribution of the crystallographic planes in thenanoparticle induced by the dimension of the dendrimercannot be discarded.
In order to establish the steady state performance of cat-alysts for methanol electrooxidation, chronoamperometrywas carried out. Figure 7 displays the potentiostatic currentdensity curves as a function of time for the heat-treatedPt-Ru materials at 0.55 V, as a typical working potentialin DMFCs. Current density values are in the same rangeobtained in Figure 6(b). The same trend established from the

International Journal of Electrochemistry 5
0 0.2 0.4 0.6 0.8 1
0
150
300
450
600
PtRu/CNF-DN-0PtRu/CNF-DN-1PtRu/CNF-DN-2PtRu/CNF-DN-3PtRu/C E-TEK
Cu
rren
tde
nsi
ty/m
Am
g−1P
t
Potential/V versus RHE
(a)
0 0.2 0.4 0.6 0.8 1
0
150
300
450
600
PtRu/CNF-DN-0 TTPtRu/CNF-DN-1 TTPtRu/CNF-DN-2 TTPtRu/CNF-DN-3 TTPtRu/C E-TEK
Cu
rren
tde
nsi
ty/m
Am
g−1P
t
Potential/V versus RHE
(b)
Figure 6: Cyclic voltammograms for methanol oxidation at room temperature on Pt-Ru synthesized catalysts. (a) Untreated catalysts (b)Heat-treated catalysts. Scan rate: 20 mVs−1. Supporting electrolyte: 0.5 M H2SO4. Methanol concentration: 2.0 M.
0 200 400 600 800 1000
0
20
40
60
80
100
Time (s)
PtRu/CNF-DN-0 TTPtRu/CNF-DN-1 TTPtRu/CNF-DN-2 TTPtRu/CNF-DN-3 TTPtRu/C E-TEK
Cu
rren
tde
nsi
ty/m
Am
g−1P
t
Figure 7: Current density versus time curves at room temperaturefor methanol oxidation on Pt-Ru synthesized catalysts. Supporingelectrolyte: 0.5 M H2SO4. Methanol concentration: 2.0 M. Appliedpotentials: 0.55 V.
CVs is also observed in Figure 7: again, PtRu/CNF-DN-3 TTand PtRu/CNF-DN-2 TT show the highest stationary currentdensities after 900 s at room temperature, whereas the lowestcurrent densities correspond to PtRu/CNF-DN-0 TT.
These results confirm that dendrimer synthesis of Pt-Runanoparticles with an appropriate heat treatment allows toprepare catalysts with better performance than commercialones.
4. Conclusions
Pt-Ru catalysts supported on carbon nanofibers have beensynthesized using dendrimers of zero, one, two, and threegeneration. All prepared materials displayed a Pt : Ru ratio of1 : 1 and metal loading close to 20%. These properties werenear to those determined for the commercial catalyst PtRu/CE-TEK used for comparison. Crystallite size varies between2.9 and 4.1 nm for the prepared materials (4.4 nm for thecommercial one).
A heat treatment at 350◦C was performed with allsynthesized catalysts trying to activate the nanoparticlessurface. Success of heat treatment was observed in theelectrochemical experiments. Thus, CO stripping curvesdisplay well-defined peaks for heat-treated catalysts, whereasuntreated materials describe broader curves with less-definedCO oxidation peak potentials. Moreover, the activity ofPtRu/CNF-DN-3 TT and PtRu/CNF-DN-2 TT towardsmethanol electrooxidation was drastically increased afterthe procedure, as demonstrated in both cyclic voltammet-ric and chronoamperometric experiments. In fact, betterperformance than commercial PtRu/C E-TEK was obtainedfor these activated materials. Then, it is concluded thatdendrimer synthesis followed by temperature activation canbe used for the preparation of highly active anodes for directmethanol fuel cells.
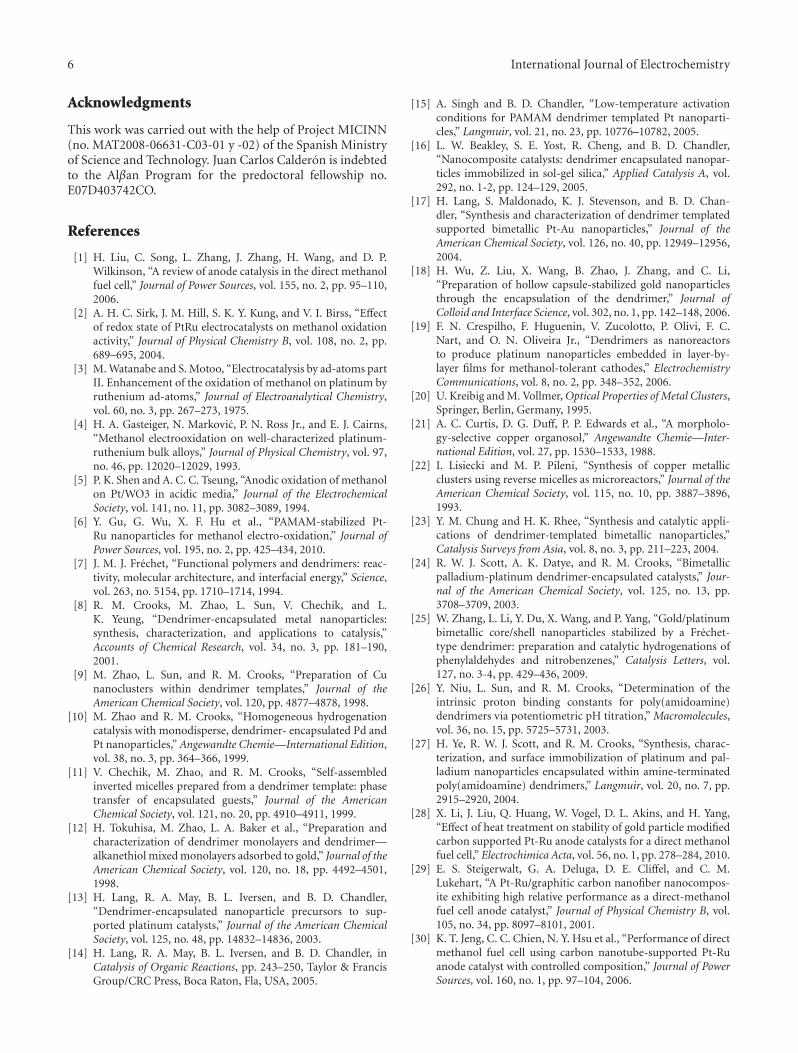
6 International Journal of Electrochemistry
Acknowledgments
This work was carried out with the help of Project MICINN(no. MAT2008-06631-C03-01 y -02) of the Spanish Ministryof Science and Technology. Juan Carlos Calderon is indebtedto the Alβan Program for the predoctoral fellowship no.E07D403742CO.
References
[1] H. Liu, C. Song, L. Zhang, J. Zhang, H. Wang, and D. P.Wilkinson, “A review of anode catalysis in the direct methanolfuel cell,” Journal of Power Sources, vol. 155, no. 2, pp. 95–110,2006.
[2] A. H. C. Sirk, J. M. Hill, S. K. Y. Kung, and V. I. Birss, “Effectof redox state of PtRu electrocatalysts on methanol oxidationactivity,” Journal of Physical Chemistry B, vol. 108, no. 2, pp.689–695, 2004.
[3] M. Watanabe and S. Motoo, “Electrocatalysis by ad-atoms partII. Enhancement of the oxidation of methanol on platinum byruthenium ad-atoms,” Journal of Electroanalytical Chemistry,vol. 60, no. 3, pp. 267–273, 1975.
[4] H. A. Gasteiger, N. Markovic, P. N. Ross Jr., and E. J. Cairns,“Methanol electrooxidation on well-characterized platinum-ruthenium bulk alloys,” Journal of Physical Chemistry, vol. 97,no. 46, pp. 12020–12029, 1993.
[5] P. K. Shen and A. C. C. Tseung, “Anodic oxidation of methanolon Pt/WO3 in acidic media,” Journal of the ElectrochemicalSociety, vol. 141, no. 11, pp. 3082–3089, 1994.
[6] Y. Gu, G. Wu, X. F. Hu et al., “PAMAM-stabilized Pt-Ru nanoparticles for methanol electro-oxidation,” Journal ofPower Sources, vol. 195, no. 2, pp. 425–434, 2010.
[7] J. M. J. Frechet, “Functional polymers and dendrimers: reac-tivity, molecular architecture, and interfacial energy,” Science,vol. 263, no. 5154, pp. 1710–1714, 1994.
[8] R. M. Crooks, M. Zhao, L. Sun, V. Chechik, and L.K. Yeung, “Dendrimer-encapsulated metal nanoparticles:synthesis, characterization, and applications to catalysis,”Accounts of Chemical Research, vol. 34, no. 3, pp. 181–190,2001.
[9] M. Zhao, L. Sun, and R. M. Crooks, “Preparation of Cunanoclusters within dendrimer templates,” Journal of theAmerican Chemical Society, vol. 120, pp. 4877–4878, 1998.
[10] M. Zhao and R. M. Crooks, “Homogeneous hydrogenationcatalysis with monodisperse, dendrimer- encapsulated Pd andPt nanoparticles,” Angewandte Chemie—International Edition,vol. 38, no. 3, pp. 364–366, 1999.
[11] V. Chechik, M. Zhao, and R. M. Crooks, “Self-assembledinverted micelles prepared from a dendrimer template: phasetransfer of encapsulated guests,” Journal of the AmericanChemical Society, vol. 121, no. 20, pp. 4910–4911, 1999.
[12] H. Tokuhisa, M. Zhao, L. A. Baker et al., “Preparation andcharacterization of dendrimer monolayers and dendrimer—alkanethiol mixed monolayers adsorbed to gold,” Journal of theAmerican Chemical Society, vol. 120, no. 18, pp. 4492–4501,1998.
[13] H. Lang, R. A. May, B. L. Iversen, and B. D. Chandler,“Dendrimer-encapsulated nanoparticle precursors to sup-ported platinum catalysts,” Journal of the American ChemicalSociety, vol. 125, no. 48, pp. 14832–14836, 2003.
[14] H. Lang, R. A. May, B. L. Iversen, and B. D. Chandler, inCatalysis of Organic Reactions, pp. 243–250, Taylor & FrancisGroup/CRC Press, Boca Raton, Fla, USA, 2005.
[15] A. Singh and B. D. Chandler, “Low-temperature activationconditions for PAMAM dendrimer templated Pt nanoparti-cles,” Langmuir, vol. 21, no. 23, pp. 10776–10782, 2005.
[16] L. W. Beakley, S. E. Yost, R. Cheng, and B. D. Chandler,“Nanocomposite catalysts: dendrimer encapsulated nanopar-ticles immobilized in sol-gel silica,” Applied Catalysis A, vol.292, no. 1-2, pp. 124–129, 2005.
[17] H. Lang, S. Maldonado, K. J. Stevenson, and B. D. Chan-dler, “Synthesis and characterization of dendrimer templatedsupported bimetallic Pt-Au nanoparticles,” Journal of theAmerican Chemical Society, vol. 126, no. 40, pp. 12949–12956,2004.
[18] H. Wu, Z. Liu, X. Wang, B. Zhao, J. Zhang, and C. Li,“Preparation of hollow capsule-stabilized gold nanoparticlesthrough the encapsulation of the dendrimer,” Journal ofColloid and Interface Science, vol. 302, no. 1, pp. 142–148, 2006.
[19] F. N. Crespilho, F. Huguenin, V. Zucolotto, P. Olivi, F. C.Nart, and O. N. Oliveira Jr., “Dendrimers as nanoreactorsto produce platinum nanoparticles embedded in layer-by-layer films for methanol-tolerant cathodes,” ElectrochemistryCommunications, vol. 8, no. 2, pp. 348–352, 2006.
[20] U. Kreibig and M. Vollmer, Optical Properties of Metal Clusters,Springer, Berlin, Germany, 1995.
[21] A. C. Curtis, D. G. Duff, P. P. Edwards et al., “A morpholo-gy-selective copper organosol,” Angewandte Chemie—Inter-national Edition, vol. 27, pp. 1530–1533, 1988.
[22] I. Lisiecki and M. P. Pileni, “Synthesis of copper metallicclusters using reverse micelles as microreactors,” Journal of theAmerican Chemical Society, vol. 115, no. 10, pp. 3887–3896,1993.
[23] Y. M. Chung and H. K. Rhee, “Synthesis and catalytic appli-cations of dendrimer-templated bimetallic nanoparticles,”Catalysis Surveys from Asia, vol. 8, no. 3, pp. 211–223, 2004.
[24] R. W. J. Scott, A. K. Datye, and R. M. Crooks, “Bimetallicpalladium-platinum dendrimer-encapsulated catalysts,” Jour-nal of the American Chemical Society, vol. 125, no. 13, pp.3708–3709, 2003.
[25] W. Zhang, L. Li, Y. Du, X. Wang, and P. Yang, “Gold/platinumbimetallic core/shell nanoparticles stabilized by a Frechet-type dendrimer: preparation and catalytic hydrogenations ofphenylaldehydes and nitrobenzenes,” Catalysis Letters, vol.127, no. 3-4, pp. 429–436, 2009.
[26] Y. Niu, L. Sun, and R. M. Crooks, “Determination of theintrinsic proton binding constants for poly(amidoamine)dendrimers via potentiometric pH titration,” Macromolecules,vol. 36, no. 15, pp. 5725–5731, 2003.
[27] H. Ye, R. W. J. Scott, and R. M. Crooks, “Synthesis, charac-terization, and surface immobilization of platinum and pal-ladium nanoparticles encapsulated within amine-terminatedpoly(amidoamine) dendrimers,” Langmuir, vol. 20, no. 7, pp.2915–2920, 2004.
[28] X. Li, J. Liu, Q. Huang, W. Vogel, D. L. Akins, and H. Yang,“Effect of heat treatment on stability of gold particle modifiedcarbon supported Pt-Ru anode catalysts for a direct methanolfuel cell,” Electrochimica Acta, vol. 56, no. 1, pp. 278–284, 2010.
[29] E. S. Steigerwalt, G. A. Deluga, D. E. Cliffel, and C. M.Lukehart, “A Pt-Ru/graphitic carbon nanofiber nanocompos-ite exhibiting high relative performance as a direct-methanolfuel cell anode catalyst,” Journal of Physical Chemistry B, vol.105, no. 34, pp. 8097–8101, 2001.
[30] K. T. Jeng, C. C. Chien, N. Y. Hsu et al., “Performance of directmethanol fuel cell using carbon nanotube-supported Pt-Ruanode catalyst with controlled composition,” Journal of PowerSources, vol. 160, no. 1, pp. 97–104, 2006.

International Journal of Electrochemistry 7
[31] L. Jin, S. P. Yang, Q. W. Tian, H. X. Wu, and Y. J. Cai, “Prepara-tion and characterization of copper metal nanoparticles usingdendrimers as protectively colloids,” Materials Chemistry andPhysics, vol. 112, no. 3, pp. 977–983, 2008.
[32] H. A. Gasteiger, N. Markovic, P. N. Ross Jr., and E. J. Cairns,“CO electrooxidation on well-characterized Pt-Ru alloys,”Journal of Physical Chemistry, vol. 98, no. 2, pp. 617–625, 1994.
SAGE-Hindawi Access to ResearchInternational Journal of ElectrochemistryVolume 2011, Article ID 276205, 5 pagesdoi:10.4061/2011/276205
Research Article
Investigation of IrO2/Pt Electrocatalysts inUnitized Regenerative Fuel Cells
V. Baglio,1 C. D’Urso,1 A. Di Blasi,1 R. Ornelas,2 L. G. Arriaga,3 V. Antonucci,1 and A. S. Arico1
1 CNR-Istituto di Tecnologie Avanzate per l’Energia “Nicola Giordano” (ITAE), Via Salita S. Lucia sopra Contesse 5,98126 Messina, Italy
2 Tozzi Apparecchiature Elettriche S.p.A., Via Zuccherificio, 10-48010 Mezzano, Italy3 Centro de Investigaciony Desarrollo Tecnologico en Electroquımica S.C., 76700 Queretaro Sanfandila, QRO, Mexico
Correspondence should be addressed to V. Baglio, [email protected]
Received 4 April 2011; Revised 16 May 2011; Accepted 8 June 2011
Academic Editor: Elena Pastor Tejera
Copyright © 2011 V. Baglio et al. This is an open access article distributed under the Creative Commons Attribution License,which permits unrestricted use, distribution, and reproduction in any medium, provided the original work is properly cited.
IrO2/Pt catalysts (at different concentrations) were synthesized by incipient wetness technique and characterized by XRD, XRF,and SEM. Water electrolysis/fuel cell performances were evaluated in a 5 cm2 single cell under Unitized Regenerative Fuel Cell(URFC) configuration. The IrO2/Pt composition of 14/86 showed the highest performance for water electrolysis and the lowestone as fuel cell. It is derived that for fuel cell operation an excess of Pt favours the oxygen reduction process whereas IrO2 promotesoxygen evolution. From the present results, it appears that the diffusion characteristics and the reaction rate in fuel cell mode aresignificantly lower than in the electrolyser mode. This requires the enhancement of the gas diffusion properties of the electrodesand the catalytic properties for cathode operation in fuel cells.
1. Introduction
A Unitized Regenerative Fuel Cell (URFC) is an energystorage system useful to be connected to renewable sourcessuch as solar energy or wind energy [1]. Such a systemconsists of a water electrolyser and a fuel cell combined inone stack, allowing a significant cost and volume reductioncompared to the two devices separated. During electrolysismode, water is electrolyzed to hydrogen and oxygen whichare used to produce electrical energy in the subsequent fuelcell mode. Compared with conventional secondary batteries,the URFC has the advantage of long-term energy storage,being free of self-discharge, and higher energy density [2,3]. Instead, compared with the conventional RegenerativeFuel Cell (RFC), which usually consists of separate fuel celland electrolyser, the URFC is a simpler and more compactsystem because it uses only one electrochemical cell [4, 5].Nevertheless, the design of an electrode to be used in anelectrolyser is inherently different than that of a fuel cellelectrode [6]. For example, for the oxygen electrode in apolymer electrolyte fuel cell, the Gas Diffusion Layer (GDL)is usually a highly hydrophobized carbon paper or carbon
cloth. However, they cannot be used as the GDL of a URFCfor the following two reasons: (i) the carbon material tendsto corrode at high potential on the oxygen electrode sideduring the water electrolysis operation and (ii) GDLs haveto achieve an appropriate balance between the hydrophobicand hydrophilic properties for both the fuel cell and waterelectrolysis operation [7]. While the electrode for waterelectrolyser is generally designed to be flooded or partiallyflooded, the fuel cell must repel water. From these consid-erations it arises clearly that the URFC is not the simplelinear combination of electrodes used in fuel cells with thoseused in electrolysis cells. For instance, the hydrogen electrodemust not only contribute to the hydrogen evolution reactionbut also must do it in the opposite direction. Nevertheless,the most critical point is the oxygen electrode, which displaysthe greater difficulties for its design [8]. To date, bifunctionalelectrocatalysts for oxygen redox reaction of URFCs includePt-Ir [9], Pt-Ru-Ir [10], Pt-IrO2 [11–15], and Pt-IrO2-RuO2 [16, 17], among which IrO2 and RuO2 are mainlyprepared by using Adams fusion method [18]. Most of theabove described bifunctional oxygen electrode catalysts areobtained by mixing an efficient electrocatalyst for oxygen
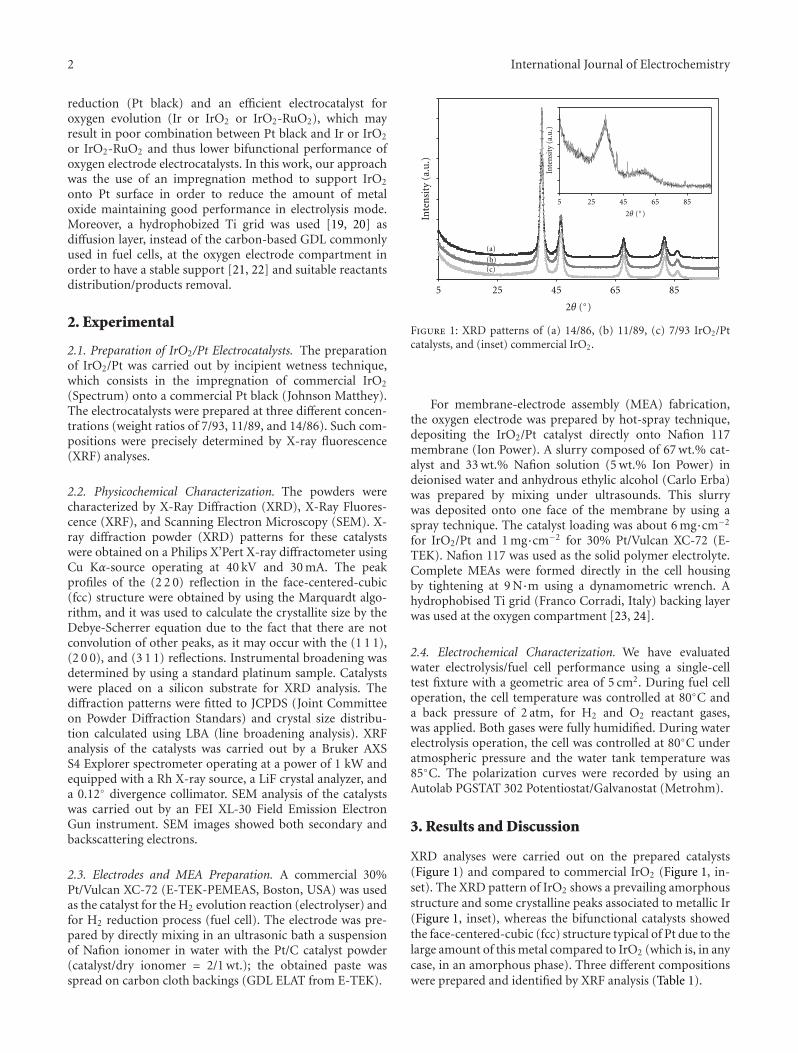
2 International Journal of Electrochemistry
reduction (Pt black) and an efficient electrocatalyst foroxygen evolution (Ir or IrO2 or IrO2-RuO2), which mayresult in poor combination between Pt black and Ir or IrO2
or IrO2-RuO2 and thus lower bifunctional performance ofoxygen electrode electrocatalysts. In this work, our approachwas the use of an impregnation method to support IrO2
onto Pt surface in order to reduce the amount of metaloxide maintaining good performance in electrolysis mode.Moreover, a hydrophobized Ti grid was used [19, 20] asdiffusion layer, instead of the carbon-based GDL commonlyused in fuel cells, at the oxygen electrode compartment inorder to have a stable support [21, 22] and suitable reactantsdistribution/products removal.
2. Experimental
2.1. Preparation of IrO2/Pt Electrocatalysts. The preparationof IrO2/Pt was carried out by incipient wetness technique,which consists in the impregnation of commercial IrO2
(Spectrum) onto a commercial Pt black (Johnson Matthey).The electrocatalysts were prepared at three different concen-trations (weight ratios of 7/93, 11/89, and 14/86). Such com-positions were precisely determined by X-ray fluorescence(XRF) analyses.
2.2. Physicochemical Characterization. The powders werecharacterized by X-Ray Diffraction (XRD), X-Ray Fluores-cence (XRF), and Scanning Electron Microscopy (SEM). X-ray diffraction powder (XRD) patterns for these catalystswere obtained on a Philips X’Pert X-ray diffractometer usingCu Kα-source operating at 40 kV and 30 mA. The peakprofiles of the (2 2 0) reflection in the face-centered-cubic(fcc) structure were obtained by using the Marquardt algo-rithm, and it was used to calculate the crystallite size by theDebye-Scherrer equation due to the fact that there are notconvolution of other peaks, as it may occur with the (1 1 1),(2 0 0), and (3 1 1) reflections. Instrumental broadening wasdetermined by using a standard platinum sample. Catalystswere placed on a silicon substrate for XRD analysis. Thediffraction patterns were fitted to JCPDS (Joint Committeeon Powder Diffraction Standars) and crystal size distribu-tion calculated using LBA (line broadening analysis). XRFanalysis of the catalysts was carried out by a Bruker AXSS4 Explorer spectrometer operating at a power of 1 kW andequipped with a Rh X-ray source, a LiF crystal analyzer, anda 0.12◦ divergence collimator. SEM analysis of the catalystswas carried out by an FEI XL-30 Field Emission ElectronGun instrument. SEM images showed both secondary andbackscattering electrons.
2.3. Electrodes and MEA Preparation. A commercial 30%Pt/Vulcan XC-72 (E-TEK-PEMEAS, Boston, USA) was usedas the catalyst for the H2 evolution reaction (electrolyser) andfor H2 reduction process (fuel cell). The electrode was pre-pared by directly mixing in an ultrasonic bath a suspensionof Nafion ionomer in water with the Pt/C catalyst powder(catalyst/dry ionomer = 2/1 wt.); the obtained paste wasspread on carbon cloth backings (GDL ELAT from E-TEK).
5 25 45 65 85
2θ (◦)
Inte
nsi
ty(a
.u.)
5 25 45 65 85
2θ (◦)
Inte
nsi
ty(a
.u.)
(a)
(b)(c)
Figure 1: XRD patterns of (a) 14/86, (b) 11/89, (c) 7/93 IrO2/Ptcatalysts, and (inset) commercial IrO2.
For membrane-electrode assembly (MEA) fabrication,the oxygen electrode was prepared by hot-spray technique,depositing the IrO2/Pt catalyst directly onto Nafion 117membrane (Ion Power). A slurry composed of 67 wt.% cat-alyst and 33 wt.% Nafion solution (5 wt.% Ion Power) indeionised water and anhydrous ethylic alcohol (Carlo Erba)was prepared by mixing under ultrasounds. This slurrywas deposited onto one face of the membrane by using aspray technique. The catalyst loading was about 6 mg·cm−2
for IrO2/Pt and 1 mg·cm−2 for 30% Pt/Vulcan XC-72 (E-TEK). Nafion 117 was used as the solid polymer electrolyte.Complete MEAs were formed directly in the cell housingby tightening at 9 N·m using a dynamometric wrench. Ahydrophobised Ti grid (Franco Corradi, Italy) backing layerwas used at the oxygen compartment [23, 24].
2.4. Electrochemical Characterization. We have evaluatedwater electrolysis/fuel cell performance using a single-celltest fixture with a geometric area of 5 cm2. During fuel celloperation, the cell temperature was controlled at 80◦C anda back pressure of 2 atm, for H2 and O2 reactant gases,was applied. Both gases were fully humidified. During waterelectrolysis operation, the cell was controlled at 80◦C underatmospheric pressure and the water tank temperature was85◦C. The polarization curves were recorded by using anAutolab PGSTAT 302 Potentiostat/Galvanostat (Metrohm).
3. Results and Discussion
XRD analyses were carried out on the prepared catalysts(Figure 1) and compared to commercial IrO2 (Figure 1, in-set). The XRD pattern of IrO2 shows a prevailing amorphousstructure and some crystalline peaks associated to metallic Ir(Figure 1, inset), whereas the bifunctional catalysts showedthe face-centered-cubic (fcc) structure typical of Pt due to thelarge amount of this metal compared to IrO2 (which is, in anycase, in an amorphous phase). Three different compositionswere prepared and identified by XRF analysis (Table 1).
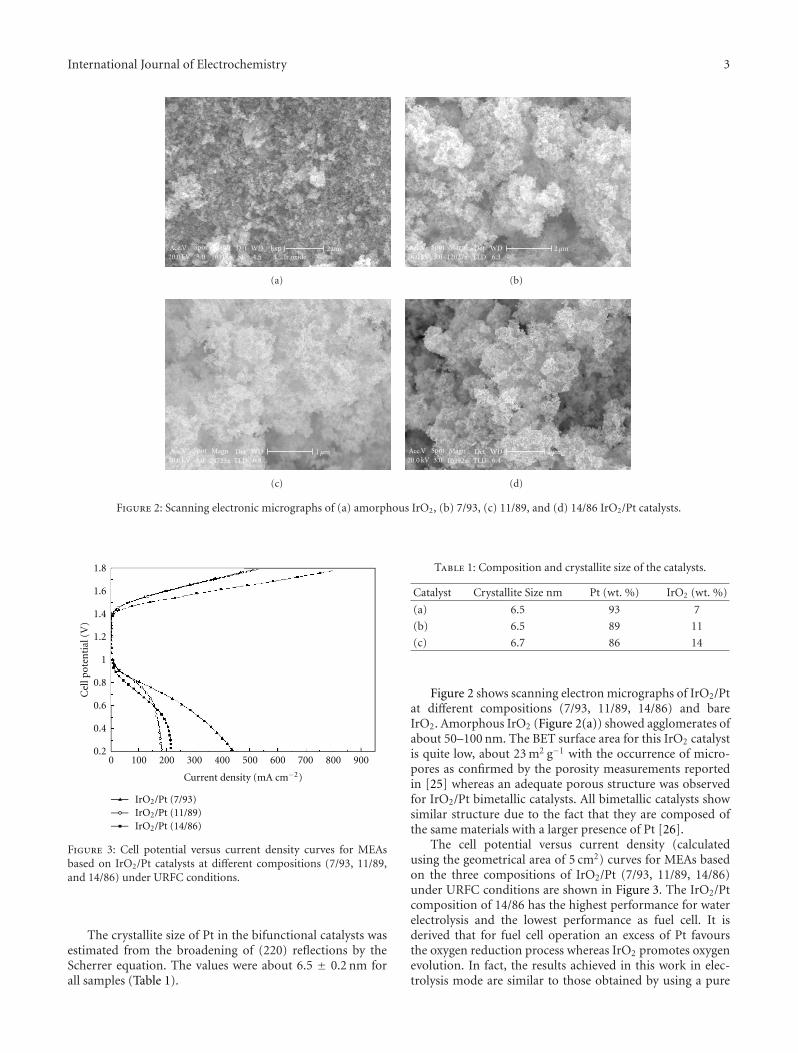
International Journal of Electrochemistry 3
Acc.V20.0 kV
Spot3.0
Magn
10318xDetSE
WD4.5 Ir oxide
2 μmExp1
(a)
Magn
12027xWD6.3
Acc.V20.0 kV
Spot3.0
2 μmDetTLD
(b)
Magn
24723xDetTLD
WD6.4
Acc.V20.0 kV
Spot3.0
1 μm
(c)
Magn
10392xDetTLD
WD6.4
Acc.V20.0 kV
Spot3.0
2 μm
(d)
Figure 2: Scanning electronic micrographs of (a) amorphous IrO2, (b) 7/93, (c) 11/89, and (d) 14/86 IrO2/Pt catalysts.
IrO2/Pt (7/93)IrO2/Pt (11/89)IrO2/Pt (14/86)
Cel
lpot
enti
al(V
)
Current density (mA cm−2)
0 100 200 300 400 500 600 700 800 9000.2
0.4
0.6
0.8
1
1.2
1.4
1.6
1.8
Figure 3: Cell potential versus current density curves for MEAsbased on IrO2/Pt catalysts at different compositions (7/93, 11/89,and 14/86) under URFC conditions.
The crystallite size of Pt in the bifunctional catalysts wasestimated from the broadening of (220) reflections by theScherrer equation. The values were about 6.5 ± 0.2 nm forall samples (Table 1).
Table 1: Composition and crystallite size of the catalysts.
Catalyst Crystallite Size nm Pt (wt. %) IrO2 (wt. %)
(a) 6.5 93 7
(b) 6.5 89 11
(c) 6.7 86 14
Figure 2 shows scanning electron micrographs of IrO2/Ptat different compositions (7/93, 11/89, 14/86) and bareIrO2. Amorphous IrO2 (Figure 2(a)) showed agglomerates ofabout 50–100 nm. The BET surface area for this IrO2 catalystis quite low, about 23 m2 g−1 with the occurrence of micro-pores as confirmed by the porosity measurements reportedin [25] whereas an adequate porous structure was observedfor IrO2/Pt bimetallic catalysts. All bimetallic catalysts showsimilar structure due to the fact that they are composed ofthe same materials with a larger presence of Pt [26].
The cell potential versus current density (calculatedusing the geometrical area of 5 cm2) curves for MEAs basedon the three compositions of IrO2/Pt (7/93, 11/89, 14/86)under URFC conditions are shown in Figure 3. The IrO2/Ptcomposition of 14/86 has the highest performance for waterelectrolysis and the lowest performance as fuel cell. It isderived that for fuel cell operation an excess of Pt favoursthe oxygen reduction process whereas IrO2 promotes oxygenevolution. In fact, the results achieved in this work in elec-trolysis mode are similar to those obtained by using a pure
4 International Journal of Electrochemistry
IrO2 in a PEM electrolyser [22, 23]. This is probably due tothe good dispersion of this metal oxide onto the Pt support.Thus, the utilization of IrO2 is maximized. However, thepresence of a larger amount of IrO2 produces better resultsin the electrolysis process. Thus, it appears necessary tooptimize the relative content of the two materials in orderto have suitable performance in both processes.
On the contrary, in fuel cell mode, the performanceis lower than that recorded in a conventional PEM fuelcell equipped with Pt catalysts in particular in the ohmicand diffusion regions [27–29]. This is probably due to thepresence of the hydrophobized Ti-grid as gas diffusion layer/current collector. In fact, fuel cell tests are performed afterthe electrolysis process, and the fuel cell cathode could becompletely flooded after operation as electrolyser, althougha hydrophobized Ti-grid is used. Accordingly, oxygen ishindered by the presence of water inside the cathode com-partment, and this diffusion drawback determines the lossof potential observed in Figure 3. For what concerns theamount of Pt in the bimetallic catalysts, it is observed thata higher amount produces lower potential losses as observedin the activation region (low current density) of the polar-ization curve. Accordingly, the performance at 0.65–0.7 V(region of interest from a point of view of the efficiency [29])is higher for the IrO2/Pt catalysts with increasing amounts ofPt (7/93 > 11/89 > 14/86). By using IrO2/Pt (14/86) catalystthe performance decreased also in the activation regionindicating that IrO2 covered Pt sites reducing in this waythe catalytic activity of the bimetallic catalyst for the oxygenreduction reaction. Since this formulation showed a betterbehaviour for the electrolysis process, it appears necessary toincrease further the catalytic properties of this sample to beused as bifunctional catalyst.
4. Conclusions
IrO2/Pt catalysts (at different concentrations) were synthe-sized and characterized in Unitized Regenerative Fuel Cell(URFC) configuration. These oxide-metal mixtures wereprepared by incipient wetness technique and characterizedby XRD, XRF, SEM, and electrochemical measurementsunder water electrolysis/fuel cell conditions. For fuel cell op-eration an excess of Pt favours the oxygen reduction processwhereas IrO2 promotes oxygen evolution. From the presentresults, it appears that the diffusion characteristics and thereaction rate in fuel cell mode are significantly lower thanin the electrolyser mode. This requires the enhancement ofthe gas diffusion properties of the electrodes and the catalyticproperties for cathode operation in fuel cells.
References
[1] W. Smith, “The role of fuel cells in energy storage,” Journal ofPower Sources, vol. 86, no. 1, pp. 74–83, 2000.
[2] A. Verma and S. Basu, “Feasibility study of a simple unitizedregenerative fuel cell,” Journal of Power Sources, vol. 135, no. 1-2, pp. 62–65, 2004.
[3] S. A. Grigoriev, P. Millet, V. I. Porembsky, and V. N.Fateev, “Development and preliminary testing of a unitized
regenerative fuel cell based on PEM technology,” InternationalJournal of Hydrogen Energy, vol. 36, no. 6, pp. 4164–4168,2011.
[4] F. Mitlitsky, B. Myers, and A. H. Weisberg, “Regenerative fuelcell systems,” Energy and Fuels, vol. 12, no. 1, pp. 56–71, 1998.
[5] S. S. Dihrab, K. Sopian, M. A. Alghoul, and M. Y. Sulaiman,“Review of the membrane and bipolar plates materials forconventional and unitized regenerative fuel cells,” Renewableand Sustainable Energy Reviews, vol. 13, no. 6-7, pp. 1663–1668, 2009.
[6] J. Pettersson, B. Ramsey, and D. Harrison, “A review of thelatest developments in electrodes for unitised regenerativepolymer electrolyte fuel cells,” Journal of Power Sources,vol. 157, no. 1, pp. 28–34, 2006.
[7] T. Ioroi, T. Oku, K. Yasuda, N. Kumagai, and Y. Miyazaki,“Influence of PTFE coating on gas diffusion backing forunitized regenerative polymer electrolyte fuel cells,” Journal ofPower Sources, vol. 124, no. 2, pp. 385–389, 2003.
[8] G. Chen, H. Zhang, H. Ma, and H. Zhong, “Effect offabrication methods of bifunctional catalyst layers on uni-tized regenerative fuel cell performance,” Electrochimica Acta,vol. 54, no. 23, pp. 5454–5462, 2009.
[9] S.-D. Yim, G.-G. Park, Y.-J. Sohn et al., “Optimization ofPtIr electrocatalyst for PEM URFC,” International Journal ofHydrogen Energy, vol. 30, no. 12, pp. 1345–1350, 2005.
[10] G. Y. Chen, D. A. Delafuente, S. Sarangapani, and T. E.Mallouk, “Combinatorial discovery of bifunctional oxygenreduction-Water oxidation electrocatalysts for regenerativefuel cells,” Catalysis Today, vol. 67, no. 4, pp. 341–355, 2001.
[11] L. L. Swette, A. B. LaConti, and S. A. McCatty, “Proton-exchange membrane regenerative fuel cells,” Journal of PowerSources, vol. 47, no. 3, pp. 343–351, 1994.
[12] L. L. Swette, N. D. Kackley, and A. B. LaConti, “Regenerativefuel cells,” in Proceedings of the 27th Intersociety EnergyConversion Engineering Conference, vol. 1, pp. 1101–1106,August 1992.
[13] H. Liu, B. L. Yi, M. Hou, J. F. Wu, Z. J. Hou, and H.M. Zhang, “Composite electrode for unitized regenerativeproton exchange membrane fuel cell with improved cycle life,”Electrochemical and Solid-State Letters, vol. 7, no. 3, pp. A56–A59, 2004.
[14] T. Ioroi, N. Kitazawa, K. Yasuda, Y. Yamamoto, and H. Tak-enaka, “Iridium oxide/platinum electrocatalysts for unitizedregenerative polymer electrolyte fuel cells,” Journal of theElectrochemical Society, vol. 147, no. 6, pp. 2018–2022, 2000.
[15] W. Yao, J. Yang, J. Wang, and Y. Nuli, “Chemical depositionof platinum nanoparticles on iridium oxide for oxygenelectrode of unitized regenerative fuel cell,” ElectrochemistryCommunications, vol. 9, no. 5, pp. 1029–1034, 2007.
[16] A. Cisar, O. Murphy, and E. Clarke, US Patent 0068544, 2003.[17] Y. Zhang, C. Wang, N. Wan, and Z. Mao, “Deposited
RuO2-IrO2/Pt electrocatalyst for the regenerative fuel cell,”International Journal of Hydrogen Energy, vol. 32, no. 3,pp. 400–404, 2007.
[18] R. Adams and R. L. Shriner, “Platinum oxide as a catalystin the reduction of organic compounds. III. Preparation andproperties of the oxide of platinum obtained by the fusionof chloroplatinic acid with sodium nitrate,” Journal of theAmerican Chemical Society, vol. 45, no. 9, pp. 2171–2179, 1923.
[19] V. Baglio, A. Di Blasi, T. Denaro et al., “Synthesis, character-ization and evaluation of IrO2-RuO2 electrocatalytic powdersfor oxygen evolution reaction,” Journal of New Materials forElectrochemical Systems, vol. 11, no. 2, pp. 105–108, 2008.
International Journal of Electrochemistry 5
[20] A. Di Blasi, C. D’Urso, V. Baglio et al., “Preparation andevaluation of RuO2-IrO2, IrO2-Pt and IrO2-Ta2O5 catalysts forthe oxygen evolution reaction in an SPE electrolyzer,” Journalof Applied Electrochemistry, vol. 39, no. 2, pp. 191–196, 2009.
[21] S. Song, H. Zhang, X. Ma, Z.-G. Shao, Y. Zhang, and B. Yi,“Bifunctional oxygen electrode with corrosion-resistive gasdiffusion layer for unitized regenerative fuel cell,” Electrochem-istry Communications, vol. 8, no. 3, pp. 399–405, 2006.
[22] S. Siracusano, V. Baglio, C. D’Urso, V. Antonucci, andA. S. Arico, “Preparation and characterization of titaniumsuboxides as conductive supports of IrO2 electrocatalysts forapplication in SPE electrolysers,” Electrochimica Acta, vol. 54,no. 26, pp. 6292–6299, 2009.
[23] V. Antonucci, A. Di Blasi, V. Baglio et al., “High temperatureoperation of a composite membrane-based solid polymerelectrolyte water electrolyser,” Electrochimica Acta, vol. 53,no. 24, pp. 7350–7356, 2008.
[24] V. Baglio, R. Ornelas, F. Matteucci et al., “Solid polymerelectrolyte water electrolyser based on Nafion-TiO2 compositemembrane for high temperature operation,” Fuel Cells, vol. 9,no. 3, pp. 247–252, 2009.
[25] J. C. Cruz, V. Baglio, S. Siracusano et al., “Nanosized IrO2
electrocatalysts for oxygen evolution reaction in an SPEelectrolyzer,” Journal of Nanoparticle Research, vol. 13, no. 4,pp. 1639–1646, 2011.
[26] www.chemicals.matthey.com/.
[27] C. Tori, M. Baleztena, C. Peralta et al., “Advances in the de-velopment of a hydrogen/oxygen PEM fuel cell stack,” Inter-national Journal of Hydrogen Energy, vol. 33, no. 13, pp. 3588–3591, 2008.
[28] J. A. Ruiz and C. F. Zinola, “On the mathematical modelling ofdiffusion-migration mass transport of protons,” InternationalJournal of Chemical Reactor Engineering, vol. 8, article A39,2010.
[29] A. S. Arico, A. Stassi, E. Modica et al., “Performance and deg-radation of high temperature polymer electrolyte fuel cell cat-alysts,” Journal of Power Sources, vol. 178, no. 2, pp. 525–536,2008.
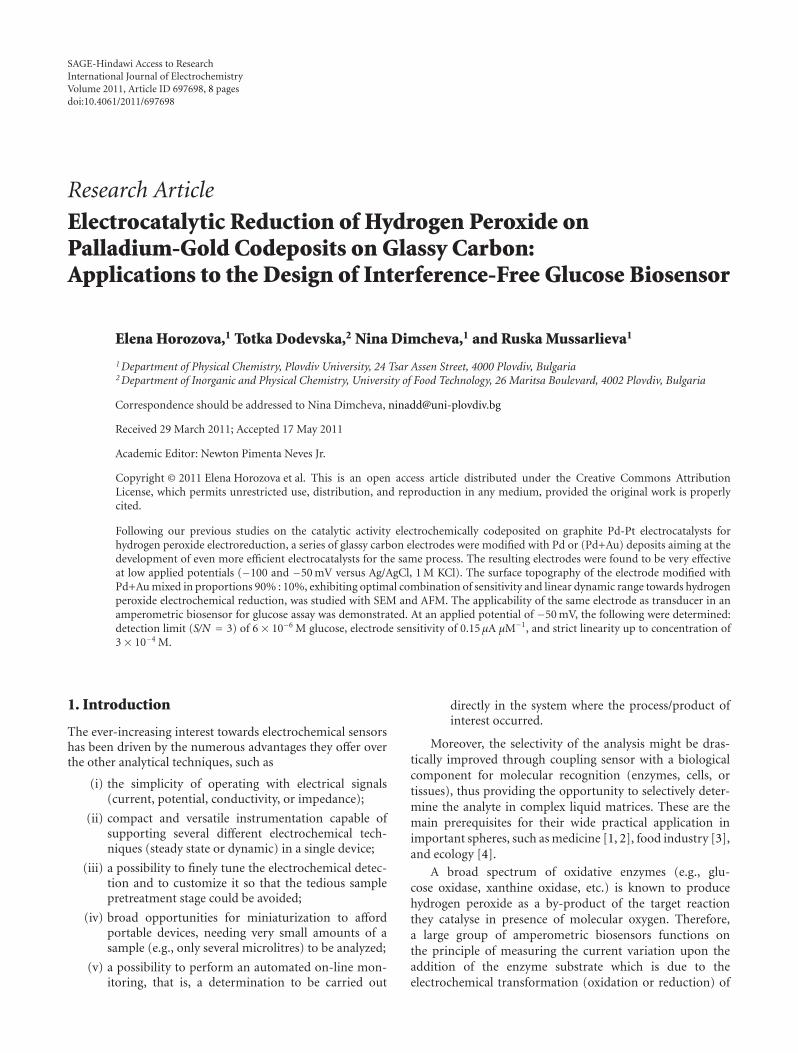
SAGE-Hindawi Access to ResearchInternational Journal of ElectrochemistryVolume 2011, Article ID 697698, 8 pagesdoi:10.4061/2011/697698
Research Article
Electrocatalytic Reduction of Hydrogen Peroxide onPalladium-Gold Codeposits on Glassy Carbon:Applications to the Design of Interference-Free Glucose Biosensor
Elena Horozova,1 Totka Dodevska,2 Nina Dimcheva,1 and Ruska Mussarlieva1
1 Department of Physical Chemistry, Plovdiv University, 24 Tsar Assen Street, 4000 Plovdiv, Bulgaria2 Department of Inorganic and Physical Chemistry, University of Food Technology, 26 Maritsa Boulevard, 4002 Plovdiv, Bulgaria
Correspondence should be addressed to Nina Dimcheva, [email protected]
Received 29 March 2011; Accepted 17 May 2011
Academic Editor: Newton Pimenta Neves Jr.
Copyright © 2011 Elena Horozova et al. This is an open access article distributed under the Creative Commons AttributionLicense, which permits unrestricted use, distribution, and reproduction in any medium, provided the original work is properlycited.
Following our previous studies on the catalytic activity electrochemically codeposited on graphite Pd-Pt electrocatalysts forhydrogen peroxide electroreduction, a series of glassy carbon electrodes were modified with Pd or (Pd+Au) deposits aiming at thedevelopment of even more efficient electrocatalysts for the same process. The resulting electrodes were found to be very effectiveat low applied potentials (−100 and −50 mV versus Ag/AgCl, 1 M KCl). The surface topography of the electrode modified withPd+Au mixed in proportions 90% : 10%, exhibiting optimal combination of sensitivity and linear dynamic range towards hydrogenperoxide electrochemical reduction, was studied with SEM and AFM. The applicability of the same electrode as transducer in anamperometric biosensor for glucose assay was demonstrated. At an applied potential of −50 mV, the following were determined:detection limit (S/N = 3) of 6 × 10⁻⁶ M glucose, electrode sensitivity of 0.15 μA μM−1, and strict linearity up to concentration of3× 10−4 M.
1. Introduction
The ever-increasing interest towards electrochemical sensorshas been driven by the numerous advantages they offer overthe other analytical techniques, such as
(i) the simplicity of operating with electrical signals(current, potential, conductivity, or impedance);
(ii) compact and versatile instrumentation capable ofsupporting several different electrochemical tech-niques (steady state or dynamic) in a single device;
(iii) a possibility to finely tune the electrochemical detec-tion and to customize it so that the tedious samplepretreatment stage could be avoided;
(iv) broad opportunities for miniaturization to affordportable devices, needing very small amounts of asample (e.g., only several microlitres) to be analyzed;
(v) a possibility to perform an automated on-line mon-itoring, that is, a determination to be carried out
directly in the system where the process/product ofinterest occurred.
Moreover, the selectivity of the analysis might be dras-tically improved through coupling sensor with a biologicalcomponent for molecular recognition (enzymes, cells, ortissues), thus providing the opportunity to selectively deter-mine the analyte in complex liquid matrices. These are themain prerequisites for their wide practical application inimportant spheres, such as medicine [1, 2], food industry [3],and ecology [4].
A broad spectrum of oxidative enzymes (e.g., glu-cose oxidase, xanthine oxidase, etc.) is known to producehydrogen peroxide as a by-product of the target reactionthey catalyse in presence of molecular oxygen. Therefore,a large group of amperometric biosensors functions onthe principle of measuring the current variation upon theaddition of the enzyme substrate which is due to theelectrochemical transformation (oxidation or reduction) of
2 International Journal of Electrochemistry
the generated H2O2. The biosensors based on registering thecurrent from the electrochemical oxidation of the formedhydrogen peroxide suffer from poor selectivity, mostly dueto the high operational potentials, at which the compoundsnormally attending biological liquids (organic acids, neu-rotransmitters, and drugs) are co-oxidised, thus leading tooverestimated analyte levels. Alternatively, reducing electro-chemically H2O2 at low working potentials (usually around0 V versus Ag/AgCl) [5], where interfering substances areelectrochemically inert, allows for a much more selectiveassay of the analyte. In respect to studies on the surfacemodified with micro- and nanostructures carbonaceouselectrodes as efficient electrocatalysts of hydrogen peroxide,both oxidation and reduction [6–13] are currently on highdemand.
Various types of carbonaceous materials have been inves-tigated most often as modified electrodes for determiningH2O2: graphite [6, 14], glassy carbon [7, 8, 10, 15–19],carbon-paste electrodes [20, 21], carbon nanotubes [22–24], and so forth. With these electrodes, the selectivityof the electrochemical response to hydrogen peroxide isimproved by using different catalytically active modificationcomponents: transition metals and their oxides [15, 21],platinum metals, dispersed on their own or mixed withother platinum metals [7, 25], and with nanostructuredcomposite films [8, 26]. Studies aimed at the electroanalyticaldetection of H2O2 with micro- and nanostructured carbonfilms containing metal particles (2–5 nm), such as Pt, Ni, Cu,and Ir [26], have become common in recent years.
In electrochemical sensor technologies, special atten-tion is paid to carbon nanotubes (CNTs) as a promisingelectrode material. CNTs have demonstrated to possess aunique combination of excellent structural, mechanical, andelectrochemical characteristics [22]. CNT-based electrodes,promoted with metal nanoparticles, are distinguished withtheir high catalytic activity and have been successfullyused for detecting H2O2 [23, 24]. The modification wasperformed through the adsorption of nanoparticles fromcolloidal solutions or through electrodeposition from asolution of the salt of the respective metal. The secondapproach is often preferred due to the possibility of strictand accurate control allowing for the high reproducibility ofthe modification procedure. Contemporary studies provedthe electrodeposition as an attractive and cheap methodfor building-up nanosized metal structures, which doesnot require expensive equipment [27, 28]. By varying theconditions of modification (applied potential, compositionof the electrolyte, deposition time, nature of the carrier, etc.),micro- and nanostructured composite metal deposits withhigh electrocatalytic activity can be obtained.
Our research has shown that highly porous graphitematerials, modified through potentiostatic deposition ofPt, Pd, and mixtures of (Pd+Pt) and (Pd+Au) in variedproportions, prove to be effective electrocatalysts for thereduction of hydrogen peroxide at low working potentials [9,10]. In addition, modified graphites were characterised witha simple modification protocol, high operational stabilityover a wide pH-range, and high operational stability with
retaining catalytic activity for over 1 year that motivated usto use them as electrochemical transducers in the designof amperometric biosensors based on the electroreductionof hydrogen peroxide. This study continues our research inthe above-mentioned direction, with glassy carbon beingthe solid support to be modified with microquantities ofpure Pd and a mixture (Pd+Au) deposited electrochemicallyon it. The choice of the carbon material, glassy carbon,is motivated by its high mechanical and chemical stabilityin aggressive media, and above all by its fullerene-relatedstructure [29], that is, properties that distinguish it fromgraphite. In addition, substituting one of the components ofthe catalytically active phase, Pt with gold would potentiallyaffect the catalytic activity towards the target reaction(H2O2 electroreduction), and the new data would provideus with a better understanding of the factors affectingthe catalytic process as a whole. Based on the above, thepresent study deals with the development of an efficient andselective electrocatalyst for the reduction of H2O2 throughmodification of glassy carbon with microdeposits of Pd anda mixture of (Pd+Au). Their applicability as transducers inamperometric biosensors, based on hydrogen peroxide pro-ducing oxidoreductases, is also demonstrated.
2. Experimental
2.1. Materials. Glucose oxidase (GOx) (E.C. 1.1.3.4) fromAspergillus niger (Fluka Biochemica), with homogeneous ac-tivity of 198 U mg−1 (1 U corresponds to the amount ofthe enzyme which oxidizes 1 μmoL glucose per min atpH 7.0 and 25◦C); D-glucose monohydrate (Valerus, Sofia,Bulgaria). Hydrogen peroxide and chemicals used for pre-paring buffer solutions, Na2HPO4 × 12H2O, citric acid,KOH, and H3PO4, were purchased from Fluka. All solutionswere prepared with double-distilled water. The β-D-glucosesolution (5 × 10⁻³ M in phosphate-citrate buffer, pH 7.0)was allowed to mutarotate for 24 h before use.
2.2. Preparation of the Electrodes. Glassy carbon (GC) la-mellae with a geometric surface Sgeom = 1.35 cm2 wereused. The catalytically active components were depositedin potentiostatic regime (Edeposit = +0.05 V versus reversiblehydrogen electrode) via a brief electrolysis (tdeposit = 10 s)from the following electrolytes: 2% solution of PdCl2 in0.1 M HCl, alone or mixed with 2% solution of HAuCl4in 0.1 M HCl in the following volume to volume ratios:90% : 10%, 70% : 30%, or 50% : 50%. The respective molarproportions of Pd to Au in the electrodeposition baths havebeen determined to be 17 : 1; 9 : 2; 2 : 1. The surface coveragewas estimated to be ca. 18 μg cm−2. The prepared electrodeswere allowed to age for 3–5 weeks until the stabilizationof the surface occurs. By the end of ageing period, thechronoamperometric data showed a decrease of the activeelectrode surface with 15%.
The electrodes will be further denoted in the text aselectrodes types A, B, C, and D as follows:
(i) glassy carbon modified with individual Pd (electrodetype A);

International Journal of Electrochemistry 3
(ii) glassy carbon modified with Pd+Au mixed in a ratioof 90% : 10% (w/w, electrode type B);
(iii) glassy carbon modified with Pd+Au mixed in a ratioof 70% : 30% (w/w, electrode type C);
(iv) glassy carbon modified with Pd+Au mixed in a ratioof 50% : 50% (w/w, electrode type D).
2.3. Apparatus and Measurements. All electrochemical meas-urements were performed in a three-electrode cell withseparated compartments (working volume 10–15 mL). AnAg/AgCl, 1 M KCl electrode was used as a reference electrode,and platinum wire as a counter electrode. The electro-chemical setup also involved a bipotentiostat, type BiPAD(TACUSSEL, Villeurbanne, France); a generator, type EG-20(Elpan, Lubawa, Poland); a digital voltmeter, type 1AB105(ZPU, Pravets, Bulgaria). The solutions were softly bubbledwith argon during the measurements, in order to decreasethe background current, but not to completely deaerate thesolutions. For the experiments with the enzyme electrodes,the access of oxygen to the electrolyte was assured bykeeping the cell open. The operational characteristics of theseries-modified electrodes were examined by the polarizationcurves’ method in potentiostatic regime (phosphate-citratebuffer, pH 7.0). For maintaining constant temperature athermostat UH (VEB MLW Prufgerate-Werk, Medingen,Germany) was used. The pH of the buffer solutions wasadjusted with a pH-meter OP-208 (Radelkis, Budapest, Hun-gary).
3. Results and Discussion
3.1. Electrocatalytic Reduction of Hydrogen Peroxide. Thesteady-state polarization curves on glassy carbon electrodes,modified with deposits of Pd only (type A electrode) andwith the mixtures of (Pd+Au) (types B, C, and D electrodes)in presence of hydrogen peroxide recorded over the potentialrange from −250 to +250 mV (versus Ag/AgCl) at 25◦C, areshown in Figure 1.
Cathode currents in presence of H2O2 resulting from itselectrochemical reduction were observed over the studiedrange of potentials for all four modified glassy carbonelectrodes. In the case of a pure glassy carbon electrode andglassy carbon modified with deposits of Au only, no suchcurrents were noted (not shown). Regions of almost limitingcurrent values (plateau) around and below 0 V are observableon the polarization curves for electrodes of types A, B, C,and D, which indicates that each of the modified electrodesmight be potentially useful in the electroanalytical assay ofhydrogen peroxide. The plateau region was found to bedependent on the nature of the catalytically active modifier(deposits of Pd only, or of palladium-gold mixtures in variedproportions). Limiting current values over the potentialrange from −100 to +50 mV characterise two of the glassycarbon electrodes: the one modified with Pd only (type A,closed circles) and the type B electrode (open squares). Just aswide is the plateau for the type C electrode (open triangles),though in the potential region from −50 to +100 mV.The type D electrode plateau (asterix), spanning the range
−300 −200 −100 0 100 200 300
I s(µ
A)
E (mV)
Electrode type AElectrode type B
Electrode type CElectrode type D
−70
−50
−30
−10
10
30
Figure 1: Steady-state current as a function of the applied potentialat modified glassy carbon electrodes in 0.1 M H2O2 present; phos-phate-citrate buffer, pH 7.0; reference electrode Ag/AgCl (1 M KCl);temperature 25◦C.
from −50 to +50 mV, is the narrowest. Figure 1 shows thatbesides the width of the plateau, the activity of the glassycarbon electrodes in hydrogen peroxide electroreduction alsodepends on the composition of the catalytically active phase.The activity of the electrodes estimated as the values of theelectrode response towards hydrogen peroxide in the plateauregion decreases in the order
type D ∼ type B > type A > type C. (1)
With all types of glassy carbon, the dependence of theelectrode signal (cathode current) on the H2O2 concen-tration at three potentials from the plateau region −0,−50, and −100 mV (versus Ag/AgCl) was studied in aphosphate-citrate buffer, pH 7.0, at room temperature. Theelectrode response was found to increase linearly with thesubstrate concentration at the three chosen potentials, withsensitivities (dI/dC, determined from the linear part ofcalibration graphs, n = 3) depending on both the appliedpotential and the type of the modifying catalytically activecomponent (Figure 2).
For modified glassy carbon of types B, C, and D, thesensitivity increases as the working potential shifts to thenegative direction. As a general rule, the electrode sensitivityat potentials −50 and −100 mV was found to be between 1.2and twice as high as the sensitivity registered at 0 V (Table 1).For glassy carbon modified with Pd only (type A), therewere no differences observed in the values of the electrodesignal over the same potential range. The linear dynamicrange of the electrode signal (in μM) also differs for allelectrodes as dependent on the applied potential and on thetype of the modifying component For the type A electrode;however, the linearity of the signal, as well as the sensitivity,increases as the potential shifts negatively. For the other threeelectrodes—of types B, C, and D, there is no correlationbetween the linearity of the response and the shifts of thepotential in the cathode direction. There is no dependence
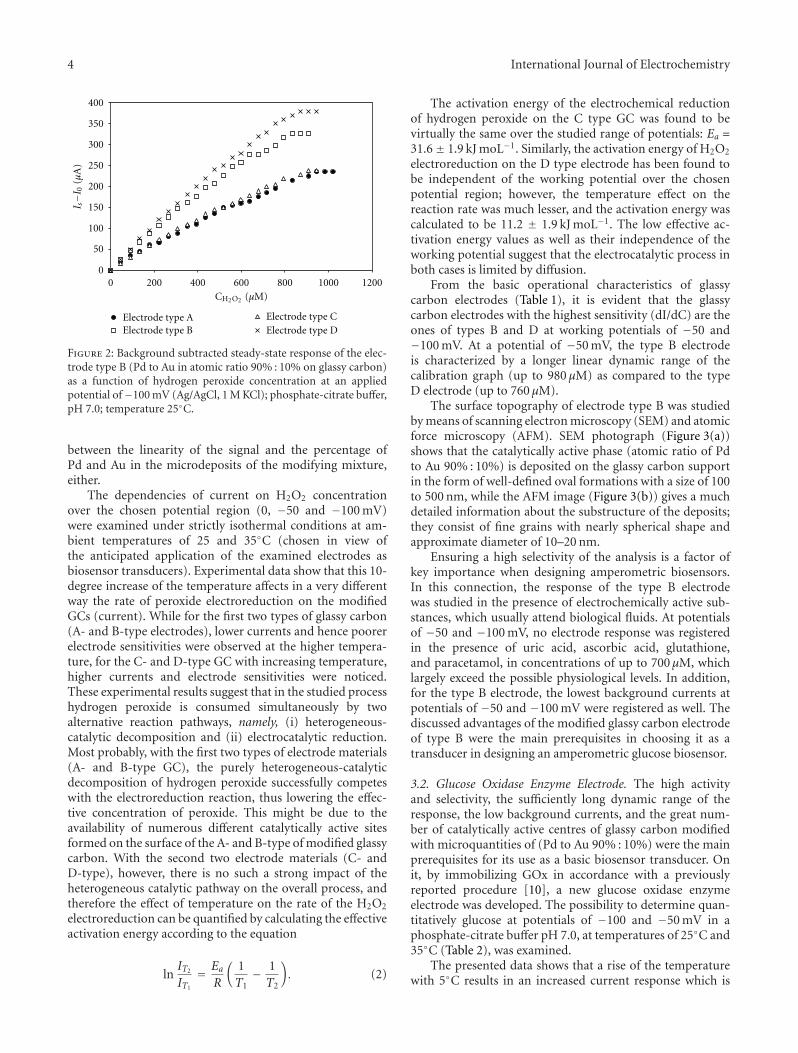
4 International Journal of Electrochemistry
Electrode type AElectrode type B
Electrode type CElectrode type D
0 200 400 600 800 1000 12000
50
100
150
200
250
300
350
400
CH2O2 (µM)
I s−I
0(µ
A)
Figure 2: Background subtracted steady-state response of the elec-trode type B (Pd to Au in atomic ratio 90% : 10% on glassy carbon)as a function of hydrogen peroxide concentration at an appliedpotential of−100 mV (Ag/AgCl, 1 M KCl); phosphate-citrate buffer,pH 7.0; temperature 25◦C.
between the linearity of the signal and the percentage ofPd and Au in the microdeposits of the modifying mixture,either.
The dependencies of current on H2O2 concentrationover the chosen potential region (0, −50 and −100 mV)were examined under strictly isothermal conditions at am-bient temperatures of 25 and 35◦C (chosen in view ofthe anticipated application of the examined electrodes asbiosensor transducers). Experimental data show that this 10-degree increase of the temperature affects in a very differentway the rate of peroxide electroreduction on the modifiedGCs (current). While for the first two types of glassy carbon(A- and B-type electrodes), lower currents and hence poorerelectrode sensitivities were observed at the higher tempera-ture, for the C- and D-type GC with increasing temperature,higher currents and electrode sensitivities were noticed.These experimental results suggest that in the studied processhydrogen peroxide is consumed simultaneously by twoalternative reaction pathways, namely, (i) heterogeneous-catalytic decomposition and (ii) electrocatalytic reduction.Most probably, with the first two types of electrode materials(A- and B-type GC), the purely heterogeneous-catalyticdecomposition of hydrogen peroxide successfully competeswith the electroreduction reaction, thus lowering the effec-tive concentration of peroxide. This might be due to theavailability of numerous different catalytically active sitesformed on the surface of the A- and B-type of modified glassycarbon. With the second two electrode materials (C- andD-type), however, there is no such a strong impact of theheterogeneous catalytic pathway on the overall process, andtherefore the effect of temperature on the rate of the H2O2
electroreduction can be quantified by calculating the effectiveactivation energy according to the equation
lnIT2
IT1
= EaR
(1T1− 1
T2
). (2)
The activation energy of the electrochemical reductionof hydrogen peroxide on the C type GC was found to bevirtually the same over the studied range of potentials: Ea =31.6± 1.9 kJ moL−1. Similarly, the activation energy of H2O2
electroreduction on the D type electrode has been found tobe independent of the working potential over the chosenpotential region; however, the temperature effect on thereaction rate was much lesser, and the activation energy wascalculated to be 11.2 ± 1.9 kJ moL−1. The low effective ac-tivation energy values as well as their independence of theworking potential suggest that the electrocatalytic process inboth cases is limited by diffusion.
From the basic operational characteristics of glassycarbon electrodes (Table 1), it is evident that the glassycarbon electrodes with the highest sensitivity (dI/dC) are theones of types B and D at working potentials of −50 and−100 mV. At a potential of −50 mV, the type B electrodeis characterized by a longer linear dynamic range of thecalibration graph (up to 980 μM) as compared to the typeD electrode (up to 760 μM).
The surface topography of electrode type B was studiedby means of scanning electron microscopy (SEM) and atomicforce microscopy (AFM). SEM photograph (Figure 3(a))shows that the catalytically active phase (atomic ratio of Pdto Au 90% : 10%) is deposited on the glassy carbon supportin the form of well-defined oval formations with a size of 100to 500 nm, while the AFM image (Figure 3(b)) gives a muchdetailed information about the substructure of the deposits;they consist of fine grains with nearly spherical shape andapproximate diameter of 10–20 nm.
Ensuring a high selectivity of the analysis is a factor ofkey importance when designing amperometric biosensors.In this connection, the response of the type B electrodewas studied in the presence of electrochemically active sub-stances, which usually attend biological fluids. At potentialsof −50 and −100 mV, no electrode response was registeredin the presence of uric acid, ascorbic acid, glutathione,and paracetamol, in concentrations of up to 700 μM, whichlargely exceed the possible physiological levels. In addition,for the type B electrode, the lowest background currents atpotentials of −50 and −100 mV were registered as well. Thediscussed advantages of the modified glassy carbon electrodeof type B were the main prerequisites in choosing it as atransducer in designing an amperometric glucose biosensor.
3.2. Glucose Oxidase Enzyme Electrode. The high activityand selectivity, the sufficiently long dynamic range of theresponse, the low background currents, and the great num-ber of catalytically active centres of glassy carbon modifiedwith microquantities of (Pd to Au 90% : 10%) were the mainprerequisites for its use as a basic biosensor transducer. Onit, by immobilizing GOx in accordance with a previouslyreported procedure [10], a new glucose oxidase enzymeelectrode was developed. The possibility to determine quan-titatively glucose at potentials of −100 and −50 mV in aphosphate-citrate buffer pH 7.0, at temperatures of 25◦C and35◦C (Table 2), was examined.
The presented data shows that a rise of the temperaturewith 5◦C results in an increased current response which is
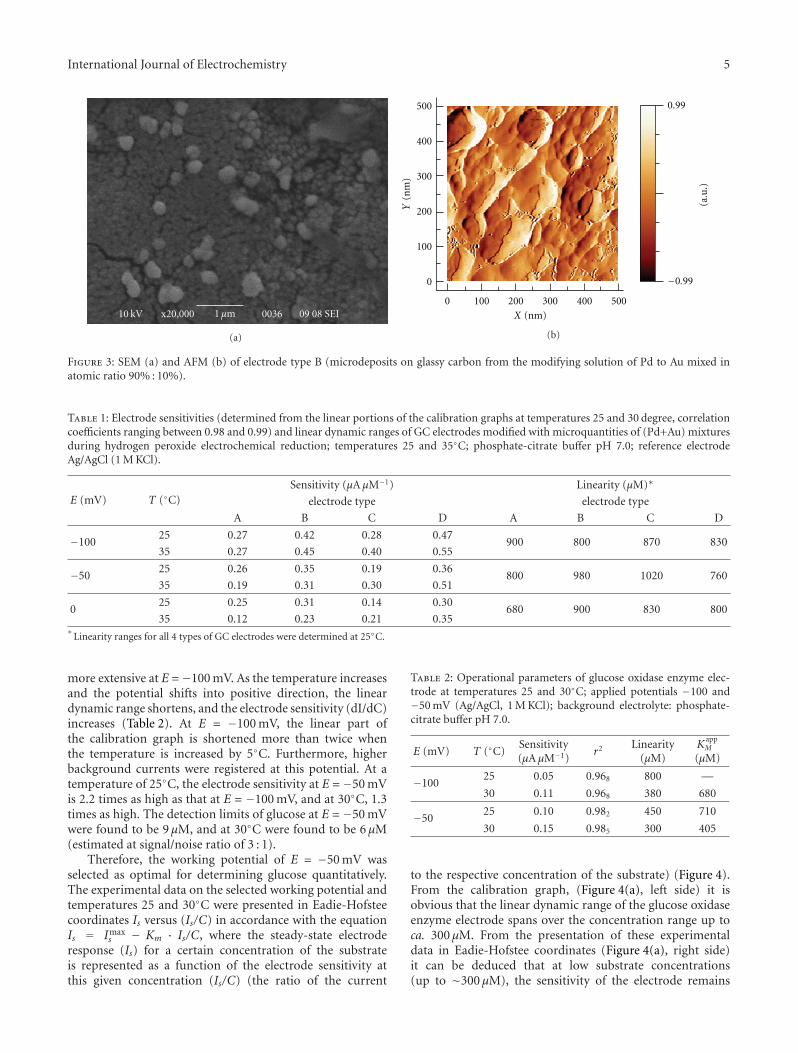
International Journal of Electrochemistry 5
10 kV 1 µm 0036 09 08 SEIx20,000
(a)
0
100
200
300
400
500
0 100 200 300 400 500
X (nm)
Y(n
m)
0.99
−0.99
(a.u
.)
(b)
Figure 3: SEM (a) and AFM (b) of electrode type B (microdeposits on glassy carbon from the modifying solution of Pd to Au mixed inatomic ratio 90% : 10%).
Table 1: Electrode sensitivities (determined from the linear portions of the calibration graphs at temperatures 25 and 30 degree, correlationcoefficients ranging between 0.98 and 0.99) and linear dynamic ranges of GC electrodes modified with microquantities of (Pd+Au) mixturesduring hydrogen peroxide electrochemical reduction; temperatures 25 and 35◦C; phosphate-citrate buffer pH 7.0; reference electrodeAg/AgCl (1 M KCl).
E (mV) T (◦C)Sensitivity (μA μM−1) Linearity (μM)∗
electrode type electrode type
A B C D A B C D
−10025 0.27 0.42 0.28 0.47
900 800 870 83035 0.27 0.45 0.40 0.55
−5025 0.26 0.35 0.19 0.36
800 980 1020 76035 0.19 0.31 0.30 0.51
025 0.25 0.31 0.14 0.30
680 900 830 80035 0.12 0.23 0.21 0.35
∗Linearity ranges for all 4 types of GC electrodes were determined at 25◦C.
more extensive at E =−100 mV. As the temperature increasesand the potential shifts into positive direction, the lineardynamic range shortens, and the electrode sensitivity (dI/dC)increases (Table 2). At E = −100 mV, the linear part ofthe calibration graph is shortened more than twice whenthe temperature is increased by 5◦C. Furthermore, higherbackground currents were registered at this potential. At atemperature of 25◦C, the electrode sensitivity at E = −50 mVis 2.2 times as high as that at E = −100 mV, and at 30◦C, 1.3times as high. The detection limits of glucose at E = −50 mVwere found to be 9 μM, and at 30◦C were found to be 6 μM(estimated at signal/noise ratio of 3 : 1).
Therefore, the working potential of E = −50 mV wasselected as optimal for determining glucose quantitatively.The experimental data on the selected working potential andtemperatures 25 and 30◦C were presented in Eadie-Hofsteecoordinates Is versus (Is/C) in accordance with the equationIs = Imax
s − Km · Is/C, where the steady-state electroderesponse (Is) for a certain concentration of the substrateis represented as a function of the electrode sensitivity atthis given concentration (Is/C) (the ratio of the current
Table 2: Operational parameters of glucose oxidase enzyme elec-trode at temperatures 25 and 30◦C; applied potentials −100 and−50 mV (Ag/AgCl, 1 M KCl); background electrolyte: phosphate-citrate buffer pH 7.0.
E (mV) T (◦C)Sensitivity(μA μM−1)
r2 Linearity(μM)
KappM
(μM)
−10025 0.05 0.968 800 —
30 0.11 0.968 380 680
−5025 0.10 0.982 450 710
30 0.15 0.985 300 405
to the respective concentration of the substrate) (Figure 4).From the calibration graph, (Figure 4(a), left side) it isobvious that the linear dynamic range of the glucose oxidaseenzyme electrode spans over the concentration range up toca. 300 μM. From the presentation of these experimentaldata in Eadie-Hofstee coordinates (Figure 4(a), right side)it can be deduced that at low substrate concentrations(up to ∼300 μM), the sensitivity of the electrode remains
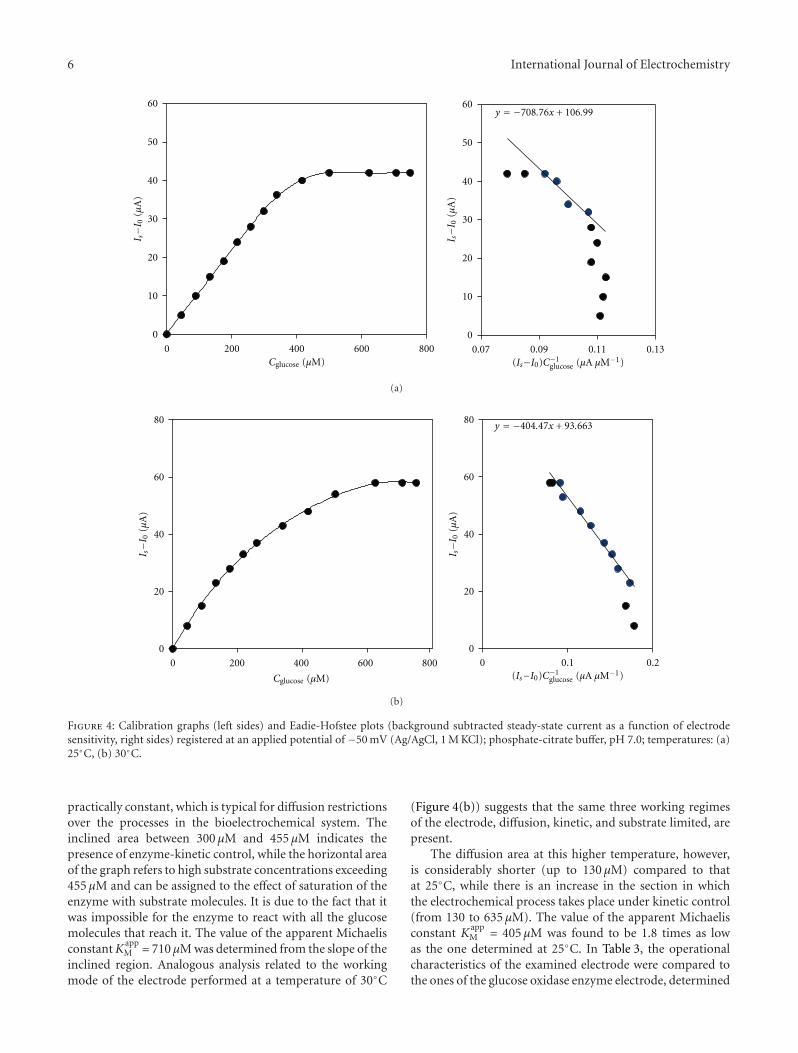
6 International Journal of Electrochemistry
0
10
20
30
40
50
60
0
10
20
30
40
50
60
0 200 400 600 800Cglucose (µM)
y = −708.76x + 106.99
0.07 0.09 0.11 0.13
I s−I
0(µ
A)
I s−I
0(µ
A)
(Is−I0)C−1glucose (µA µM−1)
(a)
y = −404.47x + 93.663
Cglucose (µM)
0 0.1 0.20
20
40
60
80
0
20
40
60
80
200 400 600 8000
I s−I
0(µ
A)
I s−I
0(µ
A)
(Is−I0)C−1glucose (µA µM−1)
(b)
Figure 4: Calibration graphs (left sides) and Eadie-Hofstee plots (background subtracted steady-state current as a function of electrodesensitivity, right sides) registered at an applied potential of −50 mV (Ag/AgCl, 1 M KCl); phosphate-citrate buffer, pH 7.0; temperatures: (a)25◦C, (b) 30◦C.
practically constant, which is typical for diffusion restrictionsover the processes in the bioelectrochemical system. Theinclined area between 300 μM and 455 μM indicates thepresence of enzyme-kinetic control, while the horizontal areaof the graph refers to high substrate concentrations exceeding455 μM and can be assigned to the effect of saturation of theenzyme with substrate molecules. It is due to the fact that itwas impossible for the enzyme to react with all the glucosemolecules that reach it. The value of the apparent MichaelisconstantK
appM = 710 μM was determined from the slope of the
inclined region. Analogous analysis related to the workingmode of the electrode performed at a temperature of 30◦C
(Figure 4(b)) suggests that the same three working regimesof the electrode, diffusion, kinetic, and substrate limited, arepresent.
The diffusion area at this higher temperature, however,is considerably shorter (up to 130 μM) compared to thatat 25◦C, while there is an increase in the section in whichthe electrochemical process takes place under kinetic control(from 130 to 635 μM). The value of the apparent Michaelisconstant K
appM = 405 μM was found to be 1.8 times as low
as the one determined at 25◦C. In Table 3, the operationalcharacteristics of the examined electrode were compared tothe ones of the glucose oxidase enzyme electrode, determined
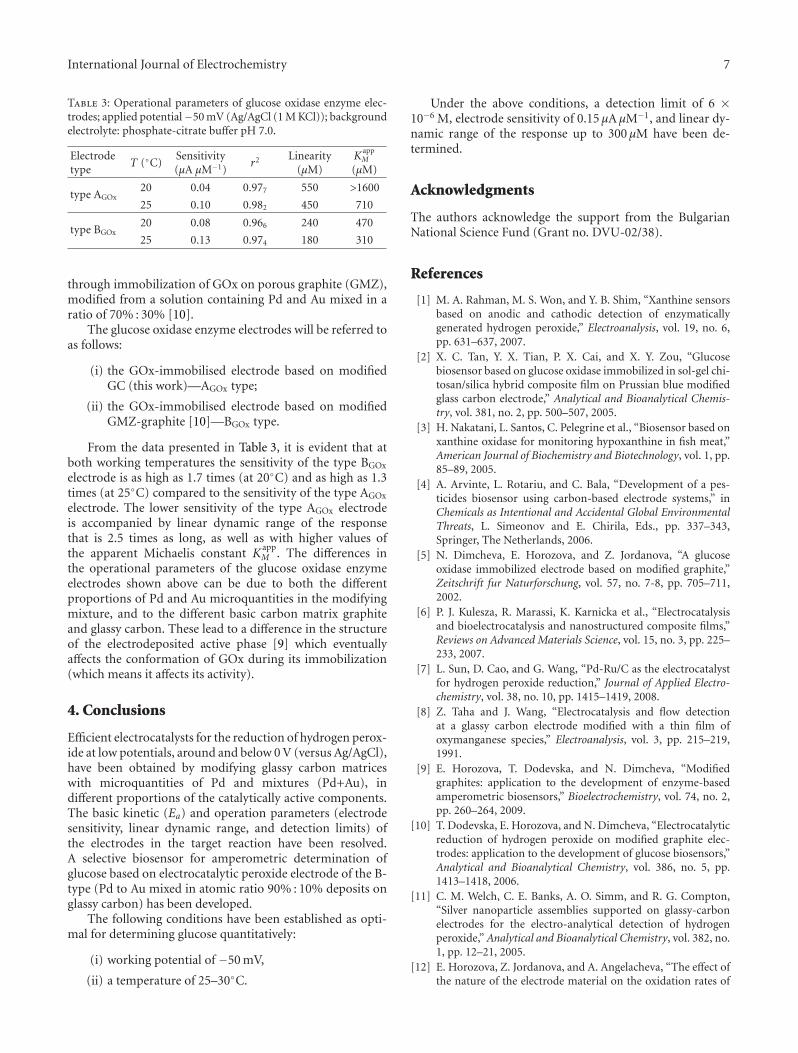
International Journal of Electrochemistry 7
Table 3: Operational parameters of glucose oxidase enzyme elec-trodes; applied potential−50 mV (Ag/AgCl (1 M KCl)); backgroundelectrolyte: phosphate-citrate buffer pH 7.0.
Electrodetype
T (◦C)Sensitivity(μA μM−1)
r2 Linearity(μM)
KappM
(μM)
type AGOx20 0.04 0.977 550 >1600
25 0.10 0.982 450 710
type BGOx20 0.08 0.966 240 470
25 0.13 0.974 180 310
through immobilization of GOx on porous graphite (GMZ),modified from a solution containing Pd and Au mixed in aratio of 70% : 30% [10].
The glucose oxidase enzyme electrodes will be referred toas follows:
(i) the GOx-immobilised electrode based on modifiedGC (this work)—AGOx type;
(ii) the GOx-immobilised electrode based on modifiedGMZ-graphite [10]—BGOx type.
From the data presented in Table 3, it is evident that atboth working temperatures the sensitivity of the type BGOx
electrode is as high as 1.7 times (at 20◦C) and as high as 1.3times (at 25◦C) compared to the sensitivity of the type AGOx
electrode. The lower sensitivity of the type AGOx electrodeis accompanied by linear dynamic range of the responsethat is 2.5 times as long, as well as with higher values ofthe apparent Michaelis constant K
appM . The differences in
the operational parameters of the glucose oxidase enzymeelectrodes shown above can be due to both the differentproportions of Pd and Au microquantities in the modifyingmixture, and to the different basic carbon matrix graphiteand glassy carbon. These lead to a difference in the structureof the electrodeposited active phase [9] which eventuallyaffects the conformation of GOx during its immobilization(which means it affects its activity).
4. Conclusions
Efficient electrocatalysts for the reduction of hydrogen perox-ide at low potentials, around and below 0 V (versus Ag/AgCl),have been obtained by modifying glassy carbon matriceswith microquantities of Pd and mixtures (Pd+Au), indifferent proportions of the catalytically active components.The basic kinetic (Ea) and operation parameters (electrodesensitivity, linear dynamic range, and detection limits) ofthe electrodes in the target reaction have been resolved.A selective biosensor for amperometric determination ofglucose based on electrocatalytic peroxide electrode of the B-type (Pd to Au mixed in atomic ratio 90% : 10% deposits onglassy carbon) has been developed.
The following conditions have been established as opti-mal for determining glucose quantitatively:
(i) working potential of −50 mV,
(ii) a temperature of 25–30◦C.
Under the above conditions, a detection limit of 6 ×10⁻⁶ M, electrode sensitivity of 0.15 μA μM−1, and linear dy-namic range of the response up to 300 μM have been de-termined.
Acknowledgments
The authors acknowledge the support from the BulgarianNational Science Fund (Grant no. DVU-02/38).
References
[1] M. A. Rahman, M. S. Won, and Y. B. Shim, “Xanthine sensorsbased on anodic and cathodic detection of enzymaticallygenerated hydrogen peroxide,” Electroanalysis, vol. 19, no. 6,pp. 631–637, 2007.
[2] X. C. Tan, Y. X. Tian, P. X. Cai, and X. Y. Zou, “Glucosebiosensor based on glucose oxidase immobilized in sol-gel chi-tosan/silica hybrid composite film on Prussian blue modifiedglass carbon electrode,” Analytical and Bioanalytical Chemis-try, vol. 381, no. 2, pp. 500–507, 2005.
[3] H. Nakatani, L. Santos, C. Pelegrine et al., “Biosensor based onxanthine oxidase for monitoring hypoxanthine in fish meat,”American Journal of Biochemistry and Biotechnology, vol. 1, pp.85–89, 2005.
[4] A. Arvinte, L. Rotariu, and C. Bala, “Development of a pes-ticides biosensor using carbon-based electrode systems,” inChemicals as Intentional and Accidental Global EnvironmentalThreats, L. Simeonov and E. Chirila, Eds., pp. 337–343,Springer, The Netherlands, 2006.
[5] N. Dimcheva, E. Horozova, and Z. Jordanova, “A glucoseoxidase immobilized electrode based on modified graphite,”Zeitschrift fur Naturforschung, vol. 57, no. 7-8, pp. 705–711,2002.
[6] P. J. Kulesza, R. Marassi, K. Karnicka et al., “Electrocatalysisand bioelectrocatalysis and nanostructured composite films,”Reviews on Advanced Materials Science, vol. 15, no. 3, pp. 225–233, 2007.
[7] L. Sun, D. Cao, and G. Wang, “Pd-Ru/C as the electrocatalystfor hydrogen peroxide reduction,” Journal of Applied Electro-chemistry, vol. 38, no. 10, pp. 1415–1419, 2008.
[8] Z. Taha and J. Wang, “Electrocatalysis and flow detectionat a glassy carbon electrode modified with a thin film ofoxymanganese species,” Electroanalysis, vol. 3, pp. 215–219,1991.
[9] E. Horozova, T. Dodevska, and N. Dimcheva, “Modifiedgraphites: application to the development of enzyme-basedamperometric biosensors,” Bioelectrochemistry, vol. 74, no. 2,pp. 260–264, 2009.
[10] T. Dodevska, E. Horozova, and N. Dimcheva, “Electrocatalyticreduction of hydrogen peroxide on modified graphite elec-trodes: application to the development of glucose biosensors,”Analytical and Bioanalytical Chemistry, vol. 386, no. 5, pp.1413–1418, 2006.
[11] C. M. Welch, C. E. Banks, A. O. Simm, and R. G. Compton,“Silver nanoparticle assemblies supported on glassy-carbonelectrodes for the electro-analytical detection of hydrogenperoxide,” Analytical and Bioanalytical Chemistry, vol. 382, no.1, pp. 12–21, 2005.
[12] E. Horozova, Z. Jordanova, and A. Angelacheva, “The effect ofthe nature of the electrode material on the oxidation rates of
8 International Journal of Electrochemistry
hydrogen peroxide, ascorbic acid, uric acid and gloutathione,”Bulletin of Electrochemistry, vol. 13, no. 7, pp. 321–326, 1997.
[13] R. L. R. P. Fagury, K. O. Lupetti, and O. Fatibello-Filho, “Flexi-ble potentiometric minisensor based on manganese dioxide-composite for the determination of hydrogen peroxide inbleach and pharmaceutical products,” Analytical Letters, vol.38, no. 12, pp. 1857–1867, 2005.
[14] A. S. Kumar and S. Sornambikai, “Selective amperometricsensing of hydrogen peroxide with nafionlcopper particulateschemically modified electrode,” Indian Journal of ChemistrySection A, vol. 48, no. 7, pp. 940–945, 2009.
[15] H. Ryoo, Y. Kim, J. Lee, W. Shin, N. Myung, and H. G. Hong,“Immobilization of horseradish peroxidase to electrochemi-cally deposited gold-nanoparticles on glassy carbon electrodefor determination of H2O2,” Bulletin of the Korean ChemicalSociety, vol. 27, no. 5, pp. 672–678, 2006.
[16] L. Duan, Q. Xu, F. Xie, and S. Wang, “Hydrogen peroxidebiosensor based on the bioelectrocatalysis of myoglobin incor-porated in multi-walled carbon nanotubes/chitosan compos-ite film,” International Journal of Electrochemcal Science, vol. 3,pp. 118–124, 2008.
[17] A. Ernst, O. Makowski, B. Kowalewska, K. Miecznikowski,and P. J. Kulesza, “Hybrid bioelectrocatalyst for hydrogen per-oxide reduction: immobilization of enzyme within organic-inorganic film of structured Prussian Blue and PEDOT,”Bioelectrochemistry, vol. 71, no. 1, pp. 23–28, 2007.
[18] S. Varma and C. K. Mitra, “Bioelectrochemical studies on cata-lase modified glassy carbon paste electrodes,” ElectrochemistryCommunications, vol. 4, no. 2, pp. 151–157, 2002.
[19] V. M. Ivama and S. H. P. Serrano, “Rhodium-prussianblue modified carbon paste electrode (Rh-PBMCPE) foramperometric detection of hydrogen peroxide,” Journal of theBrazilian Chemical Society, vol. 14, no. 4, pp. 551–555, 2003.
[20] K. Schachl, H. Alemu, K. Kalecher, J. Jezkova, I. Svancara,and K. Vytras, “Amperometric determination of hydrogenperoxide with a manganese dioxide-modified carbon pasteelectrode using flow injection analysis,” Analyst, vol. 122, pp.985–989, 1997.
[21] S. Arjsiriwat, M. Tanticharoen, K. Kirtikara, K. Aoki, and M.Somasundrum, “Metal-dispersed conducting polymer-coatedelectrode used for oxidase-based biosensors,” ElectrochemistryCommunications, vol. 2, no. 6, pp. 441–444, 2000.
[22] K. Balasubramanian and M. Burghard, “Biosensors based oncarbon nanotubes,” Analytical and Bioanalytical Chemistry,vol. 385, no. 3, pp. 452–468, 2006.
[23] P. Yang, W. Wei, C. Tao, B. Xie, and X. Chen, “Nano-silver/multi-walled carbon nanotube composite films forhydrogen peroxide electroanalysis,” Microchimica Acta, vol.162, no. 1-2, pp. 51–56, 2008.
[24] M. Yang, Y. Yang, Y. Liu, G. Shen, and R. Yu, “Plat-inum nanoparticles-doped sol-gel/carbon nanotubes compos-ite electrochemical sensors and biosensors,” Biosensors andBioelectronics, vol. 21, no. 7, pp. 1125–1131, 2006.
[25] R. Garjonyte and A. Malinauskas, “Amperometric sensor forhydrogen peroxide, based on Cu2O or CuO modified carbonpaste electrodes,” Fresenius’ Journal of Analytical Chemistry,vol. 360, no. 1, pp. 122–123, 1998.
[26] O. Niwa, “Electroanalytical chemistry with carbon film elec-trodes and micro and nano-structured carbon film-basedelectrodes,” Bulletin of the Chemical Society of Japan, vol. 78,no. 4, pp. 555–571, 2005.
[27] T. Oyama, T. Okajima, and T. Ohsaka, “Electrodeposition ofgold at glassy carbon electrodes in room-temperature ionic
liquids,” Journal of the Electrochemical Society, vol. 154, no. 6,pp. D322–D327, 2007.
[28] E. Alvarez and R. Salinas, “Electrochemically deposited Pdnanocrystals on vitreous carbon,” in Proceedings of the 2ndMercosur Congress on Process Systems Engineering, Rio deJaneiro, Brasil, 2005.
[29] P. J. F. Harris, “Fullerene-related structure of commercialglassy carbons,” Philosophical Magazine, vol. 84, no. 29, pp.3159–3167, 2004.

SAGE-Hindawi Access to ResearchInternational Journal of ElectrochemistryVolume 2011, Article ID 289032, 9 pagesdoi:10.4061/2011/289032
Research Article
The Electrochemical Development of Pt(111)SteppedSurfaces and Its Influence on Methanol Electrooxidation
E. Teliz,1 V. Dıaz,2 R. Faccio,3 A. W. Mombru,3 and C. F. Zinola2
1 Nucleo Ingenierıa Electroquımica, Facultad de Ingenierıa, Instituto de Ingenierıa Quımica-Laboratorio de ElectroquımicaFundamental, Facultad de Ciencias, Instituto de Quımica Biologica, Rodo 1843, Udelar, Montevideo 11400, Uruguay
2 Nucleo Ingenierıa Electroquımica, Facultad de Ingenierıa, Instituto de Ingenierıa Quımica-Laboratorio deElectroquımica Fundamental, Facultad de Ciencias, Instituto de Quımica Biologica, Rodo 1843 , Udelar, Montevideo 11400, Uruguay
3 Laboratorio de cristalografıa, estado solido y materiales (Cryssmat-Lab), DETEMA, Centro NanoMat, Polo Tecnologico de Pando,Facultad de Quımica, Gral. Flores 2224, Udelar, Montevideo 11000, Uruguay
Correspondence should be addressed to V. Dıaz, [email protected]
Received 1 April 2011; Accepted 6 May 2011
Academic Editor: Maria E. Martins
Copyright © 2011 E. Teliz et al. This is an open access article distributed under the Creative Commons Attribution License, whichpermits unrestricted use, distribution, and reproduction in any medium, provided the original work is properly cited.
The progress in the preparation of new electrode surfaces by electrochemical treatments exhibiting high faradaic efficienciestowards industrial electrocatalytic processes has gained more attention in today’s scientific community. Most of the papersreport new catalysts dispersed on different substrates, but some fundamental studies required for electrochemical and physicalcharacterizations are sometimes forgotten. In this paper, we make a full staging of two electrochemical treatments that can beconducted to enhance the electrocatalytic activity of platinum surfaces, such as, electrofacetting through square wave potentialprograms and constant cathodic polarizations in the net hydrogen evolution region. The cathodic treatment applied at −2 Vclearly develops (111) stepped planes similarly to the electrofacetting performed after applying the square wave program between1.40 V and 0.70 V at 2.5 kHz. The X-ray diffraction patterns of both surfaces as well as on other electrofacetted platinum electrodesare obtained for comparison purposes. Moreover, the electrocatalytic activity towards methanol electrooxidation also exhibitsequivalent coulombic efficiencies and 200% higher than on polycrystalline platinum as demonstrated by linear sweep voltammetryand potentiostatic current decays.
1. Introduction
A solid surface is a physical region that confines the crys-tal growth and the emergence of new physical propertiesdifferent to those of the bulk. In the case of a solid/(liquidor gas) interface, the heterogeneous catalyst can lead tosignificant changes depending on the presence or the absenceof an electric field. Moreover, a single-crystal (sc) solid/liquidinterface is of special interest since it restricts the freedomdegrees of surface mobility. Thus, surface atoms can takepositions different from those expected depending on thecharacteristics of the applied electrode potential. This surfacephenomenon is called reconstruction and is usually studiedin physics with the help of ultrahigh vacuum (UHV)techniques [1]. However, this process strongly depends onthe nature of the metal. Thus, platinum type metals areconsidered one of the most important catalysts as anodes
and cathodes in polymer electrolyte fuel cells. This is mainlydue to the large values of exchange current densities ofthe electrochemical reactions and the surface stability inthe case of electrodissolution and/or electrodeposition [2,3]. Surface reconstruction at platinum/solution interface isusually the result of an electronic redistribution occurring asa consequence of either ion adsorption or oxygen-containingspecies formation, finally leading to surface facets. In the caseof polycrystalline (pc) surfaces, the formation of facets of afixed crystal orientation is of particular interest for industrialapplications such as electrosynthesis, fuel cell technology,and electrolysis [4, 5] due to the large stability even atpotentials as high as 1.6 V.
The surface structure of a sc can be checked by anumber of selected techniques such as scanning tunnelingmicroscopy (STM) and atomic force microscopy (AFM) [6];however, in the case of electrofaceted surfaces the atomic
2 International Journal of Electrochemistry
resolution is difficult to achieve due to the large numberof defects. Moreover, other techniques are currently used toobtain the fingerprint of the electrode surface such as cyclicvoltammetry (CV), which offers current versus potentialdata for sc and also for pc surfaces. CVs give importantinformation about the adsorption/desorption states, phaseformation of transitions, and so forth at the electrode surfaceas a function of potential. From the CV of platinum recordedbetween the potentials of solvent stability, one can distin-guish the potential regions corresponding to the double-layer charging, hydroxide/oxide layer formation/reduction,and hydrogen adsorption/desorption [7].
In the case of noble metal interfaces, some CV currentpeaks can be assigned to defined X-ray diffraction (XRD)patterns [8, 9]. It was commonly accepted that a voltammet-ric peak is directly connected to a single X-ray excitation.However, it has been found that current intensities canalso change between subsequent cycles because of surfacerestructuring induced by the electrode potential cycling [10,11]. In the case of platinum, the effects of such cycles havebeen interpreted [12] as the progressive development of(110) or higher atomic stepped equivalent facets because ofplatinum oxide phase formation and reduction.
The morphology and structure of a catalyst surface hasa strong weight on its electrochemical reactivity [3]. Thermo-or potential-induced surface reconstruction has beenobserved on clean metal surfaces with different crystallogra-phies depending on type of atmosphere where the processis developed. If the rearrangement of surface atoms goesmuch further than atomic spacing, macroscopic changes,which are called surface reshaping, could happen to thesurface morphology [13]. In particular, when pc metalsare treated by periodic perturbing potentials, they aresusceptible to remarkable changes in surface roughnessand in the distribution of crystallographic faces, whichis denoted as preferred crystallographic orientations viaelectrochemical faceting, [6, 8]. Tian et al. [14] reported thesynthesis of platinum nanocrystals using repetitive squarewave routines, and the obtained nanocrystals display high-index facets with a 400% more reactive activity than existingcommercial platinum catalysts. Thus, surface restructuringin electrochemistry produces changes in the kinetics or evenin the mechanism of various processes because of theirstrong sensitivity towards the metal surface structure [12,15]. It has to be said that pc surfaces also exhibit surfacerestructuring, and in the case of the application of periodicpotentials, they lead to the electroformation of microfacets[12]. It is well known that the application of fast potentialperiodic programs on platinum, rhodium, iridium, gold, orpalladium produces permanent morphological changes withdefined orientations, which depend on the potential limitsand frequency of the routine by a microfacetting process [16–18]. The electrochemical responses of these stepped surfacesare similar to those of stepped crystalline surfaces [19, 20].
It has been shown in a previous paper [21] that besidesthe main forces that drive the surface restructuration andmicrofacetting (oxygen and hydrogen electrosorption) thefrequency of the square wave potential itself leads to a
single propagation mode. This is the one responsible of thecrystal lattice surface rearrangement, with new equilibriumpositions that can be calculated with the potential periodicperturbations as parameters.
The voltammetry for the oxidation of methanol onsc platinum shows a clear hysteresis between the positiveand negative going scans due to the accumulation of thepoisoning intermediate at low potentials and its oxidationabove 0.7 V versus RHE [22]. Additionally, the reaction isalso very sensitive to the surface structure. The Pt(111)electrode has the lowest catalytic activity and the smallesthysteresis in a single voltammetric scan whereas Pt(100)electrode displays a much higher catalytic activity and a fastpoisoning reaction. On the other hand, Pt(110) electrodedepends on the pretreatment of the surface [23].
Besides the studies with the three basal planes, methanolelectrooxidation was also performed on stepped platinumsurfaces in order to clarify how exactly the step densityinfluences this reaction. Shin and Korzenicwski [24] sug-gested that an increase of the step density catalyzes methanoldecomposition whereas Tripkovic and Popvic [25] showedthat the increase in the step density leads to a decrease inthe surface activity towards methanol electrooxidation, bothauthors using Pt[n(111) × (100)]. Housmans and Koper[26] studied methanol oxidation on Pt[n(111) × (110)]stepped surfaces, and reported an increase in the activitywith the step density, suggesting that the presence of stepswith a (110) orientation catalyzes methanol decomposition,carbon monoxide oxidation, and also the direct methanoloxidation. These kinds of studies are relevant not only froma fundamental point of view, but also for technical purposes,that is, once the proper crystallographic orientation isfound, the technical electrode can be designed. Surfacesnanoparticules should be deposited in the carbon supportedwith the corresponding crystallographic orientation thatresulted with the best electrocatalytic performance.
2. Experimental
Electrochemical runs were performed using a three-electrodecompartment cell with a pc platinum wire of 0.5 mm diame-ter as a working electrode (99.999% purity, from GoodfellowCambridge). A large area smooth platinum counter electrodeand a reversible hydrogen reference electrode with a Luggin-Haber capillary tip completed the electrochemical system.Potential values in the text are given on the hydrogenreference electrode (RHE) scale. We employed 1 M sulphuricacid (96–98% analytical reactive from Baker) as support-ing electrolyte, which was prepared using ultrapure waterfrom Millipore-MilliQ plus (18.2 MΩ cm of resistivity). Weperformed the electrochemical experiments using a PGZ301 Voltalab potentiostat-galvanostat with the Voltamaster 4software.
To obtain the electrofacetted platinum surfaces (PtF), theelectrodes were subjected to different potential techniques.However, the most attractive of all was the repetitive squarewave potential scanning (RSWPS) in the symmetric formto avoid large surface roughness. To optimize the squarewave potential parameters, we changed the lower Ed and
International Journal of Electrochemistry 3
upper Eu potentials together with the applied frequency, f ,only in the symmetric mode during a certain time t. Inall cases, the process was followed by registering the CVprofile of the interface between 0.05 and 1.45 V at 0.10 Vs−1,always comparing with the nonperturbed electrode. Thepreferential oriented surface (facetted surface) with symme-tries equivalent to (111) and (100) are obtained by widelychanging the parameters shown above. The electrochemicalexperiments comprised the following stages: (i) electrodepretreatment involving repetitive triangular potential cyclingat 0.1 Vs−1 between 0.05 and 1.50 V until a stabilizedvoltammogram was attained; (ii) the pretreated electrodewas subsequently subjected to an RSWPS between Ed andEu at f , during a certain time t or a cathodic treatment atE = −2 V during 30 min; (iii) the CV of the treated electrodewas recorded again under the same conditions indicated in(i); (iv) XRD of the treated electrode were then obtainedsystematically.
We used the following criteria to estimate the develop-ment of preferred crystallographic orientation [6, 16]. Themain voltammetric peak at low potentials of weakly boundhydrogen electrosorption at the platinum/acid interface (h1),originally assigned to the H-adatom-Pt(111) site interaction,corresponds to H-electrosorption on disturbed Pt(111)surfaces with a larger number of Pt(110) sites whereas themain voltammetric peak at higher potentials (h2; stronglybound H-adatoms) represents the H-adatom-Pt(100) siteinteraction. Accordingly, the height ratio between these twopeaks, h2/h1, can be taken arbitrarily to follow the degree ofpreferred crystallographic orientation achieved throughoutthe treatment described in (ii). Thus, for the untreatedplatinum surfaces electrode, the average h2/h1 ratio was ca.0.84.
The most representative and relevant results involved arepetitive 5 KHz wave between Eu = 1.50 V and Ed = 0 Vfor faceted Pt(100) surfaces and the application of a 2.5 KHzbetween Eu = 1.40 V and Ed = 0.70 V for faceted Pt(111)surfaces. The current transients were recorded during theprocess and a potentiostatic holding at 0.05 V for 10 minwas applied to eliminate dissolved molecular hydrogen undercontinuous nitrogen bubbling. Immediately after and undera continuous potential control, the CVs were run from0.05 to 0.70 V at 0.10 Vs−1. All runs were achieved at 20 ±2◦C, under free oxygen conditions using nitrogen (99.998%purity) from Linde-Gas.
In order to study the electrocatalytic performance of thenew surfaces produced by the electrofacetted and cathodicpretreatments two methodologies were carried out inoxygen-free 0.1 M methanol + 1 M sulphuric media, namely,linear sweep voltammetry and potentiostatic chronoamper-ometric curves. Linear sweep voltammetry was conductedon each surface starting from 0.10 V and scanning towardspositive values at 0.010 Vs−1. Chronoamperometric curveswere performed until 10 minutes at 0.60 V and 0.70 V for thenonperturbed and the treated surfaces. The charge densityvalues under the chronoamperometric plots were calculateduntil that time only for comparison purposes.
X-ray powder diffraction data were collected using aRigaku ULTIMA IV, 285 mm radius, Powder Diffractometer
operating in Bragg-Brentano geometry. CuKα radiation (λ =1.5418 A) monochromatized with a diffracted beam bentgermanium crystal was used to collect data over the 39 to90 degree 2θ range in steps of 0.02◦ and 0.01◦ deg using ascintillation detector. Peak positions were extracted from thediffractograms using the program POWDERX [27]. Multipledatasets were collected for each sample in order to obtainrepresentative values.
3. Results
3.1. Electrochemical Characterization. Figure 1(a) depicts theelectrochemical profile of platinum after annealing. For thesesurfaces the current intensities ratio between h2 and h1 is0.84. This is the original surface, which is taken as the blankof all the applied pretreatments. Figure 1(b) shows in thiscase a clear trend to develop the (111) terraces with a ratioh2/h1 = 0.52. The RSWPS treatment under the conditionsdescribed in Figure 1(c) produces remarkable changes in thevoltammetric response of the treated surfaces as well as inthe corresponding surface morphologies comparing to theblank. Likewise, the relative distribution of voltammetricpeaks is modified, that is, the Pt F100 develops the h2/h1 =1.80 ratio. On the other hand, the cyclic voltammetric profileas a result of the cathodic treatment is shown in Figure 1(d).The relative distribution of peaks is between the blank andthe profile of Pt F(111), that is the h2/h1 ratio is 0.75. Due tothe appearance of more electrochemical contributions, thevoltammetric contours are slightly wider. It is likely that astepped surface arises with global (111) planes between thatwe consider the blank and the Pt F111.
3.2. Structural Characterization by X-Ray Powder Diffraction(XRPD). All the samples shown above in Figure 2 exhibitpeak positions strictly corresponding to Pt0, which indicatesno further oxidation at the catalyst occurring after applyingthe RSWPS. It is important to mention that all the samplespresent good stability, since they were also measured afterperiods of one month and presented no difference in thediffractograms.
When comparing the diffractograms of the treated sam-ples, important changes can be seen in the relative intensityof the Bragg’s peaks. This fact reflects the preferentialorientation obtained by the RSWPS and the stepped planesdeveloped after the CT, see Table 1 for details.
In the first case, the starting sample corresponds tothe pc platinum wire with the intensity of (220) and(311) reflections considerable higher than the others. Sinceit is difficult to establish a direct comparison betweenthe occurrences of lattice planes with the correspondingreflection intensities, we defined a “weighted intensities”using relative currents. The weights are cleared in terms ofthe intensities of the bulk platinum reflections. For example,platinum bulk has I(111) = 100 and I(200) = 53. Theyhave equal occurrence in pc samples, so the direct ratiobetween unnormalized intensities leads to I(111)/I(200) =0.53. If we define the weighted ratio as Iw(111)/Iw(200) =I(111)/I(200) ∗ (Ibulk(200)/Ibulk(111)) = 1, the number

4 International Journal of Electrochemistry
−80
−60
−40
−20
0
20
40
0 0.2 0.4 0.6 0.8 1 1.2 1.4 1.6
I(μ
A)
E (V)
(a)
−80
−60
−40
−20
0
20
40
0 0.2 0.4 0.6 0.8 1 1.2 1.4 1.6
I(μ
A)
E (V)
(b)
−80
−60
−40
−20
0
20
40
0 0.2 0.4 0.6 0.8 1 1.2 1.4 1.6
I(μ
A)
E (V)
(c)
0 0.2 0.4 0.6 0.8 1 1.2 1.4 1.6−250
−200
−150
−100
−50
0
50
100
I(μ
A)
E (V)
(d)
Figure 1: Cyclic voltammetry in 1 M sulphuric acid between 0.05 V and 1.50 V run at 0.10 Vs−1 for (a) Pt pc annealing h2/h1 = 0.84; (b)Pt F(111) after a RSWPS Ed = 0.70 V, Eu = 1.40 V, f = 2.5 kHz, t = 10 minutes, h2/h1 = 0.52; (c) Pt F(100) after an RSWPS Ed = 0.00 V,Eu = 1.50 V, f = 5.0 kHz, t = 10 minutes, h2/h1 = 1.80; (d) CT Pt after E = −2 V, t = 30 minutes. h2/h1 = 0.75.
give us a direct estimation of the proportion between latticeplanes.
Table 2 presents the weighted ratio for all the studiedsamples. According with this data pc platinum has animportant contribution from (100) reflection in comparisonwith (111), that is, Iw(100)/Iw(111) = 3.34. This behavioris similar to the sample with CT, followed by the samplewith faceting treatment to (100) direction (F100). The sametrend is observed for (311) reflection in the three cases. Themain difference between pc and CT platinum is in the (220)reflection, which is considerably high for the first sample.The XRPD is not grazing incidence experiments, so theconclusions cannot be only attributed to surface phenomena,but they can be attributed to both surface and bulk material.In this sense, the pc orient planes (220) and (311) and (200)can be easily interpreted in terms of (111) and (100) surfacestepping like (111) × (111) → (220) and (111) × (100) →
(311). This feature is slightly modified after the CT, since theintensity of the (220) reflection is reduced by a factor of ca.3.8. This fact is interpreted as a reduction in the (111)×(111)stepping, when a restitution of the (111) reflection occurscharacterized by the weighted ratio Iw(111)/Iw(222) = 1.09.According to this, the CT favors the (111) and (100) steppingas presented in Figure 2 and Table 2.
Regarding the Pt F100 sample, the faceting process doesnot establish a clear change in the proportion of the (200)lattice planes, since the weighted ratio shows the lowest valueafter comparing Pt F100 with pc platinum and CT platinum.Another feature is the intensity of the (220) reflection,which shows an intermediate contribution with an intensitypositioned between those of pc and CT platinum.
Finally, the Pt F111 sample is the one with greatestdifferences, with a nearly net contribution arises from the(111) lattice planes referred with the (222) lattice planes.
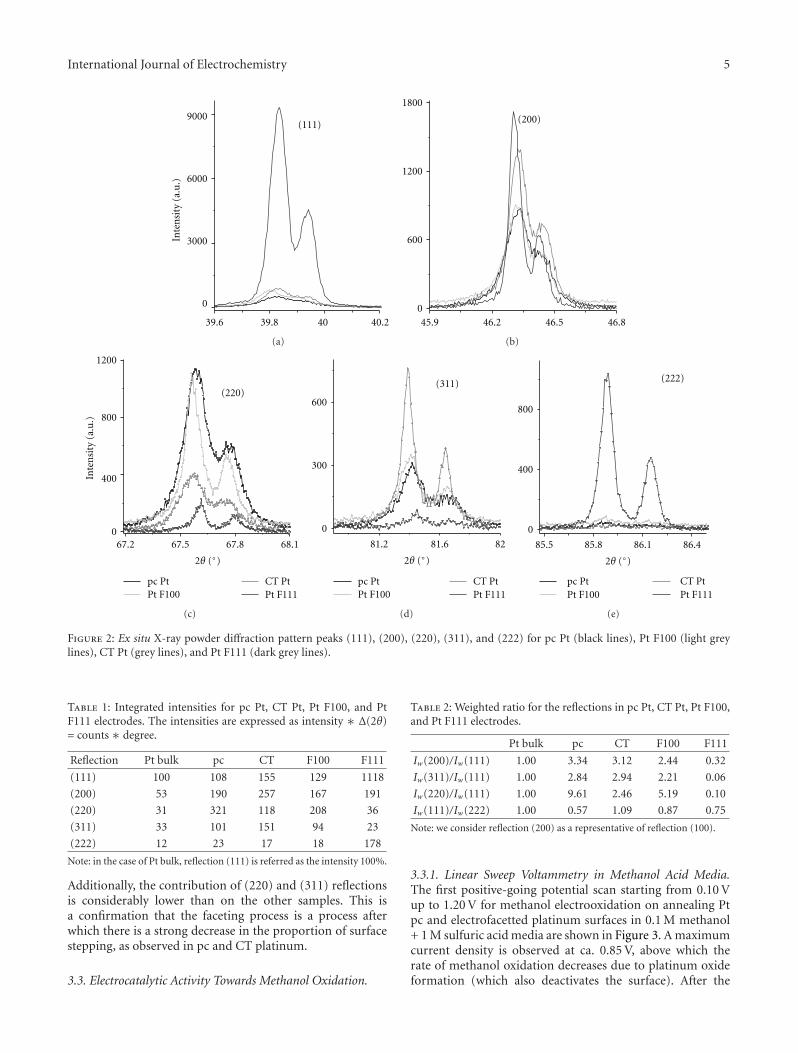
International Journal of Electrochemistry 5
0
3000
6000
9000
Inte
nsi
ty(a
.u.)
(111)
39.6 39.8 40 40.2
(a)
0
600
1200
1800
(200)
45.9 46.2 46.5 46.8
(b)
0
400
800
1200
(220)
Inte
nsi
ty(a
.u.)
2θ (◦)67.2 67.5 67.8 68.1
pc PtPt F100
CT PtPt F111
(c)
300
600
0
(311)
2θ (◦)81.2 81.6 82
pc PtPt F100
CT PtPt F111
(d)
0
400
800
(222)
2θ (◦)85.5 85.8 86.1 86.4
pc PtPt F100
CT PtPt F111
(e)
Figure 2: Ex situ X-ray powder diffraction pattern peaks (111), (200), (220), (311), and (222) for pc Pt (black lines), Pt F100 (light greylines), CT Pt (grey lines), and Pt F111 (dark grey lines).
Table 1: Integrated intensities for pc Pt, CT Pt, Pt F100, and PtF111 electrodes. The intensities are expressed as intensity ∗ Δ(2θ)= counts ∗ degree.
Reflection Pt bulk pc CT F100 F111
(111) 100 108 155 129 1118
(200) 53 190 257 167 191
(220) 31 321 118 208 36
(311) 33 101 151 94 23
(222) 12 23 17 18 178
Note: in the case of Pt bulk, reflection (111) is referred as the intensity 100%.
Additionally, the contribution of (220) and (311) reflectionsis considerably lower than on the other samples. This isa confirmation that the faceting process is a process afterwhich there is a strong decrease in the proportion of surfacestepping, as observed in pc and CT platinum.
3.3. Electrocatalytic Activity Towards Methanol Oxidation.
Table 2: Weighted ratio for the reflections in pc Pt, CT Pt, Pt F100,and Pt F111 electrodes.
Pt bulk pc CT F100 F111
Iw(200)/Iw(111) 1.00 3.34 3.12 2.44 0.32
Iw(311)/Iw(111) 1.00 2.84 2.94 2.21 0.06
Iw(220)/Iw(111) 1.00 9.61 2.46 5.19 0.10
Iw(111)/Iw(222) 1.00 0.57 1.09 0.87 0.75
Note: we consider reflection (200) as a representative of reflection (100).
3.3.1. Linear Sweep Voltammetry in Methanol Acid Media.The first positive-going potential scan starting from 0.10 Vup to 1.20 V for methanol electrooxidation on annealing Ptpc and electrofacetted platinum surfaces in 0.1 M methanol+ 1 M sulfuric acid media are shown in Figure 3. A maximumcurrent density is observed at ca. 0.85 V, above which therate of methanol oxidation decreases due to platinum oxideformation (which also deactivates the surface). After the
6 International Journal of Electrochemistry
Table 3: Integrated charge densities found under the currenttransients for methanol electrooxidation after 10 min. in oxygen-free 0.1 M methanol + 1 M sulphuric media on the studied platinumsurfaces.
Charge density (mC·cm−2)
0.60 V 0.70 V
Pt F100 <3 99.6
Pt F111 61.5 180.6
CT Pt 6.9 197.4
pc Pt <3 97.7
0
300
600
900
1200
1500
1800
0.2 0.4 0.6 0.8 1 1.2
j(μ
A·cm
−2)
Figure 3: First positive-going potential scan for methanol oxidationrun at 0.10 Vs−1 between 0.10 and 1.20 V in oxygen-free 0.1 Mmethanol + 1 M sulphuric media on Pt F(111) (dotted gray lines);CT Pt (gray lines); Pt F(100) (dark gray lines) and annealed Pt(black lines).
pretreated procedure was applied in acid solution, the peakcurrent density for Pt F111 depicts the greatest value, verysimilar to CT Pt. These values were more than 200%greater than that obtained on the untreated electrode. Theelectrocatalytic activity of pretreated surfaces was enhancedeven after several cycles; contrary to the expected results oncarbon monoxide poisoning induced on platinum surfaces.
3.3.2. Chronoamperometric Plots in Methanol Acid Media.Chronoamperometric curves were run for methanol oxi-dation on all platinum surfaces under two different con-stant potentials 0.60 V (not shown) and 0.70 V (Figure 4).All surfaces usually illustrate a typical diffusion-controlledcurrent decay, but at 0.70 V, pc surfaces exhibit a first currentincrease at very short times. This fact is the result of acompetitive process between adsorbed carbon monoxideand methanol oxidations with opposite contributions inthe parallel oxidation mechanism, that is, the competitionbetween the series and direct methanol oxidations. The pcplatinum surface seems to be poisoned by a greater extentof carbon monoxide adsorbates. This effect is not observedat potentials lower than 0.70 V. The charge density at a fixedpotential found under the current transients evidenced thereal electrocatalytic activity of the surface. Table 3 representsthe integration of the charge until 10 min (as comparison)for treated and untreated electrodes as a function of the
0
100
200
300
400
500
600
700
800
900
0 100 200 300 400 500 600
t (s)
j(μ
A·cm
−1)
Figure 4: Chronoamperometric plots for methanol oxidation inoxygen-free 0.1 M methanol + 1 M sulphuric media at 700 mV on:pc Pt (black lines), Pt F100 (light grey lines), CT Pt (grey lines), andPt F111 (dark grey lines).
potential. At 0.60 V, methanol oxidation did show a currentcontribution on the cathodic treated surface as well as on thePt F111, not distinguished on the others surfaces. However,for 0.70 V, the charge densities found on the CT and Pt F111surfaces are always higher than those of untreated platinumand other electrofacetted surfaces.
4. Discussion
The electrode composition plays an important role in thecourse of an electrocatalytic reaction, especially in thepoison species removal. However, the surface morphologyof technical electrodes is also important since it controlsother factors associated with the formation and conversion ofadsorbates. The relationship between the particle shape andthe surface structure is of real importance in Electrocatalysissince its optimization is one of the best ways to enhance theselectivity and efficiency in the search of an adequate surfacedistribution for coadsorbate reactions.
Platinum crystallizes as a face centered cubic system witha cell parameter of 3.92 A. This system presents three baseplanes normal to the (111), (110), and (100) vectors in itsthree-dimensional crystal lattice. In fact the (110) plane isreally (110) = (111) × (111), and not a true basal plane, soit is the first clue of an intrinsic atomic reconstruction. Thesethree main vectors are the origin of the lowest Miller indicessurfaces with a single type of symmetry. When the Millerindices increase, also does the complexity of the surface. Forsimplicity, these high Miller indices surfaces are consideredas a combination of the different base planes in differentproportions yielding terraces, monoatomic step and alsokinks. The stepped surfaces present atomic terraces witha define orientation corresponding to a single base plane,separated by monoatomic steps of a certain symmetry. Langet al. [28] proposed that the stepped surfaces have to benamed taking the Miller indices of each terrace and step,with also the number of atomic files at the terrace. The
International Journal of Electrochemistry 7
nomenclature for a stepped surface is M(s)[n(hkl)× (h′k′l′)]being M the chemical symbol of the metal, n the number ofatomic files at the terrace, the letter s between parenthesisindicates that it is a stepped surface and (hkl) and (h′k′l′)the Miller indices of the base planes that define the terracesand steps, respectively.
Methanol electrooxidation on platinum stepped or dis-ordered surfaces is driven by two important factors; the totalsurface charge and the presence of water adjacent moleculesin the aqueous phase. At the Pt(111) single crystal surface,the methanol molecule is located at a reactive position dueto the formation of hydrogen bonds with a preadsorb watermolecule [29]. It has been observed that the hydrogen bondstrength of the methanol-water interaction at the (211)surfaces is larger than on (111), leading to a more exothermicadsorption for methanol [30]. However, the importance ofthe presence of preadsorbed water is demonstrated from thefact of the lower total exothermic condition for the cascadedehydrogenation (0.7 eV) at the Pt(111)/water interphasethan at the Pt(111)/vacuum interphase [31, 32]. This factis explained by the stabilization of the hydrogen bondin the complex and the weakened of the water/platinuminteraction. Thus, adsorbed water molecules on platinumin acid media vibrates from 3500 to 3000–3100 cm−1, butin the presence of adsorbate neighbours changes to a newvibration range due to the asymmetric stretching of theO-H bond at 3658 cm−1 [33]. Using in situ ATR-SEIRAStechniques it is demonstrated that water coexists withadsorbed carbon monoxide derived from methanol partialoxidation. Water is consumed during oxidation according tothe adsorbed water and on-top carbon monoxide intensities.This is a strong confirmation that both water and carbonmonoxide molecules coexists at the surface and that eachspecies directly react from the surface promoting the furtheroxidation of other methanol molecules [34].
On the other hand, the change in the structure of theinterfacial water structure caused by methanol adsorptionis responsible of the difference between the experimentalpotential of zero charge (pzc) determined for the Pt(111-)CO interaction, 1.10 V, and the pzc estimated for the Pt(111-)water, 0.23 V [35]. Using these values it is possible to calculatemean angle between the water dipolar moment and theplatinum surface. At room temperature pzc, diminishes from7.85◦ for Pt(111-) water to 1.46◦ for Pt(111)-CO [35]. Changand Weaver [36] have found that the water coadsorption atlow coverages favours on Pt(111) the formation of bridgeCOads. The vibration frequencies for linear and bridgegeometries at high surface coverages by carbon monoxideare at least 20–30 cm−1 lower in the electrochemical environ-ments than in UHV conditions. These environmental effectsobserved for the COads bond suggests that the double layereffects are much more important than expected in the earlystages of the anodic electrocatalytic reactions. Besides, thesame important interaction between water and COads hasbeen also observed using in situ IRAS and STM techniques[37]. Adsorbed carbon monoxide on Pt(111) at 0.40 V showsa strong interaction with water molecules at the externallayer retarding methanol oxidation to carbon dioxide, whileits adsorption at 0.050 V reports lower values of oxidation
onset potentials. Moreover, it has been also reported that[29] methanol oxidation starts with the formation of a stronginteraction leading to a hydrogen bond between the hydroxylgroup of methanol with the water molecule. The first stepof the reaction is the anchorage of a carbon-hydrogen bondfocused towards the platinum surface. In this sense, ourresults clearly shows a larger activity in the case of thecathodic treated and the (111-) faceted platinum surfaceswhere the presence of stepped (111) planes are able toproduce this strong interaction between partially dissociatedwater on (111) steps and adsorbed carbon monoxide frommethanol partial oxidation on (100) terraces. The perfectcombination of both effects of a proper crystal orientationat the steps and a distinct but adequate in the terracesare the theoretical concept in the catalysts design for theelectrocatalytic oxidation reaction. The Pt F111 surfaceexhibit a good catalytic activity at lower potentials than CTPt, but the latter exhibits larger charge densities at 0.70 V.This fact is the result of adsorbed hydroxyl species areproduced on Pt F111 at lower potentials increasing thenthe catalytic activity at 0.60 V. However, since methanolposses a larger affinity towards the (100) oriented surfaces(as a consequence of its structural spatial conformation), at0.70 V the stepped (111)× (100) produced from the cathodicpolarization method will exhibit a higher activity towardsmethanol oxidation. The relation between crystallographicorientation and oxidation catalytic activities are confirmedin the case of comparing Pt F100 and pc platinum surfaces.
5. Conclusions
(a) The electrochemical perturbation of platinum surfacesthrough RSWPS changes the surface relative distribution ofcrystallographic planes. This effect reaches the bulk of themetal up to the first layers of platinum, making possible theX-ray diffraction analysis.
(b) A net and practically single (111) plane contributionis obtained after obtaining a Pt F111 surface, however, for PtF100, a stepped surface with a (220) plane main contributionis developed. The latter seems to be more an intermediatesurface between pc and CT platinum. Moreover, the rear-rangement produced at the CT platinum surface, yields facetswith stepped planes equivalent to [n(111)× (100)].
(c) The electrocatalytic studies towards methanol oxi-dation conclude that both Pt F111 and CT Pt exhibitsimilar results and better than pc platinum with also abetter tolerance upon surface poisoning. According to ourknowledge water species are activated on (111) terraces atlower potentials than on (100) planes leading to adsorbedOH species with larger adsorption energies. Consequently,methanol adsorbates are not able to displace these orderedwater species only enabling its surface diffusion from (111)terraces to (100) steps to finally adsorb there.
(d) The simple application of a constant cathodiccurrent in the true hydrogen evolution region on pc plat-inum enhances the catalytic activity towards methanol
8 International Journal of Electrochemistry
electrooxidation, since the stepped Pt[n(111) × (100)] aremorphologically more adequate to catalyse the reaction.
Acknowledgments
The authors are greatly acknowledged to the PDT Projectsof the Education Ministerial Office. V. Dıaz, R. Faccio, A.W.Mombru, and C. F. Zinola are researchers at the ChemistryArea of PEDECIBA United Nations.
References
[1] P. V. Pavlov and A. F. Jojlov, Solid State Physics, chapter 5 and7, Mir, Moscow, Russia, 1987.
[2] C. Sanchez and E. Leiva, “The NEMCA effect,” in Handbookof Fuel Cells, W. Vielstich, H. A. Gasteiger, and A. Lamm, Eds.,vol. 2, chapter 5, John Wiley & Sons, Chichester, UK, 2003.
[3] N. M. Markovı and P. N. Ross Jr., “Surface science studies ofmodel fuel cell electrocatalysts,” Surface Science Reports, vol.45, no. 4-6, pp. 117–229, 2002.
[4] G. A. Somorjai, Introduction to Surface Chemistry and Cataly-sis, chapter 2, John Wiley & Sons, New York, NY, USA, 1994.
[5] G. A. Somorjai, Electrochemical Surface Science: MolecularPhenomena at Electrode Surfaces, American Chemical Society,Washington, DC, USA, 1988.
[6] A. J. Arvia, J. C. Canullo, E. Custidiano, C. L. Perdriel, andW. E. Triaca, “Electrochemical faceting of metal electrodes,”Electrochimica Acta, vol. 31, no. 11, pp. 1359–1368, 1986.
[7] S. Trasatti and O. A. Petrii, “Real surface area measurements inelectrochemistry,” Journal of Electroanalytical Chemistry, vol.327, no. 1-2, pp. 353–376, 1992.
[8] M. Fleischmann and B. W. Mao, “In situ X-Ray diffractionmeasurements of the surface structure of Pt in the presence of“weakly” adsorbed H,” Journal of Electroanalytical Chemistry,vol. 247, no. 1-2, pp. 311–313, 1988.
[9] H. P. Klug and L. E. Alexander, X-Ray Diffraction Procedures forPolycrystalline and Amorphous Materials, John Wiley & Sons,New York, NY, USA, 2nd edition, 1974.
[10] L. A. Kibler, A. Cuesta, M. Kleinert, and D. M. Kolb, “In-situSTM characterization of the surface morphology of platinumsingle crystal electrodes as a function of their preparation,”Journal of Electroanalytical Chemistry, vol. 484, no. 1, pp. 73–82, 2000.
[11] D. M. Kolb, “Structure studies of metal electrodes by in-situscanning tunneling microscopy,” Electrochimica Acta, vol. 45,no. 15-16, pp. 2387–2402, 2000.
[12] W. E. Triaca and A. J. Arvia, “The electrochemical facettingof metal surfaces: preferred crystallographic orientation androughening effects in electrocatalysis,” Journal of AppliedElectrochemistry, vol. 20, no. 3, pp. 347–356, 1990.
[13] A. S. Dakkouri and D. M. Kolb, “Reconstruction of gold sur-faces,” Interfacial Electrochemistry, chapter 10, Marcel Dekker,New York, NY, USA, 1999.
[14] N. Tian, Z. Y. Zhou, S. G. Sun, Y. Ding, and L. W. Zhong,“Synthesis of tetrahexahedral platinum nanocrystals withhigh-index facets and high electro-oxidation activity,” Science,vol. 316, no. 5825, pp. 732–735, 2007.
[15] A. J. Arvia, R. C. Salvarezza, and W. E. Triaca, “Thedevelopment of metal overlayers with smooth and roughtopographies,” Electrochimica Acta, vol. 34, no. 8, pp. 1057–1071, 1989.
[16] A. Visintın, J. C. Canullo, W. E. Triaca, and A. J. Arvia,
“Changes in real surface area, crystallographic orientationand morphology of platinum electrodes caused by periodicpotential treatments: phenomenological approach,” Journal ofElectroanalytical Chemistry, vol. 239, no. 1-2, pp. 67–89, 1988.
[17] W. E. Triaca, T. Kessler, J. C. Canullo, and A. J. Arvia, “Studyof the optimal conditions for the development of preferredoriented platinum surfaces by means of fast square wavepotential perturbations,” Journal of the Electrochemical Society,vol. 134, no. 5, pp. 1165–1172, 1987.
[18] A. C. Chialvo, W. E. Triaca, and A. J. Arvra, “Changes inthe electrochemical response of noble metals produced bysquare-wave potential perturbations. A new technique for thepreparation of reproducible electrode surfaces of interest inelectrocatalysis,” Journal of Electroanalytical Chemistry, vol.146, no. 1, pp. 93–108, 1983.
[19] J. Gomez, L. Vazquez, A. M. Baro et al., “Surface topography of(100)-type electro-faceted platinum from scanning tunnellingmicroscopy and electrochemistry,” Nature, vol. 323, no. 6089,pp. 612–614, 1986.
[20] L. Vazquez, J. Gomez, A. M. Baro et al., “Scanning tunnelingmicroscopy of electrochemically activated platinum surfaces.A direct ex-situ determination of the electrode nanotopogra-phy,” Journal of the American Chemical Society, vol. 109, no. 6,pp. 1730–1733, 1987.
[21] C. Bello and C. F. Zinola, “Crystallographic rearrangementof platinum induced by square wave potentials,” Journal ofColloid and Interface Science, vol. 258, no. 2, pp. 259–265, 2003.
[22] C. Lamy, J. M. Leger, J. Clavilier, and R. Parsons, “Structuraleffects in electrocatalysis. A comparative study of the oxidationof CO, HCOOH and CH3OH on single crystal Pt electrodes,”Journal of Electroanalytical Chemistry, vol. 150, no. 1-2, pp. 71–77, 1983.
[23] M. T. M Koper, S. C. S. Lay, and E. Herrero, Fuel Cell Catalysis:A Surface Science Approach, chapter 6, John Wiley & Sons, NewYork, NY, USA, 2009.
[24] J. Shin and C. Korzenicwski, “Infrared spectroscopic detectionof CO formed at step and terrace sites on a corrugatedelectrode surface plane during methanol oxidation,” Journalof Physical Chemistry, vol. 99, no. 11, pp. 3419–3422, 1995.
[25] A. V. Tripkovic and K. D. Popovic, “Oxidation of methanol onplatinum single crystal stepped electrodes from [110] zone inacid solution,” Electrochimica Acta, vol. 41, no. 15, pp. 2385–2394, 1996.
[26] T. H. M. Housmans and M. T. M. Koper, “Methanol oxidationon stepped Pt[n(111) × (110)] electrodes: a chronoampero-metric study,” Journal of Physical Chemistry B, vol. 107, no. 33,pp. 8557–8567, 2003.
[27] C. Dong, “PowderX: windows-95-based program for powderX-Ray diffraction data processing,” Journal of Applied Crystal-lography, vol. 32, no. 4, p. 838, 1999.
[28] B. Lang, R. W. Joyner, and G. A. Somorjai, “Low energyelectron diffraction studies of high index crystal surfaces ofplatinum,” Surface Science, vol. 30, no. 2, pp. 440–453, 1972.
[29] C. Hartnig and E. Spohr, “The role of water in the initial stepsof methanol oxidation on Pt(1 1 1),” Chemical Physics, vol.319, no. 1–3, pp. 185–191, 2005.
[30] C. Hartnig, J. Grimminger, and E. Spohr, “The role of waterin the initial steps of methanol oxidation on Pt(2 1 1),”Electrochimica Acta, vol. 52, no. 6, pp. 2236–2243, 2007.
[31] R. Paul and S. J. Paddison, “Variational methods for thesolution of the Ornstein-Zernicke equation in inhomogeneoussystems,” Physical Review E, vol. 67, no. 1, part 2, Article ID161081, 11 pages, 2003.
[32] Y. Okamoto, O. Sugino, Y. Mochizuki, T. Ikeshoji, and
International Journal of Electrochemistry 9
Y. Morikawa, “Comparative study of dehydrogenation ofmethanol at Pt(1 1 1)/water and Pt(1 1 1)/vacuum interfaces,”Chemical Physics Letters, vol. 377, no. 1-2, pp. 236–242, 2003.
[33] H. Shiroishi, Y. Ayato, K. Kunimatsu, and T. Okada, “Studyof adsorbed water on Pt during methanol oxidation byATR-SEIRAS (surface-enhanced infrared absorption spec-troscopy),” Journal of Electroanalytical Chemistry, vol. 581, no.2, pp. 132–183, 2005.
[34] A. Cuesta, H. Shiroishi, Y. Ayato, K. Kunimatsu, and T.Okada, “Comments on the paper by H. Shiroishi, Y. Ayato, K.Kunimatsu and T. Okada entitled ”Study of adsorbed wateron Pt during methanol oxidation by ATR-SEIRAS (surface-enhanced infrared absorption spectroscopy)” [J. Electroanal.Chem. 581 (2005) 132],” Journal of Electroanalytical Chem-istry, vol. 587, no. 2, pp. 329–332, 2006.
[35] A. Cuesta, “Measurement of the surface charge density of CO-saturated Pt(1 1 1) electrodes as a function of potential: thepotential of zero charge of Pt(1 1 1),” Surface Science, vol. 572,no. 1, pp. 11–22, 2004.
[36] S. C. Chang and M. J. Weaver, “Coverage- and potential-dependent binding geometries of carbon monoxide at orderedlow-index platinum- and rhodium-aqueous interfaces: com-parisons with adsorption in corresponding metal-vacuumenvironments,” Surface Science, vol. 238, no. 1–3, pp. 142–162,1990.
[37] K. Yoshimi, M.-B. Song, and M. Ito, “Carbon monoxideoxidation on a Pt(111) electrode studied by in-situ IRAS andSTM: coadsorption of CO with water on Pt(111),” SurfaceScience, vol. 368, no. 1–3, pp. 389–395, 1996.
SAGE-Hindawi Access to ResearchInternational Journal of ElectrochemistryVolume 2011, Article ID 404605, 5 pagesdoi:10.4061/2011/404605
Research Article
Some Applications of Bayes’ Rule in Probability Theory toElectrocatalytic Reaction Engineering
Thomas Z. Fahidy
Chemical Engineering Department, University of Waterloo, 200 University Avenue West, Waterloo, ON, Canada N2L 3G1
Correspondence should be addressed to Thomas Z. Fahidy, [email protected]
Received 7 February 2011; Accepted 25 April 2011
Academic Editor: Carlos F. Zinola
Copyright © 2011 Thomas Z. Fahidy. This is an open access article distributed under the Creative Commons Attribution License,which permits unrestricted use, distribution, and reproduction in any medium, provided the original work is properly cited.
Bayesian methods stem from the principle of linking prior probability and conditional probability (likelihood) to posteriorprobability via Bayes’ rule. The posterior probability is an updated (improved) version of the prior probability of an event, throughthe likelihood of finding empirical evidence if the underlying assumptions (hypothesis) are valid. In the absence of a frequencydistribution for the prior probability, Bayesian methods have been found more satisfactory than distribution-based techniques.The paper illustrates the utility of Bayes’ rule in the analysis of electrocatalytic reactor performance by means of four numericalexamples involving a catalytic oxygen cathode, hydrogen evolution on a synthetic metal, the reliability of a device testing the qualityof an electrocatalyst, and the range of Tafel slopes exhibited by an electrocatalyst.
1. Introduction
In a comprehensive overall treatment of the subject matter,Bockris and Khan [1] discuss electrocatalysis with respect tovarious physicochemical properties of substance and surface,for example, exchange current density, work function, bondstrength, metal complexes, trace elements adatom effects,enzymatic catalysis, poisons, crystal face effects, and so forth,under the aegis of “phenomenological electrode kinetics”. Inthe domain of ERE, the assessment of electrocatalyst (EC)performance also includes additional parameters related tocatalyst preparation (i.e., possible defectiveness in speci-mens), cell construction, and human factors affecting reactoroutput.
This paper was written with this dichotomy in mind,from the vantage point of the electrochemical engineer,whose responsibilities dealing with production quota, thepossibility of (temporary) reactor breakdown, safety, andenvironmental considerations reach well beyond purely sci-entific quantities. Major tools for dealing with these respon-sibilities are provided by probability-based (e.g., statistical)methods. Bayes’ rule is one such tool, whose specific ap-plication to scenarios with EC is the subject of this article.
2. Brief Theory
Following a concise definition [2] for the purposes of thispaper, Bayes’ rule for two events may be expressed as
P(A/B) = P(B/A)P(A)P(B)
, (1)
where P(A/B) is the probability of event A occurring if eventB has already occurred, and
P(B) = P(B/A)P(A) + P(B/A′)P(A′), (2)
which is the probability of event B occurring, given theconditional probabilities (likelihoods) P(B/A) relating it toevent A and P(B′/A) relating it to its opposite event A′.In an EC reactor a case for Bayes’ rule would exist, forinstance, when the loss of effectiveness in an EC may ormay not be due to premature detachment of the catalyticlayer. If A is the event of detachment and B is the event ofdeterioration (demise) of the EC, then B/A would be theevent of demise due to layer detachment, A′ the event of anondetachment cause of deterioration, and B/A′ the eventof deterioration due to a nondetachment cause. In termsof event probabilities, (1) yields the probability P(A/B) that
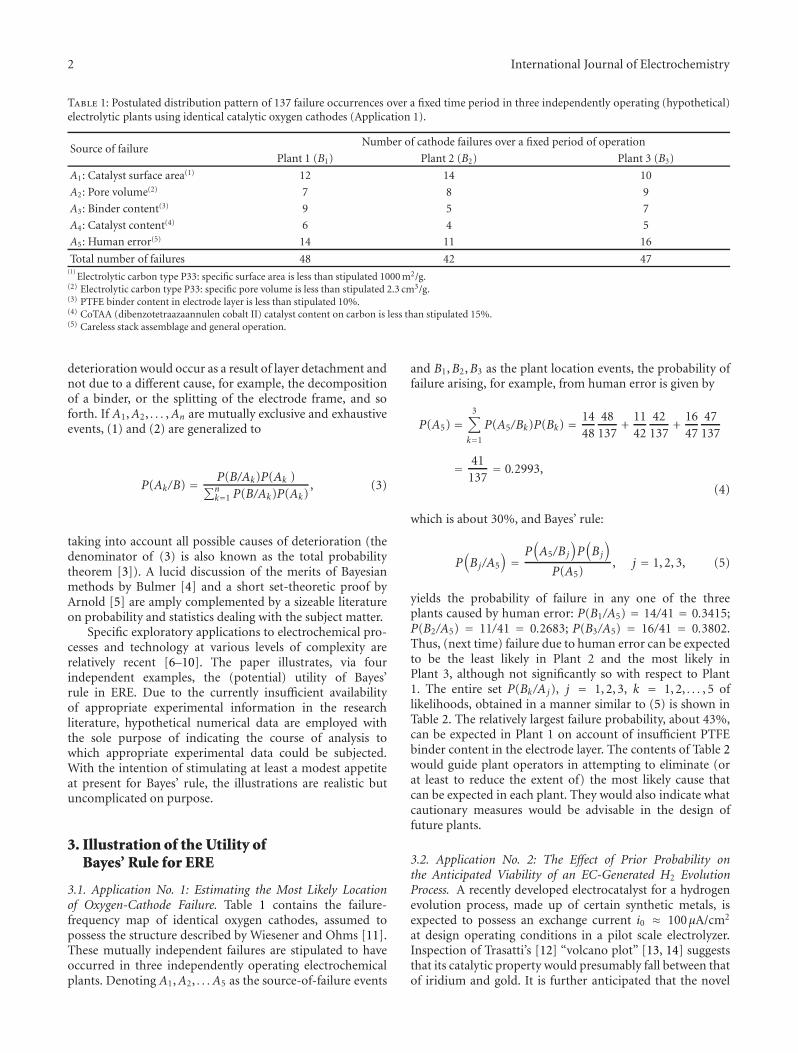
2 International Journal of Electrochemistry
Table 1: Postulated distribution pattern of 137 failure occurrences over a fixed time period in three independently operating (hypothetical)electrolytic plants using identical catalytic oxygen cathodes (Application 1).
Source of failureNumber of cathode failures over a fixed period of operation
Plant 1 (B1) Plant 2 (B2) Plant 3 (B3)
A1: Catalyst surface area(1) 12 14 10
A2: Pore volume(2) 7 8 9
A3: Binder content(3) 9 5 7
A4: Catalyst content(4) 6 4 5
A5: Human error(5) 14 11 16
Total number of failures 48 42 47(1)
Electrolytic carbon type P33: specific surface area is less than stipulated 1000 m2/g.(2) Electrolytic carbon type P33: specific pore volume is less than stipulated 2.3 cm3/g.(3) PTFE binder content in electrode layer is less than stipulated 10%.(4) CoTAA (dibenzotetraazaannulen cobalt II) catalyst content on carbon is less than stipulated 15%.(5) Careless stack assemblage and general operation.
deterioration would occur as a result of layer detachment andnot due to a different cause, for example, the decompositionof a binder, or the splitting of the electrode frame, and soforth. If A1,A2, . . . ,An are mutually exclusive and exhaustiveevents, (1) and (2) are generalized to
P(Ak/B) = P(B/Ak)P(Ak )∑nk=1 P(B/Ak)P(Ak)
, (3)
taking into account all possible causes of deterioration (thedenominator of (3) is also known as the total probabilitytheorem [3]). A lucid discussion of the merits of Bayesianmethods by Bulmer [4] and a short set-theoretic proof byArnold [5] are amply complemented by a sizeable literatureon probability and statistics dealing with the subject matter.
Specific exploratory applications to electrochemical pro-cesses and technology at various levels of complexity arerelatively recent [6–10]. The paper illustrates, via fourindependent examples, the (potential) utility of Bayes’rule in ERE. Due to the currently insufficient availabilityof appropriate experimental information in the researchliterature, hypothetical numerical data are employed withthe sole purpose of indicating the course of analysis towhich appropriate experimental data could be subjected.With the intention of stimulating at least a modest appetiteat present for Bayes’ rule, the illustrations are realistic butuncomplicated on purpose.
3. Illustration of the Utility ofBayes’ Rule for ERE
3.1. Application No. 1: Estimating the Most Likely Locationof Oxygen-Cathode Failure. Table 1 contains the failure-frequency map of identical oxygen cathodes, assumed topossess the structure described by Wiesener and Ohms [11].These mutually independent failures are stipulated to haveoccurred in three independently operating electrochemicalplants. Denoting A1,A2, . . . A5 as the source-of-failure events
and B1,B2,B3 as the plant location events, the probability offailure arising, for example, from human error is given by
P(A5) =3∑
k=1
P(A5/Bk)P(Bk) = 1448
48137
+1142
42137
+1647
47137
= 41137
= 0.2993,
(4)
which is about 30%, and Bayes’ rule:
P(Bj/A5
)=
P(A5/Bj
)P(Bj
)
P(A5), j = 1, 2, 3, (5)
yields the probability of failure in any one of the threeplants caused by human error: P(B1/A5) = 14/41 = 0.3415;P(B2/A5) = 11/41 = 0.2683; P(B3/A5) = 16/41 = 0.3802.Thus, (next time) failure due to human error can be expectedto be the least likely in Plant 2 and the most likely inPlant 3, although not significantly so with respect to Plant1. The entire set P(Bk/Aj), j = 1, 2, 3, k = 1, 2, . . . , 5 oflikelihoods, obtained in a manner similar to (5) is shown inTable 2. The relatively largest failure probability, about 43%,can be expected in Plant 1 on account of insufficient PTFEbinder content in the electrode layer. The contents of Table 2would guide plant operators in attempting to eliminate (orat least to reduce the extent of) the most likely cause thatcan be expected in each plant. They would also indicate whatcautionary measures would be advisable in the design offuture plants.
3.2. Application No. 2: The Effect of Prior Probability onthe Anticipated Viability of an EC-Generated H2 EvolutionProcess. A recently developed electrocatalyst for a hydrogenevolution process, made up of certain synthetic metals, isexpected to possess an exchange current i0 ≈ 100µA/cm2
at design operating conditions in a pilot scale electrolyzer.Inspection of Trasatti’s [12] “volcano plot” [13, 14] suggeststhat its catalytic property would presumably fall between thatof iridium and gold. It is further anticipated that the novel
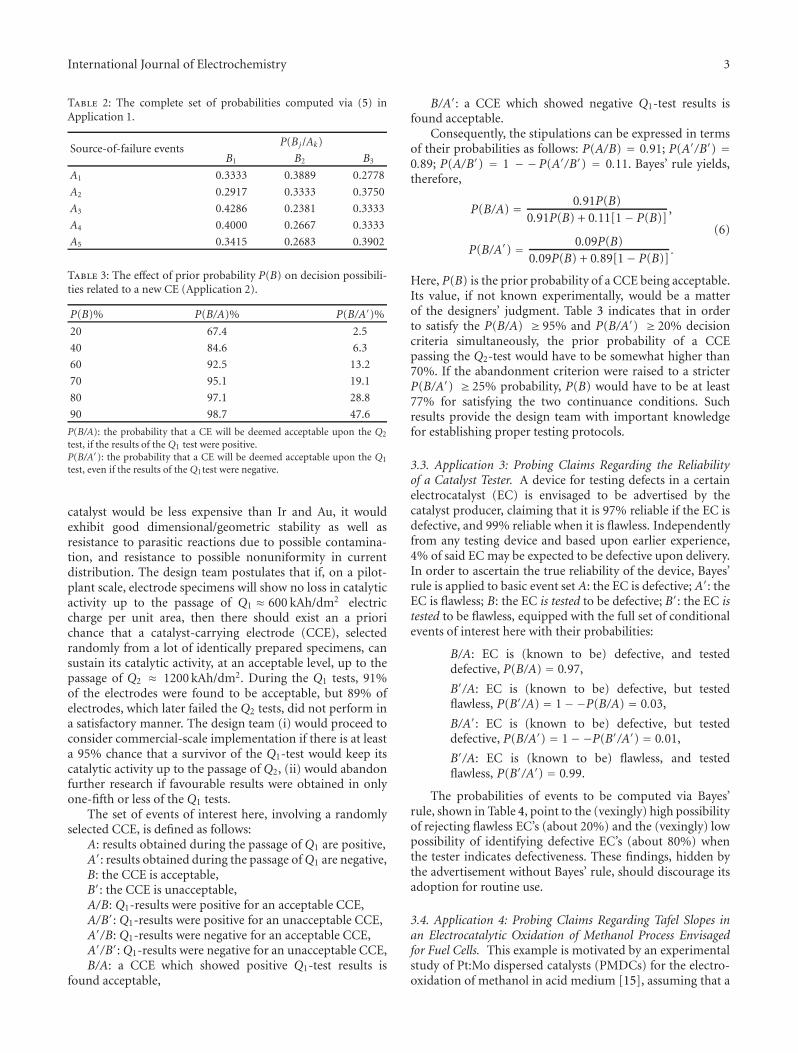
International Journal of Electrochemistry 3
Table 2: The complete set of probabilities computed via (5) inApplication 1.
Source-of-failure eventsP(B j /Ak)
B1 B2 B3
A1 0.3333 0.3889 0.2778
A2 0.2917 0.3333 0.3750
A3 0.4286 0.2381 0.3333
A4 0.4000 0.2667 0.3333
A5 0.3415 0.2683 0.3902
Table 3: The effect of prior probability P(B) on decision possibili-ties related to a new CE (Application 2).
P(B)% P(B/A)% P(B/A′)%
20 67.4 2.5
40 84.6 6.3
60 92.5 13.2
70 95.1 19.1
80 97.1 28.8
90 98.7 47.6
P(B/A): the probability that a CE will be deemed acceptable upon the Q2
test, if the results of the Q1 test were positive.P(B/A′): the probability that a CE will be deemed acceptable upon the Q1
test, even if the results of the Q1test were negative.
catalyst would be less expensive than Ir and Au, it wouldexhibit good dimensional/geometric stability as well asresistance to parasitic reactions due to possible contamina-tion, and resistance to possible nonuniformity in currentdistribution. The design team postulates that if, on a pilot-plant scale, electrode specimens will show no loss in catalyticactivity up to the passage of Q1 ≈ 600 kAh/dm2 electriccharge per unit area, then there should exist an a priorichance that a catalyst-carrying electrode (CCE), selectedrandomly from a lot of identically prepared specimens, cansustain its catalytic activity, at an acceptable level, up to thepassage of Q2 ≈ 1200 kAh/dm2. During the Q1 tests, 91%of the electrodes were found to be acceptable, but 89% ofelectrodes, which later failed the Q2 tests, did not perform ina satisfactory manner. The design team (i) would proceed toconsider commercial-scale implementation if there is at leasta 95% chance that a survivor of the Q1-test would keep itscatalytic activity up to the passage of Q2, (ii) would abandonfurther research if favourable results were obtained in onlyone-fifth or less of the Q1 tests.
The set of events of interest here, involving a randomlyselected CCE, is defined as follows:
A: results obtained during the passage of Q1 are positive,A′: results obtained during the passage of Q1 are negative,B: the CCE is acceptable,B′: the CCE is unacceptable,A/B: Q1-results were positive for an acceptable CCE,A/B′: Q1-results were positive for an unacceptable CCE,A′/B: Q1-results were negative for an acceptable CCE,A′/B′: Q1-results were negative for an unacceptable CCE,B/A: a CCE which showed positive Q1-test results is
found acceptable,
B/A′: a CCE which showed negative Q1-test results isfound acceptable.
Consequently, the stipulations can be expressed in termsof their probabilities as follows: P(A/B) = 0.91; P(A′/B′) =0.89; P(A/B′) = 1 − −P(A′/B′) = 0.11. Bayes’ rule yields,therefore,
P(B/A) = 0.91P(B)0.91P(B) + 0.11[1− P(B)]
,
P(B/A′) = 0.09P(B)0.09P(B) + 0.89[1− P(B)]
.
(6)
Here, P(B) is the prior probability of a CCE being acceptable.Its value, if not known experimentally, would be a matterof the designers’ judgment. Table 3 indicates that in orderto satisfy the P(B/A) ≥ 95% and P(B/A′) ≥ 20% decisioncriteria simultaneously, the prior probability of a CCEpassing the Q2-test would have to be somewhat higher than70%. If the abandonment criterion were raised to a stricterP(B/A′) ≥ 25% probability, P(B) would have to be at least77% for satisfying the two continuance conditions. Suchresults provide the design team with important knowledgefor establishing proper testing protocols.
3.3. Application 3: Probing Claims Regarding the Reliabilityof a Catalyst Tester. A device for testing defects in a certainelectrocatalyst (EC) is envisaged to be advertised by thecatalyst producer, claiming that it is 97% reliable if the EC isdefective, and 99% reliable when it is flawless. Independentlyfrom any testing device and based upon earlier experience,4% of said EC may be expected to be defective upon delivery.In order to ascertain the true reliability of the device, Bayes’rule is applied to basic event set A: the EC is defective; A′: theEC is flawless; B: the EC is tested to be defective; B′: the EC istested to be flawless, equipped with the full set of conditionalevents of interest here with their probabilities:
B/A: EC is (known to be) defective, and testeddefective, P(B/A) = 0.97,
B′/A: EC is (known to be) defective, but testedflawless, P(B′/A) = 1−−P(B/A) = 0.03,
B/A′: EC is (known to be) defective, but testeddefective, P(B/A′) = 1−−P(B′/A′) = 0.01,
B′/A: EC is (known to be) flawless, and testedflawless, P(B′/A′) = 0.99.
The probabilities of events to be computed via Bayes’rule, shown in Table 4, point to the (vexingly) high possibilityof rejecting flawless EC’s (about 20%) and the (vexingly) lowpossibility of identifying defective EC’s (about 80%) whenthe tester indicates defectiveness. These findings, hidden bythe advertisement without Bayes’ rule, should discourage itsadoption for routine use.
3.4. Application 4: Probing Claims Regarding Tafel Slopes inan Electrocatalytic Oxidation of Methanol Process Envisagedfor Fuel Cells. This example is motivated by an experimentalstudy of Pt:Mo dispersed catalysts (PMDCs) for the electro-oxidation of methanol in acid medium [15], assuming that a
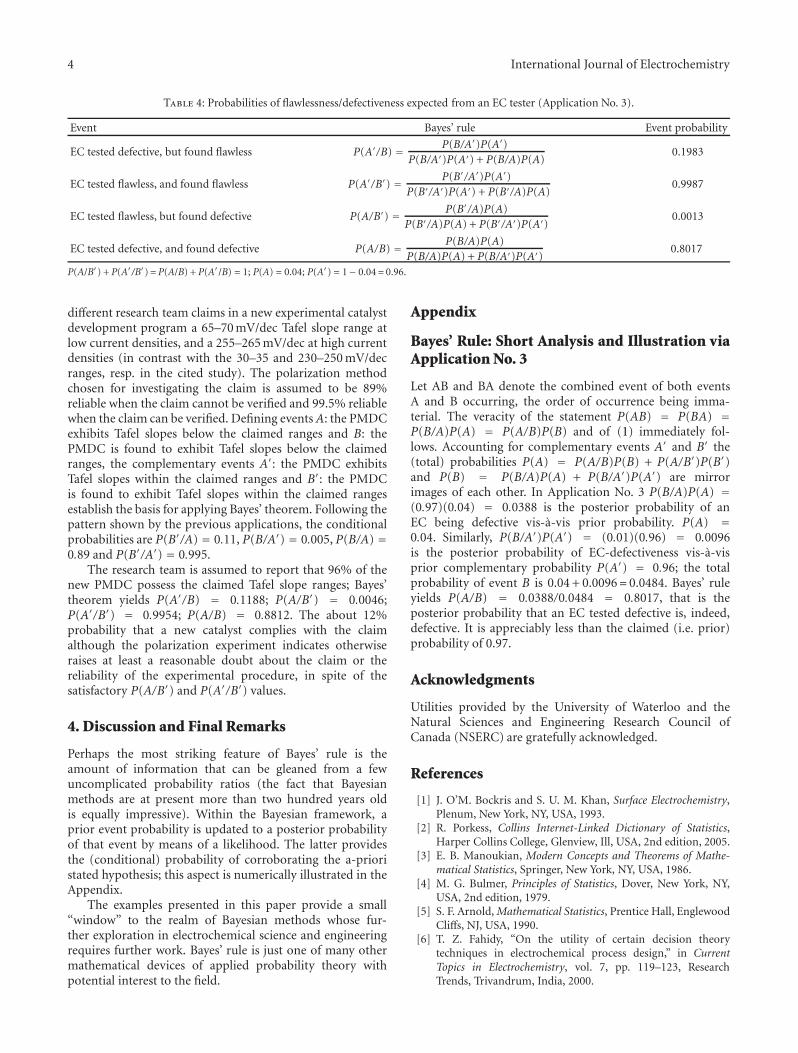
4 International Journal of Electrochemistry
Table 4: Probabilities of flawlessness/defectiveness expected from an EC tester (Application No. 3).
Event Bayes’ rule Event probability
EC tested defective, but found flawless P(A′/B) = P(B/A′)P(A′)P(B/A′)P(A′) + P(B/A)P(A)
0.1983
EC tested flawless, and found flawless P(A′/B′) = P(B′/A′)P(A′)P(B′/A′)P(A′) + P(B′/A)P(A)
0.9987
EC tested flawless, but found defective P(A/B′) = P(B′/A)P(A)P(B′/A)P(A) + P(B′/A′)P(A′)
0.0013
EC tested defective, and found defective P(A/B) = P(B/A)P(A)P(B/A)P(A) + P(B/A′)P(A′)
0.8017
P(A/B′) + P(A′/B′) = P(A/B) + P(A′/B) = 1; P(A) = 0.04; P(A′) = 1− 0.04= 0.96.
different research team claims in a new experimental catalystdevelopment program a 65–70 mV/dec Tafel slope range atlow current densities, and a 255–265 mV/dec at high currentdensities (in contrast with the 30–35 and 230–250 mV/decranges, resp. in the cited study). The polarization methodchosen for investigating the claim is assumed to be 89%reliable when the claim cannot be verified and 99.5% reliablewhen the claim can be verified. Defining eventsA: the PMDCexhibits Tafel slopes below the claimed ranges and B: thePMDC is found to exhibit Tafel slopes below the claimedranges, the complementary events A′: the PMDC exhibitsTafel slopes within the claimed ranges and B′: the PMDCis found to exhibit Tafel slopes within the claimed rangesestablish the basis for applying Bayes’ theorem. Following thepattern shown by the previous applications, the conditionalprobabilities are P(B′/A) = 0.11, P(B/A′) = 0.005, P(B/A) =0.89 and P(B′/A′) = 0.995.
The research team is assumed to report that 96% of thenew PMDC possess the claimed Tafel slope ranges; Bayes’theorem yields P(A′/B) = 0.1188; P(A/B′) = 0.0046;P(A′/B′) = 0.9954; P(A/B) = 0.8812. The about 12%probability that a new catalyst complies with the claimalthough the polarization experiment indicates otherwiseraises at least a reasonable doubt about the claim or thereliability of the experimental procedure, in spite of thesatisfactory P(A/B′) and P(A′/B′) values.
4. Discussion and Final Remarks
Perhaps the most striking feature of Bayes’ rule is theamount of information that can be gleaned from a fewuncomplicated probability ratios (the fact that Bayesianmethods are at present more than two hundred years oldis equally impressive). Within the Bayesian framework, aprior event probability is updated to a posterior probabilityof that event by means of a likelihood. The latter providesthe (conditional) probability of corroborating the a-prioristated hypothesis; this aspect is numerically illustrated in theAppendix.
The examples presented in this paper provide a small“window” to the realm of Bayesian methods whose fur-ther exploration in electrochemical science and engineeringrequires further work. Bayes’ rule is just one of many othermathematical devices of applied probability theory withpotential interest to the field.
Appendix
Bayes’ Rule: Short Analysis and Illustration viaApplication No. 3
Let AB and BA denote the combined event of both eventsA and B occurring, the order of occurrence being imma-terial. The veracity of the statement P(AB) = P(BA) =P(B/A)P(A) = P(A/B)P(B) and of (1) immediately fol-lows. Accounting for complementary events A′ and B′ the(total) probabilities P(A) = P(A/B)P(B) + P(A/B′)P(B′)and P(B) = P(B/A)P(A) + P(B/A′)P(A′) are mirrorimages of each other. In Application No. 3 P(B/A)P(A) =(0.97)(0.04) = 0.0388 is the posterior probability of anEC being defective vis-a-vis prior probability. P(A) =0.04. Similarly, P(B/A′)P(A′) = (0.01)(0.96) = 0.0096is the posterior probability of EC-defectiveness vis-a-visprior complementary probability P(A′) = 0.96; the totalprobability of event B is 0.04 + 0.0096= 0.0484. Bayes’ ruleyields P(A/B) = 0.0388/0.0484 = 0.8017, that is theposterior probability that an EC tested defective is, indeed,defective. It is appreciably less than the claimed (i.e. prior)probability of 0.97.
Acknowledgments
Utilities provided by the University of Waterloo and theNatural Sciences and Engineering Research Council ofCanada (NSERC) are gratefully acknowledged.
References
[1] J. O’M. Bockris and S. U. M. Khan, Surface Electrochemistry,Plenum, New York, NY, USA, 1993.
[2] R. Porkess, Collins Internet-Linked Dictionary of Statistics,Harper Collins College, Glenview, Ill, USA, 2nd edition, 2005.
[3] E. B. Manoukian, Modern Concepts and Theorems of Mathe-matical Statistics, Springer, New York, NY, USA, 1986.
[4] M. G. Bulmer, Principles of Statistics, Dover, New York, NY,USA, 2nd edition, 1979.
[5] S. F. Arnold, Mathematical Statistics, Prentice Hall, EnglewoodCliffs, NJ, USA, 1990.
[6] T. Z. Fahidy, “On the utility of certain decision theorytechniques in electrochemical process design,” in CurrentTopics in Electrochemistry, vol. 7, pp. 119–123, ResearchTrends, Trivandrum, India, 2000.
International Journal of Electrochemistry 5
[7] T. Z. Fahidy, “An application of Bayesian risk theory toelectrochemical processes,” Electrochimica Acta, vol. 49, no. 9-10, pp. 1397–1401, 2004.
[8] T. Z. Fahidy, “Bayesian updating of electrochemical processparameters via natural conjugate probability distributions,”Electrochimica Acta, vol. 49, no. 27, pp. 5013–5021, 2004.
[9] T. Z. Fahidy, “Probabilstic methods in the analysis of certainelectrochemical systems,” in Recent Research Developments inElectrochemistry, S. G. Pandalai, Ed., vol. 6, pp. 116–117,Transworld Research Network, Trivandrum, India, 2003.
[10] T. Z. Fahidy, “Electrochemical applications of net-benefitanalysis via Bayesian probabilities,” Journal of Applied Electro-chemistry, vol. 37, no. 6, pp. 747–752, 2007.
[11] K. Wiesener and D. Ohms, “Electrocatalysis for environmen-tally orientated electrochemical processes and environmentalprotection,” in Environmental Oriented Electrochemistry, C. A.C. Sequeira, Ed., p. 694, Elsevier, Amsterdam, The Nether-lands, 1994.
[12] S. Trasatti, “Work function, electronegativity, and electro-chemical behaviour of metals. III. Electrolytic hydrogen evolu-tion in acid solutions,” Journal of Electroanalytical Chemistry,vol. 39, no. 1, pp. 163–184, 1972.
[13] J. O’M. Bockris and S. U. M. Khan, loc. cit., Section 3.14.3, Fig.3.23, p. 268.
[14] J. O’M. Bockris and S. U. M. Khan, loc. cit., Section 3.21.6, Fig.3.31, p. 293.
[15] A. Oliveira Neto, J. Perez, W. T. Napporn, E. A. Ticianelli,and E. R. Gonzalez, “Electrocatalytic oxidation of methanol:study with Pt:Mo dispersed catalysts,” Journal of the BrazilianChemical Society, vol. 11, no. 1, pp. 39–43, 2000.
SAGE-Hindawi Access to ResearchInternational Journal of ElectrochemistryVolume 2011, Article ID 239637, 6 pagesdoi:10.4061/2011/239637
Research Article
Chiral Recognition of Amino Acids by MagnetoelectrodepositedCu Film Electrodes
Iwao Mogi and Kazuo Watanabe
Institute for Materials Research, Tohoku University, Katahira, Aoba-ku, Sendai 980-8577, Japan
Correspondence should be addressed to Iwao Mogi, [email protected]
Received 24 December 2010; Accepted 30 March 2011
Academic Editor: Carlos F. Zinola
Copyright © 2011 I. Mogi and K. Watanabe. This is an open access article distributed under the Creative Commons AttributionLicense, which permits unrestricted use, distribution, and reproduction in any medium, provided the original work is properlycited.
Chiral behavior of magnetoelectrodeposited (MED) Cu film electrodes was investigated for the electrochemical reactions of aminoacids. The Cu films were electrodeposited under a magnetic field of 5 T perpendicular to the electrode surface. Such MED Cu filmswere employed as an electrode, and cyclic voltammograms were measured for the electrochemical reactions of several kinds ofamino acids. Chiral behavior was clearly observed as oxidation current difference between the enantiomers of alanine, asparticacid, and glutamic acid. The MED film electrodes with the thickness of 50∼500 nm exhibited such chiral behavior, and theirsurface morphologies had network structures, which could be induced by the micro-MHD effect.
1. Introduction
When a magnetic field is imposed to an electrodepositionprocess (magnetoelectrodeposition), the Lorentz force actingon the faradaic current causes convection of the electrolyticsolution. This is well known as the magnetohydrodynamic(MHD) effect [1, 2]. The MHD effect leads to spiral struc-tures in the two-dimensional growth of magnetoelectrode-posited (MED) metals [3–6] and conducting polymers [7],and the three-dimensional helical structures in silicate mem-brane growth [8]. Thus, magnetoelectrodeposition has thepotential to produce chiral structures. This is called as mag-netoelectrochemical chirality. Control of chirality is one ofthe most significant subjects in biochemistry, and consider-able effort has been devoted in exploring chiral catalysts. Ifthe chiral structures can be formed in nanometer scales onthe MED films, such film surfaces would serve as an enantio-selective catalyst.
Aogaki proposed the micro-MHD effect in the electrode-position under the magnetic fields parallel to the faradaiccurrent and perpendicular to the electrode surfaces [9].In electrodeposition processes, nonequilibrium fluctuationproduces a lot of humps on the deposit surfaces. The faradaiccurrent around such humps is not parallel to the magnetic
field so that the Lorentz force could cause vortex-like convec-tion in the local areas around the humps. The micro-MHDeffect was observed in the circular structures on the MEDCu film surfaces [9] and the network structures in the Ni-alumina composite films [10]. The micro-MHD convectionbreaks the symmetry of mass transfer around the humps,and such symmetry breaking might lead to the formation ofchiral structures on the deposit surfaces [11].
We tried the magnetoelectrodeposition of Ag films andemployed them as modified electrodes. The MED Ag filmelectrodes were found to exhibit different oxidation currentsbetween the enantiomers of glucose and cysteine [12, 13].To demonstrate the universality of magnetoelectrochemicalchirality, it is necessary to examine the chiral behaviors ofthe MED films of various kinds of metals. Copper electrodesexhibit electrocatalytic behaviors for the electro-oxidationof alcohols and amino acids in alkaline aqueous solutions[14, 15]. The electrocatalytic reactions are sensitive to thesurface structure of the electrode through specific adsorptionof reactant molecules. If the reactant has chirality, itselectrocatalytic reaction could be sensitive to the chirality ofthe electrode surface. In this paper, we report the magneto-electrodeposition of Cu films and their characteristic chiralelectrode behaviors for amino acids.
2 International Journal of Electrochemistry
Referenceelectrode Deposited
film
Workingelectrode
Counterelectrode
Superconducting magnet
−B +B
i
Figure 1: Schematic representation of magnetoelectrodeposition ina superconducting magnet. Magnetic fields B are applied to parallel(+) or antiparallel (−) to faradaic currents, and they are perpendic-ular to the electrode surface.
1st2nd
0.30.20.10−0.1−0.2−0.3
E/V versus Ag/AgCl
−0.2
0
0.2
0.4
0.6
0.8
1
1.2
i(m
Acm−2
)
Cu 0 T-filmin NaOHaq
Figure 2: CVs of the Cu 0T-film electrode in a 0.1 M NaOHaqueous solution. The 1st sweep (solid line) corresponds to thepretreatment of the Cu film electrode, and the 2nd sweep (dashedline) represents the background current. The potential sweep ratewas 10 mV s−1.
2. Experimental
All chemicals were reagent grade and were used as received.For electrochemical experiments, a conventional system withthe following three electrodes was employed: a polycrys-talline Pt disc working electrode with a diameter of 3 mm,a Cu or Pt plate counter electrode, a Ag | AgCl | NaCl(3 M (M = mol dm−3)) reference electrode. A potentiostat(Princeton Applied Research model 263A) was used for allthe electrochemical experiments.
+5 T0 T
100806040200
t (s)
0
−5
−10
−15
−20
−25
−30
i(m
Acm−2
)
Cu at −0.4 V
Figure 3: Current-time curves during the Cu electrodeposition in0 T and +5 T.
Cu electrodeposition was conducted in a 50 mM CuSO4
aqueous solution containing 0.5 M H2SO4. The Cu filmswere formed on the Pt working electrode by the potentio-static electrodeposition at a potential of −0.4 V. The filmthickness was controlled by a passing charge, and the thick-ness could be approximately estimated from the density ofCu (8.93 g cm−3), the electrode area and the passing charge.The usual film thickness was c.a. 150 nm at the passing chargeof 0.4 C cm−2.
Figure 1 shows a schematic representation of the magne-toelectrodeposition. The electrochemical cell was placed atthe bore center in a cryocooled superconducting magnet(Sumitomo Heavy Industries Ltd.), which is installed in theHigh Field Laboratory of Tohoku University and can producemagnetic fields of up to 5 T. An applied magnetic field B wasperpendicular to the working electrode surface, and it wasparallel (+B) or antiparallel (−B) to the faradaic current. Thefilms prepared at +5 T or −5 T are called the +5T-film or the−5T-film, respectively. The temperature within the magnetbore was controlled at 25◦C by circulating thermoregulatedwater.
The magnetoelectrodeposited (MED) films were used asmodified electrodes, and their chiral properties were exam-ined by measuring cyclic voltammograms (CVs) of the enan-tiomers of several kinds of amino acids (alanine, asparticacid, lysine, etc.) in a 0.1 M NaOH aqueous solution. BecauseCu metal is more easily oxidized than amino acids, theCu film electrodes underwent a pretreatment of a potentialsweep (−0.3∼0.3 V) in the NaOH solution before the CVmeasurements, as shown in Figure 2 (the solid line). Inthis potential sweep, the oxidation from Cu to Cu(I) occursaround −0.05 V, and the oxidation from Cu(I) to Cu(II)occurs around 0.02 V [14], forming a stable oxide film ofCuO. The oxidation current became very small in the 2ndpotential sweep (the dashed line in Figure 2), indicating thatthe film surface is covered by CuO after the pretreatment.
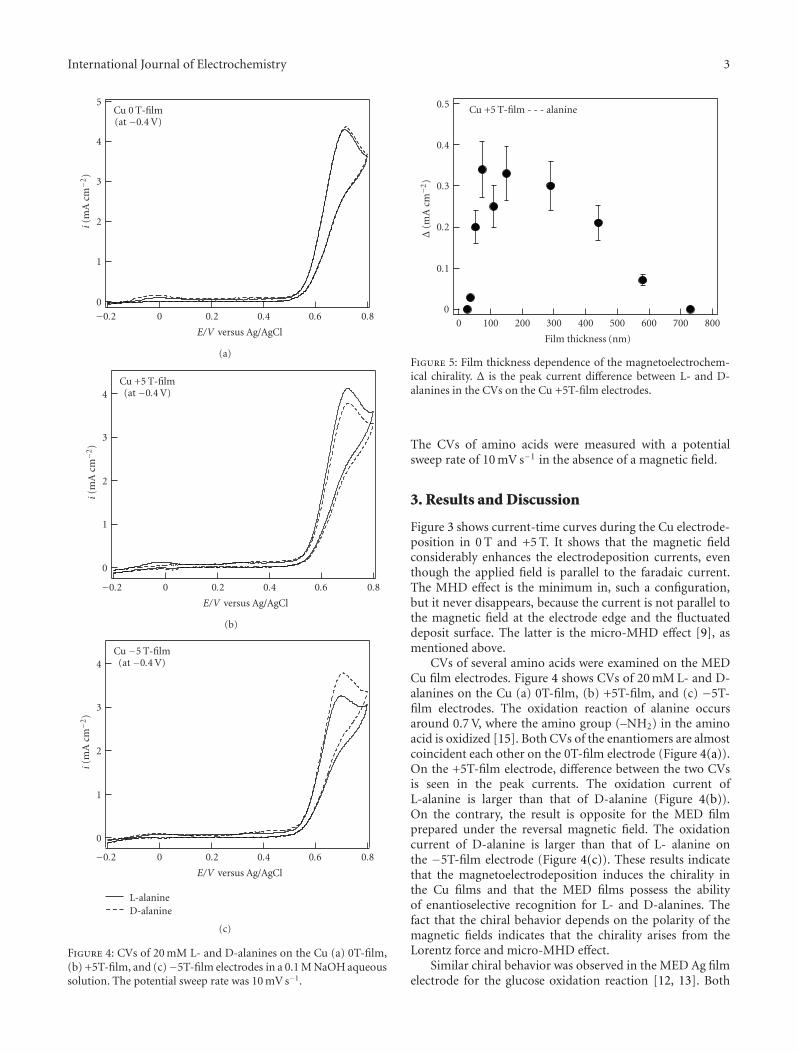
International Journal of Electrochemistry 3
0.80.60.40.20−0.2
E/V versus Ag/AgCl
0
1
2
3
4
5
i(m
Acm−2
)
Cu 0 T-film(at −0.4 V)
(a)
0.80.60.40.20−0.2
E/V versus Ag/AgCl
0
1
2
3
4
i(m
Acm−2
)
Cu +5 T-film(at −0.4 V)
(b)
L-alanineD-alanine
0.80.60.40.20−0.2
E/V versus Ag/AgCl
0
1
2
3
4
i(m
Acm−2
)
Cu −5 T-film(at −0.4 V)
(c)
Figure 4: CVs of 20 mM L- and D-alanines on the Cu (a) 0T-film,(b) +5T-film, and (c)−5T-film electrodes in a 0.1 M NaOH aqueoussolution. The potential sweep rate was 10 mV s−1.
Cu +5 T-film - - - alanine
8007006005004003002001000
Film thickness (nm)
0
0.1
0.2
0.3
0.4
0.5
Δ(m
Acm−2
)
Figure 5: Film thickness dependence of the magnetoelectrochem-ical chirality. Δ is the peak current difference between L- and D-alanines in the CVs on the Cu +5T-film electrodes.
The CVs of amino acids were measured with a potentialsweep rate of 10 mV s−1 in the absence of a magnetic field.
3. Results and Discussion
Figure 3 shows current-time curves during the Cu electrode-position in 0 T and +5 T. It shows that the magnetic fieldconsiderably enhances the electrodeposition currents, eventhough the applied field is parallel to the faradaic current.The MHD effect is the minimum in, such a configuration,but it never disappears, because the current is not parallel tothe magnetic field at the electrode edge and the fluctuateddeposit surface. The latter is the micro-MHD effect [9], asmentioned above.
CVs of several amino acids were examined on the MEDCu film electrodes. Figure 4 shows CVs of 20 mM L- and D-alanines on the Cu (a) 0T-film, (b) +5T-film, and (c) −5T-film electrodes. The oxidation reaction of alanine occursaround 0.7 V, where the amino group (–NH2) in the aminoacid is oxidized [15]. Both CVs of the enantiomers are almostcoincident each other on the 0T-film electrode (Figure 4(a)).On the +5T-film electrode, difference between the two CVsis seen in the peak currents. The oxidation current ofL-alanine is larger than that of D-alanine (Figure 4(b)).On the contrary, the result is opposite for the MED filmprepared under the reversal magnetic field. The oxidationcurrent of D-alanine is larger than that of L- alanine onthe −5T-film electrode (Figure 4(c)). These results indicatethat the magnetoelectrodeposition induces the chirality inthe Cu films and that the MED films possess the abilityof enantioselective recognition for L- and D-alanines. Thefact that the chiral behavior depends on the polarity of themagnetic fields indicates that the chirality arises from theLorentz force and micro-MHD effect.
Similar chiral behavior was observed in the MED Ag filmelectrode for the glucose oxidation reaction [12, 13]. Both
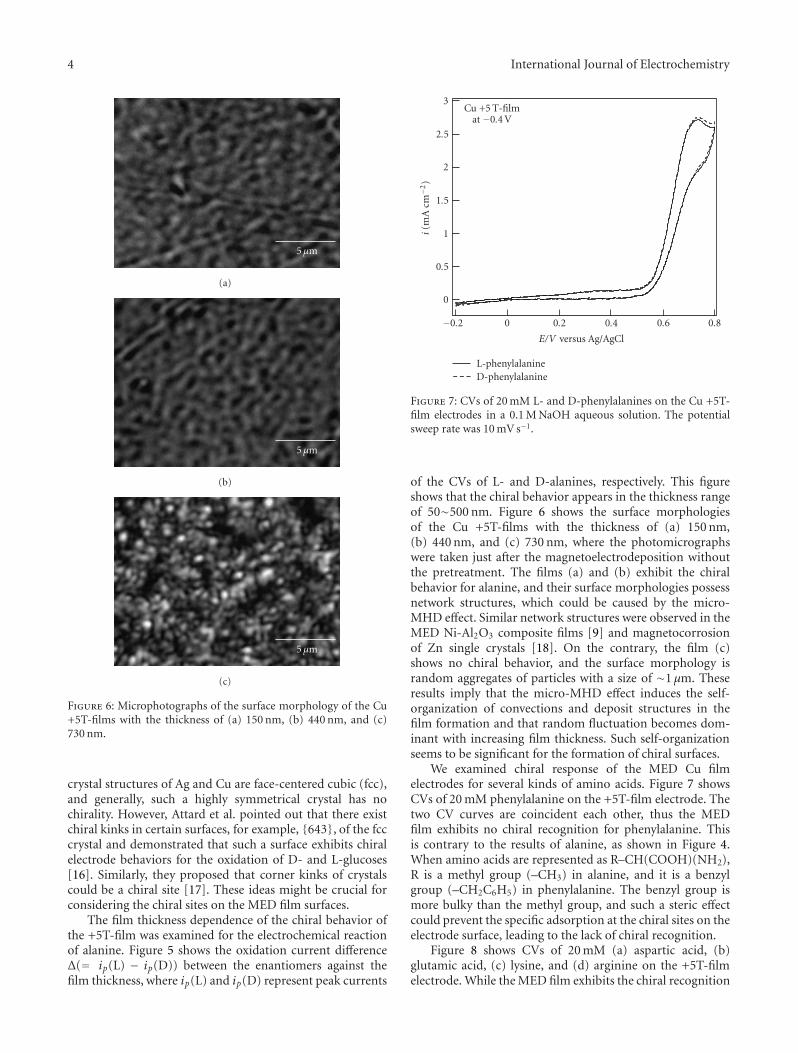
4 International Journal of Electrochemistry
5 μm
(a)
5 μm
(b)
5 μm
(c)
Figure 6: Microphotographs of the surface morphology of the Cu+5T-films with the thickness of (a) 150 nm, (b) 440 nm, and (c)730 nm.
crystal structures of Ag and Cu are face-centered cubic (fcc),and generally, such a highly symmetrical crystal has nochirality. However, Attard et al. pointed out that there existchiral kinks in certain surfaces, for example, {643}, of the fcccrystal and demonstrated that such a surface exhibits chiralelectrode behaviors for the oxidation of D- and L-glucoses[16]. Similarly, they proposed that corner kinks of crystalscould be a chiral site [17]. These ideas might be crucial forconsidering the chiral sites on the MED film surfaces.
The film thickness dependence of the chiral behavior ofthe +5T-film was examined for the electrochemical reactionof alanine. Figure 5 shows the oxidation current differenceΔ(= ip(L) − ip(D)) between the enantiomers against thefilm thickness, where ip(L) and ip(D) represent peak currents
L-phenylalanineD-phenylalanine
0.80.60.40.20−0.2
E/V versus Ag/AgCl
0
0.5
1
1.5
2
2.5
3
i(m
Acm−2
)
Cu +5 T-filmat −0.4 V
Figure 7: CVs of 20 mM L- and D-phenylalanines on the Cu +5T-film electrodes in a 0.1 M NaOH aqueous solution. The potentialsweep rate was 10 mV s−1.
of the CVs of L- and D-alanines, respectively. This figureshows that the chiral behavior appears in the thickness rangeof 50∼500 nm. Figure 6 shows the surface morphologiesof the Cu +5T-films with the thickness of (a) 150 nm,(b) 440 nm, and (c) 730 nm, where the photomicrographswere taken just after the magnetoelectrodeposition withoutthe pretreatment. The films (a) and (b) exhibit the chiralbehavior for alanine, and their surface morphologies possessnetwork structures, which could be caused by the micro-MHD effect. Similar network structures were observed in theMED Ni-Al2O3 composite films [9] and magnetocorrosionof Zn single crystals [18]. On the contrary, the film (c)shows no chiral behavior, and the surface morphology israndom aggregates of particles with a size of ∼1 μm. Theseresults imply that the micro-MHD effect induces the self-organization of convections and deposit structures in thefilm formation and that random fluctuation becomes dom-inant with increasing film thickness. Such self-organizationseems to be significant for the formation of chiral surfaces.
We examined chiral response of the MED Cu filmelectrodes for several kinds of amino acids. Figure 7 showsCVs of 20 mM phenylalanine on the +5T-film electrode. Thetwo CV curves are coincident each other, thus the MEDfilm exhibits no chiral recognition for phenylalanine. Thisis contrary to the results of alanine, as shown in Figure 4.When amino acids are represented as R–CH(COOH)(NH2),R is a methyl group (–CH3) in alanine, and it is a benzylgroup (–CH2C6H5) in phenylalanine. The benzyl group ismore bulky than the methyl group, and such a steric effectcould prevent the specific adsorption at the chiral sites on theelectrode surface, leading to the lack of chiral recognition.
Figure 8 shows CVs of 20 mM (a) aspartic acid, (b)glutamic acid, (c) lysine, and (d) arginine on the +5T-filmelectrode. While the MED film exhibits the chiral recognition
International Journal of Electrochemistry 5
L-aspartic acidD-aspartic acid
0.80.60.40.20−0.2
E/V versus Ag/AgCl
0
1
2
3
4
i(m
Acm−2
)
Cu +5 T-filmat −0.4 V
(a)
L-glutamic acidD-glutamic acid
0.80.60.40.20−0.2
E/V versus Ag/AgCl
0
0.5
1
1.5
2
2.5
3
i(m
Acm−2
)
Cu +5 T-filmat −0.4 V
(b)
L-lysineD-lysine
0.80.60.40.20−0.2
E/V versus Ag/AgCl
0
2
4
6
i(m
Acm−2
)
Cu +5 T-filmat −0.4 V
(c)
L-arginineD-arginine
0.80.60.40.20−0.2
E/V versus Ag/AgCl
0
2
4
6
8
i(m
Acm−2
)Cu +5 T-film
at −0.4 V
(d)
Figure 8: CVs of the enantiomers of (a) aspartic acid, (b) glutamic acid, (c) lysine, and (d) arginine on the Cu +5T-film electrodes ina 0.1 M NaOH aqueous solution. The potential sweep rate was 10 mV s−1.
for aspartic and glutamic acids, it shows no chiral behaviorfor lysine and arginine. The molecular structures of R-groupsare clearly different between the formers and the latters. TheR-groups of aspartic and glutamic acids involve a carboxylgroup (–COOH), on the contrary, those of lysine andarginine involve an amino group (–NH2). These facts suggestthat the carboxyl group promotes the specific adsorptionon the electrode surface, leading to the chiral recognition.On the other hands, the amino group participates in theelectrode reaction and contributes to the large oxidationcurrents, as shown in Figures 8(c) and 8(d). This seems tobe crucial for the lack of chiral recognition for lysine andarginine.
There remains interesting open issues where the chiralsite is on the MED film surface, why such a chiral sitecan survive after the surface oxidation in the pretreatmentprocess, and how the chiral site recognizes the molecularchirality of amino acids. To elucidate these issues in futurestudies leads to a design of electrocatalytic chiral surfaceusing the magnetoelectrodeposition technique.
4. Conclusion
We have shown that the MED Cu film electrodes exhibit chi-ral behaviors for the oxidation of the enantiomers of alanine,
6 International Journal of Electrochemistry
aspartic acid, and glutamic acid and that such magnetoelec-trochemical chirality depends on the film thickness. Takingaccount of our previous results of the chirality of the MEDAg films [12, 13], the observation of the chirality in the MEDCu films implies that the magnetoelectrochemical chirality isa universal phenomenon in the magnetoelectrodeposition ofmetals. It is noteworthy that the magnetoelectrodeposition isable to provide chiral surfaces without any chiral chemicals,and this novel technique would be applicable to new designof chiral catalysts and sensors.
Acknowledgment
The magnetoelectrochemical experiments were performed inthe High Field Laboratory for Superconducting Materials,IMR Tohoku University.
References
[1] R. Aogaki, K. Fueki, and T. Mukaibo, “Application of mag-netohydrodynamic effect to the analysis of electrochemicalreactions-1,” Denki Kagaku, vol. 43, no. 9, pp. 504–508, 1975.
[2] T. Z. Fahidy, “Magnetoelectrolysis,” Journal of Applied Electro-chemistry, vol. 13, no. 5, pp. 553–563, 1983.
[3] I. Mogi, S. Okubo, and Y. Nakagawa, “Dense radial growthof silver metal leaves in a high magnetic field,” Journal of thePhysical Society of Japan, vol. 60, no. 10, pp. 3200–3202, 1991.
[4] I. Mogi, M. Kamiko, and S. Okubo, “Magnetic field effects onfractal morphology in electrochemical deposition,” Physica B,vol. 211, no. 1–4, pp. 319–322, 1995.
[5] J. M. D. Coey, G. Hinds, and M. E. G. Lyons, “Magnetic-fieldeffects on fractal electrodeposits,” Europhysics Letters, vol. 47,no. 2, pp. 267–272, 1999.
[6] V. Heresanu, R. Ballou, and P. Molho, “Electrochemicalgrowth of Zn and Fe arborescence under normal magneticfield,” Magnetohydrodynamics, vol. 39, no. 4, pp. 461–469,2003.
[7] I. Mogi and M. Kamiko, “Pattern formation in magneto-electropolymerization of pyrrole,” Denki Kagaku, vol. 64, no.7, pp. 842–844, 1996.
[8] W. Duan, S. Kitamura, I. Uechi, A. Katsuki, and Y. Tanimoto,“Three-dimensional morphological chirality induction usinghigh magnetic fields in membrane tubes prepared by a silicategarden reaction,” Journal of Physical Chemistry B, vol. 109, no.28, pp. 13445–13450, 2005.
[9] R. Aogaki, “Micro-MHD effect on electrodeposition in thevertical magnetic field,” Magnetohydrodynamics, vol. 39, no. 4,pp. 453–460, 2003.
[10] T. Yamada and S. Asai, “Distribution control of dispersedparticles in a film fabricated by composite plating methodusing a high magnetic field,” Journal of the Japan Institute ofMetals, vol. 69, no. 2, pp. 257–262, 2005.
[11] R. Aogaki, R. Morimoto, A. Sugiyama, and M. Asanuma, “Ori-gin of chirality in magnetoelectrodeposition,” in Proceedings ofthe 6th International Conference on Electromagnetic Processingof Materials, pp. 439–442, Dresden, Germany, 2009.
[12] I. Mogi and K. Watanabe, “Chiral electrode behavior of mag-netoelectrodeposited silver films,” ISIJ International, vol. 47,no. 4, pp. 585–587, 2007.
[13] I. Mogi and K. Watanabe, “Magnetoelectrochemical chiralityin Ag electrodeposition,” Journal of Chemistry and ChemicalEngineering, vol. 4, no. 11, pp. 16–22, 2010.
[14] N. Torto, T. Ruzgas, and L. Gorton, “Electrochemical oxida-tion of mono- and disaccharides at fresh as well as oxidizedcopper electrodes in alkaline media,” Journal of Electroanalyti-cal Chemistry, vol. 464, no. 2, pp. 252–258, 1999.
[15] P. Luo, F. Zhang, and R. P. Baldwin, “Constant potentialamperometric detection of underivatized amino acids andpeptides at a copper electrode,” Analytical Chemistry, vol. 63,no. 17, pp. 1702–1707, 1991.
[16] G. A. Attard, C. Harris, E. Herrero, and J. Feliu, “The influenceof anions and kink structure on the enantioselective electro-oxidation of glucose,” Faraday Discussions, vol. 121, pp. 253–266, 2002.
[17] G. A. Attard, A. Ahmadi, D. J. Jenkins et al., “The characterisa-tion of supported platinum nanoparticles on carbon used forenantioselective hydrogenation,” ChemPhysChem, vol. 4, no.2, pp. 123–130, 2003.
[18] K. Shinohara, K. Hashimoto, and R. Aogaki, “Hexagonalcorrosion pattern upon cleavage of a zinc single crystal undera vertical high magnetic field,” Chemistry Letters, vol. 31, no.8, pp. 778–779, 2002.