Principal-Oscillation-Pattern Analysis of Gene Expression
10
Principal-Oscillation-Pattern Analysis of Gene Expression Daifeng Wang 1,3 , Ari Arapostathis 1 , Claus O. Wilke 2 , Mia K. Markey 1,3 * 1 Department of Electrical and Computer Engineering, The University of Texas at Austin, Austin, Texas, United States of America, 2 Section of Integrative Biology, Center for Computational Biology and Bioinformatics and Institute for Cellular and Molecular Biology, The University of Texas at Austin, Austin, Texas, United States of America, 3 University of Texas Biomedical Informatics Lab and Department of Biomedical Engineering, The University of Texas at Austin, Austin, Texas, United States of America Abstract Principal-oscillation-pattern (POP) analysis is a multivariate and systematic technique for identifying the dynamic characteristics of a system from time-series data. In this study, we demonstrate the first application of POP analysis to genome-wide time-series gene-expression data. We use POP analysis to infer oscillation patterns in gene expression. Typically, a genomic system matrix cannot be directly estimated because the number of genes is usually much larger than the number of time points in a genomic study. Thus, we first identify the POPs of the eigen-genomic system that consists of the first few significant eigengenes obtained by singular value decomposition. By using the linear relationship between eigengenes and genes, we then infer the POPs of the genes. Both simulation data and real-world data are used in this study to demonstrate the applicability of POP analysis to genomic data. We show that POP analysis not only compares favorably with experiments and existing computational methods, but that it also provides complementary information relative to other approaches. Citation: Wang D, Arapostathis A, Wilke CO, Markey MK (2012) Principal-Oscillation-Pattern Analysis of Gene Expression. PLoS ONE 7(1): e28805. doi:10.1371/ journal.pone.0028805 Editor: Rodrigo Alexandre Panepucci, Hemocentro de Ribeira ˜o Preto, HC-FMRP-USP, Brazil Received July 4, 2011; Accepted November 15, 2011; Published January 10, 2012 Copyright: ß 2012 Wang et al. This is an open-access article distributed under the terms of the Creative Commons Attribution License, which permits unrestricted use, distribution, and reproduction in any medium, provided the original author and source are credited. Funding: The authors have no support or funding to report. Competing Interests: The authors have declared that no competing interests exist. * E-mail: [email protected] Introduction Genes whose expression varies differentially and periodically over the cell cycle have been identified by both experimental and computational methods [1,2,3,4,5,6]. Existing methods analyze individual genes or small-scale gene sets; in contrast, our goal is a systematic, multivariate method for analysis of genome-wide gene- expression data. A graphical approach has been applied to model gene expression data systematically in [7], but it does not identify the genome-wide dynamic patterns such as oscillation patterns. Principal-oscillation-pattern (POP) analysis is a data-driven multi- variate and systematic technique for identifying the dynamic characteristics of a system using dynamic system equations. It has been widely used to analyze climate data in the geosciences [8], but to the best of our knowledge, this is the first time that POP analysis has been applied to identify oscillation patterns in gene expression. Typically, the dynamics of a genomic system are too complicated to be known explicitly. In POP analysis, a complex system is linearized using a set of first order ordinary differential equations (ODEs). These ODEs correspond to the state equation in systems theory; their parameters can be inferred from data. The state equation with perturbations has been applied to model gene expression in [9], but a typical genome-wide gene expression dataset does not reveal the perturbation signals explicitly. Moreover, the method in [9] did not analyze dynamic characteristics from the state equations to identify the genes that express differentially and periodically over the cell cycle. However, POP analysis identifies the dynamic patterns of the genomic system directly from the eigenvalues and eigenvectors of the system matrix. However, genome-wide gene-expression data sets normally have a limited number of time samples. Since the number of time samples is much fewer than the number of genes, estimation of the genomic system matrix is underdetermined. In order to solve this problem, we use the idea of dimensionality reduction to construct an eigen-genomic system that consists of significant eigengenes calculated from the singular value decomposition (SVD) [10]. We obtain the POPs for the eigen-genomic system, and then make use of the linear relationship between the eigen-genomic system and the genomic system to infer the POPs of the genomic system. We evaluate the applicability of POP analysis to genomic systems using both simulation and real-world datasets. Using simulation data, we check the capability of POP analysis to recover the oscillation amplitudes and phases defined by the simulation parameters. Using real-world data, we compare POP analysis with both the results of experiments and existing computational methods [1,2,3,4,5,6]. We demonstrate that the systematic, multivariate approach of POP analysis can accurately identify genes that are differentially and periodically expressed across the cell cycle. Methods We model gene expression data from a system point of view; i.e., the genome-wide time-series gene-expression data X (t)[R N for N genes at time-points t~t 1 ,t 2 ,:::,t m is expressed as a matrix first-order ordinary differential equation, also known as the state equation in systems theory, as follows: dX (t)=dt~AX (t), ð1Þ where A[R N|N is the genomic system matrix, which models how the current genomic state X(t) affects the state change rate dX(t)/dt, PLoS ONE | www.plosone.org 1 January 2012 | Volume 7 | Issue 1 | e28805
Transcript of Principal-Oscillation-Pattern Analysis of Gene Expression

Principal-Oscillation-Pattern Analysis of Gene ExpressionDaifeng Wang1,3, Ari Arapostathis1, Claus O. Wilke2, Mia K. Markey1,3*
1 Department of Electrical and Computer Engineering, The University of Texas at Austin, Austin, Texas, United States of America, 2 Section of Integrative Biology, Center
for Computational Biology and Bioinformatics and Institute for Cellular and Molecular Biology, The University of Texas at Austin, Austin, Texas, United States of America,
3 University of Texas Biomedical Informatics Lab and Department of Biomedical Engineering, The University of Texas at Austin, Austin, Texas, United States of America
Abstract
Principal-oscillation-pattern (POP) analysis is a multivariate and systematic technique for identifying the dynamiccharacteristics of a system from time-series data. In this study, we demonstrate the first application of POP analysis togenome-wide time-series gene-expression data. We use POP analysis to infer oscillation patterns in gene expression.Typically, a genomic system matrix cannot be directly estimated because the number of genes is usually much larger thanthe number of time points in a genomic study. Thus, we first identify the POPs of the eigen-genomic system that consists ofthe first few significant eigengenes obtained by singular value decomposition. By using the linear relationship betweeneigengenes and genes, we then infer the POPs of the genes. Both simulation data and real-world data are used in this studyto demonstrate the applicability of POP analysis to genomic data. We show that POP analysis not only compares favorablywith experiments and existing computational methods, but that it also provides complementary information relative toother approaches.
Citation: Wang D, Arapostathis A, Wilke CO, Markey MK (2012) Principal-Oscillation-Pattern Analysis of Gene Expression. PLoS ONE 7(1): e28805. doi:10.1371/journal.pone.0028805
Editor: Rodrigo Alexandre Panepucci, Hemocentro de Ribeirao Preto, HC-FMRP-USP, Brazil
Received July 4, 2011; Accepted November 15, 2011; Published January 10, 2012
Copyright: ! 2012 Wang et al. This is an open-access article distributed under the terms of the Creative Commons Attribution License, which permitsunrestricted use, distribution, and reproduction in any medium, provided the original author and source are credited.
Funding: The authors have no support or funding to report.
Competing Interests: The authors have declared that no competing interests exist.
* E-mail: [email protected]
Introduction
Genes whose expression varies differentially and periodically overthe cell cycle have been identified by both experimental andcomputational methods [1,2,3,4,5,6]. Existing methods analyzeindividual genes or small-scale gene sets; in contrast, our goal is asystematic, multivariate method for analysis of genome-wide gene-expression data. A graphical approach has been applied to modelgene expression data systematically in [7], but it does not identifythe genome-wide dynamic patterns such as oscillation patterns.Principal-oscillation-pattern (POP) analysis is a data-driven multi-variate and systematic technique for identifying the dynamiccharacteristics of a system using dynamic system equations. It hasbeen widely used to analyze climate data in the geosciences [8], butto the best of our knowledge, this is the first time that POP analysishas been applied to identify oscillation patterns in gene expression.
Typically, the dynamics of a genomic system are too complicatedto be known explicitly. In POP analysis, a complex system islinearized using a set of first order ordinary differential equations(ODEs). These ODEs correspond to the state equation in systemstheory; their parameters can be inferred from data. The stateequation with perturbations has been applied to model geneexpression in [9], but a typical genome-wide gene expression datasetdoes not reveal the perturbation signals explicitly. Moreover, themethod in [9] did not analyze dynamic characteristics from the stateequations to identify the genes that express differentially andperiodically over the cell cycle. However, POP analysis identifies thedynamic patterns of the genomic system directly from theeigenvalues and eigenvectors of the system matrix.
However, genome-wide gene-expression data sets normallyhave a limited number of time samples. Since the number of time
samples is much fewer than the number of genes, estimation of thegenomic system matrix is underdetermined. In order to solve thisproblem, we use the idea of dimensionality reduction to constructan eigen-genomic system that consists of significant eigengenescalculated from the singular value decomposition (SVD) [10]. Weobtain the POPs for the eigen-genomic system, and then make useof the linear relationship between the eigen-genomic system andthe genomic system to infer the POPs of the genomic system.
We evaluate the applicability of POP analysis to genomic systemsusing both simulation and real-world datasets. Using simulationdata, we check the capability of POP analysis to recover theoscillation amplitudes and phases defined by the simulationparameters. Using real-world data, we compare POP analysis withboth the results of experiments and existing computational methods[1,2,3,4,5,6]. We demonstrate that the systematic, multivariateapproach of POP analysis can accurately identify genes that aredifferentially and periodically expressed across the cell cycle.
Methods
We model gene expression data from a system point of view;i.e., the genome-wide time-series gene-expression data X (t)[RN
for N genes at time-points t~t1,t2,:::,tm is expressed as a matrixfirst-order ordinary differential equation, also known as the stateequation in systems theory, as follows:
dX (t)=dt~AX (t), ð1Þ
where A[RN|N is the genomic system matrix, which models howthe current genomic state X(t) affects the state change rate dX(t)/dt,
PLoS ONE | www.plosone.org 1 January 2012 | Volume 7 | Issue 1 | e28805
and also encapsulates the dynamic characteristics of the genomicsystem, and in this paper, we denote as Rn1|n2 the set of n1|n2
real matrices.Estimating the genomic system matrix A is an underdetermined
problem since the number of time samples is typically much lessthan the number of genes. Instead of estimating the genomicsystem matrix, the eigen-genomic system matrix, denoted as ~AA, isestimated. The eigen-genomic system is introduced in Eigen-genomic System Dynamic pattern Analysis (ESDA) in [11]. Theeigen-genomic system consists of the first few significanteigengenes. The eigengenes can be calculated from the singularvalue decomposition (SVD) of the gene-expression data matrix.The significant eigengenes are defined to be those that explainmost of the covariance of the gene-expression data matrix.
Eigen-genomic systemIn this section, we introduce to calculate the eigen-genomic
system matrix. The singular value decomposition (SVD) of X isdenoted as svd(X )~USVT~WVT . We denote the expression offirst r significant eigengenes at time t as E(t)[Rr, which are thefirst r rows of VT . By the linear relationship between geneexpressions and eigengene expressions in ESDA, we know that
X (t)~WE(t), ð2Þ
where W[RN|r is the coefficient matrix of genes on the first rsignificant eigengenes.
By Equation (1) and Equation (2), the eigen-genomic systemmatrix ~AA satisfies
dE(t)=dt~~AAE(t): ð3Þ
The relationship between the genomic system matrix A and theeigen-genomic system matrix ~AA[Rr|r is given by
~AA~W #AW , ð4Þ
where W #[Rr|N is the pseudo-inverse of W .The eigen-genomic system equation is given by Equation (3).
After discretizing it into a difference equation, we obtain
E(tzt)~e~AAtE(t)~BE(t), ð5Þ
where t is the time interval between measurement time points andB~e
~AAt[Rr|r.We can estimate B from the eigengene expressions E(t) at
t~t1,t2,:::,tm as follows:
B~E2E#1 , ð6Þ
where E2~j ::: j
E(t2) ::: E(tm)j ::: j
0
@
1
A[Rr|(m{1),
E1~j ::: j
E(t1) ::: E(tm{1)j ::: j
0
@
1
A[Rr|(m{1), and
tiz1~t1zit,i~2,:::,m.
POP analysisBy Equation (5), the eigengene expression E(t) can be
decomposed as the linear combination of eigenvectors of B asfollows:
E(t)~Xr
i~1
ai(t)Mi, ð7Þ
where Mi[Cr is the ith eigenvector of B, and ai(t) is the coefficientof E(t) on Mi.
The coefficient satisfies the dynamic equation:
ai(tzt)~lti ai(t), ð8Þ
where li is the eigenvalue of B. Thus, the coefficient ai(t) can becalculated as
ai(t)~ltbi, ð9Þ
where bi is a scaling factor. Without loss of generality, we assumethat bi~1, i~1,2,:::,r:
The eigen-genomic system matrix B is not necessarilysymmetric, so the eigenvalues of B may be complex. Thus, if lis an eigenvalue of B with its eigenvector M, then its conjugate, l#
is also an eigenvalue of B with eigenvector M#.For a complex conjugate pair of eigenvalues, l and l#, we let
l~sejv, where j is the imaginary unit. The real part of theireigenvectors is denoted as MR[Rr, and the imaginary part of theireigenvectors is denoted as MI[Rr.
After summing the terms of the complex conjugate eigenvectorsin Equation (7), their sum, denoted as M(t), is given by
M(t)~ltMzl#tM#~stejvt(MRzjMI)zste{jvt(MR{jMI)
~2st( cos (vt)MR{ sin (vt)MI),ð10Þ
which shows that the oscillation with frequency v is driven by thepatterns MR and MI. Thus, MR and MI are referred to as theprincipal oscillation patterns (POPs) of the eigen-genomic system.
By Equation (2), the relationship between gene expression andeigengene expression is linear, so gene expression X (t) is also alinear summation of ai(t),i~1,2,:::,r. The portion of the summa-tion of the coefficients corresponding to the POPs, MR and MI ofthe eigen-genomic system to X (t), denoted as P(t), is given by
P(t)~WM(t)~2st( cos (vt)WMR{ sin (vt)WMI)~
2st( cos (vt)PR{ sin (vt)PI)ð11Þ
Principal-Oscillation-Pattern of Gene Expression
PLoS ONE | www.plosone.org 2 January 2012 | Volume 7 | Issue 1 | e28805

where PR~WMR[RN and PI~WMI[RN are referred to as thePOPs of the genomic system. They drive the oscillation processwith the angular frequency v; i.e., the period = 2p=v.
From a system point of view, the oscillation part of a genomicsystem is a periodic process starting from PR to {PI to {PR toPI, and then back to PR (as shown in Figure S1).
For an individual gene, for example, the nth element of a POPrepresents the coefficient of the nth gene on this POP. We denoteits coefficients on the POPs, PR and PI, as pn,R and pn,I,respectively. We convert the coefficient pair (pn,R,pn,I) into polarcoordinates (rn,hn) as follows:
rn~ffiffiffiffiffiffiffiffiffiffiffiffiffiffiffiffiffiffiffiffip2
n,Rzp2n,I
q, ð12Þ
hn~ tan{1 (pn,I=pn,R), ð13Þ
where rn represents the oscillation amplitude of the POPs, and hn
represents the oscillation phase of the POPs. A high POPamplitude rn means that the gene expression level oscillatesstrongly with the angular frequency v as shown in Figure 1. ThePOP phase hn unveils the stage at which the gene expressionachieves its peak value.
Overview of AnalysisWe now perform a series of analyses to determine the strengths
and limitations of POP analysis as applied to gene expression data:
a. Can POP analysis recover known periodic features of agenomic system? To address this question, we apply POPanalysis to simulation data. At the system level, we check if theperiod of the POPs recovers the one defined in the simulatedoscillation process. At the gene level, we check if theamplitudes of the POPs are highly positively correlated withthe simulated amplitudes of the oscillating strengths, andlikewise if the phases of the POPs match the simulated phases.
b. What is the sensitivity of POP analysis, i.e., for genes that havebeen experimentally verified as being periodically expressed,does POP analysis identify them as periodically expressed? Toaddress this question, we examine the results of POP analysison genes that are experimentally considered to be periodicbased on previously reported experimental investigations ofgene expression across the cell cycle.
c. What is the specificity of POP analysis, i.e., does POP analysisfalsely identify genes as periodic that are not actuallyperiodically expressed? To address this question, we examinethe results of POP analysis on genes that have never beenidentified by either previous experiments or existing compu-tational methods as periodic across the cell cycle.
d. Can POP analysis identify genes that are likely to beperiodically expressed but that were missed in previouslyreported previous experiments? To address this question, weexamine annotations [12] of genes that POP analysis identifiesas periodically expressed across the cell cycle but that previousexperimental methods don’t identify as such.
e. Can POP analysis identify genes that are unlikely to beperiodically expressed across the cycle, yet were previouslyreported as such by previous experiments? To address thisquestion, we examine annotations [12] of genes that POPanalysis identifies as probably not periodically expressed butthat experimental methods identify as periodically expressedacross the cell cycle.
f. How does POP analysis compare with existing computationalmethods for identifying periodically expressed genes? Toaddress this question, we evaluate the results of POP analysisrelative to existing computational methods [1,2,3,4,5,6].
Simulation dataWe simulate the time series expression of each gene using the
following first order differential equation, which is widely used inmodeling gene-expression data:
dx(t)=dt~u(t){kx(t), ð14Þ
where x(t) is the gene expression at time t, u(t) is the transcriptionrate also known as the production rate, and k is the decay rateconstant. Thus, the gene-expression change rate dx(t)=dt is equalto the difference between the production rate u(t) and thedegradation rate kx(t). The production rate u(t) drives theoscillation of x(t). If u(t) is zero, then x(t) will be a decay process.If u(t) is oscillating, then x(t) will oscillate as well.
Therefore, using Equation (14), we obtain simulated expressionsof 4000 genes at 0,7,14, ... ,119 minutes. These time points wereselected to match those of a widely used budding-yeast cell-cycledata set with a-factor-based synchronization [5]. We generate thesimulated decay half-lives using the lognormal distribution that fitthe experimental measurements for mRNA decay half-lives in[13], and obtain the decay rate constant k using k = -ln(2)/half-life. We let the production rate, u(t), which generates theoscillation process, be u(t)~b cos (vtzQ)zn(t). We set theangular frequency, v, as v = 2p/30, which corresponds to a 30minute period of the oscillation process. The simulated phase Q is arandom number uniformly distributed on [0, 2p]. The simulatedamplitude b is also a random number uniformly distributed on [0,0.1] such that simulated expressions are positive. Ten-percentGaussian noise, n(t)*N(0,b=10), is added to the production rate
Figure 1. POP amplitude and phase. For the nth gene, the nth
element of a POP represents the coefficient of the nth gene on the POP.Its coefficients of the POPs, PR and PI , are denoted as pn,R and pn,I ,respectively. We convert the coefficient pair (pn,R,pn,I) into polarcoordinates (rn ,hn), where rn represents the POP amplitude and hn
represents the POP phase. A high POP amplitude means that the geneexpression level oscillates strongly with the angular frequency v. ThePOP phase unveils the stage at which gene expression achieves its peakvalue.doi:10.1371/journal.pone.0028805.g001
Principal-Oscillation-Pattern of Gene Expression
PLoS ONE | www.plosone.org 3 January 2012 | Volume 7 | Issue 1 | e28805
such that the first five significant eigengenes explain at least 98%covariance of simulated gene expressions.
Real-world dataWe apply POP analysis to a widely studied budding-yeast
(Saccharomyces cerevisiae) gene-expression dataset with a-factor-basedsynchronization [5]. The state equation (1) assumes that thegenomic system matrix is constant, so the estimate of B by Equation(6), which describes the dynamic evolution between adjacent timesamples of eigen-genomic system, requires that we have an equaltime sampling interval. The gene expressions with a-factor-basedsynchronization were measured at t = 0, 7, 14, … , 119 minutescovering two cell cycles of around 120 minutes with an equal timesampling interval of 7 minutes [5]. We obtain N = 4598 genes withno more than three missing samples and ratios of Mean Intensity toMedian Background Intensity in both Channel 1 and Channel 2being greater than 1.5. We estimate the missing samples using thesingular value decomposition method as in [10], and normalize timeseries expression data for each gene such that its norm of expressionlevels at all time samples is equal to one.
Results
Simulation dataWe select the first five significant eigengenes to comprise the
eigen-genomic system of the simulated data. The eigenvalues ofthe eigen-genomic system matrix are summarized in Table S1.The first and second eigenvalues are complex conjugate, whichcorrespond to the POPs with a period of 30 minutes that recoverthe period defined by the simulation parameters. The third,fourth, and fifth eigenvalues are real, so they do not represent theoscillation process but rather the slow, median, and fast decayprocesses of the system, which are discussed in [11].
Thus, we focus on the POPs corresponding to the first and secondeigenvalues. These two POPs, PRand PI, are plotted in Figure 2.The horizontal axis represents the POP phases of the simulatedgenes in degrees, which unveils when the expression levels of thesimulated genes peak. The vertical axis represents the coefficients ofsimulated genes on each POP. Over 360 degrees, i.e., over a periodof 30 minutes, the envelopes of PR and PI are cosine and the sinewaves, respectively, which shows that PR drives the cosineoscillation, and PI drives the sine oscillation of genomic system.The envelopes of PR and PI are determined by the genes that havelarge POP coefficients on these POPs. If a gene has a largecoefficient value for either POP at a certain phase, it means that theoscillation pattern of the gene’s expression is strong at this phase.
Pearson correlation between POP amplitudes andsimulation amplitudes
We investigate the relationship between the amplitudes definedby the simulation parameters and the amplitudes extracted fromthe simulated data via POP analysis. The Pearson correlationbetween the simulated and POP amplitudes over 4000 simulatedgenes is 0.99 with p,0.01 (Figure S2). Thus, the POP amplitudesrecover the oscillation amplitudes defined by the simulationparameters. A high POP amplitude of a gene means that itsexpression level is strongly oscillating with a period of 30 minutes.
Pearson correlation between POP phase and simulationphases
The phases extracted by POP analysis recover the phasesdefined by the simulation parameters; the Pearson correlation ofthe sine values of their phases is 0.96 with p,0.01 (Figure S3). So,
the POP phase of a simulated gene reflects the phase of theoscillation process in its expression.
Budding yeast (Saccharomyces cerevisiae) cell cycleexpression data
We choose the first five significant eigengenes as the eigen-genomic system of the budding yeast since they capture more than98% of the covariance of the data matrix [10]. The eigen-genomicsystem matrix of the budding yeast has eigenvalues (as shown inTable S2). The first and second complex conjugate eigenvaluescorrespond to POPs with a period of 65.7 minutes, which falls intothe estimated period of the cell cycle (66611 minutes) of buddingyeast with a-factor-based synchronization [5,14]. We plot POPcoefficients versus POP phases for all 4598 genes in Figure 3 (POPamplitudes and phases are included in Table S3). The PR and PI
have approximately cosine and sine envelopes, respectively, whichare driven by genes that have large values of the POP coefficients.Thus, these genes have strong oscillation patterns.
Genes periodically expressed across the cell cycle havehigh POP amplitudes
In order to assess the sensitivity of POP analysis for identifyingperiodically expressed genes, we examine the results of POPanalysis on genes that are experimentally considered to be periodicbased on previously reported experimental investigations of geneexpression across the cell cycle. In our model, a gene that isperiodically expressed across the cell cycle should have aproduction rate in Equation (14) that has a strong oscillatingprocess with a period matching the length of the cell cycle. Thus,we investigate whether the mean POP amplitude of genes that areknown to be periodically expressed across the cell cycle is higherthan the mean POP amplitude of other genes.
As summarized in [1], small-scale experiments have measuredexpression level changes or investigated cell cycle transcriptionfactors for individual genes. Throughout this paper, we refer tomethods that infer cell-cycle genes by computational means fromgenome-wide gene-expression time-series as ‘computational meth-ods’, and we refer to methods that infer cell-cycle genes byidentifying periodically expressions in small-scale experiments, orpromoters of genes bound by known cell cycle transcriptionfactors, as ‘experimental methods’. Experimental methods haveidentified a total of 465 cell-cycle genes, including 113 genes thatare expressed periodically across cell cycle [2,5], and 402 genesthat are bound by known cell-cycle transcription factors at theirpromoters [15,16], which drive the oscillation processes ofexpression in transcription rate in Equation (14), and, thus, canbe inferred to be periodically expressed. We compare the POPamplitudes of these genes to the POP amplitudes of other genesnot known to be modulated by the cell cycle. Out of 4598 genesreported in the budding yeast dataset with a-factor-basedsynchronization, there are 344 cell cycle genes identified byexperimental methods. The mean of the POP amplitudes of these344 ‘cell cycle’ genes (0.12) is significantly (p,0.01) greater thanthe mean of the POP amplitudes of the rest of the genes (0.07)according to a two-sample t-test with unequal variances. (Theirvariances are not statistically equivalent, F test, p,0.01.) Inaddition, a permutation test [17] also indicates that the mean ofthe POP amplitudes of these 344 ‘cell cycle’ genes is statisticallysignificantly (p,0.01) greater than the mean of the POPamplitudes of the rest of the genes. The permutation test isimplemented as follows: we randomly select 344 genes withoutreplacement, and calculate the difference between the mean oftheir POP amplitudes and the mean of the POP amplitudes of the
Principal-Oscillation-Pattern of Gene Expression
PLoS ONE | www.plosone.org 4 January 2012 | Volume 7 | Issue 1 | e28805

Figure 2. POPs of the simulated genomic system. The horizontal axis represents the POP phases of simulated genes, which unveils when theexpression levels of the simulated genes peak. The vertical axis represents the coefficients of simulated genes on each POP. Over 360 degrees that gothrough a period of 30 minutes, the envelopes of PR and PI consisting the genes that have large POP coefficients on either POPs, are the cosine andthe sine waves, respectively, which shows that PR drives the cosine oscillation, and PI drives the sine oscillation of genomic system.doi:10.1371/journal.pone.0028805.g002
Figure 3. POPs of the real genomic system, budding yeast genomic system. The horizontal axis represents the phases of genes in degree oneach POP. The vertical axis represents the coefficients of genes on each POP. The PR and PI have approximately cosine and sine envelopes,respectively, which is driven by genes around envelopes that have large values of POP coefficients. Thus, these genes have strong oscillation patterns.doi:10.1371/journal.pone.0028805.g003
Principal-Oscillation-Pattern of Gene Expression
PLoS ONE | www.plosone.org 5 January 2012 | Volume 7 | Issue 1 | e28805
rest of the genes. We repeat this random selection 10,000 times,and record the resulting 10,000 differences of the means. The p-value is calculated as the proportion of the differences of the meansthat are greater than or equal to the difference of the meansobserved for actual 344 ‘cell cycle’ genes compared to the rest ofthe genes.
Genes maximally expressed in the same phase of the cellcycle have similar POP phases
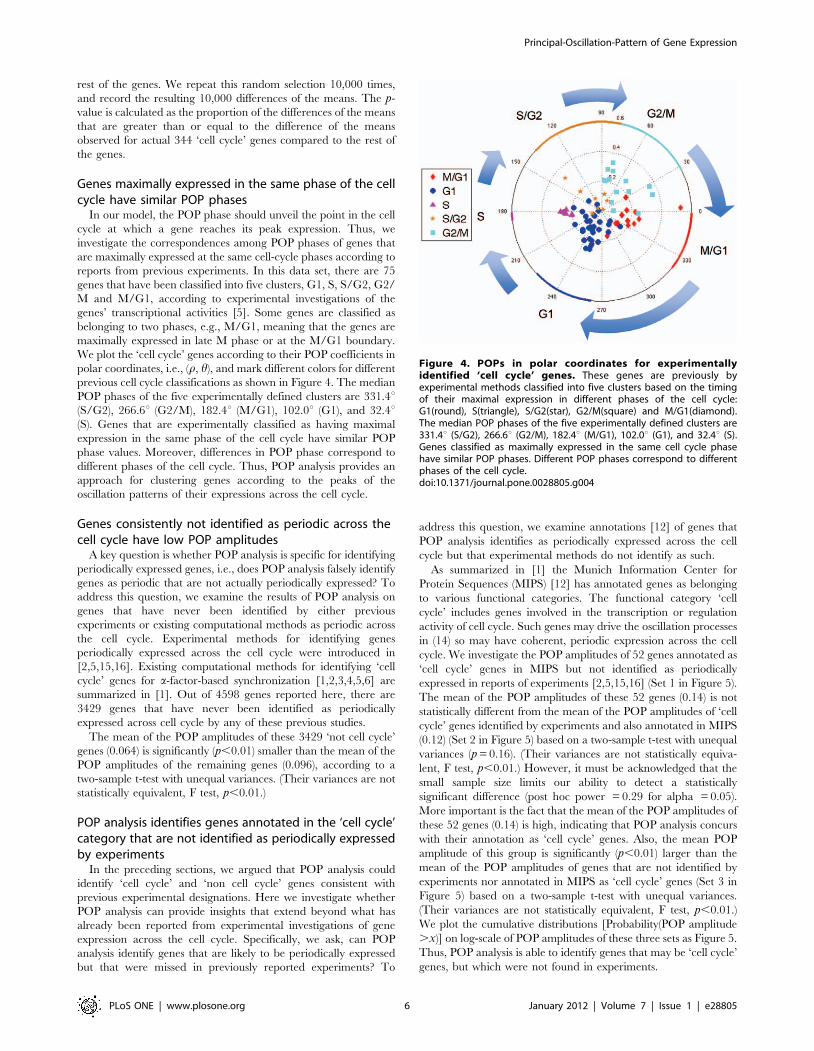
In our model, the POP phase should unveil the point in the cellcycle at which a gene reaches its peak expression. Thus, weinvestigate the correspondences among POP phases of genes thatare maximally expressed at the same cell-cycle phases according toreports from previous experiments. In this data set, there are 75genes that have been classified into five clusters, G1, S, S/G2, G2/M and M/G1, according to experimental investigations of thegenes’ transcriptional activities [5]. Some genes are classified asbelonging to two phases, e.g., M/G1, meaning that the genes aremaximally expressed in late M phase or at the M/G1 boundary.We plot the ‘cell cycle’ genes according to their POP coefficients inpolar coordinates, i.e., (r, h), and mark different colors for differentprevious cell cycle classifications as shown in Figure 4. The medianPOP phases of the five experimentally defined clusters are 331.4u(S/G2), 266.6u (G2/M), 182.4u (M/G1), 102.0u (G1), and 32.4u(S). Genes that are experimentally classified as having maximalexpression in the same phase of the cell cycle have similar POPphase values. Moreover, differences in POP phase correspond todifferent phases of the cell cycle. Thus, POP analysis provides anapproach for clustering genes according to the peaks of theoscillation patterns of their expressions across the cell cycle.
Genes consistently not identified as periodic across thecell cycle have low POP amplitudes
A key question is whether POP analysis is specific for identifyingperiodically expressed genes, i.e., does POP analysis falsely identifygenes as periodic that are not actually periodically expressed? Toaddress this question, we examine the results of POP analysis ongenes that have never been identified by either previousexperiments or existing computational methods as periodic acrossthe cell cycle. Experimental methods for identifying genesperiodically expressed across the cell cycle were introduced in[2,5,15,16]. Existing computational methods for identifying ‘cellcycle’ genes for a-factor-based synchronization [1,2,3,4,5,6] aresummarized in [1]. Out of 4598 genes reported here, there are3429 genes that have never been identified as periodicallyexpressed across cell cycle by any of these previous studies.
The mean of the POP amplitudes of these 3429 ‘not cell cycle’genes (0.064) is significantly (p,0.01) smaller than the mean of thePOP amplitudes of the remaining genes (0.096), according to atwo-sample t-test with unequal variances. (Their variances are notstatistically equivalent, F test, p,0.01.)
POP analysis identifies genes annotated in the ‘cell cycle’category that are not identified as periodically expressedby experiments
In the preceding sections, we argued that POP analysis couldidentify ‘cell cycle’ and ‘non cell cycle’ genes consistent withprevious experimental designations. Here we investigate whetherPOP analysis can provide insights that extend beyond what hasalready been reported from experimental investigations of geneexpression across the cell cycle. Specifically, we ask, can POPanalysis identify genes that are likely to be periodically expressedbut that were missed in previously reported experiments? To
address this question, we examine annotations [12] of genes thatPOP analysis identifies as periodically expressed across the cellcycle but that experimental methods do not identify as such.
As summarized in [1] the Munich Information Center forProtein Sequences (MIPS) [12] has annotated genes as belongingto various functional categories. The functional category ‘cellcycle’ includes genes involved in the transcription or regulationactivity of cell cycle. Such genes may drive the oscillation processesin (14) so may have coherent, periodic expression across the cellcycle. We investigate the POP amplitudes of 52 genes annotated as‘cell cycle’ genes in MIPS but not identified as periodicallyexpressed in reports of experiments [2,5,15,16] (Set 1 in Figure 5).The mean of the POP amplitudes of these 52 genes (0.14) is notstatistically different from the mean of the POP amplitudes of ‘cellcycle’ genes identified by experiments and also annotated in MIPS(0.12) (Set 2 in Figure 5) based on a two-sample t-test with unequalvariances (p = 0.16). (Their variances are not statistically equiva-lent, F test, p,0.01.) However, it must be acknowledged that thesmall sample size limits our ability to detect a statisticallysignificant difference (post hoc power = 0.29 for alpha = 0.05).More important is the fact that the mean of the POP amplitudes ofthese 52 genes (0.14) is high, indicating that POP analysis concurswith their annotation as ‘cell cycle’ genes. Also, the mean POPamplitude of this group is significantly (p,0.01) larger than themean of the POP amplitudes of genes that are not identified byexperiments nor annotated in MIPS as ‘cell cycle’ genes (Set 3 inFigure 5) based on a two-sample t-test with unequal variances.(Their variances are not statistically equivalent, F test, p,0.01.)We plot the cumulative distributions [Probability(POP amplitude.x)] on log-scale of POP amplitudes of these three sets as Figure 5.Thus, POP analysis is able to identify genes that may be ‘cell cycle’genes, but which were not found in experiments.
Figure 4. POPs in polar coordinates for experimentallyidentified ‘cell cycle’ genes. These genes are previously byexperimental methods classified into five clusters based on the timingof their maximal expression in different phases of the cell cycle:G1(round), S(triangle), S/G2(star), G2/M(square) and M/G1(diamond).The median POP phases of the five experimentally defined clusters are331.4u (S/G2), 266.6u (G2/M), 182.4u (M/G1), 102.0u (G1), and 32.4u (S).Genes classified as maximally expressed in the same cell cycle phasehave similar POP phases. Different POP phases correspond to differentphases of the cell cycle.doi:10.1371/journal.pone.0028805.g004
Principal-Oscillation-Pattern of Gene Expression
PLoS ONE | www.plosone.org 6 January 2012 | Volume 7 | Issue 1 | e28805

POP analysis identifies genes as unlikely to beperiodically expressed that are not annotated as ‘cellcycle’ but are labeled as periodically expressed byexperiments
A central question for POP analysis is whether it can be used toidentify genes that may have been incorrectly labeled as beingperiodically expressed over the cell cycle based on reports ofexperimental methods. To address this question, we examineannotations [12] of genes that POP analysis identifies as probablynot periodically expressed but that experimental methods identifyas periodically expressed across the cell cycle.
There are 21 out of 344 experimentally identified ‘cell cycle’genes that have particularly low POP amplitudes (lowest 10% ofthe set). We examine their MIPS annotations to evaluate themerits of the POP analysis for these genes. We find that MIPSdoes not annotate 16 out of these 21 genes (,76%) as ‘cell cycle’genes, which is consistent with the results of the POP analysis.These results indicate that experiments may mistakenly identifysome genes as ‘cell cycle’ genes that can be correctly recognized asaperiodic with the assistance of POP analysis.
Identification of cell cycle genes by POP amplitudesA high POP amplitude indicates that a gene’s expression is
strongly periodic across the cell cycle. Thus far in our analyses, wehave avoided applying arbitrary thresholds and have evaluated thePOP approach based on comparison of distributions. However, inpractical application of POP analysis to gene expression data, itwould be valuable to apply a fixed threshold to denote some genesas ‘periodic’ and others as ‘aperiodic’. While such a threshold isnecessarily data-set specific, we present a general approach forselecting an appropriate cutoff.
In order to choose a threshold on POP amplitudes to identify‘cell cycle’ genes for the dataset with a-factor-based synchroniza-tion, we plot the cumulative distributions [Probability(POPamplitude .x)] on log-scale of POP amplitudes of all 4598 genes(solid curve) and all genes excluding 344 experimentally identified‘cell cycle’ genes (dashed curve) as shown in Figure 6. By visualinspection, we see that the gap between the two curves starts atPOP amplitude < 0.1, which we take as the threshold forsubsequent analysis. There are 846 genes in this data set whosePOP amplitudes are greater than 0.1. A similar approach can beapplied for other gene expression data sets in order to identify adata-set specific threshold for identifying genes with periodicexpression.
POP analysis compares favorably with existingcomputational methods for identifying ‘cell cycle’ genesand can potentially complement other approaches
In this assessment, we compare the sets of genes identified asperiodically expressed across the cell cycle by POP analysis and sixexisting computational methods (Table S4). A detailed summaryon these methods can be found in [1].
The overlap with the ‘cell cycle’ genes reported fromexperimental methods (all 465 genes) is also considered. We firstcompare POP with existing computational methods by analyzingthe overlaps of the sets of genes identified by the different methods,and likewise the overlaps with the set of genes identified in reportsof experiments. Then, we analyze the potential benefits ofcombining POP with existing methods.
Comparative analysisEach of the computational methods identifies a substantial
number of genes as periodic that are not flagged by POP nor werereported as such from experiments (e.g., 371 for Spellman’s
Figure 5. Cumulative distributions of POP amplitudes fordemonstrating that previous experimental methods may miss‘cell cycle’ genes. Cumulative distributions (Probability(POP ampli-tude .x)) in log-scale of POP amplitudes of three sets: Set 1 - 52 genesannotated as ‘cell cycle’ genes in MIPS but not identified as periodicallyexpressed in reports of experimental methods [2,5,15,16]; Set 2 - ‘cellcycle’ genes identified by experiments and also annotated in MIPS; Set3 - genes that are not identified by experiments nor annotated in MIPSas ‘cell cycle’ genes.doi:10.1371/journal.pone.0028805.g005
Figure 6. Cumulative distributions of POP amplitudes forselecting the POP amplitude threshold. Cumulative distributions(Probability(POP amplitude .x)) on log-scale of POP amplitudes of all4598 genes (solid curve) and all genes excluding 344 cell cycle genesidentified in experiments (dashed curve). By visual inspection, we seethat the gap between two curves starts at POP amplitude < 0.1, whichwe consider is the cutoff. There are 846 genes whose POP amplitudesare greater than 0.1.doi:10.1371/journal.pone.0028805.g006
Principal-Oscillation-Pattern of Gene Expression
PLoS ONE | www.plosone.org 7 January 2012 | Volume 7 | Issue 1 | e28805
method [5]). Likewise, POP analysis marks many genes as periodicthat are not identified as such by the other computational methodsconsidered nor by the experimental approach (e.g., 477 for POPanalysis relative to Spellman’s method). The same is true for theexperimental approach; several genes are identified as periodicacross the cell cycle that are not flagged by POP analysis or theother computational method considered (e.g., 221 for experimentsrelative to Spellman’s method). However, there are also sizeablesubsets wherein there is some agreement between the computa-tional and experimental approaches. For example, Spellman’smethod and POP analysis both identify 137 genes as periodicacross the cell cycle that are recorded as such based onexperiments. Thus, there is a notably fraction of genes for whichSpellman’s method, POP analysis, and experiments agree.However, more interesting are the small subsets for which thereis some but not universal agreement. For example, there are 208genes flagged by both Spellman’s and POP analysis that are notidentified by experiments. Thus, we next investigate the potentialbenefits to be had from adding POP analysis to anothercomputation method, such as Spellman’s method.
Complementary analysisWe analyze the potential benefits of combining the results of
POP analysis and existing methods. We analyze Spellman’smethod as an example here, and provide similar comparisonresults for other computational methods in Figure S4 and TableS5.
Out of 800 genes identified by Spellman’s method asperiodically expressed over the cell cycle, 220 (28%) are alsonoted as such in reports of experiments. If we consider the 454genes flagged by Spellman’s method which are not flagged by POPanalysis, the percentage that are also experimentally identified as‘cell cycle’ drops to 18%. On the other hand, if we consider the345 genes for which both Spellman and POP analysis indicate thatthey are likely to be periodically expressed, the percentage that arealso experimentally identified as ‘cell cycle’ increases to 40%.Similar results are obtained when other computational methodsare considered (data included in Table S4, Figure S4 and TableS5). These analyses suggest that combining POP analysis withother computational methods for identifying periodically ex-pressed genes may increase the yield over those methods operatingindependently, as benchmarked against experimental methods.
Discussion
In this paper, we have presented an application of POP analysisto genome-wide gene expression data. We model the genomicsystem using the first-order matrix ordinary-differential equation,which is known as the state equation in systems theory. Due to thesmall number of time samples and the huge number of genes in atypical genome-wide gene-expression data set, we first estimate theeigen-genomic system matrix that is much lower dimensional andmore amenable to solve. The POPs of the eigen-genomic systemare then identified. By multiplying the POPs of the eigen-genomicsystem by the coefficient matrix that maps between genes andeigengenes, we obtain the POPs of the genomic system.
We first evaluate the POPs using simulation data. Theamplitudes and phases of the POPs extracted from the simulateddata are found to highly correlate with the amplitudes and phasesdefined by the parameters of the simulation. Thus, POP analysiswell recovers the amplitudes and phases of the oscillation processesthat drive the periodical expressions of genes in simulation.
Real-world data, the budding yeast gene expression data with a-factor-based synchronization, is also used to evaluate POP analysis
for gene expression data. The POP amplitudes of the cell cyclegenes identified by previous experiments are found to besignificantly greater than POP amplitudes of the rest of the genes.In addition, we demonstrate that the POP phases matchedexperimental cell cycle phase classifications. On average, the POPamplitudes of genes that have never been identified by eitherexperiments or existing computational methods are significantlysmaller than POP amplitudes of the rest of the genes. We find thatPOP analysis is able to identify possible ‘cell cycle’ genes that arenot identified by experiments but that are annotated as ‘cell cycle’genes. Moreover, we show that some genes identified inexperiments as periodically expressed over the cell cycle had lowPOP amplitudes and are not annotated as ‘cell cycle’ genes. Wealso present a method to decide the threshold on the POPamplitude to identify genes as periodically expressed across the cellcycle. Previous experiments were implemented for individualgenes rather than genome-wide, so they may not be accurate toreveal the dynamic characteristics of genes that are driven bygenes’ interactions at genome system-level, which might explainthe discrepancies that POP analysis reports.
Finally, we demonstrate that combining the results of POPanalysis with that of existing computational approaches foridentifying periodically expressed genes has the potential toprovide an increased yield relative to only using existingcomputational approaches. It is not unexpected that POP analysisprovides complementary information relative to existing compu-tational methods given that POP is a very different approach toidentifying periodically expressed genes. A detailed summary onthese methods can be found in [1]; we review only briefly here toexplain how they are different from POP analysis. All six of theexisting computational methods considered in this study analyzeexpression levels for individual genes only, as opposed to a systemof genes, and identify periodic expression by fitting the individualgene expression level over time to common mathematicalfunctions: sine functions [2,3,5], single-pulse models [6], andcubic splines [4]. However, the dynamic characteristics of a gene’sexpression are driven by interactions with other genes at genomicsystem-level; analyzing genes one-by-one cannot capture theseinterdependencies. The use of common functions enablesstraightforward mathematical analysis; however, they may notaccurately capture the dynamic characteristics of a particularbiological system. Moreover, fitting all genes to the same functionmay not unveil the dynamic characteristics of individual genessince the quality of the fit may vary from gene to gene. POPanalysis, on the other hand, is a data-driven method that obtainsthe dynamic characteristics of each gene based on a genomicsystem-level model using systems theory.
We should point out that computationally classifying a gene as‘cell cycle’ or not ultimately depends on the criteria used forquantifying the periodic expression, e.g., POP amplitude is thecriterion in the proposed method. The value of an approach forclassifying genes is ultimately determined by whether the methodenables new insight into the biological system. Towards the goal,the choice of the threshold on the POP amplitude to define ‘cellcycle’ genes makes use of previously reported experimental results.Moreover, the comparison of the results of POP analysis,experiments, and a gene annotation database suggests that POPanalysis may in fact enable scientific discovery, not merelyreproduction of established knowledge.
The real-world dataset that we have used [5] is 13 years old andhas been analyzed in hundreds of follow-up studies. We chose thiswell-studied data set precisely for this reason. The main point of ourpaper is to present a novel method, one that we believe can identifycell-cycle genes in a better and more systematic way than previous
Principal-Oscillation-Pattern of Gene Expression
PLoS ONE | www.plosone.org 8 January 2012 | Volume 7 | Issue 1 | e28805

methods. By using a well-understood data set as the basis for ouranalysis, we have a solid reference of previous works against whichwe can compare our results. However, in order to verify our findings,we have also applied POP analysis to a newer dataset, Alpha 30 in[18]. This dataset includes 4774 genes at time, 0, 5, 10, … , 120minutes. Out of those 4774 genes in the Alpha 30 data set, there are3512 genes (74%) reported in the Spellman’s dataset that we mainlyapplied above. We obtained similar results with the Alpha 30 dataset. The first and second complex conjugate eigenvalues correspondto POPs with a period of 69 minutes, which falls into the estimatedperiod of the cell cycle (66611 minutes) of budding yeast with a-factor-based synchronization [5,14]. We include POP amplitudesand phases in Table S6. The mean of the POP amplitudes ofexperimentally identified ‘cell cycle’ genes is significantly (p,0.01)greater than the mean of the POP amplitudes of the rest of the genesaccording to both a two-sample t-test with unequal variances and apermutation test. The POP amplitude threshold < 0.04, and thereare 478 genes whose POP amplitudes are greater than this threshold.Out of those 478 genes, there are 202 genes (42%) also identified byour method using the Spellman’s dataset.
There are limitations to the application of POP analysis to geneexpression data. In particular, POP analysis requires that the timesamples be taken as equal intervals. Thus, POP analysis cannot beapplied to genome-wide gene expression data that were sampled atunequal time intervals, which is a common experimental design.One possible strategy to overcome this limitation would be tointerpolate the data first and then sample at equally-timed intervals[9]. It should also be noted that whereas existing computationalapproaches for identifying periodically expressed genes considereach gene one-by-one, POP analysis of genome-wide expression isopen to the opposite criticism; that is, when POP analysis is appliedto whole-genome data, the expression level of each gene is modeledas possibly being dependent on the expression level of all othergenes. In reality, the expression level of a given gene likely dependsupon the expression levels of some subset of the genome. In futurework, POP analysis could potentially be combined with data miningtechniques to create more biologically plausible models of periodicgene expression that employ a flexible system size that may besmaller than the whole genome.
In conclusion, we present the first application of POP analysis, amultivariate and systematic method, to genome-wide geneexpression data to identify genes that are periodically expressedacross the cell cycle. Using both simulation and real-world data,we show that POP analysis is not only compares favorably withexperiments and existing computational methods, but that it alsoprovides complementary information relative to other approaches.
Supporting Information
Figure S1 Dynamic trajectory of principal oscillationpatterns (POPs). The POPs, PR and PI, two N-dimensionalvectors, drive the cosine and sine, respectively, of the oscillationpart with angular frequency v. The oscillation part of an N-dimensional genomic system starts from PR to {PI to {PR to PI,and then back to PR with period ~2p=v.(DOC)
Figure S2 Scatter plot and Pearson correlation of POPamplitudes vs. Simulated amplitudes. The Pearson corre-lation between the gene expression amplitudes defined in thesimulation and the amplitudes recovered by POP analysis is 0.99with p,0.01. Thus, the POP amplitudes well recover thesimulation oscillation amplitudes.(DOC)
Figure S3 Scatter plot and Pearson correlation of POPphases vs. Simulated phases. There is high Pearsoncorrelation between the gene expression phases defined in thesimulation and the phases recovered by POP analysis (rho = 0.96with p,0.01 for sine values). So, the POP phase of a simulatedgene reflects the phase of the oscillation process in its expression.(DOC)
Figure S4 ‘Cell cycle’ genes identified by Experimentvs. POP vs. Existing methods. Venn diagrams show overlapsof ‘cell cycle’ genes identified by previous experiments, POPanalysis and each existing computational method.(DOC)
Table S1 Eigenvalues and POP period of simulatedgenomic system.(DOC)
Table S2 Eigenvalues and POP period of the genomicsystem of the budding yeast with a factor-basedsynchronization.(DOC)
Table S3 POP amplitudes and phases of all 4598 genes.(XLS)
Table S4 ‘Cell cycle’ genes identified by POP, experi-ment, MIPS and existing computational methods.(XLS)
Table S5 Overlap in percentage of experimentallyidentified ‘cell cycle’ genes identified by POP andexisting methods.(XLS)
Table S6 POP amplitudes and phases of all 4774 genesin Dataset alpha 30, http://labs.fhcrc.org/breeden/cellcycle/.(XLS)
Acknowledgments
Daifeng Wang would like to thank Dr. Hua Su in the Department ofGeological Sciences in the Jackson School of Geosciences at TheUniversity of Texas at Austin for helpful discussions.
Author Contributions
Conceived and designed the experiments: DW AA COW MKM.Performed the experiments: DW MKM. Analyzed the data: DW.Contributed reagents/materials/analysis tools: DW COW MKM. Wrotethe paper: DW MKM.
References
1. de Lichtenberg U, Jensen LJ, Fausboll A, Jensen TS, Bork P, et al. (2005)Comparison of computational methods for the identification of cell cycle-regulated genes. Bioinformatics 21: 1164–1171.
2. Johansson D, Lindgren P, Berglund A (2003) A multivariate approach applied tomicroarray data for identification of genes with cell cycle-coupled transcription.Bioinformatics 19: 467–473.
3. Lu X, Zhang W, Qin ZS, Kwast KE, Liu JS (2004) Statistical resynchronizationand Bayesian detection of periodically expressed genes. Nucleic Acids Res 32:447–455.
4. Luan Y, Li H (2004) Model-based methods for identifying periodically expressedgenes based on time course microarray gene expression data. Bioinformatics 20:332–339.
Principal-Oscillation-Pattern of Gene Expression
PLoS ONE | www.plosone.org 9 January 2012 | Volume 7 | Issue 1 | e28805

5. Spellman PT, Sherlock G, Zhang MQ, Iyer VR, Anders K, et al. (1998)Comprehensive identification of cell cycle-regulated genes of the yeastSaccharomyces cerevisiae by microarray hybridization. Mol Biol Cell 9:3273–3297.
6. Zhao LP, Prentice R, Breeden L (2001) Statistical modeling of large microarraydata sets to identify stimulus-response profiles. Proc Natl Acad Sci U S A 98:5631–5636.
7. Shi Y, Klustein M, Simon I, Mitchell T, Bar-Joseph Z (2007) Continuous hiddenprocess model for time series expression experiments. Bioinformatics 23:i459–467.
8. von Storch H, Burger G, Schnur R, von Storch J-S (1995) Principal OscillationPatterns: A Review. Journal of Climate 8: 377–400.
9. Bansal M, Della Gatta G, di Bernardo D (2006) Inference of gene regulatorynetworks and compound mode of action from time course gene expressionprofiles. Bioinformatics 22: 815–822.
10. Alter O, Brown PO, Botstein D (2000) Singular value decomposition forgenome-wide expression data processing and modeling. Proc Natl Acad Sci U S A97: 10101–10106.
11. Wang D, Markey MK, Wilke CO, Arapostathis A (2011) Eigen-genomic SystemDynamic-pattern Analysis (ESDA): Modeling mRNA Degradation. IEEE/ACMTransactions on Computational Biology and Bioinformatics, in press.
12. Mewes HW, Frishman D, Guldener U, Mannhaupt G, Mayer K, et al. (2002)MIPS: a database for genomes and protein sequences. Nucleic Acids Res 30:31–34.
13. Wang Y, Liu CL, Storey JD, Tibshirani RJ, Herschlag D, et al. (2002) Precisionand functional specificity in mRNA decay. Proc Natl Acad Sci U S A 99:5860–5865.
14. Shedden K, Cooper S (2002) Analysis of cell-cycle gene expression inSaccharomyces cerevisiae using microarrays and multiple synchronizationmethods. Nucleic Acids Res 30: 2920–2929.
15. Lee TI, Rinaldi NJ, Robert F, Odom DT, Bar-Joseph Z, et al. (2002)Transcriptional regulatory networks in Saccharomyces cerevisiae. Science 298:799–804.
16. Simon I, Barnett J, Hannett N, Harbison CT, Rinaldi NJ, et al. (2001) Serialregulation of transcriptional regulators in the yeast cell cycle. Cell 106: 697–708.
17. Moore DS (2009) The practice of business statistics : using data for decisions.New York: W.H. Freeman and Co.
18. Pramila T, Wu W, Miles S, Noble WS, Breeden LL (2006) The Forkheadtranscription factor Hcm1 regulates chromosome segregation genes and fills theS-phase gap in the transcriptional circuitry of the cell cycle. Genes Dev 20:2266–2278.
Principal-Oscillation-Pattern of Gene Expression
PLoS ONE | www.plosone.org 10 January 2012 | Volume 7 | Issue 1 | e28805