
Control of Myosin motor activity and Actin filament translation ...
Upload
khangminh22Category
view
1download
0
ARTICLE
A biochemical network controlling basal myosinoscillationXiang Qin 1,2,3, Edouard Hannezo 4,5, Thomas Mangeat1,2, Chang Liu1,2,6, Pralay Majumder7, Jiaying Liu1,2,
Valerie Choesmel-Cadamuro1,2, Jocelyn A. McDonald8, Yiyao Liu3, Bin Yi6 & Xiaobo Wang 1,2
The actomyosin cytoskeleton, a key stress-producing unit in epithelial cells, oscillates
spontaneously in a wide variety of systems. Although much of the signal cascade regulating
myosin activity has been characterized, the origin of such oscillatory behavior is still unclear.
Here, we show that basal myosin II oscillation in Drosophila ovarian epithelium is not con-
trolled by actomyosin cortical tension, but instead relies on a biochemical oscillator involving
ROCK and myosin phosphatase. Key to this oscillation is a diffusive ROCK flow, linking
junctional Rho1 to medial actomyosin cortex, and dynamically maintained by a self-activation
loop reliant on ROCK kinase activity. In response to the resulting myosin II recruitment,
myosin phosphatase is locally enriched and shuts off ROCK and myosin II signals. Coupling
Drosophila genetics, live imaging, modeling, and optogenetics, we uncover an intrinsic bio-
chemical oscillator at the core of myosin II regulatory network, shedding light on the spatio-
temporal dynamics of force generation.
DOI: 10.1038/s41467-018-03574-5 OPEN
1 Université de Toulouse, UPS, F-31062 Toulouse, France. 2 CNRS, LBCMCP, F-31062 Toulouse, France. 3 Department of Biophysics, School of Life Scienceand Technology, University of Electronic Science and Technology of China, Chengdu, 610054 Sichuan, P. R. China. 4 The Wellcome Trust/Cancer ResearchUK Gurdon Institute, University of Cambridge, Cambridge CB2 1QN, UK. 5 Institute of Science and Technology Austria, Am Campus 1, A-3400Klosterneuburg, Austria. 6 Department of Anesthesia, Southwest Hospital, Third Military Medical University, Chongqing 400038, P.R. China. 7 Department ofLife Sciences, Presidency University, Kolkata 700073, India. 8 Division of Biology, Kansas State University, Manhattan, KS 66506, USA. These authorscontributed equally: Xiang Qin, Edouard Hannezo. Correspondence and requests for materials should be addressed to Y.L. (email: [email protected])or to B.Y. (email: [email protected]) or to X.W. (email: [email protected])
NATURE COMMUNICATIONS | (2018) 9:1210 | DOI: 10.1038/s41467-018-03574-5 | www.nature.com/naturecommunications 1
1234
5678
90():,;

T issue morphogenesis, the acquisition of the three-dimensional (3D) shape of tissues and organs, is drivenby biological forces that are typically generated by mole-
cular motors, such as non-muscle myosin II (Myo-II) pullingfilamentous actin (F-actin)1,2. The activity of the Myo-II mole-cule, composed of two heavy chains (MHC), two regulatory lightchains (MRLC), and two essential light chains, is regulated bydynamic phosphorylation and dephosphorylation of MRLC3,4.Phosphorylation and dephosphorylation of MRLC, mainly byRho-associated protein kinase (ROCK) and myosin light-chainphosphatase (MLCP), respectively, govern an active or inactivestate of the Myo-II molecule, thus controlling both its interactionwith actin filaments and the generation of contractile force4,5.
Actomyosin networks are very dynamic and often undergo cyclesor pulses of assembly and disassembly1. Pulses of actomyosin net-works have been observed in several Drosophila tissue morpho-genesis processes, including apical constrictions of invaginatingmesoderm cells and delaminating neuroblasts, ectoderm cell inter-calation during germ band extension, follicle cells during oogenesis,and amnioserosa cells during dorsal closure, but also during Xeno-pus gastrulation and mouse embryo compaction6–17. Several com-peting explanations for this phenomenon have been put forward,including mechanosensitive assembly10, balance between contrac-tion forces and turnover11, or phosphorylation–dephosphorylationcycles of MRLC18. Consistent with a control viaphosphorylation–dephosphorylation cycles, spatio-temporal corre-lation between ROCK-MLCP and Myo-II has been observed invarious morphogenetic processes18–22. However, how such cyclesare generated and regulated is still unclear.
Basal actomyosin pulses, also essential for tissue morphogenesis,occur at the basal domain of ovarian epithelial follicle cells duringDrosophila oogenesis9, a biological process to give rise to matureeggs. This basal actomyosin oscillation is thought to create an ani-sotropic mechanical force, along the dorsal-ventral (DV) axis, inorder to constrict the underlying tissue and thus eventually give themature egg its characteristic anterior–posterior (AP) elongation9.Studies9,19,23 have demonstrated that Rho1 and ROCK positivelycontrol basal Myo-II intensity, while Flapwing (Flw), one catalyticsubunit of MLCP, negatively governs both basal Myo-II intensityand the initiation of basal Myo-II oscillation.
Here, through a combination of time-lapse live cell imaging,genetic, and optogenetic tools, and a physical based reactiondiffusion modeling, we demonstrate that basal Myo-II oscillationis controlled by a biochemical oscillatory network involvingspatio-temporal patterns of ROCK and MLCP, giving rise toactivator/inhibitor dynamics.
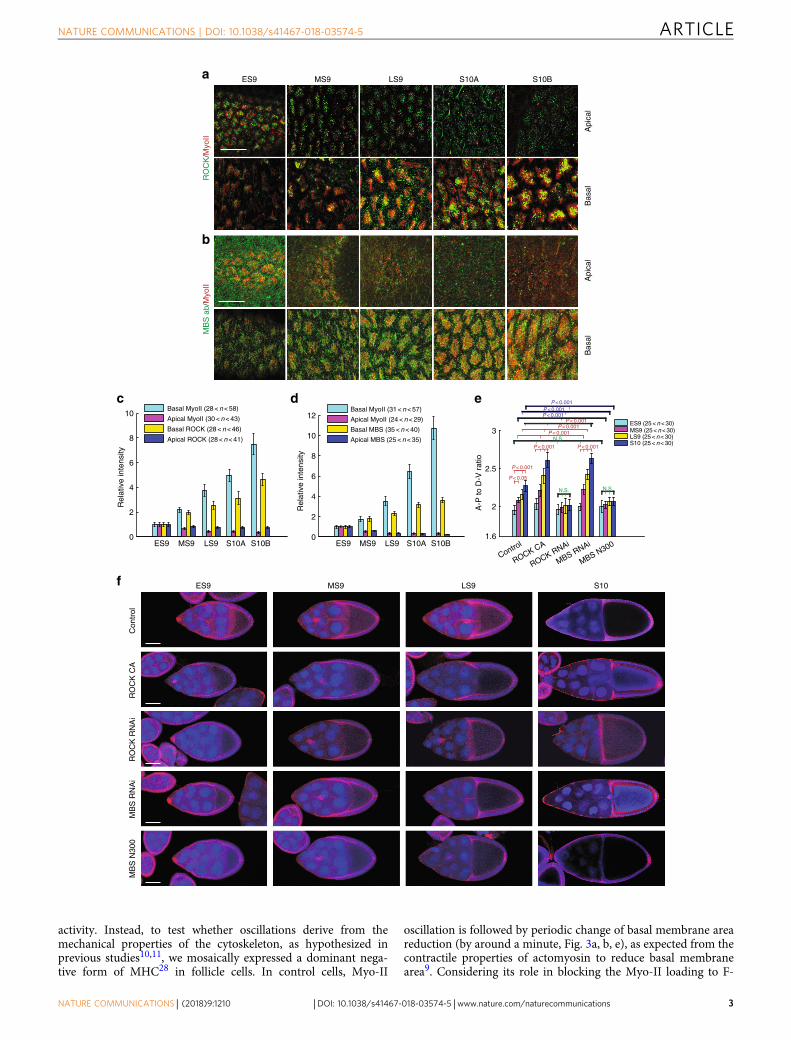
ResultsBasal shift of Myo-II regulatory network during elongation.Basal Myo-II oscillation starts from the developing early stage 9and it lasts until the end of stage 10B during Drosophila oogen-esis9. During these periods, Myo-II displays a prominent shiftfrom the apical to basal domain. Since ROCK and myosin-binding subunit (MBS, the regulatory subunit of MLCP24) arewell known activator and inhibitor of Myo-II phosphorylationand its mediated contraction, we assessed the spatio-temporaldistribution of both proteins in follicle cells. Consistent withMyo-II patterns, both ROCK and MBS proteins display promi-nent and gradual shifts from apical to basal domain from earlystage 9 to stage 10B (Fig. 1a–d). As basal Myo-II activity plays acritical role in controlling tissue elongation9, we tested whethertissue elongation would be affected upon changes of ROCK orMBS activity. Firstly, we confirmed the knockdown efficiency of
MBS RNAi in follicle cells (Supplementary Fig. 1a, b). Consistentwith their predicted effect on Myo-II activity, the activation ofROCK (by overexpression of ROCK active form) and the inhi-bition of MBS (by MBS RNAi expression) both significantlyenhance the elongation of egg chambers, while the inhibition ofROCK (by ROCK RNAi expression) and the activation of MBS(by overexpressing MBS active form25) both result in rounder eggchambers (Fig. 1e, f). These results indicate that ROCK and MBSare involved in regulating Myo-II activity and governing tissueelongation. We therefore asked whether ROCK, MBS, and otherMyo-II regulators were involved in the oscillatory properties ofMyo-II.
Oscillatory phase shift within Myo-II regulatory network. Westarted by assessing the spatio-temporal dynamics of theRho1–ROCK–MLCP signaling cascade. Firstly, we noticed thatRho1 intensity and activity are strongly distributed at basaljunctional membrane, with almost undetectable signal at basalmedial cortex, where oscillating Myo-II is present (Fig. 2a, c andref. 23). In addition, we did not detect a prominent pulsatilepattern of basal membrane Rho1 intensity and activity, duringperiods of Myo-II pulses (Fig. 2b, d, k and SupplementaryMovie 1). We next assessed the dynamics of ROCK and MLCPsignals. Basal ROCK levels oscillate with the same period as basalMyo-II levels, but preceding Myo-II by nearly 1 min (Fig. 2e, f, j, land Supplementary Movie 2). Next, we assessed the dynamiccorrelation between Myo-II and MLCP. Here, we tracked thespatio-temporal dynamics of MBS and Flw, the respective reg-ulatory and catalytic subunits of MLCP26. To validate whetherour MBS fluorescence reporters reflect with precision the endo-genous MBS signals during basal Myo-II oscillation, we comparedMBS fluorescence reporters and MBS antibody staining at dif-ferent stages of Myo-II oscillations, and found that MBS reporterscorrelated strongly with MBS antibody stainings (SupplementaryFig. 1c–i). Importantly, although the total MBS protein levels perbasal area remain constant throughout Myo-II oscillations, MBSdisplays periodic cycles of redistribution towards the medial poolwhere Myo-II is located, with the same period, but prominentlytrailing behind by almost 1 min (Supplementary Fig. 1j, k, 2a–c, g,i and Supplementary Movie 3). Similar to the spatio-temporaldynamics of MBS signals, endogenous Flw signals, detected by theprotein-trap line flw-YFP-15927, are spatially colocalized with,and temporally synchronized, with MBS signals (SupplementaryFig. 2d–f, h, i and Supplementary Movie 4). Thus, Flw also dis-plays periodic cycles of redistribution toward the medial Myo-IIenriched pool, with the similar period and 1min-delay (Fig. 2g–land Supplementary Movie 5). Taken together, our resultsdemonstrate that ROCK, Myo-II, and local MLCP display similar,but temporally shifted oscillatory patterns at the basal medialcortex (Fig. 2j, l), while membrane Rho1 level and activity remainconstant (Fig. 2k). This indicates that, similar to observations inthe Drosophila embryo20, Myo-II basal oscillations are not dic-tated by an upstream Rho1 oscillation, thus leading us to askwhether oscillations could be intrinsically encoded in the sig-naling network downstream of Rho1.
Oscillation is not dependent on actomyosin contraction force.A key question is whether such oscillations derive from themechanical or chemical properties of actomyosin networks. UsingY27632 to inhibit the ROCK kinase activity and thus Myo-IIcontraction20 cannot answer this question precisely, as it isexpected to affect both mechanics, via changing the contractilityof Myo-II, and the chemical network by blocking Rock kinase
ARTICLE NATURE COMMUNICATIONS | DOI: 10.1038/s41467-018-03574-5
2 NATURE COMMUNICATIONS | (2018) 9:1210 | DOI: 10.1038/s41467-018-03574-5 | www.nature.com/naturecommunications
activity. Instead, to test whether oscillations derive from themechanical properties of the cytoskeleton, as hypothesized inprevious studies10,11, we mosaically expressed a dominant nega-tive form of MHC28 in follicle cells. In control cells, Myo-II
oscillation is followed by periodic change of basal membrane areareduction (by around a minute, Fig. 3a, b, e), as expected from thecontractile properties of actomyosin to reduce basal membranearea9. Considering its role in blocking the Myo-II loading to F-
ES9 MS9 LS9 S10A S10B
ES9 MS9 LS9 S10A S10B0
2
4
6
8
10
12
Basal MyoII (31 <n< 57)
Apical MyoII (24 <n< 29)
Basal MBS (35 <n< 40)
Apical MBS (25 <n< 35)
RO
CK
/Myo
IIM
BS
ab/
Myo
II
Api
cal
Bas
alA
pica
lB
asal
Rel
ativ
e in
tens
ity
a
b
c d
Rel
ativ
e in
tens
ity
ES9 MS9 LS9 S10A S10B0
2
4
6
8
10
Basal MyoII (28 <n< 58)
Apical MyoII (30 <n< 43)
Basal ROCK (28 <n< 46)
Apical ROCK (28 <n< 41)
RO
CK
CA
RO
CK
RN
Ai
ES9 MS9 LS9
MB
S R
NA
iM
BS
N30
0C
ontr
ol
S10
ES9 (25 <n< 30)MS9 (25 <n< 30)LS9 (25 <n< 30)S10 (25 <n< 30)
fROCK RNAi
MBS N300
MBS RNAi
ROCK CAContro
l
A-P
to D
-V r
atio
1.6
2
2.5
3
N.S. N.S.
P< 0.001P< 0.001
P< 0.001
P< 0.05
e
N.S.P< 0.001
P< 0.001P< 0.001
P< 0.001P< 0.001
P< 0.001
NATURE COMMUNICATIONS | DOI: 10.1038/s41467-018-03574-5 ARTICLE
NATURE COMMUNICATIONS | (2018) 9:1210 | DOI: 10.1038/s41467-018-03574-5 | www.nature.com/naturecommunications 3

actin28, overexpression of dominant negative MHC inhibits theactomyosin contractility, and accordingly, no prominent changeof basal area reduction can be observed in this condition (Fig. 3c,d). Strikingly however, this inhibition of actomyosin contractilitydid not affect basal Myo-II oscillation; strong Myo-II oscillationsare still present, with periods and intensities undistinguishablefrom those of control cells (Fig. 3c–g). These results confirmedthat actomyosin contractility does not control basal Myo-IIoscillation, and thus rather suggest that, in this system, membranearea changes are a passive consequence of Myo-II oscillation,rather than an active feedback, in contrast to a previous model10.This led us to investigate whether basal Myo-II oscillation couldinstead arise from a biochemical oscillator.
Oscillations initiate from a ROCK flow beginning at junction.First question that arises is the nature of the Myo-II activatorinitiating a cycle of oscillation. As Rho1, the better characterizedupstream activator of Myo-II, is restricted to the membrane, weasked whether and how Rho1 could provide cues to the medial-restricted Myo-II pool. Interestingly, we observed that ROCKoscillation starts at the basal junctional membrane, where Rho1resides, and then propagates inward (Fig. 4a, b and Supplemen-tary Movie 6). To quantify this, we applied a “mean field spatialanalysis” method named as “optical flow” analysis after denoisingof raw images (see Methods section), and detected strong flowmovements for both ROCK and Myo-II signals in basal domainof oscillating follicle cells (Fig. 4c). ROCK flow movements occurearlier than those of Myo-II around 1min (Fig. 4d, e), which issimilar to the intensity temporal delay between these twoproteins at the medial basal pool (Fig. 2j, l). Interestingly, thisis in stark contrast to intercalating ectoderm cells, characterizedby the inverse patterns between flow movement and signalintensity20.
This suggests that the initiation of intensity increase andmovement could be dependent on the ROCK interaction withmembrane active Rho1, which unfolds and activates ROCK29. Totest this hypothesis, we used the chemical inhibitor Rhosin toblock Rho1 activity in order to determine the effect on bothintensity change and flow movement of ROCK signals. Comparedwith the control, treatment of Rhosin strongly results in the lossof ROCK distribution at basal junction (Fig. 4f–h). Consistently,follicle cells with the Rho1 inhibition have much weaker intensityincrease and flow movement of ROCK signals (Fig. 4g, i). Thus,the interaction of ROCK with membrane active Rho1 appears toinitiate both signal increase and flow movement. However, asRho1 activity and concentration do not oscillate, such aninteraction alone would simply produce a uniform concentrationof ROCK. From the theoretical perspective, activator/inhibitortype dynamics have the potential to create such self-organizedoscillatory patterns, even in the absence of possible upstreamregulators (other than Rho1) that could be oscillatory30.
Positive and negative regulators of basal ROCK signals.Therefore, we checked how activating or inhibiting the membersof the Rho1 to MLCP signaling cascade affected the levels and
dynamics of wild type (WT) ROCK. As expected, active anddominant negative forms of Rho1 respectively increase anddecrease ROCK concentration in the basal medial pool (Fig. 5aand Supplementary Fig. 3a). It is believed that ROCK acts as aninhibitor of MBS, thus relieving the inhibitory effect of MLCP onMyo-II31. Surprisingly, inhibiting (resp. constitutively activating)MBS increased (resp. decreased) basal medial ROCK concentra-tion 2-fold, arguing for the converse negative feedback, eitherdirect or indirect, of MBS on ROCK (Fig. 5a and SupplementaryFig. 3a). Moreover, overexpression of an active form of ROCKstrongly enhanced the accumulation of WT ROCK in the basalmedial pool, indicating that open and active ROCK might be ableto amplify the accumulation and flow movement of WT ROCKmolecules. To validate these findings, we repeated the experi-ments while measuring ROCK levels via antibody staininginstead, and found the same results (Supplementary Fig. 4).
Next, we hypothesized that this ROCK amplification could beeither via direct control of ROCK accumulation, i.e., via anoligomerization mechanism with auto or trans-phosphorylationbetween different ROCK molecules29, or via the indirect controlof Myo-II phosphorylation, in which the formation of Myo-IImini-filaments would serve as a scaffold for additional ROCKaccumulation. To test the latter hypothesis, we investigated theeffect of Myo-II phosphorylation-mimic mutant (Myo-II EE) onROCK levels, and found on the contrary an inhibitory effectcompared to control and unphosphorylatable mutant (Myo-IIWT form and Myo-II AA form, in Fig. 5a and SupplementaryFigs. 3a–f, 4e, f). A recent study demonstrated that Myo-II EE hadmuch weaker motor activity and thus less contractile property32.However, in the presence of WT genetic background, over-expression of Myo-II EE in follicle cells strongly enhanced theformation of stress fibers and also the elongation of egg chambers,while overexpression of Myo-II AA significantly reduced both(Supplementary Fig. 3g–j). The different effects of Myo-II EE vs.AA forms on ROCK levels, together with on stress fibers andactomyosin contractility, contradicted the hypothesis of the Myo-II mini-filament–mediated ROCK signal amplification. Interest-ingly, although the aforementioned overexpression of dominantnegative MHC inhibited the actomyosin contractility (Fig. 3c, d),we found that this did not affect the basal medial ROCKlevels (Supplementary Fig. 4e, f). This further indicates thatactomyosin contractility is not necessary for ROCK signal self-amplification. These data thus hint to the fact that ROCK kinaseactivity could self-amplify ROCK signals via its oligomerizationmechanism.
Altogether, our findings demonstrate that ROCK can bothdisplay self-amplification, and be repressed by MBS.
Modeling of oscillatory characteristics and phase shift. Giventhe uncovered regulatory interactions, we next asked whetherthese would be sufficient, from a theoretical perspective, to giverise to self-organized Myo-II oscillations. We therefore mathe-matically modeled the evolution in time of ROCK, Myo-II, andMBS/flw concentrations (resp. denoted R, m, and M). Beforeasking about spatial flow patterns, we first made the simplifying
Fig. 1 ROCK, Myo-II, and MBS signals have an apical to basal distribution switch during the periods of basal Myo-II oscillation and control morphogenetictissue elongation. a, b Apical and basal views of follicle cells from egg chambers at early stage 9, middle stage 9, late stage 9, stage 10A, and stage 10B,marked by the presence of MyoII-mCherry (red) with ROCK-GFP (green) (a), and MyoII-mCherry (red) with ΜΒS-antibody staining (green) (b),respectively. Both scale bars are 30 μm. c, d Quantifications of relative apical and basal ROCK/Myo-II intensities (c) and MBS/Myo-II intensities (d) atdifferent stages. e Quantification of the A–P to D–V length ratio in early stage 9, middle stage 9, late stage 9, and stage 10 egg chambers expressing theindicated transgenes. f Morphology of early stage 9, middle stage 9, late stage 9, and stage 10 egg chambers expressing the indicated transgenes, stainingby Armadillo and DAPI, 4ʹ,6-diamidino-2-phenylindole. All scale bars are 50 μm. n is the number of samples (cells in c and d from four independent eggchambers) analyzed. Error bars indicate ±s.d. NS means not significant, p < 0.001 means significant difference by Student’s t-test
ARTICLE NATURE COMMUNICATIONS | DOI: 10.1038/s41467-018-03574-5
4 NATURE COMMUNICATIONS | (2018) 9:1210 | DOI: 10.1038/s41467-018-03574-5 | www.nature.com/naturecommunications

0.3
0.6
0.9
1.2
1.5
1.7
Time (min)0 3 6 9 12 15 18
0.5
0.7
0.9
1.1
1.3
1.5
3 60.3
0.6
0.9
1.2
1.5
1.7
Time (min)
0 91.1
1.15
1.2
1.25
1.3
Rho
FR
ET
junc
tion/
med
ial r
atio
5 10 150.3
0.6
0.9
1.2
1.5
1.7
Time (min)0
0.3
0.6
0.9
1.2
1.5
1.7
Rho
1/M
yoII
Rho
1M
yoII
RO
CK
/Myo
IIR
OC
KM
yoII
Rho
FR
ET
Rho
YF
PM
yoII
a
b
c
d
e
f
g
h i
0 min 3 min 6 min 9 min 0 min 3 min 6 min 9 min
0.9
1.35
0 min 3 min 6 min 9 min
Flw
/Myo
IIF
lwM
yoII
0 min 3 min 6 min 9 min
0.8
0.9
1
1.1
1.2
0.5
0.75
1
1.25
1.5
Rel
ativ
e lo
cal F
lw in
tens
ity
Rel
ativ
e lo
cal M
yoII
inte
nsity
0 5 10 15Time (min) Time (min)
−10 −8 −6 −4 −2 0 2 4 6 8 10
−0.4
−0.2
0
0.2
0.4
0.6
0.8
1
MyoII-GFP/MyoII-mCherry (n=21)ROCK-GFP/MyoII-mCherry (n=17)Local Flw−YFP/local MyoII-mCherry (n=15)
Time offset (min)
Cor
rela
tion
coef
ficie
nt
−0.6
k
−10 −8 −6 −4 −2 0 2 4 6 8 10
Rho-GFP/MyoII-mCherry (n=22)
Time offset (min)
Cor
rela
tion
coef
ficie
nt
−0.4
−0.2
0
0.2
0.4
0.6
0.8
1
−0.6
l
−1
0
1
2
Tim
e of
fset
(m
in)
MyoII (n=21)
ROCK (n=17)
Local Flw (n=15)
P<0.001
P<0.001
MyoII-GFP/MyoII-mCherry (n=20)Total Flw-YFP/MyoII-mCherry (n=20)Rho FRET/MyoII-mCherry (n=18)
j
Rel
ativ
e M
yoII
inte
nsity
Rel
ativ
e R
OC
K in
tens
ity
Rel
ativ
e M
yoII
inte
nsity
Rel
ativ
e M
yoII
inte
nsity
Rel
ativ
e R
ho1
inte
nsity
0.7
0.8
0.9
1
1.1
1.2
1.3
0.7
0.8
0.9
1
1.1
1.2
1.3
Rel
ativ
e to
tal F
lw in
tens
ity
Rel
ativ
e to
tal M
yoII
inte
nsity
0 5 10 15
Fig. 2 Myo-II pulses with its regulators ROCK and Flw at the medial basal cortex but not with basal junction Rho1. a, c, e, g Time-lapse series of therepresentative oscillating follicle cells, labeled with Rho1-GFP and MyoII-mCherry (a), Rho FRET activity and MyoII-mCherry (c), ROCK-GFP and MyoII-mCherry (e), Flw-YFP and MyoII-mCherry (g), respectively. In c, Top panel is the processed Rho FRET signal; middle panel is YFP channel only; bottompanel is Myo-II signal. All scale bars are 5 μm. b, d, f, h, i Quantifications of the dynamic change of Rho1-GFP and MyoII-mCherry intensities (b), Rho FRETactivity and MyoII-mCherry intensity (d), ROCK-GFP and MyoII-mCherry intensities (f), Flw-YFP and MyoII-mCherry intensities (i) in one oscillating cell,and Flw-YFP and MyoII-mCherry (h) in a local basal medial region of one oscillating cell (marked by dotted square in g), respectively. Intensity of eachchannel is normalized to its mean in b, d, f, h, i, except that Rho FRET activity is original value in d. j, k Average temporal cross-correlation of MyoII-mCherry with MyoII-GFP (cyan), ROCK-GFP (magenta) and local Flw-YFP (yellow) (j), MyoII-mCherry with MyoII-GFP (cyan), total Flw-YFP (magenta),Rho FRET activity (yellow) and Rho1-GFP (blue) (k). l Time offset calculated from the cross-correlation analysis. n is the number of samples analyzed. Allerror bars indicate ±s.d. p < 0.001 means significant difference by Student’s t-test
NATURE COMMUNICATIONS | DOI: 10.1038/s41467-018-03574-5 ARTICLE
NATURE COMMUNICATIONS | (2018) 9:1210 | DOI: 10.1038/s41467-018-03574-5 | www.nature.com/naturecommunications 5

assumption of uniform basal concentrations which in non-dimensional form reads
dRdt
¼ RτR
1�Mð Þ
dmdt
¼ � mτm
1� ARþ BMð Þ þ Jτm
dMdt
¼ m�Mð ÞτM
where the model has been reduced to three equations with five
9 12 150.3
0.6
0.9
1.2
1.5
1.7
Time (min)0 3 6
−20
−10
0
10
20
Rat
e of
bas
al a
rea
redu
ctio
n (μ
m²)
3 6 9 120.3
0.6
0.9
1.2
1.5
1.7
Time (min)0 15
−20
−10
0
10
20
Rat
e of
bas
al a
rea
redu
ctio
n (μ
m2 )
a b
c d
e
mC
D8
GF
PM
yoII
−20 −10 0 10 20−0.6
−0.3
0
0.3
0.6
1
Control (n=20)DN zipper (n=20)
Myo
II in
tens
ity -
are
a re
duct
ion
cros
s-co
rrel
atio
n co
effic
ient
Time offset (min)
0 min 3 min 6 min 9 min 12 min 15 min
D
V
A P
D
V
A P
mC
D8
GF
PD
N z
ippe
r G
FP
Myo
II
3 4 5 6 7 8 9 1040
30
20
10
0
10
20
30
40
Myosin oscillation cycle (min)
% o
f cyc
le
Control n=23DN Zipper n=24
f
Control DN zipper0
0.2
0.4
0.6
0.8
1
1.2 n=35 n=36
Rel
ativ
e M
yoII
inte
nsity
0%
5%
10%
15%
0%
5%
10%
15%
g
0 min 3 min 6 min 9 min 12 min 15 min
N.S.
Rel
ativ
e M
yoII
inte
nsity
Rel
ativ
e M
yoII
inte
nsity
WT
DN zipper
Fig. 3 Myo-II undergoes periodic accumulation and disassembly no matter whether Myo-II is able to be loaded on F-actin or not. a, c Time-lapse series ofthe representative wild type (a) and dominant negative MHC-expressing (c) follicle cells, labeled with mCD8-GFP and MyoII-mCherry. Both scale bars are10 μm. The digitized cell contour is color-coded on the basis of the percentage decrease in surface area relative to the maximum area captured duringimaging, as indicated in the heat map. b, d Quantifications of the dynamic change of relative Myo-II intensity and rate of basal area reduction from thesame wild type (b) and dominant negative MHC-expressing (d) follicle cells. eMyo-II intensity-area reduction cross-correlation coefficient in the wild typevs. dominant negative MHC-expressing follicle cells. f, g Quantifications of relative Myo-II intensities (f) and oscillating cycle time period (g) in theindicated transgene-expressing GFP-positive cells compared with wild-type cells in the same tissue sample. n is the number of samples analyzed. All errorbars indicate ±s.d. NS means no significant difference by Student’s t-test
ARTICLE NATURE COMMUNICATIONS | DOI: 10.1038/s41467-018-03574-5
6 NATURE COMMUNICATIONS | (2018) 9:1210 | DOI: 10.1038/s41467-018-03574-5 | www.nature.com/naturecommunications

d
e
a b
f
Time (min)
–8 –6 –4 –2 0 2 4 6 8–0.6
–0.3
0
0.3
0.6
1
Time offset (min)
Cor
rela
tion
coef
ficie
nt
5 min4 min3 min2 min 6 min
Control Rhosin
Rhosin0
10
20
30
40
50
60
Control
% o
f cel
ls w
ith R
OC
Km
embr
ane
dist
ribut
ion n=26
n=20
P< 0.001
RO
CK
/Rho
1
0 min 3 min
g
0.9
1
1.2
1.4
1.6
0 5 10 15 20 25
Mea
n R
OC
K in
tens
ity(n
orm
aliz
ed to
min
imal
)
Time (min)
1.1
1.3
1.5
c
RO
CK
/Rho
1
RO
CK
/Rho
1
RO
CK
RO
CK
Rho
1
Rho
1
RO
CK
flow
h
Control Rhosin0
20
40
60
80
100
120
140
% o
f cel
ls w
ith R
OC
Kflo
w m
ovem
ent
n=21
n=20
P< 0.001
i
RO
CK
/Myo
II
RO
CK
flow
Myo
II flo
w
0 5 10 15
0.5
1
1.5
0.5
1
1.5
Mea
n M
yoII
flow
vel
ocity
Mea
n R
OC
K fl
ow v
eloc
ity
0.3
1.8
0.3
1.8
2 min 3 min 4 min 5 min 6 min
6 min 0 min 3 min 6 min9 min 9 min
Fig. 4 Myo-II pulsatility follows a flow movement of ROCK initiated at basal junction. a Time-lapse series of one representative follicle cell labeled withROCK-GFP and Rho1-mCherry, followed by the time-lapse series analysis of flow velocity of ROCK signals. b Quantification of the dynamic change of meanROCK intensity, which is normalized to its minimal value. The rectangle region is the period when ROCK is in close proximity to Rho1 at and near the basaljunction. c Dynamics of ROCK and Myo-II signals by the analysis of “Optical flow” method. Upper panels show the time-lapse series of ROCK-GFP andMyoII-mCherry signals in one representative oscillatory follicle cell basal domain. Lower panels show the time-lapse series analysis of flow velocity ofROCK and Myo-II signals. d Quantification of the dynamic change of mean Myo-II and ROCK flow velocities in one oscillating follicle cell. Velocity of eachchannel is normalized to its mean. e Average temporal cross-correlation of Myo-II velocity with ROCK velocity. f, g Time-lapse series of the representativeoscillating follicle cell labeled with ROCK-GFP and Rho1-mCherry, in either control (f) or Rhosin treatment condition (g). All scale bars are 5 μm. hQuantification of the percentage of cells with ROCK membrane distribution in control vs. Rhosin treatment conditions. i Quantification of the percentage ofcells with ROCK flow movement in control vs. Rhosin treatment conditions. n is the number of samples analyzed. All error bars indicate ±s.d. p < 0.001means significant difference by Student’s t-test
NATURE COMMUNICATIONS | DOI: 10.1038/s41467-018-03574-5 ARTICLE
NATURE COMMUNICATIONS | (2018) 9:1210 | DOI: 10.1038/s41467-018-03574-5 | www.nature.com/naturecommunications 7

free parameters: the three characteristic time scales of ROCK,Myo-II, and MBS/flw recruitment (τR, τm,τM), and two interac-tions coefficients A and B, respectively describing the effect ofROCK and MBS/flw on Myo-II. As detailed in SupplementaryNote 2, we found that the aforementioned combination of ROCKself-activation and ROCK inhibition by MBS/flw was sufficient togenerically generate biochemical oscillations. Moreover, themodel qualitatively reproduced well the time-delay betweenROCK, Myo-II, and MBS/Flw successive oscillations (Fig. 5b, dand Supplementary Note 2). To be able to make morequantitative predictions, we wished to contain the parameterset, and quantified, in particular, the recovery times of all threecomponents. We thus performed Fluorescence Recovery afterPhotobleaching (FRAP) experiments, with confocal variablevolumes (see Methods section and Supplementary Note 1) tocalculate diffusion coefficients and characteristic recovery timesfrom each protein of interest. A classical diffusion fitting lawshowed different recoveries times τi for Myo-II (half-life time ofrecovery: 60 ± 30 s), ROCK (15 ± 7 s), and Flw (38 ± 15 s)(Fig. 5c and Supplementary Fig. 5). We thus used these as inputsfor our model. Importantly, a theoretical prediction is that thedelays between ROCK and Myo-II (resp. Myo-II and MBS/Flw)should be closely related to the characteristic recovery time ofMyo-II (resp. MBS/Flw), see Supplementary Note 2 andSupplementary Fig. 6a–e, l for a phase diagram. Generically, atheoretical sensitivity analysis showed that the period of theoscillation Tp, as well as the delays between ROCK, Myo-II (t1),and MBS/Flw (t2) were robust with respect to the remaining twoparameters, and fitted well the data (Fig. 5d and SupplementaryNote 2 for details, Tp ≈ 7 min, t1 ≈ 50 s, t2 ≈ 40 s), so that themodel reproduces accurately the observed oscillations and timesequence between the three components.
Quantitative prediction of perturbation on the oscillator. Next,we further tested our biochemical oscillator model. In particular,we sought to predict quantitatively the mutant experiments via insilico considerations. We first tested the effect of modifying theactivity of Rho1, and found that above a certain value, it desen-sitizes the system, destroying oscillations, reminiscent of the effectof the external potential in the FitzHugh-Nagumo model ofspiking neurons33 (Supplementary Fig. 6h and SupplementaryNote 2). Importantly, experimental activation and inhibition ofRho1 strongly increase and decrease basal Myo-II intensityrespectively, both with Myo-II oscillation becoming undetectable(Fig. 6a–h). We then investigated theoretically the effect ofmodifying the activity of ROCK and MBS/Flw, keeping all otherparameters constant (Supplementary Note 2 for details), andfound for both, a robust positive correlation between the resultingperiod and amplitude of Myo-II oscillations (Fig. 5e–g andSupplementary Fig. 6a–e). Importantly, we tested experimentallythis unexpected prediction, and found that activation and inhi-bition of ROCK respectively increase and decrease both Myo-IIoscillatory amplitude and cycle time period (Fig. 6i–p). Strikingly,activation and inhibition of MBS respectively decrease andincrease both Myo-II oscillatory amplitude and cycle time(Fig. 6q–x). This confirmed experimentally the model predictionof a robust positive correlation between the period of the oscil-lation and its amplitude (Fig. 5g). One should note that in themodel, the amplitude of oscillation is more sensitive to change inROCK/MBS activity than the experimental counter-part, whichcould be due to saturation effects in the kinetic coefficientsentering in our simplified model, and/or additional secondaryfeedbacks.
Modeling of spatio-temporal oscillations. In a second modelstep, we wondered whether we could reproduce the observeddiffusive flow of ROCK signals in the model scheme. For this, weintroduced the spatial counter-part to the above model, assumingthe exact same reaction kinetics, but additionally allowing ROCK,Myo-II, and Flw to diffuse spatially on the basal surface, asobserved from the aforementioned FRAP experiments (Supple-mentary Fig. 5; see Methods section). Interestingly, we found thatMyo-II recovery displays minimal 2D diffusion in the basal plane,and is thus dictated by turnover from the cytoplasmic pool(Supplementary Fig. 5). For ROCK and Flw, the recovery is withturnover from the cytoplasmic pool, but also a significant 2Ddiffusion along the basal area (Supplementary Fig. 5), whichprovides a potential explanation for the centripetal flows ofROCK and Flw observed during oscillations. Importantly, asRho1 is only present at the edge of cell, numerical simulations ofthe model predict that ROCK is first activated at the boundary,and then propagates as a kinematic wave towards the cell basalcenter at a constant velocity, mirroring the data, before being“caught up” by MBS/Flw at the edge (Fig. 5h–j for a 1D numericalintegration and Supplementary Fig. 6i–k for a 2D numericalintegration).
Confirmation of the biochemical oscillator by optogenetics. Tofurther and directly probe the spatio-temporal dynamics of thebiochemical oscillator, we introduced an optogenetic methodnamed as GFP-LARIAT (Supplementary Fig. 7a), which werecently established in Drosophila in vivo to create a light-inducible GFP trap and thus disturb the localization and functionof GFP-tagged proteins23,34. Here, we used GFP-LARIAT toinduce the clustering trap of ROCK-GFP, Flw-YFP, or MBS-GFPin order to assess the effect on Myo-II. Firstly, we confirmed thatthe clustering trap of ROCK-GFP or Flw-YFP/MBS-GFP by light-induced GFP-LARIAT reduces or enhances the phosphorylationof MRLC, respectively, in follicle cells, compared with controlcells (Fig. 7a–d and Supplementary Fig. 8a–c). Clustering trap ofROCK-GFP gradually and strongly reduces pulsatile Myo-IIsignals, while clustering trap of Flw-YFP or MBS-GFP graduallyand significantly enhances Myo-II oscillations, compared withcontrol conditions (Fig. 7e–k, Supplementary Figs. 7b–g, 8d–i,and Supplementary Movies 7–12). Before light illumination, bothROCK and Flw/MBS are highly co-localized with Myo-II. Withthe clustering progression, both ROCK and Flw/MBS tend toseparate from Myo-II, indicating the functional loss of GFP-tagged proteins in control of downstream signals, compared withcontrol (Supplementary Figs. 7h, i, 8j). Therefore, our optogeneticresults fully confirmed in a more direct manner the main con-clusion acquired by genetics and modeling.
DiscussionHere, we have demonstrated that a biochemical oscillator invol-ving ROCK and MLCP, two key regulators of Myo-II, controlsbasal Myo-II oscillation, which is important in normal Drosophilaegg chamber elongation. ROCK functionally links its upstreamcontrol (active Rho1 at and near basal junctional membrane) withits downstream substrates (Myo-II at basal medial region). Thislink is dependent on a directional flow movement of ROCK fromjunctional membrane to medial cortical region. As ROCK shuttlesmedially, the signals of ROCK get self-amplified by its kinaseactivity-dependent accumulation, which leads to phosphorylationand mini-filament accumulation of Myo-II. This in turn governsthe redistribution of MLCP signals toward the regions of Myo-II
ARTICLE NATURE COMMUNICATIONS | DOI: 10.1038/s41467-018-03574-5
8 NATURE COMMUNICATIONS | (2018) 9:1210 | DOI: 10.1038/s41467-018-03574-5 | www.nature.com/naturecommunications

a b c
d e
f g
h
ROCK MyoII
Am
plitu
de
Time (min)A
mpl
itude
Am
plitu
de
Time (min)
Strong ROCKlonger period
Weak ROCKshorter period
Osc
illat
ion
perio
d
Oscillation amplitude
Varying ROCK activityVarying MBS/flw activity
Basal surface
Pref
eren
tial a
ctiv
atio
n
of R
OC
K
x
10 Normalized position x
10
4
6
8
2
10
Tim
e (m
in)
10
0
4
6
8
2
Tim
e (m
in)
Normalized position x
Kymograph ROCK Kymograph MyoII
Control set of parameters
1
2
3
4
5
6
7
0.5
1.0
1.5
2.0
0 5 10 15 20
1
2
3
4
0 5 10 15 20Time (min)
0 5 10 15 20
i
0
50
100
150FRAP half-time
Tim
e (s
ec)
j
0
0.5
1
1.5
2
2.5
C
ontro
lR
ho C
AD
N R
ho
n=34
n=18
n=23
n=17
n=21
n=20
RO
CK
CA
MBS
N30
0 M
BS R
NAi
n=20
Myo
II EE
n=18
Myo
II W
T
P< 0.001
N.S.
P< 0.001
n=20
Myo
II AA Fl
w
RO
CK
Myo
II
Rel
ativ
e ba
sal m
edia
l
RO
CK
inte
nsity
0.5 1.0 1.54
5
6
7
8
9
10
2
0
MBS/flw
Fig. 5 In silico predictions of basal Myo-II oscillations and flow movements. a Quantification of relative ROCK-GFP intensity in the basal medial pool fromthe indicated transgene-expressing mCD8RFP-positive cells compared with wild-type cells in the same sample. The representative images have beenshown in Supplementary Fig. 3a, from which ROCK-GFP signals at the basal medial region have been analyzed. n is the number of samples analyzed. Allerror bars indicate ±s.d. NS means no significant difference, while p < 0.001 means significant difference by Student’s t-test. b Summary schematics of theinferred interaction diagram between ROCK, Myo-II, and MBS/Flw, showing both positive and negative interactions. c The half-life recovery time of Flw-YFP, ROCK-GFP, and MyoII-GFP after photobleaching. d In silico predictions on the dynamics of the ROCK/Myo-II/Flw system, based on the interactionsof b and the measured FRAP recovery kinetics in c, matching the experimentally observed oscillations. e, f Increasing (resp. decreasing) the activity ofROCK theoretically increases (resp. decreases) both the period and the amplitude of the oscillation (the control parameters were A= 0.8 and B= 0.5). gPredicted correlation between oscillation amplitude and period upon manipulation of either ROCK (red) or MBS/Flw (blue) activity. h–j Schematics (h) ofadding a spatial component to the model; we assume that ROCK is preferentially activated on the junctional membrane due to Rho1 localization, andcorresponding simulated kymographs for ROCK (i) and Myo-II (j) showing that oscillations still occur, but start at the junctional membrane, resulting in adiffusive flow from membrane to center
NATURE COMMUNICATIONS | DOI: 10.1038/s41467-018-03574-5 ARTICLE
NATURE COMMUNICATIONS | (2018) 9:1210 | DOI: 10.1038/s41467-018-03574-5 | www.nature.com/naturecommunications 9

accumulation, in order to inactivate ROCK and Myo-II, andrestart a cycle (Supplementary Fig. 9).
This biochemical oscillator controlling basal Myo-II con-tractility shares some similarities with the recently reported
oscillatory signaling cascade that regulates apical Myo-II con-traction in the intercalating ectoderm cells20; both oscillatorysignaling cascades contain ROCK, Myo-II, and MBS, and there isa significant temporal delay between Myo-II and MBS signals,
Rho
CA
DN
Rho
RO
CK
CA
RO
CK
RN
Ai
MB
S N
300
MB
S R
NA
i
3 4 5 6 7 8 9 10 40
20
0
20
40
MyoII oscillation cycle (min)
3 4 5 6 7 8 9 10 MyoII oscillation cycle (min)
3 4 5 6 7 8 9 10 MyoII oscillation cycle (min)
3 4 5 6 7 8 9 10 MyoII oscillation cycle (min)
% o
f cyc
le
40
20
0
20
40
% o
f cyc
le
40
20
0
20
40
% o
f cyc
le
40
20
0
20
40
% o
f cyc
le
mCD8 GFP/MyoII
mCD8 GFP/MyoII
mCD8 GFP/MyoII
mCD8 GFP/MyoII
mCD8 GFP/MyoII
mCD8 GFP/MyoII
mCD8 GFP MyoII
Rel
Myo
II os
cilla
tion
ampl
itude
mCD8 GFP MyoII
mCD8 GFP MyoII
mCD8 GFP MyoII
mCD8 GFP MyoII
mCD8 GFP MyoII
a b
e f g
3 4 5 6 7 8 9 40
20
0
20
40
MyoII oscillation cycle (min)
% o
f cyc
le
3 4 5 6 7 8 ∞
∞
9 40
20
0
20
40
MyoII oscillation cycle (min)
% o
f cyc
lei j k
m n o
q r s
u v w
Control (n=20)
Rho CA (n=20)
Control (n=20)
Rho CA (n=20)
0
0.25
0.75
1
1.25P< 0.001
0
0.25
0.75
1
1.25
0
1
2
0
0.25
0.75
1
1.25
0
0.25
0.75
1
1.25
0
1
2
Control (n=20)DN Rho (n=20)
Control (n=20)DN Rho (n=20)
Control (n=20)
ROCK CA (n=20)
Control (n=20)
ROCK CA (n=20)
Control (n=22)ROCK RNAi (n=22)
Control (n=22)ROCK RNAi (n=22)
Control (n=20)
MBS N300 (n=20)
Control (n=20)
MBS N300 (n=20)
Control (n=20)MBS RNAi (n=20)
Control (n=20)MBS RNAi (n=20)
P< 0.001
P< 0.001
P< 0.001
P< 0.001
P< 0.001
Rel
Myo
II os
cilla
tion
ampl
itude
Rel
Myo
II os
cilla
tion
ampl
itude
Rel
Myo
II os
cilla
tion
ampl
itude
Rel
Myo
II os
cilla
tion
ampl
itude
Rel
Myo
II os
cilla
tion
ampl
itude
d
h
l
p
t
x
Time (min)0 5 10 15
0
0.25
0.5
0.75
1
1.25DN Rho,n=20
0 5 10 150
1
2
3
4
5Rho CA,n=20
Mea
nm
edia
l myo
II in
tens
ity
Mea
nm
edia
l myo
II in
tens
ityM
ean
med
ial m
yoII
inte
nsity
Mea
nm
edia
l myo
II in
tens
ity
Time (min)
Time (min)0 5 10 15
0.1
0.4
0.7
1
1.3ROCK RNAi,n=22
Mea
nm
edia
l myo
II in
tens
ity
Time (min)0 5 10 15
0.1
0.4
0.7
1
1.3
MBS N300,n=20
Mea
nm
edia
l myo
II in
tens
ity
Time (min)0 5 10 15
0
1
2
3
4MBS RNAi,n=20
Time (min)0 5 10 15
0.5
1
1.5
2
2.5
3
3.5ROCK CA,n=20
c1.5
0.5
1.5
0.5
1.5
0.5
1.5
0.5
1.5
0.5
0.5
1.5
ARTICLE NATURE COMMUNICATIONS | DOI: 10.1038/s41467-018-03574-5
10 NATURE COMMUNICATIONS | (2018) 9:1210 | DOI: 10.1038/s41467-018-03574-5 | www.nature.com/naturecommunications

which not only allows the formation of biochemical oscillationbut also shut off all biochemical signals. However, these twooscillatory systems are quite different in several aspects. Firstly,Rho1 seems to be only transiently in contact with ROCK but notto Myo-II or MBS in basal Myo-II oscillation, while Rho1 movestogether with ROCK and actomyosin networks in apical Myo-IIoscillation. This difference might stem from the subcellularlocalization variation of the Rho1–Myo-II signal cascade. Sec-ondly, Myo-II signals have prominent spatio-temporal delay fromROCK signals during basal Myo-II oscillation, while ROCK andMyo-II signals are synchronized in ectoderm cells. Thirdly, wepropose that ROCK/Myo-II flows in our system are diffusive andbiochemical in nature, as the inhibition of actomyosin con-tractility (via the expression of the dominant negative form ofMHC) did not affect ROCK levels or dynamics, providing acomplementary mechanism to the force-driven physical advec-tion of the actomyosin contraction networks. A possible expla-nation for the large difference in time cycle between these twoMyo-II oscillations would be that the basal condensed stress fibersmight block the physical advection of biochemical molecules andthus slow down the speed of flow movement and oscillating cycleperiod. It was striking in this regard to observe from FRAPexperiments that Myo-II does not significantly diffuse laterally,with most of its dynamics associated with exchange kinetics withthe cytoplasmic pool.
In the oscillatory ectoderm cells, apical E-cadherin differencealong DV and AP axis membrane plays a major role in con-trolling the specific direction of Myo-II flow movement from thejunctional membrane to medial apical cortex8,35. However, basalE-cadherin levels are quite equal along DV vs. AP membrane23,indicating that basal Myo-II flow movement is not due to the E-cadherin tension variance. We also excluded the possibility thatthe contraction of medial Myo-II motors triggers the flow ofROCK signals. Our studies indicate that signaling spatial differ-ence is critically important in the formation of flow movementsand signal oscillations (Figs. 2 and 5h–j). How exactly ROCKsignals get self-amplified by its kinase activity, and then dis-assembled by MBS during flow movements, would be animportant next step to further dissect molecularly this oscillation.In particular, the amplification and disassembly of ROCK signalsmight be via the direct interaction of ROCK/ROCK or ROCK/MBS, or via another intermediate factor which is linked with andpossibly controlled by both ROCK and MBS.
Interestingly, although biomechanical effects, including acto-myosin contractility, are dispensable for basal Myo-II oscillation,they still have key roles for morphogenesis. It is noteworthy thatthe occurrence of this biochemical oscillator is concomitant tostrong tissue shape change. Indeed, any misregulation of thefactors in this oscillator strongly changes the underlying tissueshape. Thus, it remains unclear if the oscillator has a defined
function for morphogenesis, or if it is a necessary consequence ofincreased contractility, due to the structure of the ROCK/Myo-II/MBS regulatory network. Interestingly, however, different fromthe defective phenotype induced by exacerbated apical Myo-IIcontractility, enhanced basal Myo-II contractility results in thestronger phenotype of egg chamber elongation9,23. It indicatesthat basal pulsatile actomyosin contractility might function tocreate a gradual, but not acute, tissue elongation during mor-phogenesis so that a functional organ is precisely developed.
MethodsDrosophila stocks and genetics. The following fly stocks were used: Sqh::RLCmyosinII–mCherry and Sqh::RLCmyosinII-GFP6 (from Eric E. Wieschaus),DN Zipper (from Daniel Kiehart), Ubi::ROCK–GFP36 (from Yohanns Bellaiche),UAS-ROCKRNAi, UAS-MBSRNAi (from Vienna Drosophila RNAi center), UAS-Sqh WT, UAS-Sqh EE, UAS-Rho CA, UAS-ROCK CA, UAS-MBS N300, Rho1-GFP, Rho-mCherry, UAS-Rho DN, ROK[1]/FM7 (from Bloomington Drosophilastock center), hsGal4/CyO, MKRS/TM6B was used to express UAS lines in folliclecells in the experiments of Rho FRET dynamics. For ROCK/myo-II and ROCK/Rho1 dynamics, Ubi::ROCK–GFP on the third chromosome were combined withROK[1]/FM7 mutant flies in order to prevent the side effect of ectopic ROCKoverexpression. Clones were generated using FLP-OUT technique by crossing UAStransgenic flies with: (1) P[hsp70-flp]; Sqh::Sqh–mCherry; UAS-mCD8GFP,AyGal4; (2) P[hsp70-flp];+/+; UAS-mCD8GFP, AyGal4; (3) P[hsp70-flp];+/+; Ay(CD2)Gal4. To detect ROCK signal in mosaic clones, Ubi::ROCK-GFP on the Xchromosome were needed to be combined with UAS transgenic flies first, and thenclones were generated using FLP-OUT technique by doing the second cross with P[hsp70-flp];+/+; UAS-mCD8RFP, AyGal4. All stocks and crosses were maintainedat room temperature. For signal analysis in mosaic clones, hsFLPase was inducedfor 1 h at 37 °C twice with a 5 h interval, then flies were kept at 18 °C for 2 days andthen fattened at 25 °C for overnight before dissection. For the analysis of tissueelongation, P[hsp70-flp];+/+; Ay(CD2)Gal4 was used for cross and later heatshock treatment, which can induce more than 90% clone cells in egg chamber.hsFLPase of this mosaic system was induced for 1 h at 37 °C once, then the flieswere kept at 18 °C for 1–2 days and then fattened at 25 °C overnight before dis-section. For the experiments of Rho FRET dynamics, hsGal4 flies were incubated at37 °C for 1 h and the flies were kept at 25 °C for 5–6 h before dissection. ForLARIAT experiments, hsGal4 was used to induce LARIAT expression in ovaryfollicle cells, and all steps were carried on in dark condition, including cross,maintenance, and heat shock. Flies were treated with heat shock at 37 °C for 1 h,and then incubated 2–3 h at 25 °C before dissection. Drosophila ovaries were dis-sected and egg chambers were mounted under red light before blue lightillumination.
DNA constructs and transgenic fly generation. Full length MBS cDNA wasobtained from Genebank and amplified by primers listed below. The plasmids ofUbi-MBS-GFP and Ubi-MBS-RFP were generated by in-fusion cloning (Clontech).The flies were generated by Bestgene Inc. using w1118 fly.
PCR to amplify MBS. Forward 5ʹ-GGTGGAGGTGGTGGTATGTCCTCGCTGGACGC-3ʹ
Reverse 5ʹ- AATTGGGGTACGTCTAGACCAACTGGTAATGGTAGCGAC-3ʹ
PCR to amplify GFP. Forward 5ʹ-CCGGGCTGCAGGAATTCATGGTGAGCAAGGGCGAG-3ʹ
Reverse 5ʹ- ACCACCACCTCCACCCTTGTACAGCTCGTCCATGC-3ʹ
Fig. 6 Experimental perturbation confirmation of in silico prediction on basal Myo-II oscillations. a, e, i, m, q, u Basal views of follicle cell clones expressingthe indicated transgenes, marked by coexpression of mCD8GFP. Myo-II signals are monitored by MyoII-mCherry. All scale bars are 10 μm. b, f, j, n, r, vQuantifications of relative Myo-II oscillation amplitude in the indicated transgene-expressing GFP-positive cells compared with wild-type cells in the samesample. c, g, k, o, s, w Quantifications of relative Myo-II oscillating cycle time period in the indicated transgene-expressing GFP-positive cells comparedwith wild-type cells in the same sample. For both Rho CA-expressing and DN Rho-expressing cells, basal Myo-II oscillations are almost undetectable. Thus,relative Myo-II oscillation amplitude is zero in these two conditions. Symbol ∞ means that oscillating cycle time period is not prominent, also in these twoconditions. The relative Myo-II average intensity from these analyzed basal Myo-II oscillations are 1 ± 0.23 vs. 2.98 ± 0.79 in control vs. Rho CA cells, 1 ±0.20 vs. 0.19 ± 0.09 in control vs. DN Rho cells, 1 ± 0.27 vs. 2.17 ± 0.45 in control vs. ROCK CA cells, 1 ± 0.16 vs. 0.27 ± 0.11 in control vs. ROCK RNAicells, 1 ± 0.23 vs. 1.95 ± 0.52 in control vs. MBS RNAi cells, and 1 ± 0.21 vs. 0.36 ± 0.12 in control vs. MBS N300 cells, respectively. d, h, l, p, t, xQuantifications of the dynamic change of medial basal mean Myo-II intensity in the indicated transgene-expressing cells compared with one wild-type cellin the same sample. Each pink curve is the dynamic change from the average of Myo-II intensities in different cells with a range marked by pink color, andblue curve is the dynamic change of Myo-II intensity in one representative wild-type cell. n is the number of samples analyzed. All error bars indicate ±s.d.p < 0.001 means significant difference by Student’s t-test
NATURE COMMUNICATIONS | DOI: 10.1038/s41467-018-03574-5 ARTICLE
NATURE COMMUNICATIONS | (2018) 9:1210 | DOI: 10.1038/s41467-018-03574-5 | www.nature.com/naturecommunications 11

PCR to amplify mCherry. Forward 5ʹ-CCGGGCTGCAGGAATTCATGGTGAGCAAGGGCGAGG-3ʹ
Reverse 5ʹ- ACCACCACCTCCACCCTTGTACAGCTCGTCCATGC-3ʹ
Production of ROCK antisera. To produce anti-ROCK antibody, a peptide cor-responding to the C-terminus of Drosophila Rok-PA, amino acids 1350–1370(CYNNNSTDGSKISPSQSTRSSY), was synthesized by YenZym Antibodies, LLC(South San Francisco, CA). The N-terminal C was added to couple the peptide tothe KLH carrier for immunization. Two rabbits were immunized by YenZym,
p-M
LCR
OC
KR
OC
K/p
-MLC
p-M
LCF
lwF
lw/p
-MLC
a b d
0
0.7
1.4
2.8
n=20
n=20P< 0.001
Before photoexcitation
After photoexcitation
2.1
c
0
2
4
6
8
10
Before photoexcitation
After photoexcitation
n=20
n=22P< 0.001
n=18
n=18P< 0.001
ROCK/p-MLC
Ave
rage
are
a of
GF
P/Y
FP
clus
ters
(μm
²)
Flw/p-MLC
ROCK/p-MLC
Flw/p-MLC
Rel
ativ
e p-
MLC
inte
nsity
n=25
n=28
P< 0.001
j
0
0.5
1
1.5
2
2.5
n=22
n=22
P< 0.001
n=20
n=20
P< 0.001
Ave
rage
are
a of
GF
P/Y
FP
clu
ster
s (μ
m²)
e
200
0.3
0.6
0.9
1.2
Rel
ativ
e M
yoII
inte
nsity
Time (min)0 5 10 15
1
2
3
4
5
6
Rel
ativ
e ar
eaof
RO
CK
clu
ster
s0 min 5 min 10 min 15 min 20 min
Myo
IIR
OC
KR
OC
K/M
yoII
With LARIAT
g
i
0
1
2
3
Rel
ativ
e M
yoII
inte
nsity
Before photoexcitationAfter photoexcitation
n=20
n=20
P< 0.001
ROCKGFP/MyoII
RFP
FlwYFP/MyoII
RFP
ROCKGFP/MyoII
RFP
FlwYFP/MyoII
RFP
ROCKGFP/MyoII
RFP
FlwYFP/MyoII
RFP
n=20
n=20
P< 0.001
Myo
IIF
lwF
lw/M
yoII
With LARIAT
0 10 20 300
0.5
1
1.5
2
1
3
5
7
9
Rel
ativ
e M
yoII
inte
nsity
Time (min)
Rel
ativ
ear
ea o
f Flw
clu
ster
s
0 min 5 min 10 min 20 min 30 min
f
h
5
6
7
8
9
10
Before photoexcitation (15<n<20)After photoexcitation (15<n<20)
Myo
II cy
cle
time
(min
)
k
P< 0.001
P< 0.001
Dark Photoexcitation Dark Photoexcitation
Before photoexcitationAfter photoexcitation
ARTICLE NATURE COMMUNICATIONS | DOI: 10.1038/s41467-018-03574-5
12 NATURE COMMUNICATIONS | (2018) 9:1210 | DOI: 10.1038/s41467-018-03574-5 | www.nature.com/naturecommunications

YZ3971, and YZ3972. YZ3972 had the best response by ELISA and showed specificsignal on fixed tissue at 1:2000 and recognized a predicted 160 kDa band.
Dissection and mounting of Drosophila egg chamber. One to three-day-oldfemales were fattened on yeast with males for 1–2 days before dissection. Droso-phila egg chambers were dissected and mounted in live imaging medium (Invi-trogen Schneider’s insect medium with 20% FBS and with a final PH adjusted to6.9), by using a similar version of the protocol described in ref. 37. Different fromnormal mounting condition, the egg chambers were slightly compressed to over-come the endogenous curvature. In this condition, basal oscillation pattern,intensity, and period were similar to those in the condition without compression.
Imaging and FRET. Time-lapse imaging was performed with a Zeiss LSM710 orLeica SP8 confocal microscope with a ×40, numerical aperture 1.3 inverted oil lens,a 488-nm argon laser, and a 568-nm green HeNe laser. The basal focal plane, whichis about 1 μm beneath the basal surface, was selected during live imaging tomaximize the basal Myo-II intensity. For the dynamics of ROCK–GFP, MBS–GFP,MBS-RFP, or Flw-YFP, the similar basal focal plane was selected to maximize thebasal signal intensity, as basal MyoII dynamic imaging did. The same microscopesetup was used when comparing intensity between different samples. To view thesignals at different focal planes, images were taken at different Z-stack layers fromthe basal surface to the apical side.
FRET images of live cultured egg chambers were acquired with a Zeiss LSM710microscope, by using a similar version of the protocol described in ref. 38. A 458nm laser was used to excite the sample. CFP and YFP emission signals werecollected through channel I (470–510 nm) and channel II (525–600 nm),respectively. To capture single, high-resolution, and stationary images, a ×40/1.3 oilinverted objective was used. CFP and YFP images were acquired simultaneously formost of the experiments. Sequential acquisition of CFP and YFP channels inalternative orders were tested and gave the same result as simultaneous acquisition.
FRAP and photomanipulation. For FRAP experiment, ROCK-GFP, Flw-YFP, andMyoII-GFP at the medial basal cortical regions were photobleached at around 4.2micron size (488 nm laser at 100% power, 40–50 iternations) using a Zeiss LSM710confocal microscope with ×40, numerical aperture 1.3 inverted oil lens. Followingphotobleaching, confocal images were acquired at the plane of medial basal cortexevery 2 or 15 s.
For photoexcitation experiment, live-cell imaging was performed using a ZeissLSM710 confocal microscope with ×40, numerical aperture 1.3 inverted oil lens,with a 488-nm argon laser and a 568-nm green HeNe laser. LARIAT clusteringsystem was effectively induced by the blue light wavelength (400–510 nm), andthus here 488-nm argon laser was used to do the photoexcitation. To avoid thestrong photobleaching effect on both GFP and RFP signals during photoexcitation,the 488 nm laser was set at 6% power level to do both GFP signal scanning andpulsed photoexcitation of LARIAT optogenetic system in a time-lapse imagingacquisition taken every 30 s.
Drug treatments. Egg chambers were dissected in live imaging medium, and thenincubated with Rho inhibitor Rhosin39 (Merk) at 250 μM for 20 min before beingmounted for imaging.
Image processing and data analysis. Images were processed with MATLAB andImage J. For all images, the background (intensity of area without sample) wassubtracted.
Image J were used to calculate the intensity of an individual cell as the averagevalue of all pixels within the cell area. In time-lapse experiments, images wereprocessed by MATLAB to correct photobleaching automatically. For dual-colorimaging, the intensities were calculated from manually outlined cell areas ifmembrane-fluorescent protein was not present to mark cell boundaries.
For Rho FRET image, CFP and YFP images were first processed by ImageJsoftware. A background region of interest was subtracted from the original image.The YFP images were registered to CFP images using the TurboReg plugin.Gaussian smooth filter was then applied to both channels. The YFP image was
thresholded and converted to a binary mask with background set to zero. The finalratio image was generated with the MATLAB program, during which only theunmasked pixel was calculated38. To determine the FRET signal ratio betweenbasal junction and medio-basal region, each follicle cell was separated intojunctional region and medial region (based on the Myo-II distribution region incontrol cells), and then the FRET signals in either region were analyzed usingMATLAB.
The distribution of oscillation periods was generated by measuring the intervalsbetween each pair of adjacent peaks. We applied autocorrelation to calculate theperiod of time series with different time offsets. This method averages outirregularities in the sequence and gives a similar average period. We found thatautocorrelation was more robust and provided better results in analyzing irregularsignals with a small amplitude, in some genetic backgrounds with strong reductionof Myo-II intensity compared with control9. To produce the average curves whichshow the dynamic changes of medial basal mean Myo-II intensity in Fig. 6d, h, l, p,t, x, we first synchronized all oscillating cycles, from different follicle cells with thesame genetic backgrounds in several egg chambers, before this calculation. Eachpink curve is the dynamic change from the average of Myo-II intensities indifferent cells with a range marked by pink color.
To analyze the dynamics of ROCK-GFP, Flw-YFP, and MyoII-GFP, we used themethods proposed from EMBL FrapCalc software for quantitative analysis of frapdata (the software is available at https://github.com/framasoft/framacalc). Thedetailed analysis method has been outlined at Supplementary Information.
About the analysis of the ROCK-GFP and MyoII-RFP flow movements, thereare two class of methods to estimate motion without analysis of single moleculefluorescent trajectories. The first class of methods is based on direct 2D crosscorrelation (in space domain or frequency domain) end are used on ParticleIntensity Velocimetry (PIV) or in spatio-temporal correlation analysis likeSTICCS40. These methods are insensitive to noise from the image, because noise isan uncorrelated information frame by frame. But the methods need a good windowvariable size analysis and we had some difficulty to find a good estimation of subpixel motion (due to interpolation method of 2D correlation peak in the presenceof noise). We thus found that using the other family of classical motion estimation,based on optical flow analysis, provided a better read-out. We used the classicalHorn–Schunck algorithm40,41 to estimate the flow of myosin from open sourceimage analysis platform (ICY software). The algorithm assumes smoothness inmotion over the area of analysis and converges to solutions which show moresmoothness. But it is more sensitive to noise than 2D cross correlation methodsand the restauration of the image need to be done before. Thus, a 3D median filterwith the kernel size close to PSF size has been performed before the estimation ofthe optical flow. This step reduced a lot the sensitivity of the Horn-Schunk methodsto salt and pepper noise from confocal microscopy. Furthermore, an equalizationof the histogram was performed to reduce fluctuation of intensity frame by frame.The largely known contrast limited adaptive histogram equalization (CLAHE)method has been used from the open source image analysis platform (ICYsoftware)42.
Tissue elongation was measured by the AP to DV length ratio of S9 and S10 eggchambers.
For quantification of cluster formation during photoexcitation of LARIATsystem in Drosophila follicle cells, all time series of GFP images were automaticallyadjusted by MATLAB to the initial image intensity in order to reduce the effect ofphotobleaching. Then background noise was subtracted from the adjusted imagesbefore the measurement of clusters. Clusters were defined as discrete puncta offluorescence with criteria of fluorescence intensity (1200–4095 arbitrary units), size(>0.2 μm2), and circularity (0.35–1.0 arbitrary units). The area of clusters per cellswas measured with MATLAB.
Immunohistochemistry. Drosophila ovaries were dissected in Schneider’s mediumand fixed with 4% formaldehyde for 20 min for most of antibodies, except of p-MLC, in which samples were fixed with 8% formaldehyde. After fixation, the eggchambers were rinsed with PBST (PBS with 0.3% Triton X-100) three times. Theegg chambers were incubated with various first antibodies normally overnight incold room. Antibody staining was performed as described previously. Anti-ROCKantibody (rabbit, 1:1000 dilution) was produced in this study. Anti-MBS antibody(rabbit, 1:400 dilution) was from Change Tan24. Anti-Armadillo antibody (mouse
Fig. 7 Basal Myo-II oscillations are inhibited by the light-induced ROCK-GFP clustering while enhanced by Flw-YFP clustering. a, b Basal views of ROCK-GFP/p-MLC signal (a) and Flw-YFP/p-MLC signal (b) marked by p-MRLC antibody staining in the LARIAT-expressing follicle cells, under the darkcondition or after 1 h photoexcitation by visible light. Both scale bars are 10 μm. c, d Quantifications of average GFP/YFP clustering area (c) and relative p-MRLC intensity (d) before and after photoexcitation in the LARIAT-expressing follicle cells. e, f Time-lapse series of the representative LARIAT-expressingfollicle cells, labeled with ROCK-GFP and MyoII-mCherry (e) and Flw-YFP and MyoII-mCherry (f), under blue light excitation. Both scale bars are 5 μm. g, hQuantifications of the dynamic change of relative Myo-II intensity and relative area of ROCK clusters (g) and Flw clusters (h) in the LARIAT-expressingfollicle cells, under photoexcitation. i, j Quantifications of relative Myo-II intensity (i) and average GFP/YFP clustering area (j) before and afterphotoexcitation in the LARIAT-expressing follicle cells. k Quantification of oscillating cycle time period of Myo-II signals in the LARIAT-expressing folliclecells, labeled with MyoII-mCherry together with either ROCK-GFP or Flw-YFP, before and after photoexcitation. n is the number of samples analyzed. Errorbars indicate ±s.d. p < 0.001 means significant difference by Student’s t-test
NATURE COMMUNICATIONS | DOI: 10.1038/s41467-018-03574-5 ARTICLE
NATURE COMMUNICATIONS | (2018) 9:1210 | DOI: 10.1038/s41467-018-03574-5 | www.nature.com/naturecommunications 13

N27A1, 1:50 dilution) was from the Developmental Studies Hybridoma Bank.Anti-p-MLC (rabbit, 1:10 dilution) was from Cell Signaling (catalogue number3671). Secondary antibodies conjugated with Alex-488 and Alexa-561 (MolecularProbes) were used in 1:400 dilutions. Samples were imaged on a Zeiss 710 or SP8confocal microscope.
Statistics. All data are presented as mean ± standard deviation. Statistical analysisto compare results among groups was carried out by Student’s t-test with twodistribution tails. A value of P < 0.05 was considered to be statistically significant,while a value of P < 0.001 was considered to be highly statistically significant.
Code availability. The codes used for analyses of different images (including FRETand LARIAT) are available from the corresponding author on reasonable request.
Data availability. The data sets generated during and/or analysed during thecurrent study are available from the corresponding author on reasonable request.
Received: 31 August 2017 Accepted: 20 February 2018
References1. Heisenberg, C. P. & Bellaiche, Y. Forces in tissue morphogenesis and
patterning. Cell 153, 948–962 (2013).2. Kasza, K. E. & Zallen, J. A. Dynamics and regulation of contractile actin-
myosin networks in morphogenesis. Curr. Opin. Cell Biol. 23, 30–38 (2011).3. Warrick, H. M. & Spudich, J. A. Myosin structure and function in cell motility.
Annu. Rev. Cell Biol. 3, 379–421 (1987).4. Vicente-Manzanares, M., Ma, X., Adelstein, R. S. & Horwitz, A. R. Non-
muscle myosin II takes centre stage in cell adhesion and migration. Nat. Rev.Mol. Cell Biol. 10, 778–790 (2009).
5. Dawes-Hoang, R. E. et al. Folded gastrulation, cell shape change and thecontrol of myosin localization. Development 132, 4165–4178 (2005).
6. Martin, A. C., Kaschube, M. & Wieschaus, E. F. Pulsed contractions of anactin-myosin network drive apical constriction. Nature 457, 495–499 (2009).
7. Solon, J., Kaya-Copur, A., Colombelli, J. & Brunner, D. Pulsed forces timed bya ratchet-like mechanism drive directed tissue movement during dorsalclosure. Cell 137, 1331–1342 (2009).
8. Rauzi, M., Lenne, P. F. & Lecuit, T. Planar polarized actomyosin contractileflows control epithelial junction remodelling. Nature 468, 1110–1114 (2010).
9. He, L., Wang, X., Tang, H. L. & Montell, D. J. Tissue elongation requiresoscillating contractions of a basal actomyosin network. Nat. Cell Biol. 12,1133–1142 (2010).
10. Koride, S. et al. Mechanochemical regulation of oscillatory follicle celldynamics in the developing Drosophilaegg chamber. Mol. Biol. Cell 25,3709–3716 (2014).
11. Dierkes, K., Sumi, A., Solon, J. & Salbreux, G. Spontaneous oscillations ofelastic contractile materials with turnover. Phys. Rev. Lett. 113, 148102(2014).
12. An, Y. et al. Apical constriction is driven by a pulsatile apical myosin networkin delaminating Drosophila neuroblasts. Development 144, 2153–2164(2017).
13. Simoes, S., Oh, Y., Wang, M. F. Z., Fernandez-Gonzalez, R. & Tepass, U.Myosin II promotes the anisotropic loss of the apical domain duringDrosophilaneuroblast ingression. J. Cell Biol. 216, 1387–1404 (2017).
14. Maitre, J. L., Niwayama, R., Turlier, H., Nedelec, F. & Hiiragi, T. Pulsatile cell-autonomous contractility drives compaction in the mouse embryo. Nat. CellBiol. 17, 849–855 (2015).
15. Gorfinkiel, N. From actomyosin oscillations to tissue-level deformations. Dev.Dyn. 245, 268–275 (2016).
16. Skoglund, P., Rolo, A., Chen, X., Gumbiner, B. M. & Keller, R. Convergenceand extension at gastrulation require a myosin IIB-dependent cortical actinnetwork. Development 135, 2435–2444 (2008).
17. Kim, H. Y. & Davidson, L. A. Punctuated actin contractions duringconvergent extension and their permissive regulation by the non-canonicalWnt-signaling pathway. J. Cell Sci. 124, 635–646 (2011).
18. Vasquez, C. G., Tworoger, M. & Martin, A. C. Dynamic myosinphosphorylation regulates contractile pulses and tissue integrity duringepithelial morphogenesis. J. Cell Biol. 206, 435–450 (2014).
19. Valencia-Exposito, A., Grosheva, I., Miguez, D. G., Gonzalez-Reyes, A. &Martin-Bermudo, M. D. Myosin light-chain phosphatase regulates basalactomyosin oscillations during morphogenesis. Nat. Commun. 7, 10746(2016).
20. Munjal, A., Philippe, J. M., Munro, E. & Lecuit, T. A self-organizedbiomechanical network drives shape changes during tissue morphogenesis.Nature 524, 351–355 (2015).
21. Kasza, K. E., Farrell, D. L. & Zallen, J. A. Spatiotemporal control of epithelialremodeling by regulated myosin phosphorylation. Proc. Natl Acad. Sci. USA111, 11732–11737 (2014).
22. Duque, J. & Gorfinkiel, N. Integration of actomyosin contractility with cell-celladhesion during dorsal closure. Development 143, 4676–4686 (2016).
23. Qin, X. et al. Cell-matrix adhesion and cell-cell adhesion differentially controlbasal myosin oscillation and Drosophila egg chamber elongation. Nat.Commun. 8, 14708 (2017).
24. Tan, C., Stronach, B. & Perrimon, N. Roles of myosin phosphatase duringDrosophila development. Development 130, 671–681 (2003).
25. Lee, A. & Treisman, J. E. Excessive Myosin activity in mbs mutants causesphotoreceptor movement out of the Drosophila eye disc epithelium. Mol. Biol.Cell 15, 3285–3295 (2004).
26. Hartshorne, D. J., Ito, M. & Erdodi, F. Myosin light chain phosphatase:subunit composition, interactions and regulation. J. Muscle Res. Cell Motil. 19,325–341 (1998).
27. Yamamoto, S., Bayat, V., Bellen, H. J. & Tan, C. Protein phosphatase 1ss limitsring canal constriction during Drosophila germline cyst formation. PLoS ONE8, e70502 (2013).
28. Franke, J. D., Montague, R. A. & Kiehart, D. P. Nonmuscle myosin IIgenerates forces that transmit tension and drive contraction in multiple tissuesduring dorsal closure. Curr. Biol. 15, 2208–2221 (2005).
29. Riento, K. & Ridley, A. J. Rocks: multifunctional kinases in cell behaviour. Nat.Rev. Mol. Cell Biol. 4, 446–456 (2003).
30. Epstein I. R., Pojman J. A. An introduction to nonlinear chemical dynamics:oscillations, waves, patterns, and chaos (Oxford University Press, New York,NY, 1998).
31. Totsukawa, G. et al. Distinct roles of ROCK (Rho-kinase) and MLCK inspatial regulation of MLC phosphorylation for assembly of stress fibers andfocal adhesions in 3T3 fibroblasts. J. Cell Biol. 150, 797–806 (2000).
32. Vasquez, C. G., Heissler, S. M., Billington, N., Sellers, J. R. & Martin, A. C.Drosophila non-muscle myosin II motor activity determines the rate of tissuefolding. Elife 5, e20828 (2016).
33. Fitzhugh, R. Impulses and physiological states in theoretical models of nervemembrane. Biophys. J. 1, 445–466 (1961).
34. Lee, S. et al. Reversible protein inactivation by optogenetic trapping in cells.Nat. Methods 11, 633–636 (2014).
35. Levayer, R. & Lecuit, T. Oscillation and polarity of E-cadherin asymmetriescontrol actomyosin flow patterns during morphogenesis. Dev. Cell 26,162–175 (2013).
36. Bardet, P. L. et al. PTEN controls junction lengthening and stability during cellrearrangement in epithelial tissue. Dev. Cell 25, 534–546 (2013).
37. Prasad, M., Jang, A. C., Starz-Gaiano, M., Melani, M. & Montell, D. J. Aprotocol for culturing Drosophila melanogaster stage 9 egg chambers for liveimaging. Nat. Protoc. 2, 2467–2473 (2007).
38. Wang, X., He, L., Wu, Y. I., Hahn, K. M. & Montell, D. J. Light-mediatedactivation reveals a key role for Rac in collective guidance of cell movementin vivo. Nat. Cell Biol. 12, 591–597 (2010).
39. Shang, X. et al. Small-molecule inhibitors targeting G-protein-coupled Rhoguanine nucleotide exchange factors. Proc. Natl Acad. Sci. USA 110,3155–3160 (2013).
40. Hebert, B., Costantino, S. & Wiseman, P. W. Spatiotemporal image correlationspectroscopy (STICS) theory, verification, and application to protein velocitymapping in living CHO cells. Biophys. J. 88, 3601–3614 (2005).
41. Lecomte T., Thibeaux R., Guillen N., Dufour A., Olivo-Marin J. C. Fluidoptical flow for forces and pressure field estimation in cellular biology. In:2012 19th IEEE International Conference on Image Processing, 69–72 (2012).
42. Pujadas A. B., Manich M., Guillén N., Olivo-Marín J. C., Dufour A. C.Biophysical measurements in 2D and 3D live cell imaging using fluiddynamics and optical flow. In: 2016 IEEE 13th International Symposium onBiomedical Imaging (ISBI) 980–983 (2016).
AcknowledgementsWe thank Adam Martin, Yohanns Bellaiche, Daniel Kiehart, Bloomington Drosophilastock center and Vienna Drosophila RNAi center for flies. We thank Change Tan forMBS antibody. We thank Tri Toulouse platform for imaging acquisition advice. Wethank Francois Schweisguth and Karine Belguise for discussion of manuscript prepara-tion. This work was supported by the Institut National de la Santeet de la RechercheMedicale [the ATIP-Avenir program (2012–2016)]; Region Midi-Pyrenees Excellenceprogram (2013–2016); the National Natural Science Foundation of China (grant number81670552 to B.Y., 11772088, 31470906 to Y.L.); the National Science Foundation of USA(grant number NSF 1456053 to J.A.M.); and the Indian Foundation (DST [SB/YS/LS-88/2014] and UGC [MRP-MAJOR-ZOOL-2013-16812] to P.M.
ARTICLE NATURE COMMUNICATIONS | DOI: 10.1038/s41467-018-03574-5
14 NATURE COMMUNICATIONS | (2018) 9:1210 | DOI: 10.1038/s41467-018-03574-5 | www.nature.com/naturecommunications

Author contributionsX.Q. and C.L. performed image acquisition and transgene analysis. X.Q. and J.L. pro-cessed and analyzed images. E.H. did the mathematical modeling. T.M. conducted thedata analysis of FRAP experiments. V.C.-C. made the constructs for transgenic flies.P.M. and J.A.M. made the antibody for ROCK. X.Q., E.H., T.M., Y. L., B.Y., andX.W. prepared the manuscript. X.Q., E.H. and X.W. designed the experiments. Allauthors participated in the interpretation of the data and the production of the finalmanuscript.
Additional informationSupplementary Information accompanies this paper at https://doi.org/10.1038/s41467-018-03574-5.
Competing interests: The authors declare no competing interests.
Reprints and permission information is available online at http://npg.nature.com/reprintsandpermissions/
Publisher's note: Springer Nature remains neutral with regard to jurisdictional claims inpublished maps and institutional affiliations.
Open Access This article is licensed under a Creative CommonsAttribution 4.0 International License, which permits use, sharing,
adaptation, distribution and reproduction in any medium or format, as long as you giveappropriate credit to the original author(s) and the source, provide a link to the CreativeCommons license, and indicate if changes were made. The images or other third partymaterial in this article are included in the article’s Creative Commons license, unlessindicated otherwise in a credit line to the material. If material is not included in thearticle’s Creative Commons license and your intended use is not permitted by statutoryregulation or exceeds the permitted use, you will need to obtain permission directly fromthe copyright holder. To view a copy of this license, visit http://creativecommons.org/licenses/by/4.0/.
© The Author(s) 2018
NATURE COMMUNICATIONS | DOI: 10.1038/s41467-018-03574-5 ARTICLE
NATURE COMMUNICATIONS | (2018) 9:1210 | DOI: 10.1038/s41467-018-03574-5 | www.nature.com/naturecommunications 15
Copyright © 2022 FDOKUMEN