Control of Myosin motor activity and Actin filament translation ...
83
Marshall University Marshall Digital Scholar eses, Dissertations and Capstones 2009 Control of Myosin motor activity and Actin filament translation by alteration of Assay Reducing Potential Siva Krishna Nalabotu [email protected] Follow this and additional works at: hp://mds.marshall.edu/etd Part of the Fluids and Secretions Commons , Medical Biochemistry Commons , Musculoskeletal System Commons , and the Nanotechnology Commons is esis is brought to you for free and open access by Marshall Digital Scholar. It has been accepted for inclusion in eses, Dissertations and Capstones by an authorized administrator of Marshall Digital Scholar. For more information, please contact [email protected]. Recommended Citation Nalabotu, Siva Krishna, "Control of Myosin motor activity and Actin filament translation by alteration of Assay Reducing Potential" (2009). eses, Dissertations and Capstones. Paper 123.
-
Upload
khangminh22 -
Category
Documents
-
view
4 -
download
0
Transcript of Control of Myosin motor activity and Actin filament translation ...

Marshall UniversityMarshall Digital Scholar
Theses, Dissertations and Capstones
2009
Control of Myosin motor activity and Actinfilament translation by alteration of Assay ReducingPotentialSiva Krishna [email protected]
Follow this and additional works at: http://mds.marshall.edu/etdPart of the Fluids and Secretions Commons, Medical Biochemistry Commons, Musculoskeletal
System Commons, and the Nanotechnology Commons
This Thesis is brought to you for free and open access by Marshall Digital Scholar. It has been accepted for inclusion in Theses, Dissertations andCapstones by an authorized administrator of Marshall Digital Scholar. For more information, please contact [email protected].
Recommended CitationNalabotu, Siva Krishna, "Control of Myosin motor activity and Actin filament translation by alteration of Assay Reducing Potential"(2009). Theses, Dissertations and Capstones. Paper 123.

TITLE
Control of Myosin motor activity and Actin filament translation by alteration of Assay Reducing Potential
By
Siva Krishna Nalabotu B.V.Sc. & A.H.
A thesis submitted to the
Graduate faculty of the Department of Biology
at
Marshall University
In partial fulfillment of the requirements for the degree
of
Master of Science
Committee:
_____________________________ Dr. Eric R Blough, Thesis adviser
_____________________________ Dr. David Mallory, Committee member
_____________________________ Dr. Bin Wang, Committee member
06-10-2009
Summer 2009
Marshall University, Huntington, WV

ABSTRACT
The use of biomolecular motors for nanotechnological applications has been
impaired by an inability to control biomolecular motor activity in a temporal fashion.
Previous data has suggested that myosin activity can be modulated by inducing
changes in the degree of myosin oxidation. The hypothesis of this study is that myosin
motor activity can be regulated by altering the amount of antioxidants and reducing
agents present in assay solution. To test this hypothesis we systematically altered the
concentration of reducing agents and examined the effects of these changes on
myosin-dependent actin filament translation. Our findings indicate that myosin activity
can be controlled over several on-off cycles in a controlled fashion by varying the
amount of antioxidants and reducing agents in the assay medium. This strategy if
further developed may lead to new ways to control myosin motor activity in
bionanotechnological devices.
(Total words 140)

iii
ACKNOWLEDGEMENTS
This thesis would not have been possible without the support and assistance
provided by my advisor, mentor, and committee chair Dr. Eric Blough due to his
extreme generosity and kindness. Thank you Eric for providing me with the ideal work
environment; for setting high standards in my professional and personal education; for
never ending enthusiasm and availability; for inspiring me as well as believing in me.
His guidance, support and encouragement have made this scholarly journey, such a
rewarding experience and with his thoroughness in addition to his dedication have
made this research possible. Thank you Dr. David Mallory for your time you have
allotted in reviewing my work and the constructive criticism in the improvement of my
results which have been truly invaluable for this research. You are one of the best
teachers in my career. I am also grateful to Dr. Bin Wang for her valuable comments
and suggestions on my thesis. I am so grateful for my parents Venkaiah Nalabotu and
Saialaja Kumari; my brother Dr. Sarath and my sister-in-law Dr. Mahathi; and my sister
Anusha for their continuous encouragement and support throughout my studies. I would
like to extend my deepest gratitude to my esteemed colleagues Dr. Hideyo, Kolli, Kevin,
Kakarla, Katta, Gadde, Paturi, Gutta, Arvapalli, Jackie, Miaozong and Brent in the
Laboratory of Molecular Physiology for all of their help with laboratory work as well as
their friendship which gave me motivation to complete my thesis. I am so grateful to my
school teachers Satyanarayana and Prasad Babu who molded my career in this
direction. I would like to extend my gratitude to my class mates Thulluri, Chandra
Bathina, Dr. Subhashini Nelapati and to my senior Addagarla for their valuable
suggestions and support.

iv
LIST OF ABBREVIATIONS AND SYMBOLS
ADP Adenosine diphosphate
ANOVA Analysis of variance
ATP Adenosine triphosphate
BSA Bovine serum albumin
Cacl2 Calcium chloride
CCD Charge-coupled device
DNA Deoxy ribonucleic acid
DTT Dithiothretol
F-actin Filamentous actin
G-actin Glomerular actin
GODCAT Glucose oxidase and catalase in the medium of glucose
HMM Heavy meromyosin
K Potassium
KCl Potassium chloride
KDa Kilodalton
LMM Light-meromyosin
MgCl2 Magnesium Chloride
MRI Magnetic Resonance imaging
mRNA Messenger Ribonucleic acid
PDMS Polydimethylsiloxane
Pi Inorganic phosphate
SEM Standard error of the mean
-SH Sulphydral
-SS- Thiol
TMCS Trimethylchlorosilane
UV Ultraviolet
Zn2+ Zinc

v
LIST OF FIGURES
Figure 1. Structure of the myosin filament ....................................................................... 8
Figure 2. Myosin showing the actin and ATP binding sites ........................................... 10
Figure 3. Three dimensional structure of actin .............................................................. 11
Figure 4 a). Velocity of actin filaments in assay buffer with and without antioxidants b). Percentage of moving actin filaments in assay buffer with and without antioxidants ..... 28
Figure 5 a). Cyclical variation in the average velocity of filaments with and without antioxidants in the assay medium b). Cyclical Variation in the percentage of motile filaments with and without antioxidants in the assay medium ....................................... 29
Figure 6 a). Average velocity of actin filaments at different levels of oxidation by removing the reducing agents in the assay medium b). Percentage of motile actin filaments at different levels of oxidation by removing the reducing agents in the assay medium. ........................................................................................................................ 30
Figure 7 a). Displacement of actin filaments during an interval of 5 s after the initial movement. The paths of two filaments measured with Image-J software are shown. Cropped images with yellow tracks show the displacement of the filaments with an interval of 5 sec. ............................................................................................................ 31
Figure 7 b). Complete stop of the actin filaments after exchanging the buffer without antioxidants. .................................................................................................................. 32
Figure 7 c). Restart of the actin filaments after exchanging the buffer with reducing agents. The paths of two filaments measured with Image- J software are shown. Cropped images with yellow tracks show the displacement of the filaments with an interval of 5 sec ............................................................................................................. 33
Figure 8. Variation in the amounts of oxidative modification of Nitro-tyrosine residues of myosin proteins with the variation in the amount of antioxidants in the assay medium . 34
Figure 9. Variation in the amounts of oxidative modification of Nitro-cysteine residues of myosin proteins with the variation in the amount of antioxidants in the assay medium . 35
Figure 10. Variation in the amounts of oxidative modification of carbonyl groups of myosin proteins with the variation in the amount of antioxidants in the assay medium . 36

vi
LIST OF TABLES
Table 1.Cyclical variation of the average velocity (µm/s) of the actin filaments ............. 45
Table 2.Cyclical variation of the motility percentage of the actin filaments .................... 49
Table 3.Variation in the average velocity of the filaments at various levels of the
oxidation .......................................................................................................... 50
Table 4.Variation in the motility percentage of the filaments at various levels of the
oxidation .......................................................................................................... 54

vii
TABLE OF CONTENTS
ACKNOWLEDGEMENTS .......................................................................................................... iii
LIST OF ABBREVIATIONS AND SYMBOLS ............................................................................. iv
CHAPTER 1 ............................................................................................................................... 1
INTRODUCTION .................................................................................................................... 1
Purpose ................................................................................................................................................ 3
Specific aim #1 ................................................................................................................................... 4
Hypothesis ........................................................................................................................................... 4
The absence of reducing agents will have a significant effect on myosin motor activity. ....... 4
Specific aim #2 ................................................................................................................................... 4
Hypothesis ........................................................................................................................................... 4
Manipulation of reducing agent concentration can be used to cyclically control myosin
motor activity. ...................................................................................................................................... 4
CHAPTER 2 ............................................................................................................................... 5
REVIEW OF LITERATURE .................................................................................................... 5
Nanotechnology and nanobiotechnology: potential applications to mankind ........................... 5
Structure and function of motor proteins ........................................................................................ 6
Actin-myosin motor system ............................................................................................................... 7
Use of protein biomotors for nanotechnological applications .................................................... 11
Efforts to develop biomotor immobilization and patterning ........................................................ 12
Methods to load molecular cargo for transport using protein biomotor systems .................... 13
Methods to modulate protein biomotor activity ............................................................................ 13
CHAPTER 3 ..............................................................................................................................17
Introduction ...........................................................................................................................19
Materials and methods ..........................................................................................................20
Surface preparation ......................................................................................................................... 20
Motility assays ................................................................................................................................... 20
Cycling experiments ......................................................................................................................... 21
Determination of filament velocity .................................................................................................. 21
Dot blot analysis for nitro tyrosine and nitro cysteine ....................................................................... 22
Oxidized Protein Analysis .................................................................................................................... 23

viii
Statistical analysis ............................................................................................................................... 23
Results ............................................................................................................................................... 24
Discussion ......................................................................................................................................... 26
Conclusion ......................................................................................................................................... 27
CHAPTER 4 ..............................................................................................................................37
Conclusions ...........................................................................................................................37
Future Directions ...................................................................................................................38
REFERENCES .........................................................................................................................39
APPENDIX ................................................................................................................................43
CURRICULUM VITAE ...............................................................................................................68

1
CHAPTER 1
INTRODUCTION
Biomolecular motors are cellular machines that are involved in the contraction of
muscles, cell movement and the transport of cargo molecules within cells [1].
Nanobiotechnology is a young and rapidly evolving field of research at the cross roads
of biotechnology and nano science that is considered one of the key technologies of the
21st century. A long-term goal of nanobiotechnology is the utilization of biomolecular
motors for controlled cargo carriers such as liposomes to be carried on a chip, with
applications in sorting, separation, purification or assembly of materials.
Biomolecular motors use the hydrolysis of adenosine triphosphate (ATP) to
perform mechanical work with a remarkable degree of efficiency [2]. In the cell,
biomolecular motors perform a wide variety of transport functions suggesting that they
may someday be useful for the development of novel biomedical devices. There are
two classes of biomolecular motors: linear and rotary. Linear motors include the myosin
and kinesin motors while the rotary motors include the F0-F1 ATP synthase [3]. Among
the linear motor type, myosin plays an important role in the contraction of muscles and
in the transport of molecular cargo within cells. The transport of cargo by myosin occurs
along actin filaments. Actin filaments are made up of glomerular actin (G-actin)
subunits that are arranged in a head-to-tail fashion [4]. Recent work has demonstrated
the potential use of biomolecular motors for the construction of actuators and

2
transporters capable of transporting micrometer and nanometer-sized objects like
streptavidin coated beads and DNA molecules [3]. Other research in this field has been
centered on developing suitable biocompatible substrates capable of supporting myosin
activity [5]. While progress in these areas has been exciting, the application of
biomolecular motors for nanotechnological applications has been hampered by an
inability to accurately control motor activity.
In an effort to control the activity of biomolecular motors, several different
approaches have been utilized over the past few years including (1) the engineering of
Zn2+ binding sites into kinesin motors and using the modulation of Zn2+ availability to
govern the on / off state of the motor [6] , (2) the use of photo-activated ATP in an effort
to modulate motor activity by altering the amount of ATP available for hydrolysis [7] and
(3) varying the temperature of the external environment surrounding the biomolecular
motor to take advantage of the relationship between temperature and enzyme activity
[8]. Although each approach has shown promise to control protein motor activity, these
methods have yet to clearly demonstrate the ability to reversibly modulate motor activity
over several cycles of activation.

3
Purpose
The purpose of this research is to develop the means to temporally control actin
filament motility across a motor patterned surface. To fulfill this purpose we will examine
how the presence and absence of reducing agents affects the ability of the myosin
motor to translate actin filaments. The overall hypothesis of this study is that myosin
motor activity can be regulated by altering the amount of antioxidants and reducing
agents present in assay solution.
Specific Aims
Protein molecular motors such as the actin-myosin system are natural nano-
machines that convert chemical energy directly into mechanical work. Our long-range
goal is to use molecular motors for new biomedical applications. The ability to control
the activity of molecular motors in an external environment is currently lacking. Without
better mechanisms of motor control the use of these machines for applied purposes is
significantly hampered. The objective of this study is to investigate the possibility of
controlling molecular motor activity by altering the chemical composition of the buffer
that the motor resides in. The working hypothesis of this study is that myosin motor
activity can be regulated by altering the amount of antioxidants and reducing agents
present in assay solution. To test this hypothesis two specific aims will be pursued:

4
Specific aim #1
To determine if absence of reducing agents has an effect on myosin motor activity in the
in vitro motility assay.
Hypothesis
The absence of reducing agents will have a significant effect on myosin motor
activity.
Specific aim #2
To investigate if myosin motor activity can be cyclically controlled by altering the
concentration of reducing agents in the assay medium
Hypothesis
Manipulation of reducing agent concentration can be used to cyclically control
myosin motor activity.

5
CHAPTER 2
REVIEW OF LITERATURE
Introduction
A review of the pertinent literature concerning the present study will be presented
in the following chapter. The following areas will be addressed: 1) nano technology and
nanobiotechnology: potential applications to mankind, 2) Structure and function of motor
proteins, 3) Structure of the actomyosin motor system and, 4) Use of protein biomotors
for nanotechnological applications.
Nanotechnology and nanobiotechnology: potential applications to mankind
Richard Feynman is widely credited for establishing the field of nanotechnology.
Much of this credit arises from his famous talk “There’s plenty of room at the bottom”
(American Physical Society: 1959) [9]. Initial progress in the field of nanotechnology
was slow as it not until the 1980s that the scanning tunneling microscope and atomic
force microscope were developed which allowed the manipulation and observation of
single molecules. Since then, progress in the nanosciences has been rapid and has
resulted in the ability of scientists to manipulate matter at its most fundamental level.
For example, the development of the atomic force microscope has allowed researchers
to individually pattern 35 xenon atoms to spell out the word “IBM” [10]. Similarly, other
devices such as the atomic force microscopy now make it possible for scientists to
probe the atomic structure of DNA [11]. Key goals of nanotechnology are to develop

6
new molecular treatments for disease, new types of manufacturing processes and new
materials that would increase productivity while diminishing the effects of man on the
environment.
Nanobiotechnology is defined as a field that applies nanoscale principles and
techniques to understand and transform biosystems or use biological principles and
materials to create new devices and systems integrated from the nanoscale [12]. Many
of the most basic processes of life occur at the nanoscale suggesting that
understanding the design of biological systems can be useful for the development of
novel nanodevices and systems. For example, developing a better understanding of
how a cell is designed and interacts with its environment may help researchers to
develop new types of biological or chemical sensors. Such devices could have use in
many fields including diagnostics, DNA separation and in the development of new
nanomaterials that could be used imaging [13]. Recent advances in the field of
nanobiotechnology have enabled higher sensitivity in detecting cancer cells and
proteins, new methods of tumor imaging, and new materials e.g. liposomes, that could
be used to deliver medicine or other types of molecules for the treatment of cancer [14].
Structure and function of motor proteins
Motor proteins convert chemical energy derived from the hydrolysis of ATP into
mechanical energy [2]. Bionanomotors are used in muscle contraction and for the
transport of cargo molecules within cells [15]. There are two types of motor systems:
linear and rotary motor systems. Linear systems operate in a linear fashion while rotary

7
motors produce rotary motion [3]. Most of the current research in the field of these
motor proteins has centered on linear motor proteins. There are three linear motor
proteins in the cell: myosin motors which move on actin filaments and the kinesin and
dynein motors which use microtubules [3].
Compared to kinesin and dynein, the actomyosin motility system may be
advantageous for applications that involve the transport of materials. For example, the
actomyosin system enables faster transportation (up to 10 times faster with muscle
myosin II) [16] and the capacity to move heavier loads given its ability to generate
higher amount of force [3].
Actin-myosin motor system
Muscle fibers are actually composed of large single cells that had been formed
from many separate cells that have fused together. The bulk of the muscle fiber
cytoplasm is made up of myofibrils. These myofibrils contract in the presence of ATP
and calcium and in doing so generate the force used to produce movement. The
structural unit of the myofibril is the sarcomere. Each sarcomere contains an anisotropic
band that is bound by two isotropic bands. The anisotropic band is called the A-band;
the isotropic band is called the I-band [17]. In the center of the A band, there is a lighter
region known as the H-zone or H-band. The myofibrils in turn are composed of two
proteinaceous structures called myofilaments. One filament is termed the thick filament
and is about 11 nm in diameter[18] whereas the other filament is called the thin filament

8
and is 5 nm in diameter [19]. Thick filaments are made up of several hundred myosin
molecules.
Within the cell there are many types of myosin such as myosin I, myosin II,
myosin V and others[20]. Among these myosin types, myosin II is the most well known.
Myosin II is known as a conventional myosin. It is present in all non-plant eukaryotic
cells[4]. In the cells, myosin II plays an important role in muscular contraction,
cytokinesis, and vesicle transport[21].
Structure of myosin filament
Figure 1. Structure of the myosin filament

9
Myosin is an actin-based molecular motor (molecular weight ~ 520 kDa). It
consists of two large pear-shaped domains (S1) attached by their stems to a long tail
(Figure 1). It is made of six subunits. There are two heavy chains of about 220 kDa in
the head region. There is a regulatory domain in the region of the myosin head
immediately behind the globular catalytic domain consisting of four light chains. The
light chains are arranged in the form of pairs and one pair is called as essential light
chain while the other pair is known as the regulatory light chain. These light chain pairs
also used to support the neck portion of the myosin molecule and are useful to form the
core of the thick filament [19].
Heavy meromyosin (HMM) is obtained by the chymotrypsin digestion of the
myosin molecule. HMM contains two globular structures termed the S1 domain. The
structure of the S1 domain has been determined using x-ray crystallographic techniques
[18]. Within the S1 domain are two clearly defined morphological domains, which have
been termed the “motor domain” and the “regulatory domain”. The large cleft at the front
in the motor domain is the actin binding site. The smaller cleft on the side of the motor
domain is the ATP-binding site or the nucleotide binding site. The ATP binding site
contains ATPase activity and is responsible for the hydrolysis of the ATP into adenosine
di-phosphate (ADP) and inorganic phosphate (Pi). The energy released from the
hydrolysis of ATP causes the power stroke of myosin which in turn is responsible for the
translation of the actin molecule [19]. Because the S1 domain (myosin head) contains
the ATP and actin-binding sites, the myosin head can generate force (Figure 2). The
head joins with another heavy chain to form a long α-helical coiled-coil tail (Figure 1).

10
Figure 2. Myosin showing the actin and ATP binding sites
Adopted from (http://www.biomed.miami.edu/pharm/faculty_Szczesna.html)
Structure of actin filament
Actin is a very common structural component of the eukaryotic cell [22]. Actin is
also an important component of the cytoskeleton. Actin filaments are found in the
sarcomere where they play an important role in muscle contraction by binding with the
myosin filaments. Actin typically exists in two different states: globular actin (G-actin)
and filamentous actin (F-actin) [19]. G-actins can polymerize and form polar F-actin. F-
actin is a two-start right-handed helix, with a crossover every 36 nm consisting of 13-14
actin monomers and has a fast growing (plus) and slow growing (minus) end [19].

11
Figure 3. Three dimensional structure of actin
Use of protein biomotors for nanotechnological applications
Currently research activity concerning the use of protein biomotors is primarily
centered on the utilization of myosin motors which move on actin filaments and kinesin
and dynein motors which move on microtubules. As the force producing capacity of
myosin motors is high (10 times that of the kinesin motors) the utilization of myosin
motors may provide a mechanical advantage over that realized with the kinesin and
dynein motors. The development of nanodevices that could be powered by protein

12
biomotors has been hampered due to a current failure to overcome three important
problems:
(1.) The immobilization and patterning of protein biomotors onto a surface in such
a fashion that still allows enzyme function,
(2.) An inability to develop a reliable and reversible means of coupling molecular
cargo in such a way that it could be transported by protein biomotor systems,
(3.) The ability to temporally controlled protein biomotor activity.
Efforts to develop biomotor immobilization and patterning
Although very useful for the study of biomotor function, the application of
biomolecular motors for nanotechnological applications has been hindered by limitations
in the ability to accurately control the motion of the moving filaments as they travel
across the substrate surface. Given this restraint, several approaches have been
developed and utilized over the past few years to create well defined patterns of motor
proteins across a micro patterned surface. For example, motor protein binding tracks
have been produced by aligned poly (tetrafluoroethylene) films on glass, micrometer
scale grooves, and nanoimprinting lithography [23] [24]. However, in most cases, the
motility is not entirely confined to the tracks. To achieve confinement of the motility of F-
actin filaments on myosin motors, trimethylchlorosilane (TMCS) has been investigated.
An advantage of this surface type is its ability to be patterned by electron beam
lithography or by exposure to ultraviolet (UV)/ ozone treatment [25].

13
Methods to load molecular cargo for transport using protein biomotor systems
Limited work has been done in the area of cargo loading and transport in
biological nano systems since it is often viewed as the next step after directional control
as discussed above. Efforts in this area to date have focused on binding synthetic nano
elements to specific proteins, and the interaction of specific biological materials, such as
biotin and streptavidin. This strategy has been quite successful as it has been
demonstrated that microtubules and actin filaments functionalized with biotin can be
used for the transport of streptavidin coated polystyrene beads, DNA molecules and
quantum dots [24, 26]. A disadvantage of these methods is that the cargo has to be pre-
functionalized and the “cargo loading” is largely irreversible in nature.
A promising and versatile method is the use of filaments that are coated with
antibodies or single-stranded DNA oligonucleotides or any other type of biochemical
affinity capture molecule specific for the cargo to be transported [27, 28]. Several
research groups have demonstrated the transportation of materials, including DNA [29],
viruses[26], and myoglobin and BSA [28], through specific bioaffinity capture materials.
However, unloading these cargoes is still limiting the application of this technology.
Methods to modulate protein biomotor activity
Currently there are no efficient methods to control biomotor activity that are
reversible in nature. In an effort to overcome this limitation, several approaches have
been developed and utilized over the past few years include (1) the engineering of Zn2+

14
binding sites into the kinesin motors and using the modulation of Zn2+ availability to
govern the on / off state of the motor [6], (2) the use of photo-activated ATP in an effort
to modulate motor activity by altering the amount of ATP available for hydrolysis [7] and
(3) varying the temperature of the external environment surrounding the biomolecular
motor to take advantage of the relationship between temperature and enzyme activity
[8].
Initial efforts to control motor activity have been centered on the genetically
engineering new regulatory domains e.g. a Zn+2 binding site, into the native biomotor
structure [6]. Although this type of approach has demonstrated the cyclical activation and
inactivation of microtubule motility by kinesin it appears that this type of control system
exhibits a high degree of variability as the microtubule velocity is not constant after one
period of cycling. Why the velocity and percentage of moving microtubules might vary
between cycles is not known but may be related to alterations in the way the kinesin
motor is structured after the incorporation of the new regulatory domain. Current efforts
in this field are now investigating how other modifications of the kinesin protein may
affect motor activity.
In addition to genetic engineering approaches, the use of photo-activated ATP for
controlling kinesin activity has also been investigated [7]. In this approach, caged ATP
which can be activated and inactivated by exposure to ultra violet (UV) radiation is used.
It is based on the premise that exposure of the caged ATP to UV radiation will result in
the controlled liberation of ATP from the caged compound. The released ATP in turn

15
can be used by the kinesin motors to induce microtubule movement. The efficiency of
this approach and its effects on microtubule movement is dependent upon the
concentration of ATP, caged ATP, ADP, kinesin activity, the quantum yield of the
uncaging reaction, temperature, light intensity, and the mutual dependencies between
these parameters. Similar to research using engineered constructs that are responsive
to divalent metal concentration, this approach has yet to demonstrate the ability to cycle
motor activity over time.
It is well known that temperature can affect enzyme activity. Recent efforts have
demonstrated that temperature can be used to modulate myosin activity [8]. In these
experiments, thermal heating and cooling pads have been incorporated into a flow cell
that is used to house the motility assay. By controlling the flow of electricity to these
pads, the temperature of the flow cell can be varied. Although this study showed that
changes in temperature can be used to modulate the motility of F-actin filaments the
temperature extremes needed to inhibit myosin activity are likely to be incompatible
over time with currently used motility substrates. In addition, this procedure also
requires extensive modification of the flow cell.
In summary, a review of the current literature demonstrates progress in the area
of motor activity control has been made but that limitations still exist. The major
limitation in this area of inquiry is the inability to cyclically control motor activation and
inactivation. This thesis project has been designed to specifically address this gap.

16
Summary
Nanotechnology is the study of molecules or atoms at the nanoscale while
nanobiotechnology integrates the investigation of biological systems with the
nanosciences. A long term goal of nanobiotechnology is the utilization of biomolecular
motors for controlled cargo manipulation on a chip, with applications in sorting,
separation, and the purification or assembly of materials. Biomolecular motors exhibit
the ability to convert chemical energy into mechanical energy with high efficiency. For
nanotechnological purposes, most research investigating biomolecular motors has used
either myosin or kinesin. The incorporation of biomolecular motors into nanodevices will
require the ability to surmount three challenges: the development of appropriate
surfaces capable of maintaining motor activity, the reversible coupling of cargo to motor
driven structures and the ability to modulate motor activity over time. Progress in this
latter area has been steady however the ability to cycle biomolecular motors on and off
over several cycles has yet to be achieved. This thesis will address this gap in our
understanding.

17
CHAPTER 3
Control of myosin motor activity and actin filament translation by alteration of
assay reducing potential*
*The results of this thesis have been formatted for publication purposes.

18
Abstract
The study of biomolecular motors represents a rapidly and progressing field of
nanobiotechnology. Here, we present a simple method for controlling the activity of
myosin and movement of actin filaments on a myosin coated surface. Our findings
indicate varying the amount of anti oxidants in the assay buffer can be used to alter
filament motility. This data suggest that antioxidants may be useful for the selective
control of myosin II activity.

19
Introduction
Bionanomotors such as myosin and kinesin use the hydrolysis of adenosine
triphosphate (ATP) to perform mechanical work with a remarkable degree of efficiency.
In the cell, these motors perform a wide variety of transport functions suggesting that
they may someday be useful for the development of novel new biomedical devices [15,
30]. Recent work has demonstrated the potential use of bionanomotors for the
construction of actuators and transporters capable of transporting micrometer and
nanometer-sized objects [3]. While this progress have been exciting, the application of
biomolecular motors for nanotechnological applications has been hampered by an
inability to accurately control motor activity.
In an effort to overcome this limitation, several approaches have been developed
and utilized over the past few years including Zn2+ binding to genetically engineered
kinesin motors[6], photo-activated ATP[7], local anesthetics [31] and varying the
temperature of the motility chamber[8]. Although promising, these control systems have
yet to demonstrate the ability to reversibly modulate motor activity over several cycles of
activation. Here we investigate the potential of altering the concentration of reducing
agents as a means of controlling myosin activity. Our results demonstrate that myosin
motor activity can be accurately and reversibly controlled by varying amounts of
reducing agents within the assay buffer.

20
Materials and methods
Surface preparation
Glass cover slips (Cat. No. 12-540A, Fisher) were functionalized with
nitrocellulose (2% colloidin in isoamyl acetate, Okenshoji Co, Japan) using solution
deposition and soft-baking at 40ºC for 1 hr as detailed previously [32].
Motility assays
The procedures of the motility assay have been described previously [33].
Briefly, HMM was extracted from the back and leg muscle of a rabbit and purified. HMM
was prepared by limited digestion of myosin with α-chymotrypsin [32]. Actin was
extracted in the monomeric form from an actin acetone powder of chicken breast
muscle [34] and then the polymerized actin filaments were labeled with
tetramethylrhodamine-phalloidin (Molecular Probes, Inc., OR, USA). Flow cells were
constructed from a No. 2 cover slip using strips of double sided 90 µm thick tape
(Nichiban Co, Japan). The flow cell was filled with 120 µg/ml HMM diluted in the assay
buffer which contained 25 mM KCl, 2 mM MgCl2, 0.2 mM CaCl2 and 25 mM imidazole at
pH 7.0 and incubates for 5 min. Bovine serum albumin (0.1 % BSA in water) was used
to prevent the filaments from nonspecifically binding to the surface. After a 5 min
incubation, the flow cell was washed with the assay buffer, and 0.25 µg/ml labeled
filaments in assay buffer supplemented with 10 mM dithiothreitol (DTT), 4.5 mg/ml D(+)-
glucose, 0.22 mg/ml glucose oxidase and 0.036 mg/ml catalase was introduced into the
flow cell. Motility was activated by exchange of actin loading solution with assay buffer
containing 1.5mM adenosine-5`-triphosate (ATP). Motility assays were performed at

21
room temperature (20-23°C) and observed under fluorescence microscope (Olympus
BH-2, Japan) with a 100X objective (1.3 N.A., oil-immersion; UVFL100, Olympus,
Japan) through a CCD camera (Hamamatsu Photonics C2400, Japan) and a monitor.
Cycling experiments
To determine the effect of varying the concentration of reducing agents on
filament movement in vitro motility experiments were performed in the absence and
presence of reducing agents (10 mM DTT, 4.5 mg/ml D (+)-glucose, 0.22 mg/ml glucose
oxidase and 0.036 mg/ml catalase). To examine the potential of using reducing agents
to reversibly alter filament movement, filament motility was assayed before and after the
addition of motility buffer with and without antioxidants. Up to three cycles of buffer
exchange were tested. To investigate the contribution that each of the different
reducing agents may have on myosin activity, motility assays were performed using
standard conditions after the omission of an individual compound.
Determination of filament velocity
Images of the moving actin filaments were digitally recorded onto a computer
(Dell, Dimension 4300). The velocity of actin filament movement was analyzed using
software (Image J) as outlined by the manufacturer (http://rsb.info.nih.gov/ij/). Image
frames were collected at 0.5 Hz for 30 s and used for the determination of sliding
velocity. The sliding of all filaments in the images was obtained by tracking the leading
end of each filament in each frame.

22
Dot blot analysis for nitro tyrosine and nitro cysteine
The procedure for the dot blot analysis to identify the oxidative modification of
nitro cysteine and nitro tyrosine residues of myosin has been described previously [35]
For these experiments, HMM was exposed to fluorescent light for one minute to mimic
the conditions of the actual experiment. In a parallel set of experiments, GODCAT, DTT,
or GODCAT+DTT were excluded from the assay medium prior to the exposure of the
HMM to fluorescent light. Once exposed, 5 µL of protein [120 µg/mL] from each tube
was spotted onto a Hybond nitrocellulose membrane (Piscataway, NJ). Membranes
were air-dried for 20 min and blocked in 5 % BSA prepared in Tris-buffered saline
containing 0.5% Tween 20 (TBS-T) for 1 h at room temperature. Membranes were
incubated in primary antibody for 1 hour at room temperature and washed three times in
TBS-T. The following primary antibodies and dilutions were used: Nitro-Tyrosine (#
9691, Cell signaling technology) and Anti-S-Nitroso-Cysteine (SNO-Cys) (# N5411,
Sigma Aldrich) which are added at the dilutions of 1:1000 in 5% BSA prepared in TBS-
T. Immuonoreactivity was detected following incubation with a horseradish peroxidase-
labeled (HRP) IgG secondary antibody and reaction with enhanced chemiluminescence
(ECL) Western blotting detection reagent (# RPN 2106V, GE Health care). The
exposure time was adjusted to keep the integrated optical densities within a linear and
nonsaturated range. Band signal intensity was quantified by densitometry using a
flatbed scanner (Epson Pefection 3200 PHOTO) and Imaging software (AlphaEaseFC).
At least four independent experiments were performed for each condition.

23
Oxidized Protein Analysis
Oxidized myosin protein was evaluated using the OxyBlot™ Oxidized Protein
Detection Kit (Chemicon International, Monterrey, Nuevo León, México) according to
manufacture specifications. Band signal intensity was quantified by densitometry using
a flatbed scanner (Epson Perfection 3200 PHOTO) and Imaging software
(AlphaEaseFC). At least four independent experiments were performed for each
condition.
Statistical analysis
Results are presented as mean ± SEM. All comparisons were performed by
Students t-tests or a two-way analysis of variance (ANOVA) with post hoc analysis
where appropriate. For all comparisons the alpha level was set a priori at P≤ 0.05.

24
Results
Effect of reducing agent concentration on actin filament motility
Once introduced into the flow cell, the F-actin bound rigidly to the myosin
immobilized on the cover slip. Similar to previous work by our laboratory and others [36]
the addition of assay buffer containing 1.5mM ATP, 10 mM dithiothreitol, 4.5 mg/ml D
(+)-glucose, 0.22 mg/ml glucose oxidase and 0.036 mg/ml catalase stimulated the
continuous movement of the actin filaments with an average velocity in the range of
2.62 ± 0.07 µm/s at 20 – 23 °C (Figure 4 a). The average percentage of moving
filaments under these conditions was 84 ± 2% (Figure 4 b).
When the buffer was exchanged with an assay medium which contained 1.5mM
ATP in the absence of reducing agents, the actin filament movement quickly came to a
stop (Figures 4a, 4b). After observation for 5 minutes under these conditions, the assay
buffer was exchanged once again to one which contained antioxidants. Upon addition
of assay buffer with antioxidants the filaments began to move. Within a few seconds
the average velocity of the actin filaments was 2.64±0.06 µm/s while the percentage of
moving filaments was 74±2%. This cycle was repeated two additional times. During
the third cycle the average velocity of filament movement was 2.76±0.06 µm/s and
percentage of moving filaments was 73±2%. Taken together, these experiments
demonstrate that actin filament motility can be controlled by altering the presence or
absence of reducing agents in the motility buffer (Figures 5a, 5b).

25
To determine the individual effect that DTT and the oxygen scavengers
contribute to the on/off cycle, motility assays were performed using standard conditions
after omission of individual compound. Compared to that observed using the
“complete” motility buffer, the average velocity and percentage of moving actin filaments
in assay medium lacking in DTT was unchanged (2.62 ± 0.07 µm/s vs. 2.27 ± 0.05
µm/s; 84 ± 2% vs. 85 ± 2 % (Figures 3a, 3b). Conversely, the average velocity and
percentage of moving actin filaments in assay medium lacking glucose oxidase and
catalase was significantly reduced (2.62 ± 0.07 µm/s vs. 1.25 ± 0.08 µm/s, (P < 0.05);
84 ± 2% vs. 25±4 %, (P < 0.05) (Figures 3a, 3b). Taken together, these data suggest
that the omission of DTT has less of an effect on actin filament motility than the oxygen
scavengers, glucose oxidase and catalase.
To better understand the effects of the antioxidants on myosin motors, we next
analyzed the effects of fluorescent light on myosin modification using dot blotting and
oxyblot analysis (Figures 8, 9, 10). Compared to control conditions, the omission of
GODCAT or GODCAT plus DTT resulted in a significant decrease (50- 60%; P < 0.05)
in the oxidative modification of myosin. The data suggest that myosin needs to exhibit a
basal amount of oxidative modification to attain optimal activity.

26
Discussion
A current limitation for the use of bionanomotors in the development of
nanodevices is an inability to control motor activity. Here we examine if altering the
amount of reducing equivalents can be used as a means of controlling actin filament
movement. For these experiments we varied the concentration of DTT, glucose
oxidase and catalase in the motility buffer and determined the effect of these alterations
on actin filament movement. Our data demonstrate the actin motility can be halted by
the omission of antioxidants from the motility buffer (Figs 4a, 4b) and then restored
again by the addition of antioxidants to the motility chamber (Figures 5a, 5b).
Importantly, the restoration of filament velocity and the percentage of motile filaments
did not change between three cycles of activation and inhibition. To our knowledge this
finding has not been reported before. Indeed, although previous work using either
genetically engineered motor proteins or temperature modulation have failed to
demonstrate an ability to maintain or restore motor activity following inhibition [6, 8, 37].
The mechanism(s) by which alterations in the amount of DTT, glucose oxidase or
catalase may affect myosin activity are currently unknown. Previous research has
demonstrated that myosin ATPase activity can be activated and inactivated by chemical
oxidation and reduction. In these studies ATPase activity could be inhibited by the
addition of hydrogen peroxide and then restored later by the addition of the antioxidants
like cysteine or glutathione [38]. It is thought that the inactivation of myosin by hydrogen
peroxide may arise from the oxidation of sulphydral [(-SH) thiol] groups to form
disulphide linkages (-SS-). The addition of cysteine or glutathione, in turn act as

27
reducing agents to restore the thiol groups and enzyme function. In another study, it
was shown that the modification of myosin sulphydral groups causes ATPase activity to
follow a bell shaped curve [39]. Our data demonstrate a reduced myosin activity with
decreased myosin modification. Whether further increases in myosin activity with
modification beyond that observed in the present study is currently unclear.
Nonetheless, our data clearly show that oxidative modifications in the myosin molecule
can be used to regulate myosin activity in an on- and off-fashion.
Conclusion
We demonstrate that the inclusion or absence of glucose oxidase, catalase and
DTT in the myosin motility buffer can be used to control myosin activity during the in
vitro motility assay. Unlike other methods that involve metal chelation [37], the use of
local anesthetics [31] or caged-ATP [7], this technique appears to be a simple
alternative that does not require expensive equipment. These findings may be useful to
develop new means of controlling myosin motility.

28
Figure 4
Figure 4. a). Velocity of actin filaments in assay buffer with and without antioxidants
b). Percentage of moving actin filaments in assay buffer with and without antioxidants

29
Figure 5
Figure 5 a). Cyclical variation in the average velocity of filaments with and without
antioxidants in the assay medium. b). Cyclical Variation in the percentage of motile
filaments with and without antioxidants in the assay medium

30
Figure 6
Figure 6 a). Average velocity of actin filaments at different levels of oxidation by
removing the reducing agents in the assay medium. b). Percentage of motile actin
filaments at different levels of oxidation by removing the reducing agents in the assay
medium. * Significantly different from amount present in assay medium containing
antioxidants. † Significantly different from amount present in assay medium lacking
DTT. Ω Significantly different from assay medium lacking GODCAT.

31
Figure 7 a
Figure 7 a). Displacement of actin filaments during an interval of 5 s after the initial
movement. The paths of two filaments measured with Image-J software are shown.
Cropped images with yellow tracks show the displacement of the filaments with an
interval of 5 sec.

32
Figure 7 b
Figure 7 b). Complete stop of the actin filaments after exchanging the buffer without
antioxidants.

33
Figure 7 c
Figure 7 c). Restart of the actin filaments after exchanging the buffer with reducing
agents. The paths of two filaments measured with Image- J software are shown.
Cropped images with yellow tracks show the displacement of the filaments with an
interval of 5 sec
34
Figure 8
Exposed to fluorescent light for one minute
Figure 8. Effect of solution reducing potential on protein nitrosylation. * Significantly
different from positive control.

35
Figure 9
Exposed to fluorescent light for one minute
Figure 9. Effect of solution reducing potential on the degree of nitrocysteine residues
present in the assay medium. * Significantly different from positive control.

36
Figure 10
Exposed to fluorescent light for one minute
Figure 10. Effect of solution reducing potential on the degree of protein carbonylation.
* Significantly different from positive control.

37
CHAPTER 4
Conclusions
In this thesis document our recent research concerning the use of reducing
agents to control the activity of myosin ATPase and actin filament movement during the
in vitro motility assay is presented. Here we present a simple way to control the motor
activity of myosin motors in a switch on/off fashion. To accomplish this, we modified the
internal environment of the motility assay medium without any change in the average
velocity of actin filaments, by introducing and removing the antioxidants from the assay
medium with the aid of motility assay buffer. We demonstrate that alterations in the
concentration of reducing agents can be used to control actin filament movement across
a myosin coated substrate. Unlike other control methods such as use of genetically
engineered motor constructs, photo activated ATP or modulating enzyme activity by
altering environmental temperature, this technique appears to be a simple alternative
that does not require expensive equipment and obviates the use of metal chelation or
genetical engineering. Our findings may be useful in future nanodevices that use
myosin bionanomotors. These devices are imagined to load the bionanomotors with the
cargo carriers like liposomes at one place and unload the molecules from these
liposomes at a different location. To realize this, we need the motors to be controlled
temporally which is possible if they are controlled in a switch on/off fashion. So we
conclude that the development of nanodevices can be realized with the results we got, if
they are incorporated into a suitable nanodevice.

38
Future Directions
To expand upon the present research future research efforts could be undertaken to:
1. To develop a means for the transport of cargo molecules in a directed and
controlled fashion. For example, it is evident that the actin filaments can be
loaded and unloaded with the cargo carriers like liposomes (unpublished
observation). To enable this transport in a controlled fashion, the motility of the
actin filaments should be controlled precisely so that the loading and unloading
the cargo at the specific location of interest could be achieved.
2. To incorporate the use of bionanomotors into a device that could be used to sort
different molecules from one another. To achieve this goal, polydimethylsiloxane
(PDMS) molded channels could be integrated with biomolecular motors such as
myosin. Coupling a motor control system into this device may allow the ability to
stop and start motility at pre-designated areas where molecular cargo could be
picked up or dropped off.

39
REFERENCES
1. Vale, R.D. and R.A. Milligan, The way things move: looking under the hood of
molecular motor proteins. Science, 2000. 288(5463): p. 88-95.
2. Dinu, C.Z., et al., Cellular motors for molecular manufacturing. Anat Rec
(Hoboken), 2007. 290(10): p. 1203-12.
3. van den Heuvel, M.G. and C. Dekker, Motor proteins at work for nanotechnology.
Science, 2007. 317(5836): p. 333-6.
4. Sellers, J.R., Myosins: a diverse superfamily. Biochim Biophys Acta, 2000.
1496(1): p. 3-22.
5. Hess, H., G.D. Bachand, and V. Vogel, Powering nanodevices with biomolecular
motors. Chemistry, 2004. 10(9): p. 2110-6.
6. Liu, H., et al., Control of a biomolecular motor-powered nanodevice with an
engineered chemical switch. Nat Mater, 2002. 1(3): p. 173-7.
7. Henry Hess, J.C., Dong Qin, Jonathon Howard, and Viola Vogel, Light-Controlled
Molecular Shuttles Made from Motor Proteins Carrying Cargo on engineered
Surfaces. Nano Letters, 2001: p. 235-239.
8. Mihajlović, G.B., Nicolas M.; Trbović, Jelena; Xiong, Peng; von Molnár, Stephan;
Chase, P. Bryant, All-electrical switching and control mechanism for actomyosin-
powered nanoactuators. Applied Physics Letters, 2004. Volume 85.
9. Henry Hess, G.D.B., Biomolecular motors. nanotoday, 2005: p. 22-29.
10. Schweizer, D.M.E.E.K., Positioning single atoms with a scanning tunnelling
microscope. Nature, 1990. 344: p. 524-526.
40
11. Ushiki, T., Atomic force microscopy and its related techniques in biomedicine. Ital
J Anat Embryol, 2001. 106(2 Suppl 1): p. 3-8.
12. Roco, M.C., Converging science and technology at the nanoscale: opportunities
for education and training. Nat Biotechnol, 2003. 21(10): p. 1247-9.
13. Why small matters. Nat Biotechnol, 2003. 21(10): p. 1113.
14. Panchapakesan, B. and E. Wickstrom, Nanotechnology for sensing, imaging,
and treating cancer. Surg Oncol Clin N Am, 2007. 16(2): p. 293-305.
15. Roop Mallik, S.P.G., Molecular motors as cargo transporters in the cell-the good
and the ugly. Physica, 2006: p. 65-69.
16. Sundberg, M., et al., Actin filament guidance on a chip: toward high-throughput
assays and lab-on-a-chip applications. Langmuir, 2006. 22(17): p. 7286-95.
17. Huxley, H.E., The mechanism of muscular contraction. Science 164:1356-1366,
1969. Clin Orthop Relat Res, 2002(403 Suppl): p. S6-17.
18. Perry, S.V., The role of myosin in muscular contraction. Symp Soc Exp Biol,
1968. 22: p. 1-16.
19. Dreizen, P., Structure and function of the myofibrillar contractile proteins. Annu
Rev Med, 1971. 22: p. 365-90.
20. Berg JS, P.B., Cheney RE., Mol Biol Cell, 2001: p. 780-94.
21. Hodge T, C.M., A myosin family tree.J Cell Sci, 2000: p. 3353-4.
22. Steinmetz, M.O., et al., Actin: from cell biology to atomic detail. J Struct Biol,
1997. 119(3): p. 295-320.
23. Bunk, R., et al., Actomyosin motility on nanostructured surfaces. Biochem
Biophys Res Commun, 2003. 301(3): p. 783-8.

41
24. Hess, H. and V. Vogel, Molecular shuttles based on motor proteins: active
transport in synthetic environments. J Biotechnol, 2001. 82(1): p. 67-85.
25. Hideyo Takatsuki, M.K., Kevin M. Rice, B. Scott Day, Schinichi Asano, Mashiur
Rahman, Yue Zhang, Ryoki Ishikawa, Kazuhiro Kohama, and Eric R. Blough,
Assembly and Function of Myosin II on Ultraviolet/ozone patterned
Trimethylchlotosilane Substrates. J. Bionanosci, 2008: p. 35-41.
26. Bachand, G.D., et al., Active capture and transport of virus particles using a
biomolecular motor-driven, nanoscale antibody sandwich assay. Small, 2006.
2(3): p. 381-5.
27. Jia, L., et al., Microscale transport and sorting by kinesin molecular motors.
Biomed Microdevices, 2004. 6(1): p. 67-74.
28. Ramachandran, S., et al., Selective loading of kinesin-powered molecular
shuttles with protein cargo and its application to biosensing. Small, 2006. 2(3): p.
330-4.
29. Raab, M. and W.O. Hancock, Transport and detection of unlabeled nucleotide
targets by microtubules functionalized with molecular beacons. Biotechnol
Bioeng, 2008. 99(4): p. 764-73.
30. Roop Mallik, S.P.G., Molecular motors as cargo transporters in the cell-the good
and the ugly. Physica A, 2006. 372: p. 65-69.
31. Tsuda, Y., et al., Direct inhibition of the actomyosin motility by local anesthetics in
vitro. Biophys J, 1996. 71(5): p. 2733-41.

42
32. Fujita, K., et al., Myosin light chain kinase from skeletal muscle regulates an
ATP-dependent interaction between actin and myosin by binding to actin. Mol
Cell Biochem, 1999. 190(1-2): p. 85-90.
33. Samizo, K., et al., A highly sensitive method for measurement of myosin ATPase
activity by reversed-phase high-performance liquid chromatography. Anal
Biochem, 2001. 293(2): p. 212-5.
34. Kohama, K., Heterogeneity of amino acid incorporation rate in adult skeletal
muscle actin. J Biochem, 1980. 87(3): p. 997-9.
35. Marzetti, E., et al., Age-related activation of mitochondrial caspase-independent
apoptotic signaling in rat gastrocnemius muscle. Mech Ageing Dev, 2008. 129(9):
p. 542-9.
36. Kron, S.J. and J.A. Spudich, Fluorescent actin filaments move on myosin fixed to
a glass surface. Proc Natl Acad Sci U S A, 1986. 83(17): p. 6272-6.
37. Greene, A.C., A.M. Trent, and G.D. Bachand, Controlling kinesin motor proteins
in nanoengineered systems through a metal-binding on/off switch. Biotechnol
Bioeng, 2008. 101(3): p. 478-86.
38. Ziff, M., Reversible Inactivation of Adenosinetrophosphatase. The Journal of
Biological Chemistry, 1943: p. 25-29.
39. Reisler, E., Sulfhydryl modification and labeling of myosin. Methods Enzymol,
1982. 85 Pt B: p. 84-93.

43
APPENDIX
Standard in vitro motility assay
Nitrocellulose coated cover glass: 0.2% Collodion in Isoamyl acetate
Assay buffer: 25mM KCl, 2mM MgCl2, 0.2mM CaCl2, and 25mM Imidazole, pH 7.0
BSA: 1mg/ml
HMM: 120μg/ml
Actin solution(X100):
95μL Assay buffer
1μL 1mM DTT
1μL 0.216mg/ml Glucose oxidase,
1μL 0.036mg/ml Catalase
1μL 4.5mg/ml Glucose
1μL 0.25ug/ml RP-labeled F-actin
ATP solution(X100):
95μL Assay buffer
1μL 1mM DTT
1μL 0.216mg/ml Glucose oxidase,
1μL 0.036mg/ml Catalase
1μL 4.5mg/ml Glucose
1μL 1.5mMATP
44
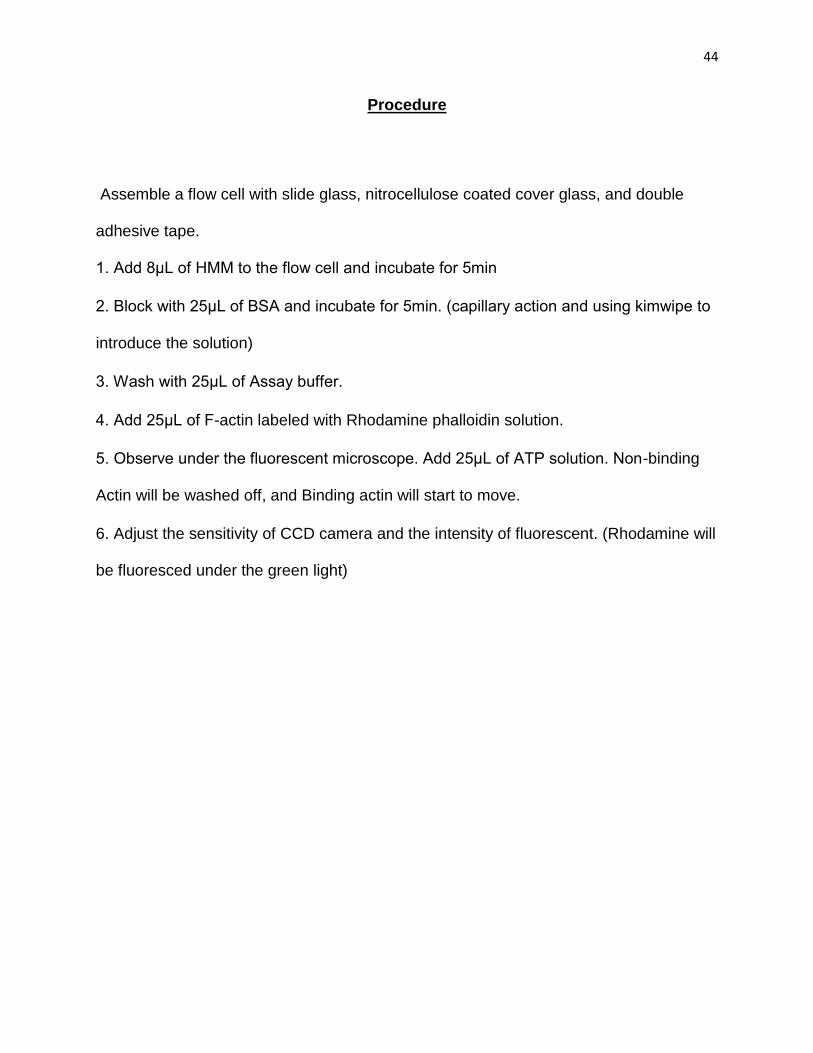
Procedure
Assemble a flow cell with slide glass, nitrocellulose coated cover glass, and double
adhesive tape.
1. Add 8μL of HMM to the flow cell and incubate for 5min
2. Block with 25μL of BSA and incubate for 5min. (capillary action and using kimwipe to
introduce the solution)
3. Wash with 25μL of Assay buffer.
4. Add 25μL of F-actin labeled with Rhodamine phalloidin solution.
5. Observe under the fluorescent microscope. Add 25μL of ATP solution. Non-binding
Actin will be washed off, and Binding actin will start to move.
6. Adjust the sensitivity of CCD camera and the intensity of fluorescent. (Rhodamine will
be fluoresced under the green light)

45
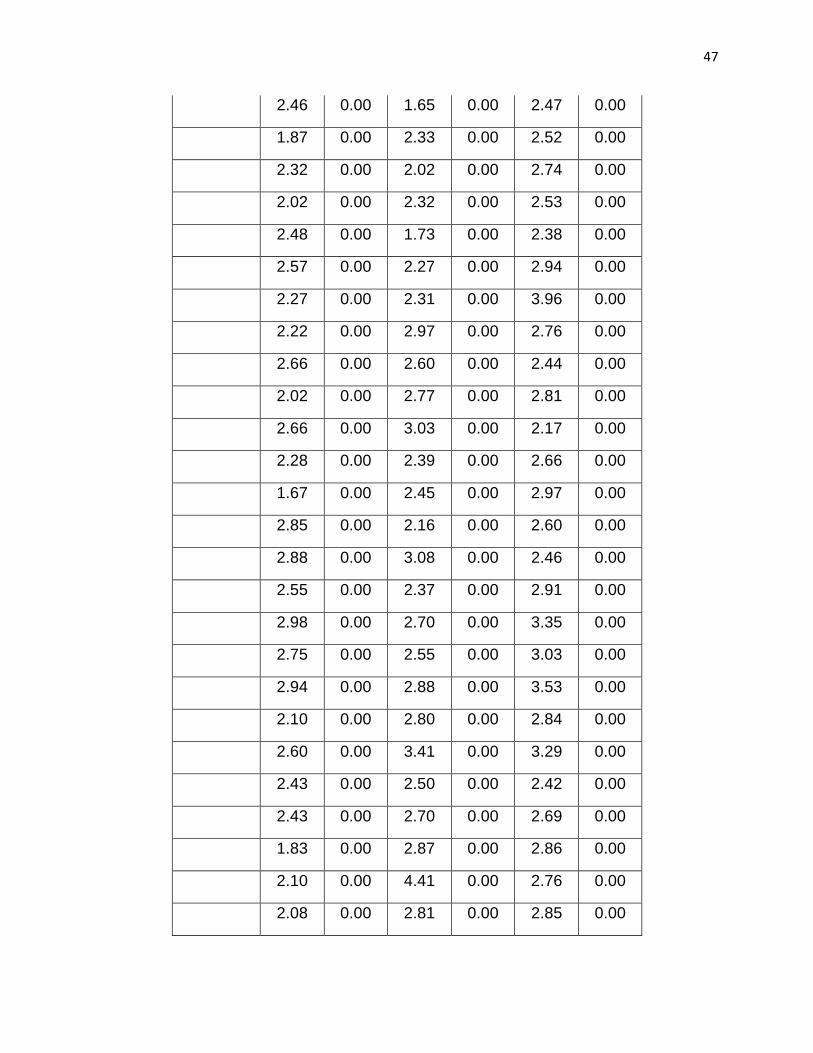
Results
Table 1.Cyclical variation of the average velocity (µm/s) of the actin filaments
Start 1 Stop 1 Start 2 Stop 2 Start 3 Stop 3
2.94 0.00 2.91 0.00 3.61 0.00
2.73 0.00 3.12 0.00 3.64 0.00
2.79 0.00 3.51 0.00 3.09 0.00
2.32 0.00 2.86 0.00 2.80 0.00
3.41 0.00 2.80 0.00 2.61 0.00
3.39 0.00 2.65 0.00 3.62 0.00
3.64 0.00 2.22 0.00 2.35 0.00
3.64 0.00 3.49 0.00 3.41 0.00
3.33 0.00 3.48 0.00 2.97 0.00
3.72 0.00 2.70 0.00 2.99 0.00
2.83 0.00 2.60 0.00 2.53 0.00
3.89 0.00 3.07 0.00 3.06 0.00
2.92 0.00 2.70 0.00 3.49 0.00
3.06 0.00 3.76 0.00 2.75 0.00
2.51 0.00 3.85 0.00 3.16 0.00
2.91 0.00 2.83 0.00 2.42 0.00
4.11 0.00 2.37 0.00 3.87 0.00
3.11 0.00 3.11 0.00 4.07 0.00
3.66 0.00 3.25 0.00 1.88 0.00
3.16 0.00 2.98 0.00 3.66 0.00
3.88 0.00 3.59 0.00 3.19 0.00
3.52 0.00 2.89 0.00 3.26 0.00

46
3.42 0.00 2.72 0.00 3.15 0.00
4.03 0.00 3.18 0.00 3.45 0.00
4.22 0.00 2.65 0.00 2.95 0.00
1.79 0.00 2.61 0.00 2.40 0.00
1.97 0.00 2.32 0.00 2.42 0.00
1.83 0.00 2.14 0.00 1.75 0.00
2.36 0.00 1.51 0.00 2.16 0.00
1.64 0.00 2.40 0.00 2.29 0.00
2.53 0.00 2.11 0.00 2.25 0.00
1.74 0.00 2.57 0.00 2.25 0.00
1.48 0.00 2.05 0.00 2.38 0.00
2.03 0.00 2.55 0.00 2.72 0.00
2.53 0.00 2.18 0.00 2.94 0.00
1.98 0.00 1.67 0.00 2.47 0.00
2.09 0.00 1.49 0.00 2.27 0.00
2.79 0.00 2.95 0.00 2.42 0.00
1.76 0.00 1.94 0.00 1.83 0.00
1.93 0.00 2.08 0.00 1.83 0.00
2.11 0.00 2.79 0.00 2.83 0.00
2.01 0.00 1.82 0.00 1.36 0.00
2.62 0.00 2.44 0.00 2.12 0.00
2.50 0.00 2.35 0.00 1.74 0.00
2.40 0.00 2.51 0.00 2.56 0.00
2.21 0.00 2.39 0.00 2.77 0.00
1.97 0.00 2.21 0.00 2.39 0.00
2.27 0.00 2.68 0.00 2.89 0.00
47
2.46 0.00 1.65 0.00 2.47 0.00
1.87 0.00 2.33 0.00 2.52 0.00
2.32 0.00 2.02 0.00 2.74 0.00
2.02 0.00 2.32 0.00 2.53 0.00
2.48 0.00 1.73 0.00 2.38 0.00
2.57 0.00 2.27 0.00 2.94 0.00
2.27 0.00 2.31 0.00 3.96 0.00
2.22 0.00 2.97 0.00 2.76 0.00
2.66 0.00 2.60 0.00 2.44 0.00
2.02 0.00 2.77 0.00 2.81 0.00
2.66 0.00 3.03 0.00 2.17 0.00
2.28 0.00 2.39 0.00 2.66 0.00
1.67 0.00 2.45 0.00 2.97 0.00
2.85 0.00 2.16 0.00 2.60 0.00
2.88 0.00 3.08 0.00 2.46 0.00
2.55 0.00 2.37 0.00 2.91 0.00
2.98 0.00 2.70 0.00 3.35 0.00
2.75 0.00 2.55 0.00 3.03 0.00
2.94 0.00 2.88 0.00 3.53 0.00
2.10 0.00 2.80 0.00 2.84 0.00
2.60 0.00 3.41 0.00 3.29 0.00
2.43 0.00 2.50 0.00 2.42 0.00
2.43 0.00 2.70 0.00 2.69 0.00
1.83 0.00 2.87 0.00 2.86 0.00
2.10 0.00 4.41 0.00 2.76 0.00
2.08 0.00 2.81 0.00 2.85 0.00

48
2.63 0.00
2.99 0.00
N 75.00 75.00 74.00 74.00 75.00 75.00
Mean 2.62 0.00 2.64 0.00 2.76 0.00
STDEV 0.66 0.00 0.55 0.00 0.55 0.00
SEM 0.08 0.00 0.06 0.00 0.06 0.00
Maximum 4.22 0.00 4.41 0.00 4.07 0.00
Minimum 1.48 0.00 1.49 0.00 1.36 0.00
Total 196.26 0.00 195.10 0.00 206.88 0.00

49
Table 2.Cyclical variation of the motility percentage of the actin filaments
Start 1 Stop 1 Start 2 Stop 2 Start 3 Stop 3
90.00 0.00 81.58 0.00 75.00 0.00
96.23 0.00 83.33 0.00 78.57 0.00
88.10 0.00 83.33 0.00 73.91 0.00
82.86 0.00 73.33 0.00 78.05 0.00
88.89 0.00 77.78 0.00 82.86 0.00
73.33 0.00 80.00 0.00 72.73 0.00
94.74 0.00 69.23 0.00 88.24 0.00
71.43 0.00 80.00 0.00 57.14 0.00
78.95 0.00 54.55 0.00 60.00 0.00
70.59 0.00 66.67 0.00 75.00 0.00
84.52 0.00 69.33 0.00 68.66 0.00
85.71 0.00 77.27 0.00 77.63 0.00
84.71 0.00 75.34 0.00 69.32 0.00
86.25 0.00 68.89 0.00 71.79 0.00
84.00 0.00 74.73 0.00 73.24 0.00
N 15.00 15.00 15.00 15.00 15.00 15.00
Average 84.02 0.00 74.36 0.00 73.48 0.00
STDEV 7.69 0.00 7.71 0.00 7.87 0.00
SEM 2.06 0.00 2.06 0.00 2.10 0.00
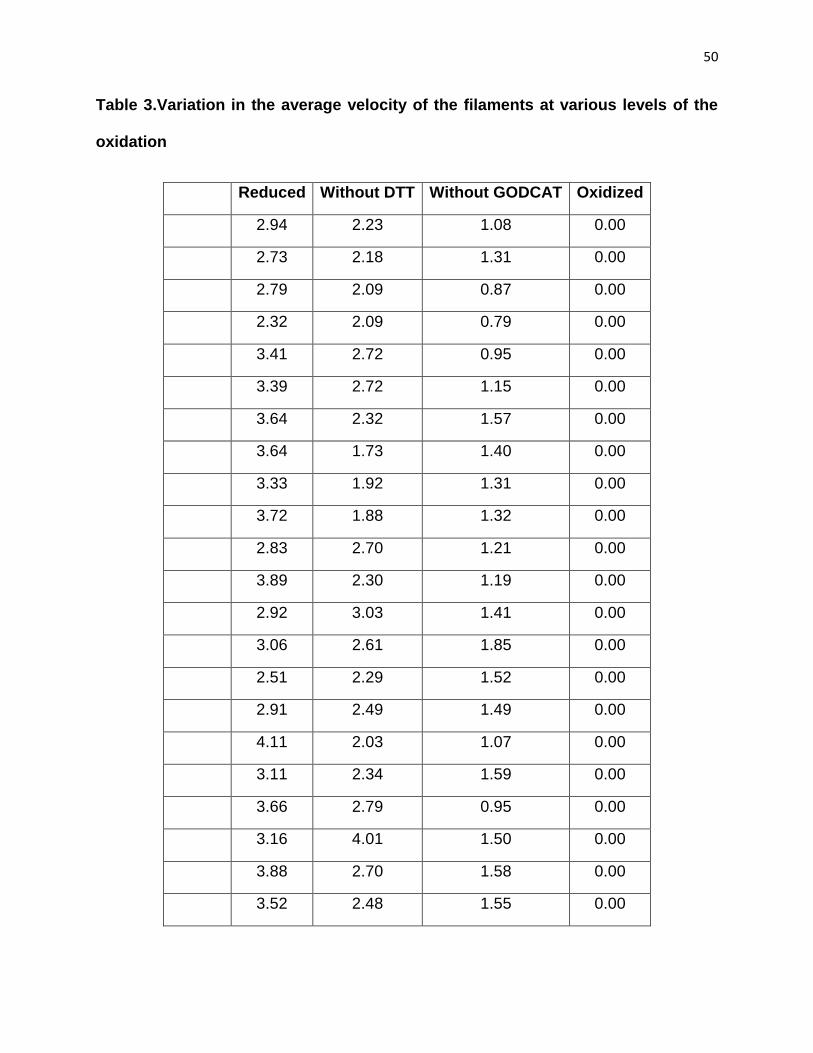
50
Table 3.Variation in the average velocity of the filaments at various levels of the
oxidation
Reduced Without DTT Without GODCAT Oxidized
2.94 2.23 1.08 0.00
2.73 2.18 1.31 0.00
2.79 2.09 0.87 0.00
2.32 2.09 0.79 0.00
3.41 2.72 0.95 0.00
3.39 2.72 1.15 0.00
3.64 2.32 1.57 0.00
3.64 1.73 1.40 0.00
3.33 1.92 1.31 0.00
3.72 1.88 1.32 0.00
2.83 2.70 1.21 0.00
3.89 2.30 1.19 0.00
2.92 3.03 1.41 0.00
3.06 2.61 1.85 0.00
2.51 2.29 1.52 0.00
2.91 2.49 1.49 0.00
4.11 2.03 1.07 0.00
3.11 2.34 1.59 0.00
3.66 2.79 0.95 0.00
3.16 4.01 1.50 0.00
3.88 2.70 1.58 0.00
3.52 2.48 1.55 0.00

51
3.42 1.98 1.12 0.00
4.03 2.18 1.64 0.00
4.22 2.02 0.00 0.00
1.79 2.19 0.00 0.00
1.97 2.19 0.00 0.00
1.83 1.73 0.00 0.00
2.36 2.60 0.00 0.00
1.64 2.03 1.60 0.00
2.53 2.03 1.53 0.00
1.74 2.06 1.18 0.00
1.48 2.45 1.09 0.00
2.03 2.15 1.90 0.00
2.53 2.65 1.84 0.00
1.98 1.90 1.41 0.00
2.09 1.57 2.24 0.00
2.79 2.78 1.71 0.00
1.76 1.62 2.10 0.00
1.93 2.21 1.34 0.00
2.11 1.88 1.43 0.00
2.01 2.03 1.85 0.00
2.62 3.16 1.81 0.00
2.50 1.80 1.22 0.00
2.40 1.63 1.56 0.00
2.21 1.94 0.00 0.00
1.97 2.53 0.00 0.00
2.27 1.78 0.00 0.00

52
2.46 2.16 0.00 0.00
1.87 1.79 1.75 0.00
2.32 2.08 1.49 0.00
2.02 2.19 1.82 0.00
2.47 2.03 2.26 0.00
2.57 2.32 1.83 0.00
2.27 2.70 1.71 0.00
2.22 2.38 1.75 0.00
2.66 2.84 1.24 0.00
2.02 2.43 1.58 0.00
2.66 2.00 1.35 0.00
2.28 2.36 1.85 0.00
1.67 2.15 1.67 0.00
2.85 2.98 1.38 0.00
2.88 2.65 1.33 0.00
2.55 2.61 1.44 0.00
2.98 2.07 1.55 0.00
2.75 2.93 1.53 0.00
2.94 1.92 1.34 0.00
2.10 3.05 0.00 0.00
2.60 2.67 0.00 0.00
2.43 2.95 1.48 0.00
2.43 2.05 1.78 0.00
1.83 1.46 1.77 0.00
2.10 1.87 0.00 0.00
2.08 1.95 0.00 0.00

53
2.63 1.38 2.63 0.00
0.00
N 75.00 75.00 75.00 75.00
Mean 2.62 2.28 1.25 0.00
STDEV 0.66 0.45 0.65 0.00
SEM 0.08 0.05 0.08 0.00
Max 4.22 4.01 2.63 0.00
Min 1.48 1.38 0.00 0.00
Total 196.26 170.71 93.75 0.00

54
Table 4.Variation in the motility percentage of the filaments at various levels of the oxidation
Reduced Without DTT Without GODCAT Oxidized
90.00 80.00 17.65 0.00
96.23 70.00 25.58 0.00
88.10 82.35 33.33 0.00
82.86 85.00 19.05 0.00
88.89 80.56 22.22 0.00
73.33 92.31 0.00 0.00
94.74 100.00 31.71 0.00
71.43 100.00 32.43 0.00
78.95 71.43 35.00 0.00
70.59 84.62 3.23 0.00
84.52 86.49 33.33 0.00
85.71 85.71 42.86 0.00
84.71 88.00 48.48 0.00
86.25 85.19 10.34 0.00
84.00 83.33 13.64 0.00
N 15.00 15.00 15.00 15.00
Average 84.02 85.00 24.59 0.00
STD DEV 7.69 8.36 14.01 0.00
SEM 2.06 2.23 3.74 0.00

55
STATISTICAL ANALYSIS
One Way Analysis of Variance Wednesday, February 25, 2009, 3:44:58 PM
Data source: Average velocities of the actin filaments in different cycles.
Normality Test: Passed (P = 0.064)
Equal Variance Test: Passed (P = 0.170)
Group Name N Missing Mean STD Dev SEM
Start-1 75 0 2.617 0.657 0.0758
Start-2 74 0 2.636 0.549 0.0638
Start-3 75 0 2.758 0.545 0.0629
Source of Variation DF SS MS F P
Between Groups 2 0.881 0.440 1.283 0.279
Residual 221 75.837 0.343
Total 223 76.718
The differences in the mean values among the treatment groups are not great enough
to exclude the possibility that the difference is due to random sampling variability; there
is not a statistically significant difference (P = 0.279).
Power of performed test with alpha = 0.050: 0.091
The power of the performed test (0.091) is below the desired power of 0.800.

56
Less than desired power indicates you are less likely to detect a difference when one
actually exists. Negative results should be interpreted cautiously.
One Way Analysis of Variance Wednesday, February 25, 2009, 3:49:42 PM
Data source: Motility percentage of the actin filaments in different cycles.
Normality Test: Passed (P = 0.057)
Equal Variance Test: Passed (P = 0.989)
Group Name N Missing Mean STD Dev SEM
Start-1 15 0 84.020 7.694 1.987
Start-2 15 0 74.357 7.711 1.991
Start-3 15 0 73.476 7.870 2.032
Source of Variation DF SS MS F P
Between Groups 2 1026.558 513.279 8.527 <0.001
Residual 42 2528.290 60.197
Total 44 3554.848

57
The differences in the mean values among the treatment groups are greater than would
be expected by chance; there is a statistically significant difference (P = <0.001).
Power of performed test with alpha = 0.050: 0.940
All Pair wise Multiple Comparison Procedures (Tukey Test):
Comparisons for factor:
Comparison Diff of Means p q P P<0.050
Start-1 vs. start-3 10.544 3 5.263 0.002 Yes
Start-1 vs. start-2 9.662 3 4.823 0.004 Yes
Start-2 vs. start-3 0.882 3 0.440 0.948 No
One Way Analysis of Variance Friday, April 10, 2009, 9:54:47 AM
Data source: Variability in the velocity of the actin filaments with the variability of the
level of the antioxidants.
Normality Test: Failed (P < 0.050)
Test execution ended by user request, ANOVA on Ranks begun
Kruskal-Wallis One Way Analysis of Variance on RanksFriday, April 10, 2009,
9:54:47 AM
Data source: Variability in the velocity of the actin filaments with the variability of the
level of the antioxidants.

58
Group N Missing Median 25% 75%
Reduced 75 0 2.525 2.093 2.939
Without DTT 75 0 2.190 1.981 2.614
Without oxygen
scavengers 75 0 1.406 1.084 1.662
Oxidized 75 0 0.000 0.000 0.000
H = 235.314 with 3 degrees of freedom. (P = <0.001)
The differences in the median values among the treatment groups are greater than
would be expected by chance; there is a statistically significant difference (P = <0.001)
To isolate the group or groups that differ from the others use a multiple comparison
procedure.
All Pair wise Multiple Comparison Procedures (Tukey Test):
Comparison Diff of Ranks q P<0.05
Reduced vs. Oxidized 14197.000 18.898 Yes
Reduced vs. without OSS 8985.500 11.961 Yes
Reduced vs. Without DTT 1805.500 2.403 No
Without DTT vs. Oxidized 12391.500 16.495 Yes

59
Without DTT vs. Without
OSS 7180.000 9.557 Yes
Without OSS vs. Oxidized 5211.500 6.937 Yes
Note: The multiple comparisons on ranks do not include an adjustment for ties.
Abbreviations: OSS (Oxygen Scavenging System- Glucose oxidase, catalase in the
medium of glucose)

60
One Way Analysis of Variance Friday, April 10, 2009, 10:01:57 AM
Data source: Variability in the percentage of motile actin filaments with the variability of
the level of the antioxidants.
Normality Test: Failed (P < 0.050)
Test execution ended by user request, ANOVA on Ranks begun
Kruskal-Wallis One Way Analysis of Variance on RanksFriday, April 10, 2009,
10:01:57 AM
Data source: Variability in the percentage of motile actin filaments with the variability of
the level of the antioxidants.
Group N Missing Median 25% 75%
Reduced 15 0 84.706 79.925 88.690
Without DTT 15 0 85.000 81.005 87.622
Without OSS 15 0 25.581 14.639 33.333
Oxidized 15 0 0.000 0.000 0.000
H = 50.033 with 3 degrees of freedom. (P = <0.001)
The differences in the median values among the treatment groups are greater than
would be expected by chance; there is a statistically significant difference (P = <0.001)
To isolate the group or groups that differ from the others use a multiple comparison
procedure.

61
All Pair wise Multiple Comparison Procedures (Tukey Test):
Comparison Diff of Ranks q P<0.05
Without DTT vs. Oxidized 555.500 8.213 Yes
Without DTT vs. without OSS 345.500 5.108 Yes
Without DTT vs. Reduced 1.000 0.0148 No
Reduced vs. Oxidized 554.500 8.198 Yes
Reduced vs. without OSS 344.500 5.093 Yes
Without oxygen vs. Oxidized 210.000 3.105 No
Note: The multiple comparisons on ranks do not include an adjustment for ties.
Abbreviations: OSS (Oxygen Scavenging System- Glucose oxidase, catalase in the
medium of glucose).
One Way Analysis of Variance Thursday, June 18, 2009, 9:29:47 AM
Data source: Nitro tyrosine
Normality Test: Passed (P = 0.470)
Equal Variance Test: Passed (P = 0.149)
Group Name N Missing Mean Std Dev SEM
HMM 6 0 27.433 3.448 1.408
HMM+F 6 0 23.533 3.564 1.455
W/O
GODCAT 6 0 13.283 2.581 1.054

62
W/O DTT 6 0 24.850 4.400 1.796
W/O AO 6 0 10.850 0.565 0.231
Source of Variation DF SS MS F P
Between Groups 4 1320.582 330.146 32.407 <0.001
Residual 25 254.685 10.187
Total 29 1575.267
The differences in the mean values among the treatment groups are greater than would
be expected by chance; there is a statistically significant difference (P = <0.001).
Power of performed test with alpha = 0.050: 1.000
All Pairwise Multiple Comparison Procedures (Student-Newman-Keuls Method) :
Comparisons for factor:
Comparison Diff of Means p q P P<0.050
HMM vs. W/O AO 16.583 5 12.727 <0.001 Yes
HMM vs. W/O GODCAT 14.150 4 10.859 <0.001 Yes
HMM vs. HMM+F 3.900 3 2.993 0.107 No
HMM vs. W/O DTT 2.583 2 1.983 0.173Do Not Test
W/O DTT vs. W/O AO 14.000 4 10.744 <0.001 Yes
W/O DTT vs. W/O GODCAT 11.567 3 8.877 <0.001 Yes
W/O DTT vs. HMM+F 1.317 2 1.010 0.482Do Not Test
HMM+F vs. W/O AO 12.683 3 9.734 <0.001 Yes
HMM+F vs. W/O GODCAT 10.250 2 7.866 <0.001 Yes
W/O GODCAT vs. W/O AO2.433 2 1.867 0.199 No

63
A result of "Do Not Test" occurs for a comparison when no significant difference is
found between two means that enclose that comparison. For example, if you had four
means sorted in order, and found no difference between means 4 vs. 2, then you would
not test 4 vs. 3 and 3 vs. 2, but still test 4 vs. 1 and 3 vs. 1 (4 vs. 3 and 3 vs. 2 are
enclosed by 4 vs. 2: 4 3 2 1). Note that not testing the enclosed means is a procedural
rule, and a result of Do Not Test should be treated as if there is no significant difference
between the means, even though one may appear to exist.

64
One Way Analysis of Variance Thursday, June 18, 2009, 10:41:48 AM
Data source: Nitro cysteine
Normality Test: Passed (P = 0.056)
Equal Variance Test: Failed (P < 0.050)
Test execution ended by user request, ANOVA on Ranks begun
Kruskal-Wallis One Way Analysis of Variance on RanksThursday, June 18, 2009,
10:41:48 AM
Data source: Nitro cysteine
Group N Missing Median 25% 75%
HMM 6 0 24.700 21.800 31.000
HMM+F 6 0 24.850 21.600 28.200
W/o
GODCAT 6 0 11.150 10.900 11.300
W/o DTT 6 0 26.450 23.100 26.600
W/o AO 6 0 12.900 12.700 13.200
H = 22.368 with 4 degrees of freedom. (P = <0.001)
The differences in the median values among the treatment groups are greater than
would be expected by chance; there is a statistically significant difference (P = <0.001)
To isolate the group or groups that differ from the others use a multiple comparison
procedure.

65
All Pairwise Multiple Comparison Procedures (Tukey Test):
Comparison Diff of Ranks q P<0.05
W/o DTT vs W/o GODCAT 112.000 5.194 Yes
W/o DTT vs W/o AO 76.000 3.524 No
W/o DTT vs HMM+F 7.500 0.348 Do Not Test
W/o DTT vs HMM 4.500 0.209 Do Not Test
HMM vs W/o GODCAT 107.500 4.985 Yes
HMM vs W/o AO 71.500 3.316 Do Not Test
HMM vs HMM+F 3.000 0.139 Do Not Test
HMM+F vs W/o GODCAT 104.500 4.846 Yes
HMM+F vs W/o AO 68.500 3.177 Do Not Test
W/o AO vs W/o GODCAT 36.000 1.669 No
Note: The multiple comparisons on ranks do not include an adjustment for ties.
A result of "Do Not Test" occurs for a comparison when no significant difference is
found between the two rank sums that enclose that comparison. For example, if you
had four rank sums sorted in order, and found no significant difference between rank
sums 4 vs. 2, then you would not test 4 vs. 3 and 3 vs. 2, but still test 4 vs. 1 and 3 vs.
1 (4 vs. 3 and 3 vs. 2 are enclosed by 4 vs. 2: 4 3 2 1). Note that not testing the
enclosed rank sums is a procedural rule, and a result of Do Not Test should be treated
as if there is no significant difference between the rank sums, even though one may
appear to exist.

66
One Way Analysis of Variance Thursday, June 18, 2009, 10:44:20 AM
Data source: Oxyblot
Normality Test: Passed (P = 0.863)
Equal Variance Test: Passed (P = 0.563)
Group Name N Missing Mean Std Dev SEM
HMM 6 0 25.133 2.448 1.000
HMM+F 6 0 27.483 2.079 0.849
W/o GODCAT 6 0 14.100 1.103 0.450
W/o DTT 6 0 23.017 2.388 0.975
W/o AO 6 0 10.233 2.433 0.993
Source of Variation DF SS MS F P
Between Groups 4 1329.895 332.474 71.800 <0.001
Residual 25 115.763 4.631
Total 29 1445.659
The differences in the mean values among the treatment groups are greater than would
be expected by chance; there is a statistically significant difference (P = <0.001).
Power of performed test with alpha = 0.050: 1.000
All Pairwise Multiple Comparison Procedures (Student-Newman-Keuls Method) :
Comparisons for factor:

67
Comparison Diff of Means p q P P<0.050
HMM+F vs. W/o AO 17.250 5 19.636 <0.001 Yes
HMM+F vs. W/o GODCAT13.383 4 15.234 <0.001 Yes
HMM+F vs. W/o DTT 4.467 3 5.084 0.004 Yes
HMM+F vs. HMM 2.350 2 2.675 0.070 No
HMM vs. W/o AO 14.900 4 16.961 <0.001 Yes
HMM vs. W/o GODCAT 11.033 3 12.559 <0.001 Yes
HMM vs. W/o DTT 2.117 2 2.409 0.101 No
W/o DTT vs. W/o AO 12.783 3 14.551 <0.001 Yes
W/o DTT vs. W/o GODCAT8.917 2 10.150 <0.001 Yes
W/o GODCAT vs. W/o AO 3.867 2 4.401 0.005 Yes

68
CURRICULUM VITAE
Siva Krishna Nalabotu
5317, Midway drive
Huntington, WV 25705
Phone: (304) 638-3696
E-mail: [email protected]
OBJECTIVES
Explore the field of science to quench my thirst for knowledge.
To work efficiently and effectively as well as grow with a prestigious
organization.
WORK EXPERIENCE
Jan 2008 – Present: Research Assistant / Assistant lab manager, Marshall
University, Huntington, WV.
o Duties: Thesis research, responsible for laboratory ordering, inventory
upkeep, P-card management, laboratory record keeping, tracking of
project resources, preparation of stock solutions, involved in overseeing
laboratory safety and compliance.
Oct 2007 - Dec 2007: Poultry pathologist, Srinivasa hatcheries, Vijayawada,
India.
o Duties: Disease diagnosis, treatment and prevention in poultry farms.
Identification of cause of disease by performing postmortem. Educating
the people about prevention and control of diseases in the farms.
April 2007 – Oct 2007: Student Internship, State institute of animal health,
Ongole, Andhra Pradesh, India.
o Duties: Performing various surgical, medical and gynecological
procedures on animals for curing the disease process, diagnosis,
treatment and prevention of diseases in various livestock, educating the

69
people about how to improve the productivity of live stock, control of
diseases by vaccination, attending various vetero legal cases like
toxicities and performing postmortem to identify the cause of death,
making people aware of various zoonotic diseases and community
outreach programs.
EDUCATION
Jan 2008- Present (Grade:3.56/4.0)
o Pursuing Master of Science Department of Biological Sciences, Marshall
University, Huntington, WV.
Aug 2002-Oct 2007 (Grade 4.0/4.0)
o Bachelor of Veterinary Science and Animal Husbandry (Equivalent to
DVM), College of Veterinary Science, Sri Venkateswara veterinary
university Tirupati, India.
LICENSE EXAMS CLEARED- For ECFVG certification
BCSE (Basic and Clinical Sciences Examination)
NAVLE (North American Veterinary Licensing Examination)
TESTS
GRE : Dec 2006, Verbal-640, Quantitative-700, Analytical writing-2.5
TOEFL: Aug 2007, Total-82.
PUBLICATIONS
1. Application of PAMAM dendrimers for use in bionanomotor systems
Madhukar Kolli, B Scott Day, Kevin M. Rice, Hideyo Takatsuki, Kazahiro
Kohama, Murali K Gadde, Siva K Nalabotu, Sunil K Kakarla and Eric R.
Blough (In preparation)

70
2. Control of myosin motor activity and actin filament translation by alteration
of assay reducing potential Siva K Nalabotu, Eric R. Blough (In
preparation)
3. Application of liposomes for cargo transport and unloading through actin
bundle-myosin motor system Hideyo Takatsuki, Hideyuki Tanaka,
Madhukar Kolli, Siva K. Nalabotu, Kazuhiro Kohama, and Eric R. Blough
(In preparation)
PROFESSIONAL MEMBERSHIPS
Association of Young Scientists Jan 2008-present
Cell Differentiation and Development centre Jan 2008-present
Veterinary Council of India Oct 2007-life time
Andhra Pradesh Veterinary Council Oct 2007-life time
AAAS (American Association for the advancements in Science).
NANO TECHNOLOGY TECHNIQUES
Purification of actin from chicken skeletal muscle.
Purification of myosin from scallop (a mollusk) and skeletal muscle of rabbit.
In-vitro motility assays.
Epi fluorescent microscopy.
Analysis of data using win DVD creator project software.
Making PDMS molds and silicon masters.
Photo lithographical patterning of proteins.
Photo patterning of proteins using UV light.
MOLECULAR BIOLOGY TECHNIQUES
SDS–PAGE
Western Blot Analysis

71
Immunohistochemistry
Protein extraction & Purification from muscle samples
ANIMAL MODELS
Trained to handle animals in research as per IACUC guidelines.
Experienced with F344XBN F1 Aging rat model, Gerbils and Obese
Syndrome X Zucker rat model.
Rat Hind limb Suspension model of Muscle Atrophy; Skeletal Muscle Stretch.
Echocardiography, electrocardiography, physiological and pathological
aspects of rats.
MICROSCOPIC TECHNIQUES
Light microscopy
Fluorescence microscopy
Confocal microscopy
CURRENT PROJECTS
Master’s Thesis Project: Control of myosin motor activity and actin filament
translation by alteration of assay reducing potential, PI: Eric R Blough, Ph. D
(Fall 2008). Marshall University, Huntington, WV.
Application of PAMAM dendrimers for use in bionanomotor systems, Primary
Investigator: Eric R Blough, PhD Marshall University, Huntington, WV (Spring
2008).
PREVIOUS RESEARCH EXPERIENCE
June 2005-Oct 2005: “Earn while you learn” poultry project in conjunction with
the department of poultry science. Primary Investigator: Dr. Ch. Srilatha,
Ph.D. College of Veterinary Science, Tirupati.

72
PRESENTATIONS
Spring 2008: 1. “Use of erythrocyte ghost cells as cargo carriers”.
2. “Metabolic syndrome - pros and cons”
Marshall University, College of Science.
Fall 2008: “Use of liposomes for controlled delivery of nano cargo in in-vitro
motility assays”, Marshall University, College of Science.
AWARDS
Jan 2008 onwards: Marshall University, NSFEPSCoR #9871948 graduate
assistantship with stipend.
Oct 2007: Best volunteer for National Social Service program during
veterinary internship program.
COMPUTING AND STATISTICAL SOFTWARE
Well-acquainted with MS Office,
Adobe® Photoshop,
Adobe® Acrobat,
Sigma Stat®,
Endnote®,
BIOPAC® Systems.
Analysis with Win DVD creator project software.
Alpha ease software,
Well acquainted with IMAGE J analysis.
COMMUNITY SERVICE AND OTHER ACTIVITIES
July 2007: Participated in National Social Service (NSS) animal health camps
and gynecology camps to treat infertility in animals.
Aug 2007 - Sep 2007: Participated in free animal health camp to treat
ailments of animals.

73
Participated in various free vaccination camps, infertility camps, spaying,
castration of stray dogs, making awareness camps for the ethical treatment
and preservation of animals and ecosystem.

74
REFERENCES
1) Dr. Eric R Blough
Room # 241 BBSC
Marshall University
Huntington, WV 25755
Phone: (304) 696-2708
2) Dr. David Mallory
Room# 326,
Science building,
Marshall University
Huntington, WV 25755
Phone: (304)696 2353
3) Dr. Bin Wang,
Room # 241S BBSC
Marshall University
Huntington, WV 25755
Phone: (304) 696-3456


![Cardiotonic bipyridine amrinone slows myosin-induced actin filament sliding at saturating [MgATP]](https://static.fdokumen.com/doc/165x107/63437f1709a7e2992b0e5f82/cardiotonic-bipyridine-amrinone-slows-myosin-induced-actin-filament-sliding-at-saturating.jpg)