A Gill Filament EROD Assay - DiVA Portal
46
Comprehensive Summaries of Uppsala Dissertations from the Faculty of Science and Technology 920 A Gill Filament EROD Assay Development and Application in Environmental Monitoring BY MARIA JÖNSSON ACTA UNIVERSITATIS UPSALIENSIS UPPSALA 2003
-
Upload
khangminh22 -
Category
Documents
-
view
4 -
download
0
Transcript of A Gill Filament EROD Assay - DiVA Portal
Comprehensive Summaries of Uppsala Dissertationsfrom the Faculty of Science and Technology 920
A Gill Filament EROD AssayDevelopment and Application in
Environmental Monitoring
BY
MARIA JÖNSSON
ACTA UNIVERSITATIS UPSALIENSISUPPSALA 2003

List of Papers
This thesis is based on the following papers, which are referred to in the text by their Roman numerals:
I Jönsson EM, Brandt I, Brunström B. 2002. A gill filament-based EROD assay for monitoring waterborne dioxin-like pollutants in fish. Environ Sci Technol. 36, 3340–3344.
II Jönsson EM, Abrahamson A, Brunström B, Brandt I, Ingebrigtsen K, Jørgensen EH. 2003. EROD activity in gills of anadromous and marine fish as a biomarker of dioxin-like pollutants. Comp Biochem Physiol C. 136, 235–243.
III Jönsson EM. Brunström B, Ingebrigtsen, K. Brandt I. 2004. Cell-specific CYP1A expression and benzo[a]pyrene adduct formation in gills of rainbow trout (Oncorhynchus mykiss) following CYP1A induction in the laboratory and in the field. Environ Toxicol Chem.23 (4) In press.
IV Jönsson EM, Abrahamson A, Brunström B, Brandt I. EROD activities in gills and liver and CYP1A enzyme localisation in gills of fish exposed to waterborne benzo[a]pyrene, PCB#126 and indigo. Manuscript.
Reprints of papers I, II and III were made with permission from the publishers.
Contents
1. Introduction.................................................................................................71.1. Background .........................................................................................71.2. Aims ....................................................................................................71.3. Environmental monitoring and biomarkers.........................................81.4. AhR agonists in the environment ........................................................91.5. Toxic effects of AhR agonists ...........................................................101.6. Toxic equivalency factors .................................................................121.7. Aryl hydrocarbon receptor activation................................................121.8. Bioactivation of PAHs ......................................................................131.9. CYP1A enzyme and bioactivation of PAHs in gills .........................141.10. Gill architecture...............................................................................15
2. Methods ....................................................................................................182.1. Laboratory exposure of fish to AhR agonists....................................182.2. Gill filament EROD assay.................................................................192.3. Autoradiography................................................................................202.4. Immunohistochemistry......................................................................202.5. Liver EROD assay.............................................................................21
3. Experiments, results and discussion..........................................................223.1. Gill filament EROD assay.................................................................22
Applicability of the gill filament assay .............................................233.3. EROD activity in gills and liver and CYP1A localisation in gills after exposure to BaP, PCB#126 and indigo ....................................................253.5. CYP1A expression and BaP adduct formation in gill cells...............293.6. Gill filament EROD induction by exposure in the field....................32
4. Evaluation of gill filament EROD activity as a biomarker of exposure ...35
5. Conclusions...............................................................................................385.1. Gill filament EROD activity as a biomarker and a monitoring tool..38

5.2. Comparison of EROD induction in the gills and liver ......................385.3. Cellular localisation of CYP1A enzyme and CYP1A-mediated formation of PAH adducts in the gills......................................................39
6. Acknowledgement ....................................................................................40
7. References.................................................................................................41
Abbreviations
AhR aryl hydrocarbon receptor NF -naphthoflavone
BSA bovine serum albumin b.w. body weight CYP cytochrome P450 DMSO dimethyl sufoxide EROD 7-ethoxyresorufin O-deethylasei.p. intraperitoneal Kow octanol/water partition coefficient PCB polychlorinated biphenyl PAH polycyclic aromatic hydrocarbon PCDD polychlorinated dibenzo-p-dioxinPCDF polychlorinated dibenzofuran TCDD 2,3,7,8-tetrachlorodibenzo-p-dioxinTEF toxic equivalency factor

7
1. Introduction
1.1. Background The fish gill is a multifunctional organ involved in respiration, osmoregulation, acid/base regulation and nitrogen excretion. These functions are carried out on a large epithelial surface, which is exposed to a continuous flow of water. The close contact with the ambient water also makes the gill an uptake site for waterborne pollutants. During a single pass through the gills up to 60% of organic chemicals present in the inspired water may be extracted (McKim et al., 1985). Polychlorinated dibenzo-p-dioxins (PCDDs) and dibenzofurans (PCDFs), coplanar polychlorinated biphenyls (PCBs) and certain polycyclic aromatic hydrocarbons (PAHs) are toxic environmental pollutants which have in common that they bind to the aryl hydrocarbon receptor (AhR), and subsequently induce the synthesis of cytochrome P4501A (CYP1A). The CYP1A enzyme can be induced in many vertebrate organs (liver, kidneys, intestines etc), including fish gills, and the induction can be measured as an increase in the CYP1A catalysed activity 7-ethoxyresorufin O-deethylase (EROD). Hepatic EROD activity in fish is customarily used as a tool to monitor pollutant levels in aquatic ecosystems. However, as readily biotransformed AhR agonists (e.g. PAHs) absorbed from the water and diet may be metabolised before reaching the liver (Van Veld et al., 1997), it is possible that hepatic EROD activity does not always accurately reflect the level of pollution, with the consequence that the pollution level may be underestimated (Levine and Oris, 1999). A better strategy would be to monitor EROD activity in both the liver and organs that are proximate to the environment (e.g. intestines and gills). This thesis focuses on the CYP1A enzyme in the gills and explores the possibility of using EROD activity in fish gills as a biomarker of exposure to AhR agonists in aquatic ecosystems.
1.2. AimsThe aim of the thesis was to increase the understanding of CYP1A in fish gills with the goal to use branchial EROD activity as a biomarker of

8
exposure to AhR agonists in the aquatic environment. The aims of paper I were to develop a gill-based EROD assay and to determine EROD induction in the gills of rainbow trout (Oncorhynchus mykiss) after exposure to waterborne CYP1A inducers in the laboratory and in the wild (paper I). The aim of paper II was to test the gill-based EROD assay in various freshwater and seawater dwelling fish. The aim of paper III was to examine the relationship between EROD activity, cellular localisation of CYP1A protein, and BaP adduct formation in the gills of fish exposed to dioxin-like compounds in the laboratory and in the wild. The aim of paper IV was to study first-pass metabolism in the gills by comparing branchial and hepatic EROD induction over time and gill cell specific localisation CYP1A enzyme in fish exposed to a readily metabolised (benzo[a]pyrene; BaP) and a persistent (PCB#126) AhR agonist. Another aim of paper IV was to examine whether the textile dye indigo causes CYP1A induction in fish.
1.3. Environmental monitoring and biomarkers An increased awareness of the problems surrounding environmental pollution has led to political decisions limiting or banning the use and release of a number of toxic compounds. In addition, environmental monitoring programs have been set up to survey contaminant levels in the ecosystems (e.g. http://europa.eu.int/comm/environment/dioxin/dioxin.pdf;October 1999). In the nation-wide Swedish contaminant monitoring programs of marine and limnic biota a range of contaminants (e.g. metals, PCBs and pesticides) are regularly analysed in the tissues of fish caught every year at selected locations along the Swedish coast and in Swedish lakes. These studies give information on spatial differences as well as time trends in the contaminant levels of the marine and limnic ecosystems (http://www.nrm.se/mg/mcom02.pdf; http://www.nrm.se/mg/fcom02.pdf; October 2002). The monitoring results are also used to evaluate the results of ongoing measures to reduce the discharges of particular compounds.
However, as chemical monitoring focuses on specific compounds, those not covered by the analytical technique will be neglected and, consequently, unidentified pollutants may be overlooked. A complement to chemical monitoring, which would increase the chances of discovering unidentified pollutants, is to analyse a battery of biomarkers in animals dwelling in the polluted areas. A biomarker is defined as a biological (molecular, biochemical, physiological, structural or behavioural) change or aberration in an organism, which can be used to estimate either exposure to chemicals or resultant effects (reviewed by Van der Oost et al., 2003; Handy et al., 2003). Hence, a biomarker may respond to various chemicals having similar effects and, if chosen correctly, the biomarker response is specific enough to indicate a particular contaminant class. Furthermore, biomarkers measure the

9
biologically available fractions of the contaminant, and at temporal exposure to readily metabolised and excreted pollutants, the biomarker response may last longer than the presence of the active compound (Handy et al., 2003). Not least important in this context is that the biomarker responses often are easier, faster, and less expensive to analyse than the corresponding chemical.
EROD activity is a well-established biomarker of exposure to AhR agonists, and the EROD response can be considered an integrated measure of all AhR agonists to which the organism is exposed. EROD activity is regarded as one of the most sensitive and specific biomarkers of AhR agonist exposure (Bucheli and Fent, 1995). Therefore, although no information on the identity of specific chemicals is obtained by EROD determination it is a tool to reveal the presence of AhR agonists in the ecosystem at an early stage of exposure.
1.4. AhR agonists in the environment PCDDs/Fs are formed during low-temperature (300–500 C) combustion of hydrocarbons in the presence of chlorine (e.g. Wikström et al., 2003), and the formation is enhanced by heavy metals (Wobst et al., 2003). PCDDs/Fs are released to the environment in several ways, for instance through the burning of chlorinated waste, from metal smelters, or through the use of pesticides containing PCDDs/Fs as by-products. PAHs are formed during incomplete combustion of organic materials (e.g. fossil fuels, wood and waste). Other sources of PAHs are petroleum spills, leakage from creosote-treated wood products and highway runoff. PCDDs/Fs and PAHs are also released through natural processes such as during forest fires, whereas the PCBs are synthetic compounds. Due to their low flammability, chemical stability, high boiling point and electrical insulating properties, technical mixtures of PCBs were formerly used in a wide variety of applications, including as insulators in electrical equipment (e.g. hydraulic and heat transfer equipment), plasticizers (in paints, plastics and rubber products) and lubricants. Although the manufacturing of PCBs was banned in many countries several decades ago, equipment and materials containing PCBs are still in use and can be sources of release into the environment.
When released to the atmosphere PCDDs/Fs and PAHs are transported as vapours or bound to particles and may thus deposit in soil, vegetation and water surfaces far from the original source through wet and dry processes (reviewed in http://europa.eu.int/comm/environment/dioxin/dioxin.pdf; October 1999). Relatively large amounts of PCDDs/Fs are present in soil (Harrad and Jones, 1992). In addition to atmospheric deposition, PCDDs/Fs (as well as PAHs, and PCBs) may enter aquatic environments through runoff of contaminated soil and through direct inputs from municipal and industrial effluents. Important properties for the behaviour of PCDDs/Fs, PCBs and
10
PAHs in water are their high octanol/water and organic carbon/water partition coefficients (Kow and Koc), which implies that they adsorb to particle bound, dissolved, and colloidal organic matter. In these forms, they may be ingested by aquatic organisms, or settle in sediments. PCDDs/Fs and PCBs have high resistance against biotransformation enzymes, whereas PAHs are readily metabolised and excreted by vertebrates. Accordingly, PCDDs/Fs and PCBs accumulate in fat tissues in animals, and biomagnify in food chains, whereas PAHs generally do not biomagnify.
In sediments, PCDDs/Fs and PCBs may persist for many years, since their decomposition is very slow. PAHs are degradable by micro-organisms, but they may persist in sediments for long periods. Although the sediments are considered to be ultimate sinks pollutants may reappear in the water column through resuspension processes, e.g. bottom currents, release of gas bubbles, and bioturbation caused by bottom-dwelling fauna.
1.5. Toxic effects of AhR agonists Many of the toxic effects of PCDDs/Fs and co-planar PCBs seem to depend on their high-affinity binding to and subsequent activation of the AhR. Of the 75 PCDD, 135 PCDF and 209 PCB congeners, 6, 10 and 12 compounds, respectively, are considered to cause AhR mediated toxicity (Van den Berg et al., 1998). The toxic mechanism is not fully understood but is known to involve AhR regulated genes (Poland and Knutson, 1982; Poellinger, 2000). More recently, the activated AhR was shown to interact with the nuclear retinoblastoma protein in eliciting cell cycle arrest (Ge and Elferink, 1998), and the AhR and the AhR-regulated genes are thought to be involved in cell cycle regulation and apoptosis (reviewed by Nebert et al., 2000). Classical effects ascribed to 2,3,7,8-tetrachlorodibenzo-p-dioxin (TCDD) in mammals are loss of appetite, hepatotoxicity, lymphoid involution (loss of thymus, spleen and lymph node tissue) and an associated immunosuppression, tumour promotion, developmental and reproductive toxicity, dermal toxicity (chloracne) and diverse effects on hormones and growth factors (reviewed by Poland and Knutson, 1982; Birnbaum and Tuomisto, 2000). TCDD is also teratogenic and a characteristic effect in mice is cleft palate. The concentrations at which TCDD-derived toxicity is observed differ largely between species.
Similar effects have been reported in both fish and mammals. Many fish are as sensitive to TCDD as the most sensitive known mammal, guinea pig (LD50 0.6–2.5 g/kg b.w.; Schwetz et al., 1973; Silkworth et al., 1982; Hahn, 2001). Mirror carp (Cyprinus carpio) showed cutaneous haemorrhages, swollen gills, decreased food intake and inhibited growth three weeks after injection (i.p.) with TCDD (3 g/kg b.w.), and 60% mortality within 12 weeks (Van der Weiden et al., 1994). After injection of TCDD in Fundulus

11
heteroclitus eggs (0.25 ng/g), the embyos showed apoptosis in several tissues (gill, brain, eye, kidney, tail, intestine, heart, blood vessels, etc) developmental abnormalities (haemorrhages, loss of vascular integrity and oedema) and reduced survival (Toomey et al., 2001). Dietary exposure of female rainbow trout to environmentally relevant concentrations of TCDD (1.8 ng/kg b.w./day) reduced survival in both females and fry (Giesy et al., 2002). Sixteen days after oral administration of 3,3´,4,4´,5-pentachlorobiphenyl (PCB#126; 50 mg/kg b.w.) in European flounder (Platichthys flesus), a reduced thymus weight, an increased liver weight and an increased number of proliferating hepatocytes were observed (Grinwis et al., 2001). A 100 times lower dose (oral) of PCB#126 induced CYP1A expression in several cell types of the European flounder (Grinwis et al., 2001). In medaka (Oryzuas latipes), an increasing number of apoptotic cells in the yolk vein correlated with increasing embryo mortality, and CYP1A expression and apoptosis were co-localised in gills and digestive tissues of fry (Cantrell et al., 1998). Waterborne exposure to TCDD (35–2100 ng/L) of zebrafish (Danio rerio) eggs resulted in e.g. yolk sac oedema, pericardial oedema, slowed heart rate and blood flow, craniofacial malformations, underdevelopment of swim bladder, degeneration of the brain and arrested gill development (Henry et al., 1997). Furthermore, in zebrafish TCDD-evoked effects were found to require CYP1A induction (Teraoka et al., 2003). Lastly, in gills of gilthead seabream (Sparus aurata) exposed to waterborne TCDD (1 pg/L) for 20 days, hyperplasia, hypertrophy and fusion of the secondary lamellae were observed, as well as CYP1A expression in the pillar cells (Arellano et al., 2001).
AhR agonistic PAHs (e.g. benzo[a]pyrene; BaP) are metabolised to mutagenic/carcincogenic reactive intermediates, largely mediated by AhR regulated cytochrome P450 (CYP) forms, such as CYP1A. Long-term exposure to sediment and water contaminated with PAHs (especially those with four and five aromatic rings) is associated with skin and liver tumours in a wide variety of freshwater, marine, and estuarine species of fish, especially bentic omnivores (reviewed by Baumann, 1998). For instance, rainbow trout exposed to BaP in the laboratory developed liver tumours within a year of dietary exposure (Hendricks et al., 1985). PAH-induced tumours in gills are rarely reported, but have been shown in zebrafish exposed to 7,12-dimethylbenz[a]anthracene (Spitsbergen et al., 2000).
However, also other effects of BaP have been reported in fish. For instance, tilapia (Oreochromis niloticus) injected (i.p.) with BaP (5 mg/kg b.w.) showed apoptotic cells in the pronephros and a reduced number of circulating lymphocytes (Holladay et al., 1998).

12
1.6. Toxic equivalency factors One of the most toxic AhR agonists is TCDD. TCDD has the highest known affinity for the AhR, which is believed to be the reason for its high toxic potency. As a means of systematising different AhR agonists by degree of toxicity, the concept of “toxic equivalency factor” (TEF) was developed. The TEF system includes compounds that fulfil four criteria: they show structural similarities with the PCDDs and PCDFs, bind to the AhR, elicit AhR-mediated biochemical and toxic responses, and are persistent and accumulate in the food chains (Van den Berg et al., 1998). Based on existing in vivo and in vitro data each compound has been given a TEF value, designating the compound’s toxic potency in relation to that of TCDD (Van den Berg et al., 1998). Consequently, TCDD (as well as 1,2,3,7,8-pentachlorodibenzo-p-dioxin) has the TEF value of one, whereas all other dioxin-like compounds have TEF values below one. TEF values for different compounds (including TCDD) vary between mammals, fish, and birds (Van den Berg et al., 1998). For instance in mammals and birds 3,3',4,4',5-pentachlorobiphenyl (PCB#126) has the TEF value of 0.1, whereas it has been given the TEF value of 0.005 in fish because of a lower toxicity relative to TCDD (Van den Berg et al., 1998). TEF values are used for risk characterisation and assessment of pollution with AhR agonists. An estimation of the pollution level in an organism can be obtained by calculating a toxic equivalent (TEQ) value, which requires the concentration of each AhR agonistic compound accumulated by the analysed organ to be determined and multiplied by the TEF value.
1.7. Aryl hydrocarbon receptor activation The mechanism of CYP1A induction in mammals has been extensively studied (reviewed by Denison and Nagy, 2003). AhR agonists are planar compounds of a certain size. Inactive AhR is present in the cytoplasm associated with several proteins including a pair of heat shock proteins (Hsp90). Upon ligand binding the AhR is presumed to undergo a conformational change to expose a nuclear localisation sequence, leading to entrance into the nucleus by the whole AhR complex. There the receptor releases the associated proteins, and subsequently heterodimerises with the AhR nuclear translocator (ARNT). The ARNT-AhR-ligand complex is a transcription factor that binds to dioxin-responsive elements in promoter/enhancer regions of the DNA, and induces genes coding for e.g. CYP1A, CYP1B, glutathione S-transferase, UDP-glucuronosyltransferase, NAD(P)H:quinone oxidoreductase (DT-diaphorase) and aldehyde dehydrogenase. In gene microarray studies of human hepatoma cells, up and down regulation of a large number of genes were shown as direct and
13
indirect responses to TCDD exposure (Frueh et al., 2001). For instance, the gene coding for the actin-binding protein adseverin is up-regulated following TCDD exposure (Svensson and Lundberg, 2001).
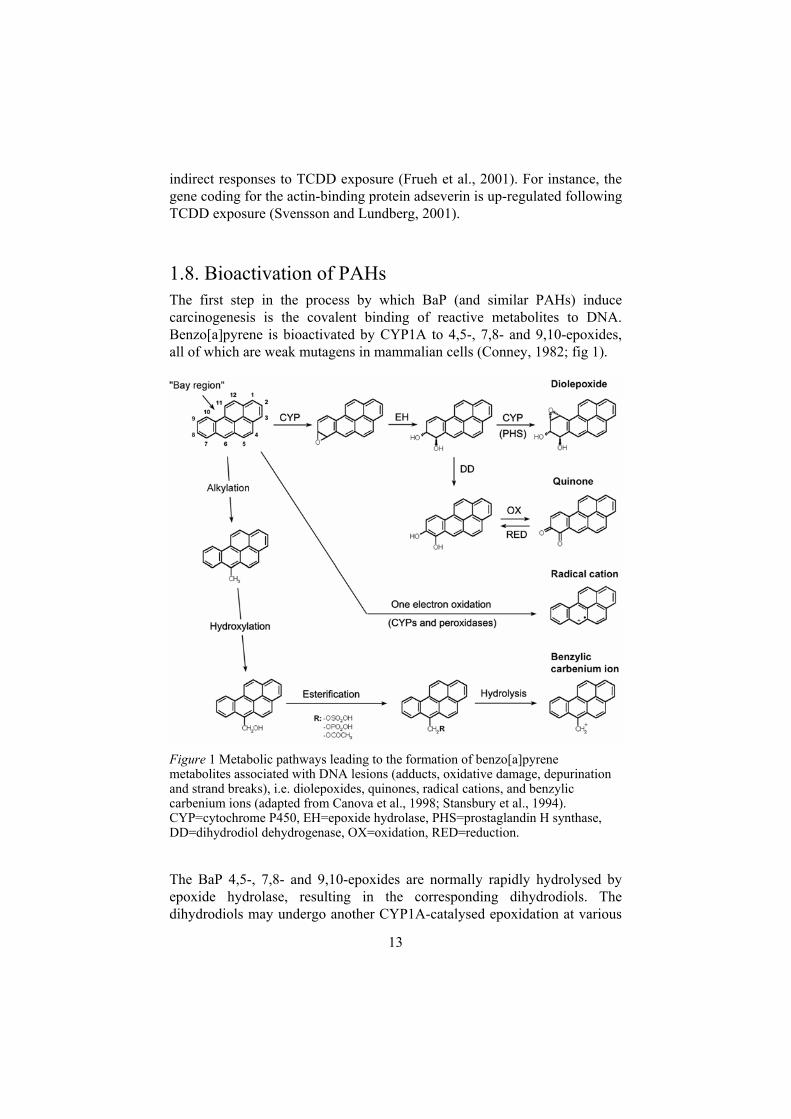
1.8. Bioactivation of PAHs The first step in the process by which BaP (and similar PAHs) induce carcinogenesis is the covalent binding of reactive metabolites to DNA. Benzo[a]pyrene is bioactivated by CYP1A to 4,5-, 7,8- and 9,10-epoxides, all of which are weak mutagens in mammalian cells (Conney, 1982; fig 1).
Figure 1 Metabolic pathways leading to the formation of benzo[a]pyrene metabolites associated with DNA lesions (adducts, oxidative damage, depurination and strand breaks), i.e. diolepoxides, quinones, radical cations, and benzylic carbenium ions (adapted from Canova et al., 1998; Stansbury et al., 1994). CYP=cytochrome P450, EH=epoxide hydrolase, PHS=prostaglandin H synthase, DD=dihydrodiol dehydrogenase, OX=oxidation, RED=reduction.
The BaP 4,5-, 7,8- and 9,10-epoxides are normally rapidly hydrolysed by epoxide hydrolase, resulting in the corresponding dihydrodiols. The dihydrodiols may undergo another CYP1A-catalysed epoxidation at various

14
positions. One resulting reactive intermediate formed from BaP is the 7,8-dihydrodiol-9,10-epoxide, which is the most mutagenic and carcinogenic BaP metabolite known in mammals (the ultimate carcinogen). According to the “bay region theory” the BaP-7,8-dihydrodiol-9,10-epoxide is resistant to epoxide hydrolase due to sterical hindrance and therefore tends to form stable DNA and protein adducts (Conney 1982; fig 1). The BaP 7,8-dihydrodiol-9,10-epoxide has four isomeric forms whereof the (+)-anti-BaP 7,8-dihydrodiol-9,10-epoxide is the most mutagenic (Conney, 1982).
Benzo[a]pyrene-7,8-dihydrodiol may be metabolised by dihydrodiol dehydrogenase into a catechol, which forms a BaP-7,8-dione (ortho-quinone) via autooxidation (Flowers et al., 1996; fig 1). The 7,8-dione is a potent CYP1A inducer that may enter the nucleus bound to the AhR and react with DNA (Burczynsky and Penning, 2000). However the most pronounced effect of BaP-7,8-diones is DNA fragmentation, caused by free radicals generated through redox cycling (Flowers et al., 1996).
Other reactive BaP intermediates are radical cations produced through CYP- or peroxidase-catalysed one-electron oxidation (fig 1). Radical BaP cations form unstable DNA-adducts that are lost spontaneously, leaving an apurinic site in the DNA (Devanesan et al., 1996). BaP adducted DNA bases have been identified in urine and faeces of rats (Rogan et al., 1990) and in urine from cigarette smokers (Casale et al., 2001).
BaP may also undergo methylation and then form a mutagenic benzylic carbenium ion through hydroxylation, esterification, and hydrolysis (Stansbury et al., 1994; fig 1).
1.9. CYP1A enzyme and bioactivation of PAHs in gills Xenobiotic-metabolizing enzymes, e.g. CYP1A, CYP1B (Leaver and George, 2000), CYP3A (Hegelund and Celander, 2003), glutathione S-transferase (Nimmo, 1985) and UDP-glucuronosyltransferase (Clarke et al., 1992) are present in the fish gill. Immunohistochemical studies in gills of fish exposed to dioxin-like compounds have shown that the CYP1A enzyme is present in pillar (endothelial) and respiratory cells (e.g. Miller et al., 1989; Smolowitz et al., 1991; Husøy et al., 1996). Waterborne exposure results in a stronger CYP1A immunostaining in the gills than dietary exposure (Van Veld et al 1997; Woodin et al., 1997).
Benzo[a]pyrene is metabolised in the gills as indicated by the fact that conjugated and non-conjugated BaP metabolites were found in gills of Northern pike, Esox lucius (Balk et al., 1984), and perfusate of rainbow trout gills (Andersson and Pärt, 1989) after waterborne exposure to BaP. Rainbow trout gills form dihydrodiols (in the 4,5-, 7,8- and 9,10-positions) and BaP-conjugates (Stegeman et al., 1984; Andersson and Pärt, 1989). Following exposure of polar cod (Boreogadus saida) to waterborne BaP at subzero
15
temperature, BaP binding was observed primarily in the gills (Ingebrigtsen et al., 2000). Light microscopy autoradiography of sections of polar cod gills showed that the BaP adducts were localised to the epithelial cells (Ingebrigtsen et al., 2000).
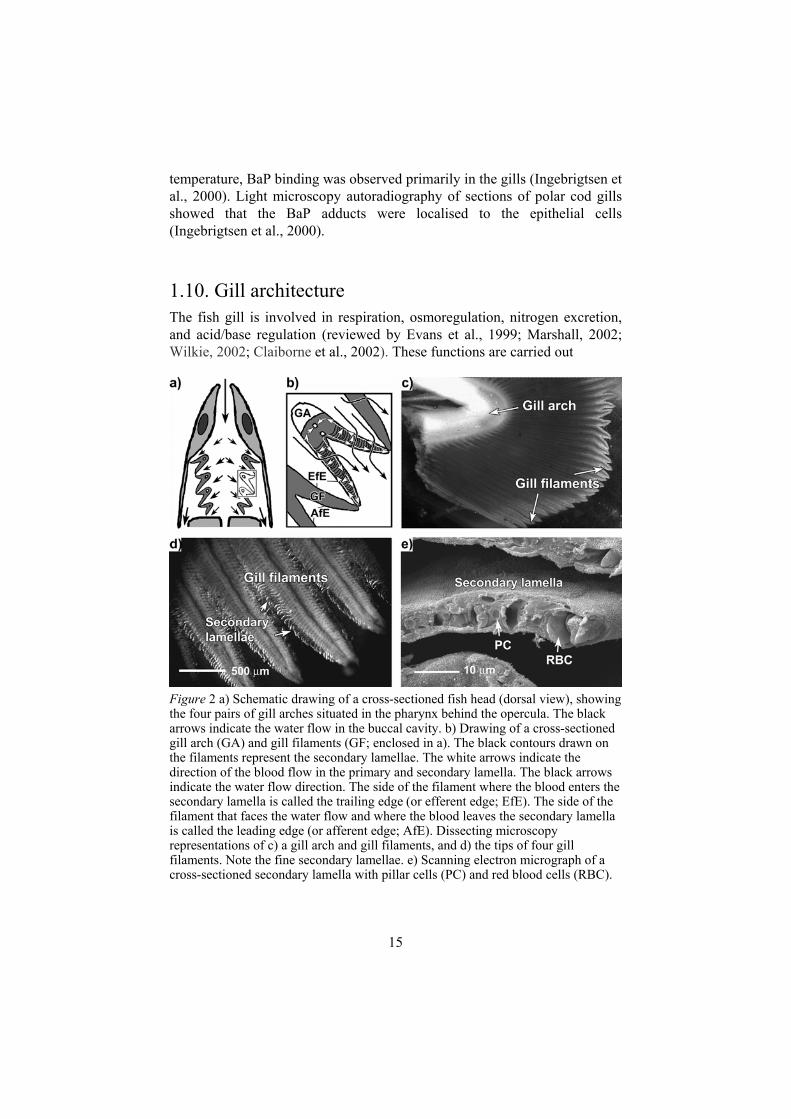
1.10. Gill architecture The fish gill is involved in respiration, osmoregulation, nitrogen excretion, and acid/base regulation (reviewed by Evans et al., 1999; Marshall, 2002; Wilkie, 2002; Claiborne et al., 2002). These functions are carried out
Figure 2 a) Schematic drawing of a cross-sectioned fish head (dorsal view), showing the four pairs of gill arches situated in the pharynx behind the opercula. The black arrows indicate the water flow in the buccal cavity. b) Drawing of a cross-sectioned gill arch (GA) and gill filaments (GF; enclosed in a). The black contours drawn on the filaments represent the secondary lamellae. The white arrows indicate the direction of the blood flow in the primary and secondary lamella. The black arrows indicate the water flow direction. The side of the filament where the blood enters the secondary lamella is called the trailing edge (or efferent edge; EfE). The side of the filament that faces the water flow and where the blood leaves the secondary lamella is called the leading edge (or afferent edge; AfE). Dissecting microscopy representations of c) a gill arch and gill filaments, and d) the tips of four gill filaments. Note the fine secondary lamellae. e) Scanning electron micrograph of a cross-sectioned secondary lamella with pillar cells (PC) and red blood cells (RBC).
16
through exchange of gases and ions at the interface of the branchial epithelium and the ambient water. Uptake and excretion of ions occur through membrane bound transport proteins (ion channels and ion pumps) in the epithelial cells (e.g. Evans et al., 1999). An efficient gas exchange is achieved through a number of adaptations. The whole cardiac output passes through the gill. The gas exchange area in contact with water is large, the water and blood flows are counter-current, and the diffusion distance between blood and water is short. The gills consist of four pairs of gill arches situated bilaterally on either side of the pharynx behind the opercula (fig 2a; reviewed by Wilson and Laurent, 2002). From each gill arch, two rows of gill filaments protrude to filter the exhaled water (fig 2a–c). The water flow and the counter-current blood flow are shown in figure 2b.
The filaments consist of the primary and the secondary lamellae (fig 2a–c). The primary lamellae carry a large number of secondary lamellae, which are the thin half-disc formed structures where gas exchange takes place (fig 2d-e). Each filament has an afferent and an efferent artery. Blood enters the lamellae from the afferent filamental artery via afferent lamellar arteries and oxygenated blood leaves the lamellae via efferent lamellar arteries, which drain into the efferent filamental artery (reviewed by Olson, 2002; fig 2b).
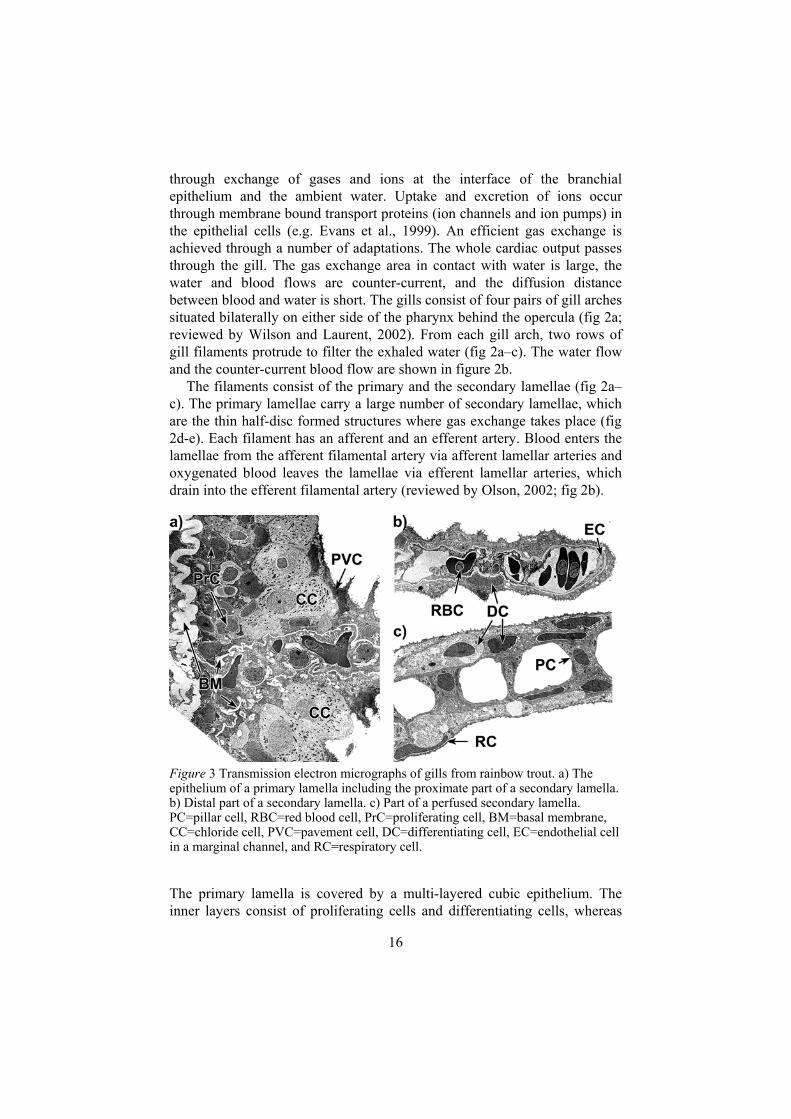
Figure 3 Transmission electron micrographs of gills from rainbow trout. a) The epithelium of a primary lamella including the proximate part of a secondary lamella. b) Distal part of a secondary lamella. c) Part of a perfused secondary lamella. PC=pillar cell, RBC=red blood cell, PrC=proliferating cell, BM=basal membrane, CC=chloride cell, PVC=pavement cell, DC=differentiating cell, EC=endothelial cell in a marginal channel, and RC=respiratory cell.
The primary lamella is covered by a multi-layered cubic epithelium. The inner layers consist of proliferating cells and differentiating cells, whereas

17
the outer layer contains chloride cells, pavement cells and mucus (goblet) cells (fig 3a). The secondary lamella is composed of a two-layered squamous epithelium and a capillary network of pillar cells (fig 3b-c). The inner layer of the epithelium of the secondary lamella contains differentiating cells, which are derived from the inner layers of the primary lamella and which will replace cells in the outer layer (respiratory and chloride cells; Zenker et al 1987). The pillar cells contain contractile microfilaments, which function to regulate the lamellar blood flow. The capillary network also includes a marginal channel of endothelial cells (fig 3b).
18
2. Methods
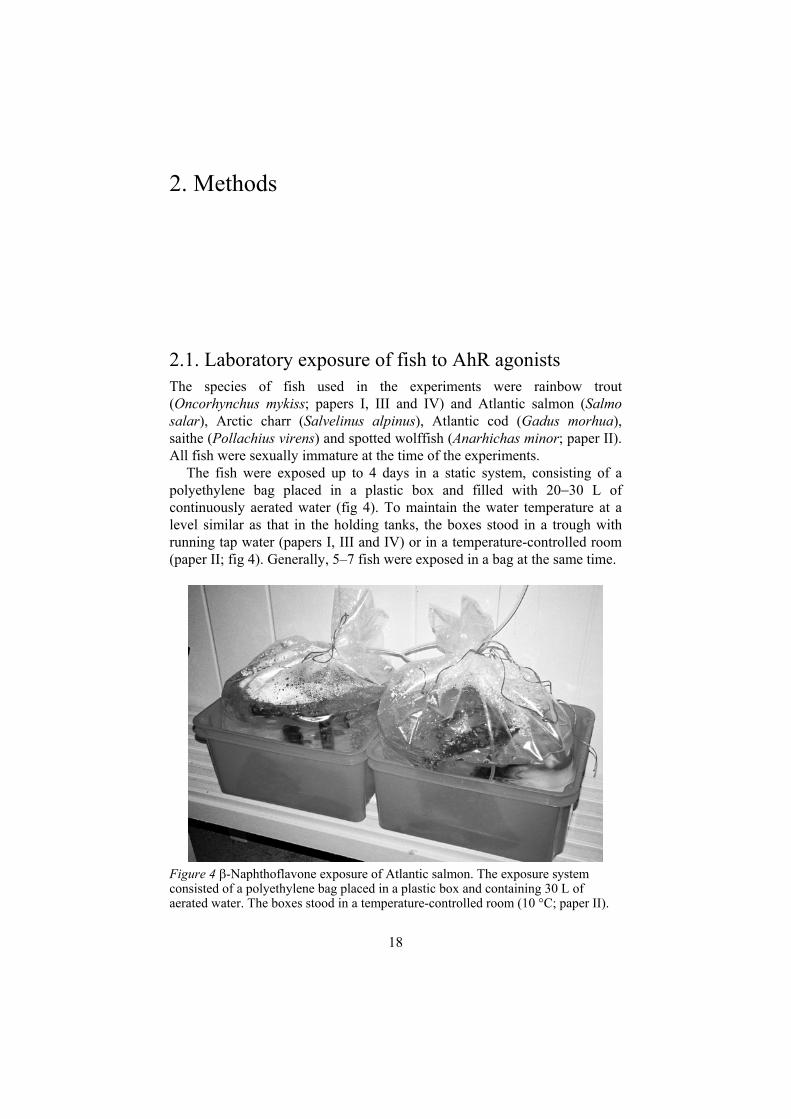
2.1. Laboratory exposure of fish to AhR agonists The species of fish used in the experiments were rainbow trout (Oncorhynchus mykiss; papers I, III and IV) and Atlantic salmon (Salmo salar), Arctic charr (Salvelinus alpinus), Atlantic cod (Gadus morhua),saithe (Pollachius virens) and spotted wolffish (Anarhichas minor; paper II). All fish were sexually immature at the time of the experiments.
The fish were exposed up to 4 days in a static system, consisting of a polyethylene bag placed in a plastic box and filled with 20 30 L of continuously aerated water (fig 4). To maintain the water temperature at a level similar as that in the holding tanks, the boxes stood in a trough with running tap water (papers I, III and IV) or in a temperature-controlled room (paper II; fig 4). Generally, 5–7 fish were exposed in a bag at the same time.
Figure 4 -Naphthoflavone exposure of Atlantic salmon. The exposure system consisted of a polyethylene bag placed in a plastic box and containing 30 L of aerated water. The boxes stood in a temperature-controlled room (10 C; paper II).

19
In most experiments (papers I IV), the model AhR agonist -naphthoflavone ( NF; 10-6 M) was used, as it is an efficient CYP1A inducer with low toxicity. In paper IV, fish were exposed to BaP (10-7 M and 10-9 M) and PCB#126 (10-8 M), which were chosen to represent one readily metabolised and one persistent inducer. In addition, the textile dye indigo (10-6 M and 10-8 M) was examined as a suspected CYP1A inducer in fish (paper IV). The chemicals were dissolved in acetone (papers I III) or DMSO (paper IV) and added to the water in polyethylene bags. The log Kow values for indigo, NF, BaP, and PCB#126 are, respectively, 3.6 (Hou et al., 1991; estimated), 4.7 (estimated), 6.0 (http://www.epa.gov/safewater/dwh/t-soc/pahs.html; October 17 2003), and 6.6 (Huang and Hong, 2002). As these compounds are hydrophobic, they can be expected to stick to the walls of the polyethylene bags. Accordingly, we found that when BaP was added to the water in a bag without fish the concentration (initially 0.64 nM) decreased to about one fifth of the initial concentration within 6 h. Hence, it should be noted that the concentrations given within brackets above are the initial concentrations.
2.2. Gill filament EROD assay A detailed description of the gill filament EROD assay is given in paper I. The gill arches are excised and placed in ice-cold HEPES-Cortland buffer (pH 7.7). Tip pieces are isolated by a cut above the septum of the gill filaments (fig 5a), and ten 2 mm long pieces are placed in wells of a 12-well tissue culture plate (fig 5b). To each well is added 0.5 ml of a “reaction buffer”, consisting of 7-ethoxyresorufin (1 M) and dicumarol (10 M) in HEPES-Cortland buffer. After 10 min of incubation (at 12 2 C), the buffer
Figure 5 a) Tip pieces are isolated from the filaments while immersed in HEPES-Cortland buffer (HC). b) Ten pieces (2 mm long) are placed in each of the wells in a 12-well tissue culture plate. Reaction buffer (consisting of 7-ethoxyresorufin [1 M]and dicumarol [10 M] in HC, pH 7.7) is added to the filament tips. After 10 and 30 min of incubation (30 and 50 min in unexposed fish), 200- l aliquots are transferred from each well to a Fluoronunc 96-well plate. c) The fluorescence in the wells with sample and resorufin standard solutions is determined in a plate reader at 544 nm (ex) and 590 nm (em).

20
is replaced with 0.7 ml of fresh reaction buffer (fig 5b). After another 10 min and 30 min of incubation (30 min and 50 min in unexposed fish), 200- laliquots are transferred from each well to a Fluoronunc 96-well plate (fig 5b–c). Aliquots (200 l) of resorufin standard solutions (0.5 250 nM) are included on the plate. The fluorescence is determined in a multi-well plate reader at the wavelengths 544 (ex) and 590 nm (em; fig 5c). EROD activity is expressed as picomole of resorufin per filament tip and minute.
2.3. Autoradiography
Fish were exposed to waterborne 3H-benzo[a]pyrene (3H-BaP) as described in table 1 (section 3.5.). After exposure, the fish were embedded in aqueous carboxymethyl cellulose (40 g/L), frozen in carbon dioxide-cooled hexane, and tape-sectioned (20 m; Ullberg, 1977). The sections were extracted with 5% (v/v) trichloroacetic acid (1 min), 50% (v/v) methanol (30 s), absolute methanol (30 s), heptane (20 s), absolute methanol (30 s), 50% methanol (30 s) and running tap water (5 min). The dried sections were pressed against Hyperfilm-3H and the film was developed after 21 days of exposure (-20 C;paper III).
For light microscopy autoradiography gill arches from the 3H-BaP-exposed fish were fixed in a phosphate-buffered (0.1 M, pH 7.4) mixture of 1.5% (v/v) glutaraldehyde and 1.5% (v/v) formaldehyde. After removal of the gill arches the gill filaments were dehydrated in 95% and absolute ethanol. This procedure extracts most of the unbound radiolabelled substance in tissues from 3H-BaP- and 3H-DMBA-treated mice (Granberg et al., 2000). The dehydrated gill filaments were embedded in Technovit 7100, sectioned (2 m) and mounted. The slides were dipped in liquid film emulsion (NTB-2 diluted in distilled water, 2:1, v/v) and kept in the dark at 4 C. After 4 months of exposure, the autoradiograms were developed, fixed
and stained with toluidine blue. Silver grains on the sections were considered as representing irreversibly bound 3H-BaP metabolites (paper III).
2.4. Immunohistochemistry Gill arches were fixed in 1% glacial acetic acid and 99% ethanol (v/v). The fixed tissue was dehydrated, embedded in paraffin, sectioned (4 m) and mounted. The sections were deparaffinized, rehydrated and then treated in the followings (between each step the slides were washed 3 times in phosphate-buffered saline, PBS, pH 7.4).
Briefly, the sections were treated with 0.3% (v/v) hydrogen peroxide in methanol (30 min) and with steam-heated citrate buffer (pH 6.6; 30 min).

21
Following incubation with 10% (v/v) horse serum in PBS (20 min), the sections were drained (not washed in PBS), covered with a mouse-anti-rainbow trout CYP1A antibody (C10-7; Biosense Laboratories, Bergen Norway; 1:500 in PBS), and incubated overnight at 4 ºC. The next day the sections were incubated with biotinylated horse-anti-mouse antibody (1:500 in PBS including 5% horse serum, v/v; 40 min) and peroxidase-coupled streptavidin-biotin complex (20 30 min).
Labelling was visualised using a mixture of 3-amino-9-ethylcarbazole (0.24 mg/ml), Photo-Flo (0.2%, v/v) and hydrogen peroxide (0.03%, v/v) in acetate buffer (0.1 M). After the last step, the sections were washed in water and mounted (papers III and IV).
2.5. Liver EROD assay EROD activity was determined using a modified method of Kennedy and Jones (1994; paper IV). Liver microsomes were prepared and resuspended in HEPES-Cortland buffer, pH 8.0 (HC 8). Standard solutions of resorufin and protein (bovine serum albumin; BSA) were prepared in HC 8. Aliquots of the microsome suspensions (50 l) and the standard solutions (40 l of resorufin and 10 l of BSA) were added to the wells of a 96-well plate, after which 160 l of reaction buffer (12.7 nM 7-ethoxyresorufin and 2.1 mMNADPH in HC 8) were added. The resorufin formation in the sample wells was monitored (10 min) through repeated measurements in a fluorescence plate reader at 544 nm and 590 nm. Finally, to determine the protein concentration 100 l of fluorescamine in acetonitile (0.3 mg/ml) were added to all wells, after which the plate was incubated with continuous shaking in the dark (15 min) and the fluorescence was determined at 390 nm and 460 nm.
22
3. Experiments, results and discussion
3.1. Gill filament EROD assay First, we hypothesised that the morphological characteristics of gill filaments might make them suitable for EROD determination ex vivo. The large area and delicate shape (5 cell layers in thickness) of the secondary lamellae would facilitate the uptake of ethoxyresorufin into the CYP1A-expressing gill cells (Miller et al., 1989; Smolowitz et al., 1991; Husøy et al., 1996). This idea proved credible as gill filaments from both unexposed and NF-exposed fish placed in a reaction buffer (10-6 M 7-ethoxyresorufin in HEPES-Cortland buffer; pH 7.7) produced quantifiable concentrations of resorufin within a 30 min period. This finding and the potential of obtaining a robust biomarker of exposure to dioxin-like environmental pollutants encouraged us to design a gill filament-based EROD assay (paper I).
Gill filaments for analysis in this assay can be sampled without respect to gill arch, as the EROD activity is similar in filaments from all four pairs of gill arches (paper II). In the assay, tip pieces are isolated by a cut above the septum of the gill filaments, and ten pieces of similar length (2 mm) are carefully selected, placed in wells of 12-well tissue culture plates, and added reaction buffer.
We found that when reaction buffer is added to filament tips, the fluorescence of the buffer initially decreases, probably due to absorption of ethoxyresorufin by the gill tissue (ethoxyresorufin has some fluorescence at the wavelengths used). To saturate the tissue with ethoxyresorufin gill filaments are preincubated in reaction buffer for 10 min before the assay is started by renewal of the buffer. The initial decrease in florescence is not completely prevented by this procedure. However, the problem is avoided by sampling each well twice. Filaments from NF-exposed fish show a constant increase of resorufin concentration in the buffer within a 10–60 min period of incubation and the wells are therefore sampled after 10 and 30 min. For filaments with low EROD activity, it takes longer to reach a stable increase in resorufin concentration and therefore wells with filaments from unexposed fish are sampled after 30 and 50 min. The EROD activity is calculated as the amount of resorufin formed between the two samplings,
23
divided by the number of filaments in the well and the time between the samplings.
For each fish, EROD activity is determined in duplicate wells. Duplicate deviations of 6.4 4.6% (n=25; mean SD), 4.5 3.3 % (n=72) and 5.4 4.8% (n=29) were observed in non-induced, F-induced, and caged fish, respectively (paper I). The small variation in activity between duplicates supports the outlined methodology.
When measuring EROD activity in gill filaments ex vivo all essential components are present in the tissue except the substrate (ethoxyresorufin), i.e. there is no need to add co-factors. However, resorufin is a substrate for DT-diaphorase and conjugation enzymes, which can be a problem when EROD activity is determined in preparations where the cytosolic fraction is not removed (e.g. intact tissue, whole cell, homogenate, and post-mitochondrial supernatant). In 9,000 g supernatants of PCB-induced rat and hamster liver, fivefold higher EROD activities were recorded when the DT-diaphorase inhibitor dicumarol was added to the reaction buffer (Lubet et al., 1985). The effect of DT-diaphorase in the gill filament EROD assay was determined by running the assay with up to 10-4 M dicumarol in the reaction buffer, and the possible effect of conjugation enzymes was examined by treating the reaction products with deconjugation enzymes ( -glucuronidase and arylsulfatase; paper I). We found that the resorufin concentration increased by approximately 33% when 10-5 M dicumarol was included in the reaction buffer, whereas treatment with deconjugation enzymes only had a minor effect (6.1 1.0% increase in resorufin fluorescence). Hence, as dicumarol is easily added in the reaction buffer, we decided to incorporate it as a component in the routine assay (paper I).
Applicability of the gill filament assay For practical reasons, it is not always possible to analyse EROD activity immediately after sampling. Therefore we examined the possibility of storing gill tissue at -80 ºC or 0 ºC, before determining gill filament EROD activity (paper I). Gill tissue was sampled from unexposed (from the holding tank) and F-exposed fish, frozen in liquid nitrogen, stored at -80 C, and thawed after 4 days. Gill tissue from other unexposed and F-exposed fish were stored in ice-cold HC buffer for 2 h–8 days. Following freezing of gill tissue, EROD activity was undetectable in the gill-filament assay, whereas no loss of activity was recorded in gills from rainbow trout (paper I) and cod (unpublished) kept in ice-cold buffer for 1 day and 2 days, respectively (no analysis was made in rainbow trout after 2 days). This result implies that the gill filament assay can be applied to wild fish, as gills can be sampled in the field and transported to the laboratory for EROD measurement.
24
The gill filament-based EROD assay was tested in Atlantic salmon (smolts), Arctic charr, Atlantic cod, saithe, and spotted wolffish using gill filaments from fish sampled from the respective holding tank (unexposed) and fish exposed (48 h) to 10-6 M NF in the ambient water (paper II). In all species except the spotted wolffish NF exposure clearly induced branchial EROD activity.
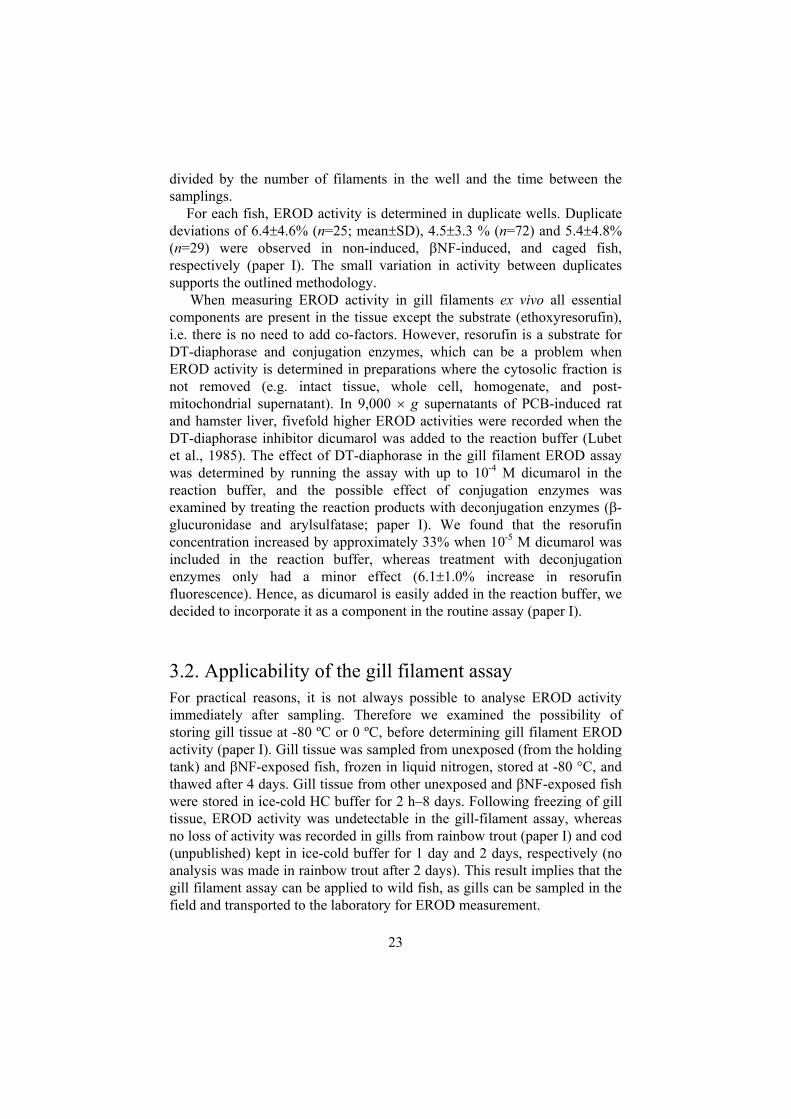
The gill filament EROD activity was also studied in differently sized Arctic charr (paper II). The small charr were one-and-a-half year old and weighed 82 19 g. The large charr were three years old and the unexposed fish weighed 960 330 g whereas the NF-exposed fish weighed 500 84 g. Similar basal and induced EROD activities were recorded in fish weighing approximately 100–1400 g and 100–500g, when the activity was expressed per gill filament tip (fig 6a). Large fish appeared to have thicker filaments than small fish, an impression which was confirmed by that protein content in the 2 mm long filament tip pieces increased with body weight (fig 6b). Hence, there was no correlation between gill filament EROD activity and protein content in the filaments, which is surprising since increased protein content indicates an increased number of cells. However, whether the number of cells with active CYP1A enzyme increases with size is unclear.
Figure 6 a) Gill filament EROD activity (a) and protein content in 2 mm long gill filament tip pieces (b) in Arctic charr of various sizes. Open and filled circles represent unexposed fish and fish exposed to -naphthoflavone (10-6 M) for 48 h.
In order to examine whether changes in smoltification status and water salinity may influence the branchial CYP1A activity, EROD activity was determined in Atlantic salmon, using parr, smolts held in freshwater, and smolts held in seawater (34‰ salinity). All three groups of salmon showed an EROD induction of similar magnitude (paper II).
25
These results indicate that the assay can be used to monitor exposure to dioxin-like pollutants in fish in various ecosystems. However, the results in spotted wolffish show that there might be species in which gill filament EROD activity is not induced by exposure to AhR agonists. Unpublished data show that gill filament EROD activity is inducible also in goldfish (Carassius auratus), brown trout (Salmo trutta), and three-spined stickleback (Gasterosteus aculeatus).
The EROD response per filament tip seems not to be affected by variation in body weight among fish. Furthermore, in Atlantic salmon smoltification status, and water salinity seem to have minor influence on the gill filament EROD activity, implying that salmon could be used to monitor pollution with AhR agonists in limnic, estuarine and marine waters.
3.3. EROD activity in gills and liver and CYP1A localisation in gills after exposure to BaP, PCB#126 and indigoBranchial and hepatic EROD activities were compared in rainbow trout following 6, 12, and 24 h of exposure to BaP (10-7 M), PCB#126 (10-8 M) and indigo (10-6 M), and in fish exposed to each compound for 24 h and then held in clean tap water for 2 and 14 days (paper IV). Fish were also exposed (for 6 and 24 h) to 10-9 M BaP and 10-8 M indigo (i.e. at 100 times lower concentrations than above). Branchial and hepatic EROD activities were also determined in unexposed fish and in fish exposed to NF for 24 h. Finally immunohistochemical localisation of CYP1A enzyme was studied in the gills of the fish exposed to NF, PCB#126, and the high concentrations of BaP and indigo for 24 h.
The basal EROD activities in gills and liver were 0.0011 0.0003 pmol/filament/min and 6.8 5.3 pmol/mg protein/min. Exposure to NF for 24 h resulted in a strong EROD induction in both the gills (0.14 0.02 pmol/filament/min) and the liver (930 230 pmol/mg protein/min).
Already after 6 h of exposure to BaP and PCB#126, strong EROD inductions (36- and 27-fold the basal level) were observed in the gills, whereas slighter inductions (9- and 7-fold the basal level) were recorded in the liver. Following indigo-exposure, a strong branchial EROD induction (23-fold the basal level) was recorded after 6 h, whereas a significant hepatic EROD induction was recorded first after 24 h.
The “maximal” branchial EROD inductions (i.e. strongest ones recorded within this experiment) were observed by 12 h and 24 h of exposure to indigo and PCB#126 (fig 7). In BaP exposed fish “maximal” inductions were recorded after 12 and 24 h, indicating that the actual induction maximum (by this BaP concentration) was reached within this period (fig 7).

26
Figure 7 The strongest (“maximal”) EROD inductions (mean SD) recorded in the gills (clear bars) and the liver (hatched bars) of rainbow trout exposed to indigo (10-6
M), benzo[a]pyrene (BaP; 10-7 M) and 3,3´,4,4´,5-pentachlorobiphenyl (PCB#126; 10-8 M). The exposure times, which varied from one compound to another are indicated above each bar. “12h (24h)” denotes that the “maximal” activity was recorded after 12 of exposure and that a similar activity was recorded after 24 h. “+2d” denotes 24 h of exposure followed by 2 days in tap water.
“Maximal” hepatic EROD inductions were observed after 24 h in indigo- and BaP- exposed fish (fig 7). In PCB#126-exposed fish, the “maximal” hepatic EROD activity was recorded after 2 days in tap water (fig 7), and the activity decreased slightly during the following 12 days (to 70% of the “maximal” activity). The branchial activity also remained induced in PCB#126-exposed fish after 2 and 14 days in tap water (27% and 21% of the “maximal” activity). After BaP exposure and 2 days in tap water, the EROD activity remained slightly induced in the gills (six-fold the basal level) and hepatic activity had decreased to 39% of the “maximal” activity (30-fold the basal level). In BaP-exposed fish held in tap water for 14 days, both branchial and hepatic activities had decreased to (or below) the basal level. In indigo-exposed fish held in tap water, the branchial and hepatic activities had declined to 3- and 5-fold the basal level after 2 days and to the basal level after 14 days.
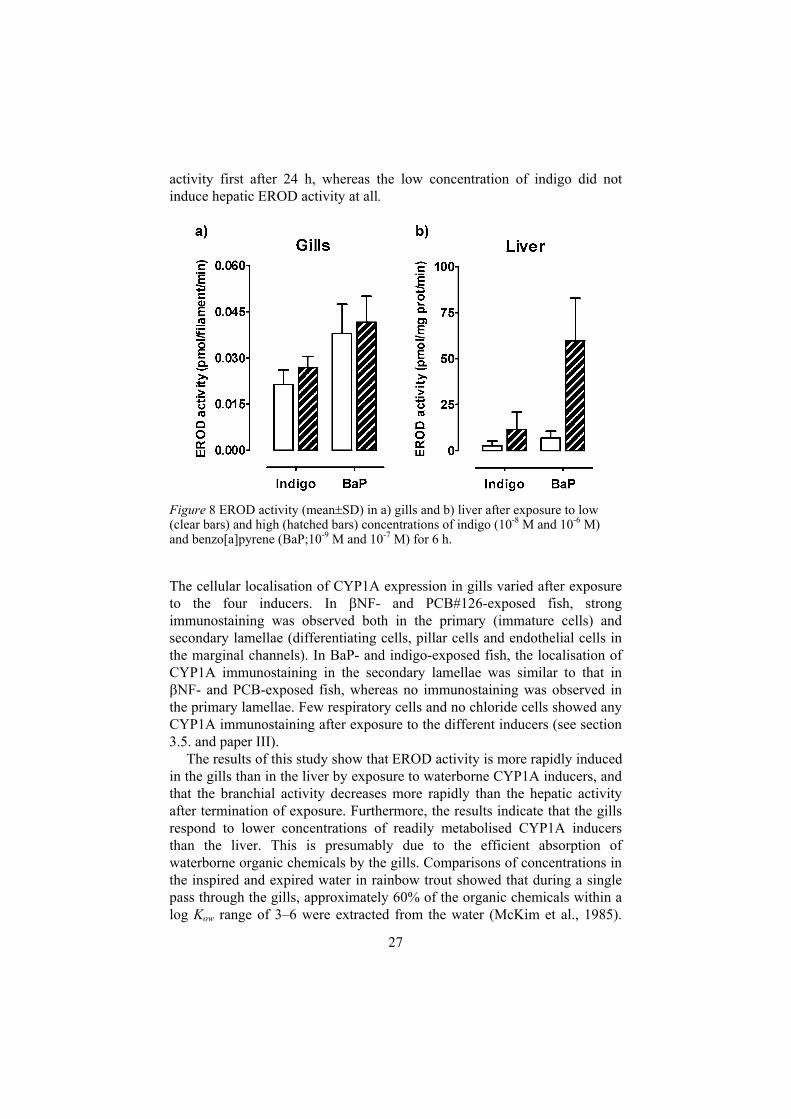
After 6 h of exposure to the low concentrations of indigo and BaP, branchial EROD inductions at similar levels as those recorded after 6 h of exposure to the higher concentrations were observed, whereas no induction of hepatic activity was recorded (fig 8). After 24 h of exposure, the branchial EROD activities remained induced in both indigo- and BaP-exposed fish, although the activities had decreased (to 54% and 19% of those recorded after 6 h). Exposure to the low concentration of BaP induced hepatic EROD
27
activity first after 24 h, whereas the low concentration of indigo did not induce hepatic EROD activity at all.
Figure 8 EROD activity (mean SD) in a) gills and b) liver after exposure to low (clear bars) and high (hatched bars) concentrations of indigo (10-8 M and 10-6 M) and benzo[a]pyrene (BaP;10-9 M and 10-7 M) for 6 h.
The cellular localisation of CYP1A expression in gills varied after exposure to the four inducers. In NF- and PCB#126-exposed fish, strong immunostaining was observed both in the primary (immature cells) and secondary lamellae (differentiating cells, pillar cells and endothelial cells in the marginal channels). In BaP- and indigo-exposed fish, the localisation of CYP1A immunostaining in the secondary lamellae was similar to that in
NF- and PCB-exposed fish, whereas no immunostaining was observed in the primary lamellae. Few respiratory cells and no chloride cells showed any CYP1A immunostaining after exposure to the different inducers (see section 3.5. and paper III).
The results of this study show that EROD activity is more rapidly induced in the gills than in the liver by exposure to waterborne CYP1A inducers, and that the branchial activity decreases more rapidly than the hepatic activity after termination of exposure. Furthermore, the results indicate that the gills respond to lower concentrations of readily metabolised CYP1A inducers than the liver. This is presumably due to the efficient absorption of waterborne organic chemicals by the gills. Comparisons of concentrations in the inspired and expired water in rainbow trout showed that during a single pass through the gills, approximately 60% of the organic chemicals within a log Kow range of 3–6 were extracted from the water (McKim et al., 1985).
28
Hence it is probable that the branchial cells rapidly accumulated high concentrations of inducer, whereas the concentration of inducer in the hepatocytes depended on redistribution from other organs. Regarding BaP and indigo, significant proportions of the inducers seemed to be biotransformed and never reached the liver. Indigo had almost the same EC50value as TCDD for AhR activation in yeast cells transfected with human AhR (Adachi et al., 2001), and the affinity for the rat AhR of indigo is similar to (or higher than) that of PCB#126 (Rannug et al., 1992; Klasson Wehler et al., 1990). However, whereas PCB#126 is persistent, indigo is presumably more readily metabolised. Indigo conjugates are present in human urine at concentrations of approximately 0.2 nM, which implies that indigo is an endogenous AhR ligand as well as a substrate for conjugation enzymes (Adachi et al., 2001). The large variation in “maximal” hepatic EROD activities induced by indigo, BaP and PCB#126 (fig 7) probably reflects differences in the extent to which these three compounds are biotransformed. The finding that the hepatic EROD activity in PCB#126-exposed fish increased following retention in clean water for 2 days supports a redistribution of PCB#126 from organs initially absorbing the compound to the liver.
After termination of exposure to EROD activity decreased more rapidly in the gills than in the liver, indicating a rapid clearance of inducers from the gills probably depending on biotransformation in the gill cells (of BaP and indigo), the large blood flow perfusing the gills (redistribution), and perhaps excretion to the water.
The finding that similar branchial EROD activities were recorded after 6 h of exposure to 10-7 and 10-9 M BaP (fig 8), indicates that also at the lower concentration, the gill cells had accumulated enough BaP to cause highest possible induction at this exposure time. After 24 h of exposure, EROD activity had increased in fish exposed to the high BaP concentration, whereas fish exposed to the low concentration showed a decreased activity. EROD activity was also higher after 12 h than after 24 h of exposure to indigo (10-6 M). Possibly, the initial strong induction of CYP1A and perhaps of other AhR regulated enzymes in the gill cells, increased the biotransformation activity enough to subsequently decrease the concentration of indigo and BaP in the water. The results of the immunolocalisation study suggest that biotransformation of the inducer at the site of absorption (secondary lamella), reduced the distribution of inducer in the cells of the primary lamella, and consequently CYP1A expression was low in these cells.
29
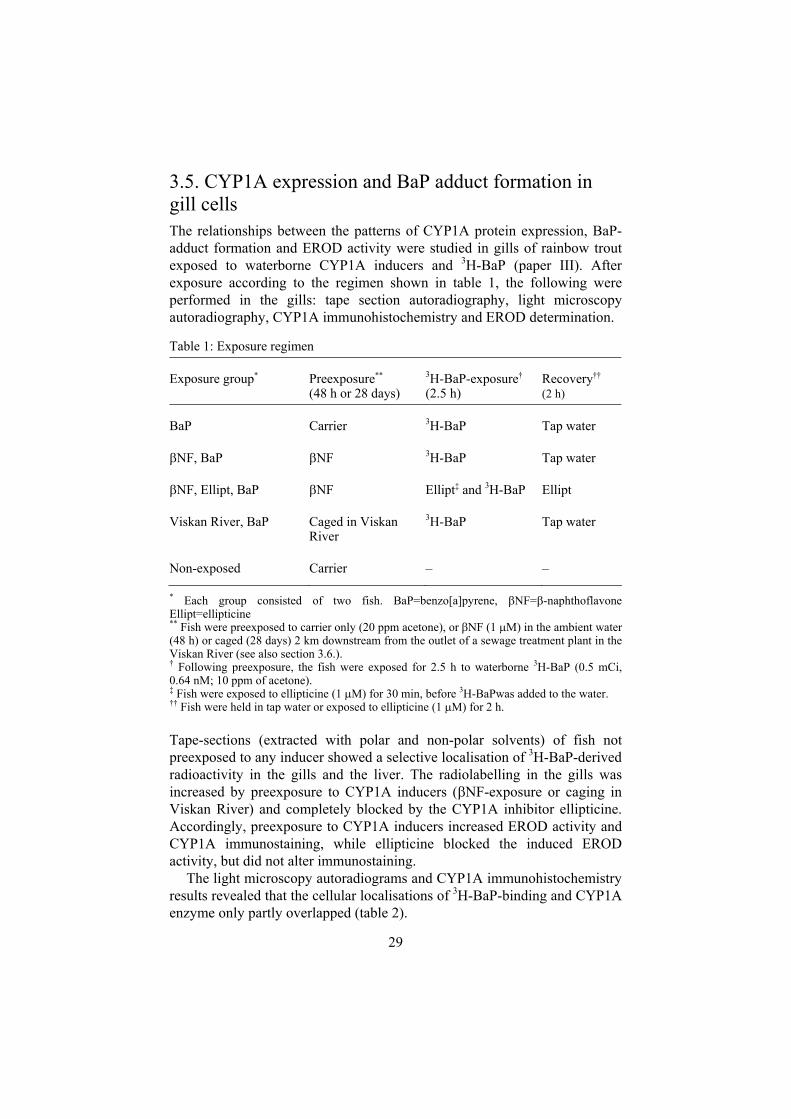
3.5. CYP1A expression and BaP adduct formation in gill cells The relationships between the patterns of CYP1A protein expression, BaP-adduct formation and EROD activity were studied in gills of rainbow trout exposed to waterborne CYP1A inducers and 3H-BaP (paper III). After exposure according to the regimen shown in table 1, the following were performed in the gills: tape section autoradiography, light microscopy autoradiography, CYP1A immunohistochemistry and EROD determination.
Table 1: Exposure regimen
Exposure group* Preexposure** (48 h or 28 days)
3H-BaP-exposure†
(2.5 h) Recovery††
(2 h)
BaP Carrier 3H-BaP Tap water
NF, BaP NF 3H-BaP Tap water
NF, Ellipt, BaP NF Ellipt‡ and 3H-BaP Ellipt
Viskan River, BaP Caged in Viskan River
3H-BaP Tap water
Non-exposed Carrier – –
* Each group consisted of two fish. BaP=benzo[a]pyrene, NF= -naphthoflavone Ellipt=ellipticine ** Fish were preexposed to carrier only (20 ppm acetone), or NF (1 M) in the ambient water (48 h) or caged (28 days) 2 km downstream from the outlet of a sewage treatment plant in the Viskan River (see also section 3.6.). † Following preexposure, the fish were exposed for 2.5 h to waterborne 3H-BaP (0.5 mCi, 0.64 nM; 10 ppm of acetone). ‡ Fish were exposed to ellipticine (1 M) for 30 min, before 3H-BaPwas added to the water. †† Fish were held in tap water or exposed to ellipticine (1 M) for 2 h.
Tape-sections (extracted with polar and non-polar solvents) of fish not preexposed to any inducer showed a selective localisation of 3H-BaP-derived radioactivity in the gills and the liver. The radiolabelling in the gills was increased by preexposure to CYP1A inducers ( NF-exposure or caging in Viskan River) and completely blocked by the CYP1A inhibitor ellipticine. Accordingly, preexposure to CYP1A inducers increased EROD activity and CYP1A immunostaining, while ellipticine blocked the induced EROD activity, but did not alter immunostaining.
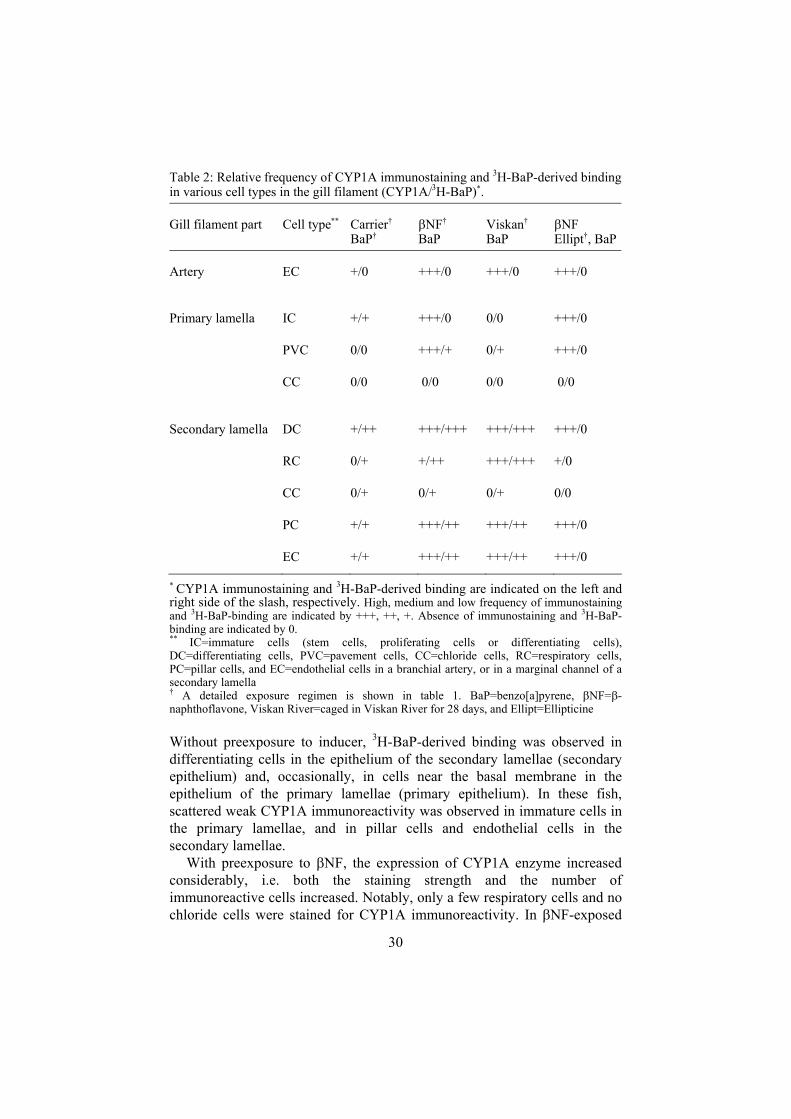
The light microscopy autoradiograms and CYP1A immunohistochemistry results revealed that the cellular localisations of 3H-BaP-binding and CYP1A enzyme only partly overlapped (table 2).
30
Table 2: Relative frequency of CYP1A immunostaining and 3H-BaP-derived binding in various cell types in the gill filament (CYP1A/3H-BaP)*.
Gill filament part Cell type** Carrier† BaP†
NF† BaP
Viskan† BaP
NF Ellipt†, BaP
Artery EC +/0 +++/0 +++/0 +++/0
Primary lamella IC +/+ +++/0 0/0 +++/0
PVC 0/0 +++/+ 0/+ +++/0
CC 0/0 0/0 0/0 0/0
Secondary lamella DC +/++ +++/+++ +++/+++ +++/0
RC 0/+ +/++ +++/+++ +/0
CC 0/+ 0/+ 0/+ 0/0
PC +/+ +++/++ +++/++ +++/0
EC +/+ +++/++ +++/++ +++/0
* CYP1A immunostaining and 3H-BaP-derived binding are indicated on the left and right side of the slash, respectively. High, medium and low frequency of immunostaining and 3H-BaP-binding are indicated by +++, ++, +. Absence of immunostaining and 3H-BaP-binding are indicated by 0. ** IC=immature cells (stem cells, proliferating cells or differentiating cells), DC=differentiating cells, PVC=pavement cells, CC=chloride cells, RC=respiratory cells, PC=pillar cells, and EC=endothelial cells in a branchial artery, or in a marginal channel of a secondary lamella † A detailed exposure regimen is shown in table 1. BaP=benzo[a]pyrene, NF= -naphthoflavone, Viskan River=caged in Viskan River for 28 days, and Ellipt=Ellipticine
Without preexposure to inducer, 3H-BaP-derived binding was observed in differentiating cells in the epithelium of the secondary lamellae (secondary epithelium) and, occasionally, in cells near the basal membrane in the epithelium of the primary lamellae (primary epithelium). In these fish, scattered weak CYP1A immunoreactivity was observed in immature cells in the primary lamellae, and in pillar cells and endothelial cells in the secondary lamellae.
With preexposure to NF, the expression of CYP1A enzyme increased considerably, i.e. both the staining strength and the number of immunoreactive cells increased. Notably, only a few respiratory cells and no chloride cells were stained for CYP1A immunoreactivity. In NF-exposed

31
fish an increased 3H-BaP binding was observed in the secondary epithelium (in differentiating cells and respiratory cells) but contrary to noninduced fish, no binding was found adjacent to the basal membrane in the primary epithelium. Following simultaneous exposure to ellipticine and 3H-BaP no binding was observed in the gills of NF-exposed fish.
In fish caged in the Viskan River for 28 days, strong CYP1A immunoreactivity was observed in all cell types in the secondary lamellae except in the chloride cells, and intense 3H-BaP labelling was observed in cells in the secondary epithelium. The primary lamellae and the proximal parts of the secondary lamellae almost entirely lacked CYP1A immunostaining and 3H-BaP labelling.
In all 3H-BaP-exposed fish (except those exposed to ellipticine) the binding in the secondary epithelium increased gradually from the afferent edge of the filament towards the efferent edge. Furthermore, no fish showed 3H-BaP-derived binding in the endothelia of the branchial arteries.
In conclusion, these results confirm that the gills are major sites of CYP1A-dependent BaP adduct formation in fish exposed to waterborne BaP (Balk et al., 1984; Sandvik et al., 1998; Ericson et al., 1999; Ingebrigtsen et al., 2000). The findings that NF-preexposure i), increased both CYP1A immunostaining and 3H-BaP adduct formation in the secondary lamellae, and ii), decreased the binding in the primary lamellae despite a strongly increased immunostaining, suggest that the localisation of BaP-adducts was determined not only by the local concentration of CYP1A enzyme but also by the bioavailability of BaP to the various branchial cells. This idea is supported by the higher concentration of BaP binding found near the efferent edge of the primary lamellae than near the afferent edge and by the presence of CYP1A protein, but no BaP binding in endothelial cells in the branchial arteries.
Furthermore, in paper IV it was shown that exposure to BaP at a relatively high concentration (10-7 M) did not induce CYP1A protein expression in the primary lamellae, whereas exposure to PCB#126 (10-8 M) and NF (10-6 M) induced CYP1A in both primary and secondary lamellae. These findings suggest that PCB#126 and NF, but not BaP, enter the primary lamellae. The results of paper IV may also help elucidate the peculiar finding that CYP1A expression was strong in the secondary lamellae but almost lacking in the primary lamellae of fish caged in the Viskan River. This may indicate that a major part of the EROD inducing compounds in the Viskan River was readily metabolised.
Other variables that could influence the concentrations of BaP adducts are the local concentrations of epoxide hydrolases, glutathione-S-transferases and other biotransformation enzymes (e.g. other CYP forms than CYP1A).
An interesting finding was that respiratory cells showed strong CYP1A expression in all fish caged in the Viskan River but not in the NF-induced fish. Similarly, the results of paper IV show CYP1A expression in few

32
respiratory cells and no chloride cells after exposure to the different inducers. A major difference between these groups of fish was the exposure time (four weeks of caging in the Viskan River, two days of NF-exposureand one day of exposure to the various inducers included in paper IV). Within four weeks, cells originating from the inner epithelial layer of the secondary lamella will differentiate and replace cells in the surface layer. An intriguing idea is that respiratory cells require exposure to AhR agonists before they are fully differentiated to express CYP1A.
3.6. Gill filament EROD induction by exposure in the fieldEROD activity was studied in rainbow trout following caging in a river in south-western Sweden, viz. the Viskan River, which runs through the town of Borås (paper I). Fish were kept in cages placed downstream (at 10 m, 100 m, and 2 km) and upstream (10 m) from the outlet of the Borås sewage treatment plant (STP), and at a reference site located upstream from the STP, approximately 10 km north of Borås and 500 m upstream from Lake Öresjö. After 28 days, the fish were transported to Uppsala. Gill filament EROD activity was analysed in five or six fish from each cage. Branchial EROD activity was also analysed after 8 days in tap water, in fish from the cages placed 10 m and 2 km downstream from the STP outlet as well as at the reference site (n=5). Additionally, water was extracted 10 m and 2 km downstream from the outlet, and at the reference site, and transported to Uppsala in polyethylene bags. Rainbow trout (n=6) were placed in the bags and exposed for 24 h (as described in section 2.1.), and then gill filament EROD activity was determined in their gills. Unexposed fish held for 24 h in a polyethylene bag with tap water and fish sampled directly from a holding tank were used as controls (n=6).
In another experiment saithe were exposed to water and sediments collected in the area of Tromsø (a town in northern Norway; paper II). Sediments from the uppermost 5 cm of the sediment layer and seawater were taken near the shore at a depth of approximately 1 m at two sites in the central harbour of Tromsø: 15 20 m from the shipyard and approximately 1 km north of the shipyard. A beach located approximately 1 km west of the Kårvik Research Station on the island of Ringvassøy (approximately 35 km from Tromsø) was chosen as a reference site. Sediments (200 g) and water (30 L) from each site were put in polyethylene bags, after which saithe were placed in the bags and exposed for 22 h (n=6).
The reference site is located in a nature conservation area and therefore not directly affected by industrial or municipal effluents. Nevertheless, a higher EROD activity was recorded in fish caged at this site than in
33
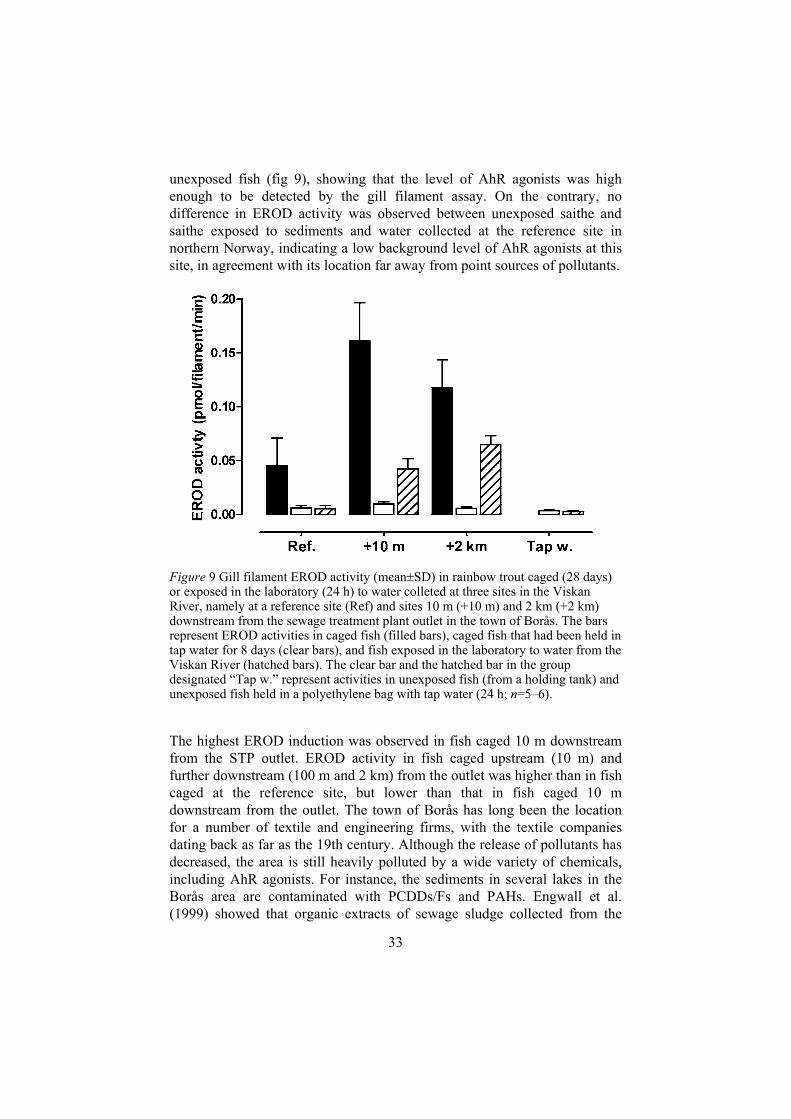
unexposed fish (fig 9), showing that the level of AhR agonists was high enough to be detected by the gill filament assay. On the contrary, no difference in EROD activity was observed between unexposed saithe and saithe exposed to sediments and water collected at the reference site in northern Norway, indicating a low background level of AhR agonists at this site, in agreement with its location far away from point sources of pollutants.
Figure 9 Gill filament EROD activity (mean SD) in rainbow trout caged (28 days) or exposed in the laboratory (24 h) to water colleted at three sites in the Viskan River, namely at a reference site (Ref) and sites 10 m (+10 m) and 2 km (+2 km) downstream from the sewage treatment plant outlet in the town of Borås. The bars represent EROD activities in caged fish (filled bars), caged fish that had been held in tap water for 8 days (clear bars), and fish exposed in the laboratory to water from the Viskan River (hatched bars). The clear bar and the hatched bar in the group designated “Tap w.” represent activities in unexposed fish (from a holding tank) and unexposed fish held in a polyethylene bag with tap water (24 h; n=5–6).
The highest EROD induction was observed in fish caged 10 m downstream from the STP outlet. EROD activity in fish caged upstream (10 m) and further downstream (100 m and 2 km) from the outlet was higher than in fish caged at the reference site, but lower than that in fish caged 10 m downstream from the outlet. The town of Borås has long been the location for a number of textile and engineering firms, with the textile companies dating back as far as the 19th century. Although the release of pollutants has decreased, the area is still heavily polluted by a wide variety of chemicals, including AhR agonists. For instance, the sediments in several lakes in the Borås area are contaminated with PCDDs/Fs and PAHs. Engwall et al. (1999) showed that organic extracts of sewage sludge collected from the

34
STP in Borås strongly induced EROD activity in vitro, thus demonstrating that the water entering the STP is polluted with AhR agonists. The present results show that water released from the STP in Borås also contains EROD-inducing compounds. However, as EROD activity was induced in fish caged 10 m upstream from the STP it appears that other sources for AhR agonists also exist in the area.
Following laboratory exposure to water extracted from the Viskan River the EROD activities were generally lower than in the caged fish. Furthermore, the activity was only slightly induced in fish exposed to water collected at the reference site (fig 9). The highest EROD activity was observed in fish exposed to water collected 2 km downstream from the STP outlet. The discrepancies between the results in laboratory-exposed and caged fish may have several explanations. As transport of water as well as exposure of fish were carried out in plastic bags, it is probable that part of the inducing capacity of the water was lost due to adsorption of the EROD inducing compounds to the plastic. Furthermore, the activities in fish exposed to water collected from the Viskan River reflect the temporal concentration of AhR agonists in the river water at the time when the water was collected. The concentration of AhR agonists may vary with fluctuations in the release of such compounds from the STP (and other sources), and with changes in the water flow of the river (i.e. variations in the amount of resuspended polluted sediments). The activity in the caged fish may be a better indicator of the average degree of pollution in the river water than that in laboratory-exposed fish. However, the branchial EROD activity can change quite rapidly, as shown by the induction recorded after 6 h of exposure to BaP, PCB#126 and indigo and the significant decrease recorded 2 days after termination of exposure to BaP and indigo (paper IV). In the caged fish, EROD activity decreased almost to the basal level after 8 days in tap water (fig 9). A smaller decrease in branchial EROD activity was observed 14 days after termination of exposure to PCB#126 (paper IV). Hence, the major part of the inducing compounds in the Viskan River could have been readily metabolised.
Saithe exposed to water and sediments collected 15 20 m and 1 km from the shipyard in the central harbour of Tromsø showed clear EROD inductions compared with the activity of saithe exposed to water and sediments from the reference site. In accordance with these results, the sites located in the harbour of Tromsø have been shown to be polluted with a variety of chemicals, including PAHs and PCBs (Jørgensen et al., 2000).
These results show that laboratory exposure to polluted sediments and/or water can be a reasonable and cost-effective alternative to monitoring EROD activity in caged or wild fish.
35
4. Evaluation of gill filament EROD activity as a biomarker of exposure
For evaluation of the strength and weakness of fish biomarkers Van der Oost et al. (2003) proposed the following criteria:
1) the assay to quantify the biomarker should be reliable (with quality assurance, QA), relatively cheap, and easy to perform;
2) the biomarker should be sensitive to pollutant exposure and/or effects in order to serve as an early warning parameter;
3) baseline data of the biomarker should be well defined in order to distinguish between natural variability (noise) and contaminant-induced stress (signal);
4) the impacts of confounding factors on the biomarker response should be well established;
5) the underlying mechanism of the relationships between the biomarker response and pollutant exposure (dosage and time) should be established;
6) the toxicological significance, e.g. the relationships between the biomarker response and the (long-term) impact on the organism, should be established.
1) The technique of using intact tissue for EROD measurement (see section 3.1.1.) instead of sub-cellular tissue fractions avoids the risk of methodological variation due to e.g. the release of proteolytic enzymes upon homogenisation and the variable recovery of membrane-bound enzymes upon centrifugation. The robustness of the assay presented in this thesis is shown by the fact that resorufin formation over time is linear for a long period (at least 60 min; paper I), and from a practical point of view, the assay is easy to perform and relatively cheap.
2) The gill filament EROD activity is a sensitive indicator of exposure to AhR agonists as demonstrated by the fact that induction was recorded after exposure to BaP at a concentration (0.25 ppb) similar to the “Maximum

36
Contaminant Level” of BaP in drinking water (0.2 ppb) set by the U. S. Environmental Protection Agency (papers III and IV). Furthermore, EROD induction was recorded in fish caged at a reference site in the Viskan River, suggesting that the assay is sensitive enough to detect exposure to AhR agonists in areas that are not affected by point sources (paper I). Branchial EROD activity seems to be a more powerful biomarker of exposure to readily metabolised AhR agonists in the water than the hepatic EROD activity, as shown by the fact that clear induction was recorded in the gills but not in the liver after exposure to 10-8 M indigo (paper IV).
3 and 4) Numerous variables could presumably affect the basal EROD activity. A difficulty with using wild fish in environmental monitoring is that in spatial and temporal comparisons, genetic variation in groups of fish from different areas and years could influence biomarker responses (as well as accumulation of chemicals). A way to reduce the influence of genetic differences is to study biomarkers following caging of farmed fish at selected locations. Another alternative, which avoids a possible effect of abiotic variables (temperature, oxygen concentration in the water, etc), is laboratory exposure of farmed fish to water and sediments collected at locations of interest. These two strategies proved successful in my experiments (papers I and II); i.e. EROD induction was discovered in rainbow trout caged at the reference site in the Viskan River by comparison with the activity in rainbow trout held in tap water. The fact that this site was influenced by EROD inducing compounds was confirmed by that rainbow trout exposed in the laboratory to water collected at the same site in Viskan River showed an increased branchial EROD activity.
The results in paper II suggest that body size, smoltification status, and water salinity have a minor influence on the gill filament EROD activity. However, it would be valuable to further elucidate the impact of various physicochemical and physiological parameters on the gill filament EROD activity.
5) The studies of EROD induction time courses in rainbow trout exposed to NF, BaP, indigo and PCB#126 show that the induction in the gills is rapid
(paper IV). For instance, following exposure to quite high concentrations of indigo (10-6 M) and BaP (10-7 M), maximal levels were reached within 12–24 h of exposure.
6) EROD induction is regarded as an early warning “effect” of dioxin exposure. The mechanism of dioxin toxicity in not fully understood, but is considered to depend on AhR activation. A number of effects of PCDDs/Fs, PCBs, and PAHs have been described in gills and other tissues in fish (see section 1.5.). In zebrafish TCDD-evoked effects were found to require CYP1A induction (Teraoka et al., 2003).
37
Hence, as a biomarker of exposure to waterborne pollutants that are agonists to the AhR, the gill filament EROD activity fulfils many of the criteria given above. The strong EROD response recorded following exposure to low inducer concentrations indicates that the gill filament assay is a powerful tool to reveal the presence of AhR agonists in aquatic ecosystems. The assay may also be used to study spatial differences in the levels of AhR agonists in aquatic ecosystems (paper I). However, the induction time course results of paper IV indicate an extensive biotransformation of readily metabolised inducers in the gills. For the interpretation of activities measured in field-exposed fish, knowledge of induction time courses at continuous waterborne exposure to readily metabolised AhR agonists would be valuable. The effect on EROD induction by co-exposure to AhR agonists and other chemicals is another field that needs further study. Finally, gill filament EROD activities should be studied after dietary exposure to readily biotransformed and persistent AhR agonists.

38
5. Conclusions
5.1. Gill filament EROD activity as a biomarker and a monitoring tool
The gill filament assay is a handy, robust and relatively cheap method.
EROD activity as determined in the gill filament assay is a sensitive biomarker of exposure to waterborne AhR agonists in the laboratory and in the field.
The largest potential of the gill filament EROD assay may be as a tool to reveal the presence of AhR agonists in aquatic ecosystems.
Gill filament EROD activity can be used as a biomarker of exposure in a variety of aquatic ecosystems, as indicated by the fact that EROD induction was observed in rainbow trout, Atlantic salmon, Arctic charr, saithe, Atlantic cod, goldfish and three-spined stickleback.
Salmon smolts can be used to monitor exposure to AhR agonists in freshwater, estuarine and marine ecosystems.
5.2. Comparison of EROD induction in the gills and liver
The gills respond to waterborne inducers more rapidly than the liver.
The rapid branchial EROD response, also found at exposure to low concentrations of waterborne inducers, was most likely due to the fact that the gills efficiently absorb hydrophobic chemicals and consequently the gill cells rapidly accumulate high concentrations of inducers.
39
The delayed EROD induction in the liver compared with the gills by waterborne exposure to the persistent inducer (PCB#126) could be due to absorption of inducer in other organs and a slow redistribution to the liver.
The delayed, or even absent, EROD induction in the liver after exposure to readily metabolised waterborne inducers (BaP and indigo) indicates a significant metabolism of such compounds in gills and possibly other organs.
EROD activity decreases more rapidly in the gills than in the liver after termination of exposure, which probably is due to biotransformation (of readily metabolised inducers) in the gill cells, efficient removal of inducers by the blood and diffusion to the water.
5.3. Cellular localisation of CYP1A enzyme and CYP1A-mediated formation of PAH adducts in the gills
Cells in the inner epithelial layers in the primary and secondary lamellae (proliferating and differentiating cells) are among the first gill cells to show CYP1A expression after exposure to waterborne inducers.
The respiratory cells, which have the most exposed position in the secondary lamellae, show CYP1A expression first after long-term exposure to AhR agonists, indicating that these cells require exposure to inducers before they reach full differentiation to express CYP1A.
An important determinant for the cellular localisation of CYP1A induction in the gills (at waterborne exposure) appears to be first-pass metabolism of inducers in the secondary lamellae. Consequently, biotransformation of the inducer at the uptake site (secondary lamellae) could reduce, or prevent, the distribution of the inducer into the cells in the primary lamellae.
Similarly, in addition to CYP1A protein expression in the cells, the cellular sites for PAH adducts formation seem to be determined by first pass metabolism of PAHs in the secondary lamellae.
Consequences of first pass metabolism in the secondary lamellae are that the cells in the secondary lamellae are sites for PAH adduct formation, but also that the exposure to carcinogenic PAHs of the immature cells in the primary lamellae and internal organs is reduced.

40
6. Acknowledgement
Most of the work on this thesis was performed at the Department of Environmental Toxicology at Uppsala University. The experimental work on paper II was performed at Kårvik research station in Tromsø, Norway.
The experiments were funded by the Swedish Research Council for Environment, Agricultural Sciences and Spatial Planning (Formas) and the Swedish Environmental Protection Agency (the Reprosafe program).
My personal thanks to
Ingvar Brandt and Björn Brunström (my supervisors) for help with creating this thesis. The thanks include rough, intuitive, enjoying and sometimes also logical discussions, guidance out of mental dead ends, as well as the fun of writing the papers together with you.
Kristian Ingebrigtsen for being a very sympathetic supervisor on distance.
Marianne Andersson for being a good friend and clever person to talk to in the mad moments.
Jan Örberg, Elin Wallin, and Kifle Ghebreab for a great deal of the hard work with the Viskan River experiment (paper I).
Even Jørgensen for hospitality in Tromsø and fruitful collaboration on paper II.
Alexandra Abrahamsson for doing most of the experimental work on paper II and as a collaborator on paper IV, always enthusiastic.
Margareta Mattsson for all the thousands (millions?) sections that made paper III.
Stefan Gunnarsson and Gary Wife for being very helpful and nice.
Gunnar Steinholz for taking care of my fish (and other animals), for help with exposure aquaria and other practical things.
Anki Sundberg for the gorgeous cats.
My parents Bernt and Margareta for always supporting me

41
7. References
Adachi J, Mori Y, Matsui S, Takigami H, Fujino J, Kitagawa H, Miller CA III, Kato T, Saeki K, Matsuda T. 2001. Indirubin and indigo are potent aryl hydrocarbon receptor ligands present in human urine. J Biol Chem. 276, 31475–31478.
Andersson T, Pärt P. 1989. Benzo[a]pyrene metabolism in perfused rainbow trout gills. Marine Environ Res. 28, 3–7.
Arellano JM, Ortiz JB, Gonzalez de Canales ML, Sarasquete C. 2001. Histopathological alterations and induction of cytochrome P-450 1A in the liver and gills of the gilthead seabream (Sparus aurata) exposed to 2,3,7,8-tetrachlorodibenzo-p-dioxin. Histochem J. 33, 663–674.
Balk L, Meijer J, De Pierre JW, Appelgren LE. 1984. The uptake and distribution of tritium labeled benzo[a]pyrene in the northern pike Esox lucius. Examination by whole body autoradiography and scintillation counting. Toxicol Appl Pharmacol. 74, 430–449.
Birnbaum LS, Tuomisto J. 2000. Non-carcinogenic effects of TCDD in animals. Food Add Contam. 17, 275–288.
Bucheli TD, Fent K. 1995. Induction of cytochrome P450 as a biomarker for environmental contamination in aquatic ecosystems. Crit Rev Sci Toxicol. 25, 201–268.
Burczynski ME, Penning TM. 2000. Genotoxic polycyclic aromatic hydrocarbon ortho-quinones generated by aldo-keto reductases induce CYP1A1 via nuclear translocation of the aryl hydrocarbon receptor. Cancer Research. 60, 908–915.
Baumann PC. 1998. Epizootics of cancer in fish associated with genotoxins in sediment and water. Mutat Res 411, 227–233.
Canova S, Degan P, Peters LD, Livingstone DR, Voltan R, Venier P. 1998. Tissue dose, DNA adducts, oxidative DNA damage and CYP1A-immunopositive proteins in mussels exposed to waterborne benzo[a]pyrene, Mutat Res. 399, 17–30.
Cantrell SM, Schlezinger J, Stegeman JJ, Tillitt DE, Hannink M. 1998. Correlation of 2,3,7,8-tetrachlorodibenzo-p-dioxin-induced apoptotic cell death in the embryonic vasculature with embryotoxicity. Toxicol Appl Pharmacol. 148, 24-34.
Casale GP, Singhal M, Bhattacharya S, RamaNathan R, Roberts KP, Barbacci DC, Zhao J, Jankowiak R, Gross ML, Cavalieri EL, Small GJ, Rennard SI, Mumford JL, Shen M. 2001. Detection and quantification of depurinated benzo(a)pyrene-adducted DNA bases in the urine of cigarette smokers and women exposed to household coal smoke. Chem Res Toxicol. 14, 192-201.
Claiborne JB, Edwards SL, Morrison-Shetlar AI. 2002. Acid-base regulation in fishes: cellular and molecular mechanisms. J Exp Zool 293, 302–319.
Clarke DJ, Burchell B, George SG. 1992. Differential expression and induction of UDP-glucuronosyltransferase isoforms in hepatic and extrahepatic tissues of a fish Pleuronectes platessa. Immunochemical and functional characterization. Toxicol Appl Pharmacol, 115, 130–136.

42
Conney AH. 1982. Induction of microsomal enzymes by foreign chemicals and carcinogenesis by polycyclic aromatic hydrocarbons: G.H.A. Clowes memorial lecture. Cancer Res. 42, 4875–4917.
Denison MS, Nagy SR. 2003. Activation of the aryl hydrocarbon receptor by structurally diverse exogenous and endogenous chemicals. Annu Rev Pharmacol Toxicol 43, 309-334.
Devanesan PD, Higginbotham S, Ariese F, Jankowiak R, Suh M, Small GJ, Cavalieri EL, Rogan EG. 1996. Depurinating and stable benzo[a]pyrene-DNA adducts formed in isolated rat liver nuclei. Chem Res Toxicol. 9, 1113–1116.
Engwall, M.; Brunström, B.; Näf, C.; Hjelm, K. Chemosphere, 1999, Levels of dioxin-like compounds in sewage sludge determined with a bioassay based on EROD induction in chicken embryo liver cultures. 38, 2327–2343.
Ericson G, Noaksson E, Balk L. 1999. DNA adduct formation and persistence in liver and extrahepatic tissues of northern pike (Esox lucius) following oral exposure to benzo[a]pyrene, benzo[k]fluoranthene and 7H-dibenzo[c,g]carbazole. Mutat Res. 427:35-45.
Evans DH, Piermarini PM, Potts WTW. 1999. Ionic transport in the fish gill epithelium. J Exp Zool 283, 641–652.
Flowers L, Bleczinski WF, Burczynski ME, Harvey RG, Penning TM. 1996. Disposition and biological activity of benzo[a]pyrene-7,8-dione. A genotoxic metabolite generated by dihydrodiol dehydrogenase. Biochem 35, 13664–13672.
Frueh FW, Hayashibara KC, Brown PO, Whitlock JP Jr. 2001 Use of cDNA microarrays to analyze dioxin-induced changes in human liver gene expression. Toxicol Lett. 122, 189–203.
Ge NL, Elferink CJ. 1998. A direct interaction between the aryl hydrocarbon receptor and retinoblastoma protein - linking dioxin signalling to the cell cycle. J Biol Chem 273, 22708–22713.
Giesy JP, Jones PD, Kannan K, Newsted JL, Tillitt DE, Williams LL. 2002. Effects of chronic dietary exposure to environmentally relevant concentrations of 2,3,7,8-tetrachlorodibenzo-p-dioxin on survival, growth, reproduction and biochemical responses of female rainbow trout (Oncorhynchus mykiss). Aquat Toxicol. 59, 35-53.
Granberg AL, Brunström B, Brandt I. 2000. Cytochrome P450-dependent binding of 7,12-dimethylbenz(a)anthracene (DMBA) and benzo(a)pyrene (B(a)P) in murine heart, lung, and liver endothelial cells. Arch Toxicol 74:593–601.
Grinwis GCM, van den Brandhof EJ, Engelsma MY, Kuiper RV, Vaasl MA, Vethaak AD, Wester PW, Vos JG. 2001. Toxicity of PCB-126 in European flounder (Platichthus flesus) with emphasis on histopathology and cytochrome P4501A induction in several organ systems. Arch Toxicol 75, 80–87.
Hahn ME. 2001. Dioxin toxicity and the aryl hydrocarbon receptor: Insights from fish and other non-traditional models. Mar Biotechnol 3, S224–S238.
Handy RD, Galloway TS, Depledge MH. 2003. A proposal for the use of biomarkers for the assessment of chronic pollution and in regulatory toxicology. Ecotoxicology 12, 331–343.
Harrad SJ, Jones KC. 1992. A source inventory and budget for chlorinated dioxins and furans in the United Kingdom environment. Sci Tot Environ 126, 89–107.
Hegelund T, Celander MC. 2003. Hepatic versus extrahepatic expression of CYP3A30 and CYP3A56 in adult killifish (Fundulus heteroclitus). Aquat Toxicol. 64, 277–91.

43
Hendricks JD, Meyers TR, Shelton DW, Casteel JL, Bailey GS. 1985. Hepatocarcinogenicity of benzo-a-pyrene to rainbow trout Salmo-gairdneri by dietary exposure and intraperitoneal injection. J Natl Cancer Inst 74, 839–852.
Henry TR, Spitsbergen JM, Hornung ME, Abnet CC, Peterson RE. 1997. Early life stage toxicity of 2,3,7,8-tetrachlorodibenzo-p-dioxin in zebrafish (Danio rerio). Toxicol Appl Pharmacol. 142, 56–68.
Holladay SD, Smith SA, Besteman EG, Deyab ASMI, Gogal RM, Hrubec T, Robertson JL, Ahmed SA. 1998. Benzo(a)pyrene-induced hypocellularity of the pronephros in tilapia (Oreochromis niloticus) is accompanied by alterations in stromal and parenchymal cells and by enhanced immune cell apoptosis. Vet Immunol Immunopathol 64, 69–82.
Hou M, Baughmanb GL, Perenich TA. 1991. Estimation of water solubility and octanol/water partition coefficient of hydrophobic dyes. Part II: Reverse-Phase High Performance Liquid Chromatography” Dyes and Pigments 16, 291–297.
Huang Q, Hong CS. 2002. Aqueous solubilities of non-ortho and mono-ortho PCBs at four temperatures. Water Research 36 3543–3552.
Husøy AM, Myers MS, Willis ML, Collier TK, Celander M, Goksøyr A. 1994. Immunohistochemical localization of CYP1A and CYP3A like isozymes in hepatic and extrahepatic tissues of Atlantic cod (Gadus morhua L.), a marine fish. Toxicol Appl Pharmacol 129, 294 308.
Ingebrigtsen K, Christiansen JS, Lindhe Ö, Brandt I. 2000. Disposition and cellular binding of 3H-benzo(a)pyrene at subzero temperatures: Studies in an aglomerular arctic teleost fish: The polar cod (Boreogadus saida). Polar Biol. 23, 503–509.
Jørgensen E, Velvin R, Killie B, 2000. Miljögifter i marine sediment og organismer i havneområdene ved Harstad, Tromsø, Hammerfest og Honningsvåg 1997-98. Overvakningsrapport nr 768/00, Akvaplan NIVA, Tromsø, Norway. 1–123 (in Norwegian).
Kennedy SW, Jones S P. 1994. Simultaneous measurement of cytochrome P4501A catalytic activity and total protein concentration with a fluorescence plate reader Anal Biochem.222, 217–223
Klasson Wehler, Brunström B, Rannug U. Bergman Å. 1990. 3,3',4,4'-Tetrachlorobiphenyl: metabolism by the chick embryo in ovo and toxicity of hydroxylated metabolites. Chem-Biol Interact. 73, 121–132.
Leaver MJ, George SG. 2000. A cytochrome P4501B gene from a fish, Pleuronectes platessa. Gene. 256, 83–91.
Levine SL, Oris JT. 1999. CYP1A expression in liver and gill of rainbow trout following waterborne exposure: Implications for biomarker determination. Aquat Toxicol. 46, 279–287.
Lubet RA, Nims RW, Mayer RT, Cameron JW, Schechtman LM. 1985. Measurement of cytochrome P-450 dependent dealkylation of alkoxy-phenoxazones in hepatic S9s and hepatocyte homogenates: effects of dicumarol. Mutat. Res., 142, 127–131.
Marshall W.S. 2002. Na+, Cl-, Ca2+ and Zn2+ transport by fish gills: retrospective review and prospective synthesis. J Exp Zool 293, 264–283.
McKim J, Schmieder P, Veith G. 1985. Absorption dynamics of organic chemical transport across trout Salmo gairdneri gills as related to octanol-water partition coefficient. Toxicol. Appl. Pharmacol. 77, 1–10.
Miller MR, Hinton DE, Stegeman JJ. 1989. Cytochrome P-450E induction and localization in gill pillar (endothelial) cells of scup and rainbow trout. Aquat Toxicol 14, 307 322.

44
Nebert DW, Roe AL, Dieter MZ, Solis WA, Yang Y, Dalton TP. 2000. Role of the aromatic hydrocarbon receptor and (Ah) gene battery in the oxidative stress response, cell cycle control, and apoptosis. Biochem Pharmacol. 59, 65–85.
Nimmo IA. 1985. The glutathione S-transferase activity in the gills of rainbow trout (Salmo gairdnerii) Cornp. Biochem. Physiol. 80B, 365–369.
Olson KR. 2002. Vascular anatomy of the fish gill. J Exp Zool 293, 214–231. Poland A, Knutson JC. 1982. 2,3,7,8-Tetrachlorodibenzo-p-dioxin and related
halogenated aromatic hydrocarbons: examination of the mechanism of toxicity. Ann Rev Pharmacol Toxicol. 22, 517–54.
Poellinger L. 2000. Mechanistic aspects – the dioxin (aryl hydrocarbon) receptor. Food Add Contam. 17, 261–266.
Rannug U, Bramstedt H, Nilsson U. 1992. The presence of genotoxic and bioactive components in indigo dyed fabrics a possible health risk? Mutat Res 282, 219–225.
Rogan EG, Ramakrishna NVS, Higginbotham S, Cavalieri EL, Jeong H, Jankowiak R, Small GJ. 1990. Identification and quantification of 7-(benzo[a]pyren-6-yl) guanine in the urine and feces of rats treated with benzo[a]pyrene. Chem Res Toxicol. 3, 441–444.
Sandvik M, Horsberg TE, Skaare JU, Ingebrigtsen K. 1998. Comparison of dietary and waterborne exposure to benzo(a)pyrene: Bioavailability, tissue disposition and CYP1A1 induction in rainbow trout (Oncorhynchus mykiss). Biomarkers3:399-410.
Schwetz BA, Norris JM, Sparschu GL, Rowe UK, Gehring PJ, Emerson JL, Gerbig CG. 1973. Toxicology of chlorinated dibenzo-p-dioxins. Environ Health Perspect 5, 87–99
Sherr C J. 1996. Cancer Cell Cycles. Science, 274, 1672–1677. Silkworth J. McMartin D, Decaprio A, Rej R, O'Keefe P, Kaminsky L. 1982. Acute
toxicity in guinea-pigs and rabbits of soot from a polychlorinated biphenyl containing transformer fire. Toxicol Appl Pharmacol. 65, 425–439.
Smolowitz RM, Hahn ME, Stegeman JJ. 1991. Immunohistochemical localization of cytochrome P-450IA1 induced by 3,3',4,4'-tetrachlorobiphenyl and by 2,3,7,8-tetrachlorodibenzofuran in liver and extrahepatic tissues of the teleost Stenotomus chrysops (scup). Drug Metab Dispos. 19, 113–123.
Spitsbergen JM, Tsai HW, Reddy A, Miller T, Arbogast D, Hendricks JD Bailey GS. 2000. Neoplasia in zebrafish (Danio rerio) treated with 7,12-dimethylbenz(a)anthracene by two exposure routes at different developmental stages. Toxicol Pathol. 28, 705–715.
Stansbury KH, Flesher JW, Gupta RC. 1994. Mechanism of aralkyl-DNA adduct formation from benzo a pyrene in vivo, Chem. Res. Toxicol. 7, 254–259.
Stegeman JJ, Woodin BR, Binder RL. 1984. Patterns of benzo[a]pyrene metabolism by varied species, organs, and developmental stages of fish. Natl Cancer Inst Monogr 65, 371–377.
Svensson C, Lundberg K. 2001. Immune-specific up-regulation of adseverin gene expression by 2,3,7,8-tetrachlorodibenzo-p-dioxin. Mol Pharmacol. 60, 135–42.
Teraoka H, Dong W, Tsujimoto Y, Iwasa H, Endoh D, Ueno N, Stegeman JJ, Peterson RE, Hiraga T. 2003. Induction of cytochrome P450 1A is required for circulation failure and edema by 2,3,7,8-tetrachlorodibenzo-p-dioxin in zebrafish. Biochem Biophys Res Com. 304, 223–228.
Toomey BH, Bello S, Hahn ME, Cantrell S, Wright P, Tillitt DE, Di Giulio RT. 2001. 2,3,7,8-Tetrachlorodibenzo-p-dioxin induces apoptotic cell death and cytochrome P4501A expression in developing Fundulus heteroclitus embryos. Aquat Toxicol. 53, 127–38.

45
Ullberg S. 1977. The technique of whole body autoradiography. Cryosectioning of large specimens. Science tools, the LKB Instrument Journal. (Special issue), LKB-Produkter, Bromma, Sweden.
Van den Berg M, Birnbaum L, Bosveld ATC, Brunström B, Cook P, Feeley M, Giesy JP, Hanberg A, Hasegawa R, Kennedy SW, Kubiak T, Larsen JC, van-Leeuwen FXR, Djien LAK, Nolt C, Peterson RE, Poellinger L, Safe S, Schrenk D, Tillitt D, Tysklind M, Younes M, Waern F, Zacharewski T. 1998. Toxic equivalency factors (TEFs) for PCBs, PCDDs, PCDFs for humans and wildlife. Environ Health Persp. 106, 775–792.
Van der Oost R, Beyer J, Vermeulen NPE. 2003. Fish bioaccumulation and biomarkers in environmental risk assessment: a review. Environ Toxicol Pharmacol. 13, 57–149.
Van der Weiden MEJ, Bleumink Rob, Seinen W, Van den Berg M. 1994. Concurrence of P450 1A induction and toxic effects in the mirror carp (Cyprinus carpio), after administration of a low dose of 2,3,7,8-tetrachlorodibenzo-p-dioxin. Aquat Toxicol. 29:147–162.
Van Veld PA, Vogelbein WK, Cochran MK, Goksøyr A, Stegeman JJ. 1997. Route-specific cellular expression of cytochrome P4501A (CYP1A) in fish (Fundulus heteroclitus) following exposure to aqueous and dietary benzo[a]pyrene. Toxicol Appl Pharmacol 142, 348–359.
Wilkie MP. 2002. Ammonia excretion and urea handling by fish gills: Present understanding and future research challenges. J Exp Zool. 293, 284–301.
Wikström E, Ryan S, Touati A, Gullett BK. 2003. Key parameters for de novo formation of polychlorinated didenzo-p-dioxins and dibenzofurans. Environ Sci Technol. 37, 1962–1970.
Wilson JM, Laurent P. 2002. Fish gill morphology: inside out. J Exp Zool 293, 192–213.
Wobst M, Wichmann H, Bahadir M. 2003. Influence of heavy metals on the formation and the distribution behaviour of PAH and PCDD/F during simulated fires. Chemosphere 51, 109–115.
Woodin BR, Smolowitz RM, Stegeman JJ. 1997. Induction of cytochrome P4501A in the intertidal fish Anoplarchus purpurescens by Prudhoe Bay Crude oil and environmental induction in fish from Prince William Sound. Environ Sci Technol. 31, 1198–1205.
Zenker WGE, Ferguson HW, Barker IK, Woodward B. 1987 Epithelial and pillar cell replacement in gills of juvenile trout, Salmo Gairdneri Richardson. Comp Biochem Physiol A 86, 423–428.
Acta Universitatis UpsaliensisComprehensive Summaries of Uppsala Dissertations
from the Faculty of Science and TechnologyEditor: The Dean of the Faculty of Science and Technology
Distribution:Uppsala University Library
Box 510, SE-751 20 Uppsala, Swedenwww.uu.se, [email protected]
ISSN 1104-232XISBN 91-554-5841-6
A doctoral dissertation from the Faculty of Science and Technology, UppsalaUniversity, is usually a summary of a number of papers. A few copies of thecomplete dissertation are kept at major Swedish research libraries, while thesummary alone is distributed internationally through the series ComprehensiveSummaries of Uppsala Dissertations from the Faculty of Science and Technology.(Prior to October, 1993, the series was published under the title “ComprehensiveSummaries of Uppsala Dissertations from the Faculty of Science”.)