Burst Tests of Filament-Wound Graphite-Epoxy Tubes - DTIC
51
SMC-TR-01-11 AEROSPACE REPORT NO. TR-2000(1494)-1 Burst Tests of Filament-Wound Graphite-Epoxy Tubes Pathfinder Test Series for Delta II GEM Motor Cases 20 December 2000 Prepared by D. J. CHANG, P. R. VALENZUELA, and T. V. ALBRIGHT Propulsion Science and Experimental Mechanics Department Space Materials Laboratory Laboratory Operations Prepared for SPACE AND MISSILE SYSTEMS CENTER AIR FORCE MATERIEL COMMAND 2430 E. El Segundo Boulevard Los Angeles Air Force Base, CA 90245 Engineering and Technology Group THE AEROSPACE CORPORATION El Segundo, California APPROVED FOR PUBLIC RELEASE; DISTRIBUTION UNLIMITED 20010516 066
-
Upload
khangminh22 -
Category
Documents
-
view
4 -
download
0
Transcript of Burst Tests of Filament-Wound Graphite-Epoxy Tubes - DTIC

SMC-TR-01-11 AEROSPACE REPORT NO. TR-2000(1494)-1
Burst Tests of Filament-Wound Graphite-Epoxy Tubes
Pathfinder Test Series for Delta II GEM Motor Cases
20 December 2000
Prepared by
D. J. CHANG, P. R. VALENZUELA, and T. V. ALBRIGHT Propulsion Science and Experimental Mechanics Department Space Materials Laboratory Laboratory Operations
Prepared for
SPACE AND MISSILE SYSTEMS CENTER AIR FORCE MATERIEL COMMAND 2430 E. El Segundo Boulevard Los Angeles Air Force Base, CA 90245
Engineering and Technology Group
THE AEROSPACE CORPORATION El Segundo, California
APPROVED FOR PUBLIC RELEASE; DISTRIBUTION UNLIMITED
20010516 066
This report was submitted by The Aerospace Corporation, El Segundo, CA 90245-4691, under Contract No. F04701-00-C-0009 with the Space and Missile Systems Center, 2430 E. El Segundo Blvd., Los Angeles Air Force Base, CA 90245. It was reviewed and approved for The Aerospace Corporation by P. D. Fleischauer, Principal Director, Space Materials Laboratory. Capt. Tom Rankin was the project officer for the program.
This report has been reviewed by the Public Affairs Office (PAS) and is releasable to the National Technical Information Service (NTIS). At NTIS, it will be available to the general public, including foreign nationals.
This technical report has been reviewed and is approved for publication. Publication of this report does not constitute Air Force approval of the report's findings or conclusions. It is published only for the exchange and stimulation of ideas.
Capt. Tom Ran SMC/CLM

REPORT DOCUMENTATION PAGE Form Approved OMB No. 0704-0188
Public reporting burden for this collection of information is estimated to average 1 hour per response, including the time for reviewing instructions, searching existing data sources, gathering and maintaining the data needed, and completing and reviewing the collection of information. Send comments regarding this burden estimate or any other aspect of this collection of information, including suggestions for reducing this burden to Washington Headquarters Services, Directorate for Information Operations and Reports, 1215 Jefferson Davis Highway, Suite 1204, Arlington, VA 22202-4302, and to the Office of Management and Budget, Paperwork Reduction Project (0704-0188), Washington, DC 20503.
1. AGENCY USE ONLY (Leave blank) 2. REPORT DATE
20 December 2000 3. REPORT TYPE AND DATES COVERED
4. TITLE AND SUBTITLE
Burst Tests of Filament-Wound Graphite-Epoxy Tubes: Pathfinder Test Series for Delta II GEM Motor Cases
5. FUNDING NUMBERS
F04701-00-C-0009 6. AUTHOR(S)
D. J. Chang, P. R. Valenzuela, and T. V. Albright
7. PERFORMING ORGANIZATION NAME(S) AND ADDRESS(ES)
The Aerospace Corporation Laboratory Operations El Segundo, CA 90245-4691
8. PERFORMING ORGANIZATION REPORT NUMBER
TR-2000(1494)-1
9. SPONSORING/MONITORING AGENCY NAME(S) AND ADDRESS(ES) Space and Missile Systems Center Air Force Materiel Command 2430 E. El Segundo Boulevard Los Angeles Air Force Base, CA 90245
10. SPONSORING/MONITORING AGENCY REPORT NUMBER
SMC-TR-01-11
11. SUPPLEMENTARY NOTES
12a. DISTRIBUTION/AVAILABILITY STATEMENT
Approved for public release; distribution unlimited
12b. DISTRIBUTION CODE
13. ABSTRACT {Maximum 200 words)
A test program was conducted to investigate the failure modes of undamaged and damaged graphite-epoxy cylindrical tubes subject to internal pressure, and to simulate the failure mode of the Delta graphite epoxy motor (GEM) case K404. There were two phases of this test program: the mini-test series and the pathfinder series.
The mini-test series, using 1.5-in. diameter tubes, included five tests. The pathfinder series, using 4.00-in. diameter tubes, included 41 tests. Two types of intentional damage were made to some of the tubes: either a longitudinal-line cut or a single-point impact. A Kodak High Speed Motion Analyzer model 4540 was used to record images of the fracture process.
Testing was conducted under three conditions: hydraulic pressurization, pneumatic pressurization with solid inserts, and pneumatic pressurization with inert propellant inserts. Several failure modes were observed. A tube with a longitudinal cut can fail in three different modes: a local leakage mode, a bursting mode with a fracture initiating from the cut, or a burst- ing mode with complete tube disintegration.
In testing of impact-damaged tubes, the results show that the burst pressure decreases with increasing impact load. At an impact load of 335 lb, the burst pressure decreases by 33% compared to the undamaged condition.
The failure initiation point of the impact-damaged tubes was not necessarily at the impact location. Apparently, impact can cause localized damage to other areas of tubes. However, thermography and ultrasound inspections failed to detect this damage. This is possibly because these nondestructive examination (NDE) techniques can detect delamination but not fiber breakage in composite materials.
14. SUBJECT TERMS
Graphite epoxy tubes, Filament-wound composites, Internal pressurization, Impact damage, Fracture
15. NUMBER OF PAGES
39 16. PRICE CODE
17. SECURITY CLASSIFICATION OF REPORT
UNCLASSIFIED
18. SECURITY CLASSIFICATION OF THIS PAGE
UNCLASSIFIED
19. SECURITY CLASSIFICATION OF ABSTRACT
UNCLASSIFIED
20. LIMITATION OF ABSTRACT
NSN 7540-01-280-5500 Standard Form 298 (Rev. 2-89) Prescribed by ANSI Std. Z39-18 298-102
Foreword
This project was funded with the support of the Medium Launch Vehicle (MLV) program office at The Aerospace Corporation. Mr. James Taylor, Director of Launch Vehicle Systems, MLV Directorate, authorized the project. Mr. David Zelisse and Dr. Paul Brennan of the MLV Directorate were the technical monitors.
ill

IV
Acknowledgements
The authors wish to acknowledge the assistance of the following personnel, who helped make this project successful. Mr. Ashok Munjal of Vehicle Systems Division helped on the tube fabrication phase of the project by visiting our tube vendor, Advanced Composite and Products Technology, Inc., Huntington Beach, California, to ensure the high quality of the tube. In the Space Materials Laboratory, Dr. James Nokes and Mr. George Panos performed thermography and ultrasonic inspection on post- impacted tubes; and Dr. Richard Welle and Ms. Andrea Birkitt helped on the acquisition of pressure time-history and high-speed camera image data. Mr. Rick Elder of the Aerospace machine shop worked closely with us to produce high-precision parts that were critical to testing success. Ms. Karen Foster of the Space Science Applications Laboratory spent numerous hours editing our high-speed camera images.
The authors are thankful to Mr. Emil Kaegi for his contribution in the set-up and data acquisition of the mini test series.
The authors are particularly thankful to Dr. Richard Welle for his valuable discussions and comments designed to improve the readability of the report.

VI

Contents
1. Background 1
2. Objectives 3
3. Test Series 5
4. Mini-Test Series 7
4.1 Specimen description 7 4.2 Test Setup 7 4.3 Test results and observations 8 4.4 Discussion 10
5. Pathfinder Test Programs 11
5.1 Specimen description 11 5.1.1 Graphite-epoxy tubes 11 5.1.2 Inert propellant insert 12 5.1.3 Artificial damage to specimens 12
5.2 End Fitting 16 5.3 Test Method 18 5.4 Data Acquisition 18
6. Test Results 21
6.1. Damage by a line cut 23 6.1.1 Hydraulic tests 24 6.1.2 Pneumatic tests with plastic inserts 24 6.1.3 Pneumatic tests with inert propellant inserts 25 6.1.4 Discussion 26
6.2 Damage by impact 28 6.2.1 Hydraulic tests 29 6.2.2 Pneumatic tests with plastic inserts 29 6.2.3 Pneumatic tests with inert propellant inserts 29 6.2.4 Discussion 29
7. Summary and Conclusions 33
8. Recommendations 35
9. References 37
Vll
Figures
1. Mini-test series specimen assembly 7
2. Failure image of mini specimen no. 4 frame #1 (initial state) 9
3. Failure image of mini specimen no. 4 frame #2 (0.44 ms) 9
4. Failure image of mini specimen no. 4 frame #3 (0.88 ms) 9
5. Failure image of mini specimen no. 4 frame #4 (1.32 ms) 9
6. Failure image of mini specimen no. 4 frame #5 (1.78 ms) 10
7. Impact load time history for 5.57-lb impactor 14
8. Impact load time history for 9.75-lb impactor (the high frequency component of the signal is an artifact of the load cell) 14
9. Impact load versus impact energy with and without inert propellant insert (5.57-lb and 9.75 lb. mass) 15
10. Ratio of absorbed energy to impact energy with and without inert propellant insert (5.57-lb mass) 15
11. Photographs showing the impact damage from an impact load of 300 lb (An inert propellant insert was used) 16
12. Cross-section sketch of end fitting 17
13. Graphite-epoxy tube specimen with end fitting 17
14. Pressure/time history of hydraulic-test for tube G2 (no insert included) 24
15. Pressure/time history of pneumatic test for tube E3 (with plastic insert) 25
16. Pressure/time history of pneumatic burst test for tube G6 (tube had an inert propellant insert) 25
17. Pneumatic test with inert propellant insert 26
18. Hydraulic test of tube G2 27
19. Pressure/time history of five incremental pressurization tests for test no. 20 (tube F5) 28
20. Pressure/time history of eight incremental pressurization tests for test no. 20 (this testseries was conducted after the tests series in Figure 19) 28
21. Burst pressure versus impact load 29
22. Failure mode of tube C2 under pneumatic gas with inert propellant insert (specimen impacted with 315-lb load) 31
23. Failure mode of tube Bl under pneumatic gas with inert propellant insert (specimen impacted with 335-lb load) 31
24. Failure mode of tube C6 under pneumatic gas with inert propellant insert (specimen impacted with 310-lb load) 32
25. NDE photographs of tube B1 (the upper is the thermography image; the lower is the ultrasound image) 32
Vlll
Tables
1. Test Summary of Mini-Test Series 8
2. Mechanical Properties of the Filaments and Epon Resin 11
3. Matrix of Impact Tests 13
4. Image Recording Capabilities of a Kodak High-speed Motion Analyzer model 4540 19
5. Description of Hydraulic-tests 21
6. Description of Pneumatic tests with Plastic Inserts 22
7. Description of Pneumatic Tests with Inert Propellant Inserts 23
IX


1. Background
The Delta 11-241 flight launched on January 17, 1997, was destroyed approximately thirteen seconds after liftoff. The failure was determined by the Accident Investigation Board (AIB) to have been caused by the rupture of one of the nine graphite-epoxy solid rocket motors (GEM/SRM), designated as SRM #2 of the vehicle. It was also known as the GEM K404.
The Accident Investigation Board concluded that SRM #2 catastrophically failed because its outer composite layers were damaged through some type of impact to the outside of the case after it was proof tested (Ref. 1). When the case was fully pressurized during launch, it split longitudinally, leading to failure of the Delta II mission. Furthermore, there was no conclusive evidence to clearly establish when or how the case damage occurred.
The current level of understanding of structural strength degradation of SRMs caused by local damage, such as an impact, is limited, making it difficult to trace the damage by observing the failure mode. Areas that warrant further investigation include the detection of damage using nondestructive examination, experimental determination of the failure modes of SRMs, and analytical predictions of strength degradation in SRMs due to damage.
In assisting the Delta II failure investigation, two series of tests were conducted. The objective of the test series was to investigate the failure modes of graphite-epoxy cylindrical tubes subject to pneumatic pressure with and without local damage. It was hoped that the observed failure mode of the GEM K404 could be duplicated in the laboratory. This report provides a detailed description of both test series and their results.

2. Objectives
A test program was conducted to provide better understanding of structural strength degradation of graphite-epoxy composites with and without local damage. The test program was designed to address the following objectives:
1. To investigate the failure modes of graphite-epoxy cylindrical tubes subject to internal pressure, with and without local damage.
2. To simulate the failure mode of the Delta GEM case K404 using a subscale cylindrical composite casing with an inert propellant insert under internal pneumatic pressure.
3. To qualitatively determine the relative failure strength degradation and delayed failure times associated with pre-existing local damage to the case.

3. Test Series
This program included two series of tests. The first series, called a mini-test series, was conducted using available graphite-epoxy tubes. This series investigated the tubes' failure modes when subject to pneu- matic pressure with and without local damage. This series demonstrated the basic technique of the tests, but used tubes with a lay-up pattern unrepresentative of the lay-up of the GEM. A second series of tests, called the pathfinder series, was then designed and conducted using filament-wound cylindrical graphite- epoxy tubes specifically fabricated to simulate the membrane lay-ups of the GEM case. These tubes had a 4-in. internal diameter, which is one-tenth the diameter of Delta II GEM case, and a comparable lay-up pattern. Some specimens from both test series also had inert propellant inserts representing the mechani- cal properties of live propellant. Artificial cuts or impact damage was made to some tube specimens to assess the strength degradation caused by the damage.
4. Mini-Test Series
4.1 Specimen description
The composite tubes available for testing were three-ply graphite-epoxy tubes. The type of graphite fiber was unknown. The lay-up angles were 75/0/-75 degrees to the axial direction. The nominal inner diameter (ID) was 1.5 in. and the wall thickness was 0.02 in. giving a radius-to-thickness ratio of 37.5. The length of the test specimens was 5.0 in.
A thick-wall annular cylinder was machined from a piece of inert solid propellant. The cylinder had an ID of 0.6 in. and an outer diameter (OD) of 1.5 in. The inert propellant cylinder fit snugly inside the composite tube. The length of the cylinder was slightly shorter than that of the tube. Both ends of the tube were sealed with epoxy into groves on stainless steel flanges used as end-fittings, and the ends of inert propellant cylinder were sealed against the end flanges with O-rings. The two flanges were joined using three brass rods at 120-deg intervals. The rods carried the axial load when the cylinders were pressurized. Under this condition, the tubes experienced only circumferential stress. Figure 1 shows the assembly, including test specimen, end-fitting, and the tie-rods.
A total of five specimens was prepared. For three specimens, a cut of 0.25-in. long in the axial direction was made on the surface of the composite tube, to a depth of one ply. The cut was located approximately 1 in. from the end of the tube. One was burst without a solid inert propellant insert. This test was for comparing the response with and without the inert propellant.
4.2 Test Setup
The test procedure involved pressurizing the cylinders using nitrogen gas. The application of the gas pressure was controlled with a solenoid-operated valve. The data acquisition system consisted of a Tektronics TDS 540A, four-channel, digital oscilloscope (for recording pressure histories); two video cameras feeding a VHS VCR; and a Kodak High-speed Motion Analyzer (model No. 4540). The high- speed camera was capable of recording speeds ranging from 250 to 40500 frames per sec and had a memory capacity of 1024 full frames.
Figure 1. Mini-test series specimen assembly.

4.3 Test results and observations
The test parameters for the five specimens are shown in Table 1. Based on the results, the following phenomena are observed:
1. The failure mode of specimens tested with an inert propellant insert, whether local initial damage existed or not, was always a line crack in the axial direction caused by the hoop stress. This is demonstrated by the high-speed camera images. Figures 2 through 6 depict sequential high-speed camera images starting from the beginning of the failure for tube no. 4. The images were taken at 2250 frames per sec. A longitudinal line cut, 0.25-in. long by one-ply deep, is visible between two white dots made using "liquid paper." In Figure 3, the crack widened after 0.44 ms. In Figure 4, the composite layers were blown out and a hole formed in the inert propellant. Figures 5 and 6 show that the hole in the inert propellant resulting from the tube rupture moved upward.
The failure mode of the specimen without an inert propellant insert was a complete disintegration and no failure origin could be identified.
3. When a local cut was made in the tube with inert propellant insert, the failure would initiate from the vicinity of the cut and then propagate axially toward both ends.
4. A delayed failure up to several seconds after pressurization is possible for damaged tubes, as evidenced by two such occurrences.
Table 1. Test Summary of Mini-Test Series
Specimen ID Inert propellant insert
VA" long by one ply deep cut
Failure pressure* (psig)
Failure Mode Remark
#1 yes no 975 (200, 280, 400,
500, 700)
Axial crack propagation
#2 yes no 1050 (850, 860)
Axial crack propagation
High speed camera data recorded.
#3 yes yes 780 (550)
Axial crack propagation
1.3 sec delayed failure.
#4 yes yes Not available. Estimated to be
between 950 and 1050(650,900)
Axial crack propagation
High speed camera data recorded.
#5 no yes 870 (500, 600, 800)
Disintegration 9.4 sec delayed failure.
* Numbers in the parentheses repre sent the pressure le weis tested rjrior to thp final failure
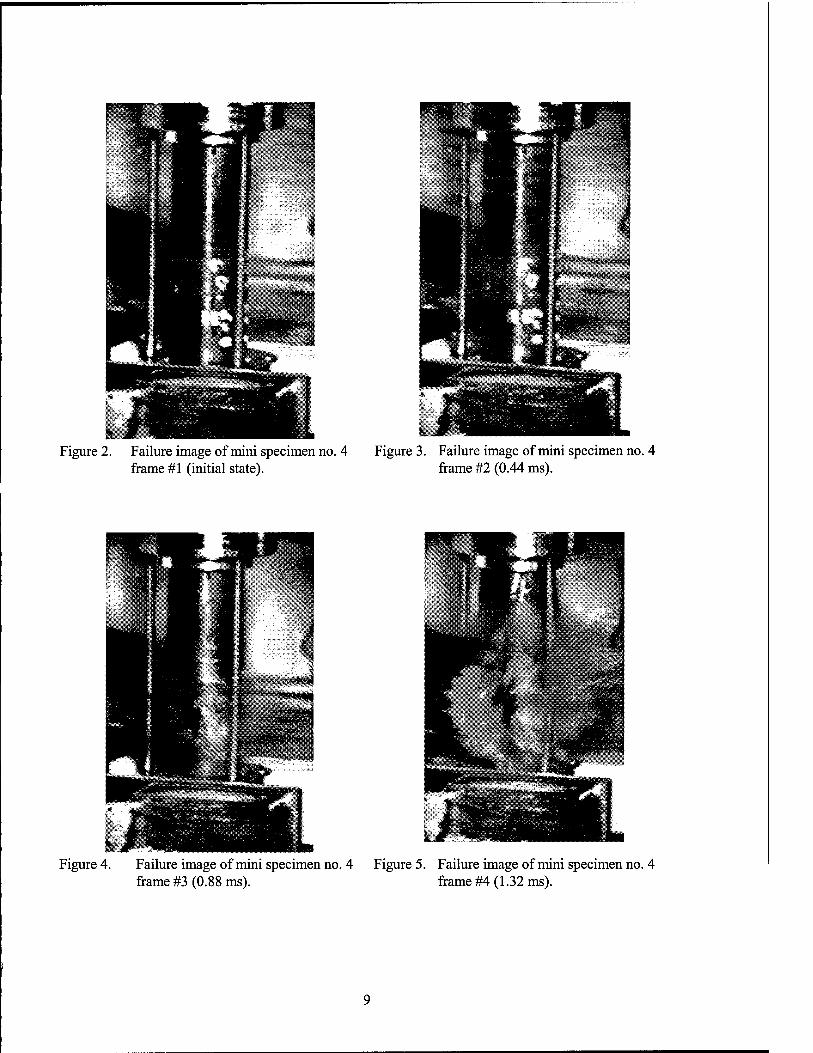
Figure 2. Failure image of mini specimen no. 4 frame #1 (initial state).
Figure 3. Failure image of mini specimen no. 4 frame #2 (0.44 ms).
Figure 4. Failure image of mini specimen no. 4 Figure 5. Failure image of mini specimen no. 4 frame #3 (0.88 ms). frame #4 (1.32 ms).
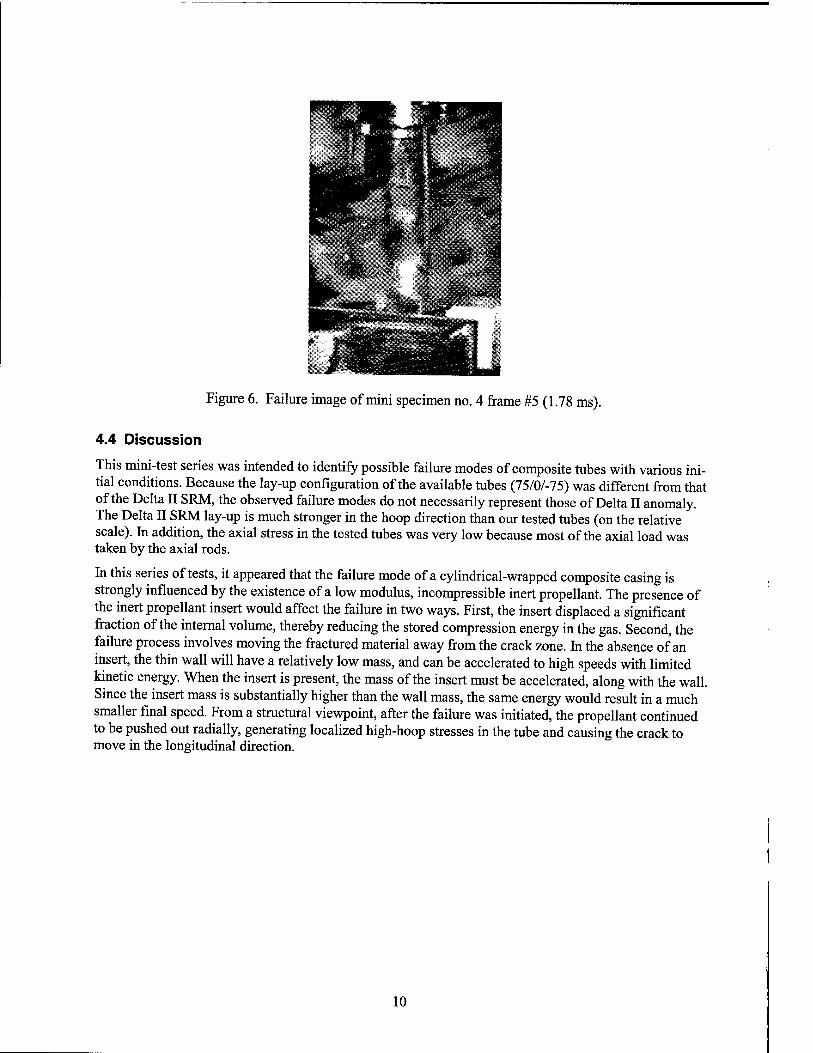
Figure 6. Failure image of mini specimen no. 4 frame #5 (1.78 ms).
4.4 Discussion
This mini-test series was intended to identify possible failure modes of composite tubes with various ini- tial conditions. Because the lay-up configuration of the available tubes (75/0/-75) was different from that of the Delta II SRM, the observed failure modes do not necessarily represent those of Delta II anomaly. The Delta II SRM lay-up is much stronger in the hoop direction than our tested tubes (on the relative scale). In addition, the axial stress in the tested tubes was very low because most of the axial load was taken by the axial rods.
In this series of tests, it appeared that the failure mode of a cylindrical-wrapped composite casing is strongly influenced by the existence of a low modulus, incompressible inert propellant. The presence of the inert propellant insert would affect the failure in two ways. First, the insert displaced a significant fraction of the internal volume, thereby reducing the stored compression energy in the gas. Second, the failure process involves moving the fractured material away from the crack zone. In the absence of an insert, the thin wall will have a relatively low mass, and can be accelerated to high speeds with limited kinetic energy. When the insert is present, the mass of the insert must be accelerated, along with the wall. Since the insert mass is substantially higher than the wall mass, the same energy would result in a much smaller final speed. From a structural viewpoint, after the failure was initiated, the propellant continued to be pushed out radially, generating localized high-hoop stresses in the tube and causing the crack to move in the longitudinal direction.
10
5. Pathfinder Test Programs
Based on the results from the five mini-tests, it was observed that the failure mode for all four tubes filled with inert propellant inserts was similar to that of Delta K404. However, since the lay-up of the mini-test specimens was different from that of the Delta II GEM, it was uncertain that the same phenomena would apply to tubes with the same ply patterns (Ref. 2) as the Delta II GEM. In addition, the effects of artificial local damage on the strength of a tube specimen needed to be addressed. A recommendation was made to and accepted by the Aerospace MLV Program Office to conduct a more extensive test series. The goals of the new tests series were to address: (1) the failure modes of graphite-epoxy tubes with the same lay- up pattern as the Delta GEM; (2) the variation of the burst pressure of these specimens under both hydraulic pressurization and pneumatic pressurization, with and without inert propellant inserts; and (3) the effects of damage such as cuts and impacts.
5.1 Specimen description
5.1.1 Graphite-epoxy tubes
The test specimens were filament-wound graphite-epoxy thin-wall tubes. The tubes were made of Toho G30-500 - 3K graphite filaments in an epoxy resin, Epon 828. The tubes had a nominal inner diameter of 4.0 in., with a nominal wall thickness of 0.060 in. The specimens were approximately one-tenth of the Delta II SRM in diameter and were intended to simulate the lay-up pattern in the GEM membrane region. The length of the tube specimen was typically 17.5 in. A special end cap was designed and fabricated for the tubes. These end caps adhered directly to the tubes, allowing the tubes themselves to carry the axial load as well as the radial load induced by the internal pressure.
The mechanical properties of the Toho G30-500 graphite filaments and Epon resin system are listed in Table 2.
In selecting the tube configuration, we considered two criteria. First, a minimum of three hoop layers would be needed to properly simulate the lay-up angle of the Delta GEM membrane region. Since hoop layers resist the pressure-induced hoop tension, a minimum of two hoop plies should be left to resist the tension after the outer hoop ply is damaged. Secondly, the tube should fail under an internal pressure of no higher than 4000 psi due to the considerations of safety, available pressure sources, and cost. Although IM7 graphite fibers are being used in the Delta II GEM motor case, its use would lead to a burst pressure of no less than 4500 psi for an undamaged 4-in. diameter tube. This 4500 psi pressure level was difficult to achieve with the pressure source available then. Our current pressurization capa- bility has been upgraded to 10,000 psi, and the 4500 psi requirement would not present any difficulty. In addition, we were more interested in the failure mode rather than the absolute strength. Therefore, a fiber with low strength but with a comparable tensile modulus, Toho 500, was deemed acceptable and was selected.
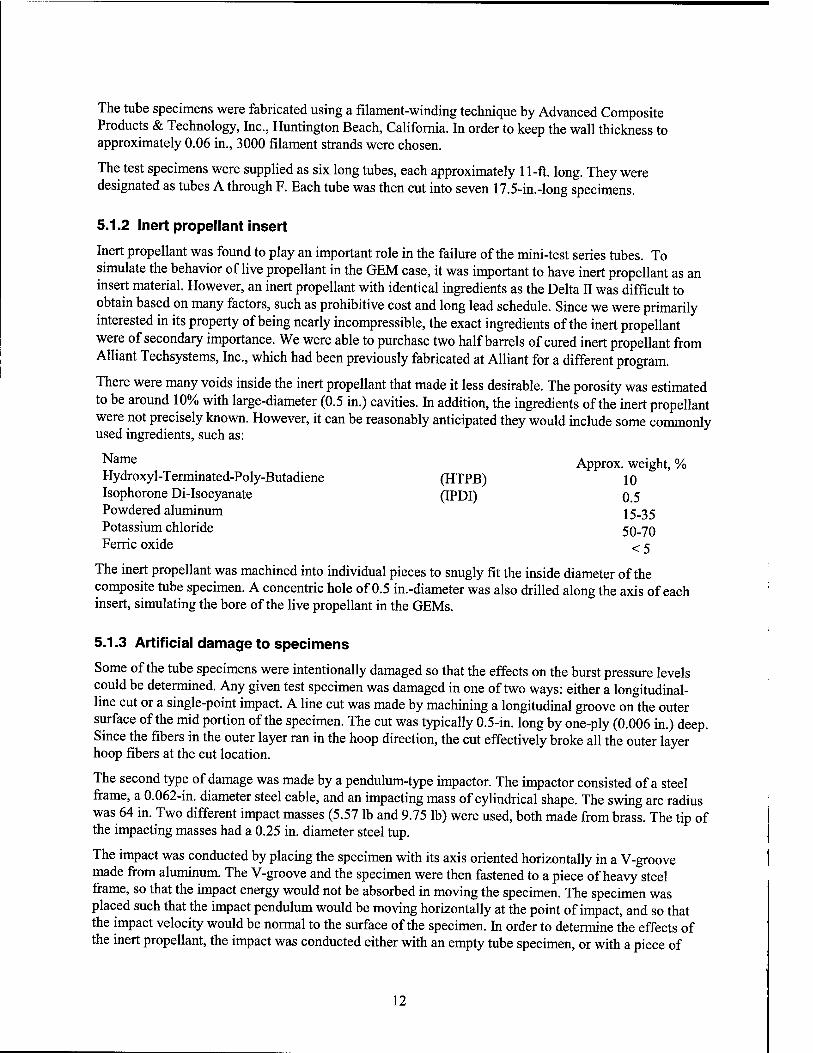
Table 2. Mechanical Properties of the Filaments and Epon Resin
Tensile modulus (psi) Ultimate tensile strength (psi) Strain-to-failure (%)
Toho filament 34x106 550 x103 1.6
Epon 828 resin 0.415 x10s 17x103 10.6
11
The tube specimens were fabricated using a filament-winding technique by Advanced Composite Products & Technology, Inc., Huntington Beach, California. In order to keep the wall thickness to approximately 0.06 in., 3000 filament strands were chosen.
The test specimens were supplied as six long tubes, each approximately 11-ft. long. They were designated as tubes A through F. Each tube was then cut into seven 17.5-in.-long specimens.
5.1.2 Inert propellant insert
Inert propellant was found to play an important role in the failure of the mini-test series tubes. To simulate the behavior of live propellant in the GEM case, it was important to have inert propellant as an insert material. However, an inert propellant with identical ingredients as the Delta II was difficult to obtain based on many factors, such as prohibitive cost and long lead schedule. Since we were primarily interested in its property of being nearly incompressible, the exact ingredients of the inert propellant were of secondary importance. We were able to purchase two half barrels of cured inert propellant from Alliant Techsystems, Inc., which had been previously fabricated at Alliant for a different program.
There were many voids inside the inert propellant that made it less desirable. The porosity was estimated to be around 10% with large-diameter (0.5 in.) cavities. In addition, the ingredients of the inert propellant were not precisely known. However, it can be reasonably anticipated they would include some commonly used ingredients, such as:
Name Hydroxyl-Terminated-Poly-Butadiene Isophorone Di-Isocyanate Powdered aluminum Potassium chloride Ferric oxide
(HTPB) (IPDI)
Approx. weight, % 10 0.5 15-35 50-70
<5
The inert propellant was machined into individual pieces to snugly fit the inside diameter of the composite tube specimen. A concentric hole of 0.5 in.-diameter was also drilled along the axis of each insert, simulating the bore of the live propellant in the GEMs.
5.1.3 Artificial damage to specimens
Some of the tube specimens were intentionally damaged so that the effects on the burst pressure levels could be determined. Any given test specimen was damaged in one of two ways: either a longitudinal- line cut or a single-point impact. A line cut was made by machining a longitudinal groove on the outer surface of the mid portion of the specimen. The cut was typically 0.5-in. long by one-ply (0.006 in.) deep. Since the fibers in the outer layer ran in the hoop direction, the cut effectively broke all the outer layer hoop fibers at the cut location.
The second type of damage was made by a pendulum-type impactor. The impactor consisted of a steel frame, a 0.062-in. diameter steel cable, and an impacting mass of cylindrical shape. The swing arc radius was 64 in. Two different impact masses (5.57 lb and 9.75 lb) were used, both made from brass. The tip of the impacting masses had a 0.25 in. diameter steel tup.
The impact was conducted by placing the specimen with its axis oriented horizontally in a V-groove made from aluminum. The V-groove and the specimen were then fastened to a piece of heavy steel frame, so that the impact energy would not be absorbed in moving the specimen. The specimen was placed such that the impact pendulum would be moving horizontally at the point of impact, and so that the impact velocity would be normal to the surface of the specimen. In order to determine the effects of the inert propellant, the impact was conducted either with an empty tube specimen, or with a piece of
12
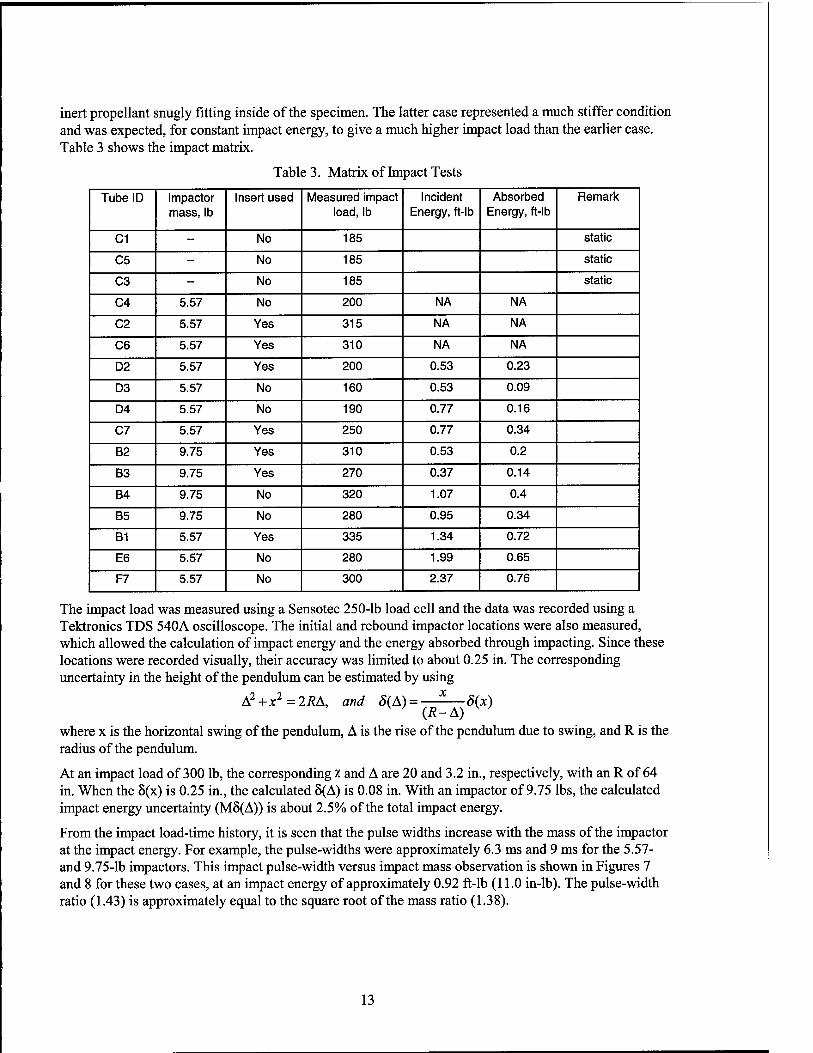
inert propellant snugly fitting inside of the specimen. The latter case represented a much stiffer condition and was expected, for constant impact energy, to give a much higher impact load than the earlier case. Table 3 shows the impact matrix.
Table 3. Matrix of Impact Tests
Tube ID Impactor mass, lb
Insert used Measured impact load, lb
Incident Energy, ft-lb
Absorbed Energy, ft-lb
Remark
C1 -- No 185 static
C5 -- No 185 static
C3 -- No 185 static
C4 5.57 No 200 NA NA
C2 5.57 Yes 315 NA NA
C6 5.57 Yes 310 NA NA
D2 5.57 Yes 200 0.53 0.23
D3 5.57 No 160 0.53 0.09
D4 5.57 No 190 0.77 0.16
C7 5.57 Yes 250 0.77 0.34
B2 9.75 Yes 310 0.53 0.2
B3 9.75 Yes 270 0.37 0.14
B4 9.75 No 320 1.07 0.4
B5 9.75 No 280 0.95 0.34
B1 5.57 Yes 335 1.34 0.72
E6 5.57 No 280 1.99 0.65
F7 5.57 No 300 2.37 0.76
The impact load was measured using a Sensotec 250-lb load cell and the data was recorded using a Tektronics TDS 540A oscilloscope. The initial and rebound impactor locations were also measured, which allowed the calculation of impact energy and the energy absorbed through impacting. Since these locations were recorded visually, their accuracy was limited to about 0.25 in. The corresponding uncertainty in the height of the pendulum can be estimated by using
.2 , „2 , o... x A1+xz=2RA, and 8(A) = -8(x) (R-A)
where x is the horizontal swing of the pendulum, A is the rise of the pendulum due to swing, and R is the radius of the pendulum.
At an impact load of 300 lb, the corresponding z and A are 20 and 3.2 in., respectively, with an R of 64 in. When the 8(x) is 0.25 in., the calculated 8(A) is 0.08 in. With an impactor of 9.75 lbs, the calculated impact energy uncertainty (M5(A)) is about 2.5% of the total impact energy.
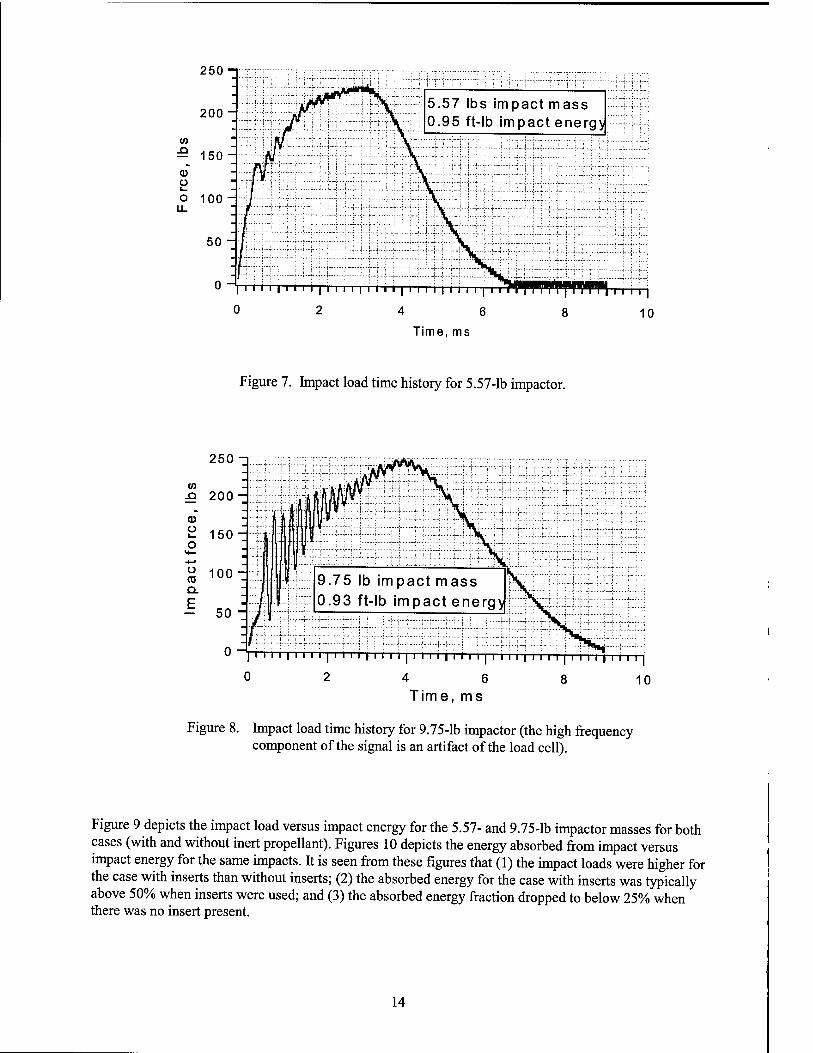
From the impact load-time history, it is seen that the pulse widths increase with the mass of the impactor at the impact energy. For example, the pulse-widths were approximately 6.3 ms and 9 ms for the 5.57- and 9.75-lb impactors. This impact pulse-width versus impact mass observation is shown in Figures 7 and 8 for these two cases, at an impact energy of approximately 0.92 ft-lb (11.0 in-lb). The pulse-width ratio (1.43) is approximately equal to the square root of the mass ratio (1.38).
13
250 -I
200 - 5.57 lbs impact mass 0.95 ft-lb impact energy
0 ~*| i I i i | i i i i | i i i i | Iiiiii 11 i i 111
4 6 Time, ms
i i i i |
10
Figure 7. Impact load time history for 5.57-lb impactor.
250-1
-Q 200-1
o 150-
£ 10° CL
1 50H
0 -i
9.75 lb impact mass 0.93 ft-lb impact energy
I''''11' ■' 11 11111111111111111111 1111111111111111111
0 2 4 6 8 10 Time, ms
Figure 8. Impact load time history for 9.75-lb impactor (the high frequency component of the signal is an artifact of the load cell).
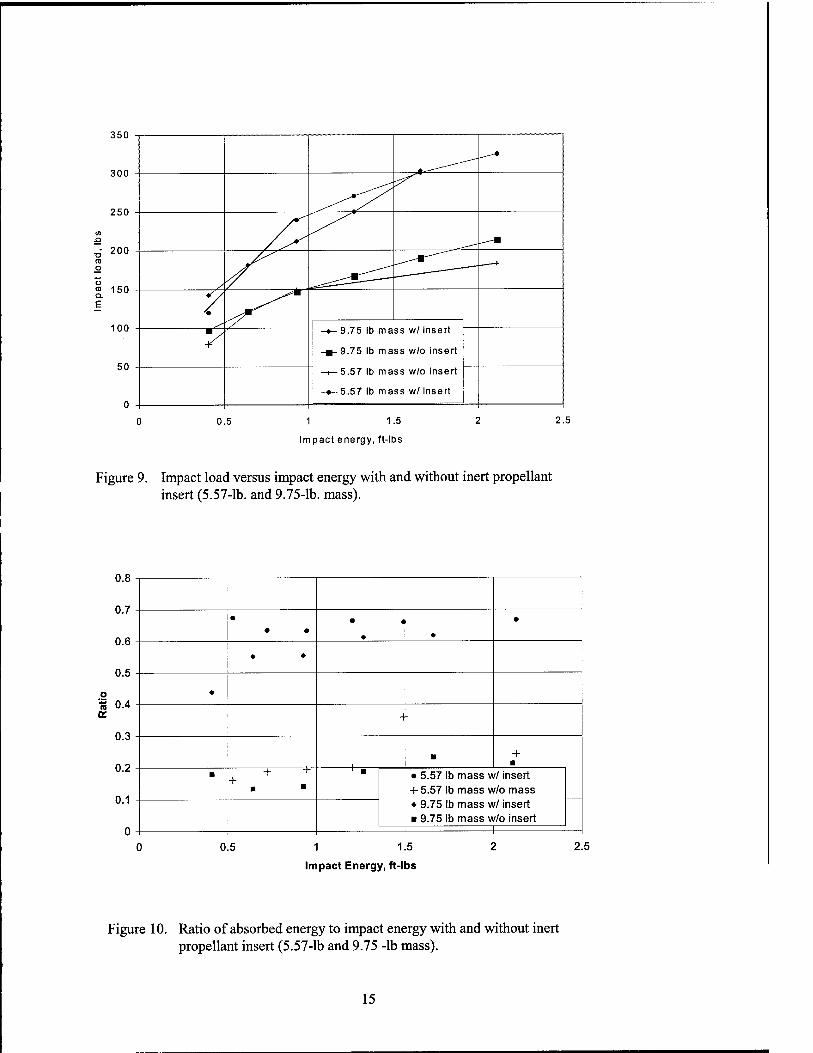
Figure 9 depicts the impact load versus impact energy for the 5.57- and 9.75-lb impactor masses for both cases (with and without inert propellant). Figures 10 depicts the energy absorbed from impact versus impact energy for the same impacts. It is seen from these figures that (1) the impact loads were higher for the case with inserts than without inserts; (2) the absorbed energy for the case with inserts was typically above 50% when inserts were used; and (3) the absorbed energy fraction dropped to below 25% when there was no insert present.
14
350
300
250
200
<o 150 Q.
E
100
50
y
V
V -*- 9.75 lb mass w/ insert
-B-9.75 lb mass w/o insert
—1—5.57 lb mass w/o insert
-•-5.57 lb mass w/ insert 1
0.5 1 1.5
Impact energy, ft-lbs
2.5
Figure 9. Impact load versus impact energy with and without inert propellant insert (5.57-lb. and 9.75-lb. mass).
0.8
0.7
0.6
0.5
o 1 0.4 U.
0.3
0.2
0.1
0
• • •
• ♦
• ♦
•
♦ ♦
♦
4
■ + ■
■ + + ■
-1-
■
1 ■ • 5.57 lb mass w/ insert + 5.57 lb mass w/o mass ♦ 9.75 lb mass w/ insert ■ 9.75 lb mass w/o insert
1 1 0.5 1 1.5
Impact Energy, ft-lbs
2.5
Figure 10. Ratio of absorbed energy to impact energy with and without inert propellant insert (5.57-lb and 9.75 -lb mass).
15
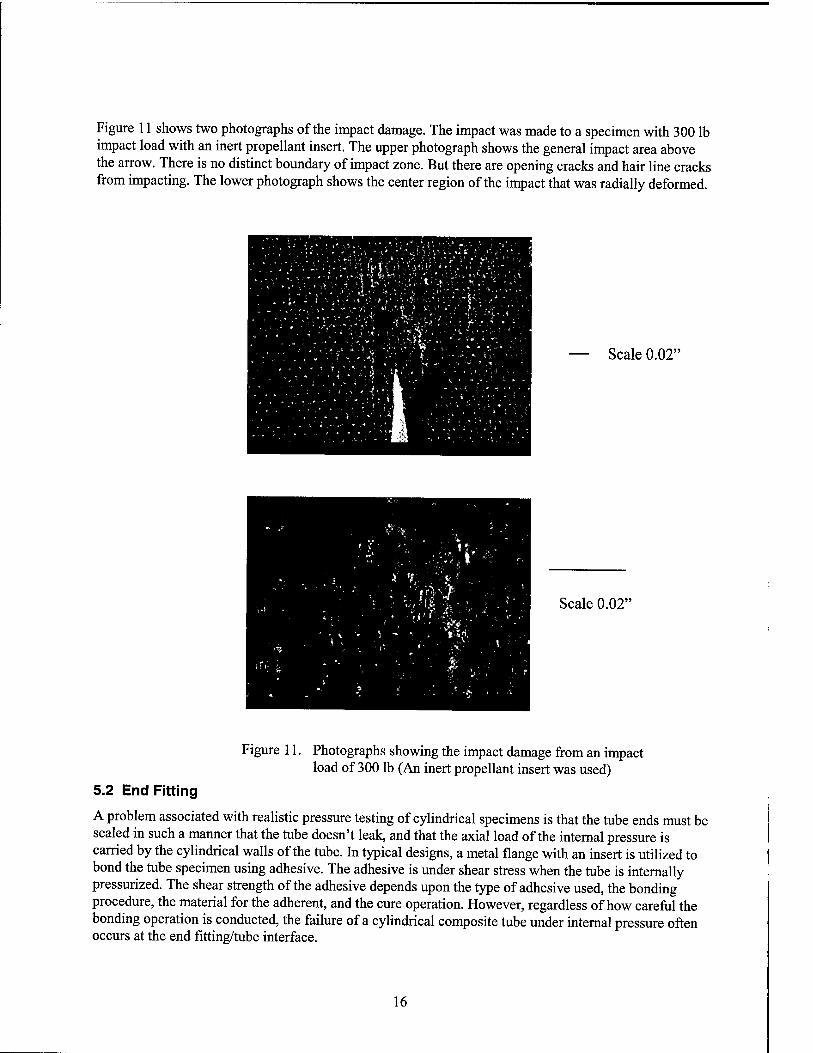
Figure 11 shows two photographs of the impact damage. The impact was made to a specimen with 300 lb impact load with an inert propellant insert. The upper photograph shows the general impact area above the arrow. There is no distinct boundary of impact zone. But there are opening cracks and hair line cracks from impacting. The lower photograph shows the center region of the impact that was radially deformed.
— Scale 0.02"
Scale 0.02"
Figure 11. Photographs showing the impact damage from an impact load of 300 lb (An inert propellant insert was used)
5.2 End Fitting
A problem associated with realistic pressure testing of cylindrical specimens is that the tube ends must be sealed in such a manner that the tube doesn't leak, and that the axial load of the internal pressure is carried by the cylindrical walls of the tube. In typical designs, a metal flange with an insert is utilized to bond the tube specimen using adhesive. The adhesive is under shear stress when the tube is internally pressurized. The shear strength of the adhesive depends upon the type of adhesive used, the bonding procedure, the material for the adherent, and the cure operation. However, regardless of how careful the bonding operation is conducted, the failure of a cylindrical composite tube under internal pressure often occurs at the end fitting/tube interface.
16
An improved end-fitting design was produced for this program.3 The basic concept is to apply a radial compression to the end-fitting insert/tube interface. This compression will generate a mechanical friction force (or shear force) when the tube and the end fitting are being pulled apart longitudinally. This increases the shear strength capability of the end fitting by an amount equal to the product of the compressive stress, the friction coefficient, and the contact area between the tube and the insert. Figure 12 shows the design of the end fitting used to generate the radial compression. The fixture includes a circular flange plate with an inner insert, a ferrule, and a retainer plate with an outer diameter equal to that of the flange. The ferrule has tapered thickness such that it is thicker toward the base and thinner at the tip. The thin section at the tip gives high radial compliance to limit stress concentrations between the ferrule and the tube that may induce early failure. The retainer plate has an inner diameter slightly smaller than the outside diameter of the ferrule so that they can interfere. Both the flange and the retainer plates have 16 holes aligned at the same radial and angular locations. In assembling the fitting, the inner surface of the tube is first bonded to the outer surface of the inner insert. The outer surface of the tube is then bonded to the inner surface of the ferrule. The interference between the retainer plate and the ferrule introduces a gap between the retainer plate and the flange. These two components are then forced to contact by tightening the 16 bolts through the holes. This procedure brings the ferrule, the tube, and the inner insert in radial compression. The radial compression increases the shear strength between the tube and the end fitting by an amount equal to JJ.NA where |X is the frictional coefficient, N is the normal compressive stress, and A the total contact area between the tube and the ferrule, and between the tube and the inner insert. The estimated values of (X, N, and A are: \i, 0.25 to 0.4; N, 8000 psi; and A, 25.0 in2. These values give allowable internal pressure between 4000 and 6300 psi. The adhesive between the epoxy and the stainless steel has a shear strength of 4000 psi, which provides a higher margin. Figure 13 depicts a specimen with the end fitting assembled.
Tube Specimen
Figure 12. Cross-section sketch of end fitting.
Figure 13. Graphite-epoxy tube specimen with end fitting.
17
5.3 Test Method
The basic test procedure involved pressurizing the test sample until it failed. For the pneumatic pressurization tests, the test samples were pressurized using high-pressure bottled nitrogen. The nitrogen flowed through a controlled throttling valve and a solenoid valve in series. The tests were initiated by opening the solenoid valve. Full pressurization typically occurred over approximately 0.5 sec for hydraulic pressurization tests, and slightly over 1.0 second for pneumatic pressurization tests. For the hydraulic pressurization tests, the specimens were first filled with water, and then the water was pressurized using the high-pressure nitrogen used for the pneumatic pressurization tests. The nitrogen/water interface was in the feed line typically about 10 inches from the test specimen.
For safety reasons, the testing was conducted inside a 46-in. cubic box made from 1-in.-thick Lexan® polycarbonate thermoplastic plate material. The maximum expected gas pressure for rupturing the specimen was estimated to be between 3000 to 3500 psi. The hollow bore of the inert propellant insert had a diameter about 0.5 inches, and a total volume of less than 5 cubic inches. To minimize the volume of the high-pressure gas when no inert propellant insert is present, a plastic insert of 3.75-in. diameter was used to displace the volume. This insert was not bonded to the inner surface of the test specimen, and left an annular gap of about 0.125 inches. With this gap, the total volume occupied by the compressed gas was approximately 40 in3. When the sample burst, the gas was contained by the thermoplastic plate enclosure, producing a 1.44-psi overpressure at a burst pressure of 3500 psi. A partial vacuum of approximately 1.0 psi was pulled in the box prior to each pneumatically pressurized test. This partial vacuum would partially compensate for the 1.44-psi overpressure. For specimens tested under hydraulic pressure, no partial vacuum was necessary since water will not generate an overpressure.
At an early stage of testing, it was observed that the water vapor in the ambient air in the enclosure box would condense to fine droplets immediately after bursting the tube in the pneumatic tests. This was caused by the rapid expansion and cooling of the high-pressure nitrogen gas inside the specimen. The water droplets created a cloud that degraded the images collected by the high-speed camera. To improve the quality of the images, dry nitrogen gas was used to purge the ambient air inside the box before each pneumatic test. This eliminated the problem. Future tests will involve dry synthetic air.
5.4 Data Acquisition
The primary data acquired for this test series included pressure/time histories and video images. The pressure/time histories were acquired using an Endevco model 8511A pressure transducer with a range of 0 to 5000 psig. The data were recorded using a 12-bit A-to-D converter card and Lab View software. Data were typically recorded at 1000 points per second. Calibration factors provided by the transducer manufacturer were used to convert the recorded voltages into pressure values
Video images were acquired both with a standard (30 Hz) frame-rate camera, and with a Kodak High- speed Motion Analyzer model 4540. This high-speed camera is capable of operating at frame rates up to 40500 frames per second and has a video array of 256 X 256 pixels. The high-speed camera can be operated at various speed levels to suit the technical needs. Table 4 lists the corresponding array size, number of frames recorded, and the duration of recorded event associated with different recording rate.
18

Table 4. Image Recording Capabilities of a Kodak High-speed Motion Analyzer model 4540
Recording rate Frame/s
Array size Number of frames recorded
Duration of recorded event, s
4500 or under 256 (H) x 256(V)* 1024 0.227
9000 256 x128 2048 0.227
13500 128 x128 4096 0.303
18000 256 x 64 4096 0.227
27000 128 x 64 8192 0.303
40500 64x64 16384 0.404
* "H" refers to horizontal direction and "V" refers to vertical direction.
In the mini-test series, a camera rate of 2250 frames per sec was used. Although the images yielded significant information about the fracture dynamics, it was not fast enough to catch more detailed fracture information. Higher rates such as 4500 and 9000 frames per second were used in the initial phase of the pathfinder tests (tubes E2 through E5 and G2). Eventually, we chose 18,000 frames per second for recording the rest of the test series. This view covered the entire tube specimen with reasonable resolution, and 4096 frames were recorded for each test.
The high-speed camera was triggered using a copper wire wound around the surface of the tube from one end to other. When the specimen burst, it broke the wire, causing a trigger signal to be sent to the camera. While waiting for the trigger signal, the camera would continuously record images, cycling through its memory. When the trigger signal was received, the camera would save the last half of the images currently in memory, and continue recording long enough to refill the other half of the memory. The net result would be a collection of sequential images centered on the trigger point. When operating at 18000 frames per sec, the camera would produce 2048 pretrigger frames and 2048 post-trigger frames.
19
20
6. Test Results
A total of 41 tests were conducted, including 11 hydraulic tests, 13 pneumatic tests with plastic inserts, and 17 pneumatic tests with inert propellant inserts. Of these 41 tests, eight burst under hydraulic pressurization, four under pneumatic pressurization with plastic inserts, and fourteen under pneumatic pressurization with inert propellant inserts. The remaining specimens failed to burst, primarily due to leaks starting at a pressure level of about 1200 psi. The leakage was caused by the cracking of the epoxy resin when stretched beyond its strain-to-failure. Although the strains of the graphite fibers under pressure-induced stresses were much smaller than the ultimate strain of the epoxy, relative displacement of fibers can lead to local strain concentration in the epoxy high enough to cause localized failures. The specimens with inert propellant inserts had the highest success while the specimens with plastic inserts had the lowest success. This is probably due to partial blockage of microcracks in the resin by the viscoelastic inert propellant. In propellant-filled tubes, the "soft" inert propellant was deformed under pressure into resin cracks plugging leaks until a substantial over-pressure built up to cause the fibers to be stressed to their ultimate strength. Tables 5 through 7 tabulate the test conditions in each of the three test categories.
Table 5. Description of Hydraulic-tests
No. Description of Test condition
Tube ID Fracture/max pressure, psi.
Time to Fracture, sec
Remark
1 0.5"x0.006" cut G3 2750 0.58
2 0.5"x0.006" cut G2 2744 0.51
3 No damage A5 3400 No fracture
4 No damage A4 2845 No fracture
5 No damage F1 3233 1.6
6 185 lb static impact C1 2350 0.7
7 200 lb Impact Load C4 2700 0.9
8 No damage D5 2000 End slipped
9 320 lb impact load no insert
B4 1908 0.44 9.75 lb impactor
10 300 lb impact load no insert
F7 2912 1.05 5.57 lb impactor Failure did not pass impact location
11 280 lb impact load no insert
E6 1732 1.28 5.57 lb impactor
21

Table 6. Description of Pneumatic tests with Plastic Inserts
No. Description of test condition
Tube ID Fracture/max. pressure, psi
Time to fracture,
sec.
Remark
1 0.5"x0.006" cut E1 1973 No fracture 2 0.5"x0.006" cut E2 2096 25.1 3 0.5"x0.006" cut E3 2030 29.2 4 0.5"x0.006" cut G4 3060 No fracture 5 0.5"x0.006" cut G5 2926 end slippage 6 0.5"x0.006" cut G1 2220 No fracture 7 0.5"x0.006" cut G1 2883 5.34 Patched G1 tube. A
re-test. Wood insert. 8 No damage A4 2856 2.07 Re-test after Hydro.
Failed after tube leaked 9 0.5"x0.006" cut F2 2250 No fracture. Multiple tests
at various pressure levels
10 No damage F5 1300 Multiple tests. Leaked at 1300 psi
11 damaged by 185 # static force
C5 2390 1.1
12 damaged by 190# impact force
D4 2608 1.15
13 Damaged by 160# impact force
D3 2360 No fracture
22
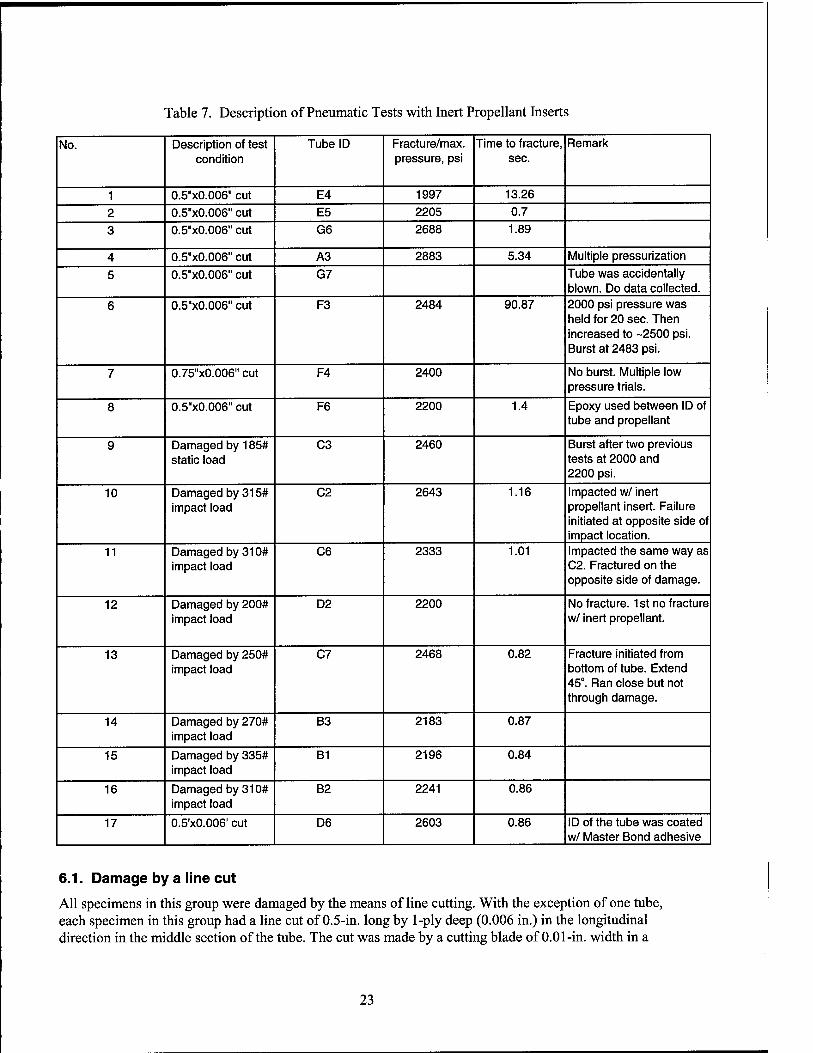
Table 7. Description of Pneumatic Tests with Inert Propellant Inserts
No. Description of test condition
Tube ID Fracture/max. pressure, psi
Time to fracture, sec.
Remark
1 0.5"x0.006" cut E4 1997 13.26
2 0.5"x0.006" cut E5 2205 0.7
3 0.5"x0.006" cut G6 2688 1.89
4 0.5"x0.006" cut A3 2883 5.34 Multiple pressurization
5 0.5"x0.006" cut G7 Tube was accidentally blown. Do data collected.
6 0.5"x0.006" cut F3 2484 90.87 2000 psi pressure was held for 20 sec. Then increased to -2500 psi. Burst at 2483 psi.
7 0.75"x0.006" cut F4 2400 No burst. Multiple low pressure trials.
8 0.5"x0.006" cut F6 2200 1.4 Epoxy used between ID of tube and propellant
9 Damaged by 185# static load
C3 2460 Burst after two previous tests at 2000 and 2200 psi.
10 Damaged by 315# impact load
C2 2643 1.16 Impacted w/ inert propellant insert. Failure initiated at opposite side of impact location.
11 Damaged by 310# impact load
C6 2333 1.01 Impacted the same way as C2. Fractured on the opposite side of damage.
12 Damaged by 200# impact load
D2 2200 No fracture. 1st no fracture w/ inert propellant.
13 Damaged by 250# impact load
C7 2468 0.82 Fracture initiated from bottom of tube. Extend 45°. Ran close but not through damage.
14 Damaged by 270# impact load
B3 2183 0.87
15 Damaged by 335# impact load
B1 2196 0.84
16 Damaged by 310# impact load
B2 2241 0.86
17 0.5'x0.006' cut D6 2603 0.86 ID of the tube was coated w/ Master Bond adhesive
6.1. Damage by a line cut
All specimens in this group were damaged by the means of line cutting. With the exception of one tube, each specimen in this group had a line cut of 0.5-in. long by 1-ply deep (0.006 in.) in the longitudinal direction in the middle section of the tube. The cut was made by a cutting blade of 0.01-in. width in a
23
mill. One tube had a 0.75-in. long by 0.006-in. deep cut. This specimen leaked without bursting and thus does not add to the data. The burst pressures and pressure rates of each type of testing are described below.
6.1.1 Hydraulic tests
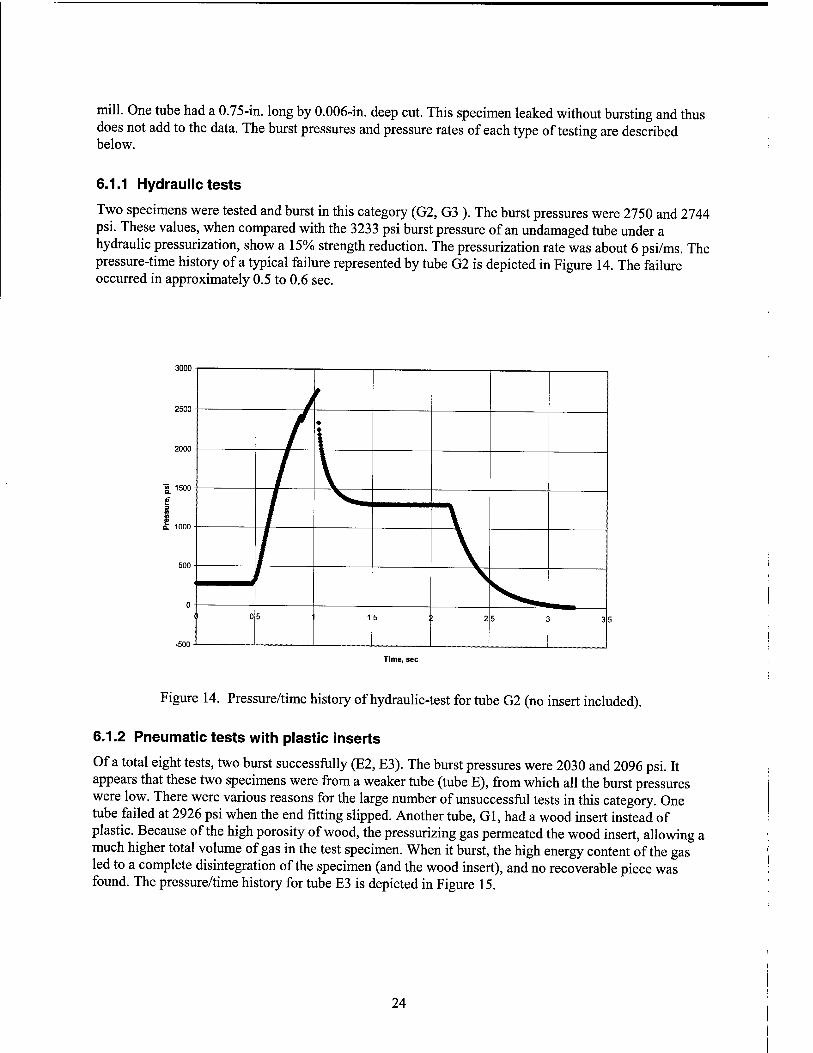
Two specimens were tested and burst in this category (G2, G3 ). The burst pressures were 2750 and 2744 psi. These values, when compared with the 3233 psi burst pressure of an undamaged tube under a hydraulic pressurization, show a 15% strength reduction. The pressurization rate was about 6 psi/ms. The pressure-time history of a typical failure represented by tube G2 is depicted in Figure 14. The failure occurred in approximately 0.5 to 0.6 sec.
3000
a 1000
-500
/
ZZ\ ft t \ / V_ II 05 15 :; 25 ;i 35
Figure 14. Pressure/time history of hydraulic-test for tube G2 (no insert included).
6.1.2 Pneumatic tests with plastic inserts
Of a total eight tests, two burst successfully (E2, E3). The burst pressures were 2030 and 2096 psi. It appears that these two specimens were from a weaker tube (tube E), from which all the burst pressures were low. There were various reasons for the large number of unsuccessful tests in this category. One tube failed at 2926 psi when the end fitting slipped. Another tube, Gl, had a wood insert instead of plastic. Because of the high porosity of wood, the pressurizing gas permeated the wood insert, allowing a much higher total volume of gas in the test specimen. When it burst, the high energy content of the gas led to a complete disintegration of the specimen (and the wood insert), and no recoverable piece was found. The pressure/time history for tube E3 is depicted in Figure 15.
24
zouu -
s a (0 w £ innn
0
\
10 15 20
Time, sec.
25 30 35
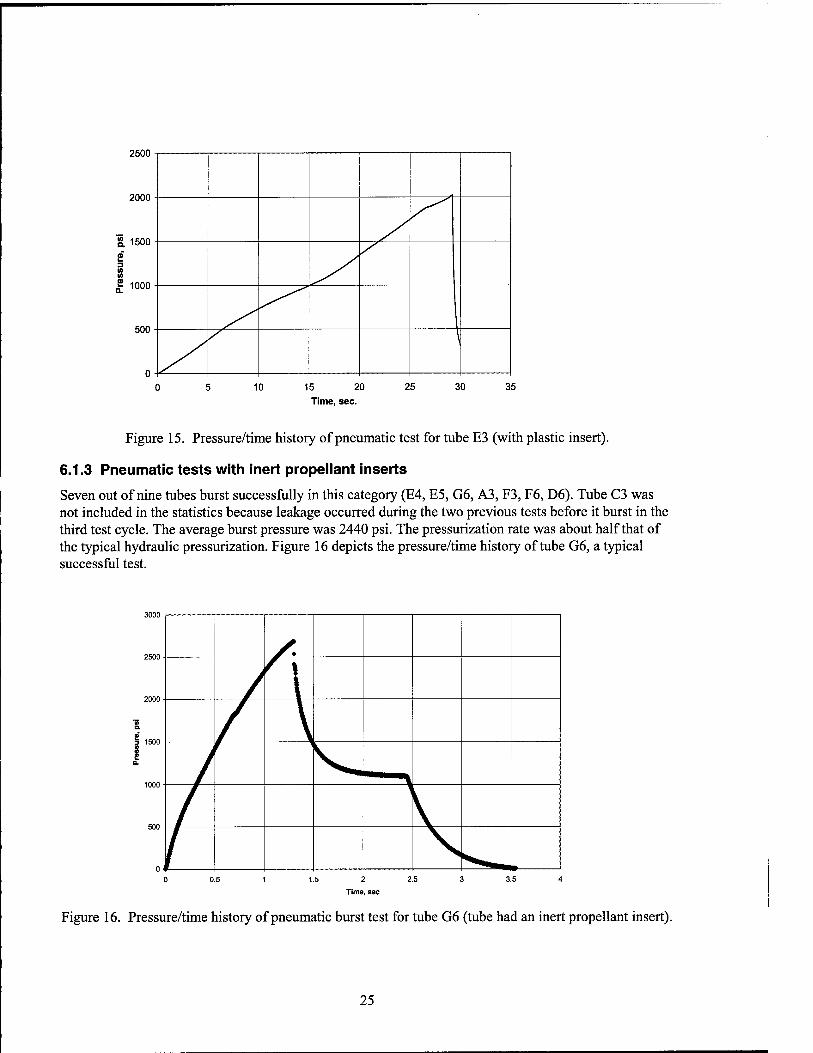
Figure 15. Pressure/time history of pneumatic test for tube E3 (with plastic insert).
6.1.3 Pneumatic tests with inert propellant inserts
Seven out of nine tubes burst successfully in this category (E4, E5, G6, A3, F3, F6, D6). Tube C3 was not included in the statistics because leakage occurred during the two previous tests before it burst in the third test cycle. The average burst pressure was 2440 psi. The pressurization rate was about half that of the typical hydraulic pressurization. Figure 16 depicts the pressure/time history of tube G6, a typical successful test.
^r ♦
/ !
1.S 2 2.5
Time, sec
Figure 16. Pressure/time history of pneumatic burst test for tube G6 (tube had an inert propellant insert).
25
6.1.4 Discussion
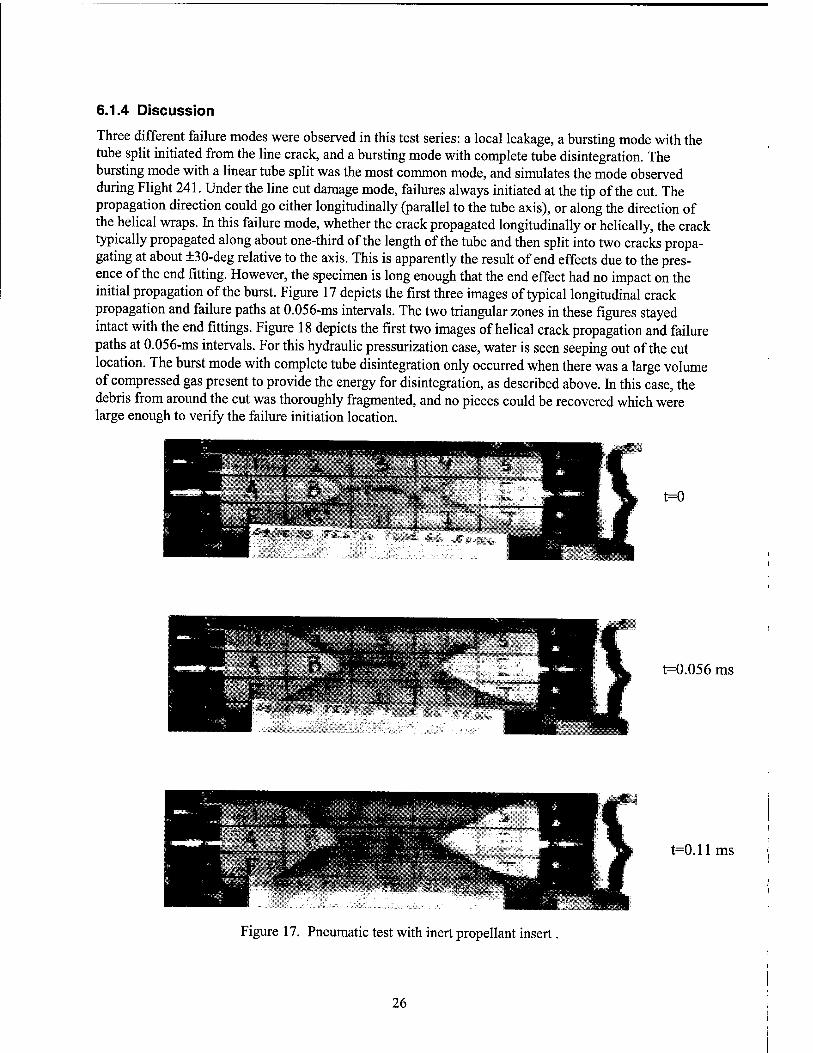
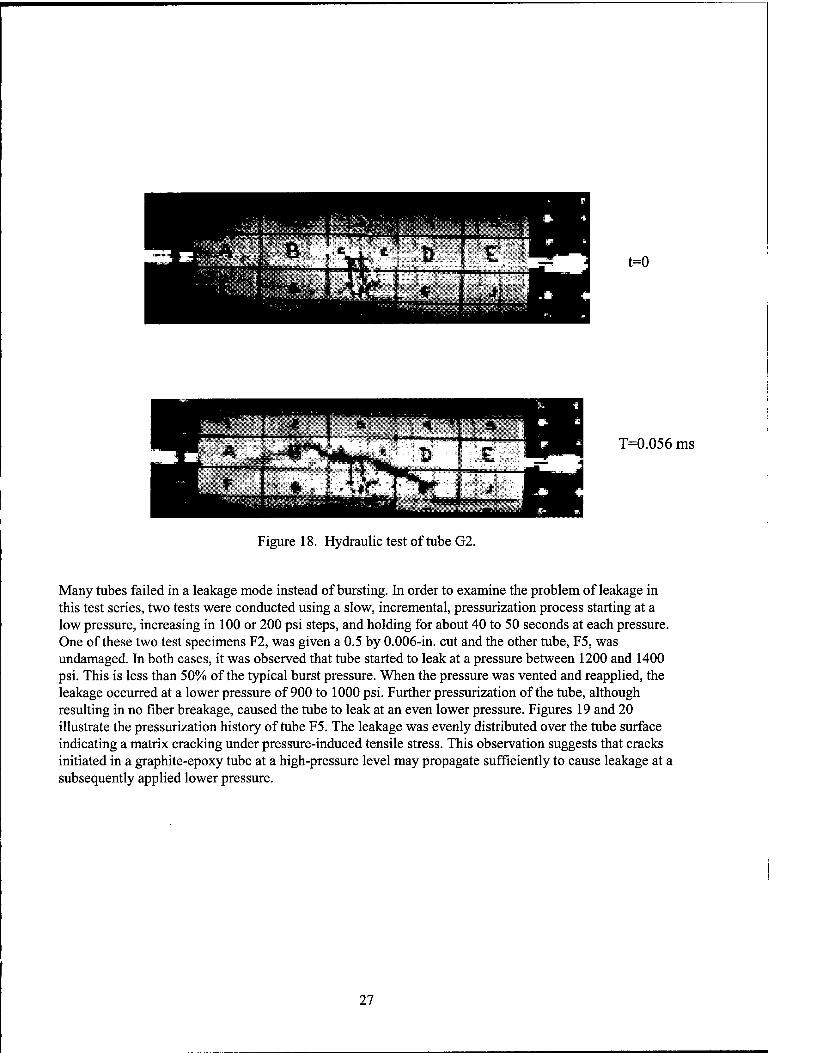
Three different failure modes were observed in this test series: a local leakage, a bursting mode with the tube split initiated from the line crack, and a bursting mode with complete tube disintegration. The bursting mode with a linear tube split was the most common mode, and simulates the mode observed during Flight 241. Under the line cut damage mode, failures always initiated at the tip of the cut. The propagation direction could go either longitudinally (parallel to the tube axis), or along the direction of the helical wraps. In this failure mode, whether the crack propagated longitudinally or helically, the crack typically propagated along about one-third of the length of the tube and then split into two cracks propa- gating at about ±30-deg relative to the axis. This is apparently the result of end effects due to the pres- ence of the end fitting. However, the specimen is long enough that the end effect had no impact on the initial propagation of the burst. Figure 17 depicts the first three images of typical longitudinal crack propagation and failure paths at 0.056-ms intervals. The two triangular zones in these figures stayed intact with the end fittings. Figure 18 depicts the first two images of helical crack propagation and failure paths at 0.056-ms intervals. For this hydraulic pressurization case, water is seen seeping out of the cut location. The burst mode with complete tube disintegration only occurred when there was a large volume of compressed gas present to provide the energy for disintegration, as described above. In this case, the debris from around the cut was thoroughly fragmented, and no pieces could be recovered which were large enough to verify the failure initiation location.
t=0
t=0.056 ms
t=0.11ms
Figure 17. Pneumatic test with inert propellant insert ,
26
t=0
T=0.056 ms
Figure 18. Hydraulic test of tube G2.
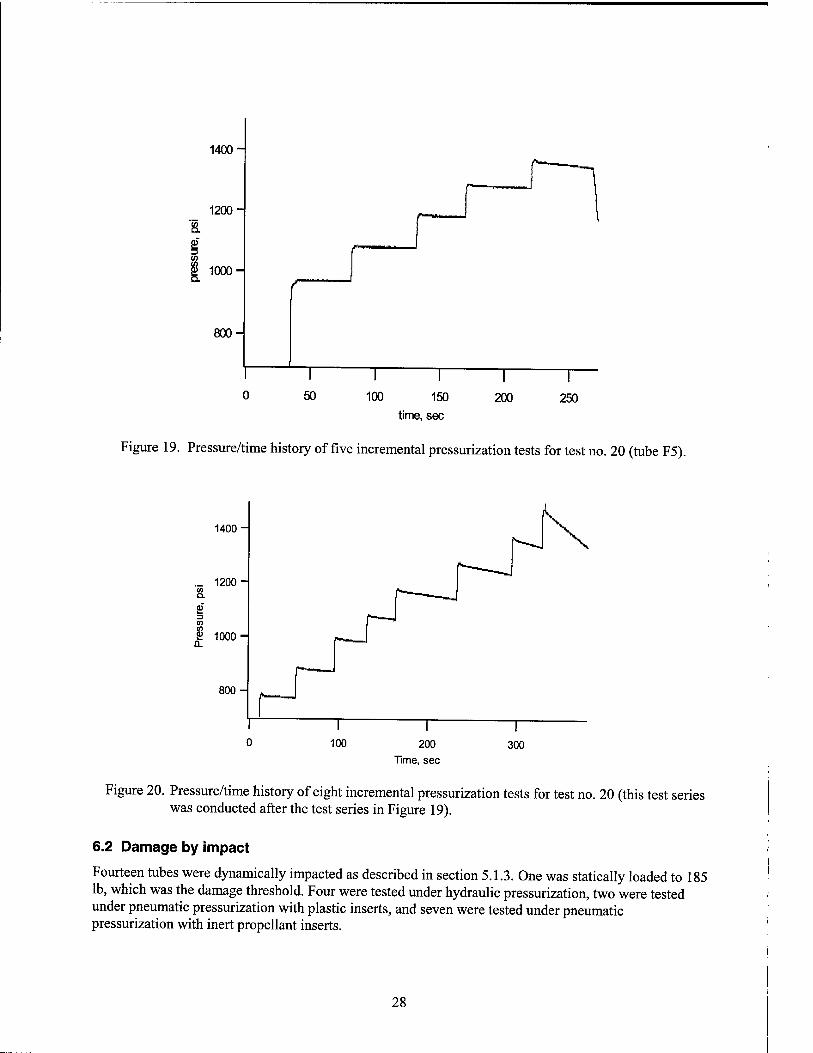
Many tubes failed in a leakage mode instead of bursting. In order to examine the problem of leakage in this test series, two tests were conducted using a slow, incremental, pressurization process starting at a low pressure, increasing in 100 or 200 psi steps, and holding for about 40 to 50 seconds at each pressure. One of these two test specimens F2, was given a 0.5 by 0.006-in. cut and the other tube, F5, was undamaged. In both cases, it was observed that tube started to leak at a pressure between 1200 and 1400 psi. This is less than 50% of the typical burst pressure. When the pressure was vented and reapplied, the leakage occurred at a lower pressure of 900 to 1000 psi. Further pressurization of the tube, although resulting in no fiber breakage, caused the tube to leak at an even lower pressure. Figures 19 and 20 illustrate the pressurization history of tube F5. The leakage was evenly distributed over the tube surface indicating a matrix cracking under pressure-induced tensile stress. This observation suggests that cracks initiated in a graphite-epoxy tube at a high-pressure level may propagate sufficiently to cause leakage at a subsequently applied lower pressure.
27
& e 3
I
1400-
r f 1200-
1000-
800-
r
I I I I 50 100 150
time, sec 200 250
Figure 19. Pressure/time history of five incremental pressurization tests for test no. 20 (tube F5).
1400-
1200-
2> in
$ 1000 -
800-
100 200
Time, sec 300
Figure 20. Pressure/time history of eight incremental pressurization tests for test no. 20 (this test series was conducted after the test series in Figure 19).
6.2 Damage by impact
Fourteen tubes were dynamically impacted as described in section 5.1.3. One was statically loaded to 185 lb, which was the damage threshold. Four were tested under hydraulic pressurization, two were tested under pneumatic pressurization with plastic inserts, and seven were tested under pneumatic pressurization with inert propellant inserts.
28
6.2.1 Hydraulic tests
Four specimens were tested and burst in this category. The impact loads varied from 200 to 320 lb, impact energies varied from 0.5 to 2.5 ft-lb, and the burst pressures varied from 2912 to 1732 psi. All specimens in this group were impact-damaged without an inert propellant insert.
6.2.2 Pneumatic tests with plastic inserts
Two specimens were tested and burst in this category (C5, D4). The recorded burst pressures were 2390 and 2608 psi. The former tube experienced a static force of 185 lb, while the latter tube was impacted with a 190-lb force. The 185-lb static force was approximately the force required to generate a crack.
6.2.3 Pneumatic tests with inert propellant inserts
Seven specimens were tested. The impacted loads varied from 185 to 335 lb, and the burst pressure varied from 2643 to 2183 psi. One tube (C3) was statically damaged. All tubes in this test series were impacted with the inert propellant inserts already present. Tables 5 through 7 (see above) show all test results in terms of burst pressures, time-to-burst, and other pertinent information.
6.2.4 Discussion
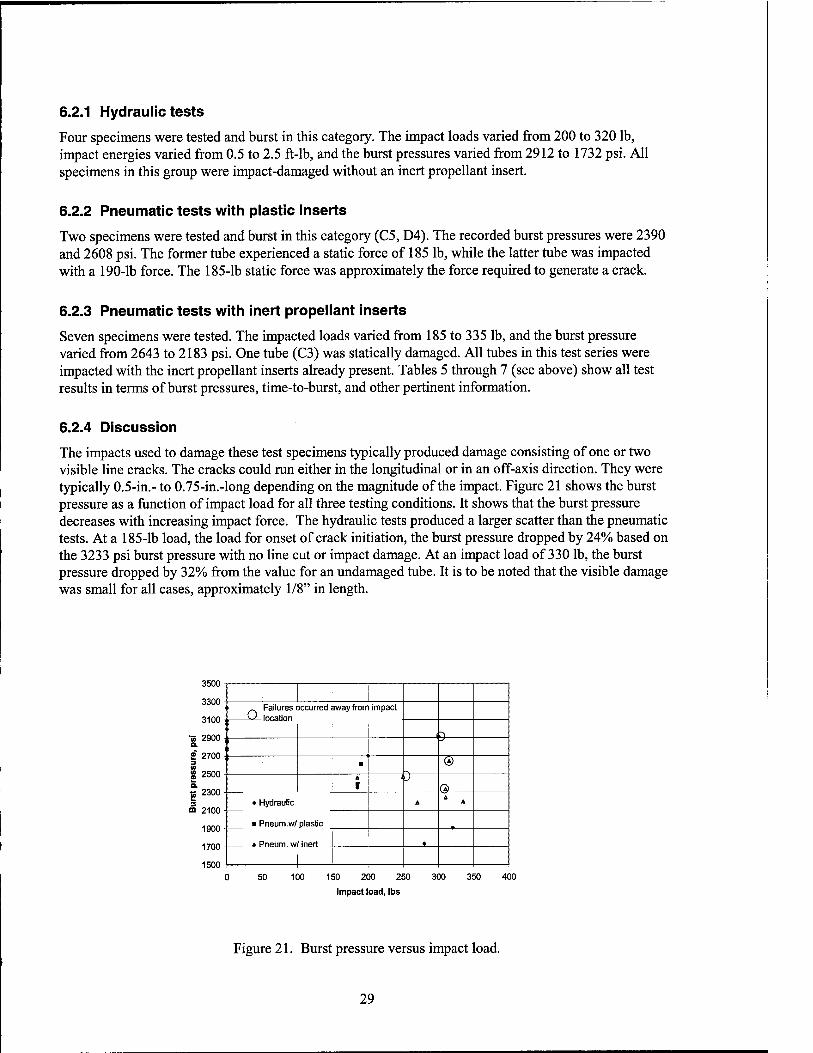
The impacts used to damage these test specimens typically produced damage consisting of one or two visible line cracks. The cracks could run either in the longitudinal or in an off-axis direction. They were typically 0.5-in.- to 0.75-in.-long depending on the magnitude of the impact. Figure 21 shows the burst pressure as a function of impact load for all three testing conditions. It shows that the burst pressure decreases with increasing impact force. The hydraulic tests produced a larger scatter than the pneumatic tests. At a 185-lb load, the load for onset of crack initiation, the burst pressure dropped by 24% based on the 3233 psi burst pressure with no line cut or impact damage. At an impact load of 330 lb, the burst pressure dropped by 32% from the value for an undamaged tube. It is to be noted that the visible damage was small for all cases, approximately 1/8" in length.
3500
3300
3100
2900
2700
2500
2300
2100
1900
1700
1500
' o Failures occurred away from impact
( r) i I I ■ w
I . J
o> ♦ Hydraulic
■ Pneum.w/ plastic
A 4 A
♦
I I 0 50 100 150 200 250 300 350 400
Impact load, lbs
Figure 21. Burst pressure versus impact load.
29

An additional 11 burst pressure data points are included in Figure 21. These data were obtained from a different program using an identical specimen configuration. The tests were conducted under hydraulic pressurization with very slow pressurization rate typically 200 to 400 seconds to burst. The average burst pressure was 2887 psi with a standard deviation of 307 psi.
The failure modes of impacted specimens are very different from those with a line cut. From the high- speed camera images, it was apparent that the failure origins of the impact-damaged tubes were not nec- essarily at the impact location. In Figure 22, tube C2, which was pneumatically tested with an inert pro- pellant insert, had the fracture origin at the upper left corner of the tube, although some hoop fibers close to the impact location had broken at 4.5 ms before the catastrophic failure occurred. Another two tubes, C7 and F7 also had fracture origins away from impact locations. On the other hand, tube Bl, which had an impact load of 335 lb, had its fracture initiated from the impact location, as illustrated by Figure 23. Figure 24 shows that the failure of tube C6, which had an impact load of 310 lb, started toward the bot- tom of the specimen despite the fact that all these tubes were impacted and tested using the same set-up. This may suggest that different types of damage might have occurred in tubes that received essentially identical impacts. However, four tubes were inspected after impact using both ultrasound and thermogra- phy techniques and no damage other than that at the impact location was observed. Figure 25 shows the two photographs of tube F7, one a thermography image and the other an ultrasound image. Unfortu- nately, there was no NDE such as acoustic emission data recorded that allowed the determination the fracture initiation location. Such data will help analyze the failure data more accurately. This type of instrumentation is definitely needed in future bursting with impacted tubes. No leakage was observed in the damage test series. All specimens that fractured away from the impact locations were also identified with individual circles in Figure 21.
It is speculated that the failure initiation away from the impact location may be the result of impact induced bending stress. An impact to the tube will create a stress wave propagating in both longitudinal and circumferential directions. The wave-induced deformation will subsequently generate bending moment throughout the entire tube at various times. The bending stress can be high because of the thin wall thickness of the tube and the compressive stress may cause fiber buckling if a local defect exists. When fibers buckle, they lose their load carrying ability and the buckled region becomes the weakest link. Failure will then initiate from this region from the subsequent pressure loading.
The other observation is the effect of pressurization rate. In the hydraulic testing, a sudden pressure drop was observed during pressurization when the pressure was above a certain value. This occurred in both line cut damaged specimens and impact damaged specimens. As depicted in Figure 14, the sudden pres- sure drop occurs at about 2400 psi for Tube G2. This phenomenon was observed in all but one hydraulic test. For pneumatic testing using either plastic or inert propellant insert, we either saw a small slope change at some point of the pressure-time trace or saw no sudden pressure drop/slope change at all. For example, the pressure time history for pneumatic testing of Tube G6 with an inert propellant insert is depicted in Figure 16. A slight slope decrease was noticed at about 1800 psi. But no sudden pressure drop occurred. Similar results were seen for specimens tested under pneumatic pressure with a plastic or inert propellant insert.
In the other test series with slow pressurization rate, no sudden pressure drop was recorded in any of the 11 tests suggesting that the pressurization rate was the primary driver of local fiber damage.
It appears that there may be a pressure rate effect that causes a sudden volume increase of the test article. This sudden increase of volume might be associated with localized fiber breakage. At a high pressuriza- tion rate, the dynamic stress associated with pressure wave could cause a sudden increase of local tensile stress that resulted in fiber breakage. Because of the near incompressibility of water, the pressurization
30

rate of hydraulic testing is about 2.5 times the rate for the two other cases under the same level of sup- plied pressure. Consequently, the induced dynamic effect would be severe for the hydraulic condition.
Impact location
Figure 22. Failure mode of tube C2 under pneumatic gas with inert propellant insert (specimen impacted with 315-lb load).
Impact location
Figure 23. Failure mode of tube Bl under pneumatic gas with inert propellant insert (specimen impacted with 335-lb load).
31

Impact location
2£Xä 1 Figure 24. Failure mode of tube C6 under pneumatic gas with inert propellant insert (specimen
impacted with 310-lb load).
Figure 25. NDE photographs of tube F7 (the upper is the thermography image; the lower is the ultrasound image).
32
7. Summary and Conclusions
A test program was conducted to investigate the failure modes of graphite-epoxy cylindrical tubes subject to internal pressure with and without local damage. It was also intended that the test series would be able to simulate the failure mode of the Delta GEM case K404.
There were two phases of this test program: the mini series and the pathfinder series. The mini-series used five 1.5-in.-diameter three-ply graphite-epoxy tape-wrapped tubes available. Four tubes had inert propellant inserts and one did not. Three tubes had a 0.25-in.-long by one-ply-deep longitudinal cut. Dry nitrogen gas was used to internally pressurize the tube in a step-wise fashion until the tube failed. The test results indicated that tubes with inert propellant inserts failed in a longitudinal manner similar to that of Delta II GEM K404. When there was no inert propellant insert, the tube disintegrated. In addition, there were time-delayed failures on two tubes.
In the second test series, graphite epoxy tubes of 4-in. diameter were fabricated with nine plies following the Delta II GEM lay-up angles. A total of 41 tubes were tested, including 11 hydraulic tests, 13 pneumatic tests with plastic inserts, and 17 pneumatic tests with inert propellant inserts. Two types of damage were made to the tubes: a longitudinal-line cut or a single-point impact. The cut was typically 0.5-in. long by one-ply (0.006-in.) deep. The impact damage was made by a pendulum-type impactor. The impact loads varied from 185 lb to 335 lb. A Kodak High-speed Motion Analyzer model 4540 was used to record the fracture images, in addition to a regular video VCR. The high-speed camera was set at 18000 frames per sec for most of the tests. Pressure/time history data of each test were acquired by the use of a computer.
Of the 41 tests, 26 tubes were successfully burst, while 15 tubes failed from leakage. Among the 26 successful bursts, eight were under hydraulic pressurization, four under pneumatic pressurization with plastic inserts, and 14 under pneumatic pressurization with inert propellant inserts.
For the tubes that had line cut damage, three different failure modes were observed: a local leakage, a bursting mode with the tube split initiated from the line crack, and a bursting mode with complete tube disintegration. The bursting mode with a linear tube split was the most common mode, and simulates the mode observed during Flight 241. Under the line cut damage mode, failures always initiated at the tip of the cut.
In the testing of impact-damaged tubes, results show that the burst pressure decreases with increasing impact load. The incipient damage load was 185 lb. At this load, the damaged tube had a burst pressure approximately 24% lower than the undamaged tube. At an impact load of 335 lb, the burst pressure decreases by 32% from the undamaged. This is very significant considering the small safety margin in current SRMs.
The apparently random failure initiation points of the impact-damaged tubes was a surprise. It is speculated that the failure-initiation away from the impact point may be the result of impact induced bending stress. The bending stress can be high because of the tube's thin wall and the compressive stress may cause fiber buckling if a local defect exists. When fibers buckle, they lose their load carrying ability and the buckled region becomes the weakest link. Failure will then initiate from this region during the subsequent pressure loading.
Apparently, the impact caused damage to other areas of the tube beyond the impact location. However, neither the thermography nor the ultrasound could pick it up. This is possibly because both these NDE techniques can only pick up delaminations, and not fiber breakage in composite materials.
33

We were not able to address time-delayed failure because the tubes would leak at a pressure above 1400 psi. We know that time-delayed failure is a very important aspect of the structural integrity for composite SRMs.
34

8. Recommendations
To further enhance our understanding of composite SRMs, the following activities are recommended:
1. Increase the database of failure strength of graphite-epoxy tubes under hydraulic and pneumatic pressure conditions.
2. Study the effect of pressurization rate.
3. Study the effect of time-delayed failure.
4. Investigate mechanisms for failures initiating away from points of impact.
5. Validate the observations using graphite-epoxy tubes, filament-wound from the IM7 graphite fibers and HBRF 55A resin used in the Delta GEM.
35

36

9. References
1. "Investigation of USAF Launch Vehicle Accident, Delta 2-241/GPS 2R-1, January 17, 1997, Cape Canaveral Air Station FL." Duane W. Deal, Colonel, USAF, Accident Investigator Officer, May 1, 1997.
2. Gardiner, D. S., E. D. Oba, and L. A. Martinez, "Field Inspection of Delta GEM Motors for Impact Damage," 10™ JANNAF Nondestructive Evaluative Subcommittee Meeting, Salt Lake City, Utah, 16-20 March 1998.
3. Chang, D. J. and P. R. Valenzuela, "Pressure Vessel Testing Fixture," U.S. Patent granted April 2001.
37

38
LABORATORY OPERATIONS
The Aerospace Corporation functions as an "architect-engineer" for national security programs, specializing in advanced military space systems. The Corporation's Laboratory Operations supports the effective and timely development and operation of national security systems through scientific research and the application of advanced technology. Vital to the success of the Corporation is the technical staff's wide-ranging expertise and its ability to stay abreast of new technological developments and program support issues associated with rapidly evolving space systems. Contributing capabilities are provided by these individual organizations:
Electronics and Photonics Laboratory: Microelectronics, VLSI reliability, failure analysis, solid-state device physics, compound semiconductors, radiation effects, infrared and CCD detector devices, data storage and display technologies; lasers and electro-optics, solid state laser design, micro-optics, optical communications, and fiber optic sensors; atomic frequency stan- dards, applied laser spectroscopy, laser chemistry, atmospheric propagation and beam control, LIDAR/LADAR remote sensing; solar cell and array testing and evaluation, battery electro- chemistry, battery testing and evaluation.
Space Materials Laboratory: Evaluation and characterizations of new materials and process- ing techniques: metals, alloys, ceramics, polymers, thin films, and composites; development of advanced deposition processes; nondestructive evaluation, component failure analysis and reli- ability; structural mechanics, fracture mechanics, and stress corrosion; analysis and evaluation of materials at cryogenic and elevated temperatures; launch vehicle fluid mechanics, heat trans- fer and flight dynamics; aerothermodynamics; chemical and electric propulsion; environmental chemistry; combustion processes; space environment effects on materials, hardening and vul- nerability assessment; contamination, thermal and structural control; lubrication and surface phenomena.
Space Science Applications Laboratory: Magnetospheric, auroral and cosmic ray physics, wave-particle interactions, magnetospheric plasma waves; atmospheric and ionospheric physics, density and composition of the upper atmosphere, remote sensing using atmospheric radiation; solar physics, infrared astronomy, infrared signature analysis; infrared surveillance, imaging, remote sensing, and hyperspectral imaging; effects of solar activity, magnetic storms and nuclear explosions on the Earth's atmosphere, ionosphere and magnetosphere; effects of elec- tromagnetic and paniculate radiations on space systems; space instrumentation, design fabrica- tion and test; environmental chemistry, trace detection; atmospheric chemical reactions, atmos- pheric optics, light scattering, state-specific chemical reactions and radiative signatures of mis- sile plumes.
Center for Microtechnology: Microelectromechanical systems (MEMS) for space applica- tions; assessment of microtechnology space applications; laser micromachining; laser-surface physical and chemical interactions; micropropulsion; micro- and nanosatellite mission analy- sis; intelligent microinstruments for monitoring space and launch system environments.
Office of Spectral Applications: Multispectral and hyperspectral sensor development; data analysis and algorithm development; applications of multispectral and hyperspectral imagery to defense, civil space, commercial, and environmental missions.
ITHE AEROSPACE ICORPORATION
2350 E. El Segundo Boulevard El Segundo, California 90245-4691
U.S.A.