Long-term stability of effects of subthalamic stimulation in Parkinson's disease: Indian Experience
Upload
independentCategory
view
1download
0
This work w
educational gran
The DBS te
Medical Trainin
M. F. Contar
from Medtronic
Research in the
Corresponde
Amsterdam, The
E-mail addre
Submitted A
1935-861X/$ -
doi:10.1016/j.br
Brain Stimulation (2011) -, -–-
www.brainstimjrnl.com
Tremor-specific neuronal oscillation pattern in dorsalsubthalamic nucleus of parkinsonian patients
Maria Fiorella Contarino,a Lo J. Bour,a Maarten Bot,a Pepijn van den Munckhof,b
Johannes D. Speelman,a Peter Richard Schuurman,b Rob M. de Biea
aDepartment of Neurology/Clinical Neurophysiology, Academic Medical Center, Amsterdam, The NetherlandsbDepartment of Neurosurgery, Academic Medical Center, Amsterdam, The Netherlands
BackgroundSubthalamic nucleus (STN) deep brain stimulation effectively improves parkinsonian symptoms. It ishypothesized that distinct functional territories with different neurophysiologic activity within the STNrelate to different symptoms.
ObjectiveThe aim of the study was to identify distinctive characteristics of STN neuronal activity related totremor by directly comparing tremor sides with no-tremor sides. In addition, we studied the spatialpattern of frequency distributions within the STN in more detail.
MethodsWe analyzed intraoperative STN single/multiunit recordings from 33 tremor sides and 23 no-tremorsides. STN tracks were normalized to a length of 1 and subdivided into eight successive layers. Thepower spectral density was split into six frequency bands: theta (3-8 Hz), alpha (9-12 Hz), lower beta(13-20 Hz), upper beta (21-30 Hz), lower gamma (31-59 Hz), and upper gamma (60-100 Hz).
ResultsTremor sides presented predominant theta frequency oscillations in the most dorsal layers of the STN,whereas in no-tremor sides beta frequencies predominated. Oscillatory activity was stronger in thedorsal STN than in the ventral, and this pattern was specific for frequencies in the theta, alpha, and betabands, but not in the gamma bands.
as supported by the ‘‘Hersenstichting Nederland’’ (Dutch Brain Foundation) (grant number 14F 06.74) to J.D.S. and from an unrestricted
t from Medtronic to the DBS team.
am of the AMC received an unrestricted educational grant from Medtronic and organizes DBS teaching courses for European Continue
g (ECMT).
ino, P. van den Munckhof, and R. M. A. de Bie received travel support from Medtronic. J. D. Speelman received honoraria and travel support
. P. R. Schuurman received honoraria and acts as a consultant for Medtronic. L. J. Bour and P. R. Schuurman act as consultant for Philips
field of DBS.
nce: Maria Fiorella Contarino, Department of Neurology/Clinical Neurophysiology Academic Medical Center, Meibergdreef 9, 1105 AZ,
Netherlands.
ugust 20, 2010; revised March 23, 2011. Accepted for publication March 31, 2011.
see front matter � 2011 Elsevier Inc. All rights reserved.
s.2011.03.011

2 Contarino et al
ConclusionsOur study supports the hypothesis that the presence of tremor is associated with a distinctive neuronaloscillations pattern. In particular, we demonstrate the specificity of the association of theta frequenciesin the dorsal STN with tremor. Identification of symptom-specific characteristics of intraoperativemicrorecordings in the STN may lead to refinement of targeting for each patient, tailored to the specificclinical presentation.� 2011 Elsevier Inc. All rights reserved.
Keywords Parkinson’s disease; deep brain stimulation; tremor; microelectrode recordings;basal ganglia
The benefits and side effects of subthalamic nucleus (STN)deep brain stimulation (DBS) for Parkinson’s disease (PD) arewell documented.1 Anatomic and neurophysiologic datasuggest that the dorsolateral portion of the STN has sensory-motor functions, whereas the ventro-medial portion isinvolved in affective and limbic functions,which could explainthe incidence of cognitive and behavioral side effects afterSTN DBS.2,3 It is hypothesized that symptom-specific topog-raphy within STN is determined by distinct neuronal oscilla-tory activity, with beta-frequency oscillations (13-30 Hz)correlating to bradykinesia and rigidity.4-8 Theta-frequencyoscillations in the basal ganglia (3-8 Hz) have been associatedwith both parkinsonian tremor and essential tremor (ET).9
However, direct comparison of STN neuronal oscillatoryactivity between PD patients with and those without tremor,or between body sides with and those without tremor, hasbeen rarely performed, and only in small case series.10-12 Tosubstantiate existing evidence and to demonstrate the speci-ficity of the association of theta frequencies with tremor, directcomparison of a large number of tremor and no-tremor sides isneeded. In the current study, we therefore defined the spatialpattern of neuronal oscillatory frequency distributions withinthe STN from microelectrode recordings of 33 tremor sidesand 23 no-tremor sides in 34 PD patients. We hypothesizethat the pattern of frequency distribution across successiveSTN layers would be different between tremor and no-tremor sides.
Table 1 Clinical characteristics of the patients included in thestudy
Number of patients 34Gender (women/men) 10/24Age at STN surgery (y) 57.3 6 10.4Disease duration at STN surgery (y) 10.7 6 3.8Levodopa-equivalent daily dosage (mg)* 1085.7 6 429.2UPDRS motor score off medication 39.8 6 11.7Number of sides 56Sides with tremor/no-tremor 33/23
STN 5 Subthalaminc nucleus; UPDRS 5 Unified Parkinson’s disease rating
scale.
* Formula for Levodopa-equivalent daily dosage: regular levodopa dose 1slow release levodopa 3 0.75 1 bromocriptine 3 10 1 apomorphine 3 101ropinirole 3 20 1 pergolide 3 100 1 pramipexole 3 100 1 (regular levo-
dopa dose 1 [slow release levodopa 3 0.75]) 3 0.2 if taking entacapone.
Methods and materials
All PD patients who underwent STN DBS fromMarch 2003(when we started using microelectrode recordings [MER])until June 2007 were considered (Table 1, Figure 1).
Surgical procedure and MER
We used frame-based three-dimensional magnetic reso-nance imaging [MRI] and Leksell Surgiplan software andstereotactic frame (Elekta Instrument AB, Stockholm,Sweden) for targeting. Standard STN coordinates were:12 mm lateral, 2 mm posterior, and 4 mm below themidcommissural point. Visual adjustments were made basedon T2-weighted MRI. Paths were planned with 15- to20-degree anterior angulation to the intercommissural line,
20- to 30-degree lateral angulation from midline, avoidingsulci, vascular structures, and lateral ventricles.
Surgery and MER were performed bilaterally withpatients being awake and without sedatives. Dopamineagonists, when used, were gradually reduced and thenstopped 3 days before surgery, while Levodopa was stoppedat least 12 hours before surgery (‘‘off medication’’),according to a standard protocol. Single/multiunit MERwere performed using Medtronic microelectrodes 291(10 mm2 exposure; impedance w1.1 MU at 220 Hz), whichcapture spikes within approximately 100-200 mm (1-3neurons) and background activity.13 Depending on preoper-ative MRI, three to five MER needles were placed in anarray with central, lateral, medial, anterior, and posteriorcannulas, 2 mm apart. Starting from a remote position,electrodes were advanced simultaneously in 0.5-mm stepsuntil substantia nigra activity was recognizable or activitysignificantly decreased in all channels. Signals were ampli-fied by 10,000 (Leadpoint, Medtronic, Minneapolis, MN),analog bandpass filtered between 500-5,000Hz (23 dB;12 dB/oct) and sampled at 24 kHz with a 16-bit A/Dconverter. Clinical testing was performed at several sites.The definitive DBS electrode was implanted at the sitewith the best therapeutic window.
Data analysis
Starting 6 mm above target, all recordings from thetrajectory with the best clinical effect, that is, the trajectory
Tremor-specific oscillations in STN 3
that was chosen for permanent stimulation, were retrospec-tively analyzed. Only trajectories with STN activity for4 mm or longer were included. The final position of allDBS electrodes was checked by coregistration of post-operative computed tomography (CT) with preoperativeMRI.
Recordings were visually inspected offline. Only thelongest, artifacts-free, stable sections (minimally 3 secondslong) were analyzed.
The motor part of the Unified Parkinson’s DiseaseRating Scale performed off medication before surgerywas used to evaluate parkinsonian symptoms. Each STNwas defined as ‘‘no-tremor side’’ when the contralateralsubscore for tremor (items 20 and 21) was 0, and ‘‘tremorside,’’ when it was larger than 0. The investigator whoperformed analyses was blinded to clinical information.
Determination of STN borders
To determine STN borders, we analyzed the root meansquare (RMS) of the signal.14 At each recorded site s, wecalculated the RMS(s) of the signal xi(s) as:
RMSðsÞ5Xn
i51jxiðsÞj=n
where n is the total number of recorded samples at eachsite and i is the ith sample. Because factors like electrodeproperties or tissue impedance may influence RMS, wecalculated a normalized RMS (NRMS) for intertrajectorycomparison. NRMS was defined as
ðRMSðsÞ2 RMSall sitesÞ=ðRMSðsÞ1 RMSall sitesÞwhere RMSall_sites is the average of RMS(s) across all sites ofthe chosen trajectory. Thus, NRMS had a value between21and 1. STN MER activity is characterized by an increase ofbackground noise amplitude and an increase of neuronalfiring: recordings were defined to be inside the STN ifNRMS(s).0 andoutside the STN ifNRMS(s),0 (Figure 2).All raw recordings were also visually inspected to verify thisattribution.
Subdivision in layers
To average recordings from corresponding STN layersacross tracks with variable length, we normalized theportion of the electrode track between entering and leavingthe STN to a length of 1.0. We subsequently subdivided itinto eight equal bins, representing successive adjacentlayers going from the dorsal to the ventral border(Figure 3; Supporting Information, Methods).
Spectral analysis
After recorded MER signals are high-pass filtered, theresulting traces contain high-frequency spike activity,which is modulated at low frequency. We extracted
low-frequency information from the signal envelope bymeans of full-wave rectification.12,15
After artifacts removal and mean subtraction, powerspectral density was obtained by computing the powerspectrum of the full-wave rectified signal. For each site, thecomplete signal was divided into nonoverlapping disjointsegments of 32,768 samples (segment length of 1.3653seconds).16 This resulted in a frequency resolution of0.7324 Hz. Spectral analysis of this signals was performedwith MATLAB 7.6 (The Mathworks, Natick, MA) usingNeurospec scripts.17
MER activity was assumed to be a realization ofstationary zero mean time series. Discrete Fourier trans-form and parameters derived from it were used for spectralanalysis. The power spectral density was averaged acrosscorresponding layers of all the trajectories.
Power spectral density was split up into six frequencybands: theta (3-8 Hz), alpha (9-12 Hz), lower beta(13-20 Hz), upper beta (21-30 Hz), lower gamma(31-59 Hz), and upper gamma (60-100 Hz).18,19 Frequen-cies below 3 Hz were not included, to exclude pulsationor movement artifacts. To compare trajectories, we normal-ized the absolute power in each frequency band at each siteby dividing it by the average absolute total power (3-100Hz) of all the sites outside the STN in the same trajectory.Recorded signals were on average 8 seconds long, witha minimum of 3 seconds (7.6% of the signals), whichalways resulted in two or more segments per single site.
Statistical analysis
We conducted a multilevel linear mixed effects modelanalysis. As some patients contributed two sides and datafrom the same patient might not be independent, ‘‘side’’ and‘‘patient’’ were used as contextual variables, by allowinga random intercept. The presence or absence of tremordefined two groups. Layers (eight levels) and frequency(six levels) were used as repeated variables and wereconsidered ordinal variables. We analyzed the main fixedeffects of tremor, frequency, and layer and their interaction(tremor*frequency, tremor*layer, and frequency*layer).A second level interaction (tremor*frequency*layer) wasincluded to test the hypothesis that the pattern of frequencydistribution would be different across the layers betweentremor and no-tremor sides. The model was estimatedwith restricted maximum likelihood. For statisticalanalysis, we used PASW statistics 18 software (formerSPSS).
Results
Fifty-five PD patients were eligible for the study. Becauseof MER unavailability, prior pallidotomy, too shorttrajectory or suboptimal electrode position, 54 nuclei

Figure 1 Flow diagram of patient inclusion. MER 5 Microelectrode recordings. * For two patients, the other side was included, for fourpatients, the other side was discarded because of one of the above mentioned reasons.
4 Contarino et al
were excluded from analysis (Figure 1). Thus, 56 STNtrajectories from 34 patients were analyzed (22 bilateraland 12 unilateral). Thirty-three sides were classifiedas ‘‘tremor sides’’ (average tremor score 3.2) and 23 as‘‘no-tremor sides.’’ Patients’ characteristics are describedin Table 1.
As spectral estimation might be less accurate in shortrecordings, we have performed sensitivity analysis toexplore if the presence of short recordings (,4 seconds)could affect the results. The number of trajectories withshort recordings was equally distributed among tremor andno-tremor sides (42% and 39%, respectively). Wecompared the power of each frequency band in each layerbetween trajectories containing short recordings and trajec-tories with no short recordings and found no significantdifference in any value (t test). Moreover, we have appliedthe main statistical model only to the group of trajectorieswith no short segments (n 5 33, 19 tremor sides, 14no-tremor sides) and obtained similar results (significanteffect of layer, significant effect of frequency, significantinteraction layer*frequency and significant interactiontremor*frequency). The second level interaction (tremor*layer*frequency) did not reach a significance level
(P 5 .056), most likely because of the smaller number oftrajectories analyzed. Therefore, we assume that the inclu-sion of trajectories with short recordings did not signifi-cantly affect the results.
There was a significant main effect of the layer (F 564.565; P , .001). Overall power in the top layers ap-peared higher than in the bottom layers (Figure 4A). Therewas also a significant main effect of the frequency bandanalyzed (F 81.444; P , .001). Power in the frequencybands 3-8 Hz, 9-12 Hz, 13-20 Hz, and 21-30 Hz appearedhigher than in the 31-100 Hz band (Figure 4B). There wasa significant interaction effect between the layer and theconsidered frequency band (F 5 42.264; P , .001). Thisindicates that the profile of spectral power in the differentfrequency bands varied according to the layer considered(Figure 4C). Indeed, in the upper layers frequenciesfrom 3 to 30 Hz appeared to have a higher power thanfrequencies from 31 to 100 Hz, whereas in the lowerlayers (six-eight) power was similarly distributed in allfrequencies. In other words, only in the dorsal STN theta,alpha, and beta frequencies appeared more representedthan gamma frequencies, whereas in the ventral STNpower was lower and equally distributed across all

Figure 2 Representative spectral activity from a tremor side (left) and a no-tremor side (right). Top: delineation of subthalamic nucleusMER activity based on normalized RMS. Bottom: distribution of power spectral density in six frequency bands across subsequent sites(same data as top panels).
Tremor-specific oscillations in STN 5
frequency bands. When layers and frequency bands wereconsidered all together, there was no significant differencebetween tremor and no-tremor sides (main effect of tremornot significant, P 5 .235). The distribution of the overallpower across the layers showed a similar pattern in tremorand no-tremor sides (interaction between layer and tremornot significant) (Figure 5A). However, tremor and no-tremor sides showed a different trend of power distribu-tion across frequencies (significant interaction betweenfrequency and tremor, F 5 6.924; P , .05). This trendwas particularly evident for theta and beta frequencybands (Figure 5B). Moreover, when calculated as a func-tion of layer, the trend of power distribution across thefrequency bands was significantly different betweentremor and no-tremor sides (interaction between layer,frequency, and tremor significant, F 5 4.172, P , .05).This was reflected by a stronger theta component in thetop layers in the tremor sides than in the no-tremor sidesand a stronger beta component in the no-tremor sides ascompared with the tremor sides, whereas there was nodifference in power distribution between tremor and no-
tremor sides in the bottom layers and in the gammafrequencies (Figure 6).
Discussion
The current study shows by means of direct comparison oftremor sides and no-tremor sides, that the prevalence oftheta-frequency oscillations in the most dorsal STN layersis specific for the nuclei contralateral to tremor, while in theabsence of tremor beta frequencies (and especially lowerbeta frequencies) predominate. Moreover, we confirmedthat in PD patients, off medication and at rest, oscillatoryactivity in the dorsal STN is stronger than in the ventralpart. This pattern is specific for theta, alpha, and betafrequencies, but not for gamma.
In the current study, we analyzed a large number of STNrecordings and used particular care in the method to reduceany possible bias. Our findings thus provide robustevidence to support current theories on the neurophysio-logic activity of the STN in parkinsonian patients.

Figure 3 Method for clustering corresponding layers of different subthalamic nuclei (STN). The portion of the electrode track betweenentering and leaving the STN was normalized to a length of 1.0, and subsequently subdivided into eight equal bins.
6 Contarino et al
Methodology
To maximize the proportion of optimal STN recordings, weanalyzed only the tracks with the best clinical effect andwith confirmed correct position. Short trajectories, whichpossibly did not follow STN major axis, were excluded. Inearlier studies, data were either described per patient, orpooled by averaging recordings based on their absolutedistance from the borders.20-22 Because STN sizes differ,23
although the anatomofunctional organization within thenucleus is similar, we pooled recordings from differentSTNs by correcting for the actual size of the nuclei. Thisnovel method allowed us to more accurately study thepattern of frequency distribution in adjoining areas. Weanalyzed intraoperative MER, which capture spikes fromone to three neurons, superimposed on backgroundactivity.13 In our recordings, local field potentials (LFPs)low frequencies were filtered out before analysis. Thus,the low frequencies analyzed after rectification of thefiltered signal reflect only the low-frequency modulationof high-frequency neuronal activity.12,24 Although the func-tional meaning of this signal is not equivalent to that ofLFPs, information gathered from single/multiunit
recordings, might be considered as representative for theoscillatory activity in the basal ganglia-cortical circuitry.25
Dorsoventral pattern
Animal and human studies suggest that the sensorimotorcircuit is located in the dorsolateral STN.2,3,20 Beta-frequency oscillations are considered important in thepathophysiology of PD, because they are prominent inthe cortico-basal-ganglia circuitry in parkinsonian patientsand inversely correlate with the motor improvementproduced by dopaminergic treatment and STNDBS.4,18,26-28 Both in single unit recordings and inLFPs, beta activity appears more represented in dorsalSTN.5,29 Our findings on single/multiunit recordingsconfirm the functional difference between dorsal andventral STN, showing a dorsoventral power gradient intheta, alpha, and beta frequencies, thus supporting target-ing of the dorsolateral STN to improve parkinsonianmotor symptoms. Gamma-frequency band oscillationsdid not show this dorsoventral pattern. Gamma activityis enhanced by dopaminergic treatment and move-ment.18,20,27,28 Our patients were off medication and at
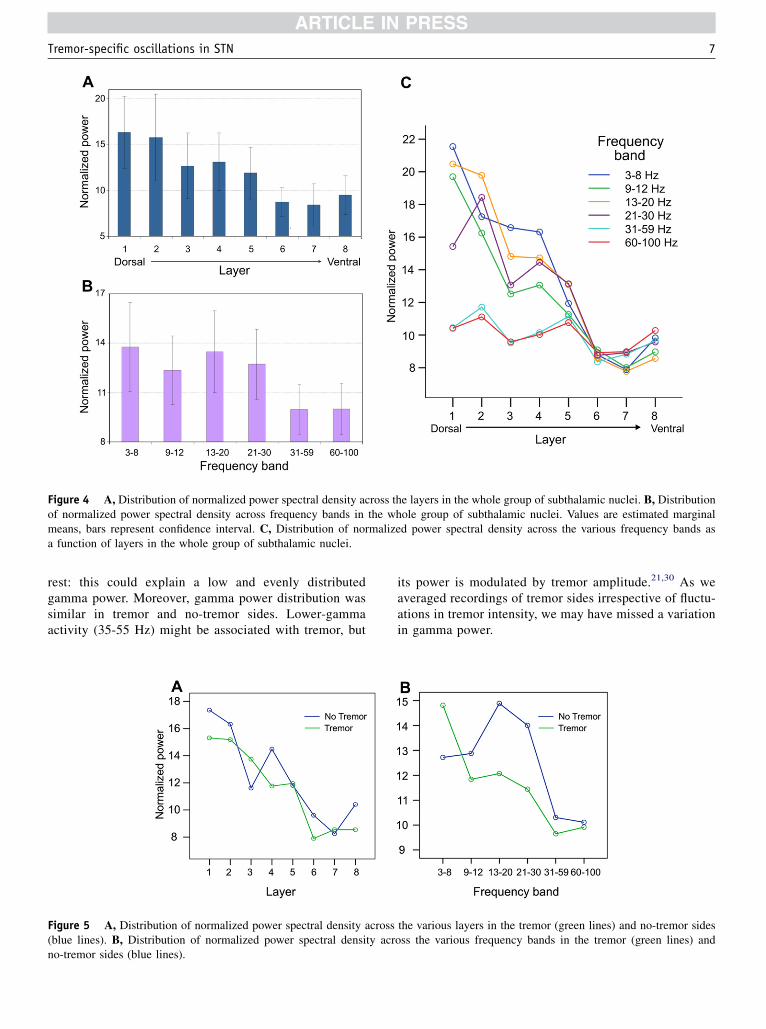
Figure 4 A, Distribution of normalized power spectral density across the layers in the whole group of subthalamic nuclei. B, Distributionof normalized power spectral density across frequency bands in the whole group of subthalamic nuclei. Values are estimated marginalmeans, bars represent confidence interval. C, Distribution of normalized power spectral density across the various frequency bands asa function of layers in the whole group of subthalamic nuclei.
Tremor-specific oscillations in STN 7
rest: this could explain a low and evenly distributedgamma power. Moreover, gamma power distribution wassimilar in tremor and no-tremor sides. Lower-gammaactivity (35-55 Hz) might be associated with tremor, but
Figure 5 A, Distribution of normalized power spectral density across(blue lines). B, Distribution of normalized power spectral density acrno-tremor sides (blue lines).
its power is modulated by tremor amplitude.21,30 As weaveraged recordings of tremor sides irrespective of fluctu-ations in tremor intensity, we may have missed a variationin gamma power.
the various layers in the tremor (green lines) and no-tremor sidesoss the various frequency bands in the tremor (green lines) and

Figure 6 A, Normalized power spectral density (PSD) in each of the eight layers in the tremor (green lines) and no-tremor sides(blue lines). B, Distribution of normalized power spectral density as a function of depth in the tremor and no-tremor sides.
8 Contarino et al
Oscillation pattern associated with tremor
We applied the analysis of spectral power as a function oflayers to directly compare tremor sides and no-tremorsides. Contralateral to tremor, theta band power appearedpredominant in top layers. On the opposite, in the absenceof tremor, beta band power was higher. These differenceswould be missed if analysis was performed irrespective oflayers. The theta-frequency range (3-8 Hz) equals that ofparkinsonian tremor. Because we did not perform spikediscrimination, we cannot exclude mechanical artifactbecause of tremor of the head or of the electrode. However,the strong theta component in the top layers is unlikely dueto a transmission artifact from the trembling limbs, becauseit was selectively present only in some of the layers and notin others. Tremor is supposed to originate from pathologicoscillatory activity in the cortico-thalamic-basal-gangliacircuitry.31,32 LFPs recorded in the STN of patients withtremor present peaks at the tremor frequency and arecoherent with EMG at the tremor frequency.33-36 The pres-ence of single neurons oscillating at tremor frequency in thedorsal STN has been demonstrated in studies on PDpatients with tremor.12,20,21,37,38 However, a direct compar-ison between tremor sides and no-tremor sides has onlybeen performed in a small number of patients. In one study
comparing four patients with tremor and two with notremor,10 and similarly in another one comparing seventremor sides with four no-tremor sides,11 single neuronsoscillating at the tremor frequency were found only in thepresence of tremor. In another study, no significant correla-tion was found between the oscillatory characteristics ofsingle STN neurons and clinical subscores for tremor,rigidity and bradykinesia.12
Alpha and beta frequency oscillations in STN neuronsare characteristic of PD and not found in ET, whereas thetafrequency oscillations are present in both groups.9 Thesefindings suggest that theta oscillations are related to tremor,irrespective of the underlying pathology. Our data stronglysupport an association between the presence of tremor andneuronal oscillatory activity at the theta frequency. In addi-tion, we show that this activity is predominant in the toplayers of the STN and that this pattern is not found in theabsence of tremor.
Beta band power was, in our study, more pronounced inno-tremor than in tremor sides. This is in agreement withearlier studies, which demonstrated that in patients withpredominant tremor only a minority of neurons oscillate orare coherent at beta frequencies21,38,39 and that power in thebeta-frequency band correlates to bradykinesia and rigidityrather than tremor.4-8
Tremor-specific oscillations in STN 9
Biochemical and clinical studies suggest that parkinso-nian tremor has a different pathophysiologic mechanismthan other symptoms.40-43 Also, the effect of dopaminergicdrugs is usually lower on tremor, whereas thalamic stereo-tactic surgery controls tremor but does not improve otherparkinsonian symptoms.44 Our findings support the hypoth-esis that different parkinsonian symptoms originate insegregated circuits.2,45
The analysis of neuronal oscillatory activity could helpidentifying tremor-associated cell-clusters in each patient.Further studies are needed to clarify whether a specificfrequency profile in the dorsal STN is involved in tremorgeneration or whether it results from proprioceptive inputsprompted by tremor. However, it appears that tremorimprovement can be obtained by stimulating the STN atthe level of tremor cells20 or at the sites where LFP-EMGcoherence at tremor frequency is detected.33 Thus, intraoper-ative identification of tremor-related cell-clusters by meansof MER could ultimately help refining STN targeting.
Our study supports the hypothesis that the presence oftremor is associated with a distinctive neuronal oscillationspattern. In particular, we demonstrate the specificity of theassociation of theta frequencies in the dorsal STN withtremor. Further studies are needed to replicate these results,possibly with a prospective design. Identification ofsymptom-specific characteristics of intraoperative MERmay lead to further refinement of STN targeting, tailoredto the specific clinical presentation.
Acknowledgments
We thank Dr. N. van Geloven and Prof. R. J. de Haan forstatistical advice, T. Boeree for artwork, and J. van derMeer for support with Matlab scripting.
References
1. Deuschl G, Schade-Brittinger C, Krack P, et al. A randomized trial of
deep-brain stimulation for Parkinson’s disease. N Engl J Med 2006;
355:896-908.
2. Parent A, Hazrati LN. Functional anatomy of the basal ganglia. II: the
place of subthalamic nucleus and external pallidum in basal ganglia
circuitry. Brain Res Brain Res Rev 1995;20:128-154.
3. Nambu A, Takada M, Inase M, Tokuno H. Dual somatotopical repre-
sentations in the primate subthalamic nucleus: evidence for ordered
but reversed body-map transformations from the primary motor cortex
and the supplementary motor area. J Neurosci 1996;16:2671-2683.
4. Kuhn AA, Tsui A, Aziz T, et al. Pathological synchronisation in the
subthalamic nucleus of patients with Parkinson’s disease relates to
both bradykinesia and rigidity. Exp Neurol 2009;215:380-387.
5. Weinberger M, Mahant N, Hutchison WD, et al. Beta oscillatory
activity in the subthalamic nucleus and its relation to dopaminergic
response in Parkinson’s disease. J Neurophysiol 2006;96:3248-3256.
6. Ray NJ, Jenkinson N, Wang S, et al. Local field potential beta activity
in the subthalamic nucleus of patients with Parkinson’s disease is asso-
ciated with improvements in bradykinesia after dopamine and deep
brain stimulation. Exp Neurol 2008;213:108-113.
7. Chen CC, Pogosyan A, Zrinzo LU, et al. Intra-operative recordings of
local field potentials can help localize the subthalamic nucleus in
Parkinson’s disease surgery. Exp Neurol 2006;198:214-221.
8. Kuhn AA, Kupsch A, Schneider GH, Brown P. Reduction in subthala-
mic 8-35 Hz oscillatory activity correlates with clinical improvement
in Parkinson’s disease. Eur J Neurosci 2006;23:1956-1960.
9. Steigerwald F, Potter M, Herzog J, et al. Neuronal activity of the
human subthalamic nucleus in the parkinsonian and nonparkinsonian
state. J Neurophysiol 2008;100:2515-2524.
10. Hutchison WD, Allan RJ, Opitz H, et al. Neurophysiological identifi-
cation of the subthalamic nucleus in surgery for Parkinson’s disease.
Ann Neurol 1998;44:622-628.
11. Levy R, Hutchison WD, Lozano AM, Dostrovsky JO. High-frequency
synchronization of neuronal activity in the subthalamic nucleus of
parkinsonian patients with limb tremor. J Neurosci 2000;20:
7766-7775.
12. Moran A, Bergman H, Israel Z, Bar-Gad I. Subthalamic nucleus func-
tional organization revealed by parkinsonian neuronal oscillations and
synchrony. Brain 2008;131:3395-3409.
13. Gerstein GL, Clark WA. Simultaneous studies of firing patterns in
several neurons. Science 1964;143:1325-1327.
14. Moran A, Bar-Gad I, Bergman H, Israel Z. Real-time refinement of
subthalamic nucleus targeting using Bayesian decision-making on
the root mean square measure. Mov Disord 2006;21:1425-1431.
15. Myers LJ, Lowery M, O’Malley M, et al. Rectification and non-linear
pre-processing of EMG signals for cortico-muscular analysis.
J Neurosci Methods 2003;124:157-165.
16. Bartlett MS. The spectral analysis of point processes. J Royal Stat Soc
Series B (Method) 1963;25:264-296.
17. Halliday DM, Rosenberg JR, Amjad AM, et al. A framework for the
analysis of mixed time series/point process datadtheory and appli-
cation to the study of physiological tremor, single motor unit
discharges and electromyograms. Prog Biophys Mol Biol 1995;64:
237-278.
18. Priori A, Foffani G, Pesenti A, et al. Rhythm-specific pharmacological
modulation of subthalamic activity in Parkinson’s disease. Exp Neurol
2004;189:369-379.
19. Marceglia S, Foffani G, Bianchi AM, et al. Dopamine-dependent
non-linear correlation between subthalamic rhythms in Parkinson’s
disease. J Physiol 2006;571:579-591.
20. Rodriguez-Oroz MC, Rodriguez M, Guridi J, et al. The subthalamic
nucleus in Parkinson’s disease: somatotopic organization and physio-
logical characteristics. Brain 2001;124:1777-1790.
21. Weinberger M, Hutchison WD, Lozano AM, Hodaie M,
Dostrovsky JO. Increased gamma oscillatory activity in the subthala-
mic nucleus during tremor in Parkinson’s disease patients.
J Neurophysiol 2009;101:789-802.
22. Kuhn AA, Trottenberg T, Kivi A, et al. The relationship between local
field potential and neuronal discharge in the subthalamic nucleus of
patients with Parkinson’s disease. Exp Neurol 2005;194:212-220.
23. Daniluk S, Davies G, Ellias SA, Novak P, Nazzaro JM. Assessment of
the variability in the anatomical position and size of the subthalamic
nucleus among patients with advanced Parkinson’s disease using
magnetic resonance imaging. Acta Neurochir (Wien) 2010;152:
201-210.
24. Zaidel A, Spivak A, Grieb B, Bergman H, Israel Z. Subthalamic span
of beta oscillations predicts deep brain stimulation efficacy for patients
with Parkinson’s disease. Brain 2010;133:2007-2021.
25. Hammond C, Bergman H, Brown P. Pathological synchronization in
Parkinson’s disease: networks, models and treatments. Trends Neuro-
sci 2007;30:357-364.
26. Levy R, Ashby P, Hutchison WD, et al. Dependence of subthalamic
nucleus oscillations on movement and dopamine in Parkinson’s
disease. Brain 2002;125:1196-1209.
27. Cassidy M, Mazzone P, Oliviero A, et al. Movement-related changes
in synchronization in the human basal ganglia. Brain 2002;125:
1235-1246.
10 Contarino et al
28. Brown P. Oscillatory nature of human basal ganglia activity: relation-
ship to the pathophysiology of Parkinson’s disease. Mov Disord 2003;
18:357-363.
29. Trottenberg T, Kupsch A, Schneider GH, Brown P, Kuhn AA.
Frequency-dependent distribution of local field potential activity
within the subthalamic nucleus in Parkinson’s disease. Exp Neurol
2007;205:287-291.
30. Trottenberg T, Fogelson N, Kuhn AA, et al. Subthalamic gamma
activity in patients with Parkinson’s disease. Exp Neurol 2006;200:
56-65.
31. Brown P, Marsden CD. What do the basal ganglia do? Lancet 1998;
351:1801-1804.
32. Hutchison WD, Dostrovsky JO, Walters JR, et al. Neuronal oscilla-
tions in the basal ganglia and movement disorders: evidence from
whole animal and human recordings. J Neurosci 2004;24:
9240-9243.
33. Reck C, Florin E, Wojtecki L, et al. Characterisation of tremor-
associated localfield potentials in the subthalamic nucleus inParkinson’s
disease. Eur J Neurosci 2009;29:599-612.
34. Liu X, Ford-Dunn HL, Hayward GN, et al. The oscillatory activity in
the Parkinsonian subthalamic nucleus investigated using the macro-
electrodes for deep brain stimulation. Clin Neurophysiol 2002;113:
1667-1672.
35. Reck C, Himmel M, Florin E, et al. Coherence analysis of local field
potentials in the subthalamic nucleus: differences in parkinsonian rest
and postural tremor. Eur J Neurosci 2010;32:1202-1214.
36. Wang SY, Liu X, Yianni J, et al. Optimising coherence estimation to
assess the functional correlation of tremor-related activity between
the subthalamic nucleus and the forearm muscles. J Neurosci Methods
2004;136:197-205.
37. Magarinos-Ascone CM, Figueiras-Mendez R, Riva-Meana C,
Cordoba-Fernandez A. Subthalamic neuron activity related to tremor
and movement in Parkinson’s disease. Eur J Neurosci 2000;12:
2597-2607.
38. Amtage F, Henschel K, Schelter B, et al. Tremor-correlated neuronal
activity in the subthalamic nucleus of Parkinsonian patients. Neurosci
Lett 2008;442:195-199.
39. Amtage F, Henschel K, Schelter B, et al. High functional connectivity
of tremor related subthalamic neurons in Parkinson’s disease. Clin
Neurophysiol 2009;120:1755-1761.
40. Stochl J, Boomsma A, Ruzicka E, Brozova H, Blahus P. On the struc-
ture of motor symptoms of Parkinson’s disease. Mov Disord 2008;23:
1307-1312.
41. Zaidel A, Arkadir D, Israel Z, Bergman H. Akineto-rigid vs. tremor
syndromes in Parkinsonism. Curr Opin Neurol 2009;22:387-393.
42. DeuschlG,Raethjen J,BaronR,etal.Thepathophysiologyofparkinsonian
tremor: a review. J Neurol 2000;247(Suppl. 5):V33-V48.
43. Rajput AH, Sitte HH, Rajput A, et al. Globus pallidus dopamine and
Parkinson motor subtypes: clinical and brain biochemical correlation.
Neurology 2008;70:1403-1410.
44. Schuurman PR, Bosch DA, Merkus MP, Speelman JD. Long-term
follow-up of thalamic stimulation versus thalamotomy for tremor
suppression. Mov Disord 2008;23:1146-1153.
45. Stein JF, Aziz TZ. Does imbalance between basal ganglia and cere-
bellar outputs cause movement disorders? Curr Opin Neurol 1999;
12:667-669.
Copyright © 2022 FDOKUMEN