Permanent tremor of Masaya Volcano, Nicaragua: Wave field analysis and source location
17
JOURNAL OF GEOPHYSICALRESEARCH, VOL. 102, NO. B10, PAGES22,529-22,545, OCTOBER 10, 1997 Permanent tremor of Masaya Volcano, Nicaragua' Wave field analysis and source location Jean-Philippe M•taxian 1'2 and Philippe Lesage • Laboratoire d'Instrumentation G6ophys•que, Universit6 de Savoie, Le Bourget-du-Lac, France Jacques Dorel • Observatoire de Physique du Globede Clermont-Ferrand (OPGC), Clermont-Ferrand, France Abstract. The Masaya Volcano, Nicaragua, is a basaltic caldera in a subduction zone. The permanent source of the volcanic tremor waslocated inside Santiago crater, at the lava lake's position and400 m belowthe NE rim, andtherefore corresponds to superficial magma activity. We used two tripartite arrays (90 m side),one semicircular array(r=120 m) in 1992, andtwo semicircular arrays (r=60 m) anda 2500 m long lineararrayradiating out from the source andon the flank of the crater in 1993.We used botha cross-spectrum method anda correlation method to determine the wave delaytime between the reference station and the other stations of an arrayandto quantify the wave field. Usingthe delays therefore by intersecting the backazimuth wave directions from the arrays, we couldpinpoint the source. Additionally, the correlation coefficients obtained asfunctions of frequency for the three components of motion confirm the inferred position of the source of tremor. The tremor's wavefield is composed of comparable quantities of dispersed Rayleigh andLove surface waves, whose phase velocities lie in the ranges 730-1240 m/s at 2 Hz and330-550 m/s at 6 Hz. The dispersive phase velocities were inverted to obtain crustal structures with a minimal number of layers. The resulting velocity models are similar for the northern andsouthern parts of thevolcano. After geometrical spreading corrections, Q2Hz = 14 andQ3Hz =31 were determined along the northern lineararray. The typicallow velocities andlow Q corresponding to the cone structure andare similar to those of other basaltic volcanoes like PuuOo, Hawaii, andKlyuchevskoy, Kamchatka. Introduction Volcanic tremor is a continuous seismic signal that precedes and accompanies mostmagmatic eruptions [Fehler, 1983; Ereditato and Luongo, 1994]. It can also occurduring quiet periods [Chouet, 1981]. Several kindsof tremor canbe distinguished according to signal and spectra shape. Harmonic tremoris characterized by single or multiplenarrow peaks in the spectra, such as those observed at Ruapehu [Hurst and Sherburn, 1993], Pavlof [McNutt, 1986], and Langila [Mori et al., 1989]. The features of this type of volcanictremor are currentlyhypothesized to be oscillating phenomena in the networkof magmachannels feeding the volcano. Othertremortypesare more complicated, appear to be broadband signals, and can resemble ordinaryseismic noise. These types of tremor havea broad spectrum composed of multiple, irregularly spaced peaks, generally between 0.5 and 5 or 6 Hz. Excellent examples are recorded at Etna [Seidi et al., 1981; Schicket al., 1982], Mount St. Helens [Malone, 1983; Fehler, 1983], Kliuchevskoi [Gotdeer et al., 1989], or Kilauea [Koyanagiet al., 1987; Ferrazzini and gki, 1992]. •Also atCentre de Recherches Volcanologiques, OPGC/CNRS, Clermont- Ferrand, France. 2Now at Institut Fran•ais de Recherche Scientifique pour le d•veloppement en Cooperation (ORSTOM), Quito, Ecuador. Copyright 1997 by the American Geophysical Union. Paper number 97JB01141. 0148-0227/97/97JB-01141 $09.00 Most previous studies attribute spectral peaks to source effects. This is supported by observations where identical spectral peaks were observed at different stations, andin other cases, temporal variations in tremor spectra have been observed in the same station [Sassa, 1935; Aki et al., 1977; Riuscetti et al., 1977;Aki and Koyanagi, 1981; Fehler, 1983; Chouet, 1988, 1992; Ferrazzini and Aki, 1992; Hurst and Sherburn,1993]. Severalsource modelshave been proposed to account for the observations of tremor or long-period events. Many characteristics of tremor may be explained as flow-induced oscillations that occur in channels or cavities possessing varied geometries (crack, sphere, pipe) while they are transportingmagmatic fluids. Pressure transients or perturbations in the established pressure are bilieved to generate the observed signals [Aki et al., 1977; Crosson and Bame, 1985; Chouet,1985, 1988, 1992; dulian, 1994]. dulian [1994] proposed that these oscillations can be excited by a nonlinear process analogous to the excitationmechanism of somemusicalinstruments. However, various studies suggest that site or path effects could be responsible for part of the observed spectra features of shallowvolcanic tremor [Omer, 1950; Gordeev et al., 1990; Gordeev, 1992; Goldstein and Chouet, 1994]. This assumption is supported by observations of spatial variability of tremor spectra [Gotdeer et al., 1990]. In order to better understandthe physical processes involved in shallow tremor, it is important to locate their seismic source with good precision and to determine the composition of the associated wave field. This is a difficult task because the onsetsof the body waves are generally 22,529
-
Upload
univ-savoie -
Category
Documents
-
view
0 -
download
0
Transcript of Permanent tremor of Masaya Volcano, Nicaragua: Wave field analysis and source location

JOURNAL OF GEOPHYSICAL RESEARCH, VOL. 102, NO. B10, PAGES 22,529-22,545, OCTOBER 10, 1997
Permanent tremor of Masaya Volcano, Nicaragua' Wave field analysis and source location
Jean-Philippe M•taxian 1'2 and Philippe Lesage • Laboratoire d'Instrumentation G6ophys•que, Universit6 de Savoie, Le Bourget-du-Lac, France
Jacques Dorel • Observatoire de Physique du Globe de Clermont-Ferrand (OPGC), Clermont-Ferrand, France
Abstract. The Masaya Volcano, Nicaragua, is a basaltic caldera in a subduction zone. The permanent source of the volcanic tremor was located inside Santiago crater, at the lava lake's position and 400 m below the NE rim, and therefore corresponds to superficial magma activity. We used two tripartite arrays (90 m side), one semicircular array (r=120 m) in 1992, and two semicircular arrays (r=60 m) and a 2500 m long linear array radiating out from the source and on the flank of the crater in 1993. We used both a cross-spectrum method and a correlation method to determine the wave delay time between the reference station and the other stations of an array and to quantify the wave field. Using the delays therefore by intersecting the back azimuth wave directions from the arrays, we could pinpoint the source. Additionally, the correlation coefficients obtained as functions of frequency for the three components of motion confirm the inferred position of the source of tremor. The tremor's wave field is composed of comparable quantities of dispersed Rayleigh and Love surface waves, whose phase velocities lie in the ranges 730-1240 m/s at 2 Hz and 330-550 m/s at 6 Hz. The dispersive phase velocities were inverted to obtain crustal structures with a minimal number of layers. The resulting velocity models are similar for the northern and southern parts of the volcano. After geometrical spreading corrections, Q2Hz = 14 and Q3Hz =31 were determined along the northern linear array. The typical low velocities and low Q corresponding to the cone structure and are similar to those of other basaltic volcanoes like Puu Oo, Hawaii, and Klyuchevskoy, Kamchatka.
Introduction
Volcanic tremor is a continuous seismic signal that precedes and accompanies most magmatic eruptions [Fehler, 1983; Ereditato and Luongo, 1994]. It can also occur during quiet periods [Chouet, 1981]. Several kinds of tremor can be distinguished according to signal and spectra shape. Harmonic tremor is characterized by single or multiple narrow peaks in the spectra, such as those observed at Ruapehu [Hurst and Sherburn, 1993], Pavlof [McNutt, 1986], and Langila [Mori et al., 1989]. The features of this type of volcanic tremor are currently hypothesized to be oscillating phenomena in the network of magma channels feeding the volcano. Other tremor types are more complicated, appear to be broadband signals, and can resemble ordinary seismic noise. These types of tremor have a broad spectrum composed of multiple, irregularly spaced peaks, generally between 0.5 and 5 or 6 Hz. Excellent examples are recorded at Etna [Seidi et al., 1981; Schick et al., 1982], Mount St. Helens [Malone, 1983; Fehler, 1983], Kliuchevskoi [Gotdeer et al., 1989], or Kilauea [Koyanagi et al., 1987; Ferrazzini and gki, 1992].
•Also at Centre de Recherches Volcanologiques, OPGC/CNRS, Clermont- Ferrand, France.
2Now at Institut Fran•ais de Recherche Scientifique pour le d•veloppement en Cooperation (ORSTOM), Quito, Ecuador.
Copyright 1997 by the American Geophysical Union.
Paper number 97JB01141. 0148-0227/97/97JB-01141 $09.00
Most previous studies attribute spectral peaks to source effects. This is supported by observations where identical spectral peaks were observed at different stations, and in other cases, temporal variations in tremor spectra have been observed in the same station [Sassa, 1935; Aki et al., 1977; Riuscetti et al., 1977; Aki and Koyanagi, 1981; Fehler, 1983; Chouet, 1988, 1992; Ferrazzini and Aki, 1992; Hurst and Sherburn, 1993]. Several source models have been proposed to account for the observations of tremor or long-period events. Many characteristics of tremor may be explained as flow-induced oscillations that occur in channels or cavities
possessing varied geometries (crack, sphere, pipe) while they are transporting magmatic fluids. Pressure transients or perturbations in the established pressure are bilieved to generate the observed signals [Aki et al., 1977; Crosson and Bame, 1985; Chouet, 1985, 1988, 1992; dulian, 1994]. dulian [1994] proposed that these oscillations can be excited by a nonlinear process analogous to the excitation mechanism of some musical instruments. However, various studies suggest that site or path effects could be responsible for part of the observed spectra features of shallow volcanic tremor [Omer, 1950; Gordeev et al., 1990; Gordeev, 1992; Goldstein and Chouet, 1994]. This assumption is supported by observations of spatial variability of tremor spectra [Gotdeer et al., 1990].
In order to better understand the physical processes involved in shallow tremor, it is important to locate their seismic source with good precision and to determine the composition of the associated wave field. This is a difficult task because the onsets of the body waves are generally
22,529

22,530 MI•TAXIAN ET AL.: PERMANENT TREMOR OF MASAYA VOLCANO
emergent, and therefore the classical methods of hypocenter determination are generally inoperative. For example, Power et al. [1994] used a conventional method for locating the seismic events recorded during the Redoubt Volcano eruption of 1989-1990. They located 83% of the volcano-tectonic events but only 16% of the long-period events during the same period. A correlation method was used by Ferrazzini et al. [1991] to determine the direction of propagation of the tremor wave field across a semicircular array at Puu Oo crater, Kilauea Volcano. They found that the wave field was propagating from the Puu Oo crater and that the tremor source is probably associated with the degassing activity in this crater. In the same study, they found that gas piston events and tremor wave fields are composed of Rayleigh and Love waves with very low phase velocities. Comparable properties are associated with tremor at Kliuchevskoi [Gordeev et al., 1990] and Etna Volcanoes [Del Pezzo et al., 1993]. These studies revealed that shallow volcanic tremor is essentially composed of surface waves and that the source is located at only several hundred meters of depth. Goldstein and Chouet [ 1994] identified consistent phases of body or surface waves in gas piston events and tremors recorded at Puu Oo and determined that the source of volcanic tremor is close to or
within the upper kilometer of the crust. In this study, we present results of observations and
analysis of the permanent tremor at Masaya Volcano. Our objectives were to analyze the wave fields, to study the spatial attenuation, and to locate the tremor source. During two field experiments in 1992 and 1993 we deployed several small-. aperture arrays on the north, east, and south flanks of Santiago crater. We used correlation and cross-spectrum methods [Aki, 1957; Poupinet et al., 1984; Ferrazzini et al., 1991 ]. The wave delay times between the stations of tripartite and semicircular arrays were obtained by the cross-spectrum method and were used to estimate the wave propagation azimuths. The intersection of the wave propagation directions obtained with each array resolves the location of the tremor source in the horizontal plane. The spatial correlation method permitted description of the types of seismic waves that compose the wave fields, their relative proportions, and the evaluation of the polarizations and phase velocities of the surface waves. Velocity models for the shallow structure were calculated by inversion of the dispersion curves.
Masaya Caldera and the Santiago Crater
The Masaya Caldera lies on the western edge of the Nicaraguan depression that contains lakes Managua and Nicaragua and is parallel to the northwest trending Quaternary volcanic front of Central America (Figure 1). The caldera is about 20-25 km southeast of the city of Managua and measures 12 x 6 km (Figure 2). It is occupied by several volcanic cones: San Pedro, Nindiri, Santiago, and Masaya (635 m) (Figure 5). Gravimetric studies [Connor and Williams, 1989; M•taxian, 1994; Bonvalot et al., 1995] show the existence of a positive anomaly with the same shape as the caldera, but it is positioned toward the caldera's northeast comer. The source of this anomaly is interpreted to be a shallow body with a density contrast of 0.5, possibly related to an older caldera structure. On the other hand, no clear anomalies are associated with the central cones. Although situated in a subduction regime, Masaya Caldera is characterized by basaltic and tholeYtic activity [Williams,
1983; Carr, 1984; Bice, 1985; Kieffer and Creusot-Eon, 1992]. This could be the result of low-pressure intracrustal fractionation (8-12 kbar) due to a thin crust [Cart, 1984], thus allowing the formation of superficial magmatic intrusions and lava lakes. The Santiago crater (Figure 2) contains an intermittent lava lake whose activity persists for a few weeks to several years. It has also experienced regular and repeated periods of strong gas emission [Stoiber et al., 1986; Van Wyk de Vries et al., 1988]. However, while it has a magma supply rate similar to other major active volcanoes like Kilauea or Etna, Santiago emits an unusually low volume of magma [Stoiber et al., 1986]. In 1989, a 50 m wide lava lake appeared after a collapse at the bottom of the Santiago crater. The lake formed 300 m beneath the crater rim, and both gas emissions and lava fountaining were observed [Smithsonian Institution, 1989]. This activity lasted for 5 weeks. The last active period started in June 1993 [Smithsonian Institution, 1993], when a new lava lake was formed by the same processes observed in 1989. The new level of the lake remained 50 m below the level previously observed in 1989 and therefore was less visible. Since that time, Santiago's activity has been characterized by minor fountaining and strong degassing which is audible from the crater rim, 400 m above the source.
Seismic Activity
Permanent tremor is the dominant seismic activity of Masaya Volcano. Amplitude and spectral content vary little with time [Mdtaxian, 1994]. Between 1989 and 1993 we registered only a few long-period events per month and, on the average, only one volcano-tectonic earthquake per day, with local magnitudes ranging between 1 and 2 (Figure 3). For the hypocentral locations of a selection of volcano- tectonic events registered during a 6 month period, most of the focii are located in the eastern part of the Santiago crater, at an average depth of 1 km below sea level, i.e., about 1.5 km under the crater floor (Figure 4). The low level of volcano-tectonic activity suggests that stresses in the volcanic structure are minor and that it is essentially an open system characterized by continous degassing whose seismic manifestation is primarily permanent tremor.
Equipment and Tremor Data
The data used in this work were obtained on Masaya Volcano during two field campaigns in 1992 and 1993. We employed three digital telemetered seismographs, each consisting of a three-channel, 16-bit recorder Lennartz PCM 5800 attached to a three-component velocity sensor (Mark Product L22) with a natural frequency of 2 Hz. The seismographs recorded data at 125 samples/s and operated with a common time base, maintaining an accuracy of 1 ms between all channels. All nine channels were telemetered to
the same recorder and encoded on magnetic tape. In 1993, owine to a seismograph's breakdown, we operated only two stations. Before the field experiment, we simultaneously recorded seismic noise at all the stations with the sensors close to each other in order to ensure that there were no
differences between the responses of the seismographs. During the first campaign, in September 1992, we
established a semicircular (R) array (r=120 m) labeled "R_array A", at a distance of 1.1 km from the Santiago crater

MI•TAXIAN ET AL.: PERMANENT TREMOR OF MASAYA VOLCANO 22,531
14 ø N
13 ø
I I
Honduras /"
ua
MaLake nagua
lO km i i
Masaya
• Apoyo
Mombacho {
jl
12 ø 0
11 ø
Quaternary volcano
Cinder cones
Caldera 50 I
km
Costa Rica
85 ø W 87 ø 86 ø
Figure l. Nicaraguan portion of the Central American volcanic front and location of Masaya Caldera (reprinted from Walker et al. [ 1993] with kind pelxnission from Elsevier Science). Shaded strips are proposed segment boundaries of Stoiber and Cart' [1973].
(Figure 5). Owing to having only three triaxal stations, we kept a fixed reference station at the center of the semicircle and positioned the two remaining stations one after the other (leapfrogging one over the other) at seven different sites placed on the circumference of the semicirdle (every 30ø). The sensor's horizontal components of the mobile stations have been aligned respectively with the radial and the tangential directions of the semicircle. During the same period, we also operated two tripartite (T) arrays of 90 m per side labeled "T_array 1" and "T_array 2" (Figure 5) at distances of 1.5 and 1.1 km, respectively, from the active crater. The R_ and the two T_arrays employed the same three stations and were installed consecutively. During the second campaign, in November 1993, we set up two R_arrays (r=60 m), labeled "R_array B" and "R_array C", at 1.0 and 0.7 km, respectively, from the Santiago crater (Figure 5). In this experiment, we used only two triaxal stations, maintaining the first one at a fixed reference point and operating the other station at seven consecutive sites placed on the circumference. The semicircl• radius was reduced because of the lack of coherency observed at frequencies higher than 2 Hz fbr signals recorded in the 1992 experiment. To quantify the
spatial attenuation of the tremor wave field, we operated a 2.5 km long linear array (L) positioned radially away from the source and on the north flank of the crater (Figure 5), using two seismographs: one as a fixed reference and the other positioned at 10 different sites 200 to 300 m apart. Each of these array experiments was performed in a short interval of time, less than half a day. The recording windows for the R_arrays (seven recordings) and L_arrays (10 recordings) lasted 10 min.
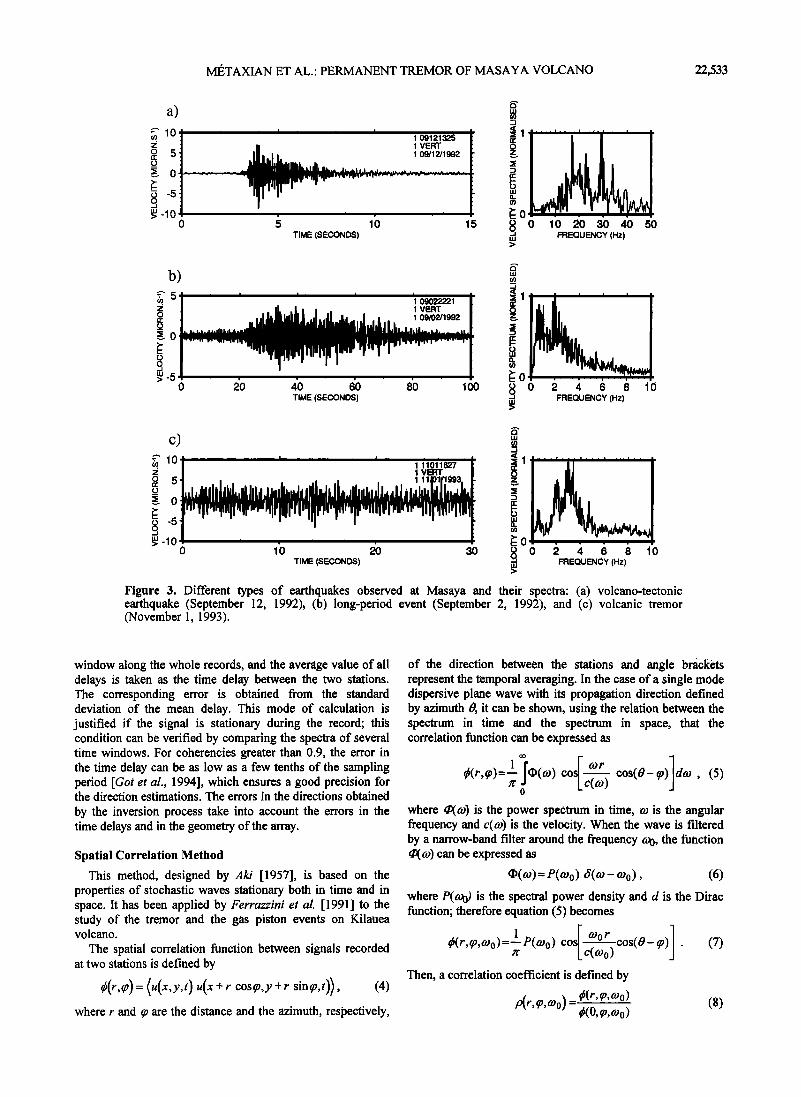
In September 1992, volcanic activity was weak and had dropped to small gas emissions in the Santiago crater. During this period, the mean tremor amplitude was 0.5 [tm s -] at a distance of 1 km from the crater. In November 1993, volcanic activity became more intense following the appearance of a lava lake, and the tremor amplitude reached 2 [tm s -1 at 1 km distance. Figure 6 shows examples of volcanic tremor registered by R_array B. The reduced displacement, which is a measure of tremor amplitude corrected for the geometrical spreading, has been calculated for the tremor recorded in 1993 close to the active crater. The value was 1.4 cm 2 at 2
Hz, compared to 2.5 cm 2 during the 1977 eruption of Masaya Volcano [Simkin et al., 1977].

M12TAXIAN ET AL.: PERMANENT TREMOR OF MASAYA VOLCANO 22,532
TICUANTEPE
86ø10'W
12ø00'N 450
350
65, • • Yon[afrO
•oo • 500
NINDIRI
200
135
Loguno
12oo0'N
.=•
233
0 km 1 2 3 •. 5 MASATEPE 86ø10'W
225
Figure 2. Map of Masaya Caldera with the main craters and the direction of lava flows. The last flows date from 1670 and 1772. Small numbers indicate the altitude in different parts of the caldera. The caldera reaches its highest point of 654 m at the Ventaron (adapted from Bice [ 1985] and Kieffer and Creusot-Eon [ 1992])0
Methods
Determination of the Direction of Wave Propagation by the Cross-Spectral Method
To obtain an estimation of the source location of tremor or
other events with an emergent onset, one can calculate the directions of wave propagation at several places on a volcano. The intersection of these directions gives the source location in the horizontal plane if one assumes that the propagation directions are constant. The azimuth of the propagation direction 0 and the apparent velocity c of the tremor waves can be obtained by studying their propagation across small- aperture arrays of three or more stations. The difference of arrival time (or time delay) between stations i and j, in the case of plane waves, is
rid' = rij/c cøs(O-(Pij) (1) where r u is the distance between stations and •u is the azimuth of the direction connecting the two geophones (Figure 7). By introducing slowness, s: l/c, equation (1) can be written as
-- = s cos0 cos•,; + s sin0 sin•,•, (2)
where the unknowns are the horizontal components of the slowness vector (s.cos0, s.sin0). The set of N-1 equations (1) or (2), where N is the number of stations (N = 3 or 8 for tripartite or semicircular arrays, respectively), can be soh, ed as a small inverse problem which also gives an estimation of errors.
The geometrical characteristics of the array (rij and eij) are measured on the ground. The main problem is to obtain a good precision on the measurement of delay, as generally no phase arrival can be identified and picked up on the seismograms recorded by the array. When the distances between sensors are small, the seismograms simultaneously recorded at the different stations look similar. The resemblance of two signals is quantified by the coherency function which is the smoothed cross spectrum normalized by the smoothed autospectra; the coherency is equal to one when the records are identical.
We estimated the delays by applying a cross-spectral method, commonly used for seismic multiplet studies [Poupinet et al., 1984; 1985; Got et al., 1994]. If two signals S 1 and S 2 differ only by a scale factor K and a time delay r, S2(t) - KSl(t-r), it is easy to show that the phase of their cross spectrum is rco, where co is the angular frequency. In this case, the coherency is equal to one. In a real case, the time delay is computed by using a weighted linear adjustment of the phase of the cross-spectrum [Poupinet et al., 1984; Frdchet, 1985]. The weight is proportional to the reciprocal of the variance of the cross-spectrum phase
C 2 w2 (co) = (co) Cmi n <C(co) <1 c2(co))
(3) w2(co)=0 C( co ) < Cmi n,
where C(co) is the coherency at angular frequency co and Cmi n is a given value. This computation is repeated on a moving
MI•TAXIAN ET AL.' PERMANENT TREMOR OF MASAYA VOLCANO 22,533
a)
0 5 10 15 TIME (SECONDS) •, 6 1•-20 30 40 50 LU FREQUENCY (Hz)
b) -7"5 ' ' ' ' ' ' ' '•
1 VERT
0 2'0 4'0 6'0 8'0 100 TIME (SECONDS) 2 4 6 8 10 FREQUENCY (Hz)
c)
J 1 VERT 5 o
•-5 -10
0 10 20 30 TIME (SECONDS)
2 4 6 8 10 FREQUENCY (Hz)
Figure 3. Different types of earthquakes observed at Masaya and their spectra: (a) volcano-tectonic earthquake (September 12, 1992), (b) long-period event (September 2, 1992), and (c) volcanic tremor (November 1, 1993).
window along the whole records, and the average value of all delays is taken as the time delay between the two stations. The corresponding error is obtained from the standard deviation of the mean delay. This mode of calculation is justified if the signal is stationary during the record; this condition can be verified by comparing the spectra of several time windows. For coherencies greater than 0.9, the error in the time delay can be as low as a few tenths of the sampling period [Got et al., 1994], which ensures a good precision for the direction estimations. The errors in the directions obtained
by the inversion process take into account the errors in the time delays and in the geometry of the array.
Spatial Correlation Method
This method, designed by Aki [1957], is based on the properties of stochastic waves stationary both in time and in space. It has been applied by Ferrazzini et al. [1991] to the study of the tremor and the gas piston events on Kilauea volcano.
The spatial correlation function between signals recorded at two stations is defined by
q3(r,co) = (u(x,y,t) u(x +r cosco,y +r sino, t)), (4) where r and q are the distance and the azimuth, respectively,
of the direction between the stations and angle brackets represent the temporal averaging. in the case of a single mode dispersive plane wave with its propagation direction defined by azimuth O, it can be shown, using the relation between the spectrum in time and the spectrum in space, that the correlation function can be expressed as
•;(r,c•)=• lcl,(co) cos. _or cos(0-(o) aco, (5) 7r Lc(co) 0
where ½(co) is the power spectrum in time, co is the angular frequency and c(co) is the velocity. When the wave is filtered by a narrow-band filter around the frequency coo, the function ½(co) can be expressed as
O(co)= P(coo) 6(co-coo), (6)
where P(c• is the spectral power density and d is the Dirac function; therefore equation (5) becomes
1 P(co0) cos[ coo r cos(O- (P)I ' (7) L(o0 ) Then, a correlation coefficient is defined by
p(r,o,o0) = •(o, •,, coo)
(8)

22,534 MI•TAXIAN ET AL.: PERMANENT TREMOR OF MASAYA VOLCANO
1326
1325
1324 589 590 591 592 593
LONGITUDE (UTM KM)
--.o
F• 0_ W n
s N
-5 1324 13'25 13'26
LATITUDE (UTM KM)
•-.0
T I-- O_ W n
-5 589 5•0 5•1 5•2 593
LONGITUDE (UTM KM)
Figure 4, Hypocenter location of volcano-tectonic earthquakes recorded from April to December ]990. Topographic curves represent 50 m contours.
and
S[ O)0r p(r,½,•o0)=co co•(O-½) =cos[•o0 =(r,½,•o0)], (9) c(co0)
where r(r,tp,co0)= r/c(coo)cos(O-tp) is the tkne delay between the stations.
Equation (9) indicates that coefficient p decreases more rapidly with increasing frequency along the propagation direction ((p = 0) and that, in an ideal case, p should be constant along the wave front ((p = 0 + zr/2). Therefore the graphical representation of the correlation coefficient can give an estimation of the direction of propagation. Next, the azimuthal average of the correlation function is introduced as
•(r): 1 fq•(r,tp)dtp . (10) In the case of single mode scalar plane waves, it follows from (5) that
rcosI • •r Lc(o) 0
Introducing the Bessel function of zero order J0 [see, e.g., Watson, 1966, p.24],
Jo(X) ] •c =- o•[x co$(O-½)]•, (]2)
the azimuthal average of the correlation function can be expressed as
•(r)= ] a•(co) or do (]3) o
For a wave filtered around coo, the azimuthally averaged correlation coefficient, obtained by using (6), (8), and (13), is
•(r,coo)=do c(cøø); . (14) Therefore, in the case of a Rayleigh wave recorded by vertical components and dropping the index of frequency coo, equation (14) gives

MI•TAXIAN ET AL.: PERMANENT TREMOR OF MASAYA VOLCANO 22,535
1328
1327.
1326
1325.
1324.
-a• lO
A 9
300
ß profile mobile station
© profile reference station
300
5
T -array 1 SAN PEDRO ..... 3 a,
CRATER -
.
,,
' --400- __
R array B .....
450 ........ /.•,?, _ ............. , ..... -- •50... '..•, •- - ..... NIND•RI '"'-* 2
ß '" •/'/,..,"",,--'-7::- ___ :•::) -T:%'
,' ?,,, f: ',.;:•i½• 0 / MASAY•,I ............. ,; CRAT .•?::':'" ',. laya lake "•v½•ø?•:::- - "'::-'-•.•a-::•:•?' /" ' ...... '-'•50 ..... ,.,...' ,. .... /' .,../
R array A " ,
-
........ • S ANri;•IXGO
R array C .. .........
589 UTM KM
5•2
Figure 5. Location of the seismograph arrays and direction of wave propagation' T_array 1 and 2 (r=90 m) set up in1992, shaded triangles; R_array A (r=120 m) set up in 1992, shaded triangles; R_array B and C (r=60 m) set up in 1993, shaded triangles; and L_array North (2.5 km) set up in 1993, solid triangles and solid circle (reference station). Azimuths of wave propagation calculated from T_ arrays 1 and 2 and R_arrays B and C: The spread of the shaded beams represents the error on the azimuth. The area of intersection of the back azimuth wave direction from the T and R_arrays indicates the source location of the tremor. The direction of wave propagation at T_array 2 is probably perturbed by a topographic effect caused by Masaya Crater. The source of the tremor is about 400 m below the rim.
pv(,co)= c, (co) where c.•(co) is the phase velocity of the Rayleigh waves. The term pv(r,co) can be obtained by measuring pv(r,½,co) for several stations evenly spaced around a semicircle of radius r with respect to a reference station at the center. Knowing pv(r,co) at different values of the frequency, the phase velocity CR(CO) can be calculated.
In order to deal with polarized waves, spatial correlation functions ½r(r,½) and ½t(r,(p) can be calculated, as in (4), for the radial and tangential components, respectively. The radial and tangential directions are defined here as parallel and perpendicular, respectively to the radii of the semicircle.
Azimuthally averaged correlation coefficients, pr(r,½) and •t(r,(p) can be derived in the same way as for pv(r,tp). In the case of Rayleigh waves, polarized parallel to the propagation direction, Aki [1957] demonstrated that these coefficients can be expressed by
c(co c(co)
•t(r,o)= • ( (or O( CR(CO)) + d2( C R (0) '
(16)
where J2 is the second-order Bessel function. In the case of Love waves with perpendicular polarization, his result is
22,536 M•,TAXIAN ET AL.' PERMANENT TREMOR OF MASAYA VOLCANO
11.03.1993 16:48
, ,
ß
ß
0 5 10 15 20 25 30 TIME (SECONDS)
Figure 6. Examples of signals recorded by the vertical component of the central station of semicircular R_array B.
c(co c(o)
(17)
1øt(r,co)=Jo CL(CO) -J2 CL(CO) , where cœ(co) is the phase velocity of Love waves.
In the general case of a superposition of Rayleigh and Love waves, under the assumption that the contributions of both waves are statistically independent, the correlation coefficients are given by
•/;"eVep Stationj/ J /• ø• ß
Figure 7. Diagram describing the cross-spectrum method. A plane wave front is passing from station i to station j, distant of ro.. 0 and q• are the angles between the wave propagation direi:tion and the noah and between the /j segment and the noah, respectively. The difference of arrival time (or time delay) between stations i and j, in the case of plane waves, is rO '=r O' /c cos(O- (,o/j).
p-•(r,co) = a[Jo(x)- J2 (x)] + (1- a)[Jo(x')+ J2 (x')]
p•(r,co) = a[Jo(x)+ J2(x)] + (1- a)[do(x')- d2(x')], (18)
where x = cor/cR(co) and x'= cor/cL(co) and a represents the proportion of Rayleigh waves in the wave field energy (0<a<l). Measuring coefficients Pv, Pr, and Pt and using relations (15) and (18), one can estimate the phase velocities cR(co) and cœ(co) and the proportion for each type of wave; (15) and (18) give two independent estimations of cR(co).
To solve these equations, we applied a nonlinear inversion method based on least squares adjustment [Tarantola and Valette, 1982]. The equation can be considered as a nonlinear relation of the form d = g(p), where d is the data vector (the correlation coefficients) and p represents the parameter vector (ci(co), CL(co), and a). The least squares problem is solved by using the iterative algorithm
Pk+, =P0 +Cpop o G[ Caodo + Gk Cpopo G•' (19) [do - g(Pa ) + G• (Pa - P0)]
where k is the iteration index, P0 represents the a priori parameter vector, Caoao and Cpopo are the covariance matrix for data and parameters, respectively, Gk is the partial derivative matrix G'/=Rg'/Rp/ and Gk T, its transpose. For example, in the case of equation (15), we have
C•vC?Jøcorlcor ) (20) 4 ' The parameters c R and c L are defined as continuous functions

MI•TAXIAN ET AL.' PERMANENT TREMOR OF MASAYA VOLCANO 22,537
of angular frequency co. The corresponding components of the parameter covariance matrix are given by [Tarantola and Valette, 1982]
{ l(cø-cø') 2} Cpp(O),o)') = 0 -2 exp 2 f/2 ' (21) where 0- is the standard deviation of parameter p and .(2 is a correlation length in the domain of the angular frequencies, which controls the smoothness of the solution. Estimations of
the errors on the parameters are obtained from the a posteriori covariance matrix
Cpp Cpopo Cpopo G T (Cdodo + G Cpopo GT) -1 = - G Cpopo (22)
Tests of the Method
In order to test the method and our program for determining the spatial correlation coefficients and to determine the optimal window widths for the computations, we used a real seismic signal for which we modified the phase to simulate its propagation in a semicircular array. The spectrum of the reference and the propagated signal are the same, the phase difference is cot. Taking a wave velocity c{co) proportionnal to 1/co and fixing the distance r, we can compute the delay r(r,{o, co), which can be used to compare the calculated functions ,o{r,co,½) and •(r, co) with the predicted functions cos[cor(r,{o, co)] and do(Cor/c(co)), according to (9) and (14).
Tests using time windows greater than 65 s show that correlation coefficients are well adjusted to the predicted functions. We computed p(r,co) for a semicircle composed
1.0 , • , I , I , I , I , 1
ß -• 0.5 •_ /' 0
o 0.0
.e -o.5 8
-1.13 • • • •
of seven sites, with one site every 30 ø , which corresponds to the configuration used on Masaya Volcano. Figure 8a shows that the computed azimuthal average fits the Bessel function up to 6 Hz. Beyond this frequency, computed and predicted curves differ, due to a summing effect on the correlation coefficients with a small number of stations. For a semicircle
composed of 13 sites, with one site every 15 ø, the azimuthally averaged correlation coefficient fits well with the Bessel function up to 10 Hz (Figure 8b). The summing effect is smaller in this case.
Study of the Wave Field Attenuation
According to Aki and Richards [1980, p. 298], one can express the attenuation of a wave by
E(r)= Eoexp - 2c(co) Q(co) ' where E(r) is the wave energy corrected for the geometrical spreading, c(co) is the phase velocity and Q(co) is the spatial quality factor. The estimate of this energy for different distances along a radial profile allows one to calculate the quality factor Q for the superficial structure. The geometrical spreading in energy is proportional to 1/r for surface waves and to 1/r 2 for body waves, where r is the distance from the source. The computation of the energy corrected for the geometrical spreading in both cases allows one to determine the type of waves (body or surface waves) that compose the tremor.
Location of the Tremor Source
We computed the coherencies and time delays for several records obtained at the T_ and R_arrays. The total length of the records lies between 2 and 10 min and the moving window is 16 s long. The signal to noise ratio (S/N) is smaller for the recordings made in 1992 than for those made in 1993. Data from R_array A (r=120 m) were not used for calculating locations because the mean coherency was less than 0.5. In the computation of delays for the T_arrays (r=90 m), we fixed the minimal coherency Cmi n to 0.6. For recordings obtained with R_arrays B and C (r=60 m), we fixed Cmi n at 0.8, essentially because of a higher level of seismic activity. We
0 2 4 6 8 10
frequency
1.0 I' ' I , I , I , I , I , / • b) ._• .o_ 0.5 -
O "
•- 0.0-
12 estimated the error in the distance between stations and the error in the azimuths to be 5 m and 5 ø, respectively, in 1992. These large errors are due to rudimentary measurement techniques and to the rough topography. For the experiments performed in 1993 (R_arrays B and C), we estimated these errors to be 2 m and 2 ø, respectively. Directions and velocities of wave propagation obtained, and their mean uncertainties, are given in Table 1.
_ - The result of source location is shown in Figure 5 as • -o.s shaded beams that represent the direction of wave
ø t propagation and their uncertainties. The beams obtained for -1.0 , , , , , T_array 1 and R_arrays B and C intersect and delimit an area 0 2 4 6 8 10 12 of about 70 m along the E-W direction and 150 m along the
frequency N-E direction, beneath the Santiago crater. This zone corresponds to the location of the lava lake, indicating that the
Figure 8. Azimuthally averaged correlation coefficients for source of the permanent tremor is associated with the the vertical component of a real signal propagated by calculation through a semicircular array (dashed lines), degassing activity of a magmatic pocket. The beam issued compared with a zero-order Bessel function (thick lines). The from T_array 2 clearly crosses the southern flank of Santiago array consists of either (a) seven stations or (b) 14 stations; crater. This indicates that the propagation direction of the the radius is 60 m. wave field is perturbed, probably due to Masaya crater which

22,538 MI•TAXIAN ET AL.: PERMANENT TREMOR OF MASAYA VOLCANO
Table 1. Azimuth of Tremor Wave Direction, Velocity, and Respective Uncertainties Calculated at R_ and T_Arrays From Wave Delay Times
Azimuth, C•a, Velocity, C•v, N ø E deg m/s m/s
T_array 1 163 2.4 2390 885 T_array 2 235 2.8 3250 1450 R_array B 191 2.1 960 70 R array C 35 2.6 755 40
is located between the source and the array. The perturbation could be either a topographic effect (the Masaya crater is 100 m deep and its rim is 150 m higher than the array) or a structural effect, although the lack of clear gravity anom•ty in this region suggests that the latter effect is less likely.
The spatial correlation method has also been used to determine the direction of wave propagation through the semicircles. In all instances, we verified that the tremor was stationary during the total duration of the recordings for each of the R_arrays. The time window duration was fixed to 65 s (8192 samples), and the recording duration varied between 300 and 600 s. The amplitude spectrum was then windowed with a boxcar having a bandwidth of 0.5 Hz. For each frequency (l<f<8 Hz), we computed the inverse discrete Fourier transform and the spatial correlation coefficients. This procedure was applied to each pair of recordings, corresponding to a different azimuth and for both horizontal and vertical components.
Figure 9 shows the correlation coefficients for the vertical component of R_arrays B and C as functions of azimuth and frequency. Identical results were derived for the horizontal components. In the case of R_array A, the isovalues of the correlation coefficients have a circular shape, which indicates that the wave field has no dominating direction of propagation. This result is probably due to a weak S/N and to the significant influence of random noise issued from all directions. R_arrays B and C produced isovalue curves that have ellipsoidal shapes. The greater axis of the ellipse is parallel to the wave front. The smaller axis, perpendicular to the preceding, and oriented in the direction in which the correlation coefficient decreases most rapidly, corresponds to the direction of wave propagation. The directions of propagation, obtained for the three components, are N190øE and N35øE for R_arrays B and C, respectively. The intersection of these directions is situated in the east part of the Santiago crater, pointing to the same area indicated by the time delay method.
Wave Field Analysis
Wc based the study of the wave fields composing the tremor using two aspects: (1) their spatial attenuation and (2) their dispersive properties.
Spatial Attenuation of the Tremor
The data wcrc recorded along a profile running north from Santiago crater (Figure 5). Two telemetered stations, one fixed and the other mobile, simultaneously registered data for 10 min in each site. Wc controlled a postcriori that the spectrum and the amplitude of the tremor were stationary during the 4 hours of total recordings. The trcmor's mcan amplitude decreases with distance away from the crater; from
about 5.1 m s -• at the summit to about 0.5 m s -1 at the edifice base (Figure 10). Likewise, the amplitude of the dominant peaks in the spectrum decreases with distance from the crater, the higher-frequency peaks being more strongly attenuated (Figure 11). We computed the energy of the tremor for each site in the range 1-3.5 Hz, normalized it by the energy at the reference station in order to correct the temporal variations, and then divided it by the normalized energy at station 1. The resultant tremor energy strongly decreases with distance for the sites close to the crater (Figure 12). We applied a correction for the geometrical spreading by multiplying the
a)
2 4 [.56
SANTIAGO
590 591
1326
1325
1324
b)
Figure 9. Contour maps of the correlation coefficients p(r,cp, coo) (equation 8) for (a) R_arrays B and (b) R_array C (vertical component), represented in polar coordinates, where the radius is the frequency and the angle is the azimuth. The long axis of the curves is parallel to the wave front. The direction of the wave propagation is orthogonal to this axis which corresponds to arrivals from Santiago crater.

MI•TAXIAN ET AL.' PERMANENT TREMOR OF MASAYA VOLCANO 22,539
i i ! i i i i i i i iii i i i i i
i
1'0 TIME (SECONDS)
5.1 I•s -] (0.42kin)
3.1 I • s-• (0.66 kin)
2.0 I• S -1 (0.95 krn)
1.7 •$-1 (1.15krn)
1.3 I•S -1 (1.53 kin)
1.1 •xs -] (1.84kin)
1.0 I • S -1 (2.06km)
0.8 • S -1 (2.45 kin)
0.7 I•.S-1 (2.83 kin)
0.5 }.15-1 (3.05 km)
Figure 10. Examples of volcanic tremor recorded on the vertical component along the northerly profile (Figure 5). Station 0 was fixed throughout the experiment and stations 1 to 10 were leapfrogged so that 10 min were recorded at the two stations 0 and i simultaneously. Shown are the maximum amplitude and the distance to the crater.
energy either by r (surface waves hypothesis) or by r 2 (body waves); r is the appropriate source-to-station distance obtained assuming that the source is situated under the lava lake, 400 m below the crater rim. The energy curve, with the r correction applied shows a constant decrease along the whole profile. On the other hand, the energy curve corrected by r 2 decreases as a function of distance only between stations close to the crater and increases for r greater than 1.5 km. Similar results were obtained for the vertical, radial, and tangential components. These results suggest that the tremor may be composed of either body or surface waves in the
1
2
3
6
_ _
1 2 3 4 5 6 7 8 FREQUENCY (Hz)
Figure 11. Spectra of the tremor recordings shown on Figure 10.
vicinity of the source but that it is probably composed mainly of surface waves at distances exceeding 1 or 1.5 km from the source. The distance at which surface waves are formed
appears to have the same order of magnitude as the source depth. In conclusion, the origin of the permanent tremor is therefore probably situated at shallow depths (within a few hundreds of meters of the surface).
Using the r-corrected energy, we computed the spatial inverse attenuation factor Q((o) in frequency bandwidths of 1 Hz, centered on two frequencies of 2 and 3 Hz. We assumed velocities of 1100 and 690 km s 'l for the 2 and 3 Hz waves, respectively. The least squares linear adjustment of the energy logarithm as a function of distance gives Q= 14 + 5 at 2 Hz and Q= 31 + 9 at 3 Hz. These values of Q represent the attenuation factor for the shallow volcanic layers.
Dispersive Properties of the Wave Field Composing the Tremor
The phase velocities of the Rayleigh and Love waves composing the tremor were determined by applying the spatial correlation method. The azimuthally averaged correlation coefficients computed for the three R_arrays are shown in Figure 13. The first zero crossing occurs at a lower frequency for R_array A than for R_arrays B and C as the zero crossing frequency is inversely proportional to the semicircle radius. R_array A was r=120 m radius and R_arrays B and C were r=60 m. To perform the inversion of the correlation coefficients (see equation (19)), we adopted a priori model dispersion curves in the form c(J)=•-I•, where f is the frequency [Bendat and Piersol, 1986; Ferrazzini et al., 1991 ]. Several tests were performed choosing different values for • and 13 in the ranges of 500 to 3000 and 0.5 to 2. Uncertainties

22,540 M•TAXIAN ET AL.: PERMANENT TREMOR OF MASAYA VOLCANO
1
ol o
Station #1 !,,\ . . no correction I • . r correction I
DI$TAN•E
Figure 12. Normalized energy of tremor for the vertical component as function of distance from the source shown with no correction of the geometrical dispersion, for either r correction (surface waves) or r 2 correction (body waves).
in the correlation coefficients have been fixed between 0.25 and 0.5 and for the velocities between 200 and 100 m s 'l, depending on the type of waves. The correlation length • which operates on the covariance matrix parameters (equation (21)) and which determines the degree of smoothing was fixed at 4 or 8 Hz, depending on the shape of the correlation coefficient curves. The variance of the Rayleigh wave proportion was fixed at 0.5. Figure 14 shows the velocity
•- 1.0 z
o
"0.5
o o z 0.0 o
'
o o-1.0
0 1 2
R_array A
3 4 5 6 FREQUENCY
1.0
r-'
.-• 0.5 .o_
o
o _
• -0.5 oo
-1.0
\
\/
R_array B
0 1 2 3 4 5 6 7 8 FREQUENCY
1.0
0.5
-0.5
-1.0
R_array C
0 i ½, ,i 3 8 FREQUENCY
vertical component
radial component
...... azimuthal component
Figure 13. Azimuthally averaged correlation coefficients as function of frequency for the vertical and horizontal components for the R_arrays A, B, and C.
curves as well as the observed and the theoretical azimuthally averaged correlation coefficients obtained after inversion for R_array B. The phase velocity curves for Rayleigh waves obtained either with the vertical or the horizontal components are similar. The phase velocities for Rayleigh and Love waves are found to be 1100 and 730 m s 'l at 2 Hz and 330 m s 'l at 6 Hz. For R_array C, these velocities are found to be 930 and 1240 m s 'l at 2 Hz and 440 and 550 m s '• at 6 Hz (Figure 15). For R_array A, these values are 930 m s -• (Rayleigh) and 740 m.s '• (Love) at 2 Hz and 360 m s '• at 6 Hz respectively. In the case of R_arrays A and B, the velocity of Rayleigh waves is greater than that of Love waves, while it is the contrary for R array C. It is notable that the proportion of Rayleigh to Love waves is almost the same for all cases (45-51%). This indicates that the two modes of polarization coexist in the wave field composing the tremor, in similar proportions.
To estimate a structural velocity model from the dispersion curves, we used a surface wave inversion program [Herrmann, 1987] and tried to find a solution with a minimal number of layers in all cases. Proceeding first by trial and error to determine an initial model, we then applied an inversion to improve the model. Figure 15 shows the results obtained for the three R_arrays. In case C, we could not simultaneously fit Rayleigh and Love curves; thus we chose to fit only Rayleigh wave curves which seem to be better constrained, since Rayleigh velocities are defined in both the vertical and horizontal components. Structural models obtained for all R_arrays are very similar. These results led to an averaged model, defining the structure of the central crater zone which is composed of three main layers overlying a half- space (Table 2).
The method used to determine the structural model
contains several limitations. The results of the inversion are
not unique, and the plane structural models do not take into account lateral heterogeneities. The presence of such heterogeneities near the array could possibly introduce local perturbations in the wave field and may explain the difficulties encountered in fitting the dispersion curves for R_array C. We also assumed that the computed dispersion curves correspond to the fundamental mode of surface waves. Aki [1957] showed that in order to fit N modes and to determine the phase velocity for Rayleigh and Love waves for N different harmonics, it is necessary to measure the spatial correlation for 2N-1 semicircles with different radii. In our
case, we assumed that a fundamental mode dominates the surface waves.

MI•TAXIAN ET AL.' PERMANENT TREMOR OF MASAYA VOLCANO 22,541
• 1.0 o
"0.5 o o z 0.0 o
• -0.5
o -1,0 o
%
%
Vertical (Z)
z 1.0
"0.5 o o z 0.0 o
5 -0.5
o -1.0 o
Radial (L)
z 1.0 o
"0.5 o o z 0.0 o
:5 -0.5
o -1.0 o
Transverse (T)
2OO0
__ 1500 o o
> 1000
500
Rayleigh waves (vertical) .Rayleigh waves (horizonhal)
,\ ....... LOVe waves
'•, R_array B \ Rayleigh waves proportion=0.51 +/- 0.01
0 1 2 3 4 5 6 7 8 FREQUENCY
Figure 14. Fit of theoretical azimuthally averaged correlation coefficients with the observed correlation coefficients for the vertical and horizontal components of R_array B. Calculated dispersion curves for the fundamental mode of Rayleigh and Love waves.
Discussion and Conclusions
The study of the seismicity of Masaya Volcano reveals a source of low-level volcano-tectonic activity, located at a shallow depth in the eastern part of Santiago crater. This volcano has an open magmatic system thath can be essentially characterized by continous degassing and permanent tremor. Localization of the tremor source is difficult to perform using conventional seismological methods because of the emergent onset of these signals. We attempted to resolve this problem by using two methods based on the use of small-aperture arrays of tripartite or semicircular form. The recordings were performed with only two or three stations operating simultaneously. These procedures, which we term "seismic goniometry," can be used to locate the source of tremor and long-period events by using the intersection of the wave
propagation direction determined from several sites. The phase of the cross spectrum between seismic tremor recording sections gives the wave delay times between two stations of the array, thus allowing the calculation of propagation directions with a good precision. In the case of Masaya, the precision for the source location is within 100 m, which is as good as classical hypocenter locations performed with arrival times. The precision could be improved by determining more accurately the array geometry and by using signals with better coherency. On the other hand, this precision can be degraded by structural or topographic effects which can distort the wave field, as observed in T_array 2.
The second procedure, based on a spatial correlation method [,4ki, 1957], gives identical results for source location but is a more difficult method to implement in the field. Seismic goniometry could be usefully applied in monitoring

22,542 M•TAXIAN ET AL.' PERMANENT TREMOR OF MASAYA VOLCANO
I
o
i I i i
(•) H.L•O
i,,, -
I
I
I
I
! _ ii
i i i
I
i
i

MI•TAXIAN ET AL.' PERMANENT TREMOR OF MASAYA VOLCANO 22,543
Table 2. Averaged Model for the Structure of the Central Crater Zone, Obtained From the Inversion of the Rayleigh and Love Dispersion curves
Vs, Vp, Thickness, Depth, Inferred Composition km/s km/s m m
0.45-0.6 1.0
0.90-1.2 2.0
1.60-2.0 3.5 2.70-4.0 4.8-5.8
50-70 50-70 poorly consolidated pyroclastic material
130-180 180-250 postcaldera composite cones
510-570 690-790 caldera structure
An interpretation of the composition of each layer is also proposed.
volcanoes, even if the source depth cannot be determined by these methods. Our study of the spatial attenuation of the tremor shows that the behavior of the wave field is consistent
with surface waves for distances from the source greater than 1 or 1.5 km. This short distance suggests that the source is superficial. These two complementary results verify that the source of tremor is directly associated with the activity of the lava lake situated 400 m beneath Santiago's NE crater rim. The permanent tremor of Masaya Volcano is then probably generated by the continous degassing in the lava lake or in very shallow resident magma bodies. However, some volume of magma is apparently retained in the upper pan of the volcano even when no lava lake is visible, since the tremor remains persistent, but with a reduced amplitude. The level of the lava lake in Santiago crater varies with time; the level has dropped by 200 m during the past 20 years.
The spectral content of the tremor may depend on the dimensions of the resonant system, or on the size of the filled magma column and on the physical features of the fluid (density, viscosity, size and amount of gas bubbles, etc.). The spectral features of the tremor can therefore be used to detect modifications in the internal dynamics associated with renewed magma ascent. Microgravimetric and deformation studies have been carried out since 1992 in the summit pan of Santiago crater. The data gathered may detect possible mass or density modifications in the superficial structure, which could also indicate a renewed magma intrusion (Bonvalot et al., 1995).
The second part of this study led to identifying the dispersive properties of the tremor and its wave type composition. The phase velocity of the Rayleigh and Love waves that compose the tremor were determined. According to the results of the different arrays, these velocities vary between 730 and 12'40 m s 'l at 2 Hz and between 330 and 550 m s 'l at 6 Hz for Love waves and between 930 and 1100 m s 'l at 2 Hz and between 330 and 440 m s 'l at 6 Hz for Rayleigh waves. Ferrazzini et al. [1991] obtained phase velocities in the same order of magnitude for the Puu Oo tremor as those of the Masaya Volcano. These velocities range from 730 and 1000 m s '• at 2 Hz to 500 and 450 m.s '• at 5 Hz, for Love and Rayleigh waves, respectively. The frequency dependence appears to be similar for these two volcanoes. The relative proportion of each type of wave, estimated to be 50% for Masaya is also the same for Puu Oo. Gordeev et al. [1990] measured the phase velocity of tremor recorded at Klyuchevskoy Volcano, Kamchatka. They found the phase velocities for the vertical and radial components to vary between 750 m s 'l at 2 Hz and 675 m s 'l at 5 Hz for
Rayleigh waves. The phase velocity for the transverse component is higher and vary between 850 m s '• at 2 Hz and 750 m s -• at 5 Hz for Love waves. These results are comparable to those found at Masaya and Puu Oo, even if the frequency dependence is less significant in this case. Del Pezzo et al. [1993] calculated an apparent velocity.of200 m s- • in the frequency band 1-2 Hz for tremor registered at Etna Volcano. All these volcanoes are basaltic and their tremor is
related to degassing of a shallow magma source. It will be interesting to compare these observations with results obtained on andesitic volcanoes.
The superficial volcanic structure, composed of a sequence of recent tephra and lava flow layers, is a very heterogeneous structure with poorly consolidated materials which can explain the low values of Q which we obtained. These values concur also with those obtained on several other volcanoes.
For example, McNutt [1986] estimated a Q of 45 + 20 for Rayleigh waves at Pavlof Volcano (Alaska). Similarly, Del Pezzo et al. [1989] and Hurst and Sherburn [1993] found a Q of 17 on Etna, Italy, and on Ruapehu, New Zealand, respectively.
From the dispersion curves, we determined a structural model for each R_array. One of the significant products of this modeling procedure is the similar result from the various R_arrays. This similarity implies that the superficial structures are probably identical both in the northern and southern portions of the volcano. The resulting models are characterized by one or two low-velocity layers with a thickness of 50 to 70 m, which probably corresponds to a thin upper layer of unconsolidated and heterogeneous materials composed of recent pyroclastic deposits and lava flows. We also identified an underlying layer with a thickness 130 to 180 m and velocities of Vs = 0.9 - 1.2 km S '1 and Vp = 2 km s 'l. This layer may correspond to the present cone structure, which grew after caldera formation. Finally, we identified a layer of about 550 m thick and with velocities of Vs - 1.6 - 2 km s 'l and Vp = 3.5 km s '•. This deepest layer can be assigned to the older volcanic materials, probably the pyroclastic materials issued during the caldera's formation.
Acknowledgments. We thank the entire staff of the geophysical department of Ineter (Instituto Nicaraguense de Estudios Teritoriales) and especially Fabio Segura, Wilfried Strauch, Pedro P6rez and Oscar P6rez for their logistical support during the field work. Alain Creusot-Eon operated the seismic network used for hypocenter locations. We also thank the geophysical department of UNAN (Universidad Nacional Autonoma de Nicaragua) and especially Salvador Guadamuz who participated on the data analysis. We are grateful to Va16rie Ferrazzini and Bernard Valette for many stimulating discussion and to Louis Pastor for his friendly and constant support. We thank P. Mothes and M. Ramos for carrefully reading the english version of this paper. We are also grateful to P. Wessel and W. H. F. Smith for GMT software. This work was
supported by the "Programme R6gional pour la Pr6vention du Risque Volcanique en Am6rique Centrale" and the "Comit6 de Coop6ration Scientifique et Technique France-Nicaragua" both granted by the "Minist•re des Affaires Etrang•res". Suggestions by Eduard Berg, Ray R. Dibble and George H. Sutton substantially improved the manuscript.
References
Aki, K., Space and time spectra of stationary stochastic waves, with special reference to microtremors, Bull. Earthquake. Res. Inst. Univ. Tokyo, 35, 415-457, 1957.
22,544 MI•TAXIAN ET AL.: PERMANENT TREMOR OF MASAYA VOLCANO
Aki, K., and R. Koyanagi, Deep volcanic tremor and magma ascent mechanism under Kilauea, Hawaii, or. Geophys. Res., 86, 7095- 7109, 1981.
Aki, K., and P. G. Richards, Quantitative Seisinology, W. H. Freeman, New York, 1980.
Aki, K., M. Felher, and D. Shamita, Source mechanism of volcanic tremor: Fluid-driven crack models and their application to the 1963 Kilauea eruption, or. Volcanol. Geotherm. Res., 2, 259-287, 1977.
Bendat, J. S., and A. G. Piersol, Random data, Analysis and Measurement Procedures, John Wiley, New York, 1986.
Bice, D. C., Quaternary volcanic stratigraphy of Managua, Nicaragua: Correlation and source assignment for multiple overlapping Plinian deposits, Geol. Soc. Am. Bull., 96, 553-566, 1985.
Bonvalot, S., J.P. M6taxian, G. Gabalda, and O. P6rez, Gravity and GPS studies at Masaya Volcano (Nicaragua): Structural modelling and monitoring volcanic activity, paper presented at IUGG XIX meeting, Boulder, Colorado, 1995.
Carr, M. J., Symetrical and segmented variation of physical and geothermical characteristics of the Central American volcanic front, or. Volcanol. Geotherm. Res., 20, 231-252, 1984.
Chouet, B., Ground motion in the near field of a fluid-driven crack and its interpretation in the study of shallow volcanic tremor, or. Geophys. Res., 86, 5985-6016, 1981.
Chouet, B., Excitation of a buried magmatic pipe: A seismic source model for volcanic tremor, or. Geophys. Res., 90, 1881-1893, 1985.
Chouet, B., Resonance of a fluid-driven crack: Radiation properties and implications for the source of long-period events and harmonic tremor, J. Geophys. Res., 93, 4373-4400, 1988.
Chouet, B., A seismic model for the source of long-period events and harmonic tremor, in Volcanic Seismology, IAVCEI Proc. Volcanol., vol. 3, edited by P. Gasparini, R. Scarpa and K. Aki, pp 133-156, Springer-Verlag, New York, 1992.
Connor, C. B., and S. N. Williams, Interpretation of gravity anomalies, Masaya caldera complex, Nicaragua, paper presented at the 12 th Caribbean Conference, St. Croix, Virgin Islands, 1989.
Crosson, R. S., and D. A. Bame, A spherical source model for low frequency volcanic earthquakes, J. Geophys. Res., 90, 10,237- 10,247, 1985.
Del Pezzo, E., E. Lombardo, and G. Spampinato, Attenuation of volcanic tremor at Mt Etna, Sicily, Bull. Seismol. Soc. Am., 79, 1989-1994, 1989.
Del Pezzo, E., S. Martino, S. Cresta, M. Martini, G. Milana, D. Patan6, and C. Sabbarese, Velocity and spectral characteristics of the volcanic tremor at Etna deduced by a small seismometer array, J. Volcanol. Geotherm. Res., 56, 369-378, 1993.
Ereditato, D., and G. Luongo, Volcanic tremor wave field during quiescent and eruptive activity at Mt. Etna (Sicily), J. Volcanol. Geotherm. Res., 61,239-251, 1994.
Felher, M. C., Observation of volcanic tremor at Mount St. Helens volcano, J. Geophys. Res., 88, 3476-3484, 1983.
Ferrazzini, V., and K. Aki, Preliminary results from a field experiment on volcanic events at Kilauea using an array of digital seismographs, in Volcanic Seismology, IAVCEI Proc. Volcanol., vol. 3, edited by P. Gasparini, R. Scarpa, and K. Aki, pp 168-189, Springer-Verlag, New York, 1992.
Ferrazzini, V., K. Aki, and B. Chouet, Characteristics of seismic waves composing Hawaian volcanic tremor and gas-piston events observed by a near-source array, or. Geophys. Res., 96, 6199- 6209, 1991.
Fr6chet, J., Sismog6n•se et doublets sismiques, th6se d'6tat, 207 pp., Univ. de Sci. et Technol. et de M6dec., Grenoble, France, 1985.
Goldstein, P., and B. Chouet, Array measurements and modeling of sources of shallow volcanic tremor at Kilauea Volcano, Hawaii, o r. Geophys. Res., 99, 2637-2652, 1994.
Gordeev, E. I., Modelling of volcanic tremor wave fields, or. Volcanol. Geotherm. Res., 51, 145-160, 1992.
Gordeev, E. I., Y. Y. Melnikov, V. I. Sinitsyn, and V. N. Chebrov, Volcanic tremor of Kliuchevskoi Volcano (1984 eruption), in Volcanic Hazards IA VCEI Proc. Volcanol., vol. 1, edited by J. H. Latter, pp. 486-503, Springer-Verlag, New York, 1989.
Gordeev, E. I., V. A. Saltykov, V. I. Sinitsyn, and V. N. Chebrov, Temporal and spatial characteristics of volcanic tremor wave fields, or. Volcanol. Geotherm. Res., 40, 89-101, 1990.
Got, J.L., J. Fr6chet and F.W.Klein, Deep fault plane geometry inferred from multiplet relative relocation beneath the south flank of Kilauea, or. Geophys. Res., 99, 15,375-15,386, 1994.
Herrmann, R. B., Surfave wave inversion program, St. Louis Univ., St. Louis, Mo., 1987.
Hurst, A. W., and S. Sherburn, Volcanic tremor at Ruapehu: Characteristics and implications for the resonant source, N.Z.d. Geol. Geophys., 36, 475-485, 1993.
Julian, B. R., Volcanic tremor: Nonlinear excitation by fluid flow, d. Geophys. Res., 99, 11,859-11,877, 1994.
Kieffer, G., and A. Creusot-Eon, La caldeira de Masaya [Nicaragua]: Une d6pression polyphas6e de type "maar", C.R. Acad. Sci., II, 315, 1403-1409, 1992.
Koyanagi, R. Y., B. Chouet, and K. Aki, Origin of volcanic tremor in Hawa'/, I, Compilation of seismic data from the Hawaiian Volcano Observatory, 1972 to 1985, U.S. Geol. Surv. Prof Pap., 1350, 1221-1258, 1987.
Malone, S. D., Volcanic earthquakes: Examples from Mt. St. Helens, report, Geophys. Program, Univ. of Wash., Seattle, 1983.
McNutt, R.S., Observations and analysis of B-type earthquakes, explosions, and volcanic tremor at Pavlof volcano, Alaska., Bull. Seismol. Soc. Am., 76, 153-175, 1986.
M6taxian, J.P., Etude sismologique et gravim6trique d'un volcan actif: Dynamisme interne et structure de la Caldeira Masaya, Nicaragua, thesis, 315 pp., Univ. de Savoie, Le Bourget-du Lac, France, 1994.
Mori, J., H. Patia, C. McKee, I. Itikarai, P. Lowenstein, P. De Saint Ours, and B. Talai, Seismicity associated with eruptive activity at Langila Volcano, Papua New Guinea, or. Volcanol. Geotherm. Res., 38, 243-255, 1989.
Omer, G. C., Volcanic tremor, Bull. Seismol. Soc. Am., 40, 175-194, 1950.
Poupinet, G., W.L. Ellsworth, and J. Fr6chet, Monitoring velocity variations in the crust using earthquake doublets: An application to the Calaveras fault, California, or. Geophys. Res., 89, 5719- 5731, 1984.
Poupinet, G., J. Fr6chet, W.L. Ellsworth, M.J. Fr6mont and F. Glaugeaud, Doublet analysis: improved accuracy for earthquake prediction studies, Earthquake Predict. Res., 1, 81-93, 1985.
Power, J. A., J. C. Lahr, R. A. Page, B. A. Chouet, C. D. Stephens, D. H. Harlow, T. L. Murray, and J. D. Davies, Seismic evolution of the 1989-1990 eruption sequence of Redoubt volcano, Alaska, or. Volcanol. Geotherm. Res., 62, 69-94, 1994.
Riuscetti, M., R. Schick, and D. Seidl, Spectral parameters of volcanic tremors at Etna, d. Volcanol. Geotherm. Res., 2, 289- 298, 1977.
Sassa, K., Volcanic micro-tremors and eruption earthquakes, Mere. Coil. Sci. Univ. Kyoto, Ser. A, 18, 255-293, 1935.
Schick, R., G. Lombardo, and G. Patane, Volcanic tremors and shocks associated with the eruptions at Etna (Sicily), September 1980, or. Volcanol. Geotherm. Res., 14, 261-279, 1982.
Seidl, D., R. Schick, and M. Riuscetti. Volcanic tremor at Etna: A model for hydraulic origin, Bull. Volcanol., 44, 43-56, 1981.
Sirnkin, T., L. 8iebert, L. McClelland, D. Bridge, C. Newhall and J. H. Latter, Volcanoes of the WorM, 232 pp., Van Nostrand Reinhold, New York, 1977.
Smithsonian Institution, SEAN bull., 18(2), 7, 1989. Smithsonian Institution, Bull. Global Volcan. Network, 18(6), 4,
1993.
Stoiber, R.E., and M.J. Carr, Quaternary volcanic and tectonic segmentation of Central America, Bull. Volcanol., 37, 304-324, 1973.
Stoiber, R.E., S. N. Williams, and B. J. Huebert, Sulfur and halogen gases at Masaya Caldera complex, Nicaragua: Total flux and variations with time, or. Geophys. Res., 9_•/, 12,215-12,231, 1986.
Tarantola, A., and B. Valette, Generalized nonlinear inverse problems solved using the least squares criterion, Rev. Geophys., 20, 219-232, 1982.
Van Wyk de Vries, B., 1i. Rymer, G. Brown, P. Hradecky, and H. Talcmo, Global volcanism network report, Bull. Global. Volcanol. Network, 13(1), 9-12, 1988.
Walker, J.A., S.N. Williams, R.I. Kalamarides, and M.D. Feigenson, Shallow open-system evolution of basaltic magma beneath a subduction zone volcano: The Masaya Caldera Complex, Nicaragua, o r. Volcanol. Geotherm. Res., 56, 379-400, 1993.

MI•TAXIAN ET AL.: PERMANENT TREMOR OF MASAYA VOLCANO 22,545
Watson G.N., A Treatise on the Theory of Bessel Functions, Cambridge Univ. Press, New York, 1966.
Williams, S. N., Geology and eruptive mechanisms of Masaya Caldera complex, Nicaragua, thesis, 160 pp., Dartmouth Coll., Hanover, N.H., 1983.
J. Dorel, Observatoire de Physique du Globe de Clemaont-Ferrand (OPGC), 12 av. des Landais, 63000 Clermont-Ferrand, France.(e- mail: dorel•opgc.univ-bpclermont.fr)
P. Lesage, Laboratoire d'Instrumentation G6ophysique, Universit6 de Savoie, 73376 Le Bourget-du-Lac, France. (e-mail: lesage•univ- savoie.fr)
J.-P. M6taxian, ORSTOM, San Ignacio 805 y Humboldt, apartado 17.11.6596, Quito, Ecuador. (e-mail: metaxian•igl 31 .epn.edu.ec)
(Received March 26, 1996; revised November 8, 1996; accepted January 13, 1997.)