PSYCHIC FALLOUT FROM BREACH OF CONFIDENTIALITY A PATIENT/ANALYST'S PERSPECTIVE

RESEARCH ARTICLE
GPR investigation of tephra fallout, Cerro Negro volcano,Nicaragua: a method for constraining parametersused in tephra sedimentation models
L. M. Courtland & S. E. Kruse & C. B. Connor &
L. J. Connor & I. P. Savov & K. T. Martin
Received: 23 April 2011 /Accepted: 26 March 2012 /Published online: 27 April 2012# Springer-Verlag 2012
Abstract Most tephra fallout models rely on the advection–diffusion equation to forecast sedimentation and hence vol-canic hazards. Here, we test the application of the advec-tion–diffusion equation to tephra sedimentation using datacollected on the proximal (350 to ~1,200 m from the vent) tomedial (greater than ~1,200 m from the vent) tephra blanketof a basaltic cinder cone, Cerro Negro volcano, located inNicaragua. Our understanding of tephra depositional pro-cesses at this volcano is significantly improved by combi-nation of sample pit data in the medial zone and high-resolution ground-penetrating radar (GPR) data collectedin the near vent and proximal zones. If the advection–diffu-sion equation applies, then the thickness of individual tephradeposits should have Gaussian crosswind profiles and ex-ponential decay with distance away from the vent. At CerroNegro, steady trade winds coupled with brief eruptions ofrelatively low energy (VEI 2–3) create relatively simpledeposits. GPR data were collected along three crosswindprofiles at distances of 700–1,600 m from the vent; samplepits were used to estimate thickness of the 1992 tephradeposit up to 13 km from the vent. Horizons identified inproximal GPR profiles exhibit Gaussian distributions with ahigh degree of statistical confidence, with diffusion coeffi-cients of ~500 m2 s−1 estimated for the deposits, confirmingthat the advection–diffusion equation is capable of modeling
sedimentation in the proximal zone. The thinning trenddownwind of the vent decreases exponentially from thecone base (350 m) to ~1,200 m from the vent. Beyond thisdistance, deposit overthickening occurs, identified in bothGPR and sample pit datasets. The combined data revealthree depositional regimes: (1) a near-vent region on thecone itself, where fallout remobilizes in granular flows upondeposition; (2) a proximal zone in which particles fall from aheight of less than ~2 km; and (3) a medial zone, in whichparticles fall from ~4 to 7 km and the deposit is thicker thanexpected based on thinning trends observed in the proximalzone of the deposit. This overthickening of the tephra blan-ket, defining the transition from proximal to medial deposi-tional facies, is indicative of transition from sedimentationdominated by fallout from plume margins to that dominatedby fallout from the buoyant eruption cloud—a feature ofdeposits previously identified in larger-volume eruptions.We interpret this change to represent a change in diffusionlaw, occurring at total particle fall times (the fall timethreshold of numerical models) of ~400 s. Thus, the detailedGPR profiles and pit data collected at Cerro Negro help tovalidate current numerical models of tephra sedimentation.
Keywords Tephra . Ground-penetrating radar . CerroNegro . Volcanic plume . Numerical model . Near-ventsedimentation
Introduction
Tephra fallout is one of the main hazards from volcaniceruptions and tremendous effort by researchers worldwidehas gone into characterizing tephra deposits in the geologicrecord and into the modeling of tephra dispersion in theatmosphere. During the last decades, a number of models
Editorial responsibility: J. Phillips
L. M. Courtland (*) : S. E. Kruse : C. B. Connor : L. J. Connor :K. T. MartinDepartment of Geology, University of South Florida,Tampa, FL, USAe-mail: [email protected]
I. P. SavovSchool of Earth and Environment, University of Leeds,Leeds, UK
Bull Volcanol (2012) 74:1409–1424DOI 10.1007/s00445-012-0603-3

have been developed that relate eruption parameters (e.g.,total eruption mass and column height) to deposit features(thickness and mass loading, and particle size distribution;e.g., Suzuki 1983; Carey and Sparks 1986; Armienti et al.1988; Macedonio et al. 1988; Glaze and Self 1991; Hurstand Turner 1999; Connor et al. 2001, 2006; Bonadonna andHoughton 2005; Bonadonna et al. 2005a, b; Pfeiffer et al.2005; Connor and Connor 2006; Barsotti et al. 2008; Scolloet al. 2008a, b). Models are most often tested by comparisonof actual deposits and model results at medial distances (~5–25 km) from the volcano, where risk to human populationsis generally greater and where deposits are often wellmapped compared with distal areas. However, these modelsdo not reproduce accurately tephra deposits in the fewproximal areas that have been well studied (e.g., Ernst etal. 1996; Houghton et al. 2004; Bonadonna et al. 2005a, b;Mannen and Ito 2007). Difficulty in modeling proximaldeposition arises due to the fact that only rare eruptionsleave accessible proximal deposits (Houghton et al. 2004).Most are buried by the eruption itself or by subsequent massflows, making comparison of sedimentation models withactual deposits problematic.
Pyle (1989) and others (e.g. Sparks et al. 1991, 1992;Fierstein and Nathenson 1992; Bonadonna et al. 1998) notethat proximal deposits often exhibit a break in slope near thetransition from fallout dominated by sedimentation fromcolumn margins to fallout dominated by sedimentation fromthe buoyant plume. Houghton et al. (2004) found that thedeposits of the 1912 Plinian eruption of Novarupta, Alaskawere characterized by concurrent sedimentation from mul-tiple eruptive regimes (e.g., sedimentation from a risingcolumn, fire fountaining, and sedimentation from a buoyantplume). Clearly, near-vent deposits are often complex be-cause of the complexity of near-vent processes such as firefountaining, lateral transport in turbulent eddies, ballistic
jets, mass flows due to rapid accumulation, and sedimenta-tion from plume margins (Bursik et al. 1992; Ernst et al.1996; Riedel et al. 2003; Houghton et al. 2004; Sable et al.2006; Mannen and Ito 2007). These processes may provedifficult to model numerically. Some of the disparity betweentephra deposit observations and models may also arise fromoversimplification of the transient nature of volcanic plumesin some tephra dispersion models
In order for tephra sedimentation models to progress, it isimportant to acquire data to clarify features of vent, proxi-mal and medial tephra facies. We document here the prox-imal to medial tephra blanket transition on a small basalticcinder cone, Cerro Negro volcano, Nicaragua (Fig. 1). Thedistal tephra blanket is not considered in the present study. Aset of ground-penetrating radar (GPR) surveys on the prox-imal tephra blanket are compared with medial observationsfrom sample pits for Cerro Negro’s 1992 eruption deposits(Martin 2004) and with best-fitting advection–diffusionmodels (Connor and Connor 2006). As expected, modelsthat fit the 1992 medial deposit underpredict proximal de-posit thicknesses. From the data, we can clearly define aproximal-to-medial transition for the 1992 deposits, down-wind from the vent. Additionally, this transition is identifiedfor multiple packages within the pre-1992 deposits as well.
The GPR surveys described here were run on the tephrablanket between 350 and 1,600 m downwind of the vent.These profiles begin in the proximal zone immediatelydownwind of the topographic slope break that marks thebase of the cone (Fig. 2) and extend into the medial zoneuntil the onset of substantial vegetation. On the cone itself,slopes are at the angle of repose, ~32°. We find that thedepositional pattern in the proximal zone is distinct fromthat on the cone itself, as well as from the medial portions ofthe blanket (here taken to include sample pits located 2–13 km from the vent). On the cone, for example, deposition
2 0
2 0
2 0
2 0
4 0
4 0
6 0
1 0 0 1 4 0
80
Cerro Negro
Caribbean Sea
Pacific Ocean
Cerro Negro
León
100 km
01 1km
1385000
1380000
520000 525000 530000
Profile in Figure 10
GPR linesPit
1992 tephra isopach (cm)
Pit/GPR comparison
Fig. 1 Location map of studyarea. Large triangleapproximate location of centerof active vent. Black circleslocations of sample pits inwhich thickness and density of1992 eruption deposits weremapped by Martin (2004).Isopach map is based on thesample pit data. Circles withcrosses sites where 200 MHzGPR profiles and CMPs wereacquired to correlate GPRprofiles with basal 1992contacts. Thick black lineslocations of GPR profiles
1410 Bull Volcanol (2012) 74:1409–1424
is governed by fallout from column margins, ballistic trans-port, and granular flow down the cone slopes. In the proximalzone, ballistics are rare and granular flow does not occur.From the GPR profiles, we establish the geometry of severaldepositional sequences. Interestingly, all the proximal sequen-ces (1992 eruption deposits and older) are themselves consis-tent with an advection–diffusion pattern: crosswind, they areGaussian in form and along the axis of dispersion they thinexponentially to about 1,200 m downwind of the vent.Beyond ~1,200 m downwind, the rate of blanket thinningdecreases relative to the proximal exponential (the blanketpackages are thicker than the best-fit proximal exponential).This change in thinning trend at ~1,200 to 1,400 m is believedto indicate where sedimentation from plume margins is super-seded by sedimentation from the buoyant eruption column.Thus, as presented in the following, our understanding ofproximal sedimentation can be improved through the use ofGPR and the interpretation of GPR results in the context oftephra sedimentation models.
Cerro Negro
We choose Cerro Negro for investigation of proximal sedi-mentation because this cinder cone has a well-documentedhistory of recent eruptions that are surprisingly consistent incharacter. Cerro Negro is a small basaltic cinder cone withinthe Central American volcanic arc that formed in 1850 andhas erupted 24 times since. Eruptions typically last hours todays and are characterized by weak to strong plumes thatreach 4–7 km above the vent (Hill et al. 1998; Connor et al.2001). Tephra falls from numerous Cerro Negro eruptionshave impacted local residents and the population center in
León, Nicaragua, ~20 km west−southwest of the vent. Themost voluminous of the eruptions (on the order of 107 m3)occurred in 1923, 1947, 1968, 1971, and 1992. Smallereruptions took place more recently in 1995 and 1999 (vol-umes 2.6×10⁶ and 0.8×10⁶ m3, respectively; LaFeminaet al. 2004; Diez et al. 2005).
As one example of this eruptive activity, Cerro Negroerupted in 1992 after 21 years of quiescence. The ~7 kmeruption column was observed by staff of the InstitutoNicaragüense de Estudio Territoriales. The activity was accom-panied by dramatic widening of the vent with the crater in-creasing from approximately 100 m to 370 m in diameter(Connor et al. 1993). The 1992 eruption consisted of twophases. The initial phase, lasting approximately 7 h, was char-acterized by an energetic plume reaching approximately 7 kminto the atmosphere. The second phase, lasting approximately17 h, was characterized by a weak, bent over plume with acolumn height varying from 1 to 4 km (Connor et al. 2001).
Martin (2004) dug 93 pits in the proximal and medialfacies of the 1992 deposits, between 1 and 13 km from thevent (Fig. 1). At each sample pit, she measured tephrathickness, deposit density, particle density, and particle sizedown to 63 μm. Connor and Connor (2006) used the Tephracode to invert the fallout accumulation data of Martin (2004)for eruption parameters using a downhill simplex algorithm.Figure 3a shows a best-fit isomass map from the Tephracode. Based on these best-fit results, Connor and Connor(2006) estimate the column height to be 6.5±0.7 km, ingood agreement with the observed maximum column heightof 7 km. Nevertheless, Fig. 3b shows that parts of thedeposit are not particularly well-fit by the model; in partic-ular, the model underpredicts the sparse pit data closest tothe vent where accumulation values are highest. Thus, while
Fig. 2 Black lines locations ofGPR profiles relative to vent.Topography data werecompiled from DGPS data fromCB Connor and PC LaFemina,DEM data acquired during thecourse of the surveys describedhere, and the 90 m SRTM(CGIAR-CSI 2004)
Bull Volcanol (2012) 74:1409–1424 1411

clearly capturing the sedimentation regime(s) responsiblefor emplacing medial deposits, the few proximal pit datasuggest that regime(s) responsible for tephra accumulationin the proximal region were not accounted for by thismodel.
Tephra dispersion models
Tephra dispersion models based on the advection–diffusionequation predict the amount of mass accumulation at geo-graphic locations, like the area about Cerro Negro, based ona set of eruption parameters (Suzuki 1983; Armienti et al.
1988; Connor et al. 2001; Costa et al. 2006; Scollo et al.2008a). The numerical simulation of tephra accumulationcan be expressed by a simplified mass-conservation equa-tion of the type (Suzuki 1983):
@Cj
@tþ wx
@Cj
@xþ wy
@Cj
@y� vk; j
@Cj
@z2þ K
@2Cj
@x2þ K
@2Cj
@y2þ Φ
ð1Þwhere x is positive in the mean downwind direction, y is themean crosswind direction, and z is vertical; Cj is the massconcentration of particles (kilogram per cubic meter) of agiven particle size class, j; wx and wy are the x and ycomponents of the wind velocity (meter per second) andvertical wind velocity is assumed to be negligible; K is ahorizontal diffusion coefficient for tephra in the atmosphere(square meter per second) and is assumed to be constant andisotropic (K 0 Kx 0 Ky); vk,j is the terminal settling velocity(meter per second) for particles of size class, j, as theseparticles fall through a level in the atmosphere, k; and Φ isthe change in particle concentration (kilogram per cubicmeter per second) at the source with time, t. The terminalsettling velocity, v, is a function of the particle’s Reynoldsnumber, which varies with atmospheric density (Bonadonnaet al. 2005a). Horizontal wind velocity is allowed to vary asa function of height in the atmosphere, but is assumed to beconstant within a specific atmospheric level. These assump-tions hold up well for medial facies at Cerro Negro wherestrong trade winds blowing WSW characterize the localwind field (Byrne et al. 2007). In the proximal region, thereis an abundance of relatively large particles (particle sizesless than −2ϕ) and plume dynamics likely have a far greatereffect on particle transport than advective transport by thelocal wind field.
An analytical solution to Eq. 1 can be written as:
fi; j x; yð Þ ¼ 1
2pσ2i; j
exp � x� xi; j� �2 þ y� yi; j
� �22σ2
i; j
!ð2Þ
for a line plume source with xi; j and yi; j representing thecoordinates of the center of the bivariate Gaussian distribution:
xi; j ¼ xi þXzik¼0
wx; k¸ zkvj; k
yi;j ¼ yi þXzik¼0
wy;k¸ zkvj;k
where the atmosphere is layered such that wx,k and wy,k aretrue mean downwind and crosswind components of windvelocity in layer k; ¸zk is the thickness of layer k, and vj,k isthe settling velocity for the particle size fraction j in layer k.This settling velocity depends on particle density, shape, and
Fig. 3 Results of a best-fit Tephra model to the 1992 deposit. a Circlessample pit locations where 1992 deposit mass (kilogram per squaremeter) was measured with size and shading proportionate to measureddeposit thickness, contours show best-fitting model predictions. bModeled accumulation versus observed accumulation at each samplepit location where more deviation from the equiline indicates lowermodel fit. Significantly, the model underestimates the observed accu-mulation at the three sites nearest the vent on the axis of dispersion,indicating the current model is not capturing proximal processes
1412 Bull Volcanol (2012) 74:1409–1424

the physical properties of the atmosphere. Here fi, j(x, y)is thefraction of erupted mass of particle size j that falls from theplume at height i and accumulates about the position x, y.
The variance of the Gaussian distribution,σ2i; j , is con-
trolled by atmospheric diffusion and horizontal spreading ofthe plume (Suzuki 1983). In this model, complex plume andatmospheric processes, for example the interaction of theplume with the atmosphere, are not explicitly considered.Instead, the effects of these processes are approximatedthrough the use of σ2
i; j. This simplification enables the model
to characterize tephra sedimentation without defining theunderlying mechanism of transport. For example, sedimen-tation from gravity driven plumes (e.g. Bursik et al. 1992)will result in a deposit with the same characteristics as thosepredicted by advection–diffusion processes and thereforewould be well modeled by the advection–diffusion equationregardless of the actual physics of sedimentation.
The source term of these models is an estimate of the massper unit time released from the eruptive column at a givenheight. Once particles leave the column, the type of diffusionthey experience is dependent on their size (Bonadonna et al.2005a). For relatively coarse particles with relatively shortparticle fall times (ti,j), such as those in the proximal zone atCerro Negro, diffusion is linear (Fick’s law) and the varianceis described by (Suzuki 1983):
σ2i; j ¼ 2K ti; j þ t
0j
� �ð3Þ
where tj′ is the horizontal diffusion time in the vertical plume
and accounts for the increase in plume diameter as a functionof height. This diffusionmodel strongly depends on the choiceof the diffusion coefficient, K, for large particles.
For fine particles with long settling times, a power lawdiffusion model is used (Bonadonna et al. 2005a). Diffusionof these particles strongly depends on the particle fall timeand the horizontal diffusion time of the ascending plume(Suzuki 1983). Because of long settling times, these particlesare deposited far from the volcano and so do not impactproximal sedimentation nearly as much as those followingthe Fickian model (Eq. 3). Dispersal patterns generated byadvection–diffusion models are especially sensitive to totalmass of erupted material and, for proximal deposits, columnheight (Scollo et al. 2009). Variations of wind direction andvelocity in time and space also have a significant effect ondeposits (Byrne et al. 2007).
Although different advection–diffusion models make dif-ferent assumptions leading to variations in their treatment ofthe eruptive column, wind field, dispersion, and otherparameters, the predicted geometry of the deposit is similarfor similar diffusion laws. For a case in which diffusion islinear, as in proximal and medial zones, the advection–diffusion model predicts that most mass will accumulatealong the axis of dispersion with off-axis deposition
governed by Gaussian diffusion, provided that the winddirection is constant, or consistent, with height above theerupting vent to the top of the plume.
Equations 1, 2, and 3 make assumptions about eruptioninput parameters and tephra dispersion in the atmosphere.Specifically, they suggest that, in steady wind conditions,deposits should be characterized by roughly exponential thin-ning downwind of the vent (with departures from exponentialthinning caused by variations in particle size and particlesettling velocity) and a Gaussian distribution of material inthe crosswind direction with maximum along a major axis ofdispersion (Bonadonna and Houghton 2005).
While point sampling of deposits has given a clear sensethat these features of tephra distribution exist in medialfacies, our goal here is to test for these deposit features inthe proximal portion of the deposit where deposit thick-nesses exceed the practical limit of hand-dug pits (~1.5–2 m in unconsolidated tephra deposits). To better character-ize these proximal deposits, a new methodology was re-quired. GPR offers an attractive alternative for imagingthicker units and offers the promise of near-continuouscoverage along 2D profiles across the tephra blanket. Anadded benefit is that we are able to test model fit statisticallyand thereby estimate the Fickian diffusion coefficient, K, forproximal deposits.
GPR imaging of tephra deposits
Ground-penetrating radar methods are similar to seismicmethods, utilizing electromagnetic waves rather than acous-tic waves. Reflection profiles are traditionally collected bymoving a single transmitter–receiver pair (kept at a fixedseparation) along a transect. Given the velocity of the wavesthrough the ground, one may calculate the thicknesses ofunderlying units by recording the time it takes the electro-magnetic waves to travel into the ground, reflect off of thetransitions between units, and be recorded by the receiverback at the surface. To determine wave velocities at selectedlocations, common midpoint (CMP) surveys are conductedby gathering data over a range of antenna separations.Alternatively, in environments with point sources such asvolcanic blocks, the velocities can be determined from anal-ysis of the form of diffractions. In tephra deposits, velocitiesare controlled principally by porosity, water content, andmatrix composition (e.g., presence of organics). Tephradeposits often exhibit pronounced internal porosity layeringassociated with individual eruptive phases; this porositylayering can generate radar wave reflections. Particularlyhigh-amplitude returns are associated with the distinctchanges in porosity and lithology that occur when eruptionstyle changes, and with paleosols or weathering horizonsthat form during quiescent periods. Thus, GPR is beautifully
Bull Volcanol (2012) 74:1409–1424 1413

suited to imaging the horizons that mark intervals betweeneruptive events. A number of studies have capitalized onGPR’s capabilities in volcanic settings (Russell and Stasiuk1997; Cagnoli and Russell 2000; Rust and Russell 2000;Cagnoli and Ulrych 2001a, b; Miyamoto et al. 2003, 2005;Chow et al. 2006; Gómez-Ortiz et al. 2006, 2007; Grimmet al. 2006; Heggy et al. 2006; Abrams and Sigurdson 2007;Gomez et al. 2008; Cassidy et al. 2009) but none to date hasfocused on tephra deposits or used GPR data to help assessor validate numerical hazard models.
Although GPR surveys can detect the presence of verythin units (millimeter to centimeter thickness), the methodcannot resolve the thickness of beds thinner than approxi-mately one fourth of the radar wavelength (e.g., Guha et al.2005). In practice in volcanic deposits (velocities, ~0.06–0.13 m/ns), vertical resolution limits range from ~30 to65 cm for 50 MHz antennas and from ~7 to 16 cm for200 MHz antennas. Depth of penetration depends principallyon the conductivity of the deposit, which varies considerablywith lithology (clay content) and antenna frequency. Veryyoung tephra deposits are typically highly resistive, withpenetrations of tens of meters for 50 MHz antennas, and upto 5 m or more for 200 MHz antennas.
On Cerro Negro, many GPR reflection events are quitedistinct and can be traced continuously for many hundreds ofmeters over the central portions of the blanket. The thicknessof packages between reflection events can be determined fromthe arrival times of reflections bounding the package and thewave velocity. Our ability to resolve thickness is lost at themargins where units thin below the GPR vertical resolutionlimit.
Methods
GPR profiles were collected in March 2004 and August andSeptember 2007 over the proximal and medial portions of theCerro Negro tephra deposits, 350–2,000 m downwind of thevent (Fig. 2). Two to three common-midpoint surveys werecollected along each profile. In addition, control surveys wereconducted adjacent to pits to verify interpretation of reflec-tions (crosses on Fig. 1). A Sensors and Software PulseEKKO100 system with 50, 100 and 200 MHz antennas was used.
The March 2004 profiles are shown as C2 and C3 onFig. 2 and were collected at 1-m intervals, sufficient forcontinuous tracking of the brightest reflection horizons.Horizontal positions were established every 50 m withhand-held GPS; elevations were extrapolated to these hori-zontal positions from a high-resolution digital elevationmodel constructed with differential L1-phase GPS. The2004 data were collected with 100 MHz antennas over thecentral portions of the tephra deposit. Of the antennas,200 MHz were used for higher spatial resolution on the
thinner blanket at the far ends of the lines and for correlationwith sample pit sites.
Profiles C1 and D were acquired in August and September2007 with both 50 and 200 MHz antennas along the thickerportions of the tephra deposit, and 200 MHz alone on the farends of the profiles. During these surveys, horizontal positionsand elevations were acquired with differential GPS; samplingintervals range from ~10 to ~50 cm. The GPR profiles wereresampled to uniform 15 or 25 cm intervals with a linearinterpolation.
In all surveys, data were acquired for 250 ns or more with asampling interval of 800 ps. Raw traces were edited (noisytraces removed), processed with a standard dewow filter, cor-rected for time-zero jumps, and are shown here with an AGCgain (longer gain windows used for lower frequency antennas).Data processing involved a combination of routines fromSensors and Software’s PulseEKKO software, the commercialpackage ReflexW from Sandmeier Scientific, Inc., and Matlabalgorithms. Data were not migrated as the dips of target hori-zons relative to the surface were generally quite low (~3°).
Six clearly-identifiable high-energy GPR reflection eventswere selected for analysis (Figs. 4 and 5). These high amplitudeevents must correspond to porosity changes, presumably rep-resenting either exposure surfaces or significant transitionswithin eruptive events. Arrival times of individual reflectionevents were extracted from the profiles either by interpolationbetween hand-picked points or by use of the phase-followeralgorithm in ReflexW. GPR pulses have a characteristic tri-lobed form that is typically not deconvolved. The variability inthe waveform of the returns from different contacts makes itimpossible to pick perfectly equivalent parts of different reflec-tion events. To maximize consistency, arrival time picks weremade on the peak of the first excursion of the pulse. Picks weremade conservatively, avoiding areas of more complex geome-try where relative thicknesses of individual units were difficultto establish. On line segments where both 50 and 200 MHzdata were acquired (central part of profile C1 and upwindportion of profile D), picks on shallow reflectors were madefrom the 200MHz data and picks on the deeper portions of thesame reflectors were made from the 50 MHz data. Becausearrival time picks were made on the first peak, a consistentupward shift in the pick of the longer-period 50 MHz arrivalwas required for a consistent fit with the 200 MHz picks.
Radar wave velocities were determined through standardanalysis of common midpoint surveys collected approxi-mately every 500 m along the profiles. In the February2004 dry season, over the thicker central portions of theblanket, root-mean-squared velocities vary from 0.13 m/nsfor the whole tephra package (5–20 m) to 0.15 m/ns for thesurficial and presumably driest uppermost meter. Dry seasonroot mean square (rms) velocities on the lateral edges of theprofiles where the tephra deposits are thinner (a few meters)range from ~0.13 to 0.15 m/ns. This variability is perhaps
1414 Bull Volcanol (2012) 74:1409–1424

due to porosity variations between layers and within layers,and to water content variability between areas slightlyhigher (and exposed to more hours of sun) and those intopographic lows. In the absence of high-resolution charac-terization of velocity variation, the whole-package value of0.13 m/ns was assumed in time-to-depth conversions of the2004 data. This value is probably somewhat low for the
shallower thinner portions of the deposits at the lateral edgesof the surveys, where thicknesses may be up to 15 % morethan estimated.
Velocities in profiles acquired in August–September 2007show more day-to-day variability associated with rainfall. Abest-fitting single velocity was established for each continu-ously acquired section of a profile from CMPs conducted at
time
(ns)
100
200
300
400
500
time
(ns)
100
200
300
400
500
distance (m) 500 400 300 200 100 0 100 200 300 400 500
400
420
440
460
C1 0
0a) Crosswind profile 770 m downwind of vent
N S
elev
atio
n (
m) x4.3
time
(ns)
0
50
100
150
200
250
300
A−base 1850BCDE−base 1992F
distance (m)
elev
atio
n (
m)
−600 −400 −200 0 200 400
390
400
410
420
430
time
(ns)
C2
0
50
100
150
200
250
300
N S
x6.3
b) Crosswind profile 1000 m downwind of vent
Fig. 4 Crosswind GPR profiles(see Figs. 1 and 2 for location).In each case, the top profileshows the GPR data, processedas described in the text. Themiddle profile shows the pickedhorizons. The bottom profileshows the profile with timesconverted to depths andcorrected for topography asdescribed in the text. Verticalexaggeration is specified on thefigure. x00 on profilesrepresents the point whereprofiles cross downwind profileD. a Profile C1, ~770 mdownwind from the vent. Dataalong this profile were collectedwith both 50 and 200 MHzantennas, only the 50 MHzprofile is shown. However,arrivals picks at shallow depthswere made from the 200 MHzprofile; these are shown withdashed lines. The discontinuityat x0180 m results from amerging of two profilesegments acquired on differentdays with different saturationconditions and hence differentvelocities. The merge isimperfect because velocitychanges are not uniformthroughout the depth range ofGPR penetration. b Profile C2,1,000 m downwind from thevent. c Profile C3, 1,600 mdownwind from the vent.Arrival times were not pickedacross a zone where the surfacetopography was not accuratelymeasured and interpolationbetween picks resulted inexcessively noisy thicknessestimates of packages
Bull Volcanol (2012) 74:1409–1424 1415

the beginning and end of each section. Best-fitting velocitiesranged from 0.095 to 0.13 m/ns. Unlike the dry season 2004data, rms velocities vary by less than ~10 % with depththroughout the tephra blanket at a given moment at a givensite; no consistent decrease in velocity with depth was ob-served. Travel times were converted to depths using uniformvelocities for whole profiles or for large sections (hundreds ofmeters) of each profile. Antenna offsets are accounted for intime-to-depth conversions. Thicknesses of the packages be-tween selected horizons were then computed simply by takingthe difference in depths between upper and lower contacts.
After package thicknesses were determined, the approxi-mate position of the peak thickness for each package wasextracted. This point should lie along the average axis ofdispersion for the eruption event or events contained in thedeposit. An overall average axis of dispersion was determinedfor all of the packages identified. Based on this overall averagedirection, we defined a perpendicular average crosswind di-rection, and projected package thicknesses onto this cross-wind direction. Finally, for each of the projected crosswindpackage thicknesses, the best-fitting Gaussian function wasdetermined in the form:
TðyÞ ¼ Ae�12
xσð Þ2 ð4Þ
where T is the deposit thickness at a given crosswind positionx, A is the peak thickness along the axis of dispersion, and σ isthe standard deviation of the Gaussian distribution, a measureof the crosswind width of the deposit. For downwind profiles,
data were projected onto a profile with the mean direction ofaxis of dispersion, and a best-fit exponential thinning functionwas determined for each package.
Results
Correlation of GPR events with eruptive history
Of the six GPR reflection events chosen for analysis (Figs. 4and 5), two can be directly correlated with known contacts.The first is horizon E, which marks the basal contact of the1992 deposits. This correlation is unambiguous, based oncomparisons of the GPR profiles and CMP surveys collect-ed with 200 MHz antennas adjacent to sample pits dug at thesouthwestern end of downwind line D and the northern endof crosswind line C2 (circles with crosses on Fig. 1). Thesecond identifiable horizon is horizon A, an exceptionallystrong reflection event that marks the boundary betweenzones with texturally distinct types of GPR returns. We notethat many of the returns that appear to be coming fromdepths beneath A are in fact reflection multiples. Below A,there are no clear primary events with the form expected fortephra fall—i.e., consistent thinning from a central axis. Thus,we infer that A marks the base of the Cerro Negro deposits,and represents the surface exposed prior to the initial eruptionof 1850.
The other reflection events marked in Figs. 4 and 5 wereselected simply because their high amplitudes make them
time
(ns)
0
50
100
150
200
distance (m)−300 −200 −100 0 100 200 300 400 500 600
340
360
380
time
(ns)
0
50
100
150
200
c) Crosswind profile 1600 m downwind of vent
SN
C1
elev
atio
n (
m) x4.3
Fig. 4 (continued)
1416 Bull Volcanol (2012) 74:1409–1424

easy to identify over many kilometers and ensure that theseevents are representative of transitions between or within erup-tions. The shallowest reflection event (horizon F) could not beclearly identified on profile C3 and the far portion of downwindprofile D because arrivals overlapped in time and were indis-tinguishable from the air wave/direct wave. Conversely, thedeepest events (horizons A and B) could not be identified onprofile C1 and on the nearest-vent portion of D because theylay below the penetration depth of the GPR signal at therespective frequencies used. Due to the fact that the majorityof horizons could not be correlated to known eruptive episodes,the tephra packages selected for investigation, with the excep-tion of the combined 1992–present package, could not beuniquely linked to historical records of column height or otherparameters of interest.
Crosswind package geometry
The crosswind profiles in Fig. 4 show successive stacks ofdeposits with the form expected for tephra deposits, with max-imum thicknesses roughly downwind of the volcano and sym-metrical thinning toward the margins. There is some variabilityin the position of peak thickness both within and betweenindividual units, indicating that the direction of the axis ofdispersion varied slightly both within individual and betweensuccessive eruptive events. Most of this variation is likely dueto small changes in the local wind field, which is characterizedby trade winds. For example, diurnal wind variations during the9-day 1995 eruption of Cerro Negro led to dual lobes in themedial deposit, with morning wind distributing tephra towards
the northwest and evening wind distributing particles towardthe southwest (Byrne et al. 2007). The durations of the maintephra producing eruptions of Cerro Negro vary from 3.6 to49 days. Thus, changes in the local wind field like thoseobserved over the course of the 1995 eruption are to beexpected. Furthermore, the small variance in the location ofpeak thickness for each package indicates that the variouseruptive events were emplaced into similar wind fields charac-terized by steady winds blowing in a northwesterly direction.
Although the overall dimensions of each of the packagesbetween strong GPR reflections vary considerably, eachpackage is remarkably Gaussian in form. Table 1 andFig. 6 show the best-fitting Gaussian parameters for theindividual packages. The width of the tephra units as cap-tured by the standard deviation of the best-fitting Gaussianfunction increases downwind from the vent as expectedfrom the advection–diffusion model.
Tephra fallout models generally assume Fickian diffusionfor short particle fallout times (e.g., Bonadonna et al. 2005a;Volentik et al. 2010). By relating the width of the Gaussian(Wσ06σ) to the diffusion coefficient (K), it is possible to solvefor the diffusion coefficient from the geometry of deposits(Bursik 1998; Sparks 1997; Bonadonna et al. 2005b):
K ¼ Wσ
4
� �2 wx
xð5Þ
where x is distance from the vent in the downwind direction(meter), wx is the x component of wind velocity (meter per
time
(ns)
0
100
200
300
400
time
(ns)
0
100
200
300
400
elev
atio
n (m
) x2.1
distance (m) 1600 1400 1200 1000 800 600 400 200 0
350
400
450
500
Downwind profile
W E
Fig. 5 Downwind profile D(location shown in Figs. 1and 2). Data were collectedwith both 50 and 200 MHzantennas near the vent, and with200 MHz antennas to ~1,800 mfrom the vent. The figuresuperimposes 50 MHz data,where collected, fortimes >100 ns onto the200 MHz profile. Theexponential fits consider datafrom ~350 to 1,200–1,400 mdownwind from the vent.Format as for Fig. 4; seeFig. 4 legend
Bull Volcanol (2012) 74:1409–1424 1417

second), and we assume that the crosswind component ofwind velocity, wy00. This is equivalent to assuming that windspeed and direction do not vary with atmospheric level. Thus,settling velocity will not vary along the path from release tothe ground. From this relationship, using the average windfield calculated from an inversion of the 1992 medial pit data,the diffusion coefficients for each of the best-fit Gaussianshave been calculated (Table 2). The observed spread in diffu-sion coefficients of 262–762 m2 s−1 is not significant asvariations of this order are found to make little difference tosedimentation values calculated with advection diffusionmodels (Scollo et al. 2008b). In other words, for modelingpurposes, the packages at these proximal locations are wellcharacterized by a value for the diffusion coefficient equal tothe average value for that package. Additionally, the
calculated diffusion coefficient values are of the same orderas those used in the Tephra numerical model; 100–1,000 m2 s−1.
Downwind package geometry
Figure 5 shows a combination of profiles run in a downwinddirection with both 50 and 200 MHz antennas. The curve inthe profile line (Figs. 1 and 2) occurs because data wereacquired along an open path through the vegetated down-wind portion of the tephra blanket. Figure 7 shows thearrival time picks converted to depth with the thicknessesof individual packages projected onto a profile line (dashedline shown in Fig. 1). From the cone slope break at ~350 mto ~1,200 m downwind of the vent, the thickness of deposits
Table 1 Best-fitting Gaussianparameters as defined in Eq. 4for deposit packages bounded byGPR reflection events shownin Fig. 4
Profiles locations shown onFig. 2. Fits shown in Fig. 6. R2
indicates quality of fit ofGaussian function (Eq. 4) toobservations
Package Amplitude A (m) Std Dev σ (m) R2
Dist from vent(km)/profile
0.77 1.0 1.6 0.77 1.0 1.6 0.77 1.0 1.6C1 C2 C3 C1 C2 C3 C1 C2 C3
AB – 3.89 1.71 – 143 217 – 0.964 0.913
BC – 1.83 0.82 – 124 168 – 0.971 0.920
CD 5.65 4.02 1.98 142 153 205 0.976 0.990 0.950
DE 5.79 3.51 1.65 132 145 177 0.989 0.986 0.959
EF 5.37 3.88 – 159 147 – 0.991 0.970 –
F surface 8.77 5.53 – 184 208 – 0.992 0.977 –
Fig. 6 Thicknesses ofpackages between picked GPRhorizons on crosswind profilesC1, C2, and C3, projected ontoprofile perpendicular to averageaxis of dispersion (data shownin Fig. 4, location shown inFig. 2). N side of each profile isto left, S right. The verticalscale is the same for all figuresexcept the lower right, whichshows the thickness of depositsover contact F. Black lineobservations. Red linebest-fitting Gaussian curve.Parameters of the best-fitGaussian curves are listed inTable 1. Profiles are shifted sothat x00 lies at central peakof Gaussian
1418 Bull Volcanol (2012) 74:1409–1424

fits an exponential decay. Beyond ~1,200 m, all packagesshow thickening relative to exponential decay.
The overthickening evident in Fig. 7 at distances beginning1,200–1,400 m from the vent marks the transition from sed-imentation dominated by fallout from the margins of theeruption column to that dominated by fallout from the buoyantvolcanic plume. The location of this transition is termed thecolumn corner (Bursik et al. 1992; Bonadonna and Philips2003) and its distance from the vent (rc) in the absence of asubstantial windfield is given by Bonadonna and Philips(2003) derived for much larger explosive eruptions:
rc ¼ 0:2Ht ð6Þwhere Ht is the maximum column height. The location of thecolumn corner as measured from the various GPR packagescorresponds to column heights of 6–7 km, typical for the moreenergetic eruptions of Cerro Negro.
We can approximate the radius, ri, of the spreadingplume at a given height, zi, with the relation developedby Bonadonna and Phillips (2003) and based on acombination of numerical studies (Morton et al. 1956)and observations of plume expansion (Sparks andWilson 1982): ri00.34zi. Taking ri03σ03σi, j , it ispossible to estimate the height of release for particlesdeposited at the locations sampled:
zi ¼ 3σ0:34
ð7Þ
which yields a narrow range of heights extending 1–2 km above the vent for particles falling in the proximalzone. The later version of the Tephra numerical model,Tephra2 (e.g., Bonadonna et al. 2005a; Volentik et al.2010), uses a fall time threshold parameter to capturethe change in diffusion law between proximal and me-dial or distal zones. The idea of the fall time thresholdis that particles with short total fall time (i.e., fallingfrom comparatively low heights in the column and/orlarge particles falling with comparatively high veloci-ties) follow a Fickian diffusion law, whereas particleswith comparatively long total fall time may follow adifferent diffusion law (e.g., power law) or be charac-terized by a different diffusion coefficient. The mediangrainsize found from granulometric analyses of the 1992deposit at the transition distance of 1,200–1,400 m isMΦ0−1.5Φ, with measured mean density ρ01,000 kg m−3
(Martin 2004). For particles falling from 2 km height, thissuggests a fall time of approximately 400 s, whichwe considerto be a reasonable fall time threshold for proximal CerroNegro deposits.
Table 2 Diffusion coefficients for each crosswind profile
Package Diffusion coefficient (m2 s−1)
770 m 1,000 m 1,600 m Average
AB – 354 510 432
BC – 266 306 286
CD 454 406 455 438
DE 392 364 339 365
EF 569 374 – 472
F 762 749 – 756
Calculated from Eq. 5 with a wind speed of 7.7 m s−1 , the averagebest-fit wind speed derived from inverting data from the medial portionof the 1992 tephra deposit
Fig. 7 Thicknesses ofpackages between picked GPRhorizons on downwind profileD, projected onto direction ofaverage axis of dispersion(data shown in Fig. 5, locationshown in Fig. 2). Black lineobservations. Red linebest-fitting exponential functionfit to points between upwindpoint and 1,200–1,400 mdownwind. Note vertical scalesdiffer. Lower right total depositthickness above horizon F
Bull Volcanol (2012) 74:1409–1424 1419

Fig. 8 Central portion ofcrosswind profile C2 shownwith five times verticalexaggeration. Top GPR data,processed as described in text.Bottom same, withinterpretation. Red areashighlight topographic lowapparently infilled by earliest1850 deposits. This is the onlyexample recognizable in theGPR data of a packagethat selectively fillstopographic lows
Fig. 9 Comparison of GPR-derived thicknesses of 1992–present deposits and the pre-dictions of the best-fittingTephra model for 1992 depos-its. Top along profile C2, wherehorizontal distances have beenprojected perpendicular to theaverage axis of dispersion.Bottom along the downwindprofile shown with dashed linein Fig. 1. Diamonds valuesfrom the nearest samplepit data projected onto thedownwind profile
1420 Bull Volcanol (2012) 74:1409–1424
Discussion
Evidence for remobilization
Only the earliest deposits at Cerro Negro (presumably 1850)show clear evidence of remobilization in the proximal zone, inthe form of selective infilling of topographic lows. Theseinfilled areas are highlighted in Fig. 8. If remobilization weresignificant, we would expect preserved tephra blankets to de-viate more significantly from a Gaussian form. Additionally,the fact that most of the fallout material imaged is well charac-terized by exponential decay indicates a lack of granular flowsaway from cone slopes, as expected.
Similarly, in the proximal and medial zones, there is noevidence of remobilization of the 1992 and older deposits. Weattribute this to the flat terrain on which the tephra blanket isdeposited and the relatively fast return period of tephra erup-tions at Cerro Negro. For example, the 1995 deposit complete-ly covers the 1992 deposit in the proximal and medial zones.
In contrast, tephra is essentially completely eroded away orreworked in the distal zone (greater than ~13 km from the vent).Although millimeter-scale accumulations occurred along thePacific coast as a result of the 1992 eruption, these depositsare now gone. Therefore, we cannot make inferences about thedistal deposits that result from Cerro Negro activity from ourdata (but see Byrne et al. (2007) for the application of mesoscaleatmospheric models to distal dispersion from Cerro Negro).
Comparison of 1992 proximal thickness and medial blanketmodels
Direct comparison of the deposits of the 1992 eruptionmeasured in sample pits (Fig. 1) and via GPR data is
complicated by the thinner, less voluminous, deposits oftwo subsequent eruptions in 1995 and 1999. At the samplepits where Martin (2004) mapped 1992 deposit thicknesses,the overlying 1995+1999 tephra units are quite thin (centi-meter to a few tens of centimeter). As a result, the potentialGPR signatures of 1992–1995 and 1995–1999 contacts arelost in the airwave/direct wave arrivals at surveys adjacentto the sample pits. However, estimates of total tephra fallvolume from the post-1992 eruptions (Hill et al. 1998;Connor et al. 2001) suggest that these deposits representonly ~14 % of the total 1992–present deposits. Thus it isreasonable to compare GPR-derived 1992-to-present depos-its with stratigraphic observations of the 1992 deposit.
Connor and Connor (2006) used the Tephra code to invertsample pit data of Martin (2004) for eruption parameters suchas column height, wind speeds, and grain size distributions.Their models, fit to the medial sample pit data, reasonablyreproduce tephra blanket thickness at any site. If the physicalassumptions in the best-fit Tephra code are valid in the prox-imal zone as well, we would expect the best-fitting tephramodels to slightly (~14%) under-predict proximal zone thick-nesses. Instead, Fig. 9 shows that the best-fit Tephra modelsgreatly underpredict 1992–present deposit thicknesses in thisproximal zone. For the crosswind profile C2, ~1,000 m down-wind from the vent, the GPR-derived 1992–present depositsare best fit by a Gaussian with amplitude A09.1 m andstandard deviation σ0185 m. At this location, the blanket isnine times thicker and less than half as wide as predicted bythe Tephra model that best-fits the medial deposit. The Tephramodel curve over the same location is characterized by am-plitude A01.1 m and standard deviation σ0410 m (Fig. 9).
In other words, a change in diffusion law is warrantedbetween proximal and medial portions of the deposit. These
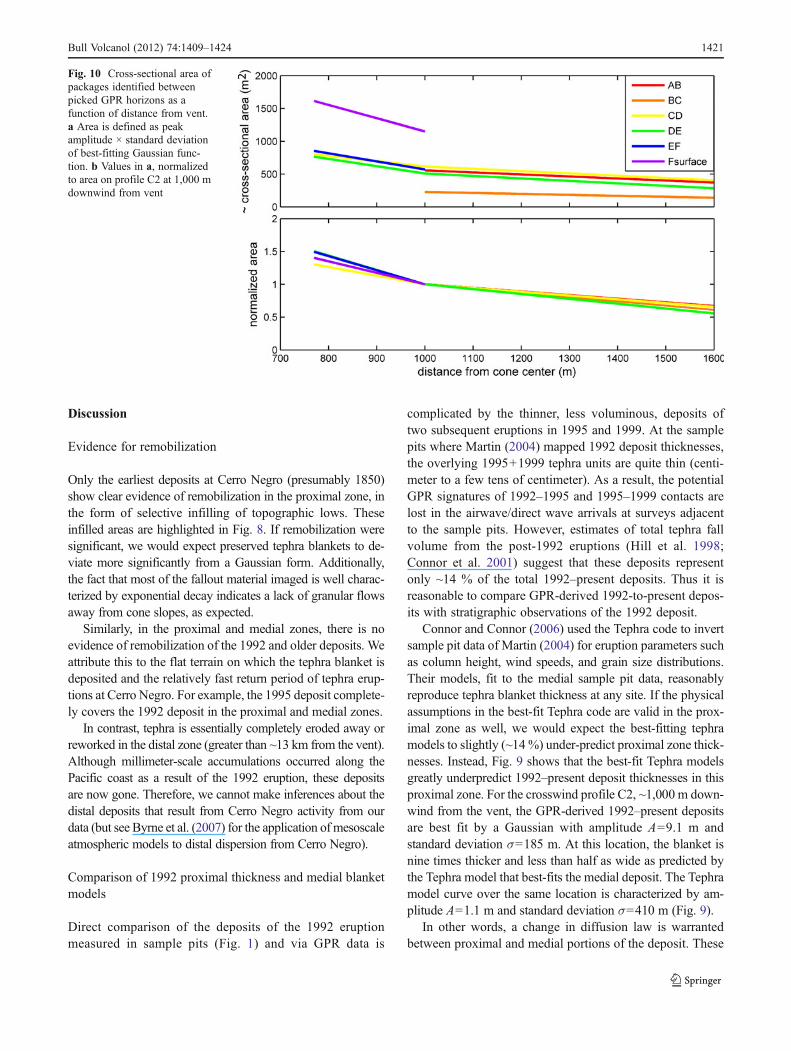
Fig. 10 Cross-sectional area ofpackages identified betweenpicked GPR horizons as afunction of distance from vent.a Area is defined as peakamplitude × standard deviationof best-fitting Gaussian func-tion. b Values in a, normalizedto area on profile C2 at 1,000 mdownwind from vent
Bull Volcanol (2012) 74:1409–1424 1421

results suggest a significant change in the fallout regime asdiscussed by Houghton et al. (2004). The amplitude andstandard deviation which characterize deposits does notchange gradually, but rather changes abruptly from proximalto medial zones. The buoyant plume represents a regime inwhich particles fall from elevations near the level of neutralbuoyancy and thus exhibit relatively long fall times whichultimately lead to a more dispersed deposit. Fallout fromplume margins occurs at a lower elevation within the plumeand is less dispersed than that from the buoyant plume. Datafrom Cerro Negro shows that this proximal depositional re-gime is well-modeled by a Gaussian process, provided theproper diffusion law is used.
Area of 1992-present deposits compared with other eruptions
Figure 10 shows that the relative cross-sectional area of tephrashed from the plume shrinks consistently as a function ofdistance downwind from the vent for the units identified.The cross-sectional area of each package (defined as theproduct of the best-fitting Gaussian amplitude and standarddeviation) is ~1/3 smaller 1,000 m from the vent than 770 mfrom the vent, and shrinks again by a similar amount over thearea between 1,000 and 2,000 m from the vent. This clearlyshows that the process producing the proximal fallout isdecaying rapidly, especially in comparison with fallout froma buoyant plume.
We note that the cross-sectional area of the 1992–presentdeposits observed on the profile C2 (1,000 m from vent) form~47 % of the total area of 1850–present deposits. (Area againassessed as the product of the best-fitting Gaussian amplitudeand standard deviation.) This is greater than the proportionalvolume of 1992–present tephra compared to 1850–presenttephra fall reported by Hill et al. (1998) and Connor et al.(2001), which is ~20 %. This result suggests that the 1992eruption resulted in a higher proportion of material depositedin this proximal zone than was typical for earlier eruptions.This observation is consistent with the decrease in volume ofthe cone itself in 1992 due to vent widening during theeruption (Hill et al. 1998). That is, much of the older conethat was blown apart in the first stage of the 1992 eruption wasredeposited in the proximal zone.
Conclusions
GPR imaging of tephra deposits can provide thickeningtrends in the proximal region where trenching is diffi-cult. When reflection horizons can be correlated toeruptive events, details of the depositional trends ofspecific eruptions can be determined and related toknown parameters such as column height. Even whenhorizons cannot be correlated to specific events, general
trends of deposits can be elucidated, such as the overallgeometry of deposits.
Interpretation of GPR data indicates the deposit within1,600 m of the vent is well characterized by three deposi-tional regimes. In the near-vent region, rapid fallout andballistic projectiles oversteepen the cone and GPR datashow abundant evidence of downslope movement by gran-ular flow. In the proximal zone away from the cone base,deposition is via fallout from column margins (greaterthan 2 km heights) and follows a Fickian diffusion law.Deposition also follows a Fickian diffusion law in themedial zone; however here fallout is from the buoyantplume and is thus characterized by a different diffusioncoefficient. The GPR data and interpretation show an abruptchange in diffusion (spreading) and amplitude (thickness onthe centerline) at 1,200–1,400 m downwind of the vent. Thisindicates the column and buoyant plume fallout regimes arephysically well separated. This physical separation is relatedto the location within the plume at which the upward veloc-ity shifts from momentum to buoyancy dominated (e.g.,Woods 1995).
GPR profiles collected at Cerro Negro exhibit remark-ably Gaussian thinning in the crosswind direction and ex-ponential decay along the axis of dispersion with distancefrom the source. Thus, deposits are well characterized by theadvection–diffusion equation even in the proximal zonewhere the underlying physics describing the transport oftephra from plume margins is unknown. These findings helpvalidate the use of the advection–diffusion model in char-acterizing tephra deposits.
Acknowledgments The authors would like to acknowledge InstitutoNicaragüense de Estudios Territoriales (INETER), Cooperativa deTurismo Rural Comunitario Pilas El Hojo, and the 2007 USF FieldGeophysics class for all of their help both with logistics and datacollection. David Pyle, Antonio Costa, and Jeremy Phillips madeextremely helpful comments on the manuscript. This researchwas funded in part by the Latin American Studies Grant, USF,and grants from the National Science Foundation (EAR-0732476 andDRL-0940839).
References
Abrams LJ, Sigurdsson H (2007) Characterization of pyroclastic falland flow deposits from the 1815 eruption of Tambora Volcano,Indonesia using ground-penetrating radar. J Volcanol GeothermRes 161:352–361
Armienti P, Macedonio G, Pareschi MT (1988) A numerical model forsimulation of tephra transport and deposition: applications to May18 Mount St. Helens eruption. J Geophys Res 93:6463–6476
Barsotti S, Neri A, Scire JS (2008) The VOL-CALPUFF model foratmospheric ash dispersal: 1. Approach and physical formulation.J Geophys Research 113:B03208. doi:10.1029/2006JB004623
Bonadonna C, Houghton BF (2005) Total grainsize distribution andvolume of tephra-fall deposits. Bull of Volcanol 67:441–456
1422 Bull Volcanol (2012) 74:1409–1424

Bonadonna C, Phillips JC (2003) Sedimentation from strong volcanicplumes. J Geophys Res 108:2340–2368
Bonadonna C, Ernst GGJ, Sparks RSJ (1998) Thickness variations andvolume estimates of tephra fall deposits; the importance of parti-cle Reynolds number. J Volcanol Geotherm Res 81:173–187
Bonadonna C, Connor CB, Houghton BF, Connor LJ, Byrne M, LaingA, Hincks T (2005a) Probabilistic modeling of tephra dispersion:hazard assessment of a multi-phase eruption at Tarawera, NewZealand. J Geophys Res 110:B03203
Bonadonna C, Phillips JC, Houghton BF (2005b) Modeling tephrasedimentation from a Ruapehu weak plume eruption. J GeophysRes 110:B08209. doi:10.1029/2004JB003515
Bursik M (1998) Tephra dispersal. In: Gilbert JS, Sparks RSJ (eds) Thephysics of explosive volcanic eruptions, vol. 145. London:Geological Society Special Publications. pp 115–144
Bursik MI, Sparks RSJ, Gilbert JS, Carey SN (1992) Sedimentation oftephra by volcanic plumes: I. Theory and its comparison with astudy of the Fogo A plinian deposit, Sao Miguel (Azores). BullVolcanol 54:29–344
Byrne MA, Laing AG, Connor CB (2007) Predicting tephra dispersionwith a mesoscale atmospheric model and a particle fall model;application to Cerro Negro Volcano. J Applied Meteorol Climatol46:121–135
Cagnoli B, Russell JK (2000) Imaging the subsurface stratigraphy inthe Ubehebe hydrovolcanic field (Death Valley, California) usingground penetrating radar. J Volcanol Geotherm Res 96:45–56
Cagnoli B, Ulrych TJ (2001a) Downflow amplitude decrease ofground penetrating radar reflections in base surge deposits. JVolcanol Geotherm Res 105:25–34
Cagnoli B, Ulrych TJ (2001b) Ground penetrating radar images ofunexposed climbing dune-forms in the Ubehebe hydrovolcanicfield (Death Valley, California). J Volcanol Geotherm Res109:279–298
Carey SN, Sparks RSJ (1986) Quantitative models of the fallout anddispersal of tephra from volcanic eruption columns. Bull Volcanol48:109–125
Cassidy NJ, Calder ES, Pavez A, Wooller L (2009) GPR-derived faciesarchitectures: a new perspective on mapping pyroclastic flowdeposits. In: Thordarson T, Self S, Larsen G, Rowland SK,Hoskuldsson A (eds) Studies in volcanology: the legacy ofGeorge Walker. Special Pubs of the Int Assoc of Volcanol andChem of the Earth's Interior 2:181–210
CGIAR-CSI (2004) Void-filled seamless SRTM data V1.International Centre for Tropical Agriculture (CIAT).CGIAR—Consortium for Spatial Information, SRTM 90 mdatabase. http:/s-1rtm.csi.cgiar.org
Chow JJ, Chang S-K, Yu H-S (2006) GPR reflection characteristicsand depositional models of mud volcanic sediments—Wushantingmud volcano field, southwestern Taiwan. J Appl Geophys 60:179–200
Connor LJ, Connor CB (2006) Inversion is the solution to dispersion:modelling tephra fallout from the 1992 eruption of Cerro Negro,Nicaragua. In Mader H, Cole S, Connor CB, Connor LJ (eds)Statistics in volcanology. Geol Soc London Spec Pub 231–242
Connor CB, Powell L, Strauch W, Navarro M, Urbina O, Rose WI(1993) The 1992 eruption of Cerro Negro, Nicaragua: an exampleof Plinian-style activity at a small basaltic cinder cone [abs.]: Eostransactions. Am Geophys Union 74:640
Connor CB, Hill BE, Winfrey B, Franklin NM, LaFemina PC (2001)Estimation of volcanic hazards from tephra fallout. Nat HazardsRev 2:33–42
Costa A, Macedonio G, Folch A (2006) A three-dimensional Eulerianmodel for transport and deposition of volcanic ashes. Earth PlanetSci Lett 241:34–647
Diez M, La Femina PC, Connor CB, Strauch W, Tenorio V (2005)Evidence of static stress changes triggering the 1999 eruption of
Cerro Negro, Nicaragua, and regional aftershock sequences.Geophys Res Lett 32:L04309. doi:10.1029/2004GL021788
Ernst GGJ, Sparks RSJ, Carey SN, Bursik MI (1996) Sedimentationfrom turbulent jets and plumes. J Geophys Res 101:5575–5589
Fierstein J, Nathenson M (1992) Another look at the calculation oftephra fallout volumes. Bull Volcanol 54:156–167
Glaze L, Self S (1991) Ashfall dispersal of the 16 September 1986,eruption of Lascar, Chile, calculated using a turbulent diffusionmodel. Geophys Res Lett 18:1237–1240
Gomez C, Lavigne F, Lespinasse N, Hadmoko DS, Wassmer P (2008)Longitudinal structure of pyroclastic-flow deposits, revealed byGPR survey, at Merapi Volcano, Java, Indonesia. J VolcanolGeotherm Res 176:439–447
Gómez-Ortiz D, Martín-Velázquez S, Martín-Crespo T, Márquez A, LilloJ, López I, Carreño F (2006) Characterization of volcanic materialsusing ground penetrating radar: a case study at Teidevolcano(Canary Islands, Spain). J Appl Geophys 59:63–78
Gómez-Ortiz D, Martín-Velázquez S, Martín-Crespo T, Márquez A,Lillo J, López I, Carreño F, Martín-González F, Herrera R, DePablo MA (2007) Joint application of ground penetrating radarand electrical resistivity imaging to investigate volcanic materialsand structures in Tenerife (Canary Islands, Spain). J ApplGeophys 62:287–300
Grimm RE, Heggy E, Clifford S, Dinwiddie C, McGinnis R, Farrell D(2006) Absorption and scattering in ground-penetrating radar:analysis of the Bishop Tuff. J Geophys Res 111:E06S02.doi:10.1029/2005JE002619
Guha S, Kruse SE, Wright EE, Kruse UE (2005) Spectral analysis ofground penetrating radar response to thin sedimentary layers.Geophys Res Lett 32:L23304. doi:10.1029/2005GL023933
Heggy E, Clifford SM, Grimm RE, Dinwiddie CL, Wyrick DY, HillBE (2006) Ground-penetrating radar sounding in mafic lavaflows: assessing attenuation and scattering losses in Mars-analogvolcanic terrains. J Geophys Res 111:E06S04. doi:10.1029/2005JE002589
Hill BE, Connor CB, Jarzemba MS, LaFemina PC (1998) 1995 erup-tions of Cerro Negro, Nicaragua and risk assessment for futureeruptions. Geol Soc Am Bull 110:1231–1241
Houghton BF, Wilson CJN, Fierstein J, Hildreth W (2004) Complexproximal deposition during the Plinian eruptions of 1912 atNovarupta, Alaska. Bull Volcanol 66:95–133
Hurst AW, Turner R (1999) Performance of the program ASHFALL forforecasting ashfall during the 1995 and 1996 eruptions ofRuapehu volcano, New Zealand. J Geol Geophys 42:615–622
LaFemina PC, Connor CB, Hill BE, Saballos JA, Strauch W (2004)Exploring the link between tectonism and magmatism: the 1999seismic swarm and eruption of Cerro Negro, Nicaragua. J VolcanolGeotherm Res 137:187–199
Macedonio G, Pareschi MT, Santacroce RA (1988) Numerical simulationof the Plinian fall phase of 79 A.D. eruption of Vesuvius. J GeophysRes 93:14817–14827
Mannen K, Ito T (2007) Formation of a scoria cone during explosiveeruption at Izu-Oshima volcano, Japan. Geophys Res Letts 34:L18302. doi:10.1029/2007GL030874
Martin K (2004) Limitations of the advection–diffusion equation formodeling tephra fallout: 1992 eruption of Cerro Negro volcano,Nicaragua. MS thesis, University of South Florida, Tampa
Miyamoto H, Haruyama J, Rokugawa S, Onishi K, Toshioka T,Koshinuma J (2003) Acquisition of ground penetrating radar datato detect lava tubes; preliminary results on the Komoriana Cave atFuji Volcano in Japan. Bull Eng Geol Environ 62:281–288
Miyamoto H, Haruyama J, Kobayashi T, Suzuki K, Okada T, NishiboriT, Showman AP, Lorenz R, Mogi K, Crown DA, Rodriguez JAP,Rokugawa S, Tokunaga T, Masumoto K (2005) Mapping thestructure and depth of lava tubes using ground penetrating radar.Geophys Res Lett 32:L21316. doi:10.1029/2005GL024159
Bull Volcanol (2012) 74:1409–1424 1423

Morton B, Taylor GL, Turner JS (1956) Turbulent gravitational convectionfrom maintained and instantaneous source. Proc R Soc 234:1–23
Pfeiffer T, Costa A, Macedonio G (2005) A model for the numericalsimulation of tephra fall deposits. J Volcanol Geotherm Res140:273–294
Pyle DM (1989) The thickness, volume and grainsize of tephra falldeposits. Bull Volcanol 51:1–15
Riedel C, Ernst GGJ, Riley M (2003) Controls on the growth andgeometry of pyroclastic constructs. J Volcanol Geotherm Res127:121–152
Russell JK, Stasiuk MV (1997) Characterization of volcanic depositswith ground-penetrating radar. Bull Volcanol 58:515–527
Rust AC, Russell JK (2000) Detection of welding in pyroclastic flowswith ground penetrating radar: insights from field and forwardmodeling data. J Volcanol Geotherm Res 95:23–34
Sable JE, Houghton BF, Wilson CJN, Carey RJ (2006) Complexproximal sedimentation from Plinian plumes: an example ofTarawera 1886. Bull Volcanol 69:89–103
Scollo S, Folch A, Costa A (2008a) A parametric and comparativestudy of different tephra fallout models. J Volcanol Geotherm176:199–211
Scollo S, Tarantola S, Bonadonna C, Coltelli M, Saltelli A (2008b)Sensitivity analysis and uncertainty estimation for tephra dispersalmodels. J Geophys Res 113:B06202. doi:10.1029/2006JB004864
Scollo S, Prestifilippo M, Spata G, D'Agostino M, Coltelli M (2009)Monitoring and forecasting Etna volcanic plumes. Nat HazardsEarth Syst Sci 9:1573–1585
Sparks RSJ, Wilson L (1982) Explosive volcanic eruptions-V,Observations of plume dynamics during the 1979 Soufrière erup-tion, St. Vincent. Geophys J R Astron Soc 69:551–570
Sparks RSJ, Carey SN, Sigurdsson H (1991) Sedimentation fromgravity currents generated by turbulent plumes. Sedimentology38:839–856
Sparks RSJ, Bursik MI, Ablay GJ, Thomas RME, Carey SN (1992)Sedimentation of tephra by volcanic plumes: 2. Controls onthickness and grain–size variations of tephra fall deposits. BullVolcanol 54:685–695
Sparks RSJ, Bursik MI, Carey SN, Gilbert JS, Glaze LS, Sigurdsson H,Woods AW (1997) Volcanic plumes. Wiley, Chichester, p 574
Suzuki T (1983) A theoretical model for dispersion of tephra. In:Shimozuru D, Yokoyama I (eds) Arc volcanism: physics andtectonics. Tokyo: Terra Publishing Co. pp 95–113
Volentik AMC, Bonadonna C, Connor CB, Connor LJ, Rosi M (2010)Modeling tephra dispersal in the absence of wind: Insights fromthe climatic phase of the 2450 BP Plinian eruption of Pululaguavolcano (Ecuador). J Volcanol Geotherm Res 193:117–136
Woods AW (1995) The dynamics of explosive volcanic eruptions. RevGeophys 33:495
1424 Bull Volcanol (2012) 74:1409–1424
Copyright © 2022 FDOKUMEN