Spectral bandwidth enhancement of GPR profiling data using multiple-frequency compositing
10
Spectral bandwidth enhancement of GPR profiling data using multiple-frequency compositing Adam D. Booth a, ⁎, Anthony L. Endres b , Tavi Murray c a Glaciology Group, School of Environment and Society, University of Swansea, Singleton Park, Swansea, SA2 8PP, United Kingdom b Department of Earth and Environmental Sciences, University of Waterloo, Waterloo, Ontario, Canada N2L 3G1 c Department of Geography, Swansea University, Swansea SA2 8PP, United Kingdom abstract article info Article history: Received 28 March 2007 Accepted 23 September 2008 Keywords: Ground penetrating radar Composite Frequency Bandwidth Resolution Deconvolution The amplitude spectrum of ground penetrating radar (GPR) reflection data acquired with a particular antenna set is normally concentrated over a spectral bandwidth of a single octave, limiting the resolving power of the GPR wavelet. Where variously-sized GPR targets are located at numerous depths in the ground, it is often necessary to acquire several profiles of GPR data using antennas of different nominal frequencies. The most complete understanding of the subsurface is obtained when those frequency-limited radargrams are jointly interpreted, since each frequency yields a particular response to subsurface reflectivity. The application of deconvolution to GPR data could improve image quality, but is often hindered by limited spectral bandwidth. We present multiple-frequency compositing as a means of combining data from several frequency-limited datasets and improving the spectral bandwidth of the GPR profile. A multiple-frequency composite is built by summing together a number of spatially-coincident radargrams, each acquired with antennae of different centre frequency. The goal of the compositing process is therefore to produce a composite radargram with balanced contributions from frequency-limited radargrams and obtain a composite wavelet that has properties approximating a delta function (i.e. short in duration and having a broad, uniform spectral bandwidth). A synthetic investigation of the compositing process was performed using Berlage wavelets as proxies for GPR source pulses. This investigation suggests that a balanced, broad bandwidth, effective source pulse is obtained by a compositing process that equalises the spectral maxima of frequency-limited wavelets prior to summation into the composite. The compositing of real GPR data was examined using a set of 225, 450 and 900 MHz GPR common offset profiles acquired at a site on the Waterloo Moraine in Ontario, Canada. The most successful compositing strategy involved derivation of scaling factors from a time-variant least squares analysis of the amplitude spectra of each frequency-limited dataset. Contributions to the composite from each nominal acquisition frequency are clear, and the trace averaged amplitude spectrum of the corresponding composite is broadened uniformly over a bandwidth approaching two-octaves. Improvements to wavelet resolution are clear when a composite radargram is treated with a spiking deconvolution algorithm. Such improvement suggests that multiple-frequency compositing is a useful imaging tool, and a promising foundation for improving deconvolution of GPR data. © 2008 Elsevier B.V. All rights reserved. 1. Introduction Ground penetrating radar (GPR) imaging is performed over a wide range of frequencies (i.e., 10 MHz to over 1 GHz). However, the frequency content of a set of profiling data is determined by the nominal antenna frequency used in the survey. This frequency content controls both the depth penetration of the GPR wavelet and the temporal and spatial resolution (Sheriff and Geldart, 1999; Grasmueck et al., 2006) of the resulting GPR image; hence the choice of antenna frequency is a fundamental parameter in survey design. Where there are variously-sized targets, to be imaged at a range of depths, it may be necessary to acquire multiple GPR datasets with different antenna frequencies. This approach would normally require separate inter- pretations of radargrams for each antenna frequency, correlating events between profiles. If frequency-limited datasets are spatially coincident (i.e., traces are recorded with antennae at the same surface locations), a more comprehensive interpretation can be obtained if those datasets are summed into a single dataset; the process of summing these frequency-limited radargrams is referred to as multi- ple-frequency compositing (Endres et al., 2004). The compositing process is a possible means both for presenting several frequency-limited radargrams in the same dataset, and also for broadening the spectral bandwidth of a GPR wavelet. Generally, a two- octave bandwidth is considered a minimum requirement for good Journal of Applied Geophysics 67 (2009) 88–97 ⁎ Corresponding author. Tel.: +44 1972 602 375. E-mail addresses: [email protected] (A.D. Booth), [email protected] (A.L. Endres), [email protected] (T. Murray). 0926-9851/$ – see front matter © 2008 Elsevier B.V. All rights reserved. doi:10.1016/j.jappgeo.2008.09.015 Contents lists available at ScienceDirect Journal of Applied Geophysics journal homepage: www.elsevier.com/locate/jappgeo
Transcript of Spectral bandwidth enhancement of GPR profiling data using multiple-frequency compositing

Journal of Applied Geophysics 67 (2009) 88–97
Contents lists available at ScienceDirect
Journal of Applied Geophysics
j ourna l homepage: www.e lsev ie r.com/ locate / jappgeo
Spectral bandwidth enhancement of GPR profiling data usingmultiple-frequency compositing
Adam D. Booth a,⁎, Anthony L. Endres b, Tavi Murray c
a Glaciology Group, School of Environment and Society, University of Swansea, Singleton Park, Swansea, SA2 8PP, United Kingdomb Department of Earth and Environmental Sciences, University of Waterloo, Waterloo, Ontario, Canada N2L 3G1c Department of Geography, Swansea University, Swansea SA2 8PP, United Kingdom
⁎ Corresponding author. Tel.: +44 1972 602 375.E-mail addresses: [email protected] (A.D. Boo
[email protected] (A.L. Endres), t.murray@
0926-9851/$ – see front matter © 2008 Elsevier B.V. Aldoi:10.1016/j.jappgeo.2008.09.015
a b s t r a c t
a r t i c l e i n f oArticle history:
Received 28 March 2007Accepted 23 September 2008Keywords:
The amplitude spectrum of gset is normally concentratedGPR wavelet. Where variounecessary to acquire severacomplete understanding of
Ground penetrating radarCompositeFrequencyBandwidthResolutionDeconvolution
the subsurface is obtained when those frequency-limited radargrams are jointlyinterpreted, since each frequency yields a particular response to subsurface reflectivity. The application ofdeconvolution to GPR data could improve image quality, but is often hindered by limited spectral bandwidth.We present multiple-frequency compositing as a means of combining data from several frequency-limiteddatasets and improving the spectral bandwidth of the GPR profile. A multiple-frequency composite is built bysumming together a number of spatially-coincident radargrams, each acquired with antennae of different
round penetrating radar (GPR) reflection data acquired with a particular antennaover a spectral bandwidth of a single octave, limiting the resolving power of thesly-sized GPR targets are located at numerous depths in the ground, it is oftenl profiles of GPR data using antennas of different nominal frequencies. The most
centre frequency. The goal of the compositing process is therefore to produce a composite radargram withbalanced contributions from frequency-limited radargrams and obtain a compositewavelet that has propertiesapproximating a delta function (i.e. short in duration and having a broad, uniform spectral bandwidth).A synthetic investigation of the compositing process was performed using Berlage wavelets as proxies for GPRsource pulses. This investigation suggests that a balanced, broad bandwidth, effective source pulse is obtainedbya compositing process that equalises the spectralmaxima of frequency-limitedwavelets prior to summationinto the composite. The compositing of real GPR data was examined using a set of 225, 450 and 900 MHz GPRcommon offset profiles acquired at a site on the Waterloo Moraine in Ontario, Canada. The most successfulcompositing strategy involved derivation of scaling factors from a time-variant least squares analysis of theamplitude spectra of each frequency-limited dataset. Contributions to the composite from each nominalacquisition frequency are clear, and the trace averaged amplitude spectrum of the corresponding composite isbroadened uniformly over a bandwidth approaching two-octaves. Improvements to wavelet resolution areclear when a composite radargram is treated with a spiking deconvolution algorithm. Such improvementsuggests that multiple-frequency compositing is a useful imaging tool, and a promising foundation forimproving deconvolution of GPR data.
© 2008 Elsevier B.V. All rights reserved.
1. Introduction
Ground penetrating radar (GPR) imaging is performed over a widerange of frequencies (i.e., 10 MHz to over 1 GHz). However, thefrequency content of a set of profiling data is determined by thenominal antenna frequency used in the survey. This frequency contentcontrols both the depth penetration of the GPR wavelet and thetemporal and spatial resolution (Sheriff and Geldart, 1999; Grasmuecket al., 2006) of the resulting GPR image; hence the choice of antennafrequency is a fundamental parameter in survey design. Where there
th),swansea.ac.uk (T. Murray).
l rights reserved.
are variously-sized targets, to be imaged at a range of depths, it may benecessary to acquire multiple GPR datasets with different antennafrequencies. This approach would normally require separate inter-pretations of radargrams for each antenna frequency, correlatingevents between profiles. If frequency-limited datasets are spatiallycoincident (i.e., traces are recorded with antennae at the same surfacelocations), a more comprehensive interpretation can be obtained ifthose datasets are summed into a single dataset; the process ofsumming these frequency-limited radargrams is referred to as multi-ple-frequency compositing (Endres et al., 2004).
The compositing process is a possible means both for presentingseveral frequency-limited radargrams in the same dataset, and also forbroadening the spectral bandwidth of a GPRwavelet. Generally, a two-octave bandwidth is considered a minimum requirement for good

89A.D. Booth et al. / Journal of Applied Geophysics 67 (2009) 88–97
resolving power (Kallweit and Wood, 1982). However, a radiated GPRwavelet typically has a one-octave bandwidth, centred about thenominal frequency of the specific antenna set (Annan, 2005). Thisbandwidth may be reduced on propagation, which further decreasesthe resolving power of the wavelet.
Limited bandwidth is also detrimental to the application ofprocessing algorithms such as deconvolution. Deconvolution is aroutine process for seismic datasets, and is robust for that applicationbecause of the broad bandwidth of the seismic wavelet (Yilmaz,2001); in contrast, deconvolution algorithms generally provide littleimprovement to image quality when applied to GPR data (Annan,2005). Application of deconvolution is complicated further by themixed-phase character of the GPR wavelet, and its non-stationaritywithin a dataset (e.g. Turner, 1994). Although it does not compensatefor phase or issues of non-stationarity, multiple-frequency composit-ing nonetheless provides a significant step towards broadening thespectral bandwidth of a GPR dataset (Malagodi et al., 1996).
Currently, there exist few published studies (Dougherty et al.,1994; Malagodi et al., 1996) on the use of the multiple-frequencycompositing process for GPR profiling data. These papers do notexamine the details of the compositing process, and their compositeradargrams generally show only marginal improvement due todominance of the lowest frequency dataset. This paper presents amore comprehensive study of both the theoretical and practicalaspects of multiple-frequency compositing, exploring more fully thepotential enhancement to a GPR dataset that can be achieved onimplementation of the technique. We demonstrate that propercompositing of several frequency-limited components can broadenthe spectral bandwidth of GPR data towards the two octave goal.
2. Synthetic analysis of multiple frequency compositing
A synthetic analysis of the compositing process was performed byexamining the results obtained from the summation of idealised GPR
Fig. 1. Synthetic GPR source wavelets for the synthetic investigation of multiple-frequencyBerlage wavelets in (A). Even though the Berlage wavelets have identical maximum abproportionally greater energy associated with longer-period wavelets.
source wavelets. The GPR sourcewavelet is represented by the Berlagewavelet (Aldridge, 1990), given by the equation:
w tð Þ = Atne−αtcos 2πf0t +/0ð ÞH tð Þ ð1ÞwhereH(t) is the Heaviside step function (i.e.,H(t)=0 for t≤0 andH(t)=1for tN0). The parameters f0 and ϕ0 are the dominant frequency andinitial phase angle, respectively, of the wavelet. The time amplitudeenvelope is defined by the time exponent n and the exponential decayfactor α. The Fourier transform of the Berlage wavelet is given by:
W fð Þ = AC n + 1ð Þ2 i2πð Þn + 1
e + i/0
f−F1ð Þn + 1 −e−iϕ0
f−F2ð Þn + 1
" #ð2aÞ
where
F1 = + f0 + i α=2πð Þ ð2bÞand
F2 = −f0 + i α=2πð Þ: ð2cÞ
The amplitude spectrum of W(f) has a single peak located near f0;the peak width is directly related to α.
Eq. (1) was used to simulate three GPR source wavelets havingdominant frequencies of 225, 450 and 900 MHz, with Eq. (2a) used toproduce amplitude spectra (Fig. 1). For all three wavelets, values ofn=2 and ϕ0=0 were used; A and α were selected such that theBerlage wavelets produced are time-scaled versions of each other.Amplitude spectra were normalised by the maximum value in the225 MHz spectrum. The peak magnitudes of the amplitude spectradecrease with wavelet frequency (Fig. 1) due to shorter waveletduration and the resultant reduction in total signal energy. Thisbehaviour indicates that wavelet amplitudes that are balanced in thetime-domain will not produce equivalently balanced spectralamplitudes.
compositing. A) 225, 400 and 900 MHz Berlage wavelets. B) Amplitude spectra of thesolute amplitude, spectral maxima decrease with increasing frequency due to the

90 A.D. Booth et al. / Journal of Applied Geophysics 67 (2009) 88–97
The principal aim of multiple-frequency compositing is to create acomposite GPR wavelet that approximates a delta function. The timedomain expression of this composite should have a short duration,high amplitude main peak with minimal sidelobe energy. In thefrequency domain, the amplitude spectrum of this composite waveletshould have a bandwidth that is broad and uniform. We examined anumber of potential methods for achieving these objectives,specifically:
a) simple summation, as applied by Dougherty et al. (1994), whereindividual wavelets are just added together,
b) scaled summation, inwhich the maximum amplitude of individualamplitude spectra are equalised prior to summation, and
c) scaled summation of synchronised wavelets, in which the max-imum absolute amplitudes of wavelets are synchronised by theapplication of time-shifts prior to the scaling amplitude spectraand summation.
Composite wavelets and corresponding amplitude spectra result-ing from these three methods are shown in Fig. 2. It should be notedthat the individual results shown in this figure have been normalisedto the maximum value of each composite wavelet and amplitudespectrum.
The simple composite wavelet (Fig. 2A) has a broad main peak, ofduration 1.67 ns, occurring at a time of 4.4 ns. Associated sidelobes arelarge, having amplitudes up to 78% of the main peak. The amplitudespectrum of this composite wavelet is dominated by the contributionfrom the 225 MHz signal, given the proportionally greater energyof this wavelet. This result shows that simple summation doesnot provide a composite wavelet with properties similar to a deltafunction.
Fig. 2. Wavelets and amplitude spectra resulting from different methods of composite constrdoes not resemble the properties of a delta function; sidelobe energy is significant (up to 78dominated by the 225 MHz wavelet. B) Composite wavelet and spectrum built from amplituwavelet peak is reduced, and the amplitude spectrum is balanced. C) Composite wavelet anenergy is greatly reduced, the duration of the main peak is reduced further, but the amplitu
Individual amplitude spectra may be equalised using multipliersderived from results given in Fig. 1B. The maximum amplitudes of the225, 450 and 900 MHz spectra are 1, 0.5 and 0.25, respectively;therefore, these spectra are equalised if the 225, 400 and 900 MHzBerlage wavelets are multiplied by factors of 1, 2 and 4, respectively,prior to compositing. Summing together these scaled waveletsproduces a composite wavelet (Fig. 2B) that resembles more closelya delta function. The duration of the main peak of the composite isreduced to 1.11 ns and its associated sidelobes have less than 30% ofthe main peak amplitude. The spectrum of this composite waveletshows significant energy at all input frequencies, indicating that thiscomposite wave has a broad and uniform bandwidth.
Synchronisation of Berlage wavelets was achieved by shifting the450 and 900 MHz wavelets by 2.22 and 3.33 ns, respectively, so thattheir main peaks were aligned with the dominant peak of the225 MHz wavelet. When combined with amplitude scaling, thistechniques improves further the composite wavelet; the main peakhas duration of 0.75 ns, and sidelobe energy is greatly reduced(Fig. 2C). The amplitude spectrum of this composite, however,contains several spectral notches that are not characteristic propertiesof a delta function. These may be problematic for of deconvolutionalgorithms (Sheriff and Geldart, 1999), which require that amplitudespectra have no near-zero values.
These modelling results show that simple summation of fre-quency-limited GPR energy is inappropriate for creating compositewavelets with delta function properties; omission of scaling yields acomposite radargram that is dominated by the low-frequency energy.This outcome explains the observation of Dougherty et al. (1994), whoobserved negligible high-frequency contribution to a composite builtusing simple summation. Scaling and synchronising the dominant
uction. A) Composite wavelet and spectrum built by simple summation. The composite% of the maximum absolute amplitude of the wavelet), and the amplitude spectrum isde-scaled component wavelets. Sidelobe energy is suppressed, the duration of the maind spectrum built from amplitude-scaled, synchronised component wavelets. Sidelobede spectrum contains several spectral notches.

91A.D. Booth et al. / Journal of Applied Geophysics 67 (2009) 88–97
peaks of wavelets produces a composite with the shortest durationand minimal sidelobes. However, the most uniform amplitudespectrum is obtained from a compositing strategy that involvesamplitude scaling alone.
Our synthetic analysis considered only isolated, idealised, GPRsource pulses to avoid the effects of wavelet interference. While few, ifany, direct observations of actual GPR source wavelets have beenreported, it is likely that the wavelets in field data are more complexthan those used in our analysis. However, it is reasonable to assumethat our basic synthetic results regarding compositing can be appliedto real GPR data. We therefore present a field example of multiple-frequency compositing to examine these ideas.
3. Field example of multi-frequency compositing
Composite radargrams were built from GPR reflection dataacquired at a site on the Waterloo Moraine west of Waterloo, Ontario,Canada, as part of a high-resolution stratigraphic study. Local geologyis described in detail by Karrow (1993). The near-surface at this site iscomposed of clean, well-graded medium-to-coarse grain sand; theseunits form variably-scaled channelised systems, indicative of deposi-tion in a glaciofluvial and/or subaquatic fan environment. The siteoffers good GPR depth penetration and multiple size scales ofstratigraphic bodies, providing targets for several sets of antennas.
Data were collected using a Sensors and Software pulseEKKO1000A system, equipped with a 200 V transmitter and bistaticantennas of centre-frequencies 225, 450 and 900MHz. Three commonoffset (CO) GPR profiles were obtained, using a fixed-offset of 0.5m foreach frequency set (note: this offset may contravene manufacturers'assembly instructions); the spatial step size for all acquisitions was0.02 m, and each profile was 2 m long. Common midpoint (CMP)gathers for each frequency were also obtained. These were located atthe centre of the profile line; the trace increment for these datasetswas also 0.02 m. For all datasets, the total recorded two-way traveltime (TWTT) was 100 ns with a temporal sampling interval of 100 ps;vertical stacking was set at 64.
When building a composite image of real GPR data from severalfrequency-limited radargrams, construction may be split into twophases:
a) frequency-limited radargrams are pre-processed independently(according to the processing flow in Table 1), then
b) component radargrams are amplitude scaled and summed toproduce the composite radargram.
All data are pre-processed using the Sandmeier Software packageReflexW, with spectral analyses and compositing performed usingMathworks Matlab. Processed 225, 450 and 900 MHz data are shownin Fig. 3Ai, Bi and Ci, respectively. It should be noted that theprocessing flow includes automatic gain control (AGC). Although AGCcan introduce windowing artefacts close to the direct airwave,amplitudes in this region of the radargram are muted later in theprocessing sequence (see later discussion). If windowing artefacts aredeemed to be problematic, an energy decay curve could be defined asan alternative to gaining amplitudes (e.g. Booth et al., 2008).
Up to four prominent, sub-horizontal reflections are identified inthe radargrams at TWTT of ≈15, 20, 30 and 50 ns (solid lines, labelled
Table 1Processing parameters for component radargrams, applied prior to amplitude scaling and s
Nominal acquisition frequency
Process 225 MHz 450 MHDewow filter DC removal: window length=4.4 ns DC remOrmsby bandpass filter Corner frequencies 50-100-250-500 MHz Corner fAutomatic gain control Window length=15 ns WindowFirst break alignment Static shift=−16.0 ns Static sh
①→④ respectively). Between these reflections are a series oflenticular events, which climb from left-to-right across the radargram(dashed lines). For the lower-resolution 225MHz component, only the50 ns reflection is clearly defined and the lenticular bedding appearsonly as a disruption to the lateral continuity of reflections. Radargramsevidence the channelised subsurface expected at this site; theprominent reflectors are interpreted as unconformity surfacesbetween periods of deposition, and the lenticular bodies as in-filledchannels within those depositional packages.
Spectral properties of the 225, 450 and 900 MHz radargrams areshown in panels ii and iii of Fig. 3A, B and C. In ii, spectra are averagedboth in time and space; in iii, the spectra are space-averaged but arecalculated within windows of 10 ns duration such that the changingspectral content of the radargram with propagation distance can beconsidered. The frequency content in the 225MHz dataset is relativelyconstant with TWTT, but is significantly reduced at TWTTgreater than30 ns in the 900 MHz dataset. Given the duration of our analysiswindow, the lowest frequency that can be reliably analysed is100 MHz; we do not consider this to alter significantly our resultssince the vast majority of signal energy occurs above this threshold.Each spectrum is obtained from a 1024-point Fourier transform, and isdisplayed up to a useful upper-limit of 1250 MHz.
We have elected to omit time-shifting from our compositeconstruction, other than to align the first-break of each trace at 0 ns(static shift shown in Table 1). In practice, it is difficult to obtainappropriate dynamic time-shifts since individual wavelets would haveto be isolated, and this is often difficult. We could avoid this problemby processing wavelets to zero-phase; however, as was shown in oursynthetic analysis, weighting alone of individual radargrams canproduce a good quality composite GPR wavelet. Further, the applica-tion of dynamic time-shifts may distort the image of subsurfacereflectivity. We therefore follow a compositing strategy that considersonly the means by which the amplitudes within individual radar-grams are weighted prior to summation.
Weighting factors were determined by considering the spectralamplitudes of individual radargrams prior to compositing. Thefollowing two strategies were developed for estimating the weightingfactors for amplitude scaling:
a) Weighting factors are the multipliers required to equalise themaximum amplitude within the trace-averaged amplitude spectraof component radargrams as performed in our synthetic analysis;this operation is referred to as dominant frequency amplitudeequalisation (DFAE).
b) Weighting factors are the output from a least-squares analysis thatattempts to match the composite amplitude spectrum to someoptimal amplitude spectrum, given a series of input componentspectra; this operation is referred to as optimal spectral whitening(OSW). Scaling factors for the OSW are calculated for fixed-duration windows of the component data such that, unlike theDFAE operation, OSW scalars are time-variant.
Although the DFAE approach is simple to apply, it has thedisadvantage that the dominant frequency within a dataset may notadequately characterise the distribution of useful signal energy, sincethe spectrum of a GPR wavelet may not be symmetrical (e.g. comparethe spectra of synthetic pulses to that of the 900 MHz radargram). A
ummation
z 900 MHzoval window length=2.2 ns DC removal window length=1.1 nsrequencies 75-150-450-900 MHz Corner frequencies 200-400-900-1800 MHzlength=10 ns Window length=10 nsift=−17.4 ns Static shift=−18.2 ns

Fig. 3. Frequency-limited datasets, processed for trials of compositing. Data are acquired with antennas that have nominal centre frequencies of A) 225 MHz, B) 450 MHz andC) 900 MHz, respectively. For each dataset, panel i shows the processed radargram (processed using the flow in Table 1), panel ii shows its average amplitude spectrum and panel iiishows the time-variant amplitude spectrum. Events ①–④ are interpreted as unconformity surfaces, with lenticular bedding between.
92 A.D. Booth et al. / Journal of Applied Geophysics 67 (2009) 88–97
more balanced set of weighting factors is obtained from OSWanalysisas it considers the distribution of energy across the entire usefulfrequency range of the component radargrams.
Application of OSW requires the derivation of frequency-variantweighting functions. We adopted a standard least-squares approach,considering the magnitude of M amplitude spectra (possibly trace-averaged, where the subsurface is laterally homogeneous) at Nfrequencies, up to a chosen upper limit; this results in the followingover-determined linear system:
Aw =
Am1f1
Am2f1
: : : AmMf1
Am1f2
Am2f2
: : : AmMf2
v v v vAm1fN
Am2fN
: : : AmMfN
26664
37775
wm1
wm2
vwmM
2664
3775 =
sf1sf2vsfN
2664
3775 = s ð3Þ
where AfM is the spectral amplitude at f MHz of the Mth frequency-
limited dataset, wm is the weighting for the mth component data setand sf is the desired spectral amplitude at f MHz of the compositeradargram. For a flat amplitude spectrum, identical values of sf should
be used (i.e., sfi=constant). The weightings are then obtained from thestandard least squares solution:
w = ATA� �
AT s: ð4Þ
A time-variant weighting function was obtained by repeating theOSW for all analysis time windows down the GPR reflection profile.
To perform robust frequency analysis, the duration of each timewindow should be greater than the longest wavelet period to besampled. Given that the dominant period of the 225 MHz energy isvirtually unchanged at all TWTT, the duration of this window wasfixed at 10 ns; time-variant windows could be used for variabledominant period. To avoid amplitude steps across successive analysiswindows, weightings were scaled by the RMS amplitude within eachwindow of the frequency-limited radargrams; the weighting functionwas then smoothed by linearly interpolating between windowcentres. Since OSW is able to consider the changing frequency contentof the component radargrams with increasing TWTT, the broadest-
93A.D. Booth et al. / Journal of Applied Geophysics 67 (2009) 88–97
bandwidth composite data are expected when this method ofamplitude scaling is employed.
The construction of composites considers spectral amplitudes ofbody-wave energy (i.e. reflected energy), hence spectra may bedistorted if direct wave energy (i.e. air- and ground-waves) is includedin analyses. The solution to the electromagnetic wave equation
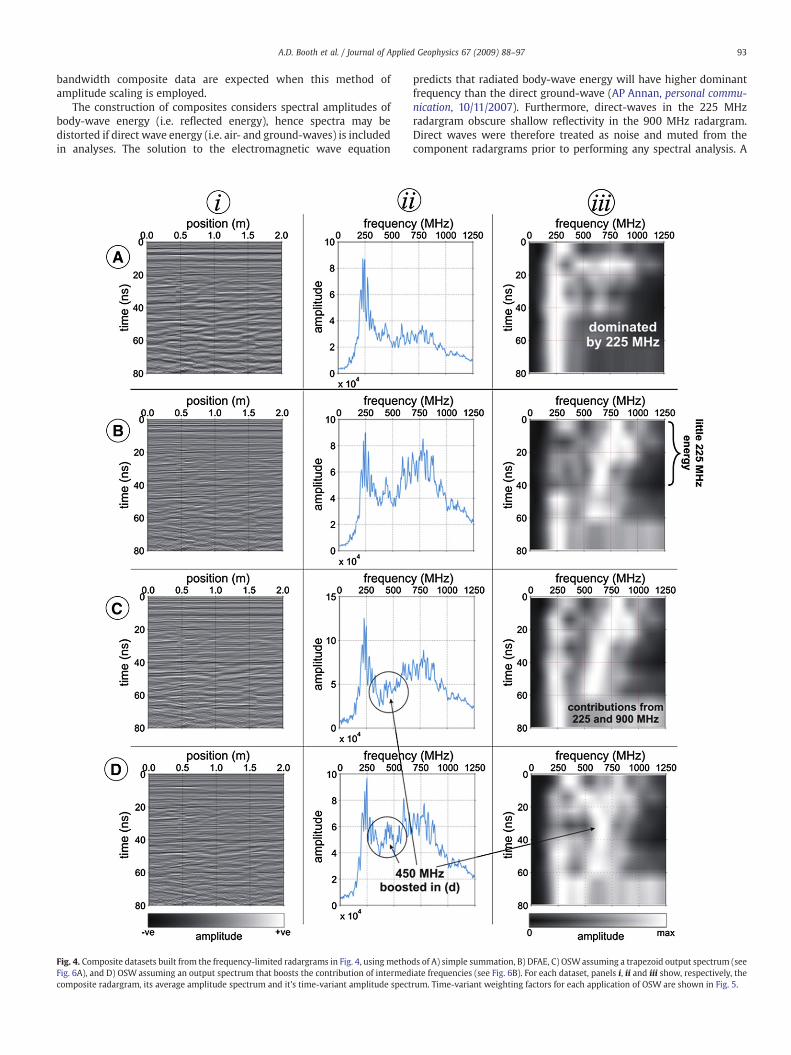
Fig. 4. Composite datasets built from the frequency-limited radargrams in Fig. 4, using methoFig. 6A), and D) OSW assuming an output spectrum that boosts the contribution of intermedcomposite radargram, its average amplitude spectrum and it's time-variant amplitude spect
predicts that radiated body-wave energy will have higher dominantfrequency than the direct ground-wave (AP Annan, personal commu-nication, 10/11/2007). Furthermore, direct-waves in the 225 MHzradargram obscure shallow reflectivity in the 900 MHz radargram.Direct waves were therefore treated as noise and muted from thecomponent radargrams prior to performing any spectral analysis. A
ds of A) simple summation, B) DFAE, C) OSWassuming a trapezoid output spectrum (seeiate frequencies (see Fig. 6B). For each dataset, panels i, ii and iii show, respectively, therum. Time-variant weighting factors for each application of OSW are shown in Fig. 5.

Fig. 6. Idealised output spectra for the application of OSW methods in Fig. 4.A) Trapezoid spectrum, used for the first application of OSW (4c). Spectral amplitude isuniform (=1) across a 190–1100 MHz bandwidth; outside of this range, amplitude isramped linearly to 0. The total bandwidth of the output spectrum is 0–1250 MHz.B) Output spectrum for the second application of OSW (4d), designed to boost thecontribution of intermediate frequencies contained in the 450 MHz data set. Thespectrum is equivalent to (a), but there is greater contribution of frequencies between380 and 580MHz; the amplitude in this bandwidth is set arbitrarily to 1.7 (i.e. 170% of itsamplitude in (a)).
94 A.D. Booth et al. / Journal of Applied Geophysics 67 (2009) 88–97
top-mute was defined, based on inspection of frequency-limited CMPgathers; data were muted in the 225 and 450 MHz radargrams, up torespective times of 18∙8 and 8∙8 ns. To prevent ringing in spectralanalysis, the mute was ramped such that signal power increased from0% at 0 ns to 100% at the mute time and was constant thereafter.
Composite radargrams and their amplitude spectra are shown inFig. 4; rows a, b, and c show composites built using simple summation(i.e., the composite of unweighted components), DFAE and OSWmethods, respectively. In each method, panels i, ii and iii show thecomposite radargram, its trace-averaged amplitude spectrum and thetime-variant amplitude spectrum. The time-variant spectral weight-ing function for the OSW is shown in Fig. 5A. The optimal chosenspectrum for the OSW spans a bandwidth from 0 to 1250 MHz (in1025 regularly-spaced frequency intervals); this optimal spectrum istrapezoidal in form, having uniform amplitude across the frequencyrange 190 to 1100 MHz with linear ramps outside of this bandwidth.This bandwidth is chosen from analysis of the range of usefulfrequencies in raw spectra. The optimal output spectrum is shownin Fig. 6A.
4. Comparison of compositing strategies
Our synthetic analyses of GPR compositing suggested that theamplitudes within component radargramsmust be scaled to compen-sate for the proportionally lower signal energy within higher-frequency acquisitions. Where such scaling is omitted from thecompositing routine and a ‘simple summation’ strategy is employed,the composite radargram is dominated by energy from the lowest-frequency acquisition. This is also observed for our real-data case; thesimple composite radargram (Fig. 4Ai) and spectra (Fig. 4Aii and iii) aredominated by energy from the 225 MHz component.
The DFAE approach to compositing (Fig. 4B) boosts the contribu-tion to the composite of high frequency energy; hence, the averagespectral properties appear much improved (4Bii). Weighting factorsfor this operation are 1.00, 1.55 and 1.94, respectively, for the 225, 450and 900 MHz radargrams. However, when spectral properties areassessed within TWTT gates (4biii), it is clear that the bandwidth of
Fig. 5. Time-variant weighting factors for the application of OSW, assuming A) atrapezoid output spectrum (see Fig. 6A) and B) an output spectrum that boosts thecontribution of intermediate frequencies. Notice that the contribution to the compositeof the 450 MHz dataset is boosted in (B).
the composite radargram changes rapidly with depth. In particular,the contribution to the composite of the 225 and 450 MHzcomponents is negligible at TWTT less than 50 ns (evident in 4biii)The deepest unconformity surface (around 50 ns TWTT) is not easilyobserved across the whole length of the radargram, particularly forpositions greater than 1 m. At TWTT greater than 50 ns, the 225 MHzcomponent is dominant. The shortcomings of this composite areattributed to the inability of the DFAE to consider the changingspectral content of component data with depth.
When built with the OSW method, the composite radargram(Fig. 4Ci) has significant contributions from high and low-frequenciesat all TWTT. These contributions improve the resolution of lenticularbedding, particularly between TWTT of 30–50 ns. Amplitude spectra(Fig. 4Cii and iii) also show strong contributions to the composite from225 and 900 MHz energy at all TWTT. The additional computationaleffort in deriving weighting factors for the OSW therefore appearsjustified, as the amplitude spectrum output from this operation issuperior to that from the DFAE.
While the previous scaling methods produced composite radar-grams with broadened spectral bandwidth, none appear able to boostsignificantly the contribution of the 450 MHz radargram to thecomposite profile. Even for the time-variant OSW, where significantcontribution from both 225 and 900 MHz components is obtained atall TWTT, there is no spectral peak corresponding to the frequencycontent of the 450MHz radargram. Omission of these frequenciesmaycreate a spectral notch that could be problematic for the application ofdeconvolution.
The apparent suppression of the 450 MHz component is attributedto the overlap at intermediate frequencies of component amplitude
95A.D. Booth et al. / Journal of Applied Geophysics 67 (2009) 88–97
spectra. For example, the dominant frequency of the 450 MHzcomponent at TWTT≈35 ns is within the bandwidth of the900 MHz component. This can be seen in Fig. 3 where the spectrafor both components have significant energy at ≈470MHz.While bothcomponents can potentially contribute energy to the composite at470 MHz, only the 900 MHz component can contribute energy ofhigher frequency. Multipliers derived from OSW are therefore biasedtowards the 900 MHz component. This bias is observed in Fig. 5A; forthe 30–40 ns time gate, the weighting factor for the 900 MHzcomponent is some 5×greater than that for the 450 MHz component.
A potential means of boosting the contribution of the 450 MHzcomponent to the composite is tomodify the optimal spectrum for thetime-variant OSW, forcing stronger contributions from these inter-mediate frequencies. For the initial OSW analysis, the optimalspectrum was uniform over frequency range 190–1100 MHz(Fig. 6A). To boost the contribution of the 450 MHz acquisition, theoptimal spectrum used in the OSW process specifies a greatercontribution (chosen arbitrarily at 170% of the initial contribution)from a frequency range 380–580 MHz; this modified optimalamplitude spectrum is shown in Fig. 6B. The resulting weightingfunction is shown in Fig. 5B, for comparisonwith the original function.There is little difference between theweighting factors for the 225 and900 MHz components, but those of the 450 MHz component areboosted for all TWTT.
The composite profile and its spectral analyses obtained from themodified OSW technique are shown in Fig. 4D. Both the average and
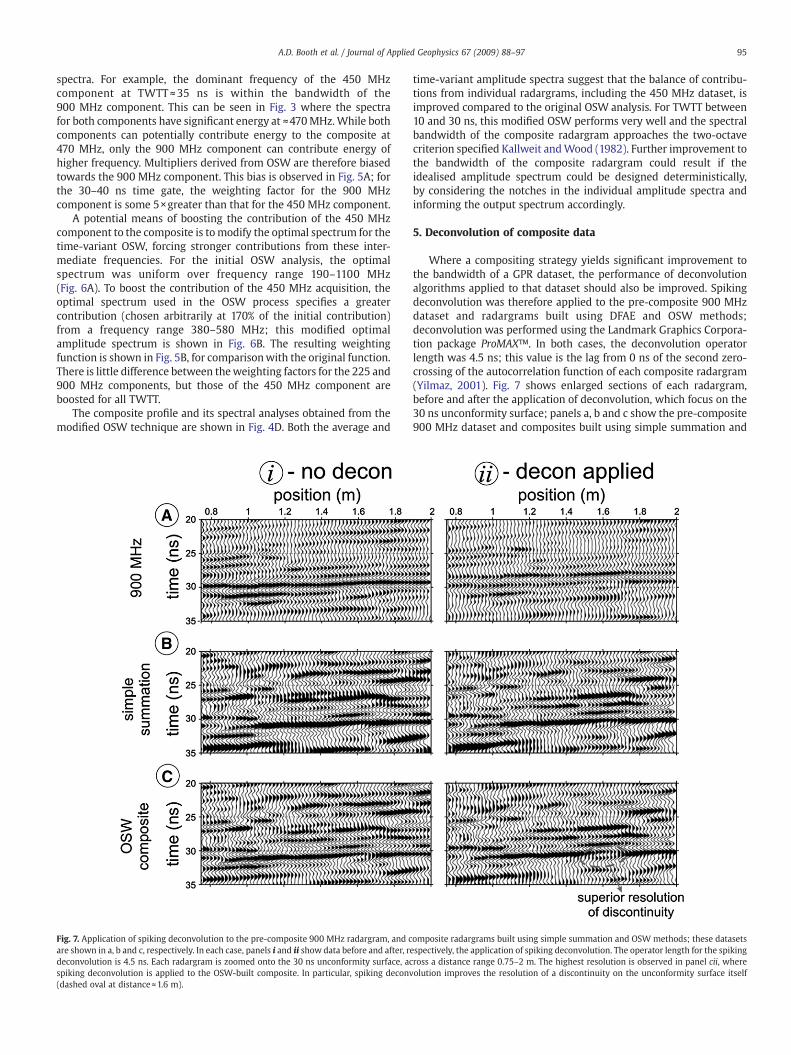
Fig. 7. Application of spiking deconvolution to the pre-composite 900 MHz radargram, and care shown in a, b and c, respectively. In each case, panels i and ii show data before and after, redeconvolution is 4.5 ns. Each radargram is zoomed onto the 30 ns unconformity surface, acspiking deconvolution is applied to the OSW-built composite. In particular, spiking deconv(dashed oval at distance≈1.6 m).
time-variant amplitude spectra suggest that the balance of contribu-tions from individual radargrams, including the 450 MHz dataset, isimproved compared to the original OSW analysis. For TWTT between10 and 30 ns, this modified OSW performs very well and the spectralbandwidth of the composite radargram approaches the two-octavecriterion specified Kallweit andWood (1982). Further improvement tothe bandwidth of the composite radargram could result if theidealised amplitude spectrum could be designed deterministically,by considering the notches in the individual amplitude spectra andinforming the output spectrum accordingly.
5. Deconvolution of composite data
Where a compositing strategy yields significant improvement tothe bandwidth of a GPR dataset, the performance of deconvolutionalgorithms applied to that dataset should also be improved. Spikingdeconvolution was therefore applied to the pre-composite 900 MHzdataset and radargrams built using DFAE and OSW methods;deconvolution was performed using the Landmark Graphics Corpora-tion package ProMAX™. In both cases, the deconvolution operatorlength was 4.5 ns; this value is the lag from 0 ns of the second zero-crossing of the autocorrelation function of each composite radargram(Yilmaz, 2001). Fig. 7 shows enlarged sections of each radargram,before and after the application of deconvolution, which focus on the30 ns unconformity surface; panels a, b and c show the pre-composite900 MHz dataset and composites built using simple summation and
omposite radargrams built using simple summation and OSW methods; these datasetsspectively, the application of spiking deconvolution. The operator length for the spikingross a distance range 0.75–2 m. The highest resolution is observed in panel cii, whereolution improves the resolution of a discontinuity on the unconformity surface itself

96 A.D. Booth et al. / Journal of Applied Geophysics 67 (2009) 88–97
OSW methods, respectively. This time window is chosen since itcorresponds to the greatest spectral enhancement by the OSWmethod in Fig. 4Diii. In each case, the application of spikingdeconvolution improves the resolution in the radargram particularlywith regard to a discontinuity on the unconformity surface itself(dashed oval in 7cii). The resolution of the subsurface is greatestwhere deconvolution is applied to the OSW-built composite radar-gram (panel c); however, there is greater relative improvement whenthe composite built using simple summation is deconvolved. This isexpected given that an aim of spiking deconvolution is to balance theamplitude spectrum of an input signal; the spectrum of the OSWcomposite is more balanced than that built using simple summation;hence there is greater improvement to the latter dataset.
Although these images require verification through boreholeinvestigation, the deconvolution trials appear to provide promisinginitial results. Our deconvolution does not consider the non-stationarity of the GPR wavelet, which could be significant for the900 MHz dataset. In further research, the frequency content of GPRwavelets could be restored prior to compositing by the application ofinverse Q⁎ filters (e.g. Turner, 1994); the time-variant spectra fromwhich we derive OSW weighting factors could be used to facilitatesuch operation.
While considering advanced processing, it is worthmentioning theomission of migration as a pre- or post-compositing operation.Although its application could improve the lateral resolution in thecomposite (Lindsey, 1989), a larger migration aperture is required forthis dataset than was allowed by our profile length (2 m). It should benoted, however, that the shortness of our profiles does not impact onthe application of compositing since it is a single-trace algorithm thatdoes not consider lateral trends in a dataset.
6. Discussion: applicability and limitations of compositing
The value of the compositing method can be considered either interms of the quality of the output image it produces or the potentialfor further processing it provides. If the principal goal of compositingis to improve image quality, our field example suggests that it is auseful method to employ; frequency-limited datasets have beencombined into a composite radargram that shows balanced contribu-tions from each input dataset. The compositing method is generallyapplicable to any GPR datasets, provided that traces of the frequency-limited radargrams are spatially coincident. This requirement isfulfilled easily with bistatic antennas that are not fixed within someprefabricated housing (e.g. in this study), or with monostaticantennas; for systems with fixed antennas, zero-offset traces can besimulated prior to compositing by the application of normal moveout(NMO) corrections if a velocity model is available. Fixed-offsetantennas typically conserve field-effort since they are typicallyattached to odometer wheels; as such, NMO corrections may berequired in most cases.
Although our study suggests that spiking deconvolution isimproved after construction of the composite, in the absence ofground-truth data it is difficult to judge the reliability of thisimprovement. As such, we acknowledge that compositing is only afirst-step towards enabling extended data processing (e.g. deconvolu-tion) and there are several aspects of the method that could beenhanced. One such aspect concerns the summation of datasets,without having first synchronised wavelet peaks. If the first-breaks ofwavelets are assumed to be coincident, their successive half-cyclesmay destructively interfere; this may degrade the signal-to-noise ratioin the composite radargram and introduce notches into its amplitudespectrum. Althoughwemake no consideration of phase spectra in thisstudy, a possible avenue of improvement would be to examine therotation to zero-phase of each frequency-limited GPR dataset.
We must also consider the possibility that the arrival time of thereflection events may not be synchronised if there is significant
velocity dispersion (e.g. Irving and Knight, 2003). Although dispersioneffects are negligible across the bandwidth used in this field study,they may be significant for studies using lower-frequency antennas.For example, our earlier work on compositing (Endres et al., 2004)considered GPR data acquired over an attenuative (clay-rich) glacialoutwash deposit using antennas of nominal frequencies 25, 50, 100and 200 MHz. Of greater significance than velocity dispersion in thatcase was the increased attenuation of the 200 MHz dataset; thisradargram could only contribute noise amplitudes to the composite atlater TWTT. Our experience to date suggests that compositing is mostsuitable for radargrams acquired in low loss settings.
7. Conclusions
In this paper, we have examined the summation of individualfrequency-limited CO profiles into a multiple-frequency compositeradargram. A successful compositing routine produces compositeradargrams that a) show balanced contributions from the frequency-limited datasets from which they are constructed, and b) containwavelets with broadened amplitude spectra, approaching the char-acteristics of a delta function. The compositing process may thereforebe considered both as an imaging tool and ameans of pre-conditioningdata prior to the application of further processes (e.g. deconvolution).
Our synthetic and field examples suggest that a simple summationof input data yields a composite radargram that is dominated by thelowest-frequency dataset. Amplitudes of input datasets should there-fore be scaled prior to summation;we recommend that this is achievedby considering a least squares optimisation of the match between theamplitude spectra of frequency-limited datasets and some idealisedcomposite amplitude spectrum. For the purposes of imaging, compo-siting provides a balanced composite radargram that shows contribu-tions from all input datasets. For facilitating deconvolution, thecompositing method provides a useful foundation but would benefitfrom further study; OSW methods can benefit the application ofspiking deconvolution, but the optimal output spectrum had to becarefully ‘fine-tuned’ in order to achieve the desired results. Currently,our pre-processing method serves only to boost signal amplitudes inthe input radargrams, but no consideration is yet given to potentiallyuseful zero-phase or phase-shifting algorithms.We therefore concludethat multiple-frequency compositing is a useful tool for joint-interpretation of frequency-limited datasets, and provides a usefuldevelopment to improving the deconvolution of radargrams.
Acknowledgments
The authors thank Colby Steelman for his assistance in the dataacquisition, and Roger Clark for his input during the development ofthe compositing method and the preparation of this manuscript. Thiswork was supported by an Individual Discovery Grant to Dr. Endresfrom the Natural Sciences and Engineering Research Council ofCanada. Adam Booth received support from the UK Natural Environ-mental Research Council for advanced study at the University of Leedsin MSc Exploration Geophysics. Additional funding was obtained fromthe Department of Canadian Studies at the University of Leeds. Weacknowledge the provision of ProMAX™ software by LandmarkGraphics Corporation via the Landmark University Grant Program,Agreement 2004-COM-024982 with the University of Leeds, UK.The comments of two anonymous reviewers greatly improved ourmanuscript.
References
Aldridge, D.F., 1990. The Berlage wavelet. Geophysics 55, 1508–1511 (Errata, vol. 56,pp. 323, 1991).
Annan, A.P., 2005. Ground-penetrating radar. In: Butler, D.K. (Ed.), Near SurfaceGeophysics. Society of Exploration Geophysics, Tulsa, OK, pp. 357–438.
Annan, A.P. Personal e-mail correspondence to A.L. Endres. Dated 10/11/2007.

97A.D. Booth et al. / Journal of Applied Geophysics 67 (2009) 88–97
Booth, A.D., Linford, N.T., Clark, R.A., Murray, T., 2008. Three-dimensional, multi-offsetground-penetrating radar imaging of archaeological targets. Archaeological Pro-spection 15, 93–112, doi:10.1002/arp.327.
Endres, A.L., Booth, A.D., Murray, T., 2004. Multi-frequency compositing of spatiallycoincident GPR datasets. Proceedings of the 10th International Conference onGround Penetrating Radar, pp. 271–274.
Dougherty, M.E., Michaels, P., Pelton, J.R., Liberty, L.M., 1994. Enhancement of groundpenetrating radar data through signal processing. Proceedings of the Symposiumon the Application of Geophysics to Engineering and Environmental Problems,pp. 1021–1028.
Grasmueck, M., Weger, R., Horstmeyer, H., 2006. Full-resolution 3D GPR imaging.Geophysics 70 (1), K12–K19.
Irving, J., Knight, R., 2003. Removal of wavelet dispersion from ground-penetratingradar data. Geophysics 68, 960–970.
Karrow, P.F., 1993. Quaternary geology Stratford-Conestogo area. Ontario GeologicalSurvey Report 283.
Kallweit, R.S., Wood, L.C., 1982. The limits of resolution of zero-phase wavelets.Geophysics 48 (7), 1035–1046.
Lindsey, J.P., 1989. The Fresnel zone and its interpretive significance. The Leading Edge,October 1989, pp. 33–39.
Malagodi, S., Orlando, L., Piro, S., 1996. Approaches to increase resolution of radarsignal. Proceedings of the 6th International Conference on Ground PenetratingRadar, pp. 283–288.
Sheriff, R.E., Geldart, L.P., 1999. Exploration Seismology, 2nd ed. Cambridge UniversityPress.
Turner, G., 1994. Subsurface radar propagation deconvolution. Geophysics 59, 215–223.Yilmaz, O., 2001. Seismic Data Processing. Society of Exploration Geophysicists, Tulsa
OK.