
A Focus on GPR and InSAR Me - Research Square
56
Non-Destructive Technologies for a Sustainable Assessment and Monitoring of Railway Infrastructures: A Focus on GPR and InSAR Methods Chiara Ferrante ( [email protected] ) Roma Tre University: Universita degli Studi Roma Tre https://orcid.org/0000-0001-8294-634X Luca Bianchini Ciampoli Roma Tre University: Universita degli Studi Roma Tre Andrea Benedetto Roma Tre University: Universita degli Studi Roma Tre Amir M. Alani University of West London Fabio Tosti University of West London Research Article Keywords: Railway Infrastructures, Sustainable Assessment and Monitoring, Non-Destructive Testing, Ground Penetrating Radar (GPR), Interferometric Synthetic Aperture Radar (InSAR) Posted Date: February 19th, 2021 DOI: https://doi.org/10.21203/rs.3.rs-216510/v1 License: This work is licensed under a Creative Commons Attribution 4.0 International License. Read Full License Version of Record: A version of this preprint was published at Environmental Earth Sciences on November 27th, 2021. See the published version at https://doi.org/10.1007/s12665-021-10068-z.
-
Upload
khangminh22 -
Category
Documents
-
view
0 -
download
0
Transcript of A Focus on GPR and InSAR Me - Research Square

Non-Destructive Technologies for a SustainableAssessment and Monitoring of RailwayInfrastructures: A Focus on GPR and InSARMethodsChiara Ferrante ( [email protected] )
Roma Tre University: Universita degli Studi Roma Tre https://orcid.org/0000-0001-8294-634XLuca Bianchini Ciampoli
Roma Tre University: Universita degli Studi Roma TreAndrea Benedetto
Roma Tre University: Universita degli Studi Roma TreAmir M. Alani
University of West LondonFabio Tosti
University of West London
Research Article
Keywords: Railway Infrastructures, Sustainable Assessment and Monitoring, Non-Destructive Testing,Ground Penetrating Radar (GPR), Interferometric Synthetic Aperture Radar (InSAR)
Posted Date: February 19th, 2021
DOI: https://doi.org/10.21203/rs.3.rs-216510/v1
License: This work is licensed under a Creative Commons Attribution 4.0 International License. Read Full License
Version of Record: A version of this preprint was published at Environmental Earth Sciences on November27th, 2021. See the published version at https://doi.org/10.1007/s12665-021-10068-z.

Non-destructive Technologies for a Sustainable Assessment and Monitoring of Railway Infrastructures: a
Focus on GPR and InSAR Methods
Chiara Ferrante1*, Luca Bianchini Ciampoli1, Andrea Benedetto1, Amir M. Alani2 and Fabio Tosti2
1Department of Engineering, Roma Tre University, Via Vito Volterra 62, 00146, Rome, Italy
e-mail: [email protected] (*Corresponding author); [email protected];
2School of Computing and Engineering, University of West London (UWL), St Mary's Road, Ealing, London
W5 5RF, UK
e-mail: [email protected]; [email protected]
Health monitoring of ballast in railway infrastructures is crucial to assure structural stability and efficiency of
the operations. To this extent, an efficient and sustainable management of maintenance is fundamental for asset
managers in setting up strategic and effective action plans.
Amongst the available methods to assess the conditions of railway infrastructures, non-destructive
technologies (NDT) are gaining popularity due to their capability to overcome main drawbacks of traditional
routine methods, such as digging trenches and visually inspect locations assumed as critical along the track.
The present paper presents an overview of the use of the Ground Penetrating Radar (GPR) and the
Interferometric Synthetic Aperture (InSAR) technologies for a sustainable monitoring of railway
infrastructures. Specifically, main traditional and non-destructive methods used for maintenance of railway
ballast materials are presented with a special focus on their sustainability. A review about the research methods
on the use of GPR and InSAR technologies for railway infrastructures also reported, including main
investigations carried out in the laboratory and the real-life environments. Furthermore, a conceptual
framework based on an integrated approach including satellite-based and ground-based investigations is

proposed, where network and local level information can be merged for the detection of critical sections and
the implementation of a more advanced predictive maintenance system.
Keywords: Railway Infrastructures; Sustainable Assessment and Monitoring; Non-Destructive Testing;
Ground Penetrating Radar (GPR); Interferometric Synthetic Aperture Radar (InSAR)
1. Introduction
Ballasted railways are important assets in modern transportation, as they have relatively contained construction
costs, good drainage and bearing capacity properties, compared to other construction types. Their main
function is the transport of freight and bulk commodities between major cities, ports, mines and sources of
agricultural goods, as well as to sustain daily journeys of commuters [1].
From bottom to top, a ballasted railway infrastructure is formed by a subgrade, a sub-ballast layer, a ballast
layer, the sleepers (timber or concrete), thee fastening mechanism and the steel rails [2]. According to
literature, ballasted railways are typically sorted in two major parts, i.e., a superstructure and a substructure.
However, this classification may vary depending on the engineering area [3]. [4], [5], [6], as ballast and sub-
ballast can be either considered as part of the superstructure [7], [8] or the substructure [7] and [8].
In the remainder of this paper, the authors will consider the configuration reported by [2] for the ballasted
railways (Figure 1), where the substructure is composed by the subgrade, the sub-ballast and the ballast layers,
whereas the superstructure includes the sleepers, the thee fastening mechanism and the steel rails. All these
components interact following a complex and integrated mechanism to respond to the effects of loads exerted
by high-speed trains and aiming at assuring safety and efficiency conditions on the infrastructure.

Figure 1 – Cross-section layout for a ballasted railway
The structural components of the superstructure work as elastic materials and generally are subject to minimal
deformations. On the other hand, ballast and sub-ballast in the substructure can be subject to more significant
deformations, due to the high-frequent stresses exerted by the circulation of convoys. This is nowadays more
exacerbated by the passage of high-speed trains [1].
Railway ballast is fundamental to be properly maintained [9] in view of a number of fundamental functions,
such as i) resisting vertical, longitudinal and lateral stresses applied to the sleepers; ii) maintaining the
alignment between tracks; iii) facilitating water drainage from the track structure [10, 11]. To this extent, it is
crucial to monitor railway ballast with a proper frequency to assure that the quality of material is not
compromised by degradation of the aggregates.
Ballast durability is in many cases influenced by edge abrasion and fragmentation under loading cycles. Many
studies have investigated the durability of ballast typically through the Los Angeles Abrasion (LAA) test in
order to correlate and establish variations between the shape characteristics and abrasion index of abraded
ballast aggregates via LAA experimentations [12, 13, 14, 15, 16].
Frequent and heavy cyclic stresses exerted by train traffic on the infrastructure, can cause rapid deformations
and degradation of the ballast layer. The deterioration of ballast further leads to the formation of fouling
materials (particles ≤ 1.2 cm) [17], affecting the whole track stability.
In general, contamination by fouling occurs when inter-granular voids in the ballast layer are filled by fine
materials [18]. Research has found that, amongst the various different mechanisms leading to the decay of

ballast and the formation of fouling, the most important relate to the fragmentation of the aggregates (76%),
the upward migration of fine-grained aggregates from the subgrade formation (13%), the migration of sub-
ballast materials (7%), the wearing of sleepers (3%) and the infiltration of weathered particles and coal droplets
from the surface to the bottom layers (1%) [19]. Consequently, fouling can compromise the functionality of
the ballast layer [11, 20] and, hence, affect safety conditions of the track. Unless the track is drained properly,
water accumulation can also verify in the ballast layer, which in turn can lead to a reduction in the shear
strength and stiffness of the material and an increase of deterioration by fouling [21]. An inaccurate estimation
of fouling along with the loss of drainage capacity of ballast may affect the infrastructure operability (e.g.,
adoption of lower and safer speed regimes) and increase the risk of catastrophic events, such as train
derailments [9].
Therefore, monitoring the condition of the ballast layer is a significant task. An efficient diagnosis of fouling
and moisture levels within the ballast layer is fundamental to asset owners for setting up strategic and effective
maintenance action plans [22].
Assessment of ballast layer conditions is traditionally performed by visual inspections and opening trenches
at certain locations along the track. However, these methods are destructive, labour-intensive, time-consuming,
and they can provide information only at the local level. On the other hand, non-destructive Testing (NDT)
methods are in high demand due to their capability to overcome the restrictions of traditional methods.
Amongst the available NDT methods, the Ground Penetrating Radar (GPR) technology is becoming
increasingly popular for the assessment of railway ballast, as it has the main advantage of providing dense and
accurate information and it makes the surveys sustainable in terms of results, time and costs involved.
Use of GPR allows to cover large sections of the infrastructure asset, avoiding important earth-moving
operations and limiting the consumption of non-renewable resources.
In this framework, the present work reports an overview on the use of GPR and InSAR methods for a
sustainable assessment of railway infrastructures. Section 2 shows the decay modes of ballast highlighting the
characteristics and the effects of the mechanisms that lead to the ballast deterioration. Afterwards, the main
traditional and non-destructive methods to perform railway ballast maintenance are discussed in Section 3 with
a particular attention to the idea of a sustainable maintenance activity. Section 4 deals with a review about
research methods on the use of GPR for railway infrastructures at the laboratory-scale of investigation as well

as in real-life. Finally, the benefits of network level NDT monitoring are discussed and conceptualised in
Section 5.
2. Railway ballast decays and their estimation
Different types of deformations may occur on a ballasted railway, as the substructure and the superstructure
can degrade in different modes. In more detail, structural deformations often occur in the substructure and
relate to issues, such as fouled ballast, poor drainage, the formation of ballast pockets and subgrade settlements
[23, 24]. In addition, it is important to mention that several failures at the superstructure level may originate
from decay at the substructure level. As an example, a poor track substructure can affect decay of the track
geometry leading to higher levels of wear or even to failure of rails, sleepers and fasteners. These occurrences
may escalate into more dramatic events such as derailments [25].
The most relevant superstructure track failures can be sorted into two main groups [26], i.e., i) track-geometry-
related faults (cross-level, alignment, longitudinal levelling, twist, and gauge) and ii) rail-surface-related faults
(surface, corrugation, long and short waves). It is worthy to notice that the above classes of failures are strictly
dependent. Although rail surface quality does not directly affect the safety and comfort of passengers, it reflects
on the deterioration rate of the geometry and, consequently, on the infrastructure life time [27].
Ballast fouling may appear by altering the strength characteristics of substructure components via reduced
durability, mud-hole formations, reduced permeability (drainage), reduced vertical, transverse, and
longitudinal stability and increased permanent deformation rates [28, 29].
As reported by [30], ballast fragmentation results in the formation of smaller crushed aggregates. These
aggregates attain a consistency similar to the gravel, which can result into an increase of the strength of the
ballast layer. This condition can be associated with the high-strength fragments in the voids after fouling that
restrain the movement of the larger ballast aggregates. This can fictitiously increase the stability and strength
properties of the rail track-bed, although it reduces its resilience. Nevertheless, a thin line exists between the
strengthening of ballast layers by fragmentation and the inhibition of drainage capacity. Studies have simulated
a wide range of challenges linked with the occurrence of ballast fouling [31], [32], [33]. Generally, small
variations in the size of inter-granular voids in ballast can affect considerably the drainage capacity of the
whole structural layer and hence, affect its life-cycle behaviour [33].

On the opposite, the observations made on the effects of coal fouling are relatively similar to those happening
in silty and clayey soils, excluding other features such as the high plasticity, the water affinity, low strength
and stiffness [30]. Contrary to other ballast-fouling mechanisms, coal fouling may occur prior to the ballast
fragmentation process, assuming that coal gets to tracks from weathered debris or via droplets from coal
conveying trains, subsequent moving trains then vibrate this debris into the voids between the ballast
aggregates [30].
2.1 Fouling quantification
The levels of fouling can be broadly identified into three main classes: clean, moderately fouled and fouled
ballast [34]. (Figure 2).
Clean ballast represents the condition of new ballast arranged over the track-bed with as-built amount of air
aggregate voids. When amount of fouling increases due to the action of deterioration, the level of
contamination will reach when all the air voids are filled with fine particles.
In the case of highly fouled ballast, several issues may occur related to poor drainage in the track, such as: (i)
a reduced ballast shear strength, stiffness, and load bearing capacity; (ii) increased settlements of the track;
(iii) softening of the subgrade soil; (iv) the formation of slurry and clay pumping under cyclic loading; (v)
ballast attrition by jetting action and freezing of water; and (vi) sleepers abrasion by water jetting [35].
Figure 2 - Fouled ballast levels a) clean ballast b) moderately fouled ballast c) highly fouled ballast
Furthermore, various different quantitative indexes have been utilised in previous research to evaluate the
ballast degradation and contamination by fouling. Fouling particles can be defined in terms of their particle
size as fine-grained particles embedded into the intergranular voids coarse-grained ballast aggregates [17, 36].
Fouling Index: The Fouling Index (FI), proposed by [19], is a commonly used index in railway engineering,
which has been extensively adopted in the US.
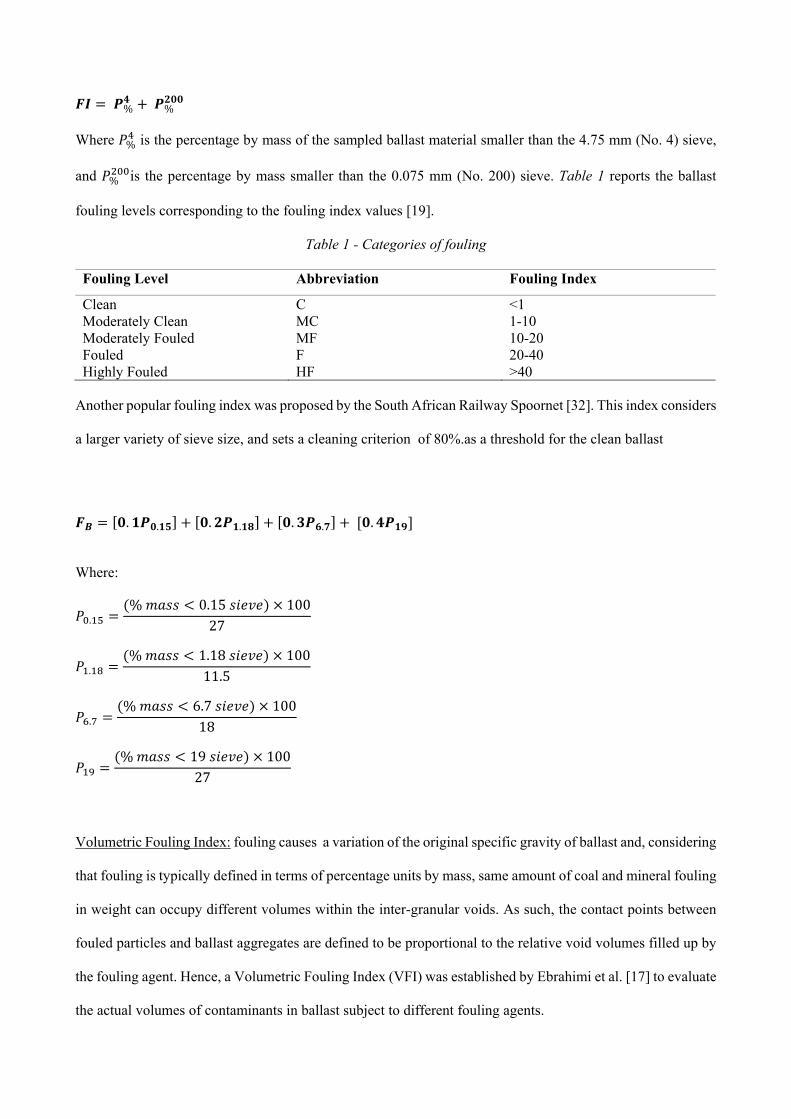
𝑭𝑰 𝑷%𝟒 𝑷%𝟐𝟎𝟎
Where 𝑃% is the percentage by mass of the sampled ballast material smaller than the 4.75 mm (No. 4) sieve,
and 𝑃% is the percentage by mass smaller than the 0.075 mm (No. 200) sieve. Table 1 reports the ballast
fouling levels corresponding to the fouling index values [19].
Table 1 - Categories of fouling
Fouling Level Abbreviation Fouling Index
Clean C <1 Moderately Clean MC 1-10 Moderately Fouled MF 10-20 Fouled F 20-40 Highly Fouled HF >40
Another popular fouling index was proposed by the South African Railway Spoornet [32]. This index considers
a larger variety of sieve size, and sets a cleaning criterion of 80%.as a threshold for the clean ballast
𝑭𝑩 𝟎. 𝟏𝑷𝟎.𝟏𝟓 𝟎. 𝟐𝑷𝟏.𝟏𝟖 𝟎. 𝟑𝑷𝟔.𝟕 𝟎. 𝟒𝑷𝟏𝟗
Where:
𝑃 . % 𝑚𝑎𝑠𝑠 0.15 𝑠𝑖𝑒𝑣𝑒 10027
𝑃 . % 𝑚𝑎𝑠𝑠 1.18 𝑠𝑖𝑒𝑣𝑒 10011.5
𝑃 . % 𝑚𝑎𝑠𝑠 6.7 𝑠𝑖𝑒𝑣𝑒 10018
𝑃 % 𝑚𝑎𝑠𝑠 19 𝑠𝑖𝑒𝑣𝑒 10027
Volumetric Fouling Index: fouling causes a variation of the original specific gravity of ballast and, considering
that fouling is typically defined in terms of percentage units by mass, same amount of coal and mineral fouling
in weight can occupy different volumes within the inter-granular voids. As such, the contact points between
fouled particles and ballast aggregates are defined to be proportional to the relative void volumes filled up by
the fouling agent. Hence, a Volumetric Fouling Index (VFI) was established by Ebrahimi et al. [17] to evaluate
the actual volumes of contaminants in ballast subject to different fouling agents.

𝑽𝑭𝑰 𝑭𝑰 𝑮𝒔𝒓𝑮𝒔𝒇
where 𝐹𝐼 is the Fouling Index expressed by [19], 𝐺 is the specific gravity value of the reference ballast
material (approximately equal to 2.6), and 𝐺 is the specific gravity value of the present fouling agent. This
expression matches with that proposed by [37], where the authors developed a percentage void contamination
model (PVC) to evaluate the fraction of the total void volume of contaminated ballast. Indraratna et al. [38]
also developed a VFI termed the void contamination index (VCI) reporting that the VCI captures accurately
the volume of varied fouling agents (e.g., clay and coal) in relation to the total volume of ballast voids.
Ballast particle contact-point contamination: with the presence of fines coating, the points of ballast particle
contacts, the stability and strength of the ballast layer become lower [39], [17], [28], [40]. To evaluate the scale
of fouling at ballast contact points, a comparative analysis is carried out between the volume of the macro
voids in contaminated and clean ballast. The following equation has been adopted for the determination of the
ratio of macro voids in ballast matrices under various conditions of fouling [17].
𝒆𝒎𝒂𝒄𝑩 𝑮𝒔𝒓𝜸𝒘𝑽𝑴𝒃 𝟏
where 𝑒 is the ratio of macro voids of ballast, 𝐺 is the specific gravity value of ballast, 𝛾 is the density
of water, 𝑉 is the total volume of the sample ballast, and 𝑀𝑏 is the mass of ballast particles (> 12 mm) in the
volume.
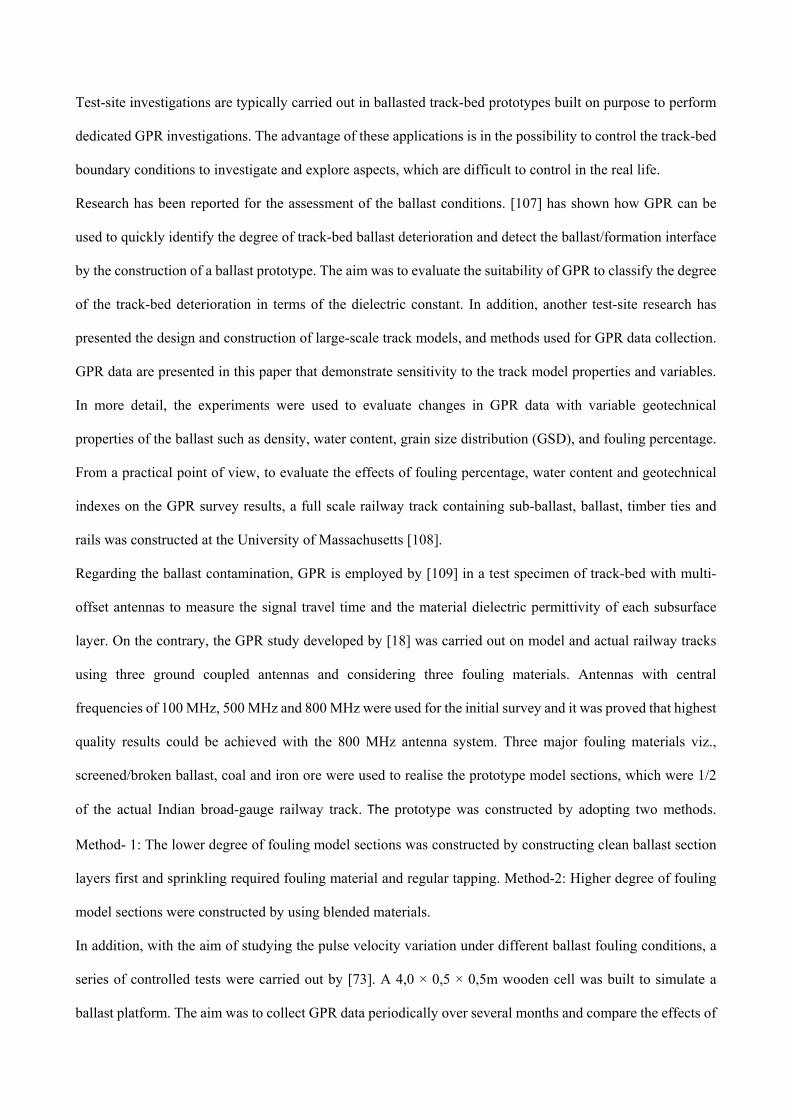
Breakage Index: The Breakage Index (BI) is the difference in the areas between the original and the final
gradation curves after the test with the fractal gradation curve [41]. The index is expressed as follows:
𝑩𝒃𝒂𝒍 𝑨𝑨 𝑪 𝟏𝟎𝟎
where 𝐵 is the breakage index and 𝐴 e C are gradation areas determined from the gradation chart as shown
in Figure 3 [42].
Relative Breakage Index: The Relative Breakage Index (RBI) is the difference in areas between the original
gradation and the final gradation curves [42]. The index is expressed as follows:

𝑩𝒃𝒂𝒍𝒓 𝑨𝑨 𝑪 𝑫 𝟏𝟎𝟎
where 𝐵 is the relative breakage index, and 𝐴, C, D are gradation areas determined from the gradation chart
as shown in Figure 3 [42], [43].
Figure 3 – Criteria for calculation of 𝐵𝑏𝑎𝑙 e 𝐵𝑏𝑎𝑙𝑟 [42]
Table 2 lists the main ballast degradation indexes and relevant literature in this area of research.
Table 2 – Ballast degradation index
Index Abbreviation Formula References
Fouling Index FI FI P% P% [19], [32]
Volumetric Fouling Index VFI VFI FI GG [17], [38]
Ballast particle contact-point contamination - e G γ VM 1 [17]
Breakage Index BI B AA C 100 [42], [41], [44]
Relative Breakage Index RBI B AA C D 100 [42], [44]
3. Railway ballast maintenance

3.1. Diagnosis and maintenance
To ensure safety and efficiency, the railroad network system must be inspected regularly to detect potential
damage to the ballast foundation and the subgrade. However, maintenance is a challenging task due to the
complexity and costs of the surveys on the track system.
An effective assessment of the ballast layer and the subgrade conditions is crucial to intervene on time and
repair decayed sections. This contributes to reduce costs of the interventions and limit the impact on the safety
of the infrastructure.
It has been observed in railway asset management that when limited funds are available, budget allocated for
maintenance is reduced (e.g., ballast cleaning and renewal operations). In a first instance, this approach may
sound reasonable, especially as a short term strategy [9]. However, this approach can jeopardise the long-term
cost-effectiveness of the overall track asset. An ineffective planning of routine and timely maintenance of rail
track-beds could escalate into more severe consequences and increase the costs [9].
Figure 4 – Deterioration process of a railway track
According to [45], three different lifespans can be identified for a railway track, i.e., the youth, the
intermediate-life and the old-age periods (Figure 4).
More specifically, the youth period is the term when the track faces significant deterioration owing to track
settlements, and preventive maintenance is here carried out to avoid early decay. The intermediate-life period
is the time interval where corrective maintenance (rectification of the geometry and partly change of used or

defective materials) is intended to mitigate the decay rate and guarantee the safety and the reliability of a track.
The old-age period is the time stage towards the end of the service life when higher decay is observed. As a
remedial action, the track component must be partially or fully replaced if the track is not suitable to meet the
requirements dictated by the quality level or, in case extraordinary high costs of maintenance are required, to
reach a target quality standard level [45].
Therefore, as mentioned before, programming an effective maintenance of a track-bed infrastructure could
avoid severe consequences as well lead to benefits related to the sustainability of the maintenance.
It is worthy of mention that the track-bed components are non-renewable materials. Therefore, an accurate and
timely maintenance allows to operate before a decay is formed to adapt different techniques at the specific
decay type, performing less operations and thus consuming less non-renewable materials.
A sustainable monitoring and detection of the track-bed could be performed by different techniques that allow
to diagnose the ballast decay at both the network and the local level.
From a practical point of view, according to [46], a good practice for the maintenance of a rail track should
aim and succeed at: i) attending to fastenings and fittings; ii) maintaining the track adequately packed together
with sustaining the line and level of the track; iii) ensuring the ballast profile to be sufficient and clean; iv)
replacing defective sleepers and maintaining the joints with a sufficient gap. More specifically, the “through
packing” approach is the most common among the non-mechanised traditional maintenance methods [46],
[47], [48]. This approach involves the following processes: i) opening of the permanent way and loosening of
fastenings; ii) examining track elements, squaring of sleepers, and alignment correction; iii) gauging, packing
of sleepers, and re-packing of joint sleepers; iv) boxing the ballast section and dressing.
However, mechanised methods are usually used in place of manual ones for maintenance purposes, due to cost
and time constraints. A manual maintenance of a rail track leads to at least ten times more man-hours compared
to the fully mechanised case [49]. A large number of machines have emerged for mechanised maintenance
over the past few years. There exist a variety of different models for heavy lifting, levelling, lining, tamping
machines, which replaced the tasks manually performed by track gangs previously [9].
In general terms, for correction and/or prevention of track geometry faults, tamping is carried out, whereas
grinding is undertaken for rail surface deteriorations [50].

The progression of tamping operations is given by [19] in Figure 5.
Figure 5 – Tamping activities
Specifically, sampling activities consist in: (a) the track and the sleepers are in a random position before the
tamping commences; (b) the track and the sleepers are raised by the tamping machine to a target level, yielding
an empty space under the sleeper; (c) the tamping tines are inserted into the ballast at both sides of the sleeper.
Note that this step may lead to ballast breakage; (d) the tamping tines exert a pressure on the ballast towards
the empty space under the sleeper, hence retaining the correct position of the rail and the sleeper. This process
may also result in ballast breakage; (e) the tamping tines are lifted from the ballast, and the machine moves on
to the next sleeper.
3.2. Assessment techniques for railway infrastructure management
Based on the existing literature, different methods and techniques have been employed to assess the track
ballast components. In general, these techniques can be grouped into destructive and non-destructive. Although
destructive techniques are still traditionally preferred in the monitoring of ballast, non-destructive testing
methods are gaining momentum in recent years as they have proven effective in reducing the maintenance
costs.
The following sections report the main techniques and their classification based on their productivity.
3.2.1 Destructive techniques
Traditional techniques are usually destructive, with a low productivity and the capability to provide local
information by sampling the ballast material. Conventional techniques for the assessment of ballast include
visual inspections, selective drill approaches and the dig-at-interval method [11]. Nevertheless, these
techniques have several drawbacks as they cannot assess comprehensively the source of damage in the ballast
and sub-ballast layers. Drilling is time consuming and it also often fails in providing adequate information
about the substructure of the track-bed [11]. Considering the huge variability of the conditions in railway

substructures, rapid and integrated assessment techniques are required. In this regard, non-destructive methods
are nowadays preferred over destructive techniques as they can provide more rapid and effective inspections
at lower costs.
3.2.2 Non-destructive techniques
Various technologies with a low, a medium and a high productivity can be listed for the assessment of ballast
conditions (Table 3). In the following sections, these technologies are classified based on their productivity
and a summary description of them is provided.
Table 3 – Non-destructive techniques classification
Techniques Standards/ Guidelines*
Data coverage
Productivity (daily) Resolutions
Inertial G: ASTM E950 – E950M (2018) [51]
Local level Low (<10 km)
0.04 Hz
Acoustic and ultrasonic R: BS EN 16729-1 (2016) [52]
Local level Low (<10 km)
10-3÷10-4 m
Image-based R: Guidelines [53] Local level Medium (10-20 km)
10-2 ÷ 1 m
Optical-based G: Guidelines [54] Local level Medium (20-50 km)
10-4 m
Electromagnetic R: BS DD ENV 50121-1 (1996) [55]; G: ASTM D6087 (2008) [56]
Local level Medium (30-70 km)
10-2÷5×10⁻² m
Satellite remote sensing G: ASTM F2327 (2015) [57]
Network level
High (>100 km)
10-3 m
*Standards are general (G) or railway related (R)
3.2.2.1 Low productivity
Inertial methods
Inertial measurements depend on a basic rule where a double integration of the acceleration returns the position
on an accelerometer. As an example, the vertical position of a wheel can be computed via double integration
of the axle-box acceleration [58]. The result provides the longitudinal level since the wheel is continuously in
contact with the rail (Figure 6).

Within this context, a model based on taking the input from vertical accelerations generated in railway axles
and measured in trains running on a routine schedule was developed. The model can compute the rail
irregularities and find the transfer function, using the Fourier transform, to relate the input and the output
functions in the frequency domain [59]. The solution is then transformed into the time domain by
implementation of the inverse Fourier transform.
Figure 6 – Inertial track measurement at the longitudinal level
Acoustic and Ultrasonic Techniques
In terms of working principles, the acoustic and ultrasonic techniques are based on the transmission of a source
pulse to the ballast surface and the reception and an amplification of a recorded pulse (Figure 7). This allows
to measure the time elapsed with an accuracy of ± 1%. The wave velocity in the medium depends on its elastic
properties and mass. The elastic properties can be estimated by knowledge of the mass and the wave
propagation in the medium [60].
Transmission of high-frequency sound signals into the rail and rail joints for detection of rail defects, i.e.,
ultrasonic testing, was reported to have been used in the USA since the 1950s [9]. However, these techniques
have started to be employed worldwide since the 1970s [61].
Recent advancements in the use of ultrasound-based automated monitoring systems for rails were discussed
by [62] along with examples of current field implementations and specific properties of ultrasonic monitoring
methods for use in railway tracks.

Figure 7 – Illustration of the air-coupled guided wave transducers
3.2.2.2 Medium productivity
Image-based methods
Since visual inspections are time-consuming, laborious, and subject to the interpretation of the operator, a more
effective vision-based automatic rail inspection system was proposed through computer vision-based
technologies. Only few research on the use of the computer vision technology exist in the area of railway
maintenance [63]. In the research presented by [63], the purpose of an automatic rail inspection system was to
detect presence/absence of sleepers and/or fasteners, by the analysis of real images collected through a digital
camera installed under a diagnostic train.
[64] has developed a system for automatic detection of potential external material in the ballast region.
Outcomes were achieved by processing the images collected by a digital line scan camera mounted under a
train. Ballast patches were identified by neural classifiers and images were processed using the edge-histogram
method. The acquired detection system was verified on a set of experiments carried out on real images that
proven accurate in identifying the ballast portion and the external materials therein.
In addition, [65] reports an investigation carried out at the laboratory scale into the grain size distribution of
railway ballast using ground-penetrating radar (GPR) and the development of an algorithm based on automatic
image analysis (Figure 8).

Figure 8 – Plan view of the ballast in a laboratory test. (a): the raw picture taken with a digital camera
suspended in the air above the centre of the formwork. (b): the binary image obtained from the image
analysis algorithm [65]
Optical-based methods
The optical methods are based typically on the use of optical fibre sensors (OFSs). Steady advancements in
the sensor technology are accelerating the evolution of structural health monitoring of civil engineering
structures [66]. An OFS system is composed of an optical source that excites a transducer (the sensitive optical
element) through a fibre optic (FO) cable. The transducer turns the initial signal of the optical source into
another signal with dissimilar properties owing to a variation of the measurand. The converted signal is
acquired by a detector and processed by the actuation circuit, which derives the information about the
measuring by way of comparison between the initial signal and the signal converted by the transducer. A
schematic system of OFSs is illustrated in Figure 9.
OFSs have many advantages over other conventional mechanical and electrical sensors, as the light weight, a
small size, a lower sensitivity to corrosion and EM interference, and an overall effectiveness due to the property
of being embedded in the structure [66]. OFS-based monitoring tools can be used for the non-destructive
evaluation of many types of engineering structures since they endure lightning strikes, resist chemical
aggressions, they can be incorporated into very tight areas, and eventually can establish sensor chains using a
single fibre [67].
Finally, [68] reported a wide spectrum of applications of OFSs such as strain, vibration, electric, acoustic and
magnetic fields, acceleration, rotation, pressure, temperature, linear and angular position, humidity, viscosity,
chemical measurements, and many others.

Figure 9 – A schematic system of OFSs
Electromagnetic techniques
Electromagnetic methods are based on the electromagnetic theory, described by the Maxwell’s equations, and
the material properties, quantified by constitutive relationships. These methods use the radar technology that
is being spread quickly among non-destructive methods in railway infrastructure applications (Figure 10).
Among these methods, GPR is an electromagnetic method that is becoming popular due to its efficiency and
reliability. GPR is a non-invasive, rapid and versatile evaluation method that allows the auscultation of long
sections of the railway track (hundreds of kilometres) in a very short time period. It provides high resolution
images (data collected every few centimetres) and, due to its non-invasive nature, it can be repeatedly used
over the same spot to study the evolution of a given decay.
Figure 10 EM wave propagation in a ballast section
3.2.2.3 High productivity
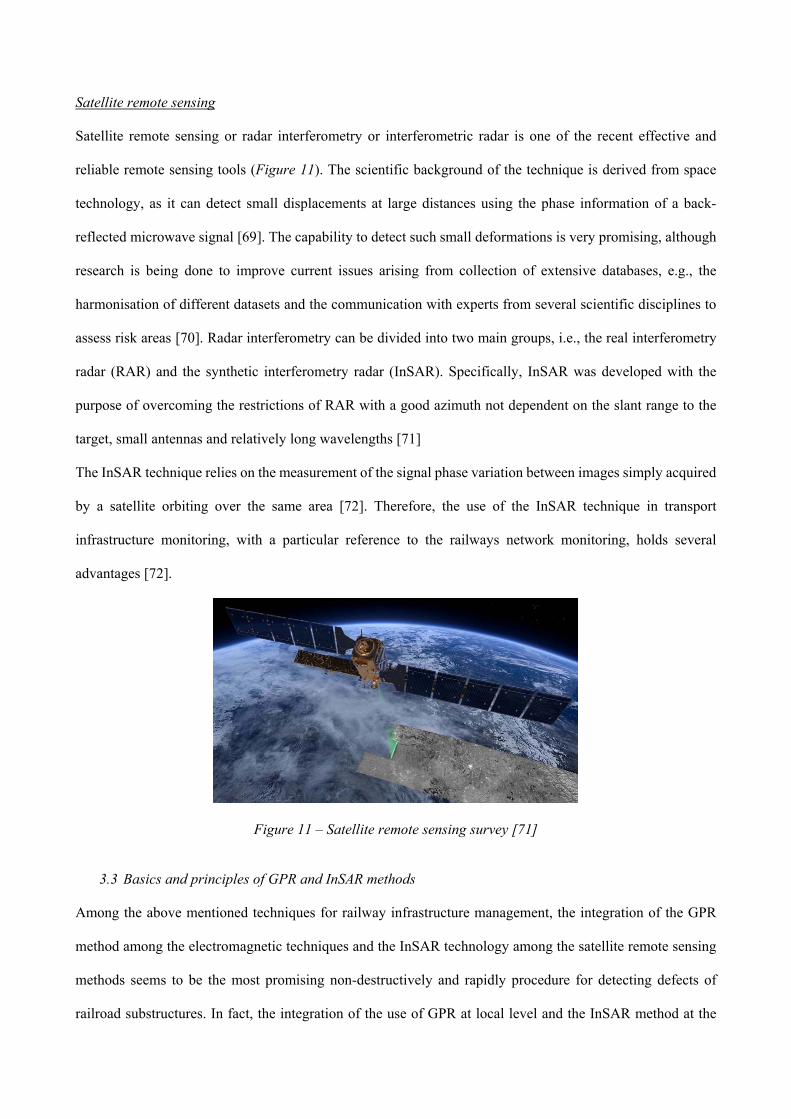
Satellite remote sensing
Satellite remote sensing or radar interferometry or interferometric radar is one of the recent effective and
reliable remote sensing tools (Figure 11). The scientific background of the technique is derived from space
technology, as it can detect small displacements at large distances using the phase information of a back-
reflected microwave signal [69]. The capability to detect such small deformations is very promising, although
research is being done to improve current issues arising from collection of extensive databases, e.g., the
harmonisation of different datasets and the communication with experts from several scientific disciplines to
assess risk areas [70]. Radar interferometry can be divided into two main groups, i.e., the real interferometry
radar (RAR) and the synthetic interferometry radar (InSAR). Specifically, InSAR was developed with the
purpose of overcoming the restrictions of RAR with a good azimuth not dependent on the slant range to the
target, small antennas and relatively long wavelengths [71]
The InSAR technique relies on the measurement of the signal phase variation between images simply acquired
by a satellite orbiting over the same area [72]. Therefore, the use of the InSAR technique in transport
infrastructure monitoring, with a particular reference to the railways network monitoring, holds several
advantages [72].
Figure 11 – Satellite remote sensing survey [71]
3.3 Basics and principles of GPR and InSAR methods
Among the above mentioned techniques for railway infrastructure management, the integration of the GPR
method among the electromagnetic techniques and the InSAR technology among the satellite remote sensing
methods seems to be the most promising non-destructively and rapidly procedure for detecting defects of
railroad substructures. In fact, the integration of the use of GPR at local level and the InSAR method at the

network level allows to carry out a timely diagnosis of hazardous situations and thus employ an effective
monitoring and a sustainable maintenance of ballasted railways.
Basics and principles of these two non-destructive techniques are described in the following paragraph.
3.3.1 GPR working principles
GPR principles feed into the EM theory wherein the physics of the EM field propagation is described by the
Maxwell’s equations and material properties are quantified by constitutive relationships. As a combination of
these two factors, the GPR signal is the output that provides information on the subsurface properties and
configuration.
The propagation of the EM waves depends on the three main electromagnetic properties of the host material
[39], i.e., the dielectric permittivity ε, the electric conductivity σ and the magnetic permeability μ.
The dielectric permittivity and the electric conductivity are strictly related to the EM wave features. ε affects
the wave velocity, and σ controls the wave attenuation. On the contrary, the magnetic permeability μ does not
relate with the propagation of the wave for all the non-magnetic materials, as it is equal to the free-space
magnetic permeability μ0.
On the other hand, the main factors affecting the penetration depth are the frequency of the emitted signal (for
structural inspections, antennas with central frequencies above 1 GHz are used) and the type of material
investigated.
From a theoretical point of view, the physics of EM fields is described by the Maxwell’s equations as follows:
𝛁 𝑬 𝝏 �⃗�𝝏𝒕
𝛁 �⃗� �⃗� 𝝏 𝑫𝝏𝒕
𝛁 ∙ �⃗� 𝒒 𝛁 ∙ �⃗� 𝟎
Where:

𝑬= strength vector of the electric field (V m-1); q= electric charge density (C m-3); 𝑩= density vector of the
magnetic flux (T); �⃗�= density vector of the electric current (A m -2); 𝑫= electric displacement vector (C m-
2); t= time (s); 𝑯== intensity vector of the magnetic field (A m-1).
Material properties are instead quantified by the following constitutive relationships: �⃗� 𝝈 𝑬 𝑫 𝜺 𝑬 𝑩 𝝁 𝑯
Combination of the EM fields' theory and the material properties allows to describe comprehensively a GPR
signal.
The most important parameters for GPR applications in railways relate to the investigation of [73]: i) thickness
of the different layers (ballast, sub-ballast, subgrade); ii) degree of contamination of the ballast; iii) moisture
content of the ballast; iv) possible settlement areas.
From a practical point of view, railway ballast consists of uniformly graded coarse aggregates with large air
voids [74]. The ballast aggregate size ranges from 38 to 102 mm. In clean ballast, the air void volume is up to
30%. Hence, when EM waves are applied by GPR to evaluate railroad ballast, the scattering response may not
be ignored. Actually, it may be the dominant response when a high-frequency antenna is used and the incident
wavelength is close to the size of air void.
Figure 12 – Propagation of the GPR signal on ballast railway

Figure 12 shows the paths of the signal propagating through ballast. The direct signal (S1) represents the
energy radiated directly from the transmitter to the receiver. The second part of the signal (S2) is the first
reflected signal from the surface of the ballast. The third part (S3) is the portion of the energy generated the
from void scattering in clean ballast. In case of a clearly defined interface between the clean and the fouled
ballast or sub-ballast, a fourth part of the signal (S4) is received from the interface reflection.
The scattering response may be the dominant response in the railroad data. As shown in Figure 12, the incident
EM field triggers the generation of surface charge or current Js , i.e., the source for a scattered field pattern.
The variation in the scattering pattern is dependent on the size of the scatterer against the incident wavelength
[75]. When ballast becomes fouled, volumetric contents of the air voids in the material decrease. Therefore,
the amount of voids can be used as a parameter to estimate ballast fouling conditions.
With regard to the propagation velocity, in the case of clean ballast this ranges between 0.12 m/ns and 0.21
m/ns. In case of ballast contaminated with fine-grained material, the propagation velocity ranges from 0.08
m/ns and 0.12 m/ns [76]. This property makes pulse velocity determination of outmost importance.
3.3.2 InSAR working principles
The InSAR technique, or SAR interferometry, allows to detect movements along the observation direction of
the SAR satellite and consists in the measurement of the signal phase variation between images acquired over
the same area, at different time stages. The occurrence of a vertical displacement at the infrastructure surface
level (e.g., the ballasted railway in Figure 13) causes the variation of the distance between the sensor and the
ground level. Hence, this affects the phase of the signal back-received by the sensor.
InSAR data can be collected regardless of the atmospheric and lighting conditions and allow the coverage of
extensive areas, due to the wide footprint of the sensor. The continuous motion of satellites permits the
collection of regularly-spaced and dense images, that allow to perform investigations with a high temporal
frequency, as opposed to the on-site low-frequency inspections. The acquisition and processing of SAR images
do not require on-site operations, hence it is not necessary the closure of the infrastructure to the traffic and
the presence of operators on the site, with related economic and safety benefits.
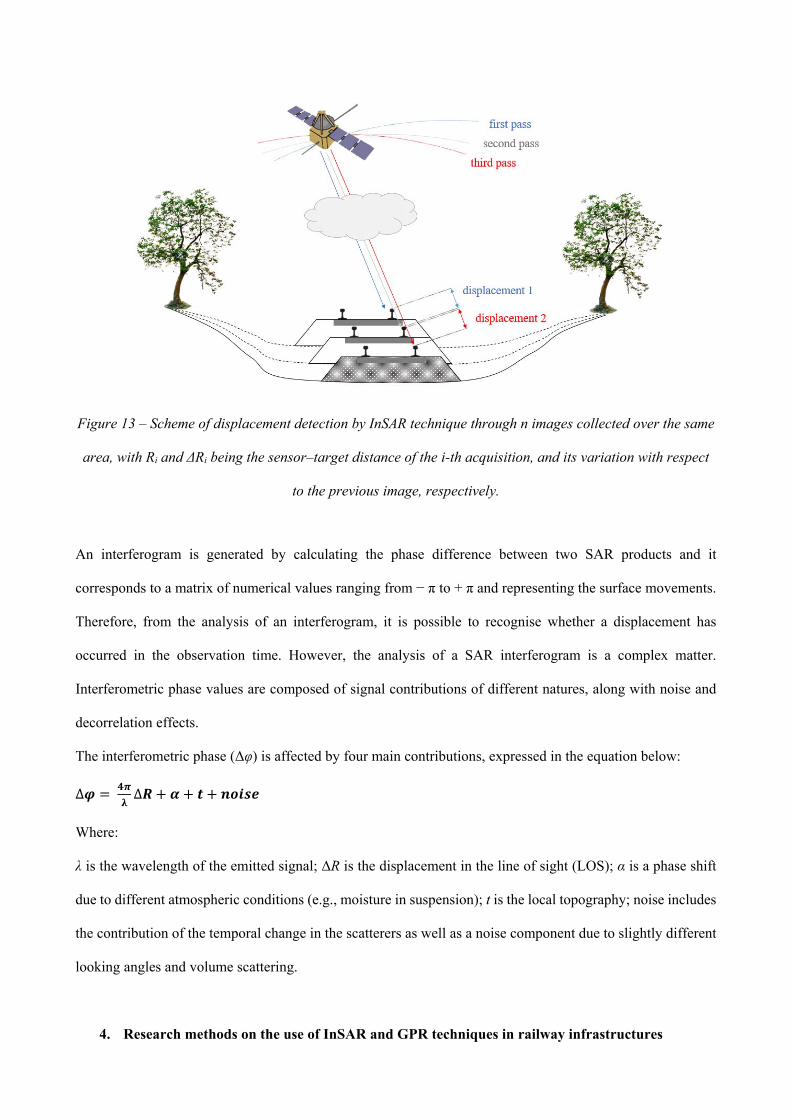
Figure 13 – Scheme of displacement detection by InSAR technique through n images collected over the same
area, with Ri and ΔRi being the sensor–target distance of the i-th acquisition, and its variation with respect
to the previous image, respectively.
An interferogram is generated by calculating the phase difference between two SAR products and it
corresponds to a matrix of numerical values ranging from − π to + π and representing the surface movements.
Therefore, from the analysis of an interferogram, it is possible to recognise whether a displacement has
occurred in the observation time. However, the analysis of a SAR interferogram is a complex matter.
Interferometric phase values are composed of signal contributions of different natures, along with noise and
decorrelation effects.
The interferometric phase (Δφ) is affected by four main contributions, expressed in the equation below: ∆𝝋 𝟒𝝅𝛌 ∆𝑹 𝜶 𝒕 𝒏𝒐𝒊𝒔𝒆
Where:
λ is the wavelength of the emitted signal; ΔR is the displacement in the line of sight (LOS); α is a phase shift
due to different atmospheric conditions (e.g., moisture in suspension); t is the local topography; noise includes
the contribution of the temporal change in the scatterers as well as a noise component due to slightly different
looking angles and volume scattering.
4. Research methods on the use of InSAR and GPR techniques in railway infrastructures

A review of research within the context of the applications of InSAR and GPR techniques in railway
engineering is given in this section. Discussed research methods are sorted according to the scale of
investigation (i.e., laboratory and numerical environments, test-site and real-life scales of investigation).
Therefore, an overview of the main research findings achieved within every application area is reported. For
each individual scale of investigation, the main applications of GPR to railway infrastructures are first reported
followed by the applications of the InSAR technology coupled with the GPR survey. In regard to these latter
applications, the InSAR technology is presented at the network scale only, due to its characteristic scale of
data coverage.
GPR has been used in a wide range of applications for railway infrastructure monitoring including the
evaluation of layer thicknesses [77], the investigation of the embankment stability [78], [79] the localisation
of trapped water areas [80], the indirect estimation of the track modulus [81], and the detection of permafrost
sections [82], [ 83], [84], [85]. A recursive repetition of GPR measurements over time allows to predict the
deterioration rate of a track substructure and to control the effectiveness of maintenance activities. This strategy
can help with an effective scheduling of the required maintenance works on a short-, medium-, and long-term
base with notable cost and time savings [73]
In this framework, the InSAR technology has proven effective for the control of surface deformations at the
network level. To this extent, an integration between InSAR and GPR allows to combine the versatility, the
high resolutionand the capability to detect the causes of defectsin the subsurface from GPR, with the provision
of extensive multi-temporal information on ground settlements from InSAR.
As a result, the adoption of this integrated data management approach within a maintenance planning can lead
to a more advanced concept of infrastructure resilience. A higher surveying accuracy by using an integrated
monitoring is expected to increase the resistance of the infrastructure to both major external events and
ordinary processes of degradation [86], [87], [88].
However, it is worthy of mention that the use of the InSAR technology for the monitoring of railway network
conditions is relatively recent compared to the use of the GPR technology, where first applications date back
to 1980, as reported by [89],. However, the potential of SAR imagery for the monitoring of civil engineering
infrastructures, such as roads and railways, has also been reported in the last few years [27].

4.1 Laboratory-scale investigations and numerical developments
Ballast characterisation is observed to be one of the most popular areas of interest according to investigations
at the laboratory scale. Several studies have been carried out with GPR and InSAR technology in this field. In
this regard, [90] has demonstrated that GPR can be used for the assessment of ballast, finding a high correlation
between the fouling index in the area scanned by GPR.
Moreover, [78] has presented an investigation of a railway subgrade using GPR, where condition indicators
were employed to ease the data interpretation process. In a recent paper, a GPR investigation for the EM
characterisation of railway ballast aggregates was performed with the use of different GPR antennas (ground-
coupled and air-coupled) and various frequency systems (600 MHz, 1000 MHz, 1600 MHz and 2000 MHz)
within a unique experimental (laboratory) setup and critical factors as well as antennas and central frequencies
most suited for the investigation of ballast were identified [91]. [92] has indicated the importance of optimising
the central frequencies of the antennas used in railway surveys according to the type of inspection. Also, the
antenna configuration was optimised in a multiple-frequency GPR system (composed of two 2 GHz antennas
and one 500 MHz antenna) for the assessment of the railroad substructure [93].
Furthermore, the assessment of railway ballast fouling using GPR has raised the interest of many researchers
and found relatively satisfactory solutions to this issue [10], [33], [74], [93], [94], [90], [73], [95], [96], [18],
[97]. [10] has presented the outcomes of a research carried out in a laboratory environment on the electrical
properties of ballast. In more detail, a comparative investigation of relative dielectric permittivity values of
clean against fouled ballast and wet against dry ballast was carried out. The propagation velocity of the EM
waves through the ballast is of utmost importance in converting the time scale of GPR data into a depth scale.
To this effect, numerous studies [76], [98], [9], [73], [99] have attempted to attain the EM wave velocity for
“time to depth GPR data conversion” purposes. In a recent study, [39] assessed clean and fouled ballast using
GPR by means of extensive laboratory experiments, signal processing and numerical modelling. A scattering
amplitude envelope method based on the energy scattered from the voids between ballast aggregates was
developed and used to distinguish between clean and fouled ballast using air-coupled GPR antenna systems
[33], [74]. Estimation of moisture in the railway substructure using GPR data is a research subject area of
major interest across the GPR community [73], [100].
In addition, a study [101] developed both at the laboratory and the real life scale of investigation reports the
use of the GPR technique in the evaluation of railway ballast under a diverse set of fouling and moisture
conditions through comprehensive laboratory experiments and field track surveys. Numerous estimation
methods were employed to attain the relative dielectric permittivity of the ballast using 2 GHz air-coupled
antenna for the laboratory tests. Experimentally obtained permittivity values were verified by the theory-based
mixing model. Field track GPR surveys using miscellaneous frequencies (400, 900, and 2000 MHz) were
undertaken, where the same type of granite ballast used in the laboratory tests, were laid along a track section
composed of metal, wooden and concrete sleepers.
In terms of numerical developments, the trend of using numerical simulation to generate synthetic GPR data
and support the interpretation of real-life and experimental conditions for railway ballast condition-assessment
is gaining momentum nowadays. This process is fostered by a significant reduction in terms of costs and time
[39]. To this effect, several studies can be mentioned where the finite-difference time-domain (FDTD)
technique was used to simulate the GPR signal [95], [65].
Finally, regarding the challenge of collecting GPR data on the ballast material underneath concrete sleepers
and rails, due to the masking effects of reinforcement bars, the target is to minimise or remove these effects in
order to attain clearer images of the ballast. Optimum surveying procedures and antenna configurations were
also considered to account for the presence of ties and rails [102], [103], [93]. In terms of signal processing
methods, [104] proposed a series of post-processing steps namely, migration, horizontal scaling, stacking and
background removal in order to minimise the impact of sleepers, whereas [105] applied a 40-trace running
average to the collected data to remove ringing noise from the sleepers.
In regard to applications about the integrated use of InSAR and GPR technologies, [106] report an overview
on the data-fusion approach between the InSAR and high-frequency GPR techniques. The study aims at
evaluating solutions to compensate technology limitations of individual techniques based on a data-fusion
approach.
4.2 Test-site investigations
Test-site investigations are typically carried out in ballasted track-bed prototypes built on purpose to perform
dedicated GPR investigations. The advantage of these applications is in the possibility to control the track-bed
boundary conditions to investigate and explore aspects, which are difficult to control in the real life.
Research has been reported for the assessment of the ballast conditions. [107] has shown how GPR can be
used to quickly identify the degree of track-bed ballast deterioration and detect the ballast/formation interface
by the construction of a ballast prototype. The aim was to evaluate the suitability of GPR to classify the degree
of the track-bed deterioration in terms of the dielectric constant. In addition, another test-site research has
presented the design and construction of large-scale track models, and methods used for GPR data collection.
GPR data are presented in this paper that demonstrate sensitivity to the track model properties and variables.
In more detail, the experiments were used to evaluate changes in GPR data with variable geotechnical
properties of the ballast such as density, water content, grain size distribution (GSD), and fouling percentage.
From a practical point of view, to evaluate the effects of fouling percentage, water content and geotechnical
indexes on the GPR survey results, a full scale railway track containing sub-ballast, ballast, timber ties and
rails was constructed at the University of Massachusetts [108].
Regarding the ballast contamination, GPR is employed by [109] in a test specimen of track-bed with multi-
offset antennas to measure the signal travel time and the material dielectric permittivity of each subsurface
layer. On the contrary, the GPR study developed by [18] was carried out on model and actual railway tracks
using three ground coupled antennas and considering three fouling materials. Antennas with central
frequencies of 100 MHz, 500 MHz and 800 MHz were used for the initial survey and it was proved that highest
quality results could be achieved with the 800 MHz antenna system. Three major fouling materials viz.,
screened/broken ballast, coal and iron ore were used to realise the prototype model sections, which were 1/2
of the actual Indian broad-gauge railway track. The prototype was constructed by adopting two methods.
Method- 1: The lower degree of fouling model sections was constructed by constructing clean ballast section
layers first and sprinkling required fouling material and regular tapping. Method-2: Higher degree of fouling
model sections were constructed by using blended materials.
In addition, with the aim of studying the pulse velocity variation under different ballast fouling conditions, a
series of controlled tests were carried out by [73]. A 4,0 × 0,5 × 0,5m wooden cell was built to simulate a
ballast platform. The aim was to collect GPR data periodically over several months and compare the effects of

time on the data. The following parameters were studied: (1) pulse velocity in sands and ballast, (2) ballast-
sand interface identification and, (3) detection of water concentration areas.
Finally, GPR surveys are also employed to investigate the ballast stability, as suggested by [78], where two
embankments with track performance problems related to structural instability were investigated. Both sites
demonstrated potential for GPR to identify substructure instability resulting in track settlement. At site 1, a
network level survey was conducted along approximately 130 km of double track. The GPR data were
collected to analyse the cause of the problem, with the aim of identifying more effective maintenance and
remedial strategies. At site 2, a dedicated investigation was conducted to evaluate the cause of chronic track
maintenance problems at a specific track location. This site was characterised by repeated track geometry
deviations that developed rapidly, requiring daily monitoring and nearly weekly track surfacing and alignment.
4.3 Real life investigations
Railway ballast thickness measurements and quality evaluations are the main applications of GPR on railways.
Ballast is made of crushed hard rocks or, sometimes, crushed gravel material, where smaller mineral particles
have been sieved away.
In a GPR study, the Swiss Federal Railways [104] inspected their railway tracks at regular intervals. Inspection
were focused on the thickness of the ballast, on the subsoil material penetrating upwards into the ballast and
on the geotechnical properties of subgrade and subsoil materials. [110] outlines recent advances in the
acquisition, processing and interpretation of GPR data in relation to a high-speed train mounting multiple-
antenna GPR systems for non-destructive assessment of the railway trackbed. The presented acquisition system
combines GPR antennas mounted beneath inspection trains, train tachometer inputs, global positioning system
(GPS) and video technologies to achieve the precise data registration required for accurate calibration of the
GPR results. The system has proven to consistently collect high quality data of rail ballast with a sampling
interval lower than 5cm at line speeds of 100 km/h.
The relative dielectric permittivity is a good indicator of ballast quality. The dielectric properties of ballast
materials have been surveyed by [10] and [111]. The main parameters affecting the dielectric properties are
the moisture content and the level of fouling [111]. [112] has presented the dielectric values of good and poor
quality ballast materials that were compared in dry, moist and wet conditions.

[101] addresses the use of non-destructive GPR methodology in the investigation of railway ballast under
different fouling and moisture conditions through comprehensive laboratory experiments and field track
surveys. Various estimation methods were employed to attain the relative dielectric permittivity of the ballast
using a 2 GHz air-coupled antenna for the laboratory tests. Values of permittivity obtained experimentally
were verified by the theory-based mixing model. Field track GPR surveys using miscellaneous frequencies
(400, 900, and 2000 MHz) were undertaken, where the same type of granite ballast used in the laboratory tests,
were laid along a track section composed of metal, wooden and concrete sleepers.
The GPR technology has been also used with multi-offset antennas to measure the signal travel time and the
material dielectric constant of the subsurface layers [113]. Results showed that the GPR pulse propagation
velocity significantly decreased 10–30% from clean to fouled ballast due to an increasing amount of fine
particles.
Ballast under different conditions generates various GPR electromagnetic scattering patterns. A field GPR
survey with multiple sets of 1 and 2 GHz air-horn antennae was conducted in 2005 at the Transportation
Technology Center, Inc. (TTCI) in Pueblo, Colorado [33]. The 2 GHz antenna was found to be more sensitive
to changes in the scattering pattern. In addition, [89] has developed a 2 GHz horn antenna which was initially
tested on ballast at the TTCI in 2005 and subsequently on Amtrak Rails near Boston, MA in 2006.
A study utilizing GPR horn antennas to evaluate railroad ballast, sub-ballast, and subgrade conditions was
conducted between January 2005 and September 2006 [114]. A representative scattering amplitude envelope
was constructed from the data and implemented in an automatic data processing sequence. Subsequently, data
from 148 mi (238 km) of track obtained with 2 GHz horn antennas were processed and the ballast fouling
condition was automatically interpreted from the GPR data. The data were collected on four different railroad
tracks located primarily in the states of Massachusetts, Nebraska, Colorado, and Wyoming in the United States.
GPR can be used to detect problems related to embankment instability with a risk for the track settlement [78].
[115] have collected data from the railway substructure using 1.0 GHz horn antennas. Data were collected
from the centreline and both sides of the rails for comparison purposes. Track stability can be affected in case
a difference between data is noticed.
Moreover, a geophysical investigation was carried out by [105] after the failure of an important railway
embankment in the south-east of Ireland. The embankment, which had a long-term history of stability

problems, was studied using a combination of GPR, electrical resistivity tomography (ERT), multichannel
analysis of surface waves (MASW) and geotechnical testing. A significant thickening of the ballast layer
around the failure location was observed using GPR, which confirmed the existence of an ongoing stability
issue in the area.
Finally, several studies have used GPR on railway infrastructures to investigate reflections in the signal. To
this extent, the GPR system faces some challenges during field surveys including high radio-frequency
interference from railroad communication and automation, and strong reflections from rails. In the study
developed by [116], dedicated techniques were used to remove the interference and reduce the strong clutter
from rails to obtain clear GPR data of the railroad substructure. A time-frequency method, short-time Fourier
transform, was then applied to extract the ballast fouling conditions at depths.
On the contrary, [117], [74] have investigated the influence of concrete railway sleepers on the GPR signal for
the assessment of railway ballast conditions. The object is to propose a data processing scheme capable to filter
out the effects of concrete sleepers on the GPR signals with compound information.
A real life InSAR and GPR applications is developed by [118] that has investigated a railway located in Puglia,
Southern Italy. Specifically, an amount of 27 and 29 images collected in ascending and descending geometry
from the COSMO-SkyMed mission, respectively, were taken into account. In regard to the data processing,
GPR data were elaborated in the Matlab™ environment according to a standard processing sequence. Test
outcomes prove the viability of the proposed methodology for monitoring the health of transport assets at
network level. Moreover, same authors [119] have employed the integration of the GPR and the Interferometric
InSAR techniques for the monitoring of the rail-abutment transition area in railway bridges. On one hand, GPR
was used to obtain structural details of the subsurface (thickness of the ballasted layer, position of the sleepers,
presence of clay/humidity spots) and to identify potential construction-related issues. Parallel to this, InSAR
analyses were mainly addressed to monitor subsidence at the rail-abutment transition area. Outcomes of this
investigation outlined the presence of subsidence at both the areas of transition and have proven the proposed
integrated approach as viable to achieve a more comprehensive assessment of the structural integrity of railway
bridges.
5. Benefits of network-level satellite remote sensing and NDT monitoring

It is known that despite the advantages listed for ballasted rail tracks, the decay modes of ballast material
exacerbate the cost of track maintenance. Asset owners spend large amount of money for rail track maintenance
and repairing to ensure proper serviceability of the railroad network.
According to statistics, average annual maintenance, and renewal (M&R) expenditures per 1 km of tracks
involve €50.000 for West-European networks. For that reason, it is essential to properly monitor each
individual railway element to maintain the infrastructure asset in a satisfactory condition [120].
Railway organisations can achieve efficient maintenance and renewal management conditions through the
optimisation between maintenance and rehabilitation works. and enabling achievement of spatial and temporal
coherence of the works. Several mathematical models for railways can be used to achieve effective and
efficient maintenance. In such a framework, the decision support systems (DSS) that incorporating new
computational maintenance optimization models have been developed. An effective decision support system
can assist asset managers in making the best decision in terms of the financial limitations and other dominant
constraints imposed upon the problem at hand [121].
Based on the potential for an integration between satellite remote sensing and NDT technologies, in this section
a railway infrastructure management system is introduced based on an integrated approach (Figure 14) in order
to optimise railway track maintenance and renewal activities. The proposed approach is developed based on
the provision of inventory data, built up in terms of identified railways network elements and as-built
information. It is characterised by two concurrent routine monitoring stages developed at two data coverage
levels, the local level for NDT and the network level for satellite remote sensing technique. Specifically, among
NDT, GPR is the technique that best fits to integration with satellite remote sensing technology, as it allows to
collect information more accurately about the causes of the distress at the local scale.
To this effect, remote sensing technologies are used to assess the entire infrastructure network in terms of
ongoing geotechnical/geodynamic processes, with a high productivity (>100 km per day) permitted by the
scale of analysis.
In case critical sections are identified, targeted inspections can be carried out with dedicated NDT techniques
with the aim to build a more comprehensive information system on the type and scale of the developing distress
at the identified infrastructure sections. The information obtained at this stage form the base of prediction
models for distress evaluation, leading to assess whether maintenance or rehabilitation are required, and what

priority level must be allocated to the identified intervention. Sections without critical spots are subject to new
screening loops until the outcome is positive.
Figure 14 – The proposed railway infrastructure management system
In parallel with remote sensing technologies, ground-based NDTs working at the local level with a low
productivity (that can reach an extension of 70 km per day). The main scope of this stage is to assess any
potential distress in the infrastructure in terms of extent (e.g. rate of the asset affected by low bearing capacity),
causes (e.g. presence of fine materials within subbase course) and effects (e.g. low stiffness spots observed by
deflection tests), that cannot be detected by satellite remote sensing.

This information is therefore integrated into the overall prediction model for the evaluation of distresses, which
returns a scale of priority of the maintenance and rehabilitation activities for individual assets of the railway
network. In case none of the information leads to the conclusion that M&R actions are required, the integrated
approach is performed again following the time scheduled monitoring routine, until variations of the stable
conditions are detected and concerning interventions are identified.
In case the need for an intervention is ascertained, the provision of a number of alternative M&R is assessed
based on the compliance to safety requirements and economic constraints. For each of the alternatives, a cost-
benefits analysis is performed, leading to the selection of the optimal strategy of M&R intervention.
Benefits of this integrated approach is demonstrated by several past research applications [106], [118], [119]
that have demonstrated the effectiveness of the coupled use of the InSAR technology and GPR method. The
findings from these studies suggest that the integrated approach can correctly characterise the railway ballast
deterioration. In fact, using complementary InSAR and NDT methods can determine the condition in the
ballasted track-bed more accurately while at the same pinpoint the causes of the deterioration since each NDT
method specializes in detecting certain deterioration types.
To understand the role of the proposed railway management system, the discussion must therefore be
broadened out to the maintenance concept. In fact, according to [122], preventive politic of maintenances is
divided into time based, condition based and predictive maintenance (Figure 15).
Time based maintenance involves cyclic activities of inspection and survey. In the time based maintenance
implementation, the time interval between an operation and the next plays a key role. The operation time
definition is based on reliability law of the element. Therefore, a time based maintenance requires collection
of statistical data on faults that with the indications of the manufacturers, allow to determine and design the
time interval.
Conversely, a condition-based or predictive approach is based on the verification of conformity by
measurement, testing, detection of the element characteristics and, hence, it allows to operate when the
element actually requires maintenance. The difference between the two approaches is that condition-based
maintenance is based on the identification of decay symptoms prior to their appearance, whereas predictive
maintenance is based on an estimation of the residual life of the infrastructure system.

Figure 15 – Ordinary maintenance plan scheme [122]
The proposed integrated approach including satellite-based surveys at the network level and the ground-based
non-destructive detection of critical sections at the local scale, well fits into the above process as an effective
predictive maintenance system.
It is worthwhile distinguishing two stages of the system, based on the application time. A first phase relates to
the beginning of the application, whereas a second phase starts when the methodology reaches the full
productivity. In fact, in the first period after the application of the method, a limited database is available for
the interpretation of the conditions of the asset. In particular, while the series of data collection are limited in
time, only late-stage and rapidly evolving distresses can be detected. Accordingly, within the first phase, the
outcome of this approach mainly fits with a condition-based maintenance, as opposed to a predictive
maintenance.
Dataset of collected information increases by repetition of the surveys and it allows the methodology to reach
its full capacity. This permits to assess the trend of deformations and distresses. Therefore, the method is here
able to timely predict the genesis and the evolution of defects in ballasted tracks. At this stage, the proposed
methodology, from now on referred to as “optimised”, becomes a totally predictive tool as a condition-based
maintenance is required in case of unexpected events only, such as major natural events or traffic accidents.
Indeed, starting from the first application of the method, the progressively increasing dataset derived from both
the satellite- and the ground-based surveys forms the base of more robust and reliable distress prediction
algorithms. These have the function to detect potentially dangerous decay phenomena at very early stage.

Accordingly, three possible maintenance approaches are identified: i) time-based maintenance; ii) condition-
based maintenance; iii) optimised condition-based. All these approaches aim at the highest reduction of the
maintenance-related costs, at the long term.
In regard to the time-based maintenance, costs are due to several cyclic activities, such as tamping, ballast
cleaning and ballast renewal [123]. These interventions, which are typically very costly as they involve all the
railway track components, are regularly scheduled regardless the actual state of decay of the asset.
Oppositely, main benefits of the condition-based maintenance are financial. In fact, this approach is based on
inspections and tests that allow to apply maintenance interventions only where required by a decrease of the
health conditions of the infrastructure. This method is thereby effective in reducing maintenance-related costs
with respect to the time based approach, increasing the operational availability of maintenance machines due
to limited time of use and improving safety by limiting scale and severity of failures. An effective planning
can save on maintenance costs and resources and it affects the safety and operational efficiency of the
maintenance activities [124]. According to literature, condition-based maintenance typically generates savings
ranging between 90% - 95% with respect to the costs of the time based maintenance [125-127]. However, as
a limitation of this approach, the separate analysis of the survey outcomes may fail in detecting decay trends,
especially in case an accurate comparison between successive inspections is lacking. Particularly, this might
stand as a critical issue at the very first application of the condition-based maintenance, when previous surveys
are missing and it is therefore impossible to retrieve information of the evolution trend of the distresses.
In view of this, an optimised condition-based scenario stands as an improvement of the previous maintenance
approach, as it allows to minimise costs while maximising benefits in terms of operational safety and
sustainability of the activities. Indeed, the integration of ground-based surveys with space-born surveillance
permits to rely on back-dated time-series of subsidence in the area of interest. These are crucial to obtain a
full knowledge of any potential geotechnical issue affecting the asset at the network level, that could be
neglected without this retroactive analysis. Furthermore, such an initial backward inspection allows to
recognise previous maintenance interventions conducted on the network and assessing their effectiveness.
Accordingly, the optimised approach improve upon the time required for condition-based methods to be
effective, at it allows use of algorithms for the prediction of decay evolution from the first application (time-
zero). Therefore, this strategy stands as a viable solution for asset owners responsible for the asset maintenance

in planning interventions that effectively limit the decay sources at the early stage of evolution. This has a
positive impact on financial and ecological aspects of the infrastructure management process.
6. Conclusions and Final Remarks
This paper presents a review of the use of the Ground Penetrating Radar (GPR) and the Interferometric
Synthetic Aperture Radar (InSAR) methods for the sustainable monitoring of railway infrastructures. The
paper is especially focussed on the efficiency of the NDT methods for a more proactive approach in
maintenance planning in this sector.
An overview of the diagnosis and maintenance issues as well as the track deformations is first given. In more
detail, the main types of deformations occurring on a ballasted railway are discussed, highlighting the role of
the fouling as one of the primary causes of failure and pointing out that an early detection is crucial to reduce
future costs of intervention as well as to limit the risk ofany potential accident event, e.g., derailments.
Specifically, it has been observed that the amount of fouling in a ballasted railway is characterised and
quantified by means of commonly used indexes.
Methods for the assessment of the track geometry have been sorted into traditional and non-destructive, and
classified based on their productivity. Within this context, satellite remote sensing and non-destructive
techniques have emerged as the most flexible, effective, sustainable and reliable techniques for assessment of
railway infrastructures. In addition, it was emphasised how GPR can be relatively easily integrated to InSAR
measurements and a review on the research methods for an integrated use of these technologies in railway
infrastructures has been presented at the laboratory and the real-life scales of investigation. Furthermore, a
conceptual framework based on an integrated approach including satellite-based and ground-based
investigations is proposed, where network and local level information can be merged for the detection of
critical sections and the implementation of a more advanced predictive maintenance system. The application
of the proposed approach has different benefits. These can be financial, e.g., for railway companies and
operators due to the totally predictive nature of the tool, environmental and ecological, which are related to a
lower use of non-renewable materials and resources. Area of development and concentration for the proposed
approach are in the need of a central railway management system to map railways both at local and network

levels and the requirement of a dataset of satellite-based information for the development of more robust back-
dated time-series analyses.
References
[1] Indraratna, B., 1st Proctor Lecture of ISSMGE: Railroad performance with special reference to ballast and
substructure characteristics, Transportation Geotechnics 7, 74–114, 2016
[2] Indraratna, B., Nimbalkar, S., Neville, T., Performace assessment of reinforced ballasted rail track, Ground
Improvement Volume 167 February 2014 Issue GI1 Pages 24–34 http://dx.doi.org/10.1680/grim.13.00018
[3] Benedetto, A., Bianchini Ciampoli, L., Brancadoro, M.G., Alani, A.M., Tosti, F., A Computer-Aided
Model for the Simulation of Railway Ballast by Random Sequential Adsorption Process, Computer-Aided
Civil and Infrastructure Engineering, 1-15, 2017
[4] Giese, E., Blum, O. & Risch, K. (1925), Linienfuhrung, Springer, Berlin, Germany
[5] Tzanakakis, K. (2013), The Railway Track and Its Long Term Behaviour, Springer, Berlin, Germany
[6] Pyrgidis, C. N. (2016), Railway Transportation Systems: Design, Construction and Operation, CRC Press,
Boca Raton, FL
[7] Indraratna, B., Nimbalkar, S. S., Ngo, N. T. & Neville, T. (2016b), Performance improvement of rail track
substructure using artificial inclusions—experimental and numerical studies, Transportation Geotechnics, 8,
69–85.
[8] Li, D., Hyslip, J., Sussmann, T. & Chrismer, S. (2016), Transportation Geotechnics, CRC Press, Roca
Baton, FL
[9] Solomon B. Railway maintenance: the men and machines that keep the railroads running. Wisconsin: MBI
Publishing Company; 2001.
[10] Clark MR, Gillespie R, Kemp T, McCann DM, Forde MC. Electromagnetic properties of railway ballast.
NDT E Int 2001;34:305–11.
[11] Al-Qadi IL, Xie W, Roberts R, Leng Z. Data analysis techniques for GPR used for assessing railroad
ballast in high radio-frequency environment. J Transport Eng 2010;136:392–9.
[12] Wnek M, Tutumluer E, Moaveni M, et al. (2013) Investigation of aggregate properties 611 influencing
railroad ballast performance. Transp Res Rec 180–189.

[13] Makarov AI, Ermakov VA, Ekimov DA (2019) Application of Textural Features in the Analysis 689 of
Breakstone Grading. J Min Sci 55: 40–44. 690
[14] Qian Y, Boler H, Moaveni M, et al. (2014) Characterizing Ballast Degradation through Los 691 Angeles
Abrasion Test and Image Analysis. Transp Res Rec J Transp Res Board 2448: 142–151. 692.
[15] Okonta FN (2014) Relationships between abrasion index and shape properties of progressively 693
abraded dolerite railway ballasts. Rock Mech Rock Eng 47: 1335–1344. 694
[16] Sun QD, Indraratna B, Nimbalkar S (2016) Deformation and Degradation Mechanisms of 695 Railway
Ballast under High Frequency Cyclic Loading. J Geotech Geoenvironmental Eng 142: 696 04015056.
[17] Ebrahimi A, Tinjum JM, Edil TB (2015) Deformational behavior of fouled railway ballast. Can 607
Geotech J 52: 344–355.
[18] Anbazhagan P, Dixit PSN, Bharatha TP. Identification of type and degree of railway ballast fouling using
ground coupled GPR antennas. J Appl Geophys 2016;126: 183–90.
https://doi.org/10.1016/j.jappgeo.2016.01.018.
[19] Selig ET, Waters JM. Track geotechnology and substructure management. London: Thomas Telford;
1994.
[20] Leng Z, Al-Qadi I. Railroad ballast evaluation using ground-penetrating radar: laboratory investigation
and field validation. Transp Res Rec J Transp Res Board 2010;2159:110–7. https://doi.org/10.3141/2159-14.
[21] Ibrekk PAY. Detecting anomalies and water distribution in railway ballast using GPR [Master’s thesis].
Norges Teknisk-naturvitenskapelige Universitet; 2015.
[22] Artagan, S., Borecky, V., Advances in the non-destructive condition assessment of railway ballast: A
focus on GPR, NDT&E International 115 102290, 2020.
[23] De Chiara F, Fontul S, Fortunato E (2014) GPR laboratory tests for railways materials dielectric properties
assessment. Remote Sens 6:9712–9728. https ://doi.org/10.3390/rs610 9712
[24] Riveiro B, Solla M (eds) (2016) Non-destructive techniques for the evaluation of structures and
infrastructure. CRC Press, Boca Raton
[25] Li D, Read D, Thompson H et al (2010) Evaluation of ground penetrating radar technologies for assessing
track substructure conditions. In: Proceedings of AREMA 2010 Annual Conference. Orlando, FL

[26] Quiroga L, Schnieder E (2013) Railway systems. In: Czichos H (ed) Handbook of technical diagnostics.
Springer, Berlin, pp 519–537
[27] Artagan, S., Bianchini Ciampoli, L., D’Amico, F., Calvi, A., Tosti, F., Non‑destructive Assessment and
Health Monitoring of Railway Infrastructures, Surveys in Geophysics, Springer 2019
https://doi.org/10.1007/s10712-019-09544-w
[28] Sadeghi J, Motieyan-Najar ME, Zakeri JA, et al. (2018) Improvement of railway ballast 613 maintenance
approach, incorporating ballast geometry and fouling conditions. J Appl Geophys 614 151: 263–273. 615
[29] Rampersad A, George TB, Mokoena R, et al. (2018) The Influence of Ballast Fouling on Track 616
Settlememt.
[30] Sussmann TR, Ruel M, Chrismer SM (2012) Source of Ballast Fouling and Influence Considerations for
Condition Assessment Criteria. Transp Res Rec J Transp Res Board 87–94.
[31] Koohmishi M, Azarhoosh A (2020) Assessment of Drainage and Filtration of Sub-ballast Course
Considering Effect of Aggregate Gradation and Subgrade Condition. Transp Geotech 24: 100378.
[32] Paiva C, Ferreira M, Ferreira A (2015) Ballast drainage in Brazilian railway infrastructures. Constr Build
Mater 92: 58–63.
[33] Al-Qadi IL, Xie W, Roberts R (2008) Scattering analysis of ground-penetrating radar data to quantify
railroad ballast contamination. NDT E Int 41: 441–447.
[34] Anbazhagan P, Indraratna B, Amarajeevi G. Characterization of clean and fouled rail track ballast
subsurface using seismic surface survey method: model and field studies. J Test Eval 2011;39:831–41
[35] Tennakoon, N., Indraratna, B., Rujikiatkamjorn, C., Nimbalkar, S. & Neville, T. (2012). The role of ballast
fouling characteristics on the drainage capacity of rail substructure. Geotechnical Testing Journal, 35 (4)
[36] Anbazhagan P, Bharatha TP, Amarajeevi G (2012) Study of Ballast Fouling in Railway Track Formations.
Indian Geotech J 42: 87–99.
[37] Feldman F, Nissen D (2002) Alternative testing method for the measurement of ballast fouling: percentage
void contamination, Cost efficient railways through engineering: Conference on Railway Engineering (CORE
2002), Wollongong, New South Wales, Australia.
[38] Indraratna B, Ngo NT, Rujikiatkamjorn C (2011) Behavior of geogrid-reinforced ballast under various
levels of fouling. Geotext Geomembranes 29: 313–322.

[39] Benedetto A, Tosti F, Bianchini Ciampoli L, et al. (2017) Railway ballast condition assessment using
ground-penetrating radar – An experimental, numerical simulation and modelling development. Constr Build
Mater 140: 508–520.
[40] Mishra D, Qian Y, Huang H, et al. (2014) An integrated approach to dynamic analysis of railroad track
transitions behavior. Transp Geotech 1: 188–200.
[41] Einav I (2007) Breakage mechanics-Part I: Theory. J Mech Phys Solids 55: 1274–1297.
[42] Koohmishi M, Palassi M (2017) Effect of particle size distribution and subgrade condition on degradation
of railway ballast under impact loads. Granul Matter 19: 1–12. 606
[43] Indraratna B, Sun Y, Nimbalkar S (2016a) Laboratory Assessment of the Role of Particle Size Distribution
on the Deformation and Degradation of Ballast under Cyclic Loading. J Geotech Geoenvironmental Eng 142:
04016016.
[44] Indraratna B, Sun Y, Nimbalkar S (2016a) Laboratory Assessment of the Role of Particle Size Distribution
on the Deformation and Degradation of Ballast under Cyclic Loading. J Geotech Geoenvironmental Eng 142:
04016016.
[45] Tzanakakis K (2013) The railway track and its long term behaviour: a handbook for a railway track of
high quality. Springer, Heidelberg
[46] Ponnuswamy S (2012) Railway transportation: engineering, operation and management. Alpha Science
International, Oxford
[47] Chandra S, Agarwal MM (2008) Railway engineering. Oxford University Press, New York
[48] Prasad A (2016) Various cost effective maintenance practices for conventional track structure. In:
AREMA 2016 annual conference & exposition, Orlando
[49] Profillidis VA (2006) Railway management and engineering. Ashgate, Farnham
[50] Quiroga L, Schnieder E (2013) Railway systems. In: Czichos H (ed) Handbook of technical diagnostics.
Springer, Berlin, pp 519–537
[51] ASTM E950 / E950M - 09(2018), Standard Test Method for Measuring the Longitudinal Profile of
Traveled Surfaces with an Accelerometer-Established Inertial Profiling Reference
[52] BS EN 16729-1 (2016), Railway applications - Infrastructure - Non-destructive testing on rails in track -
Part 1: Requirements for ultrasonic inspection and evaluation principles

[53] Johnson, Christopher Ian, Image processing techniques for the detection and characterisation of features
and defects in railway tracks, Thesis, Manchester Metropolitan University, 2016
[54] Wolfgang Habel, Francis Berghmans, Krzysztof Borzycki, Christoph Chojetzki, Guideline for Use of
Fibre Optic Sensors, COST Action 299 “FIDES”, Optical Fibres for New Challenges Facing the Information
Society, 2009
[55] BS DD ENV 50121-1 (1996), Railway applications. Electromagnetic compatibility. General
[56] ASTM D6087 (2008), Standard Test Method for Evaluating Asphalt-Covered Concrete Bridge Decks
Using Ground Penetrating Radar
[57] ASTM F2327 (2015), Standard Guide for Selection of Airborne Remote Sensing Systems for Detection
and Monitoring of Oil on Water
[58] Tsunashima H, Naganuma Y, Matsumoto A et al (2012) Condition monitoring of railway track using
inservice vehicle. In: Perpinya X (ed) Reliability and safety in railway, Intech, pp 333–356. https ://
doi.org/10.5772/35205
[59] Real J, Salvador P, Montalbán L, Bueno M (2011) Determination of rail vertical profile through inertial
methods. Proc Inst Mech Eng Part F J Rail Rapid Transit 225:14–23. https ://doi.org/10.1243/09544 097JR
RT353
[60] Trtnik G, Kavčič F, Turk G (2009) Prediction of concrete strength using ultrasonic pulse velocity and
artificial neural networks. Ultrasonics 49(1):53–60
[61] Labropoulos KC, Moundoulas P, Moropoulou A (2010) Methodology for the monitoring, control and
warning of defects for preventive maintenance of rails. In: Sciutto G (ed) WIT transactions on state of the art
in science and engineering, 1st edn. WIT Press, Ashurst, pp 89–98
[62] Santa-aho S, Nurmikolu A, Vippola M (2017) Automated ultrasound-based inspection of rails: review.
Int J Railw 10:21–29. https ://doi.org/10.7782/IJR.2017.10.2.021
[63] Malar R, Jayalakshmy S (2015) Detection of cracks and missing fasteners in railway lines using structure
topic model. IJISET - Int J Innov Sci Eng Technol 2(10):369–375
[64] Mazzeo PL, Stella E, Nitti M, Distante A (2010) Potential dangerous object detection on railway ballast
using digital image processing. In: Sciutto G (ed) WIT transactions on state of the art in science and
engineering, 1st edn. WIT Press, Ashurst, pp 79–88

[65] Bianchini Ciampoli, L., Brancadoro, M.G., Ferrante, C., Benedetto, A., Tosti, F., Alani, A.M., An
Investigation into the Railway Ballast Grading using GPR and Image Analysis, IWAGPR2017 9th
International Workshop on Advanced Ground Penetrating Radar, Edinburgh, Scotland, June 28-30, 2017.
[66] Ye XW, Su YH, Han JP (2014) Structural health monitoring of civil infrastructure using optical fiber
sensing technology: a comprehensive review. Sci World J 2014:1–11. https ://doi.org/10.1155/2014/65232 9
[67] Barrias A, Casas J, Villalba S (2016) A review of distributed optical fiber sensors for civil engineering
applications. Sensors 16:748. https ://doi.org/10.3390/s1605 0748
[68] Campanella CE, Cuccovillo A, Campanella C et al (2018) Fibre bragg grating based strain sensors: review
of technology and applications. Sensors 18:3115
[69] Pieraccini M (2013) Monitoring of civil infrastructures by interferometric radar: a review. Sci World J
2013:1–8. https ://doi.org/10.1155/2013/78696 1
[70] Chang L, Dollevoet RPBJ, Hanssen RF (2017) Nationwide railway monitoring using satellite SAR
interferometry. IEEE J Sel Top Appl Earth Obs Remote Sens 10:596–604. https ://doi.org/10.1109/ JSTAR
S.2016.25847 83
[71] ESA Radar Course 3-Synthetic Aperture Radar-ERS Radar Course 3-ESA Operational EO Missions-
Earth Online-ESA. https ://earth .esa.int/web/guest /missi ons/esa-opera tiona l-eo-missi ons/ers/instr ument
s/sar/appli catio ns/radar -cours es/conte nt-3/-/asset publi sher/mQ9R7 ZVkKg 5P/ conte nt/radar -cours e-3-
synth etic-apert ure-radar . Accessed 16 Nov 2018
[72] Ciampoli, L.B.; Gagliardi, V.; Clementini, C.; Latini, D.; Del Frate, F.; Benedetto, A. Transport
Infrastructure Monitoring by InSAR and GPR Data Fusion. Surv. Geophys. 2019, 41, 371–394.
[73] Maturana, R.M., Bautista, B.D., Aguacil, A.A., Plaza, M.R., Sandoval Castaño, S., Preventive
Maintenance of Railway Infrastructures using GPR – Ground Penetrating Radar, World Congress Railway
Research (WCRR), Lille, 2011
[74] Al-Qadi, I., Xie, W., Roberts, R., (2008) Time-Frequency Approach for Ground Penetrating Radar Data
Analysisi to Assess Railroad Ballast Condition, Research in Nondestructive Evaluation, 19:4, 219-237, DOI:
10.1080/09349840802015107
[75] P. Annan. Ground Penetrating Radar Principles, Procedures and Applications. John Wiley & Sons, Canada
(2003)
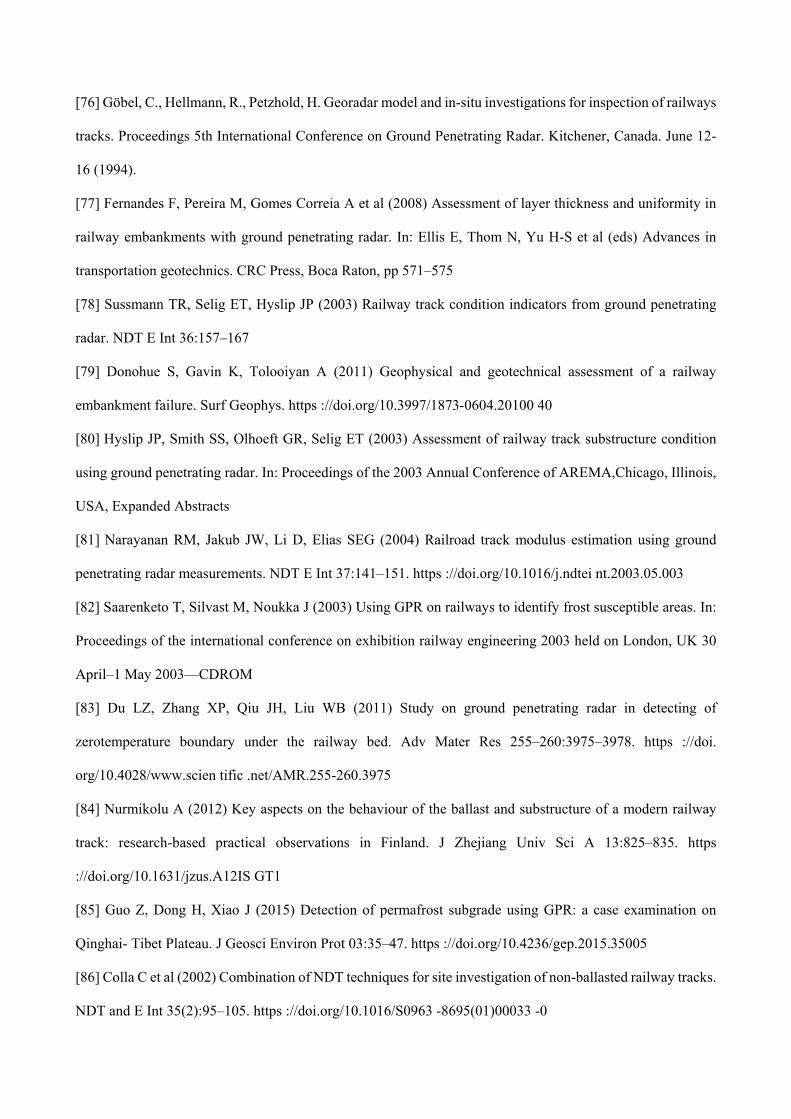
[76] Göbel, C., Hellmann, R., Petzhold, H. Georadar model and in-situ investigations for inspection of railways
tracks. Proceedings 5th International Conference on Ground Penetrating Radar. Kitchener, Canada. June 12-
16 (1994).
[77] Fernandes F, Pereira M, Gomes Correia A et al (2008) Assessment of layer thickness and uniformity in
railway embankments with ground penetrating radar. In: Ellis E, Thom N, Yu H-S et al (eds) Advances in
transportation geotechnics. CRC Press, Boca Raton, pp 571–575
[78] Sussmann TR, Selig ET, Hyslip JP (2003) Railway track condition indicators from ground penetrating
radar. NDT E Int 36:157–167
[79] Donohue S, Gavin K, Tolooiyan A (2011) Geophysical and geotechnical assessment of a railway
embankment failure. Surf Geophys. https ://doi.org/10.3997/1873-0604.20100 40
[80] Hyslip JP, Smith SS, Olhoeft GR, Selig ET (2003) Assessment of railway track substructure condition
using ground penetrating radar. In: Proceedings of the 2003 Annual Conference of AREMA,Chicago, Illinois,
USA, Expanded Abstracts
[81] Narayanan RM, Jakub JW, Li D, Elias SEG (2004) Railroad track modulus estimation using ground
penetrating radar measurements. NDT E Int 37:141–151. https ://doi.org/10.1016/j.ndtei nt.2003.05.003
[82] Saarenketo T, Silvast M, Noukka J (2003) Using GPR on railways to identify frost susceptible areas. In:
Proceedings of the international conference on exhibition railway engineering 2003 held on London, UK 30
April–1 May 2003—CDROM
[83] Du LZ, Zhang XP, Qiu JH, Liu WB (2011) Study on ground penetrating radar in detecting of
zerotemperature boundary under the railway bed. Adv Mater Res 255–260:3975–3978. https ://doi.
org/10.4028/www.scien tific .net/AMR.255-260.3975
[84] Nurmikolu A (2012) Key aspects on the behaviour of the ballast and substructure of a modern railway
track: research-based practical observations in Finland. J Zhejiang Univ Sci A 13:825–835. https
://doi.org/10.1631/jzus.A12IS GT1
[85] Guo Z, Dong H, Xiao J (2015) Detection of permafrost subgrade using GPR: a case examination on
Qinghai- Tibet Plateau. J Geosci Environ Prot 03:35–47. https ://doi.org/10.4236/gep.2015.35005
[86] Colla C et al (2002) Combination of NDT techniques for site investigation of non-ballasted railway tracks.
NDT and E Int 35(2):95–105. https ://doi.org/10.1016/S0963 -8695(01)00033 -0

[87] Sanayei M et al (2006) Damage localization and finite-element model updating using multiresponse NDT
data. J Bridge Eng 11(6):688–698. https ://doi.org/10.1061/(ASCE)1084-0702(2006)11:6(688)
[88] Solla M et al (2011) Non-destructive methodologies in the assessment of the masonry arch bridge of
Traba, Spain. Eng Fail Anal 18(3):828–835. https ://doi.org/10.1016/j.engfa ilana l.2010.12.009
[89] Roberts R, Rudy J, GSSI S (2006) Railroad ballast fouling detection using ground penetrating radar. A
new approach based on scattering from voids. ECNDT 2006–Th 45 1
[90] De Bold RP (2011) Non-destructive evaluation of railway trackbed ballast. PhD Thesis, The University
of Edinburgh
[91] Tosti F, Bianchini Ciampoli L, Calvi A et al (2017) An investigation into the railway ballast dielectric
properties using different GPR antennas and frequency systems. NDT E Int. https ://doi. org/10.1016/j.ndtei
nt.2017.10.003
[92] Saarenketo T (2006) Electrical properties of road materials and subgrade soils and the use of ground
penetrating radar in traffic infrastructure surveys. PhD Thesis, University of Oulu, Oulu
[93] Al-Qadi I, Xie W, Roberts R (2010) Optimization of antenna configuration in multiple-frequency ground
penetrating radar system for railroad substructure assessment. NDT E Int 43:20–28. https ://doi.
org/10.1016/j.ndtei nt.2009.08.006
[94] Suits LD, Sheahan TC, Su L-J et al (2010) An evaluation of fouled ballast in a laboratory model track
using ground penetrating radar. Geotech Test J 33:103045. https ://doi.org/10.1520/GTJ10 3045
[95] Zhang Q, Gascoyne J, Eriksen A (2011) Characterisation of ballast materials in trackbed using ground
penetrating radar: Part 1. In: Railway condition monitoring and non-destructive testing (RCM 2011), 5th IET
conference on. IET, pp 1–8
[96] Anbazhagan P, Lijun S, Buddhima I, Cholachat R (2011) Model track studies on fouled ballast using
ground penetrating radar and multichannel analysis of surface wave. J Appl Geophys 74:175–184. https ://doi.
org/10.1016/j.jappg eo.2011.05.002
[97] Anbazhagan P (2013) Characterization of rail track ballast fouling using ground penetration radar and
field sampling. Centre for infrastructure, Sustainable Transport and Urban Planning Indian Institute of Science,
Bangalore

[98] Jack R, Jackson P (1999) Imaging attributes of railway track formation and ballast using ground probing
radar. NDT E Int 32:457–462
[99] Tosti F, Benedetto A, Calvi A, Bianchini Ciampoli L (2016) Laboratory Investigations for the
Electromagnetic Characterization of Railway Ballast through GPR. In: Proceedings of the 16th international
conference on ground penetrating radar, Hong Kong, June 13–16, 2016. https ://doi. org/10.1109/icgpr
.2016.75726 05
[100] Khakiev Z, Shapovalov V, Kruglikov A, Yavna V (2014) GPR determination of physical parameters of
railway structural layers. J Appl Geophys 106:139–145. https ://doi.org/10.1016/j.jappg eo.2014.04.017
[101] Artagan, S., Borecky, V., Advances in the non-destructive condition assessment of railway ballast: A
focus on GPR, NDT&E International 115 102290, 2020.
[102] Manacorda G, Morandi D, Sarri A, Staccone G (2002) Customized GPR system for railroad track
verification. In: Ninth international conference on ground penetrating radar (GPR2002). International Society
for Optics and Photonics, pp 719–723
[103] Hyslip JP, Smith SS, Olhoeft GR, Selig ET (2003) Assessment of railway track substructure condition
using ground penetrating radar. In: Proceedings of the 2003 Annual Conference of AREMA,Chicago, Illinois,
USA, Expanded Abstracts
[104] Hugenschmidt, J., Railway track inspection using GPR, Journal of Applied Geophysics 43. 147–155,
2000
[105] Donohue S, Gavin K, Tolooiyan A (2011) Geophysical and geotechnical assessment of a railway
embankment failure. Surf Geophys. https ://doi.org/10.3997/1873-0604.20100 40
[106] Bianchini Ciampoli, L., Gagliardi, V., Clementini, C., Latini, D., Del Frate, F., Benedetto, A., Transport
Infrastructure Monitoring by InSAR and GPR Data Fusion, Surveys in Geophysics (2020) 41:371–394
https://doi.org/10.1007/s10712-019-09563-7
[107] G.P. Gallagher, Q. Leiper, R. Williamson, M.R. Clark, M.C. Forde, The application of time domain
ground penetrating radar to evaluate railway track ballast, NDT&E International 32 (1999) 463–468
[108] Hamed Faghihi Kashani, Carlton L. Ho, Stan Smith, Model Track Studies by Ground Penetrating Radar
(GPR) on Ballast With Different Fouling and Geotechnical Properties, Proceedings of the 2015 Joint Rail
Conference JRC2015 March 23-26, 2015, San Jose, CA, USA

[109] Kind, T., and Maierhofer, C. (2006). “Railway ballast fouling inspection by monitoring the GPR
propagation velocity with a multi-offset antenna array.” Proc., 11th Int. Conf. on Ground Penetrating Radar
[110] Asger Eriksen, Ben Venables, Jon Gascoyne & Shubho Bandyopadhyay, Benefits of high speed GPR to
manage trackbed assets and renewal strategies, PWI Conference, 19th June 2006, Brisbane, Australia
[111] Sussman TR, O´Hara KR & Selig ET (2002) Development of Material Properties for Railway
Application of Ground Penetrating Radar. Proceedings of the Ninth International Conference on Ground
Penetrating Radar, April 29–May 2, 2002, Santa Barbara, California. Editors S. Koppenjan and H. Lee. Proc.
Of SPIE, Vol. 4758: 42–47.
[112] Clark MR, Gordon MO, Giannopoulos A & Forde MC (2003) Experimental and Computer Modelling
of GPR to Characterize Trackbed Ballast. In: proceedings of World Congress on Railway Research, Scotland,
16 p.
[113] Keogh, T., and Keegan, T. R. (2006). “An integrated system for accurate tie and ballast condition
assessment.” Proc., AREMA Conf.
[114] Roger Roberts, Imad Al-Qadi, Erol Tutumluer, Andreas Kathage, Ballast Fouling Assessment Using 2
Ghz Horn Antennas – Gpr And Ground Truth Comparison From 238 Km Of Track, 2007
[115] Olhoeft GR & Selig ET (2002) Ground Penetrating Radar Evaluation of Railway Track Substructure
Conditions. Proceedings of the Ninth International Conference on Ground Penetrating Radar, April 29– May
2, 2002, Santa Barbara, California. S Koppenjan & H Lee (Eds) Proc. SPIE, Vol 4758: 48–53
[116] Imad L. Al-Qadi, Wei Xie; Roger Roberts; and Zhen Leng, Data Analysis Techniques for GPR Used for
Assessing Railroad Ballast in High Radio-Frequency Environment, Journal Of Transportation Engineering,
Asce, April 2010
[117] Bianchini Ciampoli, L., Artagan, S., Tosti, F., Calvi, A., Morteza Alani, A., & Benedetto, A. (2018). A
GPR spectral-based processing method for minimisation of concrete sleepers effects in railway ballast
investigations. In Proceedings of 41st International Conference on Telecommunications and Signal Processing,
TSP 2018. Herencsar N.
[118] Tosti, F., Gagliardi, V., D’Amico, F., Alani, A.M., Transport infrastructure monitoring by data fusion of
GPR and SAR imagery information, Transportation Research Procedia 45 (2020) 771–778

[119] Fabrizio D’Amico, Valerio Gagliardi, Luca Bianchini Ciampoli, Fabio Tosti, Integration of InSAR and
GPR techniques for monitoring transition areas in railway bridges, NDT&E International,
https://doi.org/10.1016/j.ndteint.2020.102291
[120] Jovanovic, S., Guler, H., Coko, B.: Track degradation analysis in the scope of railway infrastructure
maintenance management systems, GRADEVINAR, 67 (2015) 3, pp. 247-258,
https://doi.org/10.14256/JCE.1194.2014
[121] Rashidi, M., Lemass, B., Gibson, P.: Decision support system for concrete bridge maintenance, ISCM
II and EPMESC XII, PTS 1 and 2, AIP Conf. Proc., 1233 (2010), pp. 1372–1377, https://doi.
org/10.1063/1.3452105
[122] Linee Guida per la Manutenzione delle Infrastrutture nel Territorio, Italian Journal of Engineering
Geology and Environment, 2019
[123] Hakan Guler, Optimisation of railway track maintenance and renewal works by genetic algorithms,
GRADEVINAR 12/2016, DOI: 10.14256/JCE.1458.2015
[124] Prasad, A., Various Cost Effective Maintenance Practices for Conventional Track Structure, AREMA
2016
[125] Simson, S.A., Ferreira, L., Murray, M.H., Rail Track Maintenance Planning - An Assessment Model,
Transportation Research Record 1713, Paper No. 00-0353, 2000
[126] Dong, T., Haftka, R.T, Kim, N.H., Advantages of Condition-Based Maintenance over Scheduled
Maintenance Using Structural Health Monitoring System, Chapter Reliability and Maintenance - An Overview
of Cases, 2019
[127] Korpanec, I. ECOTRACK: Track Management System to Reduce LCC. Proc., CORE 98. University of
Central Queensland, Rockhampton, Queensland, Australia, Sept. 7–9, 1998, pp. 293–98

Figures
Figure 1
Cross-section layout for a ballasted railway
Figure 2
Fouled ballast levels a) clean ballast b) moderately fouled ballast c) highly fouled ballast Furthermore,various different quantitative indexes have been utilised in previous research to evaluate the ballastdegradation and contamination by fouling. Fouling particles can be de�ned in terms of their particle sizeas �ne-grained particles embedded into the intergranular voids coarse-grained ballast aggregates [17, 36].
Figure 3
Criteria for calculation of e [42]
Figure 4

Deterioration process of a railway track
Figure 5
Tamping activities
Figure 6
Inertial track measurement at the longitudinal level

Figure 7
Illustration of the air-coupled guided wave transducers
Figure 8
Plan view of the ballast in a laboratory test. (a): the raw picture taken with a digital camera suspended inthe air above the centre of the formwork. (b): the binary image obtained from the image analysisalgorithm [65]
Figure 9
A schematic system of OFSs

Figure 10
EM wave propagation in a ballast section

Figure 11
Satellite remote sensing survey [71]
Figure 12
Propagation of the GPR signal on ballast railway

Figure 13
Scheme of displacement detection by InSAR technique through n images collected over the same area,with Ri and ΔRi being the sensor–target distance of the i-th acquisition, and its variation with respect tothe previous image, respectively.

Figure 14
The proposed railway infrastructure management system

Figure 15
Ordinary maintenance plan scheme [122]