Comparative analysis of Hox paralog group 2 gene expression during Nile tilapia ( Oreochromis...
10
ORIGINAL ARTICLE Comparative analysis of Hox paralog group 2 gene expression during Nile tilapia (Oreochromis niloticus) embryonic development Pierre Le Pabic & Edmund J. Stellwag & Shelby N. Brothers & Jean-Luc Scemama Received: 11 May 2007 / Accepted: 7 September 2007 / Published online: 9 October 2007 # Springer-Verlag 2007 Abstract The hindbrain and pharyngeal arch-derived structures of vertebrates are determined, at least in part, by Hox paralog group 2 genes. In sarcopterygians, the Hoxa2 gene alone appears to specify structures derived from the second pharyngeal arch (PA2), while in zebrafish (Danio rerio), either of the two Hox PG2 genes, hoxa2b or hoxb2a, can specify PA2-derived structures. We previously reported three Hox PG2 genes in striped bass (Morone saxatilis), including hoxa2a, hoxa2b, and hoxb2a and observed that only HoxA cluster genes are expressed in PA2, indicative that they function alone or together to specify PA2. In this paper, we present the cloning and expression analysis of Nile tilapia (Oreochromis niloticus) Hox PG2 genes and show that all three genes are expressed in the hindbrain and in PA2. The expression of hoxb2a in PA2 was unexpected given the close phylogenetic relation- ship of Nile tilapia and striped bass, both of which are members of the order Perciformes. A reanalysis of striped bass hoxb2a expression demonstrated that it is expressed in PA2 with nearly the same temporal and spatial expression pattern as its Nile tilapia ortholog. Further, we determined that Nile tilapia and striped bass hoxa2a orthologs are expressed in PA2 well beyond the onset of chondrogenesis whereas neither hoxa2b nor hoxb2a expression persist until this stage, which, according to previous hypotheses, suggests that hoxa2a orthologs in these two species function alone as selector genes of PA2 identity. Keywords Oreochromis niloticus . Hox PG2 genes . Pharyngeal arches . Hindbrain . Evolutionary developmental biology Introduction Hox paralog group 2 (PG2) genes are critical in conferring regional identity on the embryonic hindbrain and pharyngeal arches in teleosts and tetrapods (Trainor and Krumlauf 2001). Phylogenetic reconstructions hypothesize that the Hox PG2 complement of ancestral osteichthyians was comprised of only two genes, Hoxa2 and Hoxb2 (Fig. 1). The evolutionary lineage comprising the sarcopterygians is presumed to have retained these two genes, as may have been the case for the actinopterygian stem lineage. A lineage-specific whole genome duplication event in the actinopterygian stem lineage before the origin of teleosts likely gave rise to four Hox PG2 genes (hoxa2a, hoxa2b, hoxb2a, and hoxb2b; Amores et al. 1998; Stellwag 1999). Subsequent differential loss of Hoxa2a and Hoxb2b in divergent teleost lineages resulted in variation observed among Hox PG2 genes of extant teleosts. The zebrafish (Danio rerio), a member of the superorder Ostariophysii, possesses only two Hox PG2 genes (hoxa2b and hoxb2a; Amores et al. 1998), whereas all the members of the superorder Acanthopterygii examined to date, including striped bass (Morone saxatilis), several pufferfishes, the Nile tilapia (Oreochromis niloticus), and the Japanese medaka (Oryzias latipes) each have three Hox PG2 genes (hoxa2a, hoxa2b, and hoxb2a; Fig. 1; Scemama et al. 2002; Amores et al. 2004; Jaillon et al. 2004; Santini and Bernardi 2005; Naruse et al. 2004). Despite the evolutionary divergence in Hox PG2 gene complement among the osteichthyians, all orthologs have Dev Genes Evol (2007) 217:749–758 DOI 10.1007/s00427-007-0182-z DO00182; No of Pages Communicated by T. Hollemann P. Le Pabic : E. J. Stellwag : S. N. Brothers : J.-L. Scemama (*) Department of Biology, East Carolina University, Howell Science Complex, Greenville, NC 27858, USA e-mail: [email protected]
Transcript of Comparative analysis of Hox paralog group 2 gene expression during Nile tilapia ( Oreochromis...

ORIGINAL ARTICLE
Comparative analysis of Hox paralog group 2 geneexpression during Nile tilapia (Oreochromis niloticus)embryonic development
Pierre Le Pabic & Edmund J. Stellwag &
Shelby N. Brothers & Jean-Luc Scemama
Received: 11 May 2007 /Accepted: 7 September 2007 / Published online: 9 October 2007# Springer-Verlag 2007
Abstract The hindbrain and pharyngeal arch-derivedstructures of vertebrates are determined, at least in part,by Hox paralog group 2 genes. In sarcopterygians, theHoxa2 gene alone appears to specify structures derivedfrom the second pharyngeal arch (PA2), while in zebrafish(Danio rerio), either of the two Hox PG2 genes, hoxa2b orhoxb2a, can specify PA2-derived structures. We previouslyreported three Hox PG2 genes in striped bass (Moronesaxatilis), including hoxa2a, hoxa2b, and hoxb2a andobserved that only HoxA cluster genes are expressed inPA2, indicative that they function alone or together tospecify PA2. In this paper, we present the cloning andexpression analysis of Nile tilapia (Oreochromis niloticus)Hox PG2 genes and show that all three genes are expressedin the hindbrain and in PA2. The expression of hoxb2a inPA2 was unexpected given the close phylogenetic relation-ship of Nile tilapia and striped bass, both of which aremembers of the order Perciformes. A reanalysis of stripedbass hoxb2a expression demonstrated that it is expressed inPA2 with nearly the same temporal and spatial expressionpattern as its Nile tilapia ortholog. Further, we determinedthat Nile tilapia and striped bass hoxa2a orthologs areexpressed in PA2 well beyond the onset of chondrogenesiswhereas neither hoxa2b nor hoxb2a expression persist untilthis stage, which, according to previous hypotheses,suggests that hoxa2a orthologs in these two speciesfunction alone as selector genes of PA2 identity.
Keywords Oreochromis niloticus .Hox PG2 genes .
Pharyngeal arches . Hindbrain .
Evolutionary developmental biology
Introduction
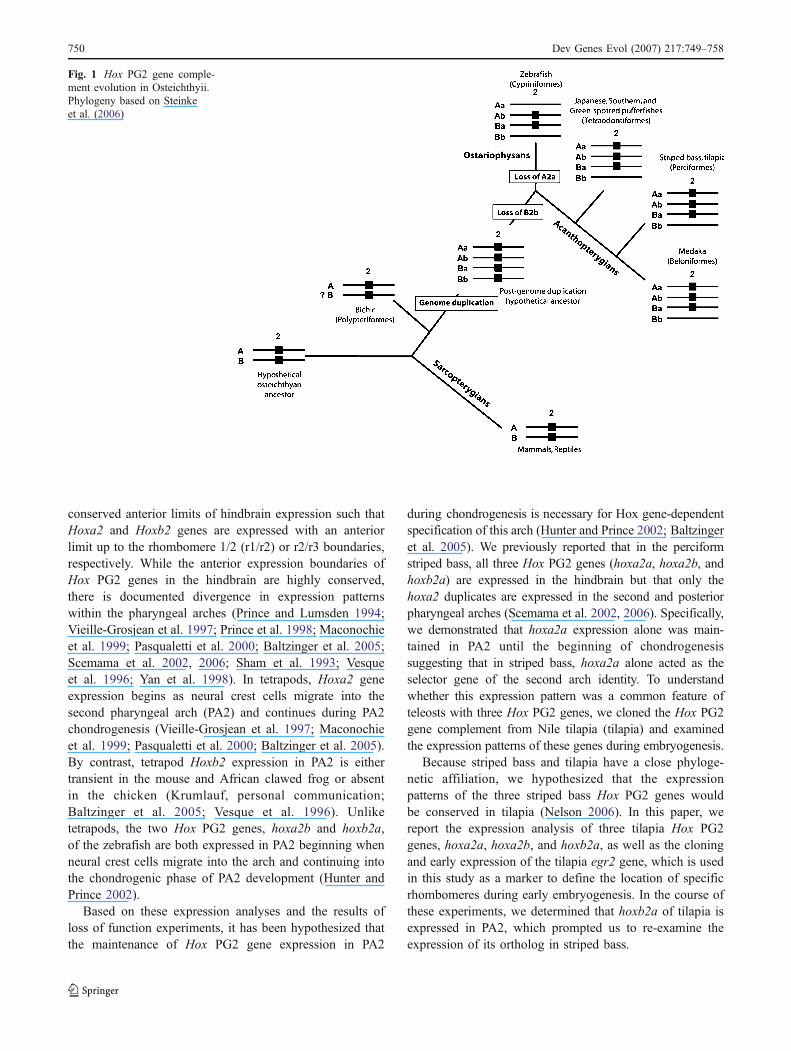
Hox paralog group 2 (PG2) genes are critical in conferringregional identity on the embryonic hindbrain and pharyngealarches in teleosts and tetrapods (Trainor and Krumlauf2001). Phylogenetic reconstructions hypothesize that theHox PG2 complement of ancestral osteichthyians wascomprised of only two genes, Hoxa2 and Hoxb2 (Fig. 1).The evolutionary lineage comprising the sarcopterygians ispresumed to have retained these two genes, as may havebeen the case for the actinopterygian stem lineage. Alineage-specific whole genome duplication event in theactinopterygian stem lineage before the origin of teleostslikely gave rise to four Hox PG2 genes (hoxa2a, hoxa2b,hoxb2a, and hoxb2b; Amores et al. 1998; Stellwag 1999).Subsequent differential loss of Hoxa2a and Hoxb2b indivergent teleost lineages resulted in variation observedamong Hox PG2 genes of extant teleosts. The zebrafish(Danio rerio), a member of the superorder Ostariophysii,possesses only two Hox PG2 genes (hoxa2b and hoxb2a;Amores et al. 1998), whereas all the members of thesuperorder Acanthopterygii examined to date, includingstriped bass (Morone saxatilis), several pufferfishes, theNile tilapia (Oreochromis niloticus), and the Japanesemedaka (Oryzias latipes) each have three Hox PG2 genes(hoxa2a, hoxa2b, and hoxb2a; Fig. 1; Scemama et al. 2002;Amores et al. 2004; Jaillon et al. 2004; Santini and Bernardi2005; Naruse et al. 2004).
Despite the evolutionary divergence in Hox PG2 genecomplement among the osteichthyians, all orthologs have
Dev Genes Evol (2007) 217:749–758DOI 10.1007/s00427-007-0182-z
DO00182; No of Pages
Communicated by T. Hollemann
P. Le Pabic : E. J. Stellwag : S. N. Brothers : J.-L. Scemama (*)Department of Biology, East Carolina University,Howell Science Complex,Greenville, NC 27858, USAe-mail: [email protected]
conserved anterior limits of hindbrain expression such thatHoxa2 and Hoxb2 genes are expressed with an anteriorlimit up to the rhombomere 1/2 (r1/r2) or r2/r3 boundaries,respectively. While the anterior expression boundaries ofHox PG2 genes in the hindbrain are highly conserved,there is documented divergence in expression patternswithin the pharyngeal arches (Prince and Lumsden 1994;Vieille-Grosjean et al. 1997; Prince et al. 1998; Maconochieet al. 1999; Pasqualetti et al. 2000; Baltzinger et al. 2005;Scemama et al. 2002, 2006; Sham et al. 1993; Vesqueet al. 1996; Yan et al. 1998). In tetrapods, Hoxa2 geneexpression begins as neural crest cells migrate into thesecond pharyngeal arch (PA2) and continues during PA2chondrogenesis (Vieille-Grosjean et al. 1997; Maconochieet al. 1999; Pasqualetti et al. 2000; Baltzinger et al. 2005).By contrast, tetrapod Hoxb2 expression in PA2 is eithertransient in the mouse and African clawed frog or absentin the chicken (Krumlauf, personal communication;Baltzinger et al. 2005; Vesque et al. 1996). Unliketetrapods, the two Hox PG2 genes, hoxa2b and hoxb2a,of the zebrafish are both expressed in PA2 beginning whenneural crest cells migrate into the arch and continuing intothe chondrogenic phase of PA2 development (Hunter andPrince 2002).
Based on these expression analyses and the results ofloss of function experiments, it has been hypothesized thatthe maintenance of Hox PG2 gene expression in PA2
during chondrogenesis is necessary for Hox gene-dependentspecification of this arch (Hunter and Prince 2002; Baltzingeret al. 2005). We previously reported that in the perciformstriped bass, all three Hox PG2 genes (hoxa2a, hoxa2b, andhoxb2a) are expressed in the hindbrain but that only thehoxa2 duplicates are expressed in the second and posteriorpharyngeal arches (Scemama et al. 2002, 2006). Specifically,we demonstrated that hoxa2a expression alone was main-tained in PA2 until the beginning of chondrogenesissuggesting that in striped bass, hoxa2a alone acted as theselector gene of the second arch identity. To understandwhether this expression pattern was a common feature ofteleosts with three Hox PG2 genes, we cloned the Hox PG2gene complement from Nile tilapia (tilapia) and examinedthe expression patterns of these genes during embryogenesis.
Because striped bass and tilapia have a close phyloge-netic affiliation, we hypothesized that the expressionpatterns of the three striped bass Hox PG2 genes wouldbe conserved in tilapia (Nelson 2006). In this paper, wereport the expression analysis of three tilapia Hox PG2genes, hoxa2a, hoxa2b, and hoxb2a, as well as the cloningand early expression of the tilapia egr2 gene, which is usedin this study as a marker to define the location of specificrhombomeres during early embryogenesis. In the course ofthese experiments, we determined that hoxb2a of tilapia isexpressed in PA2, which prompted us to re-examine theexpression of its ortholog in striped bass.
Fig. 1 Hox PG2 gene comple-ment evolution in Osteichthyii.Phylogeny based on Steinkeet al. (2006)
750 Dev Genes Evol (2007) 217:749–758

Materials and methods
Nile tilapia hoxa2a, hoxa2b, hoxb2a, and egr2 partialcDNA cloning
Tilapia hoxa2a, hoxa2b, and hoxb2a partial complementarydeoxyribonucleic acid (cDNA) were generated by reversetranscriptase–polymerase chain reaction (RT-PCR) usingtotal ribonucleic acid (RNA) isolated from stage 13embryos (Fujimura and Okada 2007; Totally RNA®,Applied Biosystems, Foster City, CA). The primers forhoxa2a were initially designed to amplify a 537-bp partialcDNA fragment of striped bass hoxa2 transcripts in aprevious study (Scemama et al. 2006): A2 exon 1: 5′-TCGCTTGCTGAGTGCCTGAC-3′ and A2 exon 2: 5′-GGTCTGTCGCTTGTGCTTC-3′. The primers for hoxa2b andhoxb2a were designed based on tilapia genomic sequences(Accession numbers AY757317 and AY757323) to amplifya 700- or a 650-bp fragment of the transcripts, respectively(tila2bF: 5′-ACTAACCCTGTCGGTGATGC-3′ andtila2bR: 5′-CCTCTGTAGCCTGCTCCAAC-3′; tilb2aF2:5′-GCCCAGCAGCCATACACGAC-3′ and tilb2aR: 5′-TTGAATACGGAGAGGAGGCG-3′). The PCR productswere cloned into the pCRII vector (Invitrogen, Carlsbad,CA), according to the manufacturer’s instructions. Theinserts were sequenced using dideoxyterminator sequencingchemistry (Big Dye v. 3.0, Applied Biosystems), and thepartial cDNA sequences are available in the GenBankdatabase under the accession numbers EF547389,EF547390, and EF547391 for tilapia hoxa2a, hoxa2b, andhoxb2a, respectively. Egr2 primers were designed toamplify a 353-bp partial cDNA fragment of striped bassegr2 transcripts in a previous study (Scemama et al. 2006):Egr2F351: 5′-GGCTACCCTCTGCTTACAGTC-3′ andEgr2R: 5′-GGAGGTGGATTTTGGTGTGTC-3′.
Striped bass hoxb2a probe construction and labeling
A partial hoxb2a cDNA was amplified by RT-PCR from 48hours postfertilization (hpf) striped bass embryonic RNA.The primers used for the PCR amplification were designedto amplify a 545-bp fragment encompassing the junctionbetween hoxb2a exon1 and exon2: msab2aex1F: 5′-TCATCCCCCCTGCCTCATCC-3′ and msab2aex2R: 5′-TCAAACAGCCTCGCTCCTCC-3′. The amplificationproduct was cloned into the pCRII® vector (Invitrogen),according to the manufacturer’s instructions. Insert orienta-tion was determined using restriction digestion with theenzymes SmaI and SpeI. SmaI only cleaved the insert onceand created two fragments of unequal length (195 and350 bp), and SpeI only cleaved the vector once 36 bp 5′ ofthe insertion site. Two clones (pMsab2a-1 and pMsab2a-5)were selected such that each contained the insert in opposite
orientations. Each clone was linearized with SpeI, anddigoxigenin-labeled sense and antisense hoxb2a riboprobeswere generated using T7 RNA polymerase with pMsab2a2-5 and pMsab2a-1, respectively (Maxiscript® transcriptionreaction kit, Applied Biosystems). Transcripts were purifiedusing the Minielute® Purification Kit from Qiagen (Valencia,CA). The quality of the transcripts was assessed bydenaturing agarose gel electrophoresis, and the transcriptswere quantified by dot-blot analysis.
Whole-mount in situ hybridization
O. niloticus (Nile tilapia) brood fish were obtained fromSouthern Farm Tilapia (Castalia, NC). The species assign-ment of the brood fish was verified using morphologicalcharacteristics (Popma and Masser 1999) and restrictionfragment length polymorphism analyses of PCR-amplified18S ribosomal DNA (El-Serafy et al. 2007). The fish wereraised at 28°C in 200 L aquaria arranged into a 2,600 Lrecirculating system. The exact time of fertilization wasdetermined by observation of spawning, and the fertilizedeggs were removed physically from the female’s mouth30 min postfertilization. Tilapia embryos were allowed todevelop at 28°C in Macdonald jars until sampled. Embry-onic stages were determined according to Fujimura andOkada (2007). Embryos were euthanized by treatment withMS-222 (0.04%, w/v) and fixed for 7 days in 4%paraformaldehyde in phosphate-buffered saline (PBS) at4°C, which are conditions that provided the best signal-to-noise ratio in the whole-mount in situ hybridizationexperiments. Embryos were then dechorionated and dehy-drated through a series of solutions containing increasingconcentrations of methanol to a final concentration of 100%and stored at 4°C until used. In situ hybridization experi-ments with tilapia and striped bass embryos were per-formed as previously described (Scemama et al. 2006) withantisense probes prepared from clones pOnia2a, pOnia2b,pMsab2a-1, pOnib2a, and pOniegr2 corresponding tohoxa2a, hoxa2b, hoxb2a, and egr2 antisense mRNA. Senseriboprobes were used in control experiments, to assessnonspecific hybridization. Identification of presumptiverhombomere 3 and 5 in tilapia embryos before theemergence of observable morphological landmarks wasperformed using the egr2 gene as a marker of r3 identity atthe one-somite stage (McKay et al. 1994) and of r3 and r5identity at the ten-somite stage (Fig. 3d). All hybridizationexperiments were performed in 48-well plates (Corning,New York, USA), and 133 ng of the probe was used perwell, with each well containing up to five embryos in afinal volume of 400 μL. Embryos up to stage 15 weredeyolked and mounted between microscope slide andcoverslip in 80% glycerol in PBS or in 1% low-melting-point agarose prepared in deionized water before examina-
Dev Genes Evol (2007) 217:749–758 751
tion and photography using a Leica DMR microscopeequipped with a Nikon D1x digital camera. Older embryoswere examined and photographed using either a LeicaMZ75 dissecting microscope or an ML Digital Lab XLT(Microptics, Ashland, VA) equipped with a Nikon D1xdigital camera. Images were processed in Adobe Photo-shop, and the figures were prepared in Adobe Illustrator.
Results and discussion
Cloning and assignment of Nile tilapia Hox PG2 genesand egr2
Cloning of partial cDNAs obtained from RT-PCR amplifi-cation of 48 hpf tilapia embryonic RNA with Hox PG2gene-specific primers generated three cDNA clonespOnia2a, pOnia2b, and pOnib2a. Basic Local AlignmentSearch Tool searches of the GenBank database at NationalCenter for Biotechnology Information with sequencesgenerated from the inserts contained in pOnia2a andpOnib2a were 99% similar to tilapia genomic sequencescorresponding to hoxa2a (accession number AF533976)and hoxb2a (accession number AY757323), respectively.
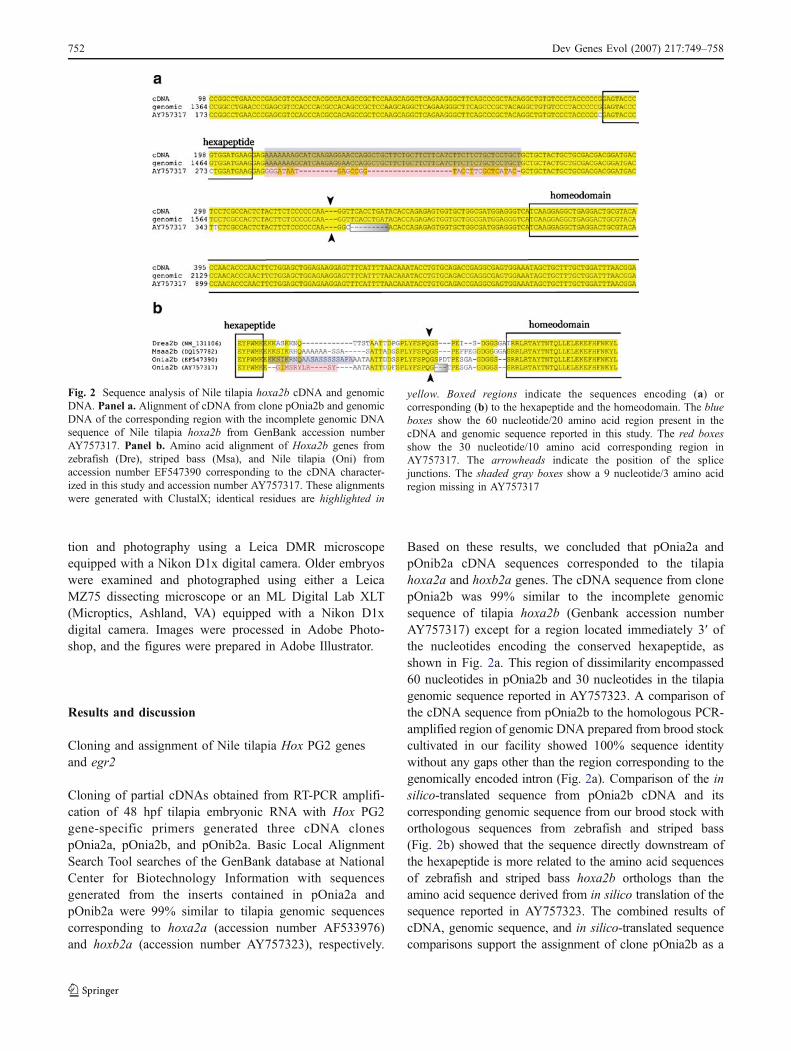
Based on these results, we concluded that pOnia2a andpOnib2a cDNA sequences corresponded to the tilapiahoxa2a and hoxb2a genes. The cDNA sequence from clonepOnia2b was 99% similar to the incomplete genomicsequence of tilapia hoxa2b (Genbank accession numberAY757317) except for a region located immediately 3′ ofthe nucleotides encoding the conserved hexapeptide, asshown in Fig. 2a. This region of dissimilarity encompassed60 nucleotides in pOnia2b and 30 nucleotides in the tilapiagenomic sequence reported in AY757323. A comparison ofthe cDNA sequence from pOnia2b to the homologous PCR-amplified region of genomic DNA prepared from brood stockcultivated in our facility showed 100% sequence identitywithout any gaps other than the region corresponding to thegenomically encoded intron (Fig. 2a). Comparison of the insilico-translated sequence from pOnia2b cDNA and itscorresponding genomic sequence from our brood stock withorthologous sequences from zebrafish and striped bass(Fig. 2b) showed that the sequence directly downstream ofthe hexapeptide is more related to the amino acid sequencesof zebrafish and striped bass hoxa2b orthologs than theamino acid sequence derived from in silico translation of thesequence reported in AY757323. The combined results ofcDNA, genomic sequence, and in silico-translated sequencecomparisons support the assignment of clone pOnia2b as a
Fig. 2 Sequence analysis of Nile tilapia hoxa2b cDNA and genomicDNA. Panel a. Alignment of cDNA from clone pOnia2b and genomicDNA of the corresponding region with the incomplete genomic DNAsequence of Nile tilapia hoxa2b from GenBank accession numberAY757317. Panel b. Amino acid alignment of Hoxa2b genes fromzebrafish (Dre), striped bass (Msa), and Nile tilapia (Oni) fromaccession number EF547390 corresponding to the cDNA character-ized in this study and accession number AY757317. These alignmentswere generated with ClustalX; identical residues are highlighted in
yellow. Boxed regions indicate the sequences encoding (a) orcorresponding (b) to the hexapeptide and the homeodomain. The blueboxes show the 60 nucleotide/20 amino acid region present in thecDNA and genomic sequence reported in this study. The red boxesshow the 30 nucleotide/10 amino acid corresponding region inAY757317. The arrowheads indicate the position of the splicejunctions. The shaded gray boxes show a 9 nucleotide/3 amino acidregion missing in AY757317
752 Dev Genes Evol (2007) 217:749–758
tilapia hoxa2b partial cDNA and suggest that the discrep-ancies observed between the pOnia2b-encoded cDNA andthe genomic sequence published as Genbank accessionnumber AY757323 may be either the result of tilapiainterstrain divergence or a PCR, cloning, or sequencingartifact related to the generation of the AY757323 sequence.Overall, these sequence comparisons and analyses supportthe assignment of clones pOnia2a, pOnia2b, and pOnib2a astilapia partial cDNAs for hoxa2a, hoxa2b, and hoxb2a genes,respectively.
We also amplified and cloned a 351-bp tilapia egr2partial cDNA (pOniegr2). The cDNA insert sequence ofpOniegr2 was 99% similar to the striped bass egr2 gene(DQ383280) and 83% related to the zebrafish egr2 gene(NM130997), which supports its assignment as a tilapiaegr2 partial cDNA.
Nile tilapia hoxa2a, hoxa2b, hoxb2a, and egr2 and stripedbass hoxb2a gene expression
Given the close taxonomic relatedness of the tilapia withstriped bass and the fact that both species have a fullcomplement of three orthologous Hox PG2 genes, wehypothesized that the expression patterns of these threegenes during embryonic development would be similar toone another. To test this hypothesis and to compare theexpression patterns of Hox PG2 genes from divergentteleosts and tetrapods, we conducted whole-mount in situhybridization experiments using Hox PG2 antisense RNAprobes on tilapia embryos fixed beginning from their onsetof expression and extending until the beginning of thelarval stage. We analyzed the expression patterns of thethree tilapia Hox PG2 genes relative to each other and totheir orthologs in other teleosts (Fig. 6) and tetrapods.
Hindbrain expression
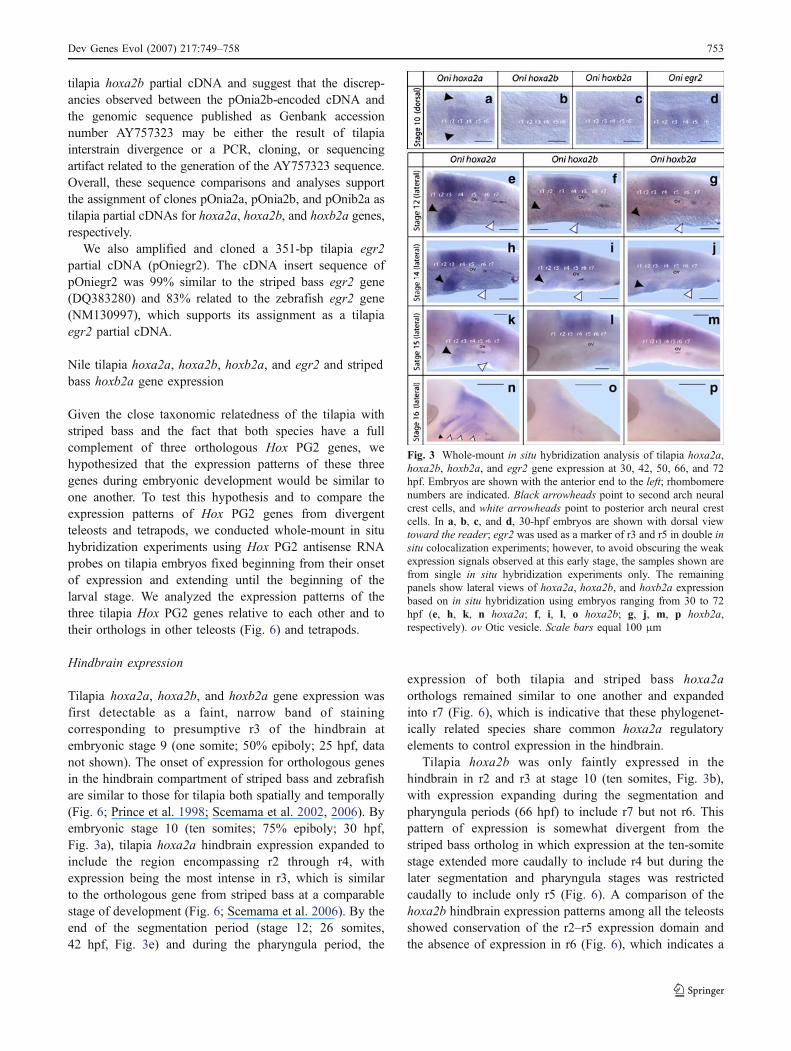
Tilapia hoxa2a, hoxa2b, and hoxb2a gene expression wasfirst detectable as a faint, narrow band of stainingcorresponding to presumptive r3 of the hindbrain atembryonic stage 9 (one somite; 50% epiboly; 25 hpf, datanot shown). The onset of expression for orthologous genesin the hindbrain compartment of striped bass and zebrafishare similar to those for tilapia both spatially and temporally(Fig. 6; Prince et al. 1998; Scemama et al. 2002, 2006). Byembryonic stage 10 (ten somites; 75% epiboly; 30 hpf,Fig. 3a), tilapia hoxa2a hindbrain expression expanded toinclude the region encompassing r2 through r4, withexpression being the most intense in r3, which is similarto the orthologous gene from striped bass at a comparablestage of development (Fig. 6; Scemama et al. 2006). By theend of the segmentation period (stage 12; 26 somites,42 hpf, Fig. 3e) and during the pharyngula period, the
expression of both tilapia and striped bass hoxa2aorthologs remained similar to one another and expandedinto r7 (Fig. 6), which is indicative that these phylogenet-ically related species share common hoxa2a regulatoryelements to control expression in the hindbrain.
Tilapia hoxa2b was only faintly expressed in thehindbrain in r2 and r3 at stage 10 (ten somites, Fig. 3b),with expression expanding during the segmentation andpharyngula periods (66 hpf) to include r7 but not r6. Thispattern of expression is somewhat divergent from thestriped bass ortholog in which expression at the ten-somitestage extended more caudally to include r4 but during thelater segmentation and pharyngula stages was restrictedcaudally to include only r5 (Fig. 6). A comparison of thehoxa2b hindbrain expression patterns among all the teleostsshowed conservation of the r2–r5 expression domain andthe absence of expression in r6 (Fig. 6), which indicates a
Fig. 3 Whole-mount in situ hybridization analysis of tilapia hoxa2a,hoxa2b, hoxb2a, and egr2 gene expression at 30, 42, 50, 66, and 72hpf. Embryos are shown with the anterior end to the left; rhombomerenumbers are indicated. Black arrowheads point to second arch neuralcrest cells, and white arrowheads point to posterior arch neural crestcells. In a, b, c, and d, 30-hpf embryos are shown with dorsal viewtoward the reader; egr2 was used as a marker of r3 and r5 in double insitu colocalization experiments; however, to avoid obscuring the weakexpression signals observed at this early stage, the samples shown arefrom single in situ hybridization experiments only. The remainingpanels show lateral views of hoxa2a, hoxa2b, and hoxb2a expressionbased on in situ hybridization using embryos ranging from 30 to 72hpf (e, h, k, n hoxa2a; f, i, l, o hoxa2b; g, j, m, p hoxb2a,respectively). ov Otic vesicle. Scale bars equal 100 μm
Dev Genes Evol (2007) 217:749–758 753
conserved function for hoxa2b in the patterning of theanterior hindbrain.
In the mouse hindbrain, where Hoxa2 is also expressedin the r2 to r5 domain, knockout experiments have shownthat Hoxa2 controls the segmentation of the anteriorhindbrain and the axonal guidance of the Vth and VIIthcranial motor nerve axons out of r2 and r4 (Gavalas et al.1997; Davenne et al. 1999; Barrow et al. 2000). Theconservation of these exit points between mouse andzebrafish (Chandrasekhar 2004) along with the similarmouse Hoxa2 and teleost HoxA cluster gene(s) hindbrainexpression in the r2 to r5 domain suggests that their role inVth and VIIth branchiomotor axon guidance has beenconserved between mammals and teleosts.
In addition to the patterning activity of Hoxa2 onbranchiomotor nerves, recent experiments, performed usingconditional Hoxa2 mouse mutants, have shown that Hoxa2plays an important role in the establishment of the assemblyof the somatosensory circuit of the trigeminal nerve bymediating arborization of the trigeminal axons with therostral principal nucleus (PrV; Oury et al. 2006). Further,the authors demonstrated that the onset of arborization bythe trigeminal axons into the PrV followed a rhombomere-specific pattern that correlated with the differential leveland distribution of Hoxa2 transcripts, with the high-expression r3 domain corresponding to wiring by maxillaryaxons and low-expression r2 domain to mandibular axons.Like their mouse Hoxa2 ortholog (Gavalas et al. 1997),tilapia hoxa2a and hoxa2b are expressed at a higher level inr3 compared to r2, which is indicative that these genes areinvolved in patterning the trigeminal somatosensory map.Despite the fact that striped bass hoxa2a is expressed morestrongly than hoxa2b in both r2 and r3, they are expressedat equal levels (Fig. 6), suggesting that tilapia and stripedbass may have evolved divergent mechanisms to pattern thetrigeminal circuit.
In zebrafish, Hox PG2 gene knockdown experiments didnot show any effect on hindbrain segmentation or pattern-ing of the branchiomotor neurons, a result that has beenattributed to incomplete inactivation of Hox PG2 genesexpression and the possible low threshold activity of thesegenes in the specification of Hox PG2 gene-dependenthindbrain structures (Hunter and Prince 2002; Ohnemuset al. 2001). However, in zebrafish, hoxa2b is expressed ata higher level in r2 than in r3 (Fig. 6; Prince et al. 1998;Hunter and Prince 2002), which is divergent from mouseand tilapia hoxA cluster gene(s) expression patterns, andsuggests that the mechanism for the assembly of thesomatosensory circuit of the trigeminal nerve is differentin zebrafish. While it has been suggested that the afferentfibers from the trigeminal ganglion cells terminate in theprimary sensory nucleus with a conserved somatotopicorganization in tilapia, the cypriniform goldfish, and other
vertebrates (Kerem et al. 2005; Puzdrowski 1988), theestablishment of the trigeminal somatosensory map duringembryonic development of the zebrafish, goldfish, andtilapia has not been examined. Further studies need to beconducted to clarify the role of differential r2/r3 Hoxa2gene expression in the development of the somatotopicorganization of the trigeminal pathway in divergent teleosts.
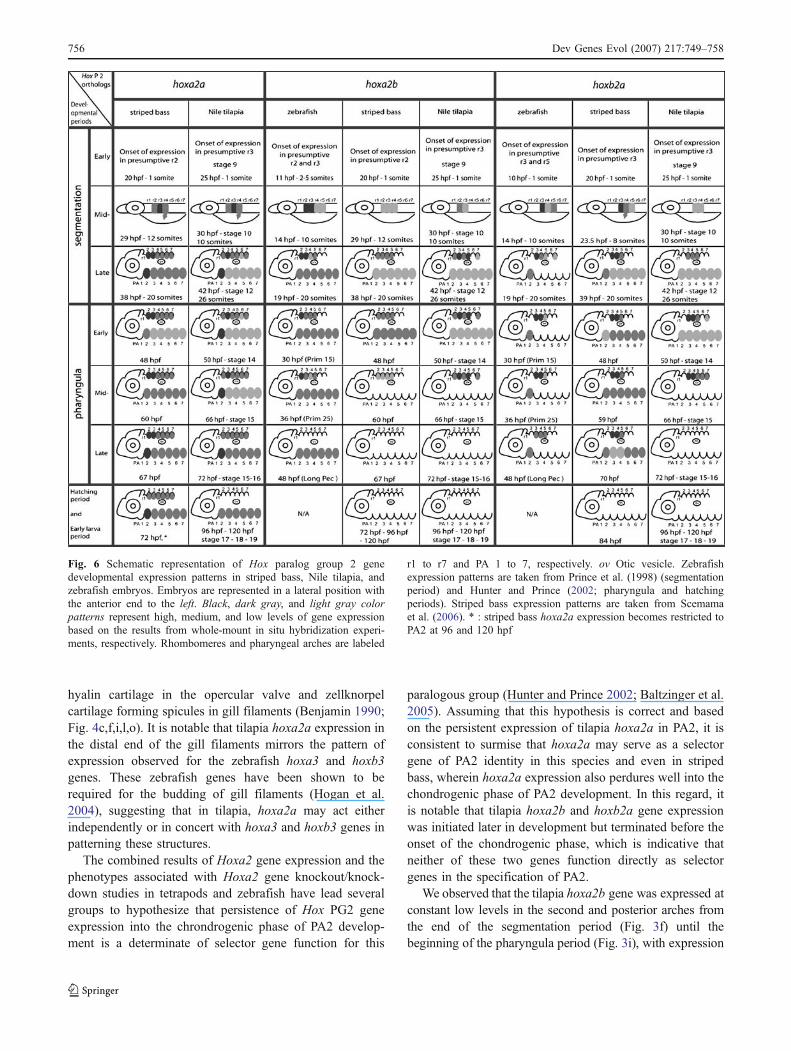
An examination of the expression patterns of the tilapiahoxb2a gene over the same developmental stages describedfor the HoxA cluster genes demonstrated that this gene wasfaintly expressed in r3–r4 at stage 10 (ten somites; Fig. 3c)with expression extending caudally to include r5 andincreasing in intensity by stage 12 (26 somites) andextending even further caudally into r7 by the pharyngulaperiod (stages 14–15/16; Fig. 3g,j,m). While the intensity ofexpression was relatively uniform among the rhombomeresbefore stage 14, the intensity of expression was elevatedslightly in r3 and r4 during the pharyngula period. Similarexpression patterns were observed for the striped bass andzebrafish hoxb2a genes (Figs. 5a–e and 6) except thattilapia hoxb2a expression in r7 was maintained throughoutthe pharyngula period. These observations suggest that themechanisms specifying hoxb2a expression in the anteriorhindbrain have been conserved in the three species, whilethose controlling expression in r7 and posteriorly havediverged in tilapia relative to striped bass and zebrafish.The conserved hoxb2a expression pattern in the anteriorhindbrain of all three teleosts is similar to the patterndescribed for mouse Hoxb2 (Sham et al. 1993) and suggeststhat like their mouse ortholog, these genes specify thesomatic motor component of the VIIth cranial nerve exitingr4 (Barrow and Capecchi 1996).
By the late pharyngula period (stage 15/16; 72 hpf),tilapia hoxa2b and hoxb2a expression receded to the dorsalaspect of the hindbrain (Fig. 3o,p), while hoxa2a continuedto be expressed intensely in rhombomeres 2 to 7 (Fig. 3n).The hindbrain expression of all three Hox PG2 genesdecreased in intensity toward the end of the pharyngulaperiod (stage 16; 80 hpf, data not shown) and eventuallybecame undetectable in this compartment by stage 17 (98hpf), which is comparable to previous observations instriped bass and zebrafish (Fig. 6; Hunter and Prince 2002;Scemama et al. 2002, 2006).
The qualitative and quantitative differences in expressionobserved between tilapia and striped bass hoxa2b andhoxb2a orthologs are indicative of significant evolutionarydivergence in the regulatory mechanisms controlling theirexpression and lead us to reject the hypothesis about similarHox PG2 expression patterns between these two species. Ofparticular interest in this regard is the similarity in hindbrainexpression patterns of the hoxa2b orthologs of striped bassand zebrafish relative to tilapia. This result argues thateither the hindbrain regulatory elements controlling expres-
754 Dev Genes Evol (2007) 217:749–758
sion of the striped bass and zebrafish orthologs are moresimilar to each other than either is to those from tilapia orthat striped bass and zebrafish hoxa2b transcriptionalregulation has undergone convergent evolution leading tocommon expression patterns.
Neural crest and pharyngeal arch expression
The tilapia hoxa2a gene, like its striped bass ortholog, wasthe first of the Hox PG2 genes to be expressed in themigratory neural crest cells and pharyngeal arches, and itsexpression persisted in the pharyngeal arches longer thanany of the other Hox PG2 genes. Tilapia hoxa2a expressionwas observed as early as developmental stage 10 (tensomites) in neural crest cells migrating out of r4 (30 hpf,Fig. 3a). After its initial expression in the neural crest cells,tilapia hoxa2a was detected in PA2 from the end of thesegmentation period through the pharyngeal stage and well
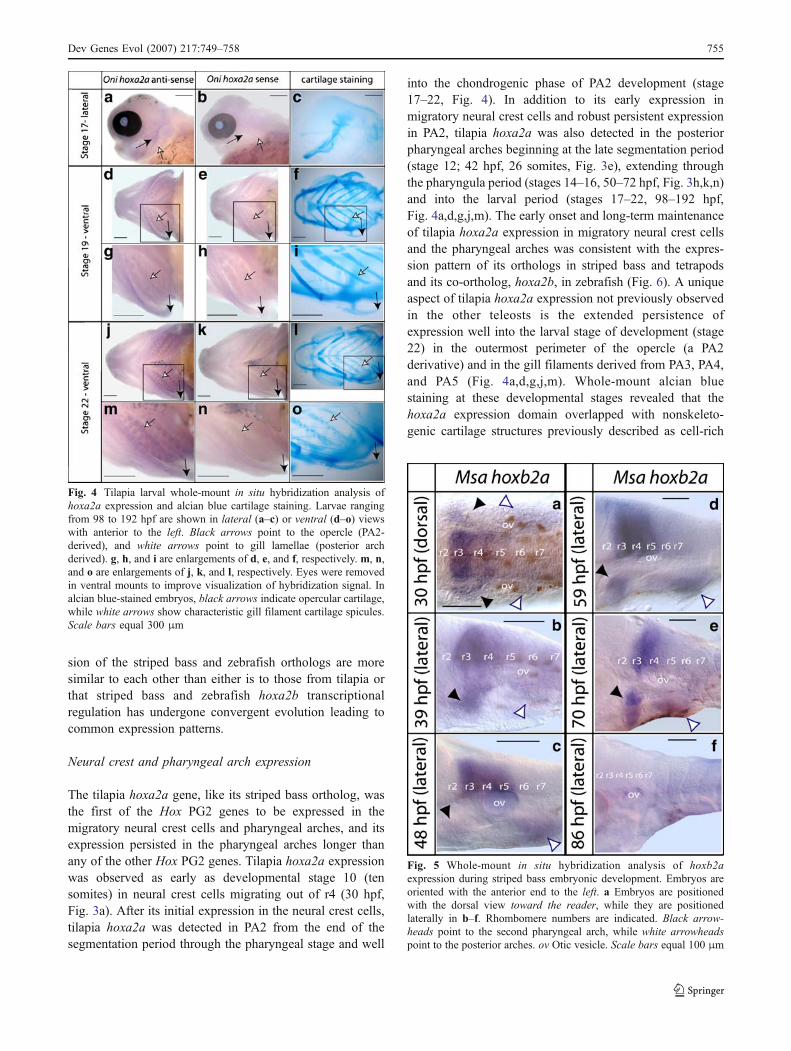
into the chondrogenic phase of PA2 development (stage17–22, Fig. 4). In addition to its early expression inmigratory neural crest cells and robust persistent expressionin PA2, tilapia hoxa2a was also detected in the posteriorpharyngeal arches beginning at the late segmentation period(stage 12; 42 hpf, 26 somites, Fig. 3e), extending throughthe pharyngula period (stages 14–16, 50–72 hpf, Fig. 3h,k,n)and into the larval period (stages 17–22, 98–192 hpf,Fig. 4a,d,g,j,m). The early onset and long-term maintenanceof tilapia hoxa2a expression in migratory neural crest cellsand the pharyngeal arches was consistent with the expres-sion pattern of its orthologs in striped bass and tetrapodsand its co-ortholog, hoxa2b, in zebrafish (Fig. 6). A uniqueaspect of tilapia hoxa2a expression not previously observedin the other teleosts is the extended persistence ofexpression well into the larval stage of development (stage22) in the outermost perimeter of the opercle (a PA2derivative) and in the gill filaments derived from PA3, PA4,and PA5 (Fig. 4a,d,g,j,m). Whole-mount alcian bluestaining at these developmental stages revealed that thehoxa2a expression domain overlapped with nonskeleto-genic cartilage structures previously described as cell-rich
Fig. 4 Tilapia larval whole-mount in situ hybridization analysis ofhoxa2a expression and alcian blue cartilage staining. Larvae rangingfrom 98 to 192 hpf are shown in lateral (a–c) or ventral (d–o) viewswith anterior to the left. Black arrows point to the opercle (PA2-derived), and white arrows point to gill lamellae (posterior archderived). g, h, and i are enlargements of d, e, and f, respectively. m, n,and o are enlargements of j, k, and l, respectively. Eyes were removedin ventral mounts to improve visualization of hybridization signal. Inalcian blue-stained embryos, black arrows indicate opercular cartilage,while white arrows show characteristic gill filament cartilage spicules.Scale bars equal 300 μm
Fig. 5 Whole-mount in situ hybridization analysis of hoxb2aexpression during striped bass embryonic development. Embryos areoriented with the anterior end to the left. a Embryos are positionedwith the dorsal view toward the reader, while they are positionedlaterally in b–f. Rhombomere numbers are indicated. Black arrow-heads point to the second pharyngeal arch, while white arrowheadspoint to the posterior arches. ov Otic vesicle. Scale bars equal 100 μm
Dev Genes Evol (2007) 217:749–758 755
hyalin cartilage in the opercular valve and zellknorpelcartilage forming spicules in gill filaments (Benjamin 1990;Fig. 4c,f,i,l,o). It is notable that tilapia hoxa2a expression inthe distal end of the gill filaments mirrors the pattern ofexpression observed for the zebrafish hoxa3 and hoxb3genes. These zebrafish genes have been shown to berequired for the budding of gill filaments (Hogan et al.2004), suggesting that in tilapia, hoxa2a may act eitherindependently or in concert with hoxa3 and hoxb3 genes inpatterning these structures.
The combined results of Hoxa2 gene expression and thephenotypes associated with Hoxa2 gene knockout/knock-down studies in tetrapods and zebrafish have lead severalgroups to hypothesize that persistence of Hox PG2 geneexpression into the chrondrogenic phase of PA2 develop-ment is a determinate of selector gene function for this
paralogous group (Hunter and Prince 2002; Baltzinger et al.2005). Assuming that this hypothesis is correct and basedon the persistent expression of tilapia hoxa2a in PA2, it isconsistent to surmise that hoxa2a may serve as a selectorgene of PA2 identity in this species and even in stripedbass, wherein hoxa2a expression also perdures well into thechondrogenic phase of PA2 development. In this regard, itis notable that tilapia hoxa2b and hoxb2a gene expressionwas initiated later in development but terminated before theonset of the chondrogenic phase, which is indicative thatneither of these two genes function directly as selectorgenes in the specification of PA2.
We observed that the tilapia hoxa2b gene was expressed atconstant low levels in the second and posterior arches fromthe end of the segmentation period (Fig. 3f) until thebeginning of the pharyngula period (Fig. 3i), with expression
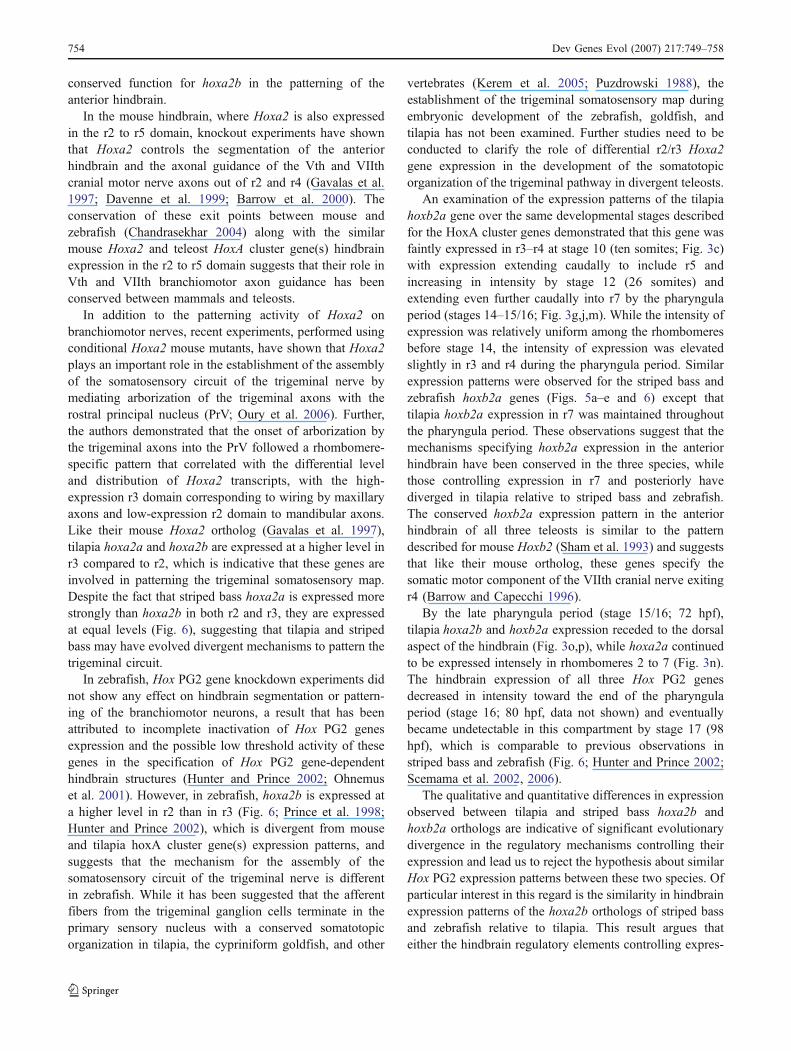
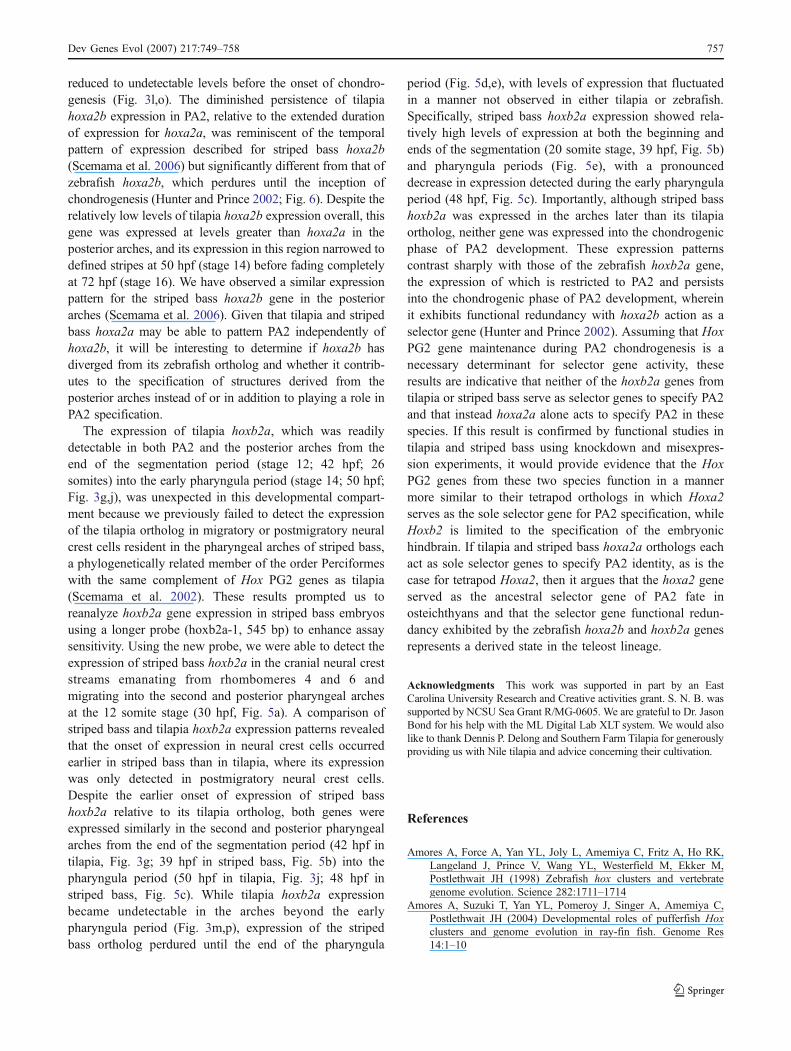
Fig. 6 Schematic representation of Hox paralog group 2 genedevelopmental expression patterns in striped bass, Nile tilapia, andzebrafish embryos. Embryos are represented in a lateral position withthe anterior end to the left. Black, dark gray, and light gray colorpatterns represent high, medium, and low levels of gene expressionbased on the results from whole-mount in situ hybridization experi-ments, respectively. Rhombomeres and pharyngeal arches are labeled
r1 to r7 and PA 1 to 7, respectively. ov Otic vesicle. Zebrafishexpression patterns are taken from Prince et al. (1998) (segmentationperiod) and Hunter and Prince (2002; pharyngula and hatchingperiods). Striped bass expression patterns are taken from Scemamaet al. (2006). * : striped bass hoxa2a expression becomes restricted toPA2 at 96 and 120 hpf
756 Dev Genes Evol (2007) 217:749–758
reduced to undetectable levels before the onset of chondro-genesis (Fig. 3l,o). The diminished persistence of tilapiahoxa2b expression in PA2, relative to the extended durationof expression for hoxa2a, was reminiscent of the temporalpattern of expression described for striped bass hoxa2b(Scemama et al. 2006) but significantly different from that ofzebrafish hoxa2b, which perdures until the inception ofchondrogenesis (Hunter and Prince 2002; Fig. 6). Despite therelatively low levels of tilapia hoxa2b expression overall, thisgene was expressed at levels greater than hoxa2a in theposterior arches, and its expression in this region narrowed todefined stripes at 50 hpf (stage 14) before fading completelyat 72 hpf (stage 16). We have observed a similar expressionpattern for the striped bass hoxa2b gene in the posteriorarches (Scemama et al. 2006). Given that tilapia and stripedbass hoxa2a may be able to pattern PA2 independently ofhoxa2b, it will be interesting to determine if hoxa2b hasdiverged from its zebrafish ortholog and whether it contrib-utes to the specification of structures derived from theposterior arches instead of or in addition to playing a role inPA2 specification.
The expression of tilapia hoxb2a, which was readilydetectable in both PA2 and the posterior arches from theend of the segmentation period (stage 12; 42 hpf; 26somites) into the early pharyngula period (stage 14; 50 hpf;Fig. 3g,j), was unexpected in this developmental compart-ment because we previously failed to detect the expressionof the tilapia ortholog in migratory or postmigratory neuralcrest cells resident in the pharyngeal arches of striped bass,a phylogenetically related member of the order Perciformeswith the same complement of Hox PG2 genes as tilapia(Scemama et al. 2002). These results prompted us toreanalyze hoxb2a gene expression in striped bass embryosusing a longer probe (hoxb2a-1, 545 bp) to enhance assaysensitivity. Using the new probe, we were able to detect theexpression of striped bass hoxb2a in the cranial neural creststreams emanating from rhombomeres 4 and 6 andmigrating into the second and posterior pharyngeal archesat the 12 somite stage (30 hpf, Fig. 5a). A comparison ofstriped bass and tilapia hoxb2a expression patterns revealedthat the onset of expression in neural crest cells occurredearlier in striped bass than in tilapia, where its expressionwas only detected in postmigratory neural crest cells.Despite the earlier onset of expression of striped basshoxb2a relative to its tilapia ortholog, both genes wereexpressed similarly in the second and posterior pharyngealarches from the end of the segmentation period (42 hpf intilapia, Fig. 3g; 39 hpf in striped bass, Fig. 5b) into thepharyngula period (50 hpf in tilapia, Fig. 3j; 48 hpf instriped bass, Fig. 5c). While tilapia hoxb2a expressionbecame undetectable in the arches beyond the earlypharyngula period (Fig. 3m,p), expression of the stripedbass ortholog perdured until the end of the pharyngula
period (Fig. 5d,e), with levels of expression that fluctuatedin a manner not observed in either tilapia or zebrafish.Specifically, striped bass hoxb2a expression showed rela-tively high levels of expression at both the beginning andends of the segmentation (20 somite stage, 39 hpf, Fig. 5b)and pharyngula periods (Fig. 5e), with a pronounceddecrease in expression detected during the early pharyngulaperiod (48 hpf, Fig. 5c). Importantly, although striped basshoxb2a was expressed in the arches later than its tilapiaortholog, neither gene was expressed into the chondrogenicphase of PA2 development. These expression patternscontrast sharply with those of the zebrafish hoxb2a gene,the expression of which is restricted to PA2 and persistsinto the chondrogenic phase of PA2 development, whereinit exhibits functional redundancy with hoxa2b action as aselector gene (Hunter and Prince 2002). Assuming that HoxPG2 gene maintenance during PA2 chondrogenesis is anecessary determinant for selector gene activity, theseresults are indicative that neither of the hoxb2a genes fromtilapia or striped bass serve as selector genes to specify PA2and that instead hoxa2a alone acts to specify PA2 in thesespecies. If this result is confirmed by functional studies intilapia and striped bass using knockdown and misexpres-sion experiments, it would provide evidence that the HoxPG2 genes from these two species function in a mannermore similar to their tetrapod orthologs in which Hoxa2serves as the sole selector gene for PA2 specification, whileHoxb2 is limited to the specification of the embryonichindbrain. If tilapia and striped bass hoxa2a orthologs eachact as sole selector genes to specify PA2 identity, as is thecase for tetrapod Hoxa2, then it argues that the hoxa2 geneserved as the ancestral selector gene of PA2 fate inosteichthyans and that the selector gene functional redun-dancy exhibited by the zebrafish hoxa2b and hoxb2a genesrepresents a derived state in the teleost lineage.
Acknowledgments This work was supported in part by an EastCarolina University Research and Creative activities grant. S. N. B. wassupported by NCSU Sea Grant R/MG-0605. We are grateful to Dr. JasonBond for his help with the ML Digital Lab XLT system. We would alsolike to thank Dennis P. Delong and Southern Farm Tilapia for generouslyproviding us with Nile tilapia and advice concerning their cultivation.
References
Amores A, Force A, Yan YL, Joly L, Amemiya C, Fritz A, Ho RK,Langeland J, Prince V, Wang YL, Westerfield M, Ekker M,Postlethwait JH (1998) Zebrafish hox clusters and vertebrategenome evolution. Science 282:1711–1714
Amores A, Suzuki T, Yan YL, Pomeroy J, Singer A, Amemiya C,Postlethwait JH (2004) Developmental roles of pufferfish Hoxclusters and genome evolution in ray-fin fish. Genome Res14:1–10
Dev Genes Evol (2007) 217:749–758 757
Baltzinger M, Ori M, Pasqualetti M, Nardi I, Rijli FM (2005) Hoxa2knockdown in Xenopus results in hyoid to mandibular homeosis.Dev Dyn 234:858–867
Barrow JR, Capecchi MR (1996) Targeted disruption of the Hoxb-2locus in mice interferes with expression of Hoxb-1 and Hoxb-4.Development 122:3817–3828
Barrow JR, Stadler HS, Capecchi MR (2000) Roles of Hoxa1 andHoxa2 in patterning the early hindbrain of the mouse. Develop-ment 127:933–944
Benjamin M (1990) The cranial cartilages of teleosts and theirclassification. J Anat 169:153–172
Chandrasekhar A (2004) Turning heads: development of vertebratebranchiomotor neurons. Dev Dyn 229:143–161
Davenne M, Maconochie MK, Neun R, Pattyn A, Chambon P,Krumlauf R, Rijli FM (1999) Hoxa2 and Hoxb2 controldorsoventral patterns of neuronal development in the rostralhindbrain. Neuron 22:677–691
El-Serafy SS, Abdel-Hameid N-AH, Awwad MH, Azab MS (2007)DNA riboprinting analysis of Tilapia species and their hybridsusing restriction fragment length polymorphisms of the smallsubunit ribosomal DNA. Aquac Res 38:295–303
Fujimura K, Okada N (2007) Development of the embryo, larva andearly juvenile of Nile tilapia Oreochromis niloticus (Pisces:Cichlidae). Developmental staging system. Dev Growth Differ49:301–324
Gavalas A, Davenne M, Lumsden A, Chambon P, Rijli FM (1997)Role of Hoxa-2 in axon pathfinding and rostral hindbrainpatterning. Development 124:3693–3702
Hogan BM, Hunter MP, Oates AC, Crowhurst MO, Hall NE, HeathJK, Prince VE, Lieschke GJ (2004) Zebrafish gcm2 is requiredfor gill filament budding from pharyngeal ectoderm. Dev Biol276:508–522
Hunter M, Prince VE (2002) Zebrafish Hox paralogue group 2 genesfunction redundantly as selector genes to pattern the secondpharyngeal arch. Dev Biol 247:367–389
Jaillon O, Aury JM, Brunet F, Petit JL, Stange-Thomann N, MauceliE, Bouneau L, Fischer C, Ozouf-Costaz C, Bernot A, Nicaud S,Jaffe D, Fisher S, Lutfalla G, Dossat C, Segurens B, Dasilva C,Salanoubat M, Levy M, Boudet N, Castellano S, Anthouard V,Jubin C, Castelli V, Katinka M, Vacherie B, Biemont C, Skalli Z,Cattolico L, Poulain J, De Berardinis V, Cruaud C, Duprat S,Brottier P, Coutanceau JP, Gouzy J, Parra G, Lardier G, ChappleC, McKernan KJ, McEwan P, Bosak S, Kellis M, Volff JN,Guigo R, Zody MC, Mesirov J, Lindblad-Toh K, Birren B,Nusbaum C, Kahn D, Robinson-Rechavi M, Laudet V, SchachterV, Quetier F, Saurin W, Scarpelli C, Wincker P, Lander ES,Weissenbach J, Roest Crollius H (2004) Genome duplication inthe teleost fish Tetraodon nigroviridis reveals the early vertebrateproto-karyotype. Nature 431:946–957
Kerem G, Yoshimoto M, Yamamoto N, Yang C-Y, Xue H-G, Ito H(2005) Somatotopic organization of the trigeminal ganglion cellsin a cichlid fish, Oreochromis (Tilapia) niloticus. Brain BehavEvol 65:109–126
Maconochie M, Krishnamurthy R, Nonchev S, Meier P, ManzanaresM, Mitchell PJ, Krumlauf R (1999) Regulation of Hoxa2 incranial neural crest cells involves members of the AP-2 family.Development 126:1483–1494
McKay IJ, Muchamore I, Krumlauf R, Maden M, Lumsden A,Lewis J (1994) The Kreisler mouse: a hindbrain segmentation
mutant that lacks two rhombomeres. Development 120:2199–2211
Naruse K, Tanaka M, Mita K, Shima A, Postlethwait J, Mitani H(2004) A Medaka gene map: the trace of ancestral vertebrateproto-chromosomes revealed by comparative gene mapping.Genome Res 14:820–828
Nelson JS (2006) Fishes of the world. Wiley, New YorkOhnemus S, Bobola N, Kanzler B, Mallo M (2001) Different levels of
Hoxa2 are required for particular developmental processes. MechDev 108:135–147
Oury F, Murakami Y, Renaud JS, Pasqualetti M, Charnay P, Ren SY,Rijli FM (2006) Hoxa2- and rhombomere-dependent developmentof the mouse facial somatosensory map. Science 313:1408–1413
Pasqualetti M, Ori M, Nardi I, Rijli FM (2000) Ectopic Hoxa2induction after neural crest migration results in homeosis of jawelements in Xenopus. Development 127:5367–5378
Popma T, Masser M (1999) Tilapia, life history and biology. SouthernRegional Aquaculture Center Publication 283
Prince V, Lumsden A (1994) Hoxa-2 expression in normal andtransposed rhombomeres: independent regulation in the neuraltube and neural crest. Development 120:911–923
Prince VE, Moens CB, Kimmel CB, Ho RK (1998) Zebrafish hoxgenes: expression in the hindbrain region of wild-type andmutants of the segmentation gene, valentino. Development125:393–406
Puzdrowski RL (1988) Afferent projections of the trigeminal nerve inthe goldfish, Carassius auratus. J Morphol 198:131–147
Santini S, Bernardi G (2005) Organization and base composition oftilapia Hox genes: implications for the evolution of Hox clustersin fish. Gene 346:51–61
Scemama JL, Hunter M, McCallum J, Prince V, Stellwag E (2002)Evolutionary divergence of vertebrate Hoxb2 expression patternsand transcriptional regulatory loci. J Exp Zool 294:285–299
Scemama JL, Vernon JL, Stellwag E (2006) Differential expression ofHoxa2a and Hoxa2b genes during striped bass embryonicdevelopment. Gene Expression Pattern 6:843–848
Sham MH, Vesque C, Nonchev S, Marshall H, Frain M, Gupta RD,Whiting J, Wilkinson D, Charnay P, Krumlauf R (1993) The zincfinger gene Krox20 regulates HoxB2 (Hox2.8) during hindbrainsegmentation. Cell 72:183–196
Steinke D, Salzburger W, Meyer A (2006) Novel relationships amongten fish model species revealed based on a phylogenomicanalysis using ESTs. J Mol Evol 62:772–784
Stellwag EJ (1999) Hox gene duplication in fish. Semin Cell Dev Biol10:531–540
Trainor PA, Krumlauf R (2001) Hox genes, neural crest cells andbranchial arch patterning. Curr Opin Cell Biol 13:698–705
Vesque C, Maconochie M, Nonchev S, Ariza-McNaughton L,Kuroiwa A, Charnay P, Krumlauf R (1996) Hoxb-2 transcrip-tional activation in rhombomeres 3 and 5 requires an evolution-arily conserved cis-acting element in addition to the Krox-20binding site. EMBO J 15:5383–5396
Vieille-Grosjean I, Hunt P, Gulisano M, Boncinelli E, Thorogood P(1997) Branchial HOX gene expression and human craniofacialdevelopment. Dev Biol (Orlando) 183:49–60
Yan YL, Jowett T, Postlethwait JH (1998) Ectopic expression of hoxb2after retinoic acid treatment or mRNA injection: disruption ofhindbrain and craniofacial morphogenesis in zebrafish embryos.Dev Dyn 213:370–385
758 Dev Genes Evol (2007) 217:749–758