Energy budget of Nile tilapia ( Oreochromis niloticus) in relation to ration size
12
Aquaculture Aquaculture 154 (1997) 57-68 Energy budget of Nile tilapia (Oreochromis niloticus) in relation to ration size Shouqi Xie *, Yibo Cui, Yunxia Yang, Jiankang Liu Institute of Hydrobiolog?;, Academia Sinica, Wuhan Hubei, 430072. People’s Republic of China Accepted 13 January 1997 Abstract Nile tilapia weighing 8.29-l 1.02 g were fed a practical diet at seven ration levels (starvation, 0.5, 1, 2, 3, 4% body weight per day and satiation) twice a day at 30°C. Feed consumption, apparent digestibility, nitrogenous excretion and growth were determined directly, and heat production was calculated by difference of energy budget. The relationship between specific growth rate in wet weight (SGR,, percentage per day) and ration size (RL, percentage per day) was a decelerating curve described as SGR, = 2.98 (1 - e-o.6’ (HL-0.43)). The apparent digestibil- ity coefficients for dry matter and protein showed a decreasing pattern with increasing ration while the apparent digestibility coefficient of energy was not significantly affected by ration size. The proportion of gross energy intake lost in nitrogenous excretion tended to decrease with increasing ration. Feed efficiency was highest, and the proportion of gross energy intake channelled to heat production was lowest, at an intermediate ration level (2% per day). The energy budget at the satiation level was: IOOZE = 16.9FE + 1.2(ZE + (I.!?) + 62.3HE + 19.6RE, where IE, FE, (ZE + UE), HE and RE represent gross energy intake, faecal energy, excretory (non-faecal) energy loss, heat production and recovered energy (growth), respectively. 0 1997 Elsevier Science B.V. Keywords: Energy budget; Oreochromis niloticus; Ration size 1. Introduction Ration is an important factor affecting growth of fish and the growth-ration relationship has been established for several fish species (Brett and Groves, 1979). The typical relationship is a decelerating curve (Brett and Groves, 1979; Cui and Wootton, 1988; Jobling, 1994), but studies resulting in linear relationships are not uncommon * Tel: 0086 27 764 7717; Fax: 008627 787 5132; E-mail: [email protected] 00448486/97/$17.00 0 I997 Elsevier Science B.V. All rights reserved. PII SOO44-8486(97)00039-2
Transcript of Energy budget of Nile tilapia ( Oreochromis niloticus) in relation to ration size

Aquaculture
Aquaculture 154 (1997) 57-68
Energy budget of Nile tilapia (Oreochromis niloticus) in relation to ration size
Shouqi Xie *, Yibo Cui, Yunxia Yang, Jiankang Liu Institute of Hydrobiolog?;, Academia Sinica, Wuhan Hubei, 430072. People’s Republic of China
Accepted 13 January 1997
Abstract
Nile tilapia weighing 8.29-l 1.02 g were fed a practical diet at seven ration levels (starvation,
0.5, 1, 2, 3, 4% body weight per day and satiation) twice a day at 30°C. Feed consumption, apparent digestibility, nitrogenous excretion and growth were determined directly, and heat production was calculated by difference of energy budget. The relationship between specific growth rate in wet weight (SGR,, percentage per day) and ration size (RL, percentage per day) was a decelerating curve described as SGR, = 2.98 (1 - e-o.6’ (HL-0.43)). The apparent digestibil- ity coefficients for dry matter and protein showed a decreasing pattern with increasing ration while the apparent digestibility coefficient of energy was not significantly affected by ration size. The proportion of gross energy intake lost in nitrogenous excretion tended to decrease with increasing ration. Feed efficiency was highest, and the proportion of gross energy intake channelled to heat production was lowest, at an intermediate ration level (2% per day). The energy budget at the satiation level was: IOOZE = 16.9FE + 1.2(ZE + (I.!?) + 62.3HE + 19.6RE, where IE, FE, (ZE + UE), HE and RE represent gross energy intake, faecal energy, excretory (non-faecal) energy loss, heat production and recovered energy (growth), respectively. 0 1997 Elsevier Science B.V.
Keywords: Energy budget; Oreochromis niloticus; Ration size
1. Introduction
Ration is an important factor affecting growth of fish and the growth-ration relationship has been established for several fish species (Brett and Groves, 1979). The typical relationship is a decelerating curve (Brett and Groves, 1979; Cui and Wootton, 1988; Jobling, 1994), but studies resulting in linear relationships are not uncommon
* Tel: 0086 27 764 7717; Fax: 008627 787 5132; E-mail: [email protected]
00448486/97/$17.00 0 I997 Elsevier Science B.V. All rights reserved.
PII SOO44-8486(97)00039-2

58 S. Xie et al./Aquaculture 154 (1997) 57-68
(Niimi and Beamish, 1974; Sullivan, 1982; Yoshida and Sakurai, 1984; Klaoudatos and Apostolopoulos, 1986; Cui et al., 1994). Whether the relationship is linear or curvilinear has important implications for aquaculture. For species which show a curvilinear growth-ration relationship, the optimum feeding strategy would be to feed the fish at a sub-maximum level, because feed efficiency would decline at the maximum ration level. For species with a linear growth-ration relationship, the optimum feeding strategy would be to feed the fish to satiation, because both feed efficiency and growth rates are maximised at maximum ration.
Nile tilapia is a widely cultured species, but the growth-ration relationship does not seem to have been studied. There was a report on the effect of ration size on growth and energy budget in Nile tilapia (Meyer-Burgdorff et al., 1989). However, only submaxi- mum ration levels were used, and growth was not determined over a whole ration range. The purpose of this study was to investigate the effect of ration size on the growth and energy budget of Nile tilapia over a range from starvation to satiation.
2. Materials and methods
The trial was carried out in a flow-through system consisting of 21 plastic tanks (58 X 33 X 42 cm, water volume 50 1). Dechlorinated tap water was heated in a reservoir tank and introduced into each tank at a rate of 0.5 1 mini’. Aeration was provided intermittently for 1 h every 2 h. Dissolved oxygen was maintained above 5 mg 1-l , pH was around 6.8 and the temperature was 30 + 2°C. The tanks were randomly assigned to different ration sizes in triplicate. The photoperiod was 12 h light: 12 h dark with the light period from 08:OO to 20:O0.
Nile tilapia (Oreochromis niloticus) (about 8 g) were collected from Puqi Fish Hatchery Farm in Hubei Province, People’s Republic of China. The fish were trans- ferred into the tanks two weeks prior to the trial for acclimation. During the acclimation period, the fish were fed the experimental diet (Table 1) at a rate of about 3% of body weight daily.
The experimental diet was formulated to contain 35% crude protein and Cr,O, was added as an indicator for digestibility determinations. Formulation and chemical compo- sition of the diet are shown in Table 1. The diet was made into 1 mm pellets using a pellet press, oven-dried at 60°C and stored at 4°C.
Seven ration levels were tested: starvation, 0.5, 1, 2, 3 and 4% of initial body weight per day, and satiation. Fish were fed twice a day (about 09:OO and 14:30). The fish were starved for one day before weighing. Four fish were randomly transferred into each tank and 20 fish were sampled from the original batch for measurement of initial body composition.
The daily feed supplied was recorded and uneaten feed was collected 20 min after feeding and dried each day. Faeces were collected twice a day and dried. Only faeces that remained intact were kept for chemical analysis. Potential loss of uneaten feed was determined by placing feed in water for 20 min and then collecting, drying and weighing. The remaining rate was then calculated and this value was used to adjust the amount of the feed intake.
S. Xie et al./Aquaculture 154 (1997) 57-68
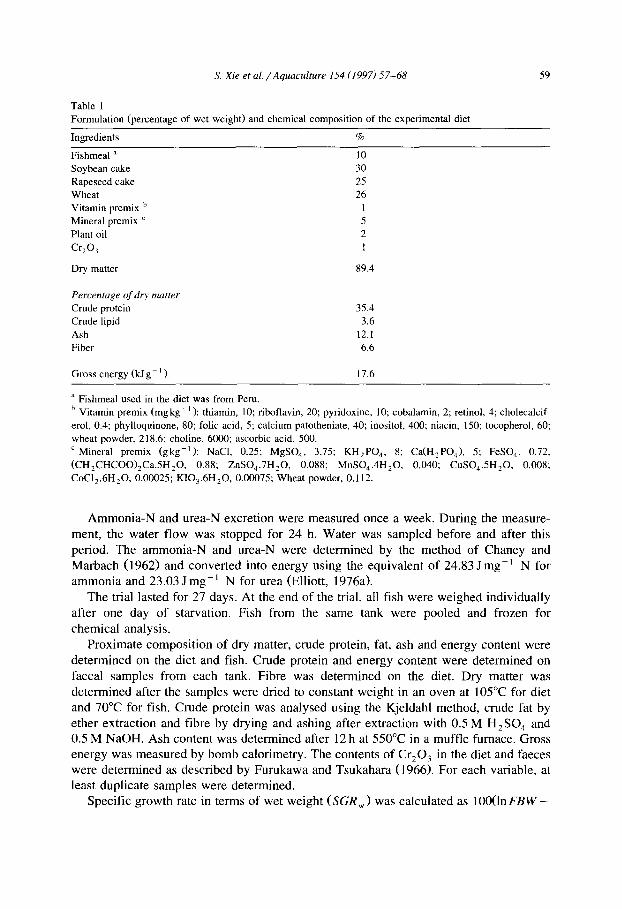
Table 1 Formulation (percentage of wet weight) and chemical composition of the experimental diet
Ingredients %
Fishmeal a 10
Soybean cake 30 Rapeseed cake 25
Wheat 26
Vitamin premix b 1 Mineral premix ’ 5
Plant oil 2
Crzo? I
Dry matter 89.4
Percentage of dry matter
Crude protein
Crude lipid
Ash
Fiber
35.4
3.6
12.1
6.6
Gross energy (kJ g - ’ ) 17.6
a Fishmeal used in the diet was from Peru.
’ Vitamin premix (mgkg- ’ ): thiamin, 10; ‘b fl rt o avin, 20; pyridoxine, 10; cobalamin, 2; retinol, 4; cholecalcif-
erol, 0.4; phylloquinone, 80; folic acid, 5; calcium patotheniate, 40; inositol, 400; niacin, 150; tocopherol, 60;
wheat powder, 218.6; choline, 6000; ascorbic acid, 500.
’ Mineral premix (gkg-‘): NaCI, 0.25; MgSO,, 3.75; KH,PO,, 8; Ca(H2P0,), 5; FeSO,, 0.72,
(CH2CHCOO),Ca.5H,0. 0.88; ZnS0,.7H,O, 0.088; MnS0,.4H20, 0.040; CuS0,.5H20, 0.008;
CoC12.6H20, 0.00025; K10,.6H,O, 0.00075; Wheat powder, 0.112.
Ammonia-N and urea-N excretion were measured once a week. During the measure- ment, the water flow was stopped for 24 h. Water was sampled before and after this period. The ammonia-N and urea-N were determined by the method of Chaney and Marbach (1962) and converted into energy using the equivalent of 24.83 Jmgg’ N for ammonia and 23.03 J mg- ’ N for urea (Elliott, 1976a).
The trial lasted for 27 days. At the end of the trial, all fish were weighed individually after one day of starvation. Fish from the same tank were pooled and frozen for chemical analysis.
Proximate composition of dry matter, crude protein, fat, ash and energy content were determined on the diet and fish. Crude protein and energy content were determined on faecal samples from each tank. Fibre was determined on the diet. Dry matter was determined after the samples were dried to constant weight in an oven at 105°C for diet and 70°C for fish. Crude protein was analysed using the Kjeldahl method, crude fat by ether extraction and fibre by drying and ashing after extraction with 0.5 M H,SO, and 0.5 M NaOH. Ash content was determined after 12 h at 550°C in a muffle furnace. Gross energy was measured by bomb calorimetry. The contents of Cr,O, in the diet and faeces were determined as described by Furukawa and Tsukahara (1966). For each variable, at least duplicate samples were determined.
Specific growth rate in terms of wet weight (SGR,) was calculated as lOO(lnFBW -

60 S. Xie et al./Aquaculture 154 (1997) 57-68
In IBW>/t where FBW and IBW are final and initial body weight, and t is experimen- tal period in days.
Specific growth rates in terms of dry matter (SGR,), protein (SGR,) and energy (SGR,) were calculated similarly. Initial chemical composition and energy content were estimated from the initial sample.
Feed efficiency in terms of wet weight (FE,,,) was calculated as
100x wet weight gain
total feed intake
Feed efficiencies in terms of dry matter (FE,), protein (FE,) and energy (FE,) were calculated similarly.
Apparent digestibility coefficients ( ADC) were calculated as
ADC of dry matter( %) = 100 1 - Cr,O, in the diet
Cr,O, in the faeces
ADC of protein (%)
(Cr,O, in the diet) X (crude protein in faeces)
’ - (Cr,O, in the faeces) X (crudeproteininthe diet)
ADC of energy (%)
= lOO( 1 - i
(Cr,O, in the diet) X ( energy content in faeces)
(Cr,O, in the faeces) X (energy content in the diet)
Energy budget was calculated using the approach of Elliott (1976b). Terminology and symbols for the energy budget followed those proposed by NRC (19811, with slight modifications: IE, gross energy intake; FE, faecal energy; (ZE + UE), excretory (non-faecal) energy loss; HE, heat production (metabolism); RE, recovered energy
Table 2 Effects of ration level on body composition and energy content of Nile tilapia (percentage or kJg-’ wet
weight) a
Ration (% Der dav) Starvation 0.5 I 2 3 4 Satiation
Dry matter
S.E. Crude protein
S.E.
Crude fat S.E.
Energy
S.E.
20.55a 0.80
12.39a 0.32
1.36a 0.35
3.06a 0.16
23.58b 0.99
14.66b
0.04
2.50a 0.59
4.10b 0.23
26.1 lbc 1.11
16.28b
0.43
3.34ab 0.98
4.69bc 0.30
27.81~
0.86 16.28b
0.39
5.40b 0.53
5.34c 0.10
26.01bc
0.78 16.04b
0.72
5.00b 0.70
5.23~ 0.26
26.94bc 24.87bc 0.77 0.43
16.04b 15.76b 0.53 0.39
5.75b 4.67b 0.37 0.08
5.65~ 5.11c 0.32 0.22
’ The means followed by different letters show significant difference (P < 0.05). Initial body composition: dry
matter, 22.87%; crude protein, 13.76%; crude fat, 3.17%; energy, 4.19kJg-‘,

S. Xie et al. / Aquaculture 154 (1997) 57-68 61
(growth). IE, FE. (ZE + UE) and RE were determined directly, and HE was calculated by difference.
Possible differences between groups were examined using a multiple range test (Newman-Keuls) after ANOVA. Two models were used to describe the growth-ration relationship. One was a logarithmic model which has been used by many authors (Allen and Wootton, 1982; Singh and Srivastava, 1985; Cui and Wootton, 1988). The other was the von Bertalanffy model. The quantitative relationships were fitted by least-squares regression and judged by coefficient of determination (R’) and residual analysis.
3. Results
Table 2 shows that body contents of dry matter, protein, fat and energy were significantly lower at lower ration levels than those at higher ration levels.
Mean values of specific growth rate at different ration levels are shown in Table 3.
The relationship between SGR and ration size was a decelerating curve (Fig. 1). The
Table 3
Effect of ration level on specific growth rate and feed efficiency of Nile tilapia a
Ration Starvation 0.5 1 2 3 4 Satiation
IBW
S.E.
SGR,
S.E.
SGR,
S.E.
SGR,
S.E.
SGR,
S.E.
FE, (‘%)
S.E.
FE, (%I S.E.
FEp (‘%;I) S.E.
FE, (a) SE.
8.56a
0.23
-0.67a
0.05
-0.47a
0.05
- I .07a
0.14
- I .45a
0.03
I I .02a
1.57
-0.18ab
0.21
- 0.03b
0.14
0.05b
0.38
- 0.39b
0.10
-33.4a
49.82
- l.6a
18.21
6.la
22.60
- 12.Oa 17.44
9.lla
0.5 1
0.48b
0.09
0.42~
0.09 l.lOc
0.24
0.39b
0.09
54.2ab
10.93
26.9ab
7.73
55.5b
5.02
27.4b
9.61
9.62a
1.04
I .67c
0.27
1.04d
0.14
2.29d
0.40
1.85~
0.12
113.3ab
23.42
41.3b
9.29
69.7b
13.21
50.2b
7.81
8.29a
0.47 2.2oc
0.40
1.16d
0.17
2.76de
0.47
2.54cd
0.20
109.lb
25.95
32.3b
8.20
60.5b
13.39
42.8b
9.64
9.44a
0.90
2.35~
0.26
1.28d
0.08
2.9lde
0.2 I
2.84d
0.08
87.5b
12.89
27.3ab
2.83
48.2b
4.66
37.9b
I .73
8.72a
0.72
2.71~
0.27
1.31d
0.10
3.21e
0.28
3.15d
0.08
54.0b
2.36 14.5ab
0.22
28.7a 0.29
19.6ab
0.73
“ Means followed by different letters show significant difference (P < 0.05).
IBW, initial body weight (g)
SGR,. specific growth rate in wet weight (‘Yc per day)
SGR,, specific growth rate in dry matter (‘% per day) SGR,, specific growth rate in protein (% per day)
SGR,, specific growth rate in energy (% per day)
FE,, feed efficiency in wet weight (%I FE,, feed efficiency in dry matter (%)
FEp, feed efficiency in protein (8) FE,, feed efficiency in energy (Y&/c)

62 S. Xie et al./Aquaculture 154 (1997) 57-68
SGRw=2.9*(,e‘0.6’(RL-0.431 R*=0.82
-1.5 - 0 1 2 3 4 5 6
Ration level (%/day)
0 1 2 3 4 5 6
Ration level (%/day)
Fig. 1. Relationship between specific growth rate in wet weight (SGR,), dry weight (SGR,), crude peotein
(SGR,), energy (SGR,) and ration level (RL) for Nile tilapia.
von Bertalanffy growth model was used to describe the relationships between SGR (percentage per day) and ration level (RL, % body weight per day):
SGR, = 2.98( 1 - e -0.61(RL-0.43)) ( R2 = 0.82, IZ = 21, P < 0.01)
SGR,=3.24(1 -e --OJ6(RL-0.3*)) (R2 = 0.86, n = 21, P < 0.01)
SGR, = 3.35( 1 - e P0.83(RL-0.37)) (R2 = 0.91, n = 21, P < 0.01)
SGR, = 3.42( 1 - e P0.69(RL-0.s6)) (R* = 0.88, IZ = 21, P < 0.01)
With increased ration, feed efficiencies increased first, and then decreased at higher rations (Table 3). The highest efficiency was observed at the 2% ration.
Analysis of variance showed a significant decrease in apparent digestibility coeffi- cients for dry matter and protein with the increase in ration level (P < O.OS>, but no

S. Xie et al./Aquaculture 154 (19971 57-68 63
(b) 4
0.37, )
L I 0 1 2 3 4 5 6
Ration level (%/day)
0 I 2 3 4 5 6
Ration level (%/day)
Fig. I (continued).
significant difference was observed in apparent digestibility coefficient of energy among the different ration groups (P > 0.05) (Table 4).
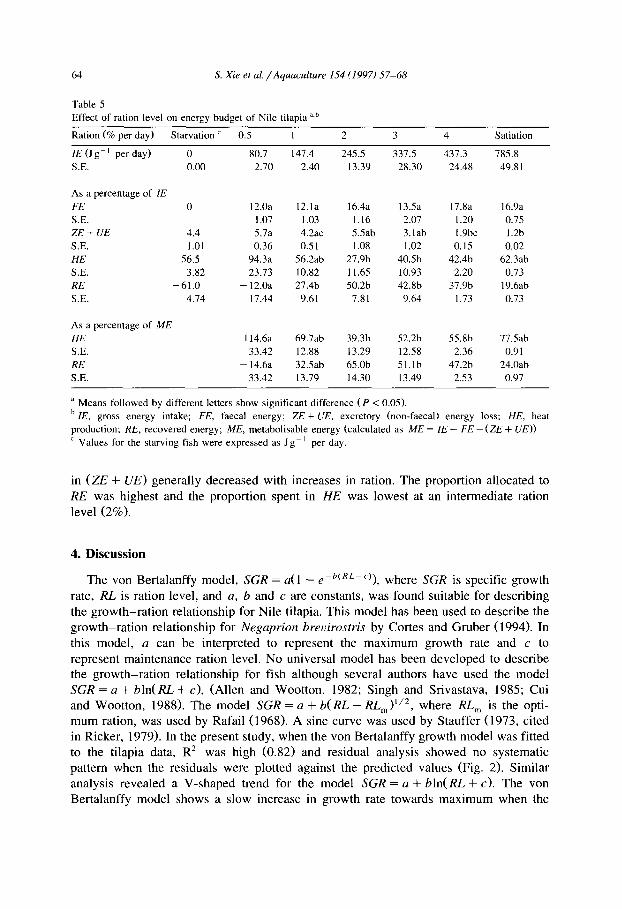
Table 5 shows the energy budget in relation to ration size. The proportion of ZE lost
Table 4
Effects of ration level on apparent digestibility coefficient ( ADC) in Nile tilapia (‘%)
Ration (‘% per day) 0.5 1 2 3 4
Dry matter 80.4a a 8l.la 76.4ab 77.6ab 74.8a
S.E. 9.14 1.11 0.95 0.95 I .72 Protein 98.0a 95.4b 94.5b 93.4b 93.2b
S.E. 3.52 0.28 0.35 0.68 0.26
Energy 87.7 87.6 83.2 86.1 81.8
S.E. 6.38 1.14 1.17 2.07 1.20
Satiation
76.9ab 0.82
93.lb
0.50
82.7 0.75
a Means followed by different letters show significant difference (P < 0.05).
64 S. Xie et al./Aquaculture 154 (1997) 57-68
Table 5
Effect of ration level on energy budget of Nile tilapia a,h
Ration (Sro per day) Starvation ’ 0.5 1 2 3 4 Satiation
IE (Jgm ’ per day) 0 80.7 147.4 245.5 337.5 437.3 785.8
S.E. 0.00 2.70 2.40 13.39 28.30 24.48 49.81
As a percentage of IE
FE 0
S.E.
ZE+UE 4.4
S.E. 1.01
HE 56.5
S.E. 3.82 RE -61.0
S.E. 4.74
As a percentage of ME
HE
S.E.
RE
S.E.
12.0a
1.07 5.7a
0.36
94.3a
23.73
- 12.0a
17.44
114.6a
33.42
- 14.6a
33.42
12.la
1.03
4.2ac
0.51
56.2ab
10.82
27.4b
9.61
69.7ab
12.88
32.5ab 13.79
16.4a
1.16
5.5ab 1.08
27.9b
11.65
50.2b
7.8 I
39.3b
13.29
65.Ob
14.30
13.5a
2.07
3.lab
1.02
40.5b
10.93
42.8b
9.64
52.2b
12.58
51.lb
13.49
17.8a
1.20
1.9bc 0.15
42.4b
2.20
37.9b
1.73
55.8b
2.36
47.2b
2.53
16.9a
0.75
1.2b
0.02
62.3ab
0.73
19.6ab
0.73
77.5ab
0.91
24.0ab
0.97
a Means followed by different letters show significant difference (P < 0.05).
b IE, gross energy intake: FE, faecal energy; ZE + UE, excretory (non-faecal) energy loss; HE, heat
production; RE, recovered energy: ME, metabolisable energy (calculated as ME = IE - FE - (ZE + UE))
’ Values for the starving fish were expressed as Jg-’ per day.
in (ZE + UE) generally decreased with increases in ration. The proportion allocated to RE was highest and the proportion spent in HE was lowest at an intermediate ration level (2%).
4. Discussion
The von Bertalanffy model, SGR = a(1 - eP h(RL-c)), where SGR is specific growth rate, RL is ration level, and a, b and c are constants, was found suitable for describing the growth-ration relationship for Nile tilapia. This model has been used to describe the growth-ration relationship for Negaprion breuirostris by Cortes and Gruber (1994). In this model, a can be interpreted to represent the maximum growth rate and c to represent maintenance ration level. No universal model has been developed to describe the growth-ration relationship for fish although several authors have used the model SGR = a + bln( RL + c), (Allen and Wootton, 1982; Singh and Srivastava, 1985; Cui and Wootton, 1988). The model SGR = a + b( RL - RL,)‘/*, where RL, is the opti- mum ration, was used by Rafail (1968). A sine curve was used by Stauffer (1973, cited in Ricker, 1979). In the present study, when the von Bertalanffy growth model was fitted to the tilapia data, R* was high (0.82) and residual analysis showed no systematic pattern when the residuals were plotted against the predicted values (Fig. 2). Similar analysis revealed a V-shaped trend for the model SGR = a + bln( RL + c). The von Bertalanffy model shows a slow increase in growth rate towards maximum when the

S. Xie et al. /Aquaculture 154 (1997) 57-68 6.5
Predicted versus Residual Values
1.6
-1.6 -0.6 0.5 1.5 2.6 3.5
Predicted Values
1.6
1
Predicted versus Residual Values
SGRw=a+b(RL+l)
R*=OBO 0
-1.6 -0.5 0.5 1.5 2.5 3.5
Predicted Values
Fig. 2. Residual analysis of two models for the growth-ration relationship for Nile tilapia.
ration level approaches the satiation level. Whether this model is suitable for other species is worth further investigation.
Feed efficiency was highest at an intermediate ration level. This result is consistent with other studies in which the growth-ration relationship was curvilinear (Brett and Groves, 1979; Jobling, 19941, but differs from the results of Meyer-Burgdorff et al. ( 1989) for Nile tilapia, in which feed efficiency decreased with increasing ration. This is probably because of the narrow range of ration levels used by Meyer-Burgdorff et al. (19891, which may have been above the optimum ration. According to our results, the optimum ration level, defined as the level at which feed efficiency is maximal, was rather low (2%) compared with the satiation level (7.8%). When the ration levels were more than 2%, growth increased slightly with increasing ration (Fig. 1). This suggests that a restricted feeding regime is more economical for tilapia culture than satiation feeding. Optimum ration, however, varied with factors such as body size and water temperature, and further studies are needed to quantify these effects.

66 S. Xie et al./Aquaculture 154 (1997) 57-68
The proportion of gross energy intake channelled into heat production showed the lowest value at an intermediate ration (2%) and was higher at lower or higher ration levels. This pattern suggests that the relationship between heat production rate and ration level is an accelerating curve. This is in agreement with the results from a study on rainbow trout (From and Rasmussen, 19841, in which heat production was directly determined through measurement of oxygen consumption. The bioenergetic basis for the decelerating growth-ration relationship in many fishes is not well demonstrated. Theo- retically speaking, the decline in feed efficiencies at higher rations could be caused by: (1) a decrease in apparent digestibility; (2) an increase in the proportion of ZE lost in (UE + ZE); and (3) an increase in the proportion of ZE spent in HE. Though some studies have reported that apparent digestibility coefficients decrease with increases in ration level (Henken et al., 1985; Jobling, 1994), others, including the present study, did not observe significant changes in apparent energy digestibility with changes in ration (Gerking, 1955; Beamish, 1972; Kelso, 1972; Windell et al., 1978; Allen, 1980; Hogendoom, 1983). Excretory energy loss is usually a small proportion of gross energy intake and changes in this component are unlikely to be a major cause for the decelerating growth-ration relationship. The fact that the proportion of ZE channelled to HE showed the lowest value at an intermediate ration and increased at lower or higher ration levels in the present study suggests that the increase in the proportion of heat production at high rations was the major cause for the decline in feed efficiency. However, in the present study, heat production was indirectly calculated by difference, and errors associated with its estimation are unknown. In most studies in which heat production is directly determined by respirometry, the heat-production-rate-energy-in- take relationship was linear (Muir and Niimi, 1972; Brett, 1976; Soofiani and Hawkins, 1982). There are, however, two major limitations in these respirometry studies: (1) fish are usually held in small respirometers and the activity level may be limited; and (2) feeding level may not be high enough to assure maximum feeding. Future studies are needed to study the heat production-ration relationship over a whole range of ration levels, using relatively large respirometers to simulate aquarium conditions.
Based on the published energy budgets for 14 fish species, Cui and Liu (1990) calculated the following average energy budget for fish fed ad libitum.
lOOME= 60HE+40RE
where ME is metabolisable energy which is calculated as ME = ZE - FE - (UE + ZE). In the present study, Nile tilapia fed to satiation allocated 76.0% of metabolizable
energy to HE, and 24.0% to RE. This suggested that Nile tilapia has a low growth efficiency and a high metabolic expenditure. This is similar to grass carp fed duckweed (Cui et al., 1994). Meyer-Burgdorff et al. (1989) reported that the proportion of the metabolizable energy used for growth was around 47%, close to the proportion at the 4% per day ration level in our study. However, this proportion in their study was not significantly affected by ration level. There may be two possible reasons for this difference. One is that they fed the fish at a restricted ration, not the entire ration range (i.e. not from starvation to satiation or ad libitum). Our results showed higher energy retention at intermediate rations. The second reason is a difference in diets. The diet they used contained 40% crude protein and 50% fish meal. In our experiment, only 10% fish

S. Xie et al./Aquaculture 154 (1997) 57-68 61
meal was used and the dietary crude protein was 35%. Feed quality can significantly affect the energy distribution (Jobling, 1994). Further studies should be conducted to investigate the effect of diet quality on the energy budget of Nile tilapia.
Acknowledgements
The project was supported by the Natural Science Foundation of China and partly by the State Key Laboratory of Freshwater Ecology and Biotechnology of China and the Natural Science Foundation of Hubei Province.
References
Allen, J.R.M., 1980. The estimation of natural feeding rate of the three-spined stickleback, Gasterosteus
aculeatus L. (Pisces). Ph.D. Thesis, University of Wales, Aberystwyth, 341 pp.
Allen, J.R.M., Wootton, R.J., 1982. The effect of ration and temperature on the growth of three-spined
stickleback, Gasterosteus aculeatus L. Journal of Fish Biology 20, 409-422.
Beamish, F.W.H., 1972. Ration size and digestion in largemouth bass, Micropterus salmoides Lacepcde.
Canadian Journal of Zoology 50, 153-164.
Brett, J.R., 1976. Feeding metabolic rates of young sockeye salmon Oncorhynchus nerka, in relation to ration
level and temperature. Fish and Marine Service Research and Development Technical Report 675, 43.
Brett, J.R., Groves, T.D.D., 1979. Physiological energetics. In, W.S. Hoar, D.J. Randall and J.R. Brett
(Editors), Fish Physiology, Vol. 8. Academic Press, New York, pp. 279-352.
Chaney, A.L., Marbach, E.P., 1962. Modified reagents for determination of urea and ammonia. Clinical
Chemistry 8, 130-132.
Cortes, E., Gruber, S.H., 1994. Effect of ration size on growth and gross conversion efficiency of young lemon
sharks, Negaprion breuirostris. Journal of Fish Biology 44, 33 l-341.
Cui, Y., Liu, J., 1990. Comparison of energy budget among six telcost. III. Growth rate and energy budget.
Comparative Biochemistry and Physiology 97 (A), 381-384.
Cui, Y., Wootton, R.J., 1988. Bioenergetics of growth of a cyprinid, Phoximus phoninus, the effect of ration,
temperature and body size on food consumption, fecal production and nitrogenous excretion. Journal of
Fish Biology 33, 43 l-443.
Cui, Y., Chen, S., Wang, S., 1994. Effect of ration size on the growth and energy budget of the grass carp,
Ctenopharyngodon idella Val. Aquaculture 123, 95- 107.
Elliott, J.M., 1976a. Energy losses in the waste of products of brown trout (Salmo trutta L.). Journal of
Animal Ecology 45, 56 l-580.
Elliott, J.M., 1976b. The energetics of feeding, metabolism and growth of brown trout (Salmo trutta L.). Journal of Animal Ecology 45, 923-948.
From, J., Rasmussen, G., 1984. A growth model, gastric evacuation, and body composition in rainbow trout,
Salmo gairdneri Richardson, 1836. Dana 3, 61-139.
Furukawa, A., Tsukahara, H., 1966. On the acid digestion method for the determination of chromic oxide as an
index substance in the study of digestibility of fish feed. Bulletin of the Japanese Society of Science and Fisheries 32, 502-506.
Gerking, S.D., 1955. Influence of rate of feeding on body composition and protein metabolism of bluegill sunfish. Physiological Zoology 28, 267-282.
Henken, A.M., Kleingeld, D.W., Tijssen, P.A.T., 1985. The effect of feeding level on apparent digestibility of dietary dry matter, crude protein and gross energy in the African catfish, Clarias gariepinus (Burchell,
1822). Aquaculture 51, l-11.
Hogendoorn, H., 1983. Growth and production of African catfish, Clarias &era (C. and V.). III. Bioenergetic
relations of body weight and feeding level. Aquaculture 35, I - 17.
68 S. Xie et al. /Aquaculture 154 (1997~ 57-68
Jobling, M., 1994. Fish Bioenergetics. Chapman and Hall, London.
K&o, J.R.M., 1972. Conversion, maintenance, and assimilation for walleye Stizostedion uitreum uitreum, as
affected by size, diet and temperature. Journal of the Fisheries Research Board of Canada 29, 1181-l 192.
Klaoudatos, S., Apostolopoulos, J., 1986. Food intake, growth, maintenance and food conversion in the
gilthead sea bream (Sparus aurotus). Aquaculture 5 1, 217-224.
Meyer-Burgdorff, K.-H., Osman, M.F., Gunther, K.D., 1989. Energy metabolism in Oreochromis niloticus.
Aquaculture 79, 283-29 1.
Muir, B.S., Niimi, A.J., 1972. Oxygen consumption of the euryhaline fish, aholehole (Kuhlia sandicicensis)
with reference to salinity, swimming and food consumption. Journal of the Fisheries Research Board of
Canada 26, 67-77.
NRC (National Research Council), 1981. Nutritional Energetics of Domestic Animals and a Glossary of
Energy Terms, 2nd revised edn. National Academy Press, Washington, DC, 63 pp.
Niimi, A.J., Beamish, F.W.H., 1974. Bioenergetics and growth of largemouth bass (Micropterus salmoides) in
relation to body weight and temperature. Canadian Journal of Zoology 52, 447-456.
Rafail, S.Z., 1968. A statistical analysis of ration and growth relationship of plaice (Pleuronectes platesso).
Journal of the Fisheries Research Board of Canada 25, 7 17-732.
Ricker, W.E., 1979. Growth rates and models. In: Hoar, W.S., Randall, D.J., Brett, J.R., (Eds.1, Fish
Physiology, Vol. 8. New York, Academic Press, pp. 678-743.
Singh, R.P., Srivastava, A.K., 1985. Effect of different ration levels on the growth and the gross conversion
efficiency in a silurid catfish, Heteropneustes fossilis (Block). Bulletin of the Institute of Zoology,
Academia Sinica 24, 69-74.
Soofiani, N.M., Hawkins, A.D., 1982. Energetic cost at different levels of feeding in juvenile cod, Gadus
morhua L. Journal of Fish Biology 21, 577-592.
Sullivan, K.M., 1982. Energetics of the sablefish, Anoplopoma jimbria, under laboratory conditions. In:
Cailliet, G.M., Simenstal, S.A., (Eds.) Gutshop ‘81-Fish Food Habit Studies. Washington Sea Grant
Publications, Seattle, pp. 106-174.
Windell, J.T., Folte, J.W., Sarokon, J.A., 1978. Effect of fish size, temperature, and amount fed on nutrient
digestibility of a pelleted diet by rainbow trout, Salmo gairdneri. Transactions of the American Fisheries
Society 107, 613-616.
Yoshida, H., Sakurai, Y., 1984. Relationship between food consumption and growth of adult walleye pollock
Thrragro chalcogramma in captivity. Bulletin of the Japanese Society of Science and Fisheries 50,
763-769.