Sl. No Taluk Village Name of disaster affected Ration Card ...
Upload
havforskningsinstituttetCategory
view
3download
0
MARINE ECOLOGY PROGRESS SERIESMar Ecol Prog Ser
Vol. 437: 215–228, 2011doi: 10.3354/meps09275
Published September 15
INTRODUCTION
Small pelagic fish such as herrings, sardines andanchovies are of great economic importance, com-prising approximately 30% of the global fish catch(FAO 2008). Their high abundance in the WorldOcean is mainly attributed to their ability to exploitlower trophic levels, i.e. plankton, very efficiently(van der Lingen et al. 2009), especially in highly pro-ductive, upwelling systems. They are a key compo-nent of the systems where they are present (Freon et
al. 2009), channeling the energy from low to hightrophic levels (van der Lingen et al. 2009). In mostecosystems, sardines are primarily non-selective fil-ter feeders (van der Lingen et al. 2009), although inlaboratory studies they have been observed to ex-hibit prey size or prey type selectivity, particularlywhen particulate feeding (van der Lingen 1994, Gar-rido et al. 2007).
Food consumption in fish is considered to dependprimarily on body size and water temperature (Job -ling 1998). Consumption increases with body size fol-
© Inter-Research 2011 · www.int-res.com*Corresponding author. Email: [email protected]
Diel feeding intensity and daily ration of the sardineSardina pilchardus
N. Nikolioudakis1,2, I. Palomera3, A. Machias4, S. Somarakis1,*
1Institute of Marine Biological Resources, Hellenic Centre for Marine Research, Thalassocosmos, 71003 Heraklion, Crete, Greece2Department of Biology, University of Crete, 71409 Heraklion, Crete, Greece
3Institute of Marine Science (ICM-CSIC), PasseigMarítim de la Barceloneta, 37−49, 08002 Barcelona, Spain4Institute of Marine Biological Resources, Hellenic Centre for Marine Research, Aghios Kosmas, 16777 Helliniko, Greece
ABSTRACT: The diel variation in feeding intensity and daily ration of the sardine Sardinapilchardus (Walbaum, 1792) was investigated based on 50 pelagic trawl hauls carried out duringthe period of thermal stratification (July 2007 and July 2008) and mixing (December 2007 and Feb-ruary 2009) in a coastal area of the North Aegean Sea (eastern Mediterranean). Concurrently col-lected hydrographic (temperature and salinity), plankton (chlorophyll a, microzooplankton andmesozooplankton) and fish parameters (somatic condition, sexual maturity and catch per uniteffort of sardine, CPUE) were used to explain seasonal and inter-annual variability in feeding peri-odicity and daily ration. A piecewise regression fitted to the weight-length data indicated a signif-icant inflexion point at a length of ~100 mm that was used to split the fish sample into adults andjuveniles. The stomach fullness index (stomach content mass/fish mass) was strongly dependenton size, and a generalized linear model was used instead to standardize stomach content mass.During summer, sardine fed consistently during daytime with a prominent peak at around sunset.In winter, high feeding rates were recorded in the early night (first 6 h after sunset) but not inthe second half of the night. Field estimates of gastric evacuation rate (R) ranged from 0.101 to0.225 h−1 and were strongly related to temperature (T) (R = 0.075e0.038T, r2 = 0.785). Daily rationswere estimated by applying the Elliott-Persson and the Eggers models and varied from 2.02 to3.67% total weight (TW) in adults and 4.18 to 5.36% TW in juveniles. A significant positive rela-tionship emerged when daily ration was regressed against the ratio of mesozooplankton biomassto sardine CPUE, implying a density-dependent rate of food consumption.
KEY WORDS: Daily ration · Feeding periodicity · Sardine · Sardina pilchardus · MediterraneanSea · Aegean Sea
Resale or republication not permitted without written consent of the publisher

Mar Ecol Prog Ser 437: 215–228, 2011
lowing a power function and is usually expressed asa proportion of body weight consumed within a dielcycle (daily ration: grams of food consumed per gramof fish weight per day) (Jobling 1998). The responseof consumption to water temperature is dome-shaped; feeding rates increase as temperature rises,reach a maximum at some intermediate temperatureand further temperature increase leads to a drasticreduction in feeding rates (Jobling 1998). Recentattempts to couple small pelagic fish bioenergeticsmodels with lower trophic level models (LTLs) havegenerally considered this size and temperaturedependency of plankton consumption (e.g. Politikoset al. 2011). However, other factors may additionallyaffect food consumption (e.g. photoperiod, reproduc-tive activity, previous days’ consumption), but havebeen poorly investigated in fish (Jobling 1998 andreferences therein).
Sardine stocks (Sardina pilchardus and Sardinopssagax) are generally found in productive coastalupwelling regions along the eastern margins of theAtlantic and Pacific Oceans (Freon et al. 2009). Incontrast, the Mediterranean Sea is one of the mostoligotrophic areas of the world, with very low nutri-ent concentrations (Azov 1991) and intense thermalstratification during summer. In this basin, smallpelagic fish stocks, including the sardine Sardinapilchardus, inhabit coastal areas typically associatedwith less saline waters (e.g. Ebro River delta in theCatalan Sea, Gulf of Lions, Po River in the AdriaticSea, North Aegean Sea) which are characterized byrelatively higher productivity (Somarakis et al. 2006).In recently developed trophic mass-balance modelsfor the Mediterranean Sea, the importance of sar-dines has been highlighted in all systems considered,namely the Catalan Sea, the Adriatic Sea and the NEAegean Sea (Tsagarakis et al. 2010).
Information on the diel variation and intensity offeeding of sardine in the Mediterranean is scarce andcontradictory. Andreu (1969) suggests that sardinesfeed during daylight, but Gómez-Larrañeta (1960)claims that feeding continues throughout the night.In upwelling regions, sardines are considered contin-uous or daytime feeders (van der Lingen et al. 2008and references therein). The main objective of thepresent study was to assess the pattern of diel period-icity, feeding intensity and consumption of sardinesand, where possible, the principal characteristics ofthe water column that might control this pattern. Theanalysis was based on fish samples collected at acoastal site in the NE Aegean Sea (eastern Mediter-ranean) that covered the entire 24 h cycle in bothsummer (July 2007 and July 2008) and winter (De-cember 2007 and February 2009). In particular, wewere interested in answering the following questions:(1) Is there any peak in the feeding intensity of sar -dines or fish fed continuously throughout the diel cy-cle; (2) Does the daily ration change with onto geny;(3) Does the daily ration differ between the reproduc-tive (winter; Ganias et al. 2007) and growing/ energystorage season (summer; Ganias et al. 2007); and(4) Do prey availability and/or physical conditions affect consumption rates?
MATERIALS AND METHODS
Data collection
Sardines Sardina pilchardus were sampled at ashallow (mean depth ≈ 30 m), coastal site in the NorthAegean Sea (Fig. 1) in the vicinity of the mouth of theNestos River. Sampling took place onboard the 25 mRV ‘Philia’ in July 2007 (S07), December 2007 (W07),July 2008 (S08) and February 2009 (W09). A smallpelagic trawl with a 7 m vertical opening and 8 mmmesh size (knot-to-knot) in the cod-end was used.Sardines were captured in a total of 50 hauls. Towduration was generally shorter than 30 min, to mini-mize stress and cod-end feeding of fish. Trawlingdepth was adjusted according to fish position in thewater column, and it was variable during the day (thetrawl was towed in a step-oblique manner) in orderto catch both adults (distributed close to the bottom)and juveniles (more surface oriented) (Anonymous2010). Trawling was carried out close to the surfaceat night, because sardines migrate to this layer atdusk where schools disperse (Giannoulaki et al.1999). Given constraints in sampling over the 24 honboard the small research vessel, trawling was car-
216
Fig. 1. Map of the study area indicating the trawling areaand the 3 sampling stations where environmental para -
meters were collected

Nikolioudakis et al.: Sardine trophodynamics
ried out at different times of day on consecutive daysin an attempt to cover the entire 24 h cycle (Fig. 2).Occasionally, sampling was not possible due to badsea conditions or the catch was negative for sardine.Hence, in order to examine the daily ration and feed-ing periodicity, samples from different dates (Fig. 2)were pooled and assigned to 8 consecutive 3 h timeintervals representing an entire diel cycle (i.e. 23:00to 02:00, 02:00 to 05:00, …, 20:00 to 23:00 h).
A SBE 25 CTD profiler was used in each samplingperiod to record temperature, salinity and fluores-cence at 3 stations covering the mean trawling path(Fig. 1). Mesozooplankton and microplankton sam-ples were collected with vertical tows of a standardWP2 net (200 µm mesh size) and a scaled-down ver-sion (25 cm diameter) of the same sampler (50 µmmesh size). Only the size fractions from 50 to 200 µmand from 200 to 2000 µm were used for biomass esti-mations of microplankton and mesozooplankton, re -spectively, after sieving each sample through appro-priate meshes to exclude organisms >200 µm and>2000 µm. Each fraction was filtered on pre-weighed
GF/C filters and dried at 60°C to constant weight.Depth-stratified water samples were also collectedfor chlorophyll a (chl a) determination.
After each haul, fish were immediately put in icedseawater, sorted into 4 size classes (40−80, 81−100,101−120 and >120 mm) and at least 20 fish per sizeclass (when possible) were frozen at −35°C. Two sizeclasses were finally considered for analysis — juve-niles (<100 mm) and adults (≥100 mm) — after merg-ing the 40−80/ 81−100 and 101−120/>120 mm sizeclasses due to insufficient numbers of fish in the origi-nal size class in each 3 h time interval (see ‘Results’).
In the laboratory, fish were thawed, and measure-ments of total length (TL, mm), total weight (TW,0.01 g) and eviscerated weight (EW, 0.01 g) weretaken. Gender, macroscopic maturity and gonadweight (GW, 0.1 mg) were also recorded. The diges-tive tracts were removed, stomachs were dissectedand their contents were washed with distilled water,filtered on pre-weighed Whatman GF/C filters anddried at 60°C to constant weight. Only contents of thestomach (cardiac, cecum and pyloric part) were ana-
217
Fig. 2. Sardina pilchardus. Boxplots of sardine length for all hauls performed in each sampling period. Boxes represent inter -quartile ranges; internal horizontal bars represent the median; whiskers represent 1.5× the interquartile range, and asterisksare given for outliers. Mean sampling time is also indicated. Nautical twilight (grey bars) and nighttime (black bars) are
also shown on the bottom axes

Mar Ecol Prog Ser 437: 215–228, 2011218
lyzed. Contents of the intestine were discarded toreduce bias caused by different rates of digestion andgut passage times (Hyslop 1980). Dry weight (DW) ofstomach contents was considered in the presentstudy. No signs of regurgitation due to samplingstress were recorded.
In addition to fish used in the stomach contentanalysis, additional specimens were collected ran-domly from the trawl catches and transferred to thelaboratory for analyses. These random samples werepooled with those used in the stomach content analy-sis to calculate weight–length relationships for eachsampling period.
Data analysis
The EW−length (TL) relationship of sardine (n =3041) caught and measured during the summercruises was examined first to assess whether a shift inallometric growth existed that could be used to sepa-rate the juvenile from the adult stage (Nikolioudakiset al. 2010). For this purpose, a piecewise regressionwas fit to the log-transformed data (natural loga-rithms):
log(EW) =
b0 + b1 log(TL) + b2{[log(TL) − b3] × [log(TL) ≥ b3]}(1)
where b0 is the y-intercept, b1 is the slope of the re -gression during the juvenile stage, b2 is the changein slope that results in the slope of the relationshipduring the adult stage, and b3 is the mean length atchange from juvenile to adult (Nikolioudakis et al.2010).
The average catch per unit effort (CPUE) of sardine(catch [kg]/haul duration [h]) in the hauls that hadbeen carried out during the night was calculated asan index of sardine density in the sampling area.Nighttime hauls were considered more representa-tive than the daytime hauls given the diel variation inaggregation patterns, vertical distribution of juve-niles and adults and changing trawling depth (seeabove) during the day (Wilson et al. 1996).
The mean somatic condition (SC) of adult or juve-nile fish in each sampling period (SP) was estimatedfrom an analysis of covariance model (ANCOVA)(Soma ra kis et al. 2011):
log(SC) = a + b1 log(TL) + b2(SP) + b3 log(TL)(SP) (2)
Estimated marginal means in each sampling periodat mean log(TL) represented the somatic condition(Somarakis et al. 2011). Multiple comparisons ofsomatic condition were made after Bonferroni adjust-
ments of significance levels. Differences in environ-mental parameters between periods were tested byANOVAs or, when assumptions of ANOVA were notmet, by Kruskal-Wallis tests. Student-Newman-Keul’s or Dunn’s tests were used for parametric andnon-parametric multiple comparisons (Zar 1999).
A total of 1934 stomachs were used in the dailyration analysis. Empty stomachs were not considered,as recommended by Bromley (1994). For each fish, astomach fullness index (SFI) was calculated by divid-ing the stomach content DW (measured to the near-est 0.1 mg) by EW [SFI = DW × 1000/EW]. SFI (andvarious modifications of it) is an index that has beenused widely in studies of daily ration (e.g. Tudela &Palomera 1995, Héroux & Magnan 1996, van der Lin-gen 1998, Plounevez & Champalbert 2000). However,when the index was applied to sardines, a strong size-dependency was revealed (see ‘Results’). Hence, wedid not use this index in any subsequent analysis.Values of stomach content DW were used insteadafter adjusting for the effect of fish size using gener-alized linear models (GLMs; McCullagh & Nelder1989). The predictor variables of GLMs were SP, sam-pling time (Time), fish EW and, in the case of adults,gender (G). The most appropriate link function anderror model were chosen on the basis of residualplots. A log-link function along with a gamma errorstructure model was found to be adequate. Modelingwas carried out using the R software (R DevelopmentCore Team 2009). All predictors and their first andsecond order interactions were initially included inthe model. The stepAIC function (R package ‘MASS’,V7.3-5; Venables & Ripley 2002) was used to selectthe significant predictors and to estimate the coeffi-cients of the models. Predictors were removed bybackward elimination based on Akaike’s informationcriterion (AIC). AIC balanced the degree of fit of amodel with the number of variables, in order to findthe most parsimonious model. Only those predictorswhich contributed significantly to the model werekept. Estimated marginal means of DW (fixed atmean EW) for each sampling period and time interval(‘effects’ package; Fox 2003) were used as inputs tothe consumption models described below.
For estimating daily ration, 2 widely used consump-tion models were considered: (1) the Elliott & Persson(E-P) model (Elliott & Persson 1978) and (2) theEggers model (Eggers 1979). In the Eggers model,feeding is considered continuous and constant dur-ing the feeding period (Tf), while in the E-P modelfeeding is assumed to be constant only within eachspecific, consecutive sampling interval. Both modelsare based on the assumption that stomach contents

Nikolioudakis et al.: Sardine trophodynamics 219
decline exponentially with time. Moreover, to per-form accurately, the E-P model requires that sam-pling intervals be 3 h or shorter (Elliott & Persson1978).
For the E-P model, consumption (Ct) for each timeinterval (t = 3 h) was estimated as:
Ct = [(St − S0e−R × t)R × t]/(1 − e−R × t) (3)
where S0 and St are the standardized stomach con-tent at the beginning and end of each time interval tand R is the instantaneous gastric evacuation rate.The daily ration (CE-P, daily ration) was calculated asthe sum of partial consumptions over the assumed Tf.The feeding period was defined as the period fromminimum to maximum standardized stomach content(Tudela & Palomera 1995). For the Eggers model, thedaily ration was estimated as:
CE = Savg × R × Tf + (Sb − Se) (4)
where Savg is the average stomach content DW overTf, and Se and Sb are the stomach content DW at theend and at the beginning of Tf, respectively. Thismodel assumes that the weight of the stomach con-tents changes significantly between the beginningand end of Tf. The standard error for CE-P was ap -proxi mated following the δ method as proposed byWorobec (1984).
The instantaneous gastric evacuation rate (R) wasestimated as recommended in Héroux & Magnan(1996): for all pairs of consecutive hauls performedduring the same day a series of R values were cal -culated:
R = (lnSt − lnS0)/ti (5)
where ti is the time elapsed between hauls. The gas-tric evacuation rate used was the maximum R (Rmax).R was estimated for each sampling pe riod separatelyfor adults and juveniles. The as sump tions for usingRmax were that stomach contents de clined exponen-tially during the non-feeding period and that no feed-ing was taking place at that time.
For comparison with results of similar studies, dailyration was also calculated as a fraction of total wetweight (%TW) by converting DW to wet weight. Forthis conversion, we assumed a water content value of87%, i.e. that of copepods of the genus Acartia(Borme 2006). Copepods are the most significant partof the diet (in terms of weight and carbon contribu-tion) for the Mediterranean sardine (authors’ unpubl.data, but see e.g. Garrido et al. 2008 for the Iberiansardine).
Finally, estimates of consumption in different sam-pling periods were compared with environmental
and fish parameters recorded during the surveysusing appropriate regression and/or ANCOVA mod-els. The density dependency of consumption wasevaluated by comparing it with the ratio of mesozoo-plankton biomass to sardine CPUE.
RESULTS
The residual plot of the weight–length relationshipof fish Sardina pilchardus caught in summer (Fig. 3A)revealed a non-random (structured) distribution ofresiduals indicative of an ontogenetic transition(Nikolioudakis et al. 2010 and references therein).The piecewise regression fitted to the weight- lengthdata [logEW = −12.12 + 3.05 × logTL + 0.343 × (logTL− 4.62) × (logTL ≥ 4.62), r2 = 0.988, p < 0.0001, n =3041) had a significant (p < 0.0001) inflexion point atthe length of 101.43 mm TL (95% confidence inter-vals: 99.03 to 103.90 mm) (Fig. 3B) and randomly dis-tributed residuals. Fish size range in each haul isshown in Fig. 2. During the winter cruises, allsardines were >100 mm (Fig. 2), with their gonadsclassified macroscopically as developing/ mature (seealso mean gonadosomatic index [GSI] values inTable 1). The weight–length relationship for winterhad randomly distributed residuals (not shown).
The water column was well stratified in summersand mixed in winters (Fig. 4), with significantlyhigher temperatures and lower surface salinities inS07 and S08 (Table 1). Productivity was higher inwinters as indicated by the increased chl a, micro -plankton and mesozooplankton, with mesozooplank-ton biomass being significantly higher only in W07(Table 1). Sardine CPUE was higher in 2007, espe-cially in S07. The somatic condition of adults waslower in winter, when GSIs were higher (sardinereproductive period) (Table 1).
Plots of the SFI against fish weight revealed thatthe SFI was often size dependent, especially in sum-mer when both juvenile and adult sardines were sam-pled (e.g. July 2007; Fig. 5). Hence, use of the SFI wasnot appropriate for comparisons of samples with dif-ferent fish sizes. We therefore adopted the GLMapproach to standardize stomach contents for theeffect of fish size.
The most parsimonious GLMs for juveniles(<100 mm) and adults (≥100 mm) explained 91.12and 75.05% of the deviance, respectively (Table 2).In both cases, Time was the predictor that explainedthe largest proportion of deviance (~77% for juve-niles and ~42% for adults). Significant interactions ofCruise and Time with fish EW were interpretable in

Mar Ecol Prog Ser 437: 215–228, 2011
terms of changing slopes of the DW−EW relationshipbetween cruises and time intervals (see also Fig. 4).With regards to adults, terms including gender (G)were not significant.
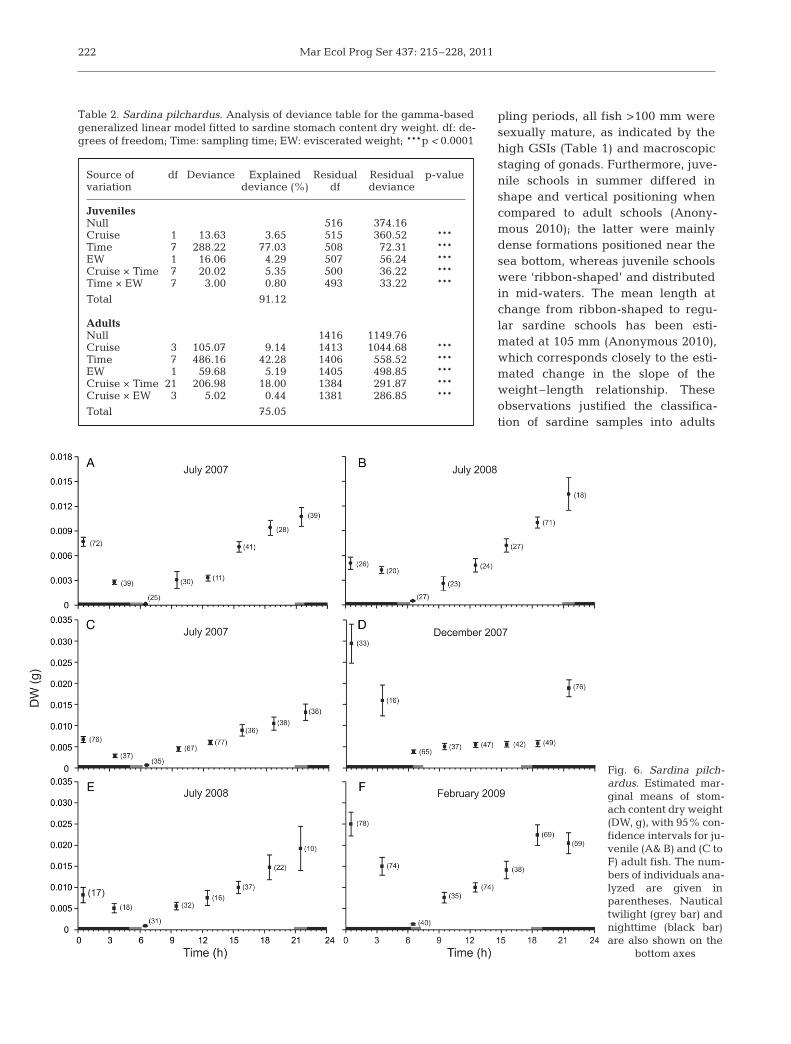
The estimated marginal means with 95% confi-dence intervals for the multiplicative effect of Cruise× Time are shown in Fig. 6. Fish EW was fixed at4.43 g for juveniles and 11.58 g for adults. A cleardaytime feeding pattern was revealed in summer forboth juveniles and adults. The lowest DWs occurredaround sunrise, progressively increasing throughoutthe course of the day, to peak at around sunset(Fig. 6A,B,C,E). All stomachs analyzed in July werefull at sunset, and prey items were intact. In winter,sardines were feeding throughout the day and con-tinued to feed in the early night (Fig. 6D,F), whichcontrasted with summer, when feeding ceased atnight. After the peak feeding time (during dusk insummer and after midnight in winter), the stomachDW dropped (Fig. 6). The degree of digestion of preyitems in stomachs increased as the night progressedfurther, implying that the non-feeding period tookplace during the night.
The estimated gastric evacuation rates are given inTable 3. R-values of juveniles and adults in summerswere similar. A significant relationship existed be -
220
S07 W07 S08 W09 Statistic
Surface temperature (°C) 26.45a 14.11b 26.86a 11.16c F = 15812.13***Surface salinity 34.37c 36.57a 34.29d 36.40b H = 18.42***Mean temperature in the water column (°C) 17.86a,b 14.72c 18.90a 11.36d H = 90.00***Mean salinity in the water column 38.02 37.18 37.85 36.74 H = 5.30Mesozooplankton biomass (mg m−3) 29.02b 36.40a 24.70b 28.05b F = 7.54***Microplankton biomass (mg m−3) 32.18c 91.04b 22.70c 130.73a F = 76.43***Mean chl a in the water column (µg l−1) 0.14c 1.36a 0.13c 0.76b F = 98.89***Catch per unit effort (kg h−1) 47.45a 26.45a 5.27b 7.68a,b F = 3.40*Condition of adults 1.07b 1.03c 1.09a 1.02d F = 4517.40***GSI 0.21c 3.91b 0.23c 4.30a H = 338.30***Condition of juveniles 0.62 – 0.61 – F = 1.49
a>b>c>dHomogenous groups
Table 1. Sardina pilchardus. Comparison of physical, biotic and fish parameters between different sampling periods in summer(S) and winter (W) of 2007, 2008 and 2009. Arithmetic means and F-values are provided, except for comparisons that did notmeet the assumptions of the analysis of variance, for which medians and the Kruskal-Wallis statistic (H) are given. Asterisks
indicate significant differences: *p < 0.05, **p < 0.01, ***p < 0.001. GSI: gonadosomatic index; (–): no data available
Fig. 3. Sardinia pilchardus. (A) Plot of the residuals of the sin-gle-stage, weight–length relationship of sardines capturedduring summers. (B) Piecewise regression fitted to the samedataset. The estimated inflection point (length at slopechange) is indicated. EW: eviscerated weight; TL: total length

Nikolioudakis et al.: Sardine trophodynamics
tween R and surface (5 m) temperature (T) (R =0.075 × e0.038T, n = 6, r2 = 0.785, p < 0.05).
Estimates of consumption by the models of Elliot-Persson and Eggers (Table 3) were highly correlated(r = 0.999, p < 0.001). Daily ration of juveniles interms of percent TW was higher (4.25 and 5.36% forS07 and S08, respectively, based on CE-P) than that ofadults (2.05 and 3.14% for S07 and S08, respectively,based on CE-P) in summer (Table 3), presumablybecause of their smaller size. In adults, daily rationwas higher during S08 (3.14%) and W09 (3.67%),with lower consumption estimated in S07 (Table 3).Finally, consumption in W07 was higher than in S07.Higher consumption in S08 and W09 was coupledwith lower sardine CPUEs (Table 1). When theratio of mesozooplankton biomass to sardine CPUE[i.e. BR = log(mesozooplankton biomass/ CPUE)] wasrelated to daily ration, a significant relationshipemerged: daily ration (CE-P, %TW) estimated was significantly and linearly related to BR when the size-class factor (juveniles or adults) was taken intoaccount (Table 4, Fig. 7A). Indeed, mean weight ofjuveniles and adults (juveniles: 4.82 g TW, adults:12.81 g TW) entered into the CE-P-on-BR regression asa significant covariate (Fig. 7B), indicating that, if alinear decrease in food consumption with fish size isassumed, consumption in terms of %TW decreasesby a factor of 0.255 g−1 increase in TW.
DISCUSSION
In contrast to upwelling areas, the MediterraneanSea is highly oligotrophic and has often been charac-terized as a marine desert (Azov 1991). However, cer-tain coastal areas under the influence of low-salinitywaters are relatively productive and contain impor-tant habitats for small pelagic fish stocks in theMediterranean (Palomera et al. 2007). In the presentstudy, the sampling area (in the coastal area in theproximity of the Nestos River) is a ‘hot-spot’ for smallpelagic fish stocks in the Aegean, with high concen-trations of both adults and juveniles (Tsagarakis et al.2010). In summer, sardine Sardina pilchardus popula-tions are dominated by juvenile fish (Machias et al.2008) that are mainly distributed in shallow waters,especially in the proximity of river mouths (Palomeraet al. 2007, Tsagarakis et al. 2010).
The abrupt change in sardine allometric growth,indicated by the significant change in slope of theweight–length relationship at about 100 mm TL,seemed to be related to the ontogenetic transitionfrom juvenile to adult. Indeed, during the winter sam-
221
Fig. 4. Averaged profiles of water temperature in the sampling area
Fig. 5. Sardina pilchardus. Stomach fullness index (SFI)against eviscerated weight (EW) for each 3 h time interval inJuly 2007 (mean time is given, i.e. 00:30 represents 23:00 to
2:00 h). Significant power relationships are also given
Mar Ecol Prog Ser 437: 215–228, 2011
pling periods, all fish >100 mm weresexually mature, as indicated by thehigh GSIs (Table 1) and macroscopicstaging of gonads. Furthermore, juve-nile schools in summer differed inshape and vertical positioning whencompared to adult schools (Anony-mous 2010); the latter were mainlydense formations positioned near thesea bottom, whereas juvenile schoolswere ‘ribbon-shaped’ and distributedin mid-waters. The mean length atchange from ribbon-shaped to regu-lar sardine schools has been esti-mated at 105 mm (Anonymous 2010),which corresponds closely to the esti-mated change in the slope of theweight–length relationship. Theseobservations justified the classifica-tion of sardine samples into adults
222
Fig. 6. Sardina pilch -ardus. Estimated mar -ginal means of stom-ach content dry weight(DW, g), with 95% con-fidence intervals for ju-venile (A& B) and (C toF) adult fish. The num-bers of individuals ana-lyzed are given inparentheses. Nauticaltwilight (grey bar) andnighttime (black bar)are also shown on the
bottom axes
Source of df Deviance Explained Residual Residual p-valuevariation deviance (%) df deviance
JuvenilesNull 516 374.16 Cruise 1 13.63 3.65 515 360.52 ***Time 7 288.22 77.03 508 72.31 ***EW 1 16.06 4.29 507 56.24 ***Cruise × Time 7 20.02 5.35 500 36.22 ***Time × EW 7 3.00 0.80 493 33.22 ***
Total 91.12
AdultsNull 1416 1149.76 Cruise 3 105.07 9.14 1413 1044.68 ***Time 7 486.16 42.28 1406 558.52 ***EW 1 59.68 5.19 1405 498.85 ***Cruise × Time 21 206.98 18.00 1384 291.87 ***Cruise × EW 3 5.02 0.44 1381 286.85 ***
Total 75.05
Table 2. Sardina pilchardus. Analysis of deviance table for the gamma-basedgeneralized linear model fitted to sardine stomach content dry weight. df: de-grees of freedom; Time: sampling time; EW: eviscerated weight; ***p < 0.0001

Nikolioudakis et al.: Sardine trophodynamics
(≥100 mm) and juveniles (<100 mm) in order to exa -mine feeding periodicity and consumption. In thePacific sardine in South Africa, smaller sardines (Age0+) had larger daily rations than larger fish (Ages 1+,2+, 3+, 4+) (van der Lingen 1998), implying that juve-nile fish might have higher energy requirements.
Juvenile sardines in the Mediterranean invest pri-marily in growth during summer, with no visiblemesenteric fat (Machias & Tsimenides 1995, authors’pers. obs.) in contrast to adult sardines which storelipids during summer, mainly to fuel egg productionin winter (Ganias et al. 2007, Garrido et al. 2008).Adult sardines in the present study were in bettersomatic condition in summer, which agrees with theknown cycles of energy storage and reproduction inthis species (Ganias et al. 2007).
The SFI is widely applied in studies of food con-sumption in fishes; however, it should be used withcaution. As with other ratio indices (e.g. the GSI[Soma rakis et al. 2004a] and condition index [Bolger& Connolly 1989]), the SFI is valid for comparisonsamong samples only when the assumption of isome-try between stomach content weight and bodyweight is met (Héroux & Magnan 1996, Somarakis etal. 2004a). In the present study, a strong dependencyof the SFI on fish weight was identified which invali-dated its use. A GLM approach was therefore fol-
223
Sampling period Size class Rmax (±SE) DW CE-P (±SE) CE-P (%TW) CE CE (%TW)
S07 J 0.197 (0.053) 0.0054 0.0266 (0.0029) 4.25 0.0262 4.18S08 J 0.215 (0.099) 0.0065 0.0335 (0.0053) 5.36 0.0332 5.31S07 A 0.196 (0.042) 0.0071 0.0342 (0.0031) 2.05 0.0337 2.02W07 A 0.101 (0.038) 0.0181 0.0426 (0.0015) 2.56 0.0443 2.66S08 A 0.225 (0.026) 0.0098 0.0524 (0.0053) 3.14 0.0520 3.12W09 A 0.139 (0.060) 0.0145 0.0611 (0.0532) 3.67 0.0603 3.62
Table 3. Sardina pilchardus. Estimates of gastric evacuation (h−1) and consumption rates (DW d−1) for sardine. Consumptionvalues are also expressed as percent total weight (%TW). S: summer; W: winter; A: adult sardines; J: juvenile sardines; Rmax:gastric evacuation rate; DW: dry weight, standardized mean stomach content; CE-P: daily ration according to the Elliott-Persson
model; CE: daily ration according to the Eggers model
Source Sum of df Mean F p-value squares square
Model 6.892 2 3.446 37.647 0.008Intercept 45.372 1 45.372 495.689 0.000BR 1.822 1 1.822 19.905 0.021Size class 5.509 1 5.509 60.189 0.004Error 0.275 3 0.092 Total 80.877 6
Corrected total 7.167 5
Table 4. Sardina pilchardus. Analysis of variance table forthe ANCOVA model fitted to sardine consumption (CE-P, aspercent total weight). BR: log(mesozooplankton biomass/
Catch per unit effort, CPUE). Adj. r2 = 0.936
Fig. 7. Sardina pilchardus. (A) ANCOVA model of consumption (CE-P) versus mesozooplankton biomass/ catch per unit effort (BR). (B) Observed versus predicted values of the multiple regression of CE-P-on-BR and fish total weight (TW)

Mar Ecol Prog Ser 437: 215–228, 2011
lowed instead to standardize stomach content DWs.In summer, both juveniles and adults fed during
daytime, with a clear peak in feeding intensity ataround sunset. In winter, the highest stomach con-tents were recorded after sunset, in the early night.Andreu (1969), based on opportunistic samples col-lected throughout the Mediterranean, suggested thatsardine feeds during daytime. In the Adriatic Sea, thegreatest feeding intensity was noted at dusk duringthe spring-to-autumn fishing season (Vu<etic 1955).Gómez-Larrañeta (1960), however, claimed that sar-dine feeding goes on throughout the night.
In the present study, sardines exhibited high stom-ach fullness at dusk and in the early night when lumi-nance levels were low. Feeding in low-light regimesis a general characteristic of clupeoid fish (Blaxter &Hunter 1982). Sardines can feed effectively at lumi-nance levels <0.2 mc (Muzinic 1964) and are able touse filter or particulate feeding over a broad prey sizespectrum very efficiently (Garrido et al. 2007), shift-ing this feeding strategy according to prey concentra-tion (van der Lingen 1994). Thus, a preliminaryanalysis of prey types in the stomachs of specimensin the sampling cruises of the present study (authors’unpubl. data) revealed that phytoplankton con-tributed numerically ~79% to sardine diet in winter,which suggested that filtering was probably the feed-ing mode employed at night. Some feeding activitywas also recorded during the day, and this behaviorhas been observed for other small pelagic fish thatare organized into schools (Fréon & Misund 1999 andreferences therein). Schooling behavior results inenhanced vigilance and reduced timidity, enablingindividuals to allocate more time to feeding, even inthe presence of predators (Fréon & Misund 1999 andreferences therein).
The high intensity of feeding of sardines duringtheir ascent to surface waters could be linked withdiel vertical migration (DVM) behavior. There areseveral factors that potentially affect (e.g. light, food,tides), and hypotheses that attempt to explain, theDVM behavior of fish (e.g. bioenergetic advantage,predation avoidance, optimization of different func-tions) (Neilson & Perry 2001). The visual stimulusrequired for the maintenance of schools (Blaxter &Hunter 1982, Fréon & Misund 1999, Bertrand et al.2008) is reduced in the period before sunset whenlight is diminishing. This leads to the relaxation ofsardine school formations and the parallel initiationof the DVM that takes place approximately 1 h be -fore sunset in the Mediterranean (Giannoulaki et al.1999). Sardine stomachs were full (summer) oralmost full (winter) around sunset, suggesting that
the ascent towards surface waters and elevated feed-ing rates are probably synchronized. Maximizationof food intake during the loosening of dense schoolsand initiation of DVM have also been reported forother small pelagic fish, e.g. Peruvian anchovetaEngraulis ringens (Bertrand et al. 2008). Mortalityrisks might also be reduced at low-luminance levels,as predators of small pelagic fish attack schoolsmainly during daytime (e.g. marine mammals, birds,fish predators) and based primarily on visual stimuli(Fréon & Misund 1999). Thus, the reduced luminancearound sunset triggers the loosening of schools,while concurrently reducing predation risk. There istherefore an increased scope for food intake duringdusk and at night.
One possible explanation for the different feedingpatterns of sardines in summer and winter is the dif-ference in thermal stratification. The high tempera-ture of surface waters in summer relative to subsur-face layers (Fig. 4) could explain the termination offeeding after sardines have ascended close to the sur-face at night. Food intake by fish increases withincreasing temperature, reaches a peak and thenfalls more or less dramatically at supra-optimal tem-perature (Jobling 1998). In sockeye salmon Onco -rhynchus nerka, for example, a significant reductionin appetite and conversion efficiencies was noted atwater temperatures from 20 to 24°C (Brett & Higgs1970), possibly reflecting limitations in the capacityof the respiratory and circulatory systems to deliveroxygen to tissues under conditions of very high oxy-gen demand (Jobling 1997); such conditions are verylikely to be met during searching, capturing and han-dling of prey. The high temperatures experienced bysardine above the thermocline in summer mighttherefore limit food intake.
Measurements of gastric evacuation rates in sar-dines and anchovies under controlled laboratory con-ditions have rarely been carried out, mainly due todifficulties in keeping small-sized clupeoid fish inexperimental tanks (Blaxter & Hunter 1982). In ourstudy, the R used for the calculation of daily rationwas the highest evacuation rate (Rmax) observed forall pairs of consecutive hauls performed during thesame day (for similar approaches see, e.g. Boisclair &Leggett [1985] and Héroux & Magnan [1996]). Theestimation of gastric evacuation rates in the fieldrequires making a number of assumptions (e.g. nofeeding takes place during the designated non-feed-ing period, captured fish have the same feeding his-tory, temperature conditions do not change over the24 h cycle) (Bernreuther et al. 2008). Additionally, thegastric evacuation rate in fish is known to be affected
224

Nikolioudakis et al.: Sardine trophodynamics 225
by a variety of factors, including prey type and size,meal type, predator type and temperature (for areview see Bromley 1994).
In the present study, the increasing degree ofdigestion of prey items as the night progressedseemed to justify the definition of non-feeding peri-ods. In summer, sardines experienced varying tem-peratures over the diel cycle owing to their DVMbehavior and the thermal stratification of the watercolumn. Hence, the Rmax values calculated during thenon-feeding period at night (when fish were locatedclose to the surface) could be higher than actual evac-uation rates in the daytime, when fish were distrib-uted below the thermocline. This, in turn, would leadto an overestimation of the consumption rates in sum-mer. Similar exponential increase in R with increas-ing temperature, such as that reported in the presentstudy, has also been found in a number of experimen-tal studies (e.g. Elliott 1972, Bernreuther et al. 2008,2009). When this relationship was used to recalculatethe evacuation rate at the depth occupied by sardinesduring daytime in summer (i.e. below the thermo-cline), the resulting mean R values for S07 and S08were lower by ~23 and ~34% for juveniles and adults,respectively. Using the recalculated values of R in theconsumption models, daily ration estimates werelower by ~15 and ~22% for juveniles and adults,respectively (average of CE-P in S07 and S08). How-ever, in a number of studies, higher evacuation rateshave been observed during the feeding period thanin the non-feeding period (Richter et al. 2002 and ref-erences therein), but see also Bernreuther et al.(2008) for an exception in Clupea harengus. Hence,even if a temperature correction was applied for R insummer during daytime, it was likely that an in -crease of R during the feeding period would counter-act the expected decrease in R due to low tempera-ture below the thermocline. Finally, in sprat Sprattussprattus, the general model describing the R−T rela-tionship predicts an increase of R with T, but a subse-quent decrease at higher T (Bernreuther et al. 2009).If the latter is also the case for sardine above thethermo cline, the calculated Rmax during nighttimecould be a realistic value to implement in the con-sumption models.
Regarding other factors affecting R, the effect offish size is debated, as in some studies no significanteffect was noted (e.g. Persson 1979), whereas, in oth-ers, the effect of size was significant (e.g. Temming &Herrmann 2001, Bernreuther et al. 2009). Prey type isalso known to affect R in Pacific sardines, with phyto-plankton prey leading to higher R values than zoo-plankton (van der Lingen 1998). If such an effect
holds true for Mediterranean sardine as well, it couldpartially explain the higher Rmax values in W09(0.139 h−1) than in W07 (0.101 h−1). Although temper-ature was significantly lower in W09 and Rmax wasexpected to be lower than that of W07, the numericalcontribution of phytoplankon in sardine diet was~83% in W09, while the respective proportion duringW07 was ~73% (authors’ unpubl. data).
Bearing in mind the above difficulties in estimatingR from field data, the estimated values of the gastricevacuation rate obtained with the Rmax approach(Boisclair & Leggett 1985, Héroux & Magnan 1996)were considered the most appropriate for the presentstudy. Gastric evacuation rates obtained for other clu-peoids like Atlantic herring Clupea harengus, Pacificsardine Sardinops sagax and Baltic sprat Sprattussprattus range from 0.09 to 0.56 h−1 (Arrhenius &Hansson 1994, van der Lingen 1998, Darbyson et al.2003, Bernreuther et al. 2008, 2009). However, directcomparisons of gastric evacuation between speciesare probably meaningless due to the dependency ofevacuation rate on temperature and food type (vander Lingen 1998) and whether R is calculated usingDW or SFI values (Héroux & Magnan 1996).
Two widely used consumption models proposed byElliott & Persson (1978) and Eggers (1979) were ap -plied here for comparative purposes. The E-P modelis generally considered to be accurate (Hayward1991) and to perform better in filter feeders and graz-ers that demonstrate feeding periodicity (Richter etal. 2002). The Eggers model, on the other hand, isconsidered more appropriate for species that feedthroughout the day on a wide range of prey types,exhibiting occasional feeding peaks and having norigid feeding periodicities (Héroux & Magnan 1996).In the case of sardine, the 2 models produced verysimilar consumption estimates, as was also the casein other studies (Boisclair & Leggett 1988, Hayward1991, Héroux & Magnan 1996, Richter et al. 2002). Al -though the key assumption of the Eggers model, i.e.continuous feeding, was not met in the present study,it provided very close estimates to the E-P model,suggesting that it could be used instead. The Eggersmodel is simpler but still robust, permitting lowersampling frequency than the E-P model (Boisclair &Leggett 1988, Héroux & Magnan 1996). However, itmay overestimate daily ration, particularly at longersampling intervals and at medium- and high-rationlevels (Hayward 1991).
The estimated daily ration values for sardine exhib-ited seasonal and inter-annual variability. The feed-ing intensity of sardine has also been reported tovary between years and seasons, being higher when

Mar Ecol Prog Ser 437: 215–228, 2011
productivity is high, especially during the spring andwinter months off the Atlantic coasts of Portugal (Gar-rido et al. 2008). In our case, summer consumptionvalues were lower than those of the following winter,when chl a and plankton biomass were both higher.Despite significant differences in mean zooplanktonbiomass and chl a concentration among seasons, con-sumption rates were not significantly correlated witheither zooplankton or chl a. Daily ration is known tovary with type of food because of differences in gas-tric evacuation rates for different prey types (van derLingen 1998). In Pacific sardine Sardinops sagax,field estimates of daily ration ranged from 0.99 to2.52 and from 2.97 to 7.58% TW d−1 for fish consum-ing zooplankton and phytoplankton, respectively(van der Lingen 1998). The latter author provided ad -ditional estimates of 1.73 to 5.18 and 2.31 to 6.93%TW for far eastern and Peruvian sardines, respec-tively. In laboratory experiments, the daily ration of 1yr old Pacific sardines fed synthetic pellets rangedfrom 1.06 to 2.40% TW (Noguchi et al. 1990). Finally,from back-calculated growth data, Watanabe & Saito(1998) estimated that the daily requirements in car-bon of juvenile sardines ranged from 5.6 to 9.6 mg Cd−1, which, according to the conversion factors usedin their study, corresponded to daily rations of 3.52and 5.68% TW for fish of ~0.83 and ~0.30 g TW,respectively.
In the Mediterranean Sea, the only available dailyration estimates for small pelagic fish are those forEuropean anchovy Engraulis encrasicolus (Tudela &Palomera 1995, 1997, Plounevez & Champalbert2000). Using an evacuation rate of 0.423 ± 0.196 h−1
(estimated in Tudela & Palomera 1995), adults of thisspecies have been found to consume from 3.4 to3.9% TW during the summer spawning period. Fur-thermore, anchovy studies in the Mediterranean(Tudela & Palomera 1995, 1997, Plounevez & Cham-palbert 2000, Borme et al. 2009) indicate a diel feed-ing intensity pattern similar to that of sardine in thepresent study during summer, i.e. daytime feeding,with peak intensity at around sunset.
One of the most interesting findings of the presentstudy was the positive relationship between con-sumption and the index of per capita food availability,i.e. the biomass ratio, log(mesozooplankton biomass/CPUE) (Fig. 7). This relationship is indicative of adensity-dependent effect, i.e. when per capita foodavailability is increased, daily ration is higher.
Density-dependence responses have increasinglybeen identified in small pelagic fish including expansion− contraction of habitats (e.g. Somarakis etal. 2004b) and changes in somatic condition, gonad
mass and length at maturity (van der Lingen et al.2006). In the Aegean Sea, the daily specific fecundityof anchovy is strongly and positively related to theratio of mesozooplankton biomass to fish biomass(Somarakis et al. 2011). This is to our knowledge thefirst time that a relationship between per capita foodavailability and consumption has been demonstrated.The implications are important, especially in coupledbiogeochemical and fish bioenergetics models inwhich small pelagic fish consumption is modeled as afunction of prey density (e.g. Politikos et al. 2011)without taking into consideration any density-depen-dent control.
Acknowledgements. The present study was part of the Euro-pean Project SARDONE (‘Improving assessment and man-agement of small pelagic species in the Mediterranean’,FP6-44294). The authors thank Dr. M. Giannoulaki, E. Schis-menou, K. Tsagarakis and the captain and the crew of theRV ‘Philia’, for their invaluable help during sampling, aswell as the technical staff of HCMR who assisted in the pre-sent study. Thanks are also due to the entire SARDONE‘feeding team’ and to all the Sardone team participants thatcollaborated in the preparation of a common protocol andthe design of feeding studies for small pelagic fish in theMediterranean. Finally, we thank the 3 anonymous review-ers who helped improve our manuscript.
LITERATURE CITED
Andreu B (1969) Las branquispinas en la caracterización delas poblaciones de Sardina pilchardus (Walb.). Inv Pesq33: 425−607 (in Spanish)
Anonymous (2010) Improving assessment and managementof small pelagic species in the Mediterranean. Finalreport to the European Commission Project FP6-44294,CNR-ISMAR, Ancona
Arrhenius F, Hansson S (1994) In situ food consumption byyoung-of-the-year Baltic sea herring Clupea harengus: atest of predictions from a bioenergetics model. Mar EcolProg Ser 110: 145−149
Azov Y (1991) Eastern Mediterranean — a marine desert?Mar Pollut Bull 23: 225−232
Bernreuther M, Herrmann JP, Temming A (2008) Laboratoryexperiments on the gastric evacuation of juvenile herring(Clupea harengus L.). J Exp Mar Biol Ecol 363: 1−11
Bernreuther M, Temming A, Herrmann JP (2009) Effect oftemperature on the gastric evacuation in sprat Sprattussprattus. J Fish Biol 75: 1525−1541
Bertrand A, Gerlotto F, Bertrand S, Gutiérrez M and others(2008) Schooling behaviour and environmental forcing inrelation to anchoveta distribution: an analysis across mul-tiple spatial scales. Prog Oceanogr 79: 264−277
Blaxter JHS, Hunter JR (1982) The biology of the clupeoidfishes. Adv Mar Biol 20: 1−223
Boisclair D, Leggett WC (1985) Rates of food exploitation bylittoral fishes in a mesotrophic north-temperate lake. CanJ Fish Aquat Sci 42: 556−566
Boisclair D, Leggett WC (1988) An in situ experimental eval-uation of the Elliott and Persson and the Eggers models
226

Nikolioudakis et al.: Sardine trophodynamics 227
for estimating fish daily ration. Can J Fish Aquat Sci 45: 138−145
Bolger T, Connolly PL (1989) The selection of suitable indicesfor the measurement and analysis of fish condition. J FishBiol 34: 171−182
Borme D (2006) Ecologia trofica dell’acciuga Engraulisencrasicolus in Adriatico settentrionale. PhD thesis, Uni-versity of Trieste
Borme D, Tirelli V, Brandt SB, Fonda Umani S, Arneri E(2009) Diet of Engraulis encrasicolus in the northernAdriatic Sea (Mediterranean): ontogenetic changes andfeeding selectivity. Mar Ecol Prog Ser 392: 193−209
Brett JR, Higgs DA (1970) Effect of temperature on the rateof gastric digestion in fingerling sockeye salmon. J FishRes Board Can 27: 1767−1779
Bromley PJ (1994) The role of gastric evacuation experi-ments in quantifying the feeding rates of predatory fish.Rev Fish Biol Fish 4: 36−66
Darbyson E, Swain DP, Chabott D, Castonguay M (2003) Dielvariation in feeding rate and prey composition of herringand mackerel in the southern Gulf of St. Lawrence. J FishBiol 63: 1235−1257
Eggers DM (1979) Comments on some recent methods forestimating food consumption by fish. J Fish Res BoardCan 36: 1018−1019
Elliott JM (1972) Rates of gastric evacuation in brown trout,Salmo trutta L. Freshw Biol 2: 1−18
Elliott JM, Persson L (1978) The estimation of daily rates offood consumption for fish. J Anim Ecol 47: 977−991
FAO (Food and Agriculture Organization) (2008) FISHSTATPlus: universal software for fishery statistical time series,Version 2.3. FAO Fisheries Department, Fishery Informa-tion, Data and Statistics Unit. Available at: www. fao. org/fishery/ statistics/software/fishstat/en (accessed on 23March, 2011)
Fox J (2003) Effect displays in R for generalised linear mod-els. J Stat Softw 8: 1−27
Fréon P, Misund OA (1999) Dynamics of pelagic fish distrib-ution and behavior: effect on fisheries and stock assess-ment. Blackwell Publishing, London
Freon P, Arísteguic J, Bertrand A, Crawford RJM and others(2009) Functional group biodiversity in Eastern Bound-ary Upwelling Ecosystems questions the wasp-waisttrophic structure. Prog Oceanogr 83: 97−106
Ganias K, Somarakis S, Koutsikopoulos C, Machias A (2007)Factors affecting the spawning period of sardine in twohighly oligotrophic seas. Mar Biol 151: 1559−1569
Garrido S, Marçalo A, Zwolinski J, van der Lingen CD(2007) Laboratory investigations on the effect of prey sizeand concentration on the feeding behaviour of Sardinapilchardus. Mar Ecol Prog Ser 330: 189−199
Garrido S, Ben-Hamadou R, Oliveira PB, Cunha ME, Chích -aro MA, van der Lingen CD (2008) Diet and feedingintensity of sardine Sardina pilchardus: correlation withsatellite-derived chlorophyll data. Mar Ecol Prog Ser 354: 245−256
Giannoulaki M, Machias A, Tsimenides N (1999) Ambientluminance and vertical migration of the sardine Sardinapilchardus. Mar Ecol Prog Ser 178: 29−38
Gómez-Larrañeta M (1960) Synopsis of biological data onSardina pilchardus of the Mediterranean and adjacentseas. FAO Fish Biol Synop 9: 137−173
Hayward RS (1991) Bias associated with using the Eggersmodel for estimating fish daily ration. Can J Fish AquatSci 48: 1100−1103
Héroux D, Magnan P (1996) In situ determination of fooddaily ration in fish: review and field evaluation. EnvironBiol Fishes 46: 61−74
Hyslop EJ (1980) Stomach contents analysis — a review ofmethods and their application. J Fish Biol 17: 411−429
Jobling M (1997) Temperature and growth: modulation ofgrowth rate via temperature change. In: Wood CM,McDonald DG (eds) Global warming: implications forfreshwater and marine fish. Cambridge University Press,Cambridge
Jobling M (1998) Feeding and nutrition in intensive fishfarming. In: Black KD, Pickering AD C (eds) Biology offarmed fish. Sheffield Academic Press, Sheffield
Machias A, Tsimenides N (1995) Biological factors affectingthe swimbladder volume of sardine (Sardina pilchardus).Mar Biol 123: 859−867
Machias A, Stergiou KI, Somarakis S, Karpouzi VS, Kapanta-gakis A (2008) Trends in trawl and purse seine catch ratesin the north-eastern Mediterranean. Med Mar Sci 9: 49−65
McCullagh P, Nelder JA (1989) Generalized linear models,monographs on statistics and applied probability 37, 2ndedn. Chapman and Hall, London
Muzinic R (1964) Some observations on the reactions of thesardine (Sardina pilchardus Walb.) to light under experi-mental conditions. Acta Adriat 11: 219−226
Neilson JD, Perry RI (2001) Fish migration, vertical. In: Steele J, Thorpe S, Turekian K (eds) Encyclopedia ofocean sciences. Academic Press, London
Nikolioudakis N, Koumoundouros G, Kiparissis S, SomarakisS (2010) Defining length-at-metamorphosis in fishes: amulti-character approach. Mar Biol 157: 991−1001
Noguchi M, Takahashi Y, Hirota Y (1990) The relationshipbetween food consumption and growth of sardine Sar di -nops melanostictus by the feeding experiment. Bull JpnSea Natl Fish Res Inst 40: 1−14 (in Japanese with Englishabstract)
Palomera I, Olivar MP, Salat J, Sabatés A, Coll M, García A,Morales-Nin B (2007) Small pelagic fish in the NWMediterranean Sea: an ecological review. Prog Oceanogr74: 377−396
Persson L (1979) The effects of temperature and differentfood organisms on the rate of gastric evacuation in perch(Perca fluviatilis). Freshw Biol 9: 99−104
Plounevez S, Champalbert G (2000) Diet, feeding behaviourand trophic activity of the anchovy (Engraulis encrasico-lus L.) in the Gulf of Lions (Mediterranean Sea). OceanolActa 23: 175−192
Politikos D, Triantafyllou GN, Petihakis G, Tsiaras K,Somarakis S, Ito SI, Megrey BA (2011) Application of abioenergetics growth model for European anchovy(Engraulis encrasicolus) linked with a lower trophic levelecosystem model. Hydrobiologia 670: 141−163
R Development Core Team (2009) R: a language and envi-ronment for statistical computing. R Foundation for Sta-tistical Computing, Vienna
Richter H, Lückstädt C, Schlechtriem C, Focken U, Becker K(2002) Evidence of violation of a basic assumption inmodels currently used for food consumption estimationin fish. Arch Fish Mar Res 49: 171−188
Somarakis S, Ganias K, Tserpes G, Koutsikopoulos C (2004a)Ovarian allometry and the use of the gonosomatic index: a case study in the Mediterranean sardine, Sardinapilchardus. Mar Biol 146: 181−189
Somarakis S, Palomera I, Garcia A, Quintanilla L, Koutsiko -poulos C, Uriarte A, Motos L (2004b) Daily egg produc-

Mar Ecol Prog Ser 437: 215–228, 2011228
tion of anchovy in European waters. ICES J Mar Sci 61: 944−958
Somarakis S, Tsianis D, Machias A, Stergiou KI (2006) Anoverview of biological data related to anchovy and sar-dine stocks in Greek waters. In: Palomares MLP, Ster-giou KI, Pauly D (eds) Fishes in databases and ecosys-tems. Fisheries Centre Reports 14, Fisheries Centre,University of British Columbia, Vancouver, p 56−64
Somarakis S, Schismenou E, Siapatis A, Giannoulaki M,Kallianiotis A, Machias A (in press) (2011) High variabil-ity in the daily egg production method parameters of aneastern Mediterranean anchovy stock: influence of envi-ronmental factors; fish condition and population density.Fish Res. doi: 10.1016/j.fishres.2010.11.027
Temming A, Herrmann JP (2001) Gastric evacuation inhorse mackerel. I. The effects of meal size, temperatureand predator weight. J Fish Biol 58: 1230−1245
Tsagarakis K, Coll M, Giannoulaki M, Somarakis S, Papa-constantinou C, Machias A (2010) Food-web traits of theNorth Aegean Sea ecosystem (eastern Mediterranean)and comparison with other Mediterranean ecosystems.Estuar Coast Shelf Sci 88: 233−248
Tudela S, Palomera I (1995) Diel feeding intensity and dailyration in the anchovy Engraulis encrasicolus in the north-west Mediterranean Sea during the spawning period.Mar Ecol Prog Ser 129: 55−61
Tudela S, Palomera I (1997) Trophic ecology of the Europeananchovy Engraulis encrasicolus in the Catalan Sea (north-west Mediterranean). Mar Ecol Prog Ser 160: 121−134
van der Lingen CD (1994) Effect of particle size and con -centration on the feeding behaviour of adult pilchard,
Sardinops sagax. Mar Ecol Prog Ser 109: 1−13van der Lingen CD (1998) Gastric evacuation, feeding peri-
odicity and daily ration of sardine Sardinops sagax in thesouthern Benguela upwelling ecosystem. S Afr J Mar Sci19: 305−316
van der Lingen CD, Fréon P, Fairweather TP, van der West-huizen JJ (2006) Density-dependent changes in repro-ductive parameters and condition of southern Benguelasardine Sardinops sagax. Afr J Mar Sci 28: 625−636
van der Lingen CD, Bertrand A, Bode A, Brodeur R and others (2009) Trophic dynamics. In: Checkley DM, AlheitJ, Oozeki Y, Roy C (eds) Climate change and smallpelagic fish. Cambridge University Press, Cambridge
Venables WN, Ripley BD (2002) Modern applied statisticswith S, 4th edn. Springer, New York, NY
Vu<etic T (1955) Contribution à la connaissance des habitudesalimentaires de la sardine adulte (Sardina pilchardusWalb.) dans l’Adriatique moyenne. Acta Adriat 7: 3−15
Watanabe Y, Saito H (1998) Feeding and growth of earlyjuvenile Japanese sardines in the Pacific waters off cen-tral Japan. J Fish Biol 52: 519−533
Wilson MT, Brodeur RD, Hinckley S (1996) Distribution andabundance of age-0 walleye pollock, Theragra chalco -gramma, in the western Gulf of Alaska during Septem-ber 1990. NOAA Tech Rep 126: 11−24
Worobec MN (1984) Field estimates of the daily ration ofwinter flounder, Pseudopleuronectes arnericanus (Wal-baum) in a southern New England salt pond. J Exp MarBiol Ecol 77: 183−196
Zar JH (1999) Biostatistical analysis, 4th edn. Prentice Hall,Engelwood Cliffs, NJ
Editorial responsibility: Konstantinos Stergiou, Thessaloniki, Greece
Submitted: March 24, 2011; Accepted: June 18, 2011Proofs received from author(s): August 27, 2011
Copyright © 2022 FDOKUMEN