DIANA-miTED: a microRNA tissue expression database
7
Published online 1 September 2021 Nucleic Acids Research, 2022, Vol. 50, Database issue D1055–D1061 https://doi.org/10.1093/nar/gkab733 DIANA-miTED: a microRNA tissue expression database Ioannis Kavakiotis 1,* , Athanasios Alexiou 1,2 , Spyros Tastsoglou 1,2 , Ioannis S. Vlachos 3,4,5 and Artemis G. Hatzigeorgiou 1,2,* 1 DIANA-Lab, Dept. of Computer Science and Biomedical Informatics, Univ. of Thessaly, 35131 Lamia, Greece, 2 Hellenic Pasteur Institute, 11521 Athens, Greece, 3 Cancer Research Institute | Harvard Medical School Initiative for RNA Medicine, Department of Pathology, Beth Israel Deaconess Medical Center, Boston, MA, USA, 4 Harvard Medical School, Boston, MA, USA and 5 Broad Institute of MIT and Harvard, Cambridge, MA, USA Received July 13, 2021; Editorial Decision August 6, 2021; Accepted August 27, 2021 ABSTRACT microRNAs (miRNAs) are short (∼23nt) single- stranded non-coding RNAs that act as potent post- transcriptional gene expression regulators. Informa- tion about miRNA expression and distribution across cell types and tissues is crucial to the understanding of their function and for their translational use as biomarkers or therapeutic targets. DIANA-miTED is the most comprehensive and systematic collection of miRNA expression values derived from the analy- sis of 15 183 raw human small RNA-Seq (sRNA-Seq) datasets from the Sequence Read Archive (SRA) and The Cancer Genome Atlas (TCGA). Metadata quality maximizes the utility of expression atlases, therefore we manually curated SRA and TCGA-derived infor- mation to deliver a comprehensive and standardized set, incorporating in total 199 tissues, 82 anatomical sublocations, 267 cell lines and 261 diseases. miTED offers rich instant visualizations of the expression and sample distributions of requested data across variables, as well as study-wide diagrams and graphs enabling efficient content exploration. Queries also generate links towards state-of-the-art miRNA func- tional resources, deeming miTED an ideal starting point for expression retrieval, exploration, compar- ison, and downstream analysis, without requiring bioinformatics support or expertise. DIANA-miTED is freely available at http://www.microrna.gr/mited. INTRODUCTION microRNAs (miRNAs) are abundant regulatory RNAs that primarily guide the cleavage, degradation, and/or transla- tional repression of their target transcripts (1). Suppression of gene expression at the post-transcriptional level is by and large attributed to miRNA function (2). To this end, the accurate cataloguing of their abundance across tissues and cell types is an indispensable tool towards the understand- ing of gene regulation and dysregulation in physiological and pathological conditions. Equally importantly, altered miRNA levels in tissues and biofluids between disease and healthy states, or within the course of a disease, can dis- criminate conditions or correlate with clinical phenotypes and outcomes, highlighting the diagnostic, prognostic, or predictive biomarker capabilities that specific miRNAs may carry (3,4). Initially, limited numbers of known miRNAs were be- ing quantified using low-yield methods, including North- ern blotting and quantitative reverse transcriptase PCR (RT-qPCR), as well as miRNA-tailored microarrays (5– 7). Advances in sequencing technologies (Next Generation Sequencing, NGS) greatly boosted data yields and pro- vided a means to massively quantify miRNAs and dis- cover novel ones (8). Currently, the state-of-the-art high throughput method to derive miRNA abundance estimates is small RNA sequencing (sRNA-Seq). Thousands of pub- licly available sRNA-Seq datasets have been deposited in raw or count format in repositories such as the Sequence Read Archive (SRA) (9) and Gene Expression Omnibus (GEO) (10), while large consortia such as The Cancer Genome Atlas (TCGA) have also generated vast datasets capturing miRNA abundance in thousands of patient samples (11). Creating a comprehensive and consistent human atlas of miRNA expression is a challenging task, since (i) avail- able datasets are provided for retrieval at various analysis levels (e.g. raw FASTQ files, count-level estimates, normal- ized expression values), they have been produced utilizing (ii) variable miRNA annotation sources and versions, as well as (iii) distinct quantification pipelines and algorithmic choices (11–14). Moreover, public repositories and individ- ual submitters annotate sample- and study-specific meta- * To whom correspondence should be addressed. Tel: +30 24210 74758; Fax: +30 24210 74997; Email: [email protected] Correspondence may also be addressed to Ioannis Kavakiotis. Tel: +30 24210 74758; Fax: +30 24210 74997; Email: [email protected] C The Author(s) 2021. Published by Oxford University Press on behalf of Nucleic Acids Research. This is an Open Access article distributed under the terms of the Creative Commons Attribution-NonCommercial License (http://creativecommons.org/licenses/by-nc/4.0/), which permits non-commercial re-use, distribution, and reproduction in any medium, provided the original work is properly cited. For commercial re-use, please contact [email protected] Downloaded from https://academic.oup.com/nar/article/50/D1/D1055/6362088 by guest on 28 May 2022
-
Upload
khangminh22 -
Category
Documents
-
view
1 -
download
0
Transcript of DIANA-miTED: a microRNA tissue expression database

Published online 1 September 2021 Nucleic Acids Research, 2022, Vol. 50, Database issue D1055–D1061https://doi.org/10.1093/nar/gkab733
DIANA-miTED: a microRNA tissue expressiondatabaseIoannis Kavakiotis1,*, Athanasios Alexiou1,2, Spyros Tastsoglou1,2, Ioannis S. Vlachos3,4,5
and Artemis G. Hatzigeorgiou 1,2,*
1DIANA-Lab, Dept. of Computer Science and Biomedical Informatics, Univ. of Thessaly, 35131 Lamia, Greece,2Hellenic Pasteur Institute, 11521 Athens, Greece, 3Cancer Research Institute | Harvard Medical School Initiative forRNA Medicine, Department of Pathology, Beth Israel Deaconess Medical Center, Boston, MA, USA, 4HarvardMedical School, Boston, MA, USA and 5Broad Institute of MIT and Harvard, Cambridge, MA, USA
Received July 13, 2021; Editorial Decision August 6, 2021; Accepted August 27, 2021
ABSTRACT
microRNAs (miRNAs) are short (∼23nt) single-stranded non-coding RNAs that act as potent post-transcriptional gene expression regulators. Informa-tion about miRNA expression and distribution acrosscell types and tissues is crucial to the understandingof their function and for their translational use asbiomarkers or therapeutic targets. DIANA-miTED isthe most comprehensive and systematic collectionof miRNA expression values derived from the analy-sis of 15 183 raw human small RNA-Seq (sRNA-Seq)datasets from the Sequence Read Archive (SRA) andThe Cancer Genome Atlas (TCGA). Metadata qualitymaximizes the utility of expression atlases, thereforewe manually curated SRA and TCGA-derived infor-mation to deliver a comprehensive and standardizedset, incorporating in total 199 tissues, 82 anatomicalsublocations, 267 cell lines and 261 diseases. miTEDoffers rich instant visualizations of the expressionand sample distributions of requested data acrossvariables, as well as study-wide diagrams and graphsenabling efficient content exploration. Queries alsogenerate links towards state-of-the-art miRNA func-tional resources, deeming miTED an ideal startingpoint for expression retrieval, exploration, compar-ison, and downstream analysis, without requiringbioinformatics support or expertise. DIANA-miTEDis freely available at http://www.microrna.gr/mited.
INTRODUCTION
microRNAs (miRNAs) are abundant regulatory RNAs thatprimarily guide the cleavage, degradation, and/or transla-tional repression of their target transcripts (1). Suppressionof gene expression at the post-transcriptional level is by and
large attributed to miRNA function (2). To this end, theaccurate cataloguing of their abundance across tissues andcell types is an indispensable tool towards the understand-ing of gene regulation and dysregulation in physiologicaland pathological conditions. Equally importantly, alteredmiRNA levels in tissues and biofluids between disease andhealthy states, or within the course of a disease, can dis-criminate conditions or correlate with clinical phenotypesand outcomes, highlighting the diagnostic, prognostic, orpredictive biomarker capabilities that specific miRNAs maycarry (3,4).
Initially, limited numbers of known miRNAs were be-ing quantified using low-yield methods, including North-ern blotting and quantitative reverse transcriptase PCR(RT-qPCR), as well as miRNA-tailored microarrays (5–7). Advances in sequencing technologies (Next GenerationSequencing, NGS) greatly boosted data yields and pro-vided a means to massively quantify miRNAs and dis-cover novel ones (8). Currently, the state-of-the-art highthroughput method to derive miRNA abundance estimatesis small RNA sequencing (sRNA-Seq). Thousands of pub-licly available sRNA-Seq datasets have been deposited inraw or count format in repositories such as the SequenceRead Archive (SRA) (9) and Gene Expression Omnibus(GEO) (10), while large consortia such as The CancerGenome Atlas (TCGA) have also generated vast datasetscapturing miRNA abundance in thousands of patientsamples (11).
Creating a comprehensive and consistent human atlasof miRNA expression is a challenging task, since (i) avail-able datasets are provided for retrieval at various analysislevels (e.g. raw FASTQ files, count-level estimates, normal-ized expression values), they have been produced utilizing(ii) variable miRNA annotation sources and versions, aswell as (iii) distinct quantification pipelines and algorithmicchoices (11–14). Moreover, public repositories and individ-ual submitters annotate sample- and study-specific meta-
*To whom correspondence should be addressed. Tel: +30 24210 74758; Fax: +30 24210 74997; Email: [email protected] may also be addressed to Ioannis Kavakiotis. Tel: +30 24210 74758; Fax: +30 24210 74997; Email: [email protected]
C© The Author(s) 2021. Published by Oxford University Press on behalf of Nucleic Acids Research.This is an Open Access article distributed under the terms of the Creative Commons Attribution-NonCommercial License(http://creativecommons.org/licenses/by-nc/4.0/), which permits non-commercial re-use, distribution, and reproduction in any medium, provided the original workis properly cited. For commercial re-use, please contact [email protected]
Dow
nloaded from https://academ
ic.oup.com/nar/article/50/D
1/D1055/6362088 by guest on 28 M
ay 2022

D1056 Nucleic Acids Research, 2022, Vol. 50, Database issue
data in a minimally systematic manner, impeding the inte-gration of datasets from various sources into one uniformdatabase.
Cataloguing miRNA expression estimates, especially indisease, is a high value scientific endeavor with numer-ous potential applications in basic and translational re-search. Currently available implementations vary in scope,breadth, and functionality. miRmine (15), HMED (16)and DASHR2 (17), aim to capture a wide variety ofsample types and tissues, and comprise 304, 401 and802 datasets, respectively. miRmine allows single/multiplemiRNA queries and outputs sample-level RPM matricesfor cell lines or tissues. DASHR2 focuses on genomic lo-calization of small RNAs, provides information regard-ing their sequence and secondary structure (by RNAfold),and features a static expression table for each small RNA.YM500v3 (18) focuses only on cancer with samples solelyderived from TCGA. SEAWeb (19) is a web application of-fering various analyses, such as differential expression andclassification, allowing users to upload their results to com-pare against the database content. SEAWeb contains 4258datasets from 10 organisms (3360 human datasets). Finally,DeepBase v3.0 (20) divides data into two classes, namely‘Cancer data’ (from TCGA and ICGC) and ‘Tissue data’(500 datasets from SRA/GEO, GTEx, ENCODE). Impor-tantly, miRNA expression values collected in DeepBase re-fer to precursors or miRNA host genes, falling short onproviding abundance estimates of the functional maturemiRNA forms in every analysis type it provides. At the timeof writing, HMED and YM500v3 were not in a functionalstate.
Until today and as mentioned above, most availabledatabases either comprise a small number of datasets or fo-cus solely or almost solely on TCGA and this is mostly dueto practical reasons. TCGA is a rather uniform resource,while GEO/SRA studies are extremely diverse in terms oflibrary preparations, adapters utilized, and sample quality.DIANA-miTED comes to bridge this gap and enable re-searchers investigate miRNA expression across the widestvariety of libraries to date, as well as to perform simple orsophisticated analyses from a single resource. The capabili-ties and entries of all available databases are presented in Ta-ble 1, which captures the number of entries from each datasource, the fold-change increase of miTED against that spe-cific source, as well as the access to tools and downstreamanalyses provided from each resource. miTED not only isthe largest such database to date but it provides direct in-terconnections to the DIANA-tools cosmos, enabling re-searchers to perform target prediction, prioritization, andfunctional investigations from a single user interface.
To generate miTED, we performed pre-processing andanalysis of >15 000 sRNA-Seq datasets retrieved fromTCGA and SRA, utilizing DIANA-mAP analysis workflow(21). DIANA-mAP ensures fully automated A-to-Z uni-form analysis of sRNA-Seq datasets, from the raw file to theexpression estimates. Our results are presented in DIANA-miTED (miRNA Tissue Expression Database), an onlineatlas of miRNA expression in healthy and disease states(http://www.microrna.gr/mited). In miTED, users can re-trieve expression values for one or multiple miRNAs and/ortissues/cell lines, identify top expressed miRNAs, or top
tissues/cell lines where a miRNA of interest is expressed themost (Figure 1).
METHODS AND RESULTS
Data collection and curation
Raw sRNA-Seq datasets originated from two resources,namely NCBI-SRA (22) and the TCGA project (23). NCBI-SRA data were identified by selecting all entries with Li-brary Strategy and organism fields as ‘miRNA-Seq’ and‘Homo sapiens’, respectively, and retrieved locally. Onlydatasets comprising tissue or cell line information metadatawere included in the analysis. TCGA sRNA-Seq datasetswere retrieved using the GDC Data Transfer Tool, alongwith the respective transcriptomic metadata from the GDCdata portal (24), while all available sample and patientmetadata were retrieved. Only sRNA-seq TCGA datasetsannotated with both patient and transcriptomic metadatawere included in the study. The selected datasets were an-alyzed with the well-defined sRNA-Seq analysis workflowDIANA-mAP (21), following strict quality controls (de-scribed in Section ‘High-throughput data analysis’), result-ing in a collection of 4142 NCBI-SRA and 11 041 TCGAanalyzed datasets.
We manually curated both NCBI-SRA and TCGA-derived metadata information to deliver to users a coher-ent and standardized set. The resulting collection offers thefollowing metadata information. ‘Sample ID’ contains thesample’s identification code in SRA (e.g. SRR1774098) orTCGA (e.g. TCGA-P8-A5KD-11A-11R-A35M-13). ‘Col-lection’ holds the origin collection of the sample (SRA orTCGA). ‘Project ID’ contains the sample’s project identi-fication code in NCBI-SRA (e.g. PRJDB2675) or TCGA(e.g. TCGA-PCPG). All entries in miTED mandatorilycontain the aforementioned information. Moreover, eachentry must either feature ‘Tissue or organ of origin’ or ‘Cellline’ information. Depending on the initial metadata, thefollowing information is provided: ‘Tissue subregion’ refersto a more specific anatomical location of the ‘Tissue ororgan of origin’. ‘Disease’ contains information about thedisease, if available. Notably, disease meta-information hasbeen annotated even in healthy samples (control patients)from the same study or from control tissue regions derivedfrom the same patient (e.g. matched healthy and neoplastictissue from a cancer patient).
High-throughput data analysis
Data processing was performed using DIANA-mAP (v1.0)(21), which is a fully automated computational pipelinewith an emphasis to pre-processing, that allows users to per-form miRNA NGS data analysis from raw data up to quan-tification and differential expression in an easy, scalable, ef-ficient and intuitive way. The tool was developed in R andperformed the pre-processing, alignment and quantificationsteps on all samples included in miTED.
Pre-processing utilized the external tools FastQC(v0.11.7) (25), DNApi (v1.1) (26), and Cutadapt (v1.16)(27). Raw datasets were quality checked allowing a mini-mum Phred score of 10, adapters were inferred when notprovided and trimmed using an 18 bp minimum allowed
Dow
nloaded from https://academ
ic.oup.com/nar/article/50/D
1/D1055/6362088 by guest on 28 M
ay 2022

Nucleic Acids Research, 2022, Vol. 50, Database issue D1057
Table 1. Comparison of DIANA-miTED against existing resources cataloguing miRNA expression. Numbers of included datasets and their fold-difference compared to miTED, available expression units, version of miRBase and miRNA-relevant functionalities of each resource are presented. NAvalues correspond to cases in which accessing the resource or performing queries failed
ResourceIncludeddatasets
Fold-increasein miTED
Expressionunits
miRBaseversion miRNA-related functionalities
Links to tools andresources
miRmine 304 ∼50 RPM v21 Search by single/multiplemiRNAs. Bulk data download.
miRBase, NCBI-SRA
HMED 401 ∼38 RPM v20 NA NADASHR2 802 ∼19 Counts, RPM v19, v21 Search by single miRNA,
coordinates, or sequence.Tissue specificity and readcoverage information. Bulkdata download.
UCSC Genome Browser
YM500v3 ∼11 000 ∼1.38 NA v21 NA NASEAWeb 4258 ∼4.2 RPM v21 Search by single/multiple
miRNAs. Differentialexpression. Gene targets(miRTarBase). Diseaseassociations. Result download.
miRBase, GeneCards,GEO, PubMed, DiseaseOntology
DeepBase v3.0 ∼11 500 ∼1.31 RPM,log2(RPM)-mean
v22 Precursor-level miRNAexpression (collected RPMvalues). Expression heatmaps.Query by dataset selection.Bulk data download.
UCSC GenomeBrowser, PubMed
DIANA-miTED 15 183 - Counts, RPM,log2(RPM)
v22 Search by single/multiplemiRNAs and/orsingle/multiple tissues or celllines. Filter disease/healthy.Search for top expressedmiRNAs. Search for top sitesby miRNA abundance. Resultdownload.
DIANA-tools(microT-CDS, TarBase,LncBase, miRPath),miRBase
Figure 1. DIANA-miTED development workflow. Initially, human raw sRNA-Seq datasets were retrieved from NCBI-SRA and TCGA (alignment filesobtained from TCGA and converted back to FASTQ format). Raw datasets were uniformly subjected to pre-processing and quality control, alignmentand quantification. Read count, RPM and log2(RPM) values were calculated for miRBase miRNAs. Metadata from both resources were curated man-ually to create a comprehensive, standardized set of metadata annotations for the analyzed datasets. DIANA-miTED resource was developed utilizingMongoDB (noSQL database), PHP/Laravel for data access layer development, and Typescript/Angular for the application layer development. miTEDfeatures extensive query, filtering and visualization options and supports local retrieval of requested data.
Dow
nloaded from https://academ
ic.oup.com/nar/article/50/D
1/D1055/6362088 by guest on 28 M
ay 2022

D1058 Nucleic Acids Research, 2022, Vol. 50, Database issue
read length after trimming. Reads were subsequentlyaligned to the GRCh38 human genome assembly usingBowtie (v1.1.1) (28), allowing up to five multi-maps perread. Finally, the aligned reads were quantified throughmiRDeep2 (v0.0.8) (12), using the miRBase v22 hairpinand mature human miRNA forms (29), and allowingone mismatch on the precursor during alignment. Theremaining DIANA-mAP and external tools’ parameters,were set to their default values.
NCBI-SRA datasets were analyzed utilizing adapter in-formation derived from metadata when available, althoughsuch information was very scarce. sRNA-Seq datasets attimes exhibit especially low mapping rates and even lessthan half of the reads can be assigned to miRNAs, dueto sample contamination or some other biological expla-nation, yet quantification results can still be considered ro-bust (30). In our case, thousands of samples were analyzedin bulk and adapter information was missing in numerouscases. In order to avoid the inclusion of erroneous resultsdue to incorrect adapter inference, we opted to conserva-tively only include samples which had at least 50% of theirpre-processed reads assigned to known miRNAs. The sameparameters were used for the analysis of the TCGA datasets,resulting in an average 79.2% [76.6–81.9, 95% confidenceinterval] rate or pre-processed reads assigned to knownmiRNAs. Read counts and read per million (RPM) unitswere directly retrieved from DIANA-mAP results, whilelog2(RPM + 1) values were calculated specifically for visu-alization purposes. The addition of 1 across all RPM val-ues during log-transformation was performed to avoid un-defined values resulting from log-transforming zeros.
Database architecture and implementation
DIANA-miTED is a NoSQL database built using the MVCarchitecture and hosted on Apache HTTP server 2.4. Thedata access layer (back-end) consists of MongoDB (https://www.mongodb.com/) and the PHP framework Laravel8 (https://laravel.com/) (PHP 7.2), while the presentationlayer (front-end) is designed using Angular 9.1 (https://angular.io/) and the Angular Material UI library (https://material.angular.io/). miTED’s data are stored in NoSQLdatabase collections and Laravel handles the connection tothem for storing and/or retrieval. Finally, on the presen-tation layer, database statistics are presented using ChartJS (https://www.chartjs.org/) and Plotly JavaScript OpenSource Graphing Library (https://plotly.com/javascript/),while Flourish (https://flourish.studio/) is utilized for themore complex visualizations.
Database content
The analysis of >120 billion reads from 15 183 sRNA-seqdatasets, 4142 (27.3%) of which were retrieved from NCBI-SRA and 11 041 (72.7%) from TCGA, yielded >120 millionexpression values (120 978 144), as read counts, reads permillion (RPM), and log2(RPM). The database comprises 12400 datasets from disease samples from 261 human patholo-gies, as well as 1386 datasets from healthy samples. 14 146samples are derived from 199 tissues/organs and 1037 sam-ples from 267 cell lines. Sex ratio is balanced within miTED,
with 6751 female-, 6123 male-derived samples (2309 unan-notated entries).
miTED INTERFACE
Querying miTED. A friendly online graphical user inter-face was implemented to enable the users search, browse,but also meta-analyze this extensive collection withoutrequiring bioinformatics support or expertise. DIANA-miTED offers three main query pages, namely Multi-query,Top-miRNAs and Top-sites through the Querying DB topmenu. The Multi-query page offers the ability to explore andcompare the expression of specific miRNAs in tissues orcell lines. The Top-miRNAs page returns the top expressedmiRNAs in a specific tissue or cell line. Finally, the Top-sites page provides the tissues or cell lines where a specificquery miRNA is the most expressed. All generated resultsand plots can be downloaded without the need for login, ap-plication, or verification procedures, through the dedicateddownload buttons (both for data tables and plots).
In the Multi-query page, users can perform queries, re-trieve, and compare the expression of one or more (evenall) miRNAs in tissues or cell lines. The dedicated searchboxes allow free-text search and selection of specific tis-sues or cell lines and miRNAs (Figure 2A). The Multi-queryform gives the opportunity to restrict a search to specific dis-eases, include only results from SRA or TCGA data collec-tions, retrieve data depending on health status (i.e. ‘Healthy’or ‘Disease’), and choose the appropriate expression unitamong read counts, RPM and log2(RPM). Results are or-ganized into three distinct sections. (A) The first sectionis dedicated to visualizing the retrieved results. Groupedboxplots enable the comparison of miRNA abundance inspecific tissues/diseases (Figure 2C). Moreover, sample dis-tributions are explored through a Sankey diagram depict-ing Tissue–Disease relationships and pie charts for gender,collection and health status (Figure 2D). (B) The secondsection caters the interconnection of miTED results withrelated DIANA resources (tools and databases) for eachmiRNA. miTED provides for each input miRNA hyper-links towards DIANA-microT-CDS (31), a web server ofpredicted miRNA targets, DIANA-Tarbase v.8 (32) a refer-ence database of experimentally supported miRNA targets,DIANA-LncBase v.3 (33), a reference repository with ex-perimentally supported miRNA targets on long non-codingRNAs, and DIANA-miRPath v.3 (34), a web server ded-icated to the assessment of miRNA regulatory roles andthe identification of controlled pathways. (C) Finally, in thethird section, a data table with sample metadata as well asthe expression of the user requested miRNAs, as describedin Materials and Methods section, is provided (Figure 2B).
The Top-miRNAs page is the second query page inmiTED resource. Through this page users can search for thetop expressed miRNAs in a specific Tissue or Cell line. Thedisplayed results include a data table showing the expressionof all miRNAs in descending order and a bar chart depict-ing the top expressed miRNAs in the desired tissue or cellline.
Top-sites page is dedicated to retrieving Tissues or Celllines where a specific miRNA is the most abundant. Similarto the Top-miRNAs page, results include a table containing
Dow
nloaded from https://academ
ic.oup.com/nar/article/50/D
1/D1055/6362088 by guest on 28 M
ay 2022

Nucleic Acids Research, 2022, Vol. 50, Database issue D1059
Figure 2. Multi-query page interface. (A) Submission form. Users may search for one or more of 2656 miRNAs (1) and Tissues (2). Both miRNAsand Tissue query boxes support free text search. Through filtering options, users may restrict their query to specific Diseases (3), Collections (4) andHealth status (5). Via the Expression value drop-down menu (6), users can choose the desired expression unit that will be returned (read counts, RPM,log2(RPM)). (B) Results table. All entries compliant to the applied criteria are returned, along with their metadata and the expression values of the selectedmiRNAs. The results list can be customized to show 20, 50, 100, 150 and 200 items per page. A useful word-based filter, Filter-down results (7), has beenimplemented to narrow-down the returned entries and focus on these that contain a very specific term of interest. Users can retrieve the results of theirquery in tab-delimited format by clicking on the Download data button (8), without the need for any sign-up, application, or verification procedure. (C)Interactive boxplot showing the miRNA abundance distribution per tissue/organ. Users can select (9) which miRNAs are visible in the diagram offeringdirect comparison among miRNAs. On hover, (10) boxplots reveal the corresponding boxplot statistics (minimum, maximum, median, lower fence, firstquartile and third quartile). (D) Interactive Sankey diagrams enable visual inspection of the tissue-disease relationships of the query results. On hover, (11)users may explore in more detail the distribution of samples. (E) Pie charts offer visual representation of the distribution of samples across Gender (12),Health state (13) and Collection (14) variables.
Dow
nloaded from https://academ
ic.oup.com/nar/article/50/D
1/D1055/6362088 by guest on 28 M
ay 2022
D1060 Nucleic Acids Research, 2022, Vol. 50, Database issue
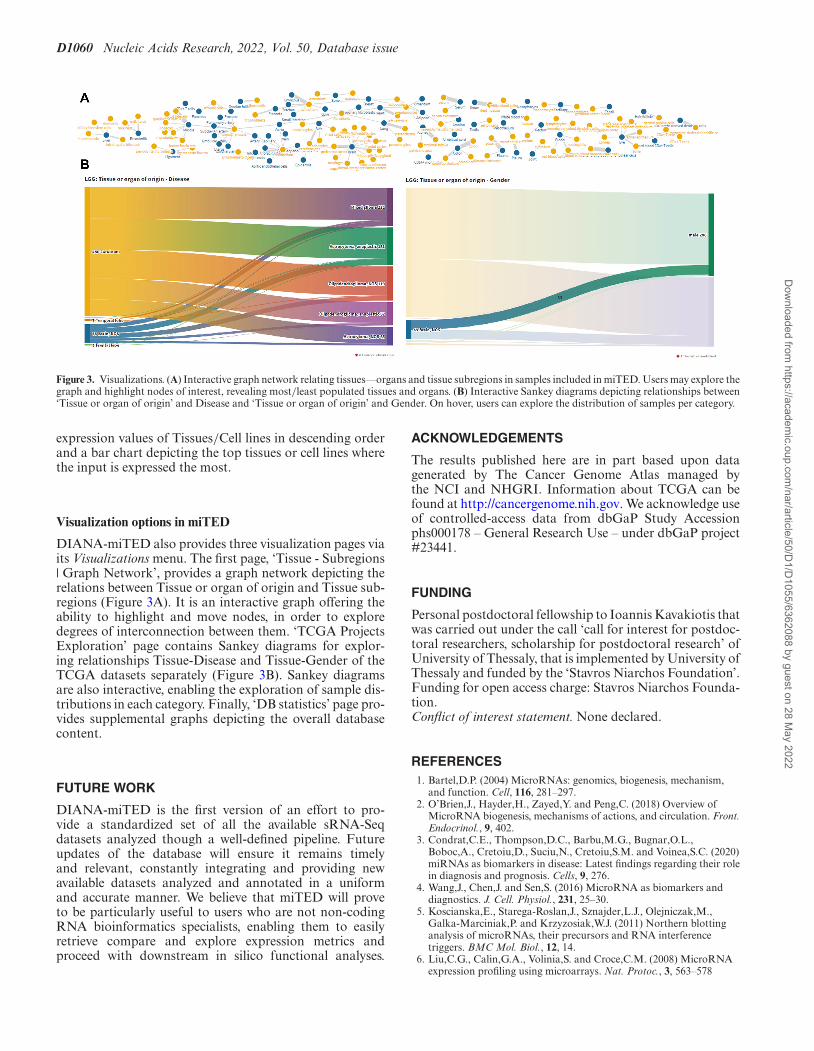
Figure 3. Visualizations. (A) Interactive graph network relating tissues––organs and tissue subregions in samples included in miTED. Users may explore thegraph and highlight nodes of interest, revealing most/least populated tissues and organs. (B) Interactive Sankey diagrams depicting relationships between‘Tissue or organ of origin’ and Disease and ‘Tissue or organ of origin’ and Gender. On hover, users can explore the distribution of samples per category.
expression values of Tissues/Cell lines in descending orderand a bar chart depicting the top tissues or cell lines wherethe input is expressed the most.
Visualization options in miTED
DIANA-miTED also provides three visualization pages viaits Visualizations menu. The first page, ‘Tissue - Subregions| Graph Network’, provides a graph network depicting therelations between Tissue or organ of origin and Tissue sub-regions (Figure 3A). It is an interactive graph offering theability to highlight and move nodes, in order to exploredegrees of interconnection between them. ‘TCGA ProjectsExploration’ page contains Sankey diagrams for explor-ing relationships Tissue-Disease and Tissue-Gender of theTCGA datasets separately (Figure 3B). Sankey diagramsare also interactive, enabling the exploration of sample dis-tributions in each category. Finally, ‘DB statistics’ page pro-vides supplemental graphs depicting the overall databasecontent.
FUTURE WORK
DIANA-miTED is the first version of an effort to pro-vide a standardized set of all the available sRNA-Seqdatasets analyzed though a well-defined pipeline. Futureupdates of the database will ensure it remains timelyand relevant, constantly integrating and providing newavailable datasets analyzed and annotated in a uniformand accurate manner. We believe that miTED will proveto be particularly useful to users who are not non-codingRNA bioinformatics specialists, enabling them to easilyretrieve compare and explore expression metrics andproceed with downstream in silico functional analyses.
ACKNOWLEDGEMENTS
The results published here are in part based upon datagenerated by The Cancer Genome Atlas managed bythe NCI and NHGRI. Information about TCGA can befound at http://cancergenome.nih.gov. We acknowledge useof controlled-access data from dbGaP Study Accessionphs000178 – General Research Use – under dbGaP project#23441.
FUNDING
Personal postdoctoral fellowship to Ioannis Kavakiotis thatwas carried out under the call ‘call for interest for postdoc-toral researchers, scholarship for postdoctoral research’ ofUniversity of Thessaly, that is implemented by University ofThessaly and funded by the ‘Stavros Niarchos Foundation’.Funding for open access charge: Stavros Niarchos Founda-tion.Conflict of interest statement. None declared.
REFERENCES1. Bartel,D.P. (2004) MicroRNAs: genomics, biogenesis, mechanism,
and function. Cell, 116, 281–297.2. O’Brien,J., Hayder,H., Zayed,Y. and Peng,C. (2018) Overview of
MicroRNA biogenesis, mechanisms of actions, and circulation. Front.Endocrinol., 9, 402.
3. Condrat,C.E., Thompson,D.C., Barbu,M.G., Bugnar,O.L.,Boboc,A., Cretoiu,D., Suciu,N., Cretoiu,S.M. and Voinea,S.C. (2020)miRNAs as biomarkers in disease: Latest findings regarding their rolein diagnosis and prognosis. Cells, 9, 276.
4. Wang,J., Chen,J. and Sen,S. (2016) MicroRNA as biomarkers anddiagnostics. J. Cell. Physiol., 231, 25–30.
5. Koscianska,E., Starega-Roslan,J., Sznajder,L.J., Olejniczak,M.,Galka-Marciniak,P. and Krzyzosiak,W.J. (2011) Northern blottinganalysis of microRNAs, their precursors and RNA interferencetriggers. BMC Mol. Biol., 12, 14.
6. Liu,C.G., Calin,G.A., Volinia,S. and Croce,C.M. (2008) MicroRNAexpression profiling using microarrays. Nat. Protoc., 3, 563–578
Dow
nloaded from https://academ
ic.oup.com/nar/article/50/D
1/D1055/6362088 by guest on 28 M
ay 2022

Nucleic Acids Research, 2022, Vol. 50, Database issue D1061
7. Chen,C., Tan,R., Wong,L., Fekete,R. and Halsey,J. (2011)Quantitation of microRNAs by real-time RT-qPCR. In: PCRProtocols. Humana Press, pp. 113–134.
8. Kozomara,A. and Griffiths-Jones,S. (2014) miRBase: annotatinghigh confidence microRNAs using deep sequencing data. NucleicAcids Res., 42, D68–D73.
9. Kodama,Y., Shumway,M., Leinonen,R. and InternationalNucleotide Sequence Database Collaboration (2012) The SequenceRead Archive: explosive growth of sequencing data. Nucleic AcidsRes., 40, D54–D56.
10. Clough,E. and Barrett,T. (2016) The Gene Expression OmnibusDatabase. Methods Mol. Biol., 1418, 93–110.
11. Chu,A., Robertson,G., Brooks,D., Mungall,A.J., Birol,I., Coope,R.,Ma,Y., Jones,S. and Marra,M.A. (2016) Large-scale profiling ofmicroRNAs for The Cancer Genome Atlas. Nucleic Acids Res., 44, e3.
12. Friedlander,M.R., Mackowiak,S.D., Li,N., Chen,W. andRajewsky,N. (2012) miRDeep2 accurately identifies known andhundreds of novel microRNA genes in seven animal clades. NucleicAcids Res., 40, 37–52.
13. Aparicio-Puerta,E., Lebron,R., Rueda,A., Gomez-Martın,C.,Giannoukakos,S., Jaspez,D., Medina,J.M., Zubkovic,A., Jurak,I.,Fromm,B. et al. (2019) sRNAbench and sRNAtoolbox 2019: intuitivefast small RNA profiling and differential expression. Nucleic AcidsRes., 47, W530–W535.
14. Rozowsky,J., Kitchen,R.R., Park,J.J., Galeev,T.R., Diao,J., Warrell,J.,Thistlethwaite,W., Subramanian,S.L., Milosavljevic,A. andGerstein,M. (2019) exceRpt: A comprehensive analytic platform forextracellular RNA profiling. Cell Syst., 8, 352–357.
15. Panwar,B., Omenn,G.S. and Guan,Y. (2017) miRmine: a database ofhuman miRNA expression profiles. Bioinformatics, 33, 1554–1560.
16. Gong,J., Wu,Y., Zhang,X., Liao,Y., Sibanda,V.L., Liu,W. andGuo,A.Y. (2014) Comprehensive analysis of human small RNAsequencing data provides insights into expression profiles andmiRNA editing. RNA biology, 11, 1375–1385.
17. Kuksa,P.P., Amlie-Wolf,A., Katanic,Z., Valladares,O., Wang,L.S. andLeung,Y.Y. (2019) DASHR 2.0: integrated database of human smallnon-coding RNA genes and mature products. Bioinformatics, 35,1033–1039.
18. Chung,I.F., Chang,S.J., Chen,C.Y., Liu,S.H., Li,C.Y., Chan,C.H.,Shih,C.C. and Cheng,W.C. (2017) YM500v3: a database for smallRNA sequencing in human cancer research. Nucleic Acids Res., 45,D925–D931.
19. Rahman,R.U., Liebhoff,A.M., Bansal,V., Fiosins,M., Rajput,A.,Sattar,A., Magruder,D.S., Madan,S., Sun,T., Gautam,A. et al. (2020)SEAweb: the small RNA Expression Atlas web application. NucleicAcids Res., 48, D204–D219.
20. Xie,F., Liu,S., Wang,J., Xuan,J., Zhang,X., Qu,L., Zheng,L. andYang,J. (2021) deepBase v3.0: expression atlas and interactiveanalysis of ncRNAs from thousands of deep-sequencing data. NucleicAcids Res., 49, D877–D883.
21. Alexiou,A., Zisis,D., Kavakiotis,I., Miliotis,M., Koussounadis,A.,Karagkouni,D. and Hatzigeorgiou,A.G. (2020) DIANA-mAP:analyzing miRNA from raw NGS data to quantification. Genes, 12,46.
22. Leinonen,R., Sugawara,H., Shumway,M. and InternationalNucleotide Sequence Database Collaboration (2011) The sequenceread archive. Nucleic Acids Res., 39, D19–D21.
23. Cancer Genome Atlas Research Network, Weinstein,J.N.,Collisson,E.A., Mills,G.B., Shaw,K.R., Ozenberger,B.A., Ellrott,K.,Shmulevich,I., Sander,C. and Stuart,J.M. (2013) The cancer genomeatlas pan-cancer analysis project. Nat. Genet., 45, 1113–1120.
24. Grossman,R.L., Heath,A.P., Ferretti,V., Varmus,H.E., Lowy,D.R.,Kibbe,W.A. and Staudt,L.M. (2016) Toward a shared vision forcancer genomic data. N. Engl. J. Med., 375, 1109–1112.
25. Andrews,S. (2010) In: FastQC: A Quality Control Tool for HighThroughput Sequence Data. Babraham Institute, Cambridge, UK.
26. Tsuji,J. and Weng,Z. (2016) DNApi: a de novo adapter predictionalgorithm for small RNA sequencing data. PLoS One, 11, e0164228.
27. Martin,M. (2011) Cutadapt removes adapter sequences fromhigh-throughput sequencing reads. EMBnet. journal, 17, 10–12
28. Langmead,B., Trapnell,C., Pop,M. and Salzberg,S.L. (2009) Ultrafastand memory-efficient alignment of short DNA sequences to thehuman genome. Genome Biol., 10, R25.
29. Kozomara,A., Birgaoanu,M. and Griffiths-Jones,S. (2019) miRBase:from microRNA sequences to function. Nucleic Acids Res., 47,D155–D162.
30. Tarallo,S., Ferrero,G., Gallo,G., Francavilla,A., Clerico,G., RealisLuc,A., Manghi,P., Thomas,A.M., Vineis,P., Segata,N. et al. (2019)Altered fecal small RNA profiles in colorectal cancer reflect gutmicrobiome composition in stool samples. mSystems, 4, e00289-19.
31. Paraskevopoulou,M.D., Georgakilas,G., Kostoulas,N., Vlachos,I.S.,Vergoulis,T., Reczko,M., Filippidis,C., Dalamagas,T. andHatzigeorgiou,A.G. (2013) DIANA-microT web server v5.0: serviceintegration into miRNA functional analysis workflows. Nucleic AcidsRes., 41, W169–W173.
32. Karagkouni,D., Paraskevopoulou,M.D., Chatzopoulos,S.,Vlachos,I.S., Tastsoglou,S., Kanellos,I., Papadimitriou,D.,Kavakiotis,I., Maniou,S., Skoufos,G. et al. (2018) DIANA-TarBasev8: a decade-long collection of experimentally supportedmiRNA-gene interactions. Nucleic Acids Res., 46, D239–D245.
33. Karagkouni,D., Paraskevopoulou,M.D., Tastsoglou,S., Skoufos,G.,Karavangeli,A., Pierros,V., Zacharopoulou,E. andHatzigeorgiou,A.G. (2020) DIANA-LncBase v3: indexingexperimentally supported miRNA targets on non-coding transcripts.Nucleic Acids Res., 48, D101–D110.
34. Vlachos,I.S., Zagganas,K., Paraskevopoulou,M.D., Georgakilas,G.,Karagkouni,D., Vergoulis,T., Dalamagas,T. and Hatzigeorgiou,A.G.(2015) DIANA-miRPath v3.0: deciphering microRNA function withexperimental support. Nucleic Acids Res., 43, W460–W466.
Dow
nloaded from https://academ
ic.oup.com/nar/article/50/D
1/D1055/6362088 by guest on 28 M
ay 2022