Multiscale analysis of heavy metal contents in Spanish agricultural topsoils
12
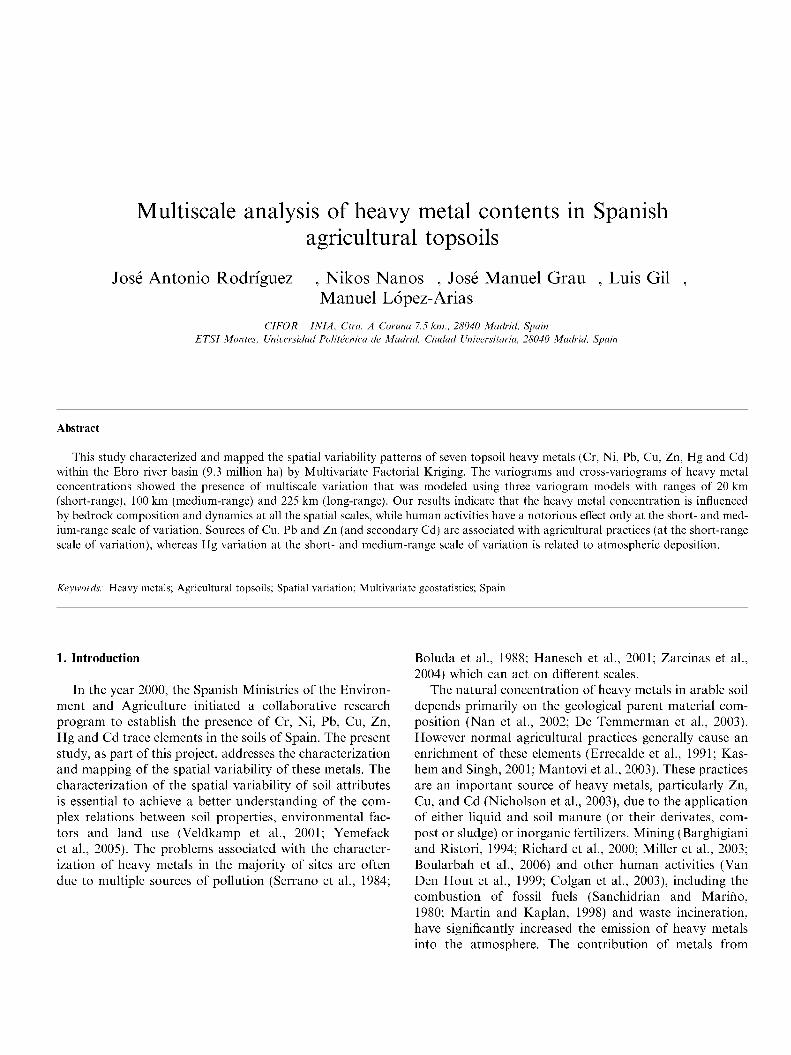
Multiscale analysis of heavy metal contents in Spanish agricultural topsoils Jose Antonio Rodriguez , Nikos Nanos , Jose Manuel Grau , Luis Gil , Manuel Lopez-Arias CIFOR - IN I A, Ctra. A Coruna 7.5 km., 28040 Madrid, Spain ETSI Monies, Universidad Politecnica de Madrid, Ciudad Universitaria, 28040 Madrid, Spain Abstract This study characterized and mapped the spatial variability patterns of seven topsoil heavy metals (Cr, Ni, Pb, Cu, Zn, Hg and Cd) within the Ebro river basin (9.3 million ha) by Multivariate Factorial Kriging. The variograms and cross-variograms of heavy metal concentrations showed the presence of multiscale variation that was modeled using three variogram models with ranges of 20 km (short-range), 100 km (medium-range) and 225 km (long-range). Our results indicate that the heavy metal concentration is influenced by bedrock composition and dynamics at all the spatial scales, while human activities have a notorious effect only at the short- and med- ium-range scale of variation. Sources of Cu, Pb and Zn (and secondary Cd) are associated with agricultural practices (at the short-range scale of variation), whereas Hg variation at the short- and medium-range scale of variation is related to atmospheric deposition. Keywords: Heavy metals; Agricultural topsoils; Spatial variation; Multivariate geostatistics; Spain 1. Introduction In the year 2000, the Spanish Ministries of the Environ- ment and Agriculture initiated a collaborative research program to establish the presence of Cr, Ni, Pb, Cu, Zn, Hg and Cd trace elements in the soils of Spain. The present study, as part of this project, addresses the characterization and mapping of the spatial variability of these metals. The characterization of the spatial variability of soil attributes is essential to achieve a better understanding of the com- plex relations between soil properties, environmental fac- tors and land use (Veldkamp et al., 2001; Yemefack et al., 2005). The problems associated with the character- ization of heavy metals in the majority of sites are often due to multiple sources of pollution (Serrano et al., 1984; Boluda et al., 1988; Hanesch et al., 2001; Zarcinas et al., 2004) which can act on different scales. The natural concentration of heavy metals in arable soil depends primarily on the geological parent material com- position (Nan et al., 2002; De Temmerman et al., 2003). However normal agricultural practices generally cause an enrichment of these elements (Errecalde et al., 1991; Kas- hem and Singh, 2001; Mantovi et al., 2003). These practices are an important source of heavy metals, particularly Zn, Cu, and Cd (Nicholson et al., 2003), due to the application of either liquid and soil manure (or their derivates, com- post or sludge) or inorganic fertilizers. Mining (Barghigiani and Ristori, 1994; Richard et al., 2000; Miller et al., 2003; Boularbah et al., 2006) and other human activities (Van Den Hout et al., 1999; Colgan et al., 2003), including the combustion of fossil fuels (Sanchidrian and Marino, 1980; Martin and Kaplan, 1998) and waste incineration, have significantly increased the emission of heavy metals into the atmosphere. The contribution of metals from
-
Upload
iberoamericana -
Category
Documents
-
view
4 -
download
0
Transcript of Multiscale analysis of heavy metal contents in Spanish agricultural topsoils
Multiscale analysis of heavy metal contents in Spanish agricultural topsoils
Jose Antonio Rodriguez , Nikos Nanos , Jose Manuel Grau , Luis Gil , Manuel Lopez-Arias
CIFOR - IN I A, Ctra. A Coruna 7.5 km., 28040 Madrid, Spain ETSI Monies, Universidad Politecnica de Madrid, Ciudad Universitaria, 28040 Madrid, Spain
Abstract
This study characterized and mapped the spatial variability patterns of seven topsoil heavy metals (Cr, Ni, Pb, Cu, Zn, Hg and Cd) within the Ebro river basin (9.3 million ha) by Multivariate Factorial Kriging. The variograms and cross-variograms of heavy metal concentrations showed the presence of multiscale variation that was modeled using three variogram models with ranges of 20 km (short-range), 100 km (medium-range) and 225 km (long-range). Our results indicate that the heavy metal concentration is influenced by bedrock composition and dynamics at all the spatial scales, while human activities have a notorious effect only at the short- and medium-range scale of variation. Sources of Cu, Pb and Zn (and secondary Cd) are associated with agricultural practices (at the short-range scale of variation), whereas Hg variation at the short- and medium-range scale of variation is related to atmospheric deposition.
Keywords: Heavy metals; Agricultural topsoils; Spatial variation; Multivariate geostatistics; Spain
1. Introduction
In the year 2000, the Spanish Ministries of the Environment and Agriculture initiated a collaborative research program to establish the presence of Cr, Ni, Pb, Cu, Zn, Hg and Cd trace elements in the soils of Spain. The present study, as part of this project, addresses the characterization and mapping of the spatial variability of these metals. The characterization of the spatial variability of soil attributes is essential to achieve a better understanding of the complex relations between soil properties, environmental factors and land use (Veldkamp et al., 2001; Yemefack et al., 2005). The problems associated with the characterization of heavy metals in the majority of sites are often due to multiple sources of pollution (Serrano et al., 1984;
Boluda et al., 1988; Hanesch et al., 2001; Zarcinas et al., 2004) which can act on different scales.
The natural concentration of heavy metals in arable soil depends primarily on the geological parent material composition (Nan et al., 2002; De Temmerman et al., 2003). However normal agricultural practices generally cause an enrichment of these elements (Errecalde et al., 1991; Kas-hem and Singh, 2001; Mantovi et al., 2003). These practices are an important source of heavy metals, particularly Zn, Cu, and Cd (Nicholson et al., 2003), due to the application of either liquid and soil manure (or their derivates, compost or sludge) or inorganic fertilizers. Mining (Barghigiani and Ristori, 1994; Richard et al., 2000; Miller et al., 2003; Boularbah et al., 2006) and other human activities (Van Den Hout et al., 1999; Colgan et al., 2003), including the combustion of fossil fuels (Sanchidrian and Marino, 1980; Martin and Kaplan, 1998) and waste incineration, have significantly increased the emission of heavy metals into the atmosphere. The contribution of metals from
anthropogenic sources in soils can be higher than the contribution from natural ones (Liu et al., 2005). Irrespectively of the origin of the source, heavy metals can produce negative effects on the quality of agricultural products (Ale-gria et al., 1991; Boluda et al., 1993; Gimeno-Garcia et al., 1996; Andreu and Boluda, 1995; Baranowska et al., 2005).
The present study extends the results of that by Rodriguez Martin et al. (2006) by analyzing the concentration of heavy metal correlations at multiple spatial scales. The objective is to analyze the spatial structure of the topsoil heavy metals content at multiple scales of variation and infer (indirectly) the factors involved (soil parent material, agricultural practices and human pollution activities) that can influence their soil concentration. Our main hypothesis is that the geostatistical theory can provide a natural way to analyze and model multivariable correlations among metal concentrations on different scales of variation. Multivariate Factorial Kriging (MFK), initially presented by Matheron (1982), has proved to be a useful method in soil science and geology (Goovaerts, 1992). The basic idea behind this technique is that the spatial variation of multiple variables may be due to factors that act on different scales of variation. If this is true for a certain dataset, then a logical partition of the total variance of the data into two scales of variation or more, may reveal these factors. Essentially, MFK is a method that may assist the identification of those factors responsible for the observed spatial distribution of the studied variables by (i) partitioning the total variance and covariance of a series of variables into multiple scales of variation, and (ii) quantifying correlations on multiple scales.
2. Materials and methods
2.1. The study area
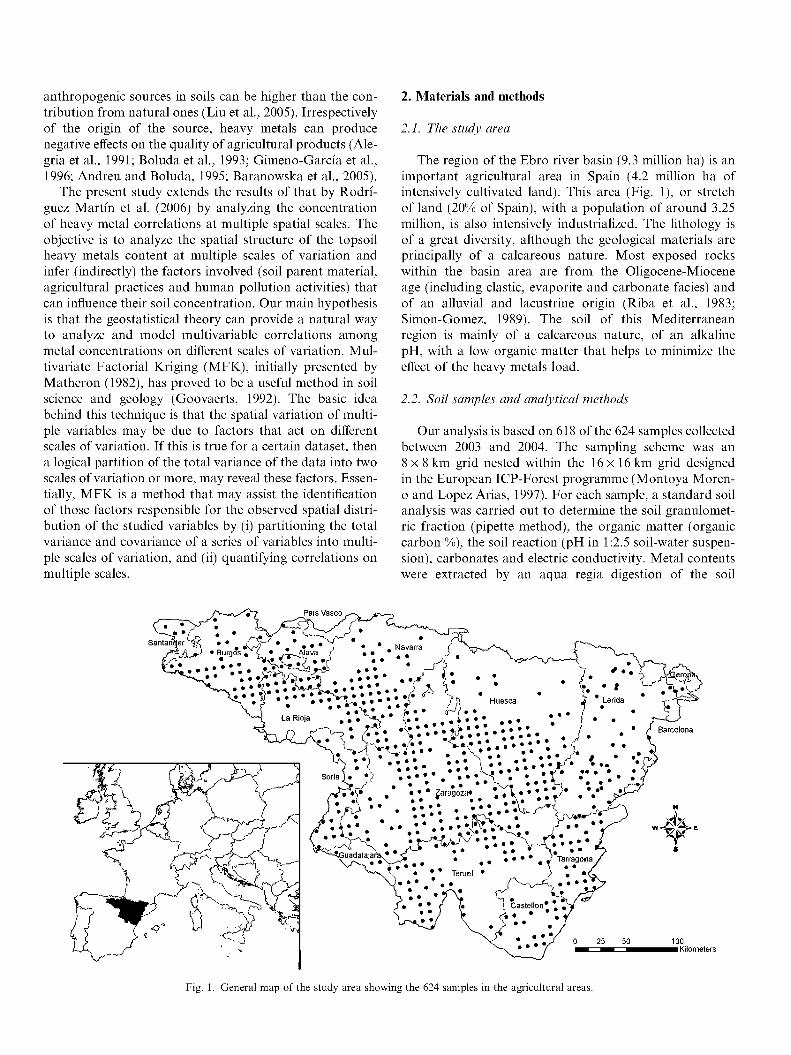
The region of the Ebro river basin (9.3 million ha) is an important agricultural area in Spain (4.2 million ha of intensively cultivated land). This area (Fig. 1), or stretch of land (20% of Spain), with a population of around 3.25 million, is also intensively industrialized. The lithology is of a great diversity, although the geological materials are principally of a calcareous nature. Most exposed rocks within the basin area are from the Oligocene-Miocene age (including clastic, evaporite and carbonate facies) and of an alluvial and lacustrine origin (Riba et al., 1983; Simon-Gomez, 1989). The soil of this Mediterranean region is mainly of a calcareous nature, of an alkaline pH, with a low organic matter that helps to minimize the effect of the heavy metals load.
2.2. Soil samples and analytical methods
Our analysis is based on 618 of the 624 samples collected between 2003 and 2004. The sampling scheme was an 8 x 8 km grid nested within the 16x16 km grid designed in the European ICP-Forest programme (Montoya Moren-o and Lopez Arias, 1997). For each sample, a standard soil analysis was carried out to determine the soil granulomet-ric fraction (pipette method), the organic matter (organic carbon %), the soil reaction (pH in 1:2.5 soil-water suspension), carbonates and electric conductivity. Metal contents were extracted by an aqua regia digestion of the soil
\ * * . ^ f * • * • • • * j • * . Navarra f V s y V . P"^"*—-, 1 .Burgos. £ • „ ^ f e w f1 • * . • • J m ^ K s ^ ^ y ^ ^ A . ^ ^ A
* < , tS • • • • • * X i • • • * i 3 / f t Huesca 2 Lenda T " T ^
<j" 0
. » • • \, K • • • * . \«
. * * * . V Tarragona
L . • * * J
0 25 50
Fig. 1. General map of the study area showing the 624 samples in the agricultural areas.

fraction. Cr, Ni, Pb, Cu, Zn and Cd were determined by Optical Emission Spectrometry. Mercury was determined by the Cold Vapor Atomic Fluorescence Method (Perkin Elmer model 2100 with FIAS 100). The accuracy of the method was verified through an analysis of a calcareous loam soil CRM 141 R, standard reference material (Que-vauviller et al., 1996). Lopez-Arias and Rodriguez (2005) have further detailed the sampling and analytical methods.
2.3. Soil properties and heavy metal contents
The soil in the area is predominately basic (the pH of 50% of samples is >8.2) and is due to the high percentage of carbonate material present (Table 1). The samples (predominately agricultural) presented a low organic matter content (average 2.20%). A high pH and a low organic matter content are the two typical characteristics which define the general make-up of Spanish Mediterranean soils. Table 1 summarizes the statistics of some soil properties and the seven heavy metals studied. The heavy metal concentrations for the analyzed samples did not show signs of significant soil contamination despite the intensive agricultural and industrial activities within the study area. Only six samples presented clear symptoms of pollution. These values were discarded after the outlier identification, and after the distribution analysis for the purpose of obtaining a distribution of each metal which was not distorted by the extreme values in the spatial analysis. As expected, soil characteristics and granulometric fractions were related to heavy metal concentrations (Rodriguez Martin et al., 2006).
2.4. Statistical and geostatistical analysis
MFK was the main tool used in the analysis (Matheron, 1982; Goovaerts, 1992; Wackernagel, 1998; Chiles and Del-finer, 1999). Experimental auto- and cross-variograms were computed using ISATIS (ISATIS, 2001).
Table 1 Statistical summary of some soil properties and metal concentrations (in mg kg"1 for Cr, Ni, Pb, Cu, Zn, Cd and ug kg"1 for Hg)
pH S.O.M CaC0 3
E C . Sand (%) Clay (%) Silt (%)
Cr Ni Pb Cu Zn Hg Cd
Mean
8 2.2
30 0.59
38.6 22.1 39.4
20 19 17 17 57 34 0.41
S.D.
1.4 16 0.85
17.1 8.7
13.1
12 9 8
12 24 39 0.16
Median
8 2
31 0.27
38 21 39
18 18 15 13 55 27
0.40
Min.
5 0.2 0 0.02 3.9 1.7 2.0
<0.1 2 4 2
11 1
<0.01
Max.
9 13 79
9 96 62 89
98 66 61
122 175 216
1.00
The Linear Model of Coregionalization (LMC) (Goovaerts, 1997; Wackernagel, 1998; Chiles and Delfiner, 1999) for the set of analyzed variables (p) was used for modeling the experimental auto- and cross-variograms. The LMC is a set of auto- and cross-variogram models in which all its variograms are linear combinations of the same set of elementary structures. An LMC with k- 1,.. .,q structures may be written as:
yy(h) = bfg^ + b®gW(h) + •••+ b®g®(h) Vi,j (1)
where yy(h) is the variogram model for variables i and/ (the auto-variogram is obtained for i —J), b}y is the partial sill for the ijth variogram for structure k, while g^(h) represents the type of variogram model (i.e. exponential, spherical, etc.) for structure k. The first structure g(1) represents the nugget effect model.
Using the LMC in Eq. (1), the problem of fitting a total ofp(p—l)/2 variogram models to their experimental counterparts is reduced to the problem of deciding the total number (q) of structures to use, as well as the type (i.e. spherical, exponential, etc.) of each structure. The decision on the number of structures to use for modeling was performed upon the basis of the experimental variograms of the seven heavy metal concentrations (previously standardized to unit variance and zero mean), as well as on the knowledge of the main geological and anthropogenic factors that may affect the spatial distribution of these concentrations.
Once the number of structures and their range of spatial correlation were decided, we used ISATIS (ISATIS, 2001) to fit the LMC. In practice, LMC fitting means adjusting the coefficients b}y of (1) in such a way that variogram models fit their experimental counterparts. ISATIS uses the algorithm presented by Goulard and Voltz (1992) for multiple-variogram fitting. This algorithm minimizes a least squares criterion under the constraint that the coregionalization matrix for all the structures used in the LMC are positive semi-definite (see Goulard and Voltz (1992) or Wackernagel (1998) for details). A coregionalization matrix for structure k is essentially a positive semi-definite symmetric (p xp) matrix with diagonal and off-diagonal elements the partial sill of the auto- and cross variogram models, respectively, obtained form the LMC fitting:
Bt
L( * )
' l l
b(k) pp
(2)
S.O.M: Soil organic matter (%). CaC03: Carbonates (%). E.C.: Soil electrical conductivity (dS/m). S.D: Standard deviation.
A separate principal component analysis (PCA) conducted for each coregionalization matrix provided a set of transformation coefficients which were subsequently used in a cokriging system to compute new composite regionalized variables, called regionalized factors. For each matrix Bk
we retained only the first two regionalized factors, which accounted for most of the dispersion in the data (trace ofBk).

A regionalized factor is a model-derived unobserved spatial variable specific to the kth spatial scale (note that hereafter the term scale or spatial scale with be used instead of structure), resulting by a decomposition of the original variables. The relative importance of each of the original variables in the composition of a regionalized factor should be interpreted if possible (as in classical PCA), taking into account the spatial scale of the analysis.
In order to facilitate this interpretation we used:
(i) the eigenvalues and the eigenvectors of the regionalized factors for each coregionalization matrix
(ii) the correlation coefficient between the extracted regionalized factors and the initial variables. Furthermore, the pair of correlation coefficients between the first two regionalized factors and the heavy metal concentrations was presented in a circle of correlation (Saporta, 1990).
(iii) the structural correlation coefficients (Goovaerts, 1997):
which is a unit-free measure of correlation among variables i and j , reflecting variable associations only at the /rth spatial scale,
(iv) maps of the spatial components of each element, which were generated using univariate factorial kri-ging, (i.e. the univariate analogue of MFK see Goovaerts (1997)).
(v) the product-moment correlation coefficients between the estimated spatial components of each element and other soil physicochemical variables (such as pH, organic matter, etc.) measured in the sample plots.
3. Results and discussion
The experimental variograms for the concentration of the seven topsoil elements (Fig. 2) indicate that spatial correlation is present at multiple spatial scales. Three elements (Ni, Zn and Cd) present three scales of variation: local (20 km approximately), intermediate (100 km) and regional (more than 200 km) scales. Three elements show a variation only at the local-regional (Cu and Pb) or intermediate-regional scales (Cr). Finally, the variogram of Hg indicates variation at a regional scale, and also a variation at an intermediate scale between 20 km and 100 km (approximately 50 km).
Based on the observed experimental variograms and the size of various lithology-type polygons, we decided to adopt an LMC composed of 3 basic structures (apart from the nugget-effect model):
yy(h) = bfg, + b$ SPHERE) + bfSFHERm(h)
+ b*;?SPHERm(h) (4)
where g0 and SPHER represent the nugget and the spherical variogram model, respectively (the range of the spherical model is indicated by its subscript). The fitted LMC is presented graphically in Figs. 2 and 3. The structural correlation coefficients resulting from this model are frequently positive (Table 2), indicating positive correlations among elements, with the exception of Cd that presents negative correlations with all the other elements at the larger scale of variation (220 km).
3.1. Within-plot variability
A PCA based on the classical variance-covariance matrix, as conducted in Rodriguez Martin et al. (2006) in the same area, revealed that Cr and Ni contents were controlled by parent material, while Cd, Cu, Hg, Pb and Zn soil concentrations indicated a mixed source from both a lithogenic and anthropogenic origin (mainly related to agronomic practices) that could not be interpreted clearly enough. According to several studies (Davies, 1997; Romic and Romic, 2003; Mico et al., 2006), the association of heavy metals with the factors in a PCA can indicate the hypothetical sources of these elements (lithogenic, anthropogenic, or mixed), although it is difficult, in some occasions, to differentiate the effect of each of these factors on the soil. The regionalized multivariate analysis presented in this paper extends previous results by conducting the factor analyses at the spatial scale at which they operate.
3.2. Short-range spatial variability
Two regionalized factors accounted for 63% of the total variance at this spatial scale (Table 3). Cu, Zn, Pb and Cd have a greater loading on Fl (Fig. 4a), and their concentration can be ascribed to anthropic input, primarily related to agronomic practises. Agricultural treatments, such as the use of fertilizers (commercial fertilizer, manure, sewage sludge), pesticides and fungicides, substantially increase the soil metals load in agricultural soils. These agricultural practices which influence the concentration of heavy metals in the soil were limited to a short-range effect. The application of liquid and solid manure, or their derivatives, i.e., compost (Breslin, 1999) or sludge (Doelsch et al., 2006), and contaminated organic waste (Tichy et al., 1997), in which some metals can be particularly concentrated (Webber, 1981), are considered an important sources that elevate the concentration of these metals in soils. In particular, copper and zinc (Mantovi et al., 2003) together with the use of Cu-based pesticides over the years through the use of copper sulfate in conventional viticulture, present a risk for crops since more than 70% of copper is specifically adsorbed (Atanassova, 1999). Zinc and cadmium concentrations increase through the use of fertilizers, but also owing to the proximity to a metal-working industry (Lin, 2002; Azimi et al., 2005). Motor traffic is another anthropic factor that has an influence on this scale, mainly on the zinc and lead contents (Bloemen et al., 1995). Although this

0 SOQOO 1OO0OO 150000 200000 m
Fig. 2. Direct experimental variograms and models for seven heavy metal concentrations.
influence is affected by traffic density and road age, it is predominantly limited to short road distances. Goovaerts (1997) also reflected a stronger relationship between lead and copper at a local scale as a consequence of common sources of man-made pollution over short distances.
The variability of Cr and Ni, associated with the second factor (Fig. 4a), suggests a lithogenic control on a local scale. Only the micro-sale components of Cr and Ni show a high correlation with the percentage of sand and clay (Table 4). It can be assumed therefore that there is strong

0 25
020
0 15
0 10
0.05
ooo
0.6O
m 0.20
0.1B
0.15-
0.11 -
012
0 10
0 0 3 -
0.06
0.04
0.02-
ooa-
4
"^—J——* • +
* Cd-Cu
A
° fl 4
1
Cd-NI
ftW-
D.30
0 25
U Q <
0 15
D.10
0Q5
OOO
o / o
P ^ - T f f l
Cr-Cu
. o _ j _
030
0 2 5 -
0.20-
0.15-
010 -
0.05-
{h) OM
? « 0.20
O.IB -
0.1ft* 0.14-
0.12
ft I P -
0 03
006 -
0.04
0.02 •
(h) *•«>.
m 0.60-
Cd-Pb
• ( ' • )
Cr-Hg
IHXOO SUOM sane nxrao _ isooo maooo Man noaw _ isoooo SMuoo
Fig. 3. Experimental cross-variograms and models for the Linear Model of Corregionalization.

Table 2 Structural correlation coefficients among the analyzed elements at different scales of variation
20 km
100 km
220 km
Cd Cr Cu Hg Ni Pb Zn
Cd Cr Cu Hg Ni Pb Zn
Cd Cr Cu Hg Ni Pb Zn
Cd
1.00 0.02 0.50 0.07
-0.02 0.17 0.55
1.00 0.95 0.94 0.04 0.82 0.96 0.99
1.00 -0.64 -0.26 -0.04 -0.12 -0.38 -0.07
Cr
1.00 -0.25 -0.28
0.42 0.25 0.08
1.00 0.98 0.33 0.96 1.00 0.91
1.00 0.65 0.24 0.42 0.48 0.27
Cu
1.00 0.22 0.27 0.43 0.93
1.00 0.28 0.92 0.99 0.90
1.00 0.54 0.53 0.60 0.60
Hg
1.00 0.03 0.41 0.24
1.00 0.59 0.28
-0.08
1.00 0.20 0.40 0.29
Ni
1.00 0.46 0.31
1.00 0.94 0.75
1.00 0.49 0.92
Pb
1.00 0.54
1.00 0.93
1.00 0.69
Zn
1.00
1.00
1.00
Table 3 Percentage of explained variance in the PCA for each coregionalization matrix
Factor 1 Factor 2 Total
Short-range variation Medium range variation Long range variation
40 93 50
23 7
20
63 100 71
relationship with the mineralogical structure of the study area (low metal concentrations of Cr and Ni were found on sand wares and reach high values on quartzites and limestone). Cr and Ni are known to be geogenically influenced (Hanesch et al., 2001). Generally, anthropic inputs of Cr and Ni in fertilizers, limestone and manure are lower than the concentrations already present in the soil (Facchi-nelli et al., 2001). Therefore, other studies associated the variability of Cr and Ni in order to control by the soil parent rock. Facchinelli et al. (2001) in Piemonte (Italy) and
Briimelis et al. (2002) in Latvia also showed that Cr and Ni grouped, and results in Facchinelli presented a litho-genic control over the distribution of these metals. There might also be a geochemical relationship with the parent material (Hanesch et al., 2001). This is well-known, in particular in basic and ultramafic rock (Facchinelli et al., 2001), principally in plutonic rocks with a low proportion of silica and feldspars.
Hg seems to be an isolated element at both this spatial scale and at higher ones. Its distribution, which is independent of the other heavy metals, reveals man-made pollution, and should have a different source than Cu and Zn (see the Discussion in the next section).
3.3. Medium-range spatial variability
The first regionalized factor for this scale, accounting for 93% of the total variation (Table 3), was strongly and positively correlated with Cd, Cr, Cu, Ni, Pb and Zn (Fig. 4b). In addition, positive correlations were found between these element's estimated spatial components and the organic matter and clay content whereas negative correlations were noted with sand content (Table 4). Fig. 5 indicates a common variation for these six heavy metals at the medium range. The concentrations of these metals pointed to the bedrock influence. The magnitude of the variogram model at this scale (100 km), coincides with most of the common lithologies in the study area, which may influence the concentration of the analyzed elements in the soil. The spatial distribution of these metals showed a good correlation with the surface evidence of the mineralogical structure. The higher values were found on quartzites, silt gravels and gypsums, contrary to lower scores presented on claystones and marls. In other case studies, Briimelis et al. (2002) showed that Cd, Pb, Cu and Zn had high loadings on the first component, and Davies (1997) showed similar metals grouped (Cu, Pb and Zn) in the same factor and explained the results as arising from pedogenesis. Goovaerts (1997) suggested that the source of Cd, Cr, Cu, Ni, Pb and Zn is geochemical when studying their distribution at a regional scale (which matched the scale of the stratigraphy).
Cr
*
4a
Ni
' Cd z j \ • •
Pb, Cu
1 . H /
0 PC1
W o
f
i
\ 4 b
eb
i 0
PCI
W o
. . . - .Cd
/
4c
Ni" '-.
Hg
P b -Cu ;
Cr /
0 PC1
Fig. 4. Correlation circle for the 20 km (4a), 100 km (4b) and 220 km (4c) scales of variation.

Table 4 Product-moment correlation coefficients between elements' spatial components and other physicochemical variables
Scale Metal Soil parameters
Cd Cr Cu Hg Ni Pb Zn
Cd Cr Cu Hg Ni Pb Zn
Cd Cr Cu Hg Ni Pb Zn
pH
0.04 0.08
-0.06 -0.07 -0.03 -0.07 -0.04
0.09 0.08 0.08
-0.06 0.06 0.08 0.10
0.34 -0.19 -0.12 -0.13 -0.06 -0.29 -0.11
E C .
0.08 -0.04
0.09 0.05 0.05
-0.01 0.09
0.00 -0.01 -0.01 -0.04 -0.02 -0.01
0.00
0.20 -0.15 -0.12 -0.08
0.03 -0.14
0.01
S.O.M
0.16 0.06 0.10 0.07 0.04 0.16 0.15
0.21 0.22 0.22 0.06 0.22 0.22 0.21
-0.11 0.16 0.13 0.19 0.03 0.23 0.08
S.O.M: Soil organic matter (%). CaC03: Carbonates (%). E.C.: Soil elect:
In accordance to the previous scale of variation, mercury seems to be an isolated element in the regionalized-component's space. The mercury spatial variability at these spatial scales is related with atmospheric deposition. Mining and other human activities, including the combustion of fossil fuels, emissions from coal-burning power plants and industrial boilers, cement and lime kilns, petroleum refineries or landfills, and waste incineration, have significantly increased the emission of Hg into the atmosphere and are the factors responsible for the observed spatial distribution (Fig. 5). Nonetheless, the specific sources of mercury cannot be determined on the basis of data collected in this study. In general, Hg accumulations were associated with atmospheric deposition (Engle et al., 2005). Dreher and Follmer (2004) estimated that 70% to 80% of mercury currently emitted into the atmosphere is of an anthropogenic origin, as it around 50%> of anthropogenic Hg entering the global cycle (Liu et al., 2003). According to Alloway (1995), the annual anthropogenic release of Hg on a global basis was approximately 3 x 10⁶ kg around the year 1900, and had increased to about three times that amount by the seventies (around 45%> was emitted into the air and 48%o to the land). Mercury vapor resides for 0.5-2 years in the atmosphere, and may travel far from its sources. Nonetheless, Hg associated with ash and soot or mining may be efficiently removed by precipitation and deposited relatively close to the source (Miller et al., 2003).
3.4. Long-range spatial variability
Six of the seven elements (basically Zn, Ni, Pb, Cu, Cr and Hg to a smaller extent) are correlated at this scale,
CaC0 3
0.05 0.01
-0.13 -0.11 -0.18 -0.23 -0.14
0.01 -0.03 -0.03 -0.20 -0.08 -0.02
0.03
0.32 -0.25 -0.20 -0.12 -0.22 -0.37 -0.22
Sand (%)
-0.06 -0.18 -0.08
0.02 -0.21 -0.14 -0.14
-0.19 -0.19 -0.19 -0.03 -0.19 -0.19 -0.19
-0.06 -0.10 -0.08 -0.03 -0.22 -0.09 -0.19
Clay (%)
0.04 0.20 0.05 0.01 0.20 0.14 0.12
0.18 0.19 0.19 0.07 0.20 0.19 0.17
-0.15 0.21 0.08 0.02 0.08 0.07 0.02
Silt (%)
0.05 0.11 0.07
-0.02 0.13 0.09 0.11
0.13 0.12 0.12
-0.01 0.11 0.13 0.13
0.18 -0.01
0.05 0.02 0.23 0.08 0.22
conductivity (dS/m).
while Cd seems to be an isolated element (Fig. 4c). This fact is also reflected in the correlation coefficients among the estimated spatial components of the studied elements and other soil variables. Only cadmium show a positive correlation with pH and carbonate contents (Table 4). Nevertheless, most of the metals tend to be available in acid pH, with the exception of Cd that tends to accumulate in calcareous soils (Boluda et al., 1988). Cadmium is specifically adsorbed by crystalline and amorphous oxides of Al, Fe and Mn. Metallic (copper, lead and zinc) and especially alkaline earth (calcium and magnesium) cations reduce Cd adsorption by competing for available specific adsorption and cation-exchange sites (Martin and Kaplan, 1998). Apart from the bedrock influence, anthropogenic activities may also increase Cd concentration in topsoils. However this assumption is not applicable in our case study since the highest Cd concentration was 1 mg kg - 1 , and the samples with a higher concentration were localized on limestone (average 0.502 mg kg - 1). Cd is considered to be a contaminant when values are higher than 3 mg kg - 1 (Gala et al., 1985), although contents above 0.5 mg kg - 1 can reflect the anthropogenic influence in the superficial horizon of soils (Errecalde et al., 1991). The spatial distribution of cadmium (Fig. 6) at this scale corresponded to the calcareous mineralogical surface.
4. Synthesis
The concentration of topsoil elements in the Ebro river basin is the result of complex interactions between human activities and natural processes. Multiscale geostatistical

Fig. 5. Spatial components (100 km scale of variation) for the seven heavy metal concentrations. Estimation of spatial components was performed by factorial kriging (univariate).
analysis has been essential to understand the heavy metals spatial relations. As expected, natural processes act at all spatial scales. The lithology is responsible for the concentration of Cr (and secondary Ni) in the topsoil on a short-range (20 km). At the medium scale of variation
(100 km), six out the seven elements are highly intercorre-lated and are also correlated with the organic matter content and soil granulometric fraction, suggesting that their mutual correlation is due to some pedogenic processes and the subsequent bedrock influence. Finally, the larger

<* -jVw**
Fig. 6. Spatial components (220 km scale of variation) for the seven heavy metal concentrations. Estimation of spatial components was performed by factorial kriging (univariate).
scale of variation (220 km) reflects the tendency of cadmium to accumulate in calcareous soils.
To date, man is acting at local spatial scales and is increasing the concentrations of Zn, Cu and Pb by using fertilizers, pesticides and fungicides related to agricultural
practises in the studied area, or at the local to medium spatial scales by increasing emissions of Hg into the atmosphere, which in turn is deposited into the topsoil (this phenomenon was particularly evident in the medium scale of variation). At any rate, human activities may increase

the content of heavy metals in the soil to reach levels that are considered to be hazardous. Although the geological conditions of the region (carbonated lithologies which give rise to a high pH) favor the fulfillment of the Directive for agricultural (86/278/EEC) on soils with pH>7, mainly for metals like Cu and Zn, their concentration in soil can increase due to an intensification of farming practices and may locally reach contaminating levels under other edaphic conditions. On the other hand, mercury cannot currently be considered contaminant, but it can constitute a risk in the near future due to increased industrial activity.
Acknowledgments
This study was supported by the Spanish Ministries of the Environment and Agricultural (MMA and MAPyA), project CC01-0013: "Research of heavy metal contents in agricultural soils of Spain". The work of Nikos Nanos was supported by the 'Ramon y Cajal' fellowship RYC-2004-001013. The authors would like express their gratitude to the MMA and MAPyA.
References
Alegria, A., Barbera, R., Boluda, R., Errecalde, F., Farre, R., Lagarda, M.J., 1991. Environmental cadmium, lead and nickel contamination: Possible relationship between soil and vegetable content. Fresen. J. Anal. Chem. 339, 654-657.
Alloway, B.J., 1995. Heavy Metals in Soils. Chapman and Hall, Glasgow, UK.
Andreu, V., Boluda, R., 1995. Application of contamination indexes on different farming soils. B. Environ. Contam. Toxicol. 54, 228-236.
Atanassova, R., 1999. Competitive effect of copper, zinc, cadmium and nickel on ion adsorption and desorption by soil clays. Water Air Soil Pollut. 113, 115-125.
Azimi, S., Rocher, V., Garnaud, S., Varrault, G., Thevenot, R., 2005. Decrease of atmospheric deposition of heavy metals in an urban area from 1994 to 2002 (Paris, France). Chemosphere 61, 645-651.
Baranowska, I., Barchanska, K., Pyrsz, A., 2005. Distribution of pesticides and heavy metal in trophic chain. Chemosphere 60, 1590-1599.
Barghigiani, C , Ristori, T., 1994. Mercury levels in agricultural products of Mt. Amiata (Tuscany, Italy). Arch. Environ. Con. Toxicol. 26, 329-334.
Bloemen, M.L., Markert, B., Lieth, H., 1995. The distribution of Cd, Cu, Pb and Zn in topsoils of Osnabriick in relation to land use. Sci. Total Environ. 166, 137-148.
Boluda, R., Andreu, V., Gilabert, M.A., Sobrino, P., 1993. Relation between reflectance of rice crop and indices of pollution by heavy metals in soils of Albufera Natural Park (Valencia, Spain). Soil Technol. 6, 351-363.
Boluda, R., Andreu, V., Pons, V., Sanchez, J., 1988. Contenido en metales pesados (Cd, Co, Cr, Cu, Ni, Pb y Zn) en suelos de la comarca La Plana de Requena - Utiel (Valencia). An. Edafol. Agrobiol. 47, 1485-1502.
Boularbah, A., Schwartz, C , Bitton, G., Morel, J.L., 2006. Heavy metal contamination from mining sites in South Morocco: 1. use of a biotest to assess metal toxicity of tailings and soils. Chemosphere 63, 802-810.
Breslin, V.T., 1999. Retention of heavy metal in agricultural soils after amending with MSW and MSW-biosolids compost. Water Air Soil Pollut. 109, 163-178.
Briimelis, G., Lapina, L., Nikodemus, O., Tabors, G., 2002. Use of the O horizon of forest soils in monitoring metal deposition in latvia. Water Air Soil Pollut. 135, 291-309.
Chiles, J.P., Delfiner, P., 1999. Geostatistics: Modeling spatial uncertainty. John Wiley and Sons, New York.
Colgan, A., Hankard, P.K., Spurgeon, D.J., Svendsen, C , Wadsworth, R.A., Weeks, J.M., 2003. Closing the loop: A spatial analysis to link observed environmental damage to predicted heavy metal emissions. Environ. Toxicol. Chem. 22, 970-976.
Davies, B.E., 1997. Heavy metal contaminated soils in an old industrial area of wales, Great Britain: source identification through statistical data interpretation. Water Air Soil Pollut. 94, 85-98.
De Temmerman, L., Vanongeval, L., Boon, W., Hoenig, M., 2003. Heavy metal content of arable soil in Northern Belgium. Water Air Soil Pollut. 148, 61-76.
Doelsch, E., Deroche, B., Van de Kerchove, V., 2006. Impact of sewage sludge spreading on heavy metal. Speciation in tropical soils (Reunion, Indian Ocean). Chemosphere 65, 286-293.
Dreher, G.B., Follmer, L.R., 2004. Mercury content of Illinois Soils. Water Air Soil Pollut. 156, 299-315.
Engle, M.A., Gustin, M.S., Lindberg, A.W., Ariya, P.A., 2005. The influence of ozone on atmospheric emissions of gaseous elemental mercury and relative gaseous mercury from substrates. Atmos. Environ. 39, 7506-7517.
Errecalde, M.F., Boluda, R., Lagarda, M.J., Farre, R., 1991. Indices de contamination por metales pesados en suelos de cultivo intensivo: Aplicacion en la comarca de LHorca (Valencia). Suelo Planta 1, 483-494.
Facchinelli, A., Sacchi, E., Mallen, L., 2001. Multivariate statistical and GIS-based approach to identify heavy metal sources in soil. Environ. Pollut. 114, 313-324.
Gala, V., Rodriguez, J., Guerra, A., 1985. Contamination por metales pesados en suelos de la Vega de Aranjuez. (I) Pb, Cd, Cu, Zn, Ni, Cr. An. Edafol. Agrobiol. 14, 1595-1608.
Gimeno-Garcia, E., Andreu, V., Boluda, R., 1996. Heavy metal incidence in the application of inorganic fertilizers and pesticides to rice farming soils. Environ. Pollut. 92, 19-25.
Goovaerts, P., 1992. Factorial kriging analysis: A useful tool for exploring the structure of multivariate spatial information. J. Soil Sci. 43, 597-619.
Goovaerts, P., 1997. Geostatistics for Natural Resources Evaluation. Applied Geostatistics Series. Oxford University Press, New York.
Goulard, M., Voltz, M., 1992. Linear coregionalization model: Tools for estimation and choice of cross variogram matrix. Math. Geol. 24, 269-286.
Hanesch, M., Scholger, R., Dekkers, M.J., 2001. The application of Fuzzy C-Means cluster analysis and non-linear mapping to a soil data set for detection of polluted sites. Phys. Chem. Earth 26, 885-891.
ISATIS, 2001. Isatis software manual. Geovariances and Ecole des Mines de Paris, Paris.
Kashem, M.A., Singh, B.R., 2001. Metal availability in contaminated soils: Effects of flooding and organic matter on changes in Eh, pH and solubility of Cd, Ni and Zn. Nutr. Cycl. Agroecosys. 61, 247-255.
Lin, Y.P., 2002. Multivariate geostatistical methods to identify and map spatial variations of soil heavy metals. Environ. Geol. 42, 1-10.
Liu, R., Wang, Q., Lu, X., Fang, F., Wang, Y., 2003. Distribution and speciation of mercury in the peat bog of Xiaoxingan Montain, northeastern China. Environ. Pollut. 124, 39-46.
Liu, W., Zhao, J., Ouyang, Z., Soderlund, L., Liu, G., 2005. Impact of sewage irrigation on heavy metal distribution and contamination in Beijing, China. Environ. Int. 31, 805-812.
Lopez-Arias, M., Rodriguez, J.A., 2005. Metales pesados, materia organica y otros parametros de la capa superficial de los suelos agrfcolas y de pastos de la Espana peninsular. I Resultados globales, INIA, Madrid.
Mantovi, P., Bonazzi, G., Maestri, E., Marmiroli, N., 2003. Accumulation of copper and zinc from liquid manure in agricultural soils and crop plants. Plant Soil 250, 249-257.
Martin, H.W., Kaplan, D.I., 1998. Temporal changes in cadmium, thallium, and vanadium mobility in soil and phytoavailabilty under field conditions. Water Air Soil Pollut. 101, 399-410.
Matheron, G., 1982. Pour une analyse krigeante de donnees regionalisees, Centre de Geostatistique, Fontainebleau.
Mico, C , Recatala, L., Peris, M., Sanchez, J., 2006. Assessing heavy metal sources in agricultural soils of an European Mediterranean area by multivariate analysis. Chemosphere 65, 863-872.
Miller, J.R., Lechler, P.J., Bridge, G., 2003. Mercury contamination of alluvial sediments within the Essequibo and Mazaruni river basins, Guyana. Water Air Soil Pollut. 148, 139-166.
Montoya Moreno, R., Lopez Arias, M., 1997. La red europea de seguimiento de dafios en bosques (Nivel I). Espafia, 1987-1996. Parques Nacionales MMA, Madrid.
Nan, Z., Zhao, C , Jijun, L., Chen, F., Sun, W., 2002. Relation between soil properties and selected heavy metal concentration in spring wheat (Triticum aestivum L.) grown in contaminated soil. Water Air Soil Pollut. 133, 205-213.
Nicholson, F.A., Smith, S.R., Alloway, B.J., Carlton-Simith, C , Chambers, B.J., 2003. An inventory of heavy metal input to agricultural soil in England and Wales. Sci. Total Environ. 311, 205-219.
Quevauviller, Ph., Muntau, H., Fortunati, U., Vercoutere, K., 1996. The Certification of Total Contents (Mass Fractions) of Cd, Co, Cr, Cu, Hg, Mn, Ni, Pb and Zn and Aqua Regia Soluble Contents (mass Fractions) of Cd, Co, Cr, Cu, Hg, Mn, Ni, Pb and Zn in a Calcareous Loam Soil - CRM 141 R. Office for of Official Publications of the European Communities, Luxembourg.
Riba, O., Reguant, S., Villena, J., 1983. Ensayo de sfntesis estratigrafica y evolutiva de la cuenca terciaria del Ebro. In Geologia de Espana (Libro Jubilar J. M. Rfos). IGME. Madrid.
Richard, S., Arnoux, A., Cerdan, P., Reynouard, C , Horeau, V., 2000. Mercury levels of soils, sediments and fish in French Guiana, South America. Water Air Soil Pollut. 124, 221-244.
Rodriguez Martin, J.A., Lopez Arias, M., Grau Corbi, J.M., 2006. Heavy metal contents in agricultural topsoils in the Ebro basin (Spain). Application of multivariate geostatistical methods to study spatial variations. Environ. Pollut. 144, 1001-1012.
Romic, M., Romic, D., 2003. Heavy metal distribution in agricultural topsoils in urban area. Environ. Geol. 43, 795-805.
Sanchidrian, J.R., Marino, M., 1980. Estudio de la contamination de suelos y plantas por metales pesados en los entornos de las autopistas que confluyen en Madrid. II contamination de suelos. An. Edafol. Agrobiol. 39, 2101-2115.
Saporta, A., 1990. Probabilites, analyse des donnees et statistique. Technip, Paris.
Serrano, M., Saura, I., Calvo-Flores, G., Aguilar, J., 1984. La contamination por metales pesados en la zona de Linares (hoja Topografica no 905). An. Edafol. Agrobiol. 42, 1913-1929.
Simon-Gomez, J.L., 1989. Late Cenonzoic stress field and fracturing in the Iberian Chain and Ebro Basin (Spain). J. Struct. Geol. 11, 285-294.
Tichy, R., Nydl, V., Kuzel, S., Kolar, L., 1997. Increased cadmium availability to crops on a sewage-sludge amended soil. Water Air Soil Pollut. 94, 361-372.
Van Den Hout, K.D., Bakker, D.J., Berdowski, J.J., Van Jaarsveld, J.A., Reinds, G.J., Bril, J., Breeuwsma, A., Groenenber, J.E., De Vries, W., Van Pagee, J.A., Villars, M., Sliggers, C.J., 1999. The impact of atmospheric deposition of non-acidifying substances on the quality of European forest soil and north sea. Water Air Soil Pollut. 109, 357-396.
Veldkamp, A., Kok, K., De Koning, G.H.J., Schoorl, J.M., Sonneveld, M.P.W., Verburg, P.H., 2001. Multi-scale system approaches in agronomic research at the landscape level. Soil Till. Res. 58, 129-140.
Wackernagel, H., 1998. Multivariate geostatistics: An introduction with applications. Springer, Berlin.
Webber, J., 1981. Trace metals in agriculture. In: Lepp, N.W. (Ed.), Effect of Heavy Metal Pollution on Plants, . In: Metals in the Environment, vol. 1. Applied Science Publishers, London, pp. 159-184.
Yemefack, M., Rossiter, D.G., Njomgang, R., 2005. Multi-scale characterization of soil variability within an agricultural landscape mosaic system in southern Cameroon. Geoderma 125, 117-143.
Zarcinas, B.A., Pongsakul, P., McLaughlin, M.J., Cocens, G., 2004. Heavy metal in soil and crops in southeast Asia. 2. Thailand. Environ. Geochem. Hlth. 26, 359-371.