Assessing heavy metal contamination in soils of the Zagreb region (Northwest Croatia) using...
13
Assessing heavy metal contamination in soils of the Zagreb region (Northwest Croatia) using multivariate geostatistics Donato Sollitto a, ⁎, Marija Romic b , Annamaria Castrignanò a , Davor Romic b , Helena Bakic b a CRA – SCA, Via C. Ulpiani 5, 70125 Bari, Italy b University of Zagreb, Faculty of Agriculture, Svetošimunska 25, 10000 Zagreb, Croatia abstract article info Article history: Received 17 April 2009 Received in revised form 27 October 2009 Accepted 23 November 2009 Keywords: Heavy metals Factor kriging analysis Multivariate geostatistics Soil pollution The assessment of soil contamination and location of pollution sources represent a crucial issue in soil remediation. Topsoil samples were collected in the Zagreb area (Northwest Croatia) and the total contents of trace and major elements were determined. A multivariate geostatistical analysis was used to estimate soil chemical composition variability. Factorial Kriging Analysis (FKA) was used to investigate the scale- dependent correlation structure of some variables by modelling co-regionalization of ten chemical variables, co-kriging specific factors and mapping them. The FKA provided two regionalized factors at different spatial scales of variability: the first factor at shorter range for Zn, Pb, Cd, Cu and Ni indicated different sources of anthropogenic contamination, whereas Ca (mainly loading on the longer range factor) was related to the lithology and parent material composition. The methodology used has proved to be a useful tool to separate geological and anthropogenic causes of variation in soil heavy metal content and to identify common pollution sources. © 2009 Elsevier B.V. All rights reserved. 1. Introduction Physical and chemical soil properties may depend on several factors, both natural and anthropogenic ones, jointly acting over different spatial and temporal scales: natural pedological processes (e.g. rock weathering and organic matter decomposition) are related to parent material, geomorphology of the area, presence of vegetation, the climate conditions and other interactions with the environment. The effects of these processes are strictly time-dependent and revealed in a quite complex structure of soils. On the other hand, soil management practices may also significantly affect pedological properties by altering soil structure mechanically due to agricultural and urban activities, and by changing chemical composition via pollution loading. The presence of some elements in a toxical concentration in the soil may be due to both natural and anthropogenic factors, therefore it often may be quite difficult to discriminate among the different causes. The parent material largely influences heavy metal content in many soil types, with concentration sometimes exceeding the critical values (Palumbo et al., 2000; Salonen and Korkka-Niemi, 2007). Some heavy metals, such as Ni, Cr and Mn, may be contained as trace elements in some rock types of volcanic and metamorphic origin (Alloway, 1995). During weathering processes the primary crystalline structures of some rock minerals are completely broken, relevant chemical elements may be thus either adsorbed in the topsoil or transported towards surface water or ground water targets. Anthropogenic sources of heavy metal contamination are mainly combustion processes in industry and transportation. Lead and cadmium are the main heavy metals arising from combustion and are often associated with zinc owing to tyre wear on the roads. Waste water from industrial processes may contain an important load of zinc, copper, chromium and nickel. Moreover, mining activities for extraction and manufacturing of metal products may result in a large amount of pollutants to be released into the atmosphere and, secondly, in the adjoining soils and waters. Long-term and extensive use of agricultural land with frequent application of pesticides (Nicholson et al., 2003) may cause heavy metals such as copper, nickel, zinc and cadmium to accumulate in the topsoil. A soil pollution assessment becomes very difficult when different sources of contamination are present and their products are variably distributed. In these cases the spatial variability of the heavy metal concentrations in soils is basic information for identifying the possible sources of contamination and to delineate the strategies of site remediation. Classic geostatistics methods based on univariate analysis can provide distribution maps for each pollutant and delineate the areas where its concentration exceeds the threshold values. Although the Catena 80 (2010) 182–194 ⁎ Corresponding author. Tel.: +39 080 5475024 E-mail address: [email protected] (D. Sollitto). 0341-8162/$ – see front matter © 2009 Elsevier B.V. All rights reserved. doi:10.1016/j.catena.2009.11.005 Contents lists available at ScienceDirect Catena journal homepage: www.elsevier.com/locate/catena
Transcript of Assessing heavy metal contamination in soils of the Zagreb region (Northwest Croatia) using...

Catena 80 (2010) 182–194
Contents lists available at ScienceDirect
Catena
j ourna l homepage: www.e lsev ie r.com/ locate /catena
Assessing heavy metal contamination in soils of the Zagreb region(Northwest Croatia) using multivariate geostatistics
Donato Sollitto a,⁎, Marija Romic b, Annamaria Castrignanò a, Davor Romic b, Helena Bakic b
a CRA – SCA, Via C. Ulpiani 5, 70125 Bari, Italyb University of Zagreb, Faculty of Agriculture, Svetošimunska 25, 10000 Zagreb, Croatia
⁎ Corresponding author. Tel.: +39 080 5475024E-mail address: [email protected] (D. Sollitt
0341-8162/$ – see front matter © 2009 Elsevier B.V. Adoi:10.1016/j.catena.2009.11.005
a b s t r a c t
a r t i c l e i n f oArticle history:Received 17 April 2009Received in revised form 27 October 2009Accepted 23 November 2009
Keywords:Heavy metalsFactor kriging analysisMultivariate geostatisticsSoil pollution
The assessment of soil contamination and location of pollution sources represent a crucial issue in soilremediation. Topsoil samples were collected in the Zagreb area (Northwest Croatia) and the total contents oftrace and major elements were determined. A multivariate geostatistical analysis was used to estimate soilchemical composition variability. Factorial Kriging Analysis (FKA) was used to investigate the scale-dependent correlation structure of some variables by modelling co-regionalization of ten chemical variables,co-kriging specific factors and mapping them. The FKA provided two regionalized factors at different spatialscales of variability: the first factor at shorter range for Zn, Pb, Cd, Cu and Ni indicated different sources ofanthropogenic contamination, whereas Ca (mainly loading on the longer range factor) was related to thelithology and parent material composition. The methodology used has proved to be a useful tool to separategeological and anthropogenic causes of variation in soil heavy metal content and to identify commonpollution sources.
o).
ll rights reserved.
© 2009 Elsevier B.V. All rights reserved.
1. Introduction
Physical and chemical soil properties may depend on severalfactors, both natural and anthropogenic ones, jointly acting overdifferent spatial and temporal scales: natural pedological processes(e.g. rock weathering and organic matter decomposition) are relatedto parentmaterial, geomorphology of the area, presence of vegetation,the climate conditions and other interactions with the environment.The effects of these processes are strictly time-dependent andrevealed in a quite complex structure of soils. On the other hand,soil management practices may also significantly affect pedologicalproperties by altering soil structure mechanically due to agriculturaland urban activities, and by changing chemical composition viapollution loading.
The presence of some elements in a toxical concentration in thesoil may be due to both natural and anthropogenic factors, thereforeit often may be quite difficult to discriminate among the differentcauses.
The parent material largely influences heavy metal content inmany soil types, with concentration sometimes exceeding the criticalvalues (Palumbo et al., 2000; Salonen and Korkka-Niemi, 2007). Someheavy metals, such as Ni, Cr and Mn, may be contained as trace
elements in some rock types of volcanic and metamorphic origin(Alloway, 1995). During weathering processes the primary crystallinestructures of some rock minerals are completely broken, relevantchemical elements may be thus either adsorbed in the topsoil ortransported towards surface water or ground water targets.
Anthropogenic sources of heavy metal contamination are mainlycombustion processes in industry and transportation. Lead andcadmium are the main heavy metals arising from combustion andare often associated with zinc owing to tyre wear on the roads.
Waste water from industrial processes may contain an importantload of zinc, copper, chromium and nickel. Moreover, mining activitiesfor extraction and manufacturing of metal products may result in alarge amount of pollutants to be released into the atmosphere and,secondly, in the adjoining soils and waters.
Long-term and extensive use of agricultural land with frequentapplication of pesticides (Nicholson et al., 2003) may cause heavymetals such as copper, nickel, zinc and cadmium to accumulate in thetopsoil.
A soil pollution assessment becomes very difficult when differentsources of contamination are present and their products are variablydistributed. In these cases the spatial variability of the heavy metalconcentrations in soils is basic information for identifying the possiblesources of contamination and to delineate the strategies of siteremediation.
Classic geostatistics methods based on univariate analysis canprovide distribution maps for each pollutant and delineate the areaswhere its concentration exceeds the threshold values. Although the

183D. Sollitto et al. / Catena 80 (2010) 182–194
concentration patterns of the elements could suggest probable sourcesof contamination (Atteia et al., 1994) each chemical element orpollutant might have its own distinctive spatial distribution makingdifficult to get an overall picture of the contamination. Therefore, inorder to put forward hypothesis about the origin of contamination, aco-regionalization analysis has been shown to be more revealing thanan univariate analysis (Castrignanò et al., 2000a,b; Bocchi et al., 2000;Bourennane et al., 2003, 2004; Romic and Romic, (2003); Romic et al.,(2004); Romic et al., (2007)). Webster et al. (1994) appliedmultivariate geostatistics to provide a more objective statement onthe source of some heavy metal in the topsoil, not only based on thevisual inspection of the concentration maps but also based on thequantitative analysis of the spatial variability of the elements and theirrelationships on different spatial scales. Moreover, they used multi-variate methods to compare the results coming from the principalcomponent analysis carried out on the concentration data with theexperimental indicator variogram applied to some categorical infor-mation, in order to relate the concentration of heavy metals to thegeology and land use of the area.
Multivariate geostatistics uses information arising from relation-ships amongvariables in order to improve estimation and to identify thedifferent causes of variation over different spatial scales (Castrignanòet al., 2009). Several possible factors affecting soil variations are likely tohave a short-range influence, whereas others operate over longerdistances; hence, soil variables are expected to be correlated in a scale-dependentway. Therefore, under assumption that it can reflect differentsources of variability, the scale-dependent correlation structure ofsome soil variables becomes crucial in environmental investigations.However, this requires a particular statistical approach by combiningclassic principal component analysis to describe correlation structureof multivariate data sets, with geostatistics that takes into account co-regionalized nature of the variables.
Geochemical data can be interpreted through the application ofFactorial Kriging Analysis (FKA), developed by Matheron (1982) andpreviously used in soil science by Goovaerts (1992), to study thespatial dependence functions among the physical and chemical soilproperties at different spatial scales. The univariate version ofFactorial Kriging allows characterisation of the spatial structures inwhich each regionalised variable can be analysed at different scales.
The objectives of this paper were to assess soil contaminationby heavy metals in the Zagreb region (Northwest Croatia) where high
Fig. 1. Geographical location of the Zagreb region w
concentrations might be due to the parent material mineralogical andchemical composition in addition to the contamination by differenttype of land use. Multivariate geostatistics application is aimed toformulate hypothesis on main sources of contamination in the topsoil,revealing the scale-dependent variation of chemical soil properties.
2. Material and methods
2.1. The study area
The Zagreb region extends for about 3000 km2 in NorthwestCroatia (Fig. 1) and is bordered in the north by Slovenia. The areaconsists of a large alluvial plain bordered in thenorth andnorthwest byamountain range, whereMt Zumberak andMtMedvednica dominate.The region is characterized by large variability in lithology, pedologicalfeatures and land use.
The oldest stratigraphic units are represented by the Paleozoicmagmatic and metamorphic complex of the deep earth crust (Fig. 2),mostly comprising diabases, gabbros, greenshist and blueshist faciesrocks outcropping at Mt Medvednica (Belak and Tibljas, 1998). Thesetypes of rocks are known to have a chemical composition character-ized by high content of heavy metals, such as Ni and Cr, which areaccumulated during the weathering processes in the soil (Alloway,1995). Mesozoic calcareous rocks (mostly dolomite and limestone)outcrop at Samobor Hills (Mt Zumberak and Mt Samoborsko).
Paleozoic–Mesozoic massif is rimmed by Miocene sediments dueto the presence of tectonic structures. These deposits are composed bya transgressive sequence of calcareous breccias and conglomerates,marls, clays, sands and silts (Vrsaljko et al., 2005).
Themain geo-lithological features are the Pliocene and Quaternaryalluvial sediments of the Sava River basin in the central and southernparts of the studied area. Terraced sediments outcrop mainly in thewestern and southwestern sectors of the region and consist of graveland sands, and secondarily of sandy and silty clays. The sediments inthe floodplain area and in the recent stream beds consist of coarsegrained sandy-clayey silts and silty clays, with thin layers of charcoalthat were flooded from the Slovenian coal mines. Moreover,Pleistocene deposits are made of pond sediments and non-carbonateloess mixed with sand and gravel. Quartz is the main component ofthe light mineral fraction of these sediments.
ith indication of the topsoil sampling locations.

Fig. 3. Simplified soil map of the study area.
Fig. 2. Simplified geologic map of the studied area.
184 D. Sollitto et al. / Catena 80 (2010) 182–194

Fig. 4. Simplified land use map of the study area.
185D. Sollitto et al. / Catena 80 (2010) 182–194
The northern and northwestern sectors of the Zagreb region arecharacterized by mountainous and hilly morphology, with topograph-ical elevation varying from few hundreds meters a.s.l. at Mt Zumberakarea up to over 1000 m a.s.l. at Mt Medvednica. The western andsouthwestern parts of the region are terraced landscape, with gentleslopes and elevation ranging between 150 and 250 m a.s.l., whereas therest of the region is a floodplain with flat morphology and elevationaround 100 m a.s.l.
The main morphological process is related to the fluvial dynamicsand the floodplain evolution. The Sava River is the main river of theregion which flows through the Zagreb region from the northwest,where it crosses themountainous terrain, to the southeast. In the centraland south-eastern sectors of the region the hydrographic system is
Table 1Statistical summary of the basic soil properties and element concentrations.
Variable Mean Median SD Min Max Skew
pH 6.86 7.11 1.00 3.45 8.36 −0.3OM % 4.41 3.95 1.93 0.81 14.1 1.3Ba (mg/kg) 224 220 68.2 12.7 421 0.1Ca (mg/kg) 18.4 5.20 37.3 0.67 214 3.2Cd (mg/kg) 0.40 0.31 0.34 0.02 4.94 5.5Co (mg/kg) 10.9 10.8 3.62 2.74 47.2 1.9Cr (mg/kg) 54.6 51.2 21.1 11.5 400 5.8Cu (mg/kg) 56.1 23.5 117 3.64 1335 4.5Fe (mg/kg) 29.7 28.9 7.77 5.85 59.1 0.2Mg (mg/kg) 8.04 6.51 5.43 0.77 36.6 2.9Mn (mg/kg) 597 556 266 79.2 4537 4.2Ni (mg/kg) 35.2 29.7 23.8 0.70 488 8.5P (mg/kg) 722 675 300 213 3023 2.3Pb (mg/kg) 23.2 19.6 14.4 1.00 216 5.2S (mg/kg) 407 349 249 47.7 2683 2.5Sr (mg/kg) 92.9 55.5 136 17.2 1846 6.1Zn (mg/kg) 77.9 70.7 33.6 27.1 479 4.2
a Median, after Reimann and de Caritat (1998)).b Mean, after Wedepohl (1995).c Maximal permissible concentrations as defined by Croatian government regulation (mg
characterized by a dense network of streams collecting water from thewhole catchment area and the transported sediments are released.
The large heterogeneity of the parent material, combined withthe climate and geomorphology of the Zagreb region, has causedthe development of a wide variety of soil types (Fig. 3). Since thefloodplain soils are mixture of thematerial eroded from the geologicalunits present in the catchment basin, the mineralogical and chemicalcomposition as well as the textural properties of the sedimentarydeposits in the alluvial region are largely influenced by the dynamic ofthe Sava River flow and its solid transportation. Hydromorphic soilsprevail in the Sava River valley, where the recent deposits form fluvialterraces. Molic Fluvisols, Calcaric Fluvisols, Eutric Cambisols, Eutricand Calcic Greysols are developed on the Holocene deposits. In the
ness Kurtosis Soils worldwidea Upper continental crustb MPCc
6 1.77 – – –
6 5.65 – – –
9 3.09 500 584 –
5 13.4 14,000 29,450 –
8 57.7 0.3 0.102 26 16.7 10 24 506 91.2 80 126 1006 29.3 25 25 1006 2.91 35,000 30,890 –
8 12.7 9000 13,510 –
8 56.0 530 527 –
1 148 20 56 606 13.6 750 665 –
4 54.2 17 14.8 1502 16.7 800 – –
7 56.5 240 333 –
8 39.6 70 65 300
kg−1).

Table 2Correlation matrix of the studied variables. All correlation coefficients N0.18 aresignificative at pb0.01.
Variable Ca Cd Co Cr Cu Mg Mn Ni Pb Zn
Ca 1Cd 0.22 1Co −0.41 0.05 1Cr −0.23 0.13 0.62 1Cu 0.26 0.08 0.06 0.17 1Mg 0.31 0.11 −0.19 0.00 0.08 1Mn −0.20 0.09 0.56 0.16 0.02 −0.16 1Ni 0.01 0.20 0.53 0.90 0.25 0.08 0.19 1Pb −0.09 0.16 0.21 0.18 0.01 0.12 0.21 1.14 1Zn −0.05 0.33 0.31 0.42 0.20 0.27 0.15 0.30 0.57 1
Fig. 5.Matrix of the experimental variogram of the gaussian variables (points) and the variogthe sample variance (dashed-points line) are also shown (Wackernagel, 2003).
186 D. Sollitto et al. / Catena 80 (2010) 182–194
area of Pleistocene terraces, Stagnic Podzoluvisols prevail on theplateau, whereas Stagnic Podzoluvisols and Glayic Podzoluvisols areprevalent on the slopes (FAO, 1998).
More than 50% of the land is used for agriculture (Fig. 4): soilsdeveloped on loamy aeolian materials are mostly used for intensivecultivation of field crops (like cereals), but some of them are underpermanent grassland.
Anthropogenic vineyard soils, classified as Aric Anthrosols (FAO,1998), of the Mt Medvednica foothills were formed on Tertiarycarbonate deposits of marl and limestone. Moreover, as the Zumber-acka Gora piedmont spreads perpendicularly to the mountains, someslopes are firmly interlinked by ridges, forming well protected,amphitheatre-shaped vineyard areas. The presence of intense agri-cultural activities imposes the risk of soil contamination due to the use
rammodels (bold line). The bounds of the hull of perfect correlation (dashed lines) and

Fig. 5 (continued).
187D. Sollitto et al. / Catena 80 (2010) 182–194
of pesticide, which sometimes may constitute a diffuse source overlarge regions.
In addition to agricultural land use other main usage classes areforest, covering the mountain areas and some parts of the terraces,pasture and orchard. Local source of pollution may be related toindustrial areas and urban networks, which are scattered distributedover the floodplain, as well as to mining activities which are mainlylocated in the upstream regions.
2.2. Soil sampling
A total of 916 topsoil (0–20 cm) sampleswere collected in the regionusing a systematic sampling on a 2-km grid, with sampling densityincreasing to 1 km near the urban area of Zagreb. The observationsites were spatially referenced using GPS and data were stored in
differentGIS layers. Site survey, carriedout during the samplingprocess,provided site-specific information related to land use and other humanactivities near the sampling points.
For the determination of soil properties, the surface soil samples(averageweight of 2 kg)were air-dried andmixedwell. A subsample ofabout 1 kg soil was sieved through a 2-mm mesh. Digestion in aquaregia (HRN ISO11466,2004)wasdoneby themicrowave techniqueonaPerkinElmer Multiwave 6MF 100 (1000W) apparatus in closed TFMvessels andwith automatic pressure and temperature regulation. Heavymetal concentrations in soil digests were determined by inductivelycoupledplasmaoptical emission spectroscopy (ICP-OES) onaVistaMPXAX (Varian).
All samples were analysed at the Analytical laboratory of theFaculty of Agriculture, University of Zagreb. Quality control procedureconsisted of reagent blanks, duplicate samples and several referenced

Fig. 5 (continued).
188 D. Sollitto et al. / Catena 80 (2010) 182–194
soil and sediment samples of a similar matrix from the interlaboratorycalibration programme (Houba et al., 1996).
2.3. Multivariate geostatistical approach
Factorial Kriging Analysis (FKA) was used to analyse the spatialstructure of the multivariate data set. The theory of the FKA methoddeveloped by Matheron (1982), which has been exhaustivelydescribed in several papers (Wackernagel, 1994; Goovaerts andWebster, 1994; Castrignanò et al., 2000a) may be schematized in thefollowing steps:
1) modelling the co-regionalization of a set of n variables, using theLinear Model of Co-regionalization (LMC);
2) analysing the correlation structure between the variables byapplying Principal Component Analysis (PCA);
3) co-kriging andmapping specific factors at the characteristic spatialscales.
The Linear Model of Co-regionalization, developed by Journel andHuijbregts (1978), considers all the studied variables as the result ofthe same independent physical processes, acting at different spatialscales u. The n(n+1)/2 simple and cross semivariograms of the nvariables are modelled by a linear combination of NS semivariogramsstandardized to unit sill gu(h). Using the matrix notation, the LMC canbe written as:
ΓðhÞ = ∑NS
u=1BuguðhÞ
where Γ(h)=|γij(h)|is a symmetric matrix of order n x n, whosediagonal and non-diagonal elements represent simple and cross
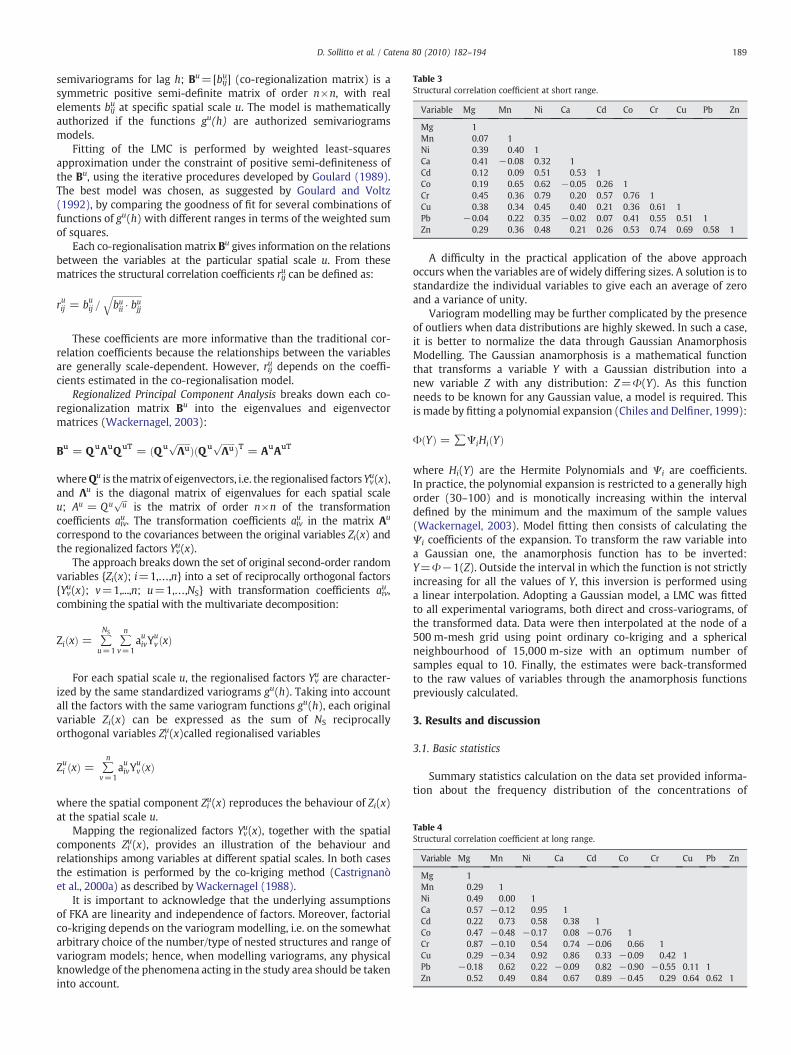
Table 3Structural correlation coefficient at short range.
Variable Mg Mn Ni Ca Cd Co Cr Cu Pb Zn
Mg 1Mn 0.07 1Ni 0.39 0.40 1Ca 0.41 −0.08 0.32 1Cd 0.12 0.09 0.51 0.53 1Co 0.19 0.65 0.62 −0.05 0.26 1Cr 0.45 0.36 0.79 0.20 0.57 0.76 1Cu 0.38 0.34 0.45 0.40 0.21 0.36 0.61 1Pb −0.04 0.22 0.35 −0.02 0.07 0.41 0.55 0.51 1Zn 0.29 0.36 0.48 0.21 0.26 0.53 0.74 0.69 0.58 1
Table 4Structural correlation coefficient at long range.
Variable Mg Mn Ni Ca Cd Co Cr Cu Pb Zn
Mg 1Mn 0.29 1Ni 0.49 0.00 1Ca 0.57 −0.12 0.95 1Cd 0.22 0.73 0.58 0.38 1Co 0.47 −0.48 −0.17 0.08 −0.76 1Cr 0.87 −0.10 0.54 0.74 −0.06 0.66 1Cu 0.29 −0.34 0.92 0.86 0.33 −0.09 0.42 1Pb −0.18 0.62 0.22 −0.09 0.82 −0.90 −0.55 0.11 1Zn 0.52 0.49 0.84 0.67 0.89 −0.45 0.29 0.64 0.62 1
189D. Sollitto et al. / Catena 80 (2010) 182–194
semivariograms for lag h; Bu=[biju] (co-regionalization matrix) is asymmetric positive semi-definite matrix of order n×n, with realelements bij
u at specific spatial scale u. The model is mathematicallyauthorized if the functions gu(h) are authorized semivariogramsmodels.
Fitting of the LMC is performed by weighted least-squaresapproximation under the constraint of positive semi-definiteness ofthe Bu, using the iterative procedures developed by Goulard (1989).The best model was chosen, as suggested by Goulard and Voltz(1992), by comparing the goodness of fit for several combinations offunctions of gu(h) with different ranges in terms of the weighted sumof squares.
Each co-regionalisation matrix Bu gives information on the relationsbetween the variables at the particular spatial scale u. From thesematrices the structural correlation coefficients riju can be defined as:
ruij = buij =ffiffiffiffiffiffiffiffiffiffiffiffiffibuii ⋅ bujj
q
These coefficients are more informative than the traditional cor-relation coefficients because the relationships between the variablesare generally scale-dependent. However, riju depends on the coeffi-cients estimated in the co-regionalisation model.
Regionalized Principal Component Analysis breaks down each co-regionalization matrix Bu into the eigenvalues and eigenvectormatrices (Wackernagel, 2003):
Bu = QuΛuQuT = ðQu ffiffiffiffiffiffiΛu
pÞðQu ffiffiffiffiffiffi
Λup
ÞT = AuAuT
whereQu is thematrix of eigenvectors, i.e. the regionalised factorsYvu(x),and Λu is the diagonal matrix of eigenvalues for each spatial scaleu; Au = Qu
ffiffiffiu
pis the matrix of order n×n of the transformation
coefficients aivu . The transformation coefficients aiv
u in the matrix Au
correspond to the covariances between the original variables Zi(x) andthe regionalized factors Yvu(x).
The approach breaks down the set of original second-order randomvariables {Zi(x); i=1,…,n} into a set of reciprocally orthogonal factors{Yvu(x); v=1,...,n; u=1,…,NS} with transformation coefficients aiv
u ,combining the spatial with the multivariate decomposition:
ZiðxÞ = ∑NS
u=1∑n
v=1auivY
uvðxÞ
For each spatial scale u, the regionalised factors Yvu are character-
ized by the same standardized variograms gu(h). Taking into accountall the factors with the same variogram functions gu(h), each originalvariable Zi(x) can be expressed as the sum of NS reciprocallyorthogonal variables Ziu(x)called regionalised variables
Zui ðxÞ = ∑n
v=1auivY
uvðxÞ
where the spatial component Ziu(x) reproduces the behaviour of Zi(x)at the spatial scale u.
Mapping the regionalized factors Yvu(x), together with the spatial
components Ziu(x), provides an illustration of the behaviour and
relationships among variables at different spatial scales. In both casesthe estimation is performed by the co-kriging method (Castrignanòet al., 2000a) as described by Wackernagel (1988).
It is important to acknowledge that the underlying assumptionsof FKA are linearity and independence of factors. Moreover, factorialco-kriging depends on the variogram modelling, i.e. on the somewhatarbitrary choice of the number/type of nested structures and range ofvariogram models; hence, when modelling variograms, any physicalknowledge of the phenomena acting in the study area should be takeninto account.
A difficulty in the practical application of the above approachoccurs when the variables are of widely differing sizes. A solution is tostandardize the individual variables to give each an average of zeroand a variance of unity.
Variogram modelling may be further complicated by the presenceof outliers when data distributions are highly skewed. In such a case,it is better to normalize the data through Gaussian AnamorphosisModelling. The Gaussian anamorphosis is a mathematical functionthat transforms a variable Y with a Gaussian distribution into anew variable Z with any distribution: Z=Φ(Y). As this functionneeds to be known for any Gaussian value, a model is required. Thisis made by fitting a polynomial expansion (Chiles and Delfiner, 1999):
ΦðYÞ = ∑ΨiHiðYÞ
where Hi(Y) are the Hermite Polynomials and Ψi are coefficients.In practice, the polynomial expansion is restricted to a generally highorder (30–100) and is monotically increasing within the intervaldefined by the minimum and the maximum of the sample values(Wackernagel, 2003). Model fitting then consists of calculating theΨi coefficients of the expansion. To transform the raw variable intoa Gaussian one, the anamorphosis function has to be inverted:Y=Φ−1(Z). Outside the interval in which the function is not strictlyincreasing for all the values of Y, this inversion is performed usinga linear interpolation. Adopting a Gaussian model, a LMC was fittedto all experimental variograms, both direct and cross-variograms, ofthe transformed data. Data were then interpolated at the node of a500 m-mesh grid using point ordinary co-kriging and a sphericalneighbourhood of 15,000 m-size with an optimum number ofsamples equal to 10. Finally, the estimates were back-transformedto the raw values of variables through the anamorphosis functionspreviously calculated.
3. Results and discussion
3.1. Basic statistics
Summary statistics calculation on the data set provided informa-tion about the frequency distribution of the concentrations of

190 D. Sollitto et al. / Catena 80 (2010) 182–194

Fig. 6. Concentration maps of the ten variables (a÷l — using an iso-frequency colour scale). (For interpretation of the references to colour in this figure legend, the reader isreferred to the web version of this article.)
191D. Sollitto et al. / Catena 80 (2010) 182–194
chemical elements in the topsoil; the results were compared withsome reference values (Table 1). The background concentrations ofthe elements in soils were mostly lower than the average elementconcentrations in the upper continental crust (Wedepohl, 1995) andwere similar to the worldwide median values in soils (Reimann andde Caritat, 1998).
Except for the cobalt, the concentrations of all other elementsexceeded the maximum permissible concentration (MPC) defined bythe Croatian government, with critical conditions recorded for copper,nickel and chromium. For these elements, themaximumconcentrationsexceed the MPC by up to ten times. Nevertheless, the mean values forall samples were lower than the critical thresholds, meaning that thehigh values are unevenly distributed in the region. Only a relativelysmall proportion of samples had concentrations of Ni, Cu and Crexceeding the MPC (9%, 8% and 1.4% of all samples, respectively).
As confirmed by the skewness values (Table 1), the concentrationsof elements are characterized by large variability, with positivelyskewed frequency distributions. This is common for heavy metals,
because they usually have low concentrations in the environment, sothat the presence of a point source of contamination may cause asharp increase of local concentration, so exceeding the thresholds.
The concentrations of Ni and Cr higher than the MPC were mainlyrecorded near the urban area of Zagreb and on the northern edge ofthe city, whereas the Cu concentration exceedingMPCwas found all overthe piedmont belt surrounding the northern Paleozoic and Mesozoicreliefs.
Only the Fe and Ba data distributions are nearly normal, with smalldifferences between the mean and median values and the skewnessvalues close to 0. In contrast, the Mg and Ca concentrations in thetopsoil showed a skewed distribution with high values where cal-careous rocks outcrop.
3.2. Co-regionalization analysis
The co-regionalization analysis was carried out for a subsetof variables, including heavy metals for which a MPC is prescribed

192 D. Sollitto et al. / Catena 80 (2010) 182–194
(Cd, Co, Cr, Cu, Ni, Pb and Zn) and other elements commonlycharacterizing the topsoil properties, such as Ca, Mg and Mn (Table 2).
The highest correlations were found for the element pairs, such asNi–Cr (0.90), Cr–Co (0.62), Zn–Pb (0.57), Mn–Co (0.56) and Ni–Co(0.53). These values represent the overall correlation between theelements, regardless of the spatial scale of variation.
Although in the multidimensional case it is not possible to choosethe number of basic structures by a statistical test, a first visual in-spection of the simple and cross experimental semivariograms (Fig. 5)suggested the presence of three basic components, corresponding todifferent spatial scales.
The first observed structure was a nugget effect, comprising theunresolved spatial variation occurring at distances smaller than thesampling scale or themeasurement error. This structure could be seenin all variograms and was the prevalent one for Ni, Co, Cr and Zn.
The second structure reflected a spatial transitive process on themedium scale, approximately up to a distance of 10,000 m, and wasrelevant for Ni, Cd, Cu, Pb and Zn.
The third structure made small contribution to the semivarianceand could represent a transitive model with a relatively large range(from 10,000 to 35,000 m). This structure was prevalent for Ca, Cuand Ni.
The direct and cross-variogramsweremodelled as the sumof threespatial structures including: a nugget effect, a spherical model withrange equal or 10,000 m and a spherical model with a range of35,000 m. The goodness of LMC fit was verified with a cross-correlation test, which produced the mean and variance values ofthe standardized error close to 0 and 1 respectively (not shown) forany Gaussian variable.
Fig. 5 shows the simple and cross experimental semivariograms(point) together with the linear co-regionalization model (bold line).All direct semivariograms appear well-structured, but most of themhave a large component of the nugget effect. In cross-variograms, Znand Ni are spatially correlated with most of the other variables,whereas the spatial correlation was null for the couples Ca–Pb, Ca–Cr,Co–Mg and Cd–Mg.
The traditional simple product–moment correlation coefficientdoes not reveal the real relationship among the variables because it(i) averages out distinct changes in the correlation structuresoccurring at different spatial scales, and (ii) includes the measure-ment errors inherent in the nugget effect. Therefore, structuralcorrelation coefficients were estimated by filtering out the nugget
Table 5Decomposition into regionalised factors from the Gaussian variables; also reported the non
gMg gMn gNi gCa gCd gCo
S1=Nugget effectFactor 1 0.1597 0.3193 0.3932 0.0938 0.1604 0.43Factor 2 0.3752 −0.5394 0.1769 0.5314 0.2896 −0.33Factor 3 0.2442 0.4076 0.2425 0.1460 0.1830 0.20Factor 4 0.4647 0.3836 −0.3162 0.1605 −0.4178 −0.21Factor 5 0.5543 −0.3947 0.0552 −0.4783 −0.3888 0.24Factor 6 −0.1530 −0.1239 −0.4761 −0.1224 0.2891 0.16Factor 7 0.1546 −0.0859 −0.5667 0.4027 0.0682 0.54Factor 8 0.3281 0.2799 −0.2937 −0.3618 0.5029 −0.39Factor 9 0.1973 0.1371 0.0432 0.2221 −0.0228 −0.08
S2=Spherical−Range=10,000.00 mFactor 1 0.2809 0.1122 0.3633 0.0812 0.3980 0.20Factor 2 −0.5557 0.2323 0.1880 −0.4321 −0.2952 0.36Factor 3 −0.2308 0.5919 −0.1161 0.1856 0.3240 0.29Factor 4 −0.0847 −0.3018 −0.3443 −0.0573 −0.2212 −0.12Factor 5 −0.4316 −0.5612 0.5346 0.0886 0.3309 0.04
S3=Spherical−Range=35,000.00 mFactor 1 0.1910 −0.0086 0.3514 0.6871 0.2494 −0.01Factor 2 −0.1226 0.2886 0.0548 −0.1894 0.6536 −0.38Factor 3 0.6388 0.3730 −0.0448 0.0811 0.2062 0.22Factor 4 0.5166 −0.0792 0.0422 −0.5146 −0.1454 0.20
effect, revealing stronger or weaker correlations for many pairs ofvariables at two chosen spatial scales (10,000 m and 35,000 m).
A high correlation coefficient at short range (Table 3) is confirmedfor the pairs Ni–Cr (0.79), Cr–Co (0.76) and Ni–Co (0.62), whereas forZn–Cr (0.74), Zn–Cu (0.69) and Cr–Cu (0.61) the values increasedwith respect to the traditional correlation coefficient. These structuralrelationships denote similar variability for the above elements at shortscale and suggest the presence of common local sources of variation,probably related to the land use.
At long range (Table 4), the correlation coefficient between Ca andMg increased up to 0.57, as expected because these elements aretypically related to the lithological composition of the subsoil,considering the limestone and dolomite rocks outcroping in theMesozoic relief. Nevertheless, the highest correlations for Ca and Mgwere obtained when they were paired with some elements, such asCa–Ni (0.95), Ca–Cu (0.86), Ca–Cr (0.74), Ca–Zn (0.67) and Mg–Cr(0.87). For all these pairs, the correlation coefficients were higher thanthose obtained for the short-range structure; however, Ca–Ni andMg–Cr were uncorrelated on the basis of the traditional simpleproduct–moment correlation coefficient.
The discussion above led to a suggestion that large-scale variabilityof Ca, Mg, Ni, Cu, Cr and Zn concentrations exist not only because ofthe lithological composition of the subsoil, but can also be due togeomorphological processes acting at a catchment scale, such as soildegradation and erosion, transportation and accumulation of theresidual products.
Some correlation coefficients changed their sign after filtering thenugget effect and the short-range structure. For example, the highnegative correlations of Co–Pb and Ca–Cd at long range becamepositive and smaller at short range. These structural relationshipssuggest that the processes acting on Co, Pb and Cd at short range maybe different in type and intensity from those influencing the sameelements at longer scale.
All the above results suggest that different processes act over thestudy area at different spatial scales.
3.3. Co-kriging estimation of the variables
The Ca and Mg maps (Fig. 6) displayed well-defined structures ofvariability, with the highest values mainly distributed over thenorthern relief and along the River Sava floodplain. These mapsclearly relate the high concentration zones to the lithological
-zero eigenvalues and the explained variance percentages for each spatial scale.
gCr gCu gPb gZn Eig.val. Ver.perc.
76 0.4544 0.2397 0.2818 0.3855 2.4755 49.1338 0.1438 0.1408 −0.1183 0.0692 0.7725 15.3305 −0.0485 −0.1857 −0.6735 −0.3605 0.5624 11.1636 −0.2265 0.3744 −0.1021 0.2985 0.3748 7.4425 0.2323 −0.1707 −0.0962 −0.0535 0.3146 6.2469 0.1865 −0.0893 −0.4930 0.5678 0.2041 4.0549 0.0069 −0.0204 0.2567 −0.3429 0.1407 2.7993 0.2885 −0.0442 0.2291 −0.2162 0.1088 2.1600 −0.1706 −0.8238 0.2448 0.3414 0.0844 1.68
12 0.2701 0.3834 0.4123 0.4255 2.1846 57.0617 0.4280 0.1142 −0.0268 −0.0160 1.0461 27.3202 −0.4813 0.2346 −0.0365 −0.2588 0.3265 8.5380 −0.1189 0.8304 −0.0557 0.0890 0.1234 3.2251 −0.2361 0.0424 −0.1552 −0.1092 0.1126 2.94
85 0.1454 0.5153 0.0336 0.1321 1.2181 62.7797 −0.2121 −0.0720 0.4612 0.1443 0.4703 24.2414 0.2989 −0.4982 −0.0949 0.0785 0.2087 10.7594 −0.0351 0.4855 0.3599 0.1699 0.0435 2.24
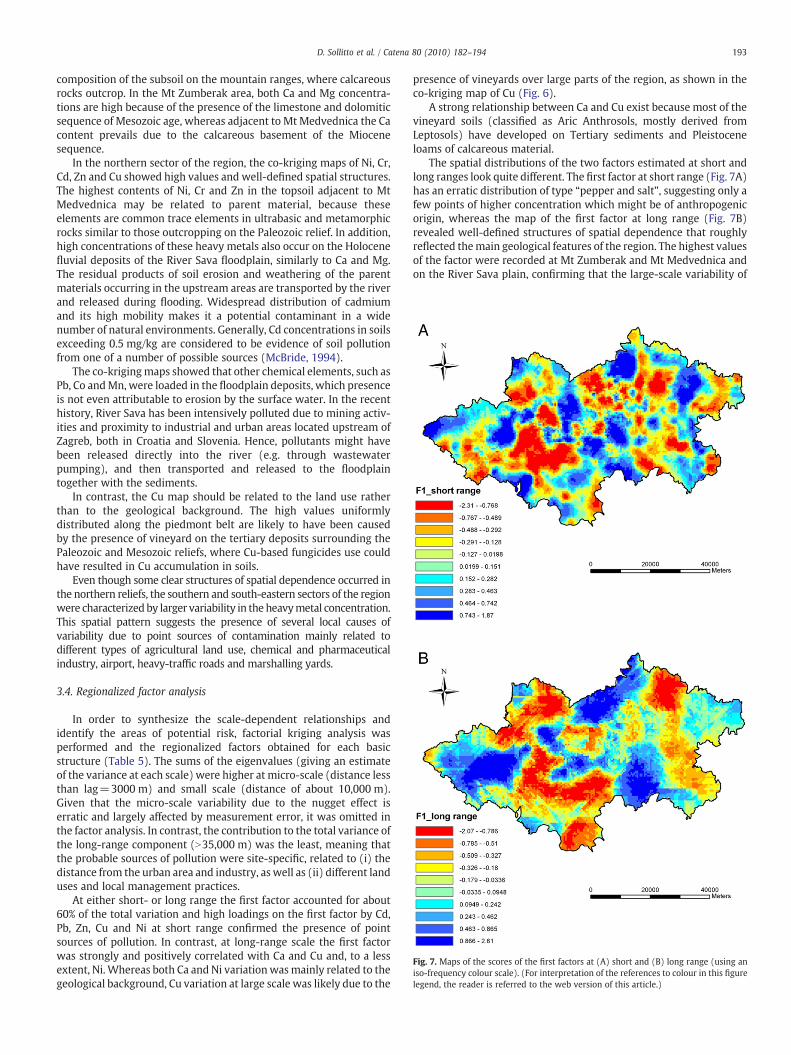
Fig. 7. Maps of the scores of the first factors at (A) short and (B) long range (using aniso-frequency colour scale). (For interpretation of the references to colour in this figurelegend, the reader is referred to the web version of this article.)
193D. Sollitto et al. / Catena 80 (2010) 182–194
composition of the subsoil on the mountain ranges, where calcareousrocks outcrop. In the Mt Zumberak area, both Ca and Mg concentra-tions are high because of the presence of the limestone and dolomiticsequence of Mesozoic age, whereas adjacent to Mt Medvednica the Cacontent prevails due to the calcareous basement of the Miocenesequence.
In the northern sector of the region, the co-kriging maps of Ni, Cr,Cd, Zn and Cu showed high values and well-defined spatial structures.The highest contents of Ni, Cr and Zn in the topsoil adjacent to MtMedvednica may be related to parent material, because theseelements are common trace elements in ultrabasic and metamorphicrocks similar to those outcropping on the Paleozoic relief. In addition,high concentrations of these heavy metals also occur on the Holocenefluvial deposits of the River Sava floodplain, similarly to Ca and Mg.The residual products of soil erosion and weathering of the parentmaterials occurring in the upstream areas are transported by the riverand released during flooding. Widespread distribution of cadmiumand its high mobility makes it a potential contaminant in a widenumber of natural environments. Generally, Cd concentrations in soilsexceeding 0.5 mg/kg are considered to be evidence of soil pollutionfrom one of a number of possible sources (McBride, 1994).
The co-krigingmaps showed that other chemical elements, such asPb, Co andMn, were loaded in the floodplain deposits, which presenceis not even attributable to erosion by the surface water. In the recenthistory, River Sava has been intensively polluted due to mining activ-ities and proximity to industrial and urban areas located upstream ofZagreb, both in Croatia and Slovenia. Hence, pollutants might havebeen released directly into the river (e.g. through wastewaterpumping), and then transported and released to the floodplaintogether with the sediments.
In contrast, the Cu map should be related to the land use ratherthan to the geological background. The high values uniformlydistributed along the piedmont belt are likely to have been causedby the presence of vineyard on the tertiary deposits surrounding thePaleozoic and Mesozoic reliefs, where Cu-based fungicides use couldhave resulted in Cu accumulation in soils.
Even though some clear structures of spatial dependence occurred inthe northern reliefs, the southern and south-eastern sectors of the regionwere characterized by larger variability in the heavymetal concentration.This spatial pattern suggests the presence of several local causes ofvariability due to point sources of contamination mainly related todifferent types of agricultural land use, chemical and pharmaceuticalindustry, airport, heavy-traffic roads and marshalling yards.
3.4. Regionalized factor analysis
In order to synthesize the scale-dependent relationships andidentify the areas of potential risk, factorial kriging analysis wasperformed and the regionalized factors obtained for each basicstructure (Table 5). The sums of the eigenvalues (giving an estimateof the variance at each scale) were higher at micro-scale (distance lessthan lag=3000 m) and small scale (distance of about 10,000 m).Given that the micro-scale variability due to the nugget effect iserratic and largely affected by measurement error, it was omitted inthe factor analysis. In contrast, the contribution to the total variance ofthe long-range component (N35,000 m) was the least, meaning thatthe probable sources of pollution were site-specific, related to (i) thedistance from the urban area and industry, as well as (ii) different landuses and local management practices.
At either short- or long range the first factor accounted for about60% of the total variation and high loadings on the first factor by Cd,Pb, Zn, Cu and Ni at short range confirmed the presence of pointsources of pollution. In contrast, at long-range scale the first factorwas strongly and positively correlated with Ca and Cu and, to a lessextent, Ni. Whereas both Ca and Ni variationwasmainly related to thegeological background, Cu variation at large scale was likely due to the
presence of vineyards over large parts of the region, as shown in theco-kriging map of Cu (Fig. 6).
A strong relationship between Ca and Cu exist because most of thevineyard soils (classified as Aric Anthrosols, mostly derived fromLeptosols) have developed on Tertiary sediments and Pleistoceneloams of calcareous material.
The spatial distributions of the two factors estimated at short andlong ranges look quite different. The first factor at short range (Fig. 7A)has an erratic distribution of type “pepper and salt”, suggesting only afew points of higher concentration which might be of anthropogenicorigin, whereas the map of the first factor at long range (Fig. 7B)revealed well-defined structures of spatial dependence that roughlyreflected themain geological features of the region. The highest valuesof the factor were recorded at Mt Zumberak and Mt Medvednica andon the River Sava plain, confirming that the large-scale variability of

194 D. Sollitto et al. / Catena 80 (2010) 182–194
heavy metals in the Zagreb region is mainly due to geological settingand hydrodynamics of the drainage system.
4. Conclusions
The assessment of pollution in the Zagreb region has revealedsome critical environmental situations where increased heavy metalconcentrations were the result of superimposed processes acting atdifferent spatial scales. The variation in the metal concentrations inthe topsoil has both natural and anthropogenic origin.
The co-regionalization analysis showed that some metals werecharacterized by both short-range and long-range variability. Long-range variability patterns of some elements seem to follow thegeological settings of the region, suggesting a probable origin by theparentmaterials. Anthropogenic contamination is not alwaysdetectablefrom the short-range variation of the element, because the pollutionmay involve natural processes as transport vectors. Pollution loadedfrom industrial ormining activities along the Sava River in the upstreamregions might be transported away over long distances, determiningtheir variation at long range. Additionally, diffuse source of pollutionmay be related to extensive vineyard land use over the piedmont beltregion, representing the main source of Cu pollution.
Multivariate geostatistical techniques may support environmentalstudies in distinguish between geological and anthropogenic causes ofpollution. The results allow to formulate hypothesis on the probablesources of pollution, especially when they are supported by additionalinformation on the land use and geology. Geostatistics can also directsupplementary sampling and more detailed direct detections, whichstill are of crucial importance in order to improve the assessment landdegradation and plan remediation actions.
Acknowledgements
The authors thank the Ministry of Science, Education andTechnology of the Republic of Croatia for financial support (Project178-1782221-2039 “Spatial variability of trace and toxic elements inagricultural soils of Croatia”). We gratefully acknowledge the valuablesuggestions and helpful comments on the manuscript from Z. Rengeland M. Kaps.
References
Alloway, B.J., 1995. Heavy Metals in Soils, 2nd edn. Blackie Academic & Professional,London. ISBN 0-7514-0198-6, 368 pp.
Atteia, O., Dubois, J.P., Webster, R., 1994. Geostatistical analysis of soil contamination inthe Swiss Jura. Environmental Pollution 86, 315–327.
Belak, M., Tibljas, D., 1998. Discovery of blueschists in the Medvednica Mountain(northern Croatia) and their significance for the interpretation of the geotectonicevolution of the area. Geologia Croatica 51 (1), 27–32.
Bocchi, S., Castrignanò, A., Fornaro, F., 2000. Application of factorial kriging for mappingsoil variation at field scale. European Journal of Agronomy 13, 295–308.
Bourennane, H., Salvador-Blanes, S., Cornu, S., 2003. Scale of spatial dependencebetween chemical properties of topsoil and subsoil over a geologically contrastedarea (Massif Central, France). Geoderma 112, 235–251.
Bourennane, H., Nicoullaud, B., Couturier, A., 2004. Exploring the spatial relationshipsbetween some soil properties andwheat yields in two soil types. Precision Agriculture5, 521–536.
Castrignanò, A., Giugliarini, L., Risaliti, R., Martinelli, N., 2000a. Study of spatialrelationships among some soil physico-chemical properties of a field in central Italyusing multivariate geostatistics. Geoderma 97, 39–60.
Castrignanò, A., Goovaerts, P., Lulli, L., Bragato, G., 2000b. A geostatistical approach toestimate probability of occurrence of Tuber melanosporum in relation to some soilproperties. Geoderma 98, 95–113.
Castrignanò, A., Costantini, A.C.E., Barbetti, R., Sollitto, D., 2009. Accounting forextensive topographic and pedologic secondary information to improve soilmapping. Catena 77, 28–38.
Chiles, J.P., Delfiner, P., 1999. Geostatistics: Modelling Spatial Uncertainty. Wiley, NewYork, NY.
Goovaerts, P., 1992. Factorial kriging analysis: a useful tool for exploring the structure ofmultivariate spatial soil information. Journal of Soil Science 53, 597–619.
Goovaerts, P., Webster, R., 1994. Scale-dependent correlation between topsoil copperand cobalt concentrations in Scotland. European Journal of Soil Science 45,79–96.
Goulard, M., 1989. Inference in coregionalization model. In: Armstrong, M. (Ed.),Geostatistics 1. Kluwer Academic Publishing, Dordrecht, pp. 397–408.
Goulard, M., Voltz, M., 1992. Linear coregionalization model: tools for estimation andchoice of cross-variogramm matrix. Mathematical Geology 24 (3), 269–286.
Houba, V.J.G., Uittenbogaard, J., Pellen, P., 1996. Wageningen evaluating programmesfor analytical laboratories (WEPAL), organization and purpose. Communications inSoil Science and Plant Analysis 27 (3–4), 421–431.
HRN ISO 11466, 2004. Soil Quality — Extraction of Trace Elements Soluble in AquaRegia. International Organisation for Standardisation. Croatian Standard Institute.
Journel, A.G., Huijbregts, C.J., 1978. Mining Geostatistics. Academic Press, London.600 pp.
Matheron, G., 1982. Pour une analyse krigeante des données regionalisées in Report732. Centre de Geostatistique, Fontainebleau.
McBride, M.B., 1994. Environmental Soil Chemistry. Oxford University Press, New York,USA.
Nicholson, F.A., Smith, S.R., Alloway, B.J., 2003. An inventory of heavy metals inputs toagricultural soils in England and Wales. The Science of the Total Environment 311,205–219.
Palumbo, B., Angelone, M., Bellanca, A., 2000. Influence of inheritance and pedogenesison heavy metal distribution in soils of Sicily, Italy. Geoderma 95 (3–4), 247–266.
Reimann, C., de Caritat, P., 1998. Chemical Elements in the Environment. Springer.Romic, M., Romic, D., 2003. Heavy metals distribution in agricultural topsoils in urban
area. Environmental Geology 43, 795–805.Romic, M., Romic, D., Dolanjski, D., 2004. Heavy metals accumulation in topsoils from
the wine-growing regions part 1. Factors which control retention. AgriculturaeConspectus Scintificus 69 (1), 1–10.
Romic, M., Hengl, T., Romic, D., 2007. Representing soil pollution by heavy metals usingcontinuous limitation scores. Computers & Geosciences 33 (10), 1316–1326.
Salonen, V., Korkka-Niemi, K., 2007. Influence of parent sediments on the concentrationof heavy metals in urban and suburban soils in Turku, Finland. AppliedGeochemistry. 22, 906–918.
Webster, R., Atteia, O., Dubois, J.P., 1994. Coregionalization of trace metals in the soil inthe Swiss Jura. European Journal of Soil Science 45, 205–218.
Vrsaljko, D., Pavelić, D., Bajraktarević, Z., 2005. Stratigraphy and palaeogeography ofMiocene deposits from the marginal area of Žumberak Mt. and the SamoborskoGorje Mts. (Northwestern Croatia). Geologia Croatica 58 (2), 133–150.
Wackernagel, H., 1988. Geostatistical techniques for interpreting multivariate spatialinformation. In: Chung, C.F. (Ed.), Quantitative Analysis of Mineral and EnergyResources. Reidel, Dordrecht, pp. 393–409.
Wackernagel, H., 1994. Cocriging versus kriging in regionalizaed multivariate dataanalysis. Geoderma 62, 437–444.
Wackernagel, H., 2003. Multivariate Geostatistics: An Introduction with Applications,3rd edn. Springer-Verlag, Berlin. 388 pp.
Wedepohl, K.H., 1995. The composition of the continental crust. Geochimica etCosmochmica Acta 59, 1217–1232.