CROATIA - Climate Change Knowledge Portal
32
CROATIA CLIMATE RISK COUNTRY PROFILE
-
Upload
khangminh22 -
Category
Documents
-
view
1 -
download
0
Transcript of CROATIA - Climate Change Knowledge Portal

iiCLIMATE RISK COUNTRY PROFILE: CROATIA
COPYRIGHT© 2021 by the World Bank Group1818 H Street NW, Washington, DC 20433Telephone: 202-473-1000; Internet: www.worldbank.org
This work is a product of the staff of the World Bank Group (WBG) and with external contributions. The opinions, findings, interpretations, and conclusions expressed in this work are those of the authors and do not necessarily reflect the views or the official policy or position of the WBG, its Board of Executive Directors, or the governments it represents.
The WBG does not guarantee the accuracy of the data included in this work and do not make any warranty, express or implied, nor assume any liability or responsibility for any consequence of their use. This publication follows the WBG’s practice in references to member designations, borders, and maps. The boundaries, colors, denominations, and other information shown on any map in this work, or the use of the term “country” do not imply any judgment on the part of the WBG, its Boards, or the governments it represents, concerning the legal status of any territory or geographic area or the endorsement or acceptance of such boundaries.
The mention of any specific companies or products of manufacturers does not imply that they are endorsed or recommended by the WBG in preference to others of a similar nature that are not mentioned.
RIGHTS AND PERMISSIONSThe material in this work is subject to copyright. Because the WBG encourages dissemination of its knowledge, this work may be reproduced, in whole or in part, for noncommercial purposes as long as full attribution to this work is given.
Please cite the work as follows: Climate Risk Profile: Croatia (2021): The World Bank Group.
Any queries on rights and licenses, including subsidiary rights, should be addressed to World Bank Publications, The World Bank Group, 1818 H Street NW, Washington, DC 20433, USA; fax: 202-522-2625; e-mail: [email protected].
Cover Photos: © Sean MacEntee, “Croatia” June 2, 2011 via Flickr, Creative Commons CC BY-NC-ND 2.0. © John Mackedon/World Bank, “Pula Arena” September 21, 2013 via Flickr, Creative Commons CC BY-NC-ND 2.0.
Graphic Design: Circle Graphics, Reisterstown, MD.

iiiCLIMATE RISK COUNTRY PROFILE: CROATIA
ACKNOWLEDGEMENTSThis profile is part of a series of Climate Risk Country Profiles developed by the World Bank Group (WBG). The country profile synthesizes most relevant data and information on climate change, disaster risk reduction, and adaptation actions and policies at the country level. The country profile series are designed as a quick reference source for development practitioners to better integrate climate resilience in development planning and policy making. This effort is managed and led by Veronique Morin (Senior Climate Change Specialist, WBG) and Ana E. Bucher (Senior Climate Change Specialist, WBG).
This profile was written by MacKenzie Dove (Senior Climate Change Consultant, WBG). Additional support was provided by Jason Johnston (Operations Analyst, WBG) and Yunziyi Lang (Climate Change Analyst, WBG).
Climate and climate-related information is largely drawn from the Climate Change Knowledge Portal (CCKP), a WBG online platform with available global climate data and analysis based on the latest Intergovernmental Panel on Climate Change (IPCC) reports and datasets. The team is grateful for all comments and suggestions received from the sector, regional, and country development specialists, as well as climate research scientists and institutions for their advice and guidance on use of climate related datasets.

ivCLIMATE RISK COUNTRY PROFILE: CROATIA
FOREWORD . . . . . . . . . . . . . . . . . . . . . . . . . . . . . . . . . . . . 1
COUNTRY OVERVIEW . . . . . . . . . . . . . . . . . . . . . . . . . . . . . . . 2Green, Inclusive and Resilient Recovery 3
CLIMATOLOGY . . . . . . . . . . . . . . . . . . . . . . . . . . . . . . . . . . 3Climate Baseline 3
Overview 3Key Trends 6
Climate Future 7Overview 7Key Trends 9
CLIMATE CHANGE RELATED NATURAL HAZARDS . . . . . . . . . . . . . . . . . 10Overview 10Key Trends 12Implications for DRM 12
CLIMATE CHANGE IMPACTS TO KEY SECTORS . . . . . . . . . . . . . . . . . . 13Agriculture 14Water 16Energy 19Health 21Tourism 23
ADAPTATION . . . . . . . . . . . . . . . . . . . . . . . . . . . . . . . . . . 24Institutional Framework for Adaptation 24Policy Framework for Adaptation 25Recommendations 26
Research Gaps 26Data and Information Gaps 27Institutional Gaps 27
CONTENTS

1CLIMATE RISK COUNTRY PROFILE: CROATIA
Climate change is a major risk to good development outcomes, and the World Bank Group is committed to playing
an important role in helping countries integrate climate action into their core development agendas. The World
Bank Group is committed to supporting client countries to invest in and build a low-carbon, climate-resilient future,
helping them to be better prepared to adapt to current and future climate impacts.
The World Bank Group is investing in incorporating and systematically managing climate risks in development
operations through its individual corporate commitments.
A key aspect of the World Bank Group’s Action Plan on Adaptation and Resilience (2019) is to help countries
shift from addressing adaptation as an incremental cost and isolated investment to systematically incorporating
climate risks and opportunities at every phase of policy planning, investment design, implementation and evaluation
of development outcomes. For all IDA and IBRD operations, climate and disaster risk screening is one of the
mandatory corporate climate commitments. This is supported by the Bank Group’s Climate and Disaster Risk
Screening Tool which enables all Bank staff to assess short- and long-term climate and disaster risks in operations
and national or sectoral planning processes. This screening tool draws up-to-date and relevant information from
the World Bank’s Climate Change Knowledge Portal, a comprehensive online ‘one-stop shop’ for global, regional,
and country data related to climate change and development.
Recognizing the value of consistent, easy-to-use technical resources for client countries as well as to support
respective internal climate risk assessment and adaptation planning processes, the World Bank Group’s Climate
Change Group has developed this content. Standardizing and pooling expertise facilitates the World Bank Group in
conducting initial assessments of climate risks and opportunities across sectors within a country, within institutional
portfolios across regions, and acts as a global resource for development practitioners.
For developing countries, the climate risk profiles are intended to serve as public goods to facilitate upstream
country diagnostics, policy dialogue, and strategic planning by providing comprehensive overviews of trends
and projected changes in key climate parameters, sector-specific implications, relevant policies and programs,
adaptation priorities and opportunities for further actions.
It is my hope that these efforts will spur deepening of long-term risk management in developing countries and our
engagement in supporting climate change adaptation planning at operational levels.
Bernice Van BronkhorstGlobal Director
Climate Change Group (CCG)
The World Bank Group (WBG)
FOREWORD

2CLIMATE RISK COUNTRY PROFILE: CROATIA
COUNTRY OVERVIEW
The Republic of Croatia belongs to the Adriatic-Mediterranean and Pannonia-Danube group of countries in
Central Europe. The total area of Croatia is 87,661 kilometers square (km2), with a land area of 56,594 km2;
territorial sea and internal sea waters account for 31,067 km2. Croatia’s seacoast extends 6,278 km (29.9%
of inland, 70.1% of islands). The state sea border is 948 km long and extends to an outer boundary of territorial
sea. The Croatian Parliament has declared an Exclusive Economic Zone (EEZ) in the Adriatic Sea on February 5,
2021. This EEZ is 23,870 km2 and reaches an epicontinental border between the Republic of Croatian and Italy.1
Croatia shares land borders with Slovenia, Hungary, Bosnia and Herzegovina, and Serbia.
The country has a population of nearly 4.1 million people (2019), with an annual growth rate of −0.5% (2019)
(Table 1). The country’s Gross Domestic Product (GDP) was $60.4 billion in 2019, experiencing annual growth of
2.9%.2 Croatia’s population is projected to reach 3.8 million and 3.3 million people in 2030 and 2050, respectively.
The urban population is expected to grow from 61.5% in 2030 to 71.3% in 2050.3 The Croatian economy is
dominated by the services sector (which includes, retail trade, transport, and government, financial, professional,
and personal services such as education, health care, and real estate services), which accounts for 59% of GDP.
Industry (including mining, manufacturing, construction, electricity, water, and gas) accounts for 26.3% of GDP and
the agricultural sector, accounts for 3% of the country’s GDP.4
1 Ministry of Environment and Nature Protection (2018). Seventh National Communication (NC6) and Third Biennial Report of The Republic of Croatia Under The United Nations Framework Convention On Climate Change URL: https://unfccc.int/sites/default/files/resource/2671905483_Croatia-NC7-BR3-2-96481035_Croatia-NC7-BR3-2-7.%20NC%20i%203.%20BR_resubmission_IX_ 2018_0.pdf
2 World Bank Open Data (2021). Data Retrieved May 2021. Data Bank: World Development Indicators. URL: https://databank.worldbank.org/source/world-development-indicators
3 World Bank Open Data (2020). Data Retrieved May 2021. Data Bank: Population Estimates and Projections. URL: https://databank.worldbank.org/data/reports.aspx?source=health-nutrition-and-population-statistics:-population-estimates-and-projections
4 World Bank Data Bank (2021). Development Indicators: Croatia. URL: http://databank.worldbank.org/data/reports.aspx?source= 2&country=UZB
5 World Bank (2021). DataBank – World Development Indicators. URL: https://databank.worldbank.org/source/world-development-indicators
6 University of Notre Dame (2020). Notre Dame Global Adaptation Initiative. URL: https://gain.nd.edu/our-work/country-index/
TABLE 1 . Data snapshot: Key development indicators5
Indicator
Life Expectancy at Birth, Total (Years) (2019) 78.4
Population Density (People per sq. km Land Area) (2018) 73.0
% of Population with Access to Electricity (2018) 100%
GDP per Capita (Current US$) (2019) $14,944.40
The ND-GAIN Index6 ranks 181 countries using a score which calculates a country’s vulnerability to climate change
and other global challenges as well as their readiness to improve resilience. This Index aims to help businesses
and the public sector better identify vulnerability and readiness in order to better prioritize investment for more
efficient responses to global challenges. Due to a combination of political, geographic, and social factors, Croatia is

3CLIMATE RISK COUNTRY PROFILE: CROATIA
recognized as vulnerable to climate change impacts, ranked 51 out of 181 countries in the 2020 ND-GAIN Index.
The more vulnerable a country is the lower their score, while the more ready a country is to improve its resilience
the higher it will be. Norway has the highest score and is ranked 1st.
Croatia submitted its Seventh National Communication (NC7) and Third Biennial Report of The Republic of Croatia
Under the UNFCCC in 2018. Croatia participated in the Updated Nationally Determined Contributions (NDC)
submitted to the UNFCCC as an EU Member State in 2020.7 The country’s adaptation priorities include availability
and accessibility of water for drinking and irrigation uses, coast and coastal zones, forestry and land use change,
agriculture, biodiversity, and human health.8
Green, Inclusive and Resilient RecoveryThe coronavirus disease (COVID-19) pandemic has led to unprecedented adverse social and economic impacts.
Further, the pandemic has demonstrated the compounding impacts of adding yet another shock on top of
the multiple challenges that vulnerable populations already face in day-to-day life, with the potential to create
devastating health, social, economic and environmental crises that can leave a deep, long-lasting mark. However,
as governments take urgent action and lay the foundations for their financial, economic, and social recovery, they
have a unique opportunity to create economies that are more sustainable, inclusive and resilient. Short and long-
term recovery efforts should prioritize investments that boost jobs and economic activity; have positive impacts on
human, social and natural capital; protect biodiversity and ecosystems services; boost resilience; and advance the
decarbonization of economies.
Climate Baseline
OverviewThe majority of Croatia experiences a moderately warm and rainy climate. Mean temperature in the lowland area
of northern Croatia is 10°C–12°C, the mountain regions experience mean temperatures of 3°C–4°C, with coastal
areas experiencing temperatures of 12–17°C. Most of the precipitation is recorded on the coastal slopes and
peaks of the Dinarides from Gorski Kotar in the northwest to the southern Velebit in the southeast. Croatia is
defined by three major geomorphological zones: the Pannonian basin, the mountain system of the Dinarides, and
CLIMATOLOGY
7 EU (2020). Updated Nationally Determined Contribution of the EU and its Member States. URL: https://www4.unfccc.int/sites/ndcstaging/PublishedDocuments/Croatia%20First/EU_NDC_Submission_December%202020.pdf
8 Ministry of Environment and Nature Protection (2018). Seventh National Communication (NC6) and Third Biennial Report of The Republic of Croatia Under The United Nations Framework Convention On Climate Change URL: https://unfccc.int/sites/default/files/resource/2671905483_Croatia-NC7-BR3-2-96481035_Croatia-NC7-BR3-2-7.%20NC%20i%203.%20BR_resubmission_IX_2018_0.pdf

4CLIMATE RISK COUNTRY PROFILE: CROATIA
Adriatic basin. The Lowland areas, up to 200 m, represent 53% of area of the country, hills and sub-mountains from
200 up to 500 m represent 26%, and mountain areas above 500 m, equate to 21% of the country. As of 2011,
23% of land area was used by for agriculture and forests covered 39% of land area.9
Croatia is a climatically complex area and has experienced a large variability in precipitation trends across the
country, over the last decades. Particularly, the mountainous region and the coastal zones are mostly affected by
drying tendencies in precipitation, especially during the summer season (May to October), while the mainland is
subjected to wetter precipitation conditions. The reduction in annual amounts of precipitation in the area north
of the Sava River results from decline in spring and autumn precipitation. In the mountains and on the Dalmatian
islands the fall season brings decline in winter and spring precipitation. On the northern Adriatic, the reduction in
precipitation amount is evident in all seasons.10 In the northeastern Mediterranean Region (or Adriatic-Ionian region,
which encompasses Croatia), heat wave events have become more frequent, longer lasting, and more severe.11
The country experiences a largely Mediterranean climate with hot, dry and sunny weather during the summer and
relatively mild, yet rainy weather during the winter in the coastal area. In the mainland, a typical continental climate
can be experienced with four distinguished seasons; warm summers and cold winters and more precipitation in
spring and late autumn/early winter. However, due to climate change, usual climate patterns are changing towards
more unpredictable seasons.
Analysis of data from the World Bank Group’s Climate Change Knowledge Portal (CCKP) (Table 2) shows
historical information for 1901–2020. Mean annual mean temperature for Croatia is 10.5°C, with average monthly
temperatures ranging between 21°C (July, August) and 0°C (December and January). Mean annual precipitation
is 1,082.7 mm. Precipitation levels increase from October to December. The largest rainfall occurs in November
(117mm)12; shown in Croatia’s latest climatology, 1991–2020, in Figure 1. Figure 2 presents the spatial variation
of observed average annual precipitation and temperature for 1991–2020.
TABLE 2 . Data snapshot: Summary statistics
Climate Variables 1901–2020
Mean Annual Temperature (°C) +10.6°C
Mean Annual Precipitation (mm) +1,082.7 mm
Mean Maximum Annual Temperature (°C) 15.4°C
Mean Minimum Annual Temperature (°C) 5.7°C
9 Ministry of Environment and Nature Protection (2018). Seventh National Communication (NC7) and Third Biennial Report of The Republic of Croatia Under The United Nations Framework Convention On Climate Change URL: https://unfccc.int/sites/default/files/resource/2671905483_Croatia-NC7-BR3-2-96481035_Croatia-NC7-BR3-2-7.%20NC%20i%203.%20BR_resubmission_IX_2018_0.pdf
10 Ministry of Environmental Protection, Physical Planning and Construction (2010). Strategy for Sustainable Development of the Republic of Croatia. URL: http://extwprlegs1.fao.org/docs/pdf/cro105236.pdf
11 Climate Adapt (2021). Adriatic-Ionian Area. URL: https://climate-adapt.eea.europa.eu/countries-regions/transnational-regions/adriatic-ionian
12 WBG Climate Change Knowledge Portal (CCKP, 2021). Croatia. URL: https://climateknowledgeportal.worldbank.org/country/croatia/climate-data-historical

5CLIMATE RISK COUNTRY PROFILE: CROATIA
Rainfall Temperature
Tem
pera
ture
(°C
) Rainfall (m
m)
Jan Feb Mar Apr May Jun Jul Aug Sep Oct Nov Dec0
6
12
18
24
0
40
80
120
160
FIGURE 1 . Average monthly temperature and rainfall for Croatia, 1991–202013
FIGURE 2 . Map of average annual temperature (°C) (left); annual precipitation (mm) (right) of Croatia, 1991–202014
13 WBG Climate Change Knowledge Portal (CCKP, 2021). Croatia. URL: https://climateknowledgeportal.worldbank.org/country/croatia/climate-data-historical
14 WBG Climate Change Knowledge Portal (CCKP, 2021). Croatia. URL: https://climateknowledgeportal.worldbank.org/country/croatia
6CLIMATE RISK COUNTRY PROFILE: CROATIA
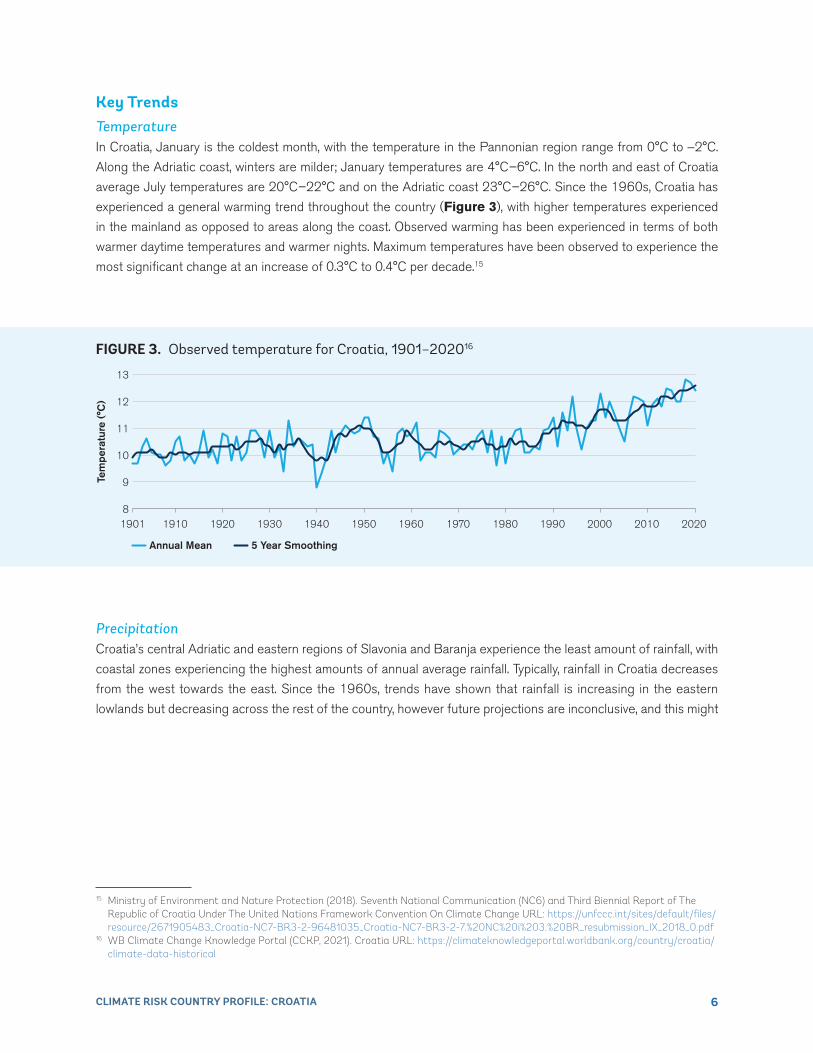
Key TrendsTemperatureIn Croatia, January is the coldest month, with the temperature in the Pannonian region range from 0°C to −2°C.
Along the Adriatic coast, winters are milder; January temperatures are 4°C–6°C. In the north and east of Croatia
average July temperatures are 20°C–22°C and on the Adriatic coast 23°C–26°C. Since the 1960s, Croatia has
experienced a general warming trend throughout the country (Figure 3), with higher temperatures experienced
in the mainland as opposed to areas along the coast. Observed warming has been experienced in terms of both
warmer daytime temperatures and warmer nights. Maximum temperatures have been observed to experience the
most significant change at an increase of 0.3°C to 0.4°C per decade.15
Tem
pera
ture
(°C
)
8
9
10
11
12
13
Annual Mean 5 Year Smoothing
19101901 1920 19601930 1940 1950 1970 1980 20001990 2010 2020
FIGURE 3 . Observed temperature for Croatia, 1901–202016
PrecipitationCroatia’s central Adriatic and eastern regions of Slavonia and Baranja experience the least amount of rainfall, with
coastal zones experiencing the highest amounts of annual average rainfall. Typically, rainfall in Croatia decreases
from the west towards the east. Since the 1960s, trends have shown that rainfall is increasing in the eastern
lowlands but decreasing across the rest of the country, however future projections are inconclusive, and this might
15 Ministry of Environment and Nature Protection (2018). Seventh National Communication (NC6) and Third Biennial Report of The Republic of Croatia Under The United Nations Framework Convention On Climate Change URL: https://unfccc.int/sites/default/files/resource/2671905483_Croatia-NC7-BR3-2-96481035_Croatia-NC7-BR3-2-7.%20NC%20i%203.%20BR_resubmission_IX_2018_0.pdf
16 WB Climate Change Knowledge Portal (CCKP, 2021). Croatia URL: https://climateknowledgeportal.worldbank.org/country/croatia/climate-data-historical

7CLIMATE RISK COUNTRY PROFILE: CROATIA
not be the steady trend.17 The country also experiences prominent dry spells, typically during the autumn months.
Summer precipitation trends have decreased most significantly.18
Climate Future
OverviewThe main data source for the World Bank Group’s Climate Change Knowledge Portal (CCKP) is the CMIP5
(Coupled Inter-comparison Project No.5) data ensemble, which builds the database for the global climate change
projections presented in the Fifth Assessment Report (AR5) of the Intergovernmental Panel on Climate Change
(IPCC). Four Representative Concentration Pathways (i.e. RCP2.6, RCP4.5, RCP6.0, and RCP8.5) were selected
and defined by their total radiative forcing (cumulative measure of GHG emissions from all sources) pathway
and level by 2100. The RCP2.6 for example represents a very strong mitigation scenario, whereas the RCP8.5
assumes business-as-usual scenario. For more information, please refer to the RCP Database. For simplification,
these scenarios are referred to as a low (RCP2.6); a medium (RCP4.5) and a high (RCP8.5) emission scenario
in this profile. Table 3 provides CMIP5 projections for essential climate variables under high emission scenario
(RCP8.5) over 4 different time horizons. Figure 4 presents the multi-model (CMIP5) ensemble of 32 Global
Circulation Models (GCMs) showing the projected changes in annual precipitation and temperature for the periods
2040–2059 and 2080–2099.
TABLE 3 . Data snapshot: CMIP5 ensemble projection
CMIP5 Ensemble Projection 2020–2039 2040–2059 2060–2079 2080–2099
Annual Temperature Anomaly (°C)
+.33 to +2.36(+1.36)
+.958 to +3.48(+2.29)
+1.71 to +4.94(+3.47)
+2.66 to +6.4(+4.56)
Annual Precipitation Anomaly (mm)
-17.39 to + 13.07(−1.21)
-19.08 to +15.55(−1.63)
-22.87 to +14.83(−2.48)
-26.98 to +13.94(−6.05)
Note: The table shows CMIP5 ensemble projection under RCP8.5. Bold value is the range (10th–90th Percentile) and values in parentheses show the median (or 50th Percentile).
17 Kalinski, V. (2017). Results of Climate Modeling at the System HPC Velebit for the development of the NAS and NAP. URL: http://prilagodba-klimi.hr/wp-content/uploads/2017/11/Klimatsko-modeliranje.pdf
18 Ministry of Environment and Nature Protection (2018). Seventh National Communication (NC6) and Third Biennial Report of The Republic of Croatia Under The United Nations Framework Convention On Climate Change URL: https://unfccc.int/sites/default/files/resource/2671905483_Croatia-NC7-BR3-2-96481035_Croatia-NC7-BR3-2-7.%20NC%20i%203.%20BR_resubmission_IX_2018_0.pdf

8CLIMATE RISK COUNTRY PROFILE: CROATIA
FIGURE 4 . CMIP5 ensemble projected change (32 GCMs) in annual temperature (top) and precipitation (bottom) by 2040–2059 (left) and by 2080–2099 (right), relative to 1986–2005 baseline under RCP8 519
19 WBG Climate Change Knowledge Portal (CCKP, 2021). Croatia Climate Data - Projections. URL: https://climateknowledgeportal.worldbank.org/country/croatia/climate-data-projections

9CLIMATE RISK COUNTRY PROFILE: CROATIA
Historical RCP 2.6 RCP 4.5 RCP 6.0 RCP 8.5
1980 2000 2020 2040 2060 2080 2100Year
18
17
16
15
14
13
12
11
10
Tem
pera
ture
(°C
)
FIGURE 5 . Projected average temperature for Croatia (Reference Period, 1986–2005)22
Jan Feb Mar Apr May Jun Jul Aug Sep Oct Nov Dec
20
18
16
14
12
10
8
6
4
2
0
Day
s
FIGURE 6 . Projected change in Summer Days (Tmax >25°C) (RCP8 5, Ensemble, Reference Period, 1986-2005)23
Key TrendsTemperatureCroatia is expected to become hotter and drier, especially in the summer. Climate change trends are projected to
increase temperatures and decrease water availability across Croatia over this century.20 Trends in temperature
show warming throughout Croatia, with higher temperatures in the mainland than the coast or the Dalmatian
areas. Maximum temperatures are expected to see the greatest degree of change, per decade. As demonstrated
in Table 3, CCKP data analysis for high emission scenarios, show monthly mean temperature changes increasing
by 1.36°C by the 2030s to more than 4°C by the 2090s. Temperature trends will see significant increase in
summer months (May to September) as well as winter and spring seasons. Minimum temperatures are projected
to experience the largest increase through mid-century. Specific ‘new hot spots’ are in the northern and western
areas of Croatia, the northern regions in Gorski Kotar and the eastern part of Lika during its winter months. The
coastal areas will experience the biggest change during summer seasons.21
Across all emission scenarios, temperatures will continue to increase for Croatia throughout the end of the century.
As seen in Figure 5, under a high-emission scenario, average temperatures will increase rapidly by mid-century.
Across the seasonal cycle (Figure 5), temperature increases will spike will be felt from April to June and again in
September and October. Increased heat and extreme heat conditions will result in significant implications for public,
the agricultural sector and water resources.
20 EU (2017). Draft Climate change Adaptation Strategy in the Republic of Croatia for the period to 2040 with a view to 2070 (White book). Croatia. URL: http://prilagodba-klimi.hr/wp-content/uploads/docs/Draft%20CC%20Adaptation%20Strategy.pdf
21 Ministry of Environment and Nature Protection (2018). Seventh National Communication (NC6) and Third Biennial Report of The Republic of Croatia Under The United Nations Framework Convention On Climate Change URL: https://unfccc.int/sites/default/files/resource/2671905483_Croatia-NC7-BR3-2-96481035_Croatia-NC7-BR3-2-7.%20NC%20i%203.%20BR_resubmission_IX_2018_0.pdf
22 WBG Climate Change Knowledge Portal (CCKP, 2021). Interactive Climate Indicator Dashboard - Agriculture. Croatia. URL https://climatedata.worldbank.org/CRMePortal/web/agriculture/crops-and-land-management?country=HRV&period=2080-2099
23 WBG Climate Change Knowledge Portal (CCKP, 2021). Interactive Climate Indicator Dashboard - Agriculture. Croatia. URL https://climatedata.worldbank.org/CRMePortal/web/agriculture/crops-and-land-management?country=HRV&period=2080-2099

10CLIMATE RISK COUNTRY PROFILE: CROATIA
PrecipitationFuture precipitation trends for the country are projected to decline steadily over the century, (eastern areas may
experience increased rainfall), however these negative trends are primarily recognized in the summer months in the
mountain regions as well as in the Adriatic areas. Annual decreases in precipitation are also expected in Istria and
Gorski Kotar, due to reduced spring rainfall. An increased number of consecutive dry days are expected to be seen over
the spring season for the northern Adriatic, with summer
seasons seeing an extended number of dry days reach
the southern coast of Croatia. Through the mid-century,
the largest decrease (just over 10 %) will be in the spring
in the southern areas of Dalmatia and in the summer
(10–15%) in the mountainous areas and in northern
Dalmatia. The largest increase in total precipitation, 5–10
%, is expected on the islands in autumn and in northern
Croatia in winter.24 Figure 7 shows the change in the
projected annual average precipitation for Croatia.25 At
a nationally aggregated scale, mean annual precipitation
for the country is expected to remain largely similar;
however, at regional scales, western and specifically
southern areas are expected to experience the most
significant reduction in precipitation.Historical RCP 2.6 RCP 4.5 RCP 6.0 RCP 8.5
1980 2000 2020 2040 2060 2080 2100Year
1100
1000
900
800
700
600
500
400P
reci
pita
tion
(mm
)
FIGURE 7 . Projected annual average precipitation in Croatia (Reference Period, 1986–2005)26
CLIMATE CHANGE RELATED NATURAL HAZARDS
OverviewCroatia, and neighboring southeast European sub-region, are at risk to natural disasters, which primarily affect
the region’s agricultural, water and energy sectors, through seasonal flooding, aridity, and periods of drought.
Temperatures are already observed to be increasing, precipitation is decreasing across key agricultural zones, and
an increase in the intensity and frequency of extreme weather events — especially droughts and heat waves have
been observed.27 This also indicates scenarios for the increasing risk of wildfires. Croatia is at risk to earthquakes
(Dinaric Arc, northwestern Croatia), flooding (Pannonia), landslides (northwestern Croatia), water scarcity (coastal
area and islands) as well as extreme heat (throughout the country). This is expected to impact agriculture and water
sectors as well as wider population health. Vulnerable groups, such as those with fewer economic opportunities
24 Ministry of Environment and Nature Protection (2018). Seventh National Communication (NC6) and Third Biennial Report of The Republic of Croatia Under The United Nations Framework Convention On Climate Change URL: https://unfccc.int/sites/default/files/resource/2671905483_Croatia-NC7-BR3-2-96481035_Croatia-NC7-BR3-2-7.%20NC%20i%203.%20BR_resubmission_IX_2018_0.pdf
25 WBG Climate Change Knowledge Portal (CCKP, 2021). Croatia Water Dashboard. Data Description. URL: https://climateknowledgeportal. worldbank.org/country/croatia/climate-sector-water
26 WBG Climate Change Knowledge Portal (CCKP, 2021). Climate Data-Projections. Croatia. URL: https://climateknowledgeportal.worldbank.org/country/croatia/climate-sector-water
27 EU (2017). Draft Climate change Adaptation Strategy in the Republic of Croatia for the period to 2040 with a view to 2070 (White book). Croatia. URL: http://prilagodba-klimi.hr/wp-content/uploads/docs/Draft%20CC%20Adaptation%20Strategy.pdf

11CLIMATE RISK COUNTRY PROFILE: CROATIA
and the young and elderly are particularly at risk to natural hazards and the increasing impacts of climate change.
Croatia has already endured various natural hazards, including droughts, floods, extreme temperatures, storms and
wildfires. Croatia is also highly prone to earthquakes, and after relative quietness in the past 20 years,28 Croatia was
hit by two strong earthquakes: M5.5 on 22 March, 2020 (wider Zagreb capital area)29 and M6.4 on 29 December,
2020 (Sisak-Moslavina County area, ca 40 km south of Zagreb)30 killing several people, causing extensive damage
to numerous homes and infrastructure as well as causing loss of livelihoods.31
Nearly a quarter of the Croatian economy is based on sectors potentially vulnerable to climate change and
extreme weather, including agriculture and tourism. This accounts for €9.23 billion a year. Between 2000 and
2007, extreme weather including droughts and floods caused average annual losses in the agricultural sector of
€173 million. The energy sector has also been affected by extreme weather: the 2003 drought cost the government
€63–69 million in compensation for power outages caused by reduced river flow and hydropower production.
Natural hazards resulting in these types of issues are likely to become more common over the coming century.32,33
Data from the Emergency Event Database: EM-Dat, presented in Table 4, shows the country has endured various
natural hazards.
TABLE 4 . Natural disasters in Croatia, 1900–202034
Natural Hazard 1900–2020 Subtype
Events Count
Total Deaths Total Affected
Total Damage (′000 USD)
Drought Drought 1 0 0 330,000
Earthquake Ground Movement 3 8 indirectly over 1.5 million
∼ $19.2 billion USD (2020 earthquakes)
Extreme Temperatures
Cold Wave 3 7 0 0
Heat Wave 2 828 200 240,000
Severe Winter Conditions
1 5 0 0
FloodFlash Flood 2 0 3,200 0
Riverine Flood 7 3 10,576 80,000
Storm Convective Storm 2 2 3,500 161,000
Wildfire Forest Fire 6 13 106 37,750
28 Hadzima-Nyarko, M. and Sipos, T. (2017). Insights from existing earthquake loss assessment research in Croatia. Earthquakes and structures. 13(4). pp. 401–411. URL: http://www.techno-press.org/content/?page=article&journal=eas&volume=13&num=4&ordernum=3
29 World Bank Group (2020). Overlooked: Examining the impact of disasters and climate shocks on poverty in the Europe and Central Asia Region. Washington, DC: World Bank. URL: http://documents1.worldbank.org/curated/en/493181607687673440/pdf/Overlooked-Examining-the-Impact-of-Disasters-and-Climate-Shocks-on-Poverty-in-the-Europe-and-Central-Asia-Region.pdf
30 Croatian Geological Society (2021). Petrinja Area Earthquake Report: URL: https://www.hgi-cgs.hr/press-release-of-the-croatian-geological-survey-hgi-cgs/
31 Uhlir, Z., Ivos, S., Orsanic, D., Bogaerts, V. R., Stanton-Geddes, Z., Katic, K. (2020). Croatia Earthquake – Rapid Damage and Needs Assessment 2020. Washington, D.C.; World Bank Group. URL: http://documents1.worldbank.org/curated/en/311901608097332728/pdf/ Croatia-Earthquake-Rapid-Damage-and-Needs-Assessment-2020.pdf
32 EU (2017). Report on the Estimated Climate Change Impacts and Vulnerability of Individual Sectors. URL: https://climate-adapt.eea.europa.eu/countries-regions/countries/croatia
33 EU (2012). Climate Vulnerability Assessment: Croatia. URL: http://www.seeclimateforum.org/upload/document/cva_croatia_-_english_final_print2.pdf
34 EM-DAT: The Emergency Events Database – Universite catholique de Louvain (UCL) – CRED, D. Guha-Sapir, Brussels, Belgium. URL: http://emdat.be/emdat_db/. Updated by the 2020 earthquakes data from various sources.

12CLIMATE RISK COUNTRY PROFILE: CROATIA
Key TrendsWhile many sectors in Croatia do have risk assessments,35 Croatia has yet to establish a functional data flow
mechanism in order to have comprehensive understanding of natural hazards in all sectors. Additionally, Croatia
does not have a central database which would systematically collect and analyze disaster loss data. The country
depends upon tourism and an increase in natural disasters in the coastal area are expected to cause significant
economic losses for the sector. Croatia’s population density and urban development greatly varies throughout the
country, and the urban coastal areas have experienced greater impacts from disasters.36
Flooding, including coastal and riverine, are particular
hazards for Croatia and damaging and potentially
life-threatening river floods are expected to occur at
least once in the next 10 years. Flooding along river
areas is considered an immediate as well as long-
term hazard for both rural and urban areas. Surface
flood hazards in urban and rural areas are also
expected to occur. Croatia is at risk to sea level rise
and resulting coastal area flooding, which will impact
coastal cities.37 Figure 8 demonstrates Croatia’s
current risk of landslides, which can be seen to be
particularly pronounced in the center of the country,
in the northwest area and along the coast.
Implications for DRMTo increase its resilience to natural hazards and climate change impacts, Croatia has plans, procedures and resources
to deal with a major disaster. However, it is still lacking in good coordination and disaster risk management,
especially in human capacity. At an operational level, the Croatian Red Cross (CRC) has contingency plans and
procedures which are in permanent upgrading process. Support to the most vulnerable population remains the
CRC’s priority and mandate. Croatian Waters has developed a well-organized flood defense structure at the national
level and activities are implemented in accordance with EU flood risk management directives. Croatia’s flood risk
management is coordinated through the national and local level as well as on the trans-boundary level, supported
by flood forecast modelling and early warning responses. Croatia have also implemented strong landslide risk
management mechanisms, which are measured and undertaken by the Ministry of Construction and Physical
Planning. These institutions oversee landslide risk assessments as well as programs for landslide disaster recovery.39
FIGURE 8 . Croatia landslide risk38
35 Croatian Government (N.D). Disaster risk assessment for the Republic of Croatia/Procjena rizika od katastrofa za Republiku Hrvatsku. URL: https://civilna-zastita.gov.hr/UserDocsImages/DOKUMENTI_PREBACIVANJE/PLANSKI%20DOKUMENTI%20I%20UREDBE/Procjena%20rizika%20od%20katastrofa%20za%20RH.pdf
36 GFDRR (2018). Croatia – Landslide Risk URL: https://www.gfdrr.org/sites/default/files/Croatia.pdf37 ThinkHazard! (2020). Croatia. URL: http://thinkhazard.org/en/report/62-croatia38 Global Risk Data Platform (2019). Croatia. URL: http://preview.grid.unep.ch/index.php?preview=map&lang=eng39 Arbanas, S. et al. (2019). Landslide risk management in Croatia: Current state. Proceedings of the 4th Symposium on Landslides in
the Adriatic-Balkan Region, Sarajevo, 2019. DOI: doi.org/10.35123/ReSyLAB_2019_40

13CLIMATE RISK COUNTRY PROFILE: CROATIA
Overall, Croatia is working to improve its resilience to increased risk of natural hazards and reduce vulnerability of
local communities and institutions to better prepare for and mitigate and respond to natural hazards and climate
change. It has incorporated disaster risk reduction strategies in all sector strategies. Additional cross-sector
coordination and collaboration as well as the development of early warning systems can improve the country’s
preparedness and resilience.40 Wider adoption and implementation of the planning tools such as the European
Flood Awareness System (EFAS) can also help to improve planning towards major risks, such as floods.41 Following
its recent earthquakes, Croatia is working to assess its DRM processes, specifically in response to earthquakes
and increase its ability to prepare for disasters as well as mitigate future impacts. This includes the allocation of
resources and for establishing the necessary legal framework covering all aspects of material and social recovery.
The implementation of measures to strengthen existing buildings and to mitigate earthquake risks is a key factor
in improving the resilience of the community in the future.42
CLIMATE CHANGE IMPACTS TO KEY SECTORS
Croatia is expected to experience a range of adverse impacts of climate change throughout the country
and across all sectors, the most significant impacts being more frequent and intense droughts, changing
precipitation patterns, prevalence of new disease vectors, increases in air and sea surface temperature, and
increasing number of consecutive dry and hot days. Visible signs of climate change include annual variation in crop
yields, sea level rise, a longer tourism season and the potential development of new tourism destinations due to
changes in local climates.43 Variable precipitation and increasing temperatures are resulting in an increasingly riskier
agricultural and water availability environment. Furthermore, climate change and global temperature increases are
impacting sea level rise, which will also have an impact in the country. Climate change is expected to impact major
economic sectors of the country such as tourism and agriculture. Financial constraints and limited institutional
capacity have limited adaptation capabilities and effective response to climatic hazards in the country. This further
threatens future sustainable agricultural production as well as the opportunity to expand and sustain tourism.
GenderAn increasing body of research has shown that climate-related disasters have impacted human populations in many
areas including agricultural production, food security, water management and public health. The level of impacts
and coping strategies of populations depends heavily on their socio-economic status, socio-cultural norms, access
to resources, poverty as well as gender. Research has also provided more evidence that the effects are not gender
neutral, as women and children are among the highest risk groups. Key factors that account for the differences
40 Holcinger, (2015). National progress report on the implementation of the Hyogo Framework for Action (2013–2015)-Croatia. URL: https://www.preventionweb.net/files/40137_HRV_NationalHFAprogress_2013-15.pdf
41 Dottori, F., et al. (2017). An operational procedure for rapid flood risk assessment in Europe. Nat. Hazards Earth Syst. Sci., 17, pp. 1111–1126.
42 Government of Croatia. (2020). Croatia Earthquake – Rapid Damage and Needs Assessment 2020. World Bank Group. URL: http:// documents1.worldbank.org/curated/en/311901608097332728/pdf/Croatia-Earthquake-Rapid-Damage-and-Needs-Assessment- 2020.pdf
43 EU (2017). Report on the Estimated Climate Change Impacts and Vulnerability of Individual Sectors. URL: https://climate-adapt.eea.europa.eu/countries-regions/countries/croatia

14CLIMATE RISK COUNTRY PROFILE: CROATIA
between women’s and men’s vulnerability to climate change risks include: gender-based differences in time use;
access to assets and credit, treatment by formal institutions, which can constrain women’s opportunities, limited
access to policy discussions and decision making, and a lack of sex-disaggregated data for policy change.44
Agriculture
OverviewAgriculture in Croatia is divided into crop production, livestock production, and fishing. Crop production includes
arable land and gardens, kitchen gardens, orchards, olive groves, vineyards, meadows and pastures, nurseries and
land with osier willows. Utilized agricultural areas comprised 23.4% of the country’s total land area. Agricultural
cultivation includes cereals (maize, wheat and barley), dried pulses, root and tuber crops, industrial plants (soy-bean,
sugar beet, sunflower, rape seed), vegetables, green fodder from arable land as well as other arable crops, flowers
and ornamental plants, seed crops and seedlings and fallow land.45 Croatia’s fishing sector is divided into maritime
and freshwater fishing. Maritime fishing occurs in the Croatian sea and freshwater fishing in ponds and open
freshwater. The majority of catch is blue fish but also includes other fish, crustaceans and oysters, other mollusks
and shellfish. Mari-culture includes fish farms for white fish (mostly sea bass and sea bream), blue fish (tuna) and
shellfish (mussels, oysters).46
Climate Change ImpactsThe agricultural sector is particularly vulnerable to climate change, due to its weather dependence.47,48 Extreme
weather events such as droughts and hail have resulted in average losses of €76 million per year from
2000–2007; 0.6% of national GDP.49 Changing climate conditions for the country may impact the annual
number of days of active vegetation (with temperature above 5°C) increases in the lowland parts the country.
This may result in cultivation of individual plants being moved depending on culture needs for heat, light and water
and will result in changing the crop rotation in farming areas, suitable areas for orchards, vineyards and olive
groves are likely to move, areas currently unsuitable for agriculture may become attractive. Increased temperatures
coupled with capability to provide adequate water (irrigation) could bring a positive effect on the increase in yields,
especially winter crops which will be cultivated under mild winter conditions. Adverse impacts i.e. drought risk,
44 World Bank Group (2016). Gender Equality, Poverty Reduction, and Inclusive Growth. URL: http://documents1.worldbank.org/curated/en/820851467992505410/pdf/102114-REVISED-PUBLIC-WBG-Gender-Strategy.pdf
45 Igor, B., Josip, T. and Paulo, P. (2020). Agriculture Management Impacts on soil Properties and Hydrological Response in Istris. Agronomy. 10(2). DOI: https://doi.org/10.3390/agronomy10020282
46 Ministry of Environment and Nature Protection (2018). Seventh National Communication (NC6) and Third Biennial Report of The Republic of Croatia Under The United Nations Framework Convention On Climate Change URL: https://unfccc.int/sites/default/files/resource/2671905483_Croatia-NC7-BR3-2-96481035_Croatia-NC7-BR3-2-7.%20NC%20i%203.%20BR_resubmission_IX_2018_0.pdf
47 EU (2017). Report on the Estimated Climate Change Impacts and Vulnerability of Individual Sectors. URL: https://climate-adapt.eea.europa.eu/countries-regions/countries/croatia
48 EU (2012). Climate Vulnerability Assessment: Croatia. URL: http://www.seeclimateforum.org/upload/document/cva_croatia_-_english_final_print2.pdf
49 EU (2017). Draft Climate change Adaptation Strategy in the Republic of Croatia for the period to 2040 with a view to 2070 (White book). Croatia. URL: http://prilagodba-klimi.hr/wp-content/uploads/docs/Draft%20CC%20Adaptation%20Strategy.pdf

15CLIMATE RISK COUNTRY PROFILE: CROATIA
hail, flood, frost, etc., may impact production of key staple crops, such as winter wheat and maize.50 Warmer sea
temperatures are likely to impact the fishing industry, potentially through an increased number of invasive species
and changing locations of shoals, which will in turn affect the economy of coastal provinces and islands. Diminished
surface runoff may also affect groundwater levels, affecting drinking water supplies as well as water availability for
irrigation needs.
The projected increased heat will increase stress on
crops and is also likely to alter the length of the growing
seasons. Decreased water availability is likely to further
reduce yields and the reduction in soil moisture may
alter suitable areas for agriculture or the production
of specific crops. Increased heat and water scarcity
conditions are likely to increase evapotranspiration,
expected to contribute to crop failure and overall
yield reductions.51 Figure 9 shows the average daily
maximum-temperature across seasonal cycles. These
higher temperatures, occurring throughout the year,
have implications for soil moisture and crop growth;
summer spikes in temperature will have impacts for
harvest seasons as well as the country’s tourism
industry and energy production and distribution.
Adaptation OptionsExpanded irrigation is one measure which can prevent or minimize the effects of climate change, in particular for
areas experiencing decreased precipitation. The reduction in crop cultures without irrigation, in average climate
conditions, can vary from 10% to 60 %, while in extreme dry conditions, it can be up to 90% depending on culture,
soil and area. Increasing the irrigated area of arable land in Croatia is likely to be necessary to maintain crop yields.
In the long term, investment in further research is required to develop detailed, economically sound adaptation
measures in this area, including the development of the agricultural education sector. Potential measures include
promoting crop rotation and encouraging farmers to use new crop varieties, including drought resistant and faster-
growing varieties.53,54 Capacity building programs are also necessary to develop educational programs for farmers,
Jan Feb Mar Apr May Jun Jul Aug Sep Oct Nov Dec
16
14
12
10
8
6
4
2
0
Tem
pera
ture
(°C
)
FIGURE 9 . Projected average daily max temperature for Croatia (RCP8 5, Ensemble, Reference Period, 1986-2005)52
50 Ministry of Environment and Nature Protection (2014). Seventh National Communication (NC6) and Third Biennial Report of The Republic of Croatia Under the United Nations Framework Convention On Climate Change URL: https://unfccc.int/sites/default/files/resource/2671905483_Croatia-NC7-BR3-2-96481035_Croatia-NC7-BR3-2-7.%20NC%20i%203.%20BR_resubmission_IX_2018_0.pdf
51 Ministry of Environment and Nature Protection (2018). Seventh National Communication (NC6) and Third Biennial Report of The Republic of Croatia Under the United Nations Framework Convention On Climate Change URL: https://unfccc.int/sites/default/files/resource/2671905483_Croatia-NC7-BR3-2-96481035_Croatia-NC7-BR3-2-7.%20NC%20i%203.%20BR_resubmission_IX_2018_0.pdf
52 WBG Climate Change Knowledge Portal (CCKP, 2020). Croatia Agriculture. Dashboard URL: https://climatedata.worldbank.org/CRMePortal/web/agriculture/crops-and-land-management?country=HRV&period=2080-2099
53 EU (2017). Report on the Estimated Climate Change Impacts and Vulnerability of Individual Sectors. URL: https://climate-adapt.eea.europa.eu/countries-regions/countries/croatia
54 EU (2012). Climate Vulnerability Assessment: Croatia. URL: http://www.seeclimateforum.org/upload/document/cva_croatia_-_english_final_print2.pdf

16CLIMATE RISK COUNTRY PROFILE: CROATIA
advising services, administrative staff, scientists, teachers and community stakeholders. Scientific agricultural
research is necessary to:
• initiate (finance) improvement projects focused on the development of populations and varieties adapted to
soil types and climate conditions in Croatia’s agricultural regions that will meet new requirements in the future,
• initiate permanent research into existing agricultural crops (maize, wheat, potato, apple, wine grape) in the areas
of Croatia or abroad (through international cooperation) containing already elements of the model predicted,
• investigate new systems of tillage, sowing (planting), sowing density, cultivation.55
Water
OverviewCroatia is characterized by significant wetland areas, especially in typically flooded areas of Drava, Danube, Sava
and Neretva catchments. While the country has a positive average water balance, the interannual distribution
of water quantities is not favorable due to the significant spatial and time difference across the country’s water
resource distribution. Croatia has a wide allocation of surface (rivers, lakes, transitional and coastal waters) and
ground waters, which are part of either Black Sea or Adriatic catchment area with watersheds running along the
mountain and alpine area. Large watercourses such as Sava, Drava and Danube with many smaller sub-catchments
dominate the Black Sea catchment area. In the Adriatic catchment area, the abundance and the length of surface
watercourses are significantly lower, but there are significant groundwater flows through karst systems. The River
of Danube, the largest and richest in water, flows through the eastern borderland of the Republic of Croatia. The
largest rivers in Istria are Mirna, Dragonja and Raša, and in Dalmatia these are Zrmanja, Krka, Cetina, and Neretva.
The Mediterranean, including the Croatian Adriatic coastline, is affected by global sea-level rises caused by thermal
expansion of the oceans and melting of the polar ice caps. Particularly at-risk from sea level rise are Croatia’s low
islands such as Krapanj (only 1.5 m above sea level) and river deltas (i.e. the Neretva river delta) which includes
large areas of agricultural land) which are vulnerable to coastal flooding as well as salinization.56,57
Climate Change ImpactsClimate change will impact Croatia’s water supply, impacting demand from the agricultural sector as well as
increasing drinking requirements. Annual distribution (and changing patterns) of rainfall is of great interest to the
water industry as the distribution of water throughout the year is critical for planning of resources as well as for
safety against disasters. Infrastructure and water management strategies are closely tuned to the annual cycle of
supply and demand. In Croatia, projected temperature and precipitation trends are likely to result in hydrological
55 Ministry of Environment and Nature Protection (2018). Seventh National Communication (NC6) and Third Biennial Report of The Republic of Croatia Under The United Nations Framework Convention On Climate Change URL: https://unfccc.int/sites/default/files/resource/2671905483_Croatia-NC7-BR3-2-96481035_Croatia-NC7-BR3-2-7.%20NC%20i%203.%20BR_resubmission_IX_2018_0.pdf
56 EU (2017). Report on the Estimated Climate Change Impacts and Vulnerability of Individual Sectors. URL: https://climate-adapt.eea.europa.eu/countries-regions/countries/croatia
57 EU (2012). Climate Vulnerability Assessment: Croatia. URL: http://www.seeclimateforum.org/upload/document/cva_croatia_-_english_ final_print2.pdf

17CLIMATE RISK COUNTRY PROFILE: CROATIA
impacts of the country’s watercourses, such as catchments, rivers and coastlines. Increasing temperatures will
also play an adverse role in evapotranspiration, changes in groundwater inflow, water level in rivers and lakes, and
water temperatures. Changes in precipitation will influence not only the discharge, but the intensity, time period
and frequency of floods and droughts as well as soil humidity, ground water recharge and the amount of water
flowing through rivers.58 Some estimates expect discharges in the largest watercourses to decrease by 10% to
20%, although in eastern parts of the country such change could be less than 10%.59 Additional natural resources
such as wetlands services (flood protection, water filtration, etc.) could also be at risk in a drier future.
Rainfall and evaporation changes also impact rates of surface water infiltration and the recharge rates for
groundwater. Low-water storage capacity increases the country’s dependence on unreliable rainfall patterns.
Changes in rainfall and evaporation for Croatia are expected to translate directly to changes in surface water
infiltration and groundwater re-charge. This has the potential for further decreased reliability of unimproved
groundwater sources and surface water sources during droughts or prolonged dry seasons. Increased strain on
pumping mechanisms leading to breakdowns if maintenance is neglected and the potential for falling water levels
in the immediate vicinity of well or borehole, particularly in areas of high demand.60 Additionally, temperature
increases have the potential to result in increased soil moisture deficits even under conditions of increasing rainfall.
Figure 10 shows the projected annual Standardized
Precipitation Evapotranspiration Index (SPEI) through the
end of the century. The SPEI is an index which represents
the measure of the given water deficit in a specific
location, accounting for contributions of temperature-
dependent evapotranspiration and providing insight
into increasing or decreasing pressure on water
resources. Negative values for SPEI represent dry
conditions, with values below −2 indicating severe
drought conditions, likewise positive values indicate
increased wet conditions. This is an important
understanding for the water sector in regard to
quantity and quality of supply for human consumption
and agriculture use as well as for the energy sector
as reductions in water availability impacts river flow and
the hydropower generating capabilities. At a nationally aggregated scale, Croatia is projected to experience heightened
dry conditions and drought severity, which will likely increase pressure on water resources for the country and region
by mid-century and by end of the century.
Historical RCP 2.6 RCP 4.5 RCP 6.0 RCP 8.5
1.0
0.5
0
–0.5
–1.0
–1.5
–2.0
–2.5
–3.0
–3.5
Inde
x
FIGURE 10 . Projected annual SPEI Drought Index in Croatia for the period, 2080–2099 (Reference Period, 1986–2005)61
58 EU (2017). Draft Climate change Adaptation Strategy in the Republic of Croatia for the period to 2040 with a view to 2070 (White book). Croatia. URL: http://prilagodba-klimi.hr/wp-content/uploads/docs/Draft%20CC%20Adaptation%20Strategy.pdf
59 EU (2017). Report on the Estimated Climate Change Impacts and Vulnerability of Individual Sectors. URL: https://climate-adapt.eea.europa.eu/countries-regions/countries/croatia
60 Oresic, D. and Canjevac, I. (2019). Groundwater resources in Croatia. Water Resources Management in Balkan Countries. URL: https:// link.springer.com/chapter/10.1007/978-3-030-22468-4_5
61 WBG Climate Change Knowledge Portal (CCKP, 2020). Croatia Water Sector Dashboard. URL: https://climatedata.worldbank.org/CRMePortal/web/water/land-use-/-watershed-management?country=HGV&period=2080-2099

18CLIMATE RISK COUNTRY PROFILE: CROATIA
Adaptation OptionsClimate change adaptation for the water sector in Croatia requires further investments in flood defense and a more
integrated approach to water resources management. Shortage of water is expected in the long run during the
vegetation period and the tourist season, when water requirements reach peak demand. Additional research should
be undertaken as well as enhanced cooperation with other countries where positive experiences in combating
drought could be applied. Capacity can be developed to simulate the physical impacts of climate on the supply,
distribution and quality of freshwater resources. An improved ability to downscale global climate model results to
the level of catchments, can improve monitoring through identification of results suitable for correlation with data
from existing runoff gauges and weather stations used for monitoring. Improved management of groundwater
extraction can aid to sustainability of Croatia’s water resources and its sustainable recharge.62 Within Croatia’s
water sector, several adaptation objectives should be prioritized:
• strengthening monitoring, research, education and management capacities at various levels and domains for
climate change impact analysis and adaptation measures,
• strengthening the capacity for construction, reconstruction and upgrading of existing systems for protection
against harmful effects of water, systems for water use and for protection of waters in a new (future) climate
conditions,
• strengthening the resilience of coastal water and communal infrastructure to the possible impacts of climate
change,
• strengthening the capacity to protect natural water and marine systems, and especially protected areas, from
the negative effects of climate change as well as for their adaptation.63
Croatia would benefit from the establishment of a national database and system of rainfall-runoff models to
project the effects of rainfall changes (for climate variability and climate change) on runoff and discharges
(including peak and low flows). This should be done in important river basins and catchments and linked to an
expanded national runoff and flooding reporting system. As such, Croatia’s Water Sector should undertake a
program to map existing groundwater resources in a comprehensive fashion, and then develop the databases
and models needed to simulate the effects of climate variability and climate change on groundwater recharge,
storage and water quality.64
62 Oresic, D. and Canjevac, I. (2019). Groundwater resources in Croatia. Water Resources Management in Balkan Countries. URL: https://link.springer.com/chapter/10.1007/978-3-030-22468-4_5
63 Ministry of Environment and Nature Protection (2018). Seventh National Communication (NC6) and Third Biennial Report of The Republic of Croatia Under The United Nations Framework Convention On Climate Change URL: https://unfccc.int/sites/default/files/resource/2671905483_Croatia-NC7-BR3-2-96481035_Croatia-NC7-BR3-2-7.%20NC%20i%203.%20BR_resubmission_IX_2018_0.pdf
64 Holcinger, (2015). National progress report on the implementation of the Hyogo Framework for Action (2013–2015)- Croatia. URL: https://www.preventionweb.net/files/40137_HRV_NationalHFAprogress_2013-15.pdf

19CLIMATE RISK COUNTRY PROFILE: CROATIA
Energy
OverviewCroatia’s energy sector is sensitive to changes in seasonal weather patterns and extremes that can affect the supply
of energy, impact transmission capacity, disrupt oil and gas production, and impact the integrity of transmission
pipelines and power distribution. Due to the country’s existing hydropower plants and the recent additions of wind
and solar generating capabilities, Croatia is exceeding the EU renewable energy target of 20% in final energy
consumption by 2020. However, wind and solar capacity accounted for just 11% of total generation capacity
in 2018.65 The production of natural gas, crude oil and heat generated by use of heat pumps also decreased.
Natural gas production has also decreased, while production of fuel wood and biomass and of other renewables
has increased over the past decade.66 Other renewable energy sources such as geothermal energy, biodiesel and
biogas, while contributing minimal amounts to overall generation, are important prospects.
Climate Change ImpactsIn Croatia, hydro-electric power generation makes up half of all electricity production. Decreased river flow would
lead to a reduction of hydro-electric power production resulting in significant extra costs, estimated at tens of
millions of Euros, to replace the generating capacity if river flow is reduced. This is likely to occur due to reduction
in rainfall and river flow disruptions. The projected decrease in precipitation, especially for key hydrologic zones as
well as change in seasonal rainfall patterns are likely to reduce hydropower potential and revenue losses. Increased
evaporation rates from existing water storage facilities may also increase production costs; costs that will inevitably
be transferred to the consumer.
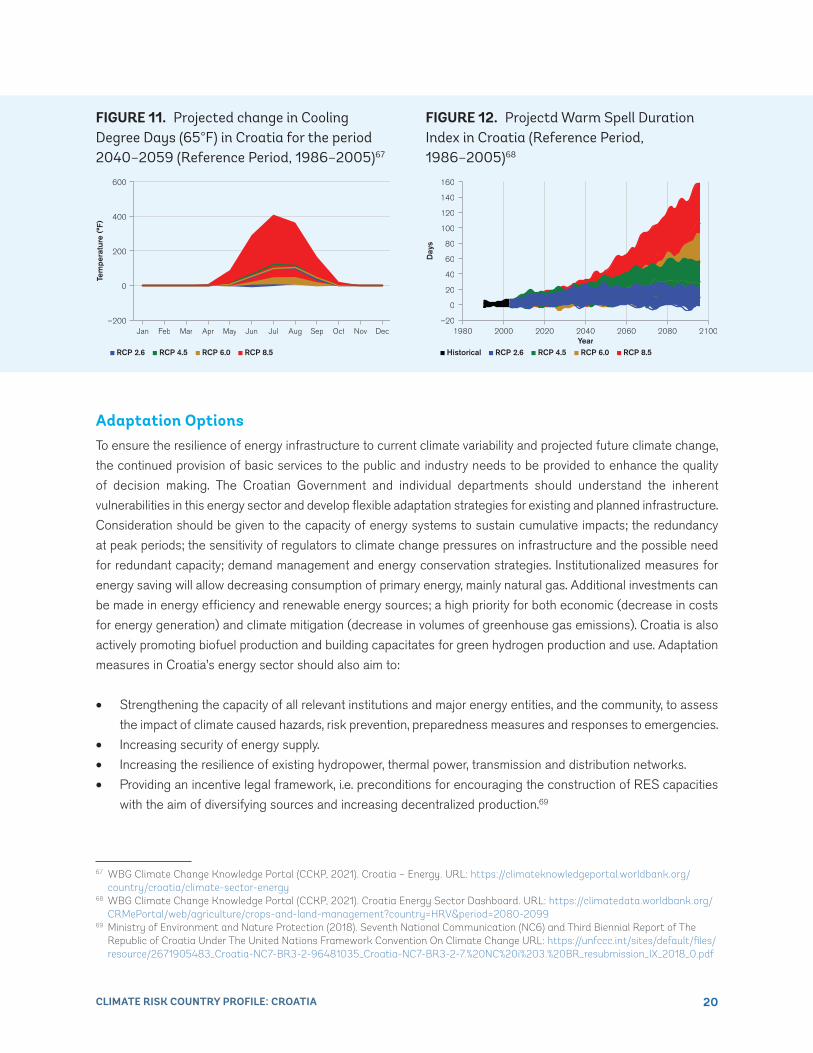
Cooling Degree Days show the relationship between daily heat and cooling demand, typically sourced through a form
of active cooling or an evaporative process. The change in cooling degree days provides insight into the potential
for extended seasons of power demand or periods in which cooling demand (power demands) might increase. As
seen in Figure 11, seasonal increases for cooling demands are expected to increase over an extended summer
period (May to September). The Warm Spell Duration Index represents the number of days in a sequence of at least
six days in which the daily maximum temperature is greater than the 90th percentile of daily maximum temperature.
As shown in Figure 12, warm spells are expected to sharply increase in the second half of the century.
65 World Bank (2018). Croatia Energy Sector Note. Energy and Extractives, Poverty and Equity Global Practices Europe and Central Asia Region (ECA). URL: http://documents1.worldbank.org/curated/en/126131551124308323/pdf/AUS0000353-WP-REVISED-P166022-PUBLIC.pdf
66 Ministry of Environment and Nature Protection (2018). Seventh National Communication (NC6) and Third Biennial Report of The Republic of Croatia Under The United Nations Framework Convention On Climate Change URL: https://unfccc.int/sites/default/files/resource/2671905483_Croatia-NC7-BR3-2-96481035_Croatia-NC7-BR3-2-7.%20NC%20i%203.%20BR_resubmission_IX_2018_0.pdf
20CLIMATE RISK COUNTRY PROFILE: CROATIA
Adaptation OptionsTo ensure the resilience of energy infrastructure to current climate variability and projected future climate change,
the continued provision of basic services to the public and industry needs to be provided to enhance the quality
of decision making. The Croatian Government and individual departments should understand the inherent
vulnerabilities in this energy sector and develop flexible adaptation strategies for existing and planned infrastructure.
Consideration should be given to the capacity of energy systems to sustain cumulative impacts; the redundancy
at peak periods; the sensitivity of regulators to climate change pressures on infrastructure and the possible need
for redundant capacity; demand management and energy conservation strategies. Institutionalized measures for
energy saving will allow decreasing consumption of primary energy, mainly natural gas. Additional investments can
be made in energy efficiency and renewable energy sources; a high priority for both economic (decrease in costs
for energy generation) and climate mitigation (decrease in volumes of greenhouse gas emissions). Croatia is also
actively promoting biofuel production and building capacitates for green hydrogen production and use. Adaptation
measures in Croatia’s energy sector should also aim to:
• Strengthening the capacity of all relevant institutions and major energy entities, and the community, to assess
the impact of climate caused hazards, risk prevention, preparedness measures and responses to emergencies.
• Increasing security of energy supply.
• Increasing the resilience of existing hydropower, thermal power, transmission and distribution networks.
• Providing an incentive legal framework, i.e. preconditions for encouraging the construction of RES capacities
with the aim of diversifying sources and increasing decentralized production.69
Jan Feb Mar Apr May Jun Jul Aug Sep Oct Nov Dec
Tem
pera
ture
(°F
)
0
200
400
–200
600
RCP 2.6 RCP 4.5 RCP 6.0 RCP 8.5
FIGURE 11 . Projected change in Cooling Degree Days (65°F) in Croatia for the period 2040–2059 (Reference Period, 1986–2005)67
Historical RCP 2.6 RCP 4.5 RCP 6.0 RCP 8.5
1980 2000 2020 2040 2060 2080 2100Year
160
140
120
100
80
60
40
20
0
–20
Day
s
FIGURE 12 . Projectd Warm Spell Duration Index in Croatia (Reference Period, 1986–2005)68
67 WBG Climate Change Knowledge Portal (CCKP, 2021). Croatia – Energy. URL: https://climateknowledgeportal.worldbank.org/country/croatia/climate-sector-energy
68 WBG Climate Change Knowledge Portal (CCKP, 2021). Croatia Energy Sector Dashboard. URL: https://climatedata.worldbank.org/CRMePortal/web/agriculture/crops-and-land-management?country=HRV&period=2080-2099
69 Ministry of Environment and Nature Protection (2018). Seventh National Communication (NC6) and Third Biennial Report of The Republic of Croatia Under The United Nations Framework Convention On Climate Change URL: https://unfccc.int/sites/default/files/resource/2671905483_Croatia-NC7-BR3-2-96481035_Croatia-NC7-BR3-2-7.%20NC%20i%203.%20BR_resubmission_IX_2018_0.pdf

21CLIMATE RISK COUNTRY PROFILE: CROATIA
Health
OverviewCroatia’s health sector was heavily impacted by the economic crisis, which resulted in a significant increase in non-
standard or precarious employment, which has added to the country’s health burden.70 More recently, access to
public health services have been improved in response to more frequent heat-wave events. General practitioners,
public health workers and homecare nurses have been given specific training in preparation for heat-waves,
including risk communication.71
Climate Change ImpactsClimate change will pose numerous direct impacts and increasing risks to the country’s population health. Higher
incidence of hot and dry summers with increased night and day temperatures is expected and more frequent
occurrences of heat waves will pose a serious threat to human health, particularly for highly vulnerable groups:
elderly and chronically ill. In winter, vascular patients suffer most from situations of low air pressure. Low air
temperatures adversely affect the respiratory diseases and asthmatic attacks are more frequent in winter due
to cold high-pressure periods and in summer seasons are also associated with the movements of a cold front.
Predicted decline in frequency of winter cold weather is also expected to result in a reduction in the number of
coronary failures, cerebrovascular insults and asthmatic attacks in winter. The projected increasing temperatures
and the projected change in number of heat days through the 2050s, are expected to impact human and animal
health, as well as present more conducive environments for bacteria, pathogens and vector borne diseases.72
While heat related health problems may occur, deaths due to cold weather may decrease during the winter time.73
Additionally, tick-borne viral encephalitis, which is transmitted by forest ticks (Ixodes ricinus), typically occurs from
spring to autumn in Croatia. Warmer and longer autumns will contribute to the extension of tick activities, and mild
winters will favor strengthened and prolonged tick survival. As annual mean temperature rise, ticks are also likely to
spread to higher altitudes; a warmer and longer autumn time contributes to extension of tick prevalence.74
Warmer and drier conditions as projected by climate scenarios may favor the spread of diseases borne by food or
water, such as diarrhea and dysentery. A consequence of warmer summers and an extended vegetation season
may also see the number of patients becoming sensitized to and affected by respiratory allergies such as seasonal
allergic rhinitis and allergic asthma caused by pollen from the trees, grasses and weeds. A warmer and drier
climate will favor the spread of allergenic plants and an increase in the number of patients suffering from allergic
respiratory diseases.75
70 WHO (2019). Croatia: Health and Employment. URL: https://apps.who.int/iris/bitstream/handle/10665/324928/9789289054034-eng.pdf?sequence=1&isAllowed=y
71 WHO (2020). Croatia. URL: http://www.euro.who.int/__data/assets/pdf_file/0006/82293/croatia_protect_health_factsheets.pdf?ua=172 Ministry of Environment and Nature Protection (2014). Sixth National Communication (NC6) and First Biennial Report of The
Republic of Croatia Under The United Nations Framework Convention On Climate Change UR: https://unfccc.int/files/national_reports/annex_i_natcom_/application/pdf/hrv_nc6.pdf
73 EU (2017). Draft Climate change Adaptation Strategy in the Republic of Croatia for the period to 2040 with a view to 2070 (White book). Croatia. URL: http://prilagodba-klimi.hr/wp-content/uploads/docs/Draft%20CC%20Adaptation%20Strategy.pdf
74 Ministry of Environment and Nature Protection (2018). Seventh National Communication (NC6) and Third Biennial Report of The Republic of Croatia Under The United Nations Framework Convention On Climate Change URL: https://unfccc.int/sites/default/files/resource/2671905483_Croatia-NC7-BR3-2-96481035_Croatia-NC7-BR3-2-7.%20NC%20i%203.%20BR_resubmission_IX_2018_0.pdf
75 WHO (2010). Croatia. URL: http://www.euro.who.int/__data/assets/pdf_file/0006/82293/croatia_protect_health_factsheets.pdf?ua=1
https://apps.who.int/iris/bitstream/handle/10665/324928/9789289054034-eng.pdf?sequence=1&isAllowed=y
https://apps.who.int/iris/bitstream/handle/10665/324928/9789289054034-eng.pdf?sequence=1&isAllowed=y

22CLIMATE RISK COUNTRY PROFILE: CROATIA
Higher temperatures, heat waves and heat extremes are a major concern for Croatia. The annual distribution
of days with a high-heat index provides insight into the health hazard of heat. Figure 13 shows the expected
Number of Days with a Heat Index >35°C through the 2090s. Heat indices in Croatia accelerate by mid-century
and continuing to sharply increase under a high-emission scenario by end of the century. Increased health threats
can be projected and monitored through the frequency of tropical nights. Tropical Nights (>20°C) (Figure 14)
represents the projected increase in tropical nights for different emission scenarios to demonstrate the difference
in expected numbers of tropical nights; expected to rapidly increase in a high-emission scenario.
Historical RCP 2.6 RCP 4.5 RCP 6.0 RCP 8.5
1980 2000 2020 2040 2060 2080 2100Year
30
25
20
15
10
5
0
–5
–10
Day
s
FIGURE 13 . Projected days with a Heat Index >35°C (Reference Period, 1986–2005)76
Historical RCP 2.6 RCP 4.5 RCP 6.0 RCP 8.5
1980 2000 2020 2040 2060 2080 2100Year
80
70
60
50
40
30
20
10
0
–10
Nig
hts
FIGURE 14 . Projected number of Tropical Nights (Tmin >20°C) (Reference Period, 1986–2005)77
Adaptation OptionsCroatia’s healthcare system personnel should be trained to be more fully aware of the relationship between
climate change and variability and health impacts. There has been no specific training of the personnel in regard
to adaptation to climate change and mitigating its negative health impacts. Increases in training and capacity
can improve the level of knowledge and skills to prevent diseases connected with climatic factors, however this
knowledge remains relatively limited among the general population. Adaptation measures in health sector should
meet several specific objectives:
• To strengthen the competencies of the health system on the effects of climate change on health.
• To strengthen the competencies of the health system to respond during future adaptation.
• Identify sectoral priorities for action related to climate change.
• Expansion of the system of monitoring health and environmental indicators related to climate change and the
risk assessment system.
• Influence on the epidemiology of diseases related to climatological factors.78
76 WBG Climate Change Knowledge Portal (CCKP, 2021). Croatia Health Sector Dashboard. URL: https://climatedata.worldbank.org/CRMePortal/web/health/systems-and-service?country=HRV&period=2080-2099
77 WBG Climate Change Knowledge Portal (CCKP, 2021). Croatia Health Sector Dashboard. URL: https://climatedata.worldbank.org/CRMePortal/web/health/systems-and-service?country=HRV&period=2080-2099
78 Ministry of Environment and Nature Protection (2018). Seventh National Communication (NC6) and Third Biennial Report of The Republic of Croatia Under The United Nations Framework Convention On Climate Change URL: https://unfccc.int/sites/default/files/resource/2671905483_Croatia-NC7-BR3-2-96481035_Croatia-NC7-BR3-2-7.%20NC%20i%203.%20BR_resubmission_IX_2018_0.pdf

23CLIMATE RISK COUNTRY PROFILE: CROATIA
Early warning systems can also be developed to improve the country’s resilience by providing timely information on
the atmospheric state and effects of such a state on the organism. Additionally, biometeorological forecasts can
impact human health through daily public informing on expected meteorological conditions in order to give certain
advice on health protection and symptoms prevention. Similar information, such as Croatia’s bio-forecasts such as
Pollen-calendars regularly appear in daily press and radio and television news broadcasts.79 General awareness
campaigns regarding climate change and its impact to human health is critical, especially for most vulnerable
groups such as children and the elderly. The expansion of studied on the assessment of climate change impacts
on population health have been requested.
Tourism
Climate Change ImpactsThe tourism sector is a critical piece of the Croatian economy and has long played a central role in the country. The
sector generates approximately 20% GDP and 28% of total employment. Hotter daytime temperatures along the
Adriatic coast may cause many beach tourists to avoid these destinations in favor of cooler locations to the north. This
could have serious economic consequences on many local communities, given the important role of beach tourism,
also for the national economy. Alternatively, climate change may benefit other areas of Croatia’s burgeoning tourism
sector by lengthening the tourist season or creating two seasons for visitors—the spring and the autumn.80
Climate Change ImpactsClimate change impacts on Croatia’s tourism industry
are expected to be significant. Given the projected
increases in temperatures and prolonged hot-seasons,
climate change impacts are expected to create
uncomfortably hot summers (specifically July and
August) along the Adriatic coast which may impact
visitors and especially beach tourism. Spring and autumn
seasons are expected to increase in attractiveness for
tourists at the Croatian coast.81 Tourism infrastructure
may also be at risk due to coastal flooding. The tourism
sector is being included in the development of future
adaptation strategies. Figure 15 shows the change in
sea level rise for Croatia’s coast line since 1993.
79 UNDP (2009). Climate Change in Croatia: New Human Development Report launched. [16 February, 2009]. URL: https://www.undp.org/content/undp/en/home/presscenter/pressreleases/2009/02/16/climate-change-in-croatia-new-human-development-report-launched.html#:∼:text=Climate%20change%20in%20Croatia%20could,the%20groundwater%20used%20for%20drinking.
80 EU (2017). Draft Climate change Adaptation Strategy in the Republic of Croatia for the period to 2040 with a view to 2070 (White book). Croatia. URL: http://prilagodba-klimi.hr/wp-content/uploads/docs/Draft%20CC%20Adaptation%20Strategy.pdf
81 WBG Climate Change Knowledge Portal (CCKP, 2020). Croatia Impacts- Sea Level Rise. URL: https://climateknowledgeportal.worldbank.org/country/croatia/impacts-sea-level-rise
82 Ministry of Environment and Nature Protection (2018). Seventh National Communication (NC6) and Third Biennial Report of The Republic of Croatia Under The United Nations Framework Convention On Climate Change URL: https://unfccc.int/sites/default/files/resource/2671905483_Croatia-NC7-BR3-2-96481035_Croatia-NC7-BR3-2-7.%20NC%20i%203.%20BR_resubmission_IX_2018_0.pdf
Sea Level Anomaly
Sea
Lev
el A
no
mal
y (m
m)
–50
0
50
100
150
1993 1995 1997 1999 2001 2003 2005 2007 2009 2011 2013 2015
FIGURE 15 . Sea level rise in Croatia, 1993–201582

24CLIMATE RISK COUNTRY PROFILE: CROATIA
83 Kalinski, V. (2017). Results of Climate Modeling at the System HPC Velebit for the development of the NAS and NAP. URL: http://prilagodba-klimi.hr/wp-content/uploads/2017/11/Klimatsko-modeliranje.pdf
84 EU (2012). Climate Vulnerability Assessment: Croatia. URL: http://www.seeclimateforum.org/upload/document/cva_croatia_-_english_final_print2.pdf
85 Ministry of Environment and Nature Protection (2018). Seventh National Communication (NC6) and Third Biennial Report of The Republic of Croatia Under The United Nations Framework Convention On Climate Change URL: https://unfccc.int/sites/default/files/resource/2671905483_Croatia-NC7-BR3-2-96481035_Croatia-NC7-BR3-2-7.%20NC%20i%203.%20BR_resubmission_IX_2018_0.pdf
Adaptation OptionsMuch of the country’s current tourism infrastructure is situated along the coast, it will be important to consider
future changes in sea level and sea surface temperature, when planning future development in the area. Plans to
extend the main tourism season to April, May, and September should be made. The past few years have indicated
that June and September have a favorable sea and air temperature, both for swimming and sunbathing, while July
and August are becoming more unstable, both in temperature and in precipitation extremes.83 Adaptation measures
in the tourism sector should include:
• Adequate flexibility of the tourism sector for the impact of climate change and the possibility of adaptation;
• Inclusion of adaptation to climate change in all segments of sustainable development of Croatian tourism;
• Compliance of tourism planning with forecasted climate change; and
• Strengthening climate change adaptation competencies of all persons engaged in the tourism sector
The Croatian government has the potential to support the tourism sector in adapting to climate change, however,
it is necessary to conduct a thorough overview to establish the most effective ways for the local and national
government structures. This would involve an examination of the direct and indirect ways in which the government
at each level is currently involved in the tourism sector, which should indicate possible ways forward for the
government to support the industry in the future.84
Institutional Framework for AdaptationCroatia has confirmed its commitment to fighting climate change as a signatory to agreements and treaties
dealing with climate change, global warming, CO2 emissions, reduction of greenhouse gases and incorporated
these into its own policies and strategies.85 Croatia has been ratified as an Annex 1 country to the UNFCCC.
In 2015, Croatia ratified the Hyogo Framework for Action and has established a National Platform for Disaster
Risk Reduction. Climate change related activities are overseen by the Ministry of Economy and Sustainable
Development, with the Climate Change Directorate. Rescue Directorate, which is responsible for coordinating
ADAPTATION

25CLIMATE RISK COUNTRY PROFILE: CROATIA
86 EU (2017). Draft Climate change Adaptation Strategy in the Republic of Croatia for the period to 2040 with a view to 2070 (White book). Croatia. URL: http://prilagodba-klimi.hr/wp-content/uploads/docs/Draft%20CC%20Adaptation%20Strategy.pdf
87 EU (2016). Nationally Determined Contribution of the EU and its Member States. URL: https://www4.unfccc.int/sites/ndcstaging/PublishedDocuments/Austria%20First/LV-03-06-EU%20INDC.pdf
88 Republic of Croatia (2019). Integrated National Energy and Climate Plan for the Republic of Croatia for the period 2021–2030. Ministry of Environment and Energy. URL: https://mingor.gov.hr/UserDocsImages/UPRAVA%20ZA%20ENERGETIKU/Strategije, %20planovi%20i%20programi/hr%20necp/Integrated%20Nacional%20Energy%20and%20Climate%20Plan%20for%20the%20 Republic%20of_Croatia.pdf
89 EU (2017). Draft Climate change Adaptation Strategy in the Republic of Croatia for the period to 2040 with a view to 2070 (White book). Croatia. URL: http://prilagodba-klimi.hr/wp-content/uploads/docs/Draft%20CC%20Adaptation%20Strategy.pdf
disaster response, is placed within the Ministry of Interior. Croatia is also engaged regionally through initiatives
such as the South East European Climate Change Framework Action Plan for Adaptation to encourage
cooperation.86 These are not legally binding agreements, however, and therefore not enforceable.
Policy Framework for AdaptationThe country’s climate change adaptation strategy is guided by its Seventh National Communication and Third
Biennial report for the UN Framework Convention on Climate Change (2018). Croatia is also a signatory to the
European Union’s Updated Nationally Determined Contributions (NDC), submitted in 2020.87 The capacity of
the Croatian state and society to adapt to climate change can be improved through the development of sectoral
adaptation strategies, which are mainstreamed across government planning. Current government strategies
relating to climate change in Croatia emphasize mitigation, and there is little mention of the concept of adaptation.
Government ministries and national bodies will need to take into account the future effects of climate change when
developing their strategic plans for the coming years and decades, including ministries and agencies responsible for
the agricultural, energy, tourism and water sectors. Additional evidence to inform policy and adaptation strategies is
needed for the development of a more comprehensive adaptation framework.
There is potential for the country to develop a low-carbon economy and to begin to actively adapt to climate
change.88 This reality, along with mainstreamed adaptation and resilience planning needs to be driven by concerted
government effort, in coordination to the development of effective cooperation and collaboration between relevant
government departments to adequately integrate climate change adaptation in existing policies, foster the
elaboration of a national climate change adaptation strategy, and national climate change adaptation plan.
Croatia has made a firm commitment to reducing emissions by introducing a carbon fee, promoting renewable
energy, encouraging energy efficiency, and committing to GHG reductions under the Kyoto Protocol. There exists
a significant amount of technological and intellectual capacity in Croatia to reduce emissions. Various businesses,
NGOs and expert organizations are already engaged. Engagement and information sharing across sectors would
improve the country’s adaptation and resilience capabilities. This is especially true among state actors that are not
already heavily engaged such as the Ministry of Agriculture, Ministry or Regional Development and EU Funds, the
Ministry of the Sea, Transport and Infrastructure, and the Ministry of Tourism.89

26CLIMATE RISK COUNTRY PROFILE: CROATIA
National Frameworks and Plans
• Law on Climate Change and Protection of Ozone Layer (2019) (Croatian)
• Integrated National Energy and Climate Plan for the Republic of Croatia for the period 2021–2030 (2019)
• Environmental Protection Act (2019) (includes Plan for Air Protection)
• Air Protection Act (2019)
• Seventh National Communication and Third Biennial Update Report (2018)
• Draft Action Plan for Implementing The Strategy on Adaptation to Climate Change in The Republic Of Croatia
for the Period From 2019 to 2023 (2017)
• National Adaptation Strategy until 2040 with an outlook on 2070 (2017, ratified 2020)
• Nationally Determined Contributions (2016)
• Sixth National Communication (2014)
• The Environmental Protection Act (2013)
• Plan for the Protection of the Air, the Ozone Layer and Climate Change Mitigation in the Republic of Croatia
(2013)
• South East European Forum on Climate Change Adaptation (2012)
Recommendations
Research Gaps• Improve science-based understanding of the nature and magnitude of physical and biophysical climate change
impacts under differing scenarios, specifically for Croatia’s health sector
• Widen the participation of the public and scientific institutions, under the coordination of the Croatian Science
of Foundation and the Meteorological and Hydrological Service for improved adaptation response coordination
and effectiveness of community participation
• Continue to build on improvements from recent investments to national hydrometeorological observation
equipment, networks and technical modeling capacities, specifically regarding the Adriatic Decadal and
Interannual Oscillations90
• Integrate data obtained from meteorological stations to support the monitoring and evaluation of long-range
transboundary pollutions across the EU
• Determine potential risks to human health due to exposure to air pollution, particularly for sensitive populations
90 Ministry of Environment and Nature Protection (2018). Seventh National Communication (NC6) and Third Biennial Report of The Republic of Croatia Under The United Nations Framework Convention On Climate Change URL: https://unfccc.int/sites/default/files/resource/2671905483_Croatia-NC7-BR3-2-96481035_Croatia-NC7-BR3-2-7.%20NC%20i%203.%20BR_resubmission_IX_2018_0.pdf

27CLIMATE RISK COUNTRY PROFILE: CROATIA
Data and Information Gaps• Modernization of existing surface and upper air meteorological network that includes updates to existing and
installation of new equipment
• Improved data availability — In many sectors such as agriculture, tourism, water resources, the data is still not
available (or limited) to estimate the impacts of future climate change for Croatia’s economy. Many of the data
needed to estimate the future damages from climate change and avoid them through adaptation would also
help with existing climate variability and help better target existing policies/programs
• Improved modelling of environmental and economic systems — Models of the Croatian economy, the climate,
and various sectors can be very helpful in understanding the causal relationships within the Croatian economy.
This is important for climate change and for economic development in general. The link between climate and
economic systems still needs to be made within Croatia
• Continued improvement of technical capacity to analyze hydro-met data and project impacts across sectors
• Develop an early warning system about dangerous hydrometeorological phenomena and climate risk management
Institutional Gaps• Coordination of the activities across sectors and actors, including Croatia’s government ministries and private
entities/ firms in order to engage with discussion on what Croatia does in addressing vulnerability to climate
and in mitigating Croatia’s emissions
• Integrate climate into the development of physical plans on the coast to minimize the risk from sea-level rise,
targeting subsidies in the agriculture sector to reduce climate vulnerability, physical planning and energy
planning that will reduce emissions but also take into account changing environmental conditions, being
prepared to deal with health problems which may arise from heat waves, and many other areas91
• Increase mechanisms for knowledge and technology transfers between Croatia and the EU regarding
environmental protections and adaptation planning
• Involve and engage the Croatian public to increase awareness of climate change impacts and the adaptation
efforts undertaken by the Croatian Government92
91 EU (2017). National Adaptation Strategy until 2040 with an outlook on 2070 (2017, ratified 2020). URL: http://prilagodba-klimi.hr/wp-content/uploads/docs/Draft%20CC%20Adaptation%20Strategy.pdf
92 Republic of Croatia (2019). Integrated National Energy and Climate Plan for the Republic of Croatia for the period 2021–2030. Ministry of Environment and Energy. URL: https://mingor.gov.hr/UserDocsImages/UPRAVA%20ZA%20ENERGETIKU/Strategije, %20planovi%20i%20programi/hr%20necp/Integrated%20Nacional%20Energy%20and%20Climate%20Plan%20for%20the%20Republic%20of_Croatia.pdf