COSTA RICA - Climate Change Knowledge Portal
36
COSTA RICA CLIMATE RISK COUNTRY PROFILE
-
Upload
khangminh22 -
Category
Documents
-
view
1 -
download
0
Transcript of COSTA RICA - Climate Change Knowledge Portal

iiCLIMATE RISK COUNTRY PROFILE: COSTA RICA
COPYRIGHT© 2021 by the World Bank Group1818 H Street NW, Washington, DC 20433Telephone: 202-473-1000; Internet: www.worldbank.org
This work is a product of the staff of the World Bank Group (WBG) and with external contributions. The opinions, findings, interpretations, and conclusions expressed in this work are those of the authors and do not necessarily reflect the views or the official policy or position of the WBG, its Board of Executive Directors, or the governments it represents.
The WBG does not guarantee the accuracy of the data included in this work and do not make any warranty, express or implied, nor assume any liability or responsibility for any consequence of their use. This publication follows the WBG’s practice in references to member designations, borders, and maps. The boundaries, colors, denominations, and other information shown on any map in this work, or the use of the term “country” do not imply any judgment on the part of the WBG, its Boards, or the governments it represents, concerning the legal status of any territory or geographic area or the endorsement or acceptance of such boundaries.
The mention of any specific companies or products of manufacturers does not imply that they are endorsed or recommended by the WBG in preference to others of a similar nature that are not mentioned.
RIGHTS AND PERMISSIONSThe material in this work is subject to copyright. Because the WBG encourages dissemination of its knowledge, this work may be reproduced, in whole or in part, for noncommercial purposes as long as full attribution to this work is given.
Please cite the work as follows: Climate Risk Profile: Costa Rica (2021): The World Bank Group.
Any queries on rights and licenses, including subsidiary rights, should be addressed to World Bank Publications, The World Bank Group, 1818 H Street NW, Washington, DC 20433, USA; fax: 202-522-2625; e-mail: [email protected].
Cover Photos: © Flore de Preneuf / World Bank, “Rural Farmhouse. Costa Rica” March 21, 2013” via Flickr, Creative Commons CC BY-NC-ND 2.0. © Flore de Preneuf / World Bank “Agroforestry, Costa Rica” March 22, 2013 via Flickr, Creative Commons CC BY-NC-ND 2.0.
Graphic Design: Circle Graphics, Inc., Reisterstown, MD.
iiiCLIMATE RISK COUNTRY PROFILE: COSTA RICA
ACKNOWLEDGEMENTSThis profile is part of a series of Climate Risk Country Profiles developed by the World Bank Group (WBG). The country profile synthesizes most relevant data and information on climate change, disaster risk reduction, and adaptation actions and policies at the country level. The country profile series are designed as a quick reference source for development practitioners to better integrate climate resilience in development planning and policy making. This effort is managed and led by Veronique Morin (Senior Climate Change Specialist, WBG) and Ana E. Bucher (Senior Climate Change Specialist, WBG).
This profile was written by Fernanda Zermoglio (Senior Climate Change Consultant, WBG) and MacKenzie Dove (Senior Climate Change Consultant, WBG). Additional support was provided by Megumi Sato (Junior Professional Officer, WBG), Jason Johnston (Operations Analyst, WBG), and Yunziyi Lang (Climate Change Analyst, WBG).
Climate and climate-related information is largely drawn from the Climate Change Knowledge Portal (CCKP), a WBG online platform with available global climate data and analysis based on the latest Intergovernmental Panel on Climate Change (IPCC) reports and datasets. The team is grateful for all comments and suggestions received from the sector, regional, and country development specialists, as well as climate research scientists and institutions for their advice and guidance on use of climate related datasets.

ivCLIMATE RISK COUNTRY PROFILE: COSTA RICA
FOREWORD . . . . . . . . . . . . . . . . . . . . . . . . . . . . . . . . . . . . 1
COUNTRY OVERVIEW . . . . . . . . . . . . . . . . . . . . . . . . . . . . . . . 2
CLIMATOLOGY . . . . . . . . . . . . . . . . . . . . . . . . . . . . . . . . . . 5Climate Baseline 5
Overview 5Key Trends 7
Climate Future 8Overview 8Key Trends 9
CLIMATE RELATED NATURAL HAZARDS . . . . . . . . . . . . . . . . . . . . . 12Overview 12Key Trends 13Implications for DRM 14
CLIMATE CHANGE IMPACTS TO KEY SECTORS . . . . . . . . . . . . . . . . . . 16Agriculture 16Water 19Energy 21Health 23Sea Level Rise 24
ADAPTATION . . . . . . . . . . . . . . . . . . . . . . . . . . . . . . . . . . 25Institutional Framework for Adaptation 25Policy Framework for Adaptation 26Recommendations 27
Research Gaps 27Data and Information Gaps 27Institutional Gaps 28
CONTENTS

1CLIMATE RISK COUNTRY PROFILE: COSTA RICA
Climate change is a major risk to good development outcomes, and the World Bank Group is committed to playing
an important role in helping countries integrate climate action into their core development agendas. The World
Bank Group is committed to supporting client countries to invest in and build a low-carbon, climate-resilient future,
helping them to be better prepared to adapt to current and future climate impacts.
The World Bank Group is investing in incorporating and systematically managing climate risks in development
operations through its individual corporate commitments.
A key aspect of the World Bank Group’s Action Plan on Adaptation and Resilience (2019) is to help countries
shift from addressing adaptation as an incremental cost and isolated investment to systematically incorporating
climate risks and opportunities at every phase of policy planning, investment design, implementation and evaluation
of development outcomes. For all IDA and IBRD operations, climate and disaster risk screening is one of the
mandatory corporate climate commitments. This is supported by the Bank Group’s Climate and Disaster Risk
Screening Tool which enables all Bank staff to assess short- and long-term climate and disaster risks in operations
and national or sectoral planning processes. This screening tool draws up-to-date and relevant information from
the World Bank’s Climate Change Knowledge Portal, a comprehensive online ‘one-stop shop’ for global, regional,
and country data related to climate change and development.
Recognizing the value of consistent, easy-to-use technical resources for client countries as well as to support
respective internal climate risk assessment and adaptation planning processes, the World Bank Group’s Climate
Change Group has developed this content. Standardizing and pooling expertise facilitates the World Bank Group in
conducting initial assessments of climate risks and opportunities across sectors within a country, within institutional
portfolios across regions, and acts as a global resource for development practitioners.
For developing countries, the climate risk profiles are intended to serve as public goods to facilitate upstream
country diagnostics, policy dialogue, and strategic planning by providing comprehensive overviews of trends
and projected changes in key climate parameters, sector-specific implications, relevant policies and programs,
adaptation priorities and opportunities for further actions.
It is my hope that these efforts will spur deepening of long-term risk management in developing countries and our
engagement in supporting climate change adaptation planning at operational levels.
Bernice Van BronkhorstGlobal Director
Climate Change Group (CCG)
The World Bank Group (WBG)
FOREWORD
2CLIMATE RISK COUNTRY PROFILE: COSTA RICA
COUNTRY OVERVIEW
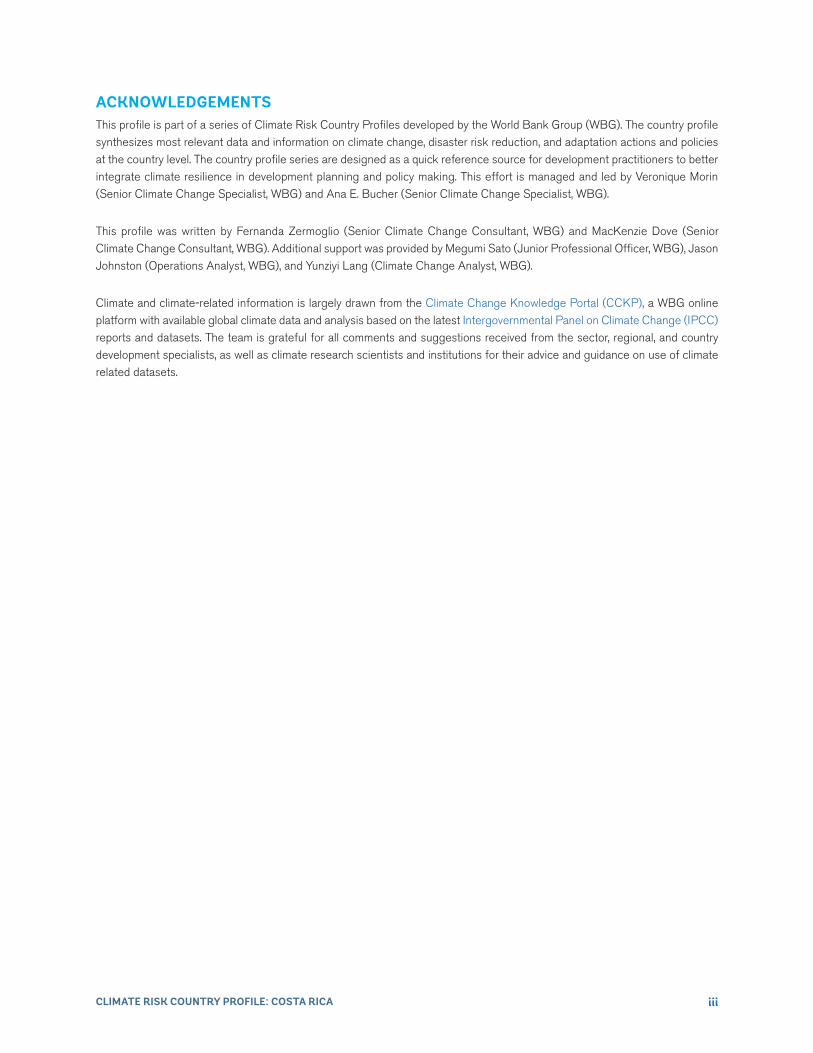
Situated between Nicaragua and Panama in
Central America, Costa Rica occupies an
area of 51,100 square kilometers (km) and
is bordered by both the Caribbean Sea in the north-
east and the North Pacific Ocean in the southwest.1
The country’s topography (Figure 1) is varied
and includes coastal plains separated by rugged
mountains, including over 100 volcanic cones. Even
though Costa Rica constitutes only 0.034% of the
total Earth surface, its habitats represent around
5% of the planet’s biodiversity. Costa Rica is known
worldwide for its conservation efforts and is a hot
spot for eco-tourism, with more than 26% of its
land under protection. Due to a combination of
geographic variations and economic factors, Costa
Rica is highly vulnerable to extreme climate events
and natural hazards. Part of this vulnerability is due
to the presence of populations in vulnerable areas
as well as the country’s severe risk to sea level rise
(primary at-risk areas include Puerto Limón, Jaco
and Puntarenas). The country also has areas prone to volcanic eruptions and unstable lands which have been degraded
by wide-spread cattle ranching or poorly planned settlements prone to landslides and flooding.2
Costa Rica is classified by the World Bank as an upper-middle-income country and ranks 62nd out of 189 countries
in the United Nation’s Human Development Index (HDI), placing it in the very high development category. With an
annual GDP of $61.5 billion in 2020, the country’s approximately 5 million people enjoy the highest standard of
living in Central America, with a per capita GNI of about US $11,500 and an unemployment rate of around 17.4%
in 2020.4 81% of Costa Rica’s population resides in urban areas, and the annual urban growth rate in 2020 was
approximately 2%.5 Population projections for 2030 point to an additional 468,000 people living in the country,
85.8% residing in urban areas, while in 2050, the country’s estimated population will top 5.773 million inhabitants,
of which 90.1% will reside in urban areas.6 The poverty rate of Costa Rica is lower in comparison to the region,
remaining around 21% for nearly 20 years (Table 1).7
1 Costa Rica (2014). Tercera Comunicación Nacional de la República de Costa Rica. URL: http://www.cac.int/sites/default/files/crinc3.pdf2 World Bank (2011). Climate Risk and Adaptation Country Profile: Costa Rica. URL: https://climateknowledgeportal.worldbank.org/
sites/default/files/2018-10/wb_gfdrr_climate_change_country_profile_for_CRI.pdf3 World Bank (2019). Internal Climate Migration Profile – Costa Rica.4 World Bank Open Data (2021). World Development Indicators. Costa Rica. URL: https://databank.worldbank.org/reports.aspx?source=
2&country5 World Bank Open Data (2021). World Development Indicators. Costa Rica. URL: https://databank.worldbank.org/reports.aspx?source=
2&country6 World Bank Open Data (2021). World Development Indicators. Costa Rica. URL: https://databank.worldbank.org/reports.aspx?source=
2&country7 World Bank Open Data (2021). World Development Indicators. Costa Rica. URL: https://databank.worldbank.org/reports.aspx?source=
2&country
FIGURE 1 . Topography of Costa Rica3

3CLIMATE RISK COUNTRY PROFILE: COSTA RICA
The ND-GAIN Index9 ranks 182 countries using a score which calculates a country’s vulnerability to climate change
and other global challenges as well as their readiness to improve resilience. This Index aims to help businesses
and the public sector better identify vulnerability and readiness in order to better prioritize investment for more
efficient responses to global challenges. Due to a combination of political, geographic, and social factors, Costa
Rica is recognized as vulnerable to climate change impacts and ranked 60th out of 182 countries in the 2020
ND-GAIN Index. The more vulnerable a country is the lower their score, while the more ready a country is to improve
its resilience the higher it will rank. Norway has the highest score and is ranked 1st. Figure 2 is a time-series plot
of the ND-GAIN Index showing Costa Rica’s progress
TABLE 1 . Data Snapshot: Key Development Indicators8
Indicator
Life Expectancy at Birth, Total (Years) (2019) 80.3
Population Density (People per sq. km Land Area) (2018) 97.9
% of Population with Access to Electricity (2019) 99.7%
GDP per Capita (Current US$) (2020) $12,076.8
FIGURE 2 . ND-GAIN Index for Costa Rica
46
47
48
49
50
51
52
53
54
55
56
Sco
re
19971995 1999 2001 2003 2005 2007 2009 2011 2013 2015 2017 2019
Costa Rica
8 World Bank Open Data (2021). World Development Indicators. Costa Rica. URL: https://databank.worldbank.org/reports.aspx?source= 2&country
9 University of Notre Dame (2020). Notre Dame Global Adaptation Initiative. URL: https://gain.nd.edu/our-work/country-index/
4CLIMATE RISK COUNTRY PROFILE: COSTA RICA
Costa Rica submitted its updated Nationally-Determined Contributions (NDC) to the UNFCCC in 2020, in support
of the country’s efforts to realize its development goals and increase its resilience to climate change by enhancing
mitigation and adaptation implementation efforts.10 De-carbonization is a priority for the country as indicated in
the country’s decarbonization plan of 2019.11 Costa Rica aims to achieve net-zero emissions by 2050.12 Adaptation
efforts, particularly in the water supply and agriculture sectors are high priorities and reflected in Costa Rica’s NDC.
In support of adaptation efforts, Costa Rica aims to strengthen capacities and promote a high degree of coordination
and teamwork between different government and civil society entities. The country also aims to support inter-
ministerial coordination efforts, which are important in guaranteeing synergies between entities and to increase
national research budgets on climate change.13 Climate change adaptation in Costa Rica is also strongly linked
with components of the National Disaster Risk Management Policy,14 through capacity building for resilience and
technology transfer. Costa Rica completed its Third National Communication (NC3) to the UNFCCC in 2014.
Green, Inclusive and Resilient RecoveryThe coronavirus disease (COVID-19) pandemic has led to unprecedented adverse social and economic impacts.
Further, the pandemic has demonstrated the compounding impacts of adding yet another shock on top of the multiple
challenges that vulnerable populations already face in day-to-day life, with the potential to create devastating health,
social, economic and environmental crises that can leave a deep, long-lasting mark. However, as governments
take urgent action and lay the foundations for their financial, economic, and social recovery, they have a unique
opportunity to create economies that are more sustainable, inclusive and resilient. Short and long-term recovery
efforts should prioritize investments that boost jobs and economic activity; have positive impacts on human, social
and natural capital; protect biodiversity and ecosystems services; boost resilience; and advance the decarbonization
of economies.
10 Costa Rica (2020). Costa Rica’s Updated Nationally Determined Contribution. URL: https://www4.unfccc.int/sites/ndcstaging/PublishedDocuments/Costa%20Rica%20First/Contribucio%CC%81n%20Nacionalmente%20Determinada%20de%20Costa%20Rica%202020%20-%20Versio%CC%81n%20Completa.pdf
11 Costa Rica (2018). Plan Nacional de Descarbonización (2018–2022). URL: https://cambioclimático.go.cr/wp-content/uploads/2020/ 01/PLAN.pdf
12 Costa Rica (2021). Costa Rica’s Updated Nationally Determined Contribution. URL: https://www4.unfccc.int/sites/ndcstaging/PublishedDocuments/Costa%20Rica%20First/Contribucio%CC%81n%20Nacionalmente%20Determinada%20de%20Costa%20Rica%202020%20-%20Versio%CC%81n%20Completa.pdf
13 Costa Rica (2021). Costa Rica’s Updated Nationally Determined Contribution. URL: https://www4.unfccc.int/sites/ndcstaging/PublishedDocuments/Costa%20Rica%20First/Contribucio%CC%81n%20Nacionalmente%20Determinada%20de%20Costa%20Rica%202020%20-%20Versio%CC%81n%20Completa.pdf
14 Costa Rica (2016–2030). Política Nacional de Gestión de Riesgo. URL: http://politica.cne.go.cr/index.php/politica/politica-nacional-de-gestion-del-riesgo-2016-2030
5CLIMATE RISK COUNTRY PROFILE: COSTA RICA
Climate Baseline
OverviewCosta Rica’s climate is characterized by well-defined annual patterns. However, these are periodically affected by
fluctuations in the temperature of the surrounding oceans, interaction of the atmospheric circulation with the volcanic
mountain range that runs northeast to southeast, and El Niño/La Niña cycles as well as Pacific Decadal Oscillation
(PDO). Regional long-term variabilities are also influenced by annual north-south displacement of the Intertropical
Convergence Zone (ITCZ), the intensity of the subtropical high-pressure system over the Caribbean Sea, the strength
of the trade winds and of the Caribbean Low-Level Jet (CLLJ).15
Costa Rica’s mountains, dominant wind patterns and ocean influences characterize the seven recognized climatic
zones of Costa Rica: North Pacific, Central Pacific, South Pacific, Central, North, and Caribbean North and Caribbean
South. The lowland regions of the country harbor a tropical and subtropical climate, while the highlands experience
colder climates. The El Niño phenomenon causes severe droughts on the Pacific coast of Costa Rica, while masses
of cold air moving in from North America during the winter months combine with the trade winds between July
and August to produce intense rains that cause flooding on central Costa Rica’s Caribbean slope. The interactions
between the trade winds from the east and the region’s topographic diversity creates the effects of “rain shadow,”
with the Caribbean slope experiencing rain practically all year round. The Pacific slope is characterized by a prolonged
dry season lasting approximately from November until April or May and a wet season during the rest of the year.
The increased intensity of the trade winds in July produces a peak of precipitation on the Caribbean slope. Daily
temperatures reach their maximum value before the start of the rainy season. Minimum temperatures show a different
pattern, with the highest values observed in July and the lowest values during the Northern Hemisphere winter.16
In recent decades, Costa Rica has seen significant changes in the patterns of precipitation and increases in temperatures,
as well as in land use and its degradation.17 Variability continues to mark the annual expression of climate, since
the frequency and intensity of multiple phenomena can increase or decrease. Therefore, the climate of Costa Rica,
in its different regions, will be marked by dry extremes, such as the drought of 200818 and rainy extremes, such as
during the El Niño of 2014–2015.19 Costa Rica has already experienced the negative impacts of climate variability,
including record economic losses from extreme hydrometeorological events such as episodes of the El Niño Southern
Oscillation (ENSO).20
CLIMATOLOGY
15 Imbach, P. et al. (2018). Future climate change scenarios in Central America at high spatial resolution. PLOS One. DOI: https:// doi.org/10.1371/journal.pone.0193570
16 Costa Rica (2014). Tercera Comunicación Nacional de la República de Costa Rica. URL: http://www.cac.int/sites/default/files/crinc3.pdf
17 Costa Rica (2018). Política Nacional de Adaptación al Cambio Climático de Costa Rica 2018–2030 (2017. URL: https://cambioclimático.go.cr/wp-content/uploads/2018/11/Pol%C3%ADtica-Nacional-de-Adaptaci%C3%B3n-al-Cambio-Clim%C3%A1tico.pdf
18 Instituto Meteorológico Nacional Costa Rica (2008). Boletin Del Enos No. 11. 12 Mayo, 2008. URL: https://www.imn.ac.cr/documents/ 10179/28146/%23%2011
19 MINAE-IMN. (2015). Costa Rica Informe Bienal de Actualización ante la Convención Marco de las Naciones Unidas sobre el Cambio Climático. (A. R. Ana Rita Chacón Araya, Ed.) San José, Costa Rica. URL: http://cglobal.imn.ac.cr/documentos/publicaciones/BUR2015/ offline/download.pdf
20 Costa Rica (2018). Política Nacional de Adaptación al Cambio Climático de Costa Rica 2018–2030 (2017). URL: https://cambioclimático.go.cr/wp-content/uploads/2018/11/Pol%C3%ADtica-Nacional-de-Adaptaci%C3%B3n-al-Cambio-Clim%C3%A1tico.pdf

6CLIMATE RISK COUNTRY PROFILE: COSTA RICA
Analysis of data from the World Bank Group’s Climate Change Knowledge Portal (CCKP) (Table 2) shows historical
climate information for the period between 1991–2020. Mean annual temperature for Costa Rica is 24.9°C, with
average monthly temperatures ranging between 23.9°C (November) and 26.1°C (April). Mean annual precipitation
is 3,061 mm, with year-round rainfall and highest rainfall occurring September to November (Figure 3).21 Figure 4
presents the spatial variation of observed average annual precipitation and temperature across Costa Rica, for the
latest climatology, 1991–2020.
TABLE 2 . Data Snapshot: Country-Level Summary Statistics
Climate Variables 1991–2020
Mean Annual Temperature (°C) 24.9°C
Mean Annual Precipitation (mm) 3,060.7 mm
Mean Maximum Annual Temperature (°C) 30.3°C
Mean Minimum Annual Temperature (°C) 19.5°C
Tem
pera
ture
(°C
)
Precipitation (m
m)
Min-Temperature Mean-Temperature Max-TemperaturePrecipitation
Jan Feb Mar Apr May Jun Jul Aug Sep Oct Nov Dec10
15
20
25
30
35
40
0
80
160
240
320
400
480
FIGURE 3 . Average Monthly Mean, Max and Min Temperature and Rainfall of Costa Rica for 1991–202022
21 WBG Climate Change Knowledge Portal (CCKP, 2021). Costa Rica Historical Data. URL: https://climateknowledgeportal.worldbank.org/country/costa-rica/climate-data-historical
22 WBG Climate Change Knowledge Portal (CCKP, 2021). Costa Rica Historical Data. URL: https://climateknowledgeportal.worldbank.org/country/costa-rica/climate-data-historical

7CLIMATE RISK COUNTRY PROFILE: COSTA RICA
Key TrendsTemperatureTemperatures in Costa Rica have already increased between 0.2 and 0.3°C per decade with a prolonged and
hotter dry season. The number of warm days increased by 2.5% and nights24 by 1.7%, while the number of cold
nights25 and cold days decreased by -2.2 and -2.4% per decade. Temperature extremes increased by between 0.2
and 0.3°C per decade since 196026 (Figure 5). Costa Rica’s high elevation areas have been observed to have
experienced the greatest degrees of temperature change, as compared to coastal areas.27
PrecipitationPrecipitation patterns exhibit a high degree of inter-annual variability in Costa Rica, while ENSO brings droughts
and warmer weather, La Niña is associated with floods and cooler weather. Costa Rica’s NC328 suggests increased
precipitation across the country, in spite of the fact that overall average annual precipitation in the region and the
number of consecutive wet days do not show significant changes. Nevertheless, from the mid-century on, extreme
precipitation events have increased significantly in both frequency of occurrence and intensity. This also relates
FIGURE 4 . Average Annual Temperature (°C) (left); Annual Precipitation (mm) (right) for Costa Rica 1991–202023
23 WBG Climate Change Knowledge Portal (CCKP, 2021). Costa Rica. Historical Data. URL: https://climateknowledgeportal.worldbank.org/ country/costa-rica/climate-data-historical
24 Luis, F. et al. (2012). Escenarios De Cambio Climático Regionalizados Para Costa Rica. Departamento de Climatología e Investigaciones Aplicadas Instituto Meteorológico Nacional Ministerio del Ambiente, Energía y Telecomunicaciones (MINAET) Costa Rica. URL: http://cglobal.imn.ac.cr/documentos/publicaciones/EscenariosCambioClimático/escenariosCCRegionalizados2012.pdf
25 “Cold” night is defined by the temperature below which 10% of days or nights are recorded in current climate of that region or season26 Costa Rica (2014). Tercera Comunicación Nacional de la República de Costa Rica. URL: http://www.cac.int/sites/default/files/crinc3.pdf27 Imbach, P. et al. (2018). Future climate change scenarios in Central America at high spatial resolution. PLOS One. DOI: https://doi.org/
10.1371/journal.pone.019357028 Costa Rica (2009). Segunda Comunicación Nacional de la República de Costa Rica. URL: http://cglobal.imn.ac.cr/documentos/
publicaciones/ComunicacionesNacionales/segundaComunicacionNacional.pdf

8CLIMATE RISK COUNTRY PROFILE: COSTA RICA
to experiencing longer dry periods in between heavy rainfall events. The trend over the last 40 years suggests a
strengthening of the hydrological cycle, with more intense rain occurring during shorter periods of time that produce
greater average precipitation per episode.29
Climate Future
OverviewThe main data source for the World Bank Group’s CCKP is the CMIP5 (Coupled Model Inter-comparison Project
Phase 5) data ensemble, which builds the database for the global climate change projections presented in the
Fifth Assessment Report (AR5) of the Intergovernmental Panel on Climate Change (IPCC). Four Representative
Concentration Pathways (i.e. RCP2.6, RCP4.5, RCP6.0, and RCP8.5) were selected and defined by their total
radiative forcing (cumulative measure of GHG emissions from all sources) pathway and level by 2100. The
RCP2.6 for example represents a very strong mitigation scenario, whereas the RCP8.5 assumes business-
as-usual scenario. For more information, please refer to the RCP Database. For simplification, these scenarios
are referred to as a low (RCP2.6); a medium (RCP4.5) and a high (RCP8.5) emission scenario in this profile.
Table 3 provides CMIP5 projections for essential climate variables under high emission scenario (RCP 8.5) over
4 different time horizons. Figure 6 presents the multi-model (CMIP5) ensemble of 32 Global Circulation Models
(GCMs) showing the projected changes in annual precipitation and temperature for the periods 2040–2059
and 2080–2099.
FIGURE 5 . Observed Average Mean Temperature for Costa Rica, 1901–2020
Annual mean Smoothed
1901 1911 19511921 1931 1941 1961 1971 19911981 2001 2011 2020
Tem
pera
ture
(°C
)
23.5
24
24.5
25
25.5
29 Costa Rica (2014). Tercera Comunicación Nacional de la República de Costa Rica. URL: http://www.cac.int/sites/default/files/crinc3.pdf
TABLE 3 . Data Snapshot: CMIP5 Ensemble Projection
Cmip5 Ensemble Projection 2020–2039 2040–2059 2060–2079 2080–2099
Annual Temperature Anomaly (°C) +0.60 to +1.48(+0.88)
+1.15 to +2.38 (+1.47)
+1.69 to +3.56(+2.22)
+2.25 to +4.78(+3.02)
Annual Precipitation Anomaly (mm) -23.47 to +26.62 (−0.97)
-43.93 to 26.01 (−3.44)
-53.48 to +43.74(−6.89)
-73.12 to +40.25(−11.07)
Note: The table shows CMIP5 ensemble projection under RCP8.5. Bold value is the range (10th–90th Percentile) and values in parentheses show the median (or 50th Percentile).

9CLIMATE RISK COUNTRY PROFILE: COSTA RICA
FIGURE 6 . Multi-model (CMIP5) Ensemble Projected Change (32 GCMs) in Annual Temperature (top) and Precipitation (bottom) by 2040–2059 (left) and by 2080–2099 (right), Relative to 1986–2005 Baseline Under RCP8 530
30 WBG Climate Change Knowledge Portal (CCKP, 2021). Costa Rica. Projected Future Climate. URL: https://climateknowledgeportal.worldbank.org/country/costa-rica/climate-data-projections
31 Luis, F. et al. (2012). Escenarios De Cambio Climático Regionalizados Para Costa Rica. Departamento de Climatología e Investigaciones Aplicadas Instituto Meteorológico Nacional Ministerio del Ambiente, Energía y Telecomunicaciones (MINAET) Costa Rica. URL: http://cglobal.imn.ac.cr/documentos/publicaciones/EscenariosCambioClimático/escenariosCCRegionalizados2012.pdf
Key TrendsTemperatureTemperatures across Costa Rica are projected to continue rising, with mean monthly temperatures projected to
rise by +1.48°C by the 2050s and by 3.08°C by the end of the century under a high-emissions scenario (RCP8.5).
Rising temperatures are projected across all months, with no significant variability across these months or spatially.
As temperatures rise, so will the critical consequences for water availability.31 Of critical importance are the number

10CLIMATE RISK COUNTRY PROFILE: COSTA RICA
of very hot days (where temperatures are above 35°C, which are projected to increase from approximately 6 to
72 days of the year by the end of the century, impacting especially the Pacific Coast and the Northern parts of the
country.32 Regionalized projections point to the most significant temperature rises occurring in the Pacific North
Region by the end of the century, with maximum temperatures projected to rise between 3 to 8°C and a minimum
temperatures projected to rise between 2 to 3°C.33
Across all emissions scenarios, temperatures are projected to continue to rise in Costa Rica, through the end of
the century. As seen in Figure 7, under a high-emissions scenario (RCP8.5), average temperatures are projected
to rise rapidly after the 2040s.34 Average hot temperatures, analyzed in terms of the number of days above 25°C,
are expected to largely be maintained across the seasonal cycle at a nationally aggregated scale (Figure 8). Rising
temperatures and extreme heat conditions will result in significant implications for human health, agriculture, water
resources, tourism, and ecosystems. The country’s hotter climate is expected to significantly impact the country’s
unique ecosystems and biodiversity.35
32 WBG Climate Change Knowledge Portal (CCKP, 2021). Costa Rica Projected Future Climate. URL: https://climateknowledgeportal.worldbank.org/country/costa-rica/climate-data-projections
33 Costa Rica (2014). Tercera Comunicación Nacional de la República de Costa Rica. URL: http://www.cac.int/sites/default/files/crinc3.pdf34 WBG Climate Change Knowledge Portal (CCKP, 2021). Costa Rica Projected Future Climate. URL: https://climateknowledgeportal.
worldbank.org/country/costa-rica/climate-data-projections35 Stan, K. et al. (2020). Climate change scenarios and projected impacts for forest productivity in Guanacaste Province (Costa Rica): lessons
for tropical forest regions. Regional Environmental Change. 20. URL: https://link.springer.com/article/10.1007/s10113-020-01602-z36 WBG Climate Change Knowledge Portal (CCKP, 2021). Interactive Climate Indicator Dashboard – Agriculture. Costa Rica. URL https://
climatedata.worldbank.org/CRMePortal/web/agriculture/crops-and-land-management?country=CRI&period=2080-209937 WBG Climate Change Knowledge Portal (CCKP, 2021). Interactive Climate Indicator Dashboard – Agriculture. Costa Rica. URL https://
climatedata.worldbank.org/CRMePortal/web/agriculture/crops-and-land-management?country=CRI&period=2080-2099
FIGURE 7 . Projected Average Temperature for Costa Rica (Reference Period, 1986–2005)36
FIGURE 8 . Projected Change in Summer Days (Tmax >25°C), 2040–2059 (RCP8 5, Reference Period, 1986–2005)37
Historical RCP 2.6 RCP 4.5 RCP 6.0 RCP 8.5
23
24
25
26
27
28
29
30
31
2000 2020 2040 2060 2080 2100
Tem
pera
ture
(°C
)
23
24
25
26
27
28
29
Projected mean-temperature Historical
FebJan Mar Apr May Jun Jul Aug Sep Oct Nov Dec

11CLIMATE RISK COUNTRY PROFILE: COSTA RICA
PrecipitationRainfall in Costa Rica is subject to significant interannual variability due to the El Niño Southern Oscillation, which brings
extremely hot and dry conditions to the Pacific and central regions of Costa Rica, while in the Caribbean it increases
rainfall. Alternatively, La Niña episodes are associated with extreme rainfall in the Pacific, Central and Northern
Regions,38 while in the Caribbean rainfall deficits are common.39 Costa Rica is also at risk from the increasing frequency
and intensity of extreme rainfall events causing floods. Regionalized projections point to rainfall decreases by 2100,
including a −13–24% reduction in the Pacific regions, especially in the Gulf of Nicoya zone, and additional reductions
in the Pacific Central Zone, especially around Jaco
and Herradura, increasing the likelihood of increased
aridity and drought. Increased rainfall is projected for
the southern zones of the Pacific, especially those
around Puerto Quepos.40,41 Changing rainfall patterns
in the country by the second half of the century suggest
an earlier onset of the rainy season as well as future
drying conditions.42
As shown in Figure 9, there is significant uncertainty
on the future of rainfall patterns for Costa Rica with
scenarios pointing to both increases and decreases in
annual precipitation by the end of the century under
a high emissions scenario for Costa Rica as a whole
(RCP8.5). However, projections point to significant
regional variability, with rainfall decreasing in Costa Rica’s
Pacific Zones and increasing in the southern Zones.43
0
500
1000
1500
2000
2500
3000
Historical RCP 2.6 RCP 4.5 RCP 6.0 RCP 8.5
2000 2020 2040 2060 2080 2100
FIGURE 9 . Projected Annual Average Precipitation in Costa Rica (Reference Period, 1986–2005)44
38 Costa Rica (2014). Tercera Comunicación Nacional de la República de Costa Rica. URL: http://www.cac.int/sites/default/files/crinc3.pdf39 Luis, F. et al. (2012). Escenarios De Cambio Climático Regionalizados Para Costa Rica. Departamento de Climatología e Investigaciones
Aplicadas Instituto Meteorológico Nacional Ministerio del Ambiente, Energía y Telecomunicaciones (MINAET) Costa Rica. URL: http://cglobal.imn.ac.cr/documentos/publicaciones/EscenariosCambioClimático/escenariosCCRegionalizados2012.pdf
40 Costa Rica (2014). Tercera Comunicación Nacional de la República de Costa Rica. URL: http://www.cac.int/sites/default/files/crinc3.pdf41 IMN (2017). Escenarios de Cambio Climático Regionalizados para Costa Rica. URL: http://cglobal.imn.ac.cr/index.php/publications/
escenarios-de-cambio-climático-regionalizados-para-costa-rica/42 Castillo, R., Amador, J., and Duran, A.M. (2018). Costa Rica Rainfall in Future Climate Change Scenarios. Earth and Space Science Open
Archive, AGU 2017 Fall Meeting. URL: https://www.essoar.org/doi/abs/10.1002/essoar.bca73dd28032a2ab.b32e48ac7d934bec.143 IMN (2017). Escenarios de Cambio Climático Regionalizados para Costa Rica. URL: http://cglobal.imn.ac.cr/index.php/publications/
escenarios-de-cambio-climático-regionalizados-para-costa-rica/44 WBG Climate Change Knowledge Portal (CCKP, 2021). Climate Data-Projections. Costa Rica. URL: https://climatedata.worldbank.
org/CRMePortal/web/agriculture/crops-and-land-management?country=CRI&period=2080-2099

12CLIMATE RISK COUNTRY PROFILE: COSTA RICA
45 UNDP (2019). Costa Rica moves forward in the process to implement its national adaptation plan. URL: https://www.globalsupportprogramme.org/costa-rica-moves-forward-process-implement-its-national-adaptation-plan
46 Costa Rica (2017). Política Nacional de Gestión del Riesgo (2016–2030). URL: https://cambioclimático.go.cr/wp-content/uploads/ 2018/08/POLITICA_NACIONAL_DE_GESTION_DEL_RIESGO.pdf
47 Costa Rica (2017). Política Nacional de Gestión del Riesgo (2016–2030). URL: https://cambioclimático.go.cr/wp-content/uploads/ 2018/08/POLITICA_NACIONAL_DE_GESTION_DEL_RIESGO.pdf
48 Barrantes, J. (2010). Tópicos Meteorológicos Y Oceanográficos, Vol. 19, No. 1(2020). URL http://cglobal.imn.ac.cr/documentos/revista/topicosmet20201/offline/RevistaTopicos2020-1.pdf
49 Costa Rica (2017). Política Nacional de Gestión del Riesgo (2016–2030). URL: https://cambioclimático.go.cr/wp-content/uploads/2018/ 08/POLITICA_NACIONAL_DE_GESTION_DEL_RIESGO.pdf
50 OCHA (2018). Costa Rica Floods – October 2018. URL: https://reliefweb.int/disaster/fl-2018-000165-cri51 Barrantes, J. (2020).Tópicos Meteorológicos Y Oceanográficos, Vol. 19, No. 1(2020). URL: http://cglobal.imn.ac.cr/documentos/revista/
topicosmet20201/offline/RevistaTopicos2020-1.pdf52 Zuniga, B. (2013). Country Report for Costa Rica. URL: https://www.droughtmanagement.info/literature/UNW-DPC_NDMP_Country_
Report_Costarica_2013.pdf53 EM-DAT: The Emergency Events Database - Université Catholíque de Louvain (UCL) – CRED, D. Guha-Sapir, Brussels, Belgium.
http://emdat.be/emdat_db/
CLIMATE RELATED NATURAL HAZARDS
OverviewCosta Rica is highly vulnerable to extreme hydrometeorological conditions and water scarcity, and climate change will
increase the level of exposure and vulnerability of the country45. Its young geological formation renders the country’s
territory additionally vulnerable to tectonic and volcanic activity, as well as the associated landslides, avalanches, water
and mud dams, and rising sediment loads.46 Costa Rica has the 8th highest economic risk exposure to three or more
hazards and 6.8% of its total area is exposed to three or more adverse natural events. Further, 77.9% of Costa Rica’s
population and 80.1% of the country’s GDP reside in areas at high risk of multiple hazards.47 Most of the country’s
emergencies are associated with events generated by rain and wind: floods, landslides, and rising tides. Disasters
within the country’s capital city of San Jose tend to be the most intense and best documented in terms of losses.48
Outside of San Jose, on average, floods, among the most intense events on a regional scale, occur at least twice a
year and a major earthquake every four years. Droughts generally affect only the Pacific Slope, associated with climate
variability, while volcanic activity is permanent, with eruption episodes that may well be repeated every 30 years.49
Floods, a result of extreme rainfall events, can affect all regions of the country and have significant impacts on the
country’s inhabitants. The floods that occurred in October of 2018, for example, brought 50–1,500 mm of rainfall
over a period of 24 hours to the Pacific regions, especially affecting the Nicoya Peninsula and the Central Pacific and
impacting over 125,000 people.50 Droughts pose the greatest risks to the North Pacific and Northern zones near
the border with Nicaragua, and increased in intensity, frequency and length, affecting agriculture and water resource
availability. The costs of hydrometeorological disasters on infrastructure in Puntarenas, Guanacaste, Limon and San
Jose between 2005–2011, for example, were estimated at $710 million dollars.51,52
Data from the Emergency Event Database: EM-Dat,53 presented in Table 4, shows the country has endured
various natural hazards, including droughts, floods, landslides, epidemic diseases, storms, earthquakes and wildfires,
costing lives, and economic damage.
https://cambioclimático.go.cr/wp-content/uploads/2018/08/POLITICA_NACIONAL_DE_GESTION_DEL_RIESGO.pdf
https://cambioclimático.go.cr/wp-content/uploads/2018/08/POLITICA_NACIONAL_DE_GESTION_DEL_RIESGO.pdf
https://cambioclimático.go.cr/wp-content/uploads/2018/08/POLITICA_NACIONAL_DE_GESTION_DEL_RIESGO.pdf
https://cambioclimático.go.cr/wp-content/uploads/2018/08/POLITICA_NACIONAL_DE_GESTION_DEL_RIESGO.pdf
https://cambioclimático.go.cr/wp-content/uploads/2018/08/POLITICA_NACIONAL_DE_GESTION_DEL_RIESGO.pdf

13CLIMATE RISK COUNTRY PROFILE: COSTA RICA
Key TrendsAs the climate changes, weather related disasters are likely to continue, exacerbating existing vulnerabilities in Costa
Rica. For example, infrastructure in the central mountains, could experience increased damage and loss from landslides
and avalanches. The most significant disasters for the country include floods, primarily riverine, but also along both the
Pacific and Caribbean coasts as sea levels rise. However, an increase in extreme rainfall events will likely continue to
cause localized flooding events in urban areas. Studies suggest that climate change could increase the frequency of
occurrence and the intensity of these phenomena. As such, the country is working to understand, anticipate, and take
action to reduce these impacts. The country’s Pacific and Caribbean coasts are vulnerable to coastal flooding from
rising seas and storm surges (Figure 10). As rainfall becomes more variable and is more concentrated in extreme
events, coupled with the effects of the El Niño Southern Oscillation phenomenon, both the frequency of floods and
droughts will likely increase, especially in the Pacific zones. Projected losses from hydrometeorological disasters by
2030 and 2050 point to direct damages costing between US $7 million and $30 million.54
Costa Rica is vulnerable to tropical and subtropical cyclones and their associated storm surges on its Caribbean
coast. Hurricane Mitch, one of the most destructive events in Central America, caused economic losses amounting
to approximately US $98 million in Costa Rica. This amount is much lower than that incurred in other countries;
however, with increasing climate variability the likelihood of cyclones is expected to increase. Evidence of acceleration
in sea level rise (up to 2–3 mm/yr) over the past decade suggests an increase in the vulnerability of low-lying coasts,
which are already subjected to increasing storm surges. Storms and flooding are expected to impact the San Jose
metropolitan area in the Northwestern Region of the Central Valley, with risks to water and sanitation systems as well
as agricultural production. 65% of the population lives in Costa Rica’s greater metropolitan areas and are at higher
TABLE 4 . Natural Disasters in Costa Rica, 1900–2020
Natural Hazard 1900–2020 Subtype
Events Count
Total Deaths Total Affected
Total Damage (’000 USD)
Drought Drought 5 24,000
Epidemic Viral Disease 3 3 21,638
FloodRiverine Flood 21 97 571,659 368,000
Undefined 8 51 196,264 35,000
Earthquake Ground Movement 17 2616 164,493 365,700
Landslide Landslide 7 200
StormTropical Cyclone 8 114 769,836 562,390
Undefined 1 3 216,000
Volcanic Activity Ash Fall 7 104 109,771 5,000
Wildfire Forest Fire 2 1,200
54 Costa Rica (2017). Política Nacional de Gestión del Riesgo (2016–2030). URL: https://cambioclimático.go.cr/wp-content/uploads/ 2018/08/POLITICA_NACIONAL_DE_GESTION_DEL_RIESGO.pdf

14CLIMATE RISK COUNTRY PROFILE: COSTA RICA
FIGURE 10 . Risk of Riverine Flood (left),57 Coastal Flood (right)58
55 Quesada-Roman, A., Villalobos-Portilla, E. and Campos-Duran, C. (2020). Hydrometeorological disasters in urban areas of Costa Rica, Central America. J. or Environmental Hazards. DOI: https://doi.org/10.1080/17477891.2020.1791034
56 Costa Rica (2014). Tercera Comunicación Nacional de la República de Costa Rica. URL: http://www.cac.int/sites/default/files/crinc3.pdf57 ThinkHazard! (2020). Costa Rica – River Flood: URL: https://thinkhazard.org/en/report/61-costa-rica/FL58 ThinkHazard! (2020). Costa Rica – Coastal Floods. URL: https://thinkhazard.org/en/report/61-costa-rica/CF
risk to damaging flooding and landslides due to poor infrastructure, urban sprawl from unregulated land-use planning,
and poverty.55 As these urban areas have high poverty rates, the climate-related trends should be analyzed in the
context of social, economic, and political variables. Storm and flood warning systems, coupled with improved sanitation
and agricultural adaption measures, would curb damage and help protect vulnerable populations. Impact assessments
should also be performed on the aquifers in this area as they are the primary source of water for over half of the
country’s population. Additionally, low-lying coastal regions impacted by sea level rise and increased severe weather
require more adequate funding for preparedness, climate proofing, and strategic public infrastructure.56
Implications for DRMThe Costa Rican government is committed to strengthening its capacity to manage and reduce disaster risks. Despite
its high exposure to adverse natural events, Costa Rica has built an efficient disaster response system and has
managed to limit vulnerabilities through the effective enforcement of building codes, environmental standards,
and land use planning. Costa Rica has also made substantial progress in strengthening its institutional and legal

15CLIMATE RISK COUNTRY PROFILE: COSTA RICA
framework and mainstreaming disaster risk management in its national development program.59 Costa Rica’s National
Disaster Management Policy for 2016–2030 recognizes the need to understand the differential vulnerabilities of
people, social, economic, and environmental systems to climate variability and change. The Policy links adaptation to
disaster risk management under a longer-term vision of capacity building that aims to prepare for future climatic risks.60
Further, Costa Rica’s National Development Plan,61 considers disaster risk management and development as
complementary actions that need to be taken in order to reduce vulnerability and capacity at territorial, national,
regional, local, and community levels to the impacts disasters on roads, energy production, and public service systems
(water, sanitation and health). Disaster risk management in Costa Rica recognizes the need to integrate environmental,
climate change and land use management into risk management process as a way of safeguarding the safety,
welfare, and sustainable development of the country. It is managed through the National Disaster Risk Management
System (SNGR in Spanish). SNGR coordinates several sub-directorates, including 1) Disaster Risk Reduction –
which is responsible for projects and regulatory measures to mainstream risk management into social and economic
planning and practices in order to mitigate disaster risks; 2) Preparing and Responding to Disasters – responsible
for preparing and executing disaster responses under emergencies; and 3) Disaster Risk Recovery – whose role is
to plan and implement actions to recover from risks. Regional and local coordination takes place in coordination with
sectorial, institutional, and technical assistant committees of disaster management and emergencies.62 The country
has also implemented a National Committee on ENSO (COENOS in Spanish) to monitor the evolution of the ENSO
phenomenon in the face of climate change and inform and coordinate with local institutions on risks (specifically,
drought risk management).63
GenderAn increasing body of research has shown that climate-related disasters have impacted human populations in many
areas including agricultural production, food security, water management and public health. The level of impacts
and coping strategies of populations depends heavily on their socio-economic status, socio-cultural norms, access
to resources, poverty as well as gender. Research has also provided more evidence that the effects are not gender
neutral, as women and children are among the highest risk groups. Key factors that account for the differences
between women’s and men’s vulnerability to climate change risks include: gender-based differences in time use;
access to assets and credit, treatment by formal institutions, which can constrain women’s opportunities, limited
access to policy discussions and decision making, and a lack of sex-disaggregated data for policy change.64
59 GFDRR (2014). Costa Rica. URL: https://www.gfdrr.org/sites/default/files/publication/country-program-update-2014-costa-rica.pdf60 Costa Rica (2015). Política Nacional de Gestión del Riesgo 2016–2030 de la República de Costa Rica. URL: https://drive.google.
com/file/d/0ByA2trMWnTn4dS1GOGNlQTFHMU0/view61 Costa Rica (2015). Política Nacional de Gestión del Riesgo 2016–2030 de la República de Costa Rica. URL: https://drive.google.com/
file/d/0ByA2trMWnTn4dS1GOGNlQTFHMU0/view62 Costa Rica (2014). Tercera Comunicación Nacional de la República de Costa Rica. URL: http://www.cac.int/sites/default/files/crinc3.pdf63 Vignola, R., Kuzdas, C., Bolanos, I. and Poveda, K. (2018). Hybrid governance for drought risk management: the case of the 2014/2015
El Niño in Costa Rica. International Journal of Disaster Risk Reduction. DOI: https://doi.org/10.1016/j.ijdrr.2018.03.01164 World Bank Group (2016). Gender Equality, Poverty Reduction, and Inclusive Growth. URL: http://documents1.worldbank.org/curated/
en/820851467992505410/pdf/102114-REVISED-PUBLIC-WBG-Gender-Strategy.pdf
16CLIMATE RISK COUNTRY PROFILE: COSTA RICA
65 Statista (2020). Costa Rica: Distribution of employment by economic sector for 2009–2019. URL: https://www.statista.com/statistics/454908/employment-by-economic-sector-in-costa-rica/
66 Statista (2020). Costa Rica: Distribution of employment by economic sector for 2009–2019. URL: https://www.statista.com/statistics/454908/employment-by-economic-sector-in-costa-rica/
67 FAO (2013). Margo de Programación Costa Rica, 2013–2015. URL: http://www.fao.org/3/a-bp519s.pdf68 OECD (2017). Review of Costa Rica’s Agricultural Policies. URL: http://www.oecd.org/countries/costarica/AgPol_CR_en.pdf69 OECD (2017). Agricultural Policies in Costa Rica, OECD Publishing, Paris. http://dx.doi.org/10.1787/9789264269125-en. URL: http://
www.oecd.org/countries/costarica/AgPol_CR_en.pdf70 FAO (2020). Costa Rica Country Profile. URL: http://www.fao.org/countryprofiles/index/en/?iso3=CRI71 Imbach, P. et al. (2017). Climate change, ecosystems and smallholder agriculture in Central America: an introduction to the special
issue. Climatic Change. 141:1–12. DOI: 10.1007/s10584-017-1920-572 FAO (2018). The successes and shortcoming of Costa Rica exports diversification policies Background paper to the UNCTAD-FAO
Commodities and Development Report 2017 Commodity Markets, Economic Growth and Development URL: http://www.fao.org/3/I8308EN/i8308en.pdf
73 OECD (2017). Review of Costa Rica’s Agricultural Policies. URL: http://www.oecd.org/countries/costarica/AgPol_CR_en.pdf
CLIMATE CHANGE IMPACTS TO KEY SECTORS
Agriculture
OverviewAgriculture is the foundation of economic development in Costa Rica. The agriculture and agribusiness sector represent
a significant contribution to the national economy, accounting for a little over 12% of the country’s employment65 and
contributed 4.25% of GDP,66 while also playing a leading role in the country’s exports, employment and incomes.67
Agriculture is the largest employer in rural areas, and accounted for a little over 31% of employment.68 Coffee,
sugar cane, maize, beans, bananas, pineapple, and oil palm are widely cultivated while specialty crops such as cacao
(in the north east) or melons and oranges (in the south) are also grown. Costa Rica’s location in Central America and
integration into regional and other trade agreements have enabled it to overcome the constraints of its small domestic
market and benefit from its comparative advantage in exportable crops. Costa Rica is among the largest exporters of
banana in the world, and the sector contributes significantly to the country’s overall GDP. While the traditional agricultural
exports of bananas, coffee, and pineapple, as well as sugarcane, palm oil and melon are still the backbone of commodity
export trade, coffee cultivation, primarily carried out in the Central region, is the key socioeconomic activity of the
country constituting 20% of GDP and generating the bulk of employment. Bean cultivation is a traditional agricultural
activity with great socioeconomic importance as it is the most consumed leguminous plant in Costa Rica.69
In 2016, the agriculture and livestock sector occupied a little over 30% of Costa Rica’s land area,70 of which little
is irrigated and 11.5% is classified as arable with permanent crops.71 Since the 1980s, Costa Rica has promoted a
model of export growth in the sector, including diversification and foreign direct investment. Diversification efforts
expanded fruit and dairy products, which currently account for approximately 80% of agriculture exports, while
coffee, tea and spices account for 11% of agriculture exports. Dairy and fisheries represent approximately 35% and
31% of livestock exports.72 Food processing represented a significant percent (25%) of the country’s manufacturing
sector in 2014.
Livestock rearing and dairy production is concentrated in the central, northeast and in the Caribbean east. Livestock
products include beef, pig meat, poultry and milk73 and their share of agricultural production has increased
attributable to livestock continues to increase, representing 35% of production in 2015. Dairy production continues

17CLIMATE RISK COUNTRY PROFILE: COSTA RICA
to exhibit significant growth, and the sub-sector grew by 105% between 1995 and 2015. Fisheries concentrated in
the southwest Pacific and northwest Pacific regions74 are an important source of foreign exchange in the country,
and a significant employer in the generally economically depressed and marginal coastal areas of the country.75 Five
landing points for fisheries products exist in the Pacific coast, while 2 landing sights are in the Caribbean coast.76
Climate Change ImpactsAgricultural activity in Costa Rica is vulnerable to the wide range of extreme events that the country regularly
experiences, including floods and droughts, as well as rising temperatures and desertification driven by poor land
use practices. Much of the country’s agroecosystems are additionally vulnerable to the effects of drought, soil
erosion, and changes in the rainfall and hydrological regimes. The projected impacts from a changing climate on food
production, agricultural livelihoods, exports and food security in Costa Rica are significant national policy concerns.77
Small scale agriculture is especially vulnerable to the impacts of El Niño and La Niña78 in areas over-exploited by
livestock. The costs of droughts have been significant in the production of basic grains (maize, beans and rice) in
the provinces of Guanacaste and Puntarenas, with costs for just 3 events (1993, 1997 and 2009) were estimated
at over US $30 million in Guanacaste and nearly 15 million US dollars in Puntarenas.79 Floods, on the other hand,
resulted in losses equating 9% of the production costs per hectare at the farm level between 1988–2009.80
Altered rainfall patterns and rising temperatures will significantly impact the country’s principal crops: rice, beans,
maize and coffee. Suitable areas for crops agricultural productivity (both for export and local food security) will change,
with some cantons gaining productivity and for certain crops and others losing productivity.81 Coffee and beans are
projected to be the most sensitive to changes by the 2030s, with significant reductions in suitable area for these
crops occurring in the provinces of San Jose, Heredia and Cartago.82 Areas suitable for banana production will
also likely to decrease, affecting the Pacific region (Provinces of Alajuela, Puntarenas and San Jose) as well as the
provinces of Limon and Cartago in the Caribbean. In contrast, rising temperatures are likely to increase the extent of
areas suitable for maize, sugarcane and cassava, particularly in the low-lying areas such as Bagaces and Santa Crus
in Guanacaste and Puntarenas.83 Further, highly specialized niche crops such as, cocoa, and other fruits will likely see
critical changes in the prevalence of pests and diseases.
74 Costa Rica (2019). Infografías diagnósticos PNDIP 2019–2011. URL: https://documentos.mideplan.go.cr/share/s/gjeXDKA8SoW1zVBawuiGJQ
75 OECD (2017). Agricultural Policies in Costa Rica. URL: http://www.oecd.org/countries/costarica/AgPol_CR_en.pdf76 INCOPESCA (2016). Report on Fisheries. URL: https://www.incopesca.go.cr/77 CCAFS (2013). La agricultura de Costa Rica y el cambio climático: ¿Dónde están las prioridades para la adaptación? URL: https://
www.researchgate.net/publication/269575938_La_agricultura_de_Costa_Rica_y_el_cambio_climático_Donde_estan_las_prioridades_para_la_adaptacion
78 Costa Rica (2014). Tercera Comunicación Nacional de la República de Costa Rica. URL: http://www.cac.int/sites/default/files/crinc3.pdf79 Costa Rica (2009). Segunda Comunicación Nacional de la República de Costa Rica. URL: http://cglobal.imn.ac.cr/documentos/
publicaciones/ComunicacionesNacionales/segundaComunicacionNacional.pdf80 Costa Rica (2014). Tercera Comunicación Nacional de la República de Costa Rica. URL: http://www.cac.int/sites/default/files/crinc3.pdf81 Hannah, L. et al. (2017). Regional modeling of climate change impacts on smallholder agriculture and ecosystems in Central
America. Climatic Change. 141:29–45. DOI: 10.1007/s10584-016-1867-y82 CCAFS (2013). Policy Brief: La agricultura de Costa Rica y el cambio climático: ¿Dónde están las prioridades para la adaptación?
URL: https://www.researchgate.net/publication/269575938_La_agricultura_de_Costa_Rica_y_el_cambio_climático_Donde_estan_las_prioridades_para_la_adaptacion
83 CCAFS (2013). Policy Brief: La agricultura de Costa Rica y el cambio climático: ¿Dónde están las prioridades para la adaptación? URL: https://www.researchgate.net/publication/269575938_La_agricultura_de_Costa_Rica_y_el_cambio_climático_Donde_estan_las_prioridades_para_la_adaptacion

18CLIMATE RISK COUNTRY PROFILE: COSTA RICA
Rising temperatures, particularly daily maximum
temperatures, pose an increased risk of heat stress for
a range of crops, livestock as well as dairy production.
Under present climate conditions, heat stress already
poses challenges for heat dissipation in livestock
populations, rendering them vulnerable to heat stress
during certain periods of the year. Heat stress can
reduce milk production as well as reproductive rates,
particularly for cattle. Specialty crops, such as coffee,
are at risk of surpassing thermal temperature ranges
as high elevation areas in the country become
increasingly warmer.84 As heat increases, so is the
likelihood of altered growing seasons. Figure 11
shows the projected change in average daily maximum
temperatures for Costa Rica across the seasonal cycle.
What is clear is that higher temperatures are expected
throughout the year.
Adaptation OptionsCosta Rica has placed a strong emphasis on climate change adaptation and greenhouse gas mitigation from the
agriculture and livestock sector.86 The State’s Policy for Agri-Food (Agro-Alimento) for 2010–2021 offers as set
of adaptive measures for the sector. For example, the recent Nationally Appropriate Mitigation Actions for coffee
growers emphasizes the commitment of the sector public, private and academic to search for innovations that
reduce emissions from coffee cultivation by reducing fertilizer use, making more efficient use of water and energy,
as well as carbon sequestration by combining coffee cultivation with timber trees.87 Costa Rica is also committed
to adaptation options include investing in the primary sector by providing incentives to diversity the crop mix,
a reassessment of crop suitability zones based on a currently more variable and changing climate, including relocating
agricultural lands which are at risk from sea level rise.88 Additional adaptation options include investing in restoring
degraded lands and replacing perennial, water dependent species with more drought resistant varieties; investing in
technological improvements such as irrigation systems and observation technologies to address a changing climate
profile; investing in improved quality beef products, especially in pasture management towards the end of the rainy
season such as silage and haymaking;89 strengthening productive value chains by incorporating small producers
from rural territories and family farmers; and strengthening national agricultural policies.90
Tem
pera
ture
(°C
)
29
30
31
32
33
34
35
36
37
38
Projected maxima of daily Tmax Historical
Jan Feb Mar Apr May Jun Jul Aug Sep Oct Nov Dec
FIGURE 11 . Projected Change in Average Daily Max Temperature for Costa Rica, 2040–2059 (RCP8 5, Reference Period 1986–2005)85
84 Hannah, L. et al. (2017). Regional modeling of climate change impacts on smallholder agriculture and ecosystems in Central America. Climatic Change. 141:29–45. DOI: 10.1007/s10584-016-1867-y
85 WBG Climate Change Knowledge Portal (CCKP, 2021). Costa Rica Agriculture. Dashboard URL: https://climatedata.worldbank.org/CRMePortal/web/agriculture/crops-and-land-management?country=CRO&period=2080-2099
86 Bouroncle, C. et al. (2013). La agricultura de Costa Rica y el cambio climático: ¿Dónde están las prioridades para la adaptación? URL: https://www.researchgate.net/publication/269575938_La_agricultura_de_Costa_Rica_y_el_cambio_climático_Donde_estan_las_prioridades_para_la_adaptacion
87 Costa Rica (2020). Proyecto de Apoyo a la NAMA Café de Costa Rica. URL: http://www.namacafe.org/88 Costa Rica (2020). Costa Rica’s Updated Nationally Determined Contribution. URL: https://www4.unfccc.int/sites/ndcstaging/
PublishedDocuments/Costa%20Rica%20First/INDC%20Costa%20Rica%20Version%202%200%20final%20ENG.pdf89 Alvarez-Vergani, C. (2015). Estratégia de adaptación climática en Costa Rica: bases para la gestión estatal e institucional. URL: https://
library.fes.de/pdf-files/bueros/fesamcentral/12281.pdf90 Costa Rica (2015). NAMA Ganadería. URL: https://cambioclimático.go.cr/wp-content/uploads/2018/10/ENGBC.pdf
19CLIMATE RISK COUNTRY PROFILE: COSTA RICA
Water
OverviewCosta Rica is a water-abundant country; with 34 hydrological basins and 59 known aquifers.91 Nevertheless, water
scarcity is a growing challenge in certain agricultural regions. The total amount of water available is estimated at
almost 113 million cubic meters per year; discounting losses for evaporation, infiltration and other processes, net
available water is 75 million cubic meters per year.92 More than 90% of water concessions (by volume) are granted to
the agro-food sector as a whole: 85% to agriculture and 6% to agroindustry.93 Costa Rica’s topography and abundant
rainfall have permitted construction of hydroelectric power plants, generating 66% of the country’s energy. At the
same time, water scarcity is a concern in some regions – the Northern Pacific in particular. Overuse exacerbates these
concerns: according to a MINAE study on the hydrological balance in 15 of the country’s 34 watersheds, inefficient
water use is a significant challenge. Water availability is hindered by surface water runoff losses (10–30%) and while
rain water collection, specifically in urban areas, is high (up to 96%), just 3–4% of this is treated.94
Climate Change ImpactsIrrigation is the major water user in Costa Rica (70.8% of mean annual inflow/recharge).95 Even though water
availability is not a problem at present, the population’s needs for reliable and clean water supply are not fully met
due to a lack of integrated water management policies. A total of 76% of the national population receives water
that is disinfected on an ongoing basis. The issue of access to quality potable water is more critical among the
highest-risk populations of the country and future climate-induced flooding events will only exacerbate it. For
example, in the Central Valley of Costa Rica an imbalance in the potable water supply is expected by 2022, due
to a combination of the effects of climate change and an expected population growth of 1.1 million people. The
Costa Rican population’s access to sources of drinking water rose slightly from 1995 to 2006, from 96% to 98%,
respectively.96
Altered rainfall patterns will inevitably impact water resource availability across Costa Rica. Climate vulnerability studies
on the three most important river basins in Costa Rica – the Reventazón, Térraba, and Grande de Tárcoles – show
alarming reductions in runoff rates and alterations in the hydrological cycle. Alterations in the water cycle could
affect water runoff, erosion, and sedimentation, thus causing severe flood-related problems. Impacts would also be
reflected in the exploitation of water resources to generate hydroelectricity, irrigation systems, aqueducts, and sewer
systems.97 Additionally, Costa Rica is expected to experience increased drying in the second half of the century, and
91 OECD (2015). Water Resources Allocation in Costa Rica. URL: http://www.oecd.org/countries/costarica/Water-Resources-Allocation-Costa-Rica.pdf
92 OECD (2015). Water Resources Allocation in Costa Rica. URL: http://www.oecd.org/countries/costarica/Water-Resources-Allocation-Costa-Rica.pdf
93 Costa Rica (2014). Tercera Comunicación Nacional de la República de Costa Rica. URL: http://www.cac.int/sites/default/files/crinc3.pdf94 Shahady, T. and Boniface, H. (2018). Water quality management through community engagement in Costa Rica. J. of Environmental
Studies and Sciences. 8: 488–502. URL: https://link.springer.com/article/10.1007/s13412-018-0504-795 OECD (2015). Water Resources Allocation in Costa Rica. URL: http://www.oecd.org/countries/costarica/Water-Resources-Allocation-
Costa-Rica.pdf96 Shahady, T. and Boniface, H. (2018). Water quality management through community engagement in Costa Rica. J. of Environmental
Studies and Sciences. 8: 488–502. URL: https://link.springer.com/article/10.1007/s13412-018-0504-797 OECD (2015). Water Resources Allocation in Costa Rica. URL: http://www.oecd.org/countries/costarica/Water-Resources-Allocation-
Costa-Rica.pdf

20CLIMATE RISK COUNTRY PROFILE: COSTA RICA
with increases in extreme rainfall events, but longer
time dry spells in between these heavy rainfall events.
Drying is expected to be most pronounced in Costa
Rica’s southern zones.98
Figure 12 shows the projected annual Standardized
Precipitation Evapotranspiration Index (SPEI), an index
which represents the measure of the given water deficit
in a specific location, accounting for contributions
of temperature-dependent evapotranspiration and
providing insight into increasing or decreasing pressure
on water resources. Negative values for SPEI represent
dry conditions, with values below −2 indicating severe
drought conditions, likewise positive values indicate
increased wet conditions. This is an important
understanding for the water sector in regard to quantity and quality of supply for human consumption and agriculture
use as well as for the energy sector as reductions in water availability impacts river flow and the hydropower generating
capabilities. At national scale, Costa Rica is expected to experience decreased SPEI through the end of the century,
representing drier conditions across a national scale.
Adaptation OptionsAdaptation in the water resources sector should focus on 1) understanding the synergies between impacts from land
use practices on water resources, both surface and groundwater; 2) updating and investing in compliance measures
of the current legal framework for water resource management, taking into account basic principles of adaptation
and projected risks, and including adaptive measures such as price regulation, encouraging the efficient use of
water resources, and improving the equitable distribution of the same. Additional adaptation measures such include
awareness raising activities aimed at civil society to improve their understanding the risks to water resources a
changing climate can pose, and thus encouraging water conservation practices.100 Water management capacity needs
to be built, and in cooperation with all water use sectors, real water needs for the country are required to regulate
supply and demand under a changing climate, especially in the dry season.101 Guaranteeing water supply security
via reforestation of springs, water recharge areas and riverine zones, together with the regulation and delimitation of
buffer areas could safeguard future resources.
Historical RCP 2.6 RCP 4.5 RCP 6.0 RCP 8.5
2.0
1.5
1.0
0.5
–0.5
0
–1.0
–2.0
–1.5
–2.5
–3.5
–3.0
Ann
ual S
PE
I dro
ught
inde
x
FIGURE 12 . Projected Annual SPEI Drought Index in Costa Rica, 2080–2099 (Reference Period, 1986–2005)99
98 Castillo, R., Amador, J., and Duran, A.M. (2018). Costa Rica Rainfall in Future Climate Change Scenarios. Earth and Space Science Open Archive, AGU 2017 Fall Meeting. URL: https://www.essoar.org/doi/abs/10.1002/essoar.bca73dd28032a2ab.b32e48ac7d934bec.1
99 WBG Climate Change Knowledge Portal (CCKP, 2021). Costa Rica. Water Sector Dashboard. URL: https://climatedata.worldbank.org/CRMePortal/web/agriculture/crops-and-land-management?country=CRO&period=2080-2099
100 Costa Rica (2021). Costa Rica’s Updated Nationally Determined Contribution. URL: https://www4.unfccc.int/sites/ndcstaging/PublishedDocuments/Costa%20Rica%20First/Contribucio%CC%81n%20Nacionalmente%20Determinada%20de%20Costa%20Rica%202020%20-%20Versio%CC%81n%20Completa.pdf
101 Alvarez-Vergani, C. (2015). Estratégia de adaptación climática en Costa Rica: bases para la gestión estatal e institucional. URL: https://library.fes.de/pdf-files/bueros/fesamcentral/12281.pdf

21CLIMATE RISK COUNTRY PROFILE: COSTA RICA
Energy
OverviewCosta Rica has a state-led electricity model focused on hydroelectric power, managed by the Electrical Institute (ICE).102
Costa Rica’s energy consumption is based on the use of three sources: oil derivatives, electricity, and biomass.103
Installed capacity in Costa Rica is approximately 11,210 GWh, of which 77% is sourced from hydro, 0.3% from
thermal plants, 6% from geothermal plants, 12% from wind, 1% from biomass and 0.2% from solar. In 2017, 70%
of the country’s energy as generated by Costa Rica’s ICE. Demand increased by 1.1% between 2016 and 2017. The
country’s electricity generation in recent years has been almost 100% renewable and the country aims to achieve and
maintain 100% electricity generation from renewable energy by 2030.104 Installed thermal provides backup capacity
of the system in critical hydrological periods when hydropower generation is reduced. Demand projections point to
significant increases in energy needs for Costa Rica by 2040.105
Climate Change ImpactsProjected rainfall and temperature scenarios indicate that some regions may see reductions in rainfall, which would
reduce runoff to rivers, water stored in dams and aquifer recharge.106 Additionally, floods resulting from heavy rains can
damage critical energy infrastructure. Runoff levels are expected to rise in coastal regions, negatively impacting energy
infrastructure along the coast via floods and landslides, and the increasing the occurrence of natural disasters.107
Gradual alterations in precipitation patterns, especially lower average precipitation will also affect the resource base
of hydropower by leading to declining runoff and reduced river flows, which in turn affect the volume and timing of
water availability. Additionally, higher temperatures, through evaporation, can significantly reduce water available from
reservoirs. As temperatures rise, the dynamics of demand and supply of electricity will change in Costa Rica. A recent
analysis on the impacts of rising temperatures on hydropower production identified the basins of the Reventazón,
Pacuare, Parrita and San Carlos as facing significant reductions in energy generating potential, while the basins of
Sixaola and Matina will likely face increased erosion and landslides.108 As Costa Rica continues to pursue economic
growth and increased living standards for its population, increased demand is likely to also focus on the attainment
and use of air conditioning and other cooling mechanisms as the country warms. This will put additional strain on the
country’s energy transmission network and result in increasing spikes during high-heat periods.109
102 Feoli, L. (2018). The Policy and Institutional Effects on Contentious Politics in Costa Rica’s Energy Sector. European Review of Latin American and Caribbean Studies. 106(2018): 75–102. URL: https://www.jstor.org/stable/26608621
103 Costa Rica (2009). Segunda Comunicación Nacional de la República de Costa Rica. URL: http://cglobal.imn.ac.cr/documentos/publicaciones/ComunicacionesNacionales/segundaComunicacionNacional.pdf
104 Costa Rica (2020). Costa Rica’s Updated Nationally Determined Contribution. URL: https://www4.unfccc.int/sites/ndcstaging/PublishedDocuments/Costa%20Rica%20First/Contribucio%CC%81n%20Nacionalmente%20Determinada%20de%20Costa%20Rica%202020%20-%20Versio%CC%81n%20Completa.pdf
105 Instituto Costarricense De Electricidad Direccion Corporativa De Electricidad (2018). Informe Ejecutivo Del Plan De Expansión De La Generación 2018–2034. URL: Https://Www.Grupoice.Com/Wps/Wcm/Connect/F5fd219d-700d-4abc-8422-Ecbd27f9c9fd/Informe+Ejecutivo+Peg2018-2034.Pdf?Mod=Ajperes&Cvid=Mrl1q1w
106 Instituto Costarricense De Electricidad Direccion Corporativa De Electricidad (2018). Informe Ejecutivo Del Plan De Expansión De La Generación 2018–2034. URL: Https://Www.Grupoice.Com/Wps/Wcm/Connect/F5fd219d-700d-4abc-8422-Ecbd27f9c9fd/Informe+Ejecutivo+Peg2018-2034.Pdf?Mod=Ajperes&Cvid=Mrl1q1w
107 ICEX (2011). El sector Eléctrico en Costa Rica. URL: http://www.asamblea.go.cr/sd/Documents/referencia%20y%20prestamos/BOLETINES/BOLETIN%2001/publicaciones%20recomendadas/18093.%20%20El%20sector%20el%C3%A9ctrico%20en%20Costa%20Rica.pdf
108 Costa Rica (2014). Tercera Comunicación Nacional de la República de Costa Rica. URL: http://www.cac.int/sites/default/files/crinc3.pdf109 Ramirez-Sandi, S. and Quiros-Tortos, J. (2018). Evaluating the Effects of Climate Change on the Electricity Demand of Distribution
Networks. INSPEC. DOI: 10.1109/TDC-LA.2018.8511694

22CLIMATE RISK COUNTRY PROFILE: COSTA RICA
Cooling Degree Days show the relationship between daily heat and cooling demand, typically sourced through a form
of active cooling or an evaporative process. The change in cooling degree days provides insight into the potential
for extended seasons of power demand or periods in which cooling demand (power demands) will increase. As
seen in Figure 13, seasonal increases for cooling demands are expected to increase throughout the year. The Warm
Spell Duration Index represents the number of days in a sequence of at least six days in which the daily maximum
temperature is greater than the 90th percentile of daily maximum temperature. As shown in Figure 14, warm spells
are expected to sharply increase in the second half of the century.
110 WBG Climate Change Knowledge Portal (CCKP, 2021). Costa Rica URL: https://climateknowledgeportal.worldbank.org/country/Costa Rica/climate-data-projections
111 WBG Climate Change Knowledge Portal (CCKP, 2021). Costa Rica – Energy. URL: https://climateknowledgeportal.worldbank.org/country/CRO/climate-data-projections
112 Instituto Costarricense De Electricidad Direccion Corporativa De Electricidad (2018). Informe Ejecutivo Del Plan De Expansión De La Generación 2018–2034. URL: Https://Www.Grupoice.Com/Wps/Wcm/Connect/F5fd219d-700d-4abc-8422-Ecbd27f9c9fd/Informe+Ejecutivo+Peg2018-2034.Pdf?Mod=Ajperes&Cvid=Mrl1q1w
113 Costa Rica (2014). Tercera Comunicación Nacional de la República de Costa Rica. URL: http://www.cac.int/sites/default/files/crinc3.pdf
Adaptation OptionsCosta Rica’s Expansion plan for Energy Generation for 2018–2034,112 outlines a series of adaptation strategies for the
energy sector under a changing climate. Recommendations included diversifying the energy mix, balancing supply and
demand needs, with a focus on domestic demands, as declining river flows due to a decrease in rainfall will inevitably
need to increase national prices in order to compete with energy export demands and improved water resource
management under changing conditions.113 Additional investments may need to be made in building more storage
capacity, improving turbine efficiencies or other engineering measures to make efficient use of available resources.
Integrated water use management will be required as competing demands for water begin to come into play through
increased demand for water for other uses such as irrigation and urban demands. Costa Rica is committed to building
FIGURE 13 . Projected Change in Cooling Degree Days in Costa Rica, 2040–2059 (Reference Period, 1986–2005)110
FIGURE 14 . Projected Warm Spell Duration Index in Costa Rica (Reference Period, 1986–2005)111
Coo
ling
degr
ee d
ays
Projected cooling degree days (ref-65°F) Historical
FebJan Mar Apr May Jun Jul Aug Sep Oct Nov Dec250
300
350
400
450
500
550
600
0
50
100
150
200
250
300
350
Historical RCP 2.6 RCP 4.5 RCP 6.0 RCP 8.5
2000 2020 2040 2060 2080 2100

23CLIMATE RISK COUNTRY PROFILE: COSTA RICA
public awareness of improved methods of energy conservation should be linked with energy efficiency incentives.114
Building a resilient power generation infrastructure needs to consider changes in ecological flows related to projected
decreases in precipitation.115
Health
OverviewWhile Costa Rica is a middle-income country, it still faces high poverty rates, making the health of the country’s
population vulnerable to climate change impacts. Climate change projections point to continued rising temperatures,
more variable rainfall, rising seas and more frequent extreme weather events. Impacts are expected in food and water
security, human settlements, infrastructure and ecosystems, as well as health, the latter particularly through increasing
heat stress, the altered range, seasonality and distribution of vector-borne diseases including dengue, malaria, as well
as air pollution and associated respiratory illnesses, and water-borne illnesses such as cholera and diarrheal disease.116
Highest rates of dengue transmission are associated with El Niño years located in the Provinces of Puntarenas and
Guanacaste and the cantons of Oritina, Puntarenas, Cañas, Liberia, Santa Cruz, Garabito, Montes de Oro, and others.
Malaria is concentrated in the Caribbean provinces and is associated with changes in annual precipitation and
maximum temperatures.117
Climate Change ImpactsRising temperatures will expand the range of vector-borne illnesses such as malaria and dengue into higher elevation
areas. Rainfall increases will likely decrease malaria incidence as these two appear to be inversely related. Flooding
and roughs such as those from La Niña and El Niño events can spread water-borne illnesses such as diarrheal disease
and cholera.118 Costa Rica also is affected by the presence of vector borne diseases such as malaria and dengue. The
population is vulnerable to increased presence and thus infection due to increased warming throughout the year and
changing precipitation patterns. This may result in changes to the ‘traditional’ malaria seasons, increasing vulnerability
of populations119
Rising temperatures year-round will bring a more pronounced heat season with more frequent and intense heatwaves
becoming a new norm. Figure 15 shows the projected Heat Index >35°C through the end of century; appointing
to a sharp increase in and emerging hot and humid season in mid-century and continue to sharply increase under a
high-emission scenario (RCP8.5) through the end of the century. Heat discomfort and heat stress increases mortality
114 Costa Rica (2020). Costa Rica’s Updated Nationally Determined Contribution. URL: https://www4.unfccc.int/sites/ndcstaging/PublishedDocuments/Costa%20Rica%20First/Contribucio%CC%81n%20Nacionalmente%20Determinada%20de%20Costa%20Rica%202020%20-%20Versio%CC%81n%20Completa.pdf
115 Alvarez-Vergani, C. (2015). Estratégia de adaptación climática en Costa Rica: bases para la gestión estatal e institucional. URL: https://library.fes.de/pdf-files/bueros/fesamcentral/12281.pdf
116 Costa Rica (2014). Tercera Comunicación Nacional de la República de Costa Rica. URL: http://www.cac.int/sites/default/files/crinc3.pdf117 IMN (2008). Efectos del clima, su variabilidad y cambio sobre la salud humana en Costa Rica. URL: https://latinclima.org/multimedio-cc/
recursos/mod-1/Documentos/salud-clima.pdf118 Costa Rica (2014). Tercera Comunicación Nacional de la República de Costa Rica. URL: http://www.cac.int/sites/default/files/crinc3.pdf119 Chaves, L. et al. (2020). Health policy impacts on malaria transmission in Costa Rica. Parasitology. 147(9). DOI: 10.1017/
S0031182020000621

24CLIMATE RISK COUNTRY PROFILE: COSTA RICA
and morbidity for the most vulnerable, especially the elderly, children and pregnant women. Additionally, children’s
learning ability significantly decreases with increased heat exposure. Figure 16 shows that tropical nights, minimum
temperatures (>20°C), will follow a similar warming as days with a high heat index, rising rapidly under a high-emission
scenario (RCP8.5).
120 WBG Climate Change Knowledge Portal (CCKP, 2021). Costa Rica. URL: https://climatedata.worldbank.org/CRMePortal/web/agriculture/crops-and-land-management?country=CRO&period=2080-2099
121 WBG Climate Change Knowledge Portal (CCKP, 2021). Costa Rica. URL: https://climatedata.worldbank.org/CRMePortal/web/agriculture/crops-and-land-management?country=cro&period=2080-2099
122 Alvarez-Vergani, C. (2015). Estratégia de adaptación climática en Costa Rica: bases para la gestión estatal e institucional. URL: https://library.fes.de/pdf-files/bueros/fesamcentral/12281.pdf
123 Costa Rica (2020). Costa Rica’s Updated Nationally Determined Contribution. URL: https://www4.unfccc.int/sites/ndcstaging/PublishedDocuments/Costa%20Rica%20First/Contribucio%CC%81n%20Nacionalmente%20Determinada%20de%20Costa%20Rica%202020%20-%20Versio%CC%81n%20Completa.pdf
–… 0 days 4 days 8 days 12 days 16 days 20 days
1951–1960
1961–1970
1971–1980
1981–1990
1991–2000
2001–2010
2011–2020
2021–2030
2031–2040
2041–2050
2051–2060
2061–2070
2071–2080
2081–2090
2091–2100
Jan
Feb
Mar
Apr
May
Jun
Jul
Aug
Sep
Oct
Nov
Dec
FIGURE 15 . Projected Heat Index 35 Anomaly RCP8 5 (Reference Period, 1986–2005)120
150
175
200
225
250
275
300
325
Historical RCP 2.6 RCP 4.5 RCP 6.0 RCP 8.5
2000 2020 2040 2060 2080 2100
FIGURE 16 . Projected Number of Tropical Nights (Tmin >20°C) (Reference Period, 1986–2005)121
Adaptation OptionsTo reduce the impacts of climate change on public health, context specific actions need to be implemented, particularly
ones that align with the realities of the communities affected. As such, there is a need to develop locally relevant health
vulnerability assessments.122 Costa Rica is committed to 1) developing public policies to reduce inequities in health,
2) strengthening the primary health care system to improve access, timeliness, quality and economic sustainability,
3) strengthening interventions to address the health challenges associated with environmental changes, and 4) promoting
interagency coordination particularly in light of climate change; and establishing early warning systems in non-traditional
diseases in order to support prevention and response measures.123
Sea Level RiseCosta Rica has a coastline of approximately 1,290 km, which is dominated by small scale aquaculture, fisheries, port
infrastructure, and tourism. Evidence of the acceleration in sea level rise over the last 22 years suggests and increase
in the vulnerability of low-lying coastal zones, which are already subjected to higher storm surges. These rising seas and

25CLIMATE RISK COUNTRY PROFILE: COSTA RICA
changing wave patterns can cause coastal erosion, reduce land space near sea level, including urban space, and
lead to increased saline intrusion into soils and aquifers. As shown in Figure 17, sea levels are rising around
Costa Rica, along both coasts. Global sea level rise projections point to +10 cm by 2020 and 25 cm by 2050.
By the 2090s, local sea level rise may approach 1 m above 1986–2005 levels. Rising seas are likely to cause
the expansion of the areas subject to tidal flooding and the main port cities in the country would be affected:
Puntarenas, Limón, Quepos, and Golfito.124
124 Direccion de Cambio Climatico (2018). Generalidades del Cambio Climático en Costa Rica. URL: https://cambioclimatico.go.cr/cambio-climatico/generalidades/
125 WBG Climate Change Knowledge Portal (CCKP, 2021). Impacts: Sea Level Rise. URL: https://climateknowledgeportal.worldbank.org/country/costa-rica/impacts-sea-level-rise
126 Direccion de Cambio Climatico (2018). Generalidades del Cambio Climático en Costa Rica. URL: https://cambioclimatico.go.cr/cambio-climatico/generalidades/
FIGURE 17 . Observed Mean Annual Cycle of Sea Level for Coastal Costa Rica 1993–2015; Observed Anomalies Relative to Mean of 1993–2012125
Sea
leve
l ano
mal
y (m
m)
–50
0
50
100
150
200
Year
Sea level anomaly
1993 1995 1997 1999 2001 2003 2005 2007 2009 2011 2013 2015
Institutional Framework for AdaptationNational climate action in Costa Rica is coordinated by the Dirección de Cambio Climático, which sits within the
Environment and Energy Ministry.126 Costa Rica’s National Climate Change Strategy seeks to reduce the social,
environmental, and economic impacts of climate change, while addressing the vulnerability of key sectors including
water resources, agriculture, and tourism. The country’s National Development Plan for 2015–2018, considers the
implementation of actions that introduce clean energy technologies, land management, and building the awareness
ADAPTATION

26CLIMATE RISK COUNTRY PROFILE: COSTA RICA
among the public on climate risks. The National Biodiversity Policy for 2015–2030 guides actions related to the
conservation and sustainable use of the country’s extensive biodiversity resources, and aims to integrate adaptation,
human health, and food security into its considerations. The National Health Policy also includes a comprehensive
consideration of climate risk management and adaptation, with emphasis on the prevention of diseases known
to be associated with climate, including dengue, chikungunya, and others.127 Adaptation to climate change also
has as a policy ally National Risk Management Plan (2016–2030), prepared by the National Risk Prevention and
Emergency Care, which guides the actions of the State, civil society, and the private sector in order to promote “safe
and sustainable” risk management. Adaptation linked to risk management recognizes the differential and changing
nature of the context, the needs, the priorities, and the options available for transformation and incorporates a
flexible approach to fostering the ability to act on events and prepare the systems in advance to withstand the likely
events over time.128
Policy Framework for AdaptationCosta Rica submitted its Third National Communication to the UNFCCC in 2014 and its updated Nationally Determined
Contributions in 2020. The country has made considerable gains in integrating environmental sustainability in its
economic development. Adapting to climate risks in the disaster management sector will require both a coordinated
national planning structure and local and community-level response measures. Adaptation is guided by the National
Climate Change Directorate (DCC), whose aim is to implement a strategic vision that fosters the decarbonization
of the Costa Rican economy while building resilience in human, productive and eco-systems.129 The DCC aims to
coordinate the Costa Rica’s National Climate Change Strategy, whose goal is to make the country carbon neutral by
2021. In addition, the DCC has a role in making climate change a priority at the national level and providing technical
support to efforts to support a competitive, low emissions development pathway for the country.
National Frameworks and Plans
• Updated Nationally Determined Contribution (2020)
• Second Biennial Update Report (BUR1) (2020) (Spanish)
• Política Nacional de Adaptación al Cambio Climático de Costa Rica 2018–2030 (2017) (Spanish)
• Nationally Determined Contribution (2016)
• Plan Nacional de Energía 2015–2030 (2015) (Spanish)
• Plan Nacional de Descarbonización (2018–2022) (2018) (Spanish)
• Plan de Acción de la Estratégia Nacional de Cambio Climatico (2015) (Spanish)
• Política Nacional de Gestión del Riesgo (2016–2030) (2015) (Spanish)
• Tercera Comunicación Nacional (2015) (Spanish)
• Plan Nacional de Energía (2015–2030) (Spanish)
• Plan Nacional de Desarrollo 2015–2018 (2014) (Spanish)
127 Fundación Avina (2018). Proyecto LatinoAdapta Fortaleciendo vínculos entre ciencia y política en América Latina. URL: http://www.cambioclimáticoydecisiones.org/wp-content/uploads/2018/12/Informe-Costa-Rica_2019.pdf
128 Costa Rica (2015). Política Nacional de Gestión del Riesgo 2016–2030 de la República de Costa Rica. URL: http://politica.cne.go.cr/index.php/politica/politica-nacional-de-gestion-del-riesgo-2016-2030
129 Dirección de Cambio Climático. (2020). Costa Rica- Historia. URL: https://cambioclimático.go.cr/estructura/dcc/

27CLIMATE RISK COUNTRY PROFILE: COSTA RICA
• Costa Rica’s Intended Nationally Determined Contribution (2015) (Spanish)
• Segunda Comunicación Nacional de La República de Costa Rica (2009) (Spanish)
• Estratégia Nacional de Cambio Climático (2009)
• Primera Comunicación Nacional (2001) (Spanish)
Recommendations
Research Gaps• Overall planning and research needs at the federal level should be assessed in collaboration with the private
sector, local communities and the scientific community to ensure effective climate change responses meet
projected risks and need
• Increase the research budgets of Costa Rica’s scientific institutions, particularly in promotion of research that will
support public action and awareness to climate change
• Assessments are needed in Costa Rica for both urban and coastal areas, where poor planning and unstable human
settlements have created vulnerability to flooding and landslides. An increase in storms affecting these areas will
also endanger water and sanitation systems, which are already showing signs of stress
• The impact of drought events on the Pacific Slope has not yet been extensively studied. This is especially troubling
since this region has high agricultural output. The country needs to take stock of all available climate information
in this region to determine where systematic adaption measures should be taken130
• Impact studies on watersheds and water treatment facilities should be expanded to ensure water quality and
quantity in the Northwestern Central Valley
• Long-term and recent trends of SLR, flooding, and storm surges are not always available or analyzed properly,
which is of concern as Costa Rica is highly exposed to all these adverse weather events
Data and Information Gaps• A critical axis of action in the National Adaptation Policy (2018) is to generate robust information to regarding
climatic and hydrological factors as well as their impacts, in addition to enhancing the capacities of institutions and
actors to interpret and apply that knowledge in the national and local context. With regards to data and information,
this includes the establishment of a national system to monitor climate change (Sistema Nacional de Métrica en
Cambio Climático del MINAE/INEC (SINAMECC) that will collect, generate and disseminate climate scenarios to
facilitate decision making and guide systems-based adaptation actions
• Communication and translation mechanisms need to be built and supported to address the differential needs
of critical target groups, including the private sector
• With respect to droughts, a review of the drought index evaluation system is required, in coordination with the
Caribbean Institute of Meteorology and Hydrology, including building regional capacity in understanding droughts131
130 Fundación Avina (2018). Proyecto LatinoAdapta Fortaleciendo vínculos entre ciencia y política en América Latina. URL: http:// www.cambioclimáticoydecisiones.org/wp-content/uploads/2018/12/Informe-Costa-Rica_2019.pdf
131 Zuniga, B. (2013). Country Report for Costa Rica. URL: https://www.droughtmanagement.info/literature/UNW-DPC_NDMP_Country_Report_Costarica_2013.pdf

28CLIMATE RISK COUNTRY PROFILE: COSTA RICA
Institutional Gaps• Improve institutional transparency with regards to information and knowledge by creating scientific advisory
forums to help guide climate-related research
• Integrate and regionally coordinate activities related to the surveillance, monitoring and prediction of droughts
by increasing the visibility of current activities, exploring the possibilities for regional integration of pilot projects
with those of the Global Framework on Climate Services (GFCS), and strengthening institutional links to the
Convention against desertification132
• Pilot activities with users (sectoral meetings) to know what the critical values of the drought indexes are in the
different sectors (define thresholds). The better characterization of the drought will allow the improvement of
early warning systems133
132 Costa Rica (2014). Tercera Comunicación Nacional de la República de Costa Rica. URL: http://www.cac.int/sites/default/files/crinc3.pdf133 Costa Rica (2015). Política Nacional de Gestión del Riesgo 2016–2030 de la República de Costa Rica. URL: https://drive.google.com/
file/d/0ByA2trMWnTn4dS1GOGNlQTFHMU0/view