Open-loop recycling: A LCA case study of PET bottle-to-fibre recycling
Upload
khangminh22Category
view
0download
0
i
Contamination in Recycling Thermoplastics used for manufacturing of
Consumer Durable Products
by
Elli Lazzaro
A thesis submitted to the school of Engineering and Industrial
Sciences, Swinburne University of Technology, in fulfilment of the
requirements to the degree of Master of Engineering by Research.
Hawthorn, Melbourne, Australia
November 2009

ii
DECLARATION
I, Elli Lazzaro, declare that this thesis is my own work. Where other sources of
knowledge have been used, they have been acknowledged with references made in the
text of this thesis.
Signature: …………………………………………………….
Date: ………………………………………………………….

iii
ACKNOWLEDGEMENTS
This project was funded by the Australian Government through AusIndustry and MRI
Australia.
I would like to acknowledge the continued assistance and support of my supervisors,
Igor Sbarski and John Bishop. Igor Sbarski is a research leader in the field of polymer
science at the Industrial Research Institute, Swinburne. His contribution to this research,
with his extensive knowledge and years of experience, has been invaluable.
I would also like to acknowledge my parents, Marc and Dilys Lazzaro, for their continued
support and my partner, Stu Hutchison, for his encouragement and motivation.

iv
Contamination in Recycling Thermoplastics used for manufacturing of Consumer Durable Products ABSTRACT
Diminishing land fill capacity and increased volume of waste consumer durable
products are the main drivers for the recycling of engineering thermoplastics.
Consumer durables focused on in this study include long term products, specifically
waste electrical and electronic equipment (WEEE). WEEE can be recycled in bulk or as
separated components of a disassembled machine. Bulk recycling with limited sorting is
the economically preferred option however, blending incompatible plastics, without
modification, often limits the end use of the recycled plastics. The decision to apply
expensive sorting techniques at the end of a products life should be based on
processability and mechanical properties of the engineering thermoplastics
contaminated by other polymeric materials.
This project investigates the thermal, rheological and mechanical properties of a
range of binary blends of recycled thermoplastics. An amorphous polymer, Acrylonitrile-
Butadiene-Styrene (ABS), and a semi-crystalline polymer, Polypropylene (PP), have
been blended with contaminant amounts (0-30%) of other amorphous and crystalline
polymers. Models were developed for the prediction of the properties as a function of
contamination level.
The results show that generally, these thermoplastics should be separated prior
to processing to optimize the properties of the recycled plastics. However, the
properties for some of the blends with a certain level of contamination are sufficient,
such that they can be used for various applications where the use of sorting techniques
is not economically viable.

v
Contamination in Recycling Thermoplastics used for manufacturing of Consumer Durable Products
TABLE OF CONTENTS DECLARATION .................................................................................................... II
ACKNOWLEDGEMENTS ................................................................................... III
ABSTRACT ........................................................................................................ IV
TABLE OF CONTENTS ...................................................................................... V
LIST OF TABLES ............................................................................................... IX
LIST OF FIGURES ............................................................................................. XI
NOMENCLATURE ........................................................................................... XIV
ABREVIATIONS .............................................................................................. XVII
1 INTRODUCTION ......................................................................................... 1-1
1.1 Introduction ...................................................................................................................... 1-1
1.2 Plastic Recycling ............................................................................................................. 1-1
1.2.1. Plastic Recovery ............................................................................................................ 1-2
1.3 Polymer Selection ............................................................................................................ 1-5
1.4 Polymer Recyclate Applications .................................................................................... 1-7
1.4.1. Recycled materials and homologous polymer blends ................................................... 1-7
1.4.1.1. Acrylonitrile Butadiene Styrene, ABS .................................................................... 1-7
1.4.1.2. High Impact Polystyrene, HIPS ............................................................................. 1-7
1.4.1.3. Polypropylene, PP ................................................................................................. 1-8
1.4.1.4. Nylon ..................................................................................................................... 1-8

vi
1.5 Project Aims ..................................................................................................................... 1-9
1.6 Contribution to new knowledge ..................................................................................... 1-9
1.7 Thesis Structure ............................................................................................................ 1-10
1.7.1. Chapter 1 : Introduction .............................................................................................. 1-10
1.7.2. Chapter 2 : Literature Review ..................................................................................... 1-10
1.7.3. Chapter 3 : Methodology ............................................................................................. 1-10
1.7.4. Chapter 4 : Thermal Properties of contaminated plastics ........................................... 1-10
1.7.5. Chapter 5 : Processability of contaminated plastics ................................................... 1-10
1.7.6. Chapter 6 : Mechanical Properties of contaminated plastics ...................................... 1-11
1.7.7. Chapter 7 : Conclusions.............................................................................................. 1-11
2 LITERATURE REVIEW ............................................................................... 2-1
2.1 Introduction ...................................................................................................................... 2-1
2.2 Blends ............................................................................................................................... 2-1
2.3 Miscibility.......................................................................................................................... 2-2
2.4 Blend Properties .............................................................................................................. 2-3
2.5 Recycled materials and homologous polymer blends ................................................ 2-4
2.5.1. Acrylonitrile Butadiene Styrene (ABS) ......................................................................... 2-4
2.5.2. Polypropylene (PP) ...................................................................................................... 2-4
2.5.3. High Impact Polystyrene (HIPS) .................................................................................. 2-5
2.5.4. Polyamide (PA, Nylon) ................................................................................................. 2-6 2.6 Non-homologous polymer blends ................................................................................. 2-7
2.6.1. VIRGIN BLENDS ......................................................................................................... 2-7
2.6.1.1. ABS contaminated with HIPS ................................................................................ 2-7
2.6.1.2. ABS contaminated with PA ................................................................................... 2-8
2.6.1.3. PP contaminated with ABS ................................................................................. 2-10
2.6.2. RECYLCED BLENDS ................................................................................................ 2-12
2.6.2.1. ABS contaminated with HIPS .............................................................................. 2-12
2.6.2.2. ABS contaminated with PA ................................................................................. 2-13
2.6.1.3. PP contaminated with HIPS ................................................................................ 2-14
2.7 Application of Recycled Blends ................................................................................... 2-15
2.7.1. Blends ........................................................................................................................ 2-15 2.8 Summary......................................................................................................................... 2-17

vii
3 METHODOLOGY ........................................................................................ 3-1
3.1 Introduction ...................................................................................................................... 3-1
3.2 Materials ........................................................................................................................... 3-1
3.3 Processing........................................................................................................................ 3-2
3.3.1. Extrusion ...................................................................................................................... 3-2
3.3.2. Injection Moulding ........................................................................................................ 3-5
3.4 Thermal Properties .......................................................................................................... 3-7
3.4.1. Glass Transition ........................................................................................................... 3-7
3.4.2. Degradation Region ..................................................................................................... 3-8 3.5 Rheological Properties .................................................................................................... 3-9
3.5.1. Parallel Plate Rheology.............................................................................................. 3-11
3.5.1.1. Flow ................................................................................................................... 3-12
3.5.1.2. Linear viscoelasticity ......................................................................................... 3-13
3.5.1.3. Dynamic Loading ............................................................................................... 3-13
3.5.2. Melt Flow Rate ........................................................................................................... 3-14
3.6 Mechanical Properties ................................................................................................... 3-16
3.6.1. Tensile and Flexural Testing ...................................................................................... 3-16
3.6.2. Impact Testing ........................................................................................................... 3-20
3.6.3. Dynamic Mechanical Analysis ................................................................................... 3-21
3.6.3.1. Time Temperature Superposition ...................................................................... 3-21
3.7 Statistical Analysis of Property Data ........................................................................... 3-23
3.7.1. Characterisation of the Sample Population ............................................................... 3-23
3.7.2. Statistical Analysis ..................................................................................................... 3-26
4 THERMAL PROPERTIES OF CONTAMINATED PLASTICS ..................... 4-1 4.1 Glass Transition ............................................................................................................... 4-1
4.2 Degradation Region ......................................................................................................... 4-5
5 PROCESSABILITY OF CONTAMINATED PLASTICS ............................... 5-1
5.1 Processability .................................................................................................................. 5-1
5.2 Melt Flow Rate .................................................................................................................. 5-1
5.3 Rheology........................................................................................................................... 5-8
5.3.1. Flow analysis of ABS/PP blends .................................................................................. 5-8
5.3.2. Linear Viscoelasticity of ABS/PP blends .................................................................... 5-11
5.3.3. Flow curve modelling ................................................................................................. 5-12

viii
6 MECHANICAL ANALYSIS OF CONTAMINATED PLASTICS ................... 6-1
6.1 Recycling .......................................................................................................................... 6-1
6.2 Contaminated Plastics .................................................................................................... 6-3
6.2.1. Contaminated ABS blends ........................................................................................... 6-3
6.2.2. Contaminated PP blends ........................................................................................... 6-10 6.3 Verification of Modulus through DMA measurements .............................................. 6-18
6.4 Dynamic Mechanical Analysis...................................................................................... 6-26
6.4.1. ABS contaminated with PP ........................................................................................ 6-26
6.4.2. ABS contaminated with HIPS .................................................................................... 6-31
6.4.3. ABS contaminated with nylon .................................................................................... 6-33
7 CONCLUSIONS .......................................................................................... 7-1
7.1 Statistical analysis of Mechanical Properties ............................................................... 7-1
7.2 Thermal Properties .......................................................................................................... 7-2
7.3 Processability .................................................................................................................. 7-2
7.4 Mechanical Properties ..................................................................................................... 7-4
8 REFERENCES ............................................................................................ 8-1
9 APPENDIX I................................................................................................. 9-1
9.1 Rheology........................................................................................................................... 9-1
9.1.1. Flow curves .................................................................................................................. 9-1
9.1.2. Linear viscoelasticity .................................................................................................... 9-4
9.1.3. Cox-Merz transforms ................................................................................................... 9-5
9.2 Mechanical Properties ..................................................................................................... 9-9
9.2.1. Flexural strength of ABS/PP blends ............................................................................ 9-9
9.2.2. Impact strength of contaminated ABS blends............................................................ 9-10
9.2.3. Williams-Landel-Ferry (WLF), shift factors ................................................................ 9-11

ix
LIST OF TABLES Table 1.1: Dismantling Times of WEEE (Banfield, 2000) ............................................................ 1-3
Table 1.2: Average Polymer Composition of plastic product covers (Rios, 2003) ...................... 1-5
Table 1.3: Polymer Composition of fridge shredder residue, (Pascoe, 2005) ............................ 1-6
Table 2.1: Mechanical properties of virgin and recycled ABS plastics, (Liu & Bertilsson, 1999) 2-4
Table 2.2: Mechanical properties of virgin and recycled PP plastics, (Santana et al, 2003) ...... 2-5
Table 2.3: Mechanical properties of virgin and recycled HIPS plastics, (Santana et al, 2003) ... 2-6
Table 2.4: Mechanical properties of compatibilised and impact modified blends, (Liu et al, 2002a
& 2002b) ....................................................................................................................................... 2-9
Table 2.5: Properties of Engineering Thermoplastics, (Fried, 2003) ......................................... 2-15
Table 2.6: Physical and Thermal Properties of Consumer Durable Thermoplastics, (Fried, 2003)
.................................................................................................................................................... 2-16
Table 3.1: BASF material properties ........................................................................................... 3-1
Table 3.2: Contaminant level in ABS blends ............................................................................... 3-3
Table 3.3: Contaminant level in PP blends ................................................................................. 3-3
Table 3.4: Processing temperature variables, extruder zones (T1, T2, T3, Td, respectively) and
injection molding ........................................................................................................................... 3-5
Table 3.5: Conditions for MFR measurements .......................................................................... 3-14
Table 3.6: Statistical Analysis of virgin PP and ABS ................................................................. 3-27
Table 3.7: Sample size for the mechanical properties of ABS and PP based blends ............... 3-27
Table 4.1: Glass transition temperatures of virgin amorphous materials (0C) ............................. 4-1
Table 4.2a: Glass transition temperatures of thermally recycled ABS dominant blends (0C) ..... 4-2
Table 4.2b: Glass transition temperatures of thermally recycled PP dominant blends (0C) ....... 4-2
Table 4.3: Glass transition temperatures of ABS contaminated with PP blends (0C) ................. 4-2
Table 5.1a: Standard deviation in Melt Flow Rate of recycled ABS contaminated with PP ........ 5-4
Table 5.1b: Standard deviation in Melt Flow Rate of recycled PP contaminated with ABS ........ 5-4
Table 5.2a: Model constants for ABS contaminated with PP ...................................................... 5-5
Table 5.2b: Model constants for PP contaminated with ABS ...................................................... 5-6
Table 5.3a: Power Law constants for thermally recycled ABS contaminated with PP .............. 5-18
Table 5.3b: Power Law constants for thermally recycled PP contaminated with ABS .............. 5-18
Table 5.4a: Power Law constants for post consumer recycled ABS contaminated with PP .... 5-18
Table 5.4b: Power Law constants for post consumer recycled PP contaminated with ABS .... 5-18
Table 6.1a: Tensile strength (Fmax), MPa ................................................................................ 6-2
Table 6.1b: Flexural strength (Fmax), MPa ............................................................................... 6-2
Table 6.1c: Impact strength, kJm-2 .............................................................................................. 6-2
Table 6.2: Mechanical Properties of ABS contaminated with HIPS ............................................ 6-6

x
Table 6.3a: Mechanical Properties of thermally recycled ABS contaminated with PP ............... 6-6
Table 6.3b: Mechanical properties of post consumer recycled ABS contaminated with PP ....... 6-6
Table 6.4: Mechanical Properties of ABS contaminated with Nylon ........................................... 6-8
Table 6.5a Predictive model constants for Tensile and Flexural Strength of contaminated ABS
blends ........................................................................................................................................... 6-9
Table 6.5b Predictive model constants for Impact strength of contaminated ABS blends...... 6-10
Table 6.6: Mechanical Properties of PP contaminated with HIPS ............................................ 6-13
Table 6.7a: Mechanical Properties of thermally recycled PP contaminated with ABS ............. 6-14
Table 6.7b: Mechanical Properties of post consumer recycled PP contaminated with ABS .... 6-15
Table 6.8: Mechanical Properties of PP contaminated with Nylon ............................................ 6-16
Table 6.9a Predictive model constants for Tensile and Flexural strength of contaminated PP
blends ......................................................................................................................................... 6-17
Table 6.9b Predictive model constants for Impact strength of contaminated PP blends ........ 6-17
Table 6.10: Modulus for uncontaminated thermally recycled polymers, MPa ........................... 6-18
Table 6.11a: Modulus of thermally recycled ABS contaminated with PP, MPa ........................ 6-20
Table 6.11b: Modulus of thermally recycled PP contaminated with ABS, MPa ........................ 6-20
Table 6.12: Model constants for Modulus of contaminated ABS blends ................................... 6-23
Table 6.13: Model constants for Modulus of contaminated PP blends ..................................... 6-25
Table 6.14: WLF constants for ABS contaminated with PP ...................................................... 6-29
Table 6.15: WLF constants for PP contaminated with ABS ...................................................... 6-30
Table 6.16: WLF constants for ABS contaminated with HIPS .................................................. 6-32
Table 6.17: WLF constants for ABS contaminated with Nylon .................................................. 6-34
Table I.1: Shift Factors, tA , for ABS contaminated with PP ..................................................... 9-11
Table I.2: Shift Factors, tA , for PP contaminated with ABS ..................................................... 9-11
Table I.3: Shift Factors, tA , for ABS contaminated with HIPS ................................................. 9-11
Table I.4: Shift Factors, tA , for ABS contaminated with Nylon ................................................ 9-11

xi
LIST OF FIGURES
Figure 2.1 Behaviour of blended materials ................................................................................ 2-3
Figure 3.1 The barrel of a single screw extruder, (Chokshi, R., and Zia, H., 2004) .................. 3-3
Figure 3.2 Axon single screw extruder ...................................................................................... 3-4
Figure 3.3 Control panel and die formation of the extruder ....................................................... 3-4
Figure 3.4 Battenfeld Injection Moulder (Model BA 350 / 75 PLUS) ......................................... 3-6
Figure 3.5 Die cavity of the Battenfeld Injection Moulder for mechanical testing specimens ... 3-6
Figure 3.6 TA instruments SDT 2960 ........................................................................................ 3-8
Figure 3.7 Parallel plate configurations (Semancik, 1997) ...................................................... 3-11
Figure 3.8 TA instruments AR 2000 parallel plate rheometer ................................................. 3-12
Figure 3.9 CEAST Modular Melt Flow instrument ................................................................... 3-15
Figure 3.10 Typical stress-strain curve ................................................................................... 3-17
Figure 3.11 Zwick Z010 universal tester and grips for tensile testing ..................................... 3-18
Figure 3.12 Flexural testing apparatus for the Zwick Z010 universal tester ........................... 3-19
Figure 3.13 CEAST Resil impact tester and sample jaw ........................................................ 3-20
Figure 3.14 TA instruments DMA 2980, cantilever configuration ............................................ 3-22
Figure 3.15 Tensile strength histogram for thermally recycled PP .......................................... 3-23
Figure 3.16 Tensile strength histogram for thermally recycled ABS ....................................... 3-24
Figure 3.17 Impact strength histogram for thermally recycled PP .......................................... 3-24
Figure 3.18 Impact strength histogram for thermally recycled ABS ........................................ 3-25
Figure 4.1 Glass transition temperature of ABS contaminated with PP .................................... 4-3
Figure 4.2 Glass transition temperature of PP contaminated with ABS .................................... 4-3
Figure 4.3 Tan Delta curves of post consumer recycled ABS/PP blends ................................. 4-4
Figure 4.4 TGA plots for thermally recycled PP contaminated with ABS .................................. 4-6
Figure 4.5 TGA plots for thermally recycled PP contaminated with HIPS ................................ 4-6
Figure 4.6 TGA plots for thermally and post consumer recycled materials............................... 4-7
Figure 4.7 TGA plots for post consumer recycled ABS contaminated with PP ......................... 4-7
Figure 4.8 TGA plots for post consumer recycled PP contaminated with ABS ......................... 4-8
Figure 5.1a Melt Flow Rate of recycled ABS contaminated with PP blends ............................. 5-3
Figure 5.1b Melt Flow Rate of recycled PP contaminated with ABS blends ............................. 5-3
Figure 5.2a Melt density of recycled ABS contaminated with PP blends .................................. 5-4
Figure 5.2b Melt density of recycled PP contaminated with ABS blends .................................. 5-5
Figure 5.3 Melt Flow Rate of thermally recycled ABS contaminated with HIPS ....................... 5-6
Figure 5.4 Melt Flow Rate of thermally recycled PP contaminated with HIPS .......................... 5-7
Figure 5.5 Flow curves of uncontaminated recycled ABS and PP, 2400C ................................ 5-9
xii
Figure 5.6 Flow curves of thermally recycled PP contaminated with ABS, 2400C .................. 5-10
Figure 5.7 Linear Viscoelasticity of thermally recycled blends, 2400C .................................... 5-11
Figure 5.8a Dynamic curves for ABS contaminated with PP, 2400C ...................................... 5-12
Figure 5.8b Dynamic curves for PP contaminated with ABS, 2400C ...................................... 5-13
Figure 5.9 Comparison of Flow curves and Cox-Merz transformation of thermally recycled
polymers, 2400C .................................................................................................................. 5-14
Figure 5.10 Cox-Merz transformation of thermally recycled ABS contaminated with PP, 2400C
............................................................................................................................................ .5-16
Figure 5.11 Power-law fits for Cox-Merz transformation of thermally recycled ABS contaminated
with PP, 2400C .................................................................................................................... 5-16
Figure 5.12 Cox-Merz transformation of thermally recycled PP contaminated with ABS, 2400C.
............................................................................................................................................. 5-17
Figure 5.13 Power-law fits for Cox-Merz transformation of thermally recycled PP contaminated
with ABS, 2400C .................................................................................................................. 5-17
Figure 6.1 Typical stress strain curve ........................................................................................ 6-2
Figure 6.2 Tensile and Flexural strength of recycled ABS contaminated with HIPS ................ 6-5
Figure 6.3 Impact strength of recycled ABS contaminated with HIPS ...................................... 6-5
Figure 6.4 Tensile strength of recycled ABS contaminated with PP ......................................... 6-7
Figure 6.5 Impact strength of recycled ABS contaminated with PP .......................................... 6-7
Figure 6.6 Tensile and Flexural strength of recycled ABS contaminated with Nylon ................ 6-8
Figure 6.7 Impact strength of recycled ABS contaminated with Nylon ..................................... 6-9
Figure 6.8 Tensile and Flexural strength of recycled PP contaminated with HIPS ................. 6-12
Figure 6.9 Impact strength of recycled PP contaminated with HIPS ....................................... 6-12
Figure 6.10 Tensile strength of recycled PP contaminated with ABS ..................................... 6-13
Figure 6.11 Impact strength of recycled PP contaminated with ABS ...................................... 6-14
Figure 6.12 Tensile and Flexural strength of recycled PP contaminated with Nylon .............. 6-15
Figure 6.13 Impact strength of recycled PP contaminated with Nylon .................................... 6-16
Figure 6.14 Storage Modulus of ABS contaminated with PP .................................................. 6-19
Figure 6.15 Storage Modulus of PP contaminated with ABS .................................................. 6-19
Figure 6.16 Modulus of thermally recycled ABS contaminated with PP ................................. 6-20
Figure 6.17 Modulus of post consumer recycled ABS contaminated with PP ........................ 6-21
Figure 6.18 Modulus of thermally recycled ABS contaminated with HIPS .............................. 6-22
Figure 6.19 Modulus of thermally recycled ABS contaminated with Nylon ............................. 6-22
Figure 6.20 Modulus of thermally recycled PP contaminated with ABS ................................. 6-23
Figure 6.21 Modulus of post consumer recycled PP contaminated with ABS ........................ 6-24
Figure 6.22 Modulus of thermally recycled PP contaminated with HIPS ................................ 6-24
Figure 6.23 Modulus of thermally recycled PP contaminated with Nylon ............................... 6-25

xiii
Figure 6.24 Measured data and the master curve for ABS contaminated with 10 % PP........ 6-27
Figure 6.25 Master curves for ABS contaminated with PP at 1050C ...................................... 6-28
Figure 6.26 Shift Factors for ABS contaminated with PP ........................................................ 6-28
Figure 6.27 Master curves for PP contaminated with ABS at 1050C ...................................... 6-29
Figure 6.28 Shift Factors for PP contaminated with ABS ........................................................ 6-30
Figure 6.29 Master curves for ABS contaminated with HIPS at 1050C ................................... 6-31
Figure 6.30 Shift Factors for ABS contaminated with HIPS .................................................... 6-32
Figure 6.31 Master curves for ABS contaminated with Nylon at 1050C .................................. 6-33
Figure 6.32 Shift Factors for ABS contaminated with Nylon ................................................... 6-34
Figure I.1 Flow curves of recycled polymers ............................................................................. 9-1
Figure I.2 Flow curves of thermally recycled contaminated ABS blends .................................. 9-1
Figure I.3 Flow curves of thermally recycled contaminated PP blends ...................................... 9-2
Figure I.4 Flow curves of post consumer contaminated ABS blends ........................................ 9-2
Figure I.5 Flow curves of post consumer contaminated PP blends .......................................... 9-3
Figure I.6 Flow curves of post consumer contaminated PP blends .......................................... 9-3
Figure I.7 Linear viscoelasticity of thermally recycled blends ................................................... 9-4
Figure I.8 Linear viscoelasticity of post consumer recycled blends .......................................... 9-4
Figure I.9 Flow curves and Cox-Merz transformation of thermally recycled polymers ............. 9-5
Figure I.10 Cox-Merz transformation of thermally recycled ABS contaminated with PP .......... 9-5
Figure I.11 Power-law fits for Cox-Merz transformation of thermally recycled ABS contaminated
with PP .................................................................................................................................. 9-6
Figure I.12 Cox-Merz transformation of recycled PP contaminated with ABS .......................... 9-6
Figure I.13 Power-law fits for Cox-Merz transformation of thermally recycled PP contaminated
with ABS ................................................................................................................................ 9-7
Figure I.14 Cox-Merz transformation of post consumer ABS contaminated with PP ................ 9-7
Figure I.15 Cox-Merz transformation of post consumer PP contaminated with ABS ................ 9-8
Figure I.16 Flexural strength of recycled ABS contaminated with PP ....................................... 9-9
Figure I.17 Flexural strength of recycled PP contaminated with ABS ....................................... 9-9
Figure I.18 Impact strength of contaminated ABS blends ....................................................... 9-10
xiv
NOMENCLATURE G∆ Gibbs free energy J
H∆ Enthalpy J
S∆ Entropy J K-1
T measurement temperature K
T1 zone 1 in extruder 0C
T2 zone 2 in extruder 0C
T3 zone 3 in extruder 0C
Td die temperature 0C
Tg glass transition temperature 0C
E’ storage modulus MPa
E” loss modulus MPa
δtan tangent of the phase angle, [G’/G”]
TiO2 titanium dioxide
'G storage (dynamic) modulus MPa
"G loss modulus MPa
*G complex modulus MPa
iφ volume fraction of polymer
µ , 'η dynamic viscosity (Newtonian) Pa.s
η apparent viscosity Pa.s
*η complex viscosity Pa.s
k consistency index
n power law index
•
shear rate s-1
ω oscillation frequency s-1
τ shear stress Pa
l0 initial gauge length mm
W0 initial gauge width mm
t0 initial gauge thickness mm
F applied tensile force N
A0 gauge cross sectional area m2

xv
σ Stress Pa
ε Strain
l Elongation mm
le elongation gauge length mm
lb break gauge length mm
E tensile modulus (Young’s modulus) Pa
R rate of cross head motion mm s-1
D midspan deflection at test termination mm
Y Deflection mm
L length of specimen mm
B width of specimen mm
0T reference temperature K
T measurement temperature K
tA shift factor
21 ,CC WLF constants
N sample size
x Mean
sd standard deviation
%RSD relative standard deviation
se standard error
Z 96.1=Z abscissa of the normal curve for 95% confidence
interval
%E assumed error
MFR melt flow rate g/10min
0MFR melt flow rate at 0% contamination g/10min
MFRK linear MFR constant
21 , MFRMFR KK quadratic MFR constants
ϕ fraction of contaminant, (0 ϕ 0.30)
ρ Density kg m-3
0ρ density at 0% contamination kg m-3
ρK linear density constant

xvi
maxσK linear tensile/flexural strength constant
maxσ tensile/flexural strength/maximum stress MPa
0maxσ strength of uncontaminated polymer MPa
maxFK exponential impact strength constant
maxF impact strength kJ m-2
0maxF impact strength of uncontaminated polymer kJ m-2
EK linear modulus constant

xvii
ABREVIATIONS
ABS Acrylonitrile-butadiene-styrene
ACT Australian Composite Technology
ASTM Australian Standard
CESA Consumer Electronics Suppliers Association
Cm Cox-Merz transformation
DMA dynamic mechanical analysis
DMTA dynamic mechanical thermal analysis
DSC differential scanning calorimetry
HIPS High Impact Polystyrene
HP Hewlett Packard
IRIS Industrial Research Institute, Swinburne
ISO International Standard
MA maleic anhydride
MFR Melt flow rate
MMA methyl methacrylates
PA Polyamides, including nylon 6
PACIA Plastics and Chemicals Industries Association
Pc post consumer
PC Polycarbonate
PE Polyethylene
PMMA Poly(methyl methacrylate)
POE-g-MA maleic anhydride grafted polyethylene-octene elastomer
PP Polypropylene
PVC Polyvinyl chloride
SAN Poly(styrene-co-acrylonitrile)
SEBS Styrene-b-ethylene-co-butylene-b-styrene copolymer
SEM scanning electron microscope
SMA styrene maleic anhydride
SMA25 styrene maleic anhydride with 25% maleic anhydride
TA Thermal Advantage
TGA Thermal Gravimetric Analysis

xviii
TTS Temperature Time Superposition
TV Television
WEEE Waste Electrical and Electronic Equipment
WLF Williams-Landel-Ferry

1-1
1 INTRODUCTION
1.1 Introduction
This project focuses on the recycling of polymers in waste electrical and
electronic equipment. Blends of recycled polymers were investigated to determine if
contamination will significantly affect the materials properties in considering further
applications of the recycled material. The project was conducted in collaboration with
the Industrial Research Institute Swinburne (IRIS) and MRI. MRI aims to divert the main
portion of e-waste from landfill, with a degree of recycling already in place. However, to
transform e-waste into e-commerce, recycling of plastics requires investigation.
1.2 Plastic Recycling
Diminishing land fill capacity is one of the main drivers for plastic recycling,
particularly in countries of high population density such as Japan, Germany, etc. Other
factors include the environmental benefits, the rising price of non renewable raw
materials and consumers’ perception of product stewardship. For instance, over the last
10 years recycling of plastics in Australia increased 280% from 93,547 tonnes in 1997 to
261,109 tonnes in 2007 (PACIA, 2008). Close to 50% of the plastic was recycled in
Victoria. The consumption of plastic in 1997 was 1,336,386 tonnes, compared to 1,
710,085 tonnes in 2007, which corresponds to recycle rates of 7 and 15.3%,
respectively. A large portion (~85%) of the plastic recycled was packaging material.
The recycling rate of packaging material continues to improve, while the rate of plastics
from consumer durable products has remained constant over the last 10 years. “The
rate of recycling consumer durables is influence by the time is remains in use and the
growth in its consumption”, (PACIA, 2008).
Consumer durables are non-packaging products that have varying life-spans
including toothbrushes and pens (short-term) and computer casings and whitegoods
inserts (long-term). Properties of recycled consumer durable engineering plastics can
be higher than virgin commodity. The mechanical properties are retained, even after
medium to long term use (~10years). In some cases, engineering plastics are recycled
into high value consumer durables, in which the market value exceeds recovery costs.
Major recycling of engineering plastics includes computer and electronic housing,
automotive plastics and CD’s. The use of recyclate in vehicles has increased, but

1-2
stigma in using recyclate in engineering applications has hindered widespread use,
(Scheirs, 1998).
The consumer durable engineering plastics focused on in this study were derived
from waste electrical and electronic equipment (WEEE), which includes the casings of
computers, televisions and other electronic equipment. Generally, the life time of these
consumer durables is 5-10years, inducing a disposal lag, (Scheirs, 1998). However,
rapid advances in technology continually reduce the product life span of WEEE, to less
than 2 years in some cases, (Brennan, 2002), “representing a significant loss of non-
renewable resources” (Katos & Hoye, 2005). It was estimated that about 500,000
computers become obsolete each year in Victoria, with the vast majority not being
recycled and adding to the State's waste, (John Thwaites, 2005).
The growth of the amount of WEEE has prompted the Australian government to
work on establishing a product stewardship scheme to collect and recycle WEEE (Katos
& Hoye, 2005). Byte back is a computer take back program sponsored by Sustainability
Victoria, the City of Boroondara, Hewlett Packard (HP), Sims E Recycling and K&S
Environmental. Old, unused computers are collected for reuse or recycling. Computers
that are not directly reused are taken to a recovery centre for disassembly and sorting of
the materials (i.e. metals, plastics, etc). The materials are then transported to the
respective recycling stream (Doran, 2006).
1.2.1. Plastic Recovery There are three types of recycled material sources, pre consumer, post
consumer (industrial) and post consumer (domestic), (Scheirs, 1998), with each source
of material arising from a different stage in the product life cycle. Obsolete electrical and
electronic equipment of interest in this study is a domestic post consumer source.
The first stage in recycling plastics is to identify and separate the plastic by either
disassembly or bulk recycling. Debate continues over the method, taking into
consideration economic factors verses effectiveness of separation.
Disassembly is preferred if the equipment is without complexity and easily
disassembled. Typically, a piece of equipment can take 5-20 minutes to disassemble,
see Table 1.1.

1-3
Table 1.1: Dismantling Times of WEEE (Banfield, 2000)
Table not available – see printed version
Identification of the plastic can be achieved manually, using a trained eye.
However, as the complexity of materials increases with the manipulation of blends, more
precise techniques are preferred. An example is spectroscopy: Raman scattering, in
which an unknown plastic sample is scanned (manually) reflecting Raman scattered
radiation as a distinctive vibrational signature of a specific plastic. The polymer or blend
of polymers is identified through comparison to a library of standards, (Rios, 2003),
which can then be separated into its respective stream.
Bulk recycling is preferred if the piece of equipment requires extensive
disassembly and is composed of a wide variety of materials, includes items such as key
boards. Firstly, the piece of equipment is shredded. Metallic components are removed
first: ferrous materials by magnetic separation, non ferrous materials by an Eddy-current
separator.
The technique used to separate the individual polymers is largely dependent on
the difference in the property that is the basis for the separation.
Density based separating was the first technology used to separate polymers of differing
density by manipulating the properties of a solution. However, this is limited to polymers
of different densities, so that the specific densities of the polymers requiring separation
do not overlap. Density based separation is also of limited use for ‘modified’ polymers.
Density methods include: float-sink (wet, dry, hydrophobic, preferential solvent
absorption) and hydro cyclone, (Scheirs, 1998). Electrostatic sorting involves the
transfer of charge between two different polymers, the surface of one polymer adopting
a positive charge, and the other a negative charge, (Scheirs, 1998).

1-4
Disassembly is time consuming and labour intensive, consequently limiting the
throughput volume. On the other hand, large volumes can be processed with bulk
recycling, but with a high capital and compromised purity of the separated material
depending on the method of sorting.
Contamination and modification of the plastics used in the manufacture of
electronic products impact on the recyclability of the plastics. For instance, brominated
flame retardants are hazardous and reprocessing the contaminated plastics is
undesirable. Brennan et al conducted a survey on computer casing plastics and flame
retardation. It revealed that 68 of the 100 samples were flame retarded, of these, half
contained bromine (Brennan, 2002). Modified plastics include a base polymer filled with
another material to enhance a specific property important to the end use application.
Identification and separation of these materials are difficult and reprocessing can be
detrimental to the properties of the combined material. Ultimately, the properties of the
recycled material are highly dependent on the composition on the original material and
the separation of the materials.

1-5
1.3 Polymer Selection
There are two types of plastics, thermoplastics and thermosetting plastics. They
both consist of long chain-like molecules, but differ in their intermolecular forces.
Thermoplastics have weak Van der Waals attraction holding the chains together,
which is easily weakened upon heating leading to the softening of the plastic. For this
reason waste thermoplastics can be recovered and reprocessed.
The polymers that are most significant in Waste Electrical and Electronic Equipment
include:
• ABS - Acrylonitrile butadiene styrene
• SAN - Poly(styrene-co-acrylonitrile)
• HIPS - High-impact polystyrene
• PC - Polycarbonate
• PP, PE - Polyolefins
• PA - Polyamides, including nylon 6
• PVC - Polyvinyl chloride
The approximate proportions of these plastics in some common WEEE are represented
in Table 1.2 and 1.3.
Thermoplastics can be subdivided into two categories, crystalline (ordered) and
amorphous (random). Polyamides and polyolefins are generally crystalline/semi-
crystalline, and the other above mentioned plastics are amorphous. Crystallinity varies
depending on process condition and the thermal history of the material, which
consequently impacts on the mechanical properties (Utraki, 2002).
Table 1.2: Average Polymer Composition of plastic product covers (Rios, 2003)
Table not available – see printed version

1-6
Table 1.3: Polymer Composition of fridge shredder residue, (Pascoe, 2005)
Table not available – see printed version
Ragosta et al (2001) investigated blends of ABS with PVC. Mechanical testing of
ABS/PVC blends showed that the addition of recycled PVC to ABS significantly reduced
the mechanical properties. Thermosetting plastics, such as PVC, have strong covalent
bonding between the chains, which deteriorate with excessive heat and prevents the
softening of these types of plastics. In thermo mechanical reprocessing the thermal
degradation of the PVC is enhanced by the main parameters for blending: increasing
temperature, mixing time and mechanical stresses. Furthermore, degraded PVC may
induce thermo oxidation of the butadiene phase in the ABS. In conclusion, the
properties of PVC and PVC blends would be dramatically depressed by thermal
reprocessing hence PVC will not be used in this study.

1-7
1.4 Polymer Recyclate Applications
Once the material has been sorted, there are two methods of recycling
engineering plastics. If a recycled material retains properties similar to its original
application, it can be reused in the same or similar application. This is referred to as
closed loop recycling. However, if the material significantly loses these properties
through recycling it may be reused in a different application, known as cascade
recycling, (Scheirs, 1998). The main aim of recycling is to optimise the materials
properties thereby, maximising its value upon reuse. This is limited by the level of
contamination and related to the extent of sorting.
1.4.1. Recycled materials and homologous polymer blends
1.4.1.1. Acrylonitrile Butadiene Styrene, ABS
The high impact strength of ABS make it applicable for use in outer casings, including
computer housing, telephones, fax machines, vacuums, refrigerator liners and washing
machines inserts and various automotive applications.
ABS has been used in closed loop applications in the production of new housing for
WEEE and in automotive parts. Homologous blends are preferred, containing up to
25wt% recycled material and the balance virgin ABS. This controls the colour and
enhances the mechanical properties (Scheirs, 1998).
1.4.1.2. High Impact Polystyrene, HIPS
HIPS has similar physical properties to ABS, such that separating these two polymers is
difficult due to their relatively similar densities. Both polymers have high impact
resistance attributed to the dispersion of small rubber particles within the brittle matrix
(Fried, 2003). Therefore, HIPS is used for similar applications including electronic
housing and fridge inserts.

1-8
1.4.1.3. Polypropylene, PP
Polypropylene is a low density thermoplastic, used for its toughness, and fatigue and
chemical resistance (Crawford, 1998). These properties make polypropylene attractive
in the automotive industry, including fascias, bumpers and battery casing. Recycled PP
is also largely used in the automotive industry (Scheirs, 1998).
1.4.1.4. Nylon
Nylon has a relatively higher tensile strength and melting temperature, but low impact
strength. It is not suited to applications with of high surface area to volume ratio
subjected to high speed impacts, but is commonly used for fittings in WEEE.

1-9
1.5 Project Aims
The main objective of this research is to develop models to predict the properties
of recycled thermoplastics as a function of contaminant level. These models can be
used as a tool to determine the properties of materials with a known level of
contamination based on the extent to sorting. The research will include a
comprehensive study of the recycled blends properties including thermal, rheological
and mechanical analysis. Models will be formulated by measuring the properties of a
range of polymeric blends of recycled materials used for the manufacturing of consumer
durable products.
1.6 Contribution to new knowledge
Research in the field of recycled consumer durable plastics is relatively new.
There have been a number of articles written that have identified the drawbacks of the
different recycling methods, including the reduction in properties of contaminated
recycled materials related sorting ((Rios, 2003), (Xu et al., 2006), (Pascoe, 2004 &
2005)). Properties of blends of virgin materials have been investigated that indicate the
effect of contamination ((Gupta et al., 1990), (Liu et al., 2002a)). In addition, properties
of blends of recycled materials have been investigated ((Lindsey et al., 1982), (Liu et al.,
2002b), (Santana, 2003)). However, only a small variety of blends have been analysed
and the measured properties lack detail.
This research was dedicated to relating the properties of a contaminated,
recycled material to the level of contamination. Different blends of recycled material that
simulate a level of contamination were analyzed for an extensive range of material
properties that provide information on the processing of the material and the
performance of the material in its end use application. This included thermal, rheological
and mechanical. Relationships between the properties and the level of contamination
have been modeled to predict a property for any level of contamination. The predictive
models are a simple tool that can be used to estimate the properties of contaminated
materials if an approximate level of contamination in a binary mixture is known. In
addition, dynamic mechanical analysis is a novel method for determining thermal-
mechanical properties of a recycled consumer durable material. It was used to provide
an indication of the mechanical properties over long term use of the material and to
identify phase transitions.

1-10
1.7 Thesis Structure 1.7.1. Chapter 1 : Introduction The introduction outlines the drivers behind researching the recycling of consumer
durable plastics, including methods of sorting and the potential of contamination during
the recycling process. It lists the major plastics found in WEEE and introduces the
concept of intentionally contaminating plastics to model the properties of a material with
different levels of contamination.
1.7.2. Chapter 2 : Literature Review The literature review outlines experimental work performed by other researches in the
field of recycling consumer durable plastics. Researchers have investigated the impact
on the materials properties due to recycling the individual thermoplastics. The review
focuses on miscibility of binary polymer blends and the effect of contamination on a
materials property.
1.7.3. Chapter 3 : Methodology Experimental methodology for material processing and property analysis is described in
this section. The methodology is based on the relevant Australian standards.
1.7.4. Chapter 4 : Thermal Properties of contaminated plastics Thermal properties are evaluated in this chapter to indicate a material behaviour during
processing conditions and to determine thermal processing limits.
1.7.5. Chapter 5 : Processability of contaminated plastics Processability further reflects limits on processing conditions caused by contamination.
The melt flow rate and rheology reflect the flowability of the contaminated material during
processing.

1-11
1.7.6. Chapter 6 : Mechanical Properties of contaminated plastics Mechanical properties indicate the behaviour of a contaminated material during use and
are used in identifying a suitable application for a material. The mechanical analysis of
the materials includes standard tests of tensile, flexural and impact strength, as well as,
dynamic mechanical analysis which models long term behaviour via time-temperature
superposition. Predictive models have been developed to assist in estimating a property
of a material based on the level of contamination.
1.7.7. Chapter 7 : Conclusions
The effect of contamination on a materials property is important when considering a
material for an end use application and consequently, the extent of sorting required
during the recycling process. Conclusions are drawn on property deterioration that limits
the level of contamination. In addition, models of property change with the level of
contamination provide an indication of the interaction between the blended polymers.

2-1
2 LITERATURE REVIEW
2.1 Introduction
Homologous and non-homologous contamination of virgin materials has been
investigated previously. However, blending of recycled materials, particularly consumer
durable plastics, is a relatively novel field. This study investigates blended recycled
materials that represent a know level of contamination. Typically, recycled plastics
exhibit lowered properties, including reduced molecular weight, decreased viscosity and
decreased mechanical properties. This is a result of factors associated with
reprocessing, including degradation and contamination (Case & Korzen, 2000).
2.2 Blends
A polymer blends is a mixture of at least two polymers. Homologous polymer
blends are a mixture of compatible homologous polymers. Typically, it is narrow
molecular weight distribution fractions of the same polymer. An example of homologous
polymer blends is the mixing of a portion of recycled material with virgin material of the
same polymer. On the other hand, non-homologous polymer blends is a blend of two or
more different polymers; it could be recycled polymers, virgin polymers or a combination
of both (Utracki, 1989). In this research, the contaminant is the component in the blend
present at less than 30%.

2-2
2.3 Miscibility
Miscibility is the mutual solubility of polymers within a blend. A blend is miscible,
if it is homogeneous down to the molecular level. It is governed by a negative value of
the Gibbs free energy of mixing.
STHG ∆−∆=∆ (2.1)
The miscibility of a polymer blend depends on the processing conditions and
other variables including temperature, pressure, molecular weight and chain structure.
A blend is immiscible if the Gibbs free energy is positive for the entire composition range
of the mixture of polymers: this means that the polymers coexist at equilibrium as two
distinct phases. Apart from immiscible, a mixture of polymers can be partially miscible or
totally miscible. For total miscibility, over the entire composition range
• the Gibbs free energy must be negative
• the second derivative of G with respect to volume fraction of one of the
components of the polymer mixture, iφ , must be positive
0 0,
2
2
>
∂∆∂<∆
Tpi
GGφ
and
The second derivative may not be satisfied over the entire composition range. At these
compositions the mixture will phase separate at equilibrium into two phases containing
different compositions of polymers, which is referred to as a phase rich in one of the
component polymers. This is partial miscibility (Fried, 2003), (Utracki, 1989).
Compatibilisation is the modification to the interfacial properties of an immiscible
polymer blend. This forms a polymer alloy (Utracki, 1989). Polymer alloys will not be
developed in this research as the aim of the research is to look at contamination as an
undesirable outcome of recycling and to develop models to predict the effect of recycling
on a material’s property. In addition, compatibilisation requires additional material that is
not within the scope of the project.
2-3
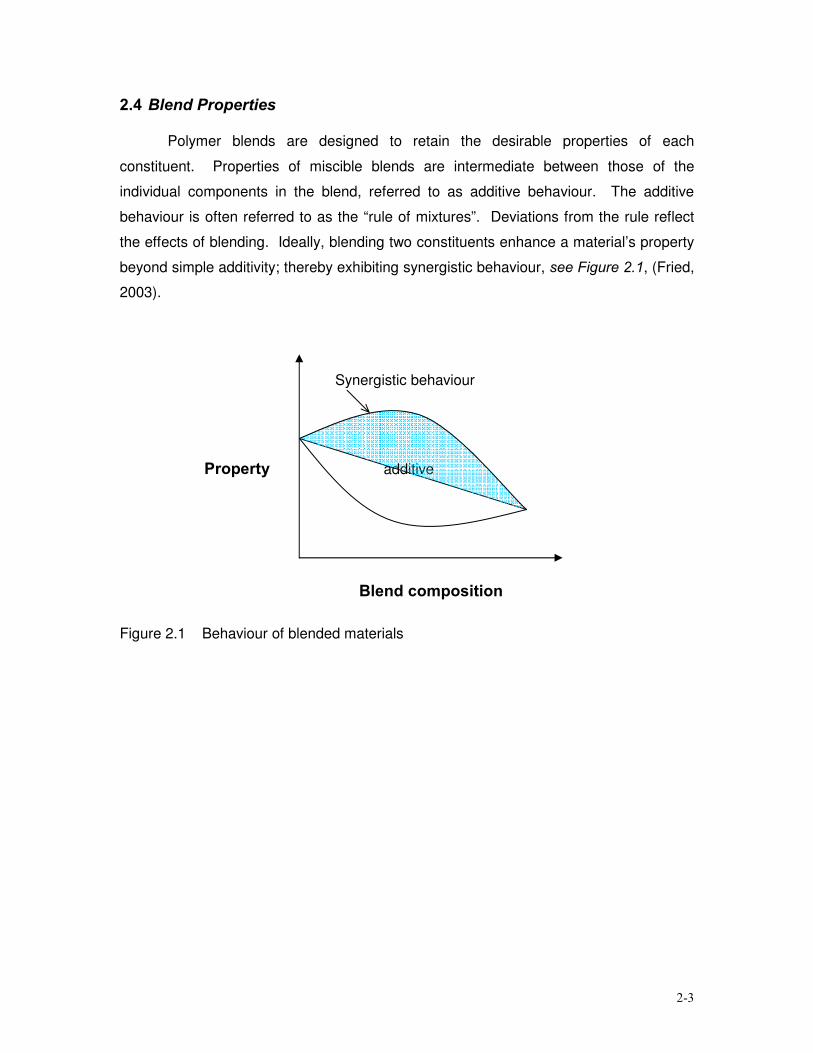
2.4 Blend Properties
Polymer blends are designed to retain the desirable properties of each
constituent. Properties of miscible blends are intermediate between those of the
individual components in the blend, referred to as additive behaviour. The additive
behaviour is often referred to as the “rule of mixtures”. Deviations from the rule reflect
the effects of blending. Ideally, blending two constituents enhance a material’s property
beyond simple additivity; thereby exhibiting synergistic behaviour, see Figure 2.1, (Fried,
2003).
Synergistic behaviour
Property additive
Blend composition
Figure 2.1 Behaviour of blended materials

2-4
2.5 Recycled materials and homologous polymer blends
2.5.1. Acrylonitrile Butadiene Styrene (ABS)
ABS is one of the cheapest and hence, most abundant engineering
thermoplastics. The most significant problem in recycling ABS is the oxidative
degradation of the rubber, butadiene. Liu & Bertilsson, (1999) recycled plastic material
obtained from dismantled cars. The material was identified as ABS based on solubility
and the results from differential scanning calorimetry (DSC). Mechanical test samples
were prepared using a co rotating twin screw extruder and injection moulding. Identical
specimens were prepared with virgin materials as a source of comparison for
mechanical testing. The research showed a reduction in impact strength and toughness
through recycling; resulting from the degradation of the rubber matrix in the recycled
material, see Table 2.1.
Table 2.1: Mechanical properties of virgin and recycled ABS plastics, (Liu & Bertilsson, 1999)
Table not available – see printed version
2.5.2. Polypropylene (PP)
PP is a low density consumer durable. In research by Santana et al (2003), the
mechanical properties of polypropylene recycled from mineral water bottles were used to
evaluate the effects of recycling. Virgin material was purchased as a comparison.
Recycled PP exhibited better elongation at break, while all other thermo mechanical
properties indicated that the effect of recycling PP is negligible, see Table 2.2. The
variation between virgin and recycled PP can be attributed to the different grade of the
polymers: the virgin material is a single grade obtained from a single supplier whereas
the recycled material is a mixture of grades from various polymer suppliers. In addition,
it is likely that the recycled material had additives used to enhance the properties for the
purpose of its original application.
2-5
Table 2.2: Mechanical properties of virgin and recycled PP plastics, (Santana et al, 2003)
Table not available – see printed version
2.5.3. High Impact Polystyrene (HIPS)
HIPS is an abundant engineering plastic in computers and other electronic
equipment. HIPS dominant post consumer equipment is generally fitted with
incompatible polymers that would require expensive disassembly and is highly
contaminated through the use of additives, such as flame retardants.
Xu et al (2000) studied blends of post consumer HIPS with virgin polymer,
analysing the impact of recycling on various mechanical properties. Post consumer
material was obtained from printer and monitor housing. The original manufacturer of
the material was unknown; hence the virgin polymer was selected based on matching
the rheological properties with the recycled material. Blends of 0, 25, 50, 75, 85,
100wt% virgin material were prepared. The blends were pseudo plastic (shear thinning -
viscosity decreases with increasing shear rate), as predicted by Utracki (1989)
“polymeric melts dominantly display pseudo plasticity”. Furthermore, the viscosity
measurements were similar for all blend types since the grade of the virgin material was
selected by matching the rheological properties of the recycled material. In terms of
mechanical properties, the tensile measurements and impact strength for the blends
increased with increasing content of post consumer resin (Xu et al, 2000).
Similar research was carried out by Santana et al (2003). Works by Santana et
al investigated HIPS recycled from disposable cups. Reprocessed and virgin materials
were thermo mechanically tested to evaluate the effects of recycling. Following works
by Xu et al., the tensile strength of the recycled material was superior. However, the
elongation at break and the impact strength of the recycled material was significantly
reduced (Santana et al, 2003).
2-6
Table 2.3: Mechanical properties of virgin and recycled HIPS plastics, (Santana et al, 2003)
Table not available – see printed version
Considering that a degree of degradation would have occurred over the product
life cycle, the superior mechanical properties of the post consumer material imply that
the original plastic of the product was of higher mechanical quality than the virgin
polymer selected for comparison. In addition, it is possible that modifiers have been
added to enhance some of the properties depending on the requirements for its original
application. These factors can account for the difference in the results between
researchers.
2.5.4. Polyamide (PA, Nylon)
Polyamide is semicrystalline with a low glass transition. It is often glass or fibre
filled to improve the stiffness at elevated temperature. Liu et al (2002b) investigated
recycling two different grades of polyamide obtained from a dismantled car, one glass
filled and one mineral filled. The glass filled grade has greater tensile properties, but
lower elongation at break and impact strength. Liu et al (2002b) suggested that the
glass fibres present in the polymer matrix lower the impact strength by acting as sites for
stress concentrations and initiation points for cracks to develop during impact (Liu et al,
2002b).
Styrene-b-ethylene-co-butylene-b-styrene copolymer, SEBS-MA was added to
the PA as a toughing agent and impact modifier. This addition significantly increased
the elongation at break and the impact strength, while depressing the tensile properties
(Liu et al, 2002b).

2-7
2.6 Non-homologous polymer blends
2.6.1. VIRGIN BLENDS
Blends of virgin materials have been investigated by a number of researchers,
((Gupta et al, 1990), (Markin & Williams, 1980), (Balakrishnan & Neelakantan, 1998),
(Lindsey et al, 1981), (Liu et al, 2002a), (Chiu et al, 2004)). The results have been used
to evaluate the effects of contamination.
2.6.1.1. ABS contaminated with HIPS
Fridge door liners are typically laminated sheets of ABS and HIPS. An ABS skin
is coextruded over the less expensive HIPS because ABS has superior chemical
resistance. Once a refrigerator becomes waste, the polymers in the plastic scrap cannot
easily be separated. Lindsey and colleagues blended ABS and HIPS to investigate the
effect of not separating these plastics. A number of blends using virgin materials were
prepared over an extensive composition range.
Mechanical tests were carried out to evaluate the effect of contamination and to
determine the potential reuse of the blends from the processed scrap. Measurements of
modulus, yield strength and % elongation over the entire composition range lie close to
the rule of mixture. This behaviour is characteristic for miscible blends.
Microscopic observations contrasted the mechanical testing, indicating
incompatibility of the two polymers. This was observed by phase segregation that had
occurred during the processing of the blends, whereby the less ductile ABS formed a
skin around the specimen. However, this may not have been detrimental for the end use
of the reprocessed scrap since these two polymers are coextruded to attain the same
affect when producing refrigerator door lining (Lindsey et al, 1981).

2-8
2.6.1.2. ABS contaminated with PA
ABS is an amorphous styrene-acrylonitrile with a dispersed butadiene phase that
improves strength. On the other hand, PA is a semicrystalline engineering plastic, with
good chemical and abrasion resistance. Liu et al (2002a) attempts to combine the
feature of each thermoplastic by producing an ABS dominant blend, simulating ABS
contaminated with PP.
Compatibility of ABS/Nylon 6 blends has been extensively investigated, and
ultimately compatibilisation is essential to produce materials with usable properties. A
number of compatibiliser/modifiers have been trialled, including methyl methacrylate
(MMA), acrylonitrile, styrene maleic anhydride (SMA) and maleic anhydride (MA). The
compatibiliser used by Liu et al (2002a), styrene-maleic anhydride with 25% maleic
anhydride (SMA25), binds with the amine group of PA forming a block copolymer with
SMA and PA blocks, thus reducing the interfacial tension between PA and SAN. SEM
micrographs revealed that compatibilisation increased as the amount of SMA25 in the
blend increased. This was seen as the reduction in PA particle size dispersed within the
polymer matrix. The compatibilised blend showed improved tensile modulus, yield
strength and elongation at break compared to uncontaminated ABS. However,
compatibilisation did not improve the impact strength of the ABS blend, which was
halved with PA contamination. This led to the addition of a core shell impact modifier,
EXL3300, which doubled the impact strength of the compatibilised blend, similar in value
to the impact strength of uncontaminated ABS.
In a concurrent study, Liu et al (2002b) investigated the use of another impact
modifier that is commonly blended with recycled PA. SEBS-MA, does not improve
impact properties of ABS/PA blends because SEBS-MA is incompatible with ABS.
Micrographs confirmed the poor affinity between ABS and SEBS-MA.

2-9
Table 2.4: Mechanical properties of compatibilised and impact modified blends, (Liu et al, 2002a & 2002b)
Table not available – see printed version
Commercial blends of immiscible polymers generally contain compatibiliser that
can be used to compatibilise an unmodified blend of recycled materials, thereby
eliminating an external compatibiliser. A small amount of a commercial blend (Triax
1120, ABS/PA) was blended with an unmodified ABS/PA blend. The mixture exhibited
superior ductility and similar impact strength, compared to uncontaminated ABS.
Another commercial blend (Cadon G2320, ABS/SMA with glass fibres) was mixed with
an impact modified ABS/PA blend for the purpose of compatibilisation. Ductility was 4
fold greater than uncontaminated ABS, but impact strength was lowered (see Table 2.4).
The glass fibres, present in the Cadon G2320 blend, are relatively well bonded yet they
act as stress concentrators, which lead to lowered impact strength (Liu et al, 2002b).
The compatibilising effect of the addition of both commercial blends was observed in
SEM micrographs by the small domain size of PA within the blend matrix.
Chiu et al (2004) researched the effect of ABS/PA compatibilisation with maleic
anhydride grafted polyethylene-octene elastomer (POE-g-MA). The optimum blend
ratio, 80wt% Nylon6 : 20wt% ABS, was determined, based on notched impact strength.
Holes in the morphology were the result of the dissolution of ABS dispersed in the nylon
6 phase, where the smallest particles coincide with the 80:20 blend.

2-10
Impact strength improved as a result of increasing POE-g-MA addition (0, 3.6, 5,
10phr); with approximately a 4 fold increase by the addition of 10phr compatibiliser. The
impact strength was enhanced by increasing the amount of compatibiliser, which
reduced the size of the dispersed ABS particles. Compatibility of the polymer system
was emphasized in the rheological properties of the blend. The shear viscosity of the
blend was lower than either polymer. However, the addition of POE-g-MA increased the
shear viscosity, as the compatibiliser effectively increased the interfacial interaction
between nylon 6 and ABS (Chiu et al, 2004).
2.6.1.3. PP contaminated with ABS
Gupta et al. (1990a, 1990b) investigated mechanical and melt rheological
properties of virgin blends of PP contaminated with ABS, PP as the major component
and a varying content of ABS (0, 5, 10, 20, 30%).
The results show that the addition of a small amount of ABS improved the impact
strength to a maximum value at 10% ABS. While increasing the ABS content beyond
10% only increased the shear induced fracture with ductility. “Ductile fracture results in
plastic flow due to recovery of stresses immediately after fracture”. Markin and Williams
(1980) refer to a type of skin-core morphology, which is phase segregation caused
during injection molding of the test specimens. The formation of an ABS-rich skin leaves
a major portion of the fracture surface (the PP-rich core) poorer in ABS content, thus
reducing the impact strength of PP/ABS blends. This was observed in the electron
micrographs of the impact fractured surfaces. Similarly, elongation and the point of
break were significantly reduced because of the brittle nature of ABS. In contrast, ABS
addition had only a minimal effect on the tensile yield strength.
Melt properties of the blends were analysed with a capillary rheometer. The
results clearly showed that viscosity at a given shear rate increased with increased ABS
content in the blends. In addition, the decrease in melt viscosity with increased shear
rate was approximately linear, and consistent with the following power law relationship:
indexlaw power
===
•
nnbB b
1- η
(2.2)
The power law exponent,n decreased with increased ABS content in the blends, which
corresponds to increased pseudo-plasticity with increased ABS content.

2-11
In conclusion, small amounts of ABS did improve the mechanical properties of
the material, while increasing pseudo-plasticity. However, high levels of ABS in PP
(10%) reduced the mechanical properties of the material, which was assumed to be the
result of phase segregation and ABS skin formation during processing.

2-12
2.6.2. RECYLCED BLENDS
2.6.2.1. ABS contaminated with HIPS
Brennan et al (2002) surveyed a number of pieces of computer casing to
determine the two most widely used plastics for these applications: ABS at 45wt% and
HIPS at 21wt%. The thermo mechanical properties of the recycled plastics were
compared to the virgin plastics. Additionally, various ABS contaminated with HIPS
blends (10, 50, 90% HIPS) of the recycled plastics were analysed as an indication of the
impact of contamination and the miscibility of the blended polymers. The glass transition
temperature, Tg, for the materials was determined using dynamic mechanical thermal
analysis (DMTA). Assuming that the virgin materials were the same grade as the
recycled plastics, recycling lowered the Tg for the uncontaminated polymers, ABS and
HIPS, 102 to 960C and 104 to 1020C, respectively. The blends exhibited a single Tg
peak and the glass transition of the ABS contaminated with HIPS increased
proportionally with increasing HIPS content, according to the “rule of mixtures”. These
characteristics indicate that these ABS contaminated with HIPS blends are
homogeneous and miscible. While an incompatible blend would exhibit two glass
transition temperatures, one for each component, and they would not vary over the
composition range.
HIPS is often referred to as ductile and ABS as semi-brittle. Recycling the
uncontaminated polymers, ABS and HIPS, led to an increase in tensile modulus and
decrease of % elongation, indicating a reduction in ductility and an increase in stiffness.
This was more prominent for HIPS. The increased stiffness of the recycled plastics was
reiterated by the substantial deterioration of impact strength. This may be the result of
degradation and the presence of impurities (i.e. the pigment TiO2) within the polymer
matrix, causing inhomogeneity. The effect of blending varied between the mechanical
properties. Tensile strength decreased with HIPS content according to the rule of
mixtures. Modulus did not change with HIPS contamination because ABS and HIPS
have the same modulus. However, it can be assumed that the blends follow the rule of
mixtures for modulus. While the elongation properties of the blends reflected synergistic
behaviour attributed to favourable interactions between the polymers. In fact, blending
“improved the elongation properties that were otherwise lost due to the recycling
process”. Contrarily, impact strength was further decreased by HIPS contamination and
negatively deviated from the rule of mixtures over the composition range. This was the
only indication that the polymers are not compatible (Brennan et al, 2002).

2-13
In conclusion, HIPS contamination improved some of the properties that were
adversely affected by recycling ABS. The authors suggest that the addition of impact
modifiers would enhance the recyclate blend, superior to either one of the recycled
polymers.
2.6.2.2. ABS contaminated with PA
Liu et al (2002b) investigated compatibilisation of ABS contaminated with PA
using recycled ABS and two grades of PA (glass filled PA and mineral filled PA) from
dismantled cars. The presence of 20% PA reduced the elongation at break and impact
strength, particularly contamination with the glass filled PA. SEM micrographs show that
the glass fibres were poorly bonded to the polymer matrix, rationalising the inferior
mechanical properties.
Additional recycled plastics were introduced to simulate the mixture of plastics
from a dismantled car, with the aim of producing useful materials without sorting. The
blending was based on the polymer ratio of the plastic proportion of a specific type of
car, ABS/(ABS/PC)/PMMA/glass reinforced PA, in respective proportions 40/40/10/10.
Since, ABS, PC and PMMA are either miscible or compatible, compatibilisation was only
required for the PA phase. SMA25 was used to compatibilise PA as it is miscible or
compatible with the other three components of the blend. In addition, EXL3300 was
added as an impact modifier. The mechanical properties for this mixed plastic blend
were greater than the ABS/PA blend. This was attributed to the lowered content of the
PA and the presence of the inherently tough PC (Liu, 2002b).

2-14
2.6.1.3. PP contaminated with HIPS
Santana et al (2003) studied compatibilizing post consumer PP contaminated
with HIPS, referencing against virgin blends (14, 25, 33 wt% HIPS). PP and HIPS were
recycled from mineral water bottles and disposable cups, respectively.
In all instances, the recycled blends exhibited higher mechanical properties
compared to the virgin blends, indicating that the recycled material was higher grade.
Impact strength and elongation at break decreased with increasing HIPS content. This
was illustrated in phase morphology by weak adherence of the dispersed HIPS phase in
the PP matrix. The decline in impact strength for recycled blends was greater, which
indicates that the effect of recycling was more significant on recycled HIPS. Therefore,
as the content of HIPS increased in the recycled blends, the depression of properties
was enhanced, (Santana et al, 2003).
The PP contaminated with HIPS blends were compatibilised with varying
amounts of SEBS (5-7%). The tensile stress at maximum load and hence, interfacial
adhesion increased with lower SEBS content (5%). Furthermore, SEM micrographs
analysing the phase morphology showed that the size of the dispersed HIPS phase was
smaller for 5% SEBS, which resulted in a higher overall HIPS interfacial area. Thus, 5%
SEBS was the optimal compatibiliser content (Santana et al, 2003).

2-15
2.7 Application of Recycled Blends
Appropriate applications for the recycled polymers can be determined by
comparing the properties of the material with virgin materials, see Table 2.5 for the
properties of individual engineering thermoplastics.
Table 2.5: Properties of Engineering Thermoplastics, (Fried, 2003)
Table not available – see printed version
2.7.1. Blends
There are a number of considerations that should be considered when designing
a polymer blend which may reduce time spent on trial and error.
Step 1: Identify properties desired by the blend and select polymers that could achieve a
number of the properties
Step 2: Match the polymers to assure the most suitable complementarily of properties
Step 3: Miscibility and compatibility of the blended polymers
Step 4: Economic evaluation, including cost of processing, additives and final value of
blended material

2-16
Physical properties are significant in the thermo mechanical reprocessing stage
of preparing a blend. Ideally, the melt temperature of the individual polymers should be
close to improve processability in terms of viscosity and mechanical mixing. It is also
convenient to blend polymers with relatively close densities to eliminate expensive
separation processes (i.e. mixture of ABS and HIPS, (Pascoe, 2004)), see Table 2.6 for
the above mentioned physical and thermal properties of various consumer durable
thermoplastics.
During the recycling process the materials are not blended out of choice, but for
reasons associated with separation of the individual polymers. For instance, time to fully
disassemble a piece of WEEE or the physical similarities which prevent complete
separation of the shredded materials.
Table 2.6: Physical and Thermal Properties of Consumer Durable Thermoplastics, (Fried, 2003)
Table not available – see printed version

2-17
2.8 Summary
This chapter highlights the limited research that has been carried out to
investigate blending of recycled consumer durable thermoplastics, especially materials
from WEEE. Blends of virgin materials, such as ABS contaminated with HIPS and ABS
contaminated with PA, were analysed and these results can be used to indicate the
effect that contamination has in the recycling of these thermoplastics. ABS
contaminated with HIPS proved to be a compatible blend. This was an important
outcome for Lindsey et al (1981), as their investigation was based on the future recycling
of refrigerator door liners that consist of ABS laminated HIPS sheets. Whereas, PA had
significant adverse effects on the properties of ABS, which Liu et al (2002a) took into
account and used compatibilisers. However, blends of virgin materials cannot be
directly compared to recycled materials because modifiers that have been used to
enhance the functionality of the material for its original use can play an important role in
blends.
Brennan et al (2002) used ABS and HIPS based computer casings and analysed
a small range of blends. Based on the analysis of glass transition temperature and
simple mechanical properties, the ABS and HIPS appear compatible and miscible when
blended. Liu et al (2002b) investigated improving a blend of ABS contaminated with PA,
attempting to improve the material’s properties using additives to compatibilise and
modifiers to improve impact strength. An ABS dominant blend, consisting of typical
materials obtained from a dismantled car including PA, was compared to the initial
blends of ABS contaminated with PA. The multi-plastic blend containing other materials,
including PC and PMMA, had superior mechanical properties. Blends of recycled PP
contaminated with HIPS were compatibilised by Santana et al, (2003), to enhance the
mechanical properties. Compatibiliser level was varied to determine the optimal level
based on SEMS micrographs used to observe the size and distribution of the dispersed
phase, which is an indicator of interfacial adhesion and thus, improved mechanical
properties.

3-1
3 METHODOLOGY 3.1 Introduction
This chapter includes a list of the materials and the methodology applied
throughout the research, including a description of the processing and the material
testing.
Polymers were blended using a single screw extruder with different portions of
the contaminated polymer to represent known levels of contamination. The pelletised
extrudate was processed into test specimens for the purpose of thermal, rheological and
mechanical testing.
3.2 Materials
Granulated injection molding grade virgin materials manufactured by BASF were
purchased from Marplex Australia Ltd, Terluran®GP-22 natural (ABS), Moplen EP203N
(PP), Polystyrol 476L (HIPS) and Ultramid®B3S (Nylon 6), see Table 3.1. The virgin
material was reprocessed in a 12mm Axon Pacific laboratory single screw extruder to
simulate recycling and to ensure a direct uncontaminated comparison with actual
recycled material. Crushed recycled material was donated by Australian Composite
Technologies (ACT), including recycled car bumpers (PP) and recycled outer casings of
computers (ABS).
Table 3.1: BASF material properties
Material Density
(g/cm3)
Impact
Strength
(kJ/m2)
Tensile Stress
at Yield
(MPa)
Melt Flow Rate
(g/10 min)
ABS Terluran®GP-22 1.04 26 45 21
HIPS Polystyrol 476L 1.05 11 26 5.8
PP Moplen EP203N 0.896 10 20 11
PA 6 Ultramid®B3S 1.13 4.0 90 198

3-2
3.3 Processing
3.3.1. Extrusion
A polymer was mixed with a measured volume of another polymer and blended
in an Axon single screw extruder, see Figure 3.1 and 3.2 (see Table 3.2 and 3.3 for
blend composition). The amount of minor polymer in these binary blends represents a
level of contamination, which indicates a degree of sorting. Granular polymer was fed
into the barrel of the extruder via a storage hopper. The barrel of the extruder is divided
into three sections, the feed, compression and metering section.
Feed zone: The purpose of this zone is to preheat and supply the plastic. A single
screw with constant flight depth must be designed to convey sufficient material further
down the barrel. Electrical heaters along the length of the barrel ensure the plastic has
melted prior to entering the metering zone.
Compression/Transition zone: The flight of the screw decreases in the compression
zone, enhancing mixing. Reducing the flight depth increases the shear rate thereby
decreasing the viscosity of the polymer mixture. In addition to mixing, the changing
screw depth removes any trapped air from proceeding further and improves heat
transfer by reducing the thickness of the plastic in contact with the heated barrel.
Metering zone: In the metering zone the flight depth remains constant, but significantly
shallower than at the feed. The shearing action of the screw further mixes the polymers
and forces the plastic melt out of the barrel through the die (Fried, 2003), (Crawford,
1998).
The die shapes the extrudate, forming strands of plastic which were solidified in a water
bath. Finally, the long lengths of solid plastic are pelletised.

3-3
Image not available – see printed version
Figure 3.1 The barrel of a single screw extruder, (Chokshi, R., and Zia, H., 2004)
Table 3.2: Contaminant level in ABS blends
Contaminant Contaminant level, vol %
PP 10, 20, 30
HIPS 10, 20, 30
Nylon 6 5, 10, 20
Table 3.3: Contaminant level in PP blends
Contaminant Contaminant level, vol %
ABS 10, 20, 30
HIPS 10, 20, 30
Nylon 6 5, 10, 20

3-4
Figure 3.2 Axon single screw extruder
Feed Hopper
Die
Barrel Section
Figure 3.3 Control panel and die formation of the extruder

3-5
3.3.2. Injection Moulding
Injection moulding produces a wide array of articles, ranging from electronic
housing to automotive parts to food containers. Granular or powdered polymer/plastic
stock stored in a hopper is fed into the barrel where it is softened by heating. The
softened plastic is forced through a nozzle into a chilled water cooled mould, which is
clamped closed. Time is allowed for the plastic to solidify before the item is ejected from
the mould. Solidification time is dependent on the material, in this instance, 5 seconds
was sufficient.
Prior to molding, the feed material was dried under vacuum, for at least 18 hours,
at 900C to eliminate air bubbles forming in the injection molding process. Mechanical
test specimens were formed in a Battenfeld Injection Moulder (Model BA 350 / 75
PLUS), see Figure 3.3 and 3.4, (see Table 3.4 for processing conditions).
Table 3.4: Processing temperature variables, extruder zones (T1, T2, T3, Td, respectively) and injection molding
Material Processing
Temperature Range1 Extruder Zones IM Temperature
Terluran®GP-22 natural (ABS) 220-2600C 210, 220, 230, 235 25, 190, 220, 240
Polystyrol 476L (HIPS) 180-2600C 200, 210, 220, 225 25, 190, 220, 240
Moplen EP203N (PP) 210-2500C 200, 210, 220, 225 25, 190, 220, 240
Ultramid®B3S (Nylon 6) 250-2700C 220, 230, 240, 245 25, 190, 220, 240
1 Product data sheet supplied by BASF plastics

3-6
Figure 3.4 Battenfeld Injection Moulder (Model BA 350 / 75 PLUS)
Figure 3.5 Die cavity of the Battenfeld Injection Moulder for mechanical testing
specimens
Die Cavity

3-7
3.4 Thermal Properties
3.4.1. Glass Transition
The glass transition temperature, Tg, was measured with the help of differential
scanning calorimetry on DSC 2920 (TA instruments) and dynamic mechanical analysis
on DMA 2980 (TA Instruments). TA Universal Analysis software was used to view and
analyse the data.
Differential scanning calorimetry compares the heat input rate required to
maintain the specimen and a reference at the same rate of temperature rise. The
differential heat flow is recorded as a function of temperature, plotted as a thermo gram.
Dynamic mechanical analysis, DMA, is a relatively new method imported from
the field of rheology. Similar to a traditional mechanical tensile tester, DMA measures a
sample’s response to an applied force and the relationship between stress and strain,
the modulus, is calculated. Modulus is a measure of the material’s stiffness, varying with
temperature and applied stress. DMA supplies an oscillating force causing a sine wave
stress resulting in a sine wave strain. The amplitude of the sine waves and the phase
lag between the applied stress and the strain response are important parameters used in
the calculation of modulus. This includes the storage modulus, G’, and loss modulus,
G”, which are measures of a material’s ability to store and lose energy, respectively.
The tangent of the phase angle (tan) is the ratio of the storage and loss modulus, also
called damping. Damping is an indicator of how efficiently a material loses energy to
molecular rearrangement and internal frictions (Menard & Raton, 1999).
Dynamic Mechanical Analysis is widely used to identify transitions in a polymer
that may be difficult to detect in less sensitive instruments, such as DSC. The glass
transition temperature can be determined a number of ways, this includes the
temperature at the onset of G’ drop, the peak of G” or the peak of tan (Menard & Raton,
1999). It is important to adopt a consistent approach for the comparison of the various
blends. The temperature at the peak of tan is the most commonly used for polymers,
although none of the methods are favoured.
The glass transition temperature was captured by a temperature ramp, room
temperature to 1500C at 100C per minute on the DMA 2980 (TA Instruments) using
Thermal Advantage instrument control software.

3-8
3.4.2. Degradation Region
Determination of the onset of polymer degradation is observed by heating a
known sample weight at a constant rate. The sample begins to volatilise once it has
reached the onset of degradation, which is identified as a drop in weight.
TA instruments SDT 2960 was used to indicate the onset of degradation by
means of Thermal Gravimetric Analysis, TGA, using Thermal Advantage instrument
control software, see Figure 3.5. Pelletised samples of similar weight (10mg) and shape
were analysed to ensure uniform surface area to volume ratio between the samples and
hence, consistent heating.
Figure 3.6 TA instruments SDT 2960

3-9
3.5 Rheological Properties
“Rheology is the science of deformation and flow” (Utracki, 1989). Rheology is
important to assess the processability of a polymer.
Newton’s law of viscosity describes the viscous flow of a Newtonian fluid relating shear
stress,τ , to shear strain rate, •γ :
Newtonian)viscosity dynamic (
==
•
µµτ (3.1)
The viscosity of a Newtonian fluid is a function of temperature and pressure,
while independent of the shear strain rate. Simple non-Newtonian behaviour is a
function of temperature, pressure and shear rate, where complex behaviour incorporates
all three variables as well as time (Fried, 2003).
Non-Newtonian fluids are divided up into two systems, dilatant (or shear
thickening) and pseudo plastic (or shear thinning). The basis for the systems is the
relationship between apparent viscosity,η , and shear rate, •γ .
•=γ
τη (3.2)
Polymeric melts dominantly display pseudo plasticity. The viscosity of a pseudo plastic
decreases with increasing shear rate.
The power law is the most widely used model for pseudo plastic behaviour to
describe the change of viscosity as a function of shear (Utracki, 1989), (Utracki, 2002).
indexlaw power
indexy consistenc
===
•
nk
k n
τ
(3.3)
The power law index, n , can be used to describe the three basic types of flow,
n =1 Newtonian behaviour
n <1 Shear thinning (or Pseudo plastic)
n >1 Shear thickening

3-10
The power law can be rearranged and include the term of the apparent viscosity
using the shear rate and apparent viscosity at a reference state, 0 and ηγ•
0 respectively
(Crawford, 1998).
nn 1
00
−
•
•
=
γ
γηη
(3.4)
The power law provides a good approximation at the high strain rates experienced
during extrusion and injection moulding.
There are two types of instruments for determining the rheological properties of a
material: capillary and rotational.
Capillary rheometry forces a fluid through a tube, establishing a relation between
volumetric flow rate and pressure drop due to friction. This technique is superior for high
viscous media as higher shear rates can be attained.
Rotational rheometers involve the shearing of a sample fluid due to rotation,
including concentric cylinder, cone and plate and parallel plate rheometers. At higher
shear rates, material failure is prevalent, especially for high viscous materials. Failure or
slippage can occur due to loss of adhesion between the sample and the plates, and
secondary flow resulting in a breakdown of laminar flow. However, empirical
relationships, based on oscillating shear flow experiments, can extend the shear rate
range. One such relationship is the Cox-Merz rule:
( )[ ] 21
22* /'' ωηη G+= (3.5)
( ) ( )
"'
'"1'
21
2*
ηηη
ηηωηωηγη
γω
γω
i−=
+==
∗
=
=
•
•
•
*η is the complex viscosity, 'η dynamic viscosity, 'G the dynamic rigidity modulus and
ω the oscillation frequency (Ferguson and Kemblowski, 1991).

3-11
3.5.1. Parallel Plate Rheology
Melt rheological properties were measured on an AR 2000 (TA instruments)
parallel plate rheometer with aluminium 25mm parallel plate geometry, see Figure 3.7.
TA Data Analysis software was used to view and model the data.
The main advantage of parallel plate rheometers over other rotation rheometers
is the easily adjustable gap, which is useful in measurements over a temperature range
as it accounts for expansion of the material.
There are two common approaches to rotational rheometry, controlled rate and
controlled stress, see Figure 3.6. Controlled rate: the lower plate is rotated and the
response of the upper plate is the measured torque (Semancik, 1997), (Ferguson and
Kemblowski, 1991). Controlled stress: the lower plate is kept stationary while a stress is
applied to the upper plate, and the rotation of that plate is measured (Semancik, 1997).
The AR 2000 is stress controlled.
Image not available – see printed version
Figure 3.7 Parallel plate configurations (Semancik, 1997)
Melt rheology measures the viscoelastic properties, which are typically steady
shear for a polymer melt. However, materials with a high viscosity tend to fail at
moderate shear rates using parallel plate configurations. In these cases, dynamic
loading (oscillation) within the materials linear viscoelastic region is appropriate, from
which extended steady shear information can be estimated using models.

3-12
Figure 3.8 TA instruments AR 2000 parallel plate rheometer
3.5.1.1. Flow
Steady shear experiments were carried out at low to moderate shear rates. In this
mode of operation, an increasing stress was applied to a sample and the strain response
and strain rate (shear rate) were measured (Whittingstall, 1997). The measured
viscosity over a range of shear rates provides an indication of the stability of the material
and the processability of the material.
Flow tests were carried out for each blend at the processing temperature used
throughout the investigation, 2400C, at a frequency of 1Hz.

3-13
3.5.1.2. Linear viscoelasticity
The linear viscoelastic region was evaluated to determine the conditions suitable
for dynamic loading experiments. In this case, a stress sweep was utilised for this
purpose, as stress is the controlled variable from which strain is calculated. The linear
region occurs where strain increases linearly with stress, constant modulus.
Stress sweep measurements were carried out at the same temperature and frequency
conditions as flow analysis with the stress controlled between 0.3 to 3500Pa.
3.5.1.3. Dynamic Loading Oscillation involves applying a sinusoidal stress wave and measuring the resultant
strain response (Whittingstall, 1997).
At the processing temperature, and the stress selected from within the linear viscoelastic
region, a frequency sweep was carried out for the range 0.1 to 100Hz. The data was
modelled to show the materials behaviour at higher shear rates.

3-14
3.5.2. Melt Flow Rate
Melt flow rate measures the rates of extrusion of a thermoplastic through an
orifice of specific length and diameter under prescribed conditions of temperature and
load. It is primarily a means of measuring the uniformity of the flow rate of a material
and can be used to distinguish between different grades of a material. It correlates to
the processability of a material, which can be compromised by the presence of additives.
Typically, a set volume of material is loaded into the preheated apparatus. A
volume of sample is pushed through the die of the instrument by the force of a standard
load. The MFR is determined by the volume extruded over a fixed time. An estimate of
density can be calculated from the measured weight of the extrudate. Reproducibility
can be achieved by ensuring the following factors are consistent throughout the
measurements, apparatus preheat time, volume of material loaded, packaging of loaded
material and moisture content of material.
Melt flow rate was measured on CEAST Modular Melt Flow, model 7024, ascribed for
ISO and ASTM standards, see Figure 3.8. Measurements were carried out according to
ASTM D1238 with conditions set based on test measurement A, see Table 3.5.
Table 3.5: Conditions for MFR measurements
ABS based blends PP based blends
Start Measurement Position Position
Type of step Time Time
End of Test Time Time
Work Temperature 200 0C 230 0C
Load 5 kg 2.16 kg
Die Length 8 mm 8 mm
Die Diameter 2.095 mm 2.095 mm

3-15
Figure 3.9 CEAST Modular Melt Flow instrument

3-16
3.6 Mechanical Properties 3.6.1. Tensile and Flexural Testing
A typical tensile test involves a dumbbell shaped sample clamped and held static
at one end and pulled at a constant rate of elongation at the other end (Fried, 2003).
Strain rate is typically between 0.5-500mm/min, depending on the standard selected for
testing (Utracki, 2002). The dimensions of the specimen include gage length, l0
=100mm, width, W0 = 10.3mm and thickness, t0 = 2.1mm.
A0
l0
W0
The applied tensile force, F, is measured up to the point of failure. Stress is
highest at the thinnest part, the gage length l, causing the specimen to snap close to the
centre. However, stress concentration at the clamped ends reduces the incidence of
premature failure. The tensile response is represented as a plot of stress () verses
strain () (Fried, 2003), see Figure 3.9.
0A
F = (3.6)
0ll
= (3.7)
length gage initiallength, gage elongation ==−= 0lel;0lell

3-17
Figure 3.10 Typical stress-strain curve
Tensile modulus (Young’s modulus, E), is the initial slope of the stress-strain curve.
Hooke’s Law relates stress and strain by the tensile modulus:
E = (3.8)
Tensile strength is the maximum stress value, beyond this stress decreases with
increasing strain. This is the point before the onset of gage narrowing, or ‘necking’.
Elongation at break is the extent of elongation of the plastic specimen prior to breaking.
100l
ll
0
0b ×−
(3.9)
ABS
PP
Strain %
break
break
Fmax
Fmax
E
Stress

3-18
Figure 3.11 Zwick Z010 universal tester and grips for tensile testing
Similarly, the flexural properties can be determined. Flexural testing was
performed on injection molded bars, 63 × 12.5 × 3mm. According to ASTM D 790, the
span to depth ratio was 16, such that the support span was 48mm. The rate of cross
head motion, R, and the midspan deflection at test termination, D, were determined
based on the standard.
3FL
bt 22
= (3.10)
2L
t6Υ=
(3.11)
specimen the of width b ,deflection theY ==

3-19
Figure 3.12 Flexural testing apparatus for the Zwick Z010 universal tester
Tensile and flexural properties were measured on a conventional mechanical
tester, Zwick model Z010, according to ASTM D 638 and 790, respectively. See Figure
3.10 for Zwick instrument and grips set up for tensile tests, and Figure 3.11 for the
flexural test apparatus. TestXpert 8.1 was used to run the tester and to evaluate the
results.

3-20
3.6.2. Impact Testing
One of the most significant properties for engineering plastics is impact strength,
representing the toughness of a material.
Methods for testing impact strength include Izod and Charpy tests. In these tests
a hammer like weight of known energy strikes the flat plane of a specimen. The energy
absorbed by the polymer is the difference in potential energy of the hammer before and
after impact (Utracki, 2002). Notches are machined into the specimen to standardise the
impact results against stress concentrators within the plastic and to assess the
sensitivity to weakening (Fried, 2003).
Notched samples were analysed for Izod impact strength conducted on a CEAST
Resil impact tester according to ASTM D 256-00, see Figure 3.12.
Figure 3.13 CEAST Resil impact tester and sample jaw

3-21
3.6.3. Dynamic Mechanical Analysis
DMA take multiple measurements across a temperature or frequency range, i.e.
1Hz is equivalent to 1 cycle per second. Hence, DMA is significantly more efficient in
obtaining dynamic mechanical data, as traditional mechanical analysis can only run a
single experiment on a sample at a fixed temperature and a fixed strain rate (Menard &
Raton, 1999). The value of storage modulus calculated by DMA is approximately
equivalent to Young’s modulus and can be used to compare the analysis methods.
Dynamic modulus was measured on TA instruments Dynamic Mechanical
Analyser 2980 using Thermal Advantage instrument control software. Injection molded
bars were prepared, 63 × 12.5 × 3mm. Testing was performed on a dual cantilever
configuration, shown in Figure 3.13.
Dynamic modulus was measured by the temperature ramp: room temperature to
1500C at 100C per minute. The dynamic (storage) modulus at room temperature was
comparable to the Young’s modulus derived from simple tensile tests.
3.6.3.1. Time Temperature Superposition
The modulus of polymeric materials during deformation and flow is dependent on
temperature and time (frequency). Under load, the chains of a polymeric material
realign to minimize localized stresses, changing the modulus over time. Time
Temperature Superposition (TTS) is used to treat limited laboratory data obtained from
short term experiments to predict properties over a broad time scale.
There are two assumptions that are the basis for the transform:
• Molecular rearrangement occurs at an accelerated rate at higher temperatures
• Temperature is directly related to time.
To obtain long term data for a desired (reference) temperature, 0T , short term
experiments need to be conducted at elevated temperatures. Shift factors; tA , predict
the horizontal shift for the short term curves at the elevated temperature relative to the
reference temperature.

3-22
The Williams-Landel-Ferry (WLF) equation is used to describe time-temperature
behaviour near the glass transition region, based on the assumption that above glass
transition temperature, Tg, the fractional free volume increases linearly with temperature:
( )( )02
01logTTCTTC
At −+−−
= (3.12)
where 1C and 2C are constants and T , is the measurement temperature.
Isothermal frequency sweeps were conducted over a temperature range. Short
term analysis covered the range 0.1-100Hz, at 5 points per decade. Low temperature
frequency sweeps can model properties over an extensive time period, relating the
change in dynamic properties during a typical period of use. The higher temperature
frequency sweeps includes the glass transition temperature range. Time temperature
superposition data and the William-Landel-Ferry model can be used to predict various
properties over time near the glass transition temperature.
The analysis was only applicable to ABS dominant blends, as ABS is an
amorphous material that has a glass transition at practical working temperatures.
TA Data Analysis software was utilized to perform the Time-Temperature
Superposition transformation, with the ability to model WLF for the calculated shift
factors.
Figure 3.14 TA instruments DMA 2980, cantilever configuration

3-23
3.7 Statistical Analysis of Property Data
3.7.1. Characterisation of the Sample Population
Characterisation of the sample population is necessary for continuous application
of statistical analysis of the property data. A large, randomly selected population was
measured for two different properties that are typical of the range of properties relevant
to this study, tensile and impact strength. In addition, the two uncontaminated base
polymers were analysed to ensure that the characteristic population assumed for the
range of blends was valid. Histograms in Figure 3.14-3.17 show the typical bell shaped
curve of a normally distributed population with a 95% confidence interval. Tensile
strength data appears to have the least variance, indicating that fewer samples are
required to achieve a 95% confidence interval.
Figure 3.15 Tensile strength histogram for thermally recycled PP

3-24
Figure 3.16 Tensile strength histogram for thermally recycled ABS
Figure 3.17 Impact strength histogram for thermally recycled PP

3-25
Figure 3.18 Impact strength histogram for thermally recycled ABS

3-26
3.7.2. Statistical Analysis
Various statistical parameter can be determined for a given sample size, N , based on a
normally distributed population, including
mean, x :
Nxx i
= (3.13)
standard deviation, sd :
( )
1
2
−−
=N
xxsd i (3.14)
relative standard deviation, %RSD :
100% ×=xsdRSD (3.15)
standard error, se :
Nsdse = (3.16)
The required sample size to achieve a 95% confidence interval for the data can be
calculated:
2
%%
×=ERSDZN (3.17)
where 96.1=Z for a 95% confidence interval with an assumed error of 10%.
The highest RSD% representing the worst case scenario was selected to standardize
the minimum number of samples required.
Table 3.6 is a statistical analysis of the tensile and impact properties of the PP and ABS
sampled for population characterization.

3-27
Table 3.6: Statistical Analysis of virgin PP and ABS
Tensile Strength Impact Strength MPa kJ/m2 PP ABS PP ABS X 19.6 42.5 12.5 17.8 1.0 1.9 1.1 0.93 RSD% 5.2 4.5 9 5 Se 0.089 0.16 0.13 0.13 N 130 130 72 124 N required 1 1 3 1
For mechanical analysis of all materials/blends, a minimum of 5 samples were
tested for tensile and flexural properties and 8 samples for impact strength. The
number of samples were confirmed in the statistical analysis of each blends based on
the largest measured standard deviation, or worst case, see Table 3.7. Tensile and
Flexural properties were easily within the confidence interval for the number of samples
tested. Likewise, the sample size for impact tests was adequate, with the exception of
one blend in the ABS/Nylon blends. This is 1 out of 28 blends where the measurement
of more than 8 samples was required.
Table 3.7: Sample size for the mechanical properties of ABS and PP based blends
ABS/PP pcABS/PP ABS/HIPS ABS/Nylon PP/HIPS PP/Nylon Tensile Strength
RSD% 3.2 5.9 0.42 0.95 1.2 2.0 N 1 2 1 1 1 1
Flexural Strength RSD% 4.5 4.0 1.1 1.8 0.93 7.1 N 1 1 1 1 1 2
Impact Strength RSD% 6.4 11 3.0 23 7.3 11 N 2 5 1 20 3 6
pc denotes post consumer (ACT) recycled blends

4-1
4 THERMAL PROPERTIES OF CONTAMINATED PLASTICS
4.1 Glass Transition
Glass transition temperature, Tg, is applicable to amorphous polymers, including
ABS and HIPS, and semi-crystalline polymers, such as PP. PP has a sub zero glass
transition temperature (-150C, Fried, 2003), which won’t be measured in this
investigation due to practical limitations. At Tg the amorphous phase is converted from a
hard glass like state to a rubbery phase, which is important to the mechanical properties
of the polymer. The glass transition temperature can be determined a number of ways,
in this case it is the peak of tan from DMA (see Figure 4.3).
The glass transition temperature of ABS and HIPS is approximately 1120C and
1080C, respectively. Thermal recycling does not appear to affect the glass transition
temperature of these two polymers (see Table 4.1 and 4.2a, b). Post consumer (ACT)
recycled ABS had a slightly lower glass transition temperature of 1100C (see Table 4.3).
Contamination of ABS causes minimal shift in the position of Tg, regardless of whether
the contaminant polymer is amorphous (HIPS) or semi-crystalline (Nylon or PP), (see
Table 4.2a and Figure 4.1). However the effect is greater for post consumer recycled
blends, such that the presence of PP in ABS elevates Tg, (see Table 4.3 and Figure 4.3).
This can be attributed to the presence of additives and possible contamination of the
post consumer recycled PP. It is likely that the Tg of the fillers used to increase the
impact strength of PP bumpers is outside the range measured. Contaminated PP
blends adopts the Tg of the amorphous polymers, regardless of the level of
contamination (see Table 4.2b and Figure 4.2).
Table 4.1: Glass transition temperatures of virgin amorphous materials (0C)
Material Tg Virgin ABS 112 Virgin HIPS 108

4-2
Table 4.2a: Glass transition temperatures of thermally recycled ABS dominant blends (0C)
Contaminant level, v/v% 0 5 10 20 30 100 PP 112 - 112 111 - -15* HIPS 112 - 112 112 112 108 Nylon 112 111 111 110 - Na
* Glass transition temperature from text, (Fried, 2003)
Table 4.2b: Glass transition temperatures of thermally recycled PP dominant blends (0C)
Contaminant level, v/v% 0 10 20 30 100 ABS -15* 112 111 111 112 HIPS -15* 108 107 107 108
*(Fried, 2003)
Table 4.3: Glass transition temperatures of ABS contaminated with PP blends (0C)
Contaminant level, v/v% 0 10 20 30 Thermal 112 112 111 112 Post Consumer 110 109 111 112

4-3
Figure 4.1 Glass transition temperature of ABS contaminated with PP
Figure 4.2 Glass transition temperature of PP contaminated with ABS

4-4
1 11
1
1
1
1
1
1
1
1
1
1
1
1
11 1
2 22
2
2
2
2
2
2
2
2
2
22
2 2
3 33
3
3
3
3
3
3
3
33
3 3
4 4 44
4
4
44
4
4
44 4
5 5 5 55
55 5
55 5 5 5
6 6 6 6 66
6 66
6 6 6 67 7 7 7 7 7 7 7 7 7 7 7 78 8 8 8 8 8 8 8 8 8 8 8 8
0.5
1.0
1.5
Tan
Del
ta
80 100 120 140
Temperature (°C) Universal V4.3A TA Instruments
Figure 4.3 Tan Delta curves of post consumer recycled ABS/PP blends
1
2
3
1 rABS
2 rABSPP_90:10
3 rABSPP_80:20
4 rABSPP_70:30
5 rPPABS_70:30
6 rPPABS_80:20
7 rPPABS_90:10
8 rPP
4
5 6
7 8

4-5
4.2 Degradation Region
Degradation temperature is the temperature where a material begins to
decompose, in the case of polymers by chain scission and vaporisation. Thermal
degradation varied between investigated polymers. TGA of thermally recycled material
clearly shows that ABS degrades at a higher temperature to PP, 4000C and 3000C,
respectively (see Figure 4.4). The extent of the shift in degradation temperature due to
recycling was greatest for polypropylene. Increasing the amount of contaminant added
to polypropylene elevated the degradation temperature region (see Figure 4.5, 4.6). For
instance, the degradation temperature of PP contaminated with ABS increased as the
proportion of contaminant increased, approaching the degradation region of
uncontaminated ABS.
Post consumer recycled material appears to have multiple onsets of degradation
at different temperatures (see Figure 4.7). Blends of these materials also have these
multiple degradation stages. This indicates the intentional addition of additives, which
was used to optimize specific material properties required for the original application,
rather than random contamination in the recycling process. This could include impact
modifiers or additives for aesthetic purposes.
Post consumer recycled PP contaminated with ABS blends behaved similarly to
thermally recycled blends, such that increased levels of ABS elevated the degradation
temperature (see Figure 4.8). On the other hand, increasing the level of contaminant PP
in ABS corresponded to an elevation in degradation temperature (see Figure 4.7).
However, the shift in the degradation temperature of the ABS contaminated with PP
blends was minor and may be accounted to inconsistency within the supplied material
and fluctuation in the measurements.

4-6
0
20
40
60
80
100
Wei
ght (
%)
0 100 200 300 400 500
Temperature (°C)
ABSvirgin–– –– – ABSrecycle––––––– PPvirgin–– –– – PPrecycle––––––– vPPvABS (70:30)–– –– – rPPrABS (70:30)––––––– rPPrABS (80:20)––––––– rPPrABS (90:10)–––––––
Universal V4.3A TA Instruments
Figure 4.4 TGA plots for thermally recycled PP contaminated with ABS
0
20
40
60
80
100
Wei
ght (
%)
0 100 200 300 400 500
Temperature (°C)
HIPSvirgin.001–– –– – HIPSrecycle.001––––––– PPvirgin.001–– –– – PPrecycle––––––– vPPvHIPS_(7030).002–– –– – rPPrHIPS_(7030).001––––––– rPPrHIPS_(8020).001––––––– rPPrHIPS_(9010).001–––––––
Universal V4.3A TA Instruments
Figure 4.5 TGA plots for thermally recycled PP contaminated with HIPS

4-7
Thermal rPP
Thermal rABS
ACT rPP
ACT rABS
20
40
60
80
100W
eigh
t (%
)
150 250 350 450
Temperature (°C) Universal V4.3A TA Instruments
Figure 4.6 TGA plots for thermally and post consumer recycled materials
1 1 1 11
1
1
1
1
1
1
1
2 2 2 2 2 2 2 22
2
2
2
2
2
2
2
2
3 3 3 3 3 3 3 33
3
3
3
3
3
3
3
4 4 4 4 4 4 4 4
4
4
4
4
4
4
4
4
1234
20
40
60
80
100
Wei
ght (
%)
0 100 200 300 400
Temperature (°C)
1 rABS_ACT.001–––––––2 rABSPP9010_ACT.001–––––––3 rABSPP8020_ACT.001–––––––4 rABSPP7030_ACT.001–––––––
Universal V4.3A TA Instruments
Figure 4.7 TGA plots for post consumer recycled ABS contaminated with PP

4-8
1 1 1 1 11
1
1
1
1
1
1
2 2 2 2 2 2 2 22
2
2
2
2
2
2
2
2
2
3 3 3 3 3 3 33
3
3
3
3
3
3
3
3
3
3
4 4 4 4 4 4 44
4
4
4
4
4
4
4
4
4
4
1
23420
40
60
80
100W
eigh
t (%
)
0 100 200 300 400
Temperature (°C)
1 rPPABS7030_ACT–––––––2 rPPABS8020_ACT–––––––3 rPPABS9010_ACT–––––––4 rPP_ACT–––––––
Universal V4.3A TA Instruments
Figure 4.8 TGA plots for post consumer recycled PP contaminated with ABS

5-1
5 PROCESSABILITY OF CONTAMINATED PLASTICS 5.1 Processability
Recycling the individual polymers did not alter the processability of the material,
but it did change the appearance through yellowing. Contamination did affect the
processability, such that the extrusion of nylon contaminated materials was interrupted
by the breaking of the brittle extrudate strands. Poor processability was also observed in
injection molding where mechanical specimens of Nylon contaminated materials and PP
contaminated ABS frequently broke in the mold cavity. The processability of post
consumer recycled ABS/PP blends appeared greater than thermal recycled blends,
improving as the level of the ‘contaminant’ increased. This may be a result of the
complex interactions between the post consumer plastics and the additives present in
the post consumer materials. Metal and resin contamination was evident in the post
consumer recycled material, which caused blockages in the screens that filtered the feed
through the extruder. Melt flow rate was measured as a preliminary investigation of
processability, while rheological properties were performed at processing conditions.
5.2 Melt Flow Rate
Melt flow rate, MFR, measurements were carried out for all blends, with the
exception of nylon contaminated materials due to the obvious signs of incompatibility
during sample preparation.
Initially, the processability of the individual plastics was investigated. The MFR
for thermally recycled PP and ABS were 12.7 and 1.40g/10min, respectively.
Comparatively, the MFR for post consumer ACT recycled PP and ABS was 13.9 and 8.8
g/10min, respectively. The MFR of post consumer recycled plastics was significantly
higher, especially the ABS. A high MFR implies low resistance to flow, a result of low
molecular weight and low interaction between polymer chains. The processing and
recycling conditions would change the length and alignment of the polymer chains,
typically improving flowability through degrading the molecular structure. However, this
is commonly offset by the negative impacts that recycling has on other properties,
including thermal and mechanical.

5-2
The effect of PP contamination in ABS appears additive, such that the MFR
increased linearly with an increasing level of contaminant (PP), see Figure 5.1a and
Table 5.2a. Whereas, the ABS contaminated PP follows a quadratic relationship with a
minimum at 25 and 15% for thermally and post consumer recycled blends, respectively,
which indicates a negative deviation from the rule of mixtures, see Figure 5.1b and Table
5.2b. However, the accuracy of these models are compromised by the significant
variation at high level of contamination (30% PP in ABS and 30% ABS in PP), which is
evident in the standard deviation; see Figures 5.1a & 5.1b and Tables 5.1a and 5.1b.
Variation in measurements within the same blend indicates poor uniformity of the flow
rate and non-homogenous blending, particularly noticeable at these high contamination
levels. This can be expected as a homogenous mixture is impossible to achieve on a
laboratory scale, single screw extruder especially with immiscible materials. Melt flow
results were confirmed by rheology, which shows that ABS was more viscous at the
processing temperature and PP contamination decreased the viscosity, see section 5.3.
Density was measured along with MFR. The densities for ABS and PP for
thermally recycled materials were 0.940 and 0.738, respectively, and for post consumer
recycled 1.05 g/mL, and 0.818g/mL, respectively. The density of the blended materials
decreased in proportion to the amount of PP added, as the density of PP is lower than
ABS, see Figure 5.2a. This is clearly shown in the models that relate density to
contaminant level, see Table 5.2a. The model constants for PP contaminated ABS
show that the change of density with contaminant level was approximately 3 times
greater for post consumer blends. Figure 5.2a shows the divergence in the density of
post consumer materials from thermally recycled material see Figure 5.2a and Table
5.2b, where, the post consumer PP contaminated ABS maintains a higher density over
the investigated range of blends. In contrast, the density of ABS contaminated PP
increased with increasing level of ABS, see Figure 5.2b. At these contamination levels,
the change in density with level is the same, regardless of the source of the recycled
material, as shown by the constant, K, see Table 5.2b.

5-3
Figure 5.1a Melt Flow Rate of recycled ABS contaminated with PP blends
Figure 5.1b Melt Flow Rate of recycled PP contaminated with ABS blends

5-4
Table 5.1a: Standard deviation in Melt Flow Rate of recycled ABS contaminated with PP
Contaminant level, v/v% 0 10 30
Thermally Recycled MFR 1.4 2.1 5.3 standard deviation 0.062 0.070 0.71
Post Consumer Recycled MFR 8.8 9.0 10.7 standard deviation 0.17 0.32 1.2
Table 5.1b: Standard deviation in Melt Flow Rate of recycled PP contaminated with ABS
Contaminant level, v/v% 0 10 30
Thermally Recycled MFR 12.7 10.7 9.7 standard deviation 0.27 0.20 0.78
Post Consumer Recycled MFR 13.9 12.2 14.0 standard deviation 0.49 0.40 1.5
Figure 5.2a Melt density of recycled ABS contaminated with PP blends

5-5
Figure 5.2b Melt density of recycled PP contaminated with ABS blends
0MFRKMFR MFR += ϕModel MRF Linear
(5.1)
022
1 MFRKKMFR MFRMFR ++= ϕϕModel MFRQuadratic
(5.2)
0ρϕρ ρ += KModeldensity Linear
(5.3)
polymer ateduncontamin ofdensity polymer ateduncontamin of RateFlow Melt
30)0(0 tcontaminan of fraction
constants
==
≤≤=
=
0
0
21
.,,,
ρ
ϕϕρ
MFR
KKKK MFRMFRMFR
Table 5.2a: Model constants for ABS contaminated with PP
KMFR MFR0 K 0 Thermal 13 1.15 -0.1 0.942 Post Consumer 6.6 8.62 -0.27 1.05

5-6
Table 5.2b: Model constants for PP contaminated with ABS
KMFR1 KMFR2 MFR0 K 0 Thermal 51 -25 12.7 0.11 0.738 Post Consumer 88 -26 13.9 0.11 0.818
The trend of MFR for the HIPS contaminated blends varied depending on the
material that it was contaminating. The MFR for uncontaminated HIPS is 5.35g/10min, a
flowability in between ABS (1.40g/10min) and PP (12.7g/10min). HIPS contaminated
ABS blends appears to follow the rule of mixtures, where increasing the amount of HIPS
increases the MFR of the blend, see Figure 5.3. This is consistent with compatible
materials. On the other hand, the addition of HIPS to PP does not appear to alter the
flowability of the material, see Figure 5.4.
Figure 5.3 Melt Flow Rate of thermally recycled ABS contaminated with HIPS

5-7
Figure 5.4 Melt Flow Rate of thermally recycled PP contaminated with HIPS

5-8
5.3 Rheology
Melt rheology testing was performed on thermal and post consumer recycled
ABS/PP blends.
The samples for rheology analysis were prepared via two different methods, a
result of the material processability. Small scale, manual injection molding was practical
for easy to process blends. Whereas, materials with a relatively high viscosity at the
processing temperature were suited to machine driven injection molding (according to
section 3.3.2.), whereby samples were cut to size from a larger sheet. Different flow
patterns arise from different sample preparation methods, which compromise the
repeatability of the results and comparison of results between samples prepared from
the two methods. However, the variability was minimal as shown in Figure 5.5, where
rPP is small scale injection molding and rPP_[IM] had been cut from a larger sheet. The
comparison between the rheological results was demonstrated repeatedly.
5.3.1. Flow analysis of ABS/PP blends
Flow rheology analysis was carried out at the processing temperature, 2400C, at
a frequency of 1Hz. The viscosity was measured at low to moderate shear rates, which
simulate a range of processes. Low shear rates include compression molding and
calendaring, at moderate shear rates, extrusion.
PP has a relatively stable viscosity over a range of low shear rates, see Figure
5.5. The viscous stability of PP, which characterises Newtonian flow, is shown in section
5.3.3. The exception is the specimen of thermally recycled PP that was produced by
cutting larger injected molded sheets, rPP240_[IM]. The injection molding of the sheet
results in parallel linear molecular alignment compared to rotational flow of the
specimens produced on the small scale injection molder. The linear alignment opposes
the rotation of the rheometer, which causes the specimen’s anomaly at low shear rates.
The viscosity of the post consumer (ACT) recycled PP was slightly higher than
the thermally recycled materials. Whereas, the post consumer (ACT) recycled ABS had
a lower viscosity, see Figure 5.5. The variation between the thermal recycled and post
consumer sources of recycled material can be attributed to a number of factors
including, the grade of the original material, additives used to enhance the properties of
the material depending on the original application, previous processing conditions and
exposure factors during product use.

5-9
0.1000 1.000 10.00 100.0shear rate (1/s)
10.00
100.0
1000
10000
1.000E5
visc
osity
(Pa.
s)
rPPrPP240_[IM]rPP_ACT_2rPP_ACTrABSrABS_2rABS_ACT
Figure 5.5 Flow curves of uncontaminated recycled ABS and PP, 2400C
() thermally recycled PP, () thermally recycled PP _ samples cut from a larger
injection molded sheet, () post consumer recycled PP _ samples 2, () post consumer
recycled PP _ samples 1, () thermally recycled ABS _ sample 1, () thermally recycled
ABS _ sample 2, (∇ ) post consumer recycled ABS
Increasing the amount of ABS contamination in PP blends, increased the
viscosity, Figure 5.6 shows this trend for thermally recycled blends. Conversely,
increasing the level of PP contamination in ABS lowered the viscosity. Flow curves for
all ABS contaminated PP and the PP contaminated ABS blends studied can be found in
Appendix I – section 9.1.1.
High shear (as per injection molding) rheological data was difficult to obtain on a
rotational rheometer, as the material failed (Shah, V., 1998). The flow curves show
signs of sample failure at moderate shear rates ( 10s-1); where the viscosity values
deviate from a smooth flow curve, see Figure 5.5. In the following sections, dynamic
loading measurements have been used to model flow curves over an extended shear
range with Cox-Merz transformation.

5-10
0.1000 1.000 10.00 100.0shear rate (1/s)
1.000
10.00
100.0
1000
10000
1.000E5
visc
osity
(Pa.
s)
rPPrPPABS9010rPPABS8020rPPABS7030rABS
Figure 5.6 Flow curves of thermally recycled PP contaminated with ABS, 2400C
() uncontaminated PP, () 10% ABS, () 20% ABS, () 30% ABS, () uncontaminated
ABS

5-11
5.3.2. Linear Viscoelasticity of ABS/PP blends
Modelling the flow properties of a polymer requires dynamic loading experiments
within the materials linear viscoelastic region. Stress sweeps provided a viscoelastic
profile that was used to identify the linear region based on a constant storage and loss
modulus. The profiles were similar for all ABS contaminated PP and PP contaminated
ABS blends, below is a graph showing the profiles of a few select blends that represent
the extent of variation within the blends, see Figure 5.7. The linear region is in the stress
range of 1-1000Pa. For the purpose of dynamic loading experiments, 50Pa is clearly
within the region for all blends and an appropriate value to set as the controlled
parameter. Profiles of all the ABS/PP blends studies can be found in Appendix I –
section 9.1.2.
1.000 10.00 100.0 1000 10000osc. stress (Pa)
1000
10000
1.000E5
G' (
Pa)
rPPrPPABS9010rPPABS7030rABSPP7030rABSPP9010
Figure 5.7 Linear Viscoelasticity of thermally recycled blends, 2400C
() uncontaminated PP, () 10% ABS, () 30% ABS, () 30% PP, () 10% PP

5-12
5.3.3. Flow curve modelling
Flow curves were generated for all the ABS/PP blends from Cox-Merz
transformations of constant stress frequency sweeps, measured at 2400C. Figure 5.8a
has the dynamic curves of ABS contaminated with PP blends, and Figure 5.8b the
dynamic curves of PP contaminated with ABS blends.
1.000 10.00 100.0 1000ang. frequency (rad/s)
1000
10000
1.000E5
1.000E6
G' (
Pa)
rABSPP9010rABSPP8020rABSPP7030
Figure 5.8a Dynamic curves for ABS contaminated with PP, 2400C
() 10% PP, () 20% PP, () 30% PP

5-13
1.000 10.00 100.0 1000ang. frequency (rad/s)
100.0
1000
10000
1.000E5
G' (
Pa)
rPPABS7030rPPABS8020rPPABS9010rPP
Figure 5.8b Dynamic curves for PP contaminated with ABS, 2400C
() uncontaminated PP, () 10% ABS, () 20% ABS, () 30% ABS
At low to moderate shear rates, the measured flow curves, and hence viscosity,
match the modelled curve from the Cox Merz transformation, see Figure 5.9. However,
the sample begins to fail at moderate shear rates, shown as a deviation of the data from
the Cox-Merz relation.

5-14
0.1000 1.000 10.00 100.0 1000shear rate (1/s)
10.00
100.0
1000
10000
1.000E5
visc
osity
(Pa.
s)
rPP cmrPPrABS cmrABS
(cm denotes Cox-Merz transformation)
Figure 5.9 Comparison of Flow curves and Cox-Merz transformation of thermally
recycled polymers, 2400C
() uncontaminated PP, () uncontaminated ABS, Cox-Merz transform,
() uncontaminated PP, () uncontaminated ABS

5-15
At 2400C, the log viscosity of the ABS and blends of ABS contaminated with PP
decreased linearly with increasing log shear rates, see Figure 5.9 and 5.10. This trend
is shear thinning or pseudo plasticity. Whereas the viscosity of PP and blends of PP
contaminated with ABS approaches Newtonian flow at low shear rates and shear
thinning at high shear rates, see Figure 5.9 and 5.12. The rate index, n, of the power
law is an indication of the flow type, see Table 5.3a, b and 5.4a, b. •
= nkτ (5.4)
index
indexy consistenc
rate ==nk
The rate index, n, is used to describe the three basic types of flow,
n=1 Newtonian behaviour
n<1 shear thinning (or Pseudoplastic)
n>1 shear thickening
The power law constants vary within and between blends, where the addition of
ABS contamination to PP increased the viscosity and increased pseudo-plasticity. The
increase in pseudo-plasticity was most evident at low shears, which was shown by the
increased slope of the flow curve; see Figure 5.12 and the decreased rate index, see
Table 5.3b and 5.4b. At higher shear rates, the variation in the value of the rate index
between the blends becomes negligible. This was also observed from the power law fit,
in which the gradient of the slopes appear the same, see Figure 5.13.
On the other hand, PP contamination of ABS does not simply reduce the
viscosity and pseudo-plasticity, with increased level of contamination. The viscosity of
these blends appears to peak at low contaminant levels (10% PP), see Table 5.3a. This
indicates a strong interaction between the blended materials at this level, linked to the
size and size distribution of the PP in the ABS matrix. This is similar to the phenomena
described by Gupta et al (1990), which suggests that at low concentrations the size of
the dispersed phase is small, which is less deformable, hence producing a high melt
viscosity.

5-16
1.000 10.00 100.0 1000shear rate (1/s)
100.0
1000
10000
1.000E5
visc
osity
(Pa.
s)
rPP cmrPP_2 cmrABSPP7030 cmrABSPP7030_2 cmrABSPP8020 cmrABSPP8020_2 cmrABSPP9010 cmrABSPP9010_2 cm
Figure 5.10 Cox-Merz transformation of thermally recycled ABS contaminated with
PP, 2400C
() uncontaminated PP _ sample 1, () uncontaminated PP _ sample 2, (∇ ) 30% PP _
sample 1, () 30% PP _ sample 2, () 20% PP _ sample 1, () 20% PP _ sample 2,
() 10% PP _ sample 1, () 10% PP _ sample 2
1.000 10.00 100.0 1000shear rate (1/s)
100.0
1000
10000
1.000E5
1.000E6
shea
r stre
ss (P
a)
rPP cmrPP_2 cmrABSPP7030 cmrABSPP7030_2 cmrABSPP8020 cmrABSPP8020_2 cmrABSPP9010 cmrABSPP9010_2 cm
Figure 5.11 Power-law fits for Cox-Merz transformation of thermally recycled ABS
contaminated with PP, 2400C

5-17
1.000 10.00 100.0 1000shear rate (1/s)
100.0
1000
10000
visc
osity
(Pa.
s)
rPP cmrPP_2 cmrPPABS9010 cmrPPABS9010_2 cmrPPABS8020 cmrPPABS8020_2 cmrPPABS7030 cmrPPABS7030_2 cm
Figure 5.12 Cox-Merz transformation of thermally recycled PP contaminated with ABS,
2400C
() uncontaminated PP _ sample 1, () uncontaminated PP _ sample 2, () 10% ABS _
sample 1, () 10% ABS _ sample 2, () 20% ABS _ sample 1, () 20% ABS _ sample 2,
( ∇ ) 30% ABS _ sample 1, () 30% ABS _ sample 2
1.000 10.00 100.0 1000shear rate (1/s)
100.0
1000
10000
1.000E5
1.000E6
shea
r st
ress
(P
a)
rPP cmrPP_2 cmrPPABS9010 cmrPPABS9010_2 cmrPPABS8020 cmrPPABS8020_2 cmrPPABS7030 cmrPPABS7030_2 cm
Figure 5.13 Power-law fits for Cox-Merz transformation of thermally recycled PP
contaminated with ABS, 2400C

5-18
Table 5.3a: Power Law constants for thermally recycled ABS contaminated with PP
low shears high shears Contaminant level, v/v% Viscosity Rate Index Viscosity Rate Index
0 6660 0.469 6710 0.537 10 11300 0.504 11700 0.503 20 8460 0.520 8870 0.515 30 5850 0.556 6340 0.534
Table 5.3b: Power Law constants for thermally recycled PP contaminated with ABS
low shears high shears Contaminant level, v/v% Viscosity Rate Index Viscosity Rate Index
0 1290 0.847 2430 0.624 10 1760 0.808 2840 0.640 20 2280 0.765 3390 0.636 30 3000 0.688 3690 0.627
Table 5.4a: Power Law constants for post consumer recycled ABS contaminated with PP
low shears high shears Contaminant level, v/v% Viscosity Rate Index Viscosity Rate Index
0 6280 0.513 6260 0.547 10 3360 0.547 3200 0.583 20 3720 0.585 4190 0.565 30 3440 0.584 3760 0.578
Table 5.4b: Power Law constants for post consumer recycled PP contaminated with ABS
low shears high shears Contaminant level, v/v% Viscosity Rate Index Viscosity Rate Index
0 3200 0.760 4200 0.652 10 3970 0.689 5010 0.621 20 4790 0.606 5190 0.580 30 3780 0.616 4450 0.575

5-19
The Cox-Merz flow curves for the post consumer recycled materials follow that of
the thermally recycled material. Over the range of blends, the addition of PP decreased
the viscosity and increased the viscous stability, approaching Newtonian flow at low
shear rates see Tables 5.3b and 5.4b. Contamination increased the variability in the
results within the post consumer blends, moreover it cannot be definitively stated that a
blend with 10% PP is more or less viscous than 30% PP, see Table 5.4b. This is
because the unblended post consumer material was not initially homogeneous for two
factors (1) the additives used in the original application of the material and (2) the
different grades that made up the recycled material. In addition, the analysis
temperature may be a contributing factor to the variation between the different recycling
methods, due to variation within the unblended materials.
Flow curves and Cox-Merz transformations of all the ABS/PP blends studied can be
found in Appendix I – section 9.1.3.

6-1
6 MECHANICAL ANALYSIS OF CONTAMINATED PLASTICS
Acrylonitrile-butadiene-styrene, high impact polystyrene, polypropylene and
Nylon are widely used thermoplastics. ABS and HIPS are amorphous, whereas, PP and
Nylon are semi-crystalline polymers. ABS and PP were selected as the base materials
for blending with the other polymers. The minor component in the blends (0-30%)
represents a known level of contamination, corresponding to the extent of sorting during
the recycling process. Mechanical properties were measured as an indication of the
materials characteristic during use, which links the material to a suitable application.
6.1 Recycling Typical stress-strain curves of the individual polymers highlights the difference in
mechanical properties. The initial linear increase of stress with strain is the modulus.
After the linear section the curve peaks at the maximum stress, which is a quantitative
expression of the tensile strength of the material. Beyond the peak the properties of the
original material are no longer retained. The following information can be obtained from
Figure 6.1, comparing the curve of ABS and PP:
• ABS has a steeper linear slope, hence greater modulus
• ABS has a higher maximum stress, indicating greater strength
• ABS has a narrower peak, where the area under the peak is the ‘work to
maximum stress’
• ABS breaks soon after the peak of maximum stress, whereas PP breaks after
significant elongation, indicating that ABS is brittle in comparison
The effect of thermal and post consumer (ACT) recycling on the tensile and
flexural properties of the individual thermoplastics appeared to be negligible. Thermal
recycling only had a minor effect on the impact strength of the individual polymers. At
most, recycling ABS resulted in a 6% reduction in impact strength; see Table 6.1a, b, c.
The extent of the effect that recycling has on the post consumer materials was
impossible to assess because the properties of the original material are unknown.
However, post consumer PP had considerably higher impact strength than the thermally
recycled material, which indicates the presence of impact modifiers.

6-2
During impact testing, a number of samples of recycled PP broke differently to the
other materials tested, complete break as opposed to partial break. Different break
types made it difficult to compare the methods of recycling and the effect of
contamination on the impact strength, as stated by the standard ASTM D 256-00.
Figure 6.1 Typical stress strain curve
Table 6.1a: Tensile strength (Fmax), MPa
Virgin Thermal Recycling
Post Consumer Recycling
PP 19.3 19.4 17.3 ABS 43.8 42.5 41.1
Table 6.1b: Flexural strength (Fmax), MPa
Virgin Thermal Recycling
Post Consumer Recycling
PP 28.8 30.7 27.1 ABS 74.9 75.7 63.7
Table 6.1c: Impact strength, kJm-2
Virgin Thermal Recycling
Post Consumer Recycling
PP 13.3 13.5 24.6 ABS 22.2 20.9 26.8
ABS
PP
Strain %
break
break
Fmax
Fmax
E
Stress

6-3
6.2 Contaminated Plastics
6.2.1. Contaminated ABS blends
The effect of contamination on the mechanical properties varied depending on
the interaction between the contaminant and ABS. Tensile and flexural properties of the
ABS were reduced by contamination with HIPS and PP. For example, an addition of
30% volume of HIPS reduced both the tensile and flexural strength by 20%, see Table
6.2. Likewise, 30% PP contamination reduced the tensile and flexural strength by
almost 40%, see Table 6.3a.
The properties of the HIPS contaminated blends were intermediate between
those of the individual components, such that they would lie on a line that connected the
properties of the pure components. In this case, a 10% incremental increase in the
amount of HIPS corresponds to a 10% reduction of the tensile and flexural strength
relative to the properties of the individual materials. Therefore, this mixture follows
closely to the rules of mixtures, which indicates that the HIPS and ABS are somewhat
compatible. A linear line of best fit relates the properties with the level of contamination
for the measured range, see Figure 6.2. This can be used to predict the tensile and
flexural properties of a material based on the contaminant level, see Table 6.5a for the
predictive model constants of the lines of best fit for all contaminated ABS blends.
In contrast, the properties of the PP contaminated ABS blends were lower than
expected based on the level of contaminant and the properties of the individual
components. In this case, the majority of points measured for the various blends would
lie below a linear line that connected the two unblended materials, such that
contamination causes a negative deviation from the rule of mixtures. This indicates that
these ABS and PP are incompatible. The tensile strength of the 30% contaminated
blend is equivalent to 60% or double the actual contamination by following the rule of
mixtures, see Table 6.3a. The reduction in mechanical properties with contaminant level
was less pronounced for post consumer PP contaminated ABS. This was obvious in the
constants for predictive modelling, where the rate of change of the mechanical
properties for post consumer blends was close to half that of the thermally recycled
blends, see Figure 6.4 and Table 6.5a. In fact, the reduction in mechanical properties of
post consumer blends follows closely to the rule of mixtures, suggesting favourable
interactions within the polymer blend. This can be accounted for by the presence of

6-4
additives, which enhance the properties of the individual polymers, as well as the
immiscible polymer blend.
Different break types in impact testing made it difficult to compare the impact
strength of the different recycling methods. The thermally recycled PP contaminated
ABS blends partially broke and the post consumer recycled material broke completely.
However, the fact that the majority of post consumer recycled blends broke completely
indicates qualitatively that this material was somewhat more brittle. Gupta et al. (1990b)
investigated the morphology of an ABS/PP blend and stated that phase separation
occurs. Phase segregation tends to occur in the molding process causing weakening of
the internal structure (Lindsey et al., 1981). Markin and Williams, Gupta et al. (1989b)
and Lindsey et al. (1981) suggest that the less ductile material, predominantly ABS,
formed a skin around the bar. The PP rich core has various sized ABS droplets
dispersed throughout, the number, shape and size distribution varying with ABS content,
(Gupta et al., 1989a). The core is a large part of the fracture surface and the absence of
ABS will significantly reduce the impact strength. Contamination significantly reduced
the impact strength of the material, regardless of the whether the material was
amorphous (HIPS), see Figure 6.3, or semi-crystalline (PP), see Figure 6.5.
Nylon has a greater tensile strength than ABS; however, the contamination of
ABS for all levels of nylon contamination only increased the tensile strength by 3%,
which is equivalent to only 10% contamination see Figure 6.6 and Table 6.4. On the
other hand, the flexural strength of nylon is less than ABS. Although, the flexural
strength was reduced by only 6% for all levels of nylon contamination, the reduction of
flexural strength is equivalent to pure Nylon. Whether the ABS was contaminated by 5%
or 20% nylon, the change in the tensile and flexural properties of the blends relative to
ABS was the same. In both cases, the negative deviation from the rule of mixtures
indicated that ABS and nylon are not compatible even though nylon contamination
improves tensile strength. Incompatibility of nylon in ABS was further highlighted in the
impact strength. The addition of only 5% Nylon halved the impact strength of the
material, see Figure 6.7.

6-5
Figure 6.2 Tensile and Flexural strength of recycled ABS contaminated with HIPS
Figure 6.3 Impact strength of recycled ABS contaminated with HIPS

6-6
Table 6.2: Mechanical Properties of ABS contaminated with HIPS
Contaminant level, v/v% 0 10 20 30 100 Tensile strength, MPa 42.5 38.7 36.4 34.0 22.6 % change -9 -14 -20 -47 Rule of Mixtures equivalent contamination 0 19 31 43 100 Flexural strength, MPa 75.7 69.0 66.6 63.4 45.5 % change -9 -12 -16 -40 Rule of Mixtures equivalent contamination 0 22 30 41 100 Impact strength, kJ/m2 20.9 10.4 7.40 6.07 8.98 % change -50 -65 -71 -57
Table 6.3a: Mechanical Properties of thermally recycled ABS contaminated with PP
Contaminant level, v/v% 0 10 20 30 100 Tensile strength, MPa 42.5 38.6 31.7 28.3 19.4 % change -9 -25 -33 -54 Rule of Mixtures equivalent contamination 0 17 47 62 100 Flexural strength, MPa 75.7 64.8 54.7 47.5 30.7 % change -14 -28 -37 -59 Rule of Mixtures equivalent contamination 0 24 47 63 100 Impact strength, kJ/m2 20.9 11.4 5.65 3.52 n/a % change -45 -73 -83
Table 6.3b: Mechanical properties of post consumer recycled ABS contaminated with PP
Contaminant level, v/v% 0 10 20 30 100 Tensile strength, MPa 42.0 41.9 36.2 32.7 17.3 % change 0 -14 -22 -59 Rule of Mixtures equivalent contamination 0 0 24 38 100 Flexural strength, MPa 67.4 63.8 57.5 51.5 25.7 % change -5 -15 -24 -62 Rule of Mixtures equivalent contamination 0 9 24 38 100 Impact strength*, kJ/m2 2.08 2.04 0.91 0.87 n/a % change -2 -56 -58
*Complete Break
See figures in Appendix I – section 9.2.1. for flexural strength curves of ABS
contaminated with PP.

6-7
Figure 6.4 Tensile strength of recycled ABS contaminated with PP
Figure 6.5 Impact strength of recycled ABS contaminated with PP

6-8
Table 6.4: Mechanical Properties of ABS contaminated with Nylon
Contaminant level, v/v% 0 5 10 20 100 Tensile strength, MPa 42.5 43.8 43.8 43.7 52.4 % change 3.0 3.1 2.9 23 Flexural strength, MPa 75.7 71.0 70.5 69.9 71.7 % change -6.2 -6.9 -7.7 -5.3 Impact strength, kJ/m2 20.9 8.06 2.12 1.07 n/a % change -61 -90 -95
Figure 6.6 Tensile and Flexural strength of recycled ABS contaminated with Nylon

6-9
Figure 6.7 Impact strength of recycled ABS contaminated with Nylon
polymer ateduncontamin of strength30)0(0 tcontaminan of fraction
constant strength
strength Flexural and Tensile for Model Linear
=≤≤=
=+=
0max
max
0maxmaxmax
.σ
ϕϕ
σϕσ
σ
σ
KK
Table 6.5a Predictive model constants for Tensile and Flexural Strength of contaminated ABS blends
Tensile strength, MPa Flexural strength, MPa
Contaminant Recycle Type Kmax max0 Kmax max0 HIPS Thermal -28 42 -39 75 PP Thermal -50 43 -95 75 PP Post Consumer -34 43 -54 68

6-10
polymer ateduncontamin of strength30)0(0 tcontaminan of fraction
constant strength
strength Impact for Model lExponentia
=≤≤=
==
0max
max
0maxmax
.
max
F
KeFF
F
KF
ϕϕ
ϕ
Table 6.5b Predictive model constants for Impact strength of contaminated ABS blends
Contaminant Recycle Type KFmax Fmax0 HIPS Thermal -4.55 20.5 PP Thermal -6.04 20.5 PP Post Consumer -3.41 2.26 Nylon Thermal -16.5 20.5
6.2.2. Contaminated PP blends
Contamination by the amorphous polymers, ABS and HIPS, enhanced the tensile
and flexural properties of PP, as both contaminants have superior mechanical
properties. For instance, 20% contamination of either polymer increases the tensile
strength by approximately 10%, see Table 6.6 and 6.7a. The relationship between the
proportion of ABS and the mechanical properties was linear, see Table 6.9a for the
predictive model constants. However, these blends did not obey the rule of mixtures,
such that although the incremental increase in strength was constant, it was less than
what would be expected for a specific level of contamination, see Table 6.7a. For
example, the change in tensile strength resulting from 20% ABS contamination was
equivalent to 10% contamination for additive behaviour. Unlike ABS, there was no
relationship between tensile or flexural strength and HIPS contaminant level, see Figure
6.8. Regardless of the contamination level, PP/HIPS blends had a tensile strength close
to the measured value of uncontaminated HIPS, approximately 15% higher than the
tensile strength for uncontaminated PP, see Table 6.6. Conversely, HIPS contamination
had a negligible effect on the flexural properties, yet the flexural strength of
uncontaminated HIPS was 50% greater, see Table 6.6.

6-11
Blending with an incompatible polymer weakens the internal structure, which is
prone to impact testing. In this instance, the impact strength of the blends was lower
than the PP, even when the contaminant (ABS) had greater impact strength, see Table
6.7a. 20% contamination of ABS and HIPS resulted in 75% and 85% reduction in
impact strength, respectively. The predictive model constants imply that HIPS
contamination had a greater effect on impact strength, whereby the exponential constant
of the HIPS model was 7.4s-1 compared to ABS, 5.7s-1. ABS and HIPS contaminated
blends partially broke, which was mainly associated with phase segregation and the
tough outer layer.
The different recycling methods were quantitatively assessed for the PP
contaminated with ABS blends. Contamination of the post consumer material caused a
greater reduction in the impact strength, where the exponential time constant of post
consumer blends was 10.1s-1, compared to the thermally recycled blends 5.7s-1. For
instance, the addition of 20% ABS reduced the impact strength of post consumer (ACT)
and thermally recycled material by 90 and 75%, respectively, see Table 6.3a, b and
Figure 6.5.
The addition of Nylon had a negligible effect on the tensile and flexural strength
of PP, see Figure 6.12. The effect of contamination on impact strength was difficult to
compare to PP based materials contaminated with the amorphous polymers. This was
attributed to the different break types between the blends. However, contamination did
reduce the impact strength as contaminant level increased, see Figure 6.13. Nylon
blends broke completely on impact; halving the impact strength with only 10%
contamination, see Table 6.8. See Table 6.9b for the predictive model constants of the
lines of best fit for all contaminated PP blends.

6-12
Figure 6.8 Tensile and Flexural strength of recycled PP contaminated with HIPS
Figure 6.9 Impact strength of recycled PP contaminated with HIPS

6-13
Table 6.6: Mechanical Properties of PP contaminated with HIPS
Contaminant level, v/v% 0 10 20 30 100 Tensile strength, MPa 19.4 21.1 21.2 21.4 22.6 % change 9 9 10 16 Rule of Mixtures equivalent contamination 0 54 58 62 100 Flexural strength, MPa 30.7 28.7 30.5 31.7 45.5 % change -6 -1 3 48 Rule of Mixtures equivalent contamination 0 -13 -1 7 100 Impact strength, kJ/m2 13.5 5.2 2.22 1.88 8.98 % change -61 -84 -86 -33
Figure 6.10 Tensile strength of recycled PP contaminated with ABS

6-14
Figure 6.11 Impact strength of recycled PP contaminated with ABS
Table 6.7a: Mechanical Properties of thermally recycled PP contaminated with ABS
Contaminant level, v/v% 0 10 20 30 100 Tensile strength, MPa 19.4 20.8 21.5 23.0 42.5 % change 7 11 19 119 Rule of Mixtures equivalent contamination 0 6 9 16 100 Flexural strength, MPa 30.7 33.6 35.2 37.7 75.7 % change 10 15 23 147 Rule of Mixtures equivalent contamination 0 7 10 16 100 Impact strength, kJ/m2 13.5 5.98 3.36 3.04 20.9 % change -56 -75 -77 55
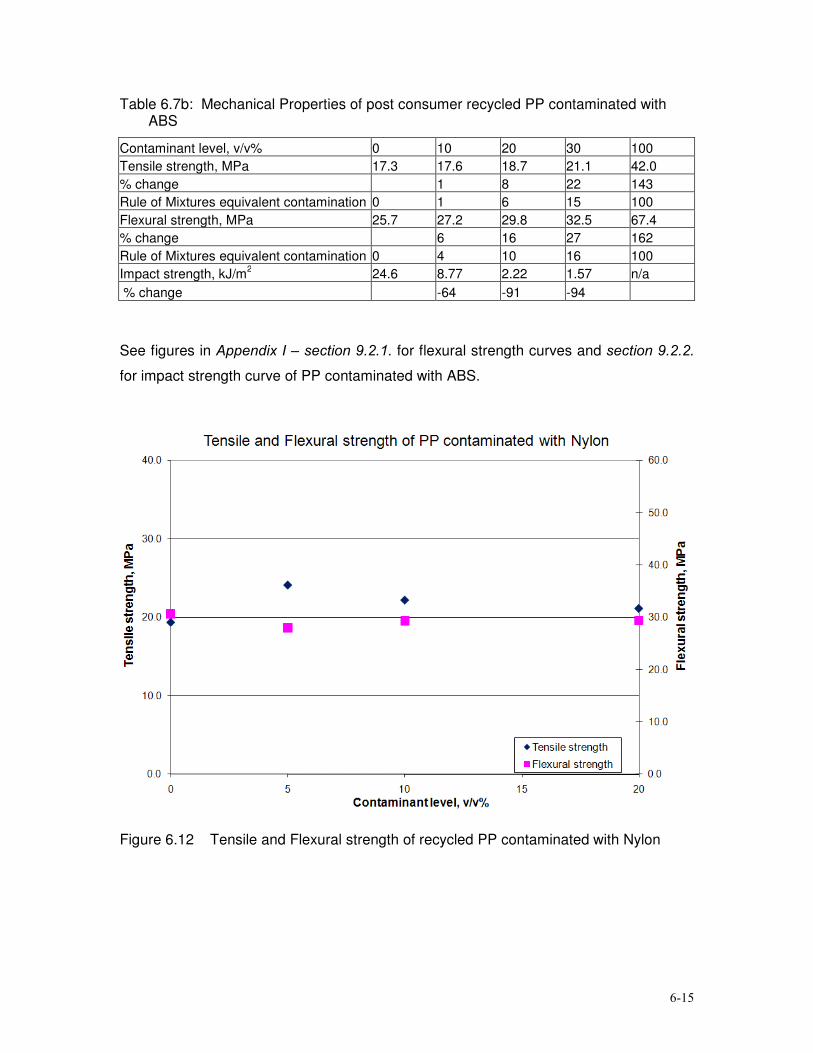
6-15
Table 6.7b: Mechanical Properties of post consumer recycled PP contaminated with ABS
Contaminant level, v/v% 0 10 20 30 100 Tensile strength, MPa 17.3 17.6 18.7 21.1 42.0 % change 1 8 22 143 Rule of Mixtures equivalent contamination 0 1 6 15 100 Flexural strength, MPa 25.7 27.2 29.8 32.5 67.4 % change 6 16 27 162 Rule of Mixtures equivalent contamination 0 4 10 16 100 Impact strength, kJ/m2 24.6 8.77 2.22 1.57 n/a % change -64 -91 -94
See figures in Appendix I – section 9.2.1. for flexural strength curves and section 9.2.2.
for impact strength curve of PP contaminated with ABS.
Figure 6.12 Tensile and Flexural strength of recycled PP contaminated with Nylon

6-16
Figure 6.13 Impact strength of recycled PP contaminated with Nylon
Table 6.8: Mechanical Properties of PP contaminated with Nylon
Contaminant level, v/v% 0 5 10 20 100 Tensile strength, MPa 19.4 24.2 22.2 21.2 52.4 % change 25 15 9 170 Rule of Mixtures equivalent contamination 0 15 9 5 100 Flexural strength, MPa 30.7 28.0 29.3 29.4 71.7 % change -9 -4 -4 134 Rule of Mixtures equivalent contamination 0 -6 -3 -3 100 Impact strength, kJ/m2 13.5 11.4 7.60 5.71 5.45 % change -16 -44 -58 -60

6-17
Table 6.9a Predictive model constants for Tensile and Flexural strength of contaminated PP blends
Tensile strength, MPa Flexural strength, MPa
Contaminant Recycle Type Kmax max0 Kmax max0 ABS Thermal 11 19 23 31 ABS Post Consumer 12 17 23 25
Table 6.9b Predictive model constants for Impact strength of contaminated PP blends
Contaminant Recycle Type KFmax Fmax0 HIPS Thermal -7.42 13.3 ABS Thermal -5.70 13.3 ABS Post Consumer -10.1 24.6 Nylon Thermal -4.45 13.3

6-18
6.3 Verification of Modulus through DMA measurements Dynamic Mechanical Analysis is a simple method for calculating the components
of the complex modulus. The storage (dynamic) modulus, G’, is the real part of the
complex modulus, G*, which is represented as a complex function under sinusoidal
conditions.
iG" + G' = *G (6.1)
The storage modulus of the initial elastic region corresponds to Young’s
modulus, E. This was measured with increasing temperature.
The storage modulus of amorphous polymer, ABS, measured at room
temperature was 2000MPa. The modulus remained relatively constant until the onset of
glass transition at approximately 1000C, see Figure 6.14. On the other hand, the storage
modulus for PP decreased with increasing temperature from the initial value at room
temperature, 820MPa, see Figure 6.15.
For the majority of the polymers and polymer blends at approximately room
temperature, the storage modulus coincided well with Young’s modulus measured using
simple tensile measurements, with a maximum variance of approximately 10%, see
Table 6.10. Contamination reduced the modulus of ABS regardless of the contaminant.
The modulus for thermally recycled ABS contaminated with PP blends changes linearly
with the relative amount of contaminant polymer in the blend, following the rule of
mixtures. For instance, the addition of 10% PP in ABS, results in approximately 10%
decreases in the modulus, see Figure 6.16. At higher temperatures it appears that the
storage modulus between the blends of different contamination levels converge at the
glass transition, such that the addition of 10% PP in ABS, resulted in a less than 10%
decreases in the modulus, see Figure 6.14.
Table 6.10: Modulus for uncontaminated thermally recycled polymers, MPa
ABS PP HIPS Nylon Simple Tensile 2235 735 2060 1955 DMA 2000 820 1885 1500

6-19
11
11
11
1
1
1
1
1
1
1
1 1 1 1
22
22
22
2
2
2
2
2
2
2 2 2 2
33
3
3
33
3
3
3
3
3
3
3 3 3 30
500
1000
1500
2000
2500S
tora
ge M
odul
us (M
Pa)
30 50 70 90 110 130 150
Temperature (°C)
1 rABS–––––––2 rABS:rPP_90:10–––––––3 rABS:rPP_80:20–––––––
Universal V4.3A TA Instruments
Figure 6.14 Storage Modulus of ABS contaminated with PP
1
1
1
1
1
1
11
11
11
1 1
2
2
2
2
2
2
2
2
2
2
22
22
3
3
3
3
3
3
3
3
3
3
33
33
0
200
400
600
800
1000
1200
Sto
rage
Mod
ulus
(M
Pa)
30 50 70 90 110 130 150
Temperature (°C)
1 rPP–––––––2 rPP:rABS_90:10–––––––3 rPP:rABS_80:20–––––––
Universal V4.3A TA Instruments
Figure 6.15 Storage Modulus of PP contaminated with ABS
1 rABS
2 rABSPP_90/10
3 rABSPP_80/20
1
2
3
1
2
3
1 rPP
2 rPPABS_90/10
3 rPPABS_80/20

6-20
Table 6.11a: Modulus of thermally recycled ABS contaminated with PP, MPa
Contaminant level, v/v% 0 10 20 30 Simple Tensile 2236 1986 1791 1649 DMA 2000 1911 1841 na % difference -12 -4 3
Table 6.11b: Modulus of thermally recycled PP contaminated with ABS, MPa
Contaminant level, v/v% 0 10 20 30 Simple Tensile 736 904 1003 1174 DMA 818 976 1005 1115 % difference 10 7 0 -5
Figure 6.16 Modulus of thermally recycled ABS contaminated with PP

6-21
The modulus of post consumer recycled ABS contaminated with PP blends
followed closely to the rule of mixtures, with a similar trend for both methods of analysis.
However, the modulus measured by the simple tensile test was 10% greater than that
measured across the blends using DMA, see Figure 6.17. This was also observed for
thermally recycled HIPS and nylon contaminated ABS, such that the value of the
modulus varies between the methods of analysis while the change of modulus with
proportion of contamination follows the same trend, see Figure 6.18 and 6.19. For HIPS
contaminated ABS, the modulus of ABS was not effected with up to 30% HIPS.
Nylon contamination reduced the modulus of ABS to some extent, whereby the addition
of 20% nylon causes a reduction of less than 10%.
PP modulus was elevated by the presence of the contaminants, ABS, nylon and
HIPS. The modulus measured by DMA increased close to the rule of mixtures. A
contamination level of 20% of HIPS, ABS or nylon resulted in approximately 20%
increase in modulus; see Figure 6.20, 6.22 and 6.23. Similar to ABS contaminated with
PP, the modulus of post consumer PP contaminated with ABS blends measured by
simple tensile testing was 10% greater than that measured by DMA, see Figure 6.21.
Figure 6.17 Modulus of post consumer recycled ABS contaminated with PP

6-22
Figure 6.18 Modulus of thermally recycled ABS contaminated with HIPS
Figure 6.19 Modulus of thermally recycled ABS contaminated with Nylon

6-23
Table 6.12: Model constants for Modulus of contaminated ABS blends
DMA Simple Tensile
Contaminant Recycle Type KE E KE E PP Thermal -793 1997 -1960 2209 PP Post Consumer -829 2050 -785 2510 HIPS Thermal 0 2000 0 2236 Nylon Thermal -730 2007 -350 2296
Figure 6.20 Modulus of thermally recycled PP contaminated with ABS
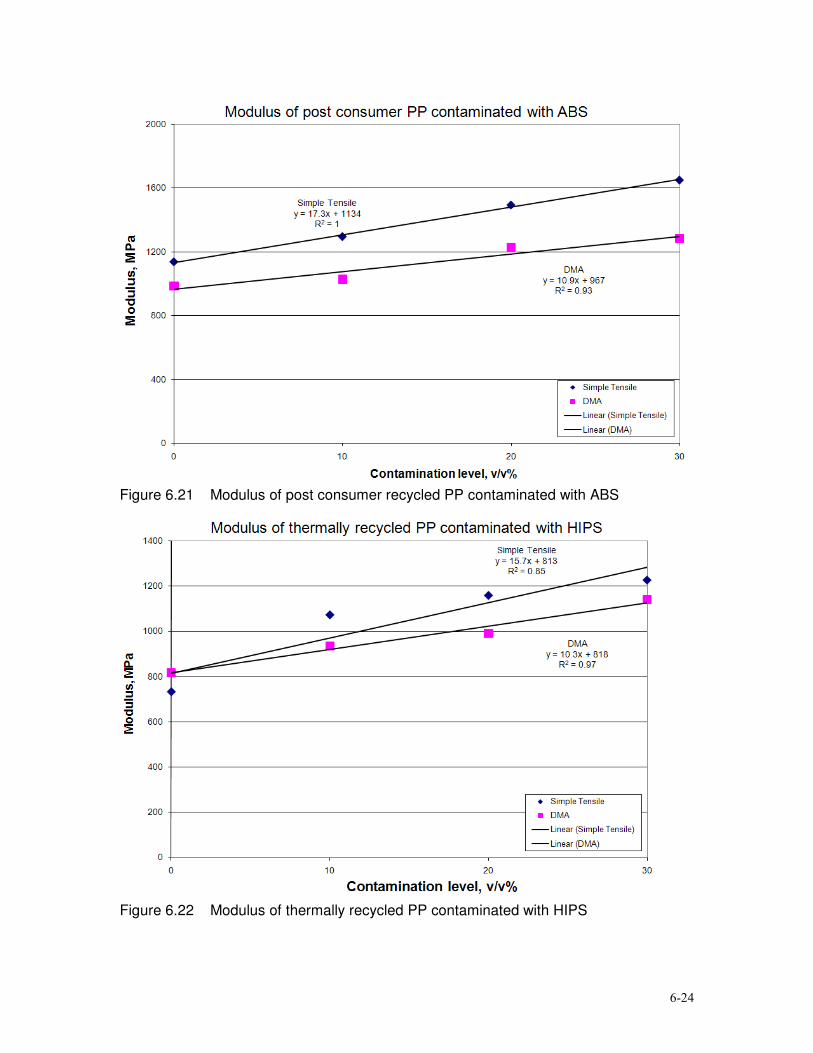
6-24
Figure 6.21 Modulus of post consumer recycled PP contaminated with ABS
Figure 6.22 Modulus of thermally recycled PP contaminated with HIPS

6-25
Figure 6.23 Modulus of thermally recycled PP contaminated with Nylon
Table 6.13: Model constants for Modulus of contaminated PP blends
DMA Simple Tensile
Contaminant Recycle Type KE E KE E ABS Thermal 922 840 1410 742 ABS Post Consumer 1090 967 1730 1134 HIPS Thermal 1030 818 1570 813 Nylon Thermal 766 840 - -

6-26
6.4 Dynamic Mechanical Analysis
In this section, DMA was used to extend the frequency range and hence, time
range of the material under load, generating a master curve. Time temperature
superposition converts small range frequency sweeps to extended time scales. This is
achieved by correlating changes in the mechanical properties with temperature to
changes with time. The Williams-Landel-Ferry (WLF) equation was used to describe
time-temperature behaviour near the glass transition region. The master curve steps
through the glass transition, which is at the maximum slope of storage modulus, G’. At
the reference temperature, CT 00 105= , the amorphous polymers, ABS and HIPS, have
a step transition at 1 and 10rad/s, respectively, see Figure 6.29. Whereas, the semi-
crystalline materials do not have a transition under these conditions and the storage
modulus remains relatively constant over time, see Figure 6.27 and 6.31 (noting that PP
has a sub zero glass transition). Therefore, only contaminated thermally recycled ABS
blends were analysed using this method due to the practical limitations of measurements
in the glass transition region of PP.
6.4.1. ABS contaminated with PP
Figure 6.24 shows the short term measured data compared to the master curve
generated at 0T for a blend of ABS contaminated with 10% PP. Time is the inverse of
frequency, hence, the storage modulus decreased with increasing time. Similarly, the
storage modulus decreased with increasing temperature at the glass transition region.

6-27
1.000E-4 0.01000 1.000 100.0 10000 1.000E6 1.000E8ang. frequency (rad/s)
1.000E6
1.000E7
1.000E8
1.000E9
1.000E10
G' (
Pa)
rABSrPP9010, 85.0rABSrPP9010, 95.0rABSrPP9010, 105.0rABSrPP9010, 115.0rABSrPP9010, 125.0rABSrPP9010, 105 0 tts
Figure 6.24 Measured data and the master curve for ABS contaminated with 10 % PP
(tts denotes time temperature superposition of the master curve)
() 850C, () 950C, () 1050C, () 1150C, (∇ ) 1250C, (×) Master curve at 1050C
For ABS contaminated with PP blends, the slope of the transition step decreased
as the level of PP increased to a point where the transition step of the PP dominant
blends was not clearly defined, see Figure 6.25 and 6.27. Initially, PP contamination
caused a reduction in storage modulus. However, in the long term, PP contamination
suppressed the reduction of the modulus at the transition, shown by the divergence of
storage modulus between the blends with different contaminant level, see Figure 6.25.
For instance, at a time after the transition the modulus of ABS contaminated with 30%
PP was almost an order of magnitude greater than 10% contamination. In contrast, the
storage modulus of PP contaminated with ABS blends converged as time increased,
such that in the long term, modulus was not affected by the amount of contamination,
see Figure 6.27.

6-28
1.000E-4 0.01000 1.000 100.0 10000 1.000E6 1.000E8ang. frequency (rad/s)
1.000E6
1.000E7
1.000E8
1.000E9
1.000E10
G' (
Pa)
rABSrABSrPP9010rABSrPP8020rABSrPP7030
Figure 6.25 Master curves for ABS contaminated with PP at 1050C
() uncontaminated ABS, () 10% PP, () 20% PP, () 30% PP
Figure 6.26 Shift Factors for ABS contaminated with PP

6-29
Table 6.14: WLF constants for ABS contaminated with PP
Contaminant level, v/v% 0 10 20 30 C1 23 18 20 23 C2 108 89 102 118
The constants for the WLF equation, C1 and C2, are similar for all the blends of
ABS contaminated with PP, see Table 6.14, derived from WLF curve fits of Figure 6.26.
When the transition is clearly defined, as for ABS dominant blends, C2 is an indication of
the transition temperature. This is contrasted by PP, nylon and blends of PP
contaminated with ABS, where the transitions weren’t defined and the constants, C1, C2,
vary significantly with contamination level, see Table 6.15.
1.000E-4 0.01000 0.1000 1.000 10.00 100.0 1000 10000 1.000E5 1.000E7ang. f requency (rad/s)
1.000E7
1.000E8
1.000E9
G' (
Pa)
rPPrABS9010rPPrABS8020rPPrABS7030
Figure 6.27 Master curves for PP contaminated with ABS at 1050C
() 10% ABS, () 20% ABS, () 30% ABS

6-30
Figure 6.28 Shift Factors for PP contaminated with ABS
Table 6.15: WLF constants for PP contaminated with ABS
Contaminant level, v/v% 10 20 30 C1 7.2E+07 182 74 C2 5.7E+08 1071 411

6-31
6.4.2. ABS contaminated with HIPS
HIPS contamination of ABS did not appear to impact on the storage modulus
over the extended time range despite the fact that that the storage modulus of HIPS was
less that ABS, see Figure 6.29. Figure 6.30 shows that the WLF curve fits of the shift
factors for each blend lie on the same curve. Hence, the constants of the WLF equation,
C1 and C2, were the same for all three levels of contamination, 17 and 83K, respectively,
see Table 6.16. Uncontaminated ABS is the curve shown on Figure 6.30 close to the
trend for the blends, but only with data values up to 1150C. This curve is steeper than
the ABS contaminated with HIPS blends, thus higher value WLF constants. HIPS, on
the other hand, has a flatter curve, and consequently lower value constants.
1.000E-4 0.01000 1.000 100.0 10000 1.000E6 1.000E8ang. f requency (rad/s)
1.000E5
1.000E6
1.000E7
1.000E8
1.000E9
1.000E10
G' (
Pa)
rABSrABSrHIPS9010rABSrHIPS8020rABSrHIPS7030rHIPS
Figure 6.29 Master curves for ABS contaminated with HIPS at 1050C
() uncontaminated ABS, () 10% HIPS, () 20% HIPS, () 30% HIPS,
() uncontaminated HIPS

6-32
Figure 6.30 Shift Factors for ABS contaminated with HIPS
Table 6.16: WLF constants for ABS contaminated with HIPS
Contaminant level, v/v% 0 10 20 30 100 C1 23 17 16 17 12 C2 108 83 82 85 73
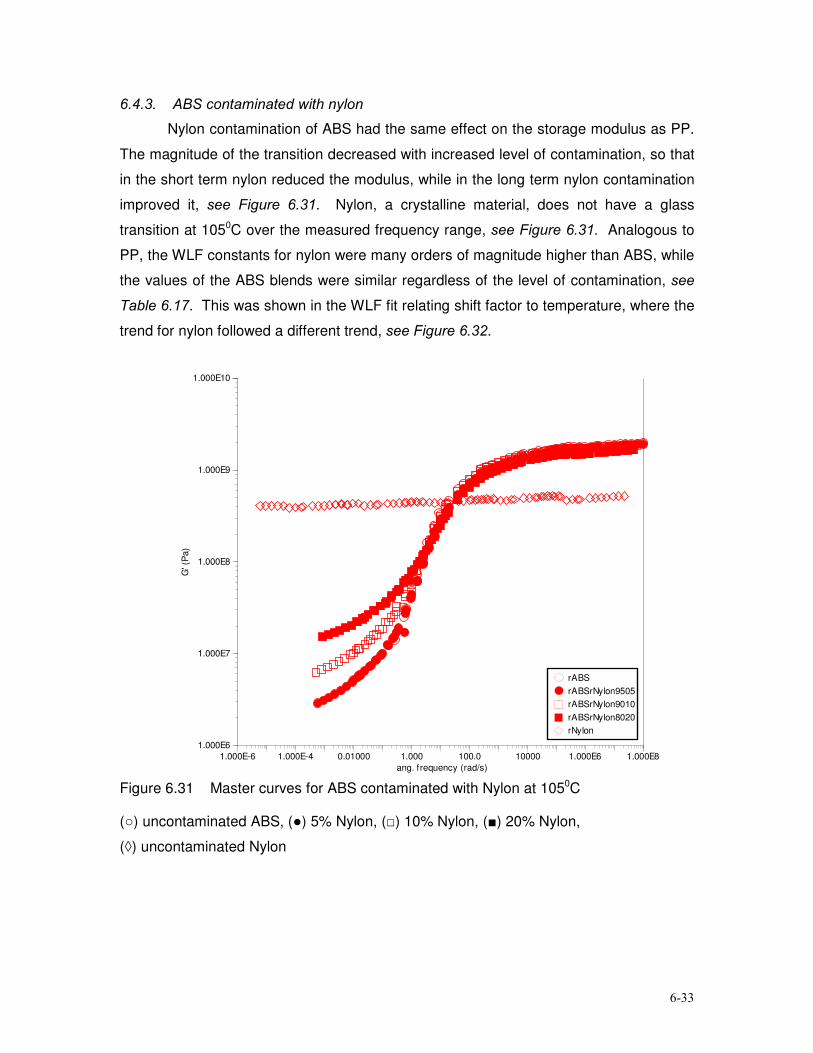
6-33
6.4.3. ABS contaminated with nylon
Nylon contamination of ABS had the same effect on the storage modulus as PP.
The magnitude of the transition decreased with increased level of contamination, so that
in the short term nylon reduced the modulus, while in the long term nylon contamination
improved it, see Figure 6.31. Nylon, a crystalline material, does not have a glass
transition at 1050C over the measured frequency range, see Figure 6.31. Analogous to
PP, the WLF constants for nylon were many orders of magnitude higher than ABS, while
the values of the ABS blends were similar regardless of the level of contamination, see
Table 6.17. This was shown in the WLF fit relating shift factor to temperature, where the
trend for nylon followed a different trend, see Figure 6.32.
1.000E-6 1.000E-4 0.01000 1.000 100.0 10000 1.000E6 1.000E8ang. frequency (rad/s)
1.000E6
1.000E7
1.000E8
1.000E9
1.000E10
G' (
Pa)
rABSrABSrNylon9505rABSrNylon9010rABSrNylon8020rNylon
Figure 6.31 Master curves for ABS contaminated with Nylon at 1050C
() uncontaminated ABS, () 5% Nylon, () 10% Nylon, () 20% Nylon,
() uncontaminated Nylon

6-34
Figure 6.32 Shift Factors for ABS contaminated with Nylon
Table 6.17: WLF constants for ABS contaminated with Nylon
Contaminant level, v/v% 0 5 10 20 100 C1 23 16 17 15 2.2E+07 C2 108 80 89 79 9.1E+07
See tables in Appendix I – section 9.2.3. for shift factors, tA , of each of the blends
analysed by DMA.

7-1
7 CONCLUSIONS
Binary blends of thermally recycled plastics were prepared to investigate the
effect of contamination on an amorphous polymer, ABS, and semi-crystalline polymer,
PP. The effect of contamination is partly dependent on the compatibility of the blended
materials and partly on the properties of the contaminant relative to the other material. A
contaminant that has lower properties will typically lower the property of that material
that it is added to. If the property of the material changes relative to the amount of
contaminant added, it follows the rules of mixtures and the mixture is considered
compatible.
Post consumer ABS/PP blends were prepared to compare against thermally
recycled blends. Minor variations and similar property trends between the recycling
methods are evidence of differences in the lifecycle and not attributed by contamination.
However, it is difficult to compare the two different recycling methods because the initial
virgin materials could have had substantially different properties resulting from different
manufacturing techniques and the use of additives to enhance the properties of the
material for its original use. Additionally, variation in exposure during a products lifecycle
will affect the extent of degradation of various properties.
7.1 Statistical analysis of Mechanical Properties
The mechanical properties of the recycled ABS and PP were normally
distributed, which was the basis for assuming that the population of these plastics
contaminated with small amounts (0-30%) of another plastic was normally distributed.
Statistical analysis indicated that to achieve a 95% confidence interval a minimum of 5
samples was required for tensile and flexural tests, and 8 for impact strength. The larger
sample size required for impact testing can be attributed to the significant variation of
impact strength in testing the material. There were a number of factors that may
account for this higher variance; predominantly the fact that the impact surface is
relatively small and any variation in the structure will affect the strength. Contamination
introduced a material into the structure, potentially an incompatible material which
results in an un-homogenous blend. This has the greatest, yet inconsistent, effect on
impact strength.

7-2
Statistical analysis of the various blends corroborated the initially stated sample
requirements determined from the ABS and PP.
7.2 Thermal Properties
The two amorphous polymers have a glass transition temperature in the
measureable range, while this transition is not a characteristic of crystalline material and
the semi crystalline PP has a sub zero Tg. Furthermore, the degradation temperature of
the amorphous polymers was greater than the crystalline polymers, which means that
higher temperatures can be applied to the amorphous materials. Recycling the
individual amorphous polymers, ABS and HIPS, did not significantly affected these
thermal properties. Whereas, the degradation temperature of the crystalline polymers,
particularly PP, was lowered, this limits the process temperature.
Contamination of ABS with semi-crystalline polymers lowered the degradation
temperature, while the degradation temperature of PP increased with the presence of
amorphous contaminants. This was expected due to the relative difference in
degradation temperature between the amorphous and semicrystalline/crystalline
polymers. The effect of contamination on the glass transition region for thermally
recycled material was negligible. In contrast, the glass transition temperature of post
consumer ABS increased with the addition of PP, possibly a result of the presence of
additives used for the purpose of the original material.
7.3 Processability
ABS contaminated with the semi-crystalline and crystalline polymers, PP and
Nylon respectively, was difficult to handle at room temperature during processing. This
was because the blending of the incompatible materials significantly lowered mechanical
properties at room temperature, and the material became brittle. In fact, solely based on
the difficulties during processing, both ABS and PP were incompatible with nylon.
Melt flow rate is a measure of the flowability of a material. Furthermore, the
rheological analysis highlights the effect of shear in relation to material flowability,
measured by viscosity as a function of shear rate. Shear induced on a material varies
between processes. For example, compression molding (low), extrusion (moderate) and
injection molding (high) operate at different shear rates.

7-3
Thermally recycled ABS was highly viscous and had a low flowability at the
processing temperature of 2400C. Qualitatively, by comparison of flow curves, PP was
less viscous and had a greater flowability and HIPS was half way between the two.
Contamination of PP with HIPS did not appear to affect the MFR, while the addition of
ABS reduced the flow of the material at the processing temperature. Flowability of post
consumer ABS was 3 times greater than the thermally recycled material. Hence, the
difference in the flowability of the individual post consumer materials was significantly
less, corresponding to a smaller change in flowability and viscosity relative to the level of
contaminant.
The contamination of ABS with PP or HIPS increased the flowability of the
material. This was further confirmed by the results from the rheological analysis of ABS
contaminated with PP. At low to moderate shear rates, ABS had a much higher
viscosity and pseudo plasticity at the processing temperature than PP. The addition of
PP appeared to systematically decrease pseudo plasticity of the ABS blend relative to
the amount of PP, approaching Newtonian behaviour as PP dominated the blend. The
reduction in viscosity with contamination means that the process temperature can be
lowered. This is advantageous for ABS because the butadiene in the polymer matrix is
sensitive to decomposition during processing.
Changes in thermal and rheological properties, due to contamination, should be
taken into account to identify operating parameters of processing techniques.

7-4
7.4 Mechanical Properties
Recycling did not substantially affect the mechanical properties of the individual
polymers, with the exception of impact strength.
HIPS contamination reduced the tensile and flexural properties of ABS, however,
these properties changed according to the proportion of HIPS in the blends, thus
following the rules of mixing. In addition, the amorphous contaminant, HIPS, did not
change the storage modulus over time, which further indicated that the HIPS and ABS
were somewhat compatible. A blend of HIPS and ABS containing less than 10% HIPS
will be suitable for a similar end use application if a reduction in impact strength can be
tolerated. This is advantageous because in a practical recycling operation it would be
difficult to completely separate these plastics due to their similar physical properties.
The tensile and flexural properties of ABS were reduced with the contaminant
level of semi-crystalline material, PP, while the crystalline material had no effect on
these properties. However, both materials caused a negative deviation from the rule of
mixtures as contaminant. This relationship indicates that ABS was incompatible with PP
and nylon, and that sorting and separation of these plastics is favourable.
Contamination of ABS with the semi-crystalline/crystalline materials changed the storage
modulus with time. In the short term, contamination reduced the modulus. However, the
shallower transition resulting from contamination suppressed the reduction in modulus,
which ultimately led to an improved modulus beyond the transition. The long term
benefit of contamination will depend on the scope of the products life cycle. Impact
strength of ABS was significantly impacted by contamination, such that 10% PP and 5%
nylon halved the impact strength. Since ABS can simply be separated from PP based
on density difference, simple sorting would produce higher value products that could
offset the costs of recycling. Although nylon contaminated ABS retains tensile and
flexural properties, the effect of nylon contamination on impact strength and
processability reduced the materials usefulness. In the case of nylon contamination,
separation is essential.
Contamination of PP with the amorphous polymers, ABS and HIPS, enhanced
the tensile and flexural properties, while nylon had no effect. However, the relation
between the tensile and flexural properties and the level of contaminant indicated that
the contaminants were incompatible with PP. This was further emphasized by the
significant effect that contamination had on the impact strength of the blended materials.

7-5
In conclusion, the thermal, rheological and mechanical properties of the
individual plastics were almost retained after thermal recycling. If impact strength is an
essential property, ABS with contaminant levels less than 10% HIPS and PP, and less
than 5% nylon, would be practical. Modifiers could be used to improve the interaction
between polymers within an incompatible blend, thereby improving the materials
properties. Otherwise, any mixture of polymers can be produced economically, without
sophisticated sorting, to produce low value products. Incomplete separation of the
materials investigated in this project will ultimately lead to plastics of inferior properties
that may not be useful in applications that the material was originally used for. Bollards
and railway beams are currently manufactured in Australia from post-consumer recycled
thermoplastics.
There are a number of areas in recycled consumer durable plastics that require
further investigation in the future. This includes:
• Test materials for chemical resistance, which may be an important property
for some of the applications of the recycled material.
• Extend the range of contaminants to include the wide range of minor
components found in WEEE.
• Increase the number of contaminants in a blend. This is because a product
may consist of more than two polymeric materials.
• Addition of modifiers to improve the interaction between the polymers in a
blend. Typically, this will improve some, if not all, of the properties of the
material.
• Accelerated aging of the virgin plastics by using UV radiation. This may
involve different lengths of exposure to simulate the variation in the lifecycle
of a product.
• Multiple thermal recycling, including aging the material with UV radiation in
between recycling.

8-1
8 REFERENCES Balakrishnan, S., and Neelakantan, N., (1998), “Mechanical Properties of Blends of Polycarbonates with Unmodified and Maleic Anhydride Grafted ABS”, Polymer International, Vol.45, UK Balart, R. Lopez, J., Garcia, D., and Salvador, M., (2005), “Recycling of ABS and PC from electrical and electronic waste. Effect of miscibility and previous degradation on final performance of industrial blends”, European Polymer Journal, Vol.41, Spain Banfield, Mark, (2000), Appliance Recycling Project - Pilot disassembly plant for whitegoods http://www.ecorecycle.sustainability.vic.gov.au/resources/documents/Appliance_Recycling_Project_Pilot_disassembly_plant_for_whi.pdf Brennan, L., Isaac, D., and Arnold, J., (2002), “Recycling of Acrylonitrile-Butadiene-Styrene and High-Impact Polystyrene from Waste Computer Equipment”, Journal of Applied Polymer Science, Vol.86, Wiley Periodicals, Inc., UK Case, R., and Korzen, A., (2000), “The effects of regrind loading levels and heat history on the properties of selected engineering polymers”, SPE ANTEC Proceedings, Vol. III, pp. 3124–3133 Chiu, H., and Hsiao, Y., (2004), “Studies on Impact-Modified Nylon 6/ABS Blends”, Polymer Engineering and Science, Vol.44 (No.12), Society of Plastics Engineers, Taiwan Chokshi, R., and Zia, H., (2004), “Hot-Melt Extrusion Technique: A Review”, Iranian Journal of Pharmaceutical Research, Iran http://www.ijpr-online.com/Docs/20041/IJPR206_files/image005.jpg&imgrefurl
Crawford, R.J., (1998), “Plastics Engineering”, 3rd edition, Butterworth-Heinemann, UK Consumer Electronics Suppliers Association [CESA], (2003), Beyond the Dead TV: Managing End-of-Life Consumer Electronics in Victoria - Full Report (1.17MB) http://www.ecorecycle.sustainability.vic.gov.au/www/html/834-tv--disassembly-trials.asp Doran, C., (2006), Byteback, http://www.ecorecycle.sustainability.vic.gov.au/www/html/1107-byteback.asp?intSiteID=1, Sustainability Victoria EcoRecycle Victoria, (2004). “Annual Survey of Victorian recycling industries”, http://www.ecorecycle.sustainability.vic.gov.au/resources/documents/Annual_Survey_of_Victorian_Recycling_Industries_2003-04.pdf Fried, J.R., (2003), “Polymer Science and Technology”, 2nd edition, Pearson Education Inc./Prentice Hall Professional Technical Reference, USA

8-2
Ferguson, J., and Kemblowski, Z., (1991), “Applied Fluid Rheology”, Elsevier Science P/L, UK Gupta, A., Jain, A., and Maiti, S., (1990), ‘Studies on Binary and Ternary Blends of Polypropylene with ABS and LDPE. II. Impact and Tensile Properties’, Journal of Applied Polymer Science, Vol. 39, pp. 515-530. Hylton, D.C., (2004), “Understanding Plastic Testing”, Carl Hanser Verlag, Munich Katos, G., and Hoye, J., (2005), “Household Electrical and Electronic Waste Benchmark Survey 2005”, Ipsos, Australia Lindsey C., Barlow, J., and Paul, D., (1981), “Blends from Reprocessed Coextruded Products”, Journal of Applied Polymer Science, Vol.26, John Wiley and Sons, Inc., USA Liu, X., and Bertilsson, H., (1999), “Recycling of ABS and ABS/PC”, Journal of Applied Polymer Science, Vol.74, John Wiley and Sons, Inc, Sweden Liu, X., Boldizar, A., Rigdahl, M., and Bertilsson, H., (2002a), “Mechanical Properties and Fracture Behavior of Blends of Acrylonitrile-Butadiene-Styrene Copolymer and Crystalline Engineering Plastics”, Journal of Applied Polymer Science, Vol.86, John Wiley and Sons, Inc, Sweden Liu, X., Boldizar, A., Rigdahl, M., and Bertilsson, H., (2002b), “Recycling of Blends of Acrylonitrile-Butadiene-Styrene (ABS) and Polyamide”, Journal of Applied Polymer Science, Vol.86, Wiley Periodicals, Inc., Sweden Markin and Williams, (1980), Journal of Applied Polymer Science, Vol. 25, Wiley Periodicals, Inc., p2451. Menard, K.P., and Raton, B., (1999), “Dynamic Mechanical Analysis, a practical introduction”, CRC Press, Fla. Mikulec, M., and Brooks, T., (2000), “Blend of Post Industrial ABS and PMMA Improves Thermal and Impact Properties”, SPE ANTEC Proceedings, Vol. III, p. 2667 Ohishi, H., Ikehara, T., and Nishi, T., (2001), “Phase Morphologies and Mechanical Properties of High Impact Polystyrene (HIPS) and Polycarbonate Blends Compatibilized with Polystyrene and Polyarylate Block Copolymer”, Journal of Applied Polymer Science, Vol.80, John Wiley and Sons, Inc., Japan Pascoe, R.D., (2004), “The use of selective depressants for the separation of ABS and HIPS by froth flotation”, Minerals Engineering, Vol.18, Elsevier Ltd., UK Pascoe, R.D., (2005), “Investigation of hydrocyclones for the separation of shredder fridge plastics”, Elsevier

8-3
Paul, S., and Kale, D., (2001), “Blends of Acrylonitrile-Butadiene-Styrene/Waste Poly(ethylene terephthalate) Compatibilized by Styrene Maleic Anhydride”, Journal of Applied Polymer Science, Vol.80, John Wiley and Sons, Inc, India Plastics and Chemicals Industries Association [PACIA], (2005), 2005 National Plastics Recycling Survey, Victoria, Australia Plastics and Chemicals Industries Association [PACIA], (2008), 2008 National Plastics Recycling Survey, Victoria, Australia, http://www.pacia.org.au/_uploaditems/docs/Recycling%20Survey%202008%20Report.pdf Ragosta, G., Musto, P., Martuscelli, E., and Russo, P., (2001), “Recycling of a plastic car component having a multilayer structure: Morphological and mechanical analysis”, Journal of Materials Science, Vol.36, Kluwer Academic Publishers, Italy Rios, P., Stuart, J., and Grant, E., (2003), “Plastics Disassembly versus Bulk Recycling: Engineering Design for End-of-Life Electronics Resource Recovery”, Environmental Science and Technology, vol.37(no.23), American Chemical Society Rubin, I., (1990), “Handbook of Plastic Materials and Technology”, Wiley Interscience, New York Santana, R.M., and Manrich, S., (2003), “Studies on Morphology and Mechanical Properties of PP/HIPS Blends from Postconsumer Plastic Waste”, Journal of Applied Polymer Science, Vol.87, Wiley Periodicals, Inc., Brazil Scheirs, J., (1998), “Polymer Recycling: Science, Technology and Applications”, John Wiley & Sons Ltd, England Shah, V., (1998), Handbook of Plastic Testing Technology, 2nd edition, SPE, John Wiley & Sons Ltd, USA Sepe, M.P., (1998), “Dynamic Mechanical Analysis for Plastic Engineering”, William Andrew Publishing. Semancik, J.R., (1997), “Yield stress measurements using controlled stress rheometry”, TA Techpublications, RH058 Utraki, L.A., (2002), “Polymer Blends Handbook”, Vol 1-2, Springer-Verlag Utraki, L.A., (1989), “Polymer Alloys and Blends: Thermodynamics and Rheology”, Hanser Publishers, Germany Whittingstall, P., (1997), “Paint evaluation using rheometry”, TA Techpublications, RH059

8-4
Xu, G.; Qiao, J.; Kuswanti, C.; Simenz, M.; Koelling, K.; Stuart, J.A.; Lilly, B, ., (2000),
“Insights into reuse of High Impact Polystyrene from post-consumer electronics
equipment housing”, Proceedings of the 2000 IEEE International Symposium on
Electronics and the Environment, Page(s):348 – 353, San Francisco, CA, USA
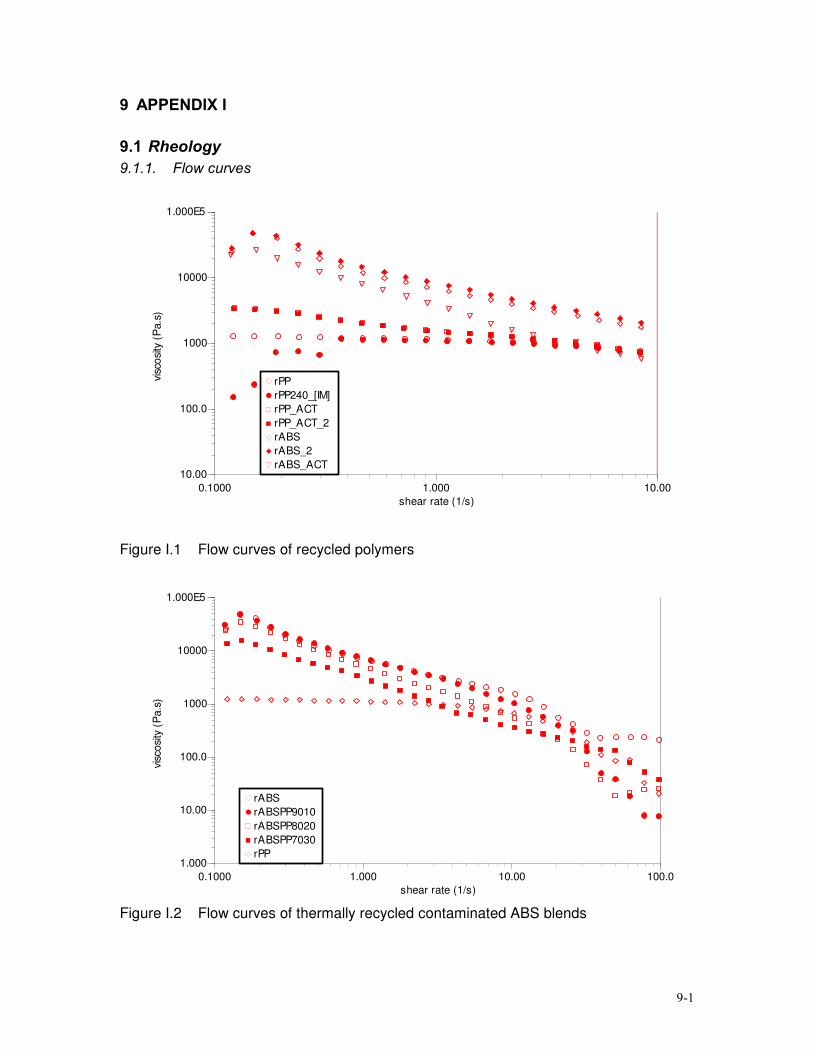
9-1
9 APPENDIX I
9.1 Rheology 9.1.1. Flow curves
0.1000 1.000 10.00shear rate (1/s)
10.00
100.0
1000
10000
1.000E5
visc
osity
(P
a.s)
rPPrPP240_[IM]rPP_ACTrPP_ACT_2rABSrABS_2rABS_ACT
Figure I.1 Flow curves of recycled polymers
0.1000 1.000 10.00 100.0shear rate (1/s)
1.000
10.00
100.0
1000
10000
1.000E5
visc
osity
(P
a.s)
rABSrABSPP9010rABSPP8020rABSPP7030rPP
Figure I.2 Flow curves of thermally recycled contaminated ABS blends

9-2
0.1000 1.000 10.00 100.0shear rate (1/s)
1.000
10.00
100.0
1000
10000
1.000E5
visc
osity
(P
a.s)
rPPrPPABS9010rPPABS8020rPPABS7030rABS
Figure I.3 Flow curves of thermally recycled contaminated PP blends
0.1000 1.000 10.00 100.0shear rate (1/s)
10.00
100.0
1000
10000
1.000E5
visc
osity
(P
a.s)
rABS_ACTrABSPP9010_ACTrABSPP8020_ACTrABSPP7030_ACTrPP_ACT
Figure I.4 Flow curves of post consumer contaminated ABS blends

9-3
0.1000 1.000 10.00 100.0shear rate (1/s)
1.000
10.00
100.0
1000
10000
visc
osity
(P
a.s)
rPP_ACTrPPABS9010_ACTrPPABS8020_ACTrPPABS7030_ACT
Figure I.5 Flow curves of post consumer contaminated PP blends
0.1000 1.000 10.00shear rate (1/s)
1.000
10.00
100.0
1000
10000
visc
osity
(P
a.s)
rPP_ACTrPPABS9010_ACTrPPABS8020_ACTrPPABS7030_ACT
Figure I.6 Flow curves of post consumer contaminated PP blends

9-4
9.1.2. Linear viscoelasticity
1.000 10.00 100.0 1000 10000osc. stress (Pa)
1000
10000
1.000E5
G' (
Pa)
rPPrPPABS9010rPPABS7030rABSPP7030rABSPP9010
Figure I.7 Linear viscoelasticity of thermally recycled blends
1.000 10.00 100.0 1000 10000osc. stress (Pa)
1000
10000
1.000E5
G' (
Pa)
rPP_ACTrPPABS8020_ACTrPPABS7030_ACTrABSPP7030_ACTrABSPP8020_ACT
Figure I.8 Linear viscoelasticity of post consumer recycled blends

9-5
9.1.3. Cox-Merz transforms
0.1000 1.000 10.00 100.0 1000shear rate (1/s)
10.00
100.0
1000
10000
1.000E5vi
scos
ity (
Pa.
s)
rPP cmrPPrABS cmrABS
Figure I.9 Flow curves and Cox-Merz transformation of thermally recycled polymers
1.000 10.00 100.0 1000shear rate (1/s)
100.0
1000
10000
1.000E5
visc
osity
(P
a.s)
rPP cmrPP_2 cmrABSPP7030 cmrABSPP7030_2 cmrABSPP8020 cmrABSPP8020_2 cmrABSPP9010 cmrABSPP9010_2 cm
Figure I.10 Cox-Merz transformation of thermally recycled ABS contaminated with PP

9-6
1.000 10.00 100.0 1000shear rate (1/s)
100.0
1000
10000
1.000E5
1.000E6
shea
r st
ress
(P
a)
rPP cmrPP_2 cmrABSPP7030 cmrABSPP7030_2 cmrABSPP8020 cmrABSPP8020_2 cmrABSPP9010 cmrABSPP9010_2 cm
Figure I.11 Power-law fits for Cox-Merz transformation of thermally recycled ABS
contaminated with PP
1.000 10.00 100.0 1000shear rate (1/s)
100.0
1000
10000
visc
osity
(P
a.s)
rPP cmrPP_2 cmrPPABS9010 cmrPPABS9010_2 cmrPPABS8020 cmrPPABS8020_2 cmrPPABS7030 cmrPPABS7030_2 cm
Figure I.12 Cox-Merz transformation of recycled PP contaminated with ABS

9-7
1.000 10.00 100.0 1000shear rate (1/s)
100.0
1000
10000
1.000E5
1.000E6
shea
r st
ress
(P
a)
rPP cmrPP_2 cmrPPABS9010 cmrPPABS9010_2 cmrPPABS8020 cmrPPABS8020_2 cmrPPABS7030 cmrPPABS7030_2 cm
Figure I.13 Power-law fits for Cox-Merz transformation of thermally recycled PP
contaminated with ABS
1.000 10.00 100.0 1000shear rate (1/s)
100.0
1000
10000
visc
osity
(P
a.s)
rABSPP7030_ACT cmrABSPP7030_ACT_2 cmrABSPP8020_ACT cmrABSPP9010_ACT cmrABSPP9010_ACT_2 cmrABS_ACT cmrABS_ACT_2 cm
Figure I.14 Cox-Merz transformation of post consumer ABS contaminated with PP

9-8
1.000 10.00 100.0 1000shear rate (1/s)
100.0
1000
10000
visc
osity
(P
a.s)
rPPABS7030_ACT cmrPPABS7030_ACT_2 cmrPPABS8020_ACT cmrPPABS9010_ACT_2 cmrPPABS9010_ACT cmrPP_ACT cmrPP_ACT_2 cm
Figure I.15 Cox-Merz transformation of post consumer PP contaminated with ABS

9-9
9.2 Mechanical Properties 9.2.1. Flexural strength of ABS/PP blends
Figure I.16 Flexural strength of recycled ABS contaminated with PP
Figure I.17 Flexural strength of recycled PP contaminated with ABS
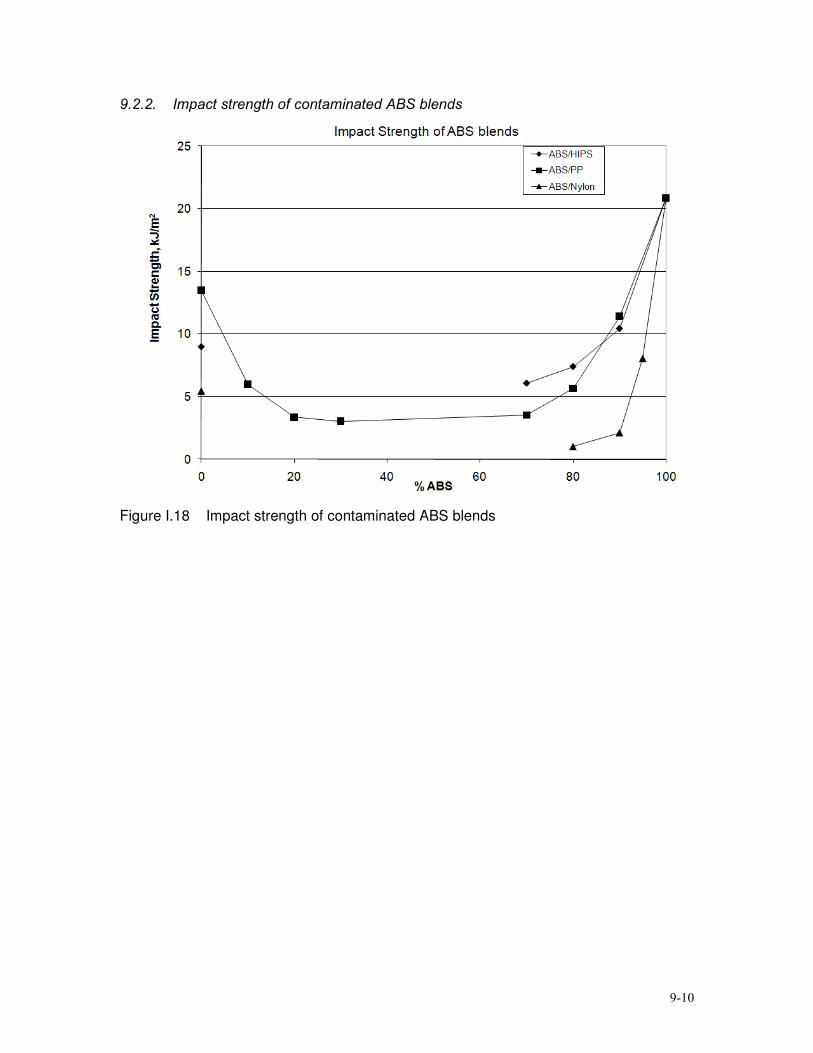
9-10
9.2.2. Impact strength of contaminated ABS blends
Figure I.18 Impact strength of contaminated ABS blends

9-11
9.2.3. Williams-Landel-Ferry (WLF), shift factors
Table I.1: Shift Factors, tA , for ABS contaminated with PP
Contaminant level, v/v% Temperature, 0C 0 10 20 30
85 5.19 5.03 4.75 4.52 95 2.59 2.59 2.59 2.59 105 0 0 0 0 115 -1.86 -1.85 -1.86 -1.88 125 n/a -3.14 -3.15 -3.18
Table I.2: Shift Factors, tA , for PP contaminated with ABS
Contaminant level, v/v% Temperature, 0C 10 20 30
85 2.24 3.33 3.65 95 1.40 2.03 2.23 105 0.00 0.00 0.00 115 -1.30 -1.86 -1.89 125 -2.74 -3.25 -3.35
Table I.3: Shift Factors, tA , for ABS contaminated with HIPS
Contaminant level, v/v% Temperature, 0C 0 10 20 30 100
85 5.19 5.19 5.19 5.08 4.50 95 2.59 2.59 2.59 2.49 1.90 105 0 0 0 0 0 115 -1.86 -1.84 -1.82 -1.81 -1.30 125 n/a -3.13 -3.12 -3.11 -2.62
Table I.4: Shift Factors, tA , for ABS contaminated with Nylon
Contaminant level, v/v% Temperature, 0C 0 5 10 20 100
85 5.19 5.19 4.96 4.88 4.54 95 2.59 2.59 2.59 2.52 2.27 105 0 0 0 0 0 115 -1.86 -1.81 -1.80 -1.70 -2.43 125 n/a -3.05 -3.10 -2.86 -5.03
Copyright © 2022 FDOKUMEN