Feedstock Recycling of Plastics
607
universitätsverlag karlsruhe Feedstock Recycling of Plastics Selected Papers presented at the Third International Symposium on Feedstock Recycling of Plastics M. Müller-Hagedorn H. Bockhorn editors
-
Upload
khangminh22 -
Category
Documents
-
view
1 -
download
0
Transcript of Feedstock Recycling of Plastics
universitätsverlag karlsruhe
Feedstock Recycling of PlasticsSelected Papers presented at the Third International Symposium on Feedstock Recycling of Plastics
M. Müller-HagedornH. Bockhorneditors


M. Müller-Hagedorn, H. Bockhorn (editors)
Feedstock Recycling of Plastics Selected Papers presented at the Third International Symposium on Feedstock
Recycling of Plastics


Feedstock Recycling of Plastics
Selected Papers presented at the Third International Symposium on Feedstock Recycling of Plastics& Other Innovative Plastics Recycling Techniques
Karlsruhe, Germany, September 25 - 29, 2005
M. Müller-Hagedorn H. Bockhorneditors
Universitätsverlag Karlsruhe 2005 Print on Demand
ISBN 3-937300-76-7
Impressum
Universitätsverlag Karlsruhec/o UniversitätsbibliothekStraße am Forum 2D-76131 Karlsruhewww.uvka.de
Dieses Werk ist unter folgender Creative Commons-Lizenz lizenziert: http://creativecommons.org/licenses/by-nc-nd/2.0/de/
Preface
The International Symposium on Feedstock Recycling (ISFR) provides a forum for open high-level discussions on the chemical and material recycling of plastics and plastics con-taining waste fractions and to foster relationships in joint research. Scientists, engineers, offi cials, and others interested or involved in recycling of plastics are invited to attend and participate in this triannual event. In so doing, the founders of this event hope to establish a central vehicle for the rapid exchange of ideas and results emanating from the many diverse areas associated with the recycling of plastics. The 1st ISFR was held in Sendai, Japan, in 1999, and the 2nd ISFR was held in Ostend, Belgium, in 2002. The 3rd ISFR took place in Karlsruhe, Germany, from 25-29 September 2005.
This volume contains selected papers of the Third International Symposium on Feedstock Recycling of Plastics & other Innovative Plastics Recycling Techniques. The publishing of the Proceedings of this Symposium as collection of “mini papers” allows a very large number of papers to be bound into a single volume giving the reader an overview over actual fundamental and applied research on feedstock recycling of plastics. The papers are arranged according to the main conference topics:
1. Pyrolysis or Solvolysis2. Synthesis gas production by means of gasifi cation or of partial oxidation3. Energy derived from plastics, rubber, and other high caloric waste streams4. Innovative techniques in mechanical recycling5. Life Cycle Assessment and Risk Management in plastic recycling.
The Third International Symposium on Feedstock Recycling was organised by the Institute for Chemical Technology and Polymer Chemistry, University of Karlsruhe, Germany, by the Okayama University Center of Excellence (COE) Program for the 21st Century, Japan, and by the Research Association for Feedstock Recycling of Plastics (FSRJ), Japan. It was co-organised by Plastic Waste Management Institute (PWMI), Japan, Vinyl Environmen-tal Council (VEC), Japan, The Council for PET Bottle Recycling, Japan, PlasticsEurope, European Council of Vinyl Manufacturers (ECVM), and PETCORE, Belgium.
The editors would like to offer their gratitude to the members of the Symposiums’ Scien-tifi c Committee for reviewing the submitted papers in much less time than usual. They also thank Christian Wetzel for his never ending help in the preparation of this book.
M. Müller-Hagedorn
H. Bockhorn
Karlsruhe, August 2005
Scientifi c Committee
Prof. Dr. J. Aguado (Rey Juan Carlos University, Spain)
Prof. Dr. M. Blazsó (Hungarian Academy of Sciences, Hungary)
Prof. Dr. H. Bockhorn (University of Karlsruhe, Germany)
Prof. Dr. A. Buekens (Free University of Brussels, Belgium)
Dr. M. Day (NRC, Canada)
Dr. Chih. C. Chao (Industrial Technology Research Institute, Taiwan)
Dr. Soo-Hyun Chung (Korea Institute of Energy Research, Korea)
Dr. M. M. Fisher (American Plastics Council, USA)
Prof. Dr. W. Kaminsky (University of Hamburg, Germany)
Dr. J. M. N. van Kasteren (Technical University of Eindhoven, Netherlands)
Prof. Dr. M. A. Keane (University of Kentucky, USA)
Dr. J. Kovarova (Academy of Science, Czech Republic)
Mr. R. Liberton (Valorlux, Luxemburg)
Prof. Dr. F. La Mantia (University of Palermo, Italy)
Prof. Dr. F. T. T. Ng (University of Waterloo, Canada)
Prof. Dr. A. Oku (Kyoto Institute of Technology, Japan)
Prof. Dr. A. Okuwaki (Tohoku University, Japan)
Prof. Dr. Y. Ono (Okayama University, Japan)
Prof. Dr. C. Roy (Laval University, Canada)
Prof. Dr. Y. Sakata (University of Okayama, Japan)
Prof. Dr. C. Vasile (Technical University of Iasi, Romania)
Prof. Dr. Yu-Zhong Wang (Sichuan University, China)


Contents
FEEDSTOCK RECYCLING BY PYROLYSIS OR SOLVOLYSIS
Pyrolysis: Processes – Strategies – Usages – Modelling
CHEMICAL CONVERSION OF PLASTIC WASTES TO MONOMERSA. Oku
3
PYROLYSIS OILS OF PLASTIC WASTESM. Blazsó
11
DEVELOPMENT OF WASTE PLASTICS LIQUEFACTION TECHNOLOGY, FEEDSTOCK RECYCLING IN JAPANM. Shioya1, T. Kawanishi, N. Shiratori, H. Wakao, E. Sugiyama, H. Ibe, T. Abe
19
REACTOR DESIGN AND OPERATION OF SMALL-SIZE LIQUEFACTION PLANTS FOR WASTE PLASTICSY. Kodera, Y. Ishihara, K. Saido and T. Kuroki
27
ESTIMATION OF CONTENT AND COMPOSITION OFMUNICIPAL SOLID WASTEI. Hasegawa, F. Nakanishi, Y. Ohmukai and K. Mae
35
UPGRADING OF LIGHT THERMAL CRACKING OIL DERIVED FROM WASTE PLASTICS IN OIL REFINERYT. Kawanishi, N. Shiratori, H. Wakao, E. Sugiyama, H. Ibe, M. Shioya,T. Abe
43
THERMAL CRACKING OF POLYALKENE WASTES AS A SOURCE OF PETROCHEMICAL FEEDSTOCKSE. Hájeková and M. Bajus
51
PYROLYSIS OF DIFFERENT PLASTIC-CONTAININGWASTE STREAMSI. de Marco, B. Caballero, M.F. Laresgoiti, A. Torres, M.J. Chomón,G. Fernandez
57
MECHANISTIC MODELING OF POLYMER PYROLYSISS. E. Levine, T. M. Kruse, and L. J. Broadbelt
65
SIMULATION AND EXPERIMENTS OF POLYETHYLENE PYROLYSIS IN A FLUIDIZED BED PROCESSW. Kaminsky, F. Hartmann
73
ISFR - 2005
THE THERMOCHEMICAL CONVERSION OF AGRICULTURAL WASTES IN A BUBBLING FLUIDIZED BEDS. H. Lee, Y. C. Choi, J. H. Kim and J. G. Lee
81
OPERATION RESEARCH OF A MOVING-BED REACTOR;DEMONSTRATION PLANT FOR FUEL-OIL PRODUCTIONY. Kodera, Y. Ishihara, K. Saido and T. Kuroki
89
FUEL GAS PRODUCTION BY POLYOLEFIN DECOMPOSITION USING A MOVING-BED REACTORY. Kodera, Y. Ishihara and T. Kuroki
95
Pyrolysis/Solvolysis of Halogen containing Plastics or Plastic Mixtures
FEEDSTOCK RECYCLING OF PVDC MIXED PLASTICS: EFFECT OF PET AND DEHALOGENATION OF LIQUID PRODUCTST. Bhaskar, A. Muto, Y. Sakata
101
INFLUENCE OF POLY(BISPHENOL A CARBONATE) AND POLY(ETHYLENE TEREPHTHALATE) ON POLY(VINYL CHLORIDE) DEHYDROCHLORINATIONK. German, K. Kulesza, M. Florack, J. Pielichowski
109
CATALYTIC RECYLING OF PVC WASTEM.A. Keane and P.M. Patterson
117
DEGRADATION OF PVC WITHOUT ANOMALOUS STRUCTURESK. Endo, T. Nomaguchi, and N. Emori
125
ENVIRONMENTALLY-BENIGN POROUS CARBONS FROM DECHLORINATED WASTE PVCN. Kakuta, K. Shirono, H. Ohkita and T. Mizushima
133
DECHLORINATION OF POLY(VINYL CHLORIDE) WITH AQUEOUS AMMONIA SOLUTION UNDER HYDROTHERMAL CONDITIONSY. Akaike, Y. Wakayama, K. Hashimoto and T. Funazukuri
141
DECHLORINATION OF PVC AND PVDC USING NAOH/EGT. Yoshioka, S. Imai, M. Ieshige, A. Okuwaki
147
Contents
PYROLYSIS OF THE PLASTICS AND THERMOSETS FRACTIONS OF USED COMPUTERS AND LIQUID FRACTION UPGRADINGC. Vasile, M.A. Brebu, T. Karayildirim, J. Yanik and H. Darie
153
PYROLYSIS OF HALOGEN-CONTAINING POLYMER MIXTURESE. Jakab, T. Bhaskar and Y. Sakata
163
PYROLYSIS STUDY OF PVC - METAL OXIDE MIXTURES: QUANTITATIVE PRODUCTS ANALYSIS AND CHLORINE FIXATION ABILITY OF METAL OXIDESY. Masuda, T. Uda, O. Terakado and M. Hirasawa
169
HYDROTHERMAL DECHLORINATION OF POLY(VINYL CHLORIDE) IN THE ABSENCE AND THE PRESENCE OF HYDROGEN PEROXIDES. Suga, Y. Wakayama and T. Funazukuri
175
PYROLYSIS OF HIPS-Br/PVDC MIXED WITH PET AND DEHALOGENATION OF LIQUID PRODUCTST. Bhaskar, A. Muto, Y.Sakata
183
EFFECT OF CATALYST/SORBENT ON THE DECHLORINATION EFFICIENCY FOR THE DEGRADATION OF POLYMERIC WASTEChiung-Fang, Liu, Shun-Chih, King, Ming-Der, Chen
191
Thermal Degradation/Solvolysisunder unconventional Conditions or catalytically enforced
ENHANCED PRODUCTION OF α-OLEFINS BY THERMAL DEGRADATION OF HDPE IN DECALIN SOLVENTD. P. Serrano, J. Aguado, G. Vicente, N. Sánchez and L. Esteban
199
THERMAL DEGRADATION OF THERMOSETTING RESIN WASTE WITH VEGETABLE OILM. Takayanagi, K. Sano, M. Nishimaki, K. Takami, R. Takahashi, Y. Sato and K. Hirano
207
SOLVO-CYCLE PROCESS: A NEW RECYCLING PROCESSFOR USED PLASTIC FOAM BY PLASTICS-DERIVED SOLVENTY. Kodera, Y. Ishihara, T. Kuroki and S. Ozaki
217
ISFR - 2005
CHEMICAL RECOVERY OF FLEXIBLE POLYURETHANE FOAM WASTES: AN INTEGRATED PROCESS.C. Molero, A. de Lucas and J. F. Rodríguez
223
UTILIZATION OF BY-PRODUCTS ORIGINATED IN THE CHEMICAL RECYCLING OF FLEXIBLE POLYURETHANE FOAMSC. Molero, A. de Lucas and J. F. Rodríguez
231
CHEMICAL RECYCLING OF WOOD BIOMASS VIA HYDROTHERMAL TREATMENTA. Sera, T. Bhaskar, S. Karagoz, A. Muto, Y. Sakata
239
CHANGE IN INTERACTION BY PRESSUREDURING THE PYROLYSIS OF PLASTICS MIXTUREY. Ohmukai, K. Kubo, I. Hasegawa and K. Mae
247
DECOMPOSITION REACTION OF THERMALLY STABLE POLYMERS IN HIGH TEMPERATURE WATERH. Tagaya, T. Kamimori and B. Hatano
255
DEPOLYMERIZATION KINETICS AND MECHANISM OF POLYMERS IN SUB- AND SUPERCRITICAL FLUIDSM. Sasaki, T. Iwaya, M. Genta, and M. Goto
263
CHEMICAL RECYCLING OF NYLONS BY OXIDATIVE DEGRADATION WITH NITROGEN DIOXIDE IN SUPERCRITICAL CARBON DIOXIDEN. Yanagihara, N. Abe, H. Takama and M. Yoshida
271
PYROLYSIS OF POLYESTERS IN THE PRESENCE OF CA(OH)2
G. Grause, T. Yoshioka, T. Handa, S. Otani, H. Inomata, T. Mizoguchi,A. Okuwaki
279
CATALYTIC DEGRADATION OF THE MIXTURE OF POLYPROPYLENE (PP) AND POLYSTYRENE (PS) OVER BAO/ZSM-5 CATALYST PREPARED BY SOLID-STATE INTERACTION UNDER MICROWAVE IRRADIATIONQian Zhou, Wei Qu, Wen-Wen Lan, Yu-Zhong Wang
287
CONSIDERATIONS ON THE PYROLYSIS OF OLEFINIC PLASTICS BY USING SYNTHETIC CATALYSTS ORIGINATED FROM FLY ASHSoo Hyun Chung, Jeong-Geol Na, Seong-Soo Kim and Sang Guk Kim, Jong-In Dong and Young-Kwon Park
293
Contents
CATALYTIC DEGRADATION OF PLASTIC WASTES INVESTIGATED BY Py-GC/MSJ. Aguado, D.P. Serrano, G. San Miguel
301
CATALYTIC UPGRADING OF HIGHER 1-ALKENES FROM POLYETHYLENE THERMAL CRAKING BY MODIFIED WACKER OXIDATIONJ.M. Escola, J.A. Botas, M. Bravo and P. García
309
PYROLYSIS OF POLYOLEFINS BY ZIEGLER-NATTA CATALYSTSI. Javier Núñez Zorriqueta, W. Kaminsky
317
DEVELOPMENT OF A FEEDSTOCK RECYCLING PROCESS FOR CONVERTING WASTE PLASTICS TO PETROCHEMICALSJ. Nishino, M. Itoh, Y. Fujiyoshi, Y. Matsumoto, R. Takahashi and Y. Uemichi
325
CATALYTIC CRACKING OF HDPE OVER MCM-48Y.-M. Kim, S. Kim, Y.-K. Park, J. Man Kim, J.-K. Jeon
333
SYNTHESIS GAS PRODUCTION BY MEANS OF GASIFICATION OROF PARTIAL OXIDATION
A STUDY ON THE CHARACTERIZATION OF VACUUM RESIDUE GASIFICATION IN AN ENTRAINED-FLOW GASIFIERYoung-Chan Choi, Jae-Goo Lee, Jae-Chang Hong, and Yong-Goo Kim
341
FEEDSTOCK RECYCLING OF POLYETHYLENE-WOOD MIXTURES BY GASIFICATIONJ.M.N. van Kasteren and H. O. Mbele
349
A STUDY ON DME SYNTHESIS FROM WASTED PLASTICS AND WOODY BIOMASSM. Yukumoto, M. Omiya and Y. Ohno
357
GASIFICATION OF WASTE PLASTICS BY STEAM REFORMINGT. Tsuji, S. Okajima and T. Masuda
365
DEVELOPMENT OF ROTARY KILN TYPEGASIFICATION SYSTEMHideki Nakagome, Kiyoshi Imai, Mina Sakano, Tsuyoshi Noma, Hidetohi Ibe and Masanori Kobayashi
371

ISFR - 2005
RAPID PYROLYSIS OF PE, PP, AND PS IN A BATCH TYPE FLUIDIZED BED REACTORH. Yasuda, O. Yamada, M. Kaiho, T. Shinagawa, S. Matsui, T. Iwasaki, and S. Shimada
381
GASIFICATION OF PET FOR THE PRODUCTION OF SYNGAST. Yoshioka, T. Handa, G. Grause, H. Inomata, T. Mizoguchi
387
EFFECT OF NATURAL AND SYNTHETIC ZEOLITES FOR THE GASIFICATION OF POLYETHYLENE AND POLYPROPELENEA. Nigo, T. Bhaskar, A. Muto, Y. Sakata
395
ENERGY DERIVED FROM PLASTICS, RUBBER, AND OTHER HIGH CALORIFIC WASTE STREAMS
PRODUCTION OF GAZEOUS AND LIQUID FUELS BY GASIFICATION OR PYROLYSIS OF PLASTICSC. Gisèle Jung and André Fontana
403
EFFECT OF STEAM AND SODIUM HYDROXIDE ON THE PRODUCTION OF HYDROGEN FROM DEHYDROCHLORINATED POLY(VINYL CHLORIDE)T. Kamo, K. T., J. Otomo, and H. Takahashi
409
VALUABLE HYDROCARBONS FROM PLASTIC WASTES BY MILD CRACKINGN. Miskolczi, L. Bartha, Gy. Deák
415
Contents
INNOVATIVE TECHNIQUES IN MECHANICAL RECYCLING
CHALLENGES OF PVC RECYCLING IN JAPANT. Sakauchi
423
EMVIRONMENTAL REGULATIONS AND POLYMER RECYCLING IN JAPAN AFTER ISFR 2002 N. Kusakawa
427
RECYCLING OF WASTE FROM ELECTRONIC AND ELECTRICAL EQUIPMENT IN THE NETHERLANDSP.P.A.J. van Schijndel and J.M.N. van Kasteren
435
CONSTRUCTION OF THE SYSTEM FOR WASTE PLASTICS RECYCLING PROMOTION AND GLOBAL WARMING SUPPRESSION IN TOHOKU DISTRICT OF JAPANK. Yamaguchi
441
DRY SEPARATION OF ACTUAL SHREDDED BULKY WASTESBY FLUIDIZED BED TECHNOLOGYY. Kakuta, T. Matsuto, Y. Tojo and T.Matsuo
449
IDENTIFICATION OF POLYMER TYPES IN SAUDI ARABIAN WASTE PLASTICSM. N. Siddiqui, M. F. Ali and S. H. H. Redhwi
457
PREPARATION AND CHARACTERIZATIONOF REGENERATED LDPE/EPDM BLENDSR. Irinislimane, N. Belhaneche-Bensemra, A. Benlefki
465
SYNTHETIC PAPER FROM POLYPROPYLENE POST-CONSUMERR. M. Campomanes-Santana, I.S. B. Perez and S. Manrich
473
UPGRADING OF PVC FROM CREDIT CARDS BY BLENDS WITH STYRENIC PLASTICSD. García, J. López, L. Sánchez, J. E.Crespo
481
UPGRADING STYRENE WASTES. EFFECT OF IMPURITIES AND PREVIOUS DEGRADATION ON FINAL PERFORMANCEF. Parres, R. Balart, J. López, L. Sánchez
489
ISFR - 2005
PA-66/PEAl BLENDS FROM RECYCLED WASTEC. Desiderá and M. I. Felisberti
495
REUSE OF POST-CONSUMER POLY(ETHYLENE TEREPHTHALATE) (PET) IN TOUGHENED BLENDSM. Aglietto, M.-B. Coltelli, S. Savi, I. Della Maggiore
503
IMPROVING THE BIODEGRADABILITY AND MECHANICAL STRENGTH OF CORNSTARCH-LDPE BLENDS THROUGH FORMULATIONM. Nikazar, B. Safari, B. Bonakdarpour, Z. Milani
509
EFFECT OF LIMESTONE ON CHLORINE COMPOUNDS EMISSION DURING MODEL MUNICIPAL WASTE PYROLYSIS/GASIFICATIONY. Sekine, M. Matsuzawa, Y. Miyai, H. Okutsu, E. Kikuchi, M. Matsukata
517
A PRACTICAL METHOD FOR CHEMICAL RECYCLING OF FRP. DMAP AS AN EFFECTIVE CATALYST FOR DEGRADATION OF FRPS IN SUPERCRITICAL ALCOHOLSA. Kamimura, T. Kuratani, K. Yamada and F. Tomonaga
525
FORMATION OF SUBMICRON SCALE FIBROUS CARBONACEOUS COMPOUNDS THROUGH PYROLYSIS OF PET IN THE PRESENCE OF METAL OXIDESO. Terakado and M. Hirasawa
531
NANO-CRYSTALLINE CARBON COMPOSITE/METAL OXIDE CATALYSTS THROUGH WOOD BIOMASS (SAWDUST) ANDION EXCHANGE RESINSA. Muto, B. Thallada, Y. Sakata
537
OXIDATION OF WASTE POLYOLEFINS TO CARBOXYLIC ACIDSM. Yoshida, A. Urushibata, Y. Imai, and N. Yanagihara
545
Contents
LIFE CYCLE ASSESSMENT AND RISK MANAGEMENT IN PLASTIC RECYCLING
STRATEGIC SOLID WASTE MANAGEMENT FOR SUSTAINABLE SOCIETYM. Tanaka
553
ECONOMICAL ELV RECYCLING UNDER ECOLOGICAL FRAMEWORK CONDITIONSW. Fey
561
PVC RECOVERY OPTIONS: ENVIRONMENTAL AND ECONOMIC SYSTEM ANALYSISJ. Kreißig, M. Baitz, J. Schmid, P. Kleine-Möllhoff, I. Mersiowsky, H. Leitner
569
PLASTICS AS SOURCES OF ENVIRONMENTAL POLLUTANTSK. Saido, Y. Kodera, T. Kuroki and S. Yada
577
STRATEGIC PLANNING TOOL FOR WASTE MANAGEMENT BASED ON WLCA/WLCC AND ITS APPLICATION ON WASTE PLASTICSM. Tanaka, Y. Matsui and C. Takeuchi
581


McC
ann
Eri
ckso
n B
CA
Der neue Opel Astra GTC. Nur Fliegen ist schöner.
Halten Sie sich jetzt ordentlich fest. Schließlich sieht der neue Opel Astra GTC nicht nur mehr als dynamisch aus, er ist es auch. Auf Wunsch mit SportSwitch und IDSPlus Sportfahrwerk ausgerüstet, bietet er Ihnen einfach alles, was das Autofahren noch schöner und noch sportlicher macht. Mehr unter opel.de oder 0180 55510 (0,12 €/Min.).


Pyrolysis / Solvolysis 3
CHEMICAL CONVERSION OF PLASTIC WASTESTO MONOMERS
Akira OkuResearch Institute for Production Development
15 Morimoto-cho, Shimogamo, Sakyo-ku, Kyoto 606-0805, [email protected]
Abstract: To be presented here is that the most appropriate social network for recycling plastic wastes is the one that centers monomer (or chemical) recycling technology. Sev-eral merits of this network are: 1) chemical market for recycled monomers is as wide as the virgin plastic. 2) impurity problem that obstructs horizontal recycling is solvable.3) prototypes of chemical technology for converting polymers to monomers are known. 4) ideology of reproducing the same plastic from the wastes will change our life-style better than previous. 5) easygoing policy of biomass-plastic industries that relies on eco-logical carbon-circle (carbon-neutral circuit) can be abandoned. Several challenges in industrial scales have started in Japan in the last couple of years in Japan, and we will see more lights in the near future.
1. Introduction
How to solve the problem of plastic wastes at both manufacturers’ and consumers’ stages is now a big issue for the global conservation of organic carbon resources, particularly petroleum, because we are learning that biomass is not almighty in use nor limitless in quantity. We are also learning now that petroleum-based plastic can become a continu-ing and reproducible man-made resource while petroleum is not. [1] This reproducibility may be even greater than the biomass-based plastic materials so far. Therefore, we should deliberately show to the biomass family a leading model how to store and reproduce ma-terials within a man-made sphere without relying on ecological carbon-neutral circuits (Scheme 1). [4]
Answer to the issue can be obtained from different facets: [2] e.g., (1) innovation in the design of plastic materials directed toward longevity and recyclable property based on resource productivity, (2) line-up of versatile recycling technologies based on monomer recycling, (3) innovation of economic and industrial networks for improving the fl ow of plastics based on material-lease concept. (4) energy- and resource-saving assessment in the plastic reproduction on wide-viewing, deep-sighting, and long-term bases.
To actuate such efforts by chemical means, human society must repeatedly use plas-tic materials before reaching nonrenewable termination. Indeed, toward this goal, many resource-conscious scientists have been devoting themselves for decades. In Japan, a number of colleagues in academia and industries have demonstrated that plastics can be

ISFR - 20054
effectively recycled practically via monomers. [2] In a variety of recycling styles of plastic wastes, the monomer (chemical) route seems to be a primary solution of the issue because it reproduces the identical parent plastics and consequently benefi ts the mother market. [2]
In this chapter, the current technologies of monomer (chemical) recycling and their facing problems in Japan shall be described. In addition, the author proposes a new revision of resource concept by adding an intellectual criterion of importance. [14]
2. State of arts in the monomer recycling of plastic wastes in Japan. What is wrong, what is benefi cial for posterity?
On the basis of chemical recycling concept, poly(ethylene terephthalate) (PET), poly(carbonate) (PC), and poly(olefi n)s (PO) have started their recycling in industrial scales. A conceptual problem there exists is that while petroleum-based plastic (PBP) pays effort in recycling, biomass-based plastic is not taking the same track [4] by delib-erately naming it “bio-degradable plastic (BDP)”. The people in that business stress that biomass is reproducible via the “carbon-neutral” circuit and, therefore, its plastic products are not necessarily recycled. This contradicts the way of PBP. Indeed, biomass-based plastic (BBP) is an important eco-material but BDP is not because the latter is not recy-cled. In the same sense, PBP are more ecological and reproducible materials than BDP. Scheme 1 shows that BBP (or BDP) must be recycled as many times as possible because its manufacturing energy that is consumed from the resource stage is greater than PBP in general. Based on this concept, several chemical recycling technologies for PBP have started their business in industrial scales in Japan.
Figure 1: Recycle Circuit of Organic Resources.
plants
sun light
CO2 emission
incineration energy
biodegradable
global factory,long-term
agricultural energy
carbohydrates, hydrocarbons,plant oils, etc
transport & manufact. energy
chemicals, materialsman-made circuit,
short-term
recycle
artificial energy
energy productsoil, wastes
Pyrolysis / Solvolysis 5
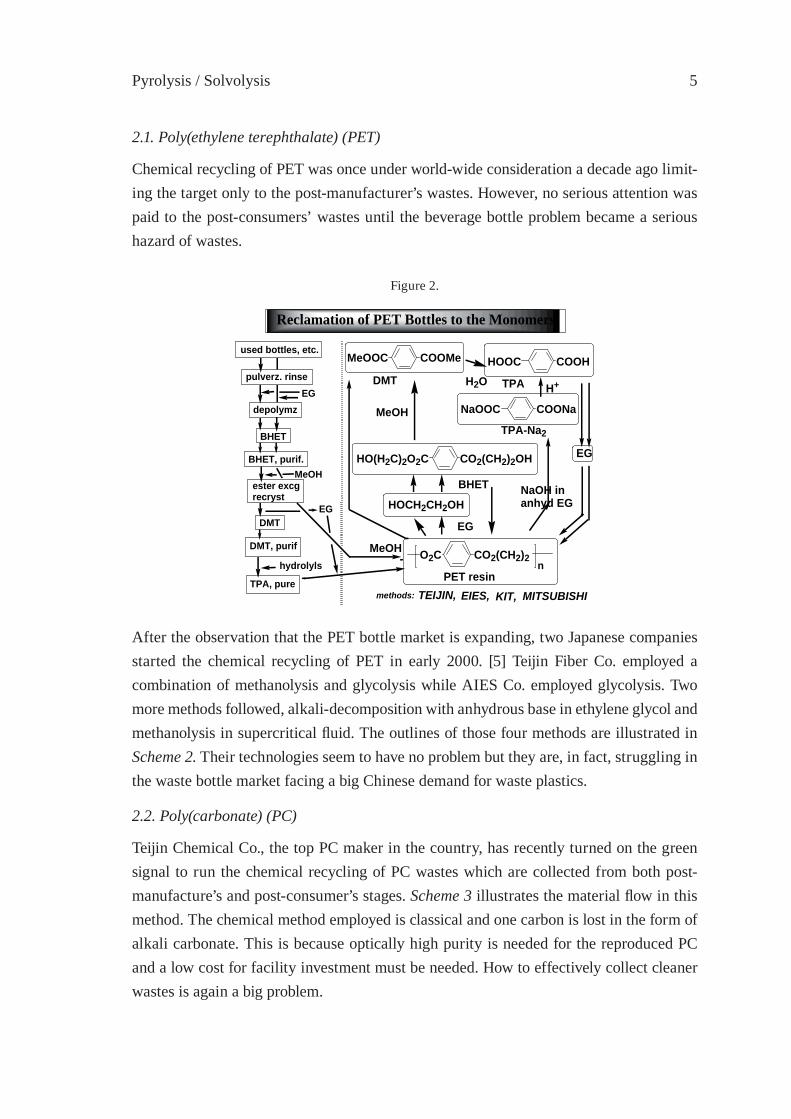
2.1. Poly(ethylene terephthalate) (PET)
Chemical recycling of PET was once under world-wide consideration a decade ago limit-ing the target only to the post-manufacturer’s wastes. However, no serious attention was paid to the post-consumers’ wastes until the beverage bottle problem became a serious hazard of wastes.
Figure 2.
COOMeMeOOC COOHHOOC
COONaNaOOC
CO2(CH2)2OHHO(H2C)2O2C
CO2(CH2)2O2C
HOCH2CH2OH
MeOH
EG
EG
H+TPAH2ODMT
MeOHTPA-Na2
BHET
PET resin
used bottles, etc.
pulverz. rinse
depolymz
BHET, purif.
ester excgrecryst
DMT
DMT, purif
BHET
TPA, pureEIES,TEIJIN, KIT,
EG
MeOH
EG
hydrolyls
Reclamation of PET Bottles to the Monomers
n
NaOH in anhyd EG
MITSUBISHImethods:
After the observation that the PET bottle market is expanding, two Japanese companies started the chemical recycling of PET in early 2000. [5] Teijin Fiber Co. employed a combination of methanolysis and glycolysis while AIES Co. employed glycolysis. Two more methods followed, alkali-decomposition with anhydrous base in ethylene glycol and methanolysis in supercritical fl uid. The outlines of those four methods are illustrated in Scheme 2. Their technologies seem to have no problem but they are, in fact, struggling in the waste bottle market facing a big Chinese demand for waste plastics.
2.2. Poly(carbonate) (PC)
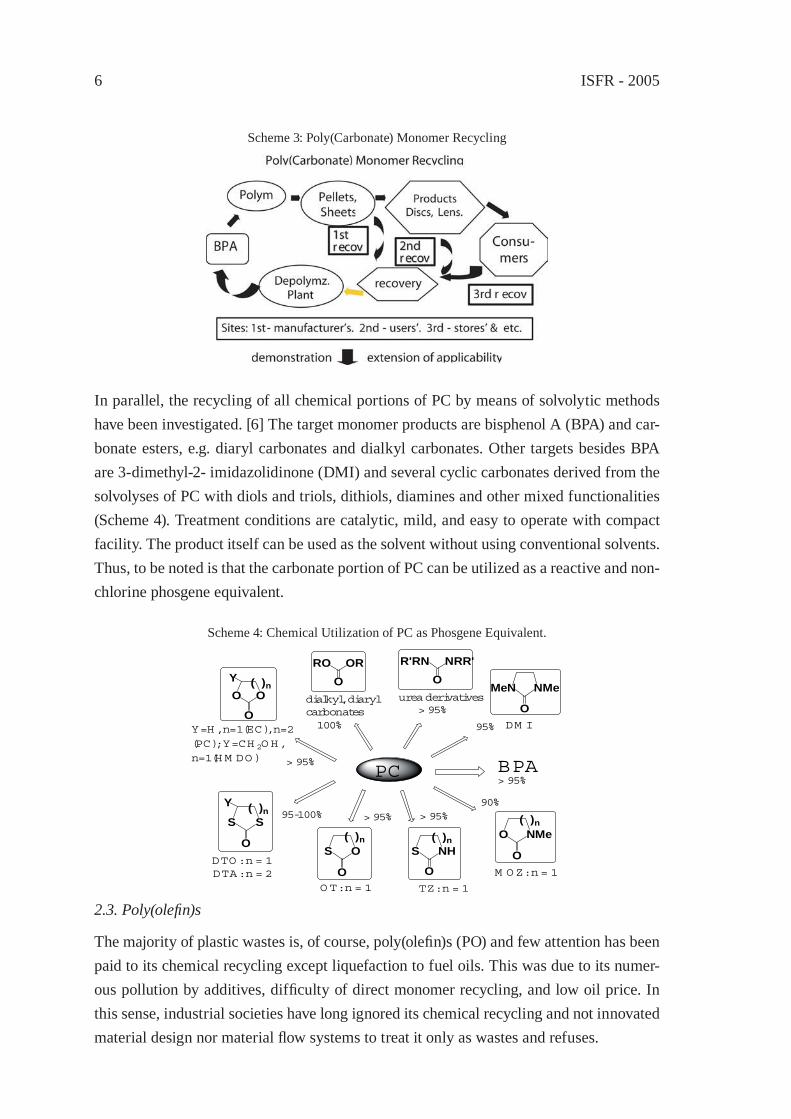
Teijin Chemical Co., the top PC maker in the country, has recently turned on the green signal to run the chemical recycling of PC wastes which are collected from both post-manufacture’s and post-consumer’s stages. Scheme 3 illustrates the material fl ow in this method. The chemical method employed is classical and one carbon is lost in the form of alkali carbonate. This is because optically high purity is needed for the reproduced PC and a low cost for facility investment must be needed. How to effectively collect cleaner wastes is again a big problem.
ISFR - 20056
Scheme 3: Poly(Carbonate) Monomer Recycling
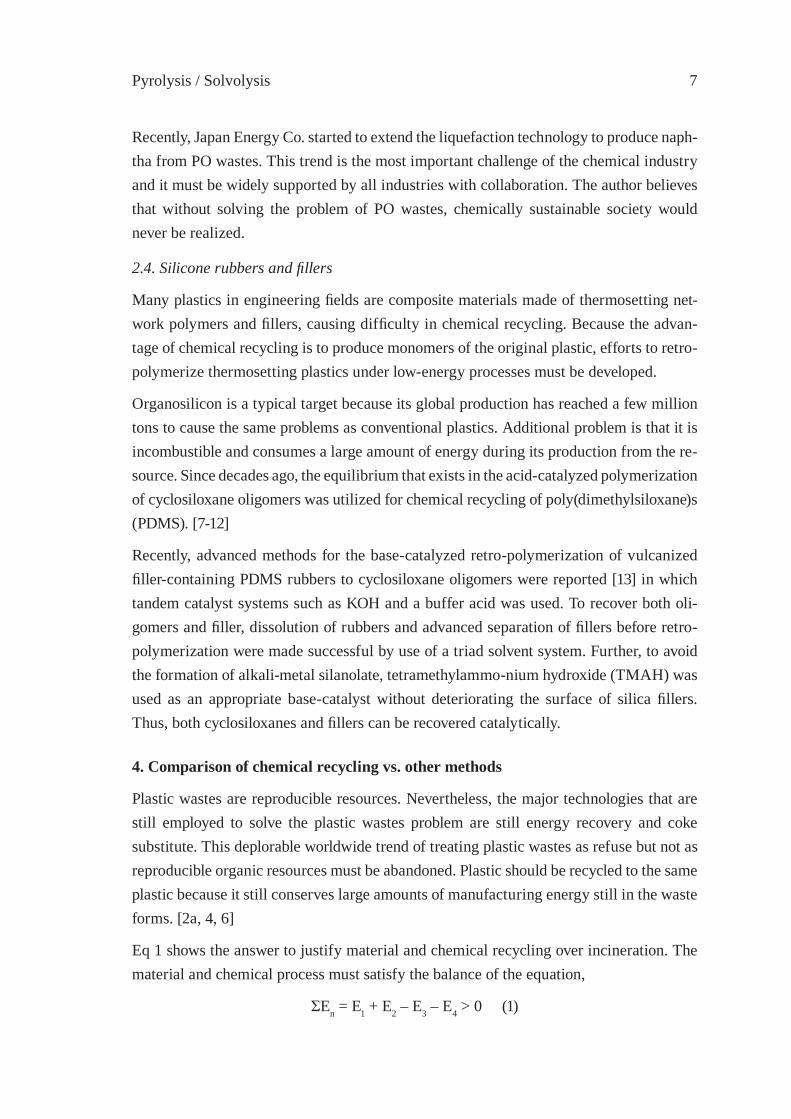
In parallel, the recycling of all chemical portions of PC by means of solvolytic methods have been investigated. [6] The target monomer products are bisphenol A (BPA) and car-bonate esters, e.g. diaryl carbonates and dialkyl carbonates. Other targets besides BPA are 3-dimethyl-2- imidazolidinone (DMI) and several cyclic carbonates derived from the solvolyses of PC with diols and triols, dithiols, diamines and other mixed functionalities (Scheme 4). Treatment conditions are catalytic, mild, and easy to operate with compact facility. The product itself can be used as the solvent without using conventional solvents. Thus, to be noted is that the carbonate portion of PC can be utilized as a reactive and non-chlorine phosgene equivalent.
Scheme 4: Chemical Utilization of PC as Phosgene Equivalent.
S S
OS O
O
O NMe
OS NH
ODTO: n = 1
O T: n = 1 TZ: n = 1
M OZ: n = 1DTA: n = 2
BPA
O O
O
Y
Y=H , n=1(EC), n=2 (PC); Y=CH 2O H, n=1(H M DO)
MeN NMe
O
RO ORO
( )n
( )n
( )n
( )n
( )n
R'RN NRR'O
Y
dialkyl, diarylcarbonates
urea derivatives
DM I95%
> 95%
> 95%
100%
> 95%
95-100% > 95% > 95%90%
PC
2.3. Poly(olefi n)s
The majority of plastic wastes is, of course, poly(olefi n)s (PO) and few attention has been paid to its chemical recycling except liquefaction to fuel oils. This was due to its numer-ous pollution by additives, diffi culty of direct monomer recycling, and low oil price. In this sense, industrial societies have long ignored its chemical recycling and not innovated material design nor material fl ow systems to treat it only as wastes and refuses.
Pyrolysis / Solvolysis 7
Recently, Japan Energy Co. started to extend the liquefaction technology to produce naph-tha from PO wastes. This trend is the most important challenge of the chemical industry and it must be widely supported by all industries with collaboration. The author believes that without solving the problem of PO wastes, chemically sustainable society would never be realized.
2.4. Silicone rubbers and fi llers
Many plastics in engineering fi elds are composite materials made of thermosetting net-work polymers and fi llers, causing diffi culty in chemical recycling. Because the advan-tage of chemical recycling is to produce monomers of the original plastic, efforts to retro-polymerize thermosetting plastics under low-energy processes must be developed.
Organosilicon is a typical target because its global production has reached a few million tons to cause the same problems as conventional plastics. Additional problem is that it is incombustible and consumes a large amount of energy during its production from the re-source. Since decades ago, the equilibrium that exists in the acid-catalyzed polymerization of cyclosiloxane oligomers was utilized for chemical recycling of poly(dimethylsiloxane)s (PDMS). [7-12]
Recently, advanced methods for the base-catalyzed retro-polymerization of vulcanized fi ller-containing PDMS rubbers to cyclosiloxane oligomers were reported [13] in which tandem catalyst systems such as KOH and a buffer acid was used. To recover both oli-gomers and fi ller, dissolution of rubbers and advanced separation of fi llers before retro-polymerization were made successful by use of a triad solvent system. Further, to avoid the formation of alkali-metal silanolate, tetramethylammo-nium hydroxide (TMAH) was used as an appropriate base-catalyst without deteriorating the surface of silica fi llers. Thus, both cyclosiloxanes and fi llers can be recovered catalytically.
4. Comparison of chemical recycling vs. other methods
Plastic wastes are reproducible resources. Nevertheless, the major technologies that are still employed to solve the plastic wastes problem are still energy recovery and coke substitute. This deplorable worldwide trend of treating plastic wastes as refuse but not as reproducible organic resources must be abandoned. Plastic should be recycled to the same plastic because it still conserves large amounts of manufacturing energy still in the waste forms. [2a, 4, 6]
Eq 1 shows the answer to justify material and chemical recycling over incineration. The material and chemical process must satisfy the balance of the equation,
ΣEn = E1 + E2 – E3 – E4 > 0 (1)
ISFR - 20058
where E1 = oil required as the energy for plastic manufacturing, E2 = oil as material re-source, E3 = oil required as the energy in reproduction process of plastic, E4 = oil equiva-lent to the energy recoverable from incineration.
If the balance ΣEn is positive, plastic wastes should be recycled because more than the oil corresponding to ΣEn can be saved, meaning that this oil is reproduced in addition to the plastic reproduction. A number of poly-condensation plastics including PET and PC are known to qualify this requirement so does poly(olefi n)s. To be stressed is that the systems and technologies are still the matter of continuous improvement.
5. Novel defi nition of resources for sustainability
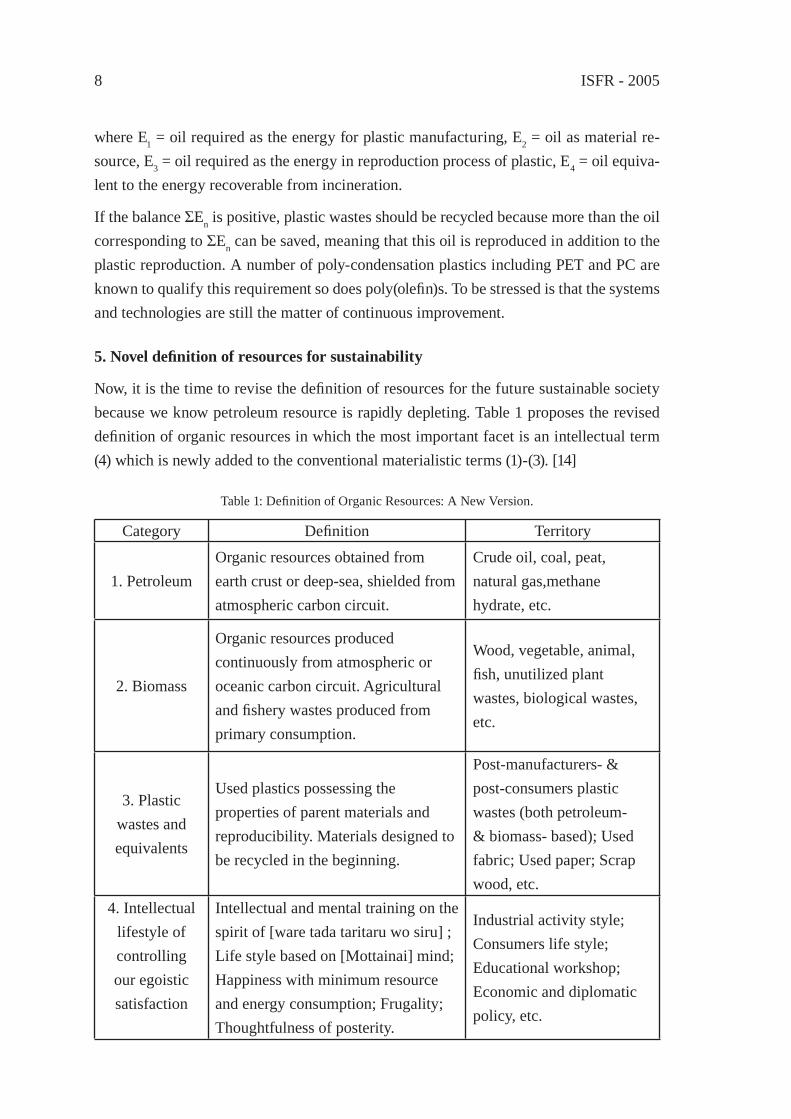
Now, it is the time to revise the defi nition of resources for the future sustainable society because we know petroleum resource is rapidly depleting. Table 1 proposes the revised defi nition of organic resources in which the most important facet is an intellectual term (4) which is newly added to the conventional materialistic terms (1)-(3). [14]
Table 1: Defi nition of Organic Resources: A New Version.
Category Defi nition Territory
1. PetroleumOrganic resources obtained from earth crust or deep-sea, shielded from atmospheric carbon circuit.
Crude oil, coal, peat, natural gas,methane hydrate, etc.
2. Biomass
Organic resources produced continuously from atmospheric or oceanic carbon circuit. Agricultural and fi shery wastes produced from primary consumption.
Wood, vegetable, animal, fi sh, unutilized plant wastes, biological wastes, etc.
3. Plastic wastes and equivalents
Used plastics possessing the properties of parent materials and reproducibility. Materials designed to be recycled in the beginning.
Post-manufacturers- & post-consumers plastic wastes (both petroleum- & biomass- based); Used fabric; Used paper; Scrap wood, etc.
4. Intellectual lifestyle of controlling our egoistic satisfaction
Intellectual and mental training on the spirit of [ware tada taritaru wo siru] ; Life style based on [Mottainai] mind; Happiness with minimum resource and energy consumption; Frugality; Thoughtfulness of posterity.
Industrial activity style; Consumers life style; Educational workshop; Economic and diplomatic policy, etc.

Pyrolysis / Solvolysis 9
Taking the plastic resources in consideration, the fi rst resource (1) is petroleum that was and will be most reliable for long. In parallel, the second resource (2) is biomass that connects our future dream more or less to sustainability because, in principle, biomass is reproducible regardless of how we behave now. Defi nition of the third resource (3) includes plastic and other massive organic wastes. This is rather new but not novel nowa-days. Regardless of petroleum or biomass, plastic wastes reserve considerable amounts of manufacturing energy which is generally larger than the petroleum used for materials. Thus, incineration and biodegradation are the methods that reject this precious energy wastefully and do not recover it.
The fourth defi nition of resource (4) proposed here is a novel addition. It centers a Zen concept [: ware tada taritaru wo siru], an old Japanese-Chinese phrase being taught at Zen temples, and it is a powerful help of “Reduction” among three Rs. This phrase deal-ing with the problem of intellectual control of satisfaction must be translated to meet the future life style with deep appreciation. It says that without intellectual and mental power, we could never control our egoistic demanding for economic prosperity, technology, and easy way of life. This is also equivalent to another phrase “frugality is the biggest natural resource” as is proposed by H. Shingu. [15]
Although term (4) is our eternal problem, other terms are solvable. The solution is hold by industrial, economic, and political society whose eyes are directed toward posterity.
6. References
[1] (a) C. J. Campbell, JH. Laherrere. Scientifi c American 1998 (March); 78.[2] Reviews: (a)A. Oku. Fiber (Sen-i Gakkaishi) 1999; 55: 166. (b) A. Oku, J. Japanese
Society of Waste Management Experts, 2002, 13, 91.[3] JCII Report, Japan, “Proposal of New Strategy for the Recycling of Plastic Wastes”.
May 2001.[4] A. Oku “Biomass: dark sides and bright sides”, Nippon Hyoron Sha (2005).[5] (a) A. Oku, L.-C. Hu, E. Yamada. J. Appl. Polym. Sci. 1997; 63: 595. (b) L.-C. Hu, A.
Oku, E. Yamada. Polymer 1998; 39: 3841. [6] (a) S. Hata, H. Goto, E. Yamada, A. Oku, Polymer, 2002, 43, 2109. (b) S. Hata, H.
Goto, A. Oku, J. Appl. Polym. Sci., 2003, 90, 2959. (c) A. Oku, S. Tanaka, S. Hata, Polymer 2000; 41: 6749.
[7] T. A. Koshkina, A. V. Kisina, A. S. Shapatin, Zh. Prikl. Khim., 1993, 66, 1662.[8] (a) T. D. Wilford, DE Pat. 4300168, 1994. (b) C. V. Allandrieu, D. V. Cardinaud, DE
Pat. 19619002, 1996. (c) J. S. Razzano, US Pat. 6037486, 2000.[9] W. Knies, G. Vogel, V. Frey, DE Pat. 4126319, 1992.[10] T. Bunce, A. E. Surgenor, GB Pat. 2331992, 1999.
ISFR - 200510
[11] P. Hron, M. Schätz, Plasty Kaučuk, 1990, 27, 33.[12] W. Knies, G. Vogl, W. Guske, DE Pat. 19502393, 1996.[13] (a) W. Huang, Y. Ikeda, A. Oku, Polymer, 2003, 43, 7289. (b) A. Oku, W. Huang, Y.
Ikeda, Polymer, 2002, 43, 7295. (c) Y. Ikeda, W. Huang, A. Oku, Green Chemistry, 2003, 5, 508.
[14] A. Oku, “Reproduction of Plastic. Resource-consciousness of Scientists and Technologists” (Japanese). Invited chapter to Chemistry (Kagaku), Kagaku Dojin, 2005, in press.
[15] H. Shingu, The Science Council of Japan, National Symposium on Atomic Energy, Tokyo, Proceedings (Japanese) pp.71-76 (May, 2005).

Pyrolysis / Solvolysis 11
PYROLYSIS OILS OF PLASTIC WASTESM. Blazsó
Institute of Materials and Environmental Chemistry, CRC, Hungarian Academy of Sciences, Budapest, Hungary, [email protected]
Abstract: A series of synthetic polymers that are frequent components of several types plastic wastes have been pyrolysed, and the resulting oils were analysed by GC-MS. The relative contribution of four distillation fractions of pyrolysis oil (gasoline, diesel oil, heavy oil, and wax) depends very much on the nature of the polymers pyrolysed. Gasoline fraction in rubber, ABS, ester segmented polyurethane, phenolic resin and PVC pyrolysis oil are similarly dominant, but their chemical composition is quite different. The detailed analysis of the oil constituents reveals the dangers of polluting or toxic compounds or precursors, as well as reactive components. A few potential upgrading ways are demon-strated by transformation and/or elimination of toxic and reactive compounds with silica-alumina or zeolite catalysts.
1. Introduction
Most polymers composing the wide variety of plastic wastes are converted at least partly to compounds of low molecular mass by pyrolysis, in a volatility range typical for oils. The plastic waste pyrolysis oils are expected to have of high calorifi c value because of their high carbon and hydrogen contents. Nevertheless, the chemical composition of sev-eral widespread polymers differs considerably from that of petroleum, having much high-er oxygen and nitrogen content. The pyrolysis oils of such materials are of less promising quality. Moreover, other characteristics of oils - such as stability and cleanliness - should be also seriously taken into consideration, when wastes are the feed of pyrolysis oil gen-eration.
On line pyrolysis-GC/MS analysis of a plastic provides fast and one run information on the chemical composition of pyrolysis products within the whole range of volatility from gases to heavy oils [1]. In this work results obtained by this method on a variety of plastics are outlined in order to achieve a wide-ranging picture on the relation between the nature of plastic waste and the chemical composition of the pyrolysis product components of various volatility in the resulting pyrolysis oil.
The detailed analysis of the constituents of pyrolysis oils produced from common waste plastic types reveals the presence of reactive components responsible for oil instability, moreover, toxic compounds or precursors could be also traced. Potential upgrading ways of the pyrolysis oils are proposed for the elimination of such elements.
ISFR - 200512
2. Oil obtained by thermal decomposition of waste plastics
Oils are generated from most synthetic polymers at above the temperature at which they start to decompose: generally between 350-600 °C. At considerably higher temperatures thermal cracking commonly produces more gaseous products, while carbonisation lead-ing to char may be also more extensive. The pyrolytic oils characterised in this work were obtained for each polymer at 50-100 °C higher temperature than the decomposition started.
2.1. Volatility ranges of plastic derived oils
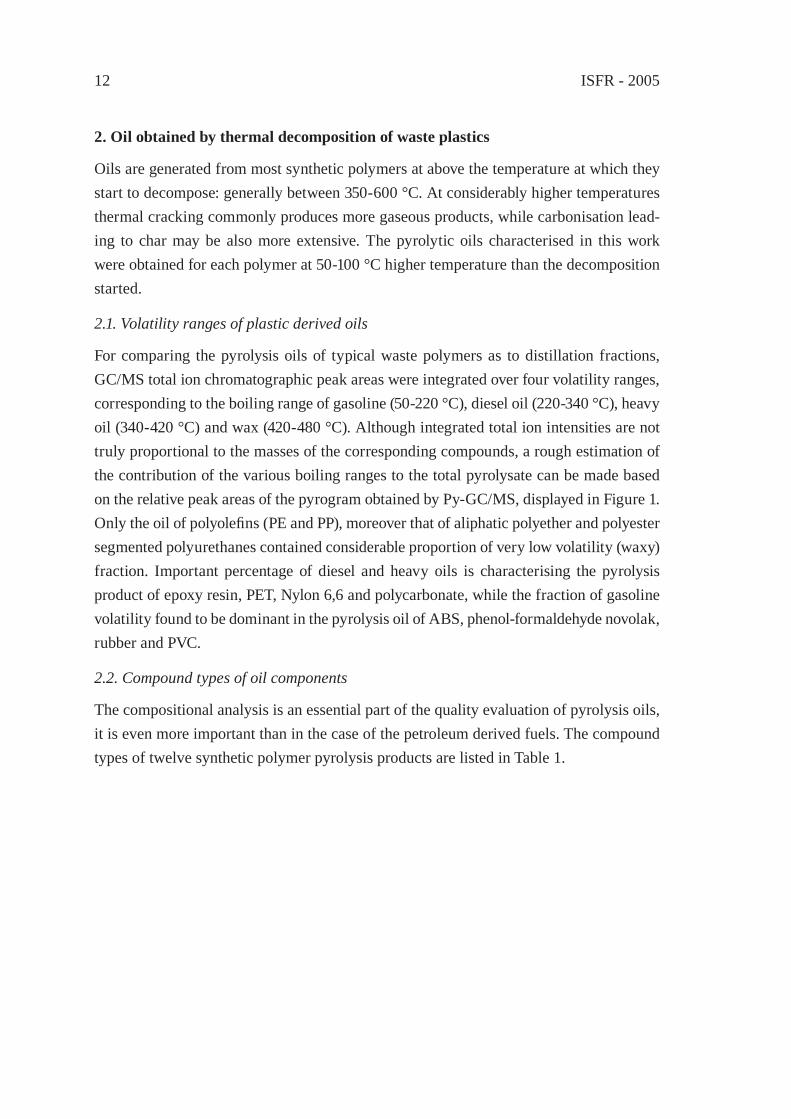
For comparing the pyrolysis oils of typical waste polymers as to distillation fractions, GC/MS total ion chromatographic peak areas were integrated over four volatility ranges, corresponding to the boiling range of gasoline (50-220 °C), diesel oil (220-340 °C), heavy oil (340-420 °C) and wax (420-480 °C). Although integrated total ion intensities are not truly proportional to the masses of the corresponding compounds, a rough estimation of the contribution of the various boiling ranges to the total pyrolysate can be made based on the relative peak areas of the pyrogram obtained by Py-GC/MS, displayed in Figure 1. Only the oil of polyolefi ns (PE and PP), moreover that of aliphatic polyether and polyester segmented polyurethanes contained considerable proportion of very low volatility (waxy) fraction. Important percentage of diesel and heavy oils is characterising the pyrolysis product of epoxy resin, PET, Nylon 6,6 and polycarbonate, while the fraction of gasoline volatility found to be dominant in the pyrolysis oil of ABS, phenol-formaldehyde novolak, rubber and PVC.
2.2. Compound types of oil components
The compositional analysis is an essential part of the quality evaluation of pyrolysis oils, it is even more important than in the case of the petroleum derived fuels. The compound types of twelve synthetic polymer pyrolysis products are listed in Table 1.
Pyrolysis / Solvolysis 13
0%
20%
40%
60%
80%
100%
PE PP PU-es ter PU-ether
50-220
220-340
340-420
420-480
0%
20%
40%
60%
80%
100%
Epoxy PET Nylon 6,6 PC
50-220
220-340340-420
0%
20%
40%
60%
80%
100%
ABS Ph-form Rubber PVC
50-220220-340340-420
Figure 1: Contribution of the various boiling ranges to the total pyrolysis oil of synthetic polymers(Short names of the polymers are defi ned in Table 1).

ISFR - 200514
Table 1: Chemical composition of the various pyrolysis oil distillation fractions.
Polymer Short namePyrolysis products
Volatility range (°C)
Compound type
Polyethylene PE 50-480 n-alkanes, -alkenes, -alkadienes
Polypropylene PP 50-480 iso-alkanes, -alkenes, -alkadienes
Polyisoprene Rubber 50-420 iso-alkadiene, alkenylcycloalkene
Phenol-formaldehyde novolak Ph-form
50-220
340-420
phenol, alkylphenols
alkylenebisphenols
Poly(ethylene terephthalate) PET
50-340
340-420
aromatic acids, esters
aromatic esters
Polycarbonate PC
70-220
220-340
340-420
phenol, alkylphenols
alkenylphenols, phenylalkylphenols
alkylenebisphenols
Epoxy resin Epoxy
50-220
220-340
340-420
phenol, alkylphenols
alkenylphenol
alkylenebisphenols
Poly(vinyl chloride) PVC 50-340 aromatic, alkylaromatic
Poly(acrylonitrile-co- butadiene -co-styrene) ABS 50-420 alkenyl-, alkylbenzene alkenyl-,
alkylnitrile
Polyurethane, polyester segmented PU-ester
50-220
220-340
340-420
420-480
alkanediole, alkanoic ketone, ether
alkanoic esters
aromatic isocianate
alkanoic esters
Polyurethane, polyether segmented PU-ether
50-220
220-340
340-420
420-480
alkanediole, alkanoic ethers
alkanoic ethers
aromatic isocianate
alkanoic ethers
Polyamide 6,6 Nylon 6,650-220
220-420
alkanoic ketone, -amine, -nitrile
alkylamides

Pyrolysis / Solvolysis 15
The chemical nature of pyrolysis products varies from polymer to polymer and in several cases from fraction to fraction as well. Although the compounds originating from the thermal decomposition of a given polymer are refl ecting the chemical structure of the macromolecule, the disintegration pathway more often leads through the rearrangement of a particular molecular segment than by mere scission of the chemical bonds [2]. In some cases the elemental composition of the pyrolysis oil is noticeably different from that of the source polymer due to the elimination of small molecules in to the gaseous phase, such as carbon monoxide and carbon dioxide from polyester, polyamide and polycar-bonate, water from polyamide and phenolic resin, aceto- and acrylonitrile from ABS, and hydrogen chloride from PVC.
There are several reactive compounds in nearly all kinds of pyrolysis oil that are respon-sible for instability, such as alkenes, alkadienes, alkenyl group containing compounds produced from PE, PP, ABS and rubber, phenols from phenolic and epoxy resins and from polycarbonate, acids from polyesters, isocianates from polyurethanes, amines from polyamides. Hence the fractions in which these components are present must be treated to enhance their stability, if stored or transported prior to utilisation.
2.3. Polluting or toxic compounds
The pyrolysis oil of plastics wastes for fuel utilization should be strictly controlled be-cause they contain not only hydrocarbons. The materials composed only of hydrogen and carbon atoms are producing only carbon oxides and water when burned completely. But plastics contain components originating from processing (colorants, fi llers, soften-ers, fl ame retardants, antioxidants, etc) that may be the source of polluting or toxic com-pounds. From the point of view of environmental protection we must be aware of the presence of chlorine- and bromine-containing compounds in the plastic wastes. PVC is the most frequent source of chlorinated components, while brominated compounds ap-plied for fl ame retardance may have also important contribution for instance in electronic wastes. The critical combustion products of nitrogen-containing compounds (amides, amines, nitriles) the nitrogen oxides (NOX) are not welcomed either. Fortunately syn-thetic polymers rarely contain sulfur, so evolution of sulfur dioxide is atypical in the case of most pyrolysis oils.
3. Upgrading pyrolysis oils
The technologies developed for refi ne petroleum-derived fuel oils are available but should be utilized with precautions for improving pyrolysis oils. The special characteristics of nearly each of the huge variety of pyrolysis oils require new techniques for getting stable and clean fuel.
ISFR - 200516
3.1. Changing volatility range
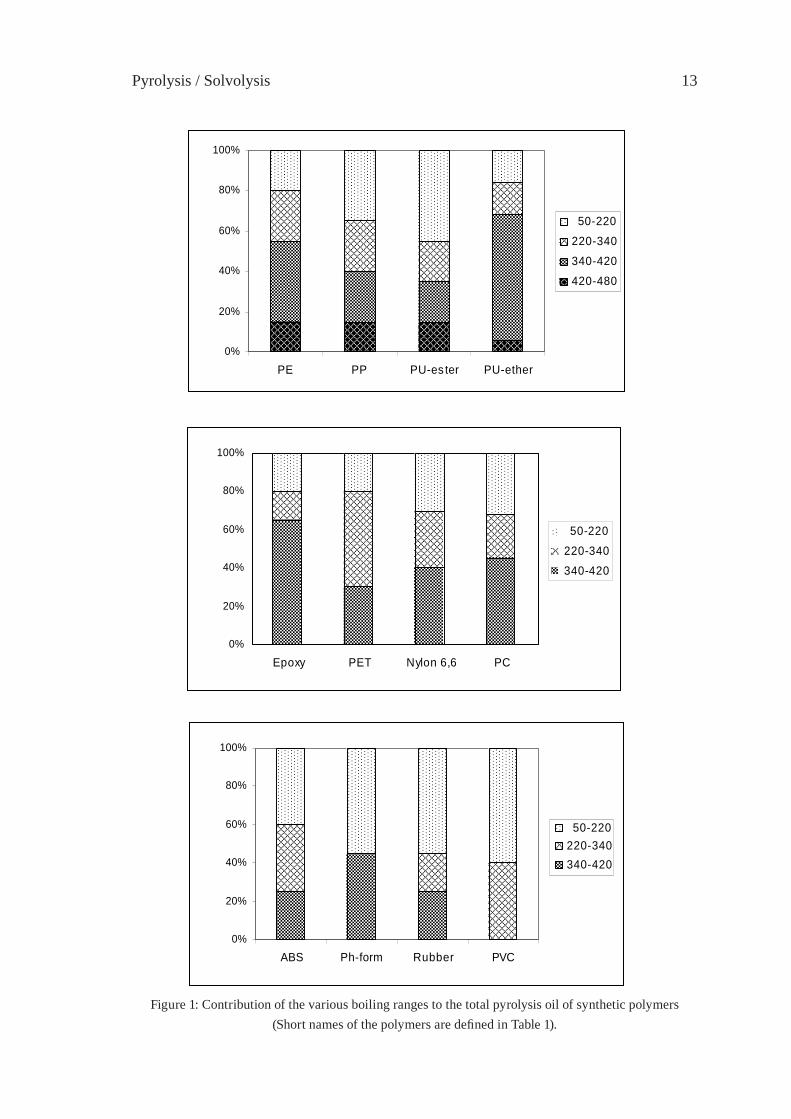
Since several polymers are decomposing to numerous compounds by pyrolysis covering a quite wide distillation range, silica-alumina and zeolite may be useful catalysts for chang-ing volatility range of pyrolysis oils [3]. In Figure 2 the chromatograms of the same HDPE pyrolysis oil are compared when passed through a sodium zeolite and a fl uid cracking catalyst bed. It is important to note that not only the volatility but the nature of the prod-ucts are also changed: alkenes and alkadienes have been transformed partially to alkanes by sodium zeolite and to aromatic hydrocarbons by fl uid cracking catalyst.
5 10 1 5 20 25 Retention time /min
HDPE
through FCC
through NaY
50-220°C 220-340°C 340-420°C Distillation range
Figure 2: Gas chromatogram of HDPE pyrolysis oil obtained at 500 °C (bottom)that passed through Na Y zeolite (second row) and through FCC bed (top).
Cracking catalysts are converting dimers and trimers produced by pyrolysis from ABS in to monomers. In this way the gasoline range fraction in the pyrolysis oil is considerably enhanced, at the same time the unsaturated compounds are partially saturated, namely ethylbenzene formed from styrene. Moreover, the nitrogen content of the gasoline frac-tion is diminished, because acrylonitrile monomer moved out to the gaseous phase.
3.2. Elimination of reactive components
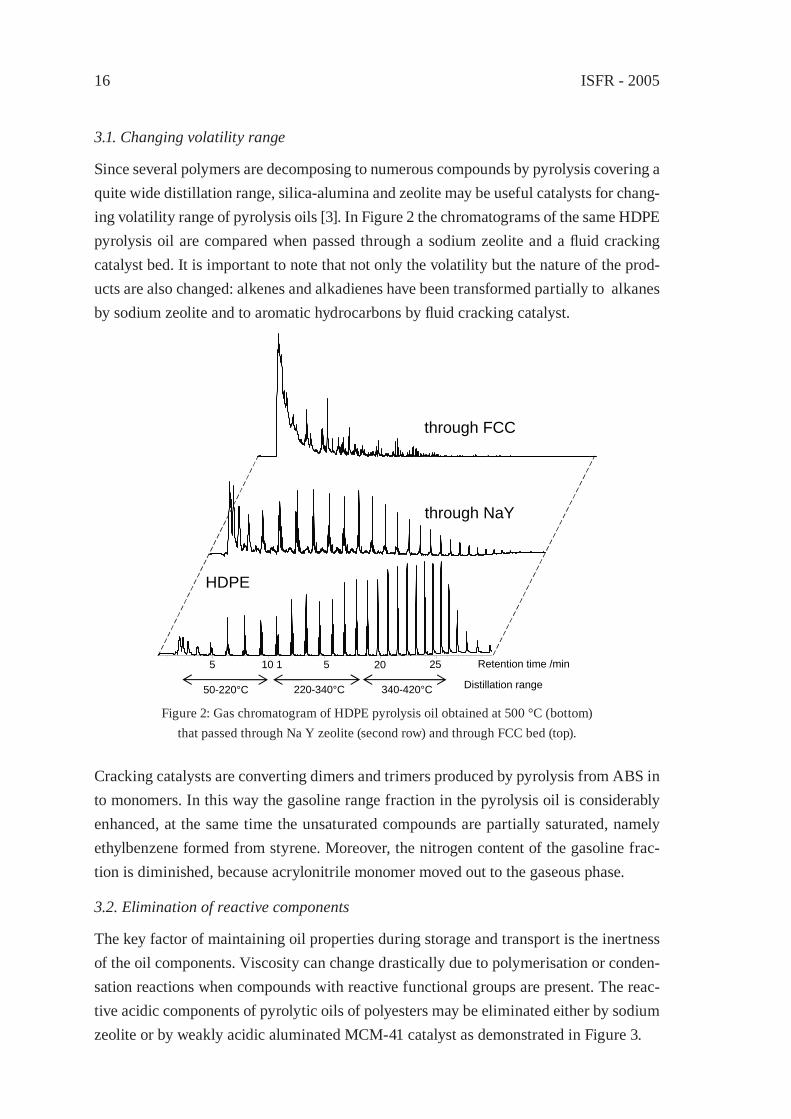
The key factor of maintaining oil properties during storage and transport is the inertness of the oil components. Viscosity can change drastically due to polymerisation or conden-sation reactions when compounds with reactive functional groups are present. The reac-tive acidic components of pyrolytic oils of polyesters may be eliminated either by sodium zeolite or by weakly acidic aluminated MCM-41 catalyst as demonstrated in Figure 3.
Pyrolysis / Solvolysis 17
4 8 12 1 6 20 24
Retention time /min
Ac E
Ac E
d
E
b b
CO2
CO2
CO2
d
PET pyrolysate
through Na Y
through MCM-41
E
Figure 3: Gas chromatogram of PET pyrolysis products at 500 °C (bottom),that obtained through Na Y zeolite (second row), and through MCM-41 silica-alumina (top).
Ac, aromatic carboxylic acid; E, aromatic acid ester; b, benzene; d, biphenyl.
3.3. Elimination or separation of polluting compounds
Chlorinated organic compounds may be formed during pyrolysis of such plastic wastes in which PVC is one of the components [4, 5]. Brominated bisphenolic fl ame retardants thermally decompose to bromo-, dibromo- and tribromophenols. It must be taken into consideration that chlorinated and brominated phenols are precursors of polychlorinated and polybrominated dibenzodioxins (PCDD and PBDD), thus dehalogenation is essential before using halogenated phenol containing pyrolysis oil as a fuel. Sodium forms of zeo-lite (13X and NaY molecular sieves) proved to be successful dehalogenating catalyst for cleaning pyrolysis oils of electronic wastes [6].
References
[1] Blazsó, M., J. Anal. Appl. Pyrol. 39:1 (1997).[2] Stivala, S.S., Kimura, J., and Reich, L., in Degradation and Stabilisation of
Polyolefi ns, Jellinek, H.H.G. (Ed), Elsevier, Amsterdam, 1983. pp.1- 65.[3] Uemichi, Y., Nakamura, J., Itoh, T., Sugioka, M., Garforth A.A., and Dwyer, J.,
Ind. Eng. Chem. Res. 38:385 (1999).[4] Blazsó, M., J. Anal. Appl. Pyrol. 51:73 (1999).[5] Kubatovics, F., and Blazsó, M., Macromol. Chem. Phys. 201: 349 ( 2000).[6] Blazsó, M., J. Anal. Appl. Pyrol. 74:344 (2005).

ISFR - 200518
Pyrolysis / Solvolysis 19
DEVELOPMENT OF WASTE PLASTICS LIQUEFACTION TECHNOLOGY, FEEDSTOCK RECYCLING IN JAPAN
M. Shioya1, T. Kawanishi2, N. Shiratori2, H. Wakao3, E. Sugiyama4, H. Ibe4, T. Abe5
1Sapporo Plastics Recycling Co., Ltd., 45-57 Nakamura-Cho, Higashi-ku, Sapporo-shi, Hokkaido, Japan
2Petroleum Refi ning Research & Technology Center, Japan Energy Corporation3-17-35 Niizo-Minami Toda-shi, Saitam, Japan
3Petroleum Refi ning Dept., Japan Energy Corporation2-10-1 Toranomon, Minato-ku, Tokyo, Japan
4Toshiba Corporation, 1-1, Shibaura 1-Chome, Minato-ku, Tokyo, Japan5Rekiseikouyu Co., Ltd., 3-1 Heiwa-Cho, Niigata-shi, Niigata, Japan
[email protected], Fax +81-3-5444- 9289
Abstract: As already introduced in ISFR99 and ISFR2002, Sapporo Plastics Recycling Co., Ltd. (SPR) in Sapporo Japan and Rekiseikouyu Co., Ltd. in Niigata Japan had de-veloped and put to practical use of the liquefaction processing plant for municipal waste plastics including PVC and PET. SPR’s system is designed for 14,800 ton (7,400 ton / year x 2 lines) per year of municipal waste plastics, and has been operated since 2000. And Rekiseikouyu’s system is designed for 6,000 ton per year of municipal waste plastics, has been operated since 1999.From the 2004 fi scal year, the actual proof of the Feedstock Recycling which returns the generation oil of both the liquefaction processing plant of Sapporo-shi and Niigata-shi to an oil refi nery was started towards realization of liquefaction - Feedstock Recycling of a future waste plastic still more.
1. Introduction
The Kyoto Protocol also went into effect this year, and everybody’s positive measure which turned the global warming stop to reduction of the greenhouse gas in an earth scale at the slogan has been needed increasingly. Should not just Japan which imported especially most petroleum resources in large quantities, and has enjoyed the comfortable living environment for it to origin stop exporting a waste plastic easily, and should not tackle construction of resource circulation type society and local adhesion type recycle-orientation?
Although the self-governing bodies which collect a waste plastic separately are increas-ing in number gradually in Japan, „ liquefaction - feedstock recycling“ of a waste plastic makes the basis of the waste plastic recycling in Container Packaging Recycling Law of Japan as a positive measure for the resource circulation type society rooted in an area while having the feature which was excellent in the correspondence to a resource drain
ISFR - 200520
problem, reduction of environmental load, the fl exibility of a recycled article, the possi-bilities to the future, etc., and thinks that the further promotion and progress are required. Even if it turns its eyes to the crude-oil jump of these days, we think that the importance is increasing day by day.
2. Outline of Plastic Recycling Plant in Japan
Two large-sized waste plastics liquefaction processing plants are located in Japan now. Sapporo Plastic Recycling Co., Ltd. (abbreviated name; SPR) was installed in Sapporo-shi which performs the original idea of Container Packaging Recycling Law faithfully and the basis of the Sapporo citizen cooperation, and the city recycling housing complex, and time was started to formal enforcement of the law and it started commercial operation in April in 2000 in all.
Toshiba Corp. takes charge of technical development, a design, and construction, and waste plastic acceptance capability is 14,800t/year (7,400t/year (21.75t/(day)) x 2 lines). Although fi ve years or more pass after an operation start, by the load beyond predeter-mined capability (the amount of piece series of liquefaction processing equipment rated processings; 20t/(day)), stable operation is continued favorably. In Japan, the amount of waste plastic arrival of goods has also increased every year in the situation whose self-governing body which collects a general system waste plastic separately increases gradu-ally.
On the other hand, although Rekiseikouyu Co., Ltd. in Niigata-shi will pass seven years or more after an operation start, it receives the general system waste plastic of Niigata-shi, and is continuing operation favorably.
3. Track Record Outline of SPR Plant
The general system waste plastic collected by type from ordinary homes by the coopera-tion of a self-governing body to collect separately is liquefaction processed after carrying in and a pretreatment after foreign substance separation of metal with the sorting facili-ties of each self-governing body in the back liquefaction processing plant compressed and packed up in the shape of a veil.
3P (Polyethylene(PE), Polypropylene(PP), Polystyrene(PS)) are suitable for processing, and although Polyvinyl chloride(PVC), Polyvinylidene chloride(PVDC), and Polyvinyli-dene terephthalate(PET) are unsuitable and it also becomes the prevention factor of cor-rosion or a blockade, as for 3P contained in the general system waste plastic discarded from a home, various waste plastic and a foreign substance are intermingled at about 60 percent. The liquefaction processing plant enabled processing in the state (a SPR plant in all [ PVC, PVDC, PET ] about 18%) where PVC with diffi cult sorting, PET, etc. mixed,
Pyrolysis / Solvolysis 21
out of the collected general system waste plastic, and it was realized aiming at the stable type recycling plant of the local adhesion type which liquefaction-processing a general system waste plastic collectively.
From the 2004 fi scal year, the actual proof of the feedstock recycling which returns the generation oil of both the liquefaction processing plant of Sapporo-shi and Niigata-shi to an oil refi nery was started towards realization of „liquefaction - feedstock recycling“ of a future waste plastic still more.
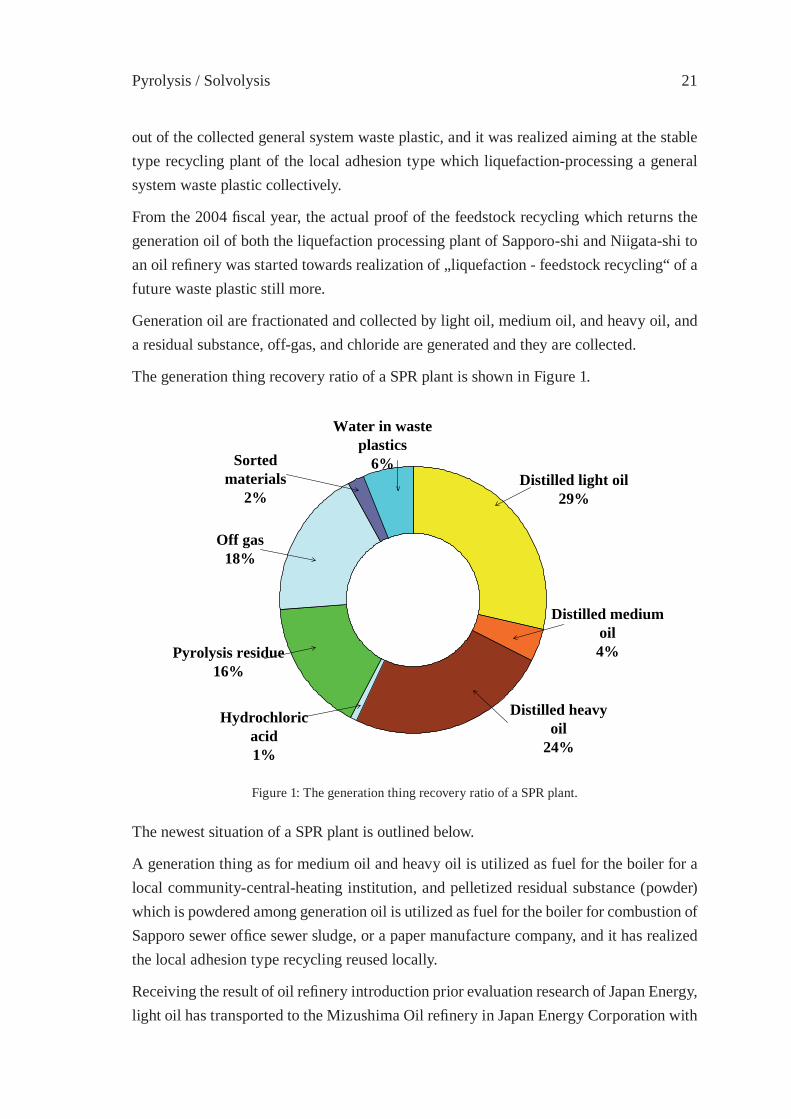
Generation oil are fractionated and collected by light oil, medium oil, and heavy oil, and a residual substance, off-gas, and chloride are generated and they are collected.
The generation thing recovery ratio of a SPR plant is shown in Figure 1.
Water in wasteplastics
6%Sortedmaterials
2%
Off gas18%
Pyrolysis residue16%
Hydrochloricacid1%
Distilled heavyoil
24%
Distilled mediumoil4%
Distilled light oil29%
Figure 1: The generation thing recovery ratio of a SPR plant.
The newest situation of a SPR plant is outlined below.
A generation thing as for medium oil and heavy oil is utilized as fuel for the boiler for a local community-central-heating institution, and pelletized residual substance (powder) which is powdered among generation oil is utilized as fuel for the boiler for combustion of Sapporo sewer offi ce sewer sludge, or a paper manufacture company, and it has realized the local adhesion type recycling reused locally.
Receiving the result of oil refi nery introduction prior evaluation research of Japan Energy, light oil has transported to the Mizushima Oil refi nery in Japan Energy Corporation with

ISFR - 200522
the light oil generated in Rekiseikouyu Co., Ltd., Inc. of Niigata-shi in order to aim at the feedstock recycling to oil refi ning from April, 2004, and actual proof operation which utilizes hydrogenation refi ning equipment there and attains reuse-ization as petroleum products was started. This „liquefaction - feedstock recycling“ is the fi rst in Japan. The track record that waste plastic generation light oil could be processed favorably without problem was made a 2004-fi scal year.
Moreover, chloride is also recycled as a neutralizer of a local papermill among generation things, and stable operation is under continuation in the state of full recycling except slight moisture and pretreatment residual substances (metal foreign substance etc.). Transition of the amount of waste plastic arrival of goods and the amount of liquefaction processings for every fi scal year since SPR plant operation start from 2000 are shown in Figure 2.
0
2,000
4,000
6,000
8,000
10,000
12,000
14,000
2000 2001 2002 2003 2004 2005
[ton]
the amount of wasteplastic arrival of goods�
the amount of liquefaction processings
Figure 2: Transition of the amount of waste plastic arrival of goods and the amount of liquefaction processings for the every fi scal year since SPR plant operation start from 2000.
Main technical features are the following three points.1) The measure against mixing of PVC and PET in a waste plastic 2) Normal pressure thermal reactor which raised the rate of liquefaction conversion3) Generation of the oil which is excellent in fl exibility
Main technical issues for success of these systems were countermeasures for decomposed gas of PVC and PET that may cause blockage or corrosion of the systems, we have con-quered these technical issues and continuing favorable stable operation.
In recent years, in Japan, the amount of PET used is increasing and the amount of PET mixing to the liquefaction processing plant is increasing. The quantity of PET mixed into waste plastic materials in connection with this has also been increasing. (In SPR, about 15% of PET mixes)
However, when PET mixed into the waste plastic, benzoic acid generated in heat decom-position at low temperature (400 oC or less), and also in SPR, the following big two prob-

Pyrolysis / Solvolysis 23
lems arose in the initial stage of operation owing to this.
1) Distillation tower is damaged by high temperature corrosion.
2) Blockade of heavy oil piping and heat exchanger by the corrosion product.
As solution of these problems, the measure which adds the small quantity of slaked lime was performed to the pelletized waste plastic by SPR.
The benzoic acid generated by heat decomposition of PET became benzoic acid calcium (solid) by this, this will come to be discharged by the residual substance, and mixing in generation oil will be avoided. This measure is successful, the measure against PET mix-ing which could not be made in what the liquefaction processing plant is achieved, and it came to be able to perform stable operation after it.
4. Progress Situation of Feedstock Recycling
Although decomposition oil is distilled and being fractionated in both the liquefaction processing plant of Sapporo-shi and Niigata-shi to light oil, medium oil, and heavy oil, there are many generation ratios of the light oil of gasoline, and surplus lightweight crude oil has occurred according to change and the seasonal factor of the amount of accept-ance.
From the 2004 fi scal year, actual proof operation of feedstock recycling was started at the Mizushima oil refi nery. Actual proof operation which aimed at application to the techni-cal real equipment developed on the laboratory level aims at grasp of the problem at the time of the light oil processing in real equipment, and establishment of the solution.
The subject for performing actual proof operation, its purpose, and the present situation are shown in Table 1. It generates in both the liquefaction-processing plant, and light oil is transported to the Mizushima oil refi nery, and is once sent to the tank.
Hydrogenation refi ning equipment has the function to remove the nitrogen compounds, sulfur compounds and so on for using as naphtha for petrochemical industry. About 800kl of light oil was treated in the 2004 fi scal year. Various problems were able to be cleared and it was able to leave the track record that light oil could be processed favorably. The waste plastic generation light oil of as planned 1500kL of the beginning the 2005 fi scal year which corresponds in 2nd of actual proof operation is due to be processed.

ISFR - 200524
Table 1: Check item at the time of actual proof operation in an oil refi nery.
Check item Purpose The present situation
Properties Grasp of the variation in the quality of decomposition oil
<Good>The properties of light oil are
stable.
Storage stabilities Grasp of the stability within a tank
<Good>There are no problems for
storage.
Mixed stabilities
Grasp of the stability at the time of mixture with the
equipment materials oil for processing
<Good>There are no problems of
mixing with various fractions of petroleum.
Thermal stabilitiesDirt to heat exchanger and a heating furnace, infl uence of
getting blocked.
<Good>There are no infl uence on the
fouling.
Corrosive Infl uence on into a tank and piping.
<Good>With no problem in operation
Hydrogenation refi ning
Examination of process-ing conditions, infl uence on a catalyst life and product
quality.
<Good>There is no infl uence on a ca-talyst life and product quality.
5. Future liquefaction - feedstock Recycling Model
In both the liquefaction process plant of Sapporo-shi and Niigata-shi, the operation track record is steadily improved as a liquefaction-processing plant which can also accept and process the waste plastic which is not suitable for liquefaction process of PVC, PET, etc. for general system waste plastic. By carrying the generation oil of an liquefaction process plant into oil-refi ning plants, such as an oil refi nery, as it is as in the future as promotion of feedstock recycling, the true recycling returned to the oil which is the materials of waste plastic where the large cost cut of liquefaction-processing plant is aimed at is realized, it is more economical, discharge of carbon dioxide is suppressed as much as possible, and the prospect that the small adhesion type advanced chemical recycling plant of environ-mental load is realizable is fully. The „liquefaction - feedstock recycling model plan“ to realize the above is shown in Figure 3.
Pyrolysis / Solvolysis 25
6. Conclusion
Waste plastic liquefaction which is true resource circulation recycling of a plastic - oil refi nery feedstock recycling - plastic production of the generation oil by liquefaction - the prospect that the circulation loop of the formation of waste plastic oil was realizable showed a certain thing enough.
For Japan which depends for most crude oil from the Middle East on import, the measure against security of petroleum-resources energy is becoming still more important by the crude-oil jump of these days. It is thought that it is indispensable to promote the technol-ogy of the formation of feedstock recycling of a waste plastic when establishing local adhesion type recycling and recycling technology which build true recycle orientation and resource circulation type society, and the whole world reaches far and wide. On the occa-sion of Container Packaging Recycling Law revision this year in Japan, this fundamental soul is incorporated exactly, the priority of “liquefaction - feedstock recycling” increases, and it is requested strongly that the ground in which this technology spreads through the world widely is established.
References
[1] Eiichi Sugiyama, H.Ibe, “A Process of Municipal Waste Plastic Thermal Dwgrada-tion into Fuel Oil” ISFR 1999-11.
[2] H.Ibe, Eiichi Sugiyama, Masaaki Fukushima, Shigeshirou Takahashi “Operarional Report of Waste Plastic Liquefation Plant in Japan” ISFR 2002-11.

ISFR - 200526
Pyrolysis / Solvolysis 27
REACTOR DESIGN AND OPERATION OFSMALL-SIZE LIQUEFACTION PLANTS FOR WASTE PLASTICS
Y. Kodera1*, Y. Ishihara1, K. Saido2 and T. Kuroki3
1National Inst. for Adv. Industrial Sci. & Tech., Tsukuba, Japan2Nihon University, 3Polymer Decomposition Lab. Inc., Miyazaki, Japan
Abstract: A small-scale fuel production is an important solution to the feedstock recycling of post-consumer plastic wastes in terms of the costs of waste collection and transporta-tion in current waste treatment businesses in Japan. A tank reactor has been the major plant in the Japanese R&D history of the small-scale production of fuel oil. The perform-ance of a tank reactor was examined and a new type of a fl ow reactor termed “moving-bed reactor” was proposed to meet the small-scale feed stock fuel production with respect to the performance in terms of coke formation and continuous operation.
1. Business background of feedstock recycling of waste plastics
Waste plastics generate at many factories and offi ces in scattered places, and by small dis-posal amounts. There is a trade-off between the economics of a large-scale processing and the various demerits of a large-scale transportation. Small-sized plants of 2 – 6 ton/day are required for the cost effective processing of on-site recycling in each factory or a local community in terms of the costs of collection and transportation and the current business scale of waste-treatment companies in Japan. Despite to the many projects for over three decades, there is no small-sized reactor commercially operated for oil production from the waste plastics under the schemes of Containers and Packaging Recycling Law.
In Japan, there are several large-scale processes larger than 20t/d for the production of fuel oil and syngas, in which the facilities were built under the strong fi nancial supports of the government. However, medium and small-sized enterprises cannot operate their recycling businesses by using such large plants with respect to the plant cost and the uses of the large amounts of the products. Additionally, one suspects the larger-scale transpor-tation giving the more critical environmental pollution to the local community as well as the more fuel consumption.
2. Some backgrounds in reactor selection
As a small-sized plant for plastic wastes recycling, a fl uidized-bed reactor is not com-mercially operated in Japan due to the cost and operational problems. A kiln is a typical facility for incinerating or drying solid wastes. The waste plastics liquefaction in a kiln requires energy-consuming external heating rather than internal heating because of the formation of infl ammable gas. To save the energy input, a fl uidized-bed reactor with par-

ISFR - 200528
tial oxidation is commercially operated as a part of a large-scale production process for syngas production. The high facility costs of the gas supply for fl uidization and partial oxidation and the operational complexity are overcome by the large-scale production of the product at high market values. However, this will not meet to the small-scale recycling in a factory or local community.
Polyolefi ns are converted into volatile compounds via viscous polymer melts. The oil production business was not profi table because of the low quality of the oil products and the low performance of the conventional type of small-sized plants.
A tank reactor has been a typical reactor for oil production in Japan, which is originally designed for a liquid-phase reaction. The obstacles to achieve the profi table business of oil production are caused by the inappropriate selection of the reactor. The low process-ing ability of the plant, typically of a tank reactor, is found in the processing rate and the yields of the products.
In this paper, the technical and the economic problems were examined in the polymer decomposition using a tank reactor with respect to the slow heat transfer to polymer melt and the large coke formation. A new reactor for plastics treatment termed moving-bed re-actor is proposed to meet the business demands, and the performance of the reactor were compared with that of a tank reactor.
3. Features of polymer decomposition in a tank reactor
3.1. Simulated heat transfer to polymer in a tank reactor
The kinetic analysis based on molecular weight distributions of a polymer with time was proposed because one can discusses the decomposition ki-netics of polymer melt rather the rate of oil distilla-tion in the conventional kinetics [1, 2, 3]. However, the crucial problem to the practical process for polymer decomposition is often the effective heat transfer to a polymer and the reaction intermedi-ates from a heat-transfer surface. Heat transfer to polymer melt [4] is empirically known to govern the processing rates of a commercial reactor. Dif-ferent from polymerization reactor modelling, there have been little references on theoretical modelling of the heat transfer of a polymer at de-composition in a reactor. A preliminary simulation was performed by using Eqs (1) and (2) under the conditions in Table 1.
Heat Heat
Polymer temperatures were simulated based on the balance of heat input from the wall and heat loss by reaction and volatilization of the reaction products.
r = 0 m r = 0.5 r = 0.25
Figure 1: Polymer in a tank reactor.

Pyrolysis / Solvolysis 29
ρ•Cp•(∂T/∂t) = κ•[(1/r)•(∂T/∂r) + (∂2T/∂r2)] – ∆Hr•ρ – ∆Hv•ρ (1)dP(r)/dt = kd P(r) (2)
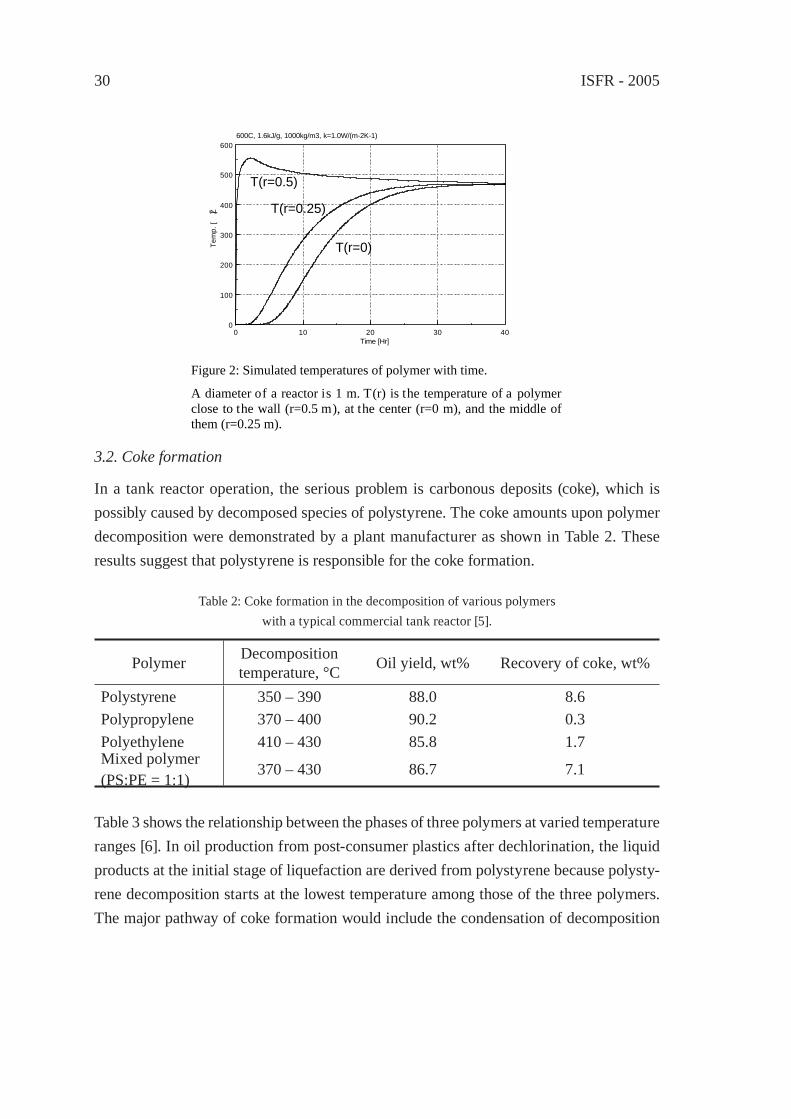
To simulate the temperature of polymer melt at pyrolysis, a tank reactor of 1m in diam-eter is assumed to be fi lled with polymer without vacancy (Fig. 1). The polymer is heated only from the reactor wall but not from the bottom. The horizontal distributions along the radius of polymer temperatures were simulated as preliminary examinations. Constant values are assumed as follows; total amounts of the heats of reaction and volatilization of 1.6kJ/g, density 1000kg/m3, thermal conductivity of 1.0 W/(m-2K-1), pre-exponential value is 4.3x10¹⁵min-1 and E is 24.4 kcal/mol concerning kd. The reactor wall temperature is at 600 °C in an instant at time 0, the temperatures of polymer at r = 0 (center of the reac-tor), r = 0.25m, and r = 0.5m (inner surface of the reactor) were shown in Fig. 2. Although stir and natural convection are ignored in this example, the rapid raise of polymer tem-perature T(r=0.5) was observed only near the reactor wall. Even if a mechanical stirrer is equipped, it is diffi cult to stir polymer melt until it becomes a low viscous liquid.
Table 1: Mathematical modelling conditions.
Purpose of modelling and assumptionsThis mathematical model aims to draw temperature distributions of a polymer melt in a tank reactor.The temperature distributions along a radius of a tank reactor are calculated. The distribution along a vertical axis of a tank reactor is ignored.Flow with stir or convection is ignored.Physical data of polymer melt such as thermal conductivity and specifi c heat areindependent of temperature, and are set to be constant.Polymer melt gives oil, and the resulting oil is vaporised without mass transfer resistance.
1.
2.
3.4.
5.
Nomenclaturesr radius [cm] Cp specifi c heat [J kg-1 K-1]t time [min] κ thermal conductivity [W m-1 K-1]T(r,t) temperature of polymer melt [°C] ∆Hr heat of reactionρ polymer density [kg-1 m3] ∆Hv heat of volatilizationP(r) Molar concentration of a polymer
at r [mol/m-3]kd overall rate of oil formation from
polymer melt [min-1]
ISFR - 200530
3.2. Coke formation
In a tank reactor operation, the serious problem is carbonous deposits (coke), which is possibly caused by decomposed species of polystyrene. The coke amounts upon polymer decomposition were demonstrated by a plant manufacturer as shown in Table 2. These results suggest that polystyrene is responsible for the coke formation.
Table 2: Coke formation in the decomposition of various polymerswith a typical commercial tank reactor [5].
Polymer Decomposition temperature, °C Oil yield, wt% Recovery of coke, wt%
Polystyrene 350 – 390 88.0 8.6Polypropylene 370 – 400 90.2 0.3Polyethylene 410 – 430 85.8 1.7Mixed polymer(PS:PE = 1:1)
370 – 430 86.7 7.1
Table 3 shows the relationship between the phases of three polymers at varied temperature ranges [6]. In oil production from post-consumer plastics after dechlorination, the liquid products at the initial stage of liquefaction are derived from polystyrene because polysty-rene decomposition starts at the lowest temperature among those of the three polymers. The major pathway of coke formation would include the condensation of decomposition
600C, 1.6kJ/g, 1000kg/m3, k=1.0W/(m-2K-1)
0 10 20 30 40Time [Hr]
0
100
200
300
400
500
600
Tem
p. [�
Ž]
Figure 2: Simulated temperatures of polymer with time.
A diameter of a reactor is 1 m. T(r) is the temperature of a polymer close to the wall (r=0.5 m), at the center (r=0 m), and the middle of them (r=0.25 m).
T(r=0.5)
T(r=0)
T(r=0.25)
Pyrolysis / Solvolysis 31
products of polystyrene [7].
Table 3: The phases of three polymers at varied temperature ranges [6].
Polymer Polymer melt phase, °C Liquid phase, °C Decomposition/Volatilization, °C
Polyethylene 90 – 165 165 – 455 455 – 520Polypropylene 125 – 195 195 – 420 420 – 500
Polystyrene – 100 – 395 395 – 455
Coke is seldom formed in polystyrene decomposition of a small amount like in ther-mogravimetric analysis. This is because the rapid mass transfer of the decomposition intermediates. The serious mass transfer resistance can be expected in a thick layer of polystyrene melt in a tank reactor. Polycondensation of decomposition intermediates of low molecular weights is occurred near the reactor wall, and results in the formation of coke. The coke thus formed plays a role as heat insulation. And the operation requires the more heat input to achieve the liquefaction at a practical rate. Enhanced evaporation of the low boiling points species under a reduced pressure or using a nitrogen fl ow could be the solutions to avoid coke formation in a laboratory scale experiments.
3.3. Reactor design for the less coke formation and the effective heat transfer
The practical problems typically lie in the type of a reactor, which lacks suitable per-formance such as a decomposition rate of a polymer per energy input and the effective evaporation of the decomposition products without undesirable secondary reactions like coking.
Because serious coke formation is considered inevitable for the polymer decomposition in a tank reactor, one often chooses some options like 1) a batch operation twice a day with removal of coke after cooling down and 2) a continuous removal device with the reactor, which raises a plant cost and lowers oil yield.
The key for polymer decomposition is to control the reaction environment such as heat transfer and mass transfer of a polymer and the decomposed species.
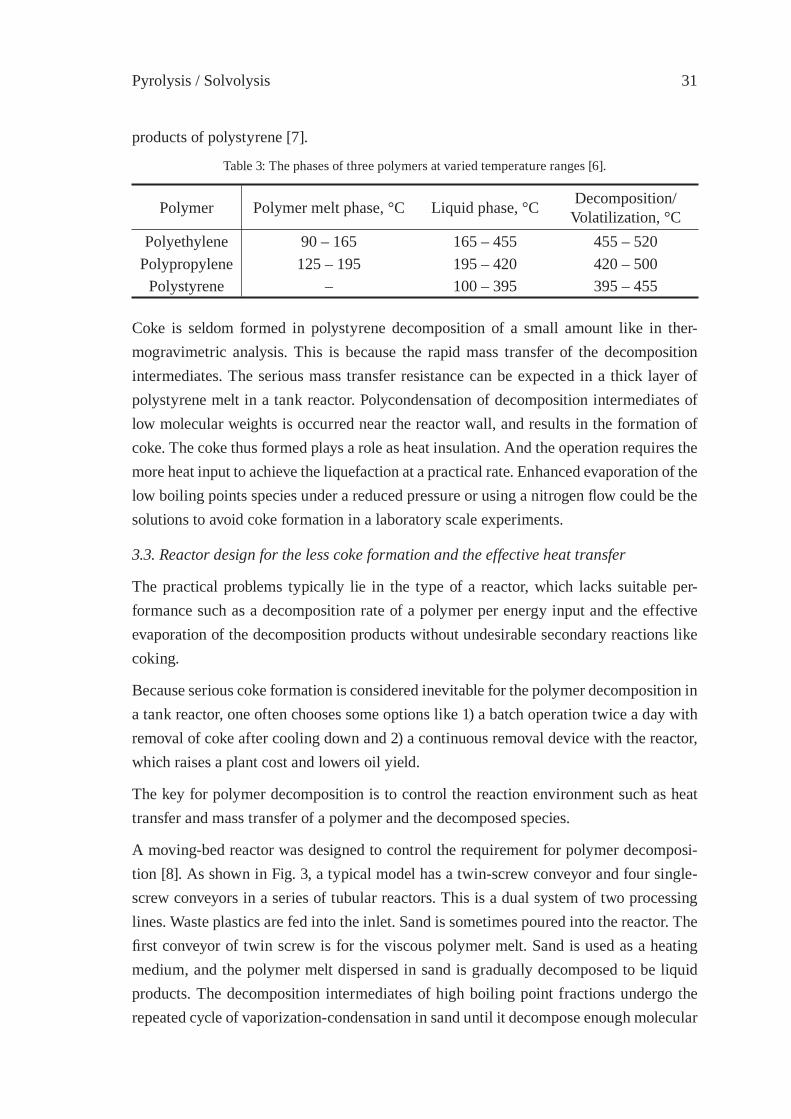
A moving-bed reactor was designed to control the requirement for polymer decomposi-tion [8]. As shown in Fig. 3, a typical model has a twin-screw conveyor and four single-screw conveyors in a series of tubular reactors. This is a dual system of two processing lines. Waste plastics are fed into the inlet. Sand is sometimes poured into the reactor. The fi rst conveyor of twin screw is for the viscous polymer melt. Sand is used as a heating medium, and the polymer melt dispersed in sand is gradually decomposed to be liquid products. The decomposition intermediates of high boiling point fractions undergo the repeated cycle of vaporization-condensation in sand until it decompose enough molecular
ISFR - 200532
weights to be distilled out of the reactor. Because the polymer melt is dispersed on sand, the decomposition products are readily evaporated to the vacant of the reactor without
Figure 3: A moving-bed reactor of the scale of a demonstration plant
The dimensions are expressed in millimetre.
Feed inlet
further heating. Thus, coke formation can be avoided.
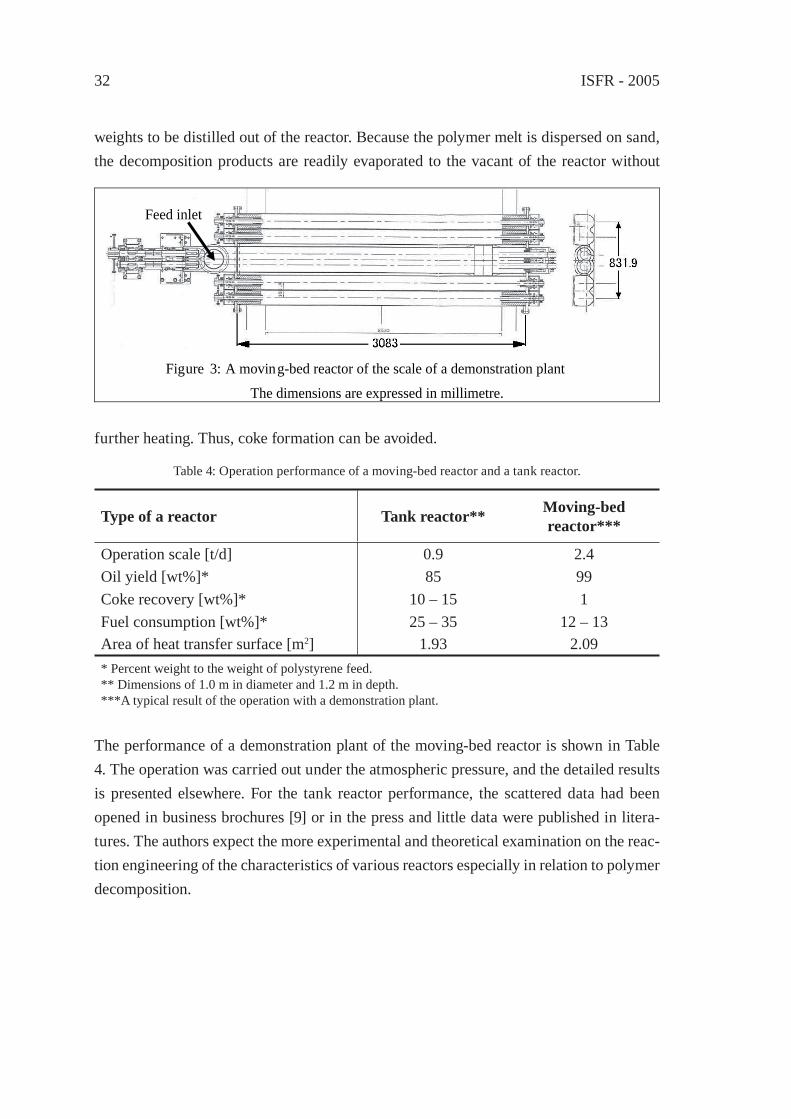
Table 4: Operation performance of a moving-bed reactor and a tank reactor.
Type of a reactor Tank reactor** Moving-bed reactor***
Operation scale [t/d] 0.9 2.4Oil yield [wt%]* 85 99Coke recovery [wt%]* 10 – 15 1Fuel consumption [wt%]* 25 – 35 12 – 13Area of heat transfer surface [m2] 1.93 2.09* Percent weight to the weight of polystyrene feed.** Dimensions of 1.0 m in diameter and 1.2 m in depth.***A typical result of the operation with a demonstration plant.
The performance of a demonstration plant of the moving-bed reactor is shown in Table 4. The operation was carried out under the atmospheric pressure, and the detailed results is presented elsewhere. For the tank reactor performance, the scattered data had been opened in business brochures [9] or in the press and little data were published in litera-tures. The authors expect the more experimental and theoretical examination on the reac-tion engineering of the characteristics of various reactors especially in relation to polymer decomposition.

Pyrolysis / Solvolysis 33
Table 5: Economic evaluation of small liquefaction plants [9].
Reactor → Tank Tank Flowa)
ConditionsMaximum Treatment capacity [t/day] 1.0 1.5 2.4Treatment capacity per year [t/year] 300 450 720Oil yields [A] [t/year] 270b) 405b) 684c)
Fuel consumption [B] [wt%] 30 30 10Oil for sale [A – A•B/100] [t/year] 189 283.5 615.6
Payment[Initial cost] Plant [million yen] 70 80 50 Maintenance [↑] 3.0 3.0 3.0 Interest and insurance, etc. [↑] 4.0 4.0 4.0 Transportation and assembly [↑] - - 5.0 Mechanical pre-treatment [↑] - - 4.0Total [↑] 77 87 66Depreciation cost [million yen/y] [C]: 4 years 19.25 21.75 16.50[Running cost] Personnel expenses [million yen/year] 10.0 10.0 15.0 Utility [↑] 3.0 3.0 4.0Total [D] [↑] 13.0 1.30 1.90
RevenueDisposal charge [million yen/year] 18.0 27.0 43.2Sales price of oil [million yen/year] 2.835 4.253 9.234Total [E] [million yen/year] 20.835 31.253 52.434
Balance(E) – [(C)+(D)] [million yen/year] (-)11.42 (-)3.50 (+)16.9Total balance of current day [yen/day] (-)38050 (-)11656 (+)56446Total balance of current year [million yen/year] (-)11.42 (-)3.50 (+)16.93Treatment cost [yen/kg] (-)38.1 (-)7.8 (+)23.5
The operations are carried out for 300 days/year.a) polystyrene was used as the feed. b) Yield: 90wt%, heavy oil. c) Yield: 90wt%, light oil and kerosine. The disposal
charge is 60 yen/kg. The selling price of oil, 15 yen/kg. Total balance of the current day = [E – (C+D)]/ 300 days.
ISFR - 200534
4. Cost analysis
Recycling costs are based on the process performance such as the processing rate per energy input, or processed amounts in a unit time and energy, and a plant cost. Table 5 shows the cost analysis of a tank reactor and the moving-bed reactor as a continuous fl ow reactor of [9]. Depending on the business models and the social environments in differ-ent area and countries, the fi gures like a product price and a disposal charge will vary. Although one should evaluate the transportation costs and the environmental infl uences like the emissions of NOx and PM (particulate matter) in each recycling scale, Life cycle assessments on the selection of the processing method and the scale will be discussed in relation to the processing technologies elsewhere in future.
In conclusion, coke formation is governed by the two initial conditions of a reactor struc-ture and a kind of plastics. For the increase of oil yields and the reduction of coke amounts, one has to design a reactor under the consideration of the effective heat transfer to a poly-mer and the effective mass transfer of decomposed intermediates. A moving-bed reactor was proposed. The performance of the new reactor was technically and economically compared with that of a tank reactor. The quantitative evaluation of the effectiveness of the heat and the mass transfer of the reactor for polymer decomposition and the compari-son of each type of the reactors for a small or a large scale recycling will be the tasks on reaction engineering and LCA in the future.
References
[1] Kruse, T. M., Wong, H.-W., and Broadbelt, L. J., Ind. Eng. Chem. Res. 42:2722 (2003).
[2] Sterling, W. J., and McCoy, B. J., AIChE J. 47:2289 (2001).[3] Kodera, Y., and McCoy, B. J., J. Japan Petroleum Inst. 46:155 (2003).[4] Keating M. Y., and McLarsen, C. S., Thermochimica Acta 166:69 (1990).[5] Technical sheet provided by Sumikin Management, Co. Ltd.[6] Unpublished data from a database of the National Institute of Advanced Industrial
Science and Technology.[7] Ishihara, Y., Kodera, Y., Kuroki, T., Preprints of Div. Polym. Chem., Am. Chem. Soc.,
Aug. 2005. In press.[8] Kuroki, T., Japan patent, H8-176555 (1996).[9] Ishihara, Y., Saido, K., and Kuroki, T., J. Japan Petroleum Inst. 46:77 (2003).
Pyrolysis / Solvolysis 35
ESTIMATION OF CONTENT AND COMPOSITION OF MUNICIPAL SOLID WASTE
I. Hasegawa, F. Nakanishi, Y. Ohmukai and K. Mae*
Department of Chemical Engineering, Kyoto University, Kyoto, Japan,[email protected]
Abstract: An estimation method was presented for the content of each component in the municipal solid waste and for the elemental composition. Co-pyrolysis of plastics and biomass was examined as a means to get information about the contents. It was clarifi ed that polyethylene and polypropylene contents were estimated from the yields of the eth-ylene and C5 gas evolved during pyrolysis at 530 °C and biomass content was estimated from CO2 yield respectively. On the other hand, the elemental composition of the munici-pal waste was obtained from the fi xed elemental composition of plastics and the variable elemental composition of biomass, which could be determined with the higher heating value using a calorimeter.
1. Introduction
The disposal of municipal solid waste is now recognized to be a major environmental is-sue in Japan. Municipal solid waste consists of plastics, paper, woody materials, and the miscellaneous. Pyrolysis is an attractive process which can convert such a various kinds of waste together into valuable gaseous and solid chemicals. Unlike the conventional processes, the variation in the feed composition which originates from the reuse of wastes as source materials would be a serious obstacle to the stable operation. According to the feed variation, change in the operating condition and additions of other specifi c material are required in order to keep the products spec. To do so, collecting of the information on the content of each component and the elemental composition of feed is very important. However, it is diffi cult to get information about the representative value from the small amount analysis because of the actual large size of municipal wastes. In this work, we present a method for estimating the content of each component and elemental composi-tion in the feed municipal waste simply from the measurement of the gases formed during pyrolysis and heating value analysis of the feed mixture with diameter around a few mil-limeter. Municipal solid waste in Japan contains only a few percent poly(vinyl chloride) and poly(ethylene terephthalate) [1], so we assume that the municipal solid waste consists of low-density polyethylene, polypropylene, polystyrene, and biomass including paper or cellulose.
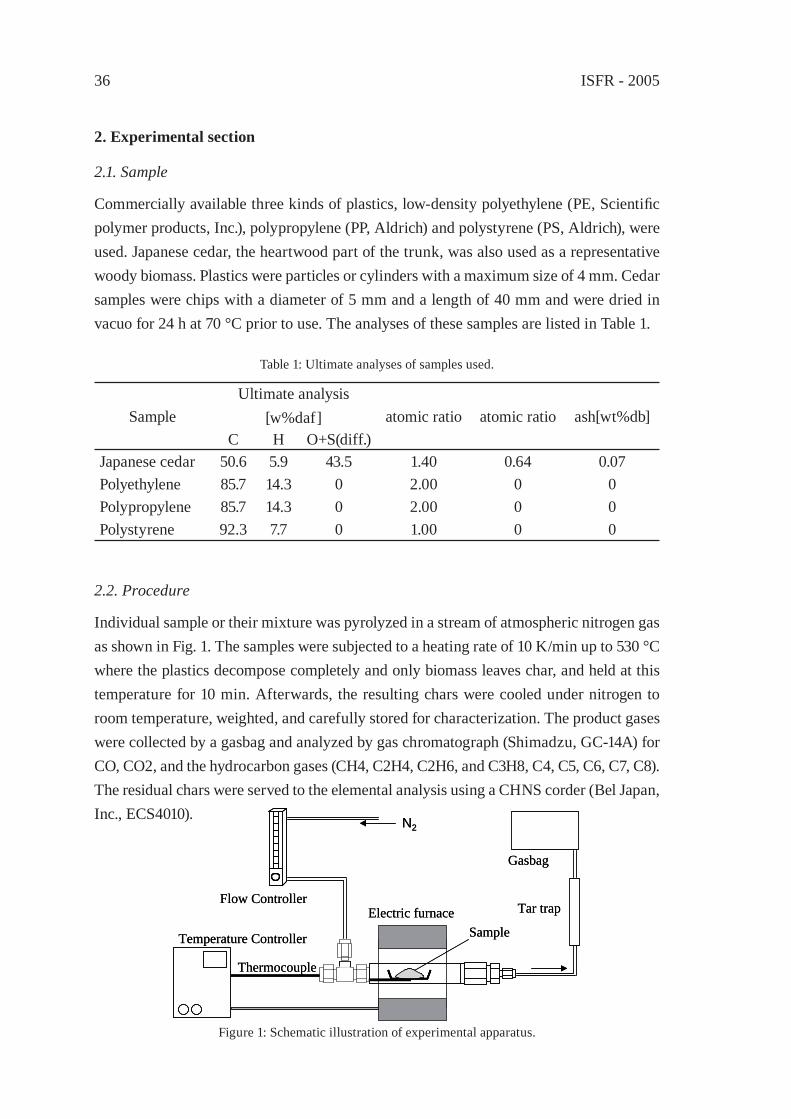
ISFR - 200536
2. Experimental section
2.1. Sample
Commercially available three kinds of plastics, low-density polyethylene (PE, Scientifi c polymer products, Inc.), polypropylene (PP, Aldrich) and polystyrene (PS, Aldrich), were used. Japanese cedar, the heartwood part of the trunk, was also used as a representative woody biomass. Plastics were particles or cylinders with a maximum size of 4 mm. Cedar samples were chips with a diameter of 5 mm and a length of 40 mm and were dried in vacuo for 24 h at 70 °C prior to use. The analyses of these samples are listed in Table 1.
Table 1: Ultimate analyses of samples used.
SampleUltimate analysis
[w%daf] atomic ratio atomic ratio ash[wt%db]C H O+S(diff.)
Japanese cedar 50.6 5.9 43.5 1.40 0.64 0.07Polyethylene 85.7 14.3 0 2.00 0 0Polypropylene 85.7 14.3 0 2.00 0 0Polystyrene 92.3 7.7 0 1.00 0 0
2.2. Procedure
Individual sample or their mixture was pyrolyzed in a stream of atmospheric nitrogen gas as shown in Fig. 1. The samples were subjected to a heating rate of 10 K/min up to 530 °C where the plastics decompose completely and only biomass leaves char, and held at this temperature for 10 min. Afterwards, the resulting chars were cooled under nitrogen to room temperature, weighted, and carefully stored for characterization. The product gases were collected by a gasbag and analyzed by gas chromatograph (Shimadzu, GC-14A) for CO, CO2, and the hydrocarbon gases (CH4, C2H4, C2H6, and C3H8, C4, C5, C6, C7, C8). The residual chars were served to the elemental analysis using a CHNS corder (Bel Japan, Inc., ECS4010).
Thermocouple
Temperature Controller Sample
Flow Controller
N2
Electric furnace Tar trap
Gasbag
Thermocouple
Temperature Controller Sample
Flow Controller
N2
Electric furnace Tar trap
Gasbag
Figure 1: Schematic illustration of experimental apparatus.
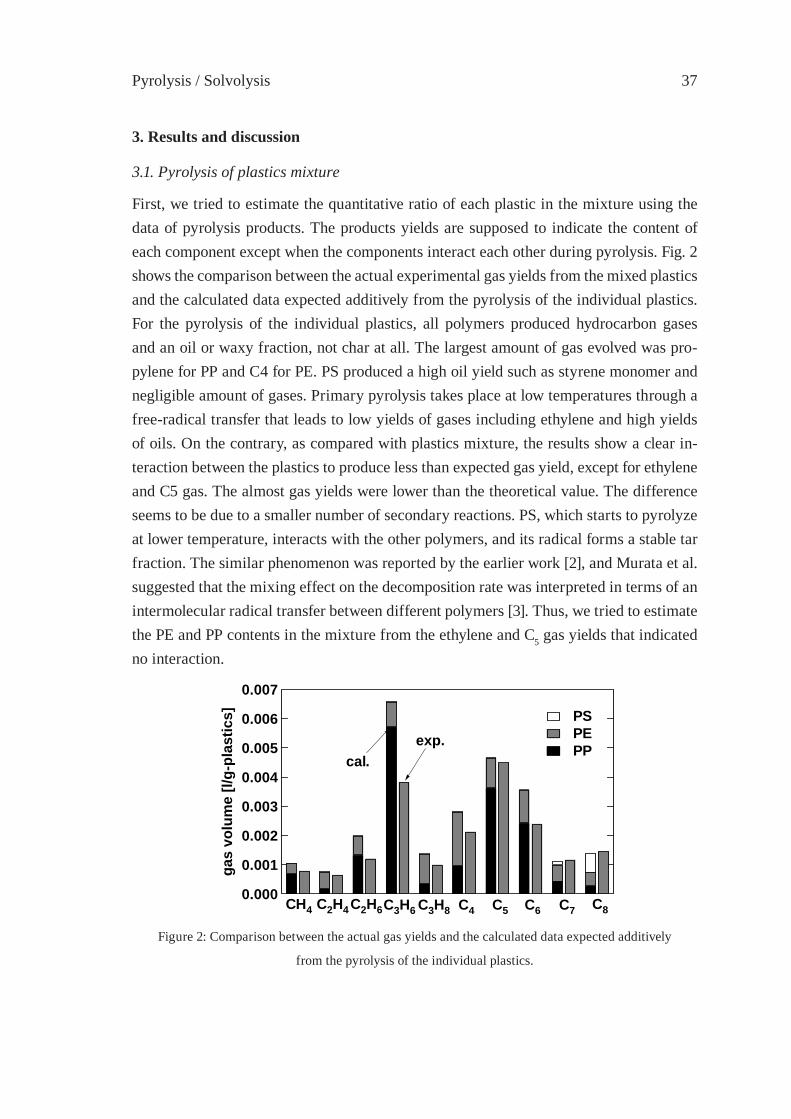
Pyrolysis / Solvolysis 37
3. Results and discussion
3.1. Pyrolysis of plastics mixture
First, we tried to estimate the quantitative ratio of each plastic in the mixture using the data of pyrolysis products. The products yields are supposed to indicate the content of each component except when the components interact each other during pyrolysis. Fig. 2 shows the comparison between the actual experimental gas yields from the mixed plastics and the calculated data expected additively from the pyrolysis of the individual plastics. For the pyrolysis of the individual plastics, all polymers produced hydrocarbon gases and an oil or waxy fraction, not char at all. The largest amount of gas evolved was pro-pylene for PP and C4 for PE. PS produced a high oil yield such as styrene monomer and negligible amount of gases. Primary pyrolysis takes place at low temperatures through a free-radical transfer that leads to low yields of gases including ethylene and high yields of oils. On the contrary, as compared with plastics mixture, the results show a clear in-teraction between the plastics to produce less than expected gas yield, except for ethylene and C5 gas. The almost gas yields were lower than the theoretical value. The difference seems to be due to a smaller number of secondary reactions. PS, which starts to pyrolyze at lower temperature, interacts with the other polymers, and its radical forms a stable tar fraction. The similar phenomenon was reported by the earlier work [2], and Murata et al. suggested that the mixing effect on the decomposition rate was interpreted in terms of an intermolecular radical transfer between different polymers [3]. Thus, we tried to estimate the PE and PP contents in the mixture from the ethylene and C5 gas yields that indicated no interaction.
Figure 2: Comparison between the actual gas yields and the calculated data expected additively
from the pyrolysis of the individual plastics.
0.007
0.006
0.005
0.004
0.003
0.002
0.001
0.000
gas
volu
me
[l/g-
plas
tics] PS
PE PP
exp.cal.
CH4 C2H4 C2H6C3H6 C3H8 C4 C5 C6 C7 C8
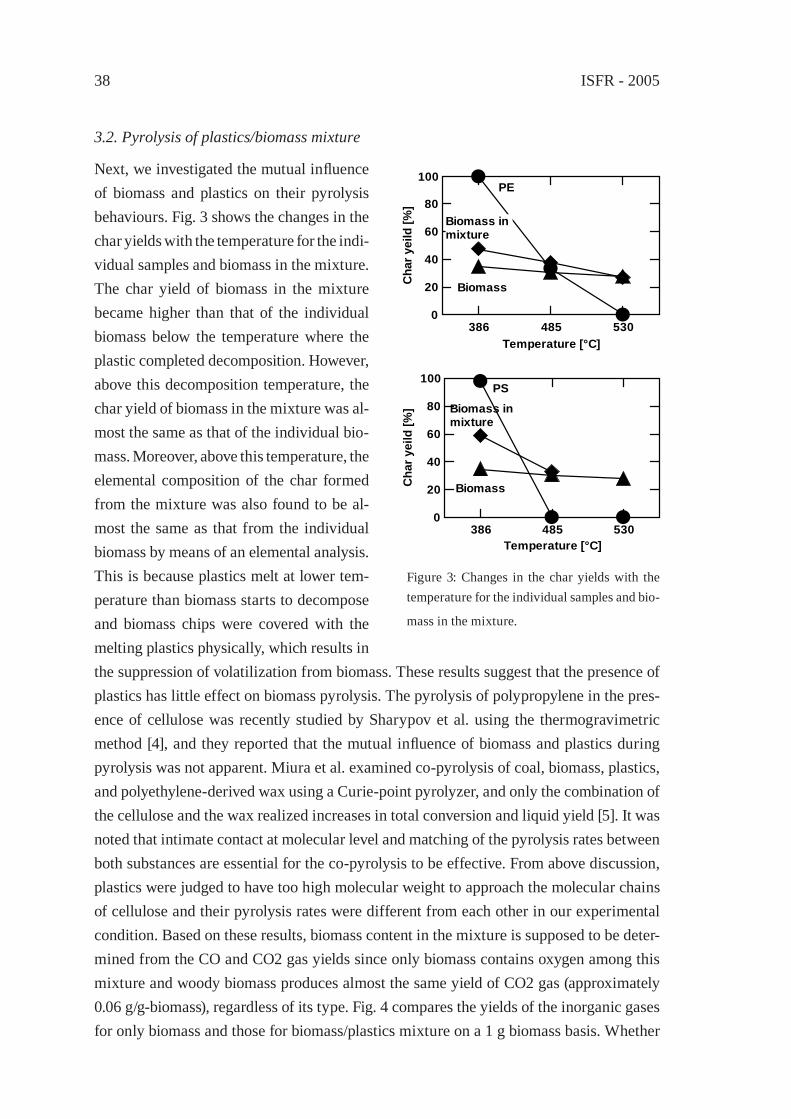
ISFR - 200538
3.2. Pyrolysis of plastics/biomass mixture
Next, we investigated the mutual infl uence of biomass and plastics on their pyrolysis behaviours. Fig. 3 shows the changes in the char yields with the temperature for the indi-vidual samples and biomass in the mixture. The char yield of biomass in the mixture became higher than that of the individual biomass below the temperature where the plastic completed decomposition. However, above this decomposition temperature, the char yield of biomass in the mixture was al-most the same as that of the individual bio-mass. Moreover, above this temperature, the elemental composition of the char formed from the mixture was also found to be al-most the same as that from the individual biomass by means of an elemental analysis. This is because plastics melt at lower tem-perature than biomass starts to decompose and biomass chips were covered with the melting plastics physically, which results in the suppression of volatilization from biomass. These results suggest that the presence of plastics has little effect on biomass pyrolysis. The pyrolysis of polypropylene in the pres-ence of cellulose was recently studied by Sharypov et al. using the thermogravimetric method [4], and they reported that the mutual infl uence of biomass and plastics during pyrolysis was not apparent. Miura et al. examined co-pyrolysis of coal, biomass, plastics, and polyethylene-derived wax using a Curie-point pyrolyzer, and only the combination of the cellulose and the wax realized increases in total conversion and liquid yield [5]. It was noted that intimate contact at molecular level and matching of the pyrolysis rates between both substances are essential for the co-pyrolysis to be effective. From above discussion, plastics were judged to have too high molecular weight to approach the molecular chains of cellulose and their pyrolysis rates were different from each other in our experimental condition. Based on these results, biomass content in the mixture is supposed to be deter-mined from the CO and CO2 gas yields since only biomass contains oxygen among this mixture and woody biomass produces almost the same yield of CO2 gas (approximately 0.06 g/g-biomass), regardless of its type. Fig. 4 compares the yields of the inorganic gases for only biomass and those for biomass/plastics mixture on a 1 g biomass basis. Whether
100
80
60
40
20
0
Cha
r yei
ld [%
]
386 485 530Temperature [°C]
PSBiomass in mixture
Biomass
100
80
60
40
20
0
Cha
r yei
ld [%
]
386 485 530Temperature [°C]
PE
Biomass
Biomass in mixture
Figure 3: Changes in the char yields with the temperature for the individual samples and bio-
mass in the mixture.
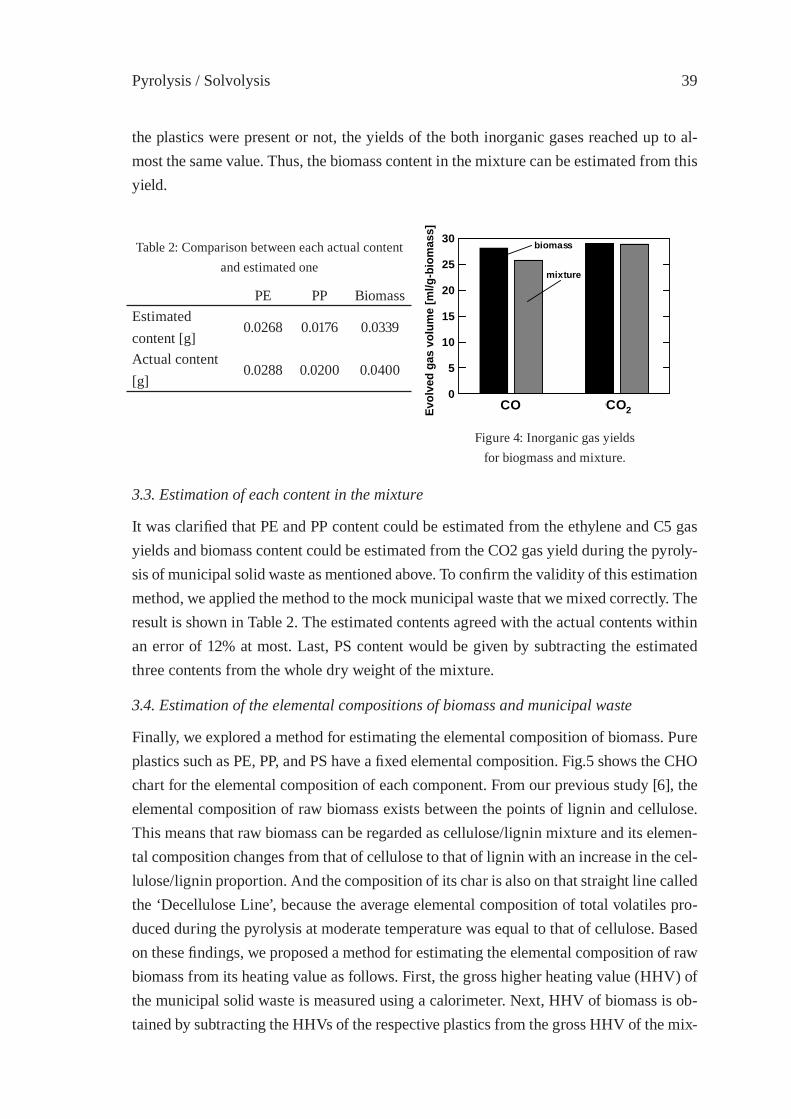
Pyrolysis / Solvolysis 39
the plastics were present or not, the yields of the both inorganic gases reached up to al-most the same value. Thus, the biomass content in the mixture can be estimated from this yield.
Table 2: Comparison between each actual content and estimated one
PE PP BiomassEstimated content [g]
0.0268 0.0176 0.0339
Actual content [g]
0.0288 0.0200 0.0400
30
25
20
15
10
5
0
Evol
ved
gas
volu
me
[ml/g
-bio
mas
s]
CO CO2CO CO2
biomass
mixture
Figure 4: Inorganic gas yieldsfor biogmass and mixture.
3.3. Estimation of each content in the mixture
It was clarifi ed that PE and PP content could be estimated from the ethylene and C5 gas yields and biomass content could be estimated from the CO2 gas yield during the pyroly-sis of municipal solid waste as mentioned above. To confi rm the validity of this estimation method, we applied the method to the mock municipal waste that we mixed correctly. The result is shown in Table 2. The estimated contents agreed with the actual contents within an error of 12% at most. Last, PS content would be given by subtracting the estimated three contents from the whole dry weight of the mixture.
3.4. Estimation of the elemental compositions of biomass and municipal waste
Finally, we explored a method for estimating the elemental composition of biomass. Pure plastics such as PE, PP, and PS have a fi xed elemental composition. Fig.5 shows the CHO chart for the elemental composition of each component. From our previous study [6], the elemental composition of raw biomass exists between the points of lignin and cellulose. This means that raw biomass can be regarded as cellulose/lignin mixture and its elemen-tal composition changes from that of cellulose to that of lignin with an increase in the cel-lulose/lignin proportion. And the composition of its char is also on that straight line called the ‘Decellulose Line’, because the average elemental composition of total volatiles pro-duced during the pyrolysis at moderate temperature was equal to that of cellulose. Based on these fi ndings, we proposed a method for estimating the elemental composition of raw biomass from its heating value as follows. First, the gross higher heating value (HHV) of the municipal solid waste is measured using a calorimeter. Next, HHV of biomass is ob-tained by subtracting the HHVs of the respective plastics from the gross HHV of the mix-
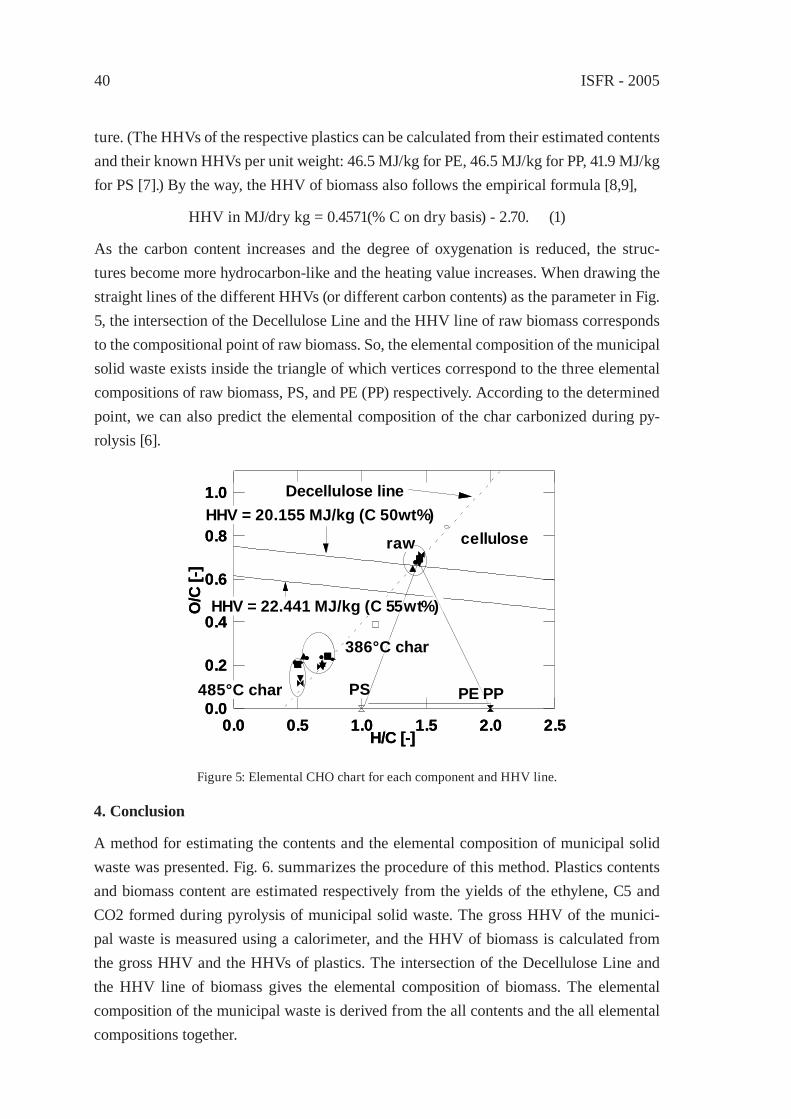
ISFR - 200540
ture. (The HHVs of the respective plastics can be calculated from their estimated contents and their known HHVs per unit weight: 46.5 MJ/kg for PE, 46.5 MJ/kg for PP, 41.9 MJ/kg for PS [7].) By the way, the HHV of biomass also follows the empirical formula [8,9],
HHV in MJ/dry kg = 0.4571(% C on dry basis) - 2.70. (1)
As the carbon content increases and the degree of oxygenation is reduced, the struc-tures become more hydrocarbon-like and the heating value increases. When drawing the straight lines of the different HHVs (or different carbon contents) as the parameter in Fig. 5, the intersection of the Decellulose Line and the HHV line of raw biomass corresponds to the compositional point of raw biomass. So, the elemental composition of the municipal solid waste exists inside the triangle of which vertices correspond to the three elemental compositions of raw biomass, PS, and PE (PP) respectively. According to the determined point, we can also predict the elemental composition of the char carbonized during py-rolysis [6].
1.0
0.8
0.6
0.4
0.2
0.0
O/C
[-]
2.52.01.51.00.50.0H/C [-]
celluloseraw
386°C char
485°C char
HHV = 20.155 MJ/kg (C 50wt%)
HHV = 22.441 MJ/kg (C 55wt%)
PS PE PP
Decellulose line1.0
0.8
0.6
0.4
0.2
0.0
O/C
[-]
2.52.01.51.00.50.0H/C [-]
celluloseraw
386°C char
485°C char
HHV = 20.155 MJ/kg (C 50wt%)
HHV = 22.441 MJ/kg (C 55wt%)
PS PE PP
Decellulose line
Figure 5: Elemental CHO chart for each component and HHV line.
4. Conclusion
A method for estimating the contents and the elemental composition of municipal solid waste was presented. Fig. 6. summarizes the procedure of this method. Plastics contents and biomass content are estimated respectively from the yields of the ethylene, C5 and CO2 formed during pyrolysis of municipal solid waste. The gross HHV of the munici-pal waste is measured using a calorimeter, and the HHV of biomass is calculated from the gross HHV and the HHVs of plastics. The intersection of the Decellulose Line and the HHV line of biomass gives the elemental composition of biomass. The elemental composition of the municipal waste is derived from the all contents and the all elemental compositions together.
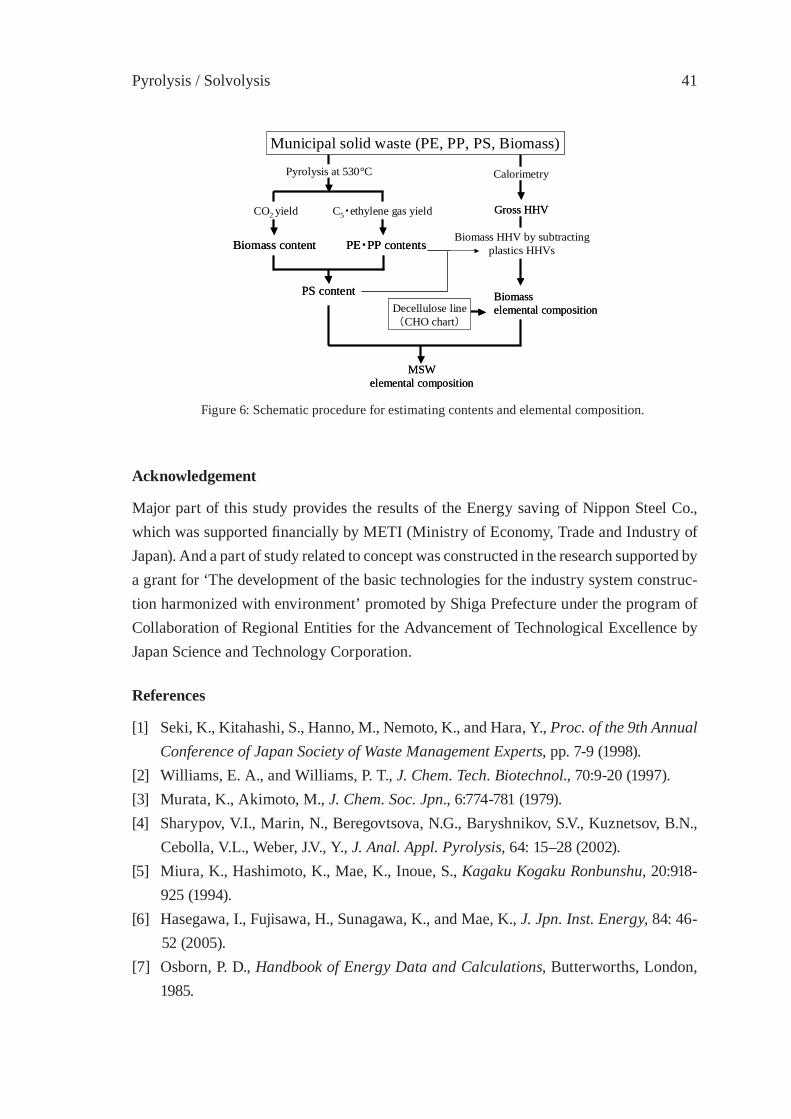
Pyrolysis / Solvolysis 41
Acknowledgement
Major part of this study provides the results of the Energy saving of Nippon Steel Co., which was supported fi nancially by METI (Ministry of Economy, Trade and Industry of Japan). And a part of study related to concept was constructed in the research supported by a grant for ‘The development of the basic technologies for the industry system construc-tion harmonized with environment’ promoted by Shiga Prefecture under the program of Collaboration of Regional Entities for the Advancement of Technological Excellence by Japan Science and Technology Corporation.
References
[1] Seki, K., Kitahashi, S., Hanno, M., Nemoto, K., and Hara, Y., Proc. of the 9th Annual Conference of Japan Society of Waste Management Experts, pp. 7-9 (1998).
[2] Williams, E. A., and Williams, P. T., J. Chem. Tech. Biotechnol., 70:9-20 (1997).[3] Murata, K., Akimoto, M., J. Chem. Soc. Jpn., 6:774-781 (1979).[4] Sharypov, V.I., Marin, N., Beregovtsova, N.G., Baryshnikov, S.V., Kuznetsov, B.N.,
Cebolla, V.L., Weber, J.V., Y., J. Anal. Appl. Pyrolysis, 64: 15–28 (2002).[5] Miura, K., Hashimoto, K., Mae, K., Inoue, S., Kagaku Kogaku Ronbunshu, 20:918-
925 (1994).[6] Hasegawa, I., Fujisawa, H., Sunagawa, K., and Mae, K., J. Jpn. Inst. Energy, 84: 46-
52 (2005).[7] Osborn, P. D., Handbook of Energy Data and Calculations, Butterworths, London,
1985.
PE・PP contentsBiomass content
PS content
Gross HHV
MSWelemental composition
Municipal solid waste (PE, PP, PS, Biomass)
C5・ethylene gas yieldCO2 yield
Calorimetry
Biomass HHV by subtractingplastics HHVs
Pyrolysis at 530°C
Biomass elemental compositionDecellulose line
(CHO chart)
PE・PP contentsBiomass content
PS content
Gross HHV
MSWelemental composition
Municipal solid waste (PE, PP, PS, Biomass)
C5・ethylene gas yieldCO2 yield
Calorimetry
Biomass HHV by subtractingplastics HHVs
Pyrolysis at 530°C
Biomass elemental compositionDecellulose line
(CHO chart)
Figure 6: Schematic procedure for estimating contents and elemental composition.

ISFR - 200542
[8] Klass, D. L., Biomass for Renewable Energy, Fuels, and Chemicals, Academic Press, San Diego, 1998, pp. 77.
[9] Thipkhunthoda, P., Meeyoob, V., Rangsunvigita, P., Kitiyanana, B., Siemanonda, K., Rirksomboon, T., Fuel, 84:849-857 (2005).
Pyrolysis / Solvolysis 43
UPGRADING OF LIGHT THERMAL CRACKING OIL DERIVED FROM WASTE PLASTICS IN OIL REFINERY
T. Kawanishi1*, N. Shiratori1, H. Wakao2, E. Sugiyama3, H. Ibe3, M. Shioya4, T. Abe5
1Petroleum Refi ning Research & Technology Center, Japan Energy Corporation3-17-35 Niizo-Minami Toda-shi, Saitama, Japan
2Petroleum Refi ning Dept., Japan Energy Corporation2-10-1, Toranomon, Minato-ku, Tokyo, Japan
3Toshiba Corporation, 1-1, Shibaura 1-Chome, Minato-ku, Tokyo, Japan4Sapporo Plastics Recycling Co., Ltd., 45-57 Nakamura-Cho, Higashi-ku, Sapporo-shi,
Hokkaido, Japan5 Rekiseikouyu Co., Ltd., 3-1 Heiwa-Cho, Niigata-shi, Niigata, Japan,
[email protected], Fax +81-48-433-7628
Abstract: As an useful way for the recycling of plastics, the feedstock recycling of light thermal cracking oil derived from municipal waste plastics (LTCO) has been studied and demonstrated by a Japanese oil refi ner. The strategy taken is to co-process LTCO with petroleum in an oil refi nery in order to minimize the investment for the feedstock recycling. LTCO has many differences in its contaminants compared with a correspond-ing petroleum fraction. Since LTCO has higher chlorine, nitrogen and olefi n compounds, fouling in oil refi ning equipments and the oil products’ qualities are the main issues to be solved. We have developed a successful fl ow scheme and demonstrated its effi ciency utilizing an existing upgrading unit at Mizushima Oil Refi nery in 2004.
1. Introduction
Reutilization of waste plastics has been a very important issue in Japan from an environ-mental protection viewpoint. Among the effective reutilization methods such as injection into blast furnace and gasifi cation, liquefaction of waste plastics is a promising way to open up the material recycling of the plastics [1].
The amount of the waste plastics in Japan reached to about 10 million tons/ year. One half of the waste plastics is recycled already, but the other half is either incinerated or reclaimed. One million tons of waste plastics could be reused as 5.16 million barrels (about 820 thousand KL) of hydrocarbons by liquefaction. This amount corresponds to one day of crude oil consumption in Japan. Until last year the way to material recycling of liquefi ed products from waste plastics by thermal cracking had not been established, in other words, liquefi ed hydrocarbons had been used as home fuel in the liquefaction plants together with other fuel. Three fractions of thermal cracking oil are available at the liquefaction plants in Japan. We have studied the feedstock recycling of light thermal
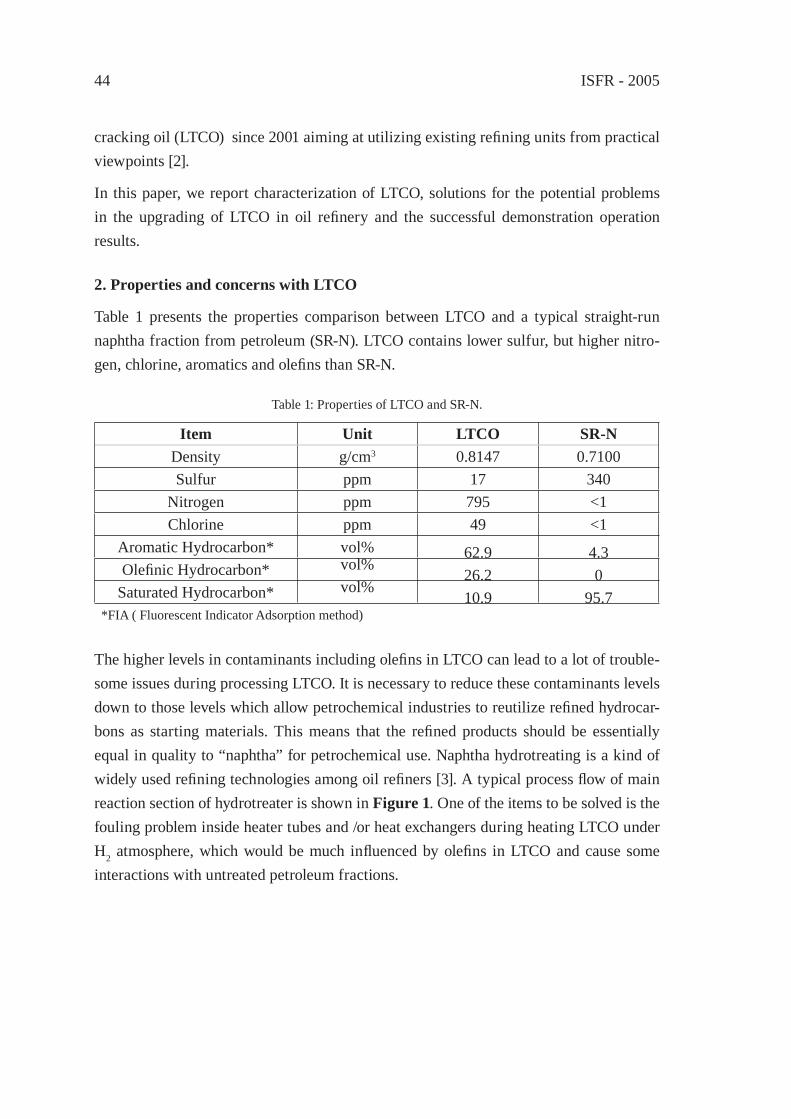
ISFR - 200544
cracking oil (LTCO) since 2001 aiming at utilizing existing refi ning units from practical viewpoints [2].
In this paper, we report characterization of LTCO, solutions for the potential problems in the upgrading of LTCO in oil refi nery and the successful demonstration operation results.
2. Properties and concerns with LTCO
Table 1 presents the properties comparison between LTCO and a typical straight-run naphtha fraction from petroleum (SR-N). LTCO contains lower sulfur, but higher nitro-gen, chlorine, aromatics and olefi ns than SR-N.
Table 1: Properties of LTCO and SR-N.
Item Unit LTCO SR-NDensity g/cm3 0.8147 0.7100Sulfur ppm 17 340
Nitrogen ppm 795 <1Chlorine ppm 49 <1
Aromatic Hydrocarbon* vol% 62.9 4.3Olefi nic Hydrocarbon* vol%
26.2 0Saturated Hydrocarbon* vol%
10.9 95.7*FIA ( Fluorescent Indicator Adsorption method)
The higher levels in contaminants including olefi ns in LTCO can lead to a lot of trouble-some issues during processing LTCO. It is necessary to reduce these contaminants levels down to those levels which allow petrochemical industries to reutilize refi ned hydrocar-bons as starting materials. This means that the refi ned products should be essentially equal in quality to “naphtha” for petrochemical use. Naphtha hydrotreating is a kind of widely used refi ning technologies among oil refi ners [3]. A typical process fl ow of main reaction section of hydrotreater is shown in Figure 1. One of the items to be solved is the fouling problem inside heater tubes and /or heat exchangers during heating LTCO under H2 atmosphere, which would be much infl uenced by olefi ns in LTCO and cause some interactions with untreated petroleum fractions.
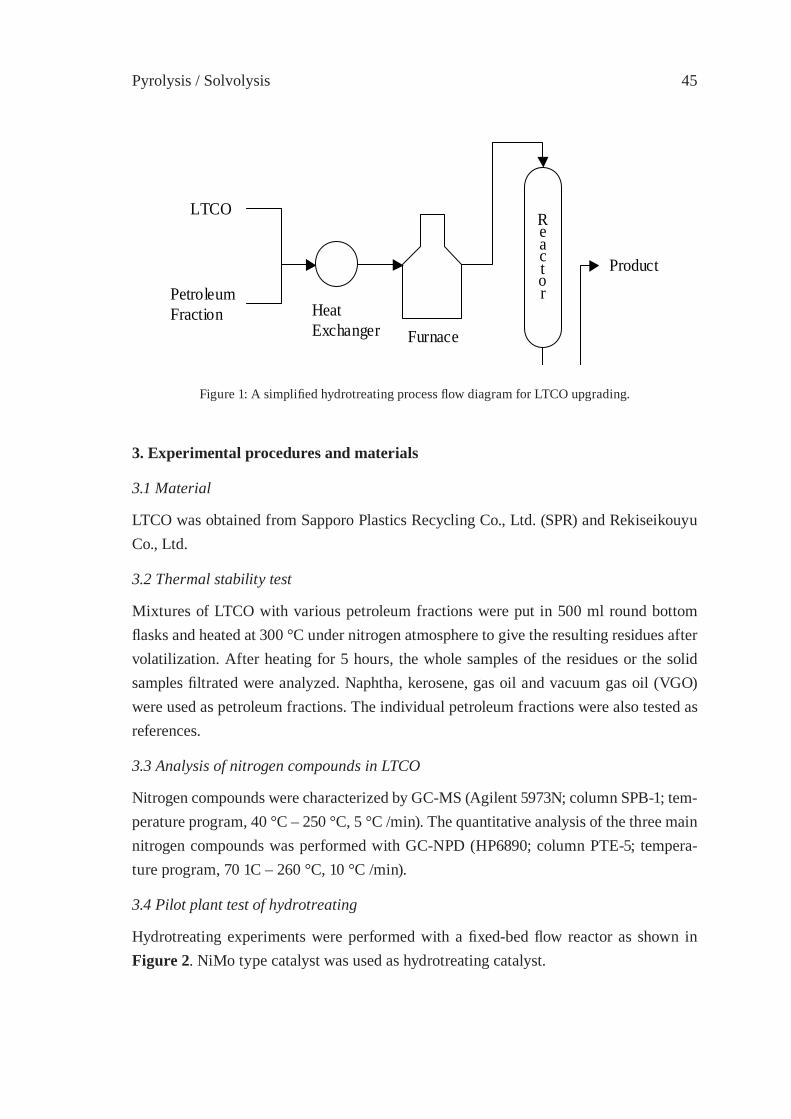
Pyrolysis / Solvolysis 45
Reactor
HeatExchanger Furnace
Product
LTCO
PetroleumFraction
Figure 1: A simplifi ed hydrotreating process fl ow diagram for LTCO upgrading.
3. Experimental procedures and materials
3.1 Material
LTCO was obtained from Sapporo Plastics Recycling Co., Ltd. (SPR) and Rekiseikouyu Co., Ltd.
3.2 Thermal stability test
Mixtures of LTCO with various petroleum fractions were put in 500 ml round bottom fl asks and heated at 300 °C under nitrogen atmosphere to give the resulting residues after volatilization. After heating for 5 hours, the whole samples of the residues or the solid samples fi ltrated were analyzed. Naphtha, kerosene, gas oil and vacuum gas oil (VGO) were used as petroleum fractions. The individual petroleum fractions were also tested as references.
3.3 Analysis of nitrogen compounds in LTCO
Nitrogen compounds were characterized by GC-MS (Agilent 5973N; column SPB-1; tem-perature program, 40 °C – 250 °C, 5 °C /min). The quantitative analysis of the three main nitrogen compounds was performed with GC-NPD (HP6890; column PTE-5; tempera-ture program, 70 1C – 260 °C, 10 °C /min).
3.4 Pilot plant test of hydrotreating
Hydrotreating experiments were performed with a fi xed-bed fl ow reactor as shown in Figure 2. NiMo type catalyst was used as hydrotreating catalyst.
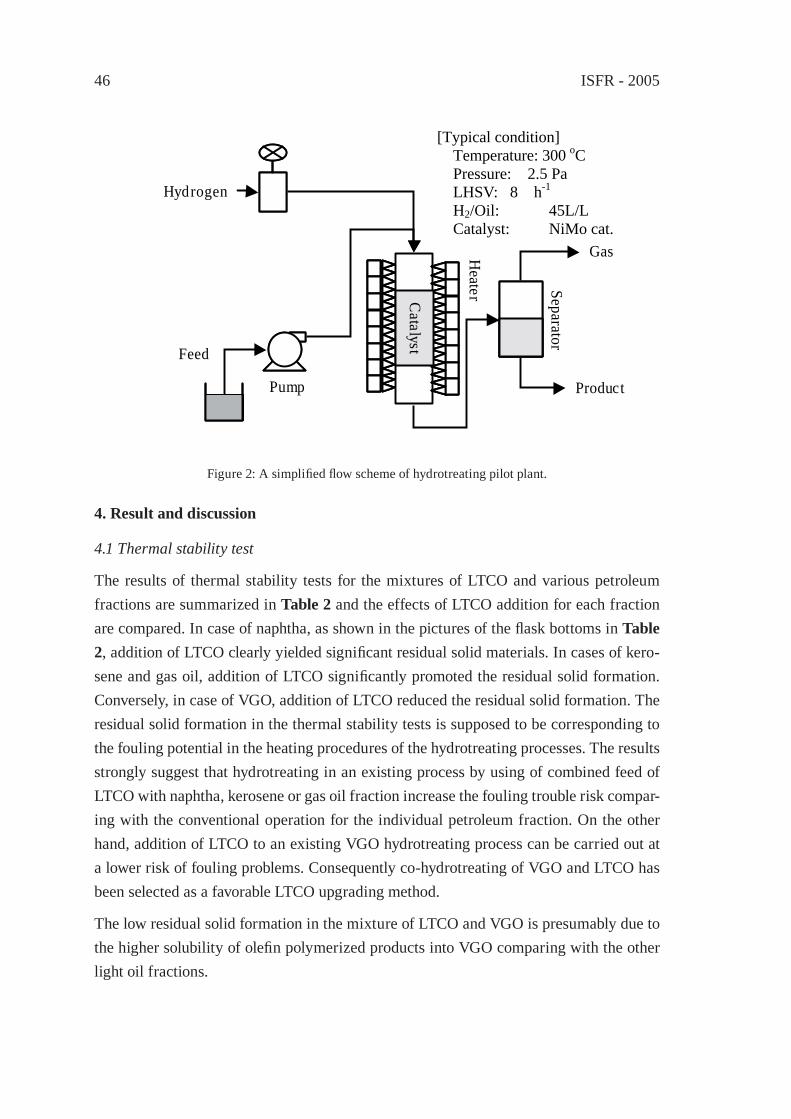
ISFR - 200546
4. Result and discussion
4.1 Thermal stability test
The results of thermal stability tests for the mixtures of LTCO and various petroleum fractions are summarized in Table 2 and the effects of LTCO addition for each fraction are compared. In case of naphtha, as shown in the pictures of the fl ask bottoms in Table 2, addition of LTCO clearly yielded signifi cant residual solid materials. In cases of kero-sene and gas oil, addition of LTCO signifi cantly promoted the residual solid formation. Conversely, in case of VGO, addition of LTCO reduced the residual solid formation. The residual solid formation in the thermal stability tests is supposed to be corresponding to the fouling potential in the heating procedures of the hydrotreating processes. The results strongly suggest that hydrotreating in an existing process by using of combined feed of LTCO with naphtha, kerosene or gas oil fraction increase the fouling trouble risk compar-ing with the conventional operation for the individual petroleum fraction. On the other hand, addition of LTCO to an existing VGO hydrotreating process can be carried out at a lower risk of fouling problems. Consequently co-hydrotreating of VGO and LTCO has been selected as a favorable LTCO upgrading method.
The low residual solid formation in the mixture of LTCO and VGO is presumably due to the higher solubility of olefi n polymerized products into VGO comparing with the other light oil fractions.
[Typical condition] Temperature: 300 oC Pressure: 2.5 Pa LHSV: 8 h-1 H2/Oil: 45L/L Catalyst: NiMo cat.
Product
Gas
Hydrogen
FeedC
atalyst
Heater Separator
Pump
Figure 2: A simplifi ed fl ow scheme of hydrotreating pilot plant.
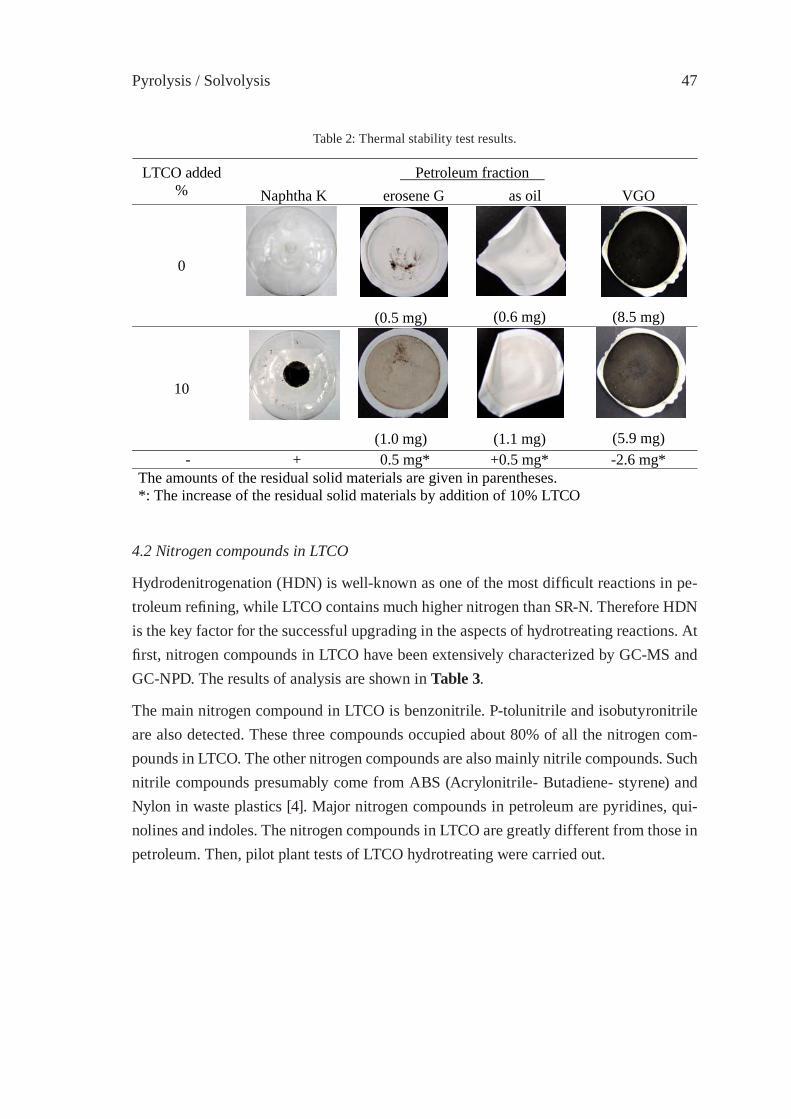
Pyrolysis / Solvolysis 47
4.2 Nitrogen compounds in LTCO
Hydrodenitrogenation (HDN) is well-known as one of the most diffi cult reactions in pe-troleum refi ning, while LTCO contains much higher nitrogen than SR-N. Therefore HDN is the key factor for the successful upgrading in the aspects of hydrotreating reactions. At fi rst, nitrogen compounds in LTCO have been extensively characterized by GC-MS and GC-NPD. The results of analysis are shown in Table 3.
The main nitrogen compound in LTCO is benzonitrile. P-tolunitrile and isobutyronitrile are also detected. These three compounds occupied about 80% of all the nitrogen com-pounds in LTCO. The other nitrogen compounds are also mainly nitrile compounds. Such nitrile compounds presumably come from ABS (Acrylonitrile- Butadiene- styrene) and Nylon in waste plastics [4]. Major nitrogen compounds in petroleum are pyridines, qui-nolines and indoles. The nitrogen compounds in LTCO are greatly different from those in petroleum. Then, pilot plant tests of LTCO hydrotreating were carried out.
Petroleum fraction LTCO added % Naphtha K erosene G as oil VGO
0
(0.5 mg) (0.6 mg) (8.5 mg)
10
(1.0 mg) (1.1 mg) (5.9 mg) - + 0.5 mg* +0.5 mg* -2.6 mg*
The amounts of the residual solid materials are given in parentheses. *: The increase of the residual solid materials by addition of 10% LTCO
Table 2: Thermal stability test results.
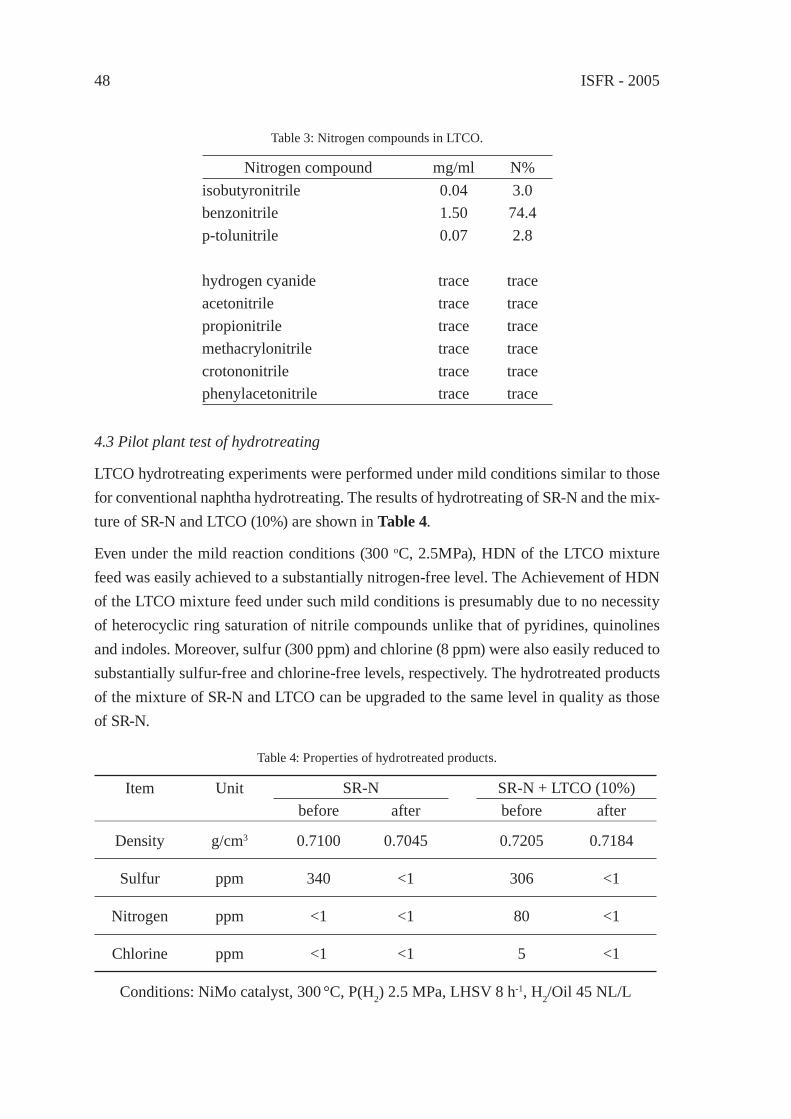
ISFR - 200548
Table 3: Nitrogen compounds in LTCO.
Nitrogen compound mg/ml N%isobutyronitrile 0.04 3.0benzonitrile 1.50 74.4p-tolunitrile 0.07 2.8
hydrogen cyanide trace traceacetonitrile trace tracepropionitrile trace tracemethacrylonitrile trace tracecrotononitrile trace tracephenylacetonitrile trace trace
4.3 Pilot plant test of hydrotreating
LTCO hydrotreating experiments were performed under mild conditions similar to those for conventional naphtha hydrotreating. The results of hydrotreating of SR-N and the mix-ture of SR-N and LTCO (10%) are shown in Table 4.
Even under the mild reaction conditions (300 oC, 2.5MPa), HDN of the LTCO mixture feed was easily achieved to a substantially nitrogen-free level. The Achievement of HDN of the LTCO mixture feed under such mild conditions is presumably due to no necessity of heterocyclic ring saturation of nitrile compounds unlike that of pyridines, quinolines and indoles. Moreover, sulfur (300 ppm) and chlorine (8 ppm) were also easily reduced to substantially sulfur-free and chlorine-free levels, respectively. The hydrotreated products of the mixture of SR-N and LTCO can be upgraded to the same level in quality as those of SR-N.
Table 4: Properties of hydrotreated products.
Item Unit SR-N SR-N + LTCO (10%)before after before after
Density g/cm3 0.7100 0.7045 0.7205 0.7184
Sulfur ppm 340 <1 306 <1
Nitrogen ppm <1 <1 80 <1
Chlorine ppm <1 <1 5 <1
Conditions: NiMo catalyst, 300 °C, P(H2) 2.5 MPa, LHSV 8 h-1, H2/Oil 45 NL/L
Pyrolysis / Solvolysis 49
4.4 Demonstration in oil refi nery
The demonstration operation in Mizushima Oil Refi nery was started in April 2004 in order to confi rm the effect on various units by accepting LTCO from SPR and Rekiseik-ouyu Co., Ltd.
Cumulative throughput of LTCO treated in the oil refi nery is shown in Figure 3. About 800 KL of LTCO was upgraded from April, 2004 to March, 2005 without any problem.
0
200
400
600
800
1000
4/1/04 6/30/04 9/28/04 12/27/04 3/27/05
Cum
ula
tive
thro
ugh
put
(KL)
Figure 3: Cumulative throughput of LTCO treated in Mizushima Oil Refi nery.
5. Conclusion
We have developed a successful fl ow scheme to co-process LTCO with petroleum in an oil refi nery and demonstrated that utilizing an existing upgrading unit at Mizushima Oil Refi nery in 2004. Key issues in the application, fouling in oil refi ning equipment and the oil products’ qualities have been successfully solved.
The upgrading of LTCO has been continued and the throughput of LTCO will be increased in the near furture. Moreover, the upgrading technology of LTCO will be extended to that of the whole fractions of thermal cracking oil derived from waste plastics. The feedstock recycling by the co-processing of petroleum and thermal cracking oil derived from mu-nicipal waste plastics is promising as an useful way of recycling of plastics.

ISFR - 200550
References
[1] E.Sugiyama, H. Muta, H.Ibe, 1st International Symposium on Feedstock Recycling of Plastics, 1999-11.
[2] E. Sugiyama, K. Wakai, N. Shiratori, T. Kawanishi, T. Abe, The Japan Society of Waste Management Experts., 15, 584- 586 (2004).
[3] C.Savu, C. Vasile, E. Voicu-Bosovei, Riv. Combust., 49, 145-153 (1995).[4] Mihai Brebu, M.Azhar Uddin, Akinori Muto, and Yusaku Sakata, Energy & Fuels,
14, 920-928 (2000).
Pyrolysis / Solvolysis 51
THERMAL CRACKING OF POLYALKENE WASTES AS A SOURCE OF PETROCHEMICAL FEEDSTOCKS
E. Hájeková* and M. BajusFaculty of Chemical and Food Technology, Slovak University of Technology, Bratislava,
Slovakia, [email protected]
Abstract: Thermal cracking of polymers was investigated as feedstock recycling for the preparation of intermediates that can be used as refi nery feedstocks. The infl uence of the thermal cracking temperature from 300 to 490 °C on the yields and composition of the derived products mainly from cracking of LDPE or PP, eventually from PS, PET and PVC was studied. Both LDPE and PP produced a hydrocarbon gas, a light-yellow oil/wax fraction and little solid residue.Propene, propane, 1-butene, butane, ethane, 1-pentene and ethene dominated in gases form LDPE. Propene, pentane, methylpropene and ethane prevailed in the gases from thermal decomposition of PP.
1. Introduction
Polyethylene (L/LDPE, HDPE), polypropylene (PP), polystyrene (PS), poly(ethylene terephthalate) (PET) and poly(vinyl chloride) (PVC) are important components of mu-nicipal solid waste. Numbers of reports have been published on different approaches of feedstock and/or chemical recycling of polyalkenes including thermal [1-6] and catalytic degradation [7-9], and hydrocracking [10, 11]. These processes enable transformation of waste polyalkenes into valuable petrochemicals or fuels.
Thermal decomposition of polyalkenes leads to a complex mixture of products. In general terms, up to four product fractions can be recovered: gases, oils, solid waxes and a solid residue. In dependence on the process temperature (cracking < 600 °C, pyrolysis ≥ 600 °C) a variety of products and applications can be envisaged from the thermal decomposi-tion of polymeric materials: fuel gases, olefi nic gases useful in chemical synthesis, naph-tha and middle distillates, oil fraction, long-chain paraffi ns and olefi ns, coke, etc. [12].
Several petrochemical companies have considered the possible recycling of plastic wastes in existing refi nery facilities, which would avoid the need to invest and build new process-ing plants. This alternative is based on the similarity of elementary composition between plastics and petroleum fractions [12]. Research of different scientists [3-5] showed the possibility of fi xed-bed or fl uidised-bed thermal decomposition of mixed-plastics waste using mild conditions (450 °C to 550 °C) for the production of high yields of oil-waxy hydrocarbons suitable as co-feed for many downstream processing units. The condensed oil/wax can be mixed with liquid petroleum fractions. This mixture may be used as refi n-ery feedstock; for example it may be fed to a steam cracker, to produce reusable olefi ns [5, 6] or fed to a catalytic cracker to produce gasoline or upgraded in a hydrocracker [5].
ISFR - 200552
Based on the detailed analysis of oils and waxes from polyethylene thermal decomposi-tion at 500 °C to 700 °C, Williams and Williams [4] came to the conclusion that the wax produced from the thermal decomposition of LDPE was a very pure aliphatic material, with no aromatics and could be used as substitute for petroleum derived feedstock. The oils produced up to 550 °C also contained no aromatic hydrocarbons or PAH, however, the oils derived from pyrolysis in the range from 600 °C to 700 °C were found to contain increasing concentrations of aromatic hydrocarbons and PAH up to 25% of the oil.
Oil/wax products from polyethylene cracking are composed predominantly from linear alkanes and 1-alkenes in the range of carbon atom from C8 to C57 [4]. On the contrary, prod-ucts of catalytic degradation contain high proportion of aromatics [13]. Kiran and Gillham [14] presented the fact that the oil/wax fraction formed during PP cracking was a complex mixture of branched alkenes and alkanes. Such composition of oil/waxes from cracking of PE or PP at mild temperatures seems to be favourable, because straight-chain paraf-fi ns produce in steam cracking high yields of straight-chain alkenes (mainly ethene), and branched hydrocarbons yield some branched products (mainly propene). Higher α-olefi ns decompose by similar paths to paraffi ns and the products are similar to those observed in paraffi n steam-cracking [15]. Aromatics are undesirable in steam-cracking feeds, because they greatly contribute to coke formation and give small yields of alkenes.
The necessity of the detailed analysis of the derived products from polymer cracking is evident from the presented facts. The content of alkanes, alkenes, alkadienes and aromat-ics determines the character of their further chemical recycling. In our case the knowl-edge of the detailed composition of the feedstock enables to optimise conditions both for the thermal cracking of waste polyalkenes and also for the copyrolysis of oil/wax frac-tions from polyalkenes with naphtha to produce low molecular weight alkenes (ethene and propene).
2. Experimental
Tested polymers LDPE, PP, PS, PET and PVC were virgin plastics. They were thermally decomposed separately in a stainless-steel batch reactor which was described in detail in our previous paper [6], at 300 – 490 °C, thus forming gaseous, oil/wax products and in some cases also solid residue. To obtain only low heat gradients in the reactor, we gradu-ally heated the polymer with precisely programmed rate of heating. The fi nal temperature in the reactor was reached between 35 to 50 minutes in dependene on the vaue of the fi nal temperature. This level of temperature in the reactor was maintained for another 30 minutes to allow for the release of the maximum amount of decomposing products from the reactor. This construction enables the stirring of the molten polymer by bubbles of fl owing nitrogen, which can also help to lower temperature gradients in the melting. The
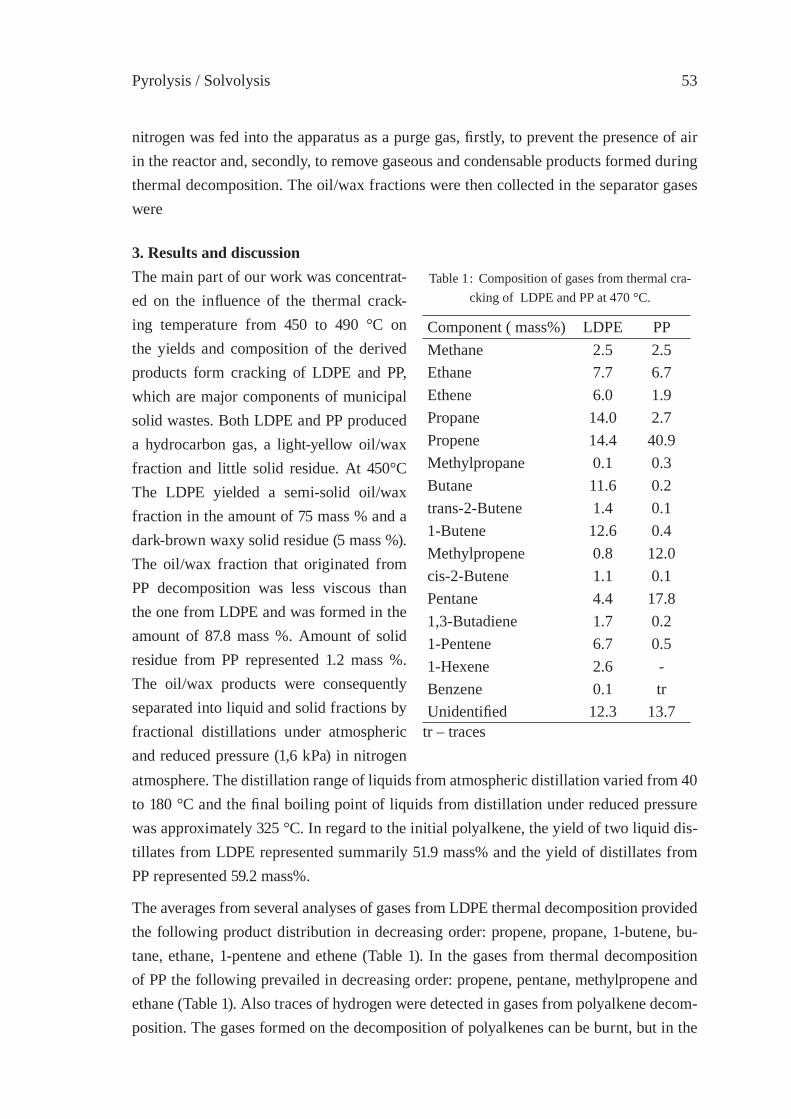
Pyrolysis / Solvolysis 53
nitrogen was fed into the apparatus as a purge gas, fi rstly, to prevent the presence of air in the reactor and, secondly, to remove gaseous and condensable products formed during thermal decomposition. The oil/wax fractions were then collected in the separator gases were
3. Results and discussionTable 1: Composition of gases from thermal cra-
cking of LDPE and PP at 470 °C.
Component ( mass%) LDPE PPMethane 2.5 2.5Ethane 7.7 6.7Ethene 6.0 1.9Propane 14.0 2.7Propene 14.4 40.9Methylpropane 0.1 0.3Butane 11.6 0.2trans-2-Butene 1.4 0.11-Butene 12.6 0.4Methylpropene 0.8 12.0cis-2-Butene 1.1 0.1Pentane 4.4 17.81,3-Butadiene 1.7 0.21-Pentene 6.7 0.51-Hexene 2.6 -Benzene 0.1 trUnidentifi ed 12.3 13.7
tr – traces
The main part of our work was concentrat-ed on the infl uence of the thermal crack-ing temperature from 450 to 490 °C on the yields and composition of the derived products form cracking of LDPE and PP, which are major components of municipal solid wastes. Both LDPE and PP produced a hydrocarbon gas, a light-yellow oil/wax fraction and little solid residue. At 450°C The LDPE yielded a semi-solid oil/wax fraction in the amount of 75 mass % and a dark-brown waxy solid residue (5 mass %). The oil/wax fraction that originated from PP decomposition was less viscous than the one from LDPE and was formed in the amount of 87.8 mass %. Amount of solid residue from PP represented 1.2 mass %. The oil/wax products were consequently separated into liquid and solid fractions by fractional distillations under atmospheric and reduced pressure (1,6 kPa) in nitrogen atmosphere. The distillation range of liquids from atmospheric distillation varied from 40 to 180 °C and the fi nal boiling point of liquids from distillation under reduced pressure was approximately 325 °C. In regard to the initial polyalkene, the yield of two liquid dis-tillates from LDPE represented summarily 51.9 mass% and the yield of distillates from PP represented 59.2 mass%.
The averages from several analyses of gases from LDPE thermal decomposition provided the following product distribution in decreasing order: propene, propane, 1-butene, bu-tane, ethane, 1-pentene and ethene (Table 1). In the gases from thermal decomposition of PP the following prevailed in decreasing order: propene, pentane, methylpropene and ethane (Table 1). Also traces of hydrogen were detected in gases from polyalkene decom-position. The gases formed on the decomposition of polyalkenes can be burnt, but in the
ISFR - 200554
case of fl uid cracking of polyalkenes, they can be returned to the process as fl uidizing gas. They can also be added to the streams of gases that are formed at the steam cracking unit and thus the already existing equipment for separation of gases from steam cracking can be utilized.
By analysis of LDPE oil/wax fraction using GC-MS we have confi rmed the already pre-sented fact that the signal of each carbon atom number is resolved into two main peaks: corresponding linear alkane and 1-alkene. The presence of small amounts of dienes has also been registrated.
The most suitable raw materials for the industrial production of low-molecular alkenes are those that have high alkane content and do not contain many aromatics that are precursors of coke. That is why the most suitable conditions seemed to be to prepare oil/waxes at 450 °C when the ratio of unsaturated and saturated molecules in oil/wax fraction is rather low and aromatics are not present. We determined molecular weight distribution of oil/wax fractions from LDPE and PP using gel-permeation chromatography. The values show that during LDPE and PP thermal decomposition a 30- or even 60- fold decrease of molecular mass has occurred.
During thermal decomposition of polystyrene, liquid was formed as a prevailing product. The high content of styrene in this liquid was confi rmed by analysis. Pentane and C4-hy-drocarbons were the main components of gas formed during decomposition of PS.
PET was thermally decomposed at 390 °C on formation of solid products, which chocked up cooler and also output of the reactor. The part of the solid product carbonised. Carbon dioxide and ethylene were the main components in gaseous products.
PVC was thermally decomposed at 300 °C. Gaseous products and carbonised residue was formed. As the main components in the gas, benzene and hydrocarbons C6 were identi-fi ed. The presence of HCl, formed during decomposition of PVC, caused intense corro-sion of the equipment.
References
[1] Walendzievski, J., Fuel. Process. Technol. 86:1265 (2005).[2] Predel, M., and Kaminsky, W., Polym. Degrad. Stabil. 70:373 (2000).[3] Kastner, H., and Kaminsky, W., Hydrocarbon Proc. May:109 (1995).[4] Williams, P.T. and Williams, E.A., J. Anal. Appl. Pyrolysis 51:107 (1999).[5] Kirkwood, K.C., Leng, S.A., and David, W., Polymer Cracking, US Patent 5364995
(1992).[6] Hájeková, E., and Bajus, M., J. Anal. Appl. Pyrolysis 74:271 (2005).
Pyrolysis / Solvolysis 55
[7] Kargöz, S., Yanik, J., Uçar, S., Saglam, M., and Song, Ch., Appl. Catal. A-Gen. 242:51 (2003).
[8] De la Puente, G., Klocker, C., and Sedran, U., Appl. Catal. B-Environ. 36:279 (2002).
[9] Serrano, D.P., Aguado, J., Escola, J.M., and Garagorri, E., J. Anal. Appl. Pyrolysis 58-59:789 (2001).
[10] Simon, C.M., and Kaminsky, W., J. Anal. Appl. Pyrolysis 38:75 (1996).[11] Metecan, I.H., Ozkan, A.R., Isler, R., Yanik, J., Saglam, M., and Yuksel, M., Fuel
84:619 (2005).[12] Aguado, J., and Serrano, D., Feedstock Recycling of Plastic Wastes, The Royal Society
of Chemistry, 1999, p.21.[13] Aguado, J., Sotelo, J.L., Serrano, D.P., Calles, J.A., and Escola, J.M., Energy Fuels
11:1225 (1997).[14] Kiran, E., and Gillham, J.K., J. Appl. Polym. Sci. 20:2045 (1976).[15] Albright, L.F., Crynes, B.L., and Corcoran, W.H., Pyrolysis: Theory and Industrial
Practice, Academic Press, 1983, pp.71-78.

ISFR - 200556
Pyrolysis / Solvolysis 57
PYROLYSIS OF DIFFERENT PLASTIC-CONTAININGWASTE STREAMS
I. de Marco*, B. Caballero, M.F. Laresgoiti, A. Torres, M.J. Chomón, G. FernandezEscuela Superior de Ingenieros de Bilbao. Alda. Urquijo s/n, 48013 Bilbao. Spain,
Abstract: A study of pyrolysis as a means of treating plastic containing waste streams has been carried out. Different wastes, which include materials from real electric and electronic equipments (WEEEs), such as wires of polyethylene (PE), table phones, mobile phones and printed circuit boards, and materials from the automobile shredder plants, such as light and heavy automotive shredder residues (ASRs), have been pyrolysed under N2 in a 3,5 dm3 autoclave at 500 ºC for 30 minutes. It can be concluded that pyrolysis can be an appropriate technique for recycling PE wires, table and mobile phones, circuit boards and heavy ASR; with all of them valuable solid, liquid and gaseous products are obtained. On the contrary light ASR does not yield valuable products and therefore its recycling by pyrolysis is not of interest.
1. Introduction
The pyrolysis process can be at present considered as a promising technique for treating plastic rich waste streams. During pyrolysis, heating to moderate temperatures in an inert atmosphere, the organic volatile matter of the waste (plastics, rubber, etc.) is decomposed to gases and liquids, which can be useful as fuels or source of chemicals. The inorganic components (metals, fi llers, glasses, etc.) remain almost unaltered, and consequently these products can be recovered and reused. Therefore pyrolysis is a type of feedstock recycling which enables also to recycle valuable inorganic components of waste streams.
Pyrolysis is especially appropriate for treating complex waste streams, which contain many different plastics mixed with other organic and inorganic materials, for which me-chanical separation and recycling is not technical or economically feasible, and therefore they do not have a clear alternative of recycling. This is the case of wastes such as ASRs (Automotive Shredder Residues) and WEEEs (Wastes of Electric and Electronic Equip-ments). Additionally the recent and stricter EU legislation (The Landfi ll Directive, Incin-eration of Directive, End-of-Life Vehicles (ELV) and WEEE Directives) is promoting the investigation and development of new recycling alternatives.
In this paper a experimental study on the possibilities of pyrolysis as a means of treating several WEEE streams (polyethylene wires, table and mobile phones and printed circuit boards) and ELV streams (heavy and light ASRs) is presented.

ISFR - 200558
2. Experimental
2.1. Characteristics of the samples pyrolysed
Two types of streams have been studied in pyrolysis: wastes of electric and electronic equipment (WEEE) and wastes from end of life vehicles, namely automotive shredder residues (ASR).
The WEEEs streams were selected with the criteria that they should be polymer rich wastes and that for the moment, there was not a clear alternative for their recycling. The following four samples were selected:
- Polyethylene (PE) wires. It is the waste stream obtained after a process in which most of the Cu and Al of the wires is removed by fl otation. As a result a polyethylene rich frac-tion with some Al and Cu left is produced.
- Table phones. It is the waste stream that results from grinding table phones (base, card phone and wire included), once the magnetic parts have been separated.
- Mobile phones. The same as table phones, it is the waste stream that results from grind-ing the phones once the magnetic parts have been removed.
- Printed circuit boards. It is a complex high metal containing sample, which is obtained by grinding printed circuit boards.
These samples were provided by a Spanish recycling company, which is mainly devoted to the recovering of metals from WEEEs.
Concerning the ELV streams two types of samples coming from industrial automobile shredder plants were studied. The so-called light ASR, which is the lighter fraction sepa-rated from the total product shredded in a fi rst step by simple suction; it is about 19 weight % of the total product shredded. And the so-called heavy ASR, which is what is left after ferrous metals are magnetically removed from the non-sucked stream; it is about 9 weight % of the total product shredded. Both types of ASRs are rich in polymeric materials and at present, have no clear alternative of recycling.
The composition of both the WEEE and the ASR samples are presented in Table 1. It can be seen that PE wires, both type of phones and the heavy ASR have a rather high content of organic matter; therefore they are expected to give high liquid and gas yields in py-rolysis. On the contrary circuit boards and the light ASR have a very high proportion of inorganics; consequently they will have lower liquid/gas pyrolysis yields.
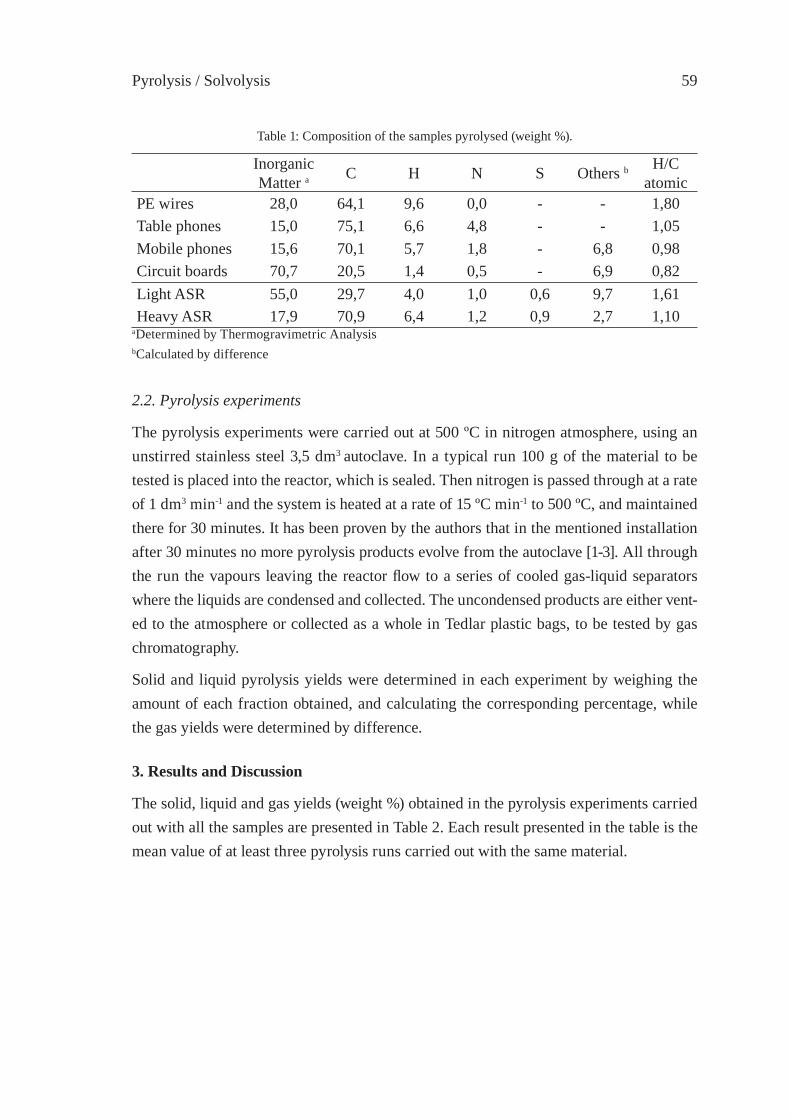
Pyrolysis / Solvolysis 59
Table 1: Composition of the samples pyrolysed (weight %).
InorganicMatter a C H N S Others b H/C
atomicPE wires 28,0 64,1 9,6 0,0 - - 1,80Table phones 15,0 75,1 6,6 4,8 - - 1,05Mobile phones 15,6 70,1 5,7 1,8 - 6,8 0,98Circuit boards 70,7 20,5 1,4 0,5 - 6,9 0,82Light ASR 55,0 29,7 4,0 1,0 0,6 9,7 1,61Heavy ASR 17,9 70,9 6,4 1,2 0,9 2,7 1,10
aDetermined by Thermogravimetric Analysis bCalculated by difference
2.2. Pyrolysis experiments
The pyrolysis experiments were carried out at 500 ºC in nitrogen atmosphere, using an unstirred stainless steel 3,5 dm3 autoclave. In a typical run 100 g of the material to be tested is placed into the reactor, which is sealed. Then nitrogen is passed through at a rate of 1 dm3 min-1 and the system is heated at a rate of 15 ºC min-1 to 500 ºC, and maintained there for 30 minutes. It has been proven by the authors that in the mentioned installation after 30 minutes no more pyrolysis products evolve from the autoclave [1-3]. All through the run the vapours leaving the reactor fl ow to a series of cooled gas-liquid separators where the liquids are condensed and collected. The uncondensed products are either vent-ed to the atmosphere or collected as a whole in Tedlar plastic bags, to be tested by gas chromatography.
Solid and liquid pyrolysis yields were determined in each experiment by weighing the amount of each fraction obtained, and calculating the corresponding percentage, while the gas yields were determined by difference.
3. Results and Discussion
The solid, liquid and gas yields (weight %) obtained in the pyrolysis experiments carried out with all the samples are presented in Table 2. Each result presented in the table is the mean value of at least three pyrolysis runs carried out with the same material.
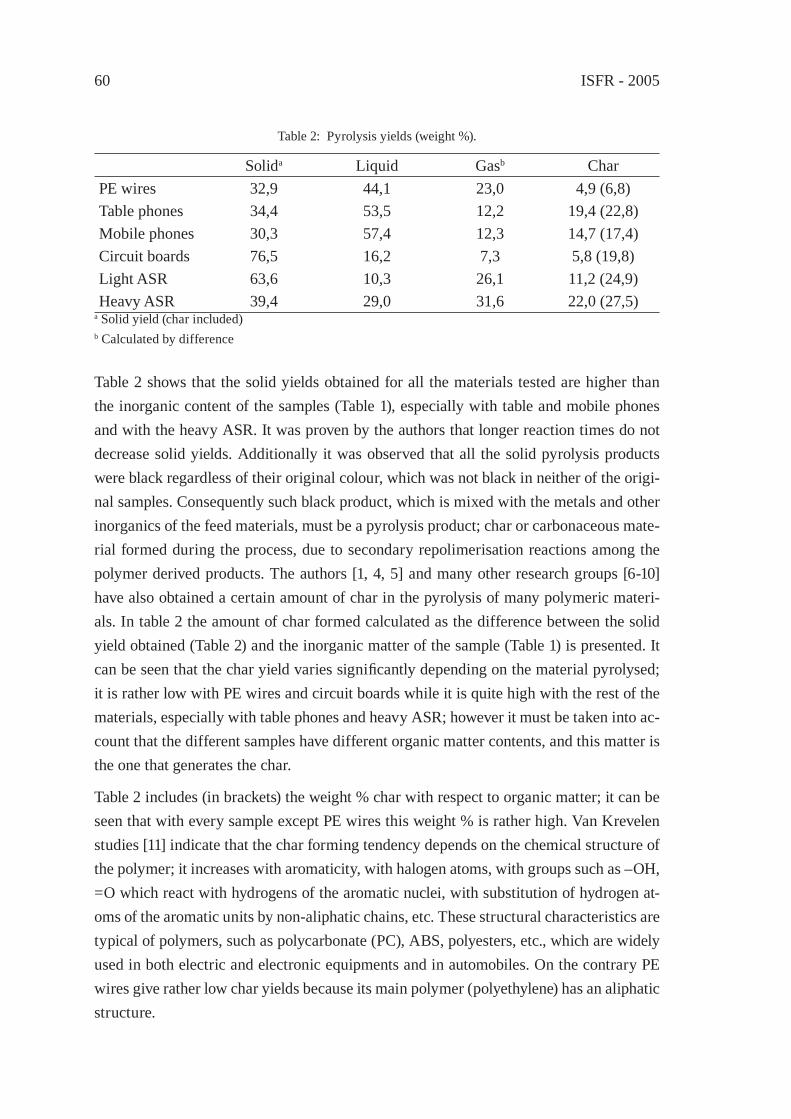
ISFR - 200560
Table 2: Pyrolysis yields (weight %).
Solida Liquid Gasb CharPE wires 32,9 44,1 23,0 4,9 (6,8)Table phones 34,4 53,5 12,2 19,4 (22,8)Mobile phones 30,3 57,4 12,3 14,7 (17,4)Circuit boards 76,5 16,2 7,3 5,8 (19,8)Light ASR 63,6 10,3 26,1 11,2 (24,9)Heavy ASR 39,4 29,0 31,6 22,0 (27,5)
a Solid yield (char included)b Calculated by difference
Table 2 shows that the solid yields obtained for all the materials tested are higher than the inorganic content of the samples (Table 1), especially with table and mobile phones and with the heavy ASR. It was proven by the authors that longer reaction times do not decrease solid yields. Additionally it was observed that all the solid pyrolysis products were black regardless of their original colour, which was not black in neither of the origi-nal samples. Consequently such black product, which is mixed with the metals and other inorganics of the feed materials, must be a pyrolysis product; char or carbonaceous mate-rial formed during the process, due to secondary repolimerisation reactions among the polymer derived products. The authors [1, 4, 5] and many other research groups [6-10] have also obtained a certain amount of char in the pyrolysis of many polymeric materi-als. In table 2 the amount of char formed calculated as the difference between the solid yield obtained (Table 2) and the inorganic matter of the sample (Table 1) is presented. It can be seen that the char yield varies signifi cantly depending on the material pyrolysed; it is rather low with PE wires and circuit boards while it is quite high with the rest of the materials, especially with table phones and heavy ASR; however it must be taken into ac-count that the different samples have different organic matter contents, and this matter is the one that generates the char.
Table 2 includes (in brackets) the weight % char with respect to organic matter; it can be seen that with every sample except PE wires this weight % is rather high. Van Krevelen studies [11] indicate that the char forming tendency depends on the chemical structure of the polymer; it increases with aromaticity, with halogen atoms, with groups such as –OH, =O which react with hydrogens of the aromatic nuclei, with substitution of hydrogen at-oms of the aromatic units by non-aliphatic chains, etc. These structural characteristics are typical of polymers, such as polycarbonate (PC), ABS, polyesters, etc., which are widely used in both electric and electronic equipments and in automobiles. On the contrary PE wires give rather low char yields because its main polymer (polyethylene) has an aliphatic structure.
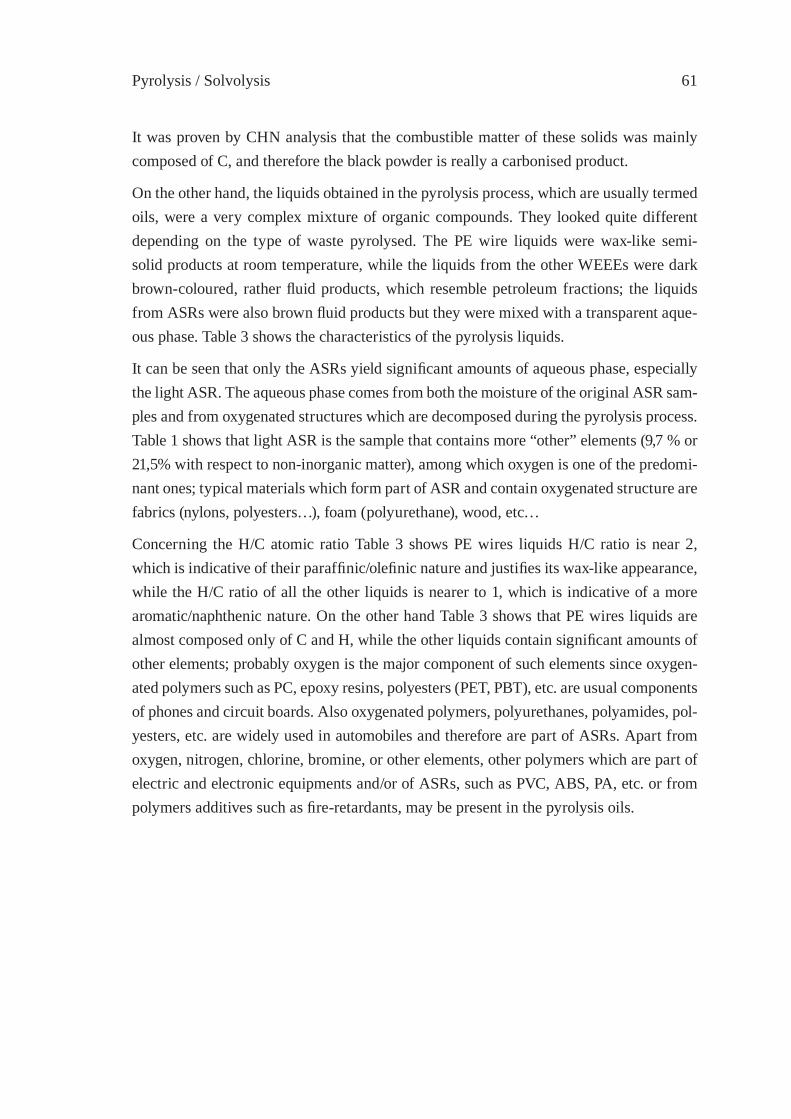
Pyrolysis / Solvolysis 61
It was proven by CHN analysis that the combustible matter of these solids was mainly composed of C, and therefore the black powder is really a carbonised product.
On the other hand, the liquids obtained in the pyrolysis process, which are usually termed oils, were a very complex mixture of organic compounds. They looked quite different depending on the type of waste pyrolysed. The PE wire liquids were wax-like semi-solid products at room temperature, while the liquids from the other WEEEs were dark brown-coloured, rather fl uid products, which resemble petroleum fractions; the liquids from ASRs were also brown fl uid products but they were mixed with a transparent aque-ous phase. Table 3 shows the characteristics of the pyrolysis liquids.
It can be seen that only the ASRs yield signifi cant amounts of aqueous phase, especially the light ASR. The aqueous phase comes from both the moisture of the original ASR sam-ples and from oxygenated structures which are decomposed during the pyrolysis process. Table 1 shows that light ASR is the sample that contains more “other” elements (9,7 % or 21,5% with respect to non-inorganic matter), among which oxygen is one of the predomi-nant ones; typical materials which form part of ASR and contain oxygenated structure are fabrics (nylons, polyesters…), foam (polyurethane), wood, etc…
Concerning the H/C atomic ratio Table 3 shows PE wires liquids H/C ratio is near 2, which is indicative of their paraffi nic/olefi nic nature and justifi es its wax-like appearance, while the H/C ratio of all the other liquids is nearer to 1, which is indicative of a more aromatic/naphthenic nature. On the other hand Table 3 shows that PE wires liquids are almost composed only of C and H, while the other liquids contain signifi cant amounts of other elements; probably oxygen is the major component of such elements since oxygen-ated polymers such as PC, epoxy resins, polyesters (PET, PBT), etc. are usual components of phones and circuit boards. Also oxygenated polymers, polyurethanes, polyamides, pol-yesters, etc. are widely used in automobiles and therefore are part of ASRs. Apart from oxygen, nitrogen, chlorine, bromine, or other elements, other polymers which are part of electric and electronic equipments and/or of ASRs, such as PVC, ABS, PA, etc. or from polymers additives such as fi re-retardants, may be present in the pyrolysis oils.
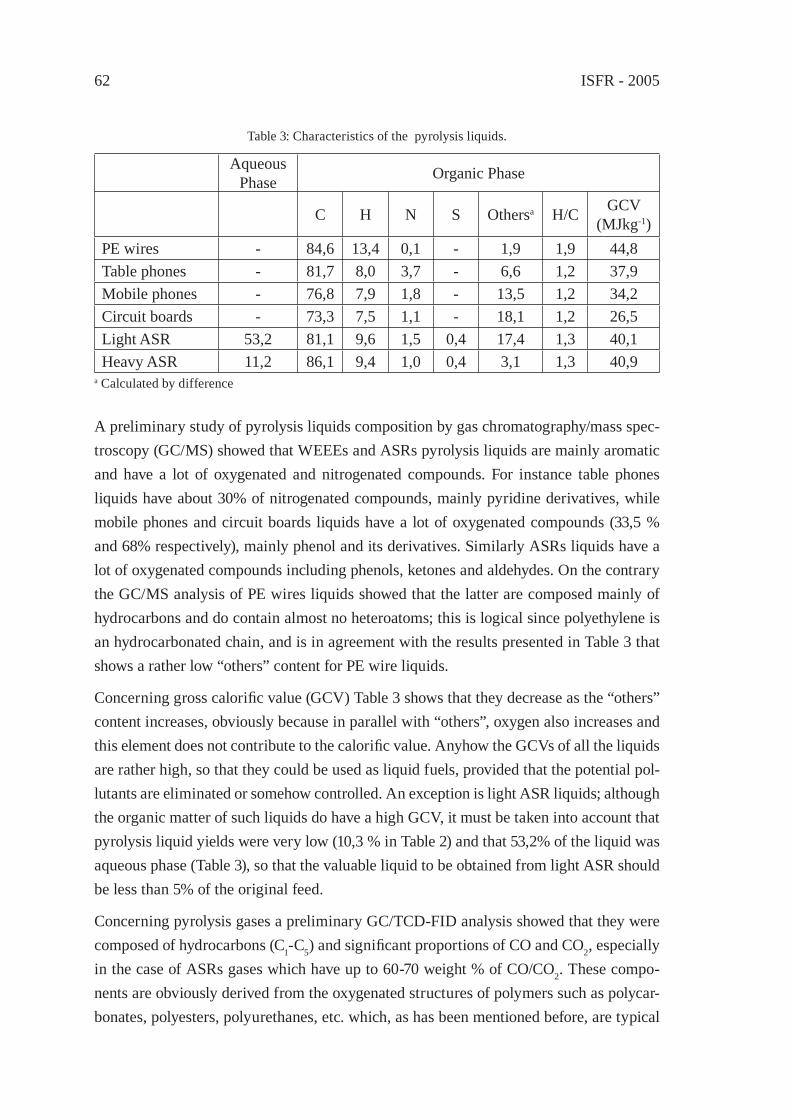
ISFR - 200562
Table 3: Characteristics of the pyrolysis liquids.
AqueousPhase Organic Phase
C H N S Othersa H/C GCV(MJkg-1)
PE wires - 84,6 13,4 0,1 - 1,9 1,9 44,8Table phones - 81,7 8,0 3,7 - 6,6 1,2 37,9Mobile phones - 76,8 7,9 1,8 - 13,5 1,2 34,2Circuit boards - 73,3 7,5 1,1 - 18,1 1,2 26,5Light ASR 53,2 81,1 9,6 1,5 0,4 17,4 1,3 40,1Heavy ASR 11,2 86,1 9,4 1,0 0,4 3,1 1,3 40,9
a Calculated by difference
A preliminary study of pyrolysis liquids composition by gas chromatography/mass spec-troscopy (GC/MS) showed that WEEEs and ASRs pyrolysis liquids are mainly aromatic and have a lot of oxygenated and nitrogenated compounds. For instance table phones liquids have about 30% of nitrogenated compounds, mainly pyridine derivatives, while mobile phones and circuit boards liquids have a lot of oxygenated compounds (33,5 % and 68% respectively), mainly phenol and its derivatives. Similarly ASRs liquids have a lot of oxygenated compounds including phenols, ketones and aldehydes. On the contrary the GC/MS analysis of PE wires liquids showed that the latter are composed mainly of hydrocarbons and do contain almost no heteroatoms; this is logical since polyethylene is an hydrocarbonated chain, and is in agreement with the results presented in Table 3 that shows a rather low “others” content for PE wire liquids.
Concerning gross calorifi c value (GCV) Table 3 shows that they decrease as the “others” content increases, obviously because in parallel with “others”, oxygen also increases and this element does not contribute to the calorifi c value. Anyhow the GCVs of all the liquids are rather high, so that they could be used as liquid fuels, provided that the potential pol-lutants are eliminated or somehow controlled. An exception is light ASR liquids; although the organic matter of such liquids do have a high GCV, it must be taken into account that pyrolysis liquid yields were very low (10,3 % in Table 2) and that 53,2% of the liquid was aqueous phase (Table 3), so that the valuable liquid to be obtained from light ASR should be less than 5% of the original feed.
Concerning pyrolysis gases a preliminary GC/TCD-FID analysis showed that they were composed of hydrocarbons (C1-C5) and signifi cant proportions of CO and CO2, especially in the case of ASRs gases which have up to 60-70 weight % of CO/CO2. These compo-nents are obviously derived from the oxygenated structures of polymers such as polycar-bonates, polyesters, polyurethanes, etc. which, as has been mentioned before, are typical
Pyrolysis / Solvolysis 63
components of both WEEEs and ASRs. The exception in this case was again PE wires, since they do not contain heteroatomic structures, the CO/CO2 content of PE wire gases was rather low. The GCV of the gases varied from ≅ 27 MJ Nm-3 for light ASR to ≅ 60 MJ Nm-3 for PE wires. It has been reported by several authors [12-15] that pyrolysis gases of other materials, even with lower GCV than that of light ASR, are suffi cient to provide the energy requirements of the process plant. So it can be considered that in WEEEs and ASRs pyrolysis the gases will be also enough energy sources for the process.
References
[1] Torres, A., Pirólisis de Residuos Poliméricos Compuestos Termoestables. Productos Obtenidos y sus Aplicaciones, PhD Thesis, Universidad del País Vasco, Spain, (1998).
[2] de Marco, I., Legarreta, J.A., Cambra, J.F., Chomón, M.J., Torres, A., Laresgoiti, M.F., and Gondra, K, in: Euromat Conference Procedings, Venecia (Italy), 1:503 (1995).
[3] de Marco, I., Legarreta, J.A., Cambra, J.F., Chomón, M.J., Torres, A., Laresgoiti, M.F., Gondra, K and Zahn E, in: III International Congress Energy Environment and Technologycal Innovation, Caracas (Venezuela), 1: 225 (1995).
[4] I. de Marco, J.A. Legarreta, M.F. Laresgoiti, A. Torres, J.F. Cambra, M.J. Chomón, B.M. Caballero, J. Chem. Tech. Biotechnol., 69: 187 (1997).
[5] de Marco, I., Caballero, B.M, Torres, A., Laresgoiti, M.F., Chomón, M.J., Cabrero, M.A., J. Chem. Tech. Biotechnol., 77/7: 817 (2002).
[6] W. Kaminsky, Makromol. Chem., Macromol. Symp., 48/49: 381 (1991).[7] W. Kaminsky, Makromol. Chem., Macromol. Symp., 57: 145 (1992).[8] N. Grittner, W. Kaminsky, G. Obst, J. Anal. Appl. Pyrolysis, 25: 293 (1993).[9] W. Kaminsky, Emerging Technologies in Plastics Recycling, ACS Symposium Series,
513, American Chemical Society Publishers, Washington DC, 6: 60 (1992).[10] W. K aminsky, Adv. Polym. Tech., 14: 337 (1995).[11] D.W. Van Krevelen, Thermal Decomposition. Properties of Polymers, Elsevier, The
Netherlands, (1990) Chapter 21.[12] Norris, D.R., Development of the Pyrolysis Process for Recycling of SMC, Eagle-
Picher Plastics División, 277, (1992).[13] SMC Automotive Alliance U.S.A., Pyrolysis as a Means of Recycling Thermoset
Composites, The Annual Conference, Composites Institute. The Society of the Plastics Industry, Inc., Washington D.C. Feb. (1991).
[14] SMC Automotive Alliance U.S.A., Reinforced Plastics, Oct., 44, (1992). [15] Kaminsky, W., Makromol. Chem., Macromol Symp., 48/49: 381, (1991).

ISFR - 200564
AknowledgementsThe authors thank the Spanish MCYT (PPQ 2001-0757-CO2-01 and CTQ (2004-07046-CO2-01) and the Basque Country University (91UPV 00112.345-13643/2001) for fi nancial assistance for this work.
Pyrolysis / Solvolysis 65
MECHANISTIC MODELING OF POLYMER PYROLYSISS. E. Levine, T. M. Kruse, and L. J. Broadbelt*
Northwestern University, Evanston, Illinois, [email protected]
Abstract: A mechanistic modeling framework has been developed for polymer pyrolysis. This framework has been successfully applied to polystyrene (PS), polypropylene (PP), and PS/PP mixture pyrolysis, showing excellent agreement with experimental data for both molecular weight decay and product evolution. The modeling framework uses population balances utilizing the method of moments for polymeric species. Low molecular weight products and their related specifi c radicals are tracked explicitly. Structure-reactivity relationships link structural and thermodynamic properties of reactants and products to rate constants. The modeling framework has been shown to provide insight into interactions between components in mixed polymer pyrolysis and into the reaction pathways, as well as predictive capability for product distributions.
1. Introduction
Polymer pyrolysis, while conceptually simple, involves a very complex network of free radical reactions leading to a diverse product distribution. An understanding of the com-plex chemistry and the specifi c reaction pathways that lead to the various products is important for furthering this technology for resource recovery from polymeric waste. By understanding the specifi c reaction pathways involved in pyrolysis, optimal reaction conditions and improved reactor designs can be determined. Mechanistic modeling is a powerful tool for understanding this chemistry.
Constructing mechanistic models of manageable size to describe polymer pyrolysis is challenging. The polydisperse, high molecular weight nature of polymer chains leads to thousands of different species with distinct chain lengths and chemical compositions (unsaturated moieties, radical character, etc.). Tracking each of these species explicitly is too computationally demanding for current hardware. Mechanistic models for polymer pyrolysis demand a high level of detail, yet still need to be computationally manageable.
We have developed a modeling framework utilizing the method of moments to track polymeric species that contains suffi cient detail to track different structural features that impact reactivity and includes low molecular weight radicals and molecules explicitly. The kinetic parameters are specifi ed using structure-reactivity relationships that correlate kinetic parameters to thermodynamic properties that can be estimated based on structural features. This framework has allowed detailed yet manageable mechanistic models to be developed for PS [1], PP [2], and PS/PP mixture [3] pyrolysis.

ISFR - 200566
2. Modeling Framework
2.1 Mechanistic Chemistry
The method of moments was used to develop differential equations describing the pyroly-sis kinetics. The terms of the moment equations included rate equations derived from el-ementary reaction types. The modeling framework currently includes the following reac-tion types: (1) chain fi ssion. (2) radical recombination, (3) allyl chain fi ssion, (4) hydrogen abstraction, (5) mid-chain β-scission, (6) radical addition, (7) end-chain β-scission, (8) disproportionation, (9) 1,3 end-hydrogen transfer, (10) 1,5 end-hydrogen transfer, (11) 1,4 end-hydrogen transfer, (12) 1,6 end-hydrogen transfer, (13) 1,3 mid-hydrogen transfer, (14) 1,4 mid-hydrogen transfer, (15) 1,5 mid-hydrogen transfer. PS was modeled using reaction types 1-10, and PP was modeled using reaction types 1-15. The framework is extensible such that more reaction types can easily be added to it if they are deemed necessary.
2.2 Specifi cation of Rate Parameters
The use of elementary reaction steps in the model requires specifi cation of rate param-eters for each reaction. The rate parameters in the model are dependent not only on the reaction type but also on the structural and thermodynamic properties of the reactants and products. The Arrhenius relationship was assumed to be valid, necessitating that a frequency factor and an activation energy be specifi ed for each reaction. Based on the concept of a reaction family, each reaction of a given type is assumed to share the same frequency factor. These values were taken from the polymerization, depolymerization, and other related hydrocarbon chemistry literature.
The structures and thermodynamic properties of the reactants and products of a given elementary step were linked to the rate constant through the activation energy which was described using the Evans-Polanyi relationship [4]. The activation energy is related linearly to the heat of reaction, E = E0 + α∆HR, where E is the activation energy, E0 is the intrinsic barrier, α is the transfer coeffi cient, and ∆HR is the heat of reaction. Heats of reaction can be obtained from experimental polymerization data or derived from experi-mental or theoretical values for molecular mimics undergoing analogous reactions.
The effect of transport on termination reactions and chain transfer reactions were ac-counted for by introducing rate constants that were dependent on chain length. A simpli-fi ed version of Smoluchowski’s equation [5] was implemented for diffusion-controlled termination reactions. The rate constants for chain transfer reactions were multiplied by a factor inversely proportional to the size of the abstracting radical based on results from collision theory [6].
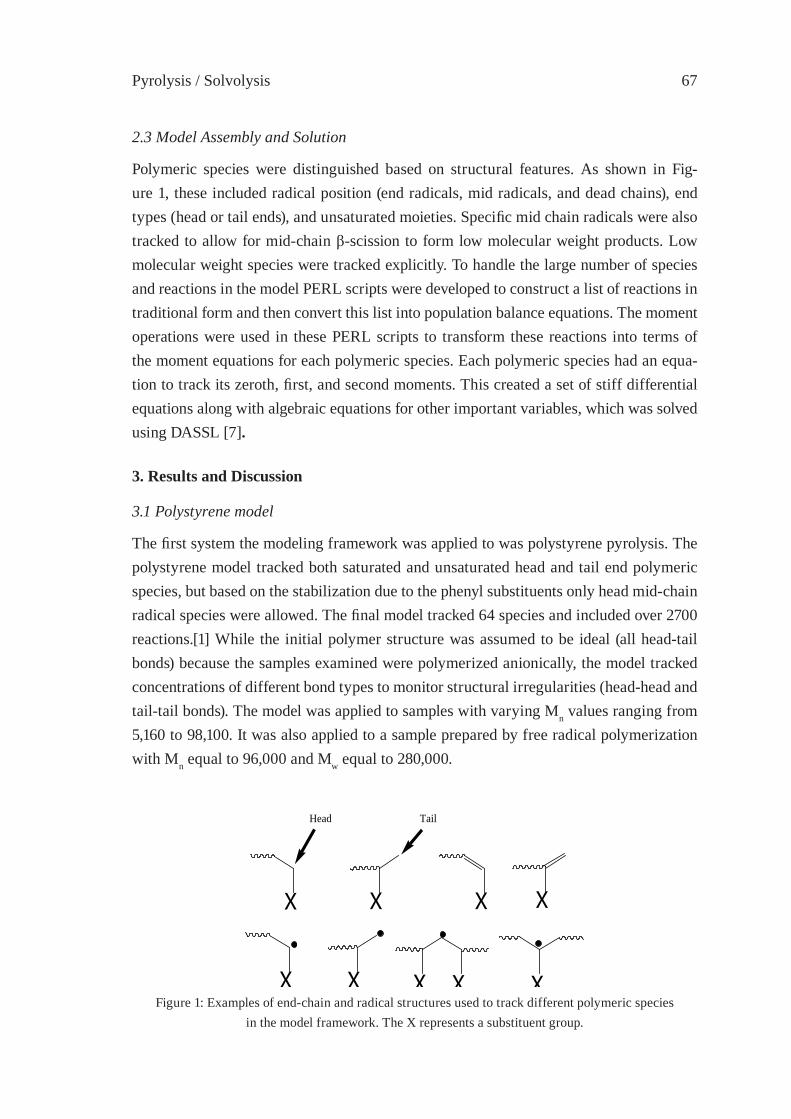
Pyrolysis / Solvolysis 67
2.3 Model Assembly and Solution
Polymeric species were distinguished based on structural features. As shown in Fig-ure 1, these included radical position (end radicals, mid radicals, and dead chains), end types (head or tail ends), and unsaturated moieties. Specifi c mid chain radicals were also tracked to allow for mid-chain β-scission to form low molecular weight products. Low molecular weight species were tracked explicitly. To handle the large number of species and reactions in the model PERL scripts were developed to construct a list of reactions in traditional form and then convert this list into population balance equations. The moment operations were used in these PERL scripts to transform these reactions into terms of the moment equations for each polymeric species. Each polymeric species had an equa-tion to track its zeroth, fi rst, and second moments. This created a set of stiff differential equations along with algebraic equations for other important variables, which was solved using DASSL [7].
3. Results and Discussion
3.1 Polystyrene model
The fi rst system the modeling framework was applied to was polystyrene pyrolysis. The polystyrene model tracked both saturated and unsaturated head and tail end polymeric species, but based on the stabilization due to the phenyl substituents only head mid-chain radical species were allowed. The fi nal model tracked 64 species and included over 2700 reactions.[1] While the initial polymer structure was assumed to be ideal (all head-tail bonds) because the samples examined were polymerized anionically, the model tracked concentrations of different bond types to monitor structural irregularities (head-head and tail-tail bonds). The model was applied to samples with varying Mn values ranging from 5,160 to 98,100. It was also applied to a sample prepared by free radical polymerization with Mn equal to 96,000 and Mw equal to 280,000.
X X X X
Head Tail
X X X X XFigure 1: Examples of end-chain and radical structures used to track different polymeric species
in the model framework. The X represents a substituent group.
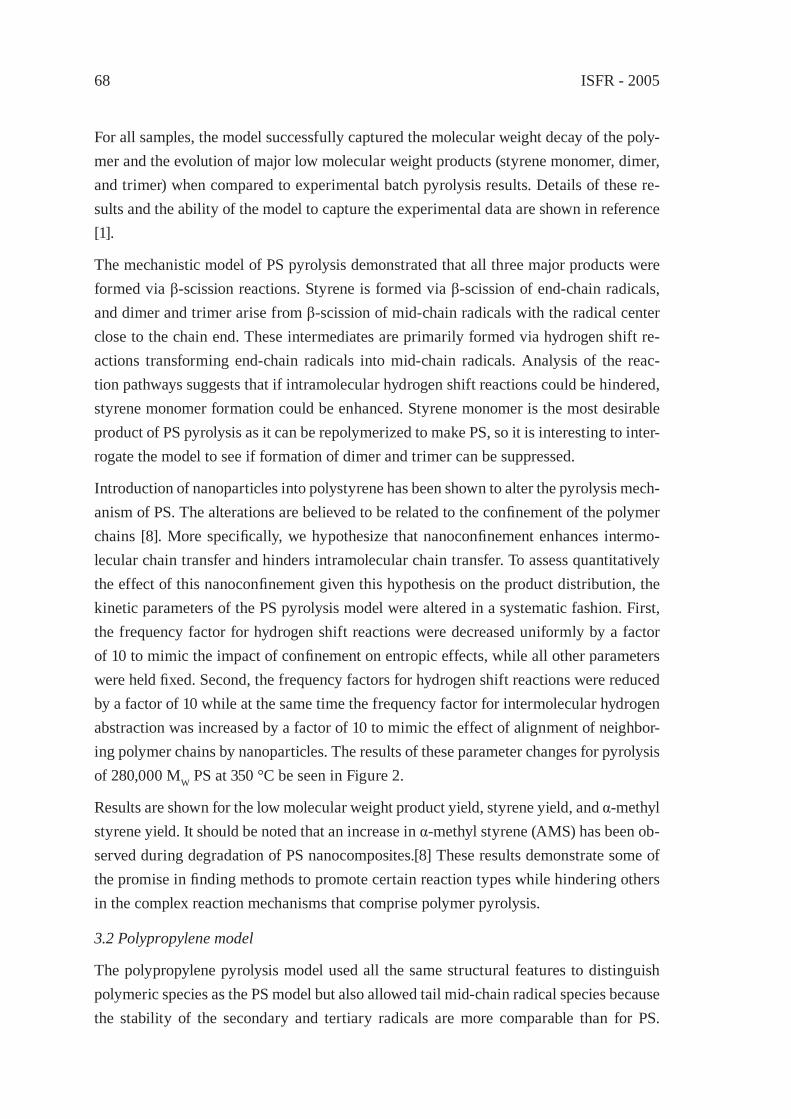
ISFR - 200568
For all samples, the model successfully captured the molecular weight decay of the poly-mer and the evolution of major low molecular weight products (styrene monomer, dimer, and trimer) when compared to experimental batch pyrolysis results. Details of these re-sults and the ability of the model to capture the experimental data are shown in reference [1].
The mechanistic model of PS pyrolysis demonstrated that all three major products were formed via β-scission reactions. Styrene is formed via β-scission of end-chain radicals, and dimer and trimer arise from β-scission of mid-chain radicals with the radical center close to the chain end. These intermediates are primarily formed via hydrogen shift re-actions transforming end-chain radicals into mid-chain radicals. Analysis of the reac-tion pathways suggests that if intramolecular hydrogen shift reactions could be hindered, styrene monomer formation could be enhanced. Styrene monomer is the most desirable product of PS pyrolysis as it can be repolymerized to make PS, so it is interesting to inter-rogate the model to see if formation of dimer and trimer can be suppressed.
Introduction of nanoparticles into polystyrene has been shown to alter the pyrolysis mech-anism of PS. The alterations are believed to be related to the confi nement of the polymer chains [8]. More specifi cally, we hypothesize that nanoconfi nement enhances intermo-lecular chain transfer and hinders intramolecular chain transfer. To assess quantitatively the effect of this nanoconfi nement given this hypothesis on the product distribution, the kinetic parameters of the PS pyrolysis model were altered in a systematic fashion. First, the frequency factor for hydrogen shift reactions were decreased uniformly by a factor of 10 to mimic the impact of confi nement on entropic effects, while all other parameters were held fi xed. Second, the frequency factors for hydrogen shift reactions were reduced by a factor of 10 while at the same time the frequency factor for intermolecular hydrogen abstraction was increased by a factor of 10 to mimic the effect of alignment of neighbor-ing polymer chains by nanoparticles. The results of these parameter changes for pyrolysis of 280,000 MW PS at 350 °C be seen in Figure 2.
Results are shown for the low molecular weight product yield, styrene yield, and α-methyl styrene yield. It should be noted that an increase in α-methyl styrene (AMS) has been ob-served during degradation of PS nanocomposites.[8] These results demonstrate some of the promise in fi nding methods to promote certain reaction types while hindering others in the complex reaction mechanisms that comprise polymer pyrolysis.
3.2 Polypropylene model
The polypropylene pyrolysis model used all the same structural features to distinguish polymeric species as the PS model but also allowed tail mid-chain radical species because the stability of the secondary and tertiary radicals are more comparable than for PS.
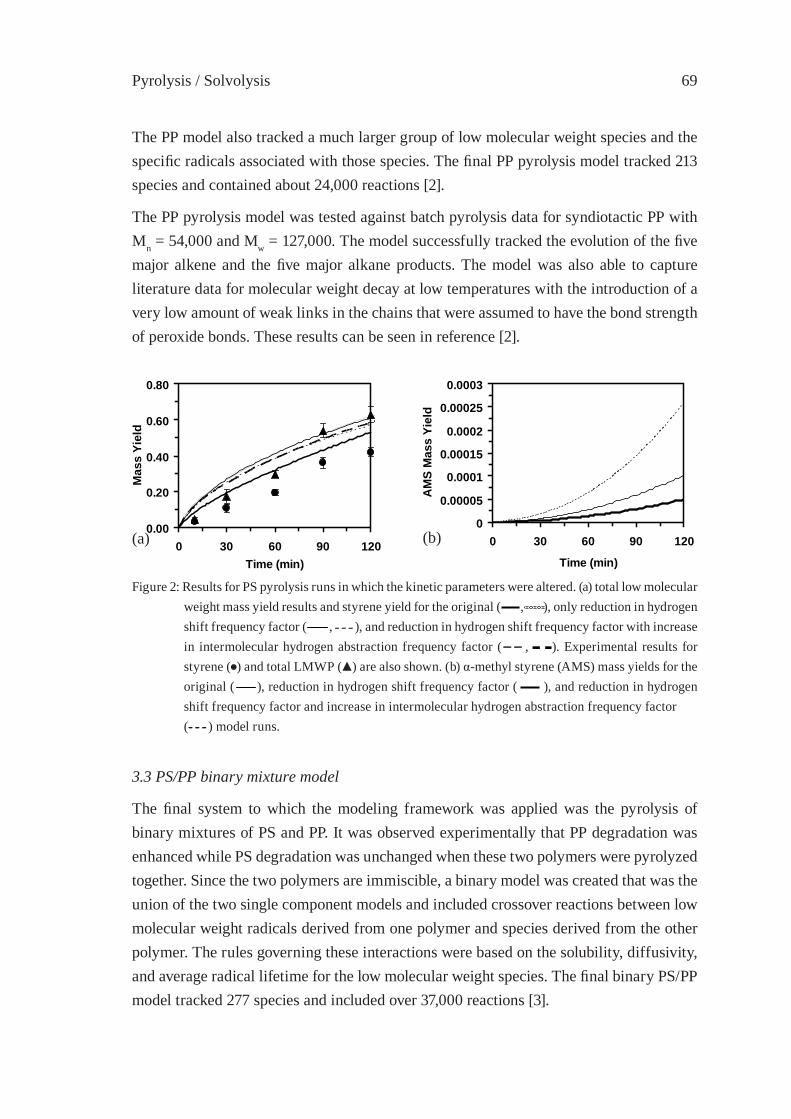
Pyrolysis / Solvolysis 69
The PP model also tracked a much larger group of low molecular weight species and the specifi c radicals associated with those species. The fi nal PP pyrolysis model tracked 213 species and contained about 24,000 reactions [2].
The PP pyrolysis model was tested against batch pyrolysis data for syndiotactic PP with Mn = 54,000 and Mw = 127,000. The model successfully tracked the evolution of the fi ve major alkene and the fi ve major alkane products. The model was also able to capture literature data for molecular weight decay at low temperatures with the introduction of a very low amount of weak links in the chains that were assumed to have the bond strength of peroxide bonds. These results can be seen in reference [2].
0
0.00005
0.0001
0.00015
0.0002
0.00025
0.0003
0 30 60 90 120
Time (min)
AM
S M
ass
Yiel
d
0.00
0.20
0.40
0.60
0.80
0 30 60 90 120Time (min)
Mas
s Yi
eld
Figure 2: Results for PS pyrolysis runs in which the kinetic parameters were altered. (a) total low molecular weight mass yield results and styrene yield for the original ( , ), only reduction in hydrogen shift frequency factor ( , ), and reduction in hydrogen shift frequency factor with increase in intermolecular hydrogen abstraction frequency factor ( , ). Experimental results for styrene (●) and total LMWP (▲) are also shown. (b) α-methyl styrene (AMS) mass yields for the original ( ), reduction in hydrogen shift frequency factor ( ), and reduction in hydrogen shift frequency factor and increase in intermolecular hydrogen abstraction frequency factor
( ) model runs.
3.3 PS/PP binary mixture model
The fi nal system to which the modeling framework was applied was the pyrolysis of binary mixtures of PS and PP. It was observed experimentally that PP degradation was enhanced while PS degradation was unchanged when these two polymers were pyrolyzed together. Since the two polymers are immiscible, a binary model was created that was the union of the two single component models and included crossover reactions between low molecular weight radicals derived from one polymer and species derived from the other polymer. The rules governing these interactions were based on the solubility, diffusivity, and average radical lifetime for the low molecular weight species. The fi nal binary PS/PP model tracked 277 species and included over 37,000 reactions [3].
(a) (b)
ISFR - 200570
The model was able to successfully capture the experimentally observed behavior for py-rolysis of PS/PP mixtures. All kinetic parameters from the single component studies were applied without adjustment to the binary model and one additional parameter related to the amount of low molecular weight radicals allowed to move from one polymeric region to another was introduced and fi t. The model was able to capture the behavior of systems with no premixing and those that had been intimately premixed to enhance the crossover of low molecular weight radicals. The results from this model can be seen in reference [3]. The mechanistic detail of this model led to a description of how PP is enhanced while PS is unaffected when the two polymers are co-pyrolyzed. This mechanism for interactions may provide predictive capabilities that would allow one to assess which combinations of polymers may have favorable or detrimental effects during co-pyrolysis.
4. Conclusions
The mechanistic modeling framework detailed above was successfully applied to poly-styrene, polypropylene, and PS/PP mixture pyrolysis. By utilizing population balance equations, the method of moments, and structure-reactivity relationships, models of man-ageable size with mechanistic detail were developed for complex polymer degradation re-action networks. These models provided mechanistic insight into the complex chemistry underlying polymer pyrolysis. Insight gained from modeling PS pyrolysis into the reac-tion pathways to the major products suggested the ratio of intramolecular to intermolecu-lar hydrogen transfer strongly impacted the selectivity to styrene monomer. Incorporation of nanoparticles into PS has been shown to alter the degradation characteristics, and we showed that small changes in the kinetic parameters of these two key reaction families can lead to large and favorable changes in the product distribution. The framework devel-oped was suffi ciently general that it could be easily extended to more complex systems such as PP and PP/PS pyrolysis. The PS/PP mixture model created new understanding of the interactions between immiscible polymers that can account for variations in kinetic coupling during co-pyrolysis for different binary mixtures. Application of the modeling framework to probe the effects of mixture composition, reaction conditions, and struc-tural heterogeneities is currently underway.
Pyrolysis / Solvolysis 71
References
[1] Kruse, T.M., Woo, O.S., Wong, H.-W., Khan, S.S., and Broadbelt, L.J., Macromolecules 35:7830 (2002).
[2] Kruse, T.M., Wong, H.-W., and Broadbelt, L.J., Macromolecules 36:9594 (2003).[3] Kruse, T.M., Levine, S.E., Wong, H.-W., Duoss, E., Lebovitz, A.H., Torkelson, J.M.,
and Broadbelt, L.J., J. Anal. Appl. Pyrol. 73:342 (2005).[4] Evans, M.G., and Polanyi, M.T., Faraday Soc. 34:11 (1938).[5] Cussler, E.L., Diffusion: Mass Transfer in Fluid Systems, Cambridge University
Press, Cambridge, UK, 1997, p. 419.[6] Watanebe, M., Tsukagoshi, M., Hirakoso, H., Adschiri, T., Arai, K., AIChE J. 46:843
(2000).[7] Petzold, L.R., DASSL Differential/Algebraic System Solver, Sandia National
Laboratories, Livermore, CA, 1983. [8] Jang, B.N., and Wilkie, C.A., Polymer 46:2933 (2005).

ISFR - 200572
Pyrolysis / Solvolysis 73
SIMULATION AND EXPERIMENTS OF POLYETHYLENE PYROLYSIS IN A FLUIDIZED BED PROCESS
W. Kaminsky*, F. HartmannInstitute for Technical and Macromolecular Chemistry, University of Hamburg
Abstract: Experiments of the feedstock recycling of polyethylene were carried out in a laboratory and small pilot plant under different conditions to obtain data for the up-scale of a technical plant. The main component of the pyrolysis such as methane, ethene, pro-pene, benzene, and toluene were studied in dependence of temperature, throughput and fl ow gas rate. Statistical planning in test runs led to regression equations for the effects. It could be shown that by pyrolysis temperatures of more than 700 °C, the benzene forma-tion follows after the condensation of ethylene and butadiene. At pyrolysis temperatures of about 500 °C, high amounts of waxy products are formed. The main product fraction – a mixture of aliphatic waxes – was characterized more exactly by Field Desorption Mass Spectrometry (FD-MS) and contains a characteristic distribution of alkanes, alkenes, and alkadienes with chain lengths between 35 and 70 carbon atoms. A simulation method was developed which describes the formation of these waxy products. A high infl uence has the evaporation of the long chained hydrocarbons during the pyrolysis.
1. Introduction
Polyethylene (PE) is the worldwide most produced polymer with about 60 million tons per year and the main component of plastic waste. PE contains only hydrogen and carbon atoms and is therefore excellent suitable for feedstock recycling to obtain oil and gas. A lot of work has been carried out in recent years to investigate the pyrolysis of the dif-ferent types of PE [1-4]. Catalytic pyrolysis increases the possibilities and the product composition [5-8]. Some authors use fl uidized bed reactors because of the high heat and mass transfer and low residence time. To optimize the product composition and to make an upscale it is necessary to know equations of the product composition from the main process parameters like temperature, pressure, feeding rate, fl ow gas rate in the case of fl uidized bed process.
By high temperatures of 700-800 °C in a fl uidized bed, mainly gas and aromatics are found. The preliminary degradation products are aromatized by sedundary reactions. The whole set of kinetic information is very high. We used therefore statistical methods to fi nd a dependence of the product composition from some process parameters. By low pyrolysis temperatures of only 450-550 °C, mainly aliphatic hydrocarbons are formed by primarily degradation reactions. In this case, a simulation on the product composition is possible using kinetic equations and fl uidized bed process parameters.
ISFR - 200574
2. Results and Discussion
The pyrolysis of polyethylene was carried out in a laboratory fl uidized bed with a through-put capacity of 2 kg/h and a small pilot plant with a capacity of 10 – 30 kg/h. The used pyrolysis plants are described elsewhere [9,10]. For the experiments, LDPE as pellets with a size of 3-5 mm were used.
The pilot plant has been operating for more than 700 hours. Within these runs it has been proved that the process needs 40 % of the produced gas for heating up the process. At a pyrolysis temperature of 710 °C and a feed of 20 kg/h, 8 m3/h of gas was produced. From this, 3,2 m3/h were burned in the four fi re tubes supplying 150 106J/h. 32 % of this are needed as cracking energy, the other are used to heat up the fl uidized gas and the products (34 %) looses with the exhaust gases (27 %) and insulation losses of the reactor (10 %).
3. Statistic optimerization
At 16 runs the process was optimized to achieve the yields of methane, ethene, benzene, and others by varying the temperature of the fl uid bed, the feed rate, and the fl ow rate of the fl uidizing gas. Statistical planning of test runs led to the following effects and regres-sion equations. The yields of ethylene and benzene can be calculated from the following equation, using percentage weight in relation to the feed:
wt-% benzene = 21.095 + 2.323 t – 1.381 d + 0.731 w – 0.680 td + 0.581 dw + 0.104 tw – 0.377 t2 - 0.910 d2 – 0.457 w2
wt% ethylene = 18.733 – 1.195 t – 0.132 d – 1.785 w – 2.436 td + 2.643 dw – 9,341 tw . 1,618 t2 + 3.240 d2 + 1.263 w2
in which
Figures 1 shows he graphic of the benzene production in dependence of the pyrolysis temperature and the fl ow gas rate. The amount of benzene increases with a higher temperature and a higher fl ow gas rate (Fig. 1. The differences indicate that benzene is formed in one direction while there are mechanisms to form and to destroy ethylene. The pyrolysis by high temperatures of more than 700 °C is a complex process. There are two stage mechanisms. In the fi rst stage, polyethylene is decomposed into small, mostly olefi nic compounds. During the second stage, aromatics are produced by reactions of the olefi ns and diolefi ns (secondary reactions). By these reactions, also methane and hydrogene is formed (Table 1). By raising the temperature and the fl ow gas rate, more cycles of the product gas are possible and more benzene is formed.
Cº 30Cº 750etemperaturt −= ,
kg/h 5,3kg/h 14,18throughputd −= , and
/hm 365/hm 32,85gas/hfluidizingw 3
3−=

Pyrolysis / Solvolysis 75
4. Kinetic simulation
Using temperatures below 600 °C for the pyrolysis of polyethylene, nearly no secondary side reactions happen. Under these conditions it is possible by kinetic constants and fl u-idized gas simulation to simulate the molar mass distribution of the formed waxy prod-ucts.
Figure 1: Benzene formation by the pyrolysis of PE in dependence of temperature and fl ow gas rate. Benzene concentration in wt%; throughput rate of PE = 14,1 kg/h.
To verify the simulated data, test runs were carried out by 510 °C in the laboratory fl uid-ized bed plant. The waxy products were analyzed by Field Desorption Mass Spectrometry (Fig. 2).
Each signal group is characterized by six peaks for the α-ω-dienes, α-alkenes, and al-kanes and their isomers containing one 13C-isotop. It could be shown that the high-boil-ing wax fraction contains hydrocarbon products with chain lengths between 15 and 70 carbon atoms.
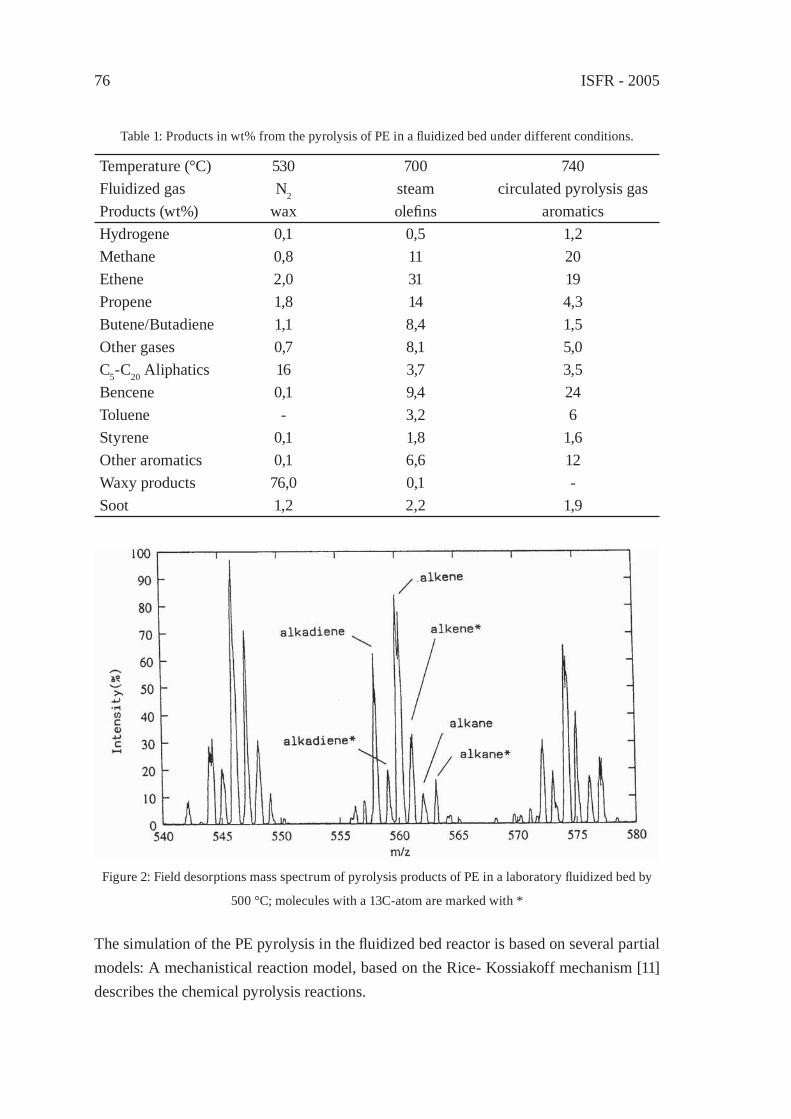
ISFR - 200576
Table 1: Products in wt% from the pyrolysis of PE in a fl uidized bed under different conditions.
Temperature (°C) 530 700 740Fluidized gas N2 steam circulated pyrolysis gasProducts (wt%) wax olefi ns aromaticsHydrogene 0,1 0,5 1,2Methane 0,8 11 20Ethene 2,0 31 19Propene 1,8 14 4,3Butene/Butadiene 1,1 8,4 1,5Other gases 0,7 8,1 5,0C5-C20 Aliphatics 16 3,7 3,5Bencene 0,1 9,4 24Toluene - 3,2 6Styrene 0,1 1,8 1,6Other aromatics 0,1 6,6 12Waxy products 76,0 0,1 -Soot 1,2 2,2 1,9
Figure 2: Field desorptions mass spectrum of pyrolysis products of PE in a laboratory fl uidized bed by
500 °C; molecules with a 13C-atom are marked with *
The simulation of the PE pyrolysis in the fl uidized bed reactor is based on several partial models: A mechanistical reaction model, based on the Rice- Kossiakoff mechanism [11] describes the chemical pyrolysis reactions.
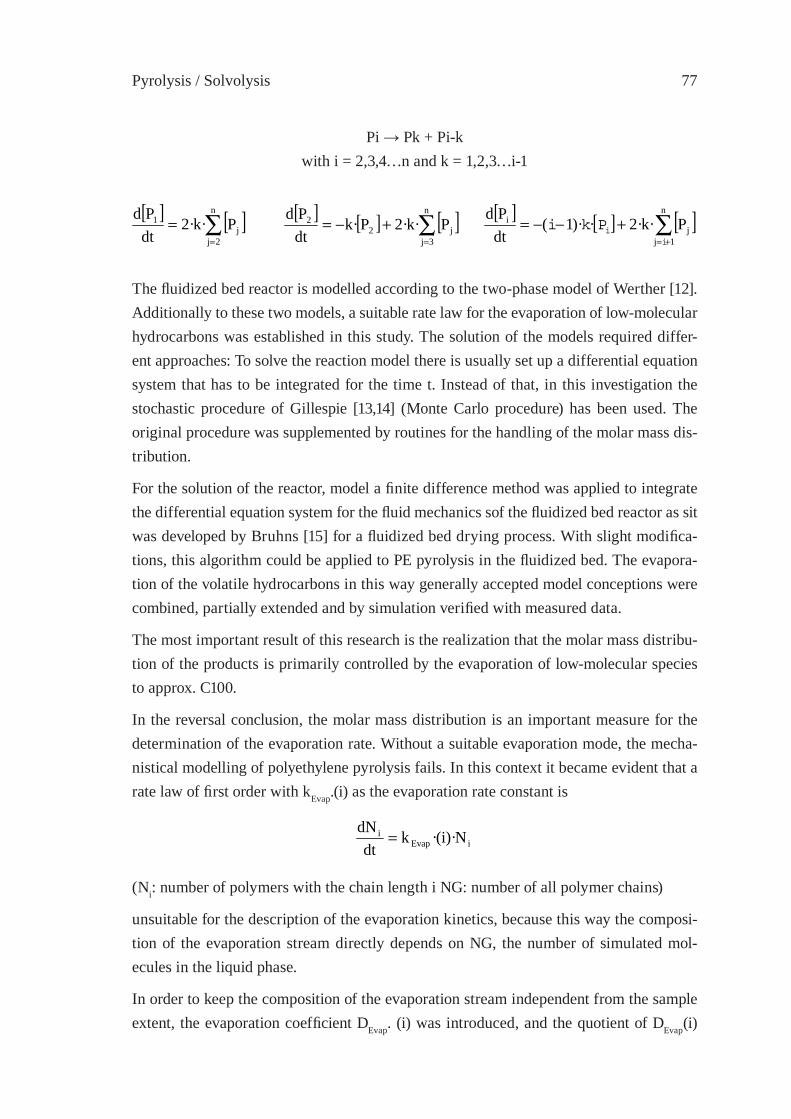
Pyrolysis / Solvolysis 77
Pi → Pk + Pi-kwith i = 2,3,4…n and k = 1,2,3…i-1
The fl uidized bed reactor is modelled according to the two-phase model of Werther [12]. Additionally to these two models, a suitable rate law for the evaporation of low-molecular hydrocarbons was established in this study. The solution of the models required differ-ent approaches: To solve the reaction model there is usually set up a differential equation system that has to be integrated for the time t. Instead of that, in this investigation the stochastic procedure of Gillespie [13,14] (Monte Carlo procedure) has been used. The original procedure was supplemented by routines for the handling of the molar mass dis-tribution.
For the solution of the reactor, model a fi nite difference method was applied to integrate the differential equation system for the fl uid mechanics sof the fl uidized bed reactor as sit was developed by Bruhns [15] for a fl uidized bed drying process. With slight modifi ca-tions, this algorithm could be applied to PE pyrolysis in the fl uidized bed. The evapora-tion of the volatile hydrocarbons in this way generally accepted model conceptions were combined, partially extended and by simulation verifi ed with measured data.
The most important result of this research is the realization that the molar mass distribu-tion of the products is primarily controlled by the evaporation of low-molecular species to approx. C100.
In the reversal conclusion, the molar mass distribution is an important measure for the determination of the evaporation rate. Without a suitable evaporation mode, the mecha-nistical modelling of polyethylene pyrolysis fails. In this context it became evident that a rate law of fi rst order with kEvap.(i) as the evaporation rate constant is
(Ni: number of polymers with the chain length i NG: number of all polymer chains)
unsuitable for the description of the evaporation kinetics, because this way the composi-tion of the evaporation stream directly depends on NG, the number of simulated mol-ecules in the liquid phase.
In order to keep the composition of the evaporation stream independent from the sample extent, the evaporation coeffi cient DEvap. (i) was introduced, and the quotient of DEvap(i)
[ ] [ ]∑=
=n
2jj
1 P2·k·dtPd
[ ] [ ] [ ]∑=
+−=n
3jj2
2 P2·k·Pk·dtPd
[ ] [ ] [ ]∑
+=
+−−=n
1jj
i P2·k··)·1(dtPd
iiPki
iEvapi ·(i)·Nk
dtdN
=

ISFR - 200578
and NG was used instead of the constant kEvap. ·f(i) was the fact that different functions f could be compared easily this way, so that the rate law takes the form:
With this empirical rate law, the composition of the evaporation stream becomes exclu-sively dependent on D0,Evap.. Different compositions of the evaporation stream could be simulated by the variation of D0,Evap. It became evident that values of D0,Evap. In the order of magnitude of 103 – 104 s-1 (Fig. 3) are best suitable to describe the experimental results. D0,Evap. Values greater than 104 s-1 result in a too high a portion of high-boiling compo-nents in the evaporation stream, values smaller than 103s-1 result in a predominance of the portion of low-molecular components. In this context, the form of the function f (i) which differ particularly in the low-molecular range, cause only slightly different product compositions.
( )i
,0i ·N·
dtdN
G
Evap
N
ifD=
Figure 3: Mass spectrum simulation of the pyrolysis products of PE by 510 °C with an evaporation coeffi cient for the waxy products of D0,Evap = 5 · 103 s-1.
Furthermore, the simulation shows that conversion in the gaseous phase is neglegibly small at temperatures of 500 °C. The reason is that the absolute concentrations in the gaseous phase are too low to cause a considerable propagation reaction. Therefore, under the – for a pyrolysis – mild conditions examined here primary cracking almost exclusively takes place in the melt and secondary cracking hardly occurs in the gaseous phase.
Pyrolysis / Solvolysis 79
The portions of low-molecular products up to C11 which are higher than predicted by the simulation, are caused by non-statistical reactions in primary cracking which were ne-glected in the reaction model.
As far as it was examined, the simulated radical concentration in the polymer melt was nearly constant. This fact fortifi ed the quasi-stationary state assumption.
This study emphasized the enormous infl uence the evaporation has on the composition of volatile hydrocarbons formed by pyrolysis of polyethylene.
References
[1] Kaminsky, W. and Sinn, H., in J. Brandrup et al., eds., Recycling and Recovery of Plastics, Hanser, New York, 1996, p. 435.
[2] Arena, U., and Mastellone, M.L., Chemical Engineering Science 55: 2849 (2000).[3] Bockhorn, H., Hentschel, J., Hornung, A., and Hornung, U., Chem. Eng. Sci. 54: 3043
(1999).[4] Williams, E.A., and Williams, P., J. Anal. App. Pyrolysis 40-41: 347 (1997).[5] Mastellone, M.L., Perugini, F., Ponte, M., and Arena, U., Polym. Degrad. Stab. 76:
479 (2002).[6] Mastral, F.J., Esperanza, E., Berrulco, C., Juste, M., and Ceamanos, J., J. Anal. App.
Pyrolysis 70: 1 (2003).[7] Luo, G., Suto, S., Yasu, S., and Kato, K., Polym. Degrad. Stab. 70: 97 (2000).[8] Kaminsky, W., Schlesselmann, B., and Simon, C.M., Polym. Degrad. Stab. 53: 189
(1996).[9] Kaminsky, W., Predel, M., and Sadiki, A., Polym. Degrad. Stab. 85: 1045 (2004).[10] Kaminsky, W., and Rössler, H., Chemtech 2: 108 (1992).[11] Kossiakoff, A., and Rice, F.O., J. Am. Chem. Soc. 65: 590 (1943).[12] Werther, J., Chem. Eng. Sci. 35: 372 (1980).[13] Gillespie, D.T., J. Phys. Chem. 81: 2340 (1977).[14] Gillespie, D.T., J. Computational Phys. 22: 403 (1976).[15] Bruhns, S., Thesis, Technical University Hamburg-Harburg, 2002.

ISFR - 200580

Pyrolysis / Solvolysis 81
THE THERMOCHEMICAL CONVERSION OF AGRICULTURAL WASTES IN A BUBBLING FLUIDIZED BED
S. H. Lee*, Y. C. Choi, J. H. Kim and J. G. LeeThermal Process Research Center, Korea Institute of Energy Research, Daejeon,
Korea, [email protected]
Abstract: A bubbling fl uidized bed pyrolyzer (0.2m I. D. and 2m high) has been used to investigate the characteristics of thermochemical conversion of biomass. For the captur-ing the bio-oil mist, multiple heat exchanger and electrostatic precipitator were equipped at the exit of cyclone. The larch sawdust, rice husk and so on are used in this experiment. The effect of bed temperature (350-600 °C), gas volumetric rate (40-60l/min), feeding rate (0.5-3kg/h), oxygen ratio (0-21wt%) and the type of agricultural wastes on the yield and composition of bio oil have been investigated. The bio oil is composed of propionic acid, furfural, phenol, vanillin, levoglucosan and so on. As the reaction temperature increases, the peak intensity of high molecular compounds decreases in composition to low molecu-lar compounds such as phenol.
1. Introduction
Recently, biomass resources from a wide variety of forestry and agricultural resources, industrial processing residues, and municipal solid and urban wood residue have been studied for conversion into alternative fuels or valuable chemicals because of satisfying environmental concerns over fossil fuel usage and its contribution to the Greenhouse Effect [1]. There are many thermal processes to convert biomass into energy, fuels and chemicals [2]: direct combustion, gasifi cation, pyrolysis and so on. Among thermal proc-esses, pyrolysis process is suitable for production of liquid with various chemicals.
Pyrolysis process has used ablative tube, ablative plate, circulating transported bed, stirred bed, rotating cone, entrained fl ow, augur kiln, and fl uidized bed. Among the processes, fl uidization technology has known to be a promising process to convert biomass materials into useful liquid products because it has higher heat transfer rates, precise temperature control and rapid cooling of the pyrolysis products [4]. Fluidized bed reactors have been using widely in industrial processes such as combustor, gasifi ers, fl uid catalytic cracking (FCC) regenerator, name but a few because there are many advantages; easy handling, rapid mixing of solid, no rapid temperature changes, high heat and mass transfer rate, and so on [5].
Korea’s geographic and climatic conditions are suitable for growing crops and trees. Wood is easily accessible in Korea, because over 70% of the country area is forested. Spe-cially, the needle shaped leaf trees like larch would take up 79% of forest tree species [3].

ISFR - 200582
Also, rice husks are available in large quantities because rice is theprincipal food farmed and consumed in Korea. Nowadays, some scientists have studied to convert agricultural wastes such as larch sawdust and rice husk into energy [6, 7]. However there is not enough information of bio-oil with various chemicals from Korean agricultural wastes.
In this study, a bubbling fl uidized bed was used to investigate the conversion of agricul-tural wastes into bio-oil with various chemicals. The effect of operation conditions in fl uidized beds, such as bed temperature, gas velocity, feed rate, oxygen ratio and so on, on the yield and the composition of bio-oil have been investigated.
2. Experimental
The fl uidized bed apparatus consists of gas fl ow meters, pre-heater, fl uidized bed reactor, screw feeder, cyclone, multiple heat exchanger and electrostatic precipitator shown sche-matically in Fig. 1.
Figure 1: Bubbling fl uidized bed reactor of this experiment.
Reactant gases (N2 and air) were fed to the fl uidized bed (I.D. 0.2m and 2m high) through the fl ow meters and pre-heater. The electric pre-heater is used to rise the temperature of reactant gases. To obtain a good distribution of gases and reduce the dead zone, a dis-tributor with 7 bubble caps was applied in the bubbling fl uidized bed. The fl uidized bed material was sand with an average diameter of 220µm.
The entrained char and bed particles were collected by cyclone. For capturing the bio-oil aerosol, multiple heat exchanger and electrostatic precipitator were equipped at the exit of cyclone. Temperature and pressure distributions were measured in the fl uidized bed and cyclone. Pressure taps were mounted fl ush with the wall of the column and connected to the manometers. Electric heaters were installed at the fl uidized bed (5 kW) to raise reactor temperature to the pyrolysis temperature of the agricultural wastes (350-650 °C). Also, ash-drain ports were installed at the bottom of the reactor (H = 0.05 m). The larch saw-
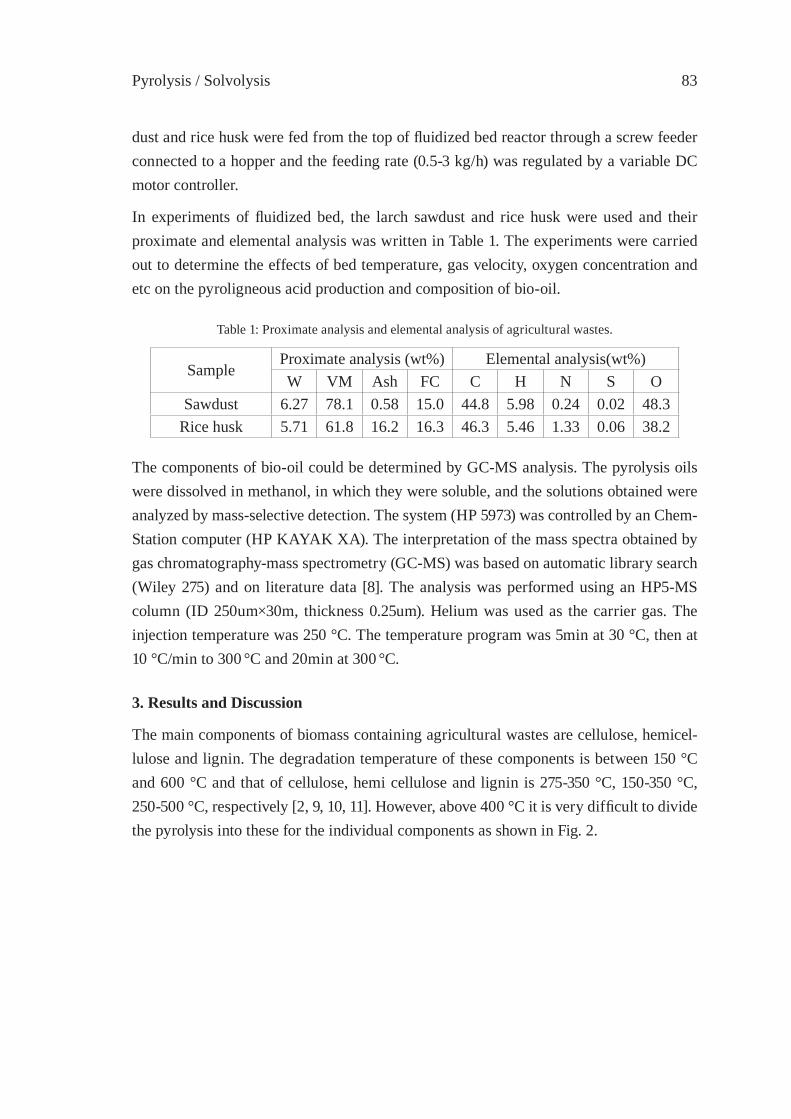
Pyrolysis / Solvolysis 83
dust and rice husk were fed from the top of fl uidized bed reactor through a screw feeder connected to a hopper and the feeding rate (0.5-3 kg/h) was regulated by a variable DC motor controller.
In experiments of fl uidized bed, the larch sawdust and rice husk were used and their proximate and elemental analysis was written in Table 1. The experiments were carried out to determine the effects of bed temperature, gas velocity, oxygen concentration and etc on the pyroligneous acid production and composition of bio-oil.
Table 1: Proximate analysis and elemental analysis of agricultural wastes.
SampleProximate analysis (wt%) Elemental analysis(wt%)W VM Ash FC C H N S O
Sawdust 6.27 78.1 0.58 15.0 44.8 5.98 0.24 0.02 48.3Rice husk 5.71 61.8 16.2 16.3 46.3 5.46 1.33 0.06 38.2
The components of bio-oil could be determined by GC-MS analysis. The pyrolysis oils were dissolved in methanol, in which they were soluble, and the solutions obtained were analyzed by mass-selective detection. The system (HP 5973) was controlled by an Chem-Station computer (HP KAYAK XA). The interpretation of the mass spectra obtained by gas chromatography-mass spectrometry (GC-MS) was based on automatic library search (Wiley 275) and on literature data [8]. The analysis was performed using an HP5-MS column (ID 250um×30m, thickness 0.25um). Helium was used as the carrier gas. The injection temperature was 250 °C. The temperature program was 5min at 30 °C, then at 10 °C/min to 300 °C and 20min at 300 °C.
3. Results and Discussion
The main components of biomass containing agricultural wastes are cellulose, hemicel-lulose and lignin. The degradation temperature of these components is between 150 °C and 600 °C and that of cellulose, hemi cellulose and lignin is 275-350 °C, 150-350 °C, 250-500 °C, respectively [2, 9, 10, 11]. However, above 400 °C it is very diffi cult to divide the pyrolysis into these for the individual components as shown in Fig. 2.
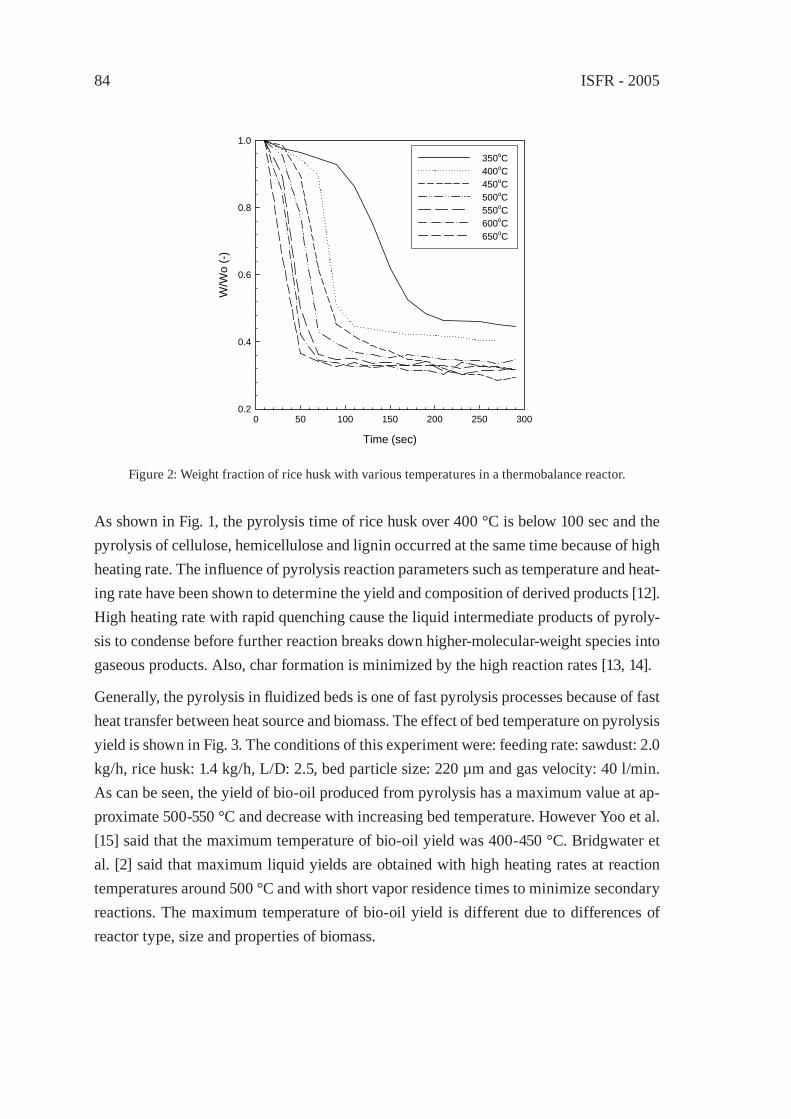
ISFR - 200584
Figure 2: Weight fraction of rice husk with various temperatures in a thermobalance reactor.
As shown in Fig. 1, the pyrolysis time of rice husk over 400 °C is below 100 sec and the pyrolysis of cellulose, hemicellulose and lignin occurred at the same time because of high heating rate. The infl uence of pyrolysis reaction parameters such as temperature and heat-ing rate have been shown to determine the yield and composition of derived products [12]. High heating rate with rapid quenching cause the liquid intermediate products of pyroly-sis to condense before further reaction breaks down higher-molecular-weight species into gaseous products. Also, char formation is minimized by the high reaction rates [13, 14].
Generally, the pyrolysis in fl uidized beds is one of fast pyrolysis processes because of fast heat transfer between heat source and biomass. The effect of bed temperature on pyrolysis yield is shown in Fig. 3. The conditions of this experiment were: feeding rate: sawdust: 2.0 kg/h, rice husk: 1.4 kg/h, L/D: 2.5, bed particle size: 220 µm and gas velocity: 40 l/min. As can be seen, the yield of bio-oil produced from pyrolysis has a maximum value at ap-proximate 500-550 °C and decrease with increasing bed temperature. However Yoo et al. [15] said that the maximum temperature of bio-oil yield was 400-450 °C. Bridgwater et al. [2] said that maximum liquid yields are obtained with high heating rates at reaction temperatures around 500 °C and with short vapor residence times to minimize secondary reactions. The maximum temperature of bio-oil yield is different due to differences of reactor type, size and properties of biomass.
Time (sec)
0 50 100 150 200 250 300
W/W
o (-)
0.2
0.4
0.6
0.8
1.0
350oC 400oC 450oC 500oC 550oC 600oC 650oC
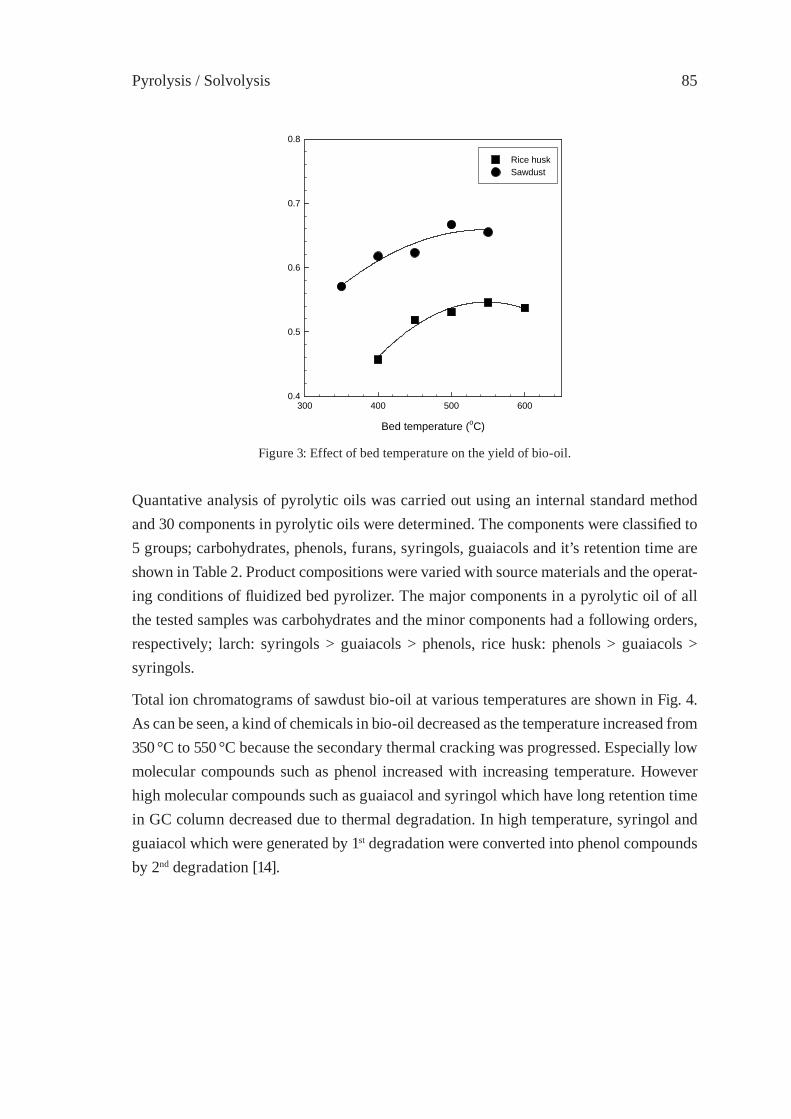
Pyrolysis / Solvolysis 85
Bed temperature (oC)
300 400 500 6000.4
0.5
0.6
0.7
0.8
Rice huskSawdust
Figure 3: Effect of bed temperature on the yield of bio-oil.
Quantative analysis of pyrolytic oils was carried out using an internal standard method and 30 components in pyrolytic oils were determined. The components were classifi ed to 5 groups; carbohydrates, phenols, furans, syringols, guaiacols and it’s retention time are shown in Table 2. Product compositions were varied with source materials and the operat-ing conditions of fl uidized bed pyrolizer. The major components in a pyrolytic oil of all the tested samples was carbohydrates and the minor components had a following orders, respectively; larch: syringols > guaiacols > phenols, rice husk: phenols > guaiacols > syringols.
Total ion chromatograms of sawdust bio-oil at various temperatures are shown in Fig. 4. As can be seen, a kind of chemicals in bio-oil decreased as the temperature increased from 350 °C to 550 °C because the secondary thermal cracking was progressed. Especially low molecular compounds such as phenol increased with increasing temperature. However high molecular compounds such as guaiacol and syringol which have long retention time in GC column decreased due to thermal degradation. In high temperature, syringol and guaiacol which were generated by 1st degradation were converted into phenol compounds by 2nd degradation [14].
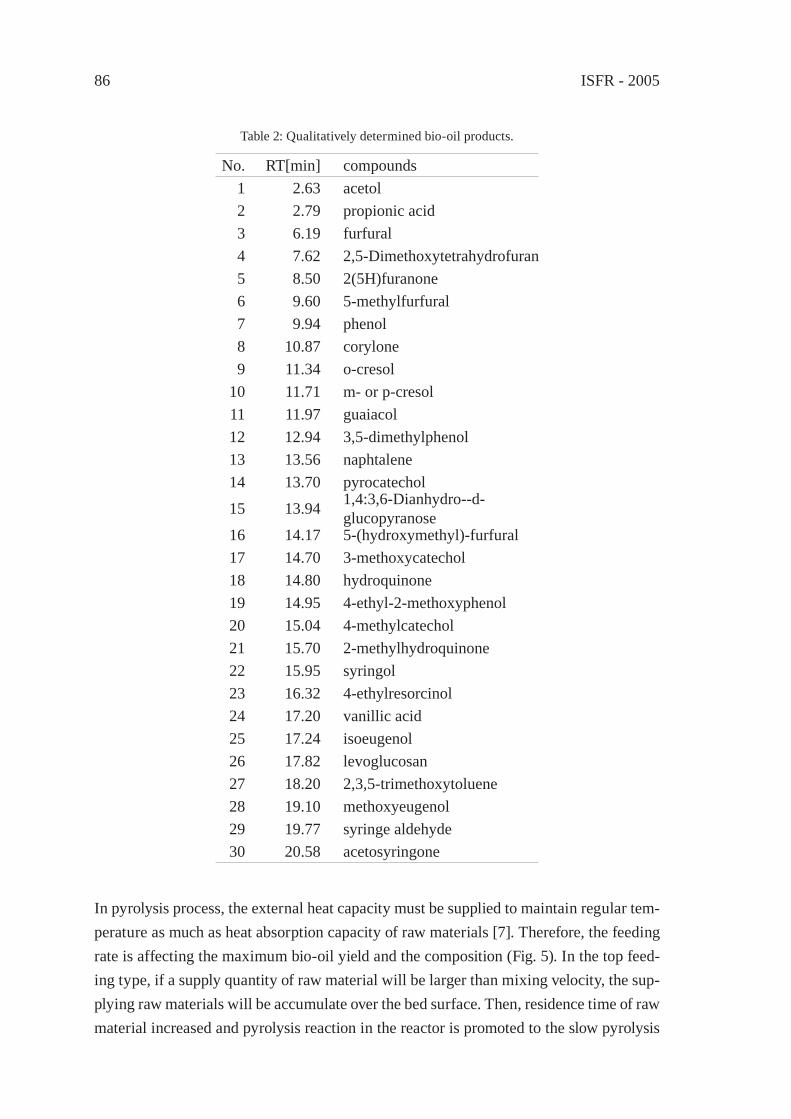
ISFR - 200586
Table 2: Qualitatively determined bio-oil products.
No. RT[min] compounds1 2.63 acetol2 2.79 propionic acid3 6.19 furfural4 7.62 2,5-Dimethoxytetrahydrofuran5 8.50 2(5H)furanone6 9.60 5-methylfurfural7 9.94 phenol8 10.87 corylone9 11.34 o-cresol
10 11.71 m- or p-cresol11 11.97 guaiacol12 12.94 3,5-dimethylphenol13 13.56 naphtalene14 13.70 pyrocatechol
15 13.94 1,4:3,6-Dianhydro--d-glucopyranose
16 14.17 5-(hydroxymethyl)-furfural17 14.70 3-methoxycatechol18 14.80 hydroquinone19 14.95 4-ethyl-2-methoxyphenol20 15.04 4-methylcatechol21 15.70 2-methylhydroquinone22 15.95 syringol23 16.32 4-ethylresorcinol24 17.20 vanillic acid25 17.24 isoeugenol26 17.82 levoglucosan27 18.20 2,3,5-trimethoxytoluene28 19.10 methoxyeugenol29 19.77 syringe aldehyde30 20.58 acetosyringone
In pyrolysis process, the external heat capacity must be supplied to maintain regular tem-perature as much as heat absorption capacity of raw materials [7]. Therefore, the feeding rate is affecting the maximum bio-oil yield and the composition (Fig. 5). In the top feed-ing type, if a supply quantity of raw material will be larger than mixing velocity, the sup-plying raw materials will be accumulate over the bed surface. Then, residence time of raw material increased and pyrolysis reaction in the reactor is promoted to the slow pyrolysis
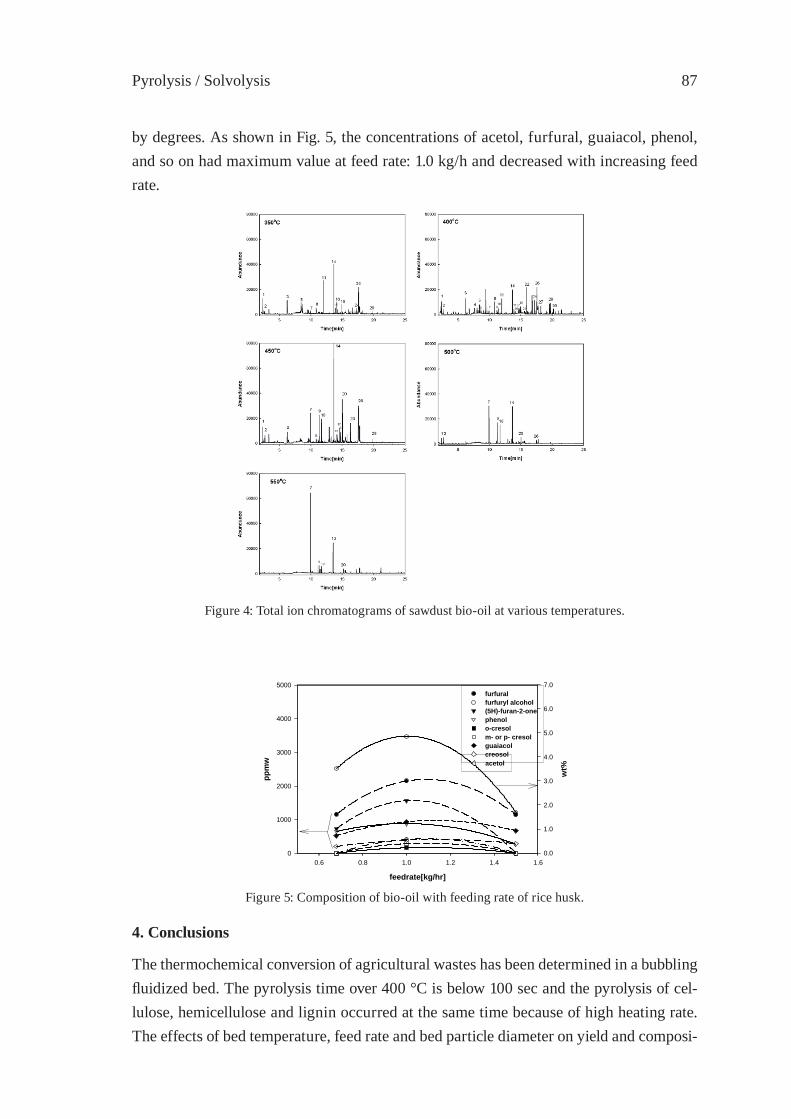
Pyrolysis / Solvolysis 87
by degrees. As shown in Fig. 5, the concentrations of acetol, furfural, guaiacol, phenol, and so on had maximum value at feed rate: 1.0 kg/h and decreased with increasing feed rate.
feedrate[kg/hr]
0.6 0.8 1.0 1.2 1.4 1.6
wt%
0.0
1.0
2.0
3.0
4.0
5.0
6.0
7.0
acetol
ppm
w
0
1000
2000
3000
4000
5000furfuralfurfuryl alcohol (5H)-furan-2-one phenol o-cresol m- or p- cresolguaiacolcreosol
Figure 4: Total ion chromatograms of sawdust bio-oil at various temperatures.
Figure 5: Composition of bio-oil with feeding rate of rice husk.
4. Conclusions
The thermochemical conversion of agricultural wastes has been determined in a bubbling fl uidized bed. The pyrolysis time over 400 °C is below 100 sec and the pyrolysis of cel-lulose, hemicellulose and lignin occurred at the same time because of high heating rate. The effects of bed temperature, feed rate and bed particle diameter on yield and composi-
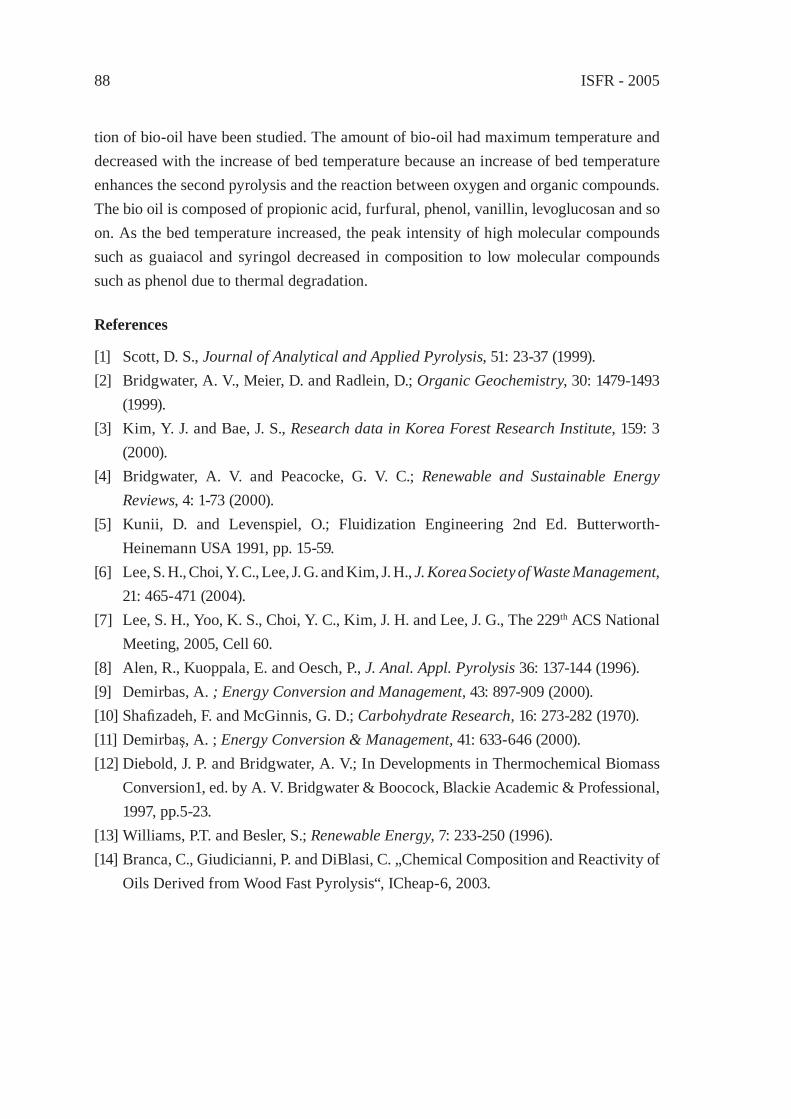
ISFR - 200588
tion of bio-oil have been studied. The amount of bio-oil had maximum temperature and decreased with the increase of bed temperature because an increase of bed temperature enhances the second pyrolysis and the reaction between oxygen and organic compounds. The bio oil is composed of propionic acid, furfural, phenol, vanillin, levoglucosan and so on. As the bed temperature increased, the peak intensity of high molecular compounds such as guaiacol and syringol decreased in composition to low molecular compounds such as phenol due to thermal degradation.
References
[1] Scott, D. S., Journal of Analytical and Applied Pyrolysis, 51: 23-37 (1999).[2] Bridgwater, A. V., Meier, D. and Radlein, D.; Organic Geochemistry, 30: 1479-1493
(1999).[3] Kim, Y. J. and Bae, J. S., Research data in Korea Forest Research Institute, 159: 3
(2000).[4] Bridgwater, A. V. and Peacocke, G. V. C.; Renewable and Sustainable Energy
Reviews, 4: 1-73 (2000).[5] Kunii, D. and Levenspiel, O.; Fluidization Engineering 2nd Ed. Butterworth-
Heinemann USA 1991, pp. 15-59.[6] Lee, S. H., Choi, Y. C., Lee, J. G. and Kim, J. H., J. Korea Society of Waste Management,
21: 465-471 (2004).[7] Lee, S. H., Yoo, K. S., Choi, Y. C., Kim, J. H. and Lee, J. G., The 229th ACS National
Meeting, 2005, Cell 60.[8] Alen, R., Kuoppala, E. and Oesch, P., J. Anal. Appl. Pyrolysis 36: 137-144 (1996).[9] Demirbas, A. ; Energy Conversion and Management, 43: 897-909 (2000).[10] Shafi zadeh, F. and McGinnis, G. D.; Carbohydrate Research, 16: 273-282 (1970).[11] Demirbaş, A. ; Energy Conversion & Management, 41: 633-646 (2000).[12] Diebold, J. P. and Bridgwater, A. V.; In Developments in Thermochemical Biomass
Conversion1, ed. by A. V. Bridgwater & Boocock, Blackie Academic & Professional, 1997, pp.5-23.
[13] Williams, P.T. and Besler, S.; Renewable Energy, 7: 233-250 (1996).[14] Branca, C., Giudicianni, P. and DiBlasi, C. „Chemical Composition and Reactivity of
Oils Derived from Wood Fast Pyrolysis“, ICheap-6, 2003.
Pyrolysis / Solvolysis 89
OPERATION RESEARCH OF A MOVING-BED REACTOR;DEMONSTRATION PLANT FOR FUEL-OIL PRODUCTION
Y. Kodera1*, Y. Ishihara1, K. Saido2 and T. Kuroki3
1AIST, Tsukuba, Japan, 2Nihon University, Narashino, Japan,3Polymer Decomposition Lab. Inc., Miyazaki, Japan, [email protected]
Abstract: A novel liquefaction plant with a moving-bed reactor has been developed. This project aims at developing a process for continuous treatment of waste plastics in a small-sized plant. A bench plant was used to optimize the reaction conditions, and a demonstration plant was used for confi rming the continuous liquefaction of plastics. Re-pelletized pieces of waste polystyrene and foamed polystyrene were used as the feed. After operating fi ve hours, a minimum carbonization of approximately 1% was observed; this confi rmed the possibility for long-term operations.
1. Introduction
The reduction of incineration and landfi ll treatments is the key for achieving a “recycling-based society.” Since the recycling of waste plastics lacks economical balance, nearly 80% of waste plastics are incinerated or treated by landfi ll in Japan. Additionally, “waste plastics recycling” in steel production can be considered as a new type of incineration in-stead of the recycling method involving cokes substitutes [1]. This method can be realized by the large-scale transportation of enormous amount of wastes; this requires a suitable logistical system accompanied by a lower emission of toxic substances.
We have proposed “community recycling,” in which local enterprises can continue their operations suffi cient profi ts while the recycled products are used by the local community. For the purpose of collection and transportation in current waste treatment businesses, a small-sized plant with a capacity of approximately three tons per day can meet the recy-cling requirements in Japan. Although there have been many development projects, they usually comprised oil production plants with a capacity of one ton per day. Due to the lack of economical balance, small-sized plants that produce oil from waste plastics are no longer functioning under the scheme of the Containers and Packaging Recycling Law.
A newly developed plant termed moving-bed reactor [2] was constructed, and operation research was performed. A bench plant equipped with a single-screw conveyor was used to optimize the reaction conditions, and a demonstration plant with a twin-screw and multiple single-screw conveyors was used to examine the performance in terms of coke formation and safe operation.
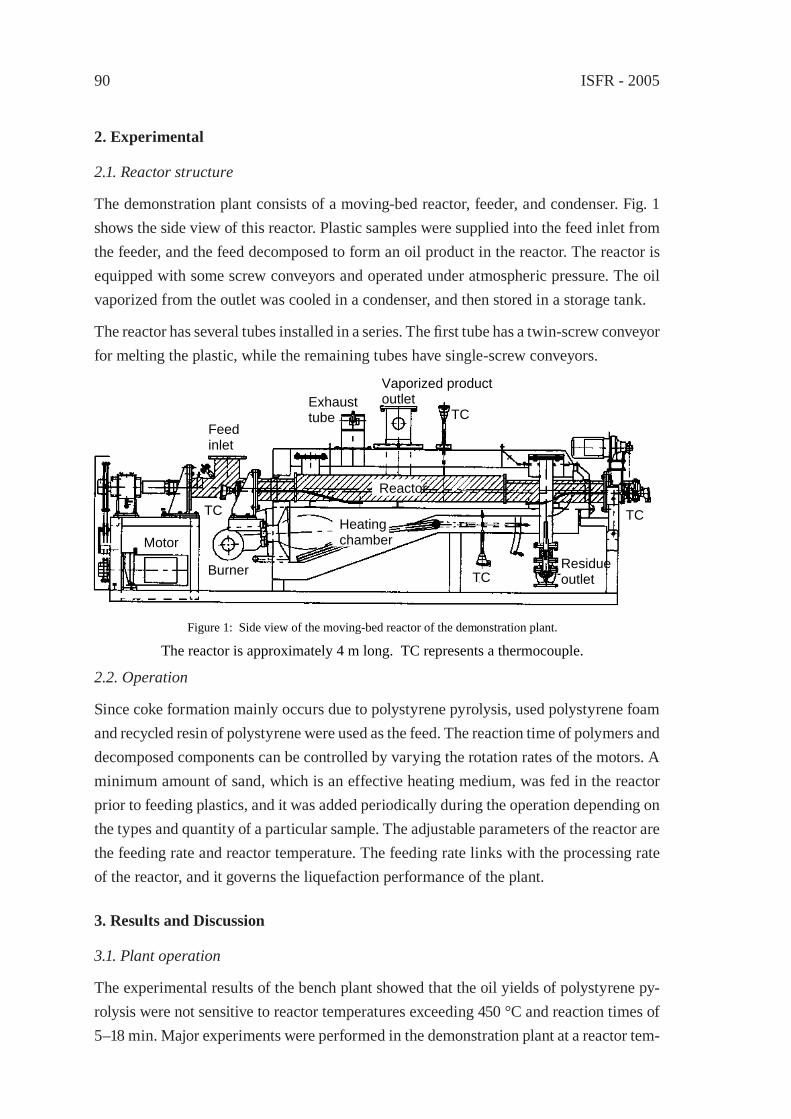
ISFR - 200590
2. Experimental
2.1. Reactor structure
The demonstration plant consists of a moving-bed reactor, feeder, and condenser. Fig. 1 shows the side view of this reactor. Plastic samples were supplied into the feed inlet from the feeder, and the feed decomposed to form an oil product in the reactor. The reactor is equipped with some screw conveyors and operated under atmospheric pressure. The oil vaporized from the outlet was cooled in a condenser, and then stored in a storage tank.
The reactor has several tubes installed in a series. The fi rst tube has a twin-screw conveyor for melting the plastic, while the remaining tubes have single-screw conveyors.
Figure 1: Side view of the moving-bed reactor of the demonstration plant.
The reactor is approximately 4 m long. TC represents a thermocouple.
Feed inlet
TC
Reactor
Burner
Heating chamber
Residue outlet
Vaporized product outlet
TC TC
TC
Motor
Exhaust tube
2.2. Operation
Since coke formation mainly occurs due to polystyrene pyrolysis, used polystyrene foam and recycled resin of polystyrene were used as the feed. The reaction time of polymers and decomposed components can be controlled by varying the rotation rates of the motors. A minimum amount of sand, which is an effective heating medium, was fed in the reactor prior to feeding plastics, and it was added periodically during the operation depending on the types and quantity of a particular sample. The adjustable parameters of the reactor are the feeding rate and reactor temperature. The feeding rate links with the processing rate of the reactor, and it governs the liquefaction performance of the plant.
3. Results and Discussion
3.1. Plant operation
The experimental results of the bench plant showed that the oil yields of polystyrene py-rolysis were not sensitive to reactor temperatures exceeding 450 °C and reaction times of 5–18 min. Major experiments were performed in the demonstration plant at a reactor tem-
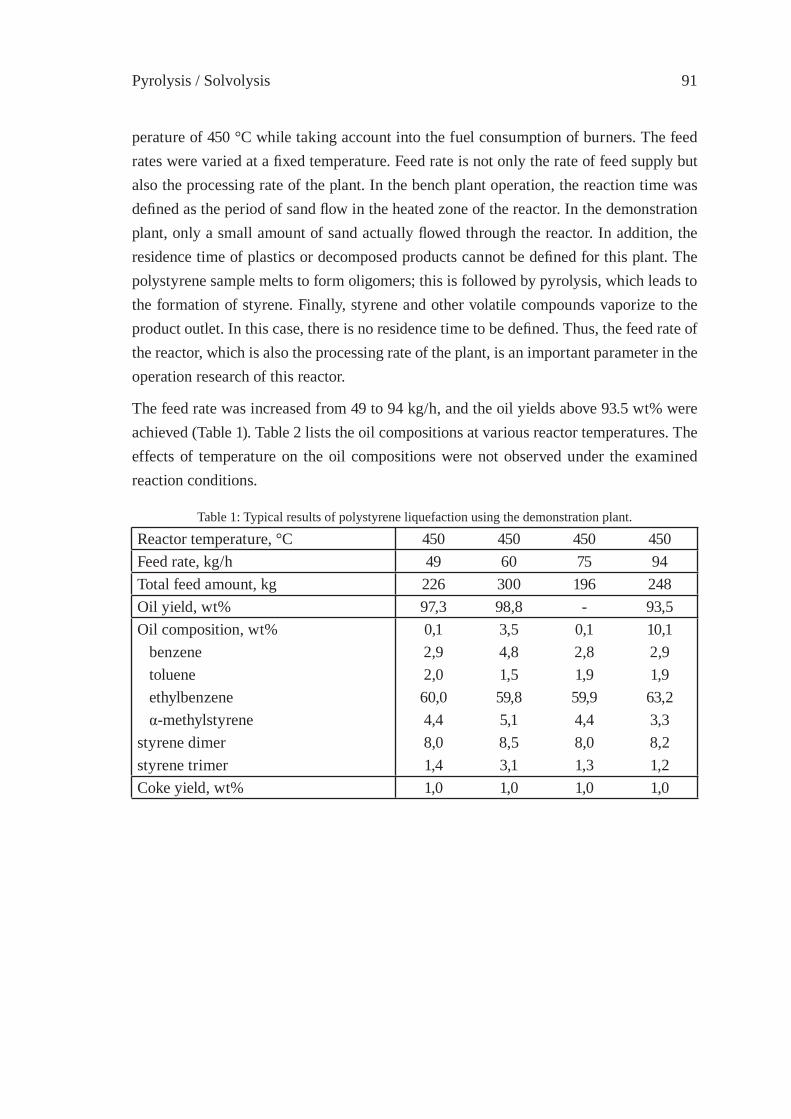
Pyrolysis / Solvolysis 91
perature of 450 °C while taking account into the fuel consumption of burners. The feed rates were varied at a fi xed temperature. Feed rate is not only the rate of feed supply but also the processing rate of the plant. In the bench plant operation, the reaction time was defi ned as the period of sand fl ow in the heated zone of the reactor. In the demonstration plant, only a small amount of sand actually fl owed through the reactor. In addition, the residence time of plastics or decomposed products cannot be defi ned for this plant. The polystyrene sample melts to form oligomers; this is followed by pyrolysis, which leads to the formation of styrene. Finally, styrene and other volatile compounds vaporize to the product outlet. In this case, there is no residence time to be defi ned. Thus, the feed rate of the reactor, which is also the processing rate of the plant, is an important parameter in the operation research of this reactor.
The feed rate was increased from 49 to 94 kg/h, and the oil yields above 93.5 wt% were achieved (Table 1). Table 2 lists the oil compositions at various reactor temperatures. The effects of temperature on the oil compositions were not observed under the examined reaction conditions.
Table 1: Typical results of polystyrene liquefaction using the demonstration plant.
Reactor temperature, °C 450 450 450 450Feed rate, kg/h 49 60 75 94Total feed amount, kg 226 300 196 248Oil yield, wt% 97,3 98,8 - 93,5Oil composition, wt% 0,1 3,5 0,1 10,1 benzene 2,9 4,8 2,8 2,9 toluene 2,0 1,5 1,9 1,9 ethylbenzene 60,0 59,8 59,9 63,2 α-methylstyrene 4,4 5,1 4,4 3,3styrene dimer 8,0 8,5 8,0 8,2styrene trimer 1,4 3,1 1,3 1,2Coke yield, wt% 1,0 1,0 1,0 1,0
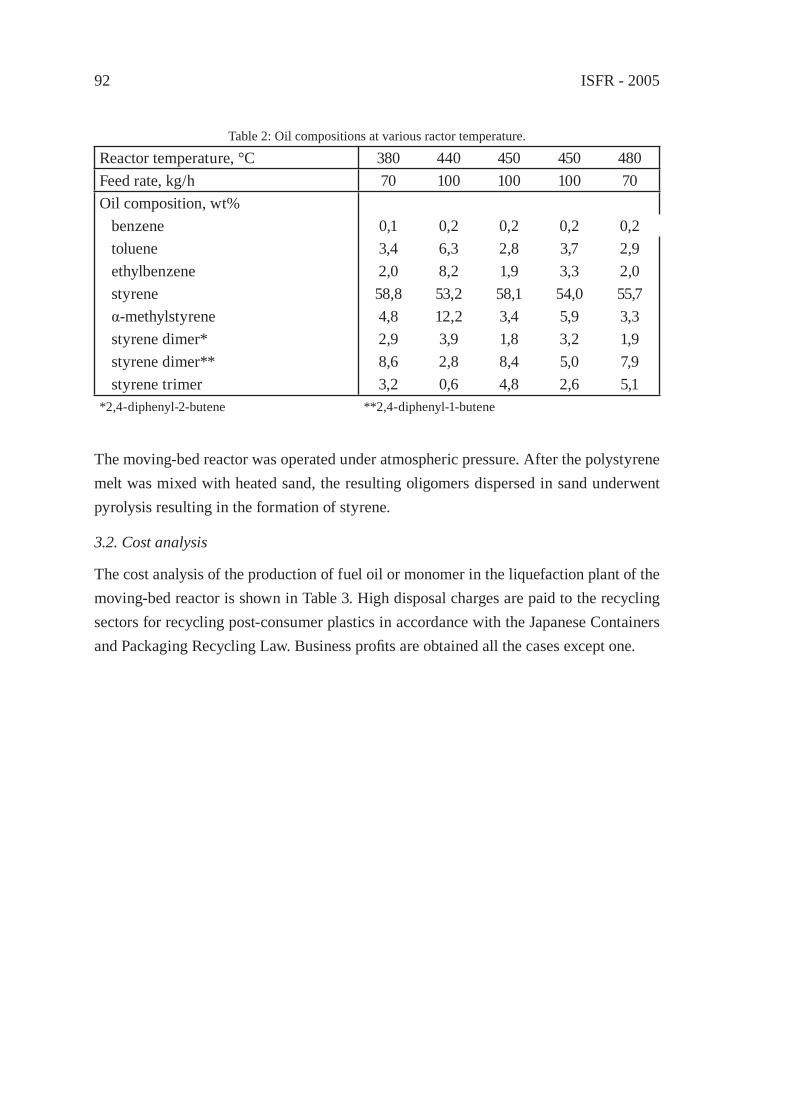
ISFR - 200592
Table 2: Oil compositions at various ractor temperature.
Reactor temperature, °C 380 440 450 450 480Feed rate, kg/h 70 100 100 100 70Oil composition, wt% benzene 0,1 0,2 0,2 0,2 0,2 toluene 3,4 6,3 2,8 3,7 2,9 ethylbenzene 2,0 8,2 1,9 3,3 2,0 styrene 58,8 53,2 58,1 54,0 55,7 α-methylstyrene 4,8 12,2 3,4 5,9 3,3 styrene dimer* 2,9 3,9 1,8 3,2 1,9 styrene dimer** 8,6 2,8 8,4 5,0 7,9 styrene trimer 3,2 0,6 4,8 2,6 5,1*2,4-diphenyl-2-butene **2,4-diphenyl-1-butene
The moving-bed reactor was operated under atmospheric pressure. After the polystyrene melt was mixed with heated sand, the resulting oligomers dispersed in sand underwent pyrolysis resulting in the formation of styrene.
3.2. Cost analysis
The cost analysis of the production of fuel oil or monomer in the liquefaction plant of the moving-bed reactor is shown in Table 3. High disposal charges are paid to the recycling sectors for recycling post-consumer plastics in accordance with the Japanese Containers and Packaging Recycling Law. Business profi ts are obtained all the cases except one.
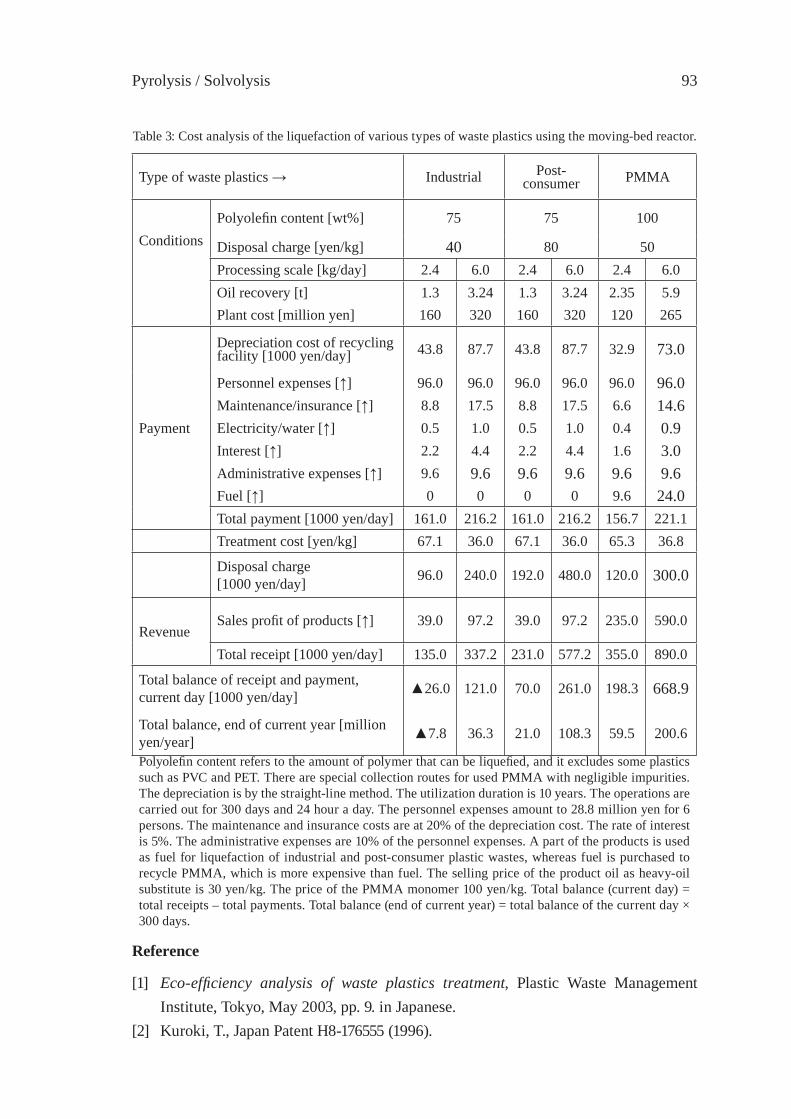
Pyrolysis / Solvolysis 93
Table 3: Cost analysis of the liquefaction of various types of waste plastics using the moving-bed reactor.
Type of waste plastics → Industrial Post-consumer PMMA
ConditionsPolyolefi n content [wt%] 75 75 100
Disposal charge [yen/kg] 40 80 50Processing scale [kg/day] 2.4 6.0 2.4 6.0 2.4 6.0Oil recovery [t] 1.3 3.24 1.3 3.24 2.35 5.9Plant cost [million yen] 160 320 160 320 120 265
Payment
Depreciation cost of recycling facility [1000 yen/day] 43.8 87.7 43.8 87.7 32.9 73.0
Personnel expenses [↑] 96.0 96.0 96.0 96.0 96.0 96.0Maintenance/insurance [↑] 8.8 17.5 8.8 17.5 6.6 14.6Electricity/water [↑] 0.5 1.0 0.5 1.0 0.4 0.9Interest [↑] 2.2 4.4 2.2 4.4 1.6 3.0Administrative expenses [↑] 9.6 9.6 9.6 9.6 9.6 9.6Fuel [↑] 0 0 0 0 9.6 24.0Total payment [1000 yen/day] 161.0 216.2 161.0 216.2 156.7 221.1Treatment cost [yen/kg] 67.1 36.0 67.1 36.0 65.3 36.8
Disposal charge[1000 yen/day] 96.0 240.0 192.0 480.0 120.0 300.0
RevenueSales profi t of products [↑] 39.0 97.2 39.0 97.2 235.0 590.0
Total receipt [1000 yen/day] 135.0 337.2 231.0 577.2 355.0 890.0
Total balance of receipt and payment, current day [1000 yen/day] ▲26.0 121.0 70.0 261.0 198.3 668.9
Total balance, end of current year [million yen/year] ▲7.8 36.3 21.0 108.3 59.5 200.6
Polyolefi n content refers to the amount of polymer that can be liquefi ed, and it excludes some plastics such as PVC and PET. There are special collection routes for used PMMA with negligible impurities. The depreciation is by the straight-line method. The utilization duration is 10 years. The operations are carried out for 300 days and 24 hour a day. The personnel expenses amount to 28.8 million yen for 6 persons. The maintenance and insurance costs are at 20% of the depreciation cost. The rate of interest is 5%. The administrative expenses are 10% of the personnel expenses. A part of the products is used as fuel for liquefaction of industrial and post-consumer plastic wastes, whereas fuel is purchased to recycle PMMA, which is more expensive than fuel. The selling price of the product oil as heavy-oil substitute is 30 yen/kg. The price of the PMMA monomer 100 yen/kg. Total balance (current day) = total receipts – total payments. Total balance (end of current year) = total balance of the current day × 300 days.
Reference
[1] Eco-effi ciency analysis of waste plastics treatment, Plastic Waste Management Institute, Tokyo, May 2003, pp. 9. in Japanese.
[2] Kuroki, T., Japan Patent H8-176555 (1996).

ISFR - 200594
Pyrolysis / Solvolysis 95
FUEL GAS PRODUCTION BY POLYOLEFIN DECOMPOSITION USING A MOVING-BED REACTOR
Y. Kodera1*, Y. Ishihara1 and T. Kuroki2
1National Inst. for Adv. Industrial Sci. & Tech., Tsukuba, Japan2Polymer Decomposition Lab. Inc., Miyazaki, Japan
Abstract: Conventional pyrolysis of waste plastics, carried out in a tank or kiln, gives fuel oil of wide boiling ranges. For the effective conversion of polyolefi ns into fuel gas, a new type of thermal process has been developed using a moving-bed reactor. Gas production at 75 – 94 wt% was achieved in the operation research. With regard to polymer decomposition mechanism, the key points are the reactor design and reaction control.
1. Introduction
The production of oil from waste plastics has been expected as the primary solution for the overfl ow of landfi lls and the limitation of resources. In spite of many R&D projects over the last three decades, it is reported that the recycling of waste plastics in oil pro-duction processes covers only a negligible amount in the total amount of waste plastics generated in Japan. The economical disadvantages of the oil production process are due to technical problems such as low treatment ability depending on the type of the reactor with high-energy consumption [1], and low quality of oil.
The produced oil is distributed to end-users typically as a cheaper substitute to heavy oil. Further, it has limited uses in applications such as industrial boilers, burners, and power generators. On the other hand, in Japan, fuel gas is two to three times more expensive than fuel oil, and it has wider applications, for example, it can be used in liquid-gas-pow-ered cars and gas cogeneration systems with lower emission of toxic substances.
If fuel gas can be obtained as a major product from waste plastics, the processing facility does not require a distillation process and storage tanks for each distillate. Moreover, the production of fuel gas can be a new feedstock recycling process. The aim of this research project is to develop a process for fuel gas production, and this will be a profi table busi-ness for the treatment of waste plastics even on a small scale of about 3 tons/day.
2. Technical background of fuel gas production
An important factor in the formation of gaseous products is the control of the reaction environment in terms of the components in each phase — polymer melt, liquid, and gas [2]. Steam was used to supply in order to obtain gaseous products from polypropylene at 75 wt% in a table-top apparatus [3, 4].
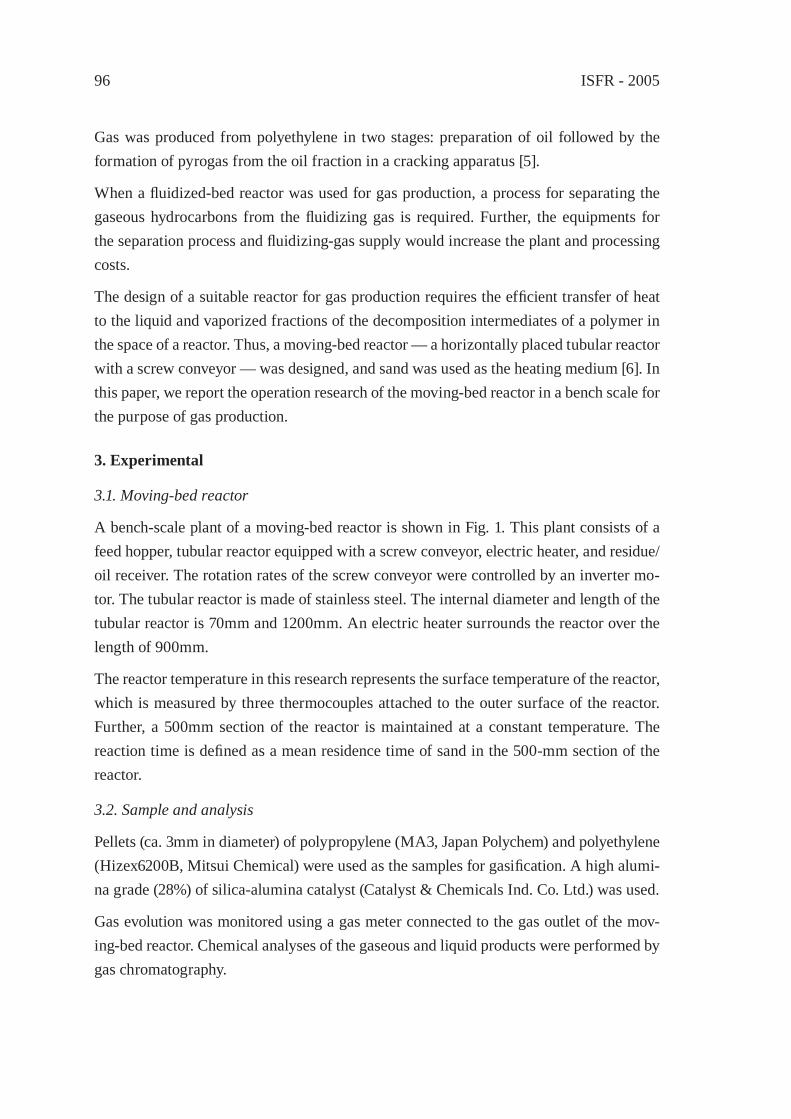
ISFR - 200596
Gas was produced from polyethylene in two stages: preparation of oil followed by the formation of pyrogas from the oil fraction in a cracking apparatus [5].
When a fl uidized-bed reactor was used for gas production, a process for separating the gaseous hydrocarbons from the fl uidizing gas is required. Further, the equipments for the separation process and fl uidizing-gas supply would increase the plant and processing costs.
The design of a suitable reactor for gas production requires the effi cient transfer of heat to the liquid and vaporized fractions of the decomposition intermediates of a polymer in the space of a reactor. Thus, a moving-bed reactor — a horizontally placed tubular reactor with a screw conveyor — was designed, and sand was used as the heating medium [6]. In this paper, we report the operation research of the moving-bed reactor in a bench scale for the purpose of gas production.
3. Experimental
3.1. Moving-bed reactor
A bench-scale plant of a moving-bed reactor is shown in Fig. 1. This plant consists of a feed hopper, tubular reactor equipped with a screw conveyor, electric heater, and residue/oil receiver. The rotation rates of the screw conveyor were controlled by an inverter mo-tor. The tubular reactor is made of stainless steel. The internal diameter and length of the tubular reactor is 70mm and 1200mm. An electric heater surrounds the reactor over the length of 900mm.
The reactor temperature in this research represents the surface temperature of the reactor, which is measured by three thermocouples attached to the outer surface of the reactor. Further, a 500mm section of the reactor is maintained at a constant temperature. The reaction time is defi ned as a mean residence time of sand in the 500-mm section of the reactor.
3.2. Sample and analysis
Pellets (ca. 3mm in diameter) of polypropylene (MA3, Japan Polychem) and polyethylene (Hizex6200B, Mitsui Chemical) were used as the samples for gasifi cation. A high alumi-na grade (28%) of silica-alumina catalyst (Catalyst & Chemicals Ind. Co. Ltd.) was used.
Gas evolution was monitored using a gas meter connected to the gas outlet of the mov-ing-bed reactor. Chemical analyses of the gaseous and liquid products were performed by gas chromatography.

Pyrolysis / Solvolysis 97
3.3. Plant operation
Plastic pellets (0.8kg) were mixed with sand (7.2kg), and stored in a feed hopper. In cata-lytic reactions, plastic pellets (0.8kg) were mixed with the silica-alumina catalyst (0.4kg) and sand (6.8kg). The mixture was supplied into the tubular reactor at a constant rate in under nitrogen atmosphere. The internal pressure was maintained atmospheric pressure. The reactor was maintained at a fi xed temperature. Analytical samples were collected from a gas outlet, and the volume of gas evolution was monitored using a gas meter. After feeding the sample mixture, the reactor was cooled overnight at room temperature. The liquid product and sand were stored in a separate section of the residue/oil receiver.
Figure 1: A bench-scale plant of a moving-bed reactor.
Reactor Inverter motor
Feed hopper
Residue/oil receiver
Electric heater Pyrogas
4. Results and Discussion
4.1. Pyrolysis and catalytic gasifi cation of polypropylene
Typically, polypropylene decomposes into gaseous and liquid products at a reactor tem-perature of 700 °C and a reaction time of 10min. Fig. 2 shows the gas chromatogram of the resulting gas fraction. The C2 component represents a mixture of ethylene and ethane.
As C3 products, polypropylene is dominant. Hydrogen is less than 0.1 wt%. As the op-eration period increased, polypropylene was gradually fed into the reactor and the gas evolution increased, as shown in Fig. 3. The period prior to gas evolution corresponds to the time required by a plastic sample to reach the heated section. At a reactor tempera-ture of 600 °C, the gas and liquid yields were controlled by varying the reaction time, as shown in Fig. 4. Different from gasifi cation in other reactors such as a fl uidized-bed
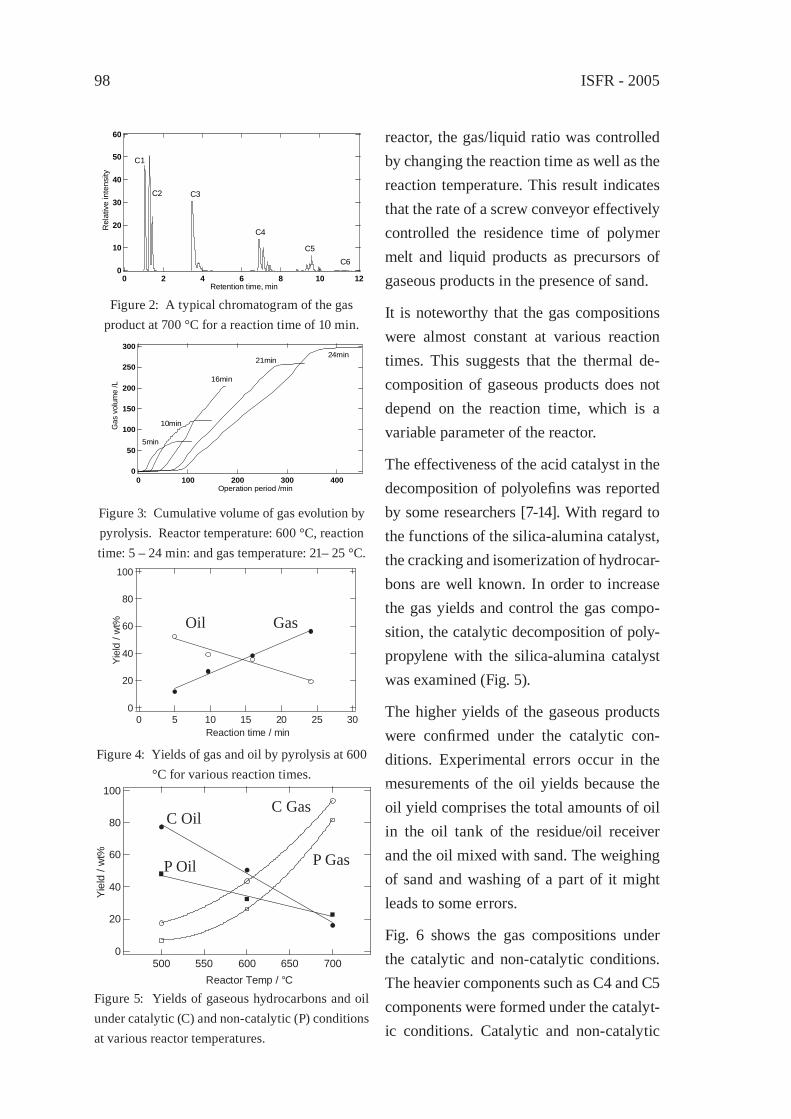
ISFR - 200598
reactor, the gas/liquid ratio was controlled by changing the reaction time as well as the reaction temperature. This result indicates that the rate of a screw conveyor effectively controlled the residence time of polymer melt and liquid products as precursors of gaseous products in the presence of sand.
It is noteworthy that the gas compositions were almost constant at various reaction times. This suggests that the thermal de-composition of gaseous products does not depend on the reaction time, which is a variable parameter of the reactor.
The effectiveness of the acid catalyst in the decomposition of polyolefi ns was reported by some researchers [7-14]. With regard to the functions of the silica-alumina catalyst, the cracking and isomerization of hydrocar-bons are well known. In order to increase the gas yields and control the gas compo-sition, the catalytic decomposition of poly-propylene with the silica-alumina catalyst was examined (Fig. 5).
The higher yields of the gaseous products were confi rmed under the catalytic con-ditions. Experimental errors occur in the mesurements of the oil yields because the oil yield comprises the total amounts of oil in the oil tank of the residue/oil receiver and the oil mixed with sand. The weighing of sand and washing of a part of it might leads to some errors.
Fig. 6 shows the gas compositions under the catalytic and non-catalytic conditions. The heavier components such as C4 and C5 components were formed under the catalyt-ic conditions. Catalytic and non-catalytic
60
50
40
30
20
10
0121086420
Retention time, min
Rel
ativ
e in
tens
ity
C1
C6C5
C4
C3C2
Figure 2: A typical chromatogram of the gas product at 700 °C for a reaction time of 10 min.
300
250
200
150
100
50
04003002001000
Operation period /min
Gas
vol
ume
/L
24min21min
16min
10min
5min
Figure 3: Cumulative volume of gas evolution by pyrolysis. Reactor temperature: 600 °C, reaction time: 5 – 24 min: and gas temperature: 21– 25 °C.
100
80
60
40
20
0302520151050
100
80
60
40
20
0
Reaction time / min
Yiel
d / w
t% Oil Gas
Figure 4: Yields of gas and oil by pyrolysis at 600 °C for various reaction times.
100
80
60
40
20
0700650600550500
100
80
60
40
20
0
Reactor Temp / °C
Yiel
d / w
t%
Oil
Yiel
d / w
t%
C OilC Gas
P Oil P Gas
Figure 5: Yields of gaseous hydrocarbons and oil under catalytic (C) and non-catalytic (P) conditions at various reactor temperatures.
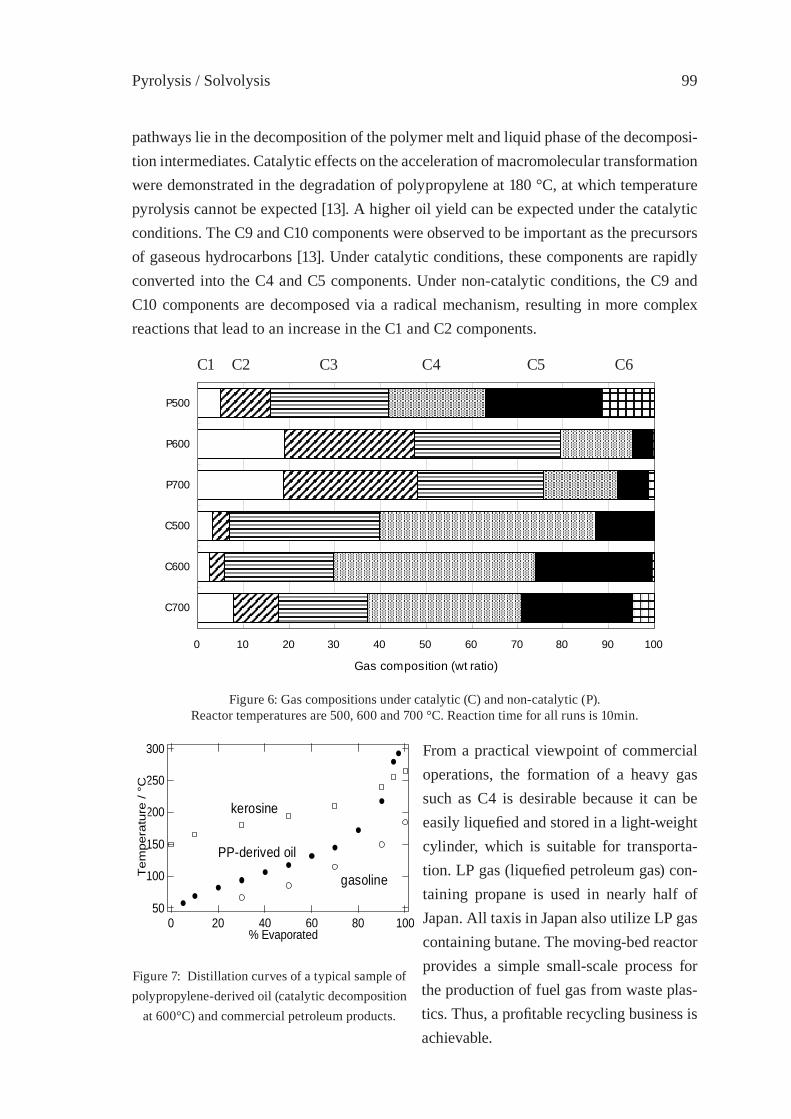
Pyrolysis / Solvolysis 99
pathways lie in the decomposition of the polymer melt and liquid phase of the decomposi-tion intermediates. Catalytic effects on the acceleration of macromolecular transformation were demonstrated in the degradation of polypropylene at 180 °C, at which temperature pyrolysis cannot be expected [13]. A higher oil yield can be expected under the catalytic conditions. The C9 and C10 components were observed to be important as the precursors of gaseous hydrocarbons [13]. Under catalytic conditions, these components are rapidly converted into the C4 and C5 components. Under non-catalytic conditions, the C9 and C10 components are decomposed via a radical mechanism, resulting in more complex reactions that lead to an increase in the C1 and C2 components.
C1 C2 C3 C4 C5 C6
0 10 20 30 40 50 60 70 80 90 100
C700
C600
C500
P700
P600
P500
Gas composition (wt ratio)
Figure 6: Gas compositions under catalytic (C) and non-catalytic (P).Reactor temperatures are 500, 600 and 700 °C. Reaction time for all runs is 10min.
From a practical viewpoint of commercial operations, the formation of a heavy gas such as C4 is desirable because it can be easily liquefi ed and stored in a light-weight cylinder, which is suitable for transporta-tion. LP gas (liquefi ed petroleum gas) con-taining propane is used in nearly half of Japan. All taxis in Japan also utilize LP gas containing butane. The moving-bed reactor provides a simple small-scale process for the production of fuel gas from waste plas-tics. Thus, a profi table recycling business is achievable.
300
250
200
150
100
50100806040200
kerosine
gasoline
PP-derived oil
% Evaporated
Tem
pera
ture
/ °C
Figure 7: Distillation curves of a typical sample of polypropylene-derived oil (catalytic decomposition
at 600°C) and commercial petroleum products.

ISFR - 2005100
Fig. 7 shows the distillation curve of a typical oil sample of gasifi cation by-product and commercial petroleum products. The oil obtained from polypropylene gasifi cation can be used as fuel oil for heating the reactor of a commercial plant.
Similar to polypropylene, polyethylene gave gaseous products at 75 wt% under the py-rolysis conditions of a reactor temperature of 700 °C and a reaction time of 10min.
References
[1] Ishihara, Y., Saido, K., and Kuroki, T., J. Japan Petroleum Inst. 46:77 (2003).[2] Westerhout, R. W. J., Kuipers, J. A. M., and van Swaaij, W. P. M., Ind. Eng. Chem.
Res. 37:841 (1998).[3] Kuroki, T., Sawaguchi, T., Hashima, T., Kawashima, T., and Ikemura, T., Nippon
Kagaku Kaishi, 322 (1976).[4] Sawaguchi, T., Kuroki, T., Isono, T., and Ikemura, T., Nippon Kagaku Kaishi, 565
(1977).[5] Tsuji, T., Tanaka, Y., Shibata, T., Uemaki, O., Itoh, H., Nippon Kagaku Kaishi, 759
(1999).[6] Kuroki, T., Japan Patent.[7] Yamamoto, M., Nippon Kagaku Kaishi, 1547 (1978).[8] Uemichi, Y., and Ayame, A., Nippon Kagaku Kaishi 1741 (1980).[9] Uemichi, Y., Kashiwaya, M., Tsudate, M., and Ayame, A., Bull. Chem. Soc. Jpn.
55:2767 (1983).[10] Nanbu, H., Sakuma, Y., Ishihara, Y., Takesue, T., and Ikemura, T., Polym. Degr. Stab.
19:61 (1987).[11] Ishihara, Y., Nanbu, H., Iwata, C., Ikemura, T., Takesue, T., Bull. Chem. Soc. Jpn.,
62:2981 (1989).[12] Ishihara, Y., Nanbu, H., Saido, K., Ikemura, T., Takesue, T. Polymer, 33:3482 (1992).[13] Ishihara, Y., Nanbu, H., Saido, K., Ikemura, T., Takesue, T., and Kuroki, T., Fuel,
72:1115 (1993).[14] Sakata, Y., Uddin, M. A., Muto, A., J. Anal. Appl. Pyrol., 51:135 (1999).
Pyrolysis / Solvolysis 101
FEEDSTOCK RECYCLING OF PVDC MIXED PLASTICS: EF-FECT OF PET AND DEHALOGENATION OF LIQUID PRODUCTS
T. Bhaskar, A. Muto, Y. Sakata*Department of Applied Chemistry, Okayama University, 3-1-1 Tsushima Naka, Okaya-
ma 700-8530, Japan, [email protected]
Abstract: The pyrolysis of poly (vinylidene chloride) (PVDC), poly (ethylene) (PE), poly (propylene) (PP), poly (styrene) (PS) mixed with PET and/or HIPS-Br were performed at 430 °C and dehalogenated the liquid products with calcium hydroxide carbon composite (CaH-C). The interaction of degradation products from individual (PE, PP and PS) and mixed (3P is an equal mixture of PE, PP and PS) plastics with the PVDC degradation products was investigated and compared with the poly (vinyl chloride) PVC. The forma-tion of chlorinated hydrocarbons in the liquid products were in the order of PS/PVDC > 3P/PVDC > PP/PVDC > PE/PVDC. The quantity of chlorinated hydrocarbons were less compared with the PVC mixed plastics pyrolysis liquid products even though the chlorine content in PVDC is higher than in PVC. The detailed analysis of pyrolysis products and effect of PET on the formation of products were discussed.
1. Introduction
The disposal of halogenated mixed waste plastics is serious environmental problem. Re-cycling by pyrolysis has high potential for heterogeneous waste plastic materials, as the separation is not economical. Municipal waste plastic (MWP) is a mixture of halogenated (PVC and PVDC) and non-halogenated plastics (PP, PE, PS, PET etc). There has been a plethora of research work monographs on the feedstock recycling of plastic wastes [1], pyrolysis of individual and mixed plastics such as PP/PE, PP/PS, PE/PS mixed with and without PVC plastics into liquid products and new pathways in plastic recycling and the current status of plastics recycling has been highlighted [2-5]. It is well know that thee pyrolysis of mixed plastics containing PVC produces inorganic and subsequently organic chlorine compounds during the initial stages of pyrolysis process [3, 4]. The presence of such halogen compounds in the liquid products obviates to use as a fuel or feedstock in refi nery. In our previous reports, we have reported on the thermal and catalytic deg-radation of individual PE/PVC, PP/PVC, and PS/PVC by silica-alumina catalysts and dechlorination by iron oxides (FeOOH and Fe3O4 sorbents) [3,4]. Sakata et al. studied the spontaneous degradation of municipal waste plastics at low temperature (320 °C) and the dechlorination treatment was carried out with special attention to the gas-solid reaction between the hydrogen chloride deriving from the PVC and the aluminum foil contained in waste plastics [5]. Bhaskar et al., [6, 7] reported the liquefaction of mixed plastics (PE/PP/PS) containing PVC and dechlorination of liquid products by calcium carbonate carbon
ISFR - 2005102
composite (Ca-C) sorbent and optimized the dechlorination reaction conditions with the simulated HCl gas [6-7].
In the present investigation, we report the pyrolysis of PVDC with PE, or PP, or PS, or 3P; 3P/PVDC with PET, HIPS-Br and/or PET, and comparison with the PVC mixed plastics (PE, PP, PS and 3P with PVC). The TG/DTA analysis of sample plastics was performed to understand the decomposition behavior and formation of compounds. The detailed in-vestigation on the distribution of degradation products, chlorine, and bromine content in various degradation products was discussed.
2. Experimental
Materials. The high-density polyethylene (PE) was obtained from Mitsui Chemical Co. Ltd., Japan; polypropylene (PP) from Ube Chemical Industries Co. Ltd., Japan; polysty-rene (PS) from Asahi Kasei Industries Co., Ltd., Japan; and poly (vinylidene chloride) (PVDC) from Geon Chemical Co. Ltd. The grain sizes of PP, PE, PS, PVC, HIPS-Br, and PET were about 3 mm X 2 mm. The PVDC was in a powder form and was used as re-ceived. The mixture of PP, PE, and PS was abbreviated as 3P and used in the manuscript. The chlorine content in PVC was 52.4 wt% and PVDC was 73.2 wt%. The remaining samples were commercially available plastic samples.
Pyrolysis procedure. Pyrolysis of PVDC (10 g), PP (9g)/PVDC (1 g), PS (9 g)/PVDC (1 g), 3P (PE (3 g)+PP ( 3g)+PS (3 g))/PVDC (1 g), PE (9 g)/PVDC (1 g) etc., was performed in a glass reactor (length: 350 mm; id 30 mm) under atmospheric pressure by batch opera-tion with identical experimental conditions. Briefl y, 10 g of mixed plastics was loaded into the reactor for thermal degradation and in another reactor quartz grains (thermal) were charged and kept at 350 °C. The quartz grains were used to maintain the similar space velocities in the absence of catalyst/sorbent (dehalogenation). In a typical run, the reactor was purged with nitrogen gas (purity 99.99 %) at a fl ow rate of 30 ml min-1 and held at 120 °C for 60 min to remove the physically adsorbed water from the plastic sample. The reactor temperature was increased to the degradation temperature (430 °C) at a heating rate of 15 °C/min. A schematic experimental setup for the pyrolysis of mixed plastics and the detailed analysis procedure can be found in elsewhere [6, 8]. The TG analysis was performed on Shimadzu TGA-51 instrument using approximately 20-30 mg of plastic sample in the nitrogen atmosphere (50 ml/min). The rate of heating was 5 °C/min (from room temperature) and the maximum temperature was 800 °C.
Analysis procedure. The quantitative analysis of the liquid products (collected once at the end of experiment) was performed using GC-FID. The distribution of halogen com-pounds and the quantity of halogen content in liquid products was analyzed using GC-AED. The amount of Cl and Br in water trap was analyzed using an ion chromatograph.
Pyrolysis / Solvolysis 103
The quantitative determination of halogen in residue was measured using combustion fl ask and then subjected to ion chromatograph. The qualitative analysis of liquid products were performed using GC-MS. The detailed analytical conditions can be found in our earlier reports [9]. The composition of the liquid products was characterized using C-NP grams (C stands for carbon and NP from normal paraffi n) and Cl-NP gram (Cl stands for chlorine). The curves were obtained by plotting the weight percent of Cl, which was in the liquid products against the carbon number of the normal paraffi n determined by comparing the retention times from GC analysis using a nonpolar column. In briefl y, the NP gram is a carbon number distribution of hydrocarbons derived from the gas chroma-togram based on boiling points of a series of normal paraffi ns. Further details on the NP gram can be found elsewhere [9].
3. Results and Discussion
PVDC mixed with PE, PP, and PS: The pyrolysis of PVDC, PP/PVDC, PS/PVDC, PE/PVDC and 3P/PVDC were performed under atmospheric pressure at 430 °C. The deg-radation products were classifi ed into three groups: gas, liquid, and solid residue. Table 1 shows the yield of degradation products and average carbon number (Cnp), density of liquid products. The pyrolysis of PVDC (pure) could not produce any liquid products and major portion was gas (68 wt%) and residue (32 wt%), due to the presence of high chlorine (73.2 wt%) in PVDC. The result is expected as with the earlier studies [10] on the pyroly-sis of PVC (pure) could produce ca. 4% of liquid products. The pyrolysis of PP/PVDC, PS/PVDC, PE/PVDC and 3P/PVDC yielded the liquid products ca. 60 wt%, 74 wt% in case of PE/PVDC. There are no signifi cant differences in the average carbon number (Cnp), other than in PS/PVDC. The density of liquid products from PE/PVDC and 3P/PVDC are relatively higher than PP/PVDC and PS/PVDC liquid products. It might be due to the presence of low and high molecular weight hydrocarbons with 3P, PE mixed plastics than low molecular weight hydrocarbons with PP, and PS mixed plastics. The Cnp of liquid products obtained from PS/PVDC showed that about 14, as the composition of PS/PVDC liquid products are styrene monomer, dimer and trimer. The distribution of chlorine in various degradation products from PVDC, PP/PVDC, PS/PVDC and PE/PVDC are sum-marized in Table 2. In addition, the distribution of chlorine content with the PVC and PP/PVC, PS/PVC and PE/PVC pyrolysis liquid products were taken from our earliest studies for comparison [3]. It is clear from the table 2 that the formation of chlorinated hydrocar-bons was higher with the PVC mixed plastic samples than PVDC (20 wt% PVC contains 1048 mg of chlorine and 10 wt% of PVDC contains 732 mg of chlorine). The chlorine content in PVDC (10 wt%) mixed plastics is about 70 % of chlorine in PVC (20 wt%) mixed plastics. In the PVDC mixed plastics the presence of chlorinated hydrocarbons in the liquid products were in the order of PS/PVDC>3P/PVDC>PP/PVDC>PE/PVDC. It is
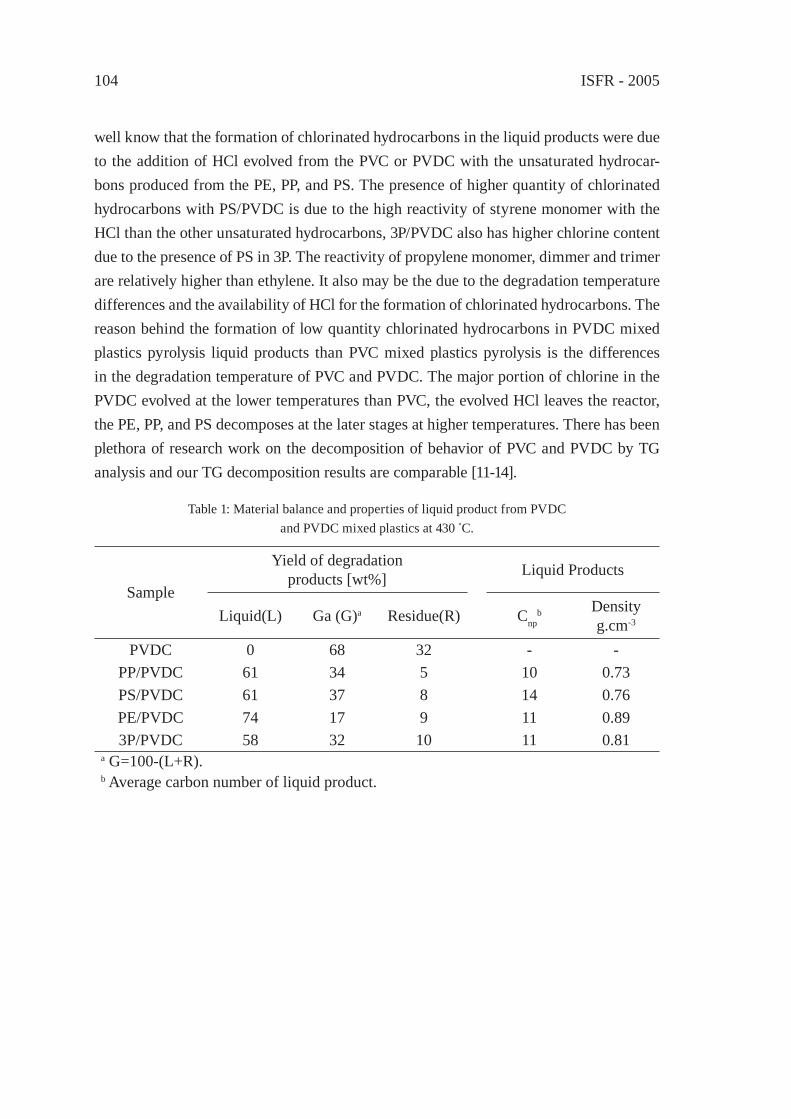
ISFR - 2005104
well know that the formation of chlorinated hydrocarbons in the liquid products were due to the addition of HCl evolved from the PVC or PVDC with the unsaturated hydrocar-bons produced from the PE, PP, and PS. The presence of higher quantity of chlorinated hydrocarbons with PS/PVDC is due to the high reactivity of styrene monomer with the HCl than the other unsaturated hydrocarbons, 3P/PVDC also has higher chlorine content due to the presence of PS in 3P. The reactivity of propylene monomer, dimmer and trimer are relatively higher than ethylene. It also may be the due to the degradation temperature differences and the availability of HCl for the formation of chlorinated hydrocarbons. The reason behind the formation of low quantity chlorinated hydrocarbons in PVDC mixed plastics pyrolysis liquid products than PVC mixed plastics pyrolysis is the differences in the degradation temperature of PVC and PVDC. The major portion of chlorine in the PVDC evolved at the lower temperatures than PVC, the evolved HCl leaves the reactor, the PE, PP, and PS decomposes at the later stages at higher temperatures. There has been plethora of research work on the decomposition of behavior of PVC and PVDC by TG analysis and our TG decomposition results are comparable [11-14].
Table 1: Material balance and properties of liquid product from PVDCand PVDC mixed plastics at 430 °C.
Sample
Yield of degradation products [wt%] Liquid Products
Liquid(L) Ga (G)a Residue(R) Cnpb Density
g.cm-3
PVDC 0 68 32 - -PP/PVDC 61 34 5 10 0.73PS/PVDC 61 37 8 14 0.76PE/PVDC 74 17 9 11 0.893P/PVDC 58 32 10 11 0.81
a G=100-(L+R).b Average carbon number of liquid product.
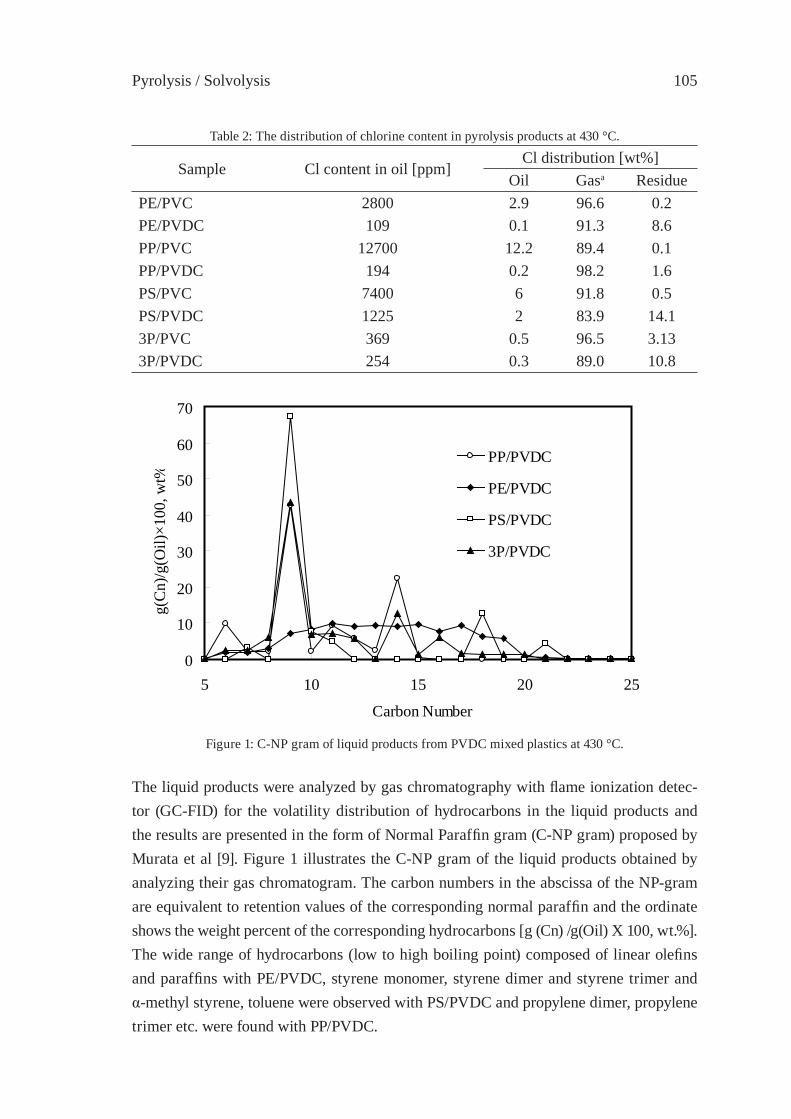
Pyrolysis / Solvolysis 105
Table 2: The distribution of chlorine content in pyrolysis products at 430 °C.
Sample Cl content in oil [ppm]Cl distribution [wt%]
Oil Gasa ResiduePE/PVC 2800 2.9 96.6 0.2PE/PVDC 109 0.1 91.3 8.6PP/PVC 12700 12.2 89.4 0.1PP/PVDC 194 0.2 98.2 1.6PS/PVC 7400 6 91.8 0.5PS/PVDC 1225 2 83.9 14.13P/PVC 369 0.5 96.5 3.133P/PVDC 254 0.3 89.0 10.8
0
10
20
30
40
50
60
70
5 10 15 20 25
Carbon Number
g(C
n)/g
(Oil)
×100
, wt%
PP/PVDC
PE/PVDC
PS/PVDC
3P/PVDC
Figure 1: C-NP gram of liquid products from PVDC mixed plastics at 430 °C.
The liquid products were analyzed by gas chromatography with fl ame ionization detec-tor (GC-FID) for the volatility distribution of hydrocarbons in the liquid products and the results are presented in the form of Normal Paraffi n gram (C-NP gram) proposed by Murata et al [9]. Figure 1 illustrates the C-NP gram of the liquid products obtained by analyzing their gas chromatogram. The carbon numbers in the abscissa of the NP-gram are equivalent to retention values of the corresponding normal paraffi n and the ordinate shows the weight percent of the corresponding hydrocarbons [g (Cn) /g(Oil) X 100, wt.%]. The wide range of hydrocarbons (low to high boiling point) composed of linear olefi ns and paraffi ns with PE/PVDC, styrene monomer, styrene dimer and styrene trimer and α-methyl styrene, toluene were observed with PS/PVDC and propylene dimer, propylene trimer etc. were found with PP/PVDC.
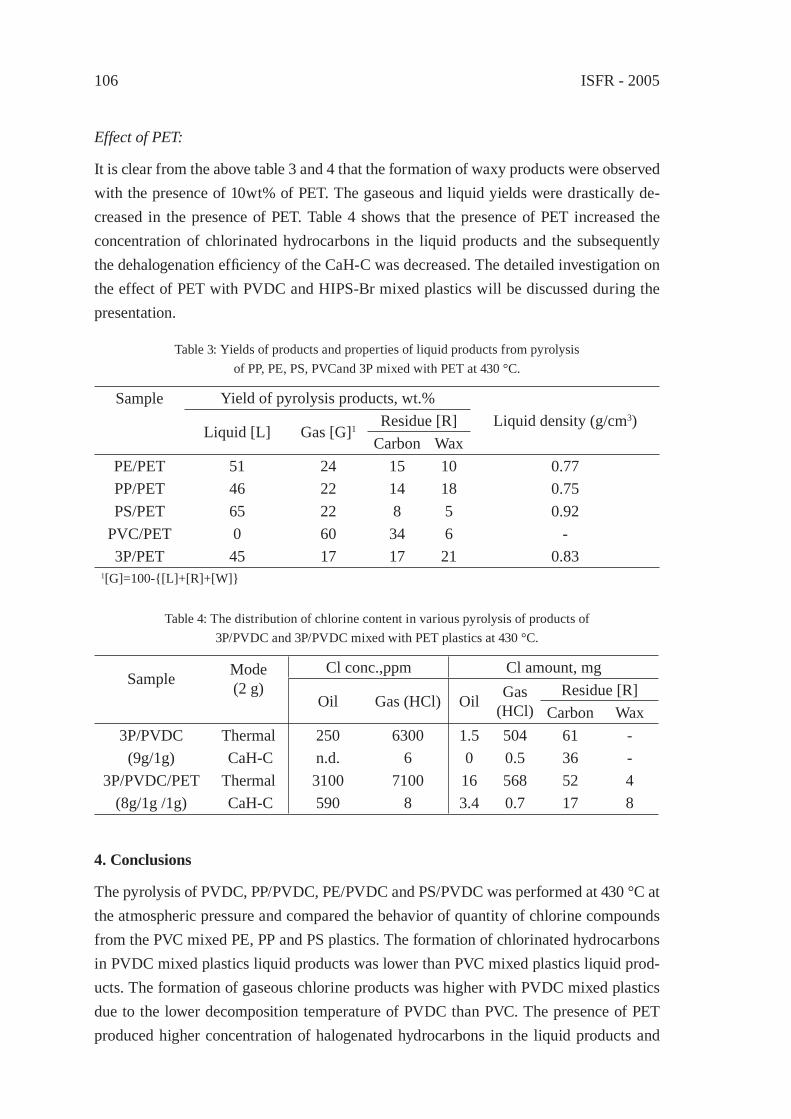
ISFR - 2005106
Effect of PET:
It is clear from the above table 3 and 4 that the formation of waxy products were observed with the presence of 10wt% of PET. The gaseous and liquid yields were drastically de-creased in the presence of PET. Table 4 shows that the presence of PET increased the concentration of chlorinated hydrocarbons in the liquid products and the subsequently the dehalogenation effi ciency of the CaH-C was decreased. The detailed investigation on the effect of PET with PVDC and HIPS-Br mixed plastics will be discussed during the presentation.
Table 3: Yields of products and properties of liquid products from pyrolysisof PP, PE, PS, PVCand 3P mixed with PET at 430 °C.
Sample Yield of pyrolysis products, wt.%Liquid density (g/cm3)
Liquid [L] Gas [G]1 Residue [R]Carbon Wax
PE/PET 51 24 15 10 0.77PP/PET 46 22 14 18 0.75PS/PET 65 22 8 5 0.92
PVC/PET 0 60 34 6 -3P/PET 45 17 17 21 0.83
1[G]=100-{[L]+[R]+[W]}
Table 4: The distribution of chlorine content in various pyrolysis of products of3P/PVDC and 3P/PVDC mixed with PET plastics at 430 °C.
Sample Mode(2 g)
Cl conc.,ppm Cl amount, mg
Oil Gas (HCl) Oil Gas(HCl)
Residue [R]Carbon Wax
3P/PVDC Thermal 250 6300 1.5 504 61 -(9g/1g) CaH-C n.d. 6 0 0.5 36 -
3P/PVDC/PET Thermal 3100 7100 16 568 52 4(8g/1g /1g) CaH-C 590 8 3.4 0.7 17 8
4. Conclusions
The pyrolysis of PVDC, PP/PVDC, PE/PVDC and PS/PVDC was performed at 430 °C at the atmospheric pressure and compared the behavior of quantity of chlorine compounds from the PVC mixed PE, PP and PS plastics. The formation of chlorinated hydrocarbons in PVDC mixed plastics liquid products was lower than PVC mixed plastics liquid prod-ucts. The formation of gaseous chlorine products was higher with PVDC mixed plastics due to the lower decomposition temperature of PVDC than PVC. The presence of PET produced higher concentration of halogenated hydrocarbons in the liquid products and

Pyrolysis / Solvolysis 107
the dehalogenation effi ciency of catalysts/sorbents was affected. The suitable amount of catalyst/sorbent ratio and optimized conditions has produced the halogen free liquid prod-ucts.
References
[1] Aguado, J., Serrano, D., In: Clark, J.H., editor. RSC Clean Technology monographs, on Feedstock Recycling of Waste Plastic. Cambridge: Royal Society of Chemistry, 1999.
[2] Kaminsky, W., Angew. Makromol. Chem. 232:151-165(1995).[3] Shiraga, Y., Uddin, M.A., Muto, A., Narazaki, M., Sakata, Y., Murata, K., Energy &
Fuels. 13(2):428-432(1999).[4] Uddin, M.A., Sakata, Y., Shiraga, Y., Muto, A., Murata, K., Ind. Eng. Chem. Res.
38(4):1406-1410(1999).[5] Sakata, Y., Uddin, M.A., Muto, A., Narazaki, M., Koizumi, K., Murata, K., Kaji,
M., Ind. Eng. Chem. Res. 37:2889(1998).[6] Bhaskar, T., Uddin, M.A., Kaneko, K., Kusaba, K., Matsui, T., Muto, A., Sakata, Y.,
Murata, K., Energy & Fuels. 17:75-80 (2003).[7] Bhaskar, T., Matsui, T., Nitta, K., Uddin, M.A., Muto, A., Sakata, Y., Energy &
Fuels. 16:1533-1539(2002).[8] Bhaskar, T., Uddin, M.A., Murai, K., Kaneko, K., Hamano, K., Kusaba, K., Muto,
A., Sakata, Y., J. Anal. Appl. Pyrolysis. 70:579-587(2003).[9] Murata, K., Hirano, Y., Sakata, Y., Uddin, M.A., J. Anal. Appl. Pyrolysis. 65:71-
90(2002). [10] Sakata, Y., Uddin, M.A., Koizumi, K., Murata, K., Polym. Deg. Stab. 53:111-
117(1996).[11] Akama, T., Yoshioka, T., Suzuki, K., Uchida, M., Okuwaki A., Chem. Lett.
540(2001).[12] German, K., Kulesza, K., Polymery. 48(5):337-342(2003).[13] Knumann, R., Bockhorn, H., Combus. Sci. Tech. 101:285(1994).[14] McNeill, I.C., Memetea, L. Cole, W.J., Polym. Degrad. Stab. 49:181(1995).

ISFR - 2005108
Pyrolysis / Solvolysis 109
INFLUENCE OF POLY(BISPHENOL A CARBONATE) AND POLY(ETHYLENE TEREPHTHALATE) ON POLY(VINYL
CHLORIDE) DEHYDROCHLORINATION
K. German1, K. Kulesza2, M. Florack, J. Pielichowski11Department of Chemistry and Technology of Polymers,
Cracow University of Technology,Kraków, Poland2“Blachownia” Institute of Heavy Organic Synthesis, Kędzierzyn-Koźle, Poland,
Abstract: Recycling of PVC wastes is a serious problem due to high chlorine content in this polymer. Dehydrochlorination (DHC) of PVC-containing polymer wastes produces solid residue (half-carbonizate) which conversion to pyrolysis oil in petrochemical plant seems to be attractive way of recycling of PVC wastes. Unfortunately, some polymer ad-mixtures cause with HCl chloroorganic compounds formation in half-carbonizate. The article describes infl uence of polycarbonates on PVC wastes, recycled in a two- stage method. It was found that the presence of PC causes formation of small amounts of benzyl chloride and other chloroaryl or chloroalkylaryl compounds. Poly(ethylene terephtha-late) interact with HCl forming plenty of various chlorocompounds, not only chloroethyl esters of terephthalic and benzoic acids.
1. Introduction
The disposal of plastic wastes will be important part of chemical industry because of large quantities of produced plastics and their environmental impact. Chlorine-containing polymers cause problems during material or energetic recycling due to their decomposi-tion with HCl evolution. The most common used chlorine-containing polymer is PVC, which decomposition limits material recycling considerably due to worsening of proper-ties: -CH2-CHCl- mers eliminate HCl under temperature (or light) infl uence - PVC gets yellowish or even blackish and it lost plasticity. Such wastes can be used as raw material for pyrolysis or for gasifi cation. A choice between those two methods depends on reac-tivity of PVC in reaction with steam and on an amount of chlorine in half-carbonizate residue after HCl elimination from PVC.
Two main, almost not overlapping stages of mass loss are observed during thermal analy-sis of PVC [1, 2]. In one series of experiments 0,5 g sample of pure PVC was undergone dehydrochlorination (DHC) reaction at temperature up to 400 °C - DHC was broken, when the solid residue (half-carbonizate) was free of chlorine (with accuracy of conducto-metric analysis of eliminated HCl). DHC was followed by pyrolysis and it caused mainly formation of aromatic hydrocarbons - chloroogranic compounds were not found by GC-
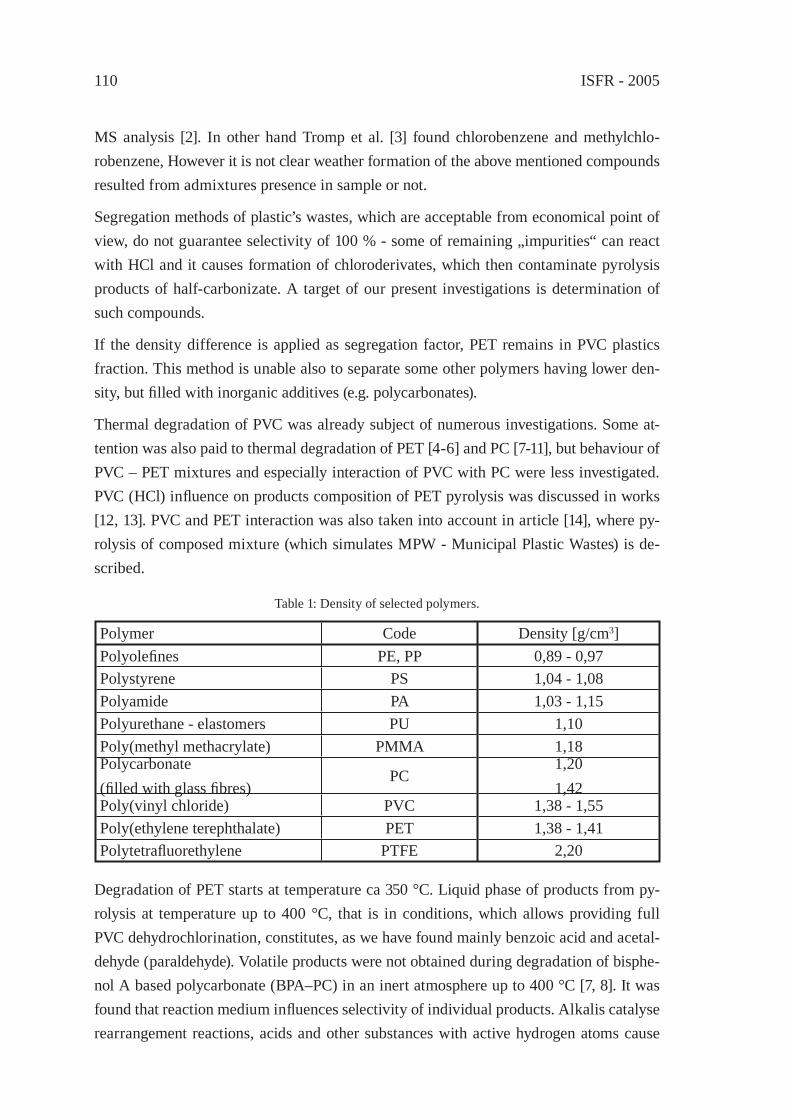
ISFR - 2005110
MS analysis [2]. In other hand Tromp et al. [3] found chlorobenzene and methylchlo-robenzene, However it is not clear weather formation of the above mentioned compounds resulted from admixtures presence in sample or not.
Segregation methods of plastic’s wastes, which are acceptable from economical point of view, do not guarantee selectivity of 100 % - some of remaining „impurities“ can react with HCl and it causes formation of chloroderivates, which then contaminate pyrolysis products of half-carbonizate. A target of our present investigations is determination of such compounds.
If the density difference is applied as segregation factor, PET remains in PVC plastics fraction. This method is unable also to separate some other polymers having lower den-sity, but fi lled with inorganic additives (e.g. polycarbonates).
Thermal degradation of PVC was already subject of numerous investigations. Some at-tention was also paid to thermal degradation of PET [4-6] and PC [7-11], but behaviour of PVC – PET mixtures and especially interaction of PVC with PC were less investigated. PVC (HCl) infl uence on products composition of PET pyrolysis was discussed in works [12, 13]. PVC and PET interaction was also taken into account in article [14], where py-rolysis of composed mixture (which simulates MPW - Municipal Plastic Wastes) is de-scribed.
Table 1: Density of selected polymers.
Polymer Code Density [g/cm3]Polyolefi nes PE, PP 0,89 - 0,97Polystyrene PS 1,04 - 1,08Polyamide PA 1,03 - 1,15Polyurethane - elastomers PU 1,10Poly(methyl methacrylate) PMMA 1,18Polycarbonate(fi lled with glass fi bres)
PC1,201,42
Poly(vinyl chloride) PVC 1,38 - 1,55Poly(ethylene terephthalate) PET 1,38 - 1,41Polytetrafl uorethylene PTFE 2,20
Degradation of PET starts at temperature ca 350 °C. Liquid phase of products from py-rolysis at temperature up to 400 °C, that is in conditions, which allows providing full PVC dehydrochlorination, constitutes, as we have found mainly benzoic acid and acetal-dehyde (paraldehyde). Volatile products were not obtained during degradation of bisphe-nol A based polycarbonate (BPA–PC) in an inert atmosphere up to 400 °C [7, 8]. It was found that reaction medium infl uences selectivity of individual products. Alkalis catalyse rearrangement reactions, acids and other substances with active hydrogen atoms cause
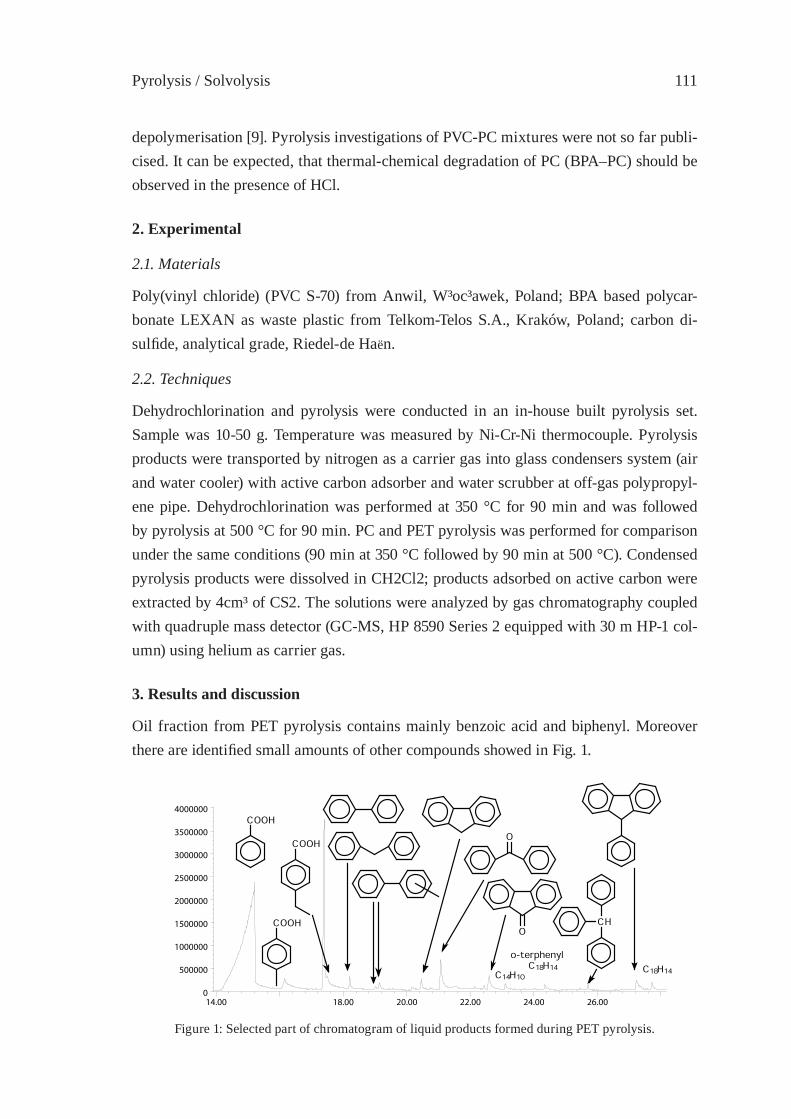
Pyrolysis / Solvolysis 111
depolymerisation [9]. Pyrolysis investigations of PVC-PC mixtures were not so far publi-cised. It can be expected, that thermal-chemical degradation of PC (BPA–PC) should be observed in the presence of HCl.
2. Experimental
2.1. Materials
Poly(vinyl chloride) (PVC S-70) from Anwil, W³oc³awek, Poland; BPA based polycar-bonate LEXAN as waste plastic from Telkom-Telos S.A., Kraków, Poland; carbon di-sulfi de, analytical grade, Riedel-de Haën.
2.2. Techniques
Dehydrochlorination and pyrolysis were conducted in an in-house built pyrolysis set. Sample was 10-50 g. Temperature was measured by Ni-Cr-Ni thermocouple. Pyrolysis products were transported by nitrogen as a carrier gas into glass condensers system (air and water cooler) with active carbon adsorber and water scrubber at off-gas polypropyl-ene pipe. Dehydrochlorination was performed at 350 °C for 90 min and was followed by pyrolysis at 500 °C for 90 min. PC and PET pyrolysis was performed for comparison under the same conditions (90 min at 350 °C followed by 90 min at 500 °C). Condensed pyrolysis products were dissolved in CH2Cl2; products adsorbed on active carbon were extracted by 4cm³ of CS2. The solutions were analyzed by gas chromatography coupled with quadruple mass detector (GC-MS, HP 8590 Series 2 equipped with 30 m HP-1 col-umn) using helium as carrier gas.
3. Results and discussion
Oil fraction from PET pyrolysis contains mainly benzoic acid and biphenyl. Moreover there are identifi ed small amounts of other compounds showed in Fig. 1.
14.00 18.00 20.00 22.00 24.00 26.000
500000
1000000
1500000
2000000
2500000
3000000
3500000
4000000COOH
COOH
COOHO
O
C14H10
o-terphenylC18H14
CH
C18H14
Figure 1: Selected part of chromatogram of liquid products formed during PET pyrolysis.
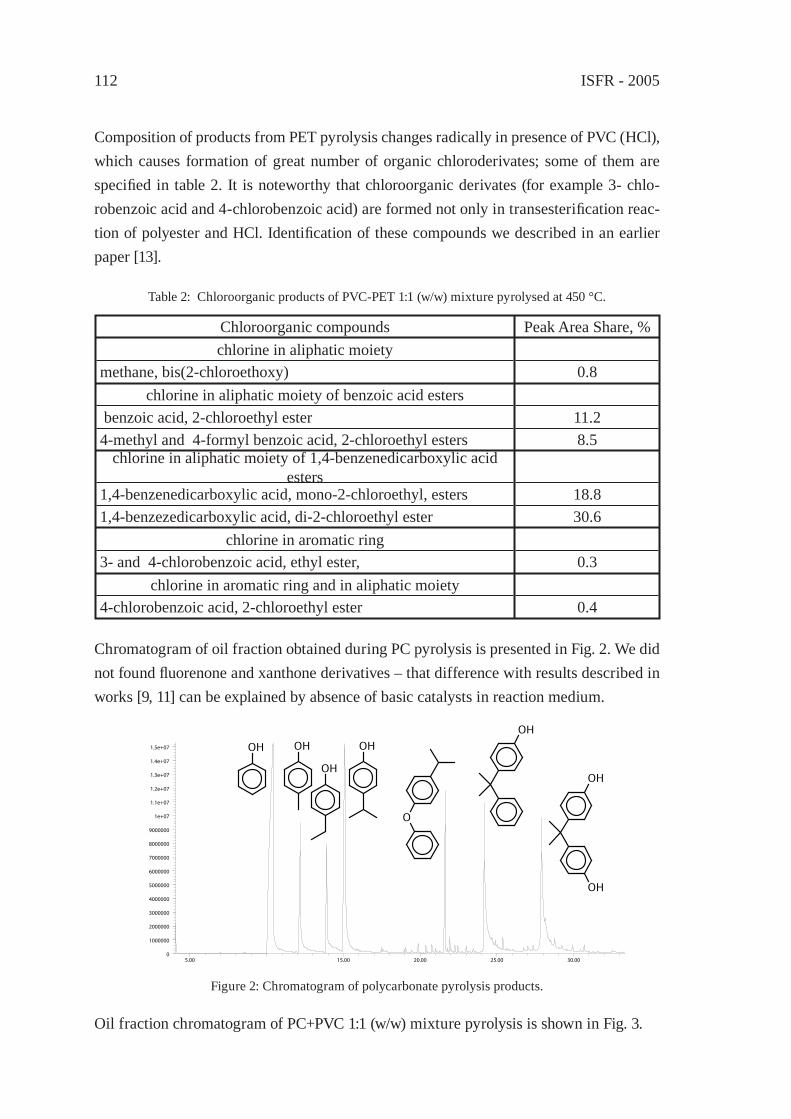
ISFR - 2005112
Composition of products from PET pyrolysis changes radically in presence of PVC (HCl), which causes formation of great number of organic chloroderivates; some of them are specifi ed in table 2. It is noteworthy that chloroorganic derivates (for example 3- chlo-robenzoic acid and 4-chlorobenzoic acid) are formed not only in transesterifi cation reac-tion of polyester and HCl. Identifi cation of these compounds we described in an earlier paper [13].
Table 2: Chloroorganic products of PVC-PET 1:1 (w/w) mixture pyrolysed at 450 °C.
Chloroorganic compounds Peak Area Share, %chlorine in aliphatic moiety
methane, bis(2-chloroethoxy) 0.8chlorine in aliphatic moiety of benzoic acid esters
benzoic acid, 2-chloroethyl ester 11.24-methyl and 4-formyl benzoic acid, 2-chloroethyl esters 8.5
chlorine in aliphatic moiety of 1,4-benzenedicarboxylic acid esters
1,4-benzenedicarboxylic acid, mono-2-chloroethyl, esters 18.81,4-benzezedicarboxylic acid, di-2-chloroethyl ester 30.6
chlorine in aromatic ring3- and 4-chlorobenzoic acid, ethyl ester, 0.3
chlorine in aromatic ring and in aliphatic moiety4-chlorobenzoic acid, 2-chloroethyl ester 0.4
Chromatogram of oil fraction obtained during PC pyrolysis is presented in Fig. 2. We did not found fl uorenone and xanthone derivatives – that difference with results described in works [9, 11] can be explained by absence of basic catalysts in reaction medium.
5.00 15.00 20.00 25.00 30.000
1000000
2000000
3000000
4000000
5000000
6000000
7000000
8000000
9000000
1e+07
1.1e+07
1.2e+07
1.3e+07
1.4e+07
1.5e+07 OH OH
OH
OH
O
OH
OH
OH
Figure 2: Chromatogram of polycarbonate pyrolysis products.
Oil fraction chromatogram of PC+PVC 1:1 (w/w) mixture pyrolysis is shown in Fig. 3.
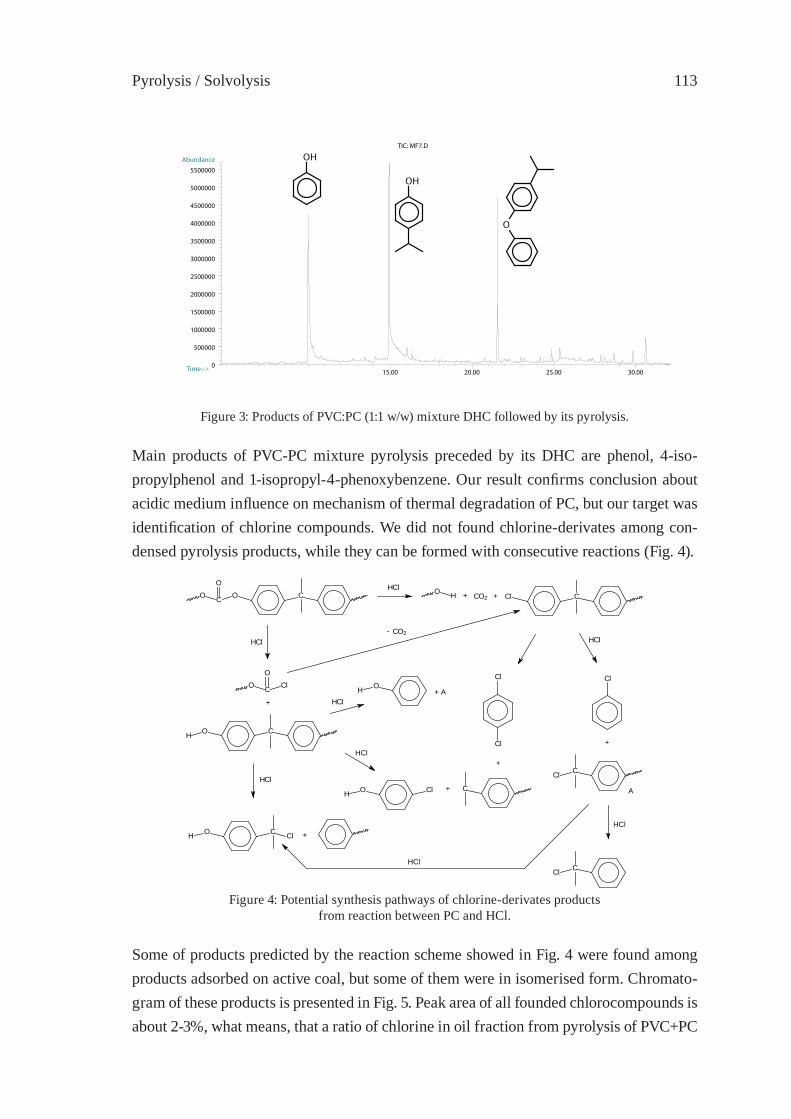
Pyrolysis / Solvolysis 113
15.00 20.00 25.00 30.000
500000
1000000
1500000
2000000
2500000
3000000
3500000
4000000
4500000
5000000
5500000
Time-->
Abundance
TIC: MF7.D
OH
OH
O
Figure 3: Products of PVC:PC (1:1 w/w) mixture DHC followed by its pyrolysis.
Main products of PVC-PC mixture pyrolysis preceded by its DHC are phenol, 4-iso-propylphenol and 1-isopropyl-4-phenoxybenzene. Our result confi rms conclusion about acidic medium infl uence on mechanism of thermal degradation of PC, but our target was identifi cation of chlorine compounds. We did not found chlorine-derivates among con-densed pyrolysis products, while they can be formed with consecutive reactions (Fig. 4).
OC
O
O C
HCl
HCl
O CH
C
O
O Cl
+
CClO H + CO2 +
HCl
O CH Cl +
HCl
OH Cl C+
- CO2HCl
Cl
Cl
+
Cl
+
CCl
HCl
HCl
CCl
HCl
OH
A
+ A
Figure 4: Potential synthesis pathways of chlorine-derivates productsfrom reaction between PC and HCl.
Some of products predicted by the reaction scheme showed in Fig. 4 were found among products adsorbed on active coal, but some of them were in isomerised form. Chromato-gram of these products is presented in Fig. 5. Peak area of all founded chlorocompounds is about 2-3%, what means, that a ratio of chlorine in oil fraction from pyrolysis of PVC+PC
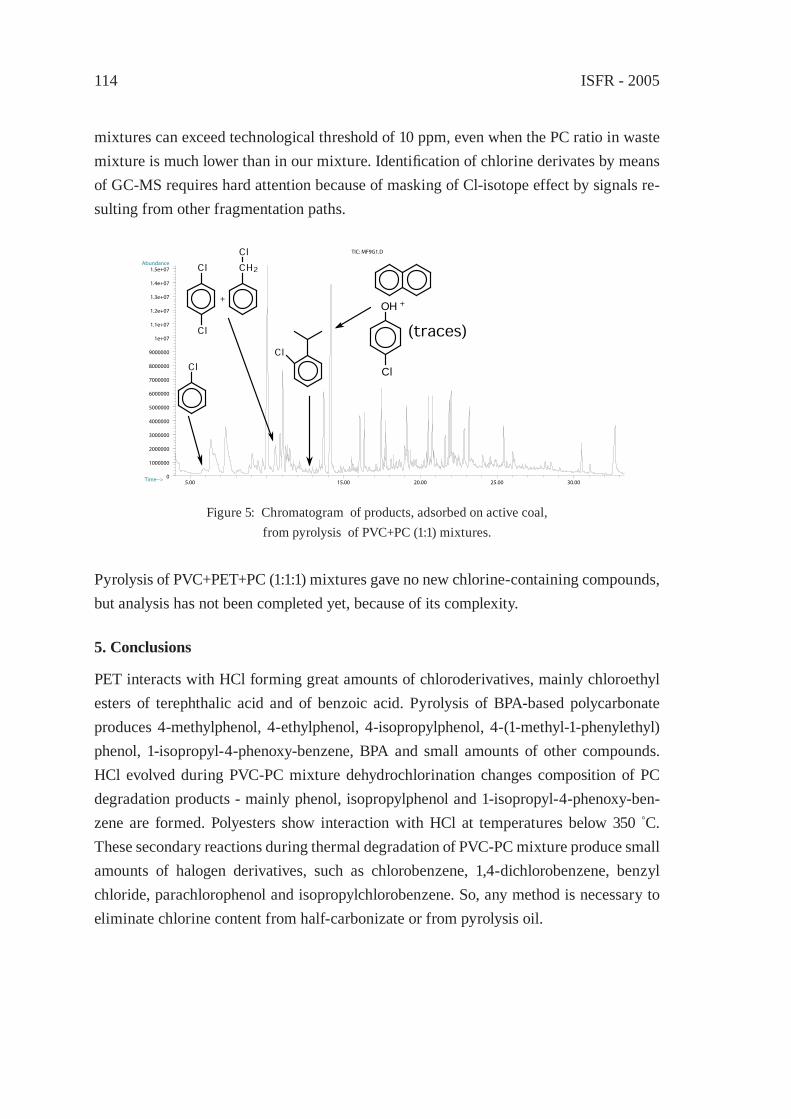
ISFR - 2005114
mixtures can exceed technological threshold of 10 ppm, even when the PC ratio in waste mixture is much lower than in our mixture. Identifi cation of chlorine derivates by means of GC-MS requires hard attention because of masking of Cl-isotope effect by signals re-sulting from other fragmentation paths.
5.00 15.00 20.00 25.00 30.000
1000000
2000000
3000000
4000000
5000000
6000000
7000000
8000000
9000000
1e+07
1.1e+07
1.2e+07
1.3e+07
1.4e+07
1.5e+07
Time-->
Abundance
TIC: MF9G1.D
Cl
Cl
Cl
+
CH2
Cl
Cl
+OH
Cl
(traces)
Figure 5: Chromatogram of products, adsorbed on active coal,from pyrolysis of PVC+PC (1:1) mixtures.
Pyrolysis of PVC+PET+PC (1:1:1) mixtures gave no new chlorine-containing compounds, but analysis has not been completed yet, because of its complexity.
5. Conclusions
PET interacts with HCl forming great amounts of chloroderivatives, mainly chloroethyl esters of terephthalic acid and of benzoic acid. Pyrolysis of BPA-based polycarbonate produces 4-methylphenol, 4-ethylphenol, 4-isopropylphenol, 4-(1-methyl-1-phenylethyl) phenol, 1-isopropyl-4-phenoxy-benzene, BPA and small amounts of other compounds. HCl evolved during PVC-PC mixture dehydrochlorination changes composition of PC degradation products - mainly phenol, isopropylphenol and 1-isopropyl-4-phenoxy-ben-zene are formed. Polyesters show interaction with HCl at temperatures below 350 °C. These secondary reactions during thermal degradation of PVC-PC mixture produce small amounts of halogen derivatives, such as chlorobenzene, 1,4-dichlorobenzene, benzyl chloride, parachlorophenol and isopropylchlorobenzene. So, any method is necessary to eliminate chlorine content from half-carbonizate or from pyrolysis oil.
Pyrolysis / Solvolysis 115
References
[1] Bockhorn, H., Hornung, A., Hornung, U., Teepe, S., Weichmann, J., Combust. Sci. Techn., 116-117:129-151 (1996).
[2] German, K, Pielichowski, J., Pielichowski, K., Nowa technologia recyklingu odpadów tworzyw sztucznych zawieraj¹cych chlor (New Recycling Technology of Chlorine-containing Plastics), Investigation Project Report PB/71/S2/94/06, 1997.
[3] Tromp, P. J .J., Oudhuis, A. B. J., Moulijn, J. A., Chlorine removal from Polyvinylchloride (PVC) by means of low-temperature pyrolysis, DGMK - Fachbereichstagung „Grundlagen und Prozesse der Pyrolyse und Verkokung”, 6-8 Sept., Essen, 1989.
[4] Masuda, T., Miwa, Y., Tamagawa, A., Mukai, S. R., Hashimoto, K., and Ikeda, Y., Polym. Degr. Stab. 58:315 (1997).
[5] Dzięcioł, M., Trzeszczyński, J., J. Appl. Polym. Sci. 77:1894 (2000).
[6] Yoshioka, T., Grause, G., Eger, C., Kaminsky, W., Okuwaki, A., Polym. Degr. Stab. 86:499 (2004).
[7] Paci, M., La Mantia, F. P., Polym. Degr. Stab. 63:11 (1999).
[8] Robertson, J.E., Thermal Degradation Studies of Polycarbonate, Blacksburg, VA, 2001.
[9] Jang, B. N., Wilkie, Ch. A., Polym. Degr. Stab. 86:419 (2004).
[10] Puglisi, C., Samperi, F., Carroccio, S., Montaudo, G., Macromolecules 32:8821 (1999).
[11] Oba, K., Ishida, Y., Ito, Y., Ohtani, H., Tsuge, S., Macromolecules 33:8173 (2000).
[12] Oba, K., Ohtani, H., Tsuge, S., Polym. Degr. Stab. 74:171 (2001).
[13] Kulesza, K., German, K., J. Anal. Appl. Pyrol., 67:123 (2003).
[14] Bhaskar, T., Uddin, Md.A., Murai, K., Kaneko, J., Hamano, K., Kusaba, T., Muto, A., Sakata, Y., J. Anal. Appl. Pyrol. 70:579 (2003).

ISFR - 2005116

Pyrolysis / Solvolysis 117
CATALYTIC RECYLING OF PVC WASTEM.A. Keane1* and P.M. Patterson2
1Chemical Engineering, School of Engineering and Physical Sciences, Heriot-Watt University, Edinburgh, Scotland
2Center for Applied Energy Research, University of Kentucky, Lexington, KY, USA
Abstract: A temperature programmed PVC dechlorination has been studied in a continu-ously stirred batch reactor where the variables considered include fi nal reaction tem-perature (350 °C and 440 °C), carrier gas (Ar vs. H2) and the inclusion of a catalyst (Pd/Al2O3). A thermogravimetric-mass spectrometric pre-screening established signifi cant mass loss (ca. 60%) between 250-350 °C mainly resulting from the elimination of HCl with a secondary loss at higher temperatures (> 400°C) due to the production of volatile hydrocarbons. An increase in reaction temperature favoured liquid and gas generation with a reduction in the amount of residual solid remaining in the reactor. The inclusion of catalyst lowered the Cl content in the liquid fraction by over two orders of magnitude with a preferential gas phase alkane production.
1. Introduction
Waste plastic is an enormous potential resource which, with the correct treatment, can serve as hydrocarbon raw material or as a fuel. Indeed, thermal degradation of waste plas-tic into liquid hydrocarbons is now emerging as a viable chemical means of polymer recy-cle [1]. While thermal degradation requires high temperatures and yields a broad product range, catalytic degradation represents a more progressive approach, providing control over product composition with a signifi cantly lower operating temperature. Suffi cient progress has now been made in the catalytic processing of polyethylene/polypropylene over solid acids, notably silica-alumina and zeolite, to enable some optimization of liquid, solid or gaseous hydrocarbon product fractions through the judicious choice of operating conditions [2]. Where the polymeric waste contains a halogenated component, eg. PVC, thermal degradation generates an array of halogenated organics in the oil. Tightening legislation has necessitated the removal of any Cl from PVC-derived oil; a conversion of waste PVC into fuel oil requires a dechlorination step. Pyrolysis of PVC results in a ran-dom scissioning of the polymer chains generating products with widely varying molecu-lar weights and uncontrolled Cl content [3]. While a move to a catalytic transformation should impose some control over the ultimate product(s), there is a dearth of information concerning catalytic degradation of Cl containing polymers. Sakata et al. [4] have shown that a degradation of polyethylene/PVC and polypropylene/PVC over Fe catalysts is ef-fective in removing the Cl content as HCl. The full extent of the catalytic impact in terms of product distribution is still open to question but it is clear that catalytic dechlorination

ISFR - 2005118
is a feasible route to a Cl free hydrocarbon product. Recent work in these laboratories has served to demonstrate that hydrodechlorination over supported Pd and Ni represents a vi-able means of controlled Cl removal (solely as HCl) from polychlorinated model reactants [5, 6] and has informed our choice of catalyst to promote PVC conversion.
1.1 Thermogravimetric Screening
Thermogravimetric analysis was undertaken to establish the temperature dependence of PVC degradation. The temperature programmed treatment was conducted using a Seiko Instruments Inc. TG/DTA 320 Simultaneous thermogravimetric/differential thermal ana-lyzer coupled to a Micromass PC residual gas analyzer. A known quantity of PVC was placed in a Pt sample pan and heated at 10 °C/min to 450 °C in 150 cm3/min He, where the effl uent gas was monitored over the mass range 10 – 100; the resultant TGA/MS results are shown in Fig. 1. The PVC underwent a rapid signifi cant loss in mass commencing at ca. 280 °C (Fig. 1(a)) that corresponded to the evolution of HCl (Fig. 1(b), some low mo-lecular weight hydrocarbons are also released during this stage but are not shown in the fi gure) and which accounted for a ca. 60 % loss of the initial mass. This is followed by a plateau region, where no mass loss was observed (over the T range 360 – 420°C) and an ensuing loss at higher temperature. This secondary mass loss (ca. 20%) was not accompa-nied by any HCl production and can be attributed to the release of more complex volatile hydrocarbon (HC) species, including aromatics; there was no detectable Cl2 in the effl u-ent stream. This thermogravimetric response is in good agreement with profi les reported in the literature [7, 8]. Based on this initial screening, two critical temperatures can be identifi ed as a basis to assess the effi cacy of catalytic PVC processing, i.e. post-thermally induced HCl release/pre-HC release (350 °C) and post-HC release (440 °C).

Pyrolysis / Solvolysis 119
1.2 The Catalyst
A commercial (Aldrich Chemical Co.) Pd/Al2O3 was employed in this study: the critical physico-chemical characteristics are given in Table 1. Alumina supported Pd has been demonstrated elsewhere [9, 10] to deliver high chloroarene hydrodehalogenation effi cien-cies under ambient reaction conditions. The Pd loading was determined by inductively coupled plasma-optical emission spectrometry (ICP-OES, Vista-PRO, Varian Inc.) from the diluted extract of aqua regia. BET surface area/H2 chemisorption measurements were conducted using the commercial CHEM-BET 3000 (Quantachrome Instrument): H2 up-take/BET values were reproducible to within ±5%. The Pd particle diameters, based on HRTEM (JEOL 2000 TEM microscope) analysis, spanned the range <2-15nm to give an average particle size of 2.3nm, that is based on a measurement of 650 individual particles. The room temperature H2 adsorption (recorded in Table 1) was measured at a H2 partial pressure of 0.004 atm. There was no detectable H2 uptake on the alumina carrier alone and the tabulated H2 uptake represents a surface dissociatively chemisorbed species as-sociated with the supported Pd phase. Moreover, it is well established that Pd can absorb H2 to form a Pd hydride at ambient temperature where H2 partial pressure exceeds 0.0224
Figure 1: (a) Mass loss (solid line) and DTG (dotted line) profi les as a function of time where PVC is heated at 10 °C/min to 450 °C in 150 cm³/min He and (b) the mass spectrometric signal obtained for HCl
(solid line). The temperature profi le (dashed line) is also shown in (b).
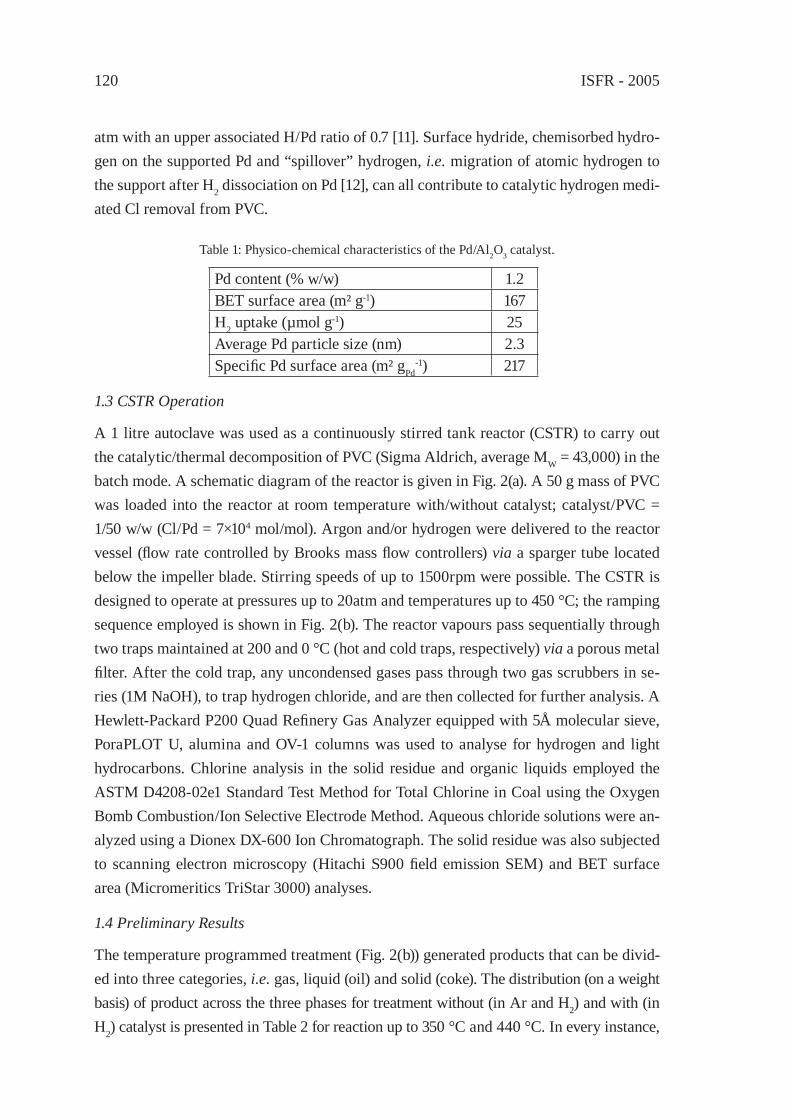
ISFR - 2005120
atm with an upper associated H/Pd ratio of 0.7 [11]. Surface hydride, chemisorbed hydro-gen on the supported Pd and “spillover” hydrogen, i.e. migration of atomic hydrogen to the support after H2 dissociation on Pd [12], can all contribute to catalytic hydrogen medi-ated Cl removal from PVC.
Table 1: Physico-chemical characteristics of the Pd/Al2O3 catalyst.
Pd content (% w/w) 1.2BET surface area (m² g-1) 167H2 uptake (µmol g-1) 25Average Pd particle size (nm) 2.3Specifi c Pd surface area (m² gPd
-1) 217
1.3 CSTR Operation
A 1 litre autoclave was used as a continuously stirred tank reactor (CSTR) to carry out the catalytic/thermal decomposition of PVC (Sigma Aldrich, average MW = 43,000) in the batch mode. A schematic diagram of the reactor is given in Fig. 2(a). A 50 g mass of PVC was loaded into the reactor at room temperature with/without catalyst; catalyst/PVC = 1/50 w/w (Cl/Pd = 7×10⁴ mol/mol). Argon and/or hydrogen were delivered to the reactor vessel (fl ow rate controlled by Brooks mass fl ow controllers) via a sparger tube located below the impeller blade. Stirring speeds of up to 1500rpm were possible. The CSTR is designed to operate at pressures up to 20atm and temperatures up to 450 °C; the ramping sequence employed is shown in Fig. 2(b). The reactor vapours pass sequentially through two traps maintained at 200 and 0 °C (hot and cold traps, respectively) via a porous metal fi lter. After the cold trap, any uncondensed gases pass through two gas scrubbers in se-ries (1M NaOH), to trap hydrogen chloride, and are then collected for further analysis. A Hewlett-Packard P200 Quad Refi nery Gas Analyzer equipped with 5Å molecular sieve, PoraPLOT U, alumina and OV-1 columns was used to analyse for hydrogen and light hydrocarbons. Chlorine analysis in the solid residue and organic liquids employed the ASTM D4208-02e1 Standard Test Method for Total Chlorine in Coal using the Oxygen Bomb Combustion/Ion Selective Electrode Method. Aqueous chloride solutions were an-alyzed using a Dionex DX-600 Ion Chromatograph. The solid residue was also subjected to scanning electron microscopy (Hitachi S900 fi eld emission SEM) and BET surface area (Micromeritics TriStar 3000) analyses.
1.4 Preliminary Results
The temperature programmed treatment (Fig. 2(b)) generated products that can be divid-ed into three categories, i.e. gas, liquid (oil) and solid (coke). The distribution (on a weight basis) of product across the three phases for treatment without (in Ar and H2) and with (in H2) catalyst is presented in Table 2 for reaction up to 350 °C and 440 °C. In every instance,
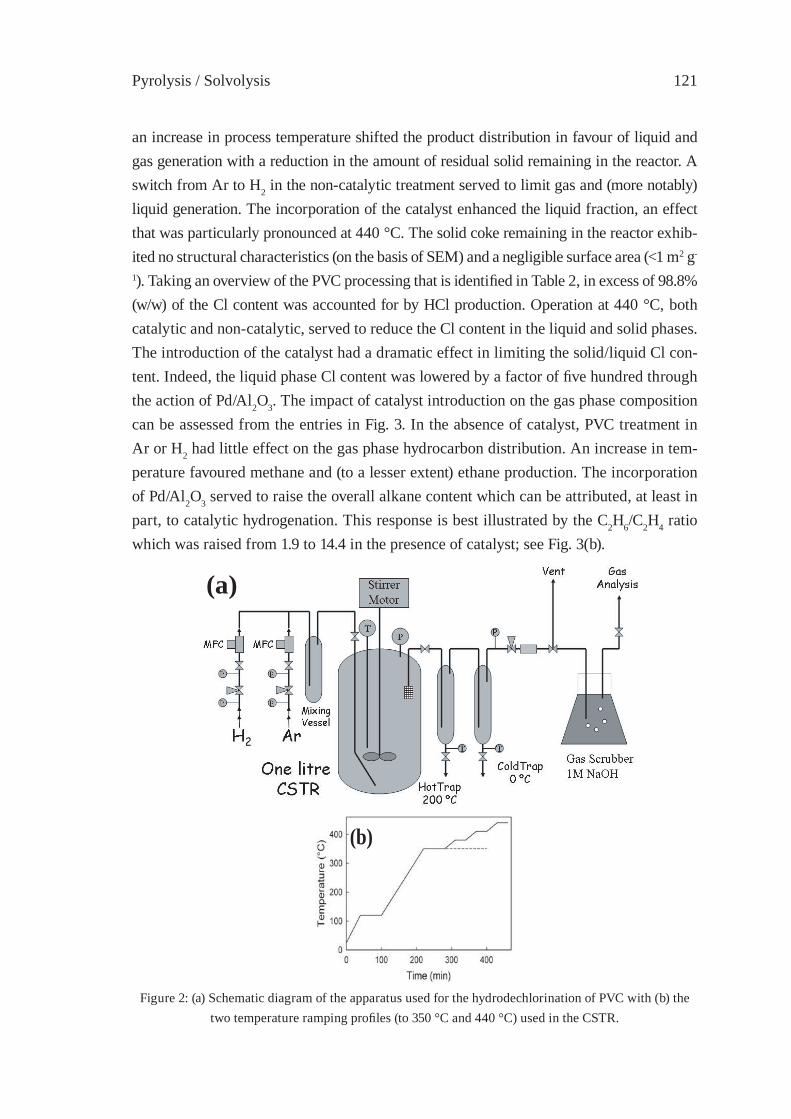
Pyrolysis / Solvolysis 121
an increase in process temperature shifted the product distribution in favour of liquid and gas generation with a reduction in the amount of residual solid remaining in the reactor. A switch from Ar to H2 in the non-catalytic treatment served to limit gas and (more notably) liquid generation. The incorporation of the catalyst enhanced the liquid fraction, an effect that was particularly pronounced at 440 °C. The solid coke remaining in the reactor exhib-ited no structural characteristics (on the basis of SEM) and a negligible surface area (<1 m2 g-
1). Taking an overview of the PVC processing that is identifi ed in Table 2, in excess of 98.8% (w/w) of the Cl content was accounted for by HCl production. Operation at 440 °C, both catalytic and non-catalytic, served to reduce the Cl content in the liquid and solid phases. The introduction of the catalyst had a dramatic effect in limiting the solid/liquid Cl con-tent. Indeed, the liquid phase Cl content was lowered by a factor of fi ve hundred through the action of Pd/Al2O3. The impact of catalyst introduction on the gas phase composition can be assessed from the entries in Fig. 3. In the absence of catalyst, PVC treatment in Ar or H2 had little effect on the gas phase hydrocarbon distribution. An increase in tem-perature favoured methane and (to a lesser extent) ethane production. The incorporation of Pd/Al2O3 served to raise the overall alkane content which can be attributed, at least in part, to catalytic hydrogenation. This response is best illustrated by the C2H6/C2H4 ratio which was raised from 1.9 to 14.4 in the presence of catalyst; see Fig. 3(b).
Figure 2: (a) Schematic diagram of the apparatus used for the hydrodechlorination of PVC with (b) the two temperature ramping profi les (to 350 °C and 440 °C) used in the CSTR.
(a)
(b)
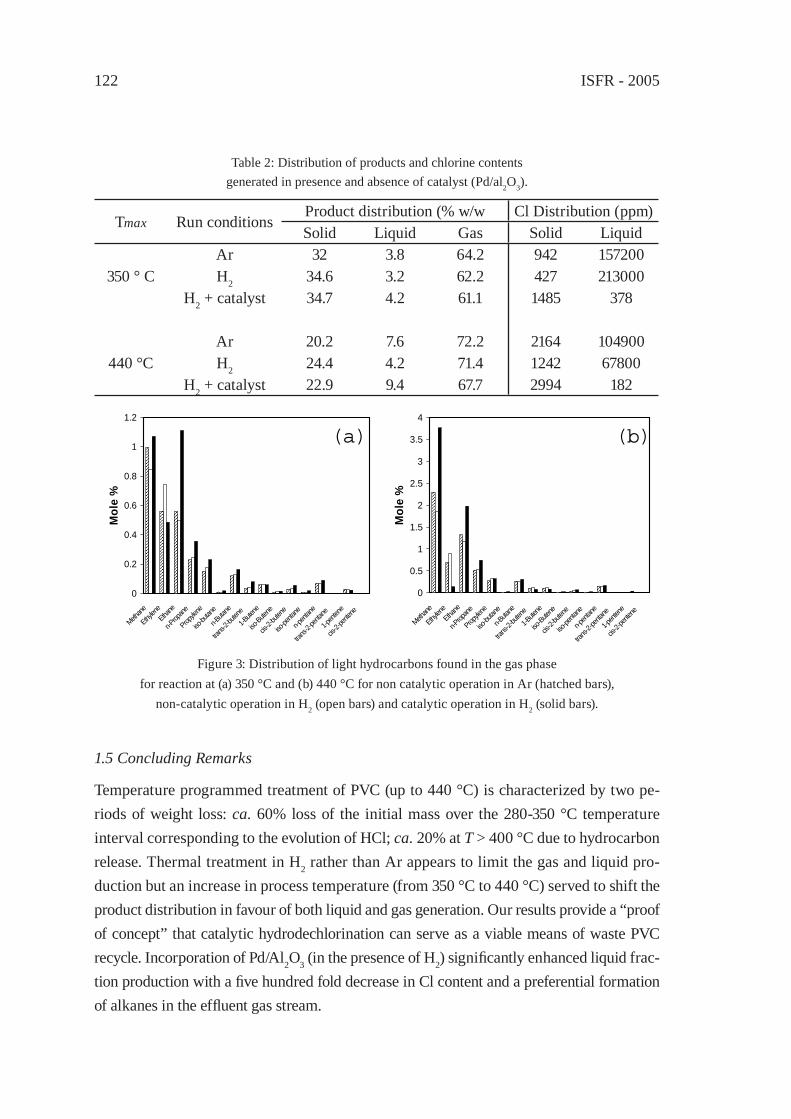
ISFR - 2005122
1.5 Concluding Remarks
Temperature programmed treatment of PVC (up to 440 °C) is characterized by two pe-riods of weight loss: ca. 60% loss of the initial mass over the 280-350 °C temperature interval corresponding to the evolution of HCl; ca. 20% at T > 400 °C due to hydrocarbon release. Thermal treatment in H2 rather than Ar appears to limit the gas and liquid pro-duction but an increase in process temperature (from 350 °C to 440 °C) served to shift the product distribution in favour of both liquid and gas generation. Our results provide a “proof of concept” that catalytic hydrodechlorination can serve as a viable means of waste PVC recycle. Incorporation of Pd/Al2O3 (in the presence of H2) signifi cantly enhanced liquid frac-tion production with a fi ve hundred fold decrease in Cl content and a preferential formation of alkanes in the effl uent gas stream.
Table 2: Distribution of products and chlorine contentsgenerated in presence and absence of catalyst (Pd/al2O3).
Tmax Run conditionsProduct distribution (% w/w Cl Distribution (ppm)Solid Liquid Gas Solid Liquid
350 ° CAr 32 3.8 64.2 942 157200H2 34.6 3.2 62.2 427 213000
H2 + catalyst 34.7 4.2 61.1 1485 378
440 °CAr 20.2 7.6 72.2 2164 104900H2 24.4 4.2 71.4 1242 67800
H2 + catalyst 22.9 9.4 67.7 2994 182
0
0.2
0.4
0.6
0.8
1
1.2
Methane
Ethylen
eEtha
ne
n-Prop
ane
Propyle
ne
iso-bu
tane
n-Buta
ne
trans-
2-bute
ne
1-Bute
ne
iso-Bute
ne
cis-2-
buten
e
iso-pe
ntane
n-pen
tane
trans-
2-pen
tane
1-pen
tene
cis-2-
pente
ne
Mol
e %
0
0.5
1
1.5
2
2.5
3
3.5
4
Methane
Ethylen
eEtha
ne
n-Prop
ane
Propyle
ne
iso-bu
tane
n-Buta
ne
trans-
2-bute
ne
1-Bute
ne
iso-Bute
ne
cis-2-
buten
e
iso-pe
ntane
n-pen
tane
trans-
2-pen
tane
1-pen
tene
cis-2-
pente
ne
Mol
e %
(a) (b)
Figure 3: Distribution of light hydrocarbons found in the gas phasefor reaction at (a) 350 °C and (b) 440 °C for non catalytic operation in Ar (hatched bars),
non-catalytic operation in H2 (open bars) and catalytic operation in H2 (solid bars).
Pyrolysis / Solvolysis 123
2. Acknowledgements
The authors are grateful to Dr. J. Neathery and M. Milling for their contribution to this work, which was supported in part by the National Science Foundation through Grant CTS-0328955.
References
[1] McCaffrey, W.C., Cooper, D.G., and Kamal, M.R., Polym. Degrad. Stabil. 62: 513 (1998).
[2] Uemichi, Y., Makino, Y., and Kanazuka, T., J. Anal. App. Pyrol. 16: 229 (1989).[3] Karagoz, S., Karayildirim, T., Uncar, S., Yuksel, M., and Yanik, J., Fuel 82: 415
(2003).[4] Lingaiah, N., Uddin, M.A., Morikawa, K., Muto, A., Murata, K., and Sakata, Y.,
Green Chem. 3: 74 (2001).[5] Murthy, K.V., Patterson, P.M., Jacobs, G., Davis, B.H., and Keane, M.A., J. Catal.
223: 74 (2004).[6] Keane, M.A., Appl. Catal. A: General 271: 109 (2004).[7] Ma, S., Lu, J., and Gao, J., Energy & Fuels 16: 338 (2002).[8] Qiao, W.M., Yoon, S.H., Korai, Y., Mochida, I., Inoue, S., Sakurai, T., and
Shimohara, T., Carbon 42: 1321 (2004).[9] Yuan, G., and Keane, M.A., J. Catal. 225: 510 (2004).[10] Yuan, G., and Keane, M.A., Appl. Catal. B: Environmental 48: 275 (2004).[11] Krishnankutty, N., Li, J., Vannice, M.A., Appl. Catal. A: General 173: 137 (1998).[12] Conner Jr, C.W., and Falconer, J.L., Chem. Rev. 95: 759 (1995).

ISFR - 2005124
Pyrolysis / Solvolysis 125
DEGRADATION OF PVC WITHOUT ANOMALOUS STRUCTURESKiyoshi Endo*, Tsuyoshi Nomaguchi, and Nobuyoshi Emori
Department of Applied Chemistry, Graduate School of Engineering, Osaka-City University,
Sugimoto, Sumiyoshi-ku, Osaka, 558-8585 [email protected]
Abstract: Degradation of LPVC (A linearly chained PVC) obtained with half-titanocene catalysts and APVC (Not a linearly PVC) has been investigated. From analysis of LPVC, it was proved that the polymer has no defect structures. The initial decomposition temperature of the LPVC obtained from half-titanocene catalyzed polymerization was higher than that of APVC obtained from radical polymerization. The decomposition of LPVC prepared with half-titanocene catalysis gave product mixtures in which the ratio of HCl/aromatic compounds were higher than that obtained from APVC.
1. Introduction
Poly(vinyl chloride) (PVC) is one of the most utilizing resins in the world and a large amount of PVC is produced year by year for a variety of purposes such as pipes and building materials [1]. PVC resins have good physical properties, for example durability, acid resistance, and f lame retardance. On the other hand, PVC included in the waste plastics becomes the chlorine supply source, and this is one of the reasons for the generation of hazardous organic chloride compounds in the incinerator [2]. It is difficult to say that the combustion is favorable method for the treatment of the waste plastics especially for PVC. It is, thus, necessary to develop a safer method for the treatment of waste plastics.[3] If the complete dechlorination of PVC can be achieved as pre-treatment for combustion, the gen-eration of hazardous organic chloride compounds in the incinerator can be pre-vented. It has become feasible to treat PVC as well as other plastics safely.
Commercialized PVC is produced mainly by radical suspension polymerization. When radical polymerization is used for the production of PVC, many anomalous struc-tures should be incorporated in the main chains as shown in Fig. 1.
These anomalous structures provide thermal instability to this PVC (abbreviated as APVC) [4,5]. A linearly chained PVC (abbreviated as LPVC) without anomalous units can change the PVC’s feedstock recycling process. Thus, the thermal decomposition of PVC which produces aromatic compound and halogenated substances will also change, leading to new idea of recycling of PVC. For this purpose, we synthesized LPVC without anomalous structure by using Cp*Ti(OR)3/MAO (R:CH3,C6H5) catalysts, and the degra-dation of synthesized LPVC and APVC has been investigated.
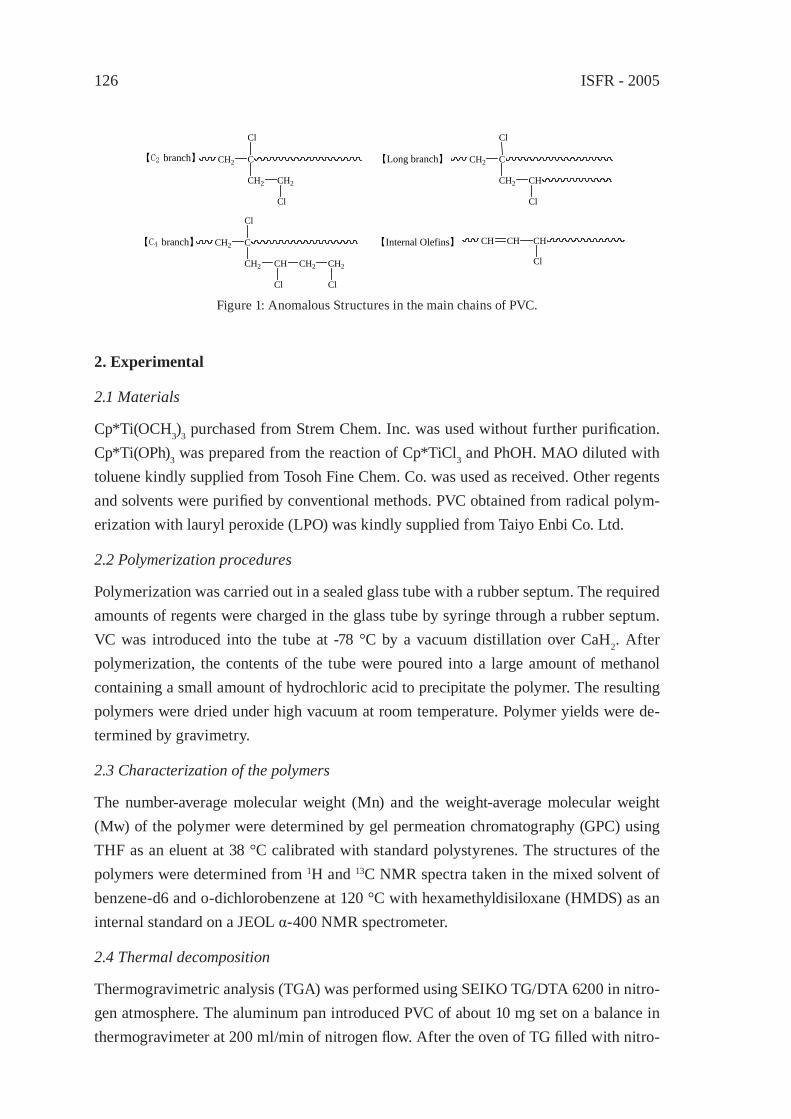
ISFR - 2005126
2. Experimental
2.1 Materials
Cp*Ti(OCH3)3 purchased from Strem Chem. Inc. was used without further purifi cation. Cp*Ti(OPh)3 was prepared from the reaction of Cp*TiCl3 and PhOH. MAO diluted with toluene kindly supplied from Tosoh Fine Chem. Co. was used as received. Other regents and solvents were purifi ed by conventional methods. PVC obtained from radical polym-erization with lauryl peroxide (LPO) was kindly supplied from Taiyo Enbi Co. Ltd.
2.2 Polymerization procedures
Polymerization was carried out in a sealed glass tube with a rubber septum. The required amounts of regents were charged in the glass tube by syringe through a rubber septum. VC was introduced into the tube at -78 °C by a vacuum distillation over CaH2. After polymerization, the contents of the tube were poured into a large amount of methanol containing a small amount of hydrochloric acid to precipitate the polymer. The resulting polymers were dried under high vacuum at room temperature. Polymer yields were de-termined by gravimetry.
2.3 Characterization of the polymers
The number-average molecular weight (Mn) and the weight-average molecular weight (Mw) of the polymer were determined by gel permeation chromatography (GPC) using THF as an eluent at 38 °C calibrated with standard polystyrenes. The structures of the polymers were determined from 1H and 13C NMR spectra taken in the mixed solvent of benzene-d6 and o-dichlorobenzene at 120 °C with hexamethyldisiloxane (HMDS) as an internal standard on a JEOL α-400 NMR spectrometer.
2.4 Thermal decomposition
Thermogravimetric analysis (TGA) was performed using SEIKO TG/DTA 6200 in nitro-gen atmosphere. The aluminum pan introduced PVC of about 10 mg set on a balance in thermogravimeter at 200 ml/min of nitrogen fl ow. After the oven of TG fi lled with nitro-
CH2 C
Cl
CH2 CH2
Cl
CH2 C
Cl
CH2 CH
Cl
CH2 C
Cl
CH2 CH
Cl
CH2 CH2
Cl
CH CH CH
Cl
【C2 branch】 【Long branch】
【C4 branch】 【Internal Olefins】
Figure 1: Anomalous Structures in the main chains of PVC.
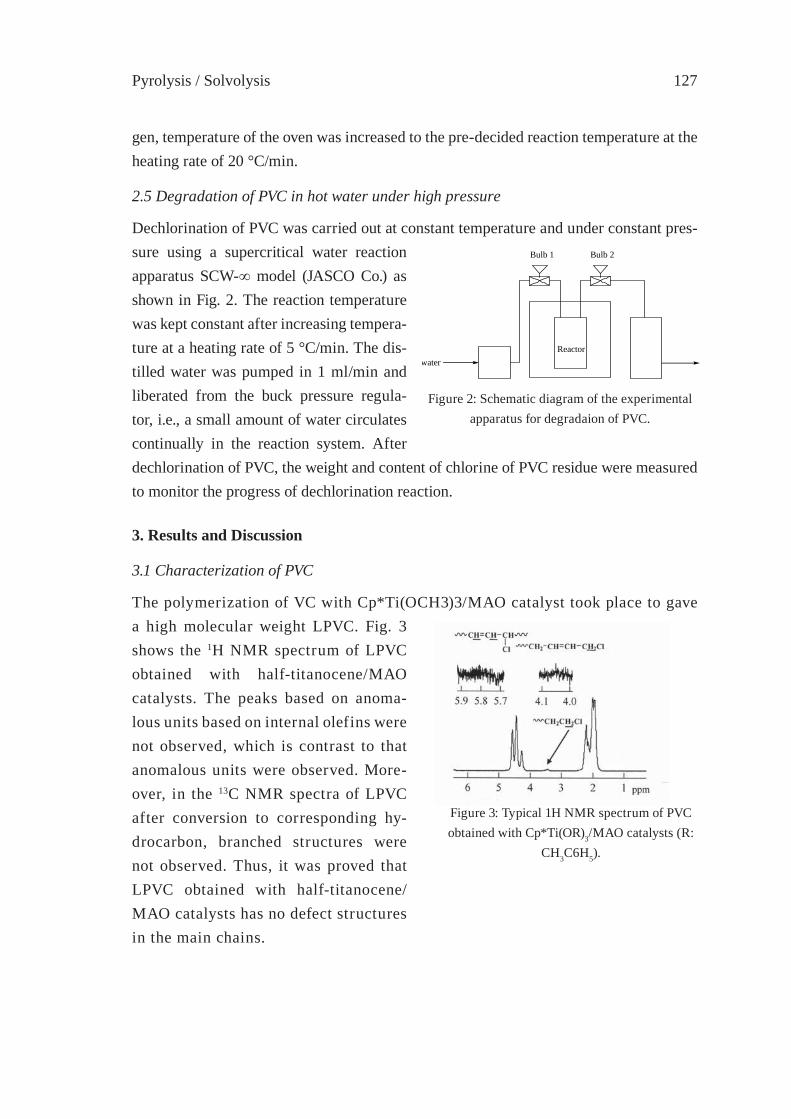
Pyrolysis / Solvolysis 127
gen, temperature of the oven was increased to the pre-decided reaction temperature at the heating rate of 20 °C/min.
2.5 Degradation of PVC in hot water under high pressure
Dechlorination of PVC was carried out at constant temperature and under constant pres-sure using a supercritical water reaction apparatus SCW-∞ model (JASCO Co.) as shown in Fig. 2. The reaction temperature was kept constant after increasing tempera-ture at a heating rate of 5 °C/min. The dis-tilled water was pumped in 1 ml/min and liberated from the buck pressure regula-tor, i.e., a small amount of water circulates continually in the reaction system. After dechlorination of PVC, the weight and content of chlorine of PVC residue were measured to monitor the progress of dechlorination reaction.
3. Results and Discussion
3.1 Characterization of PVC
The polymerization of VC with Cp*Ti(OCH3)3/MAO catalyst took place to gave a high molecular weight LPVC. Fig. 3 shows the 1H NMR spectrum of LPVC obtained with half-titanocene/MAO catalysts. The peaks based on anoma-lous units based on internal olefins were not observed, which is contrast to that anomalous units were observed. More-over, in the 13C NMR spectra of LPVC after conversion to corresponding hy-drocarbon, branched structures were not observed. Thus, it was proved that LPVC obtained with half-titanocene/MAO catalysts has no defect structures in the main chains.
water
Bulb 1 Bulb 2
Reactor
Figure 2: Schematic diagram of the experimental apparatus for degradaion of PVC.
Figure 3: Typical 1H NMR spectrum of PVC obtained with Cp*Ti(OR)3/MAO catalysts (R:
CH3C6H5).
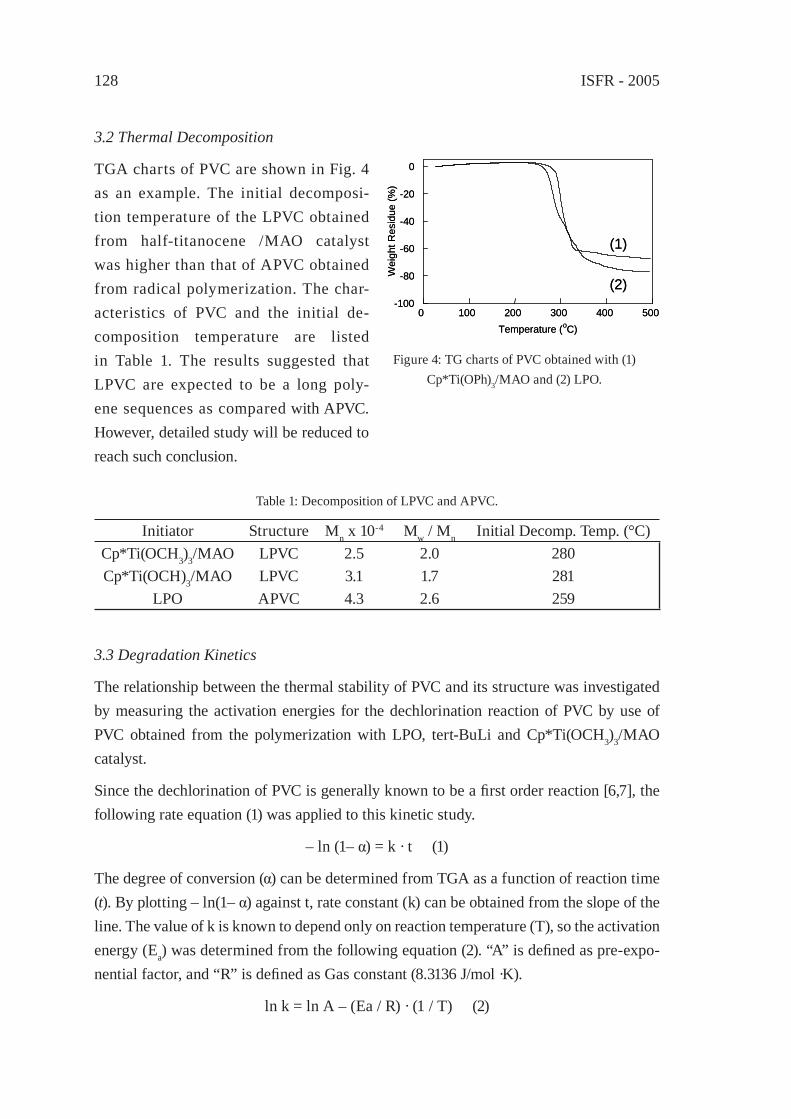
ISFR - 2005128
3.2 Thermal Decomposition
TGA charts of PVC are shown in Fig. 4 as an example. The initial decomposi-tion temperature of the LPVC obtained from half-titanocene /MAO catalyst was higher than that of APVC obtained from radical polymerization. The char-acteristics of PVC and the initial de-composition temperature are listed in Table 1. The results suggested that LPVC are expected to be a long poly-ene sequences as compared with APVC. However, detailed study will be reduced to reach such conclusion.
Table 1: Decomposition of LPVC and APVC.
Initiator Structure Mn x 10-4 Mw / Mn Initial Decomp. Temp. (°C)Cp*Ti(OCH3)3/MAO LPVC 2.5 2.0 280Cp*Ti(OCH)3/MAO LPVC 3.1 1.7 281
LPO APVC 4.3 2.6 259
3.3 Degradation Kinetics
The relationship between the thermal stability of PVC and its structure was investigated by measuring the activation energies for the dechlorination reaction of PVC by use of PVC obtained from the polymerization with LPO, tert-BuLi and Cp*Ti(OCH3)3/MAO catalyst.
Since the dechlorination of PVC is generally known to be a fi rst order reaction [6,7], the following rate equation (1) was applied to this kinetic study.
– ln (1– α) = k · t (1)
The degree of conversion (α) can be determined from TGA as a function of reaction time (t). By plotting – ln(1– α) against t, rate constant (k) can be obtained from the slope of the line. The value of k is known to depend only on reaction temperature (T), so the activation energy (Ea) was determined from the following equation (2). “A” is defi ned as pre-expo-nential factor, and “R” is defi ned as Gas constant (8.3136 J/mol ·K).
ln k = ln A – (Ea / R) · (1 / T) (2)
0 100 200 300 400 500-100
-80
-60
-40
-20
0
Temperature (oC)
Wei
ght R
esid
ue (%
)
(1)
(2)
0 100 200 300 400 500-100
-80
-60
-40
-20
0
Temperature (oC)
Wei
ght R
esid
ue (%
)
(1)
(2)
Figure 4: TG charts of PVC obtained with (1) Cp*Ti(OPh)3/MAO and (2) LPO.
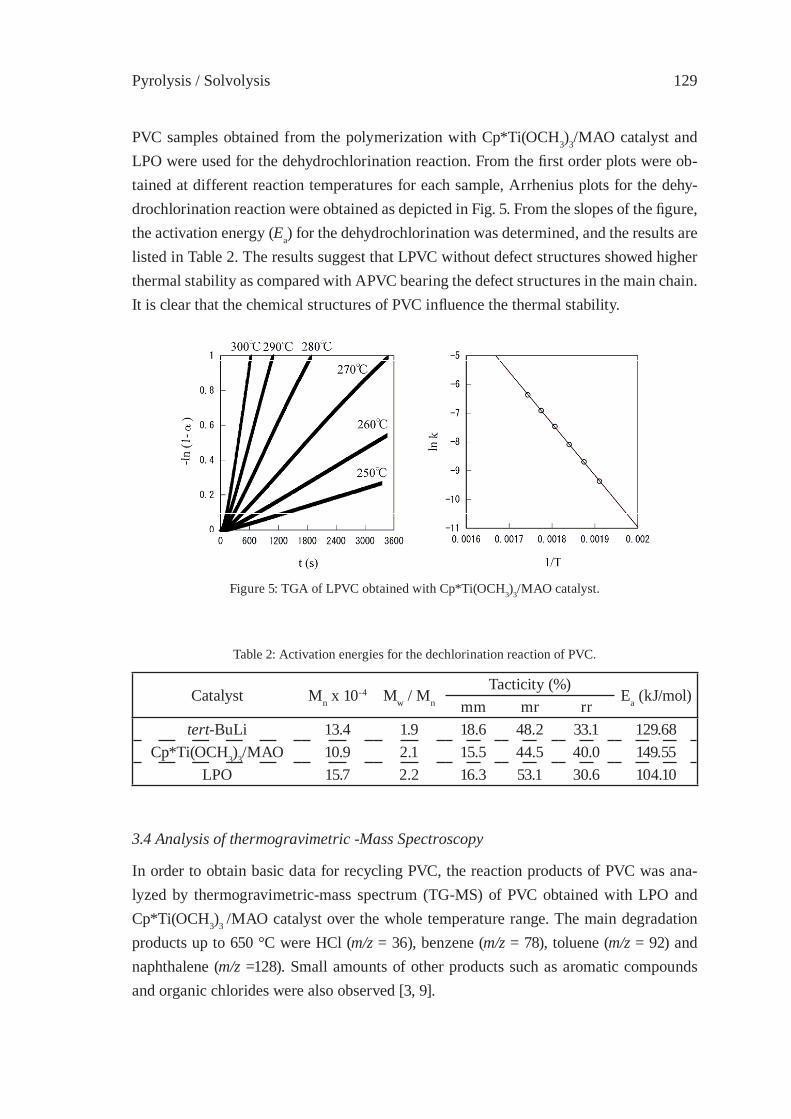
Pyrolysis / Solvolysis 129
PVC samples obtained from the polymerization with Cp*Ti(OCH3)3/MAO catalyst and LPO were used for the dehydrochlorination reaction. From the fi rst order plots were ob-tained at different reaction temperatures for each sample, Arrhenius plots for the dehy-drochlorination reaction were obtained as depicted in Fig. 5. From the slopes of the fi gure, the activation energy (Ea) for the dehydrochlorination was determined, and the results are listed in Table 2. The results suggest that LPVC without defect structures showed higher thermal stability as compared with APVC bearing the defect structures in the main chain. It is clear that the chemical structures of PVC infl uence the thermal stability.
Figure 5: TGA of LPVC obtained with Cp*Ti(OCH3)3/MAO catalyst.
Table 2: Activation energies for the dechlorination reaction of PVC.
Catalyst Mn x 10-4 Mw / Mn
Tacticity (%)Ea (kJ/mol)
mm mr rrtert-BuLi 13.4 1.9 18.6 48.2 33.1 129.68
Cp*Ti(OCH3)3/MAO 10.9 2.1 15.5 44.5 40.0 149.55LPO 15.7 2.2 16.3 53.1 30.6 104.10
3.4 Analysis of thermogravimetric -Mass Spectroscopy
In order to obtain basic data for recycling PVC, the reaction products of PVC was ana-lyzed by thermogravimetric-mass spectrum (TG-MS) of PVC obtained with LPO and Cp*Ti(OCH3)3 /MAO catalyst over the whole temperature range. The main degradation products up to 650 °C were HCl (m/z = 36), benzene (m/z = 78), toluene (m/z = 92) and naphthalene (m/z =128). Small amounts of other products such as aromatic compounds and organic chlorides were also observed [3, 9].
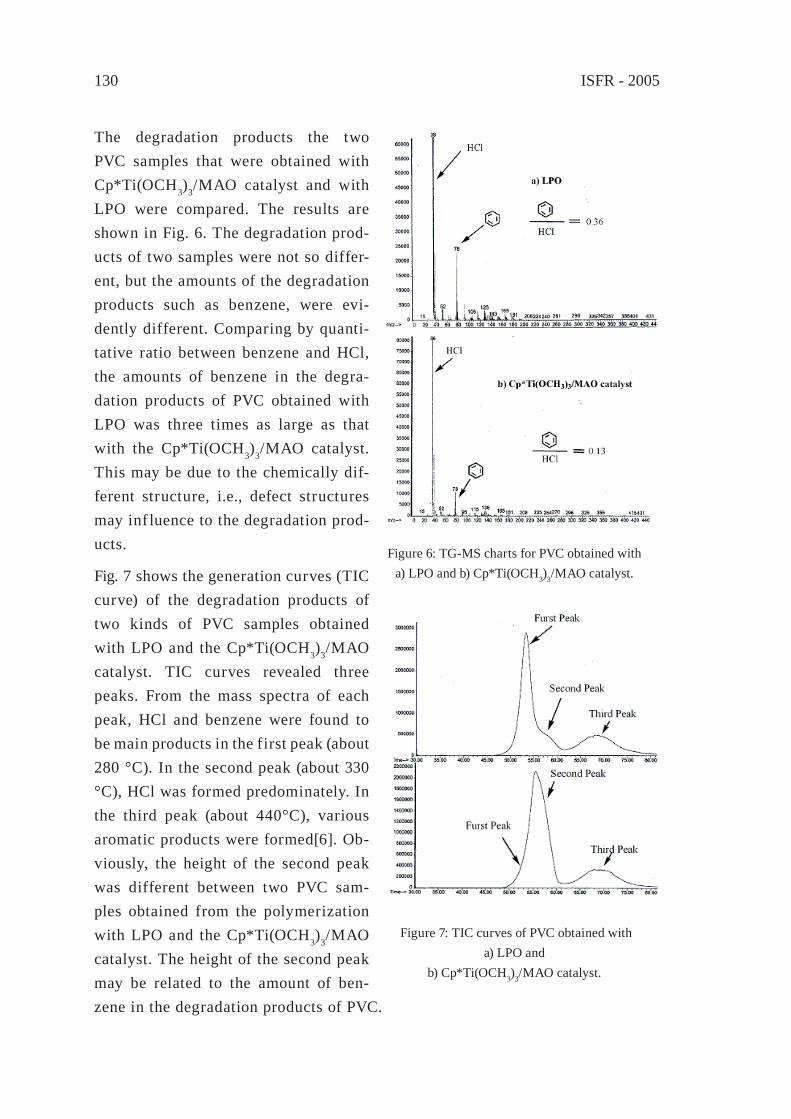
ISFR - 2005130
The degradation products the two PVC samples that were obtained with Cp*Ti(OCH3)3/MAO catalyst and with LPO were compared. The results are shown in Fig. 6. The degradation prod-ucts of two samples were not so differ-ent, but the amounts of the degradation products such as benzene, were evi-dently different. Comparing by quanti-tative ratio between benzene and HCl, the amounts of benzene in the degra-dation products of PVC obtained with LPO was three times as large as that with the Cp*Ti(OCH3)3/MAO catalyst. This may be due to the chemically dif-ferent structure, i.e., defect structures may inf luence to the degradation prod-ucts.
Fig. 7 shows the generation curves (TIC curve) of the degradation products of two kinds of PVC samples obtained with LPO and the Cp*Ti(OCH3)3/MAO catalyst. TIC curves revealed three peaks. From the mass spectra of each peak, HCl and benzene were found to be main products in the first peak (about 280 °C). In the second peak (about 330 °C), HCl was formed predominately. In the third peak (about 440°C), various aromatic products were formed[6]. Ob-viously, the height of the second peak was different between two PVC sam-ples obtained from the polymerization with LPO and the Cp*Ti(OCH3)3/MAO catalyst. The height of the second peak may be related to the amount of ben-zene in the degradation products of PVC.
Figure 6: TG-MS charts for PVC obtained witha) LPO and b) Cp*Ti(OCH3)3/MAO catalyst.
Figure 7: TIC curves of PVC obtained witha) LPO and
b) Cp*Ti(OCH3)3/MAO catalyst.

Pyrolysis / Solvolysis 131
The amount of benzene in the degradation products of APVC obtained with LPO was larger than that of LPVC obtained with the Cp*Ti(OCH3)3/MAO catalyst. It was re-vealed that the presence of defect structures infl uenced the degradation processes such as the generation of intermediates and volatile products.
3.5 Degradation of PVC in hot and under high pressure water
The infl uence on atmosphere for the dechlo-rination of PVC was examined. The results are shown in Fig. 8. The rate of the dechlo-rination reaction of PVC in N2 stream was higher than that of the conditions that the reaction was performed under high pres-sure and at high temperature in water. This may be explained by the auto-acceleration effect of HCl [8].
The dechlorination of PVC fi lm was car-ried out at 300 °C for 60 min in water and in N2 stream. The color of the PVC after the dechlorination in N2 stream turned to black leading to the formation of the char. On the other hand, the color of the PVC after the dechlorination in water didn’t turn to black. Both PVC residues had a same composition consisting of only carbon and hydrogen. Nevertheless, the colors of them were different, suggesting that the chemical structures such as the polyene length and the cross-linking structure were different. This may be explained by the distribution of polyene structures in the chain.
4. Conclusion
The thermal stability of LPVC prepared from half-titanocene catalysts was higher than that of APVC obtained with LPO. The decomposition of LPVC gave a product mixture in which the ratios of HCl/aromatic compounds were higher than that obtained from APVC. In addition, the amount of aromatic compounds was less than those obtained from APVC. We believe that LPVC provides a better process for the recycling of PVC than that for APVC.
The decomposition of LPVC under high pressure in hot water was also examined, and we found that an auto-acceleration of dehalogenation was not the case here. The color of the product after the treatment was different from the decomposition in air.
0
20
40
60
80
100
200 220 240 260 280
Reaction Temperature (℃)
1
2
wei
ght r
esid
ue (%
)
Figure 8: Dechlorination of PVC for 30 min(1) under high pressure (19.6 MPa) in water and
(2) in N2 stream.
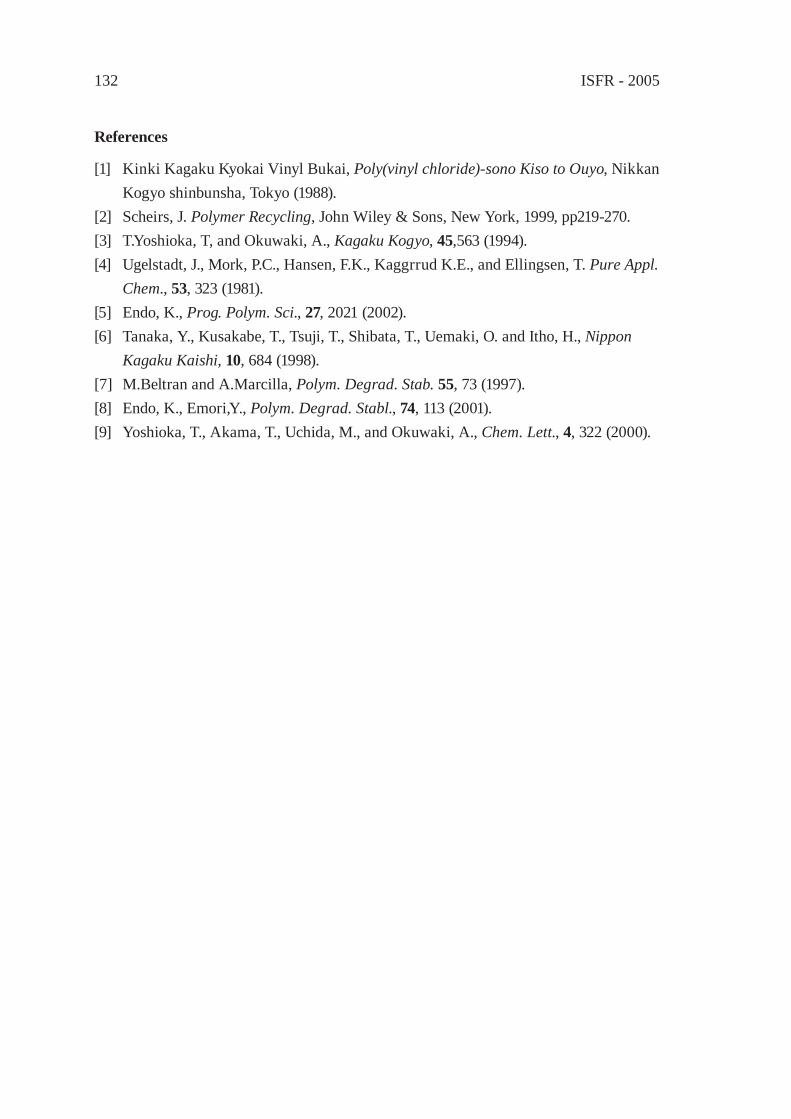
ISFR - 2005132
References
[1] Kinki Kagaku Kyokai Vinyl Bukai, Poly(vinyl chloride)-sono Kiso to Ouyo, Nikkan Kogyo shinbunsha, Tokyo (1988).
[2] Scheirs, J. Polymer Recycling, John Wiley & Sons, New York, 1999, pp219-270.[3] T.Yoshioka, T, and Okuwaki, A., Kagaku Kogyo, 45,563 (1994).[4] Ugelstadt, J., Mork, P.C., Hansen, F.K., Kaggrrud K.E., and Ellingsen, T. Pure Appl.
Chem., 53, 323 (1981).[5] Endo, K., Prog. Polym. Sci., 27, 2021 (2002).[6] Tanaka, Y., Kusakabe, T., Tsuji, T., Shibata, T., Uemaki, O. and Itho, H., Nippon
Kagaku Kaishi, 10, 684 (1998).[7] M.Beltran and A.Marcilla, Polym. Degrad. Stab. 55, 73 (1997).[8] Endo, K., Emori,Y., Polym. Degrad. Stabl., 74, 113 (2001).[9] Yoshioka, T., Akama, T., Uchida, M., and Okuwaki, A., Chem. Lett., 4, 322 (2000).

Pyrolysis / Solvolysis 133
ENVIRONMENTALLY-BENIGN POROUS CARBONS FROM DECHLORINATED WASTE PVC
N. Kakuta, K. Shirono, H. Ohkita and T. MizushimaDepartment of Materials Science, Toyohashi University of Technology,
Tempaku, Toyohashi 441-8580, Japan, [email protected]
Abstract: Porous carbons was prepared from dechlorinated waste PVC(Noubi). The dechlorinated Noubi fi lm was pre-oxidized at 573 K to modify into a non-graphitizable form and carbonized at 873 K in an inert atmosphere. A potassium activation method was employed in a char/KOH ratio of 1/3 at 1023 K. Surface areas of porous carbons were in excess of 1000 m2/g and micropores were generated predominantly. The same results were also achieved by use of a large scale system without problems. The roles of potassium on the activation step are not only the micropore formation at low temperatures but also the neutralization of the residual Cl species. As potassium is an essential element for plants, the dechlorinated Noubi fi lm modifi ed by potassium might be applied to an agricultural fi eld as environmentally -benign materials.
1. Introduction
Poly(vinyl chloride) (PVC) is one of widely-used plastics in many fi elds due to valuable characteristics such as low price, water resistance, fl ame resistance and etc. In Japan, agricultural PVC fi lms, so-called “Noubi”, have been manufactured. The Noubi fi lm was developed for the agricultural use, particular for greenhouses due to its light permeabil-ity and a high durability performance under severe climatic conditions. Until now, more than 50% of waste Noubi fi lms is submitted to materials reprocessing for a mechanical recycling [1]. However, less than 50% of waste Noubi fi lms is still remaining as untreated PVC fi lms and they are disposed by means of the landfi ll and incineration. In deed, the incineration of PVC is the most conventional method but results in serious pollution prob-lems: the formation of hazardous chlorinated compounds (hydrochloric acid, chlorine gas and dioxin-related compounds) in fl ue gas and/or soil.
The dechlorination of PVC is usually a requisite process for the fi nal utilization of PVC wastes. For the recovery of Cl species evolved, many studies have been undertaken and continued, but the approach to the effective utilization of recovered chlorinated com-pounds is still not found. Unfortunately, most of hydrochloric acid obtained from dechlo-rination process is neutralized by sodium hydroxide (NaOH) or calcium oxide(CaO), and sodium chloride (NaCl) solution is discarded after diluting with plenty of water. Recently, Ueno et al. proposed a new method of recovering of chlorine gas from molten CaCl2 and O2 for the reuse of Cl2 gas [2].
ISFR - 2005134
To utilze dechlorinated PVC, the dechlorinated PVC whose degree of dechlorination is up to 99% [3] was subjected to pyrolysis to fi nd ways for the feedstock recycle [4-7], com-bustion for the energy recovery [8], and synthesis of carbon materials [9-10]. However, the negative infl uence of residual Cl species is still not negligible in industrial plants for pyrolysis and combustion, especially when a large amount of dechlorinated samples are used as feed. The production of activated carbons is attractive for practical use and many studies on the production of activated carbons from waste materials have been reported [11-16] and their physical characteristics for purifi cation and elimination of hazardous compounds in the gas and liquid phases have become clear too.
In the present work, we attempt the preparation of porous carbons from the dechlorinated Noubi fi lm with the purpose of utilizing residual Cl species. Generally, two activation methods, physical and chemical activation, are employed for the pore formation. The physical activation is carried out using steam or CO2 at higher temperatures to activate H2O and CO2 molecules as oxidants. Although Cl contents decrease drastically during the activation procedures, it is diffi cult to completely remove Cl species. On the other hand, the chemical activation using alkali reagents is preferable in order to remove the residual Cl species. In particular, potassium hydroxide (KOH) is expected to neutalize residual Cl species and form pores at lower temperatures. Another advantage is that if the residual potassium compounds(i.e. KCl etc.) exist on the carbons, they can be utilized as a fertilizer when the porous carbons are used for some agricultural purposes. However, sodium hydroxide (NaOH) is not to be used for this purpose because plants are damaged by sodium chloride(NaCl). Therefore, we investigated the preparation of porous carbons by the chemical activation method, using KOH in both small and large scales.
2. Experimental
2.1. Sample preparation
Noubi fi lms were dechlorinated using the dechlorination system(The Japan Steel Works, Ltd., Hiroshima Plant). The typical condition is as follows: a mixture of waste Noubi fi lm (70%) and polyolefi n fi lm (30%) was dechlorinated at 653 K in an inert atmosphere at a feeding rate of 40 kg/h. The hard specimen obtained was crushed and pulverized for ex-perimental use. Chlorine content was found to be lower than 1% showing that more than 99% of chlorine was successfully removed.
2.2. Carbonization and Activation
Four gram of dechlorinated sample was loaded on a ceramic boat and this boat was placed inside a tubular reactor. After heating at 873 K under N2 fl ow, the resulting sample melted and adhered fi rmly on the wall of the ceramic boat. Therefore, the pre-oxidation prior to

Pyrolysis / Solvolysis 135
the carbonization was tried. The sample inside the reactor was heated under air fl ow (150 ml/min) at a heating rate of 7.5 K/min, held at 573 K for several hours, followed by heat-ing under N2 fl ow (100 ml/min) at a heating rate of 6.0 K/min, and fi nally held at 873 K for 1 h. After cooling to room temperature, the char obtained was impregnated with KOH solution. The char/KOH ratios were varied within the range of 1/3 to 1/4 based on the previous results [17]. The wet sample was dried in an oven at 383 K for 24h. For activa-tion, the impregnated sample was heated stepwise for the activation under N2 fl ow (100 ml/min) at heating rate of 7.0 K/min up to 673 K, and then at heating rate of 13.3 K/min up to 1023 K. After the activation, the sample was neutralized by the addition of diluted hydrochloric acid under vigorous stirring for 15 min and the resulting liquid was allowed to stand for a long time. Finally, the precipitate was fi ltrated and dried at 383 K for 24 h.
2.3. Characterization of porous carbons
Adsorption desorption isotherms of N2 were measured at 77 K using an adsorption apparatus(BELSORP mini, BEL Japan Inc., Japan). The pore size distributions were cal-culated by the Barrett, Joyner and Halenda(BJH) method using desorption isotherms. The Brunauer-Emmett-Teller(BET) surface areas were mostly measured by one point N2 adsorption method using a glass-made simple apparatus and the surface areas were cal-culated by the t-plot method, too.
3. Results and Discussion
3.1. Effect of pre-oxidation and carbonization periods
The pre-oxidation and carbonization conditions are highly correlated with yields and properties of porous carbons. The pre-oxidation and carbonization temperatures were chosen to be 573 K and 873 K, respectively [17]. The yields and surface areas observed are summarized in Table 1. The yields of resulting chars were found to be about 30%. The surface areas increased with an increase in carbonization time when the pre-oxida-tion was 1 h and they also increased with increasing in pre-oxidation time. Consequently, Table 1 suggests that the prolonged pre-oxidation is effective to obtain high surface areas after the carbonization. Walker et al. reported that 85 per cent of carbon from the dechlo-rinated PVC was in the form of graphite-like layers due to the good graphitizability of the carbon[18]. In addition, the dechlorinated PVC carbon was also of interest to study with pitch-based carbon fi ber as source materials [10], suggesting that the melting is the char-acteristics of the graphitizable carbon. Since the graphitizable property is undesirable for the preparation of activated carbons, the pre-oxidation is requisite to modify the carbon into non-graphitizable form.
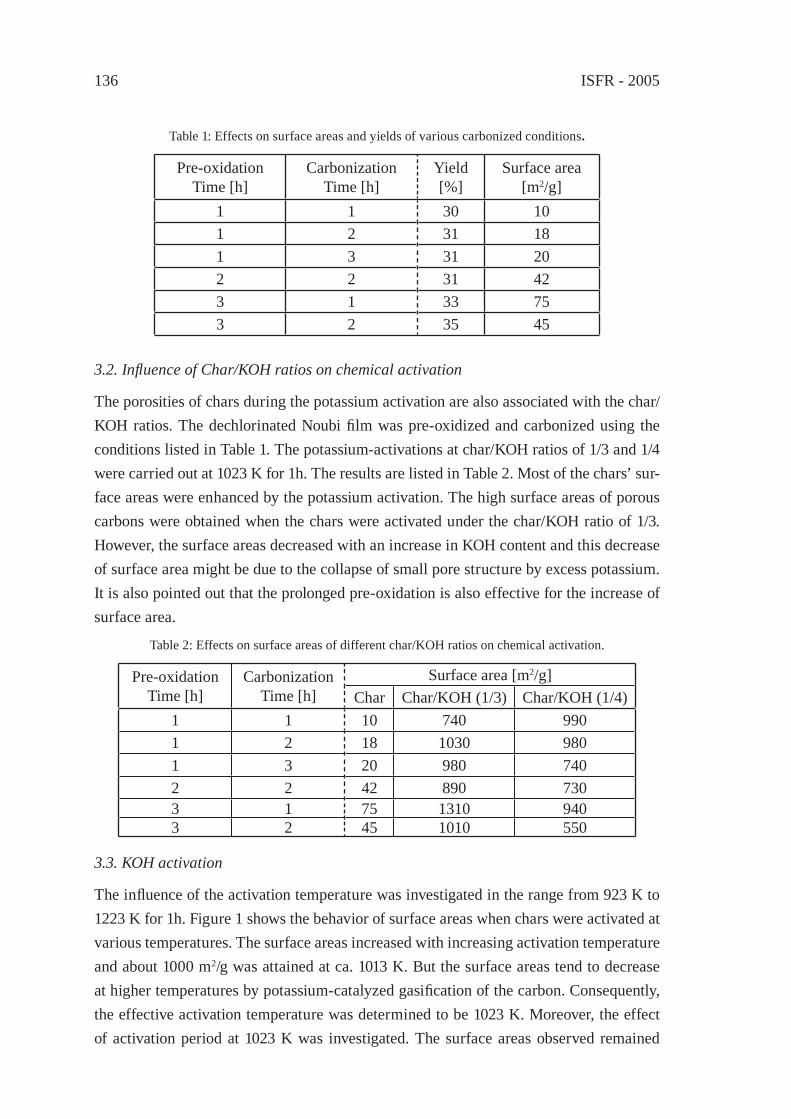
ISFR - 2005136
3.2. Infl uence of Char/KOH ratios on chemical activation
The porosities of chars during the potassium activation are also associated with the char/KOH ratios. The dechlorinated Noubi fi lm was pre-oxidized and carbonized using the conditions listed in Table 1. The potassium-activations at char/KOH ratios of 1/3 and 1/4 were carried out at 1023 K for 1h. The results are listed in Table 2. Most of the chars’ sur-face areas were enhanced by the potassium activation. The high surface areas of porous carbons were obtained when the chars were activated under the char/KOH ratio of 1/3. However, the surface areas decreased with an increase in KOH content and this decrease of surface area might be due to the collapse of small pore structure by excess potassium. It is also pointed out that the prolonged pre-oxidation is also effective for the increase of surface area.
3.3. KOH activation
The infl uence of the activation temperature was investigated in the range from 923 K to 1223 K for 1h. Figure 1 shows the behavior of surface areas when chars were activated at various temperatures. The surface areas increased with increasing activation temperature and about 1000 m2/g was attained at ca. 1013 K. But the surface areas tend to decrease at higher temperatures by potassium-catalyzed gasifi cation of the carbon. Consequently, the effective activation temperature was determined to be 1023 K. Moreover, the effect of activation period at 1023 K was investigated. The surface areas observed remained
Table 1: Effects on surface areas and yields of various carbonized conditions.
Pre-oxidationTime [h]
CarbonizationTime [h]
Yield[%]
Surface area[m2/g]
1 1 30 101 2 31 181 3 31 202 2 31 423 1 33 753 2 35 45
Table 2: Effects on surface areas of different char/KOH ratios on chemical activation.
Pre-oxidationTime [h]
CarbonizationTime [h]
Surface area [m2/g]Char Char/KOH (1/3) Char/KOH (1/4)
1 1 10 740 9901 2 18 1030 9801 3 20 980 7402 2 42 890 7303 1 75 1310 9403 2 45 1010 550
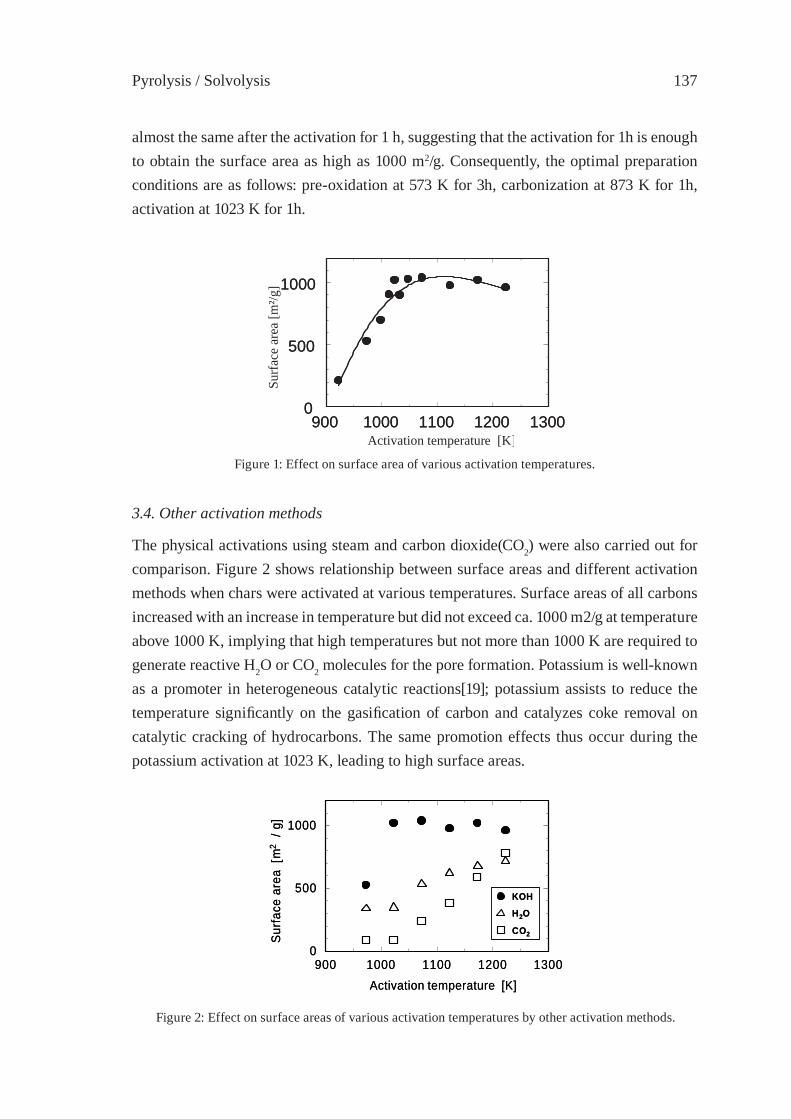
Pyrolysis / Solvolysis 137
almost the same after the activation for 1 h, suggesting that the activation for 1h is enough to obtain the surface area as high as 1000 m2/g. Consequently, the optimal preparation conditions are as follows: pre-oxidation at 573 K for 3h, carbonization at 873 K for 1h, activation at 1023 K for 1h.
900 1000 1100 1200 1300 0
500
1000
900 1000 1100 1200 1300 0
500
1000
Activation temperature [K]
Surf
ace
area
[m²/g
]
Figure 1: Effect on surface area of various activation temperatures.
3.4. Other activation methods
The physical activations using steam and carbon dioxide(CO2) were also carried out for comparison. Figure 2 shows relationship between surface areas and different activation methods when chars were activated at various temperatures. Surface areas of all carbons increased with an increase in temperature but did not exceed ca. 1000 m2/g at temperature above 1000 K, implying that high temperatures but not more than 1000 K are required to generate reactive H2O or CO2 molecules for the pore formation. Potassium is well-known as a promoter in heterogeneous catalytic reactions[19]; potassium assists to reduce the temperature signifi cantly on the gasifi cation of carbon and catalyzes coke removal on catalytic cracking of hydrocarbons. The same promotion effects thus occur during the potassium activation at 1023 K, leading to high surface areas.
Figure 2: Effect on surface areas of various activation temperatures by other activation methods.
900 1000 1100 1200 13000
500
1000
Surfa
ce a
rea
[m2
/ g]
Activation temperature [K]
KOH
H2O
CO2
900 1000 1100 1200 13000
500
1000
Surfa
ce a
rea
[m2
/ g]
Activation temperature [K]
KOH
H2O
CO2
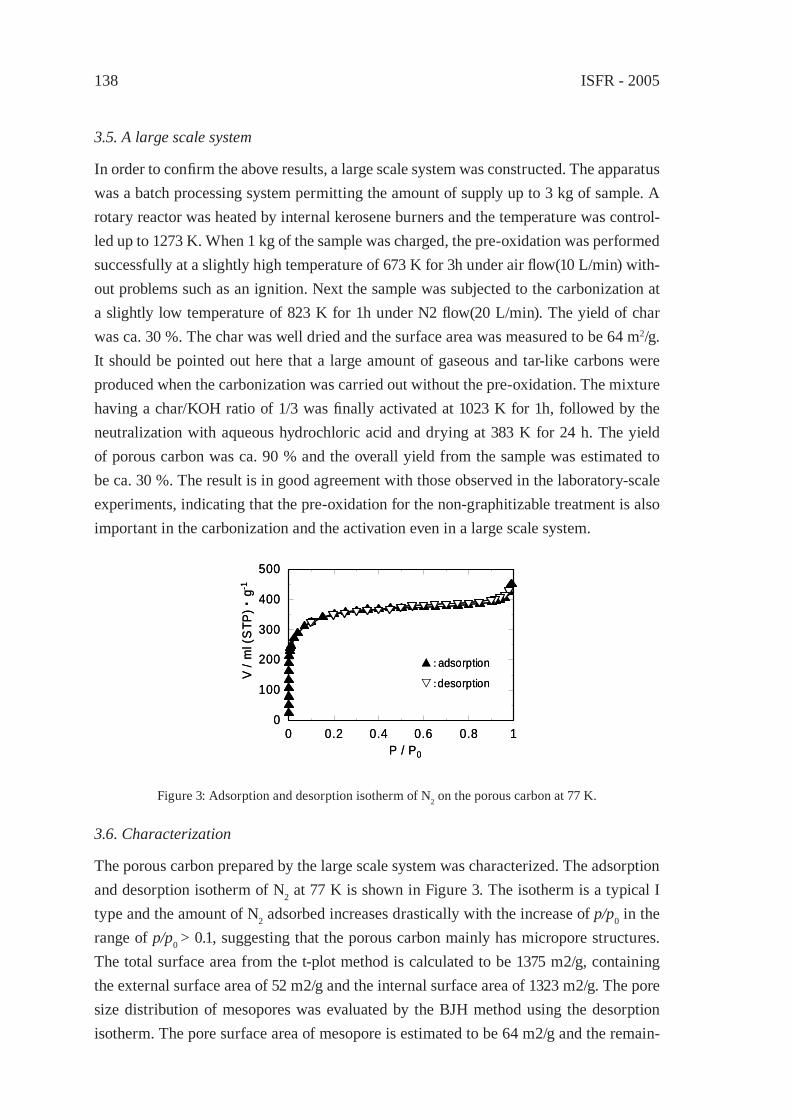
ISFR - 2005138
3.5. A large scale system
In order to confi rm the above results, a large scale system was constructed. The apparatus was a batch processing system permitting the amount of supply up to 3 kg of sample. A rotary reactor was heated by internal kerosene burners and the temperature was control-led up to 1273 K. When 1 kg of the sample was charged, the pre-oxidation was performed successfully at a slightly high temperature of 673 K for 3h under air fl ow(10 L/min) with-out problems such as an ignition. Next the sample was subjected to the carbonization at a slightly low temperature of 823 K for 1h under N2 fl ow(20 L/min). The yield of char was ca. 30 %. The char was well dried and the surface area was measured to be 64 m2/g. It should be pointed out here that a large amount of gaseous and tar-like carbons were produced when the carbonization was carried out without the pre-oxidation. The mixture having a char/KOH ratio of 1/3 was fi nally activated at 1023 K for 1h, followed by the neutralization with aqueous hydrochloric acid and drying at 383 K for 24 h. The yield of porous carbon was ca. 90 % and the overall yield from the sample was estimated to be ca. 30 %. The result is in good agreement with those observed in the laboratory-scale experiments, indicating that the pre-oxidation for the non-graphitizable treatment is also important in the carbonization and the activation even in a large scale system.
Figure 3: Adsorption and desorption isotherm of N2 on the porous carbon at 77 K.
3.6. Characterization
The porous carbon prepared by the large scale system was characterized. The adsorption and desorption isotherm of N2 at 77 K is shown in Figure 3. The isotherm is a typical I type and the amount of N2 adsorbed increases drastically with the increase of p/p0 in the range of p/p0 > 0.1, suggesting that the porous carbon mainly has micropore structures. The total surface area from the t-plot method is calculated to be 1375 m2/g, containing the external surface area of 52 m2/g and the internal surface area of 1323 m2/g. The pore size distribution of mesopores was evaluated by the BJH method using the desorption isotherm. The pore surface area of mesopore is estimated to be 64 m2/g and the remain-
V / m
l (S
TP)・
g-1
P / P0
▲:adsorption
▽:desorption
0 0.2 0.4 0.6 0.8 10
100
200
300
400
500
V / m
l (S
TP)・
g-1
P / P0
▲:adsorption
▽:desorption
0 0.2 0.4 0.6 0.8 10
100
200
300
400
500
Pyrolysis / Solvolysis 139
ing is attributed to the pore surface area of micropore. The summary of surface areas is listed in Table 3. This indicates that the potassium activation is preferable to generate the micropores at low temperatures. Evans et al. attempted to prepare the potassium acti-vated carbon from PVC without the pre-oxidation[9].They concluded that the PVC carbon produced a low surface area, although the potassium activation was carried out at 1023 K for 1h using the char/KOH ratio of 1/4. They also mentioned that the PVC carbon is a graphitizable carbon. Consequently, the non-graphitizable treatment is facilitated when the dechlorinated PVC is subjected to the carbonization and to the activation. Finally, the dioxin content was found to be less than the environmental abundance.
4. Conclusion
Porous carbons were successfully prepared from dechlorinated Noubi fi lms by a combi-nation of the non-graphitizable treatment and the potassium activation. The method was also extended to a large scale system for practical use. The porous carbons modifi ed by potassium might be utilized in agricultural fi elds.
Acknowledgement
The authors are grateful to the Japan Society for Promotion of Science for support of this research through a Grant-in Aid for Scientifi c Research(16201019). N.K. also acknowl-edges Mrs. Sakai,T., Natsume, K., Yagyu, H., Yamagai, K., and Nakajima, T., for their cooperation.
References
[1] Noubi Recycle Acceleration Council, http://www.noubi-rc.jp/.[2] Kondo, T., Sukigara, T., Itoh, K., Azuma, N., Ueno, A., Momose, Y., Ind. Eng.
Chem. Res. 42:6040(2003).[3] Yoshinaga, T., Yamabe, M., Kito, T., Ichiki, T., Ogata, M., Chen, J., Fujino, H.,
Tanimura, and T., Yamanobe, T., Polym. Degrad. Stab. 86:541(2004).[4] Knumann, R., and Bochhorn, H., Combust. Sci. and Tech. 101:285(1994).[5] Czegeny, Z., Jakab, E., and Blazso, M., Macromol. Mater. Eng. 287:277(2002).[6] Lingaiah, N., Uddin, Md. A., Muto, A., Sakata, Y., Imai, T., and Murata, K., Appl.
Catal. A. 207:79(2001).[7] Zhou, Q., Tang, C., Wang, Yu-Z., and Zheng, L., Fuel 83:1727(2004).[8] Borgianni, D., Filippis, P. De, Pochetti, F., and Paolucci, M., ibid. 81:1827(2002).[9] Evans, M. J. B., Halliop, E., and MacDonald, J. A. F., Carbon 37:269(1999).[10] Qiao, W. M., Yoon, S. H., Korai, Y., Mochida, I., Inoue, S., Sakurai, T., and
Shimohara, T., ibid. 42:1327(2004).

ISFR - 2005140
[11] Nagano, S., Tamon, H., Adzumi, T., Nakagawa, K., and Suzuki, T., ibid. 38:915(2000).
[12] Horikawa, T., Hayashi, J., and Muroyama, K., ibid. 40:709(2002).[13] Hayashi, J., Horikawa, T., Muroyama, K., and Gomes, V. G., Micropor. Mesopor.
Mater. 55:63(2002).[14] Hayashi, J., Horikawa, T., Takeda, I., Muroyama, K., and Ani, F. N., Carbon
40:2381(2002).[15] Lin, Y-R., and Yeng, H., Micropor. Mesopor. Mater. 54:167(2002).[16] Okada, K., Yamamoto, N., Kameshima, Y., and Yasumori, A., J. Colloid Interface
Sci. 262:179(2003).[17] Shimizu, A, Graduation Thesis of Toyohasi University of Technology, (2002).[18] Walker Jr., P. L., ed., Chamistry and Physics of Crabon, Marcel Dekker, New York,
1966, pp. 257-371. [19] Bonzel, H. P., Bradshaw, A. M., and Ertl, G., ed., Physics and Chemistry of Alkali
metal Adsorption, Elsevier, Amsterdam,1989, pp. 293-306, 347-377.
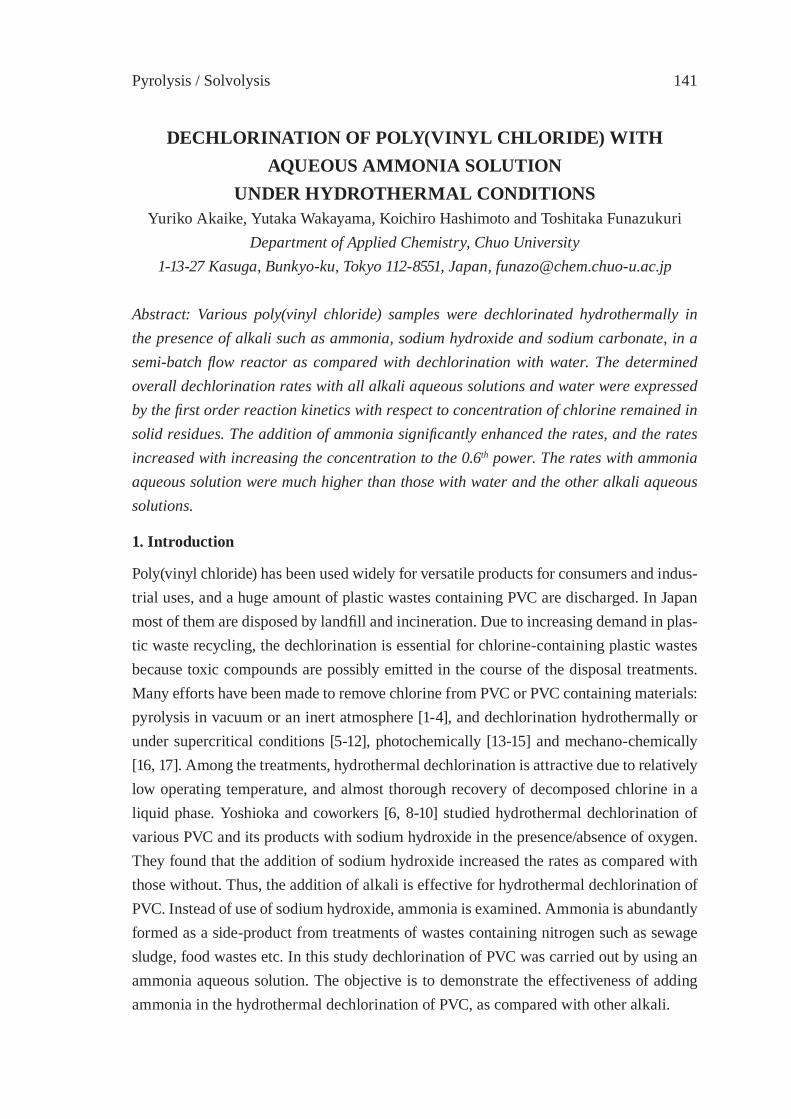
Pyrolysis / Solvolysis 141
DECHLORINATION OF POLY(VINYL CHLORIDE) WITH AQUEOUS AMMONIA SOLUTION
UNDER HYDROTHERMAL CONDITIONSYuriko Akaike, Yutaka Wakayama, Koichiro Hashimoto and Toshitaka Funazukuri
Department of Applied Chemistry, Chuo University1-13-27 Kasuga, Bunkyo-ku, Tokyo 112-8551, Japan, [email protected]
Abstract: Various poly(vinyl chloride) samples were dechlorinated hydrothermally in the presence of alkali such as ammonia, sodium hydroxide and sodium carbonate, in a semi-batch fl ow reactor as compared with dechlorination with water. The determined overall dechlorination rates with all alkali aqueous solutions and water were expressed by the fi rst order reaction kinetics with respect to concentration of chlorine remained in solid residues. The addition of ammonia signifi cantly enhanced the rates, and the rates increased with increasing the concentration to the 0.6th power. The rates with ammonia aqueous solution were much higher than those with water and the other alkali aqueous solutions.
1. Introduction
Poly(vinyl chloride) has been used widely for versatile products for consumers and indus-trial uses, and a huge amount of plastic wastes containing PVC are discharged. In Japan most of them are disposed by landfi ll and incineration. Due to increasing demand in plas-tic waste recycling, the dechlorination is essential for chlorine-containing plastic wastes because toxic compounds are possibly emitted in the course of the disposal treatments. Many efforts have been made to remove chlorine from PVC or PVC containing materials: pyrolysis in vacuum or an inert atmosphere [1-4], and dechlorination hydrothermally or under supercritical conditions [5-12], photochemically [13-15] and mechano-chemically [16, 17]. Among the treatments, hydrothermal dechlorination is attractive due to relatively low operating temperature, and almost thorough recovery of decomposed chlorine in a liquid phase. Yoshioka and coworkers [6, 8-10] studied hydrothermal dechlorination of various PVC and its products with sodium hydroxide in the presence/absence of oxygen. They found that the addition of sodium hydroxide increased the rates as compared with those without. Thus, the addition of alkali is effective for hydrothermal dechlorination of PVC. Instead of use of sodium hydroxide, ammonia is examined. Ammonia is abundantly formed as a side-product from treatments of wastes containing nitrogen such as sewage sludge, food wastes etc. In this study dechlorination of PVC was carried out by using an ammonia aqueous solution. The objective is to demonstrate the effectiveness of adding ammonia in the hydrothermal dechlorination of PVC, as compared with other alkali.
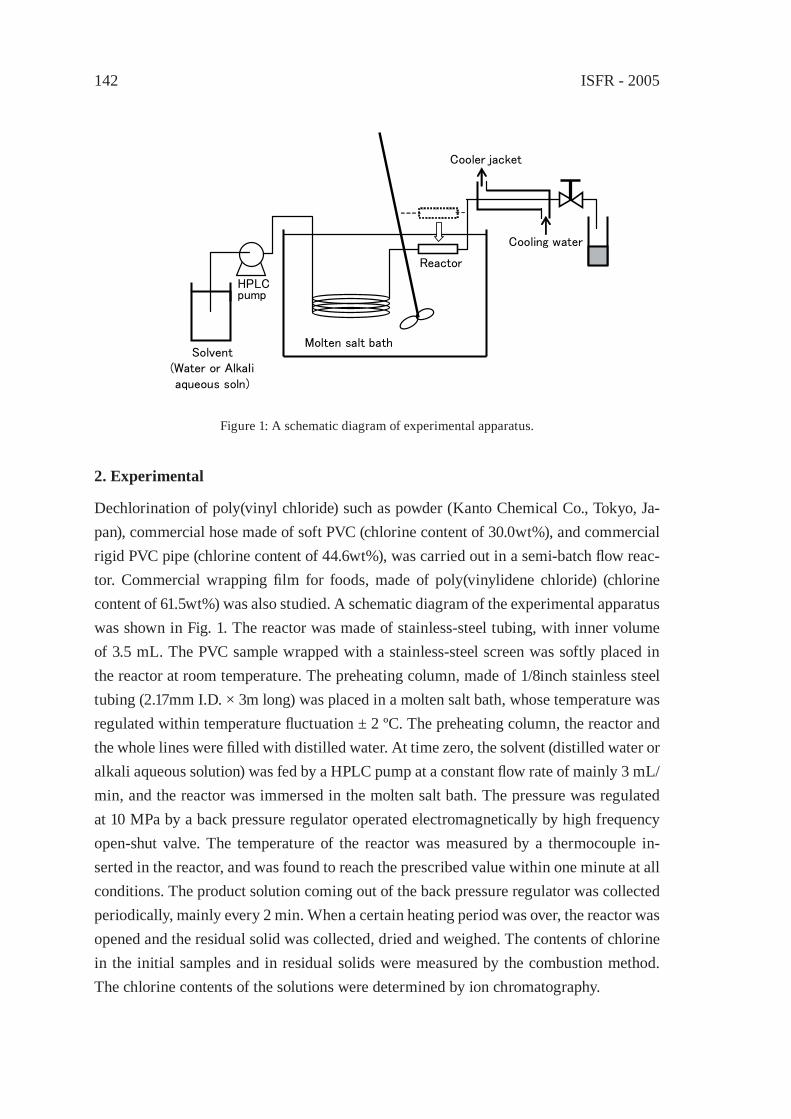
ISFR - 2005142
2. Experimental
Dechlorination of poly(vinyl chloride) such as powder (Kanto Chemical Co., Tokyo, Ja-pan), commercial hose made of soft PVC (chlorine content of 30.0wt%), and commercial rigid PVC pipe (chlorine content of 44.6wt%), was carried out in a semi-batch fl ow reac-tor. Commercial wrapping fi lm for foods, made of poly(vinylidene chloride) (chlorine content of 61.5wt%) was also studied. A schematic diagram of the experimental apparatus was shown in Fig. 1. The reactor was made of stainless-steel tubing, with inner volume of 3.5 mL. The PVC sample wrapped with a stainless-steel screen was softly placed in the reactor at room temperature. The preheating column, made of 1/8inch stainless steel tubing (2.17mm I.D. × 3m long) was placed in a molten salt bath, whose temperature was regulated within temperature fl uctuation ± 2 ºC. The preheating column, the reactor and the whole lines were fi lled with distilled water. At time zero, the solvent (distilled water or alkali aqueous solution) was fed by a HPLC pump at a constant fl ow rate of mainly 3 mL/min, and the reactor was immersed in the molten salt bath. The pressure was regulated at 10 MPa by a back pressure regulator operated electromagnetically by high frequency open-shut valve. The temperature of the reactor was measured by a thermocouple in-serted in the reactor, and was found to reach the prescribed value within one minute at all conditions. The product solution coming out of the back pressure regulator was collected periodically, mainly every 2 min. When a certain heating period was over, the reactor was opened and the residual solid was collected, dried and weighed. The contents of chlorine in the initial samples and in residual solids were measured by the combustion method. The chlorine contents of the solutions were determined by ion chromatography.
Cooling water
Cooler jacket
Molten salt bath
Reactor
Solvent(Water or Alkali aqueous soln)
HPLC pump
Figure 1: A schematic diagram of experimental apparatus.

Pyrolysis / Solvolysis 143
3. Results and Discussion
In Figure 2 the effect of solvents on dechlo-rination for PVC powder at 230 ºC in a semi-batch reactor is compared. The rate of dechlorination with 0.6M ammonia aque-ous solution is remarkably faster than those with distilled water and 1 M NaOH and 1 M Na2CO3 aqueous solutions. Note that at initial times shorter than 8 min, the rates with NaOH aqueous solution are faster than those with ammonia aqueous solution.
Figure 3 shows the effects of ammonia concentrations on dechlorination with the solutions at various ammonia concentra-tions at 230 ºC in the semi-batch reactor. Over the wide range of the concentrations from 0.0006 to 6 M, dechlorination rates increase with increasing ammonia concen-tration, and are expressed by the fi rst order reaction kinetics with respect to chlorine content remained in solid sample, as shown in Fig. 4. It is interesting that dechlorination with 0.0006 M ammonia aqueous solution gradually increase with increasing time in the initial stage (less than 30 min in Fig. 3), but the dechlorination steeply increase with time thereafter.
Figure 5 plots overall fi rst order rate con-stant vs. ammonia concentration at 230 ºC. The rates are strongly correlated with ammonia concentration with a slope of 0.6 over the four order magnitude of ammonia concentrations, while those with aqueous solutions of sodium hydroxide and sodium carbonate are leveled off at concentrations higher than 0.01 to 0.1 mol/L (not shown in fi gure).
Figure 2: Time changes of dechlorination with four solvents: ○, 0.6 M NH3 aq. soln; Δ, 1 M NaOH aq. soln; ▲, 1 M Na2CO3 aq. soln; +, distilled water; for PVC powder at 230 ºC in a semi-batch reactor.
Figure 3: Time changes of dechlorination for vari-ous ammonia concentrations: ▼, 0.0006M; □, 0.006M; ■, 0.06M; ○, 0.6M; ●, 6M for PVC powder at 230 ºC in a semi-batch reactor.
Figure 4: Chlorine remained in residual solid vs. time, based on initial chlorine content at various ammonia concentrations: ▼, 0.0006M; □, 0.006M; ■, 0.06M; ○, 0.6M; ●, 6M at 230 ºC for PVC pow-der in a semi-batch reactor.
0 50 100 1500
20
40
60
80
100
Reaction time [ min]
Dec
hlor
inat
ion
[%]
0 10 20 30 400
20
40
60
80
100
Reaction time [min]
Dec
hlor
inat
ion
[%]
0 50 100 1500.05
0.1
0.5
1
Reaction time [min]
Chl
orin
e re
mai
ned
C/C
0
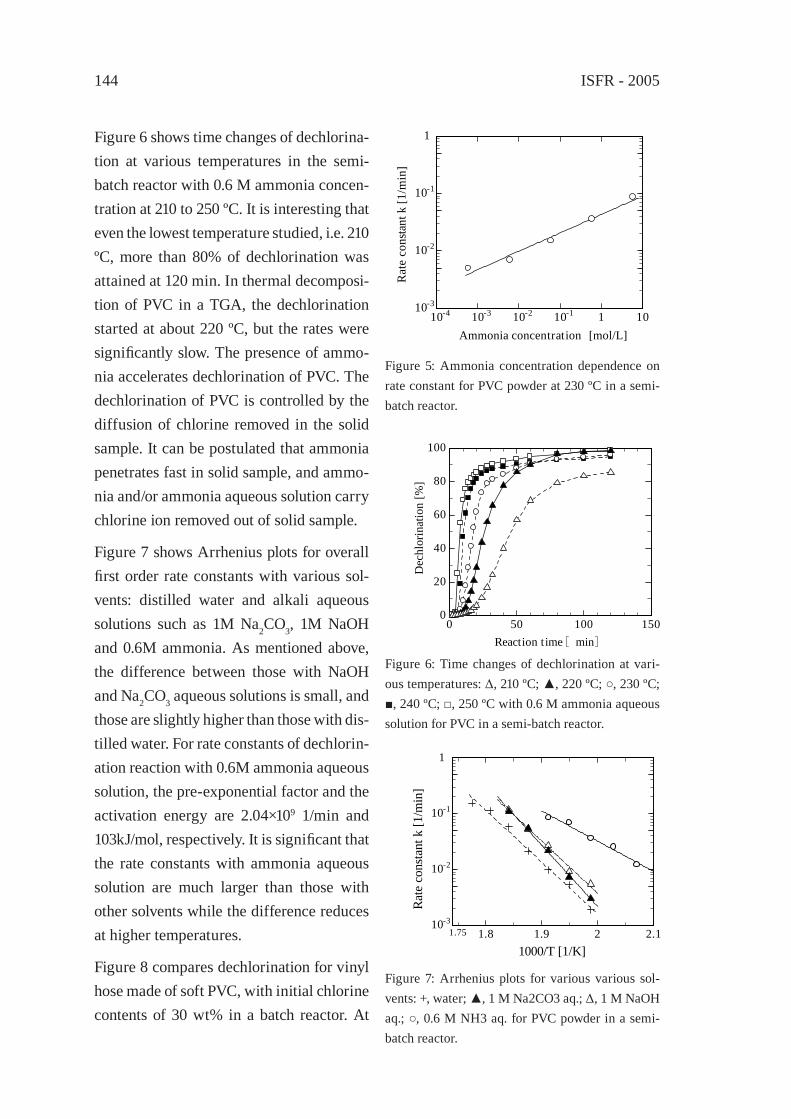
ISFR - 2005144
Figure 6 shows time changes of dechlorina-tion at various temperatures in the semi-batch reactor with 0.6 M ammonia concen-tration at 210 to 250 ºC. It is interesting that even the lowest temperature studied, i.e. 210 ºC, more than 80% of dechlorination was attained at 120 min. In thermal decomposi-tion of PVC in a TGA, the dechlorination started at about 220 ºC, but the rates were signifi cantly slow. The presence of ammo-nia accelerates dechlorination of PVC. The dechlorination of PVC is controlled by the diffusion of chlorine removed in the solid sample. It can be postulated that ammonia penetrates fast in solid sample, and ammo-nia and/or ammonia aqueous solution carry chlorine ion removed out of solid sample.
Figure 7 shows Arrhenius plots for overall fi rst order rate constants with various sol-vents: distilled water and alkali aqueous solutions such as 1M Na2CO3, 1M NaOH and 0.6M ammonia. As mentioned above, the difference between those with NaOH and Na2CO3 aqueous solutions is small, and those are slightly higher than those with dis-tilled water. For rate constants of dechlorin-ation reaction with 0.6M ammonia aqueous solution, the pre-exponential factor and the activation energy are 2.04×10⁹ 1/min and 103kJ/mol, respectively. It is signifi cant that the rate constants with ammonia aqueous solution are much larger than those with other solvents while the difference reduces at higher temperatures.
Figure 8 compares dechlorination for vinyl hose made of soft PVC, with initial chlorine contents of 30 wt% in a batch reactor. At
Figure 5: Ammonia concentration dependence on rate constant for PVC powder at 230 ºC in a semi-batch reactor.
Figure 6: Time changes of dechlorination at vari-ous temperatures: Δ, 210 ºC; ▲, 220 ºC; ○, 230 ºC; ■, 240 ºC; □, 250 ºC with 0.6 M ammonia aqueous solution for PVC in a semi-batch reactor.
Figure 7: Arrhenius plots for various various sol-vents: +, water; ▲, 1 M Na2CO3 aq.; Δ, 1 M NaOH aq.; ○, 0.6 M NH3 aq. for PVC powder in a semi-batch reactor.
10-4 10-3 10-2 10-1 1 1010-3
10-2
10-1
1
Ammonia concentration [mol/L]
Rat
e co
nsta
nt k
[1/m
in]
0 50 100 1500
20
40
60
80
100
Reaction time [ min]
Dec
hlor
inat
ion
[%]
1.8 1.9 2 2.110-3
10-2
10-1
1000/T [1/K]
Rat
e co
nsta
nt k
[1/m
in]
1
1.75
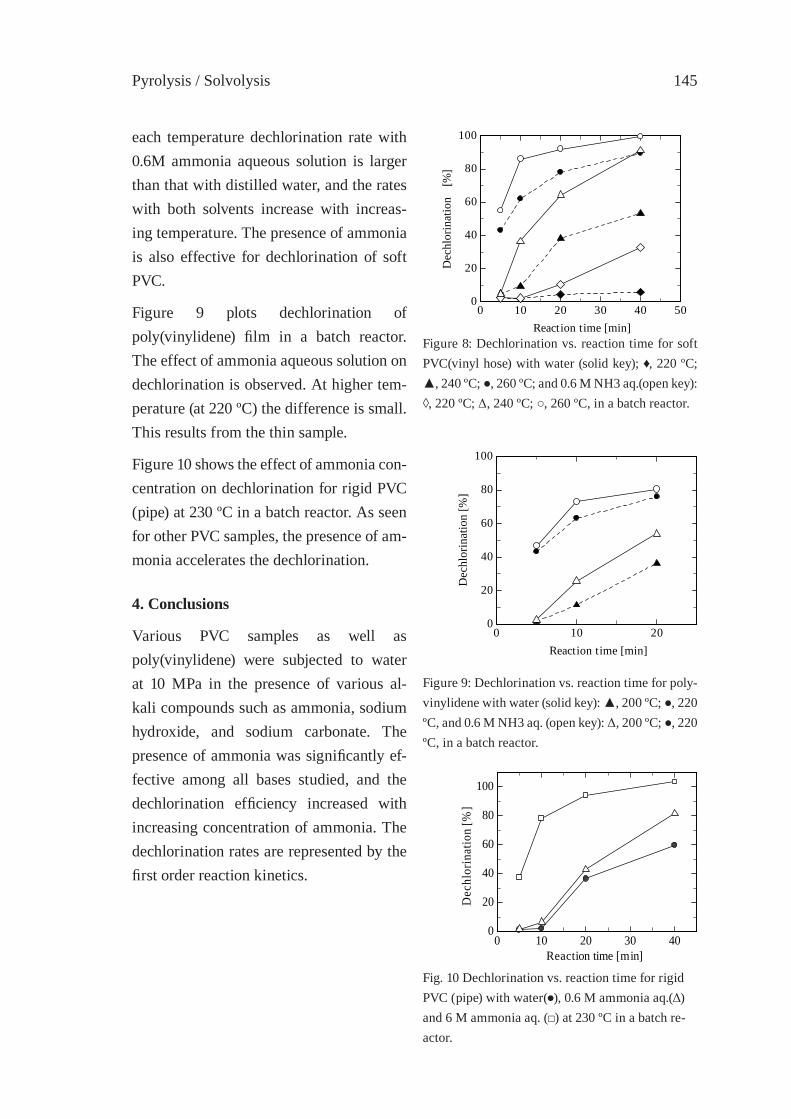
Pyrolysis / Solvolysis 145
each temperature dechlorination rate with 0.6M ammonia aqueous solution is larger than that with distilled water, and the rates with both solvents increase with increas-ing temperature. The presence of ammonia is also effective for dechlorination of soft PVC.
Figure 9 plots dechlorination of poly(vinylidene) fi lm in a batch reactor. The effect of ammonia aqueous solution on dechlorination is observed. At higher tem-perature (at 220 ºC) the difference is small. This results from the thin sample.
Figure 10 shows the effect of ammonia con-centration on dechlorination for rigid PVC (pipe) at 230 ºC in a batch reactor. As seen for other PVC samples, the presence of am-monia accelerates the dechlorination.
4. Conclusions
Various PVC samples as well as poly(vinylidene) were subjected to water at 10 MPa in the presence of various al-kali compounds such as ammonia, sodium hydroxide, and sodium carbonate. The presence of ammonia was signifi cantly ef-fective among all bases studied, and the dechlorination effi ciency increased with increasing concentration of ammonia. The dechlorination rates are represented by the fi rst order reaction kinetics.
0 10 20 30 40 500
20
40
60
80
100
Reaction time [min]
Dec
hlor
inat
ion
[%]
Figure 8: Dechlorination vs. reaction time for soft PVC(vinyl hose) with water (solid key); ♦, 220 ºC; ▲, 240 ºC; ●, 260 ºC; and 0.6 M NH3 aq.(open key): ◊, 220 ºC; Δ, 240 ºC; ○, 260 ºC, in a batch reactor.
0 10 200
20
40
60
80
100
Reaction time [min]
Dec
hlor
inat
ion
[%]
Figure 9: Dechlorination vs. reaction time for poly-vinylidene with water (solid key): ▲, 200 ºC; ●, 220 ºC, and 0.6 M NH3 aq. (open key): Δ, 200 ºC; ●, 220 ºC, in a batch reactor.
0 10 20 30 400
20
40
60
80
100
Reaction time [min]
Dec
hlor
inat
ion
[%]
Fig. 10 Dechlorination vs. reaction time for rigid PVC (pipe) with water(●), 0.6 M ammonia aq.(Δ) and 6 M ammonia aq. (□) at 230 ºC in a batch re-actor.
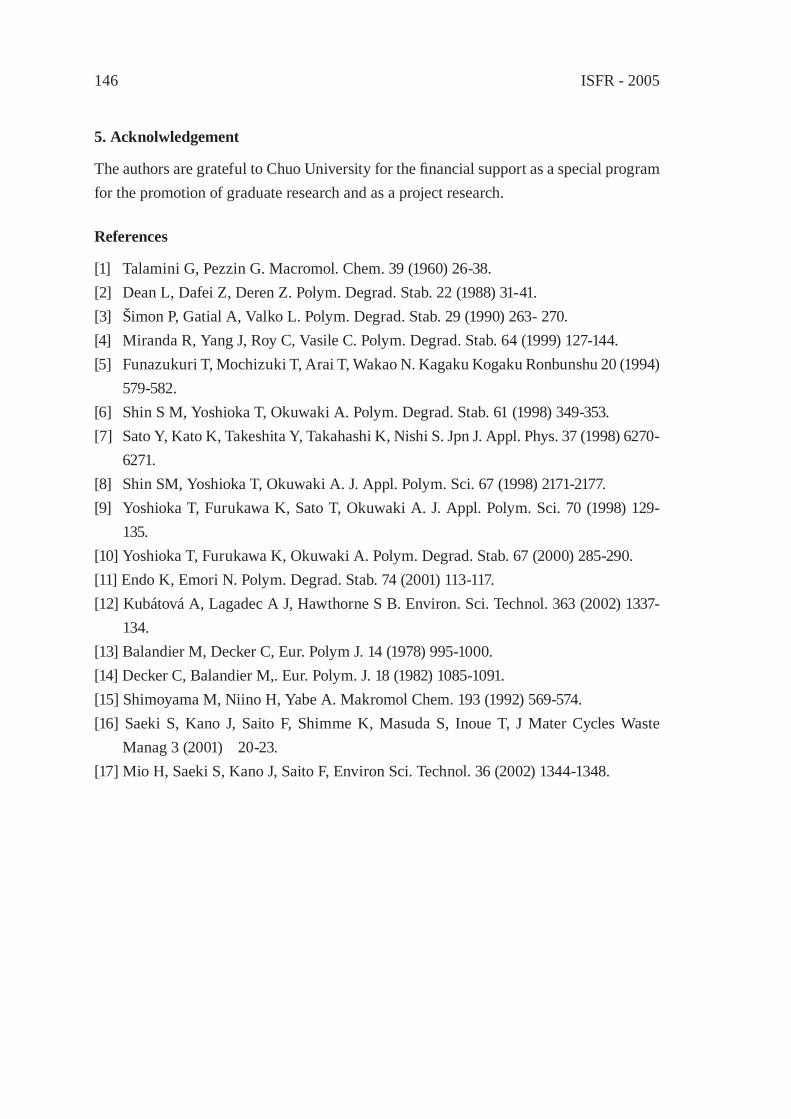
ISFR - 2005146
5. Acknolwledgement
The authors are grateful to Chuo University for the fi nancial support as a special program for the promotion of graduate research and as a project research.
References
[1] Talamini G, Pezzin G. Macromol. Chem. 39 (1960) 26-38.[2] Dean L, Dafei Z, Deren Z. Polym. Degrad. Stab. 22 (1988) 31-41.[3] Šimon P, Gatial A, Valko L. Polym. Degrad. Stab. 29 (1990) 263- 270.[4] Miranda R, Yang J, Roy C, Vasile C. Polym. Degrad. Stab. 64 (1999) 127-144.[5] Funazukuri T, Mochizuki T, Arai T, Wakao N. Kagaku Kogaku Ronbunshu 20 (1994)
579-582.[6] Shin S M, Yoshioka T, Okuwaki A. Polym. Degrad. Stab. 61 (1998) 349-353.[7] Sato Y, Kato K, Takeshita Y, Takahashi K, Nishi S. Jpn J. Appl. Phys. 37 (1998) 6270-
6271.[8] Shin SM, Yoshioka T, Okuwaki A. J. Appl. Polym. Sci. 67 (1998) 2171-2177.[9] Yoshioka T, Furukawa K, Sato T, Okuwaki A. J. Appl. Polym. Sci. 70 (1998) 129-
135.[10] Yoshioka T, Furukawa K, Okuwaki A. Polym. Degrad. Stab. 67 (2000) 285-290.[11] Endo K, Emori N. Polym. Degrad. Stab. 74 (2001) 113-117.[12] Kubátová A, Lagadec A J, Hawthorne S B. Environ. Sci. Technol. 363 (2002) 1337-
134.[13] Balandier M, Decker C, Eur. Polym J. 14 (1978) 995-1000.[14] Decker C, Balandier M,. Eur. Polym. J. 18 (1982) 1085-1091.[15] Shimoyama M, Niino H, Yabe A. Makromol Chem. 193 (1992) 569-574.[16] Saeki S, Kano J, Saito F, Shimme K, Masuda S, Inoue T, J Mater Cycles Waste
Manag 3 (2001) 20-23.[17] Mio H, Saeki S, Kano J, Saito F, Environ Sci. Technol. 36 (2002) 1344-1348.

Pyrolysis / Solvolysis 147
DECHLORINATION OF PVC AND PVDC USING NAOH/EGToshiaki Yoshioka1, Shogo Imai1, Masashi Ieshige1, Akitsugu Okuwaki2
1Graduate School of Environment Studies, Tohoku University2Professor Emeritus of Tohoku University
Aramaki Aza Aoba 6-6- 07, Aoba-ku Sendai 980-8579, Japan,[email protected], Tel/Fax +81-22-795-7211
1. Introduction
The chemical recycling of vessel–wrapping waste plastics (VWWP) different from PET has started in 2000 in Japan. With the exception of sodium chloride the main resource of chlorine in VWWP are plastics containing chlorine such as PVC and PVDC, but the chlorine content in products from liquefaction or dehydrochlorination using extruders are often high and diffi cult to process in operating petroleum refi nery plants. In addition, the dry-dehydrochlorination residue of PVC is hardly to liquefy by thermal or catalytic decomposition under liquefaction conditions. Dechlorination treatment is necessary for the chemical recycling of waste plastics containing chlorine, high dechlorination is not necessarily required. However, it is indispensable to realize a high dechlorination in order to utilize the dechlorinated plastics in a wide range.
Many studies for the PVC treatment by wet-processes were reported regardless of solvent systems until now. Particularly, the wet-processes using NaOH solutions show usually high dechlorination rates by chemical reactions different to radical reactions observed during thermal decomposition. For examples, usefull chemicals, such as oxalic acid, ben-zenecarboxylic acids etc., are produced by oxygen-oxidation of pure PVC powder [1] and vinylidene chloride-vinyl chloride copolymer powder [2], rigid PVC pellets [3] and fl exible PVC pellets [4] in 1- 25 mol/kg-H2O NaOH solutions at 150 - 265 oC and partial oxygen pressure of 1 - 10 MPa. In this case, the dechlorination progressed as a zero-order reaction and, its activation energy was 9.8 kcal/mol. On the other hand, it was reported that dechlo-rination was a fi rst -order reaction under more gentle conditions such as 0.33 mol/dm-3 M NaOH and 2 MPa Po2 [5] than that of preceeding. The dechlorination progressed as a fi rst-order reaction without oxygen, and the apparent activation energy was 49 kcal/mol [6] in 1 - 8 mol/kg-H2O-NaOH at 250 -300 oC. That of commercial PVC material such as agricultural fl exible PVC fi lm was 30 kcal/mol [7]. Recently, a new process similar to the Stigsæs Industrimiljø A/S process was develloped with 20,000 t/y. This process has the disadvantage of a high pressure process.
In this work, direct removal of chlorine from PVC and PVDC has been investigated in NaOH/EG. This method has the advantage that the reaction takes place under atospheric pressure, because of the high boiling point of EG (196 oC).

ISFR - 2005148
2. Experiment
PVC resin powder and PVDC copolymer powder of a particle size of 0.1 mm without any additives (admixture, antioxidants and degradation inhibitors) were examined. All others chemicals used in this study were reagent grade.
The mixture of PVC powder and/or PVDC copolymer powder of 0.1 g and described concentration of NaOH in ethylene glycol was put into a 100 ml three-lot fl ask of pyrex after replacing the air by nitrogen. The reaction was carried out at several temperatures between 130 and 196 oC.
The amounts of chloride ions in the reaction solution and chlorine in the residue was de-termined by ion chromatography and elemental analysis. Some particles of the samples were examined by Scanning electron microscope (SEM). The chemical structure of the surface was measured by diffuse refl ection with FT-IR.
3. Results and Discussions
3.1. PVC
Figure 1 shows the effect of tempera-ture on the dechlorination of PVC in 1 M NaOH/EG. The rate of the dechlorination increased with the temperature. It reached almost 100 % in 50 minutes at 190 °C. The apparent fi rst order plot for these results showed linearity with a correlation coeffi -cient of more than 0.99. Figure 2 shows the Arrhenius plot of the apparent rate constant k in this work together with previous results in 1 M NaOH/H2O. The apparent activation energy (Ea) is 170 kJ/mol. This value means that the dechlorination in NaOH solutions proceeds as a chemical reaction. The acti-vation energy in NaOH/H2O is 190 kJ/mol. Since the activation energy of both meth-ods are in the same order of magnitude, it is suggested that the reaction mechanism in EG is similar to that in aqueous solution. But the rate constant of the reaction in EG
0 60 120 180 240
20
40
60
80
100
0
Dec
hlor
inat
ion
(%)
Time (min)
190℃
170℃
160℃
150℃
130℃
190℃
170℃
160℃
150℃
130℃
0 60 120 180 240
20
40
60
80
100
0
Dec
hlor
inat
ion
(%)
Time (min)
190℃
170℃
160℃
150℃
130℃
190℃
170℃
160℃
150℃
130℃
0 60 120 180 240
20
40
60
80
100
0
Dec
hlor
inat
ion
(%)
Time (min)
190℃
170℃
160℃
150℃
130℃
190℃
170℃
160℃
150℃
130℃
Figure 1: Dechlorination of PVC in1 M NaOH/EG.
1/T×103 (K-1)
250 200 150
Temperature (oC)
2.6 2.4 2.2 2.0 1.8
Lnk
5
0
- 5
- 10
1M NaOH/H2O
1M NaOH/EG
1/T×103 (K-1)
250 200 150
Temperature (oC)
2.6 2.4 2.2 2.0 1.8
Lnk
5
0
- 5
- 10
1M NaOH/H2O
1M NaOH/EG
Figure 2: Arrhenius plot of the apparent rateconstant k.
increased about 150 times compared with the reaction in H2O. The feature of this system is the ability to carry out the refl ux at 195 oC below the boiling point of EG.
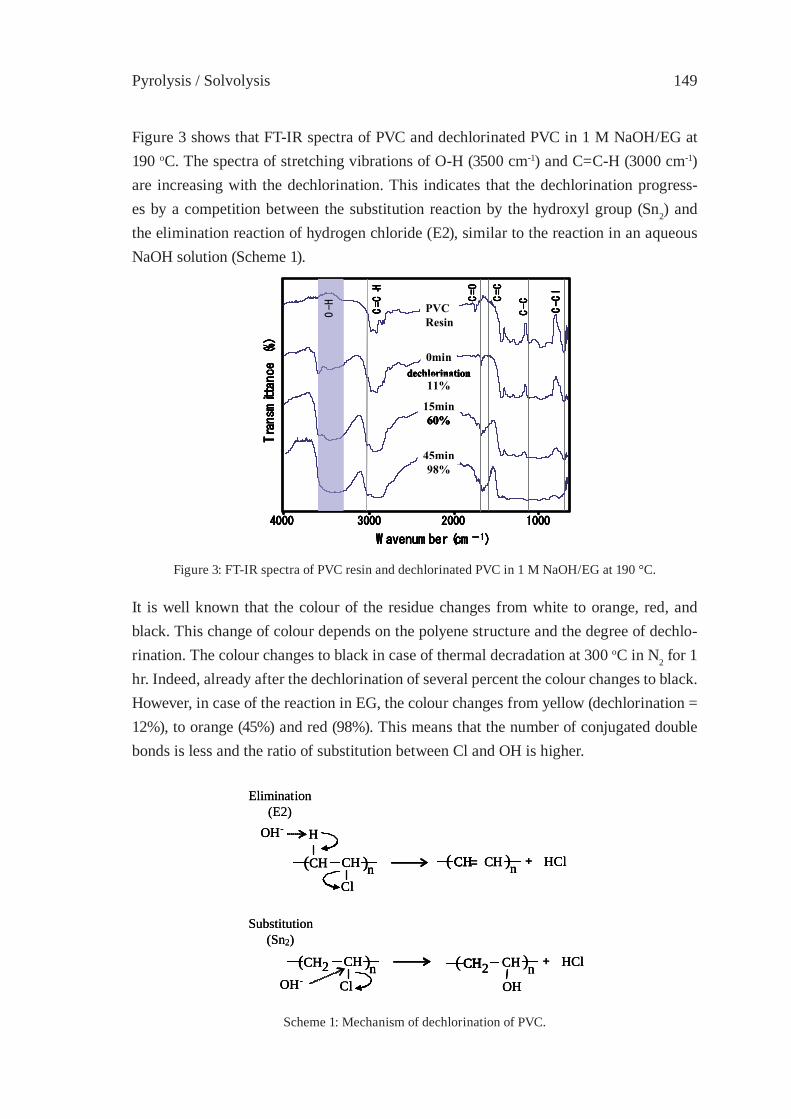
Pyrolysis / Solvolysis 149
Figure 3 shows that FT-IR spectra of PVC and dechlorinated PVC in 1 M NaOH/EG at 190 oC. The spectra of stretching vibrations of O-H (3500 cm-1) and C=C-H (3000 cm-1) are increasing with the dechlorination. This indicates that the dechlorination progress-es by a competition between the substitution reaction by the hydroxyl group (Sn2) and the elimination reaction of hydrogen chloride (E2), similar to the reaction in an aqueous NaOH solution (Scheme 1).
Elimination(E2)
Substitution(Sn2)
CH CH
H
Cl
CH= nCH CH + HCln
OH‑
( )( )
OH22CH CH
Cl
CH nCH CH + HClnOH‑
( )( )
Elimination(E2)
Substitution(Sn2)
CH CH
H
Cl
CH= nCH CH + HCln
OH‑
( )( )CH CH
H
Cl
CH= nCH CH + HCln
OH‑
( )( )
OH22CH CH
Cl
CH nCH CH + HClnOH‑
( )( )OH
22CH CH
Cl
CH nCH CH + HClnOH‑
( )( )
Figure 3: FT-IR spectra of PVC resin and dechlorinated PVC in 1 M NaOH/EG at 190 °C.
It is well known that the colour of the residue changes from white to orange, red, and black. This change of colour depends on the polyene structure and the degree of dechlo-rination. The colour changes to black in case of thermal decradation at 300 oC in N2 for 1 hr. Indeed, already after the dechlorination of several percent the colour changes to black. However, in case of the reaction in EG, the colour changes from yellow (dechlorination = 12%), to orange (45%) and red (98%). This means that the number of conjugated double bonds is less and the ratio of substitution between Cl and OH is higher.
Scheme 1: Mechanism of dechlorination of PVC.
TTransm
ittance (%)
4000 3000 2000 1000
W avenum ber (cm -1)
C-C
C=C‐H
O-H C=C
C-C
l
PVCResin
0min
15min
45minC=O
11%
60%
98%
dechlorination
Transm
ittance (%)
4000 3000 2000 1000
W avenum ber (cm -1)
C-C
C=C‐H
O-H C=C
C-C
l
PVCResin
0min
15min
45minC=O
11%
60%
98%
dechlorination
Transm
ittance (%)
4000 3000 2000 1000
W avenum ber (cm -1)
C-C
C=C‐H
O-H C=C
C-C
l
PVCResin
0min
15min
45minC=O
11%
60%
98%
dechlorination
Transm
ittance (%)
4000 3000 2000 1000
W avenum ber (cm -1)
C-C
C=C‐H
O-H C=C
C-C
l
PVCResin
0min
15min
45minC=O
11%
60%
98%
dechlorination
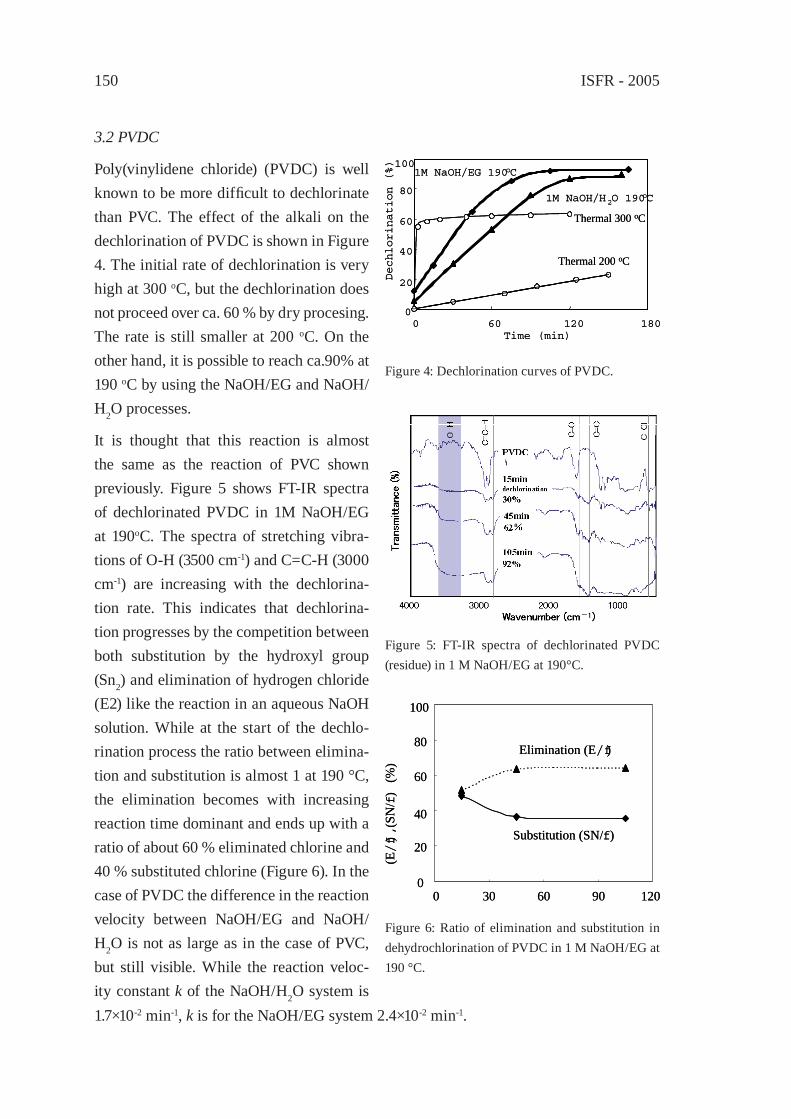
ISFR - 2005150
3.2 PVDC
Poly(vinylidene chloride) (PVDC) is well known to be more diffi cult to dechlorinate than PVC. The effect of the alkali on the dechlorination of PVDC is shown in Figure 4. The initial rate of dechlorination is very high at 300 oC, but the dechlorination does not proceed over ca. 60 % by dry procesing. The rate is still smaller at 200 oC. On the other hand, it is possible to reach ca.90% at 190 oC by using the NaOH/EG and NaOH/H2O processes.
It is thought that this reaction is almost the same as the reaction of PVC shown previously. Figure 5 shows FT-IR spectra of dechlorinated PVDC in 1M NaOH/EG at 190oC. The spectra of stretching vibra-tions of O-H (3500 cm-1) and C=C-H (3000 cm-1) are increasing with the dechlorina-tion rate. This indicates that dechlorina-tion progresses by the competition between both substitution by the hydroxyl group (Sn2) and elimination of hydrogen chloride (E2) like the reaction in an aqueous NaOH solution. While at the start of the dechlo-rination process the ratio between elimina-tion and substitution is almost 1 at 190 °C, the elimination becomes with increasing reaction time dominant and ends up with a ratio of about 60 % eliminated chlorine and 40 % substituted chlorine (Figure 6). In the case of PVDC the difference in the reaction velocity between NaOH/EG and NaOH/H2O is not as large as in the case of PVC, but still visible. While the reaction veloc-ity constant k of the NaOH/H2O system is
20
40
60
80
100
0
Dechlorination (%)
0 60 120 180Time (min)
Thermal 300 oC
Thermal 200 oC
1M NaOH/H2O 190 oC
1M NaOH/EG 190 oC
20
40
60
80
100
0
Dechlorination (%)
0 60 120 180Time (min)
Thermal 300 oC
Thermal 200 oC
1M NaOH/H2O 190 oC
1M NaOH/EG 190 oC
Figure 4: Dechlorination curves of PVDC.
Figure 5: FT-IR spectra of dechlorinated PVDC (residue) in 1 M NaOH/EG at 190°C.
Elimination (E/f )
0 30 60 90 120
(E/f ), (S
N/f )
(%)
20
40
60
80
100
0
Substitution (SN/f )
Elimination (E/f )
0 30 60 90 120
(E/f ), (S
N/f )
(%)
20
40
60
80
100
0
Substitution (SN/f )
Figure 6: Ratio of elimination and substitution in dehydrochlorination of PVDC in 1 M NaOH/EG at 190 °C.
1.7×10⁻² min-1, k is for the NaOH/EG system 2.4×10⁻² min-1.
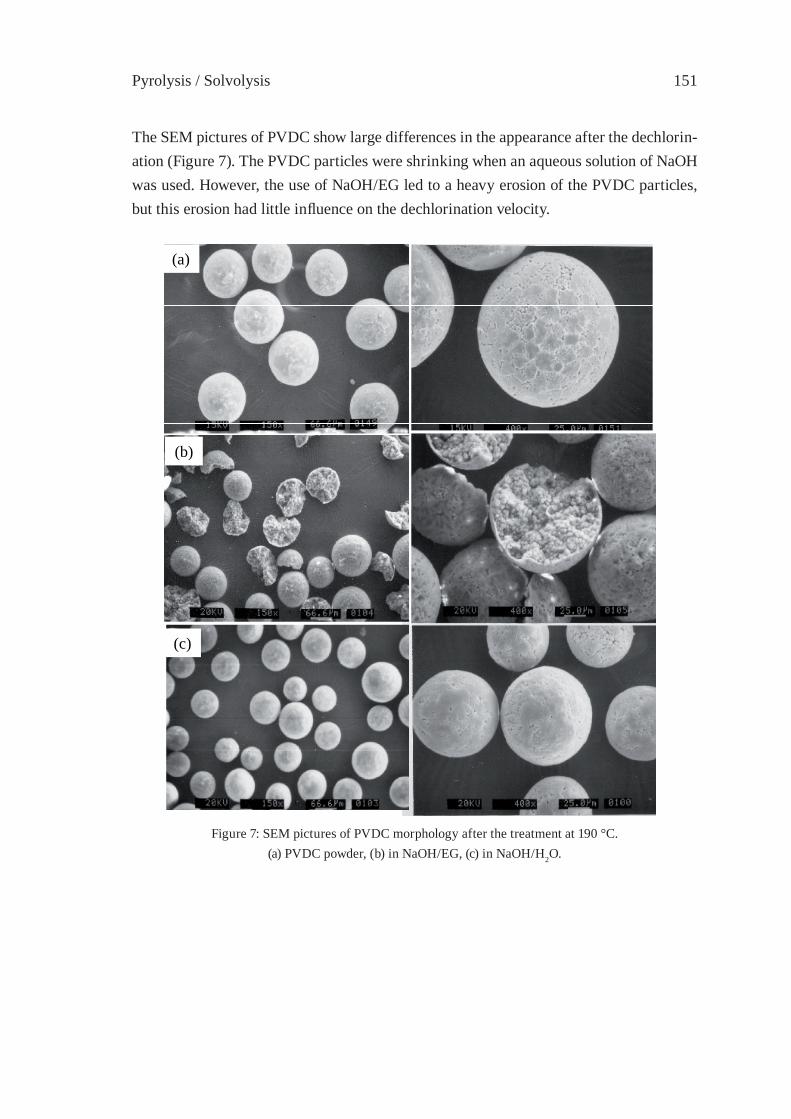
Pyrolysis / Solvolysis 151
The SEM pictures of PVDC show large differences in the appearance after the dechlorin-ation (Figure 7). The PVDC particles were shrinking when an aqueous solution of NaOH was used. However, the use of NaOH/EG led to a heavy erosion of the PVDC particles, but this erosion had little infl uence on the dechlorination velocity.
(a)
(b)
(c)
(a)
(b)
(c)
Figure 7: SEM pictures of PVDC morphology after the treatment at 190 °C.(a) PVDC powder, (b) in NaOH/EG, (c) in NaOH/H2O.
ISFR - 2005152
3. Conclusion
The use of the NaOH/EG system for the removal of chlorine out of highly chlorinated plastics increases the dechlorination velocity signifi cantly related to aqueous solutions of NaOH. The velocity has increased by the factor of 150 for PVC and by the factor of 1.5 for PVDC. Even if the SEM shows strong changes in the appearance of the plastics, the main reason for the higher dechlorination velocity is the better permeation of the plastics by the EG compared with water.
This results are interesting and indicate the possibility that highly chlorinated plastics such as PVC and PVDC, can be easily dechlorinated at moderate pressures and tempera-tures, in order to acchieve pumpable feedstocks for the use in crackers for heavy oil, for the reduction in blast furnaces, for hydrogenation processes, for pyrolysis, or the produc-tion of water-gas.
References
[1] T.Yoshioka, S.Yasuda, K.Kawamura, T.Sato and A.Okuwaki, Nippon Kagaku Kaishi, 1992, 534.
[2] T.Yoshioka, K.Furukawa, S.Sato and A.Okuwaki, Energy and Resources, 16, 165 (1995).
[3] T. Yoshioka, K.Furukawa, and A. Okuwaki, Polym. Degrad. Stab., 67, 285 (2000).[4] T.Yoshioka, K.Furukawa, T.Sato, and A.Okuwaki, J. App. Polym. Sci., 70, 129
(1998).[5] S.M. Shin, T. Yoshioka and A. Okuwaki, Polym. Degrad. Stab., 61, 349 (1998).[6] S.M. Shin, T. Yoshioka and A. Okuwaki, J. App. Polym. Sci., 67, 2171 (1998).[7] S. M. Shin, T. Yoshioka and A. Okuwaki, J. Jpn. Waste Management Experts, 9,
141 (1998).
Pyrolysis / Solvolysis 153
PYROLYSIS OF THE PLASTICS AND THERMOSETS FRACTIONS OF USED COMPUTERS AND LIQUID FRACTION UPGRADING
C. Vasile1, M.A. Brebu1, T. Karayildirim2, J. Yanik2 and H. Darie1
1Romanian Academy, “P.Poni” Institute of Macromolecular Chemistry, Department of Physical Chemistry of Polymers, 41A Grigore Ghica Voda Alley, Ro. 700487, IASI,
ROMANIA, [email protected] University, Faculty of Science, Department of Chemistry, 35100, Izmir, Turkey
Abstract: Pyrolysis of plastic and thermosets fractions (keyboard, case and printed cir-cuits board and their mixture) of used computers was studied by thermogravimetry and batch reactor pyrolysis. The degradation products before and after upgrading by thermal and thermocatalytic (over DHC-8 and a home made activated carbon catalyst) hydroge-nation were separated in three fractions, solid, liquid and gaseous, each of them being characterized by suitable methods such as gas chromatography (GC-MSD, GC-AED), infrared (IR) and 1H-NMR spectroscopy, elemental analysis, etc. The hydrogenation led to elimination of the most of hazardous toxic compounds mainly those containing bromi-ne, therefore upgraded pyrolysis liquids can be safely used as fuel or in petrochemical industry fl ows.
1. Introduction
Increased production of computers, the progress in their performance and design led to increased worn-out products and thus it become necessary to recover some materials and to protect environment of new type of pollution. The recent estimates of waste electric and electronic equipment (WEEE) arising, the results cover the period of 1998-2008 and suggest that the amount of waste electrical and electronic equipment will increase until 300,000-350,000 metric tons per annum is reached [1]. Electronic scrap is considered as a peculiar type of waste. They consist of thermoplastics (HIPS, ABS, ABS-PC) for casing and of thermosets (epoxy resins) as major printed circuits board (PCB) materials. Metal parts separated and sent to metal processing. It is high output of heavy metals to the environment and of waste streams. The most casing can be reprocessed. When try-ing to recover the plastic material from discarded electronic devices (~30 - 40 wt% from the WEEE), we have to take into consideration the unusually high halogen, nitrogen and sulphur content because pf fl ame-retardants incorporated and that the thermosetting poly-mers cannot be remoulded or reprocessed by remelting [2]. Pyrolysis seems to be a suitable way to recover materials and energy without components separation because the majority of the macromolecular organic substances decompose to volatile compounds at elevated temperatures, while metals, inorganic fi llers and supports generally remain unchanged, although an effi cient method to reduce the toxic compounds should be applied. The py-
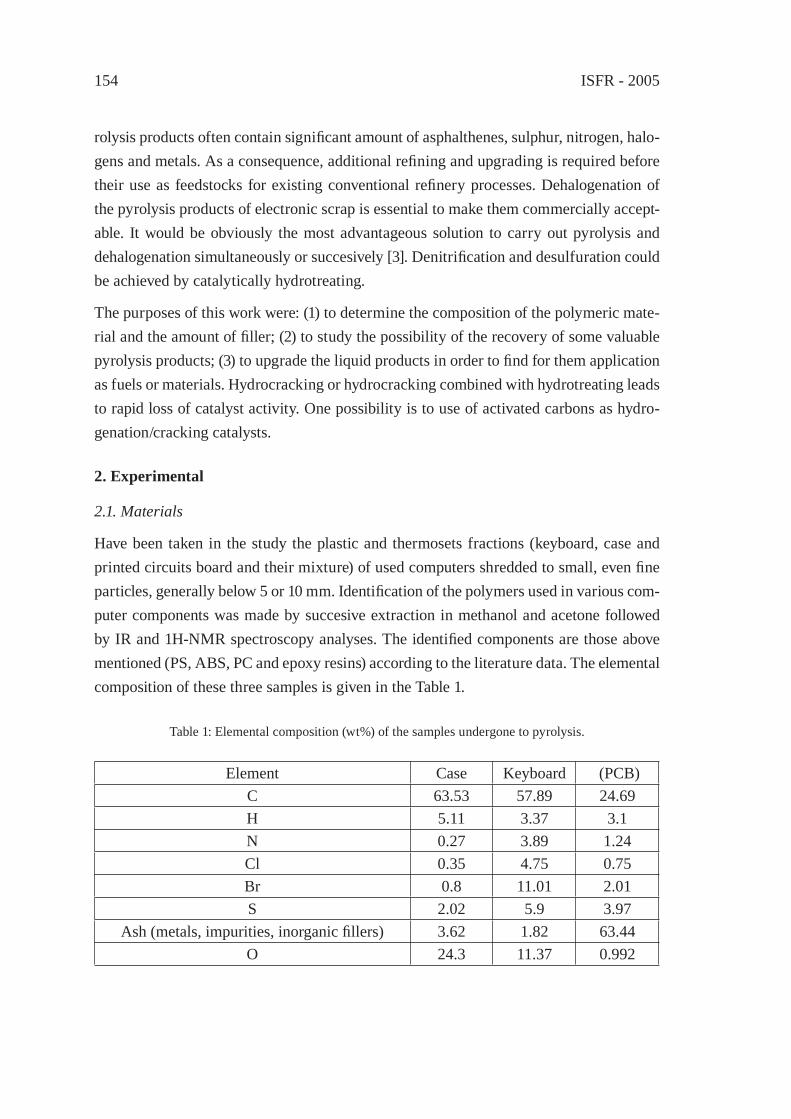
ISFR - 2005154
rolysis products often contain signifi cant amount of asphalthenes, sulphur, nitrogen, halo-gens and metals. As a consequence, additional refi ning and upgrading is required before their use as feedstocks for existing conventional refi nery processes. Dehalogenation of the pyrolysis products of electronic scrap is essential to make them commercially accept-able. It would be obviously the most advantageous solution to carry out pyrolysis and dehalogenation simultaneously or succesively [3]. Denitrifi cation and desulfuration could be achieved by catalytically hydrotreating.
The purposes of this work were: (1) to determine the composition of the polymeric mate-rial and the amount of fi ller; (2) to study the possibility of the recovery of some valuable pyrolysis products; (3) to upgrade the liquid products in order to fi nd for them application as fuels or materials. Hydrocracking or hydrocracking combined with hydrotreating leads to rapid loss of catalyst activity. One possibility is to use of activated carbons as hydro-genation/cracking catalysts.
2. Experimental
2.1. Materials
Have been taken in the study the plastic and thermosets fractions (keyboard, case and printed circuits board and their mixture) of used computers shredded to small, even fi ne particles, generally below 5 or 10 mm. Identifi cation of the polymers used in various com-puter components was made by succesive extraction in methanol and acetone followed by IR and 1H-NMR spectroscopy analyses. The identifi ed components are those above mentioned (PS, ABS, PC and epoxy resins) according to the literature data. The elemental composition of these three samples is given in the Table 1.
Table 1: Elemental composition (wt%) of the samples undergone to pyrolysis.
Element Case Keyboard (PCB)C 63.53 57.89 24.69H 5.11 3.37 3.1N 0.27 3.89 1.24Cl 0.35 4.75 0.75Br 0.8 11.01 2.01S 2.02 5.9 3.97
Ash (metals, impurities, inorganic fi llers) 3.62 1.82 63.44O 24.3 11.37 0.992
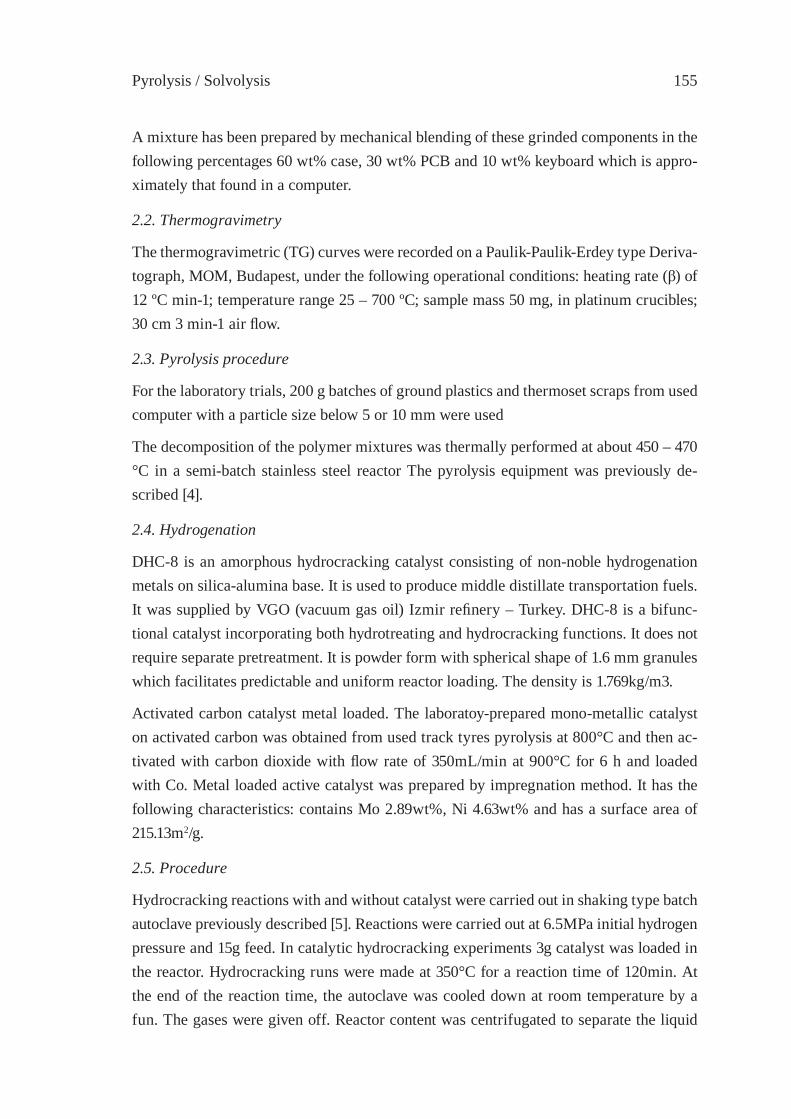
Pyrolysis / Solvolysis 155
A mixture has been prepared by mechanical blending of these grinded components in the following percentages 60 wt% case, 30 wt% PCB and 10 wt% keyboard which is appro-ximately that found in a computer.
2.2. Thermogravimetry
The thermogravimetric (TG) curves were recorded on a Paulik-Paulik-Erdey type Deriva-tograph, MOM, Budapest, under the following operational conditions: heating rate (β) of 12 ºC min-1; temperature range 25 – 700 ºC; sample mass 50 mg, in platinum crucibles; 30 cm 3 min-1 air fl ow.
2.3. Pyrolysis procedure
For the laboratory trials, 200 g batches of ground plastics and thermoset scraps from used computer with a particle size below 5 or 10 mm were used
The decomposition of the polymer mixtures was thermally performed at about 450 – 470 °C in a semi-batch stainless steel reactor The pyrolysis equipment was previously de-scribed [4].
2.4. Hydrogenation
DHC-8 is an amorphous hydrocracking catalyst consisting of non-noble hydrogenation metals on silica-alumina base. It is used to produce middle distillate transportation fuels. It was supplied by VGO (vacuum gas oil) Izmir refi nery – Turkey. DHC-8 is a bifunc-tional catalyst incorporating both hydrotreating and hydrocracking functions. It does not require separate pretreatment. It is powder form with spherical shape of 1.6 mm granules which facilitates predictable and uniform reactor loading. The density is 1.769kg/m3.
Activated carbon catalyst metal loaded. The laboratoy-prepared mono-metallic catalyst on activated carbon was obtained from used track tyres pyrolysis at 800°C and then ac-tivated with carbon dioxide with fl ow rate of 350mL/min at 900°C for 6 h and loaded with Co. Metal loaded active catalyst was prepared by impregnation method. It has the following characteristics: contains Mo 2.89wt%, Ni 4.63wt% and has a surface area of 215.13m2/g.
2.5. Procedure
Hydrocracking reactions with and without catalyst were carried out in shaking type batch autoclave previously described [5]. Reactions were carried out at 6.5MPa initial hydrogen pressure and 15g feed. In catalytic hydrocracking experiments 3g catalyst was loaded in the reactor. Hydrocracking runs were made at 350°C for a reaction time of 120min. At the end of the reaction time, the autoclave was cooled down at room temperature by a fun. The gases were given off. Reactor content was centrifugated to separate the liquid
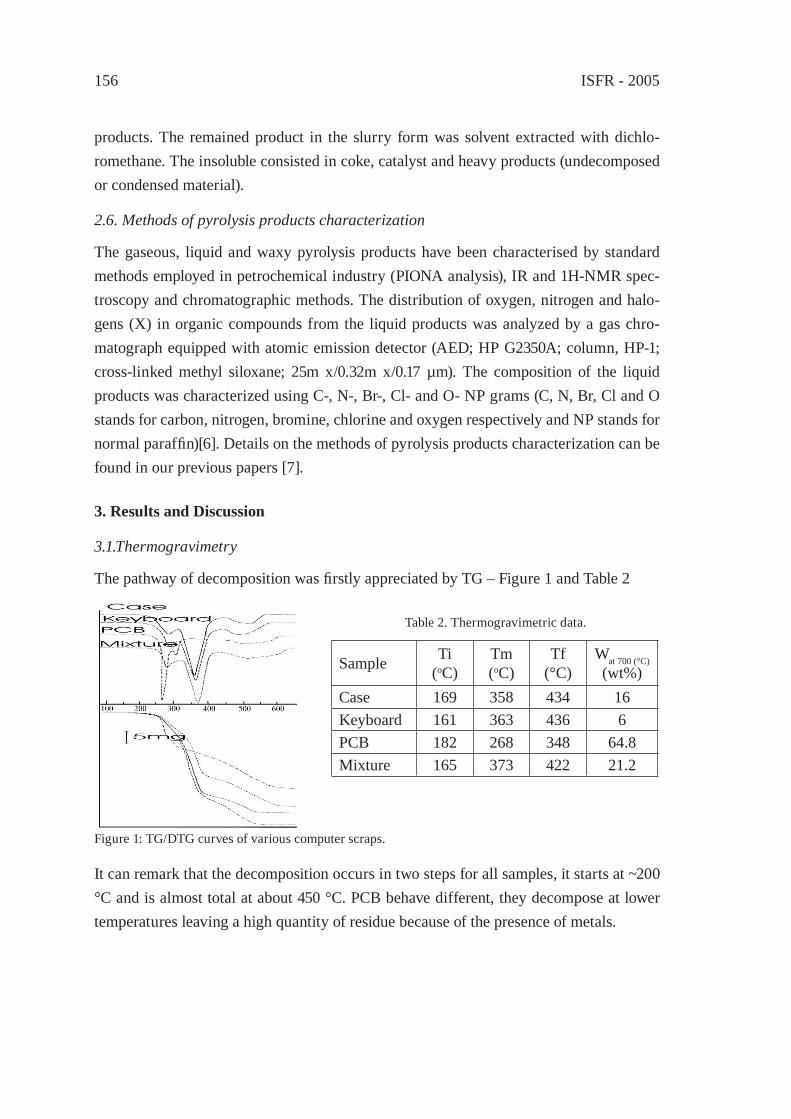
ISFR - 2005156
products. The remained product in the slurry form was solvent extracted with dichlo-romethane. The insoluble consisted in coke, catalyst and heavy products (undecomposed or condensed material).
2.6. Methods of pyrolysis products characterization
The gaseous, liquid and waxy pyrolysis products have been characterised by standard methods employed in petrochemical industry (PIONA analysis), IR and 1H-NMR spec-troscopy and chromatographic methods. The distribution of oxygen, nitrogen and halo-gens (X) in organic compounds from the liquid products was analyzed by a gas chro-matograph equipped with atomic emission detector (AED; HP G2350A; column, HP-1; cross-linked methyl siloxane; 25m x/0.32m x/0.17 µm). The composition of the liquid products was characterized using C-, N-, Br-, Cl- and O- NP grams (C, N, Br, Cl and O stands for carbon, nitrogen, bromine, chlorine and oxygen respectively and NP stands for normal paraffi n)[6]. Details on the methods of pyrolysis products characterization can be found in our previous papers [7].
3. Results and Discussion
3.1.Thermogravimetry
The pathway of decomposition was fi rstly appreciated by TG – Figure 1 and Table 2
Table 2. Thermogravimetric data.
Sample Ti (oC)
Tm (oC)
Tf (°C)
Wat 700 (°C) (wt%)
Case 169 358 434 16Keyboard 161 363 436 6PCB 182 268 348 64.8Mixture 165 373 422 21.2
Figure 1: TG/DTG curves of various computer scraps.
It can remark that the decomposition occurs in two steps for all samples, it starts at ~200 °C and is almost total at about 450 °C. PCB behave different, they decompose at lower temperatures leaving a high quantity of residue because of the presence of metals.
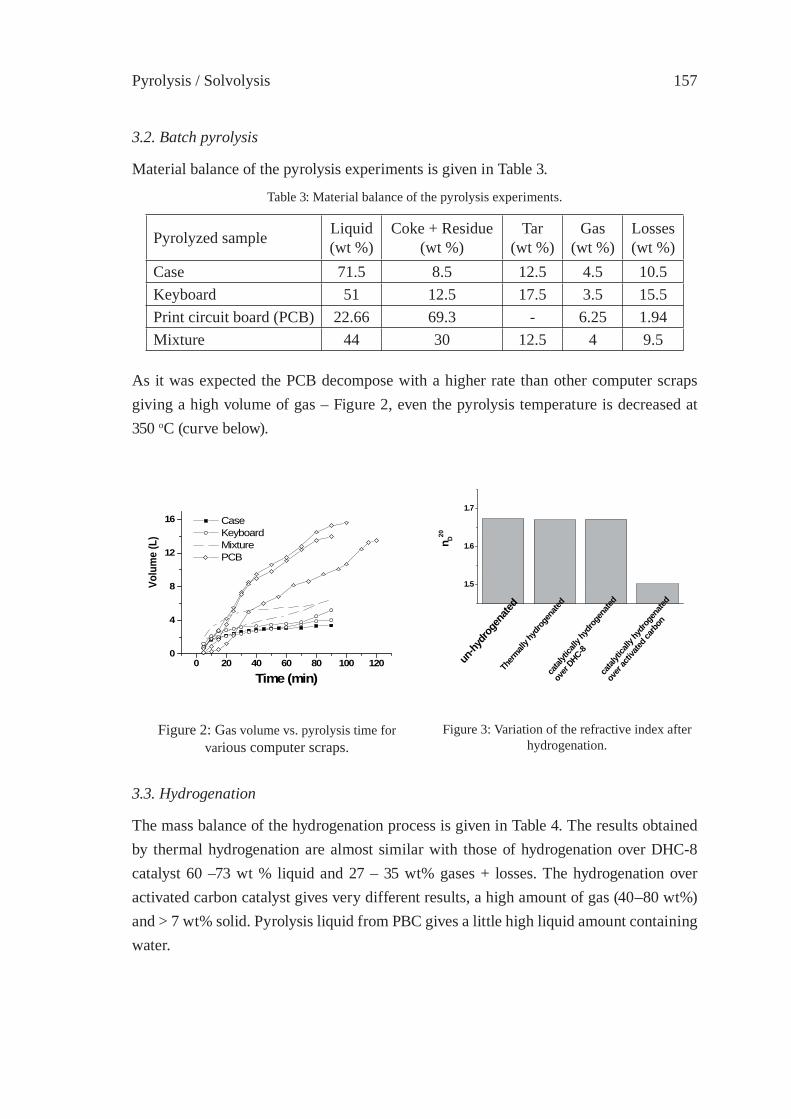
Pyrolysis / Solvolysis 157
3.2. Batch pyrolysis
Material balance of the pyrolysis experiments is given in Table 3.
Table 3: Material balance of the pyrolysis experiments.
Pyrolyzed sample Liquid(wt %)
Coke + Residue(wt %)
Tar(wt %)
Gas(wt %)
Losses(wt %)
Case 71.5 8.5 12.5 4.5 10.5Keyboard 51 12.5 17.5 3.5 15.5Print circuit board (PCB) 22.66 69.3 - 6.25 1.94Mixture 44 30 12.5 4 9.5
As it was expected the PCB decompose with a higher rate than other computer scraps giving a high volume of gas – Figure 2, even the pyrolysis temperature is decreased at 350 oC (curve below).
0 20 40 60 80 100 1200
4
8
12
16
Volu
me
(L)
Time (min)
Case Keyboard Mixture PCB
1.5
1.6
1.7
catal
ytica
lly hy
drog
enate
d
over
activ
ated c
arbon
catal
ytica
lly hy
drog
enate
d
over
DHC-8un
-hydr
ogen
ated
Therm
ally h
ydro
gena
ted
n D20
Figure 2: Gas volume vs. pyrolysis time for
various computer scraps.Figure 3: Variation of the refractive index after
hydrogenation.
3.3. Hydrogenation
The mass balance of the hydrogenation process is given in Table 4. The results obtained by thermal hydrogenation are almost similar with those of hydrogenation over DHC-8 catalyst 60 –73 wt % liquid and 27 – 35 wt% gases + losses. The hydrogenation over activated carbon catalyst gives very different results, a high amount of gas (40–80 wt%) and > 7 wt% solid. Pyrolysis liquid from PBC gives a little high liquid amount containing water.
ISFR - 2005158
Table 4: Mass balance of hydrogenation processes.
Nr. Hydrogenation processT= 350 oC
Liquid (wt%)
Solid (wt%)
Gas and losses (wt%)
KeyboardThermal 62.5 0.3 35.5Catalytic DHC-8 70.47 2.01 29.53Catalytic activated carbon 23.2 6.69 70.11
CaseThermal 64.84 3.87 31.29Catalytic DHC-8 60.65 2.1 37.35Catalytic activated carbon 11.35 10.03 78.62
MixtureThermal 72.39 0.133 27.48Catalytic DHC-8 65.67 0.06 34.27Catalytic activated carbon 49.11 3.32 47.57
In the case of hydrogenation over activated carbon, the change in composition is also sig-nifi cant because the refractive indices of the pyrolysis oil decreases mainly after catalyti-cally hydrogenation over activated carbon – Figure 3. The 1H-NMR spectra and GC-MS chromatograms of all three kinds of liquid pyrolysis products are almost similar, however the signals corresponding to the unsaturated structures (3 – 5.5 ppm) are much higher for liquid resulted from keyboard than those in the spectrum of liquid from case, while those of liquid from the mixture have signals of intermediary height. After hydrogenation these signals dissapear – Table 5 - the aromatic hydrocarbons content remains approximately constant, isoparaffi ns content increases while olefi ns are eliminated as appears both from 1H-NMR spectra – Table 5 and chromatographic analyses – Figures 4.
Table 5: Hydrocarbons content (vol %) (from 1-NMR spectra) of the pyrolysis oil of polymer mixture before and after hydrogenation.
Sample Aromatic Paraffi ns Olefi ns H/C Isoparaffi n index RON
Mixture unhydrogenated 62.75 0 47.89 0.99 0.01 87.02
Thermally hydrogenated 72.43 27.57 0 1.21 0.05 88.39
Hydrogenated over DHC-8 66.70 33.30 0 1.21 0.04 87.73
Hydrogenated over activated carbon 65.51 34.49 0 1.25 0.04 87.56
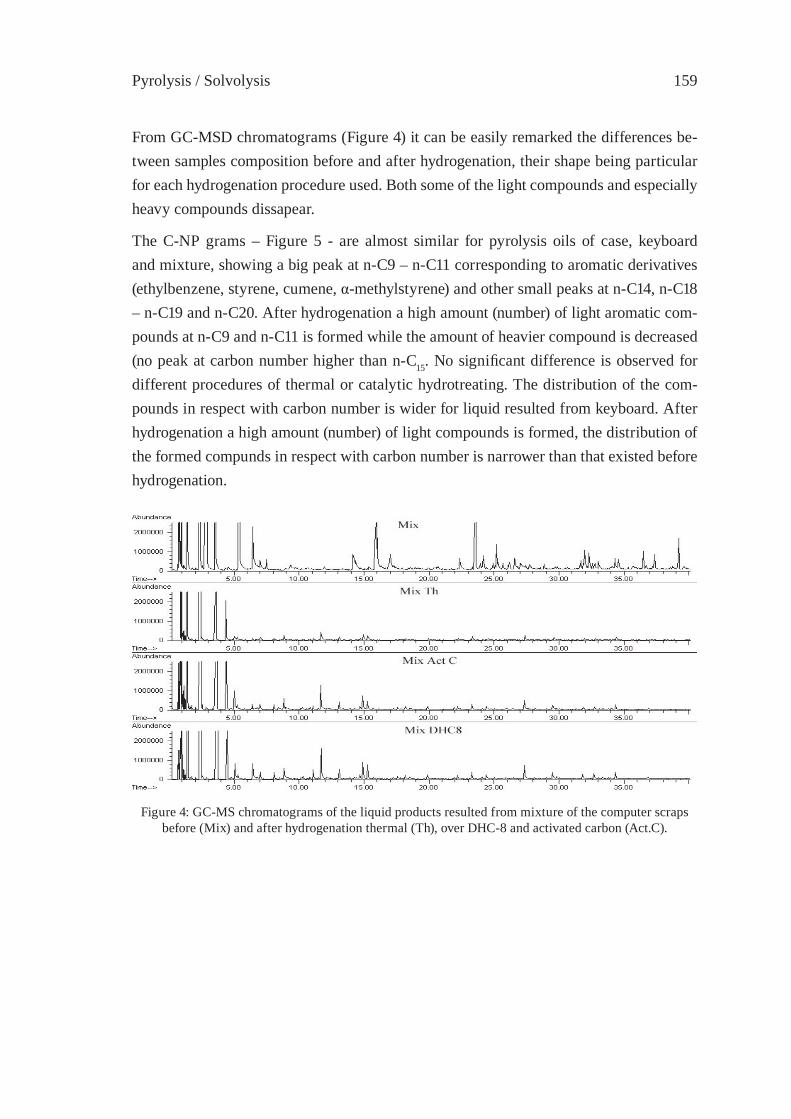
Pyrolysis / Solvolysis 159
From GC-MSD chromatograms (Figure 4) it can be easily remarked the differences be-tween samples composition before and after hydrogenation, their shape being particular for each hydrogenation procedure used. Both some of the light compounds and especially heavy compounds dissapear.
The C-NP grams – Figure 5 - are almost similar for pyrolysis oils of case, keyboard and mixture, showing a big peak at n-C9 – n-C11 corresponding to aromatic derivatives (ethylbenzene, styrene, cumene, α-methylstyrene) and other small peaks at n-C14, n-C18 – n-C19 and n-C20. After hydrogenation a high amount (number) of light aromatic com-pounds at n-C9 and n-C11 is formed while the amount of heavier compound is decreased (no peak at carbon number higher than n-C15. No signifi cant difference is observed for different procedures of thermal or catalytic hydrotreating. The distribution of the com-pounds in respect with carbon number is wider for liquid resulted from keyboard. After hydrogenation a high amount (number) of light compounds is formed, the distribution of the formed compunds in respect with carbon number is narrower than that existed before hydrogenation.
Figure 4: GC-MS chromatograms of the liquid products resulted from mixture of the computer scraps before (Mix) and after hydrogenation thermal (Th), over DHC-8 and activated carbon (Act.C).
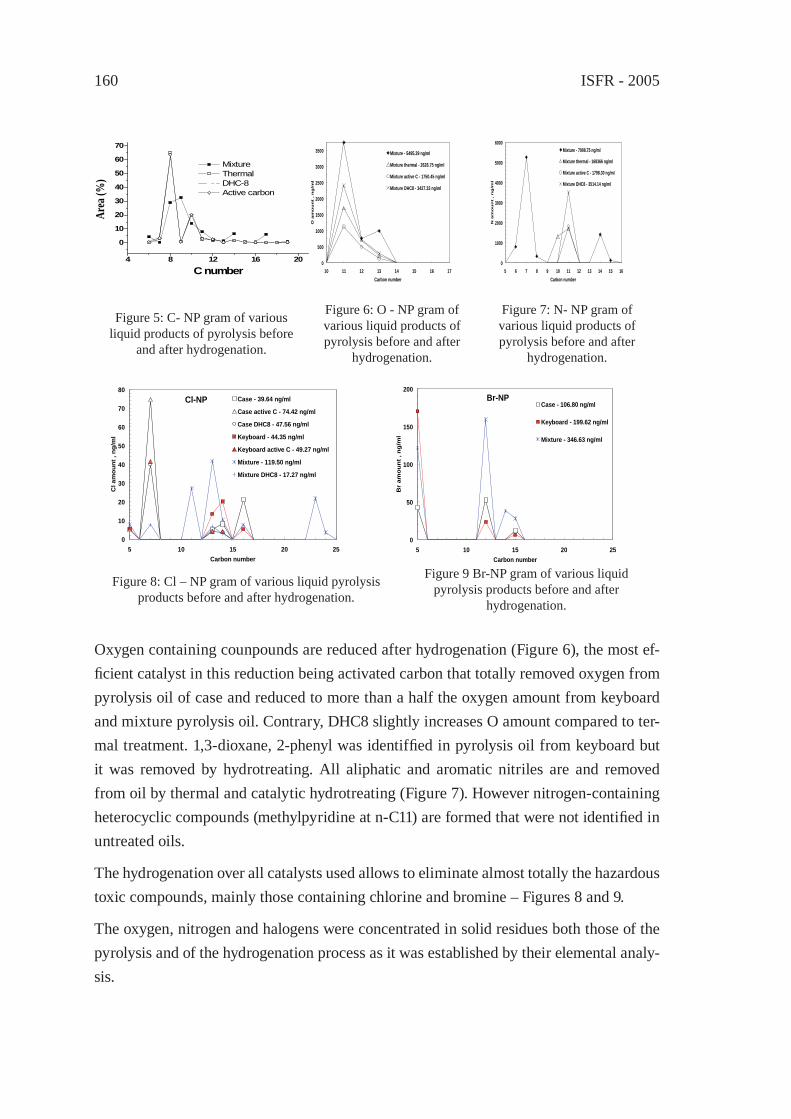
ISFR - 2005160
4 8 12 16 20
0
10
20
30
40
50
60
70
Mixture Thermal DHC-8 Active carbon
Area
(%)
C number0
500
1000
1500
2000
2500
3000
3500
10 11 12 13 14 15 16 17Carbon number
O a
mo
un
t , n
g/m
l
Mixture - 5495.39 ng/ml
Mixture thermal - 2626.75 ng/ml
Mixture active C - 1750.45 ng/ml
Mixture DHC8 - 3427.33 ng/ml
0
1000
2000
3000
4000
5000
6000
5 6 7 8 9 10 11 12 13 14 15 16Carbon number
N a
mo
un
t , n
g/m
l
Mixture - 7908.75 ng/ml
Mixture thermal - 168366 ng/ml
Mixture active C - 1798.30 ng/ml
Mixture DHC8 - 3514.14 ng/ml
Figure 5: C- NP gram of various liquid products of pyrolysis before
and after hydrogenation.
Figure 6: O - NP gram of various liquid products of pyrolysis before and after
hydrogenation.
Figure 7: N- NP gram of various liquid products of pyrolysis before and after
hydrogenation.
0
10
20
30
40
50
60
70
80
5 10 15 20 25Carbon number
Cl a
mou
nt ,
ng/m
l
Case - 39.64 ng/ml
Case active C - 74.42 ng/ml
Case DHC8 - 47.56 ng/ml
Keyboard - 44.35 ng/ml
Keyboard active C - 49.27 ng/ml
Mixture - 119.50 ng/ml
Mixture DHC8 - 17.27 ng/ml
Cl-NP
0
50
100
150
200
5 10 15 20 25Carbon number
Br
amo
un
t , n
g/m
lCase - 106.80 ng/ml
Keyboard - 199.62 ng/ml
Mixture - 346.63 ng/ml
Br-NP
Figure 8: Cl – NP gram of various liquid pyrolysis products before and after hydrogenation.
Figure 9 Br-NP gram of various liquid pyrolysis products before and after
hydrogenation.
Oxygen containing counpounds are reduced after hydrogenation (Figure 6), the most ef-fi cient catalyst in this reduction being activated carbon that totally removed oxygen from pyrolysis oil of case and reduced to more than a half the oxygen amount from keyboard and mixture pyrolysis oil. Contrary, DHC8 slightly increases O amount compared to ter-mal treatment. 1,3-dioxane, 2-phenyl was identiffi ed in pyrolysis oil from keyboard but it was removed by hydrotreating. All aliphatic and aromatic nitriles are and removed from oil by thermal and catalytic hydrotreating (Figure 7). However nitrogen-containing heterocyclic compounds (methylpyridine at n-C11) are formed that were not identifi ed in untreated oils.
The hydrogenation over all catalysts used allows to eliminate almost totally the hazardous toxic compounds, mainly those containing chlorine and bromine – Figures 8 and 9.
The oxygen, nitrogen and halogens were concentrated in solid residues both those of the pyrolysis and of the hydrogenation process as it was established by their elemental analy-sis.
Pyrolysis / Solvolysis 161
4. Conclusions
Pyrolysis experiments were carried out in order to recover valuable products and/or en-ergy from thermoplastics and thermosts fraction of computer wastes. The temperature range of 430 – 460 oC was found to be the optimal interval for pyrolysis experiments. After hydrogenation most of the hazardeous compounds have been eliminated, therefore the upgraded pyrolysis products can be safely used as fuel or in petrochemical industry.
5. References
[1] Feszty K., Murchison C., Baird J., Jamnejad G.,Waste Management & Research, 21 207, (2003).
[2] Allred R.E., Sampe J. 32, 46 (1996).[3] Mazzocchiaa C., Kaddouri A., Modica G., Nannicini R., Audisio G., Barbieri C.,
Bertini F., J. Anal. Appl. Pyrolysis 70, 263 (2003).[4] Vasile C., Pakdel H., Brebu M., Onu P., Darie H., Ciocăleu S.: J. Anal. Appl. Pyrolysis,
57, 287 (2001).[5] Karagoz S., Karayildirim T., Ucar S., Yuksel M., Yanik J., Fuel 82 415 – 423,(2003).[6] Murata K., Makino M., Nippon Kagaku Kaishi, 1, 192 (1975).[7] Brebu M., Vasile C., Darie R, Darie H., Uddin Md. A., Sakata Y.: Revue Roumaine
de Chimie, 47 (10-11) 1185 (2002).[8] Shiraga Y.,. Uddin M. A, Muto A., Narazaki M., Sakata Y., Murata K., Proc. 1998 Int.
Symp. on Advanced Energy Technology, Sapporo, 185 (1998).

ISFR - 2005162
Pyrolysis / Solvolysis 163
PYROLYSIS OF HALOGEN-CONTAININGPOLYMER MIXTURES
E. Jakab1*, T. Bhaskar2 and Y. Sakata2
1Institute of Materials and Environmental Chemistry, Chemical Research Center, Hungarian Academy of Sciences, H-1525 Budapest P.O. Box 17, Hungary
2Department of Applied Chemistry, Okayama University, 3-1-1 Tsushima-Naka, Okayama 700-8530, Japan, [email protected]
Abstract: The thermal decomposition of various mixtures of ABS, PET and PVC has been studied in order to clarify the reactions between the components of mixed polymers. ABS contains brominated epoxi resin fl ame retardant and antimony trioxide synergist. It was established that the decomposition rate curves (DTG) of the mixtures were different from the summed curves of the individual components indicating the interactions between the decomposition reactions of the polymer components. The dehydrochlorination rate of PVC was sensitive for the presence of other components. Brominated and chlorinated aromatic esters were detected from the mixtures containing PET and halogen-contain-ing polymers. It is concluded that reactions occur between the polymer components and fl ame retardants and hydrogen chloride released from PVC.
1. Introduction
Incineration of halogen-containing polymers leads to the formation of harmful halogen-ated dioxins. Therefore pyrolysis seems a more promising alternative for the recycling of halogen-containing plastic waste. Pyrolysis produces valuable chemicals or fuels from waste plastics. However, pyrolytic recycling of waste plastics of halogen content requires special attention since it should be combined with the elimination of halogenated prod-ucts. In order to elaborate a proper dehalogenation process, detailed knowledge of the reaction mechanisms of the formation of halogenated products is necessary. Luda et al [1] studied the thermal decomposition of fi re retardant epoxi resins based on diglycidyl ether of bisphenol A and identifi ed various mono- and dibrominated phenols and aliphatic products. The formation of various brominated aromatic products was monitored dur-ing pyrolysis of fl ame-retarded high-impact polystyrene (HIPS) [2]. Chlorinated organic compounds have been identifi ed in the pyrolysis oil of the mixture of poly(vinyl chloride) (PVC) and poly(ethylene terephthalate) (PET) [3]. PVC generally affects the decomposi-tion of other polymers due to the catalytic effect of HCl released [4-7]. Dehydrochlorina-tion of PVC is promoted by the presence of polyamides and polyacrylonitrile [8]. Sakata et al. [9-11] studied the catalytic dehalogenation process of chlorinated and brominated or-ganic compounds formed during the pyrolysis of mixed plastics. Knümann and Bochorn [12] have studied the decomposition of PVC-containing polymer mixtures and concluded

ISFR - 2005164
that a separation of plastic mixtures is possible by temperature-controlled pyrolysis in recycling processes.
The major components of the waste from electric and electronic equipment are HIPS and acrylonitrile-butadiene-styrene copolymer (ABS), which contain brominated fl ame re-tardants. However, the waste plastics from residential electronics recycling contain other polymers including PE, PP, PVC and PET. The components of mixed plastics infl uence the thermal decomposition of each others during pyrolysis. The aim of the present work is to investigate the thermal decomposition process of polymer mixtures that can be present in plastics waste. The thermal decomposition at low heating rate has been monitored by thermogravimetry/mass spectrometry (TG/MS), while the fast pyrolysis processes have been studied by pyrolysis-gas chromatography/mass spectrometry (Py-GC/MS).
2. Experimental
2.1. Samples
Poly(ethylene terephthalate) (PET) was obtained from Eastman Kodak Co., Ltd and poly(vinyl chloride) (PVC) from Geon Chemical Co. Ltd. Japan. Commercially available acrilonitrile-butadiene-styrene copolymer (ABS) containing brominated epoxy oligomer fl ame retardant and Sb2O3 synergist was used in the present investigation. The samples were mechanically mixed to simulate the situation in the municipal waste.
2.2. Methods
2.2.1. Thermogravimetry/mass spectrometry (TG/MS)
The TG/MS system is built of a Perkin-Elmer TGS-2 thermobalance and a HIDEN HAL 2/301 PIC quadrupole mass spectrometer. Typically 0.5-1 mg polymer samples were placed into the platinum sample pan and heated at a 10 °C min-1 up to 600 °C in argon atmosphere. Portions of the volatile products were introduced into the mass spectrometer through a glass lined metal capillary transfer line heated to 300°. The quadrupole mass spectrometer operated at a 70 eV electron energy.
2.2.2. Pyrolysis–gas chromatography/mass spectrometry (Py–GC/MS)
Pyrolysis experiments were carried out on a Pyroprobe 2000 pyrolyzer (Chemical Data Systems). About 0.5 mg samples were pyrolyzed at 600 °C (calibrated temperature) for 20 s in a quartz tube using helium as a carrier gas. Analysis of the volatile products was accomplished on line with a GC/MS (Agilent Techn. Inc. 6890 GC / 5973 MSD) using HP-5MS capillary column (30 m × 0.25 mm i.d., 0.25 µm fi lm thickness). The pyrolysis interface and the GC injector were kept at 320 and 300 °C, respectively. The GC oven was programmed to hold at 40 °C for 1 min and then increase to 320 °C at a rate of 10 °C
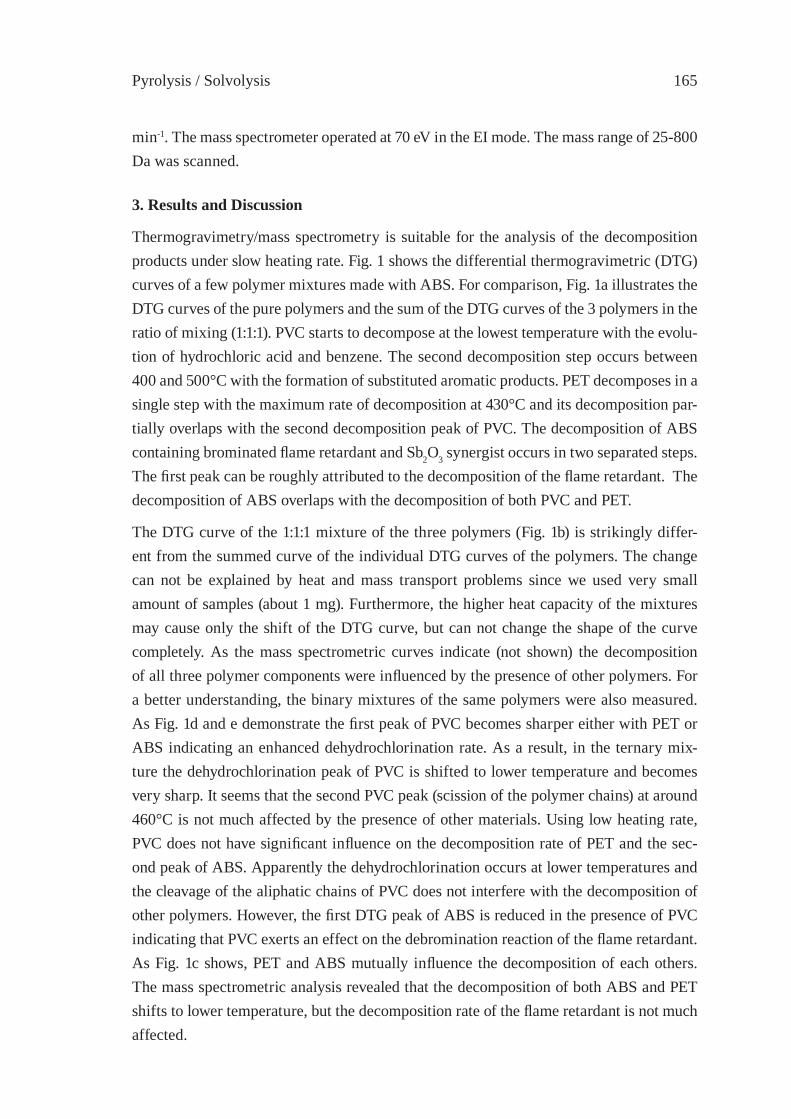
Pyrolysis / Solvolysis 165
min-1. The mass spectrometer operated at 70 eV in the EI mode. The mass range of 25-800 Da was scanned.
3. Results and Discussion
Thermogravimetry/mass spectrometry is suitable for the analysis of the decomposition products under slow heating rate. Fig. 1 shows the differential thermogravimetric (DTG) curves of a few polymer mixtures made with ABS. For comparison, Fig. 1a illustrates the DTG curves of the pure polymers and the sum of the DTG curves of the 3 polymers in the ratio of mixing (1:1:1). PVC starts to decompose at the lowest temperature with the evolu-tion of hydrochloric acid and benzene. The second decomposition step occurs between 400 and 500°C with the formation of substituted aromatic products. PET decomposes in a single step with the maximum rate of decomposition at 430°C and its decomposition par-tially overlaps with the second decomposition peak of PVC. The decomposition of ABS containing brominated fl ame retardant and Sb2O3 synergist occurs in two separated steps. The fi rst peak can be roughly attributed to the decomposition of the fl ame retardant. The decomposition of ABS overlaps with the decomposition of both PVC and PET.
The DTG curve of the 1:1:1 mixture of the three polymers (Fig. 1b) is strikingly differ-ent from the summed curve of the individual DTG curves of the polymers. The change can not be explained by heat and mass transport problems since we used very small amount of samples (about 1 mg). Furthermore, the higher heat capacity of the mixtures may cause only the shift of the DTG curve, but can not change the shape of the curve completely. As the mass spectrometric curves indicate (not shown) the decomposition of all three polymer components were infl uenced by the presence of other polymers. For a better understanding, the binary mixtures of the same polymers were also measured. As Fig. 1d and e demonstrate the fi rst peak of PVC becomes sharper either with PET or ABS indicating an enhanced dehydrochlorination rate. As a result, in the ternary mix-ture the dehydrochlorination peak of PVC is shifted to lower temperature and becomes very sharp. It seems that the second PVC peak (scission of the polymer chains) at around 460°C is not much affected by the presence of other materials. Using low heating rate, PVC does not have signifi cant infl uence on the decomposition rate of PET and the sec-ond peak of ABS. Apparently the dehydrochlorination occurs at lower temperatures and the cleavage of the aliphatic chains of PVC does not interfere with the decomposition of other polymers. However, the fi rst DTG peak of ABS is reduced in the presence of PVC indicating that PVC exerts an effect on the debromination reaction of the fl ame retardant. As Fig. 1c shows, PET and ABS mutually infl uence the decomposition of each others. The mass spectrometric analysis revealed that the decomposition of both ABS and PET shifts to lower temperature, but the decomposition rate of the fl ame retardant is not much affected.
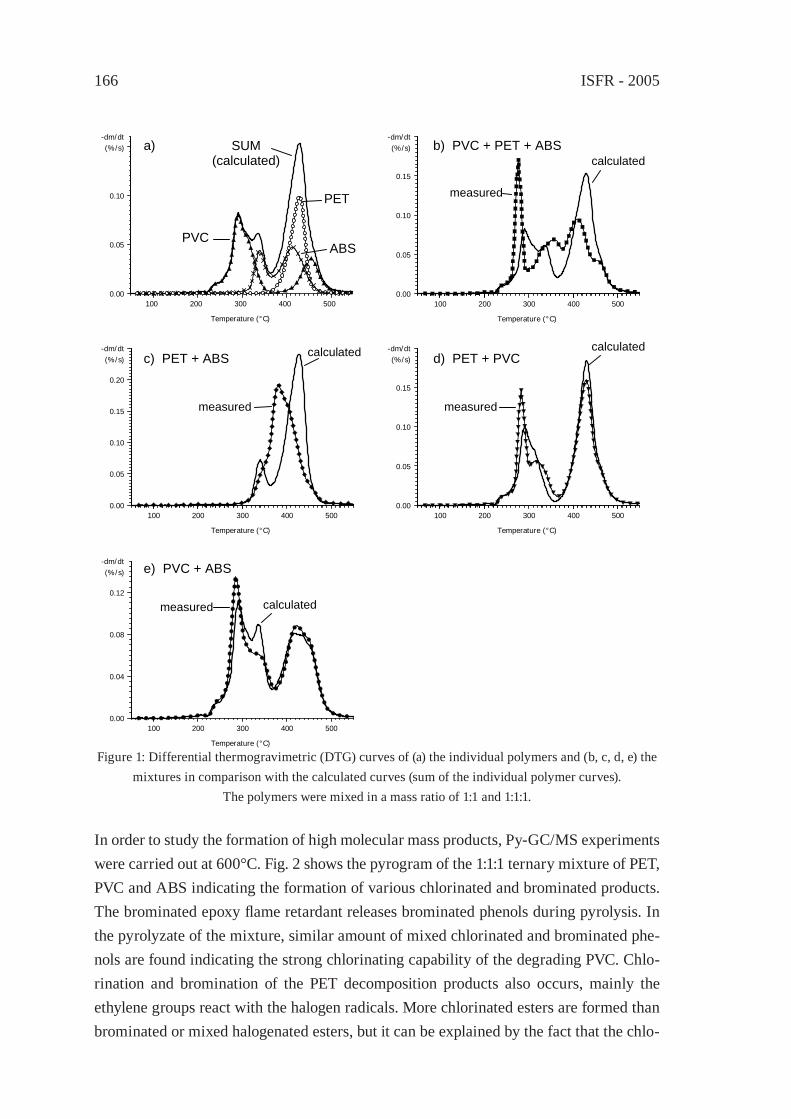
ISFR - 2005166
Figure 1: Differential thermogravimetric (DTG) curves of (a) the individual polymers and (b, c, d, e) the mixtures in comparison with the calculated curves (sum of the individual polymer curves).
The polymers were mixed in a mass ratio of 1:1 and 1:1:1.
In order to study the formation of high molecular mass products, Py-GC/MS experiments were carried out at 600°C. Fig. 2 shows the pyrogram of the 1:1:1 ternary mixture of PET, PVC and ABS indicating the formation of various chlorinated and brominated products. The brominated epoxy fl ame retardant releases brominated phenols during pyrolysis. In the pyrolyzate of the mixture, similar amount of mixed chlorinated and brominated phe-nols are found indicating the strong chlorinating capability of the degrading PVC. Chlo-rination and bromination of the PET decomposition products also occurs, mainly the ethylene groups react with the halogen radicals. More chlorinated esters are formed than brominated or mixed halogenated esters, but it can be explained by the fact that the chlo-
Temperature (°C)
100 200 300 400 5000.00
0.04
0.08
0.12
-dm/dt(%/s)
measured calculated
e) PVC + ABS
Temperature (°C)
100 200 300 400 5000.00
0.05
0.10
0.15
-dm/dt(%/s) b) PVC + PET + ABS
measured
calculated
Temperature (°C)
100 200 300 400 5000.00
0.05
0.10
-dm/dt(%/s)
PVC
SUM (calculated)
a)
PET
ABS
Temperature (°C)
100 200 300 400 5000.00
0.05
0.10
0.15
0.20
-dm/dt(%/s) c) PET + ABS
measured
calculated
Temperature (°C)
100 200 300 400 5000.00
0.05
0.10
0.15
-dm/dt(%/s)
measured
calculated d) PET + PVC

Pyrolysis / Solvolysis 167
rine content of PVC is higher than the bromine content of ABS. It can be concluded that all the tree polymers infl uence the decomposition of each others and signifi cant amount of various chlorinated and brominated products are released during the decomposition of the mixture.
Figure 2: Total ion chromatogram of the pyrolysis products of the mixture of PET + PVC + ABS.
Acknowledgements
This study was supported by the Hungarian National Research Fund (OTKA No. T037704 and T047377).
References
[1] M.P. Luda, A.I. Balabanovich, G. Camino, J. Anal. Appl. Pyrol., 65 (2002) 25-40.[2] E. Jakab, Md.A. Uddin, T. Bhaskar, Y. Sakata, J. Anal. Appl. Pyrol., 68-69 (2003)
83-99.[3] K. Kulesza, K. German, J. Anal. Appl. Pyrol., 67 (2003) 123-134.[4] M. Blazsó, B. Zelei, and E. Jakab, J. Anal. Appl. Pyrol., 1995, 35, 221.[5] F. Kubatovics and M. Blazsó, Macromol. Chem. Phys., 2000, 201, 349.[6] Z. Czégény and M. Blazsó, J. Anal. Appl. Pyrol., 2001, 58-59, 95.
ISFR - 2005168
[7] M. Day, J. D. Cooney, C. Touchette-Barrette, and S. E Sheehan, J. Anal. Appl. Pyrol., 1999, 52, 199.
[8] Z. Czégény, E. Jakab, and M. Blazsó, Macromol. Mater. Eng., 2002, 287, 277.[9] Y. Sakata, Md.A. Uddin, A. Muto, M. Narazaki, K, Koizumi, K. Murata, M. Kaji,
Ind. Eng. Chem. Res., 37 (1998) 2889-2892.[10] Md.A. Uddin, T. Bhaskar, J. Kaneko, A. Muto, Y. Sakata, T. Matsui, Fuel, 81 (2002)
1819-1825.[11] T. Bhaskar, J. Kaneko, A. Muto, Y. Sakata, E. Jakab, T. Matsui, Md.A. Uddin, J.
Anal. Appl. Pyrol., 72 (2004) 27-33.[12] R. Knümann and H. Bockhorn, Combust. Sci. Technol., 1994, 101, 285.
Pyrolysis / Solvolysis 169
PYROLYSIS STUDY OF PVC - METAL OXIDE MIXTURES: QUANTITATIVE PRODUCTS ANALYSIS AND
CHLORINE FIXATION ABILITY OF METAL OXIDESY. Masuda, T. Uda, O. Terakado1* and M. Hirasawa1
Institute of Multidisciplinary Research for Advanced Materials, Tohoku University, Sendai, Japan
1Current Address: Department of Materials Science and Engineering, Graduate School of Engineering, Nagoya University, Nagoya, Japan, [email protected]
Abstract: Thermal decomposition of poly(vinyl chloride), PVC, in the presence of various metal oxide, MO, has been studied under inert atmosphere. The pyrolysis products have been quantitatively analysed. In general, the addition of oxide leads to the reduction of the amount of liquid products such as benzene: the addition of ZnO and Fe2O3 is espe-cially effective, reducing more than 70 % compared to the case of the pure PVC. With re-spect to the environmental aspect of the emission of hydrogen chloride from the pyrolysis of PVC, the chlorination ability of metal oxide has been discussed and compared among the oxides. It was found that the trivalent rare earth oxide showed remarkable ability to fi x Cl from PVC in the form of oxychloride.
1. Introduction
Pyrolysis treatment of waste plastics is an attractive method, in which the volume can be drastically reduced and the feedstock recycling of synthetic polymers are expected. Thermal decomposition of PVC, one of the commodity polymers, causes the emission of hydrogen chloride, that is crucial for the corrosion of pyrolysis pipe line. In the present study, we have carried out quantitative product analysis of pyrolysis of the variety of mix-ture of PVC and metal oxide. This information is especially important for the feedstock recycling of PVC as well as simultaneous recycling process of metallurgical dusts, con-taining mainly metal oxides, and waste polymers, that we have proposed in our previous study [1].
2. Experimental
The details of the all experimental procedures are described elesewhere [2]. The sample was prepared by the physical mixing of PVC powder (Wako pure chemicals Co., Ltd.: particle diameter ~ 160 μm) and reagent grade of metal oxide (particle size: 1-10 μm). The composition of [PVC]:[MO]=2:1 was mainly investigated in this study. Pyrolysis was carried out at various temperauters in alumina reaction boot placed in quartz tube. A helium gas fl ow of 100 ml/min was passed through the quartz tube. After the pyrolysis compartment acetone trap, water trap and gas bag were placed in a line to collect light
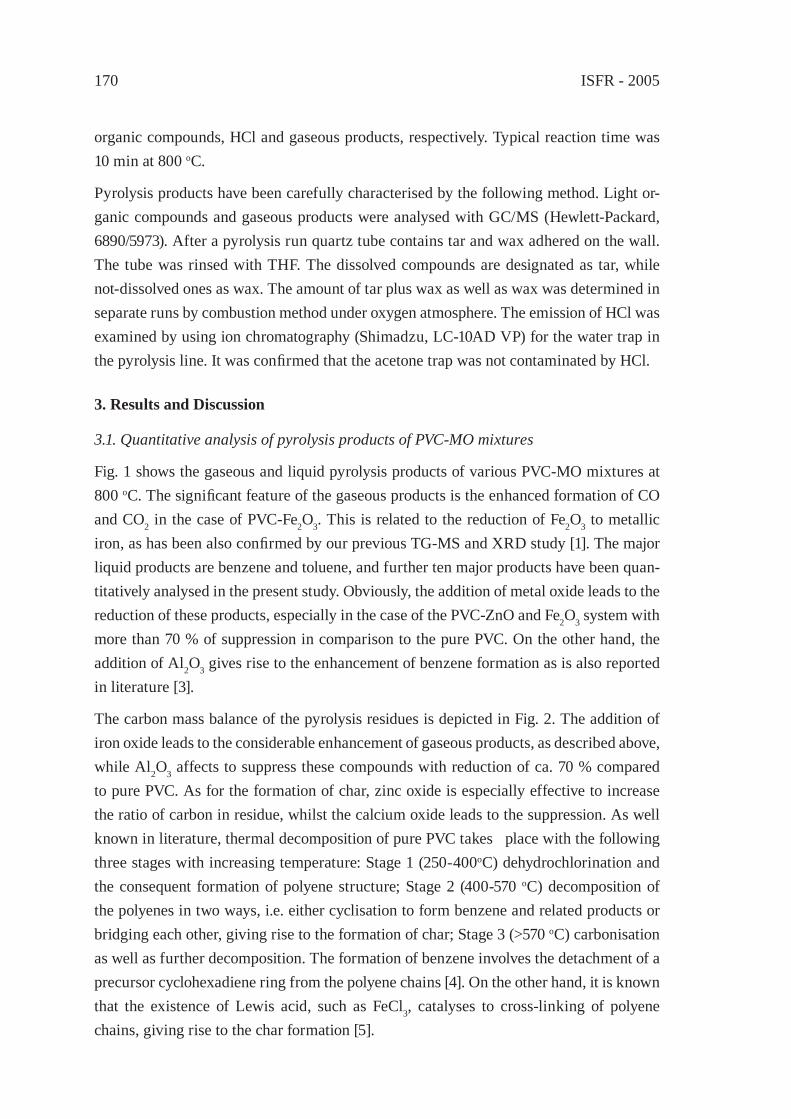
ISFR - 2005170
organic compounds, HCl and gaseous products, respectively. Typical reaction time was 10 min at 800 oC.
Pyrolysis products have been carefully characterised by the following method. Light or-ganic compounds and gaseous products were analysed with GC/MS (Hewlett-Packard, 6890/5973). After a pyrolysis run quartz tube contains tar and wax adhered on the wall. The tube was rinsed with THF. The dissolved compounds are designated as tar, while not-dissolved ones as wax. The amount of tar plus wax as well as wax was determined in separate runs by combustion method under oxygen atmosphere. The emission of HCl was examined by using ion chromatography (Shimadzu, LC-10AD VP) for the water trap in the pyrolysis line. It was confi rmed that the acetone trap was not contaminated by HCl.
3. Results and Discussion
3.1. Quantitative analysis of pyrolysis products of PVC-MO mixtures
Fig. 1 shows the gaseous and liquid pyrolysis products of various PVC-MO mixtures at 800 oC. The signifi cant feature of the gaseous products is the enhanced formation of CO and CO2 in the case of PVC-Fe2O3. This is related to the reduction of Fe2O3 to metallic iron, as has been also confi rmed by our previous TG-MS and XRD study [1]. The major liquid products are benzene and toluene, and further ten major products have been quan-titatively analysed in the present study. Obviously, the addition of metal oxide leads to the reduction of these products, especially in the case of the PVC-ZnO and Fe2O3 system with more than 70 % of suppression in comparison to the pure PVC. On the other hand, the addition of Al2O3 gives rise to the enhancement of benzene formation as is also reported in literature [3].
The carbon mass balance of the pyrolysis residues is depicted in Fig. 2. The addition of iron oxide leads to the considerable enhancement of gaseous products, as described above, while Al2O3 affects to suppress these compounds with reduction of ca. 70 % compared to pure PVC. As for the formation of char, zinc oxide is especially effective to increase the ratio of carbon in residue, whilst the calcium oxide leads to the suppression. As well known in literature, thermal decomposition of pure PVC takes place with the following three stages with increasing temperature: Stage 1 (250-400oC) dehydrochlorination and the consequent formation of polyene structure; Stage 2 (400-570 oC) decomposition of the polyenes in two ways, i.e. either cyclisation to form benzene and related products or bridging each other, giving rise to the formation of char; Stage 3 (>570 oC) carbonisation as well as further decomposition. The formation of benzene involves the detachment of a precursor cyclohexadiene ring from the polyene chains [4]. On the other hand, it is known that the existence of Lewis acid, such as FeCl3, catalyses to cross-linking of polyene chains, giving rise to the char formation [5].
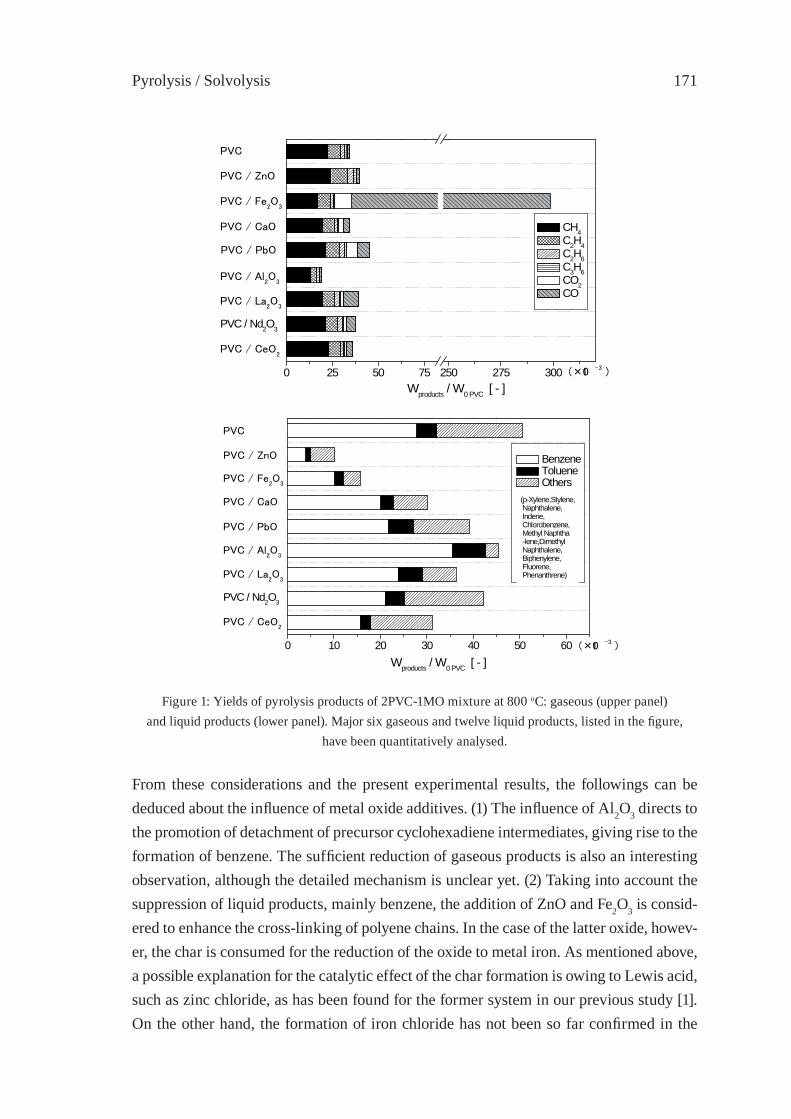
Pyrolysis / Solvolysis 171
Figure 1: Yields of pyrolysis products of 2PVC-1MO mixture at 800 oC: gaseous (upper panel)and liquid products (lower panel). Major six gaseous and twelve liquid products, listed in the fi gure,
have been quantitatively analysed.
From these considerations and the present experimental results, the followings can be deduced about the infl uence of metal oxide additives. (1) The infl uence of Al2O3 directs to the promotion of detachment of precursor cyclohexadiene intermediates, giving rise to the formation of benzene. The suffi cient reduction of gaseous products is also an interesting observation, although the detailed mechanism is unclear yet. (2) Taking into account the suppression of liquid products, mainly benzene, the addition of ZnO and Fe2O3 is consid-ered to enhance the cross-linking of polyene chains. In the case of the latter oxide, howev-er, the char is consumed for the reduction of the oxide to metal iron. As mentioned above, a possible explanation for the catalytic effect of the char formation is owing to Lewis acid, such as zinc chloride, as has been found for the former system in our previous study [1]. On the other hand, the formation of iron chloride has not been so far confi rmed in the
0 10 20 30 40 50 60
PVC / Al2O
3
(×10 -3 )
Wproducts / W0 PVC [ - ]
Benzene Toluene Others
(p-Xylene,Stylene, Naphthalene, Indene, Chlorobenzene, Methyl Naphtha -lene,Dimethyl Naphthalene, Biphenylene, Fluorene, Phenanthrene)
PVC / Nd2O3
PVC / CeO2
PVC / La2O
3
PVC / PbO
PVC / Fe2O
3
PVC / ZnO
PVC / CaO
PVC
0 25 50 75 250 275 300
PVC / Al2O
3
(×10 -3 )
Wproducts / W0 PVC [ - ]
CH4 C2H4 C2H6 C3H6 CO2 CO
PVC / Nd2O3
PVC / CeO2
PVC / La2O
3
PVC / PbO
PVC / Fe2O
3
PVC / ZnO
PVC / CaO
PVC
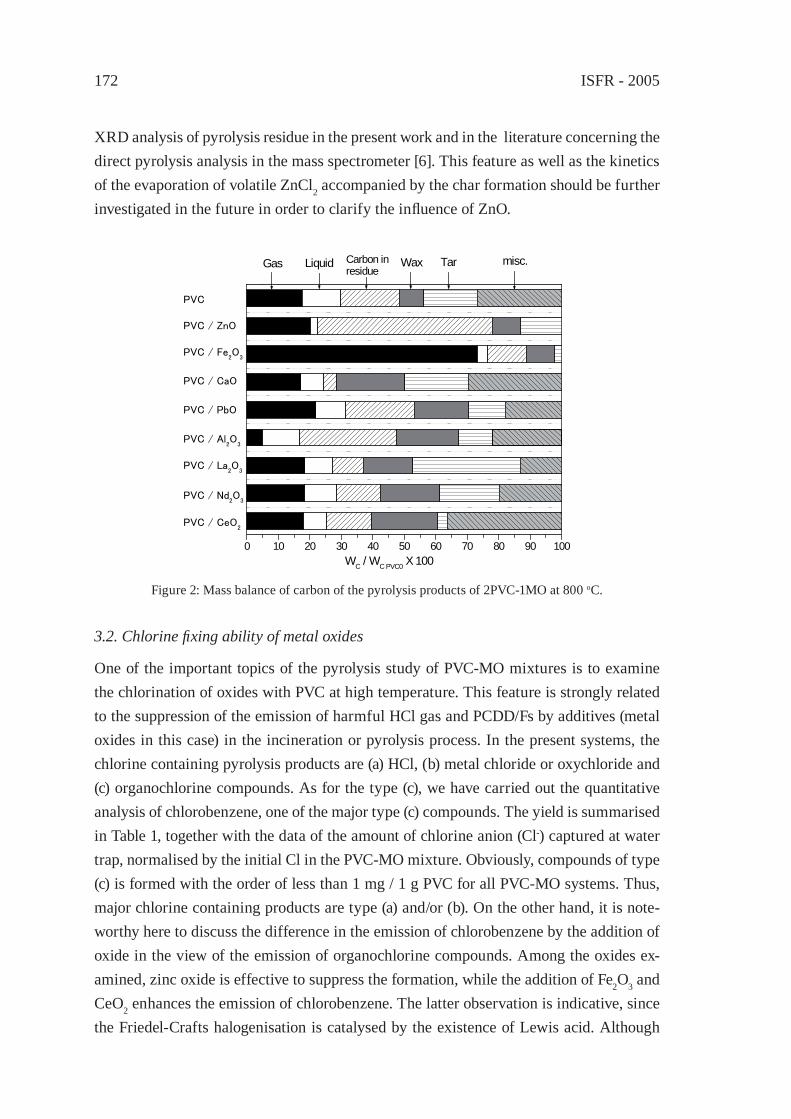
ISFR - 2005172
XRD analysis of pyrolysis residue in the present work and in the literature concerning the direct pyrolysis analysis in the mass spectrometer [6]. This feature as well as the kinetics of the evaporation of volatile ZnCl2 accompanied by the char formation should be further investigated in the future in order to clarify the infl uence of ZnO.
0 10 20 30 40 50 60 70 80 90 100
misc.TarWaxCarbon in residue
LiquidGas
PVC / Al2O
3
WC / WC PVC0 X 100
PVC / CeO2
PVC / Nd2O
3
PVC / La2O
3
PVC / PbO
PVC / Fe2O
3
PVC / ZnO
PVC / CaO
PVC
Figure 2: Mass balance of carbon of the pyrolysis products of 2PVC-1MO at 800 oC.
3.2. Chlorine fi xing ability of metal oxides
One of the important topics of the pyrolysis study of PVC-MO mixtures is to examine the chlorination of oxides with PVC at high temperature. This feature is strongly related to the suppression of the emission of harmful HCl gas and PCDD/Fs by additives (metal oxides in this case) in the incineration or pyrolysis process. In the present systems, the chlorine containing pyrolysis products are (a) HCl, (b) metal chloride or oxychloride and (c) organochlorine compounds. As for the type (c), we have carried out the quantitative analysis of chlorobenzene, one of the major type (c) compounds. The yield is summarised in Table 1, together with the data of the amount of chlorine anion (Cl-) captured at water trap, normalised by the initial Cl in the PVC-MO mixture. Obviously, compounds of type (c) is formed with the order of less than 1 mg / 1 g PVC for all PVC-MO systems. Thus, major chlorine containing products are type (a) and/or (b). On the other hand, it is note-worthy here to discuss the difference in the emission of chlorobenzene by the addition of oxide in the view of the emission of organochlorine compounds. Among the oxides ex-amined, zinc oxide is effective to suppress the formation, while the addition of Fe2O3 and CeO2 enhances the emission of chlorobenzene. The latter observation is indicative, since the Friedel-Crafts halogenisation is catalysed by the existence of Lewis acid. Although
Pyrolysis / Solvolysis 173
the formation of FeCl3 has not been observed, as mentioned above, a possibility cannot be explicitly excluded for the generation of catalytic amount of Lewis acid, as described above. This is further to be investigated in the future work.
Table 1: Change in yield of chlorobenzene in liquid products and chlorine anion at water trapby the addition of metal oxides for the pyrolysis of 2PVC-1MO mixture at 800 oC.
Oxide None ZnO CaO Fe2O3 PbO La2O3 Nd2O3 CeO2 Al2O3
WCB(mg)/WPVC(g) 0.15 0.03 0.07 0.24 0.07 0.06 0.15 0.25 0.09Trapped Cl (wt.%) 92 36 51 69 30 3.1 25 78 90
WCB: mass of chlorobenzene, WPVC: mass of PVC
As for the formation of hydrogen chloride gas, the results listed in Table 1 directly refl ect the amount of emitted HCl, since chemical analysis showed the negligible amount of metal cation found in the trap, which attributes neither metal chloride nor oxychloride to the origin of Cl- in the trap. As shown in the table, the emission of HCl is, in general, suppressed by the addition of metal oxide, especially effectively in the case of La2O3. A XRD analysis of the pyrolysis residue indicates the formation of lanthanum oxychloride (LaOCl). We can, therefore, conclude that ca. 95 % of the initial chlorine is fi xed as pyrolysis residue in the form of LaOCl. It is also an interesting issue to consider the dif-ference in HCl emission among the rare earth oxides examined in the present work. The tetravalent cerium oxide shows far less chlorine fi xing ability than trivalent oxides. This is presumably explained by the fact that the latter oxides do not involve the reduction process to form oxychlorides, while tetravalent CeO2 requires the reduction process from Ce(IV) to Ce(III). As for the difference in the chlorination between La2O3 and Nd2O3, a possible explanation is based on a thermodynamical consideration, whereby LaOCl can exist in wider range of partial pressure of chlorine and oxygen than neodymium oxychlo-ride. Further studies on the kinetics of the chlorination reaction are required to get insight into the mechanisms of chlorine fi xing by rare earth oxides.
As for the effect of other oxides, the emission of HCl is also suppressed by the addition of ZnO and PbO, though this is in conjunction to the formation of volatile metal chloride, as found also in our previous study [1]. The addition of iron oxide does not signifi cantly affect the suppression of HCl formation because the oxide is not mainly converted to chloride nor oxychloride but converted to metallic iron owing to the reduction process under the present experimental conditions. In the case of CaO, which is commonly used as chlorine absorbent in many applications, nearly half of chlorine is fi xed as the complex form of calcium compounds as found in XRD measurement. The detailed identifi cation of the compounds is not possible because of the hydration of a possible product CaCl2

ISFR - 2005174
after experiment. Taking into account the water-insoluble property of LaOCl, the use of La2O3 as chlorine capture agent is considered to be advantageous in comparison to the conventional absorbents, e.g. calcium oxide, since the incineration products of the latter, such as CaCl2, can easily fl ow out through soil into the environment. It should be here also noted that sludge discharged from magnet production industry contains rich amount of rare earth oxides and that the oxychloride can be further converted to the oxide by the conventional hydrolysis process at high temperature.
References
[1] Zhang, B., Yan, X.Y., Shibata, K., Uda, T., Tada, M. and Hirasawa, M., Mater. Trans. JIM 41:1342 (2000).
[2] Masuda, Y., Uda, T., Terakado, O., and Hirasawa, M., in preparation.[3] Blaszó, M. and Jakab, E., J. Anal. Appl. Pyrol. 49:125 (1999).[4] Lattimer, R.P. and Kroenke, W.J., J. Appl. Polym. Sci. 25:10 (1980) and 27:1355
(1982).[5] Carty, P., Metcalfe, E. and White, S., Polymer 33:2704 (1992).[6] Ballistreri, A., Montaudo, G., Puglisi, C., Scamporrino, E. and Vitalini, D., J. Polym.
Sci. Polym. Chem. Ed. 19:1397 (1981).
Pyrolysis / Solvolysis 175
HYDROTHERMAL DECHLORINATION OF POLY(VINYL CHLORIDE) IN THE ABSENCE AND THE
PRESENCE OF HYDROGEN PEROXIDEShoji Suga, Yutaka Wakayama and Toshitaka Funazukuri*
Department of Applied Chemistry, Chuo University, 1-13-27 Kasuga, Bunkyo-ku, Tokyo, 112-8551, Japan, [email protected]
Abstract: Poly(vinyl chloride) was dechlorinated under hydrothermal conditions, at tem-peratures from 503 to 563 K and 10 MPa in a semi-batch fl ow reactor in the absence and the presence of hydrogen peroxide. The dechlorination rates with water and 0.03-mol•l-1 H2O2 aqueous solution were represented by the fi rst order reaction kinetics, with respect to chlorine content remained in solid sample, with the activation energies of 178 and 141 kJ•mol-1 and the pre-exponential factors of 5.55×10¹⁵ and 3.75×10¹² min-1, respectively. The dechlorination rates were accelerated by adding hydrogen peroxide, and scission of C-C bonds partly occurred in the presence of hydrogen peroxide while almost no organic carbon was eluted with water over the range of temperature studied.
1. Introduction
Poly(vinyl) chloride (PVC) is widely used as industrial and consumer products such as shield material, pipes, fi lms, wrapping sheets etc. Plastic wastes containing PVC are often disposed of by incineration and landfi ll in Japan. However, most municipal cities have faced to the disposal problems of PVC such as the emission of toxic compounds from the incineration and the shortage of landfi ll sites. Thus, the dechlorination is signifi cantly important for the material or chemical recycling, or energy recovery from PVC contain-ing wastes.
Dechlorination of PVC has been made thermally in inert or oxidative atmospheres [1-4], photochemically [5-7] and mechanochemically [8,9]. Recently, in addition to these dechlorination processes operated at vacuum or at ambient pressure, hot pressurized water with/without additives has also been employed as a solvent for the dechlorination reaction [10-17]. Hot pressurized water, including supercritical water, has focused attention as a solvent and a reaction medium due to the unique physical properties such as higher values of ion product [H+][OH-][18]. Moreover, in this process chlorine ion can be recovered in the aqueous solution. However, the rates were not determined well because the conditions studied are limited, and the comparison of the rates reported with a batch reactor was diffi cult due to an autocatalytic effect [1,19,20] caused by HCl produced. Dechlorination rate of PVC is reported to be accelerated in the presence of HCl; by the pretreatment with HCl [19] and in an atmosphere of HCl [20]. Thus, the measurements of the rates in a fl ow
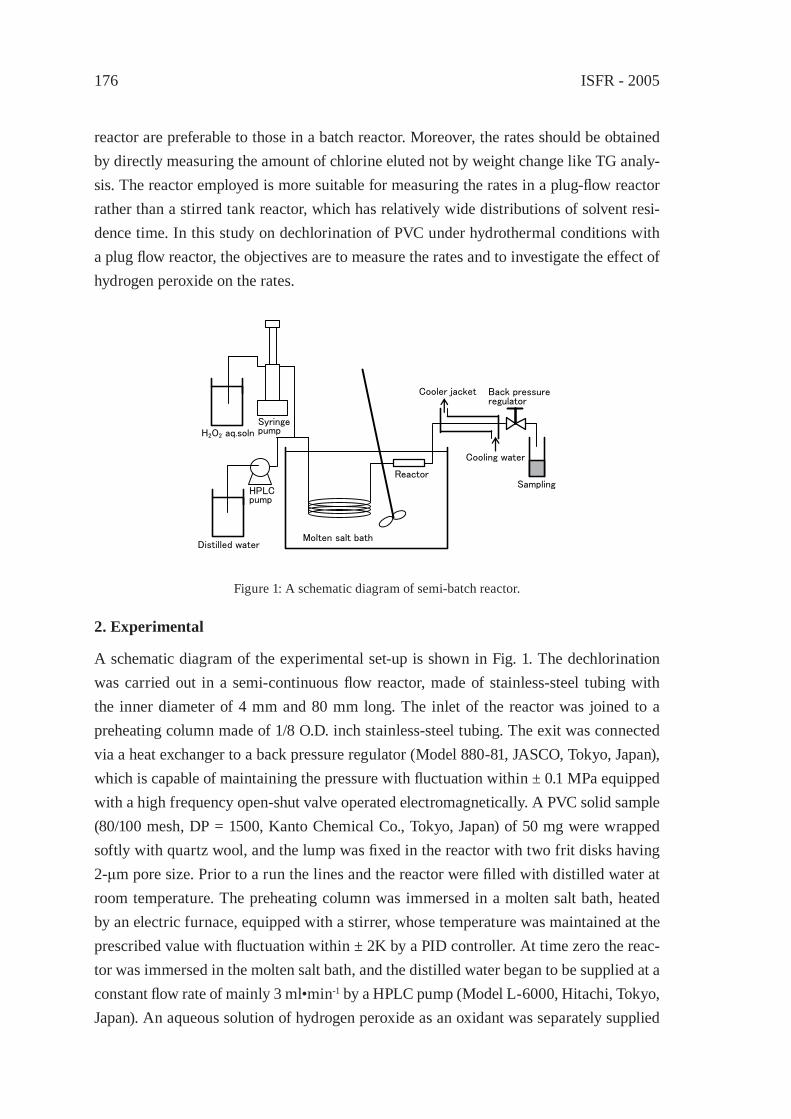
ISFR - 2005176
reactor are preferable to those in a batch reactor. Moreover, the rates should be obtained by directly measuring the amount of chlorine eluted not by weight change like TG analy-sis. The reactor employed is more suitable for measuring the rates in a plug-fl ow reactor rather than a stirred tank reactor, which has relatively wide distributions of solvent resi-dence time. In this study on dechlorination of PVC under hydrothermal conditions with a plug fl ow reactor, the objectives are to measure the rates and to investigate the effect of hydrogen peroxide on the rates.
Cooling water
Cooler jacket Back pressure regulator
Sampling
Molten salt bath
Reactor
Distilled water
HPLC pump
H2O2 aq.solnSyringe pump
Figure 1: A schematic diagram of semi-batch reactor.
2. Experimental
A schematic diagram of the experimental set-up is shown in Fig. 1. The dechlorination was carried out in a semi-continuous fl ow reactor, made of stainless-steel tubing with the inner diameter of 4 mm and 80 mm long. The inlet of the reactor was joined to a preheating column made of 1/8 O.D. inch stainless-steel tubing. The exit was connected via a heat exchanger to a back pressure regulator (Model 880-81, JASCO, Tokyo, Japan), which is capable of maintaining the pressure with fl uctuation within ± 0.1 MPa equipped with a high frequency open-shut valve operated electromagnetically. A PVC solid sample (80/100 mesh, DP = 1500, Kanto Chemical Co., Tokyo, Japan) of 50 mg were wrapped softly with quartz wool, and the lump was fi xed in the reactor with two frit disks having 2-μm pore size. Prior to a run the lines and the reactor were fi lled with distilled water at room temperature. The preheating column was immersed in a molten salt bath, heated by an electric furnace, equipped with a stirrer, whose temperature was maintained at the prescribed value with fl uctuation within ± 2K by a PID controller. At time zero the reac-tor was immersed in the molten salt bath, and the distilled water began to be supplied at a constant fl ow rate of mainly 3 ml•min-1 by a HPLC pump (Model L-6000, Hitachi, Tokyo, Japan). An aqueous solution of hydrogen peroxide as an oxidant was separately supplied

Pyrolysis / Solvolysis 177
by a syringe pump (Model 100DX, ISCO, U.S.A.). The pressure of the system was main-tained at the prescribed pressure, mainly at 10 MPa by the back pressure regulator. The product solution eluted from the reactor was collected every 2 minutes at the exit of the back pressure regulator. The contents of total organic carbon and chlorine were analyzed by a TC analyzer (Model 5000A, Shimadzu, Kyoto, Japan) and an ion chromatograph (Model DX-120, Dionex Japan, Tokyo, Japan), respectively. The contents of carbon and hydrogen in residual solid were analyzed by a CHN analyzer (Model 2400, Perkin Elmer Japan, Tokyo), and that of chlorine was measured by the combustion method: the residual solid of 5 mg was burnt in a fl ask fi lled with oxygen, and the product gas was absorbed in a sodium hydroxide aqueous solution. The chlorine content in the solution was deter-mined by ion chromatography.
∇
0 50 100 150 200 2500
10
20
30
40
50
60
PVC loaded [mg]
Chl
orin
e el
uted
[%]
0 50 100 150 2000.05
0.1
0.5
1
Time [min]
C/C
0 [-]
1.75 1.8 1.85 1.9 1.95 2 2.050.001
0.002
0.005
0.01
0.02
0.05
0.1
0.2
103/T [K-1]
Rate
con
stant
k [m
in-1
]
water
0.03-molキl-1 H2O2 aq.
Figure 2: Effect of PVC loaded on dechlorination with water at 533 K and 10 min in a batch reactor.
Figure 3: Cumulative chlorine eluted and chlorine eluted in fraction with water at 543 K and a fl ow
rate of 3 ml•min-1.
Figure 4: Semi-logarithmic plot of C/C0 for chlorine vs. time at various temperatures; 503 K (○), 513 K(●), 523 K(Δ), 533 K(▲), 543 K(□), 555
K(■), 563 K( ).
Figure 5: Arrhenius plots of fi rst order rate constants with water (○) and 0.03-mol•l-1 H2O2
aqueous solution (▲).
0 10 20 30 40 500
20
40
60
80
100
0
2
4
6
8
10
Time [min]
Cum
ulat
ive
chlo
rine
elut
ed [%
]
Chl
orin
e el
uted
in fr
actio
n [%
min
-1]
·

ISFR - 2005178
3. Results and discussion
3.1. Dechlorination with water
Figure 2 shows the effect of the amount of the PVC sample loaded on the degree of dechlorination in a batch reactor with water at 533 K and 10 min. The degree of dechlo-rination increased with the amount of PVC loaded. This results from the autocatalytic effect caused by HCl produced [1,19,20], and the rates are signifi cantly affected by the amount of the sample loaded in a batch reactor. Thus, a fl ow reactor is preferably used to measure the rates.
Figure 3 shows time change of chlorine eluted at each fraction and the cumulative value at 543 K, 10 MPa and a water fl ow rate
0 20 40 600.5
0.6
0.7
0.8
0.9
1
Time [min]
C/C
0 for
chl
orin
e [-
]
Figure 6: Semi-logarithmic plot of C/C0 vs. time
at 503 K, various H2O2 concentrations and a fl ow rate of 3 ml•min-1.
of 3 ml•min-1 in the fl ow reactor shown in Fig. 1. Chlorine ion was continuously eluted and the concentration in the fraction reached the maximum value at 10 min, and thereafter decreased gradually. Correspondingly, after 2 min the pH value rapidly decreased to pH = 3 (not shown), and the minimum value reached at 5 min, and then the values increased slowly with time. At 50 min nearly 85 % of chlorine was eluted in the solution.
The time changes of chlorine at various temperatures were similar to that shown in Fig. 3. At temperatures of 553 and 563 K, more than 90 % of chlorine was eluted at less than 30 min. At each temperature the chlorine was eluted after 4 min, and no elution was ob-served during heat-up period of 2 min. Note that the temperature rise in the reactor was measured with a thermocouple, and it took times shorter than one minute to attain to the prescribed temperature. From some tracer response measurements, the solvent residence times in the reactor were less than a minute. The fi nal degree of dechlorination, i.e. at 180 min, reached nearly 100 % at temperatures higher than 553 K. Total organic carbon eluted in the solution was not detected in the absence of hydrogen peroxide except in the solution eluted with water in the initial stages up to 4 min at all temperatures studied. However, in the presence of H2O2 the organic carbon was eluted somewhat. The effects of solvent fl ow rates on dechlorination rates were not observed over the studied range from 1 to 5 ml•min-1.

Pyrolysis / Solvolysis 179
Figure 4 plots C/C0 for chlorine vs. reaction time at various temperatures. As shown, since the plots were expressed with each straight line at each temperature in the major dechlo-rination stage, the overall dechlorination rates can be expressed by the fi rst order reaction kinetics as follows:
0
kCdt
dC =− (1)
by integrating Eq.(1)
( )1ln ttkC
C −−=
(2)
where C and C0 are the chlorine contents at time t and the initial value, respectively, k is the overall rate constant in min-1, and t1 is an induction time, including a heat-up period.
Figure 5 shows Arrhenius plots of k for water and 0.03-mol•l-1 hydrogen peroxide aqueous solution. The latter case is described later. The plots with water can be expressed with a straight line, and the activation energy and the pre-exponential factor are 178 kJ•mol-1 and 5.55×10¹⁵ min-1, respectively.
3.2. Effect of hydrogen peroxide
Figure 6 plots C/C0 for chlorine vs. time with various hydrogen peroxide concentrations at 503 K, where the chlorine contents were obtained by subtracting the eluted amounts of chlorine from the initial value in solid sample. The presence of hydrogen peroxide ac-celerates the dechlorination, and the reaction can be represented by the fi rst order reaction kinetics.
Figure 7 shows C/C0 for (a) organic carbon and (b) chlorine vs. reaction time at various temperatures with 0.03-mol•l-1 hydrogen peroxide aqueous solution. Organic carbon was also eluted in the presence of the oxidant while almost no organic carbon was detected with water at the same temperatures. As depicted, the rates can be expressed by the fi rst order reaction kinetics. With 0.03-mol•l-1H2O2 aq. solution the activation energy and the pre-exponential factor are 148 kJ•mol-1 and 1.76×10¹³ min-1, respectively, as shown in Fig. 5. Note that the elution of chlorine began at 4 min, but that of organic carbon was observed after 2 min.
Figure 8 shows rate constants k vs. concentration of hydrogen peroxide at 503 K, where kwater is the rate constant with water at 503 K. The presence of hydrogen peroxide was effective for dechlorination at concentrations higher than 0.003 mol•l-1, and the rates at 0.03 mol•l-1 were nearly leveled off. The slope for kH2O2 was about 1.2 except for the high-est and the lowest H2O2 concentrations. In an atmosphere of oxygen, the rates were re-
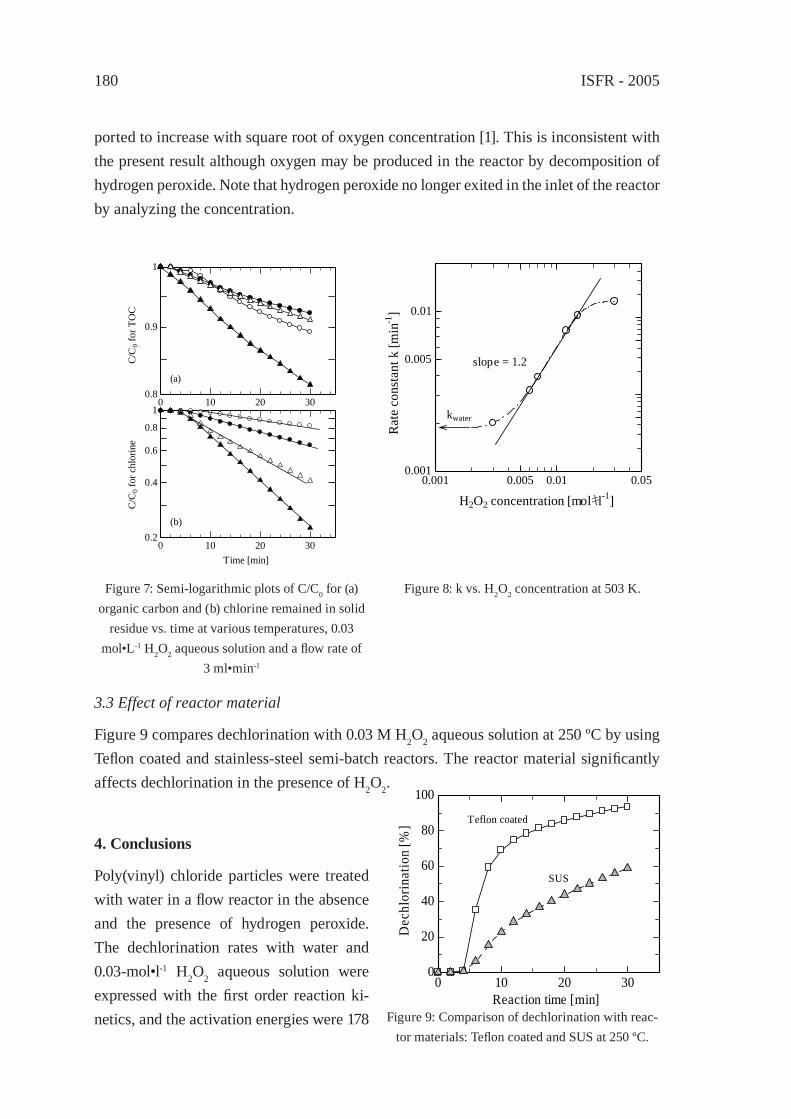
ISFR - 2005180
0 10 20 300.8
0.9
1
C/C
0 for
TO
C
(a)
0 10 20 300.2
0.4
0.6
0.8
1
C/C
0 for
chl
orin
e
Time [min]
(b)
0.001 0.005 0.01 0.050.001
0.005
0.01
H2O2 concentration [molキl-1]
Rat
e co
nsta
nt k
[min
-1]
kwater
slope = 1.2
Figure 7: Semi-logarithmic plots of C/C0 for (a) organic carbon and (b) chlorine remained in solid
residue vs. time at various temperatures, 0.03 mol•L-1 H2O2 aqueous solution and a fl ow rate of
3 ml•min-1
Figure 8: k vs. H2O2 concentration at 503 K.
ported to increase with square root of oxygen concentration [1]. This is inconsistent with the present result although oxygen may be produced in the reactor by decomposition of hydrogen peroxide. Note that hydrogen peroxide no longer exited in the inlet of the reactor by analyzing the concentration.
3.3 Effect of reactor material
Figure 9 compares dechlorination with 0.03 M H2O2 aqueous solution at 250 ºC by using Tefl on coated and stainless-steel semi-batch reactors. The reactor material signifi cantly affects dechlorination in the presence of H2O2.
0 10 20 300
20
40
60
80
100
Reaction time [min]
Dec
hlor
inat
ion
[%] Teflon coated
SUS
4. Conclusions
Poly(vinyl) chloride particles were treated with water in a fl ow reactor in the absence and the presence of hydrogen peroxide. The dechlorination rates with water and 0.03-mol•l-1 H2O2 aqueous solution were expressed with the fi rst order reaction ki-netics, and the activation energies were 178 Figure 9: Comparison of dechlorination with reac-
tor materials: Tefl on coated and SUS at 250 ºC.
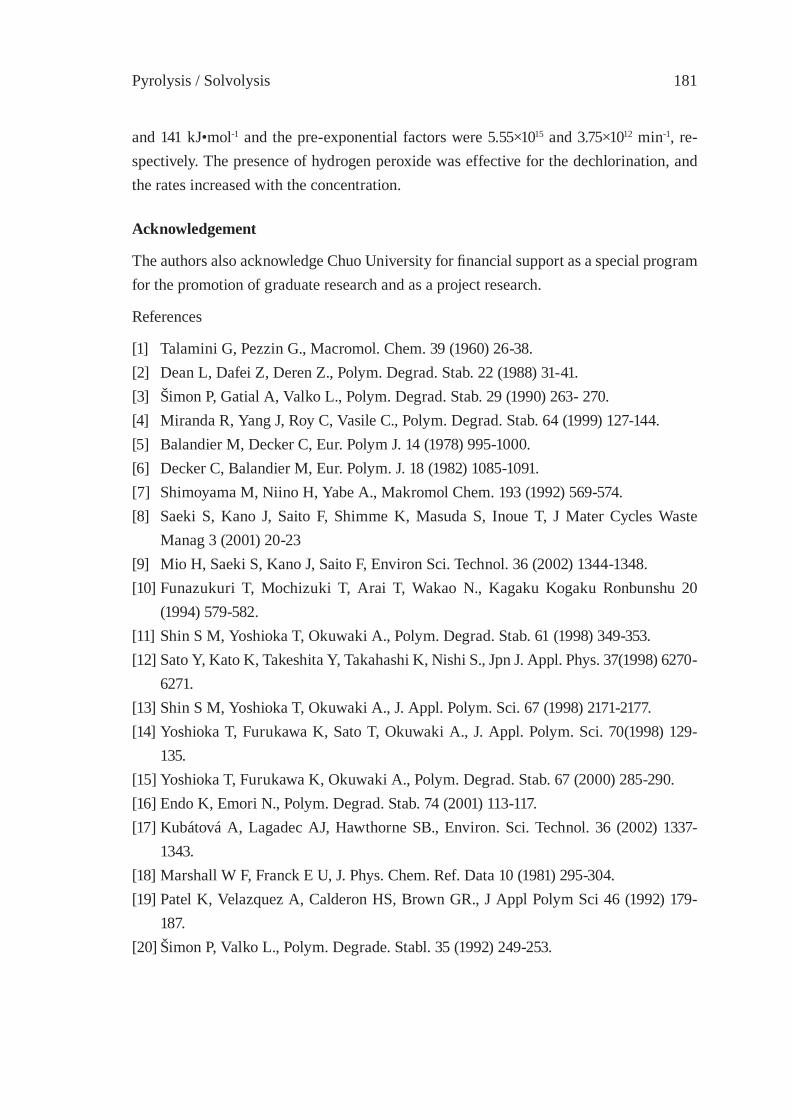
Pyrolysis / Solvolysis 181
and 141 kJ•mol-1 and the pre-exponential factors were 5.55×10¹⁵ and 3.75×10¹² min-1, re-spectively. The presence of hydrogen peroxide was effective for the dechlorination, and the rates increased with the concentration.
Acknowledgement
The authors also acknowledge Chuo University for fi nancial support as a special program for the promotion of graduate research and as a project research.
References
[1] Talamini G, Pezzin G., Macromol. Chem. 39 (1960) 26-38.[2] Dean L, Dafei Z, Deren Z., Polym. Degrad. Stab. 22 (1988) 31-41.[3] Šimon P, Gatial A, Valko L., Polym. Degrad. Stab. 29 (1990) 263- 270.[4] Miranda R, Yang J, Roy C, Vasile C., Polym. Degrad. Stab. 64 (1999) 127-144.[5] Balandier M, Decker C, Eur. Polym J. 14 (1978) 995-1000.[6] Decker C, Balandier M, Eur. Polym. J. 18 (1982) 1085-1091.[7] Shimoyama M, Niino H, Yabe A., Makromol Chem. 193 (1992) 569-574.[8] Saeki S, Kano J, Saito F, Shimme K, Masuda S, Inoue T, J Mater Cycles Waste
Manag 3 (2001) 20-23 [9] Mio H, Saeki S, Kano J, Saito F, Environ Sci. Technol. 36 (2002) 1344-1348. [10] Funazukuri T, Mochizuki T, Arai T, Wakao N., Kagaku Kogaku Ronbunshu 20
(1994) 579-582.[11] Shin S M, Yoshioka T, Okuwaki A., Polym. Degrad. Stab. 61 (1998) 349-353.[12] Sato Y, Kato K, Takeshita Y, Takahashi K, Nishi S., Jpn J. Appl. Phys. 37(1998) 6270-
6271.[13] Shin S M, Yoshioka T, Okuwaki A., J. Appl. Polym. Sci. 67 (1998) 2171-2177.[14] Yoshioka T, Furukawa K, Sato T, Okuwaki A., J. Appl. Polym. Sci. 70(1998) 129-
135.[15] Yoshioka T, Furukawa K, Okuwaki A., Polym. Degrad. Stab. 67 (2000) 285-290.[16] Endo K, Emori N., Polym. Degrad. Stab. 74 (2001) 113-117.[17] Kubátová A, Lagadec AJ, Hawthorne SB., Environ. Sci. Technol. 36 (2002) 1337-
1343.[18] Marshall W F, Franck E U, J. Phys. Chem. Ref. Data 10 (1981) 295-304.[19] Patel K, Velazquez A, Calderon HS, Brown GR., J Appl Polym Sci 46 (1992) 179-
187.[20] Šimon P, Valko L., Polym. Degrade. Stabl. 35 (1992) 249-253.

ISFR - 2005182
Pyrolysis / Solvolysis 183
PYROLYSIS OF HIPS-Br/PVDC MIXED WITH PET ANDDEHALOGENATION OF LIQUID PRODUCTS
T. Bhaskar*, A. Muto, Y.SakataDepartment of Applied Chemistry, Okayama University, 3-1-1 Tsushima Naka,
Okayama 700-8530, Japan, [email protected]
Abstract: Pyrolysis of poly (vinylidene chloride) (PVDC), brominated fl ame retardant containing high impact polystyrene (HIPS-Br), poly (ethylene) (PE), poly (propylene) (PP), poly (styrene) (PS) mixed with poly (ethylene terephthalate) (PET) were performed under atmospheric pressure at 430 °C using a semi-batch operation. The presence of PET in the pyrolysis mixture of PP/PE/PS/PVDC/HIPS-Br affected signifi cantly the for-mation of pyrolysis products and the pyrolysis behavior of plastic mixture. The effects are (i) the yield of liquid product was decreased and formation of gaseous products increased during the thermal decomposition, (ii) the waxy residue was observed in addition to the solid carbon residue (iii) in the presence of PET, the dehalogenation of liquid products was diffi cult.
1. Introduction
The conversion of waste plastics into fuel represents a sustainable way for the recovery of the organic content from polymeric waste and also preserves valuable petroleum resourc-es, in addition to protecting the environment [1-2]. Pyrolysis of waste plastics is favored because of the high rates of conversion into oil, which can be used as fuel or feedstock in refi nery. Recycling by pyrolysis has high potential for heterogeneous waste plastic materi-als, as the separation is not economical. There has been plethora of research work on the pyrolysis of plastics and utilization of pyrolysis products for various applications [3-8].
The waste from electric and electronic equipment mostly consists of high impact polysty-rene (HIPS), acrylonitrile-butadiene-styrene copolymer (ABS) and these plastics contain various additives, fl ame retardants, fi llers etc. It is known that the pyrolysis of mixed plastics containing PVC or PVDC produces inorganic and subsequently organic chlorine compounds during the initial stages of pyrolysis process [9-11]. The disposal of halogen-ated mixed waste plastics is a serious environmental problem. Hornung et al [12] reported the dehalogenation of brominated organic compounds from the pyrolysis of brominated fl ame retardant plastics with the poly propylene as a reductive agent. The separation of brominated additives from inert and valuable materials in electronic scrap can be done by an established pyrolysis procedure called Haloclean® [13].
The pyrolysis of brominated fl ame retardant containing high impact polystyrene (HIPS-Br) mixed plastics and dehalogenation of liquid products with iron oxide carbon compos-

ISFR - 2005184
ite (Fe-C) was reported earlier [14, 15]. Studies on Hydrothermal treatment of HIPS-Br and recovery of halogen free plastics were reported [16]. The effect of PET on pyrolysis of 3P/PVC/HIPS-Br and pyrolysis of PVDC mixed plastics were reported in our earlier publications [17]. In the present investigation, we report the pyrolysis of 3P/PVDC/HIPS-Br and 3P/PVDC/HIPS-Br/PET under atmospheric pressure at 430°C. The distribution of chlorine and bromine content in the degradation products, effect of PET in pyrolysis mixture, dehalogenation of liquid products by calcium hydroxide (CaH-C), and iron oxide (Fe-C) carbon composites were investigated.
2. Experimental
Materials. The PE was obtained from Mitsui Chemical Co. Ltd., Japan; PP from Ube Chemical Industries Co. Ltd., Japan; PS from Asahi Kasei Industries Co., Ltd., Japan; and PVDC from Geon Chemical Co. Ltd (Cl content in PVDC: 73.2 wt%). Commercially available high impact polystyrene (HIPS) containing brominated (Br: 10.8 wt. %) fl ame retardant was used in the present investigation. The synergist Sb2O3 was 5 wt. %, the fl ame retardant was decabromodiphenyl oxide (DDO). Poly (ethylene terephthalate) (PET) was obtained from Eastman Kodak Co., Ltd. The grain sizes of PP, PE, PS and PVC were about 3 mm x 2 mm. The mixture of PP, PE, and PS was abbreviated as 3P and used in the manuscript.
Pyrolysis and analysis procedure. Pyrolysis of 3P ( PE (3 g)/PP ( 3g)/PS (3 g))/PVDC (1 g), 3P ( PE (3 g)/PP ( 3g)/PS (2 g))/PVDC (1 g)/HIPS-Br (1 g) and 3P ( PE (2 g)/PP ( 3g)/PS (2 g))/PVDC (1 g)/HIPS-Br (1 g)/PET (1 g) was performed in a glass reactor (length: 350 mm; id 30 mm) under atmospheric pressure by batch operation with identical experi-mental conditions. The reactor temperature was increased to the degradation temperature (430 °C) at a heating rate of 15 °C/min. A schematic experimental setup for the pyrolysis of mixed plastics, detailed analysis procedure and others can be found in our earlier re-ports [7, 18, 24]. The amount of Cl and Br content (condensable gaseous products such as HCl, HBr) in water trap was analyzed using an ion chromatograph (DIONEX, DX-120 Ion Chromatograph) and designated as gas (HBr) in table 2 and table 3. The halogenated hydrocarbons in the (non-condensable) gaseous products were not analyzed. The quanti-tative determination of chlorine and bromine in residue was measured using combustion fl ask and then subjected to ion chromatograph.
The composition of the liquid products was characterized using C-NP grams (C stands for carbon and NP from normal paraffi n), Cl-NP gram (Cl stands for chlorine) and Br-NP gram (Br stands for bromine). In briefl y, the NP gram is a carbon number distribution of hydrocarbons derived from the gas chromatogram based on boiling points of a series of normal paraffi n’s. Further details on the NP gram can be found elsewhere [19]. Powder
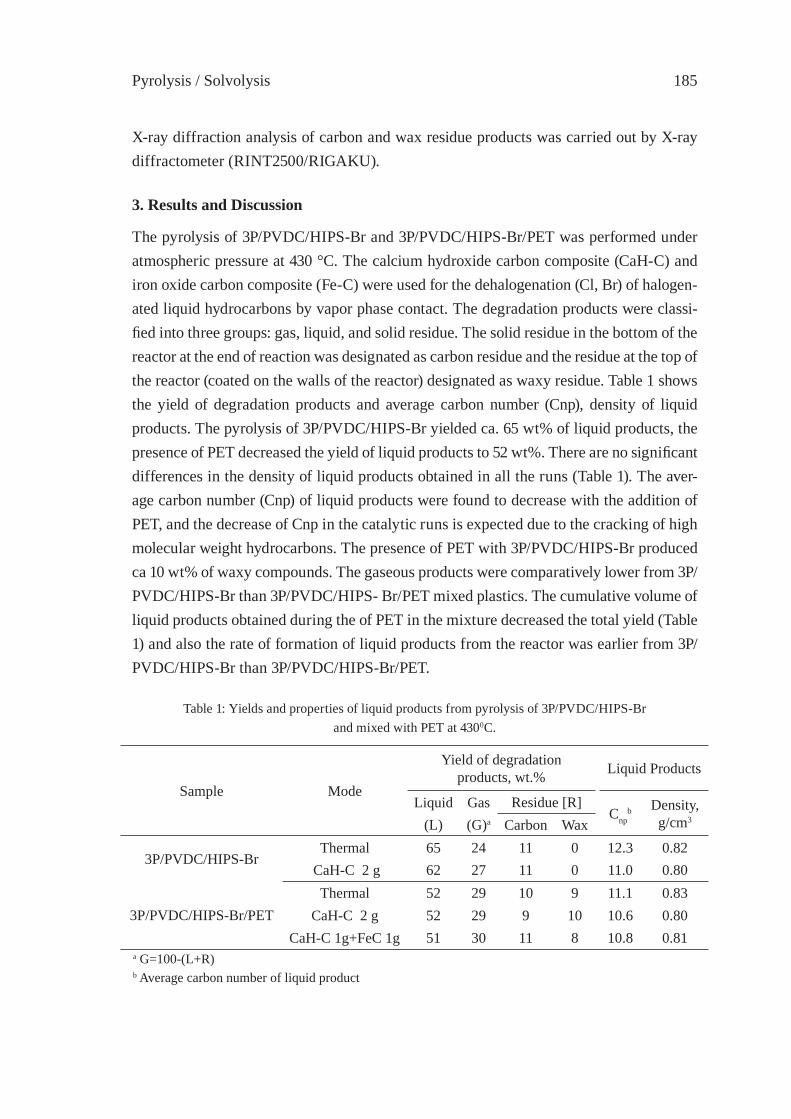
Pyrolysis / Solvolysis 185
X-ray diffraction analysis of carbon and wax residue products was carried out by X-ray diffractometer (RINT2500/RIGAKU).
3. Results and Discussion
The pyrolysis of 3P/PVDC/HIPS-Br and 3P/PVDC/HIPS-Br/PET was performed under atmospheric pressure at 430 °C. The calcium hydroxide carbon composite (CaH-C) and iron oxide carbon composite (Fe-C) were used for the dehalogenation (Cl, Br) of halogen-ated liquid hydrocarbons by vapor phase contact. The degradation products were classi-fi ed into three groups: gas, liquid, and solid residue. The solid residue in the bottom of the reactor at the end of reaction was designated as carbon residue and the residue at the top of the reactor (coated on the walls of the reactor) designated as waxy residue. Table 1 shows the yield of degradation products and average carbon number (Cnp), density of liquid products. The pyrolysis of 3P/PVDC/HIPS-Br yielded ca. 65 wt% of liquid products, the presence of PET decreased the yield of liquid products to 52 wt%. There are no signifi cant differences in the density of liquid products obtained in all the runs (Table 1). The aver-age carbon number (Cnp) of liquid products were found to decrease with the addition of PET, and the decrease of Cnp in the catalytic runs is expected due to the cracking of high molecular weight hydrocarbons. The presence of PET with 3P/PVDC/HIPS-Br produced ca 10 wt% of waxy compounds. The gaseous products were comparatively lower from 3P/PVDC/HIPS-Br than 3P/PVDC/HIPS- Br/PET mixed plastics. The cumulative volume of liquid products obtained during the of PET in the mixture decreased the total yield (Table 1) and also the rate of formation of liquid products from the reactor was earlier from 3P/PVDC/HIPS-Br than 3P/PVDC/HIPS-Br/PET.
Table 1: Yields and properties of liquid products from pyrolysis of 3P/PVDC/HIPS-Brand mixed with PET at 4300C.
Sample Mode
Yield of degradation products, wt.% Liquid Products
Liquid Gas Residue [R]Cnp
b Density,g/cm3(L) (G)a Carbon Wax
3P/PVDC/HIPS-BrThermal 65 24 11 0 12.3 0.82
CaH-C 2 g 62 27 11 0 11.0 0.80
3P/PVDC/HIPS-Br/PETThermal 52 29 10 9 11.1 0.83
CaH-C 2 g 52 29 9 10 10.6 0.80CaH-C 1g+FeC 1g 51 30 11 8 10.8 0.81
a G=100-(L+R) b Average carbon number of liquid product
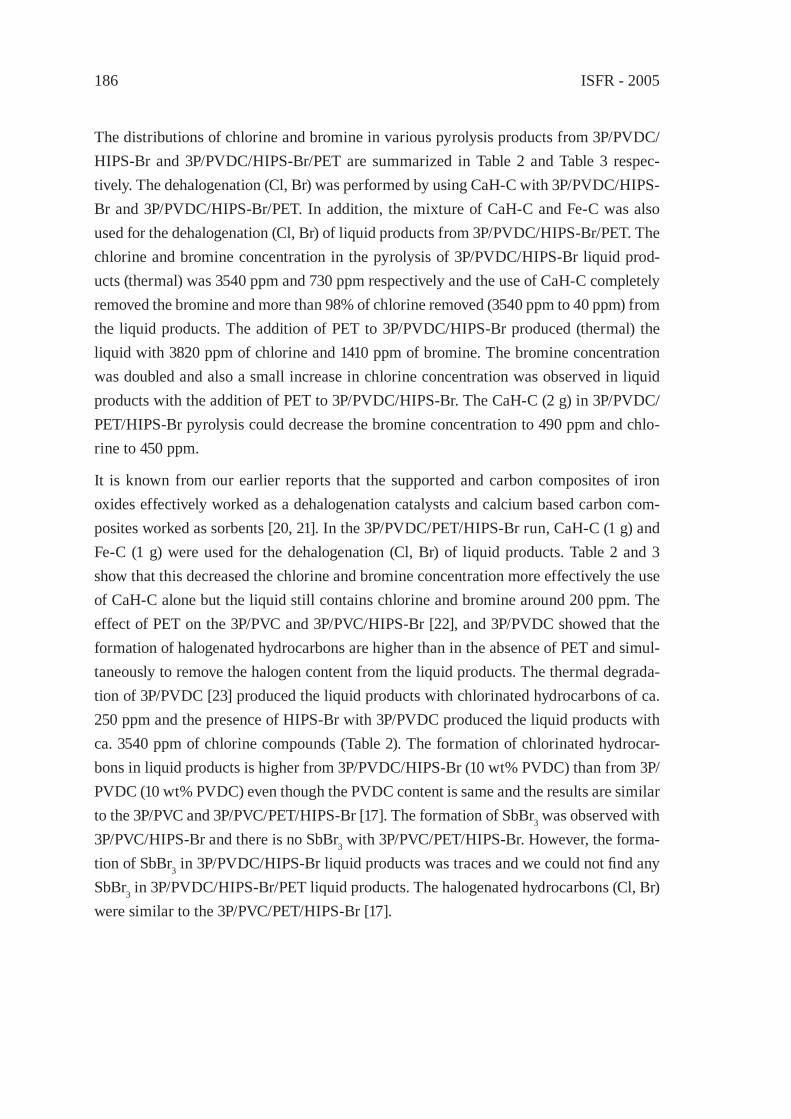
ISFR - 2005186
The distributions of chlorine and bromine in various pyrolysis products from 3P/PVDC/HIPS-Br and 3P/PVDC/HIPS-Br/PET are summarized in Table 2 and Table 3 respec-tively. The dehalogenation (Cl, Br) was performed by using CaH-C with 3P/PVDC/HIPS-Br and 3P/PVDC/HIPS-Br/PET. In addition, the mixture of CaH-C and Fe-C was also used for the dehalogenation (Cl, Br) of liquid products from 3P/PVDC/HIPS-Br/PET. The chlorine and bromine concentration in the pyrolysis of 3P/PVDC/HIPS-Br liquid prod-ucts (thermal) was 3540 ppm and 730 ppm respectively and the use of CaH-C completely removed the bromine and more than 98% of chlorine removed (3540 ppm to 40 ppm) from the liquid products. The addition of PET to 3P/PVDC/HIPS-Br produced (thermal) the liquid with 3820 ppm of chlorine and 1410 ppm of bromine. The bromine concentration was doubled and also a small increase in chlorine concentration was observed in liquid products with the addition of PET to 3P/PVDC/HIPS-Br. The CaH-C (2 g) in 3P/PVDC/PET/HIPS-Br pyrolysis could decrease the bromine concentration to 490 ppm and chlo-rine to 450 ppm.
It is known from our earlier reports that the supported and carbon composites of iron oxides effectively worked as a dehalogenation catalysts and calcium based carbon com-posites worked as sorbents [20, 21]. In the 3P/PVDC/PET/HIPS-Br run, CaH-C (1 g) and Fe-C (1 g) were used for the dehalogenation (Cl, Br) of liquid products. Table 2 and 3 show that this decreased the chlorine and bromine concentration more effectively the use of CaH-C alone but the liquid still contains chlorine and bromine around 200 ppm. The effect of PET on the 3P/PVC and 3P/PVC/HIPS-Br [22], and 3P/PVDC showed that the formation of halogenated hydrocarbons are higher than in the absence of PET and simul-taneously to remove the halogen content from the liquid products. The thermal degrada-tion of 3P/PVDC [23] produced the liquid products with chlorinated hydrocarbons of ca. 250 ppm and the presence of HIPS-Br with 3P/PVDC produced the liquid products with ca. 3540 ppm of chlorine compounds (Table 2). The formation of chlorinated hydrocar-bons in liquid products is higher from 3P/PVDC/HIPS-Br (10 wt% PVDC) than from 3P/PVDC (10 wt% PVDC) even though the PVDC content is same and the results are similar to the 3P/PVC and 3P/PVC/PET/HIPS-Br [17]. The formation of SbBr3 was observed with 3P/PVC/HIPS-Br and there is no SbBr3 with 3P/PVC/PET/HIPS-Br. However, the forma-tion of SbBr3 in 3P/PVDC/HIPS-Br liquid products was traces and we could not fi nd any SbBr3 in 3P/PVDC/HIPS-Br/PET liquid products. The halogenated hydrocarbons (Cl, Br) were similar to the 3P/PVC/PET/HIPS-Br [17].
Pyrolysis / Solvolysis 187
Table 2: Distribution of chlorine content in the pyrolysis products of 3P/PVDC/HIPS-Br and
mixed with PET at 430 °C.
Sample Mode
Cl conc. (ppm) Cl amount, mg
Oil Gas(HCl) Oil Gas
(HCl)Residue [R]
Carbon Wax
3P/PVDC/HIPS-BrThermal 3540 6440 23 515 42 -
CaH-C 2 g 44 5 0 0.4 35 -
3P/PVDC/HIPS-Br/PETThermal 3820 7700 20 616 23 6
CaH-C 2 g 450 6 2 0.4 29 5 CaH-C 1g+Fe-C 1g 280 36 1 3 36 4
Table 3: Distribution of bromine content in the pyrolysis products of 3P/PVDC/HIPS-Br andmixed with PET at 430 °C.
Sample Mode
Br conc., ppm Br amount, mg
Oil Gas(HBr) Oil Gas
(HBr)Residue [R]
Carbon Wax
3P/PVDC/HIPS-Br Thermal 730 320 5 25 13 -Ca-C 2 g n.d. 2 0 0.2 12 -
3P/PVDC/HIPS-Br/PETThermal 1410 240 7 19 12 2Ca-C 2 g 490 2 3 0.2 10 3
Ca-C1g+Fe-C1g 190 14 1 1 14 9
Figure 1: C-NP gram of liquid products obtained at 430 °C.
0
10
20
30
40
50
60
70
3 5 7 9 11 13 15 17 19 21 23 25 27 Carbon Number
3P/PVDC/HIPS-Br Thermal
3P/PVDC/HIPS-Br CaH-C 2g
3P/PVDC/HIPS-Br/PET Thermal
3P/PVDC/HIPS-Br/PET CaH-C 2g
3P/PVDC/HIPS-Br/PET CaH-C 1g+Fe-C 1g
g(C
n) X
100
/g(O
il),w
t%
ISFR - 2005188
The liquid products were analyzed by gas chromatography with fl ame ionization detec-tor (GC-FID) for the volatility (boiling point) distribution of hydrocarbons in the liquid products and the results are presented in the form of Normal Paraffi n gram (C-NP gram) is proposed by Murata et al. [19]. Figure 2 illustrates the C-NP gram of the liquid prod-ucts obtained by analyzing their gas chromatogram. The carbon numbers in the abscissa of the NP-gram are equivalent to retention values (boiling point) of the corresponding normal paraffi n and the ordinate shows the weight percent of the corresponding hydrocar-bons [g (Cn) /g(Oil) X 100, wt.%]. The wide range of hydrocarbons (low to high boiling point) composed of linear olefi ns and paraffi ns are present in all the runs and there are no signifi cant differences in the boiling point distribution of liquid products in all the runs (with and without CaH-C and Fe-C). The hydrocarbons such as styrene monomer, styrene dimer, styrene trimer, α-methyl styrene, toluene from PS; propylene dimer, propylene trimer etc. from PP can be found in the C-NP gram.
Similar to the C-NP gram, the carbon number distribution of chlorinated or brominated hydrocarbons [weight percent of chlorine or bromine = g (Cl or Br) /g (Oil) X 100, wt.%] in the liquid product was prepared from the GC-AED chromatogram. Cl-NP gram showed the major portion of chlorinated hydrocarbons in 3P/PVDC/HIPS-Br and 3P/PVDC/PET/HIPS-Br are same and formation of new Cl-compounds in the presence of PET was ob-served. The main chlorine containing hydrocarbons are in the boiling point range of n-C6, n-C8, n-C10 and n-C19 and chlorinated hydrocarbons exists in the carbon number less than n-C20 of normal paraffi n boiling point. The drastic increase of brominated hydrocarbons at n-C9 and n-C19 is signifi cant with the addition of PET. The brominated hydrocarbons observed till C21. The main bromine containing hydrocarbons are in the boiling point range of n-C6, n-C9, n-C11, n-C16, and n-C19.
Powder X-ray diffraction (XRD) analysis of carbon residue from 3P/PVDC/HIPS-Br and carbon residue and wax residue from 3P/PVDC/HIPS-Br/PET pyrolysis (thermal) were performed and the results show that the analysis of carbon residue from 3P/PVDC/HIPS-Br showed the presence of a small and single peak due to Sb2O3 but the carbon residue from 3P/PVDC/HIPS-Br/PET showed the presence of various antimony oxides and also a peak due to antimony bromine oxide. The wax residue of 3P/PVDC/HIPS-Br/PET run showed a crystalline nature and the presence of SbBr3.
4. Conclusions
The pyrolysis of 3P/PVDC/HIPS-Br and 3P/PVDC/HIPS-Br/PET was performed at 430°C at atmospheric pressure and the distribution of halogen (chlorine and bromine) content in degradation products was analyzed. Calcium hydroxide carbon composite (CaH-C) and
Pyrolysis / Solvolysis 189
iron oxide carbon composite was applied for the dehalogenation of liquid products. The yield of liquid products was decreased and the yield of gaseous products was increased with the addition of PET. The dehalogenation of hydrocarbons was not complete with the CaH-C (1g or 2 g) alone or with the combination of Fe-C (1 g) in the presence of PET with 3P/PVDC/HIPS-Br. Traces of SbBr3 were found in the liquid products of 3P/PVDC/HIPS-Br/PET. It can be concluded that the presence of small quantities of PET can produce the higher concentration of halogenated hydrocarbons in the liquid products.
References
[1] Sakata, Y., Uddin, MA., Muto, A., Koizumi, K., Narazaki, M., Murata, K., Kaji, K. Polym. Recy. 1996;2(4):309-315.
[2] Kaminsky W. Angew. Makromol. Chem. 1995;232:151-165.[3] Walendziewski J. Fuel. 2002;81(4):473-481.[4] Pifer A, Sen A. Angew. Chem. Int. Ed. 1998;37(23):3306-3308.[5] Serrano DP, Aguado J, Escola JM, Garagorri E. J. Anal. Appl. Pyro. 2001;58-59:789-
801. [6] Sakata Y, Uddin MA, Muto A, Narazaki M, Koizumi K, Murata K, Kaji M. Ind. Eng.
Chem. Res. 37 (1998) 2889.[7] Bhaskar T, Uddin MA, Kaneko K, Kusaba K, Matsui T, Muto A, Sakata Y, Murata
K. Energy & Fuels. 2003;17:75-80.[8] Uemichi Y, Nakamura J, Itoh T, Sugioka M. Garforth AA, Dwyer J. Ind. Eng. Chem.
Res. 1999;38(2):385-390.[10] Sakata Y, Uddin MA, Koizumi K, Murata K. Polym. Deg. Stabil. 1996;53:111-117.[11] Shiraga Y, Uddin MA, Muto A, Narazaki M, Sakata Y, Murata K. Energy & Fuels
1999;13(2):428-432.[12] Hornung A, Donner S, Balabanovich A, Seifert H. J. Clean. Prod. 2005;13:525-530
and references therein.[13] Luda MP, Camino G, Balabanovich AI, Hornung A. Macromol. Symp. 2002;180:141-
151.[14] Sakata, Y., Bhaskar, T., Uddin, MA., Muto, A., Matsui, T., J. Mat. Cycles. Waste.
Managment. 2003;5:113-124.[15] Bhaskar T, Matsui T, Uddin MA, Kaneko J, Muto A, Sakata Y. Appl. Catal. B.
2003;43:229-241.[16] Uddin MA, Bhaskar T, Kusaba T, Hamano K, Muto A, Sakata Y. Green. Chem.
2003;5:260-263.[17] Bhaskar T, Kaneko J, Muto A, Sakata Y, Jakab E, Matsui T, Uddin MA. J. Anal.
Appl. Pyro. 2004;72:27-33.[18] Bhaskar T, Uddin MA, Murai K, Kaneko K, Hamano K, Kusaba K, Muto A, Sakata
ISFR - 2005190
Y. J. Anal. Appl. Pyrolysis. 2003;70:579-587.[19] Murata, K., Hirano, Y., Sakata, Y., Uddin, MA., J. Anal. Appl. Pyrolysis. 2002;65:71-
90. [20] Bhaskar, T., Matsui, T., Nitta, K., Uddin, MA., Muto, A., Sakata, Y., Energy & Fuels.
2002;16:1533-1539.[21] Lingaiah, N., Uddin, MA., Muto, A., Murata, K., Sakata, Y., Green Chem. 2001;3(2):74-
75.[22] Bhaskar, T., Matsui, T., Kaneko, J., Uddin, MA., Muto, A., Sakata Y. Green. Chem.
2002;4:372-375.[23] Bhaskar, T., Tanabe, M., Muto, A., Sakata, Y., Liu, CF., Chen, MD., Chao, CC., Polym.
Deg. Stab. 89;2005:38-42.
Pyrolysis / Solvolysis 191
EFFECT OF CATALYST/SORBENT ON THE DECHLORINATION EFFICIENCY FOR THE DEGRADATION OF POLYMERIC
WASTEChiung-Fang, Liu*, Shun-Chih, King, Ming-Der, Chen
Division of Waste Treatment and Recovery Technology, CESH, ITRI, Taiwan*[email protected]
Abstract: The growing number of plastic waste is creating a disposal problem therefore, the recycling of plastic waste is getting an important topic in Taiwan and all over the world. Municipal plastic waste consists of PE, PP, PS, PVC and PET and their rates depend on the classifi cation degree of plastics. The high content of Cl in the pyrolysis oil causes many demerits such as apparatus damage, diffi culty in operation and main-tenance and make it impossible to use the oil for further applications. In this study, we found that the dechlorination effi ciencies of plastic waste containing PVC/PE in 1/100 and 10/100 ratios were excellent. Plastic waste recycling by pyrolysis can achieve the goal in compliance with both purpose of resource development and waste reuse.
1. Introduction
According to the recent report from the Republic of China Environmental Protection Administration (ROCEPA, 1998-2003) each person in Taiwan produces 0.89 - 1.13 kg/d of garbage with plastics making-up about 20 wt. % of all municipal solid waste (MSW). Plastics are low-cost and got used widely nowadays. Due to their non-biodegradable na-ture, the disposal is becoming a serious environmental problem. Among these waste plas-tics, the poly(vinyl chloride) (PVC) contributes about 10% in the plastic wastes of MSW [1] and about 47% in the commonly used plastics according to the proportion of amounts of supply/demand in Taiwan [2]. The PVC may be the most serious problem because of its corrosion potential during incineration. A proper thermal pyrolysis method may solve the disposal problems and corrosion issues during the incineration of PVC as well as use the energy or produce primary chemicals from PVC mixed plastics [3, 4].
Studies on the PVC pyrolysis have been performed by some researchers [5, 6] to investi-gate the structural changes during the thermal decomposition of PVC. Some investigators have greatly contributed to understanding of PVC pyrolysis [5, 7-9]. Recently, researches working on the PVC pyrolysis gether with other plastics, e. g. PE, PET, PP, PS, ABS [10-13] have developed effective catalyst/sorbents for dehalogenation (Cl, Br) of the derived oil obtained from pyrolysis of waste plastics containing PVC or ABS. The thermal and catalytic degradation of waste plastic mixtures is one of the best methods to recover valu-able materials and energy content.

ISFR - 2005192
The pyrolytic experiments were carried out in a batch reactor over a wide temperature range. In this work, we study the degradation of waste plastics containing PE and PVC and the effect of Fe- and Ca- based catalyst/sorbent for the removal of chlorine from py-rolysis oil.
2. Experimental
2.1. Materials
Commercial-grade HDPE and PVC were used in this study. They were both supplied by the USI Far East Co. Ltd of Taiwan. The N2 gas was purchased from Shin-Da Co., Ltd of Hsinchu, Taiwan, and had a purity of 99.9%.
The Fe-C and Ca-C composites were prepared by Toda Kogyo Corporation, Hiroshima, Japan; their preparation method has been presented elsewhere [14]. The same company supplied the FeOOH and the CaCO3.
2.2. Pyrolysis test
Experiments for the degradation of PE and PVC were performed in a stainless reactor under atmospheric pressure using a batch operation. The experimental apparatus used in this study is composed of three main parts: pyrolysis reactor, catalytic reactor, and con-densation unit (Figure 1), and both pyrolysis and catalytic reactors had 400 mm height and 100 mm id and were perforated at the bottom to facilitate the passage of the sweep gas. In this study, 100 g of PE with 0 g, 1 g and 10 g of PVC was used for each run. The plastics pellet was dispersed in the bottom of the pyrolysis reactor. The mixture of cata-lyst/sorbent (50g/50g) were loaded into the catalytic reactor. After loading plastics and catalyst/sorbent, the pyrolysis and catalytic reactors were heated to 480 °C and 350 °C respectively. In a similar way, the thermal degradation of plastics was carried out in the absence of catalyst/sorbent. The gaseous products were condensed (using cold water con-denser) into liquid products and trapped in a measuring jar.
Figure 1: Schematic diagram ofexperimental apparatus.
1. N2 cylinder 2. Pressure reducing regulator
3. Rotameter 4. Thermocouple5. Pyrolysis
reactor6. Furnace
7. Catalytic reactor
8. Collection unit 1
9. Condensation unit
10. Collection unit 2
11. Acid absorber
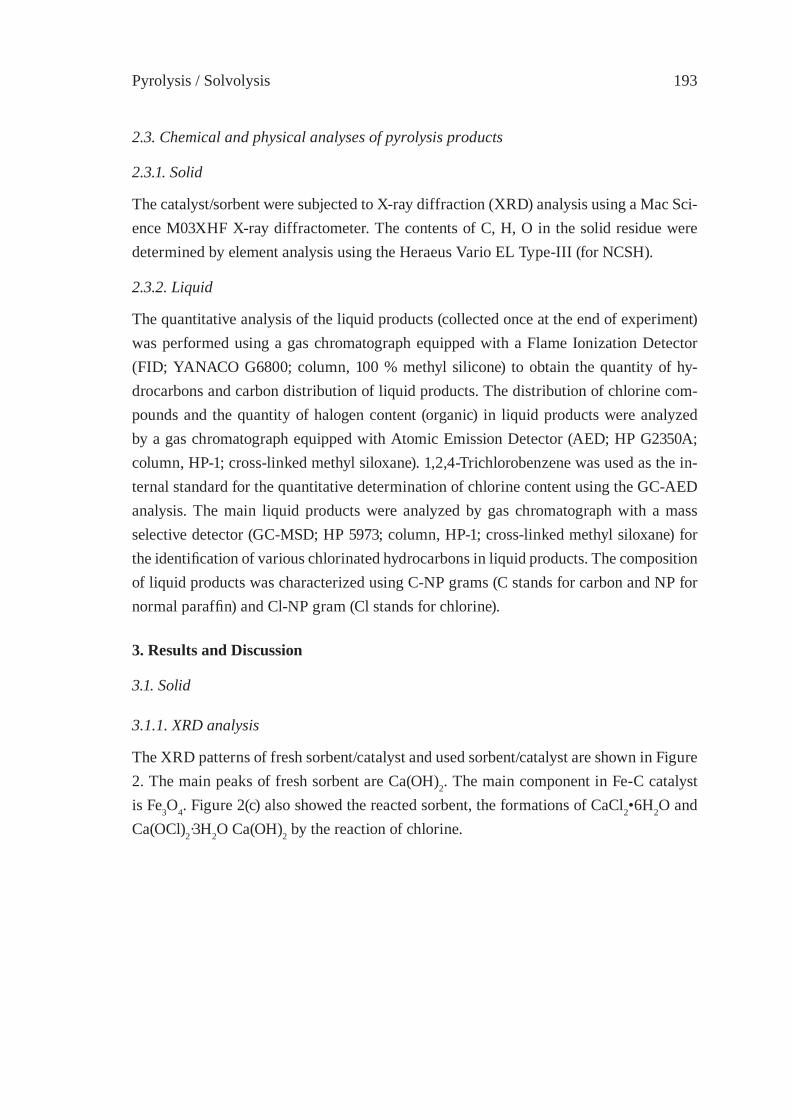
Pyrolysis / Solvolysis 193
2.3. Chemical and physical analyses of pyrolysis products
2.3.1. Solid
The catalyst/sorbent were subjected to X-ray diffraction (XRD) analysis using a Mac Sci-ence M03XHF X-ray diffractometer. The contents of C, H, O in the solid residue were determined by element analysis using the Heraeus Vario EL Type-III (for NCSH).
2.3.2. Liquid
The quantitative analysis of the liquid products (collected once at the end of experiment) was performed using a gas chromatograph equipped with a Flame Ionization Detector (FID; YANACO G6800; column, 100 % methyl silicone) to obtain the quantity of hy-drocarbons and carbon distribution of liquid products. The distribution of chlorine com-pounds and the quantity of halogen content (organic) in liquid products were analyzed by a gas chromatograph equipped with Atomic Emission Detector (AED; HP G2350A; column, HP-1; cross-linked methyl siloxane). 1,2,4-Trichlorobenzene was used as the in-ternal standard for the quantitative determination of chlorine content using the GC-AED analysis. The main liquid products were analyzed by gas chromatograph with a mass selective detector (GC-MSD; HP 5973; column, HP-1; cross-linked methyl siloxane) for the identifi cation of various chlorinated hydrocarbons in liquid products. The composition of liquid products was characterized using C-NP grams (C stands for carbon and NP for normal paraffi n) and Cl-NP gram (Cl stands for chlorine).
3. Results and Discussion
3.1. Solid
3.1.1. XRD analysis
The XRD patterns of fresh sorbent/catalyst and used sorbent/catalyst are shown in Figure 2. The main peaks of fresh sorbent are Ca(OH)2. The main component in Fe-C catalyst is Fe3O4. Figure 2(c) also showed the reacted sorbent, the formations of CaCl2•6H2O and Ca(OCl)2·3H2O Ca(OH)2 by the reaction of chlorine.
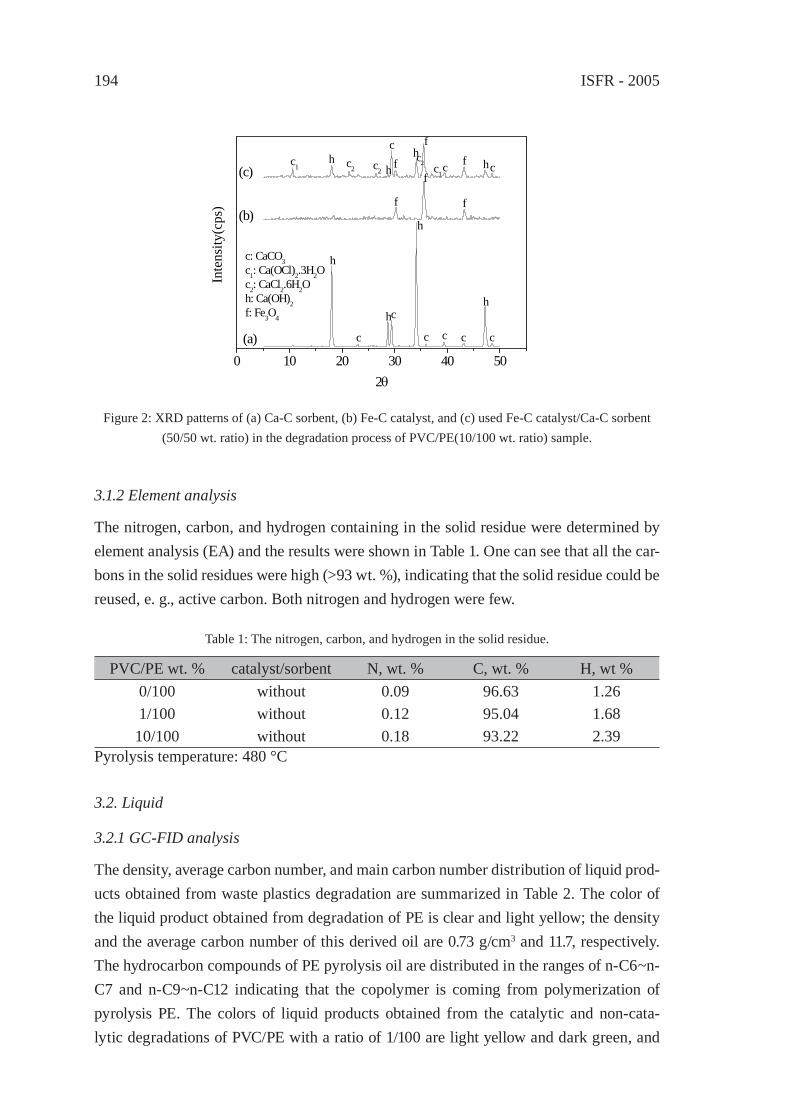
ISFR - 2005194
3.1.2 Element analysis
The nitrogen, carbon, and hydrogen containing in the solid residue were determined by element analysis (EA) and the results were shown in Table 1. One can see that all the car-bons in the solid residues were high (>93 wt. %), indicating that the solid residue could be reused, e. g., active carbon. Both nitrogen and hydrogen were few.
Table 1: The nitrogen, carbon, and hydrogen in the solid residue.
PVC/PE wt. % catalyst/sorbent N, wt. % C, wt. % H, wt %0/100 without 0.09 96.63 1.261/100 without 0.12 95.04 1.6810/100 without 0.18 93.22 2.39
Pyrolysis temperature: 480 °C
3.2. Liquid
3.2.1 GC-FID analysis
The density, average carbon number, and main carbon number distribution of liquid prod-ucts obtained from waste plastics degradation are summarized in Table 2. The color of the liquid product obtained from degradation of PE is clear and light yellow; the density and the average carbon number of this derived oil are 0.73 g/cm3 and 11.7, respectively. The hydrocarbon compounds of PE pyrolysis oil are distributed in the ranges of n-C6~n-C7 and n-C9~n-C12 indicating that the copolymer is coming from polymerization of pyrolysis PE. The colors of liquid products obtained from the catalytic and non-cata-lytic degradations of PVC/PE with a ratio of 1/100 are light yellow and dark green, and
0 10 20 30 40 50
f
chc ffc
hh
h c2c2c2 c1
c1
f
f
f
cccc
c
c
h
h
h
hc: CaCO3c1: Ca(OCl)2.3H2Oc2: CaCl2.6H2Oh: Ca(OH)2f: Fe3O4
(c)
(b)
(a)
Inte
nsity
(cps
)
2θ
Figure 2: XRD patterns of (a) Ca-C sorbent, (b) Fe-C catalyst, and (c) used Fe-C catalyst/Ca-C sorbent (50/50 wt. ratio) in the degradation process of PVC/PE(10/100 wt. ratio) sample.
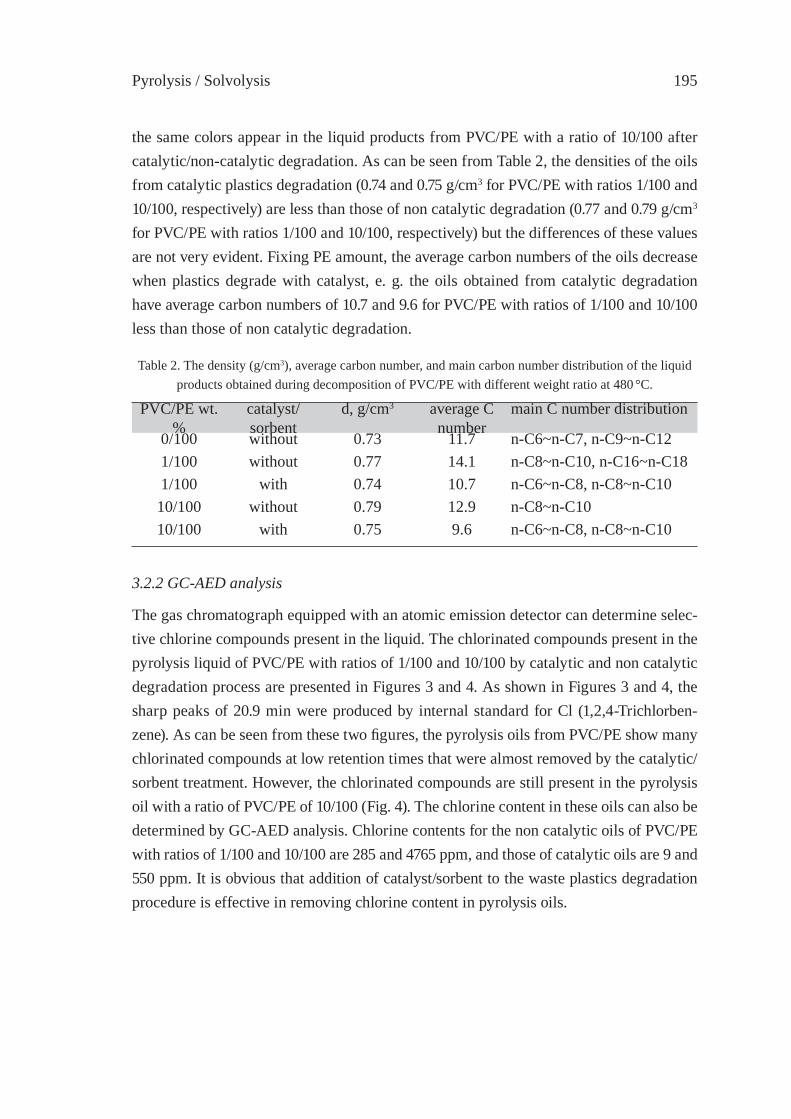
Pyrolysis / Solvolysis 195
the same colors appear in the liquid products from PVC/PE with a ratio of 10/100 after catalytic/non-catalytic degradation. As can be seen from Table 2, the densities of the oils from catalytic plastics degradation (0.74 and 0.75 g/cm3 for PVC/PE with ratios 1/100 and 10/100, respectively) are less than those of non catalytic degradation (0.77 and 0.79 g/cm3 for PVC/PE with ratios 1/100 and 10/100, respectively) but the differences of these values are not very evident. Fixing PE amount, the average carbon numbers of the oils decrease when plastics degrade with catalyst, e. g. the oils obtained from catalytic degradation have average carbon numbers of 10.7 and 9.6 for PVC/PE with ratios of 1/100 and 10/100 less than those of non catalytic degradation.
Table 2. The density (g/cm3), average carbon number, and main carbon number distribution of the liquid products obtained during decomposition of PVC/PE with different weight ratio at 480 °C.
PVC/PE wt. %
catalyst/sorbent
d, g/cm3 average C number
main C number distribution
0/100 without 0.73 11.7 n-C6~n-C7, n-C9~n-C121/100 without 0.77 14.1 n-C8~n-C10, n-C16~n-C181/100 with 0.74 10.7 n-C6~n-C8, n-C8~n-C1010/100 without 0.79 12.9 n-C8~n-C1010/100 with 0.75 9.6 n-C6~n-C8, n-C8~n-C10
3.2.2 GC-AED analysis
The gas chromatograph equipped with an atomic emission detector can determine selec-tive chlorine compounds present in the liquid. The chlorinated compounds present in the pyrolysis liquid of PVC/PE with ratios of 1/100 and 10/100 by catalytic and non catalytic degradation process are presented in Figures 3 and 4. As shown in Figures 3 and 4, the sharp peaks of 20.9 min were produced by internal standard for Cl (1,2,4-Trichlorben-zene). As can be seen from these two fi gures, the pyrolysis oils from PVC/PE show many chlorinated compounds at low retention times that were almost removed by the catalytic/sorbent treatment. However, the chlorinated compounds are still present in the pyrolysis oil with a ratio of PVC/PE of 10/100 (Fig. 4). The chlorine content in these oils can also be determined by GC-AED analysis. Chlorine contents for the non catalytic oils of PVC/PE with ratios of 1/100 and 10/100 are 285 and 4765 ppm, and those of catalytic oils are 9 and 550 ppm. It is obvious that addition of catalyst/sorbent to the waste plastics degradation procedure is effective in removing chlorine content in pyrolysis oils.
ISFR - 2005196
(A)
(B)
Figure 3: GC-AED selective analysis of chlorine compounds for the liquid products obtained during de-composition of PVC/PE (1/100 wt. ratio) sample at 480 °C; (A) without catalyst/sorbent, (B) with
catalyst/sorbent.
(B)
(A)
Figure 4: GC-AED selective analysis of chlorine compounds for the liquid products obtained during de-composition of PVC/PE (10/100 wt. ratio) sample at 480 °C; (A) without catalyst/sorbent, (B) with
catalyst/sorbent.
Pyrolysis / Solvolysis 197
3.2.3 GC-MSD analysis
The oil obtained from PVC/PE degradation with a ratio of PVC/PE of 10/100 without cata-lyst/sorbent was used for GC-MS analysis. To avoid sampling errors, the same pyrolysis oil as used for the GC-AED analysis was taken. The major compounds with retention times less than 10 min are: 3-Methyl-1-pentene, 1,2-Dichloro-propane, 1-Hexene, Phe-nylethyne, alpha-Methylstyrene, Cyclootane, and 1-Dodecene. The compounds contain-ing Cl were formed due to PVC decomposition.
4. Conclusion
The pyrolysis of PVC/PE mixtures were carried out in a pyrolysis reactor (degradation at 480 °C) with a subsequent dechlorination process at 350 °C with a catalyst/sorbent unit under atmospheric pressure. The results of this study show that the catalyst/sorb-ent not only decreases the Cl content but also reduces the average carbon number in the pyrolysis oils. The Fe-C act as catalyst and Ca-C as sorbent. The Ca-C sorbent react with Cl-containing compounds and produce CaCl2 •6H2O and Ca(OCl)2•3H2O which are deli-quescence [15].
The results of this study are useful to the design and operation of the thermal degrada-tion system using catalyst/sorbent to remove the chlorine produced from waste plastics pyrolysis and improve the value of recycling oil.
Acknowledgments
The authors express their sincere thanks to the Department of Industrial Technology of the Republic of China, Taiwan for its fi nancial support under project F33ANK3400. We would like to thank Professor Yusaku Sakata and Dr. Thallada Bhaskar in the Depart-ment of Applied Chemistry Faculty of Engineering Okayama University for their valuable discussion and providing the analysis instruments.
Reference
[1] Republic of China Environmental Protection Administration, ROC EPA, ROC EPA79-006-07-202 (1991).
[2] Petrochemical Industrial Association of Taiwan, Petrochemical Industry, 4, p13 (1991).
[3] Wilkins, E. S. and Wilkins M. G., J. Environ. Sci. Health, A 20, pp149-175 (1985).[4] Scott, D. S., Czernik S. R., Piskorz J., and Radlein St. A. G., Energy and Fuels, 4,
pp407-411 (1990).[5] Baum, B. and Wartman L. H., J. Appl. Polym. Sci., 28, pp537-546 (1958).[6] Krimm, S. and Enomoto S., J. Polym. Sci.: Part A 2, pp669-678 (1964).
ISFR - 2005198
[7] Stromberg, R. R., Straus S., and Achhammer B. G., Polym. Degrad. Stab., 35, pp355-368 (1959).
[8] He, Z., X. Hu and Sun G., Polym. Degrad. Stab. 24, pp127-135 (1989).[9] Van Hoang, T. and Guyot A., Polym. Degrad. Stab. 32, pp93-103 (1991).[10] Mihai B., Bhaskar, T., Murai, K., Muto, A., Sakata, Y., and Azhar Uddin, Md.,
Chemosphere, 56, pp433-440 (2004).[11] Bhaskar, T., Azhar Uddin, Md., Kaneko, J., Matsui, T., Muto, A., and Sakata, Y.,
Progress in Rubber, Plastics and Recycling Technology, 20(2), pp163-170 (2004).[12] Bhaskar, T., Azhar Uddin, Md., Kaneko, J., Matsui, T., Muto, A., and Sakata, Y., J.
Anal. Appl. Pyrolysis, 72, pp27-33 (2004).[13] Matsui, T., Okita, T., Fujii, Y., Hakata, T., Imai, T., Bhaskar, T., and Sakata, Y.,
Applied Catalyst A: General, 261, pp135-141 (2004).[14] Bhaskar, T., Matsui, T., Nitta, K., Uddin, MA., Muto, A., and Sakata, Y., Energy
Fuel, 16, pp1533-1539 (2002).[15] Young, J. F., Journal of Applied Chemistry, 17, p241 (1967).
Pyrolysis / Solvolysis 199
ENHANCED PRODUCTION OF α-OLEFINS BY THERMAL DEGRADATION OF HDPE IN DECALIN SOLVENT
D.P. Serrano*, J. Aguado, G. Vicente, N. Sánchez and L. EstebanDepartment of Chemical and Environmental Technology,
Rey Juan Carlos University, Móstoles, [email protected]
Abstract: In the present work, the thermal degradation of HDPE in the presence of decalin has been investigated as a step in feedstock recycling. The study is focused on the effects of the plastic/decalin ratio, time and temperature on the product distribution. The addition of decalin increased the production of both gas and liquid products, since the solvent augmented the mass and heat transfer phenomena during the thermal degradation. Besides, the presence of this solvent favours the production of gaseous olefi ns and C5-C32 α-olefi ns, which indicates that decalin modifi es the thermal degradation mechanism. High temperatures, longer reaction times and high amounts of decalin also contribute to the production of low molecular-weight products, increasing the selectivity to olefi ns, the main component being linear α-olefi ns which are products of commercial interest.
1. Introduction
Polyolefi ns (low-density polyethylene, high-density polyethylene and polypropylene) are plastic materials used extensively in containers and packaging. They represent approximately 60% of the total amount of plastics in urban solid waste [1]. In Western Europe, the current strategies to deal with these wastes are still based in landfi lling and incineration without energy recovery to a great extent (around 62 % of the total available plastic waste collectable in 2002) [2]. In this context, the European Union launched the 94/62/CE directive on packaging and packaging waste in 1994, which has been recently amended through Directive 2004/12/CE. According to the new directive, between 55 % as a minimum and 80 % as a maximum by weight of packaging waste has to be recycled no later than 2009.
A promising alternative for the reprocessing of waste plastics is feedstock recycling, which allows the conversion of plastics residues into raw chemicals, monomers for plastics or hydrocarbon feedstocks. In this way, thermal degradation has been used to convert different polyolefi ns into hydrocarbon mixtures [3,4,5]. The thermal decomposition of polyolefi ns at 400 ºC or higher temperatures produce a mixture of hydrocarbons that is formed by a gas fraction (C1–C4), a liquid fraction (C5–C18) and a solid residue (C18–C70). For each number of carbon atoms, three main components are produced: the corresponding n-paraffi n, α-olefi n and α,ω-diene. The relative proportion of these products depends on
ISFR - 2005200
the thermal degradation operating conditions.
Polymer thermal degradation involves complex reactions through a radical mechanism, being very dependent on pressure, reactor geometry, heat transfer rate and mixing intensity. Polymers have high viscosity, which complicates the process, since it hinders mass and heat transfer phenomena [6,7]. This circumstance is one of the obstacles for the development of industrial plants for the thermal degradation of plastics wastes. In this sense, the addition of solvents can improve the mass and heat transfers, decreasing, in turn, the required temperature and increasing the yield of the liquid hydrocarbons. In addition, the solvent may be able to modify the thermal degradation mechanism, which, in turn, would facilitate the production of specifi c hydrocarbons.
A number of researchers have studied the thermal degradation of polymers using several solvents. However, most of these works have been focused on plastics different from polyolefi ns, mainly polystyrene [6,7,8,9]. The thermal degradation of polyethylene is particularly important since this polyolefi n is the major component of plastics wastes. In the present work, we have investigated the thermal cracking of high-density polyethylene (HDPE) using decalin as a solvent to increase the yields of C5-C32 α-olefi ns, which are products of commercial interest for the chemical industry. The study is focused on the effect of operating conditions on the product distribution. The results obtained are also compared with those corresponding to the solventless reactions.
2. Experimental procedure
2.1. Materials
The polyolefi n used in this work was high-density polyethylene, provided by REPSOL-YPF. The solvent (decalin) had 98 % purity and was purchased from ACROS.
2.2. Reaction system
The thermal cracking reactions were performed in a 100 ml stainless steel autoclave provided by a mechanical stirrer and surrounded by an electric blanket for transferring heat to the reaction mixture. The reactor was equipped with appropriate temperature and pressure controls. A thermocouple was in contact with the reaction mixture and was capable of maintaining the reaction temperature within 1 ºC of the set value. The pressure gauge allowed us to follow the reaction progress and to keep pressure below 150 bars, the safety limit for the autoclave.
2.3. Experimental procedure
The reactions were conducted varying the plastic/solvent mass ratios (1/10, 3/10, 5/10 and 7/10), temperature (350, 375, 400 and 425 ºC) and time (1, 3, 5 and 7 hours). The

Pyrolysis / Solvolysis 201
corresponding solventless reactions were also carried out to compare the results.
Initially, the HDPE beads were washed, dried and ground cryogenically below 1 mm particle size. In each experiment, the reactor was loaded with the plastic and the solvent, being fl ushed with nitrogen until an oxygen-free medium can be ensured. Subsequently, the autoclave was hermetically sealed, pressurized at 20 bars and heated at the reaction temperature under a nitrogen atmosphere. The temperature was maintained for a determined time of reaction before cooling down to room temperature. The gaseous products were then collected in a gas sampling bag and analysed in a Varian 3800 gas chromatograph equipped with a 10 m length × 0.25 mm Chrompack capillary column. The solid and liquid products were removed from the reactor, weighed and then separated by vacuum distillation. The distillate fraction is composed of the decalin and liquid hydrocarbons. The residue corresponded to high molecular weight hydrocarbons and non-converted plastic. Both fractions were analysed by gas chromatography using a Varian 3800 chromatograph with a 1 m length × 0.25 mm capillary column (CP-SIL 5 CB).
3. Results and discussion
3.1. Infl uence of the plastic/solvent ratio
Four reactions were performed with a reaction time of 5 hours at 400ºC. Figure 1 shows the effect of the plastic/solvent ratio on the yields for different hydrocarbon groups, based on the number of carbon atoms. The yields of the C1-C4 fraction (gaseous hydrocarbons) rose with the amount of solvent, but this increase was more signifi cant between the 3/10 (7.8 %) and the 1/10 plastic/solvent ratio (25 %). In a parallel way, an increase in the C5-C20 hydrocarbon yields was observed when the reaction was carried out with a 1/10 plastic/solvent ratio in comparison with the solventless reaction. The corresponding yield values were 30.6 and 9.2 %, respectively. The other hydrocarbon fraction yields were comparatively lower. In this sense, the presence of decalin enhances the polyolefi n conversion, allowing the production of low molecular-weight products. This result may be interpreted in terms of a better heat and mass transfer due to the solvent presence.
Gaseous hydrocarbons were broken down by hydrocarbon type and represented in Figure 2. Signifi cant amounts of olefi ns were found in the gaseous fraction, increasing when the plastic/solvent ratio decreased. The paraffi n yield values, however, were signifi cantly lower in comparison with the olefi n ones. At an HDPE/decalin ratio of 1/10, the olefi n and paraffi n yields were 23.28 and 1.73 % wt, respectively. These results indicate that the presence of this solvent modifi es the thermal cracking mechanism to produce gaseous olefi ns, which may be used as buildings blocks for the petrochemical industry.
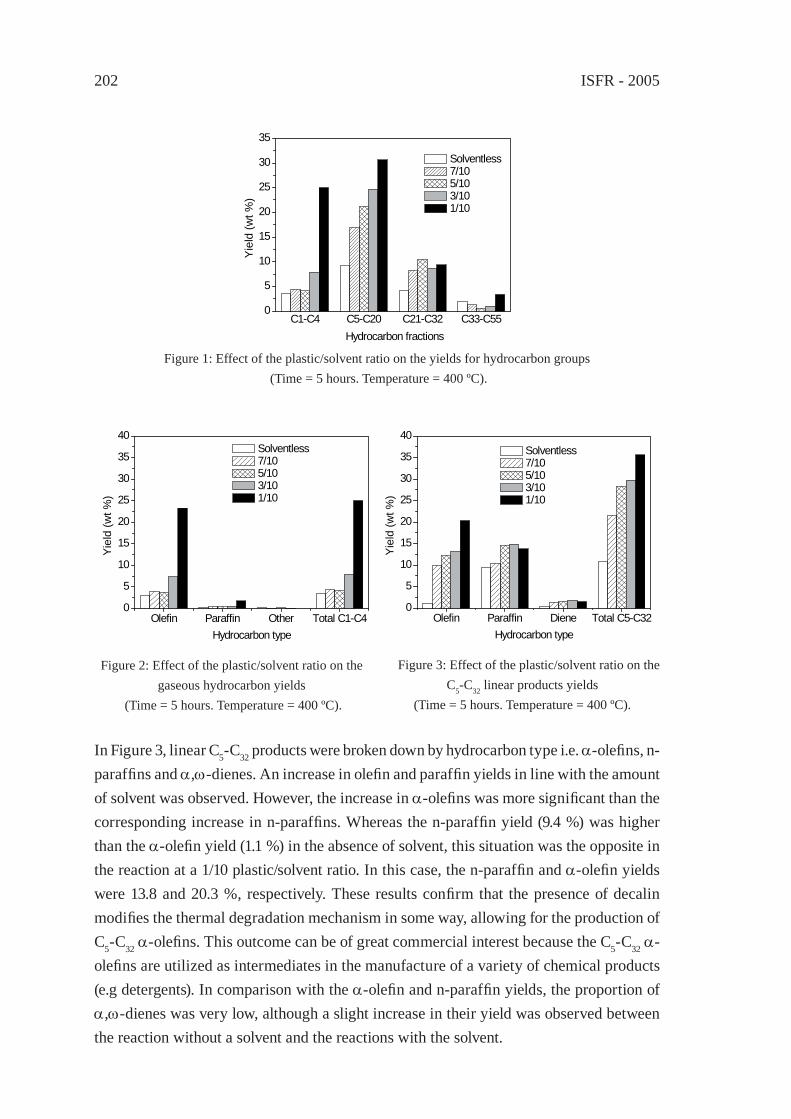
ISFR - 2005202
In Figure 3, linear C5-C32 products were broken down by hydrocarbon type i.e. α-olefi ns, n-paraffi ns and α,ω-dienes. An increase in olefi n and paraffi n yields in line with the amount of solvent was observed. However, the increase in α-olefi ns was more signifi cant than the corresponding increase in n-paraffi ns. Whereas the n-paraffi n yield (9.4 %) was higher than the α-olefi n yield (1.1 %) in the absence of solvent, this situation was the opposite in the reaction at a 1/10 plastic/solvent ratio. In this case, the n-paraffi n and α-olefi n yields were 13.8 and 20.3 %, respectively. These results confi rm that the presence of decalin modifi es the thermal degradation mechanism in some way, allowing for the production of C5-C32 α-olefi ns. This outcome can be of great commercial interest because the C5-C32 α-olefi ns are utilized as intermediates in the manufacture of a variety of chemical products (e.g detergents). In comparison with the α-olefi n and n-paraffi n yields, the proportion of α,ω-dienes was very low, although a slight increase in their yield was observed between the reaction without a solvent and the reactions with the solvent.
C1-C4 C5-C20 C21-C32 C33-C550
5
10
15
20
25
30
35
Hydrocarbon fractions
Yie
ld (w
t %)
Solventless 7/10 5/10 3/10 1/10
Figure 1: Effect of the plastic/solvent ratio on the yields for hydrocarbon groups (Time = 5 hours. Temperature = 400 ºC).
Olefin Paraffin Other Total C1-C40
5
10
15
20
25
30
35
40
Yie
ld (w
t %)
Hydrocarbon type
Solventless 7/10 5/10 3/10 1/10
Olefin Paraffin Diene Total C5-C320
5
10
15
20
25
30
35
40
Yie
ld (w
t %)
Hydrocarbon type
Solventless 7/10 5/10 3/10 1/10
Figure 2: Effect of the plastic/solvent ratio on the gaseous hydrocarbon yields
(Time = 5 hours. Temperature = 400 ºC).
Figure 3: Effect of the plastic/solvent ratio on the C5-C32 linear products yields
(Time = 5 hours. Temperature = 400 ºC).
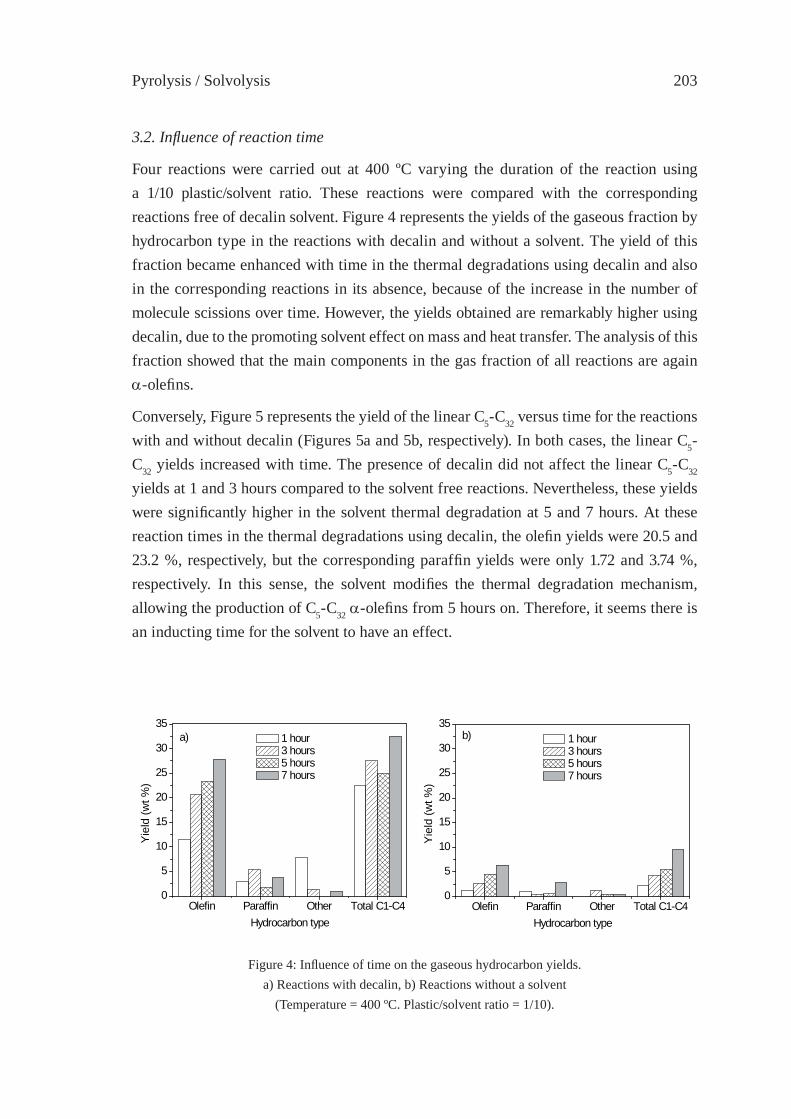
Pyrolysis / Solvolysis 203
3.2. Infl uence of reaction time
Four reactions were carried out at 400 ºC varying the duration of the reaction using a 1/10 plastic/solvent ratio. These reactions were compared with the corresponding reactions free of decalin solvent. Figure 4 represents the yields of the gaseous fraction by hydrocarbon type in the reactions with decalin and without a solvent. The yield of this fraction became enhanced with time in the thermal degradations using decalin and also in the corresponding reactions in its absence, because of the increase in the number of molecule scissions over time. However, the yields obtained are remarkably higher using decalin, due to the promoting solvent effect on mass and heat transfer. The analysis of this fraction showed that the main components in the gas fraction of all reactions are again α-olefi ns.
Conversely, Figure 5 represents the yield of the linear C5-C32 versus time for the reactions with and without decalin (Figures 5a and 5b, respectively). In both cases, the linear C5-C32 yields increased with time. The presence of decalin did not affect the linear C5-C32 yields at 1 and 3 hours compared to the solvent free reactions. Nevertheless, these yields were signifi cantly higher in the solvent thermal degradation at 5 and 7 hours. At these reaction times in the thermal degradations using decalin, the olefi n yields were 20.5 and 23.2 %, respectively, but the corresponding paraffi n yields were only 1.72 and 3.74 %, respectively. In this sense, the solvent modifi es the thermal degradation mechanism, allowing the production of C5-C32 α-olefi ns from 5 hours on. Therefore, it seems there is an inducting time for the solvent to have an effect.
Olefin Paraffin Other Total C1-C40
5
10
15
20
25
30
35a)
Yie
ld (w
t %)
Hydrocarbon type
1 hour 3 hours 5 hours 7 hours
Olefin Paraffin Other Total C1-C40
5
10
15
20
25
30
35b)
Yie
ld (w
t %)
Hydrocarbon type
1 hour 3 hours 5 hours 7 hours
Figure 4: Infl uence of time on the gaseous hydrocarbon yields. a) Reactions with decalin, b) Reactions without a solvent
(Temperature = 400 ºC. Plastic/solvent ratio = 1/10).
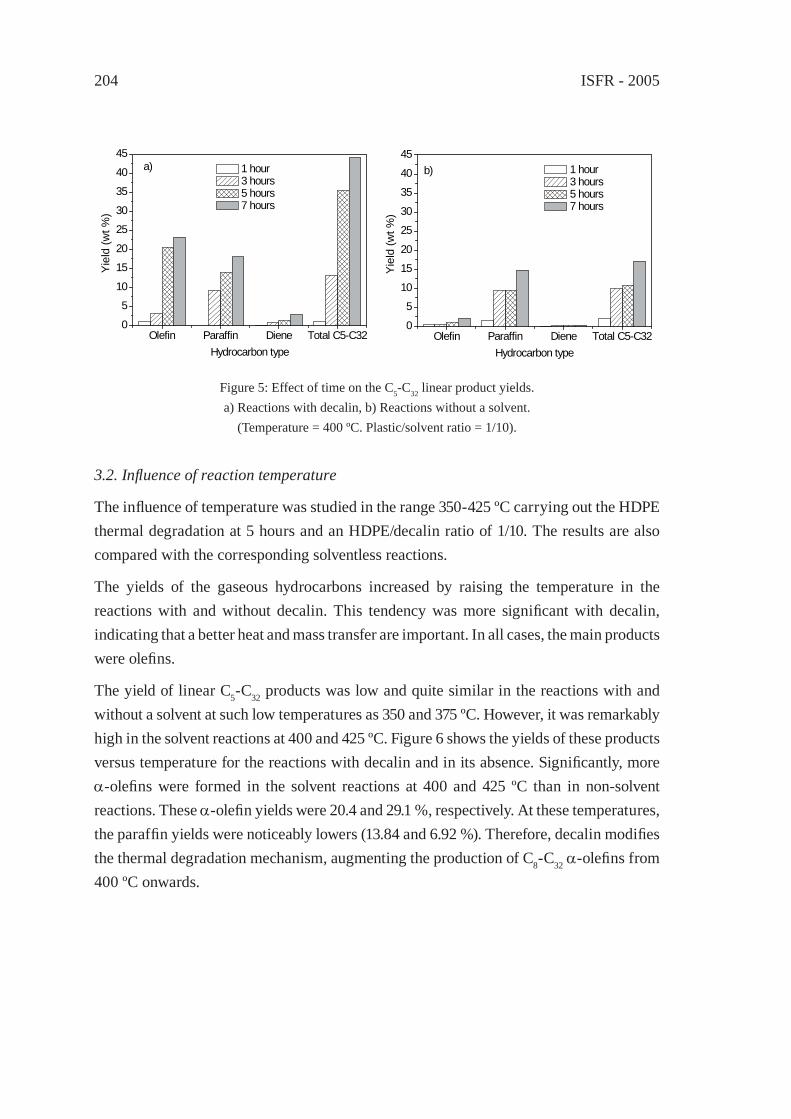
ISFR - 2005204
Olefin Paraffin Diene Total C5-C320
5
10
15
20
25
30
35
40
45b)
Yiel
d (w
t %)
Hydrocarbon type
1 hour 3 hours 5 hours 7 hours
3.2. Infl uence of reaction temperature
The infl uence of temperature was studied in the range 350-425 ºC carrying out the HDPE thermal degradation at 5 hours and an HDPE/decalin ratio of 1/10. The results are also compared with the corresponding solventless reactions.
The yields of the gaseous hydrocarbons increased by raising the temperature in the reactions with and without decalin. This tendency was more signifi cant with decalin, indicating that a better heat and mass transfer are important. In all cases, the main products were olefi ns.
The yield of linear C5-C32 products was low and quite similar in the reactions with and without a solvent at such low temperatures as 350 and 375 ºC. However, it was remarkably high in the solvent reactions at 400 and 425 ºC. Figure 6 shows the yields of these products versus temperature for the reactions with decalin and in its absence. Signifi cantly, more α-olefi ns were formed in the solvent reactions at 400 and 425 ºC than in non-solvent reactions. These α-olefi n yields were 20.4 and 29.1 %, respectively. At these temperatures, the paraffi n yields were noticeably lowers (13.84 and 6.92 %). Therefore, decalin modifi es the thermal degradation mechanism, augmenting the production of C8-C32 α-olefi ns from 400 ºC onwards.
Olefin Paraffin Diene Total C5-C320
5
10
15
20
25
30
35
40
45a)
Yiel
d (w
t %)
Hydrocarbon type
1 hour 3 hours 5 hours 7 hours
Figure 5: Effect of time on the C5-C32 linear product yields. a) Reactions with decalin, b) Reactions without a solvent.
(Temperature = 400 ºC. Plastic/solvent ratio = 1/10).
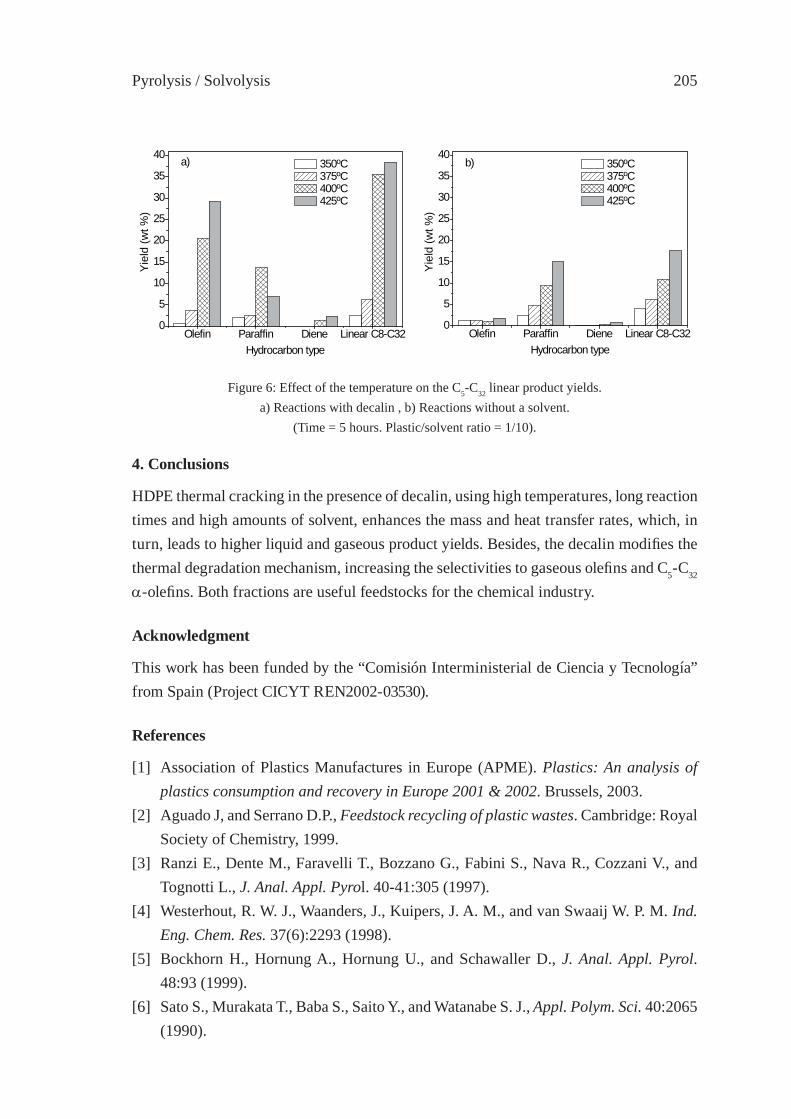
Pyrolysis / Solvolysis 205
4. Conclusions
HDPE thermal cracking in the presence of decalin, using high temperatures, long reaction times and high amounts of solvent, enhances the mass and heat transfer rates, which, in turn, leads to higher liquid and gaseous product yields. Besides, the decalin modifi es the thermal degradation mechanism, increasing the selectivities to gaseous olefi ns and C5-C32 α-olefi ns. Both fractions are useful feedstocks for the chemical industry.
Acknowledgment
This work has been funded by the “Comisión Interministerial de Ciencia y Tecnología” from Spain (Project CICYT REN2002-03530).
References
[1] Association of Plastics Manufactures in Europe (APME). Plastics: An analysis of plastics consumption and recovery in Europe 2001 & 2002. Brussels, 2003.
[2] Aguado J, and Serrano D.P., Feedstock recycling of plastic wastes. Cambridge: Royal Society of Chemistry, 1999.
[3] Ranzi E., Dente M., Faravelli T., Bozzano G., Fabini S., Nava R., Cozzani V., and Tognotti L., J. Anal. Appl. Pyrol. 40-41:305 (1997).
[4] Westerhout, R. W. J., Waanders, J., Kuipers, J. A. M., and van Swaaij W. P. M. Ind. Eng. Chem. Res. 37(6):2293 (1998).
[5] Bockhorn H., Hornung A., Hornung U., and Schawaller D., J. Anal. Appl. Pyrol. 48:93 (1999).
[6] Sato S., Murakata T., Baba S., Saito Y., and Watanabe S. J., Appl. Polym. Sci. 40:2065 (1990).
Olefin Paraffin Diene Linear C8-C320
5
10
15
20
25
30
35
40 a)
Y
ield
(wt %
)
Hydrocarbon type
350ºC 375ºC 400ºC 425ºC
Olefin Paraffin Diene Linear C8-C320
5
10
15
20
25
30
35
40b)
Yie
ld (w
t %)
Hydrocarbon type
350ºC 375ºC 400ºC 425ºC
Figure 6: Effect of the temperature on the C5-C32 linear product yields. a) Reactions with decalin , b) Reactions without a solvent.
(Time = 5 hours. Plastic/solvent ratio = 1/10).

ISFR - 2005206
[7] Karaduman A., Şimşek E. H., Çiçek B., and Bilgesü A.Y. J. Anal. Appl. Pyrol. 62:273 (2002).
[8] Murakata T., Wagatsuma S., Saito Y., Suzuki T., and Sato S., Polymer 34:1431 (1993).
[9] Karaduman A., Energ Source 24:667 (2002).
Pyrolysis / Solvolysis 207
THERMAL DEGRADATION OF THERMOSETTING RESIN WASTE WITH VEGETABLE OIL
Masaaki Takayanagi a, Keiichiro Sano b, Michiyo Nishimaki b, Kazukiyo Takami c, Ryo Takahashi c, Yoshiki Sato d and Katsuhiko Hirano e
aNisshin OilliO Group LTD., chuo-ku, Tokyo, Japan, [email protected] Ins. of Env. Sci., Fujiyoshida, Japan, [email protected]
cKanagawa Ind. Tech. Res. Ins ., Ebina, dAIST, Tsukuba, eShibaura Ins. of Tech., Tokyo
Abstract: It is diffi cult to recycle fi ber reinforced plastics (FRP) waste because the unsaturated polyester (UP) of thermosetting resin and inorganic fi bers of fi ller are used. In this study, a new thermal degaradation method of FRP waste in vegetable oil was examined for the recycling. In this method, the UP degradation and the separation of glass fi ber from degraded UP were achieved very simply. Further, it has been found that the ortho-phthalic acid of UP raw material was precipitated in the degradation oil when the FRP degraded under sealed pressurization, on the other hand, the needle shape crystal which mixed the ortho-phthalic acid and the phthalic anhydride was educed when the vaporized gases were cooled at the FRP degradation reaction under atmospheric pressure. These decomposition materials extracted from UP degradation reaction have a possibility of being chemically recyclable. Some fundamental data of FRP degaradation and the new recycling process were investigated.
1. Introduction
The FRP is used in various structural materials including bathtub, pleasureboat, train and airplane due to the lightweight, fastness and corrosion resistance. However, an epoch-making technology of FRP recycling has not been invented in the world, because many FRP comprise thermosetting resin such as UP or epoxy resin and contain glass fi ber or carbon fi ber. Most FRP wastes are treated by means of incineration or landfi ll processe which infl ict damage on environment. In the present time, some studies have been reported for the FRP recycling such as liquefaction by high temperature degradation under high pressure, energy recovery by an incineration of the waste and reusing of the residual substance as cement raw material. In addition, material recycling such as reusing technology of the crushed FRP as plastic fi llers has been developed. However, an innovative recycling method with effective matching of the cost and the environmental preservation has not been developed. Therefore, FRP recycling has not been spread yet in the world. Especially, the study of a chemical recycling such as an extraction of chemical materials from the thermosetting resin is just going to be late. Several years before, we have reported the thermal degradation method of thermosetting resin in vegetable oil under atmospheric condition to liquefy the resin [1, 2]. In this method, various plastics
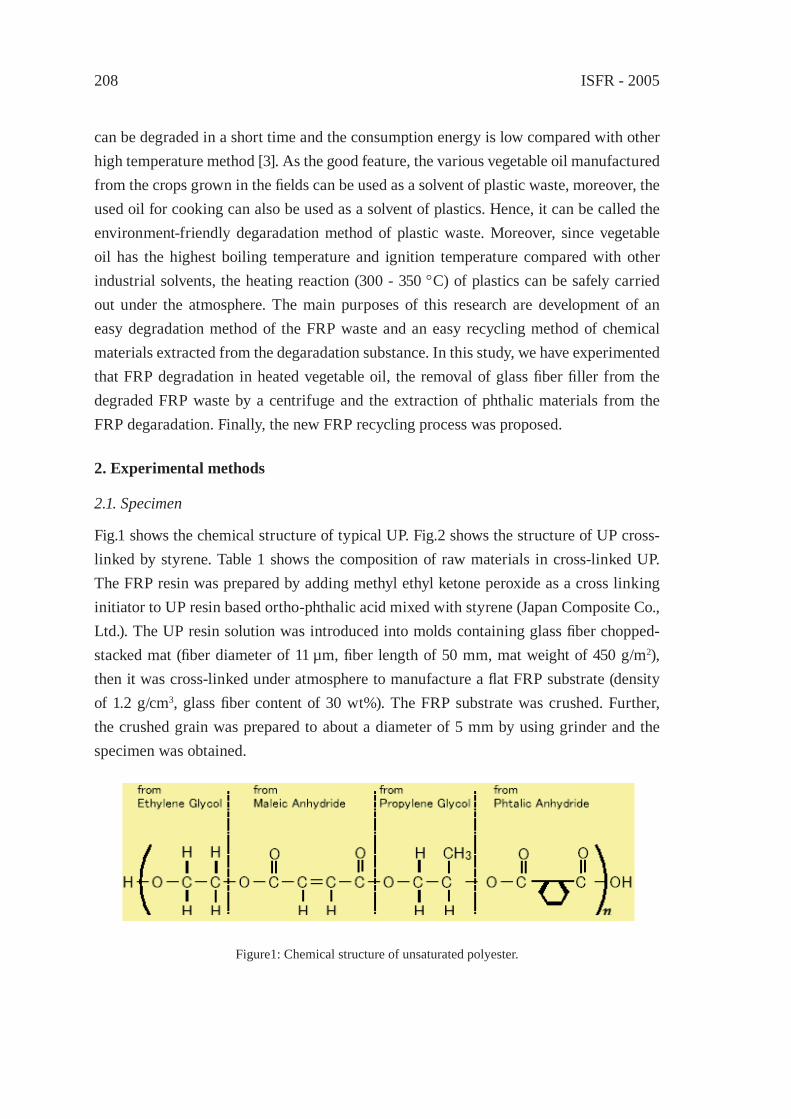
ISFR - 2005208
can be degraded in a short time and the consumption energy is low compared with other high temperature method [3]. As the good feature, the various vegetable oil manufactured from the crops grown in the fi elds can be used as a solvent of plastic waste, moreover, the used oil for cooking can also be used as a solvent of plastics. Hence, it can be called the environment-friendly degaradation method of plastic waste. Moreover, since vegetable oil has the highest boiling temperature and ignition temperature compared with other industrial solvents, the heating reaction (300 - 350 °C) of plastics can be safely carried out under the atmosphere. The main purposes of this research are development of an easy degradation method of the FRP waste and an easy recycling method of chemical materials extracted from the degaradation substance. In this study, we have experimented that FRP degradation in heated vegetable oil, the removal of glass fi ber fi ller from the degraded FRP waste by a centrifuge and the extraction of phthalic materials from the FRP degaradation. Finally, the new FRP recycling process was proposed.
2. Experimental methods
2.1. Specimen
Fig.1 shows the chemical structure of typical UP. Fig.2 shows the structure of UP cross-linked by styrene. Table 1 shows the composition of raw materials in cross-linked UP. The FRP resin was prepared by adding methyl ethyl ketone peroxide as a cross linking initiator to UP resin based ortho-phthalic acid mixed with styrene (Japan Composite Co., Ltd.). The UP resin solution was introduced into molds containing glass fi ber chopped-stacked mat (fi ber diameter of 11 µm, fi ber length of 50 mm, mat weight of 450 g/m2), then it was cross-linked under atmosphere to manufacture a fl at FRP substrate (density of 1.2 g/cm3, glass fi ber content of 30 wt%). The FRP substrate was crushed. Further, the crushed grain was prepared to about a diameter of 5 mm by using grinder and the specimen was obtained.
Figure1: Chemical structure of unsaturated polyester.
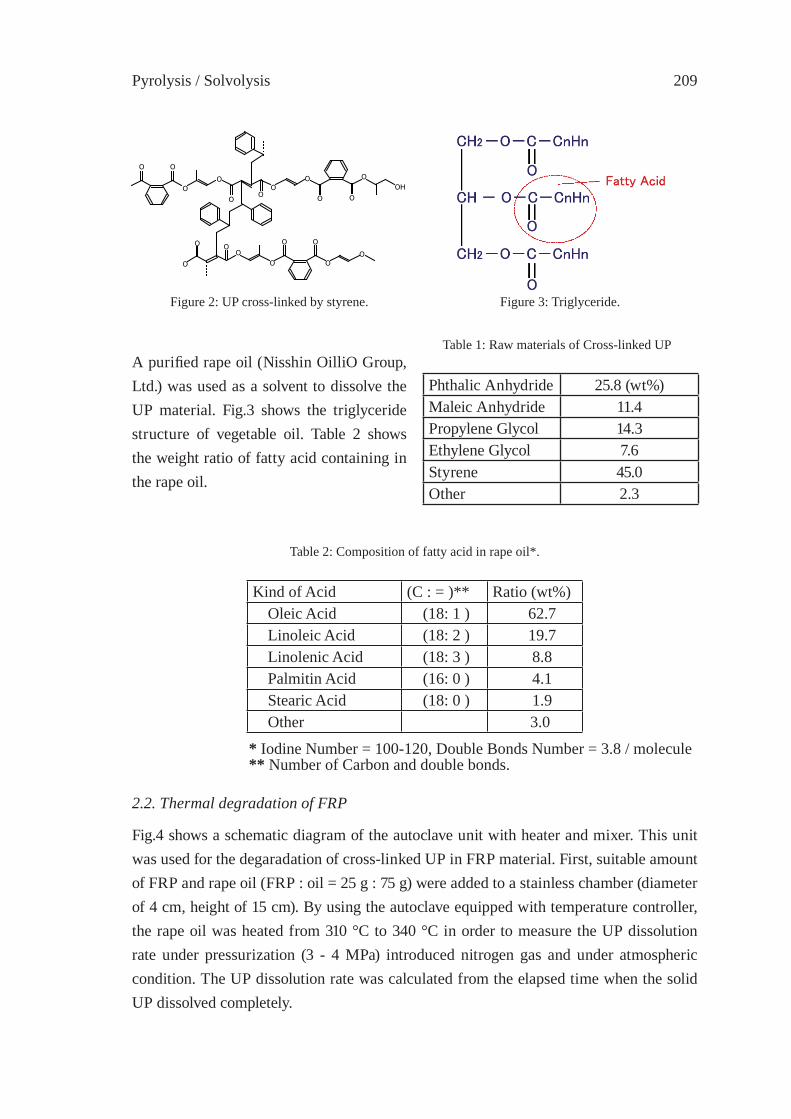
Pyrolysis / Solvolysis 209
OO
OO
O
O
O
OH
O
OO O
O OO
O O
OO
O O
Figure 2: UP cross-linked by styrene. Figure 3: Triglyceride.
Table 2: Composition of fatty acid in rape oil*.
Kind of Acid (C : = )** Ratio (wt%)Oleic Acid (18: 1 ) 62.7Linoleic Acid (18: 2 ) 19.7Linolenic Acid (18: 3 ) 8.8Palmitin Acid (16: 0 ) 4.1Stearic Acid (18: 0 ) 1.9Other 3.0.
Table 1: Raw materials of Cross-linked UP .
Phthalic Anhydride 25.8 (wt%)Maleic Anhydride 11.4Propylene Glycol 14.3Ethylene Glycol 7.6Styrene 45.0 Other 2.3
* Iodine Number = 100-120, Double Bonds Number = 3.8 / molecule** Number of Carbon and double bonds.
A purifi ed rape oil (Nisshin OilliO Group, Ltd.) was used as a solvent to dissolve the UP material. Fig.3 shows the triglyceride structure of vegetable oil. Table 2 shows the weight ratio of fatty acid containing in the rape oil.
2.2. Thermal degradation of FRP
Fig.4 shows a schematic diagram of the autoclave unit with heater and mixer. This unit was used for the degaradation of cross-linked UP in FRP material. First, suitable amount of FRP and rape oil (FRP : oil = 25 g : 75 g) were added to a stainless chamber (diameter of 4 cm, height of 15 cm). By using the autoclave equipped with temperature controller, the rape oil was heated from 310 °C to 340 °C in order to measure the UP dissolution rate under pressurization (3 - 4 MPa) introduced nitrogen gas and under atmospheric condition. The UP dissolution rate was calculated from the elapsed time when the solid UP dissolved completely.
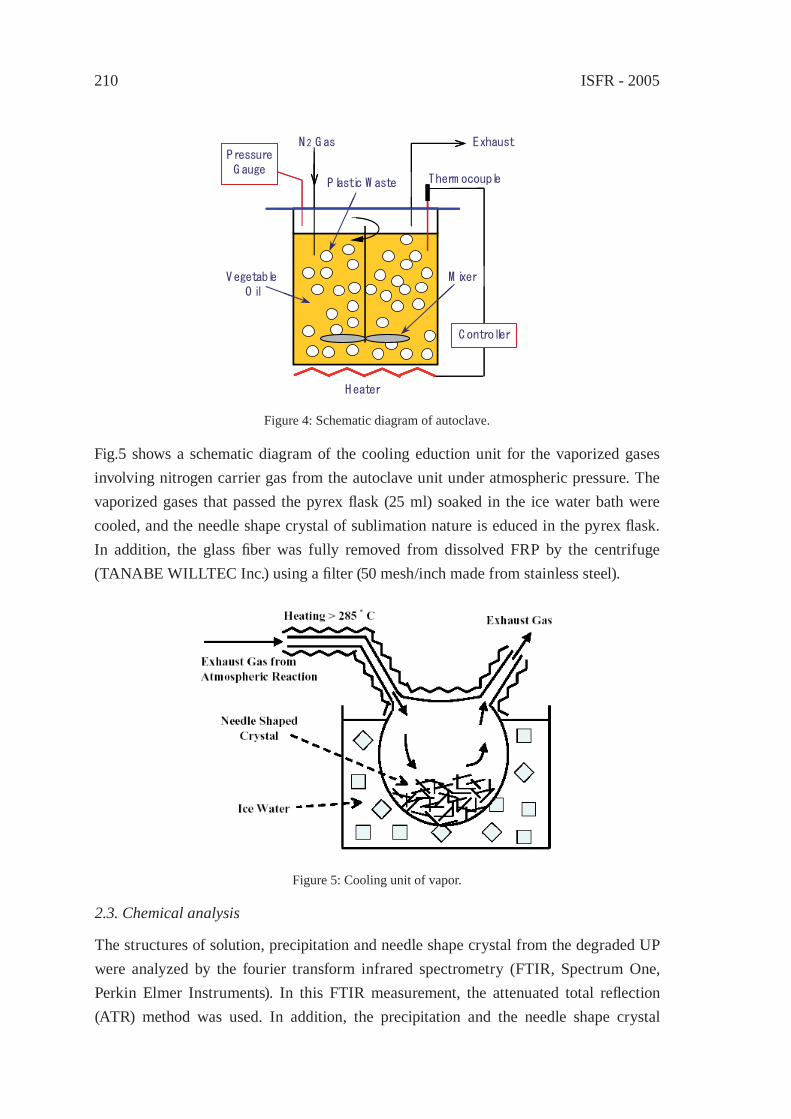
ISFR - 2005210
M ixer
Heater
N 2 G as
Plastic W aste
C ontroller
Therm ocouple
ExhaustPressure G auge
VegetableO il
M ixer
Heater
N 2 G as
Plastic W aste
C ontroller
Therm ocouple
ExhaustPressure G auge
VegetableO il
Fig.5 shows a schematic diagram of the cooling eduction unit for the vaporized gases involving nitrogen carrier gas from the autoclave unit under atmospheric pressure. The vaporized gases that passed the pyrex fl ask (25 ml) soaked in the ice water bath were cooled, and the needle shape crystal of sublimation nature is educed in the pyrex fl ask. In addition, the glass fi ber was fully removed from dissolved FRP by the centrifuge (TANABE WILLTEC Inc.) using a fi lter (50 mesh/inch made from stainless steel).
Figure 4: Schematic diagram of autoclave.
Figure 5: Cooling unit of vapor.
2.3. Chemical analysis
The structures of solution, precipitation and needle shape crystal from the degraded UP were analyzed by the fourier transform infrared spectrometry (FTIR, Spectrum One, Perkin Elmer Instruments). In this FTIR measurement, the attenuated total refl ection (ATR) method was used. In addition, the precipitation and the needle shape crystal
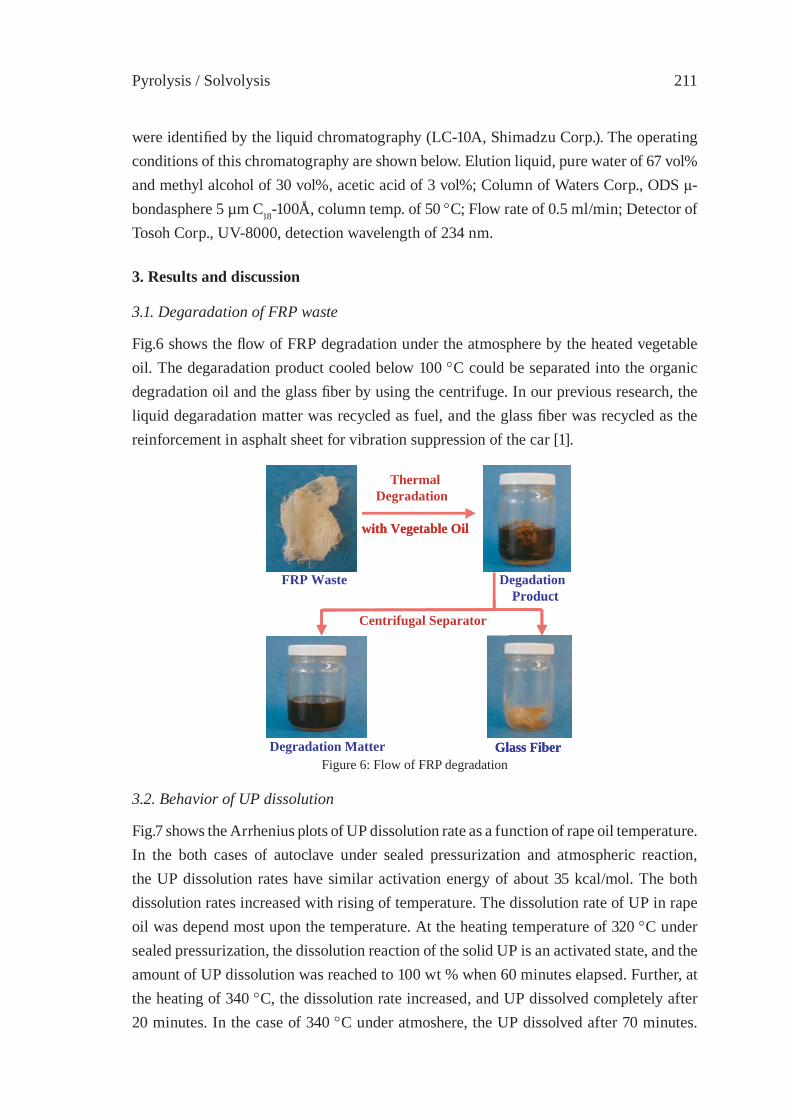
Pyrolysis / Solvolysis 211
were identifi ed by the liquid chromatography (LC-10A, Shimadzu Corp.). The operating conditions of this chromatography are shown below. Elution liquid, pure water of 67 vol% and methyl alcohol of 30 vol%, acetic acid of 3 vol%; Column of Waters Corp., ODS μ-bondasphere 5 µm C18-100Å, column temp. of 50 °C; Flow rate of 0.5 ml/min; Detector of Tosoh Corp., UV-8000, detection wavelength of 234 nm.
3. Results and discussion
3.1. Degaradation of FRP waste
Fig.6 shows the fl ow of FRP degradation under the atmosphere by the heated vegetable oil. The degaradation product cooled below 100 °C could be separated into the organic degradation oil and the glass fi ber by using the centrifuge. In our previous research, the liquid degaradation matter was recycled as fuel, and the glass fi ber was recycled as the reinforcement in asphalt sheet for vibration suppression of the car [1].
Thermal Degaradation
with Vegetable Oil
FRP Waste DegradationProduct
Degradation Matter Glass Fiber
Centrifugal Separator
Thermal Degradation
with Vegetable Oil
FRP Waste DegadationProduct
Glass Fiber
Centrifugal Separator
Figure 6: Flow of FRP degradation
3.2. Behavior of UP dissolution
Fig.7 shows the Arrhenius plots of UP dissolution rate as a function of rape oil temperature. In the both cases of autoclave under sealed pressurization and atmospheric reaction, the UP dissolution rates have similar activation energy of about 35 kcal/mol. The both dissolution rates increased with rising of temperature. The dissolution rate of UP in rape oil was depend most upon the temperature. At the heating temperature of 320 °C under sealed pressurization, the dissolution reaction of the solid UP is an activated state, and the amount of UP dissolution was reached to 100 wt % when 60 minutes elapsed. Further, at the heating of 340 °C, the dissolution rate increased, and UP dissolved completely after 20 minutes. In the case of 340 °C under atmoshere, the UP dissolved after 70 minutes.
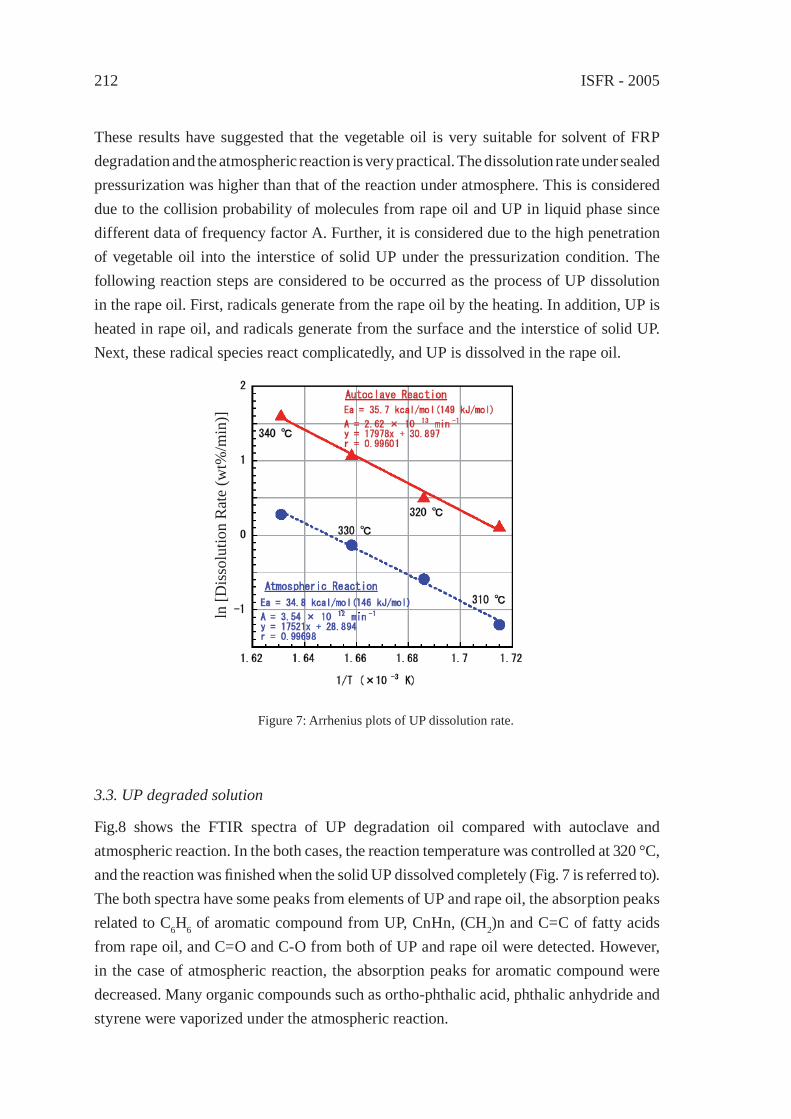
ISFR - 2005212
These results have suggested that the vegetable oil is very suitable for solvent of FRP degradation and the atmospheric reaction is very practical. The dissolution rate under sealed pressurization was higher than that of the reaction under atmosphere. This is considered due to the collision probability of molecules from rape oil and UP in liquid phase since different data of frequency factor A. Further, it is considered due to the high penetration of vegetable oil into the interstice of solid UP under the pressurization condition. The following reaction steps are considered to be occurred as the process of UP dissolution in the rape oil. First, radicals generate from the rape oil by the heating. In addition, UP is heated in rape oil, and radicals generate from the surface and the interstice of solid UP. Next, these radical species react complicatedly, and UP is dissolved in the rape oil.
ln [D
isso
lutio
n R
ate
(wt%
/min
)]
Figure 7: Arrhenius plots of UP dissolution rate.
3.3. UP degraded solution
Fig.8 shows the FTIR spectra of UP degradation oil compared with autoclave and atmospheric reaction. In the both cases, the reaction temperature was controlled at 320 °C, and the reaction was fi nished when the solid UP dissolved completely (Fig. 7 is referred to). The both spectra have some peaks from elements of UP and rape oil, the absorption peaks related to C6H6 of aromatic compound from UP, CnHn, (CH2)n and C=C of fatty acids from rape oil, and C=O and C-O from both of UP and rape oil were detected. However, in the case of atmospheric reaction, the absorption peaks for aromatic compound were decreased. Many organic compounds such as ortho-phthalic acid, phthalic anhydride and styrene were vaporized under the atmospheric reaction.
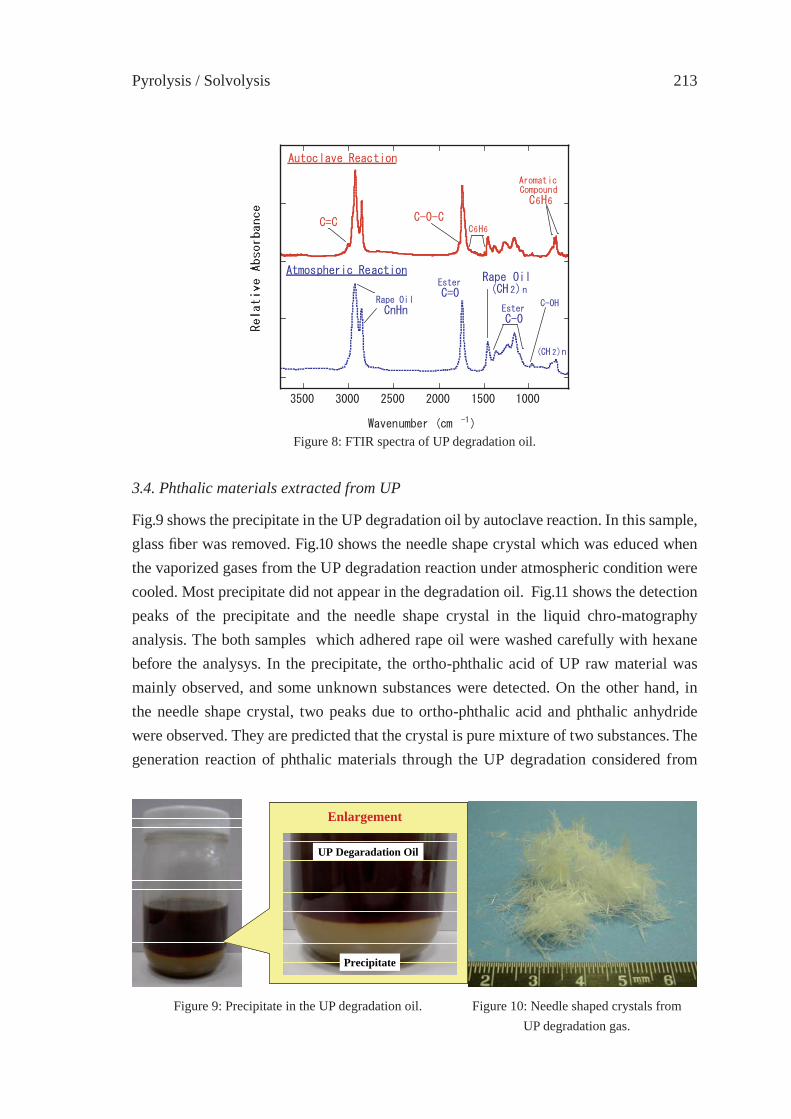
Pyrolysis / Solvolysis 213
Figure 8: FTIR spectra of UP degradation oil.
Enlargement
UP Degaradation Oil
Precipitate
Enlargement
UP Degaradation Oil
Precipitate
3.4. Phthalic materials extracted from UP
Fig.9 shows the precipitate in the UP degradation oil by autoclave reaction. In this sample, glass fi ber was removed. Fig.10 shows the needle shape crystal which was educed when the vaporized gases from the UP degradation reaction under atmospheric condition were cooled. Most precipitate did not appear in the degradation oil. Fig.11 shows the detection peaks of the precipitate and the needle shape crystal in the liquid chro-matography analysis. The both samples which adhered rape oil were washed carefully with hexane before the analysys. In the precipitate, the ortho-phthalic acid of UP raw material was mainly observed, and some unknown substances were detected. On the other hand, in the needle shape crystal, two peaks due to ortho-phthalic acid and phthalic anhydride were observed. They are predicted that the crystal is pure mixture of two substances. The generation reaction of phthalic materials through the UP degradation considered from
Figure 9: Precipitate in the UP degradation oil. Figure 10: Needle shaped crystals from UP degradation gas.
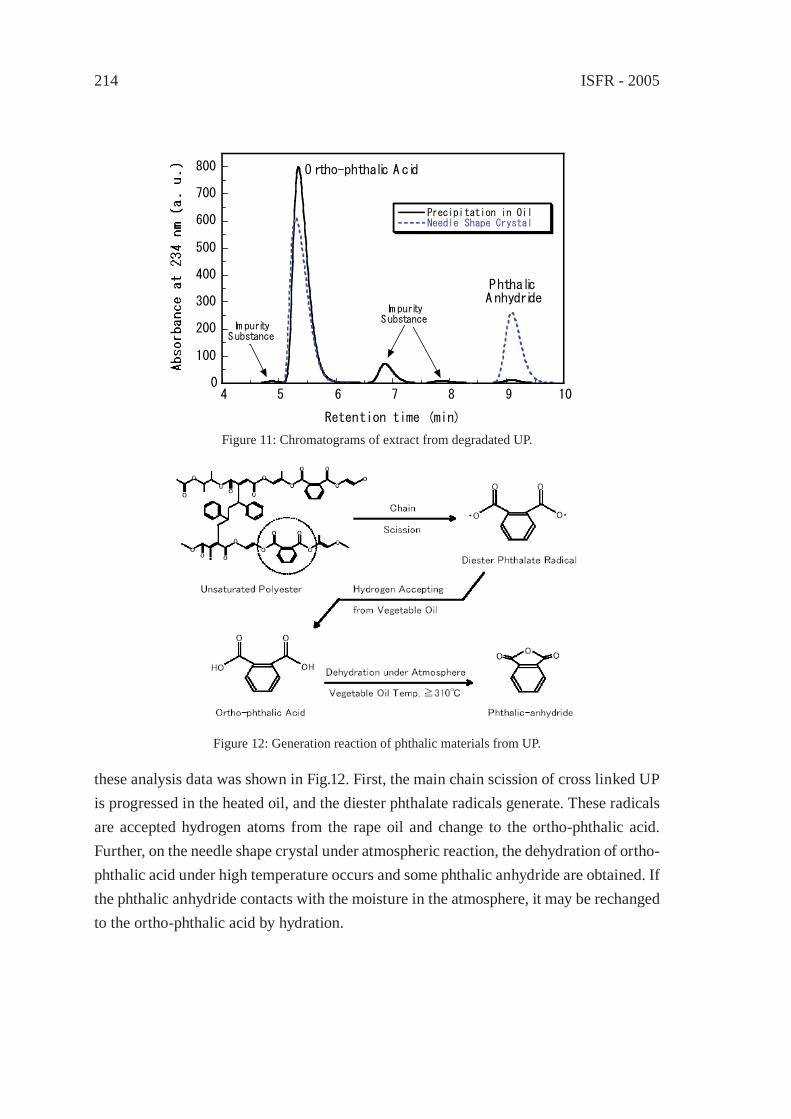
ISFR - 2005214
these analysis data was shown in Fig.12. First, the main chain scission of cross linked UP is progressed in the heated oil, and the diester phthalate radicals generate. These radicals are accepted hydrogen atoms from the rape oil and change to the ortho-phthalic acid. Further, on the needle shape crystal under atmospheric reaction, the dehydration of ortho-phthalic acid under high temperature occurs and some phthalic anhydride are obtained. If the phthalic anhydride contacts with the moisture in the atmosphere, it may be rechanged to the ortho-phthalic acid by hydration.
0
100
200
300
400
500
600
700
800
4 5 6 7 8 9 10
Precipitation in OilNeedle Shape Crystal
Retention time (min)
O rtho-phthalic A cid
Phthalic A nhydride
Im puritySubstance
Im puritySubstance
Figure 11: Chromatograms of extract from degradated UP.
Figure 12: Generation reaction of phthalic materials from UP.
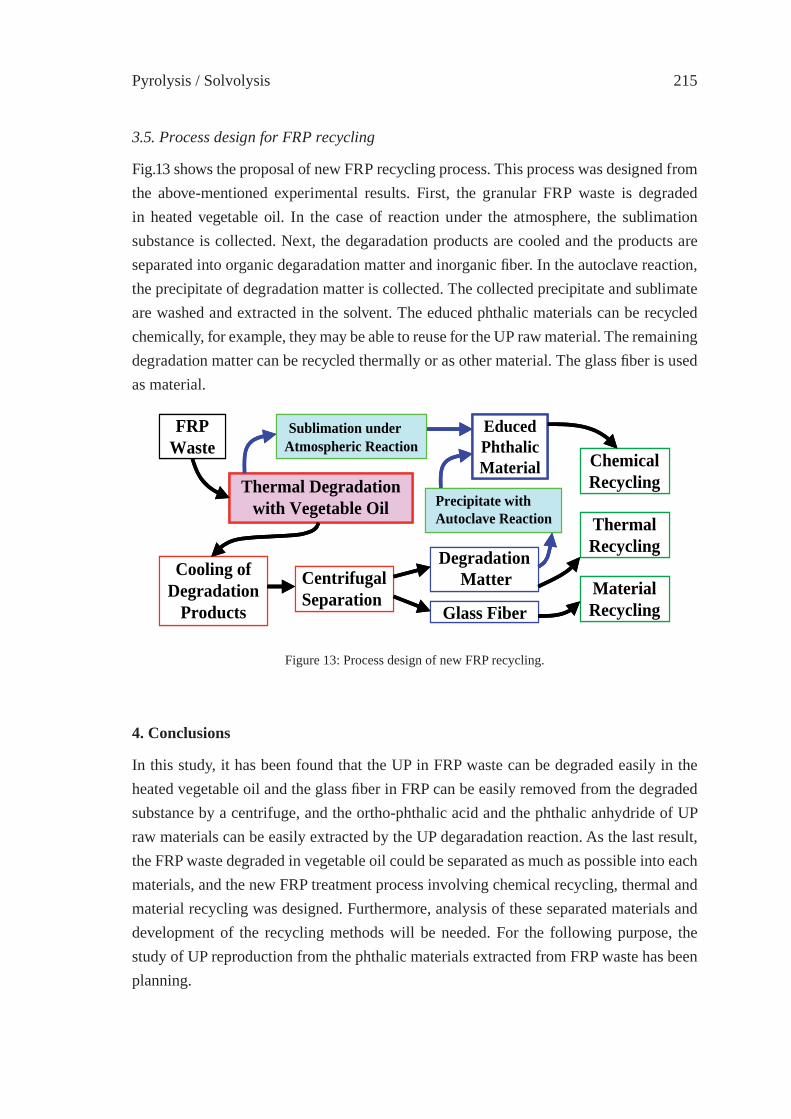
Pyrolysis / Solvolysis 215
Thermal Degradation with Vegetable Oil
Cooling ofDegradation
Products
CentrifugalSeparation
Glass Fiber
DegradationMatter
FRPWaste
Educed PhthalicMaterial Chemical
Recycling
MaterialRecycling
Sublimation underAtmospheric Reaction
Precipitate withAutoclave Reaction Thermal
Recycling
Thermal Degradation with Vegetable Oil
Cooling ofDegradation
Products
CentrifugalSeparation
Glass Fiber
DegradationMatter
FRPWaste
Educed PhthalicMaterial Chemical
Recycling
MaterialRecycling
Sublimation underAtmospheric Reaction
Precipitate withAutoclave Reaction Thermal
Recycling
3.5. Process design for FRP recycling
Fig.13 shows the proposal of new FRP recycling process. This process was designed from the above-mentioned experimental results. First, the granular FRP waste is degraded in heated vegetable oil. In the case of reaction under the atmosphere, the sublimation substance is collected. Next, the degaradation products are cooled and the products are separated into organic degaradation matter and inorganic fi ber. In the autoclave reaction, the precipitate of degradation matter is collected. The collected precipitate and sublimate are washed and extracted in the solvent. The educed phthalic materials can be recycled chemically, for example, they may be able to reuse for the UP raw material. The remaining degradation matter can be recycled thermally or as other material. The glass fi ber is used as material.
4. Conclusions
In this study, it has been found that the UP in FRP waste can be degraded easily in the heated vegetable oil and the glass fi ber in FRP can be easily removed from the degraded substance by a centrifuge, and the ortho-phthalic acid and the phthalic anhydride of UP raw materials can be easily extracted by the UP degaradation reaction. As the last result, the FRP waste degraded in vegetable oil could be separated as much as possible into each materials, and the new FRP treatment process involving chemical recycling, thermal and material recycling was designed. Furthermore, analysis of these separated materials and development of the recycling methods will be needed. For the following purpose, the study of UP reproduction from the phthalic materials extracted from FRP waste has been planning.
Figure 13: Process design of new FRP recycling.

ISFR - 2005216
References
[1] Negami, M., Sano, K., and Yoshimura, M., et al., JSAE Review, 24: 221-225 (2003).
[2] Takayanagi, M., and Sano, K., Collection of papaers of Polytronic, 143-146 (2003).[3] Sato, Y., Kodera, Y., and Kamo, T., Energy & Fuels, 13: 364-368 (1999).
Pyrolysis / Solvolysis 217
SOLVO-CYCLE PROCESS: A NEW RECYCLING PROCESSFOR USED PLASTIC FOAM BY PLASTICS-DERIVED SOLVENT
Y. Kodera1*, Y. Ishihara1, T. Kuroki2 and S. Ozaki3
1National Inst. for Adv. Industrial Sci. & Tech., Tsukuba, Japan2Polymer Decomposition Lab. Inc., Miyazaki, Japan
3Japan Expanded Polystyrene Recycling Association (JEPSRA), [email protected]
Abstract: Volume reduction is crucial for achieving the recycling of foamed plastic wastes. Polystyrene was catalytically converted into an organic solvent under catalytic reaction conditions. The resulting solvent was used for shrinking foamed polystyrene. AIST’s Solvo-cycle process for used polystyrene foams involves two stages, 1) Defoaming with the high-temperature vapor of polystyrene-derived solvent („Solvo-shrink” module) and 2) catalytic decomposition of the resulting polystyrene melt giving the defoaming solvent (moving-bed accelerated liquefaction module).
1. Introduction
Wastes of bulky packages and insulation boards composed of foamed plastics lead to economic diffi culties in terms of transportation as well as technical diffi culties such as the necessity for a recycling treatment. Volume reduction is the key for achieving the recycling of foamed plastic wastes. The typical methods of volume reduction are mechanical melting with an extruder and solvent defoaming with an appropriate solvent. Bricks (ingots) or pellets of used polystyrene are then processed for the manufacture of recycled products. These processes usually require expensive equipment with a high-torque motor, which consume a considerable amount of electric power or expensive solvents. An alternative process is required to establish an economically feasible process for the recycling of foamed plastics.
A joint project of AIST, the Polymer Decomposition Laboratory and JEPSRA aims at a cost-effective system for the purpose of volume reduction using vapors of an organic solvent obtained during this process. Fig. 1 shows the comparison of the „Solvo-cycle process” for used polystyrene foams and the conventional methods. The Solvo-cycle process comprises two stages; 1) defoaming of plastic foams with the high-temperature vapor of polystyrene-derived solvent („Solvo-shrink” module), and 2) catalytic conversion of the resulting polystyrene melt into a solvent for the defoaming (moving-bed accelerated liquefaction module).
In particular, with regard to the treatment of polystyrene foam, the catalytic conversion of polystyrene into an organic solvent is reported in this paper. The organic solvent derived from polystyrene is used as a defoaming solvent and fuel oil for the process; and it is also sold commercially.
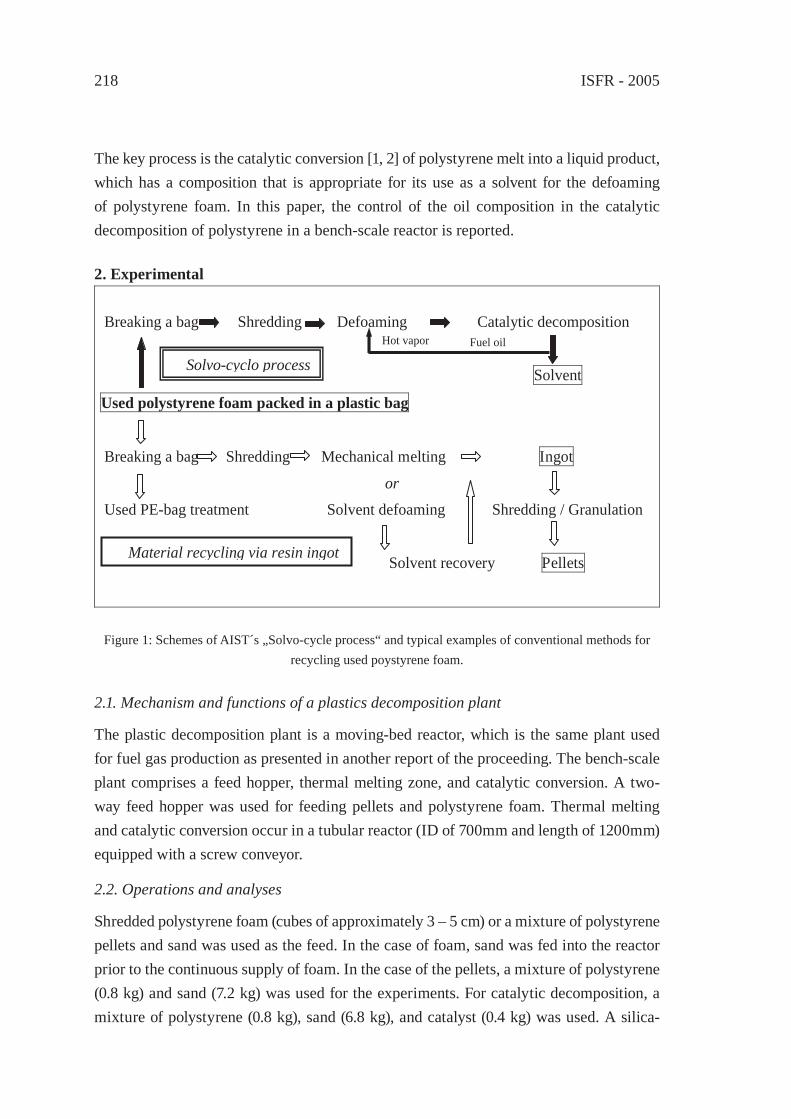
ISFR - 2005218
The key process is the catalytic conversion [1, 2] of polystyrene melt into a liquid product, which has a composition that is appropriate for its use as a solvent for the defoaming of polystyrene foam. In this paper, the control of the oil composition in the catalytic decomposition of polystyrene in a bench-scale reactor is reported.
2. Experimental
Breaking a bag Shredding Defoaming Catalytic decomposition
Solvent
Used polystyrene foam packed in a plastic bag
Breaking a bag Shredding Mechanical melting Ingot
or
Used PE-bag treatment Solvent defoaming Shredding / Granulation
Solvent recovery Pellets
Solvo-cyclo process
Material recycling via resin ingot
Fuel oil Hot vapor
Figure 1: Schemes of AIST´s „Solvo-cycle process“ and typical examples of conventional methods for recycling used poystyrene foam.
2.1. Mechanism and functions of a plastics decomposition plant
The plastic decomposition plant is a moving-bed reactor, which is the same plant used for fuel gas production as presented in another report of the proceeding. The bench-scale plant comprises a feed hopper, thermal melting zone, and catalytic conversion. A two-way feed hopper was used for feeding pellets and polystyrene foam. Thermal melting and catalytic conversion occur in a tubular reactor (ID of 700mm and length of 1200mm) equipped with a screw conveyor.
2.2. Operations and analyses
Shredded polystyrene foam (cubes of approximately 3 – 5 cm) or a mixture of polystyrene pellets and sand was used as the feed. In the case of foam, sand was fed into the reactor prior to the continuous supply of foam. In the case of the pellets, a mixture of polystyrene (0.8 kg) and sand (7.2 kg) was used for the experiments. For catalytic decomposition, a mixture of polystyrene (0.8 kg), sand (6.8 kg), and catalyst (0.4 kg) was used. A silica-
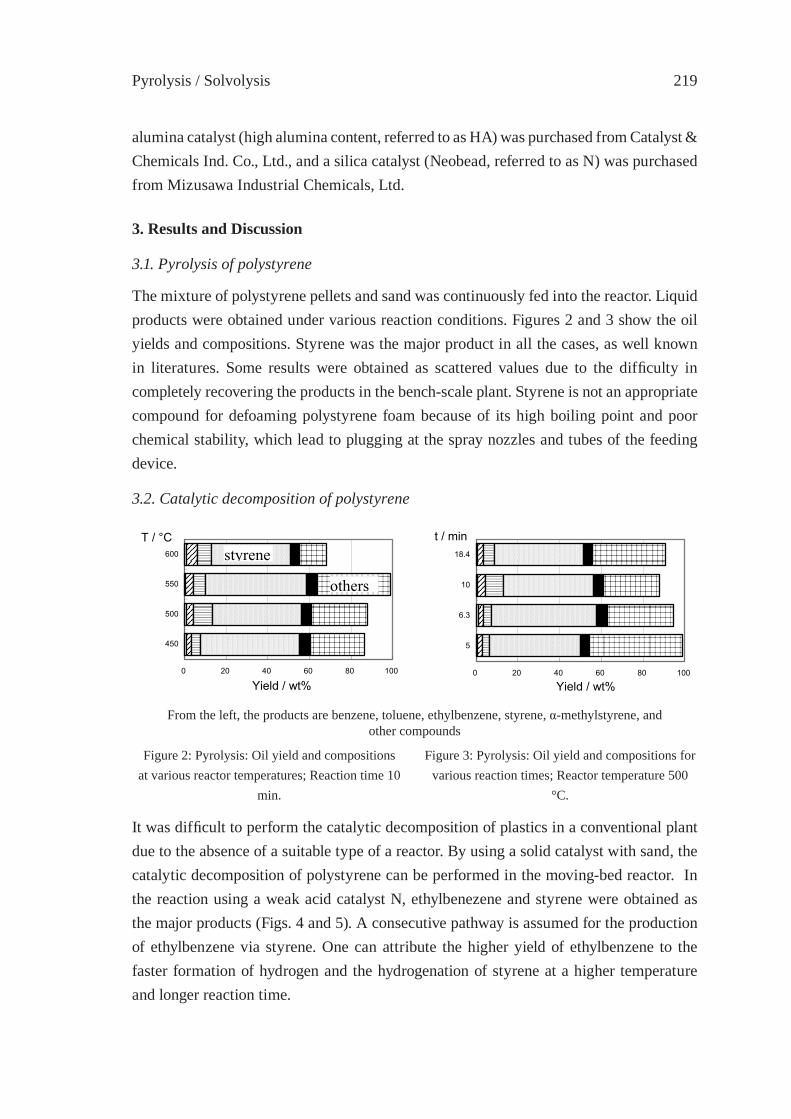
Pyrolysis / Solvolysis 219
alumina catalyst (high alumina content, referred to as HA) was purchased from Catalyst & Chemicals Ind. Co., Ltd., and a silica catalyst (Neobead, referred to as N) was purchased from Mizusawa Industrial Chemicals, Ltd.
3. Results and Discussion
3.1. Pyrolysis of polystyrene
The mixture of polystyrene pellets and sand was continuously fed into the reactor. Liquid products were obtained under various reaction conditions. Figures 2 and 3 show the oil yields and compositions. Styrene was the major product in all the cases, as well known in literatures. Some results were obtained as scattered values due to the diffi culty in completely recovering the products in the bench-scale plant. Styrene is not an appropriate compound for defoaming polystyrene foam because of its high boiling point and poor chemical stability, which lead to plugging at the spray nozzles and tubes of the feeding device.
3.2. Catalytic decomposition of polystyrene
0 20 40 60 80 100
450
500
550
600
0 20 40 60 80 100
5
6.3
10
18.4styrene
others
Yield / wt% Yield / wt%
T / °C t / min
Figure 2: Pyrolysis: Oil yield and compositions at various reactor temperatures; Reaction time 10
min.
Figure 3: Pyrolysis: Oil yield and compositions for various reaction times; Reactor temperature 500
°C.
From the left, the products are benzene, toluene, ethylbenzene, styrene, α-methylstyrene, and other compounds
It was diffi cult to perform the catalytic decomposition of plastics in a conventional plant due to the absence of a suitable type of a reactor. By using a solid catalyst with sand, the catalytic decomposition of polystyrene can be performed in the moving-bed reactor. In the reaction using a weak acid catalyst N, ethylbenezene and styrene were obtained as the major products (Figs. 4 and 5). A consecutive pathway is assumed for the production of ethylbenzene via styrene. One can attribute the higher yield of ethylbenzene to the faster formation of hydrogen and the hydrogenation of styrene at a higher temperature and longer reaction time.

ISFR - 2005220
When the strong acid catalyst HA was used, the major product was benzene, as shown in Figs. 6 and 7. HA reacts a phenyl group and leads to the formation of benzene [2]. A smaller amount of liquid products is obtained at 600 °C due to the large amount of gas and coke formation.
An important factor in the treatment of foamed plastics is the method of supplying the feed to the reactor because it governs the rate of processing. The total amounts of foamed plastic wastes processed per operating period directly refl ect the profi t that can be obtained from recycling. A screw feeder for supplying foamed polystyrene was designed and attached to the reactor. By assessing the effect of the vapor generated in the reactor on melting polystyrene foam, the rapid feeding of the foam was confi rmed.
0 20 40 60 80 100
450
500
550
600
0 20 40 60 80 100
5
6.3
10
18.4
Yield / wt% Yield / wt%
T / °C t / min styreneEB
Figure 4: Catalysis (N): Oil yields and compositions at various reactor temperatures;
Reaction time 10 min.
Figure 5: Catalysis (N): Oil yields and compositions for various reaction times;
Reactor temperature 500 °C.
From the left, the products are benzene, toluene, ethylbenzene (EB), styrene, α-methylstyrene, and other compounds
0 20 40 60 80 100
450
500
600
0 20 40 60 80 100
5
6.4
9.7
24
Yield / wt% Yield / wt%
T / °C t / min
benzene
Figure 6: Catalysis (HA): Oil yields and compositions at various reactor temperatures;
Reaction time 10 min.
Figure 5: Catalysis (HA): Oil yields and compositions for various reaction times;
Reactor temperature 500 °C.
From the left, the products are benzene, toluene, ethylbenzene, styrene, α-methylstyrene, and other compounds
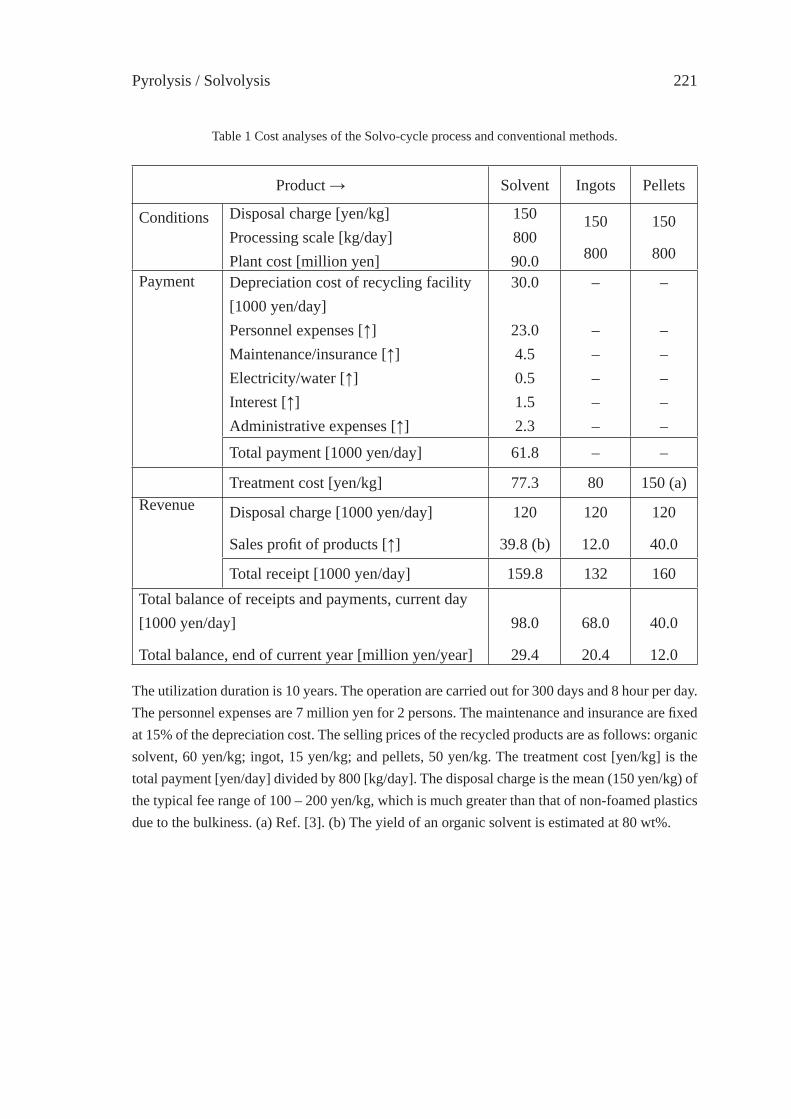
Pyrolysis / Solvolysis 221
Table 1 Cost analyses of the Solvo-cycle process and conventional methods.
Product → Solvent Ingots Pellets
Conditions Disposal charge [yen/kg]Processing scale [kg/day]Plant cost [million yen]
15080090.0
150
800
150
800
Payment Depreciation cost of recycling facility [1000 yen/day]Personnel expenses [↑]Maintenance/insurance [↑]Electricity/water [↑]Interest [↑]Administrative expenses [↑]
30.0
23.04.50.51.52.3
–
–––––
–
–––––
Total payment [1000 yen/day] 61.8 – –
Treatment cost [yen/kg] 77.3 80 150 (a)Revenue Disposal charge [1000 yen/day]
Sales profi t of products [↑]
120
39.8 (b)
120
12.0
120
40.0
Total receipt [1000 yen/day] 159.8 132 160Total balance of receipts and payments, current day [1000 yen/day]
Total balance, end of current year [million yen/year]
98.0
29.4
68.0
20.4
40.0
12.0
The utilization duration is 10 years. The operation are carried out for 300 days and 8 hour per day. The personnel expenses are 7 million yen for 2 persons. The maintenance and insurance are fi xed at 15% of the depreciation cost. The selling prices of the recycled products are as follows: organic solvent, 60 yen/kg; ingot, 15 yen/kg; and pellets, 50 yen/kg. The treatment cost [yen/kg] is the total payment [yen/day] divided by 800 [kg/day]. The disposal charge is the mean (150 yen/kg) of the typical fee range of 100 – 200 yen/kg, which is much greater than that of non-foamed plastics due to the bulkiness. (a) Ref. [3]. (b) The yield of an organic solvent is estimated at 80 wt%.
ISFR - 2005222
3.4. Cost analysis
The cost analyses of the Solvo-cycle process and other methods are summarized in Table 1. In the table, the treatment cost of the Solvo-cycle process is found to be the lowest among all treatment costs, and it is approximately half the cost of pellet production. In the Solvo-cycle process, the organic solvents can be distributed to end users, while ingots and pellets require further processing. Although the economic benefi ts in each process depend on the local situation with respect to supply/demand, the production of an organic solvent is advantageous in terms of lower energy/material input as compared to the other recycling methods.
References
[1] Nanbu, H., Sakuma, Y., Ishihara, Y., Takesue, T., Ikemura, T., Polym. Degrad. Stab. 19:61 (1987).
[2] Ide, S., Ogawa, T., Kuroki, T., Ikemura, T., J. Appl. Polym. Sci. 29:2561 (1984).[3] Saeki, Y., Plastics 50(11):22 (1999). In Japanese.
Pyrolysis / Solvolysis 223
CHEMICAL RECOVERY OF FLEXIBLE POLYURETHANE FOAM WASTES: AN INTEGRATED PROCESS.
C. Molero, A. de Lucas and J. F. Rodríguez*Dep. of Chemical Engineering. University of Castilla-La Mancha, Ciudad Real, Spain
Abstract: The general purpose of polyurethane (PU) chemical recycling is to recover the constituent polyol. By means of a two-phase glycolysis process, quality recovered polyols can be obtained from fl exible PU foams. In this study, an integrated process for two-phase glycolysis has been developed. The process conducted at pilot scale in comparison with lab scale yielded a similar recovery of raw materials. The upper phase was constituted by the recovered polyols and the bottom one by the reaction by-products. The recovered polyols have been subjected to purifi cation by aqueous liquid-liquid extraction. From the residual phase obtained, the excess of glycolyzing agent has been recovered by distillation for reuse in the glycolysis. The vacuum residue has been applied in rigid polyol synthesis, allowing the complete use of glycolyzates from PU´s.
1. Introduction
Polyurethanes (PU) have been used in diverse areas, being one of the most versatile polymers. Flexible foams are the most important group, reaching the 29% of the total PU production and are widely used in furniture, mattresses and automotive seats [1]. As a direct consequence of their commercial success an increasing quantity of wastes is disposed by landfi lling. Said wastes comprise not only postconsumed products but also scrap from slabstock manufacturing. The economical and environmental problems involved arise from the high percentage of scrap produced, which represents a 10% in weight of the total volume of foam. One technological option for waste disposal of PU foam other than landfi lling is recycling. Physical processes such melt–processing methods are successfully applied to thermoplastics, but in the case of PU foams, due to their crosslinked structure, most of them are not suitable [2]. Only rebonding has been developed for carpet underlay. An alternative way to recycling includes chemical treatment to convert the PU back into its starting raw materials, especially polyols. Hydrolysis, treatment with esters of phosphoric acid, aminolysis with low weight alkanolamines and glycolysis have been described as suitable procedures to break down the polyurethane chain [3-7]. Most of these processes produce a liquid mixture of products containing hydroxyl active groups, which can be used only in blending with raw materials. Nevertheless, better quality products can be achieved from fl exible polyurethane foams using a two-phase glycolysis, enabled by the higher molecular weight of polyols used in this kind of PU. By means of an excess of glycolysis agent, much larger than the stoichiometric quantity, the reaction product splits
ISFR - 2005224
in two phases, where the upper layer is mainly formed by the recovered polyol from the PU and the bottom layer by the excess of glycolysis agent [8].
As described in previous works [9-10], the authors have been working in the design of an integrated process for the recovery of polyols from fl exible polyurethane foams by means of two-phase glycolysis, with new characteristics in order to obtain quality recovered products. The choice of glycol and catalyst is an important factor affecting properties of the recovered products, as well as time to reach the complete degradation of the foam. In these studies, two-phase glycolysis reactions of industrial fl exible PU foams based in polyether polyols were conducted with different low weight glycols and catalysts, in order to study their effect on the process. Among the glycols studied, diethylene glycol (DEG) was the most suitable glycol to obtain the highest quality polyol. Different catalysts for the process were also studied: diethanolamine (DEA), titanium n-butoxide and potassium and calcium octoate, which had not been previously described in such applications. The performance of the new catalysts was comparable or even better than the described catalysts, proving to be an improved low cost alternative to traditional catalysts.
In this way, in order to develop an integrated process for the recycling, once studied the reaction conditions it is necessary the study of further purifi cation of the recovered polyol, as well as give value to the bottom phase of the process. In this work, the washing of the polyol phase and the recovery of glycol excess from the bottom phase have been optimized. This last task will solve economic and environmental problems related to this kind of technology.
2. Experimental
2.1. Glycolysis reactions
Industrial samples of fl exible PU foam based on polyether polyol (M~3500) and toluene diisocyanate (TDI) were scrapped with an arbitrary diameter ranging from 5 to 25mm. The scrap foam was reacted in a 1:1.5 mass ratio with a glycolysis agent constituted by diethylene glycol (DEG) (PS, from Panreac, Spain) and diethanolamine (DEA) (PS, Panreac, Spain) as catalyst in a mass ratio to glycol 1:6. The glycolysis reactions were carried out in a 40 dm3 fl ask equipped with stirrer, heating control system and refl uxing condenser under nitrogen atmosphere to avoid oxidation. The glycolysis agent was placed in the fl ask and when the temperature raised the desired level, the required quantity of scrap foam was added during one and a half hour according to its dissolution. The zero time for the reaction was taken when all the foam was fed. Temperature was kept at 189 ºC during the feeding and the reaction.
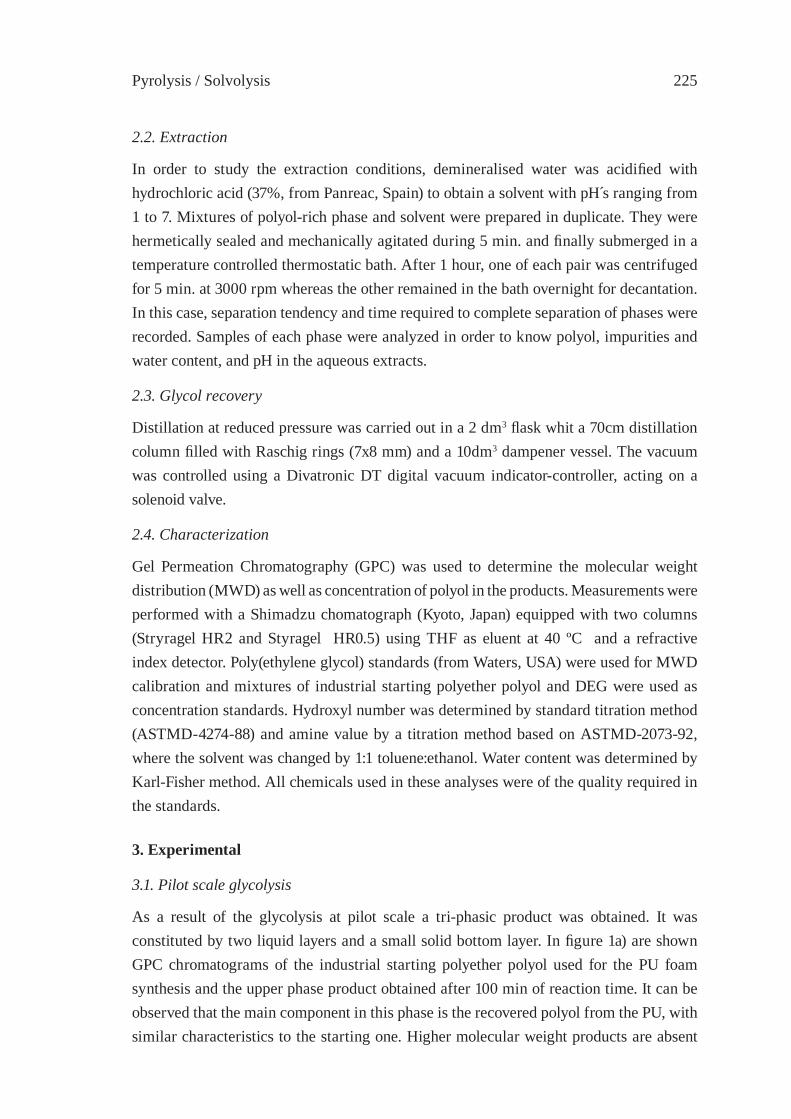
Pyrolysis / Solvolysis 225
2.2. Extraction
In order to study the extraction conditions, demineralised water was acidifi ed with hydrochloric acid (37%, from Panreac, Spain) to obtain a solvent with pH s ranging from 1 to 7. Mixtures of polyol-rich phase and solvent were prepared in duplicate. They were hermetically sealed and mechanically agitated during 5 min. and fi nally submerged in a temperature controlled thermostatic bath. After 1 hour, one of each pair was centrifuged for 5 min. at 3000 rpm whereas the other remained in the bath overnight for decantation. In this case, separation tendency and time required to complete separation of phases were recorded. Samples of each phase were analyzed in order to know polyol, impurities and water content, and pH in the aqueous extracts.
2.3. Glycol recovery
Distillation at reduced pressure was carried out in a 2 dm3 fl ask whit a 70cm distillation column fi lled with Raschig rings (7x8 mm) and a 10dm3 dampener vessel. The vacuum was controlled using a Divatronic DT digital vacuum indicator-controller, acting on a solenoid valve.
2.4. Characterization
Gel Permeation Chromatography (GPC) was used to determine the molecular weight distribution (MWD) as well as concentration of polyol in the products. Measurements were performed with a Shimadzu chomatograph (Kyoto, Japan) equipped with two columns (Stryragel HR2 and Styragel HR0.5) using THF as eluent at 40 ºC and a refractive index detector. Poly(ethylene glycol) standards (from Waters, USA) were used for MWD calibration and mixtures of industrial starting polyether polyol and DEG were used as concentration standards. Hydroxyl number was determined by standard titration method (ASTMD-4274-88) and amine value by a titration method based on ASTMD-2073-92, where the solvent was changed by 1:1 toluene:ethanol. Water content was determined by Karl-Fisher method. All chemicals used in these analyses were of the quality required in the standards.
3. Experimental
3.1. Pilot scale glycolysis
As a result of the glycolysis at pilot scale a tri-phasic product was obtained. It was constituted by two liquid layers and a small solid bottom layer. In fi gure 1a) are shown GPC chromatograms of the industrial starting polyether polyol used for the PU foam synthesis and the upper phase product obtained after 100 min of reaction time. It can be observed that the main component in this phase is the recovered polyol from the PU, with similar characteristics to the starting one. Higher molecular weight products are absent
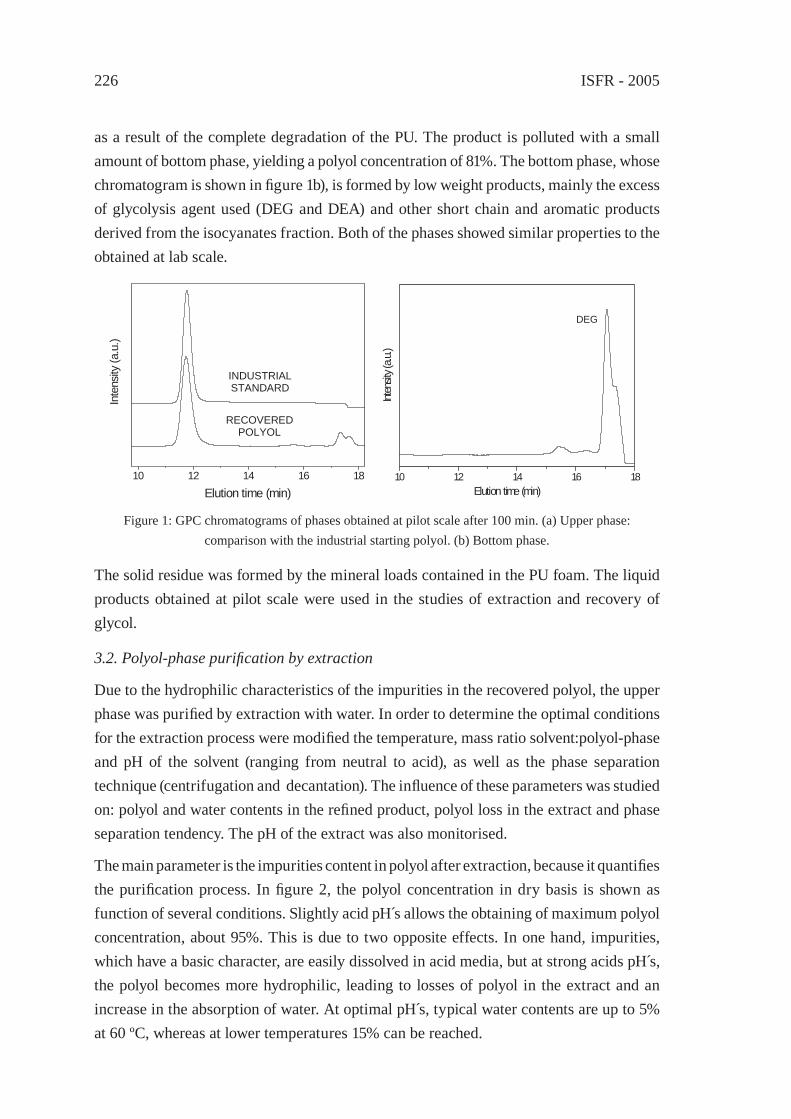
ISFR - 2005226
as a result of the complete degradation of the PU. The product is polluted with a small amount of bottom phase, yielding a polyol concentration of 81%. The bottom phase, whose chromatogram is shown in fi gure 1b), is formed by low weight products, mainly the excess of glycolysis agent used (DEG and DEA) and other short chain and aromatic products derived from the isocyanates fraction. Both of the phases showed similar properties to the obtained at lab scale.
The solid residue was formed by the mineral loads contained in the PU foam. The liquid products obtained at pilot scale were used in the studies of extraction and recovery of glycol.
3.2. Polyol-phase purifi cation by extraction
Due to the hydrophilic characteristics of the impurities in the recovered polyol, the upper phase was purifi ed by extraction with water. In order to determine the optimal conditions for the extraction process were modifi ed the temperature, mass ratio solvent:polyol-phase and pH of the solvent (ranging from neutral to acid), as well as the phase separation technique (centrifugation and decantation). The infl uence of these parameters was studied on: polyol and water contents in the refi ned product, polyol loss in the extract and phase separation tendency. The pH of the extract was also monitorised.
The main parameter is the impurities content in polyol after extraction, because it quantifi es the purifi cation process. In fi gure 2, the polyol concentration in dry basis is shown as function of several conditions. Slightly acid pH s allows the obtaining of maximum polyol concentration, about 95%. This is due to two opposite effects. In one hand, impurities, which have a basic character, are easily dissolved in acid media, but at strong acids pH s, the polyol becomes more hydrophilic, leading to losses of polyol in the extract and an increase in the absorption of water. At optimal pH s, typical water contents are up to 5% at 60 ºC, whereas at lower temperatures 15% can be reached.
Figure 1: GPC chromatograms of phases obtained at pilot scale after 100 min. (a) Upper phase: comparison with the industrial starting polyol. (b) Bottom phase.
10 12 14 16 18
Inte
nsity
(a.u
.)
Elution time (min)
RECOVERED POLYOL
INDUSTRIAL STANDARD
10 12 14 16 18Elution time (min)
Inten
sity (
a.u.)
DEG
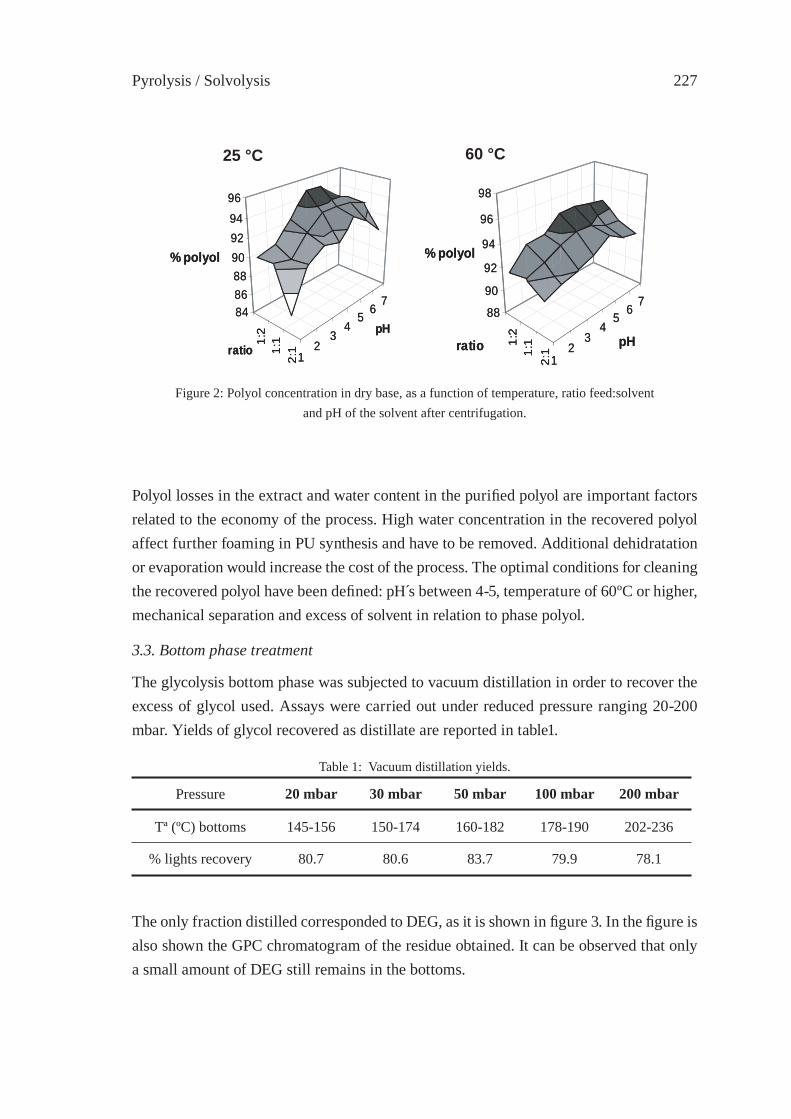
Pyrolysis / Solvolysis 227
Figure 2: Polyol concentration in dry base, as a function of temperature, ratio feed:solvent and pH of the solvent after centrifugation.
1:2
1:1
2:1
12
34
56
788
90
92
94
96
98
% polyol
ratio pH1:2
1:1
2:1
12
34
56
7848688909294
96
% polyol
ratio
pH
1:2
1:1
2:1
12
34
56
788
90
92
94
96
98
% polyol
ratio pH1:2
1:1
2:1
12
34
56
7848688909294
96
% polyol
ratio
pH
25 °C 60 °C
Polyol losses in the extract and water content in the purifi ed polyol are important factors related to the economy of the process. High water concentration in the recovered polyol affect further foaming in PU synthesis and have to be removed. Additional dehidratation or evaporation would increase the cost of the process. The optimal conditions for cleaning the recovered polyol have been defi ned: pH s between 4-5, temperature of 60ºC or higher, mechanical separation and excess of solvent in relation to phase polyol.
3.3. Bottom phase treatment
The glycolysis bottom phase was subjected to vacuum distillation in order to recover the excess of glycol used. Assays were carried out under reduced pressure ranging 20-200 mbar. Yields of glycol recovered as distillate are reported in table1.
Table 1: Vacuum distillation yields.
Pressure 20 mbar 30 mbar 50 mbar 100 mbar 200 mbar
Tª (ºC) bottoms 145-156 150-174 160-182 178-190 202-236
% lights recovery 80.7 80.6 83.7 79.9 78.1
The only fraction distilled corresponded to DEG, as it is shown in fi gure 3. In the fi gure is also shown the GPC chromatogram of the residue obtained. It can be observed that only a small amount of DEG still remains in the bottoms.
ISFR - 2005228
According to yields obtained, and in order in order not to produce cracking in the distillation residue, 50 mbar was selected as appropriate pressure. Cracking in the residue modifi es their chemical properties and therefore, further applicability. The bottoms of the column, due to the high content of active end groups (hydroxyl and primary amines) have been used as initiator in rigid polyol synthesis. The procedure of alkoxylation and foaming to obtain new rigid PU foams has been described in a following communication [11].
Amine content in the recovered glycol was analyzed, and according to this, catalyst was added to reach the fi xed quantity for glycolysis. The use of the recovered glycol achieved the complete degradation of the polyurethane, being the fi nal properties of the recovered polyol the same as than using fresh glycol.
According to the studies on the further treatment of both phases, an integrated process for the glycolysis can be proposed. The fl ow diagram, which includes polyol purifi cation and use of the bottom phase, is shown in fi gure 4.
The main advantage comprises the feedback of the excess of glycol to the glycolysis, as well as conversion of the residue in raw materials for PU manufacturing. Therefore, the recovery of a quality polyol can be achieved avoiding the economical and environmental problems derived by secondary products generation.
Figure 3: Overlapped GPC chromatograms of the distillate and residue obtained from the bottom phase at 50 mbar.
10 12 14 16 18
distillate residue
Inte
nsity
(a.u
.)
retention time
DEG
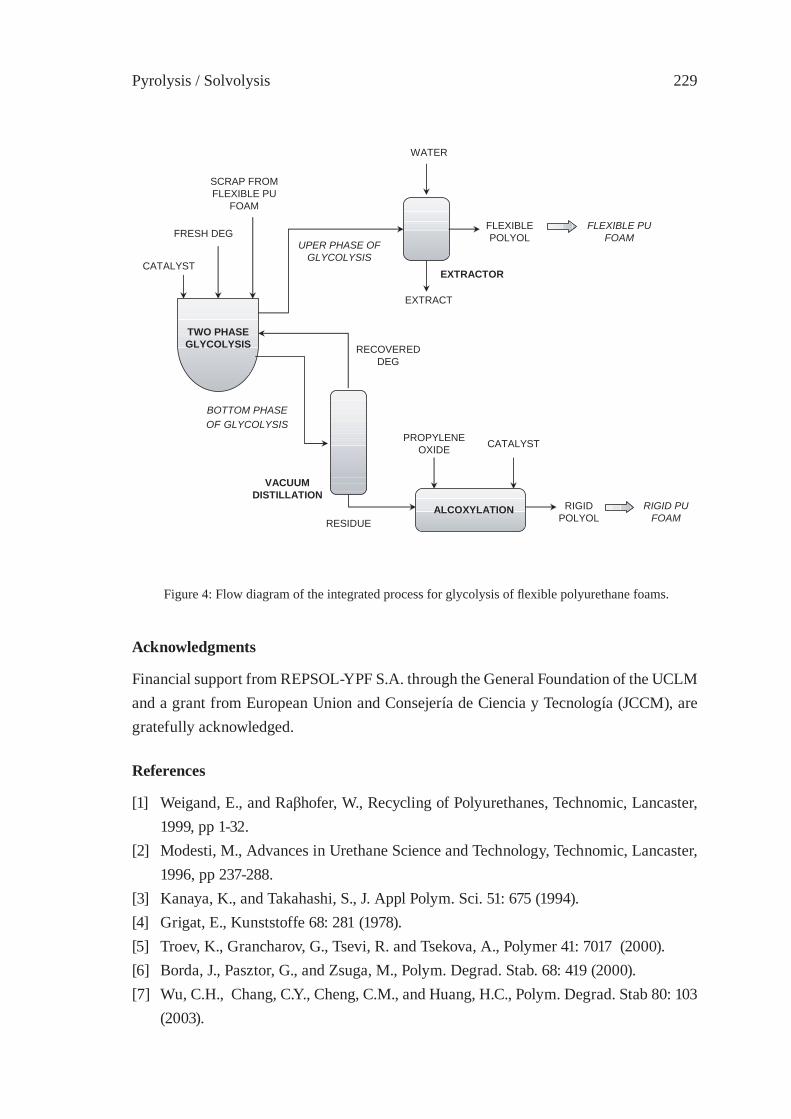
Pyrolysis / Solvolysis 229
Figure 4: Flow diagram of the integrated process for glycolysis of fl exible polyurethane foams.
Acknowledgments
Financial support from REPSOL-YPF S.A. through the General Foundation of the UCLM and a grant from European Union and Consejería de Ciencia y Tecnología (JCCM), are gratefully acknowledged.
References
[1] Weigand, E., and Raβhofer, W., Recycling of Polyurethanes, Technomic, Lancaster, 1999, pp 1-32.
[2] Modesti, M., Advances in Urethane Science and Technology, Technomic, Lancaster, 1996, pp 237-288.
[3] Kanaya, K., and Takahashi, S., J. Appl Polym. Sci. 51: 675 (1994).[4] Grigat, E., Kunststoffe 68: 281 (1978).[5] Troev, K., Grancharov, G., Tsevi, R. and Tsekova, A., Polymer 41: 7017 (2000).[6] Borda, J., Pasztor, G., and Zsuga, M., Polym. Degrad. Stab. 68: 419 (2000).[7] Wu, C.H., Chang, C.Y., Cheng, C.M., and Huang, H.C., Polym. Degrad. Stab 80: 103
(2003).
RECOVERED DEG
UPER PHASE OF GLYCOLYSIS
WATER
EXTRACTOR
FLEXIBLE POLYOL
FLEXIBLE PU FOAM
BOTTOM PHASE OF GLYCOLYSIS
RESIDUE
PROPYLENE OXIDE CATALYST
RIGID POLYOL
VACUUM DISTILLATION
ALCOXYLATION RIGID PU FOAM
SCRAP FROM FLEXIBLE PU
FOAM
TWO PHASE GLYCOLYSIS
FRESH DEG
EXTRACT
CATALYST

ISFR - 2005230
[8] Hemel, S., Held, S., Hicks, D., and Hart, M., Kunststoffe 88: 223 (1998).[9] Molero, C., Lucas, A. de, and Rodríguez, J.F., Polym. Degrad. Stab. In press (2005).[10] Molero, C., Lucas, A. de, Pérez, M., and Rodríguez, J.F., Global Symposium on
Recycling, Waste Treatment and Clean Technology Vol II, INASMET & The Minerals, Metals & Materials Society, San Sebastian, 2004, pp. 1681-1690.
[11] Molero, C., Lucas, A. de, and Rodríguez, J.F., Proceedings of ISFR 2005, Karlsruhe.

Pyrolysis / Solvolysis 231
UTILIZATION OF BY-PRODUCTS ORIGINATED IN THE CHEMICAL RECYCLING OF FLEXIBLE POLYURETHANE
FOAMSC. Molero, A. de Lucas and J. F. Rodríguez*
Dep. of Chemical Engineering, University of Castilla-La Mancha, Ciudad Real, Spain [email protected]
Abstract: Flexible polyurethane foams can be advantageously treated by two-phase glycolysis in order to recover polyols with improved quality. However, one of the liquid products obtained, which containing reaction by-products and the excess of glycol used, implies an environmental and economic problem which should be solved. The main purpose of this work is the study of the utilization of these by-products. Most of the glycol could be recovered for reuse in glycolysis by means of vacuum distillation. The remaining vacuum residue, contains the glycolysis by-products, was investigated as initiator in new polyol synthesis. Propoxylation was carried out to obtain polyols with suitable properties in foaming assays. The complete replacement of a commercial polyol in rigid polyurethane foams was achieved.
1. Introduction
In general, chemolysis or chemical recycling of polyurethanes (PU) involves treatment with steam, glycols or amines to break the urethane bonds and generate materials which may be used again in the manufacturing of a new urethane product [1,2]. The main target in chemical recycling of fl exible PU foams is the recovery of the constituent polyol. Most of the treatments yield a liquid mixture of products containing hydroxyl active groups, which are usually blended with raw materials. In order to improve the quality of the recovered products, bi-phasic processes (two liquid phases) have been developed with alkanolamines and low weight glycols for fl exible PU foams [3,4]. The upper phase is mainly formed by the valuable recovered polyol, whereas the bottom one contains the by-products of the process and the excess of glycol or amine used.
The bottom phase is a side product of the recycling process and implies an environmental and economic problem which should be solved. The main purpose of this work is the study of utilization of the by-products obtained after the two-phase glycolysis of fl exible polyurethane foams.
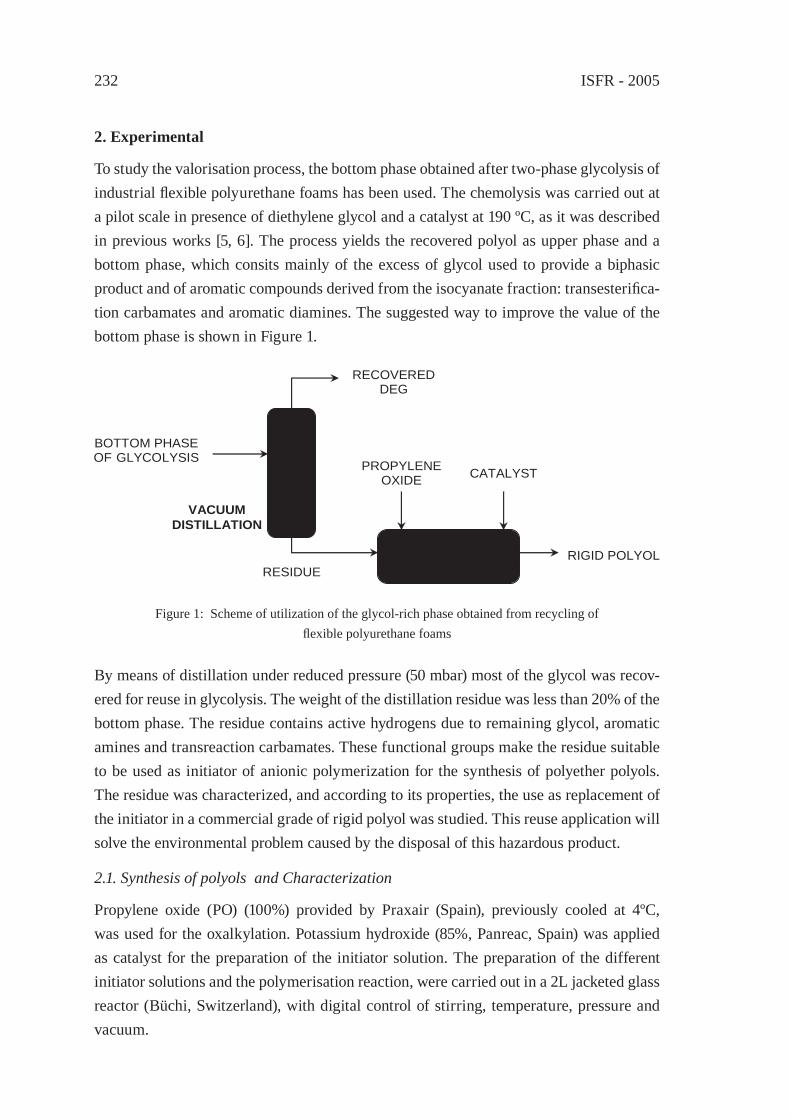
ISFR - 2005232
2. Experimental
To study the valorisation process, the bottom phase obtained after two-phase glycolysis of industrial fl exible polyurethane foams has been used. The chemolysis was carried out at a pilot scale in presence of diethylene glycol and a catalyst at 190 ºC, as it was described in previous works [5, 6]. The process yields the recovered polyol as upper phase and a bottom phase, which consits mainly of the excess of glycol used to provide a biphasic product and of aromatic compounds derived from the isocyanate fraction: transesterifi ca-tion carbamates and aromatic diamines. The suggested way to improve the value of the bottom phase is shown in Figure 1.
Figure 1: Scheme of utilization of the glycol-rich phase obtained from recycling of fl exible polyurethane foams
BOTTOM PHASE OF GLYCOLYSIS
RECOVERED DEG
RESIDUE
PROPYLENE OXIDE CATALYST
RIGID POLYOL
VACUUM DISTILLATION
ALCOXYLATION
By means of distillation under reduced pressure (50 mbar) most of the glycol was recov-ered for reuse in glycolysis. The weight of the distillation residue was less than 20% of the bottom phase. The residue contains active hydrogens due to remaining glycol, aromatic amines and transreaction carbamates. These functional groups make the residue suitable to be used as initiator of anionic polymerization for the synthesis of polyether polyols. The residue was characterized, and according to its properties, the use as replacement of the initiator in a commercial grade of rigid polyol was studied. This reuse application will solve the environmental problem caused by the disposal of this hazardous product.
2.1. Synthesis of polyols and Characterization
Propylene oxide (PO) (100%) provided by Praxair (Spain), previously cooled at 4ºC, was used for the oxalkylation. Potassium hydroxide (85%, Panreac, Spain) was applied as catalyst for the preparation of the initiator solution. The preparation of the different initiator solutions and the polymerisation reaction, were carried out in a 2L jacketed glass reactor (Büchi, Switzerland), with digital control of stirring, temperature, pressure and vacuum.
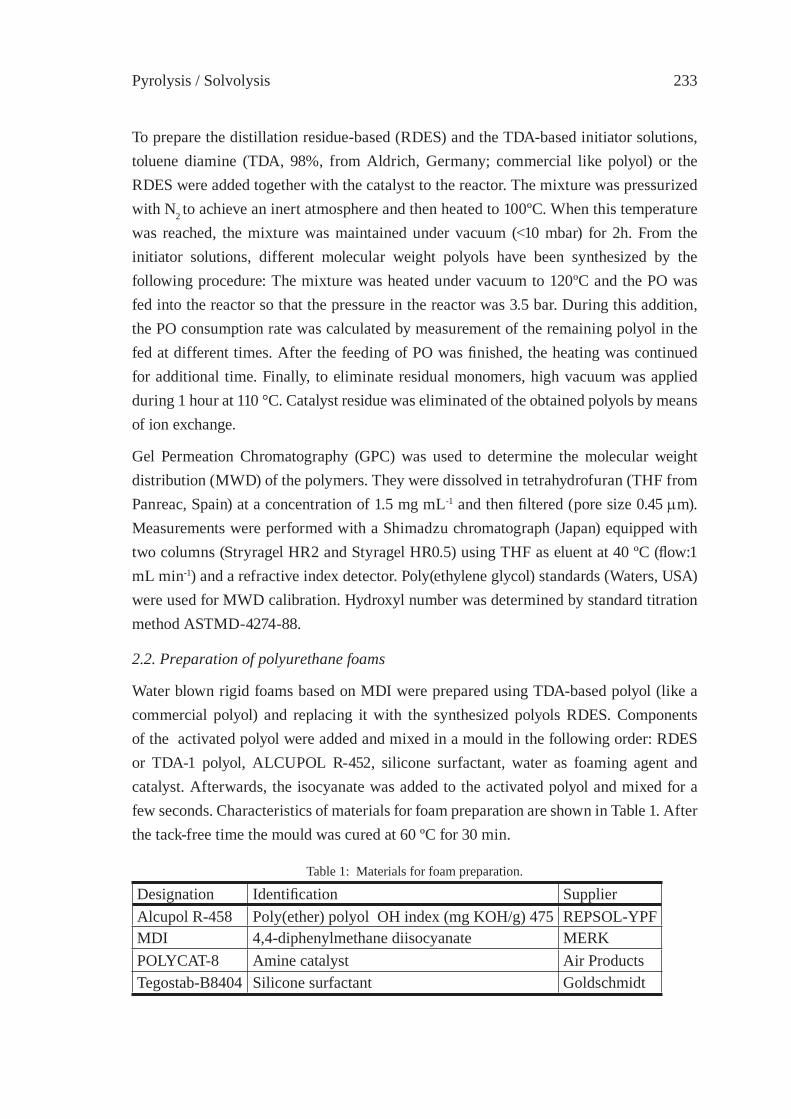
Pyrolysis / Solvolysis 233
To prepare the distillation residue-based (RDES) and the TDA-based initiator solutions, toluene diamine (TDA, 98%, from Aldrich, Germany; commercial like polyol) or the RDES were added together with the catalyst to the reactor. The mixture was pressurized with N2 to achieve an inert atmosphere and then heated to 100ºC. When this temperature was reached, the mixture was maintained under vacuum (<10 mbar) for 2h. From the initiator solutions, different molecular weight polyols have been synthesized by the following procedure: The mixture was heated under vacuum to 120ºC and the PO was fed into the reactor so that the pressure in the reactor was 3.5 bar. During this addition, the PO consumption rate was calculated by measurement of the remaining polyol in the fed at different times. After the feeding of PO was fi nished, the heating was continued for additional time. Finally, to eliminate residual monomers, high vacuum was applied during 1 hour at 110 °C. Catalyst residue was eliminated of the obtained polyols by means of ion exchange.
Gel Permeation Chromatography (GPC) was used to determine the molecular weight distribution (MWD) of the polymers. They were dissolved in tetrahydrofuran (THF from Panreac, Spain) at a concentration of 1.5 mg mL-1 and then fi ltered (pore size 0.45 µm). Measurements were performed with a Shimadzu chromatograph (Japan) equipped with two columns (Stryragel HR2 and Styragel HR0.5) using THF as eluent at 40 ºC (fl ow:1 mL min-1) and a refractive index detector. Poly(ethylene glycol) standards (Waters, USA) were used for MWD calibration. Hydroxyl number was determined by standard titration method ASTMD-4274-88.
2.2. Preparation of polyurethane foams
Water blown rigid foams based on MDI were prepared using TDA-based polyol (like a commercial polyol) and replacing it with the synthesized polyols RDES. Components of the activated polyol were added and mixed in a mould in the following order: RDES or TDA-1 polyol, ALCUPOL R-452, silicone surfactant, water as foaming agent and catalyst. Afterwards, the isocyanate was added to the activated polyol and mixed for a few seconds. Characteristics of materials for foam preparation are shown in Table 1. After the tack-free time the mould was cured at 60 ºC for 30 min.
Table 1: Materials for foam preparation.
Designation Identifi cation SupplierAlcupol R-458 Poly(ether) polyol OH index (mg KOH/g) 475 REPSOL-YPFMDI 4,4-diphenylmethane diisocyanate MERKPOLYCAT-8 Amine catalyst Air ProductsTegostab-B8404 Silicone surfactant Goldschmidt
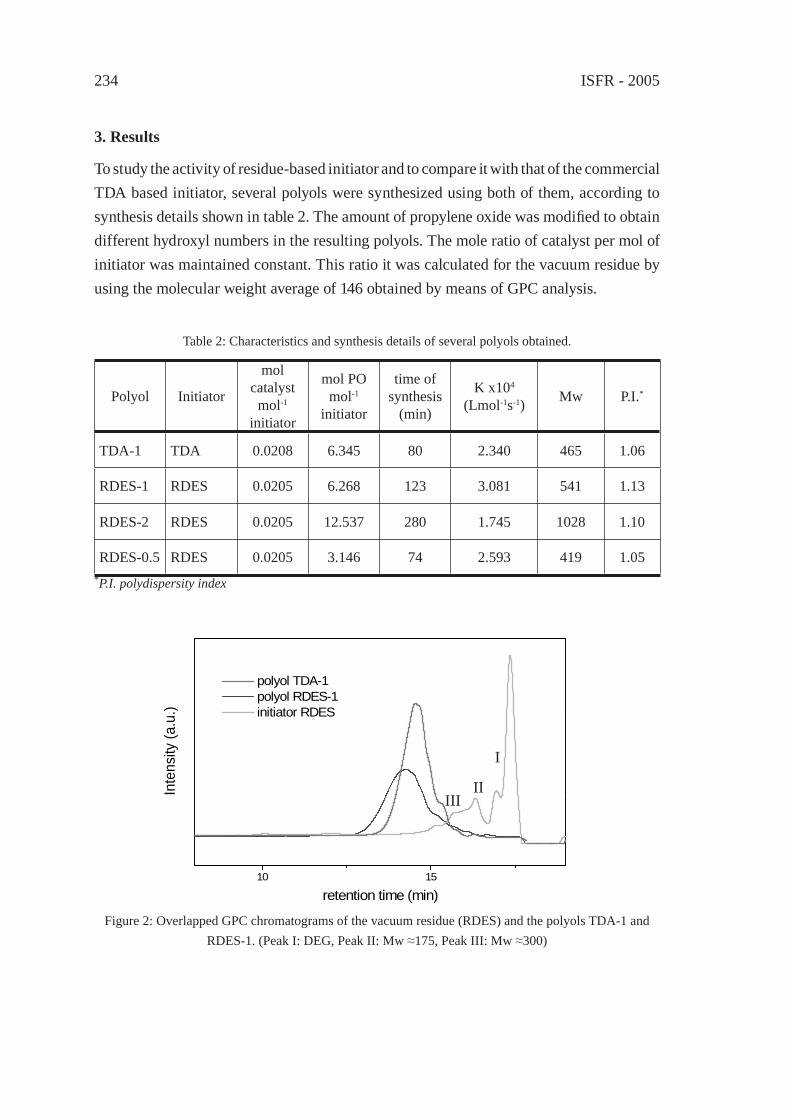
ISFR - 2005234
3. Results
To study the activity of residue-based initiator and to compare it with that of the commercial TDA based initiator, several polyols were synthesized using both of them, according to synthesis details shown in table 2. The amount of propylene oxide was modifi ed to obtain different hydroxyl numbers in the resulting polyols. The mole ratio of catalyst per mol of initiator was maintained constant. This ratio it was calculated for the vacuum residue by using the molecular weight average of 146 obtained by means of GPC analysis.
Table 2: Characteristics and synthesis details of several polyols obtained.
Polyol Initiator
mol catalyst
mol-1
initiator
mol PO mol-1
initiator
time of synthesis
(min)
K x104
(Lmol-1s-1) Mw P.I.*
TDA-1 TDA 0.0208 6.345 80 2.340 465 1.06
RDES-1 RDES 0.0205 6.268 123 3.081 541 1.13
RDES-2 RDES 0.0205 12.537 280 1.745 1028 1.10
RDES-0.5 RDES 0.0205 3.146 74 2.593 419 1.05*P.I. polydispersity index
Figure 2: Overlapped GPC chromatograms of the vacuum residue (RDES) and the polyols TDA-1 and RDES-1. (Peak I: DEG, Peak II: Mw ≈175, Peak III: Mw ≈300)
10 15
polyol TDA-1 polyol RDES-1 initiator RDES
Inte
nsity
(a.u
.)
retention time (min)
I
IIIII
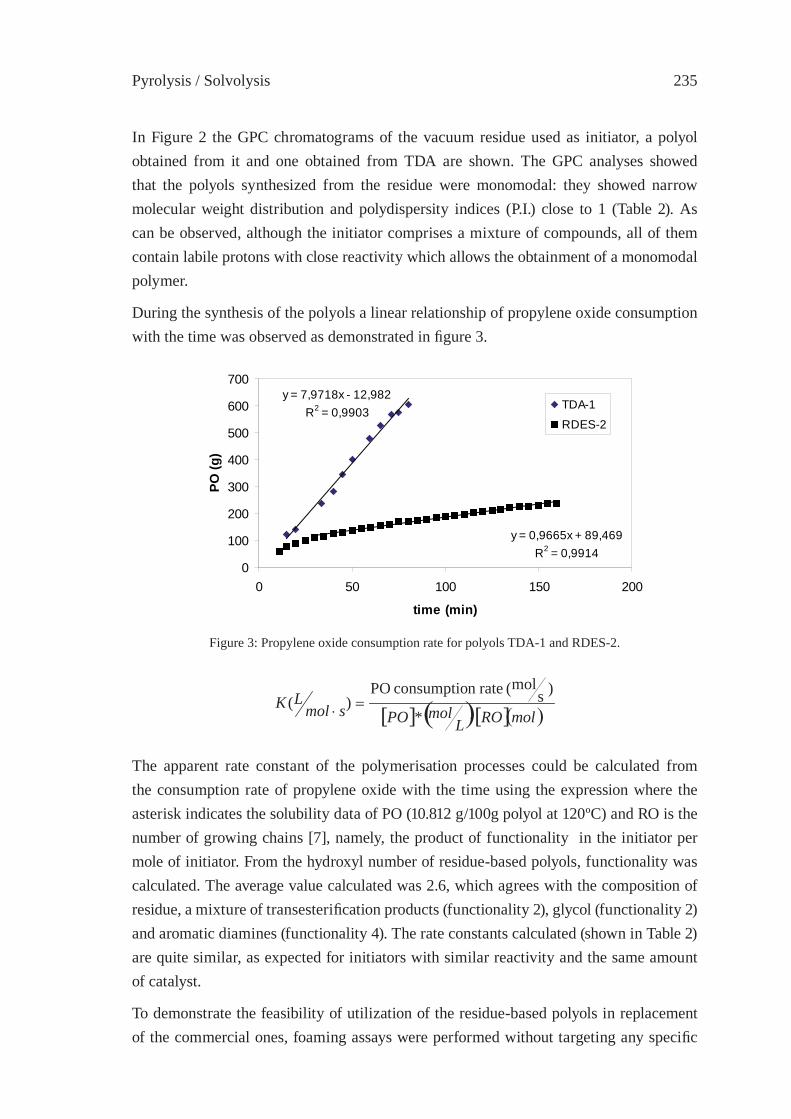
Pyrolysis / Solvolysis 235
In Figure 2 the GPC chromatograms of the vacuum residue used as initiator, a polyol obtained from it and one obtained from TDA are shown. The GPC analyses showed that the polyols synthesized from the residue were monomodal: they showed narrow molecular weight distribution and polydispersity indices (P.I.) close to 1 (Table 2). As can be observed, although the initiator comprises a mixture of compounds, all of them contain labile protons with close reactivity which allows the obtainment of a monomodal polymer.
During the synthesis of the polyols a linear relationship of propylene oxide consumption with the time was observed as demonstrated in fi gure 3.
y = 7,9718x - 12,982R2 = 0,9903
y = 0,9665x + 89,469R2 = 0,9914
0
100
200
300
400
500
600
700
0 50 100 150 200
time (min)
PO (g
)
TDA-1
RDES-2
Figure 3: Propylene oxide consumption rate for polyols TDA-1 and RDES-2.
[ ] ( )[ ]( )molROLmolPOsmol
LK⋅
=⋅ *
) smol( raten consumptio PO
)(
The apparent rate constant of the polymerisation processes could be calculated from the consumption rate of propylene oxide with the time using the expression where the asterisk indicates the solubility data of PO (10.812 g/100g polyol at 120ºC) and RO is the number of growing chains [7], namely, the product of functionality in the initiator per mole of initiator. From the hydroxyl number of residue-based polyols, functionality was calculated. The average value calculated was 2.6, which agrees with the composition of residue, a mixture of transesterifi cation products (functionality 2), glycol (functionality 2) and aromatic diamines (functionality 4). The rate constants calculated (shown in Table 2) are quite similar, as expected for initiators with similar reactivity and the same amount of catalyst.
To demonstrate the feasibility of utilization of the residue-based polyols in replacement of the commercial ones, foaming assays were performed without targeting any specifi c

ISFR - 2005236
application in this step of the research. The formulations and properties of several foams are shown in Table 3.
Although the foaming profi les (cream time and rise time) and densities showed slight differences due to the reactivity and functionality of the polyols, the foamed polyurethanes did not show any structural fault.
Table 3: Formulations and properties of rigid foams.
Formulation (pbw)
product Foam T100-125 Foam T50-125 Foam T0-125
Alcupol R-458 100 100 100
TDA-1 101 50 0
RDES-1 0 50 100
Water 1.02 1.09 1.02
POLYCAT-8 1.04 1.04 1.07
Tegostab B8404 2.18 2.13 2.09
MDI 264 249 237
Isocyanate Index 125 125 125
Cream time (s) 15 20 20
Rise time (s) 110 110 97
Density (Kg m-3) 72 63 67
4. Conclusion
The vacuum residue can provide valuable raw products because TDA based polyol was completely replaced with residue based polyols. The foaming assays were done without adjustment of the formulation, only isocyanate index, according to hydroxyl values. Since the chemical structure of RDEST synthesized polyols is different from the reference polyol, properties like hardness and elongation at break, as well as others, would be modifi ed. In order to develop products with targeted properties, formulations must be developed considering specifi c properties of these polyols. This is the common procedure in the development of polyurethane products from new raw materials [8].
Pyrolysis / Solvolysis 237
The study has established a method to give value to the by-products obtained after two-phase glycolysis of fl exible polyurethane foams. It could solve some economic and environmental problems related to polyurethane recycling technology.
Acknowledgments
Financial support from REPSOL-YPF S.A. through the General Foundation of the UCLM and a grant from European Union and Consejería de Ciencia y Tecnología (JCCM), are gratefully acknowledged.
References
[1] Modesti, M., Advances in Urethane Science and Technology, Technomic, Lancaster, 1996, pp 237-288.
[2] Borda, J., Pasztor, G., and Zsuga, M., Polym. Degrad. Stab. 68: 419 (2000).[3] Kanaya, K., and Takahashi, S., J. Appl Polym. Sci. 51: 675 (1994).[4] Hemel, S., Held, S., Hicks, D., and Hart, M., Kunststoffe 88: 223 (1998).[5] Molero C., Lucas A. de, Pérez M., and Rodríguez J.F., Global Symposium on Recycling,
Waste Treatment and Clean Technology Vol II, INASMET & The Minerals, Metals & Materials Society, San Sebastian, 2004, pp. 1681-1690.
[6] Molero, C., Lucas, A. de, and Rodríguez, J.F., Polym. Degrad. Stab. In press (2005).[7] Lucas, A. de, Rodríguez, L., Pérez-Collado, M., Sánchez P., and Rodríguez, J.F.,
Polym. Int. 51:1066 (2002).[8] Sendijarevic, V., proceedings POLYURETHANES 2004, Las Vegas, October 18-20
(2004).

ISFR - 2005238
Pyrolysis / Solvolysis 239
CHEMICAL RECYCLING OF WOOD BIOMASS VIA HYDROTHERMAL TREATMENT
A. Sera, T. Bhaskar, S. Karagoz, A. Muto, Y. Sakata*Department of Applied Chemistry, Okayama University, 3-1-1 Tsushima Naka,
Okayama 700-8530, Japan; E-mail: [email protected]
Abstract: Thermo-chemical conversion of wood biomass using alkaline aqueous catalysts was performed at low temperatures of 280 °C. Various reaction conditions were carried out to optimize the reaction parameters for obtaining high oil yields and to decrease the solid residues to less than 5 wt%. Environmentally benign separation and analysis process applied for the identifi cation of compounds at different stages to understand the nature of products from different portions of wood biomass. The analyses of lignin, cellulose, hemi-cellulose and ash contents of different types of wood biomass were performed. Under the optimized reaction temperature and time, the effect of various alkaline (Na, K, Rb, and Cs) hydroxides and carbonates were investigated. The volatility distribution of hydrocarbons was characterized by using C-NP gram (C stands for carbon number and NP stands for normal paraffi n).
1. Introduction
The world reserves of economically exploitable fossil organic raw material (oil, gas, and coal) are limited and the expected growth of the world population is increasing rapidly. Under these circumstances, the sustainable growth scenario requires switching from fossil fuel to renewable forms of energy and organic raw material. Biomass is renewable and alternative energy source for obtaining fuels and valuable chemicals etc., Biomass can be converted into H2 and medium heating value gas [1], and for other applications such as catalyst support [2]. Biomass was also utilized for the preparation of nano-crystalline metal oxide catalysts [3-4]. There have been various processes for utilization of biomass as an alternative energy resource. Biomass liquefaction for liquid fuel was carried by some solvents such as ethylene-glycol [5]. Hydrothermal process has a special importance, as water is unique and environmentally benign solvent. Direct liquefaction of wood by catalyst was carried out in the presence of K2CO3 and it was reported that a marked catalytic effect of potassium carbonate was observed [6-9]. However, we could not fi nd an effective separation method with the detailed products distribution and analysis of liquid (oil) products individually. In our earlier reports, affect of various reaction parameters [10] and Rb and Cs carbonates for the production of phenols [11] from wood biomass carried out. In the present communication, we report the effect of catalysts and concentration on the hydrothermal treatment of biomass and biomass components such as lignin, cellulose and hemicellulose and analysis of liquid products by volatility distribution by normal

ISFR - 2005240
paraffi n gram (C-NP).
2. Experimental Section
Materials Wood biomass (sawdust from pine) used in this study was obtained from Yonebayashi Milling Co., Ishikawa prefecture, Japan and used as received. The solvents (acetone, ether, ethyl acetate) and base catalyst (K2CO3) were purchased from Wako Chemicals, Japan and used as received.
Experimental procedureHydrothermal liquefaction experiments were conducted in a 200 ml TaS-02-HC type autoclave at 280 °C for 15 min for all the runs used in the present investigation. Thermal run was also performed in the absence of catalyst (only water). Effect of biomass ratio to water was performed in the absence of catalyst. In a typical catalytic hydrothermal liquefaction experiment, the reactor was loaded with 5g (dry basis) of wood biomass and 30 ml of alkaline solution. The reactor was purged fi ve times with nitrogen to remove the inside air. Reactants were agitated vertically at 60 ≅ cycles/min using stirrer as shown in our recent report [11]. The temperature was then raised up to 280 °C at heating rate of 3 °C/min and kept for 15 min at 280 °C. After the reaction time, the reactor was cooled down to the room temperature by fan. The procedure for separation and extraction of reaction products are described in scheme 1 further details on the analysis of products given elsewhere [11]. Solid products were extracted with acetone (150 ml) in a Soxhlet extraction apparatus. Oils including oil 1, oil 2, and oil 3 obtained from low temperature hydrothermal liquefaction of wood biomass were analyzed by gas chromatograph equipped with a mass selective detector [GC-MS; HP 5973; column, HP-1].
3. Results and Discussion
Hydrothermal liquefaction of biomass was carried out at different temperatures i.e., 180 °C, 250 °C and 280 °C for 15 min and 60 min. The temperature has affected both product composition and yield of products. The low reaction temperature and time i.e., 180 °C for 15 min, the conversion of sawdust was 26.7 wt% and the total oil yield was found to be 3.8 wt%. With increasing the temperature from 180 °C (15min) to 250 °C (15 min), total oil yield was increased from 3.8 to 7.6 wt%. Further increase in the temperature to 280 °C (15 min) led to increase total oil yield from 7.6 to 8.5 wt% (Table 1). The increase of reaction temperature from 180 °C (60min) to 250 °C (60min) and 280 °C (60min) increased the conversion of biomass from 30.6 wt% to 56.4 wt% and 58.9 wt% respectively. There is no appreciable increase in the conversion of biomass with the increase of temperature from 250 °C to 280 °C The water-soluble hydrocarbons were the highest (45%) at the
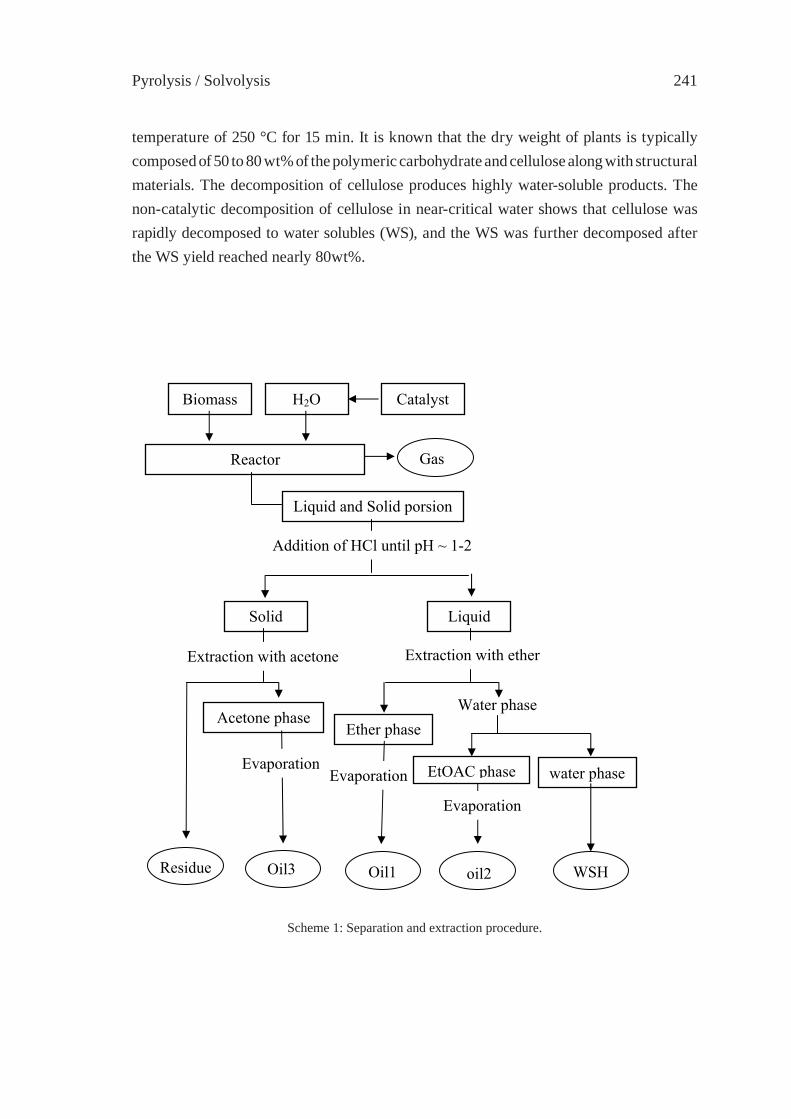
Pyrolysis / Solvolysis 241
temperature of 250 °C for 15 min. It is known that the dry weight of plants is typically composed of 50 to 80 wt% of the polymeric carbohydrate and cellulose along with structural materials. The decomposition of cellulose produces highly water-soluble products. The non-catalytic decomposition of cellulose in near-critical water shows that cellulose was rapidly decomposed to water solubles (WS), and the WS was further decomposed after the WS yield reached nearly 80wt%.
Scheme 1: Separation and extraction procedure.
Biomass H2O Catalyst
Reactor Gas
Liquid and Solid porsion
Addition of HCl until pH ~ 1-2
Solid Liquid
Extraction with acetone Extraction with ether
Acetone phase
Evaporation
Ether phase
Evaporation
Water phase
EtOAC phase water phase
Evaporation
Residue Oil3 Oil1 oil2 WSH

ISFR - 2005242
Table 1: Mass balance of products distribution from thermal (water) and catalytic hydrothermal treatment of wood biomass at 280 °C for 15 min.
Liquid (oil)
No Solution Conv.a
wt%Gase
wt%Residuef
wt%WSHg
wt%
Oil1b
wt%Oil2c
wt%Oil3d wt%
Totalwt%
1 Water 58 1 0 7 9 10 42 402 NaOH 86 8 2 12 22 12 14 523 Na2CO3 89 9 2 13 23 12 12 544 KOH 91 12 2 15 29 12 9 515 K2CO3 96 15 2 17 34 11 4 516 CsOH 79 9 1 11 21 11 21 477 CsCO3 84 10 2 11 22 14 16 488 RbOH 85 10 2 11 24 13 15 489 RbCO3 88 12 2 11 25 16 12 47
From the above discussion, it is clear that the hydrothermal liquefaction at 280°C for 15 min showed the reasonable yields. Under these optimized conditions, catalytic hydrothermal treatment of wood biomass was performed at 280 °C for 15 min in the presence of alkaline solutions (NaOH, Na2CO3, KOH, K2CO3, RbOH, RbCO3, CsOH and CsCO3). Based on the yield of liquid products, the catalytic activity can be ranked as follows: K2CO3>KOH>RbCO3>RbOH>Na2CO3>NaOH>CsCO3>CsOH>Water and based on the decrease of feed material (conversion) the order of the hydroxides and carbonates are K2CO3>KOH>Na2CO3>RbCO3> NaOH>RbOH> CsCO3>CsOH>Water. In thermal run, the yield of solid residue was about 42 % whereas it was 4.0 % in the presence of K2CO3. Catalytic hydrothermal treatment of biomass produced mainly phenolic compounds. In thermal run, furan derivatives were observed whereas these compounds could not be observed in catalytic runs. Base solutions have found an important effect on the degradation of wood biomass in terms of both oil yield and conversion. In thermal run, the yield of oil1 was 1.3 wt% whereas it was almost from 6 to 12 times greater with various base solutions. Oil1, oil 2 was viscous liquid at room temperature and whereas oil3 was tarry. The volatility distribution of hydrocarbons (ether extract) was characterized by using C-NP gram and it showed that the majority of hydrocarbons for all runs including thermal were distributed boiling point range of n-C11.
The composition of biomass derived oil is quite complex mixture. We have used the

Pyrolysis / Solvolysis 243
GC-MS analysis data and presented the boiling point distribution of biomass derived oil (oil1). Figure 1 is called C-NP (normal paraffi n) gram, which was obtained by plotting the area fraction of individual components against the equivalent carbon number of normal paraffi ns. The carbon numbers in the abscissa represent the equivalent boiling point (B. P.) range of normal paraffi ns. The details about C-NP gram can be found elsewhere [13]. The oxygenated hydrocarbons from both thermal and catalytic runs are distributed in the boiling point range of C7 to C16. It can be clearly seen that the majority of hydrocarbons in oil1 in all runs including thermal run are distributed at C11. Among the catalysts tested, Na2CO3 produced the highest amount of hydrocarbons at C11, which were about 56 %. 2-Methoxy-phenol mainly contributed to increase the hydrocarbons at C11, as 2-methoxy-phenol was major compound in oil1 in case of Na2CO3. At C11 (174.0~195.8 °C), the hydrocarbons were about 50 % in case of NaOH, about 42 % in case of thermal, about 36 % in case of KOH and about 28 % in case of K2CO3. It is clear that the use of K2CO3 led to form other oxygenated hydrocarbons such as benzenediol derivatives and 4-ethyl-2-methoxy-phenol. Thus, boiling point of the hydrocarbons from K2CO3 was distributed about 28% at C11, 15% at C12, 23% at C13, 20% at C14. It is interesting that the hydrocarbons at C13 were about 23 % in cases of K2CO3 and KOH whereas they were about 11% in cases of NaOH and Na2CO3. It can be clearly seen that the distribution of hydrocarbons from thermal run had a sharp peak at C8, which is mainly 2-furancarboxaldehyde.
The hydrothermal liquefaction was also performed with wood biomass (sawdust), non-wood biomass (rice husk), and major biomass components i.e., lignin, cellulose. With
Figure 1: C-NP gram of oil 1 (ether extract) obtained from thermal and catalytic runs (selected) at 280 °C for 15 min.
0
10
20
30
40
50
60
3 5 7 9 11 13 15 17 19 21 23 25 27
Are
a , %
Thermal
NaOH
Na2CO3
KOH
K 2CO3
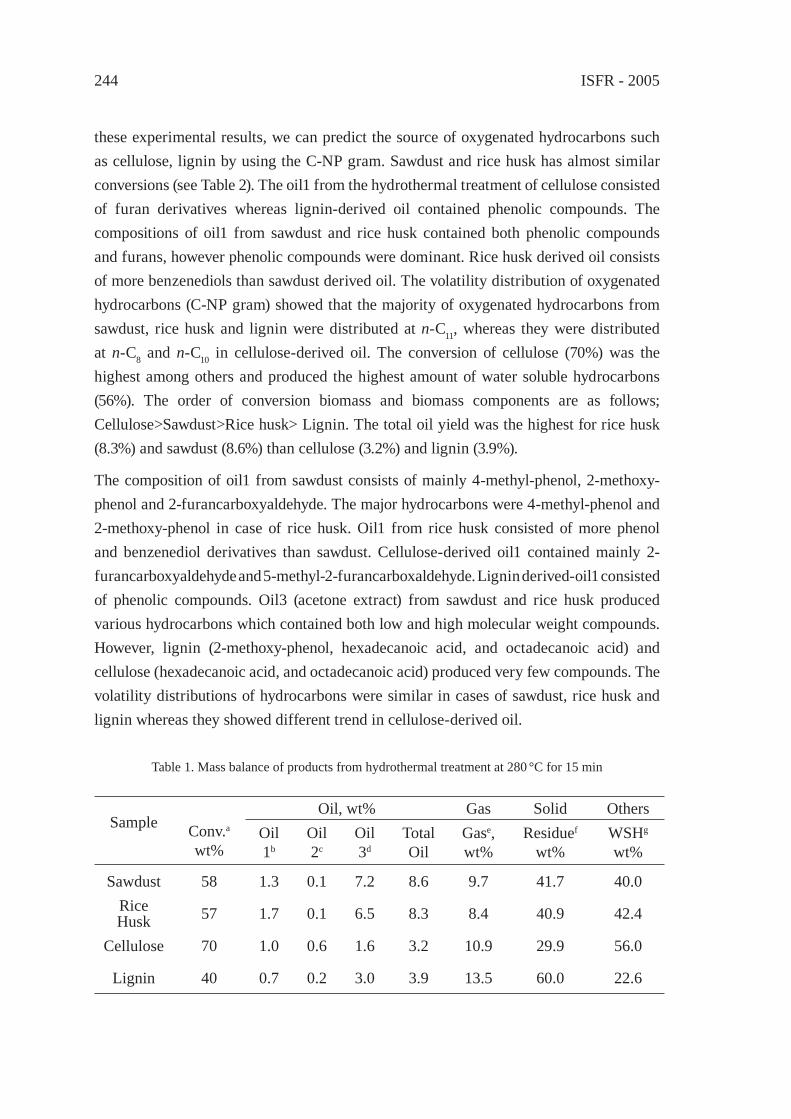
ISFR - 2005244
these experimental results, we can predict the source of oxygenated hydrocarbons such as cellulose, lignin by using the C-NP gram. Sawdust and rice husk has almost similar conversions (see Table 2). The oil1 from the hydrothermal treatment of cellulose consisted of furan derivatives whereas lignin-derived oil contained phenolic compounds. The compositions of oil1 from sawdust and rice husk contained both phenolic compounds and furans, however phenolic compounds were dominant. Rice husk derived oil consists of more benzenediols than sawdust derived oil. The volatility distribution of oxygenated hydrocarbons (C-NP gram) showed that the majority of oxygenated hydrocarbons from sawdust, rice husk and lignin were distributed at n-C11, whereas they were distributed at n-C8 and n-C10 in cellulose-derived oil. The conversion of cellulose (70%) was the highest among others and produced the highest amount of water soluble hydrocarbons (56%). The order of conversion biomass and biomass components are as follows; Cellulose>Sawdust>Rice husk> Lignin. The total oil yield was the highest for rice husk (8.3%) and sawdust (8.6%) than cellulose (3.2%) and lignin (3.9%).
The composition of oil1 from sawdust consists of mainly 4-methyl-phenol, 2-methoxy-phenol and 2-furancarboxyaldehyde. The major hydrocarbons were 4-methyl-phenol and 2-methoxy-phenol in case of rice husk. Oil1 from rice husk consisted of more phenol and benzenediol derivatives than sawdust. Cellulose-derived oil1 contained mainly 2-furancarboxyaldehyde and 5-methyl-2-furancarboxaldehyde. Lignin derived-oil1 consisted of phenolic compounds. Oil3 (acetone extract) from sawdust and rice husk produced various hydrocarbons which contained both low and high molecular weight compounds. However, lignin (2-methoxy-phenol, hexadecanoic acid, and octadecanoic acid) and cellulose (hexadecanoic acid, and octadecanoic acid) produced very few compounds. The volatility distributions of hydrocarbons were similar in cases of sawdust, rice husk and lignin whereas they showed different trend in cellulose-derived oil.
Table 1. Mass balance of products from hydrothermal treatment at 280 °C for 15 min
Sample Conv.a wt%
Oil, wt% Gas Solid OthersOil 1b
Oil 2c
Oil 3d
TotalOil
Gase,wt%
Residuef
wt%WSHg
wt%
Sawdust 58 1.3 0.1 7.2 8.6 9.7 41.7 40.0Rice Husk 57 1.7 0.1 6.5 8.3 8.4 40.9 42.4
Cellulose 70 1.0 0.6 1.6 3.2 10.9 29.9 56.0
Lignin 40 0.7 0.2 3.0 3.9 13.5 60.0 22.6
Pyrolysis / Solvolysis 245
4. Conclusions
The hydrothermal liquefaction of wood biomass was performed at low temperature (280 °C) and short reaction times (15 min). The solid biomass was converted to more than 95 wt% with less than 1 M concentration of base catalysts (K2CO3). An effective separation procedure was employed and anlysed the liquid products obtained at various stages and this led us to understand the source of those compounds. The results were compared with hydrothermal liquefaction of wood biomass components such as lignin, cellulose and also non-woody biomass. The liquid products were characterized by volatility distribution. Qualitative and semi-quantitative analyses of hydrocarbons were performed by gas chromatographs and the detailed results will be discussed during the presentation. The liquefaction products such as oil products can be upgraded or used as fuel and the water soluble hydrocarbons (dissolved carbon compounds) can be used to produce the hydrogen by steam reforming method.
5. References
[1] Ferdous, D., Dalai, A.K., Bej, S.K., Thring, R.W., Can. J. Chem. Eng. 79:913-922 (2001).
[2] Yamada, N., Muto A., Uddin, Md. A., Kojima, K., Ibaraki, S., Marumo,C., Sakata, Y., Electrochemistry. 69:434-436 (2001).
[3] Muto A., Bhaskar, T., Kaneshiro Y., Uddin, Md.A., Sakata, Y., Kusano, Y., Murakami, K., Green Chemistry. 5:480-483 (2003).
[4] Muto A., Bhaskar, T., Kaneshiro Y., Sakata, Y., Kusano, Y., Murakami, K., Appl. Catal. A. Gen. 275:173-181(2004).
[5] Rezzoug, S-A., Capart, R., Appl. Energ.72:631-644(2002).[6] Minowa, T., Fang, Z., Ogi, T., Vargehyi, G., J.Chem. Eng. Jpn 31-1:131-134(1998).[7] Minowa, T., Zhen, F., Ogi, T., Varhegyi, G., J.Chem. Eng. Jpn 30:186-190(1997).[8] Ogi, T., Yokayama, S., Koguchi, K., Sekiyu Gakkaishi 28(3):239-245(1985).[9] Minowa, T., Zhen, F., Ogi, T., Varhegyi, G., J.Chem. Eng. Jpn.30:186-190(1997).[10] Karagoz, S., Bhaskar, T., Muto, A., Sakata, Y., Uddin Md. A., Energy Fuels, 18:234-
241(2004).[11] Karagoz, S., Bhaskar, T., Muto, A., Sakata, Y., Fuel. 83:2293-2299(2004).[12] Sinag, A., Kruse, A., Schwarzkopf, V. Ind. Eng. Chem. Res. 42:3516-3521(2004).[13] Murata, K., Sato, Y., Sakata, Y., J. Anal. Appl. Pyrolysis 71:569-589(2004).
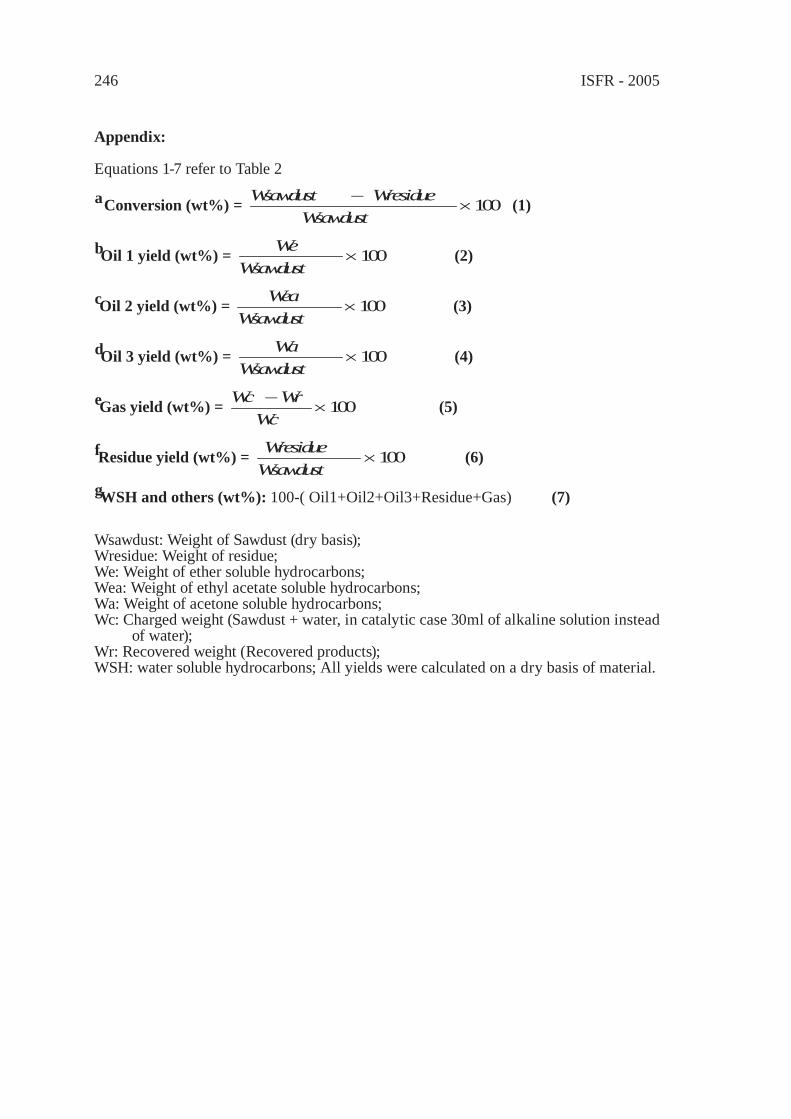
ISFR - 2005246
Appendix:
Equations 1-7 refer to Table 2
Wsawdust: Weight of Sawdust (dry basis);Wresidue: Weight of residue; We: Weight of ether soluble hydrocarbons; Wea: Weight of ethyl acetate soluble hydrocarbons; Wa: Weight of acetone soluble hydrocarbons; Wc: Charged weight (Sawdust + water, in catalytic case 30ml of alkaline solution instead
of water); Wr: Recovered weight (Recovered products); WSH: water soluble hydrocarbons; All yields were calculated on a dry basis of material.
a Conversion (wt%) = 100×−
Wsawdust WresidueWsawdust (1)
bOil 1 yield (wt%) = 100×Wsawdust
We (2)
cOil 2 yield (wt%) = 100×Wsawdust
Wea (3)
dOil 3 yield (wt%) = 100×Wsawdust
Wa (4)
eGas yield (wt%) = 100×−
WcWrWc (5)
fResidue yield (wt%) = 100×Wsawdust Wresidue (6)
gWSH and others (wt%): 100-( Oil1+Oil2+Oil3+Residue+Gas) (7)
Pyrolysis / Solvolysis 247
CHANGE IN INTERACTION BY PRESSUREDURING THE PYROLYSIS OF PLASTICS MIXTURE
Y. Ohmukai, K. Kubo, I. Hasegawa and K. MaeDepartment of Chemical Engineering, Kyoto University, Kyoto, Japan
Abstract: Low density polyethylene (PE), polystyrene (PS) and polypropylene (PP) were pyrolyzed in a high-pressure batch reactor and a low-pressure gas-fl owing reactor in order to clarify the effect of reaction phase. Residue yield of PE was remarkably decreased by adding other radical-donating plastics under high pressure pyrolysis. On the other hand, the gas yield was decreased by mixing plastics under low pressure. The result suggests the possibility of a new pyrolysis method that combines the additive plastic supply and the pressure control for recovering chemicals from plastic mixture.
1. Introduction
Management of waste plastics is one of big concerns in Japan from the viewpoint of resource saving and environmental aspect. Material recycle schemes are established for some kinds of plastics such as PET, but fairly large amounts of plastics are disposed as a mixture with garbage. The present management of such a mixture is mainly combustion accompanied by large amount of CO2 emission. Pyrolysis of the garbage mixture is attractive in the point of the recovery of chemicals, the separation of components into solid, liquid, and gas phases. Extending this feature of pyrolysis, we proposed a new pyrolysis method in which the plastic mixture was pyrolyzed with an additive plastic in liquid phase or gas phase by pressure control. In this process, it is a key factor to utilize effectively the interaction between plastics. While many studies have been made on the effect of interaction between plastics on the TGA curve, little attention has been given to that on product distribution [1,2]. In this paper, several kinds of plastic mixtures were pyrolyzed under high or low pressure, and the interactions between plastics in liquid and gas phases were examined in order to clarify the possibility of the proposed method.
2. Experimental section
Low density polyethylene (PE), polystyrene (PS) and polypropylene (PP) were used as representative model plastics. Japanese Cypress was also used in order to estimate the interaction between plastic and biomass. Each sample was pyrolyzed by itself or mixed with another component in the weight ratio of 1 to 1. The pyrolysis was performed in two ways using reactors shown in Fig.1. One is the pyrolysis of mixture in a high pressure batch reactor (length: 12 cm; i.d. 1.07 cm) to elucidate the interaction between plastics in liquid phase at the stage of primary decomposition. About 1 g mixed sample was pyrolyzed for

ISFR - 2005248
30 min at 450°C in 0.6 MPa of N2 by immersing the reactor in a sand bath. The product gases were collected by gas bag and analyzed by gaschromatograph (Shimadzu, GC-14A). The liquid and solid product were classifi ed into acetone-soluble (tar) and acetone-insoluble matter (residue) and served to TOF-MS measurement (Shimadzu/KRATOS, KOMPACT-MALDI-II). The tar and residue yields were determined by the TG analysis. The other is the pyrolysis of plastic mixtures at 600 °C in a stream of atmospheric N2 gas to clarify the interaction between product gases at the stage of secondary gas phase reaction. The product gases passed through a trap cooled with liquid nitrogen, and then they were collected by a gas bag. The products which left the reactor and remained in the reactor were classifi ed into tar and/or wax and residue respectively. Analysis was carried out similar to the process applied in the high pressure experiments.
3. Results and discussion
3.1. Product distribution on pyrolysis in high pressure
Fig.2 shows the product distribution of pyrolysis of each sample in high pressure. PP and PS were decomposed into gas and tar with almost no residue in high pressure experiments while about 50 wt% residue was left in the reactor after pyrolysis of PE. In addition, the residue of PE pyrolysis was spherical about 6 mm in diameter, and that shows that large parts of the system would be liquid during the reaction. Thus, product distribution of high pressure pyrolysis depends on the type of plastics. The main reason of it is that pyrolysis temperature of PE is higher than that of other plastics (PE, PP and PS is pyrolyzed at 460, 450 and 400°C; TGA at 10 K min-1). On the other hand, we used dodecane as a
Figure 1: Experimental systems: the left is high pressure batch reactor and the right is reactor through which N2 fl ow in 300 ml min-1.
PressureIndicator
Stop Valve
Stop Valve
Sand Bath
CompressedAir
Temperature Controller
TC
N2
FlowMeter
Sand BathCompressedAir
tar, gas
Temperature Controller
TC
Sand Bath
PressureIndicator
Stop Valve
Stop Valve
Sand Bath
CompressedAir
Temperature Controller
TC
PressureIndicator
Stop Valve
Stop Valve
Sand Bath
CompressedAir
Temperature Controller
TC
N2
FlowMeter
Sand BathCompressedAir
tar, gas
Temperature Controller
TC
Sand Bath
N2N2
FlowMeter
Sand BathCompressedAir
tar, gas
Temperature Controller
TC
Sand Bath
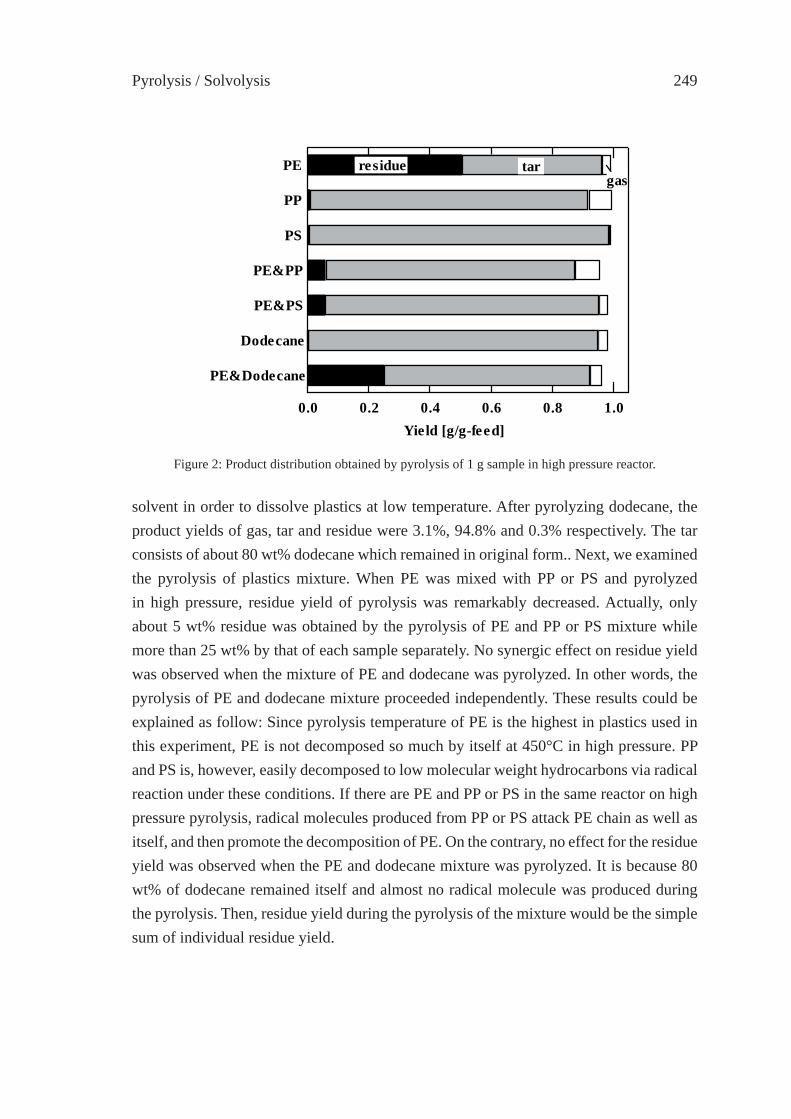
Pyrolysis / Solvolysis 249
solvent in order to dissolve plastics at low temperature. After pyrolyzing dodecane, the product yields of gas, tar and residue were 3.1%, 94.8% and 0.3% respectively. The tar consists of about 80 wt% dodecane which remained in original form.. Next, we examined the pyrolysis of plastics mixture. When PE was mixed with PP or PS and pyrolyzed in high pressure, residue yield of pyrolysis was remarkably decreased. Actually, only about 5 wt% residue was obtained by the pyrolysis of PE and PP or PS mixture while more than 25 wt% by that of each sample separately. No synergic effect on residue yield was observed when the mixture of PE and dodecane was pyrolyzed. In other words, the pyrolysis of PE and dodecane mixture proceeded independently. These results could be explained as follow: Since pyrolysis temperature of PE is the highest in plastics used in this experiment, PE is not decomposed so much by itself at 450°C in high pressure. PP and PS is, however, easily decomposed to low molecular weight hydrocarbons via radical reaction under these conditions. If there are PE and PP or PS in the same reactor on high pressure pyrolysis, radical molecules produced from PP or PS attack PE chain as well as itself, and then promote the decomposition of PE. On the contrary, no effect for the residue yield was observed when the PE and dodecane mixture was pyrolyzed. It is because 80 wt% of dodecane remained itself and almost no radical molecule was produced during the pyrolysis. Then, residue yield during the pyrolysis of the mixture would be the simple sum of individual residue yield.
1.00.80.60.40.20.0Yield [g/g-feed]
PE&Dodecane
Dodecane
PE&PS
PE&PP
PS
PP
PE residue tar gas
Figure 2: Product distribution obtained by pyrolysis of 1 g sample in high pressure reactor.
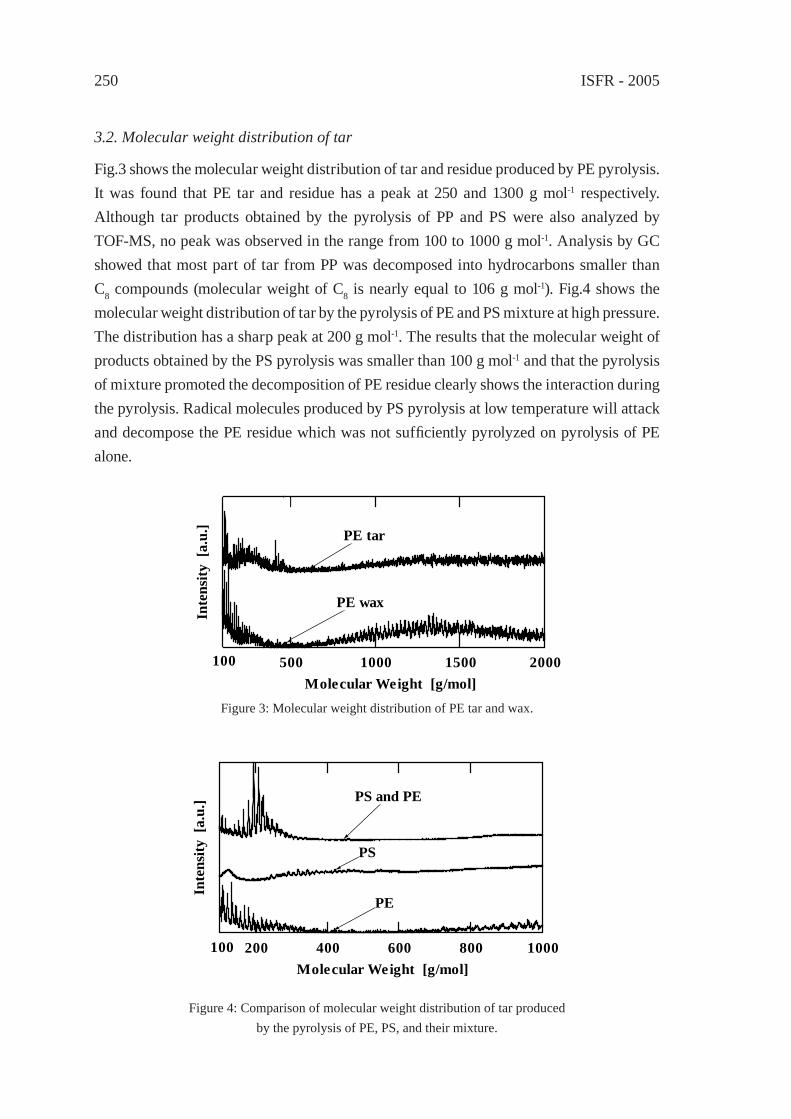
ISFR - 2005250
3.2. Molecular weight distribution of tar
Fig.3 shows the molecular weight distribution of tar and residue produced by PE pyrolysis. It was found that PE tar and residue has a peak at 250 and 1300 g mol-1 respectively. Although tar products obtained by the pyrolysis of PP and PS were also analyzed by TOF-MS, no peak was observed in the range from 100 to 1000 g mol-1. Analysis by GC showed that most part of tar from PP was decomposed into hydrocarbons smaller than C8 compounds (molecular weight of C8 is nearly equal to 106 g mol-1). Fig.4 shows the molecular weight distribution of tar by the pyrolysis of PE and PS mixture at high pressure. The distribution has a sharp peak at 200 g mol-1. The results that the molecular weight of products obtained by the PS pyrolysis was smaller than 100 g mol-1 and that the pyrolysis of mixture promoted the decomposition of PE residue clearly shows the interaction during the pyrolysis. Radical molecules produced by PS pyrolysis at low temperature will attack and decompose the PE residue which was not suffi ciently pyrolyzed on pyrolysis of PE alone.
Inte
nsity
[a.
u.]
1000800600400200Molecular Weight [g/mol]
PE
PS
PS and PE
100
Inte
nsity
[a.
u.]
200015001000500Molecular Weight [g/mol]
PE tar
PE wax
100
Figure 3: Molecular weight distribution of PE tar and wax.
Figure 4: Comparison of molecular weight distribution of tar produced by the pyrolysis of PE, PS, and their mixture.
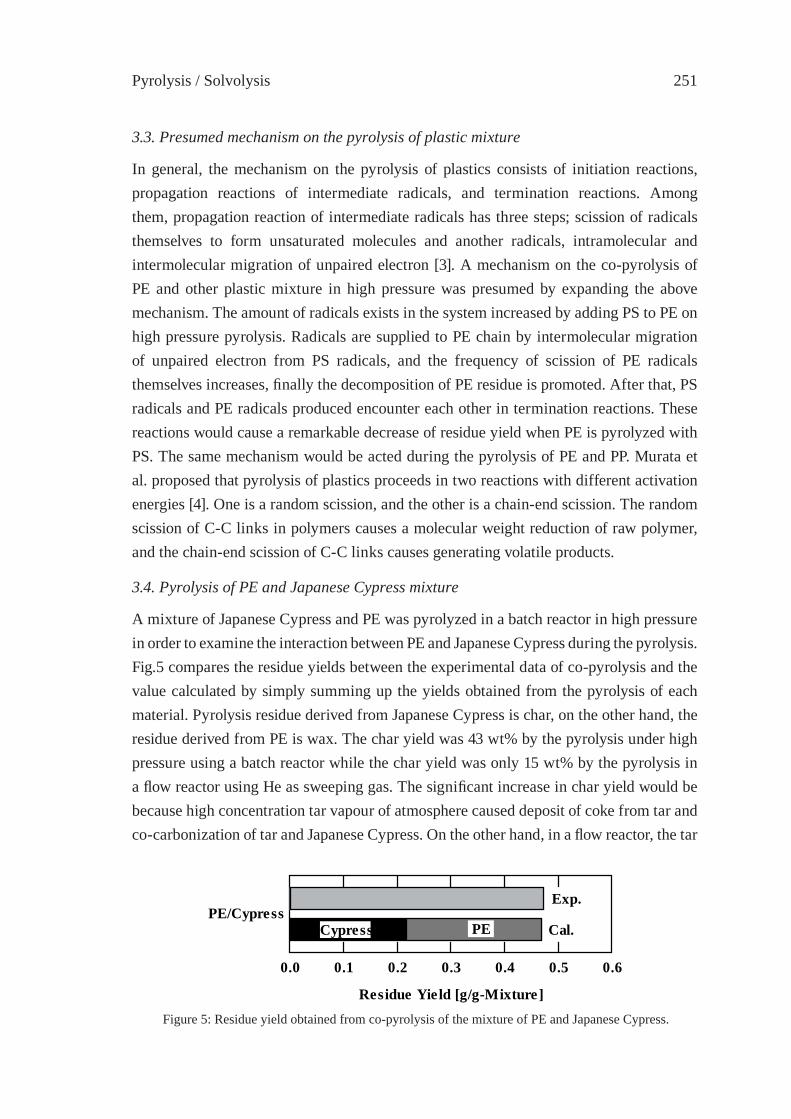
Pyrolysis / Solvolysis 251
3.3. Presumed mechanism on the pyrolysis of plastic mixture
In general, the mechanism on the pyrolysis of plastics consists of initiation reactions, propagation reactions of intermediate radicals, and termination reactions. Among them, propagation reaction of intermediate radicals has three steps; scission of radicals themselves to form unsaturated molecules and another radicals, intramolecular and intermolecular migration of unpaired electron [3]. A mechanism on the co-pyrolysis of PE and other plastic mixture in high pressure was presumed by expanding the above mechanism. The amount of radicals exists in the system increased by adding PS to PE on high pressure pyrolysis. Radicals are supplied to PE chain by intermolecular migration of unpaired electron from PS radicals, and the frequency of scission of PE radicals themselves increases, fi nally the decomposition of PE residue is promoted. After that, PS radicals and PE radicals produced encounter each other in termination reactions. These reactions would cause a remarkable decrease of residue yield when PE is pyrolyzed with PS. The same mechanism would be acted during the pyrolysis of PE and PP. Murata et al. proposed that pyrolysis of plastics proceeds in two reactions with different activation energies [4]. One is a random scission, and the other is a chain-end scission. The random scission of C-C links in polymers causes a molecular weight reduction of raw polymer, and the chain-end scission of C-C links causes generating volatile products.
3.4. Pyrolysis of PE and Japanese Cypress mixture
A mixture of Japanese Cypress and PE was pyrolyzed in a batch reactor in high pressure in order to examine the interaction between PE and Japanese Cypress during the pyrolysis. Fig.5 compares the residue yields between the experimental data of co-pyrolysis and the value calculated by simply summing up the yields obtained from the pyrolysis of each material. Pyrolysis residue derived from Japanese Cypress is char, on the other hand, the residue derived from PE is wax. The char yield was 43 wt% by the pyrolysis under high pressure using a batch reactor while the char yield was only 15 wt% by the pyrolysis in a fl ow reactor using He as sweeping gas. The signifi cant increase in char yield would be because high concentration tar vapour of atmosphere caused deposit of coke from tar and co-carbonization of tar and Japanese Cypress. On the other hand, in a fl ow reactor, the tar
Figure 5: Residue yield obtained from co-pyrolysis of the mixture of PE and Japanese Cypress.
0.60.50.40.30.20.10.0
Residue Yield [g/g-Mixture]
Exp.
Cal.Cypress PE PE/Cypress
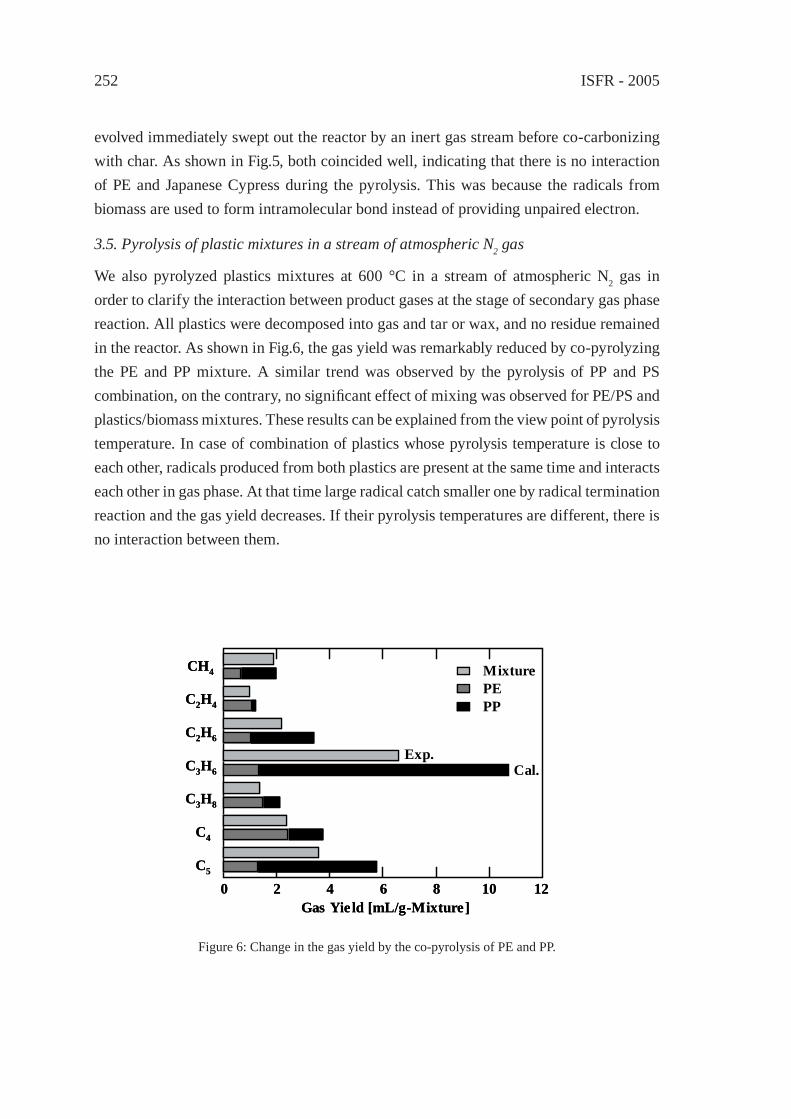
ISFR - 2005252
evolved immediately swept out the reactor by an inert gas stream before co-carbonizing with char. As shown in Fig.5, both coincided well, indicating that there is no interaction of PE and Japanese Cypress during the pyrolysis. This was because the radicals from biomass are used to form intramolecular bond instead of providing unpaired electron.
3.5. Pyrolysis of plastic mixtures in a stream of atmospheric N2 gas
We also pyrolyzed plastics mixtures at 600 °C in a stream of atmospheric N2 gas in order to clarify the interaction between product gases at the stage of secondary gas phase reaction. All plastics were decomposed into gas and tar or wax, and no residue remained in the reactor. As shown in Fig.6, the gas yield was remarkably reduced by co-pyrolyzing the PE and PP mixture. A similar trend was observed by the pyrolysis of PP and PS combination, on the contrary, no signifi cant effect of mixing was observed for PE/PS and plastics/biomass mixtures. These results can be explained from the view point of pyrolysis temperature. In case of combination of plastics whose pyrolysis temperature is close to each other, radicals produced from both plastics are present at the same time and interacts each other in gas phase. At that time large radical catch smaller one by radical termination reaction and the gas yield decreases. If their pyrolysis temperatures are different, there is no interaction between them.
Figure 6: Change in the gas yield by the co-pyrolysis of PE and PP.
Gas Yield [mL/g-Mixture]
Mixture PE PP
Exp.Cal.
0
CH4
C2H4
C2H6
C3H6
C3H8
C4
C5
2 4 6 8 10 12Gas Yield [mL/g-Mixture]
Mixture PE PP
Exp.Cal.
0
CH4
C2H4
C2H6
C3H6
C3H8
C4
C5
2 4 6 8 10 12
Pyrolysis / Solvolysis 253
4. Conclusion
Several kinds of plastic mixtures were pyrolyzed under high or low pressure, and the interactions between plastics in liquid and gas phase during pyrolysis were examined. PE was pyrolyzed into tar on high pressure pyrolysis by adding PP or PS, although little amount of PE decomposed at 450°C during the pyrolysis of solely PE. This was because the radicals produced from PS or PP promoted the decomposition of C-C bond in PE in a liquid phase at high pressure. From these results, the decomposition rate of PE and the product distribution could be shifted through changing the reaction fi eld into liquid or gas phase by pressure swing. This suggests the possibility of a new pyrolysis method that combined the additive plastic supply and the pressure control for recovering chemicals from plastic mixture.
Acknowledgement
Major part of this report provides the results of the Energy saving projects of Nippon Steel Co., which was supported fi nancially by METI (Ministry of Economy, Trade and Industry of Japan).
References
[1] Faravelli, T., Bozzano, G., Colombo, M., Ranzi, E. and Dente, M., J. Anal. Appl. Pyrolysis, 70:761 (2003).
[2] Martin-Gullon, I., Esperanza, M. and Font, R., J. Anal. Appl. Pyrolysis, 58-59:635 (2001).
[3] Mastral, F. J., Esperanza, E., Berrueco, C., Juste, M. and Ceamanos, J. Anal. Appl. Pyrolysis, 70:1 (2003).
[4] Murata, K., Sato, K. and Sakata, Y., J. Anal. Appl. Pyrolysis, 71:569 (2004).

ISFR - 2005254

Pyrolysis / Solvolysis 255
DECOMPOSITION REACTION OF THERMALLY STABLE POLYMERS IN HIGH TEMPERATURE WATER
H. Tagaya*, T. Kamimori and B. HatanoDepartment of Chemistry and Chemical Engineering, Yamagata University, 4-3-16
Jonan, Yonezawa, Yamagata 992-8510 Japan [email protected]
Abstract: Thermally stable polymers including diphenyl moieties were decomposed into their monomeric compounds in high temperature water (HTW). To elucidate the mechanism of the reaction, model compounds of thermally stable polymers such as substituted diphenyls were reacted. Furthermore, two thermally stable polymers, T1 and T2, including diphenyl, phthalic acid and hydroxybenzoic acid moieties were reacted in HTW. Production of monomeric compounds was confi rmed by GC/MS indicating that in HTW thermally stable polymers also decomposed although no reaction was observed in organic solvent. The addition of basic compounds was effective.
1. Introduction
In recent years, the increase of the amount of waste plastics becomes a serious prob-lem. Therefore, the chemical recycling of waste plastics into their monomers has been gaining greater attention as a means of obtaining valuable products from waste plastics [1]. Thermal cracking of thermoplastic resin is well-known technique and fl uidized-bed pyrolysis technology has been under development [2]. We have already confi rmed that waste polymers such as polycarbonate and phenol resins were decomposed into their monomeric compounds in sub- and supercritical water under an Ar atmosphere [3-6].
Supercritical water has been received more and more attention as a medium for chemical reaction in recent years [7]. Water near or above its critical point (Tc = 374.2 °C, Pc = 22.1MPa) possesses many properties very different from those of ambient liquid water, such as high ion product, low dielectric constant and good solubility of various materials [8]. These properties can be controlled continuously by varying temperature and pressure and expand the application of water as an inexpensive and environmentally benign solvent. The organic chemical reactions in near- and supercritical water were focused on wastewater treatment, post-use polymers decomposition and chemical synthesis.
Under supercritical conditions, water, organic compounds and gases are completely miscible. Furthermore, it is pointed out that the supercritical water is emerging as a medium, which could provide the optimum conditions for a variety of chemical reactions among them the destruction of hazardous waste.

ISFR - 2005256
In this study, to obtain information and to develop decomposition reaction process of waste plastics in HTW including supercritical water, model compounds and thermally stable polymers were reacted in sub- and supercritical water by using 10 ml tubing bomb reactor. Diphenyls are known as materials having high thermal stability because their aromatic moieties are bridged three-dimensionally by methylene, ether and carbonyl bonds [9].
2. Experimental
Reaction was conducted in a stainless 316 tubing bomb reactor with a volume of 10cm3. Typically, 0.1g of model compound or polymer and 1 - 7 ml of water were introduced in the reactor, then the air in the reactor was replaced with argon. The loaded and sealed reactor was placed in fl uidized sand bath (Techne SBL-2D) which was preheated to reaction temperature (250 – 400 °C). The reactants attained the fi nal temperature within 2 min and were kept isothermal to within 1 °C. When the reaction time (15 – 540 min) was reached, the reactor was cooled to the ambient temperature in less than 1min by cold-water bath.
The products were identifi ed qualitatively by gas chromatography-mass spectrometry (GC-MS, Shimadzu, QP-5000) and were analyzed quantitatively by gas chromatography (GC, Shimadzu, GC-9A).
Two thermally stable polymers, T1 and T2 were kindly supplied by chemical companies. Their thermal characteristics were analyzed by using a Seiko SSC5200 apparatus in fl ow of nitrogen at a heating rate of 10 °C/min.
3. Results and Discussion
3.1. Reaction of Model Compounds
It is well known that thermal cleavage of methylene bond is not easy [10,11]. However, we have found that various chemical bonds including methylene bond were cleaved in HTW including supercritical water and chemical participation of water on the reaction was suggested [12-16].
Bond dissociation energies of carbon - oxygen and carbon - carbon bond between phenyl units are 90.0 and 103.0 kcal/mol, respectively and larger than 76.5 kcal/mol of methylene carbon – phenyl carbon bond as shown in Figure 1. It is well known that various thermally stable polymers contain these bonds.
Therefore, compounds containing diphenyl moieties as shown in Figure 2 were reacted as polymer model compounds in HTW including superctitical water.
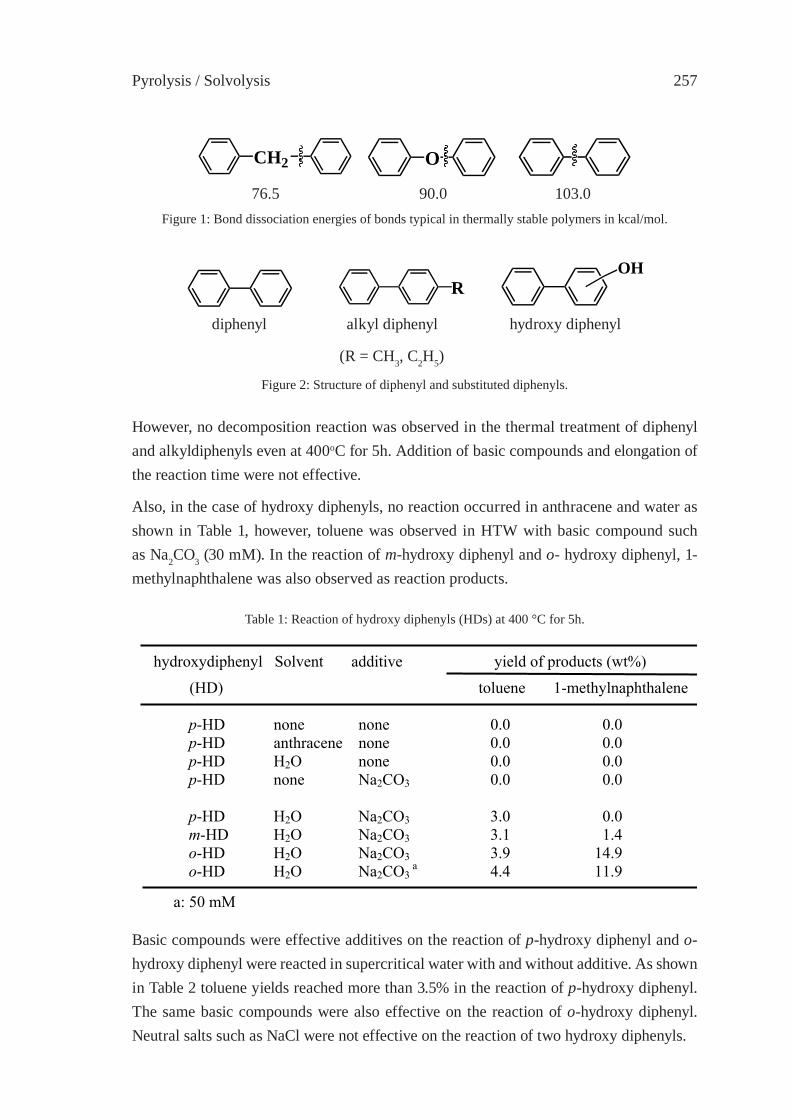
Pyrolysis / Solvolysis 257
However, no decomposition reaction was observed in the thermal treatment of diphenyl and alkyldiphenyls even at 400oC for 5h. Addition of basic compounds and elongation of the reaction time were not effective.
Also, in the case of hydroxy diphenyls, no reaction occurred in anthracene and water as shown in Table 1, however, toluene was observed in HTW with basic compound such as Na2CO3 (30 mM). In the reaction of m-hydroxy diphenyl and o- hydroxy diphenyl, 1-methylnaphthalene was also observed as reaction products.
Table 1: Reaction of hydroxy diphenyls (HDs) at 400 °C for 5h.
CH2 O
76.5 90.0 103.0 Figure 1: Bond dissociation energies of bonds typical in thermally stable polymers in kcal/mol.
diphenyl alkyl diphenyl hydroxy diphenyl
(R = CH3, C2H5)
Figure 2: Structure of diphenyl and substituted diphenyls.
ROH
hydroxydiphenyl Solvent additive yield of products (wt%)
(HD) toluene 1-methylnaphthalene
p-HD none none 0.0 0.0 p-HD anthracene none 0.0 0.0 p-HD H2O none 0.0 0.0 p-HD none Na2CO3 0.0 0.0
p-HD H2O Na2CO3 3.0 0.0 m-HD H2O Na2CO3 3.1 1.4 o-HD H2O Na2CO3 3.9 14.9 o-HD H2O Na2CO3
a 4.4 11.9
a: 50 mM
Basic compounds were effective additives on the reaction of p-hydroxy diphenyl and o-hydroxy diphenyl were reacted in supercritical water with and without additive. As shown in Table 2 toluene yields reached more than 3.5% in the reaction of p-hydroxy diphenyl. The same basic compounds were also effective on the reaction of o-hydroxy diphenyl. Neutral salts such as NaCl were not effective on the reaction of two hydroxy diphenyls.

ISFR - 2005258
Reaction pressure increase with an increase in the injection volume of water in the reactor. Reaction pressure and temperature were important factors on the reaction as shown in Table 3. o-Hydroxy diphenyl was more reactive than p-hydroxy diphenyl and total yield of identifi ed products reached 28% for 9 h.
3.2. Reaction Mechanism of Decomposition Reaction
In the reaction of o-hydroxy diphenyl, production of 1-methylnaphthalene was confi rmed. Gas analyses in the products suggested the presence of decarbonylation reaction. Decarbonylation followed by recyclization might lead the production of 1-methylnaphthalene as shown in Figure 3. The yield of 1-methylnaphthalene reached near 20% in the reaction for 9h.
Table 2: The effect of additive on the reaction of p-hydroxy-diphenyl und o-hydroxy-diphenyl at 400 °C for 5h.
amount time p-hydroxy diphenyl o-hydroxy diphenyl
(ml) (h) yield of toluene yield of toluene yield of 1-methylnaphthalene
1 1 0.0 2.7 1.2 1 9 3.1 2.8 2.0 3 5 3.0 3.9 14.9 5 1 2.9 3.6 2.4 5 9 4.3 8.5 19.7 7 1 2.8 3.7 2.3
O
HO
O
HO
Figure 3: Reaction scheme of o-hydroxy diphenyl into 1-methylnaphthalene and toluene in HTW including supercritical water.
3.3. Reaction of Thermally Stable Polymers
Two thermally stable polymers, HT1 and HT2 were reacted in HTW including supercritical water. They include diphenyl, hydroxy benzoic acid and phthalic acid moietes as shown in Figure 4.
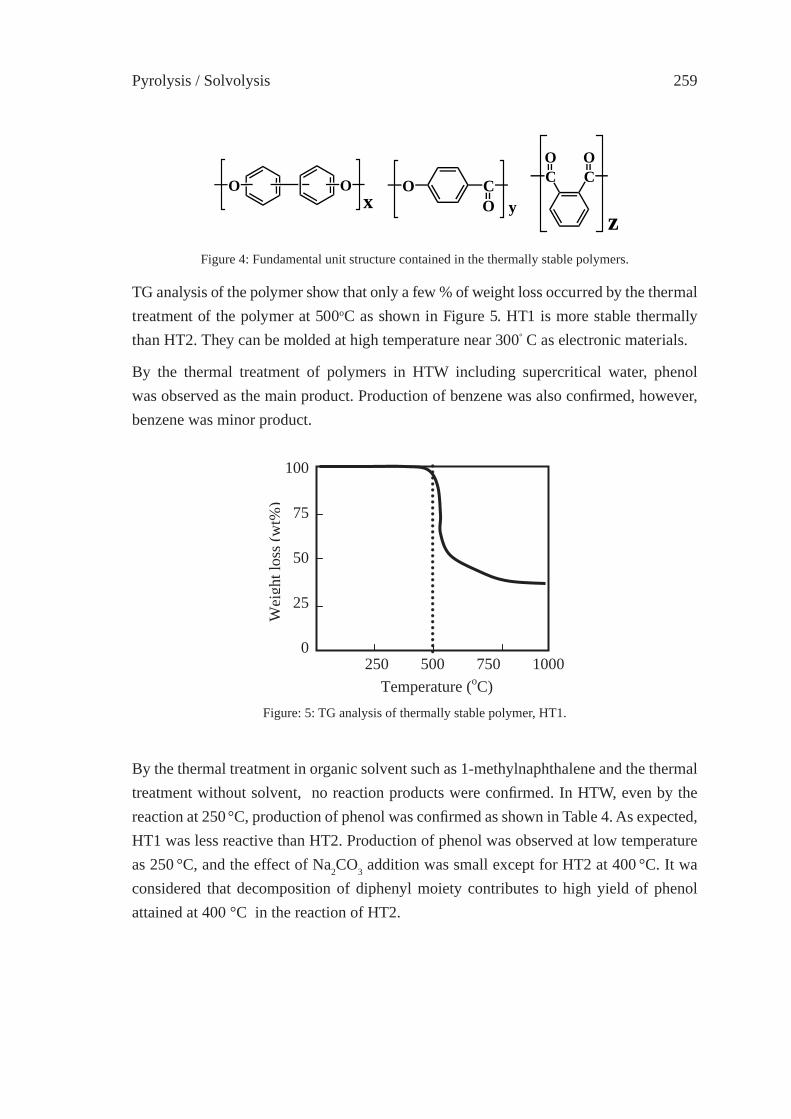
Pyrolysis / Solvolysis 259
TG analysis of the polymer show that only a few % of weight loss occurred by the thermal treatment of the polymer at 500oC as shown in Figure 5. HT1 is more stable thermally than HT2. They can be molded at high temperature near 300º C as electronic materials.
By the thermal treatment of polymers in HTW including supercritical water, phenol was observed as the main product. Production of benzene was also confi rmed, however, benzene was minor product.
O CO y
z
C CO O
O Ox
Figure 4: Fundamental unit structure contained in the thermally stable polymers.
Figure: 5: TG analysis of thermally stable polymer, HT1.
250 500 750 1000 Temperature (oC)
100
75
50
25
0
Wei
ght l
oss (
wt%
)
By the thermal treatment in organic solvent such as 1-methylnaphthalene and the thermal treatment without solvent, no reaction products were confi rmed. In HTW, even by the reaction at 250 °C, production of phenol was confi rmed as shown in Table 4. As expected, HT1 was less reactive than HT2. Production of phenol was observed at low temperature as 250 °C, and the effect of Na2CO3 addition was small except for HT2 at 400 °C. It wa considered that decomposition of diphenyl moiety contributes to high yield of phenol attained at 400 °C in the reaction of HT2.
ISFR - 2005260
4. Conclusions
Hydroxy diphenyls are thermally stable compounds and no reaction occured in organic solvent even at 400 °C, however, in HTW with basic compounds such as Na2CO3, decomposition products were obtained. These results and polymer decomposition suggest the high potential of water as chemical recycling solvent of waste plastics. Various thermoplastic resins can be decomposed into their monomeric compounds in HTW. In this case pyrolysis is the main route. Thermal treatement in HTW can be applied to decomposition reaction of thermoset resins in which solvolysis process play an important role on the decomposition.
References
[1] Bisio, A., Xanthos, M., How to manage plastics waste. Hanser Publishers, New York, 1995.
[2] Kaminsky, W., Schlesselman, B., Simon, C., Hydrocarbon Process. 74: 109 (1995).[3] Tagaya, H., Suzuki, Y., Kadokawa, J., Karasu, M., Chiba, K., Chem. Lett. 47
(1997).[4] Tagaya, H., Suzuki, Y., Asou, T., Kadokawa, J., Chiba, K., Chem Lett. 937 (1998). [5] Tagaya, H., Katoh, K., Kadokawa, J., Chiba, K., Polymer Degradation and
Stability, 64: 289 (1999).[6] Suzuki, Y., Tagaya, H., Asou, T., Kadokawa, J., Chiba, K., Ind. Eng. Chem. Res.
38: 1391 (1999).[7] Savage, P.E., Chem. Rev. 99: 603 (1999).
Table 4: The effect of reaction temperature on the reaction of termally stable polymers, HT1 and HT2 for 1 h.
amount (ml) additive 250 °C 300 °C 400 °C
HT1 none none 0.0 H2O 1 none 12.2 26.6 30.7 H2O 3 none 9.8 27.0 32.4 H2O 1 Na2CO3 17.2. 29.0 33.7
HT2 H2O 1 none 31.7 34.6 31.8 H2O 3 none 24.8 31.9 33.7 H2O 1 Na2CO3 30.5 33.9 40.7
Pyrolysis / Solvolysis 261
[8] Shaw, R.W., Brill, T.B.,. Clifford, A. A., Eckert, C. A., Franck E.U., Chem. Eng. News, 69: 26 (1991).
[9] Huppert, G. L., Wu, B. C., Townsend, S. H., Klein, M. T., Paspek, S. C., Ind. Eng. Research, 28: 161 (1989).
[10] Benjamin, B., Raaen, V., Maaupin, P., Brown, L., Collins, C., Fuel, 57: 269 (1978)[11] Allen, D., Avalas, G., Fuel, 63: 586 (1984).[12] Tagaya, H., Suzuki, Y., Komuro, N., Kadokawa, J., J. Mater. Cycles Waste Manage., 3: 32-37 (2001).[13] Dai, Z., Hatano, B., Kadokawa, J., Tagaya, H., Polymer Degradation and Stability
76: 179 (2002).[14] Shibasaki, Y., Kamimori, T., and Tagaya, H., Polymer Degradation and Stability,
83: 481 (2004).[15] Tagaya, H., Shibasaki, Y., Kato, C., Kadokawa, J., and Hatano, B., J. Mater Cycles
Waste Manag., 6: 1 (2004).[16] Dai, Z., Hatano, B., Tagaya, H., Polymer, Polym. Degradation Stability, 80: 353
(2003).

ISFR - 2005262
Pyrolysis / Solvolysis 263
DEPOLYMERIZATION KINETICS AND MECHANISM OF POLYMERS IN SUB- AND SUPERCRITICAL FLUIDS
M. Sasaki*, T. Iwaya, M. Genta, and M. GotoDepartment of Applied Chemistry and Biochemistry, Kumamoto University, 2-39-1 Kurokami, Kumamoto 860-8555, Japan, [email protected]
Abstract: Nylon 6 was reacted in water under near-critical and supercritical conditions. It was found that nylon 6 could be rapidly and selectively depolymerized to ε-caprolactam under these hydrothermal conditions. Nylon 12 was also treated in near-critical and supercritical water. As a result, it was shown that nylon 12 could be almost completely depolymerized to lighter molecular-weight materials including the monomers. In near future the detailed information about molecular-weight distributions formed during the reaction will be clarifi ed.
1. Introduction
The plastic use traces the wholeheartedness of diversifi cation and increase, and the problem of the treatment of the waste plastic has become also serious. The request for recycling waste plastic has heightened, for instance, the regulation regarding container packaging renewable resources has carried out since 1997 and the development of the processing technology of waste plastic, especially of the chemical recycling technology suitable for environmental preservation, has been expected. The chemical recycling is a method for recovering resource from the waste plastic by chemical transformation, and it is possible to classify into thermal decomposition, depolymerization (monomer) and partial oxidation (gasifi cation) from the viewpoint of the reaction. Although any technology has been already utilized practically, the development of a new method has been required because there are some problems of corrosion of the equipment by using strong acids and the increase in the equipment cost due to slow reaction rate.
Hydrothermal reaction has been recently focused on as one of useful reaction fi elds for chemical recycling as well as waste resource recovery by the use of the peculiar and excellent characteristic of water near the critical point (critical temperatures: 647.4 K; critical pressure: 22.1 MPa). It is comparatively easy to depolymerize the condensation polymerization polymers to their monomers via hydrolysis of the plastics. It is well known that condensation polymerization polymers with ether linkages, ester bonds and acid amide combinations can be easily converted to their monomers in supercritical water or supercritical alcohol by solvolysis such as hydrolysis and methanolysis. Poly(ethylene terephthalate) (PET) is the plastic among the condensation polymerization polymers that the research for chemical recycling has been advanced on, and the reaction features of PET in supercritical water [1, 2] or in supercritical methanol [3-5] have been already
ISFR - 2005264
reported. Recently, Genta et al. [6] reported the detailed data on the rate of monomer formation and reaction mechanism of PET with supercritical methanol, and found that the method has a superiority that a short treatment time as well as a remarkable reduction of the amount of impurity compared with those of conventional steam method and thermal decomposition method can be realized.
On the other hand, nylon is the polymer which has acid amide linkages. For example, nylon-6 is synthesized through the ring-opening polymerization of ε-caprolactam, and is widely profi table as clothing, industrial fi ber and packaging fi lm, etc. Nylon-6 can be hydrolyzed under the hydrothermal condition including the supercritical region of water and it can be expected that ε-aminocaproic acid and its cyclodehydration product „ε-caprolactam” might be recovered quantitatively. Sato et al. [7] found that hydrolysis of nylon-6 in supercritical water at 20 MPa, 653 K and 10 min using a batch-type reactor resulted in the high yield of ε-caprolactam of 86 %. They also succeeded that about 60 % of nylon-6 could be depolymerized to its monomer „ε-caprolactam” by the treatment at 658 K for 15 - 20 min with a fl ow-type reactor. In this paper, results of experiments of nylon-6 [8] and nylon-12 at various operating conditions with a batch-type reactor under the hydrothermal conditions are shown in order to know effects of operating conditions. The reaction mechanisms for the nylons are also discussed based on the experimental data obtained in this study.
2. Experimental and analytical methods
2.1. Experimental section
In this study, the batch-type reactor (AKICO Co., Ltd., internal volume: 5.0 mL) which made of SUS316 was used. An electric furnace (AKICO, Co., Ltd.) with a function of shaking was employed in order to heat the reactor and keep it at constant reaction temperatures during the reaction. Nylon-6 (Sigma Aldrich Co.) and nylon-12 (Ube Industries, Ltd.) were used as raw materials.
At fi rst, raw material of about 0.1 g was loaded and an amount of degas water which was calculated using WaterTM v.3.3 (Summit Research Co., USA) was enclosed so that a desired pressure can be attained. It was then installed into the electric furnace which preheated to a reaction temperature (573 - 673 K), and reacted for fi xed times (5 - 60 min). Afterwards, the reactor was cooled rapidly by introducing cold water into it to terminate further reactions. After cooling, contents of the reactor were collected.
2.2. Analytical procedure
The fi nal concentration of 0.2 wt% of the reaction solution was controlled by adding degas water and then fi ltrate it. The fi ltrate was analyzed by high performance liquid
Pyrolysis / Solvolysis 265
chromatography (HPLC) to identify the components and quantify their concentrations. In the HPLC analysis, Asahipak ODP column (length: 150 mm) was used at 30 oC and a fl ow rate of 0.5 mL min-1 of the mobile phase (0.1 % acetic acid solution/acetnitrile = 9/1) under the analyzing system of JASCO-Borwin (JASCO Co., Ltd., Japan). The detectors used were a photodiode array detector (JASCO Co., Ltd., Model MD-1510) and a differential refractive index detector (JASCO Co., Ltd., Model RI-1530). Gas chromatography – Mass spectroscopy (GC-MS; Hewlett-Packard, Model Chemstation Vectra) was also used. The yield of ε- aminocaproic acid and ε- caprolactam was calculated by the following equation.
( ) 100% ×=nylonuntreatedinmolesUnit
componentmonomereachofMolesmolYield
3. Results and Discussion
Nylon-6 was reacted at various temperatures, pressures, and reaction times. In the case that nylon-6 was reacted under the hydrothermal condition (at 573 K for 5 – 30 min, or at 603 and 633 K for 5 – 10 min), all products were formed in two phases, a colorless clear liquid phase and a white solid phase. It can be considered from the HPLC analysis that the white solid portion is unreacted nylon-6 or high molecular-weight oligomers. For extended reaction times at these subcritical temperatures, the product solution was colorless clear liquid and unreacted nylon-6 or high molecular-weight oligomers did not exist. This result shows that the depolymerization of nylon-6 or its oligomers take time to form monomers (ε-caprolactam and ε-aminocaproic acid). On the contrary, the solid residue was hardly recovered at all the reaction times (5 - 60 min) at 673 K because of rapid hydrolysis at this condition.
From these results, it was shown that the depolymerization of nylon-6 could rapidly progress in water near and above the critical point. Also, it became clear that the effective conversion of nylon-6 into water-soluble oligomers and monomers was possible by controlling the reaction time even under hydrothermal conditions, which are an atmosphere lower than the critical temperature and critical pressure of water. Fig. 1(a) and 1(b) show typical results of variation of ε-caprolactam yield, ε-aminocaproic acid yield, and combined yield of the two at 573 and 603 K, respectively. The experimental result shows that the yields of ε-caprolactam and ε-aminocaproic acid were almost equivalent in short reaction times, but the yield of the ε-aminocaproic acid rapidly decreased with reaction time and fi nally reached to zero, although the yield of ε-caprolactam maintained constant. From this, it can be guessed that ε-aminocaproic acid is dehydrated and cyclized during the reaction to form ε-caprolactam and/or it is decomposed further to lower molecular-weight substances.
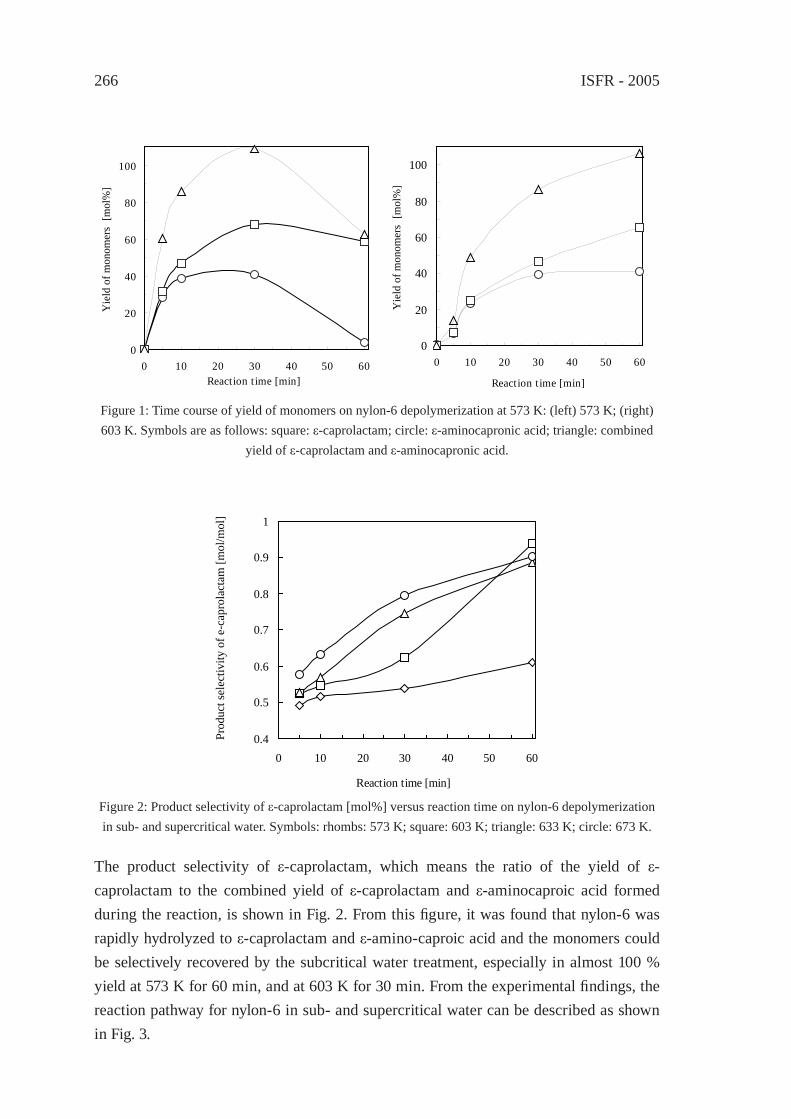
ISFR - 2005266
0
20
40
60
80
100
0 10 20 30 40 50 60
Reaction time [min]Y
ield
of m
onom
ers
[mol
%]
0
20
40
60
80
100
0 10 20 30 40 50 60Reaction time [min]
Yie
ld o
f mon
omer
s [m
ol%
]
Figure 1: Time course of yield of monomers on nylon-6 depolymerization at 573 K: (left) 573 K; (right) 603 K. Symbols are as follows: square: ε-caprolactam; circle: ε-aminocapronic acid; triangle: combined
yield of ε-caprolactam and ε-aminocapronic acid.
0.4
0.5
0.6
0.7
0.8
0.9
1
0 10 20 30 40 50 60
Reaction time [min]
Prod
uct s
elec
tivity
of e
-cap
rola
ctam
[mol
/mol
]
Figure 2: Product selectivity of ε-caprolactam [mol%] versus reaction time on nylon-6 depolymerization in sub- and supercritical water. Symbols: rhombs: 573 K; square: 603 K; triangle: 633 K; circle: 673 K.
The product selectivity of ε-caprolactam, which means the ratio of the yield of ε-caprolactam to the combined yield of ε-caprolactam and ε-aminocaproic acid formed during the reaction, is shown in Fig. 2. From this fi gure, it was found that nylon-6 was rapidly hydrolyzed to ε-caprolactam and ε-amino-caproic acid and the monomers could be selectively recovered by the subcritical water treatment, especially in almost 100 % yield at 573 K for 60 min, and at 603 K for 30 min. From the experimental fi ndings, the reaction pathway for nylon-6 in sub- and supercritical water can be described as shown in Fig. 3.
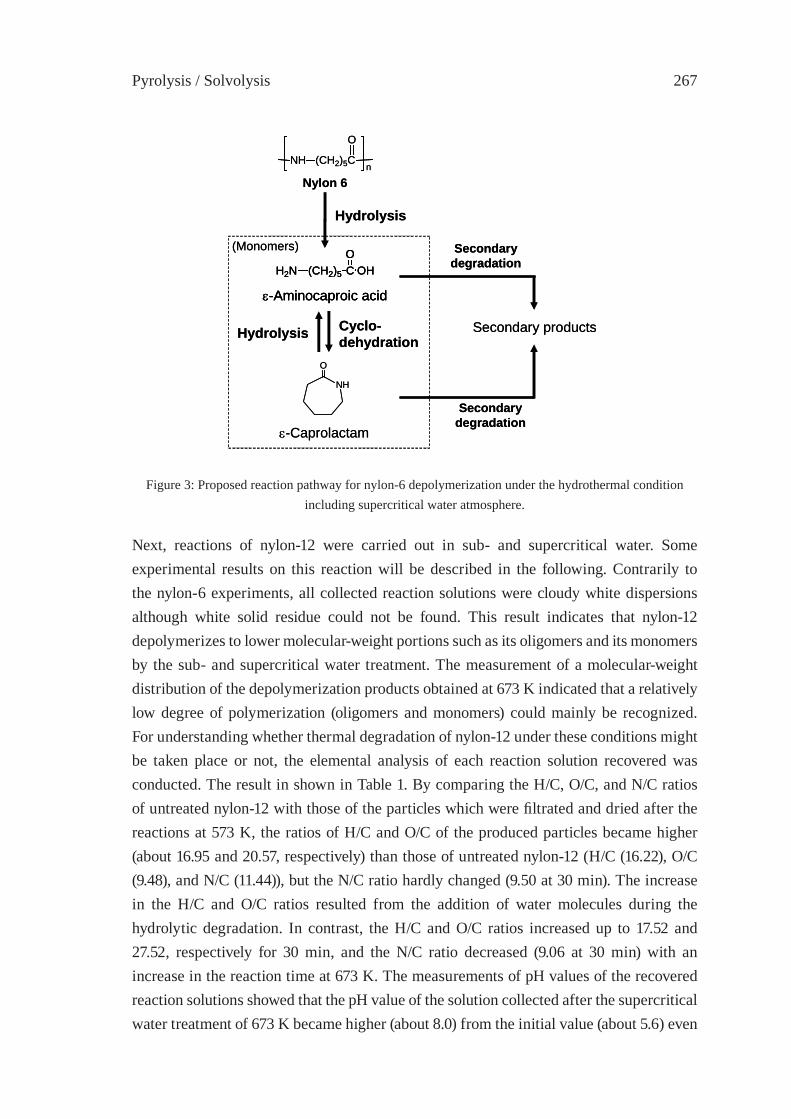
Pyrolysis / Solvolysis 267
Next, reactions of nylon-12 were carried out in sub- and supercritical water. Some experimental results on this reaction will be described in the following. Contrarily to the nylon-6 experiments, all collected reaction solutions were cloudy white dispersions although white solid residue could not be found. This result indicates that nylon-12 depolymerizes to lower molecular-weight portions such as its oligomers and its monomers by the sub- and supercritical water treatment. The measurement of a molecular-weight distribution of the depolymerization products obtained at 673 K indicated that a relatively low degree of polymerization (oligomers and monomers) could mainly be recognized. For understanding whether thermal degradation of nylon-12 under these conditions might be taken place or not, the elemental analysis of each reaction solution recovered was conducted. The result in shown in Table 1. By comparing the H/C, O/C, and N/C ratios of untreated nylon-12 with those of the particles which were fi ltrated and dried after the reactions at 573 K, the ratios of H/C and O/C of the produced particles became higher (about 16.95 and 20.57, respectively) than those of untreated nylon-12 (H/C (16.22), O/C (9.48), and N/C (11.44)), but the N/C ratio hardly changed (9.50 at 30 min). The increase in the H/C and O/C ratios resulted from the addition of water molecules during the hydrolytic degradation. In contrast, the H/C and O/C ratios increased up to 17.52 and 27.52, respectively for 30 min, and the N/C ratio decreased (9.06 at 30 min) with an increase in the reaction time at 673 K. The measurements of pH values of the recovered reaction solutions showed that the pH value of the solution collected after the supercritical water treatment of 673 K became higher (about 8.0) from the initial value (about 5.6) even
Figure 3: Proposed reaction pathway for nylon-6 depolymerization under the hydrothermal condition including supercritical water atmosphere.
Hydrolysis
Hydrolysis Cyclo-dehydration
NH (CH2)5C
O
n
NH
O
Nylon 6
H2N (CH2)5 C OHO
ε-Aminocaproic acid
ε-Caprolactam
Secondarydegradation
Secondary products
Secondarydegradation
(Monomers)
Hydrolysis
Hydrolysis Cyclo-dehydration
NH (CH2)5C
O
n
NH
O
Nylon 6
H2N (CH2)5 C OHO
ε-Aminocaproic acid
H2N (CH2)5 C OHO
ε-Aminocaproic acid
ε-Caprolactam
Secondarydegradation
Secondary products
Secondarydegradation
(Monomers)
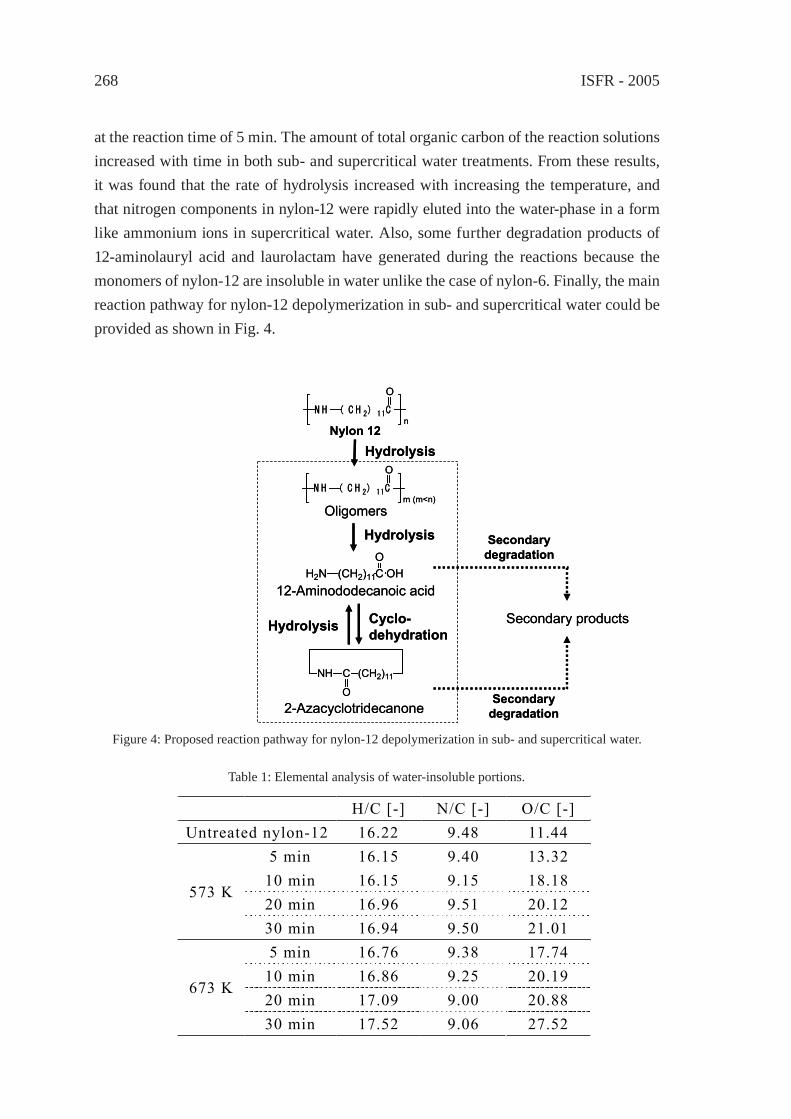
ISFR - 2005268
at the reaction time of 5 min. The amount of total organic carbon of the reaction solutions increased with time in both sub- and supercritical water treatments. From these results, it was found that the rate of hydrolysis increased with increasing the temperature, and that nitrogen components in nylon-12 were rapidly eluted into the water-phase in a form like ammonium ions in supercritical water. Also, some further degradation products of 12-aminolauryl acid and laurolactam have generated during the reactions because the monomers of nylon-12 are insoluble in water unlike the case of nylon-6. Finally, the main reaction pathway for nylon-12 depolymerization in sub- and supercritical water could be provided as shown in Fig. 4.
Figure 4: Proposed reaction pathway for nylon-12 depolymerization in sub- and supercritical water.
Hydrolysis
Hydrolysis Cyclo-dehydration
Nylon 12
12-Aminododecanoic acid
2-Azacyclotridecanone
Secondarydegradation
Secondary products
Secondarydegradation
N H ( C H 2) 11C
O
n
H2N (CH2)11C OHO
NH C
O
(CH2)11
Oligomers
N H ( C H 2) 11C
O
m (m<n)
Hydrolysis
Hydrolysis
Hydrolysis Cyclo-dehydration
Nylon 12
12-Aminododecanoic acid
2-Azacyclotridecanone
Secondarydegradation
Secondary products
Secondarydegradation
N H ( C H 2) 11C
O
n
H2N (CH2)11C OHO
NH C
O
(CH2)11
Oligomers
N H ( C H 2) 11C
O
m (m<n)
Hydrolysis
Table 1: Elemental analysis of water-insoluble portions.
H/C [-] N/C [-] O/C [-] Untreated nylon-12 16.22 9.48 11.44
5 min 16.15 9.40 13.32 10 min 16.15 9.15 18.18 20 min 16.96 9.51 20.12
573 K
30 min 16.94 9.50 21.01 5 min 16.76 9.38 17.74
10 min 16.86 9.25 20.19 20 min 17.09 9.00 20.88
673 K
30 min 17.52 9.06 27.52
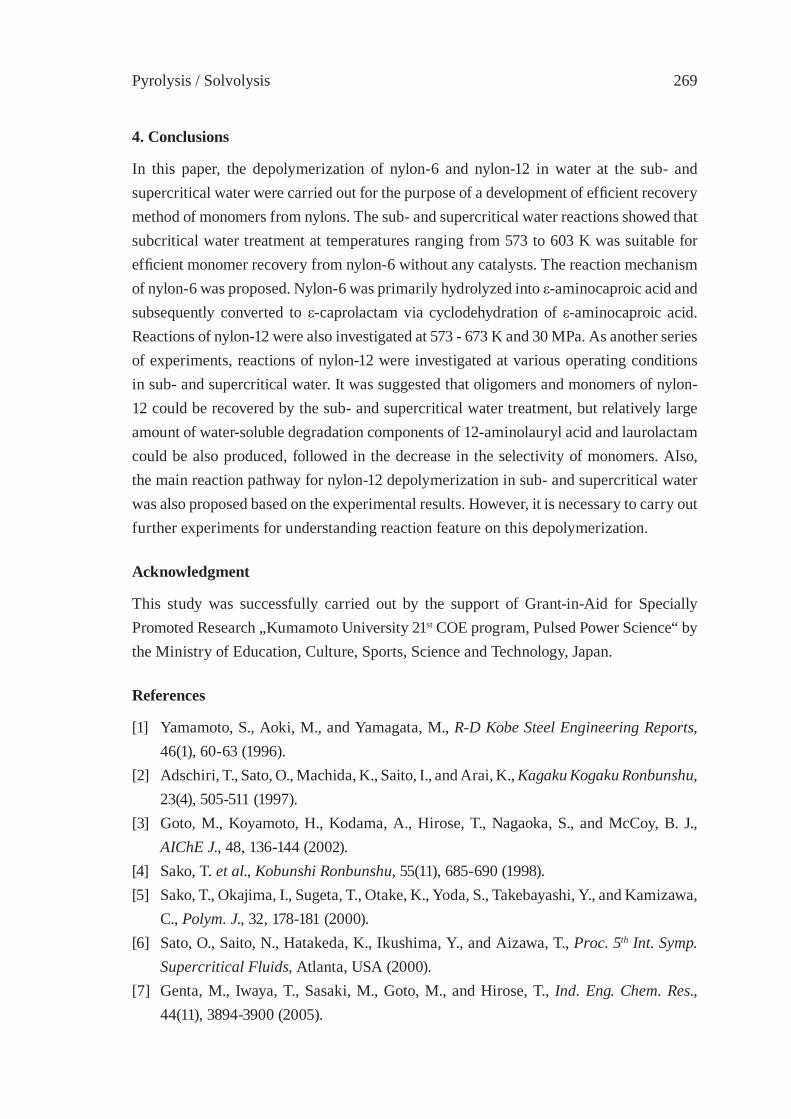
Pyrolysis / Solvolysis 269
4. Conclusions
In this paper, the depolymerization of nylon-6 and nylon-12 in water at the sub- and supercritical water were carried out for the purpose of a development of effi cient recovery method of monomers from nylons. The sub- and supercritical water reactions showed that subcritical water treatment at temperatures ranging from 573 to 603 K was suitable for effi cient monomer recovery from nylon-6 without any catalysts. The reaction mechanism of nylon-6 was proposed. Nylon-6 was primarily hydrolyzed into ε-aminocaproic acid and subsequently converted to ε-caprolactam via cyclodehydration of ε-aminocaproic acid. Reactions of nylon-12 were also investigated at 573 - 673 K and 30 MPa. As another series of experiments, reactions of nylon-12 were investigated at various operating conditions in sub- and supercritical water. It was suggested that oligomers and monomers of nylon-12 could be recovered by the sub- and supercritical water treatment, but relatively large amount of water-soluble degradation components of 12-aminolauryl acid and laurolactam could be also produced, followed in the decrease in the selectivity of monomers. Also, the main reaction pathway for nylon-12 depolymerization in sub- and supercritical water was also proposed based on the experimental results. However, it is necessary to carry out further experiments for understanding reaction feature on this depolymerization.
Acknowledgment
This study was successfully carried out by the support of Grant-in-Aid for Specially Promoted Research „Kumamoto University 21st COE program, Pulsed Power Science“ by the Ministry of Education, Culture, Sports, Science and Technology, Japan.
References
[1] Yamamoto, S., Aoki, M., and Yamagata, M., R-D Kobe Steel Engineering Reports, 46(1), 60-63 (1996).
[2] Adschiri, T., Sato, O., Machida, K., Saito, I., and Arai, K., Kagaku Kogaku Ronbunshu, 23(4), 505-511 (1997).
[3] Goto, M., Koyamoto, H., Kodama, A., Hirose, T., Nagaoka, S., and McCoy, B. J., AIChE J., 48, 136-144 (2002).
[4] Sako, T. et al., Kobunshi Ronbunshu, 55(11), 685-690 (1998).[5] Sako, T., Okajima, I., Sugeta, T., Otake, K., Yoda, S., Takebayashi, Y., and Kamizawa,
C., Polym. J., 32, 178-181 (2000).[6] Sato, O., Saito, N., Hatakeda, K., Ikushima, Y., and Aizawa, T., Proc. 5th Int. Symp.
Supercritical Fluids, Atlanta, USA (2000).[7] Genta, M., Iwaya, T., Sasaki, M., Goto, M., and Hirose, T., Ind. Eng. Chem. Res.,
44(11), 3894-3900 (2005).

ISFR - 2005270
[8] Goto, M., Umeda, M., Kodama, A., Hirose, T., and Nagaoka, S., Kobunshi Ronbunshu, 58(10), 548-551 (2001).
Pyrolysis / Solvolysis 271
CHEMICAL RECYCLING OF NYLONS BY OXIDATIVE DEGRADATION WITH NITROGEN DIOXIDE IN
SUPERCRITICAL CARBON DIOXIDEN. Yanagihara1, N. Abe1, H. Takama1 and M. Yoshida2
1Dept. of Biosciences, Teikyo University, Utsunomiya, Japan2Dept. of Appl. Chemistry, Utsunomiya University, Utsunomiya, Japan
Abstract: From the standpoint of low cost, moderate critical conditions and environmentally benign nature, applying supercritical carbon dioxide (scCO2) as a reaction medium, and choosing NO2 as an oxidant, 7 typical nylons (nylon-6; -11; -12; -4,6; -6,6; -6,9 and -6,12) were aimed to oxidatively degrade in order to obtain valuable chemical resources. Any of the different types of nylons used in this study was successfully decomposed with NO2 in scCO2 under relatively mild conditions (140 °C, 1 h, and 11 MPa), and aliphatic α, ω-diacids such as succinic, glutaric and adipic acids were obtained in good yields.
1. Introduction
Supercritical Fluids (SCF), and supercritical CO2 (scCO2) in particular, have recently attracted much attention as the fourth phase for performing chemical processes besides gas, liquid and solid phases. They present unusual media for chemical reactions, based on their unique physico-chemical characteristics, such as miscibility with other gases, high mixing rates and relatively weak molecular association [1]. Among the SCFs, scCO2 seems to be most attractive as a reaction medium, because of the low critical temperature (304 K) and pressure (7.4 MPa), as well as the non-toxic and non-fl ammable nature and low cost. Furthermore, CO2 separation form the reaction mixture is energy-effi cient and the product is directly obtained by simple pressure reduction. Thus, scCO2 shows promise as an environmentally acceptable solvent for a wide range of chemical, analytical, and materials processes including extraction and materials processing [2], SCF chromatography [3], polymerization [4], catalytic reactions [5], etc.
On the other hand, although the landfi ll space is limited, the production of polymeric materials keeps rising every year in the world. It becomes increasingly important to develop new techniques for reducing the amount of material lost to the landfi ll [6]. In general, recycling techniques would be classifi ed to three categories; namely, thermal recycling, material recycling and chemical recycling. Although chemical recycling might be defi ned as the breakdown of polymeric waste into materials that are reusable as fuel or chemical, the difference in defi nition between material recycling and chemical recycling is something ambiguous, and it seems that chemical recycling has not been paid much attention. Moreover, it should be mentioned that almost all chemical recycling being done
ISFR - 2005272
today focuses on the use of olefi nic addition polymers.
Of the ca. 14 million tons of plastic materials produced in Japan in 2004, 70% were addition polymers and the rest constituted of condensation polymers. In the meantime, ca. 10 million tons of plastics are wasted every year, in which the effective rate of utilization is about 55%. In addition, the percentages occupied by each recycling processings are: 67% thermal recycling, 28% material recycling and 5% chemical recycling, respectively. Among plastics, polyamides represent only 2% in the total production of plastics in Japan in 2004, and the production of nylons is even smaller. However, consumption of nylons is to be expected to increase, since they are known to be typical engineering plastics, which are strong, stiff, abrasion-resistant and also solvent-resistant materials.
In particular, because of nylons’ own outstanding mechanical and chemical properties, some drastic conditions are required in order to chemically treat these polymers. Monomerizations of nylon-6 [7] and nylon-6,6 [8] have been done in sub- and/or supercritical water. Pifer and Sen have reported an oxidative degradation of nylon-6,6 by a mixture of NO and O2 [9]. Here we describe a new oxidative degradation procedure that can convert nylons into valuable organic compounds, applying aforementioned scCO2 as a reaction medium combined together with NO2 as an oxidant.
2. Experimental
2.1. Materials and Measurements
Nylons (3-5 mm pellet) were purchased form Aldrich Chemical Co., and used as received. All other reagents were obtained form Wako Pure Chemical Industries Ltd., and were used without further purifi cation. Analytical GLC was performed on a Shimadzu GC-16A instrument equipped with a fl ame ionization detector. 1H-NMR spectra were recorded on a Varian Unity INOVA-400 (400 MHz) spectrometer. GC-MS analyses were carried out at the Research and Development Department, Fujikura Kasei Co. Ltd., and were taken with a Shimadzu GCMS-QP5050A spectrometer system.
2.2. General Procedure
All the reactions were conducted batchwise in a 50 cm3 high-pressure stainless steel reactor with a magnetic stirrer. Ca. 0.5 g of polymer sample was placed into the reactor, and the reactor was purged fi rstly with a small amount of liquid CO2 to avoid the direct contact of the sample with neat NO2. Then, a certain amount of liquid NO2 was charged, and liquid CO2 was again introduced into the reactor. In each step at the introduction of NO2 and CO2, it was necessary to record their amount by weighing the whole reactor so that a reaction pressure was controlled by those total amounts, since the fi nal total pressure of the reactor at a certain temperature would be predicted based on the preliminary obtained
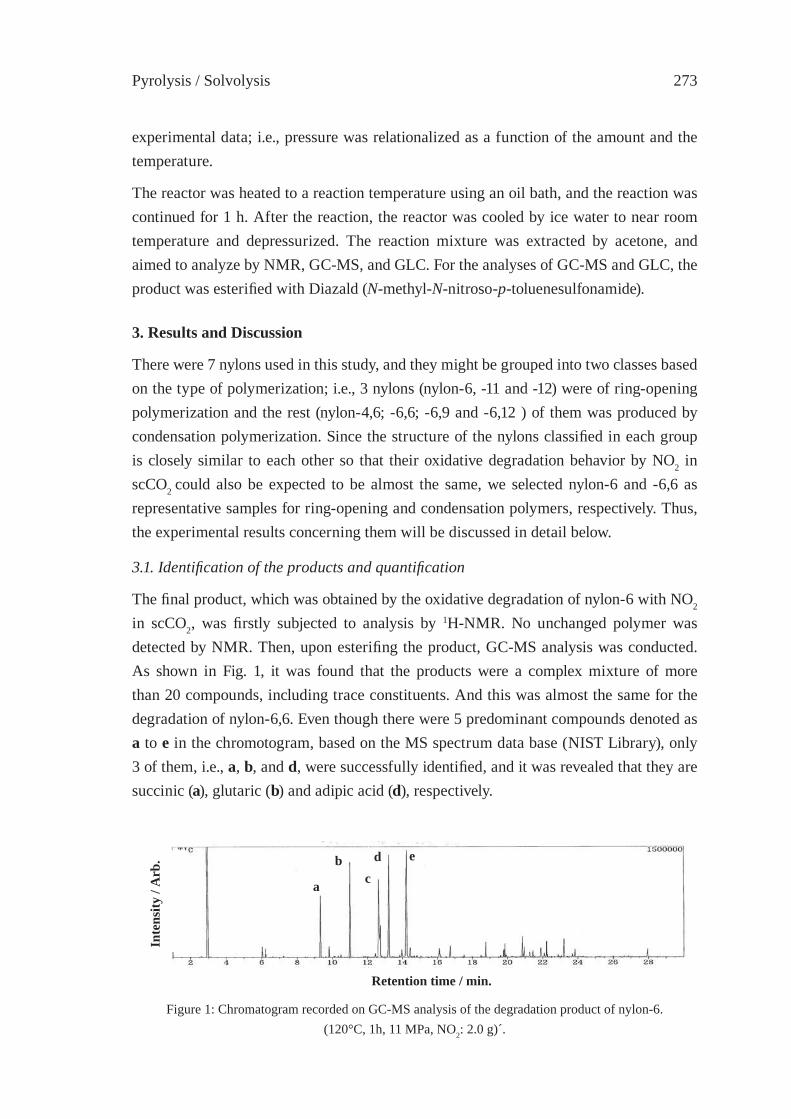
Pyrolysis / Solvolysis 273
experimental data; i.e., pressure was relationalized as a function of the amount and the temperature.
The reactor was heated to a reaction temperature using an oil bath, and the reaction was continued for 1 h. After the reaction, the reactor was cooled by ice water to near room temperature and depressurized. The reaction mixture was extracted by acetone, and aimed to analyze by NMR, GC-MS, and GLC. For the analyses of GC-MS and GLC, the product was esterifi ed with Diazald (N-methyl-N-nitroso-p-toluenesulfonamide).
3. Results and Discussion
There were 7 nylons used in this study, and they might be grouped into two classes based on the type of polymerization; i.e., 3 nylons (nylon-6, -11 and -12) were of ring-opening polymerization and the rest (nylon-4,6; -6,6; -6,9 and -6,12 ) of them was produced by condensation polymerization. Since the structure of the nylons classifi ed in each group is closely similar to each other so that their oxidative degradation behavior by NO2 in scCO2 could also be expected to be almost the same, we selected nylon-6 and -6,6 as representative samples for ring-opening and condensation polymers, respectively. Thus, the experimental results concerning them will be discussed in detail below.
3.1. Identifi cation of the products and quantifi cation
The fi nal product, which was obtained by the oxidative degradation of nylon-6 with NO2 in scCO2, was fi rstly subjected to analysis by 1H-NMR. No unchanged polymer was detected by NMR. Then, upon esterifi ng the product, GC-MS analysis was conducted. As shown in Fig. 1, it was found that the products were a complex mixture of more than 20 compounds, including trace constituents. And this was almost the same for the degradation of nylon-6,6. Even though there were 5 predominant compounds denoted as a to e in the chromotogram, based on the MS spectrum data base (NIST Library), only 3 of them, i.e., a, b, and d, were successfully identifi ed, and it was revealed that they are succinic (a), glutaric (b) and adipic acid (d), respectively.
Figure 1: Chromatogram recorded on GC-MS analysis of the degradation product of nylon-6. (120°C, 1h, 11 MPa, NO2: 2.0 g)´.
Retention time / min.
Inte
nsity
/ A
rb.
a
b c
d e

ISFR - 2005274
While all of the products were not completely identifi ed, we focused our attention on the predominant products, specifi cally on the aliphatic α, ω-diacids, and attempted to verify various effects on the yield of them, varying the experimental conditions such as reaction temperature, time, pressure and quantity of NO2. In the course of the quantitative analyses of the products, we defi ned the yield of each α, ω-diacids as follows.
Figure 2: MS spectra: (A) MS spectra of d recorded on the chromoatogram of GC-MS analysis of the degradation product of nylon-6; (B) MS spectra of data base of adipic acid.
Inte
nsity
/ A
rb.
m/z / u
(A)
(B)
yield(%) of each α,ω − diacid =observedamountin mole
theoretical amountin molex 100
In the above equation, in the case the nylons prepared by condensation polymerization, it was proposed that twice the moles of diacids will be theoretically obtained from the initial amount in moles of polymeric repeat unit, since it is probably reasonable to consider that α, ω-diacids might be originated from both units of diamine and dicarboxylic acid moieties. On the other hand, mole ratio of 1:1 between the theoretical amount and the observed amount was assumed for nylon-6, -11 and -12.
3.2. Effect of experimental factors on the yield of α, ω-diacids
The effect of temperature on the yields has been examined, while reaction time, pressure and amount of NO2 were kept constant. As can be seen in Fig. 3, in both the cases of nylon-6,6 and -6, the total yields of the acids increase with increasing temperature. In the case of nylon-6,6, the amount of adipic acid is almost unchanged over the range of temperature up to 140 °C. On the contrary, for nylon-6, both the amount of glutaric acid and succinic acid increase continuously, as temperature rises.
As shown in Fig.4, elongation of the reaction time leads to the lowering of the total yield of the diacids for both nylon samples. Moreover, for the two samples, it should be emphasized that the amount of adipic acid decreases drastically as the reaction time elongates. However, that of succinic acid increases with progressing the time.

Pyrolysis / Solvolysis 275
0
20
40
60
80
100
1 3 6 12
Succinic Acid
Glutaric Acid
Adipic Acid
Time / h
Yie
ld /
%
0
20
40
60
80
100
1 3 6 12
Succinic Acid
Glutaric Acid
Adipic Acid
Time / h
Yie
ld /
%
0
20
40
60
80
100
60 80 100 120 140
Succinic Acid
Glutaric Acid
Adipic Acid
Temperature / C
Yie
ld /
%
0
20
40
60
80
100
60 80 100 120 140
Succinic Acid
Glutaric Acid
Adipic Acid
Temperature / C
Yie
ld /
%
0
20
40
60
80
100Succinic Acid
Glutaric Acid
Adipic Acid
NO 2 / g0.5 1.0 2.0 3.0 4.0
Yie
ld /
%
0
20
40
60
80
100Succinic Acid
Glutaric Acid
Adipic Acid
0.5 1.0 2.0 3.0 4.0
Yie
ld /
%
NO 2 / g
Figure 4: Effect of time on the yield of α,ω-diacids obtained by the oxidative degradation of nylons. (A) nylon-6,6; (B) nylon-6. (sample: 0.5 g; 140 °C; 10 MPa; NO2: 2.0 g).
Figure 5: Effect of NO2 amount on the yield of α,ω-diacids obtained by the oxidative degradation of nylons. (A) nylon-6,6; (B) nylon-6. (sample: 0.5 g; 1 h; 140 °C; 10 MPa).
Figure 3: Effect of temperature on the yield of α,ω-diacids -diacids obtained by the oxidative degradation of nylons. (A) nylon-6,6; (B) nylon-6. (sample: 0.5 g; 1 h; 10 MPa; NO2: 2.0 g).
(A) (B)
(A) (B)
(A) (B)
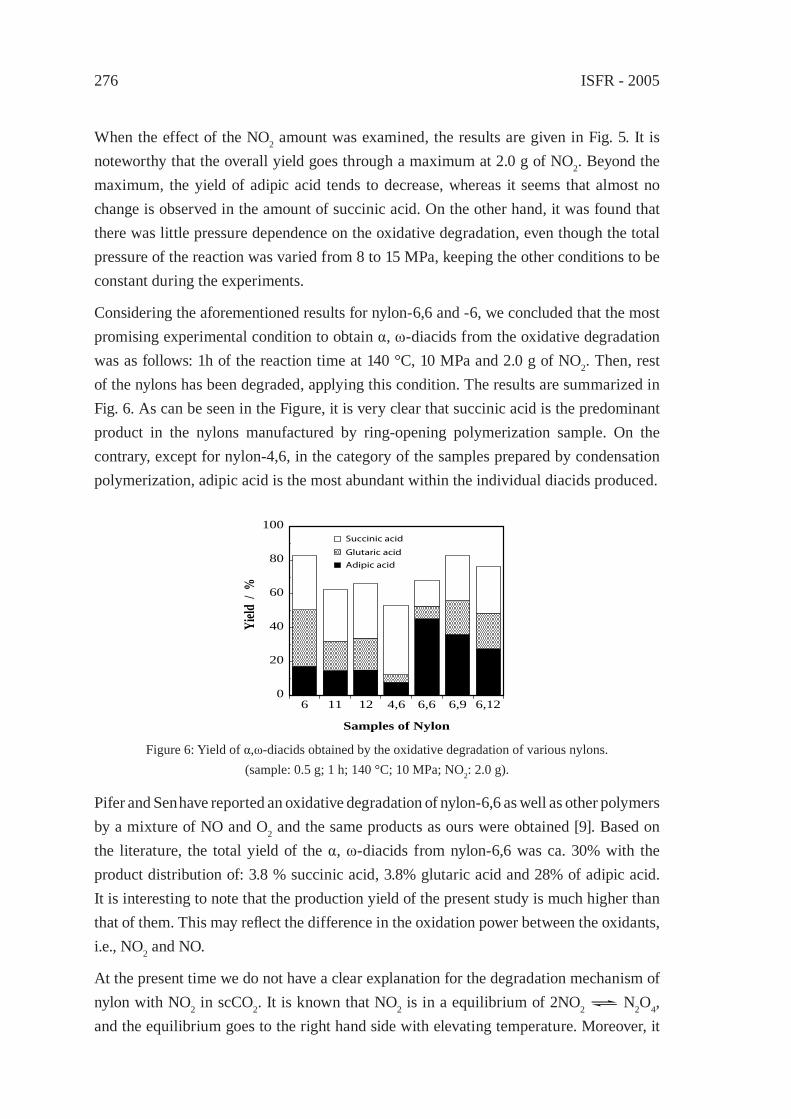
ISFR - 2005276
When the effect of the NO2 amount was examined, the results are given in Fig. 5. It is noteworthy that the overall yield goes through a maximum at 2.0 g of NO2. Beyond the maximum, the yield of adipic acid tends to decrease, whereas it seems that almost no change is observed in the amount of succinic acid. On the other hand, it was found that there was little pressure dependence on the oxidative degradation, even though the total pressure of the reaction was varied from 8 to 15 MPa, keeping the other conditions to be constant during the experiments.
Considering the aforementioned results for nylon-6,6 and -6, we concluded that the most promising experimental condition to obtain α, ω-diacids from the oxidative degradation was as follows: 1h of the reaction time at 140 °C, 10 MPa and 2.0 g of NO2. Then, rest of the nylons has been degraded, applying this condition. The results are summarized in Fig. 6. As can be seen in the Figure, it is very clear that succinic acid is the predominant product in the nylons manufactured by ring-opening polymerization sample. On the contrary, except for nylon-4,6, in the category of the samples prepared by condensation polymerization, adipic acid is the most abundant within the individual diacids produced.
Figure 6: Yield of α,ω-diacids obtained by the oxidative degradation of various nylons.(sample: 0.5 g; 1 h; 140 °C; 10 MPa; NO2: 2.0 g).
0
20
40
60
80
100
6 11 12 4,6 6,6 6,9 6,12
�
�
�
Succinic acid
Glutaric acidAdipic acid
Samples of Nylon
Yield
/ %
Pifer and Sen have reported an oxidative degradation of nylon-6,6 as well as other polymers by a mixture of NO and O2 and the same products as ours were obtained [9]. Based on the literature, the total yield of the α, ω-diacids from nylon-6,6 was ca. 30% with the product distribution of: 3.8 % succinic acid, 3.8% glutaric acid and 28% of adipic acid. It is interesting to note that the production yield of the present study is much higher than that of them. This may refl ect the difference in the oxidation power between the oxidants, i.e., NO2 and NO.
At the present time we do not have a clear explanation for the degradation mechanism of nylon with NO2 in scCO2. It is known that NO2 is in a equilibrium of 2NO2 N2O4, and the equilibrium goes to the right hand side with elevating temperature. Moreover, it
Pyrolysis / Solvolysis 277
has been pointed out that N2O4 exhibits characteristic dissociations depending on various conditions [10]: for example, N2O4 NO2
+ + NO2- in the acidic condition; N2O4
NO+ + NO3- in the basic condition; and N2O4 2NO2• by heating. According to the
results of the present study, i.e., with increasing temperature the total yield of α, ω-diacids is increasing, it is quite presumably that radical species of NO2 play an important role in the oxidative degradation of nylons.
When an attempt to react hexamethylenediamine under the standard experimental conditions was made, a vigorous reaction occurred instantaneously. The sample was burned out and no products were left. On the other hand, when adipic acid was subjected to the same reaction conditions, the product mixture consisted of unchanged adipic acid (56% in yield) along with glutaric acid (5%) and succinic acid (8%). And this result was essentially the same for glutaric and succinic acids. Moreover, it is considerably interesting to note that only 93% of succinic acid was recovered when this acid was chosen as the starting authentic sample. Therefore, the following mechanism can be postulated for the good yield of α, ω-diacids formation: fi rstly NO2 radical exclusively attacks the NH moiety of each amide bonds on the polymer chain, and carboxyl radical and alkyl radical are formed instantaneously. These radicals react with O2 or hydroxyl radical subsequently, which originated from NO2 and/or previously formed alkyl radical. Then, loss of carbon dioxide occurs from a carboxyl group followed by further oxidation of the resultant alkyl radical to the lower carboxylic acid. This successive radical oxidation may proceed until succinic acid forms, which should be the lowest and more stable diacid that can be formed under the experimental conditions of the present study. Since diacids such as malonic and oxalic acids, that are lower acids than succinic acid, have never been found in this study, it may be true that those lower acids are unstable and are easily oxidized to carbon dioxide at the last stage.
Taking into account the difference of the number of carbon in the repeat unit of each nylons, together with the above assumption on the degradation mechanism, the production distribution of α, ω-diacids between the different categories of nylons used in the present study is also rationalized. In addition, when the fi nal gas phase products after completion of the degradation of nylon-6,6 were analyzed by GLC, a large amount of N2 was qualitatively recognized together with a trace amount of N2O. It is, therefore, possible that the NO2 is reduced to innocuous N2.
ISFR - 2005278
4. Conclusion
A wide variety of nylons can be oxidatively degraded under mild conditions by NO2 in scCO2, and useful organic compounds such as adipic, glutaric and succinic acids are produced in good yields. This may promise a new route for chemical recycling of nylons.
References
[1] Noyori, R., Chem. Rev. 99:353(1999).[2] McHugh, M. A., and Krukonis, V., Supercritical Fluid Extraction, 2nd ed., Butterworth
Heinemann, Boston, MA, 1994.[3] Bright, F. V., and McNally, M. E. P., Supercritical Fluid Technology, American
Chemical Society, Washington, DC, 1992.[4] Desimone, J. M., Maury, E. E., Menceloglu, Y. Z., McClain, J. B., Romack, T. J., and
Combes, J. R., Science 26:356(1994).[5] Jessop, P. G., Ikariya, T., and Noyori, R., Nature 368:231(1994).[6] Rader, C. P., Baldwin, S. D., Cornell, D. D., Sadler, G. D., and Stockel, R. F., Plastics,
Rubber, and Paper Recycling, American Chemical Society, Washington, DC, 1995.[7] Goto, M., Umeda, M., Kodama, A., Hirose, T., and S. Nagaoka, Kobunnsi Ronbunshu
58:548(2001).[8] Meng, L., Zhang, Y., Huang, Y., Shibata, M., and Yosomiya, R., Polym. Degrad.
Stabil. 83:389(2004).[9] Piefer, A., and Sen, A., Angew. Chem. Int. Ed. 37:3306(1998).[10] Bochman, O. B., and Vogt, C. M., J. Am. Chem. Soc. 80:2987(1958).

Pyrolysis / Solvolysis 279
PYROLYSIS OF POLYESTERS IN THE PRESENCE OF CA(OH)2Guido Grause1*, Toshiaki Yoshioka1, Tomohiko Handa1, Shoichi Otani1, Hiroshi
Inomata2, Tadaaki Mizoguchi1, Akitsugu Okuwaki3
1 Environmental Conservation Research Institute, Tohoku University2 Supercritical Fluid Technology Center, Graduate School of Engineering,
Tohoku University3 Emeritus Professor of the Tohoku University
Aramaki Aza Aoba 07, Aoba-ku Sendai 980-8579, [email protected], Tel, Fax +81-22-217-7213
Abstract: In this work the conversion of polyesters (PET, PBT and PEN) into feedstocks with high aromatic contents was investigated. Ca(OH)2 was found as an appropriate medium for the hydration of the polyesters and the following decarboxylation of the resulting carbonic acids. Also a suggestion for the pathway of the reaction including all main components is given for PBT as an example. Benzene was obtained in yields up to 80 % (PET) and 67 % (PBT) and naphthalene up to 88 % (PEN) relating to the chain forming carbonic acid at a temperature of 700 C. Under these conditions the aliphatic part of the polymer is almost completely oxidised.
1. Introduction
Poly(ethylene terephthate) (PET) is the most used thermoplastic polyester. Used as fi bres, fi lms and bottles it covers about 95 % of all produced polyesters. But it is not the only one. Poly(butylene terephthalate) (PBT) and poly(ethylene naphthalene-2,6-dicarboxylate) (PEN) are also polyesters with a rising consumption. PBT increased from 145 kt in 2001 to 170 kt in 2003 in Western Europe [1]. Due to its fast crystallisation, it is suitable for injection molding [2]. The higher prize of the plastic can be compensated by the faster processing. PEN, however, shows better properties compared with PET in lower gas permeation for oxygen and carbon dioxide. Hence, it is a direct competitor to PET for food applications [3]. Many different methods were already developed for PET for mechanical and feedstock recycling. Hydrolysis [4], methanolysis [5] and glycolysis [6] are well investigated for PET. These methods should also work for PBT [7] or PEN [8], but only few works are published until now. While PEN is used in similar applications as PET [9], PBT is often used in blends accompanied with styrene-acrylonitrile-copolymer (SAN) or acrylonitrile-butadiene-styrene-copolymers (ABS). For these blends the way of solvolysis is diffi cult to realized, due to the fact that SAN and ABS are polymers which are affected just slightly under solvolysis conditions.
But also combustion and pyrolysis can cause problems by releasing organic acids from polyester. These esters usually sublime and cause blocking problems and corrosion, as

ISFR - 2005280
well. In this work we show that the addition of calcium hydroxide to polyester led to a complete decarboxylation of the pyrolysis products and a reduction of the carboneous residue, as well.
2. Experimental
For these experiments grinded PET, PBT and PEN (Teijin) with particle sizes between 150 µm and 300 µm were used. Ca(OH)2 and Ethanol were delivered from Kanto Kagaku.
The experiments were carried out in a quartz tube with a diameter of 20 mm and a length of 440 mm embedded in an electric furnace (Fig. 1). A punched plate covered with glass wool was located in the middle of the reactor forming the bottom of the reaction cell. The sample holder with a helium gas connection was located at the top of the quartz tube. For PET, additional, a steam generator was connected [9]. Liquid products were gathered in a cooling trap cooled with liquid nitrogen and gaseous products in a gas bag.
The experiments were carried out at 700 °C. The volatile products were carried out of the reactor by a 50 ml/min Helium gas stream. After the helium neutralisation the sample, consisting of 150 µg to 250 µg PBT, PEN or 1 g PET, respectively, and different amounts of Ca(OH)2 (molar ratios of Ca(OH)2/polymer: m=0, 1, 3, 5 or 10), was dropped into the reactor over a period of 15 min (PET: 20 min). After a complete reaction time of 30 min the reaction was stopped by opening the furnace and fast cooling of the sample. To ensure that all volatile products were collected in the trap and the gas bag the helium stream was kept for several minutes. After defrosting the cooling trap the liquid products were collected in ethanol.
Figure 1: Pyrolysis apparatus.
He
Ice
Liquid N2
Glass wool
Gas bag
Electric furnace Flow meter
Sample
Sample holder Water
Pyrolysis reactor

Pyrolysis / Solvolysis 281
The composition of the liquid products was determined by GC-MS (HP6890, HP4973, HP-5MS). The quantitative determination of the liquid products was carried out by GC-FID (GL Science GC 390, CP-Sil 24 CB). The gaseous products were analysed by GC-TCD (GL Science 323, Carboplot P7).
3. Results and Discussion
Aim of these experiments was the reduction of residues and carbonic acids, as well, which are usually produced in high amount during the pyrolysis of polyesters. It is known, that calcium salts of carbonic acids tend to decarboxylation. Calcium hydroxide should also increase the velocity of the saponifi cation of polyesters and reduce the residence time of the educt and the products.
Using Ca(OH)2 as an additive during the pyrolysis of polyesters showed, in fact, several positive effects. When polyesters are pyrolysed usually a large amount of residue is formed (PET: 30 wt%, PBT: 52 wt%, PEN: 53 wt%) (Tab.1 and 2). Gases and volatile solid products appear in similar amounts, while liquid products are barely observed. The gas consists mainly of carbon oxides (PET: 32 wt%, PBT: 19 wt%, PEN: 25 wt%), while the solid products show a broad spectrum of different components with poor economic value. Especially organic acids, like benzoic acid in PET (4.2 wt%) and PBT (12 wt%) (terephthalic acid was not quantifi ed) and naphthenic acid in PEN (0.5 wt%) can cause corrosion and blocking problems in recycling facilities.
The addition of Ca(OH)2 changed the product distribution drastically. Carbonic acids were destroyed completely after m=3. Other oxygen containing compounds were reduced signifi cantly. With the exception of acetophenone (PET), 2-methylnaphthylketone (PEN) and tetrahydrofuran (PBT) after m=3 no oxygen containing compounds were found in the fraction of the volatile products. The yield of acetophenone was reduced 20 times and that of 2-methylnaphthylketone 14 times from m=0 to m=10, while the yield of tetrahydrofuran increased. The decarboxylation capability of the Ca(OH)2 led to an increasing yield of aromatic hydrocarbons. Especially benzene and naphthalene were obtained in high yields from PET (88 % benzene), from PBT (67 % benzene) at m=10 and from PEN (80 % naphthalene) at m=5. The yields of other hydrocarbons were almost unaffected. The fact that during the pyrolysis of PEN no benzene was obtained shows also that under this reaction conditions the origin of the aromatics was just the decarboxylation of the terephthalic and the naphthenic acid and no aromatisation reaction from the aliphatic part of the polyester took place.
Besides the reduction of oxygen-containing compounds another source for benzene and naphthalene was the lower formation of residue. Obviously the amount of the residue and the fraction of carbon fi xed in the solid decreased with increasing amounts of Ca(OH)2. It
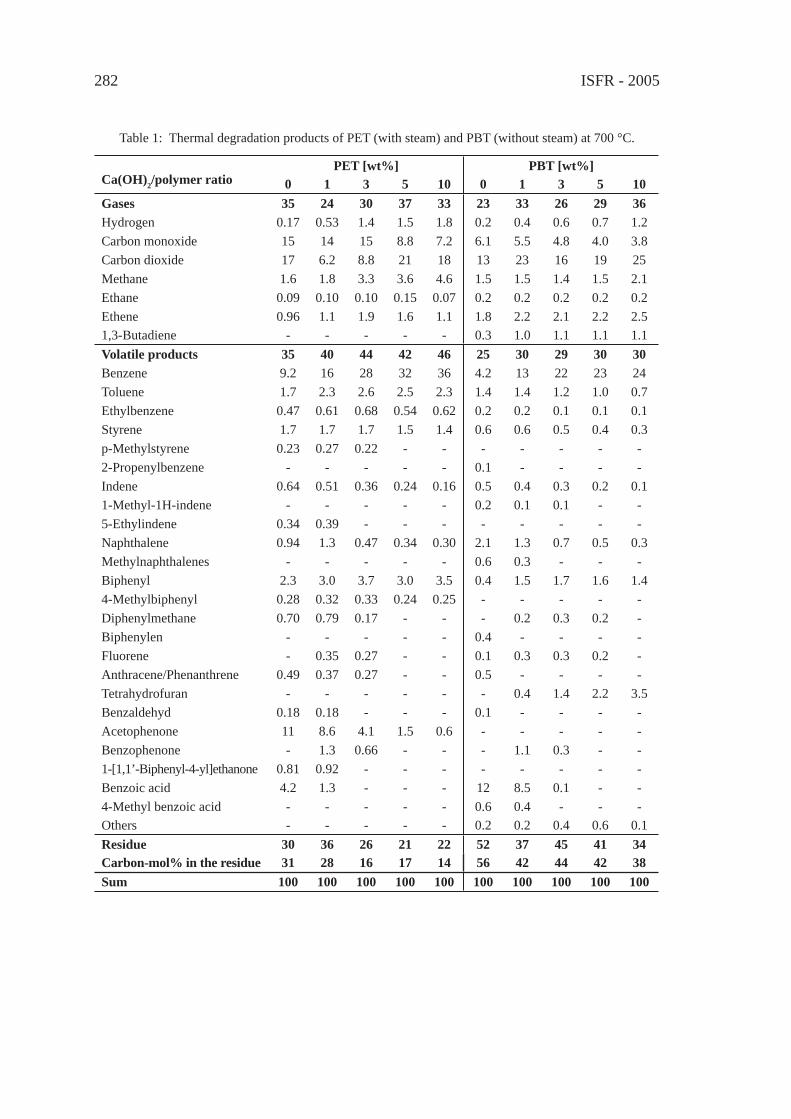
ISFR - 2005282
Table 1: Thermal degradation products of PET (with steam) and PBT (without steam) at 700 °C.
PET [wt%] PBT [wt%]Ca(OH)2/polymer ratio 0 1 3 5 10 0 1 3 5 10Gases 35 24 30 37 33 23 33 26 29 36Hydrogen 0.17 0.53 1.4 1.5 1.8 0.2 0.4 0.6 0.7 1.2Carbon monoxide 15 14 15 8.8 7.2 6.1 5.5 4.8 4.0 3.8Carbon dioxide 17 6.2 8.8 21 18 13 23 16 19 25Methane 1.6 1.8 3.3 3.6 4.6 1.5 1.5 1.4 1.5 2.1Ethane 0.09 0.10 0.10 0.15 0.07 0.2 0.2 0.2 0.2 0.2Ethene 0.96 1.1 1.9 1.6 1.1 1.8 2.2 2.1 2.2 2.51,3-Butadiene - - - - - 0.3 1.0 1.1 1.1 1.1Volatile products 35 40 44 42 46 25 30 29 30 30Benzene 9.2 16 28 32 36 4.2 13 22 23 24Toluene 1.7 2.3 2.6 2.5 2.3 1.4 1.4 1.2 1.0 0.7Ethylbenzene 0.47 0.61 0.68 0.54 0.62 0.2 0.2 0.1 0.1 0.1Styrene 1.7 1.7 1.7 1.5 1.4 0.6 0.6 0.5 0.4 0.3p-Methylstyrene 0.23 0.27 0.22 - - - - - - -2-Propenylbenzene - - - - - 0.1 - - - -Indene 0.64 0.51 0.36 0.24 0.16 0.5 0.4 0.3 0.2 0.11-Methyl-1H-indene - - - - - 0.2 0.1 0.1 - -5-Ethylindene 0.34 0.39 - - - - - - - -Naphthalene 0.94 1.3 0.47 0.34 0.30 2.1 1.3 0.7 0.5 0.3Methylnaphthalenes - - - - - 0.6 0.3 - - -Biphenyl 2.3 3.0 3.7 3.0 3.5 0.4 1.5 1.7 1.6 1.44-Methylbiphenyl 0.28 0.32 0.33 0.24 0.25 - - - - -Diphenylmethane 0.70 0.79 0.17 - - - 0.2 0.3 0.2 -Biphenylen - - - - - 0.4 - - - -Fluorene - 0.35 0.27 - - 0.1 0.3 0.3 0.2 -Anthracene/Phenanthrene 0.49 0.37 0.27 - - 0.5 - - - -Tetrahydrofuran - - - - - - 0.4 1.4 2.2 3.5Benzaldehyd 0.18 0.18 - - - 0.1 - - - -Acetophenone 11 8.6 4.1 1.5 0.6 - - - - -Benzophenone - 1.3 0.66 - - - 1.1 0.3 - -1-[1,1’-Biphenyl-4-yl]ethanone 0.81 0.92 - - - - - - - -Benzoic acid 4.2 1.3 - - - 12 8.5 0.1 - -4-Methyl benzoic acid - - - - - 0.6 0.4 - - -Others - - - - - 0.2 0.2 0.4 0.6 0.1Residue 30 36 26 21 22 52 37 45 41 34Carbon-mol% in the residue 31 28 16 17 14 56 42 44 42 38Sum 100 100 100 100 100 100 100 100 100 100
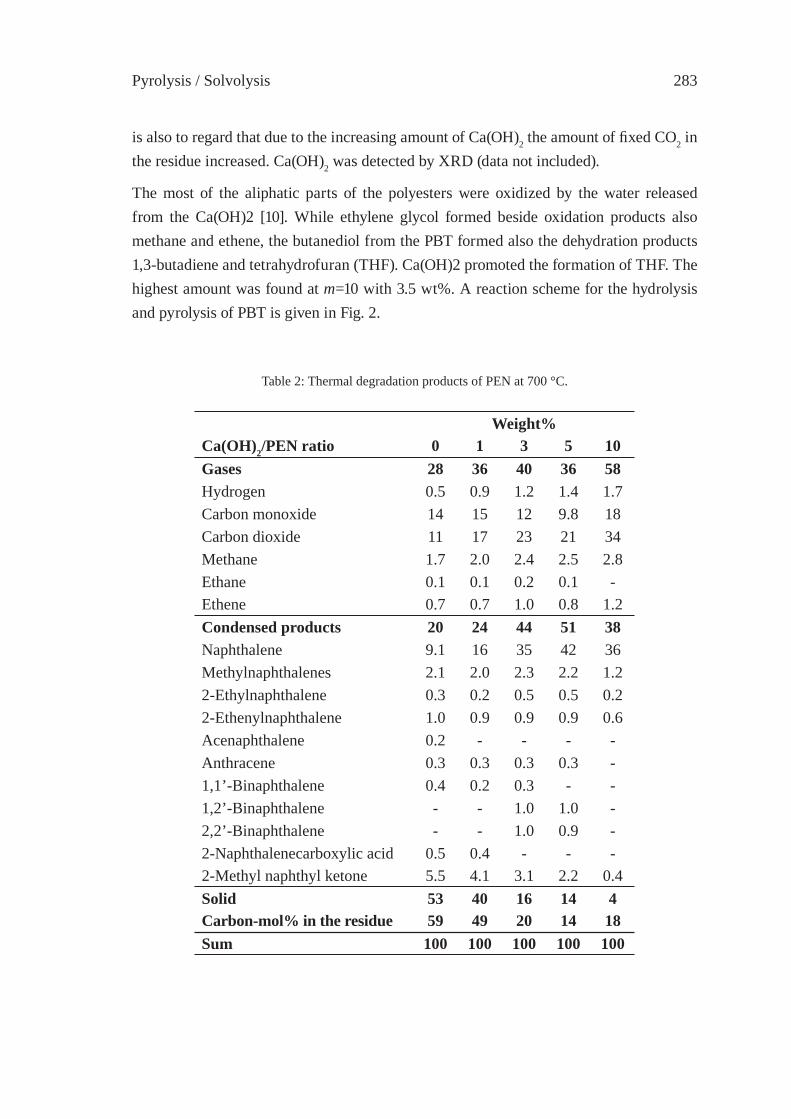
Pyrolysis / Solvolysis 283
is also to regard that due to the increasing amount of Ca(OH)2 the amount of fi xed CO2 in the residue increased. Ca(OH)2 was detected by XRD (data not included).
The most of the aliphatic parts of the polyesters were oxidized by the water released from the Ca(OH)2 [10]. While ethylene glycol formed beside oxidation products also methane and ethene, the butanediol from the PBT formed also the dehydration products 1,3-butadiene and tetrahydrofuran (THF). Ca(OH)2 promoted the formation of THF. The highest amount was found at m=10 with 3.5 wt%. A reaction scheme for the hydrolysis and pyrolysis of PBT is given in Fig. 2.
Table 2: Thermal degradation products of PEN at 700 °C.
Weight%Ca(OH)2/PEN ratio 0 1 3 5 10Gases 28 36 40 36 58Hydrogen 0.5 0.9 1.2 1.4 1.7Carbon monoxide 14 15 12 9.8 18Carbon dioxide 11 17 23 21 34Methane 1.7 2.0 2.4 2.5 2.8Ethane 0.1 0.1 0.2 0.1 -Ethene 0.7 0.7 1.0 0.8 1.2Condensed products 20 24 44 51 38Naphthalene 9.1 16 35 42 36Methylnaphthalenes 2.1 2.0 2.3 2.2 1.22-Ethylnaphthalene 0.3 0.2 0.5 0.5 0.22-Ethenylnaphthalene 1.0 0.9 0.9 0.9 0.6Acenaphthalene 0.2 - - - -Anthracene 0.3 0.3 0.3 0.3 -1,1’-Binaphthalene 0.4 0.2 0.3 - -1,2’-Binaphthalene - - 1.0 1.0 -2,2’-Binaphthalene - - 1.0 0.9 -2-Naphthalenecarboxylic acid 0.5 0.4 - - -2-Methyl naphthyl ketone 5.5 4.1 3.1 2.2 0.4Solid 53 40 16 14 4Carbon-mol% in the residue 59 49 20 14 18Sum 100 100 100 100 100
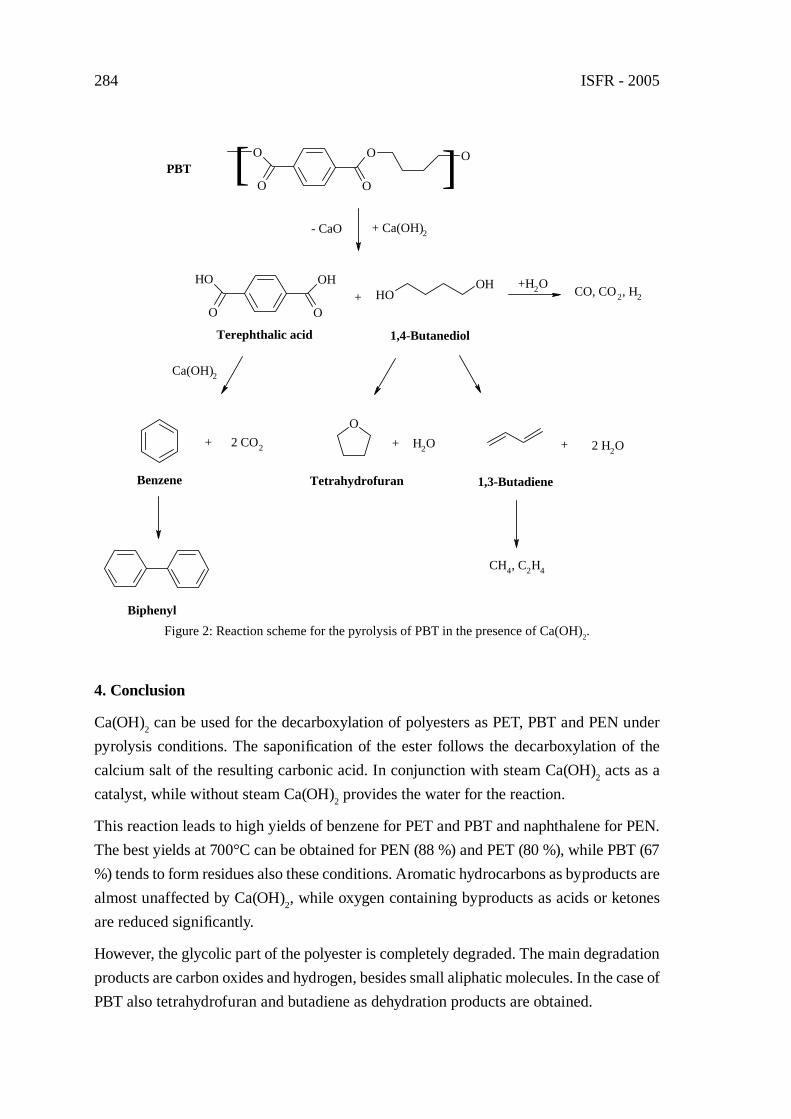
ISFR - 2005284
4. Conclusion
Ca(OH)2 can be used for the decarboxylation of polyesters as PET, PBT and PEN under pyrolysis conditions. The saponifi cation of the ester follows the decarboxylation of the calcium salt of the resulting carbonic acid. In conjunction with steam Ca(OH)2 acts as a catalyst, while without steam Ca(OH)2 provides the water for the reaction.
This reaction leads to high yields of benzene for PET and PBT and naphthalene for PEN. The best yields at 700°C can be obtained for PEN (88 %) and PET (80 %), while PBT (67 %) tends to form residues also these conditions. Aromatic hydrocarbons as byproducts are almost unaffected by Ca(OH)2, while oxygen containing byproducts as acids or ketones are reduced signifi cantly.
However, the glycolic part of the polyester is completely degraded. The main degradation products are carbon oxides and hydrogen, besides small aliphatic molecules. In the case of PBT also tetrahydrofuran and butadiene as dehydration products are obtained.
Figure 2: Reaction scheme for the pyrolysis of PBT in the presence of Ca(OH)2.
O
O
O
O
O
+ Ca(OH)2
OH
O
OH
O+ OH
OH
+ 2 CO2
Ca(OH)2
O+ H2O + 2 H2O
PBT
Terephthalic acid 1,4-Butanediol
Benzene Tetrahydrofuran 1,3-Butadiene
Biphenyl
- CaO
+H2O CO, CO2, H2
CH4, C2H4
[ ]

Pyrolysis / Solvolysis 285
References
[1] Plastic Business Data and Charts (status: 2004-10-04), http://www.vke.de.[2] Gallucci, R.R., Patel, B. R., Modern Polyesters, Wiley, Chichester, 2003, pp. 293-
322.[3] Callander, D. D., Modern Polyesters, Wiley, Chichester, 2003, pp. 323-334.[4] Campanelli, J. R., Kamal, M. R., Cooper, D. G., J.Appl.Polym.Sci., 48:443 (1993).[5] Anon., E. I., du Pont de Nemours and Co., British Pat., 784,248 (1957).[6] Baliga, S., Wong, W. T., J.Polym.Sci.,Part A, Polym.Chem., 27:2071 (1989).[7] Shibata, M., Masuda, T., Yosomiya, R., Ling-Hui, M., J.Polym.Sci.,Part A, Polym.
Chem., 77:3228 (2000).[8] Chun, J.-H., Han, J.-S., Kim, S. H., Journal of Industrial and Engineering Chemistry,
4, 145 (1998).[9] Yoshioka, T., Kitagawa, E., Mizoguchi, T., Okuwaki A., Chemistry Letters 33:282
(2004).[10] Grause, G., Kaminsky, W., Fahrbach, G., Polym. Degrad. Stab. 85:571 (2004).

ISFR - 2005286
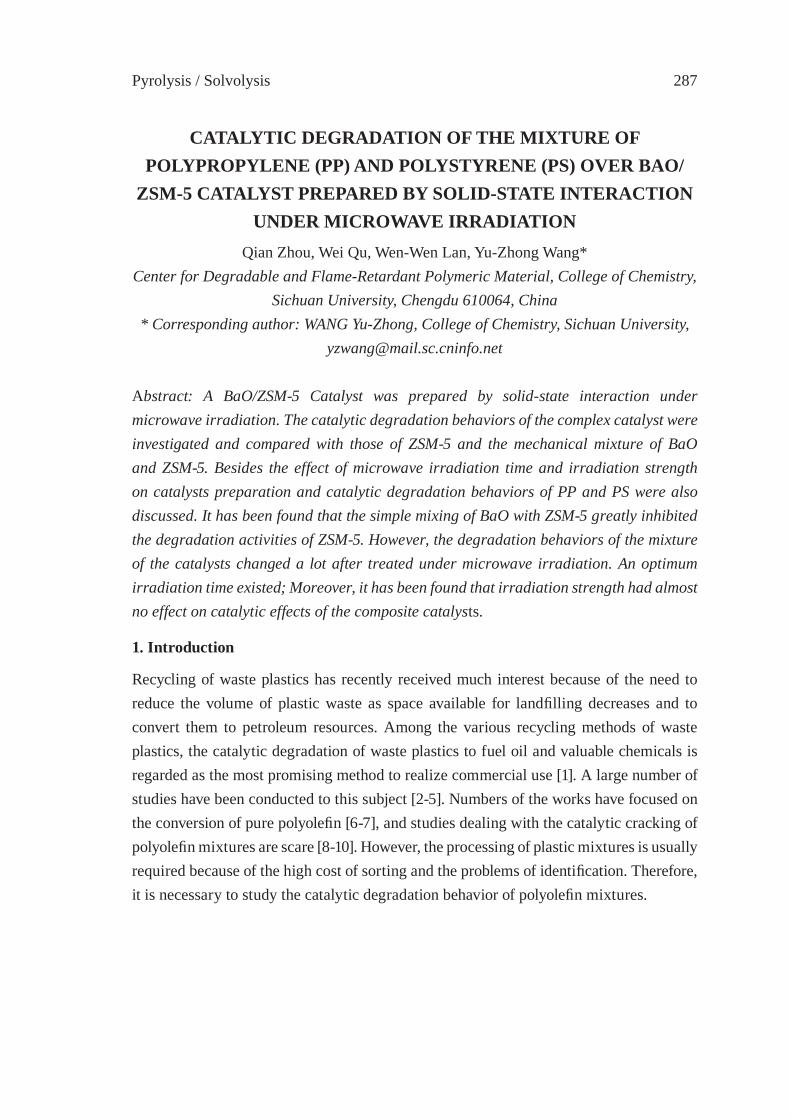
Pyrolysis / Solvolysis 287
CATALYTIC DEGRADATION OF THE MIXTURE OF POLYPROPYLENE (PP) AND POLYSTYRENE (PS) OVER BAO/
ZSM-5 CATALYST PREPARED BY SOLID-STATE INTERACTION UNDER MICROWAVE IRRADIATION
Qian Zhou, Wei Qu, Wen-Wen Lan, Yu-Zhong Wang*Center for Degradable and Flame-Retardant Polymeric Material, College of Chemistry,
Sichuan University, Chengdu 610064, China* Corresponding author: WANG Yu-Zhong, College of Chemistry, Sichuan University,
Abstract: A BaO/ZSM-5 Catalyst was prepared by solid-state interaction under microwave irradiation. The catalytic degradation behaviors of the complex catalyst were investigated and compared with those of ZSM-5 and the mechanical mixture of BaO and ZSM-5. Besides the effect of microwave irradiation time and irradiation strength on catalysts preparation and catalytic degradation behaviors of PP and PS were also discussed. It has been found that the simple mixing of BaO with ZSM-5 greatly inhibited the degradation activities of ZSM-5. However, the degradation behaviors of the mixture of the catalysts changed a lot after treated under microwave irradiation. An optimum irradiation time existed; Moreover, it has been found that irradiation strength had almost no effect on catalytic effects of the composite catalysts.
1. Introduction
Recycling of waste plastics has recently received much interest because of the need to reduce the volume of plastic waste as space available for landfi lling decreases and to convert them to petroleum resources. Among the various recycling methods of waste plastics, the catalytic degradation of waste plastics to fuel oil and valuable chemicals is regarded as the most promising method to realize commercial use [1]. A large number of studies have been conducted to this subject [2-5]. Numbers of the works have focused on the conversion of pure polyolefi n [6-7], and studies dealing with the catalytic cracking of polyolefi n mixtures are scare [8-10]. However, the processing of plastic mixtures is usually required because of the high cost of sorting and the problems of identifi cation. Therefore, it is necessary to study the catalytic degradation behavior of polyolefi n mixtures.

ISFR - 2005288
2. Experimental
2.1 Materials.
PS (QLXJIB) and PP (F401) used in this study were supplied by Lanzhou Petrochemical Corporation (Lanzhou, China), and they were used without additional treatment. ZSM-5 and BaO was provided by Catalyst Plant of Qilu Petrochemical Corporation (Zibo, China) and by Shanghai Chemical reagent company (Shanghai, China), respectively. BaO/ZSM-5 composite catalyst was prepared as follows: 10wt% of BaO was mixed with ZSM-5, after grinding for 30mins to ensure a full mixing; the mixture was exposed to microwave irradiation for certain times. The mechanical mixtures of BaO and ZSM-5 were prepared for comparison.
2.2 Degradation of Plastics and Product Analysis
The degradations of the mixture of PS and PP were carried out in an in-house designed stainless steel reactor (60ml volume) by batch operation. Experimental details and product analyses have been described previously [4]. The temperature profi le incorporating of a stepwise temperature increase was employed. The reactor was heated from room temperature to 120°C during 20min and the temperature was held for 60 min. Then the temperature was increased from 120°C to 330°C for 1h, 380°C for the next 1h, and fi nally 430°C for another 1h. This temperature program was not only suffi cient for the full degradation of PS and PP, but also can evaluate their catalytic performance for a range of temperatures. The plastic conversion was defi ned as the sum of collected gaseous and liquid products with regard to the initially loaded polyolefi n.
3. Results and Discussion
ZSM-5 is a catalyst widely used in petroleum industry, and it can enhance the thermal degradation of PP that exhibits a higher degradation rate [4]. For the mixture of PS and PP the functions of percent conversion of thermal and catalytic degradation vs. reaction time were shown in Figure 1. As can be seen, after adding ZSM-5 the system shows a much lower degradation rate, indicating that ZSM-5 inhibit the degradation of the mixture containing PS, which is quite different from the catalytic degradation behaviors of PP.
For PP thermal degradation, the narrow pore structure of ZSM-5 catalysts prevents the molecules of PP and PS from diffusing into the cavities of the catalysts to react on the inner acid sites, therefore, only a slight catalytic effect was observed [4]. On the other hand, for PS it was suggested that cross-linking reactions promoted by the acid sites of the ZSM-5 catalysts caused a lower degradation degree of PS [11]. Judging from the results obtained, it was suggested that PS was the controlling factor for catalytic degradation the mixture of PP and PS. For thermal degradation of PS, BaO was found to have good
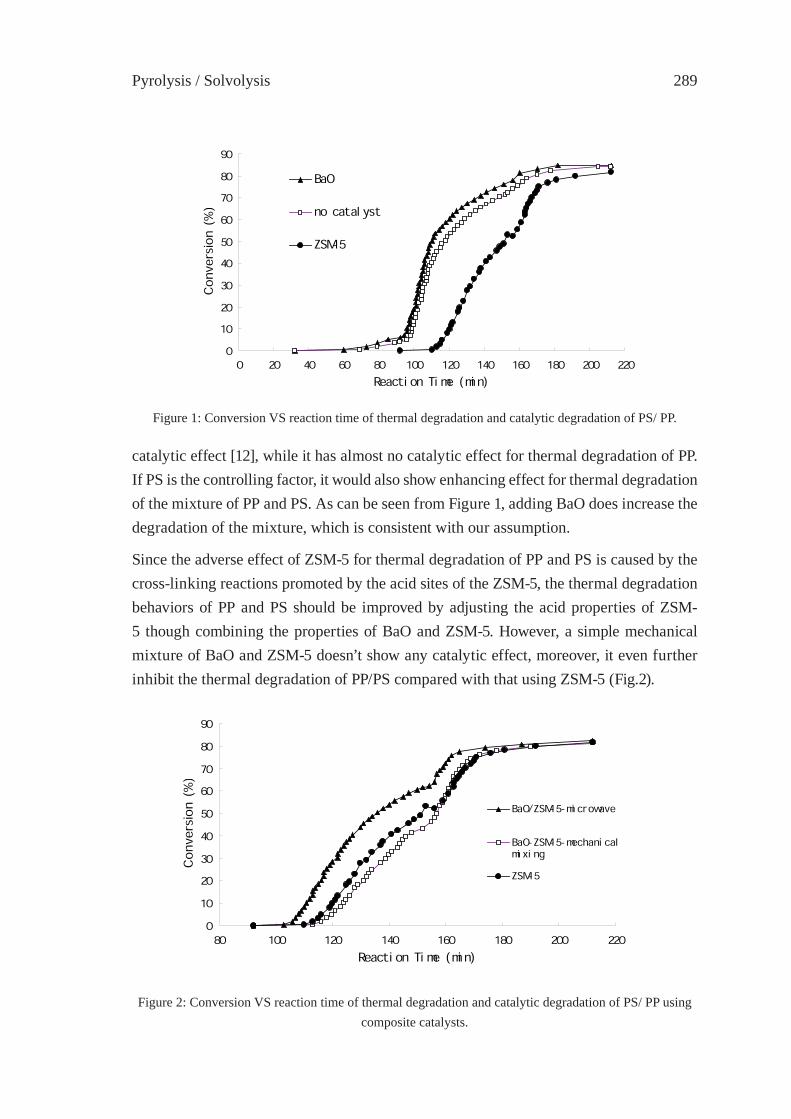
Pyrolysis / Solvolysis 289
catalytic effect [12], while it has almost no catalytic effect for thermal degradation of PP. If PS is the controlling factor, it would also show enhancing effect for thermal degradation of the mixture of PP and PS. As can be seen from Figure 1, adding BaO does increase the degradation of the mixture, which is consistent with our assumption.
Since the adverse effect of ZSM-5 for thermal degradation of PP and PS is caused by the cross-linking reactions promoted by the acid sites of the ZSM-5, the thermal degradation behaviors of PP and PS should be improved by adjusting the acid properties of ZSM-5 though combining the properties of BaO and ZSM-5. However, a simple mechanical mixture of BaO and ZSM-5 doesn’t show any catalytic effect, moreover, it even further inhibit the thermal degradation of PP/PS compared with that using ZSM-5 (Fig.2).
0
10
20
30
40
50
60
70
80
90
80 100 120 140 160 180 200 220
Reacti on Ti me (mi n)
Conve
rsio
n (
%)
BaO/ZSM-5-mi crowave
BaO-ZSM-5-mechani calmi xi ng
ZSM-5
Figure 2: Conversion VS reaction time of thermal degradation and catalytic degradation of PS/ PP using composite catalysts.
0
10
20
30
40
50
60
70
80
90
0 20 40 60 80 100 120 140 160 180 200 220
Reacti on Ti me (mi n)
Conve
rsio
n (
%)
BaO
no catal yst
ZSM-5
Figure 1: Conversion VS reaction time of thermal degradation and catalytic degradation of PS/ PP.
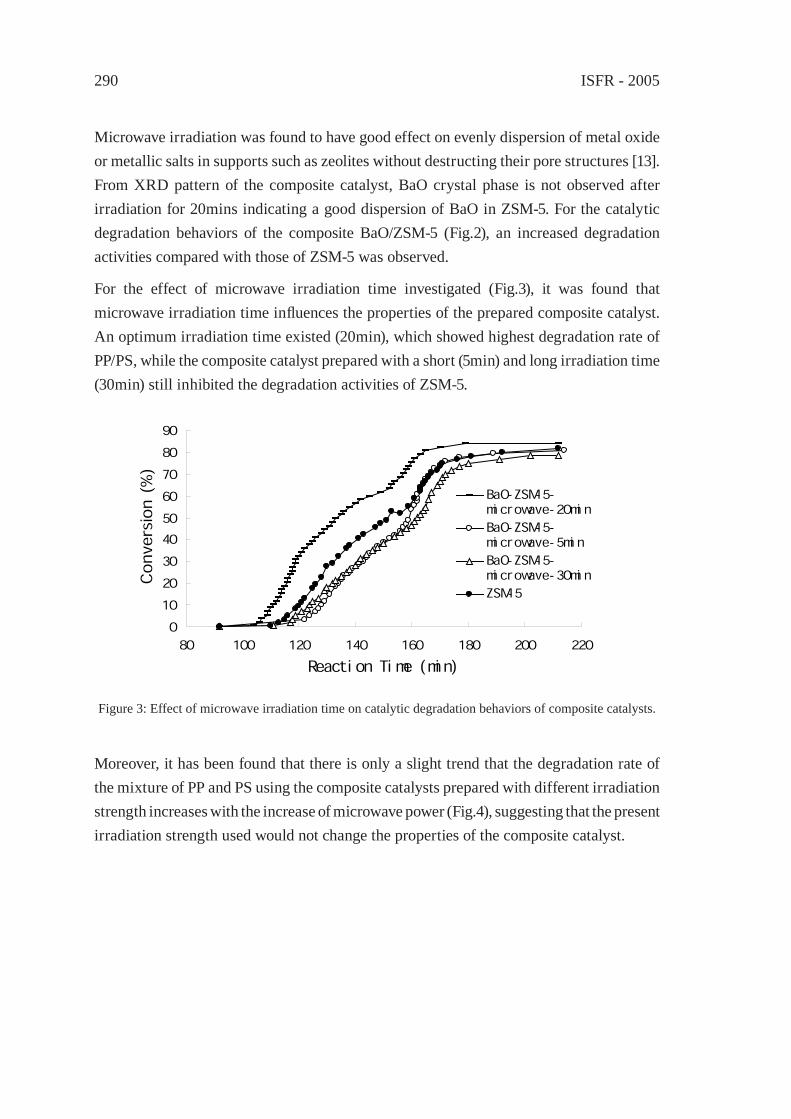
ISFR - 2005290
Microwave irradiation was found to have good effect on evenly dispersion of metal oxide or metallic salts in supports such as zeolites without destructing their pore structures [13]. From XRD pattern of the composite catalyst, BaO crystal phase is not observed after irradiation for 20mins indicating a good dispersion of BaO in ZSM-5. For the catalytic degradation behaviors of the composite BaO/ZSM-5 (Fig.2), an increased degradation activities compared with those of ZSM-5 was observed.
For the effect of microwave irradiation time investigated (Fig.3), it was found that microwave irradiation time infl uences the properties of the prepared composite catalyst. An optimum irradiation time existed (20min), which showed highest degradation rate of PP/PS, while the composite catalyst prepared with a short (5min) and long irradiation time (30min) still inhibited the degradation activities of ZSM-5.
0
10
20
30
40
50
60
70
80
90
80 100 120 140 160 180 200 220
Reacti on Ti me (mi n)
Conve
rsio
n (
%)
BaO-ZSM-5-mi crowave-20mi nBaO-ZSM-5-mi crowave-5mi nBaO-ZSM-5-mi crowave-30mi nZSM-5
Figure 3: Effect of microwave irradiation time on catalytic degradation behaviors of composite catalysts.
Moreover, it has been found that there is only a slight trend that the degradation rate of the mixture of PP and PS using the composite catalysts prepared with different irradiation strength increases with the increase of microwave power (Fig.4), suggesting that the present irradiation strength used would not change the properties of the composite catalyst.
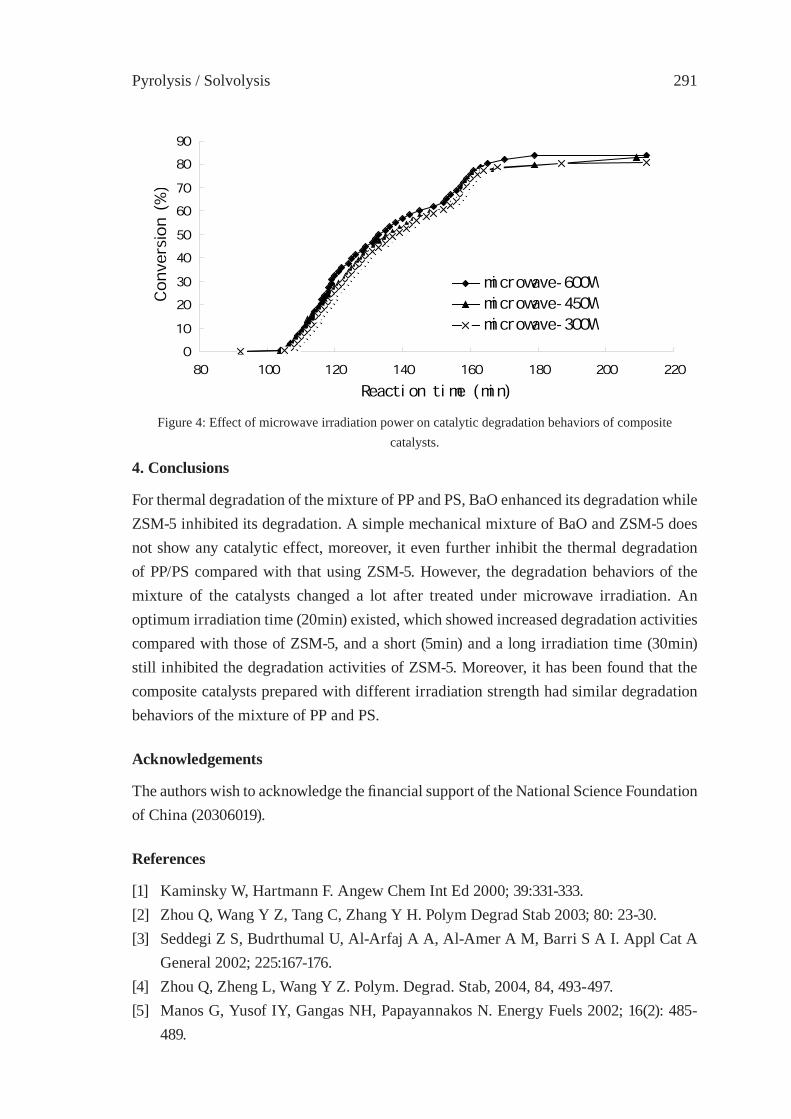
Pyrolysis / Solvolysis 291
4. Conclusions
For thermal degradation of the mixture of PP and PS, BaO enhanced its degradation while ZSM-5 inhibited its degradation. A simple mechanical mixture of BaO and ZSM-5 does not show any catalytic effect, moreover, it even further inhibit the thermal degradation of PP/PS compared with that using ZSM-5. However, the degradation behaviors of the mixture of the catalysts changed a lot after treated under microwave irradiation. An optimum irradiation time (20min) existed, which showed increased degradation activities compared with those of ZSM-5, and a short (5min) and a long irradiation time (30min) still inhibited the degradation activities of ZSM-5. Moreover, it has been found that the composite catalysts prepared with different irradiation strength had similar degradation behaviors of the mixture of PP and PS.
Acknowledgements
The authors wish to acknowledge the fi nancial support of the National Science Foundation of China (20306019).
References
[1] Kaminsky W, Hartmann F. Angew Chem Int Ed 2000; 39:331-333.[2] Zhou Q, Wang Y Z, Tang C, Zhang Y H. Polym Degrad Stab 2003; 80: 23-30.[3] Seddegi Z S, Budrthumal U, Al-Arfaj A A, Al-Amer A M, Barri S A I. Appl Cat A
General 2002; 225:167-176.[4] Zhou Q, Zheng L, Wang Y Z. Polym. Degrad. Stab, 2004, 84, 493-497.[5] Manos G, Yusof IY, Gangas NH, Papayannakos N. Energy Fuels 2002; 16(2): 485-
489.
0
10
20
30
40
50
60
70
80
90
80 100 120 140 160 180 200 220
Reacti on ti me (mi n)
Conve
rsio
n (
%)
mi crowave-600Wmi crowave-450Wmi crowave-300W
Figure 4: Effect of microwave irradiation power on catalytic degradation behaviors of composite catalysts.
ISFR - 2005292
[6] Masuda T, Kuwahara H, Mukai S R, Hashimoto K. Chem Eng Sci 1999; 54: 2773-2779.
[7] Dufaud V, Basset JM. Angew Chem Int Ed 1998; 37: 806-810.[8] Kim J R, Yoon J H, Park D W. Polym Degrad Stab 2002; 76: 61-67.[9] Serrano D P, Aguado J, Escola J M. Ind Eng Chem Res 2000; 39: 1177-1184.[10] Tang C, Wang Y Z, Zhou Q, Zheng L. Polym Degrad Stab 2003; 81: 89-94.[11] Serrano DP, Aguado J, Escola JM. Appl Catal B: Environ 2000;25:81.[12] Zhang Z, Hirose T, Nishio S, Morioka Y, Azuma N, Ueno A, Ohkita H, Okada M,
Ind. Eng. Chem. Res. 1995, 34:4514-4519.[13] Yin DH, Qin LS, Liu JF, Yin DL, Acta. Phys.Chim.Sin.2004, 20(9): 1150-1154
(Chinese).
Pyrolysis / Solvolysis 293
CONSIDERATIONS ON THE PYROLYSIS OF OLEFINIC PLASTICS BY USING SYNTHETIC CATALYSTS ORIGINATED
FROM FLY ASHSoo Hyun Chung1, Jeong-Geol Na1, Seong-Soo Kim1 and Sang Guk Kim1, Jong-In
Dong² and Young-Kwon Park²1Korea Institute of Energy Research, Daejeon, Korea, [email protected]
²University of Seoul, Seoul, Korea
Abstract: Catalytic pyrolysis of low density polyethylene has been investigated over various fl y ash-derived silica-alumina catalysts (FSAs). FSAs were prepared by a simple activation method which basically includes NaOH treatment of fl y ash by fusion method, followed by aging process. The effects of synthesis condition such as NaOH/fl y ash weight ratio and aging time were examined by XRD, BET and NH3-TPD to clarify the controlling factors affecting the catalytic activity. To obtain the catalyst showing high activity, it is necessary to produce silica and alumina species that can be easily co-precipitated into solid acid catalyst by destruction of fl y ash structure. The catalytic performance of FSA obtained under optimal conditions was as good as that of commercial catalysts, demonstrating its effectiveness.
1. Introduction
Among various technologies for waste plastics treatment, pyrolysis is considered as the most promising one since waste plastics can be upgraded into valuable fuel oils and chemicals by this technology.
Pyrolysis can be conducted with/without catalyst [1–3]. The advantages of catalytic pyrolysis against thermal pyrolysis are lower degradation temperatures and narrower molecular size distributions of products [3, 4]. Due to these advantages, catalytic pyrolysis has been an attractive research topic in this area of waste plastic recycling technology. However, economic effi ciency still remains to be solved since commercial catalysts are generally expensive and have relatively short catalyst life in the pyrolysis process. In order to develop catalyst having a low price, much effort have been performed [3 – 7].
This study was aimed at developing a low price catalyst which is suitable for waste plastics pyrolysis. Fly ash, which is waste material generated from coal-fi red power plants was used as silica and alumina source for solid acid catalyst. Due to the similarity in chemical composition of fl y ash to some volcanic materials, many researchers have synthesized zeolites from fl y ash and applied these fl y ash-derived zeolites as cation exchanger for the removal of heavy metals from waste water and also as molecular sieves for the separation and recovery of gases such as CO2, SO2 and NH3 [8].
ISFR - 2005294
In our previous work [5, 6], fl y ash-derived catalysts containing faujasitic zeolites were developed for pyrolysis of polypropylene. However, it was shown that their catalytic activity was too weak to be applied in LDPE pyrolysis. Fly ash-derived zeolites (FAZs) were composed of not only faujasitic materials appropriate for pyrolysis, but also by-products such as NaP1 zeolites and unreacted fl y ash. Moreover, zeolite type and thus its catalytic activity depend on fl y ash type used [11]. This indicates that it is diffi cult to obtain reproducible catalysts.
In this study, amorphous silica-alumina catalysts (FSAs) were synthesized by activation of fl y ash with NaOH. Factors affecting the performance of FSAs, i.e., NaOH/fl y ash weight ratio and activation time, were investigated. A series of pyrolysis experiment of LDPE were conducted to evaluate the performance of FSAs. The performance of these catalysts for LDPE pyrolysis was assessed in terms of the degradation temperature and simulated boiling point distribution of the liquid products of LDPE pyrolysis. The physicochemical properties of the FSAs were also characterized and related to their catalytic performance for the pyrolysis of LDPE.
2. Experimental
2.1. Synthesis of FSAs
Fly ash powder with an average diameter of 20 – 30 μm used in this study was supplied by Boryung coal-fi red power plants in Korea. FSAs were synthesized by dissolution of silica and alumina from fl y ash, followed by co-precipitation of the dissolved ions.
100 g of fl y ash was mixed with different amounts of NaOH (70, 120 and 170 g). This mixture was fused in air at 600 oC for 1.5 h. The fused product was cooled and dissolved in distilled water, followed by an activation process with agitation in a reactor at room temperature for different periods (8, 16 and 32 h). The synthesis conditions are summarized in Table 1. The resulting materials were separated into a solid phase and a waste solution by fi ltration. The solid phase was washed several times with 1 M NH4Cl and then dried at 60 oC for 24 h. At the end of the process, the solid acid catalyst was prepared by calcining at 500 oC for 4 h in air.
2.2. Characterization of FSAs
To examine the crystallinity of the synthesized catalysts, the X-ray diffraction (XRD) patterns were analyzed. The specifi c surface area and the pore volume were measured by BET apparatus. The acid strength distribution of the active sites was determined by a temperature programmed desorption experiment of ammonia (NH3-TPD).
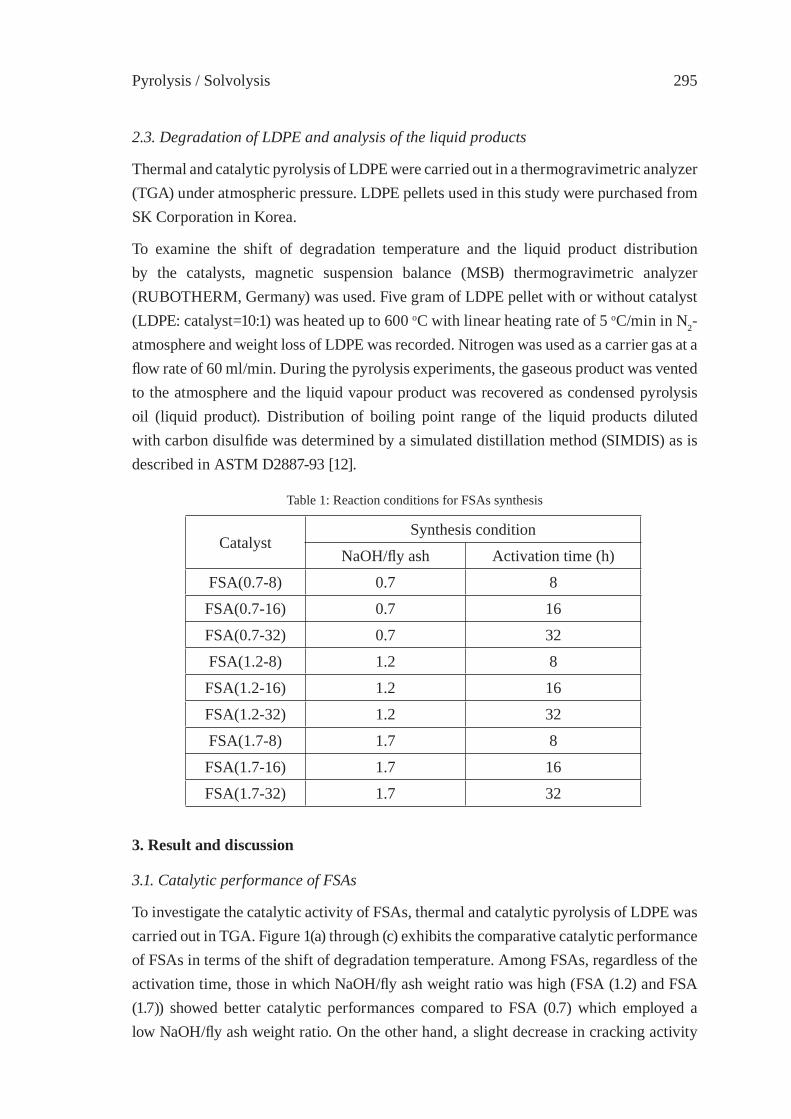
Pyrolysis / Solvolysis 295
2.3. Degradation of LDPE and analysis of the liquid products
Thermal and catalytic pyrolysis of LDPE were carried out in a thermogravimetric analyzer (TGA) under atmospheric pressure. LDPE pellets used in this study were purchased from SK Corporation in Korea.
To examine the shift of degradation temperature and the liquid product distribution by the catalysts, magnetic suspension balance (MSB) thermogravimetric analyzer (RUBOTHERM, Germany) was used. Five gram of LDPE pellet with or without catalyst (LDPE: catalyst=10:1) was heated up to 600 oC with linear heating rate of 5 oC/min in N2-atmosphere and weight loss of LDPE was recorded. Nitrogen was used as a carrier gas at a fl ow rate of 60 ml/min. During the pyrolysis experiments, the gaseous product was vented to the atmosphere and the liquid vapour product was recovered as condensed pyrolysis oil (liquid product). Distribution of boiling point range of the liquid products diluted with carbon disulfi de was determined by a simulated distillation method (SIMDIS) as is described in ASTM D2887-93 [12].
Table 1: Reaction conditions for FSAs synthesis
CatalystSynthesis condition
NaOH/fl y ash Activation time (h)
FSA(0.7-8) 0.7 8
FSA(0.7-16) 0.7 16
FSA(0.7-32) 0.7 32
FSA(1.2-8) 1.2 8
FSA(1.2-16) 1.2 16
FSA(1.2-32) 1.2 32
FSA(1.7-8) 1.7 8
FSA(1.7-16) 1.7 16
FSA(1.7-32) 1.7 32
3. Result and discussion
3.1. Catalytic performance of FSAs
To investigate the catalytic activity of FSAs, thermal and catalytic pyrolysis of LDPE was carried out in TGA. Figure 1(a) through (c) exhibits the comparative catalytic performance of FSAs in terms of the shift of degradation temperature. Among FSAs, regardless of the activation time, those in which NaOH/fl y ash weight ratio was high (FSA (1.2) and FSA (1.7)) showed better catalytic performances compared to FSA (0.7) which employed a low NaOH/fl y ash weight ratio. On the other hand, a slight decrease in cracking activity
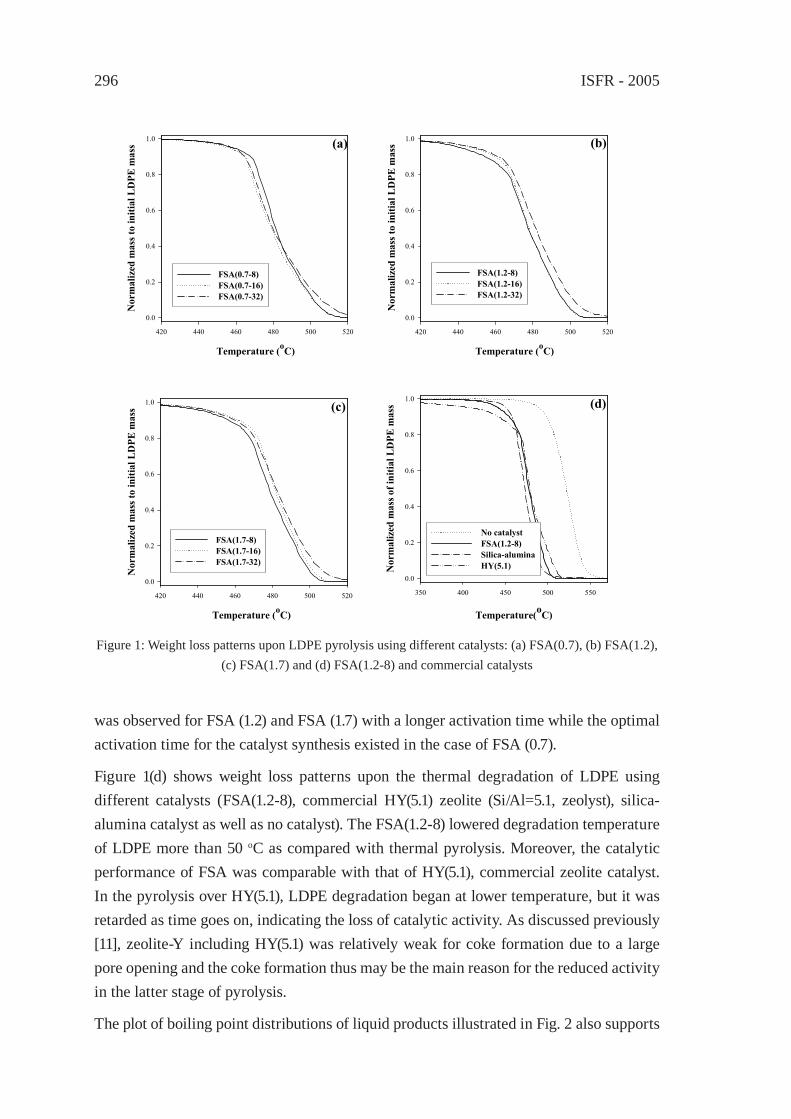
ISFR - 2005296
was observed for FSA (1.2) and FSA (1.7) with a longer activation time while the optimal activation time for the catalyst synthesis existed in the case of FSA (0.7).
Figure 1(d) shows weight loss patterns upon the thermal degradation of LDPE using different catalysts (FSA(1.2-8), commercial HY(5.1) zeolite (Si/Al=5.1, zeolyst), silica-alumina catalyst as well as no catalyst). The FSA(1.2-8) lowered degradation temperature of LDPE more than 50 oC as compared with thermal pyrolysis. Moreover, the catalytic performance of FSA was comparable with that of HY(5.1), commercial zeolite catalyst. In the pyrolysis over HY(5.1), LDPE degradation began at lower temperature, but it was retarded as time goes on, indicating the loss of catalytic activity. As discussed previously [11], zeolite-Y including HY(5.1) was relatively weak for coke formation due to a large pore opening and the coke formation thus may be the main reason for the reduced activity in the latter stage of pyrolysis.
The plot of boiling point distributions of liquid products illustrated in Fig. 2 also supports
Figure 1: Weight loss patterns upon LDPE pyrolysis using different catalysts: (a) FSA(0.7), (b) FSA(1.2), (c) FSA(1.7) and (d) FSA(1.2-8) and commercial catalysts
Temperature (oC)
420 440 460 480 500 520
Nor
mal
ized
mas
s to
initi
al L
DPE
mas
s
0.0
0.2
0.4
0.6
0.8
1.0
FSA(0.7-8)FSA(0.7-16)FSA(0.7-32)
(a)
Temperature (oC)
420 440 460 480 500 520
Nor
mal
ized
mas
s to
initi
al L
DPE
mas
s
0.0
0.2
0.4
0.6
0.8
1.0
FSA(1.2-8)FSA(1.2-16)FSA(1.2-32)
(b)
Temperature (oC)
420 440 460 480 500 520
Nor
mal
ized
mas
s to
initi
al L
DPE
mas
s
0.0
0.2
0.4
0.6
0.8
1.0
FSA(1.7-8)FSA(1.7-16)FSA(1.7-32)
(c)
Temperature(oC)
350 400 450 500 550
Nor
mal
ized
mas
s of i
nitia
l LD
PE m
ass
0.0
0.2
0.4
0.6
0.8
1.0
No catalystFSA(1.2-8)Silica-aluminaHY(5.1)
(d)
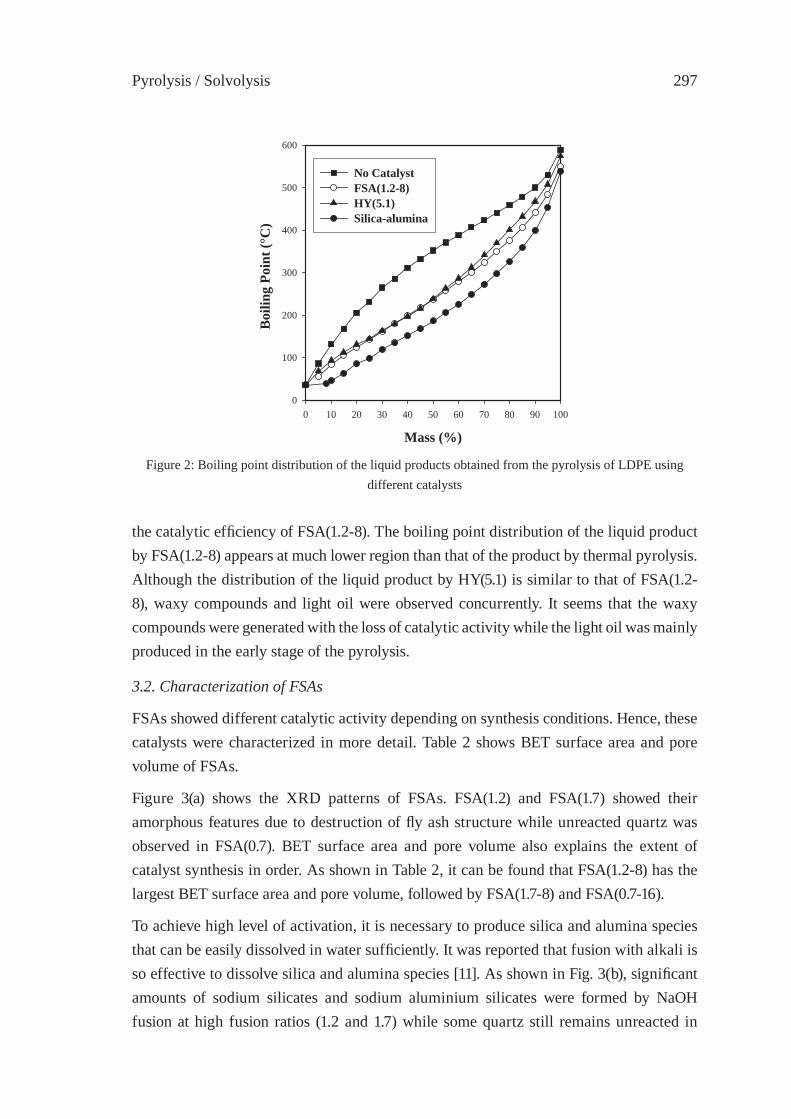
Pyrolysis / Solvolysis 297
Figure 2: Boiling point distribution of the liquid products obtained from the pyrolysis of LDPE using different catalysts
Mass (%)
0 10 20 30 40 50 60 70 80 90 100
Boi
ling
Poin
t (°C
)
0
100
200
300
400
500
600
No CatalystFSA(1.2-8)HY(5.1)Silica-alumina
the catalytic effi ciency of FSA(1.2-8). The boiling point distribution of the liquid product by FSA(1.2-8) appears at much lower region than that of the product by thermal pyrolysis. Although the distribution of the liquid product by HY(5.1) is similar to that of FSA(1.2-8), waxy compounds and light oil were observed concurrently. It seems that the waxy compounds were generated with the loss of catalytic activity while the light oil was mainly produced in the early stage of the pyrolysis.
3.2. Characterization of FSAs
FSAs showed different catalytic activity depending on synthesis conditions. Hence, these catalysts were characterized in more detail. Table 2 shows BET surface area and pore volume of FSAs.
Figure 3(a) shows the XRD patterns of FSAs. FSA(1.2) and FSA(1.7) showed their amorphous features due to destruction of fl y ash structure while unreacted quartz was observed in FSA(0.7). BET surface area and pore volume also explains the extent of catalyst synthesis in order. As shown in Table 2, it can be found that FSA(1.2-8) has the largest BET surface area and pore volume, followed by FSA(1.7-8) and FSA(0.7-16).
To achieve high level of activation, it is necessary to produce silica and alumina species that can be easily dissolved in water suffi ciently. It was reported that fusion with alkali is so effective to dissolve silica and alumina species [11]. As shown in Fig. 3(b), signifi cant amounts of sodium silicates and sodium aluminium silicates were formed by NaOH fusion at high fusion ratios (1.2 and 1.7) while some quartz still remains unreacted in
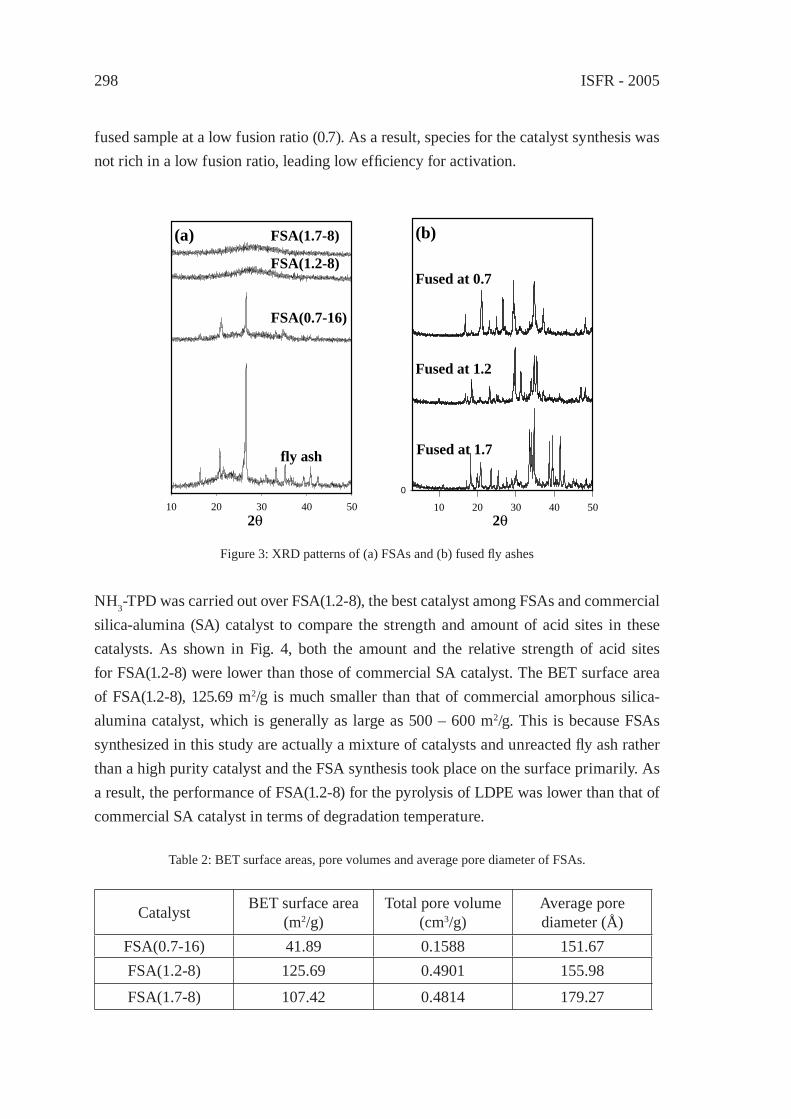
ISFR - 2005298
fused sample at a low fusion ratio (0.7). As a result, species for the catalyst synthesis was not rich in a low fusion ratio, leading low effi ciency for activation.
10 20 30 40 50
fly ash
FSA(0.7-16)
FSA(1.2-8)
2θ
FSA(1.7-8)(a)
10 20 30 40 50
0
2θ
Fused at 1.7
Fused at 1.2
Fused at 0.7
(b)
Figure 3: XRD patterns of (a) FSAs and (b) fused fl y ashes
NH3-TPD was carried out over FSA(1.2-8), the best catalyst among FSAs and commercial silica-alumina (SA) catalyst to compare the strength and amount of acid sites in these catalysts. As shown in Fig. 4, both the amount and the relative strength of acid sites for FSA(1.2-8) were lower than those of commercial SA catalyst. The BET surface area of FSA(1.2-8), 125.69 m2/g is much smaller than that of commercial amorphous silica-alumina catalyst, which is generally as large as 500 – 600 m2/g. This is because FSAs synthesized in this study are actually a mixture of catalysts and unreacted fl y ash rather than a high purity catalyst and the FSA synthesis took place on the surface primarily. As a result, the performance of FSA(1.2-8) for the pyrolysis of LDPE was lower than that of commercial SA catalyst in terms of degradation temperature.
Table 2: BET surface areas, pore volumes and average pore diameter of FSAs.
Catalyst BET surface area (m2/g)
Total pore volume (cm3/g)
Average pore diameter (Å)
FSA(0.7-16) 41.89 0.1588 151.67FSA(1.2-8) 125.69 0.4901 155.98
FSA(1.7-8) 107.42 0.4814 179.27
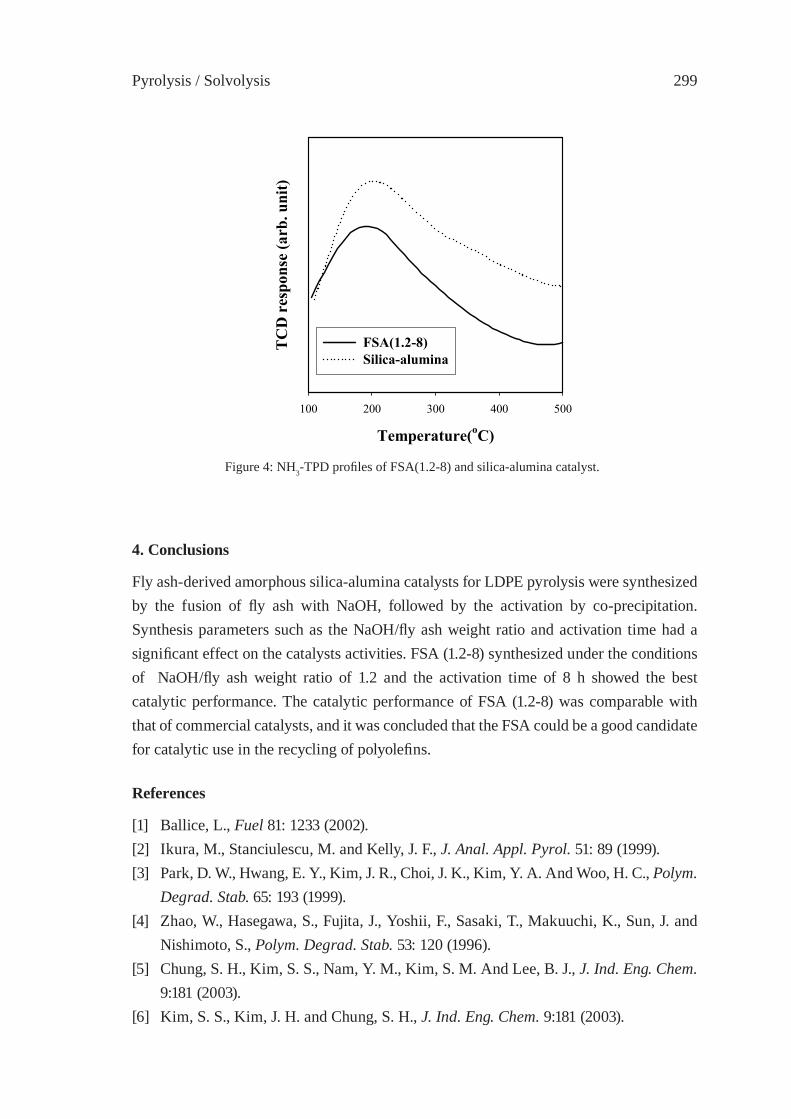
Pyrolysis / Solvolysis 299
4. Conclusions
Fly ash-derived amorphous silica-alumina catalysts for LDPE pyrolysis were synthesized by the fusion of fl y ash with NaOH, followed by the activation by co-precipitation. Synthesis parameters such as the NaOH/fl y ash weight ratio and activation time had a signifi cant effect on the catalysts activities. FSA (1.2-8) synthesized under the conditions of NaOH/fl y ash weight ratio of 1.2 and the activation time of 8 h showed the best catalytic performance. The catalytic performance of FSA (1.2-8) was comparable with that of commercial catalysts, and it was concluded that the FSA could be a good candidate for catalytic use in the recycling of polyolefi ns.
References
[1] Ballice, L., Fuel 81: 1233 (2002).[2] Ikura, M., Stanciulescu, M. and Kelly, J. F., J. Anal. Appl. Pyrol. 51: 89 (1999).[3] Park, D. W., Hwang, E. Y., Kim, J. R., Choi, J. K., Kim, Y. A. And Woo, H. C., Polym.
Degrad. Stab. 65: 193 (1999).[4] Zhao, W., Hasegawa, S., Fujita, J., Yoshii, F., Sasaki, T., Makuuchi, K., Sun, J. and
Nishimoto, S., Polym. Degrad. Stab. 53: 120 (1996).[5] Chung, S. H., Kim, S. S., Nam, Y. M., Kim, S. M. And Lee, B. J., J. Ind. Eng. Chem.
9:181 (2003).[6] Kim, S. S., Kim, J. H. and Chung, S. H., J. Ind. Eng. Chem. 9:181 (2003).
Figure 4: NH3-TPD profi les of FSA(1.2-8) and silica-alumina catalyst.
Temperature(oC)
100 200 300 400 500
TC
D r
espo
nse
(arb
. uni
t)
FSA(1.2-8)Silica-alumina

ISFR - 2005300
[7] Sakata, Y., Uddin, M. A. and Muto, A., J. Anal. Appl. Pyrol. 51:135 (1999).[8] Uddin, M. A., Sakata, Y., Muto, A., Shiraga, Y., Koizumi, K., Kanada, Y. and Murata,
K., Micropor. Mesopor. Mater. 21:557 (1998).[9] Querol, X., Plana, F., Alastuey, A. and Lopez-Soler, A., Fuel 76: 793 (1997).[10] Shigemoto, N., Hayashi, H. and Miyaura, K., J. Mater. Sci. 28: 4781 (1993).[11] Garforth, A., Fiddy, S., Lin, Y. H., Ghanbari-Siakhali, A., Sharratt, P. N. and Dwyer,
J., Thermochimica Acta 294: 65 (1997).[12] American Society for Testing and Materials, ASTM D2887 (1994).
Pyrolysis / Solvolysis 301
CATALYTIC DEGRADATION OF PLASTIC WASTES INVESTIGATED BY Py-GC/MSJ. Aguado, D.P. Serrano, G. San Miguel
Universidad Rey Juan Carlos, ESCET, C/ Tulipán, 28933, Móstoles, Madrid, Spain, [email protected], Fax + 34 91 6647490
Abstract: Pyrolysis coupled with Gas Chromatographic separation and Mass Spectrometry detection (Py-GC/MS) has been used to study the catalytic conversion of pure and waste polyethylene over fi ve acid solids of comparable aluminium content but different textural and acid properties. Zeolitic materials presented marked shape selectivity towards the formation of single-ring aromatics (mainly toluene, m/p-xylene and benzene), an effect that was particularly notable in nanocrystalline n-ZSM-5 (up to 59.22 % aromatics) but less signifi cant in standard ZSM-5 (36.42 %) and Beta zeolite (35.03 %). Mesostructured catalysts favoured the formation of lighter C2-C5 as well as a wide range of branched paraffi ns and alkyl derivate aromatic products. This paper contains a detailed description of the products generated in each case.
1. Introduction
Feedstock recycling technologies are attracting increasing attention as an alternative to waste plastic disposal, with potential to process large amounts of this waste stream [1-2]. One of these technologies is thermal cracking, which involves the degradation of the plastic polymer by means of temperature. The process results in the formation of hydrocarbon mixtures whose composition depends primarily on plastic type and process conditions (temperature, heating rate, furnace type, secondary reactions). In addition of reducing the reaction temperature, the use of certain acid catalysts has been reported to have an effect on the nature of the products generated, promoting in certain cases the formation of highly valuable aromatics and light olefi nic hydrocarbons [3-4].
Zeolites are crystalline aluminosilicates consisting of SiO4 and AlO4- tetrahedra arranged
into a three dimensional porous structure. The aluminium present in this framework generates a negative net charge that is compensated by extra-framework protons, thus providing the solid with Bronsted acid properties. The microporous character of zeolites has been made responsible for their reduced catalytic activity in the cracking of plastic polymers. The presence of narrow micropore channels is responsible for diffusional and steric impediments that reduce the accessibility of bulky polymer molecules to its internal acid sites.
Mesostructured aluminosilicates were fi rst discovered in the early nineties and have been extensively investigated for their acid properties. These materials present amorphous pore
ISFR - 2005302
walls and a uniform pore structure that may be tailored to specifi c dimensions by selecting the appropriate template molecules. Generally speaking, mesostructured solids exhibit lower acid properties but wider pore channels than zeolites, which reduce the diffusional and steric issues in polymer cracking.
Pyrolysis coupled with Gas Chromatographic separation and Mass Spectrometry detection (Py-GC/MS) has been used in this work to study the thermal and catalytic conversion of pure and waste polyethylene over fi ve acid solids including three zeolites (standard ZSM-5, nanocrystalline n-ZSM-5 and zeolite Beta) and two mesostructured solids (Al-SBA-15 and Al-MCM-41). The composition of the products has been related to the acid and textural properties of the catalysts.
2. Experimental
The plastic polymers employed in this work include a pure low density polyethylene (hereafter referred to as LDPE) commercialised by Repsol-YPF (Madrid, Spain) and a waste polyethylene (URB), obtained from municipal plastic waste and provided by GAIKER (Zamudio, Spain). The catalysts were synthesised and characterised in our laboratories according to procedures published in literature [3-5].
Py-GC/MS was performed using a CDS Pyroprobe model 2000 pyrolyser (Chemical Data Systems, Oxford, PA) using less than 250 μg of plastic and between 200-300 μg of catalyst. Pyrolysis was conducted at 700ºC heating at 10,000ºC/s. Chromatographic separation was performed on a Varian 3800 GC analyser using a Varian VF-5 (30 m, 0.25 mm) capillary column operated at a constant helium fl ow of 1.0 ml/min. The oven was programmed set to 0ºC for 2 min and then heat up to 315ºC at 6ºC/min. Identifi cation of the evolved species was based on their mass spectra using a NIST MS library and by comparing their elution times with commercial standards.
3. Results and discussion
3.1 Polymer and catalyst characterisation
Pure LDPE exhibited no ash content (< 0.1 wt%) and negligible amounts (< 1 ppm) of metallic impurities. In contrast, residual polyethylene URB contained 1.8 wt% ash with signifi cant levels of calcium (5940 ppm), titanium (11541 ppm) and chlorine (6510 ppm), the latter being attributed to PVC contamination.
The results in Table 1 show higher aluminium levels in the zeolitic samples (Si/Al ratios between 30 and 35) and lower in mesostructured solids (between 40-52). Amorphous silica (SiO2), which was used in this work as a reference non-acid material, exhibited no aluminium content. Ammonia TPD analyses were used to evaluate the acid character of the
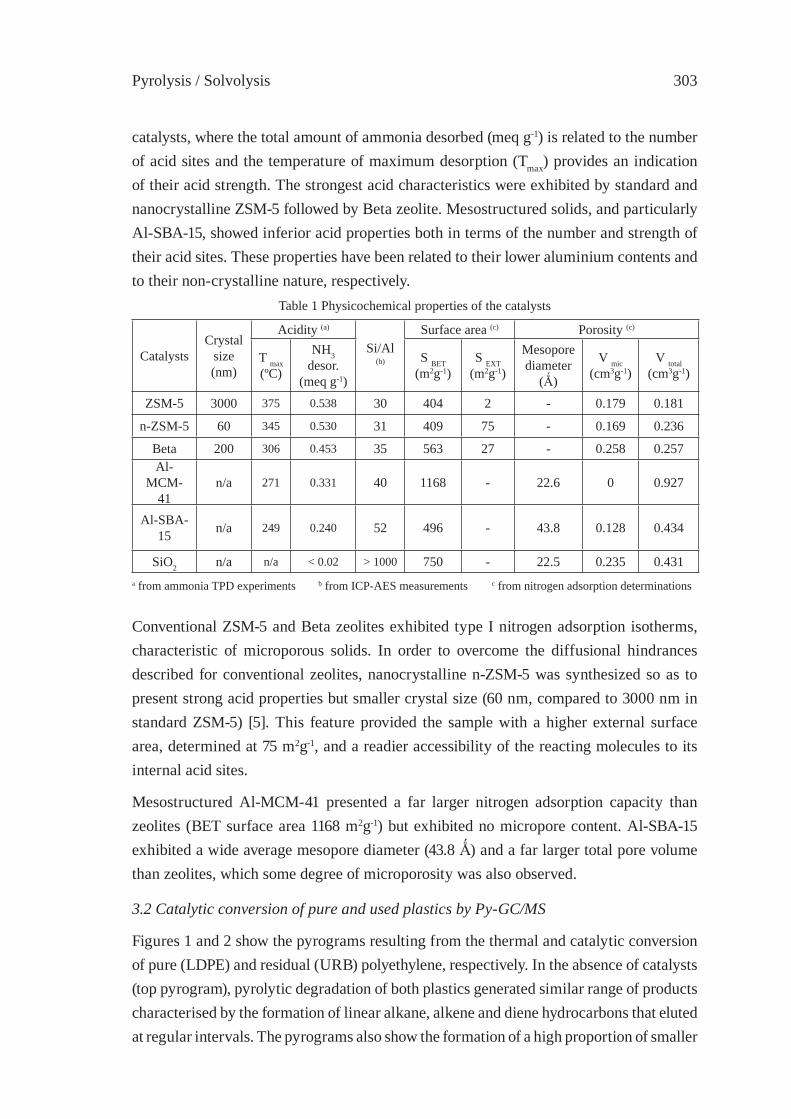
Pyrolysis / Solvolysis 303
Conventional ZSM-5 and Beta zeolites exhibited type I nitrogen adsorption isotherms, characteristic of microporous solids. In order to overcome the diffusional hindrances described for conventional zeolites, nanocrystalline n-ZSM-5 was synthesized so as to present strong acid properties but smaller crystal size (60 nm, compared to 3000 nm in standard ZSM-5) [5]. This feature provided the sample with a higher external surface area, determined at 75 m2g-1, and a readier accessibility of the reacting molecules to its internal acid sites.
Mesostructured Al-MCM-41 presented a far larger nitrogen adsorption capacity than zeolites (BET surface area 1168 m2g-1) but exhibited no micropore content. Al-SBA-15 exhibited a wide average mesopore diameter (43.8 Ǻ) and a far larger total pore volume than zeolites, which some degree of microporosity was also observed.
3.2 Catalytic conversion of pure and used plastics by Py-GC/MS
Figures 1 and 2 show the pyrograms resulting from the thermal and catalytic conversion of pure (LDPE) and residual (URB) polyethylene, respectively. In the absence of catalysts (top pyrogram), pyrolytic degradation of both plastics generated similar range of products characterised by the formation of linear alkane, alkene and diene hydrocarbons that eluted at regular intervals. The pyrograms also show the formation of a high proportion of smaller
Table 1 Physicochemical properties of the catalysts
CatalystsCrystal
size (nm)
Acidity (a)
Si/Al(b)
Surface area (c) Porosity (c)
T max (ºC)
NH3 desor.
(meq g-1)
S BET(m2g-1)
S EXT (m2g-1)
Mesopore diameter
(Ǻ)
V mic(cm3g-1)
V total(cm3g-1)
ZSM-5 3000 375 0.538 30 404 2 - 0.179 0.181
n-ZSM-5 60 345 0.530 31 409 75 - 0.169 0.236
Beta 200 306 0.453 35 563 27 - 0.258 0.257Al-
MCM-41
n/a 271 0.331 40 1168 - 22.6 0 0.927
Al-SBA-15 n/a 249 0.240 52 496 - 43.8 0.128 0.434
SiO2 n/a n/a < 0.02 > 1000 750 - 22.5 0.235 0.431a from ammonia TPD experiments b from ICP-AES measurements c from nitrogen adsorption determinations
catalysts, where the total amount of ammonia desorbed (meq g-1) is related to the number of acid sites and the temperature of maximum desorption (Tmax) provides an indication of their acid strength. The strongest acid characteristics were exhibited by standard and nanocrystalline ZSM-5 followed by Beta zeolite. Mesostructured solids, and particularly Al-SBA-15, showed inferior acid properties both in terms of the number and strength of their acid sites. These properties have been related to their lower aluminium contents and to their non-crystalline nature, respectively.
ISFR - 2005304
molecular weight hydrocarbons (C2-C5) that eluted at retention times up to 4.0 min. The main components identifi ed in the light fraction include propene (retention time 1.84 min), 1,3-butadiene (2.08 min), 1,3-pentadiene (3.06 min) and 1,2-dimethylcyclopropane (3.20 min).
A similar range of products were generated when the degradation of both LDPE and URB polyethylenes were conducted over amorphous silica (SiO2), which confi rmed the lack of catalytic activity of this non-acid solid.
Catalytic degradation over the three zeolites tested in this work (standard ZSM-5, nanocrystalline n-ZSM-5 and Beta) produced a similar range of products, with a signifi cant increase in the light hydrocarbon fraction, a strong selectivity towards the formation of single ring aromatic species and complete elimination of long chain hydrocarbon products.
Results show that textural properties did not have much infl uence in catalytic behaviour of the solids regarding their products distribution. Previous works using batch reactors or thermogravimetic determinations had reported signifi cant differences between the catalytic activity of standard and nanocrystalline ZSM-5 [3,4].
This is explained by the higher catalyst to polymer ratios employed in Py-GC/MS (above 1/1 instead of less than 1/10 used in catalytic cracking experiments), the higher reaction temperatures (700 ºC) and the disposition of the catalyst in the sample tube, which facilitates the reforming of vapours originally generated from the thermal or catalytic cracking of the polymer.
Overall, the results observed for pure (LDPE) and used (URB) polyethylene were comparable to each other, presenting a consistent picture of the shape selectivity of each catalyst and confi rming the reliability of the analytical method. Thus, the results discussed hereafter correspond to the catalytic conversion of pure LDPE.
The results show a higher proportion of light hydrocarbons (defi ned as those eluting at retention times below 4 min) when using standard ZSM-5 (47.34 %) and Beta zeolites (45.41 %) but lower levels with nanocrystalline n-ZSM-5 (35.58 %). However, the latter exhibited a stronger selectivity towards the formation of single ring aromatic compounds (estimated at 42.98 %). Owing to the similar acid characteristics exhibited by both ZSM-5, the higher aromatic fraction yielded by the nanocrystalline sample should be attributed primarily to its textural properties, which facilitate the access of primary olefi nic hydrocarbons to its internal active sites, thus promoting their reforming into aromatic species. Toluene (retention time 9.94 min and up to 15.34 %) was the most abundant of the aromatic species, followed by m/p-xylene (13.21-13.26 min and up to 12.68%) and benzene (6.60 min and up to 10.15 %). Other aromatic species identifi ed in the pyrograms include ethylbenzene

Pyrolysis / Solvolysis 305
Figure 1: Pyrograms showing the thermal and catalytic conversion of pure LDPE.
10 20 30 40 minutes
0
25
50
75
kCounts
0
25
50
75
kCounts
0.0
0.5
1.0
1.5
MCounts
0.0
0.5
1.0
1.5
MCounts
0100200300400500600
kCounts
0.000.250.500.751.001.25
MCounts
050
100150200250300
kCounts
RIC all 00 LDPE 0C.SMS
RIC all ldpe alc sio2 mthoc001.SMS
RIC all 00 ALC MTH0C ZSM001.SMS
RIC all 00 ALC ZSMNAN METH0C.SMS
RIC all 00 alc beta mthoc 001.SMS
RIC all 00 LDPE MTH0C MCMSG.SMS
RIC all 00 alc sba mthoc.SMS
9.94
13.21-
13.26
13.90
9.94
13.21-
13.26
13.90
16.90
9.94
13.21-
13.26
13.9016.90
3.20
6.60
22.05
22.05
24.70
24.70
22.05
24.70
12.95
12.95
9.94
13.9016.90
LDPE + ZSM-5
LDPE + n-ZSM-5
LDPE + Beta
LDPE + Al-MCM-41
LDPE + Al-SBA-15
LDPE + SiO2
6.60
12.95
3.20
6.60
3.20
Light C 3-C5
hydrocarbons
C20
C15
C10C6
6.609.94
C16
C14
C15C10 C20
C20
9.9413.21
-
13.26
C10 C12
LDPE no catalyst
C20C15
C10C6
3.20
3.201.84
2.08
3.20
1.842.08
2.08
2.08
2.08
Light C 3-C5
hydrocarbons
3.06
3.06
2.08
1.84
1.84
1.84
2.08
1.84
1.84
(12.95 min), o-xylene (13.90 min), 1,2,4-trimethylbenzene (16.90 min), naphthalene (22.05 min) and 1-methylnaphthalene (24.70 min)
Owing to their weaker acid properties, mesostructured acid solids (Al-MCM-41 and Al-SBA-15) did not exhibit the strong selectivity towards the formation of aromatic

ISFR - 2005306
Figure 2: Pyrograms showing the thermal and catalytic conversion of used URB.
10 20 30 40 minutes
0255075
100125
kCounts
0100200300400500
kCounts
0100200300400500600
kCounts
0.00.51.01.52.02.53.0
MCounts
0
100200
300
400kCounts
0100200300400500600
kCounts
0.000.250.500.751.001.25
MCounts
RIC all 00 REP MTHOC.SMS
RIC all 00 REP SIO2 MTHOC.SMS
RIC all 00 rep zsm5 mthoc001.SMS
RIC all 00 REP ZNAN MTHOC.SMS
RIC all 00 rep beta mthoc001.SMS
RIC all 00 REP MCMSG MTHOC.SMS
RIC all 00 REP SBA MTHOC.SMS
9.94
13.21-
13.26
13.90
9.94
13.21-
13.26
13.90
16.90
9.94
13.21-
13.26
13.90
16.90
3.32
6.60
22. 05
22.05
24.70
24.70
22. 05
24.70
12.95
12.95
9.94
13.9016.90
6.60
12.95
3.20
6.60
C20
C15
C10C6
6.60 9.94
C15
C15
C10C20
C209.94
13.21-
13.26
URB + SiO2
URB + Al-SBA-15
URB + Al-MCM-41
URB + n-ZSM-5
URB + Beta
URB + ZSM-5
URB no catalyst
C20
C15C10
6.60
6.60
Light C 3-C5
hydrocarbons C6
3.062.08
1.84
Light C 3-C5
hydrocarbons
3.062.08
1.84
1.84
2.08
Light C 3-C5
hydrocarbons
3.06
2.08
1.84
3.20
3.06
2.08
1.84
3.20
3.06
2.08
1.84
species observed in zeolites. Compared to purely thermal degradation, the presence of mesostructured solids caused substantial elimination of long chain hydrocarbons and a marked increase in the proportion of light species. This behaviour was particularly notable in the case of Al-SBA-15 (57.86 % of light hydrocarbons) while catalytic conversion over Al-MCM-41 was characterised by the formation of a broader range of aliphatic, olefi nic
Pyrolysis / Solvolysis 307
and alkyl derivate aromatic species of varying molecular weight than had been observed in zeolitic materials. This suggests that the wider pore channels in Al-MCM-41 permits a wider range of alkylation possibilities than in zeolites, where steric impediments only allow the formation of a narrower range of products. The high production of light hydrocarbons over these materials in Py-GC/MS experiments is in contrast with the results obtained in standard reaction systems, which may be attributed to the higher degradation temperature applied in the former promoting a more intense thermal and catalytic cracking reaction of the long chain hydrocarbons.
4. Conclusions
Py-GC/MS is a fast and convenient technique to investigate the catalytic conversion of polymeric materials. Owing to their strong acid properties, zeolitic materials exhibited marked shape selectivity towards the formation of single ring aromatic species (particularly toluene and m/p-xylene) and favoured the complete elimination of long chain hydrocarbons and the formation of a lighter C2-C5 fraction. Aromatic production was slightly higher in nanocrystalline ZSM-5, which was associated with an easier access of its internal acid sites, whereas conventional ZSM-5 and Beta zeolite generated higher levels of light hydrocarbons. However, this difference was less marked than had been observed in cracking experiments on standard reaction systems, which has been attributed to the catalytic reforming of the original products.
Owing to their weaker acid properties, mesostructured Al-SBA-15 generated a very limited aromatic fraction but yielded a complex mixture of long chain linear, branched and cyclic hydrocarbon species. Al-MCM-41 produced a very wide range of aromatic and aliphatic products of varying molecular size, which has been attributed to a combination of medium acid properties and the presence of wider pore channels that permitted a wider degree of alkylation possibilities on the aromatic species.
Acknowledgements
The authors gratefully acknowledge fi nancial support from Ministerio de Ciencia y Tecnologia (project CICYT REN2002-0350/TECNO), and also to REPSOL-YPF and GAIKER (Spain) for providing the plastic samples. G. San Miguel wishes to thank Ministerio de Ciencia y Tecnología for the scholarship under the Ramon y Cajal programme.
ISFR - 2005308
References
[1] J. Aguado, D. Serrano, Feedstock recycling of plastic wastes, Series Editor J.H. Clark, The Royal Society of Chemistry, Cambridge, UK (1999).
[2] A. Tukker, Plastic waste feedstock recycling, chemical recycling and incineration, Rapra Review Reports Vol. 3, Report 148, Shropshire, UK (2002).
[3] D. P. Serrano, J. Aguado, J.M. Escola, E. Garagorri, J.M. Rodríguez, L. Morselli, G. Palazzi, R. Orsi, Appl. Catal., 49 (2004) 257.
[4] D. P. Serrano, J. Aguado, J. M. Escola, J. M. Rodríguez, G. San Miguel, J. Anal. Appl. Pyrolysis, 73, (2005) 79.
[5] R. Van Grieken, J.L. Sotelo, J.M. Menéndez, J. A. Melero, Micropor. Mesopor. Mater. 39 (2000) 135.
Pyrolysis / Solvolysis 309
CATALYTIC UPGRADING OF HIGHER 1-ALKENES FROM POLYETHYLENE THERMAL CRAKING BY MODIFIED
WACKER OXIDATIONJ.M. Escola, J.A. Botas*, M. Bravo and P. García
Department of Chemical and Environmental Technology, ESCET, Universidad Rey Juan Carlos, c/ Tulipán s/n, 28933. Móstoles (Spain), [email protected]
Abstract: The economic success of the feedstock recycling procedures of plastic wastes is increasingly dependent on the conversion of the starting residue into more valuable chemicals. Regarding this subject, thermal cracking of polyethylenes allows the preparation of equimolar mixtures of n-paraffi ns and 1-alkenes within the C2-C100 range [1]. The results obtained by the oxidation of a model 1-olefi n (1-dodecene) as well as a distillate cut (C10-C25) of the product from the thermal cracking of an urban polyethylene waste with a modifi ed Wacker system is described in this work.
1. Introduction
Plastics have become essential materials in our life. As a result, their consumption has been growing continuously during the last decade leading to an proportional increase in the generated amount of plastic waste, that reached 37 million tons only in the European Union in 2003. Despite signifi cant advances during the last years, land fi lling still remains the preferred choice of plastic waste management in Western Europe (72%) [1]. This situation is regarded as unacceptable under the premises of sustainable development because it leads to a loss of potential raw materials and to unwanted environmental pollution. Energy recovery of plastic waste is another alternative of increasing implementation although it is put into question by the public opinion due to possible emission of toxic compounds. Recycling is an environmentally interesting alternative since it tries to reuse plastic materials (mechanical recycling) or convert them into useful fuels or raw chemicals, for instance the starting monomers (feedstock recycling) [2]. However, mechanical recycling is limited to thermoplastic materials. In addition, the quality of the recycled plastic from polymer mixtures is decreasing with every cycle, so that this method is limited to several cycles. In contrast, chemical feedstock recycling is becoming a more attractive alternative [3].
The profi tability of the different feedstock recycling procedures of plastic waste is requiring the conversion of the starting residue into more valuable chemicals. For example, for polyolefi ns (polyethylene, polypropylene), catalytic conversions towards hydrocarbon mixtures has been proposed as a feasible feedstock recycling method [4,5] but these are low-cost products which can only be used as fuels.
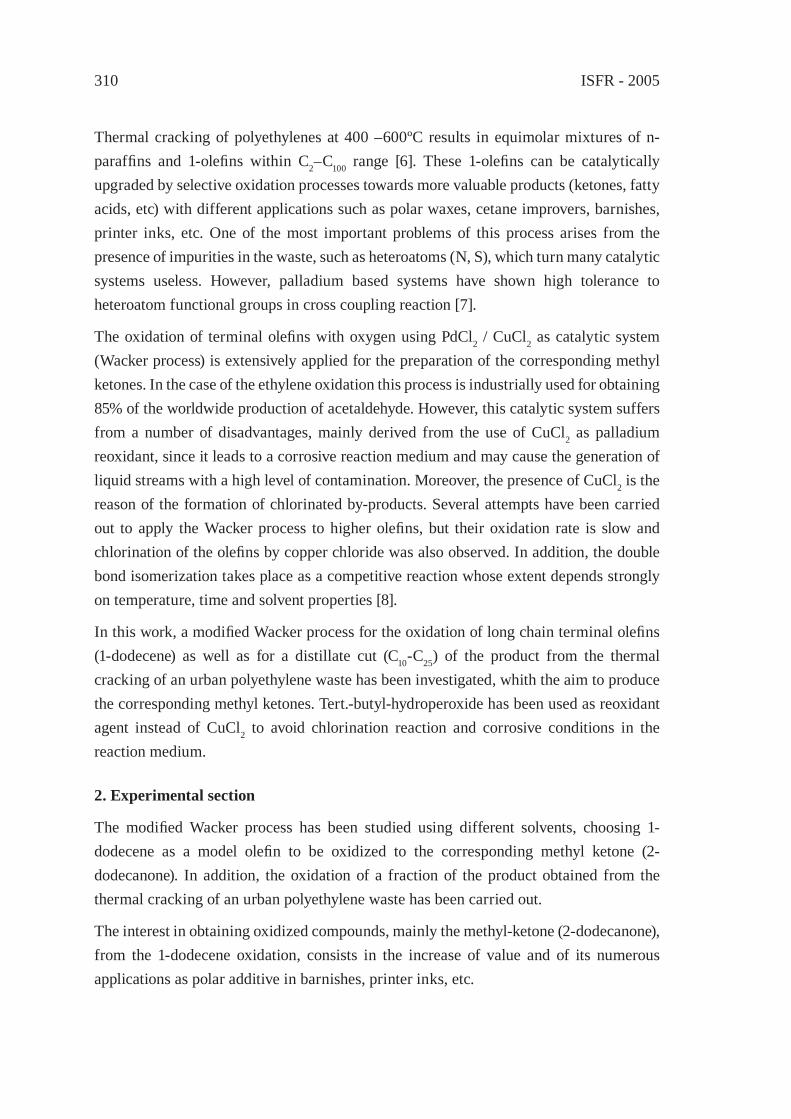
ISFR - 2005310
Thermal cracking of polyethylenes at 400 –600ºC results in equimolar mixtures of n-paraffi ns and 1-olefi ns within C2–C100 range [6]. These 1-olefi ns can be catalytically upgraded by selective oxidation processes towards more valuable products (ketones, fatty acids, etc) with different applications such as polar waxes, cetane improvers, barnishes, printer inks, etc. One of the most important problems of this process arises from the presence of impurities in the waste, such as heteroatoms (N, S), which turn many catalytic systems useless. However, palladium based systems have shown high tolerance to heteroatom functional groups in cross coupling reaction [7].
The oxidation of terminal olefi ns with oxygen using PdCl2 / CuCl2 as catalytic system (Wacker process) is extensively applied for the preparation of the corresponding methyl ketones. In the case of the ethylene oxidation this process is industrially used for obtaining 85% of the worldwide production of acetaldehyde. However, this catalytic system suffers from a number of disadvantages, mainly derived from the use of CuCl2 as palladium reoxidant, since it leads to a corrosive reaction medium and may cause the generation of liquid streams with a high level of contamination. Moreover, the presence of CuCl2 is the reason of the formation of chlorinated by-products. Several attempts have been carried out to apply the Wacker process to higher olefi ns, but their oxidation rate is slow and chlorination of the olefi ns by copper chloride was also observed. In addition, the double bond isomerization takes place as a competitive reaction whose extent depends strongly on temperature, time and solvent properties [8].
In this work, a modifi ed Wacker process for the oxidation of long chain terminal olefi ns (1-dodecene) as well as for a distillate cut (C10-C25) of the product from the thermal cracking of an urban polyethylene waste has been investigated, whith the aim to produce the corresponding methyl ketones. Tert.-butyl-hydroperoxide has been used as reoxidant agent instead of CuCl2 to avoid chlorination reaction and corrosive conditions in the reaction medium.
2. Experimental section
The modifi ed Wacker process has been studied using different solvents, choosing 1-dodecene as a model olefi n to be oxidized to the corresponding methyl ketone (2-dodecanone). In addition, the oxidation of a fraction of the product obtained from the thermal cracking of an urban polyethylene waste has been carried out.
The interest in obtaining oxidized compounds, mainly the methyl-ketone (2-dodecanone), from the 1-dodecene oxidation, consists in the increase of value and of its numerous applications as polar additive in barnishes, printer inks, etc.

Pyrolysis / Solvolysis 311
2.1 Oxidation reactions
Catalytic oxidation reactions have been carried out in a stirred glass batch reactor. The reaction mixture is continuously stirred at 300 r.p.m and the reaction temperature was held constant at 80 ºC.
Tert butyl hydroperoxide (TBHP) was used as the palladium reoxidant agent, since it has been demonstrated that TBHP is a good substitute of the CuCl2 (reoxidant) in the Wacker process. Solvents with different polarities (Acetonitrile, tetrahydrofurane, cyclohexane, sulfolane, and dimethylformamide) were selected as reaction media in order to analyze their effect on reaction selectivity.
The reaction medium was composed of 0.056 moles of 1-dodecene, of the necessary stoichiometric amount of TBHP, and of a solvent (acetonitrile, tetrahydrofurane, cyclohexane, sulfolane and dimethylformamide). The mixture was placed in the batch reactor, and after 5 minutes of homogenization the PdCl2 was added. The molar ratios used in the reaction medium were: solvent/substrate 10:1, oxidant/substrate 6:1, substrate/catalyst 50:1.
The reaction mixtures can be biphasic, depending on the used solvent. In these cases, a fi xed amount of tetrahydrofurane was added into reaction mixture in order to convert the biphasic mixture in a single-phase when the experiment was fi nished. This homogenization is necessary for the correct analysis of the reaction products.
Experiments were carried out using different reaction times in order to study the progress of the conversion and selectivity of the modifi ed Wacker process.
2.2. Analysis
The composition of the reaction mixture has been determined by GC (Figure 1) and FT-IR analysis. For the quantitative analysis of the composition of the reaction mixture it is necessary to calibrate the analytical equipment with the following procedure. The GC calibration has been made with a standard solution (tetraline as internal pattern). This solution has been prepared by mixing 1-dodecene or 2-dodecanone with tetraline and tetahydrofurane as solvent in different concentrations. Thus two calibration curves were obtained for both main compounds. In addition the FT-IR calibration was made using similar mixtures with different concentrations of the main compounds as well.
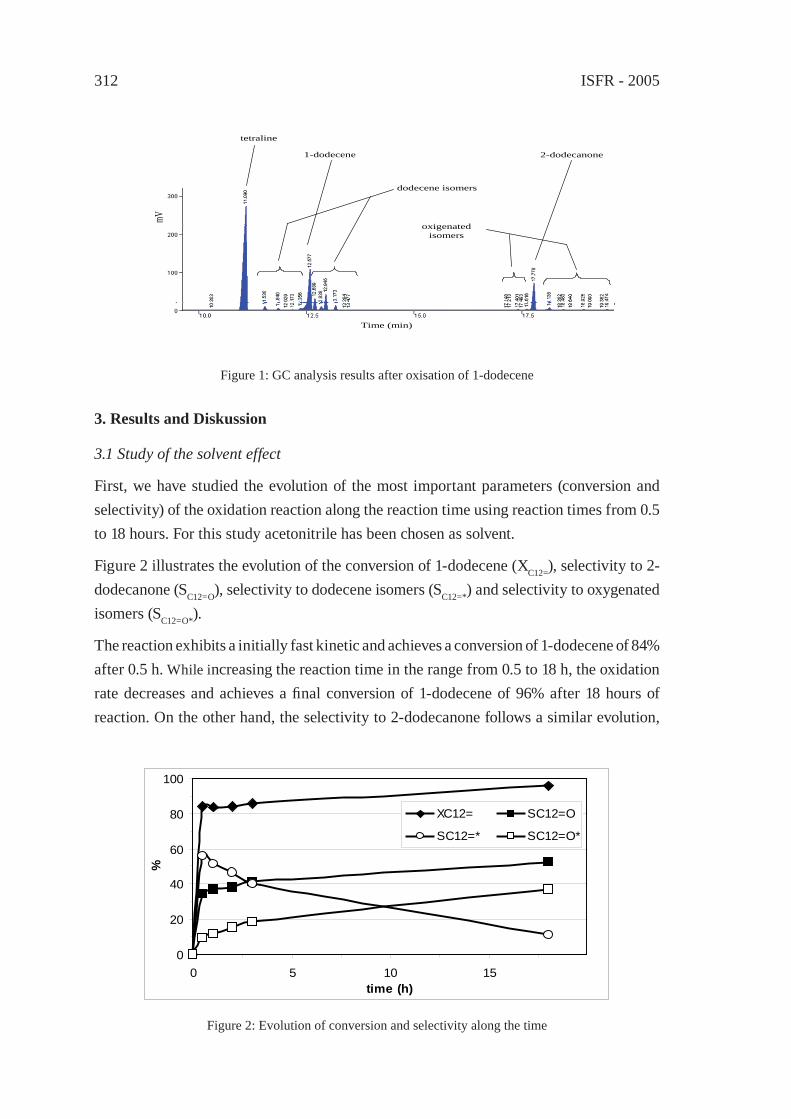
ISFR - 2005312
3. Results and Diskussion
3.1 Study of the solvent effect
First, we have studied the evolution of the most important parameters (conversion and selectivity) of the oxidation reaction along the reaction time using reaction times from 0.5 to 18 hours. For this study acetonitrile has been chosen as solvent.
Figure 2 illustrates the evolution of the conversion of 1-dodecene (XC12=), selectivity to 2-dodecanone (SC12=O), selectivity to dodecene isomers (SC12=*) and selectivity to oxygenated isomers (SC12=O*).
The reaction exhibits a initially fast kinetic and achieves a conversion of 1-dodecene of 84% after 0.5 h. While increasing the reaction time in the range from 0.5 to 18 h, the oxidation rate decreases and achieves a fi nal conversion of 1-dodecene of 96% after 18 hours of reaction. On the other hand, the selectivity to 2-dodecanone follows a similar evolution,
tetraline
1-dodecene 2-dodecanone
dodecene isomers
oxigenated isomers
Time (min)
mV
Figure 1: GC analysis results after oxisation of 1-dodecene
0
20
40
60
80
100
0 5 10 15time (h)
%
XC12= SC12=O
SC12=* SC12=O*
Figure 2: Evolution of conversion and selectivity along the time
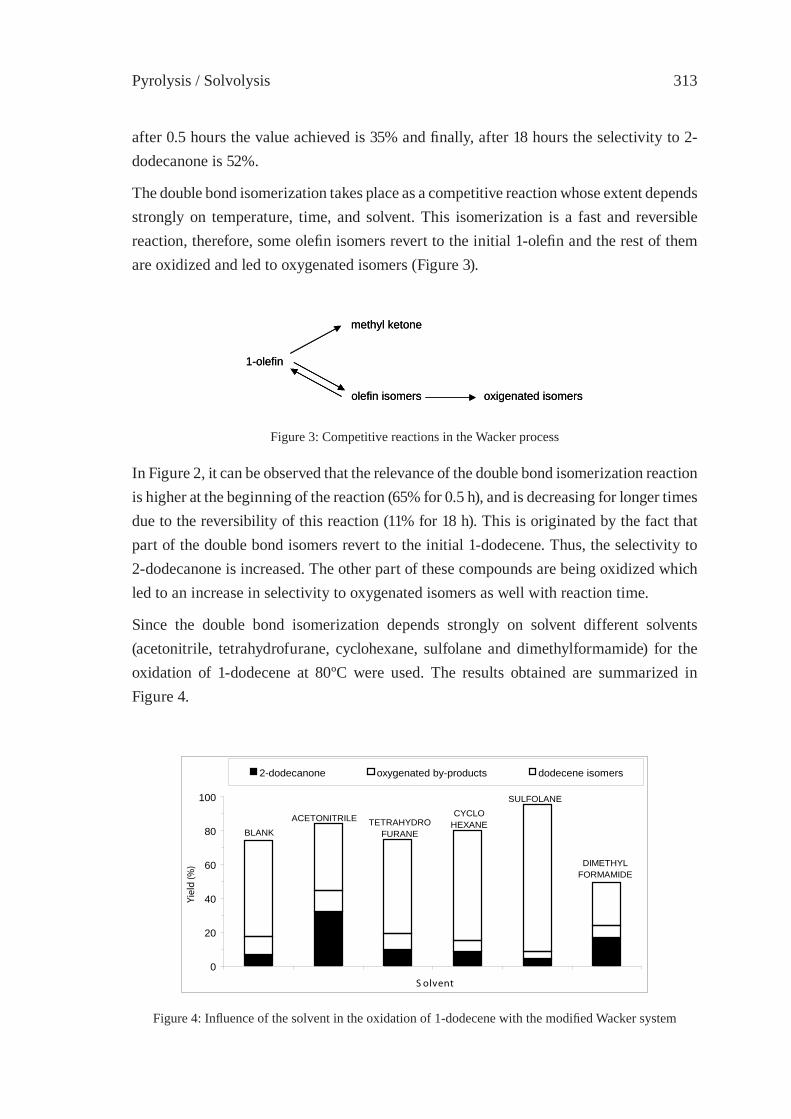
Pyrolysis / Solvolysis 313
after 0.5 hours the value achieved is 35% and fi nally, after 18 hours the selectivity to 2-dodecanone is 52%.
The double bond isomerization takes place as a competitive reaction whose extent depends strongly on temperature, time, and solvent. This isomerization is a fast and reversible reaction, therefore, some olefi n isomers revert to the initial 1-olefi n and the rest of them are oxidized and led to oxygenated isomers (Figure 3).
1-olefin
methyl ketone
olefin isomers oxigenated isomers
1-olefin
methyl ketone
olefin isomers oxigenated isomers
Figure 3: Competitive reactions in the Wacker process
In Figure 2, it can be observed that the relevance of the double bond isomerization reaction is higher at the beginning of the reaction (65% for 0.5 h), and is decreasing for longer times due to the reversibility of this reaction (11% for 18 h). This is originated by the fact that part of the double bond isomers revert to the initial 1-dodecene. Thus, the selectivity to 2-dodecanone is increased. The other part of these compounds are being oxidized which led to an increase in selectivity to oxygenated isomers as well with reaction time.
Since the double bond isomerization depends strongly on solvent different solvents (acetonitrile, tetrahydrofurane, cyclohexane, sulfolane and dimethylformamide) for the oxidation of 1-dodecene at 80ºC were used. The results obtained are summarized in Figure 4.
0
20
40
60
80
100
S olvent
Yiel
d (%
)
2-dodecanone oxygenated by-products dodecene isomers
BLANKACETONITRILE TETRAHYDRO
FURANE
CYCLOHEXANE
SULFOLANE
DIMETHYLFORMAMIDE
Figure 4: Infl uence of the solvent in the oxidation of 1-dodecene with the modifi ed Wacker system

ISFR - 2005314
Along with the irreversible oxidation, competitive reversible isomerization by double bond shift is also occurring in all cases. Conversions were always above 70% except for the case with dimethylformamide (40%). However, the yields towards 2-dodecanone and oxygenated by-products varied markedly with solvents. In acetonitrile, the highest yield of 2-dodecanone (32%) was attained while the corresponding one of dodecene isomers were attained with sulfolane (87%). The polarity of the studied solvents decreases in the order: cyclohexane > tetrahydrofurane > acetonitrile > dimethylformamide > sulfolane. A clear relation between the polarity and the obtained results have not been found. The most effective solvent is acetonitrile, but for the rest of the solvents this effi ciency does not follow any order corresponding with the polarity.
The suitable choice of the solvent is a key parameter for the substrate oxidation, likely due to a certain specifi c interaction of the solvent with the palladium complex.
3.2 Oxidation of a thermal urban polyethylene waste
The wax product from the thermal cracking of an urban polyethylene waste has been distillated into two fractions, a liquid (~ C10-C25) and a solid one. In general, for this kind of thermally treated waste the olefi n/paraffi n molar ratio is approximately one.
The liquid distillate was also oxidized by the modifi ed Wacker system using acetonitrile as solvent at 80 ºC and a reaction time of 6 hours. FT-IR spectra of the starting and treated samples were measured to analyze the advance of the oxidation reaction. Figure 5 shows two spectra, before and after the reaction. The fi rst one shows a broad signal at 1640 cm-1, typical for samples with a double bond. After the reaction this band decreases and a new signal at 1720 cm-1 corresponding to a carbonyl carbon appears. Hence, oxidation of double bond has been carried out and led to the required oxygenated compounds: methyl-ketones and internal ketones. The oxidation of this urban waste polyethylene thermal cracking wax led to a good yield of close to 30%.
3000 2000 1000 0
0.0
0.5
1.0
1.5
before oxidation
after oxidation
1720 cm-1
1640cm-1
Abso
rbanc
e
cm-1
Figure 5: FT-IR spectra before and after the oxidation a thermal urban polyethylene waste

Pyrolysis / Solvolysis 315
4. Conclusion
The oxidation of long chain 1-olefi ns towards 2-methyl ketones with high conversions and selectivity have been performed using a modifi ed Wacker process with TBHP as reoxidant and different solvents at 80 °C.
The modifi ed Wacker oxidation of 1-dodecene using acetonitrile as solvent shows a high conversion and selectivity towards 2-dodecanone. The extent of the competing isomerization reaction was substantially decreased by acetonitrile compared with the other solvents studied, probably due to the biphasic nature of the system. The use of longer reaction times gave rise to higher conversions and improved selectivity. It has also been demonstrated that the polarity of the solvent has no direct infl uence on the reaction selectivity.
Finally, the C10-C25 cut of an urban waste polyethylene thermal cracking wax has been oxidized by the modifi ed Wacker process, applying the best conditions detected in the 1-dodecene studies. This oxidation took place with a promising yield (~ 30%).
5. Acknowledgements
We want to thank “Ministerio de Ciencia y Tecnología” (project CICYT REN2002-03530) for the fi nancial support of this research. We also want to thank Repsol-YPF for providing the plastic samples used in this work.
6. References
[1] Association of Plastics Manufacturers in Europe (APME), Summary Report: An Analysis of Plastics Consumption and Recovery in Western Europe 2003, Brussels (2004)
[2] Aguado J., Serrano D.P., Feedstock Recycling of Plastic Wastes, Royal Society of Chemistry (1999).
[3] Serrano, D.P., Aguado J., Rodríguez J.M., Morselli, L., Orsi R., J. Anal. Appl. Pyrolysis, 68-69:481, (2003).
[4] Aguado, J., Serrano, D., Romero, M.D. and Escola, J.M., Chem. Commun., 725 (1996).
[5] Kaminsky, W., Schmidt, H. and Simon, C.M., Macromol. Symp., 152:191 (2000).[6] Wampler, T.P., J. Anal. Appl. Pyrolysis, 15:187 (1989).[7] Frisch, A.C. and Beller, M., Angew. Chem. Int. Ed., 44:674 (2005).[8] Aguado, J., Serrano, D.P., Van Grieken, R., Escola, J.M., García, R., Carretero, S., 4th
World Congreso on Oxidation Catalysis, 493 (2001).

ISFR - 2005316

Pyrolysis / Solvolysis 317
PYROLYSIS OF POLYOLEFINS BY ZIEGLER-NATTA CATALYSTS
Ignacio Javier Núñez Zorriqueta, Walter KaminskyUniversity of Hamburg, Institute of Technical and Macromolecular Chemistry,
Bundesstrasse 45, 20146 Hamburg, [email protected]
Abstract: High temperatures needed for pyrolysis in industrial processes make these processes expensive. A possibility to operate and decrease the pyrolysis temperatures is the use of catalytical systems [1-3] . State of the art is the use of FCC catalyst. It would be more economical if the Ziegler-Natta catalysis for synthesis can also be used for depolymerization of polyolefi ns. To obtain the desired products, our present work uses Ziegler-Natta catalyst compounds such as titanium chlorides or superacids to reduce operation temperatures using the Hamburg Pyrolysis Process.
1. Introduction
The consumption of plastics increases day by day. All these plastics fi nish their useful life equally and fi nally they have to be removed from environment. The by far most important plastics are polyolefi ns which are mainly produced by Ziegler-Natta catalyst. The best dispose of these plastics is the feedstock recycling coming along with the recovery of raw materials.
The present work is focused on polypropylene. Pyrolysis of this material has been studied as a recycling technology [4-5]. At temperatures of 800 ºC mainly the monomer and another light hydrocarbon fractions can be recovered. While decreasing the pyrolysis temperature, it can be observed that the amount of heavy oil fractions increases. But if the temperature is increased to a certain minimum value the pyrolysis reaction can not go on anymore. The high temperatures needed in the process make this technology not rentable in the economical point of view.
In the present work it has been used Ziegler-Natta catalyst to study the products obtained and the infl uence of the catalysts in the pyrolysis reaction.
2. Experimental
2.1. Material
The feedstock is a polypropylene of industrial quality. The physical properties are characterized by the molar mass (Mw) with around 316.000 g/mol, melting point (Tm) with 150 ºC and 90 % of the molecule is isotactic. The material is presented in pellets with a particle size of 3 mm approximately.

ISFR - 2005318
The catalysts used in the study are TiCl3 and TiCl4. TiCl3 is a red-violet solid with crystalline appearance, melting point (Tm) 425 ºC (decomposes), no boiling point described, and density (ρ) 2.700 kg/m3. TiCl4 is a colourless to yellow liquid, melting point (Tm) with –24 ºC, boiling point (Tb) with 136.5 ºC and density (ρ) 1.300 kg/m3.
2.2. Equipment
The experiments were carried out in two different types of reactors. One of them is a laboratory pyrolysis batch reactor called PR-1 (Fig. 1) with a volume of 100 ml witch is heated with an electrical resistance. The capacity of the reactor is about 10 g of material per run.
Figure 1: Flow sheet of the batch reactor pyrolysis plant (1- 10 g per run).
To begin with the atmosphere there has to be mentioned that the whole system works under nitrogen atmosphere. The reactor was heated until the reaction temperature was reached while the material stayed in the silo. The silo was opened when the temperature was achieved, and the material fell down to the reactor. All the products obtained crossed a distillation column cooled with water and a nitrogen cooling trap. All the oils were condensed in this trap meanwhile the gases were put into storage.
The second reactor used for the experiments was an indirect heated fl uidized-bed reactor
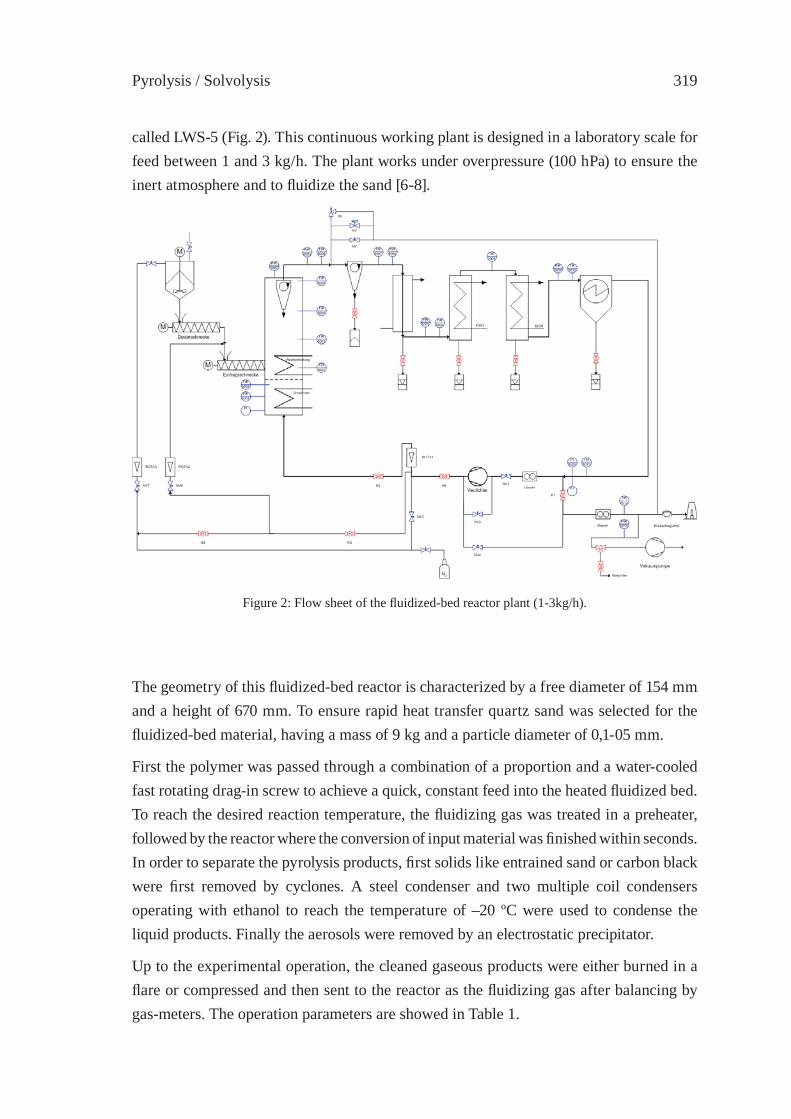
Pyrolysis / Solvolysis 319
called LWS-5 (Fig. 2). This continuous working plant is designed in a laboratory scale for feed between 1 and 3 kg/h. The plant works under overpressure (100 hPa) to ensure the inert atmosphere and to fl uidize the sand [6-8].
Figure 2: Flow sheet of the fl uidized-bed reactor plant (1-3kg/h).
The geometry of this fl uidized-bed reactor is characterized by a free diameter of 154 mm and a height of 670 mm. To ensure rapid heat transfer quartz sand was selected for the fl uidized-bed material, having a mass of 9 kg and a particle diameter of 0,1-05 mm.
First the polymer was passed through a combination of a proportion and a water-cooled fast rotating drag-in screw to achieve a quick, constant feed into the heated fl uidized bed. To reach the desired reaction temperature, the fl uidizing gas was treated in a preheater, followed by the reactor where the conversion of input material was fi nished within seconds. In order to separate the pyrolysis products, fi rst solids like entrained sand or carbon black were fi rst removed by cyclones. A steel condenser and two multiple coil condensers operating with ethanol to reach the temperature of –20 ºC were used to condense the liquid products. Finally the aerosols were removed by an electrostatic precipitator.
Up to the experimental operation, the cleaned gaseous products were either burned in a fl are or compressed and then sent to the reactor as the fl uidizing gas after balancing by gas-meters. The operation parameters are showed in Table 1.
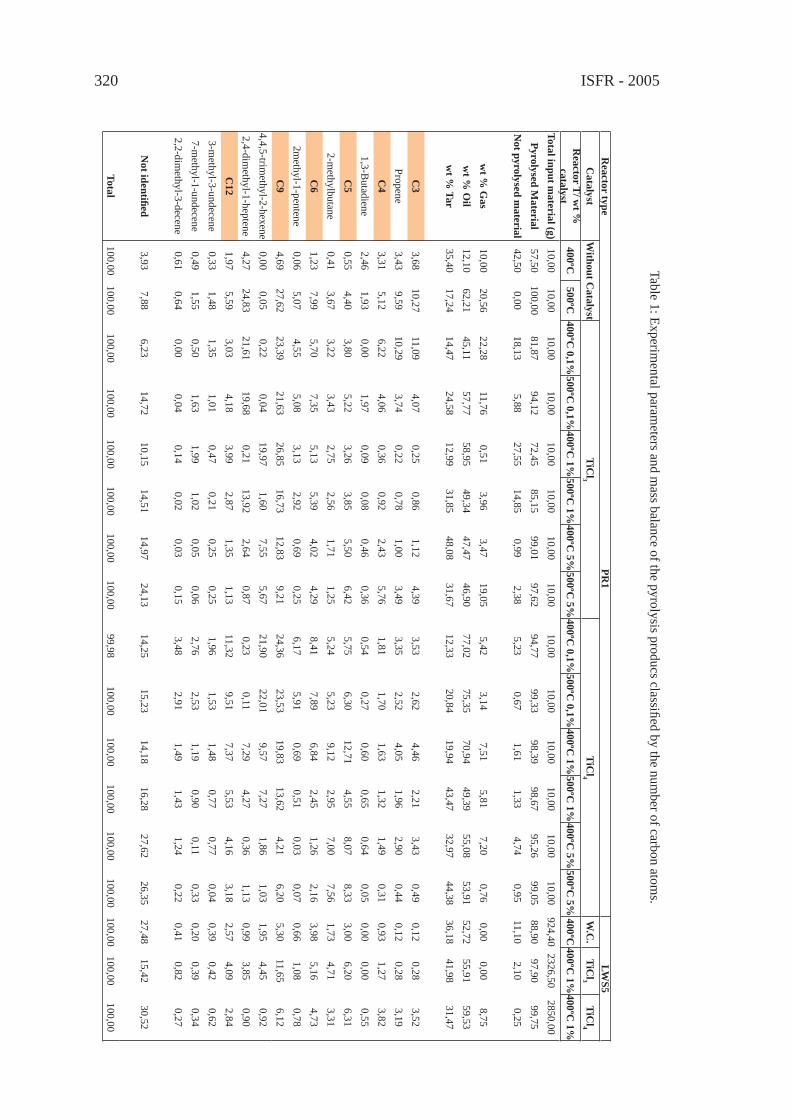
ISFR - 2005320
Reactor type
PR1
LWS5
Catalyst
Without C
atalystTiC
l3TiC
l4W
.C.
TiCl3
TiCl4
Reactor T
/ wt %
catalyst
400ºC500ºC
400ºC 0,1%
500ºC 0,1%
400ºC 1%
500ºC 1%
400ºC 5%
500ºC 5%
400ºC 0,1%
500ºC 0,1%
400ºC 1%
500ºC 1%
400ºC 5%
500ºC 5%
400ºC400ºC
1%400ºC
1%
Total input material (g)
10,0010,00
10,0010,00
10,0010,00
10,0010,00
10,0010,00
10,0010,00
10,0010,00
924,402326,50
2850,00Pyrolysed M
aterial57,50
100,0081,87
94,1272,45
85,1599,01
97,6294,77
99,3398,39
98,6795,26
99,0588,90
97,9099,75
Not pyrolysed m
aterial42,50
0,0018,13
5,8827,55
14,850,99
2,385,23
0,671,61
1,334,74
0,9511,10
2,100,25
wt %
Gas
10,0020,56
22,2811,76
0,513,96
3,4719,05
5,423,14
7,515,81
7,200,76
0,000,00
8,75w
t % O
il12,10
62,2145,11
57,7758,95
49,3447,47
46,9077,02
75,3570,94
49,3955,08
53,9152,72
55,9159,53
wt %
Tar35,40
17,2414,47
24,5812,99
31,8548,08
31,6712,33
20,8419,94
43,4732,97
44,3836,18
41,9831,47
C3
3,6810,27
11,094,07
0,250,86
1,124,39
3,532,62
4,462,21
3,430,49
0,120,28
3,52Propene
3,439,59
10,293,74
0,220,78
1,003,49
3,352,52
4,051,96
2,900,44
0,120,28
3,19C
43,31
5,126,22
4,060,36
0,922,43
5,761,81
1,701,63
1,321,49
0,310,93
1,273,82
1,3-Butadiene
2,461,93
0,001,97
0,090,08
0,460,36
0,540,27
0,600,65
0,640,05
0,000,00
0,55C
50,55
4,403,80
5,223,26
3,855,50
6,425,75
6,3012,71
4,558,07
8,333,00
6,206,31
2-methylbutane
0,413,67
3,223,43
2,752,56
1,711,25
5,245,23
9,122,95
7,007,56
1,734,71
3,31C
61,23
7,995,70
7,355,13
5,394,02
4,298,41
7,896,84
2,451,26
2,163,98
5,164,73
2methyl-1-pentene
0,065,07
4,555,08
3,132,92
0,690,25
6,175,91
0,690,51
0,030,07
0,661,08
0,78C
94,69
27,6223,39
21,6326,85
16,7312,83
9,2124,36
23,5319,83
13,624,21
6,205,30
11,656,12
4,4,5-trimethyl-2-hexene
0,000,05
0,220,04
19,971,60
7,555,67
21,9022,01
9,577,27
1,861,03
1,954,45
0,922,4-dim
ethyl-1-heptene4,27
24,8321,61
19,680,21
13,922,64
0,870,23
0,117,29
4,270,36
1,130,99
3,850,90
C12
1,975,59
3,034,18
3,992,87
1,351,13
11,329,51
7,375,53
4,163,18
2,574,09
2,843-m
ethyl-3-undecene0,33
1,481,35
1,010,47
0,210,25
0,251,96
1,531,48
0,770,77
0,040,39
0,420,62
7-methyl-1-undecene
0,491,55
0,501,63
1,991,02
0,050,06
2,762,53
1,190,90
0,110,33
0,200,39
0,342,2-dim
ethyl-3-decene0,61
0,640,00
0,040,14
0,020,03
0,153,48
2,911,49
1,431,24
0,220,41
0,820,27
Not identifi ed
3,937,88
6,2314,72
10,1514,51
14,9724,13
14,2515,23
14,1816,28
27,6226,35
27,4815,42
30,52
Total100,00
100,00100,00
100,00100,00
100,00100,00
100,0099,98
100,00100,00
100,00100,00
100,00100,00
100,00100,00
Table 1: Experimental param
eters and mass balance of the pyrolysis producs classifi ed by the num
ber of carbon atoms.
Pyrolysis / Solvolysis 321
2.3. Analytical methods
The preliminary analysis was carried out in a pyrolysis–gas chromatograph–mass spectrometer (Py–GC–MS, Pyrolyzer: Shimadzu PYR-4A, GC: Shimadzu GC-17A, MS: Shimadzu QP5000, J&W Scientifi c DB-5MS) in order to fi nd the appropriate pyrolysis temperature and to reduce the number of needed experiments.
The gas fraction was analyzed quantitatively by gas chromatography with a fl ame ionization detector (GC–FID, Chrompack CP 9002, Chrompack CP-Al2O3/KCl-Plot) for the hydrocarbons and by gas chromatography with a thermal conductivity detector (GC–TCD, Chrompack CP 9001, Chrompack Carboplot P7) for the permanent gases (N2, H2, CO,CO2). Both measurements were correlated via methane and the response factors of the hydrocarbons were calculated. The qualitative analysis of the hydrocarbons was carried out by gas chromatography with mass spectrometer (GC–MS, GC: HP 5890, MS: Fisons Instruments VG 70 SE, Chrompack CP-Al2O3/KCl-Plot).
The oil fraction was characterized by GC–FID (HP 5890, Macherey & Nagel SE 52) and GC–MS (GC: HP 5890, MS: Fisons Instruments VG 70 SE, Macherey & Nagel SE 52) and the results were covered by an elementary analysis (Carlo Erba CE 1106 CHNS-O, following DIN 51721). The water content was determined by titrating following the Karl–Fischer method (Methrom E 547, ISO 8534). A simulated distillation column was used to characterize the tar fraction (GC–FID, HP 5890 SII, Varian WCOT Ulti-Metal CP SimDist CB) as well as the elementary analysis and an MS (Fisons Instruments VG 70 SE).
In addition to the elementary analysis of the carbon black and the polymer, the physical properties were measured using nuclear magnetic resonance spectroscopy (13C NMR, Bruker Ultrashield 400), differential scanning calorimetry (DSC, Mettler Toledo DSC 821) and gel permeation chromatography (GPC, Waters 150-C-ALC/GPC).
3. Results and discussion
The experiments were conducted at 400 ºC and 500 ºC and atmospheric pressure. The amounts of material and catalyst and the experimental results are shown in Table 1 and in Fig. 3 and Fig 4.
All products were collected and balanced. In order to avoid secondary crack reactions, the different oily fractions were mixed to be distilled at a pressure of 3 hPa up to 160 ºC representing the conditions of atmospheric pressure and 300 ºC.
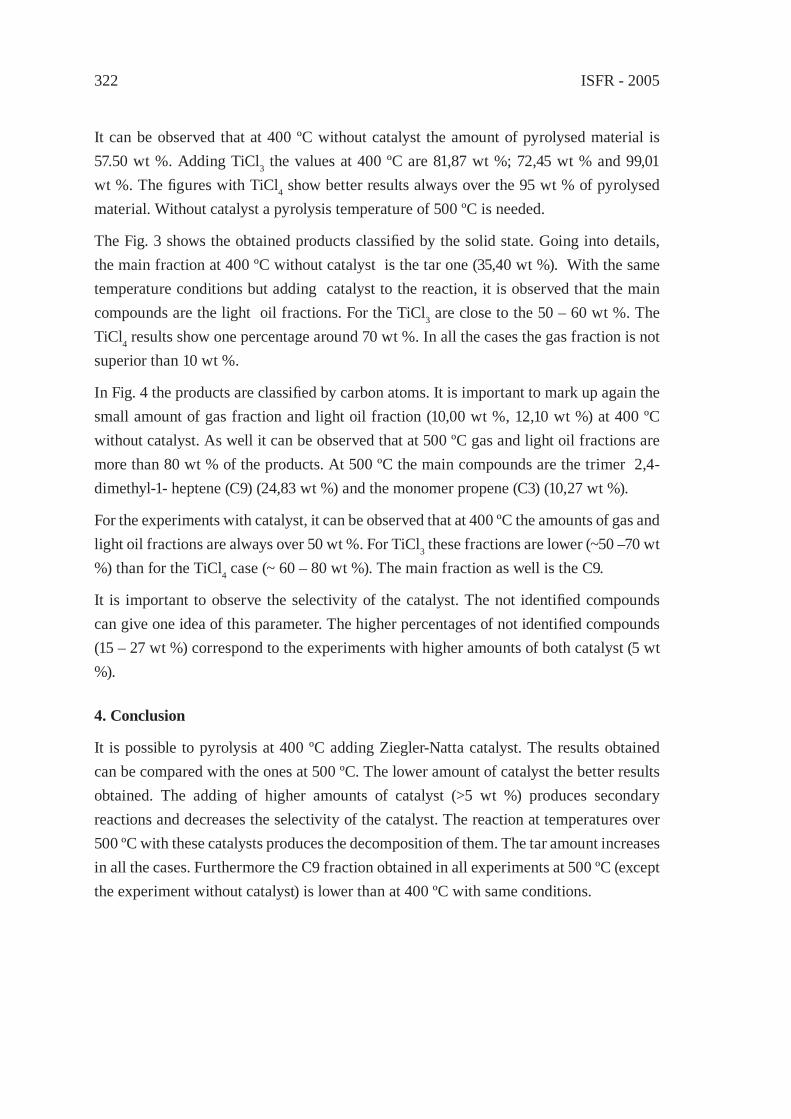
ISFR - 2005322
It can be observed that at 400 ºC without catalyst the amount of pyrolysed material is 57.50 wt %. Adding TiCl3 the values at 400 ºC are 81,87 wt %; 72,45 wt % and 99,01 wt %. The fi gures with TiCl4 show better results always over the 95 wt % of pyrolysed material. Without catalyst a pyrolysis temperature of 500 ºC is needed.
The Fig. 3 shows the obtained products classifi ed by the solid state. Going into details, the main fraction at 400 ºC without catalyst is the tar one (35,40 wt %). With the same temperature conditions but adding catalyst to the reaction, it is observed that the main compounds are the light oil fractions. For the TiCl3 are close to the 50 – 60 wt %. The TiCl4 results show one percentage around 70 wt %. In all the cases the gas fraction is not superior than 10 wt %.
In Fig. 4 the products are classifi ed by carbon atoms. It is important to mark up again the small amount of gas fraction and light oil fraction (10,00 wt %, 12,10 wt %) at 400 ºC without catalyst. As well it can be observed that at 500 ºC gas and light oil fractions are more than 80 wt % of the products. At 500 ºC the main compounds are the trimer 2,4- dimethyl-1- heptene (C9) (24,83 wt %) and the monomer propene (C3) (10,27 wt %).
For the experiments with catalyst, it can be observed that at 400 ºC the amounts of gas and light oil fractions are always over 50 wt %. For TiCl3 these fractions are lower (~50 –70 wt %) than for the TiCl4 case (~ 60 – 80 wt %). The main fraction as well is the C9.
It is important to observe the selectivity of the catalyst. The not identifi ed compounds can give one idea of this parameter. The higher percentages of not identifi ed compounds (15 – 27 wt %) correspond to the experiments with higher amounts of both catalyst (5 wt %).
4. Conclusion
It is possible to pyrolysis at 400 ºC adding Ziegler-Natta catalyst. The results obtained can be compared with the ones at 500 ºC. The lower amount of catalyst the better results obtained. The adding of higher amounts of catalyst (>5 wt %) produces secondary reactions and decreases the selectivity of the catalyst. The reaction at temperatures over 500 ºC with these catalysts produces the decomposition of them. The tar amount increases in all the cases. Furthermore the C9 fraction obtained in all experiments at 500 ºC (except the experiment without catalyst) is lower than at 400 ºC with same conditions.
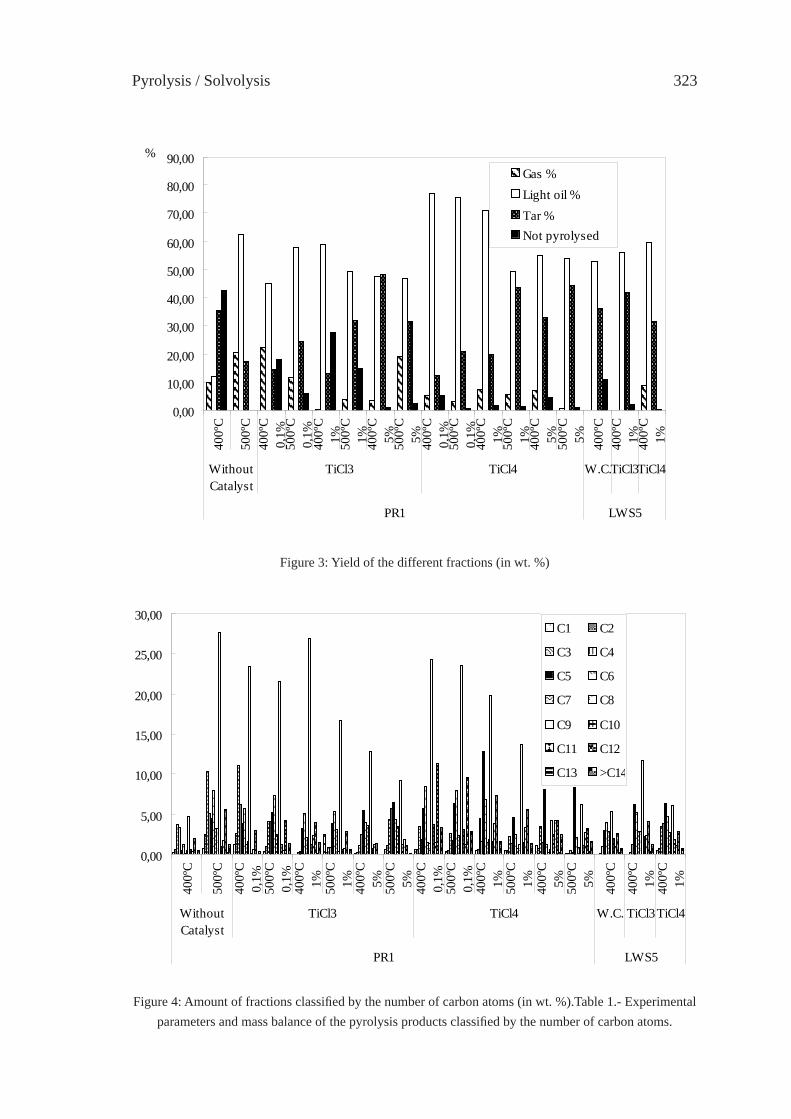
Pyrolysis / Solvolysis 323
0,00
10,00
20,00
30,00
40,00
50,00
60,00
70,00
80,00
90,00
400º
C
500º
C40
0ºC
0,1%
500º
C0,
1%40
0ºC
1% 500º
C1% 400º
C5% 500º
C5% 400º
C0,
1%50
0ºC
0,1%
400º
C1% 500º
C1% 400º
C5% 500º
C5% 400º
C40
0ºC
1% 400º
C1%
WithoutCatalyst
TiCl3 TiCl4 W.C.TiCl3TiCl4
PR1 LWS5
%Gas %Light oil %Tar %Not pyrolysed
Figure 3: Yield of the different fractions (in wt. %)
0,00
5,00
10,00
15,00
20,00
25,00
30,00
400º
C
500º
C
400º
C0,
1%50
0ºC
0,1%
400º
C1% 500º
C1% 400º
C5% 500º
C5% 400º
C0,
1%50
0ºC
0,1%
400º
C1% 500º
C1% 400º
C5% 500º
C5% 400º
C
400º
C1% 400º
C1%
WithoutCatalyst
TiCl3 TiCl4 W.C. TiCl3TiCl4
PR1 LWS5
C1 C2
C3 C4
C5 C6
C7 C8
C9 C10
C11 C12
C13 >C14
Figure 4: Amount of fractions classifi ed by the number of carbon atoms (in wt. %).Table 1.- Experimental parameters and mass balance of the pyrolysis products classifi ed by the number of carbon atoms.
ISFR - 2005324
5. References
[1] J. Mertinkat, Ph.D. Thesis, University of Hamburg, Germany, 1999[2] J. Mertincat, A. Kirsten, M. Predel, W. Kaminsky, J. Anal. Appl. Pyrolysis 49 (1999)
87-95.[3] J. Aguado, D.P. Serrano, J.M. Escola, E. Garagorri, Cat. Today 75 (2002) 257-262[4] J. Brandrup, M. Bittner, W. Michaeli, G. Menges, (Eds.), Recycling and Recovery of
Plastics, Hanser, Munich, 1996.[5] J.A. Conesa, i. Martin-Gullon, R. Font, J. Jauhiainen, Environ. Sci. Technol. 38 (2004)
3189-3194.[6] M. Predel, and W. Kaminsky, Polym. Degrad. Stab. 70 (2000) 373.[7] H. Schmidt, C. Simon, W. Kaminsky, Macromol. Symp. 152 (2000) 191.[8] J.S. Kim, W. Kaminsky, J. Anal. Appl. Pyrolysis 51 (1999) 127.

Pyrolysis / Solvolysis 325
DEVELOPMENT OF A FEEDSTOCK RECYCLING PROCESS FOR CONVERTING WASTE PLASTICS TO PETROCHEMICALS
Junya Nishino1, Masaaki Itoh1, Yoshinobu Fujiyoshi1, Yoshihisa Matsumoto2, Ryo Takahashi2 and Yoshio Uemichi3
1 Ishikawajima-Harima Heavy Industries Co., Ltd., Yokohama, Japan,[email protected]
2Kanagawa Industrial Technology Research Institute3 Muroran Institute of Technology, Muroran, Japan
Abstract: The catalytic degradation of polyolefi n using H-gallosilicates was examined in the present study using a bench scale reactor (1.0 kg/hr) with continuous feeding and 3 types of polyolefi n plastics (high-density polyethylene pellets, industrial waste polyethylene pellets, waste polyolefi n pellets). The main products are benzene, toluene, and xylenes (BTX), and their maximum total was about 50 wt%. Production of BTX does not depend so much on the type of plastics except in the case of waste polyolefi n pellets. In the case of waste polyolefi n pellets, gases of C3 to C5 were more than those for HDPE and industrial waste polyethylene pellets. In 40 days operation, coking and sintering of catalyst were observed, showing that the optimization of regeneration conditions is needed for long term operations.
1. Introduction
As of 2001, 10.16 million tons per year of municipal and industrial waste plastics were discharged in our country. The Ministry of the Environment enforced the Containers and Packaging Recycling Law in 1997 for the recycling waste plastics for containers and packaging, which at 5.28 million tons account for about 70% of municipal wastes, for “PET bottles” and in 2000 for “other plastics.” For recycling plastics, material recycling, chemical recycling, and thermal recycling are available. The Containers and Packaging Recycling Law stipulates material and chemical recycling for “other plastics.” In 2001, 14% of recycling was material recycling, 2% was chemical recycling, and 36% was thermal recycling, and the ratio of the chemical recycling is very low. To construct a social system that will allow smooth and effi cient recycling in order to realize an environment-friendly society, recycling methods should be balanced quantitatively so that optimal recycling methods including the cascade method can be selected in accordance with the type and quality of waste plastics, and the ratio of the chemical recycling can be raised.
As chemical recycling, liquefaction, gasifi cation, smelting by blast furnace, smelting by coke oven, and solvolysis are available. Most of the waste plastics subject to the Containers and Packaging Recycling Law that are chemically recycled, are processed through smelting by blast furnace and smelting by coke oven, and liquefaction is less than 10%
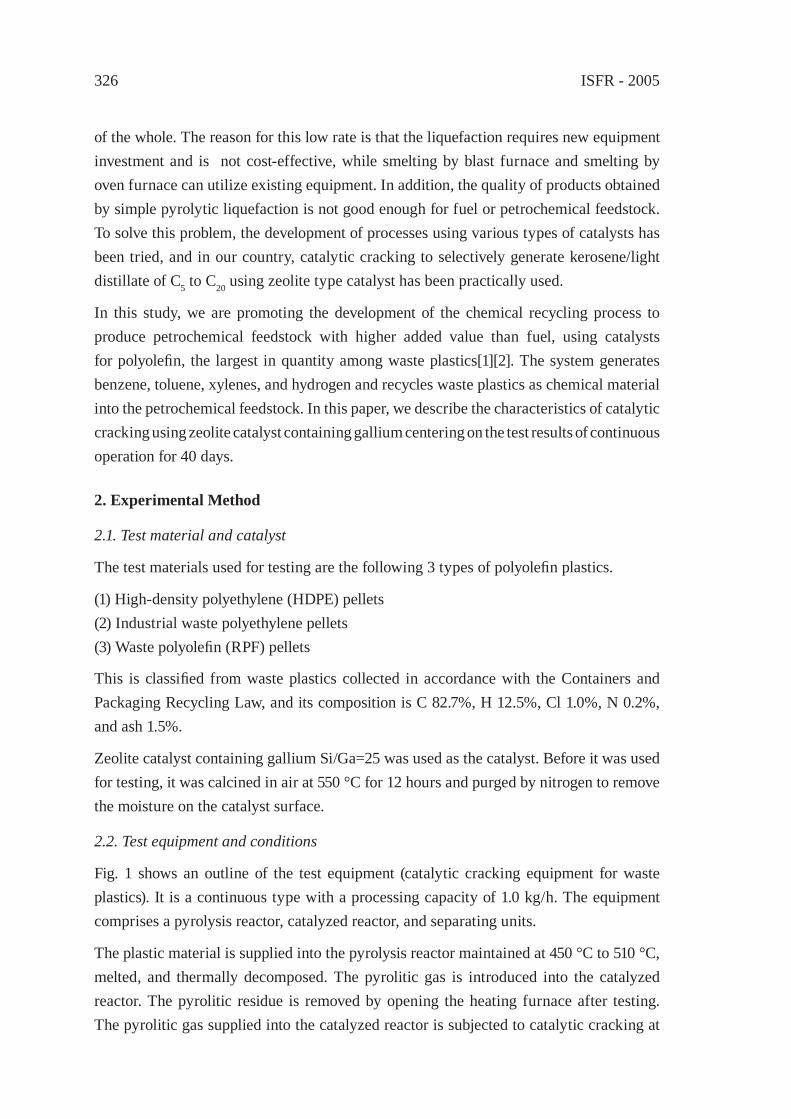
ISFR - 2005326
of the whole. The reason for this low rate is that the liquefaction requires new equipment investment and is not cost-effective, while smelting by blast furnace and smelting by oven furnace can utilize existing equipment. In addition, the quality of products obtained by simple pyrolytic liquefaction is not good enough for fuel or petrochemical feedstock. To solve this problem, the development of processes using various types of catalysts has been tried, and in our country, catalytic cracking to selectively generate kerosene/light distillate of C5 to C20 using zeolite type catalyst has been practically used.
In this study, we are promoting the development of the chemical recycling process to produce petrochemical feedstock with higher added value than fuel, using catalysts for polyolefi n, the largest in quantity among waste plastics[1][2]. The system generates benzene, toluene, xylenes, and hydrogen and recycles waste plastics as chemical material into the petrochemical feedstock. In this paper, we describe the characteristics of catalytic cracking using zeolite catalyst containing gallium centering on the test results of continuous operation for 40 days.
2. Experimental Method
2.1. Test material and catalyst
The test materials used for testing are the following 3 types of polyolefi n plastics.
(1) High-density polyethylene (HDPE) pellets(2) Industrial waste polyethylene pellets(3) Waste polyolefi n (RPF) pellets
This is classifi ed from waste plastics collected in accordance with the Containers and Packaging Recycling Law, and its composition is C 82.7%, H 12.5%, Cl 1.0%, N 0.2%, and ash 1.5%.
Zeolite catalyst containing gallium Si/Ga=25 was used as the catalyst. Before it was used for testing, it was calcined in air at 550 °C for 12 hours and purged by nitrogen to remove the moisture on the catalyst surface.
2.2. Test equipment and conditions
Fig. 1 shows an outline of the test equipment (catalytic cracking equipment for waste plastics). It is a continuous type with a processing capacity of 1.0 kg/h. The equipment comprises a pyrolysis reactor, catalyzed reactor, and separating units.
The plastic material is supplied into the pyrolysis reactor maintained at 450 °C to 510 °C, melted, and thermally decomposed. The pyrolitic gas is introduced into the catalyzed reactor. The pyrolitic residue is removed by opening the heating furnace after testing. The pyrolitic gas supplied into the catalyzed reactor is subjected to catalytic cracking at
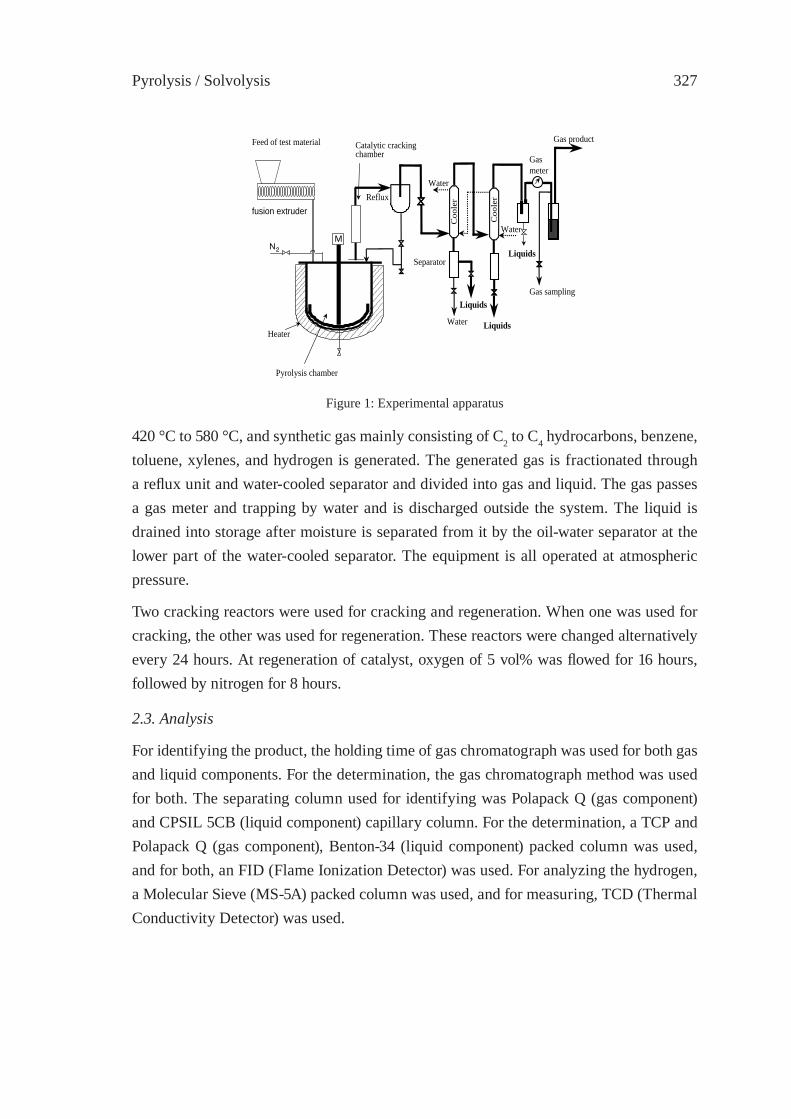
Pyrolysis / Solvolysis 327
420 °C to 580 °C, and synthetic gas mainly consisting of C2 to C4 hydrocarbons, benzene, toluene, xylenes, and hydrogen is generated. The generated gas is fractionated through a refl ux unit and water-cooled separator and divided into gas and liquid. The gas passes a gas meter and trapping by water and is discharged outside the system. The liquid is drained into storage after moisture is separated from it by the oil-water separator at the lower part of the water-cooled separator. The equipment is all operated at atmospheric pressure.
Two cracking reactors were used for cracking and regeneration. When one was used for cracking, the other was used for regeneration. These reactors were changed alternatively every 24 hours. At regeneration of catalyst, oxygen of 5 vol% was fl owed for 16 hours, followed by nitrogen for 8 hours.
2.3. Analysis
For identifying the product, the holding time of gas chromatograph was used for both gas and liquid components. For the determination, the gas chromatograph method was used for both. The separating column used for identifying was Polapack Q (gas component) and CPSIL 5CB (liquid component) capillary column. For the determination, a TCP and Polapack Q (gas component), Benton-34 (liquid component) packed column was used, and for both, an FID (Flame Ionization Detector) was used. For analyzing the hydrogen, a Molecular Sieve (MS-5A) packed column was used, and for measuring, TCD (Thermal Conductivity Detector) was used.
Heater
Feed of test material
Gas product
M
Gas meter
Water
Liquids Liquids
Water
Water
Coo
ler
Coo
ler
Separator
Reflux
Catalytic cracking chamber
Pyrolysis chamber
N2
Gas sampling
Liquids
fusion extruder
Figure 1: Experimental apparatus

ISFR - 2005328
3. Results and discussion
3.1 Continuous operation for 40 days using HDPE pellets
Fig. 2 shows the results of continuous operation for 40 days. In this fi gure, each point represents the average amount of products a day. The amounts of liquid and BTX were constant for about 30 days but slightly decreased after then. The yield of liquid was about 55 wt% and of BTX was about 50 wt%.
Figure 2:Results of continuous operation for 40 days.
Figure 3: Results of 48hours operation with HDPE pellets.

Pyrolysis / Solvolysis 329
Figure 4: Results of 48hours operation with industrial waste polyethylene pellets.
Figure 5: Results of 48hours operation with RPF pellets.
3.2. Effects of kinds of plastics on cracking
Figs. 3, 4 and 5 show the results of operation for 48 hours using 3 kinds of polyolefi n pellets, such as HDPE, industrial waste polyethylene and RPF. In each operation, catalysts were regenerated after 24hours.
In the operation for industrial waste polyethylene pellets, the total amount of products and the amount of BTX slowly increased. But after about 12 hours, these were the same as those for HDPE pellets.
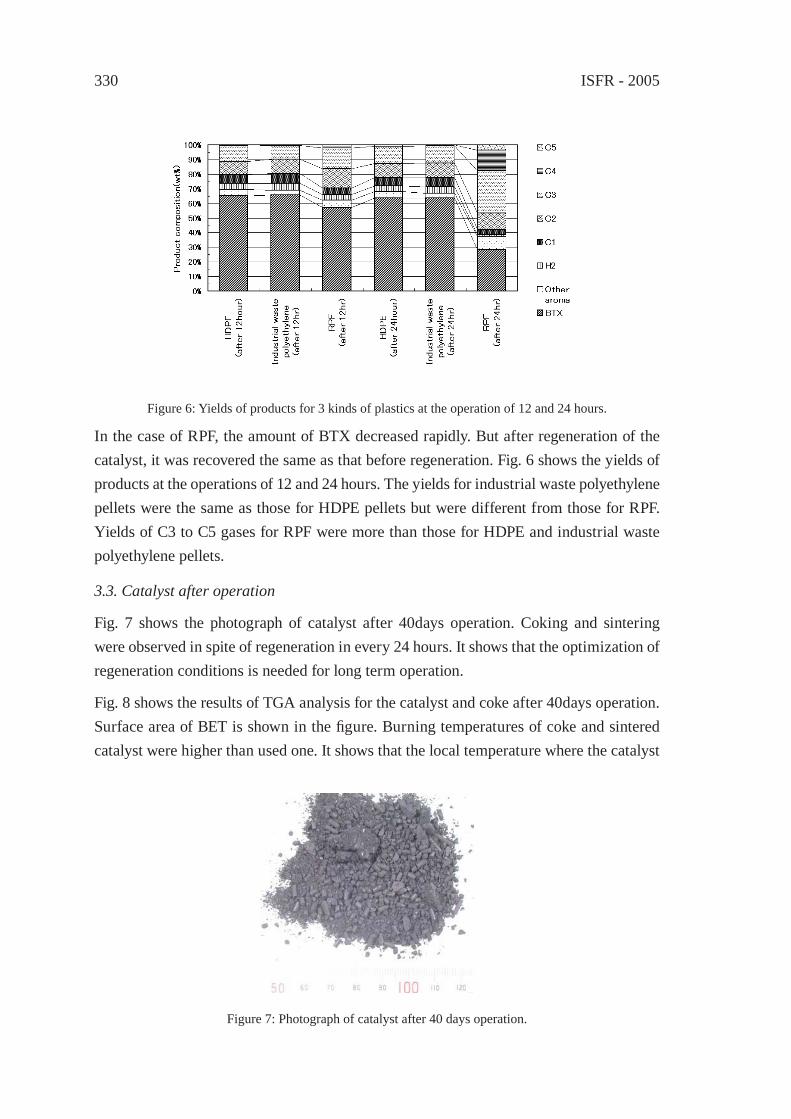
ISFR - 2005330
In the case of RPF, the amount of BTX decreased rapidly. But after regeneration of the catalyst, it was recovered the same as that before regeneration. Fig. 6 shows the yields of products at the operations of 12 and 24 hours. The yields for industrial waste polyethylene pellets were the same as those for HDPE pellets but were different from those for RPF. Yields of C3 to C5 gases for RPF were more than those for HDPE and industrial waste polyethylene pellets.
3.3. Catalyst after operation
Fig. 7 shows the photograph of catalyst after 40days operation. Coking and sintering were observed in spite of regeneration in every 24 hours. It shows that the optimization of regeneration conditions is needed for long term operation.
Fig. 8 shows the results of TGA analysis for the catalyst and coke after 40days operation. Surface area of BET is shown in the fi gure. Burning temperatures of coke and sintered catalyst were higher than used one. It shows that the local temperature where the catalyst
Figure 6: Yields of products for 3 kinds of plastics at the operation of 12 and 24 hours.
Figure 7: Photograph of catalyst after 40 days operation.
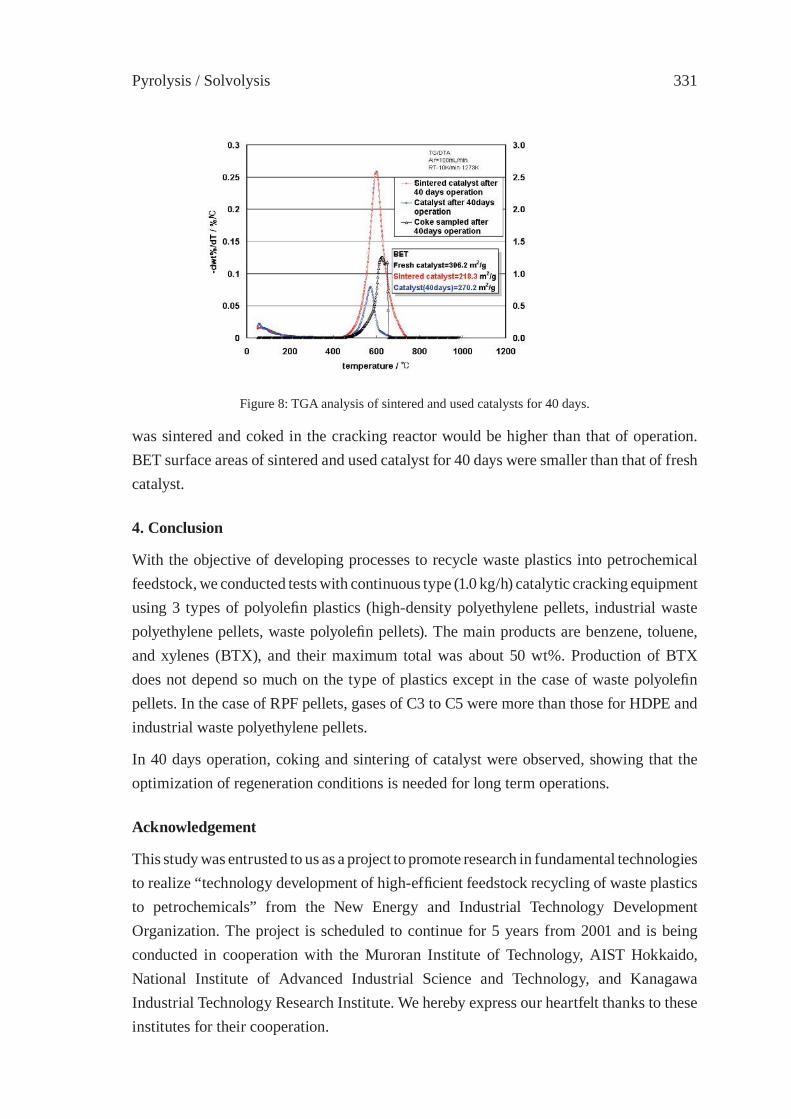
Pyrolysis / Solvolysis 331
Figure 8: TGA analysis of sintered and used catalysts for 40 days.
was sintered and coked in the cracking reactor would be higher than that of operation. BET surface areas of sintered and used catalyst for 40 days were smaller than that of fresh catalyst.
4. Conclusion
With the objective of developing processes to recycle waste plastics into petrochemical feedstock, we conducted tests with continuous type (1.0 kg/h) catalytic cracking equipment using 3 types of polyolefi n plastics (high-density polyethylene pellets, industrial waste polyethylene pellets, waste polyolefi n pellets). The main products are benzene, toluene, and xylenes (BTX), and their maximum total was about 50 wt%. Production of BTX does not depend so much on the type of plastics except in the case of waste polyolefi n pellets. In the case of RPF pellets, gases of C3 to C5 were more than those for HDPE and industrial waste polyethylene pellets.
In 40 days operation, coking and sintering of catalyst were observed, showing that the optimization of regeneration conditions is needed for long term operations.
Acknowledgement
This study was entrusted to us as a project to promote research in fundamental technologies to realize “technology development of high-effi cient feedstock recycling of waste plastics to petrochemicals” from the New Energy and Industrial Technology Development Organization. The project is scheduled to continue for 5 years from 2001 and is being conducted in cooperation with the Muroran Institute of Technology, AIST Hokkaido, National Institute of Advanced Industrial Science and Technology, and Kanagawa Industrial Technology Research Institute. We hereby express our heartfelt thanks to these institutes for their cooperation.

ISFR - 2005332
References
[1] Nishino, J., Itoh, M., Ishinomori, T., Kubota, N. and Uemichi, Y., J. Mater. Cycles Waste Manag., 5, 89-93(2003).
[2] Nishino, J., Itoh, M., Fujiyoshi, H., Ishinomori, T. and Kubota, N., IHI Engineering Rev., 37(2), 64-70(2004).
Pyrolysis / Solvolysis 333
CATALYTIC CRACKING OF HDPE OVER MCM-48Young-Min Kim1, Seungdo Kim1*, Young-Kwon Park2, Ji Man Kim3, Jong-Ki Jeon4
1Dept. of Environmental System Engineering, Hallym Univ., Korea2Faculty of Environmental Engineering, University of Seoul, Korea
3Dept. of Chemistry, Sungkyunkwan University, Korea4Dept. of Chemical Engineering, Kongju University, Korea
Abstract: This paper presents the catalytic cracking characteristics of high density polyethylene (HDPE) over MCM-48. The performances of Si-MCM-48 and Al-MCM-48 in terms of activation energy of HDPE decomposition reaction and quality of oil products were compared with those of other catalysts such as Si-MCM-41, Al-MCM-41, ZSM-5, and Beta. Revised Ozawa method [1] was applied to evaluate the functional relationship of activation energy with respect to conversion. Pyro-GC/FID was used to characterize the pyrolysis products. The catalytic performances of MCM-48 were analogous to those of MCM-41 with a minor difference in deactivation behaviour. Owing to the three-dimensional pore structures of Al-MCM-48, slower deactivation was observed than Al-MCM-41 having one-dimensional pore structures. Al-MCM-48 reveals higher activation energy values for HDPE decomposition than ZSM-5 and Beta, probably suggesting the inferior kinetic performance of Al-MCM-48. Al-MCM-48 generates highly complex mixtures of various hydrocarbons (HCs) including branched, cyclic, and aromatic species. To compare with ZSM-5 and Beta catalysts, Al-MCM-48 generated higher portion of oil products, but exhibited broader distribution of decomposition products.
1. Introduction
Most waste plastics in Korea has been landfi lled or incinerated despite of its high potential for recovering valuable compounds. Effective methods have been sought to recycle waste plastics. Among various candidates, pyrolysis has been regarded as one of the most promising technologies. Recent sharp rising of oil price may make it possible for pyrolysis of waste plastics to be economically competitive. Pyrolysis of waste plastics, however, has
suffered from the disadvantages of broad product spectrum and high energy input [2].
Catalytic pyrolysis can improve the product selectivity and reduce energy input. Most previous studies on catalytic pyrolysis of HDPE have used microporous materials like zeolites [3-6]. Some researchers applied mesoporous materials as catalysts for thermal cracking of HDPE. Owing to larger openings, the mesoporous materials are capable of offering higher accessibility of bulky substances like HDPE to inner active sites more effectively. Recently, MCM-41 that is one of the commonest mesoporous catalysts was reported to allow higher conversion as well as excellent selectivity for gasoline [7]. However,
ISFR - 2005334
few studies on the application of MCM-48 containing three dimensional pore openings have been carried out to HDPE pyrolysis. As MCM-48 is expected to be resistant to pore blocking, MCM-48 expectedly exhibits much higher activity than MCM-41 having one dimensional openings [8,9]. This paper addresses the catalytic performance of MCM-48 on the pyrolysis of HDPE in view of pyrolysis kinetics and characteristics of products as a result of comparing with MCM-41, ZSM-5, and Beta.
2. Material and Methods
2.1. Material
Powdered HDPE with an average molecular weight of 182,000 was used here and supplied by Samsung Total Petrochemical Co. (B230A). Silica forms of MCM-41 and MCM-48 were obtained through hydrothermal synthesis methods [10] using Cethyltrimethyl Ammonium (CTA) Bromide as a templating agent. Aluminum incoporated forms (Si/Al=30) of MCM-41 and MCM-48 were synthesized via post grafting route [11]. To evaluate the performance of MCM-48, we compared with that of MCM-41 and two zeolite catalysts (Si/Al=25): ZSM-5 (ALSI-PENTA, SH-27) and Beta (ZEOLYST, CP-814E). Table 1 describes some information on the catalysts used here.
All catalysts and polymers were sieved to obtain particle sizes ranging from 125 to 200 μm. The catalysts were then activated from room temperature to 773 K at a linear heating rate of 10 K/min under nitrogen atmosphere at a fl ow rate of 80 ml/min.
Table 1: SiO2/Al2O3 ratio, pore diameters, and surface areas of catalysts used here.
Catalyst SiO2/Al2O3 ratio Pore diameter (Å) Surface area (m2/g)Si-MCM-41 - 28 1120Si-MCM-48 - 28 1380Al-MCM-41 30 27 1032Al-MCM-48 30 28/29 1432
Beta 25 5.5-7.6 680ZSM-5 25 5.0-5.5 400
2.2. Kinetic Analysis
Pyrolysis kinetics of HDPE over catalysts was evaluated with a thermogravimetric analyzer (PerkinElmer, Pyris Diamond). Thermogravimetric analysis (TGA) was carried out with 4 mg sample (HDPE : catalyst= 3 : 1) from 303 to 773 K at heating rates of 2, 3, and 4 K/min under nitrogen atmosphere at a fl ow rate of 80 ml/min. Revised Ozawa method [1] was introduced for kinetic analysis. To assess the deactivation extent of Al-MCM-41 and Al-MCM-48, the catalysts were repetitively applied to TGA with fresh HDPE over fi ve
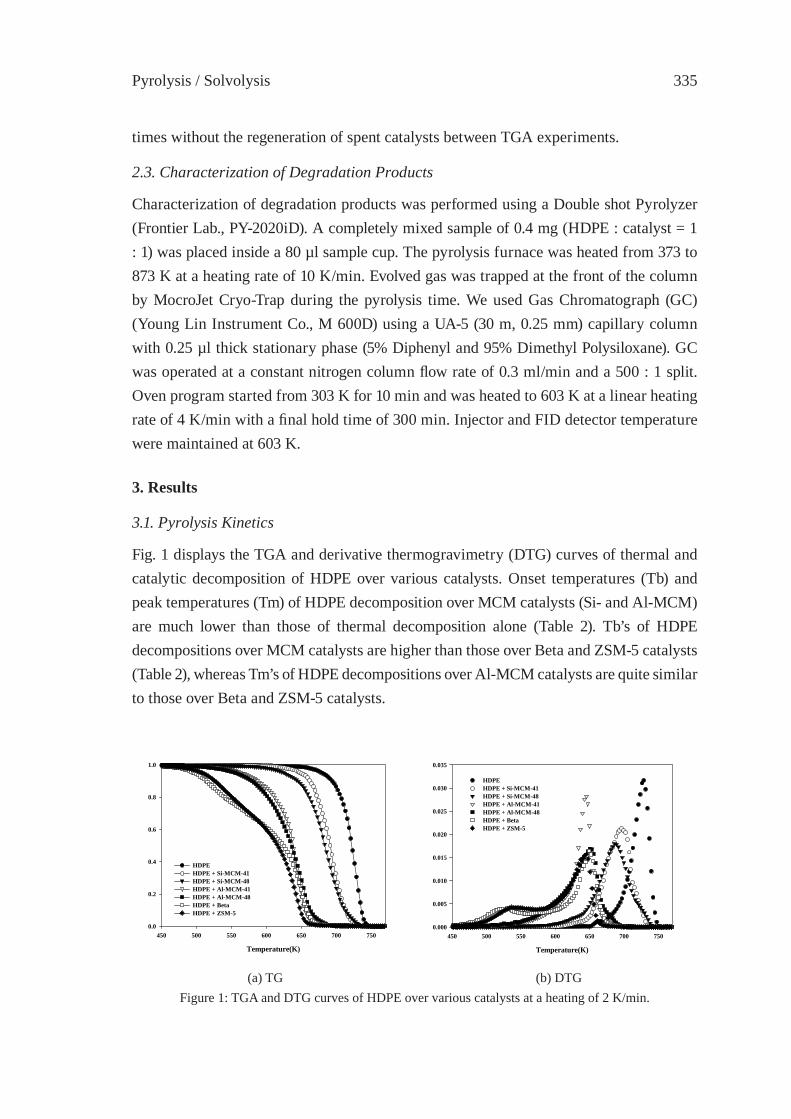
Pyrolysis / Solvolysis 335
times without the regeneration of spent catalysts between TGA experiments.
2.3. Characterization of Degradation Products
Characterization of degradation products was performed using a Double shot Pyrolyzer (Frontier Lab., PY-2020iD). A completely mixed sample of 0.4 mg (HDPE : catalyst = 1 : 1) was placed inside a 80 µl sample cup. The pyrolysis furnace was heated from 373 to 873 K at a heating rate of 10 K/min. Evolved gas was trapped at the front of the column by MocroJet Cryo-Trap during the pyrolysis time. We used Gas Chromatograph (GC) (Young Lin Instrument Co., M 600D) using a UA-5 (30 m, 0.25 mm) capillary column with 0.25 µl thick stationary phase (5% Diphenyl and 95% Dimethyl Polysiloxane). GC was operated at a constant nitrogen column fl ow rate of 0.3 ml/min and a 500 : 1 split. Oven program started from 303 K for 10 min and was heated to 603 K at a linear heating rate of 4 K/min with a fi nal hold time of 300 min. Injector and FID detector temperature were maintained at 603 K.
3. Results
3.1. Pyrolysis Kinetics
Fig. 1 displays the TGA and derivative thermogravimetry (DTG) curves of thermal and catalytic decomposition of HDPE over various catalysts. Onset temperatures (Tb) and peak temperatures (Tm) of HDPE decomposition over MCM catalysts (Si- and Al-MCM) are much lower than those of thermal decomposition alone (Table 2). Tb’s of HDPE decompositions over MCM catalysts are higher than those over Beta and ZSM-5 catalysts (Table 2), whereas Tm’s of HDPE decompositions over Al-MCM catalysts are quite similar to those over Beta and ZSM-5 catalysts.
Temperature(K)
450 500 550 600 650 700 7500.0
0.2
0.4
0.6
0.8
1.0
HDPEHDPE + Si-MCM-41HDPE + Si-MCM-48 HDPE + Al-MCM-41HDPE + Al-MCM-48HDPE + BetaHDPE + ZSM-5
Temperature(K)
450 500 550 600 650 700 7500.000
0.005
0.010
0.015
0.020
0.025
0.030
0.035
HDPEHDPE + Si-MCM-41HDPE + Si-MCM-48HDPE + Al-MCM-41HDPE + Al-MCM-48HDPE + BetaHDPE + ZSM-5
(a) TG (b) DTGFigure 1: TGA and DTG curves of HDPE over various catalysts at a heating of 2 K/min.
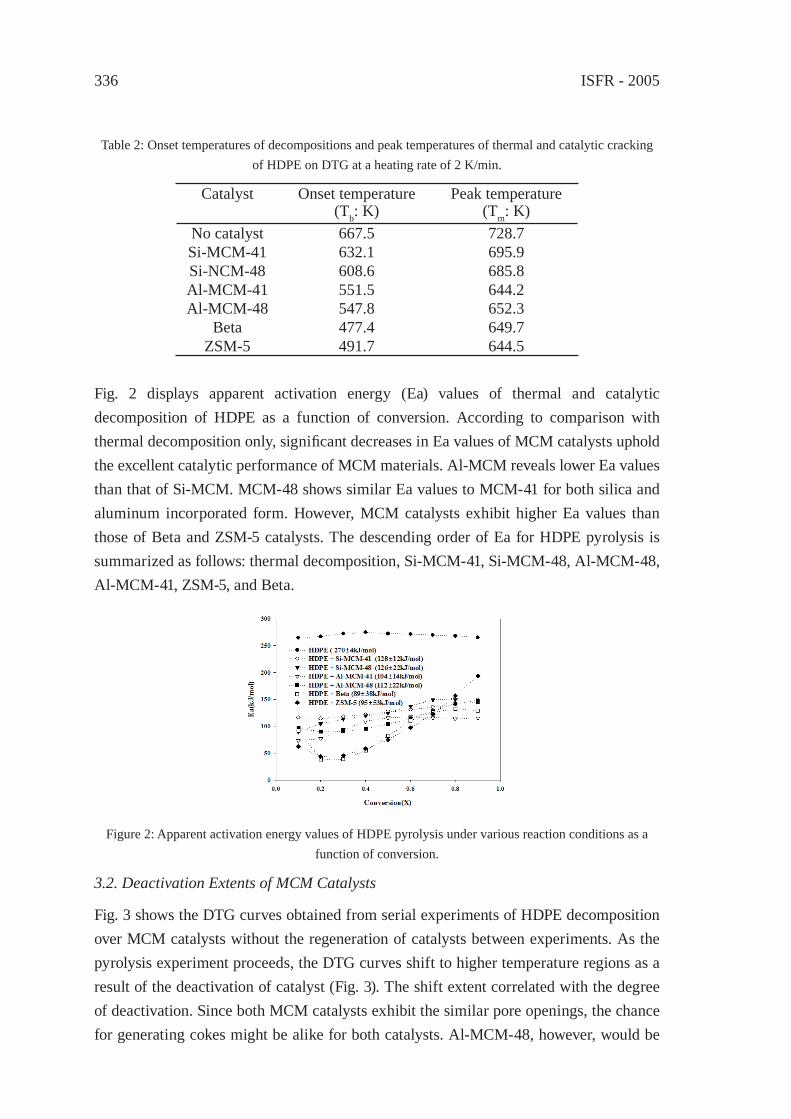
ISFR - 2005336
Catalyst Onset temperature (Tb: K)
Peak temperature (Tm: K)
No catalyst 667.5 728.7Si-MCM-41 632.1 695.9Si-NCM-48 608.6 685.8Al-MCM-41 551.5 644.2Al-MCM-48 547.8 652.3
Beta 477.4 649.7ZSM-5 491.7 644.5
Fig. 2 displays apparent activation energy (Ea) values of thermal and catalytic decomposition of HDPE as a function of conversion. According to comparison with thermal decomposition only, signifi cant decreases in Ea values of MCM catalysts uphold the excellent catalytic performance of MCM materials. Al-MCM reveals lower Ea values than that of Si-MCM. MCM-48 shows similar Ea values to MCM-41 for both silica and aluminum incorporated form. However, MCM catalysts exhibit higher Ea values than those of Beta and ZSM-5 catalysts. The descending order of Ea for HDPE pyrolysis is summarized as follows: thermal decomposition, Si-MCM-41, Si-MCM-48, Al-MCM-48, Al-MCM-41, ZSM-5, and Beta.
Table 2: Onset temperatures of decompositions and peak temperatures of thermal and catalytic cracking of HDPE on DTG at a heating rate of 2 K/min.
3.2. Deactivation Extents of MCM Catalysts
Fig. 3 shows the DTG curves obtained from serial experiments of HDPE decomposition over MCM catalysts without the regeneration of catalysts between experiments. As the pyrolysis experiment proceeds, the DTG curves shift to higher temperature regions as a result of the deactivation of catalyst (Fig. 3). The shift extent correlated with the degree of deactivation. Since both MCM catalysts exhibit the similar pore openings, the chance for generating cokes might be alike for both catalysts. Al-MCM-48, however, would be
Figure 2: Apparent activation energy values of HDPE pyrolysis under various reaction conditions as a function of conversion.
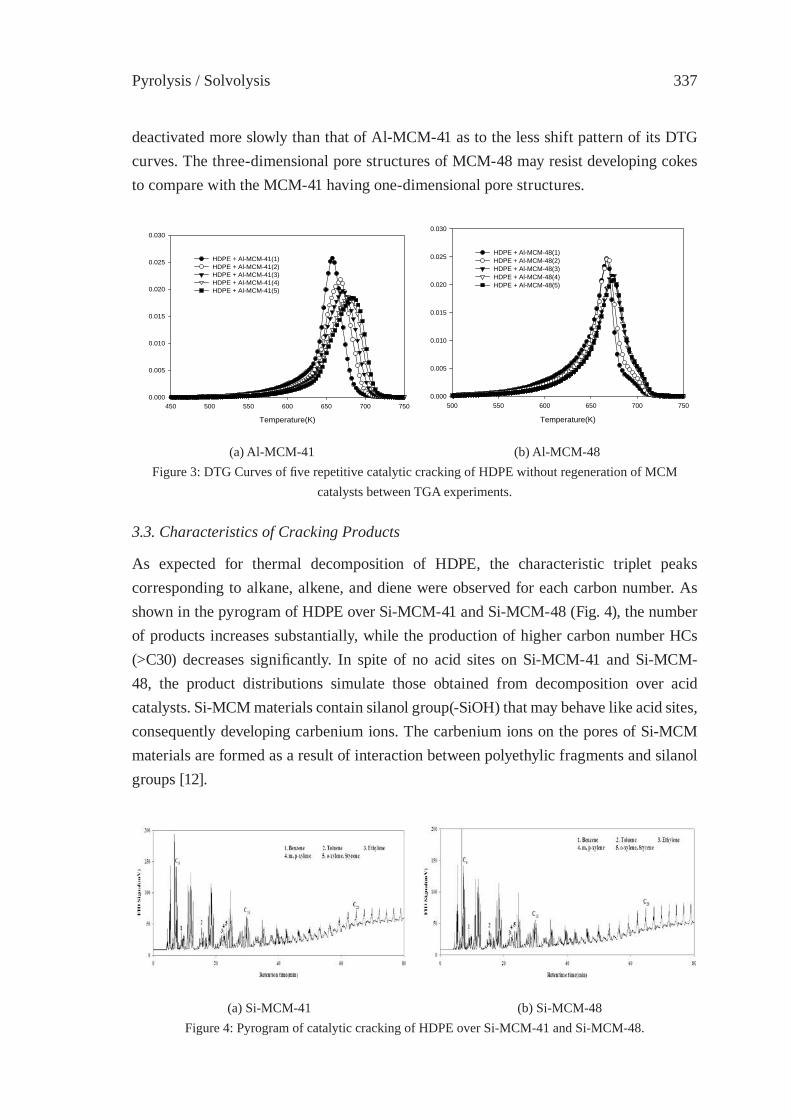
Pyrolysis / Solvolysis 337
deactivated more slowly than that of Al-MCM-41 as to the less shift pattern of its DTG curves. The three-dimensional pore structures of MCM-48 may resist developing cokes to compare with the MCM-41 having one-dimensional pore structures.
Temperature(K)
450 500 550 600 650 700 7500.000
0.005
0.010
0.015
0.020
0.025
0.030
HDPE + Al-MCM-41(1)HDPE + Al-MCM-41(2)HDPE + Al-MCM-41(3)HDPE + Al-MCM-41(4)HDPE + Al-MCM-41(5)
Temperature(K)
500 550 600 650 700 7500.000
0.005
0.010
0.015
0.020
0.025
0.030
HDPE + Al-MCM-48(1)HDPE + Al-MCM-48(2)HDPE + Al-MCM-48(3)HDPE + Al-MCM-48(4)HDPE + Al-MCM-48(5)
(a) Al-MCM-41 (b) Al-MCM-48Figure 3: DTG Curves of fi ve repetitive catalytic cracking of HDPE without regeneration of MCM
catalysts between TGA experiments.
3.3. Characteristics of Cracking Products
As expected for thermal decomposition of HDPE, the characteristic triplet peaks corresponding to alkane, alkene, and diene were observed for each carbon number. As shown in the pyrogram of HDPE over Si-MCM-41 and Si-MCM-48 (Fig. 4), the number of products increases substantially, while the production of higher carbon number HCs (>C30) decreases signifi cantly. In spite of no acid sites on Si-MCM-41 and Si-MCM-48, the product distributions simulate those obtained from decomposition over acid catalysts. Si-MCM materials contain silanol group(-SiOH) that may behave like acid sites, consequently developing carbenium ions. The carbenium ions on the pores of Si-MCM materials are formed as a result of interaction between polyethylic fragments and silanol groups [12].
(a) Si-MCM-41 (b) Si-MCM-48Figure 4: Pyrogram of catalytic cracking of HDPE over Si-MCM-41 and Si-MCM-48.
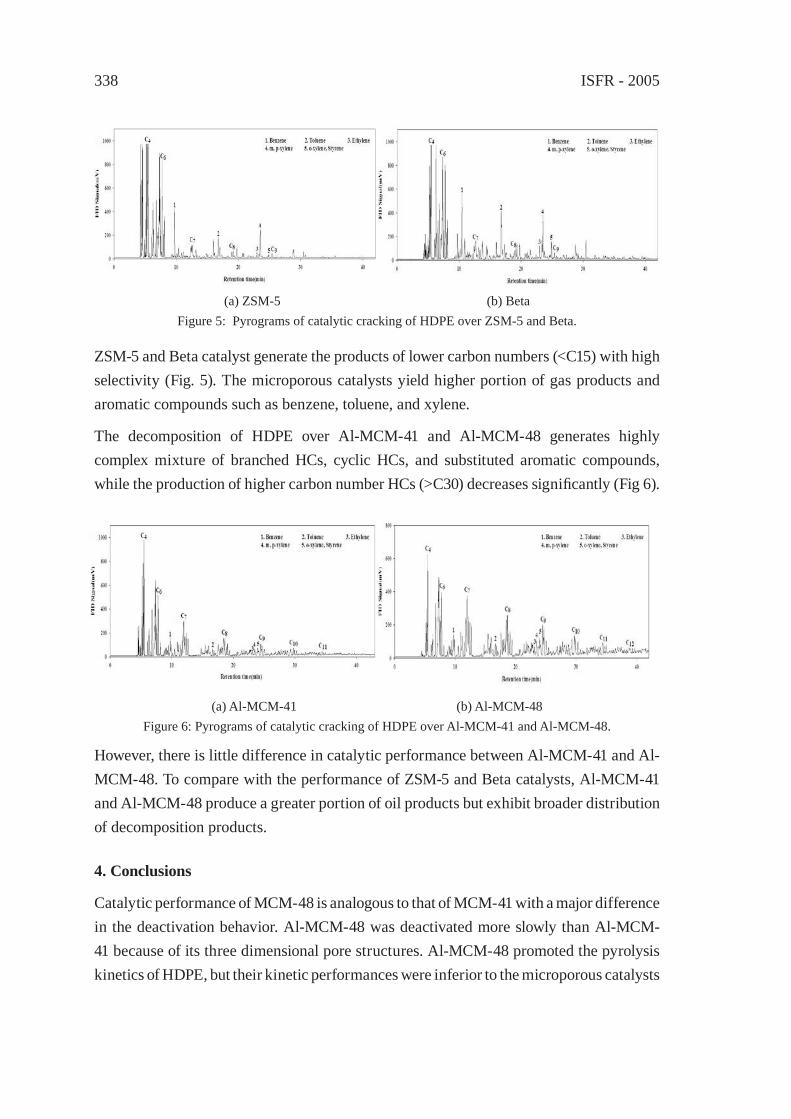
ISFR - 2005338
ZSM-5 and Beta catalyst generate the products of lower carbon numbers (<C15) with high selectivity (Fig. 5). The microporous catalysts yield higher portion of gas products and aromatic compounds such as benzene, toluene, and xylene.
The decomposition of HDPE over Al-MCM-41 and Al-MCM-48 generates highly complex mixture of branched HCs, cyclic HCs, and substituted aromatic compounds, while the production of higher carbon number HCs (>C30) decreases signifi cantly (Fig 6).
(a) ZSM-5 (b) BetaFigure 5: Pyrograms of catalytic cracking of HDPE over ZSM-5 and Beta.
(a) Al-MCM-41 (b) Al-MCM-48Figure 6: Pyrograms of catalytic cracking of HDPE over Al-MCM-41 and Al-MCM-48.
However, there is little difference in catalytic performance between Al-MCM-41 and Al-MCM-48. To compare with the performance of ZSM-5 and Beta catalysts, Al-MCM-41 and Al-MCM-48 produce a greater portion of oil products but exhibit broader distribution of decomposition products.
4. Conclusions
Catalytic performance of MCM-48 is analogous to that of MCM-41 with a major difference in the deactivation behavior. Al-MCM-48 was deactivated more slowly than Al-MCM-41 because of its three dimensional pore structures. Al-MCM-48 promoted the pyrolysis kinetics of HDPE, but their kinetic performances were inferior to the microporous catalysts
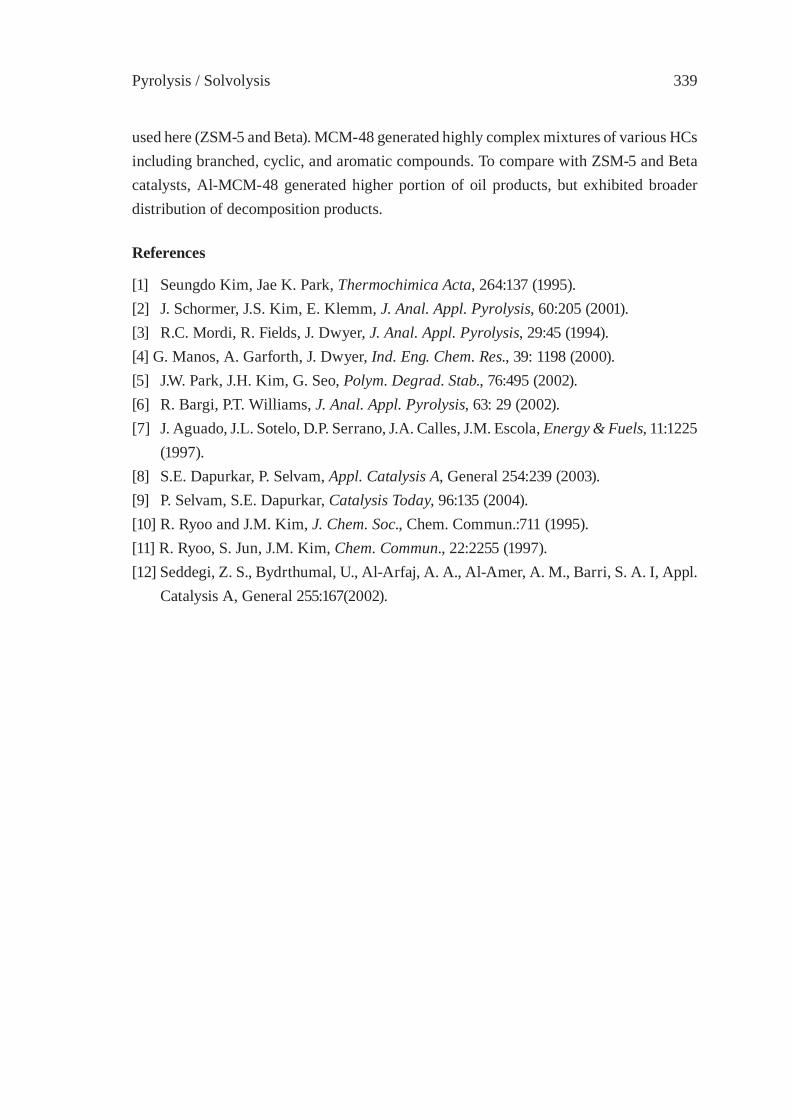
Pyrolysis / Solvolysis 339
used here (ZSM-5 and Beta). MCM-48 generated highly complex mixtures of various HCs including branched, cyclic, and aromatic compounds. To compare with ZSM-5 and Beta catalysts, Al-MCM-48 generated higher portion of oil products, but exhibited broader distribution of decomposition products.
References
[1] Seungdo Kim, Jae K. Park, Thermochimica Acta, 264:137 (1995).[2] J. Schormer, J.S. Kim, E. Klemm, J. Anal. Appl. Pyrolysis, 60:205 (2001).[3] R.C. Mordi, R. Fields, J. Dwyer, J. Anal. Appl. Pyrolysis, 29:45 (1994).[4] G. Manos, A. Garforth, J. Dwyer, Ind. Eng. Chem. Res., 39: 1198 (2000).[5] J.W. Park, J.H. Kim, G. Seo, Polym. Degrad. Stab., 76:495 (2002).[6] R. Bargi, P.T. Williams, J. Anal. Appl. Pyrolysis, 63: 29 (2002).[7] J. Aguado, J.L. Sotelo, D.P. Serrano, J.A. Calles, J.M. Escola, Energy & Fuels, 11:1225
(1997).[8] S.E. Dapurkar, P. Selvam, Appl. Catalysis A, General 254:239 (2003).[9] P. Selvam, S.E. Dapurkar, Catalysis Today, 96:135 (2004).[10] R. Ryoo and J.M. Kim, J. Chem. Soc., Chem. Commun.:711 (1995).[11] R. Ryoo, S. Jun, J.M. Kim, Chem. Commun., 22:2255 (1997).[12] Seddegi, Z. S., Bydrthumal, U., Al-Arfaj, A. A., Al-Amer, A. M., Barri, S. A. I, Appl.
Catalysis A, General 255:167(2002).

ISFR - 2005340
Synthesis Gas Production 341
A STUDY ON THE CHARACTERIZATION OF VACUUM RESIDUE GASIFICATION IN AN ENTRAINED-FLOW GASIFIER
Young-Chan Choi, Jae-Goo Lee, Jae-Chang Hong, and Yong-Goo KimFossil Energy & Environment Dept, Korea Institute of Energy Research (KIER)
P.O.BOX 103, Yusong-Gu, Daejon 305-343, Korea, [email protected]
Abstract: Approx. 200,000 bpd vacuum residue oil is produced from oil refi neries in Korea. These are supplying to use asphalt, high sulfur fuel oil, and upgrading at the residue hydro-desulfurization unit. High sulfur fuel oil can be prepared by blending oil residue with light distillate to bring fuel oil characteristic in the range of commercial specifi cation, which will become more stringent restrictive in the near future in Korea. Vacuum residue oil has high energy content, however due to the its high viscosity, high sulfur content and high concentration of heavy metals represent improper low grade fuel, which is considered diffi cult to gasify.At present, over 20 commercial scaled IGCC plants using feedstocks with vacuum residue oil for gasifi cation are under construction and operating stage in worldwide. The experiments were conducted using 1Ton/day entrained-fl ow gasifi er in KIER(Korea Institute of Energy Research) to investigate a number of operating parameters during gasifi cation, such as effects of temperature vs. viscosity of vacuum residue, reaction temperature, pressure, oxygen/V.R ratio, steam/V.R ratio. As a results, experiment runs were evaluated under the reaction temperature ranged from 1,250-1,350 °C, heating value : 2,000-2,500 kcal/Nm3, syngas composition(CO+H2) : 80-85%, cold gas effi ciency: 60-70%, oxygen/V.R : 0.8-1.0, steam/V.R : 0.4-0.5 respectively.
1. Introduction
Only entrained-fl ow gasifi ers are suitable for gasifying solids as well as liquid hydrocarbons such as heavy residue oils, cocks and coals. Currently commercial scaled entrained-fl ow gasifi ers both the Shell SGP and Texaco gasifi ers have a successful track record of operation and under construction on the type of feedstocks for IGCC power plants in worldwide. There is considerable scope in the short-to-medium term for oil and petroleum cock-fi re IGCCs plants integrated with refi nery processes. The key derives are the refi ners’ need to fi nd routes for the disposal of heavy oil residues and petroleum coke and their need for hydrogen to upgrade other refi nery products. There is scope for up to 14 GWe of oil-fi red IGCC in the European Union (EU) by 2010. In the year 2000, Texaco has constructed and commissioned 12 projects of oil residue and cocks gasifi cation plants for IGCC and hydrogen productions in worldwide. Among them eight gasifi cation projects were fed by some type of heavy residue oil, three by petro-coke and coal to produce power, steam, chemicals, hydrogen, and methanol.
ISFR - 2005342
Some of refi nery companies in Korea have proceeded feasibility study to construct commercial residue-IGCC plants in their refi neries areas. The LG-Caltex assesed in feasibility study to construct a 500-700 MWe Independent Power Producer (IPP) in the Yosu Refi nery site to produce electric power, steam, and hydrogen. The SK Corp. has completed engineering and construction feasibility studies for installation of heavy residue-IGCC plant at its Ulsan Refi nery to make a 435 MWe electric power and process steam and hydrogen.
Since an early 1990, KIER has developed entrained-fl ow, pressurized oxygen-blown gasifi er to make medium-BTU gas for power generation of IGCC and hydrogen. This research is under implementing one of IGCC research for the Alternative Energy Research Program of MOIE, Korean government. Recently KIER has developed 1.0 Ton/day entrained-fl ow gasifi er to use some of vacuum residue from oil refi neries as feedstocks for gasifi cation.
The objective of this research is to develop the gasifi cation technology of heavy residue oil, which can respond sensitively to the load changes with a quick reaction velocity and use the entrained-fl ow gasifi er that has a simple process and equipment. That technology may contribute to IGCC generation, hydrogen producing process and transformation of syngas into clean liquid fuel. Domestic refi neries produce about 200,000bbl of heavy residue oil a day. For that, this research tries to understand the characteristics of heavy residue oil gasifi cation and problems related to operations by partly changing design of the 0.5T/D coal gasifi er KIER owns and by checking the system to improve reactivity. Also, this research tries to acquire component technologies and operation technologies related to heavy residue oil gasifi cation process.
2. Experimental
2.1 Experimental Apparatus
A schematic diagram and overview of vacuum residue feed type entrained-fl ow gasifi er is shown in Fig. 1 and the overview of 1.0 T/D VR gasifi er is shown in Fig. 2, which is modifi ed existing coal gasifi er for the vacuum residue oil gasifi cation.
The VR gasifi er consists of three sections; main burner and auxiliary LPG burner for preheating at top, the reaction zone in the center, and the syngas and unburned carbon quenching at the bottom of reactor. The reactor consists of three pieces of 30cm sections and one 70cm section, each with a 20 cm ID. For the VR feeding system, mixture of super heated VR/steam is fed into a high temperature and high pressure reaction vessel is lined with high density alumina castable. The VR is suffi ciently heated to lower its viscosity to handle fl uidity, and is transferred by plunger pump and mixed with high pressure steam. The VR/steam mixture is passing through the super heater and atomized with oxygen through a special designed single burner, which is mounted on the top of the gasifi er. In
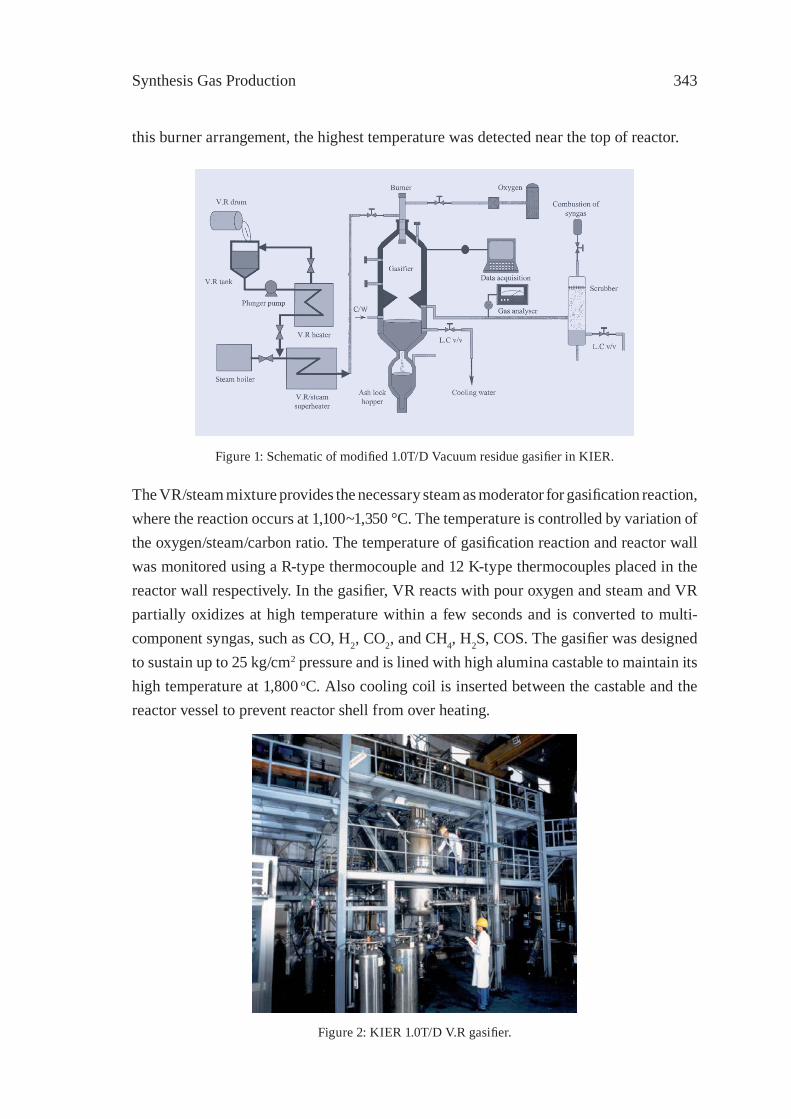
Synthesis Gas Production 343
Figure 1: Schematic of modifi ed 1.0T/D Vacuum residue gasifi er in KIER.
this burner arrangement, the highest temperature was detected near the top of reactor.
The VR/steam mixture provides the necessary steam as moderator for gasifi cation reaction, where the reaction occurs at 1,100~1,350 °C. The temperature is controlled by variation of the oxygen/steam/carbon ratio. The temperature of gasifi cation reaction and reactor wall was monitored using a R-type thermocouple and 12 K-type thermocouples placed in the reactor wall respectively. In the gasifi er, VR reacts with pour oxygen and steam and VR partially oxidizes at high temperature within a few seconds and is converted to multi- component syngas, such as CO, H2, CO2, and CH4, H2S, COS. The gasifi er was designed to sustain up to 25 kg/cm2 pressure and is lined with high alumina castable to maintain its high temperature at 1,800 oC. Also cooling coil is inserted between the castable and the reactor vessel to prevent reactor shell from over heating.
Figure 2: KIER 1.0T/D V.R gasifi er.

ISFR - 2005344
The syngas, unburned carbon and trace of mineral matters in vacuum residue are cooled by quenching water at the bottom of reactor before leaving the gasifi er. The unburned carbon and trace elements in syngas are removed at the carbon scrubber, which further cools the syngas and delivers to the high temperature desulfurization unit and rest of syngas is burned at the fl are stack. After cooling the syngas, it is analyzed by on-line infra red analyzer and G/C for monitoring process control to maintain optimal operating conditions. The gasifi cation system was designed by considering safety aspects and can stand with high pressure and high temperature. The process control systems of gasifi er are inter-locked with each other for the safety aspect and can be easily shut down when they run unstable operating conditions.
2.2 Experimental Conditions
The experiment study using a 1 Ton/day oxygen- blown, vacuum residue feed entrained fl ow gasifi er was tested. 7 test runs have been conducted for Vacuum residue oil from S oil refi nery in Ulsan, Korea. The ultimate analysis of experiment vacuum residue oil and heating value are shown in Table 1.
Table 1: Ultimate Analysis of Vacuum Residue (S oil, unit : wt.%).
Name of Sample Carbon Hydrogen Nitrogen Sulfur
H.H Value
(kcal/kg)V.R 81.85 10.03 0.20 5.72 10,010
Before injection of vacuum residue/steam mixtures introduced into the entrained-fl ow gasifi er, the gasifi er was preheated for 15~20 hours up to the reaction temperature about 1200 °C by using LPG preheating burner and fl ue gas is drafted by induced draft fan to the atmosphere. The experimental conditions and operating parameters in this gasifi cation experiments are shown in Table 2.
Table 2: Experimental conditions for VR entrained-fl ow gasifi er.
Parameters Gasifi cation ConditionsVR viscosity (P,
120~240°C) 40~7VR feed rate (Ton/day) 0.5~1.0VR feeding temperature
(°C) 180~250O2 feed rate (Nm3/hr) 10~25
Steam feed rate (kg/hr) 4~25Reaction temperature
(°C) 1,100~1,300Operating pressure (kg/
cm2ab) 1~6
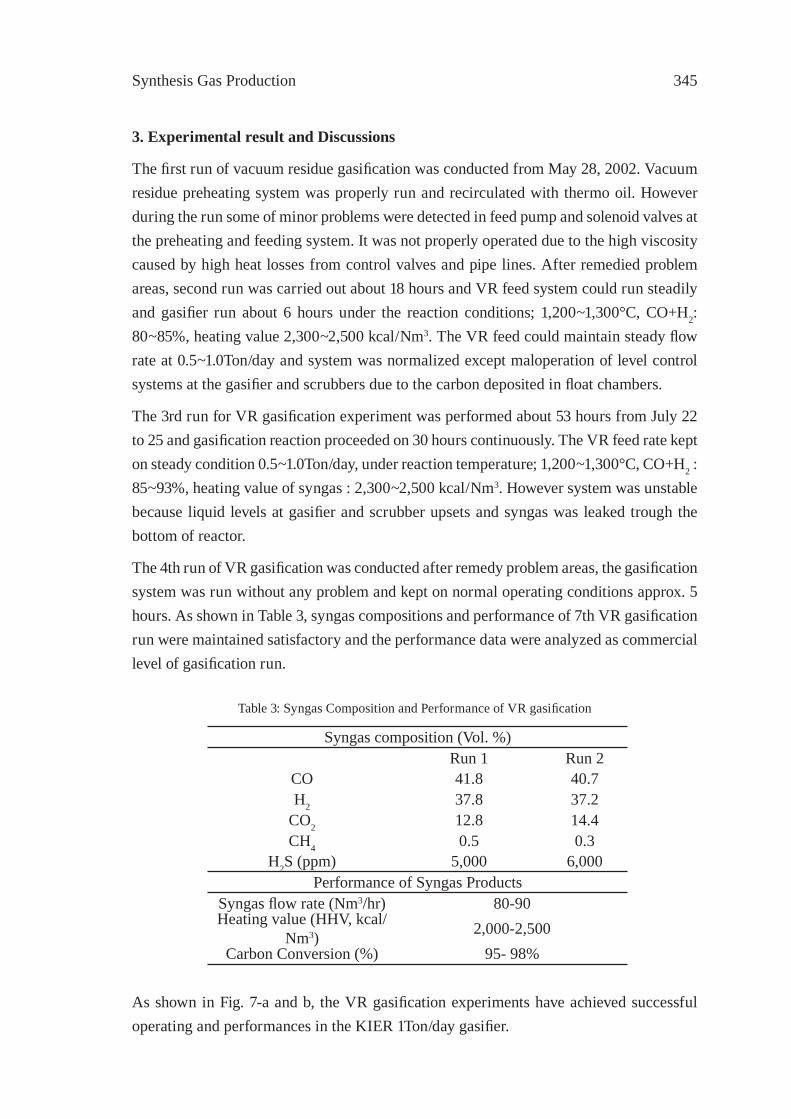
Synthesis Gas Production 345
3. Experimental result and Discussions
The fi rst run of vacuum residue gasifi cation was conducted from May 28, 2002. Vacuum residue preheating system was properly run and recirculated with thermo oil. However during the run some of minor problems were detected in feed pump and solenoid valves at the preheating and feeding system. It was not properly operated due to the high viscosity caused by high heat losses from control valves and pipe lines. After remedied problem areas, second run was carried out about 18 hours and VR feed system could run steadily and gasifi er run about 6 hours under the reaction conditions; 1,200~1,300°C, CO+H2: 80~85%, heating value 2,300~2,500 kcal/Nm3. The VR feed could maintain steady fl ow rate at 0.5~1.0Ton/day and system was normalized except maloperation of level control systems at the gasifi er and scrubbers due to the carbon deposited in fl oat chambers.
The 3rd run for VR gasifi cation experiment was performed about 53 hours from July 22 to 25 and gasifi cation reaction proceeded on 30 hours continuously. The VR feed rate kept on steady condition 0.5~1.0Ton/day, under reaction temperature; 1,200~1,300°C, CO+H2 : 85~93%, heating value of syngas : 2,300~2,500 kcal/Nm3. However system was unstable because liquid levels at gasifi er and scrubber upsets and syngas was leaked trough the bottom of reactor.
The 4th run of VR gasifi cation was conducted after remedy problem areas, the gasifi cation system was run without any problem and kept on normal operating conditions approx. 5 hours. As shown in Table 3, syngas compositions and performance of 7th VR gasifi cation run were maintained satisfactory and the performance data were analyzed as commercial level of gasifi cation run.
Table 3: Syngas Composition and Performance of VR gasifi cation
Syngas composition (Vol. %)Run 1 Run 2
CO 41.8 40.7H2 37.8 37.2
CO2 12.8 14.4CH4 0.5 0.3
H2S (ppm) 5,000 6,000Performance of Syngas Products
Syngas fl ow rate (Nm3/hr) 80-90Heating value (HHV, kcal/
Nm3) 2,000-2,500Carbon Conversion (%) 95- 98%
As shown in Fig. 7-a and b, the VR gasifi cation experiments have achieved successful operating and performances in the KIER 1Ton/day gasifi er.
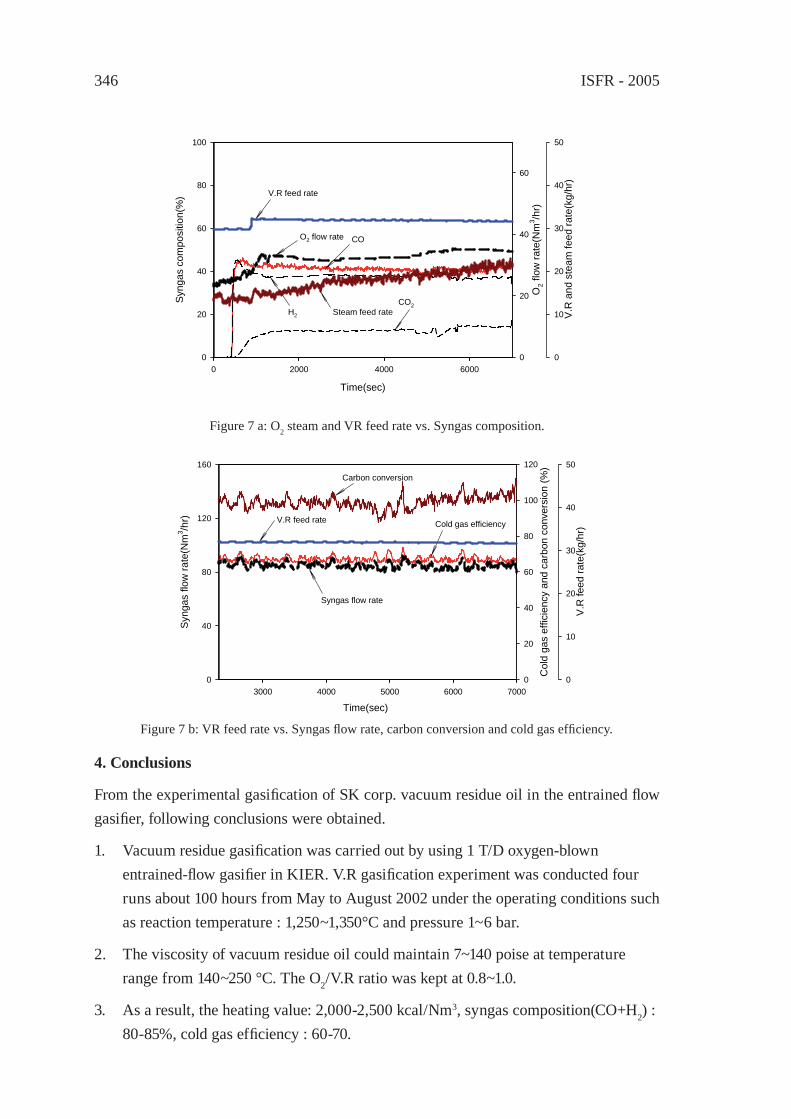
ISFR - 2005346
4. Conclusions
From the experimental gasifi cation of SK corp. vacuum residue oil in the entrained fl ow gasifi er, following conclusions were obtained.
1. Vacuum residue gasifi cation was carried out by using 1 T/D oxygen-blown entrained-fl ow gasifi er in KIER. V.R gasifi cation experiment was conducted four runs about 100 hours from May to August 2002 under the operating conditions such as reaction temperature : 1,250~1,350°C and pressure 1~6 bar.
2. The viscosity of vacuum residue oil could maintain 7~140 poise at temperature range from 140~250 °C. The O2/V.R ratio was kept at 0.8~1.0.
3. As a result, the heating value: 2,000-2,500 kcal/Nm3, syngas composition(CO+H2) : 80-85%, cold gas effi ciency : 60-70.
Figure 7 a: O2 steam and VR feed rate vs. Syngas composition.
Time(sec)
0 2000 4000 6000
Syn
gas
com
posi
tion(
%)
0
20
40
60
80
100
O2 f
low
rate
(Nm
3 /hr)
0
20
40
60
H2
O2 flow rate
V.R feed rate
CO
V.R
and
ste
am fe
ed ra
te(k
g/hr
)
0
10
20
30
40
50
Steam feed rateCO2
Figure 7 b: VR feed rate vs. Syngas fl ow rate, carbon conversion and cold gas effi ciency.
Time(sec)3000 4000 5000 6000 7000
Syn
gas
flow
rate
(Nm
3 /hr)
0
40
80
120
160
Col
d ga
s ef
ficie
ncy
and
carb
on c
onve
rsio
n (%
)
0
20
40
60
80
100
120
Cold gas efficiencyV.R feed rate
Syngas flow rate
V.R
feed
rate
(kg/
hr)
0
10
20
30
40
50Carbon conversion
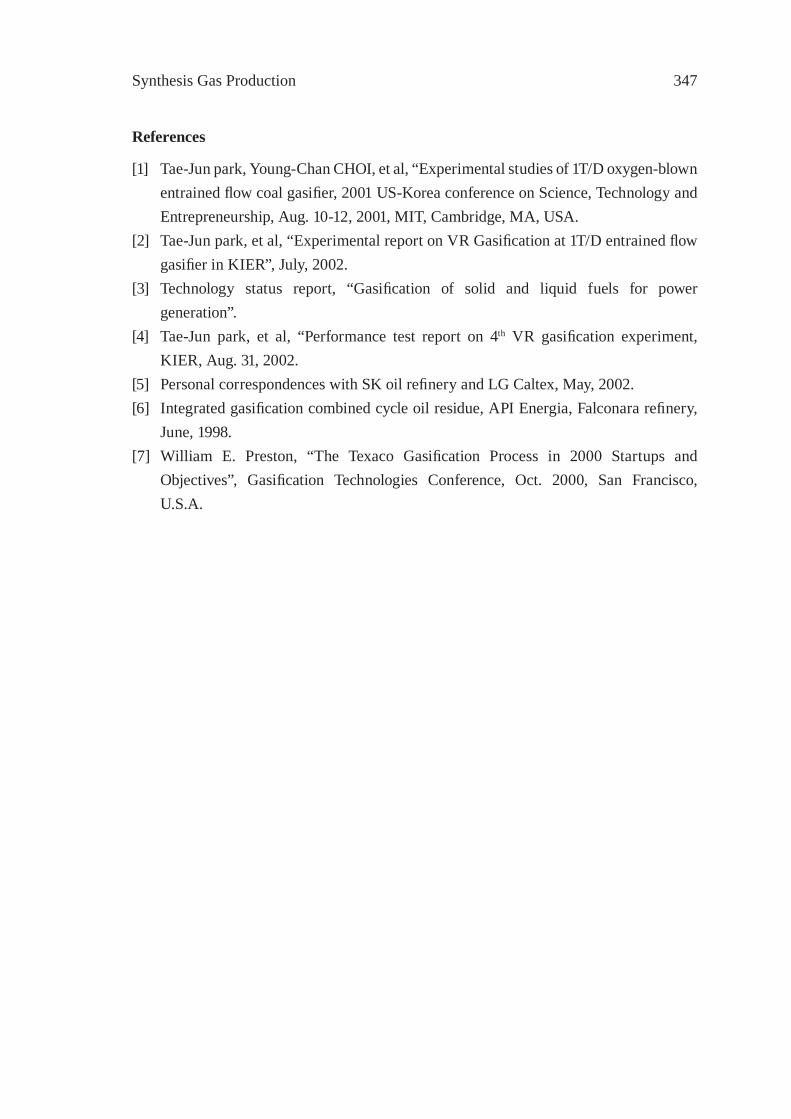
Synthesis Gas Production 347
References
[1] Tae-Jun park, Young-Chan CHOI, et al, “Experimental studies of 1T/D oxygen-blown entrained fl ow coal gasifi er, 2001 US-Korea conference on Science, Technology and Entrepreneurship, Aug. 10-12, 2001, MIT, Cambridge, MA, USA.
[2] Tae-Jun park, et al, “Experimental report on VR Gasifi cation at 1T/D entrained fl ow gasifi er in KIER”, July, 2002.
[3] Technology status report, “Gasifi cation of solid and liquid fuels for power generation”.
[4] Tae-Jun park, et al, “Performance test report on 4th VR gasifi cation experiment, KIER, Aug. 31, 2002.
[5] Personal correspondences with SK oil refi nery and LG Caltex, May, 2002.[6] Integrated gasifi cation combined cycle oil residue, API Energia, Falconara refi nery,
June, 1998.[7] William E. Preston, “The Texaco Gasifi cation Process in 2000 Startups and
Objectives”, Gasifi cation Technologies Conference, Oct. 2000, San Francisco, U.S.A.

ISFR - 2005348
Synthesis Gas Production 349
FEEDSTOCK RECYCLING OF POLYETHYLENE-WOOD MIXTURES BY GASIFICATION
J.M.N. van Kasteren1* and H. O. Mbele2
1 Eindhoven University of Technology – Department of Chemical EngineeringP.O. Box 513, 5600 MB, Eindhoven, The Netherlands
* Corresponding author. Tel +31-40- 2473589, [email protected] University of Dar es Salaam, College of Engineering, Chemical and Process
Department, P.O. Box 35131, Dar es Salaam, Tanzania
Abstract: This paper describes the gasifi cation of polyethylene (PE)-wood mixtures to syngas (H2 and CO) with the aim of feedstock recycling via direct fermentation of syngas to ethanol. Gasifi cation experiments (fl uidized bed, 800-950 °C) have been done at different conditions to optimize the composition of syngas suitable for fermentation purposes. The results obtained show that the gasifi cation of PE and wood is possible and that the effect of the combination can either be benefi cial or detrimental according to the desired outcome of the gasifi cation process. For maximum yield of CO and H2 it is necessary to minimize PE content and ER and maximize temperature.
1. Introduction
Due to increased pressure on feedstock of oil and other fossil fuels there is a need of fi nding new alternative fuels, other than fossil fuel. In addition to this depletion problem there is the problem of the negative environmental impact of wastes accumulation. In the search for a more sustainable solution the study of co-gasifi cation of biomass and plastic wastes with the aim of feedstock recycling via direct fermentation of syngas to ethanol is very relevant and worthwhile of studying. Furthermore, the treatment of biomass and plastic waste effectively contributes to the increase of sanitory conditions especially for developing countries. Pinto et.al [1] studied the co-gasifi cation of wood and PE in a lab reactor with steam. They concluded that plastic could be benefi cial for the process dependent on what the fi nal use for the syngas is. However, they did not investigate the infl uence of oxygen on the process. We are going to investigate the infl uence of oxygen and polyethylene on the wood gasifi cation with respect to optimizing for CO and Hydrogen yield. This last is required because according to literature CO and H2, can be converted to ethanol by anaerobic bacteria such as Clostridium Ijungdahlii [2-5].
6CO + 3H 2O → CH3CH2OH+ 4CO2 (i)
6H2 + 2CO2 → CH3CH2OH +3H2O (ii)
The advantage of such a process is that from every Carbon source, which can be gasifi ed to CO and H2, ethanol can be produced. The direct fermentation of syngas to ethanol [3,
ISFR - 2005350
4] makes the production of ethanol possible from all kinds of biological feedstocks and this makes the introduction of ethanol as a fuel more feasible. This enlarges the feedstock possibilities for ethanol production tremendously. In this way low valuable hydrocarbon containing waste streams can be used to be upgraded to ethanol, which is becoming one of the mayor transport fuels of the future. According to Klasson et al.[4] the most important problem of this fermentation process is the mass transfer of CO and H2 to the liquid (water) phase. Research should be done to improve this. In order to couple both processes it is crucial that as much CO and/of H2 can be retrieved from the biomass/waste input streams. Especially with the use of polyethylene ethylene will be formed which will be detrimental to the bacteria [5]. So it is better to choose process conditions, which minimize the ethylene production and maximizes CO and H2 production.
In this work, the infl uence of feed composition (wood mixed with polyethylene) is studied at different process conditions. Variables are temperature, equivalent ratio and steam addition. The aim is to determine the optimal conditions for maximizing yield CO, yield H2 and their combination.
2. Theory
The overall idea is to convert the carbon and hydrogen present in the feedstock to CO and H2 according to the formula:
CxHyOz + ((x/2-z/2)O2 → xCO + y/2H2 (1)
Competing reaction is the complete combustion:
CxHyOz + (x+y/4-z/2)O2 → xCO2 + (y/2)H2O (2)
This CO, H2 and CO2 mixture will be converted to C2H5OH and acetic acid according to Klasson [5]:
6CO + 3H2O→ C2H5OH + 4CO2
4CO + 2H2O→ CH3COOH + 2CO2
6H2 + 2CO2 → C2H5OH + 3H2O4H2 + 2CO2 → CH3COOH + 2H2O
Ethanol production can be boosted to 10 times as high as the ethanol production [5]. This is done by substrate limitations. Overall this will result in:
CO + H2 → 0.3125C2H5OH + 0.03125CH3COOH +0.3125CO2
In practice this will mean that for every ethanol produced also 10% of acetic acid is formed. This acetic acid is removed via distillation as the fermentor produces 4-5wt% ethanol water mixture. For fuel purposes the ethanol water mixtures is distilled to 95% ethanol.
Synthesis Gas Production 351
Generally the process of biomass gasifi cation occurs through three steps. The initial devolatilisation or pyrolysis step occur at lower temperatures and produces gas (mainly CO2, H2, CO, CH4 and water vapour), primary tar (bio-diesel) and char. Experiments performed at higher temperatures (700-900°C) [5-6] suggest that primary tar is being cracked down to secondary tar and gases (CO2, CO, CH4, C2H4, C2H6, H2) Van den Aarsen [6] presented expressions for the decomposition of secondary tar to CO, CH4 and char. After pyrolysis, the secondary reactions start to take place involving the volatile products. Finally the gasifi cation of the remaining carbonaceous materials and the char will take place. For polythylene (PE) there is no devolatilisation step. As temperature increases, bond breakage occurs throughout the PE molecule structure, which hence decomposes into ethylene and small molecular radicals and atoms, some of which may participate in the gasifi cation reactions.
3. Experimental methods
The experiments were carried out in a fl uidized bed gasifi er FBD with an inside diameter of 65 mm and 550 mm of total height under steady state conditions with respect to the product-gas composition, attained within 15-25 minutes after the beginning of the fuel feeding. The gasifi er was placed inside an electrical furnace, which provides the necessary gasifi cation heat. The whole lab-scale gasifi cation unit is divided into three parts namely gas and steam feeder, reactor (gasifi er) and product separation and analysis, and described in detail by Slapak et al [6]. The operating conditions studied were varied as followed: Temperatures tested were 1043, 1123 and 1223K. Feedstock composition used were: wood:polyethylene(PE)-ratio 1:0, 6:1, 1:1 and 0:1 on weight basis. Also for comparison the gasifi cation of pure PE was done. For each value of temperature values of Equivalent Ratio (ER) were set at 0.2 and 0.4.
From elemental analysis of wood fuel and PE and considering the major elements, the wood fuel and PE may be represented on a molar basis as CH1.7O0.7 and C2H4 respectively. Based on this composition the ER was calculated, the complete combustion to CO2 and H2O being ER =1 (mole/mole). Nitrogen fl ow rate was constant for all experiments 1140 ml/min and O2 fl ow of 0-650ml/min depended on the amount and composition of feedstock as well as the desired ER. The bed material applied in these experiments was quartz sand of particle diameter dp, particle density δp, surface area SA and porosity of 106μm, 2650kgm-3, 28*103m2m-3 and 0.52 [-] respectively. The fl uidized bed is heated up and kept at the desired temperature (1043, 1123 and 1223K) via the electric furnace. Feedstock (100-250 mg/min) was manually fed at the top of the reactor. The gas produced left the reactor, passing through a cyclone to remove particulates. Tars and condensable liquids carried by the gas were removed in a quenching system. The typical duration of a single gasifi cation test was 1 hour in the steady state region. During each test the gas

ISFR - 2005352
composition was continuously monitored by two parallel connected Chrompack Micro gaschromatographs for H2, O2, N2, CH4, CO, CO2, C2H6, C2H4, C3H8, C3H6 and C4H10.
The effects of equivalent ratio, process temperature and feedstock composition on carbon to gas conversion and gas composition were determined. Carbon to gas conversion was calculated by dividing the amount of carbon in the gas-phase by the amount of carbon in the fuel while the composition were calculated based on nitrogen free produced gas. The results are expressed in terms of carbon to gas conversion and gas compositions.
First pure wood was gasifi ed at different temperatures and ERs and then co-gasifi cation of wood mixed with low density polyethylene plastic (LDPE) was done to test the effect of adding plastic to the wood. Matchsticks as source of wood were used as feedstock in the gasifi cation experiments at different temperatures and ERs.
4. Results and discussions
From fi gures 1 and 2 it can be seen that increase of temperature has signifi cant effect on carbon conversion when feedstock with small amount of PE used.
50.00
60.00
70.00
80.00
90.00
1043 1123 1223
Temperature [K]
C-Con
versi
on [%
]
PE C-ratio=0.00
PE C-ratio=0.24PE C-ratio=0.64
PE C-ratio=1.00
Figure 1: Carbon to gas conversion as a function of feedstock composition and temperature at ER of 0.2, Bed material is quartz, PE C-ratio= amount of Carbon in PE
compared to total amount of Carbon in the feed.
Probably this is due to the effect that PE gasifi cation produces more hydrogen which in turn gasifi es char originated from biomass. With higher content of PE the conversion decreases with temperature. This is due to higher production of char.
Table 1 shows the syngas composition as function of temperature, ER and feed composition. It appears that H2 increases with an increase of both temperature and PE content while the reverse trend is found in CO production.

Synthesis Gas Production 353
Table 1: Syngas composition at different gasifi cation conditions
ER Temp. Feed C1. H2 CO CO2 CH4 HCs2
[-] oC W:P [-] [%] [%] [%] [%] [%]0.2 770 1.0 :0.0 9.01 49.86 19.11 9.47 7.410.2 850 1.0 :0.0 10.00 44.00 24.69 9.84 6.700.2 950 1.0 :0.0 12.77 42.02 24.37 11.49 6.09
0.4 770 1.0 :0.0 5.89 41.84 25.25 6.10 3.830.4 850 1.0 :0.0 7.63 38.12 31.02 8.23 5.890.4 950 1.0 :0.0 8.91 32.77 38.07 9.32 5.23
0.2 770 6.0 :1.0 8.32 45.17 20.69 10.04 10.930.2 850 6.0 :1.0 10.16 36.80 30.18 9.80 9.820.2 950 6.0 :1.0 13.50 34.96 28.73 12.61 8.89
0.4 770 6.0 :1.0 6.33 40.34 29.90 7.29 9.080.4 850 6.0 :1.0 7.54 28.50 44.28 7.88 7.470.4 950 6.0 :1.0 10.54 25.52 46.30 8.65 5.74
0.2 770 1.0 :1.0 8.10 39.58 10.86 15.44 21.450.2 850 1.0 :1.0 10.14 24.84 31.59 12.21 16.300.2 950 1.0 :1.0 19.75 16.01 35.69 13.81 8.99
0.4 770 1.0 :1.0 6.17 24.22 39.62 9.42 16.840.4 850 1.0 :1.0 8.47 20.29 42.19 9.76 12.790.4 950 1.0 :1.0 10.60 16.58 45.68 10.03 10.60
0.2 770 0.0 :1.0 8.78 25.78 12.25 14.50 32.830.2 850 0.0 :1.0 13.73 11.96 29.57 17.22 22.200.2 950 0.0 :1.0 17.83 10.39 25.54 20.51 22.65
0.4 770 0.0 :1.0 7.05 17.62 34.68 10.95 22.320.4 850 0.0 :1.0 7.67 9.32 46.66 10.90 19.400.4 950 0.0 :1.0 13.89 6.72 46.46 14.02 13.61
1 Feed composition on weight basis wood (W) to plastic (P)2 HC’s are C2H6, C2H4, C3H8, C3H6, and C4H10
The combined yield of the two gases is higher for feedstock with less amount of PE compared to wood than feedstock with higher amount of PE. The amount of CH4 and other higher HCs increase as PE content does. At higher ER the content of CO and H2 decreases as expected due to more oxidation to CO2 and H2O. The increase of temperature reduced the amount of HCs and increase the amount of hydrogen but an increase of CO2 and reduction of CO was observed.

ISFR - 2005354
Overall conclusion is that the yield of CO and H2 is optimal at high temperatures and lower PE content. This is due to the fact that PE forms a lot of higher hydrocarbons at low temperature and a lot of char at higher temperatures, while wood forms a lot of char at low temperatures and more CO at high temperatures. Also the ER ratio should not be higher than 0.2 to prevent too much CO2 formation. The addition of steam can in this respect be very helpful to increase the yield of CO and H2. Experiments investigating the effect of steam are currently carried out and their results are still to be published.
5. Conclusions
The results obtained show that the gasifi cation of PE and wood is possible and that the effect of the combination can either be benefi cial or detrimental according to the desired outcome of the gasifi cation process. For maximum yield of CO and H2 it is necessary to minimize PE content and ER and maximize temperature.
Further investigations on the effect of other parameters are to be done like steam addition in order to bring the goal of optimizing operating conditions for syngas production with high composition of CO and H2. The gasifi cation at higher temperature with steam addition is expected to increase the yield of H2 and CO as predicted by water- gas reaction.
50.00
60.00
70.00
80.00
90.00
100.00
1043 1123 1223
Temperature [K]
C-Co
nvers
ion [%
]
PE=0%
PE=15%
PE=50%
PE=100%
Figure 2: Carbon conversion as a function of feedstock composition and temperature at ER of 0.4, Bed material is quartz, PE ratio on weight basis.
Synthesis Gas Production 355
6. References
[1] Pinto F, Franco C., André, R.N., Miranda, M., Gulyurtlu, I., Cabrita, I. Co-gasifi cation study of biomass mixed with plastic wastes, Fuel 81, 291-297 (2002)
[2] Marshall D. Bredwell, Prashant Srivastava, and R. Mark Worden. Reactor Design Issues for Synthesis-Gas Fermentations. Biotechnology Progress, 15, 834-844 (1999).
[3] Phillips J.R, Clausen E.C, Gaddy J.L. Synthesis gas as substrate for the biological production of fuels and chemicals, Applied biochemistry and biotechnology, vol. 45/46, 145-157 (1994).
[4] Klasson K.T., Ackerson M.D., Clausen E.C. and Daddy J.L. Biological conversion of coal and coal-derived synthesis gas. Fuel Vol 72, (12) 1673-1678 (1993).
[5] Klasson, K.T., Elmore, B. B. Vega, J.L., Ackerson, M. D., Clausen, E.C. and Daddy, J.L.. Biological Production of Liquid and Gaseous Fuels from Synthesis-Gas. Applied Biochemistry and Biotechnology, 24/25, 857-873 (1990).
[6] Van den Aarsen , F. G., Fluidized bed wood gasifi er Performance and modelling, Ph.D thesis university of Twenty, The Netherlands, 1985.
[7] Slapak M.J.P, Van Kasteren J.M.N and Drinkenburg A.A.H, Polym. Adv. Technol. 10, 596-602 (1999).
[8] Mbele H, Kasteren, J.M.N. van, Katima, J., Lemstra P.J. and Temu A., The effect of temperature, equivalent ratio and feedstock composition on wood-plastic gasifi cation, Proceedings 2nd World Conference on Biomass for Energy, Industry and Climate Protection, Rome 10-14 May 2004, 817-820.

ISFR - 2005356
Synthesis Gas Production 357
A STUDY ON DME SYNTHESIS FROM WASTED PLASTICS AND WOODY BIOMASS
Masao Yukumoto, Mamoru Omiya and Yotaro OhnoJFE Holdings, Inc., 1-2 Marunouchi 1-chome, Chiyoda-ku Tokyo 100-0005 Japan, m-
Abstract: DME (Dimethyl Ether) attracts now big attention worldwide as a clean and economical carrier of alternative energy. It can be synthesized from various resources, such as natural gas, coal, wasted plastics, and biomass. Furthermore, because of its
properties similar to propane, it has many potential uses such as electric power generation, household and diesel engine fuel. In this study, two scenarios of DME synthesized from biomass are investigated at Maniwa Area, in Okayama Prefecture, Japan. In the scenario 1, DME is synthesized from bark waste of 40 tons per day gasifi ed with air. The scenario 2 is DME synthesized from 40 tons per day of bark waste and 60 tons per day of wasted plastics with an oxygen blowing gasifi er. These scenarios are discussed from the point of carbon dioxide emission reduction and compared with current systems.
1. Introduction
It is great signifi cant to realize the biomass energy systems which is characterized as one of the pillars of the sustainable society, because of the multiple advantageous effects, such as global warming countermeasures, rising self-suffi ciency ratio in the energy supply, national land conservation, regional development and biomass industry structural improvement. Dimethyl ether (DME), which is recently recognized as a new clean fuel and is synthesized from natural gas, coal and biomass, will give a solution of secure energy supply and environmental conservation. In this paper, we designed the hybrid systems of DME and electric power generation using biomass available in a rural area, at Maniwa Area, in Okayama Prefecture, Japan and evaluated the life cycle inventry of carbon dioxide. The analysis shows that the system using both bark and plastic wastes reduces carbon dioxide emission in comparison with the already existing system.
2. Outline of direct DME synthesis process
2.1. Gasifi cation and reforming process
The standard treatment fl ow of gasifi cation and reforming pro cess is shown in Fig. 1. Wasted plastics and woody biomass are compacted without pretreatment, followed by drying and pyrolysis by indi rect heating in the degassing channel. The pyrolyzed waste product is then charged into the high temperature reactor, where it is melted at high temperature by reac tion with oxygen and pyrolyzed carbon to form gas. This gas passes
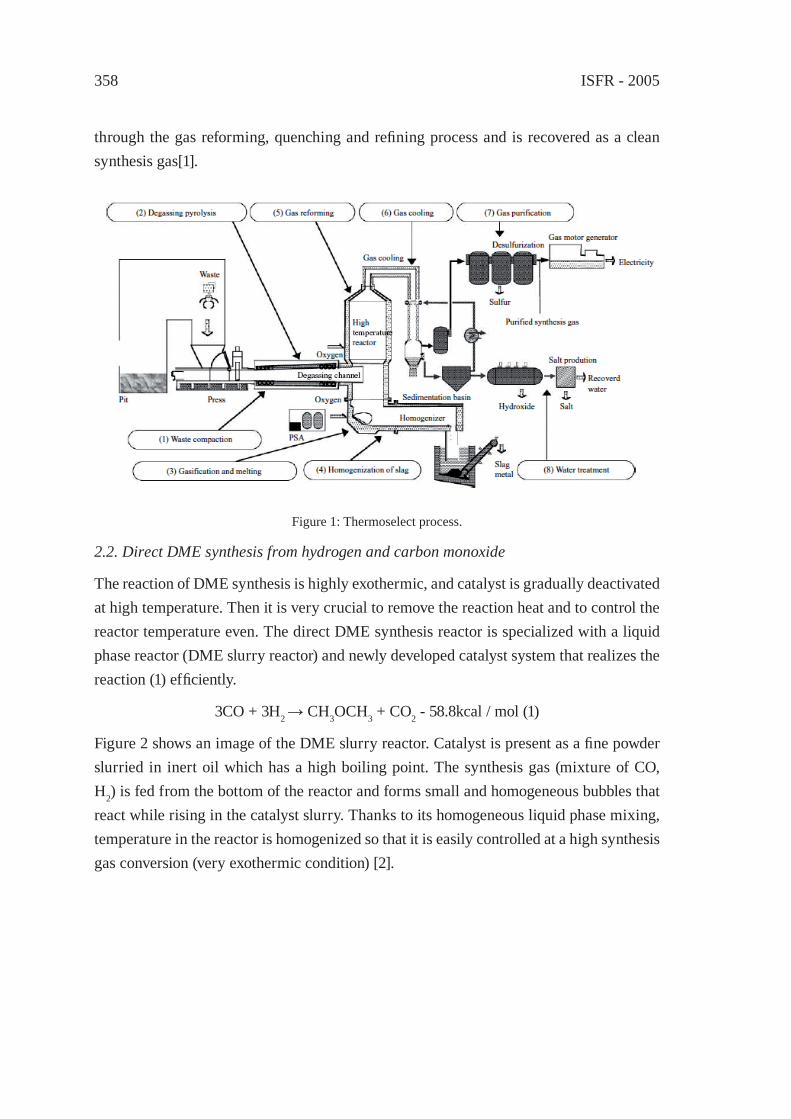
ISFR - 2005358
through the gas reforming, quenching and refi ning process and is recovered as a clean synthesis gas[1].
Figure 1: Thermoselect process.
2.2. Direct DME synthesis from hydrogen and carbon monoxide
The reaction of DME synthesis is highly exothermic, and catalyst is gradually deactivated at high temperature. Then it is very crucial to remove the reaction heat and to control the reactor temperature even. The direct DME synthesis reactor is specialized with a liquid phase reactor (DME slurry reactor) and newly developed catalyst system that realizes the reaction (1) effi ciently.
3CO + 3H2 → CH3OCH3 + CO2 - 58.8kcal / mol (1)
Figure 2 shows an image of the DME slurry reactor. Catalyst is present as a fi ne powder slurried in inert oil which has a high boiling point. The synthesis gas (mixture of CO, H2) is fed from the bottom of the reactor and forms small and homogeneous bubbles that react while rising in the catalyst slurry. Thanks to its homogeneous liquid phase mixing, temperature in the reactor is homogenized so that it is easily controlled at a high synthesis gas conversion (very exothermic condition) [2].
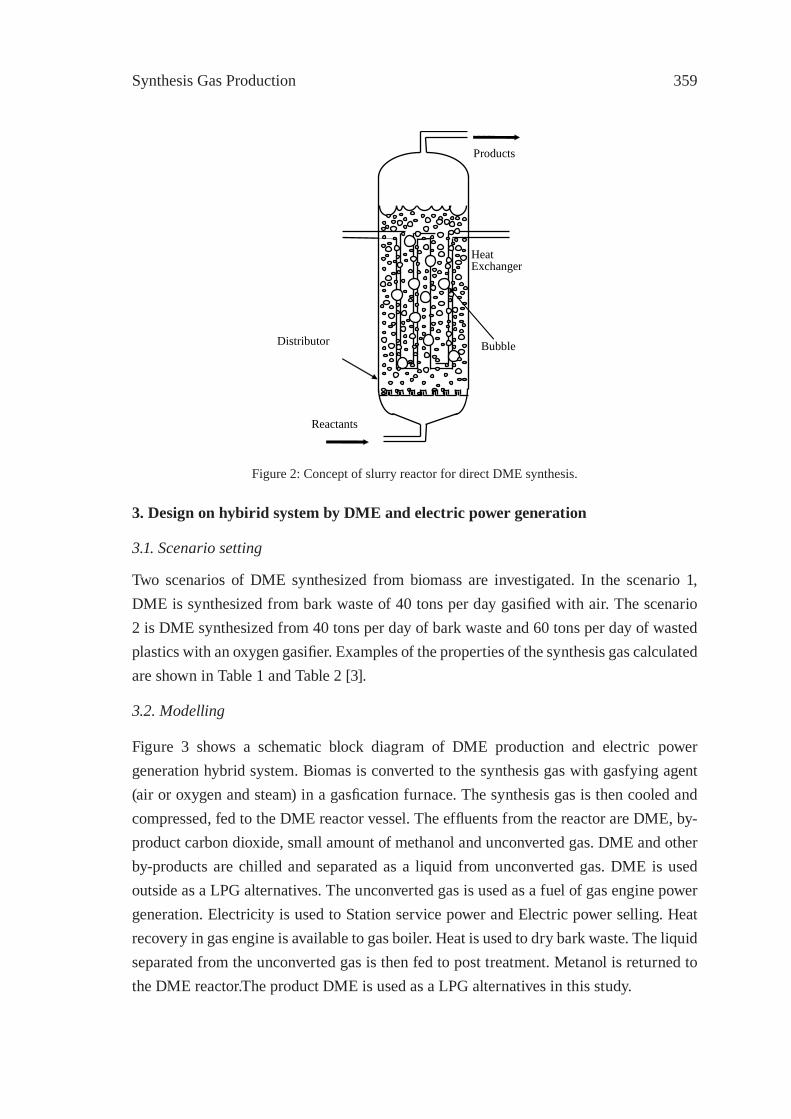
Synthesis Gas Production 359
3. Design on hybirid system by DME and electric power generation
3.1. Scenario setting
Two scenarios of DME synthesized from biomass are investigated. In the scenario 1, DME is synthesized from bark waste of 40 tons per day gasifi ed with air. The scenario 2 is DME synthesized from 40 tons per day of bark waste and 60 tons per day of wasted plastics with an oxygen gasifi er. Examples of the properties of the synthesis gas calculated are shown in Table 1 and Table 2 [3].
3.2. Modelling
Figure 3 shows a schematic block diagram of DME production and electric power generation hybrid system. Biomas is converted to the synthesis gas with gasfying agent (air or oxygen and steam) in a gasfi cation furnace. The synthesis gas is then cooled and compressed, fed to the DME reactor vessel. The effl uents from the reactor are DME, by-product carbon dioxide, small amount of methanol and unconverted gas. DME and other by-products are chilled and separated as a liquid from unconverted gas. DME is used outside as a LPG alternatives. The unconverted gas is used as a fuel of gas engine power generation. Electricity is used to Station service power and Electric power selling. Heat recovery in gas engine is available to gas boiler. Heat is used to dry bark waste. The liquid separated from the unconverted gas is then fed to post treatment. Metanol is returned to the DME reactor.The product DME is used as a LPG alternatives in this study.
Figure 2: Concept of slurry reactor for direct DME synthesis.
Reactants
Products
Heat Exchanger
Distributor Bubble
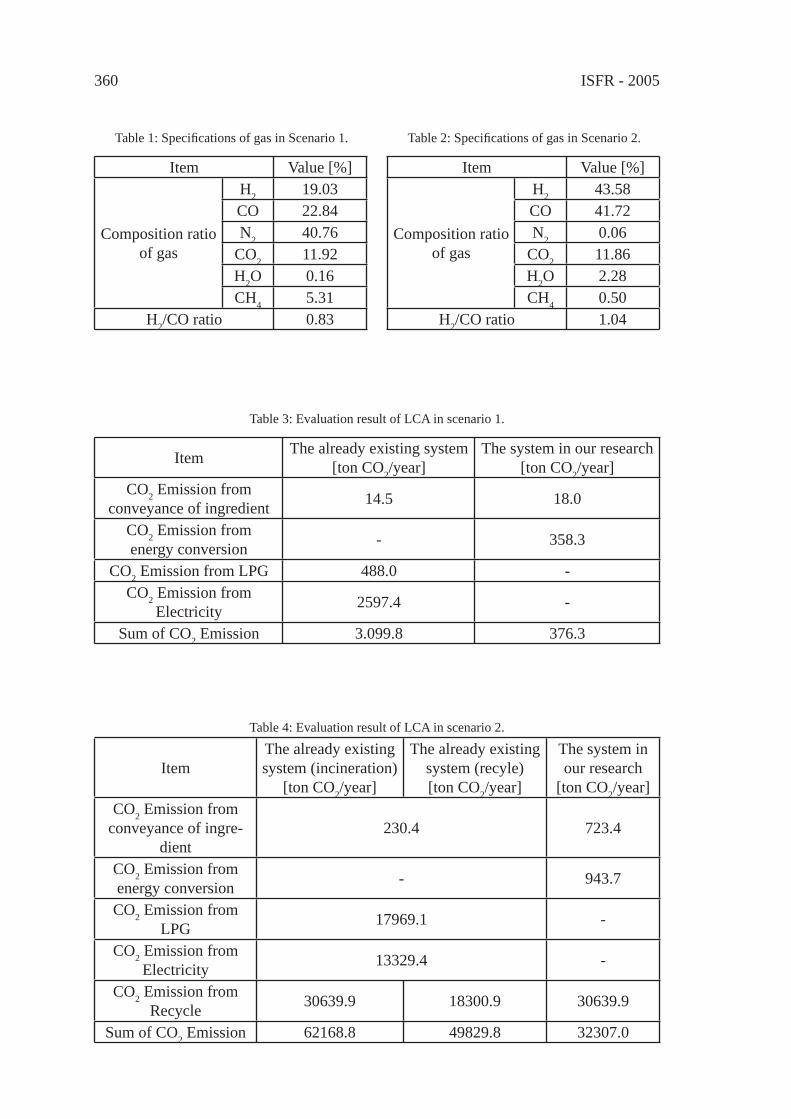
ISFR - 2005360
Table 1: Specifi cations of gas in Scenario 1.
Item Value [%]
Composition ratio of gas
H2 19.03CO 22.84N2 40.76
CO2 11.92H2O 0.16CH4 5.31
H2/CO ratio 0.83
Table 2: Specifi cations of gas in Scenario 2.
Item Value [%]
Composition ratio of gas
H2 43.58CO 41.72N2 0.06
CO2 11.86H2O 2.28CH4 0.50
H2/CO ratio 1.04
Table 3: Evaluation result of LCA in scenario 1.
Item The already existing system [ton CO2/year]
The system in our research [ton CO2/year]
CO2 Emission fromconveyance of ingredient 14.5 18.0
CO2 Emission fromenergy conversion - 358.3
CO2 Emission from LPG 488.0 -CO2 Emission from
Electricity 2597.4 -
Sum of CO2 Emission 3.099.8 376.3
Table 4: Evaluation result of LCA in scenario 2.
ItemThe already existing system (incineration)
[ton CO2/year]
The already existing system (recyle)[ton CO2/year]
The system in our research
[ton CO2/year]CO2 Emission from
conveyance of ingre-dient
230.4 723.4
CO2 Emission fromenergy conversion - 943.7
CO2 Emission from LPG 17969.1 -
CO2 Emission fromElectricity 13329.4 -
CO2 Emission fromRecycle 30639.9 18300.9 30639.9
Sum of CO2 Emission 62168.8 49829.8 32307.0
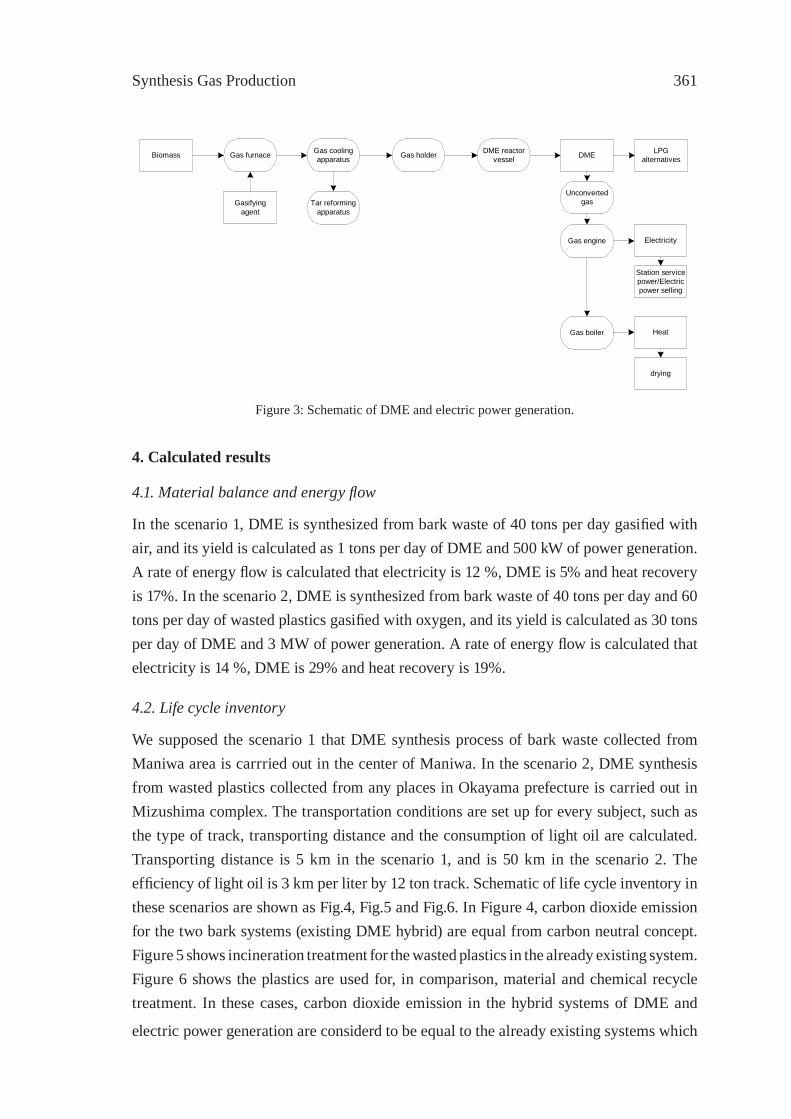
Synthesis Gas Production 361
4. Calculated results
4.1. Material balance and energy fl ow
In the scenario 1, DME is synthesized from bark waste of 40 tons per day gasifi ed with air, and its yield is calculated as 1 tons per day of DME and 500 kW of power generation. A rate of energy fl ow is calculated that electricity is 12 %, DME is 5% and heat recovery is 17%. In the scenario 2, DME is synthesized from bark waste of 40 tons per day and 60 tons per day of wasted plastics gasifi ed with oxygen, and its yield is calculated as 30 tons per day of DME and 3 MW of power generation. A rate of energy fl ow is calculated that electricity is 14 %, DME is 29% and heat recovery is 19%.
4.2. Life cycle inventory
We supposed the scenario 1 that DME synthesis process of bark waste collected from Maniwa area is carrried out in the center of Maniwa. In the scenario 2, DME synthesis from wasted plastics collected from any places in Okayama prefecture is carried out in Mizushima complex. The transportation conditions are set up for every subject, such as the type of track, transporting distance and the consumption of light oil are calculated. Transporting distance is 5 km in the scenario 1, and is 50 km in the scenario 2. The effi ciency of light oil is 3 km per liter by 12 ton track. Schematic of life cycle inventory in these scenarios are shown as Fig.4, Fig.5 and Fig.6. In Figure 4, carbon dioxide emission for the two bark systems (existing DME hybrid) are equal from carbon neutral concept. Figure 5 shows incineration treatment for the wasted plastics in the already existing system. Figure 6 shows the plastics are used for, in comparison, material and chemical recycle treatment. In these cases, carbon dioxide emission in the hybrid systems of DME and
electric power generation are considerd to be equal to the already existing systems which
Biomass DME
Gasifyingagent
Gas furnace Gas coolingapparatus
Tar reformingapparatus
Gas engine
Gas holder
Gas boiler
DME reactorvessel
Unconvertedgas
Heat
drying
LPGalternatives
Electricity
Station servicepower/Electricpower selling
Figure 3: Schematic of DME and electric power generation.
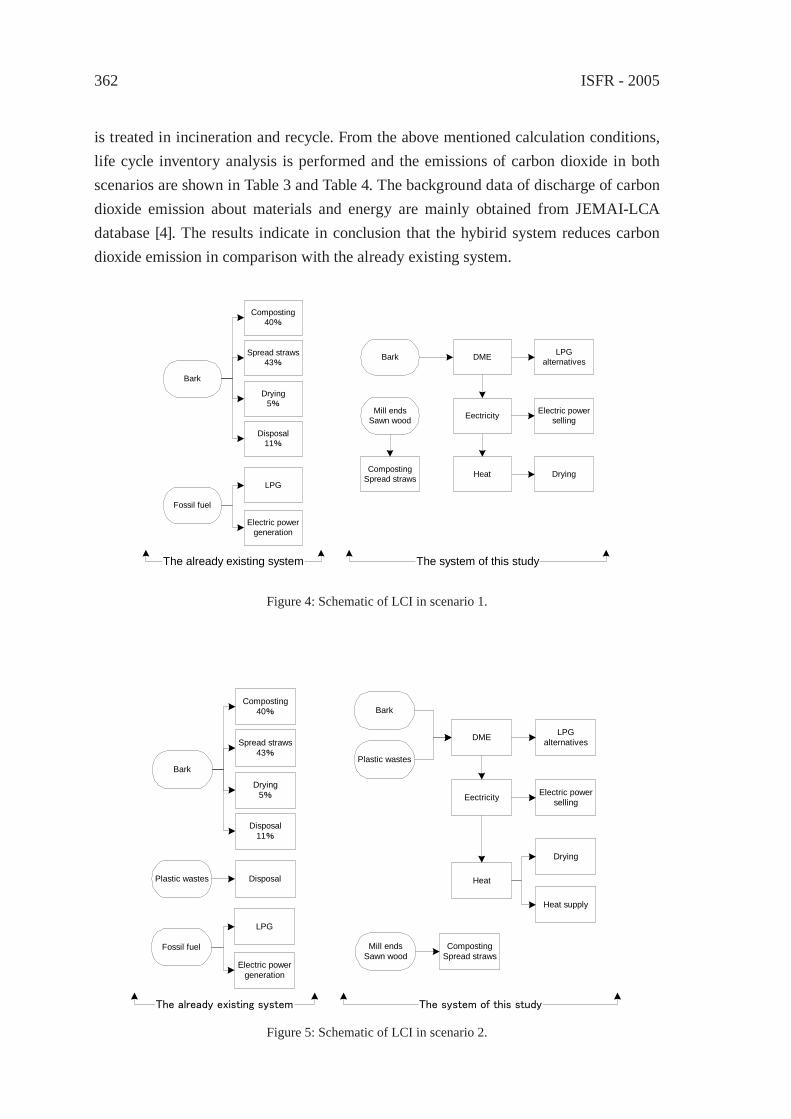
ISFR - 2005362
is treated in incineration and recycle. From the above mentioned calculation conditions, life cycle inventory analysis is performed and the emissions of carbon dioxide in both scenarios are shown in Table 3 and Table 4. The background data of discharge of carbon dioxide emission about materials and energy are mainly obtained from JEMAI-LCA database [4]. The results indicate in conclusion that the hybirid system reduces carbon dioxide emission in comparison with the already existing system.
Disposal11%
Bark
Drying5%
Composting40%
Spread straws43%
Fossil fuel
LPG
Bark DME LPGalternatives
DryingCompostingSpread straws
Mill endsSawn wood Eectricity Electric power
selling
Heat
The already existing system The system of this study
Electric powergeneration
Figure 4: Schematic of LCI in scenario 1.
The already existing system The system of this study
Plastic wastes Disposal
Fossil fuel
LPG
Electric powergeneration
Disposal11%
Bark
Drying5%
Composting40%
Spread straws43%
Bark
DME LPGalternatives
Drying
Eectricity Electric powerselling
Heat
Plastic wastes
Heat supply
CompostingSpread straws
Mill endsSawn wood
Figure 5: Schematic of LCI in scenario 2.
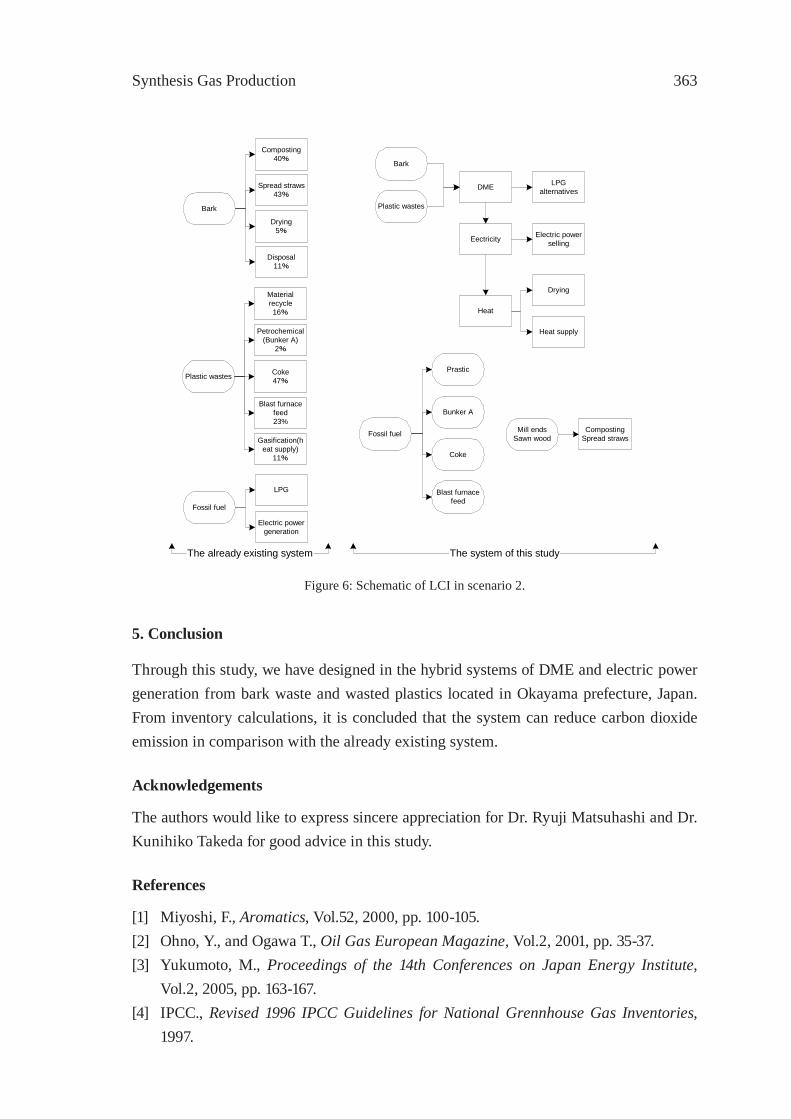
Synthesis Gas Production 363
5. Conclusion
Through this study, we have designed in the hybrid systems of DME and electric power generation from bark waste and wasted plastics located in Okayama prefecture, Japan. From inventory calculations, it is concluded that the system can reduce carbon dioxide emission in comparison with the already existing system.
Acknowledgements
The authors would like to express sincere appreciation for Dr. Ryuji Matsuhashi and Dr. Kunihiko Takeda for good advice in this study.
References
[1] Miyoshi, F., Aromatics, Vol.52, 2000, pp. 100-105.[2] Ohno, Y., and Ogawa T., Oil Gas European Magazine, Vol.2, 2001, pp. 35-37.[3] Yukumoto, M., Proceedings of the 14th Conferences on Japan Energy Institute,
Vol.2, 2005, pp. 163-167.[4] IPCC., Revised 1996 IPCC Guidelines for National Grennhouse Gas Inventories,
1997.
Plastic wastes
Materialrecycle16%
Petrochemical(Bunker A)
2%
Coke47%
Blast furnacefeed23%
Gasification(heat supply)
11%
Fossil fuel
LPG
Bark
DME LPGalternatives
Drying
CompostingSpread straws
Mill endsSawn wood
Eectricity Electric powerselling
Heat
The already existing system The system of this study
Electric powergeneration
Plastic wastes
Heat supply
Prastic
Bunker A
Blast furnacefeed
Coke
Fossil fuel
Disposal11%
Bark
Drying5%
Composting40%
Spread straws43%
Figure 6: Schematic of LCI in scenario 2.

ISFR - 2005364

Synthesis Gas Production 365
GASIFICATION OF WASTE PLASTICS BY STEAM REFORMINGT. Tsuji*, S. Okajima and T. Masuda
Graduate school of Engineering, Hokkaido University, Sapporo, [email protected]
The process to produce synthesis gas from waste plastics by steam reforming has been investigated. To evaluate this process, the steam reforming of the oils derived from LDPE and polystyrene were carried out using a lab scale fl uidized bed reactor. Carbon conver-sion, gas yield and gas compositions were examined. Although the plastic oils contain many heavy hydrocarbons and aromatics, they were well gasifi ed under the conditions at temperatures above 1023K, steam carbon ratio= 3.5 and WHSV= 1hr-1. The product gas contained about 70 vol.% hydrogen.
1. Introduction
The production of gas by reacting hydrocarbons with steam in the presence of catalyst is well known process, which has been established since the 1930s. A vast of studies has been reported for the steam reforming of natural gas, naphtha, and other hydrocarbons. However the steam reforming of the oil derived from waste plastics has not been reported hitherto. The advantage of this process compared to the conventional waste plastic gasi-fi cation process (partial oxidation process) is to produce hydrogen rich syn-gas without using of pure oxygen. The product gas can be used not only as a chemical feedstock but also as hydrogen resources for fuel cell in the future.
The authors studied the characteristics of the steam reforming of the oils derived from low-density polyethylene (LDPE) and polystyrene (PS) by using a small tubular reactor [1]. These oils are well gasifi ed with very high carbon conversions and low coking rates at temperatures above 973K in spite of the heavy molecular weight components that the waste plastic oil contains. In this paper, the study using a lab scale fl uidized bed reactor is reported.
2. Steam Reforming of Waste Plastics
The process to produce synthesis gas from waste plastics by steam reforming is composed by two stages (Fig.1); the fi rst stage is a liquefaction of waste plastics and the second stage is a steam reforming of the light oil from the fi rst thermal decomposition stage. As steam reforming is a strong endothermic reaction, the heat of reaction is provided by combustion of some fraction of heavy oil arising from the fi rst stage. This makes the energy effi ciency of the whole system very high.
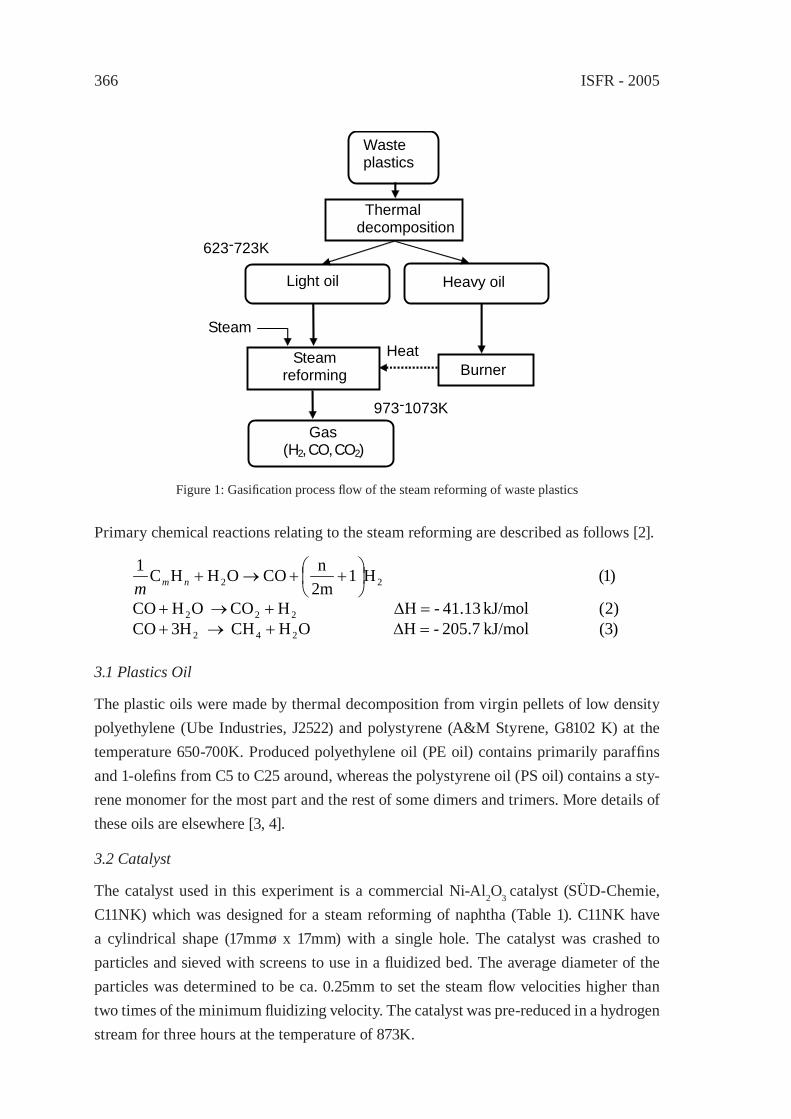
ISFR - 2005366
Thermal decomposition
Waste plastics
Steam reforming
Gas (H2, CO, CO2)
Light oil
Steam
623-723K
Heavy oil
Burner Heat
973-1073K
Figure 1: Gasifi cation process fl ow of the steam reforming of waste plastics
Primary chemical reactions relating to the steam reforming are described as follows [2].
)3( kJ/mol 205.7 -H OHCH H3CO)2( kJ/mol 41.13 -H HCO OHCO
)1( H12mnCOOHHC1
242
222
22
=∆+→+=∆+→+
++→+ nmm
3.1 Plastics Oil
The plastic oils were made by thermal decomposition from virgin pellets of low density polyethylene (Ube Industries, J2522) and polystyrene (A&M Styrene, G8102 K) at the temperature 650-700K. Produced polyethylene oil (PE oil) contains primarily paraffi ns and 1-olefi ns from C5 to C25 around, whereas the polystyrene oil (PS oil) contains a sty-rene monomer for the most part and the rest of some dimers and trimers. More details of these oils are elsewhere [3, 4].
3.2 Catalyst
The catalyst used in this experiment is a commercial Ni-Al2O3 catalyst (SÜD-Chemie, C11NK) which was designed for a steam reforming of naphtha (Table 1). C11NK have a cylindrical shape (17mmø x 17mm) with a single hole. The catalyst was crashed to particles and sieved with screens to use in a fl uidized bed. The average diameter of the particles was determined to be ca. 0.25mm to set the steam fl ow velocities higher than two times of the minimum fl uidizing velocity. The catalyst was pre-reduced in a hydrogen stream for three hours at the temperature of 873K.
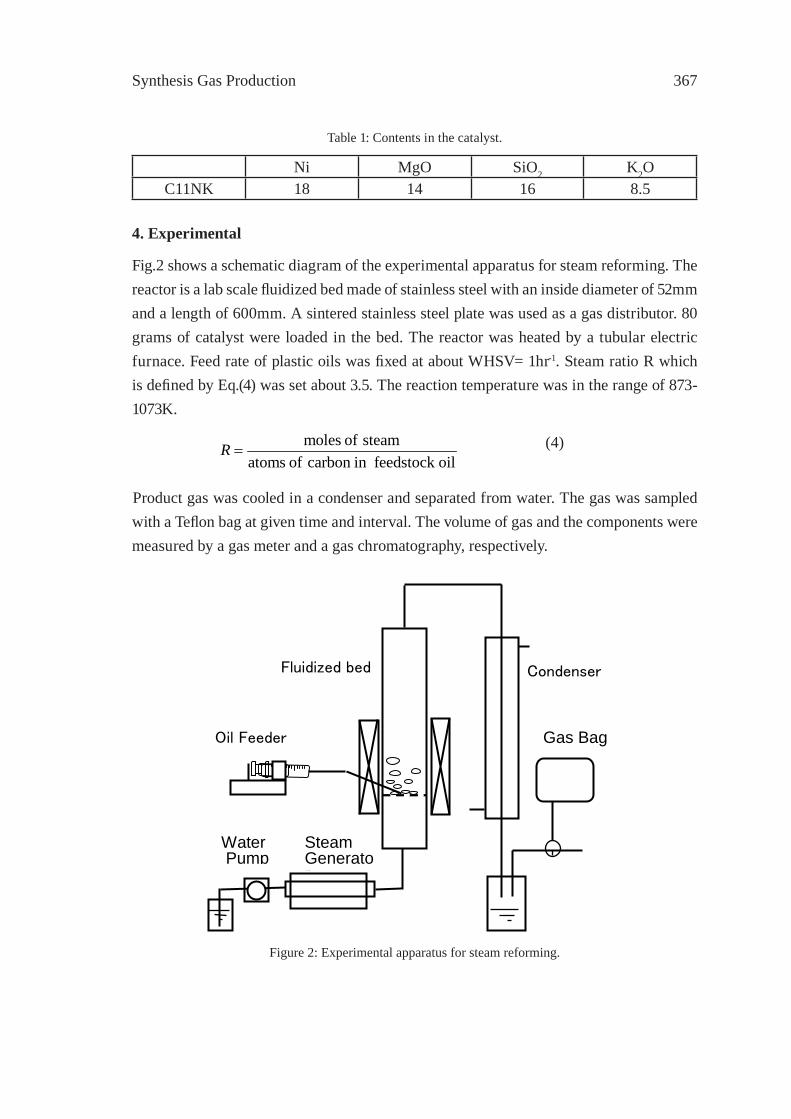
Synthesis Gas Production 367
Table 1: Contents in the catalyst.
Ni MgO SiO2 K2OC11NK 18 14 16 8.5
4. Experimental
Fig.2 shows a schematic diagram of the experimental apparatus for steam reforming. The reactor is a lab scale fl uidized bed made of stainless steel with an inside diameter of 52mm and a length of 600mm. A sintered stainless steel plate was used as a gas distributor. 80 grams of catalyst were loaded in the bed. The reactor was heated by a tubular electric furnace. Feed rate of plastic oils was fi xed at about WHSV= 1hr-1. Steam ratio R which is defi ned by Eq.(4) was set about 3.5. The reaction temperature was in the range of 873- 1073K.
oilfeedstock in carbon of atoms
steam of moles=R
Product gas was cooled in a condenser and separated from water. The gas was sampled with a Tefl on bag at given time and interval. The volume of gas and the components were measured by a gas meter and a gas chromatography, respectively.
(4)
Gas Bag Oil Feeder
Water Pump
Condenser
Steam Generator
Fluidized bed
Figure 2: Experimental apparatus for steam reforming.
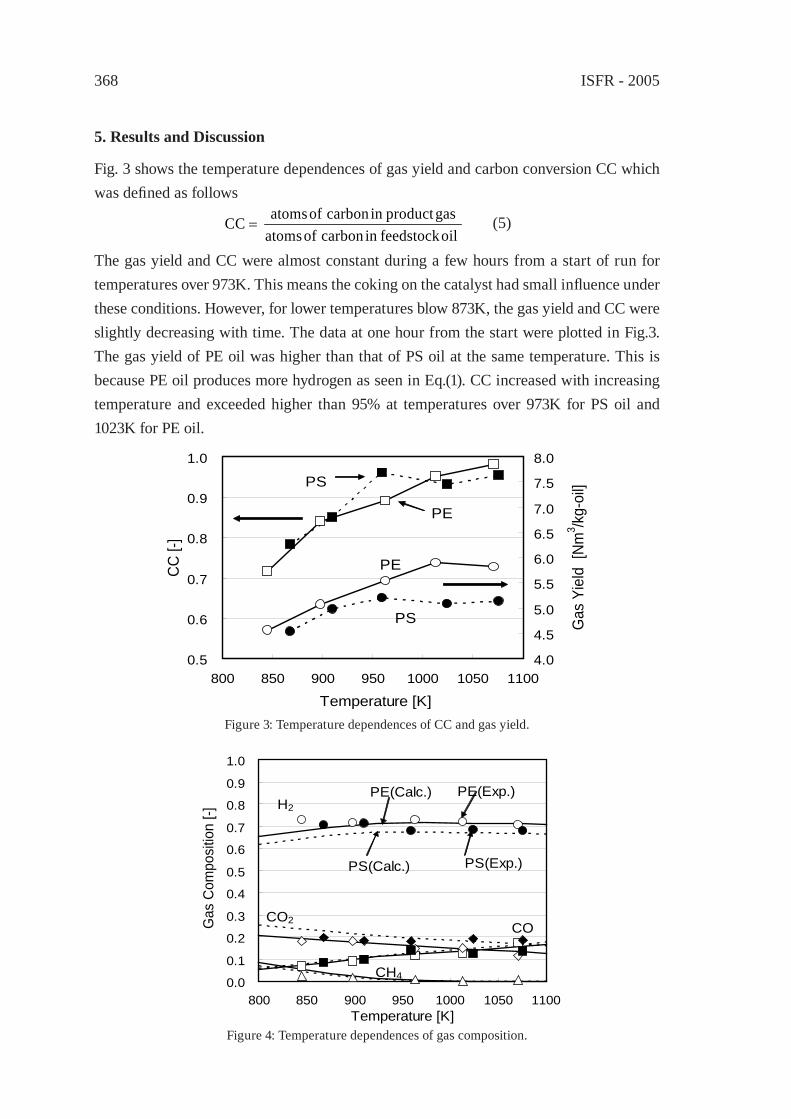
ISFR - 2005368
5. Results and Discussion
Fig. 3 shows the temperature dependences of gas yield and carbon conversion CC which was defi ned as follows
The gas yield and CC were almost constant during a few hours from a start of run for temperatures over 973K. This means the coking on the catalyst had small infl uence under these conditions. However, for lower temperatures blow 873K, the gas yield and CC were slightly decreasing with time. The data at one hour from the start were plotted in Fig.3. The gas yield of PE oil was higher than that of PS oil at the same temperature. This is because PE oil produces more hydrogen as seen in Eq.(1). CC increased with increasing temperature and exceeded higher than 95% at temperatures over 973K for PS oil and 1023K for PE oil.
oilfeedstock in carbon of atomsgasproduct in carbon of atomsCC = (5)
0.5
0.6
0.7
0.8
0.9
1.0
800 850 900 950 1000 1050 1100 Temperature [K]
CC [-
]
4.0
4.5
5.0
5.5
6.0
6.5
7.0
7.5
8.0
Gas
Yie
ld [N
m3 /k
g-oi
l]PS
PE
PS
PE
Figure 3: Temperature dependences of CC and gas yield.
0.0
0.1
0.2
0.3
0.4
0.5
0.6
0.7
0.8
0.9
1.0
800 850 900 950 1000 1050 1100Temperature [K]
Gas
Com
posi
tion
[-]
H2
CO2
CH4
CO
PE(Calc.)
PS(Calc.)
PE(Exp.)
PS(Exp.)
Figure 4: Temperature dependences of gas composition.
Synthesis Gas Production 369
Fig.4 shows the product gas compositions for both PE oil and PS oil. The hydrogen yields for both oils were very high (about 70 vol. %). Although the H/C ratio of PE oil is about two times greater than that of PS oil, their hydrogen yields were not so much different. This is due to the water gas shift reaction (Eq.(2)). The solid curves (for PE oil) and dotted curves (for PS oil) in Fig.5 are gas component profi les calculated based on the equilibri-ums of Eq.(4) and Eq.(5) [1]. The calculated profi les explained the experimental results very well except for lower temperatures where CC was also decreasing.
6. Conclusion
Although the oils derived from plastics contain a lot of heavy molecular weight compo-nents and aromatics, the carbon conversion for the steam reforming of these oils was very high at temperatures above 1023K and the coking did not infl uenced so much. Therefore, the production of hydrogen or synthesis gas from waste plastics by steam reforming will be one of the promising processes of recycling or recovery of energy.
Acknowledgments
The fi nancial support of Plastic Waste Management Institute (Japan) for this study is gratefully acknowledged. The provide of catalyst from SÜD-CHEMIE CATALYSTS JAPAN, INC. is sincerely appreciated.
References
[1] Tsuji,T., Sasaki, A., Okajima, S. and Masuda, T., Kagaku Kougaku Ronbunshu 30:705-709(2004).
[2] Catalysis Society of Japan Ed.; Series of Monographs on the Science and Engineering of Catalysis Vol. IX, (Shokubai kougaku kouza 9), Chijinshokan, Tokyo, Japan, 1965, p.195.
[3] Tsuji T., Tanaka, Y. and Itoh, H., J Mater Cycles Waste Manag 3: 2-7 (2001).[4] Tsuji, T., Hasegawa, K. and Masuda, T., J Mater Cycles Waste Manag, 5:102-106
(2003).

ISFR - 2005370

Synthesis Gas Production 371
DEVELOPMENT OF ROTARY KILN TYPEGASIFICATION SYSTEM
Hideki Nakagome1*, Kiyoshi Imai2, Mina Sakano2, Tsuyoshi Noma2, Hidetohi Ibe2 and Masanori Kobayashi2
1 Chiba University,1-33, Yayoi, Inage-ku, Chiba 263-8522, Japan2Toshiba Corporation, 1-1, Shibaura, 1-Chome, Minato-ku, Tokyo 105-8001, Japan,
Abstract: This paper reports a waste gasifi cation system equipped with a pyrolysis ro-tary kiln and gas cracker. After building a pilot plant, we advanced to construction of a demonstration plant to a commercial plant. In a gasifi cation system, energy is used after purifying the gasifi ed gas. Since gasifi cation is performed in a hot reduction atmosphere, there is a strong possibility of generating high-temperature corrosion and generation of dioxins is strictly controlled. Furthermore, although the amount of calories per unit ca-pacity of the generated clean fuel gas is low, improved effi ciency of generating electricity from waste materials is expected when using this system since it can be combined with an effi cient power generation system.
1. Introduction
Gasifi cation is a thermal process for converting coal, biomass, or solid waste into gases that can be burnt in gas engines or gas turbines. The principles of gasifi cation have been known since the 18th century, and commercial applications started in 1830. By 1850, the greater part of London had gaslights, and there was an established gas industry manufac-turing producer gas from coal and biomass fuels.
Table 1: The progress of pyrolysis gasifi cation system
Scale Status Waste Types Operation
Specifi cation
Gasifi ca-tion
Gascleaning
Chargasifi cation
Gasengine
4.6ton/day Pilot
ASR
Municalwaste
Wasteplastics
98/99~9/9 ○ ○ - ○
10ton/day
Demon-stration
Municipalwaste 00/4~ ○ ○ ○ ○
60ton/day
Commer-cial ASR 01/7~ ○ ○ - ○

ISFR - 2005372
The advent of petroleum accelerated a decline in the need for producer gas. The energy crisis of the 1970s renewed interest in biomass gasifi cation systems, and environmental-ists are questioning the continued use of fossil fuels. The need for sustainable energy production has prompted new research into the possibility of gasifi cation becoming a key source of energy production.
Nowadays, the Integrated Gasifi cation Combined Cycle (IGCC) project is progressing successfully in Japan, and a program for utilizing biomass energy, which naturally in-cludes gasifi cation technologies, has been widely spread since 2002 with considerable fi nancial support from the Japanese government.
Gasification System
Char Gasification (optional)
Gasifier Gas
Glass
Granul
Gas Cleanup
Wet Scrubber
Desulfurizing Equipment
Clean Synthesis Gas
Exhaust Gas
Energy Production
Gas Engine
Gaseous Fuel
Pyrolysis Rotary Kiln
Gas Cracker
Waste Heat
Boiler
Bag
Crushed Waste
Gaseous
Fuel
Input Energy
Cracked Gas
Pyrolysis Char
Carbon Powder
Output Energy
Smelting Reactor
Ai
Oxygen
① (& ③)
③
②
①
②
Figure 1: Process fl ow diagram.

Synthesis Gas Production 373
Concerning the development of waste gasifi cation, the Institute of Applied Energy (IAE), New Energy and Industrial Technology Development Organization (NEDO), and Minis-try of Economy, Trade and Industry (METI) are strongly promoting high-effi ciency waste power generation programs. In 1997, Toshiba introduced a design concept for a pyrolysis gasifi cation system from PKA Umwelttechnik GmbH & Co. KG. Making full use of the manufacturing and processing techniques would allow completion of the construction of the pilot plant (4.6 tons/day), which operates in the heavy electric domain. Additional ex-perience may be gained in the demonstration plant (10 tons/day) and the commercial plant (60 tons/day) that are to be built after the pilot plant attains stable operation.
2. Experiment
2.1 General description
From the viewpoint of energy power gen-eration, the calorifi c power of waste per unit weight as compared with fossil fuels, such as petroleum, natural gas, and coal, is low, and has the special feature that calorie fl uctuations are large, by virtue of its composition. Furthermore, in the con-taminant, the heavy-metal components, such as corrosion components for chlo-rine, are usually contained.
In an incinerator, energy is usually col-lected after burning waste, and the toxic substances in the combustion gas are sub-sequently removed. Therefore, considering the toxic substances and the calorie fl uctua-tions of the wastes, it is diffi cult to perform effi cient power generation, which uses high temperature and a high-pressure boiler.
A gasifi cation system, however, generates fuel gas with a clean and stable calorifi c power since it is possible to remove any toxic substances just after generating gas from the wastes. Furthermore, the infl uence of a deoxidized atmosphere on dioxin generation is not clear.
2.2 Process description
(1) Pyrolysis Crushed waste is conveyed into a rotary tube. A pyrolysis drum is heated externally with clean synthesis gas burners. Pyrolysis occurs in the absence of oxygen at a temperature between 500 and 600 with a residence time of approximately 60 minutes
0% 20% 40% 60% 80% 100%
Moisture Ash Volatile matter Fixed carbon
Municipal waste
ASR
Brown coal
Figure 2: Three components of Municipal waste, ASR (Automobile shredder residue), and Brown coal for reference, lower calorifi c values are 10,279kJ/kg (2,455kcal/kg) for Municipal waste, 22,233kJ/kg (5,310kcal/kg) for ASR, and 21,186kJ/kg (5,060kcal/kg) for Brown coal.
ISFR - 2005374
during which the organic constituents volatilize, producing pyrolysis gas. The generated synthesis gas is used to heat the pyrolysis drum.
(2) Pyrolysis gas conversion The pyrolysis gas is drawn through a glowing zone in the gas converter. The organic constituents of the carbonization gas are cracked into short-chain components at temperatures between 1000 and 1200. The water vapor in the py-rolysis gas, together with the carbon present in the reactor, forms carbon monoxide and hydrogen. In addition to the thermal destruction of organic pollutants, the gas converter acts as a particle removal device and results in the homogenization of the cracked gas, which leaves the reactor towards the top. The boiler quenches the cracked gas and subse-quently collects carbon powder, using the bag fi lter.
(3) Gas cleaning The cracked gas is subjected to wet scrubbing, in which inorganic acid pollutants, dust, and heavy-metal compounds are washed out. The desulfurizing equip-ment then removes hydrogen sulfi de from the cracked gas.
(4) Char gasifi cation (optional) The pyrolysis char and the carbon powder enters the reactor from the top. With the aid of oxygen, the carbon is converted into gas in a high temperature smelting reactor. In this reaction, heat is set free, which melts the ash. The temperature of the reactor is set to between 1300 and 1500 °C. The fl uid slag is then drawn off and quenched in water. The produced gasifi er gas in the reactor is drawn off via the lower oven, confl uent with the cracked gas.
(5) Power generation The clean synthesis gas produced can be converted directly to elec-trical power by combustion in gas engines.
3. Results and Discussion
3.1 Characterization of Waste
As the preceding chapter described, when thought of as an energy source, waste can-not be called a good fuel. The fi rst reason is the low amount of calories per unit weight compared with fossil fuels, and the changing amount of calories according to the quality of waste. The second reason is that considerable amounts of chlorine, sulfur, and heavy metals are contained in the waste.
Three components (moisture, ash, and combustibles) of municipal waste, automobile shredder residue (ASR), and brown coal are shown in Fig. 2 for reference. Although it was hard to express uniquely since the composition of the waste had such large fl uctuations, the most typical composition for each kind of waste is shown for the full waste sample for performing elementary and composition analysis.
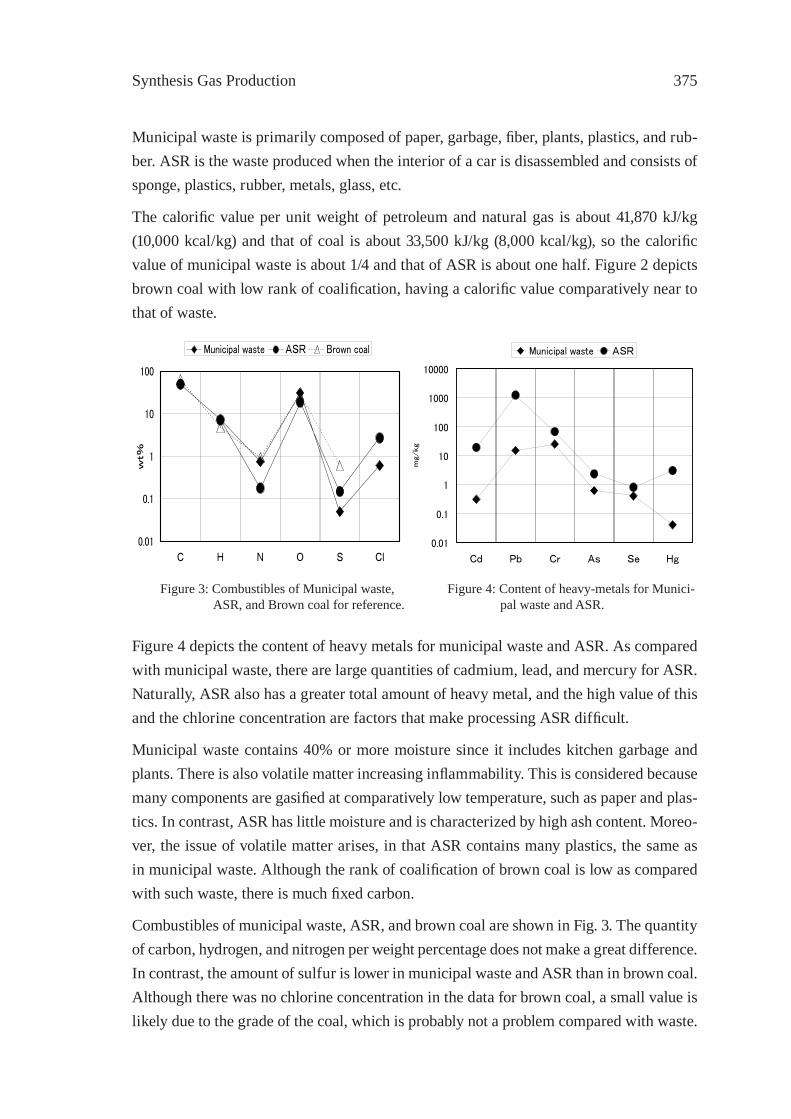
Synthesis Gas Production 375
Municipal waste is primarily composed of paper, garbage, fi ber, plants, plastics, and rub-ber. ASR is the waste produced when the interior of a car is disassembled and consists of sponge, plastics, rubber, metals, glass, etc.
The calorifi c value per unit weight of petroleum and natural gas is about 41,870 kJ/kg (10,000 kcal/kg) and that of coal is about 33,500 kJ/kg (8,000 kcal/kg), so the calorifi c value of municipal waste is about 1/4 and that of ASR is about one half. Figure 2 depicts brown coal with low rank of coalifi cation, having a calorifi c value comparatively near to that of waste.
0.01
0.1
1
10
100
1000
10000
Cd Pb Cr As Se Hg
mg/kg
Municipal waste ASR
0.01
0.1
1
10
100
C H N O S Cl
wt%
Municipal waste ASR Brown coal
Figure 3: Combustibles of Municipal waste, ASR, and Brown coal for reference.
Figure 4: Content of heavy-metals for Munici-pal waste and ASR.
Figure 4 depicts the content of heavy metals for municipal waste and ASR. As compared with municipal waste, there are large quantities of cadmium, lead, and mercury for ASR. Naturally, ASR also has a greater total amount of heavy metal, and the high value of this and the chlorine concentration are factors that make processing ASR diffi cult.
Municipal waste contains 40% or more moisture since it includes kitchen garbage and plants. There is also volatile matter increasing infl ammability. This is considered because many components are gasifi ed at comparatively low temperature, such as paper and plas-tics. In contrast, ASR has little moisture and is characterized by high ash content. Moreo-ver, the issue of volatile matter arises, in that ASR contains many plastics, the same as in municipal waste. Although the rank of coalifi cation of brown coal is low as compared with such waste, there is much fi xed carbon.
Combustibles of municipal waste, ASR, and brown coal are shown in Fig. 3. The quantity of carbon, hydrogen, and nitrogen per weight percentage does not make a great difference. In contrast, the amount of sulfur is lower in municipal waste and ASR than in brown coal. Although there was no chlorine concentration in the data for brown coal, a small value is likely due to the grade of the coal, which is probably not a problem compared with waste.
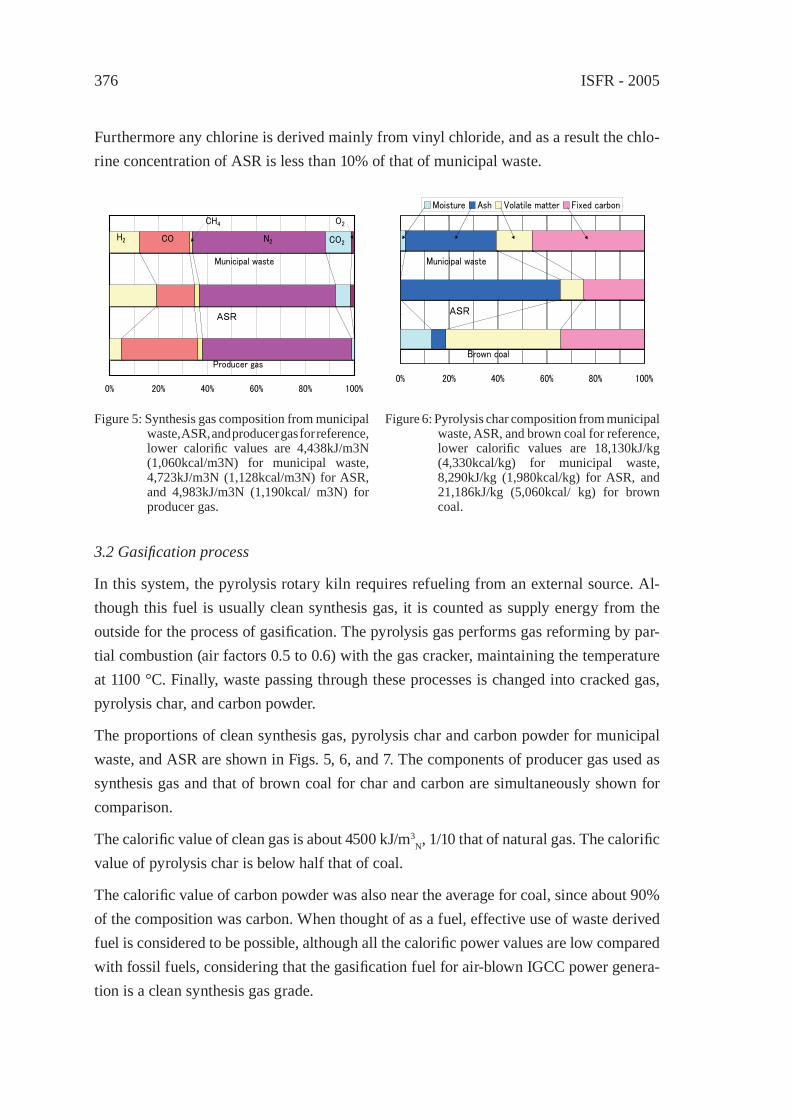
ISFR - 2005376
Furthermore any chlorine is derived mainly from vinyl chloride, and as a result the chlo-rine concentration of ASR is less than 10% of that of municipal waste.
0% 20% 40% 60% 80% 100%
Moisture Ash Volatile matter Fixed carbon
Municipal waste
ASR
Brown coal
0% 20% 40% 60% 80% 100%
H2 CO
CH4
N2 CO2
O2
Municipal waste
ASR
Producer gas
3.2 Gasifi cation process
In this system, the pyrolysis rotary kiln requires refueling from an external source. Al-though this fuel is usually clean synthesis gas, it is counted as supply energy from the outside for the process of gasifi cation. The pyrolysis gas performs gas reforming by par-tial combustion (air factors 0.5 to 0.6) with the gas cracker, maintaining the temperature at 1100 °C. Finally, waste passing through these processes is changed into cracked gas, pyrolysis char, and carbon powder.
The proportions of clean synthesis gas, pyrolysis char and carbon powder for municipal waste, and ASR are shown in Figs. 5, 6, and 7. The components of producer gas used as synthesis gas and that of brown coal for char and carbon are simultaneously shown for comparison.
The calorifi c value of clean gas is about 4500 kJ/m3N, 1/10 that of natural gas. The calorifi c
value of pyrolysis char is below half that of coal.
The calorifi c value of carbon powder was also near the average for coal, since about 90% of the composition was carbon. When thought of as a fuel, effective use of waste derived fuel is considered to be possible, although all the calorifi c power values are low compared with fossil fuels, considering that the gasifi cation fuel for air-blown IGCC power genera-tion is a clean synthesis gas grade.
Figure 5: Synthesis gas composition from municipal waste, ASR, and producer gas for reference, lower calorifi c values are 4,438kJ/m3N (1,060kcal/m3N) for municipal waste, 4,723kJ/m3N (1,128kcal/m3N) for ASR, and 4,983kJ/m3N (1,190kcal/ m3N) for producer gas.
Figure 6: Pyrolysis char composition from municipal waste, ASR, and brown coal for reference, lower calorifi c values are 18,130kJ/kg (4,330kcal/kg) for municipal waste, 8,290kJ/kg (1,980kcal/kg) for ASR, and 21,186kJ/kg (5,060kcal/ kg) for brown coal.

Synthesis Gas Production 377
3.3 Energy conversion effi ciency estimation
In this gasifi cation system, waste (amount of energy W) and gaseous fuel for the rotary kiln (F) are used as an energy source, and synthesis gas (SG), pyrolysis char (CH), and carbon powder (CA) are collected. Therefore, if the ratio of the amount of input energy to the amount of recovery output energy is calculated, the energy conversion effi ciency (η) from waste to gas and char can be drawn. An equation is shown below.
η = (SG+CH+CA)/(W+F)×100% (1)
The effectiveness of the 1 MW system was 36%. For the 15 MW system, it was 68%. The effi ciency of both systems was equivalent to the heat loss due to a smelting reactor.
Based on the effi ciencies in Figs. 8 and 9, a trial calculation of the power generation end effectiveness when combined with a power generation system was made. The power gen-
0% 10% 20% 30% 40%
Gas engine
Gas turbine system
IGCC system
0% 20% 40% 60% 80% 100%
1MW system
15MW system
Cracked gas Gasifier gas
Figure 9: Energy conversion effi ciency of 1MW and 15MW system, in case of Gasifi cation system and Char gasifi cation.
Figure 10: Power generation end effectiveness of 15MW system, in case of gas supply for gas engine and gas turbine system, gas and char supply for IGCC system.
0% 20% 40% 60% 80% 100%
M oisture Ash Volatile m atter Fixed carbon
M unicipal w aste
ASR
Brown coal
0% 20% 40% 60% 80% 100%
1MW system
15MW system
C racked gas Pyrolysis char C arbon powder
Figure 7: Carbon powder composition from muni-cipal waste, ASR, and brown coal for reference, lower calorifi c values are 31,779kJ/kg (7,590kcal/kg) for municipal waste, 30,816kJ/kg (7,360kcal/kg) for ASR, and 21,186kJ/kg.
Figure 8: Energy conversion effi ciency of 1MW and 15MW system, in case of Gasifi cation system.
ISFR - 2005378
eration end effectiveness of a gas engine was assumed to be 35%. The power generation end effectiveness of a gas turbine was estimated at 50%. IGCC power generation resulted in 50% power generation end effectiveness for the gas supply, and 40% power generation end effectiveness for the char supply. In addition, for the gas turbine and IGCC power generation, fuels were assumed to be supplied to a commercial power generation system at a level of hundreds of MW. The power generation end effectiveness was 24% for the gas engine, 34% for the gas turbine, and 36% for IGCC (Fig. 10).
If waste gasifi cation plants on the order of 50 MW (about a 200 t/d system for a lower calorifi c value of 20,000 kJ/kg level) were put next to 100 thermal power plants in Japan, and if they generated electricity at about 40% effi ciency, 2,000 MW of electric power could be obtained. The target value for electricity generation from waste materials in Japan in 2010 is 4,170 MW, therefore this value is equal to about half of the target value.
The scale of a plant system may also be considered with an injection energy base. When municipal waste with a calorifi c value of 10,000 kJ/kg is supplied to a 10 t/d plant, the amount of injection energy is about 1 MW (exactly 1.2 MW). Moreover, if ASR with a calorifi c value of 22,000 kJ/kg is supplied to a 60 t/d plant, it will be calculated at about 15 MW. Therefore, a 10 t/d plant is called a 1 MW system and a 60 t/d plant is called a 15 MW system in the following paragraphs.
The energy conversion effi ciency, which is extracted from the energy balance data, is shown in Fig. 8. Effi ciency was 81% in the 15 MW system and 53% in the 1 MW system. The effi ciency of the 15 MW system is thought to be close to the saturation value. The results from gasifying all the pyrolysis char and carbon powder using a smelting reactor are presented in Fig. 9. In addition, assuming the 15 MW system does not have a smelting reactor, we calculated the effi ciency by assuming the amount of heat loss based on the results from the 1 MW system.
In this case, due to the need to convert the energy of pyrolysis char and carbon powder into gasifi er gas (amount of energy GG) with a smelting reactor, the effi ciency decreases a little. The calculation approach is shown below.
η = (SG+GG)/(W+F)×100% (2)
4. Conclusions
The following things about the waste gasifi cation system were clarifi ed by using a pyroly-sis rotary kiln and gas cracker to obtain operation data, a pilot project, a demonstration, and a commercial plant. A gasifi cation system differs from the usual incineration system in the following ways. First, the possibility that a reduction atmosphere would control the generation of high-temperature corrosion and the generation of dioxins, two principal subjects of an incinerator, was shown.
Synthesis Gas Production 379
Second, since clean fuel gas causes little damage to power generation equipment, the fuel supply for the existing power generation system, which uses a fossil fuel, was also considered. Combining this with an effi cient power generation system raises the energy conversion effi ciency of waste.
References
[1] Nakagome, H. et al., Development of waste gasifi cation system, Proceedings of the International Conference of Power Engineering-03(ICOPE-03),Kobe,Vol.1: pp117-122 (2003).
[2] Nakajima,R.,et al., Development of Pyrolysis Gasifi cation Waste Treatment System, ISWA in Asian Cities 2000,Hong Kong,2000, pp.146-150.
[3] Imai,K., et al., Development of 10ton/day pyrolysis gasifi cation waste treatment demonstration plant, ISWA World Congress 2001, Stavanger,2001, pp.371-376.
[4] W.Kempf, Pyrolysis and Gasifi cation of Waste: A Worldwide Review, Juniper Consultancy Services Limited, 2000, pp.163-171.
[5] Sthlberg, R.,et al., Mass and Energy Balances of the Thermoselect Demonstration Plant, ASME 17th Biennial Conference on Solid Waste, 1996.
[6] K.Tuppurainen,et al., Formation of PCDDs and PCDFs in Municipal Waste Incineration and its Inhibition Mechanisms: A Review, Chemosphere, Vol.36, No.7, Elsevier Science Ltd.,1998, pp.1493-1511.

ISFR - 2005380
Synthesis Gas Production 381
RAPID PYROLYSIS OF PE, PP, AND PSIN A BATCH TYPE FLUIDIZED BED REACTOR
H. Yasuda1*, O. Yamada1, M. Kaiho1, T. Shinagawa2, S. Matsui2, T. Iwasaki2,and S. Shimada3
1National Institute of Advanced Industrial Science & Technology, Tsukuba, Japan2JFE Engineering Corporation, Kawasaki, Japan
3The University of Tokyo, Tokyo, Japan, [email protected]
Abstract: In order to simulate the reaction occurred in an actual rapid pyrolyzer/ gasifi er, a fl uidized bed type batch reactor was designed and used. Rapid pyrolysis of polyethyl-ene, polypropylene, and polystyrene was carried out at 1073K in nitrogen within a reac-tion time range of 2-20s. Difference in product distribution with varying reaction time was observed apparently among PE, PP, and PS. It is considered that PE reacts to gas or liquid products slowly and change in PP products is small so that reactions fi nish in 2s mostly. Most of PS cracks to styrene or light aromatic compounds in 2s or less, they react to heavier products in the longer reaction time. The difference in the reactivity between sorts of plastics should be considered when waste plastics, mixed with various kinds of materials, are used in rapid pyrolysis/gasifi cation processes.
1. Introduction
The amount of waste plastics in Japan is about 10 million tons yearly. 58% of waste plastics were utilized in 2003 by some ways such as mechanical recycling, feedstock recycling, and energy recovery. The percentage in utilization of waste plastics is increas-ing. In these years, mixed waste plastics have been provided accompanying with several regulations [1]. For example, “other plastics”, plastics other than PET, is collected with the Containers and Packaging Law. The amount of the “other plastics” was about 400 thou-sand tons in 2003 and is increasing rapidly. Mixed waste plastics are also supplied from the recycling systems which are based on the other regulations. For the mixed plastics, rapid conversion processes with high temperature, such as gasifi cation, raw material for blast furnace, and others, seems most suitable way to utilize waste plastics effi ciently. It is important to discuss the rapid pyrolysis and/or gasifi cation of mixed plastics based on the each component’s property of the raw materials in order to obtain valuable products.
Lots of research works were reported about the pyrolysis of plastics at low temperature in the ranges of 573-773K. Experiments with constant heating rate using such equipment as TG were popular way to investigate the property of plastics pyrolysis. Considering the rapid pyrolysis and/or gasifi cation processes, however, knowledge about pyrolysis at high temperature and in the condition of rapid heating rate is required. Some research works were reported about plastics pyrolysis/gasifi cation at high temperature and with rapid
ISFR - 2005382
heating rate [2-5]. The results reported in these literature offer useful knowledge for rapid pyrolysis of plastics. It is also essential to know the initial stage of the plastics’ pyrolysis so that pyrolysis experiments with varying reaction time are required. To control the reac-tion time was diffi cult using conventional equipments.
In this paper, a fl uidized bed type batch reactor was designed and used in order to simu-late the reaction occurred in an actual rapid pyrolyzer/gasifi er. The reaction can be set optionally using the reactor. Rapid pyrolysis of polyethylene (PE), polypropylene (PP), and polystyrene (PS) was carried out at 1073K. The products distribution was analyzed.
2. Experimental
PE (Aldrich 42,796-9, MI(Melt Index; ASTM D 1238): 4g/10min), PP(Aldrich 42,786-1, MI: 4), and PS(Aldrich 44,114-7, MI: 3.4) were used in this work. Sample plastics were pulverized and sized to 40-50 micrometers. 0.5g of sample was used for each experi-ment.
A fl uidized bed type batch reactor was made and used for rapid pyrolysis. Samples are charged directly into the high temperature zone of the reactor. Reaction condition such as heating rate in an actual rapid pyrolyzer/gasifi er can be simulated with charging samples directly into. After a scheduled reaction time, all the materials remained in the reactor including product gas, remained samples, and bed materials are removed from the reactor to terminate reaction instantaneously. Reaction time is controlled optionally. Scheme of the reactor is shown in Fig. 1.
Before reaction runs: The reactor was heated up to 1073K, bed material (silica sand; 125-250 *10-6 m) fl uidized by nitrogen, and gas passed through reactor was exhausted. The gas reservoir was evacuated by the pump. Sample was settled inside the sample tube (valve V1 open; V2-V5 close in Fig. 1).
Starting the reactions: The reaction was started with opening V2, sample was injected instantaneously by compressed “sample feed gas”. In this instance, V3 was also opened (and V1 was closed) to collect the product gas into the gas bag. The liquid product was captured with the fi lter 1 during the reaction. Reaction time was varied from 2 to 20 s.
Terminating the reaction: After the scheduled reaction time, V5 was opened to collect the product gas remained in the reactor to gas reservoir. At the same time, V4 was opened to promote removing the materials from the reactor by compressed “sweep gas”. Solids in-cluding remained sample and bed materials were collected by the cyclone, liquid product was captured with the fi lter 2 (V2 and V3 close).
The composition of the products was analyzed with GC-TCD, GC-FID and GC-MS.

Synthesis Gas Production 383
3. Results and Discussion
Changes in the distribution of the prod-ucts with reaction times are shown in Figs. 2(a), (b), and (c). Carbon conver-sion of each product from PE is shown in Fig. 2(a), from PP in Fig. 2(b), and from PS in Fig. 2(c). C4Hx refers to C4 hydrocarbons including butane, butene, and others, C5Hx includes pen-tane, pentene, and others. “C8 Bz. de-riv.” shows C8 aromatic hydrocarbons such as xylene, ethylbenzene, and sty-rene. “Others(gas)” refers to total of other gaseous products and “tar” indi-cates total amount of liquid products.
In the case of PE, both total amounts of the gaseous and the liquid products increased monotonously. The changes
Figure 1: The batch fl uidized bed rapid pyrolyser terminating reaction instantaneously.
V1
sample feed gas
V2
V3
V4
V5
sample tube
fluidizing gas
CycloneGas reservoir
Gas bag
Vacuum pump
filter 2
filter 1
sample
sand
reactor
electric heater
sweep gas
0
10
20
30
40
50
60
70
80
90
100
2 5 10 20Reaction time (s)
Car
bon
conv
ersi
on to
resp
ectiv
e pr
oduc
ts (%
)
CH4 C2H4 C2H6 C3H6 C3H8 C4Hx C5Hx Benzene Toluene C8 Bz. deriv. Others(gas) tar
Figure 2(a): Carbon conversion to rapid pyrolysis products from PE.

ISFR - 2005384
in the total amounts of products moderated with reaction time. C2H4 is the most part as about 40% of the products and the in-crease in the amount of C2H4 is predomi-nant. CH4 and C3H6 increased from 2 to 5s, their amounts were mostly stable from 5 to 20s. Both amounts of C4Hx and C5Hx were changed little. Benzene decreased from 2 to 10s, increased from 10 to 20s. Toluene and C8 (C8 Bz. deriv.) decreased unreliev-edly. Olefi ns such as C2H4 and C3H6 were almost ten times larger amount than par-affi nic hydrocarbons, C2H6 and C3H8 re-spectively. There was complexity of the change in benzene amount. It is considered that the decomposition and the production of benzene were occurred competitively. The later increase in benzene is assumed to be caused by the production from the decomposition of toluene and C8, or by the formation from the lighter compounds such as C2H4 or so.
For PP, carbon conversion to the total prod-uct gas reached to 80% in 2s, and then de-creased slightly. CH4 and C2H4 increased moderately, C3 through C5 were steady. BTX (benzene, toluene, and C8) tended to decrease, but benzene reversed to in-crease some from 10s. The amount of tar increased from 2 to 10s, decreased to 20s. The rearrangement of the product distribu-tion was observed though the total amount of products was changed little.
As for PS, total conversion to the gaseous and the liquid products decreased with reac-tion time clearly. C8 from PS was mainly styrene, the conversion to styrene reached to 20% in 2s, which was about half of the product gas. Each amount of C1 through C5 was small. BTX decreased from 2 to 10s. From 10 to 20s, Benzene increased slightly, toluene
0
10
20
30
40
50
60
70
80
90
100
2 5 10 20Reaction time (s)
Car
bon
conv
ersi
on to
resp
ectiv
e pr
oduc
ts (%
)
Figure 2(b): Carbon conversion to rapid pyrolysis products from PP.
0
10
20
30
40
50
60
70
80
90
100
2 5 10 20Reaction time (s)
Car
bon
conv
ersi
on to
resp
ectiv
e pr
oduc
ts (%
)
Figure 2(c): Carbon conversion to rapid pyrolysis products from PS.

Synthesis Gas Production 385
was almost constant and C8 increased largely. By contrast, tar increased from 2 to 10s, decreased to 20s.
Results indicates that reduction of molecular length is slow for PE, fast for both PP and PS. Conversion to gaseous products seems to be fi nished mostly in 2s for both PP and PS, the conversion from gaseous products to liquids or solids go on by polymerization or condensation reaction after that. These kinds of reactions were major for PS especially, resulting in producing the heavier materials from styrene which was formed in the early stage of the pyrolysis.
Conclusions
Rapid pyrolysis of PE, PP, and PS was carried out at 1073K in nitrogen within a reaction time range of 2-20s using the fl uidized bed type batch reactor. Difference in product dis-tribution with varying reaction time was observed apparently among PE, PP, and PS. It is considered that PE reacts to gas or liquid products slowly and change in PP products is small so that reactions fi nish in 2s mostly. Most of PS cracks to styrene or light aromatic compounds in 2s or less, they react to heavier products in the longer reaction time. The difference in the reactivity between sorts of plastics should be considered when mixed waste plastics are used in rapid pyrolysis/gasifi cation processes effi ciently.
Acknowledgements
Authors thank both Mr. M. Kihara and Mr. K. Fujiwara, former Master course students in Univ. of Tokyo, for their technical assistance.
References
[1] Kusakawa, N., Proc. the 2nd ISFR, Introductory Lectures 2, Ostend, Belgium, 2002[2] Mastral, F. J., et al., J. Anal. Appl. Pyrol., 70, 1-17 (2003).[3] Karaduman, A., et al., J. Anal. Appl. Pyrol., 60, 179-186 (2001).[4] Milne, B. J., et al., J. Anal. Appl. Pyrol., 51, 157-166 (1999). [5] Kaminsky, W., et al., J. Anal. Appl. Pyrol., 32, 19-27 (1995).

ISFR - 2005386
Synthesis Gas Production 387
GASIFICATION OF PET FOR THE PRODUCTION OF SYNGASToshiaki Yoshioka1*, Tomohiko Handa1, Guido Grause1, Hiroshi Inomata2,
Tadaaki Mizoguchi11 Environmental Conservation Research Institute, Tohoku University
2) Supercritical Fluid Technology Center, Graduate School of Engineering,Tohoku University
Aramaki Aza Aoba 07, Aoba-ku Sendai 980-8579, Japan,[email protected], Tel / Fax. +81-22-217-7211
Abstract: The gasifi cation of PET took place in the presence of nickel oxide. In a fi rst series of experiments calcium hydroxide was used as water source. A PET/Ca(OH)2/NiO mixture (molar ratio: 1/5/10) released just gases and left carboneous residue. Other liq-uid or solid products were not observed. The use of PET/NiO mixtures (molar ratio: 1/5 or 1/10) showed similar results. More gaseous products were obtained, but all pyrolysis products were not converted to CO, CO2 and H2, due to the lower height of the fi xed bed and the resulting shorter residence time. The best results were obtained at 900 °C with the highest conversion rates. The calorifi c values were rather low with a maximum value of 12 MJ/kg.
1. Introduction
PET is one of the plastics with the highest increase in consumption. The world-wide con-sumption of PET will almost double from 2003 (9.1 Mt) to 2010 (17.5 Mt) [1]. Especially the replacement of glass bottles by PET bottles leads to a strong raise of this material. Post consumer PET-bottles are a pure material with defi ned properties. Thus, it is mechanical recycled and reused in different fi elds as for fi bres, fi lms or automotive parts [2]. In the food packaging sector just small amounts of this material are in use due to health con-cerns.
Another possibility of using post consumer PET-bottles is the feedstock recycling in order to obtain valuable basic materials for the chemical industry. For instance, hydrolysis leads to terephthalic acid and glycol [3], [4], and methanolysis to dimethyl terephthalate [5]. The hydrolysis over Ca(OH)2 yields a high amount of benzene[6]. Char obtained from the pyrolysis of PET can be converted to active carbon by the activation with CO2 [7].
Another promising way is the gasifi cation of PET resulting in synthesis gas [8]. There is a widespread area for the use of syngas in traditional fi elds as in the Haber-Bosch-process or Fischer-Tropsch-Process. But also new processes like the synthesis of methanol [9] or dimethyl ether [10] as new fuels use syngas as feedstock. The direct use of syngas in fuel cells [11] is also an alternative way.
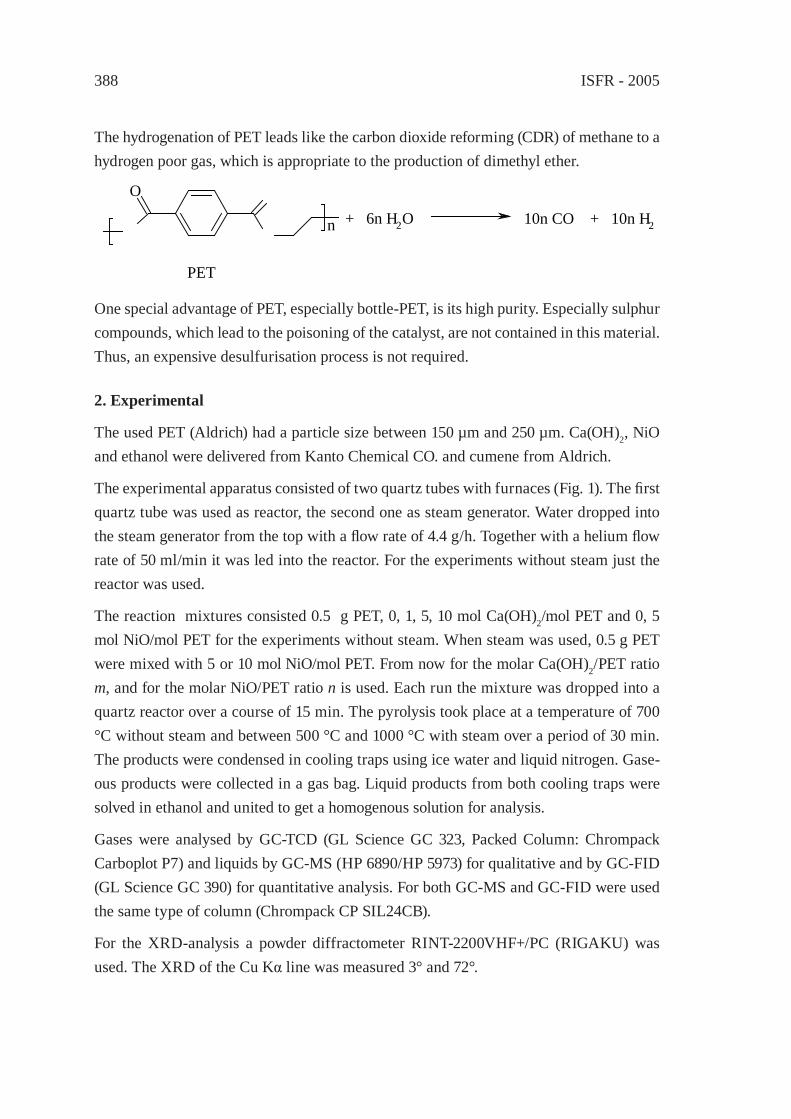
ISFR - 2005388
The hydrogenation of PET leads like the carbon dioxide reforming (CDR) of methane to a hydrogen poor gas, which is appropriate to the production of dimethyl ether.
O
n + 6n H2O 10n CO + 10n H2
PET
One special advantage of PET, especially bottle-PET, is its high purity. Especially sulphur compounds, which lead to the poisoning of the catalyst, are not contained in this material. Thus, an expensive desulfurisation process is not required.
2. Experimental
The used PET (Aldrich) had a particle size between 150 µm and 250 µm. Ca(OH)2, NiO and ethanol were delivered from Kanto Chemical CO. and cumene from Aldrich.
The experimental apparatus consisted of two quartz tubes with furnaces (Fig. 1). The fi rst quartz tube was used as reactor, the second one as steam generator. Water dropped into the steam generator from the top with a fl ow rate of 4.4 g/h. Together with a helium fl ow rate of 50 ml/min it was led into the reactor. For the experiments without steam just the reactor was used.
The reaction mixtures consisted 0.5 g PET, 0, 1, 5, 10 mol Ca(OH)2/mol PET and 0, 5 mol NiO/mol PET for the experiments without steam. When steam was used, 0.5 g PET were mixed with 5 or 10 mol NiO/mol PET. From now for the molar Ca(OH)2/PET ratio m, and for the molar NiO/PET ratio n is used. Each run the mixture was dropped into a quartz reactor over a course of 15 min. The pyrolysis took place at a temperature of 700 °C without steam and between 500 °C and 1000 °C with steam over a period of 30 min. The products were condensed in cooling traps using ice water and liquid nitrogen. Gase-ous products were collected in a gas bag. Liquid products from both cooling traps were solved in ethanol and united to get a homogenous solution for analysis.
Gases were analysed by GC-TCD (GL Science GC 323, Packed Column: Chrompack Carboplot P7) and liquids by GC-MS (HP 6890/HP 5973) for qualitative and by GC-FID (GL Science GC 390) for quantitative analysis. For both GC-MS and GC-FID were used the same type of column (Chrompack CP SIL24CB).
For the XRD-analysis a powder diffractometer RINT-2200VHF+/PC (RIGAKU) was used. The XRD of the Cu Kα line was measured 3° and 72°.

Synthesis Gas Production 389
Figure 1: Pyrolysis apparatus for the gasifi cation of PET.
3. Results and Discussion
3.1 Calciumhydroxide
NiO showed interesting catalytic effects on PET pyrolysis in the presence of steam. Without any oxidant the effect of NiO on PET is negligible [8]. The amounts of gases and residue are almost identical. However, adding Ca(OH)2 to the NiO containing composition (n=5) changed the mass balance completely. Already with m=1 the amount of gases increased strongly from 37 % without Ca(OH)2 to about 70 % in the experiments with Ca(OH)2 (Tab. 1). The main products in the gas were CO, CO2 and H2. Beside them some hydrocarbons like methane and ethene were produced. While the gas yield remained almost constant in the investigated range, the H2 and CO2 yield increased and the CO yield decreased. While with m=1 still 2.7 wt% benzene and 2.5 wt% acetophenone were detected, with m=10 no liquid and solid products were found. But the rise of m did not lead to a higher gas yield at all. Instead of that the amount of residue increased. Thus, also the amount of PET-carbon in the gas decreased from m=1 to m=10 due to the increasing content of CO2 and H2, while the amount of CO decreased. 63 % of the PET-carbon remained in the residue (m=10).
The abrupt rise of the gas yield was caused by the oxidation of solid and liquid products by water released from the Ca(OH)2 forming CaO. Additional, XRD data showed the formation of CaCO3 in the residue by absorbing CO2. The gasifi cation was stopped by the lack of water provided from the Ca(OH)2.
He
Ice
Liquid N2
Glass wool
Gas bag
Electric furnace Flow meter
Sample
Sample holder Water
Pyrolysis reactor
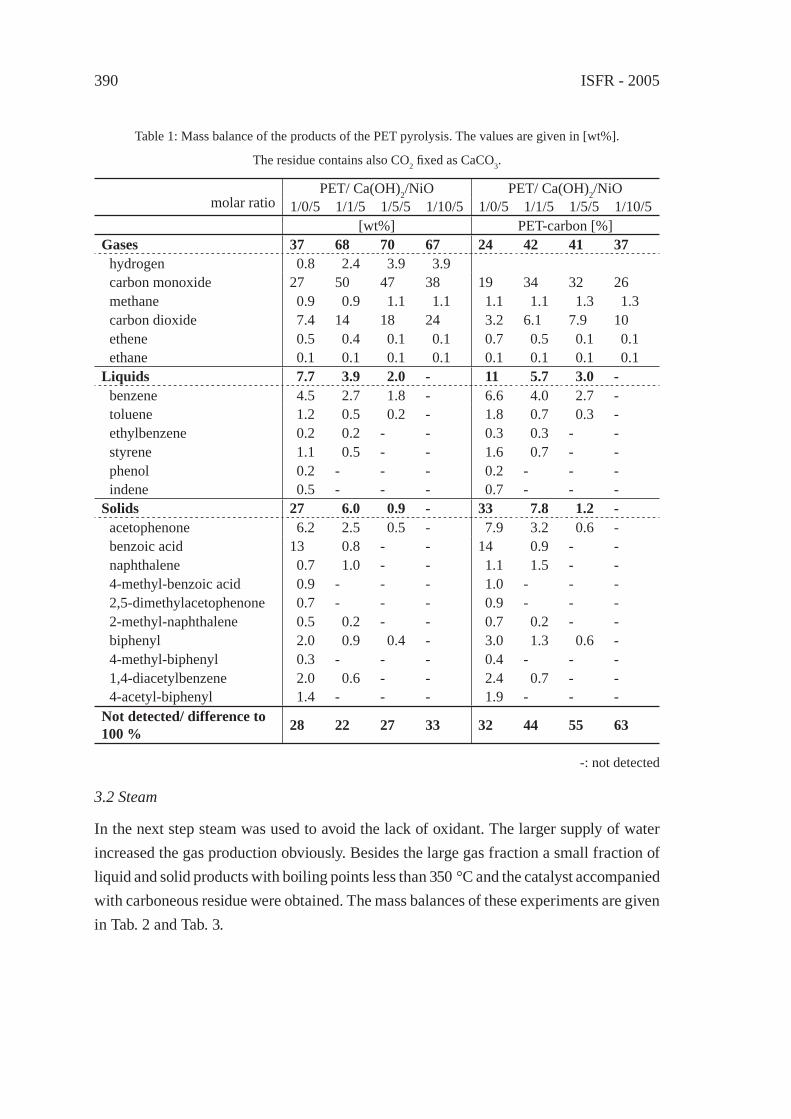
ISFR - 2005390
3.2 Steam
In the next step steam was used to avoid the lack of oxidant. The larger supply of water increased the gas production obviously. Besides the large gas fraction a small fraction of liquid and solid products with boiling points less than 350 °C and the catalyst accompanied with carboneous residue were obtained. The mass balances of these experiments are given in Tab. 2 and Tab. 3.
Table 1: Mass balance of the products of the PET pyrolysis. The values are given in [wt%].
The residue contains also CO2 fi xed as CaCO3.
PET/ Ca(OH)2/NiO PET/ Ca(OH)2/NiOmolar ratio 1/0/5 1/1/5 1/5/5 1/10/5 1/0/5 1/1/5 1/5/5 1/10/5
[wt%] PET-carbon [%]Gases 37 68 70 67 24 42 41 37
hydrogen 0.8 2.4 3.9 3.9carbon monoxide 27 50 47 38 19 34 32 26methane 0.9 0.9 1.1 1.1 1.1 1.1 1.3 1.3carbon dioxide 7.4 14 18 24 3.2 6.1 7.9 10ethene 0.5 0.4 0.1 0.1 0.7 0.5 0.1 0.1ethane 0.1 0.1 0.1 0.1 0.1 0.1 0.1 0.1
Liquids 7.7 3.9 2.0 - 11 5.7 3.0 -benzene 4.5 2.7 1.8 - 6.6 4.0 2.7 -toluene 1.2 0.5 0.2 - 1.8 0.7 0.3 -ethylbenzene 0.2 0.2 - - 0.3 0.3 - -styrene 1.1 0.5 - - 1.6 0.7 - -phenol 0.2 - - - 0.2 - - -indene 0.5 - - - 0.7 - - -
Solids 27 6.0 0.9 - 33 7.8 1.2 -acetophenone 6.2 2.5 0.5 - 7.9 3.2 0.6 -benzoic acid 13 0.8 - - 14 0.9 - -naphthalene 0.7 1.0 - - 1.1 1.5 - -4-methyl-benzoic acid 0.9 - - - 1.0 - - -2,5-dimethylacetophenone 0.7 - - - 0.9 - - -2-methyl-naphthalene 0.5 0.2 - - 0.7 0.2 - -biphenyl 2.0 0.9 0.4 - 3.0 1.3 0.6 -4-methyl-biphenyl 0.3 - - - 0.4 - - -1,4-diacetylbenzene 2.0 0.6 - - 2.4 0.7 - -4-acetyl-biphenyl 1.4 - - - 1.9 - - -
Not detected/ difference to 100 % 28 22 27 33 32 44 55 63
-: not detected
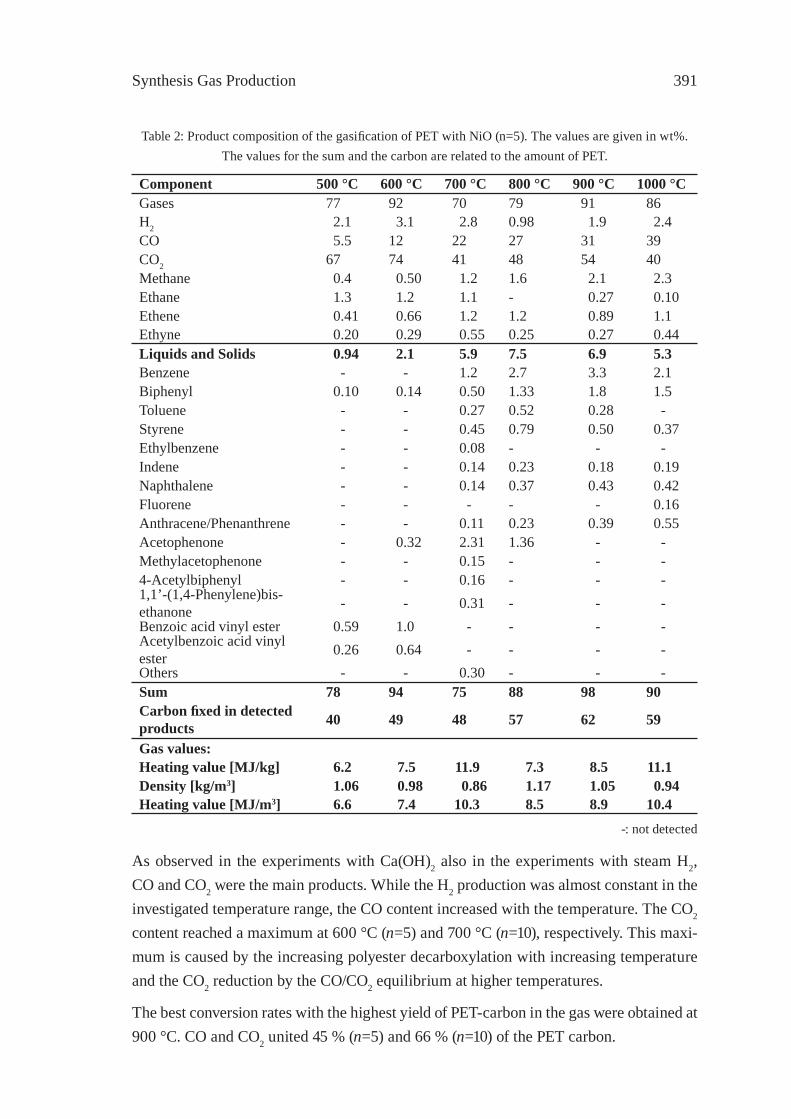
Synthesis Gas Production 391
Table 2: Product composition of the gasifi cation of PET with NiO (n=5). The values are given in wt%.The values for the sum and the carbon are related to the amount of PET.
Component 500 °C 600 °C 700 °C 800 °C 900 °C 1000 °CGases 77 92 70 79 91 86H2 2.1 3.1 2.8 0.98 1.9 2.4CO 5.5 12 22 27 31 39CO2 67 74 41 48 54 40Methane 0.4 0.50 1.2 1.6 2.1 2.3Ethane 1.3 1.2 1.1 - 0.27 0.10Ethene 0.41 0.66 1.2 1.2 0.89 1.1Ethyne 0.20 0.29 0.55 0.25 0.27 0.44Liquids and Solids 0.94 2.1 5.9 7.5 6.9 5.3Benzene - - 1.2 2.7 3.3 2.1Biphenyl 0.10 0.14 0.50 1.33 1.8 1.5Toluene - - 0.27 0.52 0.28 -Styrene - - 0.45 0.79 0.50 0.37Ethylbenzene - - 0.08 - - -Indene - - 0.14 0.23 0.18 0.19Naphthalene - - 0.14 0.37 0.43 0.42Fluorene - - - - - 0.16Anthracene/Phenanthrene - - 0.11 0.23 0.39 0.55Acetophenone - 0.32 2.31 1.36 - -Methylacetophenone - - 0.15 - - -4-Acetylbiphenyl - - 0.16 - - -1,1’-(1,4-Phenylene)bis-ethanone - - 0.31 - - -Benzoic acid vinyl ester 0.59 1.0 - - - -Acetylbenzoic acid vinyl ester 0.26 0.64 - - - -Others - - 0.30 - - -Sum 78 94 75 88 98 90Carbon fi xed in detected products 40 49 48 57 62 59
Gas values:Heating value [MJ/kg] 6.2 7.5 11.9 7.3 8.5 11.1Density [kg/m3] 1.06 0.98 0.86 1.17 1.05 0.94Heating value [MJ/m3] 6.6 7.4 10.3 8.5 8.9 10.4
-: not detected
As observed in the experiments with Ca(OH)2 also in the experiments with steam H2, CO and CO2 were the main products. While the H2 production was almost constant in the investigated temperature range, the CO content increased with the temperature. The CO2 content reached a maximum at 600 °C (n=5) and 700 °C (n=10), respectively. This maxi-mum is caused by the increasing polyester decarboxylation with increasing temperature and the CO2 reduction by the CO/CO2 equilibrium at higher temperatures.
The best conversion rates with the highest yield of PET-carbon in the gas were obtained at 900 °C. CO and CO2 united 45 % (n=5) and 66 % (n=10) of the PET carbon.
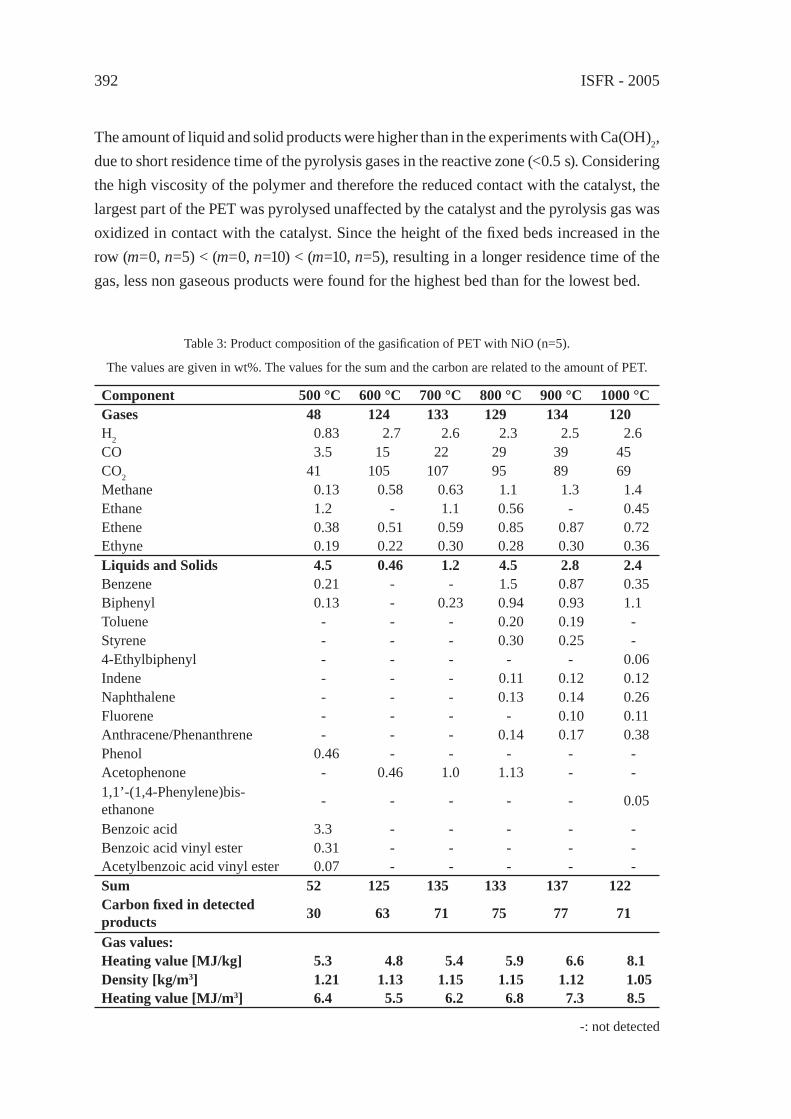
ISFR - 2005392
The amount of liquid and solid products were higher than in the experiments with Ca(OH)2, due to short residence time of the pyrolysis gases in the reactive zone (<0.5 s). Considering the high viscosity of the polymer and therefore the reduced contact with the catalyst, the largest part of the PET was pyrolysed unaffected by the catalyst and the pyrolysis gas was oxidized in contact with the catalyst. Since the height of the fi xed beds increased in the row (m=0, n=5) < (m=0, n=10) < (m=10, n=5), resulting in a longer residence time of the gas, less non gaseous products were found for the highest bed than for the lowest bed.
Table 3: Product composition of the gasifi cation of PET with NiO (n=5).
The values are given in wt%. The values for the sum and the carbon are related to the amount of PET.
Component 500 °C 600 °C 700 °C 800 °C 900 °C 1000 °CGases 48 124 133 129 134 120H2 0.83 2.7 2.6 2.3 2.5 2.6CO 3.5 15 22 29 39 45CO2 41 105 107 95 89 69Methane 0.13 0.58 0.63 1.1 1.3 1.4Ethane 1.2 - 1.1 0.56 - 0.45Ethene 0.38 0.51 0.59 0.85 0.87 0.72Ethyne 0.19 0.22 0.30 0.28 0.30 0.36Liquids and Solids 4.5 0.46 1.2 4.5 2.8 2.4Benzene 0.21 - - 1.5 0.87 0.35Biphenyl 0.13 - 0.23 0.94 0.93 1.1Toluene - - - 0.20 0.19 -Styrene - - - 0.30 0.25 -4-Ethylbiphenyl - - - - - 0.06Indene - - - 0.11 0.12 0.12Naphthalene - - - 0.13 0.14 0.26Fluorene - - - - 0.10 0.11Anthracene/Phenanthrene - - - 0.14 0.17 0.38Phenol 0.46 - - - - -Acetophenone - 0.46 1.0 1.13 - -1,1’-(1,4-Phenylene)bis-ethanone - - - - - 0.05
Benzoic acid 3.3 - - - - -Benzoic acid vinyl ester 0.31 - - - - -Acetylbenzoic acid vinyl ester 0.07 - - - - -Sum 52 125 135 133 137 122Carbon fi xed in detected products 30 63 71 75 77 71
Gas values:Heating value [MJ/kg] 5.3 4.8 5.4 5.9 6.6 8.1Density [kg/m3] 1.21 1.13 1.15 1.15 1.12 1.05Heating value [MJ/m3] 6.4 5.5 6.2 6.8 7.3 8.5
-: not detected
Synthesis Gas Production 393
4. Conclusion
The results of this fi xed bed experiments show that the gasifi cation of PET is an appropri-ate way for the production of syngas. Up to 77 % of the carbon in the PET was converted into gases and oils, 66 % in CO and CO2 by themselves, at 900 °C (n=10). At this tempera-ture the H2/CO ratio is about 1. This gas is suitable for the production of dimethylether, for instance. While the hydrogen content was almost independent from the temperature the CO/CO2 ratio increased with the temperature according to their equilibrium.
Differences in the height of the fi xed beds show also that the residence time is an impor-tant factor. With the highest fi xed bed no liquid and solid byproducts were observed.
These results can just be seen as a preliminary test for this process, due to the fact that this type of reactor is not the optimal solution. More sophisticated reactors like fl uidised bed reactors will lead to higher conversion rates. But regarding the residence time of the resulting gas in the reactive zone of the reactor was less than 1 s shows the effi ciency of the Ni/NiO system as a catalyst for the conversion of PET to syngas.
References
[1] VKE: Plastics Business Data and Charts, Internet-version from 04.Oct.2004, http://www.vke.de.
[2] A. Oromiehie, A. Mamizadeh, Polym. Int. 53 728-732 (2004).[3] J. R. Campanelli, M. R. Kamal and D. G. Cooper, J. Appl. Polym. Sci., 48 443-451
(1993).[4] G. Grause, W. Kaminsky, G. Fahrbach, Polym. Degrad. Stab., 85 571-575 (2004).[5] Anon., E. I., du Pont de Nemours and Co., British Pat., 784,248 (1957) .[6] T. Yoshioka, E. Kitagawa, T. Mizoguchi, A. Okuwaki, Chemistry Letters, 33 282-283
(2004).[7] J. B. Parra, C. O. Ania, A. Arenillas, F. Rubiera, J. J. Pis, Applied Surface Science 238
304-308 (2004)[8] T. Yoshioka, T. Handa, G. Grause, Z. Lei, H. Inomata, T. Mizoguchi, Polymer
Degradation and Stability, accepted.[9] J. R. Rostrup-Nielsen, Chemical Engineering Science, 50 4061-4071 (1995).[10] F. Kaoru, A. Kenji, S. Tsutomu, T. Hiroo, Chemistry Letter 12 2051-2054 (1984).[11] D. L. Trimm, Z. I. Önsan, Catalyst Reviews 43 31-84 (2001).

ISFR - 2005394
Synthesis Gas Production 395
EFFECT OF NATURAL AND SYNTHETIC ZEOLITES FOR THE GASIFICATION OF POLYETHYLENE AND POLYPROPELENE
A. Nigo, T. Bhaskar, A. Muto, Y. Sakata*Department of Applied Chemistry, Okayama University, 3-1-1 Tsushima Naka,
Okayama 700-8530, Japan; [email protected]
Abstract: Pyrolysis of polyolefi ns such as polyethylene (PE) and polypropylene (PP) was performed by thermal and liquid phase catalytic contact mode with supported Ga cata-lysts i.e., Hokkaido natural zeolite (HNZ), Na-ZSM-5 and Nb2O5 etc. The cumulative formation of liquid products, qualitative and quantitative analysis of pyrolysis products were performed by different gas chromatographs. The physico-chemical properties of the used catalysts were related to the pyrolysis of PE and PP process. Major portion of publi-cations on this topic were perfomed in the vapour phase contact with different solid acid and non-acid catalysts and compared their physico-chemical properties. The addition of gallium promoted the formation of olefi nic hydrocarbons in liquid and gaseous products and formation of aromatic hydrocarbons (substituted benzene compounds).
1. Introduction
Accumulation of enormous amounts of plastic waste produced all over the world has negative implications on the environment. The pyrolysis of organic materials has received renewed attention due to the possibility of converting these wastes into useful energetic products or into valuable chemicals. End product yields and properties of the products obtained from a pyrolysis process are determined by the raw material decomposition (primary reactions) and by the reactions undergone by the primary volatiles (secondary reactions). The extent of the secondary reactions depends on the experimental equipment as well as on the operating conditions. The literature on the pyrolysis of polyolefi n’s into valuable chemicals, aromatics and fuels has mushroomed in various journals, reviews and books [1-8].
The decomposition of plastics and cracking/reforming of products is of importance for the production of selective and valuable hydrocarbons from waste plastics. The optimization of reaction conditions and selection of suitable catalyst is a key factor. The use of oxide catalysts, mesoporous silicas, and zeolites has been extensively used for the production of fuels and chemicals. In the present investigation, we used the natural zeolite obtained from Hokkaido, Japan and impregnated with Ga and used in the liquid phase contact (LPC) of pyrolysis of PE and PP. In the oxidation catalysis, Niobia (Nb2O5) was used as support, promoter and as a unique solid acid. The effect of Nb2O5 and Ga/Nb2O5 has been used for the pyrolysis of PE and PP.
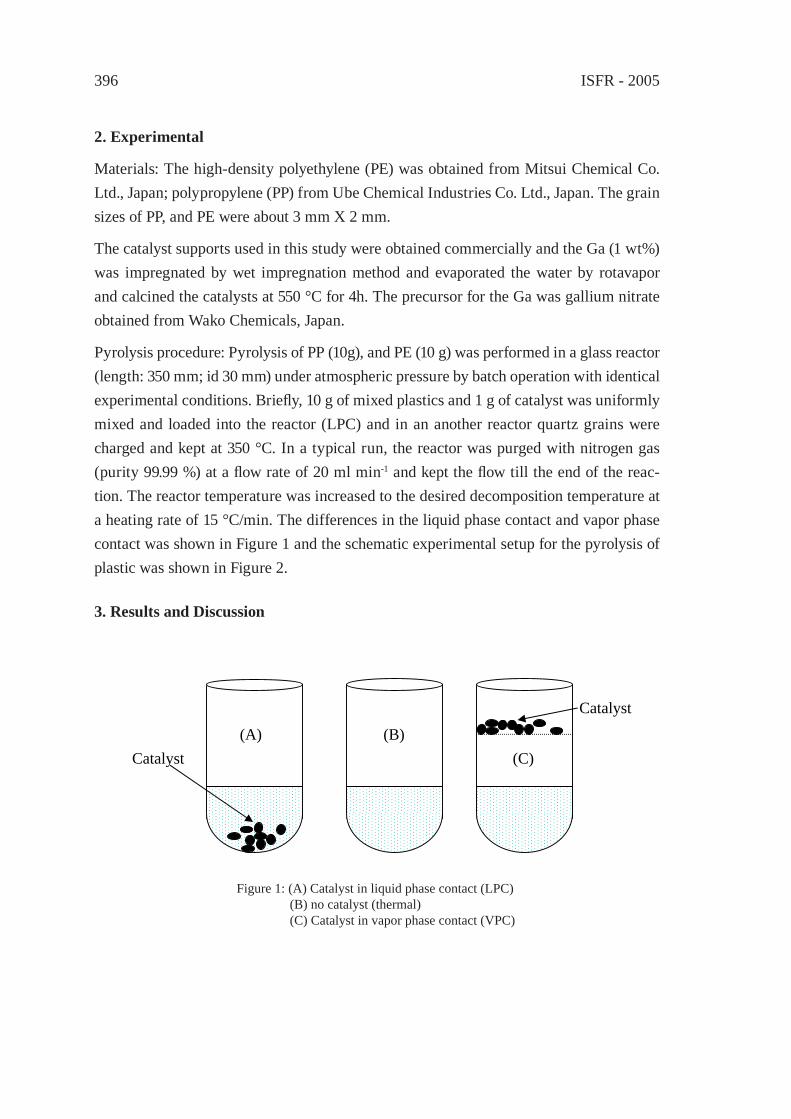
ISFR - 2005396
2. Experimental
Materials: The high-density polyethylene (PE) was obtained from Mitsui Chemical Co. Ltd., Japan; polypropylene (PP) from Ube Chemical Industries Co. Ltd., Japan. The grain sizes of PP, and PE were about 3 mm X 2 mm.
The catalyst supports used in this study were obtained commercially and the Ga (1 wt%) was impregnated by wet impregnation method and evaporated the water by rotavapor and calcined the catalysts at 550 °C for 4h. The precursor for the Ga was gallium nitrate obtained from Wako Chemicals, Japan.
Pyrolysis procedure: Pyrolysis of PP (10g), and PE (10 g) was performed in a glass reactor (length: 350 mm; id 30 mm) under atmospheric pressure by batch operation with identical experimental conditions. Briefl y, 10 g of mixed plastics and 1 g of catalyst was uniformly mixed and loaded into the reactor (LPC) and in an another reactor quartz grains were charged and kept at 350 °C. In a typical run, the reactor was purged with nitrogen gas (purity 99.99 %) at a fl ow rate of 20 ml min-1 and kept the fl ow till the end of the reac-tion. The reactor temperature was increased to the desired decomposition temperature at a heating rate of 15 °C/min. The differences in the liquid phase contact and vapor phase contact was shown in Figure 1 and the schematic experimental setup for the pyrolysis of plastic was shown in Figure 2.
3. Results and Discussion
Catalyst
Catalyst
(A) (B) (C)
Figure 1: (A) Catalyst in liquid phase contact (LPC)(B) no catalyst (thermal)(C) Catalyst in vapor phase contact (VPC)
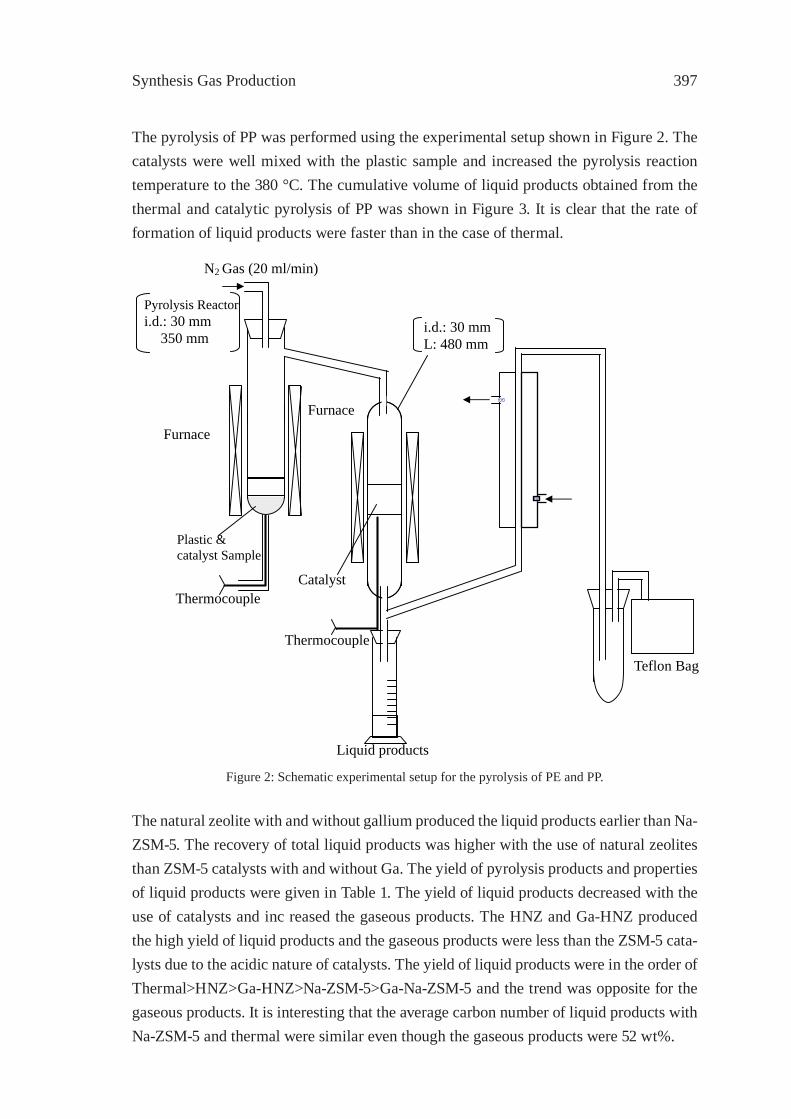
Synthesis Gas Production 397
The pyrolysis of PP was performed using the experimental setup shown in Figure 2. The catalysts were well mixed with the plastic sample and increased the pyrolysis reaction temperature to the 380 °C. The cumulative volume of liquid products obtained from the thermal and catalytic pyrolysis of PP was shown in Figure 3. It is clear that the rate of formation of liquid products were faster than in the case of thermal.
Teflon Bag
Liquid products
N2 Gas (20 ml/min)
Furnace
Plastic & catalyst Sample
Catalyst Thermocouple
Thermocouple
Condenser
Trap
Pyrolysis Reactor i.d.: 30 mm L: 350 mm
Furnace
i.d.: 30 mm L: 480 mm
Figure 2: Schematic experimental setup for the pyrolysis of PE and PP.
The natural zeolite with and without gallium produced the liquid products earlier than Na-ZSM-5. The recovery of total liquid products was higher with the use of natural zeolites than ZSM-5 catalysts with and without Ga. The yield of pyrolysis products and properties of liquid products were given in Table 1. The yield of liquid products decreased with the use of catalysts and inc reased the gaseous products. The HNZ and Ga-HNZ produced the high yield of liquid products and the gaseous products were less than the ZSM-5 cata-lysts due to the acidic nature of catalysts. The yield of liquid products were in the order of Thermal>HNZ>Ga-HNZ>Na-ZSM-5>Ga-Na-ZSM-5 and the trend was opposite for the gaseous products. It is interesting that the average carbon number of liquid products with Na-ZSM-5 and thermal were similar even though the gaseous products were 52 wt%.
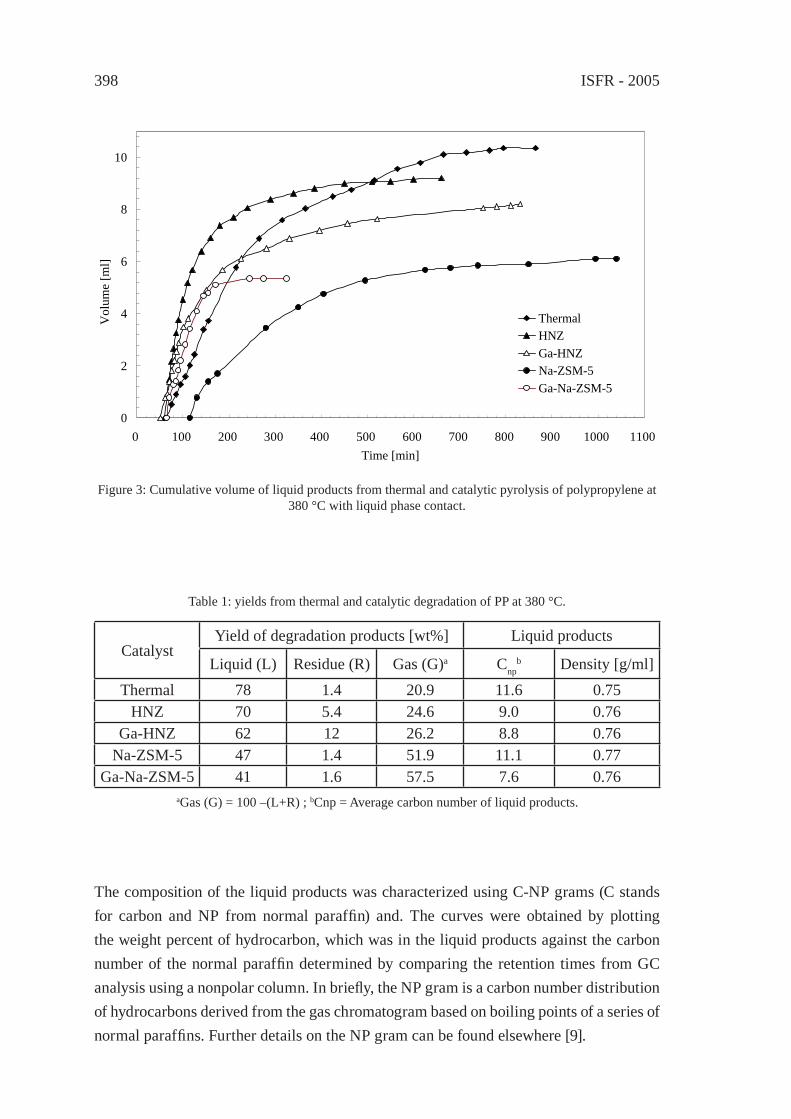
ISFR - 2005398
0
2
4
6
8
10
0 100 200 300 400 500 600 700 800 900 1000 1100Time [min]
Vol
ume
[ml]
ThermalHNZGa-HNZNa-ZSM-5Ga-Na-ZSM-5
Figure 3: Cumulative volume of liquid products from thermal and catalytic pyrolysis of polypropylene at 380 °C with liquid phase contact.
Table 1: yields from thermal and catalytic degradation of PP at 380 °C.
CatalystYield of degradation products [wt%] Liquid products
Liquid (L) Residue (R) Gas (G)a Cnpb Density [g/ml]
Thermal 78 1.4 20.9 11.6 0.75HNZ 70 5.4 24.6 9.0 0.76
Ga-HNZ 62 12 26.2 8.8 0.76Na-ZSM-5 47 1.4 51.9 11.1 0.77
Ga-Na-ZSM-5 41 1.6 57.5 7.6 0.76aGas (G) = 100 –(L+R) ; bCnp = Average carbon number of liquid products.
The composition of the liquid products was characterized using C-NP grams (C stands for carbon and NP from normal paraffi n) and. The curves were obtained by plotting the weight percent of hydrocarbon, which was in the liquid products against the carbon number of the normal paraffi n determined by comparing the retention times from GC analysis using a nonpolar column. In briefl y, the NP gram is a carbon number distribution of hydrocarbons derived from the gas chromatogram based on boiling points of a series of normal paraffi ns. Further details on the NP gram can be found elsewhere [9].
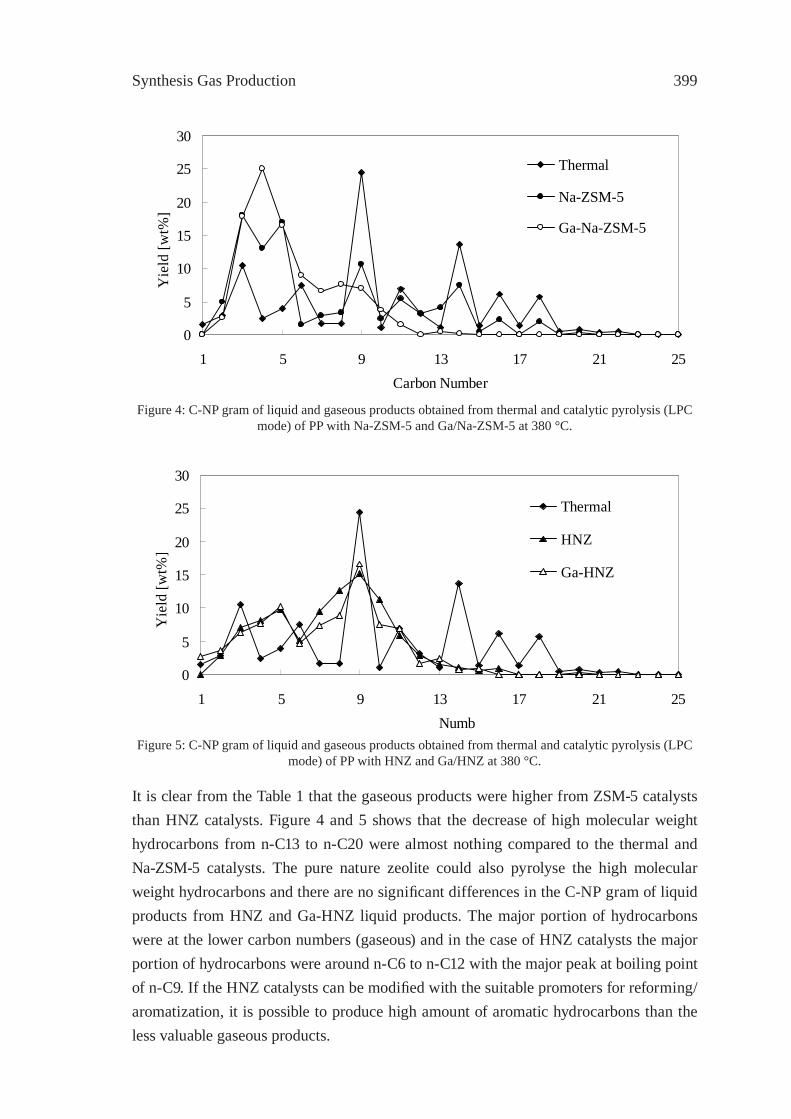
Synthesis Gas Production 399
0
5
10
15
20
25
30
1 5 9 13 17 21 25Carbon Number
Yie
ld [w
t%]
Thermal
Na-ZSM-5
Ga-Na-ZSM-5
0
5
10
15
20
25
30
1 5 9 13 17 21 25Numb
Yie
ld [w
t%]
Thermal
HNZ
Ga-HNZ
Figure 4: C-NP gram of liquid and gaseous products obtained from thermal and catalytic pyrolysis (LPC mode) of PP with Na-ZSM-5 and Ga/Na-ZSM-5 at 380 °C.
Figure 5: C-NP gram of liquid and gaseous products obtained from thermal and catalytic pyrolysis (LPC mode) of PP with HNZ and Ga/HNZ at 380 °C.
It is clear from the Table 1 that the gaseous products were higher from ZSM-5 catalysts than HNZ catalysts. Figure 4 and 5 shows that the decrease of high molecular weight hydrocarbons from n-C13 to n-C20 were almost nothing compared to the thermal and Na-ZSM-5 catalysts. The pure nature zeolite could also pyrolyse the high molecular weight hydrocarbons and there are no signifi cant differences in the C-NP gram of liquid products from HNZ and Ga-HNZ liquid products. The major portion of hydrocarbons were at the lower carbon numbers (gaseous) and in the case of HNZ catalysts the major portion of hydrocarbons were around n-C6 to n-C12 with the major peak at boiling point of n-C9. If the HNZ catalysts can be modifi ed with the suitable promoters for reforming/aromatization, it is possible to produce high amount of aromatic hydrocarbons than the less valuable gaseous products.
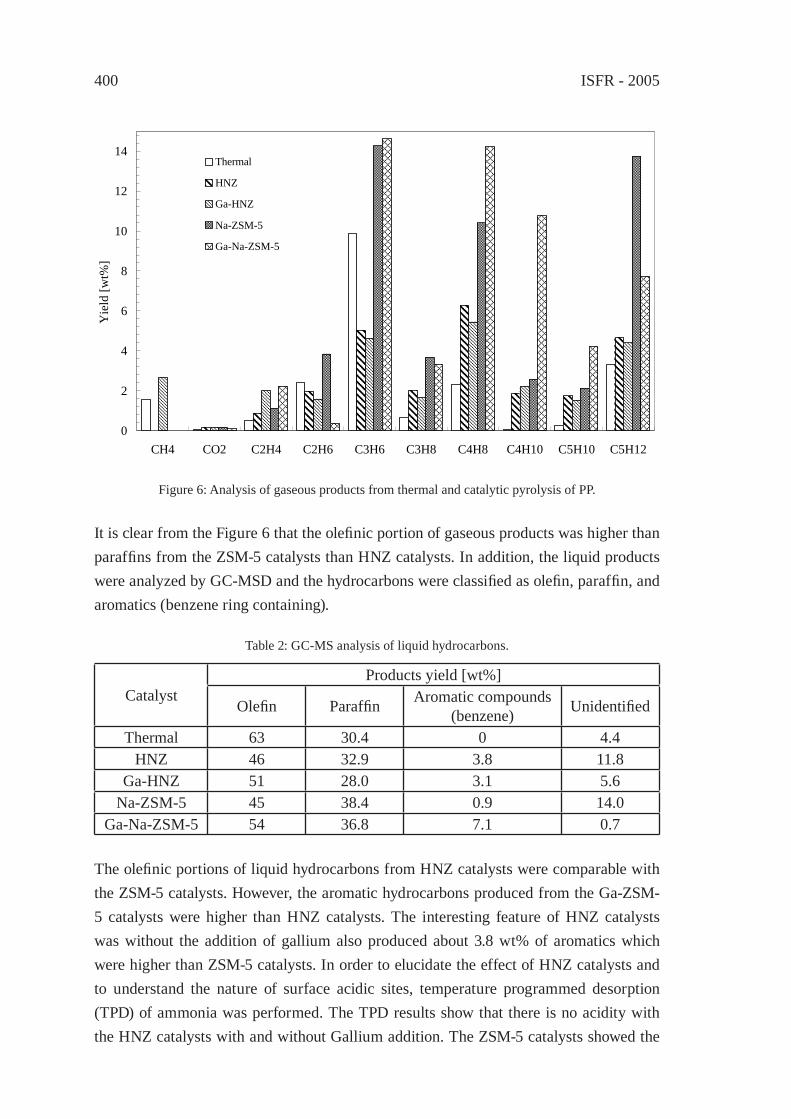
ISFR - 2005400
0
2
4
6
8
10
12
14
CH4 CO2 C2H4 C2H6 C3H6 C3H8 C4H8 C4H10 C5H10 C5H12
Yie
ld [w
t%]
Thermal
HNZ
Ga-HNZ
Na-ZSM-5
Ga-Na-ZSM-5
Figure 6: Analysis of gaseous products from thermal and catalytic pyrolysis of PP.
It is clear from the Figure 6 that the olefi nic portion of gaseous products was higher than paraffi ns from the ZSM-5 catalysts than HNZ catalysts. In addition, the liquid products were analyzed by GC-MSD and the hydrocarbons were classifi ed as olefi n, paraffi n, and aromatics (benzene ring containing).
Table 2: GC-MS analysis of liquid hydrocarbons.
CatalystProducts yield [wt%]
Olefi n Paraffi n Aromatic compounds (benzene) Unidentifi ed
Thermal 63 30.4 0 4.4HNZ 46 32.9 3.8 11.8
Ga-HNZ 51 28.0 3.1 5.6Na-ZSM-5 45 38.4 0.9 14.0
Ga-Na-ZSM-5 54 36.8 7.1 0.7
The olefi nic portions of liquid hydrocarbons from HNZ catalysts were comparable with the ZSM-5 catalysts. However, the aromatic hydrocarbons produced from the Ga-ZSM-5 catalysts were higher than HNZ catalysts. The interesting feature of HNZ catalysts was without the addition of gallium also produced about 3.8 wt% of aromatics which were higher than ZSM-5 catalysts. In order to elucidate the effect of HNZ catalysts and to understand the nature of surface acidic sites, temperature programmed desorption (TPD) of ammonia was performed. The TPD results show that there is no acidity with the HNZ catalysts with and without Gallium addition. The ZSM-5 catalysts showed the

Synthesis Gas Production 401
higher acidity as expected. The profi les and quantitative determination of TPD and other characterization results will be discussed during the presentation.
4. Conclusions
The catalytic pyrolysis of PP was performed with liquid phase contact using natural zeolite and gallium impregnated natural z n-C13 to n-C20eolite catalysts. The applicability of natural zeolites for the production of valuable hydrocarbons from the waste plastics was tested and the results are promising. The pyrolysis results were compared with the conventional ZSM-5 based catalysts and the results were comparable.
References
[1] Sakata, Y., Uddin, M.A., Koizumi, K., Murata, K., Chem. Lett. 245, 1996.
[2] Kaminsky, W., Angew. Makromol. Chem. 232:151-165 (1995).
[3] Remias, J.E., Pavlosky, T.A., Sen, A., C.R. Acad. Sci. Paris, Seie IIc. Chemistry. 3:627-629 (2000).
[4] Aguado, J., Sotelo, J.L., Serrano, D.P., Calles, J.A., Escola, J.M., Energy & Fuels. 11:1225-1231(1997).
[5] Uemichi, Y., Takuma, K., Ayame, A., Chem. Comm. 1975, 1998.
[6] Uddin, M.A., Sakata, Y., Muto, A., Shiraga, Y., Koizumi, K., Kanada, Y., Murata, K., Micro. Meso. Mat. 21:557-564 (1998).
[7] Sakata, Y., Uddin, M.A., Muto, A., Kanada, Y., Koizumi, K., Murata, K., J. Anal. Appl. Pyo. 43:15-25 (1997).
[8] Ohkita, H., Nishiyama, R., Tochihara, Y., Mizushima, T., Kakuta, N., Morioka, Y., Ueno, A., Namiki, Y., Tanifuji, S., Katoh, H., Sunazuka, H., Nakayama, R., Kuroyanagi, T., Ind. Eng. Chem. Res. 32:3112-3126 (1993).
[9] Murata, K., Hirano, Y., Sakata, Y., Uddin, M.A., J. Anal. Appl. Pyro. 65:71-90 (2002).

Energy derived from Plastics 403
PRODUCTION OF GAZEOUS AND LIQUID FUELS BYGASIFICATION OR PYROLYSIS OF PLASTICS
C.Gisèle Jung and André FontanaUniversité Libre de Bruxelles (ULB), Solvay Business School Centre Emile Bernheim
- Industrial Chemistry Department, [email protected]
Abstract: When the recovery of mixed plastics is not economically viable, the main issue today is land fi lling or incineration. The present study shows the opportunities in produc-ing gaseous or liquid substitution fuels by pyrolysis or gasifi cation. By both processes, the issued fuels characteristics are quite different so that the application fi elds have to be optimized.If plastics are mixed with other waste, sorting could be too expensive. Using our predic-tive model, pyrolysis mass balance could be evaluated so that the fuels qualities could be predicted.
1. Indroduction
The use of polymers has increased by a factor of about 3 since 1980 and life cycle analysis shows that energy and raw material saving could be reached by the reprocessing of plas-tics recovered from waste streams. Today, PVC, PE and PET are easily sorted from differ-ent waste streams for reprocessing, but all sorting plants evolve large quantities of mixed plastics. For a lot of waste streams, as well as for sorting plant refuse, it is not economic to separate the different kinds of polymers. This explains the large part of plastic waste land fi lling in Europe. An alternative way consists in pelletizing the mix in order to be gasifi ed, but the preparation costs are relatively high. Another clean alternative consists in producing solid, liquid and gaseous fuels by pyrolysis. Moreover, selected additions dur-ing pyrolysis could entrap pollutants such as chlorine and heavy metals [1, 2, 3].
The main advantage of pyrolysis over direct combustion in a waste-to energy unit is a tremendous reduction in the volume of product gases (10 to 20 folds). This leads to a signifi cant reduction in the complexity of the exhaust gas purifi cation system. Moreover, pyrolysis of waste containing plastics could be performed with less charge preparation, so that minerals and metals are easily separated during the solid fuel conditioning and less ash are produced.
2. Carbonization: from lab scale results to pilot and industrial performances
The thermal decomposition of polymers which generates degradation products has been largely studied during the last years. Different techniques are used and the products issued from different technologies are classifi ed in two main categories “slow” and “fast/fl ash” pyrolysis. There is a strong dependence of the carbonisation products in relation with the
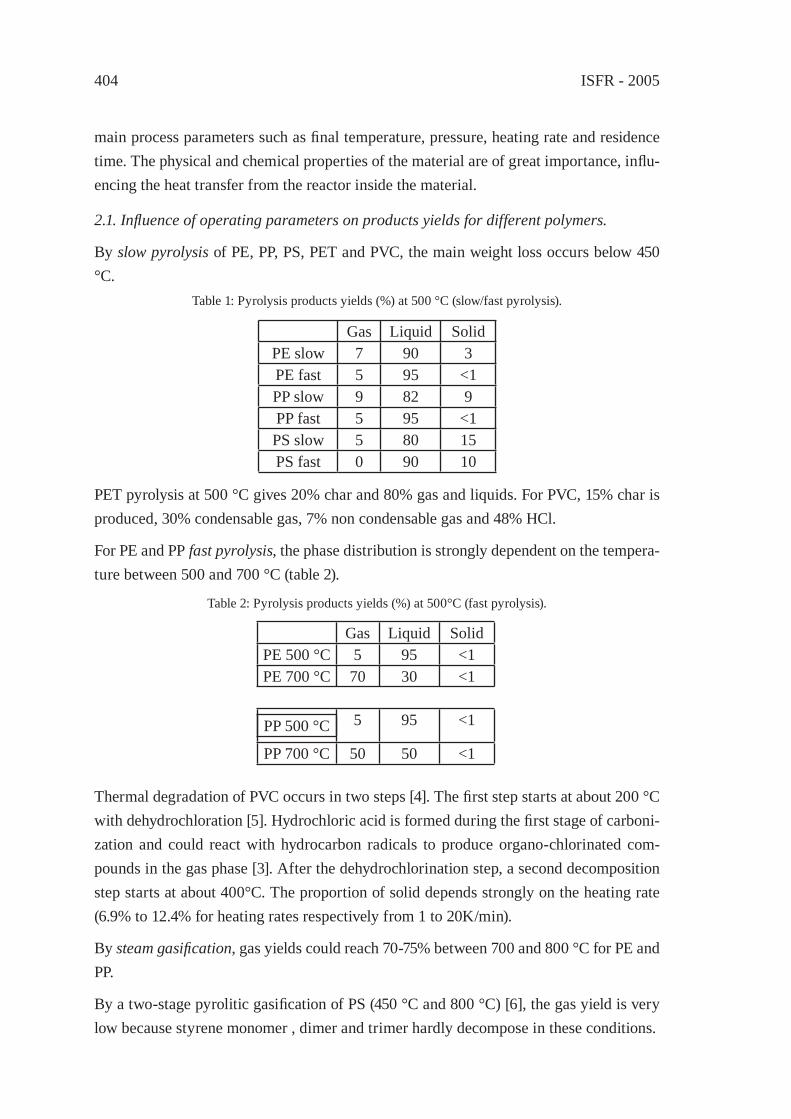
ISFR - 2005404
main process parameters such as fi nal temperature, pressure, heating rate and residence time. The physical and chemical properties of the material are of great importance, infl u-encing the heat transfer from the reactor inside the material.
2.1. Infl uence of operating parameters on products yields for different polymers.
By slow pyrolysis of PE, PP, PS, PET and PVC, the main weight loss occurs below 450 °C.
Table 1: Pyrolysis products yields (%) at 500 °C (slow/fast pyrolysis).
Gas Liquid SolidPE slow 7 90 3PE fast 5 95 <1PP slow 9 82 9PP fast 5 95 <1PS slow 5 80 15PS fast 0 90 10
PET pyrolysis at 500 °C gives 20% char and 80% gas and liquids. For PVC, 15% char is produced, 30% condensable gas, 7% non condensable gas and 48% HCl.
For PE and PP fast pyrolysis, the phase distribution is strongly dependent on the tempera-ture between 500 and 700 °C (table 2).
Table 2: Pyrolysis products yields (%) at 500°C (fast pyrolysis).
Gas Liquid SolidPE 500 °C 5 95 <1PE 700 °C 70 30 <1
PP 500 °C 5 95 <1
PP 700 °C 50 50 <1
Thermal degradation of PVC occurs in two steps [4]. The fi rst step starts at about 200 °C with dehydrochloration [5]. Hydrochloric acid is formed during the fi rst stage of carboni-zation and could react with hydrocarbon radicals to produce organo-chlorinated com-pounds in the gas phase [3]. After the dehydrochlorination step, a second decomposition step starts at about 400°C. The proportion of solid depends strongly on the heating rate (6.9% to 12.4% for heating rates respectively from 1 to 20K/min).
By steam gasifi cation, gas yields could reach 70-75% between 700 and 800 °C for PE and PP.
By a two-stage pyrolitic gasifi cation of PS (450 °C and 800 °C) [6], the gas yield is very low because styrene monomer , dimer and trimer hardly decompose in these conditions.
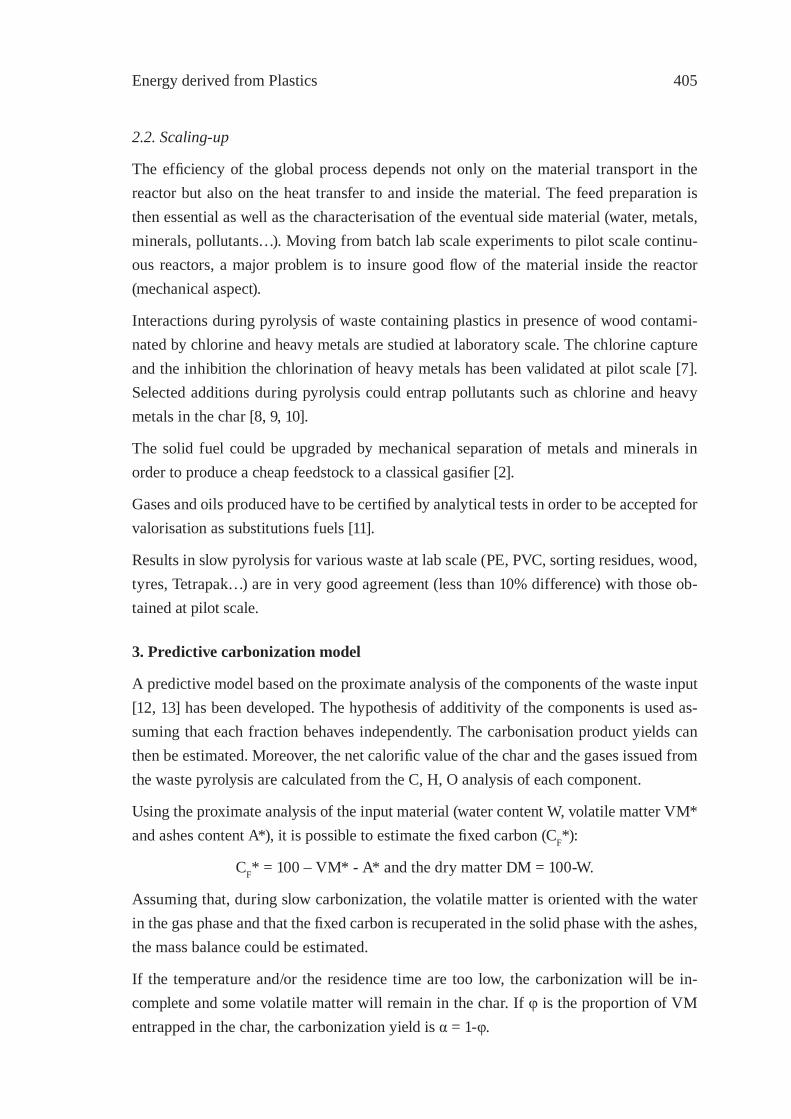
Energy derived from Plastics 405
2.2. Scaling-up
The effi ciency of the global process depends not only on the material transport in the reactor but also on the heat transfer to and inside the material. The feed preparation is then essential as well as the characterisation of the eventual side material (water, metals, minerals, pollutants…). Moving from batch lab scale experiments to pilot scale continu-ous reactors, a major problem is to insure good fl ow of the material inside the reactor (mechanical aspect).
Interactions during pyrolysis of waste containing plastics in presence of wood contami-nated by chlorine and heavy metals are studied at laboratory scale. The chlorine capture and the inhibition the chlorination of heavy metals has been validated at pilot scale [7]. Selected additions during pyrolysis could entrap pollutants such as chlorine and heavy metals in the char [8, 9, 10].
The solid fuel could be upgraded by mechanical separation of metals and minerals in order to produce a cheap feedstock to a classical gasifi er [2].
Gases and oils produced have to be certifi ed by analytical tests in order to be accepted for valorisation as substitutions fuels [11].
Results in slow pyrolysis for various waste at lab scale (PE, PVC, sorting residues, wood, tyres, Tetrapak…) are in very good agreement (less than 10% difference) with those ob-tained at pilot scale.
3. Predictive carbonization model
A predictive model based on the proximate analysis of the components of the waste input [12, 13] has been developed. The hypothesis of additivity of the components is used as-suming that each fraction behaves independently. The carbonisation product yields can then be estimated. Moreover, the net calorifi c value of the char and the gases issued from the waste pyrolysis are calculated from the C, H, O analysis of each component.
Using the proximate analysis of the input material (water content W, volatile matter VM* and ashes content A*), it is possible to estimate the fi xed carbon (CF*):
CF* = 100 – VM* - A* and the dry matter DM = 100-W.
Assuming that, during slow carbonization, the volatile matter is oriented with the water in the gas phase and that the fi xed carbon is recuperated in the solid phase with the ashes, the mass balance could be estimated.
If the temperature and/or the residence time are too low, the carbonization will be in-complete and some volatile matter will remain in the char. If φ is the proportion of VM entrapped in the char, the carbonization yield is α = 1-φ.
ISFR - 2005406
The carbonization yield could be a TGA analysis at low heating rate for the same input material. Sampling is then the main problem for mg sample analysis. Therefore, the use of larger scale TGA devices up to 5g is recommended.
This model has been validated for used tyres, biomass, Tetrapak® boxes, mix of plastic wastes, etc and gives rather good agreement (less than 10% difference) with experimental results for slow pyrolysis [13].
4. Fuel valorization
4.1 By pyrolysis
As the pyrolitic gases are not diluted by nitrogen or by combustion products, the calorifi c values of the pyrolytic gases can reach about 40 MJ/kg. Products yields from mixed plas-tics pyrolysis are about 2.9% char, 75.1% oils and 9.6% non-condensable gas [14, 15].
During co-pyrolysis and gasifi cation of PVC with cellulose derived material (wood and straw) the chars are relatively non reactive. When lignin is present in the waste, these compounds could be adsorbed on the char [16]. Addition of basic compounds during py-rolysis leads to the formation of calcium chloride in the char that could be leached out by washing. This approach has been tested at pilot and industrial scale [7].
4.2 By gasifi cation
By air gasifi cation, the syngas produced has a rather low heating value, between 4 and 6 MJ/m3 according to the nature of the waste input. With oxygen gasifi cation, the gas could reach 8 – 14 MJ/m3. The best results could be obtained by steam gasifi cation (up to 18 MJ/m3). The raw gas contains generally tars and fi ne char particles. The advantages in using the produced gas fuel directly by combustion in a boiler or in a furnace are that these hot gases do not have to be cleaned in great extent. The installed piping and burners have to be able to tolerate some contaminants in order to avoid fouling or clogging.
Energy derived from Plastics 407
When the gas is used into gas turbines or prime movers in order to generate power or electricity, they have to be cleaned at high specifi cations [17].
It can be seen that a signifi cant proportion of the energy content of the waste is recovered by the gasifi cation of the char and that the ultimate residue is decreased in comparison with the quantity of bottom ash produced compared to direct incineration [2].
References
[1] Fontana A., Laurent Ph., Jung C.G., Gehrmann H. M.J., Beckmann M., Erdöl, Erdgas Kohle, 2001, 117, 362-366.
[2] Fontana A., Braekman-Danheux C., Laurent Ph., Gasifi cation, the Gateway to a Cleaner Future, IchemE meeting, Dresden, 1998.
[3] Fontana A., Environnemental Protection Bulletin, 1998, 055, 3-5.[4] Knümann R., Bockhorn H., Combustion Science and Technology, 1994, 101, 285-
299.[5] Murty M.V.S., Rangarajan P., Grulke E.A., Bhattacharyya D., Fuel Process.Tech,
1996, 49, 75-90.[6] Tsuji T., Tanaka Y., Shibata T., Feedstock recycling of plastics, Sendai, Tohoku
University Press, 1999.[7] Gehrmann H.J., Beckmann M., Jung C.G., Fontana A., Proceedings, Session 1,
Incineration 2001, IchemE meeting, Brussels, July 2001, 14p.[8] Fontana A., Laurent Ph., Jung C.G., Gehrmann H. M.J., Beckmann M., Erdöl,
Erdgas Kohle, 2001, 117, 362-366.[9] Jung C.G., Fontana A., Proceedings ISFR, Ostende, Belgium, 2002.[10] Jung C.G., Fontana A., MoDeSt Workshop on Recycling of Polymeric Materials,
Karlsruhe, July, 2003.[11] Blazsó M., Plenary Lecture, 16th International Symposium on Analytical and
Applied Pyrolysis Alicante, May 2004.[12] Jung C.G., de Belder E., Fontana A., ThermoNet meeting, Brugge, April 2004.[13] Jung C.G., de Belder E., Fontana A., 16th International Symposium on Analytical
and Applied Pyrolysis, Alicante, May 2004.[14] Williams E.A., Williams P. T., J.Chem. Tech. Biotech, 1997, 70: 9-20.[15] Williams P.T., Williams. E. A., J. anal. appl. Pyrolysis, 1997, 40-41: 347-363.[16] Laurent Ph., Kestemont C., Braekman-Danheux C., Fontana A., Erdöl, Erdgas
Kohle, 2000, 116, 89-92.[17] Danheux C., D’Haeyere A., Fontana A., Laurent Ph., Fuel, 1998, 77(1/2), 55-59.

ISFR - 2005408
Energy derived from Plastics 409
EFFECT OF STEAM AND SODIUM HYDROXIDE ON THE PRODUCTION OF HYDROGEN FROM
DEHYDROCHLORINATED POLY(VINYL CHLORIDE)Tohru Kamo, Kanji Takaoka*, Junichiro Otomo**, and Hiroshi Takahashi**
National Institute of Advanced Industrial Science and Technology,* Department of Applied Chemistry, School of Engineering, The University of Tokyo,
**Department of Environmental Chemical Engineering, Kogakuin University16-1 Onogawa, Tsukuba, Ibaraki 305-8569, Japan, [email protected]
Abstract: Dehydrochlorinated poly(vinyl chloride) (PVC) was pyrolyzed with steam in the presence of sodium hydroxide at 3.0 MPa and 560–660 °C. In some experiments, activated carbon was used as a model material of resideu. Hydrogen and sodium carbonate were produced mainly, and methane was detected as a minor product. The rate of hydrogen production increased with partial steam pressure and NaOH/C molar ratio. However, the rate became saturated at NaOH/C ratios higher than 3.0. The activation energy of the hydrogen-production reaction was 178 kJ/mol by assuming fi rst-order reaction rate. These experimental results suggest that physical contact between the solid sample, liquid sodium hydroxide, and gaseous steam is important for hydrogen production.
1. Introduction
Recovery of plastics in waste electric equipments and end-of-life vehicles disposed in an area, and supply the materials to existing local industies in the same area as chemicals or energy resources is effective not only in terms of solving environmental problems but also in terms of the development of new distributed energy system. Especially hydrogen is expected as a energy source for a fuel cell, and a common energy medium between vari-ous renewable energy resources. Hydrogen production technology from fossil resources by partial oxidation have been developed. However, it is not suitable for small distribued hydrogen production, because reaction have been carried out at higher tempreature than 1000 °C. In the presence of calcium hydroxide (Ca(OH)2), hydrogen was produced from coal and other organic materials with steam at the comparatively low temperature of 700 °C [1-3]. However, the reaction must be carried out at more than 10 MPa of steam partial pressure to prevent decomposition of Ca(OH)2 to calcium oxide (CaO). Recently, an interesting technology, in which hydrogen can be produced from water and carbon under relatively milder conditions in the presence of sodium hydroxide, was proposed [4, 5]. Because reactions are carried out in the presence of alkali, the production of haz-ardous halogenated organic compounds is expected to be negligible even if halogenated compounds such as PVC and bromine fl ame retardants are contained in the waste; and halogen elements are recovered in the form of stable, safe mineral salts.
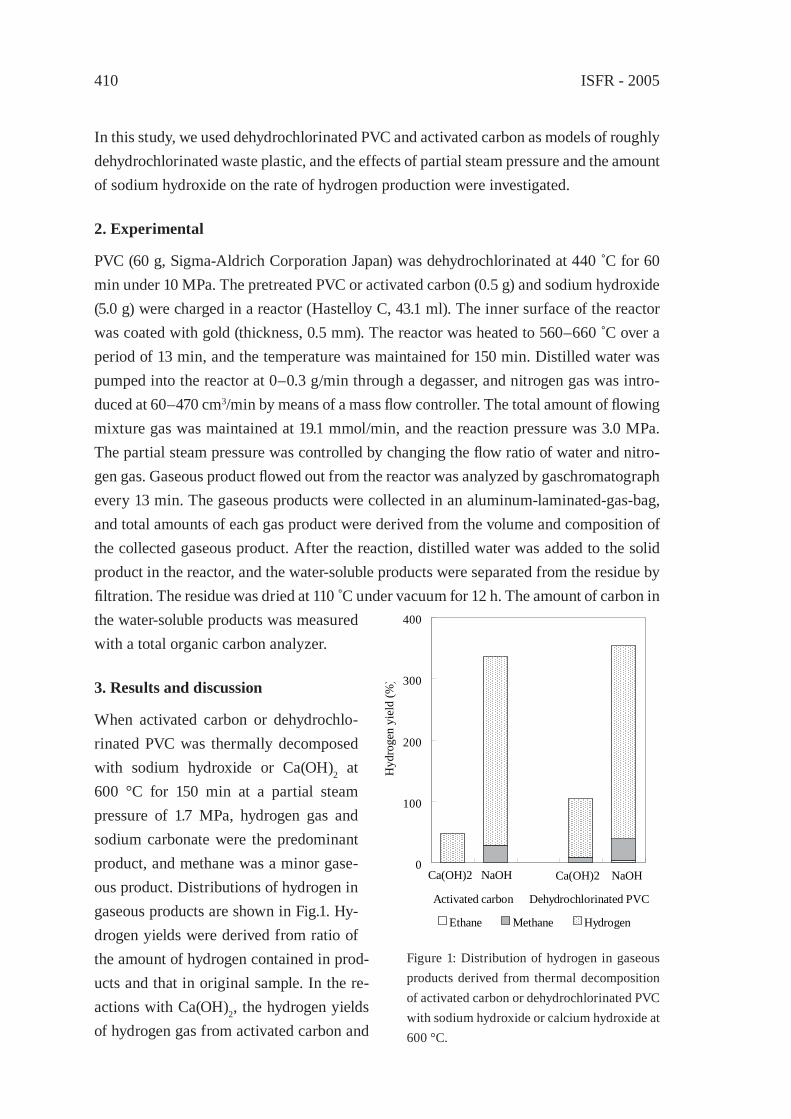
ISFR - 2005410
In this study, we used dehydrochlorinated PVC and activated carbon as models of roughly dehydrochlorinated waste plastic, and the effects of partial steam pressure and the amount of sodium hydroxide on the rate of hydrogen production were investigated.
2. Experimental
PVC (60 g, Sigma-Aldrich Corporation Japan) was dehydrochlorinated at 440 ˚C for 60 min under 10 MPa. The pretreated PVC or activated carbon (0.5 g) and sodium hydroxide (5.0 g) were charged in a reactor (Hastelloy C, 43.1 ml). The inner surface of the reactor was coated with gold (thickness, 0.5 mm). The reactor was heated to 560–660 ˚C over a period of 13 min, and the temperature was maintained for 150 min. Distilled water was pumped into the reactor at 0–0.3 g/min through a degasser, and nitrogen gas was intro-duced at 60–470 cm3/min by means of a mass fl ow controller. The total amount of fl owing mixture gas was maintained at 19.1 mmol/min, and the reaction pressure was 3.0 MPa. The partial steam pressure was controlled by changing the fl ow ratio of water and nitro-gen gas. Gaseous product fl owed out from the reactor was analyzed by gaschromatograph every 13 min. The gaseous products were collected in an aluminum-laminated-gas-bag, and total amounts of each gas product were derived from the volume and composition of the collected gaseous product. After the reaction, distilled water was added to the solid product in the reactor, and the water-soluble products were separated from the residue by fi ltration. The residue was dried at 110 C under vacuum for 12 h. The amount of carbon in the water-soluble products was measured with a total organic carbon analyzer.
3. Results and discussion
When activated carbon or dehydrochlo-rinated PVC was thermally decomposed with sodium hydroxide or Ca(OH)2 at 600 °C for 150 min at a partial steam pressure of 1.7 MPa, hydrogen gas and sodium carbonate were the predominant product, and methane was a minor gase-ous product. Distributions of hydrogen in gaseous products are shown in Fig.1. Hy-drogen yields were derived from ratio of the amount of hydrogen contained in prod-ucts and that in original sample. In the re-actions with Ca(OH)2, the hydrogen yields of hydrogen gas from activated carbon and
Ca(OH)2 NaOH0
100
200
300
400
Ca(OH)2 NaOH
Hyd
roge
n yi
eld
(%)
Ethane Methane Hydrogen
Activated carbon Dehydrochlorinated PVC
Figure 1: Distribution of hydrogen in gaseous products derived from thermal decomposition of activated carbon or dehydrochlorinated PVC with sodium hydroxide or calcium hydroxide at 600 °C.

Energy derived from Plastics 411
dehydrochlorinated PVC were only 48% and 95%, respectively. In the presence of sodium hydroxide, the hydrogen yields of hydrogen gas from activated carbon and dehydrochlorinated PVC increased to 309% and 315%, respectively. The sig-nifi cant hydrogen yield increases indicate that in the presence of sodium hydroxide, hydrogen gas was produced from activat-ed carbon and dehydrochlorinated PVC even at low partial steam pressures at 600 ˚C. The molar yield of hydrogen gas was approximately 2 times that of sodium car-bonate, which suggests that the reaction shown in Eq. 1 was the main reaction un-der these experimental conditions.
C + 2NaOH + H2O → Na2CO3 + 2H2 (1)
The time dependences of the fl ow rate of hydrogen FH (mol/min) and methane FM (mol/min) produced from activated carbon and dehydrochlorinated PVC are shown in Fig.2. The internal temperature of the reactor reached a constant value at 15 minutes of reaction time, and then the fl ow rates of the hydrogen and meth-ane were highest. The amount of fl owing methane was close to 10% of the amount of hydrogen for both starting materials, irrespective of the reaction time. How-ever, relatively large amounts of fl owing methane, equivalent to half the hydrogen production rate, were observed only at the beginning of the reaction of dehydro-chlorinated PVC. These experimental re-sults suggest that methane was produced through two reaction paths: direct ther-
-6.0
-4.0
-2.0
0.0
2.0
0 30 60 90 120Reaction time (min)
ln( F
H o
r FM
)
Hydrogen from activated carbonMethane from activated carbonHydrogen from dehydrochlorinated carbonMethane from dehydrochlorinated carbon
Figure 2: Time dependence of the fl ow rates of hydrogen (FH) and methane (FM) in the reaction of activated carbon or dehydrochlorinated PVC at 600 °C.
0.00
0.01
0.02
0.03
0.04
0.05
0.0 1.0 2.0 3.0Partial steam pressure (MPa)
r (1/
min
)
Activated carbon Dehydrochlorinated PVC
Figure 3: Effect of partial steam pressure on the rate of hydrogen production from activated carbon or dehydrochlorinated PVC at 600 °C.

ISFR - 2005412
mal decomposition of dehydrochlorinated PVC during the heating period and secondary reaction of carbon and hydrogen once it was formed.
The gasifi cation rate per unit mass of remaining sample (r) is defi ned by Eq. 2 in terms of the weight-loss rate (dX/dt), conversion (X), a reaction rate constant (k), and an exponen-tial function of partial steam pressure (Psteam)n. In our work, we assumed fi rst-order reac-tion rate for the gasifi cation, because the logarithm of the hydrogen fl ow rates decreased linearly with reaction time, at least at the beginning of the reaction. Flow rate of gaseous hydrogen from reactor (FH) was derived from Eq. 3. The rate constant for hydrogen pro-duction (r) was obtained from slope of the line shown in Fig. 2.
0.00
0.01
0.02
0.03
0 1 2 3 4 5NaOH/C (mol/mol)
r (1/
min
)
Activated carbon Dehydrochlorinated PVC
Figure 4: Effect of NaOH/C ratio on the rate of hydrogen production from activated carbon and dehydrochlorinated PVC at 600 °C.
(2)
rtAFH −=)ln( (3)
A: costant , r: reaction time
In the reaction of activated carbon or dehydrochlorinated PVC with sodium hydroxide, the gasifi cation rate increased with partial steam pressure (Fig. 3). The reaction order with respect to the partial steam pressure was calculated to be 0.69 by means of a least-squares method for Eq. 2. The reaction order with respect to steam for gasifi cation was close to the value obtained for gasifi cation of char [6,7] derived from coal.
nsteamPk
dtdX
Xr )(
)1(1
=
−=
The rate of hydrogen production increased linearly with the sodium hydroxide/carbon molar ratio (NaOH/C) at ratios less than 3 (Fig. 4). However, the hydrogen pro-duction rate became saturated at ratios higher than 3. Because activated carbon and dehydrochlorinated PVC were sol-ids under our experimental conditions, physical contact effi ciency between the sample and liquid sodium hydroxide had an upper limit, even when excess sodium hydroxide was added. Saturation of the hydrogen production rate at NaOH/C ra-tios higher than 3 implies that the contact effi ciency of NaOH and carbon reached a maximum. The experimental results sug-gest that hydrogen is produced through a
Energy derived from Plastics 413
reaction related carbon, steam, and sodium hydroxide directly in the presence of sodium hydroxide.
From Arrhenius plots of the rate of hydrogen production from activated carbon and dehy-drochlorinated PVC, the activation energy was calculated to be 178 kJ/mol. The activation energy is almost equal to that of the steam gasifi cation of coal [6].
Infl uence of particle diameter on the rate of hydrogen production was not observed in the thermal decomposition of roughly crashed activated carbon or fi nely pulverized dehydro-chlorinated PVC. These experimental results imply that rate of hydrogen production is controlled by a reaction of carbon with steam and sodium hydroxide penetrated in sample particles.
4. Conclusion
By using sodium hydroxide, hydrogen can be produced from activated carbon or dehy-drochlorinated PVC under relatively mild conditions: less than 3.0 MPa of partial steam pressure at 600 °C. The rate of hydrogen production increased with partial steam pressure and NaOH/C molar ratio; however, the rate approached a constant value at ratios greater than 3.0 of NaOH/C. The activation energy of the hydrogen production reaction was 178 kJ/mol by assuming fi rst-order reaction rate. These results suggest that hydrogen was produced through a reaction involving carbon, steam, and sodium hydroxide.
References
[1] Lin S-Y, Suzuki Y, Hatano H, Harada M. Energy Fuel 2001;15:339.[2] Lin S Y, Harada M, Suzuki Y, Hatano H. Fuel 2002;81:2079.[3] Sato S, Lin S Y, Suzuki Y, Hatano H, Fuel 2003;82:561.[4] Nagase K, Shimodaira T, Ito M, Kudo S, 82nd CATSJ Meeting Abstract 1998;344.[5] Sakata M, Nagase K, Kokaitokkyokoho H10-251001.[6] Kajitani S, Hara S, Matsuda H, Fuel 2002;81:539.[7] Takarada T, Ida N, Hiroki A, Kanbara S, Yamamoto M, Kato K, Nenryokyoukaishi
1988;67;1061.

ISFR - 2005414
Energy derived from Plastics 415
VALUABLE HYDROCARBONS FROM PLASTIC WASTES BY MILD CRACKING
N. Miskolczi, L. Bartha, Gy. DeákUniversity of Veszprém, Department of Hydrocarbon and Coal Processing, Veszprém,
Hungary, e-mail:[email protected]
1. Introduction
Nowadays the question of utilization of plastic wastes is in the focus of waste management, in consequence of increasing consumption and production of plastics, which generates further environmental problems [1,2]. Recycling has a share of only about 10%, which is extremely low, because by landfi lling and incineration the problem cannot be solved in the long run. According to publications the most investigated way of the degradation is the thermal and/or catalytic cracking in batch reactor.
The description of the cracking in batch and continuous reactor by the same kinetic model is also problematic because of the difference of reactors. The main problem is the exact determination of the real temperature and residence (or reaction) time.
In this paper the cracking behaviour and the effects of cracking parameters (e.g. residence time, temperature) on the product properties of different plastic wastes were investigated. Different conventional products of the hydrocarbon industry e.g. naphtha, middle distillates and heavy oils were produced from products of cracking which have advantageous properties for further fuel-like applications because of the one possibility is for their utilization is mixing in fuels as blending components. Also a kinetic model of the cracking of polymers was presented which might be used both in case of batch and continuous cracking.
2. Experimental
2.1. Raw materials
Commercial waste plastics from the packaging industry and the agriculture were used as raw materials. Table 1 shows the main properties of the applied polymers. Each polymer contained sulphur and nitrogen from additives (e.g. fi re or fume retardants and antioxidants).
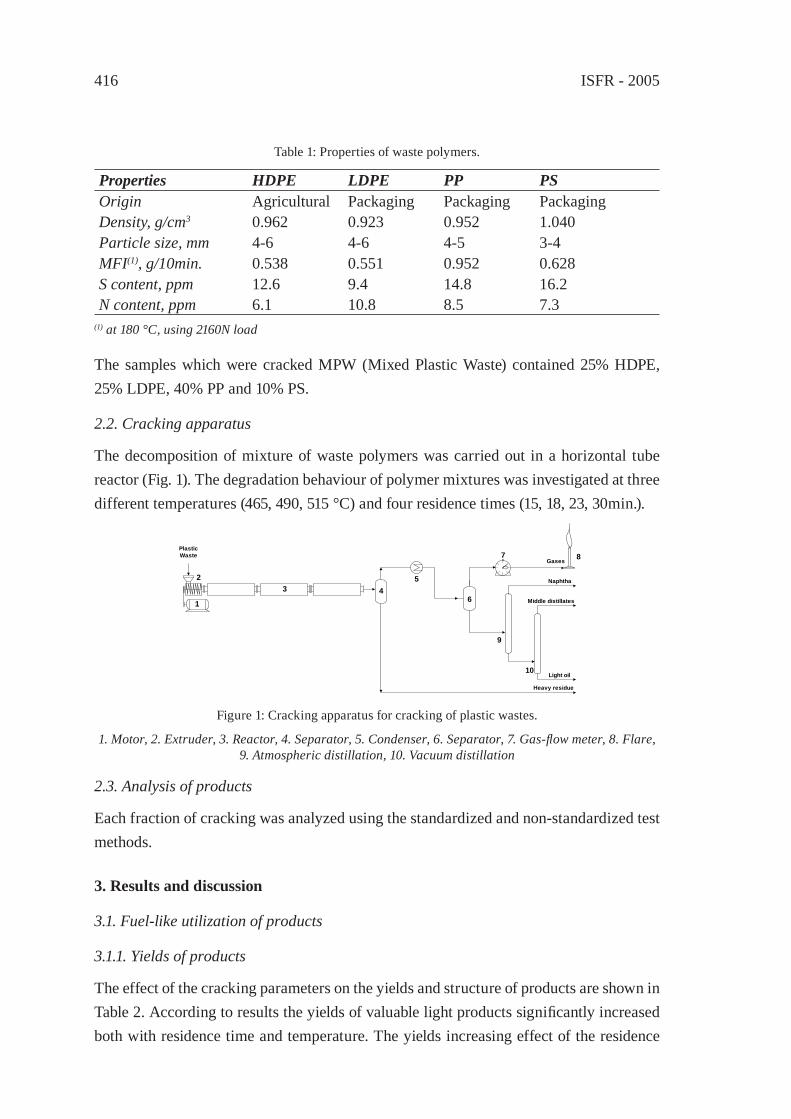
ISFR - 2005416
Table 1: Properties of waste polymers.
Properties HDPE LDPE PP PSOrigin Agricultural Packaging Packaging PackagingDensity, g/cm3 0.962 0.923 0.952 1.040Particle size, mm 4-6 4-6 4-5 3-4MFI(1), g/10min. 0.538 0.551 0.952 0.628S content, ppm 12.6 9.4 14.8 16.2N content, ppm 6.1 10.8 8.5 7.3
(1) at 180 °C, using 2160N load
The samples which were cracked MPW (Mixed Plastic Waste) contained 25% HDPE, 25% LDPE, 40% PP and 10% PS.
2.2. Cracking apparatus
The decomposition of mixture of waste polymers was carried out in a horizontal tube reactor (Fig. 1). The degradation behaviour of polymer mixtures was investigated at three different temperatures (465, 490, 515 °C) and four residence times (15, 18, 23, 30min.).
PlasticWaste
Gases999
8
3 4
7
9
10Light oil
1
2
6
5 Naphtha
Middle distillates
Heavy residue
Figure 1: Cracking apparatus for cracking of plastic wastes.
1. Motor, 2. Extruder, 3. Reactor, 4. Separator, 5. Condenser, 6. Separator, 7. Gas-fl ow meter, 8. Flare, 9. Atmospheric distillation, 10. Vacuum distillation
2.3. Analysis of products
Each fraction of cracking was analyzed using the standardized and non-standardized test methods.
3. Results and discussion
3.1. Fuel-like utilization of products
3.1.1. Yields of products
The effect of the cracking parameters on the yields and structure of products are shown in Table 2. According to results the yields of valuable light products signifi cantly increased both with residence time and temperature. The yields increasing effect of the residence
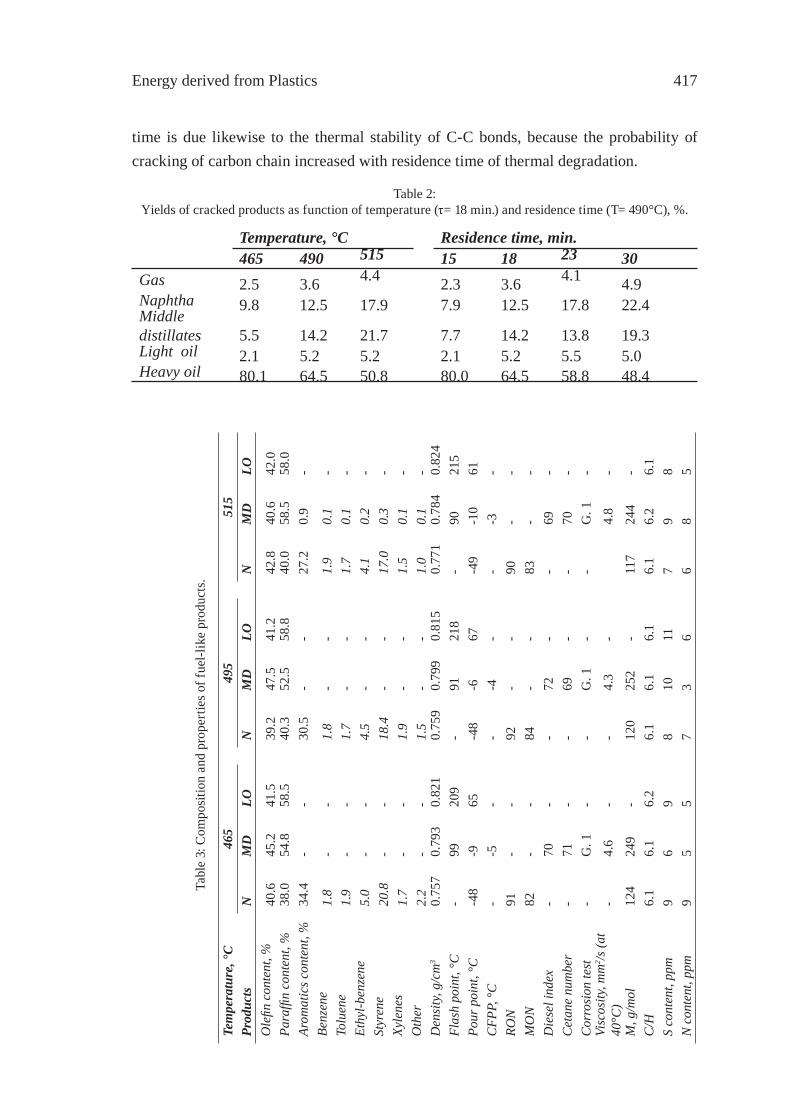
Energy derived from Plastics 417
time is due likewise to the thermal stability of C-C bonds, because the probability of cracking of carbon chain increased with residence time of thermal degradation.
Table 2:Yields of cracked products as function of temperature (τ= 18 min.) and residence time (T= 490°C), %.
Temperature, °C Residence time, min.465 490 515 15 18 23 30
Gas 2.5 3.6 4.4 2.3 3.6 4.1 4.9Naphtha 9.8 12.5 17.9 7.9 12.5 17.8 22.4Middle distillates 5.5 14.2 21.7 7.7 14.2 13.8 19.3Light oil 2.1 5.2 5.2 2.1 5.2 5.5 5.0Heavy oil 80.1 64.5 50.8 80.0 64.5 58.8 48.4
Tabl
e 3:
Com
posit
ion
and
prop
ertie
s of f
uel-l
ike
prod
ucts
.
Tem
pera
ture
, °C
465
495
515
Prod
ucts
NM
DLO
NM
DLO
NM
DLO
Ole
fi n c
onte
nt, %
40.6
45.2
41.5
39.2
47.5
41.2
42.8
40.6
42.0
Para
ffi n
cont
ent,
%38
.054
.858
.540
.352
.558
.840
.058
.558
.0Ar
omat
ics c
onte
nt, %
34.4
--
30.5
--
27.2
0.9
-Be
nzen
e1.
8-
-1.
8-
-1.
90.
1-
Tolu
ene
1.9
--
1.7
--
1.7
0.1
-Et
hyl-b
enze
ne5.
0-
-4.
5-
-4.
10.
2-
Styr
ene
20.8
--
18.4
--
17.0
0.3
-Xy
lene
s1.
7-
-1.
9-
-1.
50.
1-
Oth
er2.
2-
-
1.5
--
1.
00.
1-
Den
sity
, g/c
m3
0.75
70.
793
0.82
10.
759
0.79
90.
815
0.77
10.
784
0.82
4Fl
ash
poin
t, °C
-99
209
-91
218
-90
215
Pour
poi
nt, °
C-4
8-9
65-4
8-6
67-4
9-1
061
CFP
P, °C
--5
--
-4-
--3
-RO
N91
--
92-
-90
--
MO
N82
--
84-
-83
--
Die
sel i
ndex
-70
--
72-
-69
-C
etan
e nu
mbe
r-
71-
-69
--
70-
Cor
rosi
on te
st-
G. 1
--
G. 1
--
G. 1
-Vi
scos
ity, m
m2 /s
(at
40°C
)-
4.6
--
4.3
-4.
8-
M, g
/mol
124
249
-12
025
2-
117
244
-C
/H6.
16.
16.
26.
16.
16.
16.
16.
26.
1S
cont
ent,
ppm
96
98
1011
79
8N
con
tent
, ppm
95
57
36
68
5
ISFR - 2005418
3.1.2. Gases
The composition of gases formed in cracking reactions of polymer blends contained most-ly C2, C3 and C4 hydrocarbons and the cracking parameters did not affect signifi cantly the composition of gaseous products. The calculated heating values of gases were 46-47 MJ/kg, which were quite high to use of gases in energy generation.
3.1.3. Liquids
Properties of products obtained by cracking of MPW are shown in Table 3. By the separation of products obtained by cracking of waste plastics different fuel like fractions were separated: naphtha (N), middle distillates (MD) and light oil fractions (LO).
3.1.3.1. Naphtha-like fraction
The naphtha-like fraction contained C5-C16 hydrocarbons, and this fraction had of about one third aromatic content due to cracking of polystyrene. It is well known that cracking of polystyrene results monomer and ethyl-benzene in the highest probability, whereas formation of benzene, toluene, xylenes and other aromatics can be observed at a smaller extent. Due to the polypropylene content of MPWs samples the triple sequence could be detected within of aliphatic compounds. Fractions had an olefi n content of 40-50% and high octane numbers. Whereas owing to the aromatics the sensitivities of naphtha like fractions were also high.
3.1.3.2. Middle distillates
Middle distillates contained mostly aliphatic hydrocarbons and the concentration of aro-matics was not more than 1% because aromatics with lower boiling point accumulated in the naphtha-like fraction. Aliphatic hydrocarbons showed the triple sequence in middle distillates too. These are favourable properties for further fuel-like application. Both the cetane numbers and diesel indexes of products were high enough, while the CFPP was rather low.
3.1.3.3. Light oil
The light oil fractions contained C22-C30 hydrocarbons and these had mainly olefi n and paraffi n content without aromatics and naphthenes and their hydrocarbon composition did not change signifi cantly in function of concentration of heteroatom containing polymers.
3.1.3.4. Heavy oil
These fractions were wax-like and their melting points were about 100 °C and they con-tained mainly aliphatic paraffi ns, olefi ns and aromatics (bp.>380 °C). Aromatics were present as oligomers of styrene, which could not be distilled from the melted polymers.

Energy derived from Plastics 419
The molecular weight of residue was 1500-2000g/mol depending on the parameters of cracking. Because of the cracking and separation of volatile products from the degraded polymer melt the highest densities were observed in case of heavy residues. Their calorifi c values were about 41 MJ/kg, which is high enough for energy generation.
3.2. Reaction kinetics of cracking
The modelling of the batch and continuous cracking by the same kinetic approach is problematical, because of the diffi culties of the determination of the real temperature and residence or reaction time of cracking. Temperature is detected inside the molten polymer in case of batch cracking, while generally outside the reactor wall in case of continuous cracking. Therefore the real temperature of molten polymer is only predicable. It is a great diffi culty, because the relationship between reaction rate (and hereby yield of volatile products) and temperature is exponential according to the Arrhenius equation. The other problem is the defi ning of the reaction or residence time. For the determination of the temperature surface the solution of the heat transfer equations as function of the changing time is needed. There are approximate solutions e.g. the method of Binder and Schmidt.
Municipal plastic waste samples were cracked both in batch [3-5] and continuous reactor. The data obtained by the batch cracking was used for the determination of kinetic parameters of cracking of MPW. The kinetic model which was used was the fi rst order approach, because earlier experimental work came to the conclusion that the fi rst order kinetic well described the degradation of polyolefi ns [5-9]. The kinetic parameters (activation energy, reaction rate constant and preexponential factor) obtained by the batch cracking was used to determine the yields of product of continuous cracking. Then results of model and experimental were compared. The yields of products are shown in Table 4.
Table 4: The yield of products, %.
Reaction time, min. 420°C 430°C 450°C
0 0,0 0,0 0,010 9,4 14,5 45,120 19,2 28,7 74,830 32,5 46,1 81,940 41,9 67,2 84,250 55,7 85,7 89,060 70,4 91,5 92,0
The value of the reaction rate constants calculated from the results of batch cracking at 420, 430 and 450 °C were 0,0089, 0,0126 and 0,0384, respectively. The Arrhenius plot is shown in Fig. 2. According to Fig. 2 the activation energy and preexponential factor of cracking of MPW was 207kJ/mol and 31,198.
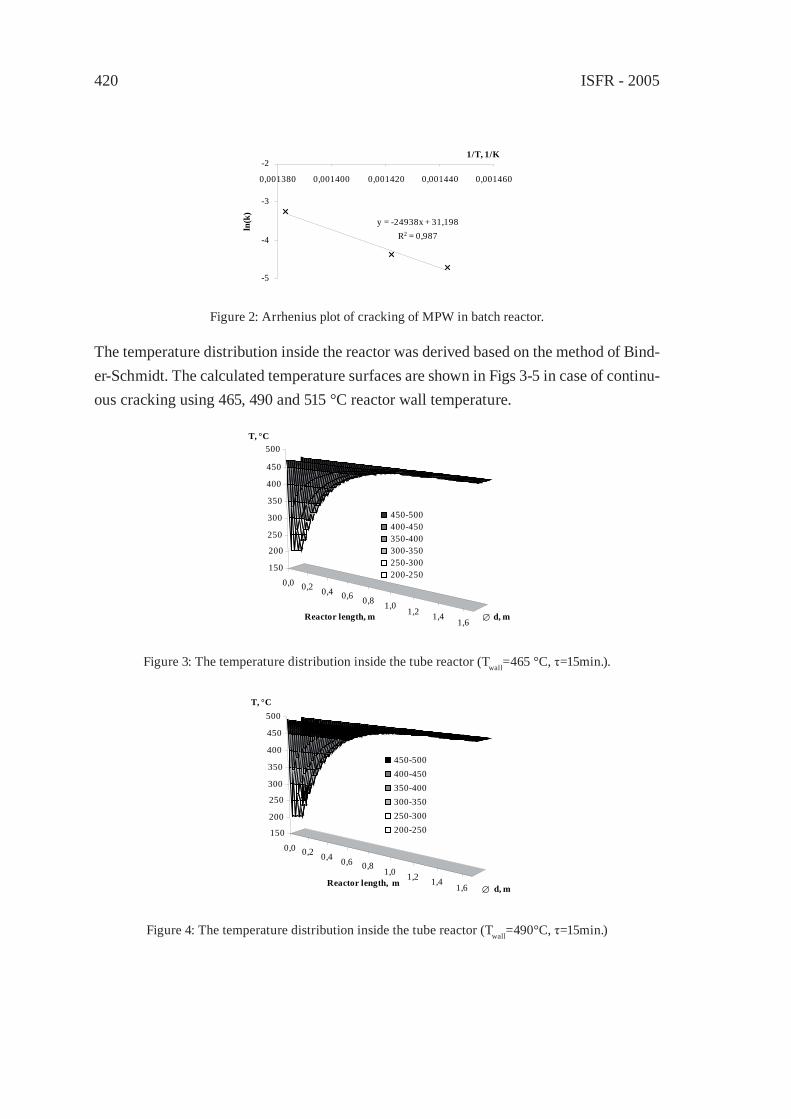
ISFR - 2005420
y = -24938x + 31,198R2 = 0,987
-5
-4
-3
-2
0,001380 0,001400 0,001420 0,001440 0,001460
1/T, 1/K
ln(k
)
Figure 2: Arrhenius plot of cracking of MPW in batch reactor.
The temperature distribution inside the reactor was derived based on the method of Bind-er-Schmidt. The calculated temperature surfaces are shown in Figs 3-5 in case of continu-ous cracking using 465, 490 and 515 °C reactor wall temperature.
0,0 0,2 0,4 0,6 0,8 1,01,2 1,4
1,6
150
200
250
300
350
400
450
500
450-500400-450350-400300-350250-300200-250
∅ d, mReactor length, m
T, °C
Figure 3: The temperature distribution inside the tube reactor (Twall=465 °C, τ=15min.).
0,0 0,2 0,4 0,6 0,81,0 1,2 1,4
1,6
150
200
250
300
350
400
450
500
450-500400-450350-400300-350250-300200-250
∅ d, mReactor length, m
T, °C
Figure 4: The temperature distribution inside the tube reactor (Twall=490°C, τ=15min.)
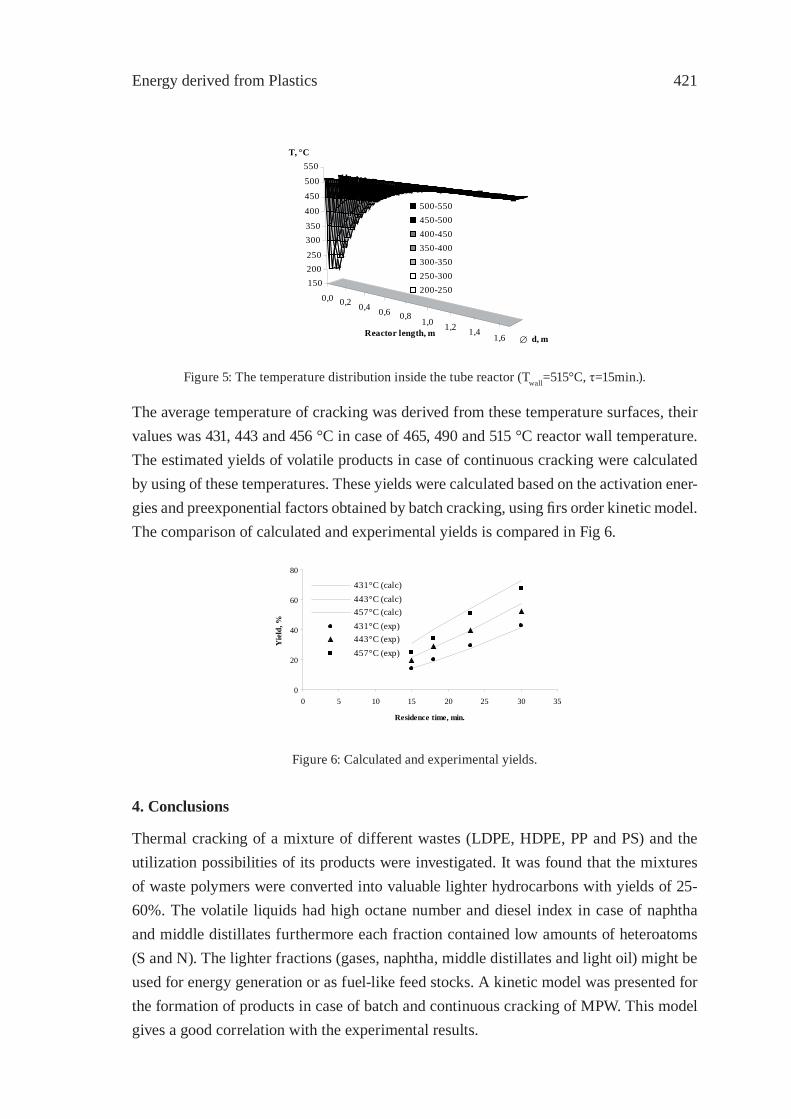
Energy derived from Plastics 421
0,0 0,2 0,4 0,6 0,81,0 1,2 1,4
1,6
150200250
300350
400
450
500
550
500-550450-500400-450350-400300-350250-300200-250
∅ d, mReactor length, m
T, °C
Figure 5: The temperature distribution inside the tube reactor (Twall=515°C, τ=15min.).
The average temperature of cracking was derived from these temperature surfaces, their values was 431, 443 and 456 °C in case of 465, 490 and 515 °C reactor wall temperature. The estimated yields of volatile products in case of continuous cracking were calculated by using of these temperatures. These yields were calculated based on the activation ener-gies and preexponential factors obtained by batch cracking, using fi rs order kinetic model. The comparison of calculated and experimental yields is compared in Fig 6.
0
20
40
60
80
0 5 10 15 20 25 30 35
Residence time, min.
Yie
ld, %
431°C (calc)443°C (calc)457°C (calc)431°C (exp)443°C (exp)457°C (exp)
Figure 6: Calculated and experimental yields.
4. Conclusions
Thermal cracking of a mixture of different wastes (LDPE, HDPE, PP and PS) and the utilization possibilities of its products were investigated. It was found that the mixtures of waste polymers were converted into valuable lighter hydrocarbons with yields of 25-60%. The volatile liquids had high octane number and diesel index in case of naphtha and middle distillates furthermore each fraction contained low amounts of heteroatoms (S and N). The lighter fractions (gases, naphtha, middle distillates and light oil) might be used for energy generation or as fuel-like feed stocks. A kinetic model was presented for the formation of products in case of batch and continuous cracking of MPW. This model gives a good correlation with the experimental results.
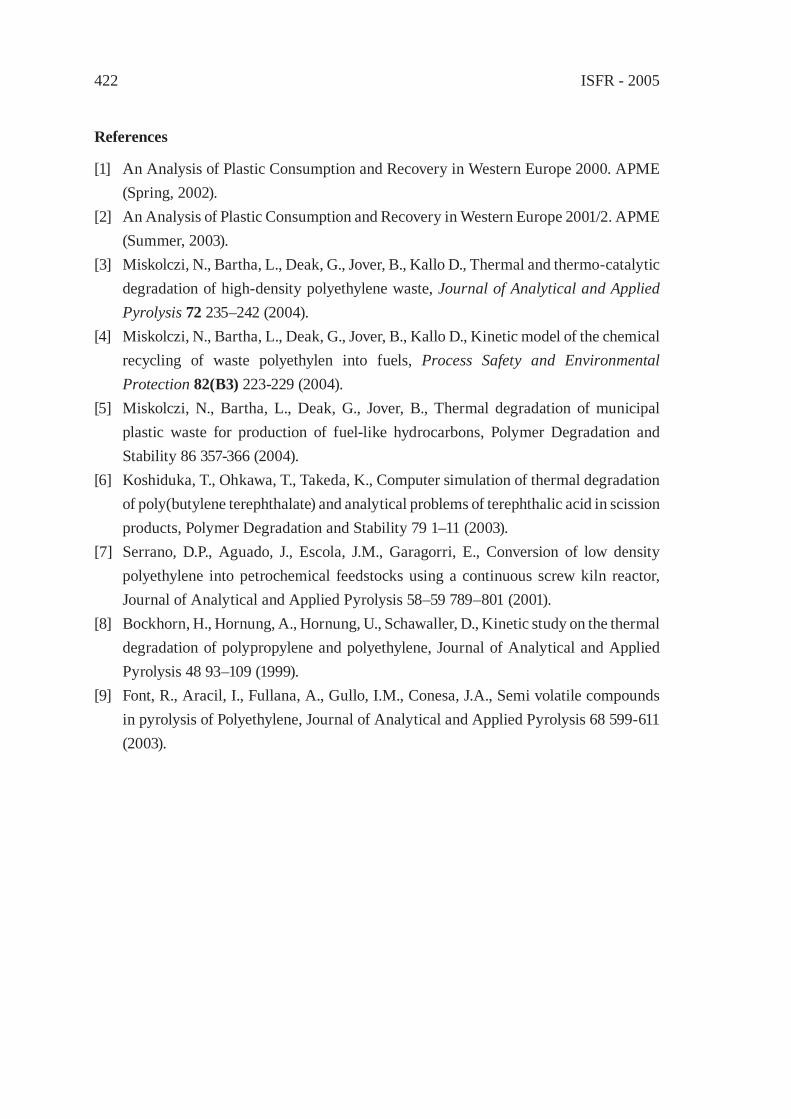
ISFR - 2005422
References
[1] An Analysis of Plastic Consumption and Recovery in Western Europe 2000. APME (Spring, 2002).
[2] An Analysis of Plastic Consumption and Recovery in Western Europe 2001/2. APME (Summer, 2003).
[3] Miskolczi, N., Bartha, L., Deak, G., Jover, B., Kallo D., Thermal and thermo-catalytic degradation of high-density polyethylene waste, Journal of Analytical and Applied Pyrolysis 72 235–242 (2004).
[4] Miskolczi, N., Bartha, L., Deak, G., Jover, B., Kallo D., Kinetic model of the chemical recycling of waste polyethylen into fuels, Process Safety and Environmental Protection 82(B3) 223-229 (2004).
[5] Miskolczi, N., Bartha, L., Deak, G., Jover, B., Thermal degradation of municipal plastic waste for production of fuel-like hydrocarbons, Polymer Degradation and Stability 86 357-366 (2004).
[6] Koshiduka, T., Ohkawa, T., Takeda, K., Computer simulation of thermal degradation of poly(butylene terephthalate) and analytical problems of terephthalic acid in scission products, Polymer Degradation and Stability 79 1–11 (2003).
[7] Serrano, D.P., Aguado, J., Escola, J.M., Garagorri, E., Conversion of low density polyethylene into petrochemical feedstocks using a continuous screw kiln reactor, Journal of Analytical and Applied Pyrolysis 58–59 789–801 (2001).
[8] Bockhorn, H., Hornung, A., Hornung, U., Schawaller, D., Kinetic study on the thermal degradation of polypropylene and polyethylene, Journal of Analytical and Applied Pyrolysis 48 93–109 (1999).
[9] Font, R., Aracil, I., Fullana, A., Gullo, I.M., Conesa, J.A., Semi volatile compounds in pyrolysis of Polyethylene, Journal of Analytical and Applied Pyrolysis 68 599-611 (2003).
Innovative techniques in mechanical recycling 423
CHALLENGES OF PVC RECYCLING IN JAPANT. Sakauchi
Vinyl Environmental Council, Tokyo, Japan, [email protected]
Abstract: In Japan, mechanical recycling of PVC is more advanced than that for other plastics. However, most PVC wastes have other materials mixed in them, therefore me-chanical recycling has its limits. Therefore, in cooperation with some Japanese com-panies, VEC (Vinyl Environmental Council) have studied various methods of treatment to deal with the numerous forms of PVC waste. We are taking on 3 challenges upon the treatment of PVC wastes; 1. recycling of chlorine, 2. effective use of mixed waste, and 3. recycling of heavy metal component within PVC. Here we will review individual cases.
1. Introduction
Commercial based mechanical recycling (MR) of PVC has been conducted in Japan for a few decades. Therefore, mechanical recycling of PVC is more advanced than those for other plastics within Japan. The mechanical recycling rate of PVC in 2003 was 23%, which was clearly higher compared to other general purpose plastics, for example, the rates are 11% for PE and 12% for PP. The most important condition for mechanical recy-cling is to have as little contamination (i.e. mixture of other materials) as possible in the waste stream. Since there is a wide range of applications and waste forms in PVC, the amount of waste PVC with appropriate purity is limited. We VEC have developed vari-ous chemical recycling technologies since the late 1990s as recycling methods that can accept various mixtures. As a result, a commercial method has started operation where PVC products are decomposed to yield hydrocarbons and hydrogen chloride which are to be re-used as raw materials.
Among the new challenges of chemical recycling in Japan, fi rst of all, is how to re-use the chlorine which comprises more than 60% of the PVC weight. The second point is how to effectively re-use wastes without having to remove other types of plastics, soil, metals, and inorganic matters from the waste stream. The third point is how to separate and col-lect lead stabilizers included in PVC compounds. VEC is in the process of demonstrating treatment of wastes which incorporates these three points and adopting existing processes from industries other than the chemical industry.
2. Recycling Facilities in Commercial Operation
JFE Steel started a recycling business to treat PVC rich PVC products which yields reduc-ing agents for blast furnaces. In a rotary kiln, PVC waste is thermally decomposed under approximately 350 °C in a nitrogen airfl ow. Hydrocarbons (char) that yields as a residue from the decomposition is used as reducing agents for iron ores, and the hydrogen chlo-
ISFR - 2005424
ride gas is collected as hydrochloric acid to be used as metal wash (to remove rust). Last year, approximately 3 thousand tons of PVC pipes, wall coverings and agricultural fi lms etc., were treated. The company is accumulating experience in treating various forms of PVC waste. There is diffi culty in applying this method to treat waste streams that contain more than 20% of other thermoplastic materials.
Based on the Container and Packaging Recycling Law, Kobe Steel is operating a recy-cling plant which recycles municipal plastic packaging wastes into reducing agents for blast furnaces. Previously, they had removed materials including PVC from the waste stream and had landfi lled this portion. Upon the government’s request to boost the effec-tiveness of the recycling, they started to decompose this separated portion by a vacuum twin screw extruder system, and utilized the char as reducing agents for blast furnaces since April 2004. In order to complete the process, they are currently developing a new and low costing hydrochloric acid collection and refi ning process. The characteristic of this twin screw extruder method is that plastic waste of any PVC content can be treated.
3. Effective Use of Chlorine
As for the effective use of chlorine, we are attempting two methods at an existing large scale industrial process using hydrogen chloride. Neither process have any problem hav-ing trace amounts of impurities in the collected hydrogen chloride yielded from decom-posing PVC.
The fi rst method is to use the yielded hydrogen chloride as chemicals for refi ning metals. At a metal refi ning process called the chlorinated volatilization method, the industrial hy-drochloric acid is substituted by the hydrogen chloride resulting from the decomposition of PVC. This is a two stage process in which the fi rst unit incinerates PVC under com-plete combustion, and lets the generated hydrogen chloride react with metals and metallic oxides to generate volatized metal chlorides. The second unit separates and collects the volatized metal chlorides. Fillers and inorganic substances that were included in the PVC wastes are collected as slag and used as raw materials for cement, etc.
The second method in order to effectively use chlorine is to use it in treating fl y ashes that are generated from waste incinerators. Such fl y ashes are trapped by bag fi lters or electrostatic precipitators. In order to neutralize sulfur oxides (SOx) and to prevent regen-eration of dioxins, amounts of base, usually lime, that far exceeds the equivalent needed for neutralization is added. As a result, the pH levels of the fl y ash are kept at 10-12 or higher. Under such strongly basic condition, elution of heavy metals concentrated within the fl y ash could become a problem upon after treatment; therefore acid chemicals are needed for neutralization. Here, the hydrochloric acid derived from hydrogen chloride which generated from the cracking of PVC can be used as an alternative to industrial

Innovative techniques in mechanical recycling 425
hydrochloric acid. Regarding this method, a high temperature melting process of the fl y ash is also considered. In that case, calcium carbonate which is added in the PVC does not yield calcium chloride; therefore it is possible that the chlorine component could be effec-tively converted to hydrogen chloride. In another project, use of plasticized PVC waste is tested for pre treatment of fl y ashes. Plasticized PVC waste and fl y ash is mixed in a high speed mixer. The fl y ash particles are strongly bound together by the plasticized PVC to yield granules. By this method, the volume of the fl y ash could be reduced signifi cantly, and minimize fl y-off. Also by feeding these granules into the furnace, both fl y ash and neutralizer could be provided.
4. Effective use of PVC mixed plastics waste
As for the effective use of PVC mixed plastics waste, we have made trials based on gasi-fi cation cracking processes. For waste streams with various substances mixed in it, it is economically unreasonable to separate them accurately into each material. It is more practical to utilize such mixed plastics as is.
The fi rst such process to be put into use is the pressurized two staged gasifi cation method (the Ebara-Ube process or in short, the EUP process). This was developed by Ube In-dustries Ltd. and Ebara Corporation under support from the Plastics Waste Management Institute. Under this method, plastics waste under the Container and Packaging Recycling Law is gasifi ed and cracked. The collected hydrogen is used as a raw material for am-monia synthesis, and the collected hydrogen chloride is absorbed in aqueous ammonia to produce ammonium chloride. Under lisence from Ube and Ebara, Showa Denko K.K. adopted the EUP cracking technology, where hydrogen is used as a raw material to pro-duce ammonia, and hydrogen chloride is used as industrial salt.
VEC has worked with Sumitomo Metal Industries, Ltd. for several years on the research of PVC waste treatment by smelting gasifi cation furnace for gaining refi ned gas. Here, CO, H2, and HCl is yielded from cracking of PVC waste. It was proven that from the mixed gas, more than 90% of the chlorine can be retrieved as hydrochloric acid. Today, the company has built 2 plants in Japan and has started treatment of ASR (Automotive Shredder Residue) which contains 5 to 8% of PVC.
Last year, in collaboration with Dowa Mining Co., VEC started testing treatment of mixed plastic waste from the construction sector which includes 5 to 20% of PVC at the company’s metal recycling process. As a result, as with the ASR previously treated in the same process, it was demonstrated that metals could be recycled also from mixed plastic waste originating from the construction sector. Dowa Mining Co. is a non ferrous metal-lurgy company, and their business regards wastes as a source of metals. In their process, mixed plastics waste is fi rst fed into a fl uidized bed furnace to be incinerated and gasi-

ISFR - 2005426
fi ed, then fed into a secondary incinerator for complete combustion. The combustion heat is recovered at a high effi ciency boiler. The sand used in the fl uidized bed and the ashes trapped in the fl ue gas treatment, both of which contain metals, could be fed to the metal refi ning process in order to collect metals such as copper, lead and zinc. VEC expects this method to have potential in treating mass quantities of mixed plastic wastes with low PVC content.
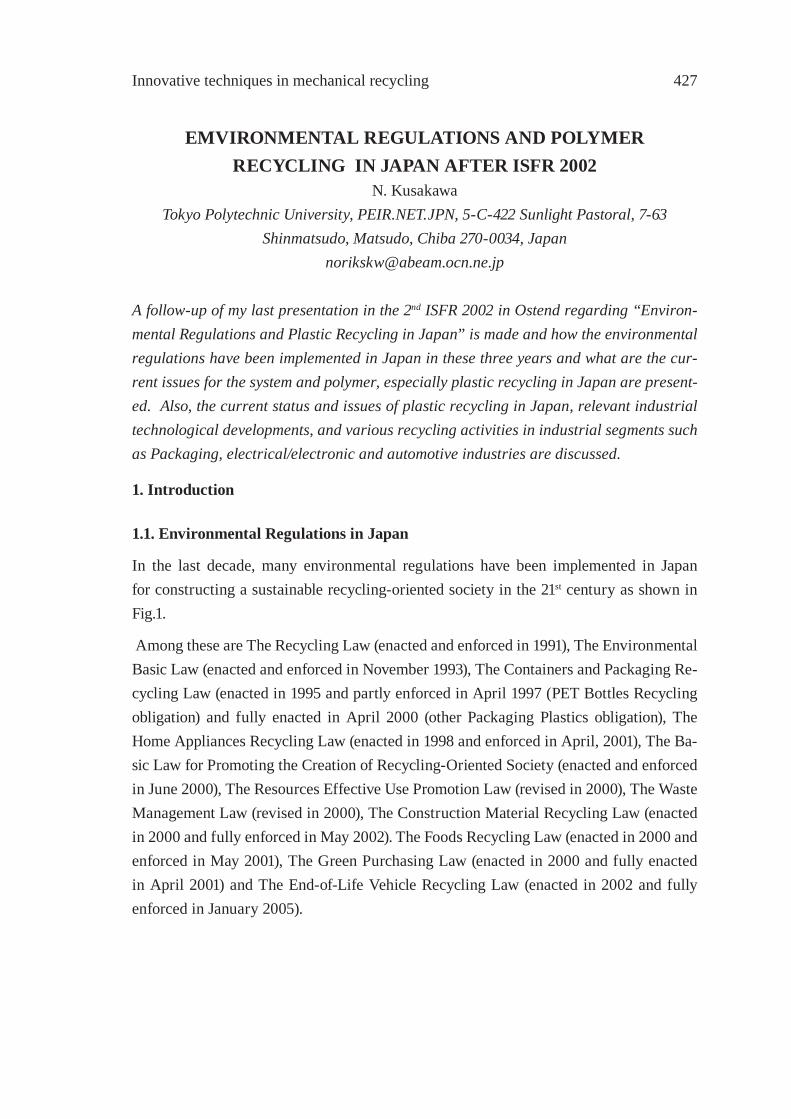
Innovative techniques in mechanical recycling 427
EMVIRONMENTAL REGULATIONS AND POLYMER RECYCLING IN JAPAN AFTER ISFR 2002
N. KusakawaTokyo Polytechnic University, PEIR.NET.JPN, 5-C-422 Sunlight Pastoral, 7-63
Shinmatsudo, Matsudo, Chiba 270-0034, [email protected]
A follow-up of my last presentation in the 2nd ISFR 2002 in Ostend regarding “Environ-mental Regulations and Plastic Recycling in Japan” is made and how the environmental regulations have been implemented in Japan in these three years and what are the cur-rent issues for the system and polymer, especially plastic recycling in Japan are present-ed. Also, the current status and issues of plastic recycling in Japan, relevant industrial technological developments, and various recycling activities in industrial segments such as Packaging, electrical/electronic and automotive industries are discussed.
1. Introduction
1.1. Environmental Regulations in Japan
In the last decade, many environmental regulations have been implemented in Japan for constructing a sustainable recycling-oriented society in the 21st century as shown in Fig.1.
Among these are The Recycling Law (enacted and enforced in 1991), The Environmental Basic Law (enacted and enforced in November 1993), The Containers and Packaging Re-cycling Law (enacted in 1995 and partly enforced in April 1997 (PET Bottles Recycling obligation) and fully enacted in April 2000 (other Packaging Plastics obligation), The Home Appliances Recycling Law (enacted in 1998 and enforced in April, 2001), The Ba-sic Law for Promoting the Creation of Recycling-Oriented Society (enacted and enforced in June 2000), The Resources Effective Use Promotion Law (revised in 2000), The Waste Management Law (revised in 2000), The Construction Material Recycling Law (enacted in 2000 and fully enforced in May 2002). The Foods Recycling Law (enacted in 2000 and enforced in May 2001), The Green Purchasing Law (enacted in 2000 and fully enacted in April 2001) and The End-of-Life Vehicle Recycling Law (enacted in 2002 and fully enforced in January 2005).
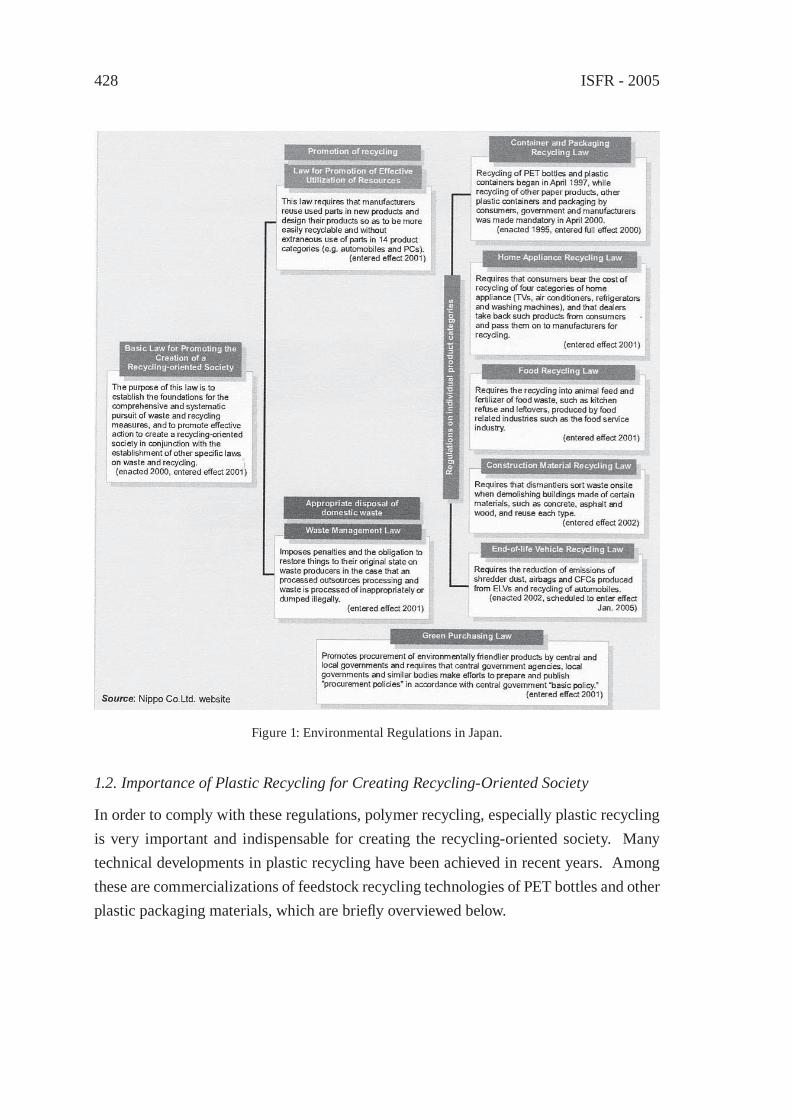
ISFR - 2005428
Figure 1: Environmental Regulations in Japan.
1.2. Importance of Plastic Recycling for Creating Recycling-Oriented Society
In order to comply with these regulations, polymer recycling, especially plastic recycling is very important and indispensable for creating the recycling-oriented society. Many technical developments in plastic recycling have been achieved in recent years. Among these are commercializations of feedstock recycling technologies of PET bottles and other plastic packaging materials, which are briefl y overviewed below.
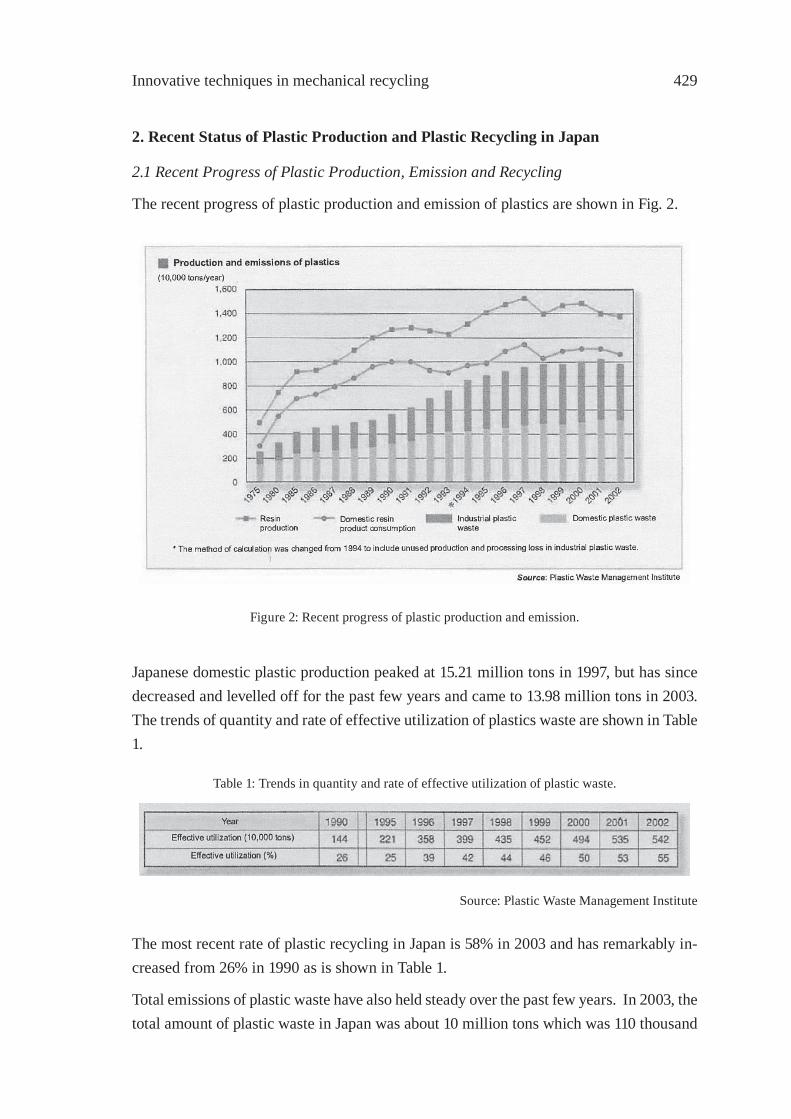
Innovative techniques in mechanical recycling 429
2. Recent Status of Plastic Production and Plastic Recycling in Japan
2.1 Recent Progress of Plastic Production, Emission and Recycling
The recent progress of plastic production and emission of plastics are shown in Fig. 2.
Figure 2: Recent progress of plastic production and emission.
Japanese domestic plastic production peaked at 15.21 million tons in 1997, but has since decreased and levelled off for the past few years and came to 13.98 million tons in 2003. The trends of quantity and rate of effective utilization of plastics waste are shown in Table 1.
Table 1: Trends in quantity and rate of effective utilization of plastic waste.
Source: Plastic Waste Management Institute
The most recent rate of plastic recycling in Japan is 58% in 2003 and has remarkably in-creased from 26% in 1990 as is shown in Table 1.
Total emissions of plastic waste have also held steady over the past few years. In 2003, the total amount of plastic waste in Japan was about 10 million tons which was 110 thousand
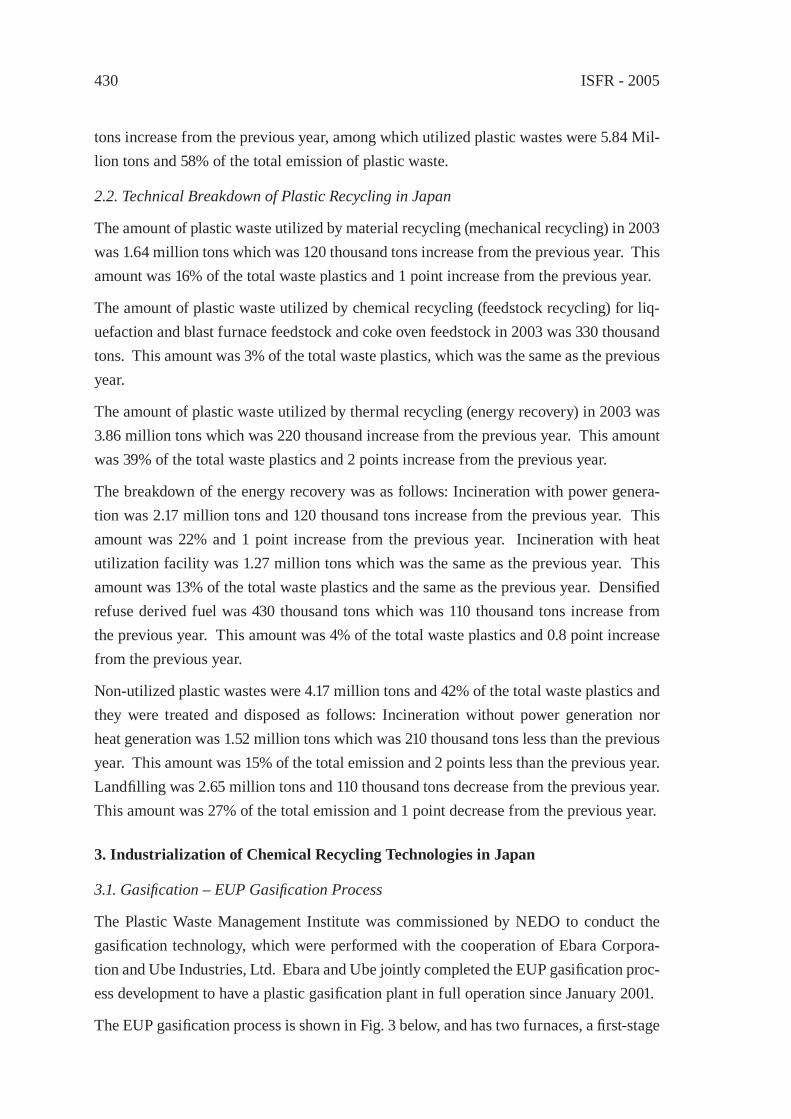
ISFR - 2005430
tons increase from the previous year, among which utilized plastic wastes were 5.84 Mil-lion tons and 58% of the total emission of plastic waste.
2.2. Technical Breakdown of Plastic Recycling in Japan
The amount of plastic waste utilized by material recycling (mechanical recycling) in 2003 was 1.64 million tons which was 120 thousand tons increase from the previous year. This amount was 16% of the total waste plastics and 1 point increase from the previous year.
The amount of plastic waste utilized by chemical recycling (feedstock recycling) for liq-uefaction and blast furnace feedstock and coke oven feedstock in 2003 was 330 thousand tons. This amount was 3% of the total waste plastics, which was the same as the previous year.
The amount of plastic waste utilized by thermal recycling (energy recovery) in 2003 was 3.86 million tons which was 220 thousand increase from the previous year. This amount was 39% of the total waste plastics and 2 points increase from the previous year.
The breakdown of the energy recovery was as follows: Incineration with power genera-tion was 2.17 million tons and 120 thousand tons increase from the previous year. This amount was 22% and 1 point increase from the previous year. Incineration with heat utilization facility was 1.27 million tons which was the same as the previous year. This amount was 13% of the total waste plastics and the same as the previous year. Densifi ed refuse derived fuel was 430 thousand tons which was 110 thousand tons increase from the previous year. This amount was 4% of the total waste plastics and 0.8 point increase from the previous year.
Non-utilized plastic wastes were 4.17 million tons and 42% of the total waste plastics and they were treated and disposed as follows: Incineration without power generation nor heat generation was 1.52 million tons which was 210 thousand tons less than the previous year. This amount was 15% of the total emission and 2 points less than the previous year. Landfi lling was 2.65 million tons and 110 thousand tons decrease from the previous year. This amount was 27% of the total emission and 1 point decrease from the previous year.
3. Industrialization of Chemical Recycling Technologies in Japan
3.1. Gasifi cation – EUP Gasifi cation Process
The Plastic Waste Management Institute was commissioned by NEDO to conduct the gasifi cation technology, which were performed with the cooperation of Ebara Corpora-tion and Ube Industries, Ltd. Ebara and Ube jointly completed the EUP gasifi cation proc-ess development to have a plastic gasifi cation plant in full operation since January 2001.
The EUP gasifi cation process is shown in Fig. 3 below, and has two furnaces, a fi rst-stage
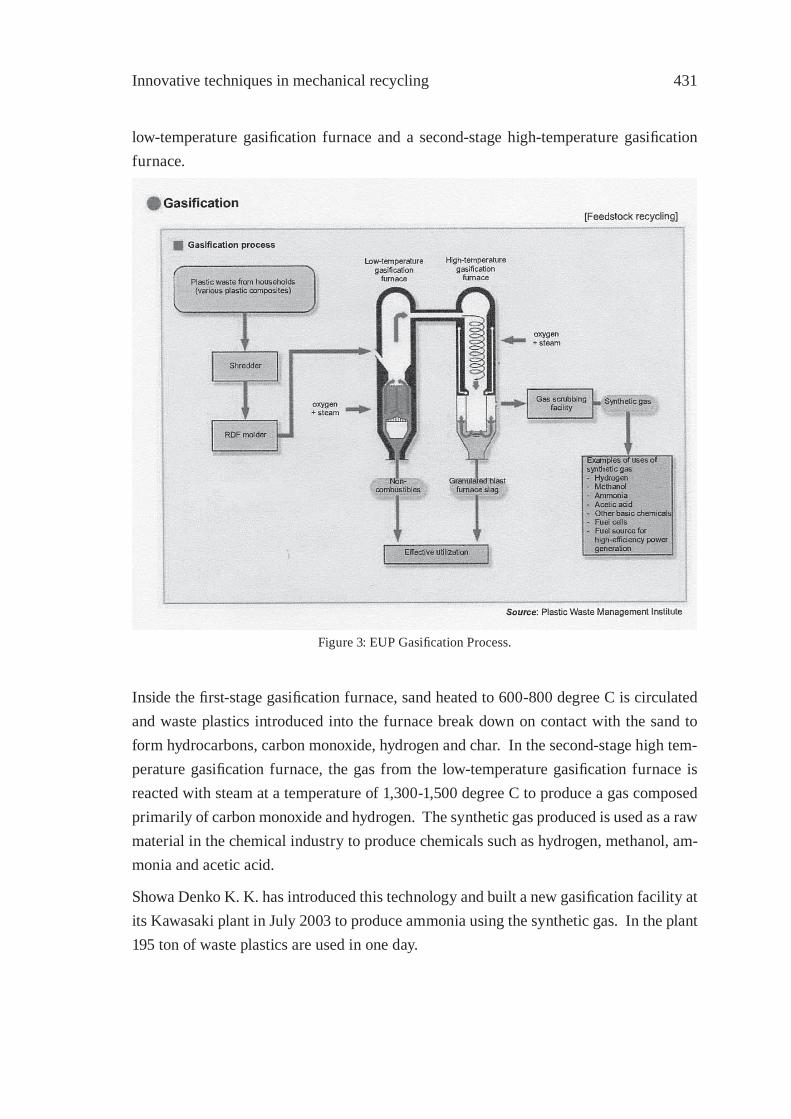
Innovative techniques in mechanical recycling 431
low-temperature gasifi cation furnace and a second-stage high-temperature gasifi cation furnace.
Figure 3: EUP Gasifi cation Process.
Inside the fi rst-stage gasifi cation furnace, sand heated to 600-800 degree C is circulated and waste plastics introduced into the furnace break down on contact with the sand to form hydrocarbons, carbon monoxide, hydrogen and char. In the second-stage high tem-perature gasifi cation furnace, the gas from the low-temperature gasifi cation furnace is reacted with steam at a temperature of 1,300-1,500 degree C to produce a gas composed primarily of carbon monoxide and hydrogen. The synthetic gas produced is used as a raw material in the chemical industry to produce chemicals such as hydrogen, methanol, am-monia and acetic acid.
Showa Denko K. K. has introduced this technology and built a new gasifi cation facility at its Kawasaki plant in July 2003 to produce ammonia using the synthetic gas. In the plant 195 ton of waste plastics are used in one day.
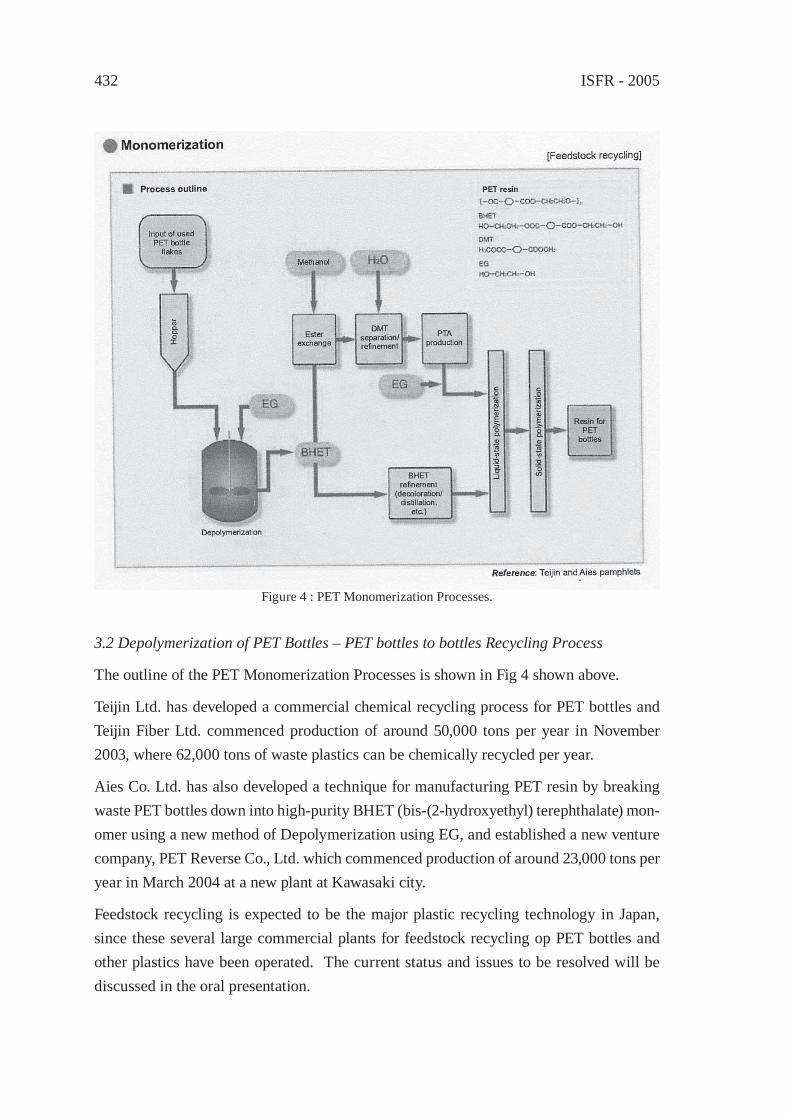
ISFR - 2005432
Figure 4 : PET Monomerization Processes.
3.2 Depolymerization of PET Bottles – PET bottles to bottles Recycling Process
The outline of the PET Monomerization Processes is shown in Fig 4 shown above.
Teijin Ltd. has developed a commercial chemical recycling process for PET bottles and Teijin Fiber Ltd. commenced production of around 50,000 tons per year in November 2003, where 62,000 tons of waste plastics can be chemically recycled per year.
Aies Co. Ltd. has also developed a technique for manufacturing PET resin by breaking waste PET bottles down into high-purity BHET (bis-(2-hydroxyethyl) terephthalate) mon-omer using a new method of Depolymerization using EG, and established a new venture company, PET Reverse Co., Ltd. which commenced production of around 23,000 tons per year in March 2004 at a new plant at Kawasaki city.
Feedstock recycling is expected to be the major plastic recycling technology in Japan, since these several large commercial plants for feedstock recycling op PET bottles and other plastics have been operated. The current status and issues to be resolved will be discussed in the oral presentation.

Innovative techniques in mechanical recycling 433
4. Current Status and Issues of Plastic Recycling in Main Industrial Segments
Current status and issues of plastic recycling in the industrial segments of Packaging In-dustry, Electrical/Electronic Industry and Automotive Industry will be overviewed.
4.1. Packaging Industry
According to the Packaging Recycling Law enacted in 1995, PET bottles’ recycling was enforced in April 1997 and other Packaging Plastic recycling was enforced in April 2000 in Japan. Thanks to the regulation, the recycling rate of the PET bottles has reached 61% in 2003 and 402 thousand tons of other packaging plastic materials have been collected and 385 thousand tons were recycled in Japan.
4.2. Electrical/Electronic Industry
The Home Appliances Recycling Law enacted in 1998 and enforced in April, 2001 obli-gates the recycling of home appliances (currently television sets, refrigerators, washing machines and air conditioners) and imposes the following duties on manufactures, im-porters, retailers, municipalities and consumers.
Manufacturers or importers are required to take back, if requested, products that they manufactured or imported after use and recycle them. Retailers must take back, if request-ed, products covered by the law and pass the products to the manufacturer or importer. Municipalities must drop-off collected products covered by the law to the manufacturer or importer or recycle such products themselves. Consumers must take waste products back to the retailer and pay a charge for collection, transportation and recycling.
Although plastic materials are currently not obligated to be recycled in this law, they are considered to be the target material for recycling in the next revision of the law expected in around 2008. So manufactures etc. are currently recycling plastic materials from the waste home appliances.
4.3. Automotive Industry
The Law on Recycling of End-of-Life Vehicles (ELV Recycling Law) was enacted in 2002 and fully enforced in January 2005. Accordingly, from February this year, owners of a motor vehicle must pay the recycling fee before the vehicle registration or inspection. The amount of the recycling fee varies from a vehicle to vehicle according to its manufacturer or model and ranges from Yen 7,000-18,000 in small to medium-sized cars.
The law is based on the delegation of tasks among businesses that have been responsible for the automotive recycling infrastructure to date. It prescribes that measures must be taken to reduce the amount of waste from end-of-life vehicles being sent to landfi lls, and

ISFR - 2005434
to help prevent illegal dumping, as well as ways to deal with ASR (which has not been recycled in the past system), CFCs and air bags, etc.
References
[1] Kusakawa, N. The 2nd International Symposium on Feedstock Recycling of Plastics & Other Innovative Recycling Techniques (ISFR 2002), Ostend, Belgium, September 8-12, Introductory lecture A80, (2002).
[2] Kusakawa, N., IUPAC Polymer Conference (IUPAC-PC2002) PREPRINTS, Kyoto, Japan, December 2-5, 2002, p. 623 (2002).
[3] Kusakawa, N., The Proceedings of 12th OCU International Symposium Material and Civilization, Osaka City University, 27-29 October, 2004, Osaka, Japan, pp. 111-117 (2002).
Innovative techniques in mechanical recycling 435
RECYCLING OF WASTE FROM ELECTRONIC AND ELECTRICAL EQUIPMENT IN THE NETHERLANDS
P.P.A.J. van Schijndel1* and J.M.N. van Kasteren1
1Eindhoven University of Technology, Polymer Technology Department, PO Box 513, 5600 MB Eindhoven, the Netherlands
Abstract: An innovative research program in the Netherlands has shown that it is techni-cal and economical feasible to collect and convert waste from electrical and electronic equipment, WEEE, into sound products for reuse. Redesign of equipment and improved waste treatment can lower the environmental impact in the whole lifecycle of these prod-ucts. Mechanical testing and fi eld tests have shown that the plastic fraction from WEEE treatment can be purifi ed into its different plastic fractions for reuse in a technically and economically feasible way. Environmental studies have shown that dedicated disman-tling, shredding and separation give the largest environmental improvements for larger equipment, e.g. equipment with a cathode ray tube, is treated in such a way. From an environmental point of separate treatment of small equipment like mobile phones give better results compared to treatment of mixed equipment.
1. Introduction
The use of plastics in electronic and electrical equipment (E&E) is increasing rapidly, see Figure 1. Besides plastics, steel and glass these products also contain toxic compounds e.g. CFC’s, fl ame retardants and heavy metals like mercury, copper, cadmium and lead. These components will leak into the environment when E&E products discarded are not treated in the right way. For this reason the Dutch government set up rules regarding the collection of different types of E&E products. Collected products are being dismantled and shreddered in order to reclaim hazardous materials like CFC’s but also useful mate-rials like ferro and non-ferro metals. The plastic waste fraction was not seen as a useful stream for a long time and would therefore be incinerated or land fi lled.
2. Program on improving the environmental impact CE
For the last 5 years an innovative research program (IOP Heavy Metals) was carried out to improve the environmental impact of E&E waste in the Netherlands. The objective of this program was to develop an environmentally sound recycling process for plastics from consumer electronics, which cleans the plastics not only from unwanted additives but also upgrades their material performance [1]. The research was focused in several areas of importance, schematically shown in Figure 2, namely 1) Design of E&E equipment for better end-of-life performance, 2) Improvement of E&E waste collection, 3) Improvement
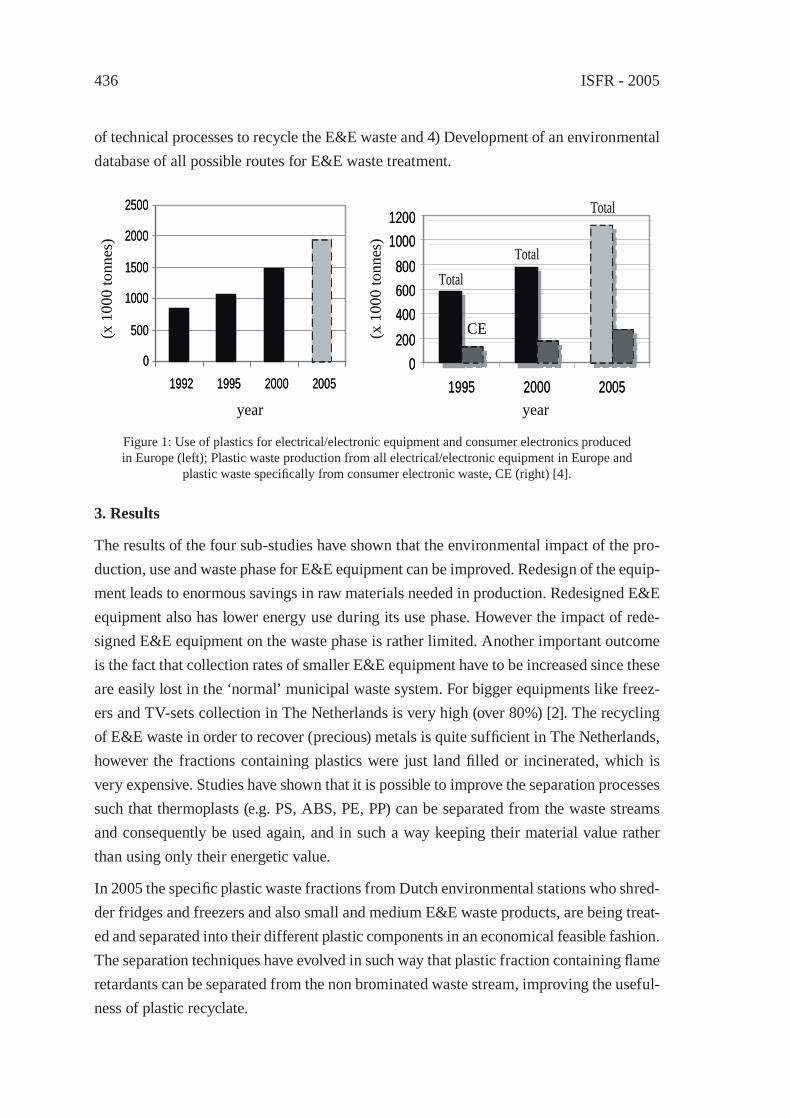
ISFR - 2005436
of technical processes to recycle the E&E waste and 4) Development of an environmental database of all possible routes for E&E waste treatment.
0
500
1000
1500
2000
2500
1992 1995 2000 2005
(x10
00 t
on
nes
)
0
500
1000
1500
2000
2500
1992 1995 2000 2005
(x10
00 t
on
nes
)
0200400600800
10001200
1995 2000 20050
200400600800
10001200
1995 2000 2005
(x 1
000
tonn
es)
(x 1
000
tonn
es)
Total
Total
year year
Total
CE
Figure 1: Use of plastics for electrical/electronic equipment and consumer electronics produced in Europe (left); Plastic waste production from all electrical/electronic equipment in Europe and
plastic waste specifi cally from consumer electronic waste, CE (right) [4].
3. Results
The results of the four sub-studies have shown that the environmental impact of the pro-duction, use and waste phase for E&E equipment can be improved. Redesign of the equip-ment leads to enormous savings in raw materials needed in production. Redesigned E&E equipment also has lower energy use during its use phase. However the impact of rede-signed E&E equipment on the waste phase is rather limited. Another important outcome is the fact that collection rates of smaller E&E equipment have to be increased since these are easily lost in the ‘normal’ municipal waste system. For bigger equipments like freez-ers and TV-sets collection in The Netherlands is very high (over 80%) [2]. The recycling of E&E waste in order to recover (precious) metals is quite suffi cient in The Netherlands, however the fractions containing plastics were just land fi lled or incinerated, which is very expensive. Studies have shown that it is possible to improve the separation processes such that thermoplasts (e.g. PS, ABS, PE, PP) can be separated from the waste streams and consequently be used again, and in such a way keeping their material value rather than using only their energetic value.
In 2005 the specifi c plastic waste fractions from Dutch environmental stations who shred-der fridges and freezers and also small and medium E&E waste products, are being treat-ed and separated into their different plastic components in an economical feasible fashion. The separation techniques have evolved in such way that plastic fraction containing fl ame retardants can be separated from the non brominated waste stream, improving the useful-ness of plastic recyclate.
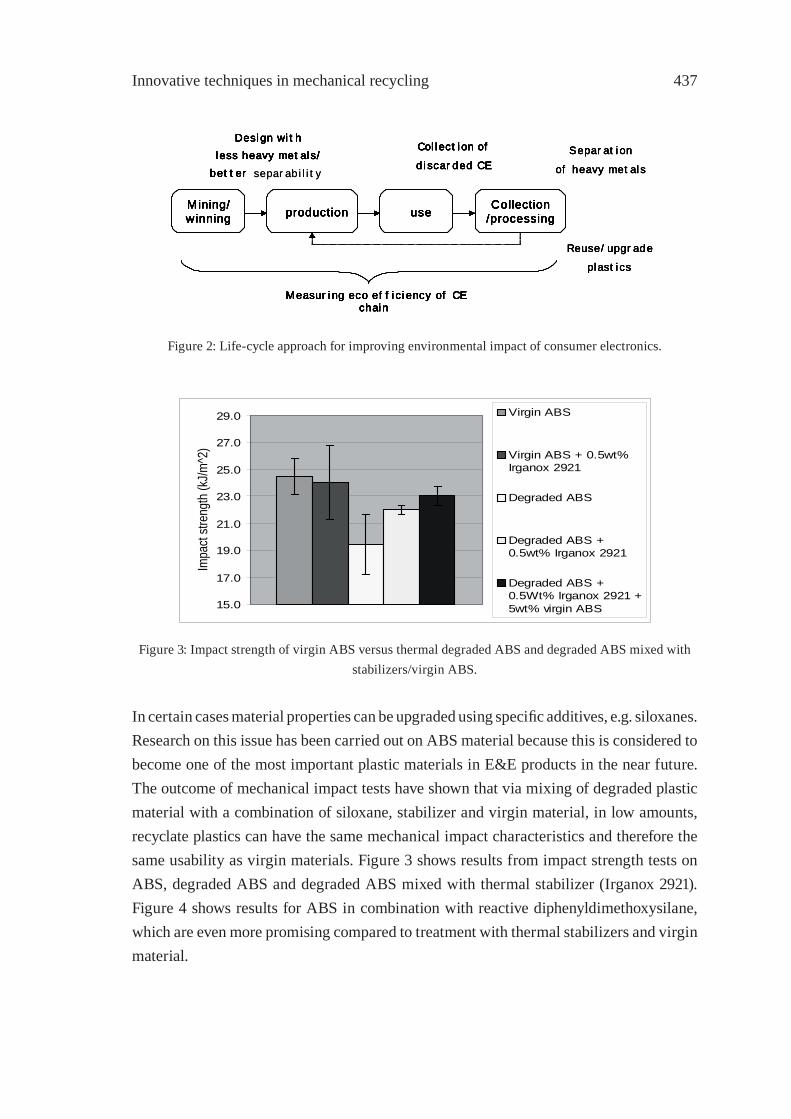
Innovative techniques in mechanical recycling 437
15.0
17.0
19.0
21.0
23.0
25.0
27.0
29.0
Impa
ct str
engt
h (k
J/m^2
)
Virgin ABS
Virgin ABS + 0.5wt%Irganox 2921
Degraded ABS
Degraded ABS +0.5wt% Irganox 2921
Degraded ABS +0.5Wt% Irganox 2921 +5wt% virgin ABS
Figure 3: Impact strength of virgin ABS versus thermal degraded ABS and degraded ABS mixed with stabilizers/virgin ABS.
In certain cases material properties can be upgraded using specifi c additives, e.g. siloxanes. Research on this issue has been carried out on ABS material because this is considered to become one of the most important plastic materials in E&E products in the near future. The outcome of mechanical impact tests have shown that via mixing of degraded plastic material with a combination of siloxane, stabilizer and virgin material, in low amounts, recyclate plastics can have the same mechanical impact characteristics and therefore the same usability as virgin materials. Figure 3 shows results from impact strength tests on ABS, degraded ABS and degraded ABS mixed with thermal stabilizer (Irganox 2921). Figure 4 shows results for ABS in combination with reactive diphenyldimethoxysilane, which are even more promising compared to treatment with thermal stabilizers and virgin material.
Reuse/upgrade plastics
Mining/ winning production use Collection
/processing
Measuring eco efficiency of CE chain
Design with less heavy metals/
better separability
Collection ofdiscarded CE
Separationof heavy metals
Reuse/upgrade plastics
Mining/ winning production use Collection
/processing
Measuring eco efficiency of CE chain
Design with less heavy metals/
better
Collection ofdiscarded CE
Mining/ winning production use Collection
/processing
Measuring eco efficiency of CE chain
Design with less heavy metals/
better
Collection ofdiscarded CE
Separationof heavy metals
Reuse/upgrade plastics
Mining/ winning production use Collection
/processing
Measuring eco efficiency of CE chain
Design with less heavy metals/
better separability
Collection ofdiscarded CE
Separationof heavy metals
Reuse/upgrade plastics
Mining/ winning production use Collection
/processing
Measuring eco efficiency of CE chain
Design with less heavy metals/
better
Collection ofdiscarded CE
Mining/ winning production use Collection
/processing
Measuring eco efficiency of CE chain
Design with less heavy metals/
better
Collection ofdiscarded CE
Separationof heavy metals
Figure 2: Life-cycle approach for improving environmental impact of consumer electronics.
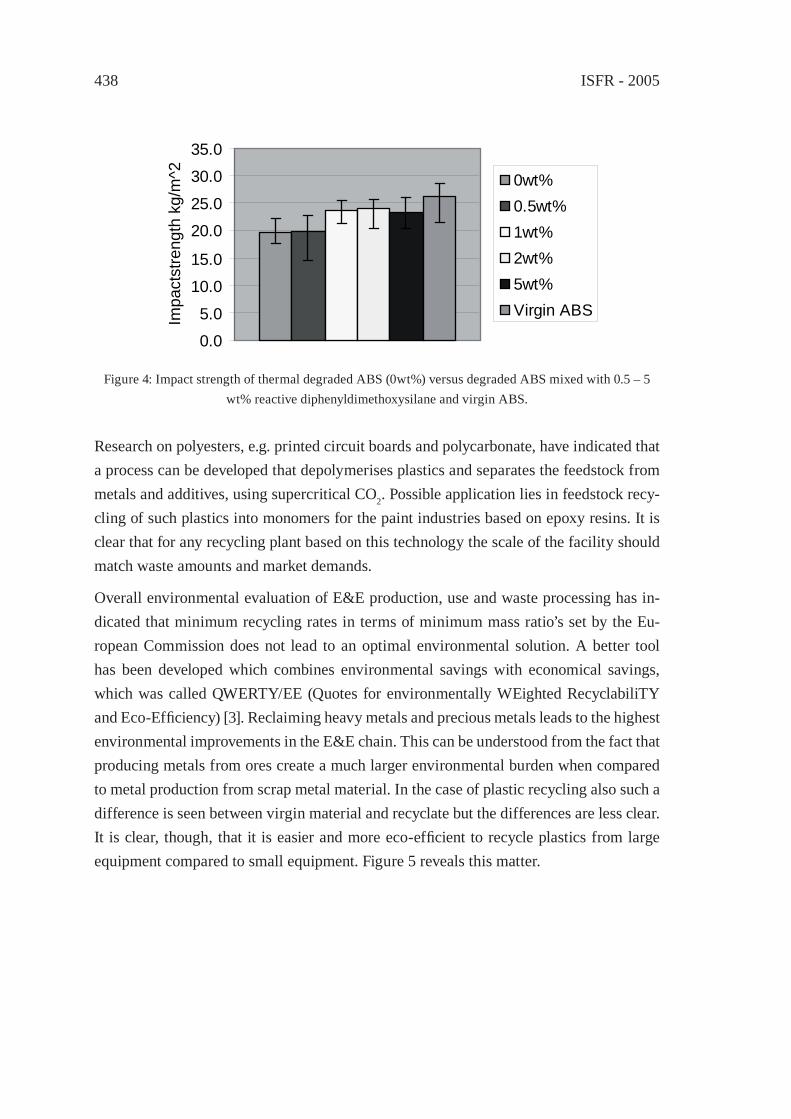
ISFR - 2005438
0.0
5.0
10.0
15.0
20.0
25.0
30.0
35.0Im
pact
stre
ngth
kg/
m^2 0wt%
0.5wt%1wt%2wt%5wt%Virgin ABS
Figure 4: Impact strength of thermal degraded ABS (0wt%) versus degraded ABS mixed with 0.5 – 5 wt% reactive diphenyldimethoxysilane and virgin ABS.
Research on polyesters, e.g. printed circuit boards and polycarbonate, have indicated that a process can be developed that depolymerises plastics and separates the feedstock from metals and additives, using supercritical CO2. Possible application lies in feedstock recy-cling of such plastics into monomers for the paint industries based on epoxy resins. It is clear that for any recycling plant based on this technology the scale of the facility should match waste amounts and market demands.
Overall environmental evaluation of E&E production, use and waste processing has in-dicated that minimum recycling rates in terms of minimum mass ratio’s set by the Eu-ropean Commission does not lead to an optimal environmental solution. A better tool has been developed which combines environmental savings with economical savings, which was called QWERTY/EE (Quotes for environmentally WEighted RecyclabiliTY and Eco-Effi ciency) [3]. Reclaiming heavy metals and precious metals leads to the highest environmental improvements in the E&E chain. This can be understood from the fact that producing metals from ores create a much larger environmental burden when compared to metal production from scrap metal material. In the case of plastic recycling also such a difference is seen between virgin material and recyclate but the differences are less clear. It is clear, though, that it is easier and more eco-effi cient to recycle plastics from large equipment compared to small equipment. Figure 5 reveals this matter.
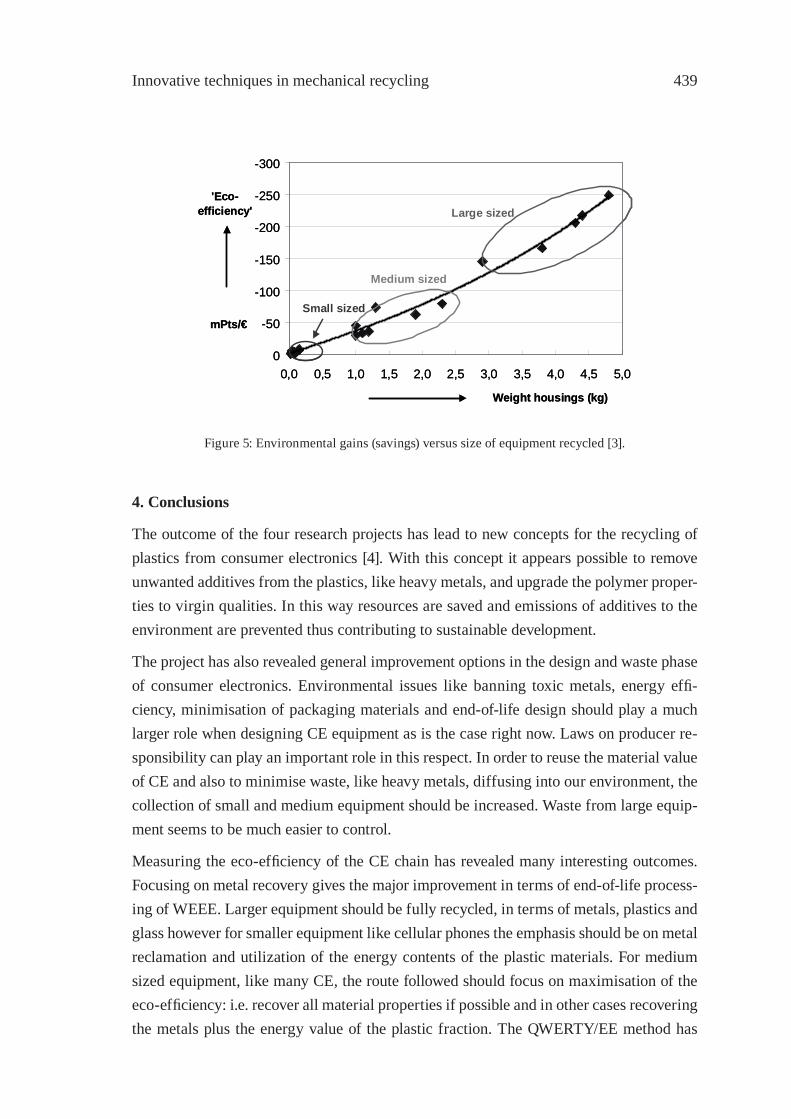
Innovative techniques in mechanical recycling 439
-300
-250
-200
-150
-100
-50
00,0 0,5 1,0 1,5 2,0 2,5 3,0 3,5 4,0 4,5 5,0
mPts/€
Weight housings (kg)
'Eco-efficiency' Large sized
Medium sized
Small sized
-300
-250
-200
-150
-100
-50
00,0 0,5 1,0 1,5 2,0 2,5 3,0 3,5 4,0 4,5 5,0
mPts/€
Weight housings (kg)
'Eco-efficiency' Large sized
Medium sized
Small sized
Figure 5: Environmental gains (savings) versus size of equipment recycled [3].
4. Conclusions
The outcome of the four research projects has lead to new concepts for the recycling of plastics from consumer electronics [4]. With this concept it appears possible to remove unwanted additives from the plastics, like heavy metals, and upgrade the polymer proper-ties to virgin qualities. In this way resources are saved and emissions of additives to the environment are prevented thus contributing to sustainable development.
The project has also revealed general improvement options in the design and waste phase of consumer electronics. Environmental issues like banning toxic metals, energy effi -ciency, minimisation of packaging materials and end-of-life design should play a much larger role when designing CE equipment as is the case right now. Laws on producer re-sponsibility can play an important role in this respect. In order to reuse the material value of CE and also to minimise waste, like heavy metals, diffusing into our environment, the collection of small and medium equipment should be increased. Waste from large equip-ment seems to be much easier to control.
Measuring the eco-effi ciency of the CE chain has revealed many interesting outcomes. Focusing on metal recovery gives the major improvement in terms of end-of-life process-ing of WEEE. Larger equipment should be fully recycled, in terms of metals, plastics and glass however for smaller equipment like cellular phones the emphasis should be on metal reclamation and utilization of the energy contents of the plastic materials. For medium sized equipment, like many CE, the route followed should focus on maximisation of the eco-effi ciency: i.e. recover all material properties if possible and in other cases recovering the metals plus the energy value of the plastic fraction. The QWERTY/EE method has

ISFR - 2005440
shown to be a very useful tool to check the eco-effi ciency of different waste scenarios. Practical studies at Dutch recycling companies have revealed that in the Dutch situation the plastic fractions from CE can be separated into the different plastic fractions for reuse, in an economical, environmental and technical feasible manner. This would predict that the same, full material recycling of waste from electronic and electrical equipment, will be achievable in all other EU countries in the coming years.
References
[1] Kasteren J.M.N. van, Schijndel, P.P.A.J. van, Ron A.J. de and Stevels A.L.N., Int. J. of Environmental Conscious Design & Manufacturing, 9 (2), 23-30 (2000).
[2] Melissen F., Designing collection rate enhancing measures for ‘small’ consumer electronics, PhD thesis, Eindhoven University of Technology, The Netherlands, 2003.
[3] Huisman J., The Qwerty/EE concept – Quantifying recyclability and eco-effi ciency for End-of-life treatment of consumer electronic products, PhD thesis, TU Delft, The Netherlands, 2003.
[4] Lemmens A.M.C. and Schijndel P.P.A.J. van, IOP heavy metals in consumer electronics - Integration of research, IOP publication, SenterNovem The Netherlands (a copy can be requested from the authors), February 2004.

Innovative techniques in mechanical recycling 441
CONSTRUCTION OF THE SYSTEM FOR WASTE PLASTICS RECYCLING PROMOTION AND GLOBAL WARMING
SUPPRESSION IN TOHOKU DISTRICT OF JAPANKazuyoshi Yamaguchi
Tohoku Electric Power Engineering and Construction Co., Inc., Sendai, Japan, [email protected]
Abstract: Tohoku Bureau of Economy, Trading and Industry and Tohoku Economic Fed-eration Inc. have investigated the system for promoting the waste recycling and suppress-ing the global warming in co-operation. First, the functions to be endowed with to this system have been derived. Next, the simulation model has been introduced in order to derive the measures for improving the waste recycling ratio and suppressing the amount of CO2 emission generated by the waste transportation and treatment. And last, the waste engineering plastics recycling system that has been started to operate in a part of Tohoku district has been mentioned.
1. Introduction
1.1. Actual Waste Discharge and Treatment Situations in Tohoku District
The area of Tohoku district located in the northern part of Japan is wide with 19.8% of the whole country, but the industrial production share is merely 7.6%. On the other hand, the amount of industrial waste discharge reaches 10.8%. This difference depends on the discharge of domestic animals’ excreta (dung and urine), as the dairy farming is active in Tohoku district. The ratio of domestic animals’ excreta in the industrial waste is 32.9% and far exceeds 22.6% of a national average. In addition, the ratio of industrial waste treatment is about 14% and far exceeds the ratio of discharge (10.8%). This is because the waste fl ows in from Kanto district that includes Tokyo City to Tohoku district.
On the other hand, the number of waste recycling equipment in Tohoku district is few (1.8 equipments/1000 km2) and smaller than the half of that in Kyushu district located in the southern part of Japan (4.0 equipments/1000 km2). This equipment is dotted in the whole Tohoku district. The waste recycling ratio in Tohoku district is not high, and the waste dischargers bury the waste on the nearby land (landfi ll) after the treatment for the volume reduction although they hope to recycle. But in Japan, the land for the waste landfi ll is narrow, and this situation is the same in Tohoku district where the area is comparatively wide. According to the questionnaire survey to the industrial waste dischargers, it is im-possible to transport the waste to the recycling equipment because the transportation expense is high.
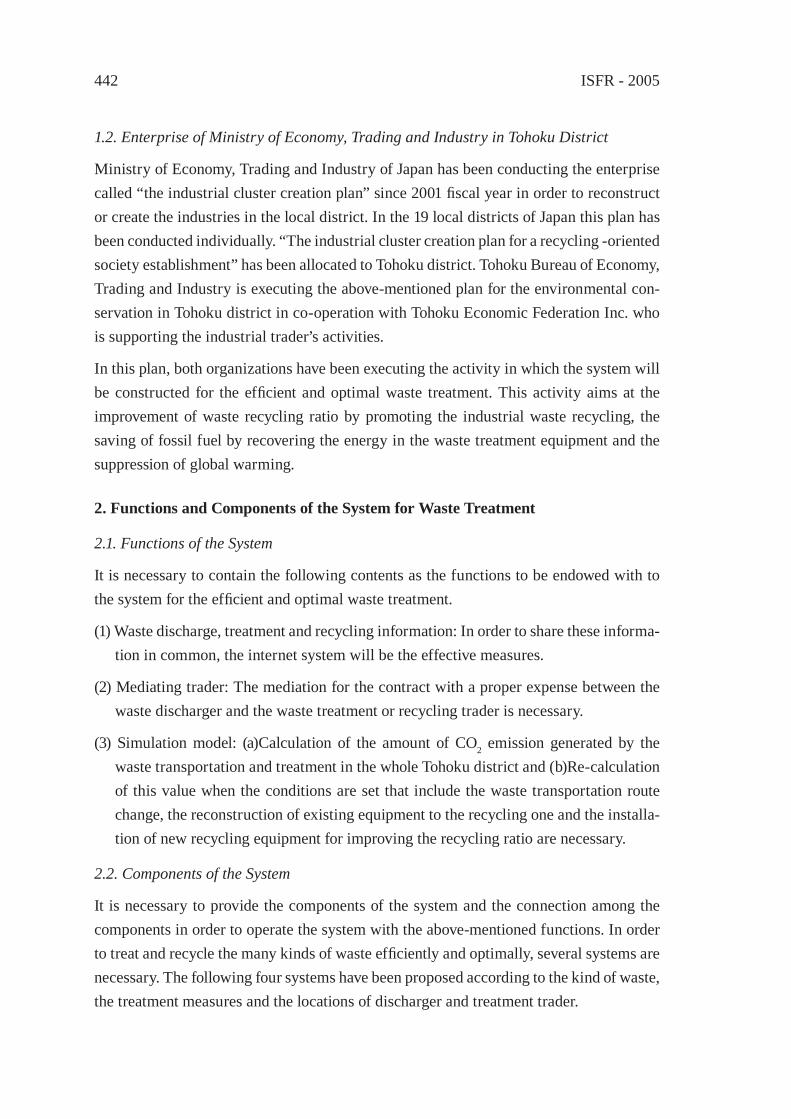
ISFR - 2005442
1.2. Enterprise of Ministry of Economy, Trading and Industry in Tohoku District
Ministry of Economy, Trading and Industry of Japan has been conducting the enterprise called “the industrial cluster creation plan” since 2001 fi scal year in order to reconstruct or create the industries in the local district. In the 19 local districts of Japan this plan has been conducted individually. “The industrial cluster creation plan for a recycling -oriented society establishment” has been allocated to Tohoku district. Tohoku Bureau of Economy, Trading and Industry is executing the above-mentioned plan for the environmental con-servation in Tohoku district in co-operation with Tohoku Economic Federation Inc. who is supporting the industrial trader’s activities.
In this plan, both organizations have been executing the activity in which the system will be constructed for the effi cient and optimal waste treatment. This activity aims at the improvement of waste recycling ratio by promoting the industrial waste recycling, the saving of fossil fuel by recovering the energy in the waste treatment equipment and the suppression of global warming.
2. Functions and Components of the System for Waste Treatment
2.1. Functions of the System
It is necessary to contain the following contents as the functions to be endowed with to the system for the effi cient and optimal waste treatment.
(1) Waste discharge, treatment and recycling information: In order to share these informa-tion in common, the internet system will be the effective measures.
(2) Mediating trader: The mediation for the contract with a proper expense between the waste discharger and the waste treatment or recycling trader is necessary.
(3) Simulation model: (a)Calculation of the amount of CO2 emission generated by the waste transportation and treatment in the whole Tohoku district and (b)Re-calculation of this value when the conditions are set that include the waste transportation route change, the reconstruction of existing equipment to the recycling one and the installa-tion of new recycling equipment for improving the recycling ratio are necessary.
2.2. Components of the System
It is necessary to provide the components of the system and the connection among the components in order to operate the system with the above-mentioned functions. In order to treat and recycle the many kinds of waste effi ciently and optimally, several systems are necessary. The following four systems have been proposed according to the kind of waste, the treatment measures and the locations of discharger and treatment trader.
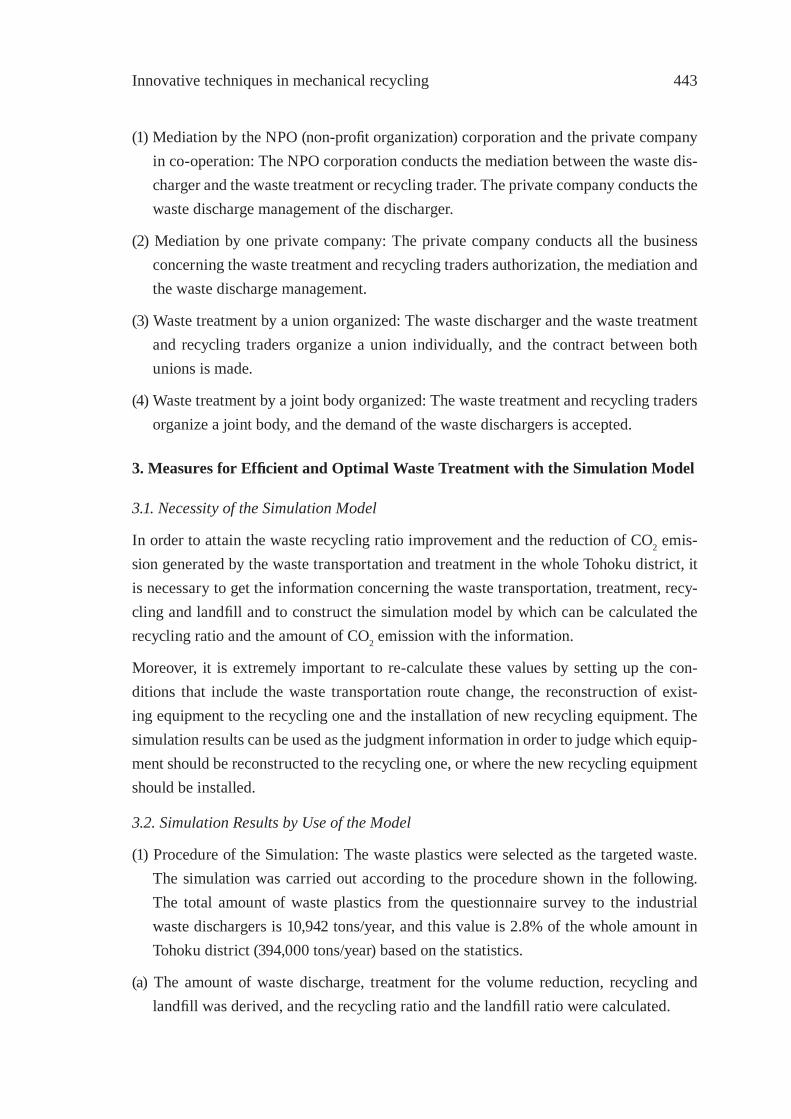
Innovative techniques in mechanical recycling 443
(1) Mediation by the NPO (non-profi t organization) corporation and the private company in co-operation: The NPO corporation conducts the mediation between the waste dis-charger and the waste treatment or recycling trader. The private company conducts the waste discharge management of the discharger.
(2) Mediation by one private company: The private company conducts all the business concerning the waste treatment and recycling traders authorization, the mediation and the waste discharge management.
(3) Waste treatment by a union organized: The waste discharger and the waste treatment and recycling traders organize a union individually, and the contract between both unions is made.
(4) Waste treatment by a joint body organized: The waste treatment and recycling traders organize a joint body, and the demand of the waste dischargers is accepted.
3. Measures for Effi cient and Optimal Waste Treatment with the Simulation Model
3.1. Necessity of the Simulation Model
In order to attain the waste recycling ratio improvement and the reduction of CO2 emis-sion generated by the waste transportation and treatment in the whole Tohoku district, it is necessary to get the information concerning the waste transportation, treatment, recy-cling and landfi ll and to construct the simulation model by which can be calculated the recycling ratio and the amount of CO2 emission with the information.
Moreover, it is extremely important to re-calculate these values by setting up the con-ditions that include the waste transportation route change, the reconstruction of exist-ing equipment to the recycling one and the installation of new recycling equipment. The simulation results can be used as the judgment information in order to judge which equip-ment should be reconstructed to the recycling one, or where the new recycling equipment should be installed.
3.2. Simulation Results by Use of the Model
(1) Procedure of the Simulation: The waste plastics were selected as the targeted waste. The simulation was carried out according to the procedure shown in the following. The total amount of waste plastics from the questionnaire survey to the industrial waste dischargers is 10,942 tons/year, and this value is 2.8% of the whole amount in Tohoku district (394,000 tons/year) based on the statistics.
(a) The amount of waste discharge, treatment for the volume reduction, recycling and landfi ll was derived, and the recycling ratio and the landfi ll ratio were calculated.

ISFR - 2005444
(b) By estimating the distance among the discharge place, the treatment or recycling place and the landfi ll place, the total transportation distance was calculated. The waste plas-tics were assumed to be transported with a 10 tons dump truck.
(c) The amount of CO2 emission generated by the waste transportation, treatment and recycling was calculated. The amount of CO2 reduction was also calculated by recov-ering the electric power in the heat recovery equipment and by saving a fossil fuel in the equipment that uses the waste plastics as a fuel.
(d) The measure was set in every prefecture of Tohoku district for improving the recy-cling ratio against the calculated current situation. The measure includes the follow-ing item, namely the waste plastics that are sent to the equipment for burning up or the landfi ll will be transported to the existing electric power recovery equipment or the equipment that uses the waste plastics as a fuel. If these equipments are not ex-isted, it was assumed that the recovery or recycling equipment will be reconstructed or newly installed. By use of the set condition in every prefecture, the recycling ratio and the amount of CO2 emission was re-calculated. The difference between both calcula-tion results was derived as the improved values of the recycling ratio and the reduced amount of CO2 emission.
(2) Simulation Results: As shown in Fig. 1, the change in the transportation distance in every prefecture is different. But, the total transportation distance has shortened by about 9% in the whole Tohoku district (298,212 → 271,544km). As shown in Fig. 2, the great decrease in landfi ll ratio (22.4 → 3.2%) and the great increase in recycling ratio (38.6 → 69.3%) have been attained. As shown in Fig. 3, although the gross amount of CO2 emission increases greatly (12,559 → 16,758 ton CO2/year), the net amount of CO2 emission decreases greatly (8,779 → 5,159 ton CO2/year), because the amount of CO2 reduction increases greatly (3,780 → 11,599 ton CO2/year). The net amount of CO2 emission is defi ned as the gross amount of CO2 emission minus the amount of CO2 reduction.
(3) Evaluation of the Simulation Results: A large improvement effect by the recycling promotion has been achieved in the whole Tohoku district. The transportation and treatment expense calculation is necessary in addition to the amount of CO2 emission calculation taken up in this simulation.
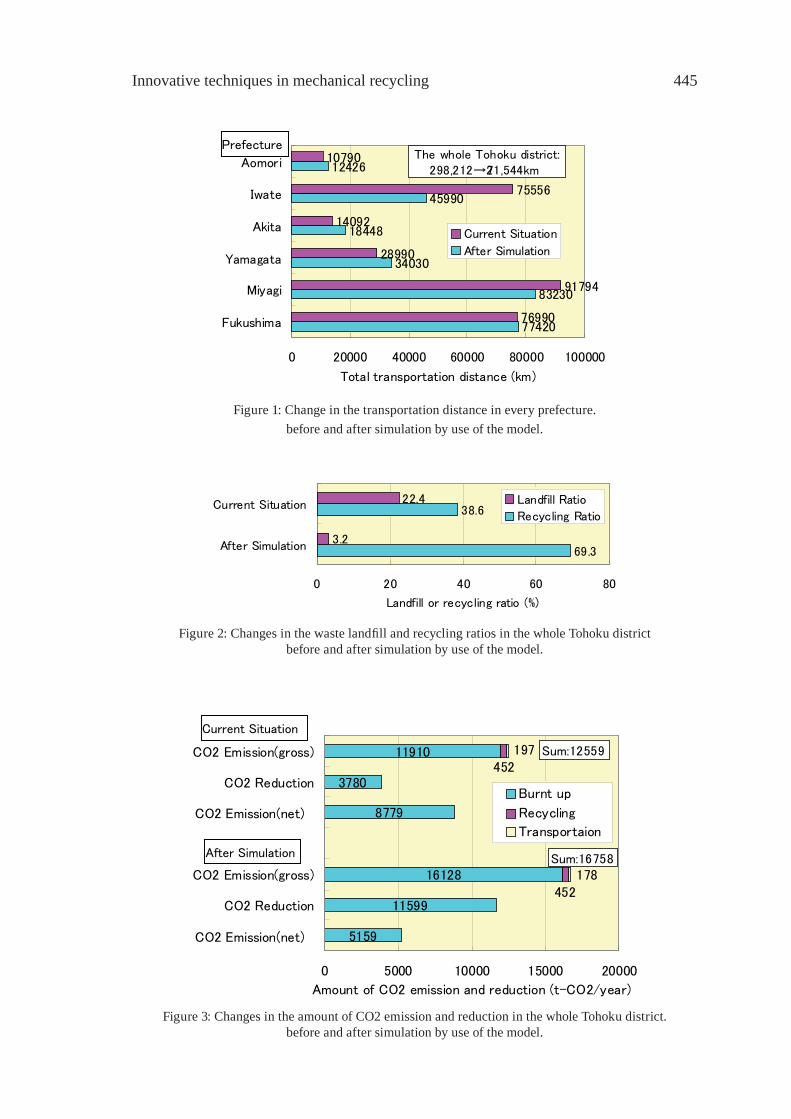
Innovative techniques in mechanical recycling 445
77420
83230
34030
18448
45990
12426
76990
91794
28990
14092
75556
10790
0 20000 40000 60000 80000 100000
Fukushima
Miyagi
Yamagata
Akita
Iwate
Aomori
Total transportation distance (km)
Current Situation
After Simulation
The whole Tohoku district:298,212→271,544km
Prefecture
Figure 1: Change in the transportation distance in every prefecture.before and after simulation by use of the model.
69.3
38.6
3.2
22.4
0 20 40 60 80
After Simulation
Current Situation
Landfill or recycling ratio (%)
Landfill Ratio
Recycling Ratio
Figure 2: Changes in the waste landfi ll and recycling ratios in the whole Tohoku districtbefore and after simulation by use of the model.
5159
11599
16128
8779
3780
11910452
452
197
178
0 5000 10000 15000 20000
CO2 Emission(net)
CO2 Reduction
CO2 Emission(gross)
CO2 Emission(net)
CO2 Reduction
CO2 Emission(gross)
Amount of CO2 emission and reduction (t-CO2/year)
Burnt up
Recycling
Transportaion
Sum:12559
Sum:16758
Current Situation
After Simulation
Figure 3: Changes in the amount of CO2 emission and reduction in the whole Tohoku district.before and after simulation by use of the model.
ISFR - 2005446
4. Example of the Operation of Waste Recycling System
4.1. Actual Waste Engineering Plastics Discharge Situations
Although the above-mentioned systems (1) and (2) are ideal forms, the ideal system con-struction and operation are diffi cult in a short time. It seems that (3) waste treatment by a union organized of the above-mentioned four systems can be introduced easily.
The many minor traders that make the parts by use of the engineering plastics are existed in Tohoku district, and the waste engineering plastics are generated in these traders. The waste amount is several tons - ten and several tons per month in every trader. The waste is stocked in the open space of every trader, and when the stocked amount reaches to about ten tons, the waste is sent to the nearby landfi ll place. But, they have the consciousness to try to recycle the waste if the transportation expense is reasonable. In order to con-struct the system for recycling the waste engineering plastics that are discharged by the small amount from the many minor traders in every spot of Tohoku district, the several investigations for the system construction have been carried out and the system opera-tion has been started. First, three prefectures (Miyagi, Fukushima and Yamagata) located in the southern part of Tohoku district have been targeted as the operation region of the system.
4.2. Items Investigated for the System Construction
In order to operate this system economically and optimally, the following items have been investigated.
(1) Selection of the recycling equipment: The equipment (for example, rotary kiln) in which the waste plastics can be used as a fuel has been searched, and the trader located in the place away from the targeted region by 300km has been decided.
(2) Selection of the waste plastics crushing equipment: The trader that can crush the plastics into about 10 – 50 mm to use as a fuel in the recycling equipment has been searched, and the trader located in the targeted region has been decided.
(3) Optimization of the expense in the waste plastics collection and transportation: The transportation expense between the crushing equipment and the recycling one is al-most the same as the expense when the crushed waste plastics are purchased as a fuel. The transportation expense between the waste discharger and the crushing equipment has been reduced to the optimal value by employing the transportation trader with the cheap expense (a returning free time after another goods transportation is used) and by collecting and transporting the waste plastics of several dischargers together. In order to operate the collection and transportation in co-operation effi ciently, the union has been organized by the dischargers and the transportation schedule management

Innovative techniques in mechanical recycling 447
that includes the waste discharge management has been executed by the mediating trader.
Figure 4: shows the system components location in this recycling system.
Location of the system components
100 km
Targeted area of discharger (1)
Recycling equipment (1)
Plastics crushing trader (1)
Recycling equipment (2)
Targeted area of discharger (2)
Plastics crushing trader (2)
4.3. Result of the Recycling System Operation
The recycling system has been constructed and operated by taking three above -men-tioned items into the system, and almost the same expense has been realized as the one when the waste is burnt up or sent to the landfi ll individually.
The 23 dischargers have entered into the union called “EPR (engineering plastics recy-cling) promotion conference”. As a result of the system operation from January 2004 to March 2005, the amount of 302 tons waste plastics has been recycled, and 438 tons coal have been saved.
As shown in Fig. 4, fi rst, the system operation has been started with one crushing trader and one recycling equipment in the region of three prefectures. Now, the numbers of crushing trader and recycling equipment have increased and the region has also increased to four prefectures.
In order to increase the recycling amount of waste plastics, the following items will be executed:
(1) The trader that produce the plastics and papers pellet by using the waste paints as a binder will be added to the system.
ISFR - 2005448
(2) The trader that produce the plastics solidifi ed block by heating and half-melting the soft plastics with cheap expense will be also added to the system.
5. Conclusion
In order to contribute to the waste recycling promotion and the global warming suppres-sion, the system by which the effi cient and optimal waste treatment can be realized has been investigated in the whole Tohoku district.
Among the derived functions of the system, the simulation model by which the waste recycling ratio increment and the amount of CO2 emission decrement can be calculated in the whole Tohoku district is important. The simulation results has been introduced in order to derive the measures that include the waste transportation route change, the recon-struction of existing equipment to the recycling one and the installation of new recycling equipment.
In addition, toward the construction of the overall system that covers the whole Tohoku district, the waste engineering plastics recycling system has been constructed and oper-ated in a part of Tohoku district. The system is intended to recycle the waste plastics as a fuel in place of the coal.
From now, the amount of waste plastics recycling will be increased, the several systems similar to the above-mentioned one by which the other wastes are recycled will be oper-ated, and the activity will be executed for constructing the overall system.
Reference
[1] K.Yamaguchi and K.Yamauchi: Proceeding of “Global symposium on recycling, waste treatment and clean technology” (REWAS’2004),Vol-3, pp.2507-2514.
Innovative techniques in mechanical recycling 449
DRY SEPARATION OF ACTUAL SHREDDED BULKY WASTESBY FLUIDIZED BED TECHNOLOGY
Y. Kakuta*, T. Matsuto, Y. Tojo and T.MatsuoDiv. of Environment and Resources Engineering, Hokkaido University, Sapporo, Japan,
Abstract: In order to reduce the volume of waste for recycling and landfi lling, bulky wastes, such as furniture and small home appliances are usually shredded and separated into combustibles and incombustibles by particle size, using a screen, after metals are recovered. However, since separation effi ciency is low, fl uidized bed separation using difference of density is applied as a replacement for particle size separation in this study. Light combustible materials, such as wood, paper, and plastics fl oat on the surface, while heavy incombustible materials, such as metal and glass sink to the bottom. The recovery ratios of all combustibles and all incombustibles are 90%, and the Newton effi ciency as total separation effi ciency is 80%, which is much higher than 33% for particle size sepa-ration.
1. Introduction
In order to reduce the volume of waste for recycling and landfi lling, bulky wastes, such as furniture and small home appliances are usually shredded and separated into combusti-bles and incombustibles by particle size, using a screen, after metals are recovered. Com-bustibles are transported to incineration facilities, and incombustibles are disposed of in landfi ll sites. However, since separation effi ciency is low, the combustible product has 20-50 % incombustible content, while the incombustible product has 20-55 % combustible content [1]. More effective separation technology is required because the current ineffi -cient system causes a clinker problem in incinerators and stabilization delay in landfi lls.
In this study, fl uidized bed separation using difference of density is applied as a replace-ment for particle size separation. There have been a number of reports on the application and research of such systems.
Z. Tanaka et al. reported that a fl uidized bed unit using glass beads made it possible to separate plastics of small density difference in a batch experiment where uniform shape particles and chips of PET, PVC and HDPE were used as samples [2]. Oshitani et al. examined material separation of actual automotive shredder dust in a continuous experi-ment [3].
Sekito et al. studied composition and particle characteristics of shredded wastes for ef-fective separation. They concluded that separation by density difference was more suit-able for separation of combustibles and incombustibles than air-speed separation [4]. This
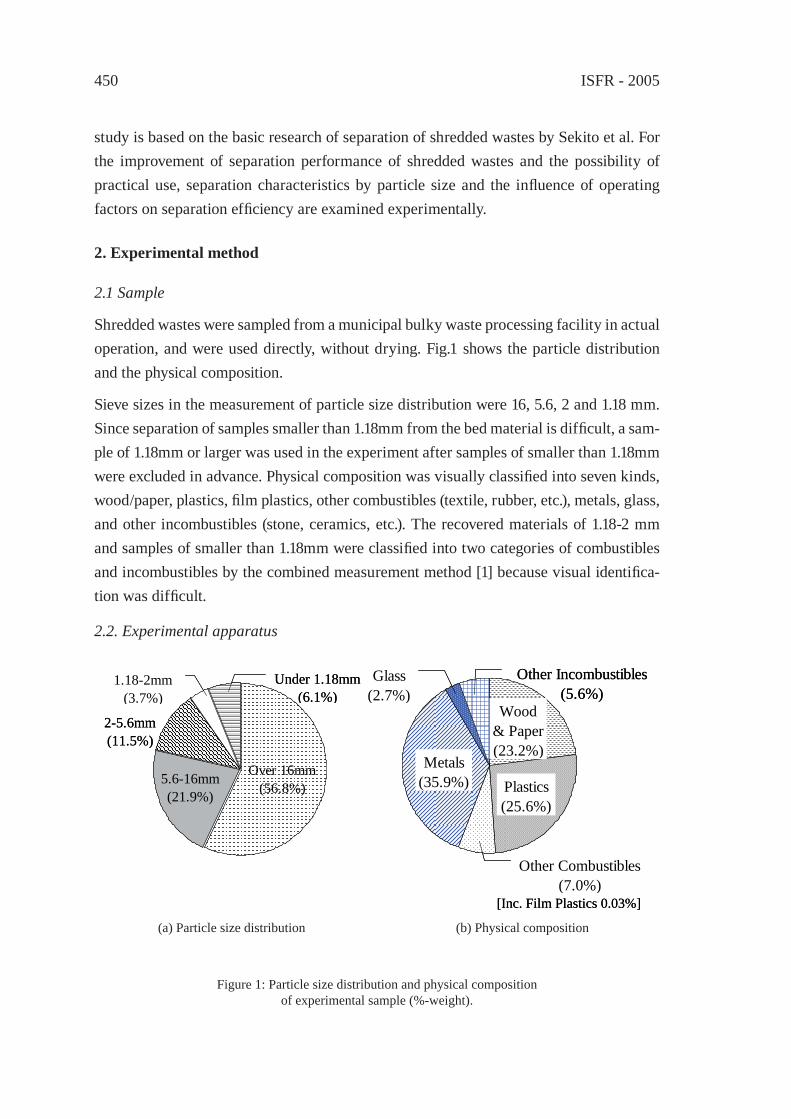
ISFR - 2005450
study is based on the basic research of separation of shredded wastes by Sekito et al. For the improvement of separation performance of shredded wastes and the possibility of practical use, separation characteristics by particle size and the infl uence of operating factors on separation effi ciency are examined experimentally.
2. Experimental method
2.1 Sample
Shredded wastes were sampled from a municipal bulky waste processing facility in actual operation, and were used directly, without drying. Fig.1 shows the particle distribution and the physical composition.
Sieve sizes in the measurement of particle size distribution were 16, 5.6, 2 and 1.18 mm. Since separation of samples smaller than 1.18mm from the bed material is diffi cult, a sam-ple of 1.18mm or larger was used in the experiment after samples of smaller than 1.18mm were excluded in advance. Physical composition was visually classifi ed into seven kinds, wood/paper, plastics, fi lm plastics, other combustibles (textile, rubber, etc.), metals, glass, and other incombustibles (stone, ceramics, etc.). The recovered materials of 1.18-2 mm and samples of smaller than 1.18mm were classifi ed into two categories of combustibles and incombustibles by the combined measurement method [1] because visual identifi ca-tion was diffi cult.
2.2. Experimental apparatus
[Inc. Film Plastics 0.03%]
1.18-2mm(3.7%)
Under 1.18mm(6.1%)
Over 16mm(56.8%)
5.6-16mm(21.9%)
2-5.6mm(11.5%)
Wood& Paper(23.2%)
Plastics(25.6%)
Other Combustibles(7.0%)
Metals(35.9%)
Other Incombustibles(5.6%)
Glass(2.7%)
[Inc. Film Plastics 0.03%]
1.18-2mm(3.7%)
Under 1.18mm(6.1%)
Over 16mm(56.8%)
5.6-16mm(21.9%)
2-5.6mm(11.5%)
Wood& Paper(23.2%)
Plastics(25.6%)
Other Combustibles(7.0%)
Metals(35.9%)
Other Incombustibles(5.6%)
Glass(2.7%)
(a) Particle size distribution (b) Physical composition
Figure 1: Particle size distribution and physical compositionof experimental sample (%-weight).

Innovative techniques in mechanical recycling 451
網
Sample Feed
Air FlowControl Valve
Air Distributor
Fluidized Bed Unit
Glass BeadCirculating Conveyor
Sinking MaterialRecovery Conveyor
Floating MaterialRecovery Screen
FloatingMaterial
Sinking Material
: Floating material flow: Sinking material flow: Glass bead flow
Blower
Manometer
Orifice PlateSinking MaterialRecovery Screen
250
160
440
140
200
500
25°
Floating Material Outlet
Sinking Material Outlet
Size unit:mm
The separation experimental apparatus of a fl uidized bed is shown in Fig.2. The appa-ratus was composed of an air supply section, the fl uidized bed unit and the recovery section. The air supply section included a blower, manometers and control valves. The fl uidized bed unit was equipped with an air distributor and recovered materials outlets. The recovery section was composed of a sinking material recovery conveyor and a glass bead circulating conveyor. The fl uidized bed unit was made of a transparent acrylic board of 10mm thickness. Airfl ow rate and conveyor speed were controlled by inverter. Glass beads of 340μm were used as a bed material, and the bulky density in the fl uidized bed was 1.5g/cm3 according to measurements with model samples.
The experimental sample of shredded wastes was manually supplied from the open top of the fl uidized bed unit, and separated into fl oating material and sinking material. Float-ing materials were continuously discharged from the outlet together with fl uidized glass beads by overfl ow, and these materials were then separated from glass beads on the re-covery screen. Meanwhile, sinking materials went along the slope of the bed bottom and were continuously discharged to a screw type recovery conveyor through the outlet. They were separated from the glass beads on the recovery screen set at the end of the conveyor. It was confi rmed by a previous experiment that a suitable angle of slope was 25 degrees. Glass beads separated from the recovery materials were continuously returned to the open top of the fl uidized bed unit by the circulating conveyor.
Figure 2: Schematic diagram of experimental apparatus.
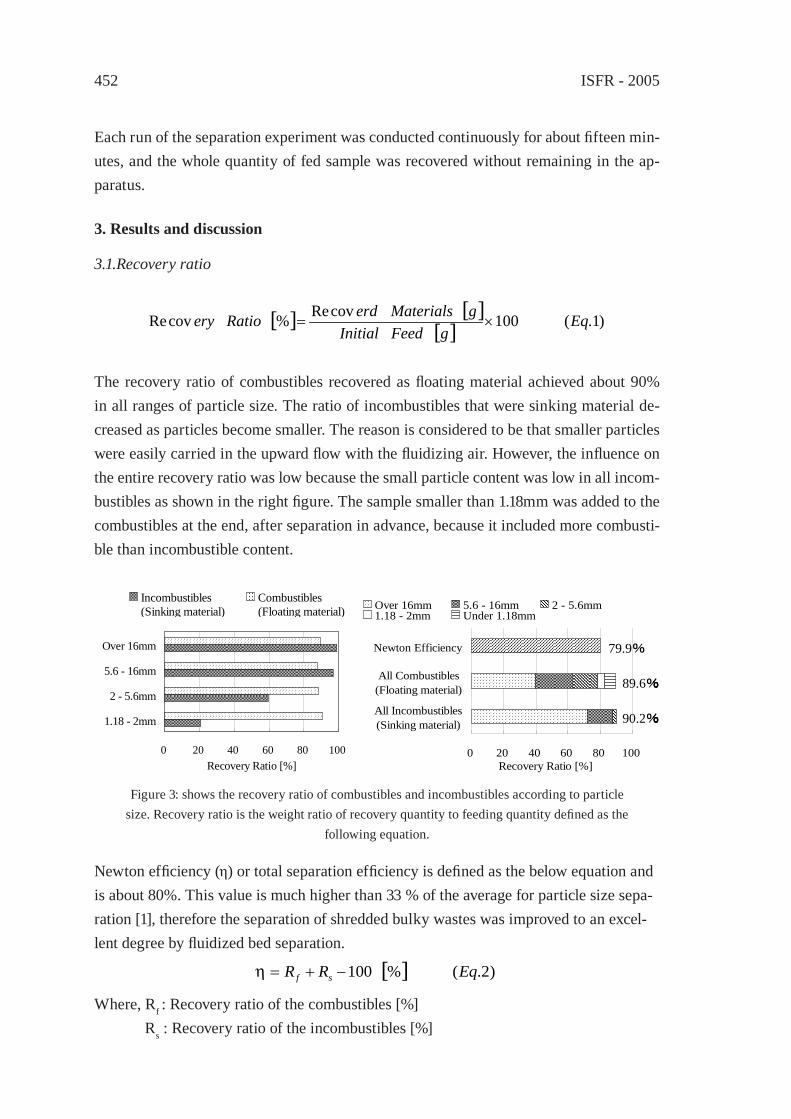
ISFR - 2005452
Each run of the separation experiment was conducted continuously for about fi fteen min-utes, and the whole quantity of fed sample was recovered without remaining in the ap-paratus.
3. Results and discussion
3.1.Recovery ratio
0 20 40 60 80 100
1.18 - 2mm
2 - 5.6mm
5.6 - 16mm
Over 16mm
Recovery Ratio [%]
Incombustibles(Sinking material)
Combustibles(Floating material)
0 20 40 60 80 100
All Incombustibles(Sinking material)
All Combustibles(Floating material)
Newton Efficiency
Recovery Ratio [%]
Over 16mm 5.6 - 16mm 2 - 5.6mm1.18 - 2mm Under 1.18mm
90.2%
89.6%
79.9%
0 20 40 60 80 100
All Incombustibles(Sinking material)
All Combustibles(Floating material)
Newton Efficiency
Recovery Ratio [%]
Over 16mm 5.6 - 16mm 2 - 5.6mm1.18 - 2mm Under 1.18mm
90.2%
89.6%
79.9%
Figure 3: shows the recovery ratio of combustibles and incombustibles according to particle size. Recovery ratio is the weight ratio of recovery quantity to feeding quantity defi ned as the
following equation.
[ ] [ ][ ] )1.(100covRe%covRe EqgFeedInitial
gMaterialserdRatioery ×=
The recovery ratio of combustibles recovered as fl oating material achieved about 90% in all ranges of particle size. The ratio of incombustibles that were sinking material de-creased as particles become smaller. The reason is considered to be that smaller particles were easily carried in the upward fl ow with the fl uidizing air. However, the infl uence on the entire recovery ratio was low because the small particle content was low in all incom-bustibles as shown in the right fi gure. The sample smaller than 1.18mm was added to the combustibles at the end, after separation in advance, because it included more combusti-ble than incombustible content.
Newton effi ciency (η) or total separation effi ciency is defi ned as the below equation and is about 80%. This value is much higher than 33 % of the average for particle size sepa-ration [1], therefore the separation of shredded bulky wastes was improved to an excel-lent degree by fl uidized bed separation.
[ ] )2.(%100 EqRR sf −+=η
Where, Rf : Recovery ratio of the combustibles [%]Rs : Recovery ratio of the incombustibles [%]
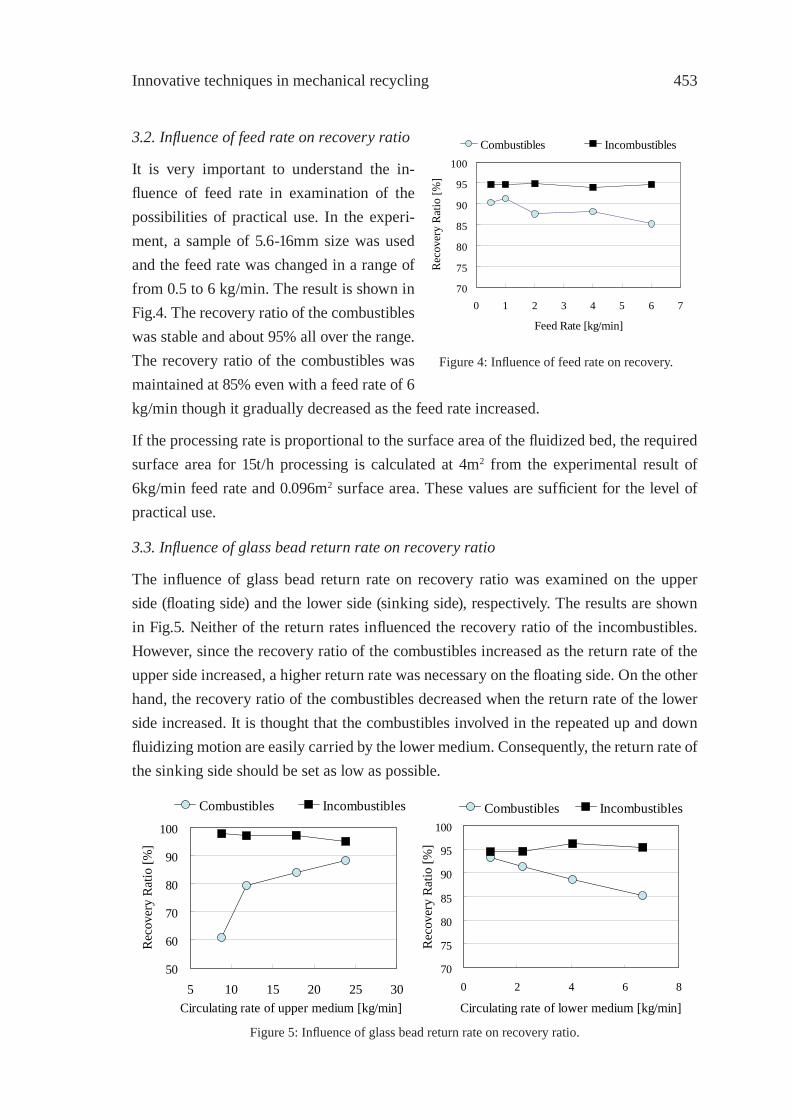
Innovative techniques in mechanical recycling 453
3.2. Infl uence of feed rate on recovery ratio
It is very important to understand the in-fl uence of feed rate in examination of the possibilities of practical use. In the experi-ment, a sample of 5.6-16mm size was used and the feed rate was changed in a range of from 0.5 to 6 kg/min. The result is shown in Fig.4. The recovery ratio of the combustibles was stable and about 95% all over the range. The recovery ratio of the combustibles was maintained at 85% even with a feed rate of 6 kg/min though it gradually decreased as the feed rate increased.
If the processing rate is proportional to the surface area of the fl uidized bed, the required surface area for 15t/h processing is calculated at 4m2 from the experimental result of 6kg/min feed rate and 0.096m2 surface area. These values are suffi cient for the level of practical use.
3.3. Infl uence of glass bead return rate on recovery ratio
The infl uence of glass bead return rate on recovery ratio was examined on the upper side (fl oating side) and the lower side (sinking side), respectively. The results are shown in Fig.5. Neither of the return rates infl uenced the recovery ratio of the incombustibles. However, since the recovery ratio of the combustibles increased as the return rate of the upper side increased, a higher return rate was necessary on the fl oating side. On the other hand, the recovery ratio of the combustibles decreased when the return rate of the lower side increased. It is thought that the combustibles involved in the repeated up and down fl uidizing motion are easily carried by the lower medium. Consequently, the return rate of the sinking side should be set as low as possible.
Figure 4: Infl uence of feed rate on recovery.
70
75
80
85
90
95
100
0 1 2 3 4 5 6 7
Feed Rate [kg/min]
Rec
over
y R
atio
[%]
Combustibles Incombustibles
50
60
70
80
90
100
5 10 15 20 25 30Circulating rate of upper medium [kg/min]
Rec
over
y R
atio
[%]
Combustibles Incombustibles
70
75
80
85
90
95
100
0 2 4 6 8
Circulating rate of lower medium [kg/min]
Rec
over
y R
atio
[%]
Combustibles Incombustibles
Figure 5: Infl uence of glass bead return rate on recovery ratio.
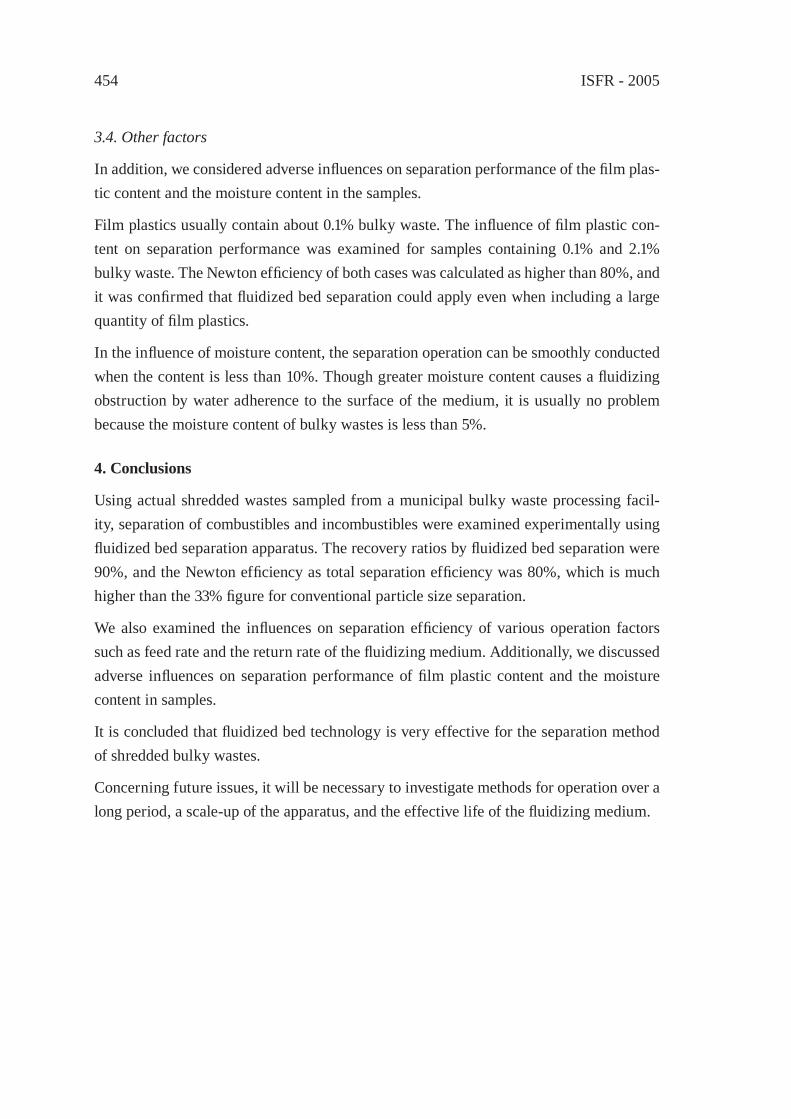
ISFR - 2005454
3.4. Other factors
In addition, we considered adverse infl uences on separation performance of the fi lm plas-tic content and the moisture content in the samples.
Film plastics usually contain about 0.1% bulky waste. The infl uence of fi lm plastic con-tent on separation performance was examined for samples containing 0.1% and 2.1% bulky waste. The Newton effi ciency of both cases was calculated as higher than 80%, and it was confi rmed that fl uidized bed separation could apply even when including a large quantity of fi lm plastics.
In the infl uence of moisture content, the separation operation can be smoothly conducted when the content is less than 10%. Though greater moisture content causes a fl uidizing obstruction by water adherence to the surface of the medium, it is usually no problem because the moisture content of bulky wastes is less than 5%.
4. Conclusions
Using actual shredded wastes sampled from a municipal bulky waste processing facil-ity, separation of combustibles and incombustibles were examined experimentally using fl uidized bed separation apparatus. The recovery ratios by fl uidized bed separation were 90%, and the Newton effi ciency as total separation effi ciency was 80%, which is much higher than the 33% fi gure for conventional particle size separation.
We also examined the infl uences on separation effi ciency of various operation factors such as feed rate and the return rate of the fl uidizing medium. Additionally, we discussed adverse infl uences on separation performance of fi lm plastic content and the moisture content in samples.
It is concluded that fl uidized bed technology is very effective for the separation method of shredded bulky wastes.
Concerning future issues, it will be necessary to investigate methods for operation over a long period, a scale-up of the apparatus, and the effective life of the fl uidizing medium.
Innovative techniques in mechanical recycling 455
References
[1] Sekito T., Tanaka N., Matsuto T., Matsuo T., J. Japan Soc. Waste Management Experts 8:190-199 (1997) [Japanese].
[2] Tanaka Z., Oshitani J., Morisaki Y., Takeuchi H., Kondo K., Proc. Soc. Chem. Eng. Japan 64:J302(1999) [Japanese].
[3] Oshitani J., Kiyoshima K., Tanaka Z., J. Chem. Eng. Japan 29:8-14(2003) [Japanese].
[4] Sekito T., Tanaka N., Matsuto T., Waste Management & Research 21:299-308 (2003).

ISFR - 2005456
Innovative techniques in mechanical recycling 457
IDENTIFICATION OF POLYMER TYPESIN SAUDI ARABIAN WASTE PLASTICS
M. N. Siddiqui, M. F. Ali and S. H. H. RedhwiDepartment of Chemistry
King Fahd University of Petroleum & MineralsDhahran 31261, Saudi Arabia, [email protected]
Abstract: In this study, we report the use of infrared, NMR spectroscopy, x-ray diffraction (XRD) and differential scanning calorimetric (DSC) techniques for the identifi cation of different type of polymers present in the Saudi Arabian plastic wastes such as polyethyl-ene (LDPE, HDPE), polypropylene, polystyrene, PET and PVC. Infrared and NMR spec-troscopy have provided the information on different types CH3 and CH2 groups present in various polymers. The XRD analysis of polymers provided spectral lines whose in-tensities vary with the type of each constituent polymer. The DSC provided the different crystalline melting temperature, glass transition, and onset temperature for the peak and percent crystallinity data for different polymers present in plastic waste. The combined use of IR, XRD and DSC measurements for the identifi cation of polymers types in the Saudi Arabian plastic wastes yielded very useful and effective results.
1. Introduction
The recycling of waste plastics is steadily and widely gaining importance because of se-rious environmental challenge they pose and disposal problem all over the world. Saudi Arabia is one of the major producers of plastic in the world with total production capacity of around six million metric tons per year. There is a pressing need for rapid and accurate identifi cation of various polymers comprising plastics. Identifi cation of different type of polymers present in the post-consumer plastic wastes is an inherent problem in recycling since different polymers may undertake different reaction paths during the co-liquefac-tion processes. Therefore, for the proper of depolymerization of waste plastics, a rapid, correct and simple identifi cation of these polymers is very crucial. Two different types of spectroscopic processes are available to identify polymer types in plastics. The fi rst type analyzes the polymer without changing its structure or appearance, and avoids any kind of damage or change of appearance. The second type is a process which, through rapid pyrolysis, shatters the polymer into fragments [1].
The objective of our study was to look into the available techniques for the identifi cation of various plastics in the waste for segregation purposes. Most of our efforts were directed towards spectroscopic methods of analysis due to their non-destructive and speedy char-acteristics. Several techniques have been reported in the literature for the identifi cation of these polymers in plastic wastes. In this study, we report the use of infrared, NMR
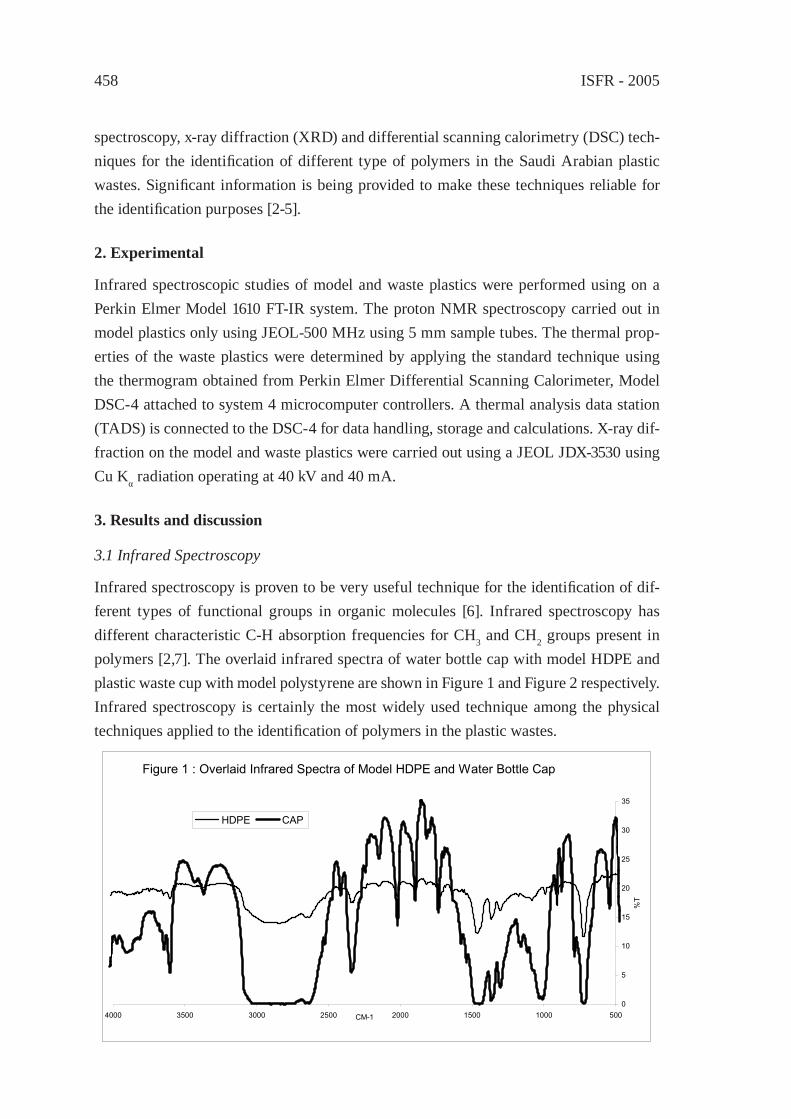
ISFR - 2005458
spectroscopy, x-ray diffraction (XRD) and differential scanning calorimetry (DSC) tech-niques for the identifi cation of different type of polymers in the Saudi Arabian plastic wastes. Signifi cant information is being provided to make these techniques reliable for the identifi cation purposes [2-5].
2. Experimental
Infrared spectroscopic studies of model and waste plastics were performed using on a Perkin Elmer Model 1610 FT-IR system. The proton NMR spectroscopy carried out in model plastics only using JEOL-500 MHz using 5 mm sample tubes. The thermal prop-erties of the waste plastics were determined by applying the standard technique using the thermogram obtained from Perkin Elmer Differential Scanning Calorimeter, Model DSC-4 attached to system 4 microcomputer controllers. A thermal analysis data station (TADS) is connected to the DSC-4 for data handling, storage and calculations. X-ray dif-fraction on the model and waste plastics were carried out using a JEOL JDX-3530 using Cu Kα radiation operating at 40 kV and 40 mA.
3. Results and discussion
3.1 Infrared Spectroscopy
Infrared spectroscopy is proven to be very useful technique for the identifi cation of dif-ferent types of functional groups in organic molecules [6]. Infrared spectroscopy has different characteristic C-H absorption frequencies for CH3 and CH2 groups present in polymers [2,7]. The overlaid infrared spectra of water bottle cap with model HDPE and plastic waste cup with model polystyrene are shown in Figure 1 and Figure 2 respectively. Infrared spectroscopy is certainly the most widely used technique among the physical techniques applied to the identifi cation of polymers in the plastic wastes.
Figure 1 : Overlaid Infrared Spectra of Model HDPE and Water Bottle Cap
0
5
10
15
20
25
30
35
5001000150020002500300035004000 CM-1
%T
HDPE CAP
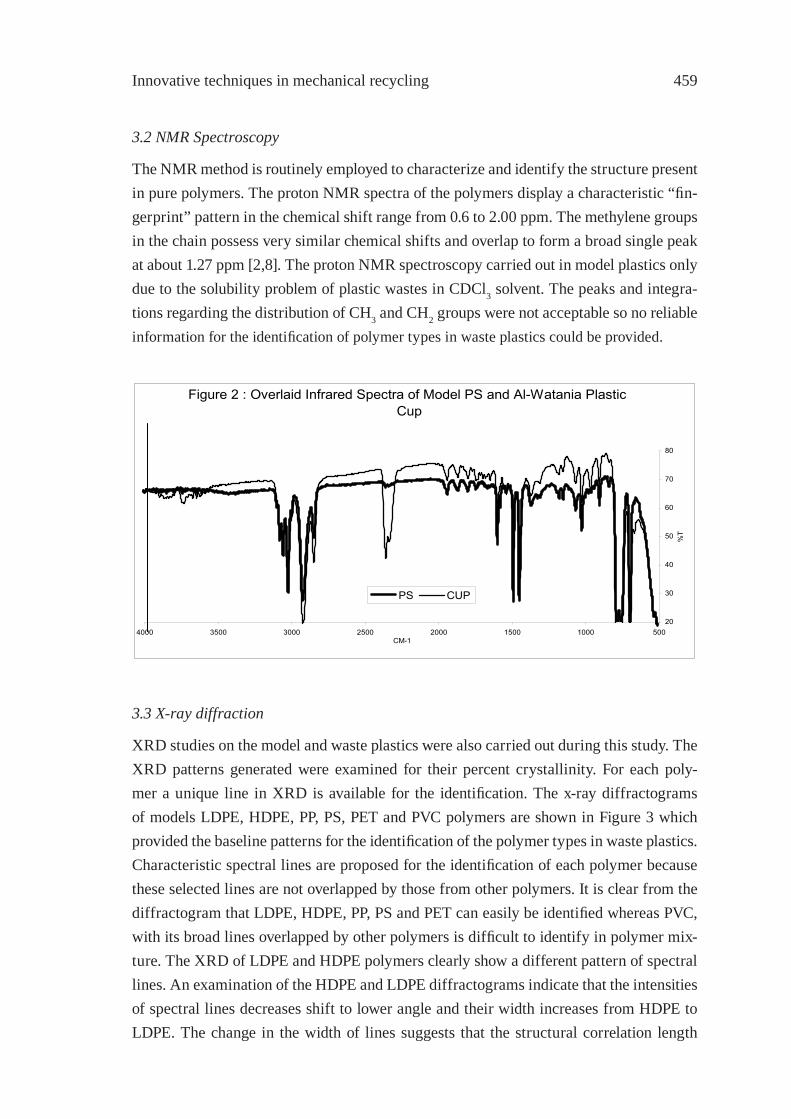
Innovative techniques in mechanical recycling 459
3.2 NMR Spectroscopy
The NMR method is routinely employed to characterize and identify the structure present in pure polymers. The proton NMR spectra of the polymers display a characteristic “fi n-gerprint” pattern in the chemical shift range from 0.6 to 2.00 ppm. The methylene groups in the chain possess very similar chemical shifts and overlap to form a broad single peak at about 1.27 ppm [2,8]. The proton NMR spectroscopy carried out in model plastics only due to the solubility problem of plastic wastes in CDCl3 solvent. The peaks and integra-tions regarding the distribution of CH3 and CH2 groups were not acceptable so no reliable information for the identifi cation of polymer types in waste plastics could be provided.
3.3 X-ray diffraction
XRD studies on the model and waste plastics were also carried out during this study. The XRD patterns generated were examined for their percent crystallinity. For each poly-mer a unique line in XRD is available for the identifi cation. The x-ray diffractograms of models LDPE, HDPE, PP, PS, PET and PVC polymers are shown in Figure 3 which provided the baseline patterns for the identifi cation of the polymer types in waste plastics. Characteristic spectral lines are proposed for the identifi cation of each polymer because these selected lines are not overlapped by those from other polymers. It is clear from the diffractogram that LDPE, HDPE, PP, PS and PET can easily be identifi ed whereas PVC, with its broad lines overlapped by other polymers is diffi cult to identify in polymer mix-ture. The XRD of LDPE and HDPE polymers clearly show a different pattern of spectral lines. An examination of the HDPE and LDPE diffractograms indicate that the intensities of spectral lines decreases shift to lower angle and their width increases from HDPE to LDPE. The change in the width of lines suggests that the structural correlation length
Figure 2 : Overlaid Infrared Spectra of Model PS and Al-Watania Plastic Cup
20
30
40
50
60
70
80
5001000150020002500300035004000CM-1
%T
PS CUP
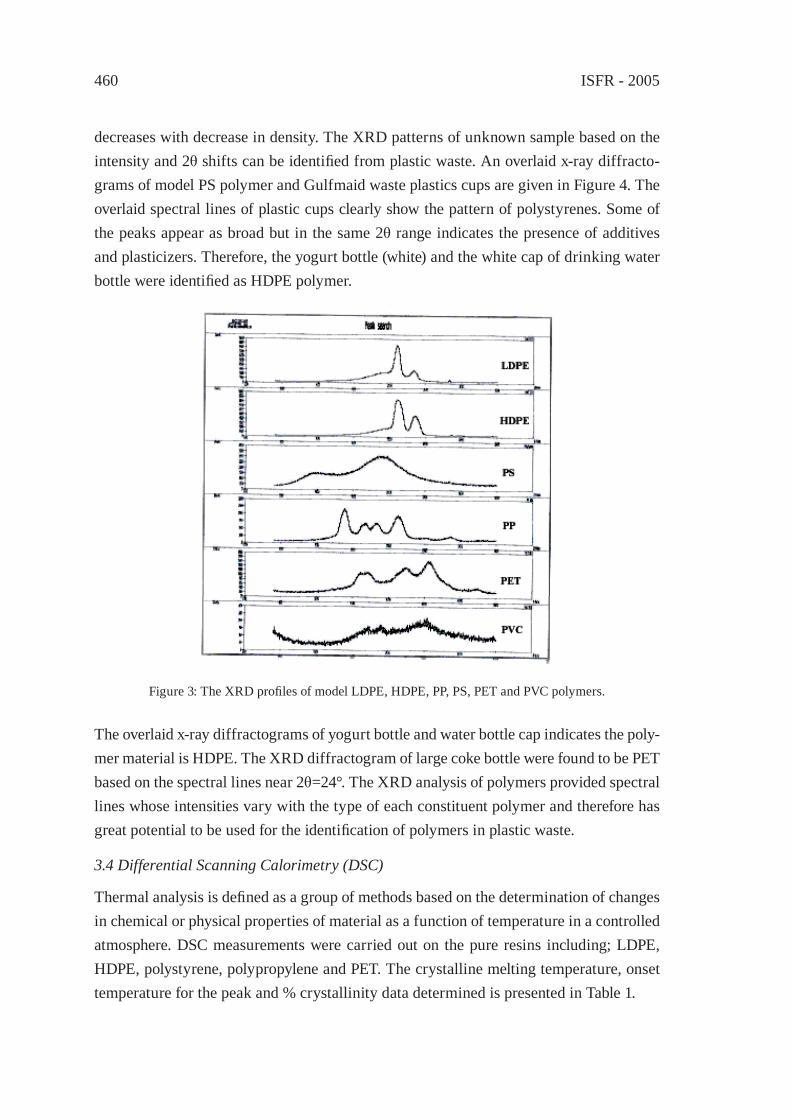
ISFR - 2005460
decreases with decrease in density. The XRD patterns of unknown sample based on the intensity and 2θ shifts can be identifi ed from plastic waste. An overlaid x-ray diffracto-grams of model PS polymer and Gulfmaid waste plastics cups are given in Figure 4. The overlaid spectral lines of plastic cups clearly show the pattern of polystyrenes. Some of the peaks appear as broad but in the same 2θ range indicates the presence of additives and plasticizers. Therefore, the yogurt bottle (white) and the white cap of drinking water bottle were identifi ed as HDPE polymer.
Figure 3: The XRD profi les of model LDPE, HDPE, PP, PS, PET and PVC polymers.
The overlaid x-ray diffractograms of yogurt bottle and water bottle cap indicates the poly-mer material is HDPE. The XRD diffractogram of large coke bottle were found to be PET based on the spectral lines near 2θ=24°. The XRD analysis of polymers provided spectral lines whose intensities vary with the type of each constituent polymer and therefore has great potential to be used for the identifi cation of polymers in plastic waste.
3.4 Differential Scanning Calorimetry (DSC)
Thermal analysis is defi ned as a group of methods based on the determination of changes in chemical or physical properties of material as a function of temperature in a controlled atmosphere. DSC measurements were carried out on the pure resins including; LDPE, HDPE, polystyrene, polypropylene and PET. The crystalline melting temperature, onset temperature for the peak and % crystallinity data determined is presented in Table 1.
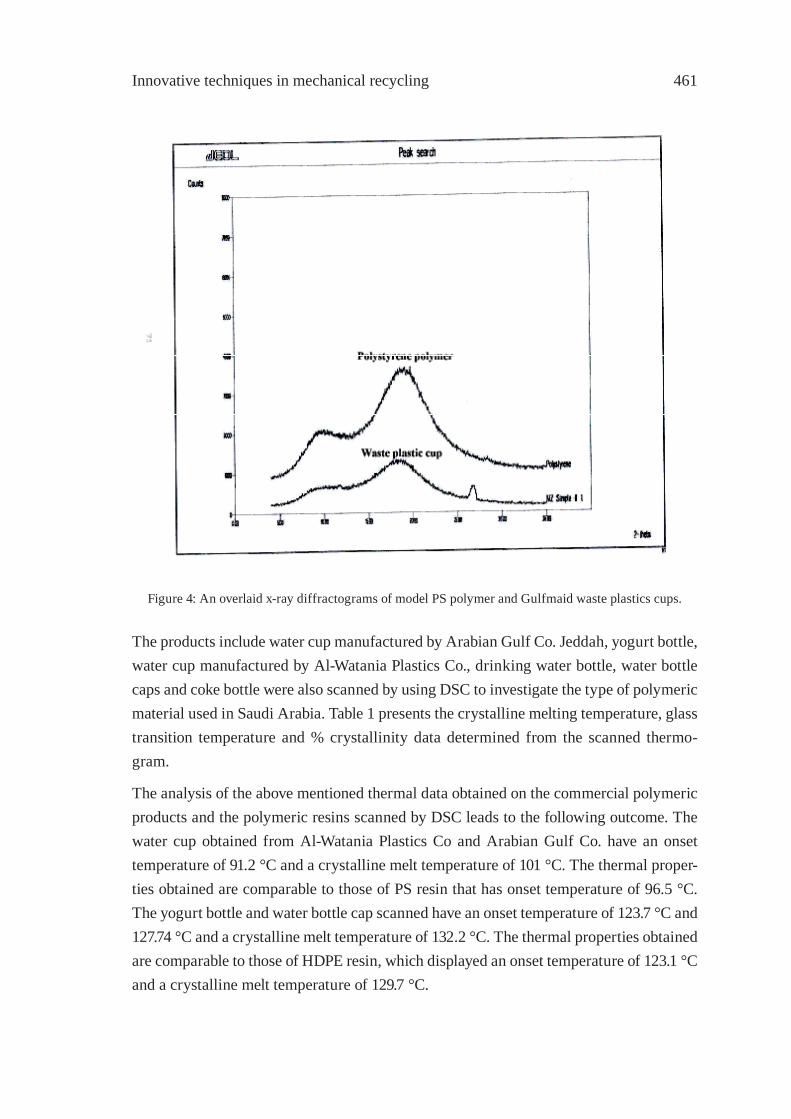
Innovative techniques in mechanical recycling 461
Figure 4: An overlaid x-ray diffractograms of model PS polymer and Gulfmaid waste plastics cups.
The products include water cup manufactured by Arabian Gulf Co. Jeddah, yogurt bottle, water cup manufactured by Al-Watania Plastics Co., drinking water bottle, water bottle caps and coke bottle were also scanned by using DSC to investigate the type of polymeric material used in Saudi Arabia. Table 1 presents the crystalline melting temperature, glass transition temperature and % crystallinity data determined from the scanned thermo-gram.
The analysis of the above mentioned thermal data obtained on the commercial polymeric products and the polymeric resins scanned by DSC leads to the following outcome. The water cup obtained from Al-Watania Plastics Co and Arabian Gulf Co. have an onset temperature of 91.2 °C and a crystalline melt temperature of 101 °C. The thermal proper-ties obtained are comparable to those of PS resin that has onset temperature of 96.5 °C. The yogurt bottle and water bottle cap scanned have an onset temperature of 123.7 °C and 127.74 °C and a crystalline melt temperature of 132.2 °C. The thermal properties obtained are comparable to those of HDPE resin, which displayed an onset temperature of 123.1 °C and a crystalline melt temperature of 129.7 °C.

ISFR - 2005462
Table 1: Thermal Properties of Polymeric Products
Polymeric ProductsCrystalline Melt Temperature, °C
(Tm/Tg)
Onset Temperature, °C % Crystallinity
LDPE 118 106.3 28.9HDPE 129.7 123.1 56.8
Polystyrene 230/104.4 96.5 -Polypropylene 164 153.8 28.1
PET 248.5 240.8 -Water Cup, Arabian
Gulf Co. Jeddah 230/103.21 - -
Water Cup, Al-Watania Plastics Co 230/101 91.2 -
Yogurt Bottle 132.2 123.7 -Water Bottle Cup 127.74/- 123.46 56.64
Drinking Water Bottle 250 237.3 -Coke Bottel 251.0 241.5 -
The drinking water bottle scanned has an onset temperature of 237.3 °C and a crystalline melt temperature of 250 °C. The thermal properties as shown in Table 3 show that they are comparable to those of PET resin material, which displayed an onset temperature of 240.8 °C and a crystalline melt temperature of 248.5 °C. The fi fth plastic product, coke bottle, tested show an onset temperature of 241.5 °C and a crystalline melt temperature of 251°C. This material is also comparable to PET resin. The PET thermal properties showed an onset temperature of 240.8 °C and a crystalline melt temperature of 248.5 °C. Based on the results obtained, DSC can also be considered as a very reliable tool for the identifi ca-tion of polymers in waste plastics.
4. Conclusion
It can be concluded that the combined use of IR, XRD and DSC measurements for the identifi cation of polymers in the plastic wastes would be very useful and effective. IR based techniques are rapid and superior in identifying different grades of plastics and polymers. It will be worthwhile to explore this task in more detail in order to develop highly sensitive spectroscopic methods for the identifi cation and quantifi cation of various plastics in a mixture.
Innovative techniques in mechanical recycling 463
5. Acknowledgement
The authors are grateful to the KACST for providing the fi nancial support through Re-search Grant No. AR-18-22 and KFUPM for facility support which has resulted in the preparation and presentation of this paper.
References
[1] United Nations Industrial Development Organization. (UNIDCO) Advances in Materials Technology Monitor, Vol. 2, p. 4, 1995.
[2] Koeing, J. L., Spectroscopy of Polymers, Elsevier Science Inc. USA, 1999 2nd Edition.
[3] Alexander, L. E., X-ray Diffraction Methods in Polymer Science, Krieger Pub. Co. Malabar, FL, U.S.A., 1985.
[4] Hopkins, E. J., Physics Dept. West Virginia University, WV, U.S.A., Personal Communication, 1997.
[5] Hamid, S. H. and Pichard, W. H., Application of Infrared Spectroscopy in Polymer Degradation, “Polymer-Plastics Technology and Engineering”, 273, 303-334, 1988.
[6] Colthup, N. B.; Daty, L. H. and Wimberley, S. E., Introduction to Infrared and Raman Spectroscopy, Academic press Inc., New York, 1975.
[7] Siesler, H. W. and Holland-Moritz, K., Infrared and Raman Spectroscopy of Polymers, Practical Spectroscopy Series, Vol. 4, 1980, Marcel and Dekker Inc., USA.
[8] Simons, W. W. and Zanger, M., The Sadtler Guide to the NMR Spectra of Polymers, Sadtler Research Laboratories Inc., England, 1973.

ISFR - 2005464
Innovative techniques in mechanical recycling 465
PREPARATION AND CHARACTERIZATIONOF REGENERATED LDPE/EPDM BLENDS
R. Irinislimane1, N. Belhaneche-Bensemra 1*, A. Benlefki 2
1Ecole Nationale Polytechnique, BP 182 El - Harrach, Alger, Algeria2Université de Boumerdes, Algeria, [email protected]
Abstract: The present work aims to the valorization of regenerated low density poly-ethylene (LDPE) by blending with little quantities of ethylene-propylene-diene mono-mer (EPDM). Three types of regenerated LDPE (rLDPE) from different waste sources (greenhouses, milk pouches,…) were characterized in terms of physico-chemical (density, melt fl ow index, water absorption, melting temperature and structure by Fourier trans-form infrared (FTIR) spectroscopy) and mechanical properties (tensile properties and hardness). The optimization of the peroxide content required for the vulcanization of the LDPE/EPDM blends was due by measuring torque and tensile strength. Once the perox-ide optimized, different blends were obtained by varying the EPDM content. The obtained results showed that this kind of blending has contributed considerably in performing tensile properties of rLDPE.
1. Introduction
In recent years interest in the recycling of plastic materials has increased notably because of environmental as well as economic concerns [1, 4]. Polyolefi ns occupy the largest share of the plastics market and are becoming the most recycled polymeric materials [5].The im-portance of polymer blending has been increased because it has become a useful approach for the preparation of materials with new desirable properties absent in each component of the blend. Plastics rubber blends attract the attention of many investigators in recent years because of their ease of processing, low cost and promising physical properties. The aim of this paper is the valorization of regenerated rLDPE by blending with little quantities of EPDM in the presence of a peroxide.
2. Experimental
Three regenerated LDPE coming from different sources (Table 1) and obtained after mill-ing, washing and extrusion in a conventional recycling plant were used. Virgin LDPE (B24/2) and EPDM (NORDEl IP 4640) were commercial products from ENIP (Algeria) and UMAC-MIDWEST (USA), respectively.The crosslinking agent was di- tertio butyl peroxide ( Luperox F40 MGEVT) from ATOFINA (France). Stearic acid (Loxiol G20 ) from HENKEL ( Germany) was used.
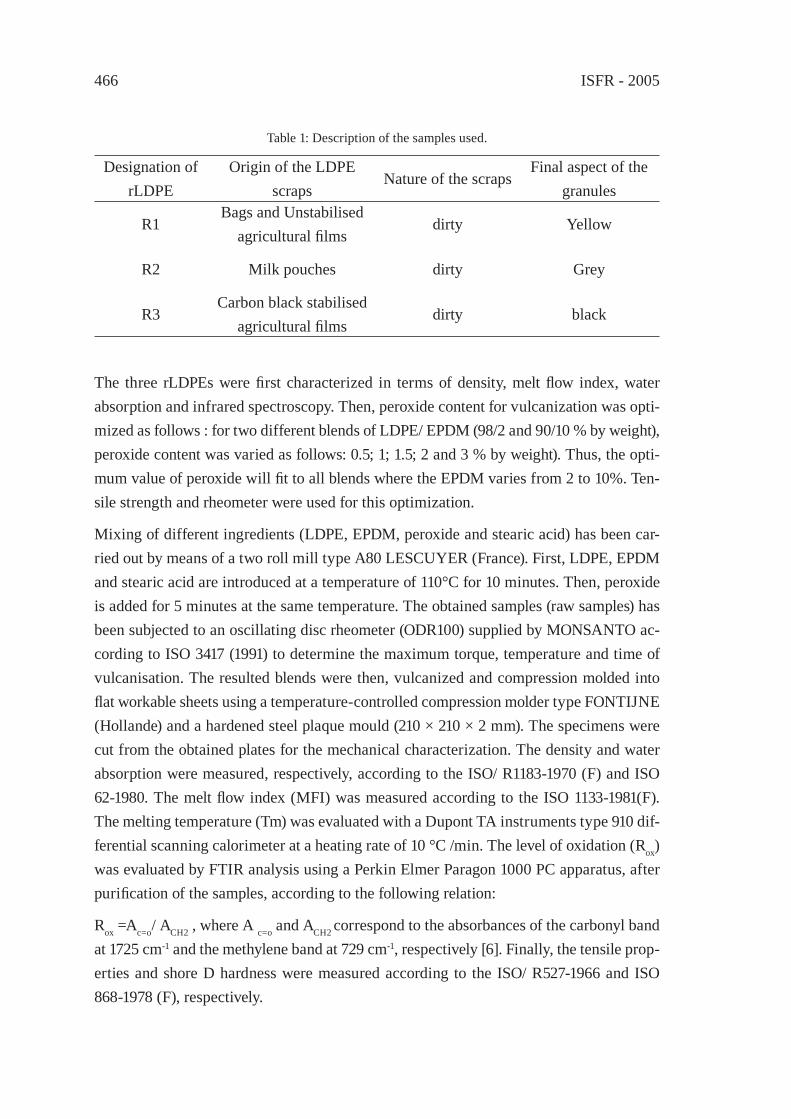
ISFR - 2005466
Table 1: Description of the samples used.
Designation of rLDPE
Origin of the LDPE scraps
Nature of the scrapsFinal aspect of the
granules
R1Bags and Unstabilised
agricultural fi lmsdirty Yellow
R2 Milk pouches dirty Grey
R3Carbon black stabilised
agricultural fi lmsdirty black
The three rLDPEs were fi rst characterized in terms of density, melt fl ow index, water absorption and infrared spectroscopy. Then, peroxide content for vulcanization was opti-mized as follows : for two different blends of LDPE/ EPDM (98/2 and 90/10 % by weight), peroxide content was varied as follows: 0.5; 1; 1.5; 2 and 3 % by weight). Thus, the opti-mum value of peroxide will fi t to all blends where the EPDM varies from 2 to 10%. Ten-sile strength and rheometer were used for this optimization.
Mixing of different ingredients (LDPE, EPDM, peroxide and stearic acid) has been car-ried out by means of a two roll mill type A80 LESCUYER (France). First, LDPE, EPDM and stearic acid are introduced at a temperature of 110°C for 10 minutes. Then, peroxide is added for 5 minutes at the same temperature. The obtained samples (raw samples) has been subjected to an oscillating disc rheometer (ODR100) supplied by MONSANTO ac-cording to ISO 3417 (1991) to determine the maximum torque, temperature and time of vulcanisation. The resulted blends were then, vulcanized and compression molded into fl at workable sheets using a temperature-controlled compression molder type FONTIJNE (Hollande) and a hardened steel plaque mould (210 × 210 × 2 mm). The specimens were cut from the obtained plates for the mechanical characterization. The density and water absorption were measured, respectively, according to the ISO/ R1183-1970 (F) and ISO 62-1980. The melt fl ow index (MFI) was measured according to the ISO 1133-1981(F). The melting temperature (Tm) was evaluated with a Dupont TA instruments type 910 dif-ferential scanning calorimeter at a heating rate of 10 °C /min. The level of oxidation (Rox) was evaluated by FTIR analysis using a Perkin Elmer Paragon 1000 PC apparatus, after purifi cation of the samples, according to the following relation:
Rox =Ac=o/ ACH2 , where A c=o and ACH2 correspond to the absorbances of the carbonyl band at 1725 cm-1 and the methylene band at 729 cm-1, respectively [6]. Finally, the tensile prop-erties and shore D hardness were measured according to the ISO/ R527-1966 and ISO 868-1978 (F), respectively.

Innovative techniques in mechanical recycling 467
3. Results and Discussion
3.1 Preliminary characterization of the rLDPEs
The physico- chemical properties of virgin LDPE and rLDPEs are given in Table 2.The densities of the rLDPEs are comparable to that of virgin LDPE and similar to literature [4].
Melt fl ow index increases directly with fl uidity and inversely with viscosity. An increased value of MFI means a reduced molecular weight (Mw). According to results of Table 2, R1 has the highest Mw followed by R2 and then by R3. It can be suggested that R1is the more crosslinked since it comes from unstabilised agricultural fi lms that were subjected to photo and thermo-oxidative degradation. However, R3 possesses the lowest Mw which may be due to the fact that it comes from stabilized agricultural fi lms that has been sub-jected to chain scission reactions during their initial utilization.
In spite of its low level, water absorption (expressed in %) for the three rLDPEs was su-perior than that of virgin LDPE. Water absorption results are in harmony with MFI ones. Moreover, the melting temperature varies inversely with MFI. R3 which has the highest MFI has the lowest Tm.
Table 2: Physico- chemical properties of virgin LDPE and rLDPE.
Sample Density (g /cm3) MFI Tm (°C)Water absorption
at 23 °C (%)Rox
Virgin LDPE 0.924 1.06* 110.00 0.0210 0.00R1 0.927 0.51** 125.70 0.0483 0.42R2 0.922 0.54* 122.60 0.0482 0.24R3 0.930 0.70* 120.34 0.0534 0.24
* : nominal load = 2.16 kg** : nominal load = 5.00 kg
FTIR analysis ( Rox ) showed that R2 and R3 have the same oxidation level which is lower than that of R1. This is evident since R3 is coming from carbon black stabilized fi lms. However R1 comes from unstabilized agricultural fi lms that have been subjected to out-door ageing. So the spectroscopic characterization results are in harmony with previous results. Table 3 shows the mechanical properties of virgin LDPE and rLDPEs. Stress and strain at break points of the three rLDPEs are lower than that of virgin LDPE. This can be explained by a decrease in tensile properties of the regenerated samples. These properties that are a good criteria for quality can tell us about deterioration levels of these materials. R3 possesses the lowest stress and strain at break (8.92 MPa and 300%). This concords with previous results which showed that the Mw for R3 is the lowest due to chain scission reactions. R2 that comes from milk pouches and contains hardener (for its fi rst applica-

ISFR - 2005468
tion) showed the highest stress (12.64 Mpa). Concerning R1, it has the highest elongation at break (550 %) and stress at break higher than that of R3, that means the higher molecu-lar weight resulting from crosslinking reactions that happened during the life use of the product (no stabilizer).
The shore D hardness values of the three rLDPEs are relatively higher than those of vir-gin LDPE. This result confi rms that they were subject to some reticulations during their initial utilization which leads to an increase in their superfi cial rigidity.
Table 3: Mechanical properties of virgin LDPE and rLDPE.
SampleStress at break
[MPa]Strain at break [ %] Shore D hardness
Virgin LDPE 13.090 650.00 53R1 12.000 550.00 54R2 12.640 525.00 55R3 08.920 300.00 54
3.2 Peroxide optimization for the vulcanization of the LDPE / EPDM blends
From table 4 it can be seen that the torque increases with the amount of peroxide and there is no optimum for the blends considered.
So the optimum can’t be determined in theses conditions, but we could obtain from the rheometer results the average time and temperature that were 7 minutes and 170 °C.
Stress at break as a function of peroxide concentration is presented in fi gures 1, 2 and 3 for R1/EPDM (98/2, 90/10), R2/EPDM (98/2, 90/10) and R3/EPDM (98/2, 90/10) respec-tively.
Table 4: Rheometer results.
Maximum torque [dNm]R1/EPDM R2/EPDM R3/EPDM
Peroxide [%] 98/2 90/10 98/2 90/10 98/2 90/100.5 11.32 13.87 16.11 16.09 11.16 11.691.0 18.15 20.72 21.44 22.32 18.87 21.021.5 27.90 31.41 29.80 33.01 25.81 28.762.0 34.21 40.50 35.25 42.00 32.21 39.543.0 48.66 60.39 46.98 57.26 44.45 54.93
Figure 1 shows for the two blends considered an optimum peroxide value of 1.5 % and will be so for all blends of R1/ EPDM in the interval [98/2, 90/10]. Figure 2 shows for the two blends considered an optimum peroxide value of 1% and will be so for all blends of R2/EPDM in the interval (98/2, 90/10). Concerning R3, fi gure 3 shows an optimum peroxide value of 1.5% for the blend 98/2, and 1% for the blend 90/10. So for all blends

Innovative techniques in mechanical recycling 469
R3/EPDM of composition between [98/2, 90/10], 1% is chosen as optimum
for the two reasons:
- At 1.5% peroxide there is a big difference between the two stresses, while at 1 % stresses are superposed.
- For economic reasons.
Figure1: Variation of stress at break as a function of the level of peroxide in the case of R1.
0.0 0.5 1.0 1.5 2.0 2.5 3.0 10
11
12
13
14
15
16
17
18
R1/EPDM [98/2]
R1/EPDM [90/10]
Stre
ss a
t bre
ak [M
Pa]
Amount of peroxide [ wt %]
Figure 2: Variation of stress at break as a function of the level of peroxide in the case of R2.
0.0 0.5 1.0 1.5 2.0 2.5 3.0 10
11
12
13
14
15
16
17
18
R2 / EPDM [98/2]
R2 / EPDM [90/10]
Stre
ss a
t bre
ak [M
Pa]
Amount of Peroxide [wt % ]
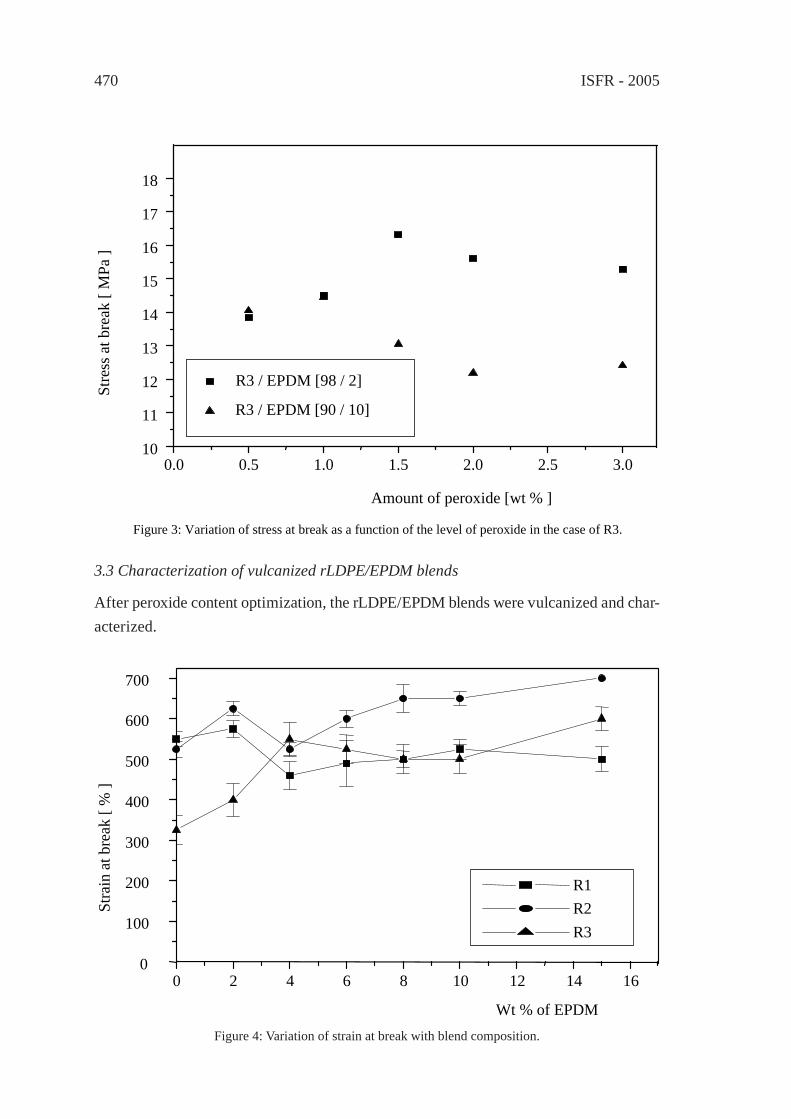
ISFR - 2005470
3.3 Characterization of vulcanized rLDPE/EPDM blends
After peroxide content optimization, the rLDPE/EPDM blends were vulcanized and char-acterized.
Figure 3: Variation of stress at break as a function of the level of peroxide in the case of R3.
Stre
ss a
t bre
ak [
MPa
]
0.0 0.5 1.0 1.5 2.0 2.5 3.0 10
11
12
13
14
15
16
17
18
R3 / EPDM [98 / 2]
R3 / EPDM [90 / 10]
Amount of peroxide [wt % ]
0 2 4 6 8 10 12 14 16 0
100
200
300
400
500
600
700
Stra
in a
t bre
ak [
% ]
Wt % of EPDM
R1 R2 R3
Figure 4: Variation of strain at break with blend composition.
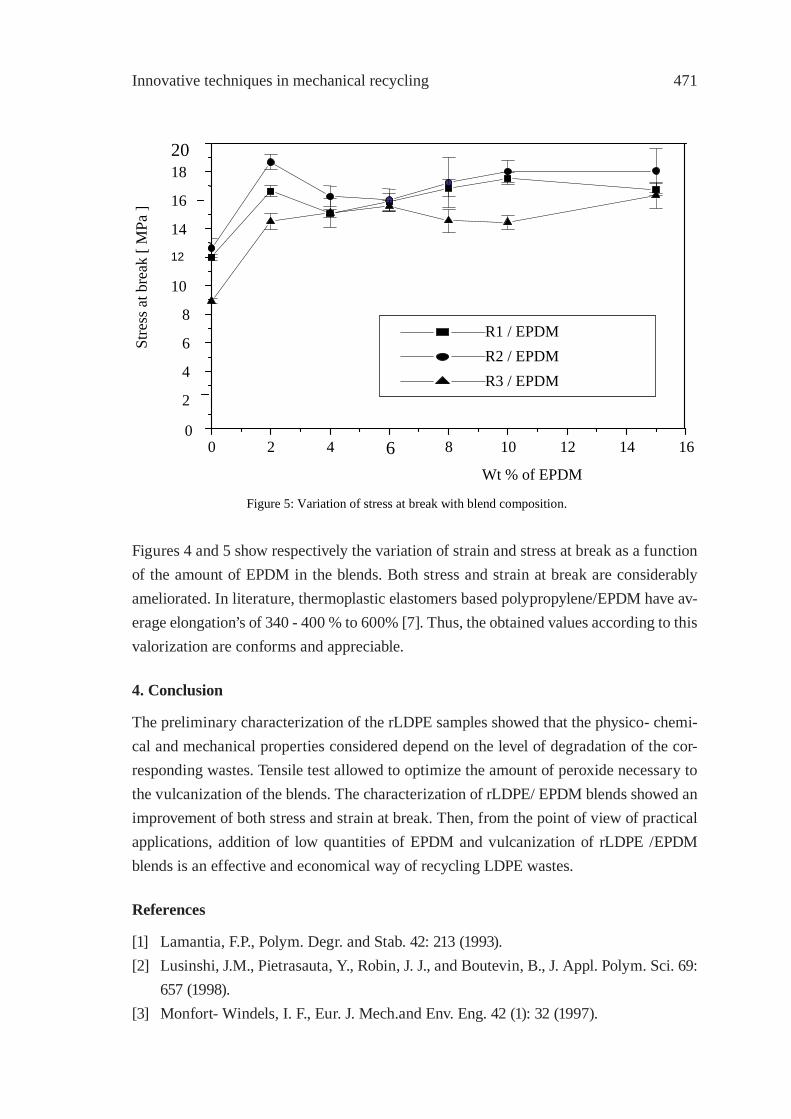
Innovative techniques in mechanical recycling 471
Figures 4 and 5 show respectively the variation of strain and stress at break as a function of the amount of EPDM in the blends. Both stress and strain at break are considerably ameliorated. In literature, thermoplastic elastomers based polypropylene/EPDM have av-erage elongation’s of 340 - 400 % to 600% [7]. Thus, the obtained values according to this valorization are conforms and appreciable.
4. Conclusion
The preliminary characterization of the rLDPE samples showed that the physico- chemi-cal and mechanical properties considered depend on the level of degradation of the cor-responding wastes. Tensile test allowed to optimize the amount of peroxide necessary to the vulcanization of the blends. The characterization of rLDPE/ EPDM blends showed an improvement of both stress and strain at break. Then, from the point of view of practical applications, addition of low quantities of EPDM and vulcanization of rLDPE /EPDM blends is an effective and economical way of recycling LDPE wastes.
References
[1] Lamantia, F.P., Polym. Degr. and Stab. 42: 213 (1993).[2] Lusinshi, J.M., Pietrasauta, Y., Robin, J. J., and Boutevin, B., J. Appl. Polym. Sci. 69:
657 (1998).[3] Monfort- Windels, I. F., Eur. J. Mech.and Env. Eng. 42 (1): 32 (1997).
Figure 5: Variation of stress at break with blend composition.
16
Wt % of EPDM
R1 / EPDM R2 / EPDM R3 / EPDM
0 2 4 6 8 10 12 14 0
2
4
6
8
10
12
14
16
18 20
Stre
ss a
t bre
ak [
MPa
]

ISFR - 2005472
[4] Belhaneche- Bensemra, N., and Chabou, M. A., Ann. Chim.- Sci. Mat. 27: 93 (2002).
[5] Berdjane, K., Benachour, D., Berdjane, Z., Rueda, F., Balta Calleja, D. R., J. Appl. Polym. Sci. 89: 2046 (2003).
[6] Akay, G., Tinçer, T., and Ergoz, H. E., Eur. Polym. J. 16: 601 (1980).[7] White, J. R., Degradation (Weatherability),CD-ROM Polymeric Materials
Encyclopedia, CRC Press INC, 1996.
Innovative techniques in mechanical recycling 473
SYNTHETIC PAPER FROMPOLYPROPYLENE POST-CONSUMER
R. M. Campomanes-Santana1*, I.S. B. Perez2 and S. Manrich2
1ADESPEC-Institute for Technological Research, São Paulo University, SP, Brazil2Department of Material Engineering, Federal University of São Carlos, SP, Brazil,
Abstract: In the last years, the volume of municipal plastics waste (MPW) has largely increased resulting in a critical problem for modern society and future generations. The aim of this work is to obtain composite fi lms of polypropylene (PP) to substitute cellulose paper. The plastic component of this composite is PP from mineral water bottle (PPb) collected from municipal plastic waste (MPW) and CaCO3 as fi ller. Composite fi lms with weight ratio of PPb/CaCO3 of 60:40 were processed to two screw rate. These fi lms were surface treated by corone discharge. Preliminary results have shown a good printability with pencil and pen ink on these fi lms without treating and an improved printability with ink jet after surface treating. These fi lms will be compared to cellulose paper by physical characterizations.
1. Introduction
The pulp and paper industry uses very large amounts of water and creates considerable effl uent problems during the actual production of this industry’s products. On the other hand, the plastic industry does not create environmental problems comparable with those the pulp and paper industry during its production, but create a problem during the fi nal disposal after use, it is the plastic post-consumer. In many cases plastics goods are pro-duced to satisfy the requirements of weather, water, acid and corrosion resistance and, therefore, their disposal is often described as a serious ecological problem: a) The dif-fi culty of reduction of volume to allow economic disposal. In the last years, the volume of municipal plastics waste (MPW) has largely increased resulting in a critical problem for modern society and future generations and b) the diffi culty of degrading polymeric substances to a condition where natural decay mechanism can operate.
A possible alternative solution passes necessarily by improved techniques of recycling that will direct at least toward an adequate use of these materials [1, 2].
A substantial part of MPW is composed of mixed polymers. The processing of plastics mixtures for recycling has been attempted with some success; however poor mechani-cal properties and uncertain economic values can limit more versatile recovering [3, 4]. Polyolefi nes, PET and PS as well as HIPS are among the most common plastics waste, because they are among the most frequently used commercial plastics in our daily lives
ISFR - 2005474
as well as in industries [5].
Polypropylene (PP) is used in a very wide variety of products, only a few of which can be readily collected, sorted and recovered, after they have served their intended purpose. In relation to PP fi lms, the use of biaxial oriented PP fi lms is directed to packaging ap-plications, where low permeability of moisture is required. These fi lms present a high tear initiation resistance and low tear propagation resistance. However, a disadvantage of these fi lms is that it is not receptive to ordinary ballpoint pen ink, pencil and water-based inks, letterpress and off set printing inks [6, 7]. Composite fi lms of PP, known in the art as synthetic paper, are other trend to obtain a fi lm capable of receiving inks [8 - 10].
The different processing conditions to obtain synthetic paper from virgin resin are de-scribed in several patents [9 - 10]. These composite fi lms contain inorganic fi llers and additives, such as calcium carbonate (CaCO3), kaolin, titanium dioxide, talc and diatoma-ceous earth that improve their rigidity, tensile resistance, opacity and good printing prop-erty [9, 11]. The presence of CaCO3 in the fi lm imparts the formation of voids, and this fi rstly provides a reduction in a density, secondly, such voids improve the opacity as it allows the light rays to be diffracted [7, 8, 11]. On the other hand, the quality of the fi lm depends on the volume fraction, size, dispersion and shape of the voids. For instance, large voids reduce strength and impair printability. Moreover, the way in which voids form can also affect productivity [12, 13].
Publications about studies on composite fi lms from municipal plastic waste (MPW) are very scarce [14, 15, 16]. In those works were the mechanical recycling of post-consumer rigid plastic was analyzed considering the effects of varying materials, composition of PP/CaCO3
[14, 15] e PET/polyolephines/CaCO3 [16] composites, as well as process type and thermo-chemical surface treatment, on physical-mechanical and surface properties of the obtained composite fi lms.
Therefore, one alternative of solution will be the recycling of plastic pos-consumer and process new products, such as the composite fi lms.
Composite fi lms are paper-like plastics fi lm produced by extrusion technology without any additional treatment of the surface of the fi lm (e.g. thin paper-like polypropylene fi lm). Plastic paper is an important development in the fi eld of the already conventional technology of producing plastics fi lms that have been replacing paper without being “pa-per-like”. The new types of paper-like fi lms have a large-scale potential market, mainly in packaging.
Synthetic paper comprises a wide range of new products based on plastics fi lm, which un-dergoes various types of treatment, like clay coating and or fi lling with titanium dioxide, silicon dioxide, calcium carbonate, etc., to achieve “paper resemblance” (opacity, rigidity,
Innovative techniques in mechanical recycling 475
creasing ability and good printability). This process is sometimes called “paperizing” of plastics fi lm. Synthetic papers of this type are mainly used for art paper applications, whereby the properties of plastics lead to qualities superior to those of pulp-based art paper.
The aim of this work is to obtain composite fi lms of polypropylene (PP) to substitute cel-lulose paper and to study the effects of the surface treatment by corona discharge on the composite fi lms of polypropylene from post consumer through physical-chemical and morphology properties.
2. Experimental
The materials used in the recycled composite was PP from mineral water bottles of 0.5, 1.5 and 3.5 L, obtained from selectively collected plastic waste in Federal University of São Carlos, SP, Brazil and calcium carbonate (CaCO3) as fi ller (Inacarb 700 from Quim-barra Group-Brazil). PP was pre-ground, washed only with water, dried and ground again in the fl akes form [17]. Composite granulation (pellets) of PPb/CaCO3 (60:40) in weight was carried out in a Werner Pfl eiderer twin-screw extruder, at 150 rpm and with tempera-ture profi le of 225, 235, 235, 240, 240 and 240 oC. Also other additives were added to the composite: 3 % wt of TiO2 as pigment, 1 % wt of SiO2 as anti-blocking agent and 0,2 % wt Irganox B215 as stabilizing agent. The composite fi lms of PP/fi ller was processed in a fi lm-blowing extruder, CIOLA IF40 to rate screw of 500 and 800 rpm (nominal) and with temperature profi le of 190, 200, 210 and 220 oC in the fourth sections Composite fi lm was fi nally was fi nally subjected to treatment by corona discharge to improve surface tension of the skin layer.
Surface morphology was characterized with the scanning electron microscope (SEM) LO mod. Stereoscan 440. Surface tension was measured by a pendant drop method performed in the goniometer TANTEC, model CAM-Micro, based on ASTM D724-89 standard, us-ing two liquids: water and methylene iodide. Ink adherence was determined based on ASTM D3359 standard. The Physical-chemical characterization used to the fi lm-compos-ite surface were, grammage (ASTM D646), humidity (TAPPI T411) and oil absorption (NBR 6043) were evaluated
3. Results and Discussion
In the fi gure 1 are showed the morphologic surface of fi lm-composite processed at 500 rpm. Observe in the fi gure 1 (a) a rugose surface with a good dispersion of fi ller in the matrix. Despite a higher magnifi cation of the micrograph fi gure 1 (b), the presence of microcavitations on the fi lm surface was scarce and can be considered negligible.

ISFR - 2005476
Figure 1: SEM micrographs of recycled fi lm-composite surface processed at 500 rpm, with magnifi ca-tion of (a) 1000 times, and (b) 6000 times.
In the fi gure 2 are showed the morphologic surface of fi lm-composite processed at 800 rpm. Also, we observe in the fi gure 2(a) a rugose surface with a good dispersion of fi ller (CaCO3) in the matrix too. The presence and formation of microcavitations on the fi lm surface are shown in the magnifi cated micrograph of the fi gure 2 (b). This result indi-cates that the presence of CaCO3 in the fi lm surface layer imparts the formation of voids when the fi lm is subjected to the biaxial orientation. Such voids fi rstly provide a reduc-tion in the density. Secondly, such voids improve the opacity as it alloys the light rays to be diffracted [6, 7, 8]. This result (higher opacity) is very important for to application in synthetic paper.
Figure 2: SEM micrographs of recycled fi lm-composite surface processed at 800 rpm, with magnifi ca-tion of (a) 1000 times, and (b) 6000 times.
In relation to the physical-chemical properties of fi lm-composite surface, in the table 1 are shown the grammage and thickness of the cellulose paper and the fi lm-composite. We observed the grammage and thickness of cellulose paper present homogeneous values with lower deviations than the fi lms composites, as well as these values are near to fi lm-composite (800 rpm).
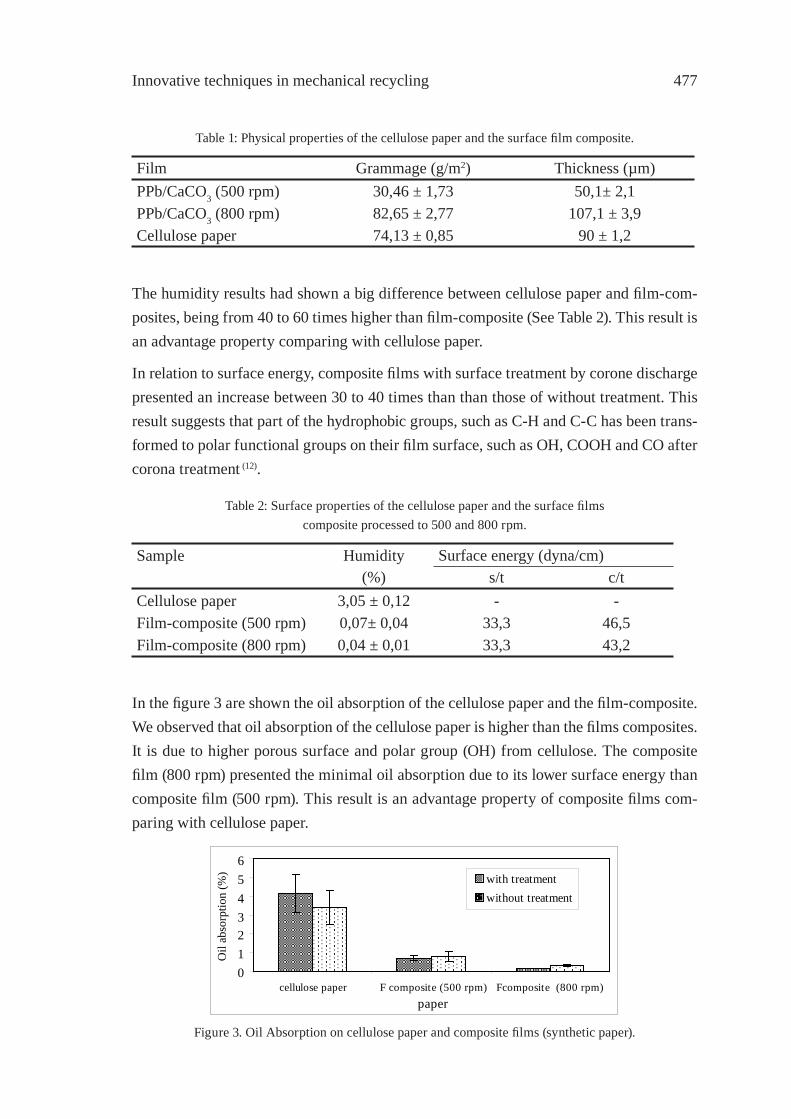
Innovative techniques in mechanical recycling 477
Table 1: Physical properties of the cellulose paper and the surface fi lm composite.
Film Grammage (g/m2) Thickness (µm)PPb/CaCO3 (500 rpm) 30,46 ± 1,73 50,1± 2,1PPb/CaCO3 (800 rpm) 82,65 ± 2,77 107,1 ± 3,9Cellulose paper 74,13 ± 0,85 90 ± 1,2
The humidity results had shown a big difference between cellulose paper and fi lm-com-posites, being from 40 to 60 times higher than fi lm-composite (See Table 2). This result is an advantage property comparing with cellulose paper.
In relation to surface energy, composite fi lms with surface treatment by corone discharge presented an increase between 30 to 40 times than than those of without treatment. This result suggests that part of the hydrophobic groups, such as C-H and C-C has been trans-formed to polar functional groups on their fi lm surface, such as OH, COOH and CO after corona treatment (12).
Table 2: Surface properties of the cellulose paper and the surface fi lmscomposite processed to 500 and 800 rpm.
Sample Humidity Surface energy (dyna/cm)(%) s/t c/t
Cellulose paper 3,05 ± 0,12 - -Film-composite (500 rpm) 0,07± 0,04 33,3 46,5Film-composite (800 rpm) 0,04 ± 0,01 33,3 43,2
In the fi gure 3 are shown the oil absorption of the cellulose paper and the fi lm-composite. We observed that oil absorption of the cellulose paper is higher than the fi lms composites. It is due to higher porous surface and polar group (OH) from cellulose. The composite fi lm (800 rpm) presented the minimal oil absorption due to its lower surface energy than composite fi lm (500 rpm). This result is an advantage property of composite fi lms com-paring with cellulose paper.
0123456
cellulose paper F composite (500 rpm) Fcomposite (800 rpm)paper
Oil
abso
rptio
n (%
) with treatmentwithout treatment
Figure 3. Oil Absorption on cellulose paper and composite fi lms (synthetic paper).
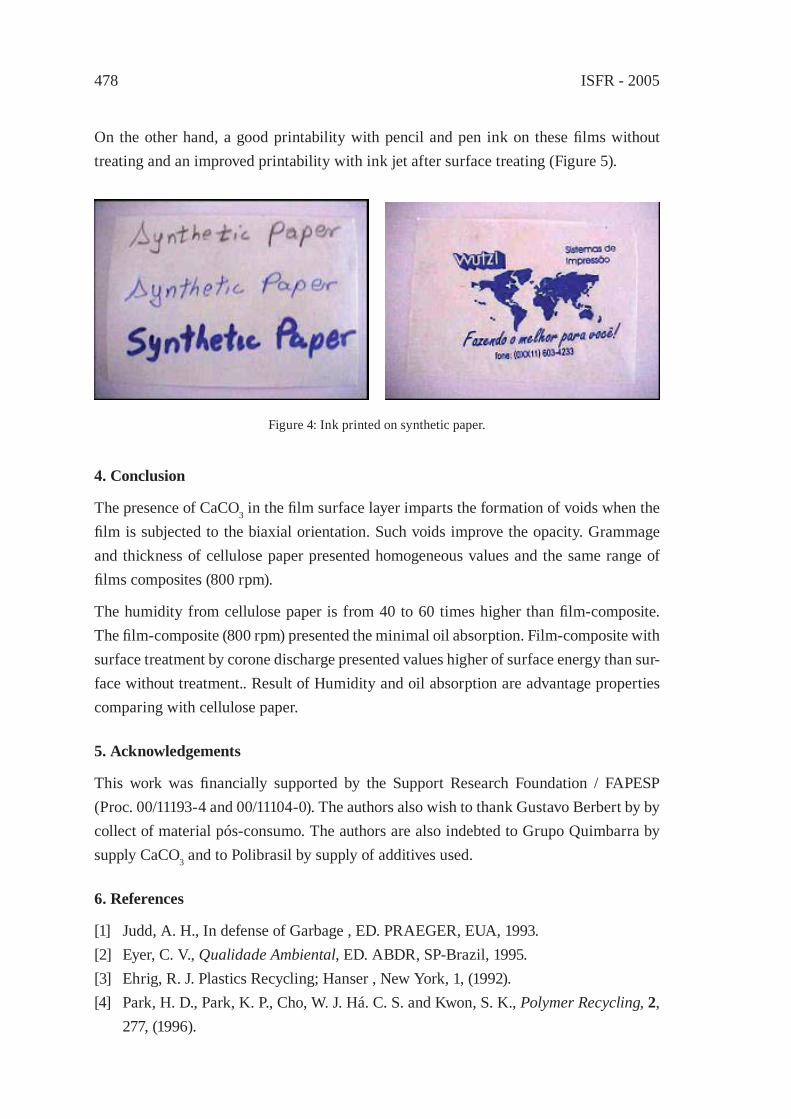
ISFR - 2005478
On the other hand, a good printability with pencil and pen ink on these fi lms without treating and an improved printability with ink jet after surface treating (Figure 5).
Figure 4: Ink printed on synthetic paper.
4. Conclusion
The presence of CaCO3 in the fi lm surface layer imparts the formation of voids when the fi lm is subjected to the biaxial orientation. Such voids improve the opacity. Grammage and thickness of cellulose paper presented homogeneous values and the same range of fi lms composites (800 rpm).
The humidity from cellulose paper is from 40 to 60 times higher than fi lm-composite. The fi lm-composite (800 rpm) presented the minimal oil absorption. Film-composite with surface treatment by corone discharge presented values higher of surface energy than sur-face without treatment.. Result of Humidity and oil absorption are advantage properties comparing with cellulose paper.
5. Acknowledgements
This work was fi nancially supported by the Support Research Foundation / FAPESP (Proc. 00/11193-4 and 00/11104-0). The authors also wish to thank Gustavo Berbert by by collect of material pós-consumo. The authors are also indebted to Grupo Quimbarra by supply CaCO3 and to Polibrasil by supply of additives used.
6. References
[1] Judd, A. H., In defense of Garbage , ED. PRAEGER, EUA, 1993.[2] Eyer, C. V., Qualidade Ambiental, ED. ABDR, SP-Brazil, 1995.[3] Ehrig, R. J. Plastics Recycling; Hanser , New York, 1, (1992).[4] Park, H. D., Park, K. P., Cho, W. J. Há. C. S. and Kwon, S. K., Polymer Recycling, 2,
277, (1996).
Innovative techniques in mechanical recycling 479
[5] Instituto de Pesquisas Tecnológicas, “Lixo Municipal- manual de Gerenciamento Integrado”, Publ. IPT 2163, Agosto, 1996, SP, p.172.
[6] Prioleau, R.M. Recycling of Polypropylene in Plastics, Rubber and paper Recycling, ACS Symposium Series, 609, Chap. 7, Editors: Rader, C. et al., 1994.
[7] Mannar, S. M., European Patent Application, Patent No.93300071-3, 1994.[8] Ohno, A. et al., European Patent Application, Patent No.95102507.1, 1995.[9] Yamanaka et al., US Patent&Trademark Offi ce, No. 6,086,987, 2000.[10] Ota, S. et al., US Patent&Trademark Offi ce, No. 6,136,750, 2000.[11] Ito, K. et al., Plastics, Rubber and Composites, 31, pp. 1-7, 2002.[12] Inagaki, N., Tasaka, S., Shimada, S., J. of Applied Polymer Science, 79(15), pp. 808-
815, 2000.[13] Lu, Q-H et al., J. of Applied Polymer Science, 82, pp. 2739-2743, 2001.[14] Manrich, S., Polymer Recycling, v. 5, No. 4, 2000, p. 213-221.[15] Santana, R.M.C. and Manrich, S., International Congress ANTEC, San Francisco,
USA, May, 5-9, 2002.[16] Santana, R.M.C.; Ravazzi, R.; Danella, O. E. e Manrich, S., VI International Conference
on Frontiers of Polymers and Advanced Materials-ICFPAM, Pernambuco, Brasil, 2001.
[17] Trevizan, D., Campomanes S., R. and Manrich, S. Otimização dos parâmetros do sistema de Lavagem/Secagem dos copos de HIPS provenientes da coleta seletiva do campus, VII Congresso de Iniciação Científi ca (CIC), UFSCar/ São Carlos, Brazil, Anais pp. TE450, 2000.

ISFR - 2005480
Innovative techniques in mechanical recycling 481
UPGRADING OF PVC FROM CREDIT CARDS BY BLENDSWITH STYRENIC PLASTICS
D. García*, J. López, L. Sánchez, J. E.CrespoPolytechnic University of Valencia, Department of Mechanical and Materials
Engineering. Paseo del Viaducto, 1, 03801, Alcoy (Spain)*e-mail:[email protected]
Abstract: The aim of this work is about the improvement of performance of recycled PVC coming from credit cards by means of mixing with different styrenic materials as viable solution with the aim of increasing the benefi ts of this recycled PVC and by this way to increase its applications. Styrene Acrylonitrile copolymer (SAN) and Acrylonitrile Butadiene Styrene copolymer (ABS) have been used for this blends. These materials are characterized by their high thermal stability. Miscibility has been determined in the dif-ferent blends by means of differential scanning calorimetry (DSC). Also, the infl uence of styrenic materials on thermal stability of recycled PVC has been analyzed using Vicat softening temperature (VST). Finally it has been carried out the study of mechanical properties of the blends.
1. Introduction
PVC is one of the most used plastics in the market, with a worldwide annual production capacity of more than 30 million annual tons; it is the second largest volume thermo-plastic, just behind polyolefi nes [1]. This great production can be attributed to unique properties [2] that PVC possesses due to low cost and process versatility, combined with good physical and chemical properties. Because of this PVC is used in great variety of ap-plications. Production of pipes for hydro-sanitary fi xtures is an important application for recycled PVC. In these products thermal stability is one of the most important properties, so Vicat Softening Point (VST) is used as a quality control.
The main problem about use of the recycled PVC waste is the reduction of performance because of the degradation suffered by the material due to processing or service life [3-5]. These phenomena can disable the use of the recycled material in those applications where fulfi l of some requirements is required regarding to thermal stability or mechanical properties.
On the other hand, PVC substitution by PET in packing sector has originated the disap-pearance of a residual source of excellent quality characterized by a good stiffness and used by other industries, like hydro-sanitary sector, main consumer of recycled PVC. The use of PVC coming from fl exible sheets arises as alternative; however, in front of the residual coming from the packing industry, the PVC coming from credit cards presents

ISFR - 2005482
a lower stiffness, since the origin product possesses high fl exibility. For this reason, this material is not appropriate for hydro-sanitary sector which has a strict normative.
2. Experimental
2.1. Materials
The materials used for this study are shown below. Some properties of these materials are shown in Table 1.
i) Recycled PVC in pellet form supplied by Crearplast, S.L. (Ibi, Spain), coming from credit card residues with standard fi lm grade. This PVC were washed to remove any contaminants and crushed in a granulator, then extruded adding 1 p.h.r. of calcium zinc stabilizer, 0,5 p.h.r. calcium stereate and 2,5 p.h.r. of calcium carbonate powder.
ii) SAN POLIDUX® S-580 in pellet form supplied by Repsol Química, S.A. (Madrid, Spain).
iii) ABS POLIDUX® A-164 in pellet form supplied by Repsol Química, S.A. (Madrid, Spain).
Table 1: Properties of materials used.
Density (g/cm3) K value MFI (g/10min)Recycled PVC 1.35 62 -
SAN POLIDUX® S-580 1.08 - 10.1ABS POLIDUX® A-164 1.06 10.4
2.2 Preparation of blends and samples
Blends of recycled PVC with raw and recycled SAN of different mass fraction of poly-mers (0/100, 10/90, 20/80, 30/70 ,40/60, 50/50, 60/40, 70/30, 80/20, 90/10 and 100/0) were mixed using a two-roll mill (front roll 170 ºC; rear roll 180 ºC) for 5 min. Samples for impact Charpy impact and tensile test were obtained using hot plate press at 140 ºC for 5 min and shaped with a universal clipper. Samples that could not be shaped because of its brittleness were machined.
2.3 Differential scanning calorimetry analysis
Miscibility of the different components of PVC blends has been followed through the changes on glass transition temperature (Tg) by using registers of DSC obtained with a Mettler-Toledo 821 (Mettler Toledo Inc., Schwerzenbach, Switzerland). Samples of 5-7 mg were subjected to a fi rst heating process (30-120 ºC at 10 ºC/min) followed by a slow cooling process to remove thermal history and were heated again (30-160 ºC at 10 ºC/min) until degradation. Measurements of glass transition temperature were made on the second
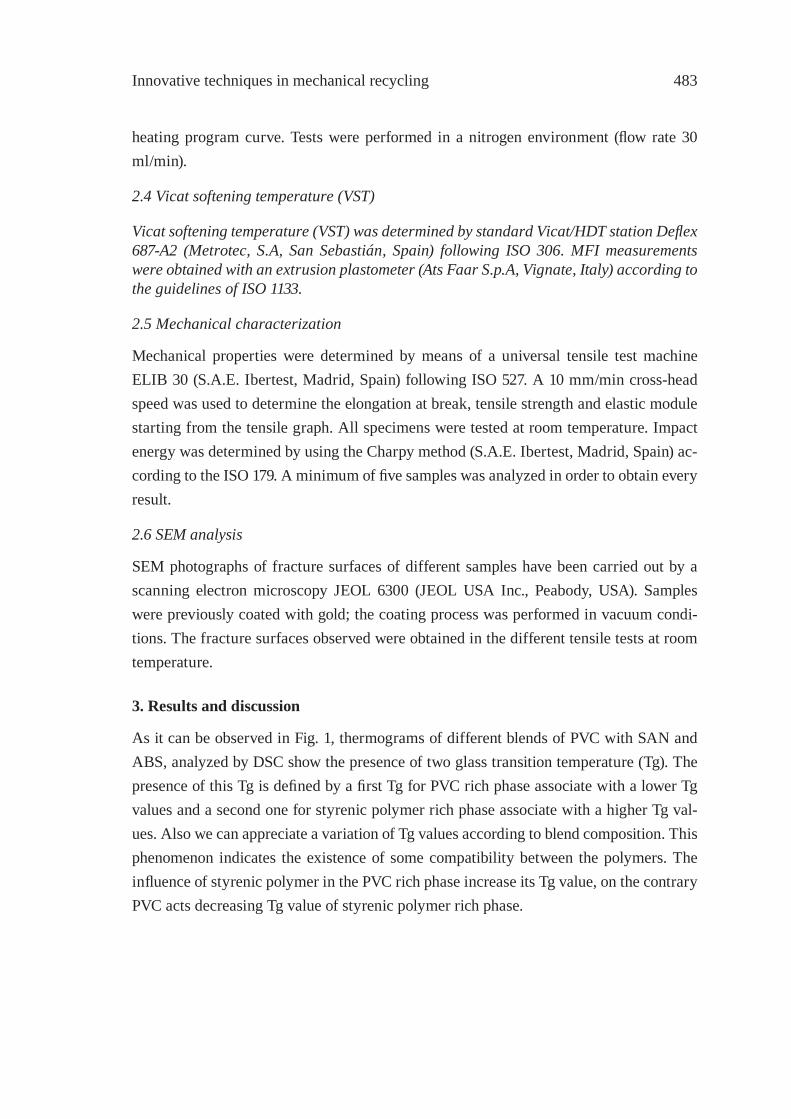
Innovative techniques in mechanical recycling 483
heating program curve. Tests were performed in a nitrogen environment (fl ow rate 30 ml/min).
2.4 Vicat softening temperature (VST)
Vicat softening temperature (VST) was determined by standard Vicat/HDT station Defl ex 687-A2 (Metrotec, S.A, San Sebastián, Spain) following ISO 306. MFI measurements were obtained with an extrusion plastometer (Ats Faar S.p.A, Vignate, Italy) according to the guidelines of ISO 1133.
2.5 Mechanical characterization
Mechanical properties were determined by means of a universal tensile test machine ELIB 30 (S.A.E. Ibertest, Madrid, Spain) following ISO 527. A 10 mm/min cross-head speed was used to determine the elongation at break, tensile strength and elastic module starting from the tensile graph. All specimens were tested at room temperature. Impact energy was determined by using the Charpy method (S.A.E. Ibertest, Madrid, Spain) ac-cording to the ISO 179. A minimum of fi ve samples was analyzed in order to obtain every result.
2.6 SEM analysis
SEM photographs of fracture surfaces of different samples have been carried out by a scanning electron microscopy JEOL 6300 (JEOL USA Inc., Peabody, USA). Samples were previously coated with gold; the coating process was performed in vacuum condi-tions. The fracture surfaces observed were obtained in the different tensile tests at room temperature.
3. Results and discussion
As it can be observed in Fig. 1, thermograms of different blends of PVC with SAN and ABS, analyzed by DSC show the presence of two glass transition temperature (Tg). The presence of this Tg is defi ned by a fi rst Tg for PVC rich phase associate with a lower Tg values and a second one for styrenic polymer rich phase associate with a higher Tg val-ues. Also we can appreciate a variation of Tg values according to blend composition. This phenomenon indicates the existence of some compatibility between the polymers. The infl uence of styrenic polymer in the PVC rich phase increase its Tg value, on the contrary PVC acts decreasing Tg value of styrenic polymer rich phase.
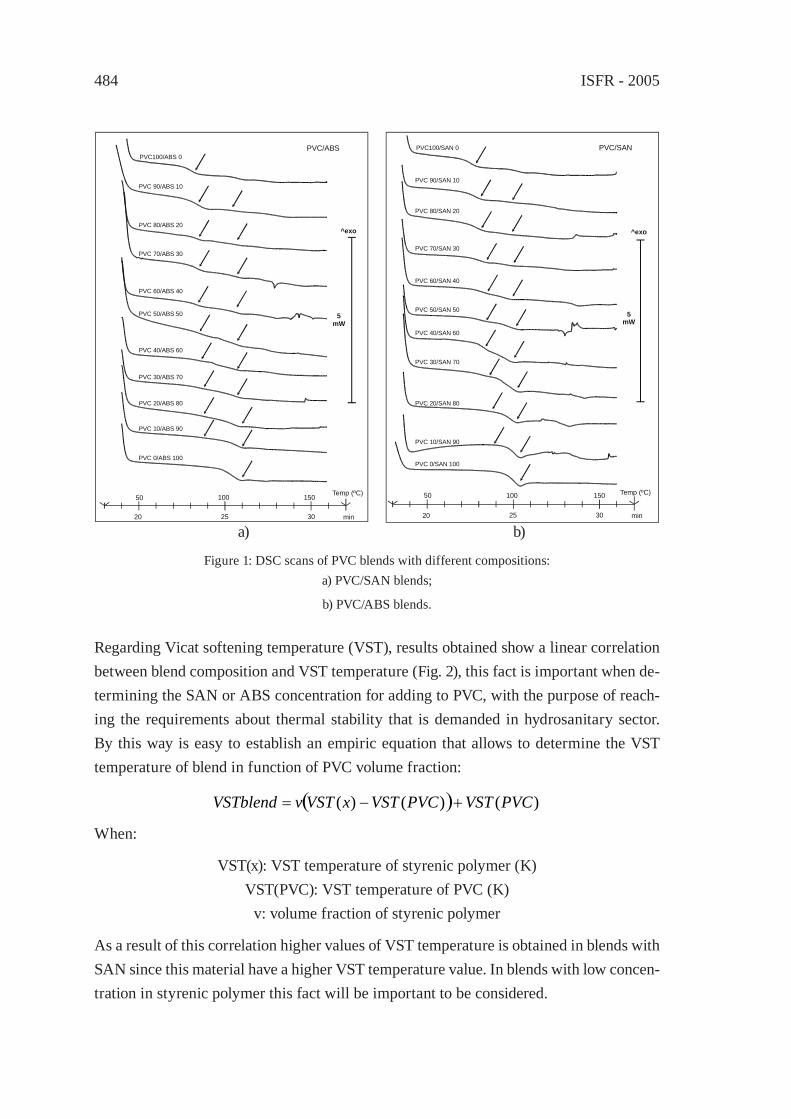
ISFR - 2005484
a) b)
Figure 1: DSC scans of PVC blends with different compositions:a) PVC/SAN blends;
b) PVC/ABS blends.
Regarding Vicat softening temperature (VST), results obtained show a linear correlation between blend composition and VST temperature (Fig. 2), this fact is important when de-termining the SAN or ABS concentration for adding to PVC, with the purpose of reach-ing the requirements about thermal stability that is demanded in hydrosanitary sector. By this way is easy to establish an empiric equation that allows to determine the VST temperature of blend in function of PVC volume fraction:
^exo
5mW
50 100 150
20 25 30 min
Temp (ºC)
PVC 90/SAN 10
PVC100/SAN 0
PVC 80/SAN 20
PVC 70/SAN 30
PVC 60/SAN 40
PVC 50/SAN 50
PVC 40/SAN 60
PVC 30/SAN 70
PVC 20/SAN 80
PVC 10/SAN 90
PVC 0/SAN 100
PVC/SAN
^exo
5mW
50 100 150 Temp (ºC)
20 25 30 min
PVC 90/ABS 10
PVC100/ABS 0
PVC 80/ABS 20
PVC 70/ABS 30
PVC 60/ABS 40
PVC 50/ABS 50
PVC 40/ABS 60
PVC 30/ABS 70
PVC 20/ABS 80
PVC 10/ABS 90
PVC 0/ABS 100
PVC/ABS
( ) )()()( PVCVSTPVCVSTxVSTvVSTblend +−=
When:
VST(x): VST temperature of styrenic polymer (K)VST(PVC): VST temperature of PVC (K)
v: volume fraction of styrenic polymer
As a result of this correlation higher values of VST temperature is obtained in blends with SAN since this material have a higher VST temperature value. In blends with low concen-tration in styrenic polymer this fact will be important to be considered.
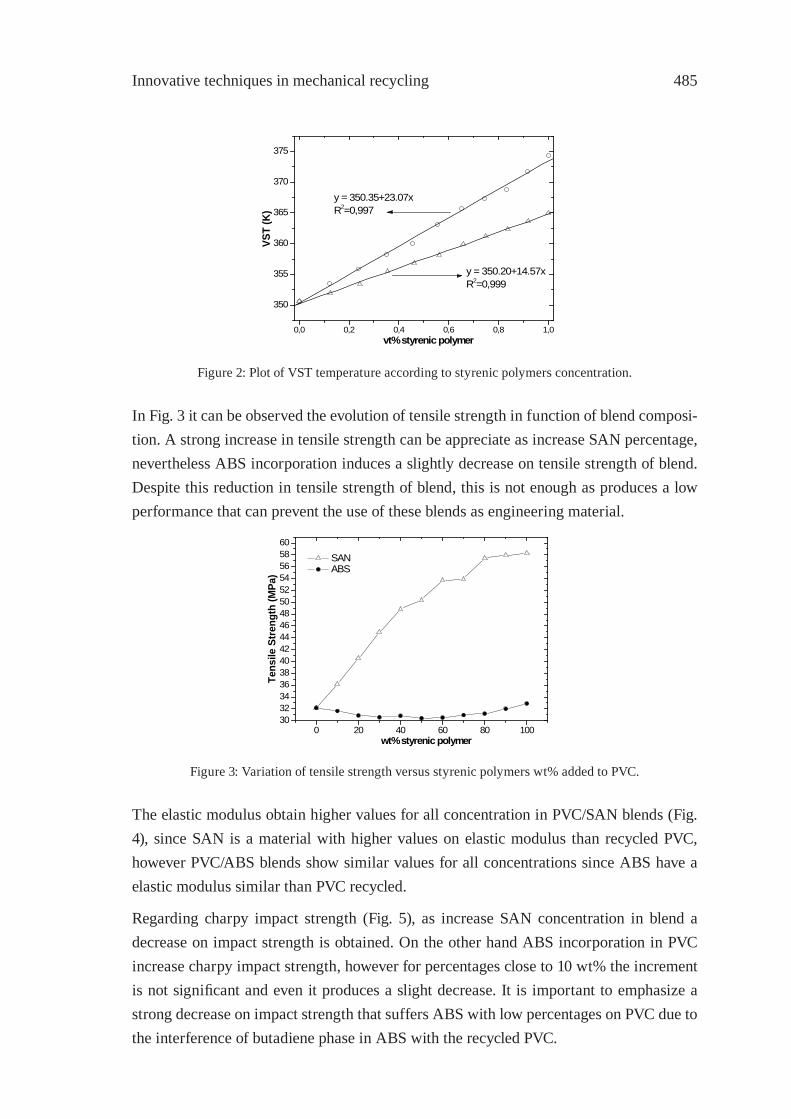
Innovative techniques in mechanical recycling 485
0,0 0,2 0,4 0,6 0,8 1,0
350
355
360
365
370
375
y = 350.20+14.57xR2=0,999
y = 350.35+23.07xR2=0,997
VST
(K)
vt% styrenic polymer
Figure 2: Plot of VST temperature according to styrenic polymers concentration.
In Fig. 3 it can be observed the evolution of tensile strength in function of blend composi-tion. A strong increase in tensile strength can be appreciate as increase SAN percentage, nevertheless ABS incorporation induces a slightly decrease on tensile strength of blend. Despite this reduction in tensile strength of blend, this is not enough as produces a low performance that can prevent the use of these blends as engineering material.
0 20 40 60 80 10030323436384042444648505254565860
wt% styrenic polymer
SAN ABS
Tens
ile S
tren
gth
(MPa
)
Figure 3: Variation of tensile strength versus styrenic polymers wt% added to PVC.
The elastic modulus obtain higher values for all concentration in PVC/SAN blends (Fig. 4), since SAN is a material with higher values on elastic modulus than recycled PVC, however PVC/ABS blends show similar values for all concentrations since ABS have a elastic modulus similar than PVC recycled.
Regarding charpy impact strength (Fig. 5), as increase SAN concentration in blend a decrease on impact strength is obtained. On the other hand ABS incorporation in PVC increase charpy impact strength, however for percentages close to 10 wt% the increment is not signifi cant and even it produces a slight decrease. It is important to emphasize a strong decrease on impact strength that suffers ABS with low percentages on PVC due to the interference of butadiene phase in ABS with the recycled PVC.
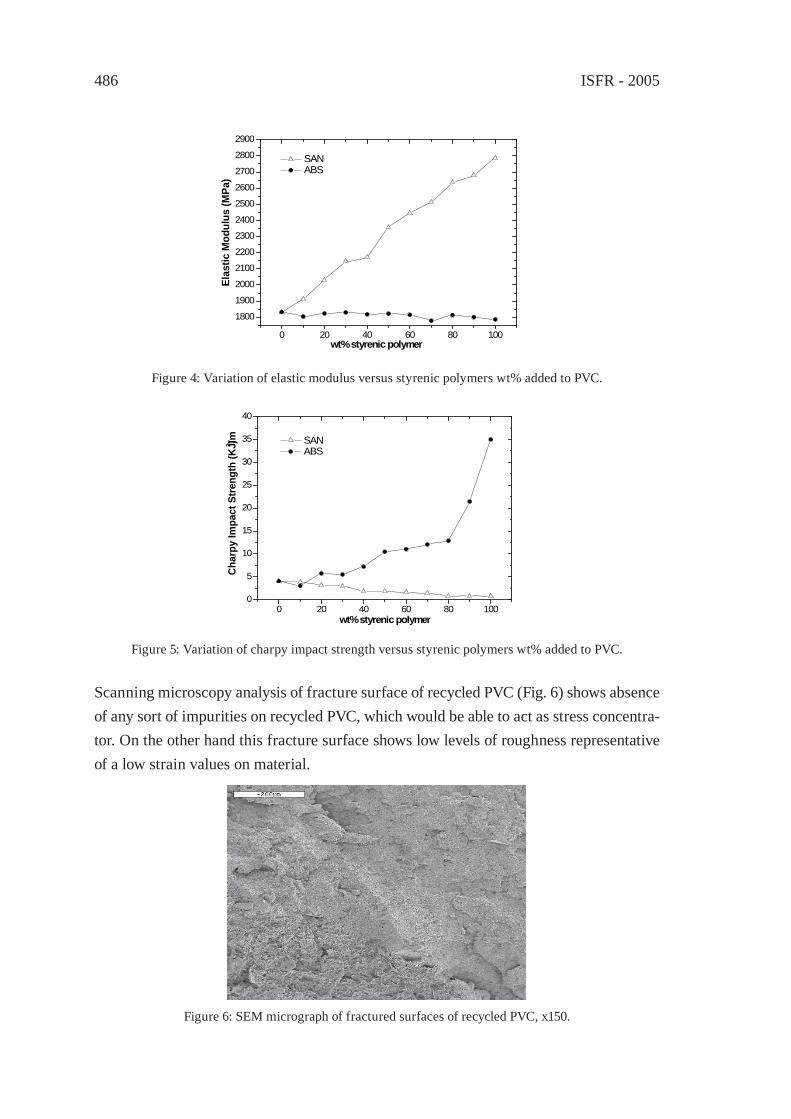
ISFR - 2005486
0 20 40 60 80 100
1800
1900
2000
2100
2200
2300
2400
2500
2600
2700
2800
2900
wt% styrenic polymer
Elas
tic M
odul
us (M
Pa)
SAN ABS
Figure 4: Variation of elastic modulus versus styrenic polymers wt% added to PVC.
0 20 40 60 80 1000
5
10
15
20
25
30
35
40
SAN ABS
Char
py Im
pact
Stre
ngth
(KJ/
m2 )
wt% styrenic polymer
Figure 5: Variation of charpy impact strength versus styrenic polymers wt% added to PVC.
Scanning microscopy analysis of fracture surface of recycled PVC (Fig. 6) shows absence of any sort of impurities on recycled PVC, which would be able to act as stress concentra-tor. On the other hand this fracture surface shows low levels of roughness representative of a low strain values on material.
Figure 6: SEM micrograph of fractured surfaces of recycled PVC, x150.

Innovative techniques in mechanical recycling 487
4. Conclusions
SAN and ABS addition on PVC allow to increase thermal properties of recycled PVC de-termined by vicat softening temperature (VST) showing a linear correlation between sty-renic polymer concentration and VST temperature. PVC/SAN blends obtain higher values on VST temperature than PVC/ABS blends, since butadiene in ABS offers lower thermal properties. On the other hand, styrenic polymer addition on PVC produces a strong vari-ation on mechanical properties; however results obtained show a signifi cant connection with styrenic polymer nature (SAN or ABS). On this matter SAN incorporation induces an increase on mechanical resistant properties, however a reduction on mechanical duc-tile properties is observed. Regarding to PVC/ABS blends, ABS incorporation improve mechanical ductile properties attributed to butadiene content in ABS.
Acknowledgments
The authors thank “Ministerio de Ciencia y Tecnología”, CICYT Ref: MAT 2003-05511 for their fi nancial support.
References
[1] Braun, D., J. Vinyl Addit. Technol. 7:168 (2001).[2] Summers, J.W., J. Vinyl Addit. Technol. 3:130 (1997).[3] Ulutan, S., J. Appl. Polym. Sci. 90:3994 (2003).[4] Yarahmadi, N., Jakubowicz, I., Gevert, T., Polym. Degrad. Stabil. 73:93 (2001).[5] Sombatsompop, N., Sungsanit, K., J. Appl. Polym. Sci. 89:2738 (2003).

ISFR - 2005488
Innovative techniques in mechanical recycling 489
UPGRADING STYRENE WASTES. EFFECT OF IMPURITIES AND PREVIOUS DEGRADATION ON FINAL PERFORMANCE
F. Parres*, R. Balart, J. López, L. SánchezPolytechnic University of Valencia, Department of Mechanical and Materials
Engineering. Paseo del Viaducto, 1, 03801, Alcoy (Spain),*e-mail: [email protected]
Abstract: The use of styrenic polymers in the packing industry has increased considerably in the last years and as a consequence, a big amount of styrenic residues are generated every year. These polymers are sensitive to degradation (thermal and foto-degradation) processes which can highly infl uence on fi nal performance of the upgraded materials. Also, as we are working with waste materials it is possible to fi nd some impurities mixed with styrenic residues. The miscibility/compatibility of the impurities can be responsible, at a certain extent, of the decrease on fi nal performance of the recycled materials. The most important impurities are poliolefi ns (mainly polyethylene and polypropylene) and, in certain cases, some traces of thermoplastic polyesters.
1. Introduction
During last years the consumption of polymers has increased considerably, since these materials offer a great variety of properties. One of the most remarkable properties of polymers is their low density; this property is especially important in certain industrial sectors which require light weight materials such as packing industry; in this industry, substitution of traditional materials by plastics has allowed great energy effi ciency.
On the other hand, materials used in packing industry show a very short life cycle so big amount of plastics residues are generated with the consequent environmental problems associated to them. Polystyrene (and its derivatives) is used in different industrial sec-tors, although packing industry is the one of most important consumer due to an easy processing and excellent properties for food contact. Styrenic polymers are sensitive to both thermal and photo degradation processes. Thermal degradation can be attributed to processing and re-processing conditions and photo degradation can be related to the wastes storage. This degradation processes can promote an early degradation on the up-graded material.
As we are working with recycled materials, it is possible (and diffi cult to avoid) to fi nd some impurities which can compromise fi nal performance of upgraded polystyrene. The presence of impurities is related with the separation processes of the different polystyrene wastes streams.
ISFR - 2005490
The main aim of this work is to upgrade styrene wastes coming from packing industry and to study the infl uence of the photo-degradation processes and presence of impurities (mainly poliolefi ns) on fi nal performance of upgraded materials. These impurities are mainly polyethylene and polypropylene but in some cases it is possible to fi nd thermoplas-tic polyesters and acetal polymers.
2. Experimental
Differential scanning calorymetry technique has been used to determine the presence of impurities by using a Mettler-Toledo 821 DSC (Mettler Toledo Inc., Schwarzenbach, Switzerland).
Several mixtures of HIPS (Empera® 514) with PP (ISPLEN PB 180 G2M) with different percentage (2.5, 5, 7.5, 10 % weigth) have been prepared to study the infl uence of im-purities about the behaviour of polystyrene. Mixtures have been processed by injection moulding to obtain samples for tensile tests.
On the other hand, and with the purpose of analyzing the infl uence of photo-degradation processes, we have used polystyrene sheets used in dairy products. In this case, sheets have been provided by the recycling company (ACTECO S.A., Alcoy, Spain). Sheets have been exposed during 12 weeks to the solar light with 45º tilt with south direction and the evolution of the mechanical properties has been carried out.
3. Results and discussion
3.1. Infl uence of impurities
It is possible to determine the presence of impurities by using thermal analysis. Differ-ential scanning calorimetry is very useful to determine (in a qualitative and quantitative way) the presence of impurities that can compromise fi nal performance. Fig 1. shows some DSC curves for different styrene wastes. We can appreciate the glass transition temperature of the styrenic phase which is close to 95-97 ºC. We can also observe the presence of two semicrystalline polymers as impurities of the styrenic phase. The endo-thermic peak near 125 ºC can be attributed to a low density polyethylene (LD-PE). The presence of polyethylene can be related with the use of this polymer as a masterbatch for colour. Polyethylene appears in very small amounts and, although it is not miscible with styrene phase, does not compromise signifi cantly fi nal performance of upgraded residues as we will see below.
The endothermic peak around 165 ºC is attributed to polypropylene impurities which can appear in considerable amounts (3-6 %). The presence of polypropylene as an impurity
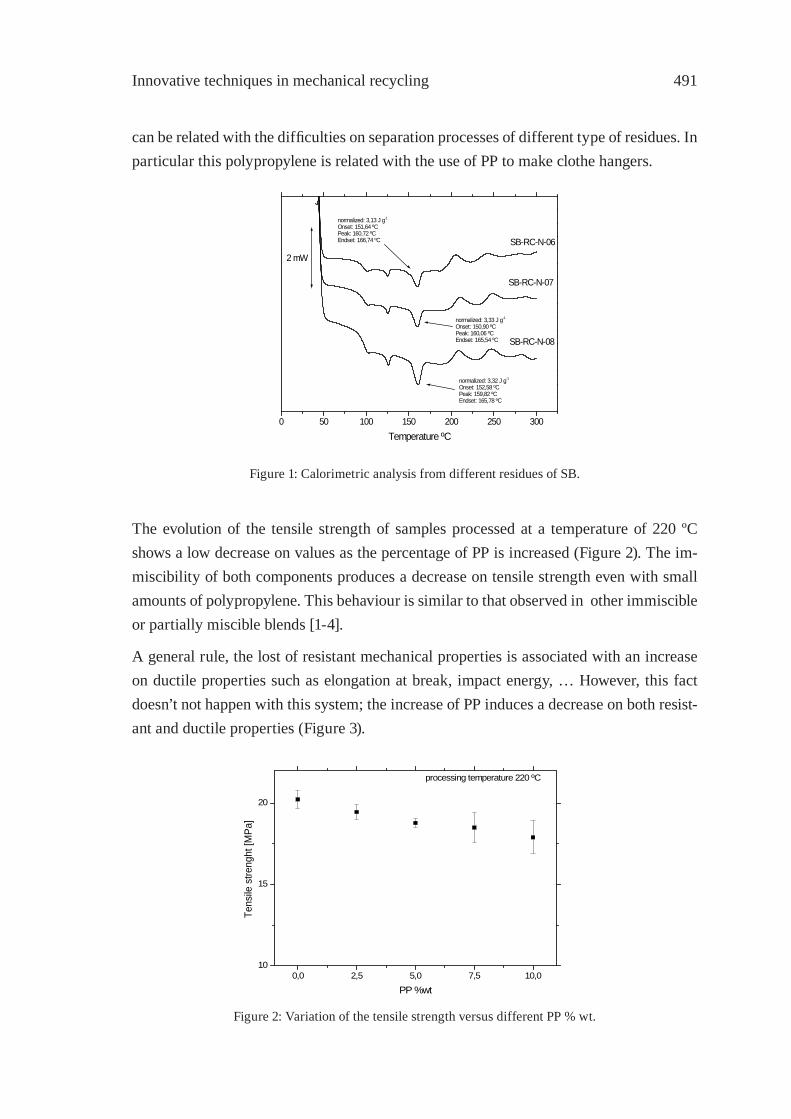
Innovative techniques in mechanical recycling 491
can be related with the diffi culties on separation processes of different type of residues. In particular this polypropylene is related with the use of PP to make clothe hangers.
0 50 100 150 200 250 300
SB-RC-N-08
SB-RC-N-07
SB-RC-N-06
2 mW
normalized: 3,32 J g-1
Onset: 152,58 ºCPeak: 159,82 ºCEndset: 165,78 ºC
normalized: 3,13 J g-1
Onset: 151,64 ºCPeak: 160,72 ºCEndset: 166,74 ºC
normalized: 3,33 J g-1
Onset: 150,90 ºCPeak: 160,06 ºCEndset: 165,54 ºC
Temperature ºC
Figure 1: Calorimetric analysis from different residues of SB.
The evolution of the tensile strength of samples processed at a temperature of 220 ºC shows a low decrease on values as the percentage of PP is increased (Figure 2). The im-miscibility of both components produces a decrease on tensile strength even with small amounts of polypropylene. This behaviour is similar to that observed in other immiscible or partially miscible blends [1-4].
A general rule, the lost of resistant mechanical properties is associated with an increase on ductile properties such as elongation at break, impact energy, … However, this fact doesn’t not happen with this system; the increase of PP induces a decrease on both resist-ant and ductile properties (Figure 3).
0,0 2,5 5,0 7,5 10,010
15
20
processing temperature 220 ºC
Tens
ile s
treng
ht [M
Pa]
PP %wt
Figure 2: Variation of the tensile strength versus different PP % wt.

ISFR - 2005492
0,0 2,5 5,0 7,5 10,00
5
10
15
20
25
30
35
40
45
50processing temperature 220 ºC
Elon
gatio
n %
PP % wt
Figure 3: Variation of the elongation versus PP % wt.
Polypropylene acts as a stress concentrator which promotes fracture since there is low compatibility /miscibility between the styrenic phase and impurity. Impurities exert a negative effect on fi nal performance if they appear in amount similar to 5%. In this case, PP can appear in the range 3-6 % and it is responsible of the decrease on mechanical properties.
3.2. Infl uence of photo-degradation processes
On the other hand, waste storage outdoors causes its weathering; this can be another factor that infl uence in the decrease on mechanical properties. In a few weeks of light exposure, it takes place a pronounced decrease on tensile strength. After 1000 hours of weathering tensile strength value remains constant (Figure 4).
The reactions that take place as a consequence of the solar exposure does not affect equal-ly the polystyrene phase than polybutadiene phase which is more sensitive to degradation processes due to the presence of a polydiene chain. Light exposure can induce reactions that can induce crosslinking processes, chain breaks, free radiacal formation… All these processes promotes a decrease on mechanical properties [5].
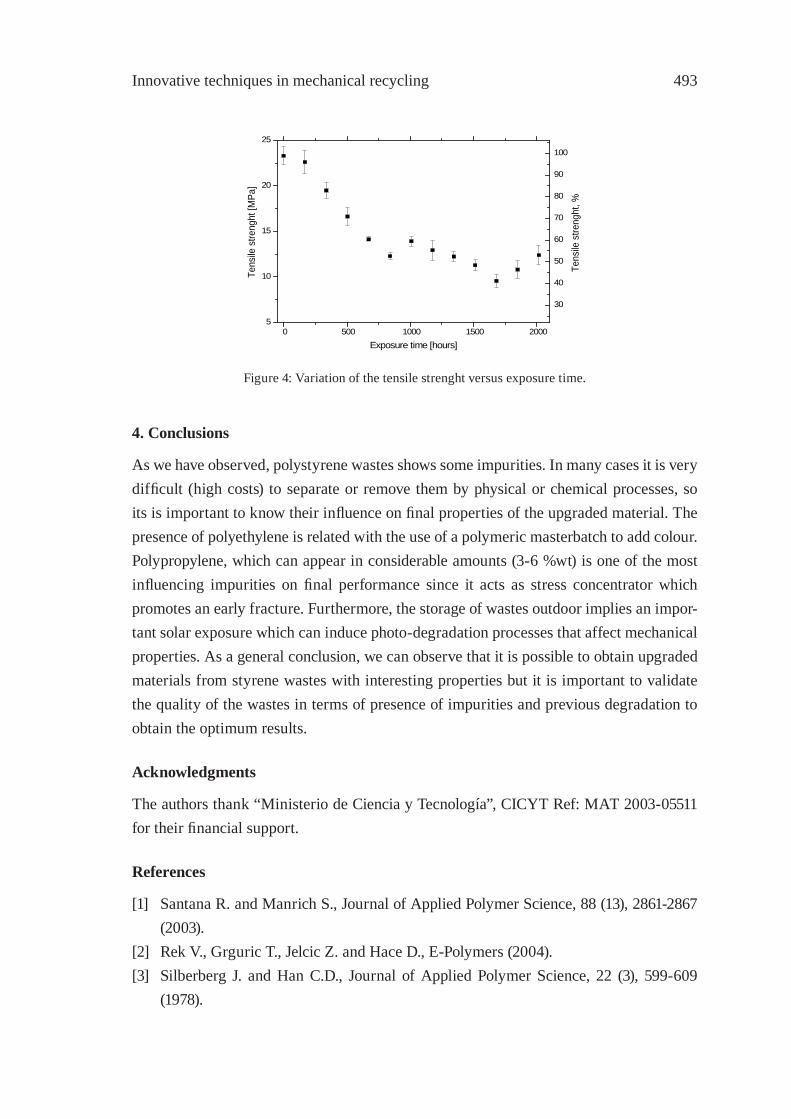
Innovative techniques in mechanical recycling 493
0 500 1000 1500 20005
10
15
20
25
Tens
ile s
treng
ht [M
Pa]
Exposure time [hours]
30
40
50
60
70
80
90
100
Tens
ile s
treng
ht, %
Figure 4: Variation of the tensile strenght versus exposure time.
4. Conclusions
As we have observed, polystyrene wastes shows some impurities. In many cases it is very diffi cult (high costs) to separate or remove them by physical or chemical processes, so its is important to know their infl uence on fi nal properties of the upgraded material. The presence of polyethylene is related with the use of a polymeric masterbatch to add colour. Polypropylene, which can appear in considerable amounts (3-6 %wt) is one of the most infl uencing impurities on fi nal performance since it acts as stress concentrator which promotes an early fracture. Furthermore, the storage of wastes outdoor implies an impor-tant solar exposure which can induce photo-degradation processes that affect mechanical properties. As a general conclusion, we can observe that it is possible to obtain upgraded materials from styrene wastes with interesting properties but it is important to validate the quality of the wastes in terms of presence of impurities and previous degradation to obtain the optimum results.
Acknowledgments
The authors thank “Ministerio de Ciencia y Tecnología”, CICYT Ref: MAT 2003-05511 for their fi nancial support.
References
[1] Santana R. and Manrich S., Journal of Applied Polymer Science, 88 (13), 2861-2867 (2003).
[2] Rek V., Grguric T., Jelcic Z. and Hace D., E-Polymers (2004).[3] Silberberg J. and Han C.D., Journal of Applied Polymer Science, 22 (3), 599-609
(1978).

ISFR - 2005494
[4] Park J.H., Sung Y.T., Kim W.N., Hong J.H., Hong B.K., Yoo T.W. and Yoon H.G., Polymer Korea, 29 (1), 19-24 (2005).
[5] Ghaffar A., Scott A., and Scott G., European Polymer Journal, 11 (3), 271-275 (1975).
Innovative techniques in mechanical recycling 495
PA-66/PEAl BLENDS FROM RECYCLED WASTEC. Desiderá1 and M. I. Felisberti2*
1,2Instituto de Química, Universidade Estadual de Campinas, Campinas, Brasil, [email protected]
Abstract: Blends of recycled polyamide-6.6 (rPA-66) were prepared with two types of polymeric industrial waste: rLDPE-EMAA – mixture of low density polyethylene (LDPE) with a small amount of poly(ethylene-co-methacrylic acid) (EMAA) - and PEAl – a mix-ture of three materials: LDPE, EMAA and aluminum particles. The blends were prepared in a twin screw extruder and were characterized by mechanical tests, dynamic-mechani-cal analysis (DMA), scanning electron microscopy (SEM) and thermogravimetric analy-sis (TGA). The blends showed intermediate properties between neat components. DMA data show phase inversion between 25 and 50 wt% of rPA-66. The thermal stability in oxidative atmosphere is higher for PEAl blends due to the aluminum particles acting as a barrier for oxygen diffusion.
1. Introduction
Polymer blending is a very interesting tool to achieve property combinations generally not available in any single polymeric material. This new material can be obtained by the combination of two or more miscible or immiscible polymers. A poor adhesion between the phases in an immiscible blend may result in poor mechanical properties and unstable phase morphology during melt processing. [1, 2]
The polyamide (PA) and polyethylene (PE) blends should present interesting properties based on the complementary behavior of the individual components, such as high tensile strength and heat strength of the PA and good processability and impact strength of PE. However, these blends are thermodynamically immiscible and mechanically incompat-ible. [3,4] A solution for the incompatibility could be reached by the addition of a third component, called compatibilizer, which promotes physical and/or chemical interactions between the components at the interface. Several studies of compatibilization of polya-mide/polyolefi n blends using copolymers containing carboxylic acid groups have been re-ported. The compatibilization effi ciency is associated to the specifi c interactions between functional groups present in the blend components as hydrogen bonding, dipole-dipole interactions and reaction occurring between the terminal end groups of PA and the car-boxylic acid groups. [5-7]
The extending of the useful life of materials through recycling has proven to be an ef-fi cient mean of reducing usage of natural resources and limiting the production of waste. Material recovery in multilayer packaging materials is complicated by the presence of materials of different nature such as paper and aluminum. The multilayer packaging is
ISFR - 2005496
composed of paper, low density polyethylene (LDPE), a small amount of ethylene-meth-acrylic acid copolymer (EMMA) and aluminum. The recycling process of this packag-ing consists of recovering paper, the major component, through centrifugation. [8] The remaining mixture of LDPE, EMAA and aluminum, a recycled composite denominated PEAl, offers an interesting combination of properties especially due to the presence of a small amount of EMAA, a common compatibilizer used in polyamide/polyolefi n blends. [9] PA is one of the most used polymers for engineering applications and its recycling represents an important area for reducing the waste mainly in automotive industry. [10, 11] The purpose of this work is to prepare blends of recycled polyamide 6.6 (rPA-66) and PEAl, a recycled composite a compatibilizer (EMAA) and aluminum as fi ller.
2. Experimental part
2.1. MaterialsPEAl containing approximately 7 % of aluminum and rLDPE-EMAA, a waste extrusion without aluminum, were supplied by Mercoplás and the commercial recycled polyamide (trade name: Polyamide 6.6 Brilliant) was supplied by Rhodia.
2.2. Blend preparationBlends were prepared in a co-rotating twin screw extruder APV 2000 (L/D = 20). The temperature profi le was 245/250/260/265 °C and rotation speed 100 rpm.
2.3 Dynamic Mechanical Analysis (DMA)
The specimens (dimensions of 9.0, 6.0 and 1.0 mm) were submitted to a sinusoidal defor-mation with frequency of 1.0 Hz, amplitude of 0.01% and temperature range from –140 to 290 ºC in a Rheometric Scientifi c DMTA V Analyzer.
2.4. Mechanical tests
The injection molded specimens (Arburg Allrounder 221 M 250-55) were submitted to tensile (ASTM D638) and impact strength tests (ASTM D256), in an EMIC DL 200 ap-paratus (5000N load cell, 30 mm/min speed) and in an EMIC AIC 1 apparatus using Izod notched bars, respectively.
2.5. Scanning electron microscopy (SEM)
The morphology of the blends was investigated using a Scanning Electron Microscope (SEM) JEOL JSM 6360LV. The samples were cryogenically fractured perpendicular to the injection fl ow direction and the fractured surfaces were coated with carbon.
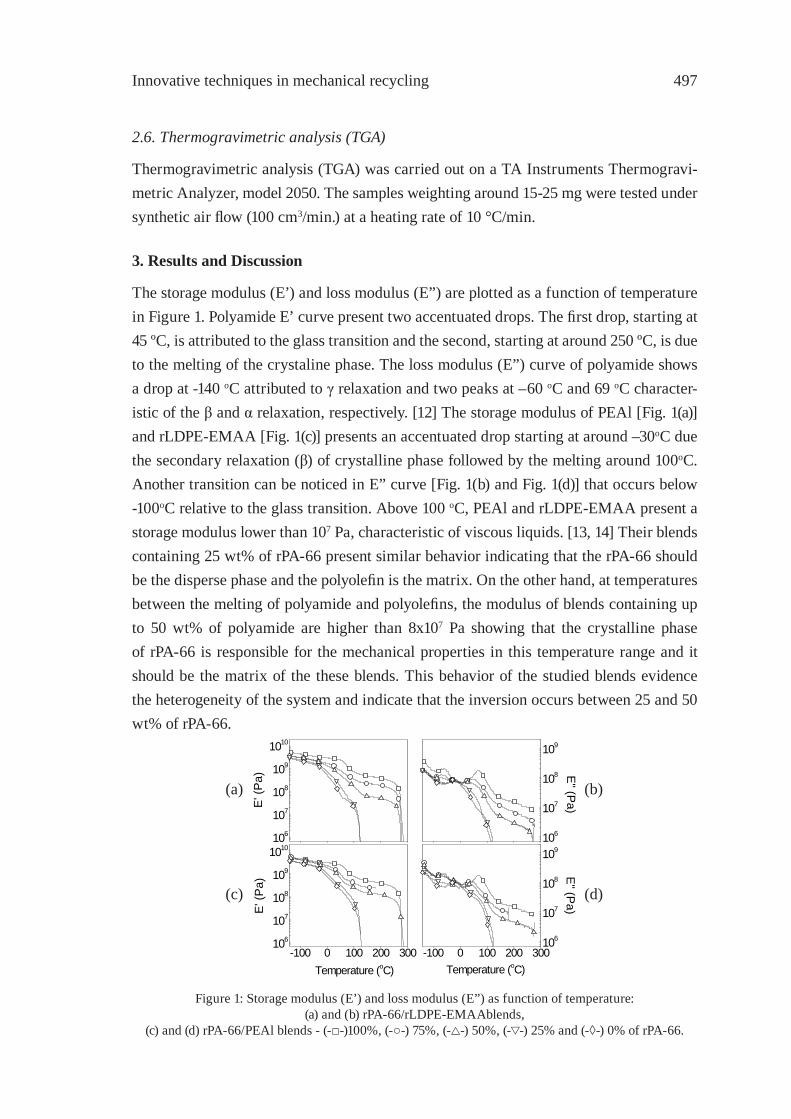
Innovative techniques in mechanical recycling 497
2.6. Thermogravimetric analysis (TGA)
Thermogravimetric analysis (TGA) was carried out on a TA Instruments Thermogravi-metric Analyzer, model 2050. The samples weighting around 15-25 mg were tested under synthetic air fl ow (100 cm3/min.) at a heating rate of 10 °C/min.
3. Results and Discussion
The storage modulus (E’) and loss modulus (E”) are plotted as a function of temperature in Figure 1. Polyamide E’ curve present two accentuated drops. The fi rst drop, starting at 45 ºC, is attributed to the glass transition and the second, starting at around 250 ºC, is due to the melting of the crystaline phase. The loss modulus (E”) curve of polyamide shows a drop at -140 oC attributed to γ relaxation and two peaks at –60 oC and 69 oC character-istic of the β and α relaxation, respectively. [12] The storage modulus of PEAl [Fig. 1(a)] and rLDPE-EMAA [Fig. 1(c)] presents an accentuated drop starting at around –30oC due the secondary relaxation (β) of crystalline phase followed by the melting around 100oC. Another transition can be noticed in E” curve [Fig. 1(b) and Fig. 1(d)] that occurs below -100oC relative to the glass transition. Above 100 oC, PEAl and rLDPE-EMAA present a storage modulus lower than 107 Pa, characteristic of viscous liquids. [13, 14] Their blends containing 25 wt% of rPA-66 present similar behavior indicating that the rPA-66 should be the disperse phase and the polyolefi n is the matrix. On the other hand, at temperatures between the melting of polyamide and polyolefi ns, the modulus of blends containing up to 50 wt% of polyamide are higher than 8x10⁷ Pa showing that the crystalline phase of rPA-66 is responsible for the mechanical properties in this temperature range and it should be the matrix of the these blends. This behavior of the studied blends evidence the heterogeneity of the system and indicate that the inversion occurs between 25 and 50 wt% of rPA-66.
Figure 1: Storage modulus (E’) and loss modulus (E”) as function of temperature:(a) and (b) rPA-66/rLDPE-EMAAblends,
(c) and (d) rPA-66/PEAl blends - (-□-)100%, (-○-) 75%, (- -) 50%, (- -) 25% and (-◊-) 0% of rPA-66.
-100 0 100 200 300106
107
108
109
1010
Temperature (oC)
E
' (P
a)
106
107
108
109
E" (P
a)
-100 0 100 200 300106
107
108
109
E" (P
a)
Temperature (oC)
106
107
108
109
1010
E' (
Pa)
(a) (b)
(c) (d)
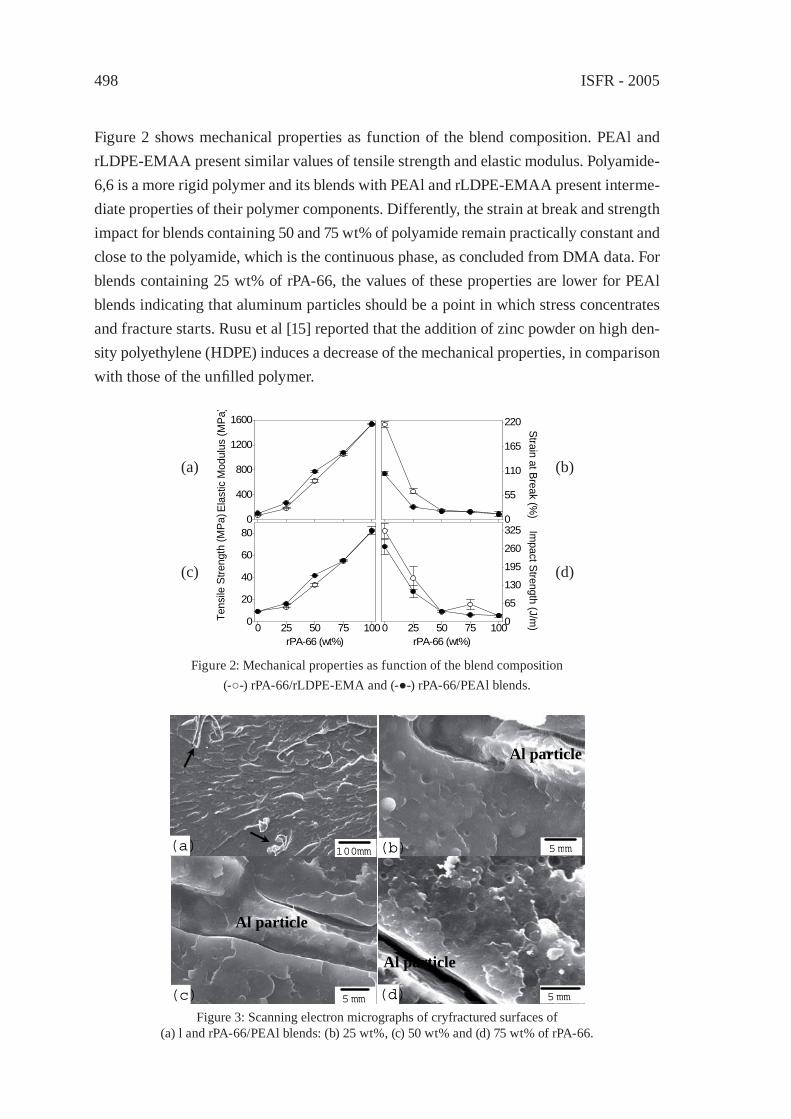
ISFR - 2005498
Figure 2 shows mechanical properties as function of the blend composition. PEAl and rLDPE-EMAA present similar values of tensile strength and elastic modulus. Polyamide-6,6 is a more rigid polymer and its blends with PEAl and rLDPE-EMAA present interme-diate properties of their polymer components. Differently, the strain at break and strength impact for blends containing 50 and 75 wt% of polyamide remain practically constant and close to the polyamide, which is the continuous phase, as concluded from DMA data. For blends containing 25 wt% of rPA-66, the values of these properties are lower for PEAl blends indicating that aluminum particles should be a point in which stress concentrates and fracture starts. Rusu et al [15] reported that the addition of zinc powder on high den-sity polyethylene (HDPE) induces a decrease of the mechanical properties, in comparison with those of the unfi lled polymer.
0
55
110
165
220
Strain at Break (%)
0
400
800
1200
1600
El
astic
Mod
ulus
(MPa
)
0 25 50 75 1000
20
40
60
80
Tens
ile S
treng
th (M
Pa)
rPA-66 (wt%)0 25 50 75 1000
65
130
195
260
325
Impact Strength (J/m
)
rPA-66 (wt%)
Figure 2: Mechanical properties as function of the blend composition(-○-) rPA-66/rLDPE-EMA and (-●-) rPA-66/PEAl blends.
(a) (b)
(c) (d)
Figure 3: Scanning electron micrographs of cryfractured surfaces of (a) l and rPA-66/PEAl blends: (b) 25 wt%, (c) 50 wt% and (d) 75 wt% of rPA-66.
(a) 100 mm
5 mm 5 mm
5 mm (b)
(c) (d)
Al particle
Al particle
Al particle
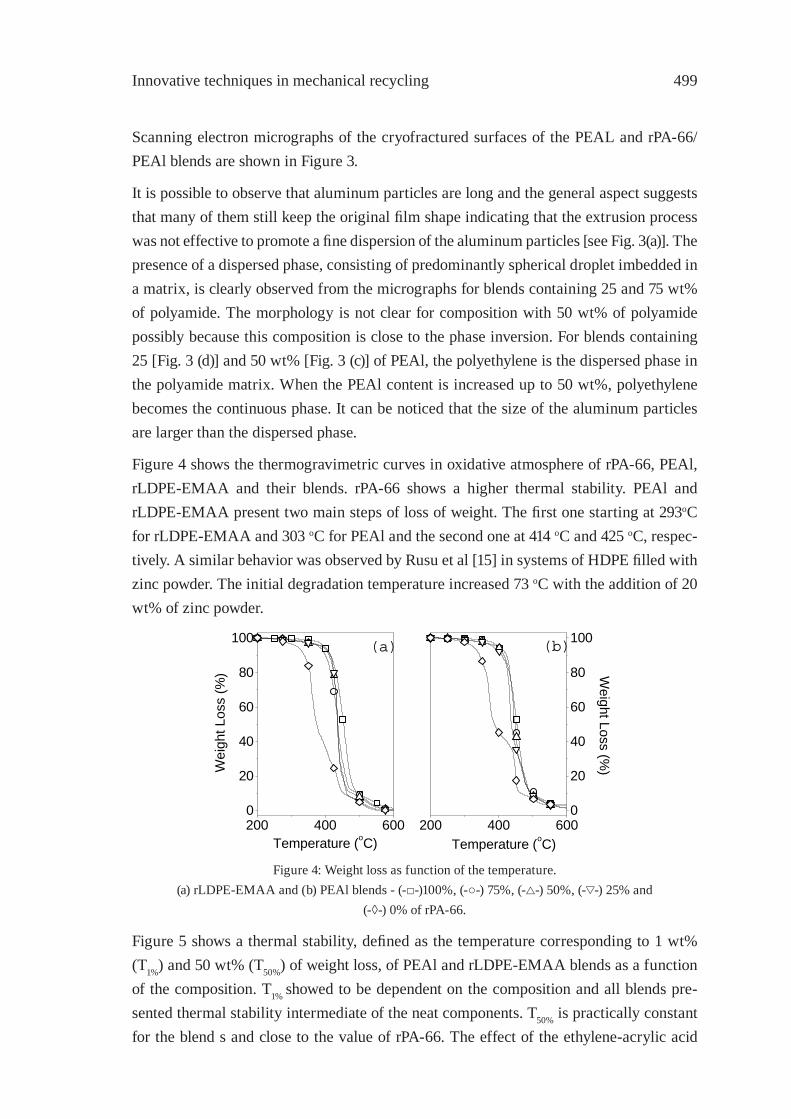
Innovative techniques in mechanical recycling 499
Scanning electron micrographs of the cryofractured surfaces of the PEAL and rPA-66/PEAl blends are shown in Figure 3.
It is possible to observe that aluminum particles are long and the general aspect suggests that many of them still keep the original fi lm shape indicating that the extrusion process was not effective to promote a fi ne dispersion of the aluminum particles [see Fig. 3(a)]. The presence of a dispersed phase, consisting of predominantly spherical droplet imbedded in a matrix, is clearly observed from the micrographs for blends containing 25 and 75 wt% of polyamide. The morphology is not clear for composition with 50 wt% of polyamide possibly because this composition is close to the phase inversion. For blends containing 25 [Fig. 3 (d)] and 50 wt% [Fig. 3 (c)] of PEAl, the polyethylene is the dispersed phase in the polyamide matrix. When the PEAl content is increased up to 50 wt%, polyethylene becomes the continuous phase. It can be noticed that the size of the aluminum particles are larger than the dispersed phase.
Figure 4 shows the thermogravimetric curves in oxidative atmosphere of rPA-66, PEAl, rLDPE-EMAA and their blends. rPA-66 shows a higher thermal stability. PEAl and rLDPE-EMAA present two main steps of loss of weight. The fi rst one starting at 293oC for rLDPE-EMAA and 303 oC for PEAl and the second one at 414 oC and 425 oC, respec-tively. A similar behavior was observed by Rusu et al [15] in systems of HDPE fi lled with zinc powder. The initial degradation temperature increased 73 oC with the addition of 20 wt% of zinc powder.
200 400 6000
20
40
60
80
100
Wei
ght L
oss
(%)
Temperature (oC)200 400 600
0
20
40
60
80
100
Weight Loss (%
)
Temperature (oC)
(a) (b)
Figure 4: Weight loss as function of the temperature.(a) rLDPE-EMAA and (b) PEAl blends - (-□-)100%, (-○-) 75%, (- -) 50%, (- -) 25% and
(-◊-) 0% of rPA-66.
Figure 5 shows a thermal stability, defi ned as the temperature corresponding to 1 wt% (T1%) and 50 wt% (T50%) of weight loss, of PEAl and rLDPE-EMAA blends as a function of the composition. T1% showed to be dependent on the composition and all blends pre-sented thermal stability intermediate of the neat components. T50% is practically constant for the blend s and close to the value of rPA-66. The effect of the ethylene-acrylic acid
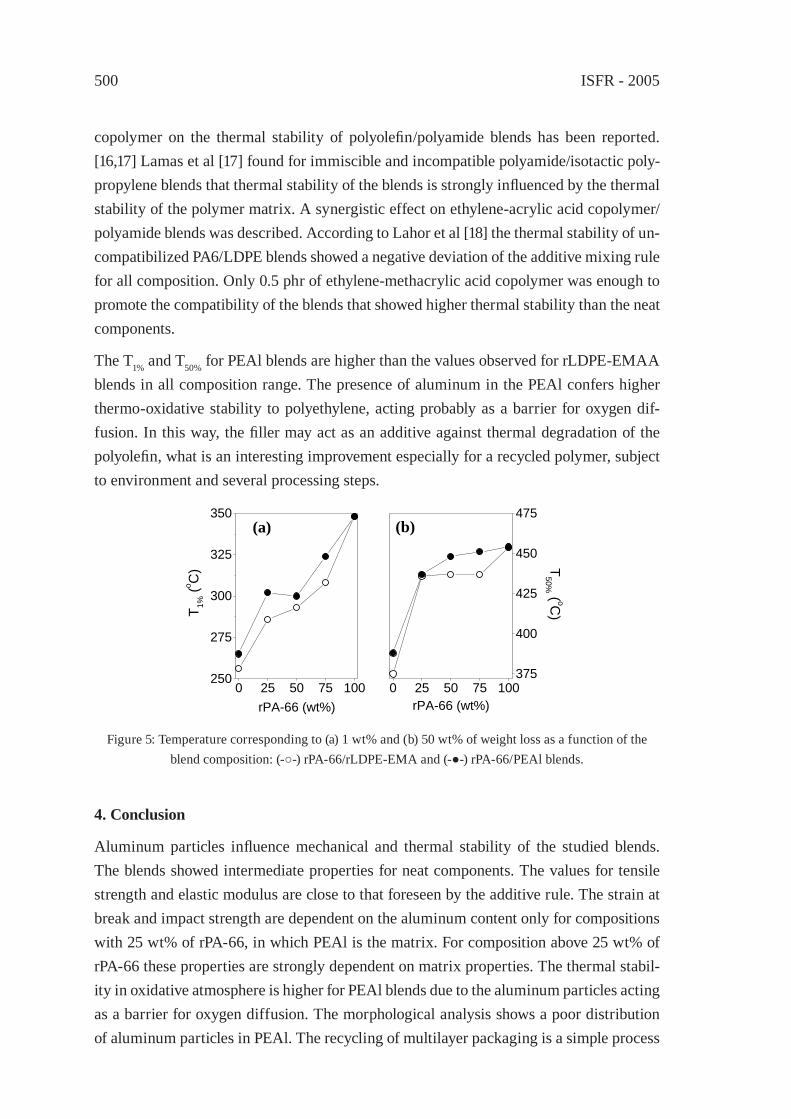
ISFR - 2005500
copolymer on the thermal stability of polyolefi n/polyamide blends has been reported. [16,17] Lamas et al [17] found for immiscible and incompatible polyamide/isotactic poly-propylene blends that thermal stability of the blends is strongly infl uenced by the thermal stability of the polymer matrix. A synergistic effect on ethylene-acrylic acid copolymer/polyamide blends was described. According to Lahor et al [18] the thermal stability of un-compatibilized PA6/LDPE blends showed a negative deviation of the additive mixing rule for all composition. Only 0.5 phr of ethylene-methacrylic acid copolymer was enough to promote the compatibility of the blends that showed higher thermal stability than the neat components.
The T1% and T50% for PEAl blends are higher than the values observed for rLDPE-EMAA blends in all composition range. The presence of aluminum in the PEAl confers higher thermo-oxidative stability to polyethylene, acting probably as a barrier for oxygen dif-fusion. In this way, the fi ller may act as an additive against thermal degradation of the polyolefi n, what is an interesting improvement especially for a recycled polymer, subject to environment and several processing steps.
0 25 50 75 100375
400
425
450
475
T50% ( oC
)
rPA-66 (wt%)0 25 50 75 100
250
275
300
325
350
T 1% (o C
)
rPA-66 (wt%)
(a) (b)
Figure 5: Temperature corresponding to (a) 1 wt% and (b) 50 wt% of weight loss as a function of the blend composition: (-○-) rPA-66/rLDPE-EMA and (-●-) rPA-66/PEAl blends.
4. Conclusion
Aluminum particles infl uence mechanical and thermal stability of the studied blends. The blends showed intermediate properties for neat components. The values for tensile strength and elastic modulus are close to that foreseen by the additive rule. The strain at break and impact strength are dependent on the aluminum content only for compositions with 25 wt% of rPA-66, in which PEAl is the matrix. For composition above 25 wt% of rPA-66 these properties are strongly dependent on matrix properties. The thermal stabil-ity in oxidative atmosphere is higher for PEAl blends due to the aluminum particles acting as a barrier for oxygen diffusion. The morphological analysis shows a poor distribution of aluminum particles in PEAl. The recycling of multilayer packaging is a simple process
Innovative techniques in mechanical recycling 501
and the recovered material shows a potential to be mixed with other thermoplastics which can be used in many possible applications.
5. Acknowledgements
The authors thank to CNPq, Capes and Fapesp for fi nancial support and Mercoplás and Rhodia (Brasil) for supplying the polymers.
References
[1] Kudva, R.A., Keskkula, H., and Paul, D.R., Polymer, 40, 6003-6021, 1999.[2] La Mantia, F.P., and Capizzi, L., Polym. Deg. Stab., 71, 285-291, 2001. [3] Willis, J.M., Caldas, V., and Favis, B.D., J. Mat. Sci., 26, 4742-4750, 1991.[4] Scaffaro, R., et al, Polymer, 44, 6954-6957, 2003.[5] Filippi, S., et al, Macromol. Chem. Phys., 203, 1512-1525, 2002.[6] Valenza, A., Geuskens, G., and Spadaro, G., Eur. Polym. J., 33, 957-962, 1997.[7] Psarki, M., Pracella, M., and Galeski, A., Polymer, 41, 4923-4932, 2000.[8] Sadao, N., US. Patente, 5,871,161, 1999.[9] Jeziórska, R., Polimery, 48, 130-133, 2003.[10] Eriksson, P.A., Boydell, P., Manson, J. A. E., and Albertsson, A. C., J. Appl. Polym.
Sci., 65, 1631-1641, 1997.[11] La Mantia, F.P., Curto, D., and Scaffaro, R., J. Appl. Polym. Sci., 86, 1899-1903,
2002.[12] Kohan, M.I., Nylon Plastics Handbook, Hanser, New York, 1995, pp. 143-149 [13] Starck, P., Eur. Polym. J., 33, 339-348, 1997.[14] Pedroso, A.G., and Rosa, D.S., Carb. Polym., 59, 1-9, 2005.[15] Rusu, M., Sofi an, N., and Rusu, D., Polym. Test., 20, 409-417, 2001.[16] Roeder, J. et al, Polym. Degrad. Stab., Article in Press, 2005.[17] Lamas, L., Mendez, G.A., Müller, A.J., and Pracella, M., Eur. Polym. J., 34, 1865-
1870,1998.[18] Lahor, A., Nithitanakul, M. and Grady, B.P., Eur. Polym. J., 40, 2409-2420, 2004.

ISFR - 2005502

Innovative techniques in mechanical recycling 503
REUSE OF POST-CONSUMER POLY(ETHYLENE TEREPHTHALATE) (PET) IN TOUGHENED BLENDS
Mauro Aglietto1, Maria-Beatrice Coltelli2*, Stefania Savi1, Irene Della Maggiore1
1Dipartimento di Chimica e Chimica Industriale, Via Risorgimento 35, Pisa, Italy 2PolyLab-INFM, c/o Dipartimento di Chimica e Chimica Industriale, Via Risorgimento
35, Pisa, [email protected]
Abstract: Post-consumer PET/ low-density polyethylene (LDPE) blends were prepared in a twin-screw extruder. Ethylene-octene rubbers grafted with different amounts of maleic anhydride (POF) were used as compatibilizer precursors to improve the compatibility between the two immiscible polymers. The improvement of compatibility was checked by electron scanning microscopy (SEM) by evaluating the dimensions and shape of dis-persed LDPE domains. Moreover the tensile properties of blends were studied by re-cording stress-strain curves and the impact properties were determined by Izod Impact tests. Useful correlations between the degree of modifi cation of POF, morphological fea-tures and mechanical performances were thus obtained. In particular a critical value of the functionalization degree of POF was found to be necessary to assure high impact strength, stiffness and ductility to the blends.
1. Introduction
The progressive increase of solid waste production in civilized western countries makes waste management more and more diffi cult for public administrations. The necessity to avoid the land fi lling of large amount of materials obliged the municipalities to exploit the selective collection of solid waste, with the aim of recovering wide volumes of material. The low density of the plastic fraction makes it particularly abundant in solid wastes in terms of volume fraction. PET is one of the most used commodity polymers and it can be easily recovered by the selective municipal collection of solid waste.
The possibility of attaining engineering materials from PET was the object of many pub-lications of the last decade [1]. The use of copolymers or functionalized polymers as compatibilizing agent is reported in many publications [2, 3]. These polymeric precursors usually present a polyolefi n-like backbone structure but bear few parts per hundred of reactive groups, able to react with PET terminal groups thus forming a precursor-PET grafted copolymer. The presence of this copolymer allows both reduction of dispersed phase diameter and enhancement of adhesion between the phases. This approach can be followed in order to prepare engineering materials from post-consumer polymers, avoid-ing a down-cycling approach [4].
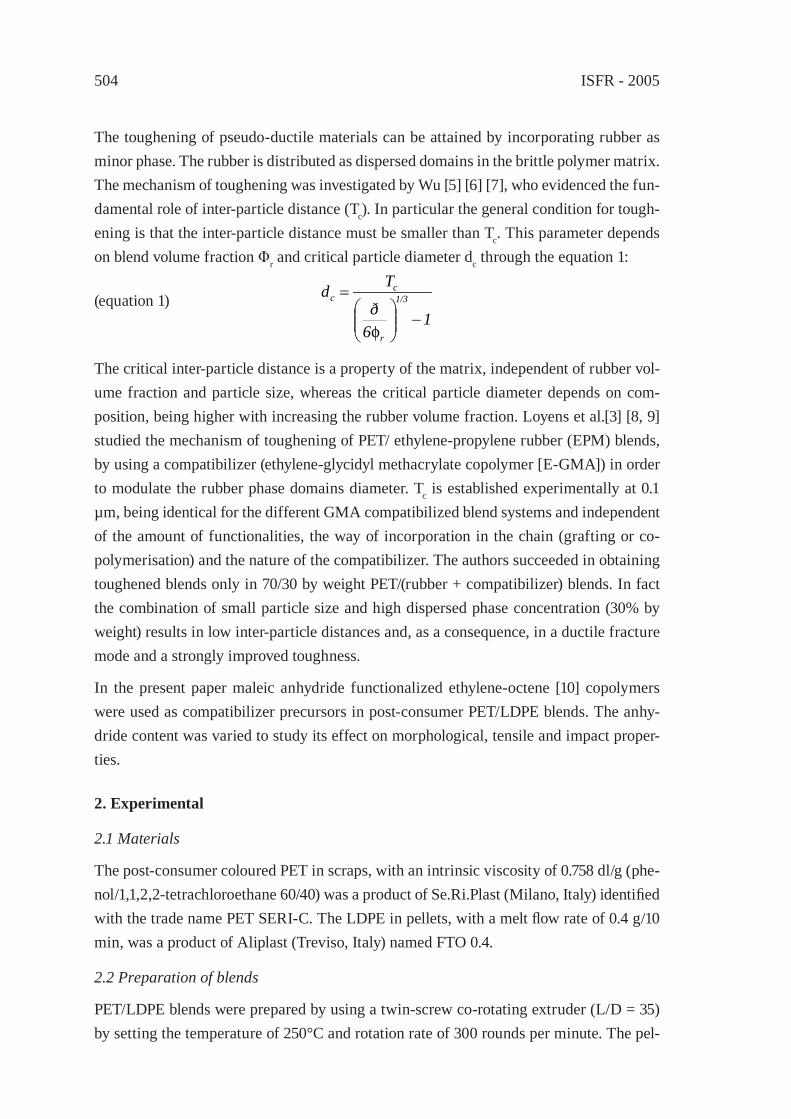
ISFR - 2005504
The toughening of pseudo-ductile materials can be attained by incorporating rubber as minor phase. The rubber is distributed as dispersed domains in the brittle polymer matrix. The mechanism of toughening was investigated by Wu [5] [6] [7], who evidenced the fun-damental role of inter-particle distance (Tc). In particular the general condition for tough-ening is that the inter-particle distance must be smaller than Tc. This parameter depends on blend volume fraction Φr and critical particle diameter dc through the equation 1:
(equation 1)
The critical inter-particle distance is a property of the matrix, independent of rubber vol-ume fraction and particle size, whereas the critical particle diameter depends on com-position, being higher with increasing the rubber volume fraction. Loyens et al.[3] [8, 9] studied the mechanism of toughening of PET/ ethylene-propylene rubber (EPM) blends, by using a compatibilizer (ethylene-glycidyl methacrylate copolymer [E-GMA]) in order to modulate the rubber phase domains diameter. Tc is established experimentally at 0.1 µm, being identical for the different GMA compatibilized blend systems and independent of the amount of functionalities, the way of incorporation in the chain (grafting or co-polymerisation) and the nature of the compatibilizer. The authors succeeded in obtaining toughened blends only in 70/30 by weight PET/(rubber + compatibilizer) blends. In fact the combination of small particle size and high dispersed phase concentration (30% by weight) results in low inter-particle distances and, as a consequence, in a ductile fracture mode and a strongly improved toughness.
In the present paper maleic anhydride functionalized ethylene-octene [10] copolymers were used as compatibilizer precursors in post-consumer PET/LDPE blends. The anhy-dride content was varied to study its effect on morphological, tensile and impact proper-ties.
2. Experimental
2.1 Materials
The post-consumer coloured PET in scraps, with an intrinsic viscosity of 0.758 dl/g (phe-nol/1,1,2,2-tetrachloroethane 60/40) was a product of Se.Ri.Plast (Milano, Italy) identifi ed with the trade name PET SERI-C. The LDPE in pellets, with a melt fl ow rate of 0.4 g/10 min, was a product of Aliplast (Treviso, Italy) named FTO 0.4.
2.2 Preparation of blends
PET/LDPE blends were prepared by using a twin-screw co-rotating extruder (L/D = 35) by setting the temperature of 250°C and rotation rate of 300 rounds per minute. The pel-
16ð
Td 1/3
r
cc
−
=
φ
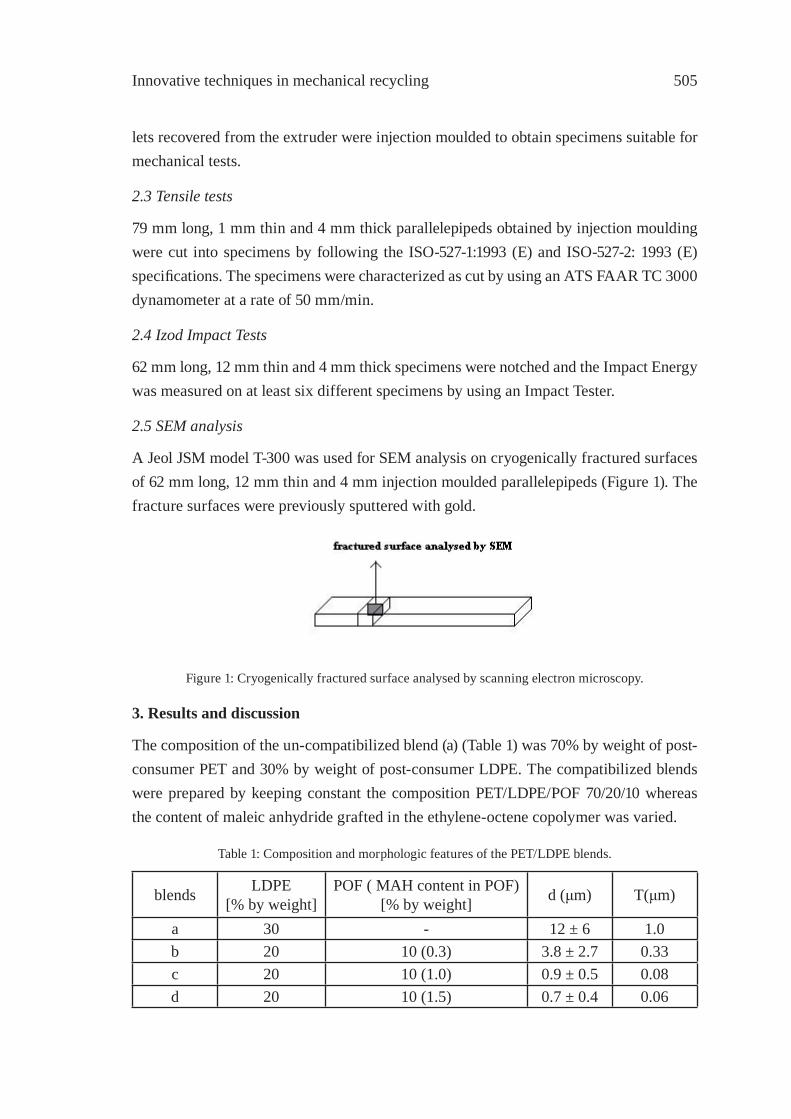
Innovative techniques in mechanical recycling 505
lets recovered from the extruder were injection moulded to obtain specimens suitable for mechanical tests.
2.3 Tensile tests
79 mm long, 1 mm thin and 4 mm thick parallelepipeds obtained by injection moulding were cut into specimens by following the ISO-527-1:1993 (E) and ISO-527-2: 1993 (E) specifi cations. The specimens were characterized as cut by using an ATS FAAR TC 3000 dynamometer at a rate of 50 mm/min.
2.4 Izod Impact Tests
62 mm long, 12 mm thin and 4 mm thick specimens were notched and the Impact Energy was measured on at least six different specimens by using an Impact Tester.
2.5 SEM analysis
A Jeol JSM model T-300 was used for SEM analysis on cryogenically fractured surfaces of 62 mm long, 12 mm thin and 4 mm injection moulded parallelepipeds (Figure 1). The fracture surfaces were previously sputtered with gold.
Figure 1: Cryogenically fractured surface analysed by scanning electron microscopy.
3. Results and discussion
The composition of the un-compatibilized blend (a) (Table 1) was 70% by weight of post-consumer PET and 30% by weight of post-consumer LDPE. The compatibilized blends were prepared by keeping constant the composition PET/LDPE/POF 70/20/10 whereas the content of maleic anhydride grafted in the ethylene-octene copolymer was varied.
Table 1: Composition and morphologic features of the PET/LDPE blends.
blends LDPE[% by weight]
POF ( MAH content in POF) [% by weight] d (μm) T(μm)
a 30 - 12 ± 6 1.0b 20 10 (0.3) 3.8 ± 2.7 0.33c 20 10 (1.0) 0.9 ± 0.5 0.08d 20 10 (1.5) 0.7 ± 0.4 0.06
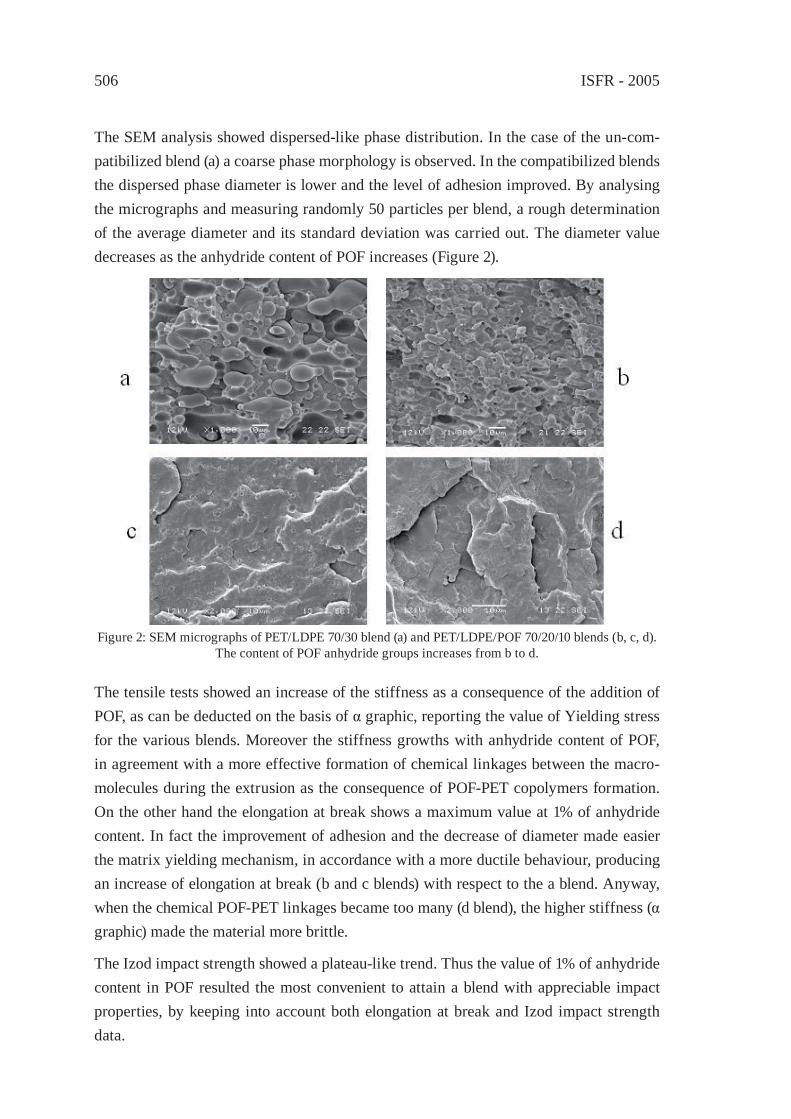
ISFR - 2005506
The SEM analysis showed dispersed-like phase distribution. In the case of the un-com-patibilized blend (a) a coarse phase morphology is observed. In the compatibilized blends the dispersed phase diameter is lower and the level of adhesion improved. By analysing the micrographs and measuring randomly 50 particles per blend, a rough determination of the average diameter and its standard deviation was carried out. The diameter value decreases as the anhydride content of POF increases (Figure 2).
Figure 2: SEM micrographs of PET/LDPE 70/30 blend (a) and PET/LDPE/POF 70/20/10 blends (b, c, d). The content of POF anhydride groups increases from b to d.
The tensile tests showed an increase of the stiffness as a consequence of the addition of POF, as can be deducted on the basis of α graphic, reporting the value of Yielding stress for the various blends. Moreover the stiffness growths with anhydride content of POF, in agreement with a more effective formation of chemical linkages between the macro-molecules during the extrusion as the consequence of POF-PET copolymers formation. On the other hand the elongation at break shows a maximum value at 1% of anhydride content. In fact the improvement of adhesion and the decrease of diameter made easier the matrix yielding mechanism, in accordance with a more ductile behaviour, producing an increase of elongation at break (b and c blends) with respect to the a blend. Anyway, when the chemical POF-PET linkages became too many (d blend), the higher stiffness (α graphic) made the material more brittle.
The Izod impact strength showed a plateau-like trend. Thus the value of 1% of anhydride content in POF resulted the most convenient to attain a blend with appreciable impact properties, by keeping into account both elongation at break and Izod impact strength data.
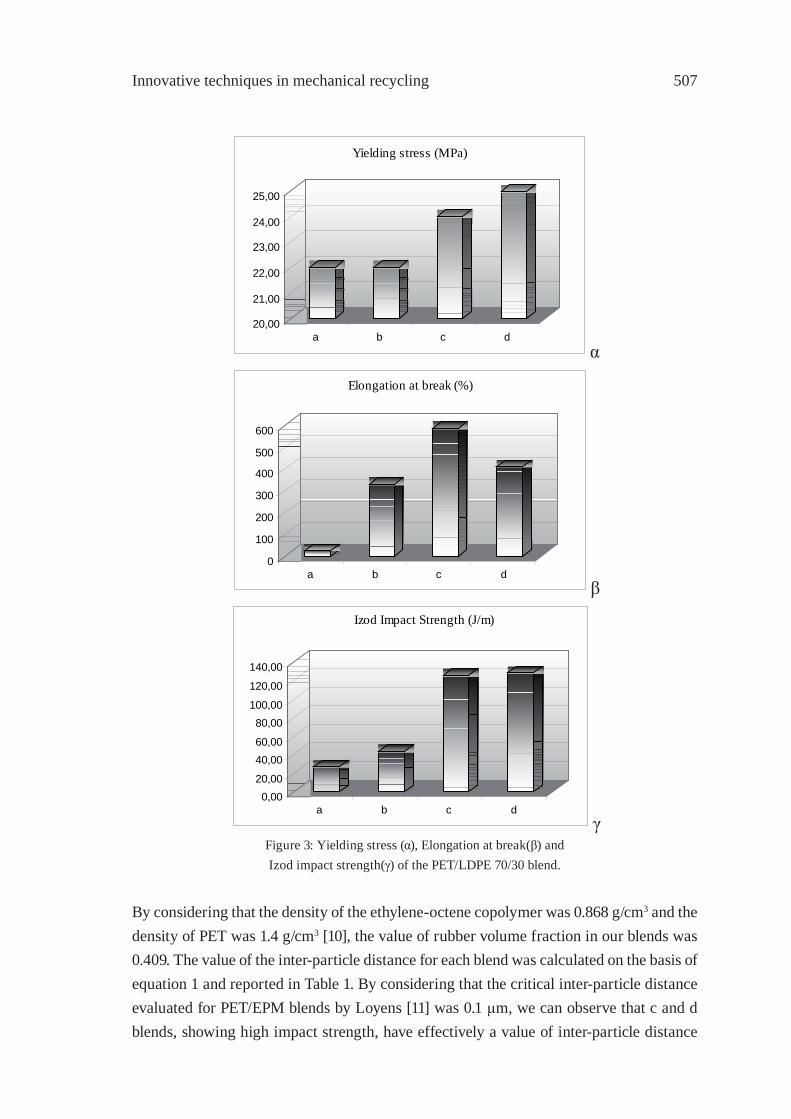
Innovative techniques in mechanical recycling 507
20,00
21,00
22,00
23,00
24,00
25,00
a b c d
Yielding stress (MPa)
α
0
100
200
300
400
500
600
a b c d
Elongation at break (%)
β
0,0020,00
40,0060,00
80,00100,00
120,00
140,00
a b c d
Izod Impact Strength (J/m)
γFigure 3: Yielding stress (α), Elongation at break(β) andIzod impact strength(γ) of the PET/LDPE 70/30 blend.
By considering that the density of the ethylene-octene copolymer was 0.868 g/cm3 and the density of PET was 1.4 g/cm3 [10], the value of rubber volume fraction in our blends was 0.409. The value of the inter-particle distance for each blend was calculated on the basis of equation 1 and reported in Table 1. By considering that the critical inter-particle distance evaluated for PET/EPM blends by Loyens [11] was 0.1 μm, we can observe that c and d blends, showing high impact strength, have effectively a value of inter-particle distance
ISFR - 2005508
lower than the critical value. Hence the correlations between morphology and mechani-cal properties previously evidenced by Loyens et al. for virgin PET/ virgin EPM rubber system were respected also in our system, where post-consumer PET and recycled LDPE were the main components.
4. Conclusions
The ethylene-octene copolymer functionalized with maleic anhydride (POF) was found to be an effective compatibilizer for PET/LDPE 70/30 blends. For the composition PET/LDPE/POF 70/20/10 the value of 1% by weight of maleic anhydride was found to give blends with increased stiffness and impact properties. For this blend a value of inter-par-ticle distance lower than the critical value was observed. Hence we obtained toughened blends in agreement with correlations between morphologic and mechanical properties evidenced by Loyens [11], but thanks to the compatibilizing effi ciency of a post-modifi ed polymer, cheaper and more suitable for post-consumer applications.
References
[1] Fann, D.-M., Huang, S. K. , and Lee J.-Y., J. .Appl. Pol. Sci. 61: 1375-1385 (1996).[2] Aglietto, M., Coltelli, M. B., Savi, S., Lochiatto, F., Ciardelli, F., Giani, M., J. Mater.
Cycles and Waste Manag. 6: 13-19 (2004).[3] Loyens, W., Groeninckx, G., Polymer. 44: 123-136 (2003).[4] Chaudhari, K.P., Kale, D.D.., Polym. Int. 52: 291-298 (2003).[5] Wu, S., J. Pol. Sci.: Pol. Phis. Edn. 21, 699-716 (1983).[6] Wu, S., Polymer 26, 1855 (1985).[7] Wu, S., J. Appl. Pol. Sci. 35, 549 (1988).[8] Loyens, W., Groeninckx, G., Polymer, 43, 5679-5691 (2002).[9] Loyens, W., Groeninckx, G., Polymer, 44, 4929-4941 (2002).[10] Awaja, F., Pavel, D., Eur. Pol. Jour., 41, 1453-1477 (2005).[11] Loyens, W., PhD Thesis, Katholieke Universiteit Leuven, 2001.
Acknowledgements
The authors thank Auserpolimeri for providing POF and assistance during the extrusion and analysis work. Moreover Regione Toscana, Toscana Ricicla and CoRePla are also acknowledged for economical support to the present research.
Innovative techniques in mechanical recycling 509
IMPROVING THE BIODEGRADABILITY AND MECHANICAL STRENGTH OF CORNSTARCH-LDPE BLENDS THROUGH
FORMULATIONM. Nikazar*1, B. Safari2, B. Bonakdarpour2, Z. Milani1
1 Department of Chemical Engineering, Center of Excellence for Petrochemical Engineering, [email protected]
2 Food Engineering and Biotechnology Group, Department of Chemical Engineering, Amirkabir University of Technology , No. 424, Hafez Ave., Tehran, Iran
Abstract: Six corn starch-LDPE fi lm blends containing starch in the range 5-40%, oleic acid as a Lewis catalyst with concentration of 5% or 10%, maleic anhydride as a cou-pling agent with concentration of 2% or 10% and benzoyl peroxide as free radical initia-tor with concentration of 0.1% or 0.25% were prepared. Fungal growth tests (ASTM G21) using Penicillium funiculosum were carried out on the samples made according to these formulations. Tensile tests (ASTM D638) and SEM imaging were also carried out on the samples before and after incubation with Penicillium funiculosum for three weeks. The effect of components in formulation on the biodegradability and strenght were studied by using the results of ASTM G21 test and SEM imaging and percentage elongation at break and tensile stress analysis.
1. Introduction
Around fi fty percent of synthetic polymers are used for packaging applications and 90 percent of these fi nd their way in municipal garbage. Due to their stability, long life and non-biodegradability, disposal of synthetic polymers is fraught with problems. These plastics just pile up in landfi ll sites, and their incineration results in the generation of heat and causes air pollution. The worst offender is polyethylene as it is the plastic with the highest usage volume in packaging applications.
The biodegradability of synthetic polymers like polyethylene can be enhanced by the addition of biodegradable additives to the formulation of plastics [1-3]. One of the most common degradable fi llers used in plastic formulations is starch [4, 5]. Raw starch is con-sidered to be a cost effective additive and meets the requirement of high thermal stability, minimum interference with fl ow properties, and minimum disturbance of product [6, 7]. Polyhedral starches, such as rice or cornstarch have been proposed as suitable dry fi ller in plastic fi lms [8]. In plastics containing blends of polyethylene with starch, microbes initially attack starch resulting in an increase in the porosity and surface to volume ra-tio of the polymer blend and a consequent enhancement of its biodegradability. In order for microbes to attack the starch they fi rst have adhere to the surface of the polymer, so polymers that have a rougher surface fi nish are more prone to microbial attack. Scan-
ISFR - 2005510
ning electron microscopy analysis have shown that starch based polymers have a textured surface whereas PE has a smooth surface [9]. Increase in the starch content and decrease in the starch granule size have been shown to enhance the biodegradability of the plastic blends [10-12].
The biodegradability of the polyethylene -starch blends can be further enhanced by the addition of other additives such as auto oxidants (for example unsaturated fatty acids and their derivatives), photo degraders (for example aromatic or aliphatic ketone), chemical degraders (for example an aliphatic polyhydroxy carboxylic acid) and various compatibi-lizers [8, 13, 14]. In the former case, after the contact of the plastic with metal salts in the soil, peroxides are formed, which result in the breakup of the polymer into low molecular weight carboxylic acids that are easily metabolized by the microbes in the soil. Lee et al [15] reported degradation of polyethylene molecules by lignin degrading bacteria in those fi lms containing starch and pro-oxidants. Sharma et al [16] found that the incorporation of pro-oxidant which consisted of metal salts and unsaturated elastomer enhanced the thermo-oxidative degradation rate of sago starch fi lled LLDPE composites. The use of glycerol plasticized starch has also been found to affect the degradability of the plastic blends [12].
On the other hand, the addition of starch to polyolefi n blends results in a reduction in their mechanical strength which necessitates an increase in the thickness of bags made from this blends [9] unless other measures are applied to combat this problem. These measures include the chemical modifi cation of starch [8, 17-21], the use of compatibilizers, such as oxidized polyethylene [22], fatty acids [8] and ethylene-co-acrylic acid [23]. The amount and size and type of starch in the blend also affects its mechanical properties with in-crease in starch content being shown to result in a worsening of mechanical and rheologi-cal properties and the processability of the system [24-26]. For example Lee [15] found a strong negative correlation between tensile and yield strength of the fi lms and average starch granule diameter. Mani and Bhattacharya [27] found that amylose to amylopectin ratio of starch affect the physical properties of starch/PE blends.
In this study the incorporation of additives in raw corn starch based LDPE blends has
been considered as a means of improving the mechanical properties and biodegradability of plastic fi lms made form these blends.
2. Materials and Methods
Low Density Polyethylene (LDPE), commercial grade cornstarch and technical grades of benzyl peroxide, maleic acid, and oleic acid were used in the preparation of the starch- LDPE fi lm blends. Mixing was accomplished using Haake mixer at 140 degrees centi-grade and 60 rpm. Materials were added to the mixer in order LDPE, benzoyl peroxide,
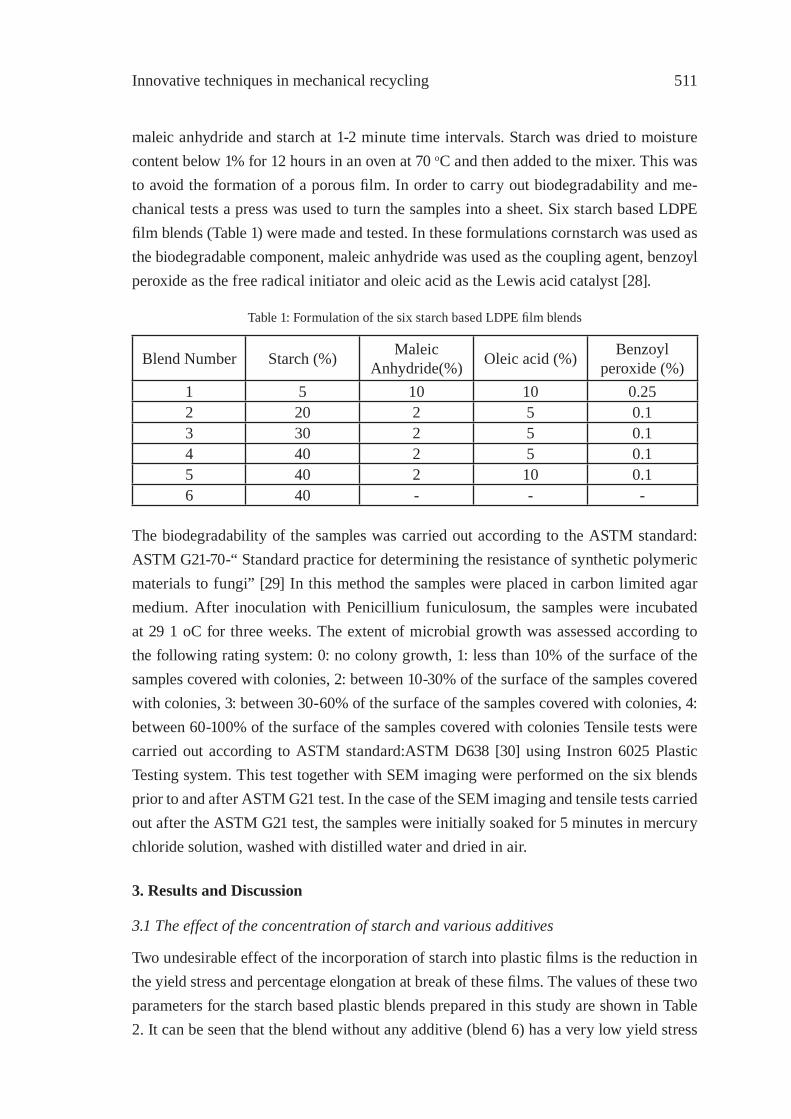
Innovative techniques in mechanical recycling 511
maleic anhydride and starch at 1-2 minute time intervals. Starch was dried to moisture content below 1% for 12 hours in an oven at 70 oC and then added to the mixer. This was to avoid the formation of a porous fi lm. In order to carry out biodegradability and me-chanical tests a press was used to turn the samples into a sheet. Six starch based LDPE fi lm blends (Table 1) were made and tested. In these formulations cornstarch was used as the biodegradable component, maleic anhydride was used as the coupling agent, benzoyl peroxide as the free radical initiator and oleic acid as the Lewis acid catalyst [28].
Table 1: Formulation of the six starch based LDPE fi lm blends
Blend Number Starch (%) Maleic Anhydride(%) Oleic acid (%) Benzoyl
peroxide (%)1 5 10 10 0.252 20 2 5 0.13 30 2 5 0.14 40 2 5 0.15 40 2 10 0.16 40 - - -
The biodegradability of the samples was carried out according to the ASTM standard: ASTM G21-70-“ Standard practice for determining the resistance of synthetic polymeric materials to fungi” [29] In this method the samples were placed in carbon limited agar medium. After inoculation with Penicillium funiculosum, the samples were incubated at 29 1 oC for three weeks. The extent of microbial growth was assessed according to the following rating system: 0: no colony growth, 1: less than 10% of the surface of the samples covered with colonies, 2: between 10-30% of the surface of the samples covered with colonies, 3: between 30-60% of the surface of the samples covered with colonies, 4: between 60-100% of the surface of the samples covered with colonies Tensile tests were carried out according to ASTM standard:ASTM D638 [30] using Instron 6025 Plastic Testing system. This test together with SEM imaging were performed on the six blends prior to and after ASTM G21 test. In the case of the SEM imaging and tensile tests carried out after the ASTM G21 test, the samples were initially soaked for 5 minutes in mercury chloride solution, washed with distilled water and dried in air.
3. Results and Discussion
3.1 The effect of the concentration of starch and various additives
Two undesirable effect of the incorporation of starch into plastic fi lms is the reduction in the yield stress and percentage elongation at break of these fi lms. The values of these two parameters for the starch based plastic blends prepared in this study are shown in Table 2. It can be seen that the blend without any additive (blend 6) has a very low yield stress
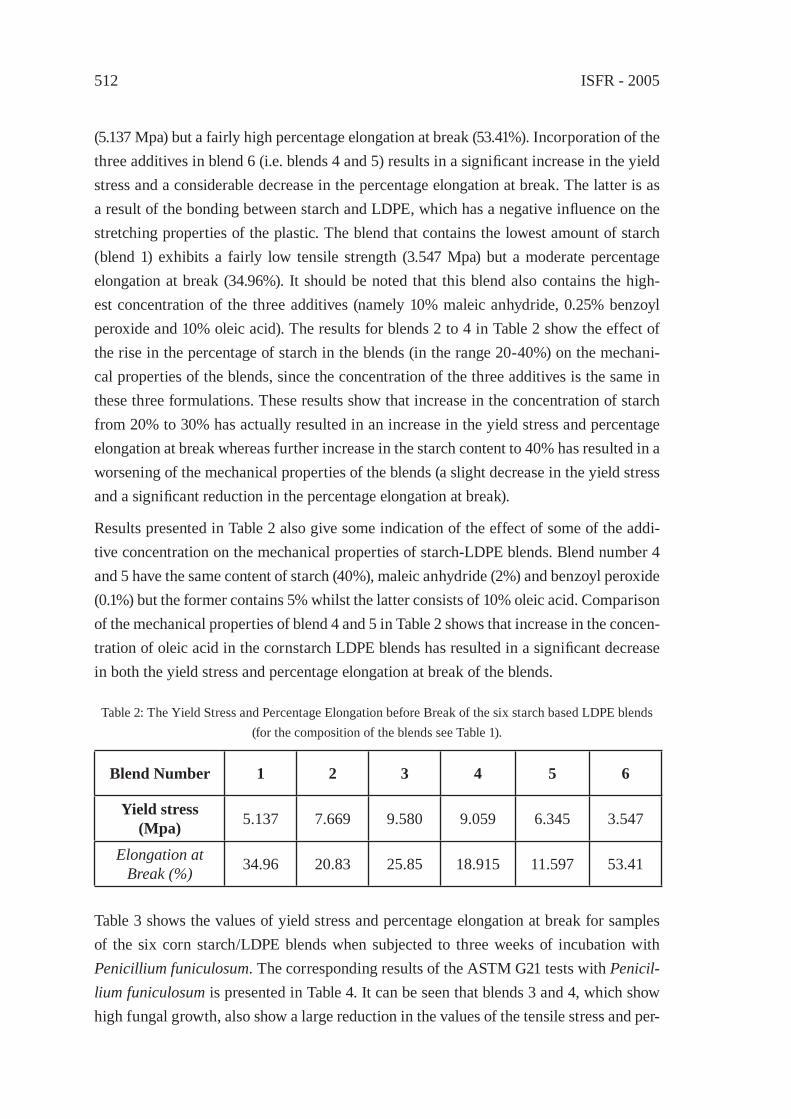
ISFR - 2005512
(5.137 Mpa) but a fairly high percentage elongation at break (53.41%). Incorporation of the three additives in blend 6 (i.e. blends 4 and 5) results in a signifi cant increase in the yield stress and a considerable decrease in the percentage elongation at break. The latter is as a result of the bonding between starch and LDPE, which has a negative infl uence on the stretching properties of the plastic. The blend that contains the lowest amount of starch (blend 1) exhibits a fairly low tensile strength (3.547 Mpa) but a moderate percentage elongation at break (34.96%). It should be noted that this blend also contains the high-est concentration of the three additives (namely 10% maleic anhydride, 0.25% benzoyl peroxide and 10% oleic acid). The results for blends 2 to 4 in Table 2 show the effect of the rise in the percentage of starch in the blends (in the range 20-40%) on the mechani-cal properties of the blends, since the concentration of the three additives is the same in these three formulations. These results show that increase in the concentration of starch from 20% to 30% has actually resulted in an increase in the yield stress and percentage elongation at break whereas further increase in the starch content to 40% has resulted in a worsening of the mechanical properties of the blends (a slight decrease in the yield stress and a signifi cant reduction in the percentage elongation at break).
Results presented in Table 2 also give some indication of the effect of some of the addi-tive concentration on the mechanical properties of starch-LDPE blends. Blend number 4 and 5 have the same content of starch (40%), maleic anhydride (2%) and benzoyl peroxide (0.1%) but the former contains 5% whilst the latter consists of 10% oleic acid. Comparison of the mechanical properties of blend 4 and 5 in Table 2 shows that increase in the concen-tration of oleic acid in the cornstarch LDPE blends has resulted in a signifi cant decrease in both the yield stress and percentage elongation at break of the blends.
Table 2: The Yield Stress and Percentage Elongation before Break of the six starch based LDPE blends (for the composition of the blends see Table 1).
Blend Number 1 2 3 4 5 6
Yield stress (Mpa) 5.137 7.669 9.580 9.059 6.345 3.547
Elongation at Break (%) 34.96 20.83 25.85 18.915 11.597 53.41
Table 3 shows the values of yield stress and percentage elongation at break for samples of the six corn starch/LDPE blends when subjected to three weeks of incubation with Penicillium funiculosum. The corresponding results of the ASTM G21 tests with Penicil-lium funiculosum is presented in Table 4. It can be seen that blends 3 and 4, which show high fungal growth, also show a large reduction in the values of the tensile stress and per-

Innovative techniques in mechanical recycling 513
centage elongation at break as a result of incubation with the fungal culture whereas the reduction in these parameters for blends 1 and 6 which have yielded none or little fungal growth after three weeks is correspondingly low. The only anomaly in the results is those for blends 2 and 5. Blend 5 has only exhibited moderate fungal growth after three weeks whereas it shows a signifi cant worsening of its mechanical properties similar to the results obtained with blend 4 which supported a high fungal growth.
Table 3: Percentage change in the values of the tensile strength and Elongation of the six blends as a re-sult of 3 weeks incubation of samples with Penicillium funiculosum
(for the composition of the six blends see Table 1).
Blend number Decrease in the Tensile Strength (%)
Decrease in Elongation (%)
1 0 22 10 233 21 404 26 505 27 486 12 18
Table 4: Results of the ASTM G21 test with Penicillium funiculosum on the six blends(for the composition of the blends and the description of the rating system
see the Materials and Methods section).
Blend number Rating1 02 33 44 45 26 1
3.2 The effect of the concentration of starch and various additives
The results of the ASTM G21 tests (Table 4) show little fungal growth after three weeks for blend 1 which contains only 5% starch and no growth for blend 6, which has large starch content, but no additives. This indicates the importance of both the starch concen-tration and the presence of the appropriate additives in the manufacture of starch based biodegradable LDPE fi lms. In this study heavy fungus growth after three weeks has been observed with blends containing 30% or 40% starch and all the three additives. Blend 5 that contains the highest concentration of oleic acid (10%) has supported only moderate fungal growth after three weeks, which indicates the inhibitory infl uence of oleic acid on fungal growth. Blend 2 shows less fungal growth compared to blends 3 and 4, which suggests an infl uence of starch concentration on the extent of fungal growth (and hence biodegradability) of cornstarch-LDPE blends.

ISFR - 2005514
Figure 1: SEM Images (magnifi cation × 400) of Blend 2 before (a)and after 3 weeks Incubation with Penicillium funiculosum (b).
SEM images of blends 2 before and after 3 weeks incubation are shown in Figure 1. These illustrate the increase in porosity of these starch-LDPE blends as a result of fungal growth.
4. Conclusion
The results showed that both the starch concentration and additive concentration in the formulation of the starch based LDPE blends affect the mechanical properties (tensile stress and percentage elongation at break) and biodegradation rates (as measured by the
ASTM G21 test). Increase of starch content to 20% and above lead to an enhancement of the rate of biodegradation as long as suitable additives were employed. The highest rate of biodegradation was obtained with blends composed of starch in the range 30-
40% and additives with concentration of oleic acid (5%), maleic anhydride (2%) and ben-zoyl peroxide (0.1%).
In the range 20-40% starch, the highest tensile strength and percentage elongation at break was obtained with blend containing 30% starch and additives with the same con-centration, which lead to the highest biodegradation rates. The concentration of starch and additives was also found to have some effect on the mechanical properties of the blend after 3 weeks incubation with Penicillium funiculosum.
Aknoledgement
The authors Would like to thank Dr B. Bonakdarpour for editing the manuscript.
(a) (b)
Innovative techniques in mechanical recycling 515
References
[1] Huang, J., Shetty, A., Wang, W., J. Adv. Polym. Tech., 10: 23-30, 1990.[2] Doi.,Y., Fukuda. K., Biodegradable plastics and polymers, Elsevier Science, 1994.[3] Potts J.E., Environmentally degradable plastics in Kirk-Othmer Encyclopedia of
Chemical Technology, Third Edition, Supplement Volume, New York: John-Wiley and Sons, 638-668, 1981.
[4] Gage, P., Tappi Journal; 73:161-169, 1990.[5] Gonslaves, K. E., Patel, S. H., Chen, X., J. Appl Polym Sci, 29: 565, 1991.[6] Aminabhavi, T.,M., Balundgi, R.,H., Cassidy, P.,E., Polym. Plast. Technol. Eng.
29:235,1990.[7] Shah, P.,B., Bandopadhyay, S., Bellare, J.,R., J. Polym. Degrade. Stab. 47(2): 165-173,
1995.[8] Griffi n,G.L. US Patent 4,021,388, 1977.[9] Davis, G.,Characterisation and characteristics of degradable polymer sacks,
Materials Characterisation, 51: 147-157, 2003.[10] Lim, S., Jane, J., Rajagopalan, S., Seib, P.A., J.Biotechnol. Prog. , 8: 51,1992.[11] Peanasky, J.S., Long, J.M., J. Polym. Sci. Part B. Physics, 29: 565,1991.[12] Zuchowska, D., Steller, R., Meissner, W., J. Polym. Degrad. Stab.,60: 471-480,1998.[13] Austin, R.G., US Patent No. 5,334,700, 1994.[14] Downie, R. H., US Patent No. 6,482,872, 2002.[15] Lee, B., Pometto, A.L., Fratzke, A., Bailey, T. B., J. Appl. Environ. Microbiol. 57(3):
678-685, 1991.[16] Sharma, N., Chang, L.P., Chu, Y.L., Ismail H, Ishiaku US, Mohd Ishak ZA. A study
on the effect of pro-oxidant on the thermo-oxidative degradation behaviour of sago starch fi lled polyethylene Polym Degrad Stab., 71(3): 381-393, 2001.
[17] Westhoff , R.P., Otey, F.H., Melhltretter, C.L., Russel, C.R., Starch-fi lled polyvinyl chloride plastics: Preparation and evaluation Industrial Engineering Chemistry Research, 13: 123-125, 1974.
[18] Kiatkamjornwong, S., Thakeow, P., Sonsuk, M., J,Polym Degrad Stab.,73(2): 363-375, 2001.
[19] Kim, M., Lee, S., Characteristics of cross-linked potato starch and starch-fi lled linear low-density Carbohydrate Polymers, 50: 331-337, 2002.
[20] Lee, S.J., Kim, S.H., Kim, M., J. Food Engineering Progress, 3:141-151,1999.[21] Evangelista, R.L., Nikolov, Z.L., Wei. S., Jane. J., Gelina, R.J., Effect of compounding
and starch modifi cation on properties of starch-fi lled low-density polyethylene, Industrial Engineering Chemistry and Research 30: 1841-1846, 1991.
[22] Jane, J., Evangelista, R.L., Wang. L., Ramrattan, S., Moore, J.A., Gelina, R.J., Corn Utilization Conference 3 Proceedings, 4:1-5,1990.
ISFR - 2005516
[23] Bikiaris, D., Prinos, K., Koutsopoulos, K., Vouroutzis, N., Pavlidou, E., Francis, N., Panayiotou, C., J. Polym. Degrad. Stab., 59(1-3):287-291, 1998.
[24] Willet, J.L., J. Appl. Poly. Sci. 54:1465,1994.[25] Roper, H., Koch, H., Starch/Starke , 42:123,1990.[26] Dintzis, F.R., Bageley, E. B., J. Appl. Poly. Sci.,56:637, 1995.[27] Mani, R., Bhattacharya, M., European Polymer Journal, 34(10):1467-1475,1998.[28] Safari, B., Making starch biodegradable through the use of starch, MSc Thesis,
Food Engineering and Biotechnology Group, Department of Chemical Engineering, Amirkabir University of Technology, Iran, 2004.
[29] Standard practice for determining the resistance of synthetic polymeric materials to fungi, ASTM G21-70, 1980.
[30] Annual book of ASTM standards ASTM D638, Vol. 08.01, pp. 248-259 PA, U.S.: ASTM International, ASTM D638, 1980.

Innovative techniques in mechanical recycling 517
EFFECT OF LIMESTONE ON CHLORINE COMPOUNDSEMISSION DURING MODEL MUNICIPAL WASTE
PYROLYSIS/GASIFICATIONY. Sekine*, M. Matsuzawa, Y. Miyai, H. Okutsu, E. Kikuchi, M. MatsukataWaseda University, 55S602, 3-4-1, Okubo, Shinjuku, Tokyo, 169-8555 Japan
Abstract: We examined the reaction mechanism of limestone and chloride compounds. Trichloloethane (TCE) was chosen as a model compound of organic chloride compound and HCl was used as that of inorganic chloride compound. Products for each reaction were identifi ed by X-ray diffraction (XRD). By changing the injection volume of chloride compounds, the chlorine absorption mechanisms of CaO and Ca(OH)2 were investigated. As a result, the reaction of TCE with CaO was not observed at all. On the other hand, the product of TCE with Ca(OH)2 was identifi ed as CaClOH. And when the volume of TCE injection was increased, only CaClOH was identifi ed. So, no further dechlorination was occurred. Whereas the products of HCl reaction with CaO were identifi ed as CaCl2 and CaCl2•2H2O.
1. Introduction
In recent years, energy systems with low load for environment and high effi ciency are required. Gasifi cation is one of important technologies for treatment of municipal waste towards construction of recycling-oriented society. On the other hand, since sources of chlorine such as PVC and NaCl are included in municipal waste, detrimental Cl com-pounds such as dioxin are detected during gasifi cation, combustion or pyrolysis of waste. HCl is considered as a cause of corrosion of reactor wall and Cl compound concerned with dioxin generation. Many studies have been made about the emission behavior during waste gasifi cation, combustion and pyrolysis, and the reaction mechanism of limestone and HCl (dechlorination) [1-4].
Especially the existence of low temperature range during volatilization of municipal waste where the reaction of limestone and HCl can be observed inside a model municipal waste particle [1, 2]. Moreover, a difference in the dechlorination were studied during model municipal waste combustion because of the difference in the source of chlorine (organic Cl compound, inorganic Cl compound)[5, 6]. However, there are also many points which are not yet clarifi ed about the emission behaviors of organic Cl compounds and the reac-tion mechanism of limestone and organic Cl compound which generated inside municipal waste particle. Up to now, organic Cl compounds were emitted during volatilization when model municipal wastes were heated by using fl uidized bed reactor. And when limestone was added in model municipal waste, the amount of organic Cl compounds was sup-pressed [7]. Moreover, model municipal waste was pyrolyzed at 500 °C and TCE was
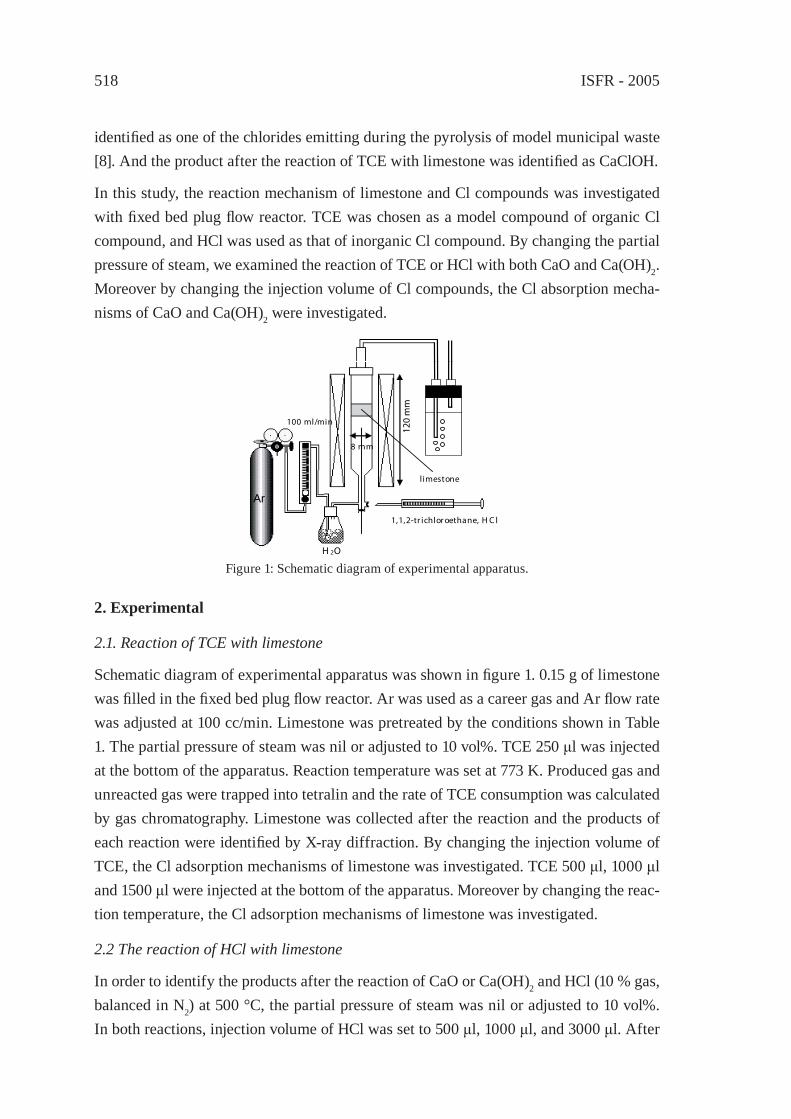
ISFR - 2005518
identifi ed as one of the chlorides emitting during the pyrolysis of model municipal waste [8]. And the product after the reaction of TCE with limestone was identifi ed as CaClOH.
In this study, the reaction mechanism of limestone and Cl compounds was investigated with fi xed bed plug fl ow reactor. TCE was chosen as a model compound of organic Cl compound, and HCl was used as that of inorganic Cl compound. By changing the partial pressure of steam, we examined the reaction of TCE or HCl with both CaO and Ca(OH)2. Moreover by changing the injection volume of Cl compounds, the Cl absorption mecha-nisms of CaO and Ca(OH)2 were investigated.
1,1,2-tr ichlor oethane, H C l
l imestone
Ar
H 2O
100 ml/min
120
mm
8 mm
Figure 1: Schematic diagram of experimental apparatus.
2. Experimental
2.1. Reaction of TCE with limestone
Schematic diagram of experimental apparatus was shown in fi gure 1. 0.15 g of limestone was fi lled in the fi xed bed plug fl ow reactor. Ar was used as a career gas and Ar fl ow rate was adjusted at 100 cc/min. Limestone was pretreated by the conditions shown in Table 1. The partial pressure of steam was nil or adjusted to 10 vol%. TCE 250 μl was injected at the bottom of the apparatus. Reaction temperature was set at 773 K. Produced gas and unreacted gas were trapped into tetralin and the rate of TCE consumption was calculated by gas chromatography. Limestone was collected after the reaction and the products of each reaction were identifi ed by X-ray diffraction. By changing the injection volume of TCE, the Cl adsorption mechanisms of limestone was investigated. TCE 500 μl, 1000 μl and 1500 μl were injected at the bottom of the apparatus. Moreover by changing the reac-tion temperature, the Cl adsorption mechanisms of limestone was investigated.
2.2 The reaction of HCl with limestone
In order to identify the products after the reaction of CaO or Ca(OH)2 and HCl (10 % gas, balanced in N2) at 500 °C, the partial pressure of steam was nil or adjusted to 10 vol%. In both reactions, injection volume of HCl was set to 500 μl, 1000 μl, and 3000 μl. After
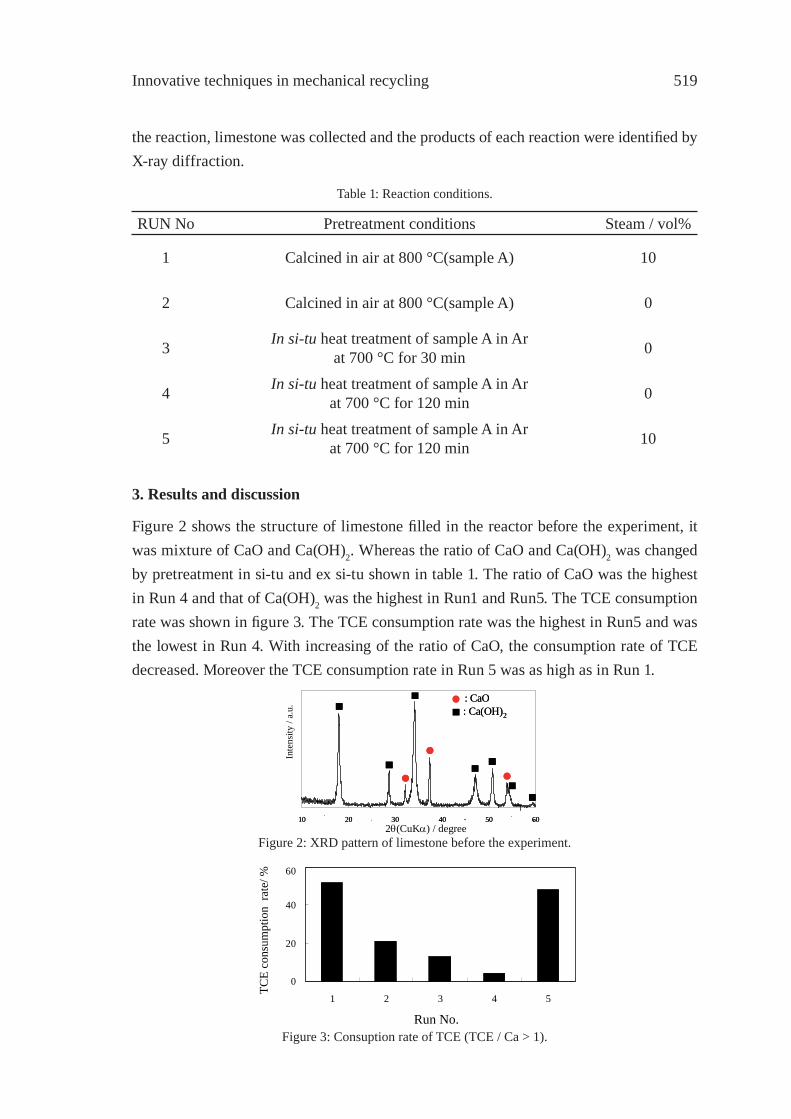
Innovative techniques in mechanical recycling 519
the reaction, limestone was collected and the products of each reaction were identifi ed by X-ray diffraction.
Table 1: Reaction conditions.
RUN No Pretreatment conditions Steam / vol%
1 Calcined in air at 800 °C(sample A) 10
2 Calcined in air at 800 °C(sample A) 0
3 In si-tu heat treatment of sample A in Arat 700 °C for 30 min 0
4 In si-tu heat treatment of sample A in Arat 700 °C for 120 min 0
5 In si-tu heat treatment of sample A in Arat 700 °C for 120 min 10
3. Results and discussion
Figure 2 shows the structure of limestone fi lled in the reactor before the experiment, it was mixture of CaO and Ca(OH)2. Whereas the ratio of CaO and Ca(OH)2 was changed by pretreatment in si-tu and ex si-tu shown in table 1. The ratio of CaO was the highest in Run 4 and that of Ca(OH)2 was the highest in Run1 and Run5. The TCE consumption rate was shown in fi gure 3. The TCE consumption rate was the highest in Run5 and was the lowest in Run 4. With increasing of the ratio of CaO, the consumption rate of TCE decreased. Moreover the TCE consumption rate in Run 5 was as high as in Run 1.
10 20 30 40 50 6010 20 30 40 50 60
Inte
nsity
/ a.
u.
2θ(CuKα) / degree
: CaO: Ca(OH)2
: CaO: Ca(OH)2
0
20
40
60
1 2 3 4 5
TCE
cons
umpt
ion
rate
/ %
Run No. Figure 3: Consuption rate of TCE (TCE / Ca > 1).
Figure 2: XRD pattern of limestone before the experiment.
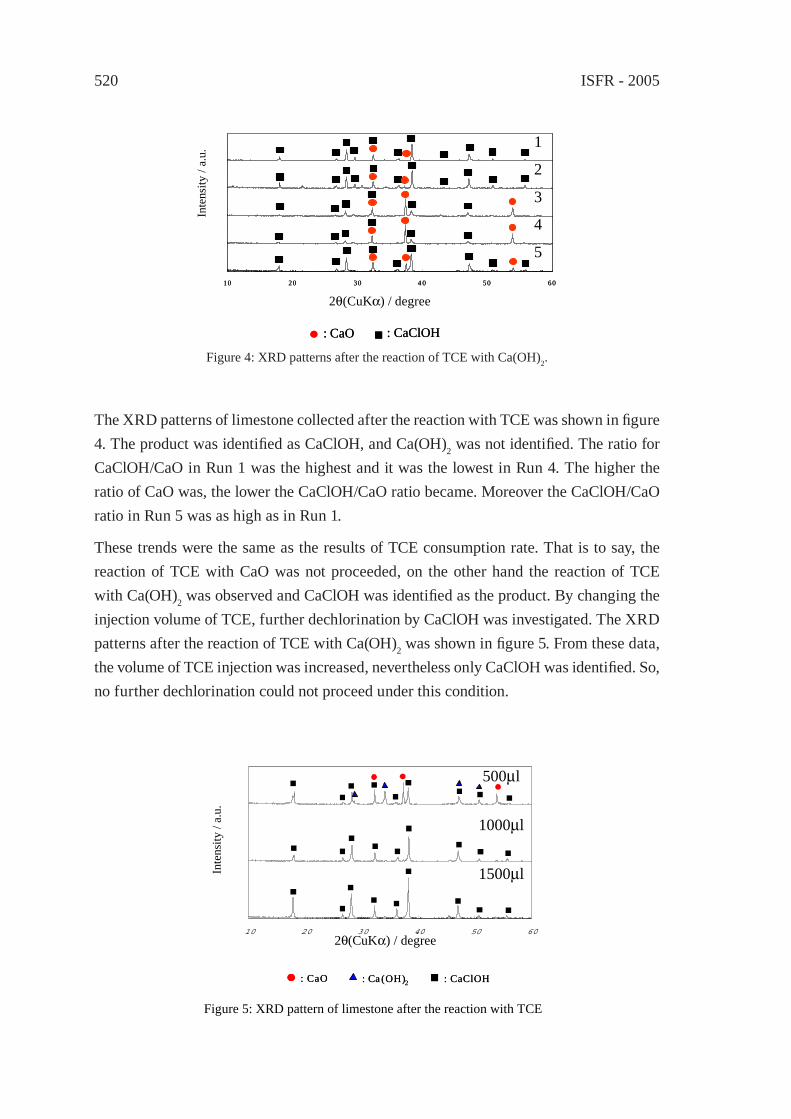
ISFR - 2005520
2θ(CuKα) / degree
Inte
nsity
/ a.
u.
10 20 30 4 0 50 6010 20 30 4 0 50 60
: CaClOH: CaO : CaClOH: CaO
1
2
3
4
5
The XRD patterns of limestone collected after the reaction with TCE was shown in fi gure 4. The product was identifi ed as CaClOH, and Ca(OH)2 was not identifi ed. The ratio for CaClOH/CaO in Run 1 was the highest and it was the lowest in Run 4. The higher the ratio of CaO was, the lower the CaClOH/CaO ratio became. Moreover the CaClOH/CaO ratio in Run 5 was as high as in Run 1.
These trends were the same as the results of TCE consumption rate. That is to say, the reaction of TCE with CaO was not proceeded, on the other hand the reaction of TCE with Ca(OH)2 was observed and CaClOH was identifi ed as the product. By changing the injection volume of TCE, further dechlorination by CaClOH was investigated. The XRD patterns after the reaction of TCE with Ca(OH)2 was shown in fi gure 5. From these data, the volume of TCE injection was increased, nevertheless only CaClOH was identifi ed. So, no further dechlorination could not proceed under this condition.
Figure 5: XRD pattern of limestone after the reaction with TCE
: CaClOH: CaO : Ca (OH)2 : CaClOH: CaO : Ca (OH)2
Inte
nsity
/ a.
u.
10 20 30 40 50 6010 20 30 40 50 602θ(CuKα) / degree
500µl
1000µl
1500µl
Figure 4: XRD patterns after the reaction of TCE with Ca(OH)2.
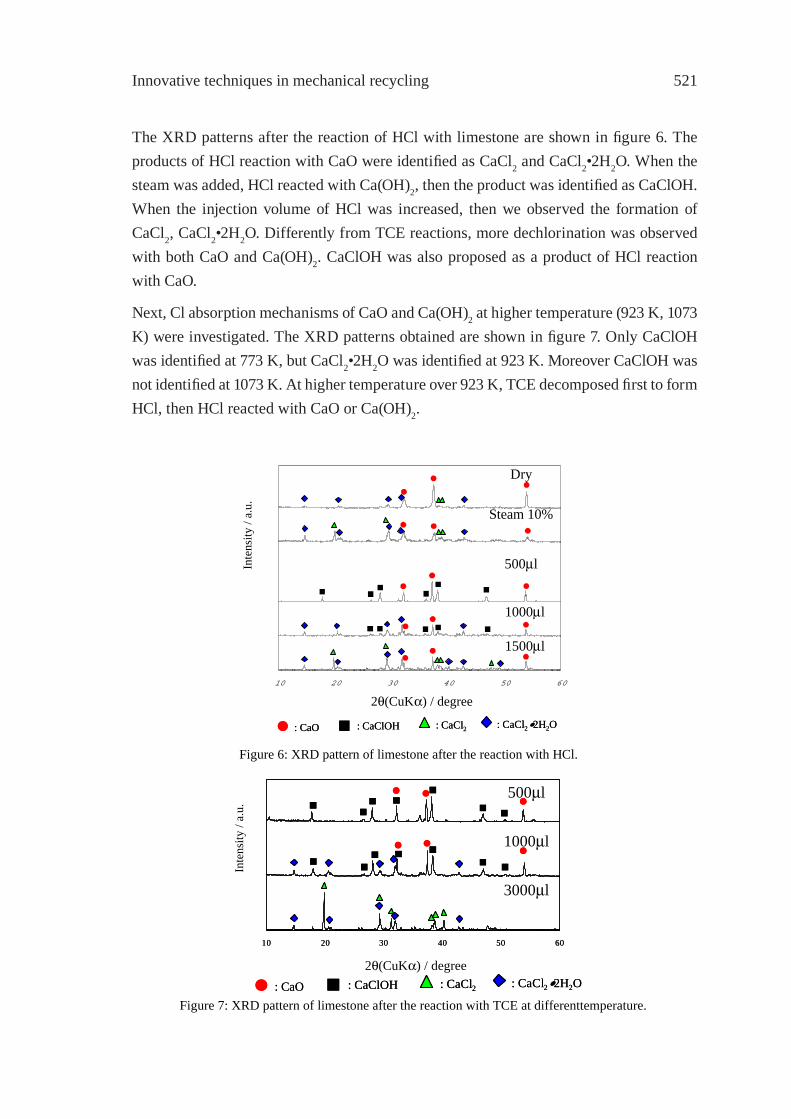
Innovative techniques in mechanical recycling 521
The XRD patterns after the reaction of HCl with limestone are shown in fi gure 6. The products of HCl reaction with CaO were identifi ed as CaCl2 and CaCl2•2H2O. When the steam was added, HCl reacted with Ca(OH)2, then the product was identifi ed as CaClOH. When the injection volume of HCl was increased, then we observed the formation of CaCl2, CaCl2•2H2O. Differently from TCE reactions, more dechlorination was observed with both CaO and Ca(OH)2. CaClOH was also proposed as a product of HCl reaction with CaO.
Next, Cl absorption mechanisms of CaO and Ca(OH)2 at higher temperature (923 K, 1073 K) were investigated. The XRD patterns obtained are shown in fi gure 7. Only CaClOH was identifi ed at 773 K, but CaCl2•2H2O was identifi ed at 923 K. Moreover CaClOH was not identifi ed at 1073 K. At higher temperature over 923 K, TCE decomposed fi rst to form HCl, then HCl reacted with CaO or Ca(OH)2.
Inte
nsity
/ a.
u.
10 20 30 40 50 6010 20 30 40 50 60
: CaClOH: CaO : CaCl2 : CaCl2•2H2O: CaClOH: CaO : CaCl2 : CaCl2•2H2O
10 20 30 40 50 6010 20 30 40 50 60
Inte
nsity
/ a.
u.
2θ(CuKα) / degree
2θ(CuKα) / degree
Figure 6: XRD pattern of limestone after the reaction with HCl.
: CaClOH: CaO : CaCl2 : CaCl2•2H2O: CaClOH: CaO : CaCl2 : CaCl2•2H2O
Figure 7: XRD pattern of limestone after the reaction with TCE at differenttemperature.
500µl
1000µl
3000µl
Dry
Steam 10%
500µl
1000µl
1500µl

ISFR - 2005522
4. Conclusion
In this study, the reaction mechanisms of limestone and Cl compounds were investigated by changing the partial pressure of steam, injection volume of Cl compounds and reaction temperatures. TCE was identifi ed as one of the Cl compounds emitting during the pyroly-sis/gasifi cation of model municipal waste at 773 K, so it was chosen as a model compound of organic Cl compounds, and HCl was used as that of inorganic Cl compounds.
The reaction of TCE with CaO was not observed. On the other hand, the reaction of TCE with Ca(OH)2 occurred and the product of the reaction was identifi ed as CaClOH. And when the volume of TCE injection was increased, only CaClOH was identifi ed. So, no further dechlorination was observed under this condition. Products of HCl reaction with CaO were identifi ed as CaCl2 and CaCl2•2H2O. When the steam was added, the HCl reaction with Ca(OH)2 was observed, the product was identifi ed as CaClOH and when the injection volume of HCl was increased, the formation of CaCl2, CaCl2•2H2O was ob-served. CaClOH was also proposed as a product of HCl reaction with CaO, because the reaction of CaO with H2O resulting from HCl reaction with CaO was proceeded and then, HCl reaction with Ca(OH)2 proceeded. At 1073 K the reaction of TCE with limestone was considered as the reaction of HCl generated from decomposition of TCE with limestone, and it was considered that both the reaction of TCE with Ca(OH)2 and that of HCl with CaO or Ca(OH)2 occurred at 923 K.
References
[1] Matsukata, M., K. Ido, K. Kusaba, M. Matsuzawa, E. Kikuchi, T. Iwasaki and K. Okuyama, “Effect of lime on Cl-containing gas emission during RDF combustion in a fl uidized bed,” Proceedings of The 6th SCEJ Symposium on Fluidization, 98-103 (2000).
[2] Sugiyama, H., S. Kagawa, H. Kamiya and M. Horio, “Chlorine Behavior in Fluidized Bed Incineration of Refuse-Derived Fuels,” ENVIRONMENTAL ENGINEERING SCIENCE, 15, 1, 97-105 (1998).
[3] Liu, G.-Q., Y. Itaya, R. Yamazaki and S. Mori “Behevior of Chlorine during Combustion of Single Cylindrical RDF,” Proceedings of The 5th SCEJ Symposium on Fluidization, 67-74 (1999).
[4] Kondo, H., H. Moritomi, R. Yoshiie and M. Nishimura, “Characteristics on HCl Absorption and Emission by Limestone,” Kagaku Kougaku Ronbunshu, 27, 5, 624-628 (2001).
[5] Naruse, I., A. Higuchi and H. Yanagino, “Emission and De-chlorination Characteristic in Refuse-Derived Fuel Combustion,” Kagaku Kougaku Ronbunshu, 27, 5, 604-609 (2001).
Innovative techniques in mechanical recycling 523
[6] Wang, Z., H. Huang, H. LI, C. Wu and Y. Chen, “HCl Formation from RDF Pyrolysis and Combustion in a Spouting-Moving Bed Reactor,” Energy & Fuels, 16, 608-614 (2002).
[7] Sekine, Y., M. Matsuzawa, H. Yazaki, E. Kikuchi, M. Matsukata, T. Iwasaki and K. Okuyama, “Emission behavior of Chlorine during combustion of the model RDF particle in bubbling fl uidized bed,” Proceedings of The 7th SCEJ Symposium On Fluidization, 213-220 (2001).
[8] Sekine, Y., M. Matsuzawa, H. Yazaki, Y. Miyai, E. Kikuchi, M. Matsukata, T. Iwasaki and S. Kinoshita, “Effect of lime on the DXN-containing gas emission model RDF combustion in a fl uidized bed,” Proceedings of The 8th SCEJ Symposium On Fluidization, 243-250 (2002).

ISFR - 2005524
Innovative techniques in mechanical recycling 525
A PRACTICAL METHOD FOR CHEMICAL RECYCLING OF FRP. DMAP AS AN EFFECTIVE CATALYST FOR DEGRADATION OF
FRPS IN SUPERCRITICAL ALCOHOLSAkio Kamimura1*, Tomohiro Kuratani1, Kazuo Yamada2 and Fumiaki Tomonaga2
1Department of Applied Chemistry, Faculty of Engineering, Yamaguchi University, Ube 755-8611 Japan
2 Yamaguchi Prefectural Industrial Technology Institute, Ube 755-0195 Japan,[email protected]
Abstract: Roughly crashed FRPs were readily decomposed into dimethyl phthalate, gly-col, polystyrene and grass fi ber by treatment with supercritical methanol in the presence of DMAP (dimethylaminopyridine). The present method provides a useful method for chemical recycling of waste FRPs.
1. Introduction
Recently, waste plastics cause serious problems from the environmental points of view. Many wonderful merits of plastics turn into troublesome demerits when waste plastics are disposed of. The best solution to treat waste plastics may be chemical recycling, where the waste is depolymerized to monomers, which are then polymerized again to convert to recycled plastics. FRP, fi ber reinforced plastic, is a plastic that is recognized as an excel-lent materials for building materials, boats and septic tanks. The amounts of the waste FRPs are currently increasing because life time of FRP products such as fi shing boats is running out. FRP is known as the most diffi cult material for depolymerization so that their practical treatments are landfi ll and incineration for the moment. Although there have been several attempts for chemical recycling of the waste FRP so far, none of them are useful for recycling both of organic constituents and grass fi bers [1].
Supercritical fl uid has currently attracted many chemists as a new reaction media [2]. It is also useful for depolymerization reaction for several plastics [3]. During the course of our investigation to use of supercritical alcohol for developing a novel chemical recycling process, we have succeeded to fi nd a practical method for chemical recycling of FRPs, in which DMAP, N,N-dimethylaminopyridine, known as an effi cient catalyst for esterifi ca-tion and amidation [4], acted as an excellent catalyst for the depolymerization (Scheme 1).
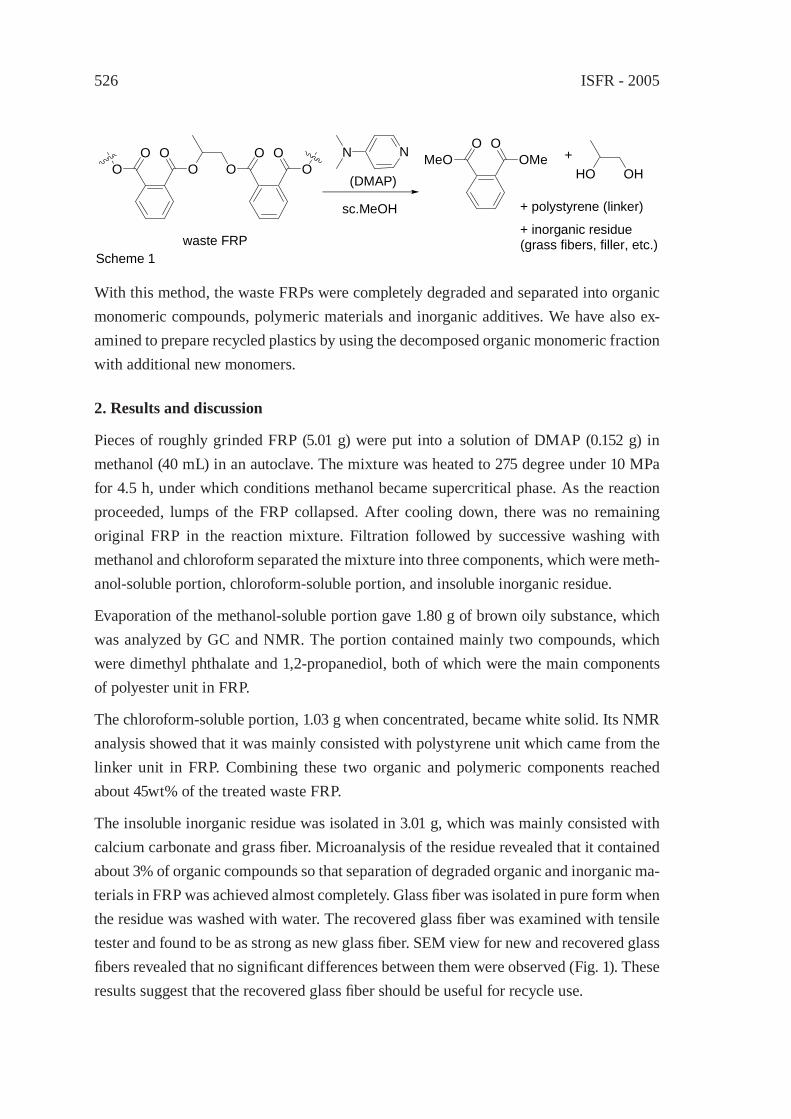
ISFR - 2005526
OOO OO
O OO
NNOO
HO OHMeO OMe
(DMAP)
sc.MeOH
waste FRPScheme 1
+
+ inorganic residue(grass fibers, filler, etc.)
+ polystyrene (linker)
With this method, the waste FRPs were completely degraded and separated into organic monomeric compounds, polymeric materials and inorganic additives. We have also ex-amined to prepare recycled plastics by using the decomposed organic monomeric fraction with additional new monomers.
2. Results and discussion
Pieces of roughly grinded FRP (5.01 g) were put into a solution of DMAP (0.152 g) in methanol (40 mL) in an autoclave. The mixture was heated to 275 degree under 10 MPa for 4.5 h, under which conditions methanol became supercritical phase. As the reaction proceeded, lumps of the FRP collapsed. After cooling down, there was no remaining original FRP in the reaction mixture. Filtration followed by successive washing with methanol and chloroform separated the mixture into three components, which were meth-anol-soluble portion, chloroform-soluble portion, and insoluble inorganic residue.
Evaporation of the methanol-soluble portion gave 1.80 g of brown oily substance, which was analyzed by GC and NMR. The portion contained mainly two compounds, which were dimethyl phthalate and 1,2-propanediol, both of which were the main components of polyester unit in FRP.
The chloroform-soluble portion, 1.03 g when concentrated, became white solid. Its NMR analysis showed that it was mainly consisted with polystyrene unit which came from the linker unit in FRP. Combining these two organic and polymeric components reached about 45wt% of the treated waste FRP.
The insoluble inorganic residue was isolated in 3.01 g, which was mainly consisted with calcium carbonate and grass fi ber. Microanalysis of the residue revealed that it contained about 3% of organic compounds so that separation of degraded organic and inorganic ma-terials in FRP was achieved almost completely. Glass fi ber was isolated in pure form when the residue was washed with water. The recovered glass fi ber was examined with tensile tester and found to be as strong as new glass fi ber. SEM view for new and recovered glass fi bers revealed that no signifi cant differences between them were observed (Fig. 1). These results suggest that the recovered glass fi ber should be useful for recycle use.
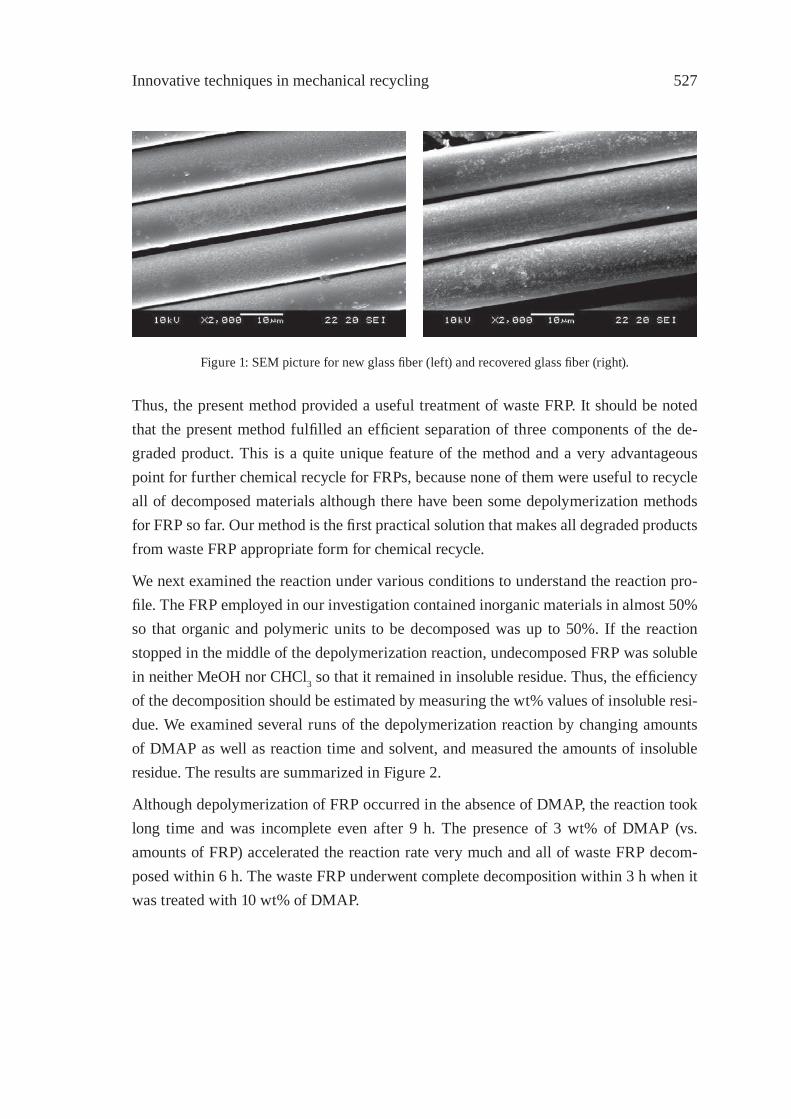
Innovative techniques in mechanical recycling 527
Figure 1: SEM picture for new glass fi ber (left) and recovered glass fi ber (right).
Thus, the present method provided a useful treatment of waste FRP. It should be noted that the present method fulfi lled an effi cient separation of three components of the de-graded product. This is a quite unique feature of the method and a very advantageous point for further chemical recycle for FRPs, because none of them were useful to recycle all of decomposed materials although there have been some depolymerization methods for FRP so far. Our method is the fi rst practical solution that makes all degraded products from waste FRP appropriate form for chemical recycle.
We next examined the reaction under various conditions to understand the reaction pro-fi le. The FRP employed in our investigation contained inorganic materials in almost 50% so that organic and polymeric units to be decomposed was up to 50%. If the reaction stopped in the middle of the depolymerization reaction, undecomposed FRP was soluble in neither MeOH nor CHCl3 so that it remained in insoluble residue. Thus, the effi ciency of the decomposition should be estimated by measuring the wt% values of insoluble resi-due. We examined several runs of the depolymerization reaction by changing amounts of DMAP as well as reaction time and solvent, and measured the amounts of insoluble residue. The results are summarized in Figure 2.
Although depolymerization of FRP occurred in the absence of DMAP, the reaction took long time and was incomplete even after 9 h. The presence of 3 wt% of DMAP (vs. amounts of FRP) accelerated the reaction rate very much and all of waste FRP decom-posed within 6 h. The waste FRP underwent complete decomposition within 3 h when it was treated with 10 wt% of DMAP.
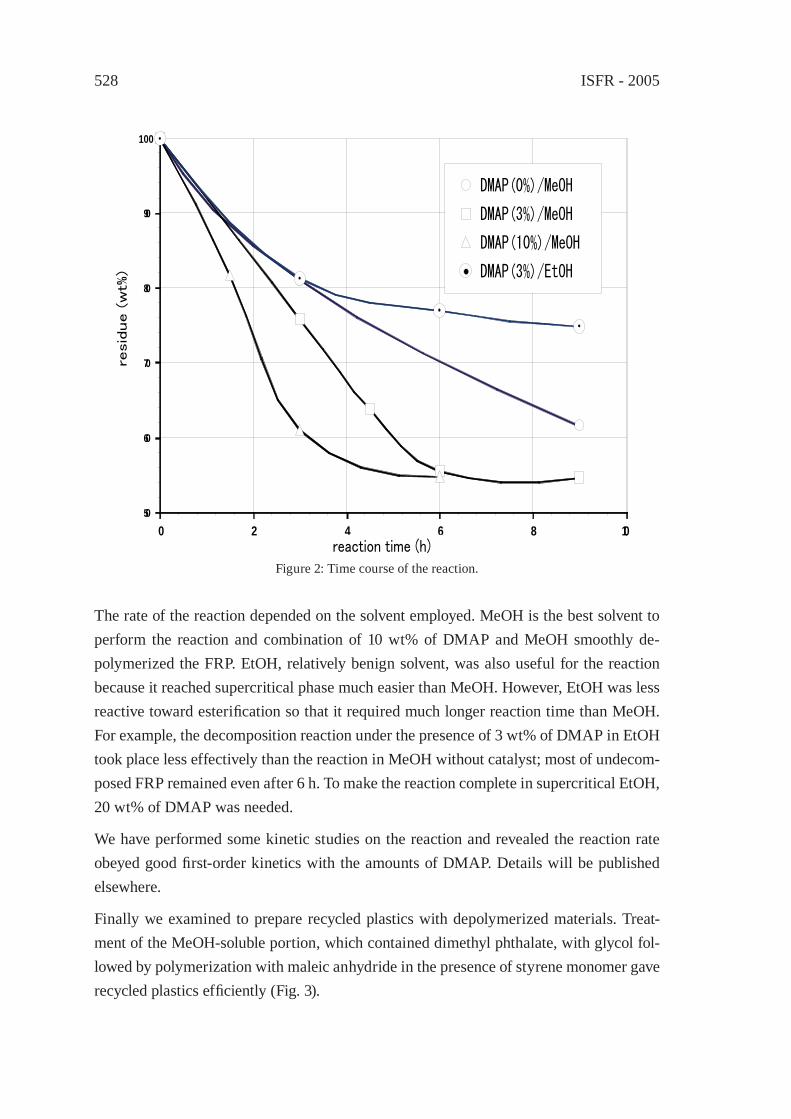
ISFR - 2005528
Figure 2: Time course of the reaction.
The rate of the reaction depended on the solvent employed. MeOH is the best solvent to perform the reaction and combination of 10 wt% of DMAP and MeOH smoothly de-polymerized the FRP. EtOH, relatively benign solvent, was also useful for the reaction because it reached supercritical phase much easier than MeOH. However, EtOH was less reactive toward esterifi cation so that it required much longer reaction time than MeOH. For example, the decomposition reaction under the presence of 3 wt% of DMAP in EtOH took place less effectively than the reaction in MeOH without catalyst; most of undecom-posed FRP remained even after 6 h. To make the reaction complete in supercritical EtOH, 20 wt% of DMAP was needed.
We have performed some kinetic studies on the reaction and revealed the reaction rate obeyed good fi rst-order kinetics with the amounts of DMAP. Details will be published elsewhere.
Finally we examined to prepare recycled plastics with depolymerized materials. Treat-ment of the MeOH-soluble portion, which contained dimethyl phthalate, with glycol fol-lowed by polymerization with maleic anhydride in the presence of styrene monomer gave recycled plastics effi ciently (Fig. 3).
50
60
70
80
90
100
0 2 4 6 8 10
DMAP(0%)/MeOH
DMAP(3%)/MeOH
DMAP(10%)/MeOH
DMAP(3%)/EtOH
reaction time (h)
resid
ue (
wt%
)
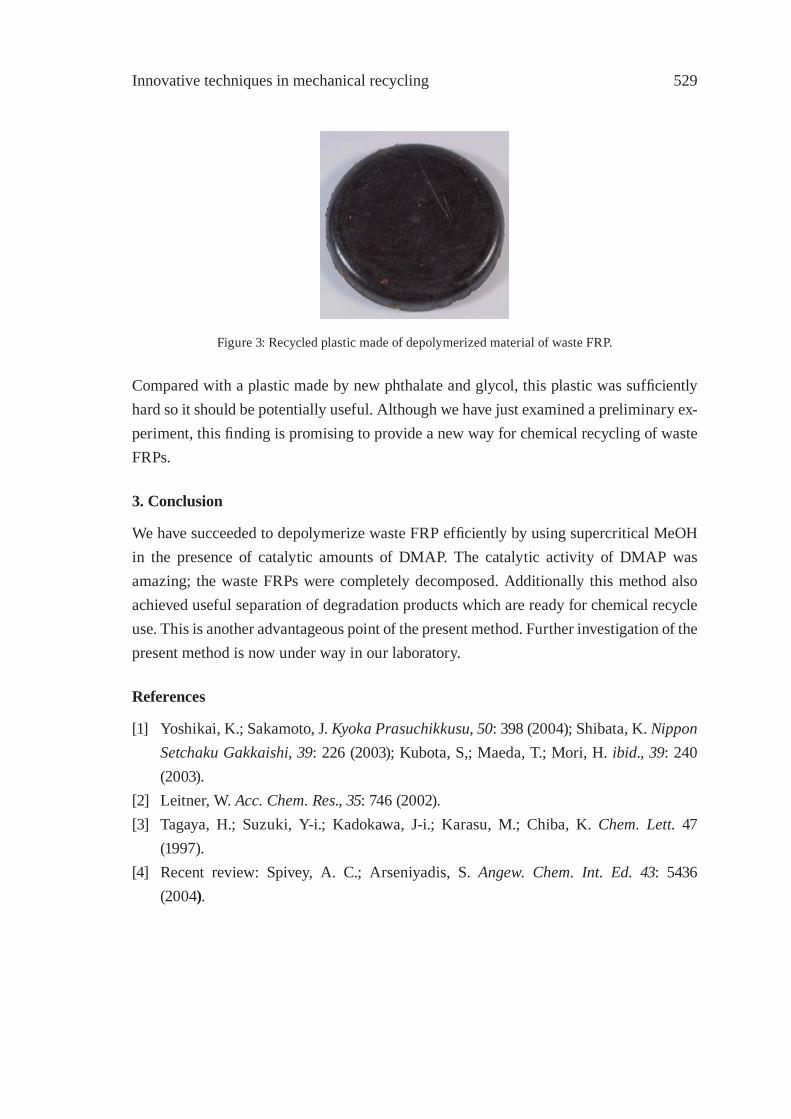
Innovative techniques in mechanical recycling 529
Figure 3: Recycled plastic made of depolymerized material of waste FRP.
Compared with a plastic made by new phthalate and glycol, this plastic was suffi ciently hard so it should be potentially useful. Although we have just examined a preliminary ex-periment, this fi nding is promising to provide a new way for chemical recycling of waste FRPs.
3. Conclusion
We have succeeded to depolymerize waste FRP effi ciently by using supercritical MeOH in the presence of catalytic amounts of DMAP. The catalytic activity of DMAP was amazing; the waste FRPs were completely decomposed. Additionally this method also achieved useful separation of degradation products which are ready for chemical recycle use. This is another advantageous point of the present method. Further investigation of the present method is now under way in our laboratory.
References
[1] Yoshikai, K.; Sakamoto, J. Kyoka Prasuchikkusu, 50: 398 (2004); Shibata, K. Nippon Setchaku Gakkaishi, 39: 226 (2003); Kubota, S,; Maeda, T.; Mori, H. ibid., 39: 240 (2003).
[2] Leitner, W. Acc. Chem. Res., 35: 746 (2002).[3] Tagaya, H.; Suzuki, Y-i.; Kadokawa, J-i.; Karasu, M.; Chiba, K. Chem. Lett. 47
(1997).[4] Recent review: Spivey, A. C.; Arseniyadis, S. Angew. Chem. Int. Ed. 43: 5436
(2004).

ISFR - 2005530

Innovative techniques in mechanical recycling 531
FORMATION OF SUBMICRON SCALE FIBROUS CARBONACEOUS COMPOUNDS THROUGH PYROLYSIS OF PET
IN THE PRESENCE OF METAL OXIDESO. Terakado* and M. Hirasawa
Institute of Multidisciplinary Research for Advanced Materials, Tohoku University, Sendai, Japan
Current address: Department of Materials Science and Engineering, Graduate School of Engineering, Nagoya University, Nagoya, Japan, [email protected]
Abstract: Thermal decomposition of poly(ethylene terephthalate), PET, with the existence of metal oxides, MO, has been investigated under inert atmosphere at temperature up to 800 °C. The pyrolysis of PET-MO mixture gives characteristic morphology of pyrolysis residues. It was found that pyrolysis residues of PET-ZnO or rare earth oxides have fi -brous morphology with the diameter ranging from ca. 20 nm for Sm2O3 to 1 μm for ZnO. On the other hand, carbonaceous compounds derived from the acid treatment of the pyrolysis residues, especially from PET-Fe2O3, exhibits high mesopores volumes. This has been confi rmed by its signifi cant ability of absorbing large organic molecules such as humic substances.
1. Introduction
Pyrolysis study of synthetic polymer with catalysis additives is very important, giving us fruitful information with respect to the potential application in feedstock recycling of waste plastics. In the pyrolysis study, a variety of interesting topics are also found, such as the formation of carbon – inorganic composite materials and catalytic activation of carbonaceous compounds originating from plastics. In the present article we address the pyrolysis of mixture of PET and metal oxides with emphasis on the formation process of carbonaceous compounds.
2. Experimental
Powder of PET (MA-525 supplied from Mitsubishi Rayon Chem. Co., Ltd., Inherent vis-cosity: 0.75, Ground down to diameter of < 250 μm) was mixed physically with com-mercial metal oxides of reagent grade with the particle size of 1-10 μm. The composition mainly studied in this work was 2 PET – 1 MO in molar ratio. Pyrolysis was carried out at various temperatures in alumina reaction boot placed in quartz tube. The helium gas fl ow of 100 ml/min was passed through the quartz tube. Typical reaction time was 10 min at 800 °C.
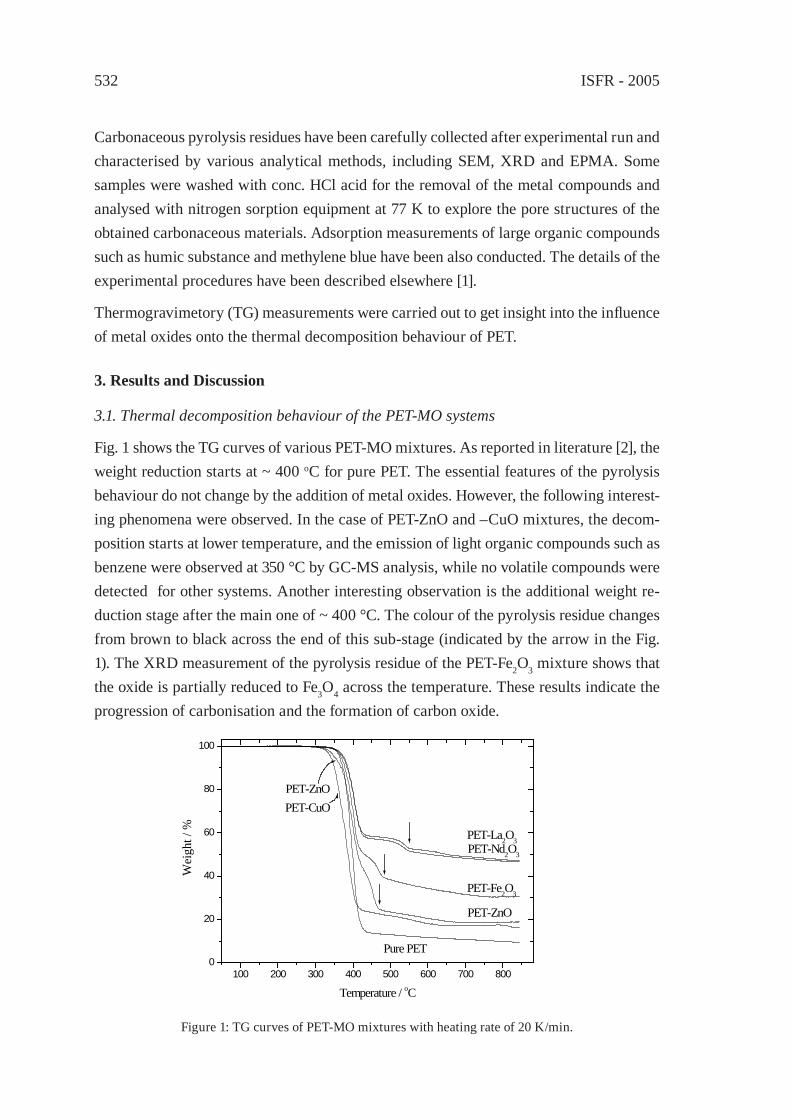
ISFR - 2005532
Carbonaceous pyrolysis residues have been carefully collected after experimental run and characterised by various analytical methods, including SEM, XRD and EPMA. Some samples were washed with conc. HCl acid for the removal of the metal compounds and analysed with nitrogen sorption equipment at 77 K to explore the pore structures of the obtained carbonaceous materials. Adsorption measurements of large organic compounds such as humic substance and methylene blue have been also conducted. The details of the experimental procedures have been described elsewhere [1].
Thermogravimetory (TG) measurements were carried out to get insight into the infl uence of metal oxides onto the thermal decomposition behaviour of PET.
3. Results and Discussion
3.1. Thermal decomposition behaviour of the PET-MO systems
Fig. 1 shows the TG curves of various PET-MO mixtures. As reported in literature [2], the weight reduction starts at ~ 400 oC for pure PET. The essential features of the pyrolysis behaviour do not change by the addition of metal oxides. However, the following interest-ing phenomena were observed. In the case of PET-ZnO and –CuO mixtures, the decom-position starts at lower temperature, and the emission of light organic compounds such as benzene were observed at 350 °C by GC-MS analysis, while no volatile compounds were detected for other systems. Another interesting observation is the additional weight re-duction stage after the main one of ~ 400 °C. The colour of the pyrolysis residue changes from brown to black across the end of this sub-stage (indicated by the arrow in the Fig. 1). The XRD measurement of the pyrolysis residue of the PET-Fe2O3 mixture shows that the oxide is partially reduced to Fe3O4 across the temperature. These results indicate the progression of carbonisation and the formation of carbon oxide.
100 200 300 400 500 600 700 8000
20
40
60
80
100
PET-ZnO
PET-CuO
PET-ZnO
PET-Fe2O3
PET-Nd2O3
PET-La2O3
Pure PET
Wei
ght /
%
Temperature / oC
Figure 1: TG curves of PET-MO mixtures with heating rate of 20 K/min.
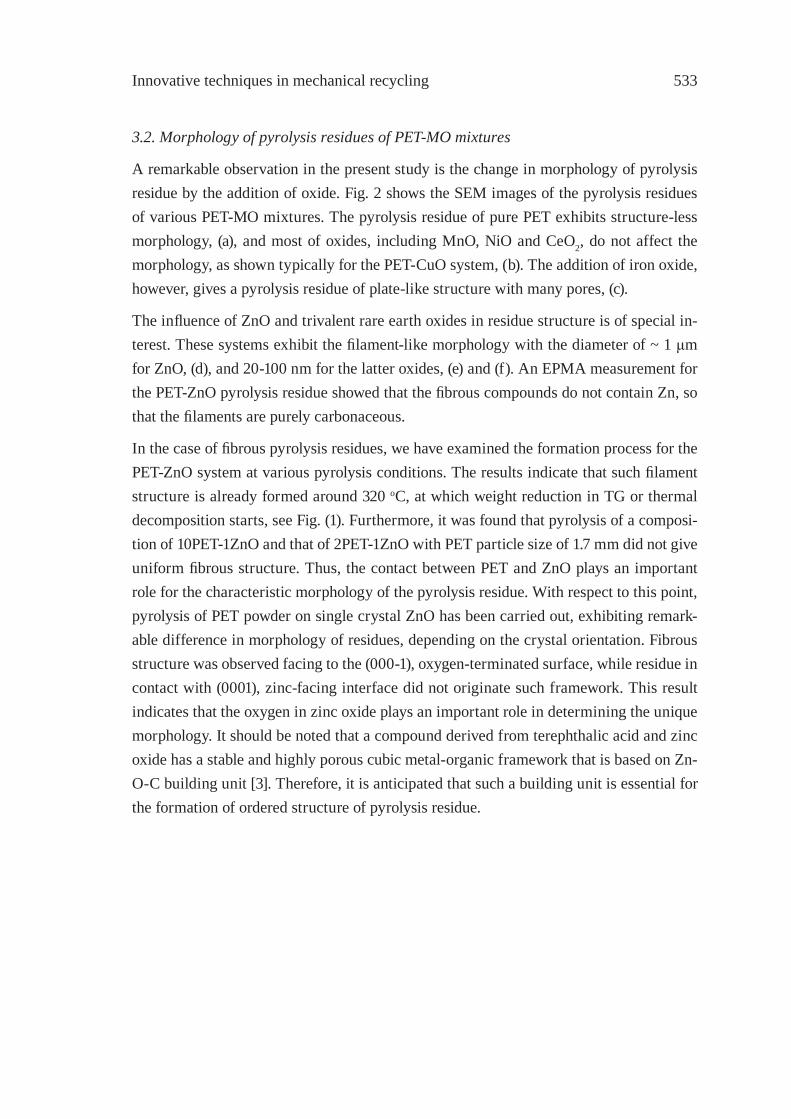
Innovative techniques in mechanical recycling 533
3.2. Morphology of pyrolysis residues of PET-MO mixtures
A remarkable observation in the present study is the change in morphology of pyrolysis residue by the addition of oxide. Fig. 2 shows the SEM images of the pyrolysis residues of various PET-MO mixtures. The pyrolysis residue of pure PET exhibits structure-less morphology, (a), and most of oxides, including MnO, NiO and CeO2, do not affect the morphology, as shown typically for the PET-CuO system, (b). The addition of iron oxide, however, gives a pyrolysis residue of plate-like structure with many pores, (c).
The infl uence of ZnO and trivalent rare earth oxides in residue structure is of special in-terest. These systems exhibit the fi lament-like morphology with the diameter of ~ 1 μm for ZnO, (d), and 20-100 nm for the latter oxides, (e) and (f). An EPMA measurement for the PET-ZnO pyrolysis residue showed that the fi brous compounds do not contain Zn, so that the fi laments are purely carbonaceous.
In the case of fi brous pyrolysis residues, we have examined the formation process for the PET-ZnO system at various pyrolysis conditions. The results indicate that such fi lament structure is already formed around 320 oC, at which weight reduction in TG or thermal decomposition starts, see Fig. (1). Furthermore, it was found that pyrolysis of a composi-tion of 10PET-1ZnO and that of 2PET-1ZnO with PET particle size of 1.7 mm did not give uniform fi brous structure. Thus, the contact between PET and ZnO plays an important role for the characteristic morphology of the pyrolysis residue. With respect to this point, pyrolysis of PET powder on single crystal ZnO has been carried out, exhibiting remark-able difference in morphology of residues, depending on the crystal orientation. Fibrous structure was observed facing to the (000-1), oxygen-terminated surface, while residue in contact with (0001), zinc-facing interface did not originate such framework. This result indicates that the oxygen in zinc oxide plays an important role in determining the unique morphology. It should be noted that a compound derived from terephthalic acid and zinc oxide has a stable and highly porous cubic metal-organic framework that is based on Zn-O-C building unit [3]. Therefore, it is anticipated that such a building unit is essential for the formation of ordered structure of pyrolysis residue.
ISFR - 2005534
Figure 2: SEM images of pyrolysis residues (Pyrolysis condition: 800 oC, 10 min, [PET]:[MO]=2:1 in case of oxide addition): (a) pure PET, (b) PET-CuO, (c) –Fe2O3, (d) –ZnO, (e) –Nd2O3, and (f) –Sm2O3.
3.3. Pore structures of carbonaceous compounds obtained from PET-MO mixtures
On the basis of the observation of the characteristic porous morphology, we have exam-ined possible application of the residue materials as adsorbents. Fig. 5 shows the nitrogen adsorption and desorption isotherm at 77 K for the samples washed with conc. HCl (See experimental section). Large hysteresis in isotherm curves of ZnO, Nd2O3 and Fe2O3 at high relative pressure indicates the development of mesopores with pore size of 2-50 nm. The BJH method [4] was applied for desorption branch in order to estimate the mesopores area, ABJH, and the results are summarised in Table 1. Included in the table are the BET surface area, ABET, where the whole pore area contributes, and mesopores ratio (ABJH / ABET×100). It should be here noted that ABJH is overestimated because of the steep region of the desorption branch at P/P0 ~ 0.42 owing to the native property of adsorptive, nitrogen molecule, so that the quantitative discussion is not possible [5]. Nevertheless, the results indicate the existence of abundant mesopores in PET-Fe2O3 system.
Innovative techniques in mechanical recycling 535
Table 1: BET surface area and mesopores ratio of carbonaceous compounds obtained from 2PET-1MO
mixture at 800 oC. All the samples are washed with conc. HCl.
Oxide Nd2O3 ZnO MnO Fe2O3 NoneBET area / m2 g-1 902 625 468 458 442
Mesopore ratio / % 71 42 7 ~ 100 ~ 0Table 2 Comparison of adsorbed HA and MB by carbonaceous compounds obtained
from 2PET-1MO mixture at 800 oC. All the samples are washed with conc. HCl.
Oxide Fe2O3
La2O3
Nd2O3
ZnO None F400
MB (%) 76 92-96 39 ~ 0 63HA (%) 48 42-44 41 ~ 0 18
This feature is also considered by the adsorption study of large molecule such as humic acid (HA) and methylene blue (MB) onto the carbonaceous compounds. The former is known to be possible precursor of halogen carcinogens in soil. In Table 2 is summarised the adsorbed amount of HA or MB by acid-treated carbonaceous powders from the re-spective aqueous solution after 2 hours of shaking at ambient temperature. Those with large mesopores ratio exhibit good ability to adsorb HA and MB in comparison to typical commercial activated carbons.
References
[1] Terakado, O., and Hirasawa, M., J. Anal. Appl. Pyrol. 73:248 (2005).[2] Martín-Gullón, I., Esperanza, M., and Font, R., J. Anal. Appl. Pyrol. 58-59:635
(2001).[3] Li, H., Eddaoudi, M., O’Keeffe, M., and Yaghi, O.M., Nature 402:276 (1999).[4] Barrett, E.P., Joyner, L.G., and Halenda, P.H., J. Amer. Chem. Soc. 73:373 (1951).[5] Sing, K.S.W., Everett, D.H., Haul, R.A.W., Moscou, L., Pierotti, R.A., Rouquerol, J.,
and Siemieniewska, T., Pure Appl. Chem. 57:603 (1985).

ISFR - 2005536

Innovative techniques in mechanical recycling 537
NANO-CRYSTALLINE CARBON COMPOSITE/METAL OXIDE CATALYSTS THROUGH WOOD BIOMASS (SAWDUST) AND
ION EXCHANGE RESINSA. Muto*, T. Bhaskar, Y. Sakata
Department of Applied Chemistry, Okayama University, 3-1-1 Tsushima Naka, Okayama 700-8530, Japan, [email protected]
Abstract: The novel catalytic preparation methods to utilize the valuable carbon based materials such as natural polymeric materials i.e., wood biomass (sawdust) and synthetic polymeric materials (ion exchange resins) were investigated to prepare carbon compos-ites and nano-crystalline metal oxide (CeO2, ZrO2 and CeO2-ZrO2) catalysts. In this re-port, we report the preparation of CeO2, ZrO2 and CeO2-ZrO2 oxide catalysts using saw-dust and ion exchange resins (IRC748 - imino diacetate group containing ion exchange resin)), TiP2O7 carbon composites using C467 ion exchange resin (phosphate group). The catalysts were characterized various adsorption and spectroscopic technique. The Ce-Zr supported catalysts were loaded with different loadings of Ni and evaluated for the par-tial oxidation of methane. The catalytic activities of TiP2O7 carbon composites evaluated for the photo catalytic decomposition of 2-propanol.
1. Introduction
Green chemistry is coming of age with interest in both academic and industrial laboratories. The use of sustainable resources is one of the concepts for the green chemistry. In case of minimizing the waste, there are two approaches, one being the traditional approach aims at reducing waste at the end of the pipeline, for example, decreasing emissions by catalytic incineration of exhaust fumes. The second approach is based on the minimizing waste at the source. In this case, innovative procedures have to be employed to change both the method and the technology used throughout the production.
In our earlier studies, we showed that the preparation of ultra fi ne W and Ni compounds by metal ion exchanged resin-carbo thermal reduction method (MIER-CTR) [1] and successfully applied for the catalytic hydrodechlorination of chlorobenzene [2]. We have also reported the use of carbothermal reduction process (CTR) for the synthesis of ultrafi ne Ti4+, Pd [3] and W [1]. Marcu et al., [4] synthesized, characterized and evaluated the TiP2O7 for oxidative dehydrogenation of n-butane in the temperature range of 683-843 K, at atmospheric pressure. Here, we report the utilization of waste biomass (sawdust) and waste ion exchange resins for the synthesis of important class nanocrystalline CeO2, ZrO2, and CeO2-ZrO2 at low carbonization temperatures (7000C) and their physico-chemical characterization by adsorption and spectroscopic techniques. In addition, we show the simple and effective method for the preparation of TiP2O7 carbon composite
ISFR - 2005538
photo catalysts by metal ion exchanged resin (C467-Ti4+) carbothermal reduction (MIER-CTR) method by using amino phosphorus acid group chelate type resins and application of TiP2O7 for photocatalytic decomposition of 2-propanol under the UV light.
2. Experimental
The nanocrystalline metal oxides such as CeO2, ZrO2, and CeO2-ZrO2 mixed oxides with (Ce : Zr as 1:1. 2:1 and 1:2) were prepared using the ZrCl4 and Ce(NO3)3 6H2O solutions by keeping the total metal concentration as 0.03M. Briefl y, about 130 g of sawdust was impregnated by using 2 L metal solutions (0.015 M of Ce and Zr) and kept for 24 h for impregnation, the solution was removed and the impregnated sawdust was dried in air for 24 h. The dried sawdust was carbonized at 7000C using rotating pot type (prototype–special made) carbonization instrument (Nagato Electrical Machine Corporation, Osaka, Japan) in N2 atmosphere (300 ml/min). The rotating-pot type carbonization instrument and detailed adsorption and characterization details can be found in elsewhere [5-6].
The TiP2O7 carbon composite catalysts were prepared by a metal ion exchanged resin carbothermal reduction method (MIER-CTR). Briefl y, commercially available (Sumitomo Chemical Industries) chelate type resin having a amino phosphorous acid group [-N-CH2-(PO3Na)2 : C467-Na+] was taken in a glass column and treated with HCl (1 M) to convert into C467-H+ by conventional ion exchange method and washed (till pH=7), dried at room temperature (RT). The known concentration of TiCl3 (Ti content 0.037 mol/l) solution (200 ml) was taken in a beaker and the C467-H+ resin was added and kept for 25 h. Then ion exchanged resin (C467-Ti3+) was washed with ion exchanged water (2 L) and dried at RT for 24 h. In a similar way C467-Ti4+ was prepared. The carbonization processes for C467-Ti4+, C467-Ti3+ was carried with the pre-heat treatment (Pre-HT) at 300-350 °C using air (300 ml/min) for 90 min.
The photocatalytic decomposition of 2-propanol by TiP2O7 was carried out at 30 °C and atmospheric pressure using the reactor [7]. Approximately, 0.5 g of catalyst was loaded in the reactor along with the 200ml of 1000 ppm aqueous IPA. 365 nm high-pressure mercury lamp was used and continuously bubbled by Air (50 ml/min). The concentration of 2-propanol before and after the photocatalytic reactor was carried out by gas chromatograph equipped with fl ame ionization detector (GC-FID, YANACO, G3800 with Thermon-1000 5% Shimadzu G-3800 glass column 2.0 m X 3.4 mm i.d.). The gaseous products were analyzed by the gas chromatograph equipped with the thermal conductivity detector (GC-TCD; YANACO) for the qualitative identifi cation of products.
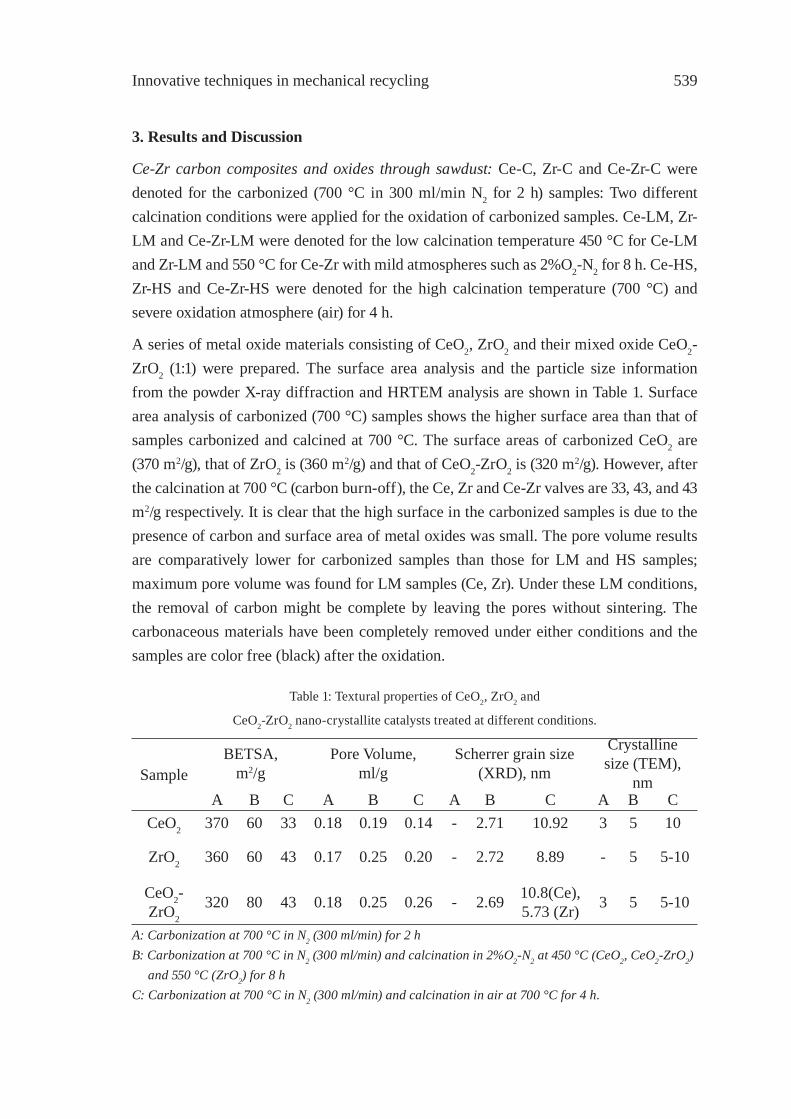
Innovative techniques in mechanical recycling 539
3. Results and Discussion
Ce-Zr carbon composites and oxides through sawdust: Ce-C, Zr-C and Ce-Zr-C were denoted for the carbonized (700 °C in 300 ml/min N2 for 2 h) samples: Two different calcination conditions were applied for the oxidation of carbonized samples. Ce-LM, Zr-LM and Ce-Zr-LM were denoted for the low calcination temperature 450 °C for Ce-LM and Zr-LM and 550 °C for Ce-Zr with mild atmospheres such as 2%O2-N2 for 8 h. Ce-HS, Zr-HS and Ce-Zr-HS were denoted for the high calcination temperature (700 °C) and severe oxidation atmosphere (air) for 4 h.
A series of metal oxide materials consisting of CeO2, ZrO2 and their mixed oxide CeO2-ZrO2 (1:1) were prepared. The surface area analysis and the particle size information from the powder X-ray diffraction and HRTEM analysis are shown in Table 1. Surface area analysis of carbonized (700 °C) samples shows the higher surface area than that of samples carbonized and calcined at 700 °C. The surface areas of carbonized CeO2 are (370 m2/g), that of ZrO2 is (360 m2/g) and that of CeO2-ZrO2 is (320 m2/g). However, after the calcination at 700 °C (carbon burn-off), the Ce, Zr and Ce-Zr valves are 33, 43, and 43 m2/g respectively. It is clear that the high surface in the carbonized samples is due to the presence of carbon and surface area of metal oxides was small. The pore volume results are comparatively lower for carbonized samples than those for LM and HS samples; maximum pore volume was found for LM samples (Ce, Zr). Under these LM conditions, the removal of carbon might be complete by leaving the pores without sintering. The carbonaceous materials have been completely removed under either conditions and the samples are color free (black) after the oxidation.
Table 1: Textural properties of CeO2, ZrO2 and
CeO2-ZrO2 nano-crystallite catalysts treated at different conditions.
SampleBETSA,
m2/gPore Volume,
ml/gScherrer grain size
(XRD), nm
Crystalline size (TEM),
nmA B C A B C A B C A B C
CeO2 370 60 33 0.18 0.19 0.14 - 2.71 10.92 3 5 10
ZrO2 360 60 43 0.17 0.25 0.20 - 2.72 8.89 - 5 5-10
CeO2-ZrO2
320 80 43 0.18 0.25 0.26 - 2.69 10.8(Ce), 5.73 (Zr) 3 5 5-10
A: Carbonization at 700 °C in N2 (300 ml/min) for 2 hB: Carbonization at 700 °C in N2 (300 ml/min) and calcination in 2%O2-N2 at 450 °C (CeO2, CeO2-ZrO2)
and 550 °C (ZrO2) for 8 hC: Carbonization at 700 °C in N2 (300 ml/min) and calcination in air at 700 °C for 4 h.
ISFR - 2005540
Powder X-ray diffraction analysis of the carbonized samples showed that the samples are amorphous in nature, no characteristic peaks due to CeO2, ZrO2 and CeO2-ZrO2 are found. After the calcinations in mild conditions, the characteristic peaks due to the CeO2, ZrO2 and (Ce, Zr)O2 appeared. From the width of the diffraction lines one can get a reasonable estimate of the mean diameter of the crystallite. For LM samples, the crystallite sizes calculated by using the Scherrer equation showed that the CeO2 has 2.7 nm crystallite size, ZrO2 has 2.72 nm and CeO2-ZrO2 has 2.69 nm. In a similar way, the characteristic peaks due to the CeO2, ZrO2 and (Ce, Zr)O2 appeared after severe conditions; the relative crystallinity of the samples was found to increase and this shows that the mean crystallite size is increased. The crystallite sizes calculated by using the Scherrer equation showed that the CeO2 has the 10.92 nm crystallite size, and ZrO2 has 8.89 nm. The deconvolution of CeO2-ZrO2 diffraction peaks shows that the CeO2 has 10.8 nm and ZrO2 has 5.73 nm crystallite sizes. LM and HS CeO2 and ZrO2 samples both were found to be cubic from the X-ray diffraction. In other investigations, Hori et al. [8] reported that cerium-zirconium mixed metal oxides in excess of 50 at.% cerium prepared via similar co-precipitation routines and aged at 1273 K exist as a cubic (fl uorite) solid solution. The surface chemistry and microstructural analysis of CexZr1-xO2-y model catalyst surfaces and the effect of zirconium substitution on crystalline structure and grain size have been well-discussed [9]. Due to the small differences in the diffraction lines of the CeO2 and ZrO2 and their mixed oxides, various researchers have used Rietveld refi nement of the XRD patters of these catalytic materials [10]. The partial oxidation of methane catalytic activities of Ni loaded metal oxides were evaluated for the partial oxidation methane and the activities were high.
3.1. TiP2O7-C characterization and catalytic activities
The carbonization conditions and characterization of TiP2O7 carbon composite catalysts prepared using C467 resin with TiCl4 and TiCl3. When the carbonization of C467-Ti3+ and C467-Ti4+ was carried out without pre-oxidation at about 300-3500C, the resin was melted. The catalyst samples prepared with pre-oxidation (air) and the carbonization in nitrogen atmosphere gave the catalyst without melting and the shape of ion exchange retained during the process; it indicates that the pre-oxidation is an essential step during the carbonization process. Two pre-oxidation temperatures such as 300 °C and 350 °C were used with the two carbonization temperatures such as 500 °C and 800 °C. However, the yield is high with the low carbonization temperature (500 °C) than the higher carbonization temperature (800 °C) with both C467-Ti3+ and C467-Ti4+. In addition, the high carbonization temperature yielded the two compounds (TiP2O7, TiPO4). The C467-Ti3+ produced the amorphous compound at 5000C and mixed phases (TiP2O7, TiPO4) at 800 °C. C467-Ti4+ produced TiP2O7 (single phase) compound with low carbonization
Innovative techniques in mechanical recycling 541
temperature (500 °C) with higher yields. Ti content in C467-Ti4+ (pre-oxidized at 350 °C and carbonized at 500 °C) was estimated by thermogravimetric analysis (TGA) and was found 0.18 g/g-cat. The broad and big peak was observed around 20-32 (2θ) is due to the carbon and the sharp peaks at the same region were due to the TiP2O7. The crystallite size of TiP2O7 in carbon matrix was calculated by the Sherrer’s equation and was found about 25 nm. This preparation method is very simple with a minimum number of steps and it is highly selective for the synthesis of TiP2O7 than reported in the literature [4]. The surface area is lower for the samples carbonized at low temperature than carbonized at higher temperature. The presence of carbon in the catalytic material acts as an interesting template. In an earlier report, carbon supported Cu-ZnO catalysts prepared from sawdust impregnated with the corresponding Cu and Zn nitrates, and these catalysts effectively used for the hydrogenation of CO2 to methanol [1-3].
The results of scanning electron microscopy image along with the energy dispersive analysis of X-rays (EDAX) for C467-Ti4+ carbonized at 500 °C. It is clear from the analysis that the Ti and P are highly and homogeneously dispersed on the surface of the catalyst. It is evident that the MIER-CTR method can produce selective TiP2O7 in the carbon matrix with homogenous dispersion. The C467-Ti4+ calcined in air clearly shows the formation of TiP2O7 and it is also compared with the pure commercial TiO2. The band gap of TiP2O7
was estimated by UV-Vis adsorption spectroscopy and the absorption onset wavelength of these catalysts suggests that the band gap of the TiP2O7 was 3.16 eV at around 320 nm.
3.2. Photocatalytic decomposition of 2-propanol
The representative data for the photocatalytic decomposition of 2-propanol with C467-Ti4+ and commercial TiO2 was performed. It showed that the concentration of 2-propanol was found to decrease with the irradiation time and levelled off after 10 h. The 2-propanol decomposition activities (mg/g-Ti) were plotted and shown in Figure 1. It is clear from the fi gure that activity of Ti in C467-Ti4+ was higher than TiO2. The analysis of gaseous products during the irradiation time showed that acetone (major) and carbon dioxide (minor) were the reaction products. Anpo et al., reported the photocatalytic reactivity of 2-propanol with the Fe ion implanted TiO2 catalysts and showed that the Fe ions implanted TiO2 photocatalysts exhibit a photocatalytic reactivity for the oxidative degradation of 2-propanol under visible light irradiation [11]. However, there is no change in the concentration of 2-propanol either irradiated with light off or light on conditions in the absence of catalyst. When the C467-Ti4+ catalyst added, the concentration of 2-propanol decreased with the light off and it reached to the equilibrium state. The change in the 2-propanol concentration during the light off condition considered as adsorption by the catalyst. Then the light was switched on and again concentration 2-propanol decreased rapidly. The change in the concentration of 2-propanol with catalyst using light-on was considered

ISFR - 2005542
as the photocatalytic decomposition of 2-propanol. The effect of surface adsorption of aliphatic alcohols and silver ion on the photocatalytic activity of TiO2 suspended in aqueous and gaseous phases were extensively studied earlier [12, 13]. The C467-Ti4+ has the TiP2O7 phase observed by XRD and the bandgap of TiP2O7 been confi rmed as 3.32 eV. The characterization of C467-Ti4+ by various spectroscopic techniques further supports the presence of TiP2O7 phase and active photocatalytic decomposition of 2-propanol. The TiP2O7 preparation method reported here is simple and effective than reported earlier [4], and the applicability of TiP2O7 for the photocatalytic decomposition of isopropanol was not found in the literature.
0
0.1
0.2
0.3
0.4
0.5
0.6
IPA
dec
ompo
sitio
n am
ount
[mg/
g-T
i]
C467-Ti4+ Texa TiO2
Figure 1: Compararision of photocatalytic activities of Ti present in TiP2O7 with TiO2
4. Conclusions
Oxidizing conditions such as calcination temperature, atmosphere and time for the preparation of nanocrystalline porous CeO2, ZrO2, and CeO2-ZrO2 metal oxides have been studied to understand their effects on textural properties. The Scherrer grain size was remarkably increased with the change from low temperature conditions to high temperature conditions. Even though the synthesis temperature was quite low, the CeO2 and ZrO2 were found to be cubic in shape; the homogeneity was relatively good at high temperature conditions and these were accompanied by an increase of crystallite size from 5 nm to 5-10 nm. The catalytic activities were high for the partial oxidation of methane. The TiP2O7 carbon composites showed the promising results for the photocatalytic decomposition of 2-propanol. From these investigations, it is clear that the wood biomass (sawdust), and ion exchange resins with different functional groups can be used for the preparation of catalysts with high catalytic activities.
Innovative techniques in mechanical recycling 543
References
[1] Sakata, Y., Muto, A., Uddin, M.A., Harino, K., J. Mater. Chem. 6:1241 (1996).[2] Lingaiah, N., Uddin, M.A., Muto, A., Sakata, Y., J. Mol. Catal.161:157(2000).[3] Suga, H., Muto, A., Uddin, M.A., Sakata, Y., Takada, J., Kusano, Y., Trans. Mat.Res.
Soc. Jpn. 25:103(2000).[4] Marcu, I.C., Sandulescu, K., Millet, J.M.M., Appl. Catal. A. 227:309(2002).[5] Muto, A., Bhaskar, T., Kaneshiro,Y., Uddin, M.A., Sakata, Y., Kusano,Y., Murakami,
K., Green. Chem. 5:480(2003).[6] Muto, A., Bhaskar, T., Kaneshiro, Y., Sakata, Y., Kusano,Y., Murakami, K., Appl.
Catal. A. Gen. 275:173(2004).[7] Muto, A., Ida, K., Bhaskar, T., Uddin, M.A., Takashima, S., Hirai, T., Sakata, Y.,
Appl. Catal. A. Gen. 275:173(2004).[8] Hori, C.E., Permana, H., Ng, K.Y.S., Brenner, A., More, K., Rahmoeller, K.M., Belton,
D., Appl. Catal. B. Environ. 16:105(1998).[9] Nelson, A.E., Schulz, K.H., Appl. Surf. Sci. 210:206(2003).[10] Liotta, L.F., Marcaluso, A., Longo, A., Pantaleo, G., Martorana, A., Deganello, G.,
Appl. Catal. A. 240:295(2003).[11] H. Yamashita, M. Harada, J. Misaka, M. Takeuchi, B. Neppolian, M. Anpo, Catal.
Today. 84:191(2003).[12] Ohtani, B., Nishimoto, S., J. Phys. Chem. 97: 920 (1993).[13] Ohtani, B., Okugawa, Y., Nishimoto, S., Kagiya, T., J. Phys. Chem. 91: 3550(1987).

ISFR - 2005544
Innovative techniques in mechanical recycling 545
OXIDATION OF WASTE POLYOLEFINSTO CARBOXYLIC ACIDS
M. Yoshida1*, A. Urushibata,1 Y. Imai,1 and N. Yanagihara2
1Dept. of Applied Chemistry, Utsunomiya University, Utsunomiya 321-8585 Japan 2Dept. of Biosciences, Teikyo University, Utsunomiya 320-8551, Japan,
Abstract: Oxidation of polyethylene with nitrogen dioxide in supercritical carbon dioxide gave dicarboxylic acids such as succinic, glutaric, adipic, pimeric, suberic, azeraic, se-bacic acid in good yiels. Stereoregular polypropylenes were also oxidized to afford syn-2,4-dimethylglutaric acid from the isotactic form and the anti-form from the syndiotactic form, stereoselectively.
1. Introduction
About a half of the plastic production is polyolefi n such as polyethylene and polypro-pylene and in proportion to the production there is much amount of the waste. Toward a sustainable and circulative society, plastic recycles have been attracted attention.
Thermoplastics can be re-melted and reused but it is diffi cult since impurities from other plastics, contamination from other waste, and degradation of the collected plastics serve to diminish the physical properties of the recycled materials. So, some energy and cost are necessary to collect, sort, and separate the waste. There is also much amount of polyolefi n waste having good qualities. For example, covering materials of power cables are made of polyethylene due to its lightness and insulation character and for the safety they have been uniformly recovered 200 thousand metric tons every year in Japan. They are chemically treated to cross linkage for avoiding melting down during electric transmission. But their character makes diffi cult for recycling and they have been treated to landfi ll.
Plastic recycle to feedstock has been diffi cult to correspond to the energy and cost be-cause the products have less value added than the original plastics. According to stepwise oxidation, value added chemical raw materials have been supplied in petrochemical in-dustry. We report here that high value added compounds such as dicarboxylic acids were obtained by oxidation of polyolefi n with nitrogen dioxide (NO2) in supercritical carbon dioxide (scCO2).
2. Results and Discussion
2.1. Oxidation of polyethylene to dicarboxylic acids
There are many kinds of polyethylene. They were oxidized with nitrogen dioxide to afford succinic, glutaric, adipic, pimeric, suberic, azelaic, and sebacic acid as shown in Fig. 1.
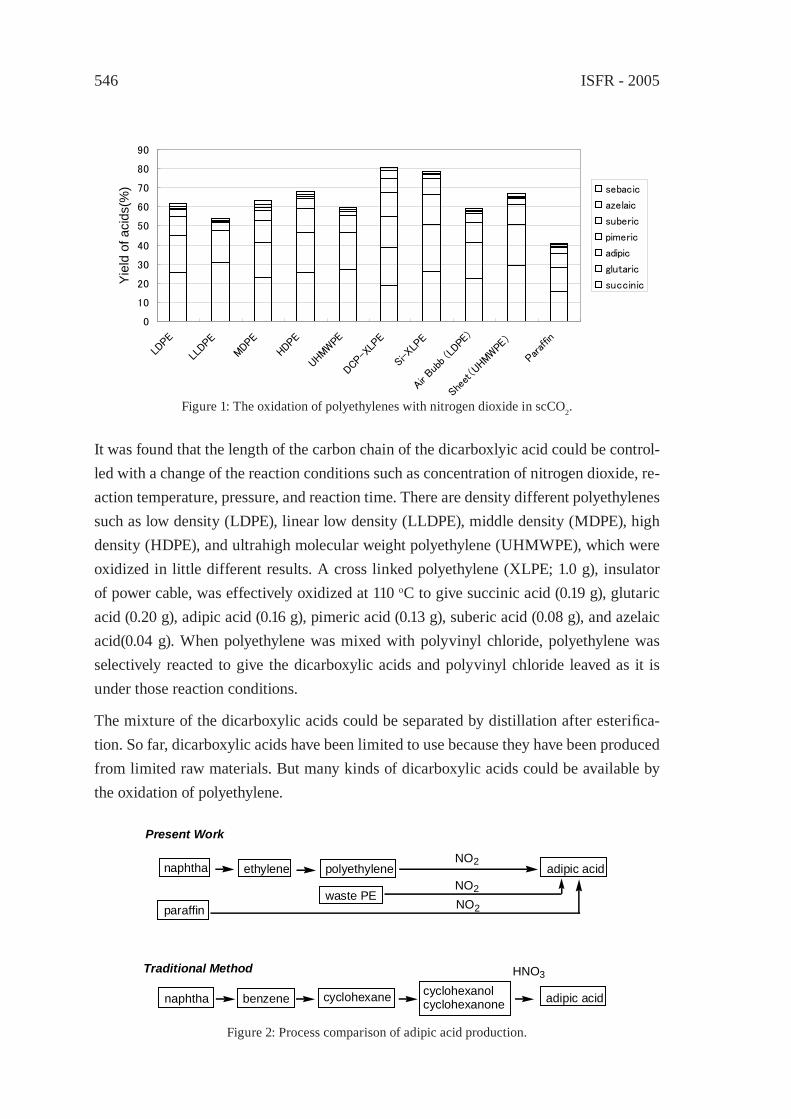
ISFR - 2005546
0
10
20
30
40
50
60
70
80
90
LDPE
LLDP
E
MDP
E
HDPE
UHMWPE
DCP-
XLPE
Si-X
LPE
Air B
ubb (L
DPE)
Shee
t(UH
MWPE
)
Paraffin
Yie
ld o
f aci
ds(%
) sebacic
azelaic
suberic
pimeric
adipic
glutaric
succinic
Figure 1: The oxidation of polyethylenes with nitrogen dioxide in scCO2.
It was found that the length of the carbon chain of the dicarboxlyic acid could be control-led with a change of the reaction conditions such as concentration of nitrogen dioxide, re-action temperature, pressure, and reaction time. There are density different polyethylenes such as low density (LDPE), linear low density (LLDPE), middle density (MDPE), high density (HDPE), and ultrahigh molecular weight polyethylene (UHMWPE), which were oxidized in little different results. A cross linked polyethylene (XLPE; 1.0 g), insulator of power cable, was effectively oxidized at 110 oC to give succinic acid (0.19 g), glutaric acid (0.20 g), adipic acid (0.16 g), pimeric acid (0.13 g), suberic acid (0.08 g), and azelaic acid(0.04 g). When polyethylene was mixed with polyvinyl chloride, polyethylene was selectively reacted to give the dicarboxylic acids and polyvinyl chloride leaved as it is under those reaction conditions.
The mixture of the dicarboxylic acids could be separated by distillation after esterifi ca-tion. So far, dicarboxylic acids have been limited to use because they have been produced from limited raw materials. But many kinds of dicarboxylic acids could be available by the oxidation of polyethylene.
Present Work
naphtha ethylene polyethylene adipic acid
paraffin
benzene cyclohexane cyclohexanolcyclohexanone
waste PE
NO2
HNO3
naphtha adipic acid
NO2
NO2
Traditional Method
Figure 2: Process comparison of adipic acid production.
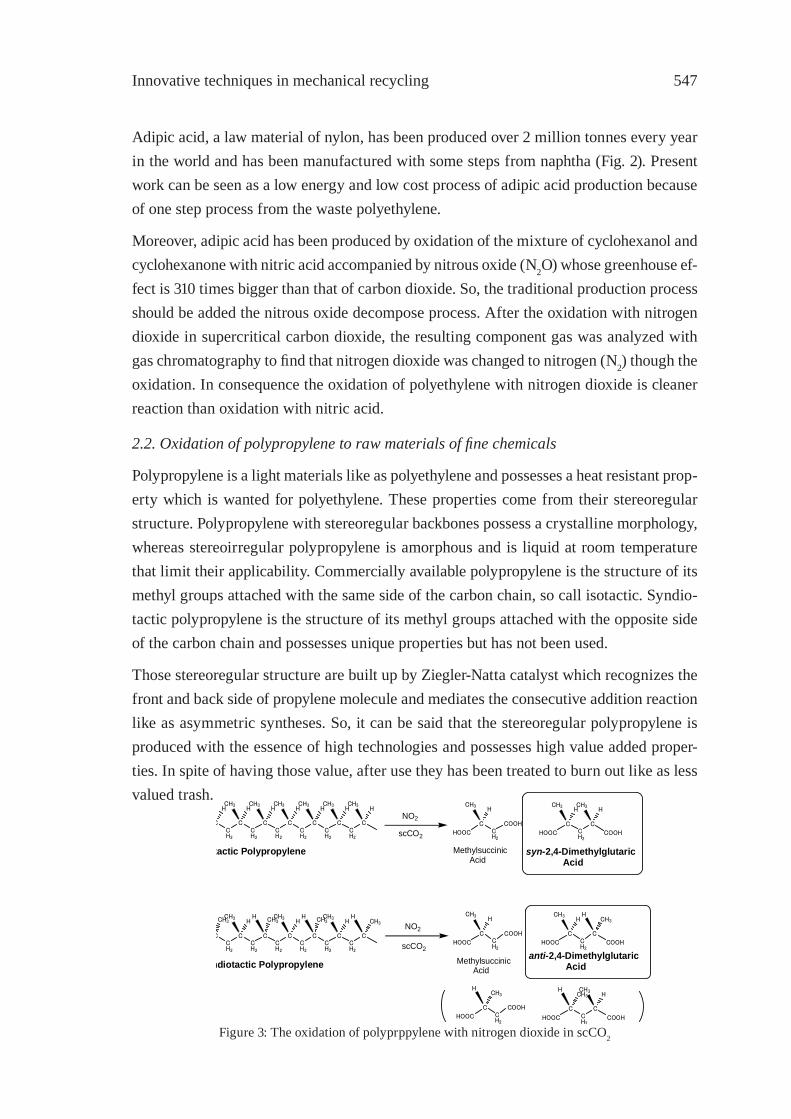
Innovative techniques in mechanical recycling 547
Adipic acid, a law material of nylon, has been produced over 2 million tonnes every year in the world and has been manufactured with some steps from naphtha (Fig. 2). Present work can be seen as a low energy and low cost process of adipic acid production because of one step process from the waste polyethylene.
Moreover, adipic acid has been produced by oxidation of the mixture of cyclohexanol and cyclohexanone with nitric acid accompanied by nitrous oxide (N2O) whose greenhouse ef-fect is 310 times bigger than that of carbon dioxide. So, the traditional production process should be added the nitrous oxide decompose process. After the oxidation with nitrogen dioxide in supercritical carbon dioxide, the resulting component gas was analyzed with gas chromatography to fi nd that nitrogen dioxide was changed to nitrogen (N2) though the oxidation. In consequence the oxidation of polyethylene with nitrogen dioxide is cleaner reaction than oxidation with nitric acid.
2.2. Oxidation of polypropylene to raw materials of fi ne chemicals
Polypropylene is a light materials like as polyethylene and possesses a heat resistant prop-erty which is wanted for polyethylene. These properties come from their stereoregular structure. Polypropylene with stereoregular backbones possess a crystalline morphology, whereas stereoirregular polypropylene is amorphous and is liquid at room temperature that limit their applicability. Commercially available polypropylene is the structure of its methyl groups attached with the same side of the carbon chain, so call isotactic. Syndio-tactic polypropylene is the structure of its methyl groups attached with the opposite side of the carbon chain and possesses unique properties but has not been used.
Those stereoregular structure are built up by Ziegler-Natta catalyst which recognizes the front and back side of propylene molecule and mediates the consecutive addition reaction like as asymmetric syntheses. So, it can be said that the stereoregular polypropylene is produced with the essence of high technologies and possesses high value added proper-ties. In spite of having those value, after use they has been treated to burn out like as less valued trash.
CH2
CCH2
CCH2
CCH2
CCH2
CCH2
C
CH3 H CH3 H CH3 H
CCH2
CCH2
CCH2
CCH2
CCH2
CCH2
C
CH3 CH3 CH3 CH3 CH3 CH3
CCH2
C
CH3 CH3
HOOC COOH
CCH2
C
CH3 H
HOOC COOH
scCO2
tactic Polypropylene syn-2,4-Dimethylglutaric Acid
H H H H H H H
C
CH3 H CH3 H CH3 H CH3
H H
H CH3
CCH2
COOH
CH3
HOOC
H
Methylsuccinic Acid
CCH2
COOH
CH3
HOOC
H
CCH2
COOH
H
HOOC
CH3
CCH2
C
H CH3
HOOC COOH
CH3 H
ndiotactic Polypropylene
NO2
scCO2
NO2
Methylsuccinic Acid
anti-2,4-Dimethylglutaric Acid
Figure 3: The oxidation of polyprppylene with nitrogen dioxide in scCO2
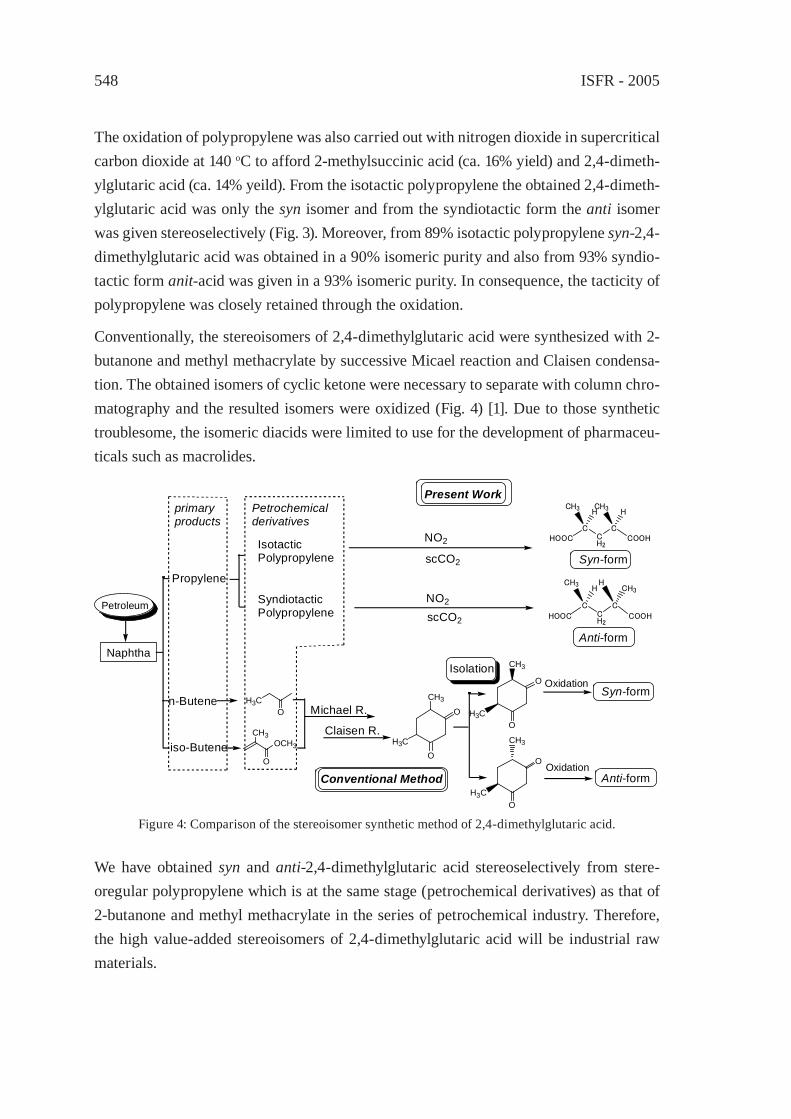
ISFR - 2005548
The oxidation of polypropylene was also carried out with nitrogen dioxide in supercritical carbon dioxide at 140 oC to afford 2-methylsuccinic acid (ca. 16% yield) and 2,4-dimeth-ylglutaric acid (ca. 14% yeild). From the isotactic polypropylene the obtained 2,4-dimeth-ylglutaric acid was only the syn isomer and from the syndiotactic form the anti isomer was given stereoselectively (Fig. 3). Moreover, from 89% isotactic polypropylene syn-2,4-dimethylglutaric acid was obtained in a 90% isomeric purity and also from 93% syndio-tactic form anit-acid was given in a 93% isomeric purity. In consequence, the tacticity of polypropylene was closely retained through the oxidation.
Conventionally, the stereoisomers of 2,4-dimethylglutaric acid were synthesized with 2-butanone and methyl methacrylate by successive Micael reaction and Claisen condensa-tion. The obtained isomers of cyclic ketone were necessary to separate with column chro-matography and the resulted isomers were oxidized (Fig. 4) [1]. Due to those synthetic troublesome, the isomeric diacids were limited to use for the development of pharmaceu-ticals such as macrolides.
CCH2
C
CH3 CH3
HOOC COOH
H H
H3CO
OCH3
O
CH3
Michael R.
Claisen R.
CH3
H3CO
O
CH3
H3CO
O
CH3
H3CO
O
CCH2
C
CH3 H
HOOC COOH
H CH3
Petroleum
Naphtha
Propylene
n-Butene
iso-Butene
IsotacticPolypropylene
SyndiotacticPolypropylene
Oxidation
Syn-form
Anti-form
Isolation
Petrochemicalderivatives
primary products
Syn-form
Anti-form
Oxidation
scCO2
scCO2
Present Work
Conventional Method
NO2
NO2
Figure 4: Comparison of the stereoisomer synthetic method of 2,4-dimethylglutaric acid.
We have obtained syn and anti-2,4-dimethylglutaric acid stereoselectively from stere-oregular polypropylene which is at the same stage (petrochemical derivatives) as that of 2-butanone and methyl methacrylate in the series of petrochemical industry. Therefore, the high value-added stereoisomers of 2,4-dimethylglutaric acid will be industrial raw materials.
Innovative techniques in mechanical recycling 549
2.3. Role of supercritical carbon dioxide
For the oxidation accompanied with breaking down a carbon-carbon bond, some power-ful oxidants are necessary. Simultaneously those oxidants are especially required to be safe reactions because those oxidations are afraid of burning and explosion if they can’t be controlled. There are very important roles for supercritical carbon dioxide to control the oxidation with nitrogen dioxide.
Supercritical fl uids are an attractive alternative to conventional solvents and are becoming more important in organic synthesis and related industries [2]. In particular, supercritical carbon dioxide is currently well investigated as an environmentally friendly solvent and is widely used due to its low cost, nontoxicity and nonfl ammability, ease of recovery and reuse, and moderate critical conditions (Tc=31 oC, Pc=7.4 MPa).
Role of supercritical carbon dixoide on the oxidation is as follows.
First, it is pointed out a dilution effect. Nitrogen dioxide is freely soluble in supercritical carbon dioxide. Low concentration of nitrogen dioxide leads the reaction rate to degrease and the heat of reaction during the oxidation can be diffused quickly. The easy heat and mass transfer is one of the characters of supercritical carbon dioxide [3].
We also examined the oxidation in nitrogen and argon to compare the dilution effect. The oxidation rates in nitrogen and argon were faster than that in carbon dioxide. The density of nitrogen and argon is lower than that of carbon dioxide at the same temperature and pressure. In consequence, using supercritical carbon dioxide as reaction medium is superior for controlling the oxidation with nitrogen dioxide. Pifer and Sen reported an oxidation of polyolefi n with oxygen and nitrogen monoxide in nitrogen to obtained di-carboxylic acids at the conditions of 170 oC for 18 h [4]. In spite of using 125 mL reactor, they oxidized only a limited amount (0.26 g) of polyolefi n, probably because of avoiding some troubles.
2 NO2 N2O4 eq. 1+ Q
The second is control of the equilibrium between nitrogen dioxide and dinitrogen tetraox-ide. It is known that nitrogen dioxide is in a equilibrium with dinitrogen tetraoxide as eq.1 [5]. High pressure can lead the equilibrium to less reactive dinitrogen tetraoxide. So, the equilibrium and reactivity of nitrogen dioxide can be controlled by the pressure of the supercritical carbon dioxide solution.
The third is radical cage effect [6]. High reactivity of nitrogen dioxide comes from its radical character. At supercritical phase, carbon dioxide molecules enclose the nitrogen dioxide radical in cage to avoid the oxidation, but when the radical cages are inserted to solid or viscose polyolefi n, nitrogen dioxide can be released and oxidize the polyolefi n.
ISFR - 2005550
3. Conclusion
Plastic has been thought an end-use product and after use they have been treated as wastes. Recent year, toward a sustainable and circulative society, plastic recycles have been at-tracted attention. Plastic recycles are necessary some energy, but they should not use more energy or more new petroleum to get some recycle products which have lower value added than that of the original plastics. We found that polyethylene was oxidized with nitrogen dioxide in supercritical carbon dioxide to afford higher value added dicarboxylic acids in good yields with safety.
Presumably because economic value of polypropylene and polyethylene is almost same, stereoregular polypropylene has rarely been evaluated its highly synthetic values, since its physical properties are superior to polyethylene. We have stereoselectively obtained syn and anit-2,4-dimethylglutaric acids from isotactic and syndiotactic polypropylene re-spectively by the oxidation without missing the synthetic values. Those results show that polyolefi n is not fi nal products but raw materials which can produce fi ne chemicals.
4. Experimental
Some kinds of polyethylene (LDPE, d 0.918; LLDPE, d 0.935; MDPE, d 0.940; HDPE, d 0.950; UHMWPE, d 0.940) and polypropylene (isotactic-PP, Mn ca 166000; syndiotactic-PP, Mn 54000) were purchased from Aldrich. Nitrogen dioxide (Toho Acetylene Co.) and carbon dioxide (Showa Tansan Co.) were supplied from gas cylinders. GC-MS analyses of the products were carried out with a Shimadzu GCMS-QP5050A spectrometer system. The quantitative analyses were performed on a gas chromatograph (Shimadzu GC-14B) equipped with a capillary column (BD-5: 30 m x 0.25 mm x 0.25 µm) detected with FID. The produced gases were analyzed by using a gas chromatograph (Shimadzu GC-16A) equipped with a packed column (for N2O, Unibease C, 2 m x 3 mm; for N2, Molecular sieves 5A, 2 m x 3 mm ) detected with TCD. 1H and 13C NMR spectra were recorded on a Varian Unity INOVA-400 (1H, 400 MHz; 13C, 100 MHz) spectrometer.
The reactions were carried out in 50 mL stainless steel reactor equipped with a burst disk, a pressure gauge, a thermocouple, and a valve. Typically, polyethylene (1.00 g) was added to the reactor and was sealed. After the reactor was purged with carbon dioxide, liquid nitrogen dioxide (3.2 g) and liquid carbon dioxide (20 g) were successively introduced at room temperature. Warnings: if the introduced mixture is leaving without stirring and elevating the temperature, high concentrated nitrogen dioxide is at the bottom of the re-actor due to its density (1491 kg/m3) and reacts explosively with the polyolefi n. To avoid explosion, reaction mixture must suffi ciently stir before heating. The reactor was care-fully elevated the temperature to 130 oC for about 2 h and then the pressure was reached to 15 MPa. The reaction was maintained the temperature for 18 h with stirring. After
Innovative techniques in mechanical recycling 551
the reaction, the reactor was cooled and the pressure was released. The reaction mixture was derived to esters with diazomethane and they were analyzed by GC-MS and NMR. The average length of the carbon chain of the dicarboxlyic dimethyl esters was estimated based on the rate of the area of methylene protons aginst methyl protons of 1H NMR.
On the PP oxidation, the stereoisomeric 2,4-dimethylglutaric acids were confi rmed by means of NMR spectra of their methyl esters. Dimethyl syn-2,4-dimethylglutarate: 1H NMR (CDCl3) δ 1.18 (3H, d, J = 7.6 Hz, CH3), 1.48 (1H, dt, J = 14.0, 6.8 Hz, CH2), 2.10 (1H, dt, 14.0, 8.0 Hz, CH2), 2.50 (2H, ddq, J = 8.0, 7.6, 6.8 Hz), 3.67 (3H, s, OCH3);
13C NMR (CDCl3) 17.13 (CH3), 37.10 (CH2), 37.13 (CH), 51.51 (OCH3), 176.41 (C=O). Dimethyl anti-2,4-dimethylglutarate: 1H NMR (CDCl3) δ 1.16 (3H, d, J = 7.6 Hz, CH3), 1.76 (2H, t, J = 7.2 Hz, CH2), 2.49 (2H, dq, J = 7.6, 7.2 Hz), 3.68 (3H, s, OCH3);
13C NMR (CDCl3) δ 17.53 (CH3), 37.34 (CH2), 37.42 (CH), 51.49 (OCH3), 176.60 (C=O).
References
[1] Stork, G., Nair. V., J. Am. Chem. Soc., 101:1315 (1979).[2] Noyiri, R., Ed. Supercritical Fluids. In Chem. Rev., 99:353 (1999).[3] Jessop, P. G., and Leitner, W., Chemical Synthesis Using Supercritical Fluids, Wiley-
VHC, New York, 1999, Chapter 1.[4] Pifer, A., and Sen, A, Angew. Chem. Int. Ed., 37:3306 (1998).[5] Bochman, O. B., and Vogt, C. M., J. Am. Chem. Soc., 80:2987 (1958).[6] Tanko, J. M., Suleman, N. K., and Fletcher, B., J. Am. Chem. Soc., 118:11958 (1996).

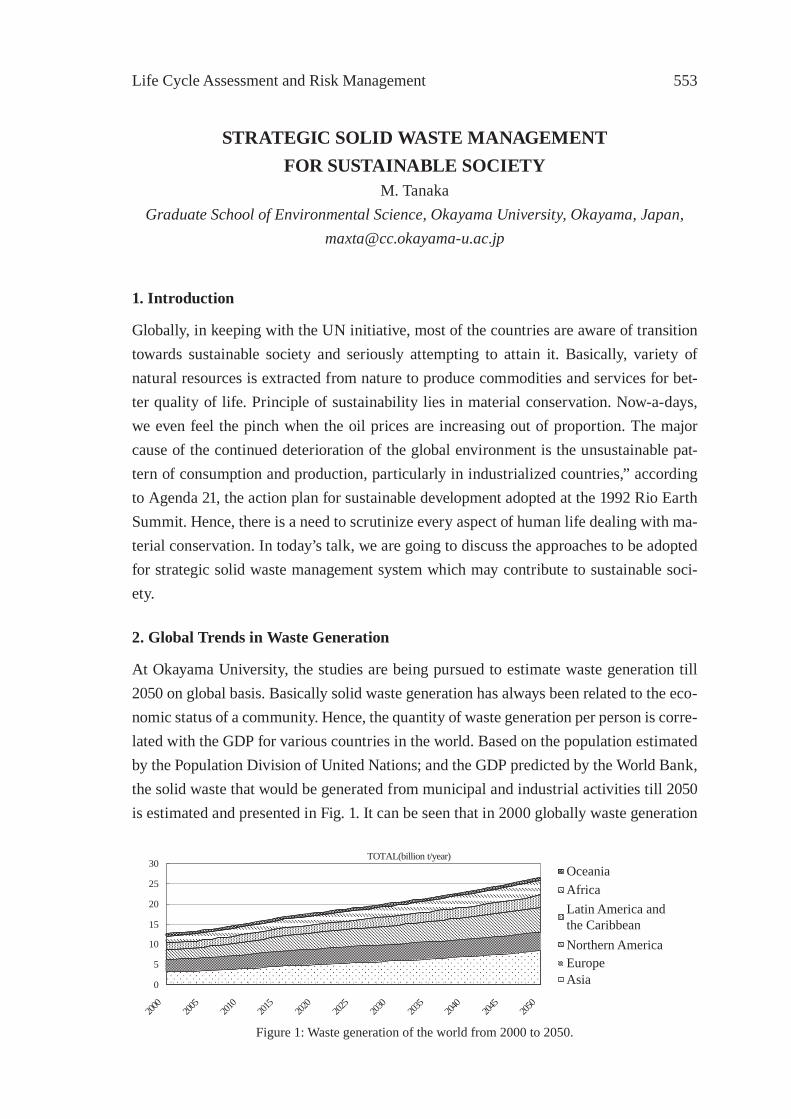
Life Cycle Assessment and Risk Management 553
STRATEGIC SOLID WASTE MANAGEMENTFOR SUSTAINABLE SOCIETY
M. TanakaGraduate School of Environmental Science, Okayama University, Okayama, Japan,
1. Introduction
Globally, in keeping with the UN initiative, most of the countries are aware of transition towards sustainable society and seriously attempting to attain it. Basically, variety of natural resources is extracted from nature to produce commodities and services for bet-ter quality of life. Principle of sustainability lies in material conservation. Now-a-days, we even feel the pinch when the oil prices are increasing out of proportion. The major cause of the continued deterioration of the global environment is the unsustainable pat-tern of consumption and production, particularly in industrialized countries,” according to Agenda 21, the action plan for sustainable development adopted at the 1992 Rio Earth Summit. Hence, there is a need to scrutinize every aspect of human life dealing with ma-terial conservation. In today’s talk, we are going to discuss the approaches to be adopted for strategic solid waste management system which may contribute to sustainable soci-ety.
2. Global Trends in Waste Generation
At Okayama University, the studies are being pursued to estimate waste generation till 2050 on global basis. Basically solid waste generation has always been related to the eco-nomic status of a community. Hence, the quantity of waste generation per person is corre-lated with the GDP for various countries in the world. Based on the population estimated by the Population Division of United Nations; and the GDP predicted by the World Bank, the solid waste that would be generated from municipal and industrial activities till 2050 is estimated and presented in Fig. 1. It can be seen that in 2000 globally waste generation
TOTAL(billion t/year)
0
5
10
15
20
25
30
2000
2005
2010
2015
2020
2025
2030
2035
2040
2045
2050
OceaniaAfricaLatin America andthe CaribbeanNorthern AmericaEuropeAsia
Figure 1: Waste generation of the world from 2000 to 2050.
ISFR - 2005554
was 12.7 billion tones which is expected to rise to 27 billion in 2050.
As per the data available from Ministry of Environment, Japan; material consumption has been estimated till 2050. Based on these values, the global material consumption could be conservatively estimated to be around 100 billion tons in 2050. This sort of huge amount either may not be available from the mother earth or may exert excessive pressure on natural ecosystem and thus it would be essential to reduce the quantity of material con-sumption as also quantity of wastes, basically to sustain the human life on the earth. In this endeavor, one of the essential measures would be to streamline the systems for waste management so as to reduce the waste generation to the maximum extent possible. In Japan, the systems are being evolved to be compatible for sustainable society
3. Evolution Towards Sustainable Society
The municipal solid waste disposal by municipalities and regional governments in Japan was initiated upon the promulgation of the „Dirt Removal Law” in 1900. Enacted after an epidemic of dysentery, pest and other infectious diseases, this law aimed at overcoming sanitary problems in cities. In 1954, the „Public Cleansing Law” was introduced to secure a hygienically sound living environment, followed by the „Waste Disposal and Public Cleansing Law” in 1970. These two constitute the main framework of the present waste management legislation. The „Waste Disposal and Public Cleansing Law”, which passed the Diet during its „Pollution Session” along with other environmental restraint laws, had a widened regulatory coverage extended from municipal solid wastes to „industrial solid wastes” generated from industrial activities. Thus a complete legislative framework for environment conservation was established.
In the last 30 years from the enactment of the „Waste Disposal and Public Cleansing Law”, the Japanese people’s life style and economic structure have undergone drastic changes with their economic affl uence in the background, with resultant quantitative growth and diversity in nature of wastes. Mass-production and mass-consumption in the human society have resulted in the depletion of forests, mineral resources and other natu-ral resources, global warming, acid rains, depletion of the ozone layer, ocean pollution and other forms of degradation of environmental quality. It has been realized that waste disposal holds the key to „sustainable society“.
The earliest actions related to waste management were public hygiene measures including those for preventing infectious diseases. A shift was subsequently affected to environ-ment hygiene measures to maintain urban functions and preserve living environment. Today waste disposal is quite signifi cant for the purpose of sustainable society.
Presently, solid waste management has acquired national status. There are several pro-fessional bodies catering to the needs of experts and professionals. On educational front,
Life Cycle Assessment and Risk Management 555
Government has sponsored a center of excellence under my leadership at Okayama Uni-versity. Japan International Cooperation Agency (JICA) has been organizing international seminars and training programs. There are several research institutes having dedicated research on waste management. Sizable amount of expenditure is spent for this activity. There are established industries to provide technological support to the system.
4. Current Practices
4.1 Basic Principles
Households and business enterprises control the generation of municipal solid waste at source, where the waste originates. Recyclable components of such waste are disposed of separately, to facilitate recycling.
Municipalities and waste disposal agencies, both of which dispose of waste, sort out use-ful components from the collected waste and put them in a recycling route. In some cases, where material recovery is not an appropriate measure because of the technical and/or economical diffi culty involved; volume reduction by intermediate treatment like incin-eration should be promoted as a measure to prolong the remaining service lives of land-fi ll disposal sites. The energy derived from the incineration should be used for resource conservation. The ultimate residue is then subjected to the environmentally sound fi nal disposal.
4.2 Disposal of Municipal Solid Waste
Japan is quite densely populated in comparison with other countries of the world, and its industries and population are concentrated in cities. As expected, in large cities, waste generation density is high, but space resources are very scarce. The diffi culty in acquir-ing suitable land in such a city for a waste treatment or disposal site increases every year. Pronounced diffi culty in such land acquisition is encountered in the case of fi nal disposal sites, which demand a very large space. In Japan, extra efforts have, therefore, been made to reduce generated waste by various intermediate treatments. Incineration, a process which can reduce the volume of waste and is hygienic for biological hazards, is utilized extensively. Municipal authorities collect solid waste, as well as, bulky refuse discharged from households. In addition, some small-scale business waste (such as restaurants’ lefto-ver food and gardeners’ organic refuse) is brought directly to facilities run by the munici-pal authorities.
The quantities of waste disposed of at municipal facilities throughout Japan add up to ap-proximately 52 million tons in 2001. That is, about 1.1 kilograms of waste is generated per capita per day. Another portion of generated waste (2.8 million tons) is retrieved through private routes (such as one provided by a self-governing organ of a local community), as
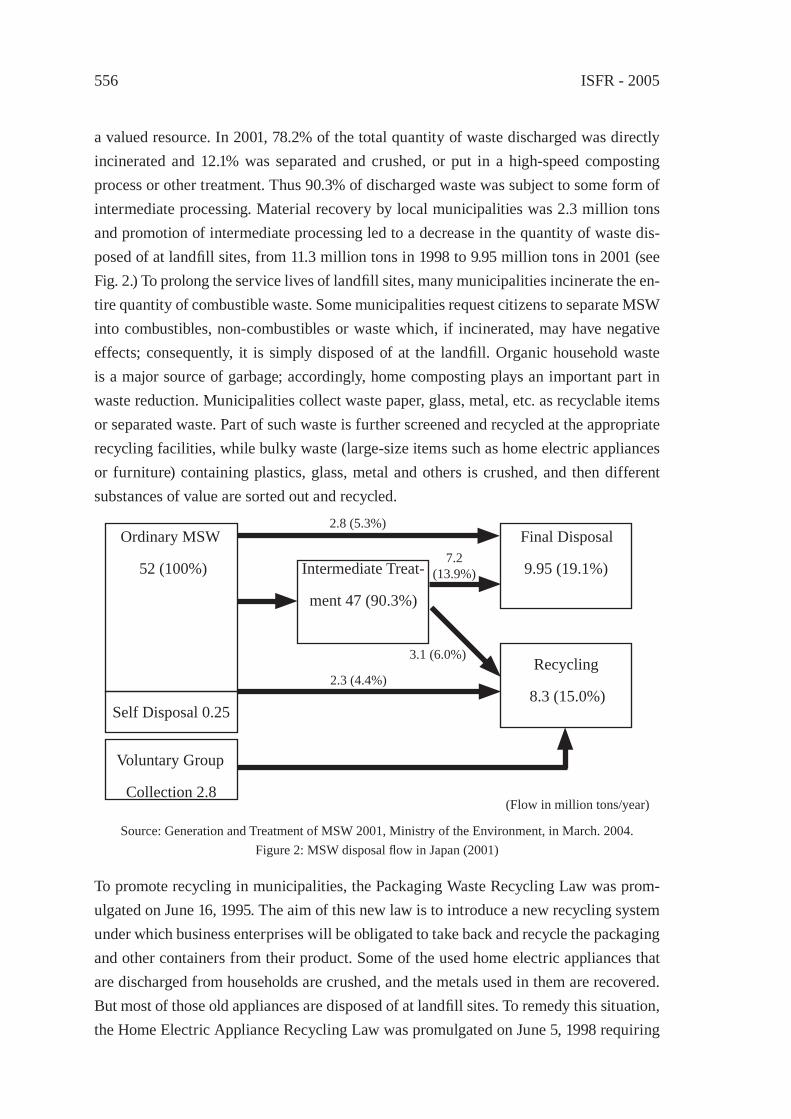
ISFR - 2005556
a valued resource. In 2001, 78.2% of the total quantity of waste discharged was directly incinerated and 12.1% was separated and crushed, or put in a high-speed composting process or other treatment. Thus 90.3% of discharged waste was subject to some form of intermediate processing. Material recovery by local municipalities was 2.3 million tons and promotion of intermediate processing led to a decrease in the quantity of waste dis-posed of at landfi ll sites, from 11.3 million tons in 1998 to 9.95 million tons in 2001 (see Fig. 2.) To prolong the service lives of landfi ll sites, many municipalities incinerate the en-tire quantity of combustible waste. Some municipalities request citizens to separate MSW into combustibles, non-combustibles or waste which, if incinerated, may have negative effects; consequently, it is simply disposed of at the landfi ll. Organic household waste is a major source of garbage; accordingly, home composting plays an important part in waste reduction. Municipalities collect waste paper, glass, metal, etc. as recyclable items or separated waste. Part of such waste is further screened and recycled at the appropriate recycling facilities, while bulky waste (large-size items such as home electric appliances or furniture) containing plastics, glass, metal and others is crushed, and then different substances of value are sorted out and recycled.
To promote recycling in municipalities, the Packaging Waste Recycling Law was prom-ulgated on June 16, 1995. The aim of this new law is to introduce a new recycling system under which business enterprises will be obligated to take back and recycle the packaging and other containers from their product. Some of the used home electric appliances that are discharged from households are crushed, and the metals used in them are recovered. But most of those old appliances are disposed of at landfi ll sites. To remedy this situation, the Home Electric Appliance Recycling Law was promulgated on June 5, 1998 requiring
Ordinary MSW
52 (100%)
Self Disposal 0.25
Voluntary Group
Collection 2.8
Intermediate Treat-
ment 47 (90.3%)
Final Disposal
9.95 (19.1%)
Recycling
8.3 (15.0%)
2.8 (5.3%)
7.2(13.9%)
3.1 (6.0%)
2.3 (4.4%)
(Flow in million tons/year)
Source: Generation and Treatment of MSW 2001, Ministry of the Environment, in March. 2004.Figure 2: MSW disposal fl ow in Japan (2001)
Life Cycle Assessment and Risk Management 557
producers to take back and recycle their home electric appliances discharged as waste. Home electric appliance manufacturers are supposed to establish a system for disman-tling disposed television sets, refrigerators, washing machines and air conditioners and for recycling the iron, copper, aluminum and glass therein.
Apart from municipalities’ separate collection of recyclables, local residents’ group for retrieval and other voluntary measures play an important role in recycling? To establish an optimum recycling system, it is essential to fully recognize the defi ciencies and draw-backs of existing methods. A more effi cient system must be worked out through close cooperation among the administrative authorities, citizens and producers, each with a defi nite assigned responsibility.
5. Development of Strategic Solid Waste Management Supporting Software (SS-WMSS, Japan) at Okayama University
5.1 Framework of the software
To support decision makers, we have been developing the planning tool for strategic solid waste management based on WLCC and WLCA (Waste LCA and LCC). The frame-work of our planning tool, „Strategic Solid Waste Management Supporting Software (SS-WMSS, Japan),” is shown in Fig. 3.
It is necessary for the software to compute cost, energy & resource consumption and environmental load due to solid waste management system. The computations have to be performed for the entire municipal solid waste management system including consump-tion & discharge, collection & transport, treatment and disposal, considering phases of installation of the facilities and their operation. Cost Benefi t Analyses are also indispen-sable for decision making.
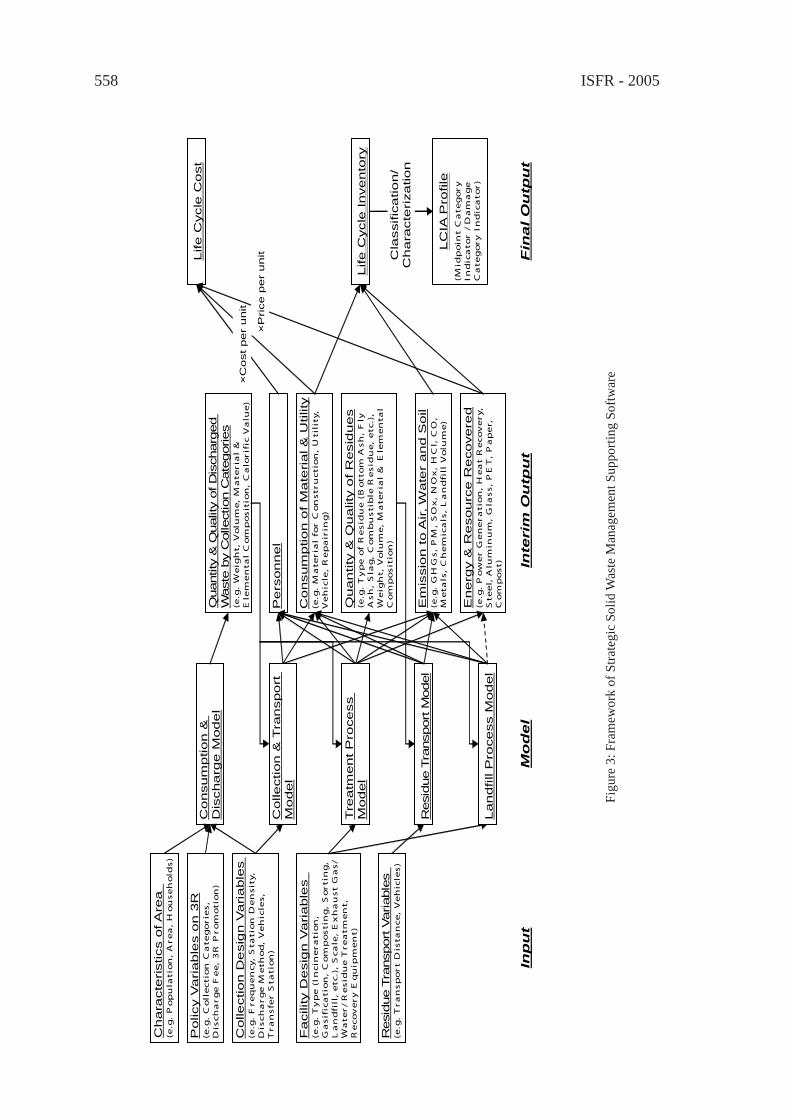
ISFR - 2005558
Co
nsum
ptio
n &
D
ischa
rge
Mod
el
Polic
y V
ari
ab
les o
n 3
R
(e.g
. C
oll
ec
tio
n C
ate
go
rie
s,
Dis
ch
ar
ge
Fe
e,
3R
Pr
om
oti
on
) Q
uantit
y &
Qualit
y of D
isch
arg
ed
Wast
e b
y C
olle
ctio
n C
ate
gories
(e.g
. W
eig
ht,
Vo
lum
e,
Ma
ter
ial
&
Ele
me
nta
l C
om
po
sit
ion
, C
alo
rif
ic V
alu
e)
Colle
ction
De
sig
n V
aria
ble
s
(e.g
. F
req
ue
ncy
, S
tati
on
De
ns
ity,
D
isc
ha
rg
e M
eth
od
, V
eh
icle
s,
Tr
an
sfe
r S
tati
on
)
Fa
cili
ty D
esig
n V
aria
ble
s
(e.g
. T
yp
e (
Inc
ine
ra
tio
n,
Ga
sif
ica
tio
n,
Co
mp
os
tin
g,
So
rti
ng
, L
an
dfi
ll,
etc
.),
Sc
ale
, E
xh
au
st
Ga
s/
Wa
ter
/ R
es
idu
e T
rea
tme
nt,
R
eco
ve
ry
Eq
uip
me
nt)
En
erg
y &
Re
sou
rce
Re
cove
red
(e
.g.
Po
we
r G
en
er
ati
on
, H
ea
t R
ec
ov
ery
, S
tee
l, A
lum
inu
m,
Gla
ss
, P
ET
, P
ap
er,
C
om
po
st)
Qu
an
tity
& Q
ua
lity o
f R
esid
ue
s
(e.g
. T
yp
e o
f R
es
idu
e (
Bo
tto
m A
sh
, F
ly
As
h,
Sla
g,
Co
mb
us
tib
le R
es
idu
e,
etc
.),
We
igh
t, V
olu
me
, M
ate
ria
l &
Ele
me
nta
l C
om
po
sit
ion
)
Chara
cte
ristics o
f A
rea
(e.g
. P
op
ula
tio
n,
Are
a,
Ho
us
eh
old
s)
Co
nsum
ptio
n o
f M
ate
rial &
Utilit
y
(e.g
. M
ate
ria
l fo
r C
on
str
uc
tio
n,
Uti
lity
, V
eh
icle
, R
ep
air
ing
)
Em
issio
n to
Air, W
ate
r a
nd S
oil
(e.g
. G
HG
s,
PM
, S
Ox
, N
Ox
, H
Cl,
CO
, M
eta
ls,
Ch
em
ica
ls,
La
nd
fill
Vo
lum
e)
Life
Cycle
Co
st
Resi
due T
ransp
ort V
ariable
s
(e.g
. T
ra
ns
po
rt
Dis
tan
ce
, V
eh
icle
s)
Life
Cycle
In
ve
nto
ry
LC
IA P
rofile
(M
idp
oin
t C
ate
go
ry
In
dic
ato
r /
Da
ma
ge
C
ate
go
ry
In
dic
ato
r)
Cla
ssific
atio
n/
Ch
ara
cte
riza
tio
n
Inp
ut
Inte
rim
Ou
tpu
t F
ina
l O
utp
ut
Mo
del
Pe
rson
nel
Colle
ction
& T
ran
spo
rt
Model
Tre
atm
en
t P
roce
ss
Model
Landfill
Pro
cess M
odel
Resi
due T
ransp
ort M
odel
×C
ost
pe
r u
nit
×P
rice
pe
r u
nit
Figu
re 3
: Fra
mew
ork
of S
trate
gic
Solid
Was
te M
anag
emen
t Sup
porti
ng S
oftw
are
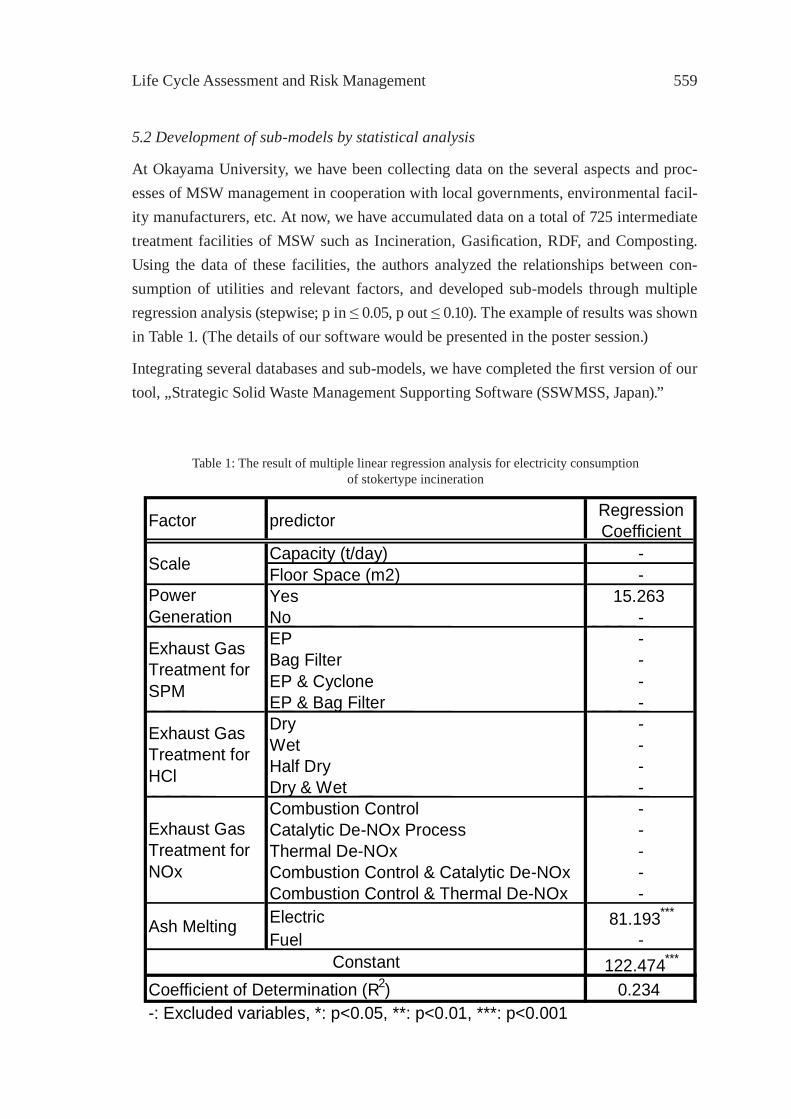
Life Cycle Assessment and Risk Management 559
5.2 Development of sub-models by statistical analysis
At Okayama University, we have been collecting data on the several aspects and proc-esses of MSW management in cooperation with local governments, environmental facil-ity manufacturers, etc. At now, we have accumulated data on a total of 725 intermediate treatment facilities of MSW such as Incineration, Gasifi cation, RDF, and Composting. Using the data of these facilities, the authors analyzed the relationships between con-sumption of utilities and relevant factors, and developed sub-models through multiple regression analysis (stepwise; p in ≤ 0.05, p out ≤ 0.10). The example of results was shown in Table 1. (The details of our software would be presented in the poster session.)
Integrating several databases and sub-models, we have completed the fi rst version of our tool, „Strategic Solid Waste Management Supporting Software (SSWMSS, Japan).”
Factor predictor Regression Coefficient
Capacity (t/day) - Floor Space (m2) - Yes 15.263 No - EP - Bag Filter - EP & Cyclone - EP & Bag Filter - Dry - Wet - Half Dry - Dry & Wet - Combustion Control - Catalytic De-NOx Process - Thermal De-NOx - Combustion Control & Catalytic De-NOx - Combustion Control & Thermal De-NOx - Electric 81.193 *** Fuel -
122.474 *** 0.234
-: Excluded variables, *: p<0.05, **: p<0.01, ***: p<0.001
Scale
Exhaust Gas Treatment for SPM
Coefficient of Determination (R 2 )
Power Generation
Exhaust Gas Treatment for HCl
Exhaust Gas Treatment for NOx
Ash Melting Constant
Table 1: The result of multiple linear regression analysis for electricity consumptionof stokertype incineration
ISFR - 2005560
6. Conclusion
Solid waste management has been an integral part of human life as also have a strong infl uence on production and consumption patterns. It may also adversely affect the en-vironment and may have long term effects on human life. In order to reduce the adverse impacts of this system, there is an urgent need for a policy shift towards internalization of waste management in the every effort and move towards attaining sustainable society. We, in line and in collaboration with the global community, have to attempt to minimize the material consumption, environmental pollution and public health hazards due to waste management. We have to promote the 3Rs. Japanese word „Mottainai” was mentioned by Prof. Wangari Maathai, Assistant Minister for Environment and Natural Resources, Gov-ernment of Kenya; Nobel Peace Laureate saying as follows.
When I learned the concept of Mottainai, I immediately knew it would be an important element of my message to the world. I liked the spiritual roots of Mottainai. I also like the fact that is captures in one term the „3Rs” that we have been campaigning for over many years. I like to spread the spirit of Mottainai to the world.
Life Cycle Assessment and Risk Management 561
ECONOMICAL ELV RECYCLING UNDER ECOLOGICAL FRAMEWORK CONDITIONS
Willi Fey, General Motors Europe, Director ELVc/o Adam Opel AG, End-of-Life Vehicles, IPC 66-01, 65423 Rüsselsheim, Germany,
Abstract: As it is required by the EU End-of-Life-Vehicle Directive, economic opera-tors have to set up systems for the collection of ELVs with adequate area coverage. The take back strategy of General Motors Europe is to prefer individual, or so called “own-marque” systems, by nominating the best treatment operators in the market to be the potential future take back and treatment network partners.Recycling plays the main role, with the two possibilities being “material” and “ feed-stock” recycling. The choice of options must depend on possible markets and customers for the products. Additional legal infl uences on future disposal and recovery have to be taken into account and put more emphasis on the need of the further development of post-shredder technologies.
Introduction
I am pleased to have the opportunity today to participate in the International Symposium on Feedstock Recycling here in Karlsruhe. This provides the possibility to exchange the views of two major industrial sectors, the “International Recycling Sector” and the “Au-tomotive Sector”. Through our intensive cooperation with the recycling sector, which is taking place since years, we enable our governments to put more and more emphasis on sustainability, both environmental and economical, with the view on the following gen-erations.
When the End-of-Life Vehicle (ELV) Directive was decided in September 2000, we faced a very big challenge, due to its transcription in all member states of the enlarged EU, in-cluding future candidates like Romania, Bulgaria and Turkey. Also in other international markets similar ideas came up, which require our involvement. Our company needed to create internally an international organization, dedicated to this subject, in order to get our vehicles free of heavy metals by July 2003 and to fi nd partners who also see an op-portunity in the take back and treatment of ELVs. Many of treatment operators from the recycling sector as well as governmental representatives have been in contact with us and do already know the GM position on ELV Recycling, which I want to present today.

ISFR - 2005562
Agenda
The main focuses of ELV related activities, as we see them today, are: fi rst, the set-up of the actual take back and treatment systems, and second, the achievement of the quotas, as outlined by the EU ELV Directive with the goal of increasing recycling and recovery, and by that, reducing landfi ll. This is directly linked to the question of which recycling tech-nologies may be applied in accordance with market demands. I will show some examples before coming to a fi nal conclusion at the end of my speech.
ELV Take-Back systems in Europe
As the ELV Directive describes, economic operators have to set up systems for the col-lection of ELVs with adequate area coverage and are held responsible for achieving recy-cling- and recovery-quotas.
Before I describe the European take-back and recycling situation on a more detailed level, I would like to provide an insight into two other major markets.
In the United-States there is no ELV law in place on a federal level which is regulating take-back and recycling of ELVs. On a state-level there are implemented some voluntary agreements, but by all means with no obligation to incur any expenses for taking back ELVs from the last owner or achieving given quotas. The ELV Take-back and recycling system is affected by free market principles and totally economic driven. However we face an upcoming discussion on mandatory removing of mercury switches from ELVs. In several states a regulation concerning this matter came into force, the main point: dismantling of mercury switched has to be paid by the automotive industry (i.e. Maine, Pennsylvania, Montana, Vermont).
In the next major market, Japan, an ELV law came into force on January 1st, 2005. It is characterized by a fond-system which is fed by 70 Euro (85 USD) in average per new vehicle at the point of sales and also per vehicle on the road during the bi-yearly technical inspection (MOT). A complex and complicated administration and supporting systems are consuming nearly one half of the fond income. Manufacturers and importers are made responsible to take back Automotive Shredder Residue, pyrotechnical units and gas for aircondition (CFC) - activities which in themself are not economically viable whereas revenues from materials or parts sales are not taken into account. Furthermore, the manu-facturers and importers have no infl uence on the take-back network, as every licensed dismantler can participate, if he wishes to do so.
In summary, the Japanese ELV law is a daunting example for unneeded over-regulation, limitation of innovation (PST) and neglecting any positive value of materials resulting from ELVs.
Life Cycle Assessment and Risk Management 563
Now, coming back to Europe! In some member-states like Portugal, Greece and years ago in the Netherlands, the expectation of the government was collective systems. We prefer individual, so called “own-marque” systems, by nominating the best treatment operators in the market as our take back and treatment network partners. In any case, those partners have to fulfi ll the legal technical and GM specifi c requirements concerning the facility and the treatment activities. Our intention is to keep the treatment chain as short as pos-sible, preferably to shred the ELVs right after pre-treatment operations. In some member states, like Germany, those pre-treatment locations have to be companies with a disman-tling license. Other countries, like France, also foresee the direct delivery by the last holder to shredder companies. As another example, Cyprus accepts ELV take back at a scrap metal recycling company with a permit for ELV treatment. Wherever required, we document an existing take back system through individual contracts with nominated take back locations, as long as individual systems are accepted by the national governments.
As legally required, the vehicles have to be pre-treated, which means removal of battery, oils, liquids and fuel, neutralization of pyrotechnical devices and removal of the catalytic converter and, where required, the removal of tires. We are still lobbying to get the option for not removing the glass as this is accepted in Germany until the end of 2005, in Den-mark and also Cyprus. In order to minimize labor intensive dismantling, we prefer that all kinds of plastic components are left in the vehicle for later separation in an industrial-ized post-shredder process, which is based on vertical co-operations in a market driven environment.
The depolluted hulks are then processed at the shredder mostly together with other metal scrap. Currently, ferrous and non-ferrous metals are recycled, whereas shredder residue is almost always sent to landfi ll. New post shredder technologies are currently being de-veloped, in order to further separate the shredder residue into different material streams, many of which represent value.
Legal infl uences on future disposal and recovery of Shredder Residue
Legal infl uences on future disposal and recovery, such as the EU Directive for the inciner-ation of residues, are taken into account in the development of post-shredder technologies. Based on the national transcription of the EU Landfi ll Directive, with subsequent national regulations for the disposal of residues, a reduced number of landfi ll sites, stricter require-ments and higher landfi ll cost are expected across Europe. In addition, the ELV Directive sets specifi c targets on the achievement of quotas for recycling, recovery and maximum disposal, which again puts more emphasis on the need for post-shredder technologies.
ISFR - 2005564
Quota achievement 2006 / 2015
With reference to the ELV Directive, certain quotas have to be met when processing ELVs. For 2006 this is in total 85% recovery with a sub-quota of 80% for reuse and recycling. For vehicles produced before 1980, the respective quota is 75% recovery and 70% reuse and recycling. By 2015 recovery shall be increased to 95%, with a recycling sub-quota of 85%. This reduces the possibility of disposal from 15% in 2006 down to 5% in 2015. As we all know, this is a big challenge for all markets, with the availability of technolo-gies varying tremendously between different countries. Additionally it is very confusing throughout the EU, as to which technologies are regarded as recycling, and which as recovery. There are different answers from our politicians even within one country like Germany with its 16 states. If some of the shredder residue is used for energy recovery, replacing virgin oil, why should a maximum of only 5% in 2006 and only 10% in 2015 be allowed to be added to the recovery rate? Therefore one of our main goals in the discus-sion with the EU Commission is to get rid of the sub-quota, as recently stated in a press release by the German Automobile Manufacturers Association VDA. On the long run, our vision is to completely get rid of any quota and just assure proper treatment with ap-propriate technology.
Monitoring
Another subject currently under discussion is monitoring. The fi nal amendment to the ELV Directive was published in April this year as a commission decision, but the transcription in national laws is still pending in the most member states. We think a lean monitoring with simple administration should be targeted. We do not need shredder campaigns for each shredder to see a tenth of a percentage difference in the shredder s effi ciency, which is intended to be used for the calculation of quota achievement by the different treatment operators. At General Motors we make all efforts to convince the national governments in all European countries to accept a fi xed metal content of 75% on average for all our vehicles, to avoid long discussion on numbers and effi ciencies. We encourage the member states not to compete with each other by reporting higher achievements than requested, to the EU Commission. The simple reporting we propose is, that required quotas were achieved.
How can the requested quotas in 2006 and 2015 be fulfi lled, and how can the recycling sector overcome the problem of a limited possibility of landfi ll in the future? Some of the treatment operators are actively dealing with spare parts and by that contribute directly to the reuse quota. We do the same with our remanufacturing program, where used parts are prepared for reuse. For this program we currently check, for example, the volume of used gear-boxes and engines that are available in the market and how our remanufacturing pro-
Life Cycle Assessment and Risk Management 565
gram can be extended to include ELV treatment centers as potential used parts suppliers. Although important, reuse is only a small portion of the total recovery picture. Recycling plays the main role, with the two possibilities being “material” and “feedstock” recycling. The choice of options must depend on possible markets and customers for the products. In mechanical recycling, a high level of separation is usually needed, for instance to sort into different kinds of plastics for a later application in new plastic parts with the required properties.
This is generally less of an issue for feedstock recycling, because material with the same required chemical properties can remain in one fraction. Let me give you one example:
Shredder Residue treatment with SiCon Post-Shredder-Technology
In the Post-Shredder separation using the SiCon process, shredder residue will be treated in order to separate shredder light and heavy fraction into valuable fractions, for which an application, or in other words, a market, a customer, exists. Apart from ferrous and non-ferrous material, other main products are sand, plastic granules and fi bers. The sand can be used in non-ferrous melting furnaces or sinterplants. The plastic granules replace oil or coke and can be used as a reducing agent in the blast furnace process. With respect to the plastic granules, it is important to mention the shortage of coke due to high world market demand, where plastic granules could become a very valuable substitute. In one of the states in Germany ( Lower Saxony ) this has recently been classifi ed as feedstock recycling. Finally, the fi bers have proven to be outstanding replacement for coal and can be used as a dewatering means for sewage sludge conditioning. The SiCon process is an example of the right decision on a technology being made by fi rst looking for markets and potential customers, then determining the product specifi cations, and then fi nally devel-oping the technology to fulfi ll customer needs. This approach optimizes the revenues and minimizes the costs.
There are other mechanical separation technologies available and under development as you most probably already know, just to mention Comet Sambre, Galloo and Scholz as three of the most prominent ones here in Europe.
All these technologies have the potential to achieve the required quota, with different per-centages and usage of recycling and energy recovery. In general those technologies have in common, that the investment as well as the gate fee, is reasonable, that the products as process output can be sold on an existing market, and that there are applications which are accepted as recycling. It is interesting to note, that both the Comet Sambre and Gal-loo processes are operational, have not been developed to meet any recycling quota, but rather out of economical considerations in response to the already high landfi ll costs in Belgium.
ISFR - 2005566
In 2002, the Association of European Vehicle Manufacturers (ACEA) contracted the U.K. based automotive and technology consultants KGP to do a study on the comparison of dif-ferent post-shredding-technologies. In addition to mechanical processes, such as SiCon, the study also looked at thermal processes such as the Reshment process, currently under discussion in Switzerland, and the EBARA Twin-Rec process used in Japan. Although gasifi cation and pyrolysis generally offer the advantage of being suitable for a wide range of different types of waste, they have a distinct disadvantage for the treatment of shredder residue. Specifi cally the initial investment for thermal technologies is many times higher than for mechanical processes. The estimated gate fees are also higher than for mechani-cal processes and the recycling rate is lower than, for example, the SiCon process.
As we can see, it is essential that decisions on technology are based on market demands and political acceptance, as well as on clear fact-oriented economic analysis. We have to think more on a European basis, where national borders are increasingly less important. Countries like for instance Latvia, Estonia or Slovenia are unlikely to have markets large enough to justify their own installations. In these situations cross-border solutions must be found.
Resposibities
It is important to note that everyone in the chain has to do his part if we are to move to-wards a more sustainable economy:
vehicle manufacturers must design their vehicles in order to be free of heavy metals and to comply with all recyclability requirements;
governments must implement improved registration / deregistration systems and police treatment operators, have to shut down those that operate outside the law;
last owners of vehicles must return their ELVs only to authorized take-back facilities
recycling companies, which are benefi ting from the increasing weight of metallic content of ELVs, must dedicate efforts to fi nding alternatives to simply landfi lling shredder resi-due.
With respect to this last point, we are spending considerable energy looking into different technical solutions. We can tell the recycling sector how much the different technologies add to the quotas, and how the economics of the different technologies compare. However only the recycling sector, and out of it mainly the shredding companies, can make the decision as to what they actually do with their materials.
Life Cycle Assessment and Risk Management 567
Conclusion
Finally, please let me summarize and emphasize once again my main conclusions:
In order to be able to use the best applicable and competitive technologies we need to get rid of the sub-quotation and the recycling hierarchy, in other words, the differentiation between Recycling and Recovery.
Decisions on post-shredder-technologies must be based on economical analysis and mar-ket demand. European solutions must be envisioned.
Post-shredder-technology is needed to cope with the future challenge of quota achieve-ment and landfi ll restrictions as well as with increasing landfi ll cost.

ISFR - 2005568

Life Cycle Assessment and Risk Management 569
PVC RECOVERY OPTIONS:ENVIRONMENTAL AND ECONOMIC SYSTEM ANALYSIS
J. Kreißig1, M. Baitz1, J. Schmid1, P. Kleine-Möllhoff2, I. Mersiowsky3, H. Leitner4
1PE Europe GmbH, Hauptstraße 111-113, 70771 Leinfelden-Echterdingen, Germany2Reutlingen University
3Tu Tech Hamburg4Vinyl 2010 – SolVin, rue Prince Albert 33, Brussels, Belgium
Goal
The PVC industry supports an integrated waste management approach under the concept of Eco-effi ciency. To this aim, an “Environmental and Economic System Analysis” of different processes and waste recovery options was performed. Mixed cable waste has been chosen as it represents a complex, large waste stream for PVC waste products and shows similarities with waste streams from other plasticized PVC applications. The en-vironmental parameters were selected with reference to current international discussion. The study was performed in accordance with the Life Cycle Assessment methodology described in ISO 14040 ff. The economic parameters per option were based on gate fees. The gate fee was calculated by the operators under comparable boundary conditions.
Scope
The function of the systems under study is “processing of 1 t mixed cable waste”. The technologies generate different quantities and qualities of recovered products (see below). The four investigated recovery technologies can be characterized as follows:
- The municipal waste incineration in the MVR Hamburg facility in Germany with the recovered products electricity, heat, HCl, and metal(s).
- The feedstock recycling with the Watech process of RGS90 A/S in Denmark. It uses py-rolysis followed by purifi cation and extraction steps. The recovered products are CaCl2, coke, pyrolysis oil (condensate) and metal(s).
- The feedstock recycling process of Stigsnæs Industrimiljø A.S. in Denmark is a hydroly-sis followed by post-heating (pyrolysis) of the dechlorinated solid fraction. The recov-ered products are NaCl, hydrocarbon (CnHm) fractions, solid residue for the production of sandblasting material, and metal(s).
- The mechanical recycling with the Vinyloop process developed by Solvay S.A. uses solvents and is based on selective dissolution, separation and precipitation of the PVC compound. The recovered products are PVC compounds and metal(s).
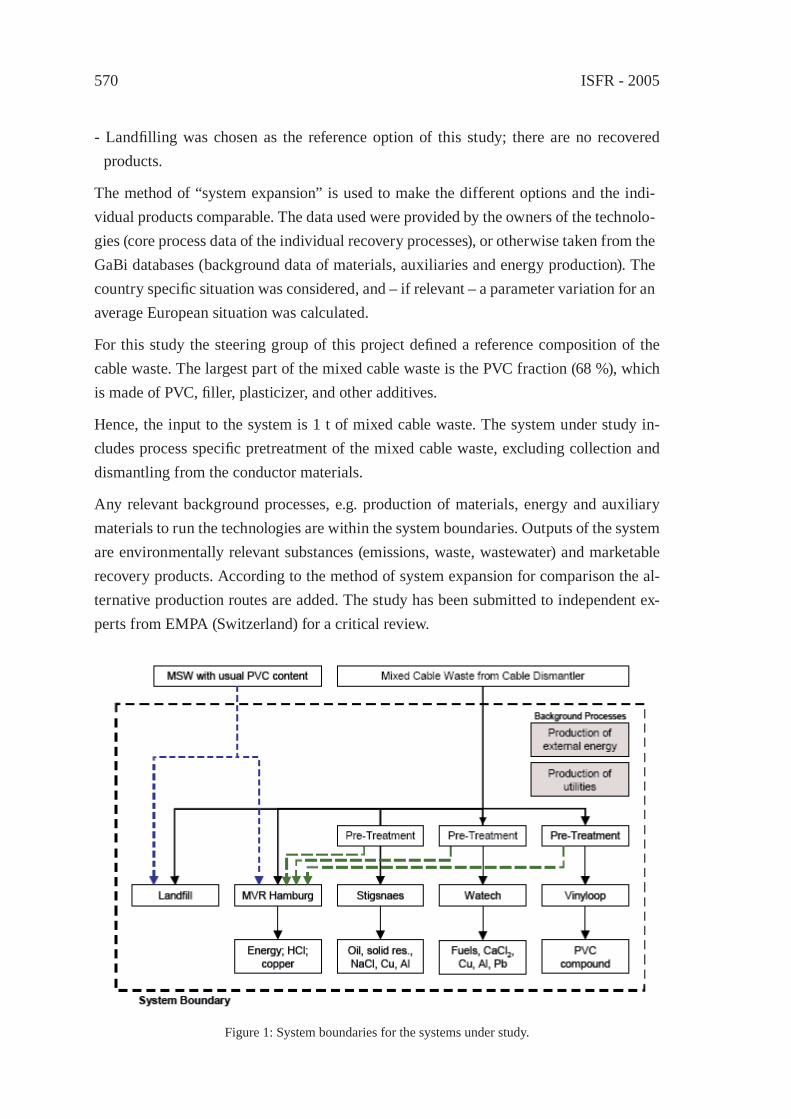
ISFR - 2005570
- Landfi lling was chosen as the reference option of this study; there are no recovered products.
The method of “system expansion” is used to make the different options and the indi-vidual products comparable. The data used were provided by the owners of the technolo-gies (core process data of the individual recovery processes), or otherwise taken from the GaBi databases (background data of materials, auxiliaries and energy production). The country specifi c situation was considered, and – if relevant – a parameter variation for an average European situation was calculated.
For this study the steering group of this project defi ned a reference composition of the cable waste. The largest part of the mixed cable waste is the PVC fraction (68 %), which is made of PVC, fi ller, plasticizer, and other additives.
Hence, the input to the system is 1 t of mixed cable waste. The system under study in-cludes process specifi c pretreatment of the mixed cable waste, excluding collection and dismantling from the conductor materials.
Any relevant background processes, e.g. production of materials, energy and auxiliary materials to run the technologies are within the system boundaries. Outputs of the system are environmentally relevant substances (emissions, waste, wastewater) and marketable recovery products. According to the method of system expansion for comparison the al-ternative production routes are added. The study has been submitted to independent ex-perts from EMPA (Switzerland) for a critical review.
Figure 1: System boundaries for the systems under study.
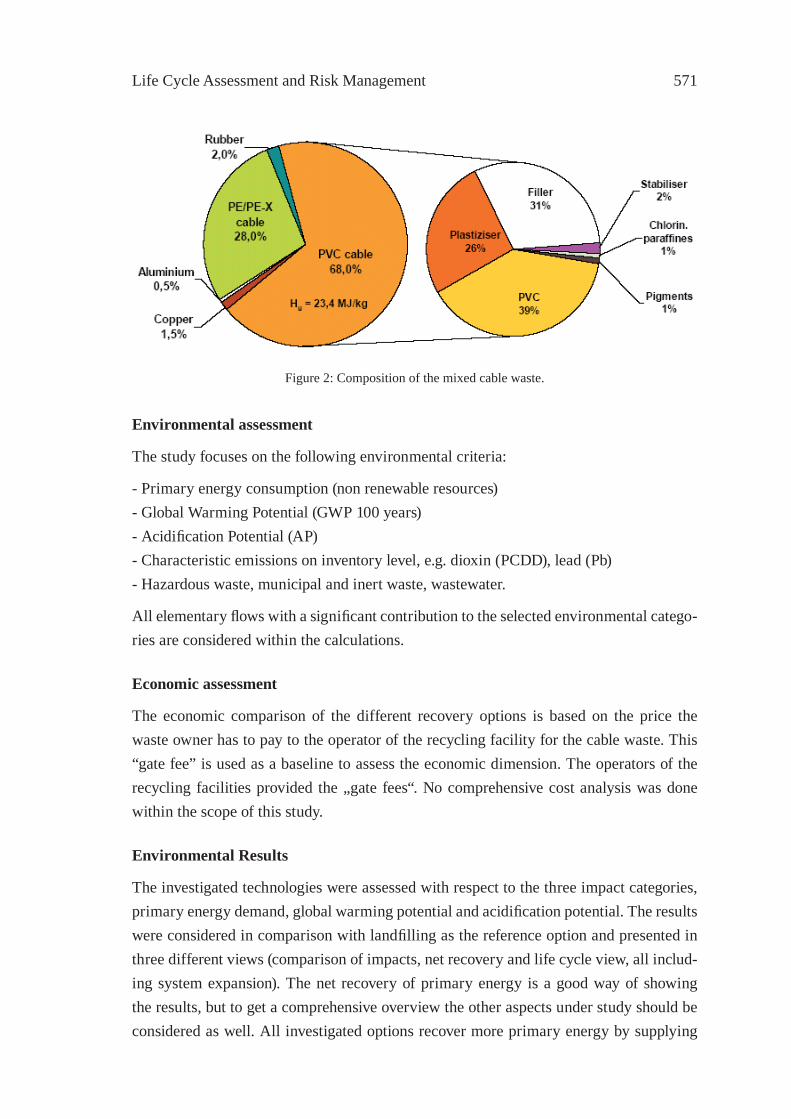
Life Cycle Assessment and Risk Management 571
Environmental assessment
The study focuses on the following environmental criteria:
- Primary energy consumption (non renewable resources) - Global Warming Potential (GWP 100 years) - Acidifi cation Potential (AP) - Characteristic emissions on inventory level, e.g. dioxin (PCDD), lead (Pb) - Hazardous waste, municipal and inert waste, wastewater.
All elementary fl ows with a signifi cant contribution to the selected environmental catego-ries are considered within the calculations.
Economic assessment
The economic comparison of the different recovery options is based on the price the waste owner has to pay to the operator of the recycling facility for the cable waste. This “gate fee” is used as a baseline to assess the economic dimension. The operators of the recycling facilities provided the „gate fees“. No comprehensive cost analysis was done within the scope of this study.
Environmental Results
The investigated technologies were assessed with respect to the three impact categories, primary energy demand, global warming potential and acidifi cation potential. The results were considered in comparison with landfi lling as the reference option and presented in three different views (comparison of impacts, net recovery and life cycle view, all includ-ing system expansion). The net recovery of primary energy is a good way of showing the results, but to get a comprehensive overview the other aspects under study should be considered as well. All investigated options recover more primary energy by supplying
Figure 2: Composition of the mixed cable waste.
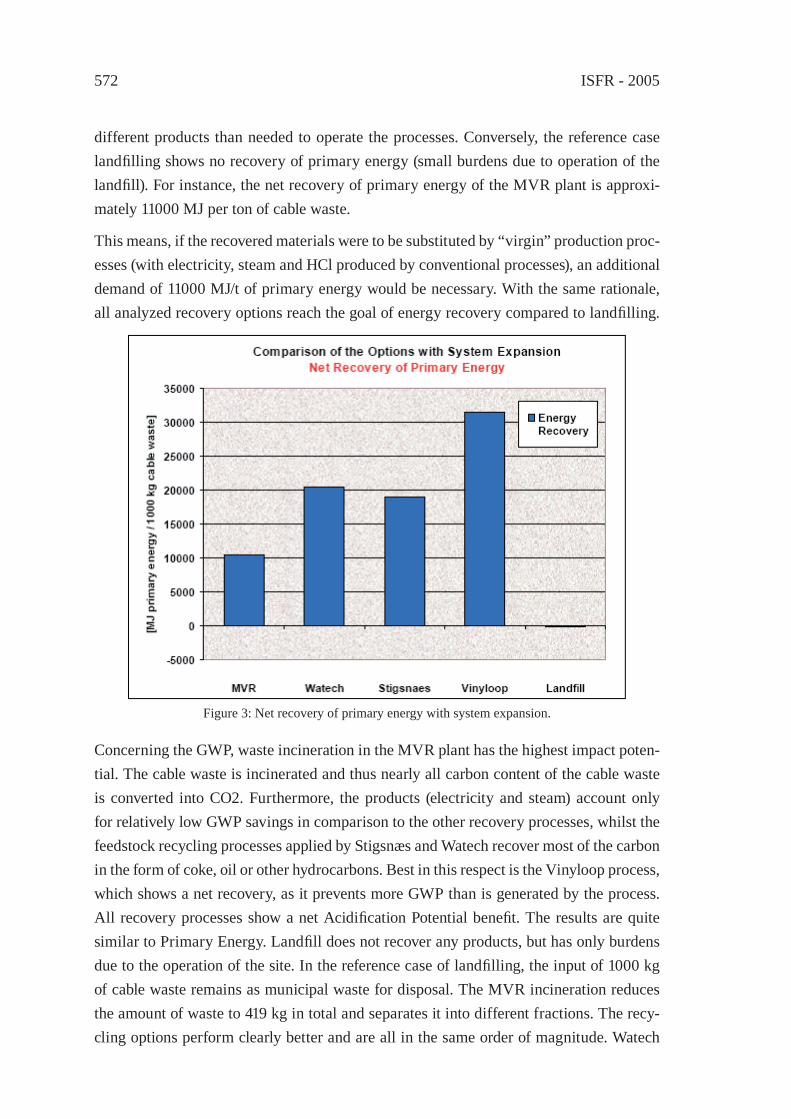
ISFR - 2005572
different products than needed to operate the processes. Conversely, the reference case landfi lling shows no recovery of primary energy (small burdens due to operation of the landfi ll). For instance, the net recovery of primary energy of the MVR plant is approxi-mately 11000 MJ per ton of cable waste.
This means, if the recovered materials were to be substituted by “virgin” production proc-esses (with electricity, steam and HCl produced by conventional processes), an additional demand of 11000 MJ/t of primary energy would be necessary. With the same rationale, all analyzed recovery options reach the goal of energy recovery compared to landfi lling.
Figure 3: Net recovery of primary energy with system expansion.
Concerning the GWP, waste incineration in the MVR plant has the highest impact poten-tial. The cable waste is incinerated and thus nearly all carbon content of the cable waste is converted into CO2. Furthermore, the products (electricity and steam) account only for relatively low GWP savings in comparison to the other recovery processes, whilst the feedstock recycling processes applied by Stigsnæs and Watech recover most of the carbon in the form of coke, oil or other hydrocarbons. Best in this respect is the Vinyloop process, which shows a net recovery, as it prevents more GWP than is generated by the process. All recovery processes show a net Acidifi cation Potential benefi t. The results are quite similar to Primary Energy. Landfi ll does not recover any products, but has only burdens due to the operation of the site. In the reference case of landfi lling, the input of 1000 kg of cable waste remains as municipal waste for disposal. The MVR incineration reduces the amount of waste to 419 kg in total and separates it into different fractions. The recy-cling options perform clearly better and are all in the same order of magnitude. Watech
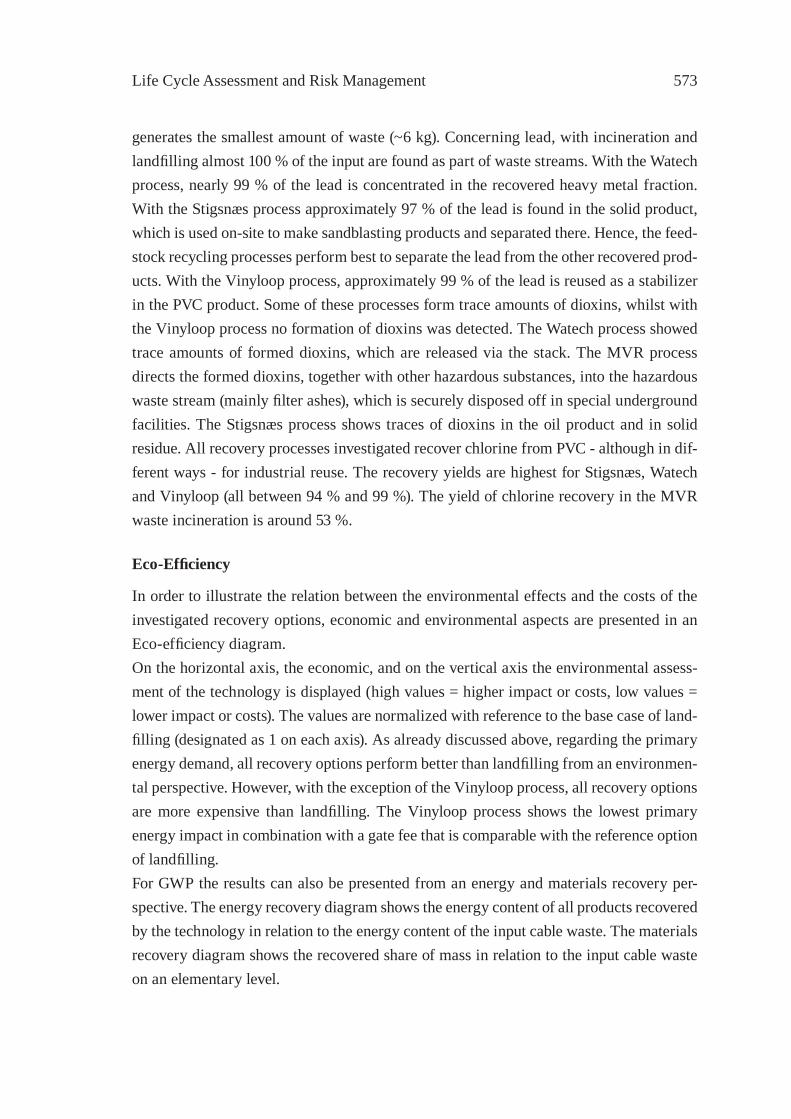
Life Cycle Assessment and Risk Management 573
generates the smallest amount of waste (~6 kg). Concerning lead, with incineration and landfi lling almost 100 % of the input are found as part of waste streams. With the Watech process, nearly 99 % of the lead is concentrated in the recovered heavy metal fraction. With the Stigsnæs process approximately 97 % of the lead is found in the solid product, which is used on-site to make sandblasting products and separated there. Hence, the feed-stock recycling processes perform best to separate the lead from the other recovered prod-ucts. With the Vinyloop process, approximately 99 % of the lead is reused as a stabilizer in the PVC product. Some of these processes form trace amounts of dioxins, whilst with the Vinyloop process no formation of dioxins was detected. The Watech process showed trace amounts of formed dioxins, which are released via the stack. The MVR process directs the formed dioxins, together with other hazardous substances, into the hazardous waste stream (mainly fi lter ashes), which is securely disposed off in special underground facilities. The Stigsnæs process shows traces of dioxins in the oil product and in solid residue. All recovery processes investigated recover chlorine from PVC - although in dif-ferent ways - for industrial reuse. The recovery yields are highest for Stigsnæs, Watech and Vinyloop (all between 94 % and 99 %). The yield of chlorine recovery in the MVR waste incineration is around 53 %.
Eco-Effi ciency
In order to illustrate the relation between the environmental effects and the costs of the investigated recovery options, economic and environmental aspects are presented in an Eco-effi ciency diagram. On the horizontal axis, the economic, and on the vertical axis the environmental assess-ment of the technology is displayed (high values = higher impact or costs, low values = lower impact or costs). The values are normalized with reference to the base case of land-fi lling (designated as 1 on each axis). As already discussed above, regarding the primary energy demand, all recovery options perform better than landfi lling from an environmen-tal perspective. However, with the exception of the Vinyloop process, all recovery options are more expensive than landfi lling. The Vinyloop process shows the lowest primary energy impact in combination with a gate fee that is comparable with the reference option of landfi lling.For GWP the results can also be presented from an energy and materials recovery per-spective. The energy recovery diagram shows the energy content of all products recovered by the technology in relation to the energy content of the input cable waste. The materials recovery diagram shows the recovered share of mass in relation to the input cable waste on an elementary level.
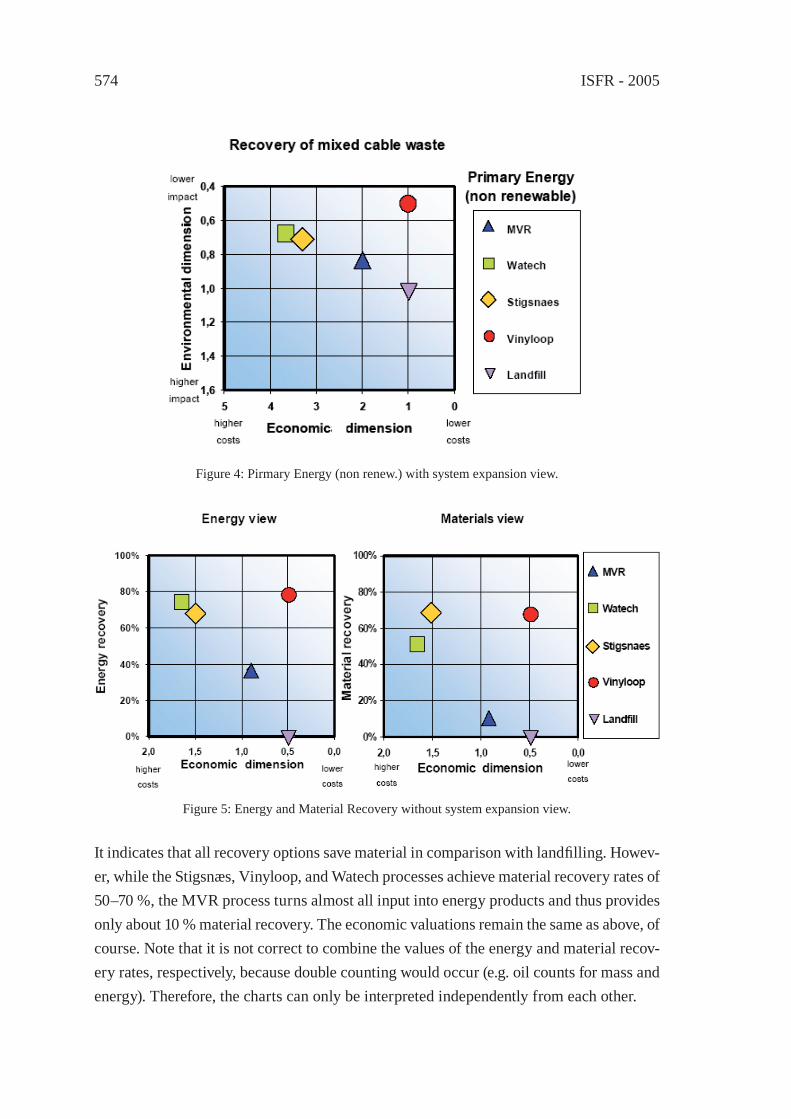
ISFR - 2005574
Figure 4: Pirmary Energy (non renew.) with system expansion view.
Figure 5: Energy and Material Recovery without system expansion view.
It indicates that all recovery options save material in comparison with landfi lling. Howev-er, while the Stigsnæs, Vinyloop, and Watech processes achieve material recovery rates of 50–70 %, the MVR process turns almost all input into energy products and thus provides only about 10 % material recovery. The economic valuations remain the same as above, of course. Note that it is not correct to combine the values of the energy and material recov-ery rates, respectively, because double counting would occur (e.g. oil counts for mass and energy). Therefore, the charts can only be interpreted independently from each other.
Life Cycle Assessment and Risk Management 575
Conclusions
The results of the environmental and economic system analysis from this study are only valid for mixed cable waste with the described composition and for the specifi c conditions of the investigated recovery plants. The environmental assessment was conducted accord-ing to the applicable standards ISO 14040 ff. Differences in national environmental poli-cies may also effect the conclusions from this study. In general, the following conclusions can be drawn:
− When considering recovery options for an integrated waste management concept, an Eco-effi ciency approach provides valuable insights in the environmental and the eco-nomic aspects of the investigated processes.
− Compared with the reference option landfi lling, all of the investigated recovery op-tions have a positive effect on the demand of primary energy, due to the recovery of either energy or materials. The Vinyloop mechanical recycling process shows the best performance in this respect, followed by the Watech and Stigsnæs feedstock recycling processes, on a similar level, and with the MVR incineration process at 3rd place.
− In addition to this criterion, the results for the other impact categories – global warm-ing potential (GWP) and acidifi cation potential (AP) – as well as the management of substance fl ows (lead and dioxin) also need to be considered. For example, the Watech and Stigsnæs processes are the only ones allowing to separate and recover lead.
− The management of the polymer as a resource plays a decisive role for the environ-mental assessment. In landfi lls, the carbon content of the waste product is “stored”, although a long-term fi xation is uncertain. Furthermore, landfi lling incurs long-term risks and liabilities, which cannot be represented in the Eco-effi ciency diagram. At least in Europe, landfi lling of plastic waste does not represent a long-term disposal op-tion from a legal point of view. Incineration processes such as MVR use the embodied energy of the polymer, while recycling processes such as Vinyloop, Watech, and Stig-snæs recover the material itself or its feedstock.
− When taking the economic dimension (gate fees) into consideration, the Vinyloop proc-ess is shown to be competitive with landfi lling, while all other recovery options entail higher costs – MVR, Stigsnæs and Watech in order of increasing gate-fees – mainly because of their low revenues for the recovered products. The task for the decision-makers remains to arrive at an evaluation of the Eco-effi ciency profi le of each recovery option under consideration. This fi nal evaluation will have to be based upon the system boundaries, conditions and specifi c demands of the technology, but will also need to take local and regional aspects into consideration.

ISFR - 2005576
Life Cycle Assessment and Risk Management 577
PLASTICS AS SOURCES OF ENVIRONMENTAL POLLUTANTSK. Saido1a*, Y. Kodera2, T. Kuroki3 and S. Yada1b
1Nihon University, aCollege of Pharmacy, bCollege of Humanities and Science,Chiba, Japan, *[email protected]
2Advanced Industrial Science and Technology3Polymer Decomposition Laboratory, Inc.
Abstract: There has been no report on the kinetics of the low-temperature disruption of plastics. In order to clarify cause of generation of environmental pollutants which exist in food cans or water of the sea and rivers, the disruption were performed at the temperature ranging 50 ° to 300 °C, at which thermoplastics often experience in use of the living life, during manufacturing processes, or after being disposed. Thermoplastics such as polystyrene were disrupted at low-temperatures. Polystyrene started the thermal disruption at 50 °C, and 2,4,5-triphenyl-1-hexene (styrene trimer) were formed. Activa-tion energy calculated on the basis of rate of styrene trimer at each temperature was 42 Kj/mol.
Introduction
Plastics are cheaply and are easy to be produced of large quantities, because the stable property is shown at the living use or waste. Plastics are disposed in landfi ll as not recy-cle, since it generates dioxin, etc. by reacting with the chlorine in the incomplete combus-tion [1, 2, 3]. Waste plastic constitutes an environmental pollutant itself [4] and the more serious problem is certain chemicals such as bisphenol A (BPA) derived from plastics which may seep out from waste plastics in landfi ll. The environmental pollutants are usu-ally low-molecular-weight compounds such as styrene oligomer [5], nonylphenol [6], BPA [7], and phthalate (PAE) [8].
We have little knowledge on the kinetics of low-temperature disruption of plastic products in a diary use or after being disposed. The present study shows that at temperature range 50 °-180 °C, the decomposition of polystyrene (PS) gives rise to 2,4,6-triphenyl-1-hexene (trimer) and 2,4-diphenyl-1-butene (dimer) at 50 °C.
Material and Method
The PS was used an unmolded pellet obtained commercially. A PS was dissolved in ben-zene, reprecipitated three times in methanol and allowed to dry for fi ve day in vacuo (3 Torr) at 25°C. The thermal disruption at low temperature was carried out in 4.90 g of heating medium (polyethyrene glycol, PEG) as a 2.0 wt% disperse solution. The details of methods were described in another report [9]. The following apparatus was used for the separation and identifi cation of the thermal disruption products : nuclear magnetic
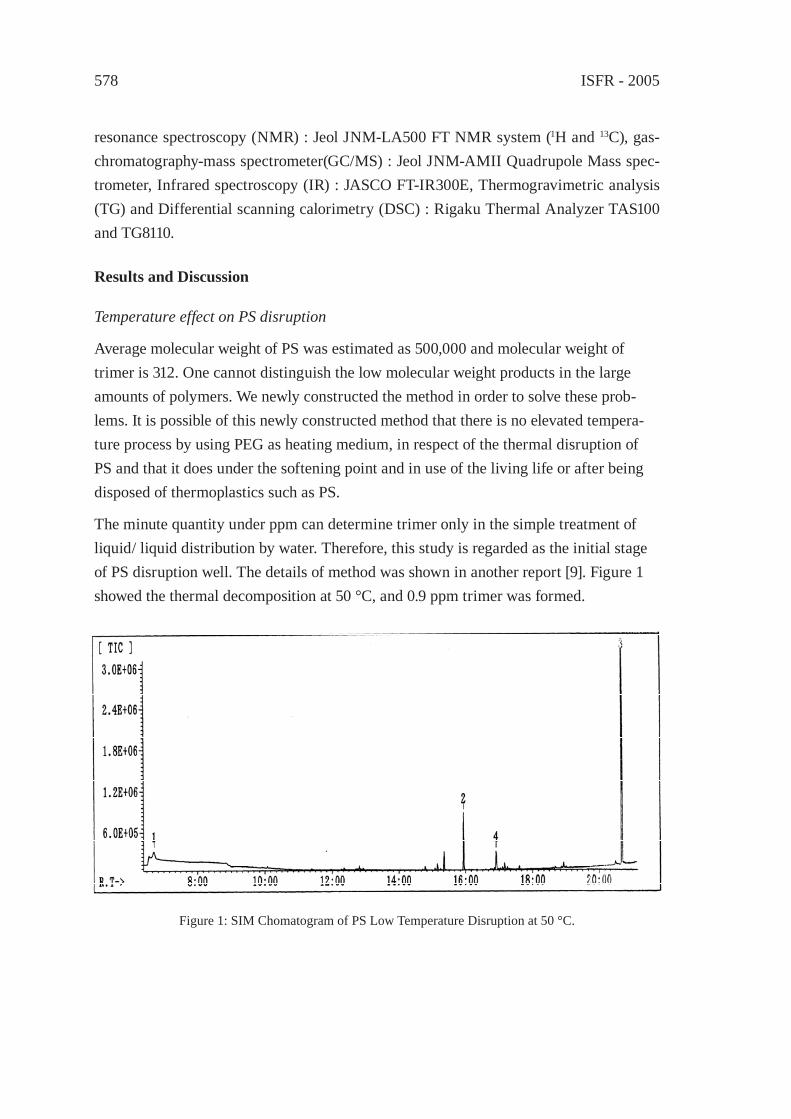
ISFR - 2005578
resonance spectroscopy (NMR) : Jeol JNM-LA500 FT NMR system (1H and 13C), gas-chromatography-mass spectrometer(GC/MS) : Jeol JNM-AMII Quadrupole Mass spec-trometer, Infrared spectroscopy (IR) : JASCO FT-IR300E, Thermogravimetric analysis (TG) and Differential scanning calorimetry (DSC) : Rigaku Thermal Analyzer TAS100 and TG8110.
Results and Discussion
Temperature effect on PS disruption
Average molecular weight of PS was estimated as 500,000 and molecular weight of trimer is 312. One cannot distinguish the low molecular weight products in the large amounts of polymers. We newly constructed the method in order to solve these prob-lems. It is possible of this newly constructed method that there is no elevated tempera-ture process by using PEG as heating medium, in respect of the thermal disruption of PS and that it does under the softening point and in use of the living life or after being disposed of thermoplastics such as PS.
The minute quantity under ppm can determine trimer only in the simple treatment of liquid/ liquid distribution by water. Therefore, this study is regarded as the initial stage of PS disruption well. The details of method was shown in another report [9]. Figure 1 showed the thermal decomposition at 50 °C, and 0.9 ppm trimer was formed.
Figure 1: SIM Chomatogram of PS Low Temperature Disruption at 50 °C.
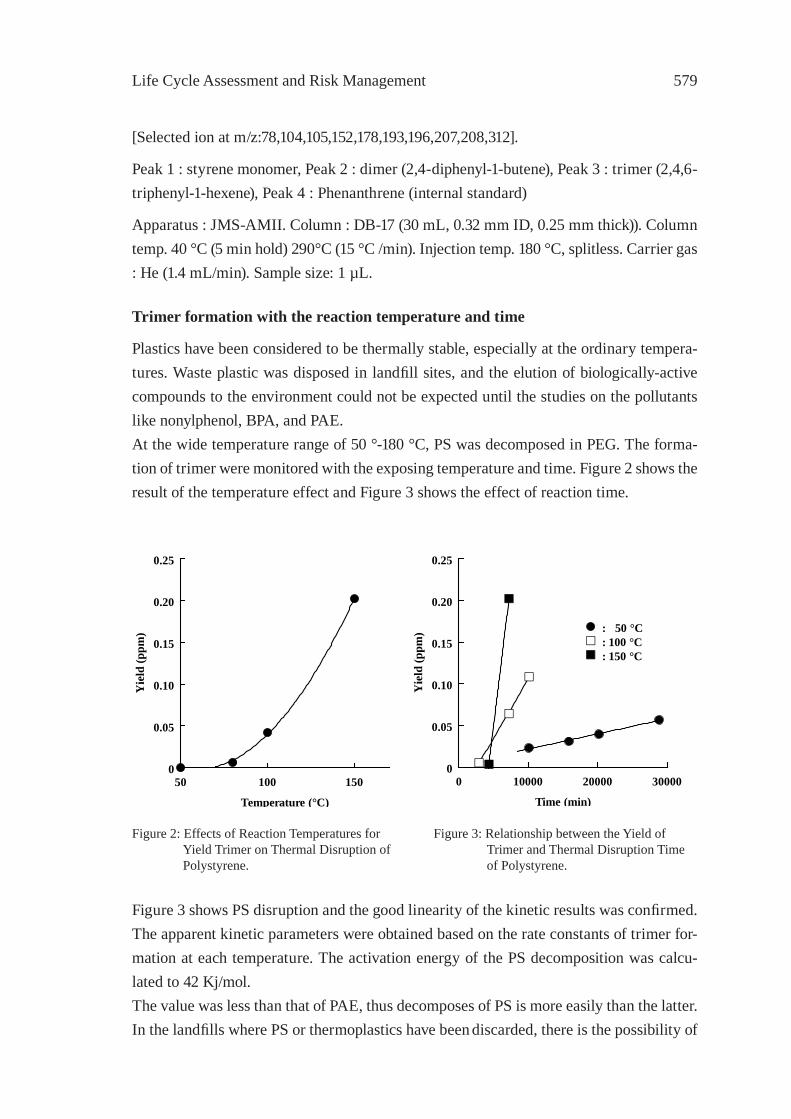
Life Cycle Assessment and Risk Management 579
[Selected ion at m/z:78,104,105,152,178,193,196,207,208,312].
Peak 1 : styrene monomer, Peak 2 : dimer (2,4-diphenyl-1-butene), Peak 3 : trimer (2,4,6-triphenyl-1-hexene), Peak 4 : Phenanthrene (internal standard)
Apparatus : JMS-AMII. Column : DB-17 (30 mL, 0.32 mm ID, 0.25 mm thick)). Column temp. 40 °C (5 min hold) 290°C (15 °C /min). Injection temp. 180 °C, splitless. Carrier gas : He (1.4 mL/min). Sample size: 1 µL.
Trimer formation with the reaction temperature and time
Plastics have been considered to be thermally stable, especially at the ordinary tempera-tures. Waste plastic was disposed in landfi ll sites, and the elution of biologically-active compounds to the environment could not be expected until the studies on the pollutants like nonylphenol, BPA, and PAE.At the wide temperature range of 50 °-180 °C, PS was decomposed in PEG. The forma-tion of trimer were monitored with the exposing temperature and time. Figure 2 shows the result of the temperature effect and Figure 3 shows the effect of reaction time.
50 100 1500
0.05
0.10
0.15
0.20
0.25
Temperature (°C)
Yie
ld (p
pm)
Figure 2: Effects of Reaction Temperatures for Yield Trimer on Thermal Disruption of Polystyrene.
0 10000 20000 300000
0.05
0.10
0.15
0.20
0.25
Time (min)
Yie
ld (p
pm) : 50 °C
: 100 °C : 150 °C
Figure 3: Relationship between the Yield of Trimer and Thermal Disruption Time of Polystyrene.
Figure 3 shows PS disruption and the good linearity of the kinetic results was confi rmed. The apparent kinetic parameters were obtained based on the rate constants of trimer for-mation at each temperature. The activation energy of the PS decomposition was calcu-lated to 42 Kj/mol.The value was less than that of PAE, thus decomposes of PS is more easily than the latter. In the landfi lls where PS or thermoplastics have been discarded, there is the possibility of
ISFR - 2005580
long-term pollution by trimer and dimer or environmental pollutants which is generated via the disruption of those materials since landfi ll temperature may remain at 50 °C or more for many years [10].
References
[1] Choudhry, G. G., Olie, K., and Hutzinger, O., Edited by Hutzinger, O., et al., Pergamon Press pp. 275-301 (1982).
[2] Karasek, F., Organohalogen Compound, 23, pp.315-317 (1995)[3] Tanaka, M., Kagaku, 52(10), 26-29 (1997).[4] Richard,C.T., Ylva,O., Richard, P. M., Anthony, D., Steven, J. R.,Anthony,
W.G.J.,Daniel, M., and Andrea, E. R., Science , 304, 838 (2004).[5] Yaguchi, K., and Suzuki, T., Anzenn kougaku, 42(5), 290-297 (2003).[6] Sakamoto, H., Matsuzaka, R., Itho, R., and Tohyama, H., J. food Hyg.Soc.Japan,
41,200, (2000).[7] Loyo, R. J. E., Schmitz-A, I., Rice, C. P., and Torrents, A., Anal.Chem., 75, 4811,
(2003).[8] Hunt, P. A., Koehler, K.E., Susiarjo, M., Hodges, C. A., Ilagan, C. R., Voigt, S.,
Thomas, B. F., and Hassold, T. I., Curr.Biol., 13, 546, (2003).[9] Saido, K., Taguchi, H., Kodera, Y., Kuroki, T., Ishihara, Y., Ryu, I. J., and Chung, S.
Y., Macromol.Res.,11(2), 87-91, (2003).[10] Yoshida, H., and Rowe, R. K., Proceedings Sardinia 2003.
Life Cycle Assessment and Risk Management 581
STRATEGIC PLANNING TOOL FOR WASTE MANAGEMENT BASED ON WLCA/WLCC AND ITS APPLICATION ON WASTE
PLASTICSM. Tanaka, Y. Matsui and C. Takeuchi
Graduate School of Environmental Science, Okayama University, Okayama, Japan, [email protected]
Abstract: The authors have been developing the planning tool for strategic waste man-agement based on WLCA and WLCC (Waste LCA and LCC). This paper introduces the framework of the tool and presents some sub-models developed. Several scenarios fo-cused on plastic wastes were also evaluated by using part of the process data compiled for the tool.
1. Introduction
In order to establish Sustainable Society, it is necessary to optimize our social system, especially our solid waste management system, concerning the trade-off relationships between cost, energy & resource consumptions, and environmental emissions. Decision makers of waste management have to seek the best balance based on quantitative infor-mation on technical/ policy options. But in reality, the decisions on waste management are often based on limited information.
2. Framework of Strategic Waste Management Support Software
Okayama University is conducting COE (Center of Excellence) Program entitled “Stra-tegic Solid Waste Management for the Sustainable Society”. To support decision makers, the authors have been developing the planning tool for strategic solid waste management based on WLCC and WLCA (Waste LCA and LCC). The framework of this tool, Strate-gic Solid Waste Management Supporting Software (SSWMSS, Japan), is shown in Fig.1.
There would be various factors which affect environmental burdens and costs of waste management. This software considers various planning factors such as “Characteristic of Area”, “Policy Variable on 3R”, “Collection Design Variables”, “Intermediate Facility Design Variables” and “Residue Transport Variables”, and evaluates how these factors have effects on environmental burdens and costs. For evaluation, we have been devel-oping models including “Consumption & Discharge Model”, “Collection & Transporta-tion Model”, “Treatment Process Model”. We can calculate some interim output such as “Quantity & Quality of Discharged Waste by Collection Categories”, “Personnel”, “Con-sumption of Material & Utility”, “Quantity & Quality of Residues”, “Emission to Air, Water and Soil”, and “Energy & Resource Recovered” by inputting planning parameters into these models. Then life cycle inventory (LCI) and Life cycle cost (LCC) were calcu-
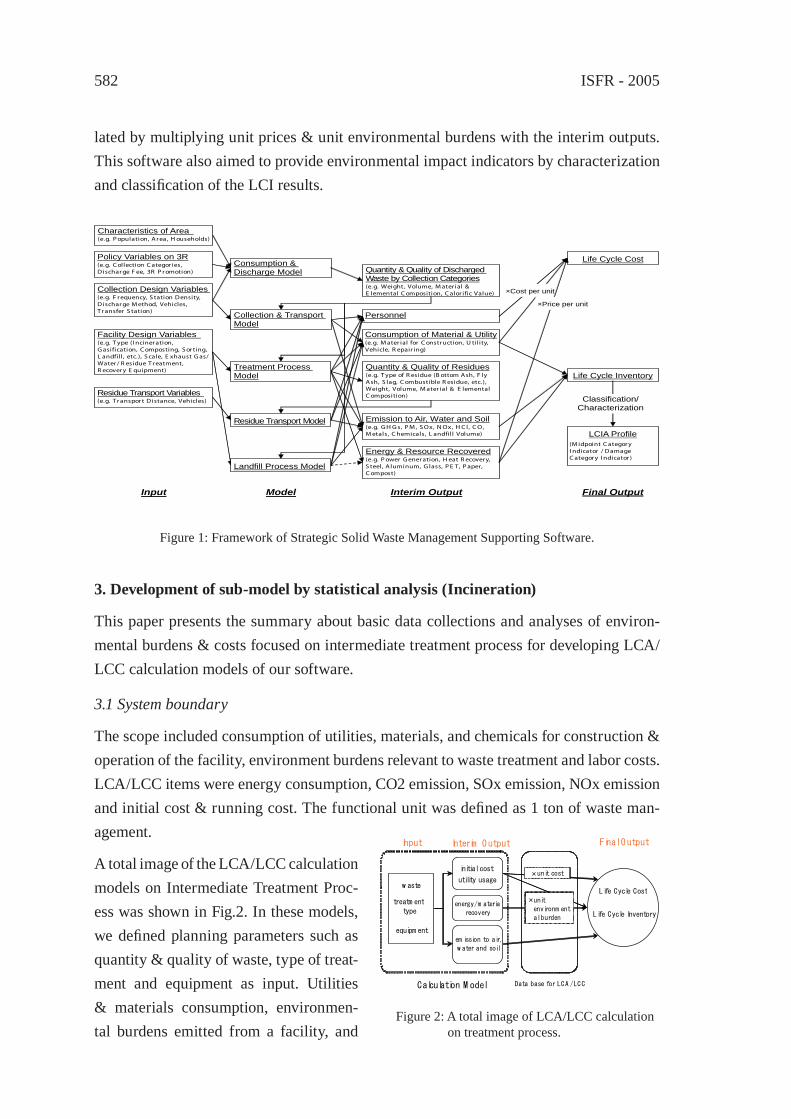
ISFR - 2005582
3. Development of sub-model by statistical analysis (Incineration)
This paper presents the summary about basic data collections and analyses of environ-mental burdens & costs focused on intermediate treatment process for developing LCA/ LCC calculation models of our software.
3.1 System boundary
The scope included consumption of utilities, materials, and chemicals for construction & operation of the facility, environment burdens relevant to waste treatment and labor costs. LCA/LCC items were energy consumption, CO2 emission, SOx emission, NOx emission and initial cost & running cost. The functional unit was defi ned as 1 ton of waste man-agement.
A total image of the LCA/LCC calculation models on Intermediate Treatment Proc-ess was shown in Fig.2. In these models, we defi ned planning parameters such as quantity & quality of waste, type of treat-ment and equipment as input. Utilities & materials consumption, environmen-tal burdens emitted from a facility, and
lated by multiplying unit prices & unit environmental burdens with the interim outputs. This software also aimed to provide environmental impact indicators by characterization and classifi cation of the LCI results.
Consumption & Discharge Model
Policy Variables on 3R (e.g. C ollection C ategor ies, D ischar ge F ee, 3R P r omotion) Quantity & Quality of Discharged
Waste by Collection Categories (e.g. Weight, Volume, M ater ial & E lemental C omposition, C alor ific Value)
Collection Design Variables (e.g. F requency, S tation Density, D ischar ge M ethod, Vehicles, T r ansfer S tation)
Facility Design Variables (e.g. T ype (I nciner ation, G asification, C omposting, S or ting, L andfil l , etc.), S cale, E xhaust G as/ Water / R esidue T reatment, R ecover y E quipment)
Energy & Resource Recovered (e.g. P ower G ener ation, H eat R ecovery, S teel, A luminum, G lass, P E T, P aper, C ompost)
Quantity & Quality of Residues (e.g. T ype of R esidue (B ottom Ash, F ly Ash, S lag, C ombustible R esidue, etc.), Weight, Volume, M ater ial & E lemental C omposition)
Characteristics of Area (e.g. P opulation, Area, H ouseholds)
Consumption of Material & Utility (e.g. M ater ial for C onstruction, U til ity, Vehicle, R epair ing)
Emission to Air, Water and Soil (e.g. G H G s, P M , S Ox, N Ox, H C l, C O, M etals, C hemicals, L andfil l Volume)
Life Cycle Cost
Residue Transport Variables (e.g. T r anspor t D istance, Vehicles)
Life Cycle Inventory
LCIA Profile (M idpoint C ategor y I ndicator / D amage C ategor y I ndicator )
Classification/ Characterization
Input Interim Output Final Output Model
Personnel Collection & Transport Model
Treatment Process Model
Landfill Process Model
Residue Transport Model
×Cost per unit
×Price per unit
Figure 1: Framework of Strategic Solid Waste Management Supporting Software.
Calculation M odel Data base for LCA /LCC
w aste
treatm ent
type
initial cost
utility usage
em ission to air,
w ater and soil
energy/m ateria
recovery
Input Interim O utput Final O utput
×unit
environm ent
al burden
Life Cycle Cost
Life Cycle Inventory
×unit cost
equipm ent
Figure 2: A total image of LCA/LCC calculation on treatment process.
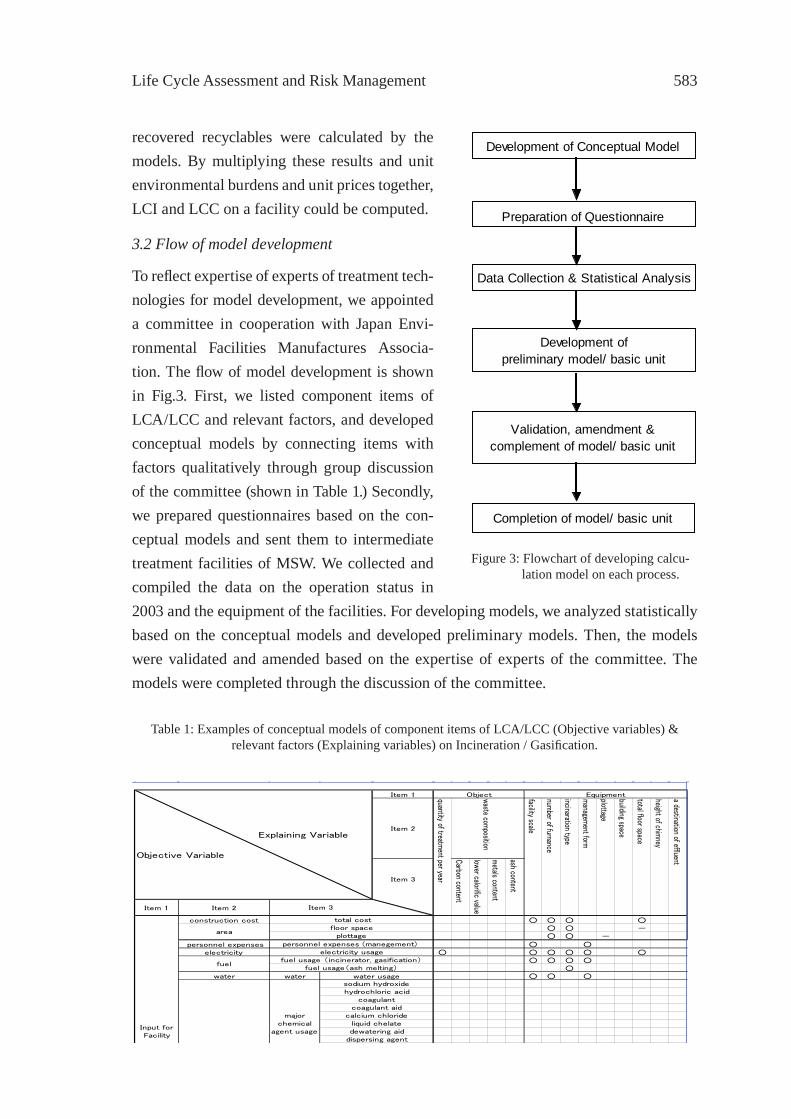
Life Cycle Assessment and Risk Management 583
recovered recyclables were calculated by the models. By multiplying these results and unit environmental burdens and unit prices together, LCI and LCC on a facility could be computed.
3.2 Flow of model development
To refl ect expertise of experts of treatment tech-nologies for model development, we appointed a committee in cooperation with Japan Envi-ronmental Facilities Manufactures Associa-tion. The fl ow of model development is shown in Fig.3. First, we listed component items of LCA/LCC and relevant factors, and developed conceptual models by connecting items with factors qualitatively through group discussion of the committee (shown in Table 1.) Secondly, we prepared questionnaires based on the con-ceptual models and sent them to intermediate treatment facilities of MSW. We collected and compiled the data on the operation status in 2003 and the equipment of the facilities. For developing models, we analyzed statistically based on the conceptual models and developed preliminary models. Then, the models were validated and amended based on the expertise of experts of the committee. The models were completed through the discussion of the committee.
Development of Conceptual Model
Preparation of Questionnaire
Data Collection & Statistical Analysis
Development ofpreliminary model/ basic unit
Validation, amendment &complement of model/ basic unit
Completion of model/ basic unit
Item 1
Item 2
Item 3
Item 1 Item 2
construction cost ○ ○ ○ ○○ ○ -○ ○ -
personnel expenses ○ ○electricity ○ ○ ○ ○ ○ ○
○ ○ ○ ○○
water water ○ ○ ○
a destination of effluent
plottage
building space
total floor space
height of chimney
facility scale
number of furnance
incinaration type
managem
ent form
Item 3
Carbon content
lower calorific value
metals content
Explaining Variable Objective Variable
Objectquantity of treatment per year
waste composition
ash content
Equipment
Input forFacility
total cost
areafloor space
plottage
personnel expenses (manegement) electricity usage
fuelfuel usage (incinerator, gasification)
fuel usage(ash melting)
water usage
majorchemical
agent usage
sodium hydroxidehydrochloric acid
coagulantcoagulant aid
calcium chlorideliquid chelatedewatering aid
dispersing agent
Figure 3: Flowchart of developing calcu-lation model on each process.
Table 1: Examples of conceptual models of component items of LCA/LCC (Objective variables) &relevant factors (Explaining variables) on Incineration / Gasifi cation.
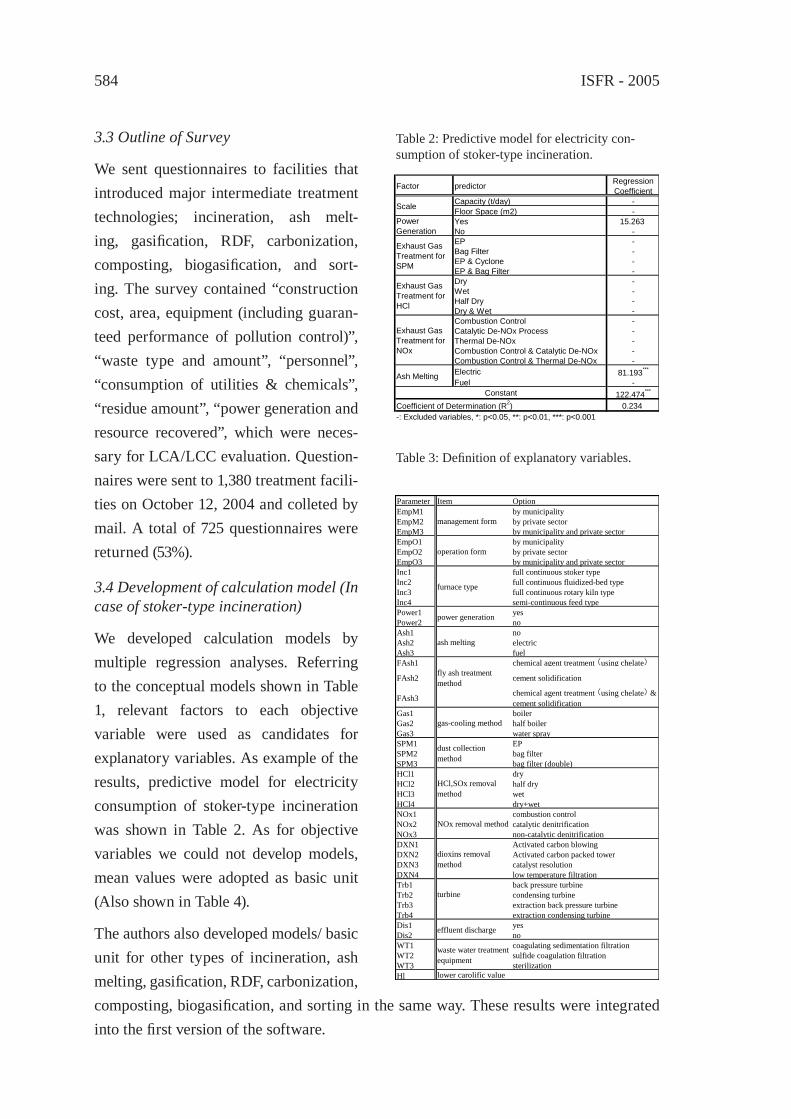
ISFR - 2005584
3.3 Outline of Survey
We sent questionnaires to facilities that introduced major intermediate treatment technologies; incineration, ash melt-ing, gasifi cation, RDF, carbonization, composting, biogasifi cation, and sort-ing. The survey contained “construction cost, area, equipment (including guaran-teed performance of pollution control)”, “waste type and amount”, “personnel”, “consumption of utilities & chemicals”, “residue amount”, “power generation and resource recovered”, which were neces-sary for LCA/LCC evaluation. Question-naires were sent to 1,380 treatment facili-ties on October 12, 2004 and colleted by mail. A total of 725 questionnaires were returned (53%).
3.4 Development of calculation model (In case of stoker-type incineration)
We developed calculation models by multiple regression analyses. Referring to the conceptual models shown in Table 1, relevant factors to each objective variable were used as candidates for explanatory variables. As example of the results, predictive model for electricity consumption of stoker-type incineration was shown in Table 2. As for objective variables we could not develop models, mean values were adopted as basic unit (Also shown in Table 4).
The authors also developed models/ basic unit for other types of incineration, ash melting, gasifi cation, RDF, carbonization, composting, biogasifi cation, and sorting in the same way. These results were integrated into the fi rst version of the software.
Factor predictor RegressionCoefficient
Capacity (t/day) -Floor Space (m2) -Yes 15.263No -EP -Bag Filter -EP & Cyclone -EP & Bag Filter -Dry -Wet -Half Dry -Dry & Wet -Combustion Control -Catalytic De-NOx Process -Thermal De-NOx -Combustion Control & Catalytic De-NOx -Combustion Control & Thermal De-NOx -Electric 81.193***
Fuel -122.474***
0.234-: Excluded variables, *: p<0.05, **: p<0.01, ***: p<0.001
Scale
Exhaust GasTreatment forSPM
Coefficient of Determination (R2)
PowerGeneration
Exhaust GasTreatment forHCl
Exhaust GasTreatment forNOx
Ash Melting
Constant
Parameter Item OptionEmpM1 by municipalityEmpM2 by private sectorEmpM3 by municipality and private sectorEmpO1 by municipalityEmpO2 by private sectorEmpO3 by municipality and private sectorInc1 full continuous stoker typeInc2 full continuous fluidized-bed typeInc3 full continuous rotary kiln typeInc4 semi-continuous feed typePower1 yesPower2 noAsh1 noAsh2 electric Ash3 fuelFAsh1 chemical agent treatment (using chelate)
FAsh2 fly ash treatmentmethod cement solidification
FAsh3 chemical agent treatment (using chelate) &cement solidification
Gas1 boilerGas2 half boilerGas3 water spraySPM1 EPSPM2 bag filterSPM3 bag filter (double)HCl1 dry HCl2 half dryHCl3 wetHCl4 dry+wetNOx1 combustion controlNOx2 catalytic denitrificationNOx3 non-catalytic denitrificationDXN1 Activated carbon blowing DXN2 Activated carbon packed towerDXN3 catalyst resolutionDXN4 low temperature filtrationTrb1 back pressure turbineTrb2 condensing turbineTrb3 extraction back pressure turbineTrb4 extraction condensing turbineDis1 yesDis2 noWT1 coagulating sedimentation filtrationWT2 sulfide coagulation filtrationWT3 sterilizationHl
management form
operation form
furnace type
power generation
ash melting
gas-cooling method
dust collectionmethod
HCl,SOx removalmethod
waste water treatmentequipment
lower carolific value
NOx removal method
dioxins removalmethod
turbine
effluent discharge
Table 2: Predictive model for electricity con-sumption of stoker-type incineration.
Table 3: Defi nition of explanatory variables.
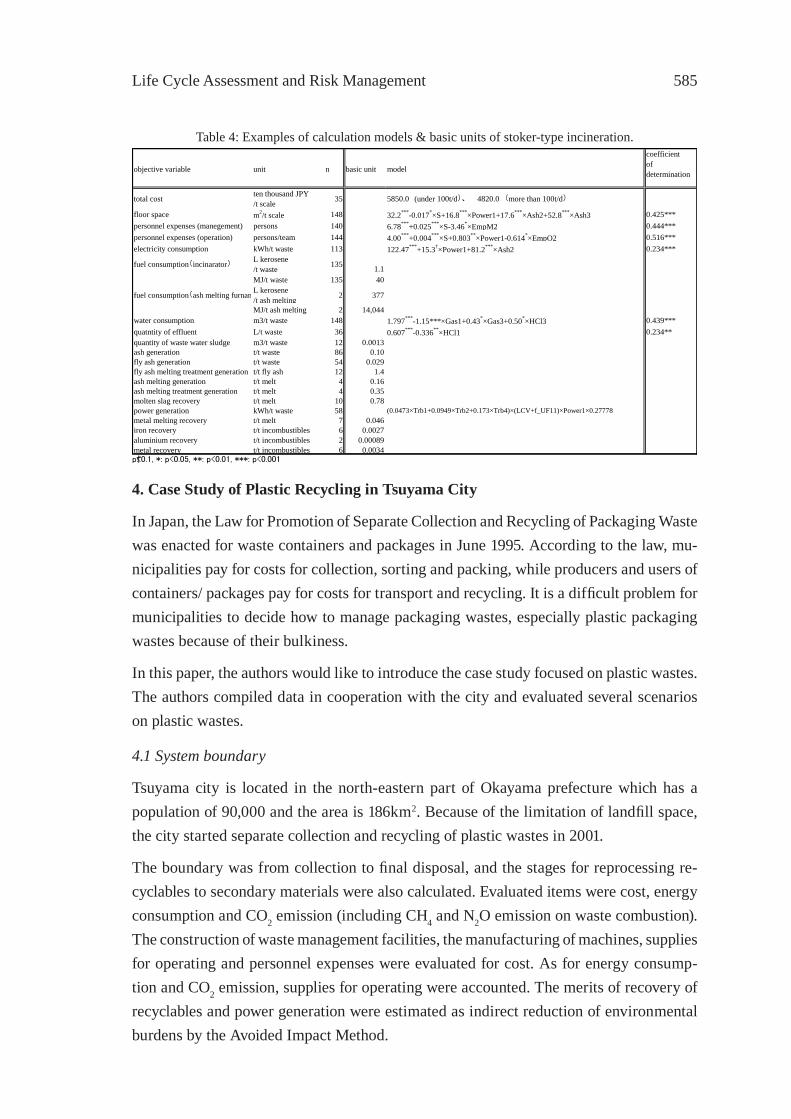
Life Cycle Assessment and Risk Management 585
4. Case Study of Plastic Recycling in Tsuyama City
In Japan, the Law for Promotion of Separate Collection and Recycling of Packaging Waste was enacted for waste containers and packages in June 1995. According to the law, mu-nicipalities pay for costs for collection, sorting and packing, while producers and users of containers/ packages pay for costs for transport and recycling. It is a diffi cult problem for municipalities to decide how to manage packaging wastes, especially plastic packaging wastes because of their bulkiness.
In this paper, the authors would like to introduce the case study focused on plastic wastes. The authors compiled data in cooperation with the city and evaluated several scenarios on plastic wastes.
4.1 System boundary
Tsuyama city is located in the north-eastern part of Okayama prefecture which has a population of 90,000 and the area is 186km2. Because of the limitation of landfi ll space, the city started separate collection and recycling of plastic wastes in 2001.
The boundary was from collection to fi nal disposal, and the stages for reprocessing re-cyclables to secondary materials were also calculated. Evaluated items were cost, energy consumption and CO2 emission (including CH4 and N2O emission on waste combustion). The construction of waste management facilities, the manufacturing of machines, supplies for operating and personnel expenses were evaluated for cost. As for energy consump-tion and CO2 emission, supplies for operating were accounted. The merits of recovery of recyclables and power generation were estimated as indirect reduction of environmental burdens by the Avoided Impact Method.
objective variable unit n basic unit model
coefficientofdetermination
total cost ten thousand JPY/t scale 35 5850.0 (under 100t/d)、 4820.0 (more than 100t/d)
floor space m2/t scale 148 32.2***-0.017*×S+16.8***×Power1+17.6***×Ash2+52.8***×Ash3 0.425***personnel expenses (manegement) persons 140 6.78***+0.025***×S-3.46*×EmpM2 0.444***personnel expenses (operation) persons/team 144 4.00***+0.004***×S+0.803**×Power1-0.614*×EmpO2 0.516***electricity consumption kWh/t waste 113 122.47***+15.3†×Power1+81.2***×Ash2 0.234***
fuel consumption(incinarator) L kerosene/t waste 135 1.1 -0.032+0.000143†×Hl 0.062†
MJ/t waste 135 40 -1.186+0.005†×Hl 0.062†
fuel consumption(ash melting furnan L kerosene/t ash melting 2 377
MJ/t ash melting 2 14,044water consumption m3/t waste 148 1.797***-1.15***×Gas1+0.43*×Gas3+0.50*×HCl3 0.439***quatntity of effluent L/t waste 36 0.607***-0.336**×HCl1 0.234**quantity of waste water sludge m3/t waste 12 0.0013ash generation t/t waste 86 0.10fly ash generation t/t waste 54 0.029fly ash melting treatment generation t/t fly ash 12 1.4ash melting generation t/t melt 4 0.16ash melting treatment generation t/t melt 4 0.35molten slag recovery t/t melt 10 0.78power generation kWh/t waste 58 (0.0473×Trb1+0.0949×Trb2+0.173×Trb4)×(LCV+f_UF11)×Power1×0.27778metal melting recovery t/t melt 7 0.046iron recovery t/t incombustibles 6 0.0027aluminium recovery t/t incombustibles 2 0.00089metal recovery t/t incombustibles 6 0.0034 †:p<0.1, *: p<0.05, **: p<0.01, ***: p<0.001
Table 4: Examples of calculation models & basic units of stoker-type incineration.
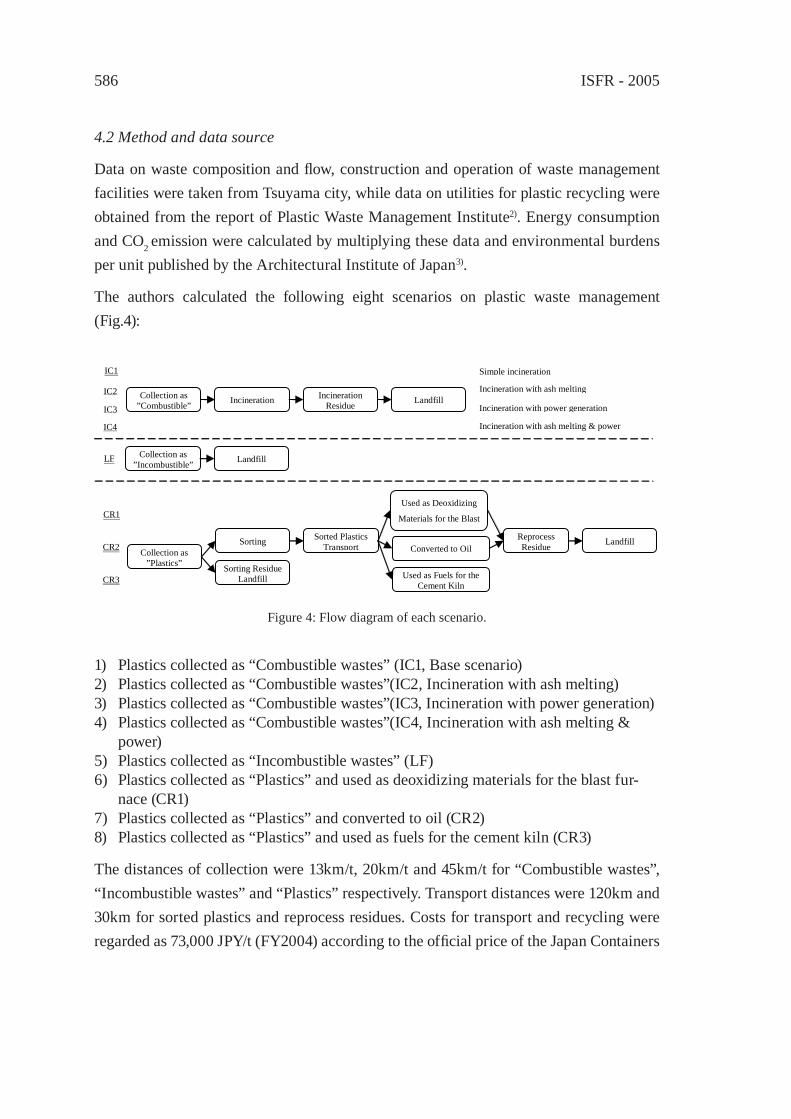
ISFR - 2005586
4.2 Method and data source
Data on waste composition and fl ow, construction and operation of waste management facilities were taken from Tsuyama city, while data on utilities for plastic recycling were obtained from the report of Plastic Waste Management Institute2). Energy consumption and CO2 emission were calculated by multiplying these data and environmental burdens per unit published by the Architectural Institute of Japan3).
The authors calculated the following eight scenarios on plastic waste management (Fig.4):
Collection as ”Combustible”
Collection as ”Incombustible”
Collection as ”Plastics”
Incineration
Landfill
Sorting
Sorting Residue Landfill
Sorted Plastics Transport
Used as Deoxidizing
Materials for the Blast
Converted to Oil
Used as Fuels for the Cement Kiln
Incineration Residue Landfill
Reprocess Residue Landfill
LF
CR1
CR2
CR3
IC1
IC2
IC3
IC4
Simple incineration
Incineration with ash melting
Incineration with power generation
Incineration with ash melting & power
Figure 4: Flow diagram of each scenario.
1) Plastics collected as “Combustible wastes” (IC1, Base scenario)2) Plastics collected as “Combustible wastes”(IC2, Incineration with ash melting)3) Plastics collected as “Combustible wastes”(IC3, Incineration with power generation)4) Plastics collected as “Combustible wastes”(IC4, Incineration with ash melting &
power)5) Plastics collected as “Incombustible wastes” (LF)6) Plastics collected as “Plastics” and used as deoxidizing materials for the blast fur-
nace (CR1)7) Plastics collected as “Plastics” and converted to oil (CR2)8) Plastics collected as “Plastics” and used as fuels for the cement kiln (CR3)
The distances of collection were 13km/t, 20km/t and 45km/t for “Combustible wastes”, “Incombustible wastes” and “Plastics” respectively. Transport distances were 120km and 30km for sorted plastics and reprocess residues. Costs for transport and recycling were regarded as 73,000 JPY/t (FY2004) according to the offi cial price of the Japan Containers
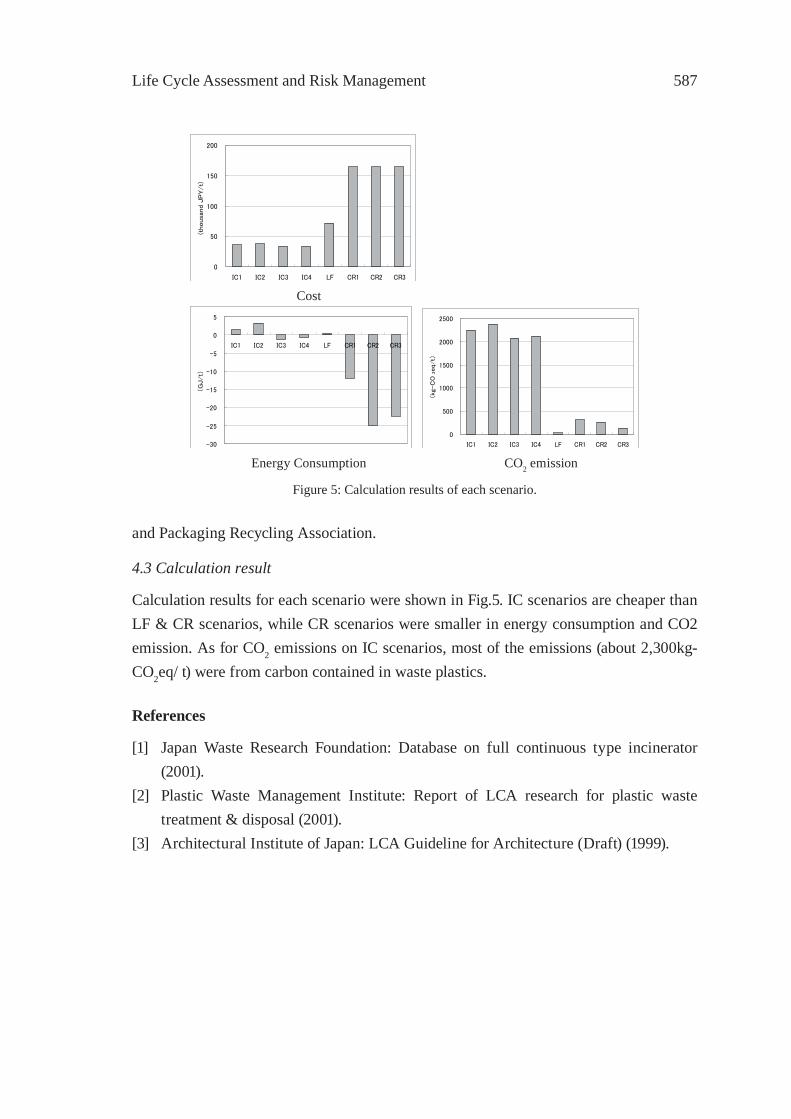
Life Cycle Assessment and Risk Management 587
0
50
100
150
200
IC1 IC2 IC3 IC4 LF CR1 CR2 CR3
(thousa
nd J
PY/t)
Cost
-30
-25
-20
-15
-10
-5
0
5
IC1 IC2 IC3 IC4 LF CR1 CR2 CR3
(G
J/t)
0
500
1000
1500
2000
2500
IC1 IC2 IC3 IC4 LF CR1 CR2 CR3
(kg
-C
O2eq/t)
Energy Consumption CO2 emission
Figure 5: Calculation results of each scenario.
and Packaging Recycling Association.
4.3 Calculation result
Calculation results for each scenario were shown in Fig.5. IC scenarios are cheaper than LF & CR scenarios, while CR scenarios were smaller in energy consumption and CO2 emission. As for CO2 emissions on IC scenarios, most of the emissions (about 2,300kg-CO2eq/ t) were from carbon contained in waste plastics.
References
[1] Japan Waste Research Foundation: Database on full continuous type incinerator (2001).
[2] Plastic Waste Management Institute: Report of LCA research for plastic waste treatment & disposal (2001).
[3] Architectural Institute of Japan: LCA Guideline for Architecture (Draft) (1999).