Biodegradability of Synthetic Plastics Polystyrene and ...
172
Biodegradability of Synthetic Plastics Polystyrene and Styrofoam by Fungal Isolates By Naima Atiq Department of Microbiology Quaid-i-Azam University Islamabad 2011
-
Upload
khangminh22 -
Category
Documents
-
view
1 -
download
0
Transcript of Biodegradability of Synthetic Plastics Polystyrene and ...

Biodegradability of Synthetic Plastics
Polystyrene and Styrofoam by Fungal
Isolates
By
Naima Atiq
Department of Microbiology Quaid-i-Azam University
Islamabad
2011

Biodegradability of Synthetic Plastics
Polystyrene and Styrofoam by Fungal
Isolates
A Thesis submitted in the partial fulfillment of the
requirements for the degree of
DOCTOR OF PHILOSOPHY
IN
MICROBIOLOGY
By
Naima Atiq
Department of Microbiology
Quaid-i-Azam University
Islamabad
2011

IN THE NAME OF ALLAH
THE MOST
COMPASSIONATE
AND
MERCIFUL

DEDICATED TO
AMMI AND AbBu

DECLARATION
The material contained in this thesis is my original work and
I have not presented any part of this thesis/work elsewhere
for any other degree.
Naima Atiq

CERTIFICATE
This thesis by Naima Atiq is accepted in its present form by
the Department of Microbiology, Quaid-i-Azam University,
Islamabad, as fulfilling the thesis requirement for the degree
of Doctor of Philosophy in Microbiology.
Internal examiner
___________________
(Dr. Safia Ahmed)
External examiner
___________________
External examiner
___________________
Chairperson
___________________
Dated: _____________

Table of Contents
Topic Page No.
List of Tables
List of Figures
List of Abbreviations
Acknowledgements
Abstract
Chapter 1 Introduction
Chapter 2 Literature Review
Chapter 3 Material & Methods
Chapter 4 Results
Chapter 5 Discussion
Conclusions
Future prospective
References
Appendices
I
II
IX
XI
XII
1
9
27
43
124
131
132
133
148

i
LIST OF TABLES
Table No. Title Page.
No.
3.1 Composition of Mineral Salt Media 29
3.2 PCR mixture for fungal DNA amplification 31
3.3 PCR mixture for Bacterial 16S ribosomal DNA Amplification 33
3.4 Experimental conditions for bacterial 16S ribosomal DNA
amplification
33
3.5 PCR mixture for amplification of ribosomal DNA for DGGE 35
4.1 Molecular identification of microorganisms isolated from
polystyrene film
50
4.2 CO2 evolved in 8 weeks duration of biodegradation of PS by
R. oryzae NA1, A. terreus NA2 and P. chrysosporium NA3
measured gravimetrically by Sturm test (Test; PS as sole
Carbon source, Control; no carbon source)
57
4.3 Gel permeation chromatography analysis of PS films treated
with fungal isolates after 8 weeks incubation at 30ºC, 120rpm
61
4.4 Gel permeation chromatography analysis of EPS films treated
with fungal isolates after 8 weeks incubation at 30ºC, 120rpm
70
4.5 Gel permeation chromatography analysis of EPS beads
treated with fungal isolates after 8 weeks incubation at 30ºC
78
4.6 Gel permeation chromatography analysis of UV pre-treated
PS films biodegraded by fungal isolates after 8 weeks
incubation at 30ºC, 120rpm
85
4.7 Gel permeation chromatography analysis of heat pre-treated
PS films biodegraded by fungal isolates after 8 weeks
incubation at 30ºC, 120rpm
93
4.8 Gel permeation chromatography analysis of PS films treated
with fungal isolates with 0.01% glucose after 12 weeks
incubation at 30ºC, 120rpm
104
4.9 Gel permeation chromatography analysis of soil buried PS
films biodegraded by fungal isolates for 6 months
120

ii
LIST OF FIGURES
Fig. No. Title Page
No.
1.1 Polymerization of styrene to produce polystyrene. 2
1.2 Types of polystyrene. 2
2.1 Styrene metabolic pathways found in bacteria (dotted line) and
fungi (bold line) composed after Francesc et al.,(2005);
O’Leary et al., (2002); Prenafeta Boldu´ et al., (2001); Weber
et al., (1995); Cox (1995); and Holland et al., (1993). (1)
Phialophora sessilis CBS 238.93; and (2) Clonostachys rosea
CBS 102.94.
21
3.1 Experimental set up of Sturm test for biodegradation studies. 39
4.1 Growth of fungal strains on polystyrene films after soil burial
(8 months) on mineral salts agar medium.
45
4.2 Environmental scanning electron micrographs of Polystyrene
films used for isolation of microorganisms showing fungal
growth 250x (a) and 2000x (b).
46
4.3 Colony morphology of selected fungal strains NA1 (a), NA2
(b) and Na3 (c) on potato dextrose agar medium.
47
4.4 Agarose gel electrophoresis visualisation of PCR Amplified
DNA using 0.8% agarose gel in TAE buffer (Lane 1,
HyperLadderTM 1; Lane 6, PCR product from strain NA1;
Lane7 from NA2 and Lane 8, PCR products from strain NA3).
48
4.5 Denaturing gradient gel electrophoresis (40% - 60%) analysis
of fungal diversity with plastic films buried in soil for 8
months, used for isolation of fungal strains (Lane 5, 6, 7, and
8).
50
4.6 Growth of fungal isolates on PS in MSM agar plates after 8
weeks incubation period at 30ºC, PS film on surface, R. oryzae
NA1 (a), A. terreus NA2 (b), P. chrysosporium NA3 (c),
Polystyrene film partially submerged in media and checked for
growth of R. oryzae NA1 (d), A. terreus NA2 (e) and P.
chrysosporium NA3 (f) on agar plate.
54

iii
4.7 Environmental Scanning Electron Micrographs of PS films
inoculated on MSM agar plates after 8 weeks incubation period
with R. oryzae NA1 (a) A. terreus NA2 and (b) P.
chrysosporium NA3 (c) (1000x).
55
4.8 Environmental scanning electron micrographs of PS films
control (a), treated with R. oryzae NA1 (b), A. terreus NA2 (c)
and P. chrysosporium NA3 (d) in shaker (30°C, 120rpm) for 8
weeks (2000x).
57
4.9 FT-IR spectra of PS treated with R. oryzae NA1 (a), A. terreus
NA2 (b) and P. chrysosporium NA3 (c) in shaker (30ºC,
120rpm) for 4 weeks (w4), 8 weeks (w8) and 12 weeks (w12)
along with untreated control.
58
4.10 FT-IR spectra of PS treated with R. oryzae NA1 (a), A. terreus
NA2 (b) and P. chrysosporium NA3 (c) in static conditions
(30ºC) for 4 weeks ((w4), 8 weeks (w8)) and 12 weeks (w12)
along with untreated control.
59
4.11 1H-NMR analysis of Polystyrene control (a) treated with R.
oryzae NA1 (b) A. terreus NA2 (c) and P. chrysosporium NA3
(d) in shaker (30ºC, 120rpm) for 8 weeks.
61
4.12 1H-NMR analysis of PS control (a) treated with R. oryzae NA1
(b) A. terreus NA2 (c) and P. chrysosporium NA3 (d) in static
conditions (30ºC) for 8 weeks.
62
4.13 HPLC analysis of biodegradation products of polystyrene
treated with R. oryzae NA1, A. terreus NA2 and P.
chrysosporium NA3 in shaker (30ºC, 120rpm) (a) in static
conditions (30°C) (b).
63
4.14 FT-IR spectra of EPS treated with R. oryzae NA1 (a) A. terreus
NA2 (b) and P. chrysosporium NA3 (c) in shaker (30ºC,
120rpm) for 4 weeks ((w4), 8 weeks (w8)) and 12 weeks (w12)
along with untreated control.
67
4.15 FT-IR spectra of EPS treated with R. oryzae NA1 (a) A. terreus
NA2 (b) and P. chrysosporium NA3 (c) in static conditions
(30ºC) for 4 weeks (w4), 8 weeks (w8) and 12 weeks (w12).
68

iv
4.16 1H-NMR analysis of EPS film control (a) treated with R. oryzae
NA1 (b) A. terreus NA2 (c) and P. chrysosporium NA3 (d) in
static conditions (30ºC) for 8 weeks.
70
4.17 HPLC analysis of biodegradation products of EPS treated with
R. oryzae NA1, A. terreus NA2 and P. chrysosporium NA3 in
shaker (30ºC, 120rpm) (a) in static conditions (30ºC) (b).
71
4.18 Growth of fungal isolates on EPS beads in mineral salt media
agar plates after 8 weeks of incubation at 30°C in static
conditions control (no fungi) (a) inoculated with R. oryzae NA1
(b) A. terreus NA2 (c) and P. chrysosporium NA3 (d).
74
4.19 Environmental scanning electron micrographs of EPS beads
control (a) treated with R. oryzae NA1 (b) A. terreus NA2 (c)
and P. chrysosporium NA3 (d) in static conditions (30ºC) for 8
weeks (70x)
75
4.20 Environmental scanning electron micrographs of EPS beads
control (a) treated with R. oryzae NA1 (b) A. terreus NA2 (c)
and P. chrysosporium NA3 (d) in static conditions (30ºC) for 8
weeks (2000x)
76
4.21 1H-NMR analysis of EPS beads control (a), treated with R.
oryzae NA1(b) A. terreus NA2 (c) and P. chrysosporium NA3
(d) in static conditions (30ºC) for 8 weeks
78
4.22 HPLC analysis of EPS beads treated with R. oryzae NA1, A.
terreus NA2 and P. chrysosporium NA3 in shaker (30ºC,
120rpm) (a) in static conditions (30ºC) (b) for the degradation
products 1-phenyl-1,2-ethandiol, 2-phenylethanol,
phenylacetaldehyde and styrene oxide.
79
4.23 FT-IR spectra of UV 1 hour pretreated PS incubated with R.
oryzae NA1 (a), A. terreus NA2 (b) and P. chrysosporium NA3
(c) in shaker (30°C, 120rpm) for 4 weeks (w4) and 8 weeks
(w8) along with untreated control.
82
4.24 FT-IR spectra of UV 2hour heat pretreated PS incubated with
R. oryzae NA1 (a), A. terreus NA2 (b) and P. chrysosporium
NA3 (c) in shaker (30ºC, 120rpm) for 4 weeks (w4) and 8
83

v
weeks (w8) along with untreated control.
4.25 1H-NMR analysis of UV 1hour pretreated PS control (a),
treated with R. oryzae NA1 (b) with A. terreus NA2 (c) and
treated with P. chrysosporium NA3 (d) in shaker (30ºC,
120rpm) for 8 weeks.
85
4.26 1H-NMR analysis of UV 2hour pretreated PS control (a),
treated with R. oryzae NA1 (b) with A. terreus NA2 (c) and
treated with P. chrysosporium NA3 (d) in shaker (30ºC,
120rpm) for 8 weeks.
86
4.27 HPLC analysis for the UV pre-treated Polystyrene
biodegradation products in culture broth of shake flask
experiment (30ºC, 120rpm) with R. oryzae NA1, A. terreus
NA2 and P. chrysosporium NA3 for 8 weeks 1hour UV pre
treated (a) 2hour UV pre treated (a).
87
4.28 FT-IR spectra of 60ºC 1hour heat pretreated PS incubated with
R. oryzae NA1 (a), A. terreus NA2 (b) and P. chrysosporium
NA3(c) in shaker (30ºC, 120rpm) for 4 weeks (w4) and 8
weeks (w8) along with untreated control.
90
4.29 FT-IR spectra of 80ºC 1hour heat pretreated PS incubated with
R. oryzae NA1 (a), A. terreus NA2 (b) and P. chrysosporium
NA3 (c) in shaker (30ºC, 120rpm) for 4 weeks (w4) and 8
weeks (w8) along with untreated control.
91
4.30 1H-NMR analysis of the broth of heat (60ºC, 1hour) pre treated
PS control with no fungal treatment (a) treated with R. oryzae
NA1 (b) A. terreus NA2 (c) and P. chrysosporium NA3 (d) in
shaker (30ºC, 120rpm) for 8 weeks.
93
4.31 1H-NMR analysis of heat (80°C, 1hour) pretreated PS control
(a), treated with R. oryzae NA1 (b) A. terreus NA2 (c) and P.
chrysosporium NA3 (d) in shaker (30ºC, 120rpm) for 8 weeks.
94
4.32 HPLC analysis of heat pre-treated PS incubated with R. oryzae
NA1, A. terreus NA2 and P. chrysosporium NA3 in shaker
(30ºC, 120rpm) for 8 weeks 60ºC 1hour heat treated (a), 80ºC
1hour heat treated (b), in shaker (30ºC, 120rpm).
95

vi
4.33 Environmental scanning electron micrographs of PS films
control (a), treated with R. oryzae NA1 (b), A. terreus NA2 (c)
and P. chrysosporium NA3 (d) with 0.01% glucose in media in
shaker (30ºC, 120rpm) for 8 weeks (2000x).
98
4.34 FT-IR spectra of PS incubated with R. oryzae NA1 (a), A.
terreus NA2 (b) and P. chrysosporium NA3 (c) with 0.01%
glucose, in shaker (30ºC, 120rpm) for 4 weeks (w4) and 8
weeks (w8) along with untreated control.
99
4.35 FT-IR spectra of PS incubated with R. oryzae NA1 (a), A.
terreus NA2 (b) and P. chrysosporium NA3 (c) with 0.01%
glucose in static conditions at 30ºC for 4 weeks (w4) and 8
weeks (w8) along with untreated control.
100
4.36 FT-IR spectra of PS incubated with R. oryzae NA1, A. terreus
NA2 and P. chrysosporium NA3 with 0.1% glucose at 30ºC,
120rpm after 4 weeks.
101
4.37 FT-IR spectra of PS incubated with R. oryzae NA1 (a), A.
terreus NA2 (b) and P. chrysosporium NA3 (c) with 0.1%
glucose in static conditions at 30ºC for 4 weeks (w4), 8 weeks
(w8) and 12 weeks (w12) along with untreated control.
102
4.38 HPLC analysis of broth of PS films after incubation with R.
oryzae NA1, A. terreus NA2 and P. chrysosporium NA3 with
added 0.01% glucose in shaker (30ºC, 120rpm) (a), in static
conditions (30ºC) (b).
104
4.39 HPLC analysis of broth of PS films incubated with R. oryzae
NA1, A. terreus NA2 and P. chrysosporium NA3 with added
0.1% glucose in shaker (30°C, 120rpm) for 4 week (b), in static
conditions (30ºC) (a).
105
4.40 FT-IR spectra of EPS incubated with R. oryzae NA1 (a), A.
terreus NA2 (b) and P. chrysosporium NA3 (c) with 0.01%
glucose, in shaker (30ºC, 120rpm) for 4 weeks (w4) and 8
weeks (w8) along with untreated control.
107
4.41 FT-IR spectra of EPS incubated with R. oryzae NA1 (a), A.
terreus NA2 (b) and P. chrysosporium NA3 (c) with 0.01%
108

vii
glucose at 30ºC for 4 weeks (w4) and 8 weeks (w8) along with
untreated control.
4.42 FT-IR spectra of EPS incubated with R. oryzae NA1, A. terreus
NA2 and P. chrysosporium NA3 with 0.1% glucose at 30ºC,
120rpm after 4 weeks.
109
4.43 FT-IR spectra of EPS incubated with R. oryzae NA1 (a), A.
terreus NA2 (b) and P. chrysosporium NA3 (c) with 0.1%
glucose in static conditions at 30ºC for 4 weeks (w4), 8 weeks
(w8) and 12 weeks (w12) along with untreated control.
110
4.44 HPLC analysis of broth samples of EPS films treated with R.
oryzae NA1, A. terreus NA2 and P. chrysosporium NA3 in
shaker (30ºC, 120rpm) (a) in static conditions (30ºC) (b) with
added 0.01% glucose.
111
4.45 HPLC analysis of broth samples of EPS films treated with R.
oryzae NA1, A. terreus NA2 and P. chrysosporium NA3 (30ºC,
120rpm) for 4 week (a) in static conditions (30ºC) (b) with
added 0.1% glucose in shaker.
112
4.46 Environmental scanning electron micrographs of PS films
buried in soil inoculated with R. oryzae NA1 (a), A. terreus
NA2 (b) and P. chrysosporium NA3(c) at 30ºC for 4 months
115
4.47 Denaturing gradient gel electrophoresis (DGGE) (40% - 60%)
analysis of fungal community attached to polystyrene films
buried in unsterilized soil (3) with fungal isolates NA1 (4),
NA2 (5), NA3 (6) and sterilized soil (10) with fungal isolates
NA1 (11), NA2 (12), NA3 (13).
116
4.48 FT-IR spectra of soil buried PS films incubated with R. oryzae
NA1, A. terreus NA2 and P. chrysosporium NA3 at 30ºC for 2
months (a) for 4 months (b) for 8 months (c).
117
4.49 FT-IR spectra of soil buried PS films inoculated with R. oryzae
NA1, A. terreus NA2 and P. chrysosporium NA3 in
unsterilized soil (a) sterilized soil (b) in flower pots for 6
months.
118
4.50 FT-IR spectra of PS starch blend film, incubated with R. oryzae 121

viii
NA1 (a), A. terreus NA2 (b) and P. chrysosporium NA3 (c) at
30ºC, 120rpm for 4 weeks (w4) and 8 weeks (w8) along with
untreated control.
4.51 FT-IR spectra of PS starch blend film, incubated with R. oryzae
NA1 (a), A. terreus NA2 (b) and P. chrysosporium NA3 (c) at
30ºC for 4 weeks (w4) and 8 weeks (w8) along with untreated
control.
122
4.52 HPLC analysis of PS starch blend films treated with R. oryzae
NA1, A. terreus NA2 and P. chrysosporium NA3 in shaker
(30ºC, 120rpm) (a), in static conditions (30ºC) (b).
123
1A Phylogenetic tree of R. oryzae NA1 148
2A Phylogenetic tree of A. terreus NA2 149
3A Phylogenetic tree of P. chrysosporium NA3 150

ix
List of Abbreviations
ABS Acrylonitrile-Butadiene Styrene
AFM Atomic Force Microscopy
ATR Attenuated Total Reflection
BLAST Basic Local Alignment Search Tool
CF Consumption Factor
DGGE Denaturing Gradient Gel Elecctrophoresis
DSC Differential Scanning Calorimetry
EH Epoxide Hydrolase
ELISA Enzyme-Linked Immunosorbent Assay
EPDM-g-PS Ethylene-Propylene-Diene-graft-Polystyrene
EPS Expandable Polystyrene
ESEM Environmental Scanning Electron Microscopy
FTIR Fourier Transform Infrared Spectroscopy
FTIR-PAS Fourier Transform Infrared Photoacoustic
Spectroscopy
GPC Gel Permeation Chromatography
GPS General purpose polystyrene
HDPE High-Density Polyethylene
HIPS High-Impact Polystyrene
HPLC High Pressure Liquid Chromatography
LDPE Low-Density Polyethylene
LDH Layered Double Hydroxides
LP Lignin Peroxidases
MALDITOFMS Matrix-Assisted Laser Desorption/Inonization Time-
Of-Flight Mass Spectrometry
MALS Multi-Angle Light Scattering Detection
MFR Mass-Flow Rate
Mn-Ps Manganese Peroxidases
MSW Municipal Solid Waste

x
MSM Mineral Salts Media
NMR Nuclear Magnetic Resonance Spectroscopy
PAA Phenylacetic Acid
PAN Polyacrylonitrile
PB Polybutadiene
PCL Polycaprolactone
PEO Poly(ethylene oxide)
PET Poly(ethylene terephthalate)
PHA Polyhydroxyalkanoate
PMS Poly(p-maleimidostyrene)
PS Polystyrene
SAN Styrene-Acrylonitrile
SBC Styrene Butadiene Copolymer
SBR Styrene-Butadiene Rubber
SEC Size Exclusion Chromatography
SEM Scanning Electron Microscopy
SLS Static Light Scattering
SPMA 3-Sulfopropyl Methacrylate
sPS Syndiotactic Polystyrene
TCA Tricarboxylic Acid
TGA Thermogravimetric Analysis
TMPTA Trimethylol Propane Trimethacrylate
TPS Thermoplastic Starch
UPR Unsaturated Polyester Resin
XRD X-Ray Diffraction

xi
Acknowledgements
In the Name of Allah the most beneficent and merciful. I owe my deepest thanks and praise to
Allah Almighty, Who gave me opportunities and courage to explore the world of
Knowledge. I don’t have words that can completely express my humble gratitude to Allah
who enabled me to complete this research work successfully.
I present Salam to Holy Prophet Hazrat Mohammad (Peace be upon him), who is a
blessing for mankind and enjoined upon his followers (Men and Women) to seek Knowledge
from cradle to grave.
Special thanks and recognition to the efforts of my Knowledgeable and most intellectual
supervisor Dr. Safia Ahmed, Professor and Chairperson , Department of Microbiology,
Quaid-i-Azam University, Islamabad, Whom valuable guidance, permanent motivation and
kind attention made it possible for me to accomplish my research work and thesis write up.
She will be a continuous source of inspiration for me in my life.
I express my sincere and deep regard to the respected Dr. Abdul Hameed Professor and Deen,
Biological Sciences, Quaid-i-Azam University, Islamabad, for his support and cooperation
during the course of my research endeavour.
My deepest thanks are extended to Dr. Fariha Hassan, Assistant Professor, Department of
Microbiology and Dr. Amer Ali Shah, Assistant Professor, Department of Microbiology,
Quaid-i-Azam University, Islamabad, for their support and assistance.
I appreciate very much the nice working environment in the Microbiology Research
Laboratory and wish to express my heartfelt thanks to all my lab fellows and department staff
members for their kind cooperation. I am grateful to Dr. M. Ishtiaq Ali, Saadia Andleeb, Dr.
Imran Javed, Masroor hussain and Bashir Ahmad for the splendid assistance in the laboratory
work, as well as M. Sajjad Shaukat for technical advice.
I appreciate the Higher Education commission, Pakistan for the financial support in all
respects during my study period, without which it was impossible for me to achieve the
objectives of my research work. I highly acknowledge the Indigenous 5000 scholarship
programme of HEC which facilitated the students to take up further studies at postgraduate
level. I also thank Dr. Geoff D. Robson and organisers of International Research Support
Initiative Program (IRSIP) for giving me opportunity to do research work abroad.
I am indebted to express special thanks to my family members whom continuous help,
motivation and prayers gave me strength and encouragement.
I would like to thank all those people who helped me and made this study to complete
successfully and apologise that I couldn’t mention personally one by one.
Naima Atiq

xii
Abstract
Polystyrene is a rigid plastic that is commonly used in crystalline and foamed form.
Biodegradation of polystyrene is very slow in natural environment and it persists for
longer period of time as solid waste. The aim of the study was to investigate the
biodegradation process of polystyrene and explore the ways to enhance the
biodegradation process. Soil burial method was used to isolate microorganisms. The
plastic films recovered from soil after 8 months were incubated on mineral salts
media (MSM) agar plates for 3 months to get the growth of only those
microorganisms that were able to grow with polystyrene for longer time. Six fungal
and five bacterial stains were isolated and identified. Three fungal isolates were
selected on the basis of biodegradability of polystyrene films in shake flask
transformation experiments analysed by Fourier transform Infrared (FTIR)
spectroscopy.
The selected fungal strains were characterized taxonomically on the basis of sequence
homology of conserved regions of 18S rRNA and were identified as Rhizopus oryzae
NA1, Aspergillus terreus NA2 and Phanerochaete chrysosporium NA3. The 18S
rRNA sequences were deposited in NCBI database with accession numbers in
Genbank FJ654430, FJ654431 and FJ654433 for strain NA1, NA2, NA3 respectively.
The biodegradation of polystyrene was studied by CO2 evolution test (Sturm test) all
the isolated showed higher CO2 levels in the test as compared to control showing
effective mineralization of polystyrene.
Biodegradation studies in liquid media with polystyrene films, expanded polystyrene
(EPS) films and beads were conducted in the static and shake flask (120rpm)
fermentation experiments at 30 ºC. Scanning electron microscopic (SEM) analysis
showed that the fungal isolates were able to establish mycelia on the polymer surface
and maximum growth was observed in glucose added mineral salts media. FTIR
spectra of the treated films showed increase in absorption spectra around 536 cm-1
,
748 cm-1
(mono substituted aromatic compound), 1026 cm-1
, 1450 cm-1
, 1492 cm-
1(C=C stretching vibration of aromatic compounds), 2916 cm
-1, 3400 cm
-1(aryl-H
stretching vibrations). Major changes were observed in 1000-1700 cm-1
and 3400 cm-1
region which indicated depolymerisation and degradation into monomers.

xiii
Molecular weight distribution was studied by gel permeation chromatography (GPC).
The weight average molecular weight and number average molecular weight
increased in the samples of polystyrene films and EPS beads treated with the fungal
isolates as compared to control while decreased in case of expanded polystyrene. The
polydispersity decreased in polystyrene and increased in EPS films. In proton nuclear
magnetic resonance (1H-NMR) spectra of polystyrene and expanded polystyrene
intensities of the signals were increased in treated samples as compared to control but
treated samples did not show any significant change in the spectra.
The degradation products of the polystyrene and expanded polystyrene were analysed
by HPLC. 1-phenyl-1,2-ethandiol, 2-phenylethanol and phenyacetaldehyde and
styrene oxide, which were oxidation degradation products of monomer styrene, were
detected in most of the cases. 1-phenyl-1,2-ethandiol was detected with highest
concentration of 21.3 ppm in media sample of polystyrene incubated with A. terreus
NA2 in shake flask and 34.7 ppm with P. chrysosporium NA3 in static conditions.
Polystyrene films were given pretreatment of UV irradiation (1-2 hr. at λ 254 nm) and
heat (60˚C and 80˚C for 1 hour) and then biodegradation was studied. UV
pretreatment of 2 hours showed enhancing effect on biodegradation by fungal isolates
indicated a decrease of weight average molecular weight in the treated samples. Heat
pretreatments did not show enhancing effect on biodegradation except P.
chrysosporium NA3 treatment of heat pretreated polystyrene films. Enhancing effect
of glucose on biodegradation of polystyrene films was observed in FTIR spectral
analysis, when glucose was used as additional carbon source in mineral salts media,
The soil buried films of polystyrene for six months showed very significant
degradation in FTIR and GPC analysis. The scanning electron micrographs of the
treated films from all the samples also confirmed the biodegradation process by
showing some changes in structure and colonization of fungi on the films. The
selected fungal strains are capable of utilising polystyrene as a sole carbon source and
have potential to be used for polystyrene biodegradation in the environment.

Chapter1 Introduction
1
1.1 POLYSTYRENE
Polystyrene (PS) is a multipurpose polymer that is used in varied applications in rigid
and foamed form. General purpose polystyrene (GPS) is clear and hard which is used
in packaging, laboratory ware, and electronics. The excellent physical and processing
properties make polystyrene suitable for a lot of applications than any other plastic
(Meenakshi et al., 2002).
Styrofoam is the trade name given to expanded polystyrene (EPS) which is used in
foam form for packaging as well as insulation in various industrial fields in the world
(Kan and Demirboga, 2009). EPS is moulded into sheets for thermoforming into trays
for packaging of fish, meat and cheeses, egg crates, tubs for food and cups. Both
foamed sheets and molded tubs are extensively used in take out restaurants because
they are lightweight, stiff and have excellent thermal insulation capability.
Polystyrene is a vinyl polymer, which make up a large family of polymers that are
made from vinyl monomers containing C=C bonds. Polystyrene molecules possess
long hydrocarbon backbone, with a benzene ring linked to every other carbon atom.
Styrene is used to produce polystyrene by free radical polymerization (Fig.1.1).
On the basis of structure polystyrene can be classified into three forms (Fig.1.2). The
polystyrene containing all of the phenyl groups on one side is termed as isotactic
polystyrene. If the phenyl groups are randomly distributed then it is called atactic
polystyrene. The free radical vinyl polymerization process yields atactic polystyrene.
The polystyrene containing phenyl groups on alternating sides of the chain is
described as syndiotactic polystyrene (sPS), which is highly crystalline. It has the
tendency to crystallize very quickly which gives it the favourable properties of high
melting temperature and chemical resistance. Structurally sPS can have more than one
crystalline form and it shows a complex polymorphic behaviour. Four main
crystalline modifications and several subforms of sPs are known (Saitoh et al., 2003;
Gupper and Kazarian, 2005).

Chapter1 Introduction
2
Figure 1.1 Polymerization of styrene to produce polystyrene
Figure 1.2 Types of polystyrene

Chapter1 Introduction
3
1.2 HISTORY OF POLYSTYRENE
Edward Simon accidently discovered polystyrene in 1839 in Germany. From the
resin of Turkish sweetgum tree, Liquidambar orientalis he obtained an oily substance,
which thickened into jelly in air; he described it as styrol oxide. In 1845 John Blyth
and August Wilhelm von Hofmann observed that the same changes occur in styrol in
the absence of oxygen. They named it as metastyrol. Marcelin Berthelot in 1866
identified that it is a polymerization process that change styrol to metastyrol. It was
described in the thesis of Hermann Staudinger (1881-1965) that a chain reaction
occurs in styrol by heating resulting in the formation of macromolecules which was
later called polystyrene. In Germany, I. G. Farben, company in 1931 started producing
polystyrene in Ludwigshafen. The Koppers Company in Pittsburgh, Pennsylvania
produced expanded polystyrene in 1959. Polystyrene with syndiotactic conformation
was synthesized for the first time in the early 1980s.
1.3 SYNTHESIS OF POLYSTYRENE
The polystyrene synthesis begins by heating the natural gas or crude oil in a "cracking
process." The yield of ethylene is dependent on the cracking temperature and is more
than 30% at 850°C. The next step in polystyrene production is alkylation of benzene
with ethylene to form ethyl-benzene. Dehydrogenation of ethylbenzene forms styrene,
which is then polymerized to yield polystyrene.
Polystyrene products are made by injection blow molding, extrusion, injection stretch
blow molding and thermoforming depending upon their applications. Extrusion and
injection molding is mostly used for clear, hard and brittle type of general purpose
polystyrene products. Extruded polystyrene foam is produced by extrusion in the form
of sheets for insulation in construction industry and other insulation purposes.
Expanded polystyrene foam products are mostly produced by thermoforming.
1.3.1 Synthesis of Expanded Polystyrene
Expanded polystyrene (EPS) is produced by using a blowing agent (pentane) to
expand the polymeric chains in order to achieve a low density foamed polystyrene.
The polystyrene (90-95%) with blowing agent (5-10%) is placed in the chamber and
then heated (100-110 ºC) by dry or wet steam, above the glass transition temperature

Chapter1 Introduction
4
of polystyrene (98 ºC). The blowing agent starts vaporising (iso-pentane at 28 ºC,
normal-pentane at 35 ºC and cyclo-pentane at 49 ºC) and permeates through the
polymer. The rising temperature causes the polymer chains to become softer and the
internal pressure of the blowing agent causes the polymer to expand. The expanded
beads are then cooled for aging purpose. The EPS beads are moulded into sheets or
tubs, cups etc by heating with steam that causes the external surface to become soft
and beads stick to each other.
1.4 OTHER POLYSTYRENE BLENDS AND COPOLYMERS
Styrene polymers have unique properties useful to produce wide range of products
(Meenakshi et al., 2002). To achieve specific properties for a particular application
styrene is mixed with other monomers such as butadiene, acrylonitrile etc. to make
blends, copolymers, graft copolymers. The improvement of the impact properties are
achieved by producing styrenic polymers such as high-impact polystyrene (HIPS) or
ABS (Vishwa-Prasad and Singh, 1997) which are used in electrical and electronic
equipment (Brennan et al., 2002).
1.4.1 High Impact Polystyrene
Poly(styrene-butadiene-styrene), or SBS is a hard rubber used in the manufacture of
tyres and tyre products also contain polystyrene in it. SBS rubber usually called as
high-impact polystyrene, or HIPS is a thermoplastic elastomer. Polybutadiene (PB)
has double bonds in it that cause polymerization with styrene as a graft copolymer.
The HIPS polymer is a multiphase system in which Polybutadiene is dispersed in a
rigid polystyrene (PS) matrix. Thus HIPS has improved fracture resistance, reduced
transparency, modulus and tensile strength (Vishwa-Prasad and Singh, 1997).
1.4.2 Polystyrene- Polyacrylonitrile copolymer (SAN)
Polyacrylonitrile (PAN) and polystyrene have favourable properties for use in
automotive industry, architecture, railway and aerospace. SAN copolymer has better
mechanical properties as compared to the Polyacrylonitrile and polystyrene.
Polystyrene–polyacrylonitrile is generally utilised in the automobile making, home
wiring and other applications (Wang et al., 2008).

Chapter1 Introduction
5
1.4.3 Acrylonitrile-butadiene-styrene (ABS)
Acrylonitrile-butadiene-styrene (ABS) is a blend that is manufactured by SAN and
polybutadiene rubber (Arnold et al., 2009). ABS has flexibility of composition,
structure and properties on the basis of ratio of monomer for diverse applications.
Styrene component imparts rigidity and easy processibility, acrylonitrile give
chemical and heat stability while, toughness and impact strength are dependet on
butadiene. ABS is used in the electronics for manufacturing parts of electronics and
automobile industry. ABS is also blended with other polymers for different
applications such as ABS/polycarbonate and ABS/polyvinyl chloride.
1.5 USES OF POLYSTYRENE
Polystyrene is used in packaging, electronics, construction, house and medical ware
and disposable food services (Meenakshi et al., 2002). Expanded polystyrene (EPS) is
used for protective packaging in electrical, pharmaceutical and retail industries etc.,
because of light weight, shock resistance, cushioning properties, and flexibility in
design possibilities. Because of thermal insulation properties, EPS is used in cold
rooms, refrigeration and building insulation (Kannan et al., 2009).
End-functionalized polystyrene act as lubricants and polymeric surfactants because
they modify the wetting behaviour of surfaces (Park et al., 2008). Organic crystals
such as polystyrene coated Meta-nitroaniline have their uses in optical devices
(Adhyapak et al., 2008). Polymeric material with a biomolecule is used for the
manufacture of biosensors, bioreactors and in the medical field (Hagiwara et al.,
2008). Polystyrene is commonly used for cell culture (Shim et al., 2008). It is used in
disposable Petri plates and other biomedical containers for its optical transparency,
durability and cost effectiveness, inert nature and nontoxicity.
When a polymer matrix is mixed with inorganic nanoparticles, the thermal (Garcia et
al., 2009), mechanical (Uhl and Wilke, 2002), optical, electrical, magnetic and
flammability properties of such a nanocomposite are much different from the polymer
matrix itself (Manzi-Nshuti et al., 2009).

Chapter1 Introduction
6
1.6 ENVIRONMENTAL EFFECTS OF POLYSTYRENE
Synthetic plastics are used in many fields such as packing, household, agricultural,
marine and architectural. Plastics have replaced natural resources like cotton, wood
and metals because of their light-weight, and durability. The average growth rate of
plastic industry in Pakistan is 15% per annum. The medium sized plastic processing
units are situated in different places in Pakistan (Sabir, 2004).
Polystyrene (PS) is a widely used thermoplastic. Its hardness, hydrophobic nature and
chemical composition cause it to persist in nature without any decomposition for
longer period of time thus cause environmental pollution (Singh and Sharma, 2008).
Floating marine debris include a large proportion of plastics especially Styrofoam that
pose a serious problem to marine life and natural ecosystems (Hinojosa and Thiel,
2009). Polystyrene packaging products are discarded in dumps, landfills or simple
litter after their useful application (Kiatkamjornwong et al., 1999). As the waste
plastic material has become a serious problem, so recycling is taking attention to save
environment and resource recovery (Pantano et al., 2009). Polystyrene waste requires
the transportation of big volume waste, which is costly and make recycling
economically unfeasible. Waste EPS doesn’t decompose in nature and causes
environmental pollutions (Kan and Demirboga, 2009)
1.7 HEALTH EFFECTS
Polystyrene is manufactured from monomer styrene. Styrene is a volatile, colourless,
strong-smelling, oily liquid. Styrene is not harmful in very small amounts in air or
food. Styrene exposure for a short time can result in eye and mucous membrane
irritation and gastrointestinal problems in humans. Styrene and its metabolites are
known to cause serious negative effects on human health (Mooney et al., 2006)
Styrene causes neurological impairment, toxic effect on liver, central nervous system.
Styrene is metabolised by a number of microbes in natural environments. Styrene
biotransformation causes the production of styrene oxide that is more toxic to human
health. Migration of styrene from expanded polystyrene cups into the hot beverages is
reported which is dependent on the fat content, Exposure temperature and time
(Khaksar and Ghazi-Khansari, 2009).
Chapter1 Introduction
7
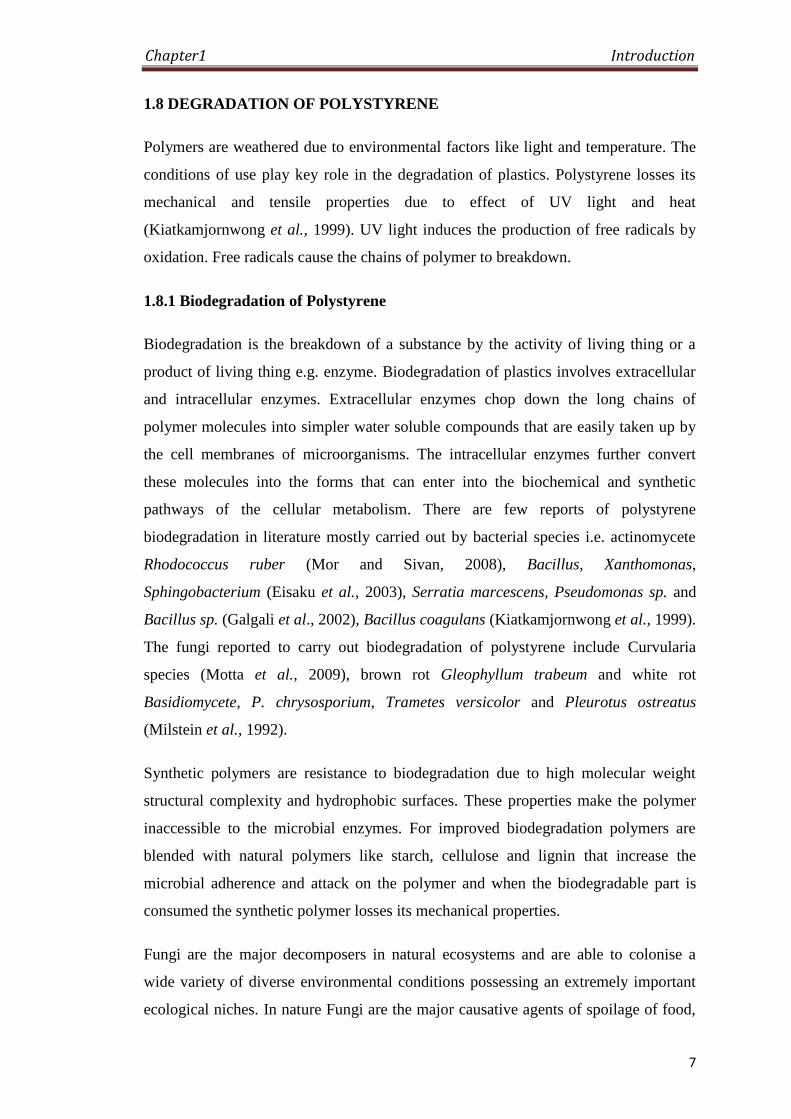
1.8 DEGRADATION OF POLYSTYRENE
Polymers are weathered due to environmental factors like light and temperature. The
conditions of use play key role in the degradation of plastics. Polystyrene losses its
mechanical and tensile properties due to effect of UV light and heat
(Kiatkamjornwong et al., 1999). UV light induces the production of free radicals by
oxidation. Free radicals cause the chains of polymer to breakdown.
1.8.1 Biodegradation of Polystyrene
Biodegradation is the breakdown of a substance by the activity of living thing or a
product of living thing e.g. enzyme. Biodegradation of plastics involves extracellular
and intracellular enzymes. Extracellular enzymes chop down the long chains of
polymer molecules into simpler water soluble compounds that are easily taken up by
the cell membranes of microorganisms. The intracellular enzymes further convert
these molecules into the forms that can enter into the biochemical and synthetic
pathways of the cellular metabolism. There are few reports of polystyrene
biodegradation in literature mostly carried out by bacterial species i.e. actinomycete
Rhodococcus ruber (Mor and Sivan, 2008), Bacillus, Xanthomonas,
Sphingobacterium (Eisaku et al., 2003), Serratia marcescens, Pseudomonas sp. and
Bacillus sp. (Galgali et al., 2002), Bacillus coagulans (Kiatkamjornwong et al., 1999).
The fungi reported to carry out biodegradation of polystyrene include Curvularia
species (Motta et al., 2009), brown rot Gleophyllum trabeum and white rot
Basidiomycete, P. chrysosporium, Trametes versicolor and Pleurotus ostreatus
(Milstein et al., 1992).
Synthetic polymers are resistance to biodegradation due to high molecular weight
structural complexity and hydrophobic surfaces. These properties make the polymer
inaccessible to the microbial enzymes. For improved biodegradation polymers are
blended with natural polymers like starch, cellulose and lignin that increase the
microbial adherence and attack on the polymer and when the biodegradable part is
consumed the synthetic polymer losses its mechanical properties.
Fungi are the major decomposers in natural ecosystems and are able to colonise a
wide variety of diverse environmental conditions possessing an extremely important
ecological niches. In nature Fungi are the major causative agents of spoilage of food,

Chapter1 Introduction
8
timber, cotton, paper etc (Pinzari et al., 2006). Fungi are successfully used to degrade
plastics and other xenobiotics (Francesc et al., 2006). Excellent adherence and
colonisation properties give advantage to the fungi for bioremediation. Once
established on a surface the fungi cover the whole area by forming mycellial mat.
Fungi are able to withstand longer periods of stress conditions and due to saprotrophic
nature they are capable of producing a diverse arsenal of enzymes that are able to
degrade the recalcitrant compounds (Gu and Gu, 2005).
AIM AND OBJECTIVES
The aim of the present study was to investigate the biodegradation of polystyrene by
indigenous fungal isolates and methods to accelerate the biodegradation process. The
aim was achieved by the following specific objectives.
• To Isolate and characterise the fungal strains associated with polystyrene
films.
• To study biodegradation of polystyrene in solid and liquid media using
selected fungal isolates.
• To analyse the biodegradation products of polystyrene by HPLC, NMR and
FTIR for possible degradation pathway.
• To Study mineralisation of polystyrene by Sturm test analysis
• To study the effect of UV and thermal pre-treatment on biodegradation

Chapter2 Literature Review
9
Polystyrene has exclusive chemical, physical, mechanical properties and applications.
It is utilised in packaging, automotive industry, telecommunication, electronics,
building insulation etc. However, its durability has caused serious pollution problems
because the polystyrene plastic waste accumulates in the environment. The build up
of discarded plastics has caused a worldwide environmental problem. Nature is unable
to get rid of plastic waste, as the majority of plastics are not decomposed by
microorganisms. Worldwide plastic production is increasing day by day as a result the
amount of plastics wastes is also raised enormously (Mukai and Doi, 1995). As the
available landfill space is decreasing the costs of solid waste disposal is also rising.
Alternatively plastic recycling is quite limited due to low economical value and
incineration is not favourable due to environmental pollution caused by emission of
harmful gases.
2.1 MECHANICAL DEGRADATION OF POLYSTYRENE
Thin films of polystyrene coated on solid surfaces were considerably degraded by
mechanical forces, on a molecular scale. The polymer degraded by non-random
multiple scissions as demonstrated by molecular weight distributions analysed by gel
permeation chromatography. The study described that the high molecular weight
polystyrene will be converted to medium and then to low molecular weight
polystyrene molecules. Polymer chain entanglement was used to explain the mode of
degradation by using computer simulations. The time of degradation, thickness of the
film and the molecular weight of the polymer determine the degradation rate (Nash
and Jacob, 1972).
Styrene-ethylene/butylene-styrene elastomer grafted with maleic anhydride (SEBS-g-
MA) and trimethylol propane trimethacrylate (TMPTA) as compatibilizers were
added to composites of recycled polymers i.e. polypropylene (PP), poly(ethylene
terephthalate) (PET), polystyrene (PS), low-density polyethylene (LDPE) and high-
density polyethylene (HDPE). Compatibilizer addition and electron radiation of the
blends was done to improve their mechanical properties and to study the possibility of
their use for plastic waste recycling (Zenkiewicz and Kurcok, 2008).
Thermo-oxidative ageing and Multiple processing were used as simulation techniques
to study the degradation of high-impact polystyrene (HIPS). Degradation was

Chapter2 Literature Review
10
analysed by melt mass-flow rate (MFR) measurements, differential scanning
calorimetry (DSC), FTIR and tensile testing. Thermo-oxidative ageing and multiple
processing introduces modification in the chemical structure of HIPS causing
oxidative instability and changes the physical properties of the materials. Service life,
processing, and mechanical recycling affects polybutadiene phase. The modifications
introduced during the life cycle of HIPS also determine its recyclability and
performance in market (Vilaplana et al., 2006).
2.2 CHEMICAL AND ELECTROCHEMICAL DEGRADATION OF
POLYSTYRENE
Polystyrene was treated by oxidizing agent alone, oxidizing agent with a transition
metal complex and oxidizing agent with inorganic acid. The FTIR spectroscopy of the
treated samples demonstrated the introduction of carbonyl and hydroxyl groups in the
polymer chains (Motta et al., 2009).
Artificial strong acid rain was used to check surface erosion of atactic polystyrene
insulating material. The surface conductivity of aged material increased due to
changes in physical and chemical structure of the deteriorated surface of PS.
Conductivity, pH and ion concentration of acid rain influence the degradation rate of
polystyrene. The concentration of actual rainwater and normal acid rain was
inadequate to cause noticeable erosion on PS insulation (Wang, 2000).
Polystyrene was subjected to oxidative degradation in solution by peroxides
(Sivalingam et al., 2003). Various concentrations of peroxide, different reaction
times, heating cycles and microwave irradiation were studied. The thermal-assisted
process was less effective then oxidative degradation with microwave.
2.3 PHOTODEGRADATION OF POLYSTYRENE
Kiatkamjornwong et al., (1999) reported that photodegradation of polystyrene in air
causes discoloration (yellowing), cross-linking, and chain scission due to oxidation. A
photodegradation mechanism was also proposed on the basis of the IR spectra of the
photoirradiated film, which indicated the formation of peroxy radical and
hydroperoxide intermediate formation. The photochemical reactions cause the
dissociation of a polystyryl radical by creating an electrochemical excited state. The

Chapter2 Literature Review
11
polystyryl radical is converted to peroxy radicals by reacting with oxygen. The peroxy
radical causes further chain scission and formation of carbonyl compounds.
Kiatkamjornwong et al., (1999) evaluated of the photosensitivity of plastic sheet after
different exposure times (0.5, 5, 10 or 21 hr.). FT-IR analyses of photo irradiated
polystyrene showed increase in the absorption peaks at 1742-1745cm-1
indicating the
presence of ketone, carbonyl groups. For polymers consisting of hydrocarbons,
oxidation must precede biodegradation.
The photo-oxidative degradation (λ ˃ 300 nm, 60°C) of high impact polystyrene
(HIPS) had been reported by Israeli et al., (1994). The photo-oxidized films were
treated with SF4 and NH3, to identify the various hydroperoxides, alcohols and
carbonyl species. Unstable intermediate photoproducts, peroxyl radicals, α, β-
unsaturated ketones and secondary hydroperoxides were produced due to
polybutadiene photooxidation. Photoproduct distribution profile showed that
photodegradation causes cross-linking at the surface of HIPS which make the polymer
impermeable to oxygen and stops the further oxidation process. However longer
wavelength exposure did not show any photoproduct distribution because cross-
linking reactions were not adequate to decrease the oxygen permeability (Israeli et al.,
1994).
Vacuum-ultraviolet irradiation of polystyrene films in the presence of oxygen
produced OH- and C=O-functionalized surfaces and morphological changes. These
changes can be used for secondary functionalization, enhanced aggregation or
printing, and microstructurization. The oxidative fragmentation occurred because of
reactive oxygen species (hydroxyl radicals, atomic oxygen, ozone) leading to
electronic excitation of the polymer causing homolysis of C–C bond and C-centred
radicals. Ozonation of the polystyrene caused oxidative functionalization of the
polymer surface but could not initiate the fragmentation of the polymer backbone
(Gejo et al., 2006).
Polychromatic 254 nm and 365 nm light were used to irradiate the styrene-butadiene
copolymer, which produced carbonyl group. A 254 nm irradiation caused unstable
hydroperoxide concentration, Weak crosslinking and strong discolouration.

Chapter2 Literature Review
12
Irradiation resulted predominantly in acetophenone chromophores and carboxylic acid
groups by chain breakage in the aliphatic regions (Allen et al., 2004).
The blends of poly(vinyl methyl ether) and polystyrene were subjected to
photooxidation. The photodegradation products were studied by infrared
spectrometry. The characterisation of the oxidation products has shown that there are
interactions between the two polymers. The modifications of the surface and the
modifications of the chemical structure of the macromolecules induced by irradiation
correlated with each other. Atomic Force Microscopy (AFM) has shown that the
changes of the surface are dependent on the irradiation time (Mailhot et al., 2000).
Nanoclay of Layered double hydroxide (LDH) organo-modified by 3-sulfopropyl
methacrylate (SPMA) was added to polystyrene as filler. The nanoclay was dispersed
into PS by benzoyl peroxide by adding small amount of initiator. The level of
dispersion and degradation due to UV light was evaluated by thermal analysis UV–
visible, FTIR and high resolution 13
C NMR spectroscopy and X-ray diffraction. Filler
only influenced the oxidation rate of the polymer (Leroux et al., 2005).
2.4 THERMAL DEGRADATION OF POLYSTYRENE
Thermal degradation of foamed polystyrene beads was investigated by Mehta et al.,
(1995). Polymer beads collapsed at 110-120°C, melted a 160°C, started to vaporise at
275°C and completely volatilize at 460-500°C. Heat of degradation was not affected
significantly by the density of the polymer or bead size. HIPS films were exposed to
80, 100, and 120°C temperatures in the presence of air to study their thermal
degradation. Thermal oxidation led to a highly crosslinked and oxidized surface of
polybutadiene due to saturation of double bonds. The oxidation of the polystyrene
matrix can be initiated by the radicals produced during thermal degradation of
polybutadiene. That caused the HIPS matrix to become thermally less stable than pure
polystyrene due to the presence of polybutadiene (Israeli et al., 1994).
The degradation kinetics of polystyrene (PS) in supercritical benzene were studied at
various temperatures (300-330 ˚C) at 5.0 MPa. The degradation rate coefficients
obtained in supercritical benzene were higher than the rate coefficients observed for
degradation of PS in subcritical solvents at high pressures and in solvents at normal
pressures (Karmore and Madras, 2000). The Combustion of expanded polystyrene

Chapter2 Literature Review
13
with and without flame retardant was studied by Rossi et al., (2001) and analysis of
smoke for the products formation showed that pyrolysis (producing styrene, alpha-
methylstyrene, 1,3-diphenylpropane) dominated over thermal oxidation (producing
phenol and benzaldehyde) during combustion. The fire retardant modified the
composition of the smoke and concentration of the gaseous products.
A new heating medium by a batch system at 190-280°C was used to clarify the
manner in which thermal decomposition of polystyrene is initiated. Thermal
decomposition of polysyrene was analyzed by GC, GPC, IR, 13
C-NMR and GC-MS.
2,4,6-triphenyl-1-hexene (trimer), 2,4-diphenyl-1-butene (dimer) and styrene
(monomer) were found o be the major decomposition products. Ethylbenzene,
propylbenzene, naphthalene, benzaldehyde, biphenyl and 1,3-diphenylpropane were
present in minor quantities. Thermal decomposition of polystyrene started near 190°C
which is used as moulding temperature of PS (Saido et al., 2003).
Allen et al., (2004) reported the thermal and photooxidation of high styrene butadiene
copolymer (SBC) as shown by the presence of aromatic ketones, aldehydes,
lactones/peracids, α,β-unsaturated carbonyl species anhydrides and hydroxyl group in
the matrix were formed. Environmental pollution is caused by waste expanded
polystyrene because it cannot biodegrade in natural environment. Kan and
Demirboga, (2009) developed recycling process for utilizing waste EPS in concrete
technology, after heat treatment at 130 ◦C and 15 min. This technique reduced the
volume about 20 times and increased the compressive strength, thermal conductivity
and density of waste EPS.
Elashmawi et al., 2008 studied the films of polyvinyl acetate and Polystyrene
(PS/PVAc) blends. Significant changes in differential scanning calorimetry (DSC),
XRD and FT-IR analysis were indicative of miscibility and interactions of both the
polymers. The results of DSC gave distinct glass transition temperatures for each
blend supporting that the blend was miscible. Watanabe et al., (2009) reported a
pyrolysis-GC/MS system for rapid evaluation of oxidative, thermal and photo
degradation of polymers in a very small quantity. PS degradation was analysed by the
system. After Exposure to air at 60°C for 1 hour the degradation products with UV
irradiation were benzoic acid, acetophenone, phenol and benzaldehyde and without

Chapter2 Literature Review
14
UV irradiation toluene, styrene and benzaldehyde, acetic acid, formic acid, acetone,
acetaldehyde and formaldehyde by oxidative thermal degradation of PS.
2.5 BIODEGRADATION OF POLYSTYRENE
Since the discovery synthetic plastics, the research was mainly focussed on
developing durable materials or very slowly degrading materials in natural
environment. The scarce landfill space, hazards of waste incineration and increasing
costs of disposing solid wastes have caused scientists to discover new approaches for
waste management. Biodegradation of synthetic polymers is a valuable solution to
this environmental problem. Polymers with higher molecular weights and decreased
solubility in aqueous environments are more resistance to microbial attack then
oligomers dimers and monomers of the same polymer. Microorganisms produce two
groups of enzymes, extracellular and intracellular. Extracellular enzymes tend to
depolymerise the long chains of polymer in order to absorb it through the cell
membrane and assimilate the degradation products further inside the cell by
intracellular enzymes. Hence Molecular weight, crystallinity and physical form are
the most important properties of polymers that determine their biodegradability
(Motta et al., 2009).
Sielicki et al., (1978) reported microbial degradation of 1,3-diphenylbutane (styrene
dimer) and [beta-14
C] polystyrene in liquid enrichment cultures and soil. [14
C]
polystyrene degradation rates in soil was measured by 14
CO2 evolution and found 1.5
to 3.0% after 4 months. Soil microorganism Nocardia, Micrococcus, Pseudomonas
and Bacillus species metabolized 1,3-diphenylbutane in enrichment cultures.
Kaplan, et al., (1979), studied the biodegradation of 14
C-labeled polystyrene phenol
formaldehyde and poly (methyl methacrylate) using five groups of soil invertebrates,
17 fungal species, and mixed microbial communities including sludge, soil, manure,
garbage, decaying plastics. Biodegradation was checked by the evolution of 14
CO2.
Fungi in axenic cultures degraded 0 to 0.24% polystyrene during 35 days. Rate of
decomposition by mixed microbial system remained 0.04 to 0.57% in 5-11 weeks.
Polystyrene is a durable thermoplastic that is generally believed to be non-
biodegradable. Otake et al., (1995) found that a sheet of polystyrene buried in soil for
32 years had no sign of degradation.

Chapter2 Literature Review
15
Pseudomonas sp. and Bacillus sp. for styrene degradation, and Xanthomonas sp. and
Sphingobacterium sp. for polystyrene decomposition were isolated and identified by
16S ribosomal DNA analysis. Bacillus sp. STR-Y-O strain decomposed both styrene
and polystyrene 40 % and 56 % of initial concentrations, respectively, in 8 days.
Limonene melted expanded polystyrene; styrene and polystyrene were decomposed
by the isolated microorganisms in this study (Eisaku et al., 2003). Fungal degradation
studies of oxidized polystyrene using Curvularia species were reported by Motta et
al., (2009). The fungus colonized the oxidized polystyrene in sabouraud plates within
9 weeks. Hyphae adhering to and penetrating the polymer’s surface were observed in
microscopic examinations. The fungus utilised PS by co-metabolism.
Raberg and Hafren, (2008) applied the plastics polystyrene and polycaprolactone to
the wood samples and treated them by brown rot (Postia placenta) for 8 weeks in agar
plates. The polystyrene treated wood samples were significantly protected from
decay. The ability of actinomycete Rhodococcus ruber C208 for biodegradation and
biofilm formation on polystyrene was analysed by Mor and Sivan, (2008). The strain
was isolated in a study for biodegradation of polyethylene. The strain produced
colonies on synthetic medium agar plates containing polystyrene powder. 0.8%
weight loss was observed within 8 weeks of treatment. The study reported that R.
ruber C208 was able of partial biodegradation, biofilm formation and colonization of
polystyrene (Mor and Sivan, 2008).
2.6 BIODEGRADATION OF POLYSTYRENE BLENDS
Polymer blends consisting of biodegradable polymer with other polymers are
described as bioblends. Compatibility with other components is the necessity of a
successful bioblend development. Mohamed et al., (2007) reported that
intermolecular interactions were present between biodegradable polycaprolactone
(PCL) and polystyrene (PS) in blended form. Decreased thermal stabilization of
PCL/PS bioblend was observed by thermogravimetric analysis (TGA).
High impact polystyrene with starch was degraded for 12 weeks by concentrated
activated sludge. Concentrated activated sludge was effective in polymer degradation
and starch accelerated the structural changes in that work (Jasso et al., 2004).

Chapter2 Literature Review
16
Styrene (1-phenylethene) graft copolymers of lignin were tested for biodegradation by
brown rot fungus G. trabeum, white rot fungi T. versicolor, P. chrysosporium and P.
ostreatus. Polystyrene pellets could not be degraded. White rot fungi secreted lignin
degrading oxidative enzymes and also degraded polystyrene component of the
copolymer (Milstein et al., 1992). Nuclear magnetic resonance (NMR) and FTIR
spectroscopy of lignin-(1-phenylethylene) graft copolymers (lignin-styrene graft
copolymers) were analyzed to further study the biodegradation by white rot fungi.
Copolymer spectra showed the loss of functional groups after incubation with fungi.
NMR spectra also demonstrated reduced resonances of aromatic region. Scanning
electron microscopy showed degradation of the surface (Milstein et al., 1994).
Kiatkamjornwong et al., (1999) prepared Graft copolymers of Cassava starch and
polystyrene and tested for degradation by UV irradiation, soil burial, outdoor
exposure and the resistance against bacteria (Bacillus coagulans 352). Analysis of
thermal properties, molecular weight, extent of degradation and tensile properties of
the polymer revealed that graft copolymer was easily degraded. Longer time was
taken by the plastics to degrade in soil burial test and no significant degradation
occurred upon indoor exposure. The destroyed areas of starch in composite PS sheets
indicated that bacteria promote the biodegradation of polystyrene plastics.
Galgali et al., (2002), used a novel strategy to increase the rate of degradation of
functionalized polystyrene. They used maleic anhydride (14% by weight) to
functionalize polystyrene and anchored small quantity of different monomeric sugars
like glucose, lactose or sucrose on it. Pure cultures of soil bacteria (Serratia
marcescens, Pseudomonas sp. and Bacillus sp.) were used to study their growth
pattern on these polymers. Infra red (IR) spectroscopy analysis, weight loss data and
Gel Permeation Chromatography data illustrated that polymers were degraded by the
bacteria. Dried waste veins of the leaves and stems of Musa paradiciaca (banana)
were used to prepare cellulose acetate and blended with polystyrene. The films of
cellulose acetate–polystyrene were made to study morphological changes, chemical
and mechanical properties of blend (Meenakshi et al., 2002).
Ward et al., (2006) reported a two step method for the conversion of polystyrene to
polyhydroxyalkanoate (PHA). Polystyrene was converted to styrene oil by pyrolysis
(520 ˚C) and then Pseudomonas putida CA-3 (NCIMB 41162) transformed it to PHA.

Chapter2 Literature Review
17
A single pyrolysis and four fermentation steps produced 6.4 g of PHA from 64 g of
polystyrene.
Polystyrene was blended with cassava starch (Manihot esculenta Crantz) and natural
plasticizer Buriti oil from a palm tree (Mauritia flexuosa L.). Plasticizer aided in the
conversion of starch into thermoplastic starch (TPS) and its blending to PS. Presence
of starch made the blend a biodegradable material because the mechanical strength
was lost and polymeric chain breakage occurred when the starch content was digested
by the microorganisms. X-ray diffraction and kinetic studies had shown that thermal
stability and the activation energy of the PS/TPS blends, is much lower compared to
PS (Pimentel et al., 2007).
Polystyrene was modified with hydrophilic monomer and natural polymers by graft
copolymerization. Biodegradation of these polymers was studied by soil burial
method. The copolymers with starch showed 37% biodegradation after soil burial of
160 days (Singh and Sharma, 2008). Schlemmer et al., (2009) reported that blending
polystyrene with thermoplastic starch (TPS) blends and using glycerol and buriti oil
as plasticizers enhanced biodegradation. Soil burial test was performed to check
biodegradation of PS/TPS blends in perforated boxes for 6 months.
2.7 BIODEGRADATION OF STYRENE
The metabolic pathways of bacteria for styrene biodegradation are well established
and studies on genetic and physiological aspects of styrene biodegradation have been
reported (Hartmans et al., 1990; Jindrova et al., 2002; O’Leary et al., 2002; Leoni et
al., 2005).
Reports in literature indicate that in aerobic conditions the majority of organisms
convert styrene to 2-phenylethanol or phenylacetaldehyde, by vinyl side chain
oxidation, followed by further oxidation to give phenylacetic acid (phenylethanoic
acid) (Hartmans et al., 1989; O’Connor et al., 1995; O’Connor et al., 1996; Velasco et
al., 1998). Styrene monooxygenase oxidises styrene to form styrene epoxide
(Hartmans, 1995). Liu et al., (2006) reported bacterial epoxide hydrolase (EH) which
was capable of enantioselective hydrolysis of racemic styrene oxide.
Chapter2 Literature Review
18
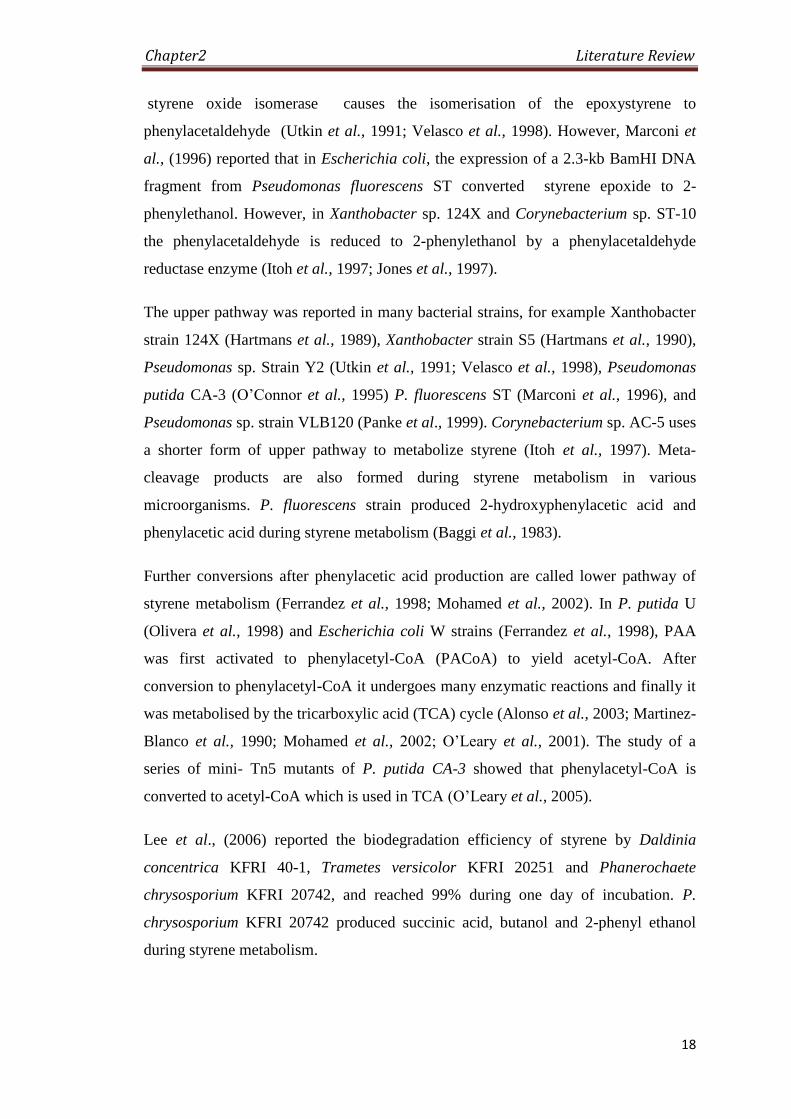
styrene oxide isomerase causes the isomerisation of the epoxystyrene to
phenylacetaldehyde (Utkin et al., 1991; Velasco et al., 1998). However, Marconi et
al., (1996) reported that in Escherichia coli, the expression of a 2.3-kb BamHI DNA
fragment from Pseudomonas fluorescens ST converted styrene epoxide to 2-
phenylethanol. However, in Xanthobacter sp. 124X and Corynebacterium sp. ST-10
the phenylacetaldehyde is reduced to 2-phenylethanol by a phenylacetaldehyde
reductase enzyme (Itoh et al., 1997; Jones et al., 1997).
The upper pathway was reported in many bacterial strains, for example Xanthobacter
strain 124X (Hartmans et al., 1989), Xanthobacter strain S5 (Hartmans et al., 1990),
Pseudomonas sp. Strain Y2 (Utkin et al., 1991; Velasco et al., 1998), Pseudomonas
putida CA-3 (O’Connor et al., 1995) P. fluorescens ST (Marconi et al., 1996), and
Pseudomonas sp. strain VLB120 (Panke et al., 1999). Corynebacterium sp. AC-5 uses
a shorter form of upper pathway to metabolize styrene (Itoh et al., 1997). Meta-
cleavage products are also formed during styrene metabolism in various
microorganisms. P. fluorescens strain produced 2-hydroxyphenylacetic acid and
phenylacetic acid during styrene metabolism (Baggi et al., 1983).
Further conversions after phenylacetic acid production are called lower pathway of
styrene metabolism (Ferrandez et al., 1998; Mohamed et al., 2002). In P. putida U
(Olivera et al., 1998) and Escherichia coli W strains (Ferrandez et al., 1998), PAA
was first activated to phenylacetyl-CoA (PACoA) to yield acetyl-CoA. After
conversion to phenylacetyl-CoA it undergoes many enzymatic reactions and finally it
was metabolised by the tricarboxylic acid (TCA) cycle (Alonso et al., 2003; Martinez-
Blanco et al., 1990; Mohamed et al., 2002; O’Leary et al., 2001). The study of a
series of mini- Tn5 mutants of P. putida CA-3 showed that phenylacetyl-CoA is
converted to acetyl-CoA which is used in TCA (O’Leary et al., 2005).
Lee et al., (2006) reported the biodegradation efficiency of styrene by Daldinia
concentrica KFRI 40-1, Trametes versicolor KFRI 20251 and Phanerochaete
chrysosporium KFRI 20742, and reached 99% during one day of incubation. P.
chrysosporium KFRI 20742 produced succinic acid, butanol and 2-phenyl ethanol
during styrene metabolism.

Chapter2 Literature Review
19
A biofilter using white rot fungi for the biodegradation of styrene was reported by
Braun Lullemann et al., (1997). White-rot fungi Phanerochaete chrysosporium,
Bjerkandera adusta, Trametes versicolor and Pleurotus ostreatus (two strains) were
taken in liquid culture and contact surface was increased by using perlite.
Lignosulphonate was found to be the best inducer for T. Versicolor and P. ostreatus
while wood meal resulted in good induction for P. Chrysosoporium and B. adusta.
HPLC analysis detected benzoic acid, 2-phenylethanol and phenyl-1,2-ethanediol and
as degradation products of [14
C]styrene by treatment with P. Ostreatus (Braun
Lullemann et al., 1997).
Styrene utilising fungi Exophiala jeanselmei and Clonostachys rosea were isolated
and enriched during biofiltration of styrene polluted air (Cox et al., 1993). Penicillium
species including P. Minioluteum, P. cf. Miczynskii, P. cf. Janthinellum and P.
fellutanum were also reported to biodegrade styrene (Cox et al., 1997; Paca et al.,
2001).
Rhodococcus rhodochrous NCIMB 13259 utilise styrene involving a cis-glycol
pathway by dioxygenation to give styrene cis-glycol, followed by dehydrogenation to
form 3-vinylcatechol. Ortho cleavage results in 2-Vinylmuconate accumulation in the
growth medium. Meta cleavage formed acetaldehyde and pyruvate as a result of the
action of enzymes (Warhurst et al., 1994) (Fig. 2.1).The yeast-like fungus Exophiala
jeanselmei disintegrate styrene by oxidation (Cox et al., 1996).

Chapter2 Literature Review
20
Figure 2.1 Styrene metabolic pathways found in bacteria (dotted line) and fungi
(bold line) composed after Francesc et al.,(2006); O’Leary et al.,
(2002); Boldu et al., (2001); Weber et al., (1995); Cox, (1995); and
Holland et al., (1993). (1) Phialophora sessilis CBS 238.93; and (2)
Clonostachys rosea CBS 102.94

Chapter2 Literature Review
21
2.8 TECHNIQUES USED IN BIODEGRADABILITY STUDIES
The test methods generally used for assessing polymer biodegradability had been
developed according to the material and applications. The methods include laboratory,
simulation and field tests. The existing methods have limitations in certain aspects
e.g. in literature presence of microorganisms on the polymer surface is used as an
indication of biodegradation. Only a small selection of fungal and bacterial species
are used for simulation testing are not representatives of microbial population of
different geographical areas (Gu and Gu, 2005).
Rate of biodegradation is dependent upon conditions of the surroundings such as
humidity and aeration. The main environmental conditions reported in literature are
classified by Van Der Zee et al., (1994) as aerobic high solids conditions such as
littering and composting, aerobic aquatic environment including sewage treatment,
marine and fresh water, anaerobic high solids environment as land filling and
anaerobic digestion, anaerobic aquatic environment e.g. waste water and sewage
treatment.
Under aerobic conditions, heterotrophic microorganisms carry out biodegradation of
complex materials and produce H2O, CO2 and microbial biomass. Anaerobes in
methanogenic conditions generate H2O, CH4, CO2 and microbial biomass or H2O,
CO2 and H2S in sulfidogenic conditions. Both environmental conditions exist in
nature, but greater population of microorganisms are aerobic as compared to anaerobs
(Gu and Gu, 2005).
2.8.1 Plate Test
Mould test methods are used to study the biodegradability of a test specimen. These
qualitative tests are based on visual quantification of fungal growth on the material
surface. ASTM G21-96 method rates the observed growth on specimens between 0
(no growth) and 4 (heavy growth). Aureobasidium pullulans, Aspergillus niger,
Penicillium purpurogenum, Stachybotrys chartarum, Chaetomium globosum and
other fungal species are used in these tests. A mixed fungal spore suspension
containing a known concentration of spores is spread on the test specimen, which is
placed on an agar-based medium. Specimens are incubated at optimal conditions for
fungal growth for a defined period of time. Many of the mould fungi known to grow

Chapter2 Literature Review
22
on wood have also been isolated from plastics, for example, Aureobasidium,
Aspergillus and Penicillium, so they are important screening organisms for both
plastic and wood (Schirp et al., 2008).
Biodegradation of two poly(3-hydroxyalkanoates) as particles in solid media agar
plates was investigated by Augusta et al., (1993). Distinct circular clear zones were
produced by seven strains of microorganisms isolated from sewage sludge. Strains
achieving high zone growth were able to degrade both poly(3-hydroxybutyrate) and
Poly(3-hydroxybutyrate-co-valerate, indicating that similar enzymatic processes are
involved in biodegradation. The solid ager plat test technique is useful in determining
the degradation abilities of microorganisms and establishing biodegradability of a
material. Agar plate test was utilised by Raberg and Hafren, (2008) to study the
biodegradability of plastic treated wood samples by brown rot Postia Placenta.
2.8.2 Weight Loss Measurement
The determination of weight loss or gravimetric method gives a quantitative
measurement of biodegradation. It is used widely for the biodegradability assessment
of polymeric materials insoluble in water. The drawback of this method is that the
synthetic recalcitrant polymers do not degrade well and there is very little change in
molecular mass of the polymer. The attached biomass and mechanical or hydrolytic
loss of polymer other than biodegradation can also cause misleading results.
2.8.3 Monitoring Metabolic CO2 Production or O2 Consumption
The biodegradability of a polymer is calculated quantitatively with laboratory test
methods studying the metabolism of the polymeric material by monitoring CO2
production or O2 consumption. The Standardised test protocols are prepared so that
following the procedures biodegradability of a given polymer can be validated. The
Sturm test (Sturm, 1973) is used for estimation of CO2 produced due to mineralisation
of polymer materials. The process also has disadvantages such as underestimation
(Muller et al., 1992). The test requires lots of manual work and human error can also
cause misleading results.
Itavaara and Vikman (1995) introduced CO2 measurement by determining changes in
electrical conductivity of a basic solution (0.1 M KOH) in an automated Sturm test.

Chapter2 Literature Review
23
Calmon et al., 2000 described an automated system of CO2 determination by IR
spectroscopy to overcome the disadvantages. ISO 14852 involves the evaluation of
CO2 produced as a result of biodegradation (Mezzanotte et al., 2005).
2.8.4 Soil Burial
Soil burial test is performed to biodegrade the polymeric material by soil
microorganisms. This technique is also used to isolate microorganisms capable of
depolymerisation of a polymer (Kyrikou and Briassoulis, 2007).
Silva et al., (2007) observed that agar or soil involving tests were more useful in
determining deterioration of wood plastic composites under laboratory conditions. It
is desirable to determine the biodegradability of plastics in natural environment where
the wasted plastic is disposed. Soil burial is employed as a field test for plastic
biodegradation because of the similarity to actual conditions of disposal (Orhan et al.,
2004). Soil burial is the most promising method among other methods used in studies
of polyolefins and modified polystyrene biodegradation (Singh and Sharma, 2008).
Biodegradation of pure polystyrene and grafted polystyrene was evaluated by soil
burial. Films were recovered from the soil after six months. Gravimetric method and
FTIR spectra of films were used to determine biodegradation. 37% biodegradation
was found after 160 days in starch polystyrene blend (Singh and Sharma, 2008).
Grima et al., (2000) described a test method to assess polymer biodegradation under
simulated soil conditions. Carbon dioxide (CO2) production, by the test reactors was
used as the determinant of biodegradation.
2.8.5 Composting
Composting is an important waste management strategy. It is carried out in specially
designed compositing facilities and need specific infrastructure. Sludge taken from
different sources consists of microbial flora with variable metabolic capabilities. The
composition of the inoculum for composting strongly influences the process of
biodegradation (Mezzanotte et al., 2005).

Chapter2 Literature Review
24
2.9 ANALYTICAL TECHNIQUES USED IN BIODEGRADATION STUSIES
2.9.1 Fourier Transform Infrared Spectroscopy (FTIR)
FTIR is useful to elucidate chemical and physical structure, hydrogen bonding, end
group detection, degradation reactions, crosslinking behavior of molecules and
copolymer composition in liquid and solid form of chemicals and polymers. FTIR
technique is employed in the biodegradation studies of polymers to assess the
chemical changes due to microbial activity (Milstein et. al., 1994; Galgali, et. al.,
2002; Mohamed et al.,, 2007; Singh and Sharma, 2008; Elashmawi et al., 2008).The
oxidation products such as aldehydes, ketones, esters and lactones contain carbonyl
groups, visible as peaks at specific wave number in FTIR spectra, are detected in
aerobic biodegradation.
To study the transparent polystyrene in the form of sheet transmission IR is more
useful than ATR (attenuated total reflection) (Wang et al., 2000). Allen et al., (2004)
determined the chemical changes in the styrene-butadiene copolymer due to thermal
and photoxidation by FTIR spectroscopy.
2.9.2 Gel Permeation Chromatography (GPC)
GPC or size exclusion chromatography (SEC) is used for the determination of
molecular mass distribution of polymers to determine changes in molecular weight
after biodegradation (Walter et al., 1995; Peng and Shen, 1999; Kale et al., 2006).
Polystyrene resins of known molecular weight are used to calibrate the instrument.
GPC is a conventional technique that separates molecules according to their
molecular size.
Saito et al.,, (2004) compared molecular weight determination efficiency of matrix-
assisted laser desorption/inonization time-of-flight mass spectrometry
(MALDITOFMS), conventional static light scattering (SLS), 1
H NMR, SEC coupled
with multi-angle light scattering detection (SECMALS) and size-exclusion
chromatography (SEC) using polystyrene. The results showed that SEC calibrated
with polystyrenes was a reliable technique for molecular weight determination.

Chapter2 Literature Review
25
2.9.3 Nuclear Magnetic Resonance Spectroscopy (NMR)
Determination of soluble fraction, tensile strength, molecular weight changes etc. is
indirect evaluation method as they don’t give any idea of chemistry of polymer
changes. NMR spectroscopy (1H and
13C NMR) is the most versatile method that can
be used as analytical tool for biodegradation in many studies (Massardier-Nageotte et
al., 2006; Shah et al., 2008; Schlemmer et al., 2009). Solid state NMR techniques
and pulsed low-resolution 1H NMR can be used to study of solid polymers samples.
NMR technique was used to investigate the gamma irradiation effects on polymers
commonly used in packaging of food. The threshold dose for a significant effect on
acrylonitrile–butadiene–styrene, high impact polystyrene, styrene–acrylonitrile, poly-
butadiene and polystyrene was determined. There was little effect of γ irradiation on
polystyrene in the absence of stabilizers. The results confirmed that polystyrene can
be used for irradiated packaging of food (Pentimalli et al., 2000). Molecular dynamics
can be studied by NMR. Multidimensional NMR method is recently used to
determine ultra-slow exchange in polymers (Qiu and Mirau, 2000).
2.9.4 Scanning Electron Microscopy (SEM)
Scanning electron microscopy (SEM) has diverse applications in studies of polymers.
Surface morphology of the films of polymers can be studied by SEM. The samples
are generally sputter-coated with gold or some metal ions before SEM examination.
The variable pressure SEM technique is helpful in direct observation without any
surface metallization at suitable magnification (Pinzari et al., 2006).
The scanning electron microscopic study of the starch-g-polystyrene graft copolymers
biodegraded by Bacillus coagulans 352 and soil burial test showed the degraded
regions of starch as holes in the sample sheets (Kiatkamjornwong et al., 1999).
Scanning electron microscopic examination was used to evaluate the compatibility of
random and triblock copolymers (Josepha et al., 2005). Surface morphologies of
polystyrene and its graft copolymers with starch and acrylic acid (Singh and Sharma,
2008) and ethylene-propylene-diene-graft-polystyrene (EPDM-g-PS) were studied by
SEM (Pticek et al., 2007).

Chapter2 Literature Review
26
2.9.5 High Pressure Liquid Chromatography (HPLC)
High pressure liquid chromatography (HPLC) is widely used to separate molecules on
the basis of their size. The principle is that the larger molecules will elute earlier as
they pass through the spaces in the column, while smaller ones elute later because
they will take longer to pass through the pores in the gel. HPLC is used to analyze the
metabolic degradation products of xenobiotics.
Styrene, epoxystyrene, phenylacetaldehyde, and 2-phenylethanol biotransformation
products were detected by reverse-phase high pressure liquid chromatography
(Marconi et al., 1996; Beltrametti et al., 1997). Phenylacetic acid concentration in the
broth of P. putida CA-3 culture was analyzed by high performance liquid
chromatography (Ward et al., 2005). Standard styrene solutions of 1, 5, 10, 20, and 30
mg/l were used to get a standard curve for quantitative analysis and study the
efficiency of styrene degradation (Lee et al., 2006).
2.9.6 Thermogravimetric Analysis (TGA)
TGA implies the heat treatment under controlled condition to record mass changes in
the sample due to heating. But it does give any information about the evolved gases
produced during thermal degradation of the sample (Bhandare et al.,, 1997). The
dynamic thermogravimetry can be used to study the temperature at the maximum
decomposition rate, rate of decomposition and the activation energy (Carrasco and
Pages, 1996).

Chapter 3 Materials and Methods
27
3.1 CHEMICALS
The chemical compounds and media were acquired from the BDH laboratory chemical
division (Pool Dorset, England), DIFCO laboratories (Detroit, Michigan, USA), Fluka
(Germany), Sigma Aldrich and Merck (Darmstadt, Germany). Polystyrene (Mol. wt.
100,000 Da) was obtained from Fluka. Expanded polystyrene beads were generously
provided by Styrotech (United Kingdom).
3.2 PREPARATION OF POLYSTYRENE FILMS
Pure polystyrene (Fluka, Mol. wt. 100,000 Da) in the form of granules was dissolved in
chloroform (Fisher Scientific) (2% w/v) and sonicated (Sonicator Heat Systema
Ultrasonics INC cell disrupter model W225R) to get homogeneous solution. The clear
solution was transferred to Petri plates and placed at room temperature to evaporate the
solvent. After 24 hrs the polystyrene film was peeled off. Similar procedure was used to
prepare films from expanded polystyrene.
3.3 MEDIA
Mineral salt media containing inorganic salts and no carbon source was used in the
present study (Kiatkamjornwong et al., 1999; Table 3.1). The pH of media was adjusted
to 7.0 prior to sterilization. The medium was sterilized at 121ºC for 15 min.
3.4 SOIL BURIAL FOR ISOLATION OF MICROBES
Soil from garbage dumping area of Quaid-i-Azam University, Islamabad, Pakistan was
mixed with manure (1: 0.25). Films prepared from expanded polystyrene were buried in
the prepared soil placed in a flower pot. To enhance the microbial activity in the soil, 400
ml glucose solution (2%) was added to the soil. The buried films recovered after 8
months (May- November 2006) were utilized to isolate the microbes that can utilize
polystyrene as a sole carbon source.

Chapter 3 Materials and Methods
28
Table 3.1 Composition of Mineral Salt Media
Contents Quantity (g/l)
K2 HPO4 1.0
KH2PO4 0.2
NaCl 1.0
CaCl2. 2H2O 0.002
H3BO3 0.005
NH4(SO4)2 1.0
MgSO4. 7H2O 0.5
CuSO4. 5H2O 0.001
ZnSO4. H2O 0.001
MnSO4. H2O 0.001
Fe2 (SO4) 3. 6H2O 0.01
Distilled water 1L

Chapter 3 Materials and Methods
29
3.5 ISOLATION OF POLYSTYRENE DEGRADING MICROORGANISMS
Polystyrene and expanded polystyrene films were recovered from soil after eight months
(May-November 2006). The films were cut into pieces, washed with sterilized water and
placed on mineral salt medium (MSM) agar plates (Motta et al., 2009). The plates were
incubated at 30ºC. Mineral salt medium consisted of only inorganic salts, and no carbon
source was added. For isolation of bacterial strains loop full of inoculum was taken from
MSM plates and streaked on nutrient agar plates. Nutrient agar plates were incubated at
30ºC. To isolate fungi small pieces of mycelia were picked up by needle and transferred
to potato dextrose agar plates (FormediumTM
Hunstanton England). Fungal cultures were
incubated at 37ºC. To exclude the growth of fungi 0.5% antifungal agent nystatin (1%
(w/v) stock sol.) was added to nutrient agar media. Streptomycin (0.5% (w/v) stock sol.)
was used as an anti bacterial agent (0.5%) in potato dextrose agar media. Sub-culturing
many times was done to separate mixtures of microorganisms and to get pure cultures.
Serial dilution and plating onto nutrient agar and potato dextrose agar plates were also
used to isolate bacteria and fungi.
3.6 SELECTION AND IDENTIFICATION OF FUNGAL STRAINS
All the isolated microorganisms were subjected to shake flask conditions at 30 ºC, 120
rpm with MSM and Polystyrene as a sole carbon source. Fungal strains for
biodegradation experiments were selected on the basis of the FTIR spectroscopy results
of fungal treated polystyrene films in shake flask conditions (4 and 8 weeks treatment).
The selected fungal strains were characterized on the basis of molecular identification
and morphology. The cultures were maintained on potato dextrose agar plates and slants.
3.7 MOLECULAR IDENTIFICATION OF FUNGAL STRAINS
3.7.1 DNA Extraction
Isolated fungi were grown in potato dextrose broth media at 120 rpm, 30ºC. After the
maximum growth, the mycelia were harvested by filtration. Fungal mycelia were washed
twice with distilled water to remove traces of media. Mycelia were dried by an air pump
by applying negative pressure.

Chapter 3 Materials and Methods
30
Fungal mycelia were converted to fine powdered form in liquid nitrogen by grinding with
the help of pestle and mortar. DNA was extracted according to Qiagen kit mini protocol
(Qiagen Ltd., Crawley, United Kingdom). The quality and quantity of extracted DNA
was determined by nanodrop spectrophotometer (Nanodrop™ 1000). The extracted DNA
was visualized by agarose gel electrophoresis. Agarose gel (0.8% (w/v) in 1x TAE buffer
(20mM Tris acetate, 10mM Sodium Acetate, 0.5mM Na2-EDTA (pH 7.4)) containing
0.1µl ethedium bromide solution was prepared. DNA was run at 80V for 20 minutes.
Gel was observed under UV light to check the DNA bands using UVI tec Gel
Documentation system.
3.7.2 PCR Amplification of Ribosomal DNA
The extracted DNA was subjected to PCR (Bio-Rad i cycler) to amplify the ribosomal
DNA segments. Fungal universal primers ITS-1 and ITS-4 (Invitrogen) were used to
amplify the ITS regions of fungal ribosomal DNA genes (White et al., 1990). DNA
polymerase kit (Bioline BiotaqTM
) and dNTPs (Bioline) were used. Primer sequences
used were ITS-1(5' TCCGTAGGTGAACCTGCGG) and ITS-4 (5'
TCCTCCGCTTATTGATATGC). The PCR reaction mixture 50 µl was prepared (Table
3.2) and run for 35 cycles with 94ºC denaturation temperature for 1 minute, annealing at
56ºC for 1 minute and amplification at 72ºC for 1 minute.
3.8 MOLECULAR IDENTIFICATION PROTOCOL FOR BACTERIA
3.8.1 DNA Extraction
A loop full of bacterial culture was transferred to 100 µl of filter sterilized distilled water,
vortex and boiled for 5 minutes. The sample was centrifuged at13,000 rpm for 10
minutes. Supernatant containing DNA was taken carefully and pellet was discarded. The
extracted DNA was run at 80V and 400mA for 35 minutes on agarose gel (0.8% (w/v) in
TAE buffer 1x containing 0.1µl ethidium bromide solution. Concentration of DNA was
determined by nanodrop spectrophotometer (Nanodrop™ 1000).

Chapter 3 Materials and Methods
31
Table 3.2 PCR mixture for fungal DNA amplification
Contents Quantity
ITS1 5µl
ITS4 5µl
MgCl2 2µl
dNTPs 1µl
Enzyme Taq polymerase 5µl
Buffer 5µl
H2O 13µl
DNA Sample 5µl
Total PCR reaction volume 50µΙ
Dilutions in sterilized water
dNTPs (each 1µl ) 4:96
ITS1 1:49
ITS4 1:49
Enzyme 1:19
Chapter 3 Materials and Methods
32
3.8.2 PCR Amplification of the 16S Ribosomal DNA
The supernatant containing the extracted DNA was used to amplify 16S ribosomal DNA
segments by PCR (Bio-Rad i cycler). Bioline, BiotaqTM
DNA Polymerase kit and dNTPs
set was used. Primer sequences used for bacteria were 6S-27F (5'-
AGAGTTTGATCCTGGCTCAG-3') and 16S-1492R (5'-
TACGGTTACCTTGTTACGACTT-3'). The PCR mixture used as listed in table 3.3 and
experimental conditions used are shown in Table 3.4.
3.9 PCR PRODUCT PURIFICATION
The concentration of amplified DNA was determined by nanodrop spectrophotometer
(Nanodrop™ 1000). QIAquick® PCR Purification Kit (Qiagen Ltd., Crawley, United
Kingdom) was used to purify PCR products. After purification DNA was run on agarose
gel with the Hyperladder1 (Bioline Ltd., London, United Kingdom) to determine the size
of amplified DNA segment.
3.10 DNA SEQUENCING
The purified DNA along with the primer dilutions were sequenced from the sequencing
facility at Faculty of life Sciences, University of Manchester, United Kingdom.
3.11 BLAST SEARCH FOR SEQUENCE HOMOLOGY
The sequencing results were subjected to Blast search at National Centre for
Biotechnology Information (NCBI) nucleotide collection database to identify the fungal
strain and study the closely related species. The Sequence Files were converted to Fast
alignment sequence tool (FASTA) files, annotated in sequin software and submitted to
NCBI Gene Bank to obtain the accession numbers.
3.12 FUNGAL DIVERSITY ASSOCIATED WITH PLASTIC FILM
The microbial population attached to the soil buried PS films was studied by Denaturing
Gradient Gel Electrophoresis (DGGE). DNA extraction kit (Fast Prep-24 MPTM
FastDNA®Kit BIO 101 Systems Q-Biogene) was used to extract DNA from Polystyrene

Chapter 3 Materials and Methods
33
Table 3.3 PCR mixture for bacterial 16S ribosomal DNA amplification
Content Quantity (µl)
Buffer (10x) 5
MgCl2 (50mM) 1.5
16S-27 (50picomol/µl) 0.4
16S-1492 (50picomol/µΙ) 0.4
dNTPs (10mM) 1
Taq polymerase 0.2
H2O 36.5
DNA sample 5
Total PCR reaction volume 50
Table 3.4 Experimental conditions for bacterial 16S ribosomal DNA amplification
Cycle 1 1x 94ºC for 3 min.
Cycle 2 30x
step 1: 94ºC for 1 min.
step 2: 56ºC for 1 min.
step 3: 72ºC for 2 min.
Cycle 3 1x 72ºC for 10 min.
Cycle 4 1x 4ºC for ∞

Chapter 3 Materials and Methods
34
films. DGGE specific primers were used to amplify ribosomal DNA sequences of
extracted DNA by PCR (Table 3.5). Forward primer (JB206c) had GC clamp (Muyzer et
al., 1993). Forward primer JB206c
(5/CGCCCGCCGCGCGCGGCGGGCGGGGCGGGGGCACGGGGGGAAGTAAAAG
TCGTAACAAGG3/) and reverse primer GM2 (5
/CTGCGTTCTTCTTCATCGAT3
/) was
used.
3.12.1 Denaturing Gradient Gel Electrophoresis (DGGE)
The amplified DNA was run on the DGGE gel. Gel Tank (Bio-Rad DcodeTM
Universal
Mutation Detection System), Power supply (Bio-Rad Power PAC 300). 30% (w/v)
Acrylamide: 0.8% (w/v) Bis-Acrylamide (Protoflow Gel, Flowgen Bioscience) was used
for gel electrophoresis. Denaturing gel was made by adding 6.6ml of 30% acrylamide,
2.1g of urea and 0.4ml of TAE buffer (50x) to make final volume of 20ml. 25%, 55%,
40% and 60% gel contained formamide, 2ml, 4.4ml, 3.2ml and 4.8ml respectively, while
urea was 2.1g, 4.6g, 3.4g and 5gm respectively in the gel solution. 10% Ammonium
persulfate (APS) 150l and N,N,N',N'-Tetramethylethylene diamine (TEMED) 8.5 l
were added to the gel just before pouring. Loading dye for DGGE containing 0.1%
Bromophenol blue sodium salt (BPB), 0.1% Orange G and 60% Glycerol was mixed with
the PCR products (1:1) for loading.
3.12.2 Casting the Gel
The gel was casted immediately after mixing the solutions since it will start to polymerize
after the addition of oxidising agents.
1. Glass plates (large & small), spacers and comb were wiped with 70% ethanol.
Glass plates and spacers were fixed on the casting stand with sandwich clamps.
2. Two 50 ml syringes were fitted with the gel solutions (Low & High) and fixed to
the gradient maker. There should be no air in the syringes and the tubes.
3. Syringe needle were fixed at the middle of the gel chamber and connected with
the syringe tubes.

Chapter 3 Materials and Methods
35
Table 3.5 PCR mixture for amplification of ribosomal DNA for DGGE
Contents Quantity
GM2 2.5µl
JB206 2.5µl
MgCl2 1.5µl
dNTPs 1µl
Enzyme Taq polymerase 0.75µl
Buffer 5µl
H2O 31.75µl
DNA Sample 5µl
Dilutions in sterilized water
dNTPs (each 2.5µl ) 10:90
GM2 1:9
JB206 1:9

Chapter 3 Materials and Methods
36
4. The gel was dispensed by turning the handle of the gradient maker at a constant
speed.
5. The comb was placed into the gel chamber carefully avoiding any air trap.
6. The gel was allowed to solidify for 2 hours.
7. The gel comb was removed after solidification and the wells were washed with
deionised H2O several times.
3.12.3 Running the Gel
The core was placed into the tank ((Bio-Rad DcodeTM
Universal Mutation Detection
System) containing 6 L of 1 x TAE buffer. The circulation was turned on to warm up the
buffer up to 60 °C. As the buffer attained the required temperature, the core was taken out
of the tank. The gel plates were attached to the core. The core was placed with the gel
into the tank and the wells were washed with 1 x TAE buffer. The samples were loaded
into the wells. The gel running conditions used were 42V, 400mA and 999min. for fungi
and 63 V, 400mA and 999 min for bacteria.
3.12.4 Gel staining
Staining solution containing 1 x TAE, 20 ml and SYBR Gold 2l was mixed in 50ml
falcon tube. The gel staining was performed by the following steps.
1. A support was placed in a plastic tray on a level surface.
2. The two glass plates containing the gel were separated. The start site of the loaded
samples was marked and the glass plate with the gel attached to it was placed on
the support in the plastic tray.
3. The staining solution (20-40 ml) was poured onto the gel so that it covered the
entire gel surface. The tray was covered with a box and left for 30 min in the dark
because SYBR Gold dye is light sensitive.
4. The gel was washed with deionised H2O for several times. The gel was soaked in

Chapter 3 Materials and Methods
37
deionised water for 10 min. in the dark.
5. The gel was visualised on gel documentation system (UVI tec Gel Doc).
3.13 POLYSTYRENE BIODEGRADATION EXPERIMENTS
All experiments were carried out in triplicates.
3.13.1 Inoculum Preparation
Spore suspension was prepared of fungal cultures. Fungi were grown in tissue culture
bottles. 20 ml of tween 20 solution (0.05% v/v) was added to each bottle, shake well and
transferred to sterile collection tubes. Concentration of spores/ml was determined by
MOD-FUCH’S ROSETHAL (0.2mm Depth 1/116mm2
WEBER England). The spore
count of Rhizopus oryzae NA1, Aspergillus terreus NA2 and Phanerochaete
chrysosporium NA3 were 5.28 X10⁵, 4.96X10
5, 4.57 X10
6 respectively. Spore suspension
was added to MSM so that final concentration was 10-3
spore per ml. Streptomycin 0.5 %
(0.05g/10 ml stock solution) was used as antibacterial agent.
3.13.2 Fungal Growth on MSM Agar Plates containing Polystyrene
The potential of selected fungal strains to grow on solid MSM with polystyrene as sole
carbon source was analyzed. MSM agar plates (2% w/v agar) were prepared. Polystyrene
films were dipped in 70% ethanol for 15 minutes (Calil et al., 2006) for surface
sterilization. The sterilized films were placed on MSM agar plates in one set of
experiment and embedded in MSM agar media in the second set. 0.5ml of fungal spore
suspension was used as inoculum. The plates were incubated at 30ºC for 8 weeks.
3.13.3 Sturm Test
Sturm test (Sturm, 1973) was used to study the metabolic utilization of polystyrene by
fungal strains (Fig. 3.1). The assembly consisted of ten vessels with 300ml content. First
four contained 3M KOH solution; central two contain MSM with spore suspension spore
suspension and last four contain 1M KOH solution. The central vessel containing the
polystyrene films was the test and the other control without any carbon source.

Chapter 3 Materials and Methods
38
Figure 3.1 Experimental set up of Sturm test for biodegradation studies

Chapter 3 Materials and Methods
39
The assembly was set in a way that air passed through the two vessels of 3M KOH
solution, test and finally through two vessels 1M KOH solution. The same was the case
with control set up. 3 M KOH solutions absorb all the atmospheric CO2 and that air was
supplied to test and control vessels where it picked up metabolic CO2. Finally the
metabolic CO2 was absorbed in 1M KOH solution, which was titrated against BaCl2
solution to produce the BaCO3 precipitates after 30 days incubation period. The
difference in weights of precipitates of test and control gave the concentration of CO2
produced as a result of biodegradation of polystyrene.
3.13.4 Treatment of PS and EPS Films with Fungal Isolates in static and shake flask
Polystyrene and EPS films were dipped in spirit for 15 minutes (Calil et al., 2006) for
surface sterilization and then added in flasks (250ml) containing MSM (100ml). The
flasks were incubated in a shaker at 120 rpm, 30ºC. Similar experiments were also set up
in static conditions at 30ºC. The experiments continued for 8 to 16 weeks.
3.13.5 UV Pre-Treatment of PS Films
Polystyrene films were irradiated by UV light (230V, 50Hz LF-106.L UVI tec limited
England) for 1 hr. and 2hr. UV lamp of 254nm wave length at an exposure distance of 3
cm was used. UV treated PS films were allowed to biodegrade by isolated fungi in MSM
under shaking condition at 120 rpm and 30ºC.
3.13.6 Heat Pre-Treatment of PS Films
Polystyrene films were exposed to heat treated at 60ºC and 80ºC for 1hr in oven (LTE
G215 Oven). Heat treated PS films were used in biodegradation studies by isolated fungi
at 30ºC and 120rpm in shaker.
3.13.7 Preparation of Polystyrene, Starch blend Films
Starch 5% (w/w) (Sigma Chemicals Co. starch soluble ACS Reagent) was added to the
PS solution in chloroform and prepared films of polystyrene, starch blend. These films
were also studied for biodegradation by the isolated fungi.

Chapter 3 Materials and Methods
40
3.13.8 Addition of Carbon Source to Media
Glucose (BDH VWR International Ltd AnalaRc
England) was added to MSM to check
the effect of carbon source on the process of biodegradation of polystyrene and EPS films
in shake flask and static conditions. 0.01% and 0.1% (w/v) concentrations of glucose in
MSM media were used for experiments.
3.13.9 Biodegradation of Expanded Polystyrene Beads
Isolated fungi were allowed to grow with expanded polystyrene (EPS) beads (Styrotech,
England) in MSM to check the biodegradation of EPS in static and shaking conditions at
30°C. The EPS beads were dipped in 70% ethanol for 15 minutes with continuous
shaking and then dried in the Laminar flow hood before placing them in flasks. 0.25gm
of EPS beads were added to 250ml flask (100ml MSM) while 1gm was added to 1l flask
(500ml MSM). The biodegradation was studied using inoculums of all the three fungal
isolates (NA1, NA2 and NA3) in shake flask experiments at 30ºC for 12 weeks.
3.13.10 Soil burial at 30ºC
Garden soil taken from Quaid-i-Azam University, Islamabad campus, was passed through
1mm sieve and placed in 500ml conical flasks (300g soil). The soil was sterilized twice
by autoclaving (121ºC, 15psi). The flasks were inoculated with the isolated fungal strains.
Sterilized water was added to saturation and flasks were kept at 30ºC. Samples of
polystyrene films were taken after 2, 4 and 8 months and analyzed by FTIR.
3.13.11 Soil Burial at Room Temperature
Polystyrene films were buried in sterilized and non-sterilized garden soil collected from
Quaid-i-Azam University, Islamabad campus, at 6 inches depth in flower pots (Plastic)
and inoculated with the spore suspension of isolated fungi. One un-inoculated control of
sterilized and non-sterilized soil was also prepared. The soil burial experiment started in
May 2007 and continued for six months until November 2007. The recovered
Polystyrene films were analysed for biodegradation by FTIR.

Chapter 3 Materials and Methods
41
3.14 ANALYSIS OF BIODEGRADATION
Biodegradation of polystyrene and Expanded polystyrene was studied by the following
analytical techniques.
3.14.1 FTIR Spectroscopy
Polystyrene films were recovered at repeated intervals and analyzed by FT-IR
spectroscopy (Bio-Rad Merlin Excaliber). Untreated PS film was used as control. The
absorbance was taken in the mid IR region of 400-4000 cm-1
wave number. FT-IR
analysis was done for almost all samples of all the experiments except the films used for
isolation and incubated on MSM agar plates.
3.14.2 Environmental Scanning Electron Microscopy
Environmental scanning electron microscopy (ESEM) (FEI Quanta 200) was used to
determine the changes on the surface of polystyrene film and colonization of fungi.
Analysis was carried out using low vacuum 0.68 Torr mode, 30KV and LFD (large field
Detector). The films recovered from all treatments were analysed by ESEM. The EPS
beads incubated with fungi were also observed for surface colonization of fungi by
ESEM.
3.14.3 Gel Permeation Chromatography
The changes in molecular weight distribution were evaluated by Gel permeation
chromatography (Viscotek GPC max VE 2001GPC Solvent/Sample Module, RI Detector
VE 3580). Column set: PL 2MB500A was used for GPC studies.
Tetrahydrofuran (THF) (Fisher Scientific) was used as mobile phase. The flow rate was
adjusted at 1 ml/ min. The injection volume was 100 µl. PS samples were dissolved in
THF 0.01% (w/v) and filtered through 0.45 µm syringe filters (Millex®-HV PVDF
13mm). Column temperature was adjusted at 30ºC and detection temperature at 35 ºC. n-
Dodecane was used as a marker.
GPC studies of PS Films obtained from shake flask experiments, UV pre-treatment, heat

Chapter 3 Materials and Methods
42
pre-treatment and soil burial were carried out. The EPS films and beads treated with
fungi were also analysed by GPC.
3.14.4 Nuclear Magnetic Resonance Spectroscopy (NMR)
1H-NMR spectroscopy was done at 300MHz (BRUKER spect). PS samples were
dissolved in deutrated chloroform 0.02 gm/2ml (w/v). The solution was filled up to 5 cm
in NMR tubes (Wilmad Labglass, Sigma Aldrich, 5mm thin wall, 8// length) and placed
in the rack for spectroscopy.
NMR spectroscopy of PS film samples acquired from shake flask and static incubation
with fungi, UV pre-treatment, heat pre-treatment experiments was accomplished. EPS
films incubated with fungi in static conditions and EPS beads treated by fungi were also
studied by NMR spectroscopy.
3.14.5 High Pressure Liquid Chromatography (HPLC)
The biodegradation products produced during the process of biodegradation were
detected by High Pressure Liquid Chromatography (HPLC) (Shimadzu). The Prominence
Liquid Chromatograph system consisted of SIL-20AC Prominence Autosampler, DGU
20A5 Prominence Degasser, CTO-10AS VP Shimadzu column oven, RF-10AXL
Shimadzu Florescence Detector and Spd-20A Prominence UV/VIS Detector. The
analysis was carried out by LC solution software.
C18 column (Supleco INC LI Chrospher RP18 5µl, 259mm x 4.6mm) was used for
chromatographic analysis. Mobile phase was 70:30 acetonitrile and water respectively.
Flow rate was adjusted at 1ml/min and 10 µl injection volume was used. The UV 210
wave length was used to detect metabolites. Samples were centrifuged and filtered
through 0.2µm filter papers before analysis. The standards used for HPLC analysis of
biodegradation products were 2-phenyl ethanol, 1-phenyl-1, 2-ethanediol,
Phenylacetaldehyde, Styrene oxide and Styrene. Liquid media samples of almost all the
experiments were subjected to HPLC analysis.

Chapter 4 Results
43
4.1 ISOLATION OF POLYSTYRENE DEGRADING MICROORGANISMS
Polystyrene films buried in soil for eight months were used as a source to isolate
microorganisms capable to degrade polystyrene. Within 4 weeks of incubation on
MSM agar the entire surface of the culture medium was covered by the microbial
consortia especially fungal mycellia in all plates (Fig. 4.1). Environmental Electron
Microscopic examination of the films that were used for isolation showed mixed
microflora adhering to the polymeric surface and fungal hyphae forming spores in all
the samples (Fig. 4.2). Six fungal isolates and five bacterial isolates were isolated and
identified on the basis of preliminary studies of biodegradation (Table 4.1).
4.2 SELECTION OF FUNGAL ISOLATES
The isolated bacterial and fungal strains were tested for the ability of adherence,
growth and biodegradation of polystyrene in liquid media in shake flask conditions.
Based on FTIR spectroscopy results three fungal strains NA1, NA2 and NA3 were
selected for further biodegradation experiments (Fig. 4.3).
4.3 IDENTIFICATION OF FUNGAL STRAINS
4.3.1 Morphological Characteristics
The morphology of fungal isolates on potato dextrose agar media was studied to
identify the fungi. The colonies of the strain NA1 were woolly and initially white,
quickly becoming gray and then develop mature sporangia as small black dots in the
mycelium. Growth rate was very rapid filling the Petri plate within 2 to 3 days (Fig.
4.3a). Colonies of NA2 were pale coloured and smooth which turned yellow and then
brown with the appearance of spores (Fig. 4.3b). After sporulation the colonies
assume a powdery appearance. The media beneath the colony became yellow. The
colonies of strain NA3 were slow growing, smooth and flat on the agar surface with
white powdery appearance. The colour of mature mycelium was pale yellow (Fig.
4.3c).
4.3.2 Molecular Characteristics
The selected fungal strains NA1, NA2 and NA3 were identified on the basis of

Chapter 4 Results
44
conserved sequences of 5.8S and 18S ribosomal RNA by molecular identification
techniques. Agarose gel electrophoresis visualization of the PCR products along with
Hyper Ladder I was used to determine the quality of DNA and fragment length (Fig.
4.4). The fragment length of the PCR products was 600 base pairs of partial 18S
complete ITS1, 5.8S, ITS4 and partial 28S ribosomal DNA. The sequences were
subjected to BLAST search in National centre for biotechnology information (NCBI)
database (Appendix A). The strains were identified as Rhizopus oryzae NA1,
Aspergillus terreus NA2 and Phanerochaete chrysosporium NA3. The sequences
were submitted to NCBI Gene bank and accession numbers were obtained (Table
4.1).
4.4 DGGE ANALYSIS OF MICROBIAL COMMUNITY
The diversity of fungi adhered to the plastic films, used for isolation, were studied by
denaturing gradient gel electrophoresis. Several DNA bands were observed along the
increasing gradient of denaturing agent that separates DNA fragments according to
their melting point and GC content. The gel picture observed under UV light showed
that numerous fungi were able to adhere and grow with the PS film (Fig. 4.5).

Chapter 4 Results
45
Figure 4.1 Growth of fungal strains on polystyrene films after soil burial (8
months) on mineral salts agar medium.

Chapter 4 Results
46
Figure 4.2 Environmental scanning electron micrographs of Polystyrene films
used for isolation of microorganisms showing fungal growth 250x (a)
and 2000x (b).
a
b

Chapter 4 Results
47
Figure 4.3 Colony morphology of the selected fungal strains NA1 (a), NA2 (b)
and NA3 (c) on potato dextrose agar medium.
a b
c

Chapter 4 Results
48
Figure 4.4 Agarose gel electrophoresis visualisation of PCR Amplified DNA
using 0.8% agarose gel in TAE buffer (Lane 1, HyperLadderTM
1;
Lane 6, PCR product from strain NA1; Lane7 from NA2 and Lane 8,
PCR products from strain NA3).
1 2 3 4 5 6 7 8

Chapter 4 Results
49
Tab
le 4
.1
Mole
cula
r id
enti
fica
tion o
f m
icro
org
anis
ms
isola
ted f
rom
poly
styre
ne
film
Acc
essi
on
nu
mb
er
FJ6
54
43
0
FJ6
54
43
1
FJ6
54
43
3
FJ6
54
43
2
FJ6
54
43
4
FJ6
54
43
5
FJ6
54
43
6
FJ6
54
43
7
FJ6
54
43
8
FJ6
54
43
9
FJ6
54
44
0
Iden
tifi
cati
on
Rh
izo
pu
s o
ryza
e
Asp
erg
illu
s t
erre
us
Ph
an
ero
cha
ete
chry
sosp
ori
um
Ga
lact
om
yces
geo
tric
um
Asp
erg
illu
s f
lavu
s
Nec
tria
m
au
riti
cola
Mic
rob
acte
riu
m s
p.
Pa
enib
aci
llu
s
uri
na
lis
Sta
ph
ylo
cocc
us
sp.
Bac
illu
s sp
.
Pse
ud
om
on
as
aeru
gin
osa
%
ho
mo
log
y
99
-10
0
97
96
-98
93
-99
99
99
-10
0
97
91
-94
97
97
98
F
val
ue
0.0
0.0
0.0
0.0
0.0
0.0
0.0
0.0
0.0
0.0
0.0
Qu
ery
cov
erag
e
99
%
90
%
95
%
70
-95
%
91
%
96
-97
%
97
%
97
%
99
%
99
%
97
%
Sco
re o
f
ho
mo
log
y
10
92
13
20-1
33
5
98
4-1
040
56
1-7
00
13
46-1
34
7
96
7-9
71
17
12-1
71
6
14
58-1
59
1
17
70-8
85
3
17
39
94
1-9
42
Acc
essi
on
nu
mb
ers
of
seq
uen
ces
giv
ing
ho
mo
log
y w
ith
tra
nsc
rip
t
EU
48
427
4.1
, E
U8
62
186
.1
FJ4
62
76
7.1
, F
J03
77
54
.1
AB
36
16
44
.1,
AB
36
16
45
.1
EF
15
91
52
.1, E
F0
879
83
.1
EF
66
15
66
.1, E
F6
615
64
.1
EU
74
783
4.1
, D
Q4
590
04
.1
EU
71
437
7.1
, E
U7
14
354
.1
EF
21
28
93
.1, A
F3
95
03
3.1
AP
00
67
16.1
, L
37
60
0.1
FJ6
41
03
6.1
, F
J64
10
17
.1
FJ7
95
68
7.1
, F
J37
41
25
.1
Iso
late
s
NA
1
NA
2
NA
3
NA
5
NA
9
NA
10
NA
23
NA
26
NA
28
NB
6
NB
26
Fu
ng
i
Bac
teri
a

Chapter 4 Results
50
Figure 4.5 Denaturing gradient gel electrophoresis (40%-60%) analysis of fungal
diversity with plastic films buried in soil for 8 months, used for
isolation of fungal strains (Lane 5, 6, 7, and 8).
1 2 3 4 5 6 7 8

Chapter 4 Results
51
4.5 BIODEGRADATION STUDIES OF POLYSTYRENE
Biodegradation of polystyrene was evaluated in the static and shake flask
fermentation experiments at 30ºC. Inoculum for experiments was prepared in 0.05%
Tween 20 solution to achieve uniform number of spores in each experiment.
4.5.1 Growth of Fungal Isolates on Polystyrene
The biodegradation ability of the selected fungal strains was individually analyzed by
their growth on PS film in MSM agar plates. Fungal growth was visible to the naked
eye on the surface of media after eight weeks treatment period (Fig. 4.6). ESEM
examination of the films showed mycellial growth and adherence of fungal isolates on
the surface of PS film. NA3 was not found to have profound growth on PS surface
(Fig. 4.7).
4.5.2 Sturm Test Analysis
Carbon dioxide evolution test also known as Sturm test was performed to establish
metabolic utilization of polystyrene by the selected fungal strains. After 4 weeks of
incubation at room temperature it was observed that there was more CO2 produced in
test containing the polymer films. The net metabolic CO2 produced as a result of
utilization of the carbon embedded in PS polymer chains was found to be highest for
P. chrysosporium NA3 (2.93 g/l). R. oryzae NA1 and A. terreus NA2 produced
almost similar amount of CO2 1.65 g/l and 1.42 g/l respectively as a result of PS
biodegradation (Table. 4.2).
4.5.3 Environmental Scanning Electron Microscopic (ESEM) Analysis
The adherence and growth of fungal isolates in shake flask conditions was observed
by environmental scanning electron microscopy (ESEM). The ESEM micrographs
showed profuse growth of fungal mycelia on polystyrene film in 8 weeks treated
samples with the three isolates (Fig. 4.8). The fungal isolates were able to adhere and
grow with PS.
4.5.4 Fourier Transform Infrared Spectroscopy (FTIR) Analysis
The Fourier Transform Infrared Spectroscopy (FTIR) analysis of films recovered in

Chapter 4 Results
52
static and shake flask experiments showed changes in intensities in different regions
of spectra showing some changes in the structure of PS due to biodegradation. FTIR
spectroscopy of the polystyrene film treated under 30ºC, 120rpm conditions by R.
oryzae NA1 showed increase in intensities at 528 cm-1
,702 cm-1
, 1215 cm-1
, 1365 cm-
1, 1735 cm
-1, 2326 cm
-1, 3024 cm
-1(aryl-H stretching vibrations)
and 3402 cm
-1(Fig.
4.9a). The highest intensities in these regions were observed at four and eight week
incubation period.
PS films treated with A. terreus NA2 showed increase in absorbance intensity at 536
cm-1
, 702 cm-1
(mono substituted aromatic compound), 1215 cm-1
, 1365 cm-1
, 1450
cm-1
, 1600 cm-1
(C=C stretching vibrations in aromatic ring), 1735 cm-1
, 2916 cm-1
,
3024 cm-1
(aryl-H stretching vibrations) in shake flask experiment (Fig. 4.9b) .
Significant increase was observed in absorption spectra of 4 and 8 week incubation
with A. terreus NA2.
P. chrysosporium NA3 treated PS samples in shake flasks showed changes in 536 cm-
1, 748 cm
-1(mono substituted aromatic compound), 1215 cm
-1, 1365 cm
-1, 1450 cm
-1,
1600 cm-1
(C=C stretching vibrations in aromatic ring), 1735 cm-1
, 2357 cm-1
, 3024
cm-1
(aryl-H stretching vibrations), 3313 cm-1
(Fig. 4.9c). There were more obvious
changes observed at 4, 8 and 16 week treatment periods with P. chrysosporium NA3.
When polystyrene films were treated in liquid media in static conditions by the three
fungal isolates R. oryzae NA1, A. terreus NA2 and P. chrysosporium NA3, FTIR
absorption spectra showed similar changes of increased intensities around 100-1200
cm-1
, 1735 cm-1
and 3000 cm-1
and 3400 cm-1
regions were observed (Fig. 4.10).
4.5.5 Gel Permeation Chromatography (GPC) Analysis
The changes in molecular weight due to biodegradation of pure polystyrene were
studied by Gel Permeation chromatography (GPC). The weight average molecular
weight (Mw) of the control polystyrene film was 243086 Da, while the Mw after 8
week fungal treatment in shaking conditions were 246252 Da, 302013 Da, 245528 Da
when treated by R. oryzae NA1, A. Terreus NA2 and P. chrysosporium NA3
respectively. The number average molecular weight (Mn) of control was observed as
72318 Da. The Mn of R. oryzae NA1, A. terreus NA2 and P. chrysosporium NA3
were 103263 Da, 154057 Da, and 111188 Da respectively. There was a decrease in

Chapter 4 Results
53
polydispersity (Mw/Mn) after treatment. A. terreus NA2 showed lowest
polydespersity (1.96) followed by P. chrysosporium NA3 (2.208) and R. oryzae NA1
(2.385) as compared to untreated control (3.361) (Table 4.3).
4.5.6 Nuclear Magnetic Resonance (NMR) Analysis
Proton nuclear magnetic resonance (1H-NMR) spectra showed aliphatic protons (-CH-
CH2-CH-) of PS in the 1-2 ppm signal region. The aromatic protons of PS gave
signals around 6-7 ppm. The increase in number of peaks was observed in the two
regions. In both shake flask and static condition maximum change in NMR spectra
was observed in the PS film treated by P. chrysosporium NA3 followed by A. terreus
NA2 (Fig. 4.11 and Fig. 4.12).
4.5.7 High Pressure Liquid Chromatography (HPLC) Analysis
High pressure liquid chromatography (HPLC) analysis was employed to detect the
biodegradation products in the extracellular media. 1-phenyl-1,2-ethandiol was
detected in 16 week incubated shake flask media sample of R. oryzae NA1, while it
was present in all the samples (8-16 week) of A. terreus NA2 and P. chrysosporium
NA3 (Fig. 4.13a). The highest concentration (21 ppm) was found in 4 week incubated
media sample of A. terreus NA2. 1-phenyl-1,2-ethandiol was found in all the samples
of static conditions with highest concentration (34.6 ppm) in 4 weeks sample of
biodegradation experiment with P. chrysosporium NA3 (Fig. 4.13b). 2-phenylethanol
(2.5 ppm) was observed in 8 week incubated shake flask media sample and 4 week
incubated static condition sample (2.9 ppm) of P. chrysosporium NA3.

Chapter 4 Results
54
Figure 4.6 Growth of fungal isolates on PS in MSM agar plates after 8 weeks
incubation period at 30ºC, PS film on surface, R. oryzae NA1 (a), A.
terreus NA2 (b), P. chrysosporium NA3 (c), Polystyrene film partially
submerged in media and checked for growth of R. oryzae NA1 (d), A.
terreus NA2 (e) and P. chrysosporium NA3 (f) on agar plate.
(a) (b) (c)
(d) (e) (f)

Chapter 4 Results
55
Figure 4.7 Environmental Scanning Electron Micrographs of PS films inoculated
on MSM agar plates after 8 weeks incubation period with R. oryzae
NA1 (a) A. terreus NA2 and (b) P. chrysosporium NA3 (c) (1000x).
(a)
(b)
(c)

Chapter 4 Results
56
Table 4.2 CO2 evolved in 8 weeks duration of biodegradation of PS by R. oryzae
NA1, A. terreus NA2 and P. chrysosporium NA3 measured
gravimetrically by Sturm test (Test; PS as sole Carbon source, Control;
no carbon source)
Fungal
isolate
CO2 Produced in
TEST (g/l)
CO2 Produced in
CONTROL(g/l)
CO2 Evolved due to
biodegradation (g/l)
NA1 19.81 + 0.94 18.16 + 0.63 1.65 + 0.35
NA2 4.06 + 0.71 2.64 + 0.43 1.42 + 0.27
NA3 6.47 + 0.91 3.50 + 0.78 2.97 + 0.45

Chapter 4 Results
57
Figure 4.8 Environmental scanning electron micrographs of PS films control (a),
treated with R. oryzae NA1 (b), A. terreus NA2 (c) and P.
chrysosporium NA3 (d) in shaker (30ºC, 120rpm) for 8 weeks (2000x).
(b) (a)
(c) (d)

Chapter 4 Results
58
(a)
(b)
(c)
Figure 4.9 FTIR spectra of PS treated with R. oryzae NA1 (a), A. terreus NA2 (b)
and P. chrysosporium NA3 (c) in shaker (30ºC, 120rpm) for 4 weeks
(w4), 8 weeks (w8) and 12 weeks (w12) along with untreated control.
-0.05
-1E-16
0.05
0.1
0.15
0.2
0.25
0.3
500 1000 1500 2000 2500 3000 3500
Ab
so
rban
ce
Wavenumber cm-
4w
8w
12w
16w
control
536
12151365
1735
2326
3024
-0.05
0
0.05
0.1
0.15
0.2
0.25
0.3
500 1000 1500 2000 2500 3000 3500
Ab
so
rban
ce
Wavenumber cm-
w4
w8
w12
w16
control
12151365
1735
2326
3024
536
-0.05
0
0.05
0.1
0.15
0.2
0.25
0.3
500 1000 1500 2000 2500 3000 3500
Ab
sorb
ance
Wavenumber cm-
w4
w8
w12
w16
control
1735
13651215
536
2326
2912
3359

Chapter 4 Results
59
(a)
(b)
(c)
Figure 4.10 FTIR spectra of PS treated with R. oryzae NA1 (a), A. terreus NA2 (b)
and P. chrysosporium NA3 (c) in static conditions (30ºC) for 4 weeks
((w4), 8 weeks (w8)) and 12 weeks (w12) along with untreated control.
-0.05
0
0.05
0.1
0.15
500 1000 1500 2000 2500 3000 3500
Ab
sorb
ance
Wavenumber cm-
Control
w4
w8
w12
1029
16272322
3302
-0.05
0
0.05
0.1
0.15
0.2
500 1000 1500 2000 2500 3000 3500
Ab
sorb
ance
Wavenumber cm-
Control
w4
w8
w12
10261612 3325
-0.05
0
0.05
0.1
0.15
0.2
500 1000 1500 2000 2500 3000 3500
Ab
sorb
ance
Wavenumber cm-
Control
w4
w8
w12
1026
16083352

Chapter 4 Results
60
Table 4.3 Gel permeation chromatography analysis of PS films treated with
fungal isolates after 8 weeks incubation at 30ºC, 120rpm
Treatment with
Weight average
molecular weight
Mw (Daltons)
Number average
molecular weight
Mn (Daltons)
Polydispersity
(Mw/Mn)
No fungus (PS control) 243086 72318 3.361
R. oryzae NA1 246252 103263 2.385
A. terreus NA2 302013 154057 1.96
P. chrysosporium NA3 245528 111188 2.208

Chapter 4 Results
61
Figure 4.11 1H-NMR analysis of Polystyrene control (a) treated with R. oryzae
NA1 (b) A. terreus NA2 (c) and P. chrysosporium NA3 (d) in shaker (30ºC, 120rpm)
for 8 weeks.

Chapter 4 Results
62
Figure 4.12 1H-NMR analysis of PS control (a) treated with R. oryzae NA1 (b) A.
terreus NA2 (c) and P. chrysosporium NA3 (d) in static conditions
(30ºC) for 8 weeks.
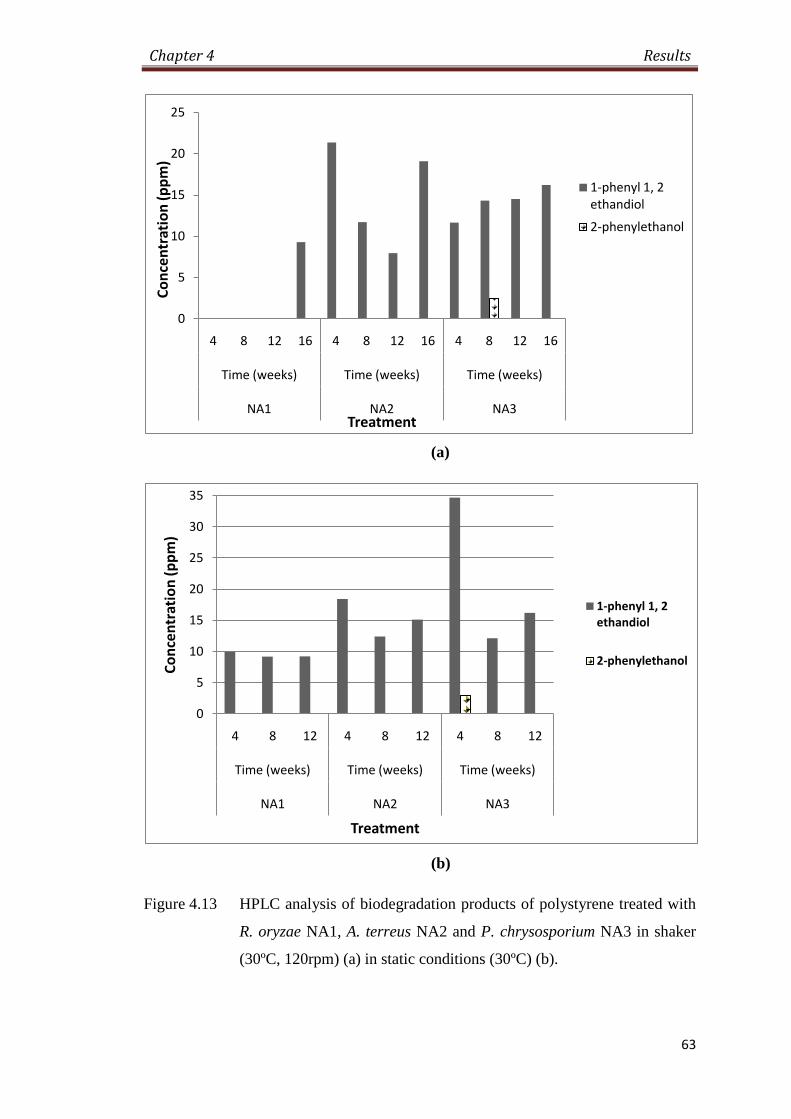
Chapter 4 Results
63
(a)
(b)
Figure 4.13 HPLC analysis of biodegradation products of polystyrene treated with
R. oryzae NA1, A. terreus NA2 and P. chrysosporium NA3 in shaker
(30ºC, 120rpm) (a) in static conditions (30ºC) (b).
0
5
10
15
20
25
4 8 12 16 4 8 12 16 4 8 12 16
Time (weeks) Time (weeks) Time (weeks)
NA1 NA2 NA3
Co
nce
ntr
atio
n (
pp
m)
Treatment
1-phenyl 1, 2 ethandiol
2-phenylethanol
0
5
10
15
20
25
30
35
4 8 12 4 8 12 4 8 12
Time (weeks) Time (weeks) Time (weeks)
NA1 NA2 NA3
Co
nce
ntr
atio
n (
pp
m)
Treatment
1-phenyl 1, 2 ethandiol
2-phenylethanol

Chapter 4 Results
64
4.6 BIODEGRADATION STUDIES OF EXPANDED POLYSTYRENE FILMS
Biodegradation of expanded polystyrene (EPS) in the form of thin films was
evaluated in order to determine whether the fungal isolates are able to grow and
degrade expanded polystyrene.
4.6.1 Fourier Transform Infrared Spectroscopy (FTIR) analysis
The FTIR analysis of films recovered in static and shake flask experiments was
carried out in order to determine the structural changes in EPS films. The FTIR
spectra showed increased absorbance intensities in different regions indicating
changes in the structure of EPS due to biodegradation. The EPS film samples treated
in shake flask conditions with R. oryzae NA1 showed increased absorbance at 1450
cm-1
, 2908 cm-1
after 12 week treatment (Fig. 4.14a), while in static conditions the
changes were observed at 536 cm-1
, 744 cm-1
(mono substituted aromatic compound),
1022 cm-1
, 1450 cm-1
, 1597 cm-1
, 1608 cm-1
(C=C stretching vibrations in aromatic
ring), 3255 cm-1
showing maximum increase after 12 week treatment (Fig. 4.15a).
A. terreus NA2 treated EPS films showed increase in absorbance intensity at 1022 cm-
1, 1450 cm
-1, 2908 cm
-1 after 12 week treatment in shake flask experiment (Fig. 4.14b)
while biodegradation experiment in static conditions the intensities increased at 536
cm-1
, 744 cm-1
(mono substituted aromatic compound), 1022 cm-1
, 1450 cm-1
, 1597
cm-1
, 1604 cm-1
(C=C stretching vibrations in aromatic ring), 3378 cm-1
(Fig. 4.15b).
P. chrysosporium NA3 treated EPS samples in shake flasks exhibited increase in
absorption peaks at 1026 cm-1
, 1450 cm-1
, 3024 cm-1
(Fig. 4.14c). There was no
significant difference in FTIR spectra of week 4 and 12. In static conditions the EPS
films treated with P. chrysosporium NA3 showed changes in FTIR spectra at 536 cm-
1, 744 cm
-1(mono substituted aromatic compound), 1072 cm
-1, 1450 cm
-1, 1608 cm
-
1(C=C stretching vibrations in aromatic ring), 3224 cm
-1(Fig. 4.15c). The changes in
spectra were more evident in 4 and 8 week treated samples.
4.6.2 Gel Permeation Chromatography (GPC) Analysis
The weight average molecular weight (Mw) determined by gel permeation
chromatography (GPC) showed a marked decrease in EPS film samples after 8 weeks
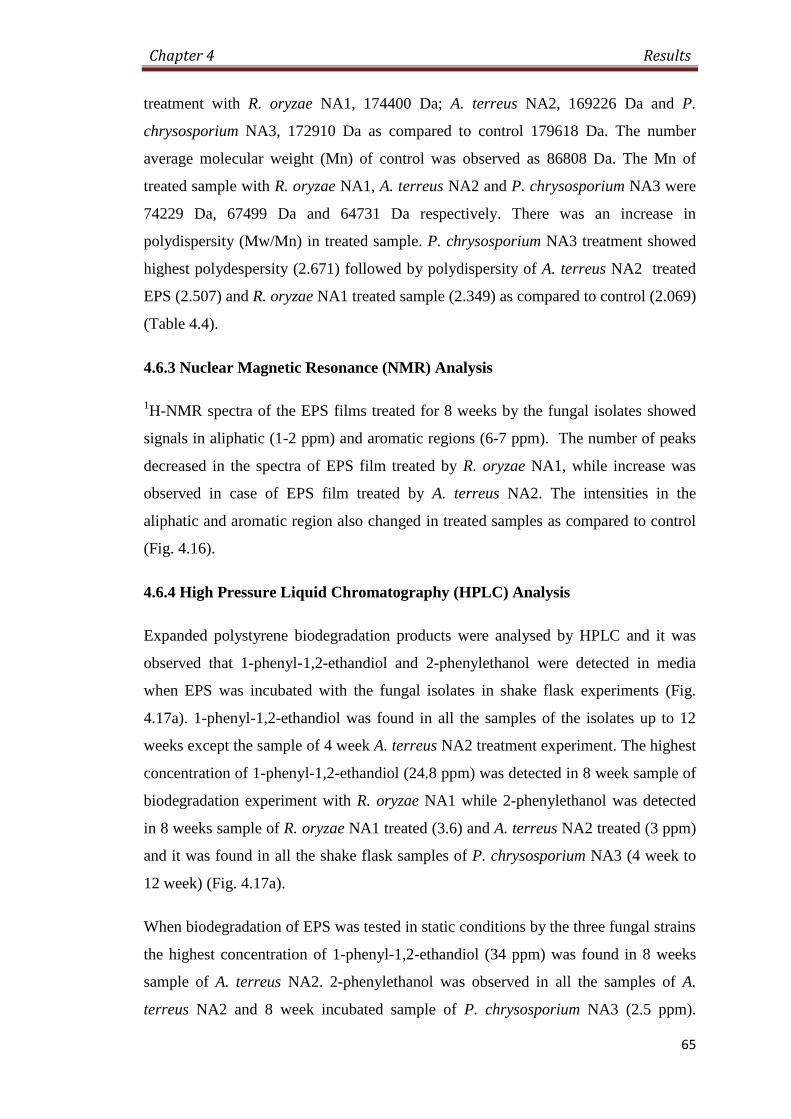
Chapter 4 Results
65
treatment with R. oryzae NA1, 174400 Da; A. terreus NA2, 169226 Da and P.
chrysosporium NA3, 172910 Da as compared to control 179618 Da. The number
average molecular weight (Mn) of control was observed as 86808 Da. The Mn of
treated sample with R. oryzae NA1, A. terreus NA2 and P. chrysosporium NA3 were
74229 Da, 67499 Da and 64731 Da respectively. There was an increase in
polydispersity (Mw/Mn) in treated sample. P. chrysosporium NA3 treatment showed
highest polydespersity (2.671) followed by polydispersity of A. terreus NA2 treated
EPS (2.507) and R. oryzae NA1 treated sample (2.349) as compared to control (2.069)
(Table 4.4).
4.6.3 Nuclear Magnetic Resonance (NMR) Analysis
1H-NMR spectra of the EPS films treated for 8 weeks by the fungal isolates showed
signals in aliphatic (1-2 ppm) and aromatic regions (6-7 ppm). The number of peaks
decreased in the spectra of EPS film treated by R. oryzae NA1, while increase was
observed in case of EPS film treated by A. terreus NA2. The intensities in the
aliphatic and aromatic region also changed in treated samples as compared to control
(Fig. 4.16).
4.6.4 High Pressure Liquid Chromatography (HPLC) Analysis
Expanded polystyrene biodegradation products were analysed by HPLC and it was
observed that 1-phenyl-1,2-ethandiol and 2-phenylethanol were detected in media
when EPS was incubated with the fungal isolates in shake flask experiments (Fig.
4.17a). 1-phenyl-1,2-ethandiol was found in all the samples of the isolates up to 12
weeks except the sample of 4 week A. terreus NA2 treatment experiment. The highest
concentration of 1-phenyl-1,2-ethandiol (24.8 ppm) was detected in 8 week sample of
biodegradation experiment with R. oryzae NA1 while 2-phenylethanol was detected
in 8 weeks sample of R. oryzae NA1 treated (3.6) and A. terreus NA2 treated (3 ppm)
and it was found in all the shake flask samples of P. chrysosporium NA3 (4 week to
12 week) (Fig. 4.17a).
When biodegradation of EPS was tested in static conditions by the three fungal strains
the highest concentration of 1-phenyl-1,2-ethandiol (34 ppm) was found in 8 weeks
sample of A. terreus NA2. 2-phenylethanol was observed in all the samples of A.
terreus NA2 and 8 week incubated sample of P. chrysosporium NA3 (2.5 ppm).

Chapter 4 Results
66
Styrene oxide was detected in 4 week (11 ppm) and 8 week (8.5 ppm) sample of A.
terreus NA2 treated sample in static conditions (Fig. 4.17b).

Chapter 4 Results
67
(a)
(b)
(c)
Figure 4.14 FTIR spectra of EPS treated with R. oryzae NA1 (a) A. terreus NA2
(b) and P. chrysosporium NA3 (c) in shaker (30ºC, 120rpm) for 4
weeks ((w4), 8 weeks (w8)) and 12 weeks (w12) along with untreated
control.
-0.05
0
0.05
0.1
0.15
0.2
500 1000 1500 2000 2500 3000 3500
Ab
sorb
ance
Wavenumber cm-
Control
w4
w12
1450
2908
-0.05
0
0.05
0.1
0.15
0.2
0.25
500 1000 1500 2000 2500 3000 3500
Ab
sorb
ance
Wavenumber cm-
control
w4
w12
1022 2908
1450
-0.03
-0.01
0.01
0.03
0.05
0.07
0.09
0.11
0.13
0.15
500 1000 1500 2000 2500 3000 3500
Ab
sorb
ance
Wavenumber cm-
control
w4
w12
10261450
3224

Chapter 4 Results
68
(a)
(b)
(c)
Figure 4.15 FTIR spectra of EPS treated with R. oryzae NA1 (a) A. terreus NA2
(b) and P. chrysosporium NA3 (c) in static conditions (30ºC) for 4
weeks (w4), 8 weeks (w8) and 12 weeks (w12).
-0.05
0
0.05
0.1
0.15
0.2
0.25
0.3
0.35
0.4
500 1000 1500 2000 2500 3000 3500
Ab
sorb
ance
Wavenumber cm-
Control
w4
w8
w12
536
1022
1450
1597
16083255
744
-0.05
0
0.05
0.1
0.15
0.2
0.25
0.3
500 1000 1500 2000 2500 3000 3500
Ab
sorb
ance
Wavenumber cm-
control
w4
w8
w12
536
1022
1450
1597
1604
3378
744
-0.05
0
0.05
0.1
0.15
0.2
0.25
500 1000 1500 2000 2500 3000 3500
Ab
sorb
ance
Wavenumber cm-
control
w4
w8
w12
536
1072
1450
1608
3224
744

Chapter 4 Results
69
Table 4.4 Gel permeation chromatography analysis of EPS films treated with
fungal isolates after 8 weeks incubation at 30ºC, 120rpm
Treatment with
Weight average
molecular weight
Mw (Daltons)
Number average
molecular weight
Mn (Daltons)
Polydispersity
(Mw/Mn)
No fungus (EPS control) 179618 86808 2.069
R. oryzae NA1 174400 74229 2.349
A. terreus NA2 169226 67499 2.507
P. chrysosporium NA3 172910 64731 2.671

Chapter 4 Results
70
Figure 4.16 1H-NMR analysis of EPS film control (a) treated with R. oryzae NA1
(b) A. terreus NA2 (c) and P. chrysosporium NA3 (d) in static
conditions (30ºC) for 8 weeks.
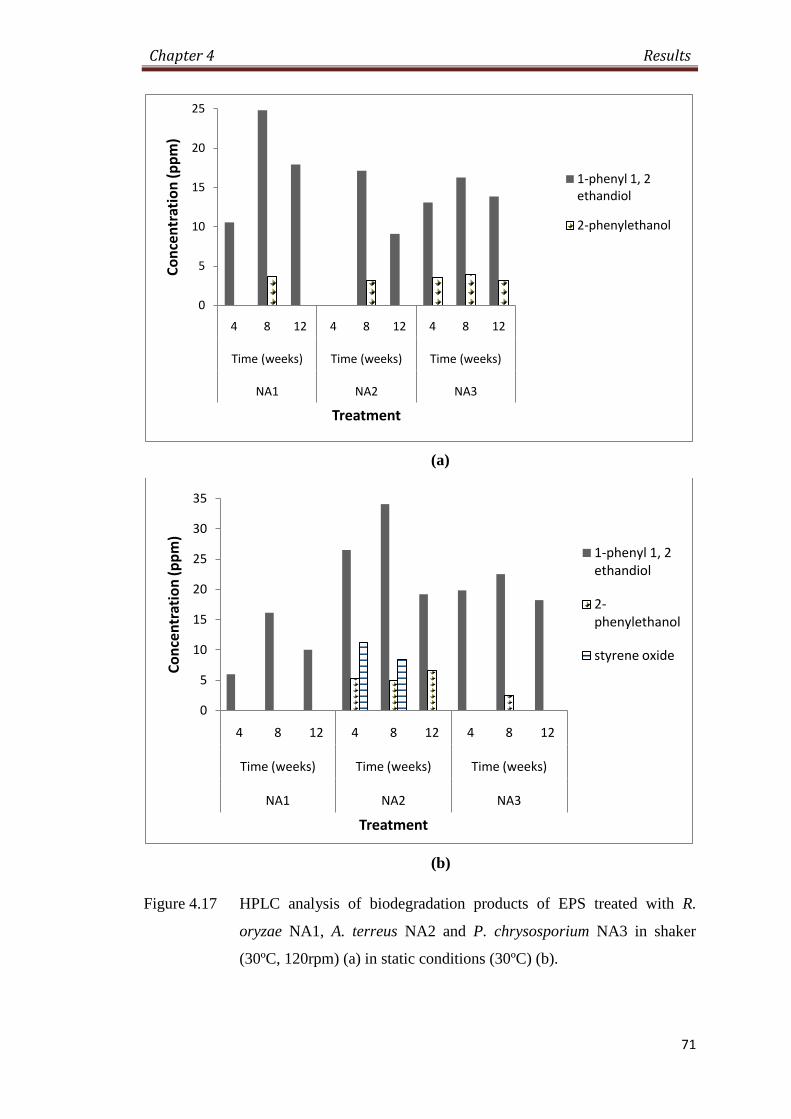
Chapter 4 Results
71
(a)
(b)
Figure 4.17 HPLC analysis of biodegradation products of EPS treated with R.
oryzae NA1, A. terreus NA2 and P. chrysosporium NA3 in shaker
(30ºC, 120rpm) (a) in static conditions (30ºC) (b).
0
5
10
15
20
25
4 8 12 4 8 12 4 8 12
Time (weeks) Time (weeks) Time (weeks)
NA1 NA2 NA3
Co
nce
ntr
atio
n (
pp
m)
Treatment
1-phenyl 1, 2 ethandiol
2-phenylethanol
0
5
10
15
20
25
30
35
4 8 12 4 8 12 4 8 12
Time (weeks) Time (weeks) Time (weeks)
NA1 NA2 NA3
Co
nce
ntr
atio
n (
pp
m)
Treatment
1-phenyl 1, 2 ethandiol
2-phenylethanol
styrene oxide

Chapter 4 Results
72
4.7 BIODEGRADATION STUDIES OF EXPANDED POLYSTYRENE (EPS)
BEADS
Biodegradability of expanded polystyrene in beads form, was determined in the static
and shake flask conditions at 30ºC.
4.7.1 Growth of Fungal Isolates on EPS Beads
The biodegradation capability of the selected fungal strains was individually analyzed
by their growth on EPS beads in MSM agar Media. Fungal growth was visible to the
naked eye on the surface of EPS beads after eight weeks treatment period (Fig. 4.18).
The colour of the media also changed from pale yellow to dark brown by R. oryzae
NA1, deep yellow by A. terreus NA2 and P. chrysosporium NA3.
4.7.2 Environmental Scanning Electron Microscopic (ESEM) Analysis
The growth of fungal isolates on EPS bead surface in static conditions was observed
by environmental scanning electron microscopy (ESEM) (Fig. 4.19). The ESEM
micrographs showed dense growth of fungal mycelia on EPS beads after 8 weeks
incubation with the fungal isolates (Fig. 4.20). The fungal isolates were able to
colonize EPS in beads form.
4.7.3 Gel Permeation Chromatography (GPC) Analysis
The changes at molecular level brought about by biodegradation of EPS beads were
analyzed by Gel Permeation chromatography (GPC). The observed weight average
molecular weight (Mw) of the control EPS bead was 196859 Da, while the Mw after 8
week fungal treatment in static conditions were 208169 Da, 198066 Da and 195050
Da when treated by R. oryzae NA1, A. terreus NA2 and P. chrysosporium NA3
respectively. The number average molecular weight (Mn) of control was observed as
92823 Da. The Mn of samples treated with R. oryzae NA1, A. terreus NA2 and P.
chrysosporium NA3 were 101668 Da, 107553 Da and 87588 Da respectively. The
polydispersity (Mw/Mn) of EPS bead treated by A. terreus NA2 was found to be the
lowest (1.842), followed by R. oryzae NA1 (2.048) as compared to control (2.121).
The polydispersity of EPS bead treated by P. chrysosporium NA3 was 2.227 (Table
4.5).

Chapter 4 Results
73
4.7.4 Nuclear Magnetic Resonance (NMR) Analysis
Proton nuclear magnetic resonance (1H-NMR) spectra of EPS beads after fungal
treatment also showed two distinct regions i.e. aliphatic and aromatic. Increase in
number of peaks and height of peak was observed in treated samples as compared to
control. Maximum changes were observed in spectra of EPS bead treated with P.
chrysosporium NA3 (Fig. 4.21).
4.7.5 High Pressure Liquid Chromatography (HPLC) Analysis
High pressure liquid chromatography (HPLC) analysis of the broth of EPS beads
degradation experiments by selected fungal isolates showed the presence of 1-phenyl-
1,2-ethandiol in the extracellular media of all the samples (shaking and static) in
varying concentrations. 2-phenylethanol was detected in all the shake flask samples (4
and 8 week) except 8 week sample of EPS beads incubated with R. oryzae NA1.
Styrene oxide (3.6 ppm) was detected in 4 week sample of A. terreus NA2 treatment
in shaking conditions (Fig. 4.22a). In static conditions samples from two sets of
experiments (250ml and 1l volume) were analyzed. The 250 ml flask samples
incubated under static experiment contained1-phenyl-1,2-ethandiol and 2-
phenylethanol in all the samples (4-12 week) except with R. oryzae NA1 that didn’t
contain any biodegradation product at 12 week incubation (Fig. 4.22b).
In 1l flask samples 1-phenyl-1,2-ethandiol was present in all the samples (4-11 week)
with highest concentration of 36.8 ppm in 4 week sample when EPS was treated with
P. chrysosporium NA3 (Fig. 4.22b). The product 2-phenylethanol was present in 4
week treated sample by R. oryzae NA1 and all the samples of treatment by A. terreus
NA2 and P. chrysosporium NA3. Phenylacetaldehyde was detected in 4 week (9.9
ppm), 8 week (11.9 ppm) and 11 week (7.7 ppm) samples of A. terreus NA2. Styrene
oxide was detected in 4 weeks samples of R. oryzae and A. terreus NA2 at
concentration of 2 ppm, 1.7 ppm respectively. Styrene oxide was present in 4 (1.5
ppm) and 8 week (3.7 ppm) samples of P. chrysosporium NA3 treated experiment.

Chapter 4 Results
74
Figure 4.18 Growth of fungal isolates on EPS beads in mineral salt media agar
plates after 8 weeks of incubation at 30ºC in static conditions control
(no fungi) (a) inoculated with R. oryzae NA1 (b) A. terreus NA2 (c)
and P. chrysosporium NA3 (d).
(c) (d)
(a) (b)

Chapter 4 Results
75
Figure 4.19 Environmental scanning electron micrographs of EPS beads control
(a), treated with R. oryzae NA1 (b), A. terreus NA2 (c) and P.
chrysosporium NA3 (d) in static conditions (30ºC) for 8 weeks (70x)
a b
c d
Chapter 4 Results
76
Figure 4.20 Environmental scanning electron micrographs of EPS beads control
(a), treated with R. oryzae NA1 (b), A. terreus NA2 (c) and P.
chrysosporium NA3 (d) in static conditions (30ºC) for 8 weeks (2000x)
b
a
c d

Chapter 4 Results
77
Table 4.5 Gel permeation chromatography analysis of EPS beads treated with
fungal isolates after 8 weeks incubation at 30ºC
Treatment with
Weight average
molecular weight
Mw (Daltons)
Number average
molecular weight
Mn (Daltons)
Polydispersity
(Mw/Mn)
No fungus (EPS control) 196859 92823 2.121
R. oryzae NA1 208169 101668 2.048
A. terreus NA2 198066 107553 1.842
P. chrysosporium NA3 195050 87588 2.227

Chapter 4 Results
78
Figure 4.21 1H-NMR analysis of EPS beads control (a), treated with R. oryzae
NA1(b), A. terreus NA2 (c) and P. chrysosporium NA3 (d) in static
conditions (30ºC) for 8 weeks

Chapter 4 Results
79
(a)
(b)
Figure 4.22 HPLC analysis of EPS beads treated with R. oryzae NA1, A. terreus
NA2 and P. chrysosporium NA3 in shaker (30ºC, 120rpm) (a), in static
conditions (30ºC) (b) for the degradation products 1-phenyl-1,2-
ethandiol, 2-phenylethanol, phenylacetaldehyde and styrene oxide.
0
5
10
15
20
25
30
4 8 4 8 4 8
Time (weeks) Time (weeks) Time (weeks)
NA1 NA2 NA3
Co
nce
ntr
atio
n (
pp
m)
Treatment
1-phenyl 1, 2 ethandiol
2-phenylethanol
styrene oxide
0
5
10
15
20
25
30
35
40
4 8 12 4 8 12 4 8 12 4 8 11 4 8 11 4 8 11
Time (weeks)
Time (weeks)
Time (weeks)
Time (weeks)
Time (weeks)
Time (weeks)
NA1 NA2 NA3 NA1 NA2 NA3
250ml flask 1l flask
Co
nce
ntr
atio
n (p
pm
)
Treatment
1-phenyl 1, 2 ethandiol
2-phenylethanol
phenylacetaldehyde
styrene oxide

Chapter 4 Results
80
4.8 BIODEGRADATION OF POLYSTYRENE FILMS PRETREATED BY
UV RADIATION
On the basis of the hypothesis that a preliminary treatment causing oxidation of the
polymer will enhance the biodegradation process, the PS samples were treated with
UV light for 1 and 2 hours and studied for the biodegradation by the selected fungal
isolates in shake flask conditions.
4.8.1 Fourier Transform Infrared Spectroscopy (FTIR) analysis
The Fourier Transform Infrared Spectroscopy (FTIR) analysis of films exhibited
increase in intensities in different regions of spectra demonstrating changes in the
structure of PS due to biodegradation when compared to UV treated control. R. oryzae
NA1 treated UV 1 hr. samples showed increase in intensities at 536 cm-1
, 748 cm-1
,
1026 cm-1
, 1361 cm-1
, 1450 cm-1
(C=C stretching vibration of aromatic compounds),
1735 cm-1
, 3313 cm-1
in 8 weeks sample (Fig.4.23a). In UV 2hr. 8 week treated
sample with R. oryzae NA1 the intensities of absorbance increased at 536 cm-1
, 748
cm-1
, 1450 cm-1
and 2912 cm-1
(Fig.4.24a).
PS UV 1hr. pre-treated films incubateded with A. terreus NA2 showed increase in
absorbance intensity at 536 cm-1
, 744 cm-1
, 1022 cm-1
, 1450 cm-1
, 1597 cm-1
in shake
flask experiment(Fig.4.23b) . The UV 2hr. pretreated demonstrated pronounced
increase around 500- 1600 cm-1
, 2357 cm-1
, 2800- 3000 cm-1
and 3400 cm-
1(Fig.4.24b).
P. chrysosporium NA3 caused the increased absorbance in UV 1hr. pre treated PS
samples in shake flasks at 500-1600 cm-1
, 2357 cm-1
, 2800 - 3000 cm-1
and 3400 cm-1
(Fig.4.23c). There was less increase in peak intensity as compared to other isolates in
UV 2hr. samples (Fig.4.24c).
4.8.2 Gel Permeation Chromatography (GPC) Analysis
The changes in molecular weight of the UV pretreated PS due to biodegradation were
studied by Gel Permeation chromatography (GPC). The weight average molecular
weight (Mw) of the UV pretreated control polystyrene film was 245356 Da. The
lowest Mw was found after UV 1hour treatment by A. terreus NA2 (223818 Da). In

Chapter 4 Results
81
UV 2hour treated samples the lowest Mw was found in the sample incubated with A.
terreus NA2 (220418 Da) as compared to control (250833 Da). The number average
molecular weight (Mn) decreased in all the UV 2hour pretreated samples incubated
with the fungal isolates (Table 4.6).
4.8.3 Nuclear Magnetic Resonance (NMR) Analysis
Proton nuclear magnetic resonance (1H-NMR) spectra of UV 1hour irradiated PS
showed increase in number of peaks in aliphatic and aromatic signal region after
treatment with the fungal isolates. Maximum number of peaks in NMR spectra was
found in the PS film treated by P. chrysosporium NA3 followed by R. oryzae NA1
(Fig. 4.25). The UV 2hour pretreated samples showed decrease in number of peaks
after incubation with R. oryzae NA1 and A. terreus NA2 while increase in case of P.
chrysosporium NA3 treatment (Fig. 4.26).
4.8.4 High Pressure Liquid Chromatography (HPLC) Analysis
HPLC analysis of the extracellular media of UV 1hour pretreated PS incubated with
the fungal isolates showed the presence of 1-phenyl-1,2-ethandiol and 2-
phenylethanol in all the samples of P. chrysosporium NA3 and 8 week sample of A.
terreus NA2 (Fig. 4.27a). In UV 2hour pretreated samples 1-phenyl-1,2-ethandiol and
2-phenylethanol were detected in the media incubated with P. chrysosporium NA3. 1-
phenyl-1,2-ethandiol was present in 8 week sample of A. terreus NA2 and P.
chrysosporium NA3 treatment. 2-phenylethanol was present in broth of 8 week
sample of PS treated with A. terreus NA2 (Fig. 4.27b).

Chapter 4 Results
82
(a)
(b)
(c)
Figure 4.23 FTIR spectra of UV 1 hour pretreated PS incubated with R. oryzae
NA1 (a), A. terreus NA2 (b) and P. chrysosporium NA3 (c) in shaker
(30ºC, 120rpm) for 4 weeks (w4) and 8 weeks (w8) along with
untreated control.
-0.05
0
0.05
0.1
0.15
0.2
0.25
500 1000 1500 2000 2500 3000 3500 4000
Ab
sorb
ance
Wavenumber cm-
Control
w4
w8
536
1026
1450 1735
1361
3313
748
-0.05
0
0.05
0.1
0.15
0.2
0.25
500 1000 1500 2000 2500 3000 3500
Ab
sorb
ance
Wavenumber cm-
Control
w4
w8
536
1022
1450
1597
744
-0.1
0
0.1
0.2
0.3
0.4
500 1000 1500 2000 2500 3000 3500
Ab
sorb
ance
Wavenumber cm-
Control
w4
w8
744
14502904
536

Chapter 4 Results
83
(a)
(b)
Figure 4.24 FTIR spectra of UV 2 hour heat pretreated PS incubated with R. oryzae
NA1 (a), A. terreus NA2 (b) and P. chrysosporium NA3 (c) in shaker
(30ºC, 120rpm) for 4 weeks (w4) and 8 weeks (w8) along with
untreated control.
-0.05
0
0.05
0.1
0.15
0.2
0.25
0.3
500 1000 1500 2000 2500 3000 3500
Ab
sorb
ance
Wavenumber cm-
Control
w4
w8
532 748
1450
2912
-0.05
0
0.05
0.1
0.15
0.2
0.25
500 1000 1500 2000 2500 3000 3500
Ab
sorb
ance
Wavenumber cm-
Control
w4
w8
1026
1450
2916
532
1627
-0.05
0
0.05
0.1
0.15
0.2
0.25
500 1000 1500 2000 2500 3000 3500
Ab
sorb
ance
Wavenumber cm-
Control
w4
w8
1022
536
1450
2916
705
1597

Chapter 4 Results
84
Table 4.6 Gel permeation chromatographic analysis of UV pre-treated PS films
biodegraded by fungal isolates after 8 weeks incubation at 30ºC,
120rpm
UV 1hour Pre treated
polystyrene
Weight average
molecular weight
Number average
molecular weight
Polydispersity
Mw (Daltons) Mn (Daltons) (Mw/Mn)
With no fungus (control) 245356 94319 2.601
with R. oryzae NA1 244531 102720 2.381
with A. terreus NA2 223818 64118 3.491
with P. chrysosporium
NA3
226780 80186 2.828
UV 2 hour pre treated
polystyrene
Weight average
molecular weight
Number average
molecular weight
Polydispersity
Mw (Daltons) Mn (Daltons) (Mw/Mn)
With no fungus (control) 250833 121741 2.06
with R. oryzae NA1 222637 89219 2.495
with A. terreus NA2 220418 86755 2.541
with P. chrysosporium
NA3
227830 85399 2.668

Chapter 4 Results
85
Figure 4.25 1H-NMR analysis of UV 1hour pretreated PS control (a), treated with
R. oryzae NA1 (b), with A. terreus NA2 (c) and treated with P.
chrysosporium NA3 (d) in shaker (30ºC, 120rpm) for 8 weeks.
(a)
(b)
(c)
(d)

Chapter 4 Results
86
Figure 4.26 1H-NMR analysis of UV 2hour pretreated PS control (a), treated with
R. oryzae NA1 (b), with A. terreus NA2 (c) and treated with P.
chrysosporium NA3 (d) in shaker (30ºC, 120rpm) for 8 weeks.
(a)
(b)
(c)
(d)

Chapter 4 Results
87
(a)
(b)
Figure 4.27 HPLC analysis for the UV pre-treated Polystyrene biodegradation
products in culture broth of shake flask experiment (30ºC, 120rpm)
with R. oryzae NA1, A. terreus NA2 and P. chrysosporium NA3 for 8
weeks 1hour UV pre treated (a) 2hour UV pre treated (a).
0
2
4
6
8
10
12
14
16
18
4 8 4 8 4 8
Time (weeks) Time (weeks) Time (weeks)
NA1 NA2 NA3
Co
nce
ntr
atio
n (
pp
m)
Treatment
1-phenyl1, 2 ethandiol2-phenylethanol
0
2
4
6
8
10
12
14
16
4 8 4 8 4 8
Time (weeks) Time (weeks) Time (weeks)
NA1 NA2 NA3
Co
nce
ntr
atio
n (
pp
m)
Treatment
1-phenyl 1, 2 ethandiol
2-phenylethanol

Chapter 4 Results
88
4.9 HEAT PRE-TREATMENT OF POLYSTYRENE FILMS
Heat causes oxidation of the polymer which enhances the biodegradation process. The
PS samples were heat pre treated at 60ºC and 80ºC for 1 hour and then treated by the
selected fungal isolates in shake flask conditions. The results of degradability of PS
samples are as under.
4.9.1 Fourier Transform Infrared Spectroscopic (FTIR) Analysis
The Fourier Transform Infrared Spectroscopy (FTIR) analysis of heat pretreated PS
films incubated with the fungal isolates depicted increase in absorbance intensities in
500-1600 cm-1
, 2357 cm-1
, 2800 - 3000 cm-1
and 3400 cm-1
region (Fig. 4.28) with
maximum increase in 60ºC pretreated PS incubated with R. oryzae NA1 for 8 weeks.
In 80ºC heat treated samples maximum change was observed in P. chrysosporium
NA3 treated samples. Absorbance at 1083 cm-1
increased up to 1.66 after 8 weeks
treatment as compared to control 0.03 (Fig.4.29).
4.9.2 Gel Permeation Chromatography (GPC) Analysis
Gel Permeation chromatography (GPC) of 60ºC heat pretreated PS showed decrease
in polydispersity in A. terreus NA2 (2.45) and P. chrysosporium NA3 (2.87) treated
samples as compared to control (3.564) (Table 4.7). In 80ºC pretreated sample weight
average molecular weight (Mw) decreased in R. oryzae NA1 treated sample (218921
Da) as compared to control (220338 Da) while degradation experiments with A.
terreus NA2 and P. chrysosporium NA3 showed increased Mw. (Table 4.7).
4.9.3 Nuclear Magnetic Resonance (NMR) Analysis
Proton nuclear magnetic resonance (1H-NMR) spectra of heat pretreated PS showed
increase in number of peaks in aliphatic and aromatic signal region after treatment
with the fungal isolates. Maximum number of peaks in NMR spectra was found in the
PS film treated by P. chrysosporium NA3 followed by A. terreus NA2 in 60ºC heat
pre treated samples (Fig. 4.30). The 80ºC heat pretreated samples showed decrease in
number of peaks as compared to control in R. oryzae NA1 and A. terreus NA2 treated
samples (Fig. 4.31).

Chapter 4 Results
89
4.9.4 High Pressure Liquid Chromatography (HPLC) Analysis
HPLC analysis of the extracellular media of 60ºC pre-treated PS showed the presence
of 1-phenyl-1,2-ethandiol and 2-phenylethanol in 8 week sample of P. chrysosporium
NA3, R. oryzae NA1 and 4 week sample of A. terreus NA2 (Fig. 4.32a). In 80ºC
pretreated samples 1-phenyl-1,2-ethandiol was detected in all the media samples
except 8 week sample of R. oryzae NA1. The highest concentration of 1-phenyl-1,2-
ethandiol appeared in 8 week sample of P. chrysosporium NA3 (20.6 ppm). 2-
phenylethanol was detected in 4 and 8 week sample of A. terreus NA2.
Phenylacetaldehyde was detected in 4 week sample of P. chrysosporium NA3 (15
ppm) (Fig. 4.32b).

Chapter 4 Results
90
(a)
(b)
(c)
Figure 4.28 FTIR spectra of 60ºC 1hour heat pretreated PS incubated with R.
oryzae NA1 (a), A. terreus NA2 (b) and P. chrysosporium NA3(c) in
shaker (30ºC, 120rpm) for 4 weeks (w4) and 8 weeks (w8) along with
untreated control.
-0.05
0
0.05
0.1
0.15
0.2
0.25
0.3
500 1000 1500 2000 2500 3000 3500
Ab
sorb
ance
Wavenumber cm-
Control
4w
w8
744
1026
1450
2912
1712
-0.05
0
0.05
0.1
0.15
0.2
0.25
500 1000 1500 2000 2500 3000 3500
Ab
sorb
ance
Wavenumber cm-
Control
w4
w8
694
29081735
-0.05
0
0.05
0.1
0.15
0.2
0.25
500 1000 1500 2000 2500 3000 3500
Ab
sorb
ance
Wavenumber cm-
Control
w4
w8
686
1450
1735
536

Chapter 4 Results
91
(a)
(b)
(c)
Figure 4.29 FTIR spectra of 80ºC 1hour heat pretreated PS incubated with R.
oryzae NA1 (a), A. terreus NA2 (b) and P. chrysosporium NA3 (c) in
shaker (30ºC, 120rpm) for 4 weeks (w4) and 8 weeks (w8) along with
untreated control.
-0.05
0
0.05
0.1
0.15
0.2
0.25
500 1000 1500 2000 2500 3000 3500
Ab
sorb
ance
Wavenumber cm-
Control
w4
w8
744
1026 2912
-0.05
0
0.05
0.1
0.15
0.2
0.25
500 1000 1500 2000 2500 3000 3500
Ab
sorb
ance
Wavenumber cm-
Control
w4
w8
748536
1022 2908
1612
-0.05
0
0.05
0.1
0.15
0.2
0.25
0.3
500 1000 1500 2000 2500 3000 3500
Ab
sorb
ance
Wavenumber cm-
Control
w4
w8
536
10831446
1608
2904

Chapter 4 Results
92
Table 4.7 Gel permeation chromatography analysis of heat pre-treated PS films
biodegraded by fungal isolates after 8 weeks incubation at 30ºC,
120rpm
60ºC 1hr pre-treated
Polystyrene
Weight average
molecular
weight
Number average
molecular weight
Polydispersity
Mw (Daltons) Mn (Daltons) (Mw/Mn)
With no fungus (control) 205028 57521 3.564
with R. oryzae NA1 219191 61707 3.552
with A. terreus NA2 232386 94716 2.454
with P. chrysosporium
NA3
236557 82289 2.875
80ºC 1hr pre-treated
Polystyrene
Weight average
molecular
weight
Number average
molecular weight
Polydispersity
Mw (Daltons) Mn (Daltons) (Mw/Mn)
With no fungus (control) 220338 78865 2.794
with R. oryzae NA1 218921 63909 3.426
with A. terreus NA2 234435 89826 2.61
with P. chrysosporium
NA3
232142 73191 2.013

Chapter 4 Results
93
Figure 4.30 1H-NMR analysis of the broth of heat (60ºC, 1hour) pre treated PS
control with no fungal treatment (a) treated with R. oryzae NA1 (b) A.
terreus NA2 (c) and P. chrysosporium NA3 (d) in shaker (30ºC,
120rpm) for 8 weeks.
(a)
(b)
(c)
(d)
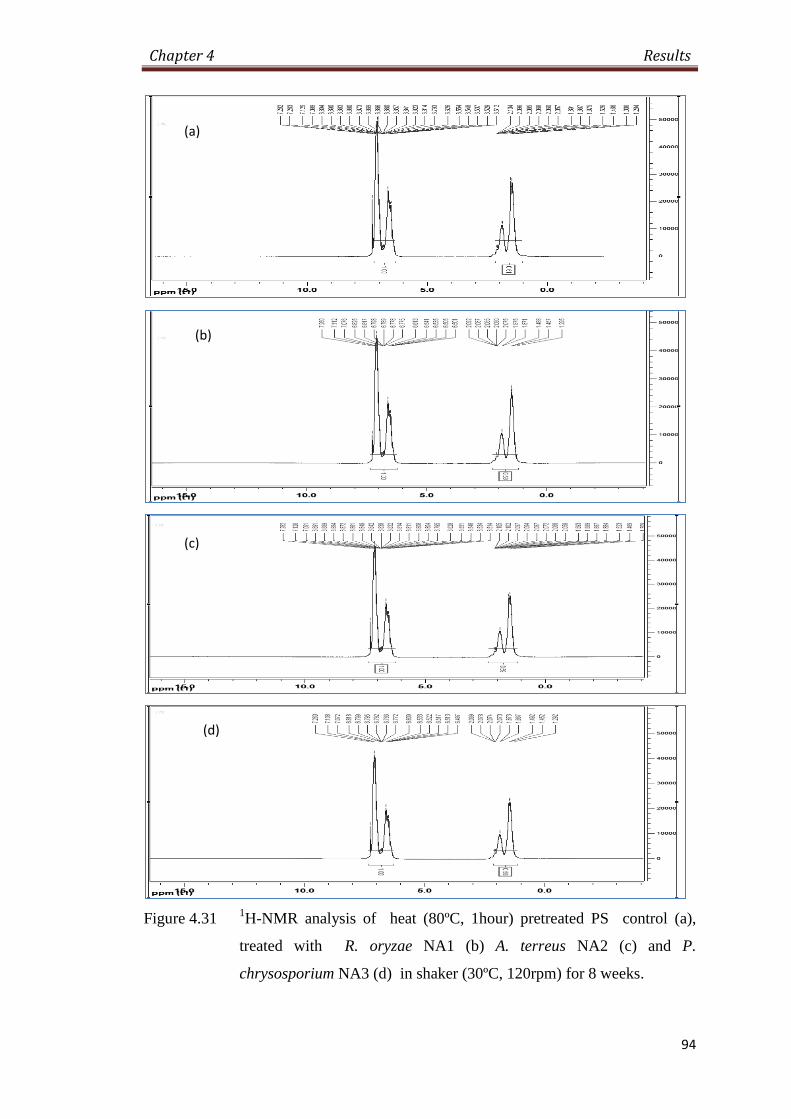
Chapter 4 Results
94
Figure 4.31 1H-NMR analysis of heat (80ºC, 1hour) pretreated PS control (a),
treated with R. oryzae NA1 (b) A. terreus NA2 (c) and P.
chrysosporium NA3 (d) in shaker (30ºC, 120rpm) for 8 weeks.
(a)
(b)
(c)
(d)

Chapter 4 Results
95
(a)
(b)
Figure 4.32 HPLC analysis of heat pre-treated PS incubated with R. oryzae NA1,
A. terreus NA2 and P. chrysosporium NA3 in shaker (30ºC, 120rpm)
for 8 weeks 60ºC 1hour heat treated (a), 80ºC 1hour heat treated (b), in
shaker (30ºC, 120rpm).
0
2
4
6
8
10
12
14
16
18
4 8 4 8 4 8
Time (weeks) Time (weeks) Time (weeks)
NA1 NA2 NA3
Co
nce
ntr
atio
n (
pp
m)
Treatment
1-phenyl1, 2 ethandiol
2-phenylethanol
0
5
10
15
20
25
4 8 4 8 4 8
Time (ppm) Time (ppm) Time (ppm)
NA1 NA2 NA3
Co
nce
ntr
atio
n (
pp
m)
Treatment
1-phenyl1, 2 ethandiol2-phenylethanol
phenylacetaldehyde

Chapter 4 Results
96
4.10 EFFECT OF GLUCOSE ON POLYSTYRENE BIODEGRADATION
PS films were biodegraded by fungal isolates with 0.01% and 0.1% glucose in media
to study the effect of additional carbon source on biodegradation process. Fungal
growth was more rapid and dense mycelium was visible around the PS films after
eight weeks treatment period.
4.10.1 Environmental Scanning Electron Microscopic (ESEM) Analysis
The growth of fungal isolates on PS film surface in shaking conditions was observed
by environmental scanning electron microscopy (ESEM) after 16 weeks of incubation
period. The ESEM micrographs showed abundant growth of fungal mycelia on PS
films (Fig. 4.33).
4.10.2 Fourier Transform Infrared Spectroscopy (FTIR) analysis
The Fourier Transform Infrared Spectroscopy (FTIR) analysis of PS films incubated
with the fungal isolates with added glucose showed increase in absorbance intensities
in 500-1600 cm-1
, 2357 cm-1
, 2800 - 3000 cm-1
and 3400 cm-1
region. There were
more changes in intensities of peaks in spectra of PS film samples of shake flask
experiment with R. oryzae NA1 and A. terreus NA2 with 0.01% glucose as compared
to the PS samples incubated with the same isolates static conditions (Fig. 4.34 and
Fig. 4.35). Similar spectral changes were observed in P. chrysosporium NA3 treated
samples with 0.01% glucose in shake flask and static conditions.
The PS samples incubated with P. chrysosporium NA3 with 0.1% glucose exhibited
more absorbance intensities in 500-1600 cm-1
, 2357 cm-1
, 2800 - 3000 cm-1
and 3400
cm-1
region, in shake flask conditions as compared to the other fungal isolates (Fig.
4.36). There were more pronounced modifications in the spectra of PS treated by A.
terreus NA2 with 0.1% glucose in static conditions at 12 week incubation period. The
region around 3400 cm-1
received more changes in treated samples as compared to
control (Fig. 4.37).

Chapter 4 Results
97
4.10.3 Gel Permeation Chromatography (GPC) Analysis
Gel Permeation chromatography (GPC) of PS treated by fungal isolates with 0.01%
glucose showed decrease in molecular weight and polydispersity as compared to
control (Table. 4.8). A. terreus NA2 treated PS film showed the lowest weight
average molecular weight (Mw) (229770 Da) with 0.01% glucose after 12 week
incubation as compared to control (243086 Da).
4.10.4 High Pressure Liquid Chromatography (HPLC) Analysis
In 0.01% added glucose conditions 2-phenylethanol was detected in all samples of P.
chrysosporium NA3 and A. terreus NA2 in shake flask experiments by HPLC
analysis (Fig. 4.38a). 1-phenyl-1,2-ethandiol was found in all samples of P.
chrysosporium NA3 and 8 week sample of A. terreus NA2 in shaking conditions with
added 0.01% glucose.
HPLC analysis of the extracellular media of 0.01% added glucose in static condition
showed the presence of 1-phenyl-1,2-ethandiol in all the samples except 8 week
sample of R. oryzae NA1 and 2-phenylethanol in 8 week sample of P. chrysosporium
NA3 (2.5 ppm). The highest concentration of 1-phenyl-1,2-ethandiol (11 ppm) was
observed in 8 week sample of P. chrysosporium NA3 (Fig. 4.38b).
The 0.1% added glucose condition 4 week sample of P. chrysosporium NA3 showed
the presence of 1-phenyl-1,2-ethandiol (19 ppm), 2-phenylethanol (8.3 ppm) and
styrene oxide (1.5 ppm), while A. terreus NA2 treated 4 week sample contained 1-
phenyl-1,2-ethandiol (16.7 ppm), 2-phenylethanol (2.9 ppm) (Fig. 4.39a). In static
conditions 1-phenyl-1,2-ethandiol was present in all the samples, 2-phenylethanol was
also detected in all samples except 4 week sample of R. oryzae NA1 and
Phenylacetaldehyde was present in all samples of A. terreus NA2 (Fig. 4.39b).

Chapter 4 Results
98
Figure 4.33 Environmental scanning electron micrographs of PS films control (a),
treated with R. oryzae NA1 (b), A. terreus NA2 (c) and P.
chrysosporium NA3 (d) with 0.01% glucose in media in shaker (30ºC,
120rpm) for 8 weeks (2000x).
(c) (d)
(a) (b)

Chapter 4 Results
99
(a)
(b)
(c)
Figure 4.34 FTIR spectra of PS incubated with R. oryzae NA1 (a), A. terreus NA2
(b) and P. chrysosporium NA3 (c) with 0.01% glucose, in shaker
(30ºC, 120rpm) for 4 weeks (w4) and 8 weeks (w8) along with
untreated control.
-0.05
0
0.05
0.1
0.15
0.2
500 1000 1500 2000 2500 3000 3500
Ab
sorb
ance
Wavenumber cm-
w4
w8
control
12151365
1735
-0.05
0
0.05
0.1
0.15
0.2
500 1000 1500 2000 2500 3000 3500
Ab
so
rba
nc
e
Wavenumber cm-
w4
w8
control12151361
17352912
-0.05
0
0.05
0.1
0.15
0.2
0.25
0.3
500 1000 1500 2000 2500 3000 3500
Ab
so
rba
nc
e
Wavenumber cm-
w4
w8
control
748
11991361 1735 2908

Chapter 4 Results
100
(a)
(b)
(c)
Figure 4.35 FTIR spectra of PS incubated with R. oryzae NA1 (a), A. terreus NA2
(b) and P. chrysosporium NA3 (c) with 0.01% glucose in static
conditions at 30ºC for 4 weeks (w4) and 8 weeks (w8) along with
untreated control.
-0.05
0
0.05
0.1
0.15
0.2
0.25
500 1000 1500 2000 2500 3000 3500
Ab
sorb
ance
Wavenumber cm-
control
w4
w8
1033
1627
2912
-0.05
0
0.05
0.1
0.15
0.2
500 1000 1500 2000 2500 3000 3500
Ab
sorb
ance
Wavenumber cm-
control
w4
w8
748
1450
1616
-0.05
0
0.05
0.1
0.15
0.2
500 1000 1500 2000 2500 3000 3500
Ab
sorb
ance
Wavenumber cm-
control
w4
w8
1029
748
1450
1616
2912

Chapter 4 Results
101
Figure 4.36 FTIR spectra of PS incubated with R. oryzae NA1, A. terreus NA2 and
P. chrysosporium NA3 with 0.1% glucose at 30ºC, 120rpm after 4
weeks.
-0.05
0
0.05
0.1
0.15
0.2
0.25
0.3
500 1000 1500 2000 2500 3000 3500
Ab
sorb
ance
Wavenumber cm-
Control
NA1
NA2
NA3
1450
1735
1026
748
2912
3024

Chapter 4 Results
102
(a)
(b)
(c)
Figure 4.37 FTIR spectra of PS incubated with R. oryzae NA1 (a), A. terreus NA2
(b) and P. chrysosporium NA3 (c) with 0.1% glucose in static
conditions at 30ºC for 4 weeks (w4), 8 weeks (w8) and 12 weeks
(w12) along with untreated control.
-0.05
0
0.05
0.1
0.15
0.2
0.25
0.3
500 1000 1500 2000 2500 3000 3500
Ab
sorb
ance
Wavenumber cm-
Control
w4
w8
w12
748
3217102
-0.2
-0.1
0
0.1
0.2
0.3
0.4
0.5
500 1000 1500 2000 2500 3000 3500
Ab
sorb
ance
Wavenumber cm-
control
w4
w8
w12
690
1002 16203217
-0.05
0
0.05
0.1
0.15
0.2
0.25
0.3
0.35
500 1000 1500 2000 2500 3000 3500
Ab
sorb
ance
Wavenumber cm-
control
w4
w8
w12
702
3294
1450
1597

Chapter 4 Results
103
Table 4.8 Gel permeation chromatography analysis of PS films treated with
fungal isolates with 0.01% glucose after 12 weeks incubation at 30ºC,
120rpm
Treatment with
Weight average
molecular weight
Mw (Daltons)
Number average
molecular weight
Mn (Daltons)
Polydispersity
(Mw/Mn)
No fungus (control) 243086 72318 3.361
R. oryzae NA1 239024 100607 2.376
A. terreus NA2 229770 81777 2.81
P. chrysosporium NA3 232302 102549 2.265

Chapter 4 Results
104
(a)
(b)
Figure 4.38 HPLC analysis of broth of PS films after incubation with R. oryzae
NA1, A. terreus NA2 and P. chrysosporium NA3 with added 0.01%
glucose in shaker (30ºC, 120rpm) (a), in static conditions (30ºC) (b).
0
2
4
6
8
10
12
14
16
18
20
4 8 4 8 4 8
Time (weeks) Time (weeks) Time (weeks)
NA1 NA2 NA3
Co
nce
ntr
atio
n (
pp
m)
Treatment
1-phenyl1, 2 ethandiol
2-phenylethanol
0
2
4
6
8
10
12
4 8 4 8 4 8
Time (weeks) Time (weeks) Time (weeks)
NA1 NA2 NA3
Co
nce
ntr
atio
n (
pp
m)
Treatment
1-phenyl 1, 2 ethandiol
2-phenylethanol

Chapter 4 Results
105
(a)
(b)
Figure 4.39 HPLC analysis of broth of PS films incubated with R. oryzae NA1, A.
terreus NA2 and P. chrysosporium NA3 with added 0.1% glucose in
shaker (30ºC, 120rpm) for 4 week (a), in static conditions (30ºC) (b).
0
2
4
6
8
10
12
14
16
18
20
NA1 NA2 NA3
Co
nce
ntr
atio
n (
pp
m)
Fungal strains
1-phenyl1, 2 ethandiol
2-phenylethanol
styrene oxide
0
10
20
30
40
50
60
70
4 8 4 8 4 8
Time (weeks) Time (weeks) Time (weeks)
NA1 NA2 NA3
Co
nce
ntr
atio
n (
pp
m)
Treatment
1-phenyl 1, 2 ethandiol
2-phenylethanol
phenylacetaldehyde

Chapter 4 Results
106
4.11 EFFECT OF GLUCOSE ON EPS BIODEGRADATION
EPS films were biodegraded by fungal isolates with 0.01% and 0.1% glucose in
media.
4.11.1 Fourier Transform Infrared Spectroscopy (FTIR) analysis
The Fourier Transform Infrared Spectroscopy (FTIR) analysis of EPS films incubated
with the fungal isolates with glucose showed increase in absorbance intensities in
500-1600 cm-1
, 2357 cm-1
, 2800 - 3000 cm-1
and 3400 cm-1
region. There was more
increase in peak intensities in both static and shake flask conditions with R. oryzae
NA1 and A. terreus NA2 treatment with 0.01% glucose addition to media (Fig. 4.40
and Fig. 4.41). PS samples incubated in shaking conditions with 0.1% glucose showed
maximum increased peak intensities with P. chrysosporium NA3 treatment (Fig.
4.42). While in static conditions R. oryzae NA1 treatment with 0.1% glucose
produced more prominent changes in peak intensities (Fig. 4.43).
4.11.2 High Pressure Liquid Chromatography (HPLC) Analysis
In 0.01% added glucose conditions 1-phenyl-1,2-ethandiol was found in all samples
of P. chrysosporium NA3 and A. terreus NA2 treatment of EPS and 2-phenylethanol
was present in P. chrysosporium NA3 treatment in shake flask experiments (Fig.
4.44a). 1-phenyl-1,2-ethandiol was found in all samples of P. chrysosporium NA3
treatment and 8 week sample of A. terreus NA2 and R. oryzae NA1 in static
conditions with added 0.01% glucose (Fig. 4.44b).
HPLC analysis of the extracellular media of 0.1% glucose in shaking conditions
showed the presence of 1-phenyl-1,2-ethandiol and 2-phenylethanol in all the
samples. Styrene oxide was detected in all samples of P. chrysosporium NA3 (11.4
ppm) and A. terreus NA2 (1.6 ppm) (Fig. 4.45a). In samples of static conditions with
0.1% glucose in media 1-phenyl-1,2-ethandiol was present in all samples, 2-
phenylethanol was present in all samples of P. chrysosporium NA3 and A. terreus
NA2 treatment and Phenylacetaldehyde was found in A. terreus NA2 treated samples
(Fig. 4.45b).

Chapter 4 Results
107
(a)
(b)
(c)
Figure 4.40 FTIR spectra of EPS incubated with R. oryzae NA1 (a), A. terreus
NA2 (b) and P. chrysosporium NA3 (c) with 0.01% glucose, in shaker
(30ºC, 120rpm) for 4 weeks (w4) and 8 weeks (w8) along with
untreated control.
-0.05
0
0.05
0.1
0.15
0.2
0.25
500 1000 1500 2000 2500 3000 3500
Ab
sorb
ance
Wavenumber cm-
control
w4
w8
748
11492912
1527
-0.05
0
0.05
0.1
0.15
0.2
0.25
500 1000 1500 2000 2500 3000 3500
Ab
sorb
ance
Wavenumber cm-
control
w4
w8
748
11492916
-0.05
0
0.05
0.1
0.15
0.2
0.25
500 1000 1500 2000 2500 3000 3500
Ab
sorb
ance
Wavenumber cm-
control
w4
w8
748
1145 2916
1450
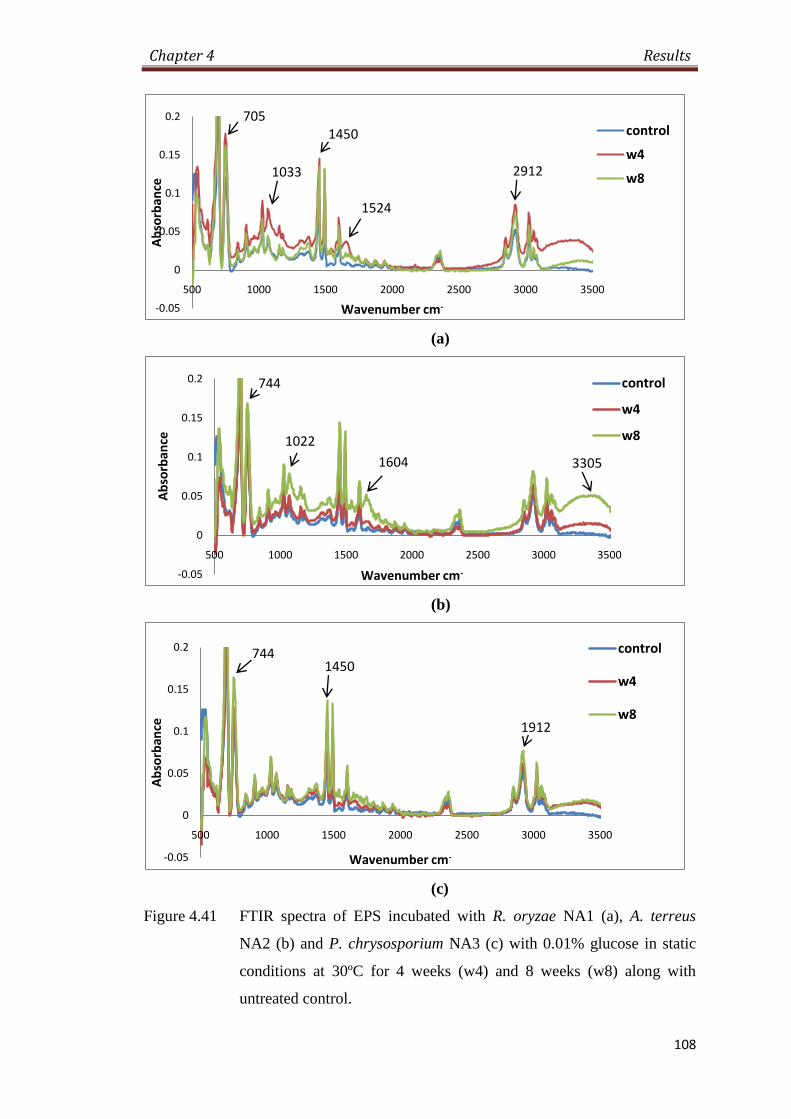
Chapter 4 Results
108
(a)
(b)
(c)
Figure 4.41 FTIR spectra of EPS incubated with R. oryzae NA1 (a), A. terreus
NA2 (b) and P. chrysosporium NA3 (c) with 0.01% glucose in static
conditions at 30ºC for 4 weeks (w4) and 8 weeks (w8) along with
untreated control.
-0.05
0
0.05
0.1
0.15
0.2
500 1000 1500 2000 2500 3000 3500
Ab
sorb
ance
Wavenumber cm-
control
w4
w8
705
1033 2912
1450
1524
-0.05
0
0.05
0.1
0.15
0.2
500 1000 1500 2000 2500 3000 3500
Ab
sorb
ance
Wavenumber cm-
control
w4
w8
744
1022
1604 3305
-0.05
0
0.05
0.1
0.15
0.2
500 1000 1500 2000 2500 3000 3500
Ab
sorb
ance
Wavenumber cm-
control
w4
w8
7441450
1912

Chapter 4 Results
109
Figure 4.42 FTIR spectra of EPS incubated with R. oryzae NA1, A. terreus NA2
and P. chrysosporium NA3 with 0.1% glucose at 30ºC, 120rpm after 4
weeks.
-0.05
0
0.05
0.1
0.15
0.2
0.25
500 1000 1500 2000 2500 3000 3500
Ab
sorb
ance
Wavenumber cm-
CONTROL
NA1
NA2
NA3
1103
1450
33521627

Chapter 4 Results
110
(a)
(b)
(c)
Figure 4.43 FTIR spectra of EPS incubated with R. oryzae NA1 (a), A. terreus
NA2 (b) and P. chrysosporium NA3 (c) with 0.1% glucose in static
conditions at 30ºC for 4 weeks (w4), 8 weeks (w8) and 12 weeks
(w12) along with untreated control.
-0.05
0
0.05
0.1
0.15
0.2
0.25
500 1000 1500 2000 2500 3000 3500
Ab
sorb
ance
Wavenumber cm-
control
w4
w8
w12
1026
1627 3359
-0.05
0
0.05
0.1
0.15
0.2
500 1000 1500 2000 2500 3000 3500
Ab
sorb
ance
Wavenumber cm-
control
w4
w8
w123356
1608
-0.05
0
0.05
0.1
0.15
0.2
0.25
500 1000 1500 2000 2500 3000 3500
Ab
sorb
ance
Wavenumber cm-
control
w4
w8
w123309
1450
702

Chapter 4 Results
111
(a)
(b)
Figure 4.44 HPLC analysis of broth samples of EPS films treated with R. oryzae
NA1, A. terreus NA2 and P. chrysosporium NA3 in shaker (30ºC,
120rpm) (a) in static conditions (30ºC) (b) with added 0.01% glucose.
0
2
4
6
8
10
12
14
16
18
4 8 4 8 4 8
Time (weeks) Time (weeks) Time (weeks)
NA1 NA2 NA3
Co
nce
ntr
atio
n (
pp
m)
Treatment
1-phenyl 1, 2 ethandiol2-phenylethanol
8
8.5
9
9.5
10
10.5
4 8 4 8 4 8
Time (weeks) Time (weeks) Time (weeks)
NA1 NA2 NA3
Co
nce
ntr
atio
n (
pp
m)
Treatment
1-phenyl 1, 2 ethandiol

Chapter 4 Results
112
(a)
(b)
Figure 4.45 HPLC analysis of broth samples of EPS films treated with R. oryzae
NA1, A. terreus NA2 and P. chrysosporium NA3 (30ºC, 120rpm) for 4
week (a) in static conditions (30ºC) (b) with added 0.1% glucose in
shaker.
0
5
10
15
20
25
NA1 NA2 NA3
Co
nce
ntr
atio
n (
pp
m)
Fungal strains
1-phenyl 1, 2 ethandiol
2-phenylethanol
styrene oxide
0
5
10
15
20
25
30
35
4 8 4 8 4 8
Time (weeks) Time (weeks) Time (weeks)
NA1 NA2 NA3
Co
nce
ntr
atio
n (
pp
m)
Treatment
1-phenyl 1, 2 ethandiol
2-phenylethanol
phenylacetaldehyde

Chapter 4 Results
113
4.12 BIODEGRADATION OF POLYSTYRENE BY SOIL BURIAL
PS films were buried in soil in flasks (controlled conditions) and flower pots (at room
temperature) and evaluated for biodegradation. The selected fungal isolates were also
added to study their biodegradation ability in soil.
4.12.1 Environmental Scanning Electron Microscopic (ESEM) Analysis
The growth of fungal isolates on PS film surface after soil burial for 4 months was
observed by environmental scanning electron microscopy (ESEM). The ESEM
micrographs showed that the fungi were able to colonise the PS in soil (Fig. 4.46).
4.12.2 Denaturant Gradient Gel Electrophoresis (DGGE) Analysis
The fungal community able to adhere and grow with the polystyrene surface along
with the selected fungal isolates was studied by denaturant gradient gel
electrophoresis (DGGE). DGGE separates DNA on the basis of GC content and heat
stability. The gel picture showed more number of bands in unsterile soil indicating
more fungal species adhering to PS as compared to the sterilized soil PS film sample
(Fig. 4.47).
4.12.3 Fourier Transform Infrared Spectroscopy (FTIR) Analysis
The Fourier Transform Infrared Spectroscopy (FTIR) analysis of PS films buried in
soil under controlled conditions with the fungal isolates show increase in absorbance
intensities in 500-1600 cm-1
region (Fig. 4.48). R. oryzae NA1 showed more
prominent peaks as compared to other isolates after 4 months incubation at 30ºC (Fig.
4.48b).
The soil buried films in natural conditions showed increased absorbance in 750-1300
cm-1
and 3400 cm-1
region (Fig. 4.49).
4.12.3 Gel Permeation Chromatography (GPC) Analysis
Gel Permeation chromatography (GPC) of soil buried PS samples demonstrated
decrease in molecular weight and polydispersity as compared to control. In the
unsterile soil buried samples the decrease in weight average molecular weight (Mw)
was almost similar in un-inoculated control (186195 Da), inoculated with R. oryzae

Chapter 4 Results
114
NA1 (186069 Da) and A. terreus NA2 (186557 Da) as compared to control (243086
Da). In sterilized soil conditions the same pattern of Mw decrease was observed
(Table. 4.9).

Chapter 4 Results
115
Figure 4.46 Environmental scanning electron micrographs of PS films buried in
soil inoculated with R. oryzae NA1 (a), A. terreus NA2 (b) and P.
chrysosporium NA3(c) at 30˚C for 4 months
(c)
(a) (b)

Chapter 4 Results
116
Figure 4.47 Denaturing gradient gel electrophoresis (DGGE) (40% - 60%) analysis
of fungal community attached to polystyrene films buried in
unsterilized soil (3) with fungal isolates NA1 (4), NA2 (5), NA3 (6)
and sterilized soil (10) with fungal isolates NA1 (11), NA2 (12), NA3
(13).
1 2 3 4 5 6 7 8 9 10 11 12 13 14 15 16

Chapter 4 Results
117
(a)
(b)
(c)
Figure 4.48 FTIR spectra of soil buried PS films incubated with R. oryzae NA1, A.
terreus NA2 and P. chrysosporium NA3 at 30ºC for 2 months (a) for 4
months (b) for 8 months (c).
-0.05
0
0.05
0.1
0.15
500 1000 1500 2000 2500 3000 3500
Ab
sorb
ance
Wavenumber cm-
Control
NA1
NA2
NA3
2916
705
-0.05
0
0.05
0.1
0.15
0.2
500 1000 1500 2000 2500 3000 3500
Ab
sorb
ance
Wavenumber cm-
Control
NA1
NA2
NA3
690
10222912
1450
-0.05
0
0.05
0.1
0.15
0.2
500 1000 1500 2000 2500 3000 3500
Ab
sorb
ance
Wavenumber cm-
Control
NA1
NA2
NA3
1018
2912

Chapter 4 Results
118
(a)
(b)
Figure 4.49 FTIR spectra of soil buried PS films inoculated with R. oryzae NA1, A.
terreus NA2 and P. chrysosporium NA3 in unsterilized soil (a)
sterilized soil (b) in flower pots for 6 months.
-0.05
0
0.05
0.1
0.15
0.2
0.25
0.3
500 1000 1500 2000 2500 3000 3500 4000
Ab
sorb
ance
Wavenumber cm-
Control
Uninoculated soil
NA1
NA2
NA3
1026
3400
-0.05
0
0.05
0.1
0.15
0.2
0.25
500 1000 1500 2000 2500 3000 3500
Ab
sorb
ance
Wavenumber cm-
control
no inoculum
NA1
NA2
NA3
1018
3400

Chapter 4 Results
119
Table 4.9 Gel permeation chromatography analysis of soil buried PS films
biodegraded by fungal isolates for 6 months at room temperature
`
Unsterilized soil burial
Treatment
Weight average
molecular weight
Number average
molecular weight
Polydispersity
Mw (Daltons) Mn (Daltons) (Mw/Mn)
Untreated Control PS 243086 72318 3.361
Unsterilized soil
uninoculated control 186195 61457 3.03
R. oryzae NA1 186069 77107 2.413
A. terreus NA2 186557 72337 2.579
P. chrysosporium NA3 191463 95119 2.013
Sterilized soil burial
Treatment
Weight average
molecular weight
Number average
molecular weight
Polydispersity
Mw (Daltons) Mn (Daltons) (Mw/Mn)
Untreated Control PS 243086 72318 3.361
Sterilized soil uninoculated
control 199217 87213 2.284
R. oryzae NA1 189834 39147 4.849
A. terreus NA2 189260 77152 2.453
P. chrysosporium NA3 193829 94958 2.041

Chapter 4 Results
120
4.13 BIODEGRADATION OF POLYSTYRENE STARCH BLEND
PS was blended with starch (5% w/w) and its biodegradation by the selected fungal
isolates was determined in shake flask and static conditions.
4.13.1 Fourier Transform Infrared Spectroscopy (FTIR) Analysis
The Fourier Transform Infrared Spectroscopy (FTIR) analysis of PS starch blend
films showed increase in peak intensity around 1000-1700 cm-1
and 3400 cm-1
. In
shaking conditions the similar increase was observed in 4 and 8 week samples of the
three fungal isolates (Fig. 4.50). The 8 weeks treated samples showed maximum
absorbance in these regions by the fungal isolates in static conditions, especially the
area around 3400 cm-1
region showed increased absorbance values of 0.149, 0.058,
0.057 after incubation with R. oryzae NA1, A. terreus NA2, P. chrysosporium NA3
respectively as compared to control (Fig. 4.51).
4.13.2 High Pressure Liquid Chromatography Analysis
High pressure liquid chromatography analysis of the media samples showed the
presence of 1-phenyl-1,2-ethandiol and 2-phenylethanol in all the samples of fungal
isolates in shaking conditions, with highest concentration of 1-phenyl-1,2-ethandiol
(17.7 ppm) and 2-phenylethanol (4.5 ppm) in 8 week sample of A. terreus NA2 (Fig.
4.52a). In static conditions 1-phenyl-1,2-ethandiol and 2-phenylethanol were found in
the samples of P. chrysosporium NA3 and 4 week sample of R. oryzae NA1 (Fig.
4.52b).

Chapter 4 Results
121
(a)
(b)
(c)
Figure 4.50 FTIR spectra of PS starch blend film, incubated with R. oryzae NA1
(a), A. terreus NA2 (b) and P. chrysosporium NA3 (c) at 30ºC, 120rpm
for 4 weeks (w4) and 8 weeks (w8) along with untreated control.
-0.05
0
0.05
0.1
0.15
0.2
500 1000 1500 2000 2500 3000 3500
Ab
sorb
ance
Wavenumber cm-
Control
w4
w8
15971022
3400
-0.05
0
0.05
0.1
0.15
500 1000 1500 2000 2500 3000 3500
Ab
sorb
ance
Wavenumber cm-
Control
w4
w8
1600
3321
1300
-0.05
0
0.05
0.1
0.15
0.2
500 1000 1500 2000 2500 3000 3500
Ab
sorb
ance
Wavenumber cm-
Control
w4
w8
1311 1600 2916
1712 3400

Chapter 4 Results
122
(a)
(b)
(c)
Figure 4.51 FTIR spectra of PS starch blend film, incubated with R. oryzae NA1
(a), A. terreus NA2 (b) and P. chrysosporium NA3 (c) at 30ºC for 4
weeks (w4) and 8 weeks (w8) along with untreated control.
-0.05
0
0.05
0.1
0.15
0.2
0.25
0.3
0.35
500 1000 1500 2000 2500 3000 3500
Ab
sorb
ance
Wavenumber cm-
control
w4
w8
744
34001600
536
-0.05
0
0.05
0.1
0.15
0.2
500 1000 1500 2000 2500 3000 3500
Ab
sorb
ance
Wavenumber cm-
control
w4
w8
1026
1635 3400
-0.05
0
0.05
0.1
0.15
0.2
500 1000 1500 2000 2500 3000 3500
Ab
sorb
ance
Wavenumber cm-
control
w4
w8
1022
1604 3400

Chapter 4 Results
123
(a)
(b)
Figure 4.52 HPLC analysis of PS starch blend films treated with R. oryzae NA1, A.
terreus NA2 and P. chrysosporium NA3 in shaker (30ºC, 120rpm) (a),
in static conditions (30ºC) (b).
0
2
4
6
8
10
12
14
16
18
20
4 8 4 8 4 8
Time (weeks) Time (weeks) Time (weeks)
NA1 NA2 NA3
Co
nce
ntr
atio
n (
pp
m)
Treatment
1-phenyl1, 2 ethandiol
2-phenylethanol
0
2
4
6
8
10
12
14
4 8 4 8 4 8
Time (weeks) Time (weeks) Time (weeks)
NA1 NA2 NA3
Co
nce
ntr
atio
n (
pp
m)
Treatment
1-phenyl 1, 2 ethandiol
2-phenylethanol

Chapter 5 Discussion
124
Biodegradation is a complex irreversible process causing the scission of polymeric
chains and structural alterations by the activity of enzymes. Most of the synthetic
plastics degrade in the natural environment by a very slow process owing to their
structural complexity, high molecular weight and hydrophobicity (Albertsson and
Karlsson, 1990; Otake et al., 1995; Sudhakar et al., 2007; Mor and Sivan, 2008).
Polystyrene (PS) is a synthetic polymer and is resistant to degradation as a
consequence of its crystallinity, mechanical properties and molecular weight
(Arvanitoyannis and Biliaderis, 1999; Kiatkamjornwong et al., 1999; Schlemmer et
al., 2009). In literature fewer reports describe the microbial utilization of polystyrene
as carbon source (Sielicki et al., 1978; Kaplan, et al., 1979; Otake et al., 1995; Eisaku
et al., 2003; Motta et al., 2009; Mor and Sivan, 2008).
The aim of this study was to investigate the process of polystyrene biodegradation and
effects of various treatments on the biodegradation process. The microorganisms were
isolated from soil, possessing the ability to metabolise the synthetic polymer
polystyrene as a sole carbon source. The potential of the selected isolates to degrade
polystyrene and expanded polystyrene was studied in detail in laboratory. The effect
of pre-treatments i.e. ultra violet light and heat, exposure to natural environment by
soil burial and additional carbon source on biodegrading capability of the selected
fungal isolates was investigated.
The expanded polystyrene thin films buried in soil for eight months were utilized to
isolate microorganisms. Soil burial method is used to determine biodegradability of
polymers because it is very close to natural disposal conditions of plastics (Orhan et
al., 2004; Singh and Sharma, 2008; Silva et al., 2007; Kyrikou and Briassoulis, 2007).
Otake et al., 1995 reported that polystyrene sheet that remained buried in soil for 32
years had no biodegradation signs.
Microorganisms that are known to biodegrade polystyrene include actinomycete
Rhodococcus ruber (Mor and Sivan, 2008), Curvularia species (Motta et al., 2009),
Bacillus, Xanthomonas, Sphingobacterium (Eisaku et al., 2003), Serratia marcescens,
Pseudomonas sp. and Bacillus sp. (Galgali et al., 2002), Bacillus coagulans
(Kiatkamjornwong et al., 1999), brown rot Gleophyllum trabeum, white rot

Chapter 5 Discussion
125
Basidiomycete, Trametes versicolor, Pleurotus ostreatus, and P. chrysosporium
(Milstein et al., 1992).
In the present study three fungal isolates were selected on the basis of preliminary
screening of isolates by FTIR spectroscopy analysis of treated polystyrene films. The
isolates were identified by morphology and ribosomal conserved sequences by
molecular identification. On the basis of morphological relationship obtained by Blast
search in NCBI database the strains were identified as R. oryzae NA1, A. terreus NA2
and P. chrysosporium NA3 and the accession numbers in Genbank are FJ654430,
FJ654431 and FJ654433 respectively. Fungi are successfully used to degrade plastics
and other xenobiotics (Francesc et al., 2006). P. chrysosporium is also reported to
biodegrade polymeric materials (Manzur et al., 1997; Sutherland et al., 1997; Shimao,
2001; Gusse et al., 2006).
Biodegradation studies were carried out in shake flask (120rpm) and static conditions
at 30ºC and at room temperature in Sturm test and soil burial conditions.
Adherence of fungal isolates with the polymer surface was observed by
environmental Scanning Electron Microscopy. The scanning electron micrographs of
PS treated in shake flask, buried in soil and EPS beads showed that the fungal isolates
were able to establish mycelia on the polymer surface (Fig.4.8, 4.19, 4.20, 4.46).
More abundant fungal growth was observed in case of addition of glucose to the
mineral salts media (Fig. 4.33). Growth and establishment of a microorganism on a
polymer is the first step for biodegradation of a polymer surface (Motta et al., 2009).
Colonisation of polystyrene for longer period of time in carbon starvation condition
also indicated that the fungi were able to utilize carbon embedded in polymer chains
as carbon and energy source. Carbon starvation conditions might also encourage the
microbial growth and adherence to the polymer (Mor and Sivan, 2008).
The biodegradation of polystyrene by the fungal isolates was studied by CO2
evolution test also known as Sturm test (Sturm, 1973). A lot of modified forms of
CO2 evolution test are reported in literature but the basic purpose was to study the
complete assimilation of polymeric carbon (Muller et al., 1992; Zee et al., 1994;
Chandra and Rustgi, 1998; Calmon et al., 2000). R. oryzae NA1, A. terreus NA2 and
P. chrysosporium NA3 produced 1.65, 1.42 and 2.93g/l CO2 respectively as a result of

Chapter 5 Discussion
126
PS biodegradation (Table 4.2). Due to the carbon starvation conditions in mineral
salts media used for biodegradation studies very low amount of CO2 is produced
(Shah et al., 2008).
Surface changes of treated films were studied by FTIR spectroscopy. FTIR
spectroscopy enables the study of a polymer at structural level and any change in the
chemical structure can be easily identified. The important absorbance peaks of
polystyrene are CH2 asymmetric and symmetric stretching around 2924 cm-1
and
2852 cm-1
, 3026 cm-1
(aromatic C–H stretches), 756 cm-1
(out-of-plane C–H bending
mode of the aromatic ring), 698 cm-1
(ring-bending vibration) and 1600 cm-1
and 1491
cm-1
(benzene ring) (Allen et al., 2004; Jang and Wilkie, 2005).
The treated samples showed maximum increase in absorbance in the important
regions of FTIR spectra with respect to biodegradation i.e. 536 cm-1
, 748 cm-1
(mono
substituted aromatic compound), 1026 cm-1
, 1450 cm-1
, 1492 cm-1
(C=C stretching
vibration of aromatic ring), 1600 cm-1
(C=C stretching vibrations in aromatic ring),
1735 cm-1
, 2916 cm-1
, 3429 cm-1
(Li et al., 2005; Leroux et al., 2005; Albunia et al.,
2006; Elashmawi et al., 2008). The characteristic absorbance bands of vinyl polymers
are 960 cm-1
(transvinylene R–CH=CH–R), 910 cm-1
(terminal vinyl –CH=CH2 and
terminal vinylidene –CR=CH2) and 842 cm-1
(Wang et al., 2000). More changes in
FTIR spectra were observed in shake flask experiments as compared to static
conditions.
Biodegradation is usually initiated by adding oxygen to the substrate. It is established
that oxidation causes the carbonyl (>C=O) as well as hydroxyl (–OH) groups
formation in the substrate. Infrared spectroscopy can be used to find out the existence
of these groups, because quite intense absorbance peaks of >C=O (1740 cm-1
) and –
OH (3400 cm-1
) bonds appear in the infrared spectrum where no other polystyrene
bands are present (Wang et al., 2000). Carboxylic acids, esters and alcohols also
present absorbance peaks in 1000-1200 cm-1
region but polystyrene also has
absorbance in this region but modification in this region with the appearance of other
oxidation peaks at 1740 cm-1
and 3400 cm-1
support the evidence of oxidation process
during biodegradation (Motta et al., 2009). Moreover absorbance peaks at 756 cm-1
,
698 cm-1
indicate the monosubstituted benzene ring in the polymer. In shake flask
experiments maximum changes were observed in PS films in 1000-1700 cm-1
region

Chapter 5 Discussion
127
while in static conditions the increase in absorbance occurred around 3400 cm-1
region. The experiments with glucose added to media also showed increased
absorbance in both 1000-1700 cm-1
and 3400 cm-1
region. The decrease of absorption
peaks after longer time of exposure with the fungus was also observed which
indicated that initial oxidation products were further degraded and utilised by the
fungi.
Molecular weight distribution was characterised by gel permeation chromatography to
study the changes caused by the biodegradation process. The weight average
molecular weight (Mw) as well as number average molecular weight (Mn) increased
in the treated samples of polystyrene films and EPS beads as compared to control
while decreased in case of expanded polystyrene (Table 4.3, 4.4 and 4.5). The
increase in molecular weight may be attributed to chain cleavage and further
crosslinking (Tsuji and Ikada, 1998; Pticek et al., 2007). Changes in molecular weight
indicate the underlying process and rate of degradation of the polymer (Siracusa et al.,
2008). The polydispersity decreased in PS and increased in EPS films (Table 4.3 and
4.4). The Mw decreased in all polystyrene samples pre-treated by UV and increased
in case of heat pre-treatment (Table 4.6 and 4.7). Weight average molecular weight
and polydispersity decreased in incubation condition with added glucose in mineral
salts media and also in all samples of soil buried polystyrene films (Table 4.8, 4.9).
Polydispersity indicate the number and distribution of chain lengths in a polymer
sample. If the polymer has a narrow range of polymer chain lengths the polydispersity
is low while a high value of polydispersity is observed when the chain lengths vary
considerably.
Proton nuclear magnetic resonance (1H-NMR) spectra of the polystyrene samples,
allowed to biodegrade by the fungal isolates were compared with the control to study
the process of biodegradation (Grivet and Delort, 2009). Polystyrene structurally
consists of an aliphatic chain with allied aromatic groups linked to every other carbon
atom. The aliphatic and aromatic protons appeared in 1-2 ppm and 6-7 ppm signal
region respectively in the H1NMR spectra. In almost all samples no new peak
appeared other then the characteristic aliphatic and aromatic protons of polystyrene.
The observation may be attributed to slow biodegradation process, appearance of
unstable products or the biodegradation products may have displaced quickly in to the

Chapter 5 Discussion
128
surrounding media e.g. styrene is a volatile compound. Oxidation by-products may
also partially dissolve in aqueous surroundings. The signal strength and number of
peaks varied between the control and treated samples.
Detection of biodegradation products was accomplished by high pressure liquid
chromatography (HPLC). HPLC standards were selected on the basis of styrene
degradation products reported in literature by the fungi (Cox, 1995; Cox et al., 1996;
Francesc et al., 2006; Lee et al., 2006; Boldu et al. 2001: Weber et al. 1995; O’Leary
et al. 2002). 1-Phenyl-1,2-ethandiol was dominant with highest concentration of 21.3
ppm in media sample of polystyrene incubated with A. terreus NA2 in shake flask and
34.6 ppm in static conditions with P. chrysosporium NA3 (Fig.4.13) (Lee et al.,
2006). 1-Phenyl-1,2-ethandiol, 2-Phenylethanol, Phenyacetaldehyde and styrene
oxide was detected in different concentrations in broth samples of biodegradation
experiments.
The HPLC results when correlated with FTIR spectroscopy results, suggest that
biodegradation process of polystyrene is oxo-biodegradation (Arvanitoyannis and
Biliaderis, 1999), which is not a rapid process (Scott and Wiles, 2001). During oxo-
degradation process, peroxidation results in the formation of biodegradable products
with low molar mass like carboxylic acid, alcohols, aldehydes and ketones (Chiellini
et al., 2007). The microorganisms responsible for the biodegradation process
assimilate the biodegradation products inside the cells (Gu and Gu, 2005; Kyrikou
and Briassoulis, 2007). The peroxidation reaction is mainly initiated by the
oxygenases and peroxidases enzymes released by the microorganisms in the
surrounding media in case of biodegradation (Van den Brink et al., 1998; Francesc et
al., 2006; Kumar and Goswami, 2008; Vatsyayan et al., 2008), UV light in
photodegradation (Sudhakar et al., 2007) and heat in thermal degradation processes
(Mailhot et al., 2000; Contat-Rodrigo and Greus, 2002; Chiellini et al., 2007).
The data obtained by HPLC also back up the assumption that the biodegradation
products were mobile and remained in media that is why they did not appeared in the
NMR analysis of the treated polystyrene and expanded polystyrene films. The fungal
isolates A. terreus NA2 and P. chrysosporium NA3 showed more active
biodegradation in terms of detected biodegradation products as compared to R. oryzae
NA1.

Chapter 5 Discussion
129
The biodegradation studies were not only conducted on thin films but the fungal
isolates were also allowed to grow on expanded polystyrene beads that are used to
make expanded polystyrene packaging products. The fungi grew rapidly with visibly
covering the surface of EPS beads and changing the colour of the media without any
other carbon source. The HPLC results showed that the EPS beads were actively
biodegraded by the fungi especially by the A. terreus NA2.
UV light promotes the oxidation process of polymers by generating free radicals
(Mailhot et. al., 2000; Singh and Sharma, 2008; Ojeda et al., 2009). Thermal
degradation of polystyrene is well documented (Jang and Wilkie, 2005; Singh and
Sharma, 2008). On the assumption that pretreatment with UV light and heat
pretreatment (60 ºC & 80 ºC for 1 hr.) may facilitate the biodegradation process,
experiments were conducted on UV and heat pretreated polystyrene films. After
incubation with the fungi the analysis of the films showed that UV and heat
pretreatment did not have any profound effect on biodegradation process. The
increased exposure time of pretreatment may increase the biodegradation efficiency.
Pre-aging treatments promote the ultimate disintegration of the samples by microbial
attack (Albertsson et al., 1995; Contat-Rodrigo and Greus, 2002; Chiellini et al.,
2007). UV pretreatment of 2 hours resulted in decrease of weight average molecular
weight of polymer. The heat pretreated (80 ºC for 1 hr.) polystyrene films after
biodegradation by P. chrysosporium NA3 resulted in increased absorption intensities
in 1000-1200 cm-1
region.
Effect of additional carbon source on biodegradation was studied by adding glucose in
media and by blending starch with polystyrene. The addition of glucose in media
resulted in visible good fungal growth. There was more biodegradation of polystyrene
and expanded polystyrene with glucose as evident by GPC, FTIR and HPLC results.
The results indicated that the addition of carbon source enhance the biodegradation
process. Polystyrene starch blend showed more changes in FTIR spectra in static
conditions while more biodegradation products were detected in shake flask
conditions. Starch increases the porosity and the surface/content ratio of conventional
synthetic polymers. As the microorganisms assimilate starch, the structural integrity
of the surrounding plastic is lost. The deterioration of the mechanical properties

Chapter 5 Discussion
130
facilitates the degradation and promotes the microbial attack of the polymeric matrix
(Kiatkamjornwong et al., 1999; Zuchowska et al., 1998; Schlemmer et al., 2009).
Biodegradation process of polystyrene was also studied in field conditions by soil
burial method along with the studies in laboratory conditions (Hesselsoe et al., 2008;
Watanabe et al., 2009). Appearance of similar dominant bands in the denaturant
gradient gel electrophoresis analysis of the soil attached to buried polystyrene films
indicated that some soil fungi were the dominant colonizers of the polymer. The
scanning electron micrographs of the soil buried films in the flasks showed the
colonization of the polymer by the fungi. The soil buried films of polystyrene for six
months showed very significant degradation in FTIR and GPC analysis. Significant
decrease in weight average molecular weight in the soil buried samples with no added
fungal inoculum indicated that other soil microbes were also involved in the
biodegradation process of polystyrene.

Conclusions
131
Conclusions
From the present study it is concluded that:
1. The soil contains microorganisms capable of adherence and growth with
polystyrene as a sole carbon source thus bringing about its biodegradation.
2. The isolates Rhizopus oryzae NA1, Aspergillus terreus NA2 and Phanerochaete
chrysosporium NA3 were able to colonize polystyrene film surface for longer
period of time without any other carbon source indicating that the isolates utilised
the polymer as carbon source.
3. The increased carbon dioxide production with polystyrene in Sturm test indicated
that biodegradation process is going on.
4. The techniques SEM, FTIR, GPC and NMR proved to be effective analytical tools
to study plastic materials such as polystyrene and expanded polystyrene films and
beads.
5. The detection of degradation products in the surrounding media of the treated
samples by HPLC confirmed that the fungal isolates were able to not only
depolymerise but biodegrade the polystyrene, expanded polystyrene films and
EPS beads.
6. The UV and heat pre-treatments did not affect biodegradation process but pre-
treatment for longer time could give better results.
7. The addition of glucose showed enhanced biodegradation of polystyrene. More
biomass was produced with additional carbon source resulting in decrease in
molecular weight and more changes in treated samples.

Future Perspectives
132
Future Perspectives
Mechanism of biodegradation of polystyrene can be studied and degradation by-
products could be identified.
Enzymes involved in biodegradation process could be isolated and their
applications could be studied.
Environmental impact of strain involved in biodegradation and the by-products
should be studied for field applications.
Genes involved in biodegradation could be studied in detail.
Strain improvement could be accomplished in order to get desired results for
biodegradation applications.
Field scale trials could be done for bioremediation of plastic waste contaminated
site.

References
133
References
1. Adhyapak, P.V., M. Islam, R. C. Aiyer, U. P. Mulik, Y. S. Negi, and D. P.
Amalnerkar. 2008. Preparation, characterization and non-linear optical
properties of pristine m-nitroaniline (m-NA) and its recycled polystyrene (Re-
PS) coated single crystals. J. Cryst. Growth. 310: 2923–2927.
2. Albertsson, A. C., and Karlsson S. 1990. The influence of biotic and abiotic
environments on the degradation of polyethylene. Prog. Polym. Sci. 15:177-
192.
3. Albertsson, A. C., C. Barenstedt, T. Lindberg, and S. Karlsson. 1995.
Degradation product pattern and morphology changes as means to differentiate
abiotically and biotically aged degradable polyethylene. Polymer. 36:3075-83.
4. Albunia, A. R., P. Musto, and G. Guerra. 2006. FTIR spectra of pure helical
crystalline phases of syndiotactic polystyrene. Polymer 47:234–242.
5. Allen, N. S., A. Barcelona, M. Edge, A. Wilkinson, C. G. Merchan, and V.
R. S. Quiteria. 2004. Thermal and photooxidation of high styreneebutadiene
copolymer (SBC). Polym. Degrad. Stab. 86:11-23.
6. Alonso, S., D. Bartolome-Martin, M. Alamo Del, E. Diaz, J. L. Garcia, and
J. Perera. 2003. Genetic characterisation of the styrene lower catabolic
pathway of Pseudomonas sp. strain Y2. Gene. 319:71–83.
7. Arnold, J.C., S. Alston, and A. Holder. 2009. Void formation due to gas
evolution during the recyclingof Acrylonitrile–Butadiene–Styrene copolymer
(ABS) fromwaste electrical and electronic equipment (WEEE). Polym. Degrad.
Stab. 94:693-700.
8. Arvanitoyannis, I., and C. G. Biliaderis. 1999. Physical properties of polyol-
plasticized edible blends made of methyl cellulose and soluble starch.
Carbohydr. Polym. 38:47-58.
9. Augusta, J., R. J. Miiller, and H. Widdecke. 1993. A rapid evaluation plate-
test for the biodegradability of plastics. Appl. Microbiol. Biotechnol. 39:673-
678.
10. Baggi, G., M. M. Boga, D. Catelani, E. Galli, and V. Treccani. 1983. Styrene
catabolism by a strain of Pseudomonas fluorescens. Syst. Appl. Microbiol.
4:141–147.

References
134
11. Beltrametti, F., A. M. Marconi, G. Bestetti, C. Colombo, E. Galli, M. Ruzzi,
and E. Zennaro. 1997. Sequencing and functional analysis of styrene
catabolism genes from Pseudomonas fluorescens ST. Appl. Environ. Microbiol.
63(6):2232–2239.
12. Bhandare, P. S., B. K. Lee and K. Krishnan. 1997. Study of Pyrolysis and
Incineration of Disposable Plastics using combined TG/Fr-IR Technique. J.
Therm. Anal. Calorim. 49: 361-366.
13. Boldu, P. F. X., A. Kuhn, D. Luykx, H. Anke, J. W. van Groenestijn, and J.
A. W. de Bont. 2001. Isolation and characterisation of fungi growing on
volatile aromatic hydrocarbons as their sole carbon and energy source. Mycol.
Res. 105: 477-484.
14. Braun-Luellemann, A., A. Majcherczyk, and A. Huettermann. 1997.
Degradation of styrene by white-rot fungi. Appl. Microbiol. Biotechnol. 47:
150-155.
15. Brennan, L. B., D. H. Isaac, and J. C. Arnold. 2002. Recycling of
acrylonitrile–butadiene–styrene and high impact polystyrene from waste
computer equipment. J. Appl. Polym. Sci. 86:572-578.
16. Calil,
M. R., F. Gaboardi, C. G. F. Guedesand, D. S. Rosa. 2006.
Comparison of the biodegradation of poly (ε-caprolactone), cellulose acetate
and their blends by the Sturm test and selected cultured fungi. Polym. Test. 25
(5): 597- 604.
17. Calmon, A. L. D. Bresson, V. B. Maurel, P. Feuilloley, and F. Silvestre.
2000. An automated test for measuring polymer biodegradation. Chemosphere.
41: 645-651.
18. Carrasco, F., and P. Pages. 1996. Thermogravimetric analysis of polystyrene:
influence of sample weight and heating rate on thermal and kinetic parameters.
J. Appl. Polym. Sci. 61(1):187–97.
19. Chandra, R., and R. Rustgi. 1998. Biodegradable Polymers. Prog. Polym. Sci.
23:1273-1335.
20. Chiellini, E., A. Corti, and S. D’Antone. 2007. Oxo-biodegradable full carbon
backbone polymers and biodegradation behaviour of thermally oxidized
polyethylene in an aqueous medium. Polym. Degrad. Stab. 92:1378-1383.

References
135
21. Contat-Rodrigo, L., and R. Greus A. 2002. Biodegradation studies of LDPE
filled with biodegradable additives: morphological changes. J Appl Polym Sci.
83:1683-1691.
22. Couto, S.R., and M. Ratto. 1998. Effects of vetratryl alcohol and manganese
(iv) oxide on lignolytic activity in semi solid cultures of Phanerochaete
chrysosporium. Biodegradation 9:143–150.
23. Cox, H. H. J., 1995. Styrene removal from waste gas by the fungus Exophiala
jeanselmei in a biofilter. PhD Thesis, University of Groningen, Groningen, the
Netherlands.
24. Cox, H. H. J., R. E. Moerman, S. Van Baalen, W. N. M. Van Heiningen, H.
J. Doddema, and W. Harder. 1997. Performance of a styrene degrading
biofilter containing the yeast Exophiala jeanselmei. Biotechnol. Bioeng.
62:216–224.
25. Cox, H. H. J., B. W. Faber, W. N. M. Van Heiningen, H. Radhoe, H. J.
Doddema, and W. Harder. 1996. Styrene metabolism in Exophiala jeanselmei
and involvement of a cytochrome P-450-dependent styrene monooxygenase.
App. Environ. Microbiol. 62(4):1471–1474.
26. Cox, H. H. J., J. H. M. Houtman, H. J. Doddema, and W. Harder. 1993.
Enrichment of fungi and degradation of styrene in biofilters. Biotechnol. Lett.
15:737-742.
27. Eisaku, O., K. T. Linn, E. Takeshi, O. Taneaki, and I. Yoshinobu. 2003.
Isolation and Characterization of Polystyrene Degrading Microorganisms for
Zero Emission Treatment of Expanded Polystyrene. Proc. Environ. Eng. Res.
40:373-379.
28. Elashmawi, I. S., N.A. Hakeem, and E.M. Abdelrazek. 2008. Spectroscopic
and thermal studies of PS/PVAc blends. Physica. B. 403:3547– 3552.
29. Ferrandez, A., B. Minambres, B. Garcia, E. R. Olivera, J. M. Luengo, J. L.
Garcia, and E. Diaz. 1998. Catabolism of phenylacetic acid in Escherichia
coli. J Biol Chem. 273:2594–25986.
30. Francesc, X., P. Boldu, R. Summerbell, and G. S. D. Hoog. 2006. Fungi
growing on aromatic hydrocarbons: biotechnology’s unexpected encounter with
biohazard? FEMS. Microbiol. Rev. 30: 109-130.

References
136
31. Galgali, P., A. J. Varma, U. S. Puntambekar, and D. V. Gokhale. 2002.
Towards biodegradable polyolefins: strategy of anchoring minute quantities of
monosaccharides and disaccharides onto functionalized polystyrene, and their
effect on facilitating polymer biodegradation. Chem. Commun. 2884-2885.
32. Garcıa, N., M. Hoyos, J. Guzman, and P. Tiemblo. 2009. Comparing the
effect of nanofillers as thermal stabilizers in low density polyethylene. Polym.
Degrad. Stab. 94:39–48.
33. Gejo, J. L., N. Manoj, S. Sumalekshmy, H. Glieman,T. Schimmel, M.
Wornera, and A. M. Braun. 2006. Vacuum-ultraviolet photochemically
initiated modification of polystyrene surfaces: morphological changes and
mechanistic investigations. Photochem. Photobiol. Sci. 5: 948–954.
34. Grima, S., V. Bellon-Maurel, P. Feuilloley, and F. Silvestre. (2000). Aerobic
biodegradation of polymers in solid-state conditions: a review of environmental
and physiocochemical parameter settings in laboratory. J. Environ. Polym.
Degrad. 8(4), 183-195.
35. Grivet, J.P., and A. M. Delort. 2009. NMR for microbiology: In vivo and in
situ applications. Prog. Nucl. Magn. Reson. Spectrosc. 54:1–53.
36. Gu, J. G., and J. D. Gu. 2005. Methods Currently Used in Testing
Microbiological Degradation and Deterioration of a Wide Range of Polymeric
Materials with Various Degree of Degradability: A Review. J. Polym. Environ.
13(1):65-74.
37. Gupper, A., and S. G. Kazarian. 2005. Study of Solvent Diffusion and
Solvent-Induced Crystallization in Syndiotactic Polystyrene Using FT-IR
Spectroscopy and Imaging. Macromolecules. 38, 2327-2332.
38. Gusse, A. C., P. Miller, and T. J. Volk. 2006. White-Rot Fungi Demonstrate
First Biodegradation of Phenolic Resin. Environ. Sci. Technol. 2006, 40, 4196-
4199.
39. Hagiwara, T., H. Hirata, and S. Uchiyama. 2008. Poly(p-maleimidostyrene)
coated cross-linked polystyrene beads as novel ultrasonic irradiation resistant
enzyme immobilization materials-Applications for biosensors and bioreactors.
React. Funct. Polym. 68:1132–1136.
40. Hartmans, S., 1995. Microbial degradation of styrene. In: Biotransformations:
microbiological degradation of health risk compounds. Elsevier Science. 227–
238.

References
137
41. Hartmans, S., J. P. Smits, M. J. van der Werf, F. Volkering, and J. A. M.
deBont. 1989. Metabolism of styrene oxide and 2-phenylethanol in the styrene
degrading Xanthobacter strain 124X. Appl. Environ. Microbiol. 55:2850–2855.
42. Hartmans, S., M. J. van der Werf, and J. A. M. de Bont. 1990. Bacterial
degradation of styrene involving a novel FAD-dependent styrene
monooxygenase. Appl. Environ. Microbiol. 56:1347-1351.
43. Hesselsoe, M., M. L. Bjerring, K. Henriksen, P. Loll and J. L. Nielsen. 2008.
Method for measuring substrate preferences by individual members of microbial
consortia proposed for bioaugmentation. Biodegradation. 19(5): 621-633.
44. Hinojosa, I. A., and M. Thiel. 2009. Floating marine debris in fjords, gulfs and
channels of southern Chile. Mar. Pollut. Bull. 58: 341–350.
45. Holland, H. L., M. Kindermann, S. Kumaresan, and T. Stefanac. 1993. Side
chain hydroxilation of aromatic compounds by fungi. Part 5. Exploring the
Benzyclic Hydroxylase of Mortiella isabellina. Tetrahedron Asymmetry. 4:
1353–1364.
46. Israeli, Y., J. Lacoste, J. Lemaire, R. P. Singh, and S. Sivaram. 1994. Photo-
and Thermoinitiated Oxidation of High-Impact Polystyrene. 1. Characterization
by FT-IR Spectroscopy. J. Polym. Sci. A. Polym. Chem. 32:485-493.
47. Itavaara, M., and M. Vikman. 1995. A simpe screening test for studying the
biodegradability of insoluble polymers. Chemosphere. 31:4359-4373.
48. Itoh, N., R. Morihama, J. Wang, K. Okada, and N. Mizuguchi. 1997.
Purification and characterization of phenylacetaldehyde reductase from a
styrene-assimilating Corynebacterium strain, ST-10. Appl. Environ. Microbiol.
63:3783–3788.
49. Jang, B. N. and C. A. Wilkie. 2005. The thermal degradation of polystyrene
nanocomposite. Polymer. 46(9):2933-2942.
50. Jasso, C. F. G., L. J. Gonzalez-Ortiz, J. R. Contreras, M. E. Mendizabal,
and G. J. Mora. 2004. The degradation of high impact polystyrene with and
without starch in concentrated activated sludge. Polym. Eng. Sci. 38(15): 863 –
869.
51. Jindrova, E., M. Chocova, K. Demnerova, and V. Brenner. 2002. Bacterial
aerobic degradation of benzene, toluene, ethylbenzene and xylene. Folia
Microbiol. 47: 83.

References
138
52. Joao, V. Comasseto, J. V., A. T. Omori, L. H. Andrade and A. L. M. Porto.
2003. Bioreduction of fluoroacetophenones by the fungi Aspergillus terreus and
Rhizopus oryzae. Tetrahedron Asymmetry. 14:711–715.
53. Jones, B. E., V. Dossonnet, E. Kuster, W. Hillen, J. Deutscher, and R. E.
Klevit. 1997. Binding of the catabolite repressor protein CcpA to its DNA
target is regulated by phosphorylation of its corepressor HPr. J. Biol. Chem.
272:26530–26535.
54. Josepha, S., F. Laupretreb, C. Negrellb, and S. Thomas. 2005.
Compatibilising action of random and triblock copolymers of poly(styrene–
butadiene) in polystyrene/polybutadiene blends: A study by electron
microscopy, solid state NMR spectroscopy and mechanical measurements.
Polymer. 46:9385–9395.
55. Kale, G., R. Auras, and S. P. Singh. 2006. Degradation of commercial
biodegradable packages under real composting and ambient exposure
conditions. J. Polym. Environ. 14:317-334.
56. Kan, A., and R. Demirboga. 2009. A new technique of processing for waste-
expanded polystyrene foams as aggregates. J. Mater. Processing. technol. 2 0 9:
2994–3000.
57. Kannan, P., J. J. Biernacki, D. P. Visco Jr., and W. Lambert. 2009. Kinetics
of thermal decomposition of expandable polystyrene in different gaseous
environments. J. Anal. Appl. Pyrolysis. 84: 139-144.
58. Kaplan, D. L., R. Hartenstein, and J. Sutter. 1979. Biodegradation of
Polystyrene, Poly(methyl methacrylate), and Phenol Formaldehyde. Appl.
Environ. Microbiol. 38(3):551-553.
59. Karmore, V., and G. Madras. 2000. Continuous distribution kinetics for the
degradation of polystyrene in supercritical benzene. Ind. Eng. Chem. Res. 39
(11):4020-4023.
60. Khaksar, M. R., and M. Ghazi-Khansari. 2009. Determination of migration
monomer styrene from GPPS (general purpose polystyrene) and HIPS (high
impact polystyrene) cups to hot drinks. Toxicol. Mech. Methods. 19(3): 257–
261.

References
139
61. Kiatkamjornwong, S., M. Sonsuk, S. Wittayapichet, P. Prasassarakich, and
P. Vejjanukroh. 1999. Degradation of styrene-g-cassava starch filled
polystyrene plastics. Polym. Degrad. Stab. 66: 323-335.
62. Kumar, A. K., P. Goswami. 2008. Purification and properties of a novel broad
substrate specific alcohol oxidase from Aspergillus terreus MTCC 6324.
Biochim. Biophys. Acta. 1784: 1552–1559.
63. Kyrikou, I., and D. Briassoulis. 2007. Biodegradation of agricultural plastic
films: A Critical Review. J Polym Environ. 15:125–150.
64. Lee, J. W., S. M. Lee, E. J. Hong, E. B. Jeung, H. Y. Kang, M. K. Kim, and
I. G. Choi. 2006. Estrogenic Reduction of Styrene Monomer Degraded by
Phanerochaete chrysosporium KFRI 20742. J. Microbiol. 44(2):177-184.
65. Leoni, L., G. Rampioni, V. D. Stefano, and E. Zennaro. 2005. Dual role of
the response regulator StyR in styrene catabolism regulation. Appl. Environ.
Microbiol. 91:5411–5419
66. Leroux, F., L. Meddar, B. Mailhot, S. M. Therias, and J. L. Gardette. 2005.
Characterization and photooxidative behaviour of nanocomposites formed with
polystyrene and LDHs organo-modified by monomer surfactant. Polymer.
46:3571–3578.
67. Levin, L., A. Viale, and A. Forchiassin. 2003. Degradation of organic
pollutants by the white rot basidiomycete Trametes trogii. Int. Biodeterior.
Biodegradation. 52:1-5.
68. Li, J., S. Guo, and X. Li. 2005. Degradation kinetics of polystyrene and EPDM
melts under ultrasonic irradiation. Polym. Degrad. Stab. 89:6-14
69. Liu, Z., J. Michel, Z. Wang, B. Witholt, and Z. Li. 2006. Enantioselective
hydrolysis of styrene oxide with the epoxide hydrolase of Sphingomonas sp.
HXN-200. Tetrahedron Asymmetry. 17:47–52.
70. Mailhot, B., S. Morlat, and J. L. Gardette. 2000. Photooxidation of blends of
polystyrene and poly(vinyl methyl ether):FTIR and AFM studies. Polymer.
41:1981–1988.
71. Manzi-Nshuti, C., D. Chen, S. Su, and C. A. Wilkie. 2009. Structure–property
relationships of new polystyrene nanocomposites prepared from initiator-
containing layered double hydroxides of zinc aluminum and magnesium
aluminum. Polym. Degrad. Stab. 94:1290–1297.

References
140
72. Manzur, A., F. Cuamatzi, and E. Favela. 1997. Effect of the growth of
Phanerochaete chrysosporium in a blend of low density polyethylene and sugar
cane bagasse. J. Appl. Polym. Sci. 66:105–111.
73. Marconi, A. M., F. Beltrametti, G. Bestetti, F. Solinas, M. Ruzzi, E. Galli,
and E. Zennaro. 1996. Cloning and characterization of styrene catabolism
genes from Pseudomonas fluorescens ST. Appl. Environ. Microbiol. 62:121–
127.
74. Martinez-Blanco H., A. Regleo, L. B. Rodrigues-Aparicio, and J. M.
Luengo. 1990. Purification and biochemical characterization of phenylacetyl-
CoA ligase from Pseudomonas putida. A specific enzyme for the catabolism of
phenylacetic acid. J. Biol. Chem. 265:7084–7090.
75. Massardier-Nageotte, V., C. Pestre, T. Cruard-Pradet, and R. Bayard.
2006. Aerobic and anaerobic biodegradability of polymer films and physico-
chemical characterization. Polym. Degrad. Stab. 91:620–627.
76. Meenakshi, P., S. E. Noorjahan, R. Rajini, U. Venkateswarlu, C. Rose, and
T. P. Sastry. 2002. Mechanical and microstructure studies on the modification
of CA film by blending with PS. Bull. Mater. Sci. 25(1): 25–29.
77. Mehta, S., S. Biederman, and S. Shivkumar. 1995. Thermal degradation of
foamed polystyrene. J. Mater Sci. 30:2944-2949.
78. Mezzanotte, V., R. Bertani, F. D. Innocenti, and M. Tosin. 2005. Influence
of inocula on the results of biodegradation tests. Polym. Degrad. Stab. 87:51-56.
79. Milstein, O., R. Gersonde, A. Huttermann , M.J. Chen, and J. J. Meister.
1992. Fungal biodegradation of lignopolystyrene graft copolymers. Appl.
Environ. Microbiol. 58(10):3225-3232.
80. Milstein, O., R. Gersonde, A. Huttermann, R. Frund, H. J. Feine, H.
D. Ludermann, M. J. Chen, and J. J. Meister. 1994. Infrared and nuclear
magnetic resonance evidence of degradation in thermoplastics based on forest
products. J. Environ. Polym. Degrad. 2(2): 137-152.
81. Milstein, O., R. Gersonde, A. Hutterman, M. J. Chen, and J. Meister. 1996.
Fungal bioremediation of lignin graft copolymers from ethane monomers. J.
Macromol. Sci.-Pure Appl. Chem. 33: 685-702.
82. Mohamed, M. E., W. Ismail, J. Heider, and G. Fuchs. 2002. Aerobic
metabolism of phenylacetic acid in Azoarcus evansli. Arch Microbiol. 178:180-
192.

References
141
83. Mohamed, A., S. H. Gordon, and G. Biresaw. 2007.
Polycaprolactone/polystyrene bioblends characterized by thermogravimetry,
modulated differential scanning calorimetry and infrared photoacoustic
spectroscopy. Polym. Degrad. Stab. 92:1177-1185.
84. Mooney, A., P. G. Ward, and K. E. O’Connor. 2006. Microbial degradation
of styrene: biochemistry, molecular genetics, and perspectives for
biotechnological applications. Appl. Microbiol. Biotechnol. 72: 1–10.
85. Mor, R., and A. Sivan. 2008. Biofilm formation and partial biodegradation of
polystyrene by the actinomycete Rhodococcus rubber. Biodegradation.
19(6):851-858.
86. Motta, O., A. Protob, F. D. Carlob, F. D. Caroa, E. Santoroa, L. Brunettia,
and M. Capunzoa. 2009. Utilization of chemically oxidized polystyrene as co-
substrate by filamentous fungi. Int. J. Hyg. Environ. Health. 212: 61-66.
87. Mukai, K., and Y. Doi. 1995. Microbial degradation of polyesters. Prog. Ind.
Microbiol. 32, 189-204.
88. Muller, R. J., J. Augusta, and M. Pantke. 1992. An interlaboratory
investigation into biodegradation of plastics; Part I: A modified Sturm-test.
Mater. org. 27: 179-189.
89. Muyzer, G., E. C. D. Waal, and A. G. Uitterlinden. 1993. Profiling of
complex microbial populations by denaturing gradient gel electrophoresis
analysis of polymerase chain reaction-amplified genes coding for 16S rRNA.
Appl. Environ. Microbiol. 59: 695-700.
90. Nash, R. J., and D. M. Jacob. 1972. Mechanical Degradation of Thin
Polystyrene Films. Faraday. Discuss. Chem. Soc. 2:210-221.
91. O’Connor, K. E., W. Duetz, B. Wind, and A. D. W. Dobson. 1996. The
effect of nutrient limitation on styrene metabolism in Pseudomonas putida CA-
3. Appl. Environ. Microbiol. 62:3594–3599.
92. O’Connor, K.E., C.M. Buckley, S. Hartmans, and A.D.W. Dobson. 1995.
Possible regulatory role for non-aromatic carbon sources in styrene degradation
by Pseudomonas putida CA-3. Appl. Environ. Microbiol. 61:544-548.
93. O’Leary, N. D., K. E. O’Connor, and A. D. W. Dobson. 2002. Biochemistry,
genetics and physiology of microbial styrene degradation. FEMS Microbiol.
Rev. 26: 403–417.

References
142
94. O’Leary, N. D., K. E. O’Connor, P. Ward, M. Goff, and A. D. W. Dobson.
2005. Genetic characterisation of accumulation of polyhydroxyalkonate from
styrene in Pseudomonas putida CA-3. Appl. Environ. Microbiol. 71:4280–4378.
95. O’Leary, N. D., K. E. O’Connor, W. Duetz, and A. D. W. Dobson. 2001.
Transcriptional regulation of styrene degradation in Pseudomonas putida CA-3.
Microbiology. 147:973-979.
96. O’Leary, N.D., W. A. Duetz, A. D. W. Dobson, and K. E. O’Connor. 2002.
Induction and repression of the sty operon in Pseudomonas putida CA-3 during
growth on phenylacetic acid under organic and inorganic nutrient-limiting
continuous culture conditions. FEMS Microbiol. Lett. 208: 263-268.
97. Oikawa, E., K. T. Linn, T. Endo, T. Oikawa, and Y. Ishibashi. 2003.
Isolation and Characterization of Polystyrene Degrading Microorganisms for
Zero Emission Treatment of Expanded Polystyrene. Proc. Environ. Eng. Res.
40: 373-379.
98. Ojeda, T. F.M., E. Dalmolin, M. M.C. Forte, R. J.S. Jacques, F. M. Bento,
and F. A.O. Camargo. 2009. Abiotic and biotic degradation of oxo-
biodegradable polyethylenes. Polym. Degrad. Stab. 94:965–970.
99. Olivera, E. R., B. Minambres, B. Garcia, C. Muniz, M. A. Moreno, A.
Ferrandez, E. Diaz, J. L. Garcia, and J. M. Luengo. 1998. Molecular
characterisation of the phenylacetic acid catabolic pathway in Pseudomonas
putida U: the phenylacetyl-CoA catabolon. Proc. Natl. Acad. Sci. 95: 6419-
6424.
100. Orhan, Y., J. Hrenovic, and H. Buyukgungor. 2004. Biodegradation of
plastic compost bags under controlled soil conditions. Acta Chim. Slov. 51:579-
588.
101. Otake, Y., T. Kobayashi, H. Ashabe, N. Murakami, and K. Ono. 1995.
Biodegradation of low density polyethylene, polystyrene, polyvinyl-chloride,
and urea formaldehyde resin buried in soil for over 32 years. J. Appl. Polym.
Sci. 56:1789-96.
102. Paca, J, B. Koutsky, M. Maryska, and M. Halecky. 2001. Styrene
degradation along the bed height of perlite biofilter. J. Chem. Technol.
Biotechnol. 76:873–878.
103. Panke, S., V. de Lorenzo, A. Kaiser, B. Witholt, and M. G. Wubbolts. 1999.
Engineering of a stable whole-cell biocatalyst capable of (S)-styrene oxide

References
143
formation for continuous two-liquid-phase applications. Appl. Environ.
Microbiol. 65: 5619-5623.
104. Pantano, I. A. G., M. F. Diaz, A. Brandolin, and C. Sarmoria. 2009.
Mathematical modeling of the catalytic degradation of polystyrene in the
presence of aluminum chloride. Polym. Degrad. Stab. 94 (2009) 566–574.
105. Park, M. K., G. Sakellariou, S. Pispas, N. Hadjichristidis, andR.
Advincula. 2008. On the quantitative adsorption behavior of multi-zwitterionic
end-functionalized polymers onto gold surfaces. Colloids. Surf. A. 326:115-121.
106. Peng, X., and J. Shen. 1999. Preparation and biodegradability of polystyrene
having pyridinium group in the main chain. Eur. Polym. J. 35:1599-1605.
107. Pentimalli, M., D. Capitani, A. Ferrando, D. Ferri, P. Ragni, and A. L.
Segre. 2000. Gamma irradiation of food packaging materials: an NMR study.
Polymer. 41: 2871–2881.
108. Pimentel, T. A. P. F., J. A. Duraes, A. L. Drummond, D. Schlemmer, R. F.
Maria, and J. A. Sales. 2007. Preparation and characterization of blends of
recycled polystyrene with cassava starch. J. Mater. Sci. 42:7530–7536.
109. Pinzari, F., G. Pasquariello, and A. D. Mico. 2006. Biodeterioration of Paper:
A SEM Study of Fungal Spoilage Reproduced Under Controlled Conditions.
Macromol. Symp. 2006, 238, 57-66.
110. Pticek, A., Z. Hrnjak-Murgic, and J. Jelencic. 2007. Effect of the structure of
ethylene-propylene-diene-graftpolystyrene graft copolymers on morphology and
mechanical properties of SAN/EPDM blends. eXPRESS Polym. Lett. 1(3):173–
179.
111. Qiu, X., and P. A. Mirau. 2000. WIM/WISE NMR Studies of Chain Dynamics
in Solid Polymers and Blends. J. Magn. Reson. 142:183–189.
112. Raberg, U., and J. Hafren. 2008. Biodegradation and appearance of plastic
treated solid wood. Int. Biodeterior. Biodegradation. 62: 210–213.
113. Rossi, M., G. Camino, and M. P. Luda. 2001. Characterisation of smoke in
expanded polystyrene combustion. Polym. Degrad. Stab. 74:507–512.
114. Sabir, I. 2004. Plastic Industry in Pakistan.
http://www.jang.com.pk/thenews/investors/nov2004/index.html.
115. Saido, K., H. Taguchi, Y. Kodera, Y. Ishihara, I. J. Ryu, and S. Y. Chung.
2003. Novel Method for Polystyrene Reactions at Low Temperature. Macromol.
Res. 11(2):87-91.

References
144
116. Saito, T., M. A. Lusenkova, S. Matsuyama, K. Shimada, M. Itakura, K.
Kishine, K. Sato, and S. Kinugasa. 2004. Reliability of molecular weight
determination methods for oligomers investigated using certified polystyrene
reference materials. Polymer. 45:8355–8365.
117. Saitoh, A., D. Amutharani, Y. Yamamoto, Y. Tsujita, H. Yoshimizu, and S.
Okamoto. 2003. Structure and properties of the mesophase of syndiotactic
polystyrene IV. Release of guest molecules from δ form of syndiotactic
polystyrene by time resolved FT-IR and WAXD measurement. Polym. J.
35(11): 868-871.
118. Schirp, A., R. E. Ibach, D. E. Pendleton, and M. P. Wolcott. 2008.
Biological degradation of wood-plasticcomposites (wpc) and strategies for
improving the resistance of wpc against biological decay. 29, p. 480-507 In T.
P. Schultz, H. Militz, M. H. Freeman, B. Goodell, D. D. Nicholas (ed.),
Development of Commercial Wood Preservatives, Efficacy, Environmental, and
Health Issues. ACS symposium series; 982, Division of Cellulose and
Renewable Materials, American Chemical Society. Oxford University Press.
119. Schlemmer, D., M. J.A. Sales, and I. S. Resck. 2009. Degradation of different
polystyrene/thermoplastic starch blends buried in soil. Carbohydr. Polym.
75(1):58-62.
120. Scott, G., and D. M. Wiles. 2001. Reviews programmed-life plastics from
polyolefins: a new look at sustainability. Biomacromolecules. 2(3): 615-622.
121. Shah, A. A., F. Hasan, A. Hameed, and S. Ahmed. 2008. Biological
degradation of plastics: A comprehensive review. Biotechnol. Adv. 26:246–265.
122. Shim, J., E. Hagerman, B. Wu, and V. Gupta. 2008. Measurement of the
tensile strength of cell–biomaterial interface using the laser spallation technique.
Acta Biomater. 4(6):1657-1658.
123. Shimao, M., 2001. Biodegradation of plastics. Curr. Opin. Biotechnol. 12:242–
7.
124. Sielicki, M., D. D. Focht, and J. P. Martin. 1978. Microbial degradation of
[14
C] polystyrene and 1, 3-diphenylbutane. Can. J. Microbiol. 24(7):798-803.
125. Silva, A., B. L. Gartner, and J. J. Morrell. 2007. Towards the development of
accelerated methods for assessing the durability of wood plastic composites. J.
Test. Eval. 35; 203–210.

References
145
126. Singh, B., and N. Sharma. 2008. Mechanistic implications of plastic
degradation. Polym. Degrad. Stab. 93:561-584.
127. Siracusa, V., P. Rocculi, S. Romani, and M. D. Ro. 2008. Biodegradable
polymers for food packaging: a review. Trends Food Sci. Technol. 19:634-643.
128. Sivalingam, G., N. Agarwal, and G. Madras. 2003. Kinetics of Microwave-
Assisted Oxidative Degradation of Polystyrene in Solution. AIChE J.
49(7):1821-1826.
129. Sturm, R. N. J., 1973. Biodegradability of nonionic surfactants: screening test
for predicting rate and ultimate biodegradation. J. Oil. Chem. Soc. 50: 159.
130. Sudhakar, M., A. Trishul, M. Doble, K. S. Kumar, S. S. Jahan, D.
Inbakandan, R. R. Viduthalai, V.R. Umadevi, P. S. Murthy, and R.
Venkatesan. 2007. Biofouling and biodegradation of polyolefins in ocean
waters. Polym. Degrad. Stab. 92:1743-1752.
131. Sutherland, G. R. J., J. Haselbach, and S. D. Aust. 1997. Biodegradation of
crosslinked acrylic polymers by a white-rot fungus. Environ. Sci. Pollut. Res
4:16-20.
132. Tsuji, H., and Ikada, Y. 1998. Properties and morphology of poly (L-lactide).
II. Hydrolysis in alkaline solution. J. Polym. Sci. A. Polym. Chem. 36(1):59-66.
133. Uhl, F. M., and C. A. Wilkie. 2002. Polystyrene/graphite nanocomposites:
effect on thermal stability. Polym. Degrad. Stab. 76: 111–122.
134. Utkin, I.B., M. M. Yakimov, L. N. Mateeva, E.I. Kozlyak, I. S. Rogozhin, Z.
G. Solomon, and A. M. Bezborodov. 1991. Degradation of styrene and
ethylbenzene by Pseudomonas species Y2. FEMS Microbiol. Lett. 77:237-242.
135. Van den Brink, H. J. M., R. F. M. van Gorcom, C. A. M. J. J. van den
Hondel and P. J. Punt. 1998. Cytochrome P450 enzyme systems in fungi.
Fungal. Genet. Biol. 23:1-17.
136. Van Der Zee, M., L. Sijtsma, G.B. Tan, H. Tournois, and D. De Wit. 1994.
Assessment of biodegradation of water insoluble polymeric materials in aerobic
and anaerobic aquatic environments. Chemosphere. 28(10):1757-1771.
137. Vatsyayan, P., A. K. Kumar, P. Goswami, and P. Goswami. 2008. Broad
substrate Cytochrome P450 monooxygenase activity in the cells of Aspergillus
terreus MTCC 6324. Bioresour. Technol. 99:68–75.

References
146
138. Velasco, A., S. Alonso, J. L. Garcia, J. Perera, and E. Diaz. 1998. Genetic
and functional analysis of the styrene catabolic cluster of Pseudomonas sp.
strain Y2. J. Bacteriol. 180:1063–1071.
139. Vilaplana, F., A. Ribes-Greus, and S. Karlsson. 2006. Degradation of
recycled high-impact polystyrene. Simulation by reprocessing and thermo-
oxidation. Polym. Degrad. Stab. 91(9):2163-2170.
140. Vishwa-Prasad, A., and R. P. Singh. 1997. Recent developments in
degradation and stabilisation of High Impact Polystyrene. J. Macromol. Sci, C.
Rev. Macromol. Chem. Phys. C37 (4): 581-598.
141. Walter, T., J. Augusta, R. J. Mtiller, H. Widdecke and J. Klein. 1995.
Enzymatic degradation of a model polyester by lipase from Rhizopus delemar.
Enzyme Microb Technol. 17: 216-224.
142. Wang, Ce., T. Xue, B. Dong, Z. Wang, and H. L. Li. 2008. Polystyrene–
acrylonitrile–CNTs nanocomposites preparations and tribological behavior
research. Wear. 265(11-12):1923-1926.
143. Wang, J. 2000. From DNA biosensors to gene chips. Nucleic. Acids. Res. 28:
3011–3016.
144. Wang, X., L. Chen and N. Yoshimura. 2000. Erosion by acid rain,
accelerating the tracking of polystyrene insulating material. J. Phys. D. Appl.
Phys. 33:1117–1127.
145. Ward, P. G., G. de Roo, and K. E. O’Connor. 2005. Accumulation of
polyhydroxyalkanoate from styrene and phenylacetic acid by Pseudomonas
putida CA-3. Appl. Environ. Microbiol. 71(4): 2046–2052.
146. Ward, P. G., M. Goff, M. Donner, W. Kaminsky, and K. E. O'Connor.
2006. A Two step chemo-biotechnological conversion of polystyrene to a
biodegradable thermoplastic. Environ. Sci. Technol. 40(7):2433-2437.
147. Warhurst, A. M., K. F. Clarke, R. A. Hill, R. A. Holt, and C. A. Fewson.
1994. Metabolism of Styrene by Rhodococcus rhodochrous NCIMB 1325.
Appl. Environ. Microbiol. 60(4):1137-1145.
148. Watanabe, C., S. Tsuge, and H. Ohtani. 2009. Development of new
pyrolysis–GC/MS system incorporated with on-line micro-ultraviolet irradiation
for rapid evaluation of photo, thermal, and oxidative degradation of polymers.
Polym. Degrad. Stab. 94:1467–1472.

References
147
149. Weber, F. J., K. C. Hage, and J. A. M. de Bont. 1995. Growth of the fungus
Cladosporium sphaerospermum with toluene as the sole carbon and energy
source. Appl. Environ. Microbiol. 61:3562–3566.
150. White, T.J., T. Bruns, S. Lee, J. Taylor. 1990. Amplification and direct
sequencing of fungal ribosomal RNA genes for phylogenetics. p. 315-322. In
M. A. Innis, D. H. Gelfand, J. J. Shinsky, T. J. White (Eds.), PCR protocols: a
guide to methods and applications. Academic Press, San Diego, CA, USA.
151. Zee, M. V. D., L. Sutsma, G. B. Tan, H. Tournois, and D. De Wit. 1994.
Assessment of biodegradation of water insoluble polymeric materials in aerobic
and anaerobic aquatic environments. Chemosphere. 28(10):1757-1771.
152. Zenkiewicz, M., and M. Kurcok. 2008. Effects of compatibilizers and electron
radiation on thermomechanical properties of composites consisting of five
recycled polymers. Polymer Testing. 27:420–427.
153. Zuchowska, D., R. Steller, and W. Meissner. 1998. Structure and properties
of degradable polyolefin–starch blends. Polym. Degrad. Stab. 60:471-480.
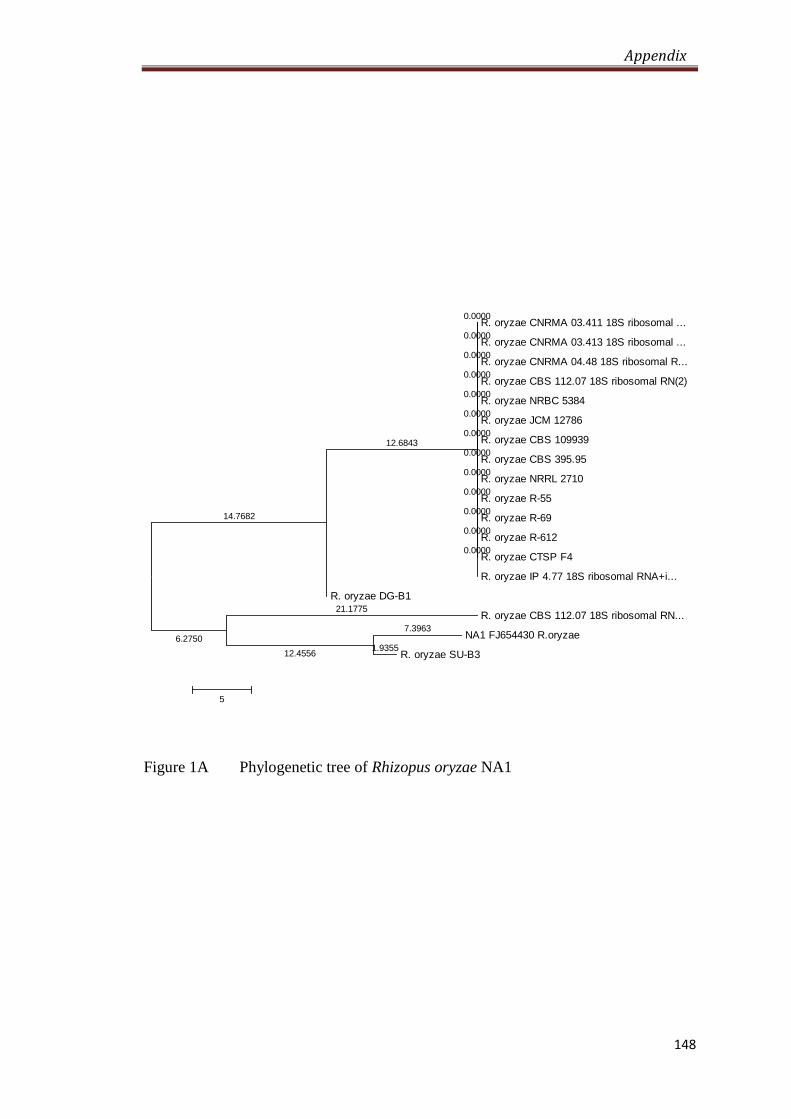
Appendix
148
Figure 1A Phylogenetic tree of Rhizopus oryzae NA1
R. oryzae CNRMA 03.411 18S ribosomal ...
R. oryzae CNRMA 03.413 18S ribosomal ...
R. oryzae CNRMA 04.48 18S ribosomal R...
R. oryzae CBS 112.07 18S ribosomal RN(2)
R. oryzae NRBC 5384
R. oryzae JCM 12786
R. oryzae CBS 109939
R. oryzae CBS 395.95
R. oryzae NRRL 2710
R. oryzae R-55
R. oryzae R-69
R. oryzae R-612
R. oryzae CTSP F4
R. oryzae IP 4.77 18S ribosomal RNA+i...
R. oryzae DG-B1
R. oryzae CBS 112.07 18S ribosomal RN...
NA1 FJ654430 R.oryzae
R. oryzae SU-B3
7.3963
1.9355
21.1775
0.0000
0.0000
0.0000
0.0000
0.0000
0.0000
0.0000
0.0000
0.0000
0.0000
0.0000
0.0000
0.0000
12.4556
6.2750
14.7682
12.6843
5

Appendix
149
Figure 2A Phylogenetic tree of Aspergillus terreus NA2
A. terreus UOA/HCPF 9927 18S ribosoma...
A. terreus UOA/HCPF 8955 18S ribosoma...
A. terreus UOA/HCPF 9995 18S ribosoma...
A. terreus UOA/HCPF 10158-2 18S ribos...
A. terreus UOA/HCPF 10178 18S ribosom...
A. terreus UOA/HCPF 10213A 18S riboso...
A. terreus UOA/HCPF 3355 18S ribosoma...
A. terreus UOA/HCPF 3706 18S ribosoma...
A. terreus UOA/HCPF 3960 18S ribosoma...
A. terreus UOA/HCPF 5704 18S ribosoma...
A. terreus UOA/HCPF 10213 18S ribosom...
A. terreus 18S ribosomal RNA+internal...
A. terreus UOA/HCPF 10536 18S ribosom...
E. sp. DC492
A. terreus NBRC 4100 internal transcr...
A. tubingensis NRRL 4851 internal tra...
A. terreus GX7-4A 18S ribosomal RNA+i...
NA2 FJ654431.1| A. terreus0.014769
0.000000
0.000000
0.000000
0.000000
0.000000
0.000000
0.000000
0.000000
0.000000
0.000000
0.000000
0.000000
0.000000
0.000000
0.002167
0.000000
0.012603
0.000869
0.000836
0.000909
0.002

Appendix
150
Figure 3A Phylogenetic tree of Phanerochaete chrysosporium NA3
u. fungus(3)
u. fungus(13)
u. fungus(2)
u. fungus(11)
u. fungus(4)
u. fungus(7)
u. fungus(5)
u. fungus(12)
P. chrysosporium NA3
P. chrysosporium UD 03/06 18S ribosom...
P. chrysosporium PV1
u. fungus(6)
P. chrysosporium liu
u. fungus
u. fungus(9)
P. chrysosporium TS03
u. fungus(8)
P. chrysosporium IFM 47473 small subu...
P. chrysosporium IFM 47494 small subu...
P. chrysosporium Bm-4
f. endophyte sp. P29-005 P29-005 inte...
P. chrysosporium UD 117/08 18S riboso...
P. chrysosporium FP 102074 18S riboso...
u. fungus(10)
P. chrysosporium KCTC 6728 18S riboso...
P. chrysosporium KCTC 6293 18S riboso...
P. chrysosporium FCL208 18S ribosomal...
12.925
0.155
0.000
0.000
0.008
17.872
0.196
0.006
14.237
9.630
15.317
17.568
12.896
18.674
0.005
7.522
0.000
10.012
12.364
2.753
10.796
0.099
24.553
14.863
0.717
13.031
8.389
5.165
7.209
1.799
4.641
5.731
3.628
1.677
1.611
0.443
0.510
2.307
5.460
9.597
6.612
0.063
5
Publications
Papers Submitted/ Published
Isolation and identification of polystyrene biodegrading bacteria from soil
Atiq, N, S. Ahmed, M. I. Ali, S. Andleeb, B. Ahmed, G. Robson (2010). African
Journal of Microbiology Research. 4(14), 1537 – 1541
An investigation of polystyrene utilization as a carbon source by Rhizopus
oryzae NA1
Naima Atiq, Safia Ahmed, Mohammed Ishtiaq Ali, Saadia Andleeb, Mohammed
Sajjad Shaukat, Geoffrey D. Robson (Submitted for publication in Polymer
Degradation and Stability (PDST-S-09-01105))
Evaluation of Biodegradability of Expanded Polystyrene and its Blends
Naima Atiq, Mariam Asif, Saadia Andleeb, Mohammed Ishtiaq Ali, Mohammed
Sajjad Shaukat, Safia Ahmed (Submitted for publication in Iranian Polymer Journal
(df5120))
Papers Presented in Conferences
Isolation of Polystyrene Degrading Soil Microorganisms
Naima Atiq, Fariha Hassan, Aamer Ali Shah, Safia Ahmed, Abdul Hameed
Sixth International Biennial Conference of Microbiology, March 18-21, 2007
Islamabd, Pakistan, (Poster Presentation).
Fungal Degradation of Polystyrene
Safia Ahmed, Mariam Asif, Fariha Hassan, Naima Atiq, Aamer Ali Shah, Abdul
Hameed
BIOMicroWorld 2007 II International Conference on Environmental, Industrial and
Applied Microbiology, 28th
Nov- 1st Dec 2007, Seville, Spain, (Paper accepted for
presentation).
An investigation of polystyrene utilization by Aspergillus terreus NA2
Naima Atiq, Mariam Asif, Saadia Andleeb, Mohammed Ishtiaq Ali, Mohammed
Sajjad Shaukat, Safia Ahmed
Economic and Social Impact of Fungal Deteriogens, (organized by British
Mycological Society and the International Biodeterioration and Biodegradation
Society), 6th - 7th April 2009, University of Manchester, (Poster presentation).
Colonisation and Biodegradation of Polystyrene by Indigenous Isolated Strain
Na3 Phanerochaete Crysosporium
Naima Atiq, Safia Ahmed, Muhammed, Ishtiaq Ali, Saadia Andleeb, Geoff Robson

Paper accepted for presentation in 3rd Congress of European Microbiologists, FEMS
2009, June 28-July 2, 2009, Gothenburg, Sweden, (Paper accepted for presentation).
Biodegradation Studies of Expanded Polystyrene Blends
Naima Atiq, Mariam Asif, Saadia Andleeb, Mohammed Ishtiaq Ali, Mohammed
Sajjad Shaukat, Safia Ahmed
9th
International Seminar on Polymer Science and Technology, Iran Polymer and
Petrochemical Institute, 17-21 October, 2009, Tehran, IRAN, (Oral Presentation).
Evaluation of Biodegradability of Expanded Polystyrene by Rhizopus oryzae NA1
Naima Atiq, Mariam Asif, Saadia Andleeb, Mohammed Ishtiaq Ali, Mohammed
Sajjad Shaukat, Safia Ahmed
9th
International Seminar on Polymer Science and Technology, Iran Polymer and
Petrochemical Institute, 17-21 October, 2009, Tehran, IRAN, (Oral Presentation).
Colonisation and Biodegradation of Expanded polystyrene beads by indigenous
isolated fungal strains
Naima Atiq, Safia Ahmed, Aamer Ali Shah, Mohammed Ishtiaq Ali, Saadia Andleeb,
Geoffrey D. Robson
BioMicroWorld2009- III International Conference on Environmental, Industrial and
Applied Microbiology, 2-4 December, 2009, Lisbon, Portugal, (Virtual Presentation).