Global Plastics Outlook
201
Global Plastics Outlook ECONOMIC DRIVERS, ENVIRONMENTAL IMPACTS AND POLICY OPTIONS
-
Upload
khangminh22 -
Category
Documents
-
view
0 -
download
0
Transcript of Global Plastics Outlook

Global Plastics OutlookECONOMIC DRIVERS, ENVIRONMENTAL IMPACTS AND POLICY OPTIONS
Glo
bal P
lastics Outlo
ok E
CO
NO
MIC
DR
IVE
RS
, EN
VIR
ON
ME
NTA
L IMP
AC
TS
AN
D P
OLIC
Y O
PT
ION
S


Global Plastics Outlook
ECONOMIC DRIVERS, ENVIRONMENTAL IMPACTS AND POLICY OPTIONS

This work is published under the responsibility of the Secretary-General of the OECD. The opinions expressed andarguments employed herein do not necessarily reflect the official views of OECD member countries.
This document, as well as any data and map included herein, are without prejudice to the status of or sovereignty overany territory, to the delimitation of international frontiers and boundaries and to the name of any territory, city or area.
The statistical data for Israel are supplied by and under the responsibility of the relevant Israeli authorities. The use ofsuch data by the OECD is without prejudice to the status of the Golan Heights, East Jerusalem and Israeli settlements inthe West Bank under the terms of international law.
Note by TurkeyThe information in this document with reference to “Cyprus” relates to the southern part of the Island. There is no singleauthority representing both Turkish and Greek Cypriot people on the Island. Turkey recognises the Turkish Republic ofNorthern Cyprus (TRNC). Until a lasting and equitable solution is found within the context of the United Nations, Turkeyshall preserve its position concerning the “Cyprus issue”.
Note by all the European Union Member States of the OECD and the European UnionThe Republic of Cyprus is recognised by all members of the United Nations with the exception of Turkey. Theinformation in this document relates to the area under the effective control of the Government of the Republic of Cyprus.
Please cite this publication as:OECD (2022), Global Plastics Outlook: Economic Drivers, Environmental Impacts and Policy Options, OECD Publishing, Paris, https://doi.org/10.1787/de747aef-en.
ISBN 978-92-64-65494-5 (print)ISBN 978-92-64-58406-8 (pdf)
Photo credits: Cover © design by Chantal Rivière/grafiklab.fr based on images © JasminkaM, Liubovart/Shutterstock.com.
Corrigenda to publications may be found on line at: www.oecd.org/about/publishing/corrigenda.htm.
© OECD 2022
The use of this work, whether digital or print, is governed by the Terms and Conditions to be found at https://www.oecd.org/termsandconditions.

3
GLOBAL PLASTICS OUTLOOK © OECD 2022
Preface
Global plastics production has grown significantly in recent decades. Highly versatile, light and affordable,
plastic materials are employed in countless industrial applications and have become extremely useful for
modern society. They help us preserve food, insulate buildings, make electronics work and increase the
fuel efficiency of our vehicles, among other things. Yet, the sheer magnitude of our societies’ consumption
of plastics bears important drawbacks. Plastics use results in a high production-related carbon footprint,
high volumes of waste, persistent pollution and harm to wildlife and ecosystems when leakage to the
environment occurs, and considerable socio-economic costs due to the negative impacts of plastic litter
on tourism and fisheries.
In recent years, the growing awareness of plastic pollution has alerted public opinion and paved the way
for stronger policy intervention on this front. Many OECD countries and emerging economies have been
implementing policies that specifically aim to reduce the negative environmental impacts associated with
different stages of the plastics lifecycle. In addition, global fora like the G7 and the G20 as well as the
United Nations Environment Assembly are increasingly focusing on marine litter and plastic pollution. The
Global Plastics Outlook: Economic Drivers, Environmental Impacts and Policy Options seeks to inform and
support these efforts.
This is the first report to comprehensively take stock of current plastics production, use and waste
generation, uncover the underlying economic drivers and map the related environmental impacts on a
global level. The report also presents four key levers that are essential to bend the plastic curve: markets
for recycled (secondary) plastics, technological innovation in plastics, domestic policy measures and
international co-operation, including international financing. Our findings point to the need for a whole of
life-cycle approach requiring policy interventions both downstream of the value chain, such as end-of-life
management, and upstream, like product design, for an effective policy mix.
The Outlook can help decision-makers understand the direction in which we are heading and help to
assess which policies can support a more sustainable and circular management of plastic materials. The
OECD stands ready to assist governments in making this transition by designing, developing and delivering
better policies to eliminate the negative environmental impacts of plastics production and ultimately
achieve plastics-free oceans and rivers for future generations. As the challenges associated with plastics
production, namely growing leakage and greenhouse gas emissions, are transboundary in nature, it will
also be crucial that countries respond to the challenge with co-ordinated and global solutions.
Mathias Cormann
Secretary-General, OECD

4
GLOBAL PLASTICS OUTLOOK © OECD 2022
Foreword
The Global Plastics Outlook: Economic Drivers, Environmental Impacts and Policy Options provides
policymakers with a comprehensive overview of the challenges ahead and potential solutions. The report
is structured as shown below. Using state-of-the-art environment-economy modelling, the Outlook
uncovers the economic drivers that give rise to unprecedented volumes of plastics use and waste. The
Outlook also maps and quantifies key environmental impacts such as plastic leakage to the environment
and greenhouse gas emissions. The Outlook then presents four levers critical to reduce the environmental
impacts of plastics: markets for recycled (secondary) plastics, technological innovation in plastics,
domestic policy measures and international co-operation.
Report roadmap

5
GLOBAL PLASTICS OUTLOOK © OECD 2022
Acknowledgements
This report was conceptualised and directed by Shardul Agrawala, Head of Division of the Environment
and Economy Integration Division (EEI) in the Environment Directorate of the OECD. Maarten Dubois led
the cross-cutting co-ordination of the report, the modelling team was led by Elisa Lanzi, and the circular
economy team was led by Peter Börkey (all OECD Environment Directorate). This report was edited by
Shardul Agrawala, Maarten Dubois, Peter Börkey and Elisa Lanzi.
The authorship of the chapters is as follows: Shardul Agrawala and Norbert Monti (Chapter 1); Maarten
Dubois, Elisa Lanzi, Ruben Bibas, Eleonora Mavroeidi, Jean Fouré, Rob Dellink, Daniel Ostalé Valriberas,
Elena Buzzi and Linda Livingstone (Chapter 2); Rob Dellink and Linda Livingstone (Chapter 3); Andrew
Brown, Frithjof Laubinger and Peter Börkey (Chapter 4), Damien Dussaux and Shardul Agrawala
(Chapter 5); Maarten Dubois, Peter Börkey, Andrew Brown and Frithjof Laubinger (Chapter 6); Frithjof
Laubinger, Peter Börkey, Maarten Dubois and Shunta Yamaguchi (Chapter 7) (all OECD Environment
Directorate). Additional contributions on Chapter 7 were provided by Ivan Haščič from the Environment
Directorate and Pierra Tortora and Daniel Prosi of the Development Co-operation Directorate. The plastics
use and waste estimates presented in the report and reported in the Global Plastic Outlook Database were
prepared by Ruben Bibas, Eleonora Mavroeidi, Rob Dellink, Daniel Ostalé Valriberas, Elisa Lanzi, and
Maarten Dubois.
The following external experts: Morten Ryberg, Teddy Serrano and Alexis Laurent (Technical University of
Denmark), Costas A. Velis, Ed Cook and Josh Cottom (University of Leeds), Laurent Lebreton (The Ocean
Cleanup) and Nikolaos Evangeliou (Norwegian Institute for Air Research) contributed to the modelling of
global plastic leakage. Roland Geyer (University of California, Santa Barbara) advised on the OECD
modelling strategy and provided valuable feedback on the report. Trinomics B.V., the Institute for Global
Environmental Studies and Prasad Modak, Louis Tronel, Flavio Ribeiro and Darina Petrova (all
independent experts) provided various country-briefs which were used to enrich the policy analysis.
The report received insightful feedback from Rodolfo Lacy (Director), Ingrid Barnsley (Deputy Director),
Bob Diderich and Eeva Leinala (all Environment Directorate) and Jens Sedemund (Development Co-
operation Directorate). The report also received expert feedback from Stephanie B. Borrelle (University of
Toronto), Johan Eyckmans (KU Leuven), Costas A. Velis (University of Leeds) and the Ellen MacArthur
Foundation. Earlier drafts also benefited from discussions during the Technical Expert Workshop on
Modelling Approaches for Plastics Use Projections, organised by the OECD on the 22 and 23 June 2020.
Aziza Perrière and Illias Mousse Iye (OECD Environment Directorate) provided administrative support.
Elizabeth Del Bourgo, William Foster, Stéphanie Simonin-Edwards and Norbert Monti (OECD Environment
Directorate), as well as Catherine Bremer (OECD Public Affairs and Communications Directorate) provided
assistance with communication and outreach aspects of the report. Linda Livingstone and Elena Buzzi
(OECD Environment Directorate) and Chantal Rivière (independent graphic designer) as well as the
WeDoData team assisted with the design of the Policy Highlights, the cover and figures throughout the
report. The report received copy-editing support from Janine Treves (OECD Public Affairs and
Communications Directorate), Fiona Hinchcliffe and Annette Hardcastle (both independent editors).
The OECD Environment Policy Committee (EPOC) was responsible for the oversight of the development
of the report. In addition, the Working Party on Resource Productivity and Waste (WPRPW) and the
Working Party on Integrating Environmental and Economic Policies (WPIEEP) reviewed earlier drafts.

6
GLOBAL PLASTICS OUTLOOK © OECD 2022
Table of contents
Preface 3
Foreword 4
Acknowledgements 5
Abbreviations and acronyms 11
Executive Summary 14
1. Overview and policy highlights 16
1.1. Introduction 17
1.2. Why a Global Plastics Outlook and what does it involve? 17
1.3. Key findings 19
1.3.1. The current plastics lifecycle is far from circular 19 1.3.2. Mismanaged plastic waste is the main source of macroplastic leakage 21 1.3.3. The 30 Mt of plastics accumulated in the ocean, and 109 Mt in rivers, will pollute
aquatic environments for decades to come 21 1.3.4. The carbon footprint of the plastics lifecycle is significant 22
1.4. Critical levers to reduce the environmental impact of plastics 23 1.4.1. Combine push and pull policies to support recycled plastics markets 23 1.4.2. Do more to boost innovation in environmental plastics 24 1.4.3. Strengthen the ambition of domestic public policies 25 1.4.4. Strengthen international co-operation to make plastics value chains more circular and
achieve net zero plastic leakage 27
References 28
Notes 30
2. Plastics flows and their impacts on the environment 31
2.1. The methodology to compose the OECD Global Plastics Outlook Database 32
2.2. The global use of plastics is growing strongly 34
2.3. Plastic waste generation depends on plastics use and product lifespans 39
2.4. The quality of plastic waste management varies across the world 42
2.5. Plastic leakage is substantial 46
2.5.1. Plastics enter and accumulate in the aquatic environment through complex pathways 50 2.5.2. Microplastics from road transport can pollute the air over wide areas 52
2.6. Plastic leakage has a variety of environmental, health and economic consequences 53
References 54
Notes 59

7
GLOBAL PLASTICS OUTLOOK © OECD 2022
3. The effects of the COVID-19 pandemic on plastics use and waste 60
3.1. The Covid-19 pandemic has disrupted the economy and the use of plastics 61
3.2. The pandemic’s impact on plastics production varies by use and sector 62
Plastics production was temporarily disrupted 62 Plastics use for health purposes increased significantly 63 Plastics use for packaging shifted across sectors 64 The temporary halt to construction had a large effect on plastics demand 66 Shrinking demand for vehicles also drove down plastics demand 66 The synthetic fibres and textiles sectors were disrupted 66
3.3. Effects on plastic waste and recycling are not clear cut 67
Plastics littering worsened 68 Plastics recycling was disrupted 69 Waste and recycling policies changed temporarily 70
3.4. OECD modelling suggests COVID-19 on balance reduced plastics use in 2020 70 Plastics use declined in 2020, but less than economic activity 71 Plastic waste may have remained stable in the short run despite the switch to single-
use plastics 74
3.5. The longer-term implications of the COVID-19 pandemic remain unclear 74
References 75
Notes 82
4. Trends in the secondary plastics markets 83
4.1. Markets for secondary plastics contribute to a more circular use of plastics 84
4.2. Plastic waste streams, collection, separation and recycling methods determine the value of
secondary plastics 85
4.3. Secondary plastics markets remain small and vulnerable despite recent growth 87
4.4. There are recent positive signs for secondary markets 89
4.4.1. Policy frameworks are being strengthened 89 4.4.2. The prices of some secondary plastic grades seems to be decoupling from primary
equivalents 91 4.4.3. Innovation in recycling is on the rise 91 4.4.4. Trade in plastic waste is expected to keep falling in the near future 92
References 96
Notes 100
5. Innovation on plastics 101
5.1. What are the trends in environmentally relevant plastics innovation? 102
5.1.1. Environmentally relevant plastics innovation is growing but is still small scale 104 5.1.2. Plastics prevention and recycling innovation is concentrated in a few countries 105
5.2. What role for policies in driving circular plastics innovation? 106
5.3. What are the latest innovation challenges? 108
5.3.1. Biodegradable plastics innovation is slowing after decades of sustained growth 108 5.3.2. Chemical recycling is only emerging but is facing significant challenges 109 5.3.3. Myriad innovations along the value chain of plastics are emerging 110
5.4. How to transition from innovation to scalability? 111
References 112
Notes 115
6. The policy landscape 117
6.1. A broad array of policy instruments is needed to address the negative impacts of plastics
use 118

8
GLOBAL PLASTICS OUTLOOK © OECD 2022
6.2. The fragmented use of economic and regulatory instruments leaves room for improvement 121
Current bans and taxes on single-use items are insufficient to restrain demand 122 Innovative policies are needed to encourage design for circularity 123 Recycling and sorting can be enhanced by making them profitable 126 Leakage pathways can be closed by investing in basic waste management
infrastructure 128 Cleaning up leaked plastics is expensive and only a policy of last resort 129
6.3. Getting the policy mix right is crucial for structural change 130
6.4. A policy roadmap for a more circular use of plastics 132
References 134
Notes 139
7. International co-operation to make plastics value chains more circular 140
7.1. Addressing the environmental consequences of global plastics value chains requires
international co-operation 141
7.2. A more comprehensive global approach to plastic pollution is needed 141
7.3. Eliminating plastic pollution will be costly for low and middle-income countries 146
7.4. Official Development Assistance (ODA) dedicated to plastic waste management is
increasing, but insufficient 147
References 151
Notes 154
Annex A. Modelling approaches used to compose the OECD Global Plastics Outlook Database 155
Annex B. Modelling the economic effects of the COVID-19 pandemic and government response measures 194
Glossary 197
Tables
Table 2.1. The OECD Global Plastics Outlook Database covers a large range of sources and methodologies 34 Table 2.2. The large range of polymers allows for a multitude of plastics applications 37 Table 2.3. Bioplastics could reduce GHG emissions from plastics production as long as negative effects from
indirect land use change are avoided 38 Table 2.4. GDP is a key driver of global plastics use 39 Table 2.5. Per capita plastic waste generation differs strongly across the world 42 Table 2.6. A complementary approach is needed to improve the understanding of plastic leakage 48 Table 2.7. Plastic leakage is substantial despite high uncertainty surrounding the estimates 48 Table 4.1. Collection and sorting processes differ by country income level 85 Table 4.2. Post-industrial and post-consumer waste streams vary in value and handling routes 86 Table 4.3. There are key differences in the economics of primary and secondary plastics 89 Table 4.4. Trade restrictions create both opportunities and risks 94 Table 6.1. The use of key policy instruments to enhance recycling is disparate across the world 127 Table 6.2. The high costs of cleaning up beach litter highlight the cost effectiveness of prevention 129 Table 7.1. The fragmented nature of global agreements on plastics is hindering environmental protection 142 Table 7.2. The SDGs highlight international ambitions to reduce the environment and health impacts of waste 143 Table 7.3. Regional organisations help to co-ordinate members’ policies and actions 144 Table A A.1. Sectoral aggregation of ENV-Linkages 158 Table A A.2. Regional aggregation of ENV-Linkages 159 Table A A.3. Share of the secondary production technology 160

9
GLOBAL PLASTICS OUTLOOK © OECD 2022
Table A A.4. Mapping plastics use by application to economic sectors 161 Table A A.5. Data sources for plastic recycling rates in base year 163 Table A A.6. Assumptions used to determine loss rates for plastic packaging waste that has been collected for
recycling 166 Table A A.7. Average loss rates by plastic type and application for high income countries and low- middle
income countries (Non-MSW) 167 Table A A.8. Average loss rates by plastic type and region for MSW and non-MSW combined 168 Table A A.9. UN Comtrade plastic waste series mapping to polymers in ENV-Linkages 169 Table A A.10. The share of litter lost to the environment in function of the regional income levels 170 Table A A.11. Sources for losses from microplastics dust 172 Table A A.12. Microplastics removal rate for different levels of wastewater treatment 174 Table A A.13. Fractions of leaked macroplastics that enter aquatic environments and that reach the ocean 176 Table A A.14. Parameters for fate of plastic in aquatic environments by polymer type 177 Table A A.15. Validation of incineration data 180 Table A A.16. Data used to model the activities of the informal recycling sector 181 Table A A.17. Deliberate dumping into water 181 Table A A.18. Plastic waste transfer rate from terrestrial to aquatic environment (% wt. y-1) 182
Figures
Figure 1.1. Only 33 million tonnes (Mt), or 9% of the 353 Mt of plastic waste, was recycled in 2019 20 Figure 1.2. Global leakage of macro-and microplastics to the environment is estimated at 22 Mt 21 Figure 1.3. Secondary production is growing, but makes up only six percent of total plastic production 23 Figure 1.4. A policy roadmap for more circular plastics use can involve a stepped approach 26 Figure 1.5. Plastic-related gross commitments for ODA have increased steadily but remain small 28 Figure 2.1. The OECD Global Plastics Outlook Database 33 Figure 2.2. Global plastics use has quadrupled in 30 years, mainly driven by emerging economies 35 Figure 2.3. The carbon footprint of a non-returnable glass bottle is higher than a plastic equivalent 36 Figure 2.4. Global plastics use by application and polymer 37 Figure 2.5. Average plastic product lifespans range from six months to 35 years 40 Figure 2.6. Almost two-thirds of plastic waste comes from relatively short-lived products such as packaging,
consumer products and textiles 41 Figure 2.7. More plastic waste is mismanaged than collected for recycling 43 Figure 2.8. Formal and informal recycling volumes and losses differ across regions 44 Figure 2.9. Global leakage of macro-and microplastics to the environment is estimated at 22 Mt 47 Figure 2.10. Leakage to the environment is high in emerging economies, especially for macroplastics 49 Figure 2.11. Rivers accumulate leaked plastics and carry them to the ocean 50 Figure 2.12. Aerial microplastic pollution from road transport is highest in highly urbanised areas 52 Figure 3.1. Production of plastic packaging in the European Union temporarily dropped 65 Figure 3.2. Global plastics use declined by more than 10 Mt in 2020, affecting almost all regions 72 Figure 3.3. Global plastics use declined by more than 10 Mt in 2020, affecting almost all sectors 73 Figure 4.1. Secondary production is growing, but makes up only six percent of total plastic production 88 Figure 4.2. The fall in plastic waste exported to China has significantly reduced global trade 92 Figure 4.3. The share of plastic waste exported has fallen drastically in some OECD regions 93 Figure 4.4. Global exports of plastic waste have shifted to other countries 95 Figure 5.1. Classification of innovation in environmentally relevant plastics technologies 103 Figure 5.2. Innovation in plastics prevention and recycling have grown the most 104 Figure 5.3. OECD countries and China lead on innovation in plastics circularity 105 Figure 5.4. Some countries specialise in circular plastics innovation 106 Figure 5.5. The German packaging ordinance prompted innovation in plastic recycling 107 Figure 5.6. Chemical recycling covers a wide range of chemical processes 109 Figure 6.1. Policy approaches to reduce plastic leakage 119 Figure 6.2. The scope of policies that affect plastics management is large 120 Figure 6.3. A comprehensive policy package requires a mix of steering and enabling policies 121 Figure 6.4. Extended producer responsibility 125 Figure 6.5. Solid waste management in Brazil has improved significantly between 2000 and 2010 128 Figure 6.6. Policy instruments vary in their potential impact on littering and recycling 130 Figure 6.7. A policy roadmap for more circular use of plastics 133 Figure 7.1. The G7 and G20 have hosted several initiatives to tackle plastic pollution 143

10
GLOBAL PLASTICS OUTLOOK © OECD 2022
Figure 7.2. The cost of preventing plastic pollution varies by ambition, policy stringency and needs 147 Figure 7.3. Plastic-related gross commitments for ODA have increased steadily but remain small 148 Figure 7.4. Asian countries attract the most plastic-related ODA 149 Figure A A.1. Methodological steps 156 Figure A A.2. Fate of microplastics in wastewaters 173 Figure A A.3. Weighted probability of leaked plastics entering aquatic environments 175 Figure A A.4. Mass balance budget model for plastic in global aquatic environments 177 Figure A A.5. ENV linkages-SPOT plugin model structure 179 Figure A A.6. Greenhouse gas emission factors for plastics lifecycle in ENV-Linkages in 2015 185 Figure A B.1. The COVID-19 pandemic and lockdown measures have reduced GDP across the world and
reduced output in most sectors 195
Boxes
Box 1.1. What is novel about the OECD’s Global Plastics Outlook? 19 Box 1.2. How has the COVID-19 pandemic affected plastics use? 22 Box 2.1. Plastics emit a high amount of greenhouse gases throughout their lifecycle 36 Box 2.2. Biobased plastics offer potential as long as land-use impacts are managed 38 Box 2.3. The environmental impacts of incineration are mixed 45 Box 2.4. State of the art in estimating the scale of the plastic leakage problem 48 Box 3.1. Which polymers are used for personal protective equipment, medical devices and COVID-19 tests? 63 Box 3.2. Tens of billions of face masks are likely to have been produced in 2020 64 Box 4.1. Formalising informal recycling remains a challenge 85 Box 4.2. Design requirements can either restrict or enable the use of secondary plastics 90 Box 4.3. Is the business case for investing in recycling improving? 91 Box 4.4. Import restrictions have reduced the share of plastic waste traded 93 Box 5.1. “Biodegradable” plastics have become controversial 108 Box 6.1. Mapping and benchmarking international policy instruments is challenging 122 Box 6.2. Targeting plastic shopping bags is only part of the picture 123 Box 6.3. Aligning regulation of chemical substances and design approaches across countries can reduce
health risks and improve circularity 124 Box 6.4. Extended Producer Responsibility has proven its worth, but challenges remain 125 Box 6.5. Taxes can be powerful levers to change behaviour, as seen in several OECD countries 126 Box 6.6. Brazil’s fight against dumping waste 128 Box 6.7. The EU Single-Use Plastics Directive discourages the use of frequently littered items 129 Box 7.1. Addressing issues that occur across global plastics value chains requires international co-operation 145 Box 7.2. Successful waste management investment requires strong regulatory frameworks and governance
mechanisms 150 Box A A.1. The ENV-Linkages model 157

11
GLOBAL PLASTICS OUTLOOK © OECD 2022
Look for the StatLinks2at the bottom of the tables or graphs in this book.To download the matching Excel® spreadsheet, just type the link into your Internetbrowser, starting with the https://doi.org prefix, or click on the link from the e-bookedition.
This book has...A service that delivers Excel® files fromthe printedpage!
Follow OECD Publications on:
http://twitter.com/OECD_Pubs
http://www.facebook.com/OECDPublications
http://www.linkedin.com/groups/OECD-Publications-4645871
http://www.youtube.com/oecdilibrary
http://www.oecd.org/oecddirect/Alerts

12
GLOBAL PLASTICS OUTLOOK © OECD 2022
Abbreviations and acronyms
ABS Acrylonitrile butadiene styrene
ASA Acrylonitrile styrene acrylate
BPA Bisphenol A
BWP(s) Brake Wear Particle(s)
CO2 Carbon dioxide
CO2e Carbon dioxide equivalent
DDE Dichlorodiphenyldichloroethylene
DDT Dichlorodiphenyltrichloroethane
DTU Technical University of Denmark
EC European Commission
ECHA European Chemical Agency
EEA European Environment Agency
EoL End of life
EPA (United States) Environmental Protection Agency
EPR Extended producer responsibility
EU European Union
EUR Euro
FLEXPART FLEXible PARTicle
GAINS Greenhouse gas – air pollution Interactions and synergies
GDP Gross domestic product
GHG Greenhouse gas
Gt Gigatonnes (billion tonnes)
GTAP Global Trade Analysis Project
Ha Hectare
HDPE High-density polyethylene
ISO International Organization for Standardization
kt Kilotonnes

13
GLOBAL PLASTICS OUTLOOK © OECD 2022
LCA Life cycle analysis
LDPE Low-density polyethylene
MSW Municipal solid waste
Mt Million tonnes
NOx Nitrous oxide
ODA Official development assistance
PAH Polycyclic aromatic hydrocarbon
PBT Polybutylene terephthalate
PC Polycarbonate
PCB Polychlorinated biphenyl
PET Polyethylene terephthalate
PM Particulate matter
PM2.5 Fine particulate matter
PP Polypropylene
PPE Personal protective equipment
PPP Purchasing power parity
PS Polystyrene
PUR Polyurethane
PVC Polyvinyl chloride
SDG Sustainable development goal
SOx Sulphur oxide
TWP(s) Tyre wear particle(s)
UN United Nations
UNCLOS United Nations Convention on the Law of the Seas
UNEA United Nations Environment Assembly
UNEP United Nations Environment Programme
USD United States Dollar
UV Ultraviolet
WEEE Waste from electrical and electronic equipment
WtE Waste to energy
WWTP Waste water treatment plant

14
GLOBAL PLASTICS OUTLOOK © OECD 2022
Executive Summary
The Global Plastics Outlook: Economic Drivers, Environmental Impacts and Policy Options offers a unique
quantified picture of the full lifecycle of plastics globally, including production, consumption, waste,
recycling, disposal, leakage and greenhouse gas emissions. Five key findings summarize the current
challenges while four critical levers are put forward to make the plastics lifecycle more circular.
Key findings
The current plastics lifecycle is far from circular. Globally, the annual production of plastics has
doubled, soaring from 234 million tonnes (Mt) in 2000 to 460 Mt in 2019. Plastic waste has more than
doubled, from 156 Mt in 2000 to 353 Mt in 2019. After taking into account losses during recycling, only
9% of plastic waste was ultimately recycled, while 19% was incinerated and almost 50% went to
sanitary landfills. The remaining 22% was disposed of in uncontrolled dumpsites, burned in open pits
or leaked into the environment.
COVID-19 increased single-use plastic waste, though plastics use fell overall. The lockdowns
and decline in economic activity during 2020 reduced plastics use by 2.2% from 2019 levels. However,
the increase in the use of protective personal equipment and single-use plastics has exacerbated
plastic littering. As the economy rebounds, plastics use is projected to pick up again, leading to a
renewed growth of plastic waste and related environmental pressures.
Mismanaged plastic waste is the main source of macroplastic leakage. In 2019 alone, 22 Mt of
plastic materials leaked into the environment. Macroplastics account for 88% of plastic leakage, mainly
resulting from inadequate collection and disposal. Microplastics, polymers with a diameter smaller than
5 mm, account for the remaining 12%, coming from a range of sources such as tyre abrasion, brake
wear or textile washing. The documented presence of these small particles in freshwater and terrestrial
environments, as well as in several food and beverage streams, suggests that microplastics contribute
substantially to the exposure of ecosystems and humans to leaked plastics and their related risks.
Significant stocks of plastics have already accumulated in aquatic environments, with 109 Mt
of plastics accumulated in rivers, and 30 Mt in the ocean. In 2019 alone, 6.1 Mt of plastic waste
leaked into rivers, lakes and the ocean. The build-up of plastics in rivers implies that leakage into the
ocean will continue for decades to come even if mismanaged plastic waste was significantly reduced.
Furthermore, cleaning up these plastics is becoming more difficult and costly as plastics fragment into
ever smaller particles.
The carbon footprint of the plastics lifecycle is significant. Plastics have a significant carbon
footprint, contributing 3.4% of global greenhouse gas emissions throughout their lifecycle. In 2019,
plastics generated 1.8 billion tonnes of greenhouse gas emissions, with 90% coming from their
production and conversion from fossil fuels. Closing material loops could reduce this footprint
substantially.
15
GLOBAL PLASTICS OUTLOOK © OECD 2022
Critical levers to reduce the environmental impact of plastics
Develop recycled plastics markets by combining push and pull policies. While global production
of secondary plastics from recycling has more than quadrupled in the last two decades, they are still
only 6% of the total feedstock. Since secondary plastics are mainly considered substitutes for primary
plastics, rather than a valuable resource in their own right, the secondary plastics market remains small
and vulnerable. Some countries have successfully strengthened their markets by “pushing” secondary
plastics supply – for example, through extended producer responsibility schemes – as well as “pulling”
demand via recycled content targets. The recent decoupling of prices for primary and secondary
polyethylene terephthalate (PET) in Europe and increasing innovation in recycling technologies are
positive signs that the combination of these policies is working.
Boost innovation for a more circular plastics lifecycle. Innovation can deliver significant
environmental benefits – by reducing the amount of primary plastics needed, prolonging the useful life
of products and facilitating recycling. This report shows that patented environmental plastics
technologies increased more than threefold between 1990 and 2017. Yet environmentally relevant
innovation makes up only 1.2% of all plastics-related innovation. More ambitious policies are needed
including a combination of investments in innovation and interventions aimed at increasing demand for
circular solutions while restraining plastics consumption overall.
Strengthen the ambition of domestic public policies. An inventory of key regulatory and economic
instruments in 50 OECD, emerging and developing countries developed for this report suggests that
the current plastics policy landscape is fragmented and can be strengthened significantly. Only
13 countries from the inventory have national policy instruments in place that provide direct financial
incentives to sort plastic waste at source. Only 25 of the countries in the inventory have effectively
implemented well-known instruments that encourage recycling, such as national landfill and
incineration taxes. Meanwhile, globally more than 120 countries have bans and taxes on single-use
plastic items, but most are limited to plastic bags or other small-volume items. This means that these
instruments are mainly effective in reducing littering, rather than restraining overall consumption of
plastics. A policy roadmap is proposed for countries to reduce the leakage of macroplastics. It involves
three increasingly ambitious phases:
o Close leakage pathways. Build sanitary waste management infrastructure, organise waste
collection and structurally reduce plastics littering by enlarging the scope of anti-littering policies
(bans or taxes of frequently littered items) and enhancing implementation of legislation.
o Create incentives for recycling and enhance sorting at source. The required measures include
extended producer responsibility (EPR) schemes, landfill taxes and incineration taxes, as well as
deposit-refund and pay-as-you-throw schemes.
o Restrain demand and optimise design to make plastic value chains more circular and recycled
plastics more price competitive. Instruments such as plastics taxes and recycled content targets
can create financial incentives to reduce use and foster circularity. Their impact could be improved
considerably by extending them to more product types and more countries.
Strengthen international co-operation to make plastics value chains more circular and achieve
net zero plastic leakage. Considering global value chains and international trade in plastics, aligning
design approaches and the regulation of chemical substances across countries will be key to improving
the circularity of plastics globally. Moreover, with mismanaged waste a widespread problem, especially
in developing countries, major investments in basic waste management infrastructure are needed. To
finance the required estimated costs of EUR 25 billion a year in low and middle-income countries, all
available sources of funding will need to be mobilised, including official development assistance which
currently covers only 2% of the financing needs. Efficient use of such investments will also require
effective legal frameworks to enforce disposal obligations.

16
GLOBAL PLASTICS OUTLOOK © OECD 2022
This overview chapter presents the motivation for and approach taken by the
Global Plastics Outlook, as well as the key findings and policy implications
1. Overview and policy highlights

17
GLOBAL PLASTICS OUTLOOK © OECD 2022
1.1. Introduction
The first manufactured plastic, Parkesine, was developed from cellulose in the mid-19th century and found
applications as a clothing waterproofer and as synthetic ivory. Almost half a century later, Bakelite became
the first truly synthetic plastic to be developed. However, it was not until 1950 that global plastics production
began its unprecedented growth, which has seen it expand 230-fold to the present day.
The rapid growth of plastics is due to their unique properties: high strength-to-weight ratio, high moldability,
impermeability to liquids, resistance to physical and chemical degradation, and low cost. They can easily
substitute for other materials (such as glass, metal, wood and natural fibres) in a wide range of applications. However, some of the desirable qualities of plastics are also their key limitations. Plastics are highly
resistant to physical and chemical degradation, which also means that they can persist as waste in the
environment for decades or even centuries.
Concern about the environmental externalities of plastics had already emerged by the 1970s when
scientists started observing plastic leakage in the aquatic environment. Numerous beach clean-up and
citizen-science initiatives burgeoned to deal with what was seen as a threat to marine wildlife. A 1987
publication, Plastics in the Ocean: More than a Litter Problem, observed that “A growing body of evidence
indicates that when discharged, lost or abandoned in the marine environment, plastic debris adversely
affects the oceans and their inhabitants in a multitude of ways” (Center for Environmental Education,
1987[1]). Growing evidence for the presence of plastics in the food chain, water supply and the air we
breathe has since raised concerns that plastics could be harming human health as well.
Despite this long history, global public concern over plastic leakage has only become widespread in the
second decade of the 21st century. A confluence of seminal research and high-profile media focus on
plastic waste in the ocean and on land, has catapulted plastics to the centre of public consciousness and
preoccupation for the environment. In 2018, “single-use” was the Collins Dictionary “word of the year”
(Collins Dictionary, 2018[2]), while 90.5% - the percentage of plastic that has never been recycled - was
the Royal Statistical Society’s “statistic of the year” (Royal Statistics Society, 2018[3]).
This surge in public attention has also coincided with a proliferation of local, national and international
policy responses. More than 100 countries have imposed restrictions or outright bans on certain single-
use plastics. International initiatives to target marine litter and plastic waste have been established under
the UN, the G7 and the G20 over the past decade (UNEP, 2020[4]; G7, 2018[5]; G20, 2019[6]). Notably within
the G20 process, the Osaka Blue Ocean Vision aims to reduce additional marine plastic litter to zero by
2050. Public-private partnerships and voluntary schemes have been established, with businesses
committing to tackle plastic leakage (see Glossary) to the environment, such as the Global Plastics
Alliance, and the Alliance to End Plastic Waste, among others (Global Plastics Alliance, 2020[7]; Alliance
to End Plastic Waste, 2020[8]).
1.2. Why a Global Plastics Outlook and what does it involve?
A global outlook on plastics can help policy makers understand the need for policy action and the scale of
the challenge. Plastics are not a homogenous product – they include different polymer types and
applications, ranging from drink bottles to cable insulation, food packaging and automotive parts. These
various plastics have different lifetimes, recyclability, and risks to the environment and to human health –
all of which call for a more granular perspective. In developing a policy agenda, governments would benefit
from a stocktake of these aspects, especially as the world emerges from the COVID-19 pandemic.
While a limited number of global stocktakes and projections of plastics along the value chain already exist
in the published literature,1 most of them rely on engineering models that describe the lifecycle of plastic
commodities in detail, but do not embed these details into a consistent global macroeconomic framework.
18
GLOBAL PLASTICS OUTLOOK © OECD 2022
Existing studies also pre-date the COVID-19 pandemic and do not take into account the disruptions and
the potential longer-term implications of the pandemic on plastics use and waste generation. Finally, they
generally do not provide a comprehensive overview of the performance of key levers available to decision
makers to curb plastics use.
The OECD Global Plastics Outlook develops a regional and sectoral perspective through a comprehensive
mapping of material flows and economic drivers throughout the plastics lifecycle. It provides an internally
consistent and comprehensive view on production, trade, and use of plastics, as well as plastic waste
management and leakage to the environment. This analysis is based on the OECD’s multi-sectoral, multi-
regional dynamic computable general equilibrium (CGE) model, ENV-Linkages (Chateau, Dellink and
Lanzi, 2014[9]), which has been extended to include plastics in 14 polymer categories and to calculate
plastic waste flows.2 Furthermore, the modelling framework has been enhanced to include both primary
and secondary (recycled – see Glossary) plastics production. The strength of CGE models such as
ENV-Linkages is their ability to embed the drivers of structural change – such as changes in demand
patterns, production modes (including increases in recycling activities) and trade specialisation – in a
consistent framework. This framework also facilitates a more detailed understanding of the consequences
of policy action, as it links the use of plastics to production input in each sector. Annex A describes the
modelling approach in more detail.
The Global Plastics Outlook consists of two volumes. This first volume quantifies current plastics
production, use, disposal and key environmental impacts throughout the plastics lifecycle. It also examines
the impacts of the COVID-19 pandemic on plastics use and waste generation. Furthermore, this volume
provides novel analysis of four key levers to improve sustainability and circularity along the plastics value
chain: markets for recycled plastics, technological innovation in plastics, domestic policy measures and
international co-operation to curb plastics use and waste generation (Box 1.1).
To complement the transversal analysis in this first volume, detailed environmental-economic modelling
will be presented in a separate second volume. This second volume makes projections of plastics use,
waste and key related environmental impacts to 2060 under a range of scenarios (OECD, forthcoming[10]).
The scenario analysis will quantify the environmental benefits and economic consequences of ambitious
policy action on plastics, exploring how environmental impacts vary with the stringency of policy action.
Together, the two volumes of the Global Plastics Outlook provide a roadmap towards net-zero plastic
leakage and a more circular use of plastics all along the lifecycle.

19
GLOBAL PLASTICS OUTLOOK © OECD 2022
Box 1.1. What is novel about the OECD’s Global Plastics Outlook?
It provides a first comprehensive mapping of material flows and economic drivers of plastics and
develops a regional and sectoral perspective. It does so while taking an internally consistent and
comprehensive view on production, trade and use of plastics, as well as on plastic waste management
and leakage to the environment.
The modelling framework has a high-level of granularity with the inclusion of primary and
secondary plastics production, 14 polymer categories and various applications.
The volumes and processes involved in plastic leakage (for both macroplastics and
microplastics) into aquatic and terrestrial environments, as well as greenhouse gas emissions
are estimated.
It is the first report to analyse how plastics use and waste have been affected by the COVID-19
pandemic across sectors and regions, and the potential implications for the years to come.
It offers a first-of-its-kind empirical analysis of environmentally relevant plastics innovation,
presented along the entire value chain. The analysis exploits textual analysis methods on patent
and trademark data to derive insights into the trends and dynamics in environmentally relevant
plastics innovation, with a special focus on the most prolific innovators.
It develops an inventory of the global plastics policy landscape, based on an in-depth
investigation of economic instruments and regulations in 50 different (OECD and non-OECD)
countries. This inventory systematically catalogues and categorises policies to allow important
insights into their potential to curb plastic waste.
It assesses the global financial costs of drastic action in low and middle-income countries, and
benchmarks these costs to the available funding from official development assistance to
facilitate making the required investments and building up the necessary policy frameworks.
1.3. Key findings
This section presents key findings from the report for the entire plastics lifecycle in 2019, from production
and accumulation in the economy, to their end-of-life fate and leakage into the environment. Figure 1.1
helps visualise the complex interactions that plastics are subject to throughout their lifecycle and places
the numbers presented below in context.
1.3.1. The current plastics lifecycle is far from circular
Population growth and higher incomes have driven up global plastics production, which has doubled,
soaring from 234 million tonnes (Mt) in 2000 to 460 Mt in 2019. In this same period, the growth of plastics
volumes outpaced economic growth by almost 40%. While COVID-19 temporarily curtailed this growth, it
is likely to rebound once again, though with a slight shift in use and waste trends (Box 1.2).
Global annual plastic waste has more than doubled, from 156 Mt in 2000 to 353 Mt in 2019. Almost two-
thirds of all plastic waste comes from applications with lifespans of less than five years: packaging (40%),
consumer products (12%) and textiles (11%). Only 55 Mt of this waste was collected for recycling, but
22 Mt ended up as a recycling residue that needed further disposal. Ultimately, 9% of plastic waste was
recycled, 19% was incinerated and almost 50% went to sanitary landfills. The remaining 22% was disposed
of in uncontrolled dumpsites, burned in open pits or leaked to the environment.

20
GLOBAL PLASTICS OUTLOOK © OECD 2022
Figure 1.1. Only 33 million tonnes (Mt), or 9% of the 353 Mt of plastic waste, was recycled in 2019
Source: OECD Global Plastics Outlook Database, https://doi.org/10.1787/c0821f81-en.

21
GLOBAL PLASTICS OUTLOOK © OECD 2022
1.3.2. Mismanaged plastic waste is the main source of macroplastic leakage
Widespread plastics use coupled with inadequate end-of-life disposal resulted in 22 Mt of plastic materials
leaking into the environment in 2019 (Figure 1.2), contributing to persistent plastic pollution. The vast
majority (19.4 Mt) are macroplastics (see Glossary), and most (82%) found their way into the natural
environment as a result of inadequate collection and disposal. Other leakage routes include littering or fly-
tipping (5%), and marine activities (1%). Microplastics (see Glossary) also make up a sizeable share of
total leakage (12%), largely reaching the environment through wear to tyres and road markings, as well as
the accidental loss of plastic pellets and washing of synthetic textile fibres.
Leakage occurs in all regions, but there are significant geographical differences in leakage drivers. OECD
countries contribute 14% to the global leakage but 36% of microplastic leakage. Non-OECD countries
account for 86% of the plastic leakage, driven mainly by the high amount of mismanaged waste ending up
in the environment. This problem is becoming worse as leakage from mismanaged waste has more than
doubled since 2000. These numbers stress the urgency of addressing waste management practices in
rapidly growing economies, while taking into account littering and the steadily increasing microplastic
leakage around the world.
Figure 1.2. Global leakage of macro-and microplastics to the environment is estimated at 22 Mt
Share of total plastic leakage into the environment, 2019
Source: OECD Global Plastics Outlook Database, https://doi.org/10.1787/c0821f81-en.
1.3.3. The 30 Mt of plastics accumulated in the ocean, and 109 Mt in rivers, will pollute
aquatic environments for decades to come
Plastic leakage is fundamentally altering marine and terrestrial ecosystems, whilst also posing substantial
risks to human livelihoods that depend on the integrity of such environments, such as tourism and fishing.

22
GLOBAL PLASTICS OUTLOOK © OECD 2022
Plastics are also a source of concern for human health through the leaching or adsorption of hazardous
chemicals, as well as their bio-accumulation in substances and organisms consumed by humans. In 2019
alone, 6.1 Mt of plastic waste leaked into rivers, lakes and the ocean. As the bulk of plastics reach the
ocean through rivers via a slow process that can take years or even decades, 109 Mt of plastics are
estimated to have accumulated in rivers globally to date, with 1.7 Mt flowing into the ocean in 2019
(Figure 1.1). Cleaning up these plastics from nature is becoming more difficult and costly as plastics
fragment into ever smaller particles.
Box 1.2. How has the COVID-19 pandemic affected plastics use?
The pandemic has altered previous trends in plastics use in myriad ways; however, there were two
main, and opposing, trends:
On the one hand, global demand for certain plastics applications grew significantly. This is
particularly true of the healthcare sector, partly driven by the ubiquitous demand for personal
protective equipment (PPE). Plastics use for face masks is estimated to be around
300 thousand tonnes in 2020. Similarly, the COVID-19 pandemic also significantly altered
economic activity and demand patterns, with a shift in demand towards take-away foods and
e-commerce, which use significant amounts of single-use plastics and plastic packaging.
On the other hand, the substantial decrease in overall economic activity during the pandemic
saw use of most plastics fall, with especially large reductions in wholesale and retail trade, motor
vehicle manufacture and construction. These three sectors alone reduced plastics use by an
estimated 8.2 Mt in 2020.
The overall effect of these countervailing trends was that 2020 saw plastics use decrease overall from
2019 levels by an estimated 2.2%, although data sources are still relatively weak. However, as the
decrease in plastics use was less substantial than the decline in global economic activity, the plastics
intensity of the economy increased in 2020 on average.
The COVID-19 pandemic also disrupted global progress in the transition to a resource-efficient and
circular economy. Many municipalities suspended recycling temporarily due to fears about
contamination; recycling value chains were disrupted; and some studies also point to a decrease in
waste sorting by households during the pandemic. In the short-run it is likely that certain applications
saw waste levels increase, such as medical and household plastic waste. However, the shrinking of
commercial activity meant less packaging use, which is likely to have dampened that increase.
Nonetheless, the switch to single-use plastics likely increased plastic leakage, with an estimated
1.6 billion face masks entering the ocean in 2020 alone (Bondaroff and Cooke, 2020[11]).
Several impacts of the pandemic on plastic waste may be long lasting. Reduced plastics use in areas
such as construction and automobiles could affect the composition of plastic waste for decades to come
given the long lifespan of many plastics used in these sectors. On the other hand, littered PPE such as
single-use facemasks could stay with us for the foreseeable future given their resistance to degradation.
If the pandemic-induced changes to human behaviour endure, these effects could be felt well beyond
the end of the pandemic. Nevertheless, although the COVID-19 pandemic may permanently leave its
mark on cumulative plastics volumes, the upward trajectory of plastics use, waste generation and
leakage will likely resume as economies enter the recovery stage and economic activity picks up again.
1.3.4. The carbon footprint of the plastics lifecycle is significant
Beyond the hazards posed to the marine and terrestrial environment as well as to humans, plastics are
also a substantial contributor to global greenhouse gas emissions. In 2019, plastics generated

23
GLOBAL PLASTICS OUTLOOK © OECD 2022
1.8 gigatonnes (Gt) of greenhouse gas (GHG) emissions – 3.4% of global emissions – with 90% of these
emissions coming from their production and conversion from fossil fuels. Closing material loops could lower
the carbon footprint of plastics substantially. The use of bioplastics derived from biomass, such as corn,
sugarcane, wheat or residues of other processes, could also reduce GHG emissions from plastics
production. However, there are important concerns about the indirect environmental effects from the
production of the required agricultural feedstock.
1.4. Critical levers to reduce the environmental impact of plastics
As countries seek to rebound from the COVID-19 pandemic and put their economies on a more sustainable
path, what levers are available to curb plastics use and reduce the related environmental challenges? The
Global Plastics Outlook identifies four critical levers for “bending the plastic curve”: recycled (secondary)
plastics markets, technological innovation for more circular plastics value chains, more coherent and
ambitious domestic policy measures and greater international co-operation.
1.4.1. Combine push and pull policies to support recycled plastics markets
Recycling has an important role to play in lowering the environmental footprint of plastics, diverting material
from more harmful waste management practices and helping to decrease demand for primary equivalents.
Yet secondary plastics, i.e. plastics produced from recycled end-of-life plastic items, currently only account
for 6% of the feedstock for new plastics produced globally. This is despite the fact that global production
of secondary plastics has more than quadrupled in two decades, from 6.8 Mt in 2000 to 29.1 Mt in 2019
(Figure 1.3).
Figure 1.3. Secondary production is growing, but makes up only six percent of total plastic production
In million tonnes (Mt), 1990-2019
Source: OECD Global Plastics Outlook Database, https://doi.org/10.1787/c0821f81-en.
StatLink 2 https://stat.link/gwun3o
0
50
100
150
200
250
300
350
400
450
500
1990 1995 2000 2005 2010 2015
Primary Secondary

24
GLOBAL PLASTICS OUTLOOK © OECD 2022
Recycling markets are the fora of exchange for the numerous actors involved at different points in the
supply chain, including the public sector, firms, traders (exporters and importers), brokers, and ultimately
manufacturers. Markets allocate recycled plastics to the use with the highest value and create a profit
motive that incentivises higher recycling rates. The larger the scale and depth of the markets, the better
secondary materials are able to compete with primary equivalents, in turn driving the environmental
benefits of recycling. However, although global production of secondary (recycled) plastics has more than
quadrupled, secondary plastics are still mainly considered substitutes for primary plastics, rather than a
valuable resource in their own right. In addition, fluctuations in the price of primary material, which
secondary plastics track closely, can greatly affect the economic viability of recycling due to the disconnect
between secondary price and the costs of secondary production (e.g. collection, sorting, and processing).
Thus, the secondary plastics market is small and vulnerable.
Another barrier inhibiting the growth of secondary plastics is the quality of plastic waste collected. The wide
range of polymers and additives (including hazardous chemicals) used in the manufacture of plastics
means that polymers in plastic waste are often co-mingled and contaminated. Moreover, if not sorted
properly, plastic waste is of little value for secondary material production due to the difficulty of extracting
impurities and the limited range of potential applications.
Regulation strongly affects the business case for recycling and the market for secondary plastics. Plastics
are only recycled on a large scale if it is profitable to do so. Economic and regulatory policy instruments
can ensure a business case for collecting and recycling plastic waste. Moreover, incentivising sorting at
source is a critical lever because the quality of sorting determines the purity and value of recycled materials,
and therefore the profitability of recycling operations. High landfill and incineration taxes are strong drivers
of recycling, as are landfill bans. However, weak environmental standards or enforcement will reduce
recycling rates and may result in mismanaged waste (OECD, 2018[12]).
In order to foster secondary plastics markets, several countries have recently strengthened policies to
simultaneously “push” supply (for example, through extended producer responsibility schemes) and “pull”
demand (e.g. via recycled content targets). The recent decoupling of prices for primary and secondary
polyethylene terephthalate (PET) (mainly for food-grade applications) in Europe and increasing innovation
in recycling technologies are positive signs that these policies are helping to strengthen secondary
markets.
Furthermore, the regulatory environments that govern markets for secondary plastics have undergone
important transformations since 2017 when the People’s Republic of China (hereafter China) introduced
its National Sword policy, banning most imports of plastic waste. These and subsequent import restrictions
have shifted trade away from traditional destinations to new markets, while simultaneously decreasing
international trade volumes and increasing the need for domestic recycling capacities. Modifications in
international law, such as the amendments to the Basel Convention3 and the OECD Decision on
Transboundary Movements of Waste,4 are expected to reinforce these trends and to lead to further on-
shoring of waste plastic recycling in advanced economies.
1.4.2. Do more to boost innovation in environmental plastics
The second lever, innovation, can deliver significant environmental benefits throughout the lifecycle of
plastics, for example by reducing the amount of virgin material needed, prolonging the useful life of
materials and facilitating recycling. As part of the Global Plastics Outlook, a novel approach was developed
to unpack the dynamics governing innovation in sustainable plastics technologies. Trends in innovation
can help in identifying both the distribution of innovation in the plastics lifecycle, the geographic hotspots
of plastics innovation, as well as the possible policy environments that lead to the emergence of intensified
innovative activity. Analysis of patent data shows that innovation for more sustainable plastics is
increasing, with patented technologies in this area increasing by a factor of 3.4 over 1990-2017. OECD

25
GLOBAL PLASTICS OUTLOOK © OECD 2022
countries and China generated 80% of these innovations; the transfer of these technologies to other
countries needs to be accelerated.
There is also a shift occurring in innovation focus from waste prevention to plastics recycling, potentially
due to policy emphasis on the latter and higher consumer willingness to pay for products made out of
recycled plastics. About half of all environmentally relevant innovations patented in 2017 focused on
plastics circularity, i.e. on the prevention and recycling of plastic waste. One-third were related to biobased
feedstock, and the remainder were aimed at the conversion or disposal of waste as well as the removal of
plastics leaked into the natural environment. Innovation in biodegradable plastics, which grew rapidly
during the last decade, has recently slowed down likely due to concerns about poor biodegradation in
natural environments. Plastic-to-plastic chemical recycling, which aims to recycle waste that cannot be
processed with mechanical recycling, is an emerging technology but faces significant challenges.
Although innovation in environmentally relevant plastics technologies is growing, it still only makes up a
minor share of all plastics-related innovation. Indeed, innovation in waste prevention and recycling
accounted for only 1.2% of plastics innovation in 2017. Quantitative evidence for plastics recycling
suggests that circular economy policies (e.g. EPR schemes) can incentivise innovation effectively;
however more ambitious policies are needed to orient technological change towards closing plastics loops
and reducing leakage to the environment. These policies should combine investments in innovation with
interventions aimed at increasing demand for circular solutions, while restraining plastics consumption
overall.
1.4.3. Strengthen the ambition of domestic public policies
Public policies are a key lever for reducing the environmental consequences of plastics production and
use. The OECD has recently developed an inventory of policies to analyse economic and regulatory policy
instruments that are exclusively focused on plastics, as well as broader instruments that target products
and waste streams, such as municipal solid waste (MSW), that contain important fractions of plastics. It
covers 50 countries: the 38 OECD member countries, and 12 non-OECD countries selected for the size of
their populations and their geographic coverage (Brazil, China, India, Indonesia, Russia and South Africa,
as well as several countries with large populations in South-East Asia and Africa).5 Overall, the inventory
covers 69% of the world’s population and 84% of global Gross Domestic Product (GDP).
Analysis of this inventory of policies suggests that the current plastics policy landscape is fragmented and
can be strengthened significantly. Only 13 countries (representing 4% of the population covered by the
inventory) have national policy instruments in place that provide direct financial incentives to sort plastic
waste at source. Similarly, only 25 countries (representing 11% of the population covered by the inventory)
have implemented well-known instruments to encourage recycling, such as national landfill and
incineration taxes. Globally, bans and taxes on single-use plastic items exist in more than 120 countries,
but their effectiveness for reducing plastic leakage can be improved. Most regulations are limited to single-
use plastic bags or other streams that are small in volume. This means that these instruments are mainly
effective in reducing leakage via littering, rather than restraining overall consumption of plastics. Moreover,
poor implementation or shifts to alternative materials with larger environmental footprints sometimes
reduce the potential benefits of these policies.
Drawing on this assessment a policy roadmap is proposed (Figure 1.4). It involves three increasingly
ambitious phases:
1. Close leakage pathways: Investing in basic waste management infrastructure and developing legal
frameworks that steer economic actors towards environmentally sound management of plastic waste
are key first steps within any national context. Organising waste collection, structurally reducing plastics
littering by enlarging the scope of anti-littering policies (bans or taxes of frequently littered items) to

26
GLOBAL PLASTICS OUTLOOK © OECD 2022
cover a broader set of items and enhancing implementation of legislation are also key for closing plastic
leakage pathways.
2. Create incentives for recycling and enhance sorting at source. Recycling plastics only occurs on
a large scale if it is profitable. Policy makers can apply taxes to landfill and incineration to make
recycling more cost competitive. By also imposing EPR, policy makers can make producers
responsible for recycling packaging and durable products such as cars, batteries, tyres and electronics.
As the quality of collected waste streams drives the feasibility and profitability of recycling, countries
can achieve much greater circularity by sharpening the financial incentives to sort waste at source.
Deposit-refund systems give a strong financial incentive to return beverage bottles, while pay-as-you-
throw makes mixed waste disposal by households more costly. If combined with policies to avoid
dumping and contaminating other waste streams, making households pay per bag or kilo of mixed
waste is an effective way to incentivise sorting at source.
3. Restrain demand and optimise design to make plastic value chains more circular and recycled
plastics more price competitive. The largest environmental gains can be achieved by reducing the
use of virgin materials and by improving product design (Watkins et al., 2019[13]). Removing support
schemes for fossil-based plastics, such as shale gas subsidies (OECD, 2016[14]), will make plastic
value chains more circular by restraining consumption and by making recycled plastics more price
competitive. By removing hazardous substances and recycling inhibitors from plastics at the design
stage, chemical hazards can be avoided and recycling rates can be increased. Upstream policy
instruments, such as plastics taxes, recycled content targets and EPR with fee modulation can all
create financial incentives to reduce use and foster circularity. Their impact could be improved
considerably by extending them to more product types and more countries.
Figure 1.4. A policy roadmap for more circular plastics use can involve a stepped approach

27
GLOBAL PLASTICS OUTLOOK © OECD 2022
1.4.4. Strengthen international co-operation to make plastics value chains more circular
and achieve net zero plastic leakage
National efforts to address the challenges linked to the use of plastics will need to be supplemented with
international co-operation for several reasons:
1. The environmental consequences of plastics polluting water bodies are often transboundary and
threaten the global commons, such as the ocean.
2. Plastics are shipped across the world as materials, products and waste streams, and supply chains
are spread across the globe – policy responses would be more effective if co-ordinated internationally.
3. Tackling both the upstream and downstream environmental challenges posed by plastics requires
innovation and investment on a significant scale, all of which can be accelerated through international
co-operation.
The international community has voiced strong ambitions to limit the leakage of plastics to the environment
and momentum is building to strengthen international co-operation to address environment and health
impacts throughout the entire plastics life cycle. Improving waste management to reduce land-based
sources of marine plastic is recognised as one of the priorities for action, alongside upstream measures to
restrain excessive use of plastics, foster design for circularity and promote reuse. For example, given the
global nature of the plastics value chains, aligning regulation of chemical substances and design
approaches across countries can reduce health risks and improve circularity.
Mismanaged waste is by far the largest source of plastic leakage. Macroplastics account for almost 90%
of total leakage, with land-based leakage coming from improper waste management practices accounting
for 93% of all macroplastics. Since the bulk of mismanaged macroplastic waste occurs in low and middle-
income countries, the investments needed in these countries are particularly large. Estimates presented
in this Outlook suggest that annual costs, of more than EUR 25 billion a year, are needed to drastically
reduce plastic leakage in low- and middle-income countries. The annual costs represent 0.3% of low and
lower middle-income countries’ GDP and would be an important financial burden, especially for the group
of least developed countries.
International support will be instrumental in accelerating the investments required in infrastructure and
changes to waste management practices, policies and governance. Official development assistance (ODA)
could be one avenue for such support. However, the share of plastic-related ODA in total ODA spending
remains marginal, accounting for only 0.2% of ODA gross commitments in 2017-19 (Figure 1.5).
Beyond ODA, additional sources of funding will need to be tapped to provide adequate and sustainable
levels of funding, including revenue from households and firms benefiting from public waste management
services, as well as domestic government subsidies and private sector investment. Enabling policy
frameworks and governance mechanisms will need to be put in place to ensure that resources are used
effectively. International support and local political leadership will be crucial in facilitating the required
investments and governance structures for high-quality infrastructure.

28
GLOBAL PLASTICS OUTLOOK © OECD 2022
Figure 1.5. Plastic-related gross commitments for ODA have increased steadily but remain small
Source: Own calculations based on (OECD, 2021[15]), OECD Data Platform on Development Finance for the Sustainable Ocean Economy and
the OECD’s Creditor Reporting System, https://stats.oecd.org/Index.aspx?DataSetCode=crs1.
StatLink 2https://stat.link/8iz6x0
References
Aguiar, A. et al. (2019), “The GTAP Data Base: Version 10”, Journal of Global Economic
Analysis, Vol. 4/1, pp. 1-27, http://dx.doi.org/10.21642/jgea.040101af.
[18]
Alliance to End Plastic Waste (2020), Alliance to End Plastic Waste,
https://endplasticwaste.org/about/ (accessed on 1 November 2020).
[8]
Benavides, P. et al. (2018), “Exploring Comparative Energy and Environmental Benefits of
Virgin, Recycled, and Bio-Derived PET Bottles”, ACS Sustainable Chemistry & Engineering,
Vol. 6/8, pp. 9725-9733, http://dx.doi.org/10.1021/acssuschemeng.8b00750.
[17]
Bondaroff, T. and S. Cooke (2020), Masks on the Beach: The Impact of COVID-19 on Marine
Plastic Pollution, OceansAsia, https://oceansasia.org/wp-content/uploads/2020/12/Marine-
Plastic-Pollution-FINAL.pdf.
[11]
Borrelle, S. et al. (2020), “Predicted growth in plastic waste exceeds efforts to mitigate plastic
pollution”, Science, Vol. 369/6510, http://dx.doi.org/10.1126/science.aba3656.
[22]
Center for Environmental Education (1987), Plastics in the Ocean: More Than a Litter Problem,
Center for Environmental Education, Washington D.C.
[1]
Chateau, J., R. Dellink and E. Lanzi (2014), “An Overview of the OECD ENV-Linkages
Model: Version 3”, OECD Environment Working Papers, No. 65, OECD Publishing, Paris,
http://dx.doi.org/10.1787/5jz2qck2b2vd-en.
[9]

29
GLOBAL PLASTICS OUTLOOK © OECD 2022
Collins Dictionary (2018), Collins 2018 Word of the Year Shortlist,
https://blog.collinsdictionary.com/language-lovers/collins-2018-word-of-the-year-shortlist/
(accessed on 22 October 2021).
[2]
Ellen MacArthur Foundation (2017), The New Plastics Economy: Rethinking the Future of
Plastics & Catalysing Action, https://ellenmacarthurfoundation.org/the-new-plastics-economy-
rethinking-the-future-of-plastics-and-catalysing.
[25]
G20 (2019), G20 Implementation Framework for Actions on Marine Plastic Litter,
https://www.mofa.go.jp/policy/economy/g20_summit/osaka19/pdf/documents/en/annex_14.pd
f (accessed on 1 November 2021).
[6]
G7 (2018), Ocean Plastics Charter,
https://www.consilium.europa.eu/media/40516/charlevoix_oceans_plastic_charter_en.pdf
(accessed on 1 November 2021).
[5]
Geyer, R., J. Jambeck and K. Law (2017), “Production, use, and fate of all plastics ever made”,
Science Advances, Vol. 3/7, p. e1700782, http://dx.doi.org/10.1126/sciadv.1700782.
[19]
Global Plastics Alliance (2020), Marine Litter Solutions - 5th Progress Report,
https://www.marinelittersolutions.com/wp-content/uploads/2020/08/ACC_12376_2020-
Marine-Litter-Solutions_V5_Pages_NoCropsBleeds.pdf (accessed on 1 November 2020).
[7]
Jambeck, J. et al. (2015), “Plastic waste inputs from land into the ocean”, Science,
Vol. 347/6223, pp. 768-771, http://dx.doi.org/10.1126/science.1260352.
[20]
Lebreton, L. and A. Andrady (2019), “Future scenarios of global plastic waste generation and
disposal”, Palgrave Communications, Vol. 5/1, p. 6, http://dx.doi.org/10.1057/s41599-018-
0212-7.
[21]
OECD (2021), Trends of ODA for a sustainable ocean economy, OECD, Paris, https://oecd-
main.shinyapps.io/ocean/.
[15]
OECD (2018), Improving Markets for Recycled Plastics: Trends, Prospects and Policy
Responses, OECD Publishing, Paris, https://dx.doi.org/10.1787/9789264301016-en.
[12]
OECD (2016), Policy Guidance on Resource Efficiency, OECD Publishing, Paris,
https://dx.doi.org/10.1787/9789264257344-en.
[14]
OECD (forthcoming), Global Plastics Outlook, Volume 2, OECD. [10]
Royal Statistics Society (2018), Statistics of the Year 2018: Winners announced,
https://rss.org.uk/news-publication/news-publications/2018/general-news/statistics-of-the-
year-2018-winners-announced/ (accessed on 22 October 2021).
[3]
Ryberg, M., A. Laurent and H. Michael (2018), “Mapping of global plastics value chain and
plastics losses to the environment: with a particular focus on marine environment”, UNEP.
[23]
Stefanini, R. et al. (2020), “Plastic or glass: a new environmental assessment with a marine litter
indicator for the comparison of pasteurized milk bottles”, The International Journal of Life
Cycle Assessment, Vol. 26/4, pp. 767-784, http://dx.doi.org/10.1007/s11367-020-01804-x.
[16]
30
GLOBAL PLASTICS OUTLOOK © OECD 2022
The Pew Charitable Trust; SYSTEMIQ (2020), Breaking The Plastic Wave: A Comprehensive
Assessment of Pathways Towards Stopping Ocean Plastic Pollution,
https://www.systemiq.earth/wp-
content/uploads/2020/07/BreakingThePlasticWave_MainReport.pdf.
[24]
UNEP (2020), Global Partnership on Marine Litter, https://www.unenvironment.org/explore-
topics/oceans-seas/what-we-do/addressing-land-based-pollution/global-partnership-marine
(accessed on 1 November 2020).
[4]
Watkins, E. et al. (2019), “Policy approaches to incentivise sustainable plastic design”, OECD
Environment Working Papers, No. 149, OECD Publishing, Paris,
https://dx.doi.org/10.1787/233ac351-en.
[13]
Notes
1 Including (Geyer, Jambeck and Law, 2017[19]; Jambeck et al., 2015[20]; Lebreton and Andrady, 2019[21];
Ryberg, Laurent and Michael, 2018[23]; The Pew Charitable Trust; SYSTEMIQ, 2020[24]; Borrelle et al.,
2020[22]; Ellen MacArthur Foundation, 2017[25]).
2 The Annex provides more details on the production structure, as well on the sectoral and regional
aggregation of the model.
3 Amendments to Annexes II, VIII and IX to the Basel Convention on the Control of Transboundary
Movements of Hazardous Wastes and their Disposal came into force on the 1 January 2021.
4 Modifications to Appendices 3 and 4 of the OECD Decision of the Council on the Control of
Transboundary Movements of Wastes Destined for Recovery Operations [OECD/LEGAL/0266] came into
force on the 1 January 2021.
5 These additional countries are Egypt, Ghana, Morocco, Nigeria, the Philippines, and Thailand.

31
GLOBAL PLASTICS OUTLOOK © OECD 2022
From production through to consumption and disposal, plastics interact with
the economy and the environment in a multitude of complex ways.
Understanding these complexities is critical for identifying challenges and
formulating effective policies. This chapter aims to quantify plastic flows in
the economy and their impacts on the environment. It begins by discussing
the methodology used, before presenting estimates and analysis of the key
steps and impacts throughout the plastics lifecycle.
2. Plastics flows and their impacts
on the environment

32
GLOBAL PLASTICS OUTLOOK © OECD 2022
KEY MESSAGES
Annual global use of plastics, including fibres and additives, has been growing continuously,
reaching 460 million tonnes (Mt) in 2019. Plastics in packaging, construction and transportation
together account for more than 60% of the weight of plastics use.
The current use of plastics is far from circular. Of the 353 Mt of global plastic waste generated
globally in 2019, only an estimated 55 Mt were collected for recycling, 22 Mt of which were
disposed. Secondary plastics accounted for barely 6% of total plastics use in 2019. In total,
67 Mt of plastic waste and residues globally were incinerated in industrial facilities and 174 Mt
were disposed of in sanitary landfills. The amount of mismanaged and littered plastic waste is
increasing and has reached 82 Mt per year. Of this, only 3 Mt is collected for proper disposal by
litter clean-up measures.
Widespread plastics use and inadequate prevention measures have led to persistent plastic
leakage. In 2019 an estimated 22 Mt of plastics leaked into the environment. The largest
leakage source (82%) is mismanaged waste, i.e. waste that is inadequately disposed of. Other
sources are abrasion and losses of microplastics (12%), littering (5%) and marine activities
(1%).
Rivers are the main route by which plastics enter the ocean, but the process can take years or
even decades. In 2019, 6.1 Mt of plastic waste are estimated to have ended up in aquatic
environments, of which 1.7 Mt flowed into the ocean. This brings the total accumulated stock of
plastics in aquatic environments in 2019 to 139 Mt. While the estimated inflows are lower than
earlier studies that do not account for the residence time of leaked plastics in rivers, the amount
is still alarming.
Microplastic emissions from tyre and brake wear particles add to air pollution in highly urbanised
regions, but are also transported to remote places, such as the Arctic where they have
implications for climate change.
Greenhouse gas emissions from the plastics lifecycle in 2019 are estimated to be 1.8 billion
tonnes, or 3.4% of global emissions, with 90% of these emissions from the production and
conversion of plastics from fossil fuel feedstock.
Overall, these quantified insights, combined with an emerging understanding of the
environmental, health and economic impacts, underline the need for an extensive policy
package and international co-operation to make plastics more circular throughout the value
chain.
2.1. The methodology to compose the OECD Global Plastics Outlook Database
Although the literature offers in-depth research on plastics use and plastic waste, a number of gaps are
hindering the analysis of the current situation and decision making by policy makers. The literature on
plastics use is limited either to the global level (Geyer, Jambeck and Law, 2017[1]), to plastics production
(IEA, 2018[2]), to a specific year across regions for a specific application or sector (Ryberg et al., 2019[3])
or to a specific region (Plastics Europe, 2020[4]). A key gap is the limited information on flows of secondary
plastics. Moreover, the scope and volumes covered by the various studies differ. For example, some
sources exclude fibres despite being a significant part of overall plastics.
There is also a lack of information on the management of waste across the world, and especially the
management of individual waste streams such as plastics. Definitions, available data, measurement
methodologies and framework conditions differ widely between countries, even for countries within the

33
GLOBAL PLASTICS OUTLOOK © OECD 2022
OECD. Recycling rates are often inconsistently reported, for instance national and municipal statistics tend
to focus on the weight of household waste collected, and sometimes include commercial waste when it is
collected by municipalities. Industrial waste statistics may include pre-consumer waste and typically rely
on sampling and extrapolation using methodologies that differ in each country. Recycling can also refer to
different concepts: quantities that are collected for recycling, material sent for reprocessing, or material
ultimately available for use as a secondary plastic. Furthermore, reported recycling rates may give an
overly optimistic view of the current status because they focus on polymers such as PET and applications
such as packaging, for which recycling is already established. By contrast, recycling rates of hard-to-
recycle plastics such as fibres are rarely reported. Countries with poor waste management infrastructure
also have the weakest published data, making it challenging to assess the amount of mismanaged waste.
This results in an incomplete view of the current international management of plastic waste.
The Global Plastics Outlook aims at understanding the drivers of plastics use and the impacts on the
environment in order to find the best way to reduce the environmental pressures of plastics production,
waste generation and management. As a first step, the OECD has developed the Global Plastics Outlook
Database1 to fill the information gaps and provide a comprehensive overview of the entire lifecycle of
plastics. The database collects and reconciles data for the full lifecycle of plastics across the world:
production, use, waste generation and waste management, including waste that is mismanaged or leaked
to the environment (Figure 2.1).
The added value of the database is to gather plastic indicators in a coherent framework. The database
was developed through a collection and reconciliation of renowned databases, review of the existing
literature and expert input. This information was then integrated in an economic modelling framework,
which ensures that all data sources are consistent and allows for analysis of the economic drivers and
environmental effects of plastics. To this end, the OECD ENV-Linkages model (Chateau, Dellink and Lanzi,
2014[5]), based on the Global Trade Analysis Project (GTAP) database2 (Aguiar et al., 2019[6]), has been
revised and expanded to link plastics data in volumes to the economic flows in the model. ENV-Linkages
splits plastics production into primary plastics and secondary plastics technologies and maps plastics use
by polymer and application to the model sectors.
Figure 2.1. The OECD Global Plastics Outlook Database

34
GLOBAL PLASTICS OUTLOOK © OECD 2022
The data and methodology used for each step are summarised in Table 2.1 and more details are provided
in Annex A. The database spans the history of the large-scale industrial production of plastics from 1950
to the present day. The database uses 2019 as reference year, since the year 2020 was impacted by
COVID-19 and economic indicators as well as materials data are still uncertain for the recently-ended
2021.
Table 2.1. The OECD Global Plastics Outlook Database covers a large range of sources and methodologies
Category Variable Sources and assumptions
Production
Primary plastics OECD ENV-Linkages model, based on GTAP10 (Aguiar et al., 2019[6]).
Secondary plastics
OECD ENV-Linkages model, using Exiobase (Stadler et al., 2018[7]) and Grand
View Research (2020[8]) for the cost structure; recycling shares (see below) and
recycling losses from Cottom, Cook and Velis (2020[9]), Chruszcz and Reeve
(2018[10]), Roosen et al. (2020[11]) and VinylPlus (2019[12]).
Use Plastics use by region,
application and polymer
Volumes of plastics by polymer and application from (Ryberg et al., 2019[3])
associated with different sectors and regions in OECD ENV-Linkages model.
Waste Plastic waste by region,
application and polymer
OECD ENV-Linkages model, based on historical consumption, and product
lifespans from Geyer, Jambeck and Law (2017[1]) .
Waste management
end-of-life fates
Recycling share
Country sources (Table A.A.5), Geyer, Jambeck and Law (2017[1]), and Kaza et
al. (2018[13]) for Municipal Solid Waste (MSW); rates for non-MSW assumed to
match MSW.
Littering share Jambeck et al. (2015[14]) for share in MSW; zero for non-MSW.
Shares for other fates Cross-country regression based on Kaza et al. (2018[13]) 3; rates for non-MSW
assumed to match MSW.
Environmental
impacts
Total leakage of macroplastics
and microplastics to the
environment by category
Based on plastics consumption, waste and waste management projections from
OECD ENV-Linkages model, adapted from Ryberg et al. (2019[3]) methodology.
Plastic leakage and
accumulation in aquatic
environments
Based on waste management projections from OECD ENV-Linkages model,
adapted from Lebreton and Andrady (2019[15]) methodology.
GHG emissions for plastic lifecycle
Based on plastic consumption, waste and waste management projections from OECD ENV-Linkages model, based on Zheng and Suh (2019[16]).
2.2. The global use of plastics is growing strongly
Growing populations and rising per capita incomes have seen the global use of plastics, including additives
and fibres, reach 460 Mt in 2019 (Figure 2.2). The used volumes of these synthetic polymers have been
increasing constantly4 and increased more rapidly than any other commodity, including steel, aluminium
and cement (IEA, 2018[2]).
In 2020, the COVID-19 pandemic had significant impacts on plastics use. On the one hand, there was a
rapid increase in demand for personal protective equipment (such as face masks), a shift from restaurant
eating to take-away and a shift from in-store shopping to online retail. On the other, plastics use in industry
and commercial sectors declined as firms faced lockdowns. On balance, plastics use declined in 2020 but
rebounded largely in 2021. These impacts are examined in detail in Chapter 3.
While plastics are produced and consumed everywhere, there are important regional variations when it
comes to total volumes of plastics demand. Two-thirds of current use is concentrated in OECD countries
and the People’s Republic of China (hereafter China) (Figure 2.2). China represents around 20% of global
plastics demand, the United States represents approximately 18%, OECD Europe represents about 18%
and the rest of the OECD countries represent around 9%. However, the relative importance of each
region’s plastics use has been changing, mirroring the economic dynamics of regions and countries. For

35
GLOBAL PLASTICS OUTLOOK © OECD 2022
instance, the share of the OECD in global consumption has been declining steadily – from 87% in 1980 to
46% in 2019. As COVID-19 was a worldwide pandemic, this share has been more or less stable since
2019. However, relatively fast economic recovery in the United States and China may have increased their
share somewhat in 2021.
Figure 2.2. Global plastics use has quadrupled in 30 years, mainly driven by emerging economies
In million tonnes (Mt), 1950-2021
Note: See Annex A for the detailed regional breakdown of the OECD ENV-Linkages regions.
Source: OECD Global Plastics Outlook Database, https://doi.org/10.1787/c0821f81-en.
StatLink 2 https://stat.link/r9vlpe
The majority of plastics in use today are virgin plastics, made from crude oil or gas. Due to the fossil-based
feedstock and the high energy consumption during refining, most greenhouse gas (GHG) emissions from
plastics can be attributed to the production stage (Box 2.1). Biobased plastics are a rather small group of
plastics with similar characteristics to fossil-based plastics, but are derived from biomass (Box 2.2).
Together fossil-based and biobased plastics can be referred to as primary plastics. Plastics made from
recycled material are called secondary plastics. Secondary plastics contribute less to GHG emissions than
primary plastics, but only accounted for 6% of global plastics use in 2019 (Chapter 4).

36
GLOBAL PLASTICS OUTLOOK © OECD 2022
Box 2.1. Plastics emit a high amount of greenhouse gases throughout their lifecycle
Traditional plastic production uses fossil fuel feedstock which is transformed into monomers in an energy-
intensive process. The OECD ENV-Linkages model uses the energy and factor intensity of economic
sectors, along with their process emission intensity, to estimate the GHG emissions in the economy.
Moreover, to quantify plastic-related emissions, the approach is complemented with plastics lifecycle
emissions factors. Based on these calculations, the estimated GHG emissions of fossil-based plastics in
2019 were 1.8 gigatonnes of carbon dioxide equivalent (Gt CO2eq.), or 3.4% of global emissions that
year.5 If the goals of the Paris Agreement are to be achieved, the growth of emissions related to plastics
must cease.
Production and conversion into products account for around 90% of the lifecycle emissions of fossil-
based plastics. GHG emissions from the production and conversion of polymers vary depending on the
polymer considered (with a range from 2.7 to 6.3 tCO2eq. per tonne of plastics). End-of-life emissions
vary significantly depending on the disposal option, with incineration the most GHG intensive
(2.3 tCO2eq. per tonne of plastics). However, some emissions can be offset when energy is recovered
through waste-to-energy processes (Gómez-Sanabria et al., 2018[17]). Recycling directly emits
0.9 tCO2eq. per tonne of plastic, but the use of secondary plastics can avoid emissions from primary
plastics production. Sanitary landfilling is the least emission-intensive disposal alternative in terms of
direct emissions, at less than 0.1 tCO2eq. per tonne of plastic, but does not generate energy that can be
used elsewhere. The impact of the leakage of plastics on GHG is not incorporated in the calculations,
but recent research by Shen et al. (2020[18]) based on experimental data by Royer et al. (2018[19])
estimates annual methane emissions to be roughly 2 Mt CO2eq.
So can replacing plastics with other materials reduce the carbon footprint of consumption (Franklin
Associates, 2018[20])? The response is ambivalent, partly due to the behavioural components of the use
of a product as well as its end-of-life management. For example, as illustrated in Figure 2.3, the carbon
footprint of a plastic bottle is not necessarily worse than its glass counterpart.
Figure 2.3. The carbon footprint of a non-returnable glass bottle is higher than a plastic equivalent
Comparison of 1-litre milk bottles, in kg CO2 eq.
Note: R-PET= 100% recycled polyethylene terephthalate (PET).
Source: Stefanini et al. (2020[21]).

37
GLOBAL PLASTICS OUTLOOK © OECD 2022
The variety of different polymers that can be produced accounts for the versatility of plastics (Table 2.2).
Figure 2.4 provides an overview of the most commonly used polymers and their applications. Different
polymers have differing properties. For example, thermoplastics can be remoulded after heating, while
thermosets are irreversibly hardened. Elastomers have elastic properties and fibres can be made of
various polymers but are defined by their shape. Biobased plastics are made of biomass as feedstock
instead of fossil fuels (Box 2.2). In addition, polymers are usually mixed or “compounded” with a wide range
of additives to further customise and improve the performance of plastics. Some of the most important
functions of additives are to prevent aging, colour the plastic, make rigid material flexible, work as a
lubricant, improve the impact resistance, reduce flammability and generate foam as a blowing agent.
Table 2.2. The large range of polymers allows for a multitude of plastics applications
Polymer Abbreviation Examples of use
Polypropylene PP Food packaging, automotive parts
Low-density polyethylene LDPE Reusable bags, food packaging film
High-density polyethylene HDPE Toys, shampoo bottles, pipes
Polyvinylchloride PVC Window frames, floor covering, pipes, cable insulation
Polystyrene PS Food packaging, insulation, electronic equipment
Polyethylene terephthalate PET Beverage bottles
Polyurethane PUR Insulation, mattresses
ABS, elastomers, biobased plastics, PBT, PC, PMMA,
PTFE, … Other Tyres, packaging, electronics, automotive, …
Fibres made of different polymers Fibres Textile applications but also in many other sectors
Note: ABS stands for Acrylonitrile butadiene styrene, PBT for Polybutylene terephthalate, PC for Polycarbonates, PMMA for Poly (methyl
methacrylate) (also known as plexiglas) and PFTE for Polytetrafluoroethylene.
Together, packaging, construction and transportation applications account for more than 60% of total
plastics use.6 The other main applications of plastics use include textiles, household consumer products
and non-household or institutional products, electronics, machinery and tyres (Figure 2.4).
Figure 2.4. Global plastics use by application and polymer
Share of plastics by application and polymer, 2019
Source: OECD Global Plastics Outlook Database, https://doi.org/10.1787/c0821f81-en.

38
GLOBAL PLASTICS OUTLOOK © OECD 2022
Box 2.2. Biobased plastics offer potential as long as land-use impacts are managed
Biobased plastics are derived from biomass such as corn, sugarcane, wheat or residues of other
processes. Their production generates fewer greenhouse gas emissions than fossil-based plastics They
can be produced as drop-in resins (as a substitute together with fossil-based plastics) or as alternative
resins with other characteristics. The majority of such plastics are produced for packaging (53%) and
textiles (11%). Asia is the region with the largest biobased plastics production capacity (45%), followed
by Europe (25%), North America (18%) and South America (12%) (European Bioplastics, 2019[22]). In
2019, biobased plastics represented around 2 Mt or 0.6% of total plastics. The volumes are growing, but
not any faster than other plastic types (OECD Global Plastics Outlook Database).
Table 2.3 compares the “cradle-to-gate” (extraction, refining and production) GHG emissions of fossil
and biobased feedstock. A negative result indicates that the carbon embodied in the product is greater
than the carbon emitted during refining and processing. Despite the positive outlook of biobased plastics
in terms of GHG emissions, their environmental impact is controversial due to their potential to drive
land-use changes such as deforestation that may lead to significant GHG emissions. If tropical forest or
other natural environments are sacrificed to make room for additional agricultural area, this would result
in loss of biodiversity and one-off carbon emissions (Brizga, Hubacek and Feng, 2020[23]). Whether the
overall carbon balance is positive depends, among others, on assumptions related to the amount of
natural area that would be converted (directly for feedstock of biobased plastics or indirectly for
agricultural activities that have to compete with feedstock for biobased plastics for arable land) and the
method used to compare one-off losses with annual recurring benefits (Liptow and Tillman, 2012[24];
Walker and Rothman, 2020[25]).
Currently only 0.7 million hectares or 0.02% of global agricultural land is used for growing feedstock for
biobased plastics (European Bioplastics, 2019[22]). Therefore, the additional pressure on agricultural land
is currently negligible and will remain so in the coming years, even if high growth rates are realised.
Table 2.3. Bioplastics could reduce GHG emissions from plastics production as long as negative effects from indirect land use change are avoided
Material Fossil fuel-based polymer (kg CO2 eq./kg) Biobased polymer (kg CO2 eq./kg)
HDPE 1.9 – 2a -0.55 – -0.88
b
PET 2.2 – 3c 1 – 2.4
d
PP 1.8 – 2e -0.2 – -0.3
f
Note: Only cradle-to-gate assessments shown in the table. Thus only extraction, refining and production are taken into account, but not the
use or end-of-life stages. A negative result indicates that the carbon embodied in the product is greater than the carbon emitted during refining
and processing. HDPE= high-density polyethylene; PET= polyethylene terephthalate; PP= polypropylene.
Sources: (a) Vanderreydt et al. (forthcoming[26]), (b) Tsiropoulos et al. (2015[27]), (c) Akanuma, Selke and Auras (2014[28]), Semba et al.
(2018[29]), (d) Tsiropoulos et al. (2015[27]), (e) Broeren et al. (2017[30]), (f) Chen and Patel (2011[31]).
Normalised indicators, such as plastic intensity relative to GDP and plastic use per capita, allow for a
comparison of plastics use across regions (Table 2.4). Regional plastics use per capita varies greatly: an
inhabitant of the United States uses 255 kg of new plastics every year on average, while the average
person in Sub-Saharan Africa uses less than one tenth of that amount. In contrast, the range of plastics
intensity relative to GDP across the world is smaller, ranging between 2.5 and 4.5 tonnes per million USD
(t/M$). OECD plastic intensity reaches 3.7 tonnes per million USD, while non-OECD countries reach
3.4 tonnes. This correlation is also found in plastics use per capita, whose OECD level is 156 kg per capita,

39
GLOBAL PLASTICS OUTLOOK © OECD 2022
compared to 39 kg per capita for non-OECD countries. The only outlier in this table is Sub-Saharan Africa,
which has the lowest plastics use per capita (16 kg/cap), but the highest plastic intensity (4.5 t/USD M).
This high intensity reflects the very low level of GDP per capita of Sub-Saharan Africa in 2019 (about
five times lower than Middle East and North Africa and twice lower than India).
Table 2.4. GDP is a key driver of global plastics use
2019
Plastics use per capita
(kg/cap)
Plastics intensity relative to GDP
(t/M$ in PPP)
World 60.1 3.5
OECD 155.8 3.7
Non-OECD 39.3 3.4
OECD
OECD America
USA 255.2 4.3
Canada 202.2 4.3
Other OECD America 65.4 3.6
OECD Europe OECD EU countries 152.9 3.6
OECD non-EU countries 124.3 3.5
OECD Pacific OECD Asia 102.4 2.6
OECD Oceania 143.9 3.1
Non-OECD
Other America Latin America 50.9 3.5
Eurasia Other EU 103.0 4.1
Other Eurasia 66.7 3.7
Middle East and Africa Middle East & North Africa 47.1 2.5
Other Africa 15.9 4.5
Other Asia
China 69.0 3.7
India 22.1 2.7
Other non-OECD Asia 31.7 3.2
Source: OECD Global Plastics Outlook Database.
2.3. Plastic waste generation depends on plastics use and product lifespans
The generation of plastic waste is strongly related to how plastics are used. The overall average lifespan
of a plastic product is almost ten years, though this depends on its use (Figure 2.5). Packaging has an
extremely short average lifespan while plastic applications in the construction sector may be in use for several
decades. Therefore, packaging waste constitutes a large share (42%) of total plastic waste generated.

40
GLOBAL PLASTICS OUTLOOK © OECD 2022
Figure 2.5. Average plastic product lifespans range from six months to 35 years
Product lifetime distributions
Source: Geyer, Jambeck and Law (2017[1]).
The global generation of plastic waste can be estimated from the amount of plastics used in previous
decades, the international trade of plastics and plastic products, as well as the average lifespan of plastics
applications (see Annex A for more details on the methodology). According to the OECD Global Plastics
Outlook Database, the plastic waste generated in 2019 amounted to 353 Mt.
At the waste stage, the ease of recycling and the potential mobility when lost to the environment are
influenced by polymer type, dimensional shape, object size, additive mix, and the items and materials
appended in assembly. Figure 2.6 highlights that the applications and polymers present in the waste stage
are different than in the consumption stage. The predominance of PP, LDPE and HDPE has become even
greater in the waste stage because they are often used for packaging applications with short lifetimes.
Similarly, since PET is mainly used for packaging, it will become waste rapidly after its initial use. By
contrast, PVC and PUR are mainly used for applications with long lifecycles. They will only enter the waste
stage many years later. These long lifecycles, combined with significant growth rates of use, result in a
relatively lower presence in plastic waste than in plastics use of those polymers. Conversely, the polymers
with long life cycles account for a relatively high share of the stock of plastics that is present in the economy.
The OECD Global Plastics Outlook Database indicates that the OECD generates almost half of all plastic
waste: the United States accounts for 21%, OECD Europe 19% and the remaining OECD countries 9%.
Outside the OECD, China produces 19% of global plastic waste, India 5% and the rest of the world 27%.
In terms of waste per capita, there are stark differences across the world (Table 2.5). The United States
had the largest plastic waste footprint in 2019, at 221 kg per capita, while OECD Europe had 114 kg plastic
waste per capita. Japan and Korea’s plastic waste generation is relatively low for industrialised countries,
averaging 69 kg per capita. Finally, China generated 47 kg of plastic waste per inhabitant in 2019, while
India generated only 14 kg per inhabitant.

41
GLOBAL PLASTICS OUTLOOK © OECD 2022
Figure 2.6. Almost two-thirds of plastic waste comes from relatively short-lived products such as packaging, consumer products and textiles
Plastic waste generated (Mt), 2019
Note: HDPE= High-density polyethylene; PET= Polyethylene terephthalate; High-density polyethylene; PVC= Polyvinylchloride; LDPE= Low-
density polyethylene; PP=Polypropylene.
Source: OECD Global Plastics Outlook Database, https://doi.org/10.1787/c0821f81-en.
StatLink 2 https://stat.link/elpign

42
GLOBAL PLASTICS OUTLOOK © OECD 2022
Table 2.5. Per capita plastic waste generation differs strongly across the world
Kg/cap, 2019
Plastic waste per capita
(kg/cap)
OECD
OECD America
USA 220.5
Canada 177.9
Other OECD America 57.9
OECD Europe OECD EU countries 121.6
OECD non-EU countries 94.4
OECD Pacific OECD Asia 68.9
OECD Oceania 62.1
Non-OECD
Other America Latin America 43.4
Eurasia Other EU 75.5
Other Eurasia 53.0
Middle East and Africa Middle East & North Africa 37.6
Other Africa 14.5
Other Asia
China 46.6
India 14.0
Other non-OECD Asia 21.4
Source: OECD Global Plastics Outlook Database.
2.4. The quality of plastic waste management varies across the world
The end-of-life fate of plastics depends on the local waste management capacities and regulations. As
highlighted in Figure 2.1 the OECD Global Plastics Outlook Database contains five different waste handling
categories (recycling, incineration, landfilling, mismanaged waste and littered waste). In Figure 2.7, the
category “collected for recycling” refers to plastic waste that is collected in order to recycle and that will,
after processing, produce secondary plastics. “Incineration” refers to incineration in a state-of-the-art
industrial facility. The third approach to manage plastics in a safe way is sanitary “landfilling”. Unfortunately,
plastic waste is often improperly managed. The treatment category “mismanaged waste” aims at
quantifying the end-of-life plastics generated in areas where state-of-the-art waste collection or treatment
facilities are not in place. The plastic waste is either not collected, collected but disposed of in dumpsites,
or collected for disposing in the environment, for example dumped directly into seas or open waters. Finally,
“littered waste” differs from mismanaged waste because littering behaviour is not necessarily correlated to
the provision of basic waste collection and disposal infrastructure. The category refers both to littering (i.e.
when users discard packaging or other products into the environment), and to fly-tipping (i.e. plastic waste
generators who consciously circumvent legislation to discard larger volumes of, for example, construction
waste into the environment). Litter can either be collected via street sweepings and other clean-up actions
or be left uncollected and leak into the environment. There are also biodegradable plastics that can be
composted at the waste stage (European Bioplastics, 2019[22]) (Chapter 5), but due to the small amounts
the OECD Plastics Outlook does not track this stream.
In most cases, differences in waste management capacities are related to regulations, geographical and
demographic characteristics and other variables. In low-income countries, economic growth can outpace
improvements in collection and disposal capacity, leading to increased volumes of mismanaged waste. By
contrast, low-income countries typically have low labour costs that make collection and high-quality sorting
of recyclables by manual labour economically feasible. Therefore, countries may encounter different waste
management challenges depending on the stages of their economic development trajectory (Figure 2.7).

43
GLOBAL PLASTICS OUTLOOK © OECD 2022
Figure 2.7. More plastic waste is mismanaged than collected for recycling
Share of plastics treated by waste management category, before recycling losses, 2019
Source: OECD Global Plastics Outlook Database, https://doi.org/10.1787/c0821f81-en.
StatLink 2 https://stat.link/4dumre
Globally, 15% or 55 Mt of plastic waste were collected for recycling in 2019.7 EU countries, as well as
China, India, Japan and Korea have above-average recycling rates. Key drivers of recycling in Europe,
Japan and Korea are extensive separate collection facilities and extended producer responsibility (EPR)
schemes that put the onus to recycle on producers of plastic products and packaging (Chapter 6). In other
parts of the world, the informal economy is the main driver of recycling, incentivised by the value of some
of the plastics (Chapter 4).
The underlying regional economic drivers not only determine the volumes of plastic waste collected for
recycling – they also affect the process losses from recycling (Figure 2.8). Globally, almost 40% of plastics
collected for recycling, or close to 22 Mt, are lost during recycling and end up being incinerated, landfilled
or mismanaged. In particular, when formal waste collection is funded by government and free to users, it
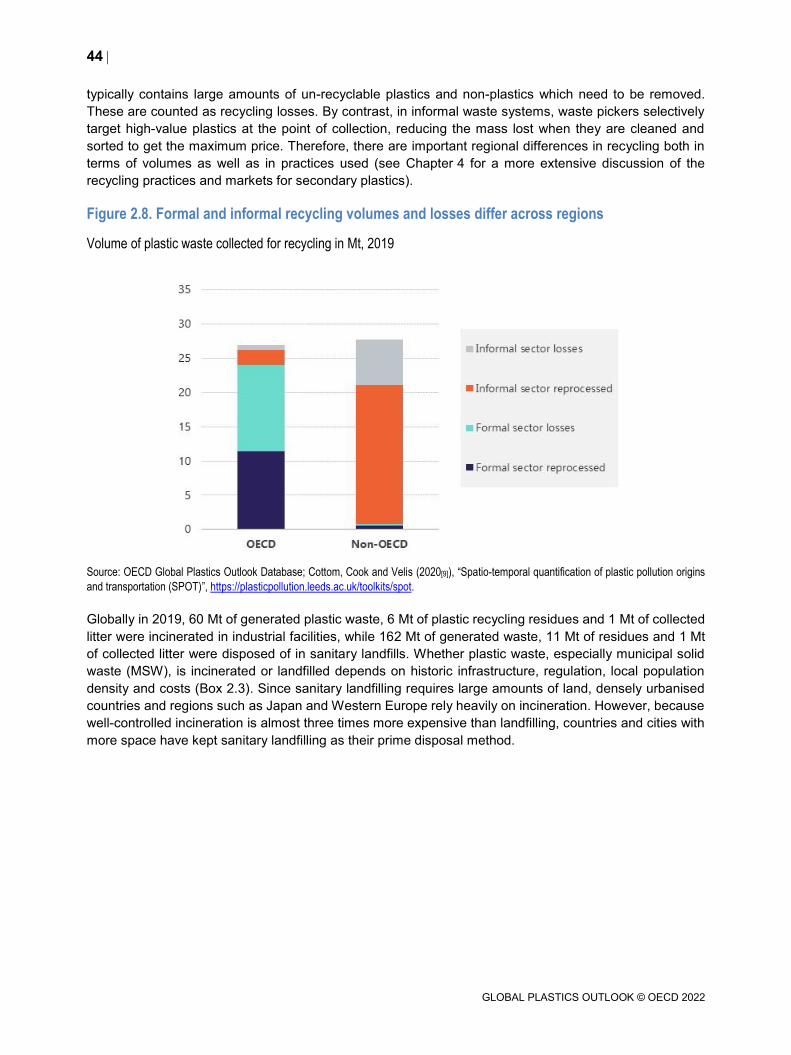
44
GLOBAL PLASTICS OUTLOOK © OECD 2022
typically contains large amounts of un-recyclable plastics and non-plastics which need to be removed.
These are counted as recycling losses. By contrast, in informal waste systems, waste pickers selectively
target high-value plastics at the point of collection, reducing the mass lost when they are cleaned and
sorted to get the maximum price. Therefore, there are important regional differences in recycling both in
terms of volumes as well as in practices used (see Chapter 4 for a more extensive discussion of the
recycling practices and markets for secondary plastics).
Figure 2.8. Formal and informal recycling volumes and losses differ across regions
Volume of plastic waste collected for recycling in Mt, 2019
Source: OECD Global Plastics Outlook Database; Cottom, Cook and Velis (2020[9]), “Spatio-temporal quantification of plastic pollution origins
and transportation (SPOT)”, https://plasticpollution.leeds.ac.uk/toolkits/spot.
Globally in 2019, 60 Mt of generated plastic waste, 6 Mt of plastic recycling residues and 1 Mt of collected
litter were incinerated in industrial facilities, while 162 Mt of generated waste, 11 Mt of residues and 1 Mt
of collected litter were disposed of in sanitary landfills. Whether plastic waste, especially municipal solid
waste (MSW), is incinerated or landfilled depends on historic infrastructure, regulation, local population
density and costs (Box 2.3). Since sanitary landfilling requires large amounts of land, densely urbanised
countries and regions such as Japan and Western Europe rely heavily on incineration. However, because
well-controlled incineration is almost three times more expensive than landfilling, countries and cities with
more space have kept sanitary landfilling as their prime disposal method.

45
GLOBAL PLASTICS OUTLOOK © OECD 2022
Box 2.3. The environmental impacts of incineration are mixed
A waste incineration plant is an industrial facility dedicated to the thermal treatment of waste. In order to
minimise potentially hazardous emissions, state-of-the-art plants incorporate extensive air pollution control
(APC) equipment. A range of technologies are available, but moving grate incinerators account for more than
93% of global capacity because of their ability to process waste streams with varying characteristics. Waste
incineration is expensive and costs almost three times more than landfilling. The main advantage is that
incineration reduces the weight and volume of waste. Indeed, the remaining ashes weigh only about 25% of
the original waste and the volume can be reduced by up to 90%, which substantially limits the need for
landfilling (Neuwahl et al., 2019[32]). Therefore, in megacities and urbanised areas where land is scarce and
public opposition to new landfills high, waste incineration can be used to dispose of large volumes of waste.
The energy released during incineration can recovered, often referred to as waste-to-energy (WtE) or
energy-from-waste (EfW). State-of-the-art WtE facilities for mixed waste can recover about 25% of the
energy contained in waste as electricity, though older facilities recover substantially less (Lombardi,
Carnevale and Corti, 2015[33]; Pavlas et al., 2011[34]). In addition, energy efficiency can be increased by
recovering heat for use in nearby industrial processes or residential areas. Nonetheless, feedstock and
operational priorities can mean that waste incineration plants operate at energy efficiencies that are
substantially below coal and gas energy production plants (Pavlas et al., 2011[34]; Colmenar-Santos
et al., 2018[35]). European plants recover most energy per tonne of MSW. This can be explained by a
combination of regulatory measures and financial incentives, as well as the composition of incinerated
waste. Lifestyles and sorting practices mean that mixed waste in Europe has a higher calorific value
since it contains less organic (wet) content than elsewhere.
There are around 2 450 active waste incineration plants around the world. Together they processed
approximately 400 Mt of MSW and other waste streams in 2019. Waste incinerators are strongly
concentrated in OECD countries and China. Japan and Korea have many small incinerators with an
average capacity of around 60 000 tonnes, compared to around 200 000 tonnes for OECD Europe, and
close to 400 000 tonnes for the United States and China.
Ecoprog (2020[36]) expects that global capacity will increase by more than 3% per year in the coming
decade, but with stark differences across regions. The growth will occur almost exclusively in China and
non-OECD Asia. Some new capacity will come online in OECD Europe in countries such as the
United Kingdom or Poland, but the overall growth is expected to be small. In Japan and Korea, gradual
closure of small unprofitable incinerators will see total capacity decline slightly. The market in the US and
Canada is expected to remain stable. While there are many plans to build waste incinerators outside of
these regions, in the past, these types of projects have been abandoned due to financial concerns,
uncertain legal frameworks, public resistance and insufficient local expertise. Therefore, growth in Africa
and Latin America is expected to be small in the next decade, but might accelerate later driven by the
growth of population and megacities.
Waste incinerators are typically used to treat mixed waste, including plastics. The environmental effects of
(plastic) waste incineration are ambiguous. The gains of recovering energy from waste are counterbalanced
by the environmental impacts of ash, residual emissions and greenhouse gases (Dijkgraaf and Vollebergh,
2004[37]; Dubois, 2013[38]). Most studies indicate that the overall environmental impact of waste incineration
with energy recovery is better than landfilling, but worse than recycling (Lazarevic et al., 2010[39]; Civancik-
Uslu et al., 2021[40]). Incineration also destroys the material that could feed the circular economy, which
aims to close material loops and maintain the highest value of materials throughout different cycles. Another
downside of incineration is that the plants are highly capital intensive, which pushes operators to use them
at full capacity. Consequently, large-scale investments in waste incineration can lock-in this infrastructure
for many years, leading to competition with recyclers for feedstock (UNEP, 2019[41]). This is especially true
when investments are linked to heat recovery and central district heating. To speed up the transition to the
circular economy, waste incineration will have to be gradually replaced by recycling and waste prevention.

46
GLOBAL PLASTICS OUTLOOK © OECD 2022
For many emerging economies, lack of technical capacities, poor governance and insufficient financial
resources at the municipal level are major bottlenecks in improving waste management practices.
Mismanaged waste is a wide category that includes waste that has not been collected and is therefore
“self-managed” by those who generate it – and who usually resort to dumping it on land, in rivers and lakes
or burning it in open uncontrolled fires. Mismanaged waste can also include waste that has been collected
but which is then subsequently deposited in dumpsites that do not have sufficient controls to prevent its
interaction with the natural environment or human receptors. These practices mainly occur in developing
countries, but they are also present in more mature economies.
Globally, approximately 79 Mt (73 Mt of waste and 5 Mt of recycling residues and 1 Mt of collected litter)
are mismanaged annually. Around 43% of that amount (34 Mt) is estimated to be captured in the inner part
of dumpsites where degradation and interaction with the environment is close to zero. One-third (26 Mt) is
burned in open, uncontrolled fires. This is mainly done by households who have to manage their waste in
the absence of waste collection services, but can also be done at dumpsites where waste is combusted
deliberately to reduce volume or to recover valuable metals. It can also be burned due to accidental and
spontaneous fires. The remainder is considered to be lost to terrestrial and aquatic environments
(Section 2.5 and Annex A). More specifically, the University of Leeds (Box 2.4) estimates that around 10%
of mismanaged waste is dumped directly onto land when there is no formal waste collection, while other
important leakage pathways are waste directly dumped into aquatic environments, dumped recycling
residues, losses from dumpsites and losses during collection and transport.
Littered waste is a specific category of improper waste handling that unfortunately is still a problem
throughout the world, even in mature economies. The amount of littered waste was more than 4 Mt globally
in 2019. An estimated 3 Mt of this litter was collected via street sweeping and other actions for disposal in
an industrial incinerator or a landfill; around 1 Mt was collected but then burned in open pits or sent to
dumpsites; and 1 Mt remained uncollected and is likely to have been lost to the environment (Section 2.5
and Annex A). However, as has been pointed out in Boucher et al. (2020[42]), uncollected litter is
exceptionally difficult to measure.
2.5. Plastic leakage is substantial
Plastic leakage has now been documented in all the major ocean basins, beaches, rivers, lakes, terrestrial
environments and even in remote locations such as the Arctic and Antarctic (OECD, 2021[43]; Eriksen et al.,
2014[44]). The research strand that aims to quantify the global magnitude of plastic leakage is relatively
recent, but following a seminal paper by Jambeck et al. (2015[14]), several other studies have proposed
models and estimates. Some researchers have focused on quantifying global plastic waste (Geyer,
Jambeck and Law, 2017[1]), while others have also attempted to understand the geographical and spatial
distribution of generated and mismanaged plastic waste (Lebreton and Andrady, 2019[15]). Other studies
have focused on leakage into the environment (Ryberg et al., 2019[3]; Borrelle et al., 2020[45]; Lau et al.,
2020[46]; Law et al., 2020[47]). Despite these efforts, there remains an urgent need to improve the
understanding of the drivers and dynamics of plastics leakage and to align existing assessment
methodologies (Box 2.4).
Global leakage to the environment (terrestrial and aquatic) is estimated to be 22 Mt in 2019 (Figure 2.9).8
However, due to the variety of sources and types of leaked plastics, as well as the unintended nature of
these plastic emissions into the environment, there is substantial uncertainty about each of categories of
plastic leakage. Moreover, this remains a conservative estimate as only known leakage sources with
sufficient data were quantified.

47
GLOBAL PLASTICS OUTLOOK © OECD 2022
Figure 2.9. Global leakage of macro-and microplastics to the environment is estimated at 22 Mt
Share of total plastic leakage into the environment, 2019
Source: OECD Global Plastics Outlook Database, https://doi.org/10.1787/c0821f81-en.
Since plastic leakage has many types and sources, leakage is often grouped into macroplastics and
microplastics. Macroplastics encompass recognisable items such as littered products and packaging, while
microplastics are solid synthetic polymers smaller than 5 mm in diameter (OECD, 2021[43]). Microplastics
are further split into primary and secondary microplastics. Primary microplastics are plastics that are
smaller than 5 mm in diameter by design, such as cosmetic scrubbing agents and biomedical uses as well
as plastic pellets accidentally lost during production or handling. By contrast, secondary microplastics refer
to microplastics which are formed from the fragmentation of larger plastics and are further differentiated
into two categories: 1) those formed during the use phase of products, such as microplastics from tyre
abrasion and synthetic microfibres from clothing and other textile products; and 2) those stemming from
the degradation and fragmentation of macroplastics that have already been lost in the environment. The
size of the plastic items or particles can influence, among other elements, their transport in the
environment, where they are deposited and their deposition rates.

48
GLOBAL PLASTICS OUTLOOK © OECD 2022
Box 2.4. State of the art in estimating the scale of the plastic leakage problem
Given that the quantification of plastic leakage is a relatively new field, studies differ in their scope,
methodology and assumptions. This plurality of methods has the benefit of providing a more complete
overview of the plastics issue, with each study drawing to a different aspect of the problem. However, it
also means that results of earlier studies diverge and are difficult to compare. For example, Jambeck et
al. (2015[48]) suggested a range of approximately 5-13 Mt for plastics emitted yearly to the ocean.
Lebreton et al. (2017[49]) estimated plastics emissions from rivers to the ocean at 1.2-2.4 Mt. Lau et al.
(2020[46]) estimated leakage to the environment at around 22-39 Mt, of which around 38% was released
to water. Borrelle et al. (2020[45]) estimated that approximately 19-23 Mt entered aquatic environments.
Each of these estimates uses different base years, definitions, estimations for plastics in use and
methodologies, all of which limit their comparability.
The OECD Global Plastics Outlook Database complements the existing literature by providing a
comprehensive overview of the amount of plastics in different lifecycle stages (Section 2.1). To include
leakage estimations in the database and ensure the results of existing methodologies are more
comparable, the OECD collaborated with three research groups: 1) a team from the Technical University
of Denmark (DTU) that led the research underlying the Ryberg et al. (2019[3]) study; 2) experts from the
University of Leeds who contributed to Lau et al. (2020[46]); and 3) Laurent Lebreton, who wrote research
papers on plastics waste generation and leakage (Lebreton et al., 2017[49]; Lebreton and Andrady,
2019[15]; Lebreton, Egger and Slat, 2019[50]), and contributed to the leakage estimations in Borrelle et al.
(2020[45]). These experts have refined and customised their analytical approaches (see Annex A) to
make the most of the information on plastics use and waste in the OECD Global Plastics Outlook
Database. Table 2.6 highlights how the complementary approaches used by these three research
groups cover key aspects of plastic leakage.
Table 2.6. A complementary approach is needed to improve the understanding of plastic leakage
Macroplastics Microplastics
Fate of mismanaged
waste flows
Leakage to
environment
(terrestrial and aquatic)
Leakage to aquatic
environments
(rivers and ocean)
Transport and degradation in aquatic
environments
Comprehensive view of
various categories
DTU
Laurent Lebreton
University of Leeds
Reconciling the approaches has allowed key insights to be obtained. However, the lack of empirical
data to validate the modelling means that these estimations are still uncertain. Table 2.7 highlights this
by showing the leakage from mismanaged waste and litter together with the upper and lower bound
estimations prepared for the Global Plastics Outlook. The database has taken the average of the
leakage proposed by the University of Leeds (low estimate) and the Danish Technical University (high
estimate) (see Annex A for more discussion). The uncertainty ranges highlight that more research is
needed to get a better grip on the current challenges.
Table 2.7. Plastic leakage is substantial despite high uncertainty surrounding the estimates
Compartment Leakage from mismanaged waste and litter Uncertainty ranges
Lost to environment (terrestrial and aquatic) 19 Mt 13 Mt a – 25 Mt b
Lost to aquatic environments 6 Mt 4 Mt a – 9 Mt c
Note: a) estimate made by University of Leeds, b) estimate made by DTU, c) estimate made by Laurent Lebreton.
Source: OECD Global Plastics Outlook Database, https://doi.org/10.1787/c0821f81-en.
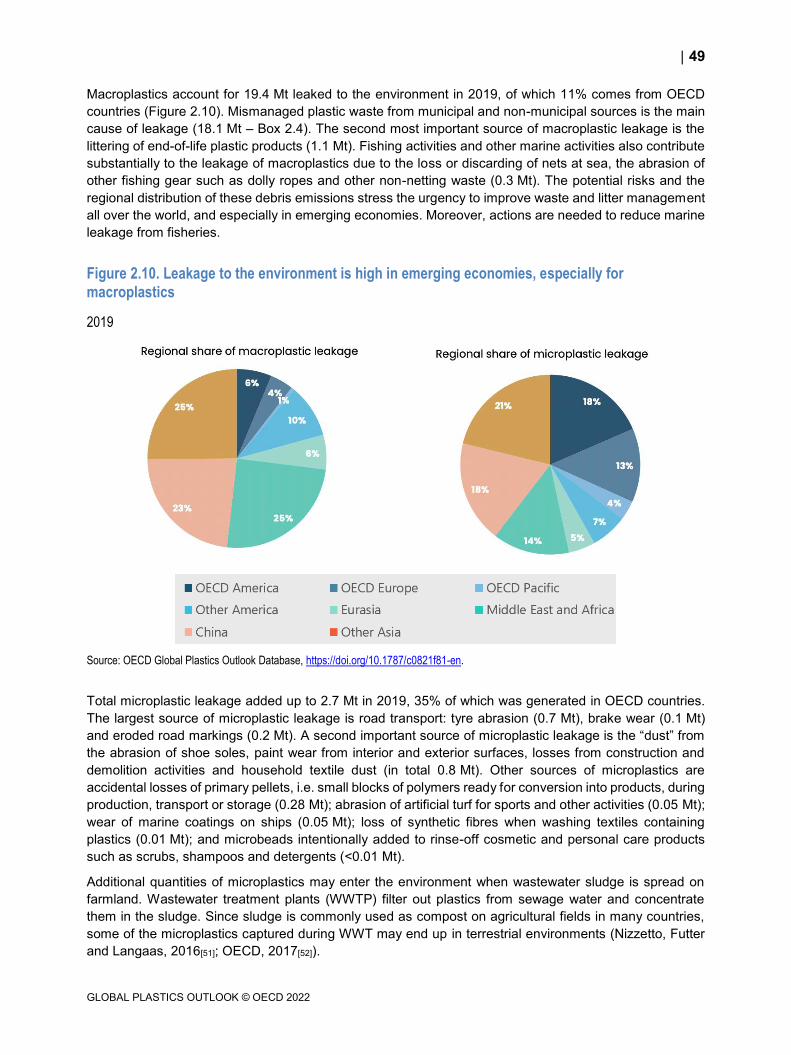
49
GLOBAL PLASTICS OUTLOOK © OECD 2022
Macroplastics account for 19.4 Mt leaked to the environment in 2019, of which 11% comes from OECD
countries (Figure 2.10). Mismanaged plastic waste from municipal and non-municipal sources is the main
cause of leakage (18.1 Mt – Box 2.4). The second most important source of macroplastic leakage is the
littering of end-of-life plastic products (1.1 Mt). Fishing activities and other marine activities also contribute
substantially to the leakage of macroplastics due to the loss or discarding of nets at sea, the abrasion of
other fishing gear such as dolly ropes and other non-netting waste (0.3 Mt). The potential risks and the
regional distribution of these debris emissions stress the urgency to improve waste and litter management
all over the world, and especially in emerging economies. Moreover, actions are needed to reduce marine
leakage from fisheries.
Figure 2.10. Leakage to the environment is high in emerging economies, especially for macroplastics
2019
Source: OECD Global Plastics Outlook Database, https://doi.org/10.1787/c0821f81-en.
Total microplastic leakage added up to 2.7 Mt in 2019, 35% of which was generated in OECD countries.
The largest source of microplastic leakage is road transport: tyre abrasion (0.7 Mt), brake wear (0.1 Mt)
and eroded road markings (0.2 Mt). A second important source of microplastic leakage is the “dust” from
the abrasion of shoe soles, paint wear from interior and exterior surfaces, losses from construction and
demolition activities and household textile dust (in total 0.8 Mt). Other sources of microplastics are
accidental losses of primary pellets, i.e. small blocks of polymers ready for conversion into products, during
production, transport or storage (0.28 Mt); abrasion of artificial turf for sports and other activities (0.05 Mt);
wear of marine coatings on ships (0.05 Mt); loss of synthetic fibres when washing textiles containing
plastics (0.01 Mt); and microbeads intentionally added to rinse-off cosmetic and personal care products
such as scrubs, shampoos and detergents (<0.01 Mt).
Additional quantities of microplastics may enter the environment when wastewater sludge is spread on
farmland. Wastewater treatment plants (WWTP) filter out plastics from sewage water and concentrate
them in the sludge. Since sludge is commonly used as compost on agricultural fields in many countries,
some of the microplastics captured during WWT may end up in terrestrial environments (Nizzetto, Futter
and Langaas, 2016[51]; OECD, 2017[52]).

50
GLOBAL PLASTICS OUTLOOK © OECD 2022
This study only included emission sources for which sufficient data were available. However, there could
be many others to include (e.g. synthetic fibres lost during other lifecycle phases). Also, the understanding
of what influences microplastic losses is still limited, so is the current understanding of the fate of
microplastics once leaked into the environment. Whilst more research is needed to develop a thorough
accounting of pollution levels and risks, this should not prevent policies from being implemented to reduce
microplastics leakage (OECD, 2021[43]).
2.5.1. Plastics enter and accumulate in the aquatic environment through complex
pathways
Transport of plastics in the environment is extraordinarily complex and the current understanding of the
behaviour of plastics released into the environment is incomplete. Plastics can be transported within and
released to three types of environments: terrestrial, aquatic and atmospheric. When plastics are emitted
to the environment, the size, weight and characteristics of polymers determine how they are transported.
For example, high-density plastics such as PVC tend to remain close to the source of leakage, while a less
dense polymer such as LDPE can be transported over large distances. Regardless of density, plastic
objects and articles may be hollow, trapping air which allows them to float. Their transport is also governed
by local weather patterns, geography and the presence of obstacles such as dams and the built
environment. It can also be influenced by extreme events such as earthquakes, tsunamis and hurricanes.
As shown in Figure 2.9, mismanaged and littered waste make up the largest share of plastics leaked to
the environment. In order to investigate the amount and spatial distribution of plastics leaked into aquatic
environments, the data above on the leakage to the environment of mismanaged and littered waste was
used in conjunction with other modelling tools that build on work initiated by Lebreton et al. (2019[50]) and
Borrelle et al. (2020[45]). This methodology takes into account the proximity of rivers to the source of
emission, the presence of dams, human habitation and coastal economic activity (see Annex A for more
information). Figure 2.11 presents a highly stylised view of the accumulation and mobility of macroplastics
in aquatic environments even though there are still many unknowns.
Figure 2.11. Rivers accumulate leaked plastics and carry them to the ocean
Source: OECD Global Plastics Outlook Database, https://doi.org/10.1787/c0821f81-en.

51
GLOBAL PLASTICS OUTLOOK © OECD 2022
Once plastics are in aquatic environments, a complex set of factors influences their transportation,
including wind, precipitation patterns, river flow and oceanic currents. High-density plastics, e.g. PET or
PVC, are likely to sink to lower levels of the water column close to the point of entry into rivers or seas,
while low-density polymers (e.g. PE and PP) and air-filled plastic items (e.g. bottles) may stay afloat and
be transported for long distances. Other effects may play a role, such as the creation of biofilms on plastics
which increases overall density and probability of sinking to the river or sea bed (Schwarz et al., 2019[53];
Tosin et al., 2012[54]). Floating plastics that make it to the ocean tend to accumulate in gyres, such as the
Great Pacific Garbage Patch, due to the convergence of the marine currents (GESAMP, 2015[55]).
The estimates for leakage to aquatic environments (6.1 Mt in 2019) and especially inflows into ocean
(1.7 Mt in 2019) are lower than most earlier studies that estimated global leakage to water (Jambeck et al.,
2015[48]; Lau et al., 2020[46]; Borrelle et al., 2020[45]) (Box 2.4). In addition to using different methodologies,
two sets of assumptions drive these differences.
The first set of assumptions relates to the fate of mismanaged waste. The OECD methodology relies on
detailed waste management modelling that assumes that one-third of the mismanaged plastic waste and
residues is burned in open pits, either locally or in dumpsites – a practice is environmentally harmful and
should be discouraged. However, it reduces the amount of plastics that can potentially end up in water
(Velis and Cook, 2021[56]). In addition, the waste management modelling assumes that around 44% of all
mismanaged waste is buried in the core of dumpsites, where it will remain for decades or even centuries.
While this risks leakage of hazardous substances and pollution of groundwater, apart from major incidents,
the volumes of plastics leaking to surface waters are small (Cook, 2020[57]). Taken together, these two
assumptions imply that less than a quarter of mismanaged plastic waste will end up in terrestrial and
aquatic environments, which is lower than the shares put forward by most other studies.
The second set of assumptions concerns the transport of plastics leaked to the environment. The approach
used in this report estimates that around 32% of leaked plastics end up in aquatic environments (the rest
accumulates in terrestrial environments). Other studies assume higher values. For example, Lau et al.
(2020[46]) use a ratio of 38%. Moreover, the OECD estimations for inflow into the ocean build on detailed
modelling of the transport and stock of plastics in rivers (Meijer et al., 2021[58]). The projected accumulation
in rivers (109 Mt in 2019) slows down the inflow of plastics to the ocean and consequently gives, in the
short term, lower estimations for the leakage to seas and ocean. Altogether, the volumes put forward in
this chapter can therefore be considered to be conservative estimations.
Once in aquatic environments, plastics are transformed further. They degrade slowly through exposure to
UV radiation, temperature differences and physical abrasion. As the material weathers, macroplastics will
fragment into microplastics and potentially into nanoplastics. The amount of microplastics produced via
the degradation of macroplastics in 2019 is estimated at 0.15 Mt in rivers and lakes, and 0.10 Mt in the
ocean. The degradation is highest in rivers and lakes because these contain the largest stocks of
accumulated macroplastics. In the ocean, degradation mainly occurs close to the shore where the
movement of leaked plastics is intensive due to waves and currents (see Annex A for more information on
the methodology).
The buoyancy of plastics also changes when they undergo degradation, fragmentation and fouling. Most
fragmented plastics tend to settle below the ocean surface, ultimately reaching sediments, which are
considered a final sink for plastic debris. This is supported by the finding that microplastics are much less
abundant on the sea surface than larger macroplastics (Eriksen et al., 2014[44]). Some estimates suggest
that over 90% of plastics that enter the ocean end up in sediments and in the lower levels of the oceanic
water column (GESAMP, 2015[55]). Macroplastics probably stay longer on the surface. Research has found
that large shares of plastic debris sampled on the ocean’s surface are decades-old (Lebreton, Egger and
Slat, 2019[50]). The force of waves and currents around the coast may be circulating plastics above and
below the waterline for a long time before plastic debris reaches the open ocean. Further research is

52
GLOBAL PLASTICS OUTLOOK © OECD 2022
needed to better understand the dynamics of plastics in aquatic environments and to design effective ways
to prevent or remove risks.
2.5.2. Microplastics from road transport can pollute the air over wide areas
Road transport, and in particular the wear of tyres and brake pads, is one of the main sources of aerial
microplastic pollution. Globally in 2019, airborne emissions from tyres were 16 times larger than emissions
from brakes, but brakes are responsible for a larger share of fine particulate matter (PM2.5, i.e. particles
with a diameter below 2.5 µm), which may have more severe health impacts (Evangeliou et al., 2020[59];
OECD, 2020[60]). Road transport-related microplastics are emitted mainly in large urban agglomerations,
such as the eastern part of North America, continental Europe and Northeast Asia (Figure 2.12).
While the majority of microplastic emissions tends to remain close to their source, where they increase the
concentration levels of PM at ground level, some particles can travel long distances, depending on the
location and atmospheric conditions (Figure 2.12). Substantial amounts of deposited microplastics have
been found in remote regions (Evangeliou et al., 2020[59]), including mountain regions and the Arctic (Allen
et al., 2019[61]; Lusher et al., 2015[62]). In the Arctic, the light-absorbing properties of tyre wear particles
may accelerate atmospheric warming, with possible consequences for the balance of the global climate
(OECD, 2021[63]).
Figure 2.12. Aerial microplastic pollution from road transport is highest in highly urbanised areas
Total suspended PM depositions from tyres and brakes in 2019, mg/m3
Note: The map displays total suspended PM10 (particles of diameter inferior to 10 µm), including particulate matter emissions of smaller sizes
(PM1 and PM2.5).
Source: OECD Global Plastics Outlook Database.
Policies can lower transport-related microplastics emissions by reducing the amount of emissions that
vehicles generate and the total number of kilometres that vehicles are driven (OECD, 2020[60]). Potential
mitigation measures include incentives for producing lighter-weight vehicles, regulating tyre composition
and reducing the vehicle-kilometres travelled by regulating urban vehicle access, and promoting public
transport, walking and cycling in urban areas. Policy makers should also prioritise research on the
magnitude and impacts of non-exhaust particulate emissions from road transport and the effectiveness of
mitigation measures to address them. Standardised approaches are needed for measuring non-exhaust

53
GLOBAL PLASTICS OUTLOOK © OECD 2022
particulate matter and developing a better understanding of how various factors (e.g. vehicle
characteristics) influence the amount of non-exhaust particulate matter generated.
2.6. Plastic leakage has a variety of environmental, health and economic
consequences
The proliferation of plastics combined with poor end-of-life waste management has resulted in widespread,
persistent plastic leakage. The longevity of plastics is of particular concern. For example, single-use plastic
products like LDPE plastic bags and HDPE milk bottles could have estimated half-lives of 5-250 years on
land and 3-58 years in marine environments (Chamas et al., 2020[64]). On the other hand, HDPE pipes
need thousands of years to completely degrade, with an estimated half-life of 1 200 years (Chamas et al.,
2020[64]).
In aquatic environments, the most visible negative effects on marine wildlife are the entanglement of marine
organisms in floating plastic debris and increased mortality following the ingestion of macro and
microplastics by marine species such as mussels, turtles, fish and sea birds. At least 690 wildlife species,
as well as coral reefs, are known to be affected (Gall and Thompson, 2015[65]). However, the negative
consequences of plastics extend beyond these first order impacts. Microplastics have been documented
in the digestive tract of several types of mussels and fish destined for human consumption (Lusher,
Hollman and Mendoza-Hill, 2017[66]). Thus, the ingestion of seafood contaminated with microplastics has
also been identified as a potentially substantial exposure pathway for humans.
Microplastic contamination is not exclusive to marine environments – it has also been documented in
freshwater and terrestrial environments, as well as in food and beverages, such as tap water, bottled water
and beer (Kosuth, Mason and Wattenberg, 2018[67]; Mintenig et al., 2019[68]). Humans are also exposed to
microplastics by inhaling airborne particles and fibres, and microplastics have been reported both in indoor
and outdoor environments (Gasperi et al., 2017[69]; Allen et al., 2019[61]). The main studies of human health
impacts of airborne microplastics have looked at exposure to non-exhaust road traffic emissions
(Figure 2.12).
Plastics may also act as a sink and transportation media for chemicals and persistent organic pollutants
(POPs), which accumulate on the surface of plastics while in seawater. Adsorbed chemicals found on
sampled plastic debris include PCBs, PAHs, DDE (a breakdown product of DDT) and trace metals (Engler,
2012[70]; Teuten et al., 2007[71]).9 Plastic fragmentation may enhance leaching of chemical substances to
the surrounding environment. Nanoplastics are of particular concern because their small size allows them
to potentially be transferred to tissues or cells (SAPEA, 2019[72]).
Furthermore, marine plastic leakage has substantial economic costs for coastal communities due to
potential negative impacts on fishing and tourism. Plastics can affect the sustainability of fisheries, while
plastic leakage on beaches deters visitors, causing financial distress to local communities reliant on
tourism. Beaumont et al. (2019[73]) estimate the economic costs of the loss of marine ecosystem services
to be around USD 3 300 per tonne of marine plastic per year.
A major challenge posed by plastics in the environment is the considerable uncertainty about the
magnitude of the damage. Firstly, there are still important gaps in the current understanding of the plastic-
health-biosphere links. Secondly, there are important uncertainties surrounding the quantities of plastics
entering the environment and their accumulation. Ultimately, the estimation of the exact volume of plastic
leakage is secondary to the intrinsic message from all these studies: plastic leakage is a major
environmental problem and it is getting worse. The longevity of plastics means that the effects of today’s
plastic leakage could become much larger in the future, causing long-term and potentially irreversible
additional damage. The urgency to act for policy makers as well as other societal decision makers is high.

54
GLOBAL PLASTICS OUTLOOK © OECD 2022
References
Aguiar, A. et al. (2019), “The GTAP Data Base: Version 10”, Journal of Global Economic
Analysis, Vol. 4/1, pp. 1-27, http://dx.doi.org/10.21642/jgea.040101af.
[6]
Akanuma, Y., S. Selke and R. Auras (2014), “A preliminary LCA case study: comparison of
different pathways to produce purified terephthalic acid suitable for synthesis of 100 % bio-
based PET”, The International Journal of Life Cycle Assessment, Vol. 19/6, pp. 1238-1246,
http://dx.doi.org/10.1007/s11367-014-0725-2.
[28]
Allen, S. et al. (2019), “Atmospheric transport and deposition of microplastics in a remote
mountain catchment”, Nature Geoscience, Vol. 12/5, pp. 339-344,
http://dx.doi.org/10.1038/s41561-019-0335-5.
[61]
Beaumont, N. et al. (2019), “Global ecological, social and economic impacts of marine plastic”,
Marine Pollution Bulletin, Vol. 142, pp. 189-195,
http://dx.doi.org/10.1016/j.marpolbul.2019.03.022.
[73]
Borrelle, S. et al. (2020), “Predicted growth in plastic waste exceeds efforts to mitigate plastic
pollution”, Science, Vol. 369/6510, pp. 1515-1518, http://dx.doi.org/10.1126/science.aba3656.
[45]
Boucher, J. et al. (2020), The marine plastic footprint, IUCN, International Union for Conservation
of Nature, http://dx.doi.org/10.2305/IUCN.CH.2020.01.en.
[42]
Brizga, J., K. Hubacek and K. Feng (2020), “The Unintended Side Effects of Bioplastics: Carbon,
Land, and Water Footprints”, One Earth, Vol. 3/1, pp. 45-53,
http://dx.doi.org/10.1016/j.oneear.2020.06.016.
[23]
Broeren, M. et al. (2017), “Environmental impact assessment of six starch plastics focusing on
wastewater-derived starch and additives”, Resources, Conservation and Recycling, Vol. 127,
pp. 246-255, http://dx.doi.org/10.1016/j.resconrec.2017.09.001.
[30]
Chamas, A. et al. (2020), “Degradation Rates of Plastics in the Environment”, ACS Sustainable
Chemistry & Engineering, Vol. 8/9, pp. 3494-3511,
http://dx.doi.org/10.1021/acssuschemeng.9b06635.
[64]
Chateau, J., R. Dellink and E. Lanzi (2014), “An Overview of the OECD ENV-Linkages
Model: Version 3”, OECD Environment Working Papers, No. 65, OECD Publishing, Paris,
http://dx.doi.org/10.1787/5jz2qck2b2vd-en.
[5]
Chen, G. and M. Patel (2011), “Plastics Derived from Biological Sources: Present and Future: A
Technical and Environmental Review”, Chemical Reviews, Vol. 112/4, pp. 2082-2099,
http://dx.doi.org/10.1021/cr200162d.
[31]
Chruszcz, A. and S. Reeve (2018), “Composition of plastic waste collected via kerbside.
Banbury, UK: W. a. R. A. P. (WRAP)”,
https://www.wrap.org.uk/sites/files/wrap/Composition%20of%20Plastic%20Waste%20Collect
ed%20via%20Kerbside%20v2.pdf.
[10]
Civancik-Uslu, D. et al. (2021), “Moving from linear to circular household plastic packaging in
Belgium: Prospective life cycle assessment of mechanical and thermochemical recycling”,
Resources Conservation and Recycling, Vol. 171, p. 105633,
http://dx.doi.org/10.1016/j.resconrec.2021.105633.
[40]

55
GLOBAL PLASTICS OUTLOOK © OECD 2022
Colmenar-Santos, A. et al. (2018), “Technological improvements in energetic efficiency and
sustainability in existing combined-cycle gas turbine (CCGT) power plants”, Applied Energy,
Vol. 223, pp. 30-51, http://dx.doi.org/10.1016/j.apenergy.2018.03.191.
[35]
Cook, E. (2020), Global review on safer end of engineered life.. [57]
Cottom, J., E. Cook and C. Velis (2020), “Spatio-temporal quantification of plastic pollution
origins and transportation (SPOT)” University of Leeds, UK,
https://plasticpollution.leeds.ac.uk/toolkits/spot/.
[9]
Dijkgraaf, E. and H. Vollebergh (2004), “Burn or bury? A social cost comparison of final waste
disposal methods”, Ecological Economics, Vol. 50/3-4, pp. 233-247,
http://dx.doi.org/10.1016/j.ecolecon.2004.03.029.
[37]
Dubois, M. (2013), “Towards a coherent European approach for taxation of combustible waste”,
Waste Management, Vol. 33/8, http://dx.doi.org/10.1016/j.wasman.2013.03.015.
[38]
Ecoprog (2020), Waste to Energy 2020/2021,
https://www.ecoprog.com/fileadmin/user_upload/extract_market_report_WtE_2020-
2021_ecoprog.pdf (accessed on 26 May 2021).
[36]
Engler, R. (2012), “The Complex Interaction between Marine Debris and Toxic Chemicals in the
Ocean”, Environmental Science & Technology, Vol. 46/22, pp. 12302-12315,
http://dx.doi.org/10.1021/es3027105.
[70]
Eriksen, M. et al. (2014), “Plastic Pollution in the World’s Oceans: More than 5 Trillion Plastic
Pieces Weighing over 250,000 Tons Afloat at Sea”, PLOS ONE, Vol. 9/12, p. e111913,
https://doi.org/10.1371/journal.pone.0111913.
[44]
European Bioplastics (2019), Bioplastics market data 2019 - Global production capacities of
bioplastics 2019-2024.
[22]
Evangeliou, N. et al. (2020), “Atmospheric transport is a major pathway of microplastics to
remote regions”, Nature Communications, Vol. 11/1, p. 3381,
http://dx.doi.org/10.1038/s41467-020-17201-9.
[59]
Franklin Associates (2018), Life cycle impacts of plastic packaging compared to substitutes in
the United States and Canada: Theoretical substitution analysis,
https://www.americanchemistry.com/better-policy-regulation/plastics/resources/life-cycle-
impacts-of-plastic-packaging-compared-to-substitutes-in-the-united-states-and-canada.
[20]
Gall, S. and R. Thompson (2015), “The impact of debris on marine life”, Marine Pollution Bulletin,
Vol. 92/1-2, pp. 170-179, http://dx.doi.org/10.1016/j.marpolbul.2014.12.041.
[65]
Gasperi, J. et al. (2017), “Microplastics in air: Are we breathing it in?”, Current Opinion in
Environmental Science & Health, Vol. 1, pp. 1-5,
http://dx.doi.org/10.1016/j.coesh.2017.10.002.
[69]
GESAMP (2015), Sources, fate and effects of microplastics in the marine environment: a global
assessment, IMO/FAO/UNESCO-IOC/UNIDO/WMO/IAEA/UN/UNEP/UNDP Joint Group of
Experts on the Scientific Aspects of Marine Environmental Protection), http://www.imo.org.
[55]
Geyer, R., J. Jambeck and K. Law (2017), “Production, use, and fate of all plastics ever made”,
Science Advances, Vol. 3/7, p. e1700782, http://dx.doi.org/10.1126/sciadv.1700782.
[1]

56
GLOBAL PLASTICS OUTLOOK © OECD 2022
Gómez-Sanabria, A. et al. (2018), “Carbon in global waste and wastewater flows – its potential
as energy source under alternative future waste management regimes”, Advances in
Geosciences, Vol. 45, pp. 105-113, http://dx.doi.org/10.5194/adgeo-45-105-2018.
[17]
Grand View Research (2020), Recycled Plastics Market: Market Analysis. [8]
IEA (2018), The future of petrochemicals: Towards more sustainable plastics and fertilisers,
International Energy Agency, Paris, https://dx.doi.org/10.1787/9789264307414-en.
[2]
IPCC (1995), Climate Change 1995: A report of the Intergovernmental Panel on Climate Change
- IPCC Second Assessment.
[74]
Jambeck, J. et al. (2015), “Plastic waste inputs from land into the ocean”, Science,
Vol. 347/6223, pp. 768-771, http://dx.doi.org/10.1126/science.1260352.
[14]
Jambeck, J. et al. (2015), “Plastic waste inputs from land into the ocean”, Science,
Vol. 347/6223, pp. 768-771, http://dx.doi.org/10.1126/science.1260352.
[48]
Kaza, S. et al. (2018), What a Waste 2.0: A Global Snapshot of Solid Waste Management to
2050, The World Bank, http://dx.doi.org/10.1596/978-1-4648-1329-0.
[13]
Kosuth, M., S. Mason and E. Wattenberg (2018), “Anthropogenic contamination of tap water,
beer, and sea salt”, PLoS ONE, Vol. 13/4, http://dx.doi.org/10.1371/journal.pone.0194970.
[67]
Lau, W. et al. (2020), “Evaluating scenarios toward zero plastic pollution”, Science,
Vol. 369/6510, pp. 1455-1461, http://dx.doi.org/10.1126/science.aba9475.
[46]
Law, K. et al. (2020), “The United States’ contribution of plastic waste to land and ocean”,
Science Advances, Vol. 6/44, p. eabd0288, http://dx.doi.org/10.1126/sciadv.abd0288.
[47]
Lazarevic, D. et al. (2010), “Plastic waste management in the context of a European recycling
society: Comparing results and uncertainties in a life cycle perspective”, Resources,
Conservation and Recycling, Vol. 55/2, pp. 246-259,
http://dx.doi.org/10.1016/j.resconrec.2010.09.014.
[39]
Lebreton, L. and A. Andrady (2019), “Future scenarios of global plastic waste generation and
disposal”, Palgrave Communications, Vol. 5/1, p. 6, http://dx.doi.org/10.1057/s41599-018-
0212-7.
[15]
Lebreton, L., M. Egger and B. Slat (2019), “A global mass budget for positively buoyant
macroplastic debris in the ocean”, Scientific Reports, Vol. 9/1, p. 12922,
http://dx.doi.org/10.1038/s41598-019-49413-5.
[50]
Lebreton, L. et al. (2017), “River plastic emissions to the world’s oceans”, Nature
Communications, Vol. 8/1, http://dx.doi.org/10.1038/ncomms15611.
[49]
Liptow, C. and A. Tillman (2012), “A Comparative Life Cycle Assessment Study of Polyethylene
Based on Sugarcane and Crude Oil”, Journal of Industrial Ecology, Vol. 16/3, pp. 420-435,
http://dx.doi.org/10.1111/j.1530-9290.2011.00405.x.
[24]
Lombardi, L., E. Carnevale and A. Corti (2015), “A review of technologies and performances of
thermal treatment systems for energy recovery from waste”, Waste Management, Vol. 37,
pp. 26-44, http://dx.doi.org/10.1016/j.wasman.2014.11.010.
[33]

57
GLOBAL PLASTICS OUTLOOK © OECD 2022
Lusher, A., P. Hollman and J. Mendoza-Hill (2017), Microplastics in fisheries and aquaculture:
status of knowledge on their occurrence and implications for aquatic organisms and food
safety, FAO Fisheries and Aquaculture Technical Paper. No. 615, Rome, Italy.
[66]
Lusher, A. et al. (2015), “Microplastics in Arctic polar waters: The first reported values of particles
in surface and sub-surface samples”, Scientific Reports, Vol. 5,
http://dx.doi.org/10.1038/srep14947.
[62]
Meijer, L. et al. (2021), “More than 1000 rivers account for 80% of global riverine plastic
emissions into the ocean”, Science Advances, Vol. 7/18,
http://dx.doi.org/10.1126/sciadv.aaz5803.
[58]
Mintenig, S. et al. (2019), “Low numbers of microplastics detected in drinking water from ground
water sources”, Science of the Total Environment, Vol. 648, pp. 631-635,
http://dx.doi.org/10.1016/j.scitotenv.2018.08.178.
[68]
Neuwahl, F. et al. (2019), Best Available Techniques (BAT) Reference Document for Waste
Incineration:Industrial Emissions Directive 2010/75/EU (Integrated Pollution Prevention and
Control), Publications Office of the European Union, Luxembourg,,
http://dx.doi.org/doi:10.2760/761437.
[32]
Nizzetto, L., M. Futter and S. Langaas (2016), Are Agricultural Soils Dumps for Microplastics of
Urban Origin?, American Chemical Society, http://dx.doi.org/10.1021/acs.est.6b04140.
[51]
OECD (2021), Policies to Reduce Microplastics Pollution in Water: Focus on Textiles and Tyres,
OECD Publishing, Paris, https://dx.doi.org/10.1787/7ec7e5ef-en.
[43]
OECD (2021), The Economic Benefits of Air Quality Improvements in Arctic Council Countries,
OECD Publishing, Paris, https://dx.doi.org/10.1787/9c46037d-en.
[63]
OECD (2020), Non-exhaust Particulate Emissions from Road Transport: An Ignored
Environmental Policy Challenge, OECD Publishing, Paris,
https://dx.doi.org/10.1787/4a4dc6ca-en.
[60]
OECD (2017), “Water: Sewage sludge production and disposal (Edition 2017)”, OECD
Environment Statistics (database), https://dx.doi.org/10.1787/14780a65-en (accessed on
20 February 2020).
[52]
Pavlas, M. et al. (2011), “Waste incineration with production of clean and reliable energy”, Clean
Technologies and Environmental Policy, Vol. 13/4, pp. 595-605,
http://dx.doi.org/10.1007/s10098-011-0353-5.
[34]
Plastics Europe (2020), Plastics - the Facts: an analysis of European plastics production,
demand and waste data.
[4]
Roosen, M. et al. (2020), “Detailed Analysis of the Composition of Selected Plastic Packaging
Waste Products and Its Implications for Mechanical and Thermochemical Recycling”,
Environmental Science & Technology, Vol. 54/20, pp. 13282-13293,
http://dx.doi.org/10.1021/acs.est.0c03371.
[11]
Royer, S. et al. (2018), “Production of methane and ethylene from plastic in the environment”,
PLOS ONE, Vol. 13/8, http://dx.doi.org/10.1371/journal.pone.0200574.
[19]

58
GLOBAL PLASTICS OUTLOOK © OECD 2022
Ryberg, M. et al. (2019), “Global environmental losses of plastics across their value chains”,
Resources, Conservation and Recycling, Vol. 151, p. 104459,
http://dx.doi.org/10.1016/j.resconrec.2019.104459.
[3]
SAPEA (2019), A Scientific Perspective on Micro-Plastics in Nature and Society, Science Advice
for Policy by European Academics, http://dx.doi.org/10.26356/microplastics.
[72]
Schwarz, A. et al. (2019), “Sources, transport, and accumulation of different types of plastic litter
in aquatic environments: A review study”, Marine Pollution Bulletin, Vol. 143, pp. 92-100,
http://dx.doi.org/10.1016/J.MARPOLBUL.2019.04.029.
[53]
Semba, T. et al. (2018), “Greenhouse gas emissions of 100% bio-derived polyethylene
terephthalate on its life cycle compared with petroleum-derived polyethylene terephthalate”,
Journal of Cleaner Production, Vol. 195, pp. 932-938,
http://dx.doi.org/10.1016/j.jclepro.2018.05.069.
[29]
Shen, M. et al. (2020), “(Micro)plastic crisis: Un-ignorable contribution to global greenhouse gas
emissions and climate change”, Journal of Cleaner Production, Vol. 254, p. 120138,
http://dx.doi.org/10.1016/j.jclepro.2020.120138.
[18]
Stadler, K. et al. (2018), “EXIOBASE 3: Developing a Time Series of Detailed Environmentally
Extended Multi-Regional Input-Output Tables”, Journal of Industrial Ecology, Vol. 22/3,
pp. 502-515, http://dx.doi.org/10.1111/jiec.12715.
[7]
Stefanini, R. et al. (2020), “Plastic or glass: a new environmental assessment with a marine litter
indicator for the comparison of pasteurized milk bottles”, The International Journal of Life
Cycle Assessment, Vol. 26/4, pp. 767-784, http://dx.doi.org/10.1007/s11367-020-01804-x.
[21]
Teuten, E. et al. (2007), “Potential for plastics to transport hydrophobic contaminants”,
Environmental Science and Technology, Vol. 41/22, pp. 7759-7764,
http://dx.doi.org/10.1021/es071737s.
[71]
Tosin, M. et al. (2012), “Laboratory Test Methods to Determine the Degradation of Plastics in
Marine Environmental Conditions”, Frontiers in Microbiology, Vol. 3, p. 225,
http://dx.doi.org/10.3389/fmicb.2012.00225.
[54]
Tsiropoulos, I. et al. (2015), “Life cycle impact assessment of bio-based plastics from sugarcane
ethanol”, Journal of Cleaner Production, Vol. 90, pp. 114-127,
http://dx.doi.org/10.1016/j.jclepro.2014.11.071.
[27]
UNEP (2019), Waste to Energy: considerations for informed decision-making,
https://wedocs.unep.org/bitstream/handle/20.500.11822/28413/WTEfull.pdf?sequence=1&isA
llowed=y.
[41]
Vanderreydt, I. et al. (forthcoming), European Environment Agency: European Topic Centre on
Waste and Materials in a Green Economy.
[26]
Velis, C. and E. Cook (2021), “Mismanagement of Plastic Waste through Open Burning with
Emphasis on the Global South: A Systematic Review of Risks to Occupational and Public
Health”, Environmental Science & Technology, Vol. 55/11, pp. 7186-7207,
http://dx.doi.org/10.1021/acs.est.0c08536.
[56]
VinylPlus (2019), “PVC Recycling in Action”,
https://vinylplus.eu/uploads/images/Leaflets/Recovinyl_21x21_04-05_web.pdf.
[12]

59
GLOBAL PLASTICS OUTLOOK © OECD 2022
Walker, S. and R. Rothman (2020), “Life cycle assessment of bio-based and fossil-based plastic:
A review”, Journal of Cleaner Production, Vol. 261, p. 121158,
http://dx.doi.org/10.1016/j.jclepro.2020.121158.
[25]
Zheng, J. and S. Suh (2019), “Strategies to reduce the global carbon footprint of plastics”, Nature
Climate Change, Vol. 9/5, pp. 374-378, http://dx.doi.org/10.1038/s41558-019-0459-z.
[16]
Notes
1 https://doi.org/10.1787/c0821f81-en.
2 The GTAP 10 database details social accounting matrices for 141 countries and regions, with global
coverage. This database describes bilateral trade patterns, production, consumption and intermediate use
of commodities and services, including capital, labour and tax revenues and use. This database is at the
basis of the OECD ENV-Linkages model’s representation of economic flows, which feeds into the Global
Plastics Outlook Database.
3 The cross-country regressions based on the What a waste 2.0 database (Kaza et al., 2018[13]) include: (a) 𝑤𝑎𝑠𝑡𝑒_𝑝𝑐𝑖 = 𝛼 + 𝛽 ∗ 𝑙𝑛(𝑔𝑑𝑝_𝑝𝑐𝑖) + 𝑟𝑖 (b) 𝑖𝑛𝑐𝑖/(𝑖𝑛𝑐𝑖 + 𝑑𝑖𝑠𝑖) = 𝛼 + 𝛽 ∗ 𝑙𝑛(𝑔𝑑𝑝_𝑝𝑐𝑖) + 𝑟𝑖 (c) 𝑚𝑖𝑠𝑖/𝑑𝑖𝑠𝑖 = 𝛼 + 𝛽 ∗ 𝑙𝑛(𝑔𝑑𝑝_𝑝𝑐𝑖) + 𝑜𝑒𝑐𝑑𝑖 where waste_pc = MSW per capita, MIS = mismanaged waste, inc = incinerated waste, dis = mismanaged + landfilled, gdp_pc = GDP per capita, oecd = dummy for OECD economies, r = regional dummies for 15 regions of ENV-Linkages, i = country.
4 With the exception of a slight dip in demand during the global financial crisis of 2008-09, providing
evidence for the correlation between economic growth and plastics use.
5 Greenhouse gases are aggregated using 100-year global warming potentials of 310 for N2O, 21 for CH4,
and 1 for CO2 (IPCC, 1995[74]).
6 The COVID-19 pandemic has caused some shifts in plastics use by polymer. The size and permanency
of these shifts are, however, too uncertain to use as basis for the analysis in this report.
7 The COVID-19 pandemic caused some disruptions to recycling in 2020, but these tended to be short-
lived.
8 There is anecdotal evidence that since the start of the pandemic, a significant portion of face masks have
leaked to the environment (Chapter 3). In terms of volume, this effect is however limited.
9 PCBs refer to polychlorinated biphenyls, PAHs to polycyclic aromatic hydrocarbon, DDE to
dichlorodiphenyldichloroethylene and DDT to dichlorodiphenyltrichloroethane.

60
GLOBAL PLASTICS OUTLOOK © OECD 2022
This chapter investigates the effects of the COVID-19 pandemic and
lockdown measures on the production, use and waste of plastics, focusing
on the short-term effects in the year 2020, in order to shed light on the
complex interactions between the effects of COVD-19 on economic activity
and plastics use. It first looks at emerging evidence for the pandemic’s impact
on specific uses and sectors, followed by an overview of the effects on waste
and recycling. It then reports on the results of a detailed OECD modelling
framework used to assess the consequences of COVID-induced changes in
sectoral and regional economic activity on plastics use more broadly. It ends
with a brief discussion of the possible longer-term implications of the
pandemic on plastics use.
3. The effects of the COVID-19
pandemic on plastics use and waste

61
GLOBAL PLASTICS OUTLOOK © OECD 2022
KEY MESSAGES
In 2020, the COVID-19 pandemic and lockdown measures had a significant impact on plastics
production, use and waste. In most sectors, plastics use declined in line with the reduction in
demand and output, especially for large-scale plastics-using sectors such as motor vehicles,
trade and construction. Global plastics use in 2020 is estimated to have declined in 2020 by
around 10 million tonnes (Mt) or 2.2%, which is 4.5% below the pre-COVID projection for 2020.
This reduction is substantially smaller than the decline in overall economic activity, with the
annual global gross domestic product (GDP) growth rate dropping from around +4% in 2019 to
-3.5% in 2020. Consequently, the plastics intensity of the economy increased on average
despite the pandemic.
In some sectors, especially healthcare, plastics use increased significantly – for instance for
face masks and other personal protective equipment. Plastics use for face masks and other
personal protective equipment is estimated to be around 300 kilotonnes, i.e. less than 0.1% of
total plastics use in 2020, or a few percent of the overall impact of the pandemic on plastics use.
In other sectors, the nature of economic activity changed, for instance from eating in restaurants
to take-away, and from in-store shopping to online retail (e-commerce). The net effects of such
shifts are unclear at the time of writing of this report, but the boosted activities use significant
amounts of single-use plastics. Plastics use declined in industrial sectors, with plastics use in
construction and motor vehicles, respectively, estimated to have declined by 4.6 and 2.6 Mt
from 2019 levels.
The pandemic has also resulted in significant disruptions to plastics recycling. This is due to the
temporary halting of separate collection in some municipalities, a temporary shift to single-use
plastics, disruptions to waste plastic trade, as well as a temporary loss of competitiveness of
recycled plastics linked to the low price of oil and resulting low prices for primary plastics.
Plastics waste has been affected by the pandemic in the short run by a switch to single-use
plastics and a switch from industrial and commercial waste to household waste. In 2020, while
total plastic waste may have remained roughly stable, municipal plastic waste most likely
increased, although robust information is not yet available. However, a significant portion of the
effects on plastic waste will be delayed to future years due to the long lifespan of many plastics
uses.
The increase in the use of protective personal equipment and single-use plastics has
exacerbated plastic littering on land and in marine environments, with negative environmental
consequences. While OECD countries are more likely to spend additional funds to collect litter
from cities, non-OECD countries face the risk of plastic litter on land infiltrating the environment.
3.1. The Covid-19 pandemic has disrupted the economy and the use of plastics
The coronavirus that is the cause of an infectious disease known as COVID-19, first discovered in Wuhan
in the People’s Republic of China in December 2019, spread to other countries and continents in less than
a few months and triggered a global health pandemic. Governments responded to the emerging crisis with
a range of measures to contain the spread, especially limiting the movement of people and goods and
shutting down economic activity.

62
GLOBAL PLASTICS OUTLOOK © OECD 2022
The COVID-19 pandemic and the associated lockdown measures have led to a significant contraction in
the global economy (OECD, 2021[1]; IMF, 2020[2]). Around the world, economic activity shrank as supply,
demand and trade were suddenly severely disrupted (Dellink et al., 2021[3]). Recovery will be a long-term
process and economic activity will likely be affected even after the health crisis is over.1
The COVID-19 pandemic has also highlighted the importance of plastics in our daily lives. Given their
properties, plastics are particularly well-suited for personal protective equipment (PPE) such as surgical
face masks, single-use medical tools and packaging. Plastics are lightweight; can be resistant to external
shocks, contamination and moisture; can be flexible; and offer various degrees of opacity. For instance,
polyvinyl chloride (PVC) offers the durability required for surgical gloves (Hamann, Sullivan and Wright,
2014[4]). Another example is polypropylene (PP) which is largely used in food packaging as it is resistant
to external influences and has a high melting point, making it suitable for microwavable containers (Marsh
and Bugusu, 2007[5]). Plastics are also often less expensive to manufacture than alternatives, such as
aluminium, and also cheaper to transport than heavier materials such as glass (Marsh and Bugusu,
2007[5]). Finally, single-use plastic items such as face masks and medical tools can reduce the potential
spread of diseases and viruses effectively, as long as they are disposed of in a sanitary manner.
The use of plastics is also ubiquitous in sectors that were negatively affected by the pandemic, such as
transport and construction – each accounting for more than 10% of annual plastic use before the COVID-19
pandemic. Meanwhile, sectors such as retail and food services saw a significant shift away from in-store
shopping and restaurants towards e-commerce, take-away and food delivery, with mixed effects on
plastics use. Thus, because plastics are used in different applications by many sectors, the overall effect
of the COVID-19 pandemic on plastics use in 2020 remains unclear. Effects should become clearer when
new evidence and data on plastics use in the different applications and sectors becomes available over
time. Annex B presents a summary of the main assumptions behind the modelling of the COVID-19
impacts in this report and the associated key economic impacts in 2020.
3.2. The pandemic’s impact on plastics production varies by use and sector
Plastics production was temporarily disrupted
Disruptions in supply chains due to lockdowns and border restrictions reduced plastics production overall.
Plastics Europe (2021[6]) estimates that worldwide plastics production decreased by 0.3% in 2020
compared to 2019. However, low oil prices at the early stage of the pandemic may have boosted production
– especially of primary plastics – by reducing the cost of raw materials (IEA, 2020[7]; US Bureau of Labor
Statistics, 2020[8]). By contrast, low oil prices imply that the growth of secondary (recycled) plastics stalled
in 2020, as the price of secondary plastics is linked to that of primary.
There are also big regional differences in the economic effects of the pandemic, and lockdown measures
varied widely across countries. Thus, the changes in plastics production varied across countries. In the
United States, production of plastic and rubber products fell drastically in March and April 2020, but almost
returned to pre-COVID levels at the end of the year. The result was a 7.5% annual decline in production
in 2020 compared to the previous year (US Board of Governors of the Federal Reserve System, 2021[9]).
European plastics production declined the most during the months of April and May, leading to an annual
production volume decline of 4.5% in 2020 compared to the previous year (Eurostat, 2021[10]). The Japan
Plastics Industry Federation (2021[11]) reports that annual plastics production decreased by 4.1% in 2020
in Japan. By contrast, Plastics Europe (2021[6]) reports that on a yearly basis, China slightly increased its
annual plastics production in 2020; this reflected both the active government response and the faster
recovery of the Chinese economy in comparison to most other countries in the second half of 2020 (OECD,
2021[1]). Given the contractions in other countries, this implied an increase in China’s global market share.

63
GLOBAL PLASTICS OUTLOOK © OECD 2022
The disruptions to economic activity in 2020 were widespread and covered all economic sectors, either
directly or indirectly. Generally, reduced production also implied the reduced use of plastics as an input. In
some sectors, plastics are a major share of production inputs, and thus the effects on plastics use were
significant, and generally negative. This section briefly presents a few examples of uses and sectors that
were significantly affected.
Plastics use for health purposes increased significantly
Plastics use for health purposes increased significantly
The health-related advantages of plastics were put under the spotlight as the COVID-19 pandemic
unfolded (Box 3.1). They are used for a variety of sanitary and medical applications and have thus
contributed immensely to the healthcare sector and public health safety. In order to limit the spread of the
virus, governments across the world mandated the use of face masks in closed spaces, such as in
transport, and often in open air spaces too (Patrício Silva et al., 2020[12]).
Box 3.1. Which polymers are used for personal protective equipment, medical devices and COVID-19 tests?
The production of PPE requires a number of polymers as feedstock. Face masks, which include
N95 respirators and surgical masks, are commonly made from PP, while the masks’ nose wire is made
out of polyethylene (PE) (Institute of Medicine, 2006[13]). Surgical gloves are commonly made from
rubber or durable plastics such as PVC (Hamann, Sullivan and Wright, 2014[4]); face shields are often
made up of polycarbonate (PC), propionate, acetate, PVC or polyethylene terephthalate glycol; and
straps holding masks and goggles in place are made out of rubber or polyetherimide (Henneberry,
2021[14]).
Similarly, medical applications need a range of polymers; a number of medical instruments that were
traditionally made of steel, ceramic or glass have gradually been replaced with plastics in recent
decades (Joseph et al., 2021[15]). PVC is the most commonly used plastic polymer in medical devices,
accounting for 25% of medical plastics use (McKeen, 2014[16]) In addition to face masks and surgical
gloves, it is used for example, in intravenous bags, drug solutions, and for many medical produces that
require tubing (e.g. infusion, injection, respiration) (Oral, Kurtz and Muratoglu, 2017[17]). Another 50%
of medical plastics demand is covered by a mix of PE, PP and polystyrene (PS) (Basmage and Hashmi,
2020[18]). PE is typically used in containers, packaging films and joint replacements; PP in syringes,
sutures and gowns; while PS is used for diagnostic instruments, disposable laboratory ware and
pipettes, for example (Basmage and Hashmi, 2020[18]).
Finally, COVID-19 tests mostly require PP (around 90%), in addition to polyester (8%) and PE (2%)
(Celis et al., 2021[19]).
Early on in the pandemic, the spike in demand for face masks was very sudden and caused a dramatic
shortage in the supply of masks worldwide (OECD, 2020[20]). Prior to the pandemic, China was responsible
for half of global face mask production. It increased its share in global production in the early months of
2020 due to a surge in global demand that could not be met by other countries (Subramanian, 2020[21]).
Plastic manufacturers in China were reportedly producing 110 million surgical masks per day at the end of
February – 12 times the volume in January (Ren, 2020[22]). By the end of April, 200 million surgical masks
were being produced daily (SCIO, 2020[23]). This corresponds to a monthly production of approximately
33 to 42 kilotonnes (kt) of face masks for the first quarter of 2020.

64
GLOBAL PLASTICS OUTLOOK © OECD 2022
In Thailand, it was reported in April 2020 that 1.5 million face masks were being used every day (National
News Bureau of Thailand, 2020[24]). Japan secured the supply of 600 million face masks just for the month
of April (METI, 2020[25]). In Bangladesh in March, which marked the first month of their lockdown,
455 million face masks and 1.2 billion gloves were used in total, corresponding to 1.6 and 3 kt of disposable
plastics use respectively (ESDO, 2020[26]). To estimate the volume of face masks used in the European
Union (EU), the European Environment Agency (EEA) uses data on the net import of PPE into the EU as
a proxy for use in the early stage of the pandemic, when European production capacity was severely
limited. Based on this, the EEA estimated that 170 kt of additional face masks and 105 kt of additional
gloves (not only plastics but also synthetic rubber) were imported between April and September 2020
(compared to business-as-usual projections) (Graulich et al., 2021[27]).
Demand for PPE has been strong throughout the COVID-19 pandemic and although there has been some
shift towards cloth masks, demand for plastic face masks remains much higher than before the pandemic.
Aside from the regional and anecdotal evidence reported above, robust data on the number of face masks
produced and discarded globally in 2020 are not yet available. An often-cited early estimate is presented
by Prata et al. (2020[28]), who extrapolate from a local context in heavily hit Italy to a global use of 129 billion
face masks per month. This would equate to more than one trillion masks for the year 2020. This reflects
the hypothetical demand for face masks that would be needed for optimal protection, but does not consider
whether supply could be increased rapidly enough to meet this demand. Using better data and taking into
account supply restrictions, more recent estimates suggest more moderate numbers, such as global
production of 52 billion face masks in 2020 (Arizton Advisory and Intelligence, 2020[29]). Box 3.2 uses a
quick-and-dirty approximation to check the validity of this estimate.
Taking an average weight of 2.7 grams per surgical mask (Graulich et al., 2021[27]), this amounts to 140 kt
of plastics use. However, this is a conservative estimate since other face masks such as N95 respirators
weigh more. To account for this and for the fact that the estimate of 52 billion masks seems conservative,
a reasonable approximation is to double that weight to 280 kt. Finally, it was estimated that 12 kt of plastic
residues from PT-PCR diagnostic tests were generated by August 2020 worldwide (Celis et al., 2021[19]);
a rough estimate for 2020 is 20 kt. Thus, plastics use for PPE has clearly increased in 2020 compared to
earlier years: total additional plastics use for PPE purposes is estimated to equal around 300 kt.
Box 3.2. Tens of billions of face masks are likely to have been produced in 2020
China produced 9 million face masks per day in January, 110 million in February (Ren, 2020[22]) and
200 million by the end of April (SCIO, 2020[23]). Using the very bold assumption that production after
April remained constant, total production for 2020 in China is estimated at 63 billion masks. In 2019,
China represented around 50% of the global market (Bown, 2020[30]; Subramanian, 2020[21]), but it is
clear that its market share went up considerably in 2020 (Section 3.2.1). Adopting a rough estimate of
75% global market share, global production would be estimated at 85 billion masks; at a constant 50%
share the estimate becomes 126 billion masks. Thus, the estimate of 52 billion masks cited above
seems conservative, but of the right order of magnitude.
Source: Own calculations based on data from Ren (2020[22]), SCIO (2020[23]) and Subramanian (2020[21]).
Plastics use for packaging shifted across sectors
In normal circumstances, almost one-third of global annual plastics use can be attributed to packaging
(Chapter 2). The COVID-19 pandemic had mixed effects on the demand for packaging in the year 2020.
On the one hand, the shift towards take-away, food delivery and e-commerce increased demand for plastic
packaging. The demand for hygiene products, including disinfectant gel – which mostly comes in plastic

65
GLOBAL PLASTICS OUTLOOK © OECD 2022
packaging – also increased. On the other hand, the closure of shops and workplaces and other limitations
to economic activity translated into reduced demand for packaging.
Graulich et al. (2021[27]) report that EU production of plastic packaging declined rapidly at the beginning of
the pandemic, but picked up later in October as restrictions were lifted by many countries. The result was
a reduction of 227 kt between April and October 2020 on the pre-COVID trend (Figure 3.1). This reflects
roughly 1.5% of total use of packaging plastics in the European Union. Plastics Europe (2021[6]) suggests
a somewhat larger drop in packaging plastics use, estimating that almost 500 kt fewer plastics were used
in Europe’s packaging sector in 2020 – just over a 2.5% decrease. The reduction is attributed to lower
production levels in sectors that demand packaging plastics, which significantly reduced the market of
commercial and industrial packaging. The Italian National consortium for the Collection and Recycling of
Plastic Packages (COREPLA) reports that in Italy plastic packaging use was 5% lower than 2019 levels in
terms of weight (COREPLA, 2021[31]).2
Figure 3.1. Production of plastic packaging in the European Union temporarily dropped
Tonnes
Note: The deviations represent short-term fluctuations from a long-term trend. These fluctuations were exacerbated from April 2020 by COVID-19
in Europe.
Source: Own elaboration based on Graulich et al. (2021[27]), “Impact of Covid-19 on single-use plastics and the environment in Europe”.
While plastic packaging production declined overall, the use of plastics for packaging in online sales
(e-commerce) increased substantially in 2020. Preliminary calculations by Graulich et al. (2021[27]) indicate
that e-commerce used an additional 11.5 to 17.5 kt of plastics in the European Union compared to
business-as-usual expectations. In China, where a relatively large share of consumer spending is
conducted online, online sales of consumer goods increased by 14.8% in 2020 compared to 2019. By
contrast, total retail sales of consumer goods decreased by 4.1% in 2020 (National Bureau of Statistics of
China, 2021[32]).
Food packaging was a source of additional plastics use in 2020 as well, as take-away and e-commerce
use significantly more single-use plastics than restaurant visits. Indeed, an increase of around 15% has
been estimated in the demand for food delivery services and in the associated plastics use and waste

66
GLOBAL PLASTICS OUTLOOK © OECD 2022
(Oliveira et al., 2021[33]). However, the decline in food packaging for shops and restaurants, which in normal
years tends to reflect a substantially larger share of the total food market, mitigates this.
Finally, there were some incentives – and in some cases even regulations (Section 3.3.3) – to switch to
single-use plastics as a perceived safer alternative to reusable bags that can be washed. For instance, the
Governor of New Hampshire issued a health order requiring stores to use single-use bags (paper or plastic)
(Tabuchi, 2020[34]). The evidence to support this push from a public health perspective is, however, weak
(Laubinger and Varghese, 2020[35]).
This anecdotal evidence suggests that while there was a visible increase in some uses of packaging
plastics, notably related to e-commerce and food delivery services, there were reductions in the use of
packaging plastics throughout the economy in sectors whose production was disrupted. Thus, although
the net effect of the COVID-19 pandemic and lockdown measures on plastics use for packaging in 2020
is unclear, it is unlikely to be large.
The temporary halt to construction had a large effect on plastics demand
The construction sector uses around one-sixth of all plastics globally (Chapter 2). In many countries,
construction activities were shut down for several months to avoid health risks. There were important
differences between countries: while for instance in Germany construction activities continued almost
unhindered during the first wave of the pandemic, many other European countries severely limited
construction activities, including France, Ireland, Italy and Spain, leading to a total reduction of more than
25% in construction activities in Europe during the second quarter of 2020 (de Vet, Nigohosyan and Nunez
Ferrer, 2021[36]).
Quantitative information on the size of the effect of the pandemic on plastics use in construction is largely
lacking, but the reduction in demand for all polymers that are commonly used in construction is estimated
to be significant (Zhou Peng, 2021[37]; S&P Global, 2020[38]). Section 3.4.1 below quantifies the effect of
the pandemic and lockdown measures on plastics demand in construction.
It is important to note that the effect on construction is likely to be short-lived: a large role is foreseen for
the construction sector in the recovery from the pandemic, and it is likely that this will be accompanied by
a corresponding surge in plastics use for construction (Section 3.5). This will be explored further in the
projections of future plastics use in Volume 2 of the Global Plastics Outlook (OECD, forthcoming[39]).
Shrinking demand for vehicles also drove down plastics demand
The demand for plastics by the motor vehicles sector was directly impacted by lower demand for cars and
supply chain disruptions. The European Automobile Manufacturers Association (2021[40]) reports that the
number of cars sold globally fell by more than 15% in 2020, compared to 2019. The decline was more
significant in Europe (-21%) than in Russia (-8%) or China (-7%) for example. North American car sales
fell in the three first quarters of 2020, but rebounded slightly in the fourth quarter, resulting in an overall
sales decline of 18% on 2019 levels. Car sales contracted the most in South America (-29%), primarily
due to the large number of COVID-19 cases and severity of lockdowns.
More than ten different plastic polymers are used to make a vehicle on average. This adds up to more than
100 kilogrammes for an average vehicle, with PP accounting for more than one-quarter (Patil, Patel and
Purohit, 2017[41]). Thus, the significant reduction in the sale of motor vehicles had a significant downward
effect on global plastics use, as shown in Section 3.4.1 below.
The synthetic fibres and textiles sectors were disrupted
The clothing sector was heavily hit by the COVID-19 pandemic as many retail outlets were forced to close
their doors when lockdowns were implemented in many countries. Moreover, there were multiple factory

67
GLOBAL PLASTICS OUTLOOK © OECD 2022
closures and supply chain disruptions in Asia, where the largest producers and exporters in the textile
industry are located (Sabanoglu, 2020[42]). Martin et al. (2020[43]) report that global production of polyester
fibres decreased by almost 9% in 2020 compared to the year before, whereas IHS Markit estimates that
polyester fibre production contracted by 1.2% in 2020, corresponding to around 500-750 kt (Clark, 2021[44];
IHS Markit, 2020[45]).
Cloth masks and other uses of textiles and synthetic fibres for PPE have increased demand for plastics,
specifically PP fibres. Nonetheless, the overall effect on the synthetic fibres and textiles sectors is
estimated to have been negative in 2020 (Martin et al., 2020[43]).
3.3. Effects on plastic waste and recycling are not clear cut
Reductions in industrial and commercial plastic waste were compensated for by increases in household
plastic waste. Even before the pandemic, 77 million tonnes (Mt) of plastic waste were being mismanaged
annually (Chapter 2). COVID-19 contributed further to the challenge of managing municipal waste properly,
especially in developing countries where resources and infrastructure are largely lacking (Das et al.,
2021[46]; AIT/UNEP, 2021[47]). Many countries faced significantly increased physical and financial
challenges in managing their solid waste. Rural regions were more affected than urban regions, as waste
treatment facilities are not evenly distributed and tend to be located near populated areas (IGES, 2020[48]).
New logistical considerations due to the shift in the origin and composition of waste, additional
requirements for performing sanitation activities and increased spending on protective gear all contributed
to these challenges (AIT/UNEP, 2021[47]). Furthermore, many waste treatment facilities were temporarily
shut down (AIT/UNEP, 2021[47]). There was a significant increase in uncontrolled landfilling and local
burning strategies, for example in India, which also reflected an attempt to prevent virus contagion (Patrício
Silva et al., 2020[12]). Illegal dumping of municipal solid waste was also recorded in OECD countries, such
as Australia, Belgium, Ireland, the Netherlands, and the United Kingdom (AIT/UNEP, 2021[47]). Many cities,
however, continued to guarantee solid waste collection, even if not necessarily separated by type of waste
(OECD, 2020[49]). Overall, a larger share than usual of plastic waste was incinerated or landfilled rather
than recovered.
Anecdotal evidence presented below suggests that municipal plastic waste increased in 2020, due to
changes in consumer behaviour. Moreover, there is evidence of an alteration of the composition of
municipal solid waste, reflecting larger shares of single-use plastics and – unsurprisingly – PPE (Yousefi
et al., 2021[50]). These increases are, however, mitigated by decreases in municipal plastic waste from
commercial activities such as accommodation and food services, as many businesses were shut down at
least temporarily. The net effect on municipal waste generation in 2020 is therefore not clear but likely
relatively small (AIT/UNEP, 2021[47]).
In Bangkok, municipal solid waste declined by 12% during the lockdown while household plastic waste
increased by 62% (Promchertoo, 2020[51]). Households in Singapore and Hong Kong, China, were also
recorded to have increased their plastic waste generation, mainly due to takeaway and online food delivery,
with single-use plastics from take-aways more than doubling in Hong Kong, China, in April 2020 compared
to 2019, for example (CGTN, 2020[52]; NUS, 2020[53]). Although no specific data on plastics are available,
households in New York and Ireland also increased their waste generation by 21% and 3.3% respectively
(RWMO, 2020[54]; Staub, 2020[55]). Finally, in Kobe, a Japanese city, household plastic waste increased by
10.3% (AIT/UNEP, 2021[47]).
Reduced industrial activity is likely to have decreased industrial plastic waste generation in 2020
(Section 3.4.2). While there is no robust evidence yet that the combined decline in industrial and
commercial waste outweighed the increase in household waste, if their waste streams declined in line with
their production levels, the decrease could be substantial. The reported increase in municipal waste is not
sufficient evidence, as many industrial waste streams are collected separately to municipal solid waste.

68
GLOBAL PLASTICS OUTLOOK © OECD 2022
The nature of medical waste, including PPE waste, changed drastically: before 2020, most PPE was used
in controlled medical facilities, which tend to have strict waste management protocols. But from 2020, a
large volume of PPE, and especially face masks, was used by individuals in public settings and ended up
as household waste. Some countries recommended double-bagging potentially infectious waste, which
may also have led to additional plastics use (IGES, 2020[48]).
Most health facilities incinerate medical waste to ensure that pathogens do not spread further (Ghodrat,
Rashidi and Samali, 2017[56]; Joseph et al., 2021[15]). This practice has been further strengthened during
the pandemic (AIT/UNEP, 2021[47]; Peng et al., 2020[57]). Medical waste in Wuhan, China, amounted to
110 to 150 tonnes per day in mid-February, and increased to 247 tonnes as the number of cases
worsened. The government of Wuhan was able to face the surge in medical plastic waste to some extent
by building a waste management facility with a capacity of 30 tonnes per day in less than two weeks (Wei,
2020[58]). In a review of five hospitals in Iran, it was found that medical waste more than doubled compared
to pre-COVID levels (Kalantary et al., 2021[59]). Medical waste generation in India averaged 163 tonnes in
the second half of 2020, peaking in September (at 183 tonnes) when the number of cases significantly
increased (Central Pollution Control Board, 2021[60]). In Manila, Jakarta, Bangkok, Ha Noi and Kuala
Lumpur, medical waste was reported to be six times higher in the first quarter of 2020 than pre-COVID
levels (ADB, 2020[61]). On the other hand, medical waste in New York was found to have declined in the
first five months of 2020. This could have been partly due to the supply shortage of PPE and the halting of
non-COVID related medical procedures; it could also reflect the fact that much of the used household and
hospital PPE was not labelled as medical waste (Wei, 2020[58]).
Plastics littering worsened
Littering of disposable PPE items, particularly face masks, gloves and cleaning wipes, increased in many
countries almost immediately after governments started recommending their use – around March 2020 in
many countries (Prata et al., 2020[28]; Roberts et al., 2021[62]). It seems likely that this increased stream of
littered PPE plastics continued in 2021 and will do so for much longer. This loss of plastics to the
environment causes a number of environmental and economic problems, as discussed in Chapter 2.
Reports and news articles describing the littering of PPE in coastal environments began accumulating
early on in the pandemic and increased throughout 2020 (e.g. (BBC News, 2020[63]; Bondaroff and Cooke,
2020[64]; Chapman and Bomford, 2020[65]). Bondaroff and Cooke (2020[64]) document the large numbers of
face masks and gloves that have littered beaches across Asia, even those that are remote. For instance,
on the small beach of Tai A Chau in the Soko Islands in Hong Kong, China, a marine conservation
organisation found 70 masks spread along a short 100-metre stretch as early as February 2020. The
composition of litter has also changed with the advent of health concerns. In two rivers in Indonesia,
approximately 15% of littered items that were collected between March and April 2020 were PPE items
(Cordova et al., 2021[66]).
Bondaroff and Cooke (2020[64]) estimate that in 2020 1.56 billion face masks entered the ocean
(corresponding to a 3% leakage assumption except for masks used in controlled medical facilities which
have lower leakage rates), resulting in 5 to 6 kt of marine plastic leakage. A higher value was reported by
Chowdhury et al. (2021[67]) who find that 150 to 390 kt may enter global oceans by the end of 2021.3 While
both values are small compared to the estimated 22 Mt of total leakage of plastics to the environment in
2019 in Chapter 2 of this report, littering as a direct result of the pandemic adds to the existing issues of
environmental pollution.
Leakage does not only occur in marine environments – it also occurs on land. A recent analysis of land-
based litter as reported by citizens of 11 OECD countries between September 2019 and October 2020
shows that face mask litter especially increased after the official onset of the pandemic. It amounted to
less than 0.01% of total litter in October 2019, but made up 0.80% of total litter a year later (Roberts et al.,

69
GLOBAL PLASTICS OUTLOOK © OECD 2022
2021[62]). While this highlights that face mask littering increased significantly due to COVID-19, it also
indicates that the share of PPE volumes in total littering remains small.
A number of reports highlight PPE littering in cities (BBC News, 2020[68]; Fazio, 2020[69]; Tesfaldet et al.,
2021[70]). This was found to have harmed some urban drainage systems, which were clogged by face
masks and gloves. This increased cleaning and replacement costs for equipment in affected areas and
heightened the risk of flooding and water pollution (Geberemariam, 2021[71]). Face masks and other PPE
litter can also be transported by drainage systems to the marine environment (Fadare and Okoffo, 2020[72]).
One study found that 170 face masks were littered on a 13-km stretch covering three streets in Bangkok
over 42 days of 5 hours of observation per day (Tesfaldet et al., 2021[70]). Another study reported that more
than one-third of 140 50-metre stretches of roads that were inspected in September and October 2020 in
Essex (United Kingdom) contained at least one PPE item, mostly face masks (Chapman and Bomford,
2020[65]). A Canadian study conducted in Toronto reports that on average 1 010 PPE items were found for
every squared kilometre of residential, commercial and hospital districts (Ammendolia et al., 2021[73]).4
While additional littering on land is aesthetically unpleasant, it is less likely to be environmentally harmful
in OECD countries, which are likely to respond by spending more on litter collection, than in non-OECD
countries. In Toronto, for instance, the cleaning costs for managing litter amounted to almost USD 113 500
(CAD 146 614) between March and the end of July 2020, most of which was directly due to the increased
amount of litter (Solid Waste Management Services, 2020[74]).5 In developing countries, however, where
litter may not be collected, this additional littering could lead to environmental degradation.
Plastics recycling was disrupted
Recycling of plastics was affected by the COVID-19 pandemic in various ways. First, disruptions to waste
management, including the reduced collection of separated waste and the reduced trade in waste,
lessened the supply of materials available for recycling (Laubinger and Varghese, 2020[35]).
Second, recycling companies were affected by the restrictions on economic activity. Recycling
programmes were suspended in many regions and informal waste collectors reduced their activities
(GMCA, 2020[75]; Martin et al., 2020[43]). Some cities in the United States suspended recycling programmes
for fear that the virus would spread by the collected items (Zambrano-Monserrate, Ruano and Sanchez-
Alcalde, 2020[76]; Staub, 2020[77]). A survey conducted in the United States indicates that 34% of recycling
companies were partially or completely closed in April 2020 (Toto, 2020[78]). During the lockdown in
Shanghai, centrally located neighbourhoods no longer had the option to separate recyclables (Bloomberg
News, 2020[79]).
Third, the global oil price dropped significantly in the first quarter of 2020 (IEA, 2020[7]; US Bureau of Labor
Statistics, 2020[8]). This reduced production costs for primary plastics, and thus the price of plastic products,
while the production costs of secondary plastics were not reduced to the same extent. Although the price
of secondary plastics has historically correlated with that of primary plastics, there is no spot market for
secondary plastics (OECD, 2018[80]) and it is unclear how much the profitability of secondary production
suffered. But it is likely that the competitiveness of the secondary plastics sector deteriorated (Brock,
2020[81]); see also Chapter 4. In Europe, many plastics recyclers temporarily shut down production in 2020
in response to government restrictions and deteriorating market conditions (PRE, 2020[82]).
The oil price picked up later in 2020, which pushed the price of primary plastics back up (IEA, 2020[7]; US
Bureau of Labor Statistics, 2020[8]). At the same time, most governments began to manage lockdown
measures better and in many countries municipalities ensured that separated waste collection was
maintained or restored. This revived the recycling industry, although regional differences remained large.
The overall effect on recycling volumes and the volumes of secondary plastics produced remain unclear,
as there were no robust data available at the time of writing to identify which trend dominated over the
course of the year.

70
GLOBAL PLASTICS OUTLOOK © OECD 2022
Global recycling volumes have not only been influenced by the COVID-19 pandemic – the market has also
been influenced by recent changes in national policies. These include mandatory minimum recycled
content standards (Chapter 6), voluntary commitments by firms, and the broader international policy
context, such as the recent amendments to the Basel Convention and China’s ban on the import of waste
(Chapter 4).
Waste and recycling policies changed temporarily
The government response measures to the COVID-19 pandemic have also affected plastics use and
waste, as well as recycling policies. In the wake of growing sanitary concerns, government actions to
reduce single-use plastic items were delayed in numerous places (Murphy, 2020[83]; Tabuchi, 2020[84]; US
State of Maine, 2020[85]). For instance, India, Portugal, Senegal and multiple states in the United States as
well as certain states and territories in Australia delayed their bans on single-use plastics, while Scotland
and the Netherlands delayed the implementation of deposit-refund schemes (da Costa, 2021[86]). Italy
delayed the implementation of its tax on plastic packaging several times; it is currently planned to take
effect in 2023 (Zecchini, 2021[87]). Several local and national governments have now proceeded to
implement these policies. For instance, New York started enforcing its ban on plastic bags in October
2020, after a seven-month delay (Associated Press, 2020[88]). In 2021, Commonwealth, state and territory
environment ministers identified eight single-use plastic products that have to be phased out nationally by
2025 (or sooner in some cases) under the National Waste Policy Action Plan (Government of Australia,
2021[89]; ACT Government, 2021[90]; Government of South Australia, 2021[91]). And despite pressure on the
EU to delay the implementation of its plastics tax, it went ahead as scheduled in July 2021 (EC, 2021[92];
Simon, 2020[93]).
As a response to the increase in illegal dumping in the early months of the pandemic, the Irish Government
provided EUR 1 million of additional funding to support efforts to tackle this issue (Government of Ireland,
2020[94]).
Recycling policies were also affected by the pandemic. For instance, Fort Collins, a municipality in
Colorado, temporarily put on hold plans to start a “community recycling ordinance” which would require
that recycling services be provided by trash haulers to most multi-family and commercial properties by the
end of 2020; it finally entered into force in July 2021 (City of Fort Collins, 2021[95]; Staub, 2020[96]). Because
of social distancing recommendations from local governments, some recycling centres reduced their
activity or even temporarily closed in the early months of the pandemic (Staub, 2020[77]). Moreover, as
some cities were experiencing collection delays due to the impacts of COVID-19 on the workforce, garbage
collection was prioritised over recycling (Staub, 2020[77]). Finally, waste pickers and other informal waste
workers were also affected by COVID-19 containment measures (Sarkodie and Owusu, 2020[97]).
Laubinger and Varghese (2020[35]) warned early on that the initially temporary reversal or halting of some
of the policy measures to reduce plastics use and waste could become permanent. This would hold back
the smooth transition towards a more resource-efficient, circular economy.
3.4. OECD modelling suggests COVID-19 on balance reduced plastics use in 2020
The anecdotal and partial evidence presented above is insufficient to assess the overall effect of the
COVID-19 pandemic and associated government response measures on global plastics use. Beyond the
selected plastics applications where a direct effect occurred, there are indirect effects on plastics use that
are driven by changes in economic activity and household consumption and by linkages between sectors.
Many sectors have reduced their production in response to a lockdown, trade barriers or falling demand,
and these have generally scaled down their plastics use accordingly.
For a complete picture, an economy-wide assessment is needed that connects plastics use to specific
economic activities, and that connects the different sectoral and regional economic activities to each other.

71
GLOBAL PLASTICS OUTLOOK © OECD 2022
As part of this Global Plastics Outlook, the ENV-Linkages modelling framework described in Chateau,
Dellink and Lanzi (2014[98]) has been used for this broad assessment.6 This section presents the results of
that modelling, while Annex B describes the economic impacts assessed in the modelling framework.
These modelling results need to be interpreted with care. First, estimates of economic activity and plastics
use for 2020 are not final at the time of writing, and updates of official statistics can be expected. Second,
the modelling assumes that plastics use by production sectors scales down roughly in proportion to output
changes.7 This excludes shifts in production technology within the sector or shifts between different parts
of the same sector, such as from eating in restaurants to take-away or from shop retail to e-commerce.
Thus, these results are more indicative of the general implications of the economic effects of the pandemic
on plastics use than of detailed use of specific polymers in specific subsectors. Nonetheless, the modelling
assessment captures most of the major trends described in Section 3.2 and emphasises that indirect
effects may be more important than the very visible direct effects for relatively small applications.
Plastics use declined in 2020, but less than economic activity
At the global level, the reduced scale of economic activity dominates the increased demand for specific
plastic applications that were outlined above. Our modelling estimates that global plastics use declined by
2.2% from 2019 levels, or 4.5% below the pre-COVID projection for 2020 (Figure 3.2 and Figure 3.3). That
is a drop of around 10 Mt from 2019 levels. Given that global GDP declined by almost 3.5% below 2019
levels (6.5% below the pre-COVID projection), the plastics intensity of the global economy actually
increased. This contrasts with the recent declining trend in the plastics intensity of the economy:
i.e. between 2015 and 2019 the growth in global plastics use was smaller than the growth in global GDP.
Some regions have seen a larger economic downturn than others, and this is reflected in their regional
plastics use (Figure 3.2). For example, the Indian economy shrunk by 6% in 2020 (13% below the pre-
COVID projection), leading to a reduction in plastics use of around 12.9% compared to the pre-COVID
projection. This is equivalent to a 7% drop in 2020 compared to 2019, or 1.9 Mt.

72
GLOBAL PLASTICS OUTLOOK © OECD 2022
Figure 3.2. Global plastics use declined by more than 10 Mt in 2020, affecting almost all regions
Regional plastics use in 2020 compared to 2019 and the pre-COVID 2020 projection
Note: The change in plastics use between 2019 and 2020 is indicated in brackets.
Source: OECD Global Plastics Outlook Database, Dellink et al. (2021[3]).
StatLink 2 https://stat.link/4e89qc
Regional changes in plastics use in 2020 are also determined by the structure of the economy, which
varies significantly across regions. Countries that specialise in sectors that use large volumes of plastics,
not least India and the Non-OECD Europe region, will have larger reductions in plastics use, just as
countries that specialise in sectors that are most severely hit by the pandemic tend to have larger
reductions in economic activity. Reductions in plastics use are smaller than GDP losses in many countries,
especially those in the EU (-3% versus -8% when compared to the pre-COVID projection) and in the OECD
Latin America region (-2% versus -9%). This reflects the fact that the substantial economic costs in these
regions are largely caused by disruptions to sectors that do not use a lot of plastics.

73
GLOBAL PLASTICS OUTLOOK © OECD 2022
Figure 3.3. Global plastics use declined by more than 10 Mt in 2020, affecting almost all sectors
Sectoral plastics use in 2020 compared to 2019 and the pre-COVID 2020 projection
Note: Direct effects of consumption changes other than human health (including PPE) as discussed in Section 3.2.2 are not included in these
calculations due to lack of robust global data. The change in plastics use between 2019 and 2020 is indicated in brackets.
Source: OECD Global Plastics Outlook Database , Dellink et al. (2021[3]).
StatLink 2 https://stat.link/gr3e8a
Sectoral plastics use declined overall, except in health-related sectors
In line with the anecdotal evidence presented in Section 3.2, the impacts of the pandemic and lockdown
measures on plastics use differ widely across sectors (Figure 3.3). Plastics use for food products is
estimated to have remained roughly unchanged from 2019 (less than 200 kt) and declined by only a few
percent below the pre-COVID projected levels for 2020. As explained above, the lockdown measures
primarily affected the way in which food was consumed, rather than the overall volume of food
consumption. Nonetheless, home delivery and take-away may have made this sector more intensive in its
use of specific plastic polymers, something which could not be accounted for in this calculation as robust
data are not (yet) available.
The big negative impact of the lockdown measures on construction activity and motor vehicles demand
has led to a reduction in plastics use in these sectors by around 4.6 Mt and 2.6 Mt, respectively, according
to the model simulations, compared to 2019 levels. This is driven by the substantial production declines in
these sectors. Each of these sectors accounts for more than 10% of total plastics use, and together with
74
GLOBAL PLASTICS OUTLOOK © OECD 2022
food products, textiles and wholesale and retail trade, these reductions largely drive the total effects of the
pandemic on plastics use.
Plastics use in the plastics and rubber production sector itself, and in the chemical sector, remain roughly
unchanged from 2019 levels, which equates to a reduction of 3% from the pre-COVID projection. This is
driven by the reduced demand for plastics products in other sectors.
Pharmaceuticals is the only sector for which the model simulates a significant increase in plastics use. The
pandemic increased demand for pharmaceutical products, including vaccines and other medicaments.
However, total plastics use in this sector remains below 2 Mt globally, and thus this increase is relatively
minor in absolute terms (around 200 kt).
According to the simulations, plastics use in the human health and social work sector (which includes the
medical sector) increased by 33% above the pre-COVID baseline projection for 2020 and 37% above 2019
levels. This can be almost completely attributed to the direct effect of PPE use in the health sector, such
as face masks and gloves, roughly estimated at around 300 kilotonnes (Section 3.2.2). However, while
this is large at the sectoral level, in absolute terms it is small in comparison to the changes in other sectors.
Plastic waste may have remained stable in the short run despite the switch to
single-use plastics
The changes in plastics use discussed above will affect volumes of plastics waste for a long time. In the
short run, much of the new or increased types of plastics use, such as for PPE, are single-use and have a
short lifespan. Much of this additional plastic has already been discarded or will be very shortly. In contrast,
the lifespans of plastics used in sectors seeing the most severely reduced demand, such as vehicle
manufacture, is often significantly longer. Furthermore, packaging material used in e.g. wholesale and
retail trade also declined, whereas packaging materials for take-away and e-commerce increased. Thus,
although in 2020 total plastic waste may have remained roughly stable (although robust information is not
yet available), the reduced plastics use in consumer products and motor vehicles, and especially in
construction, is only likely to reduce plastics waste volumes years from now. This could change, however,
if recovery from the pandemic implies a significant boost in construction and durable goods. These longer-
term projections will be explored in more detail in Volume 2 of the Global Plastics Outlook (OECD,
forthcoming[39]).
3.5. The longer-term implications of the COVID-19 pandemic remain unclear
Despite worries over the continued spread of COVID-19 for human health, and prolonged measures that
restrict economic activity, economic activity in 2021 was significantly up from 2020 levels (OECD, 2021[1]).
With a rebounding economy, plastics use is also projected to pick up again. But there are big variations in
how fast different sectors and countries will recover (Dellink et al., 2021[3]), and there is considerable
uncertainty around how the pandemic, economic activity and plastics use will evolve.
One major uncertainty that is directly relevant for plastics use and waste is the size of government recovery
packages and the extent to which they are green. For instance, if there is large-scale investment in
infrastructure boosted by these recovery packages, this will drive fast growth in construction activity, with
an associated increase in plastics use as this sector accounts for more than 10% of total plastics use. If
recovery packages are aimed at accelerating the transition towards a more resource-efficient and circular
economy (OECD, 2021[99]), fast economic recovery does not need to imply a fast increase in plastics use.
Instead, recycling and secondary use of plastics could be spearheaded, and the plastics intensity of the
economy could be reduced.
Another key uncertainty is whether behavioural changes that emerged during the lockdown periods will
become permanent, or whether things will “go back to normal”. It remains to be seen whether the fast
growth in e-commerce will continue, and whether it increases short-lived plastics use for packaging. That

75
GLOBAL PLASTICS OUTLOOK © OECD 2022
face masks and other PPE will continue to be used in the coming years is perhaps a little less uncertain,
but the amount of littered plastics resulting from this depends on how the pandemic evolves as well as on
whether behavioural changes turn out to be permanent or temporary.
The backward-looking exercise in this chapter sheds light on how interactions in the economic system are
crucial for a broad assessment of the implications of COVID-19 on plastics use. It has highlighted a
widespread reduction in plastics use in 2020 in many economic sectors, but increases in selected
applications and a shift towards more single-use plastics. Forward-looking analysis, as envisaged in
Volume 2 of the Global Plastics Outlook (OECD, forthcoming[39]), will be able to shed light on the longer-
term consequences.
References
ACEA (2021), Economic and Market Report: EU Automotive Industry Full-year 2020, European
Automobile Manufacturers Association,
https://www.acea.auto/files/Economic_and_Market_Report_full-year_2020.pdf.
[40]
ACT Government (2021), https://www.cityservices.act.gov.au/recycling-and-waste/single-use-
plastics.
[90]
ADB (2020), Managing Infectious Medical Waste during the COVID-19 Pandemic,
https://www.adb.org/publications/managing-medical-waste-covid19.
[61]
AIT/UNEP (2021), Covid-19 & Plastic Plight: a Reflection from One Year of the Pandemic,
http://www.circular-economy.ait.ac.th/downloads/COVID-
19%20&%20Plastic%20Plight%20Report.pdf.
[47]
Ammendolia, J. et al. (2021), “An emerging source of plastic pollution: Environmental presence
of plastic personal protective equipment (PPE) debris related to COVID-19 in a metropolitan
city”, Environmental Pollution, Vol. 269, p. 116160,
http://dx.doi.org/10.1016/j.envpol.2020.116160.
[73]
Arizton Advisory and Intelligence (2020), Medical Face Mask Market - Global Outlook and
Forecast 2020-2025, Market Research.com, https://www.marketresearch.com/Arizton-
v4150/Medical-Face-Mask-Global-Outlook-13345767/.
[29]
Associated Press (2020), Plastic Bag Ban Starts in New York After Months of Delay, Associated
Press, https://apnews.com/article/business-new-york-75d5e594b0090ae7263efc70f8a33f5b.
[88]
Basmage, O. and M. Hashmi (2020), “Plastic Products in Hospitals and Healthcare Systems”, in
Encyclopedia of Renewable and Sustainable Materials, Elsevier,
http://dx.doi.org/10.1016/b978-0-12-803581-8.11303-7.
[18]
BBC News (2020), Coronavirus: Discarded disposable gloves on the street, BBC News,
https://www.bbc.com/news/in-pictures-52188627.
[68]
BBC News (2020), Coronavirus: French alarm at Covid-linked Med pollution, BBC News,
https://www.bbc.com/news/world-europe-52807526.
[63]
Bloomberg News (2020), China’s War on Garbage Faces a Major Coronavirus Setback,
Bloomberg Quint, https://www.bloombergquint.com/business/china-s-war-on-garbage-faces-
a-major-coronavirus-setback.
[79]

76
GLOBAL PLASTICS OUTLOOK © OECD 2022
Bondaroff, T. and S. Cooke (2020), Masks on the Beach: The Impact of COVID-19 on Marine
Plastic Pollution, OceansAsia, https://oceansasia.org/wp-content/uploads/2020/12/Marine-
Plastic-Pollution-FINAL.pdf.
[64]
Bown, C. (2020), COVID-19: China’s exports of medical supplies provide a ray of hope, Peterson
Institute for International Economics, https://www.piie.com/blogs/trade-and-investment-policy-
watch/covid-19-chinas-exports-medical-supplies-provide-ray-hope.
[30]
Brock, J. (2020), A Reuters Special Report: The Plastic Pandemic. Covid-19 trashed the
recycling dream., Reuters, https://www.reuters.com/investigates/special-report/health-
coronavirus-plastic-recycling/.
[81]
Celis, J. et al. (2021), “Plastic residues produced with confirmatory testing for COVID-19:
Classification, quantification, fate, and impacts on human health”, Science of The Total
Environment, Vol. 760, p. 144167, http://dx.doi.org/10.1016/j.scitotenv.2020.144167.
[19]
Central Pollution Control Board (2021), COVID-19 Waste Management, Ministry of Environment,
Forest and Climate Change. Government of India, https://cpcb.nic.in/covid-waste-
management/.
[60]
CGTN (2020), Hong Kong plastic waste: Food delivery and takeouts bring surge in plastic
pollution, CGTN,
https://news.cgtn.com/news/7a497a4d33514464776c6d636a4e6e62684a4856/index.html.
[52]
Chapman, C. and K. Bomford (2020), Litter in lockdown: A study of litter in the time of
coronavirus, CPRE, https://www.cpre.org.uk/wp-content/uploads/2020/12/Litter-in-lockdown-
full-report-December-2020.pdf.
[65]
Chateau, J., R. Dellink and E. Lanzi (2014), “An Overview of the OECD ENV-Linkages
Model: Version 3”, OECD Environment Working Papers, No. 65, OECD Publishing, Paris,
http://dx.doi.org/10.1787/5jz2qck2b2vd-en.
[98]
Chowdhury, H., T. Chowdhury and S. Sait (2021), “Estimating marine plastic pollution from
COVID-19 face masks in coastal regions”, Marine Pollution Bulletin, Vol. 168, p. 112419,
http://dx.doi.org/10.1016/j.marpolbul.2021.112419.
[67]
City of Fort Collins (2021), Recycling: Recycling & Trash Ordinances,
https://www.fcgov.com/recycling/ordinances.
[95]
Clark, D. (2021), Recovery for the paraxylene industry or temporary reprieve?, IHS Markit,
https://ihsmarkit.com/research-analysis/recovery-for-the-paraxylene-industry-or-temporary-
reprieve.html?ite=997087&ito=1274&itq=3b1f1db2-19e0-4d34-b496-
811584ab7ccb&itx%5Bidio%5D=771816356.
[44]
Cordova, M. et al. (2021), “Unprecedented plastic-made personal protective equipment (PPE)
debris in river outlets into Jakarta Bay during COVID-19 pandemic”, Chemosphere, Vol. 268,
p. 129360, http://dx.doi.org/10.1016/j.chemosphere.2020.129360.
[66]
COREPLA (2021), I risultati 2020 di corepla: raccolta in aumento nonostante l’emergenza
sanitaria (+4%) e dati più omogenei tra le regioni., Consorzio Nazionale Per La Raccolta, Il
Riciclo E Il Recupero Degli Imballaggi In Plastica, https://www.corepla.it/news/i-risultati-2020-
di-corepla-raccolta-aumento-nonostante-l-emergenza-sanitaria-4-e-dati-pi-omoge.
[31]

77
GLOBAL PLASTICS OUTLOOK © OECD 2022
da Costa, J. (2021), “The 2019 global pandemic and plastic pollution prevention measures:
Playing catch-up”, Science of The Total Environment, Vol. 774, p. 145806,
http://dx.doi.org/10.1016/j.scitotenv.2021.145806.
[86]
Das, A. et al. (2021), “COVID-19 and municipal solid waste (MSW) management: a review”,
Environmental Science and Pollution Research 2021 28:23, Vol. 28/23, pp. 28993-29008,
http://dx.doi.org/10.1007/S11356-021-13914-6.
[46]
de Vet, J., D. Nigohosyan and J. Nunez Ferrer (2021), Impacts of the Covid-19 pandemic on EU
industries, European Parliament,
https://www.europarl.europa.eu/RegData/etudes/STUD/2021/662903/IPOL_STU(2021)66290
3_EN.pdf.
[36]
Dellink, R. et al. (2021), “The long-term environmental implications of COVID-19”, OECD
Environment Working Papers, No. 176, OECD Publishing, Paris,
http://dx.doi.org/10.1787/123dfd4f-en.
[3]
EC (2021), Single-use plastics, European Commission,
https://ec.europa.eu/environment/topics/plastics/single-use-plastics_en.
[92]
ESDO (2020), ESDO’s Online Press Briefing on COVID-19 Pandemic Outbreak 14,500 Tons of
Hazardous Plastic Waste in a Month, Environment and Social Development Organization
(ESDO), https://esdo.org/esdos-online-press-briefing-on-hazardous-plastic-waste-generation-
in-a-month-during-covid-19-pandemic/.
[26]
Eurostat (2021), Manufacture of rubber and plastic products, Calendar adjusted data, 2019-
2020, Eurostat.
[10]
Fadare, O. and E. Okoffo (2020), “Covid-19 face masks: A potential source of microplastic fibers
in the environment”, Science of The Total Environment, Vol. 737, p. 140279,
http://dx.doi.org/10.1016/j.scitotenv.2020.140279.
[72]
Fazio, M. (2020), Your Used Mask Needs to Make It to the Trash Can, The New York Times,
https://www.nytimes.com/2020/07/25/climate/covid-masks-discarded.html.
[69]
Geberemariam, T. (2021), “The Potential Indirect Impact of COVID-19 on Urban Drainage
Systems”, Journal of Irrigation and Drainage Engineering, Vol. 147/10, p. 02521001,
http://dx.doi.org/10.1061/(asce)ir.1943-4774.0001606.
[71]
Ghodrat, M., M. Rashidi and B. Samali (2017), “Life Cycle Assessments of Incineration
Treatment for Sharp Medical Waste”, in The Minerals, Metals & Materials Series, Energy
Technology 2017, Springer International Publishing, Cham, http://dx.doi.org/10.1007/978-3-
319-52192-3_14.
[56]
GMCA (2020), All Household Waste Recycling Centres closed from today, Greater Manchester
Combined Authority, https://www.greatermanchester-ca.gov.uk/news/all-household-waste-
recycling-centres-closed-from-today/.
[75]
Government of Australia (2021),
Commonwealth%20Department%20of%20Agriculture,%20Water%20and%20the%20Environ
ment.pdf.
[89]

78
GLOBAL PLASTICS OUTLOOK © OECD 2022
Government of Ireland (2020), Funding ringfenced to tackle illegal dumping during COVID-19,
Department of the Environment, Climate and Communications, https://www.gov.ie/en/press-
release/46f2f8-funding-ringfenced-to-tackle-illegal-dumping-during-covid-19/.
[94]
Government of South Australia (2021), https://www.replacethewaste.sa.gov.au/. [91]
Graulich, K. et al. (2021), Impact of COVID-19 on single-use plastics and the environment in
Europe, European Environment Agency.
[27]
Hamann, C., K. Sullivan and P. Wright (2014), “Protective Gloves”, in Textbook of Hand Eczema,
Springer Berlin Heidelberg, Berlin, http://dx.doi.org/10.1007/978-3-642-39546-8_28.
[4]
Henneberry, B. (2021), How to Make Personal Protective Equipment (PPE) for COVID-19
(Manufacturing and Sourcing Guide), THOMAS for Industry,
https://www.thomasnet.com/articles/plant-facility-equipment/how-to-make-ppe/.
[14]
IEA (2020), World Energy Outlook 2020, OECD Publishing, Paris,
https://dx.doi.org/10.1787/557a761b-en.
[7]
IGES (2020), Waste Management during the COVID19 Pandemic: From Response to Recovery,
United Nations Environment Programme, https://www.iges.or.jp/jp/pub/waste-management-
during-covid-19-pandemic-response-recovery/en.
[48]
IHS Markit (2020), COVID-19 Has Impacted the Global Fibers Growth Trend, IHS Markit,
https://cdn.ihsmarkit.com/www/pdf/1020/IHS-Markit-Annual-Global-Fibers-Infographic.pdf.
[45]
IMF (2020), World Economic Outlook, October 2020: A Long and Difficult Ascent, International
Monetary Fund, Washington, D.C.,
https://www.imf.org/en/Publications/WEO/Issues/2020/09/30/world-economic-outlook-
october-2020 (accessed on 22 January 2021).
[2]
Institute of Medicine (2006), Reusability of Facemasks During an Influenza Pandemic: Facing
the Flu, The National Academies Press, Washington, D.C., http://dx.doi.org/10.17226/11637.
[13]
Japan Plastics Industry Federation (2021), Plastics production, 1999 to 2000,
http://www.jpif.gr.jp/3toukei/conts/nenji/y_seihin_c.htm.
[11]
Joseph, B. et al. (2021), “Recycling of medical plastics”, Advanced Industrial and Engineering
Polymer Research, http://dx.doi.org/10.1016/j.aiepr.2021.06.003.
[15]
Kalantary, R. et al. (2021), “Effect of COVID-19 pandemic on medical waste management: a
case study”, Journal of Environmental Health Science and Engineering, Vol. 19/1, pp. 831-
836, http://dx.doi.org/10.1007/s40201-021-00650-9.
[59]
Laubinger, F. and N. Varghese (2020), COVID-19 and the looming plastics pandemic, OECD
Environment Focus, https://oecd-environment-focus.blog/2020/07/07/covid-19-and-the-
looming-plastics-pandemic/.
[35]
Marsh, K. and B. Bugusu (2007), “Food Packaging? Roles, Materials, and Environmental
Issues”, Journal of Food Science, Vol. 72/3, pp. R39-R55, http://dx.doi.org/10.1111/j.1750-
3841.2007.00301.x.
[5]

79
GLOBAL PLASTICS OUTLOOK © OECD 2022
Martin, P. et al. (2020), Can the polyester industry recover from Covid-19’s shockwaves?, Wood
Mackenzie, https://www.woodmac.com/news/opinion/can-the-polyester-industry-recover-
from-covid-19s-shockwaves/full-report/.
[43]
McKeen, L. (2014), “Plastics Used in Medical Devices”, in Handbook of Polymer Applications in
Medicine and Medical Devices, Elsevier, http://dx.doi.org/10.1016/b978-0-323-22805-
3.00003-7.
[16]
METI (2020), METI to Convey Information on Menu of Support Measures for Businesses
Affected by Novel Coronavirus Disease Utilizing LINE Application, Ministry of Economy,
Trade and Industry (METI), Government of Japan, https://www.meti.go.jp/english/covid-
19/mask.html.
[25]
Murphy, H. (2020), California Lifts Ban on Plastic Bags Amid Virus Concerns, The New York
Times, https://www.nytimes.com/2020/04/24/us/california-plastic-bag-ban-coronavirus.html.
[83]
National Bureau of Statistics of China (2021), Total Retail Sales of Consumer Goods Went Up by
4.6 percent in December 2020, National Bureau of Statistics of China,
http://www.stats.gov.cn/English/PressRelease/202101/t20210119_1812515.html.
[32]
National News Bureau of Thailand (2020), Covid-19 has positive impact on ecosystem, National
News Bureau of Thailand,
https://thainews.prd.go.th/en/news/detail/TCATG200418155259223.
[24]
NUS (2020), The poison of disposables, NUS,
https://blog.nus.edu.sg/poisonofconsumerism/2020/07/16/the-poison-of-disposables/.
[53]
OECD (2021), OECD Economic Outlook, Interim Report March 2021, OECD Publishing, Paris,
https://dx.doi.org/10.1787/34bfd999-en.
[1]
OECD (2021), The OECD Green Recovery Database : Examining the environmental implications
of COVID-19 recovery policies, https://www.oecd.org/coronavirus/en/policy-responses.
[99]
OECD (2020), Cities policy responses, https://www.oecd.org/coronavirus/policy-responses. [49]
OECD (2020), The face mask global value chain in the COVID-19 outbreak: Evidence and policy
lessons, OECD Publishing, Paris, https://dx.doi.org/10.1787/a4df866d-en.
[20]
OECD (2018), Improving Markets for Recycled Plastics: Trends, Prospects and Policy
Responses, OECD Publishing, Paris, https://dx.doi.org/10.1787/9789264301016-en.
[80]
OECD (forthcoming), Global Plastics Outlook, Volume 2, OECD. [39]
Oliveira, W. et al. (2021), “Food packaging wastes amid the COVID-19 pandemic: Trends and
challenges”, Trends in Food Science & Technology,
http://dx.doi.org/10.1016/J.TIFS.2021.05.027.
[33]
Oral, E., S. Kurtz and O. Muratoglu (2017), “7.3 Ultrahigh Molecular Weight Polyethylene Total
Joint Implants”, in Comprehensive Biomaterials II, Materials Science and Materials
Engineering, http://dx.doi.org/10.1016/b978-0-12-803581-8.10219-x.
[17]
Patil, A., A. Patel and R. Purohit (2017), “An overview of Polymeric Materials for Automotive
Applications”, Materials Today: Proceedings, Vol. 4/2, pp. 3807-3815,
http://dx.doi.org/10.1016/j.matpr.2017.02.278.
[41]

80
GLOBAL PLASTICS OUTLOOK © OECD 2022
Patrício Silva, A. et al. (2020), “Rethinking and optimising plastic waste management under
COVID-19 pandemic: Policy solutions based on redesign and reduction of single-use plastics
and personal protective equipment”, Science of The Total Environment, Vol. 742, p. 140565,
http://dx.doi.org/10.1016/j.scitotenv.2020.140565.
[12]
Peng, J. et al. (2020), “Medical waste management practice during the 2019-2020 novel
coronavirus pandemic: Experience in a general hospital”, American Journal of Infection
Control, Vol. 48/8, pp. 918-921, http://dx.doi.org/10.1016/J.AJIC.2020.05.035.
[57]
PlasticsEurope (2021), EU Plastics Production and Demand: First Estimates for 2020,
PlasticsEurope Association of Plastics Manufacturers,
https://www.plasticseurope.org/en/newsroom/news/eu-plastics-production-and-demand-first-
estimates-2020.
[6]
Prata, J. et al. (2020), “COVID-19 Pandemic Repercussions on the Use and Management of
Plastics”, Environmental Science & Technology, Vol. 54/13, pp. 7760-7765,
http://dx.doi.org/10.1021/ACS.EST.0C02178.
[28]
PRE (2020), Plastics recyclers cease production, Plastics Recyclers Europe,
https://www.plasticsrecyclers.eu/post/plastics-recyclers-cease-production.
[82]
Promchertoo, P. (2020), Food delivery services add tonnes of plastic to Thailand’s landfills
during COVID-19 crisis, https://www.channelnewsasia.com/news/asia/food-delivery-
increases-thailand-plastic-waste-during-COVID-19-12711692?cid.
[51]
Ren, D. (2020), China boosts face mask production capacity by 450 per cent in a month,
threatening a glut scenario, South China Morning Post,
https://www.scmp.com/business/companies/article/3075289/china-boosts-face-mask-
production-capacity-450-cent-month.
[22]
Roberts, K. et al. (2021), “Increased personal protective equipment litter as a result of COVID-19
measures”, Nature Sustainability, http://dx.doi.org/10.1038/s41893-021-00824-1.
[62]
RWMO (2020), Interim Report: Performance of the Waste Sector in Ireland: Covid 19 - Initial
Restrictions Phase 12th March - 18th May 2020, Regional Waste Management Offices,
https://acrplus.org/images/project/Covid-
19/RWMO_Ireland_Covid_19_Interim_Report_Waste.pdf.
[54]
S&P Global (2020), Global petrochemical trends: H2 2020, S&P Global,
https://www.spglobal.com/platts/en/market-insights/special-reports/petrochemicals/global-
petrochemical-outlook-h2-2020.
[38]
Sabanoglu, T. (2020), Top textile exporting countries worldwide 2019, Statista,
https://www.statista.com/statistics/236397/value-of-the-leading-global-textile-exporters-by-
country/.
[42]
Sarkodie, S. and P. Owusu (2020), “Impact of COVID-19 pandemic on waste management”,
Environment, Development and Sustainability 2020 23:5, Vol. 23/5, pp. 7951-7960,
http://dx.doi.org/10.1007/S10668-020-00956-Y.
[97]
SCIO (2020), Fighting COVID-19: China in Action, The State Council, The People’s Republic of
China, http://english.scio.gov.cn/whitepapers/2020-06/07/content_76135269.htm.
[23]

81
GLOBAL PLASTICS OUTLOOK © OECD 2022
Simon, F. (2020), EU dismisses industry calls to lift ban on single-use plastics, euractiv.com,
https://www.euractiv.com/section/circular-economy/news/eu-dismisses-industry-calls-to-lift-
ban-on-single-use-plastics/.
[93]
Solid Waste Management Services (2020), Impact of Covid-19 on Waste Collection and LItter in
Greenspaces and Parks, Solid Waste Management Services, Toronto,
https://www.toronto.ca/legdocs/mmis/2020/ie/bgrd/backgroundfile-156330.pdf.
[74]
Staub, C. (2020), City data shows COVID-19 impacts on recycling tonnages, Resource
Recycling, https://resource-recycling.com/recycling/2020/04/28/city-data-shows-COVID-19-
impacts-on-recycling-
tonnages/#:~:text=Recycling%20programs%20are%20reporting%20greater.
[55]
Staub, C. (2020), Coronavirus pandemic disrupts recycling sector, Resource Recycling,
https://resource-recycling.com/recycling/2020/03/17/coronavirus-pandemic-disrupts-recycling-
sector/.
[77]
Staub, C. (2020), How programs in NY, Texas and Colorado are handling COVID-19, Resource
Recycling, https://resource-recycling.com/recycling/2020/08/25/how-programs-in-ny-texas-
and-colorado-are-handling-covid-19/.
[96]
Subramanian, S. (2020), How the face mask became the world’s most coveted commodity, The
Guardian, https://www.theguardian.com/world/2020/apr/28/face-masks-coveted-commodity-
coronavirus-pandemic.
[21]
Tabuchi, H. (2020), In Coronavirus, Industry Sees Chance to Undo Plastic Bag Bans, The New
York Times, https://www.nytimes.com/2020/03/26/climate/plastic-bag-ban-virus.html.
[84]
Tabuchi, H. (2020), In Coronavirus, Industry Sees Chance to Undo Plastic Bag Bans, The New
York Times, https://www.nytimes.com/2020/03/26/climate/plastic-bag-ban-virus.html.
[34]
Tesfaldet, Y. et al. (2021), “Assessing face mask littering in urban environments and policy
implications: The case of Bangkok”, Science of The Total Environment, p. 150952,
http://dx.doi.org/10.1016/j.scitotenv.2021.150952.
[70]
Toto, D. (2020), Challenges of the unknown, Waste Today,
https://www.wastetodaymagazine.com/article/covid-19-recycling-industry-survey-responses/.
[78]
US Board of Governors of the Federal Reserve System (2021), Industrial Production:
Manufacturing: Non-Durable Goods: Plastics and Rubber Products (NAICS = 326)
[IPG326S], Federal Reserve Bank of St. Louis, https://fred.stlouisfed.org/series/IPG326S.
[9]
US Bureau of Labor Statistics (2020), From the barrel to the pump: the impact of the COVID-19
pandemic on prices for petroleum products, US Bureau of Labor Statistics,
https://www.bls.gov/opub/mlr/2020/article/from-the-barrel-to-the-pump.htm.
[8]
US State of Maine (2020), Governor Mills, Legislature Spearhead Emergency Legislative
Package to Respond to COVID-19, State of Maine: Office of Governor Janet T. Mills,
https://www.maine.gov/governor/mills/news/governor-mills-legislature-spearhead-emergency-
legislative-package-respond-covid-19-2020-03-17.
[85]
Wei, G. (2020), Medical Waste Management Experience and Lessons in COVID-19 Outbreak in
Wuhan, https://www.waste360.com/medical-waste/medical-waste-management-experience-
and-lessons-covid-19-outbreak-wuhan.
[58]

82
GLOBAL PLASTICS OUTLOOK © OECD 2022
Yousefi, M. et al. (2021), “Municipal solid waste management during COVID-19 pandemic:
effects and repercussions”, Environmental Science and Pollution Research, Vol. 28/25,
pp. 32200-32209, http://dx.doi.org/10.1007/s11356-021-14214-9.
[50]
Zambrano-Monserrate, M., M. Ruano and L. Sanchez-Alcalde (2020), “Indirect effects of COVID-
19 on the environment”, Science of The Total Environment, Vol. 728, p. 138813,
http://dx.doi.org/10.1016/j.scitotenv.2020.138813.
[76]
Zecchini, F. (2021), Italy delays contested new sugar and plastic taxes until 2023, Reuters,
https://www.reuters.com/world/europe/italy-delays-contested-new-sugar-plastic-taxes-until-
2023-2021-10-21/.
[87]
Zhou Peng, T. (2021), Petrochemicals 2020: A year of resilence and the road to recovery,
McKinsey & Company,
https://www.mckinsey.com/~/media/mckinsey/industries/chemicals/our%20insights/petroche
micals%202020%20a%20year%20of%20resilience%20and%20the%20road%20to%20recov
ery/petrochemicals-2020-a-year-of-resilience-and-the-road-to-recovery-
vf.pdf?shouldIndex=false.
[37]
Notes
1 This chapter focuses on the implications of the pandemic as they emerged in 2020. The longer-term
consequences are included in the baseline projections presented in Volume 2 of the Global Plastics
Outlook (OECD, forthcoming[39]).
2 Despite the lower input onto the market, separate collection of plastic packaging waste increased by 4%
compared to 2019 levels, mostly reflecting improvements in waste management systems in parts of the
country.
3 To reach these figures, they multiplied one face mask per day with the share of people who accept face
masks in each region (a share varying widely across countries – from 5% in Sweden to 95% in Spain, with
China at 84% and the USA at 73%). This leads to a global estimate of 140 billion face masks used per
year. They then calculated the plastic pollution using the regional shares of mismanaged waste.
4 In comparison, 4 750 items of PPE were found for every km2 of grocery store parking lots and 1 330 items
per km2 in hospital districts (Ammendolia et al., 2021[73]).
5 One quarter of the costs were attributed to the loss of labour due to COVID-19 related illness and medical
recommendations for self-isolation (Solid Waste Management Services, 2020[74]).
6 The projections of plastics use to 2060 presented in Volume 2 of the Global Plastics Outlook (OECD,
forthcoming[39]) build on these impacts in 2020 as well as on the recovery pathway laid out in Dellink et al.
(2021[3]).
7 Changes in relative prices will affect production methods and lead to some substitution effects between
various inputs in production, but the effect is relatively small compared to the effects of output changes.

83
GLOBAL PLASTICS OUTLOOK © OECD 2022
This chapter discusses recycling and explores the structure of the secondary
plastics market, tracking its expansion in recent decades. It also analyses
recent developments in policy, investment, and trade in waste and their
impacts on secondary markets.
4. Trends in the secondary plastics
markets

84
GLOBAL PLASTICS OUTLOOK © OECD 2022
KEY MESSAGES
Recycling has an important role to play in lowering plastics’ environmental footprint alongside
strategies to reduce plastic waste through reduced consumption and reuse systems. Recycling
diverts material from more harmful waste management practices, and the availability of
secondary (recycled) plastics can help lower demand for primary (virgin) plastics.
The production of secondary plastics has more than quadrupled in weight in the last 20 years
and is growing more quickly than primary plastic production. However secondary plastic markets
remain small and in 2019, secondary plastics production accounted for only 6% of total plastic
production. Most sectors continue to rely on primary plastics for economic or quality reasons.
Markets for secondary plastics remain vulnerable. Historically, secondary material has often
been used as a substitute for primary plastic. As a result, the price of secondary plastics
correlated with the price of primary plastic equivalents. This absence of a separate demand for
secondary material affects the viability of recycling, since secondary prices do not fully reflect
the costs of secondary production (e.g. collection, sorting, and processing), but follow price
patterns of primary plastics and their inputs (e.g. oil prices). As well, compared with firms that
produce primary plastics, recycling firms produce less material, are less capital-intensive and
have fewer sales making them less resilient.
There are positive signs for secondary plastics markets. Recent policies in some countries have
strengthened policies to “push” supply through taxes on non-recycled plastic waste, and “pull”
demand for secondary plastic through recycled content targets. An emerging differentiation in
price with primary equivalents in some markets for some polymers, and growing innovation in
recycling technologies, are positive signs.
Since January 2021, amendments to the Basel Convention and OECD Decision on
Transboundary Movements of Waste have set new requirements for plastic waste trade. These
measures are expected to prolong a trend of diminishing trade volumes, increasing domestic
processing and recycling, as well as exports shifting to new countries, initiated when the
People’s Republic of China introduced its National Sword policy in 2017, which banned most
imports of plastic waste.
4.1. Markets for secondary plastics contribute to a more circular use of plastics
As highlighted by the “3 R framework” (reduce, reuse, recycle), policies should seek first to reduce plastic
consumption and maintain plastic material in higher value loops, prior to recycling. Reducing plastics can
be done by optimising product design and reusing can be done by shifting from single-use to more durable
plastic products, which can lower the energy use per consumption cycle. Recycling plastics and using this
“secondary” plastic material can reduce environmental pressures when reduction or substitution away from
plastics is not feasible, or would lead to greater environmental impacts and when durable plastic product
reach their end of life. Recycling plastics is thus an important component of the circular economy.
As far as it displaces primary plastic production and does not induce additional plastic consumption,
recycling provides environmental benefits (Zink and Geyer, 2018[1]). The separate collection of plastics for
recycling helps to keep plastic waste out of landfills (where plastics can emit harmful compounds and
leachates), and incineration, during which plastics generate flue gases and other harmful emissions (Ilyas
et al., 2018[2]). Moreover, revenues from recycling encourage valuable materials to be collected and
adoption of measures for reducing the volume of mismanaged waste. Finally, recycling provides feedstock

85
GLOBAL PLASTICS OUTLOOK © OECD 2022
for secondary plastics, which can be used to make products with a reduced carbon footprint (Benavides
et al., 2018[3]; Zheng and Suh, 2019[4]).
4.2. Plastic waste streams, collection, separation and recycling methods
determine the value of secondary plastics
Recycling plastics requires several costly upstream steps, including collecting, sorting and transporting
waste. The organisation of these activities differs structurally across countries (Table 4.1). Most high-
income countries have a formal system of separate collection organised by the government. The collected
material is frequently sorted using capital-intensive processing. In contrast, in low-income countries,
separate collection and sorting of high value recyclables such as PET (polyethylene terephthalate) are
often performed by low-skilled workers or by an informal recycling sector (i.e. waste pickers). While
informal workers can perform key functions in collecting and sorting wastes, there are serious concerns
that informal recycling processes are relatively inefficient and environmentally harmful, often failing to
prevent emissions of hazardous substances and resulting in health and environmental risks (Box 4.1).
Table 4.1. Collection and sorting processes differ by country income level
Low-income countries High income countries
Collection Only partial coverage of public waste collection in cities and
almost none in the countryside.
Informal sector plays a key role in collecting and sorting
recyclables.
High-quality sorting achieved, but only for some high value
streams such as PET.
Municipal-led plastics recycling schemes are common.
Quality of sorting depends on local habits, collection
facilities for recyclables and financial incentives.
Collection systems are highly mechanised.
Sorting Manual sorting is common.
Mechanical equipment limited to balers for compaction.
Highly mechanised and capital-intensive facilities to
maximise recovery of valuable plastics.
International transport
Low- value collected waste is usually dumped.
Local recycling industry can attract flows of international waste plastics, e.g. South-East Asian States are net-
importers.
High-value plastics are recycled locally.
Low value plastics are exported for recycling elsewhere.
Source: Adapted from (OECD, 2018[5]). Improving Markets for Recycled Plastics: Trends, Prospects and Policy Responses,
https://dx.doi.org/10.1787/9789264301016-en.
Box 4.1. Formalising informal recycling remains a challenge
Informal recycling refers to waste recovery activities that are not supported or recognised by the public
sector’s waste management authorities. Activities range from waste collection and separation
(i.e. “waste picking”), to more “downstream” recycling and processing. At least 15 million people
worldwide work in the informal waste sector, collecting and recovering recyclable material from waste,
which demonstrates the prevalence of the informal sector (Medina, 2008[6]).
The impacts of the informal sector on recycling are complex and context-dependent. In developed
countries with formal waste management systems, “waste-picking” can undermine the financing of
these systems by removing valuable materials from the waste stream. However, in low-income
countries with limited formal collection and sorting, the informal waste sector can collect and sort high
value recyclables effectively (Gunsilius, 2011[7]; CWG and GiZ, 2011[8]).

86
GLOBAL PLASTICS OUTLOOK © OECD 2022
Nevertheless, there are serious environmental concerns over informal “downstream” operations such
as the recycling and treatment of waste. These operations often use crude processes that are not
environmentally sound. For instance, informal recycling processes for e-waste often involve burning
products to recover valuable metals. Informal waste processers may also discard, dump, burn or
otherwise improperly manage residual waste of insufficient economic value, causing leakage of plastics
or pollutants into the environment.
There are also serious social and public health concerns surrounding informal waste management. It is
often marginalised or vulnerable groups, including migrants, women, the unemployed, disabled and
children, who engage in waste picking, sometimes both working and living in dreadful circumstances
on dumpsites (Medina, 2008[6]). Other health impacts include exposure to hazardous emissions from
open burning (Velis and Cook, 2021[9]). The occupation is particularly socially precarious as workers
are rarely covered by social protection or health insurance. Informal enterprises are, by definition,
unregistered, which makes them vulnerable to exploitation, while their lack of proper inventories leave
operators vulnerable to theft.
A challenge for lower- and middle-income countries is therefore to find ways to formally integrate
workers engaged in the informal waste sector to secure their positive contribution, while mitigating the
environmental, health and social impacts (Wilson, Velis and Cheeseman, 2006[10]).
The origin of a plastic waste stream determines the level of purity that can be attained after recycling, and
thus the value of the resultant secondary plastic (Table 4.2). Post-industrial waste and post-consumer
commercial waste can be collected in large containers to minimise logistic costs. Moreover, control
mechanisms (e.g. training employees and visual inspection during pickup) can help to achieve high-quality
streams and high market prices. In contrast, post-consumer household waste has a high cost of collection
(e.g. kerbside collection is expensive) and often contains a substantial share of impurities. Consequently,
the collection of most household waste streams tends to generate a net cost for the municipalities in
charge. The high-income countries with the highest recycling rates tend to use Extended Producer
Responsibility schemes to finance the collection of recyclable plastics from households (explained in
Chapter 6) in order to compensate these costs.
Table 4.2. Post-industrial and post-consumer waste streams vary in value and handling routes
Post-industrial waste Post-consumer commercial waste Post-consumer household waste
Definition Waste generated during the manufacturing process (ISO, 2016[11]).
Waste generated by commercial, industrial,
or institutional facilities (ISO, 2016[11]).
Waste generated by households as end-
users of a product (ISO, 2016[11]).
Example(s) Waste generated in plastic production and conversion (Plastics Europe, 2019[12]).
Waste packaging generated in the distribution chain or waste generated by
consumers at a business’ premises (Toowoomba Region, 2020[13]).
A used plastic yoghurt pot or soft drink bottle.
Collection Via negotiated contracts with waste management companies.
Via negotiated contracts with waste management companies to collect high
volume containers. Municipalities are sometimes also involved in collecting this stream.
Typically operated or subcontracted by municipalities. Collection through kerbside and communal collection, deposit-refund
schemes, and the informal sector.
Sorting Relatively homogeneous waste
stream.
If properly sorted at source, a homogenous
waste streams can be achieved.
Intensive sorting and separation required.
Impurities often lead to downcycling.
Transport/ trade
Tends to be processed
domestically.
Can be processed domestically or exported
for recycling elsewhere.
Pure streams are domestically recycled but other streams may be exported for recycling.

87
GLOBAL PLASTICS OUTLOOK © OECD 2022
Currently, only mechanical recycling1 of PET and polyethylene (PE) plastics demonstrates widespread
commercial viability (Garcia and Robertson, 2017[14]). Mechanical recycling of polypropylene (PP) and
polyvinyl chloride (PVC) also occurs, but to a lesser extent. Compared with other forms of plastics
production and recycling (see below), mechanical recycling requires little capital investment and has fewer
barriers to entry for new firms (Hundertmark et al., 2018[15]). However, it results in varying degrees of
degradation and quality can only be maintained for a limited number of cycles involving the same material
(Hatti-Kaul et al., 2020[16]). Therefore, manufacturers often use mechanically recycled plastics for lower
value applications, known as downcycling (Ellen MacArthur Foundation, 2016[17]). Advances in design,
separation (either separate collection or using technology to sort mixed waste), pre-treatment and
recyclability can improve the output quality of mechanical recycling.
Chemical recycling operations2 can complement mechanical recycling by expanding recycling
opportunities to additional resins and waste streams (Ragaert et al., 2021[18]). However, chemical recycling
facilities are still predominantly in the pilot or demonstration stages (Hann and Connock, 2020[19]). The
primary barrier to expansion is economic feasibility. In addition, due to the high energy intensity of these
processes and their production of toxic by-products, chemical recycling may not always be environmentally
beneficial. However, the processes can produce particularly high-quality, pure material (in purification and
plastic-to-monomer applications) that can meet the standards for food applications, potentially justifying
the costs (Ragaert et al., 2021[18]). Plastic-to-fuel applications, in which plastic waste is transformed into
fuels, can generate equally high-quality end products, but some countries and stakeholders do not consider
this to be recycling. In the coming decades, industry is likely to increase investments in chemical recycling
due to its potential role in future recycling markets.
4.3. Secondary plastics markets remain small and vulnerable despite recent
growth
Recycling markets are the fora of exchange for the numerous actors involved at different points in the
supply chain, including the public sector, firms, traders (exporters and importers), brokers, and ultimately
manufacturers. Markets allocate recycled plastics to the use with the highest value and create a profit
motive that incentivises higher recycling rates. The larger the scale and depth of the markets, the better
secondary materials are able to compete with primary equivalents, in turn driving the environmental
benefits of recycling.
Secondary plastics production has more than quadrupled in the last two decades, from roughly 6.7 Mt in
2000 to 29.1 Mt in 2019, but remains small compared to primary plastics production. Production of primary
equivalents nearly doubled over the same period amounting to 431 Mt in 2019. Taken together, the
continued growth in primary production and the relatively small size of secondary production suggests that
there has not been a fundamental shift in the market to secondary plastics (Figure 4.1).

88
GLOBAL PLASTICS OUTLOOK © OECD 2022
Figure 4.1. Secondary production is growing, but makes up only six percent of total plastic production
Source: OECD Global Plastics Outlook Database, https://doi.org/10.1787/c0821f81-en.
StatLink 2 https://stat.link/9szph5
There are regional differences in secondary production capacity. The Asia-Pacific region is the largest
producer by weight, followed by Europe and North America. Recycling is likely to continue increasing in
Asia-Pacific due to growing infrastructure development as well as low labour costs. Introducing more
advanced technology and upscaling operations could further improve the quantity and quality of the supply
of secondary plastics in these markets. In Europe growth is expected due to policies such as recycled
content standards that favour the production and use of secondary plastics (Grand View Research,
2020[20]).
Economically, there are several drivers of and barriers to secondary production. Historically, secondary
material has often been used by manufacturers as a (low-cost) substitute for primary plastic. As a result
the price of secondary plastics correlated with the price of primary plastic equivalents. This absence of a
separate demand for secondary material affects the viability of recycling, since secondary material prices
do not fully reflect the costs of secondary production (e.g. collection, sorting, and processing), but follow
price patterns of primary plastics and their inputs (e.g. oil prices). This leaves secondary plastics markets
exposed to price fluctuations in primary plastics markets. As well, compared with firms that produce primary
plastics, recycling firms produce less material, are less capital-intensive and have fewer sales making them
less resilient (Table 4.3). These differences between primary and secondary markets suggest that
secondary markets are relatively small and vulnerable (OECD, 2018[5]).
0
50
100
150
200
250
300
350
400
450
500
1985 1990 1995 2000 2005 2010 2015
Pro
du
ctio
n (
Mt)
Primary Secondary

89
GLOBAL PLASTICS OUTLOOK © OECD 2022
Table 4.3. There are key differences in the economics of primary and secondary plastics
Primary plastics Secondary plastics
Business model Turn petroleum or natural gas streams into a finished product
through chemical processing
Reprocess used or otherwise discarded plastic material
so it may serve another useful purpose
Resin production volumes in selected
countries
Canada: USD 8.3 billion in sales (Deloitte, 2019[21])
Japan: 10 670 kt (Plastic Waste Management Institute,
2019[22])
Global: 10 companies responsible for over USD 816 billion
in sales (Polymer Properties Database, 2018[23])
Canada: USD 290 million in sales (Deloitte, 2019[21])
Japan: 760 kt (Plastic Waste Management Institute,
2019[22])
Global: USD 35 billion in market value by entire
industry (Locock et al., 2017[24])
Price drivers Prices of raw material feedstock such as natural gas and
crude oil and refining costs (Clews, 2016[25])
Prices of substitutes: primary polymers or other
materials (e.g. cotton for fibre)
Quality (absence of impurities)
Opportunity costs of other forms of waste
management; and
Costs of production in markets with a separate
demand for secondary plastics (OECD, 2018[5])
Profile of typical
firm
Specialist company focused on a specific stage of
production; or
Vertically integrated major energy and national oil
companies (Clews, 2016[25])
Operates at regional or local scale; and
Specialises in one or a few waste streams (Oestreich
et al., 2020[26])
Note: kt = kilotonne.
Another barrier to the growth of secondary plastics is the quality of the plastic waste collected. The wide
range of polymers and additives (including hazardous chemicals) used in the manufacture of plastics
means that polymers in plastic waste are often co-mingled and contaminated (see Annex A for more
details). Moreover, if not sorted properly and kept apart from other waste streams such as organic waste,
collected plastic waste is of little value for secondary material production due to the difficulty of extracting
impurities and the limited range of potential applications for low-grade recycled material.
Regulation strongly affects the business case for recycling activities and the market for secondary plastics.
High landfill and incineration taxes are strong drivers of recycling, as are landfill bans. However, if not
accompanied by strong environmental standards and enforcement, the risk is that waste will continue to
be dumped, incinerated or mismanaged, weakening recycling rates (OECD, 2018[5]).
4.4. There are recent positive signs for secondary markets
4.4.1. Policy frameworks are being strengthened
Public authorities are strengthening policy frameworks to both restrain the demand for primary plastics
(Chapter 6) and to replace primary plastics with secondary material in applications where plastics are the
optimal material. Previous OECD work evaluated 51 policy interventions to improve secondary plastics
markets (OECD, 2018[5]) that remain highly relevant. To summarise, policies can foster secondary markets
and increase their resilience in three ways:
Demand-“pull” measures, such as recycled content standards or green public procurement can
increase the demand for secondary materials.
Supply-“push” measures, such as extended producer responsibility (EPR) schemes or research
and development funds for recycling technologies can lower costs and improve the quality of
supply. Eco-design and information requirements, such as design standards for disassembly and
information requirements or bans of hazardous substances can further improve the quality of
supplied secondary materials (Box 4.2). Landfill and incineration taxes are further policies that
incentivise recycling.

90
GLOBAL PLASTICS OUTLOOK © OECD 2022
Policies that aim to ensure that the price of primary plastic includes the external costs of primary
production can level the playing field for recycling. Examples include taxes on primary production,
and reforming support for fossil fuel production and consumption.
Box 4.2. Design requirements can either restrict or enable the use of secondary plastics
In many countries there are strict requirements on the use of recycled plastics for food-grade material.
For example, in the European Union only recycled PET sourced from previous food contact material is
allowed to be used for food-grade applications (European Union, 2008[27]). For PET1 or high-density
polyethylene (HDPE), these requirements can be met by selectively collecting beverage containers and
milk bottles, but this is more challenging for many other polymer streams as they are often collected
together with non-food-grade material (Victory, 2020[28]).
Current design and waste collection practices only provide small amounts of the high-quality material
that meets the regulatory requirements. In the medium and long term, growing demand for secondary
plastics and subsequent price increases can encourage better supply quality and quantity.
Design requirements can help to improve the quality of plastics, enabling recycling for higher end
secondary use. Examples of such policies include bans or clear marking of hazardous additives. In
addition, policies that incentivise design for disassembly can enable greater flexibility for both re-use
and recycling.
Note: 1 PlasticsEurope considers all PET resin grades placed on the EU market to be food-contact approved (EFSA CONTAM Panel,
2016[29]).
Three recent policy developments are worth further consideration for their potential to shift the demand
and supply from primary to secondary plastics:
regulatory recycled content standards
taxes on non-recycled waste generation, and
extensive voluntary commitments by firms.
An increasing number of countries are introducing mandatory minimum recycled content standards or
similar incentives. For instance, the EU’s Single-Use Plastics Directive will require plastic bottles to contain
at least 25% recycled content by 2025 and 30% recycled content by 2030 (European Union, 2019[30]).
From 2022, California’s Assembly Bill No. 793 will require a minimum share (up to 50% in 2030) of post-
consumer recycled plastic in plastic beverage containers (California Legislative Information, 2020[31]). Also
from 2022, the UK will apply a tax (GBP 200 per tonne) on plastic packaging with less than 30% recycled
material (HM Revenue & Customs, 2020[32]). These policies aim to “pull” demand for secondary plastics
though requirements or incentives for the composition of products or packaging. In turn, demand can help
to instigate improved supply of secondary material as an input for regulated products.
In addition, several countries are planning to tax non-recycled plastic waste. The European Union
introduced a levy on its Member States of EUR 0.8 for every kilogramme of non-recycled plastic packaging
waste generated. This levy is in place since 1 January 2021 and is likely to lead to the introduction of a
round of related national taxes in the coming years (European Commission, 2021[33]). For example, Italy
and Spain have each announced they will introduce national taxes on non-recycled, single-use plastic
packaging (KPMG, 2020[34]). Market-based instruments, such as these can help to increase the cost of
waste management options that compete with recycling, lowering its relative cost. These measures can
be a “push” for recycling by increasing the quantity of material collected for recycling.
Voluntary corporate commitments may help to generate significant additional demand for recycled post-
consumer household polymers of high quality and purity. In recent years, leading brand-owners of fast-
moving consumer goods and other sectors have made an increasing number of commitments to
91
GLOBAL PLASTICS OUTLOOK © OECD 2022
incorporate post-consumer recycled material in their products. Examples include the Ellen MacArthur
Foundation’s New Plastics Economy Global Commitment and the European Circular Plastics Alliance
(Ellen MacArthur Foundation, 2021[35]; European Commission, 2021[36]). If these commitments are
realised, they will substantially increase demand for recycled plastics, especially for food-grade secondary
material.
4.4.2. The prices of some secondary plastic grades seems to be decoupling from
primary equivalents
The European PET market suggests that the combination of policy instruments and recent industry
commitments discussed above may be creating a specific demand for recycled polymers at prices that are
less dependent on the prices of substitutes (Brown and Kinner, 2020[37]). From 2018, the difference
between the reported price of secondary food-grade PET pellets and the spot price of a primary equivalent
has grown to over EUR 600/tonne in 2020 (Victory, McGeough and Tudball, 2021[38]). The difference
suggests some decoupling of primary and secondary prices in this market, especially for food-grade
applications. This specific demand for secondary material should mean prices better reflect the underlying
costs and should make demand less volatile, which should further boost recycling and secondary material
supply.
4.4.3. Innovation in recycling is on the rise
The interest of entrepreneurs and investors in the circular use of plastics is also picking up. The total
number of patents for environmentally relevant plastic innovation rose by a factor of 3.4 between 1990 and
2017 (for details see Chapter 5). In addition, new patents are increasingly focusing on waste prevention
and recycling, with about half of all patented plastic innovations in 2017 having a focus on these areas.
Changes in consumer priorities and an increasing policy emphasis on plastic recycling seem to have
improved the business case for investments in new recycling technologies and projects (Box 4.3).
Box 4.3. Is the business case for investing in recycling improving?
The business case for investing more in recycling has until recently been undermined by the low prices
of primary material (in part due to their external costs), the high cost of recycling and competition with
other disposal options. The following emerging shifts should improve the viability of secondary plastics:
Growing public awareness of plastic leakage is driving policy interventions and voluntary
commitments from the private sector and strengthening the demand for recycled material.
Technological advances are lowering recycling costs, improving the quality (i.e. price) of
secondary plastic material and expanding commercial recycling to more polymers and waste
streams.
Demand for plastics (and demand for feedstock for plastic production) is starting to grow,
especially in emerging economies.
A growing use of policies internalises the external costs of primary plastic production and
alternative waste disposal options.
However, the following developments could reduce the viability of secondary plastics:
Investment in capital-intensive waste-to-energy infrastructure establishes a long-term constant
demand for incineration, which could create a “lock-in” effect and lower the incentive to launch
recycling projects.
Technological advances in extraction or oversupply reduce the price of fossil fuels, driving down
the relative price of primary plastics.

92
GLOBAL PLASTICS OUTLOOK © OECD 2022
4.4.4. Trade in plastic waste is expected to keep falling in the near future
International trade in plastic waste and scrap can enable economic efficiencies by moving materials to
countries with a comparative advantage in recycling plastic. For example, markets in Asia – particularly
China and India – can produce secondary material cheaply due to lower labour costs and a well-developed
recycling infrastructure (Locock et al., 2017[24]). China has historically been the predominant export
destination for many OECD countries, largely for these reasons, as well as a high demand for (secondary)
plastics by its manufacturing sector. In addition, the availability of inexpensive shipping to China, driven by
the country’s trade surplus and its prominent role in global manufacturing supply chains, has facilitated
export flows to China (Wang et al., 2020[39]; Merrington, 2017[40]). The economies of scale that such trade
enables are likely to be an essential tool for strengthening secondary markets and bridging (part of) the
gap in production between primary and secondary plastics.
On the other hand, trade in waste may lead to environmental leakage, if it is motivated by differences in
the stringency or enforcement of environmental regulation (e.g. lower environmental standards for
contaminated or hazardous plastic waste treatment) (Yamaguchi, 2018[41]; Kellenberg, 2012[42]). Some
export destinations have experienced a serious influx of plastic waste that is heavily contaminated and
hard to recycle. A share of this waste is treated by the informal waste management sector, which can lead
to environmental and health issues (Box 4.1).
Global waste trade peaked in 2014, but then started to decrease following the introduction of strict import
requirements by China (Figure 4.2 and Box 4.4). Since 2013, China has imposed several drastic
restrictions on imported plastic waste in order to increase quality, reduce waste leakage and promote
recycling of domestically-collected waste. The “Green Fence” policy began in 2013 and banned imports of
mixed plastic waste that contained more than 1.5% contamination with non-recyclables (Velis, 2014[43]).
Since 2017, the “National Sword” policy has tightened this restriction to 0.5% contamination (Wang et al.,
2020[39]; Brooks, Wang and Jambeck, 2018[44]). As these new levels are challenging for industry to meet,
the policy effectively banned the vast majority of waste exports to China.
Figure 4.2. The fall in plastic waste exported to China has significantly reduced global trade
Global reported exports of plastic waste and scrap by weight and destination (2012-20)
Note: Other Asia is based on country groupings in the OECD ENV-Linkages model and does not include OECD member countries Japan and
Korea. OECD America includes Canada, USA, Chile, Colombia, Costa Rica and Mexico. See Table A.A.2 in Annex A for more information on
regional aggregations. The graph shows annual data of Harmonised Code (HS) 3915 “Waste, parings and scrap, of plastics” from UN Comtrade.
For 2016-18, the sum of monthly reported data for HS 391510, HS 391520, HS 391530 and HS 391590 are used for US reported exports. This
is to address a possible gap in annual data, as described by Law et al (2020[45]).
Source: Authors’ analysis based on UN Comtrade Database, https://comtrade.un.org, accessed 12 October 2021.
0
2
4
6
8
10
12
14
16
2012 2013 2014 2015 2016 2017 2018 2019 2020
Meg
ato
nn
es
China and Hong Kong, China Other Asia OECD Europe OECD America Rest of World
Figure 4.2. The drop of plastic waste exported to China has decreased global trade abruptlyGlobal reported export weight of plastic waste and scrap by destination type (2012-2020)
Other Asia is based on country groupings in the ENV linkages model and does not include OECD member countries Japan and Korea. Source: based on annual data from (UN Comtrade, n.d.[42]). For 2016-2018, the sum of monthly reported data for HS 391510, HS 391520, HS 391530 and HS 391590 are used for US reported exports. This is to address a possible gap in annual data, as described by Law et al (2020[43]). The data was downloaded from UN Comtrade on 12 October 2021.

93
GLOBAL PLASTICS OUTLOOK © OECD 2022
Box 4.4. Import restrictions have reduced the share of plastic waste traded
Between 2014 and 2020, the global share of plastic waste exported in overall plastic waste generated
declined from about 5.3% (15.6 Mt exported out of 296.2 Mt waste generated) to roughly 1.8% (6.4 Mt
exported out of 359.9 Mt generated). Changes in Chinese policy were especially disruptive for Australia
and New Zealand, as well as for Japan and Korea, all of which were heavily reliant on exporting plastic
waste (Figure 4.3).
The rapid reduction in waste trade, combined with the steady increase in plastic waste, has induced a
sudden surge in other outlets: domestic recycling, domestic disposal, domestic stockpiling, or unreported
trade. Initially, many companies stockpiled waste for domestic processing or for exporting at a later
stage. However, the combination of the sudden restrictions in exports and the short-term recycling
capacity limitations has likely lead to a significant amount of plastic waste being disposed of through
incineration and landfilling.
Figure 4.3. The share of plastic waste exported has fallen drastically in some OECD regions
Note: The share is a ratio of the Harmonised Code (HS) HS 3915 “Waste, parings and scrap, of plastics” reported by exporters (reporters),
organised by region, to the total weight of plastic waste generated estimated by the OECD ENV-linkages model. For 2016-2018, the sum of
monthly reported data for HS 391510, HS 391520, HS 391530 and HS 391590 are used for US reported exports.
Source: Own analysis based on UN Comtrade Database, https://comtrade.un.org, accessed 12 October 2021; and OECD Plastics Outlook
Database.
0
1
2
3
4
5
2014 2020
The share (%) of exports of plastic waste in total
plastic waste generated
Exports of plastic waste and scrap by region
Note: The share is a ratio of the HS 3915 (plastic waste and scrap) reported by exporters (reporters), organised by region, to the total weight of plastic waste generated estimated by the OECD in-house model ENV-linkages. For 2016-2018, the sum of monthly reported data for HS 391510, HS 391520, HS 391530 and HS 391590 are used for US reported exports. The data was downloaded from UN Comtrade on 12 October 2021.Source: Authors, based on UN Comtrade data (UN Comtrade, n.d.[42]) and OECD Plastics Outlook Database.
Mt
0%
5%
10%
15%
20%
2014 2015 2016 2017 2018 2019 2020
Australia and New-Zealand Canada
OECD EU 22 Japan and Korea
USA
NEW

94
GLOBAL PLASTICS OUTLOOK © OECD 2022
Table 4.4. Trade restrictions create both opportunities and risks
Opportunities Risks
National import bans lead to more exports to alternative emerging economies with relatively favourable
trade terms.
Building up recycling infrastructure and generating economic activity in alternative
import markets
Trafficking as well as illegal and potentially environmentally unsound waste management in emerging economies that are overwhelmed by imports (INTERPOL, 2020[46]). Especially relevant if
enforcement and information campaigns to disseminate trade rules and environmental laws are
insufficient
Multilateral trade restrictions (e.g. Amendments to the Basel Convention) lead to more exports to advanced
economies within the OECD.
More material likely to be efficiently recycled
in an environmentally sustainable manner
Recycling processes covered by better
governance compared with emerging
economies
Incentives to improve quality of collection
and separation
Regional trade agreements create favourable trade conditions that could inhibit global movement to markets with comparative advantage (Leigh Mills, Van
der Ven and Bodouroglou, 2020[47])
Overall more restrictions
reduce international trade and domestic
processing of plastic waste increases (sorting, recycling, incineration or
landfill).
Incentives to reduce plastic waste generation and to invest in circular economy
business models and infrastructure
Incentives to improve quality of collection
and separation
Better control of plastic waste management
Increased disposal of plastic waste and reliance on
incineration or landfilling
Increased illegal dumping where treatment capacity is
lacking
Decreased resource efficiency overall and diminished prices of secondary materials as comparative advantage available in other countries cannot be
harnessed
Trade restrictions, like those introduced by China, shift trade patterns and the demand for domestic
processing. Table 4.4 summarises the most relevant opportunities and risks linked to trade restrictions.
Following the closure of the Chinese market, global trade declined and export flows shifted to other
countries, mostly in Southeast Asia (Wang et al., 2020[39]). Exports of plastic waste to a number of
destinations increased substantially from early 2017 to mid-2018: Indonesia (218%), Malaysia (440%),
Thailand (1141%), Turkey (314%), and Vietnam (203%) (Figure 4.4). Substantial increases in imports in
such a short period put immense pressure on local recycling and waste management capacity. The
increase in exports to these destinations coincided with an increase in the detection of illegal landfilling,
waste fires and unlicensed recycling operations. As imported material is more frequently pre-sorted and of
higher value than domestically sourced waste in these countries, the increased imports have likely pushed
some domestic waste sources to be (illegally) disposed of in a context of limited recycling capacities
(INTERPOL, 2020[46]).
In response to the growing pressures from imported plastic waste on customs offices and domestic
treatment, several emerging export destinations have set their own restrictions and bans (Box 4.4).
Malaysia, Thailand and Viet Nam all implemented import restrictions over the course of 2018. This led to
decreases in exports to these countries in the second half of 2018 (Wang et al., 2020[39]). In 2019, India
also banned imports of plastic waste (Staub, 2019[48]). Exports to Malaysia, Viet Nam and most notably
Turkey, continued to rise again in 2019. In spring 2021, Turkey introduced an import ban for some types
of plastic waste, which was subsequently replaced by an enhanced licensing system (Republic of Turkey,
2021[49]).

95
GLOBAL PLASTICS OUTLOOK © OECD 2022
Figure 4.4. Global exports of plastic waste have shifted to other countries
Monthly reported exports of HS 3915 by weight (in thousand tonnes) for 2016-2020
Source: Own analysis based on monthly data of Harmonised Code (HS) 3915 “Waste, parings and scrap, of plastics” from UN Comtrade (UN
Comtrade, n.d.[50]), UN Comtrade Database, https://comtrade.un.org, accessed 12 October 2021.
The continued demand for feedstock materials in China has triggered foreign investment by Chinese
recycling firms in other Asian states. Whilst waste processing has shifted to other countries, China often
remains the ultimate destination for much of the processed secondary plastic material (Morita and Hayashi,
2018[51]; Toloken, 2020[52]). Exemplifying China’s shift from an importer of plastic waste to an importer of
processed secondary plastics, Chinese imports of secondary pellets grew from 10 000 tonnes per month
before scrap import restrictions were introduced, to around 400 000 tonnes per month in 2018 (Taylor,
2018[53]).
In addition to unilateral trade restrictions, recent amendments to the Basel Convention and OECD Council
Decision 0266 to address environmental concerns stemming from the lack of environmentally sound
management of imported plastic waste came into force in 2021:
The Conference of the Parties (COP) to the Basel Convention on the Control of Transboundary
Movements of Hazardous Wastes and Their Disposal (the Basel Convention) adopted
amendments to Annexes II, VIII and IX to restrict the transboundary movement of certain plastic
waste unless it is almost free of contamination and destined for recycling in an environmentally
sound manner (Secretariat of the Basel Convention, 2020[54]).
The OECD Decision of the Council on the Control of Transboundary Movements of Wastes
Destined for Recovery Operations [OECD/LEGAL/0266] (the OECD Decision), which is closely
interlinked with the Basel Convention and allows for facilitated intra-OECD waste shipments, was
subsequently also amended, enabling OECD Member Countries to control non-hazardous plastic
waste in line with their domestic legislation and international law (OECD, 2020[55]).
These amendments have expanded the plastic waste types that are subject to trade restrictions and have
also fragmented the rules for intra-OECD trade. The additional heterogeneity in trade rules will likely raise

96
GLOBAL PLASTICS OUTLOOK © OECD 2022
compliance costs for waste traders and increase complexity for enforcement organisations. Taken together
these developments are likely to further reduce trade volumes of affected plastic waste in the short term.
Conversely, the stricter rules could help to reduce trade in problematic and hard-to-recycle (i.e. highly
mixed or contaminated) plastic waste, lowering plastic leakage to the environment. Indirectly, the trade
rules also help incentivise better collection and sorting practices, which can improve the efficiency of
recycling in the long-term.
References
Benavides, P. et al. (2018), “Exploring Comparative Energy and Environmental Benefits of
Virgin, Recycled, and Bio-Derived PET Bottles”, ACS Sustainable Chemistry & Engineering,
Vol. 6/8, pp. 9725-9733, http://dx.doi.org/10.1021/acssuschemeng.8b00750.
[3]
Brooks, A., S. Wang and J. Jambeck (2018), “The Chinese import ban and its impact on global
plastic waste trade”, Science Advances, Vol. 4/6, http://dx.doi.org/10.1126/sciadv.aat0131.
[44]
Brown, A. and C. Kinner (2020), Will Coronavirus Change The Course Of Plastic Circularity?,
https://www.woodmac.com/news/opinion/will-coronavirus-change-the-course-of-plastic-
circularity/ (accessed on 5 October 2020).
[37]
California Legislative Information (2020), Bill Text - AB-793 Recycling: plastic beverage
containers: minimum recycled content.,
https://leginfo.legislature.ca.gov/faces/billTextClient.xhtml?bill_id=201920200AB793
(accessed on 20 October 2021).
[31]
Clews, R. (2016), Project Finance for the International Petroleum Industry, Elsevier Inc.,
http://dx.doi.org/10.1016/C2013-0-13683-5.
[25]
CWG and GiZ (2011), “The Economics of the Informal Sector in Solid Waste Management:
Economic Aspects of the Informal Sector in Solid Waste Management”,
https://www.giz.de/en/downloads/giz2011-cwg-booklet-economicaspects.pdf (accessed on
23 July 2021).
[8]
Deloitte (2019), Economic Study of the Canadian Plastic Industry, Market and Waste,
http://publications.gc.ca/collections/collection_2019/eccc/En4-366-1-2019-eng.pdf (accessed
on 26 February 2021).
[21]
EFSA CONTAM Panel (2016), “Statement on the presence of microplastics and nanoplastics in
food, with particular focus on seafood”, EFSA Journal, Vol. 14/6, p. 30,
http://dx.doi.org/10.2903/j.efsa.2016.4501.
[29]
Ellen MacArthur Foundation (2021), Global Commitment - New Plastics Economy,
https://www.newplasticseconomy.org/projects/global-commitment (accessed on
21 September 2021).
[35]
Ellen MacArthur Foundation (2016), “The New Plastics Economy: Rethinking the future of
plastics”, Ellen MacArthur Foundation January.
[17]
European Commission (2021), Circular Plastics Alliance,
https://ec.europa.eu/growth/industry/policy/circular-plastics-alliance_en (accessed on
21 September 2021).
[36]
97
GLOBAL PLASTICS OUTLOOK © OECD 2022
European Commission (2021), Plastics own resource, https://ec.europa.eu/info/strategy/eu-
budget/long-term-eu-budget/2021-2027/revenue/own-resources/plastics-own-resource_en
(accessed on 1 February 2022).
[33]
European Union (2019), DIRECTIVE (EU) 2019/904 OF THE EUROPEAN PARLIAMENT AND
OF THE COUNCIL on the reduction of the impact of certain plastic products on the
environment, https://eur-lex.europa.eu/legal-
content/EN/TXT/PDF/?uri=CELEX:32019L0904&from=EN (accessed on
21 September 2021).
[30]
European Union (2008), COMMISSION REGULATION (EC) No 282/2008 on recycled plastic
materials and articles intended to come into contact with foods and amending Regulation
(EC) No 2023/2006, https://eur-lex.europa.eu/legal-
content/EN/TXT/PDF/?uri=CELEX:32008R0282&from=EN (accessed on
21 September 2021).
[27]
Garcia, J. and M. Robertson (2017), The future of plastics recycling, American Association for
the Advancement of Science, http://dx.doi.org/10.1126/science.aaq0324.
[14]
Grand View Research (2020), Recycled Plastics Market: Market Analysis. [20]
Gunsilius, E. (2011), “The role of the informal sector in solid waste management and enabling
conditions for its integration experiences from GTZ”.
[7]
Hann, S. and T. Connock (2020), Chemical Recycling: State of Play, Eunomia,
https://www.eunomia.co.uk/reports-tools/final-report-chemical-recycling-state-of-play/
(accessed on 21 September 2021).
[19]
Hatti-Kaul, R. et al. (2020), “Designing Biobased Recyclable Polymers for Plastics”, Trends in
Biotechnology, Vol. 38/1, pp. 50-67, http://dx.doi.org/10.1016/j.tibtech.2019.04.011.
[16]
HM Revenue & Customs (2020), Plastic packaging tax - GOV.UK,
https://www.gov.uk/government/publications/introduction-of-plastic-packaging-tax/plastic-
packaging-tax (accessed on 4 May 2021).
[32]
Hundertmark, T. et al. (2018), Recycling and the future of the plastics industry,
https://www.mckinsey.com/industries/chemicals/our-insights/how-plastics-waste-recycling-
could-transform-the-chemical-industry (accessed on 21 September 2021).
[15]
Ilyas, M. et al. (2018), Plastic waste as a significant threat to environment - A systematic
literature review, De Gruyter, http://dx.doi.org/10.1515/reveh-2017-0035.
[2]
INTERPOL (2020), Emerging criminal trends in the global plastic waste market since January
2018, INTERPOL, Lyon, http://www.INTERPOL.int.
[46]
ISO (2016), ISO 14021:2016 Environmental labels and declarations - Self declared
environmental claims (Type II environmental labelling),
https://www.iso.org/obp/ui/#iso:std:iso:14021:ed-2:v1:en:sec:7.8.1.1 (accessed on
2 March 2021).
[11]
Kellenberg, D. (2012), “Trading wastes”, Journal of Environmental Economics and Management,
Vol. 64/1, pp. 68-87, http://dx.doi.org/10.1016/j.jeem.2012.02.003.
[42]

98
GLOBAL PLASTICS OUTLOOK © OECD 2022
KPMG (2020), EU: Review of the proposal for plastic tax, environmental-related measures,
https://home.kpmg/us/en/home/insights/2020/09/tnf-eu-review-porposal-plastic-tax-
environmental-related-measures.html (accessed on 4 May 2021).
[34]
Law, K. et al. (2020), “The United States’ contribution of plastic waste to land and ocean”,
Science Advances, Vol. 6/44, http://dx.doi.org/10.1126/sciadv.abd0288.
[45]
Leigh Mills, S., C. Van der Ven and C. Bodouroglou (2020), Sustainable Trade in Resources:
Global Material Flows, Circularity, and Trade, United Nations Environment Programme,
Nariobi, Kenya, https://www.unep.org/resources/publication/sustainable-trade-resources-
global-material-flows-circularity-and-trade (accessed on 10 December 2020).
[47]
Locock, K. et al. (2017), The Recycled Plastics Market: Global Analysis and Trends Copyright
and disclaimer, https://publications.csiro.au/rpr/pub?pid=csiro:EP19308 (accessed on
29 September 2020).
[24]
Medina, M. (2008), The informal recycling sector in developing countries,
https://ppp.worldbank.org/public-private-partnership/library/informal-recycling-sector-
developing-countries (accessed on 23 July 2021).
[6]
Merrington, A. (2017), “Recycling of Plastics”, in Applied Plastics Engineering Handbook:
Processing, Materials, and Applications: Second Edition, Elsevier Inc.,
http://dx.doi.org/10.1016/B978-0-323-39040-8.00009-2.
[40]
Morita, Y. and S. Hayashi (2018), “Proposals to Strengthen Japan’s Domestic Measures and
Regional Cooperation on Stable and Environmentally Sound Plastic Scrap Recycling:
Response to China’s Ban on Imports of Plastic Scrap”, IGES Policy Brief, Vol. 41,
https://www.iges.or.jp/en/pub/proposals-strengthen-japan’s-domestic-measures/en.
[51]
OECD (2020), Full summary of the amendments to the OECD Council Decision,
https://www.oecd.org/environment/waste/Full_summary_of_the_amendments_to_the_OECD
_Council_Decision.pdf (accessed on 26 October 2020).
[55]
OECD (2018), Improving Markets for Recycled Plastics: Trends, Prospects and Policy
Responses, OECD Publishing, Paris, https://dx.doi.org/10.1787/9789264301016-en.
[5]
Oestreich, J. et al. (2020), Der Abfalls der Anderen – Über die Verantwortung für die Plastikflut in
Asien, https://polyproblem.org/wp-content/uploads/POLYPROBLEM-%E2%80%93-
Wertsachen.pdf (accessed on 1 March 2021).
[26]
Plastic Waste Management Institute (2019), An introduction to plastic recycling 2019,
http://www.pwmi.or.jp/ei/plastic_recycling_2019.pdf (accessed on 26 February 2021).
[22]
Plastics Europe (2019), The Circular Economy for Plastics: A European Overview,
https://www.plasticseurope.org/en/resources/publications/1899-circular-economy-plastics-
european-overview (accessed on 2 March 2021).
[12]
Polymer Properties Database (2018), Top 10 Plastic Resin Producers, Polymer Database,
https://polymerdatabase.com/Polymer%20Brands/Plastic%20Manufacturers.html (accessed
on 6 October 2020).
[23]
Ragaert, K. et al. (2021), “(forthcoming) A stock take on the technological state-of-the-art for the
recycling of plastics ”.
[18]

99
GLOBAL PLASTICS OUTLOOK © OECD 2022
Republic of Turkey (2021), ÇEVRENİN KORUNMASI YÖNÜNDEN KONTROL ALTINDA
TUTULAN ATIKLARIN İTHALAT DENETİMİ TEBLİĞİ (ÜRÜN GÜVENLİĞİ VE DENETİMİ:
2022/3), https://www.resmigazete.gov.tr/eskiler/2021/12/20211231M4-2.htm (accessed on
22 September 2021).
[49]
Secretariat of the Basel Convention (2020), Basel Convention Plastic Waste Amendments,
http://www.basel.int/Implementation/Plasticwaste/PlasticWasteAmendments/Overview/tabid/8
426/Default.aspx (accessed on 22 December 2020).
[54]
Staub, C. (2019), “Plastic shipments to India stall as ban draws near”, Plastics Recycling Update,
https://resource-recycling.com/plastics/2019/08/14/plastic-shipments-to-india-stall-as-ban-
draws-near/ (accessed on 4 December 2020).
[48]
Taylor, B. (2018), “Is China’s shift to plastic pellet imports gaining steam?”, Recycling Today,
https://www.recyclingtoday.com/article/china-recycled-plastic-pellet-imports-
2018/#:~:text=%E2%80%9CChina's%20imported%20%5Brecycled%2Dcontent,soared%2C
%E2%80%9D%20states%20the%20group.
[53]
Toloken, S. (2020), “New limits from China on recycled pellets ‘real threat’”, Plastics News,
https://www.plasticsnews.com/news/new-limits-china-recycled-pellets-real-threat (accessed
on 5 October 2020).
[52]
Toowoomba Region (2020), Definition of domestic waste versus commercial waste,
https://www.tr.qld.gov.au/environment-water-waste/waste-recycling/waste-facilities-rubbish-
tips/7413-what-is-domestic-waste (accessed on 2 March 2021).
[13]
UN Comtrade (n.d.), Un Comtrade, United Nations Statistical Office, https://comtrade.un.org/
(accessed on 5 October 2020).
[50]
Velis, C. (2014), Global recycling markets - plastic waste: A story for one player – China. [43]
Velis, C. and E. Cook (2021), “Mismanagement of Plastic Waste through Open Burning with
Emphasis on the Global South: A Systematic Review of Risks to Occupational and Public
Health”, Environmental Science & Technology, Vol. 55/11, pp. 7186-7207,
http://dx.doi.org/10.1021/acs.est.0c08536.
[9]
Victory, M. (2020), Insight: recycling chain facing deeply challenging times but investment
opportunities remain, Independent Commodity Intelligence Services , London,
https://www.icis.com/explore/resources/news/2020/05/19/10509185.
[28]
Victory, M., H. McGeough and M. Tudball (2021), 2021 Global Market Outlook Sustainability,
https://www.icis.com/explore/resources/2021-global-market-outlook-sustainability-content/
(accessed on 28 January 2021).
[38]
Wang, C. et al. (2020), “Structure of the global plastic waste trade network and the impact of
China’s import Ban”, Resources, Conservation and Recycling, Vol. 153,
http://dx.doi.org/10.1016/j.resconrec.2019.104591.
[39]
Wilson, D., C. Velis and C. Cheeseman (2006), “Role of informal sector recycling in waste
management in developing countries”, Habitat International, Vol. 30/4, pp. 797-808,
http://dx.doi.org/10.1016/j.habitatint.2005.09.005.
[10]

100
GLOBAL PLASTICS OUTLOOK © OECD 2022
Yamaguchi, S. (2018), “International Trade and the Transition to a More Resource Efficient and
Circular Economy: A Concept Paper”, OECD Trade and Environment Working Papers,
No. 2018/03, OECD Publishing, Paris, https://dx.doi.org/10.1787/847feb24-en.
[41]
Zheng, J. and S. Suh (2019), “Strategies to reduce the global carbon footprint of plastics”, Nature
Climate Change, Vol. 9/5, pp. 374-378, http://dx.doi.org/10.1038/s41558-019-0459-z.
[4]
Zink, T. and R. Geyer (2018), “Material Recycling and the Myth of Landfill Diversion”, Journal of
Industrial Ecology, Vol. 23/3, pp. 541-548, http://dx.doi.org/10.1111/jiec.12808.
[1]
Notes
1 Mechanical recycling processes plastic waste by washing, shredding, melting, followed by re-moulding
and is often blended with virgin material to form a finished product, typically in the form of pellets.
2 Chemical recycling processes plastic waste by applying chemical agents that break down waste material
into its building blocks (either polymers, monomers or fuels).

101
GLOBAL PLASTICS OUTLOOK © OECD 2022
Innovation can occur in the production, processing and recycling of plastics.
This chapter first reviews the overall trends in innovation for environmentally
relevant plastics technologies, before investigating the empirical link between
circular economy policies and innovation. Finally, the chapter focuses on
recent trends in specific technologies and the related policy implications.
5. Innovation on plastics

102
GLOBAL PLASTICS OUTLOOK © OECD 2022
KEY MESSAGES
Innovation along the entire plastics value chain will be critical to reduce the environmental
impacts of plastics. This chapter takes a novel approach to conceptualise and quantify this
innovation on a global scale, drawing on patent and trademark data from the past three decades.
Innovation in environmentally relevant plastics technologies has steadily increased – the total
number of patents in this field rose by a factor of 3.4 between 1990 and 2017. In addition, our
analysis of trademarks, which measure low-technological innovations that are not necessarily
reflected by patents, indicates that every year between 1995 and 2017 innovation for reusing
plastics increased by 23%, while innovation for repairing plastics rose by 12%.
About half of all environmentally relevant innovations patented in 2017 focused on plastics
circularity, i.e. on the prevention and recycling of plastic waste. One-third were related to
biobased feedstock and the remainder were aimed at converting or disposing of waste as well
as removing plastics leaked into the natural environment.
The focus of patenting activity is shifting away from waste prevention to waste recycling,
potentially due to consumer priorities and the policy emphasis on plastics recycling.
Our quantitative evidence suggests that circular economy policies such as extended producer
responsibility systems can encourage innovation in plastic waste recycling. However, innovation
in plastic waste prevention and recycling remains limited, representing only 1.2% of total
innovation on plastics in 2017 – largely unchanged since 1990 (1.1%). Much more ambitious
policies are needed to direct technological change towards closing plastics loops and reducing
leakage to the environment.
Innovation activity is concentrated in OECD countries and the People’s Republic of China,
together accounting for more than 80% of all patents related to the circular use of plastics. Given
the growing problems of plastic leakage in developing countries, there is a need to accelerate
the international transfer of these technologies.
Environmental relevant plastics innovation is evolving rapidly. For example, innovation in
biodegradable plastics grew rapidly during the last decade but has recently slowed likely due to
concerns over poor biodegradation in natural environments. Plastic-to-plastic chemical recycling
technologies, which aim to recycle waste that cannot be processed with mechanical recycling,
are only emerging but face significant challenges. Many other innovations across the life cycle
of plastics are also emerging.
Innovation will only lead to scalable solutions if the demand for circular plastics is strong.
Consequently, investments in innovation should go hand in hand with education, environmental
awareness, financial incentives for behavioural change and binding regulations that should be
adapted to the local context.
5.1. What are the trends in environmentally relevant plastics innovation?
To answer this question, the present analysis measure environmentally relevant plastics innovation using
patent and trademark data. A patent is an exclusive right granted to an inventor to use and sell his invention
for a certain number of years. Patent counts are a common way to measure innovation because they
capture detailed information on recent innovations of significant market value (Narin, 1995[1]). In contrast,
trademarks measure low-technological innovations that are not necessarily reflected by patents.

103
GLOBAL PLASTICS OUTLOOK © OECD 2022
Patent counts can be used to measure innovation in environmentally relevant plastics technologies. To do
so, textual information in patent abstracts were searched in the PATSTAT database using various
combinations of keywords. For example, inventions on mechanical recycling can be identified by a search
string such as “shred plastic waste” or “recover polymer scrap”, while patents for plastic-to-plastic chemical
recycling can be identified by words such as “hydrolysis” and “glycolysis”.
Following the database sweep, the identified inventions were scrutinised to extract the patent families
related to innovation in environmentally relevant plastics technologies and were classified into three main
groups (Figure 5.1):
1. Innovations for plastics prevention and recycling: “plastics prevention” is a broad term capturing
not only plastic waste prevention innovations, but also the innovations for technologies or
processes that will use fewer plastics in the first place – they will also be referred to as innovations
for plastics circularity.
2. Innovations for converting or disposing of waste and removing leakages of plastic from the
environment.
3. Innovations in biobased feedstock.
When conducting cross-country comparison, only patent families that have been granted by multiple
national patent offices were counted in order to avoid the inflating the number of low-value patents.1 The
analysis includes patent data from 1990 and goes up to 2017 since databases for more recent years may
be incomplete due to the delay in patent registrations. Moreover, when focusing on international/regional
patent families, the available years are pushed back further – from 2017 to 2014 – due to the time lag
between the first patent application in a given country and the subsequent patent applications in other
countries.
Figure 5.1. Classification of innovation in environmentally relevant plastics technologies
Source: Dussaux and Agrawala (forthcoming[2]).
Innovation in some technologies is not necessarily captured well by patent data.2 This is the case for
inventions for reusing plastics, which contain low-tech innovation and so are generally not patented; and
for inventions for repairing plastics, which are more commercialised. The number of registered trademarks
is a more appropriate indicator to capture innovation trends in these technologies. For example,
trademarks are used to protect innovation in reusable plastic transport containers (e.g. cups); reusable

104
GLOBAL PLASTICS OUTLOOK © OECD 2022
plastic water bottles and distribution services for reusable plastic packing material. While reusable products
may seem relatively low-tech, the logistics behind shared transport systems and containers involve
innovation.
5.1.1. Environmentally relevant plastics innovation is growing but is still small scale
Innovation in environmentally relevant plastics technologies has increased rapidly over the last 30 years
(Figure 5.2). The total number of patents rose by a factor of 3.4 between 1990 and 2017. Patented
technologies for plastics prevention and recycling form the largest group and increased the most – by a
factor four. In comparison, new technologies for biobased feedstock and for converting, disposing of or
removing leakage of plastic waste rose by a factor of three.
Figure 5.2. Innovation in plastics prevention and recycling have grown the most
Worldwide patented inventions in environmentally relevant plastics technologies, 1990-2017
Source: Calculation based on textual analysis of data from the OECD, STI Micro-data Lab: Intellectual Property Database, http://oe.cd/ipstats,
June 2020.
StatLink 2 https://stat.link/ae8tnl
Between 2012 and 2017, the growth in patents for environmentally relevant plastics technologies levelled
off. Since 2012, the number of new patents for prevention and recycling technologies has remained
constant, while it has slightly declined for biobased feedstock technologies as well as for technologies
converting or disposing of waste and removing leakages of plastics from the environment. However, public
awareness of plastic waste leakage and political action to address the issue have increased following the
2015 launch of the G7 Action Plan against marine litter. Therefore, it is likely that patents will have
increased since then, but the data are not yet available.
Trademarks data provide additional insights into low-tech plastics innovation. Every year between 2013
and 2017 there were on average 65 new registered trademarks related to plastics reuse technologies and
2 700 for plastics repair technologies. The number of trademarks related to plastics reuse increased by

105
GLOBAL PLASTICS OUTLOOK © OECD 2022
23% every year between 1995 and 2017, while the number of trademarks related to plastics repair rose
by 12% every year.
Since 2012, innovation in recycling technologies has outpaced plastic waste prevention technologies; they
saw almost twice as many patents in 2017 (Figure 5.2). The shift towards recycling is probably driven by
increased environmental awareness by consumers, who are willing to pay more for recycled content, and
by policies such as extended producer responsibility (EPR) which make producers financially responsible
for recycling waste, including packaging (Chapter 6).
Although innovation in plastic waste prevention and recycling has increased since 1990, its share in overall
plastics innovation at the global level remains small. Innovation in preventing and recycling plastic waste
accounted for only 1.1% of all plastics innovation in 1991 and only 1.2% in 2017. Therefore, the large-
scale adoption of much stronger policies is needed to redirect innovation towards the circular use of
plastics.
The remainder of this section focuses on prevention and recycling technologies, since biobased feedstock
(Chapter 2) and technologies for converting or disposing of waste have been covered comprehensively in
previous chapters (see Box 2.2 and Box 2.3, among others).
5.1.2. Plastics prevention and recycling innovation is concentrated in a few countries
Innovation in plastics prevention and recycling (innovation for plastics circularity) is not evenly distributed
around the globe (Figure 5.3). The vast majority is concentrated in OECD countries and China. For
instance, only ten countries accounted for 92% of plastic prevention and recycling patents between 2010
and 2014, with Japan, the United States, China, Korea, Germany and France alone accounting for 85%.
Figure 5.3. OECD countries and China lead on innovation in plastics circularity
Regional distribution of patented inventions for plastic prevention and recycling, 2010-14
Source: Calculation based on textual analysis of data from the OECD, STI Micro-data Lab: Intellectual Property Database, http://oe.cd/ipstats,
June 2020.
Figure 5.4 looks at the top ten innovating countries and compares their global share in patented inventions
for plastics prevention and recycling with their global share in all plastics-related patents, environmental or
otherwise. Unsurprisingly, countries that innovate in plastics in general also tend to innovate in plastics

106
GLOBAL PLASTICS OUTLOOK © OECD 2022
circularity technologies. Nevertheless, some countries invest relatively greater effort in plastics prevention
and recycling technologies. For instance, France, Japan, Korea, the United Kingdom and United States
invested a relative large share of their innovation efforts in plastics circularity between 2010 and 2014. In
contrast, Germany, China and Australia were relatively less focused on plastics circularity during the same
period. Nonetheless, due to their high number of plastic-related innovations, these three countries are
leaders when considering the absolute number of circular plastics patents filed. In addition, the focus on
circular plastics technologies is likely to increase in several countries. For example, a full waste export ban
will come into effect in Australia by mid-2024 and will significantly increase the domestic demand for plastic
recycling. The growing Australian market, also supported by a public investment of AUD 190 million in
recycling modernisation, will likely spur innovation in plastic waste recycling.
This large concentration of plastics prevention and recycling innovations highlights the need to accelerate
the international transfer of these technologies towards developing countries where plastics use and
problems of plastic leakage are growing rapidly.
Figure 5.4. Some countries specialise in circular plastics innovation
Top ten inventing countries in plastics prevention and recycling innovations, global share 2010-14
Source: Calculation based on textual analysis of data from the OECD, STI Micro-data Lab: Intellectual Property Database, http://oe.cd/ipstats,
June 2020.
StatLink 2 https://stat.link/ax0bg4
5.2. What role for policies in driving circular plastics innovation?
The previous section showed that there are significant differences across countries in circular plastic
innovation. This section explores how circular economy policies contribute to these differences, using the
case study of the German packaging ordinance – the first EPR system for the recycling and recovery of
sales packaging in the world.
The 1991 packaging ordinance, replaced by the German Packaging Act (Verpackungsgesetz) in 2019,
required retailers and producers to take back and recycle a fixed but annually increasing percentage of

107
GLOBAL PLASTICS OUTLOOK © OECD 2022
packaging materials. The take-back system was deemed to be effective as the volume of packaging
materials declined by 500 000 tonnes between 1992 and 1993.
Three years after the introduction of the Packaging Ordinance, plastic recycling capacities had increased
by a factor of four (OECD, 1998[3]). Qualitative evidence suggests that this significant increase in plastic
recycling capacity was due to the sizeable positive impact of the ordinance on plastic recycling innovation.
To meet the quotas set by the take-back system, producers had to find new processes to convert plastic
waste and create new markets for secondary materials. Among the new technologies developed at the
time were new recycling processes, such as those using hydrocyclones and centrifuges to separate
individual plastics (OECD, 1998[3]).
To provide some quantitative evidence of the effect of the German packaging ordinance on plastic recycling
innovation and go further than correlation, a synthetic control method that builds a counterfactual or control
group for Germany is employed.3 This control group is composed of Canada, Japan, the Netherlands,
Korea and the United States. These are all similar to Germany in terms of recycling patents but none had
introduced a similar recycling policy around 1991.4 Using several predictors, patent filing in recycling
technologies in Germany before the regulation is introduced is successfully replicated in the control group
(Figure 5.5).5 It is found that five years after its introduction in Germany, the packaging ordinance increased
the stock of recycling innovation by 190% compared to the control group for Germany in which the
regulation is not introduced.6
Figure 5.5 also shows that there had already been a spurt in plastic recycling innovation between 1989
and 1991 in Germany. This cannot be fully explained by strategic patenting prior to the ordinance taking
effect, since it was introduced within a very short timeframe making it difficult to anticipate for most
stakeholders to anticipate. However, it could be explained by the first German Ministry of the Environment
issuing a regulation in 1988 for the take back of plastic drinks packaging in reaction to the massive use of
single-use polyethylene terephthalate (PET) bottles. This might explain the observed difference between
Germany and the control group.
Figure 5.5. The German packaging ordinance prompted innovation in plastic recycling
Note: The control group for Germany is composed of Canada (28%), Japan (12%), Netherlands (24%), Korea (13%) and the United States
(23%). The predictors used are log (patent stock in all plastic innovation), log(GDP per capita), log(energy use per capita), log(recycling patent
stock) in 1982, 1984 and 1988. An invention corresponds to a single patent family. The year of the invention corresponds to the application date
of the priority patent. Only granted patents are considered. Plastic recycling patents include mechanical recycling, plastic-to-plastic chemical
recycling, sorting and other pre-treatments. Data before 1990 includes only the Federal Republic of Germany (FRG).
Source: Calculation based on textual analysis of data from the OECD, STI Micro-data Lab: Intellectual Property Database, http://oe.cd/ipstats,
June 2020.
StatLink 2 https://stat.link/7sjehm

108
GLOBAL PLASTICS OUTLOOK © OECD 2022
This case study suggests that plastic recycling policies successfully triggered innovation in plastic
recycling. However, the effect of current and future circular economy policies on the emergence of new
technologies has yet to be fully explored. The next sections take a step back from these aggregated
analyses to present recent trends in specific environmentally relevant plastics innovation and derive policy
implications.
5.3. What are the latest innovation challenges?
5.3.1. Biodegradable plastics innovation is slowing after decades of sustained growth
Biodegradable plastics gained some popularity with the idea they would degrade in the natural environment
into carbon dioxide, water and biomass.7 They are currently used for packaging, agriculture, horticulture,
textiles and consumer goods. Global production capacities of biodegradable plastics was 1.2 Mt in 2019
or less than 0.3% of total plastics (Crevel, 2016[4]; European Bioplastics, 2019[5]).
Innovation in biodegradable plastics, measured by the number of patented inventions, doubled between
1995 and 2017. Between 2013 and 2017, 228 patent families for biodegradable plastics were granted
every year (Dussaux and Agrawala, forthcoming[2]). However, since 2013, the speed of innovation has
slowed down, probably because the environmental impact of compostable plastics has become
controversial due to the issues related to biodegradation in natural environments (Box 5.1).
Box 5.1. “Biodegradable” plastics have become controversial
Microbial degradation of biodegradable polymers is not easily achieved in a natural environment
(Wierckx et al., 2018[6]). For example, to biodegrade in a reasonable time, some polymers such as
polylactic acid (PLA) require the temperature used in industrial composting to be above 60°C (Farah,
Anderson and Langer, 2016[7]). Biodegradation also requires optimal conditions, such as the
concentration of enzymes, strains of microorganisms, temperature, pH value, humidity, oxygen supply
and light. These optimal conditions are rarely present in natural environments (Laycock et al., 2017[8];
Haider et al., 2019[9]).
Napper and Thompson (2019[10]) compared the deterioration of conventional polyethylene bags with
bags that claimed biodegradable, oxo-degradable or compostable properties. The study included
various environments, including open air, buried in soil and submersed in the marine environment. Apart
from the compostable bag in the marine environment, fragments of all bags were present in all
environments after 27 months. Moreover, some bags were still functional as grocery bags after three
years in the soil or a marine environment. Strikingly, the “biodegradable” bags used in this experiment
did not deteriorate faster than conventional polyethylene.
Although most ecotoxicity studies do not find evidence of harmful effects of degradation products
(Haider et al., 2019[9]), when it comes to PLA there are two notable exceptions. Souza et al. (2013[11])
found cytotoxic and genotoxic effects on common onions and Adhikari et al. (2016[12]) found that
microbial activity was inhibited after 84 days of incubation in the soil. Another concern is the use of oxo-
degradable plastics that contain metal salts that act as catalysers to speed up degradation (OECD,
2013[13]; Kershaw, 2015[14]). The degradation of oxo-degradable plastics can release micro fragments
of plastics and metals into the environment, but the effects on soil, water, flora and fauna are still not
well understood. Several countries have already taken regulatory action on oxo-degradable plastics.
For example, since 2015, France has banned bags and packaging made of oxo-degradable plastics
and the European Union has prohibited products made from oxo-degradable plastic since 2019.

109
GLOBAL PLASTICS OUTLOOK © OECD 2022
In addition to biodegradation issues, there are other concerns. First, some biodegradable plastics are
produced from biobased polymers, which whose have mixed environmental impacts are mixed. Second, if
collection and recycling conditions are not suitable, biodegradable plastics may compromise the quality of
the recycled resources (Hornitschek, 2012[15]; Hann et al., 2015[16]). In addition, consumers may become
confused, and put non-compostable plastics in the kitchen waste to be collected for composting.
Furthermore, labelling plastics as biodegradable may suggest that littering is acceptable (Kershaw and
Rochman, 2015[17]).
Despite these drawbacks, making plastics compostable can be an advantage for specific applications. For
example, plastics in a restaurant can be directly composted together with all kitchen waste without further
processing. Also, many different compostable plastics exist, so more innovation in this field could lead to
better polymers and new applications.
5.3.2. Chemical recycling is only emerging but is facing significant challenges
Chemical recycling involves chemical processes that break down the waste polymers into feedstock for
the production of fuels or into new polymers (Thiounn and Smith, 2020[18]). Chemical recycling is different
from incineration, which essentially recovers heat from the combustion of plastic waste. As with mechanical
recycling, sorting and pre-treatment are essential to optimise chemical recycling.
Chemical recycling can be divided in two categories (Figure 5.6). The first category is the transformation
of plastic waste mainly into fuels via thermolysis, also referred to as “plastic-to-fuels” technologies.
Examples of thermolysis processes include thermal cracking, pyrolysis, gasification, hydrothermal
liquefaction and catalytic pressureless depolymerisation (Rahimi and García, 2017[19]).8
Figure 5.6. Chemical recycling covers a wide range of chemical processes
Thermolysis of plastic waste operates at high temperatures that consume a large part of the energy
embodied in the plastics. For instance, pyrolysis typically occurs at 550°C and theoretically requires
1 328 megajoules (MJ) per kg of polyethylene (PE) waste to generate fuels with a calorific value of around
40 MJ per kg of waste (Gao, 2010[20]; Ripley, 2014[21]; Rollinson and Oladejo, 2019[22]). These relatively
high internal energy needs and the focus on the production of fuels, instead of materials, make the term
recycling controversial for most thermolysis processes.

110
GLOBAL PLASTICS OUTLOOK © OECD 2022
Each thermolysis method has different environmental impacts. For example, Khoo (2019[23]) argues that
gasification of mixed plastic waste requires ten times more energy but emits less nitrogen oxides (NOx),
sulphur dioxide (SO2) and particulate matter (PM) than pyrolysis. However, this result is based on old
references and would benefit from further research. Using life cycle analysis (LCA), Demetrious and
Crossin (2019[24]) find that pyrolysis and gasification have lower environmental impacts than landfilling, but
comparable environmental impacts to incineration with energy recovery. Khoo (2019[23]) shows that
pyrolysis and gasification have lower impacts on climate change than incineration with energy recovery,
but significantly higher impacts in terms of terrestrial acidification and particulate matter formation. In the
same study, mechanical recycling is found to vastly outperform these thermolysis processes in terms of
environmental impacts.
The second category of chemical recycling technologies is called solvolysis or “plastic-to-plastic” chemical
recycling. In this process, plastic waste is converted to monomers as feedstock for new polymers
(Figure 5.6). These chemical depolymerisation technologies include hydrolysis, alcoholysis, methanolysis,
glycolysis and aminolysis (BCG, 2019[25]; Das and Pandey, 2007[26]). Plastic-to-plastic chemical recycling
is less controversial than thermolysis because it can potentially reduce the demand for new virgin polymers.
Solvolysis or plastic-to-plastic chemical recycling aims to overcome the principal obstacle faced by
mechanical recycling (downcycling9) by yielding polymers that are identical to the originals.
Plastic-to-plastic technologies are only just emerging and are less mature than the “plastic-to-fuels”
conversion techniques. Between 1995 and 2017, innovation in plastic-to-plastic chemical recycling as
measured by patents only increased by 5.2% every year (Dussaux and Agrawala, forthcoming[2]). This is
not surprising given that plastic-to-plastic chemical recycling has only attracted interest recently, so the
patent data are not yet fully available. In interviews for this study, market actors indicated that they expect
the global capacity of pilot and demonstration plants for “plastic-to-plastic” to grow to at least 140 kilotonnes
of waste per year in 2022.10
The environmental impact of solvolysis depends on the polymer, the method used and local elements such
as the energy mix of for electricity production. One study found that solvolysis of expanded polystyrene
(PS) saves 3.3 tonnes of carbon dioxide equivalent (CO2e) per tonne of input compared to incineration,
which is currently the main route for expanded PS waste (CE Delft, 2019[27]). Conversely, De Andrade et
al. (2016[28]) showed that mechanical recycling of PLA performs better than chemical recycling via
hydrolysis and re-polymerisation, in terms of climate change, human toxicity and fossil fuel depletion.
Mechanical recycling uses 2 649 kJ of electricity per kg of residual PLA, while solvolysis uses 11 211 kJ.
However, a Dutch study found that mechanical recycling of expanded PS has the same climate impact as
solvolysis of expanded PS (Netherlands Institute for Sustainable Packaging, 2018[29]). Another LCA study
found that mechanical recycling of PET trays has lower greenhouse gas emissions than magnetic
depolymerisation,11 but that the difference is not high and limited to 0.7 tonnes of CO2e per tonne of input
(CE Delft, 2019[27]).
However, the results of these LCA studies should be treated with great caution. The environmental impact
of “plastic-to-plastic” recycling is far from being fully understood. A recent review found that it is complicated
to acquire data on environmental impacts of chemical recycling that are of good quality due to the limited
maturity of the solvolysis concept on a commercial scale (Tabrizi et al., 2020[30]). In addition, some
stakeholders warn against overly enthusiastic reactions to chemical recycling as it could reinforce the
acceptance of single-use plastics, thereby delaying the development of waste prevention technologies
(Tabrizi et al., 2020[30]).
5.3.3. Myriad innovations along the value chain of plastics are emerging
In addition to plastic-to-plastic chemical recycling, there are many other emerging innovations that aim to
address the environmental issues associated with plastics. Some notable examples include:

111
GLOBAL PLASTICS OUTLOOK © OECD 2022
Machine learning to sort plastic waste: To achieve a high level of purity, advanced techniques for
sorting plastic waste now involve “deep learning”, in which a machine is trained to recognise
different types of plastics and other materials. For example, machine learning is currently applied
to sort plastic waste from electrical and electronic equipment, such as acrylonitrile butadiene
styrene (ABS), high impact polystyrene (HIPS), polypropylene and crystal polystyrene. It is
especially useful for sorting dark plastics that are difficult to identify using near infrared techniques
due to the absorption of radiation. As computation power keeps increasing, many new algorithms
and applications will be unlocked in the future (Tarun, Sreelakshmi and Peeyush, 2019[31]).
Blockchain tools to foster recycling: The uncertainty about the quality of sorted plastics is a barrier
for plastics manufacturers (Chidepatil et al., 2020[32]). Blockchain is a digital technology that allows
detailed tracking and the verification of information. Blockchain can make the information required
by plastics manufacturers accessible when sorting is combined with multi-sensor-driven artificial
intelligence and when a large share of actors in the supply chain are willing to collaborate. For
example, Radical Innovations Group has developed a blockchain platform with smart contracts that
contain validated data on the waste source, type, colour, quantity, origin and sorting process.
Filter washing bags to reduce microplastics release at source: Plastics or other textiles can be put
into the Guppyfriend Washing Bag to reduce microfibre shedding during washing.12 After washing,
the microfibres captured in the bag can be removed and disposed of in the residual waste bin. The
laundry bag is produced from a plastic woven polyamide and is designed to maximise user-
friendliness.
Autonomous leakage removal systems in rivers and oceans: the Ocean Cleanup Interceptor
2.0 contains barriers that guide floating plastic waste to a vessel that collects the waste. The aim
is to capture leaked plastics in rivers before they enter the ocean.13 The vessel is solar-powered,
works autonomously and can store up to 50 cubic metres of trash.
New delivery models: Innovation is about more than new technologies. Loop is an example of an
organisational innovation in which the business model of a delivery service is changed to avoid
single-use packaging and to reduce the overall environmental footprint.14 Loop delivers online
orders to households in reusable containers that will afterwards be collected, cleaned and refilled.
5.4. How to transition from innovation to scalability?
With so many technologies to choose from, the question arises as to which ones should be developed and
deployed more widely to address the environmental problems caused by the production and use of plastics.
The usefulness of a technology depends strongly on the context of a country. For instance, massive
deployment of proprietary filtration systems might not be cost effective for countries that have centralised
wastewater treatment plants (WWTP) capable of capturing microplastics from wastewater installed all over
the country.15 They may, however, be effective for other countries. In addition, capturing plastic debris from
rivers makes more sense in countries where mismanaged waste is a major issue.
Innovation in products, processes and business models is essential, but is only part of what is needed. In
order to prioritise technologies for a more circular use of plastics and to give compelling incentives to
consumers and entrepreneurs, a comprehensive set of policies is required, including regulations,
education and information campaigns to drive behavioural changes. Innovations will only be scaled up if
there is strong market demand. Using regulatory obligations and financial incentives, policy makers can
set market conditions that enhance the uptake of circular technologies in consumption and production
patterns. Moreover, upstream policies will be needed to restrain the overall consumption of materials.
These policy issues are the topic of the next chapter.

112
GLOBAL PLASTICS OUTLOOK © OECD 2022
References
Adhikari, D. et al. (2016), “Degradation of bioplastics in soil and their degradation effects on
environmental microorganisms”, Journal of Agricultural Chemistry and Environment, Vol. 5/1,
p. 23.
[12]
Aguiar, A. et al. (2019), “The GTAP Data Base: Version 10”, Journal of Global Economic
Analysis, Vol. 4/1, pp. 1-27, http://dx.doi.org/10.21642/jgea.040101af.
[34]
BCG (2019), A Circular SOlution to Plastic Waste. [25]
Benavides, P. et al. (2018), “Exploring Comparative Energy and Environmental Benefits of
Virgin, Recycled, and Bio-Derived PET Bottles”, ACS Sustainable Chemistry & Engineering,
Vol. 6/8, pp. 9725-9733, http://dx.doi.org/10.1021/acssuschemeng.8b00750.
[36]
Bown, C. (2020), COVID-19: China’s exports of medical supplies provide a ray of hope, Peterson
Institute for International Economics, https://www.piie.com/blogs/trade-and-investment-policy-
watch/covid-19-chinas-exports-medical-supplies-provide-ray-hope.
[41]
CE Delft (2019), “Exploratory study on chemical recycling. Update 2019. What are the
opportunities for climate policy, now in the future?”.
[27]
Chateau, J., R. Dellink and E. Lanzi (2014), “An Overview of the OECD ENV-Linkages
Model: Version 3”, OECD Environment Working Papers, No. 65, OECD Publishing, Paris,
http://dx.doi.org/10.1787/5jz2qck2b2vd-en.
[33]
Chidepatil, A. et al. (2020), “From Trash to Cash: How Blockchain and Multi-Sensor-Driven
Artificial Intelligence Can Transform Circular Economy of Plastic Waste?”, Administrative
Sciences, Vol. 10/2.
[32]
Crevel, R. (2016), “Bio-based food packaging in Sustainable Development: Challenges and
opportunities to utilize biomassresidues from agriculture and forestry as a feedstock for bio-
based food packaging”, FAO.
[4]
Das, S. and S. Pandey (2007), “Pyrolysis and catalytic cracking of municipal plastic waste for
recovery of gasoline range hydrocarbons”, Doctoral dissertation, National Institute of
Technology Rourkela.
[26]
De Andrade, M. et al. (2016), “Life cycle assessment of poly (lactic acid)(PLA): comparison
between chemical recycling, mechanical recycling and composting.”, Journal of Polymers and
the Environment, Vol. 24/4, pp. 372-384.
[28]
Demetrious, A. and E. Crossin (2019), “Life cycle assessment of paper and plastic packaging
waste in landfill, incineration, and gasification-pyrolysis”, Journal of Material Cycles and
Waste Management, Vol. 21/4, pp. 850-860.
[24]
Dussaux, D. and S. Agrawala (forthcoming), “Quantifying innovation for a circular plastic
economy”, Forthcoming OECD ENV Working Paper.
[2]
European Bioplastics (2019), Bioplastics market data 2019 - Global production capacities of
bioplastics 2019-2024.
[5]

113
GLOBAL PLASTICS OUTLOOK © OECD 2022
Farah, S., D. Anderson and R. Langer (2016), “Physical and mechanical properties of PLA, and
their functions in widespread applications—A comprehensive review.”, Advanced drug
delivery reviews, Vol. 107, pp. 367-392.
[7]
Gao, F. (2010), “Pyrolysis of Waste Plastics into Fuels”, A Thesis, University of Canterbury.. [20]
Haider, T. et al. (2019), “Plastics of the future? The impact of biodegradable polymers on the
environment and on society”, Angewandte Chemie International Edition, Vol. 58/1, pp. 50-62.
[9]
Hann, S. et al. (2015), “The Impact of the Use of “Oxo-degradable” Plastic on the Environment”,
Final Report for the European Commission DG Environment. Project conducted under
Framework Contract No ENV.A.2/FRA/2015/0008and 07.0201/2016/748104/ETU/ENV.B.3.
[16]
Hornitschek, B. (2012), “Impact of degradable and oxydegradable plastics carrier bags on
mechanical recycling”, Report by the Transfer Center for Polymer Technology (TCKT) on
behalf of the European Plastic Converters (EuPC), p. 22.
[15]
Kershaw, P. (2015), “Biodegradable Plastics & Marine Litter: Misconceptions, Concerns and
Impacts on Marine Environments”, UNEP GPA.
[14]
Kershaw, P. and C. Rochman (2015), “Sources, fate and effects of microplastics in the marine
environment: a global assessment.”, Joint Group of Experts on the Scientific Aspects of
Marine Environmental Protection (GESAMP), Vol. 93.
[17]
Khoo, H. (2019), “LCA of plastic waste recovery into recycled materials, energy and fuels in
Singapore”, Resources, Conservation and Recycling, Vol. 145, pp. 67-77.
[23]
Law, K. et al. (2020), “The United States’ contribution of plastic waste to land and ocean”,
Science Advances, Vol. 6/44, http://dx.doi.org/10.1126/sciadv.abd0288.
[45]
Laycock, B. et al. (2017), “Lifetime prediction of biodegradable polymers”, Progress in Polymer
Science, Vol. 71, pp. 144-189.
[8]
Merrington, A. (2017), “Recycling of Plastics”, in Applied Plastics Engineering Handbook:
Processing, Materials, and Applications: Second Edition, Elsevier Inc.,
http://dx.doi.org/10.1016/B978-0-323-39040-8.00009-2.
[44]
Napper, I. and R. Thompson (2019), “Environmental deterioration of biodegradable, oxo-
biodegradable, compostable, and conventional plastic carrier bags in the sea, soil, and open-
air over a 3-year period”, Environmental science & technology, Vol. 53/9, p. 47.
[10]
Narin, F. (1995), “Patents as indicators for the evaluation of industrial research output”,
Scientometrics, Vol. 34/3, pp. 489-496.
[1]
Netherlands Institute for Sustainable Packaging (2018), “Chemical recycling of plastic packaging
materials. Analysis and opportunities for upscaling”.
[29]
OECD (2021), Trends of ODA for a sustainable ocean economy, OECD, Paris, https://oecd-
main.shinyapps.io/ocean/.
[38]
OECD (2018), Improving Markets for Recycled Plastics: Trends, Prospects and Policy
Responses, OECD Publishing, Paris, https://dx.doi.org/10.1787/9789264301016-en.
[37]

114
GLOBAL PLASTICS OUTLOOK © OECD 2022
OECD (2013), “Policies for Bioplastics in the Context of a Bioeconomy”, OECD Science,
Technology and Industry Policy Papers, No. 10, OECD Publishing, Paris,
https://dx.doi.org/10.1787/5k3xpf9rrw6d-en.
[13]
OECD (1998), “Extended Producer Responsibility Phase 2: Case study on the German
packaging ordinance”.
[3]
OECD (n.d.), Intellectual Property Database, https://www.oecd.org/sti/intellectual-property-
statistics-and-analysis.htm (accessed on 1 June 2020).
[46]
Rahimi, A. and J. García (2017), “Chemical recycling of waste plastics for new materials
production”, Nature Reviews Chemistry, Vol. 1/6, pp. 1-11.
[19]
Ren, D. (2020), China boosts face mask production capacity by 450 per cent in a month,
threatening a glut scenario, South China Morning Post,
https://www.scmp.com/business/companies/article/3075289/china-boosts-face-mask-
production-capacity-450-cent-month.
[39]
Ripley, J. (2014), “Routine Caol and Coke Analysis: Collection, Interpretation, and Use of
Analytical Data MNL57-2ND (2nd Edn), Chapter 5: Proximate Analysis”, ASTM International,
West Conshohocken, pp. 29-48.
[21]
Rollinson, A. and J. Oladejo (2019), “‘Patented blunderings’, efficiency awareness, and self-
sustainability claims in the pyrolysis energy from waste sector”, Resources, Conservation and
Recycling, Vol. 141, pp. 233-242.
[22]
SCIO (2020), Fighting COVID-19: China in Action, The State Council, The People’s Republic of
China, http://english.scio.gov.cn/whitepapers/2020-06/07/content_76135269.htm.
[40]
Souza, P. et al. (2013), “PLA and organoclays nanocomposites: degradation process and
evaluation of ecotoxicity using Allium cepa as test organism”, Journal of Polymers and the
Environment, Vol. 21/4, pp. 1052-1063.
[11]
Stefanini, R. et al. (2020), “Plastic or glass: a new environmental assessment with a marine litter
indicator for the comparison of pasteurized milk bottles”, The International Journal of Life
Cycle Assessment, Vol. 26/4, pp. 767-784, http://dx.doi.org/10.1007/s11367-020-01804-x.
[35]
Subramanian, S. (2020), How the face mask became the world’s most coveted commodity, The
Guardian, https://www.theguardian.com/world/2020/apr/28/face-masks-coveted-commodity-
coronavirus-pandemic.
[42]
Tabrizi, A. et al. (2020), “Understanding the Environmental Impacts of Chemical Recycling – ten
concerns with existing life cycle assessments”, Zero Waste Europe, Brussels.
[30]
Tarun, K., K. Sreelakshmi and K. Peeyush (2019), “Segregation of Plastic and Non-plastic Waste
using Convolutional Neural Network”, IOP Conference Series: Materials Science and
Engineering, Vol. 561/1, p. 012113.
[31]
Thiounn, T. and R. Smith (2020), “Advances and approaches for chemical recycling of plastic
waste”, Journal of Polymer Science, Vol. 58/10, pp. 1347-1364.
[18]
Wang, C. et al. (2020), “Structure of the global plastic waste trade network and the impact of
China’s import Ban”, Resources, Conservation and Recycling, Vol. 153,
http://dx.doi.org/10.1016/j.resconrec.2019.104591.
[43]

115
GLOBAL PLASTICS OUTLOOK © OECD 2022
Wierckx, N. et al. (2018), “Plastic biodegradation: Challenges and opportunities”, Consequences
of Microbial Interactions with Hydrocarbons, Oils, and Lipids Biodegradation and
Bioremediation, pp. 1-29.
[6]
Notes
1 A patent family is a collection of patent applications covering the same or similar technical content. See
Dussaux and Agrawala (forthcoming[2]) for more information on the methodology and on the advantages
and drawbacks of patent data.
2 However, use of patent data remains the favoured option since it captures all categories of innovation;
trademark data can only recover innovation in a limited number of fields.
3 See Dussaux and Agrawala (forthcoming[2]) for more details on the methodology.
4 We exclude Austria and France because they introduced an EPR scheme for packaging in 1993, and we
exclude Sweden as it introduced one in 1994.
5 The predictors used are log (patent stock in all plastic innovation), log (GDP per capita), log (energy use
per capita), log (recycling patent stock) in 1982, 1984 and 1988.
6 The predictors are well balanced between Germany and the control group. The result is robust when
backdating the treatment five years in advance. Permutation distribution of the placebo indicates that the
increase is significantly different to zero. The result is also robust when excluding all donor countries
separately (leave-one-out) except Canada. A similar analysis shows that the packaging ordinance had no
statistically significant effect on all plastic innovation. See Dussaux and Agrawala (forthcoming[2]) for more
details.
7 A European standard, EN 13432, defines biodegradability as a biodegradation level of at least 90% that
must be reached in less than six months. For disintegrability, the mass of test material residues greater
than 2 mm must be less than 10% of the initial mass.
8Catalytic pressureless depolymerisation is also known as the Katalytische Drucklose Verölung (KDV)
process.
9 Downcycling occurs during mechanical recycling when contaminated plastic waste is melted into a new
raw material the properties of which are poorer than the original plastic products. For example, the plastic
waste from a jug of milk is not used again for the production of a new jug of milk but can only be used for
less demanding applications such as a layer of a detergent packaging.
10 As not all actors were interviewed, this estimate should be taken with caution.
11 Magnetic depolymerisation is a technology developed by the Dutch start-up Ioniqa, and consists of
chemically depolymerising PET under the influence of a magnetic liquid. Magnetic depolymerisation of

116
GLOBAL PLASTICS OUTLOOK © OECD 2022
PET removes various dyes and contaminants from PET waste and produces virgin equivalent BHET that
can used as raw material for PET production (https://ioniqa.com/).
12 Guppyfriend was registered as a EUIPO trademark in December 2018 and as a USPTO trademark in
May 2020. An EPO patent was granted in November 2019. Patents were also filed in Japan and in the
United States.
13 The Interceptor was registered as a EUIPO trademark in April 2019.
14 For details see https://loopstore.com/how-it-works.
15 Nevertheless, the management of microplastics captured in WWTP sludges that are mostly used for
agricultural land is still problematic (see Chapter 2).

117
GLOBAL PLASTICS OUTLOOK © OECD 2022
Policy makers around the world are looking for effective instruments to tackle
the environmental pressures from the production, consumption and end-of-
life management of plastics. This chapter describes the policy approaches
and key instruments available to address these issues. It takes stock of the
current global policy landscape and lays out a policy roadmap to reduce the
leakage of land-based macroplastics and to make the lifecycle of plastics
more circular
6. The policy landscape

118
GLOBAL PLASTICS OUTLOOK © OECD 2022
KEY MESSAGES
Plastics have a wide range of environmental impacts, with leakage of macroplastics into the
environment as a top priority to governments. Reducing these impacts requires a
comprehensive set of complementary policy instruments, grouped into restraining demand,
designing for circularity, enhancing recycling, closing leakage pathways and cleaning up.
An inventory of economic and regulatory measures across 50 countries, representing 69% of
the global population and 84% of global gross domestic product (GDP), suggests that the
current policy landscape for plastics is fragmented and can be strengthened significantly.
Restraining demand can bring the largest environmental gains: fewer plastics in use mean less
embodied energy, fewer health risks and less plastic waste to deal with. Plastics taxes, recycled
content targets and extended producer responsibility (EPR) with fee modulation schemes can
all create financial incentives to reduce use and foster circularity. Only a few countries are
experimenting with these innovative economic instruments and targets – their adoption needs
to be extended to more products and more countries.
Recycling can be encouraged through financial incentives. EPR, landfill taxes and incineration
taxes work well for enterprises and municipalities. However, only 33 out of the 50 analysed
countries (representing 18% of the population covered by the inventory) have national
regulations and operational schemes for EPR in place, while 25 countries (representing 11% of
the covered population) have effectively implemented national landfill and incineration taxes.
Households can be encouraged to sort plastic waste at source through deposit-refund and Pay-
as-You-Throw schemes. Yet only 13 countries (representing 4% of the covered population) are
subject to such schemes.
While bans and taxes on single-use plastics are a popular approach to reducing litter – having
been implemented globally by more than 120 countries – they only target a small share of
plastics by volume and may not always have positive environmental outcomes. Enlarging the
scope of anti-littering policies and enhancing implementation of legislation on the ground is
needed to structurally reduce plastics littering.
Leakage pathways can be closed by investing in basic waste management infrastructure. With
mismanaged waste a widespread problem, especially in developing economies, major
investments in infrastructure are needed, combined with support for effective legal frameworks
to enforce disposal obligations for all economic actors.
Our analysis concludes with a roadmap which can be adopted by all countries. It involves three
increasingly ambitious phases: 1) close leakage pathways: build sanitary waste management
infrastructure, organise waste collection and ban or tax frequently littered items; 2) create
incentives for recycling and enhance sorting at source; and 3) restrain demand and optimise
design to make plastic value chains more circular and recycled plastics more price competitive.
6.1. A broad array of policy instruments is needed to address the negative
impacts of plastics use
The production, consumption and end-of-life management of plastics generate a wide range of
environmental impacts, including greenhouse gas emissions, water and air pollution, and the release of
hazardous chemicals. The most notorious negative effect of plastics is the increased mortality of marine
species, due to entanglement in floating plastic debris or ingestion of plastic particles. But plastic litter in
the marine environment also has substantial economic costs due to negative impacts on tourism and

119
GLOBAL PLASTICS OUTLOOK © OECD 2022
fishing (Krelling, Williams and Turra, 2017[1]). Human health concerns have also emerged over certain
plastic additives and substances being inhaled, or ingested in food.
Of the many of impacts of plastics use, the release of plastic waste and litter into the environment is one
of the issues currently of most concern to governments. To address this issue, there are essentially five
policy approaches that can be used (Figure 6.1):
Restrain demand: reduce the excessive amount of plastics and other materials in use by promoting
longer product lifespans, reuse, a demand shift to services and other upstream measures.
Design for circularity: make the plastic production process more circular by avoiding hazardous
materials in the lifecycle, maximising recycled content and adopting other design measures.
Enhance recycling: close material loops by sorting and recycling plastic waste.
Close leakage pathways: decrease losses into the environment through, among others, effective
waste plastic collection and disposal (e.g. disposal in sanitary landfills) and effective waste water
treatment plants (WWTP).
Clean up: remove plastic from the environment, e.g. via beach clean-up activities or installing river
litter booms that capture plastics before they flow into oceans.
Policies to address microplastics are much less well evolved than policies for macroplastics. There remains
significant uncertainty about the effectiveness of measures that can be used to mitigate unintentionally
released microplastics (e.g. those that occur during production and use, such as releases of microfibres
when garments are washed) (OECD, 2021[2]). As a consequence, there is also uncertainty about which
policy approaches are best suited to address microplastic leakage. This chapter therefore focuses on land-
based macroplastics and only includes microbeads incorporated into cosmetics and detergents because
these microplastics can easily be replaced with more environmentally friendly materials. Voluntary and
regulatory approaches to phase out and substitute intentionally added microbeads are already becoming
widespread.
Figure 6.1. Policy approaches to reduce plastic leakage
Note: EPR = Extended Producer Responsibility; MSW = municipal solid waste; WWTP = waste water treatment plant.

120
GLOBAL PLASTICS OUTLOOK © OECD 2022
Reducing the negative impacts of macroplastics requires intervention through a broad array of policy
instruments (Figure 6.2). Some of these instruments specifically target plastics, whereas others have a
broader scope and address a wider range of waste or material types. For instance, bans and taxes on
single-use plastics are very targeted and aim to diminish the use of items such as plastic bags, while landfill
taxes usually address solid waste more generally with the aim to discourage disposal and encourage
recycling or energy recovery.
Sectoral policies, such as for chemicals, waste management, agriculture or construction, can also be
useful, as can policies that address specific externalities, such as a carbon tax aiming to reduce
greenhouse gas (GHG) emissions. Some policies are more relevant at local or national levels (e.g. waste
management legislation), whereas others are implemented at the international level (e.g. trade rules for
plastic waste).
Figure 6.2. The scope of policies that affect plastics management is large
Note: MSW = municipal solid waste, SUP = single-use plastic products.
None of the policy instruments that have been selected for this review of the plastics policy landscape will
be highly effective on their own – they need to be embedded in a broader policy mix which combines a
number of mutually supportive and complementary instruments. In addition to steering policy instruments
(such as legally binding regulatory interventions, mandatory standards and economic instruments), a range

121
GLOBAL PLASTICS OUTLOOK © OECD 2022
of enabling and soft policies – such as research and development (R&D) investment, communication,
nudging and education measures, voluntary approaches and stakeholder alliances – are also needed
(Figure 6.3).
Figure 6.3. A comprehensive policy package requires a mix of steering and enabling policies
The review and assessment of a limited set of policy instruments in this report (predominantly regulatory
and economic instruments) is a substantial simplification. Nevertheless, regulatory and economic
instruments are essential to provide the right incentive structure for an environmentally sound plastics
economy and the presence of these instruments usually correlates with reduced mismanaged plastic waste
and greater plastics recycling rates, amongst others (Watkins et al., 2012[3]).
6.2. The fragmented use of economic and regulatory instruments leaves room for
improvement
The OECD has recently developed a Plastics Policy Inventory to analyse steering policy instruments. The
inventory contains key economic and regulatory policy instruments that are exclusively focused on plastics,
as well as broader instruments that target products and waste streams, such as municipal solid waste
(MSW), that contain important fractions of plastics. It covers policy in 50 countries: the 38 OECD member
countries, as well as 12 non-OECD countries selected for the size of their populations and their geographic
coverage (Brazil, the People’s Republic of China, India, Indonesia, Russia and South Africa, as well as
several countries with large populations in South-East Asia and Africa) (Table 6.1). Overall, the inventory
covers 69% of the world’s population and 84% of global GDP. The policy inventory relies on an extensive
literature review, including the OECD Policy Instruments for the Environment (PINE) database (OECD,
2021[4]), UNEP (2018[5]), Cornago et al. (2021[6]), OECD (forthcoming[7]), Ecoprog (2020[8]) and Karasik et
al. (2020[9]). Moreover, for the non-OECD countries, local experts provided individual country case studies
to validate and expand the information in the inventory. The inventory includes policies that came into force
before December 2020. Despite the extensive research, gaps in the inventory or issues with classification
are still possible, so all results need to be interpreted with care (Box 6.1).
This section draws on the analysis of the inventory to assess the global plastics policy landscape and
highlight gaps that need to be addressed, based on the five key policy areas shown in Figure 6.1.

122
GLOBAL PLASTICS OUTLOOK © OECD 2022
Box 6.1. Mapping and benchmarking international policy instruments is challenging
Mapping and comparing the use of policy instruments in different countries can yield valuable insights
and best practices. However, global inventories of polices encounter a range of difficulties:
Not all policies stated in policy documents are operational in practice.
Existing economic or industrial policies are sometimes rebranded as “circular” without actually
including new circular obligations.
In countries with a federal structure, there can be diversity in regulations adopted by the states,
provinces or regions.
Enabling policies such as communication campaigns are sometimes heralded as flagship
actions without assessing their impact.
The benefits of upstream measures to restrain demand and promote eco-design are often
intangible.
Definitions, available data, measurement methodologies and framework conditions relating to
materials and waste management differ structurally between countries.
Consequently, international policy inventories can highlight key circular economy trends, but should be
interpreted with care.
Current bans and taxes on single-use items are insufficient to restrain demand
The largest environmental gains can be achieved by reducing excessive use of plastics. Fewer plastics in
use mean less embodied energy, fewer health risks and less plastic waste to deal with. However, steering
production and consumption patterns requires sophisticated policies that take into account international
trade and potentially undesirable side-effects.
Many countries have taken measures to curb the use of microbeads in rinse-off applications, and single-
use items such as straws or polystyrene food packaging. However, most attention has been paid to single-
use plastic shopping bags. According to UNEP (2020[10]), 127 countries have already issued legislation to
either ban, tax or regulate the use of plastic shopping bags. This includes emerging markets such as
Botswana, Mongolia and Yemen. However, not all of these regulations are fully implemented or enforced
(OECD, 2021[11]). Moreover, an exclusive focus on plastics can lead to other materials being used instead,
rather than to a reduction overall (Box 6.2). Most importantly, these measures focus on small product
streams, which means that while they may reduce littering, they have less impact on total volumes in use.
There are plenty of soft measures used to restrain demand and use resources more efficiently. For
example, communication and nudging strategies are being used to promote reuse and product sharing
services (PBM, 2020[12]). However, despite frequent calls for “plastics taxes”, there are no economy-wide
taxes or obligations that steer consumption structurally away from plastics. This is partly due to the
complexity of introducing taxes in an international market and the potential disadvantages of material
substitution (Box 6.2). On the other hand, there are still many examples of fossil fuel subsidies that
incentivise overconsumption by keeping the prices of plastics feedstock low (OECD/IEA, 2021[13]).

123
GLOBAL PLASTICS OUTLOOK © OECD 2022
Box 6.2. Targeting plastic shopping bags is only part of the picture
The case of plastic shopping bags highlights how an exclusive focus on plastic products can induce
substitution without reducing the overall footprint of consumption. In recent years, taxes on single-use
plastic shopping bags have been successfully implemented in many parts of the world (IEEP, 2017[14]).
However, in some cases the exclusive focus on plastics has induced a shift to other materials, rather
than reducing materials consumption overall. For example, a 2009 litter study found that the introduction
of a partial ban on polystyrene cups in San Francisco reduced littered polystyrene cups, but also
prompted a sharp increase in the littering of paper cups instead (HDR, 2009[15]; Cornago, Börkey and
Brown, 2021[6]).
The use of plastics is often perceived by consumers as the least favourable alternative for packaging,
but there are many cases where this intuition is contradicted by life cycle analyses (LCAs) (Boesen, Bey
and Niero, 2019[16]; Stefanini et al., 2020[17]). For example, a recent meta-analysis of seven LCAs
concludes that single-use polyethylene (PE) bags have lower climate impact and cause less
acidification, eutrophication and ozone-related impacts than non-plastic single-use alternatives such as
paper bags, mainly because of their much lighter weight (UNEP, 2020[18]). Therefore, legislation that
targets products such as shopping bags should take into account possible substitution effects and aim
to incentivise reuse (Cornago, Börkey and Brown, 2021[6]).
Innovative policies are needed to encourage design for circularity
Design is deeply entrenched in both production and sales processes, and affects the environmental
footprint of plastics throughout their lifecycle. Product norms, regulatory risk assessment schemes and
bans on hazardous substances are in place in many countries. Although these regulatory instruments are
critical to detoxify materials’ lifecycles (Box 6.3), they are only able to affect a tiny share of the substances
that generate health risks (Wiesinger, Wang and Hellweg, 2021[19]). Moreover, the multitude of products
and the speed of innovation make it challenging for regulatory instruments to steer design processes.
Therefore, several countries are exploring how to apply innovative economic instruments and binding
targets to foster the design of more circular products. For instance:
France uses EPR (Box 6.4) to incentivise eco-design. By modulating EPR fees, i.e. recycling
contributions paid by producers, circular product designs receive a bonus or penalty depending on
their design criteria (Laubinger et al., 2021[20]). Similar eco-modulation measures are in place or
envisioned in Canada (Quebec), Chile, Estonia, Italy and Portugal (Box 6.4). However, more
research is needed to substantiate the effectiveness of the measure for instigating design changes.
In 2022, the United Kingdom will apply a GBP 200 per tonne tax on packaging plastics that contain
less than 30% recycled content.
The European Union has launched several new regulations:
o A directive1 which obliges Member States to introduce modulated EPR fees that take into
account, where possible, a product’s durability, reparability, re-usability and recyclability, as
well as the presence of hazardous substances. Guidance on how to implement modulated EPR
fees is currently being drafted (Laubinger et al., 2021[20]).
A mandatory 25% recycled content target for polyethylene terephthalate (PET) bottles by 2025
and 30% for all beverage bottles by 2030.2
California is the first US state to impose a recycled content target for plastics in beverage
containers. The target will start at 15% in 2022 and climb to 50% in 2050.
124
GLOBAL PLASTICS OUTLOOK © OECD 2022
Box 6.3. Aligning regulation of chemical substances and design approaches across countries can reduce health risks and improve circularity
The selection of chemicals at the design stage determines health and environmental impacts along the
entire lifecycle of a product (OECD, 2021[21]). For example, orthophthalates or phthalates are a large
group of chemicals that can, among other things, be used as a plasticiser for PVC to make the rigid
material flexible. Applications include electrical wires, gloves, toys and flexible flooring tiles as well as
cosmetics and personal care products. Phthalate use is widespread and biomonitoring of urine samples
shows that we take up significant volumes via ingestion and other routes of exposure (Holland, 2018[22];
CDC, 2021[23]; 2021[24]). Some phthalates, such as DEHP, BBP and DBP, have proven adverse health
effects (e.g. reduced long-term fertility), with high frequency of exposure, high concentrations and
cumulative exposure to different phthalates increasing the risks (Benjamin et al., 2017[25]; Engel et al.,
2021[26]; Silano et al., 2019[27]). Clearly, the use of such hazardous substances in plastics and plastic
products raises concerns at the production, use and waste stages. Risk assessments to better
understand potential impacts, government regulations to restrict their use and industry commitments to
phase out such hazardous substances, are critical to achieving safer and more circular materials.
Regulatory and industrial efforts to detoxify material loops are, however, hampered by several problems.
The first issue is the international disparity of policies, as illustrated by the example of phthalates. For
example, Australia restricts the use of DEHP in plastics applications for children to a maximum weight-
based level of 1% (Australian Competition & Consumer Commission, 2021[28]; Commonwealth of
Australia, 2011[29]). This regulation is complemented by a voluntary commitment by the Australian PVC
industry to phase out phthalates in food contact packaging, and to phase out the more mobile and
potentially more hazardous low-weight phthalates3 from all applications by 2023 (Vinyl Council Australia,
2018[30]). The United Kingdom and European Union also have legal restrictions in place for several
phthalates.4 In the EU the maximum weight-based level for DEHP, in combination with other targeted
phthalates, is 0.1% for toys and childcare applications, as well as for some other consumer applications.
In addition, the European PVC industry has succeeded in almost phasing out low molecular phthalates
by substituting them with high molecular weight phthalates and non-phthalate plasticisers (Vinyl Plus,
2021[31]; INERIS, 2021[32]). In contrast, in most non-OECD countries there are no restrictions in place
and low molecular phthalates are still widely used in consumer applications. In 2016, DEHP was not
only the largest plasticiser, with global consumption estimated at 3 million tonnes, but sales volumes
were still growing (Polymers, 2017[33]). Such disparate regulatory frameworks incur compliance costs
but leave health risks unaddressed on a global level. For example, in 2017, inspectors contributing to
an EU-wide project co-ordinated by the European Chemical Agency (ECHA), analysed almost
5 000 imported articles and found that 18% contained non-compliant chemical substances. The most
frequent breach concerned high concentrations of phthalates in toys (ECHA, 2018[34]). International
co-operation to align regulations and market conditions is needed to prevent health hazards while
generating efficiency gains by removing obstacles to trade (Chapter 7).
A second important barrier to the detoxification of material loops is the presence of historical hazardous
substances in the economy. For example, at the end-of-life stage, the presence of DEHP in recycled
plastics has created controversy regarding trade-offs between the benefits of removing hazardous
substances from materials loops, and the need to increase recycling rates. The granting of
authorisations for use of recycled soft PVC containing DEHP in the EU has led to public debate and
even legal disputes (Chemical Watch, 2021[35]; European Parliament, 2015[36]). Proactively designing
plastics with a sustainable chemistry perspective will reduce misalignment and lessen the need to deal
with legacy chemical issues in the future.

125
GLOBAL PLASTICS OUTLOOK © OECD 2022
Box 6.4. Extended Producer Responsibility has proven its worth, but challenges remain
The OECD defines EPR as an environmental policy approach that gives producers financial or physical
responsibility for a product’s entire lifecycle, including the treatment or disposal of post-consumer
products (OECD, 2001[37]) (Figure 6.4). EPR has been successfully implemented to increase recycling
rates in a range of countries and across a diversity of products, such as packaging, batteries, cars,
electronics and tyres (Kaffine and O’Reilly, 2015[38]).
Figure 6.4. Extended producer responsibility
Note: The block arrows represent physical flows of products, packaging or waste. The dotted lines represent financial flows.
The most common type of EPR works by imposing recycling targets or other obligations on producers
to internalise external costs and create a stable financing framework for recycling. Consumers pay for
waste management at the moment of procurement, rather than at the moment of disposal, which is
difficult to monitor.
Despite its success in many high-income countries, several announced EPR regulations have been
abandoned in emerging economies, due to, among other reasons, weak institutions and resistance by
stakeholders (OECD, 2016[39]). Following the public call to action on plastics, several organisations
representing international companies have taken bold positions in favour of EPR, including the
Consumer Goods Forum (2020[40]) and the Ellen MacArthur Foundation (2021[41]). The support of such
stakeholders stresses the potential of EPR to foster the circular use of plastics and may give the impetus
to promote EPR implementation across the world.
In pursuing economies of scale, most EPR schemes are organised industry-wide, which severs the link
between product design and recycling liabilities for individual producers. Consequently, without further
intervention, producers have few financial incentives to invest in eco-design (OECD, 2016[39]).
Modulating EPR fees (i.e. recycling contribution) is one way forward, allowing producers with a more
circular design to pay a lower EPR fee. Several countries are experimenting with modulated EPR fees,
but their implementation needs to be scaled up to have substantial impact (Laubinger et al., 2021[20]):
Quebec, Canada (packaging): fee reduced by 20% for packaging that is entirely manufactured
with recycled content.
Estonia (packaging): Reusable packaging does not need to be declared as long as it is reused
effectively.
France (packaging): 100% fee increase for non-recyclable material (per national guidelines) and
opaque PET with >4% mineral filler.
France (textiles): 50% fee reduction for textiles and shoes with 15% recycled fibres/materials.
France (electronics): 20% fee reduction for a washing machine or dish washer with spare parts
available up to 11 years, or post-consumer recycled content > 10%.
Portugal (packaging): 10% penalty applied to PET bottles with PVC label or metal cap, and glass
bottles with stopper made of ceramic or steel.
Chile (packaging): bonus/malus based on recyclability and recycled content of packaging.
126
GLOBAL PLASTICS OUTLOOK © OECD 2022
Recycling and sorting can be enhanced by making them profitable
Plastics are only recycled on a large scale if it is profitable to do so. Economic and regulatory policy
instruments can ensure a business case for collecting and recycling plastic waste. Moreover, incentivising
sorting at source is a critical lever because the quality of sorting determines the purity and value of recycled
materials, and therefore the profitability of recycling operations.
Table 6.1 combines data from the OECD Plastics Policy Inventory with the fraction of municipal solid waste
that is mismanaged per country (Kaza et al., 2018[42]). It suggests that there is significant scope for
countries to further strengthen their policy frameworks for recycling:
Recycling incentives for enterprises and municipalities can be strengthened effectively by EPR,
landfill taxes and incineration taxes (Box 6.4 and Box 6.5). However, Table 6.1 highlights that these
well-known policy instruments operate on a national scale only in a limited number of countries,
covering 11% of the population in the global inventory, or 42% of the OECD population.
Sorting at source by households can be enhanced effectively by deposit-refund systems for
beverage bottles and Pay-as-You-Throw schemes, i.e. schemes where citizens have to pay a
variable cost per kg or per bag of mixed waste (Box 6.5). (ACR plus, 2019[43]; Zhou et al., 2020[44]).
For example, deposit-refund systems for beverage bottles can increase collection rates beyond
90% and reduce litter rates substantially (Reloop Platform, 2020[45]). However, Table 6.1 shows
that only 4% of the population covered in the global inventory have at least one of these instruments
in place on a national scale.
Box 6.5. Taxes can be powerful levers to change behaviour, as seen in several OECD countries
Pay-as-You-Throw encourages sorting at source in Belgium
In Belgium, Pay-as-You-Throw is a central pillar of the policy portfolio to encourage citizens to sort their
waste. Flanders, one of Belgium’s three regions, mandates municipalities to set a variable price for
mixed waste collection of between EUR 0.11 and 0.33 per kg. Therefore, for a single 10kg bag of mixed
waste, the cost could reach EUR 3.3 (Government of Flanders, 2021[46]). These financial incentives,
combined with other measures, have led to one of the highest sorting and material recovery rates in
Europe and the world (Eurostat, 2021[47]; OECD, 2021[48]). A crucial success factor is combining Pay-
as-You-Throw with sustained awareness campaigns and enforcement measures to avoid mixed waste
being disposed of in recycling receptacles or dumped in the street to avoid paying the variable fee. A
fixed annual fee to finance waste management does not qualify as Pay-as-You-Throw because it does
not give financial incentives to sort waste.
The landfill tax discourages landfilling in the United Kingdom
The UK introduced a landfill tax in 1996 and has gradually increased the rates over time. The standard
rate for 2021 reached GBP 96.7 per tonne. This landfill “ladder” is considered a key driver of the
reduction of the share of MSW landfilled from 86% (440 kg per inhabitant) in 1996 to 15% (69 kg per
inhabitant) in 2018 (UK Government, 2021[49]).
Landfill taxes can only be successful when illegal dumping can be countered by effective regulation and
operational control mechanisms.
The plastic bag tax as a game-changer for plastic bag littering in Ireland
In 2002, Ireland introduced a tax of EUR 0.15 on single-use plastic bags. This acted as a direct incentive
to consumers to reduce the amount of shopping bags consumed and littering fell sharply. Discarded
plastic bags amounted to about 5% of litter pollution in 2001 but dropped to less than 0.5% after 2003
(OECD, 2021[50]).

127
GLOBAL PLASTICS OUTLOOK © OECD 2022
Table 6.1. The use of key policy instruments to enhance recycling is disparate across the world
Source: OECD Plastics Policy Inventory and (Kaza et al., 2018[42]).

128
GLOBAL PLASTICS OUTLOOK © OECD 2022
In addition to the economic and regulatory instruments showcased in Table 6.1, several countries also rely
on voluntary initiatives or agreements with the private sector. For example, in Australia the packaging
industry has committed to recycle 70% of packaging and use 50% recycled content by 2025. These targets
are nationally agreed and have subsequently steered government policies, actions and investments. The
packaging industry is proactively engaged in achieving the targets (APCO, 2022[51]). Although such
voluntary initiatives contribute strongly to enhancing the circularity of products, they are categorised as
“enabling” instruments, rather than steering policy instruments and are therefore not captured in Table 6.1.
Voluntary initiatives tend to be smaller in scope than schemes driven by legal obligations and follow, or
sometimes even prevent, policy initiatives, rather than leading the transition to more circularity (OECD,
2003[52]; Hickle, 2013[53]; Nash and Bosso, 2013[54]).
Leakage pathways can be closed by investing in basic waste management
infrastructure
The most basic but also most critical step for mitigating health hazards and plastic leakage is to build
infrastructure for safe disposal of waste, including plastics (typically sanitary landfills), and ensuring that
mixed waste is collected for transport to these facilities. As shown in Table 6.1, Kaza et al. (2018[42])
estimate that more than 10% of MSW is mismanaged in countries representing 80% of the global
population covered in the inventory. Moreover, in countries accounting for 18% of the covered population,
more than 50% of MSW is mismanaged. Within the OECD, mismanaged waste is also an important
challenge, with countries that account for 21% of the OECD’s population still mismanaging more than 10%
of their waste. As highlighted in Box 6.6, an integrated set of policies and sustained effort is needed to
address this issue. Chapter 7 also discusses the role of international co-operation to enhance basic waste
management infrastructure in developing countries. In addition, banning or limiting the use of frequently
littered plastic products is a simple and widely used measure (Section 6.2.1).
Box 6.6. Brazil’s fight against dumping waste
Dumpsites and uncontrolled landfills used to be the most common places for disposing of mixed waste
in Brazil. Although there still is a long road ahead, Brazil has made significant progress in dealing with
mismanaged waste, especially in the first decade of the 2000s (Figure 6.5). Between 2000 and 2019,
Brazil increased the share of waste disposed in sanitary landfills from 38% to 60% (ABRELPE, 2003[55];
ABRELPE, 2020[56]).
Figure 6.5. Solid waste management in Brazil has improved significantly between 2000 and 2010
Source: (ABRELPE, 2003[55]; ABRELPE, 2020[56]).

129
GLOBAL PLASTICS OUTLOOK © OECD 2022
The significant progress between 2000 and 2010 was achieved via a combination of policies and
stakeholder actions. In 1998, a Federal Law made the inappropriate disposal of solid waste an
environmental crime (Presidência da República, 1998[57]). A wider coverage of legislation and political
attention resulted in inspections of municipal bodies, closures of open-air dumps and increased financial
support for new sanitary landfills from the federal government (Neto, Petter and Cortina, 2009[58]).
Another important piece of legislation, the National Sanitation Policy, was enacted in 2007 and defined
basic sanitary conditions including provision of adequate solid waste management (Presidência da
República, 2007[59]).
After 2010, it seemed difficult to sustain the momentum although some new policies were initiated. In
2010, the National Policy on Solid Waste (NPSW) was launched (Presidência da República, 2010[60]),
but implementation of this progressive piece of legislation fell short of expectations (Alfaia, Costa and
Campos, 2017[61]; Pereira et al., 2020[62]). Two major obstacles were local authorities’ lack of expertise
and financial means. In order to provide more incentives for circular (plastic) waste management in
Brazil, the regulatory framework, enforcement of obligations on the ground and implementation of
economic instruments need to be strengthened (World Bank, 2018[63]).
Cleaning up leaked plastics is expensive and only a policy of last resort
Beach clean-up campaigns and litter removal are often organised by stakeholders and NGOs. Few
steering policy measures have focused on cleaning up leaked plastics as it is expensive (Table 6.2) and
preventing pollution in the first place is more structural. Nonetheless several EPR regulations for packaging
and EPR oblige producers to organise and finance the cleaning up of litter (Box 6.7).
Table 6.2. The high costs of cleaning up beach litter highlight the cost effectiveness of prevention
Source Country scope Clean-up scope Clean-up cost
Mouat, Lozano and Bateson (2010[64]) United Kingdom Beach litter EUR 121/t
Netherlands and Belgium Beach litter EUR 1 877/t
Hwang and Ko (2017[65]) Korea Shoreline cleaning,
marine debris USD 1 300/t
McIlgorm, Campbell and Rule (2008[66]) France Shoreline cleaning,
marine debris
Mechanical: USD 1 100-11 400/t
Manual: USD 2 200-22 800/t
Raaymakers (2007[67]) North-West Hawaiian Islands Derelict fishing gear USD 25 000/t
McIlgorm, Campbell and Rule (2008[66]) Southeast Alaska Shoreline cleaning,
marine debris
USD 2 339/t
(Direct costs only: USD 1 766/t)
Burt et al. (2020[68]) Aldabra Atoll (a remote small island) Shoreline cleaning,
marine debris USD 8 900/t
Box 6.7. The EU Single-Use Plastics Directive discourages the use of frequently littered items
EU Directive 2019/9045 focuses on the ten most commonly found plastic items on beaches plus fishing
gear. From the second half of 2021, it gradually started to phase in bans (among other measures) for
plastic cotton bud sticks, cutlery, plates, straws, stirrers, balloon sticks, expanded polystyrene for food
and beverage containers and cups. It will also impose a 25% recycled content target for beverage bottles
and the development of EPR systems for balloons, tobacco products with filters and wet wipes to
discourage pollution and finance the clean-up of litter.

130
GLOBAL PLASTICS OUTLOOK © OECD 2022
6.3. Getting the policy mix right is crucial for structural change
The regulatory and economic instruments discussed in Section 6.2 can affect recycling and littering, but
the depth of their impact on both aspects differs strongly for each instrument. If it is to increase the overall
recycling rate of plastics substantially, a policy instrument must target a large share of plastic waste. For
example, policies that target all plastics in MSW have a high potential to increase recycling. In contrast,
policies to discourage littering must target items that are frequently littered, though these often only
represent a small share of overall plastic waste. A good example is cigarette butts.
Figure 6.6. plots a selection of steering policy instruments against these two dimensions to highlight their
differences. The size of the bubbles illustrates how often a policy is used in countries covered in the Plastics
Policy Inventory. Only regulatory country-wide systems or systems operating at state, region or province
level are taken into account (Table 6.1). The most recurring policy measure is to ban or tax single-use
shopping bags (applied in 45 out of the 50 countries in the inventory), followed by EPR regulations (34 out
of 50) for packaging and durables (e.g. electronics, cars, batteries or tyres), bans or taxes on other single
use items (31 out of 50) and landfill or incineration taxes (31 out of 50).
Since the size of the bubble is driven by the number of countries that have the policy instrument in place,
the bubble size should be interpreted as the instrument’s popularity with policy makers, rather than its
coverage of global plastics. Most steering instruments taken up in the inventory apply across the whole
country, but some only apply to part of the country. For example, the 34 countries with EPR in place,
include one country with provincial schemes, and the 31 countries with landfill and incineration taxes
include 6 countries that only have waste taxes in place in some provinces or regions (Table 6.1).
Figure 6.6. Policy instruments vary in their potential impact on littering and recycling
Note: the size of the bubble illustrates the number of countries that use the instrument at national, regional or provincial level (the inventory
contains 50 countries).
Source: OECD Plastics Policy Inventory.

131
GLOBAL PLASTICS OUTLOOK © OECD 2022
The horizontal axis in Figure 6.6. shows the share of global plastics that can be targeted by these policy
instruments. Regulatory and economic instruments that target a large share of plastics can have a strong
positive impact on overall recycling rates:
Landfill and incineration taxes are effective at fostering recycling and target a large share of
total plastic waste because they can affect both MSW and industrial waste streams. The rates of
taxes applied vary significantly across countries and waste streams – for example, from a couple
of USD per tonne for landfilling inert materials to over EUR 100 per tonne for mixed waste fractions
in some countries (Box 6.5). Waste incineration taxes are implemented less often, but can
internalise the environmental impacts of incineration in an efficient way (Dubois, 2013[69]). Tax
rates on waste incineration are often lower than for landfilling. Typical rates are around EUR 10
per tonne of waste incinerated, though higher rates exist. The new EU tax on non-recycled plastics
of EUR 800 per tonne is essentially also a tax on landfilling and waste incineration, as they are the
most direct alternatives to recycling. However, this tax is imposed on the EU Member States and
it is up to them to decide whether they cascade this cost down to the waste generators.
Pay-as-You-Throw can be a highly effective measure to encourage sorting of plastic waste by
households. Many plastics are directly or indirectly managed by households and Pay-as-You-
Throw gives them a strong financial signal to minimise and sort waste streams (Box 6.5). The small
size of the bubble (only 13 countries out of 50, have a national, regional or provincial regulation in
place) highlights that this instrument is vastly underused to enhance recycling.
EPR for packaging can target a substantial share of plastic waste because packaging accounts
for almost one-third of plastics use and its lifecycle is short. Since the recycling rates of plastic
packaging are substantially lower than for other packaging materials such as glass, metals or
paper, substantial progress in recycling and circular design can be made by leveraging EPR (Box
6.4).
EPR is applied on a range of durable products, such as electronic equipment or cars. However,
plastics are often only a small part of the material composition in durable products and current
EPR systems mainly focus on the recovery of other materials such as metals. Integrating recycled
content targets and recycling targets specific to plastics in EPR regulations would foster plastics
recycling markets.
The vertical axis of Figure 6.6. focuses on the potential impact of regulatory and economic instruments on
littering. The instruments are ranked in the figure by their potential impact on reducing the amount of litter,
taking into account the occurrence of litter on beaches as counted during the Ocean Conservancy (2017[70])
coastal clean-up. The figure highlights that most instruments that target littering or other direct leakage to
the environment focus on minor shares of total plastic waste:
Single-use shopping bags are highly visible but constitute only a small part of total plastic waste.
For example, in the United States and Europe carrier bags accounted for less than 1% of total
plastic waste in 2019 (EPA, 2020[71]; OECD, 2022[72]; Plastics Recyclers Europe, 2020[73]).
Moreover, bans and taxes often only target bags with certain specifications (e.g. less than 35µm
thick), which substantially limits the volumes of plastics concerned.
Bans and taxes on other frequently littered single-use items, such as polystyrene food boxes,
plates, cups, straws and cigarettes, have the potential to prevent littering, but they target a limited
fraction of total plastic waste. For example, in the United States plastic plates and cups accounted
for less than 2% of total plastics in 2017 (EPA, 2020[71]; OECD, 2022[72]). Moreover, the policies
often only target a small part of these product streams, thus the impact of bans on single-use items
are more limited than often suggested.
The recent EU Single-Use Plastics Directive 2019/904 will impose EPR for tobacco products
with filters from January 2023 (Box 6.7). The aim is to internalise the costs of cigarette butt

132
GLOBAL PLASTICS OUTLOOK © OECD 2022
littering. In all EU Member States, producers will have to cover at least the costs of raising
awareness, cleaning up litter and monitoring results. The national regulation and operational start-
up of the various EPR schemes in the Member States are currently underway. This measure will
have an important impact on managing littered cigarette butts, but will have no impact on recycling.
Microbeads in rinse-off applications for personal care are designed to be removed with water and
so enter the waste-water system. If WWTP are in place, most of these plastics are retained in the
sludge,6 but if not they will end up in nature. A growing number of countries have introduced
microbead bans, including Canada, China, France, Italy, New Zealand, Sweden, the United
Kingdom and United States (Anagnosti et al., 2021[74]). Moreover, the European Chemical Agency
made a proposal in 2020 for an EU-wide ban on intentionally added microplastics in a range of
products (ECHA, 2020[75]). In most countries, the scope up to now is limited to rinse-off personal
care and cosmetics, while cleaning products, which sometimes also contain microbeads, have
been left untouched. Importantly, the bans have had global resonance, with leading international
companies committing to phasing out microbeads throughout their global product portfolio. The
effectiveness of the international policy measures is high, but the total volume concerned is tiny
(representing less than 0.01% of all plastics). As a consequence, these measures succeed in
reducing health and environmental risks, but do not contribute much to restraining overall plastics
demand.
Some economic instruments can affect recycling and littering simultaneously, but they also have their
limitations:
As discussed earlier, EPR for packaging is typically focused on increasing recycling rates, but
increasingly the instrument is also used to shift the responsibility for littering towards producers.
For example, packaging producers in Belgium have to finance anti-littering actions.7 However, the
scope of this obligation is limited to packaging waste and does not contain binding measurable
targets that have to be achieved.
Deposit-refund systems can induce high quality recycling or even reuse of beverage packaging
while reducing littering. However, the scope is typically limited to beverage bottles, which only make
up a limited share of total plastic waste. For example, in the United States PET bottles and jars
accounted for less than 5% of total plastic waste in 2019 (EPA, 2020[71]; OECD, 2022[72]).
Measures that target highly visible streams such as single-use plastic bags attract ample policy attention.
Many countries implement such measures and refer to them as flagship measures in the transition to a
circular economy. These policy instruments indeed help to close leakage pathways by discouraging
littering, but their impact on recycling or prevention is often limited because they target only a minor share
of overall plastics use. To close material loops and enhance recycling structurally, wider implementation
of landfill taxes, incineration taxes, Pay-as-You-Throw, deposit-refund schemes and EPR for packaging
as well as for durables is needed. Moreover, the effects of these instruments can be further complemented
by recycled content targets and other measures that encourage recycling by fostering the circular design
of products.
6.4. A policy roadmap for a more circular use of plastics
The analysis allowed to develop a high-level roadmap to combat plastic pollution and increase the
circularity of plastics along their entire lifecycle that policy makers can adapt to national conditions
(Figure 6.7). It involves a phased approach that can be implemented over time to achieve increasingly
ambitious policy objectives.

133
GLOBAL PLASTICS OUTLOOK © OECD 2022
Figure 6.7. A policy roadmap for more circular use of plastics
The roadmap emphasises the need for regulatory and economic policy instruments that can induce
economy-wide behavioural changes. For successful implementation, these steering instruments need to
be accompanied with enabling policies, such as investments in innovation, communication and
collaboration with stakeholders. The roadmap clusters the key actions into three phases:
Close leakage pathways: the most basic step for mitigating health hazards and plastics pollution
is to build sanitary waste management infrastructure, typically landfills, and organise waste
collection (Watkins et al., 2019[76]). Moreover, by banning or taxing items that are frequently
littered, leakage to the environment can be significantly reduced.
Create incentives for recycling and enhance sorting at source: recycling plastics only occurs on a
large scale if it is profitable. Policy makers can apply taxes to landfill and incineration to make
recycling more cost competitive. By also imposing EPR, policy makers can make producers
responsible for recycling packaging and durable products such as cars, batteries, tyres and
electronics. As the quality of collected waste streams drives the feasibility and profitability of
recycling, countries can achieve much greater circularity by sharpening the financial incentives to
sort waste at source. Deposit-refund systems give a strong financial incentive to return beverage
bottles, while Pay-as-You-Throw makes mixed waste disposal by households expensive. If
combined with policies to avoid dumping and contaminating other waste streams, making
householders pay per bag or kilo of mixed waste is an effective way to incentivise sorting at source.
Restrain demand and optimise design: the largest environmental gains can be achieved by
reducing the use of virgin materials and by improving product design (Watkins et al., 2019[76]).
Removing support schemes for fossil-based plastics, such as shale gas subsidies (OECD,
2016[77]), will make plastic value chains more circular by restraining consumption and by making
recycled plastics more price competitive. By removing hazardous substances and recycling
inhibitors from plastics at the design stage, chemical hazards can be avoided and recycling rates
can be increased. Several countries have launched advanced policies such as (single-use) plastic
taxes, reuse incentives, recycled content targets and fee modulation in EPR systems, but their
impact could be improved considerably by extending coverage to more product types, and more
countries.

134
GLOBAL PLASTICS OUTLOOK © OECD 2022
References
ABRELPE (2020), Panoramados dos Resíduos Sólidos no Brasil 2020. [56]
ABRELPE (2003), Panoramados dos Resíduos Sólidos no Brasil 2003. [55]
ACR plus (2019), 135 paper and packaging waste collection systems, http://www.acrplus.org. [43]
Alfaia, R., A. Costa and J. Campos (2017), “Municipal solid waste in Brazil: A review”, Waste
Management & Research: The Journal for a Sustainable Circular Economy, Vol. 35/12,
pp. 1195-1209, http://dx.doi.org/10.1177/0734242x17735375.
[61]
Anagnosti, L. et al. (2021), “Worldwide actions against plastic pollution from microbeads and
microplastics in cosmetics focusing on European policies. Has the issue been handled
effectively?”, Marine Pollution Bulletin, Vol. 162, p. 111883,
http://dx.doi.org/10.1016/j.marpolbul.2020.111883.
[74]
APCO (2022), About APCO, https://apco.org.au/about-apco (accessed on 8 February 2022). [51]
Australian Competition & Consumer Commission (2021), DEHP in plastic items, Product Safety
Australia, https://www.productsafety.gov.au/products/chemicals/dehp-in-plastic-items.
[28]
Benjamin, S. et al. (2017), “Phthalates impact human health: Epidemiological evidences and
plausible mechanism of action”, Journal of Hazardous Materials, Vol. 340,
http://dx.doi.org/10.1016/j.jhazmat.2017.06.036.
[25]
Boesen, S., N. Bey and M. Niero (2019), “Environmental sustainability of liquid food packaging:
Is there a gap between Danish consumers’ perception and learnings from life cycle
assessment?”, Journal of Cleaner Production, Vol. 210, pp. 1193-1206,
http://dx.doi.org/10.1016/j.jclepro.2018.11.055.
[16]
Burt, A. et al. (2020), “The costs of removing the unsanctioned import of marine plastic litter to
small island states”, Scientific Reports, Vol. 10/1, http://dx.doi.org/10.1038/s41598-020-
71444-6.
[68]
CDC (2021), Fourth National Report on Human Exposure to Environmental Chemicals Update,
https://www.cdc.gov/nchs/nhanes/. (accessed on 21 May 2021).
[23]
CDC (2021), Phthalates Factsheet | National Biomonitoring Program,
https://www.cdc.gov/biomonitoring/Phthalates_FactSheet.html (accessed on 21 May 2021).
[24]
Chemical Watch (2021), European Commission wins NGO appeal case on DEHP authorisation:
ClientEarth says reforms are needed to tackle SVHC use in recycled material, Chemical
Watch, https://chemicalwatch.com/347913/european-commission-wins-ngo-appeal-case-on-
dehp-authorisation.
[35]
Commonwealth of Australia (2011), Consumer Protection Notice No. 11 Of 2011: Permanent
Ban On Children’s Products Containing More Than 1% Diethylhexyl Phthalate (DEHP),
Commonwealth of Australia, https://www.legislation.gov.au/Details/F2011L00192.
[29]
Cornago, E., P. Börkey and A. Brown (2021), “Preventing single-use plastic waste: Implications
of different policy approaches”, OECD Environment Working Papers, No. 182, OECD
Publishing, Paris, https://dx.doi.org/10.1787/c62069e7-en.
[6]

135
GLOBAL PLASTICS OUTLOOK © OECD 2022
Dubois, M. (2013), “Towards a coherent European approach for taxation of combustible waste”,
Waste Management, Vol. 33/8, pp. 1776-1783,
http://dx.doi.org/10.1016/j.wasman.2013.03.015.
[69]
ECHA (2020), Microplastics, European Chemicals Agency, https://echa.europa.eu/hot-
topics/microplastics#:~:text=In%20January%202019%2C%20ECHA%20proposed,their%20re
lease%20to%20the%20environment.&text=ECHA%27s%20Committee%20for%20Risk%20A
ssessment,its%20opinion%20in%20June%202020.
[75]
ECHA (2018), Inspectors find phthalates in toys and asbestos in second-hand products,
https://echa.europa.eu/nl/-/inspectors-find-phthalates-in-toys-and-asbestos-in-second-hand-
products (accessed on 21 May 2021).
[34]
ECHA (2013), Evaluation of new scientific evidence concerning DINP and DIDP In relation to
entry 52 of Annex XVII to REACH Regulation (EC) No 1907/2006, http://echa.europa.eu/
(accessed on 26 May 2021).
[79]
Ecoprog (2020), Waste to Energy 2020/2021,
https://www.ecoprog.com/fileadmin/user_upload/extract_market_report_WtE_2020-
2021_ecoprog.pdf (accessed on 26 May 2021).
[8]
Ellen MacArthur Foundation (2021), Extended Producer Responsibility: a necessary part of the
solution to packaging waste and pollution.
[41]
Engel, S. et al. (2021), “Neurotoxicity of Ortho-Phthalates: Recommendations for Critical Policy
Reforms to Protect Brain Development in Children”, American journal of public health,
Vol. 111/4, pp. 687-695, http://dx.doi.org/10.2105/AJPH.2020.306014.
[26]
EPA (2020), Advancing Sustainable Materials Management: 2018 Tables and Figures, United
States Environment Protection Agency, https://www.epa.gov/sites/default/files/2021-
01/documents/2018_tables_and_figures_dec_2020_fnl_508.pdf.
[71]
European Parliament (2015), Don’t allow recycling of plastics that contain toxic phthalate DEHP,
warn MEPs, European Parliament News, https://www.europarl.europa.eu/news/en/press-
room/20151120IPR03616/don-t-allow-recycling-of-plastics-that-contain-toxic-phthalate-dehp-
warn-meps.
[36]
Eurostat (2021), Waste statistics, https://ec.europa.eu/eurostat/statistics-
explained/index.php?title=Waste_statistics#Waste_treatment.
[47]
Government of Flanders (2021), Afvalinzameling en sorteren,
https://www.vlaanderen.be/afvalinzameling-en-sorteren.
[46]
HDR (2009), The city of San Francisco, Streets litter Re-audit, San Francisco Environment
Department.
[15]
Hickle, G. (2013), “Comparative Analysis of Extended Producer Responsibility Policy in the
United States and Canada”, Journal of Industrial Ecology, Vol. 17/2, pp. 249-261,
http://dx.doi.org/10.1111/jiec.12020.
[53]
Holland, M. (2018), “Socio-economic assessment of phthalates”, OECD Environment Working
Papers, No. 133, OECD Publishing, Paris, https://dx.doi.org/10.1787/a38a0e34-en.
[22]

136
GLOBAL PLASTICS OUTLOOK © OECD 2022
Hwang, S. and J. Ko (2017), Achievement and progress of marine litter retrieval project in near
coast of Korea - based on activities of Korea Fisheries Infrastructure Promotion Association.
[65]
IEEP (2017), EPR in the EU Plastics Strategy and the Circular Economy: A focus on plastic
packaging, Institute for European Environmental Policy.
[14]
INERIS (2021), Phthalates substitution, https://substitution-phtalates.ineris.fr/en (accessed on
21 May 2021).
[32]
Kaffine, D. and P. O’Reilly (2015), What Have We Learned About Extended Producer
Responsibility in the Past Decade? A Survey of the recent EPR Economic Literature, OECD
Publishing, Paris.
[38]
Karasik, R. et al. (2020), 20 Years of Government Responses to the Global Plastic Pollution
Problem: The Plastics Policy Inventory, Duke University, Durham,
https://nicholasinstitute.duke.edu/sites/default/files/publications/20-Years-of-Government-
Responses-to-the-Global-Plastic-Pollution-Problem-New_1.pdf.
[9]
Kaza, S. et al. (2018), What a Waste 2.0: A Global Snapshot of Solid Waste Management to
2050, The World Bank, http://dx.doi.org/10.1596/978-1-4648-1329-0.
[42]
Krelling, A., A. Williams and A. Turra (2017), “Differences in perception and reaction of tourist
groups to beach marine debris that can influence a loss of tourism revenue in coastal areas”,
Marine Policy, Vol. 85, pp. 87-99, http://dx.doi.org/10.1016/j.marpol.2017.08.021.
[1]
Laubinger, F. et al. (2021), “Modulated fees for Extended Producer Responsibility schemes
(EPR)”, OECD Environment Working Papers, No. 184, OECD Publishing, Paris,
https://dx.doi.org/10.1787/2a42f54b-en.
[20]
McIlgorm, A., H. Campbell and M. Rule (2008), Understanding the economic benefits and costs
of controlling marine debris in the APEC region (MRC 02/2007), A report to the Asia-Pacific
Economic Cooperation Marine Resource Conservation Working Group by the National Marine
Science Centre (University of New England and Southern Cross University),Coffs Harbour,
https://d3n8a8pro7vhmx.cloudfront.net/boomerangalliance/pages/510/attachments/original/14
81158813/Understanding_the_Economic_Benefits_and_Costs_of_Controlling_Marine_Debris
_in_the_APEC_Region.pdf?1481158813.
[66]
Mouat, J., R. Lozano and H. Bateson (2010), Economic Impacts of Marine Litter, Kommunernes
Internationale Miljøorganisation (KIMO), https://www.kimointernational.org/wp/wp-
content/uploads/2017/09/KIMO_Economic-Impacts-of-Marine-Litter.pdf.
[64]
Nash, J. and C. Bosso (2013), “Extended Producer Responsibility in the United States”, Journal
of Industrial Ecology, Vol. 17/2, pp. 175-185, http://dx.doi.org/10.1111/j.1530-
9290.2012.00572.x.
[54]
Neto, R., C. Petter and J. Cortina (2009), “Report: The current situation of sanitary landfills in
Brazil and the importance of the application of economic models”, Waste Management &
Research: The Journal for a Sustainable Circular Economy, Vol. 27/10, pp. 1002-1005,
http://dx.doi.org/10.1177/0734242x09104583.
[58]
Ocean conservancy (2017), International coastal cleanup report. [70]
OECD (2022), Global Outlook Plastics Database, https://doi.org/10.1787/c0821f81-en. [72]

137
GLOBAL PLASTICS OUTLOOK © OECD 2022
OECD (2021), A Chemicals Perspective on Designing with Sustainable Plastics : Goals,
Considerations and Trade-offs, OECD Publishing, Paris, https://dx.doi.org/10.1787/f2ba8ff3-
en.
[21]
OECD (2021), OECD Environmental Performance Reviews: Belgium 2021, OECD
Environmental Performance Reviews, OECD Publishing, Paris,
https://dx.doi.org/10.1787/738553c5-en.
[48]
OECD (2021), OECD Environmental Performance Reviews: Ireland 2021, OECD Environmental
Performance Reviews, OECD Publishing, Paris, https://dx.doi.org/10.1787/9ef10b4f-en.
[50]
OECD (2021), Policies to Reduce Microplastics Pollution in Water: Focus on Textiles and Tyres,
OECD Publishing, Paris, https://dx.doi.org/10.1787/7ec7e5ef-en.
[2]
OECD (2021), Policy Instruments for the Environment (PINE) Database, http://oe.cd/pine. [4]
OECD (2021), Progress report on the implementation of the Recommendation of the Council on
Resource Productivity, https://one.oecd.org/document/C(2021)62/REV1/en/pdf.
[11]
OECD (2016), Extended Producer Responsibility: Updated Guidance for Efficient Waste
Management, OECD Publishing, Paris, https://dx.doi.org/10.1787/9789264256385-en.
[39]
OECD (2016), Policy Guidance on Resource Efficiency, OECD Publishing, Paris,
https://dx.doi.org/10.1787/9789264257344-en.
[77]
OECD (2003), Voluntary approaches for environmental policy: effectiveness, efficiency and
usage in policy mixes.
[52]
OECD (2001), Extended Producer Responsibility: A Guidance Manual for Governments, OECD
Publishing, Paris, https://dx.doi.org/10.1787/9789264189867-en.
[37]
OECD (forthcoming), The cost of preventing ocean plastic pollution. [7]
OECD/IEA (2021), Update on recent progress in reform of inefficient fossil-fuel subsidies that
encourage wasteful consumption.
[13]
PBM (2020), (2020) Tackling plastic litter: a nudging strategy for reducing consumption of single-
use disposable cups.
[12]
Pereira, A. et al. (2020), “Waste policy reforms in developing countries: A comparative study of
India and Brazil”, Waste Management & Research: The Journal for a Sustainable Circular
Economy, Vol. 38/9, pp. 987-994, http://dx.doi.org/10.1177/0734242x20938435.
[62]
Plastics Recyclers Europe (2020), Flexible films market in Europe. [73]
Polymers, A. (2017), “Global demand for plasticizers continues to rise”, Additives for Polymers,
Vol. 2017/10, pp. 10-11, http://dx.doi.org/10.1016/s0306-3747(17)30137-9.
[33]
Presidência da República (2010), Federal Law n. 12.305,
http://www.planalto.gov.br/ccivil_03/_ato2007-2010/2010/lei/l12305.htm.
[60]
Presidência da República (2007), Federal Law n. 11.445,
http://www.planalto.gov.br/ccivil_03/_ato2007-2010/2007/lei/L11445compilado.htm.
[59]

138
GLOBAL PLASTICS OUTLOOK © OECD 2022
Presidência da República (1998), Federal Law n. 9.605,
http://www.planalto.gov.br/ccivil_03/leis/L9605.htm.
[57]
Raaymakers, S. (2007), The problem of derelict fishing gear: Global review and proposals for
action, Food and Agricultural Organisation on the United Nations United Nations Environment
Programme.
[67]
Reloop Platform (2020), Global Deposit Book 2020: An Overview of Deposit Systems for one-
way Beverage Containers, https://www.reloopplatform.org/wp-content/uploads/2020/12/2020-
Global-Deposit-Book-WEB-version-1DEC2020.pdf (accessed on 19 March 2021).
[45]
Silano, V. et al. (2019), “Update of the risk assessment of di-butylphthalate (DBP), butyl-benzyl-
phthalate (BBP), bis(2-ethylhexyl)phthalate (DEHP), di-isononylphthalate (DINP) and di-
isodecylphthalate (DIDP) for use in food contact materials”, EFSA Journal, Vol. 17/12,
http://dx.doi.org/10.2903/j.efsa.2019.5838.
[27]
Stefanini, R. et al. (2020), “Plastic or glass: a new environmental assessment with a marine litter
indicator for the comparison of pasteurized milk bottles”, The International Journal of Life
Cycle Assessment, Vol. 26/4, pp. 767-784, http://dx.doi.org/10.1007/s11367-020-01804-x.
[17]
The Consumer Goods Forum (2020), Driving Positive Change,
https://www.theconsumergoodsforum.com/.
[40]
UK Government (2021), Policy paper: Changes to Landfill Tax rates from 1 April 2021,
https://www.gov.uk/government/publications/changes-to-landfill-tax-rates-from-1-april-
2021/changes-to-landfill-tax-rates-from-1-april-2021.
[49]
UNEP (2020), Single-use plastic bags and their alternatives: Recommendations from Life Cycle
Assessments, https://www.lifecycleinitiative.org/single-use-plastic-bags-and-their-alternatives-
recommendations-from-life-cycle-assessments/.
[18]
UNEP (2020), Tackling Plastic Pollution: Legislative Guide for the Regulation of Single-Use
Plastic Products, United Nations Environment Programme,
https://wedocs.unep.org/bitstream/handle/20.500.11822/34570/PlastPoll.pdf.pdf?sequence=3
&isAllowed=y.
[10]
UNEP (2018), Legal Limits on Single-Use Plastics and Microplastics: A Global Review of
National Laws and Regulations, UN Environment Programme,
https://www.unep.org/resources/publication/legal-limits-single-use-plastics-and-microplastics-
global-review-national.
[5]
van den Driesche, S. et al. (2020), “Systematic comparison of the male reproductive tract in fetal
and adult Wistar rats exposed to DBP and DINP in utero during the masculinisation
programming window”, Toxicology Letters, Vol. 335, pp. 37-50,
http://dx.doi.org/10.1016/j.toxlet.2020.10.006.
[78]
Vinyl Council Australia (2018), PVC Stewardship Program: Progress Report 2018, Vinyl Council
Australia, https://vinyl.org.au/images/vinyl/Sustainability/PSP/VCAPSPReport2018-
FINAL_VERSION.pdf.
[30]
Vinyl Plus (2021), REPORTING ON 2020 ACTIVITIES and summarising the key achievements
of the past 10 years,
https://vinylplus.eu/uploads/Progress%20Report%202021/VinylPlus%20Progress%20Report
%202021_WEB_sp.pdf (accessed on 21 May 2021).
[31]

139
GLOBAL PLASTICS OUTLOOK © OECD 2022
Watkins, E. et al. (2012), Use of Economic Instruments and Waste Management Performances.
Final report prepared for the European Commission., European Commission (DG ENV),
https://www.ecologic.eu/sites/default/files/publication/2021/2670-04-Economic-instruments-
waste-management-performance-web.pdf.
[3]
Watkins, E. et al. (2019), “Policy approaches to incentivise sustainable plastic design”, OECD
Environment Working Papers, No. 149, OECD Publishing, Paris,
https://dx.doi.org/10.1787/233ac351-en.
[76]
Wiesinger, H., Z. Wang and S. Hellweg (2021), “Deep Dive into Plastic Monomers, Additives,
and Processing Aids”, Environmental Science & Technology, Vol. 55/13, pp. 9339-9351,
http://dx.doi.org/10.1021/acs.est.1c00976.
[19]
World Bank (2018), Brazil: Integrated Solid Waste Management. [63]
Zhou, G. et al. (2020), “A systematic review of the deposit-refund system for beverage
packaging: Operating mode, key parameter and development trend”, Journal of Cleaner
Production, Vol. 251, p. 119660, http://dx.doi.org/10.1016/j.jclepro.2019.119660.
[44]
Notes
1 Waste Framework Directive 2008/98/EC, amended by Directive 2018/851, Article 8a, 4b
2 Single-Use Plastics Directive, Article 6.5. For details see
https://ec.europa.eu/environment/topics/plastics/single-use-plastics_en.
3 High weight molecular phthalates that have longer chemical chains such as DINP and DIDP have more
limited health hazards (ECHA, 2013[79]) and are less mobile within the plastic which reduces potential
exposure (van den Driesche et al., 2020[78]).
4 Including EU Regulation 2018/2005 and the US Toxic Substances Control Act.
5 https://ec.europa.eu/environment/topics/plastics/single-use-plastics_en.
6 Although microplastics captured in sludge may eventually leak into the environment via land spreading.
7 For more information on the anti-litter campaigns in Belgium: https://www.fostplus.be/en,
https://mooimakers.be/, https://www.bewapp.be/.

140
GLOBAL PLASTICS OUTLOOK © OECD 2022
This chapter reviews the current landscape of international agreements and
initiatives, as well as the status of efforts to improve it. It then zooms in on
the financial resources that would be needed to stop plastic leakage linked
to poor waste management practices in developing countries, which has
been recognised as an important priority for international co-operation.
Finally, the chapter assesses the current contribution of ODA towards this
goal
7. International co-operation to
make plastics value chains more circular

141
GLOBAL PLASTICS OUTLOOK © OECD 2022
KEY MESSAGES
The environmental damages generated by the current use and disposal of plastics, are global
problems that require international co-operation to resolve. The international community has
voiced strong ambitions to limit the pollution of the environment by plastics and momentum is
building for a binding global agreement on plastic pollution.
Improving waste management to reduce land-based sources of marine plastic is one of the
main priorities for action, alongside upstream preventative measures. Since the bulk of
macroplastic waste mismanagement occurs in low and middle-income countries, the
investments needed in these countries are particularly large.
Building the basic waste management infrastructure is estimated to cost more than
EUR 25 billion per year in low and middle-income countries.
Analysis of official development assistance (ODA) highlights that although the financial support
to address plastic leakage in developing countries is increasing, it is only a fraction of what’s
needed.
Additional sources of funding will need to be tapped into and enabling policy frameworks
established to ensure that the resources are used effectively. Without international support and
local political leadership, the required investment and governance for high-quality infrastructure
will not materialise.
7.1. Addressing the environmental consequences of global plastics value chains
requires international co-operation
National efforts to address the challenges linked to the use of plastics, described in the previous chapter,
need to be supplemented with international co-operation for several reasons:
Plastics are shipped across the world as materials, products and waste streams, and supply chains
are spread across the globe – policy responses would be more effective if co-ordinated
internationally.
The environmental consequences of plastics polluting water bodies are often transboundary and
threaten the ocean – a global commons.
Tackling both the upstream and downstream environmental challenges posed by plastics requires
innovation and investment on a significant scale, as well as a steep policy learning curve all of
which can be accelerated through international co-operation.
7.2. A more comprehensive global approach to plastic pollution is needed
Even before the rise of plastics up the political agenda, a series of international agreements had put forward
binding requirements and non-binding recommendations for managing plastics and preventing pollution
(Figure 7.1). However, this patchwork of agreements has gaps and there is no international governance
instrument that comprehensively addresses the challenges at the different stages of the plastics lifecycle.
For example, there are few policy instruments dedicated to marine plastic litter,1 national legislation on
ocean affairs is fragmented, requirements are incompletely implemented and multilateral monitoring
systems are not functional (UN Report of the Secretary-General, 2018[1]).
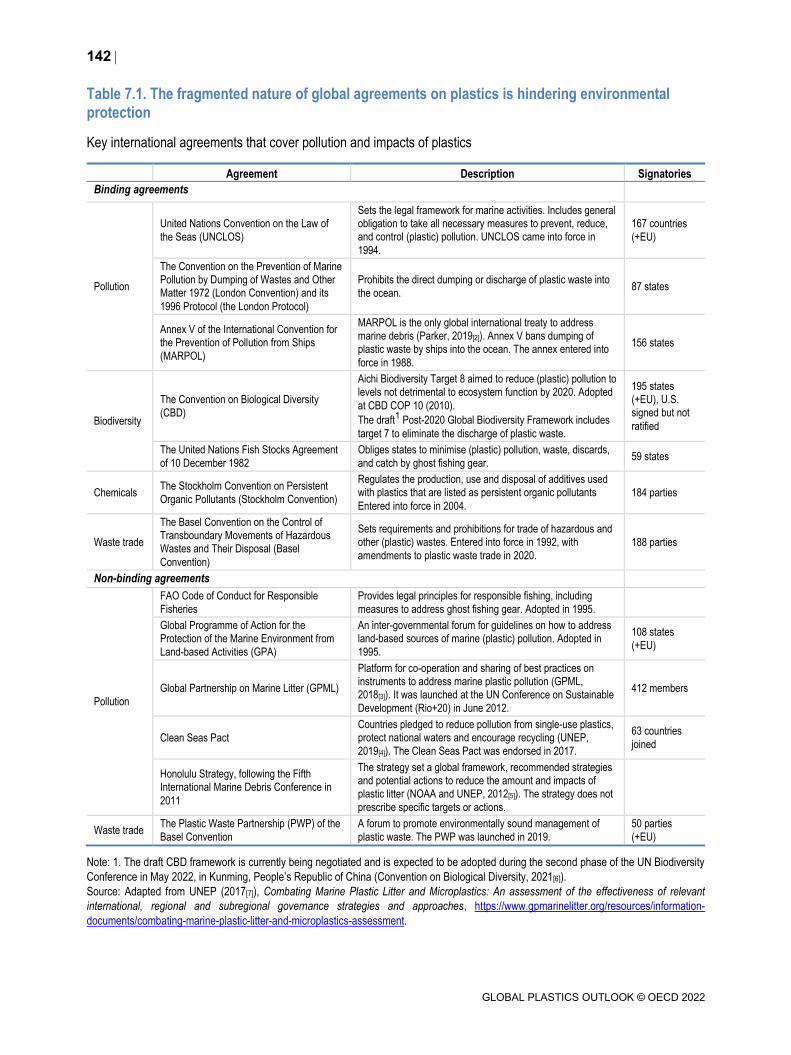
142
GLOBAL PLASTICS OUTLOOK © OECD 2022
Table 7.1. The fragmented nature of global agreements on plastics is hindering environmental protection
Key international agreements that cover pollution and impacts of plastics
Agreement Description Signatories
Binding agreements
Pollution
United Nations Convention on the Law of
the Seas (UNCLOS)
Sets the legal framework for marine activities. Includes general obligation to take all necessary measures to prevent, reduce, and control (plastic) pollution. UNCLOS came into force in
1994.
167 countries
(+EU)
The Convention on the Prevention of Marine Pollution by Dumping of Wastes and Other Matter 1972 (London Convention) and its
1996 Protocol (the London Protocol)
Prohibits the direct dumping or discharge of plastic waste into
the ocean. 87 states
Annex V of the International Convention for the Prevention of Pollution from Ships
(MARPOL)
MARPOL is the only global international treaty to address marine debris (Parker, 2019[2]). Annex V bans dumping of plastic waste by ships into the ocean. The annex entered into
force in 1988.
156 states
Biodiversity
The Convention on Biological Diversity
(CBD)
Aichi Biodiversity Target 8 aimed to reduce (plastic) pollution to levels not detrimental to ecosystem function by 2020. Adopted
at CBD COP 10 (2010).
The draft1 Post-2020 Global Biodiversity Framework includes
target 7 to eliminate the discharge of plastic waste.
195 states (+EU), U.S. signed but not
ratified
The United Nations Fish Stocks Agreement
of 10 December 1982
Obliges states to minimise (plastic) pollution, waste, discards,
and catch by ghost fishing gear. 59 states
Chemicals The Stockholm Convention on Persistent
Organic Pollutants (Stockholm Convention)
Regulates the production, use and disposal of additives used with plastics that are listed as persistent organic pollutants
Entered into force in 2004.
184 parties
Waste trade
The Basel Convention on the Control of Transboundary Movements of Hazardous Wastes and Their Disposal (Basel
Convention)
Sets requirements and prohibitions for trade of hazardous and other (plastic) wastes. Entered into force in 1992, with
amendments to plastic waste trade in 2020. 188 parties
Non-binding agreements
Pollution
FAO Code of Conduct for Responsible
Fisheries
Provides legal principles for responsible fishing, including
measures to address ghost fishing gear. Adopted in 1995.
Global Programme of Action for the Protection of the Marine Environment from
Land-based Activities (GPA)
An inter-governmental forum for guidelines on how to address land-based sources of marine (plastic) pollution. Adopted in
1995.
108 states
(+EU)
Global Partnership on Marine Litter (GPML)
Platform for co-operation and sharing of best practices on instruments to address marine plastic pollution (GPML, 2018[3]). It was launched at the UN Conference on Sustainable
Development (Rio+20) in June 2012.
412 members
Clean Seas Pact
Countries pledged to reduce pollution from single-use plastics, protect national waters and encourage recycling (UNEP,
2019[4]). The Clean Seas Pact was endorsed in 2017.
63 countries
joined
Honolulu Strategy, following the Fifth International Marine Debris Conference in
2011
The strategy set a global framework, recommended strategies and potential actions to reduce the amount and impacts of plastic litter (NOAA and UNEP, 2012[5]). The strategy does not
prescribe specific targets or actions.
Waste trade The Plastic Waste Partnership (PWP) of the
Basel Convention
A forum to promote environmentally sound management of
plastic waste. The PWP was launched in 2019.
50 parties
(+EU)
Note: 1. The draft CBD framework is currently being negotiated and is expected to be adopted during the second phase of the UN Biodiversity
Conference in May 2022, in Kunming, People’s Republic of China (Convention on Biological Diversity, 2021[6]).
Source: Adapted from UNEP (2017[7]), Combating Marine Plastic Litter and Microplastics: An assessment of the effectiveness of relevant
international, regional and subregional governance strategies and approaches, https://www.gpmarinelitter.org/resources/information-
documents/combating-marine-plastic-litter-and-microplastics-assessment.

143
GLOBAL PLASTICS OUTLOOK © OECD 2022
The Sustainable Development Goals (SDGs), adopted by the United Nations in 2015, also contain targets
that are relevant for plastic waste management and leakage (see Table 7.2 for a selection of relevant
targets). Importantly, the SDGs are aspirational and non-binding.
Table 7.2. The SDGs highlight international ambitions to reduce the environment and health impacts of waste
Most relevant Sustainable Development
Goals
Targets directly related to plastic
waste and
leakage
11.6: by 2030 reduce the adverse per capita environmental impact of cities,
through municipal and other waste
management
12.4: environmentally sound management
of waste throughout the lifecycle, reduce
release to air, water, and soil
12.5: by 2030 substantially reduce waste
generation
14.1: by 2025 prevent and reduce marine pollution, in particular from
land-based activities
Source: Adapted from (United Nations, 2021[8]).
Recent years have seen a ramping up of international attention on plastic pollution, and specifically marine
litter. As a result, a number of high-profile initiatives on plastic leakage (see Glossary) have been launched
by the G7 and subsequently by the G20 (Figure 7.1). Communiqués and commitments have primarily
focused on land-based sources of marine plastic litter. One of the flagship initiatives at the G20 level is the
Osaka Blue Ocean Vision, which was announced in 2019 and sets the strategic target of reducing plastic
leakage to the ocean to net zero by 2050. The Convention on Biological Diversity2 and the European Union
have also set additional targets;3 but, they remain voluntary.
Figure 7.1. The G7 and G20 have hosted several initiatives to tackle plastic pollution
Timeline of key G7 (top) and G20 (bottom) communiqués and commitments
Note: The G7 Oceans Plastic Charter was endorsed by Canada, France, Germany, Italy, the United Kingdom and the European Union.
In the absence of a global agreement, some regional organisations have co-ordinated their members’
policies to address particular plastic-related issues, such as marine plastic pollution (Table 7.3). However,
gaps remain in the coverage of regions and issues (UN Report of the Secretary-General, 2018[1]).

144
GLOBAL PLASTICS OUTLOOK © OECD 2022
Table 7.3. Regional organisations help to co-ordinate members’ policies and actions
Regional
organisation Description Example(s)
Regional sea conventions and
action plans
(RSCAP)
To date, 18 regional sea conventions have been established around the
world. They adopt regional action plans and protocols, provide monitoring and regional environmental assessments
related to marine litter and prevention
of pollution from land-based sources.
The Convention for the Protection of the Marine Environment of the North-East Atlantic (OSPAR convention) adopted a Regional Action Plan for Prevention and
Management of Marine Litter in the North-East Atlantic (OSPAR Commission,
2014[9]).
The Protocol Concerning Pollution from Land-Based Sources and Activities (LBS Protocol) adopted by the Cartagena Convention (UNEP, 1999[10]), and the Regional Action Plan for Marine Litter Management (RAPMaLi), address marine
litter in the wider Caribbean region (UNEP, 2014[11]).
Regional
fisheries bodies
Co-ordinate measures to address marine-based sources of plastic litter
(e.g. ghost gear)
The Indian Ocean Tuna Commission (IOTC) has banned high seas large-scale driftnets in its area of competence and also requires gear marking of flags and
buoys (Gilman et al., 2016[12]).
Large marine ecosystem
(LME) projects
Globally there are 66 LMEs that have Strategic Action Plans or co-ordinate
activities.
11 of the 66 LME projects have implemented Strategic Action Plans that identify marine litter or debris as a concern and identify measures and activities for their
members to combat marine litter (Wienrich, Weiand and Unger, 2021[13]).
Regional
economic unions
Co-ordinate policy direction through policy advice, capacity building,
regulations and legally binding
directives.
In the European Union, several directives, such as the Single-Use Plastics Directive, set requirements for Member States, including collection targets and
bans on certain single-use plastic items.
The Association of Southeast Asian Nations (ASEAN) has adopted several measures to address marine plastic litter, including the Bangkok Declaration on Combating Marine Debris and the ASEAN Framework of Action on Marine
Debris. ASEAN members have also launched a Regional Action Plan on Combating Marine Debris that sets forth 14 regional actions for plastics reduction, enhanced collection and value from waste (Ministry of the Environment Japan,
2020[14]).
The Polythene Materials Control bill of the East African Community, passed in
2016, sets a series of restrictions for manufacture, trade and use of polyethylene.
A number of governments and civil society actors have been calling for an international treaty to improve
this fragmented and incomplete policy landscape (Simon et al., 2021[15]; Duncan et al., 2020[16]; EIA,
2020[17]). Discussions on a global agreement are being held under the auspices of the UN Environment
Assembly (UNEA).4,5 An Ad Hoc Open Ended Expert Group was established in 2017 and has held four
high-level events to consider the international governance needs, completing its mandate in 2020 (AHEG,
2020[18]; IUCN, n.d.[19]). The fifth session of the UNEA will resume in Nairobi in 2022 and aims to make
further progress on resolutions on marine litter and microplastics (UNEA, 2021[20]). So far, 81 countries
have endorsed the Oceans Plastic Pollution Declaration, which calls for the development of a binding
global agreement on plastic pollution (AOISIS, 2022[21]). This support signals the likely willingness of
dozens of countries to adopt a global measure.
In this context, many countries and organisations are stressing the need to focus international co-operation
efforts on both upstream actions (Box 6.3) – such as restraining excessive use of plastics, designing for
circularity and promoting reuse – as well as downstream actions, such as enhancing recycling, minimising
leakage and cleaning up.6 On the former, the international trade community has been gearing up efforts to
address issues that occur across the global plastics value chain (see Box 7.1 for details). On the latter,
co-operation efforts focus on strengthening waste management in places where land-based sources of
marine plastic litter are particularly large. The following sections discuss the costs of reducing plastic
leakage in low- and middle-income countries and the role of official development assistance (ODA).

145
GLOBAL PLASTICS OUTLOOK © OECD 2022
Box 7.1. Addressing issues that occur across global plastics value chains requires international co-operation
The plastics value chain is becoming increasingly interconnected and globalised, requiring co-ordinated
action between countries to effectively address plastic pollution and to promote the circular use of
plastics. Acknowledging the global acceleration of plastics production and consumption and their
associated environmental impacts due to fossil fuel inputs and leakage into the environment, the
international trade community has begun to take action to seek co-operation on trade-related aspects.
One conventional aspect in trade related dimensions of the global plastic pollution issue is the
prevalence of trade in plastic waste and the related environmental risks (Chapter 4). Another important
aspect is plastic embodied in traded products, including primary, intermediate, and final forms of
plastics. There are not only apparent trade flows such as virgin plastics, plastic based commodities,
and plastic waste and scrap, but also hidden trade flows, such as plastic casings for electronic
components, plastic composites used in bumpers and dashboards in vehicles, and fruit juice sold in
plastic containers. While these fractions are not captured in official trade statistics (as they are recorded
by customs as electronics, vehicles or fruit juice), the magnitude of these fractions can be huge. Recent
estimates from the United Nations Conference on Trade and Development (UNCTAD) suggest that
exports of primary, intermediate and final forms of plastics can reach over USD 1 trillion, representing
5% of global trade in value in 2018 (Barrowclough, Deere Birkbeck and Christen, 2020[22]). This finding
implies that international co-operation efforts to combat plastic pollution should not only focus on end-
of-pipe solutions for recycling and waste management, but also need to look upstream in the plastics
value chain. In particular, product policies that aim to foster the uptake of innovative and more circular
solutions, and deter the use of hazardous additives are important (Box 6.3).
In this context, product policies, such as eco-design, eco-labelling, and green public procurement, can
play an important role (OECD, 2020[23]). For example, eco-labelling programmes are increasingly used
to stimulate demand for circular products (Laubinger and Börkey, 2021[24]). Hazardous content and
recycled content of products can be used as a basis for calculating modulated fees in extended
producer responsibility schemes (Laubinger et al., 2021[25]) (Chapter 6). Product-based standards are
also emerging in various jurisdictions setting forth material content standards (recycled content,
hazardous content), recyclability standards, reparability standards, standards on sustainable
production, material quality standards (e.g. waste and scrap, secondary materials), product quality
standards (e.g. second-hand goods, remanufactured goods) (Yamaguchi, 2021[26]).
At the same time, the fragmentation of product policies related to the circular use of plastics can
potentially act as trade impediments for businesses to pursue circular economy business models
(Yamaguchi, 2021[26]). In particular, the costs to comply with different regulations and standards, can
act as barriers for market access for businesses (Yada et al., 2017[27]). While many product policies
related to the circular use of plastics are still under consideration, international co-operation across the
plastics value chain can be essential to address these potential trade-related challenges.
In this context, a number of international co-operation initiatives are already underway. In December
2021, 68 members to the World Trade Organization (WTO) issued a joint ministerial statement on the
Informal Dialogue on Plastics Pollution and Environmentally Sustainable Plastics Trade (IDP) (WTO,
2021[28]). The initiative explores how improved trade co-operation can contribute to domestic, regional,
and global efforts to reduce plastic pollution.
International harmonisation of product policies related to circular economy and plastics is also taking
place. In 2020, the International Organization of Standardization (ISO) developed standards on eco-
design and circularity of materials (ISO, 2020[29]). Between 2019 and 2020, the EU’s standardisation

146
GLOBAL PLASTICS OUTLOOK © OECD 2022
body CEN-CENELEC developed nine standards related to “material efficiency aspects for products in
scope of eco-design legislation” (CEN-CENELEC, 2021[30]). Both initiatives may contribute to aligning
plastics policies and trade policies towards mutually supportive and coherent outcomes.
Continued dialogues appear to be critical to make the plastics value chains more circular by tackling
illegal trade in plastics, harmonising efforts on product policies, removing subsidies to fossil fuel inputs,
and harnessing trade policies including tariffs and non-tariff measures towards more sustainable
outcomes. Exploring further synergies between on-going global initiatives such as those of the WTO
and ISO, as well as forthcoming global initiatives under the UNEA process, may provide promising
avenues for addressing the trade dimensions of global plastic pollution.
7.3. Eliminating plastic pollution will be costly for low and middle-income
countries
As shown in Chapter 2, mismanaged waste is by far the largest source of plastic leakage. Macroplastics
account for almost 90% of total leakage, with land-based leakage from improper waste management
practices accounting for 95% of all macroplastics. Since the bulk of mismanaged macroplastic waste
occurs in low and middle-income countries, the investments needed in these countries are particularly
large.
An OECD report developed in conjunction with this Global Plastics Outlook (OECD, 2022 forthcoming[31])
estimates the per-capita capital (i.e. initial investment in facilities, equipment and installation) and
annualised costs (i.e. ten-year annualised capital investment costs, operating and maintenance costs).
Countries were grouped based on the stringency of their current policies (high, moderate, and low) and
the capacity of their current waste management infrastructure (high and moderate). The report makes
estimates for a moderate ambition and a high ambition investment scenario. Both scenarios target full
waste collection, recovery and disposal, but the high ambition scenario includes circular economy solutions
such as prevention measures and recycling targets, while the moderate ambition scenario included mixed
waste collection, landfilling and energy recovery.7
For countries with a moderate to low policy stringency and a low level of existing infrastructure, the
estimated initial investment required to implement the moderately ambitious investment profile is EUR 20.2
per capita, with annualised current costs of EUR 6.5 per capita (Figure 7.2). When applied to the population
of low and lower middle-income countries (using World Bank data for 2019 (World Bank, 2021[32])), this
represents an initial investment of EUR 80 billion and an annualised cost of more than EUR 25 billion.

147
GLOBAL PLASTICS OUTLOOK © OECD 2022
Figure 7.2. The cost of preventing plastic pollution varies by ambition, policy stringency and needs
Per-capita investment and annualised costs by country profile and level of investment ambition
Source: (OECD, 2022 forthcoming[31]), The Cost of Preventing Ocean Plastic Pollution.
The annual cost represents 0.3% of total GDP of the concerned low and lower middle-income countries
and would be an important financial burden, especially for the group of least developed countries.
International support will be instrumental in accelerating the investments required in infrastructure and
changes to waste management practices, policies and governance.
7.4. Official Development Assistance (ODA) dedicated to plastic waste
management is increasing, but insufficient
There are numerous international initiatives in place to help countries address marine plastic litter and
other plastics-related issues. For example, UNEP has identified 138 relevant initiatives for technical
support and 74 for financial support to countries (UNEP, 2020[33]). These initiatives differ substantially in
scope, focus, size and operations. Comparing and analysing them in a consistent way is challenging. In
contrast, international co-operation in the form of ODA is one type of support to developing countries that
can be tracked across years and regions. Therefore, this section will analyse trends in ODA and compare
the available budgets with the required investments.
Whilst ODA to address plastic pollution has increased significantly in recent years, it started from a low
base and volumes remain small relative to overall ODA finance (Figure 7.3). ODA targeting plastics
specifically increased from around USD 27 million in 2014 to USD 149 million in 2019. ODA targeting solid
waste management more generally increased from USD 224 million to USD 327 million over the same
period.
While absolute ODA finance has increased, the share of plastic-related ODA (i.e. ODA targeting plastics
specifically and ODA targeting solid waste management) compared to total ODA spending remains
marginal. In the period 2017-19, it accounted for only 0.2% of ODA gross commitments, compared to
18.6% for climate mitigation and adaptation and 4.6% for biodiversity. Currently annual ODA accounts for
less than 2% of the financial needs to set up basic waste management in developing countries
(Section 7.3).

148
GLOBAL PLASTICS OUTLOOK © OECD 2022
Figure 7.3. Plastic-related gross commitments for ODA have increased steadily but remain small
Source: Own calculations based on (OECD, 2021[34]), OECD Data Platform on Development Finance for the Sustainable Ocean Economy and
the OECD’s Creditor Reporting System, https://stats.oecd.org/Index.aspx?DataSetCode=crs1.
StatLink 2 https://stat.link/fzvote
Prior to 2017, development co-operation largely focused on improving general solid waste disposal and
management systems, which received an annual average of USD 206 million between 2008 and 2016.
While ODA to enhance solid waste management has continued to increase, and reached USD 327 million
in 2019, a growing number of emerging projects also specifically focus on plastic pollution. These projects,
for instance, support public awareness raising and the development of national strategies for plastics
management in developing countries, finance recycling and clean-up, or research into the sources and
impacts of plastic pollution. ODA targeting plastics specifically has increased significantly in recent years,
from an average of USD 34 million annually in the 2008-16 period (0.02% of global ODA) to
USD 147 million in 2019 (0.07% of global ODA in the same year).
Asian countries are the largest beneficiaries of plastic-related ODA, attracting one-third of these funds over
2017-19 (Figure 7.4). This reflects the fact that Asia is one of the worst-affected regions in the world, with
coastal populations, environments and economic sectors such as fisheries, tourism and shipping being
increasingly harmed by plastic waste leakage (Schmidt, Krauth and Wagner, 2017[35]). Countries in the
south-east of Europe that are not members of the EU were the second-largest recipients, receiving one-
quarter of plastic-related ODA in 2017-19, mostly from EU institutions and other EU countries. One-third
of plastic-related ODA is provided through regional or cross-regional allocations that target transboundary
issues and multi-country solutions for marine pollution and ocean plastics.
0.0%
0.1%
0.2%
0.3%
0.4%
0.5%
0.6%
0
100
200
300
400
500
2014 2015 2016 2017 2018 2019
Perce
nta
ge o
f tota
l OD
AU
SD
mil
lio
n,
20
18
co
nst
an
t p
rice
s
ODA for solid waste management generally
ODA for management of plastics specifically
share of ODA for plastic and solid waste management in total ODA (right axis)

149
GLOBAL PLASTICS OUTLOOK © OECD 2022
Figure 7.4. Asian countries attract the most plastic-related ODA
Plastic-related ODA flows, 2017-19. The top ten providers of ODA are depicted on the left axis while the
beneficiaries are grouped by global region on the right axis
Note: Plastic-related ODA flows include those for solid waste management generally and those for management of plastics specifically.
Source: Own calculations based on (OECD, 2021[34]), OECD Data Platform on Development Finance for the Sustainable Ocean Economy and
the OECD’s Creditor Reporting System, https://stats.oecd.org/Index.aspx?DataSetCode=crs1.
The bulk of plastic-related ODA is extended through bilateral development co-operation, which accounted
for 79% of the 2017-19 total. The top five bilateral providers were the European Union, Germany, Norway,
Sweden and Canada, collectively accounting for 64% of ODA to tackle plastic pollution. Plastic-related
ODA from multilateral providers accounts for a smaller share of the total, but has increased significantly,
from an annual average of USD 45 million over 2008-15 period to an annual average of USD 79 million
over 2016-19 (+76%). The second largest provider overall was the Asian Development Bank, which
provided 17% of ODA during the 2017-2019 period.
Recent initiatives by development banks signal increasing involvement by multilateral providers in this area
in the years to come. For example, the Asian Development Bank has issued an Action Plan for Healthy
Oceans and Sustainable Blue Economies for the Asia and Pacific region; the World Bank has established
the ProBlue trust fund; and the European Investment Bank has launched the Clean Ocean Initiative
together with France and Germany. Multilateral co-operation and international organisations can help
donors to align goals and prevent duplicative or competing bilateral aid.
In summary, while ODA targeting solid waste management and plastics has increased substantially in
recent years, it represents a very small share of the total finance needed to effectively address plastic
pollution in low and middle-income countries (as discussed in Section 7.3). Additional sources of funding
need to be tapped to provide adequate and sustainable levels of funding. These sources include revenue
from the households and firms benefiting from public waste management services, as well as domestic
government subsidies and private sector investment. For instance, one of the world’s largest consumer
goods companies, Unilever, has announced that it will help collect and process more plastic packaging
than it sells by 2025 by investing in waste management infrastructure and partnering with relevant
stakeholders (Global Plastic Action Partnership, 2021[36]; Unilever, 2021[37]).8 ODA can be instrumental for
leveraging such initiatives.

150
GLOBAL PLASTICS OUTLOOK © OECD 2022
In addition to investments in waste-management hardware, improvements to the software – i.e. the
regulatory framework, governance mechanisms and the capacity of key actors – will also be needed. The
OECD provides some recent guidance through its Implementation Handbook for Quality Infrastructure
Investment (Box 7.2). Moreover, the social implications of waste management reforms will need to be
considered carefully, as many low and middle-income countries have a large number of informal waste
pickers and waste handlers involved in these activities and reforms may affect their livelihoods (see Box 4.1
in Chapter 4). Finally, structural conditions at the macro-economic level, such as ensuring that the rule of
law is respected and that corruption does not channel investments to other destinations, are critical for
improving waste management and preventing plastic leakage.
Box 7.2. Successful waste management investment requires strong regulatory frameworks and governance mechanisms
Cost-effective techniques and relatively low-tech infrastructure, such as collecting mixed waste and
sanitary landfilling, will likely play a primordial role in reducing the amount of plastic leakage in low and
middle-income countries. The OECD’s Implementation Handbook for Quality Infrastructure Investment
puts forward the following four requirements for successful infrastructure investments for waste
management:
Adopt the necessary policy and regulatory frameworks: set up a clear institutional framework
with well-specified responsibilities for each public actor, issue legal waste management
obligations as well as standards, and develop monitoring schemes to verify compliance.
Set up strong governance mechanisms: take into account stakeholder opinions and develop a
long-term vision that determines the waste management infrastructure needed, procure
infrastructure in a competitive way that leverages the expertise inside and outside of the
country, organise infrastructure management in line with the OECD Recommendation of the
Council on the Governance of Infrastructure1 and foresee a mechanism to incorporate informal
waste pickers in the system.
Ensure adequate and stable financing: do not only focus on investments, but also ensure the
financing of recurring costs for operations and maintenance; provide sufficient investor
protection and warrant payments by the national treasury to support procurement at sub-
national level; and consider using economic instruments such as taxes that generate revenues
and incentives for waste prevention or sorting.
Enhance the capacity of sub-national governments: local authorities are typically responsible
for organising the collection and disposal of waste from households and small companies. They
need sufficient technical expertise to oversee the operations, legal tools to enforce local rules,
adequate financing, the authority to impose local taxes, and communication skills to inform as
well as motivate the population.
Note: 1available at https://legalinstruments.oecd.org/en/instruments/OECD-LEGAL-0460
Source: OECD Implementation Handbook for Quality Infrastructure Investment, https://www.oecd.org/finance/oecd-implementation-
handbook-for-quality-infrastructure-investment.htm

151
GLOBAL PLASTICS OUTLOOK © OECD 2022
References
AHEG (2020), Chair’s Summary for the Ad Hoc Open-Ended Expert Group on Marine Litter and
Microplastics, http://www.env.go.jp/press/files/en/871.pdf.
[18]
AOISIS (2022), Oceans Day Plastic Pollution Declaration, https://plasticdeclaration.aosis.org/
(accessed on 20 July 2021).
[21]
Barrowclough, D., C. Deere Birkbeck and J. Christen (2020), Global trade in plastics: insights
from the first life-cycle trade database, UNCTAD Research Paper No. 53,
UNCTAD/SER.RP/2020/12, United Nations Conference on Trade and Development,
DECEMBER 2020, https://unctad.org/system/files/official-document/ser-rp-2020d12_en.pdf.
[22]
CEN-CENELEC (2021), Material efficiency aspects for products in scope of Ecodesign
legislation, CEN/CLC/JTC 10,
https://standards.cencenelec.eu/dyn/www/f?p=205:32:0::::FSP_ORG_ID,FSP_LANG_ID:224
0017,25&cs=10B7B067CC7107748A52C1C034BB4CFD3 (accessed on 31 January 2022).
[30]
Convention on Biological Diversity (2021), Preparations for the Post-2020 Biodiversity
Framework, https://www.cbd.int/conferences/post2020 (accessed on 14 December 2021).
[6]
Duncan, J. et al. (2020), The Business Case for a UN Treaty on Plastic Pollution,
https://www.ellenmacarthurfoundation.org/our-work/activities/new-plastics-
economy/projects/un-treaty (accessed on 1 March 2021).
[16]
EIA (2020), Convention on Plastic Pollution – Toward a new global agreement to address plastic
pollution, https://eia-international.org/report/convention-on-plastic-pollution-toward-a-new-
global-agreement-to-address-plastic-pollution/ (accessed on 12 October 2021).
[17]
EU Commission (2021), “EU Action Plan: ’Towards Zero Pollution for Air, Water and Soil’”,
https://eur-lex.europa.eu/resource.html?uri=cellar:a1c34a56-b314-11eb-8aca-
01aa75ed71a1.0001.02/DOC_1&format=PDF (accessed on 12 October 2021).
[38]
Gilman, E. et al. (2016), Abandoned, lost and discarded gillnets and trammel nets, FAO, Rome. [12]
Global Plastic Action Partnership (2021), Trade and the circular economy: a deep dive into
plastics action in Ghana, https://globalplasticaction.org/blog/trade-and-the-circular-economy-
a-deep-dive-into-plastics-action-in-ghana/#:~:text=Plastic%20Action%20Partnership-
,Trade%20and%20the%20Circular%20Economy%3A%20A%20deep,into%20plastics%20acti
on%20in%20Ghana&text=The%20ca.
[36]
GPML (2018), Global Partnership on Marine Litter Purpose, Function and Organization,
https://www.gpmarinelitter.org/who-we-are/objectives (accessed on 25 February 2021).
[3]
ISO (2020), Environmental management systems — Guidelines for incorporating ecodesign, ISO
14006:2020, International Organization for Standardization.
[29]
IUCN (n.d.), “Geneva meeting deliberates on global convention to address plastic pollution _
IUCN”.
[19]
Laubinger, F. and P. Börkey (2021), “Labelling and Information Schemes for the Circular
Economy”, OECD Environment Working Papers, No. 183, OECD Publishing, Paris,
https://dx.doi.org/10.1787/abb32a06-en.
[24]

152
GLOBAL PLASTICS OUTLOOK © OECD 2022
Laubinger, F. et al. (2021), “Modulated fees for Extended Producer Responsibility schemes
(EPR)”, OECD Environment Working Papers, No. 184, OECD Publishing, Paris,
https://dx.doi.org/10.1787/2a42f54b-en.
[25]
Ministry of the Environment Japan (2020), G20 Report on Actions against Marine Plastic Litter,
https://g20mpl.org/wp-content/uploads/2020/11/G20mpl_20201130_IGES_second-edition.pdf
(accessed on 19 February 2021).
[14]
NOAA and UNEP (2012), The Honolulu Strategy: A Global Framework for Prevention and
Management of Marine Debris,
https://wedocs.unep.org/bitstream/handle/20.500.11822/10670/Honolulu%20strategy.pdf?seq
uence=1&isAllowed=y (accessed on 25 February 2021).
[5]
OECD (2021), Trends of ODA for a sustainable ocean economy, OECD, Paris, https://oecd-
main.shinyapps.io/ocean/.
[34]
OECD (2020), “Improving resource efficiency and the circularity of economies for a greener
world”, OECD Environment Policy Papers, No. 20, OECD Publishing, Paris,
https://dx.doi.org/10.1787/1b38a38f-en.
[23]
OECD (2022 forthcoming), The Cost of Preventing Ocean Plastic Pollution, OECD, Paris. [31]
OSPAR Commission (2014), Marine Litter Regional Action Plan, OSPAR, London,
https://www.ospar.org/documents?v=34422 (accessed on 25 October 2021).
[9]
Parker, L. (2019), The world agrees there’s a plastic waste crisis—can it agree on a solution?,
National Geographic.
[2]
Schmidt, C., T. Krauth and S. Wagner (2017), “Export of Plastic Debris by Rivers into the Sea”,
Environmental Science & Technology, Vol. 51/21, pp. 12246-12253,
http://dx.doi.org/10.1021/acs.est.7b02368.
[35]
Simon, N. et al. (2021), “A binding global agreement to address the life cycle of plastics”,
Science, Vol. 373/6550, pp. 43-47, http://dx.doi.org/10.1126/science.abi9010.
[15]
UN Report of the Secretary-General (2018), Gaps in international environmental law and
environment-related instruments: towards a global pact for the environment,
https://globalpact.informea.org/sites/default/files/documents/Gap-Report-Final.pdf (accessed
on 25 February 2021).
[1]
UNEA (2021), Looking ahead to the resumed UN Environment Assembly in 2022 - Message
from online UNEA-5,Nairobit22-23 February 2021,
https://papersmart.unon.org/resolution/uploads/k2100514-e.pdf#overlay-context=node/315
(accessed on 1 March 2021).
[20]
UNEP (2020), Report on the inventory of technical and financial resources or mechanisms for
supporting countries in addressing marine plastic litter and microplastics,
https://wedocs.unep.org/bitstream/handle/20.500.11822/35934/UNEP%20AHEG%204%20IN
F%207%20English%2028%20Oct%202020.pdf?sequence=7&isAllowed=y (accessed on
7 February 2022).
[33]
UNEP (2019), “Surfing a wave of change: Clean Seas campaign celebrates two years of action”,
https://www.unep.org/news-and-stories/story/surfing-wave-change-clean-seas-campaign-
celebrates-two-years-action (accessed on 25 February 2021).
[4]
153
GLOBAL PLASTICS OUTLOOK © OECD 2022
UNEP (2017), Combating marine plastic litter and microplastics:An assessment of the
effectiveness of relevant international, regional and subregional governance strategies and
approaches.
[7]
UNEP (2014), Regional Action Plan for Marine Litter Management in the wider Caribbean region
(RAPMaLi), http://gefcrew.org/carrcu/CEP_TR_72-en.pdf (accessed on 27 October 2021).
[11]
UNEP (1999), LBS Protocol Text, https://www.unep.org/cep/resources/policy-and-strategy/lbs-
protocol-text (accessed on 27 October 2021).
[10]
Unilever (2021), Rethinking plastic packaging, https://www.unilever.com/planet-and-
society/waste-free-world/rethinking-plastic-packaging/.
[37]
United Nations (2021), THE 17 GOALS | Sustainable Development, https://sdgs.un.org/goals
(accessed on 30 July 2021).
[8]
Wienrich, N., L. Weiand and S. Unger (2021), Stronger together: The role of regional instruments
in strengthening global governance of marine plastic pollution, Institute for Advanced
Sustainability Studies (IASS), Potsdam, http://dx.doi.org/10.48440/iass.2021.008.
[13]
World Bank (2021), Population, total - Low Income, Middle Income, The World Bank,
https://data.worldbank.org/indicator/SP.POP.TOTL?locations=XM-XP.
[32]
WTO (2021), MINISTERIAL STATEMENT ON PLASTIC POLLUTION AND
ENVIRONMENTALLY SUSTAINABLE PLASTICS TRADE, Revision, INFORMAL DIALOGUE
ON PLASTIC POLLUTION AND ENVIRONMENTALLY SUSTAINABLE PLASTICS TRADE
(IDP), WT/MIN(21)/8/Rev.2, World Trade Organization, 10 December 2021,
https://docs.wto.org/dol2fe/Pages/SS/directdoc.aspx?filename=q:/WT/MIN21/8R2.pdf.
[28]
Yada, J. et al. (2017), Harmonization of product energy efficiency standards and free trade
agreements: the role of international cooperation, International Partnership for Energy
Efficiency Cooperation (IPEEC),
https://www.eceee.org/library/conference_proceedings/eceee_Summer_Studies/2017/2-
policy-governance-design-implementation-and-evaluation-challenges/harmonization-of-
product-energy-efficiency-standards-and-free-trade-agreements-the-role-of-international-coo.
[27]
Yamaguchi, S. (2021), “International trade and circular economy - Policy alignment”, OECD
Trade and Environment Working Papers, No. 2021/02, OECD Publishing, Paris,
https://dx.doi.org/10.1787/ae4a2176-en.
[26]

154
GLOBAL PLASTICS OUTLOOK © OECD 2022
Notes
1 With the exception of some regional action plans on marine litter.
2 The New Global Framework for Managing Nature through 2030 includes a target to reduce pollution from
all sources to levels that are not harmful to biodiversity and ecosystem functions and human health,
including by eliminating the discharge of plastic waste.
3 The EU action plan Towards a Zero Pollution for Air, Water and Soil includes a target for EU Member
States to reduce plastic litter at sea (by 50%) and microplastics released into the environment (by 30%)
(EU Commission, 2021[38]).
4 The UNEA has previously adopted resolutions on marine plastic pollution that acknowledged the
emerging threat (UNEA Resolution 1/6), requested an assessment of current governance gaps
(UNEA Resolution 2/11), set a vision for ending plastic pollution entering oceans (UNEA Resolution 3/7),
and, most recently, acknowledged a need for greater co-ordination and knowledge sharing
(UNEA Resolution 4/6).
5 The first draft of the Post-2020 Global Biodiversity Framework, produced by UNEP for the Convention on
Biological Diversity, includes target 7, which aims to eliminate the discharge of plastic waste. The draft text
of the Post-2020 Biodiversity Framework is currently being negotiated and is expected to be adopted during
the second phase of the UN Biodiversity Conference in May 2022, in Kunming, People’s Republic of China
(Convention on Biological Diversity, 2021[6]).
6 See for example the interventions at the Ministerial Conference on Marine Litter and Plastic Pollution
under the auspices of the UN Environment Programme, held in Geneva and online on
1-2 September 2021, available at https://enb.iisd.org/ocean/conference-marine-litter-and-plastic-
pollution/summary
7 The report estimates investment costs and annualised costs. It is not a cost-benefit analysis because the
model does not include the benefits, such as the revenues generated from recycling in the high-ambition
scenario. The estimates in the study were for end-of-life plastic pollution and did not include marine-based
sources, primary microplastics or leakage from production (abrasion) or consumption (littering).
8 For other private sector initiatives, see the Ellen MacArthur Foundation’s reports at
https://archive.ellenmacarthurfoundation.org/resources/apply/global-commitment-progress-
report/organisation-reports

155
GLOBAL PLASTICS OUTLOOK © OECD 2022
Annex A. Modelling approaches used to
compose the OECD Global Plastics Outlook
Database
The Annex presents the methodologies applied to provide the estimates contained in this report and in the
OECD Global Plastics Outlook Database.1 These estimates include, plastics use, plastic waste generation,
plastic waste management and the environmental impacts of plastics, i.e. 1) leakage to the environment,
detailing the macroplastics and microplastics fractions; 2) leakage to aquatic environments; 3) particulate
matter emissions from tyre and brake abrasion; and 4) greenhouse gas (GHG) emissions.
The Annex contains the following sections:
Overview of the modelling framework
Modelling plastics use in ENV-Linkages
Modelling plastic waste and end-of-life fates in ENV-Linkages
Modelling plastic leakage to the environment (Technical University of Denmark)
Modelling plastic leakage to aquatic environments (Laurent Lebreton)
Modelling plastic leakage to terrestrial and aquatic environments (University of Leeds)
Modelling plastic leakage to the terrestrial and aquatic environments (OECD Global Plastics
Outlook Database)
Modelling particulate matter emissions to air from tyre and brake wear (Norwegian Institute for Air
Research)
Modelling greenhouse gas emissions from plastics in ENV-Linkages.
1.1. Overview of the modelling framework
This section explains in more detail the methodologies employed to obtain the estimates of plastics use,
waste and environmental impacts presented in the Outlook and included in the OECD Global Plastics
Outlook Database. Estimates have been generated by building on output from the OECD computable
general equilibrium (CGE) model ENV-Linkages (Chateau, Dellink and Lanzi, 2014[1]), by filling existing
data gaps and by generating projections on the environmental impacts.
The modelling of economic flows, plastics use, plastic waste and environmental impacts involves different
steps, as illustrated in Figure A A.1. Sectoral and regional economic estimates drive the evolution of
plastics use over time. Volumes of plastics are then used to calculate generated waste, based on product
lifespans of different applications. The waste generated is further broken down by waste treatment,
i.e. recycled (collected for recycling), incinerated, landfilled, mismanaged and littered waste (Chapter 2),
taking into account differences across regions. Finally, estimates for a subset of environmental impacts
are calculated: leakage of microplastics and macroplastics to the environment, leakage to aquatic
environments, particulate matter linked to tyre and brake wear and GHG emissions.

156
GLOBAL PLASTICS OUTLOOK © OECD 2022
The analysis relies on a suite of modelling tools. More specifically, estimates of the economic flows, plastics
use, plastic waste (Steps 1-4), and greenhouse gas emissions (within Step 5) rely on the OECD in-house
modelling tools, while other environmental impacts (also in Step 5) rely on external models. Some of the
information provided by external models in Step 5 have been used to calibrate the ENV-Linkages models
in Steps 1-4.
Figure A A.1. Methodological steps
The OECD’s in-house dynamic CGE model ENV-Linkages is used as the basis to estimate the economic
activities that drive plastics use in 2019. ENV-Linkages is a multi-sectoral, multi-regional model that links
economic activities to energy and environmental issues. A more comprehensive model description is given
in Chateau, Dellink and Lanzi (2014[1]). A description of the baseline scenario construction procedure is
given in Chateau, Rebolledo and Dellink (2011[2]), while recent baseline results are illustrated in OECD
(2019[3]).
The model is based on the Social Accounting Matrices (SAM) contained within the GTAP 10 database
(Aguiar et al., 2019[4]). This database describes bilateral trade patterns, production, consumption and
intermediate use of commodities and services, including capital, labour, tax revenues and use. The base
year of the SAM and of the model is 2014. Therefore, to obtain estimates for 2019, the ENV-Linkages
model was run to 2019 (Box A A.1 for an overview of the functioning of the model). The short-term changes
to the economy from 2014 to 2019 reflect short-term economic changes captured in international
databases: the OECD Economics Department (OECD, 2020[5]) and the International Monetary Fund
(2020[6]).
For the development of this Outlook and the Global Plastics Outlook Database, ENV-Linkages has been
enhanced to include data on plastics use, waste and waste treatment. In ENV-Linkages, plastics estimates
follow economic estimates, and, more precisely, the evolution of the production and consumption of goods
in different sectors and regions. Section 2 of this annex describes the implementation of plastics use in
ENV-Linkages, while Section 3 of this appendix describes the modelling of waste generation and waste
end-of-life fates. A summary of the data sources is available in Chapter 2.

157
GLOBAL PLASTICS OUTLOOK © OECD 2022
Box A A.1. The ENV-Linkages model
Production in ENV Linkages is assumed to operate under cost minimisation with perfect markets and
constant returns-to-scale technology. The production technology is specified as nested Constant
Elasticity of Substitution (CES) production functions in a branching hierarchy. This structure is replicated
for each output, while the parameterisation of the CES functions may differ across sectors. The model
adopts a putty/semi-putty technology specification, where substitution possibilities among factors are
assumed to be higher with new vintage capital than with old vintage capital. In the short run this ensures
inertia in the economic system, with limited possibilities to substitute away from more expensive inputs,
but in the longer run this implies a relatively smooth adjustment of quantities to price changes. Capital
accumulation is modelled as in the traditional Solow/Swan neoclassical growth model, where economic
growth is assumed to stem from the combination of labour, capital accumulation and technological
progress.
Household consumption is the result of within-period maximisation behaviour which is formally
implemented as an “Extended Linear Expenditure System”. A representative consumer in each region
- who takes prices as given - optimally allocates disposable income among the full set of consumption
commodities and savings. Saving is considered as a standard good in the utility function and does not
rely on forward looking behaviour by the consumer. The government in each region collects various
kinds of taxes in order to finance government expenditures. Assuming fixed public savings (or deficits),
the government budget is balanced through the adjustment of the tax on consumer income. In each
period, investment net-of-economic depreciation is equal to the sum of government savings, consumer
savings and net capital inflows from abroad.
International trade is based on a set of regional bilateral flows. The model adopts the Armington
specification, assuming that domestic and imported products are not perfectly substitutable. Moreover,
total imports are also imperfectly substitutable between regions of origin. Allocation of trade between
partners then responds to relative prices at the equilibrium.
Market goods equilibria imply that, on the one side, the total production of any good or service is equal
to the demand addressed to domestic producers plus exports; and, on the other side, the total demand
is allocated between the demands (both final and intermediary) by domestic producers and the import
demand.
ENV Linkages is fully homogeneous in prices and only relative prices matter. All prices are expressed
relative to the numéraire of the price system that is arbitrarily chosen as the index of OECD
manufacturing exports prices. Each region runs a current account balance, which is fixed in terms of
the numéraire.
As ENV-Linkages is recursive-dynamic and does not incorporate forward-looking behaviour, price-
induced changes in innovation patterns are not represented in the model. The model does, however,
entail technological progress through an annual adjustment of the various productivity parameters,
including e.g. autonomous energy efficiency and labour productivity improvements. Furthermore, as
production with new capital has a relatively large degree of flexibility in choice of inputs, existing
technologies can diffuse to other firms. Thus, within the CGE framework, firms choose the least-cost
combination of inputs, given the existing state of technology. The capital vintage structure also ensures
that such flexibilities are larger in the long run than in the short run.
Source: Chateau, Dellink and Lanzi, (2014[1]).

158
GLOBAL PLASTICS OUTLOOK © OECD 2022
The sectoral aggregation of the model adopted in this report is given in Table A A.1, while the regional
aggregation is presented in Table A A.2.
Table A A.1. Sectoral aggregation of ENV-Linkages
Agriculture, fisheries and forestry Manufacturing
Paddy rice Food products
Wheat and meslin Textiles
Other grains Wood products
Vegetables and fruits Chemicals
Oil seeds Basic pharmaceuticals
Sugar cane and sugar beet Primary rubber and plastic products
Fibres plant Secondary plastic products
Other crops Pulp, paper and publishing products
Cattle and raw milk Non-metallic minerals
Other animal products Fabricated metal products
Fisheries Electronics
Forestry Electrical equipment
Non-manufacturing Industries Motor vehicles
Coal extraction Other transport equipment
Crude oil extraction Other machinery and equipment
Natural gas extraction Other manufacturing including recycling
Other mining Iron and steel
Petroleum and coal products Non-ferrous metals
Gas distribution Services
Water collection and distribution Land transport
Construction Air transport
Electricity transmission and distribution Water transport
Electricity generation (8 technologies): Nuclear electricity; hydro (and geothermal); solar; wind; coal-powered electricity; gas-powered electricity; oil-powered electricity; other (combustible renewable, waste, etc.).
Insurance Trade services Business services n.e.s. Real estate activities
Accommodation and food service activities
Public administration and defence
Education
Human health and social work
Source: OECD ENV-Linkages model.

159
GLOBAL PLASTICS OUTLOOK © OECD 2022
Table A A.2. Regional aggregation of ENV-Linkages
Macro regions ENV-Linkages
countries and regions Most important comprising countries and territories
OECD
OECD America
Canada Canada
USA United States of America
Other OECD America Chile, Colombia, Costa Rica, Mexico
OECD Europe
OECD EU 22 Austria, Belgium, Czech Republic, Denmark, Estonia, Finland, France, Germany Greece, Hungary, Ireland, Italy, Latvia, Lithuania, Luxembourg, Netherlands, Poland, Portugal, Slovak Republic, Slovenia, Spain, Sweden
Other OECD Europe Iceland, Israel,1 Norway, Switzerland, Turkey, United Kingdom
OECD Pacific OECD Asia[BRE1] Japan, Korea
OECD Oceania Australia, New Zealand
Non-OECD
Other America Other Latin America Non-OECD Latin American and Caribbean countries
Eurasia
Other EU Bulgaria, Croatia, Cyprus,2 Malta, Romania
Other Europe and Caspian
Non-OECD European and Caspian countries, incl. Russian Federation
Middle East and Africa
Middle East and North Africa
Algeria, Bahrain, Egypt, Iraq, Islamic Rep. of Iran, Kuwait, Lebanon, Libya, Morocco, Oman, Qatar, Saudi Arabia, Tunisia, United Arab Emirates, Syrian Arab Rep., Western Sahara, Yemen
Other Africa Sub-Saharan Africa
Other Asia
China People’s Republic of China, Hong Kong (China)
India India
Other non-OECD Asia Other non-OECD Asian and Pacific countries
Notes: 1. The statistical data for Israel are supplied by and under the responsibility of the relevant Israeli authorities. The use of such data by
the OECD is without prejudice to the status of the Golan Heights, East Jerusalem and Israeli settlements in the West Bank under the terms of
international law. 2. Note by Turkey: The information in this document with reference to “Cyprus” relates to the southern part of the Island. There
is no single authority representing both Turkish and Greek Cypriot people on the Island. Turkey recognises the Turkish Republic of Northern
Cyprus (TRNC). Until a lasting and equitable solution is found within the context of the United Nations, Turkey shall preserve its position
concerning the “Cyprus issue”. Note by all the European Union Member States of the OECD and the European Union: The Republic of Cyprus
is recognised by all members of the United Nations with the exception of Turkey. The information in this document relates to the area under the
effective control of the Government of the Republic of Cyprus.
Source: OECD ENV-Linkages model.
1.2. Modelling plastics use in ENV-Linkages
1.2.1. Volumes
The ENV-Linkages model has been extended to include plastics volumes, for both primary and secondary
(recycled) plastics use. The data on plastics volumes is presented in million metric tonnes (Mt) and plastics
use is split by region, polymer and application.
Volumes of primary plastics on data from Ryberg at al. (2019[7]), that updates and expands on the seminal
work in Geyer, Jambeck and Law (2017[8]), providing a database for 2015. Since the estimates from Ryberg
et al. (2019[7]) were provided on the one hand by region and application, and on the other hand by
application and polymers, an assumption of homogeneity of polymers by application was taken to estimate
the primary plastics use by region, polymer and application.
Secondary plastics volumes for 2015 were estimated following a methodology deriving secondary plastics
through waste collected for recycling and recycling losses. Loss rates including sorting losses and
reprocessing losses were estimated using a methodology developed by the University of Leeds based on
a review of the literature (see Section 1.3.3 in this Annex).
The estimates of plastics use for 2019 are based on the 2015 year, using the link between plastics volumes
in Mt and plastic inputs to sectors in USD, which are estimated relying on the OECD ENV-Linkages model.
In addition, the OECD Global Plastics Outlook Database is complemented with plastics use for the past

160
GLOBAL PLASTICS OUTLOOK © OECD 2022
between 1950 and 2014, for two reasons. The first reason is to be able to accurately compute waste flows
in the future, since plastic lifetimes can span up to decades. The second reason is to form the basis for the
computation of environmental impacts, as for instance plastic leaked in the ocean accumulates over time.
The 1950-2014 historical plastics use is calculated following a step-wise approach. First, global plastics
use is taken from the Geyer, Jambeck and Law (2017[8]) study. The regional split of plastics use builds
then on weight-based estimates of waste, from a cross country regression of municipal solid waste on
gross domestic product (GDP) per capita, using What a Waste 2.0 (Kaza et al., 2018[9]), multiplied by the
regional consumption shares in 2015. Finally, for each region, the split by polymer and application is
assumed to be constant prior to 2014, based on the estimates from Ryberg et al. (2019[7]). This
methodology is constrained by data availability (and thus necessarily imperfect) but provides estimates of
plastics use by region, polymer and application.
1.2.2. Economic flows
The ENV-Linkages model has been modified to include primary and secondary plastics production.
ENV-Linkages relies on the GTAP 10 database (Aguiar et al., 2019[4]), which provides economic flows by
sector and regions for the year 2014. While in the original database primary and secondary plastic
production are aggregated in the same sector (Rubber and plastic products [RPP]), the representation of
plastic in ENV-Linkages was enhanced to allow the distinction of a technology producing primary plastic
and an alternative technology producing secondary plastics.
Similar to coal power plants and gas power plants both providing the same good (electricity), these two
technologies produce a similar plastic good, with an elasticity of substitution of 2. The production of plastic
goods was thus split with two data sources. First, the total shares in production for primary and secondary
plastics were taken from the volumes in tonnes described above (Ryberg et al. (2019[7]) for primary and
own estimates for secondary plastics). Table A A.3 describes the calculated share for the secondary plastic
production technology. Furthermore, the Exiobase 3 database (Stadler et al., 2018[10]) was used to adapt
the cost structures. The main difference stems from the material inputs: the primary technology uses fossil
fuels, while the secondary technology uses inputs from the chemical sector.
Table A A.3. Share of the secondary production technology
Region Share of secondary technology in 2015 (in tonnes)
OECD America
USA 3.9%
Canada 4.6%
Other OECD America 6.8%
OECD Europe OECD EU countries 9.0%
OECD Non-EU countries 5.9%
OECD Pacific OECD Asia 6.3%
OECD Oceania 2.4%
Other America Latin America 7.5%
Eurasia Other EU 4.9%
Other Eurasia 3.5%
Middle East and Africa Middle East & North Africa 3.5%
Other Africa 4.5%
Other Asia
China 7.3%
India 6.5%
Other non-OECD Asia 4.8%
Source: OECD ENV-Linkages model. Primary plastics are based on Ryberg et al. (2019[7]). For the calibration of secondary plastics, recycling
rate sources are detailed in Table A A.4 and loss rates for the recycling process are from Cottom et al. (2020[11]).

161
GLOBAL PLASTICS OUTLOOK © OECD 2022
1.2.3. Link between volumes and economic flows
To model plastics use in ENV-Linkages, data on plastics volumes by application and polymer have been
linked to the detailed sectoral production structure of the model and the GTAP 10 database that underlies
the model and modified to include both primary and secondary plastics. Two main sources of data (volumes
and economic flows described above) were used and put in coherence: 1) plastics production and
consumption by economic sector by GTAP 10 adapted with a primary and secondary production
technology in monetary values; and 2) regional flows of a range of plastic polymers and application-specific
flows of plastics in tonnes. Table A A.4 summarises the mapping of the economic sectors and plastics
applications. The initial values for this mapping are calibrated using data from Ryberg et al. (2019[7]),
combining polymer distribution by application at the global level with distribution of total plastics use by
region and application. The polymer distribution was taken from the global averages and applied for each
region taking into account the specific economic structures of the various regions.
Table A A.4. Mapping plastics use by application to economic sectors
Input sectors Applications Output sectors Polymers*
Plastic products
Building & construction Construction
ABS, ASA, SAN; bioplastics; HDPE; LDPE, LLDPE;
PP; PS; PUR; PVC; other
Consumer & institutional
products
Accommodation and food service activities; air transport; education; health; insurance; lumber; non-metallic minerals; Business services; other manufacturing; public services; land transport; pulp,
paper and publishing; real estate; textile; water
transport
ABS, ASA, SAN; bioplastics; HDPE; LDPE, LLDPE; PP; PS;
PUR; PVC; other
Electrical/electronic Electrical equipment; electronics ABS, ASA, SAN; bioplastics; HDPE; LDPE, LLDPE; PP; PS;
PUR; PVC; other
Industrial/machinery Fabricated metal products; iron and steel; nonferrous
metal; Machinery and equipment HDPE; LDPE, LLDPE; PP; PUR
Packaging Food products; chemical products Bioplastics; HDPE; LDPE, LLDPE;
PET; PP; PS; PUR; PVC; other
Personal care products Chemical products HDPE; PET
Transportation - other Motor vehicles; public services; other transport
equipment
ABS, ASA, SAN; bioplastics; Fibres; HDPE; LDPE, LLDPE; PP;
PUR; PVC; other
Other Other sectors Other
Chemicals
Marine coatings Other manufacturing, other transport equipment Marine coatings
Road markings Construction Road markings
Textile sector - clothing Textiles Bioplastics; fibres
Textile sector - others Textiles Fibres
Transportation - tyres Plastic products Elastomers (tyres)
Note: *See Table 2.2 in Chapter 2 for abbreviations and examples of use for those polymers.
Source: OECD ENV-Linkages model.
Based on the initial GTAP database, which presents data for 2014, primary plastics use is projected
following the flows of “plastic products” into the various corresponding demand sectors, from initial values,
following the methodology developed for the OECD’s Global Material Resources Outlook (OECD, 2019[3]).
In particular, the model incorporates a series of plastics chains from initial production to final demand,
either partially or in full depending on the particular structure of each regional economy. The basis for the
chain includes flows from “oil” or ”biomass” to “chemicals”, that are then used for the production of “plastic
products” which serve as intermediate goods or for sectors such as food product/appliances/motor
vehicles/construction, before reaching final demand. The underlying assumption is that the coefficient

162
GLOBAL PLASTICS OUTLOOK © OECD 2022
(USD/tonne per polymer, per application, per region) that links monetary flows to physical flows (in tonnes),
is kept constant. Plastics production then follows these demands, based on trade flows and plastics use.
There are three steps to project plastics use and the split of primary and secondary plastics to fulfil demand
(after 2015). First, total demand for plastics use is estimated following the evolution of the demand for the
plastic commodity (produced by both the primary and secondary technologies). Second, as collected and
sorted materials (further referred to as plastic scrap) are – after correcting for loss rates (see Section 1.3.2
on Losses from sorting and reprocessing in this Annex) - used to produce secondary plastics, the tonnes
of secondary plastics follow the growth of the secondary sector in the ENV-Linkages projections. Third,
the volumes of primary plastics are calculated as a residual between the two such that total demand for
plastics is met.
1.3. Modelling plastic waste and end-of-life fates in ENV-Linkages
1.3.1. Plastic waste
Plastic waste is calculated linking plastics use to the lifespan distribution of different applications
(representing a large range of products). Specifically, plastic waste is calculated as a function of plastics
use (in volumes), following Geyer, Jambeck and Law (2017[8]), using a methodology based on lifespan
distributions,2 under the assumption of global homogeneity.
Plastic waste of different applications is grouped into three main categories: Municipal Solid Waste (MSW),
Other, and Markings & microbeads. MSW includes packaging, consumer & institutional products,
electrical/electronic and textiles. ‘Other’ incorporates waste that is not included in MSW, therefore mostly
reflecting waste from industrial applications (including building and construction, industrial and machinery
applications, transportation applications). Markings and microbeads is a very small stream that includes
marine coatings, road markings and personal care products.
1.3.2. End-of-Life Fates
Plastic waste is divided into different waste management streams (end-of-life fates) by applying end-of-life
shares that vary across countries, polymers and waste categories. MSW and Other plastic waste
categories can be 1) recycled; 2) incinerated; or 3) discarded. The latter is further disaggregated into waste
that is disposed of in sanitary landfills, mismanaged waste and, in the case of MSW, littering. Littering is
included as a separate category to reflect the different drivers and geographical distribution compared to
mismanaged waste (this occurs mainly in regions that lack basic waste management infrastructure).
Littering is set as a constant share of municipal solid waste following the assumption in Jambeck et al.
(2015[12]). Markings & Microbeads form a very small stream (by mass) that is assumed not to be managed
and to leak directly to the environment.
The sources of end-of-life fate shares for the year 2019 vary across regions. Recycling (defined here as
material that has been collected for recycling) shares for plastics are exogenously fixed based on a range
of sources, primarily country sources (Table A A.5). To account for unreported informal recycling (which
leads to understating plastic recycling rates) or overly optimistic reported recycling rates, all reported
recycling rates were sense-tested, adapted and validated leveraging on consultations with experts and
modelling carried out by Ed Cook, Josh Cottom and Costas Velis from the University of Leeds.
The recycling shares are further split across polymers by multiplying the recycling shares for plastics by
factors that reflect the recyclability and value of individual polymers based on expert consultations and
ensuring that the estimated recycled volumes do not exceed the recycling capacities subject to data
availability. Overall, PET and HDPE are assumed to have the highest recycling rates, followed by LDPE,
PP and PVC (for construction). PUR, fibres, elastomers, bioplastics, marine coatings and road markings

163
GLOBAL PLASTICS OUTLOOK © OECD 2022
are not recycled, while only a very small proportion of PS, ABS, ASA, SAN and other polymers are
recycled.
Table A A.5. Data sources for plastic recycling rates in base year
Region Recycling Rate Source and Assumptions
USA United States Envrionmental Protection Agency (EPA) (2020[13]; 2020[14])
Canada Environment and Climate Change Canada (2019[15])
Other OECD America Based on SEMARNAT (2020[16]) and FCH (2021[17])
OECD EU countries Polymer-specific recycling rates have been determined based on expert opinion and applied to the volumes of
polymers collected for recycling by ENV-Linkages.* Other EU
OECD Non-EU countries Based on EU adjusted by the proportion of region’s MSW recycling rate to EU MSW recycling rate from What a
Waste 2.0 (Kaza et al., 2018[9])
OECD Pacific Plastic Waste Management Institute (2019[18]) and expert judgement to account for plastic recycling rates in Korea
OECD Oceania Australian Government (2020[19])**
Latin America Based on Other OECD America adjusted to account for a larger informal sector
Other Eurasia What a Waste 2.0 (Kaza et al., 2018[9])
Middle East & North Africa What a Waste 2.0 (Kaza et al., 2018[9])
Other Africa What a Waste 2.0 (Kaza et al., 2018[9])
China China Recycling Industry Development Report (2013-18) by the Ministry of Commerce (2019[20])
India Central Pollution Control Board (2019[21]) and UNIDO (2020[22])
Other non-OECD Asia What a Waste 2.0 (Kaza et al., 2018[9])
Note: *For the EU, the calculated recycling rate for total plastics has been benchmarked with the numbers presented by Plastics Europe
(2020[23]). In the OECD Global Plastics Outlook Database, the amount of plastics taken into account for the calculation of the recycling rate is
substantially higher (the denominator: total plastics in OECD Global Plastics Outlook Database includes fibres and other rarely recycled plastics).
So the total recycling rate of plastics that is included in the OECD Global Plastics Outlook Database is lower than Plastics Europe (2020[23]).
** An updated report is available: Government of Australia (2021[24]).
The use of incineration as a waste treatment type is country-specific and related to historic elements and
local population densities. The share of plastic waste that is incinerated is strongly correlated with the
share of total solid waste that is incinerated. Therefore, the incineration shares are set so that the ratio of
the incineration share to the non-recycled share is equal to the corresponding ratio for total MSW from the
What a waste 2.0 database (Kaza et al., 2018[9]). Moreover, the same incineration shares apply for non-
MSW plastic waste, namely the ‘Other’ waste category.
Regarding discarded waste, its share is equal to the residual, under the assumption that 2% of MSW is
littered at all times (Jambeck et al., 2015[12]). The discarded share is further split into sanitary landfilled and
mismanaged waste. In this analysis, mismanaged waste includes open dumping and unaccounted waste
treatments for all income levels apart from lower and lower middle income countries, for which also
unspecified landfilling, waterway treatment and other categories are included based on country level data
for MSW (Kaza et al., 2018[9]) and building on assumptions for the previous version of the database in
Jambeck et al. (2015[12]). In general, mismanaged plastic waste, as a share of total plastic waste, is
expected to decrease with income level. Following this assumption and using MSW data from Kaza et al.
(2018[9]), the share of mismanaged plastic waste was estimated by regressing the ratio of mismanaged
waste to discarded waste on GDP per capita, accounting for regulatory differences between OECD and
non-OECD countries using an OECD dummy. Specifically, the following regression was estimated for
156 countries for which complete data was available:
𝑀𝐼𝑆𝑖/(𝑀𝐼𝑆𝑖 + 𝐿𝐴𝑁𝑖) = 𝛼 + 𝛽 ∗ 𝑙𝑛(𝑔𝑑𝑝_𝑝𝑐𝑖) + 𝑂𝐸𝐶𝐷𝑖
where 𝑀𝐼𝑆𝑖 = mismanaged waste/MSW, 𝐿𝐴𝑁𝑖 = Landfilled waste/MSW, 𝑔𝑑𝑝_𝑝𝑐𝑖 = GDP per capita and
𝑂𝐸𝐶𝐷𝑖 = dummy for OECD countries, 𝑖 = country.
Finally, the share for landfilled waste is equal to the residual.

164
GLOBAL PLASTICS OUTLOOK © OECD 2022
Historical data for recycling, incineration and discarded shares of plastic waste are taken from Geyer,
Jambeck and Law (2017[8]) for the period 1980-90 for four regions – United States, European Union, China
and Rest of the World. Following, using granular data for MSW recycling and incineration rates from Kaza
et al. (2018[9]), the historical shares for 1990 were mapped to the 15 regions within ENV-Linkages, and
were linearly interpolated for the period 1990-2018 in line with the methodology previously applied in Geyer
Jambeck and Law (2017[8]). Historical data for mismanaged waste and landfilling followed the same
methodology as in the base year.
1.3.3. Losses from sorting and reprocessing (University of Leeds)
Plastic waste that has been collected for recycling almost always includes some non-plastic materials and
articles. Moreover, collected plastic waste typically includes a multitude of plastics with varying chemical
and physical composition. The degree to which these items, objects and fragments are useful to a plastics
reprocessor depends on a wide range of factors that influence the value of the material. In general, high
income countries implement recyclate collection schemes (programmes) that are designed to yield high
material mass through an accessible and simplified system that is easy for people to understand.
Conversely, in low- and middle-income countries, plastic waste collection for recycling is carried out by
informal workers (IRS) who selectively collect (cherry pick) items and objects that are most valuable,
focusing on quality and concentration rather than high yield. Even with diligent, selective collection, plastic
articles contain a multitude of intentionally and non-intentionally appended, entrapped, adhered and
entrained materials and objects that must be removed from the dominant plastic before it can be
comminuted and re-melted under pressure in an extruder. A list of characteristics of waste plastics and
their influence on the value of materials and hence their recyclability is reported by Cottom et al. (2020[11]).
Robust and generalisable loss rates during sorting and reprocessing of plastic waste that has been
collected for recycling are not commonly reported. Hestin, Faninger and Milios (2015[25]) proffered 18%
and 30% for sorting and reprocessing respectively, based on surveys of European reprocessors. However,
the nature of the survey was not reported and it is possible that plastic and non-plastic materials and
objects have been reported alongside plastic losses. The ENV-Linkages model is only concerned with
plastics so data for non-plastic materials were excluded from this component of the model.
The University of Leeds developed a theoretical model for plastic waste collected for recycling in high-
income countries and low- and middle-income countries, based on material value. Acknowledging that
collection and sorting systems vary enormously worldwide, these two generalised groups were chosen
because high income countries largely operate, either single stream collection of dry recyclate or
co-collection of mixed plastic waste alongside metal packaging. Conversely in low-income and middle-
income countries, collection of plastic waste for recycling is largely carried out by the informal recycling
sector whose participants selectively collect materials and have much lower loss rates.
Recycling losses for packaging waste collected for recycling in high income countries, are estimated based
on a dataset (Chruszcz and Reeve, 2018[26]) that reports a weighted average for all collection scheme
types across the United Kingdom. For LDPE, an approximation was made based on data reported by Lau
et al. (2020[27]) (P2O model), because LDPE is predominantly used as a as a flexible foil in packaging.
Although LDPE is commonly collected for recycling, it is almost never reprocessed in high income countries
when coming from post-consumer household sources due to the challenges associated with surface
contamination and selectivity detailed in Table A A.6. On the other hand, post-consumer LDPE from
commercial sources is commonly recycled in high-income countries as it is easily collectable and
separately and can be extruded dry, often without undergoing substantial cleaning. The result is a low loss
rate. The assumptions from Lau et al. (2020[27]) were used to determine the proportion of material that was
from commercial/institutional sources compared to household sources.

165
GLOBAL PLASTICS OUTLOOK © OECD 2022
A probability of plastic waste items being selected at the sorting stage based on material value was applied to each of the packaging and plastic
types. Cottom et al. (2020[11]) calculate these probabilities for Consummer and Institutional products, Electrical and Electronic products,
Packaging, and Textiles. Probabilities for other products have been calculated for this report and are reported in
Table A A.7. The probabilities were estimated using cost data summarised by SystemiQ and the Pew
Charitable Trust (2020[28]), recyclability imperatives detailed by Recoup (2019[29]) and data on material
actually recycled reported by Antonopoulos, Faraca and Tonini (2021[30]) and Plastics Recyclers Europe
(2020[31]). In general HDPE, PET and LDPE were considered to have a 100% chance of being selected
for reprocessing at the Materials Recovery Facilities (MRF) and PVC and PS were considered to have 0%
chance of being selected for reprocessing at the MRF. Although the evidence for PVC for packaging is
more clear cut, Antonopoulos, Faraca and Tonini (2021[30]) reported some post-consumer PS selection
taking place in Europe. However, these quantities are reported by Plastics Recyclers Europe (2020) to be
small and unusual, there is a likelihood that they do not refer to post-consumer material. The probability
was set to zero for packaging but an overall probability of 98.5% was set to allow for some small
occurrences of non-packaging material.
The loss rates at the reprocessor stage were approximated using data on plastic content reported by
Roosen et al. (2020[32]).Non plastic content was excluded and the relative masses were normalised.
High income countries were assumed to have formal collection and the plastic packaging reported there
was subject to loss rates at both sorting and reprocessing. Low and middle income countries were
assumed to have informal collection and the loss rates were therefore assumed to occur only at the
reprocessing stage as informal actors selectively collect.
The assumptions for non-packaging applications were based largely on estimates from the project expert
team, as there are no published data to support them. Consumer and institutional products were assumed
to be the same as packaging except for PVC for which evidence from VinylPlus (2019[33]) indicates some
recycling takes place. For the textiles (fibres), an estimate of 20% from financial modelling by Thompson
et al. (2012[34]) was used in the absence of any other robust data. Readers should note that this loss rate
is approximated on the basis that post-consumer textiles have been recycled into shoddy fibres and/or
flocking (stuffing) rather than items that have been ‘reused’ and are out of scope of this study.

166
GLOBAL PLASTICS OUTLOOK © OECD 2022
Table A A.6. Assumptions used to determine loss rates for plastic packaging waste that has been collected for recycling
Plastic item1
Plastic type by
dominant
polymer1
Weighted
composition1
High-income countries Low- & middle-income countries
Probability of being
rejected before
reprocessing2
Loss rate at
reprocessor adjusted
for wastage3
Net losses after
sorting &
reprocessing4
Probability of being
rejected before
reprocessing2
Loss rate at
reprocessor adjusted
for wastage3
Net losses after
sorting &
reprocessing4
Film LA recycling sacks LDPE 2.9 100 0.00 2.90 25 1.00 0.75
FILM Other film LDPE 11.2 100 0.00 11.20 25 1.00 2.88
FILM Carrier bags LDPE 1.5 100 0.00 1.50 25 1.00 0.39
B PET NATURAL PET 26.4 0 13.45 3.55 0 13.45 3.55
B PET JAZZ PET 3.1 0 13.45 0.42 0 13.45 0.42
B HDPE Milk Bottles HDPE 13.2 0 15.93 2.10 0 15.93 2.10
B HDPE All non-milk bottles HDPE 7.7 0 15.93 1.23 0 15.93 1.23
B PVC ALL PVC 0 100 0.00 0.00 100 0.00 0.00
B PP ALL PP 0.4 50 21.31 0.24 0 21.31 0.09
Pack PET NATURAL PET 10.3 0 14.63 1.51 0 14.63 1.51
Pack PET JAZZ PET 0.5 0 14.63 0.07 0 14.63 0.07
Pack HDPE NATURAL HDPE 0.1 100 0.00 0.10 0 14.63 0.01
Pack HDPE JAZZ HDPE 0.6 100 0.00 0.60 0 14.63 0.09
Pack PVC ALL PVC 0.1 100 0.00 0.10 100 0 0.10
Pack PP NATURAL PP 4.4 100 0.00 4.40 0 2.08 0.09
Pack PP JAZZ PP 5.3 100 0.00 5.30 0 2.08 0.11
Pack PS ALL PS 1.5 100 0.00 1.50 100 0 1.50
Pack EPS ALL EPS 0.4 100 0.00 0.40 100 0 0.40
Black PET PET 1.9 100 0.00 1.90 100 0 1.90
Black PP PP 0.6 100 0.00 0.60 100 0 0.60
Black Other Mixture 1.1 100 0.00 1.10 100 0 1.10
Other Mixture 0.2 100 0.00 0.20 100 0 0.20
Unidentified Mixture 1.9 100 0.00 1.90 100 0 1.90
Plastic non-packaging Mixture 4.4 100 0.00 4.40 100 0 4.40
Source: 1. Chruszcz and Reeve (2018[26]). 2. Assumptions based on polymer value by SYSTEMIQ & The Pew Charitable Trust (2020[28]), recyclability reported by Recoup (2019[29]), and material reported
to have been recycled by Antonopoulos, Faraca and Tonini (2021[30]) and Plastics Recyclers Europe (2020[31]). 3. Roosen et al (2020[32]).

167
GLOBAL PLASTICS OUTLOOK © OECD 2022
Table A A.7. Average loss rates by plastic type and application for high income countries and low- middle income countries (Non-MSW)
Plastic type by
dominant polymer
Building and Construction Industrial/Machinery Other Transportation - Other Total
(t y-1) Mass
(t y-1)
Loss rate
HIC (%)
Loss rate
LMIC (%)
Mass
(t y-1)
Loss rate
HIC (%)
Loss rate
LMIC (%)
Mass
(t y-1)
Loss rate
HIC (%)
Loss rate
LMIC (%)
Mass
(t y-1)
Loss rate
HIC (%)
Loss rate
LMIC (%)
Fibres
0.1 100.0 100.0 0.0 100.0 100.0 0.1
HDPE 1.0 20.0 5.0 0.1 20.0 5.0 1.1 20.0 5.0 0.6 98.0 90.0 2.9
LDPE, LLDPE 0.1 2.0 2.0 0.1 2.0 2.0 0.7 2.0 2.0 0.1 98.0 90.0 1.0
Other 0.0 100.0 100.0
0.2 100.0 100.0 0.1 100.0 100.0 0.4
PP 0.2 20.0 5.0 0.1 20.0 5.0
1.2 100.0 100.0 1.5
PS 0.1 100.0 100.0
0.1 100.0 100.0
0.2
PUR 0.1 40.0 10.0 0.0 40.0 10.0 0.4 40.0 10.0 0.2 100.0 100.0 0.6
PVC 0.6 18.73 18.73
0.4 40.0 18.73 0.1 100.03 100.03 1.1
Source: Calculations by Leeds University. 1. Calculated from Chruszcz and Reeve (2018[26]) and Roosen et al. (2020[32]). 2. Calculated from Lau et al. (2020[27]). 3. Approximated from data reported by
VinylPlus (2019[33]). 4. Thompson Willis and Morley (2012[34]).

168
GLOBAL PLASTICS OUTLOOK © OECD 2022
For simplicity, The European Union, the USA, and Canada were considered to have formal collection and
all other regions were considered to have predominantly informal collection for recycling. The exception
was China which has been undergoing a partial transition from informal to formal collection for recycling.
Due to the lack of robust data on the informal recycling sector, this component of the model assumed a
70:30 ratio for informal/formal collection for recycling.
Table A A.8 puts forward the outcome of the technical calculations. The calculations initially suggested
loss rates of 100% for PS and of 98.1% for “Other”, but these loss rates have both been set to the loss
rate from LDPE, to represent that these polymers are sometimes recycled, but only in small quantities.
Furthermore, to reflect that a large share of recycling of PET is rather a downcycling transformation of PET
into fibres, the modelling assumes 35% of recycled PET is transformed into fibres.
Table A A.8. Average loss rates by plastic type and region for MSW and non-MSW combined
Loss rates as percentages of collected plastics for recycling, 2016
ABS,
ASA,
SAN
Fibers HDPE LDPE,
LLDPE Other PET PP PS PUR PVC Average
OECD America
USA 100% 54% 27% 60% 44% 18% 94% 49% 57% 43% 50%
Canada 100% 55% 26% 60% 43% 18% 95% 49% 57% 43% 49%
Other OECD
America 100% 64% 17% 59% 29% 18% 24% 50% 28% 47% 30%
OECD Europe
OECD EU countries 100% 59% 24% 57% 38% 18% 90% 42% 53% 35% 44%
OECD Non-EU
countries 100% 60% 24% 60% 36% 18% 92% 45% 53% 37% 46%
OECD Pacific OECD Asia 100% 48% 22% 62% 30% 18% 92% 46% 50% 35% 44%
OECD Oceania 100% 30% 26% 67% 64% 18% 50% 45% 56% 41% 40%
Other America Latin America 100% 64% 16% 60% 26% 18% 22% 54% 27% 54% 29%
Eurasia Other EU 100% 56% 26% 63% 58% 18% 52% 44% 53% 44% 41%
Other Eurasia 100% 55% 26% 65% 58% 18% 50% 49% 55% 49% 41%
Middle East and
Africa
Middle East & North
Africa 100% 54% 19% 64% 38% 18% 31% 49% 36% 45% 33%
Other Africa 100% 71% 16% 61% 22% 18% 21% 53% 24% 56% 30%
Other Asia
China 100% 54% 20% 62% 34% 18% 48% 54% 39% 54% 36%
India 100% 34% 19% 67% 39% 18% 27% 59% 38% 60% 32%
Other non-OECD
Asia 100% 47% 23% 64% 49% 18% 41% 55% 47% 56% 37%
Global average 100% 53% 22% 61% 38% 18% 63% 49% 46% 43% 40%
Source: OECD ENV-Linkages model, based on Cottom et al. (2020[11]).
1.3.4. Modelling international trade in plastic waste
The ENV-Linkages model has been extended to include international trade in plastic waste per application
and polymer type. Volumes of plastic waste exports and imports are calculated based on data from
UN Comtrade (United Nations Statistics Division, 2020[35]) following two steps. First, total exports of plastic
waste per country and polymer are estimated using the share of plastics exports (Comtrade) to plastic
waste (output of ENV-Linkages). Second, exports are split into partner countries and polymers using the
projected country and polymer weights for 2019, and historical data for the years before. Bilateral export
and import weights per country (row weights) were calculated based on the bilateral data of export and
import values for the period 2010-19 (most recent and complete year) and for the four subcategories of
plastic waste reported in the UN Comtrade database. The latter were mapped to the polymer types

169
GLOBAL PLASTICS OUTLOOK © OECD 2022
included in ENV-Linkages (Table A A.9), to ensure that global trade balances total imports and exports,
bilateral plastic waste imports per reporter-partner pair correspond to the bilateral export of the
corresponding partner-reporter pair.
The end-of-life fates of plastic waste that is traded, differ from the domestically treated waste to reflect that
a high proportion of traded plastic waste tends to be recyclable. In particular, 50% of traded plastic waste
is expected to be recycled, with the remaining being distributed across the other waste streams following
the same proportions of end-of-life fates as domestically treated waste excluding littering.
Table A A.9. UN Comtrade plastic waste series mapping to polymers in ENV-Linkages
UN Comtrade code Series Description Polymers types in ENVLinkages
3915 Waste, parings and scrap, of plastics
391510 … of polymers of ethylene HDPE,LDPE, LLDPE, PET, PP,PUR, Elastomers (tyres)
391530 … of polymers of styrene PS
391530 … of polymers of vinyl chloride PVC
391590 … of other Fibres, Marine coatings, Road marking coatings, ABS, ASA, SAN, Other
Source: United Nations Statistics Division (2020[35]) and OECD ENV-Linkages model.
1.4. Modelling plastic leakage to the environment (Technical University of
Denmark)
Estimations on the plastic leakage are based on an interaction of the ENV-Linkages Model with other
dedicated models. Each of the dedicated models builds on earlier work that has passed peer review with
respect to estimations for current plastic leakage. The sources for leakage to the environment are varied.
Consequently, the modelling techniques to make projections on these flows differ. This section explains
the methodology and parameters employed by Teddy Serrano, Alexis Laurent, and Morten Ryberg from
the section for Quantitative Sustainability Assessment at the Technical University of Denmark (DTU) to
estimate leakage of macro and micro plastics into the environment, as well as wastewater pathway and
losses via sludge application to land.
1.4.1. Leakage of macroplastics
For losses of macroplastics, four main categories have been considered: mismanaged municipal solid
waste, mismanaged non-municipal solid waste, littering, and losses from marine activities. Plastic waste
generation is calculated by the ENV-Linkages model as explained in the previous sections. The details on
the calculations of the four categories are as follows:
Mismanaged MSW was retrieved from the ENV-Linkages model. In line with Lau (2020[27]), it was
assumed that 32% of mismanaged MSW is lost to the environment.
Mismanaged non-MSW was also retrieved from the ENV-Linkages model. Due to a lack of data
on the fate of mismanaged non-MSW, the share of mismanaged non-MSW lost to the environment
is assumed to be equal to the share of mismanaged MSW lost to the environment (32%).
Losses occurring via littering were calculated as a fraction of generated MSW in two steps. First,
in line with Jambeck et al. (2015[12]) and studies carried out for the United Kingdom and Belgium
(OVAM, 2018[36]; Resource Futures, 2019[37]), it was assumed that 2% of MSW is littered. Second,
a substantial fraction of this littered waste happens in an urban environment and is cleaned up
before it makes it to the environment. It is assumed that between 15% and 35% of littered waste is
not captured by street sweeping, storm drain catchments and pump stations (Jambeck et al.,
2015[12]). The estimated share of litter that is lost to the environment in each region, was established

170
GLOBAL PLASTICS OUTLOOK © OECD 2022
according to the income level (as GNI/cap, US dollars), with lower shares for the high-income
regions, as illustrated in (Table A A.10.).
In the ENV-Linkages model, the non-collected share of litter is considered lost to the environment.
The collected share of litter is reallocated and added to incineration, landfilling, open-pit burning
and dumping in line with the respective waste treatment shares per region (see 1.3.2 in this Annex).
Losses from marine activities (fishing gear and non-netting waste) were calculated based on the
following information: production data of fishing gear in Europe (PRODCOM, 2016) (Eunomia,
2018[38]; Eurostat, n.d.[39]) upscaled to the rest of the world based on the projected growth of fishing
activity (from the ENV-Linkages model), the assumption that 28% of plastic waste in the fishing
and aquaculture sector comes from netting (Viool et al., 2018[40]), and the assumption that 15% of
fishing gear material is lost every year during use (Viool et al., 2018[40]).
Table A A.10. The share of litter lost to the environment in function of the regional income levels
Category Low and lower-middle income Upper-middle income High income
Income level as GNI/cap [USD] < 4045 4045-12535 > 12535
Share of litter lost to the environment 35% 25% 15%
Note: The World Bank country classifications by income level: 2020-21 were used to allocate regions into low and lower-middle income, upper-
middle income, or high income categories.
Source: World Bank (2020[41]).
1.4.2. Leakage of microplastics
For losses of microplastics, ten categories have been considered: microbeads, primary pellets, textile
wash, tyre abrasion, road markings, brake dust, artificial turf, marine coatings, microplastics dust and
wastewater sludge. This section presents the methodology employed to calculate emissions of
microplastics from the sources considered. Some microplastics directly leak into the environment, but
others end up in the sewage system. The fate of the different microplastics ending up in municipal
wastewater networks, is discussed in the next section.
The category “microbeads” includes losses of microplastics intentionally added to rinse-off personal care
and cosmetic products, detergents and maintenance products that are discharged into municipal
wastewaters during use. Estimates of microbead consumption in personal care and cosmetic products
(PCCPs) are derived from the output of the ENV-Linkages model. All microbeads are assumed to end up
in the sewage system in the year that they are consumed.
The category “primary pellets” includes losses of primary plastic pellets occurring during production,
transportation, and handling. Eunomia (2018[38]) estimated the losses of plastic pellets in 2015 in the
European Union, as originating from pellet production from raw materials, intermediary handling
processes, processing and conversion, off-site waste management, and transportation and shipping.
Assuming that leakage is proportional to the quantity of plastics produced, losses for the European Union
were scaled up to the entire world based on the European production share of plastics in 2015 (Plastics
Europe, 2017[42]), and then allocated to geographical regions based on production shares. Losses from
producers, recyclers, processors and offsite waste management were assumed to enter the sewage
network as part of wastewater. Losses from Intermediary facilities and Shipping were assumed to be
directly lost to the environment.
The category “textile wash” includes losses of synthetic microfibres lost during the washing of textile and
apparel products. Estimates are computed based on the total volume (tonnes) of plastics used in the
category ‘Wearing apparel’ (following the textiles sector in ENV-Linkages) in a given year, and the
assumption that during the lifespan of a textile product 0.4% of material is lost during washing. The share

171
GLOBAL PLASTICS OUTLOOK © OECD 2022
of material lost during the lifespan of a textile and apparel product was calculated based on an assessment
of existing studies accounting for the share of synthetic material lost due to washings over several wash
cycles (De Falco et al., 2019[43]; Pirc et al., 2016[44]). It was assumed that all microfibres released during
washing enter the sewage system.
Three sources of microplastics emissions from road transport were taken into account:
The category “tyre abrasion” includes losses of elastomers originating from the abrasion of tyre
treads of cars, trucks, and motorcycles. Emission estimates are derived from traffic data on the
yearly activity in vehicle-km for passenger cars and in tonne-km for trucks from 2016 to 2019 in
each region (retrieved from the ENV-Linkages model). Wear rates (i.e. average mass of tyre tread
lost per vehicle-km, by vehicle type) employed are those reported by Eunomia (2018[38]). For trucks,
an average freight tonnage of 16 t/vehicle was estimated, based on data from Eurostat (2018[45]).
It was assumed that 46% of tyre treads is of elastomer content (Sommer et al., 2018[46]), and that
the fate of the particles is as follows: 45% are retained in the asphalt pavement or remain close to
the road, 45% is transported by road runoff and 10% is airborne (OECD, 2021[47]). The share of
particles lost into the environment is dependent on the rural/urban population share of each region
(as also used in the ENV-Growth and therefore ENV-Linkages model). In rural regions, road runoff
and airborne emissions are considered as lost to the environment, whereas the particles trapped
in the asphalt/road sides are not. In urban regions, airborne emissions are considered as lost to
the environment, particles trapped in the asphalt/road sides are not, and particles as part of road
runoff are assumed to go to a sewer system and treated as in wastewater the region where the
loss occurs.
The category “road markings” includes losses from markings applied to road surfaces. Estimates
of plastics use for road markings are generated by the ENV-Linkages model, and the fate of road
marking particles has been assumed to be similar to that of tyre abrasion particles due to a lack of
data.
The category “brake wear” includes losses of synthetic polymers originating from the wear of brake
pads and other components. From the average composition of brake pads described by Hallal et
al. (2013[48]), the polymer content of brake pads was assumed to be 23%. Similarly to the
methodology used for tyre abrasion, loss estimations were based on annual traffic data and
abrasion rates based on calculations by Eunomia (2018[38]).The fate of the microplastics in brake
dust was assumed to be similar to that of tyre abrasion particles.
The category “artificial turf” includes losses of plastics from the infill of sport turfs. Estimates in the
literature find losses of 300-730 kg / year per field in Denmark and 550 kg/year in Sweden (Løkkegaard,
Malmgren-Hansen and Nilsson, 2018[49]; Swedish EPA, 2019[50]). According to ECHA (2020[51]), the
number of artificial sport pitches will reach 39 000 by 2020 and average infill use is between 40 and
120 tonnes of material. Assuming that annual infill consumption is 1-4% of the total volume (ECHA,
2020[51]; Eunomia, 2018[38]), average yearly infill is 101 400 tonnes. Estimates for Europe were upscaled
to other regions based on artificial turf market size figures (ResearchNester, 2021[52]) and GDP growth
estimates (from the ENV-Linkages model). Based on the composition of rubber granulate used as infill, it
was assumed that 96% of all infill is microplastics.3 In terms of losses and environmental fate, in line with
Løkkegaard, Malmgren-Hansen and Nilsson (2018[49]), it was assumed that:
10% of rubber granulate particles are lost to the surrounding soil (and therefore considered as lost
to the environment).
10% are discharged with water. Based on the rural share of the population in each region provided
by the ENV-Linkages model from 2016 to 2019, it was assumed those 10% are considered as
directly lost to the environment in rural areas. In urban areas, they are considered to enter the
wastewater network. For those reaching a treatment system (primary, secondary, tertiary), all

172
GLOBAL PLASTICS OUTLOOK © OECD 2022
particles are assumed to be removed and therefore end up in sewage sludge, since the relatively
large size of turf crumbles allows them to be usually well removed in treatment plants.
The category “marine coatings” includes losses of paint and coatings worn off from ships and marine
structures. It is expected that 10% of plastics employed in the production of marine coatings is lost over
the lifespan of the product, directly into the environment (Boucher and Friot, 2017[53]).
The category “microplastics dust” is used to refer to unintentional losses of microplastics occurring during
the use phase of a number of products. Specifically, in the model five sources were taken into account:
microplastics in household textile dust, the wear off of paint from interior surfaces, the wear off of paint
from exterior surfaces, losses from construction and demolition activities, and shoe sole abrasion. These
categories do not embody an exhaustive list of all remaining microplastics losses, but only put forward
those categories for which sufficient literature has been found to quantify the resulting leakage.
For each source, with the exception of household textile dust, estimates are based on reported losses at
the scale of a country or the European Union, which have been scaled down to calculate per capita
emissions or per USD of GDP at constant Purchasing Power Parity (PPP) created, and finally scaled up
to calculate the emissions for the entire world for each year, using data provided by the ENV-Linkages
model. For interior and exterior paints, as well as exterior construction and demolition sources of dust,
GDP was used as a scaling proxy under the assumption that the use of these materials is correlated to
wealth.
For shoe sole abrasion, population data was considered a more relevant proxy. Because a person can
only wear one pair of shoes at a time, the wear of shoes is assumed to be dependent on the activity of the
person and not on wealth. In lack of better data, trends in the use of shoes are assumed to follow population
trends.
The losses estimations of household textile dust are based on a recent study, according to which airborne-
emitted synthetic fibres from textile and apparel products could represent a third of the particles lost to
water during washings (De Falco et al., 2020[54]). Therefore, the emissions of textile fibres previously
calculated during textile wash were used to calculate the losses of household textile dust.
A summary of the references used to calculate the losses from can be found in Table A A.11. It was
assumed that 15% of household textile dust (Kawecki and Nowack, 2020[55]) and 100% of microplastics
from interior paints end up in wastewater. For other sources, particles emitted in urban areas were also
assumed to enter wastewater systems, whereas they were considered lost to the environment for rural
areas.
Table A A.11. Sources for losses from microplastics dust
Microplastics dust sources Reference (Country or region) Scaling
method
Household textile dust ENV-Linkages model’s textile projections -
Interior paints Eunomia (2018[38])(EU) GDP
(USD, PPP) Exterior paints Eunomia (2018[38]) (EU)
Exterior construction and demolition Kawecki and Nowack (2020[55]) (Switzerland)
Shoe sole abrasion Lassen et al. (2016[56]) (Denmark) Population
The category “wastewater sludge” includes losses of microplastics occurring via the application of
wastewater sludge to land, as detailed in the next section.
1.4.3. The wastewater pathway and losses via sludge application to land
A large share of the emitted microplastics end up in wastewater or stormwater runoff (OECD, 2021[47]). To
estimate the quantities of microplastics that reach the environment, a stylised flow of relevant end-of-pipe

173
GLOBAL PLASTICS OUTLOOK © OECD 2022
treatment systems has been developed as illustrated in Figure A A.2. The model considers a number of
possible fates for microplastics, in line with Ryberg et al. (2019[7]). Ultimately, microplastics can either be
retained by wastewater treatment or be lost to the environment.
Figure A A.2. Fate of microplastics in wastewaters
Source: Methodology adapted from Ryberg et al. (2019[7]).
The share of microplastics emissions ending up in different pathways depends on the state of wastewater
infrastructure coverage in different countries. Allocation shares for each fate were estimated on a regional
level. For each region, most allocation shares leading to treatments (represented by yellow boxes in
Figure A A.2) were calculated using allocation shares averages of the countries composing the region,
weighted by the population of each country. An assessment of data for 187 countries showed high
variability in data availability and quality across countries. For most OECD countries, as well as Brazil,
Colombia, and South Africa, the latest available data from the OECD Environment Database (2017[57]) was
used and considered representative for wastewater treatment in 2016. For China and India, allocation
shares were based on Kalbar, Muñoz and Birkved (2017[58]).
For other countries, the reference data comes from the WHO/UNICEF Joint Monitoring Programme for
Water Supply, Sanitation and Hygiene (JMP, 2020[59]). This data is used for monitoring development in
SDG 6.3.1 “Proportion of safely treated domestic wastewater flows (%)”. In the dataset, the following
classification is used:
Safely managed: use of improved facilities which are not shared with other households and where
excreta are safely disposed in situ or transported and treated off-site.
Basic: use of improved facilities which are not shared with other households.
Limited: use of improved facilities shared between two or more households.
Unimproved: use of pit latrines without a slab or platform, hanging latrines or bucket latrines.

174
GLOBAL PLASTICS OUTLOOK © OECD 2022
Open defecation: disposal of human faeces in fields, forests, bushes, open bodies of water,
beaches and other open spaces or with solid waste (JMP 2020).
The “safely managed” share of the wastewater was assumed to at least undergo primary treatment. The
remaining share of the wastewater is modelled as being directly released to the environment. Although
this is a conservative assumption, it was not possible to retrieve more detailed data on the treatment levels
for certain regions.
A microplastics removal rate was assigned to different levels of wastewater treatment (primary, secondary,
and tertiary), as illustrated in Table A A.12 and employed to calculate the fate of microplastics passing
through wastewater treatment, following the approach by Ryberg et al. (2019[7]). The removal rate of
unspecified and independent wastewater treatment was assumed equal to the removal rate for primary
treatment. Regional data on loss of wastewater due to overflow (represented by blue boxes in Figure A A.2)
is generally lacking and the loss share was therefore modelled using the same loss shares for all regions.
It is estimated that 0.6% and 2.4% of the wastewater is lost due to overflow of the sewer system and of
the waste water treatment plant (WWTP), respectively (Magnusson et al., 2016[60]; Ryberg et al., 2019[7]).
Table A A.12. Microplastics removal rate for different levels of wastewater treatment
Treatment technology Microbeads Fibres Other microplastics
Primary treatment 86% 87% 69%
Secondary treatment 92% 92% 96%
Tertiary treatment 99% 96% 99%
Source: Calculations from Michielssen et al. (2016[61]).
Wastewater sludge is the waste by-product of wastewater treatment containing the water pollutants
removed from the influent. Sludge reuse for agricultural applications is encouraged in several countries,
mainly due to the high nutrient content and its beneficial effects on crops, as well as to reduce the need
for landfilling or incineration. However, recent evidence suggests that this practice leads to the transfer of
a share of the microplastics retained during wastewater treatment to agricultural land (Nizzetto, Futter and
Langaas, 2016[62]).
Losses into the environment via agricultural land were calculated based on the share of sludge generated
in a given year that is applied on agricultural land. Due to data scarcity on the fate of microplastics during
sludge treatment, it was assumed that there is no further removal of microplastics before sludge is applied
to land (Ryberg et al. 2019). For Canada, China and the United States, the share of sludge applied to
agricultural land follows the fractions reported by Rolsky et al. (2020[63]) (i.e. 43%, 45% and 55% for
Canada, China and the United States, respectively). Due to a lack of data, the share of wastewater sludge
applied on agricultural fields in all other countries was assumed to be equal to the European average
(i.e. 46%) (Eurostat, 2020[64]).
1.5. Modelling plastic leakage to aquatic environments (Laurent Lebreton)
This section explains the methodology and parameters employed by Laurent Lebreton to estimate the
amount of leaked plastics ending up in aquatic environments and assesses their mobility as well as
degradation in rivers and oceans.
With a wide variety of polymer types, object shapes and sizes, and the dynamic nature of aquatic
environments, quantifying sources and the fate of plastics in rivers, lakes, and the ocean is not trivial. Some
studies have recently attempted to quantify the amount of mismanaged plastic waste generated by
countries worldwide, which likely reach an aquatic environment (Borrelle et al., 2020[65]) and subsequently
the ocean (Meijer et al., 2021[66]). These studies utilise spatial models describing the generation of
mismanaged plastic waste in relation to topography and other environmental parameters. This section

175
GLOBAL PLASTICS OUTLOOK © OECD 2022
raised country-scale emission results to the modelled global regions represented in the ENV-Linkages
model. The transport of emitted plastics was estimated considering geographical variations. Then the fate
of plastics for the different regions was modelled as a function of polymer types predicted by projections
of waste generation from various sectors of the economy (from ENV-Linkages). Finally, the mass of plastics
accumulated in different aquatic environments for each region is reported.
To calculate inputs of plastics by region into aquatic environments, the analysis starts from the leakage to
environment calculated by the ENV-Linkages model. The model then computes the probability for leaked
plastics to reach an aquatic environment (rivers, lakes, and oceans) as a function of distance and terrain
slope direction. The analysis uses the national probability of emissions of plastics into aquatic
environments, adapted from Borelle et al. (2020[65]). The probability is independent of the total amount of
leaked plastic waste but may differ around the world as a function of population location and topography
of countries. In this study, the probability of emissions by region was computed by weighing country scale
emission probability by population size and formulating a regional average including confidence intervals
(Figure A A.3). The likelihood of plastic waste emissions varies by region. Island nations with
predominantly coastal populations have the highest chance that plastics leaked to the environment end up
in aquatic environments.
Figure A A.3. Weighted probability of leaked plastics entering aquatic environments
Note: The probability was calculated as the average of the country-scale fraction of emissions weighted by the population size of countries.
Source: Calculations based on Borrelle et al. (2020[65]).
In freshwater, floating plastics may be transported downstream while sinking plastics (plastics with a larger
density than freshwater, e.g. PET, PVC or PS) will inevitably reach bottom sediments. Floating plastics
may also be retained in freshwater environments in vegetation bordering the river, sediments in the river
banks, artificial barriers (e.g. dams), or lakes. Some floating plastics may also be colonised by organisms
and sink due to loss of buoyancy. A recent study estimating direct global inputs of plastics into the ocean
via waterways reported that only 1% to 2% of plastics leaked annually have a chance to reach the sea
globally within a year (Meijer et al., 2021[66]). The study utilised the same probability framework derived
from location and quantities of lost plastics to the nearest river network. Still, it computed additional
transport probabilities to river mouth from distance to the river mouth, river discharge, and river network
order. The results show around one order of magnitude less discarded plastics reaching the ocean than
the whole aquatic environment globally, including freshwater ecosystems (Table A A.13). This suggests
that a large fraction of emitted plastic waste is likely still retained inland.
0
0.1
0.2
0.3
0.4
0.5
0.6
low mid high

176
GLOBAL PLASTICS OUTLOOK © OECD 2022
Table A A.13. Fractions of leaked macroplastics that enter aquatic environments and that reach the ocean
Macro region Region
Fraction of leaked macroplastics
entering
aquatic environments
Fraction of
aquatic plastics
reaching the ocean
OECD America
USA 32% 3%
Canada 36% 3%
Other OECD America 21% 5%
OECD Europe OECD EU countries 34% 3%
OECD Non-EU countries 34% 4%
OECD Asia OECD Pacific 43% 11%
OECD Oceania 44% 2%
Other America Latin America 28% 5%
Eurasia Other EU 27% 1%
Other Eurasia 32% 1%
Middle East and Africa Middle East & North Africa 27% 4%
Other Africa 23% 4%
Other Asia
China 28% 2%
India 26% 4%
Other non-OECD Asia 34% 14%
Source: Fraction of mismanaged and littered plastic waste entering aquatic environments (adapted from Borrelle et al. (2020[65])) and fraction of
waste in aquatic environment entering the ocean environment (adapted from Meijer et al. (2021[66])) by region.
In the ocean, plastics with a larger density than seawater will sink to the bottom, accumulating in deep-sea
canyons and trenches by the action of gravity. Floating plastics, however, will be transported by the action
of waves, wind and currents. The largest part of these plastics, however, will rapidly reencounter land and
beach on a coastline. A study presenting a model of dispersion of plastics in the ocean from global coastal
sources reported that within a year, around 97% of released model particles had resided near a coastline
for more than two consecutive days (Lebreton and Andrady, 2019[67]), suggesting a significant fraction had
likely beached in that time. Rich coastal ecosystems will also facilitate the retention of floating plastics near
the coastline as, similarly to freshwater environments, organisms in the marine environment will colonise
floating plastics. Objects with smaller volume to surface ratios, such as plastic films or small microplastics,
will likely sink near the coastline. Fragments and objects with a sufficiently large volume to maintain their
buoyancy can escape the coastal environments. Over time debris tend to accumulate offshore in
subtropical latitudes. Five accumulation zones have been widely reported in the literature from field
observations and numerical models. The largest one is located in the North Pacific Ocean between Hawaii
and California (Lebreton et al., 2018[68]).
Environmental conditions will also dictate the fate of plastics during their journey in freshwater and marine
environments. Particularly under the action of sunlight, plastics degrade by photo-oxidation. As such, it is
expected that plastics near the surface in rivers, lakes, or in the ocean are more likely to degrade into
smaller particles, commonly referred to as microplastics with varying definitions (usually, particles below
1-5 mm and larger than one micron). Due to the large complexity of mechanisms and under varying
conditions, data on the degradation of plastics in natural environments is scarce. Still, results are starting
to appear with long-term experiments on the degradation of plastics in controlled environments.
Fragmentation rates expressed in the percentage of weight loss per year did not exceed 5% in a laboratory
seawater microcosm for various conventional thermoplastics (Gerritse et al., 2020[69]). This is in good
agreement with modelled whole-ocean plastic degradation rates expected by numerical models (i.e. 3% of
total ocean plastic mass degraded per year from macro- to microplastics, (Lebreton and Andrady, 2019[67]).
For the purpose of this work, the whole-ocean plastic mass budget model presented in Lebreton et al.
(2019[70]) was expanded to a simplified representation of the global aquatic environment. The model now

177
GLOBAL PLASTICS OUTLOOK © OECD 2022
differentiates between annual inputs in freshwater and the ocean, allowing floating plastic waste to circulate
from one compartment to the other over time. The model was also enhanced by differentiating inputs by
polymer types using the OECD waste projections (presented in Chapter 2). The likely fate of emitted
plastics was determined depending on their density. Additionally, the degradation rates varied between
polymers based on laboratory results (Gerritse et al., 2020[69]). The general model framework is presented
in Figure A A.4. To differentiate between freshwater and marine environment inputs, the model uses the
results from Meijer et al. (2021[66]), which provides country-scale probabilities of emissions to the ocean.
These results were upscaled to the modelled region by following the same weighted method as for inputs
into aquatic environments (see the previous section). Thus was estimated the fraction of waste emitted in
freshwater and the fraction emitted directly into the ocean for every region and per year. Starting the model
in 1951, plastics were emitted into the modelled aquatic environment from every region. Polymers with a
density higher than water were assumed to sink on the riverbed, lakebed, or seabed. Floating polymers
circulating at the surface could directly reach the coastal ocean surface within the first year or remained in
the freshwater system, likely stranded on river and lakeshores. The model also remobilised accumulated
waste in river and lakeshores, adding onto inputs from the following year. Floating polymers in the coastal
ocean surface followed the same dynamics as in the model presented in Lebreton et al. (2019[70]), with
recirculation between the shoreline and the sea surface and transfer from coastal to offshore waters.
Floating plastics accumulated in river and lake shore or on the ocean surface and shoreline were
considered in contact with sunlight, and a fraction of their mass was degraded yearly to a sink term
representing the mass of microplastics accumulated in freshwater and marine environments. For this
report, the cycle was repeated for every year until 2019.
Figure A A.4. Mass balance budget model for plastic in global aquatic environments
Note: Mass inputs by modelled region, characterised by polymer types, are accumulated from 1951 to 2019 into the plastic fate model. Plastics
with a density higher than water sink and accumulate in riverbed, lakebed and seabed. Floating plastics (density lower than water) are
transported between different aquatic compartments and are allowed to degrade into microplastics over time from contact with sunlight. The
region-specific parameter ‘i’ is the ratio between plastics remaining in freshwater and the plastics entering the marine environment
(Table A A.13). The parameters ‘s’ and ‘r’ represent the fraction of stranding and release from the global shoreline. The parameter ‘t’ is the
fraction of floating plastic circulating from the coastal to the offshore ocean. (s = 97%, r = 3%, t = 33%, (Lebreton, Egger and Slat, 2019[70])).
Finally, ‘d’ is the mass fraction degrading into microplastics annually and varies with polymer types (Table A A.14).
Source: adapted from Lebreton, Egger and Slat (2019[70]) methodology.
Table A A.14. Parameters for fate of plastic in aquatic environments by polymer type
Polymer type Micro Floats Degradation rate
in % of mass per year
HDPE No Yes 0.6
LDPE, LLDPE No Yes 0.8
PP No Yes 0.0
PET No No 4.9
PS No No 0.1
PUR No No 3.0
PVC No No -
ABS, ASA, SAN No No -

178
GLOBAL PLASTICS OUTLOOK © OECD 2022
Bioplastics No No -
Elastomers (tyres) No No -
Fibres No No -
Road marking coatings Yes No -
Marine coatings Yes No -
Other No No -
Source: Degradation rates are sourced from laboratory experiments (Gerritse et al., 2020[69]).
For this report, the model produced time series from 1951 to 2019, for each of the global regions, of inputs
and accumulation of plastic waste into rivers, lakes, and the ocean. The model allows us to produce first-
order of magnitude estimates of mass distribution in different compartments of the global aquatic
environment.
This simplified model has some limitations, and care should be given in the interpretation of the results.
The fate of plastics will vary significantly depending on the situation. These estimates should be seen as
a whole, describing the regional quantity of plastic leakage from mismanaged and littered waste expressed
by orders of magnitude of mass. Some assumptions were made in the design of the model, which does
not always reflect reality. For instance, polymers such as PET, PVC or PUR were considered as sinking
plastics, but by design, objects made with these polymers can float for a variable period of time (e.g. empty
PET bottles with cap on, PVC buoys, or extended PUR foam). On the contrary, some floating plastics such
as HDPE or LDPE may also sink rapidly (e.g. biobased plastic bags) in rivers while still considered movable
in the model.
1.6. Modelling plastic leakage to terrestrial and aquatic environments (University
of Leeds)
This section explains the methodology and parameters employed by the experts from the University of
Leeds to estimate the fate of end-of-life plastics.
1.6.1. Waste management and leakage to environment
The end-of life fate, including leakage to the environment from the waste management system, were
quantified using the Spatiotemporal Quantification of Plastic Pollution Origins and Transportation (SPOT)
model (Cottom, Cook and Velis, 2020[11]). The SPOT model predominantly estimates material flows at
Level 2 and 3 administrative boundary resolution, and therefore it had to be adapted to provide outputs at
national (Level 0) which were aggregated to OECD regional level. Material flow analysis following Brunner
and Rechberger (2016[71]) was the general methodological approach underpinning the distribution of plastic
waste generation estimates provided by the ENV-Linkages model and used to describe its flow through
the waste system as illustrated in the conceptual diagram (Figure A A.3). This hybrid model is described
hereafter as the ‘ENVLinkages-SPOT plugin’.

179
GLOBAL PLASTICS OUTLOOK © OECD 2022
Figure A A.5. ENV linkages-SPOT plugin model structure
Source: Cottom, Cook and Velis (2020[11]).
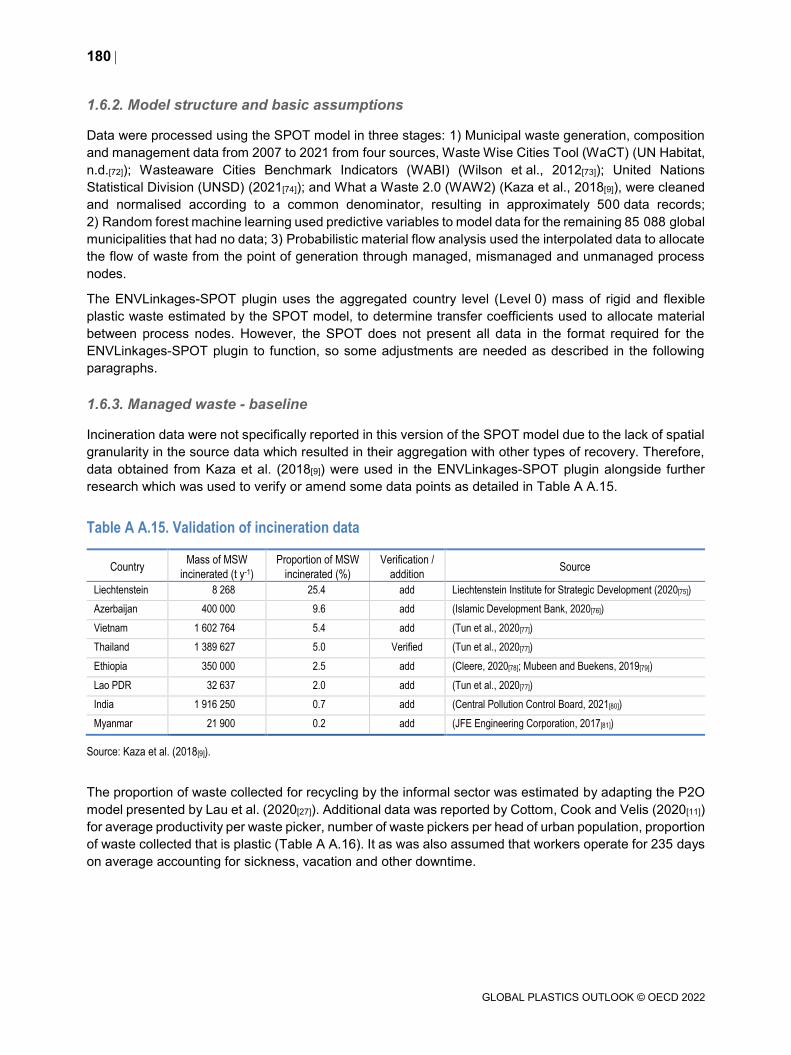
180
GLOBAL PLASTICS OUTLOOK © OECD 2022
1.6.2. Model structure and basic assumptions
Data were processed using the SPOT model in three stages: 1) Municipal waste generation, composition
and management data from 2007 to 2021 from four sources, Waste Wise Cities Tool (WaCT) (UN Habitat,
n.d.[72]); Wasteaware Cities Benchmark Indicators (WABI) (Wilson et al., 2012[73]); United Nations
Statistical Division (UNSD) (2021[74]); and What a Waste 2.0 (WAW2) (Kaza et al., 2018[9]), were cleaned
and normalised according to a common denominator, resulting in approximately 500 data records;
2) Random forest machine learning used predictive variables to model data for the remaining 85 088 global
municipalities that had no data; 3) Probabilistic material flow analysis used the interpolated data to allocate
the flow of waste from the point of generation through managed, mismanaged and unmanaged process
nodes.
The ENVLinkages-SPOT plugin uses the aggregated country level (Level 0) mass of rigid and flexible
plastic waste estimated by the SPOT model, to determine transfer coefficients used to allocate material
between process nodes. However, the SPOT does not present all data in the format required for the
ENVLinkages-SPOT plugin to function, so some adjustments are needed as described in the following
paragraphs.
1.6.3. Managed waste - baseline
Incineration data were not specifically reported in this version of the SPOT model due to the lack of spatial
granularity in the source data which resulted in their aggregation with other types of recovery. Therefore,
data obtained from Kaza et al. (2018[9]) were used in the ENVLinkages-SPOT plugin alongside further
research which was used to verify or amend some data points as detailed in Table A A.15.
Table A A.15. Validation of incineration data
Country Mass of MSW
incinerated (t y-1)
Proportion of MSW
incinerated (%)
Verification /
addition Source
Liechtenstein 8 268 25.4 add Liechtenstein Institute for Strategic Development (2020[75])
Azerbaijan 400 000 9.6 add (Islamic Development Bank, 2020[76])
Vietnam 1 602 764 5.4 add (Tun et al., 2020[77])
Thailand 1 389 627 5.0 Verified (Tun et al., 2020[77])
Ethiopia 350 000 2.5 add (Cleere, 2020[78]; Mubeen and Buekens, 2019[79])
Lao PDR 32 637 2.0 add (Tun et al., 2020[77])
India 1 916 250 0.7 add (Central Pollution Control Board, 2021[80])
Myanmar 21 900 0.2 add (JFE Engineering Corporation, 2017[81])
Source: Kaza et al. (2018[9]).
The proportion of waste collected for recycling by the informal sector was estimated by adapting the P2O
model presented by Lau et al. (2020[27]). Additional data was reported by Cottom, Cook and Velis (2020[11])
for average productivity per waste picker, number of waste pickers per head of urban population, proportion
of waste collected that is plastic (Table A A.16). It as was also assumed that workers operate for 235 days
on average accounting for sickness, vacation and other downtime.

181
GLOBAL PLASTICS OUTLOOK © OECD 2022
Table A A.16. Data used to model the activities of the informal recycling sector
Income group (World Bank) Proportion of urban population that
is an informal waste worker (%)
Productivity per waste
picker (kg d-1)
Proportion of waste collected by informal
recycling sector that is plastic (%)
High income 0.01 37.0 5
Upper middle-income 0.26 37.0 28
Lower middle income 0.19 37.0 35
Low income 0.14 37.0 35
Source: Cottom, Cook and Velis (2020[11]).
1.6.4. Dumping mismanaged waste in water
Data to quantify the deliberate dumping of waste into water by waste generators are scarce. Here we
present, for the first time, a review of census data that indicate the mass deposited directly into water by
householders in the absence of formal waste collection services (Table A A.17). Acknowledging the
uncertainty in the data and the high variability in time and across countries, we have taken a conservative
approach and approximated the issue by using the mean of the country level median proportion treated in
this way: 4.8% of uncollected waste.
Table A A.17. Deliberate dumping into water
Country Proportion of population engaged in behaviour
(median % of uncollected waste)
Source
Malawi 1.0 National Statistical Office (2020[82])
Guatemala 1.8 Guatemala, Instituto Nacional de Estadística (2018[83])
Indonesia 7.6 Sub Direktorat Statistik Lingkungan Hidup (2014[84])
Fiji 0.5 Fiji Bureau of Statistics (2018[85])
Brazil 0.4 Instituto Brasileiro de Geografia e Estatística (2010[86])
Bolivia 15.6 Instituto Nacional de Estadistica (2012[87])
Samoa 0.4 Samoa Bureau of statistics (2019[88])
Ethiopia 10.9 Population Census Commission (2007[89])
1.6.5. Plastic debris emissions to aquatic environments
The leakage transfer from terrestrial to aquatic environments was estimated using transfer ratios
suggested by Lau et al. (2020[27]) and detailed in Table A A.18.The GWPv4 (2015) (United Nations,
2019[90]) UNAdj population density map (CIESIN, 2018[91]) was used to estimate the proportion of rural and
urban inhabitants in line with Dijkstra and Poelman (2014[92]) using grid cells >300 population
and >5 000 inhabitants in contiguous cells. The urban and rural attribution was mapped onto the
HydroSHEDS 30 arc river and coastline dataset. Population data for countries above 60°N latitude were
approximated using ratios for the nearest similar countries which were below 60°N.
Waste transfer from the terrestrial to aquatic environment was estimated using transfer ratios suggested
by Lau et al. (2020[27]) and detailed in Table A A.18. The GWPv4 (2015) (United Nations, 2019[90]) UNAdj
population density map (CIESIN, 2018[91]) was used to estimate the proportion of rural and urban
inhabitants using definition from was estimated using Dijkstra and Poelman (2014[92])); that a grid cell has
>300 population and >5 000 inhabitants in contiguous cells. The urban and rural attribution was mapped
onto the HydroSHEDS 30 arc river and coastline dataset. Population data for countries above 60°N latitude
were approximated using ratios for nearest similar countries which were below 60°N.
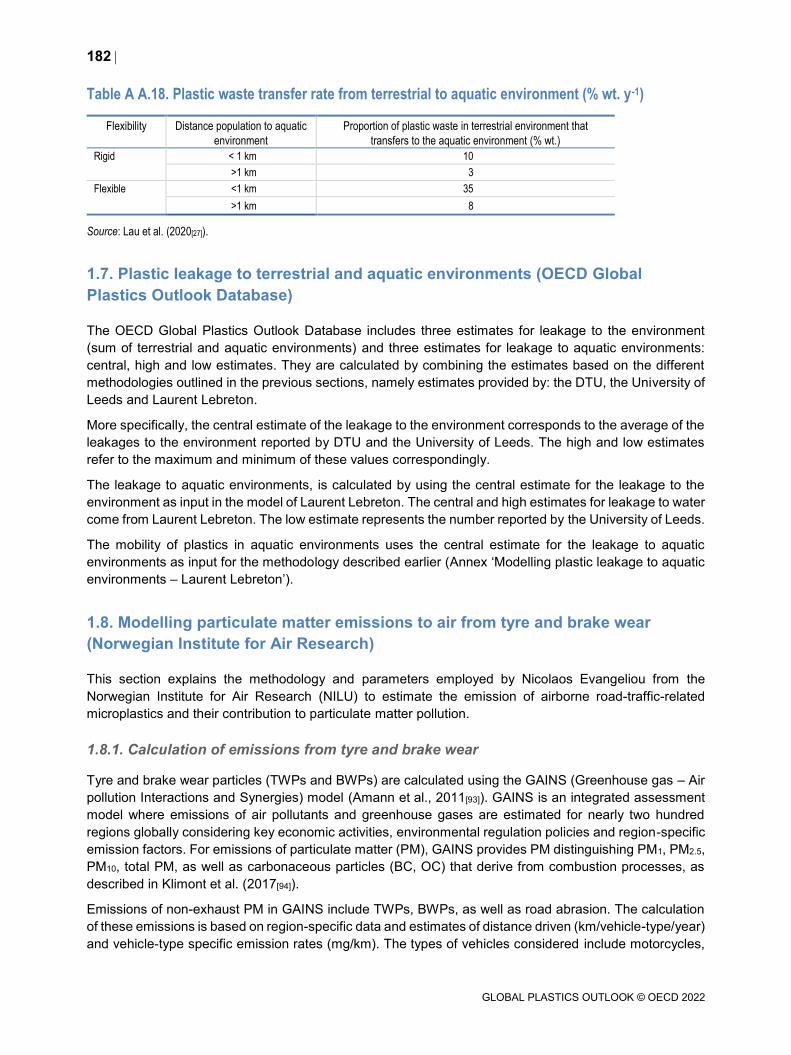
182
GLOBAL PLASTICS OUTLOOK © OECD 2022
Table A A.18. Plastic waste transfer rate from terrestrial to aquatic environment (% wt. y-1)
Flexibility Distance population to aquatic
environment
Proportion of plastic waste in terrestrial environment that
transfers to the aquatic environment (% wt.)
Rigid < 1 km 10
>1 km 3
Flexible <1 km 35
>1 km 8
Source: Lau et al. (2020[27]).
1.7. Plastic leakage to terrestrial and aquatic environments (OECD Global
Plastics Outlook Database)
The OECD Global Plastics Outlook Database includes three estimates for leakage to the environment
(sum of terrestrial and aquatic environments) and three estimates for leakage to aquatic environments:
central, high and low estimates. They are calculated by combining the estimates based on the different
methodologies outlined in the previous sections, namely estimates provided by: the DTU, the University of
Leeds and Laurent Lebreton.
More specifically, the central estimate of the leakage to the environment corresponds to the average of the
leakages to the environment reported by DTU and the University of Leeds. The high and low estimates
refer to the maximum and minimum of these values correspondingly.
The leakage to aquatic environments, is calculated by using the central estimate for the leakage to the
environment as input in the model of Laurent Lebreton. The central and high estimates for leakage to water
come from Laurent Lebreton. The low estimate represents the number reported by the University of Leeds.
The mobility of plastics in aquatic environments uses the central estimate for the leakage to aquatic
environments as input for the methodology described earlier (Annex ‘Modelling plastic leakage to aquatic
environments – Laurent Lebreton’).
1.8. Modelling particulate matter emissions to air from tyre and brake wear
(Norwegian Institute for Air Research)
This section explains the methodology and parameters employed by Nicolaos Evangeliou from the
Norwegian Institute for Air Research (NILU) to estimate the emission of airborne road-traffic-related
microplastics and their contribution to particulate matter pollution.
1.8.1. Calculation of emissions from tyre and brake wear
Tyre and brake wear particles (TWPs and BWPs) are calculated using the GAINS (Greenhouse gas – Air
pollution Interactions and Synergies) model (Amann et al., 2011[93]). GAINS is an integrated assessment
model where emissions of air pollutants and greenhouse gases are estimated for nearly two hundred
regions globally considering key economic activities, environmental regulation policies and region-specific
emission factors. For emissions of particulate matter (PM), GAINS provides PM distinguishing PM1, PM2.5,
PM10, total PM, as well as carbonaceous particles (BC, OC) that derive from combustion processes, as
described in Klimont et al. (2017[94]).
Emissions of non-exhaust PM in GAINS include TWPs, BWPs, as well as road abrasion. The calculation
of these emissions is based on region-specific data and estimates of distance driven (km/vehicle-type/year)
and vehicle-type specific emission rates (mg/km). The types of vehicles considered include motorcycles,

183
GLOBAL PLASTICS OUTLOOK © OECD 2022
cars, light-duty vehicles, buses, and heavy-duty vehicles. The estimates of distance driven for 2015 are
derived using data on fuel use in road transport from the International Energy Agency’s Word Energy
Outlook (IEA, 2011[95]), supported by national data on vehicle numbers and assumptions of per-vehicle
mileage travelled. Considering vehicle-type specific emission rates and use, allows for better reflection of
significant regional differences in fleet structure, e.g. large number of motorcycles in South and South-East
Asia and lower car ownership numbers in parts of the developing world. GAINS emissions are estimated
globally at the grid level (0.5°×0.5°) using road network data, assumptions about road-type vehicle density,
and population data.
The vehicle-type specific TWP and BWP emission factors used in GAINS draw on a review of several
measurement papers (Klimont et al., 2002[96]) that were recently updated (Klimont et al., 2017[94]) using
primarily van der Gon et al. (2013[97]), EEA (2013[98]) and Harrison et al. (2012[99]). There are large
uncertainties in emission factors including concerning the PM size distribution. GAINS provides total
suspended particulates (TSP), and then assumes that PM10 from TWPs represent about 10% of TSP, and
PM2.5 about 1% of total TWPs, whereas PM10 from BWPs is about 80% of TSP and PM2.5 is 40–50% of
total BWPs (Klimont et al., 2002[96]).
1.8.2. Atmospheric transport modelling
Emissions of PM10 calculated with the GAINS model are used as input in the FLEXPART (FLEXible
PARTicle) atmospheric transport model version 10.4 (Pisso et al., 2019[100]). Atmospheric dispersion of
particulate matter, including both transport and deposition of particles, were simulated for the reference
year 2014. The FLEXPART model was run in forward mode from 2014. Atmospheric processes affecting
particle transport in clouds (e.g. boundary layer turbulent mixing and convection processes) are
parameterised in the model (Forster, Stohl and Seibert, 2007[101]). The model was driven by 3-hourly
1°×1° operational analyses from the European Centre for Medium Range Weather Forecast (ECMWF),
the spatial output resolution of concentration and deposition fields was set to 0.5°×0.5° in a global domain
with a daily temporal resolution. In FLEXPART the dispersion of road microplastics is modelled assuming
a spherical shape of particles (Pisso et al., 2019[100]).
The simulations also accounted for below-cloud scavenging and dry deposition, assuming a particle
density for TWPs of 1 234 kg/m3, which is in the middle of the densities of 945 kg/m3 for natural rubber and
1 522 kg/m3 for synthetic rubber (Walker, 2019[102]; Federal Highway Administration Research and
Technology, 2019[103]). This density is within the reported range for microplastics (940-2 400 kg/m3) (Unice
et al., 2019[104]). For BWPs a higher density was assumed (2 000 kg/m3) considering that BWP may also
contain metals (Grigoratos and Martini, 2014[105]). Plastics are generally hydrophobic and should therefore
be rather inefficient cloud condensation nuclei (CCN) (Di Mundo, Petrella and Notarnicola, 2008[106];
Ganguly and Ariya, 2019[107]). However, coatings may make the particles more hydrophilic with time in the
atmosphere (Bond et al., 2013[108]). The efficiency of aerosols to serve as ice nuclei (IN) is also not well
known. Based on Evangeliou et al. (2020[109]), it is more realistic to use intermediate scavenging
coefficients for CCN/IN in the model.
The emissions of TWPs and BWPs were extrapolated from 2014 to 2019, using the road passenger data
from the IEA’s World Energy Outlook (IEA, 2018[110]) for the 15 geographical regions of the OECD
ENV-Linkages model. Year 2014 was taken as base year and the ratio to year 2014 was calculated for
each year between 2015 and 2019 and for each of the 15 regions (from now on referred as “regional
scaling factor”). This regional scaling factor could be negative, if the road passenger data decreased as
compared to 2015, or positive, if an increase is shown.
The FLEXPART model was run with the 2014 emissions for the 15 ENV-Linkages regions; thus creating
15 different model simulations, each representing the dispersion from the respective region. Then, the
regional scaling factor was used to scale modelled dispersion that results from each individual regional

184
GLOBAL PLASTICS OUTLOOK © OECD 2022
emission for each year between 2015 and 2019. Finally, the 15 regional annually-scaled modelled
dispersions were used to calculate global TWP and BWP estimates.
1.9. Modelling greenhouse gas emissions from primary plastics in ENV-Linkages
This section explains the methodology and parameters employed to estimate the contribution of the
lifecycle of plastics to GHG emissions at the global level, based on the OECD ENV-Linkages model.
In the GTAP database (Aguiar et al., 2019[4]), plastics production occurs in two sectors: Chemicals and
Rubber and plastics products, along with other products. In ENV-Linkages, the plastic products sectors
has been split into primary and secondary plastics production (see Section 1.2 in this Annex). The difficulty
in estimating plastic-related greenhouse gas emissions is that in ENV-Linkages there is no direct link
between emissions and emissions attributable to plastics. The plastics producing sectors use inputs from
the electricity generation sector, fossil fuel extraction sectors and other sectors of the economy. However,
these plastics producing sectors also produce other goods, so that not all emissions can be attributed to
plastics. Furthermore, emissions outside these sectors can also be attributed to plastics. Furthermore,
emissions from the extraction of raw materials and from plastic waste management, are also mixed with
emissions not attributable to plastics.
Therefore, to approximate the global lifecycle emissions from plastics, an emission factor-based approach
is retained:
𝐸𝑚𝑖𝑔,𝑡𝑝𝑙𝑎𝑠𝑡𝑖𝑐𝑠
= ∑(𝜆𝑔,𝑝,𝑡𝑝𝑟𝑜𝑑
+ 𝜆𝑔,𝑝,𝑡𝑐𝑜𝑛𝑣)
𝑝
𝐶𝑝,𝑡 + ∑ 𝜆𝑔,𝑓,𝑡𝑒𝑜𝑙 𝑊𝑓,𝑡
𝑓
where 𝐸𝑚𝑖𝑔,𝑡𝑝𝑙𝑎𝑠𝑡𝑖𝑐𝑠
are emissions of greenhouse gas 𝑔 (comprising CO2, CH4 and N2O, measured in
CO2-equivalents)4 from the plastics lifecycle at time 𝑡, 𝜆𝑔,𝑝,𝑡𝑝𝑟𝑜𝑑
and 𝜆𝑔,𝑝,𝑡𝑐𝑜𝑛𝑣 are respectively the emission factors
per tonne of plastic product for production and conversion of plastic for polymer 𝑝 that are applied to the
level of primary plastics consumption 𝐶𝑝,𝑡 estimated by the model (by convention, emissions from the
production of secondary plastics are allocated to waste management emissions). Finally, 𝜆𝑔,𝑓,𝑡𝑒𝑜𝑙 is the
emission factor for a specific end-of-life fate 𝑓 (incineration, sanitary landfilling and recycling only are
considered, due to data availability), applied to the amount of plastic waste generated 𝑊𝑗,𝑡.
The literature provides estimates of emission factors for year 2015 (Zheng and Suh, 2019[111])5 that are
used to calibrate the emissions for 2015. These emission factors comprise emissions from the whole value-
chain of plastics production, and have no reason to be constant over time due to structural changes in the
production process. As a consequence, the GHG intensity of plastics production and conversion is updated
to 2019 based on the structural change observed in the model. An index based on the global average
scope 2 emissions (direct emissions plus emissions from electricity demand) of the sectors related to
plastics production and conversion (chemicals, primary rubber and plastics products, oil extraction, gas
extraction and petroleum and coal products) represents the evolution over time of production and
conversion emissions. Another index based on scope 2 emissions of the secondary plastics sector
represents the evolution over time of recycling emission intensity, while emissions factors are constant for
incineration and landfilling (Figure A A.6).

185
GLOBAL PLASTICS OUTLOOK © OECD 2022
Figure A A.6. Greenhouse gas emission factors for plastics lifecycle in ENV-Linkages in 2015
Panel A. Production and conversion emissions by polymer type (t CO2e per tonne of plastic product)
Panel B. End-of-life emissions by end-of-life fate (t CO2e per t of plastic waste)
Note: Emissions from recycling and incineration are direct emissions from their respective industrial processes. Avoided emissions (emissions
from electricity generation that are replaced by waste incineration and emissions from primary plastics production that are replaced by secondary
plastics) are not included in the emission factors depicted here, because they are included directly in the ENV-Linkages model (changes in the
input structure of the electricity generation sector and changes in the balance between primary and secondary plastics, both being driven by the
change in the relative prices of products, are endogenously determined by the model).
Source: Adapted from Zheng and Suh (2019[111]).

186
GLOBAL PLASTICS OUTLOOK © OECD 2022
References
Aguiar, A. et al. (2019), “The GTAP Data Base: Version 10”, Journal of Global Economic
Analysis, Vol. 4/1, pp. 1-27, http://dx.doi.org/10.21642/jgea.040101af.
[4]
Amann, M. et al. (2011), “Cost-effective control of air quality and greenhouse gases in Europe:
Modeling and policy applications”, Environ. Model. Softw., Vol. 26, pp. 1489–1501.
[93]
Antonopoulos, I., G. Faraca and D. Tonini (2021), “Recycling of post-consumer plastic packaging
waste in the EU: Recovery rates, material flows, and barriers”, Waste Management, Vol. 126,
pp. 694-705, https://doi.org/10.1016/j.wasman.2021.04.002.
[30]
Australian Government, D. (2020), 2018-19 Australian plastics recycling survey - national report,
https://www.awe.gov.au/environment/protection/waste/publications/australian-plastics-
recycling-survey-report-2018-19 (accessed on 28 October 2021).
[19]
Bond, T. et al. (2013), “Bounding the role of black carbon in the climate system: A scientific
assessment”, J. Geophys. Res. Atmos., Vol. 118, pp. 5380–5552.
[108]
Borrelle, S. et al. (2020), “Predicted growth in plastic waste exceeds efforts to mitigate plastic
pollution”, Science, Vol. 369/6510, pp. 1515-1518, http://dx.doi.org/10.1126/science.aba3656.
[65]
Boucher, F. and D. Friot (2017), Primary Microplastics in the Oceans: A Global Evaluation of
Sources..
[53]
Brunner, P. and H. Rechberger (2016), Handbook of Material Flow Analysis: For Environmental,
Resource, and Waste Engineers, CRC Press,
http://dx.doi.org/doi.org/10.1201/9781315313450.
[71]
Central Pollution Control Board (2021), Report of Waste to Energy Plants in Delhi by CPCB in
OA No. 640 of 2018 (Earlier O.A. No. 22 of 2013(THC), Sukhdev Vihar Residents Welfare
Association Vs State of NCT of Delhi, https://greentribunal.gov.in/report-waste-energy-plants-
delhi-cpcb-oa-no-640-2018-earlier-oa-no-22-2013thc-sukhdev-vihar.
[80]
Central Pollution Control Board (CPCB) (2019), Annual Report for the year 2018-2019 on
Implementation of Plastic Waste Management Rules, Ministry of Environment, Forest and
Climate Change, Govt of India.
[21]
Chateau, J., R. Dellink and E. Lanzi (2014), “An Overview of the OECD ENV-Linkages
Model: Version 3”, OECD Environment Working Papers, No. 65, OECD Publishing, Paris,
http://dx.doi.org/10.1787/5jz2qck2b2vd-en.
[1]
Chateau, J., C. Rebolledo and R. Dellink (2011), “An Economic Projection to 2050: The OECD
“ENV-Linkages” Model Baseline”, OECD Environment Working Papers, No. 41, OECD
Publishing, Paris, http://dx.doi.org/10.1787/5kg0ndkjvfhf-en.
[2]
Chruszcz, A. and S. Reeve (2018), Composition of plastic waste: Results of a waste
compositional analysis of plastics at MRFs and PRFs, WRAP.
[26]
187
GLOBAL PLASTICS OUTLOOK © OECD 2022
CIESIN (2018), Gridded population of the world, version 4 (GPWv4): population count adjusted
to Match 2015 revision of UN WPP country totals, revision 11., Center for International Earth
Science Information Network - Columbia University,
https://sedac.ciesin.columbia.edu/data/set/gpw-v4-population-count-adjusted-to-2015-unwpp-
country-totals-rev11.
[91]
Cleere, R. (2020), “The New Reppie Incinerator at Koshe Landfill in Addis Ababa, Ethiopia.”,
[Online data set] Environmental Justice Atlas, https://ejatlas.org/conflict/the-new-reppie-
incinerator-at-koshe-landfill-in-addis-ababa-ethiopia-leaves-the-wastepickers-without-
livelihood.
[78]
Cottom, J., E. Cook and C. Velis (2020), “Spatio-temporal quantification of plastic pollution
origins and transportation (SPOT)”, University of Leeds, UK,
https://plasticpollution.leeds.ac.uk/toolkits/spot/.
[11]
De Falco, F. et al. (2020), “Microfiber Release to Water, Via Laundering, and to Air, via Everyday
Use: A Comparison between Polyester Clothing with Differing Textile Parameters”,
Environmental Science & Technology, doi: 10.1021/acs.est.9b06892, pp. 3288-3296,
http://dx.doi.org/10.1021/acs.est.9b06892.
[54]
De Falco, F. et al. (2019), “The contribution of washing processes of synthetic clothes to
microplastic pollution”, Scientific Reports, Vol. 9, p. 6633, https://doi.org/10.1038/s41598-019-
43023-x.
[43]
Di Mundo, R., A. Petrella and M. Notarnicola (2008), “Surface and bulk hydrophobic cement
composites by tyre rubber addition”, Constr. Build. Mater., Vol. 172, pp. 176–184.
[106]
Dijkstra, L. and H. Poelman (2014), A harmonised definition of cities and rural areas: the new
degree of urbanisation,
https://ec.europa.eu/regional_policy/sources/docgener/work/2014_01_new_urban.pdf.
[92]
ECHA (2020), Committee for Risk Assessment (RAC) Committee for Socio-economic Analysis
(SEAC). Opinion on an Annex XV dossier proposing restrictions on intentionally added
microplastics.
[51]
EMEP/EEA (2013), Air pollutant emission inventory guidebook 2013: Technical guidance to
prepare national emission inventories, http://dx.doi.org/10.2800/92722.
[98]
Environment and Climate Change Canada (2019), Economic Study of the Canadian plastic
industry, markets and waste, Environment and Climate Change Canada.
[15]
Eunomia (2018), “Investigating options for reducing releases in the aquatic environment of
microplastics emitted by (but not intentionally added in) products”, Report for DG Env EC,
Vol. Vol. 62, N/February, pp. 1596-1605, http://dx.doi.org/10.1002/lsm.22016.
[38]
Eurostat (2020), Statistics | Sewage sludge production and disposal.,
https://ec.europa.eu/eurostat/databrowser/view/ENV_WW_SPD/default/table. (accessed on
28 January 2021).
[64]
Eurostat (2018), Average loads for total road freight transport, 2018 (tonnes),
https://ec.europa.eu/eurostat/statistics-
explained/index.php?title=File:Average_loads_for_total_RFT,_2018_(tonnes).png. (accessed
on 21 May 2021).
[45]

188
GLOBAL PLASTICS OUTLOOK © OECD 2022
Eurostat (n.d.), Sold production, exports and imports by PRODCOM list (NACE Rev. 2) - annual
data, https://ec.europa.eu/eurostat/web/prodcom/data/database.
[39]
Evangeliou, N. et al. (2020), “Atmospheric transport is a major pathway of microplastics to
remote regions”, Nat Commun, Vol. 11, p. 3381, https://doi.org/10.1038/s41467-020-17201-9.
[109]
FCH (2021), “NEW PLASTICS ECONOMY”, https://fch.cl/en/initiative/new-plastics-economy. [17]
Federal Highway Administration Research and Technology (2019), User Guidelines for Waste
and Byproduct Materials in Pavement Construction.
[103]
Fiji Bureau of Statistics (2018), 2017 Fiji population and housing census.,
https://www.statsfiji.gov.fj/component/advlisting/?view=download&format=raw&fileId=5970.
[85]
Forster, C., A. Stohl and P. Seibert (2007), “Parameterization of convective transport in a
Lagrangian particle dispersion model and its evaluation”, J. Appl. Meteorol. Climatol., Vol. 46,
pp. 403–422.
[101]
Ganguly, M. and P. Ariya (2019), “Ice Nucleation of Model Nanoplastics and Microplastics: A
Novel Synthetic Protocol and the Influence of Particle Capping at Diverse Atmospheric
Environments”, ACS Earth Sp. Chem, Vol. 3, pp. 1729–1739.
[107]
Gerritse, J. et al. (2020), “Fragmentation of plastic objects in a laboratory seawater microcosm”,
Scientific Reports, Vol. 10/1, p. 10945, http://dx.doi.org/10.1038/s41598-020-67927-1.
[69]
Geyer, R., J. Jambeck and K. Law (2017), “Production, use, and fate of all plastics ever made”,
Science Advances, Vol. 3/7, p. e1700782, http://dx.doi.org/10.1126/sciadv.1700782.
[8]
Government of Australia (2021), Australian plastics flows and fates 2019-2020. [24]
Grigoratos, T. and G. Martini (2014), Non-exhaust traffic related emissions. Brake and tyre wear
PM, http://dx.doi.org/10.2790/21481.
[105]
Guatemala, Instituto Nacional de Estadística (2018), Características generales del hogar. Censo
2018: Cuadro B6.1 - Hogares por forma principal de eliminación de la basura, según
departamento. [Online data set], https://www.censopoblacion.gt/explorador.
[83]
Hallal, A. et al. (2013), “Overview of Composite Materials and their Automotive Applications”, in
Advanced Composite Materials for Automotive Applications, John Wiley & Sons, Ltd,
https://doi.org/10.1002/9781118535288.ch1.
[48]
Harrison, R. et al. (2012), “Estimation of the contributions of brake dust, tire wear, and
resuspension to nonexhaust traffic particles derived from atmospheric measurements”,
Environ. Sci. Technol., Vol. 46, pp. 6523–6529.
[99]
Hestin, M., T. Faninger and L. Milios (2015), Increased EU Plastics Recycling Targets:
Environment, Economic and Social Impact Assessment, https://743c8380-22c6-4457-9895-
11872f2a708a.filesusr.com/ugd/0af79c_d3c616e926e24896a8b82b833332242e.pdf.
[25]
IEA (2018), World Energy Outlook. [110]
IEA (2011), World Energy Outlook. [95]

189
GLOBAL PLASTICS OUTLOOK © OECD 2022
IMF (2020), World Economic Outlook, October 2020: A Long and Difficult Ascent, International
Monetary Fund, Washington, D.C.,
https://www.imf.org/en/Publications/WEO/Issues/2020/09/30/world-economic-outlook-
october-2020 (accessed on 22 January 2021).
[6]
Instituto Brasileiro de Geografia e Estatística (2010), Demographic Census: Table 1395 -
Permanent private households, by household situation and existence of bathroom or toilet
and number of toilets for the exclusive use of the household, according to the type of
household, the form of water supply, the desti, https://sidra.ibge.gov.br/tabela/1395.
[86]
Instituto Nacional de Estadistica (2012), Disposal of garbage in the house, according to province
and municipality, 2012 census [Online data set],
https://www.ine.gob.bo/index.php/estadisticas-sociales/vivienda-y-servicios-basicos/censos-
vivienda/.
[87]
IPCC (1995), Climate Change 1995: A report of the Intergovernmental Panel on Climate Change
- IPCC Second Assessment.
[112]
Islamic Development Bank (2020), Waste to Energy: Averting environnmental damage in
Azerbaijan., https://www.isdb.org/sites/default/files/media/documents/2020-
06/Success_Lflt_Azerbaijan_EN.pdf.
[76]
Jambeck, J. et al. (2015), “Plastic waste inputs from land into the ocean”, Science,
Vol. 347/6223, pp. 768-771, http://dx.doi.org/10.1126/science.1260352.
[12]
JFE Engineering Corporation (2017), Opening Ceremony for Myanmar’s First Waste to Energy
Plant, https://www.jfe-eng.co.jp/en/news/2017/20170410.html.
[81]
JMP (2020), Wash Data, https://washdata.org/data/household#!/table?geo0=region&geo1=sdg.
(accessed on 29 January 2021).
[59]
Kalbar, P., I. Muñoz and M. Birkved (2017), “WW LCI v2: A second-generation life cycle
inventory model for chemicals discharged to wastewater systems.”, Sci Total Environ.,
http://dx.doi.org/10.1016/j.scitotenv.2017.10.051.
[58]
Kawecki, D. and B. Nowack (2020), “A proxy-based approach to predict spatially resolved
emissions of macro- and microplastic to the environment”, Science of The Total Environment,
Vol. 748, p. 141137, https://doi.org/10.1016/j.scitotenv.2020.141137.
[55]
Kaza, S. et al. (2018), What a Waste 2.0: A Global Snapshot of Solid Waste Management to
2050, The World Bank, http://dx.doi.org/10.1596/978-1-4648-1329-0.
[9]
Klimont, Z. et al. (2002), Modelling Particulate Emissions in Europe. A Framework to Estimate
Reduction Potential and Control Costs.
[96]
Klimont, Z. et al. (2017), “Global anthropogenic emissions of particulate matter including black
carbon”, Atmos. Chem. Phys., Vol. 17, pp. 8681–8723.
[94]
Lassen, C. et al. (2016), Microplastics Occurrence, effects and sources of releases to the
environment in Denmark, Danish Environmental Protection Agency, Copenhagen.
[56]
Lau, W. et al. (2020), “Evaluating scenarios toward zero plastic pollution”, Science,
Vol. 369/6510, pp. 1455-1461, http://dx.doi.org/10.1126/science.aba9475.
[27]

190
GLOBAL PLASTICS OUTLOOK © OECD 2022
Lebreton, L. and A. Andrady (2019), “Future scenarios of global plastic waste generation and
disposal”, Palgrave Communications, Vol. 5/1, p. 6, http://dx.doi.org/10.1057/s41599-018-
0212-7.
[67]
Lebreton, L., M. Egger and B. Slat (2019), “A global mass budget for positively buoyant
macroplastic debris in the ocean”, Scientific Reports, Vol. 9/1, p. 12922,
http://dx.doi.org/10.1038/s41598-019-49413-5.
[70]
Lebreton, L. et al. (2018), “Evidence that the Great Pacific Garbage Patch is rapidly
accumulating plastic”, Scientific Reports, Vol. 8/1, http://dx.doi.org/10.1038/s41598-018-
22939-w.
[68]
Liechtenstein Institute for Strategic Development (2020), Circular economy strategy for
Liechtenstein., https://www.alpine-space.org/projects/greencycle/deliverables/t2/lisd---
circular-economy-strategy-for-liechtenstein-vol1-10-03-2020-1.pdf.
[75]
Løkkegaard, H., B. Malmgren-Hansen and N. Nilsson (2018), Mass balance of rubber granulate
lost from artificial turf fields, focusing on discharge to the aquatic environment.
[49]
Magnusson, K. et al. (2016), Swedish Sources and Pathways for Microplastics to the Marine
Environment..
[60]
Meijer, L. et al. (2021), “More than 1000 rivers account for 80% of global riverine plastic
emissions into the ocean”, Science Advances, Vol. 7/18,
http://dx.doi.org/10.1126/sciadv.aaz5803.
[66]
Michielssen, M. et al. (2016), “Fate of microplastics and other small anthropogenic litter (SAL) in
wastewater treatment plants depends on unit processes employed”, Environmental Science:
Water Research and Technology, Vol. 2/6, pp. 1064-1073,
http://dx.doi.org/10.1039/c6ew00207b.
[61]
Ministry of Commerce (2019), The China Recycling Industry Development Report (2013-2018). [20]
Mubeen, I. and A. Buekens (2019), “Chapter 14 - Energy From Waste: Future Prospects Toward
Sustainable Development”, in Kumar, S., R. Kumar and A. Pandey (eds.), Current
Developments in Biotechnology and Bioengineering, Elsevier, https://doi.org/10.1016/B978-0-
444-64083-3.00014-2.
[79]
National Statistical Office (2020), 2018 Malawi population and housing census: water and
sanitation report Zomba,
http://www.nsomalawi.mw/images/stories/data_on_line/demography/census_2018/Thematic_
Reports/Water%20and%20Sanitation%20Report.pdf.
[82]
Nizzetto, L., M. Futter and S. Langaas (2016), Are Agricultural Soils Dumps for Microplastics of
Urban Origin?, American Chemical Society, http://dx.doi.org/10.1021/acs.est.6b04140.
[62]
OECD (2021), Policies to Reduce Microplastics Pollution in Water: Focus on Textiles and Tyres,
OECD Publishing, Paris, https://dx.doi.org/10.1787/7ec7e5ef-en.
[47]
OECD (2020), OECD Economic Outlook, Volume 2020 Issue 2, OECD Publishing, Paris,
https://dx.doi.org/10.1787/39a88ab1-en.
[5]
OECD (2019), Global Material Resources Outlook to 2060: Economic Drivers and Environmental
Consequences, https://doi.org/10.1787/9789264307452-en.
[3]

191
GLOBAL PLASTICS OUTLOOK © OECD 2022
OECD (2017), Environment Database - Wastewater treatment (% population connected)
(dataset), http://stats.oecd.org/index.aspx?DatasetCode=WATER_TREAT. (accessed on
29 January 2021).
[57]
OVAM (2018), Huishoudelijk afval en gelikkaardig bedrijfsafval.,
https://www.ovam.be/inventarisatie-huishoudelijke-afvalstoffen.
[36]
Pirc, U. et al. (2016), “Emissions of microplastic fibers from microfiber fleece during domestic
washing”, Environ Sci Pollut Res, Vol. 23, pp. 22206–22211, https://doi.org/10.1007/s11356-
016-7703-0.
[44]
Pisso, I. et al. (2019), “The Lagrangian particle dispersion model FLEXPART version 10.4”,
Geosci. Model Dev., Vol. 12, pp. 4955–4997.
[100]
Plastic Waste Management Institute (2019), An Introduction to Plastic Recycling. [18]
Plastics Europe (2020), “Plastics – the Facts 2020”. [23]
Plastics Europe (2017), Plastics: the Facts (2017) An analysis of European plastics production,
demand and waste data, Plastics Europe.
[42]
Plastics Recyclers Europe (2020), Report on Plastics Recycling Statistics, http://743c8380-22c6-
4457-9895-
11872f2a708a.filesusr.com/ugd/dda42a_2544b63cfb5847e39034fadafbac71bf.pdf.
[31]
Population Census Commission (2007), 2007 Population and Housing Census of Ethiopia.,
https://microdata.worldbank.org/index.php/catalog/2747/download/39216.
[89]
Recoup (2019), Recyclability by Design, https://www.bpf.co.uk/design/recyclability-by-design. [29]
ResearchNester (2021), Artificial Turf: Market Insights, Demand & Growth Forecast 2027.,
https://www.researchnester.com/reports/artificial-turf-market/995. (accessed on
28 January 2021).
[52]
Resource Futures (2019), Composition analysis of litter waste in Wales. [37]
Rolsky, C. et al. (2020), “Municipal sewage sludge as a source of microplastics in the
environment.”, Curr. Opin. Environ. Sci. Heal..
[63]
Roosen, M. et al. (2020), “Detailed Analysis of the Composition of Selected Plastic Packaging
Waste Products and Its Implications for Mechanical and Thermochemical Recycling”,
Environmental Science & Technology, doi: 10.1021/acs.est.0c03371, pp. 13282-13293,
http://dx.doi.org/10.1021/acs.est.0c03371.
[32]
Ryberg, M. et al. (2019), “Global environmental losses of plastics across their value chains”,
Resources, Conservation and Recycling, Vol. 151, p. 104459,
http://dx.doi.org/10.1016/j.resconrec.2019.104459.
[7]
Samoa Bureau of statistics (2019), Samoa’s Experimental Solid Waste Accounts FY2013-14 to
FY2015-16,
https://www.sbs.gov.ws/digi/Samoa's%20Experimental%20Solid%20Waste%20Arrounts_201
3-2014%20to%202015-2016.pdf.
[88]
SEMARNAT (2020), Diagnostico basico para la gestion integral de los residuos. [16]

192
GLOBAL PLASTICS OUTLOOK © OECD 2022
Sommer, F. et al. (2018), “Tire Abrasion as a Major Source of Microplastics in the Environment”,
Aerosol and Air Quality Research, Vol. 18/8, pp. 2014-2028,
http://dx.doi.org/10.4209/aaqr.2018.03.0099.
[46]
Stadler, K. et al. (2018), “EXIOBASE 3: Developing a Time Series of Detailed Environmentally
Extended Multi-Regional Input-Output Tables”, Journal of Industrial Ecology, Vol. 22/3,
pp. 502-515, http://dx.doi.org/10.1111/jiec.12715.
[10]
Sub Direktorat Statistik Lingkungan Hidup (2014), Indikator Perilaku Peduli Lingkungan Hidup
(2014 Environmental Care Behavior Indicators,
https://www.bps.go.id/publication/2015/12/23/2cdc2ef08c706d6f205c69fc/indikator-perilaku-
peduli-lingkungan-hidup-2014.html.
[84]
Swedish EPA (2019), Microplastics in the Environment 2019,
http://www.naturvardsverket.se/Om-Naturvardsverket/Publikationer/ISBN/6900/978-91-620-
6957-5/.
[50]
SystemIQ and the Pew Charitable Trust (2020), Breaking the Plastic Wave: A Comprehensive
Assessment of Pathways Towards Stopping Ocean Plastic Pollution,
https://www.systemiq.earth/breakingtheplasticwave/.
[28]
Thompson, P., P. Willis and N. Morley (2012), A review of commercial textile fibre recycling
technologies, Waste and Resources Action Programme (WRAP), UK, https://refashion.fr/eco-
design/sites/default/files/fichiers/A%20review%20of%20commercial%20textile%20fibre%20re
cycling%20technologies.pdf.
[34]
Tun, M. et al. (2020), “Renewable Waste-to-Energy in Southeast Asia: Status, Challenges,
Opportunities, and Selection of Waste-to-Energy Technologies”, Applied Science, Vol. 10/20,
p. 7312, http://dx.doi.org/10.3390/app10207312.
[77]
UN Habitat (n.d.), Cities’ Waste Data, https://unhabitat.org/waste-wise-cities-waste-data
(accessed on 20 September 2021).
[72]
Unice, K. et al. (2019), “Characterizing export of land-based microplastics to the estuary - Part I:
Application of integrated geospatial microplastic transport models to assess tire and road
wear particles in the Seine watershed”, Sci. Total Environ., Vol. 646, pp. 1639–1649.
[104]
UNIDO (2020), Recycling of plastics in Indian perspective, UNIDO Office, VIC, Vienna,
https://www.unido.org/sites/default/files/files/2018-11/Plenary%202%20-%20Plastics%20-
%20Mohanty.pdf.
[22]
United Nations (2019), World urbanization prospects: The 2018 revision.,
https://population.un.org/wup/Publications/Files/WUP2018-Report.pdf.
[90]
United Nations Statistics Division (2020), UN Comtrade, https://comtrade.un.org (accessed on
21 September 2020).
[35]
United States Envrionmental Protection Agency (EPA) (2020), “Advancing Sustainable Materials
Management: 2018 Tables and Figures”, https://www.epa.gov/sites/default/files/2021-
01/documents/2018_tables_and_figures_dec_2020_fnl_508.pdf.
[13]
United States Envrionmental Protection Agency (EPA) (2020), Plastics: Material-Specific Data,
https://www.epa.gov/facts-and-figures-about-materials-waste-and-recycling/plastics-material-
specific-data.
[14]

193
GLOBAL PLASTICS OUTLOOK © OECD 2022
UNSD (2021), UNSD Environmental Indicators: Waste In Environment Statistics,
https://unstats.un.org/unsd/envstats/qindicators.cshtml.
[74]
van der Gon, H. et al. (2013), “The policy relevance of wear emissions from road transport, now
and in the future--an international workshop report and consensus statement”, Air Waste
Manag Assoc., Vol. 63/2, pp. 136-49, http://dx.doi.org/10.1080/10962247.2012.741055.
[97]
VinylPlus (2019), PVC Recycling in Action,
https://vinylplus.eu/uploads/images/Leaflets/Recovinyl_21x21_04-05_web.pdf.
[33]
Viool, V. et al. (2018), Study to support impact assessment for options to reduce the level of
ALDFG.
[40]
Walker, R. (2019), The mass of 300 different ‘dry’ materials. [102]
Wilson, D. et al. (2012), “Comparative analysis of solid waste management in 20 cities”, Waste
Management & Research, doi: 10.1177/0734242X12437569, pp. 237-254,
http://dx.doi.org/10.1177/0734242X12437569.
[73]
World Bank (2020), New World Bank country classifications by income level: 2020-2021.,
https://blogs.worldbank.org/opendata/new-world-bank-country-classifications-income-level-
2020-2021 (accessed on 28 January 2021).
[41]
Zheng, J. and S. Suh (2019), “Strategies to reduce the global carbon footprint of plastics”, Nature
Climate Change, Vol. 9/5, pp. 374-378, http://dx.doi.org/10.1038/s41558-019-0459-z.
[111]
Notes
1 https://doi.org/10.1787/c0821f81-en.
2 To simulate lifespan distributions for plastic applications from historical years, an exogenous component
of waste generated by earlier produced commodities is added in the first years.
3 In particular, ECHA (2020[51]) reports that the share of end-of-life tyre-derived granules would represent
78% on the infill, whereas EPDM and TPE would account for 18%, and cork 4%, by 2028. As artificial turf
is only made up of the rubber part of tyres (EuRIC MTR 2020), 96% of all infill is assumed to be
microplastics.
4 The nominal emissions of CH4 and N2O are converted to CO2-equivalents using the 100-year GWP from
2nd assessment report (IPCC, 1995[112]).
5 We would like to thank the authors for providing greenhouse-gas specific emission factors that are not
available directly in their paper.

194
GLOBAL PLASTICS OUTLOOK © OECD 2022
Annex B. Modelling the economic effects of the
COVID-19 pandemic and government response
measures
1.1. Scenario assumptions
The implications of the pandemic and lockdown measures are determined by comparing a counterfactual
pre-Covid baseline scenario, i.e. the pre-Covid projection, with a scenario where the Covid-related shocks
are included. The impacts of the COVID-19 pandemic and government response measures are based on
the following modelling assumptions; see (Dellink et al., 2021[1]) for more details:
Increases in regional unemployment levels in 2020 are based on the OECD Economic Outlook 108
(OECD, 2020[2]), the updates on GDP forecasts in the Interim Outlook (OECD, 2021[3]) and the IMF
Economic Outlook for the countries that are not covered by the OECD forecasts (IMF, 2020[4]). For
the few countries missing in both databases, ad-hoc assumptions are made based on effects in
similar countries.
Sectoral demand shocks are implemented for 2020 following Arriola and Van Tongeren (2021
forthcoming[5]). For energy sectors, the shocks are based on (IEA, 2020[6]). No demand shocks are
included for the plastics producing sectors.
Short-term government stimulus packages as provided in 2020 are implemented as a reduction in
capital and labour taxes for firms, and as a reduction in income taxes for households. These are
based on Arriola et al. (2021 forthcoming[5]).
Trade shocks are implemented as an increase in the costs of international trade (“iceberg costs”),
with a differentiation between services sectors and agriculture and manufacturing. This mimics the
trade shocks in Arriola et al. (2021 forthcoming[5]).
Reductions in regional labour productivity reflect productivity losses during lockdown and is
included crudely as a uniform decline in productivity in all sectors and regions, based on Arriola et
al. (2021 forthcoming[5]).
Finally, regional total factor productivity shocks reflecting the combined effects of all elements not
captured explicitly above are added based on the macroeconomic decline in GDP OECD (2020[2]).
This approach ensures that the immediate effects of the pandemic on the macro economy are
scaled to reach the GDP growth rates for 2020 as forecast by OECD (2020[2]) and by the IMF for
the countries that are not covered by the OECD forecasts (IMF, 2020[4]).
1.1. Economic impacts
Increased unemployment, reduced labour productivity, a collapse in demand for certain commodities and
higher trade costs all depress economic activity. This is only partially compensated by government support
to firms and households. The result is a significant contraction of global GDP in 2020, with the annual
global GDP growth rate dropping from around +4% in 2019 to -3.5% in 2020 (OECD, 2021[3]). For 2021
and beyond, the projections for global GDP are more optimistic and foresee a gradual recovery; this will
be covered in Volume 2 of the Global Plastics Outlook (OECD, forthcoming[7]).

195
GLOBAL PLASTICS OUTLOOK © OECD 2022
The pandemic is truly global and affects all economies. Moreover, economic integration means that
regional economic effects propagate through all economies. Thus, GDP levels in 2020 were well below
those of 2019 in all regions except China (Figure A B.1, left panel). However, in a normal year GDP levels
would grow, and thus the deviation between realised GDP in 2020 and the level for 2020 that was projected
pre-Covid, i.e. the 2019 GDP levels plus the expected growth rate for 2020, is larger. Thus, even though
the Chinese economy recovered rapidly from the first shock to the economy, the GDP growth rate was
much lower than anticipated.
All other regions had more substantial losses in GDP, with the largest drop compared to 2019 in the
European Union and India (cf. OECD (2021[3])), and relatively large losses compared to the pre-Covid
projection on most emerging economies as a year of expected high growth was wiped out. Furthermore,
global trade collapsed thereby depressing economic activity in emerging economies that rely heavily on
exports as a source of growth.
On balance, in 2020 GDP in the OECD countries was 5% below 2019 levels (7% below the pre-Covid
projection), while in non-OECD countries the average reduction from 2019 levels was smaller at 2%
(6% below the pre-Covid projection).
The structure of the economy plays a key role in how strong the macroeconomic effects of the pandemic
are. Parts of the services sectors were severely hit by the pandemic, especially the accommodation and
food services sector (Figure A B.1, right panel). The reductions in demand for fossil fuels were quite large,
not least through the effects of the lockdown measures on transport. Electricity demand also declined,
especially in production, as firms close down temporarily, but less than fuel use. Construction activities
and motor vehicle sales are among the most severely affected.
Figure A B.1. The COVID-19 pandemic and lockdown measures have reduced GDP across the world and reduced output in most sectors
Deviation in 2020 from pre-COVID projection
Note: Sector names are associated with the products they produce.
Source: OECD ENV-Linkages model and Dellink et al. (2021[1]).
-15% -10% -5% 0% 5% 10%
Food Products
Textiles
Construction
Motor Vehicles
Electronics
Chemical products
Basic pharmaceuticals
Rubber and plastic products
Trade
Accomodation and food services
Human health and social work
Other sectors
Total
Global sectoral output
Deviation 2020 from 2019
Deviation 2020 from pre-Covid 2020 projection

196
GLOBAL PLASTICS OUTLOOK © OECD 2022
Other manufacturing sectors are only indirectly affected: while there was – at least in the model simulations
– no direct shock to demand for the commodities of these sectors, the slowdown in other sectors, and the
reduction in consumption levels dragged these sectors down as well. This includes for instance textiles,
electronics and the chemical sector, as well as plastics and rubber production.
The only sector that is estimated to have a short-term increase in output is pharmaceuticals (as well as
some subsectors that are aggregated in larger sectors in the modelling, such as e-commerce).1 When
compared to 2019, the health sector also grew somewhat, albeit less than in the pre-Covid projection.
References
Arriola, C., P. Kowalski and F. Van Tongeren (2021 forthcoming), Assessment of the Covid-19
pandemic: insights from the METRO model, OECD.
[5]
Dellink, R. et al. (2021), “The long-term environmental implications of COVID-19”, OECD
Environment Working Papers, No. 176, OECD Publishing, Paris,
http://dx.doi.org/10.1787/123dfd4f-en.
[1]
IEA (2020), World Energy Outlook 2020, OECD Publishing, Paris,
https://dx.doi.org/10.1787/557a761b-en.
[6]
IMF (2020), World Economic Outlook, October 2020: A Long and Difficult Ascent, International
Monetary Fund, Washington, D.C.,
https://www.imf.org/en/Publications/WEO/Issues/2020/09/30/world-economic-outlook-
october-2020 (accessed on 22 January 2021).
[4]
OECD (2021), OECD Economic Outlook, Interim Report March 2021, OECD Publishing, Paris,
https://dx.doi.org/10.1787/34bfd999-en.
[3]
OECD (2020), OECD Economic Outlook, Volume 2020 Issue 2, OECD Publishing, Paris,
https://dx.doi.org/10.1787/39a88ab1-en.
[2]
OECD (forthcoming), Global Plastics Outlook, Volume 2, OECD. [7]
Notes
1 The pharmaceuticals sector comprises around 0.7% of total output of the global economy, and above 1%
in the European OECD countries (on average).

197
GLOBAL PLASTICS OUTLOOK © OECD 2022
Glossary
Disclaimer: This glossary presents definitions for key terms employed in the report. Definitions are
condensed and may not be complete. They are not to be considered official definitions, rather descriptions
of terms as used for the purpose of this report.
Term Definition used in the Global Plastics Outlook
Biobased plastics Plastics manufactured from biomass.
Degradation The partial or complete breakdown of a polymer as a result of e.g. UV radiation, oxygen attack,
biological attack. This implies alteration of the properties, such as discolouration, surface
cracking, and fragmentation.
Environmentally-relevant
plastics technologies
Plastics technologies that are relevant to the environment including technologies for prevention,
recycling, conversion or disposal of waste; for leakage removal; and for biobased feedstock.
(Waste) incineration Incineration in a state-of-the-art industrial facility.
(Sanitary) landfilling The final disposal of waste in or on land in a controlled way and according to state-of-the-art
sanitary, environmental protection and other safety requirements.
(Plastic) leakage Plastic leakage refers to plastics that enter terrestrial and aquatic environments.
Litter Waste that results from littering by individuals in the environment and from fly-tipping. Littered
waste is distinct from mismanaged waste, because littering behaviour not necessarily correlated
to the provision of basic waste collection and disposal infrastructure. Littered waste can either be
collected for further disposal or remain uncollected and leak into the environment.
Macroplastics Recognisable plastic items, such as littered plastic bottles and packaging. In this report, the use
of the term encompasses plastics above 5 mm in diameter (i.e. what is often defined as meso
and macro plastics elsewhere in the literature).
Microplastics Solid synthetic polymers smaller than 5 mm in diameter.
Mismanaged waste Waste that is not captured by any state-of-the-art waste collection or treatment facilities. It
includes waste that is burned in open pits, dumped into seas or open waters, or disposed of in
unsanitary landfills and dumpsites.
Plastic Plastic in the singular form is used as an adjective describing a noun. For example, plastic waste.

198
GLOBAL PLASTICS OUTLOOK © OECD 2022
Plastic pollution Broadly, all emissions and risks resulting from plastics production, use, waste management and
leakage.
Plastics All plastic polymers studied in the report.
Primary microplastics Plastics that are smaller than 5 mm in diameter by design, such as cosmetic scrubbing agents
and plastic pellets.
Primary or virgin plastics Plastics manufactured from fossil-based (e.g. crude oil) or biobased (e.g. corn, sugarcane, wheat)
feedstock that has never been used or processed before.
Recycling rate Depending on the context, either the share of waste that is collected for recycling or the share of
waste that is available as recycled scrap after reprocessing and after taking into account the
disposal of recycling residues.
Secondary (recycled)
plastics
Plastic polymers made from recycled material.
Secondary microplastics Microplastics that are formed from the fragmentation of larger plastics, such as microplastics from
tyre abrasion, synthetic microfibres shed from textile products and microplastics stemming from
the degradation and fragmentation of macroplastics that have already been lost to the
environment.

Global Plastics OutlookECONOMIC DRIVERS, ENVIRONMENTAL IMPACTS AND POLICY OPTIONS
While plastics are extremely useful materials for modern society, plastic production and waste generation continue to increase with worsening environmental impacts despite international, national and local policy responses, as well as industry commitments. The urgent need to make the lifecycle of plastics more circular calls for an expansion of national policies and improved international co‑operation to mitigate environmental impacts all along the value chain.
The first of two reports, this Outlook intends to inform and support policy efforts to combat plastic leakage. The report quantifies the current production, use, disposal and key environmental impacts throughout the entire plastics lifecycle and identifies opportunities for reducing the negative externalities. It also investigates how plastics use and waste have been affected by the COVID‑19 pandemic across sectors and regions. The Outlook identifies four key levers for bending the plastics curve: stronger support for recycled (secondary) plastics markets; policies to boost technological innovation in plastics; more ambitious domestic policy measures; and greater international co‑operation.
9HSTCQE*gfejef+
PRINT ISBN 978-92-64-65494-5PDF ISBN 978-92-64-58406-8
Glo
bal P
lastics Outlo
ok E
CO
NO
MIC
DR
IVE
RS
, EN
VIR
ON
ME
NTA
L IMP
AC
TS
AN
D P
OLIC
Y O
PT
ION
S