Global Structured Finance 2022 Outlook
61
spglobal.com/ratings This report does not constitute a rating action. Jan. 12, 2022 1 Jan. 12, 2022 Global Structured Finance 2022 Outlook James Manzi, CFA Washington D.C. james.manzi @spglobal.com +1-202-383-2028 Tom Schopflocher, Ph.D. New York tom.schopflocher @spglobal.com +1-212-438-6722 Brenden Kugle Centennial brenden.kugle @spglobal.com +1-303-721-4619 2022 Global Structured Finance Issuance Forecasts Key Takeaways – Buoyed by economic growth and the expectation of gradually rising interest rates, we see a generally benign credit environment for structured finance heading into 2022, albeit with some pockets of distress. Along with relatively low benchmark rates and available yields, we expect demand for structured finance to remain strong, which in turn should benefit issuance volumes. Following a 43% year-over-year increase in global issuance in 2021 to just over $1.53 trillion, we forecast another robust year, with a slight gain to $1.56 trillion. Pandemic impact remains a wild card. – We expect importance of the environmental and social components of ESG to continue growing for global investors in 2022 and beyond. The LIBOR transition will remain a key story in 2022 as the focus shifts to U.S. dollar LIBOR, with roughly 18-months to transition remaining exposures. The state of inflation and supply constraints are likely to stay in focus for their potential impacts on global economic growth. – Global real estate and CLOs round up our top themes of 2022. On the commercial side, future demand for office space is uncertain, although overall property values rebounded strongly in 2021. Ongoing lodging recovery, especially that which depends on group/business demand, and the evolution of regional malls remain in focus. On the residential side, home price appreciation has supported solid credit performance for borrowers. CLO issuance set records in 2021, with stabilizing corporate credit buoying CLO sector fundamentals. This should continue, while the high proportion of 'B-' rated obligors and falling recovery ratings bears watching. CONTENTS Introduction 2 LIBOR 4 ESG 6 United States 8 Auto Loan ABS 8 Auto Lease ABS 12 Commercial ABS 14 Unsecured Consumer ABS 19 Non-Traditional ABS 24 ABCP Muni-Structured 30 CLO 35 RMBS 38 CMBS 41 Canada 44 Europe 50 Latin America 54 Asia-Pacific 56 Australia 56 China 57 Japan 59
-
Upload
khangminh22 -
Category
Documents
-
view
1 -
download
0
Transcript of Global Structured Finance 2022 Outlook

spglobal.com/ratings This report does not constitute a rating action. Jan. 12, 2022 1
Jan. 12, 2022
Global Structured Finance 2022 Outlook
James Manzi, CFA Washington D.C. james.manzi @spglobal.com +1-202-383-2028
Tom Schopflocher, Ph.D. New York tom.schopflocher @spglobal.com +1-212-438-6722
Brenden Kugle Centennial brenden.kugle @spglobal.com +1-303-721-4619
2022 Global Structured Finance Issuance Forecasts
Key Takeaways – Buoyed by economic growth and the expectation of gradually rising interest rates, we see a
generally benign credit environment for structured finance heading into 2022, albeit withsome pockets of distress. Along with relatively low benchmark rates and available yields,we expect demand for structured finance to remain strong, which in turn should benefitissuance volumes. Following a 43% year-over-year increase in global issuance in 2021 tojust over $1.53 trillion, we forecast another robust year, with a slight gain to $1.56 trillion. Pandemic impact remains a wild card.
– We expect importance of the environmental and social components of ESG to continue growing for global investors in 2022 and beyond. The LIBOR transition will remain a key story in 2022 as the focus shifts to U.S. dollar LIBOR, with roughly 18-months to transition remaining exposures. The state of inflation and supply constraints are likely tostay in focus for their potential impacts on global economic growth.
– Global real estate and CLOs round up our top themes of 2022. On the commercialside, future demand for office space is uncertain, although overall property values rebounded strongly in 2021. Ongoing lodging recovery, especially that which dependson group/business demand, and the evolution of regional malls remain in focus. On the residential side, home price appreciation has supported solid credit performancefor borrowers. CLO issuance set records in 2021, with stabilizing corporate creditbuoying CLO sector fundamentals. This should continue, while the high proportion of'B-' rated obligors and falling recovery ratings bears watching.
CONTENTS
Introduction 2 LIBOR 4
ESG 6 United States 8
Auto Loan ABS 8 Auto Lease ABS 12 Commercial ABS 14
Unsecured Consumer ABS 19 Non-Traditional ABS 24
ABCP Muni-Structured 30 CLO 35
RMBS 38 CMBS 41
Canada 44
Europe 50 Latin America 54
Asia-Pacific 56 Australia 56
China 57 Japan 59
spglobal.com/ratings This report does not constitute a rating action. Jan. 12, 2022 2
Introduction | Global Structured Finance Outlook
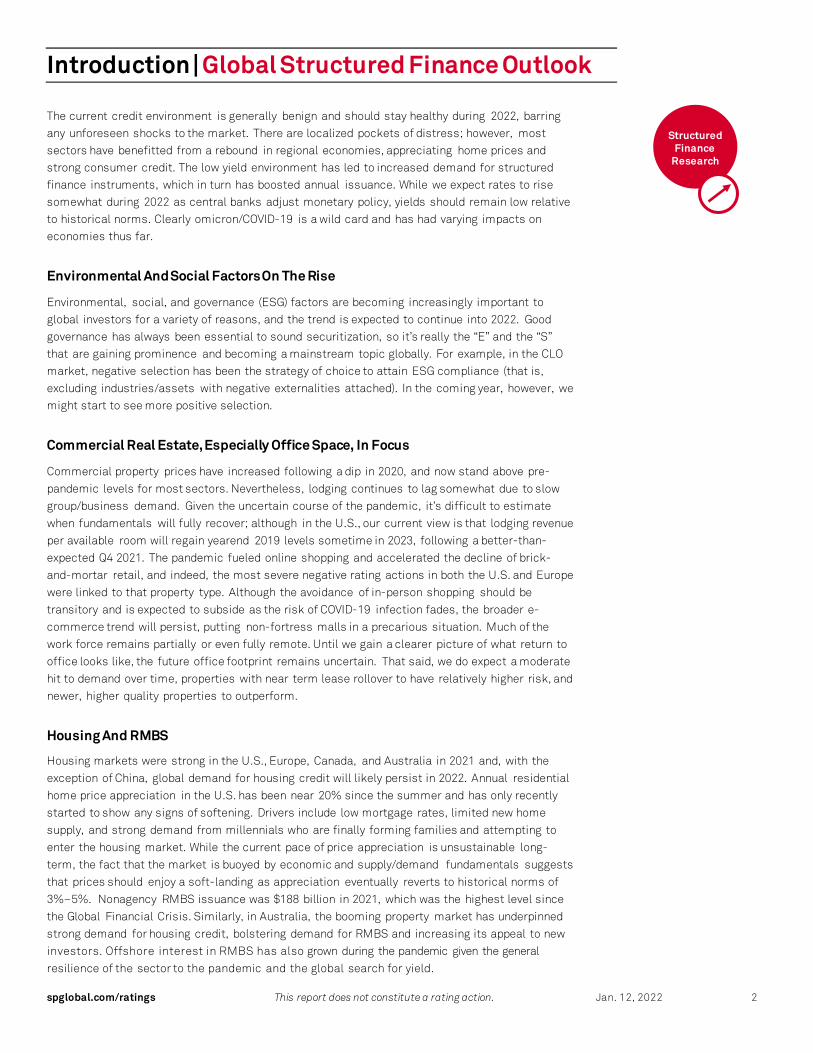
The current credit environment is generally benign and should stay healthy during 2022, barring any unforeseen shocks to the market. There are localized pockets of distress; however, most sectors have benefitted from a rebound in regional economies, appreciating home prices and strong consumer credit. The low yield environment has led to increased demand for structured finance instruments, which in turn has boosted annual issuance. While we expect rates to rise somewhat during 2022 as central banks adjust monetary policy, yields should remain low relative to historical norms. Clearly omicron/COVID-19 is a wild card and has had varying impacts on economies thus far.
Environmental And Social Factors On The Rise
Environmental, social, and governance (ESG) factors are becoming increasingly important to global investors for a variety of reasons, and the trend is expected to continue into 2022. Good governance has always been essential to sound securitization, so it’s really the “E” and the “S” that are gaining prominence and becoming a mainstream topic globally. For example, in the CLO market, negative selection has been the strategy of choice to attain ESG compliance (that is, excluding industries/assets with negative externalities attached). In the coming year, however, we might start to see more positive selection.
Commercial Real Estate, Especially Office Space, In Focus
Commercial property prices have increased following a dip in 2020, and now stand above pre-pandemic levels for most sectors. Nevertheless, lodging continues to lag somewhat due to slow group/business demand. Given the uncertain course of the pandemic, it’s difficult to estimate when fundamentals will fully recover; although in the U.S., our current view is that lodging revenue per available room will regain yearend 2019 levels sometime in 2023, following a better-than-expected Q4 2021. The pandemic fueled online shopping and accelerated the decline of brick-and-mortar retail, and indeed, the most severe negative rating actions in both the U.S. and Europe were linked to that property type. Although the avoidance of in-person shopping should be transitory and is expected to subside as the risk of COVID-19 infection fades, the broader e-commerce trend will persist, putting non-fortress malls in a precarious situation. Much of the work force remains partially or even fully remote. Until we gain a clearer picture of what return to office looks like, the future office footprint remains uncertain. That said, we do expect a moderate hit to demand over time, properties with near term lease rollover to have relatively higher risk, and newer, higher quality properties to outperform.
Housing And RMBS
Housing markets were strong in the U.S., Europe, Canada, and Australia in 2021 and, with the exception of China, global demand for housing credit will likely persist in 2022. Annual residential home price appreciation in the U.S. has been near 20% since the summer and has only recently started to show any signs of softening. Drivers include low mortgage rates, limited new home supply, and strong demand from millennials who are finally forming families and attempting to enter the housing market. While the current pace of price appreciation is unsustainable long-term, the fact that the market is buoyed by economic and supply/demand fundamentals suggests that prices should enjoy a soft-landing as appreciation eventually reverts to historical norms of 3%–5%. Nonagency RMBS issuance was $188 billion in 2021, which was the highest level since the Global Financial Crisis. Similarly, in Australia, the booming property market has underpinned strong demand for housing credit, bolstering demand for RMBS and increasing its appeal to new investors. Offshore interest in RMBS has also grown during the pandemic given the general resilience of the sector to the pandemic and the global search for yield.
Structured Finance
Research

spglobal.com/ratings This report does not constitute a rating action. Jan. 12, 2022 3
The LIBOR Transition
In 2021, nondollar LIBOR settings ended with limited negative impact observed so far. The focus has now shifted to the U.S. dollar LIBOR market for which no new LIBOR lending is permitted. This
has prompted new issuance with alterative reference rates, mostly compounded- and term-SOFR. In 2022, a federal LIBOR assistance bill is expected to pass. In addition to benefiting legacy securitizations, for which assets are governed by a variety of state laws, it would clarify Trust Indenture Act provisions and Student Loan Special Allowance Payments tied to LIBOR.
CLO Credit Worth Monitoring Amid Record Issuance
The U.S. CLO sector saw record new issuance of $188bn in 2021 and CLOs remained the highest issuing European SF sector at more than EUR38bn. We attribute the robust volumes to investors’ search for high risk-adjusted yield, coupled with CLOs’ resilient performance during the 2020
downturn and new investors entering the space. We expect issuance in both regions to remain strong in 2022 for the same reasons. In 2020, we lowered about 11% of our outstanding U.S. CLO ratings; in 2021, we upgraded about half of these downgraded ratings, in many cases back to their original ratings as collateral metrics improved. While stabilizing corporate credit has led to
improvement in U.S. CLO credit since mid-2020, we think deteriorating recovery rating profiles and declining weighted average recovery rates for some CLOs could put pressure on subordinate tranche ratings, especially if these same transactions see a potential decrease in excess spread due to shifting LIBOR-SOFR profiles on assets and liabilities.
Inflation And The Consumer
Consumer ABS credit has held up well due to government support, rising asset prices, low rates, and economic growth. Total household assets have also grown to record levels at just under $154 trillion as of third quarter 2021. Nevertheless, inflation has risen to levels not seen since the early
1980s. The U.S. Consumer Price Index (CPI) for all items increased 6.8% during the 12-months ending December and is expected to remain elevated due to supply constraints in the economy.
Global Structured Finance New Issue Volumes*
2016 2017 2018 2019 2020 2021 2022F
U.S. (bil. US$) 373 510 540 582 452 783 786
Canada (bil. C$) 18 20 25 19 11 13 13
Europe (bil. € ) 81 82 107 102 69 114 120
China (bil. US$) 116 220 292 334 432 485 500
Japan (bil. US$) 53 48 56 61 60 61 63
Australia (bil. US$) 16 36 23 31 22 38 40
Latin America (bil. US$) 12 17 9 13 13 24 24
Approximate global new issue total (bil. US$) 670 930 1,050 1,150 1,070 1,530 1,560
*We reserve the right to periodically revise these numbers retroactively as new information arises. Covered bonds, ABCP, and CLO refinancings and resets are excluded from these totals. F—Forecast. Source: S&P Global Ratings. Copyright © 2022 by Standard & Poor’s Financial Services LLC. All rights reserved.

spglobal.com/ratings This report does not constitute a rating action. Jan. 12, 2022 4
Global Structured Finance | LIBOR
Key Takeaways – Nondollar LIBOR settings in the European and Japanese securitization markets ended
with limited negative impact observed so far, with two rated transactions placed onCreditWatch negative.
– The focus of securitization markets now shifts to the U.S. dollar LIBOR market in2022–2023, for which no new LIBOR lending is permitted. This has prompted new
issuance with alterative reference rates, mostly compounded- and term-SOFR.
– A federal LIBOR assistance bill is at a highly advanced stage, having been presented to
both the House and the Senate. If passed, it would help minimize litigation byproviding legal safe harbor to replace LIBOR, clarifying the Trust Indenture Actprovisions for interest rate changes, and changing special allowance payments fromthe federal government to lenders on LIBOR-based student loans.
– During the January 2022-June 2023 transitional period, some legacy and new issuetransactions are likely to see basis risk as LIBOR continues on assets while liabilities
utilize alternative rates such as SOFR (particularly in CLO and student loan ABS).
Nondollar LIBOR Settings End On Schedule; LIBOR Transition Focus Now Shifts To U.S. Dollar LIBOR Market In 2022
With LIBOR settings for sterling, yen, swiss franc, and euro transactions recently ending, securitization markets are now shifting their focus to the U.S. dollar LIBOR settings scheduled for cessation after June 2023. The generalized prohibition on using dollar LIBOR in new transactions
by banks in U.S. markets after Dec. 31, 2021, is now underway, which should quickly promote issuance with alternative rates in active floating rate asset classes such as CLO and student loans ABS. With over 4,500 LIBOR-based securitizations outstanding rated by S&P Global Ratings, the scale of the U.S. transition away from LIBOR dwarfs that seen in sterling and yen markets.
Summary Of LIBOR Rates Coming To An End
Source: S&P Global Ratings.
Minimal Impact From LIBOR Transition In Europe And Japan Markets So Far
Many European and Japanese structured finance transactions have successfully implemented replacement rates for a smooth LIBOR transition. However, we are aware of limited transitional situations for two transactions--one Australian RMBS and one Japanese RMBS--both of which have been placed on CreditWatch negative for incomplete information regarding transition to new
interest rates with early 2022 reset dates. There are approximately 60 European and seven
PRIMARY CONTACTS
John Detweiler, CFA New York john.detweiler @spglobal.com +1-212-438-7319
Global
spglobal.com/ratings This report does not constitute a rating action. Jan. 12, 2022 5
Japanese LIBOR-based securitizations with first-quarter 2022 reset dates, and we are actively monitoring these for transition plans. While synthetic LIBOR is now available for sterling and yen exposures in which transaction parties agree, it is less likely to be a solution for U.S. markets given
that the new U.K. Critical Benchmarks (References and Administrators’ Liability) Act of 2021 supports this rate and substantially all securitizations using dollar LIBOR are governed by U.S. law. (For more information, see "European And Japanese Structured Finance Markets Approach LIBOR Cessation While U.S. Markets Prepare For A Major Shift," published Nov. 2, 2021.)
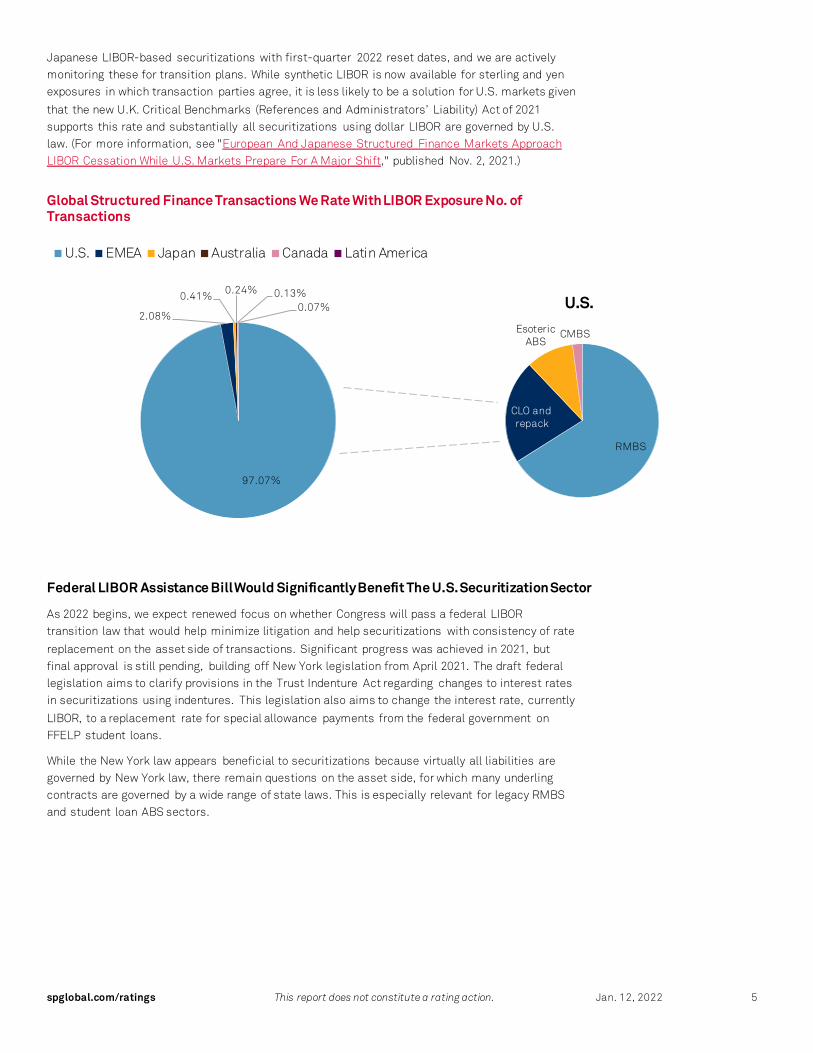
Global Structured Finance Transactions We Rate With LIBOR Exposure No. of Transactions
Federal LIBOR Assistance Bill Would Significantly Benefit The U.S. Securitization Sector
As 2022 begins, we expect renewed focus on whether Congress will pass a federal LIBOR transition law that would help minimize litigation and help securitizations with consistency of rate
replacement on the asset side of transactions. Significant progress was achieved in 2021, but final approval is still pending, building off New York legislation from April 2021. The draft federal legislation aims to clarify provisions in the Trust Indenture Act regarding changes to interest rates in securitizations using indentures. This legislation also aims to change the interest rate, currently
LIBOR, to a replacement rate for special allowance payments from the federal government on FFELP student loans.
While the New York law appears beneficial to securitizations because virtually all liabilities are governed by New York law, there remain questions on the asset side, for which many underling contracts are governed by a wide range of state laws. This is especially relevant for legacy RMBS and student loan ABS sectors.
97.07%
2.08%
0.41% 0.24% 0.13%0.07%
U.S. EMEA Japan Australia Canada Latin America
RMBS
CLO and repack
Esoteric ABS
CMBS
U.S.

spglobal.com/ratings This report does not constitute a rating action. Jan. 12, 2022 6
Global Structured Finance | ESG
Key Takeaways – Sustainable debt issuance continued to experience significant growth in 2021 as
companies and countries focus on advancing the transition to a net-zero economy.
– There remains no harmonized definition of what constitutes “green” or “social”collateral, which we believe to be among the main drivers of limited sustainablestructured finance issuance.
– ESG-related rating actions in structured finance significantly declined year over yearand we believe there will continue to be limited ESG-related rating actions in
structured finance given the structural mitigants to these risks incorporated intransaction structures.
Heightened focus on ESG will continue with innovative deal structures
Sustainable debt issuance continued to experience significant growth in 2021 (see chart below), underpinned, in part, by a heightened focus of companies and countries globally on advancing the transition to a net-zero economy as well as addressing social objectives embedded in their
sustainability strategies.
Sustainable Bonds See Record Issuance in 2021
Annual Issuance In Sustainable Debt By Instrument Type
Source: EF Bond Database; www.bonddata.org. Copyright © 2022 by Standard & Poor’s Financial Services LLC. All rights reserved.
However, growth in sustainable structured finance issuance has been limited. We believe this is attributed to several factors, including no harmonized definition of what constitutes “green” or
“social” collateral, limited origination volumes of ESG-compliant collateral, and no standardized ESG reporting framework across structured finance asset-classes. There are also concerns from market participants surrounding the legitimacy and credibility of instruments with a sustainable
PRIMARY CONTACTS
Matthew Mitchell Paris matthew.mitchell @spglobal.com +33-(0)6-17-23-72-88
Kate Scanlin New York kate.scanlin @spglobal.com +1-212-438-2002
Global
0
100
200
300
400
500
600
700
800
900
1000
1100
2018 2019 2020 2021
Bil
. $
Green bonds Social bondsSustainability bonds Sustainability-linked bondsTransition bonds Green, sustainability-linked bondsOther
spglobal.com/ratings This report does not constitute a rating action. Jan. 12, 2022 7
label. In particular, investors have expressed fears surrounding inconsistent instrument labelling, reporting, and data disclosure, with concerns arising that sustainable debt instruments may not be meaningfully differentiated from their vanilla counterparts (see “The Fear Of Greenwashing
May Be Greater Than The Reality Across The Global Financial Markets,” published Aug. 23, 2021).
Looking forward, we believe there will be greater diversification and innovation in sustainable
structured finance instruments. For example, rather than pursue “green” or “social” labelled issuance due to a lack of suitable collateral, we believe structured finance issuers may adopt sustainability-linked structures with key performance indicators (KPI) and sustainability performance targets (SPT) for the originator and servicer. These structures typically contain a
coupon ratchet with a step-up and/or step-down depending on if the SPTs are achieved. In addition, while there remain concerns regarding sustainable labels for “use-of-proceeds” securitisations, whereby the seller commits to use the issuance proceeds to originate new eligible loans rather than the collateral itself satisfying sustainability criteria, some market participants
have acknowledged that such structures may be necessary in order to facilitate change. As such, we expect to see more sustainable labelled issuance in 2022 for “use-of-proceeds” transactions but are not yet expecting a material change in collateral pool compositions. Therefore, we believe there will be a limited impact on our credit rating analysis.
We launched several ESG transparency initiatives in 2021, including ESG industry report cards, dedicated ESG paragraphs in presale reports, publishing our ESG principles criteria, and releasing
a monthly ESG in Credit Ratings Newsletter (see “ESG Industry Report Cards For Structured Finance Published,” published March 31, 2021; “Environmental, Social, And Governance Principles In Credit Ratings,” published Oct. 10, 2021; and “ESG In Credit Ratings Newsletter,” published Dec. 1, 2021). We also began publishing ESG Credit Indicators for the corporate and
infrastructure, banking, and insurance sectors, which reflect our opinion of how material the influence of ESG factors is on the various analytical components in our rating analysis (see “ESG Credit Indicator Definitions And Application,” published Oct. 13, 2021). We anticipate rolling out ESG Credit Indicators to other asset classes in 2022, including structured finance.
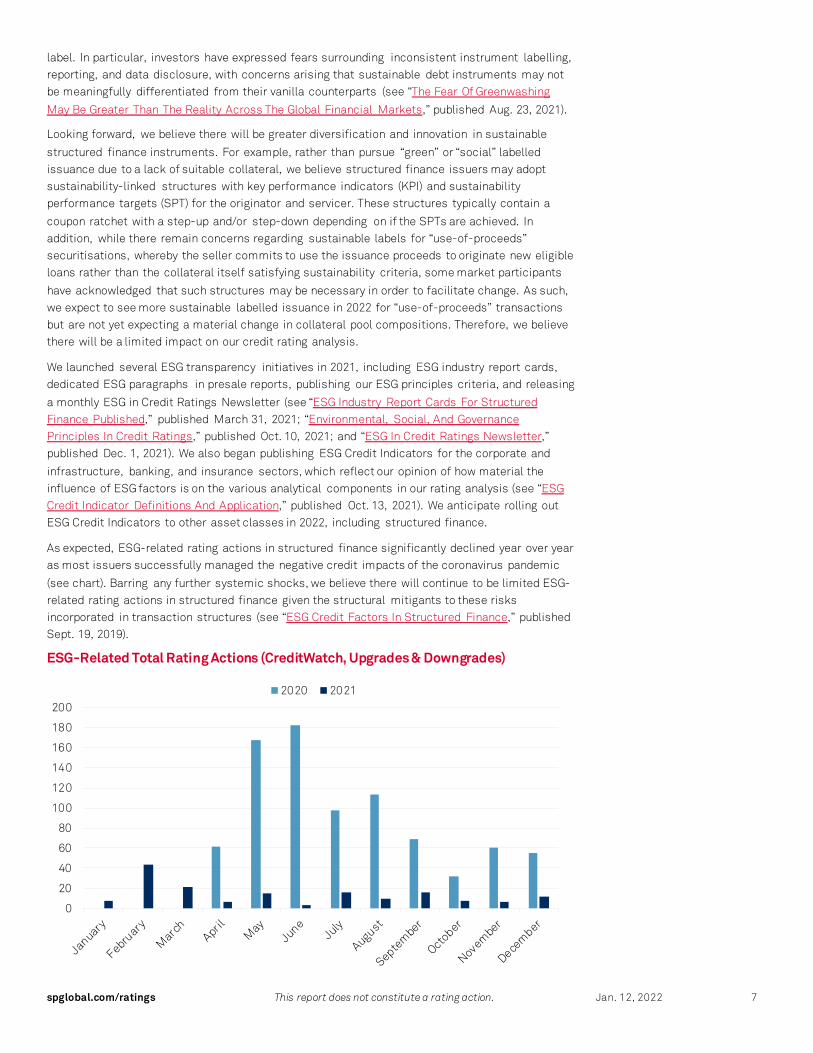
As expected, ESG-related rating actions in structured finance significantly declined year over year as most issuers successfully managed the negative credit impacts of the coronavirus pandemic
(see chart). Barring any further systemic shocks, we believe there will continue to be limited ESG-related rating actions in structured finance given the structural mitigants to these risks incorporated in transaction structures (see “ESG Credit Factors In Structured Finance,” published Sept. 19, 2019).
ESG-Related Total Rating Actions (CreditWatch, Upgrades & Downgrades)
0
20
40
60
80
100
120
140
160
180
2002020 2021

spglobal.com/ratings This report does not constitute a rating action. Jan. 12, 2022 8
U.S. | Auto Loan ABS
Key Takeaways – Auto Loan ABS issuance rose 29% in 2021 to $97.3 billion, the highest level since 2005.
– We expect 2022’s issuance to increase modestly (8%) to $105 billion due to slightlyhigher new vehicle sales, vehicle price appreciation, and greater used vehicle financingby the captives.
– Credit performance in both prime and subprime pools has been better than expectedwith recent securitizations’ cumulative net losses trending well below prior vintages atthe same seasoning point. Given our favorable economic outlook and generally
sanguine performance outlook, we expect positive ratings performance this year.
Low Unemployment And Used Vehicle Values Will Be Tailwinds
Auto loan ABS issuance accelerated 29% to approximately $97.3 billion in 2021, from $75.3 billion in 2020. This more than made up for 2020’s volume loss relative to 2019’s issuance of $82.9 billion. In fact, 2021 marked the highest level of auto loan ABS activity since 2005. Record issuance corresponded with industry auto loan originations spiking 22% year on year to $553
billion for the nine months ended Sept. 30, 2021. New vehicle shortages beefed up sales of used vehicles and caused sticker prices for both new and used vehicles to spiral upward. New U.S. light vehicle sales rose around 5% last year to approximately 15.0 million units, remaining below 2019’s 17.0 million.
Vehicle shortages contributed to captive ABS issuance declining slightly (6%) to $32.5 billion (33% of overall issuance). Meanwhile, subprime ABS increased 58% to a record $43.8 billion, and
represented 45.0% of overall issuance. Favorable financing conditions, economic stimulus payments, lower unemployment levels, and strong trade-in vehicle values helped propel greater subprime financing and ABS activity. Strong investor demand for these higher yielding assets also encouraged several relatively new subprime issuers to come to the ABS market, some of which
cater to consumers who do not have FICO scores. Subprime industry origination growth was robust through September 2021 (up 21% year over year according to the New York Fed Consumer Credit Panel). However, these loans (credit score below 620) still represented only 17% of total originations, down from a recent peak of 23% in 2015.
Issuance also rose significantly within the prime noncaptive segment (16% of issuance) and modestly within the bank category (4%). Nonprime made of up the remainder (2%).
For 2022, we’re expecting auto loan ABS volume to increase modestly (8%) to approximately $105 billion from $97.3 last year given our forecast for a modest recovery in new vehicle sales (15.5-16.0
million) and continued vehicle price inflation. We expect captive finance companies to increase their issuance as they grow new vehicle loan volume, become more focused on used vehicle financing, especially given the continued supply chain issues their manufacturers are likely to face with new vehicles for the first half of this year. We expect stable subprime issuance given that
2021 was an exceptional year, providing many consumers with cash windfalls they used for vehicle down payments. While that is unlikely to be repeated this year, plentiful financing, strong economic conditions, and declining unemployment levels, should help to maintain robust origination and securitization volumes.
PRIMARY CONTACTS
Amy Martin
New York amy.martin @spglobal.com +1-212-438-2538
Frank Trick
New York frank.trick @spglobal.com +1-212-438-1108
Key Performance Metrics
55.0%
52.0%
50.4%
4 8%
4 9%
5 0%
5 1%
5 2%
5 3%
5 4%
5 5%
5 6%
76.0%88.7%
73.4%
0 %
1 0%
2 0%
3 0%
4 0%
5 0%
6 0%
7 0%
8 0%
9 0%
1 00 %
U.S.
Subprime Recoveries
Prime Recoveries
Oct
.
Sept
.
Aug.

spglobal.com/ratings This report does not constitute a rating action. Jan. 12, 2022 9
Performance
Credit performance has not only been better than we expected when the pandemic started, but
cumulative net losses (CNLs) on securitizations undertaken since then are trending significantly lower than prior vintages. For example, prime CNLs on the quarterly 2020 securitizations are on average ranging between 0.16% to 0.24% through month 12, down significantly from 0.32% to 0.38% for the 2015-2019 vintages at the same seasoning point (see chart). Further, the 2018 and
2019 vintages, which had been trending in line with prior years, have been experiencing a back-end benefit from high recovery rates and are now reporting year over year improvement.
Prime Cumulative Prime Cumulative Net Losses By Vintage
Source: S&P Global Ratings.
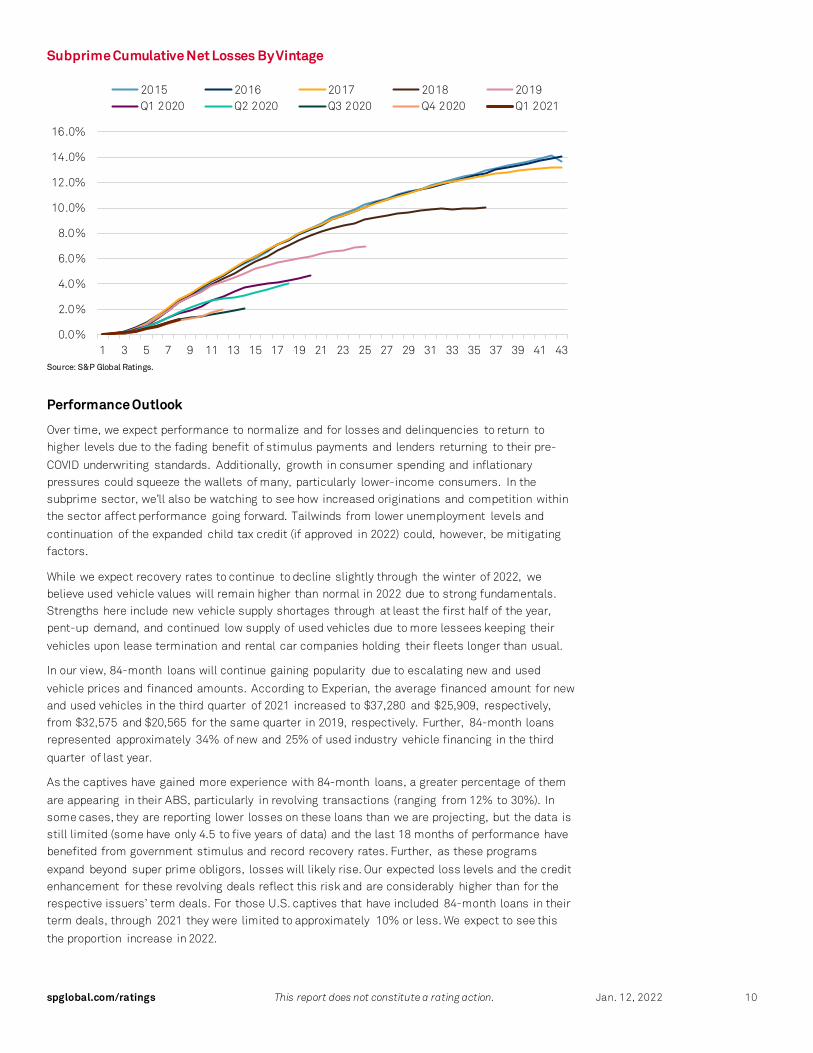
Relative to the prime pools, we’re seeing an even stronger back-end performance benefit in the
2018 and 2019 subprime auto loan securitizations (see chart below). Additionally, their 2020 and subsequent transactions are performing vastly better than prior pools. We believe the stellar performance exhibited by subprime auto has not only been due to strong recoveries but also due to the customers receiving stimulus checks, enhanced unemployment benefits, and expanded
child tax credits. Additionally, eviction and foreclosure moratoriums and student loan payment deferrals have likely benefited performance as well. Prudent lending standards, although generally relaxed since 2020, have also supported strong performance.
0.0%
0.1%
0.2%
0.3%
0.4%
0.5%
0.6%
0.7%
0.8%
0.9%
1.0%
1 3 5 7 9 11 13 15 17 19 21 23 25 27 29 31 33 35 37 39
2015 2016 2017 2018 2019Q1 2020 Q2 2020 Q3 2020 Q4 2020 Q1 2021
spglobal.com/ratings This report does not constitute a rating action. Jan. 12, 2022 10
Subprime Cumulative Net Losses By Vintage
Source: S&P Global Ratings.
Performance Outlook
Over time, we expect performance to normalize and for losses and delinquencies to return to higher levels due to the fading benefit of stimulus payments and lenders returning to their pre-
COVID underwriting standards. Additionally, growth in consumer spending and inflationary pressures could squeeze the wallets of many, particularly lower-income consumers. In the subprime sector, we’ll also be watching to see how increased originations and competition within the sector affect performance going forward. Tailwinds from lower unemployment levels and
continuation of the expanded child tax credit (if approved in 2022) could, however, be mitigating factors.
While we expect recovery rates to continue to decline slightly through the winter of 2022, we believe used vehicle values will remain higher than normal in 2022 due to strong fundamentals. Strengths here include new vehicle supply shortages through at least the first half of the year, pent-up demand, and continued low supply of used vehicles due to more lessees keeping their
vehicles upon lease termination and rental car companies holding their fleets longer than usual.
In our view, 84-month loans will continue gaining popularity due to escalating new and used
vehicle prices and financed amounts. According to Experian, the average financed amount for new and used vehicles in the third quarter of 2021 increased to $37,280 and $25,909, respectively, from $32,575 and $20,565 for the same quarter in 2019, respectively. Further, 84-month loans represented approximately 34% of new and 25% of used industry vehicle financing in the third
quarter of last year.
As the captives have gained more experience with 84-month loans, a greater percentage of them
are appearing in their ABS, particularly in revolving transactions (ranging from 12% to 30%). In some cases, they are reporting lower losses on these loans than we are projecting, but the data is still limited (some have only 4.5 to five years of data) and the last 18 months of performance have benefited from government stimulus and record recovery rates. Further, as these programs
expand beyond super prime obligors, losses will likely rise. Our expected loss levels and the credit enhancement for these revolving deals reflect this risk and are considerably higher than for the respective issuers’ term deals. For those U.S. captives that have included 84-month loans in their term deals, through 2021 they were limited to approximately 10% or less. We expect to see this
the proportion increase in 2022.
0.0%
2.0%
4.0%
6.0%
8.0%
10.0%
12.0%
14.0%
16.0%
1 3 5 7 9 11 13 15 17 19 21 23 25 27 29 31 33 35 37 39 41 43
2015 2016 2017 2018 2019Q1 2020 Q2 2020 Q3 2020 Q4 2020 Q1 2021
spglobal.com/ratings This report does not constitute a rating action. Jan. 12, 2022 11
Ratings Outlook
Better than expected performance last year, coupled with deleveraging that is inherent in auto
loan ABS led us to upgrade 579 classes, affirm 518, and downgrade none. Given our favorable economic outlook and generally positive performance outlook, we expect the positive ratings trend to continue.
Request For Comment
On Nov. 30, 2021, we published our “Request For Comment: Global Auto ABS Methodology And Assumptions” and we held a webinar Dec. 10 explaining the changes that would affect U.S. auto loan and lease ABS. A replay of the webinar is available here through Dec. 14, 2022. We are accepting comments on our proposed changes through Jan. 14, 2022.

spglobal.com/ratings This report does not constitute a rating action. Jan. 12, 2022 12
U.S. | Auto Lease ABS
Key Takeaways – Auto lease ABS issuance reached an all-time high of $27 billion in 2021, despite
dampened new vehicle sales caused by supply constraints.
– We forecast similar ABS issuance level in 2022 of approximately $28 billion.
– We expect our auto lease ABS ratings to remain stable and collateral performance tocontinue to be somewhat stronger compared to historical trends.
What To Look For Over The Next Year
Auto lease ABS issuance reached an all-time high of $27.4 billion in 2021, despite dampened new vehicle sales caused by supply constraints. The record-high issuance volume was a 42% increase from 2020 and 29% from 2019 levels, the last peak. Traditionally, auto lease ABS volume
represented 16%-20% of total auto ABS volume. In 2021, it represented 22%. We expect these volumes will persist into 2022; our outlook is for similar auto lease ABS volume of $28 billion.
U.S. New Vehicle Sales and Auto Lease ABS Issuance
F—Forecast. Source: S&P Global Ratings. Copyright © 2022 by Standard & Poor’s Financial Services LLC. All rights reserved.
There was a new entrant into the public auto lease ABS arena in 2021; Toyota Motor Credit Corporation (TMCC) securitized two deals totaling $2.55 billion. While most issuers typically issue
two transactions per year on average, GM Financial kept pace with its traditional three deals and both Hyundai and Santander increased deal issuance to three from two in 2020. BMW, which typically issues one deal per year, made up for the lack of issuance in 2020 with two deals in 2021. In addition, the average deal size has increased $100 million year-to-year since 2018 to a current
average of $1.3 billion. The low interest rate environment and robust used vehicle values were among the reasons for issuers to increase ABS funding in this sector.
It appears that the semiconductor chip shortage and supply-chain constraints will persist into 2022, at least through mid-year. Therefore, unmet demand for new vehicles will continue to shift consumers' toward buying used vehicles as an alternative, thereby driving up used vehicle values
PRIMARY CONTACTS
Jennie Lam New York jennie.lam @spglobal.com +1-212-438-2524
Frank Trick New York frank.trick @spglobal.com +1-212-438-1108
U.S.
14 13
5
9 810 11
1416
18
1416 16
2119
27 28
0
5
10
15
20
25
30
0
2
4
6
8
10
12
14
16
18
20
Bil. $
Mil
lion
un
its
Auto lease ABS (right scale) Light vehicle SAAR (left scale)

spglobal.com/ratings This report does not constitute a rating action. Jan. 12, 2022 13
from historical norms. The significant decline in off-lease vehicle returns, resulting in a reduced supply of used vehicles, also contributes to the rise of vehicle residual values. Higher average new vehicle transaction prices (increased 12% year over year to $45,000 in Sept. 2021 according to
Kelley Blue Book) may fuel more purchases through leasing, especially if interest rates rise.
We expect the credit quality of the receivables in the auto lease ABS pools will be stable and
performance will likely continue to be stronger than historical trends and exhibit healthy residual value gains. We expect stable auto lease ABS ratings trends in 2022.

spglobal.com/ratings This report does not constitute a rating action. Jan. 12, 2022 14
U.S. | Commercial ABS
Key Takeaways – We expect commercial ABS issuance of between $26 to $28 billion in 2022, led by
captive equipment issuers.
– Limited new vehicle supply attributable to the chip shortage has increased paymentrates for nondiversified dealer floorplan trusts to record levels. As a result,nondiversified trusts had very little receivable origination growth and more excess
cash available.
– Credit trends are expected to remain stable for equipment ABS collateral pools in 2022
on the heels of strong GDP growth and recovery values. Our 2022 outlook fornondiversified floorplan trusts also calls for stable performance, with losses expectedto remain near zero, primarily due to manufacturer support.
What To Look For Over The Next Year
We forecast commercial ABS issuance to range between $26 billion to $28 billion in 2022, with the potential to surpass $28 billion if the economy recovers from supply chain disruptions that have
limited economic growth. We recently revised downward our economic outlook for 2022 amid the continuation of supply-chain disruptions. We expect such disruptions to be the largest stumbling block for the U.S. economy in 2022 (see "Economic Outlook U.S. Q1 2022: Cruising At A Lower Altitude," published Nov. 29, 2021).
Commercial ABS issuance volumes increased by approximately 19% to slightly more than $25.4 billion in 2021 from $21.3 billion in 2020. Issuance volume for three of the four commercial ABS
segments (captive equipment, independent, and fleet lease) experienced year-over-year increases in 2021, just about reaching pre-pandemic levels. We had expected the overall increase for these three segments as the economy started to recover from the repercussions of the COVID 19 pandemic in 2021 and strong demand for equipment returned. However, dealer floorplan
unexpectedly continued its decline as there was no issuance from nondiversified floorplan issuers.
Top 5 Issuers In 2021
Primary Originator $ Total volume issuance (millions) No. of transactions
Enterprise Fleet Financing LLC. 3,400 3
DLL Finance LLC & Related Entities 3,011 3
CNH Industrial Capital America LLC. 2,746 3
Dell Financial Services, LLC. 2,434 2
John Deere Capital Corp. 2,078 2
Captive equipment issuers such as CNH Industrial Capital America LLC, Dell Financial Services, LLC, and John Deere Capital Corp. continued their strong presence with a combined ABS issuance volume of $10.4 billion in 2021, up from $9.2 billion in 2020. These issuers contributed nearly 40%
of the total issuance volume in 2021, close to the proportion of a year earlier. Driving the overall issuance increase in 2021 were the independent (noncaptive) equipment issuers, which nearly doubled their ABS issuance volume. DLL Finance LLC and related entities (DLL) led with three ABS
PRIMARY CONTACTS
Steve Martinez New York steve.martinez @spglobal.com +1-212-438-2881
Jason McCauley
Centennial jason.mccauley @spglobal.com +1-303-721-4336
U.S.

spglobal.com/ratings This report does not constitute a rating action. Jan. 12, 2022 15
transactions for a total of $3 billion. DLL had not entered the market in 2020 after issuing six ABS transactions from 2017 to 2019. New independent ABS equipment issuers such as Encina Equipment Finance and North Mill Equipment Funding also contributed, representing
approximately 12% of the $8.5 billion issued. Despite the COVID 19 economic dislocation, these new issuers have been able to access the ABS market and secure low-cost funding.
Fleet lease issuance increased by 50% to $6 billion in 2021, even though the chip shortage reduced supply of new vehicles. There were repeat issuances from core ABS fleet issuers such as Automotive Rentals Inc. (ARI), Element Fleet Management Corp., Enterprise Fleet Financing LLC (Enterprise), and Wheels Inc. The increase was driven by Enterprise, which issued one additional
transaction in 2021, and the return of Donlen LLC, which issued one transaction. Throughout the year fleet lessors experienced longer vehicle delivery lead times and reduced fleet incentives that resulted in higher costs. In response to these market conditions, issuers were able to manage customer demand and the limited supply in part by offering alternative vehicle makes or types.
Dealer floorplan ABS issuance halted in 2021 with no issuance by any nondiversified (or captive) floorplan issuer. These issuers were significantly impacted by supply constraints due to chip
shortages and other commodity constraints that limited vehicle production and availability of new vehicles on dealer lots. NextGear Capital Inc. (NextGear), a diversified floorplan issuer that primarily provides financing to dealers with used vehicle inventory, however, was not as severely impacted. This is because of the higher availability of used vehicles relative to new ones. While we
expect NextGear to issue ABS in 2022, nondiversified floorplan issuance will be limited to the degree that supply chain disruptions continue over the course of the year.
Credit Outlook
We expect credit trends to remain stable in 2022. In 2021, strong GDP growth and recovery values led to positive credit performance for equipment ABS collateral pools. We expect GDP growth of
3.9% and equipment investment growth of 2.1%. This growth is of a slower pace than 2021's. In addition, we anticipate equipment recovery values will remain at higher-than-normal levels in 2022 due to the limited inventory as a result of the supply chain disruptions.
Included below are several commercial ABS sectors we follow and their associated credit drivers.
Asset Overview
Agricultural equipment
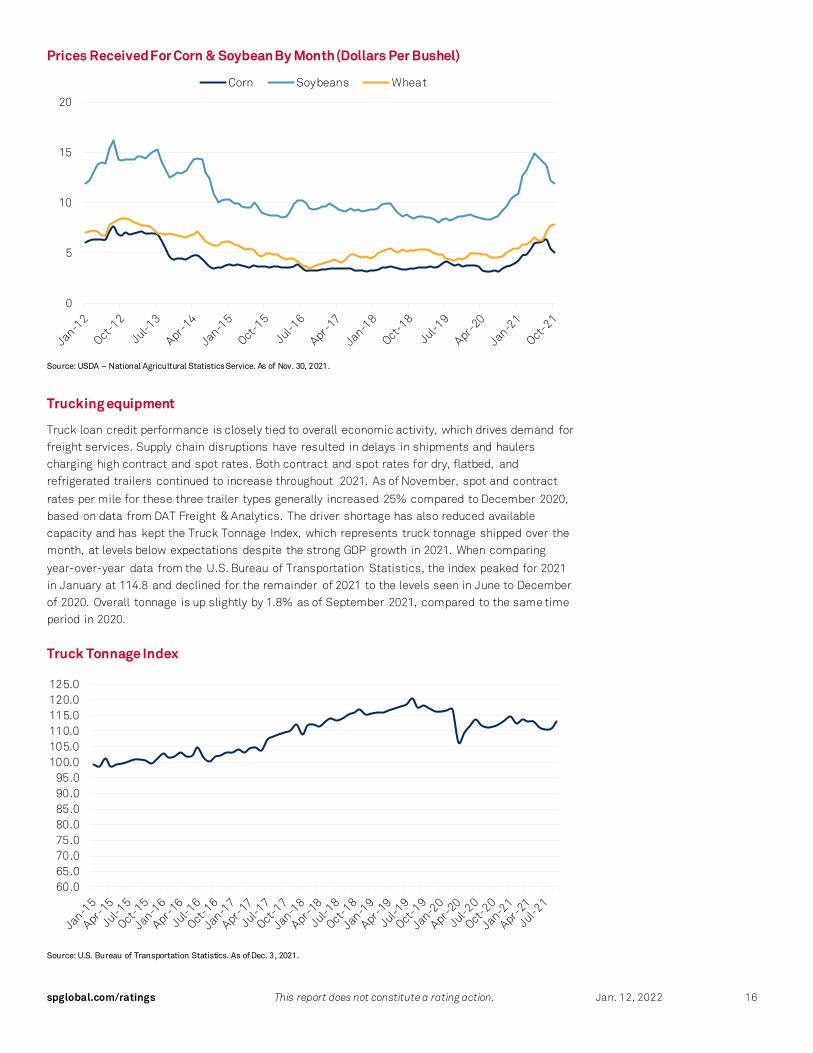
Agriculture credit performance is tied to, among other factors, crop prices and direct government support. Crop prices continued to rise in 2021 as did volume sales. This had a positive impact on net farm income. According to the USDA, total farm crop receipts are forecast at $233.0 billion in
2021, an increase of $35.4 billion or 18% from the prior year. This was primarily due to higher receipts for corn, soybeans, and wheat. Corn, soybean, and wheat prices have increased 26%, 12%, and 45%, respectively, from December of 2020. Increased exports and favorable global demand contributed to the growth here. Although prices for these crops have trended downward
recently, they remain at levels not seen since 2014. On the backdrop of strong crop prices, net farm income should end 2021 at $116.8 billion, a 23% increase over the prior year. This is despite direct government support, which will likely end the year at $27.2 billion, a 40% decrease from 2020. Most of the decrease in government support is a result of the lower supplemental disaster
assistance for the COVID 19 pandemic and the closure of the Market Facilitation Program.
spglobal.com/ratings This report does not constitute a rating action. Jan. 12, 2022 16
Prices Received For Corn & Soybean By Month (Dollars Per Bushel)
Source: USDA – National Agricultural Statistics Service. As of Nov. 30, 2021.
Trucking equipment
Truck loan credit performance is closely tied to overall economic activity, which drives demand for freight services. Supply chain disruptions have resulted in delays in shipments and haulers charging high contract and spot rates. Both contract and spot rates for dry, flatbed, and refrigerated trailers continued to increase throughout 2021. As of November, spot and contract
rates per mile for these three trailer types generally increased 25% compared to December 2020, based on data from DAT Freight & Analytics. The driver shortage has also reduced available capacity and has kept the Truck Tonnage Index, which represents truck tonnage shipped over the month, at levels below expectations despite the strong GDP growth in 2021. When comparing
year-over-year data from the U.S. Bureau of Transportation Statistics, the index peaked for 2021 in January at 114.8 and declined for the remainder of 2021 to the levels seen in June to December of 2020. Overall tonnage is up slightly by 1.8% as of September 2021, compared to the same time period in 2020.
Truck Tonnage Index
Source: U.S. Bureau of Transportation Statistics. As of Dec. 3, 2021.
60.065.070.075.080.085.090.095.0
100.0105.0110.0115.0120.0125.0
0
5
10
15
20
Corn Soybeans Wheat
spglobal.com/ratings This report does not constitute a rating action. Jan. 12, 2022 17
Small-ticket equipment
Small-ticket equipment credit performance is closely tied to the financial health of small
businesses. Since the beginning of 2021, vaccination rates increased and corresponding COVID-19 infections decreased, preventing the return of any statewide shutdowns that severely impacted small businesses. Small-ticket ABS pools in 2021 demonstrated improved credit performance from the prior year. The PayNet small business default index highlights this trend: The annualized
default index for small business peaked for the year at 3.27% in January of 2021 and has decreased consistently since then, reaching a pandemic-era low of 2.07%. PayNet data for delinquencies also followed a similar decreasing trend from the highs at the beginning of the year. For those small-ticket ABS issuers with exposures to investment-grade obligors, their credit
drivers are different since they are primarily exposed to highly rated and well-established businesses. The ABS collateral pools for these issuers have a long history of low to minimal losses and this trend continued throughout 2021. Despite our outlook for continuing improved credit performance in 2021, small-ticket issuers with exposures primarily to small businesses remain
more susceptible to volatility should COVID variants increase and force businesses to temporarily halt operations again.
Floorplan
Our 2022 outlook for nondiversified floorplan trusts is for stable performance, with losses
expected to remain near zero, primarily due to manufacturer support. We view the manufacturer's financial health, and the dealers' (as obligors of floorplan loans), as the key credit factors for this sector. Our outlook is based on our expectation that manufacturers will likely continue to provide significant financial support to dealers and may repurchase inventory upon dealer termination.
The chip shortage and limited supply of new vehicles had an outsize impact on the nondiversified trusts and their ability to generate longer-dated receivables. Most dealers were unable to source
new vehicles as they had prior to COVID-19. Vehicles that were delivered only stayed on dealer lots for a considerably shorter period due to the high demand for new vehicles. This caused receivables that were generated in the trusts to quickly turn to cash. As a result, nondiversified trusts had very little receivable origination growth and more excess cash available. With a faster inventory and
related receivable turnover, payment rates have sharply increased to record levels. Across rated nondiversified floorplan trusts, payment rates started 2021 at 62% increased through October to 163%, a year-over-year average increase of 100 percentage points.

spglobal.com/ratings This report does not constitute a rating action. Jan. 12, 2022 18
Floorplan Trust Historical Monthly Payment Rates
Source: S&P Global Ratings, Monthly Investor Reports. Ford--Ford Credit Floorplan Master Owner Trust A. Ally--Ally Master Owner Trust. Hyundai--Hyundai Floorplan Master Owner Trust. BMW--BMW Floorplan Master Owner Trust. GFORT--GMF Floorplan Owner Revolving Trust. NextGear--Nextgear Floorplan Master Owner Trust.
Since most nondiversified ABS trusts have early amortization triggers if funds held in accounts exceed a certain threshold, most of these trusts amended their transaction documents to prevent
such scenarios. These amendments did not reduce the credit enhancement required for nondiversified trusts. The nondiversified ABS notes outstanding remain sufficiently collateralized as credit enhancement is at the required levels. Our expectation is for origination growth to return to pre-COVID levels once the supply chain disruptions subside later in 2022.
The impact of supply chain disruptions on diversified floorplan differed. This was mainly because the diversified floorplan issuer we have assigned ratings on, NextGear Floorplan Master Owner
Trust (NextGear), extends financing to dealers that primarily purchase used vehicles. The supply of used vehicles was not as severely impacted from the chip shortage than the new vehicle market. Additionally, dealers in diversified floorplan collateral pools hold in inventory vehicles across many different brands, unlike captive floorplan issuers that primarily focus on one
manufacturer.
Payment rates for NextGear have trended higher but did not reach the record highs of above 100%
that nondiversifed floorplan trusts saw. Losses in the form of loss-to-liquidation rates, which peaked in 2020, also normalized in 2021. Our outlook on performance for diversified floorplan segment in 2022 is for continued stable performance based on our outlook for GDP growth.
20%
45%
70%
95%
120%
145%
170%
195%
Ford Ally Hyundai BMW GFORT NextGear
spglobal.com/ratings This report does not constitute a rating action. Jan. 12, 2022 19
U.S. | Unsecured Consumer ABS
Key Takeaways – We expect 2022 student loan ABS issuance to be slightly lower than in 2021, at $30
billion, with strong private student loan (PSL) issuance offset by lower FFELPissuance. We anticipate credit strength among post-2009 PSL transactions to
continue into 2022, with some negative rating actions on the small, alreadyspeculative grade set of outstanding pre-2009 legacy PSL classes.
– We forecast $17 billion in U.S. credit card ABS volumes, acknowledging the potentialfor higher volumes in an environment of broader rather than transitory inflation
expectations. Our outlook is stable for credit card ABS collateral performance andratings.
– Personal loan ABS issuance exceeded $17 billion in 2021, surpassing expectationsand exceeding the previous issuance high of $15 billion in 2019. The surge in issuance
in 2021 is directly attributable to deal flow from marketplace lending platforms. Weexpect lenders to expand originations further as the economy strengthens and forsegment credit performance to remain stable.
– Verizon continues to be the only U.S. wireless carrier to issue device payment plan
agreement-backed ABS bonds, having issued two transactions in 2021 totaling $3.1billion. Due to the essential nature of wireless devices, Verizon’s transactionscontinue to show little or no effect from the COVID-19 pandemic in terms of delinquencies and losses.
Student Loan ABS
We forecast student loan ABS issuance in 2022 will be slightly lower than in the previous year, at
$30 billion. A volume increase in 2021 was primarily driven by the securitization of loans from the Wells Fargo portfolio of private student loans under the Nelnet issuer name combined with a one-time jump in FFELP issuance. We expect private student loan (PSL) issuance to continue to be a driver in 2022, somewhat offset by lower FFELP issuance. The sale of four large Nelnet
transactions, backed by mostly Wells Fargo PSL originations, was a strong indicator of investor interest in PSL ABS. It was the first-time private student loans originated by Wells Fargo were included in ABS term transactions.
Frequent issuers in the PSL ABS space such as Navient, Sallie Mae Bank, College Ave, and SOFI, continue to bring collateral to the ABS market that reflect consistent credit profiles with high average FICO scores and a large percentage of cosigners for the in-school loan products. These
borrowers have maintained stable performance throughout the pandemic. We made no credit-based downgrades during 2021 on any post-2009 PSL transactions. We expect credit strength to continue in 2022. Excluding the Nelnet transactions, the refinance loan issuance outpaced the in-school loan issuance in 2021 and we expect the same in 2022. The state student loan authority
PSL issuers were active in 2021, as we expect them to be in 2022. These issuers support higher education with their states and have been very consistent over the years, with strong asset and rating performance. We see this continuing in 2022.
We are expecting negative rating actions in the small pre-2009 legacy in-school PSL segment. More than 70% of the 74 classes outstanding are already in the speculative grade range due to previous poor performance. These classes have minimal or no credit enhancement protection and
many are currently either vulnerable or highly vulnerable to nonpayment.
PRIMARY CONTACTS
Kate Scanlin New York kate.scanlin @spglobal.com +1-212-438-2002 Analytical Manager
John Anglim New York john.anglim @spglobal.com +1-212-438-2385 Student Loan ABS
Sanjay Narine, CFA
Toronto sanjay.narine @spglobal.com +1-416-507-2548 Credit Card ABS
Piper Davis, CFA New York piper.davis @spglobal.com +1-212-438-1173 Credit Card ABS
spglobal.com/ratings This report does not constitute a rating action. Jan. 12, 2022 20
In 2021 Navient and Nelnet were again the larger FFELP ABS issuers, but it was deal activity from state student loan authority issuers that lifted FFELP issuance for the first time in several years. A few of these transactions were refinancing previously issued transactions so we don’t expect to
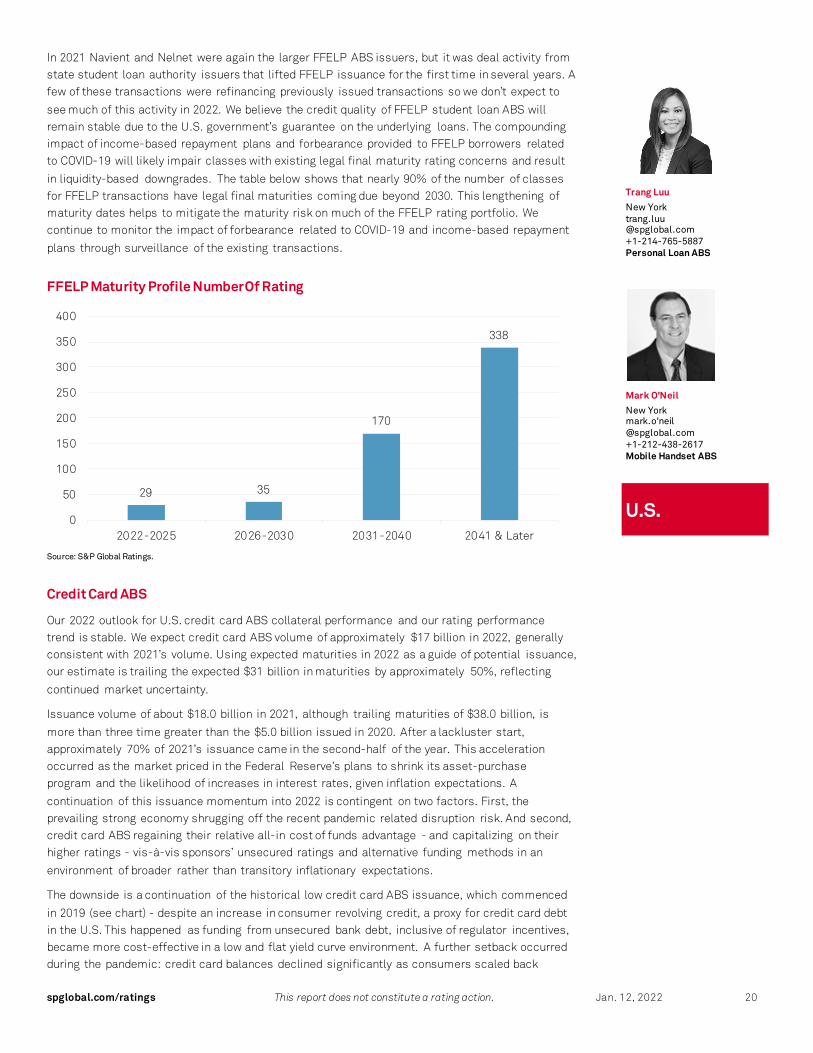
see much of this activity in 2022. We believe the credit quality of FFELP student loan ABS will remain stable due to the U.S. government’s guarantee on the underlying loans. The compounding impact of income-based repayment plans and forbearance provided to FFELP borrowers related to COVID-19 will likely impair classes with existing legal final maturity rating concerns and result
in liquidity-based downgrades. The table below shows that nearly 90% of the number of classes for FFELP transactions have legal final maturities coming due beyond 2030. This lengthening of maturity dates helps to mitigate the maturity risk on much of the FFELP rating portfolio. We continue to monitor the impact of forbearance related to COVID-19 and income-based repayment
plans through surveillance of the existing transactions.
FFELP Maturity Profile Number Of Rating
Source: S&P Global Ratings.
Credit Card ABS
Our 2022 outlook for U.S. credit card ABS collateral performance and our rating performance trend is stable. We expect credit card ABS volume of approximately $17 billion in 2022, generally consistent with 2021’s volume. Using expected maturities in 2022 as a guide of potential issuance, our estimate is trailing the expected $31 billion in maturities by approximately 50%, reflecting
continued market uncertainty.
Issuance volume of about $18.0 billion in 2021, although trailing maturities of $38.0 billion, is
more than three time greater than the $5.0 billion issued in 2020. After a lackluster start, approximately 70% of 2021’s issuance came in the second-half of the year. This acceleration occurred as the market priced in the Federal Reserve’s plans to shrink its asset-purchase program and the likelihood of increases in interest rates, given inflation expectations. A
continuation of this issuance momentum into 2022 is contingent on two factors. First, the prevailing strong economy shrugging off the recent pandemic related disruption risk. And second, credit card ABS regaining their relative all-in cost of funds advantage - and capitalizing on their higher ratings - vis-à-vis sponsors’ unsecured ratings and alternative funding methods in an
environment of broader rather than transitory inflationary expectations.
The downside is a continuation of the historical low credit card ABS issuance, which commenced
in 2019 (see chart) - despite an increase in consumer revolving credit, a proxy for credit card debt in the U.S. This happened as funding from unsecured bank debt, inclusive of regulator incentives, became more cost-effective in a low and flat yield curve environment. A further setback occurred during the pandemic: credit card balances declined significantly as consumers scaled back
29 35
170
338
0
50
100
150
200
250
300
350
400
2022-2025 2026-2030 2031-2040 2041 & Later
Trang Luu
New York trang.luu @spglobal.com +1-214-765-5887 Personal Loan ABS
Mark O'Neil
New York mark.o'neil @spglobal.com +1-212-438-2617 Mobile Handset ABS
U.S.

spglobal.com/ratings This report does not constitute a rating action. Jan. 12, 2022 21
spending and increased savings. The recent turn in the cycle as the economy continues to strengthen is positive for credit card ABS (see chart).
Credit Card ABS Issuance
Source: S&P Global Ratings.
U.S. Personal Savings And Revolving Consumer Credit
Source: S&P Global Ratings.
-
10,000
20,000
30,000
40,000
50,000
60,000
2015 2016 2017 2018 2019 2020 2021 2022F
$ m
illi
on
Maturities Issuance
0.00
0.20
0.40
0.60
0.80
1.00
1.20
0.0
5.0
10.0
15.0
20.0
25.0
30.0
35.0
40.0
2015 2016 2017 2018 2019 2020 2021
$ trillion
% o
f dis
pos
able
inco
me
U.S. personal saving rate (left scale) U.S. revolving consumer credit (right scale)
spglobal.com/ratings This report does not constitute a rating action. Jan. 12, 2022 22
U.S. Credit Card: Receivables U.S. Credit Card: Payment Rate
U.S. Credit Card: Yield U.S. Credit Card: Payment Rate
Source: S&P Global Ratings.
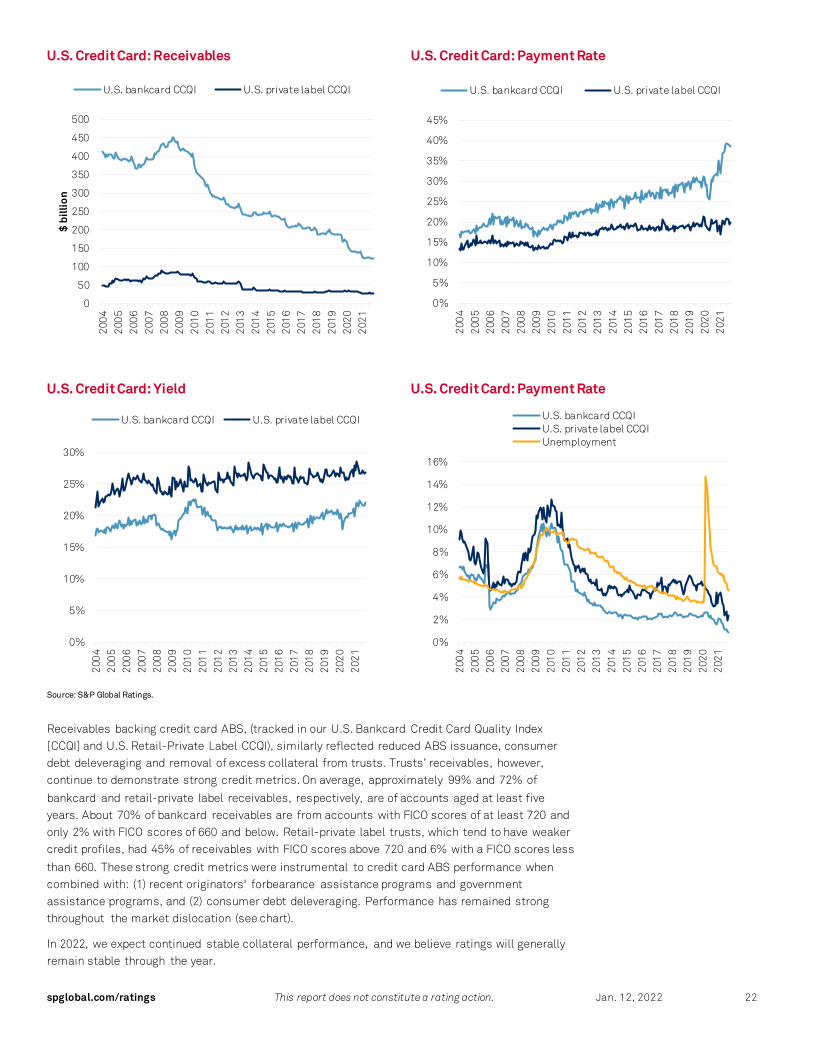
Receivables backing credit card ABS, (tracked in our U.S. Bankcard Credit Card Quality Index [CCQI] and U.S. Retail-Private Label CCQI), similarly reflected reduced ABS issuance, consumer debt deleveraging and removal of excess collateral from trusts. Trusts’ receivables, however, continue to demonstrate strong credit metrics. On average, approximately 99% and 72% of
bankcard and retail-private label receivables, respectively, are of accounts aged at least five years. About 70% of bankcard receivables are from accounts with FICO scores of at least 720 and only 2% with FICO scores of 660 and below. Retail-private label trusts, which tend to have weaker credit profiles, had 45% of receivables with FICO scores above 720 and 6% with a FICO scores less
than 660. These strong credit metrics were instrumental to credit card ABS performance when combined with: (1) recent originators' forbearance assistance programs and government assistance programs, and (2) consumer debt deleveraging. Performance has remained strong throughout the market dislocation (see chart).
In 2022, we expect continued stable collateral performance, and we believe ratings will generally remain stable through the year.
0
50
100
150
200
250
300
350
400
450
500
200
42
005
200
62
007
200
82
009
201
02
011
201
22
013
201
42
015
201
62
017
201
82
019
202
02
021
$ bi
llion
U.S. bankcard CCQI U.S. private label CCQI
0%
5%
10%
15%
20%
25%
30%
35%
40%
45%
200
42
005
200
62
007
200
82
009
201
02
011
201
22
013
201
42
015
201
62
017
201
82
019
202
02
021
U.S. bankcard CCQI U.S. private label CCQI
0%
5%
10%
15%
20%
25%
30%
200
42
005
200
62
007
200
82
009
201
02
011
201
22
013
201
42
015
201
62
017
201
82
019
202
02
021
U.S. bankcard CCQI U.S. private label CCQI
0%
2%
4%
6%
8%
10%
12%
14%
16%2
004
200
52
006
200
72
008
200
92
010
201
12
012
201
32
014
201
52
016
201
72
018
201
92
020
202
1
U.S. bankcard CCQIU.S. private label CCQIUnemployment
spglobal.com/ratings This report does not constitute a rating action. Jan. 12, 2022 23
Personal Loan ABS
Heading into 2021, uncertainty lingered after issuance volume took a hit in 2020 compared with a
year earlier for personal loan ABS. However, after a sluggish start, there was a resounding rebound in issuance during 2021. Issuance exceeded $17 billion over the year, surpassing expectations, and exceeding the previous issuance high of $15 billion in 2019. The surge in issuance in 2021 is directly attributable to deal flow from marketplace lending platforms. Branch-
based lenders such as OneMain, Lendmark, Mariner, and Regional Management had issuance that totaled approximately $2.9 billion, or just 17% of total issuance. For 2022, we forecast total issuance will build on this year’s momentum and reach $20 billion.
The strengthening economy, falling unemployment and favorable loan performance during 2021 have led to loan origination growth and increased confidence and demand from investors. This ABS segment remains fragmented, with many different issuers and a variety of business models
that target borrowers from a wide spectrum of credit. For 2022, we expect lenders to expand originations further as the economy shows more strength. Credit performance should remain within a narrow band of current performance if lenders stay disciplined in their origination growth and the economy and employment track in positive directions. Overall, we expect our ratings to
remain stable. However, we are mindful that this is a segment that involves nonprime borrowers and capital structures that include ratings in the lower investment grade and speculative grade ranges that may be susceptible to rating pressure when asset performance deteriorates.
U.S. Mobile Handset ABS
As we enter 2022, Verizon continues to be the only U.S. wireless carrier to issue ABS bonds backed by device payment plan agreements (DPPAs). From July 2016 through December 2020, Verizon completed 13 discrete term ABS issuances totaling $17.6 billion. As of December 2021, the first six transactions (VZOT 2016-1 to VZOT 2018-1) were redeemed; the seventh through 10th
transactions (VZOT 2018-A to VZOT 2019-C) had entered amortization; and the 11th through 13th transactions (VZOT 2020-A to VZOT 2020-C) remained in their two-year revolving periods.
In 2021, Verizon shifted its wireless DPPA ABS issuance platform from that of discrete trusts to series issuance from the Verizon Master Trust. So far, under this master trust structure, Verizon has issued two note series (2021-1 and 2021-2) totaling $3.1 billion. Other notable changes to Verizon’s ABS transactions in 2021 included the inclusion of longer-term DPPAs (up to 30 months
from 24-months) and business DPPAs (up to 10% of the portion of the pools backing the note series). Eligibility criteria and concentration limits and the transaction capital structures for these master trust-backed issuances remain essentially unchanged from Verizon’s discrete term transaction structures.
Verizon’s transactions continue to show little or no effect from the COVID-19 pandemic in terms of delinquencies and losses. We believe this is because of the essential nature of wireless devices
and their affordability (total cost and monthly loan payments are approximately $1,000 and $35, respectively). In addition, when necessary, Verizon has the ability to contact users and compel payment electronically.
Cumulative losses in Verizon’s six completed transactions (2016-1 to 2018-1) have been very stable, at 2.2%-2.6% of the original pool balance. This is the result of the transactions’ consistent pool compositions. S&P Global Ratings has continued to upgrade the subordinate classes in
Verizon’s transactions at the conclusion of their revolving periods.
We project Verizon’s annual volume for 2022 at $3.0-$4.0 billion, likely up slightly from its 2021
volume of $3.1 billion. We also believe that the credit performance of DPPA loans and DPPA-backed ABS bond transactions will remain stable going forward.
spglobal.com/ratings This report does not constitute a rating action. Jan. 12, 2022 24
U.S. | Non-Traditional ABS
Key Takeaways – Aircraft: We expect aircraft lease ABS collateral performance to continue to be
affected by the decline in global air travel.
– Container and Railcar: Performance for the container sector is expected to remain strong as demand for shipping remains high.
– Data Centers: We expect stable performance in 2022 across the transactions we’verated as demand for hyperscale facilities in primary data center markets is likely to remain strong.
– Small Business: Collateral performance in 2022 depends in part on the evolution ofCOVID 19 and the pace of recovery among certain industries impacted by travel and
consumer consumption.
– Stranded: We expect continued stable performance in the sector due to the strength
of the true-up.
– Timeshare: We expect performance to be stable in 2022 supported in part by, pent-up
demand for leisure travel.
– Triple-Net Lease: We expect industrial REITs will continue to perform favorably while
industrial properties should remain resilient.
– Whole Business: We expect the restaurant industry to face continued cost inflation
and operators across the restaurant industry are expected to continue takingincremental pricing action to partially offset rising costs. This dynamic may beperformance-neutral, or even positive, for securitization collections in the near term,though pressure on unit level margins could challenge overall system health in the
longer term.
U.S. Non-Traditional ABS: Growth And Relatively Stable Ratings Likely In Most Sectors
New issuance volume in non-traditional ABS continues to grow, offering relatively high yield, resilience in collateral performance throughout the pandemic, and stable ratings in most sub-sectors.
In 2021, we rated 73 transactions across 15 sectors – a 12% increase over 2019 and 16% over 2020. In 2021, we reviewed 679 of our ratings outstanding in the sector, resulting in 593 affirmations, 67 upgrades, and 19 downgrades.
PRIMARY CONTACTS
Ildiko Szilank New York ildiko.szilank @spglobal.com +1-212-438-2614 Analytical Manager
Jay Srivats
San Francisco jay.srivats @spglobal.com +1-347-266-5103 Analytical Manager
Jesse Sable
New York jesse.sable @spglobal.com +1-212-438-6719
Deborah Newman
New York deborah.newman @spglobal.com +1-212-438-4451
spglobal.com/ratings This report does not constitute a rating action. Jan. 12, 2022 25
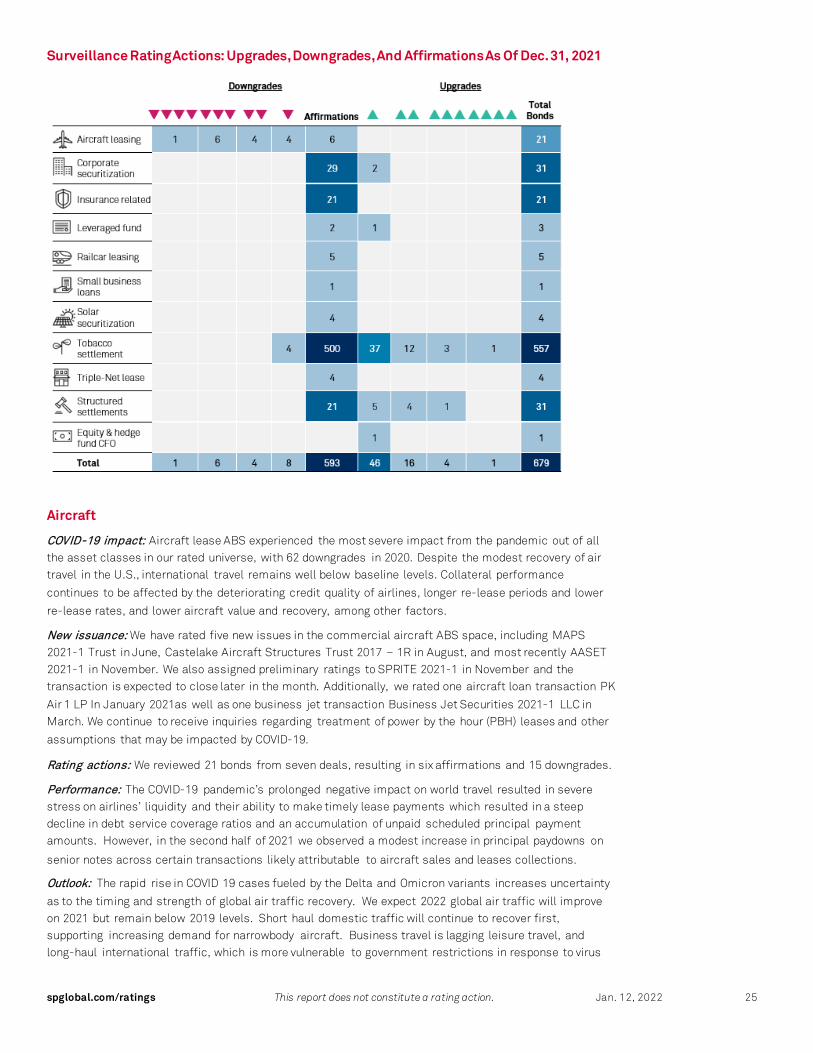
Surveillance Rating Actions: Upgrades, Downgrades, And Affirmations As Of Dec. 31, 2021
Aircraft
COVID-19 impact: Aircraft lease ABS experienced the most severe impact from the pandemic out of all the asset classes in our rated universe, with 62 downgrades in 2020. Despite the modest recovery of air travel in the U.S., international travel remains well below baseline levels. Collateral performance
continues to be affected by the deteriorating credit quality of airlines, longer re-lease periods and lower
re-lease rates, and lower aircraft value and recovery, among other factors.
New issuance: We have rated five new issues in the commercial aircraft ABS space, including MAPS 2021-1 Trust in June, Castelake Aircraft Structures Trust 2017 – 1R in August, and most recently AASET 2021-1 in November. We also assigned preliminary ratings to SPRITE 2021-1 in November and the transaction is expected to close later in the month. Additionally, we rated one aircraft loan transaction PK
Air 1 LP In January 2021as well as one business jet transaction Business Jet Securities 2021-1 LLC in March. We continue to receive inquiries regarding treatment of power by the hour (PBH) leases and other
assumptions that may be impacted by COVID-19.
Rating actions: We reviewed 21 bonds from seven deals, resulting in six affirmations and 15 downgrades.
Performance: The COVID-19 pandemic’s prolonged negative impact on world travel resulted in severe stress on airlines’ liquidity and their ability to make timely lease payments which resulted in a steep decline in debt service coverage ratios and an accumulation of unpaid scheduled principal payment amounts. However, in the second half of 2021 we observed a modest increase in principal paydowns on
senior notes across certain transactions likely attributable to aircraft sales and leases collections.
Outlook: The rapid rise in COVID 19 cases fueled by the Delta and Omicron variants increases uncertainty
as to the timing and strength of global air traffic recovery. We expect 2022 global air traffic will improve on 2021 but remain below 2019 levels. Short haul domestic traffic will continue to recover first, supporting increasing demand for narrowbody aircraft. Business travel is lagging leisure travel, and long-haul international traffic, which is more vulnerable to government restrictions in response to virus

spglobal.com/ratings This report does not constitute a rating action. Jan. 12, 2022 26
outbreaks, is weakest of all. Demand for the widebody aircraft that carry long haul international
passengers has stabilized at low levels, but it will likely take several more years to regain 2019 levels.
Container And Railcar
COVID-19 impact: Initially, container trade volumes declined as a result of the pandemic. However,
beginning in mid-2020, they began to recover and have remained strong since. Demand has increased, in large part, due to the growth in e-commerce, with goods being shipped from Asia to North America and Europe. In any case, containers and railcars in rated securitizations tend to be on long term leases and
are not directly affected by short term fluctuations in demand.
New issuance: Container and railcar issuance continues this year, with ten deals rated in container and
eight deals rated in railcar.
Rating actions: We affirmed ratings on four notes from one deal totaling a balance of $428 million and
representing 10% of our rated book in the railcar sector.
Performance: Utilization and lease rates remain at relatively high levels, especially in the container
space, and most of the outstanding ABS transactions continue to pay down according to schedule.
Outlook: While world trade continues its recovery toward pre-pandemic levels, we expect performance for the container sector to remain strong through the end of the year as availability for units slowly picks
up and demand for shipping remains high.
Data Centers
COVID-19 impact: Lockdowns and other preventative measures in response to the COVID-19 pandemic accelerated economic digitization, cloud adoption, and demand for connectivity. In our view, this further
strengthened industry fundamentals for long-term data center demand. The response to the pandemic
also highlighted the essential nature of data centers.
New issuance: In addition to the inaugural Aligned 2021-1 data center securitization, we assigned
ratings to subsequent series of data center-backed bonds from three issuers in 2021.
Rating actions: We took no rating actions in the data center sector in 2021.
Performance: Data centers are critical for maintaining economic activity, so the operating performance
of in-service facilities remains generally undisrupted, and projects under development remain largely on track. Despite some concerns of oversupply and pricing pressure in specific domestic markets, we
believe supply and demand remain relatively balanced.
Outlook: S&P Global Ratings has a positive bias on the data center industry and our outlook for the next few years is stable. We view the growth of data (including new technologies such as artificial intelligence and driverless cars), the broader adoption of cloud environments, and the continued growth of data
center outsourcing as key secular drivers. We think these drivers will support sustained growth for data
center landlords over the next several years.
Small Business
COVID-19 impact: Although the COVID-19 pandemic and the related government mandated closures on
businesses and social distancing measures severely impacted many small businesses, securitization performance has generally remained stable. Securitizations collateralized by SBA 7(a) loans benefitted directly from the government support package, which covered principal, interest, and fees on Small Business Administration loans starting from April 2020, and through subsequent rounds of aid and
incentives. We note a brief spike in delinquencies during Q4 2020, which has since stabilized. We continue to monitor performance on these loans as government incentives expire. Thus far, there has
been no significant impact to date on SBA 7(a)-backed transactions.
New issuance: We rated one new issuance in 2021.

spglobal.com/ratings This report does not constitute a rating action. Jan. 12, 2022 27
Rating actions: We have affirmed one bond.
Performance: Collateral delinquencies in our rated small business ABS universe could rise, which could increase liquidity risk, obligor defaults, and longer-term credit risk. Structural features embedded in these transactions can mitigate liquidity risk. Collateral pools with higher concentrations in industries hit
by travel and consumer consumption restrictions are more vulnerable to obligor defaults.
Outlook: We remain cautious, based on a potential slower recovery in certain industries from COVID-19
impacts as well as additional virus variants emerging.
Solar
COVID-19 impact: Residential solar performed well through the pandemic, primarily due to the credit quality of the borrower base and the nature of the employment conditions of customers, who were largely able to work from home. GoodLeap, the most recent issuer in the space, has no loans in their portfolio subject to any deferment, forbearance, or other relief measure in connection with any COVID-19-related
relief program.
New issuance: We rated two solar ABS new issue transactions, GooldLeap Sustainable Home Solutions
Trust Series 2021-4 and 2021-5. These represent the first new solar ABS transactions we have rated since 2016. The transactions are collateralized by loans backed by residential solar energy and storage
systems.
Rating actions: In October 2021, we received notice of the voluntary prepayment of six bonds across four SolarCity (Tesla) deals. A seventh bond in one of those deals was also paid down in early November 2021.
We affirmed four bonds from two deals, with a current balance of $189 million.
Performance: In 2021, we observed an increase in cumulative customer defaults on two solar asset-backed bonds. While this brought the transaction's DSCR down slightly, the cumulative defaults remain
well below our projections for the transaction at the 'BBB+ (sf)' and 'BB (sf)' levels and, therefore, we
affirmed those ratings.
Outlook: From now through the end of 2023, we expect distributed solar generation to continue to grow rapidly, fueled by declining photovoltaic system installation costs. SEIA sees the two-year extension of the federal, solar Investment Tax Credit through 2023 driving double-digit growth for the next two years. Additional growth drivers may include President Biden's infrastructure plan and policies aiming to
increase the use of distributed solar generation.
Stranded Assets
COVID-19 impact: While changes in demand and restrictions on certain collection efforts have created headwinds in the industry, we believe the COVID-19 pandemic's impact on the utility sector has not been
as bad as anticipated. Key drivers of our view include resilient liquidity positions, revenue losses from commercial and industrial shutdowns being offset by increases in residential consumption, and
regulation supporting the recovery of expenses that may be incurred due to the pandemic.
New Issuance: We have rated five recovery rate-backed new issuances.
Rating actions: We took no rating actions.
Performance: Performance has been stable primarily due to the true-up mechanism and the uncapped,
irrevocable, non-bypassable nature of the charge. There have been no rating actions in this sector.
Outlook: The path to continued stability in the sector includes recouping costs incurred from COVID-19
pandemic payment moratoriums, as well as managing longer-term rate adjustments for increased maintenance and operating costs. As the broader economy emerges from the effects of the COVID-19 pandemic, increased rate case performance should allow for greater recoveries of these costs from
customers.

spglobal.com/ratings This report does not constitute a rating action. Jan. 12, 2022 28
Timeshare
COVID-19 impact: In the second and third quarters of 2020, the timeshare sector experienced a spike in
requests for deferrals and increased delinquencies due to the impact of COVID-19 containment measures. Since then, we have observed a significant slowdown in this trend, primarily because of the pickup in bookings and occupancy at drive-to destinations, as well as the ability to "bank" points to satisfy future pent-up demand for vacations. We believe securitizations' available liquidity in the form of
excess spread and a reserve account is generally sufficient to absorb a temporary reduction in cash flow
due to an increase in delinquencies.
New issuance: Ramp up in vaccine production and rollouts gathering pace around the world has led to
increased confidence in domestic travel. YTD, we have rated seven timeshare new issuances.
Rating actions: To reflect the uncertain and weakened U.S. economic and sector outlook, early in 2020 we increased our base-case default assumption by 1.25x to stress defaults from 'B' to 'BB' rating
scenarios. There have been no rating actions in the timeshare sector YTD.
Performance: Although delinquencies and pandemic-related deferrals spiked at the height of the pandemic, they are now near pre-pandemic levels. Within lodging, the performance of timeshare loan
securitizations were stable, with bookings and occupancy steadily rising.
Outlook: We expect the stable performance trends to continue well into 2022, supported by ongoing leisure travel recovery, which was robust during the second half of 2021 due to pent-up demand.
Bookings and occupancy are at pre-pandemic levels at most of the resorts and expected to support the
strong recovery.
Triple-Net Lease
COVID-19 impact: Following a sharp downward movement in debt service coverage ratios (DSCRs) in
March and April 2020, we placed 29 ratings on 6 triple-net lease (NNN) ABS transactions on CreditWatch with negative implications in 2020. After observing a fairly rapid recovery in DSCR levels, and relatively low rates of tenant delinquency and defaults, we removed all 29 ratings from CreditWatch and affirmed
them in July 2020. Performance remained generally stable through year-end 2021.
Advance notice of proposed criteria change: On Sept. 7, 2021, we announced that we are reviewing our criteria for rating single-tenant real estate triple-net lease-backed transactions issued in North America
and that our ratings in this sector could change as a result. The nature of any potential rating changes will depend on the final criteria adopted. We cannot provide an estimated completion date for our criteria
review at this time.
New issuance: New issuance has remained strong. We rated eight new series of NNN ABS in 2021, for approximately $7.8bn of new issuance. One series we rated was for a new issuer, CMFT Net Lease Master
Issuer LLC, sponsored by CIM Real Estate Finance Operating Partnership L.P.
Rating actions: We affirmed four ratings on notes from a single transaction with a current balance of
$1.93 billion. This represents 5% of our rated book in this sector.
Performance: Transaction DSCRs have remained strong and delinquency rates low since several months
of pandemic-driven weakness in the first half of 2020.
Outlook: We expect industrial REITs will continue to perform favorably, primarily driven by strong, if not increasing, e-commerce demand. Industrial properties should remain resilient, having suffered less than
retail and office properties during the COVID-19 pandemic, owing to their high-quality tenants and
mission-critical nature.
Whole Business
COVID-19 impact: We observed that most U.S. quick-service restaurants recovered quickly from
temporary closures resulting from the pandemic due to the availability of drive-thrus and delivery. The
spglobal.com/ratings This report does not constitute a rating action. Jan. 12, 2022 29
closures of many mom-and-pop stores also contributed to the resiliency of these large, franchised systems. Many of the other issuers we rate, primarily service providers, also proved resilient, as they offer essential services such as car maintenance and residential/commercial cleaning. We continue to closely
monitor areas of business that are recovering more slowly, such as gyms, dine-in restaurants, and
international stores.
New issuance: The corporate securitization new issuance market has been active in 2021. We rated 10
new issuances in 2021. Each of these transactions were from established issuers.
Rating actions: We reviewed 31 bonds from 16 deals, with a current balance of $13.1 billion, representing 38% of our rated book in this sector. We affirmed our ratings on 29 bonds and upgraded ratings on two, based on the respective transactions’ brand strength, cash flow coverage, and liquidity,
among other factors.
Performance: Same-store sales and systemwide sales through year-end 2021 generally reflect a strong
recovery since the lows of March 2020 as most temporarily closed units reopened.
Outlook: The restaurant industry, which constitutes the majority of S&P’s rated U.S. whole business universe, has recently faced rapid cost inflation related to key commodities as well as higher freight and
labor costs. We believe that this supply chain and labor inflation will continue to put pressure on unit-level EBITDA well into 2022. We expect operators across the restaurant industry to continue to take incremental pricing action to partially offset rising costs but will not be able to fully recover its profit margin in the next twelve months. Because most WBS transactions we rate are majority royalty-based,
where royalties are paid by franchisees as a percentage of gross revenue, near-term securitization collections could benefit from rising consumer prices. In the longer term, however, transaction performance could by impacted if the erosion of unit-level margins causes an elevated level of store
closures. Because of this, we will continue to closely monitor store-level profitability going forward.

spglobal.com/ratings This report does not constitute a rating action. Jan. 12, 2022 30
U.S. | ABCP Muni-Structured
Key Takeaways – U.S. asset-backed commercial paper (ABCP) outstanding to remain in the range of
$270- $280 billion in 2022.
– U.S. ABCP sector and rating performance trend to remain stable; we continue toexpect somewhat stronger collateral performance.
– Muni-structured variable-rate debt obligations (VRDOs) rebounded in 2021 after anunsurprising 2020 decline. We expect 2021 year-end VRDO/letter of credit (LOC) CPissuance of approximately $5.5 billion, up from 2020’s $4.4 billion.
– Tender option bond (TOBs) 2021 new issuance has remained low compared to previousyears. We anticipate similar volume in 2022, with potential room for growth to $7.5
billion in new issuance par.
ABCP To Exhibit Stable Issuance, Ratings And Collateral Performance In 2022
ABCP outstanding peaked to pre-pandemic levels at $267.5 billion in June 2021; however, utilization rates hovered around 50-60% during the remainder of the year, which is comparable to historic lows, albeit outstanding increased to $281.4 billion leading to higher utilization at year end. Several factors led to low ABCP issuances last year. The low interest rate environment and
the expectation that the Fed will accelerate its tightening schedule because of inflation looking less transitory ignited a large volume of ABS term issuances in third and fourth quarters of 2021, offsetting funding in ABCP programs. Additionally, the sustained low interest rate environment, robust level of bank deposits, and global supply chain issues further dampened growth in ABCP.
Despite pandemic-related uncertainty, we expect ABCP outstanding during 2022 to be around $270 billion-$280 billion, fueled by growth in the economy (3.9% in 2022), policy rate liftoff (third quarter 2022), robust consumer spending, specifically for durable goods, a strong labor market, and a weakening impact of COVID-19, noting that the omicron variant’s effect is yet to be
determined (see “Economic Outlook US Q1 2022: Cruising At A Lower Altitude,” published Nov. 29, 2021). This estimate is in line with the $281.4 billion outstanding as of Dec 31, 2021.
Stable Ratings Supported By Stable Bank Fundamentals
The U.S. ABCP sector and rating performance trend remains stable. We continue to expect stable
collateral performance in the prime auto loans and leases, dealer floorplan, commercial equipment and private student loan. Meanwhile, the outlook for subprime auto loans, credit cards, unsecured consumer loans and FFELP student loans is somewhat weaker. Notably, exposure to the somewhat weaker sector in partially supported programs is only ~3% of the
invested amount as of August 2021. Our stable rating performance is based on high investment grade ratings on banks and nonbank institutions providing liquidity support to the US ABCP programs – this included 86.4% of fully supported programs and fully supported transactions funded in partially supported programs and 13.6% for the partially supported programs as of
August 2021. Financial institutions in North America are generally performing well and European and Japanese banks are also stable. Currently, we rate ABCP issued by 54 programs in the US. Of these, six are rated 'A-1+', and 48 are rated 'A-1'. None of the sponsors/liquidity providers supporting these programs are on CreditWatch with negative implications and a one-notch
movement in our long-term issuer credit ratings on them would not necessarily lead to a change in
PRIMARY CONTACTS
Cathy de la Torre New York cathy.de.la.torre @spglobal.com +1-212-438-0502 Analytical Manager
Radhika Kalra
New York radhika.kalra @spglobal.com +1-212-438-2143 ABCP
Dev Vithani New York dev.vithani @spglobal.com +1-212-438-1714 ABCP
Alexander Gombach
New York alexander.gombach @spglobal.com +1-212-438-2882 VRDO

spglobal.com/ratings This report does not constitute a rating action. Jan. 12, 2022 31
the short-term rating under our linking methodology (see “Methodology For Linking Long-Term and Short-Term Ratings," published April 7, 2017).
ABCP Exposure
*Prime/Nonprime/Subprime category is used for sellers where borrowing base allows for all three asset classes
**Commercial other includes commercial fleet leases, future flow, CDO, insurance premium and manufactured housing
*** Fully supported transactions (where exposure is only directly related to bank counterparty) is the largest class of the entire portfolio
Source: S&P Global Ratings. Copyright © 2022 by Standard & Poor’s Financial Services LLC. All rights reserved.
Collateral Performance Remains Strong With High Credit Enhancement Multiples
For ABS, we generally expect a stable to strong collateral performance in 2022 for the majority of assets funded in ABCP programs.
While collateral performance in certain sectors, including credit cards, unsecured consumer loans, and FFELP are somewhat weaker loss coverage multiples remain robust for these assets
funded in partially supported ABCP programs. In addition, these programs benefit from a fungible layer of programwide support or funding the asset on the liquidity bank's balance sheet. Collateral performance remains strong with high credit enhancement multiples.
Total commitment (mil. $)
% Net investment (mil. $) %
Autos 31,376 9.9 18,299 8.3
Prime auto loans 16,833 5.3 12,781 5.8
Nonprime auto loans
2.98 0.0 2.98 0.0
Subprime auto loans
3,485 1.1 1,329 0.6
Auto leases 8,430 2.7 3,775 1.7
Prime/nonprime/ subprime auto loans
2,625 0.8 410 0.2
Student Loans 5,591 1.8 3,299 1.5
Private student loans
4,267 1.3 2,347 1.1
FFELP student loans
1,323 0.4 952 0.4
Credit Cards 7,525 2.4 2,492 1.1
Bank cards 5,625 1.8 1,679 0.8
Retail cards 1,900 0.6 813 0.4
Equipment and Commercial Other**
3,128 1.0 1,793 0.8
Dealer Floorplan 1,758 0.6 512 0.2
Trade Receivables 3,103 1.0 1,529 0.7
Consumer- Other 3,068 1.0 1,908 0.9
Mobile handsets 1,294 0.4 1,232 0.6
Unsecured consumer loans
1,774 0.6 677 0.3
Fully Supported** 260,773 82.4 189,869 86.4
Fully supported in partially supported conduits
38,737 12.2 20,679 9.4
Fully supported conduits 222,036 70.2 169,190 77.0
Total 316,321 100.0 219,701 100.0
PRIMARY CONTACTS
Mindy Xu
New York mindy.xu @spglobal.com +1-212-438-2879 TOB
Mayumi Shimokawa
New York mayumi.shimokawa @spglobal.com +1-212-438-2606 Repack
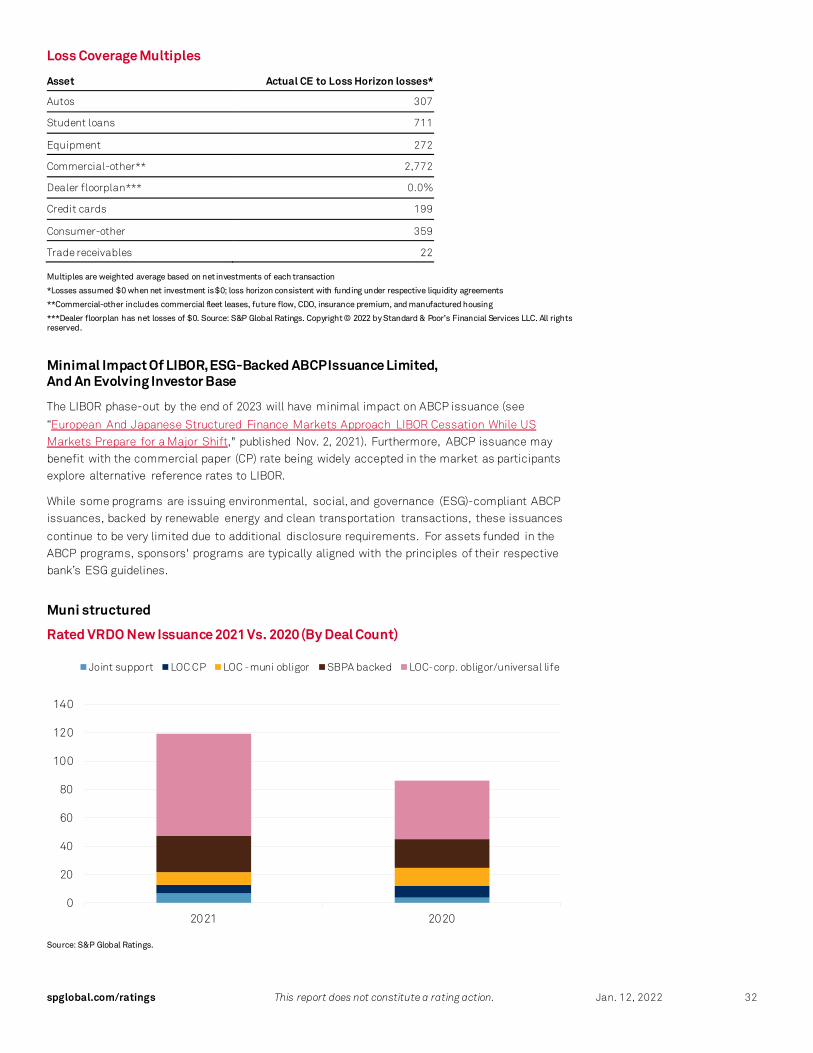
spglobal.com/ratings This report does not constitute a rating action. Jan. 12, 2022 32
Loss Coverage Multiples
Asset Actual CE to Loss Horizon losses*
Autos 307
Student loans 711
Equipment 272
Commercial-other** 2,772
Dealer floorplan*** 0.0%
Credit cards 199
Consumer-other 359
Trade receivables 22
Multiples are weighted average based on net investments of each transaction
*Losses assumed $0 when net investment is $0; loss horizon consistent with funding under respective liquidity agreements
**Commercial-other includes commercial fleet leases, future flow, CDO, insurance premium, and manufactured housing
***Dealer floorplan has net losses of $0. Source: S&P Global Ratings. Copyright © 2022 by Standard & Poor’s Financial Services LLC. All rights reserved.
Minimal Impact Of LIBOR, ESG-Backed ABCP Issuance Limited, And An Evolving Investor Base
The LIBOR phase-out by the end of 2023 will have minimal impact on ABCP issuance (see
“European And Japanese Structured Finance Markets Approach LIBOR Cessation While US Markets Prepare for a Major Shift," published Nov. 2, 2021). Furthermore, ABCP issuance may benefit with the commercial paper (CP) rate being widely accepted in the market as participants explore alternative reference rates to LIBOR.
While some programs are issuing environmental, social, and governance (ESG)-compliant ABCP issuances, backed by renewable energy and clean transportation transactions, these issuances
continue to be very limited due to additional disclosure requirements. For assets funded in the ABCP programs, sponsors' programs are typically aligned with the principles of their respective bank’s ESG guidelines.
Muni structured
Rated VRDO New Issuance 2021 Vs. 2020 (By Deal Count)
Source: S&P Global Ratings.
0
20
40
60
80
100
120
140
2021 2020
Joint support LOC CP LOC -muni obligor SBPA backed LOC-corp. obligor/universal life

spglobal.com/ratings This report does not constitute a rating action. Jan. 12, 2022 33
Muni-structured VRDOs rebounded in 2021 after an unsurprising 2020 decline. We expect 2021 year-end VRDO/LOC CP issuance of approximately $5.5 billion, up from 2020’s $4.4 billion. This total par comprises issuance across four main product types: jointly supported issues, standby
bond purchase agreement “liquidity-backed” issues, single LOC support, and LOC-backed CP.
Healthcare and transportation were the dominate sectors with approximately $1.3 billion and
$454 million in par, respectively. We saw an increase in the popularity of Universal Life Insurance Policy-backed transactions, which are taxable VRDO issuances utilized by high-net-worth individuals for estate planning purposes. More of this type of VRDO was issued than any other in 2021.
In 2021 we began disclosing our view of ESG factors in VRDOS. Our general view is that ESG factors that impact the rated support providers likewise impact the VRDO issuance itself, since
the support provider is the sole rating linkage. We do not view project-related ESG factors as relevant to VRDO repayment. This is because VRDO debt holders are shielded from the underlying projects through third-party support.
In terms of bank rating actions, 2021 was also another generally stable year. Such actions are the main drivers of rating changes in this area. We downgraded M&T Bank to 'A-/A-2'; this was the largest action in this area (see "M&T Bank Corp. Long-Term Rating Lowered To 'BBB+' From 'A-'
On Weakening Asset Quality; Outlook Stable," published Sept. 10, 2021). Ratings on major banks remain stable as indicated in “Large U.S. Banks' Profitability Should Rise Despite Limited Reserve Releases, published Nov. 17, 2021.
We expect trends in 2022 to roughly be a continuation of those of 2021. Low cost of funds for fixed rate issuances have made variable rate issues less attractive in recent years. A general expectation of rising rates could lead to increased variable rate issuance assuming the cost of
funds remains attractive, and banks remain willing to extend credit.
In the year ahead, we will watch for any issuance impacts of the newly passed infrastructure bill,
particularly around the newly designated tax-exempt Private Activity Bonds (PABs). These bonds will finance projects in broadband construction and carbon dioxide capture facilities. We do not expect to see significant issuance for these projects immediately, however.
Tender Option Bonds
New issuance of TOBs in 2021 remained low compared to previous years. As of December 2021,
S&P Global Ratings issued ratings on 171 TOB Transactions, a 40% decrease in new issuance volume relative to the same period last year, though only a corresponding 1% decrease in trust par. Given current economic conditions, we anticipate similar rated volume in 2022, with potential room for growth to $7.5 billion in new issuance par.
The number of rating actions taken on tender option bonds has decreased by 48% from the same period last year, reflecting a significant stabilization of ratings in the related public finance
sectors. Additionally, 62% of the actions in 2021 were upgrades.
This year has also seen a few new TOB programs enter the market, continuing the trend of
proprietary trust structures incorporating unrated and taxable underlying securities. These taxable structures include liquidity facilities that are necessarily more restricted in their exit remedies, as the tender-option-termination events are absent.
In 2022, given the expected rising interest rates, and improving credit conditions of the related public finance sectors due in part to increased federal stimulus, we expect TOB issuance to be similar to 2021's, with a slight increase in issuance volume possible.

spglobal.com/ratings This report does not constitute a rating action. Jan. 12, 2022 34
Referenced Repackaged Securities
There was no new issuance of Referenced Repacked Securities (RRS) in 2021. While the market
continued to find ways to get higher yield in a low interest environment, we did not rate any new structures in 2021. Additionally, we have seen a decrease in rating actions (down 65% from 79 ratings to 27 ratings); this was due to COVID-19 impact on the underlying transaction ratings stabilizing. Rating actions taken in 2021 were on RRS in the utility and retail sectors.
We maintain ratings on approximately 107 issues, with a total par value of approximately $9.70 billion.

spglobal.com/ratings This report does not constitute a rating action. Jan. 12, 2022 35
U.S. | CLO
Key Takeaways – The U.S. CLO sector saw record new issuance of about $187 billion in 2021. We
attribute the robust volume to investors’ search for high risk-adjusted yield, coupledwith CLOs' resilient performance during the 2020 downturn. We expect issuance to
remain strong in 2022 (though not quite as robust as in 2021), at around $160 billion.
– CLO refinancing and reset volume was even more robust, tallying north of $245 billion
on the year. Pent-up demand from the wider spreads exhibited in 2020 contributed tothe record issuance. We expect CLO refinancing/reset volume of around $125 billion in2022.
– Beginning in 2022, new issue transactions will need to be indexed to SOFR or anotherbenchmark as opposed to LIBOR. This might depress issuance in the first quarter asthe loan and CLO markets engage in price discovery and sort out the appropriate
spreads above the new benchmarks. However, we expect the market to find its footingearly in the year.
Benchmark Transition And (Near) Record Issuance Likely
The U.S. CLO market roared back to life in 2021, with a record amount of new issue transactions following a pandemic-driven slowdown in 2020. It turns out that CLO demand during the pandemic was only temporarily suppressed, and the factors driving robust CLO issuance ahead of the
pandemic were still in place in 2021: Investors still have cash to put to work, are searching for yield, and perceive CLOs as offering attractive risk-adjusted yields against assets they consider comparable, such as CMBS senior notes and investment-grade corporate bonds. Add to that concerns over rising interest rates (which add to the appeal of floating-rate investments) and new
investors taking note of resilient CLO performance during the 2020 downturn, and the market ends up with the record-setting $187 billion in CLO new issue volume we saw in 2021. Volume was nearly half again as much as the previous record of $129 billion, set in 2018.
We expect U.S. CLO new issuance in 2022 to be quite robust, although not quite reaching the heights seen in 2021.We forecast $160 billion in new issuance for the year. New investors (especially insurance companies) continue to dip their toe into the CLO market, while current CLO
investors are potentially increasing the amount they have allocated to the market. The transition away from LIBOR will certainly impact the CLO market, but we don’t think it will be too big of an obstacle for issuance. Both corporate loans and CLO tranches are currently indexed to LIBOR, but starting in 2022, new issue transactions will need to be indexed to SOFR or another benchmark.
This might depress issuance in the first quarter as the loan and CLO markets engage in price discovery and sort out the appropriate spreads above the new benchmarks, but we think the market will find its footing early in the year and then get back to issuing new CLOs.
CLO refinancing and reset volume was even more robust in 2021. In these transactions, an existing CLO is taken and sees the spreads on its notes reduced with few other changes to the transaction documents (in a CLO refinancing) or sees the spreads reduced while also pushing out the maturity
dates and other items in the documents (resets). These tallied $245 billion in 2021 as CLO market spreads tightened and were “in the money” for many tranches. There was also pent-up demand from 2020, when few refinancings and resets got done because CLO market spreads were much wider. Adding the demand, some of the new issue CLOs that got done in 2020 were issued at very
wide spreads; these were issued with very short noncall periods that ended in 2021, adding to the
PRIMARY CONTACTS
Stephen Anderberg
New York stephen.anderberg @spglobal.com +1-212-438-8991
Daniel Hu
New York daniel.hu @spglobal.com +1-212-438-2206
Key Performance Metrics
Issuance – $ billion.
a–Actual. f—Forecast.
U.S.
$92
$188$160
0 %
2 00 0 %
4 00 0 %
6 00 0 %
8 00 0 %
1 00 0 0 %
1 20 0 0 %
1 40 0 0 %
1 60 0 0 %
1 80 0 0 %
2 00 0 0 %
4.6%
0.4%1.0%
0 %
1 %
1 %
2 %
2 %
3 %
3 %
4 %
4 %
5 %
5 %
LL Default Rates
2020
2021
2022
F
Issuance
SEP2
0
SEP2
1
SEP2
2
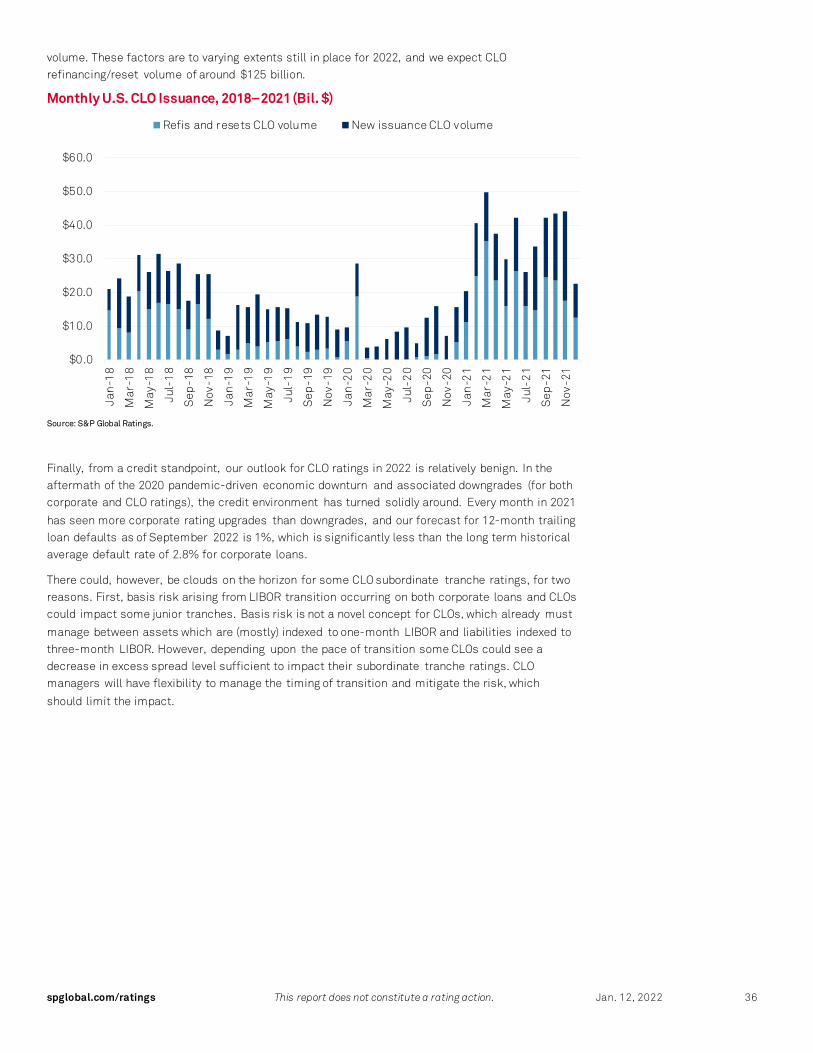
spglobal.com/ratings This report does not constitute a rating action. Jan. 12, 2022 36
volume. These factors are to varying extents still in place for 2022, and we expect CLO refinancing/reset volume of around $125 billion.
Monthly U.S. CLO Issuance, 2018–2021 (Bil. $)
Source: S&P Global Ratings.
Finally, from a credit standpoint, our outlook for CLO ratings in 2022 is relatively benign. In the aftermath of the 2020 pandemic-driven economic downturn and associated downgrades (for both corporate and CLO ratings), the credit environment has turned solidly around. Every month in 2021
has seen more corporate rating upgrades than downgrades, and our forecast for 12-month trailing loan defaults as of September 2022 is 1%, which is significantly less than the long term historical average default rate of 2.8% for corporate loans.
There could, however, be clouds on the horizon for some CLO subordinate tranche ratings, for two reasons. First, basis risk arising from LIBOR transition occurring on both corporate loans and CLOs could impact some junior tranches. Basis risk is not a novel concept for CLOs, which already must
manage between assets which are (mostly) indexed to one-month LIBOR and liabilities indexed to three-month LIBOR. However, depending upon the pace of transition some CLOs could see a decrease in excess spread level sufficient to impact their subordinate tranche ratings. CLO managers will have flexibility to manage the timing of transition and mitigate the risk, which
should limit the impact.
$0.0
$10.0
$20.0
$30.0
$40.0
$50.0
$60.0
Jan
-18
Mar
-18
May
-18
Jul-
18
Sep
-18
Nov
-18
Jan
-19
Mar
-19
May
-19
Jul-
19
Sep
-19
Nov
-19
Jan
-20
Mar
-20
May
-20
Jul-
20
Sep
-20
Nov
-20
Jan
-21
Mar
-21
May
-21
Jul-
21
Sep
-21
Nov
-21
Refis and resets CLO volume New issuance CLO volume

spglobal.com/ratings This report does not constitute a rating action. Jan. 12, 2022 37
Recovery Ratings For Assets In Reinvesting U.S. BSL CLOs (2017-2021)
Source: S&P Global Ratings
Additionally, recovery rating profiles in some CLO collateral pools have been deteriorating as managers trade loans. This drop in assumed recovery rates reflects trends in the broader
corporate loan market, with the weighted average recovery estimate across first-lien broadly syndicated loans dropping from 70% in Q1 2017 to under 65% as of Q4 2021. Our recovery ratings on loans are a fundamental input into our rating analysis, along with the credit ratings on the companies that issue the loans, and the drop in CLO weighted average recovery rates could also
affect subordinate CLO tranche ratings from some transactions.
0.0%
5.0%
10.0%
15.0%
20.0%
25.0%
30.0%
35.0%
40.0%
2017YE 2018YE 2019YE 2020YE 2021YE
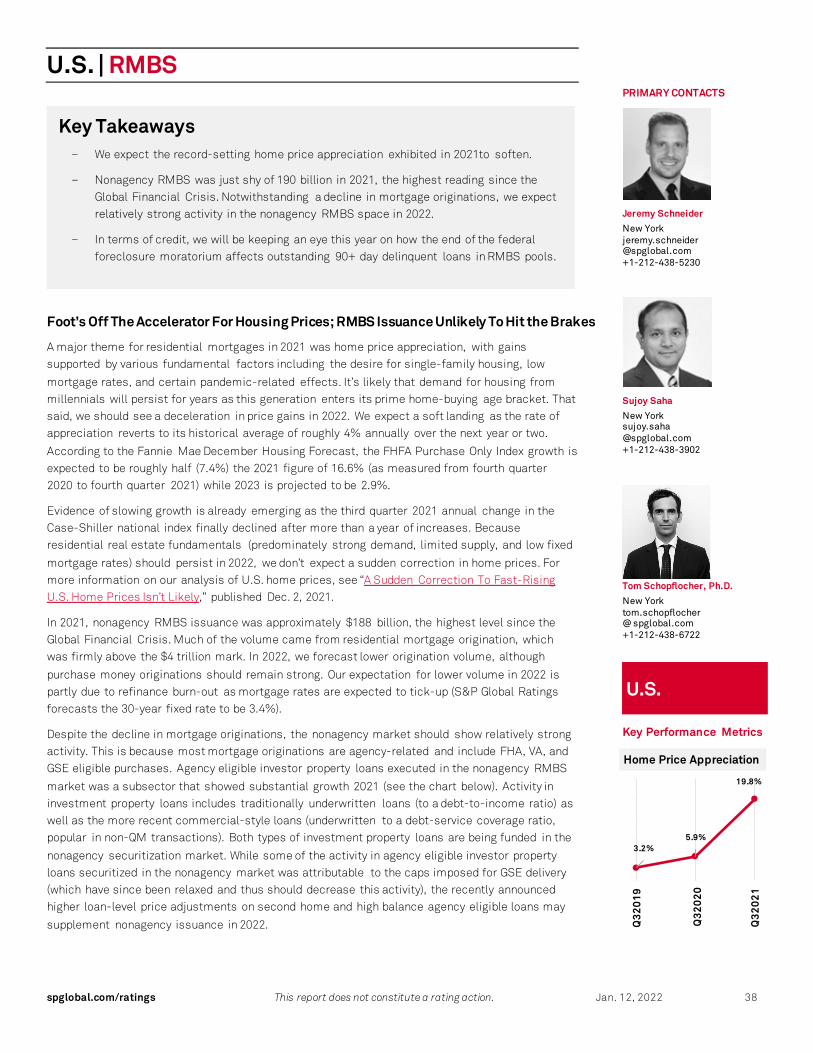
spglobal.com/ratings This report does not constitute a rating action. Jan. 12, 2022 38
U.S. | RMBS
Key Takeaways – We expect the record-setting home price appreciation exhibited in 2021to soften.
– Nonagency RMBS was just shy of 190 billion in 2021, the highest reading since theGlobal Financial Crisis. Notwithstanding a decline in mortgage originations, we expectrelatively strong activity in the nonagency RMBS space in 2022.
– In terms of credit, we will be keeping an eye this year on how the end of the federal foreclosure moratorium affects outstanding 90+ day delinquent loans in RMBS pools.
Foot’s Off The Accelerator For Housing Prices; RMBS Issuance Unlikely To Hit the Brakes
A major theme for residential mortgages in 2021 was home price appreciation, with gains supported by various fundamental factors including the desire for single-family housing, low
mortgage rates, and certain pandemic-related effects. It’s likely that demand for housing from millennials will persist for years as this generation enters its prime home-buying age bracket. That said, we should see a deceleration in price gains in 2022. We expect a soft landing as the rate of appreciation reverts to its historical average of roughly 4% annually over the next year or two.
According to the Fannie Mae December Housing Forecast, the FHFA Purchase Only Index growth is expected to be roughly half (7.4%) the 2021 figure of 16.6% (as measured from fourth quarter 2020 to fourth quarter 2021) while 2023 is projected to be 2.9%.
Evidence of slowing growth is already emerging as the third quarter 2021 annual change in the Case-Shiller national index finally declined after more than a year of increases. Because residential real estate fundamentals (predominately strong demand, limited supply, and low fixed
mortgage rates) should persist in 2022, we don’t expect a sudden correction in home prices. For more information on our analysis of U.S. home prices, see “A Sudden Correction To Fast-Rising U.S. Home Prices Isn’t Likely,” published Dec. 2, 2021.
In 2021, nonagency RMBS issuance was approximately $188 billion, the highest level since the Global Financial Crisis. Much of the volume came from residential mortgage origination, which was firmly above the $4 trillion mark. In 2022, we forecast lower origination volume, although
purchase money originations should remain strong. Our expectation for lower volume in 2022 is partly due to refinance burn-out as mortgage rates are expected to tick-up (S&P Global Ratings forecasts the 30-year fixed rate to be 3.4%).
Despite the decline in mortgage originations, the nonagency market should show relatively strong activity. This is because most mortgage originations are agency-related and include FHA, VA, and GSE eligible purchases. Agency eligible investor property loans executed in the nonagency RMBS
market was a subsector that showed substantial growth 2021 (see the chart below). Activity in investment property loans includes traditionally underwritten loans (to a debt-to-income ratio) as well as the more recent commercial-style loans (underwritten to a debt-service coverage ratio, popular in non-QM transactions). Both types of investment property loans are being funded in the
nonagency securitization market. While some of the activity in agency eligible investor property loans securitized in the nonagency market was attributable to the caps imposed for GSE delivery (which have since been relaxed and thus should decrease this activity), the recently announced higher loan-level price adjustments on second home and high balance agency eligible loans may
supplement nonagency issuance in 2022.
PRIMARY CONTACTS
Jeremy Schneider
New York jeremy.schneider @spglobal.com +1-212-438-5230
Sujoy Saha
New York sujoy.saha @spglobal.com +1-212-438-3902
Tom Schopflocher, Ph.D.
New York tom.schopflocher @ spglobal.com +1-212-438-6722
Key Performance Metrics
U.S.
3.2%5.9%
19.8%
0 %
5 %
1 0%
1 5%
2 0%
2 5%
Home Price Appreciation
Q32
019
Q32
020
Q32
021
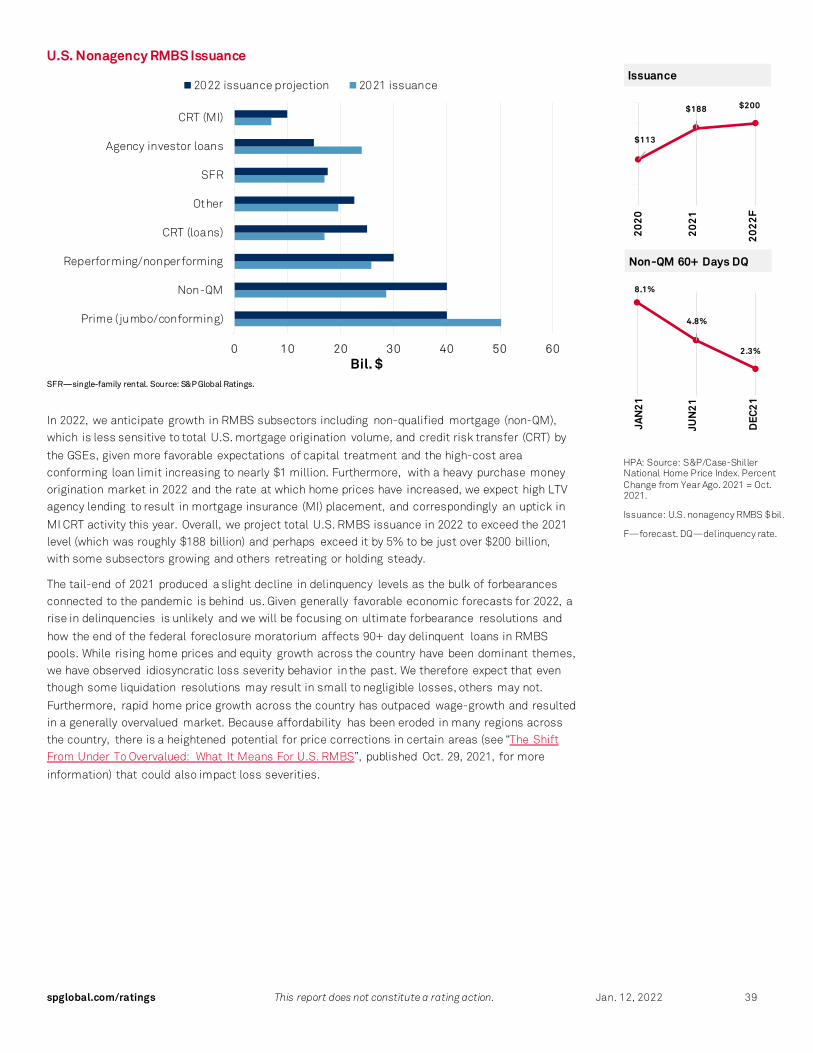
spglobal.com/ratings This report does not constitute a rating action. Jan. 12, 2022 39
U.S. Nonagency RMBS Issuance
SFR—single-family rental. Source: S&P Global Ratings.
In 2022, we anticipate growth in RMBS subsectors including non-qualified mortgage (non-QM), which is less sensitive to total U.S. mortgage origination volume, and credit risk transfer (CRT) by
the GSEs, given more favorable expectations of capital treatment and the high-cost area conforming loan limit increasing to nearly $1 million. Furthermore, with a heavy purchase money origination market in 2022 and the rate at which home prices have increased, we expect high LTV agency lending to result in mortgage insurance (MI) placement, and correspondingly an uptick in
MI CRT activity this year. Overall, we project total U.S. RMBS issuance in 2022 to exceed the 2021 level (which was roughly $188 billion) and perhaps exceed it by 5% to be just over $200 billion, with some subsectors growing and others retreating or holding steady.
The tail-end of 2021 produced a slight decline in delinquency levels as the bulk of forbearances connected to the pandemic is behind us. Given generally favorable economic forecasts for 2022, a rise in delinquencies is unlikely and we will be focusing on ultimate forbearance resolutions and
how the end of the federal foreclosure moratorium affects 90+ day delinquent loans in RMBS pools. While rising home prices and equity growth across the country have been dominant themes, we have observed idiosyncratic loss severity behavior in the past. We therefore expect that even though some liquidation resolutions may result in small to negligible losses, others may not.
Furthermore, rapid home price growth across the country has outpaced wage-growth and resulted in a generally overvalued market. Because affordability has been eroded in many regions across the country, there is a heightened potential for price corrections in certain areas (see “The Shift From Under To Overvalued: What It Means For U.S. RMBS”, published Oct. 29, 2021, for more
information) that could also impact loss severities.
HPA: Source: S&P/Case-Shiller National Home Price Index. Percent Change from Year Ago. 2021 = Oct. 2021.
Issuance: U.S. nonagency RMBS $ bil.
F—forecast. DQ—delinquency rate.
$113
$188 $200
0 %
5 00 0 %
1 00 0 0 %
1 50 0 0 %
2 00 0 0 %
2 50 0 0 %
8.1%
4.8%
2.3%
0 %
1 %
2 %
3 %
4 %
5 %
6 %
7 %
8 %
9 %
Issuance
2020
2021
2022
F
Non-QM 60+ Days DQ
JAN
21
JUN
21
DEC
21
0 10 20 30 40 50 60
Prime (jumbo/conforming)
Non-QM
Reperforming/nonperforming
CRT (loans)
Other
SFR
Agency investor loans
CRT (MI)
Bil. $
2022 issuance projection 2021 issuance

spglobal.com/ratings This report does not constitute a rating action. Jan. 12, 2022 40
One-Month CPR And 60+ Days DQ
Source: S&P Global Ratings.
We expect a decline in RMBS prepayments, as measured by the 1-month conditional prepayment rate, or
CPR. This is due primarily to the significant portion of the portfolio that has been able to lock in historically low interest rates and is no longer incentivized to refinance. At this point, the share of the portfolio that has not refinanced has possibly indicated that it is unlikely to ever do so. Prepayments certainly influence bond pricing; however, credit effects are also important given their contribution to
deleveraging and their impact on excess interest generation for certain structures that use spread as
credit enhancement.
0%
10%
20%
30%
40%
50%
60%
0%
2%
4%
6%
8%
10%
12%
14%
16%
On
e-Mon
th C
PR60
+ D
ays
DQ
60+ days DQ: prime/conforming 2.0 60+ days DQ: CRT
60+ days DQ: non-QM CPR: prime/conforming 2.0
CPR: CRT CPR: non-QM

spglobal.com/ratings This report does not constitute a rating action. Jan. 12, 2022 41
U.S. | CMBS
Key Takeaways – Issuance for the year was at its largest since the global financial crisis, mainly because
of outsize single-asset, single-borrower (SASB) volume.
– U.S. CMBS delinquency and forbearance rates continued to fall in 2021 and overallCRE valuations are 14% higher than just prior to the pandemic. However, office, retailand lodging valuations remain little changed from their pre-pandemic levels.
– We project $110 billion in 2022 new issuance, in line with the $110 billion of 2021.
What To Look FOR Over The Next Year
We expect $110 billion in private-label U.S. CMBS issuance in 2022 (not including commercial real estate [CRE] CLOs). In 2021, issuance was up roughly 104% year-over-year to $110 billion.
For the private-label CMBS market, 2021 was a record-setting year. Despite the fact commercial real estate (CRE), and CMBS by extension, has and continues to be the sector most directly
affected by the pandemic, issuance reached a post-Global Financial Crisis high of $110 billion¹. However, unlike in the period prior to the crisis, the SASB sector, thanks to the preferability of floating-rate debt in the prior year rate environment including more prepayment flexibility, was the leading engine of issuance volume in 2021. It accounted for 71% of total volume. Looking
ahead, we see prior-year tailwinds as well as current and potentially new headwinds that could challenge issuance growth in the year ahead. On the plus side, investor demand for CRE debt, particularly for multifamily and industrial subsectors, remains strong allowing for heightened liquidity. Moreover, government-imposed containment measures deployed early in the pandemic
have eased, allowing pockets of the lodging and retail sectors to flourish and garner lender and investor interest. Lastly, though not a record by any measure, a notable amount of existing CMBS debt ($24.3 billion from loans with balances of $100 million or greater) is due in first half of 2022. This will bring refinancing opportunities.
Chief among potential challenges to growth might be expectations for higher interest rates and asset purchase tapering by the Federal Reserve, as it tries to control inflation. Higher rates and
the expectation of more increases could benefit fixed-rate conduit issuance at the expense of floating-rate SASBs. However, we presume the overall affect would dampen growth, much as it did the last time interest rates were increasing, in 2018. At that time though, rates then were higher than current levels.
Another challenge to maintaining or exceeding SASB volume relates to the record number of blockbuster financings in 2021. Of the $78 billion in SASB volume for the year, $26.9 billion or 35%
came from 10 transactions, each with a securitized balance of $2 billion or more, a record by a wide margin. While asset value appreciation combined with the huge amount of capital (both equity and debt) currently able to be deployed suggests further growth, we believe current levels might be difficult to maintain.
Lastly, yet unanswered questions of the near-term outlook for certain segments of lodging and the near and median term outlook for the office sector may leave CMBS issuance unable to fire on all
cylinders. Viewed collectively, the balance of probabilities suggests to us private-label CMBS issuance volume will be about the same as 2021, with somewhat lower SASB and somewhat higher conduit issuance.
PRIMARY CONTACTS
Senay Dawit New York senay.dawit @spglobal.com +1-212-438-0132
James Manzi, CFA
Washington D.C. james.manzi @spglobal.com +1-202-383-2028
U.S.

spglobal.com/ratings This report does not constitute a rating action. Jan. 12, 2022 42
¹Combined with the CreCLO market's record-setting issuance of $45 billion, aggregate private-label issuance was at $155 billion and just below levels last observed in 2005. In our view, the transitional nature of current CreCLO collateral has much common in with latter year CMBS 1.0 collateral.
Credit Outlook & Performance
Current interest rates remain near historic lows and cap rates, though showing variability among various property types, overall continue to trade at historically low levels. According to Green
Street's Commercial Property Price Index (CPPI), aggregate property prices as of November 2021 had increased 24% for the year and were 14% higher than just prior to the pandemic. However, prices for properties in sectors harder hit by the pandemic, such as retail establishments, hotels, and offices, were little changed and remained close to their pre-pandemic levels. Historically low
cap rates point to high valuation pressures. By contrast, according to the Federal Reserve Board's November 2021 Financial Stability Report, the spreads of cap rates to Treasury yields remained close to or above their historical averages, suggesting that investors currently receive moderate compensation for holding CRE risk.
On the performance side, as of yearend 2021, the overall CMBS delinquency rate was down 335bps to around 3.6%, though with continued uneven credit performance by property type. The
chart below shows that the lodging late payment rate reached a recent peak over 20%, and now sits at around 7.79%, while retail stands at around 7.4%. — Office, multifamily, and industrial, the other three major areas, remain below 2.3%. Though the overall delinquency rate is down, the share of delinquent loans that are 60-plus days is 87.4%. Furthermore, the loans that are 120-
plus-days account for 37.7% of all delinquent loans. Beyond the delinquency rate, an additional 5.9% of loans can be classified as either in forbearance or currently requesting forbearance relief, and over 88.4% of that is attributed to lodging/retail backed loans.
By property type, we focus on multiple areas, though ratings closely tied to lodging, retail, and near-term loan maturing office collateral, especially in SASBs, remain priorities.
Lodging
We don't expect hotel revenue per available room (RevPAR) to recover to 2019 levels until sometime in 2023. While leisure travel has rebounded significantly in 2021, corporate demand, and meeting and group demand levels are significantly depressed and will likely recover more gradually as companies return to the office and resume corporate travel, and as larger group
meetings, both corporate and social, resume as corporate travel policies are eased and fear of travel subsides. Our approach to deriving sustainable net cash flow and value will depend on recent monthly performance trends, hotel-specific demand generators, and performance trends prior to the pandemic.
Retail
Retail malls have faced significant challenges and deteriorating revenues for the past several years. This was due to factors, including a proliferation of retailer bankruptcies and store closures as consumer shopping preferences shifted to e-commerce from brick-and-mortar stores.
Meanwhile, grocery-anchored retail, home improvement stores, and some larger big-box retailers are generally outperforming traditional retail stores. Given this bifurcated outlook, we revised in late 2020 our capitalization rate assumptions for retail malls to reflect the long-term secular challenges facing the sector.
Office
The office sector faces some uncertainty going forward, although delinquencies remain relatively low at 2.3% as of December 2021. Office demand has begun to decline in key markets, and it is uncertain when or if a big return to the workplace will take place. The pandemic will continue to weigh on vacancy and rent growth. However, rent collections should remain high because the

spglobal.com/ratings This report does not constitute a rating action. Jan. 12, 2022 43
tenant base is strong and diverse, and leases long, supporting cash flow. Therefore, declines will occur gradually as leases expire. Notwithstanding, our property cashflow analysis remains focused on stressing sustainable rents, current and expected market vacancies, and where
warranted, raising our cap rates on a case-by-case basis to address risks unique to a given property such as heightened lease rollover exposure. We expect this picture to come into a sharper focus over the coming quarters, with more clarity likely in mid or late 2022, as more workers return to their offices, and corporations making longer-term decisions. Further, we expect results to vary
by industry (see "Remote Working Is Testing U.S. Office Landlords' Credit Quality," published Feb. 11, 2021).
Delinquency Rate By Property Type
Source: S&P Global Ratings.
0%
5%
10%
15%
20%
25%
Jan
-17
Mar
-17
May
-17
Jul-
17
Sep
-17
Nov
-17
Jan
-18
Mar
-18
May
-18
Jul-
18
Sep
-18
Nov
-18
Jan
-19
Mar
-19
May
-19
Jul-
19
Sep
-19
Nov
-19
Jan
-20
Mar
-20
May
-20
Jul-
20
Sep
-20
Nov
-20
Jan
-21
Mar
-21
May
-21
Jul-
21
Sep
-21
Nov
-21
Multifamily Lodging Industrial Office Retail
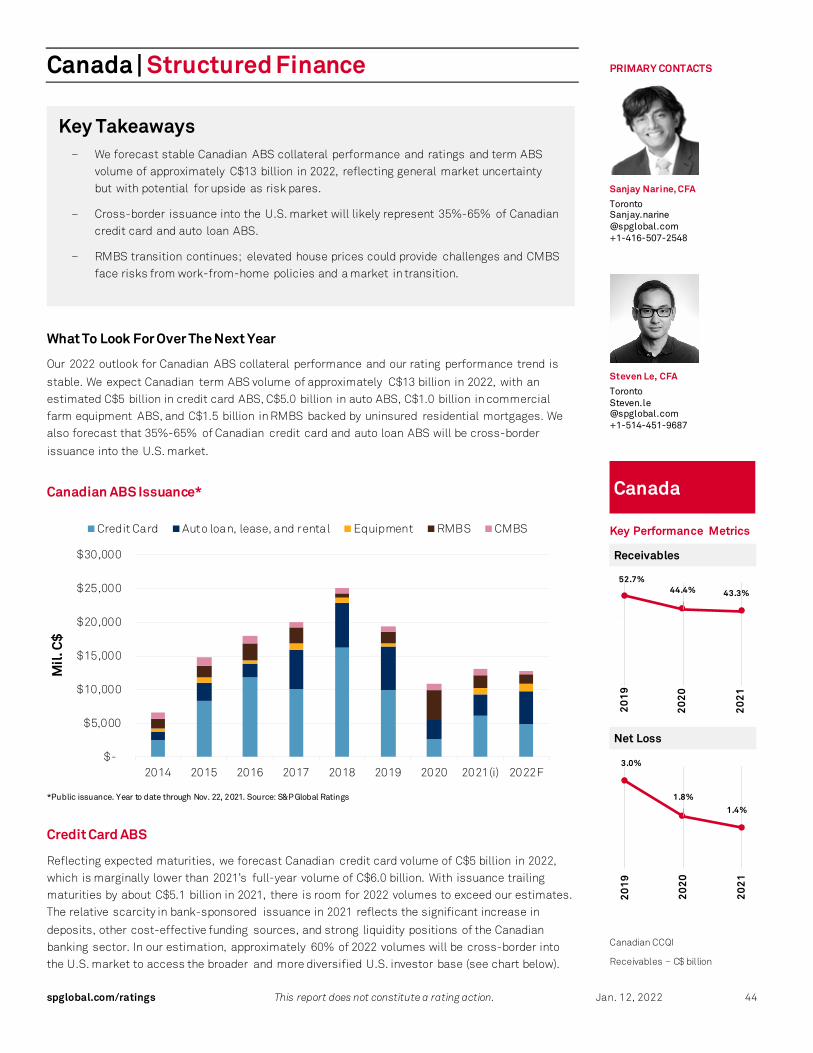
spglobal.com/ratings This report does not constitute a rating action. Jan. 12, 2022 44
Canada | Structured Finance
Key Takeaways – We forecast stable Canadian ABS collateral performance and ratings and term ABS
volume of approximately C$13 billion in 2022, reflecting general market uncertaintybut with potential for upside as risk pares.
– Cross-border issuance into the U.S. market will likely represent 35%-65% of Canadiancredit card and auto loan ABS.
– RMBS transition continues; elevated house prices could provide challenges and CMBSface risks from work-from-home policies and a market in transition.
What To Look For Over The Next Year
Our 2022 outlook for Canadian ABS collateral performance and our rating performance trend is
stable. We expect Canadian term ABS volume of approximately C$13 billion in 2022, with an estimated C$5 billion in credit card ABS, C$5.0 billion in auto ABS, C$1.0 billion in commercial farm equipment ABS, and C$1.5 billion in RMBS backed by uninsured residential mortgages. We also forecast that 35%-65% of Canadian credit card and auto loan ABS will be cross-border
issuance into the U.S. market.
Canadian ABS Issuance*
*Public issuance. Year to date through Nov. 22, 2021. Source: S&P Global Ratings
Credit Card ABS
Reflecting expected maturities, we forecast Canadian credit card volume of C$5 billion in 2022, which is marginally lower than 2021’s full-year volume of C$6.0 billion. With issuance trailing maturities by about C$5.1 billion in 2021, there is room for 2022 volumes to exceed our estimates. The relative scarcity in bank-sponsored issuance in 2021 reflects the significant increase in
deposits, other cost-effective funding sources, and strong liquidity positions of the Canadian banking sector. In our estimation, approximately 60% of 2022 volumes will be cross-border into the U.S. market to access the broader and more diversified U.S. investor base (see chart below).
PRIMARY CONTACTS
Sanjay Narine, CFA
Toronto Sanjay.narine @spglobal.com +1-416-507-2548
Steven Le, CFA
Toronto Steven.le @spglobal.com +1-514-451-9687
Key Performance Metrics
Canadian CCQI
Receivables – C$ billion
Canada
52.7%44.4% 43.3%
0 %
1 0%
2 0%
3 0%
4 0%
5 0%
6 0%
3.0%
1.8%
1.4%
0 %
1 %
1 %
2 %
2 %
3 %
3 %
4 %
$-
$5,000
$10,000
$15,000
$20,000
$25,000
$30,000
2014 2015 2016 2017 2018 2019 2020 2021(i) 2022F
Mil
. C$
Credit Card Auto loan, lease, and rental Equipment RMBS CMBS
Receivables
Net Loss
2019
2020
2021
2019
2020
2021
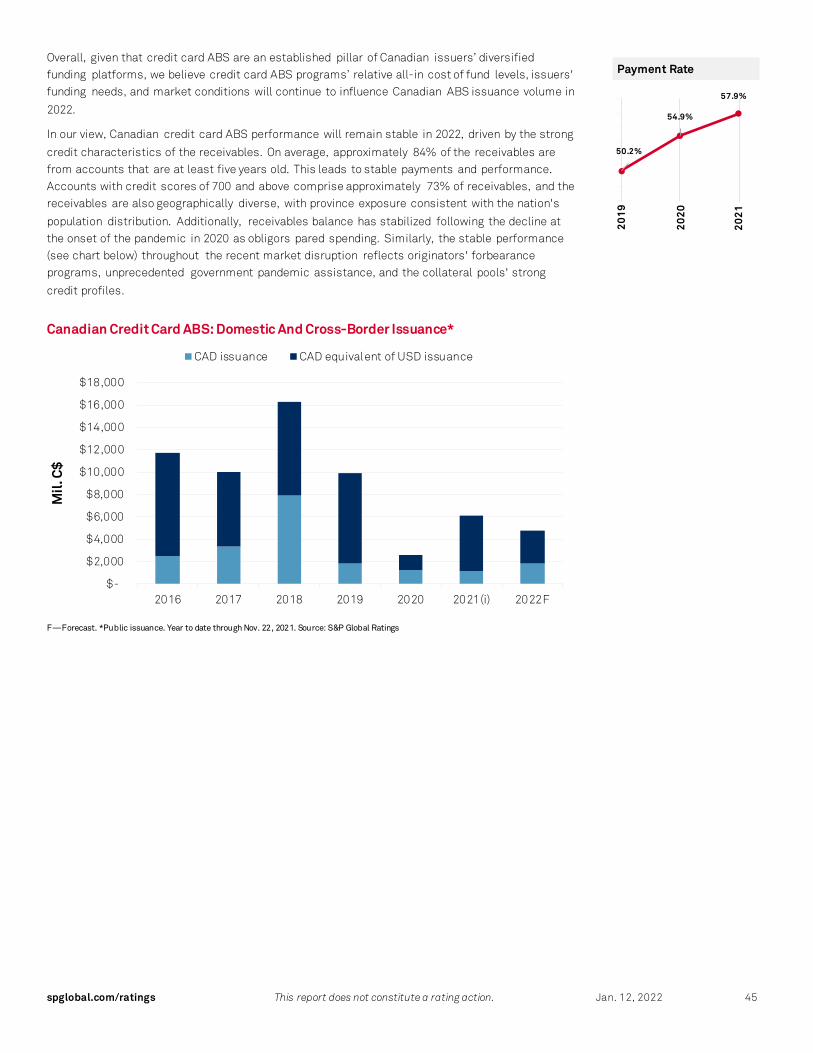
spglobal.com/ratings This report does not constitute a rating action. Jan. 12, 2022 45
Overall, given that credit card ABS are an established pillar of Canadian issuers’ diversified funding platforms, we believe credit card ABS programs’ relative all-in cost of fund levels, issuers' funding needs, and market conditions will continue to influence Canadian ABS issuance volume in
2022.
In our view, Canadian credit card ABS performance will remain stable in 2022, driven by the strong
credit characteristics of the receivables. On average, approximately 84% of the receivables are from accounts that are at least five years old. This leads to stable payments and performance. Accounts with credit scores of 700 and above comprise approximately 73% of receivables, and the receivables are also geographically diverse, with province exposure consistent with the nation's
population distribution. Additionally, receivables balance has stabilized following the decline at the onset of the pandemic in 2020 as obligors pared spending. Similarly, the stable performance (see chart below) throughout the recent market disruption reflects originators' forbearance programs, unprecedented government pandemic assistance, and the collateral pools' strong
credit profiles.
Canadian Credit Card ABS: Domestic And Cross-Border Issuance*
F—Forecast. *Public issuance. Year to date through Nov. 22, 2021. Source: S&P Global Ratings
$-
$2,000
$4,000
$6,000
$8,000
$10,000
$12,000
$14,000
$16,000
$18,000
2016 2017 2018 2019 2020 2021(i) 2022F
Mil
. C$
CAD issuance CAD equivalent of USD issuance
50.2%
54.9%
57.9%
4 6%
4 8%
5 0%
5 2%
5 4%
5 6%
5 8%
6 0%
Payment Rate
2020
2019
2021
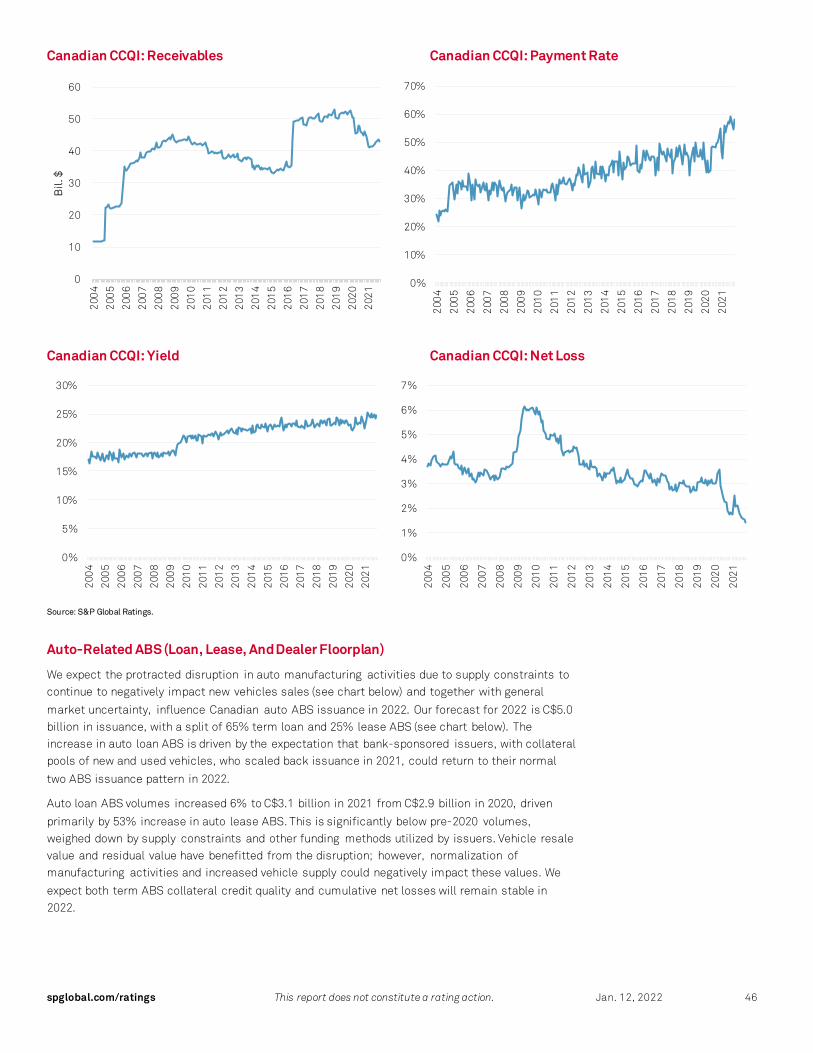
spglobal.com/ratings This report does not constitute a rating action. Jan. 12, 2022 46
Canadian CCQI: Receivables Canadian CCQI: Payment Rate
Canadian CCQI: Yield Canadian CCQI: Net Loss
Source: S&P Global Ratings.
Auto-Related ABS (Loan, Lease, And Dealer Floorplan)
We expect the protracted disruption in auto manufacturing activities due to supply constraints to continue to negatively impact new vehicles sales (see chart below) and together with general
market uncertainty, influence Canadian auto ABS issuance in 2022. Our forecast for 2022 is C$5.0 billion in issuance, with a split of 65% term loan and 25% lease ABS (see chart below). The increase in auto loan ABS is driven by the expectation that bank-sponsored issuers, with collateral pools of new and used vehicles, who scaled back issuance in 2021, could return to their normal
two ABS issuance pattern in 2022.
Auto loan ABS volumes increased 6% to C$3.1 billion in 2021 from C$2.9 billion in 2020, driven
primarily by 53% increase in auto lease ABS. This is significantly below pre-2020 volumes, weighed down by supply constraints and other funding methods utilized by issuers. Vehicle resale value and residual value have benefitted from the disruption; however, normalization of manufacturing activities and increased vehicle supply could negatively impact these values. We
expect both term ABS collateral credit quality and cumulative net losses will remain stable in 2022.
0
10
20
30
40
50
602
004
200
5
200
6
200
7
200
8
200
9
201
0
201
1
201
2
201
3
201
4
201
5
201
6
201
7
201
8
201
9
202
0
202
1
Bil
. $
0%
10%
20%
30%
40%
50%
60%
70%
200
4
200
5
200
6
200
7
200
8
200
9
201
0
201
1
201
2
201
3
201
4
201
5
201
6
201
7
201
8
201
9
202
0
202
1
0%
5%
10%
15%
20%
25%
30%
200
4
200
5
200
6
200
7
200
8
200
9
201
0
201
1
201
2
201
3
201
4
201
5
201
6
201
7
201
8
201
9
202
0
202
1
0%
1%
2%
3%
4%
5%
6%
7%
200
4
200
5
200
6
200
7
200
8
200
9
201
0
201
1
201
2
201
3
201
4
201
5
201
6
201
7
201
8
201
9
202
0
202
1
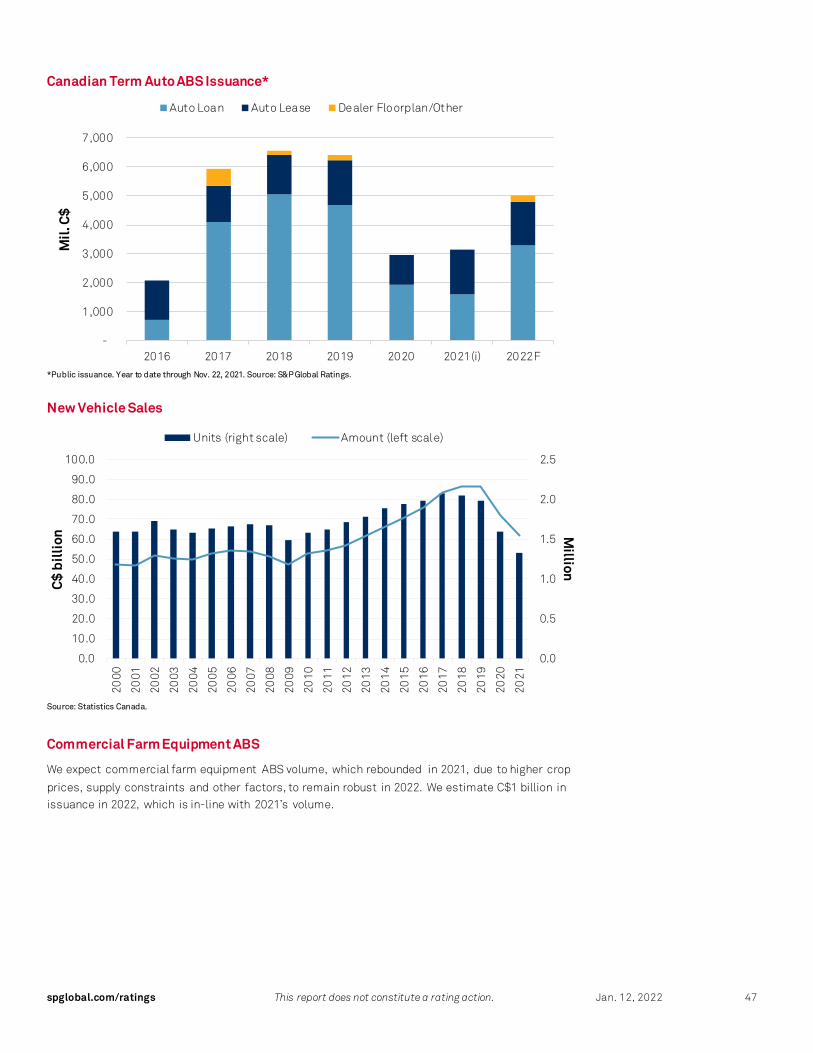
spglobal.com/ratings This report does not constitute a rating action. Jan. 12, 2022 47
Canadian Term Auto ABS Issuance*
*Public issuance. Year to date through Nov. 22, 2021. Source: S&P Global Ratings.
New Vehicle Sales
Source: Statistics Canada.
Commercial Farm Equipment ABS
We expect commercial farm equipment ABS volume, which rebounded in 2021, due to higher crop
prices, supply constraints and other factors, to remain robust in 2022. We estimate C$1 billion in issuance in 2022, which is in-line with 2021’s volume.
-
1,000
2,000
3,000
4,000
5,000
6,000
7,000
2016 2017 2018 2019 2020 2021(i) 2022F
Mil
. C$
Auto Loan Auto Lease Dealer Floorplan/Other
0.0
0.5
1.0
1.5
2.0
2.5
0.0
10.0
20.0
30.0
40.0
50.0
60.0
70.0
80.0
90.0
100.0
2000
2001
2002
2003
2004
2005
2006
2007
2008
2009
2010
2011
2012
2013
2014
2015
2016
2017
2018
2019
2020
2021
Million
C$
bil
lion
Units (right scale) Amount (left scale)

spglobal.com/ratings This report does not constitute a rating action. Jan. 12, 2022 48
Canadian Term Equipment ABS Issuance*
*Public issuance. Year to date through Nov. 22, 2021. Source: S&P Global Ratings.
RMBS
We expect RMBS volumes to be C$1.5 billion in 2022, up from 2021’s C$0.9 billion, as the risk overhang from mortgage deferrals related to the pandemic disruption is pared. The transition to private-label nonguaranteed and noninsured mortgage-backed RMBS from federal government-guaranteed and insured MBS programs, coupled with elevated home prices, will continue to
influence the development of a broad and liquid RMBS market and by extension, volumes.
National home prices will remain elevated due to low interest rates, supply constraints, and
elevated demand. Nevertheless, Canadian lenders' capital levels and credit underwriting, including borrower stress test, remain robust. These lenders are primarily banks who originate approximately 75% of residential mortgage credit. Additionally, borrowers’ equity, stable debt servicing levels, robust savings level, and declining unemployment should mitigate the effects of
any short-term correction in house prices.
Canadian Household Measures (% Of Disposable Income)
Source: Statistics Canada.
-
200
400
600
800
1,000
1,200
2016 2017 2018 2019 2020 2021(i) 2022F
Mil
. C$
-
5
10
15
20
25
30
Q1
200
0Q
4 2
000
Q3
200
1Q
2 2
002
Q1
200
3Q
4 2
003
Q3
200
4Q
2 2
005
Q1
200
6Q
4 2
006
Q3
200
7Q
2 2
008
Q1
200
9Q
4 2
009
Q3
201
0Q
2 2
011
Q1
201
2Q
4 2
012
Q3
201
3Q
2 2
014
Q1
201
5Q
4 2
015
Q3
201
6Q
2 2
017
Q1
201
8Q
4 2
018
Q3
201
9Q
2 2
020
Q1
202
1
%
Debt service Mortgage debt service Household saving

spglobal.com/ratings This report does not constitute a rating action. Jan. 12, 2022 49
CMBS
We believe companies' work-from-home policies and other evolving challenges within the sector
will likely constraint CMBS issuance in 2022. Our estimate is for C$0.50 billion which is below the C$1.0 billion of 2021.
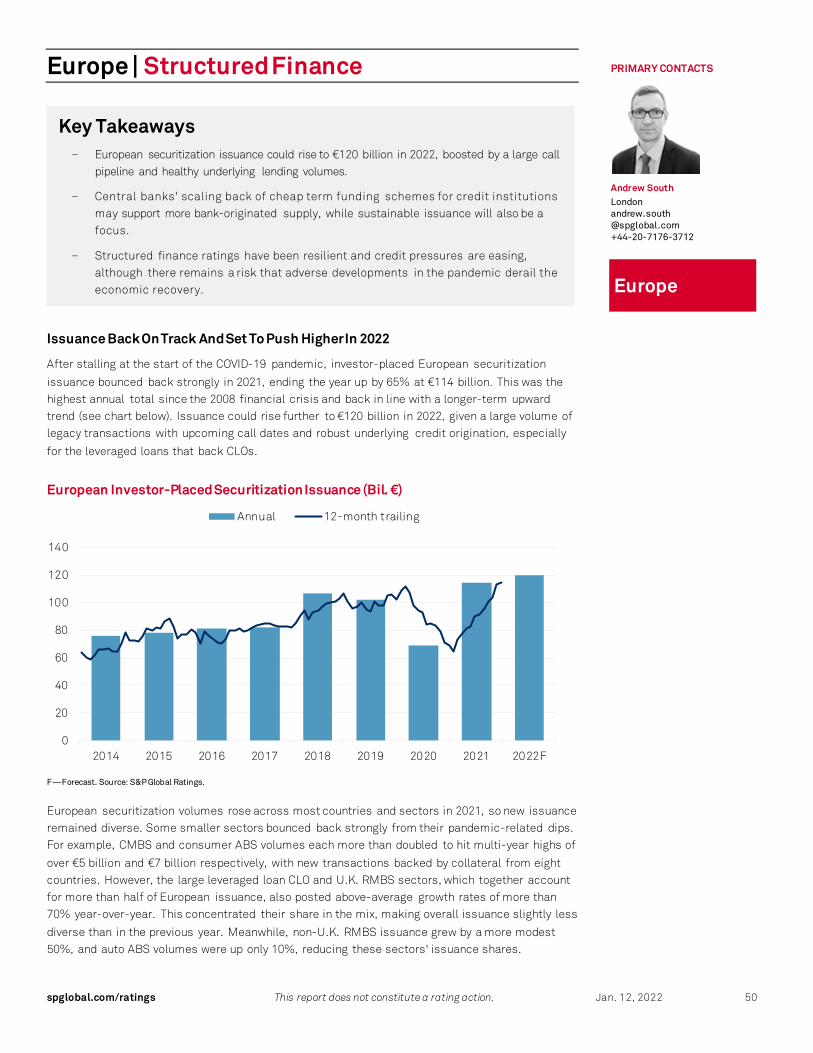
spglobal.com/ratings This report does not constitute a rating action. Jan. 12, 2022 50
Europe | Structured Finance
Key Takeaways – European securitization issuance could rise to €120 billion in 2022, boosted by a large call
pipeline and healthy underlying lending volumes.
– Central banks' scaling back of cheap term funding schemes for credit institutions may support more bank-originated supply, while sustainable issuance will also be a focus.
– Structured finance ratings have been resilient and credit pressures are easing, although there remains a risk that adverse developments in the pandemic derail the economic recovery.
Issuance Back On Track And Set To Push Higher In 2022
After stalling at the start of the COVID-19 pandemic, investor-placed European securitization
issuance bounced back strongly in 2021, ending the year up by 65% at €114 billion. This was the highest annual total since the 2008 financial crisis and back in line with a longer-term upward trend (see chart below). Issuance could rise further to €120 billion in 2022, given a large volume of legacy transactions with upcoming call dates and robust underlying credit origination, especially
for the leveraged loans that back CLOs.
European Investor-Placed Securitization Issuance (Bil. €)
F—Forecast. Source: S&P Global Ratings.
European securitization volumes rose across most countries and sectors in 2021, so new issuance remained diverse. Some smaller sectors bounced back strongly from their pandemic-related dips. For example, CMBS and consumer ABS volumes each more than doubled to hit multi-year highs of
over €5 billion and €7 billion respectively, with new transactions backed by collateral from eight countries. However, the large leveraged loan CLO and U.K. RMBS sectors, which together account for more than half of European issuance, also posted above-average growth rates of more than 70% year-over-year. This concentrated their share in the mix, making overall issuance slightly less
diverse than in the previous year. Meanwhile, non-U.K. RMBS issuance grew by a more modest 50%, and auto ABS volumes were up only 10%, reducing these sectors' issuance shares.
PRIMARY CONTACTS
Andrew South London andrew.south @spglobal.com +44-20-7176-3712
Europe
0
20
40
60
80
100
120
140
2014 2015 2016 2017 2018 2019 2020 2021 2022F
Annual 12-month trailing

spglobal.com/ratings This report does not constitute a rating action. Jan. 12, 2022 51
CLOs remained the highest-issuance sector in 2021, at more than €38 billion. We believe CLO volumes could continue at a heightened level of about €35 billion in 2022, given the growing number of managers active in the European market and continued strength in leveraged loan
originations, fueled by M&A activity. These issuance figures do not include CLO refinancings and resets, which accounted for a record €60 billion in additional activity in 2021. For most of the year, CLO liability spreads remained tighter than in 2019 and 2020, so managers had strong incentives to refinance or reset many transactions that exited their noncall periods. Volumes were inflated
because many 2020 vintage CLOs were structured with short noncall periods in anticipation of a trend toward lower financing costs, which subsequently materialized. We expect CLO refinancing and reset activity to slow but continue in 2022.
Refinancing could also be a significant driver of RMBS issuance growth in the year ahead. We estimate that transactions with outstanding balances of almost €30 billion-equivalent, predominantly in the U.K., have first call dates in 2022. If most of these transactions are called
and refinanced through the securitization market, this will provide a strong fillip to overall volumes. That said, just five transactions account for half of this figure, so the effect on issuance could depend on seller motivations and market conditions around call dates.
Underlying lending to households and nonfinancial corporates in the U.K. and the eurozone has been resilient over the past few years, with low-single-digit annual growth rates, which even rose at the height of the pandemic. All else being equal, this would support net issuance of wholesale
funding, although securitization's share of the overall funding mix always also depends on the availability and cost of issuers' alternatives.
Bank originators in particular have benefited from an embarrassment of riches when it comes to funding options. As part of their monetary policy response to the COVID-19 pandemic, the European Central Bank (ECB) and the Bank of England revived liquidity schemes to provide credit institutions with cheap term funding. Banks have also seen strong deposit growth, fueled by a
slowdown in household and corporate spending. Together, these effects sharply reduced banks' incentives to issue wholesale funding, stifling bank-originated structured finance supply, which accounted for an all-time low of 18% of total issuance in 2021.
However, this trend could begin to reverse in 2022 as central banks scale back support and pandemic-driven borrower behavior normalizes. In the U.K., financial institutions have taken £200 billion of four-year funding from the Bank of England's TFSME facility, but this closed to new
drawdowns in October 2021. Given the scale, banks will have to carefully manage a gradual refinancing of this debt, potentially including a staged return to wholesale debt markets. In the eurozone, the ECB has yet to announce the timing and details for any extension of its targeted longer-term refinancing operations (TLTROs), following the last scheduled drawdown under the
current scheme in mid-December 2021. Tighter terms on future operations could increase the relative appeal of a return to private sector funding markets for some eurozone banks.
While these aspects of monetary policy normalization could increase structured finance supply, ongoing quantitative easing should also continue to support demand for eligible securitizations. For example, we don't expect the ECB to taper its main asset purchase program before the end of 2023. At the same time, inflationary pressures and recent interest rate volatility could bolster
private sector demand for European securitized credit. In this context, the sector's combination of floating rates and yield pickup could appeal to a broader range of fixed income investors seeking to lower portfolio duration, subject to mandate constraints.
Focus on environmental, social, and governance (ESG) considerations in European structured finance increased in 2021. Against a backdrop of wider regulatory developments on disclosure and issuance standards, more originators than ever before came to market with securitizations
labelled green or social. Across the ABS, CMBS, and RMBS sectors, we saw eight such transactions during the year, accounting for more than 4% of total issuance. We expect the importance of sustainable finance features to grow further in 2022. However, issuance momentum could be hampered by slow origination of new sustainable collateral and the rate at
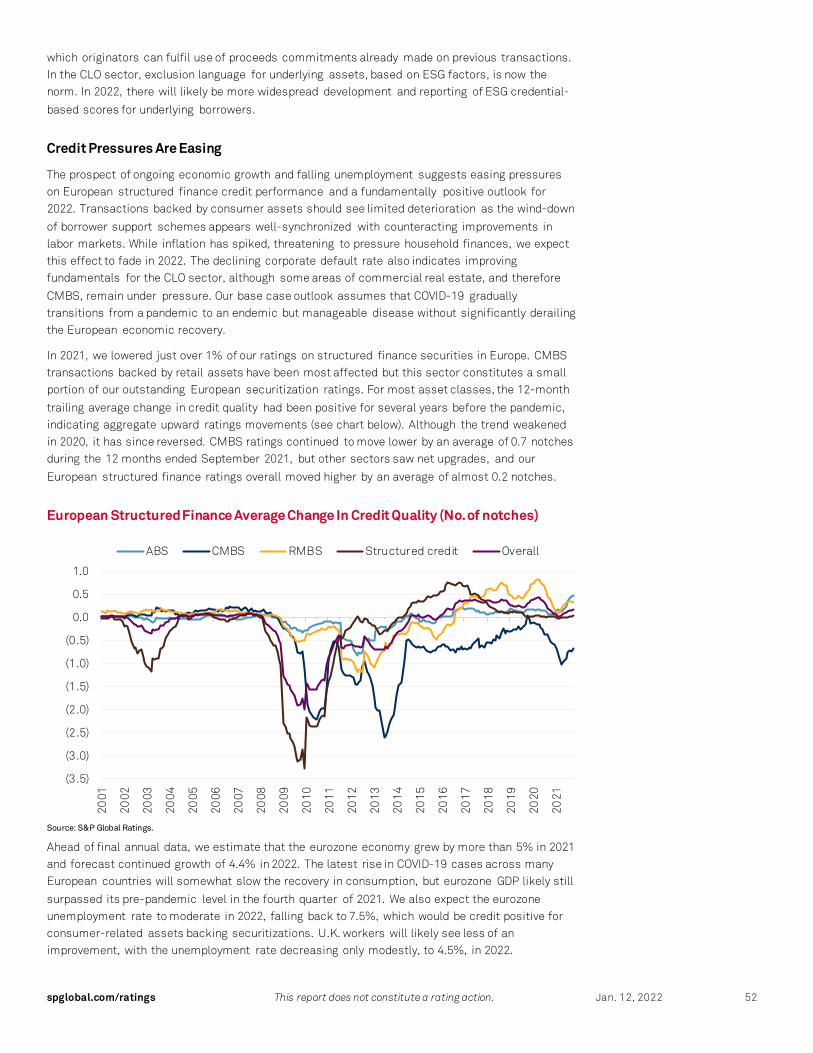
spglobal.com/ratings This report does not constitute a rating action. Jan. 12, 2022 52
which originators can fulfil use of proceeds commitments already made on previous transactions. In the CLO sector, exclusion language for underlying assets, based on ESG factors, is now the norm. In 2022, there will likely be more widespread development and reporting of ESG credential-
based scores for underlying borrowers.
Credit Pressures Are Easing
The prospect of ongoing economic growth and falling unemployment suggests easing pressures on European structured finance credit performance and a fundamentally positive outlook for 2022. Transactions backed by consumer assets should see limited deterioration as the wind-down
of borrower support schemes appears well-synchronized with counteracting improvements in labor markets. While inflation has spiked, threatening to pressure household finances, we expect this effect to fade in 2022. The declining corporate default rate also indicates improving fundamentals for the CLO sector, although some areas of commercial real estate, and therefore
CMBS, remain under pressure. Our base case outlook assumes that COVID-19 gradually transitions from a pandemic to an endemic but manageable disease without significantly derailing the European economic recovery.
In 2021, we lowered just over 1% of our ratings on structured finance securities in Europe. CMBS transactions backed by retail assets have been most affected but this sector constitutes a small portion of our outstanding European securitization ratings. For most asset classes, the 12-month
trailing average change in credit quality had been positive for several years before the pandemic, indicating aggregate upward ratings movements (see chart below). Although the trend weakened in 2020, it has since reversed. CMBS ratings continued to move lower by an average of 0.7 notches during the 12 months ended September 2021, but other sectors saw net upgrades, and our
European structured finance ratings overall moved higher by an average of almost 0.2 notches.
European Structured Finance Average Change In Credit Quality (No. of notches)
Source: S&P Global Ratings.
Ahead of final annual data, we estimate that the eurozone economy grew by more than 5% in 2021 and forecast continued growth of 4.4% in 2022. The latest rise in COVID-19 cases across many European countries will somewhat slow the recovery in consumption, but eurozone GDP likely still
surpassed its pre-pandemic level in the fourth quarter of 2021. We also expect the eurozone unemployment rate to moderate in 2022, falling back to 7.5%, which would be credit positive for consumer-related assets backing securitizations. U.K. workers will likely see less of an improvement, with the unemployment rate decreasing only modestly, to 4.5%, in 2022.
(3.5)
(3.0)
(2.5)
(2.0)
(1.5)
(1.0)
(0.5)
0.0
0.5
1.0
2001
2002
2003
2004
2005
2006
2007
2008
2009
2010
2011
2012
2013
2014
2015
2016
2017
2018
2019
2020
2021
ABS CMBS RMBS Structured credit Overall
spglobal.com/ratings This report does not constitute a rating action. Jan. 12, 2022 53
For sectors backed by consumer lending, the underlying obligors have benefited from both income support through furlough schemes and reduced outgoings through payment holidays. The negative effect of these support schemes ending for marginal borrowers could gradually feed
through to securitization collateral performance in 2022, despite falling unemployment. That said, we have seen little evidence of deterioration so far, and servicers generally seem well-equipped to manage these cases.
Inflationary pressures are another concern for household finances, with headline figures in late 2021 reaching highs not seen in a decade for both the U.K. and eurozone. However, this effect was due to likely transient mismatches between supply and demand as economies re-opened and
one-off distortions introduced by the end of pandemic-related tax cuts. We therefore expect inflation to slow going into 2022 as these temporary drivers begin to fade. By contrast, house price inflation, which has also been robust, looks set to continue in most European countries. This would be credit positive for outstanding residential mortgage pools.
For corporate-backed transactions, there remains some downside risk to ratings if credit distress among underlying borrowers rises, although this seems increasingly likely to be sector-specific.
For example, parts of the tourism industry will likely take more time to recover to pre-pandemic activity levels than some other sectors, given ongoing precautions over international travel and potentially longer-term changes in consumer behavior.
However, the overall picture is more positive than it was a year ago. For example, we forecast the annualized default rate for European speculative-grade corporates could fall to 2.5% by September 2022 from a recent peak of more than 6%. The impact for European CLO ratings will
partly depend on how well collateral managers continue to mitigate credit deterioration through trading activity.
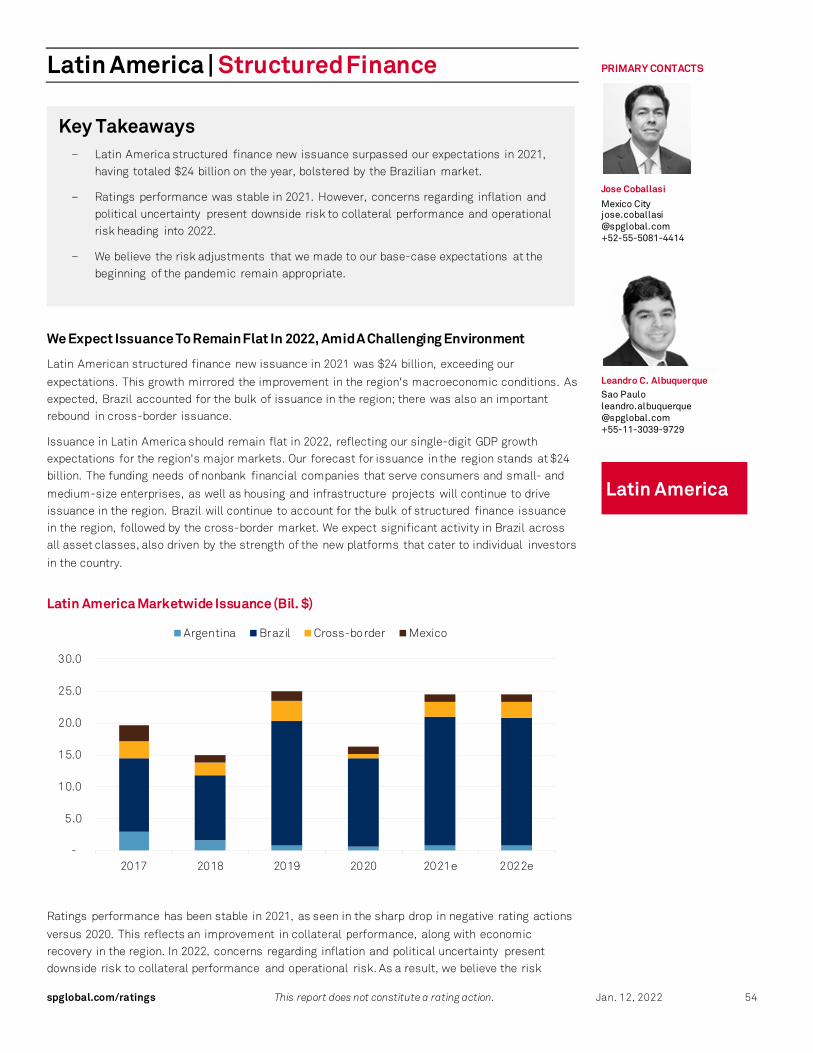
spglobal.com/ratings This report does not constitute a rating action. Jan. 12, 2022 54
Latin America | Structured Finance
Key Takeaways – Latin America structured finance new issuance surpassed our expectations in 2021,
having totaled $24 billion on the year, bolstered by the Brazilian market.
– Ratings performance was stable in 2021. However, concerns regarding inflation and political uncertainty present downside risk to collateral performance and operational risk heading into 2022.
– We believe the risk adjustments that we made to our base-case expectations at the beginning of the pandemic remain appropriate.
We Expect Issuance To Remain Flat In 2022, Amid A Challenging Environment
Latin American structured finance new issuance in 2021 was $24 billion, exceeding our
expectations. This growth mirrored the improvement in the region's macroeconomic conditions. As expected, Brazil accounted for the bulk of issuance in the region; there was also an important rebound in cross-border issuance.
Issuance in Latin America should remain flat in 2022, reflecting our single-digit GDP growth expectations for the region's major markets. Our forecast for issuance in the region stands at $24 billion. The funding needs of nonbank financial companies that serve consumers and small- and
medium-size enterprises, as well as housing and infrastructure projects will continue to drive issuance in the region. Brazil will continue to account for the bulk of structured finance issuance in the region, followed by the cross-border market. We expect significant activity in Brazil across all asset classes, also driven by the strength of the new platforms that cater to individual investors
in the country.
Latin America Marketwide Issuance (Bil. $)
Ratings performance has been stable in 2021, as seen in the sharp drop in negative rating actions
versus 2020. This reflects an improvement in collateral performance, along with economic recovery in the region. In 2022, concerns regarding inflation and political uncertainty present downside risk to collateral performance and operational risk. As a result, we believe the risk
-
5.0
10.0
15.0
20.0
25.0
30.0
2017 2018 2019 2020 2021e 2022e
Argentina Brazil Cross-border Mexico
PRIMARY CONTACTS
Jose Coballasi
Mexico City jose.coballasi @spglobal.com +52-55-5081-4414
Leandro C. Albuquerque Sao Paulo leandro.albuquerque @spglobal.com +55-11-3039-9729
Latin America

spglobal.com/ratings This report does not constitute a rating action. Jan. 12, 2022 55
adjustments that we made to our base case expectations at the beginning of the pandemic remain appropriate, particularly in the ABS asset classes. Finally, the omicron variant is also an additional consideration that we shall incorporate into our analysis, particularly when we evaluate the
liquidity position of rated transactions, given the potential for new mobility restrictions.
spglobal.com/ratings This report does not constitute a rating action. Jan. 12, 2022 56
Australia | Structured Finance
Key Takeaways – We expect new issuance levels to remain flat or be slightly up in 2022 given the record
levels of issuance in 2021.
– Credit performance across all structured finance asset classes will likely be robust in 2022, given the historically low interest rate environment and strong jobs market.
– Rising interest rates may create a credit headwind for new borrowers with higher debt-to-income levels, but we expect most borrowers to be able to absorb a moderate increase in rates.
Australian structured finance new issuance continued to gather pace over the course of 2021. The first half of the year was mostly a nonbank affair, with the Reserve Bank of Australia’s Term
Funding Facility providing a cheap funding alternative to banks. The expiration of this facility in June 2021 saw banks re-emerge from the new issuance sidelines, resulting in a busy second half of the year. Issuance was up 73% year on year from $US22 billion in November 2020 to over $US38 billion in November 2021.
The majority of issuance was for RMBS, but ABS increased noticeably in 2021, with several new deals coming to market. The booming property market has underpinned strong demand for
housing credit, bolstering demand for RMBS and increasing its appeal to new investors. Offshore interest in RMBS has also grown during the pandemic. This is because of the general resilience of the sector to the pandemic and the global search for yield. With more issuance coming to market, spreads started to drift wider in the second half of the year. Consumer lending has also had a
pandemic boost, with several new issuers coming to market in 2021, including buy now pay later (BNPL) issuers, those dealing with solar receivables, and the originator of the first unsecured SME securitization. Given the record levels of issuance in 2021, we expect Australian structured finance to be more stable in 2022. We anticipate new issuance levels will remain flat or be slightly
up on 2021 levels.
Credit performance across all structured finance asset classes should be robust in 2022, given the
historically low interest rate environment and strong jobs market. Many borrowers adopted a cautionary approach to financial management in lockdowns, building up repayment buffers and adding further resilience to household finances. Rising interest rates are a credit headwind for new borrowers with higher debt-to-income (DTI) levels. This may require some borrowers to make
spending readjustments in lieu of higher repayment costs. We expect lenders to work with more highly leveraged borrowers, and borrowers rolling onto variable rates from ultralow fixed rate mortgage rates to mitigate the risk of payment shock. In our view, most borrowers will be able to absorb a moderate increase in interest rates however, given the inclusion of interest-rate buffers
in debt serviceability assessments.
Recent lockdowns have had minimal impact on collateral performance, with the levels of loans
under mortgage deferral arrangements following the most recent lockdowns in Victoria and New South Wales less than 1.0% across the wider RMBS sector. The combined effect of government income support measures, low interest rates, and a temporary mortgage holiday reprieve from banks, has helped many borrowers impacted by lockdowns to stay afloat financially. Rising,
broad-based property prices have also helped borrowers self-manage their way out of arrears by improving their refinancing prospects or voluntarily selling their properties to unlock equity and cashflow.
Primary Contacts
Erin Kitson Melbourne erin.kitson @spglobal.com +61-3-9631-2166
Narelle Coneybeare
Melbourne narelle.coneybeare @spglobal.com +61-2-9255-9838
Key Performance Metrics
Australia
0.99% 0.95%
0.79%
0 %
0 %
0 %
1 %
1 %
1 %
1 %
Prime RMBS SPIN
JAN
21
MAY
21
OCT
21

spglobal.com/ratings This report does not constitute a rating action. Jan. 12, 2022 57
China | Structured Finance
Key Takeaways – We expect modest year-over-year growth of 3% for China structured finance issuance
in 2022.
– Much of the growth will likely be made up of increased corporate risk-related ABS and auto loan ABS offerings, offset by the RMBS sector amid regulatory shifts and an expected drop in residential sales.
– Collateral performance of our rated transactions is expected to remain stable.
Issuance
We expect Chinese structured finance issuance volume to increase about 3% to RMB3.2 trillion (US$ 500 billion equivalent) in 2022 (see chart). Corporate risk-related sectors are expected to exhibit growth in the mid-single digits, in part reflecting our economic growth forecast of 4.9% in 2022 but offset by a strained property sector. RMBS volumes will likely drop moderately, largely
due to our forecast 10% drop in residential sales in 2022 and the uncertainty of regulatory shifts. We expect flat-to-modest growth in auto loan ABS, supported by projected 3%-5% growth in light vehicle sales for China in 2022 and a steady auto loan penetration rate. That said, the auto loan ABS issuance volume could be offset by increasing use of facilities that employ revolving
structures.
Securitization Issuance Growth Decelerated
Note: Including issuance under the credit asset securitization (CAS) scheme managed by the China Banking and Insurance Regulatory Commission (CBIRC) and the People's Bank of China (PBOC), the securitization scheme managed by the China Securities Regulatory Commission (CSRC), and the asset-backed notes (ABN) scheme managed by China’s National Association of Financial Market Institutional Investors (NAFMII). Source: Chinabond, WIND; compiled by S&P Global Ratings. Copyright © 2021 by Standard & Poor’s Financial Services LLC. All rights reserved.
PRIMARY CONTACTS
Jerry Fang
Hong Kong Jerry.fang @spglobal.com +852-2533-3518
China
0%
10%
20%
30%
40%
50%
60%
70%
0
500
1,000
1,500
2,000
2,500
3,000
3,500
2012 2013 2014 2015 2016 2017 2018 2019 2020 2021
Bil
. RM
B
Annual issuance (left scale) Yoy change (right scale)

spglobal.com/ratings This report does not constitute a rating action. Jan. 12, 2022 58
Collateral Performance
Our rated Chinese auto loan ABS and RMBS continue to demonstrate strong and stable credit
metrics. These include low and stable delinquency rates since first-quarter 2020. This is partly because of favorable loan attributes such as low loan-to-value ratios.
Rating Outlook
We expect our ratings outlook on Chinese auto loan ABS and RMBS to remain stable for 'AAA'
rated tranches and stable to positive for other investment-grade ('AA+' through 'BBB-') rated classes. This is based on our expectation for stable collateral performance, increased credit enhancement support for most of the static pool-backed deals because the rated notes amortize over time. We also expect our ratings outlook on Chinese credit card ABS to remain stable as we
just assigned ratings in last December.
Sector Highlights
Green ABS emerged, in part thanks to supportive government policies in 2021. Green ABS issuance is likely to remain limited in 2022, although we believe it will pick up in the coming
decade. In the RMBS sector, we don't expect our rated Chinese RMBS to be affected by the likely default of certain Chinese developers in 2022. However, it is worth watching how the unfolding events will affect property sales, property price movements, trends for mortgage loan origination, and regulatory moves. All variables are critical for the Chinese RMBS sector. In credit card ABS, we
assigned our first ratings on a credit card ABS transaction from China in 2021; this was also a first for an international rating agency. We expect such issuance to remain opportunistic in 2022.

spglobal.com/ratings This report does not constitute a rating action. Jan. 12, 2022 59
Japan | Structured Finance
Key Takeaways – We anticipate a mild increase in new issuance volume of Japanese structured finance
in 2022, led by ABS and RMBS issuance, which accounted for 95% of offerings in 2021.
– Tempering this expectation for a volume increase is the risk of a new COVID variant leading to a constraint of economic activity, which could impair issuance levels.
– We expect the performance of loans backing Japanese structured finance transactions to remain generally stable in 2022.
In 2022, we expect a mild increase in new issuance volume of Japanese structured finance, to approximately US$63 billion. Issuance levels returned to a mild upward trend in 2021, as was the pattern in the years before the pandemic.
ABS and RMBS dominates structured finance issuance in Japan. It continued in 2021 to make up more than 95% of total issuance. Within the ABS sector, the major sub-asset class was consumer
loans such as auto loan ABS and mobile phone installment ABS. Within the RMBS sector, issuance from Japan Housing Finance Agency accounted for about a quarter of overall Japanese structured finance issuance in 2021. There was limited issuance from CMBS and CDOs. We expect these trends to continue in 2022. COVID-19 infection rates in Japan have decreased significantly since
autumn 2021 and remained low until around the end of the year. However, the situation is fluid as infections have been increasing from the beginning of 2022. If a new variant leads to stringent constraint of economic activity in Japan, this may push down issuance levels for Japanese Structured Finance in 2022.
Japan Securitization Issuance (Bil. $)
Asset
type 2020 2021 2022F
ABS 30 35 36
RMBS 28 24 25
ABS—Asset-backed securities. RMBS—Residential mortgage-backed securities. F—Full-year forecast. Source: S&P Global Ratings. Copyright © 2022 by Standard & Poor’s Financial Services LLC. All rights reserved.
We expect the performance of loans backing Japanese structured finance transactions to be generally stable in 2022. In 2021, the performance of these loans was relatively stable even under the economic stress related to the Japanese government’s multiple declarations of states of
emergency due to the pandemic. We expect the unemployment rate in Japan will remain low, at less than 3% in 2022 and the following couple of years. We expect low unemployment and low interest rates will underpin stable performance of loans backing Japanese structured finance in 2022.
PRIMARY CONTACTS
Yuji Hashimoto Tokyo yuji.hashimoto @spglobal.com +81-3-4550-8275J
Japan

spglobal.com/ratings This report does not constitute a rating action. Jan. 12, 2022 60
Investor Contact Kieran McShane
New York +1-212-438-5872 Kieran.mcshane @spglobal.com
Media Contact Orla Obrien
Boston +1-857-407-8559 Orla.obrien @spglobal.com
This report does not constitute a rating action.

spglobal.com/ratings This report does not constitute a rating action. Jan. 12, 2022 61
Copyright © 2022 by Standard & Poor’s Financial Services LLC. All rights reserved. No content (including ratings, credit-related analyses and data, valuations, model, software or other application or output therefrom) or any part thereof (Content) may be modified, reverse engineered, reproduced or distributed in any form by any means, or stored in a database or retrieval system, without the prior written permission of Standard & Poor’s Financial Services LLC or its affiliates (collectively, S&P). The Content shall not be used for any unlawful or unauthorized purposes. S&P and any third-party providers, as well as their directors, officers, shareholders, employees or agents (collectively S&P Parties) do not guarantee the accuracy, completeness, timeliness or availability of the Content. S&P Parties are not responsible for any errors or omissions (negligent or otherwise), regardless of the cause, for the results obtained from the use of the Content, or for the security or maintenance of any data input by the user. The Content is provided on an “as is” basis. S&P PARTIES DISCLAIM ANY AND ALL EXPRESS OR IMPLIED WARRANTIES, INCLUDING, BUT NOT LIMITED TO, ANY WARRANTIES OF MERCHANTABILITY OR FITNESS FOR A PARTICULAR PURPOSE OR USE, FREEDOM FROM BUGS, SOFTWARE ERRORS OR DEFECTS, THAT THE CONTENT’S FUNCTIONING WILL BE UNINTERRUPTED OR THAT THE CONTENT WILL OPERATE WITH ANY SOFTWARE OR HARDWARE CONFIGURATION. In no event shall S&P Parties be liable to any party for any direct, indirect, incidental, exemplary, compensatory, punitive, special or consequential damages, costs, expenses, legal fees, or losses (including, without limitation, lost income or lost profits and opportunity costs or losses caused by negligence) in connection with any use of the Content even if advised of the possibility of such damages. Credit-related and other analyses, including ratings, and statements in the Content are statements of opinion as of the date they are expressed and not statements of fact. S&P’s opinions, analyses and rating acknowledgment decisions (described below) are not recommendations to purchase, hold, or sell any securities or to make any investment decisions, and do not address the suitability of any security. S&P assumes no obligation to update the Content following publication in any form or format. The Content should not be relied on and is not a substitute for the skill, judgment and experience of the user, its management, employees, advisors and/or clients when making investment and other business decisions. S&P does not act as a fiduciary or an investment advisor except where registered as such. While S&P has obtained information from sources it believes to be reliable, S&P does not perform an audit and undertakes no duty of due diligence or independent verification of any information it receives. Rating-related publications may be published for a variety of reasons that are not necessarily dependent on action by rating committees, including, but not limited to, the publication of a periodic update on a credit rating and related analyses. To the extent that regulatory authorities allow a rating agency to acknowledge in one jurisdiction a rating issued in another jurisdiction for certain regulatory purposes, S&P reserves the right to assign, withdraw or suspend such acknowledgement at any time and in its sole discretion. S&P Parties disclaim any duty whatsoever arising out of the assignment, withdrawal or suspension of an acknowledgment as well as any liability for any damage alleged to have been suffered on account thereof. S&P keeps certain activities of its business units separate from each other in order to preserve the independence and objectivity of their respective activities. As a result, certain business units of S&P may have information that is not available to other S&P business units. S&P has established policies and procedures to maintain the confidentiality of certain non-public information received in connection with each analytical process. S&P may receive compensation for its ratings and certain analyses, normally from issuers or underwriters of securities or from obligors. S&P reserves the right to disseminate its opinions and analyses. S&P's public ratings and analyses are made available on its Web sites, www.standardandpoors.com (free of charge), and www.ratingsdirect.com and www.spcapitaliq.com (subscription) and may be distributed through other means, including via S&P publications and third-party redistributors. Additional information about our ratings fees is available at www.standardandpoors.com/usratingsfees. Australia: S&P Global Ratings Australia Pty Ltd holds Australian financial services license number 337565 under the Corporations Act 2001. S&P Global Ratings' credit ratings and related research are not intended for and must not be distributed to any person in Australia other than a wholesale client (as defined in Chapter 7 of the Corporations Act). STANDARD & POOR’S, S&P and RATINGSDIRECT are registered trademarks of Standard & Poor’s Financial Services LLC.