Agricultural Income and Finance Outlook
54
United States Department of Agriculture www.ers.usda.gov A Report from the Economic Research Service Abstract Net farm income is forecast at $81.6 billion in 2010, up 31 percent from 2009 and 26 percent higher than the 10-year average of $64.8 billion for 2000 to 2009. Net cash income at $92.5 billion would be a nominal record, 2.3 percent above the prior record attained in 2008. Net value added is expected to increase by almost $20 billion in 2010 to $132.0 billion. Production expenses are forecast to rise moderately, reversing the signif cant declines seen in 2009. However, nominal total production expenses in 2010 and 2009 still constitute the second- and third-highest totals ever. Farm business equity (assets minus debt) is expected to rise nearly 4 percent, largely due to an expected 3-percent increase in the value of farm business real estate and a 2-percent decline in farm business debt. The farm business sector’s debt-to-asset ratio is expected to decline to 11.3 percent and the debt-to-equity ratio is expected to decline to 12.8 percent in 2010, indicating that the farm sector’s solvency position remains strong. Average net cash income for farm businesses is expected to increase throughout much of the country in 2010. The expected strong recovery in dairy, hog, and cattle receipts will result in much higher average net cash incomes for farm businesses in the Northern Crescent, Basin and Range, and Prairie Gateway. In the Northern Crescent, where dairy is a prominent commodity, average net cash income for farm businesses is forecast to increase by over 58 percent. Incomes are expected to be almost 50 percent higher in 2010 for farm businesses in the Basin and Range region where cattle are an important commodity, a region that showed the largest percentage decline in average net cash income in 2009. Average farm household income of principal farm operators—from farm and off-farm sources—is forecast to be $83,194 in 2010, up 7.8 percent from 2009. This contrasts with the change for the 2008 to 2009 period, when average farm household income declined by 3.3 percent. Timothy Park, Mary Ahearn, Ted Covey, Kenneth Erickson, J. Michael Harris, Todd Kuethe, Chris McGath, Mitch Morehart, Andrew Morton, Stephen Vogel, Jeremy Weber, Robert Williams, and Shawn Wozniak Agricultural Income and Finance Outlook AIS-90 December 2010 Approved by USDA’s World Agricultural Outlook Board
-
Upload
independent -
Category
Documents
-
view
1 -
download
0
Transcript of Agricultural Income and Finance Outlook

United States Department of Agriculture
www.ers.usda.gov
A Report from the Economic Research Service
Abstract
Net farm income is forecast at $81.6 billion in 2010, up 31 percent from 2009 and 26 percent higher than the 10-year average of $64.8 billion for 2000 to 2009. Net cash income at $92.5 billion would be a nominal record, 2.3 percent above the prior record attained in 2008. Net value added is expected to increase by almost $20 billion in 2010 to $132.0 billion. Production expenses are forecast to rise moderately, reversing the signif cant declines seen in 2009. However, nominal total production expenses in 2010 and 2009 still constitute the second- and third-highest totals ever. Farm business equity (assets minus debt) is expected to rise nearly 4 percent, largely due to an expected 3-percent increase in the value of farm business real estate and a 2-percent decline in farm business debt. The farm business sector’s debt-to-asset ratio is expected to decline to 11.3 percent and the debt-to-equity ratio is expected to decline to 12.8 percent in 2010, indicating that the farm sector’s solvency position remains strong.
Average net cash income for farm businesses is expected to increase throughout much of the country in 2010. The expected strong recovery in dairy, hog, and cattle receipts will result in much higher average net cash incomes for farm businesses in the Northern Crescent, Basin and Range, and Prairie Gateway. In the Northern Crescent, where dairy is a prominent commodity, average net cash income for farm businesses is forecast to increase by over 58 percent. Incomes are expected to be almost 50 percent higher in 2010 for farm businesses in the Basin and Range region where cattle are an important commodity, a region that showed the largest percentage decline in average net cash income in 2009. Average farm household income of principal farm operators—from farm and off-farm sources—is forecast to be $83,194 in 2010, up 7.8 percent from 2009. This contrasts with the change for the 2008 to 2009 period, when average farm household income declined by 3.3 percent.
Timothy Park, Mary Ahearn, Ted Covey, Kenneth Erickson, J. Michael Harris, Todd Kuethe, Chris McGath, Mitch Morehart, Andrew Morton, Stephen Vogel, Jeremy Weber, Robert Williams, and Shawn Wozniak
Agricultural Income andFinance Outlook
AIS-90
December 2010
Approved by USDA’s World Agricultural
Outlook Board

iiAgricultural Income and Finance Outlook / AIS-90 / December 2010
Economic Research Service/USDA
Acknowledgments
The authors would like to thank David Stallings of the World Agricultural Outlook Board and ERS colleagues Robert Hoppe, Erik O’Donoghue, and Pat Sullivan for their reviews. Thanks also to our editor, Priscilla Smith; to Wynnice Pointer-Napper for graphic layout and design; and to Chengxia You for map design.

iiiAgricultural Income and Finance Outlook / AIS-90 / December 2010
Economic Research Service/USDA
Contents
Chapter 1Net Farm Income Forecast Up 31 Percent in 2010 . . . . . . . . . . . . . . . . . . 2 Livestock and Cotton Receipts Expected To Bounce Back in 2010 . . . . . 3 Crop Farms To Contribute 64 Percent of U.S. Agriculture’s Net Value Added in 2010. . . . . . . . . . . . . . . . . . . . . . . . . . . . . . . . . . . . 4 Government Payments Forecast at $12.4 Billion . . . . . . . . . . . . . . . . . . 12 Spatial Concentration and Program Coverage Overlap of Direct Payments and Crop Insurance Subsidies . . . . . . . . . . . . . . . . . 13 Why ARMS and Sector Accounts Estimates of Government Payments Differ . . . . . . . . . . . . . . . . . . . . . . . . . . . . . . . 15 Moderate Rise Expected for U.S. Farm Production Expenses . . . . . . . . 16
Chapter 2Farm Household Income, Net Worth, and Well-Being . . . . . . . . . . . . . . 20 Trends in Farm Household Income and Net Worth. . . . . . . . . . . . . . . . . 20 Farm Household Net Worth . . . . . . . . . . . . . . . . . . . . . . . . . . . . . . . . . . 24 Household Income Sources and Financial Portfolios, by Farm Size . . . 24 Farm Households Compared With the U.S. Population . . . . . . . . . . . . . 27
Chapter 3Earnings Differ Among Farm Businesses and Enterprises . . . . . . . . . . 28
Chapter 4Farm Business Balance Sheet and Financial Performance . . . . . . . . . . 32 Unused Debt Repayment Capacity Expected To Increase in 2010 . . . . . 33 Net Cash Flow . . . . . . . . . . . . . . . . . . . . . . . . . . . . . . . . . . . . . . . . . . . . 34 Pr of tability of Farm Sector Investments Rising . . . . . . . . . . . . . . . . . . . 36 Farms’ Net income and Solvency Position . . . . . . . . . . . . . . . . . . . . . . . 37
Special ArticleLow Levels of At-Risk Farm Business Collateral Security and Debt . . . . . . . . . . . . . . . . . . . . . . . . . . . . . . . . . . . . . . . . . . . . . . . . . 39 Fixed vs. Variable Rate Loans . . . . . . . . . . . . . . . . . . . . . . . . . . . . . . . . 41 Potential Impact of Reductions in the Market Value of Farm Assets on Farm Business Debt-to-Asset Ratios . . . . . . . . . . . 42 Potential Impacts of Changes in Interest Rates on Debt At Risk . . . . . . 43
References . . . . . . . . . . . . . . . . . . . . . . . . . . . . . . . . . . . . . . . . . . . . . . . . . . 45
Appendix: Forecast Methods and Accuracy . . . . . . . . . . . . . . . . . . . . . . 46
Information Contacts. . . . . . . . . . . . . . . . . . . . . . . . . . . . . . . . . . . . . . . . . 50

1Agricultural Income and Finance Outlook / AIS-90 / December 2010
Economic Research Service/USDA
Introduction
In this report, we compare the farm business and farm household outlook in December 2009 with the December 2010 outlook and discuss the key factors underlying the 2010 income and f nancial outlook. Chapter 1 discusses the farm income outlook and summarizes important drivers inf uencing the earnings of U.S. farm operations (value of production, direct Government payments, other sources of farm income, production expenses, and payments to stakeholders).
Chapter 2 discusses farm household income, net worth, and well-being. Average farm operator household income is forecast to be $83,194 in 2010, up 7.8 percent from the 2009 estimate. Current income, however, can be an incomplete indicator of the well-being of farm operator households. Equity, or net worth, is more useful as an indicator of longer term performance of the farm household. In 2009, the average net worth of farm operator households was $915,019. Although operator households typically derive most of their wealth from farm assets, many farm households have a variety of nonfarm investments, including f nancial investments and nonfarm real estate.
Chapter 3 presents the farm business income forecasts. U.S. agriculture is a diverse sector represented by a complex mix of business enterprises. Income forecasts highlight the diversity of f nancial outcomes and are based on applying sector level forecasts and receipts and expenses to the latest Agricultural Resource Management Survey (ARMS) data. ARMS is conducted by USDA’s National Agricultural Statistics Service (NASS) in conjunction with the Economic Research Service (ERS). Average net cash income for farm businesses (intermediate- and commercial-sized operations) is projected to be $79,200 in 2010, 30.7 percent above the 2009 estimate of $60,600.
Chapter 4 covers the market fundamental affecting farm asset values. Farm sector debt is expected to fall to about $240 billion in 2010 with real-estate debt dropping about 2 percent and non-real-estate debt dropping by about 3 percent. The favorable f nancial position of the U.S. agricultural sector is highlighted by two related indicators. First, the share of farms classif ed as vulnerable—high debt burden (over 40 percent of assets) and negative net income—dropped in this decade to the lowest levels that ERS has recorded. By 2009, only 5 percent of farms were vulnerable, the result of expanding income levels and asset values growing faster than debt. Second, entering 2010, over 60 percent of U.S. farmers reported both positive income and relatively low farm debt and were classif ed as being in a favorable f nancial position.
The Special Article assesses the f nancial performance and solvency of farm businesses in the face of increased f nancial and commodity market volatility. Agricultural debt at risk remains relatively low but early warning indicators on delinquent and nonperforming loans held by insured commercial banks show a rise in potential loan defaults.
In 2009, livestock farms held the largest share of debt at risk—56 percent.Even so, if interest rates should increase in the near future, ARMS data suggest only a modest impact on the number of f nancially stressed farms.

2Agricultural Income and Finance Outlook / AIS-90 / December 2010
Economic Research Service/USDA
CHAPTER 1
Net Farm Income Forecast Up 31 Percent in 2010
• Net farm income is forecast at $ 81.6 billion in 2010, up 31 percent from 2009 and 26 p ercent higher than the 10-year average of $64.8 billion for 2000 to 2009.
• Farm operations with over $1 million in 2010 sales receive almost 55 percent of U.S. agriculture’s net farm income and account for over 60 percent of U.S. l ivestock value of production while ma king up just over 2 percent of U.S. farm operations.
• Production e xpenses a re f orecast to r ise m oderately, re versing t he signif cant declines seen in 2009.
Net farm income is forecast at $81.6 billion in 2010, up 31 percent from 2009 and 26 percent higher than the 10-year average of $64.8 billion for 2000 to 2009. Net cash income at $92.5 billion would be a nominal record, 2.3 percent above the prior record attained in 2008. Net value added is expected to increase by almost $20 billion in 2010 to $132.0 billion. The net value added of agriculture to the U.S. economy in inf ation-adjusted terms reached its two highest levels since the mid-1970s in 2004 and 2008. Inf ation-adjusted net cash income has reached levels not seen since the mid-1970s.Real net cash income has exceeded $80 billion three times from 2000 to 2009. The mid-1970s was the last comparable period when U.S. farming enjoyed multiple years of sustained levels of high output and income.
The 2000 to 2009 decade was characterized by high and persistent levels of volatility in agricultural commodity and input (feed, fuel, and fertilizer) markets. This volatility is ref ected in year-to-year shifts in farm income during the decade. Net farm income increased in 6 of the 10 years, posting an average increase of 26.6 percent in the years with increases in farm income, and falling an average of 23.5 percent in the 4 years (2002, 2005, 2006, and 2009) when net farm income decreased.
Net cash income includes only cash receipts and expenses and is generally less variable than net farm income. Farmers can manage the timing of crop and livestock sales and of the purchase of inputs to reduce the variability in their net cash income. Nonetheless, during 2000-09, farmers’ net cash income showed a signif cant degree of variability. In the 6 years when net cash income rose, the average increase was 10.4 percent. In years when net cash income decreased, the average decrease was 15.9 percent.
The values of both crop and livestock production have trended steadily upward since 1970. However, the year-to-year movements in the two measures have not always been synchronized. In 2010, the percentage increase in the value of livestock production (16.6 percent) is expected to be more than f ve times that of crop production (3.1 percent). A primary factor driving the forecast for higher farm income in 2010 is the projected increase in cash receipts for all the livestock categories, led by double-digit growth in meat animals and dairy products. Net value added and net farm income have followed the value of commodity production over both the long term and in

3Agricultural Income and Finance Outlook / AIS-90 / December 2010
Economic Research Service/USDA
year-to-year f uctuations. Because farmers typically do not vary their produc-tion mix dramatically from year to year, purchases of production inputs have been relatively stable. Purchased inputs have been more stable than crop and livestock value of production, except for 2007-08, when they had double-digit increases. Increases in expenses for purchased inputs are projected to show an increase of 2.5 percent in 2010 after posting a 6.4-percent decline in 2009.
The recovery in farm income shows a change in the pattern observed in 2009. The declines in all three measures of U.S. farm income that occurred in 2009 were driven by declines in annual crop cash receipts and declines in cash receipts for all the livestock categories. The 2009 fall in farm income was attributable mostly to large declines in crop and livestock prices at the farm level.
Livestock and Cotton Receipts Expected To Bounce Back in 2010
Dairy receipts are expected to increase by almost a third in 2010, as milk prices received by dairy farmers are projected to increase more than $3 per hundredweight (cwt). Cattle and calf cash receipts are expected to increase 13 percent in 2010. Hog cash receipts are expected to increase 26 percent over 2009 cash receipts due to stable pork demand and lower year-over-year pork production. Broiler cash receipts are expected to increase over 11 percent in 2010 due to an increase in prices and to the gradual reopening of exports to Russia. Egg cash receipts are expected to increase slightly in 2010 due to increased exports to Asia and the European Union, more than offsetting losses in exports to Canada and Mexico.
From 2004 through 2010, the nominal value of farm sector production of crops and livestock increased over 25 percent (f g 1.1). Over three-quarters of that increase ref ects gains in the value of U.S. crop production. The value of crop production was about 49 percent of the agricultural sector’s total value of production in 2004 to 2006, but accounted for 57 percent of the total from 2007 to 2010. Increases in the value of corn and soybean production from 2004 through 2010 accounted for 93 percent of the increase in feed crops and
Figure 1.1
Value of crop and livestock production, 1970-2010$ billion
Note: 2010 forecast.Source: USDA, Economic Research Service.
Value of crop production
Value of livestock production
1970 75 80 85 90 95 2000 05 100
25
50
75
100
125
150
175
200

4Agricultural Income and Finance Outlook / AIS-90 / December 2010
Economic Research Service/USDA
94 percent of the rise in oil crops. These increases partially ref ect the impact that bioenergy has had on the value added to the U.S. economy by the farm sector (table 1.1). Both corn for grain and soybean receipts are expected to experience solid gains in 2010 ref ecting increased quantities sold at higher prices, benef ting from anticipated increases in domestic use and exports (f g 1.2). Crop production is expected to account for about 55.6 percent of the total value of farm sector production in 2010.
Cotton receipts are expected to experience a sharp increase in 2010. Strong domestic and foreign demand for cotton combined with increased U.S. production, and continued tight global supplies are expected to lead to large increases in prices and quantities sold for both lint and seed. A rise expected in 2010 wheat cash receipts ref ects increased domestic use and a projected rise in exports. Declines in production are expected for apples, pears, and grapes, while the cranberry crop is expected to exceed last year’s crop. California is expected to produce record navel orange and walnut crops. Total citrus production in Florida is expected to decline. Vegetable and melon receipts overall are expected to increase despite declines in receipts for pota-toes. Record yields are expected to produce a large increase in U.S. produc-tion of dry beans and higher 2010 cash receipts.
Crop Farms To Contribute 64 Percent of U.S. Agriculture’s Net Value Added in 2010
Crop farms account for less than half of U.S. farm operations but make up more than 70 percent of the sector’s payments to stakeholders and more than 57 percent of U.S. agriculture’s net farm income (table 1.2). Crop farms are expected to contribute almost 64 percent of U.S. agriculture’s 2010 net value added, with cash grain and soybean farms accounting for half of that (f g. 1.3). High-value crop farms accounted for less than 7 percent of all U.S. farms in 2009, but accounted for nearly one-third of the value of the sector’s crop production.
Size matters in agriculture. Bigger farm operations, while fewer in number, contribute the bulk of the value of U.S. farm production and receive the lion’s
Figure 1.2
Annual average prices for crops, 1990-2010$ bushel
Note: 2010 forecast.Source: USDA, National Agricultural Statistics Service.
Soybeans
Corn
1990 92 94 96 98 2000 02 04 06 08 100
2
4
6
8
10
12

5Agricultural Income and Finance Outlook / AIS-90 / December 2010
Economic Research Service/USDA
Table 1.1 Value added to the U.S. economy by the agricultural sector via the production of goods and services, 2006-10
United StatesComponent accounts1 2006 2007 2008 2009 2010
2000-09average
Change2009 to
2010
$ billionValue of crop production 118.7 151.1 185.1 169.0 174.2 126.0 5.2Food grains 9.1 13.6 18.7 14.4 14.5 10.1 0.1Feed crops 29.4 42.3 58.9 50.2 53.0 32.4 2.9Cotton 5.5 6.5 5.2 3.5 5.7 4.8 2.2Oil crops 18.5 24.6 28.7 31.9 33.7 20.0 1.7Fruits and tree nuts 17.3 18.7 19.3 19.0 18.9 15.7 0.0Vegetables 18.0 19.3 21.0 20.6 21.7 17.7 1.1All other crops 24.2 25.2 25.0 24.1 25.6 23.2 1.4Home consumption 0.1 0.1 0.1 0.1 0.1 0.1 0.0Value of inventory adjustment3 -3.6 0.9 8.2 5.3 1.0 1.9 -4.2
Value of livestock production 119.3 138.4 140.3 119.2 139.0 117.2 19.8Meat animals 63.7 65.1 65.0 58.6 68.2 59.0 9.6Dairy products 23.4 35.5 34.8 24.3 31.5 25.9 7.2Poultry and eggs 26.6 33.1 36.8 32.5 35.7 27.9 3.2Miscellaneous livestock 4.8 4.9 4.8 4.3 4.4 4.4 0.1Home consumption 0.3 0.3 0.3 0.3 0.3 0.2 0.0Value of inventory adjustment3 0.5 -0.4 -1.6 -0.8 -1.1 -0.3 -0.3
Revenues from services and forestry 36.4 38.1 42.0 42.7 42.4 33.1 -0.3Machine hire and customwork 2.6 2.7 3.0 4.0 4.1 2.8 0.1Forest products sold 1.0 0.7 0.7 0.7 0.7 0.8 0.0Other farm income 13.2 14.2 17.7 17.3 16.3 12.4 -1.0Gross imputed rental value of farm dwellings 19.5 20.6 20.5 20.7 21.3 17.1 0.6
Value of agricultural sector production 274.4 327.6 367.3 330.9 355.7 276.3 24.8
less: Purchased inputs 153.7 184.3 203.0 190.0 194.7 151.4 4.7
Farm origin 61.1 73.4 79.8 77.0 78.7 60.4 1.7Feed purchased 31.4 41.9 46.9 45.0 44.7 32.5 -0.3Livestock and poultry purchased 18.6 18.8 17.7 16.5 19.2 17.1 2.7Seed purchased 11.0 12.6 15.1 15.5 14.8 10.8 -0.8
Manufactured inputs 37.5 46.3 55.0 49.0 49.3 37.0 0.4Fertilizers and lime 13.3 17.7 22.5 20.1 18.1 13.8 -2.0Pesticides 9.0 10.5 11.7 11.5 11.1 9.4 -0.4Petroleum fuel and oils 11.3 13.8 16.2 12.7 15.5 10.0 2.8Electricity 3.8 4.3 4.5 4.6 4.6 3.8 0.0
Other intermediate expenses 55.2 64.6 68.1 64.0 66.6 54.0 2.6Repair and maintenance of capital items 12.5 14.3 14.8 14.7 15.4 12.4 0.6Machine hire and customwork 3.5 3.8 4.1 3.9 3.9 3.8 0.1Marketing, storage, and transportation expenses 9.1 10.3 10.1 10.3 10.4 8.6 0.2Contract labor 3.0 4.4 4.7 3.9 3.7 3.4 -0.2Miscellaneous expenses 27.1 31.7 34.4 31.3 33.2 25.8 1.9
plus: Net government transactions 6.2 0.9 0.9 1.2 1.2 7.6 0.0
Direct Government payments 15.8 11.9 12.2 12.3 12.4 16.4 0.2Motor vehicle registration and licensing fees 0.6 0.6 0.6 0.6 0.7 0.6 0.0Property taxes 9.0 10.3 10.7 10.4 10.6 8.3 0.1
Gross value added 126.9 144.3 165.3 142.1 162.3 132.5 20.1—continued

6Agricultural Income and Finance Outlook / AIS-90 / December 2010
Economic Research Service/USDA
share of agriculture’s net farm income (see box, “Measuring Agriculture’s Value Added and Net Farm Income”). For example, farm operations with over $1 million in 2010 sales are expected to account for over 60 percent of U.S. livestock value of production and almost 54 percent of U.S. agriculture’s 2010 net farm income (table 1.3).
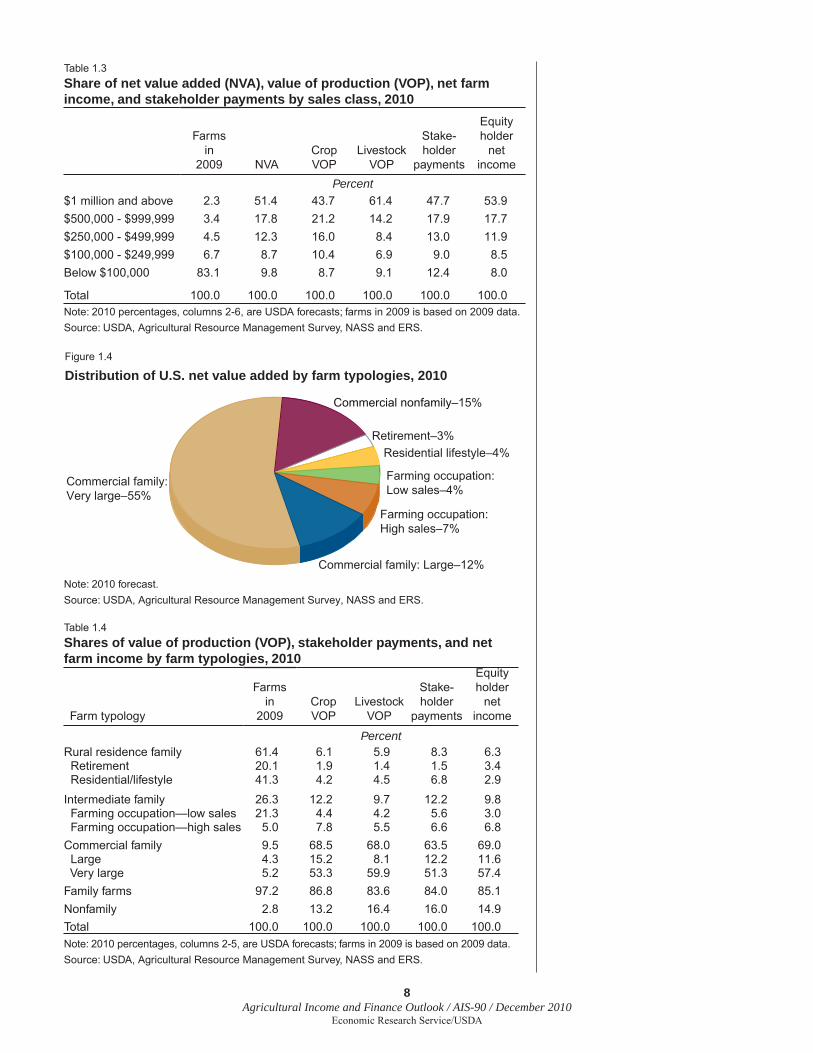
Commercial farms—those with over $250,000 in annual sales—are expected to account for over 80 percent of U.S. agriculture’s net value added in 2010 (f g. 1.4). Very large commercial farms—those with annual sales exceeding $1 million—alone generate more than half of U.S. value of production and net farm income (table 1.4) (see box, “Farm Types,” p. 10). Family farms, which include both commercial and noncommercial farms, are expected to account for almost 85 percent of net farm income (see box, “Farm Income and Costs: Glossary,” p. 9).
Table 1.1 Value added to the U.S. economy by the agricultural sector via the production of goods and services, 2006-10—Continued
United StatesComponent accounts1 2006 2007 2008 2009 2010
2000-09average
Change2009 to
2010$ billion
less: Capital consumption 26.2 27.0 28.7 30.1 30.3 24.3 0.2Net value added 100.7 117.2 136.6 112.0 132.0 108.1 20.0
less Payments to stakeholders 43.2 46.9 50.0 49.8 50.4 43.3 0.6Employee compensation (total hired labor) 21.2 24.2 25.0 24.9 25.5 21.0 0.6Net rent received by nonoperator landlords 7.6 7.6 9.6 9.8 10.0 8.7 0.2Real estate and nonreal estate interest 14.4 15.1 15.4 15.2 14.9 13.5 -0.2
Net farm income 57.4 70.3 86.6 62.2 81.6 64.8 19.4 Note: 2010 forecast. 1For explanation of terms, see box, “Farm Income and Costs: Glossary,” p. 9.Source: USDA, Economic Research Service.
Table 1.2Shares of value of production (VOP), stakeholder payments, and net farm income by farm production specialty, 2010
Farmsin
2009CropVOP
LivestockVOP
Stake-holder
payments
Equityholder
net income
PercentCrops farms: 46.3 95.7 5.5 71.2 57.4 Cash grain and soybean 14.7 52.1 4.0 33.6 30.1 Other f eld crops 24.9 11.3 1.3 8.7 8.4 High-value crops 6.7 32.3 0.2 28.9 18.9Livestock farms: 53.7 4.3 94.5 28.8 42.6 Beef cattle 29.6 2.0 32.8 9.8 13.3 Hogs 1.0 1.0 10.9 2.8 3.4 Poultry 2.1 0.3 22.9 2.9 15.5 Dairy 2.3 0.6 22.8 9.5 8.9 General livestock 18.7 0.4 5.1 3.8 1.5Total 100.0 100.0 100.0 100.0 100.0Note: 2010 percentages are USDA forecasts while the percent of farms is based on 2009 ARMS.Source: USDA, Agricultural Resource Management Survey, NASS and ERS.

7Agricultural Income and Finance Outlook / AIS-90 / December 2010
Economic Research Service/USDA
Figure 1.3
Distribution of U.S. net value added by farm production specialty, 2010
Note: 2010 forecast.Source: USDA, Agricultural Resource Management Survey, NASS and ERS.
Cash grain and soybean32%
Other field crops9%
High-value crops23%
Beef cattle–12%
Hogs–3%
Poultry–10%
Dairy–9%General livestock–2%
USDA measures U.S. agriculture’s value added and net f arm income using two approaches: one ba sed on agg regate farm-sector data and the second based on farm-level data. Both approaches generate data used in this publication’s tables and f gures. Tables and f gures relying on value-added measures from the farm-level accounts have as a source line “USDA, Agricultural Resource Management Survey, NASS and ERS.”
Farm-sector approach
The farm-sector approach relies on farm-sector data obtained from a wide variety of sources, including farm-level data from ARMS, USDA’s survey of individual farm-level operations conducted by the National Agricultural Statistics Service (NASS) in conjunction with the Economic Research Service (ERS). In general, sectorwide data neither identify nor distinguish individual farms. Therefore, the sector approach is restricted to constructing sector totals for different value-added measures for the United States.
Farm-level approach
The farm-level approach relies almost entirely on ARMS surveys of individual farm operations. The advantage of using farm-level data is that it allows ERS to look at the distribution of value-added at the farm level rather than estimating a single farm-sector estimate. Farm-level data make it possible to identify and dis-tinguish the differing contributions of U.S. value added among stakeholders and equity holders, specialization of farm output, and sizes of farm operation. Each year, ARMS produces a farm-level estimate of value added that is as consistent as possible with sectorwide measures of value added and its components. Weighted estimates of farm-level value added are compared with sectorwide estimates pro-duced from multiple sources of data as a check for consistency.
Measuring Agriculture’s Value Added and Net Farm Income: Farm-Sector and Farm-Level Approaches
8Agricultural Income and Finance Outlook / AIS-90 / December 2010
Economic Research Service/USDA
Figure 1.4
Distribution of U.S. net value added by farm typologies, 2010
Note: 2010 forecast.Source: USDA, Agricultural Resource Management Survey, NASS and ERS.
Retirement–3%Residential lifestyle–4%
Farming occupation: Low sales–4%
Farming occupation: High sales–7%
Commercial family: Large–12%
Commercial family: Very large–55%
Commercial nonfamily–15%
Table 1.4Shares of value of production (VOP), stakeholder payments, and net farm income by farm typologies, 2010
Farm typology
Farmsin
2009CropVOP
LivestockVOP
Stake-holder
payments
Equityholder
net income
PercentRural residence family 61.4 6.1 5.9 8.3 6.3 Retirement 20.1 1.9 1.4 1.5 3.4 Residential/lifestyle 41.3 4.2 4.5 6.8 2.9Intermediate family 26.3 12.2 9.7 12.2 9.8 Farming occupation—low sales 21.3 4.4 4.2 5.6 3.0 Farming occupation—high sales 5.0 7.8 5.5 6.6 6.8Commercial family 9.5 68.5 68.0 63.5 69.0 Large 4.3 15.2 8.1 12.2 11.6 Very large 5.2 53.3 59.9 51.3 57.4Family farms 97.2 86.8 83.6 84.0 85.1Nonfamily 2.8 13.2 16.4 16.0 14.9Total 100.0 100.0 100.0 100.0 100.0Note: 2010 percentages, columns 2-5, are USDA forecasts; farms in 2009 is based on 2009 data.Source: USDA, Agricultural Resource Management Survey, NASS and ERS.
Table 1.3Share of net value added (NVA), value of production (VOP), net farm income, and stakeholder payments by sales class, 2010
Farmsin
2009 NVACropVOP
LivestockVOP
Stake-holder
payments
Equityholder
net income
Percent$1 million and above 2.3 51.4 43.7 61.4 47.7 53.9$500,000 - $999,999 3.4 17.8 21.2 14.2 17.9 17.7$250,000 - $499,999 4.5 12.3 16.0 8.4 13.0 11.9$100,000 - $249,999 6.7 8.7 10.4 6.9 9.0 8.5Below $100,000 83.1 9.8 8.7 9.1 12.4 8.0
Total 100.0 100.0 100.0 100.0 100.0 100.0Note: 2010 percentages, columns 2-6, are USDA forecasts; farms in 2009 is based on 2009 data.Source: USDA, Agricultural Resource Management Survey, NASS and ERS.

9Agricultural Income and Finance Outlook / AIS-90 / December 2010
Economic Research Service/USDA
A full glossary is available at www.ers.usda.gov/Data/FarmIncome/Finfi dmu.htm.
Net Value Added
Net value added represents:
• the total value of the farm sector’s production of goods and services, less payments to other (nonfarm) sectors of the economy
• production agriculture’s addition to the national economy
• the sum of the economic returns to all the providers of factors of production; farm employees, lenders, land-lords, and farm operators.
ERS value-added estimates are used by the U.S. Department of Commerce’s Bureau of Economic Analysis in the develop-ment of the National Income Accounts and Gross Domestic Products as well as by the Organization for Economic Cooperation and Development in its international agricul-tural accounts.
Net Farm Income
Net farm income is the portion of the net value added by agriculture to the national economy earned by farm opera-tors (i.e., the entrepreneurial earnings of those individuals who share in the risks of production and materially partici-pate in the operation of the business). Farm operators typi-cally benefi t most from the increases and assimilate most of the declines arising from short-term, unanticipated weather and market conditions.
Net Cash Income
Net cash income is the cash earnings realized within a cal-endar year from the sales of farm production and the conver-sion of assets, both inventories (in years in which reduced) and capital consumption, into cash.
Stakeholders
Stakeholders are individuals and institutions that contrib-ute factors of production (land, labor, and capital) to farm-ing operations for a rate of return fi xed in advance of the production factors’ use in production. Land is rented from landlords, laborers are paid a wage, and interest is paid on money borrowed from lenders. In each case the earnings are agreed upon in advance, so the contributor bears no risks of the uncertainties inherent in production and marketing of the output.
Farm Operators
Farm operators, contractors, partners, and other investors also contribute factors of production but are distinguished from stakeholders because they do so in order to share in the profi ts and thereby assume the risks of production and markets. Profi ts are determined as the residual after pay-ment for purchased inputs, making allowances for replac-ing the capital consumed in the production processes. Managerial skills in production and marketing are another factor contributed by stakeholders that affects the profi ts and thus their earnings.
Prominent among other investors are family members, par-ticularly parents and siblings, who have an ownership inter-est in the farm or family corporation but don’t perform the management functions of the principal operator. They may manage a particular function (bookkeeping, fi eldwork, tend-ing to the livestock, etc.), work only in critical stages in pro-duction, or have full-time work off the farm and contribute only their owned capital. The remuneration for their contri-butions of land, labor and/or capital will be a share of the profi ts (if any) that are not known until production processes and marketing are completed.
Returns to Operators
Returns to operators, as with net farm income, is a measure of the earnings of farm operators (defi ned as those individu-als who share in the risks of production and materially par-ticipate in the operation of the business) from production of commodities and farm business activities.
Inventory Change
The inventory components of crop and livestock output rep-resent the value of the change in inventories as opposed to the change in the value of inventories. Under the concept of national income accounting, income is a measure of the net value of production occurring within the calendar year. Changes in the value of stocks produced in prior years as a consequence of price changes are not appropriate for inclu-sion as income. Thus, the quantity changes in inventories are computed and then valued at calendar-year weighted-average market prices in order to avoid the inclusion of the effects of capital gains and losses on stocks of farmer-owned commodities held in inventory.
Farm-Related Income
Farm-related income is the value derived from those eco-nomic activities reliant on resources of the farm enterprise in addition to crop and livestock output. Examples are cus-tom harvesting for cash, forestry sales, and the imputed rental value of the farmhouse.
Farm Income and Costs: Glossary

10Agricultural Income and Finance Outlook / AIS-90 / December 2010
Economic Research Service/USDA
U.S. agriculture’s annual net value added is split among its equity holders and stakeholders. Farm-equity holders’ share is referred to as net farm income. Equity holders can expect their share of U.S. agriculture’s net value added to increase in 2010 (table 1.5). Contractors (who contract with farmers to receive animals and products at the farm level and move them to slaughter/whole-sale) are expected to accrue the greatest annual share increase, ref ecting the large expected increase in livestock value of production. Geographically, the Heartland and Fruitful Rim regions contribute half of U.S. agriculture’s net value added (f g. 1.5).
Small family farms (gross farm sales less than $250,000)1
Retirement farms. Small farms whose operators report they are retired, although they continue to farm on a small scale. These operations sell enough farm prod-ucts (at least $1,000 worth) to qualify as farms under the current farm def nition.2
Residential/lifestyle farms. Small farms whose operators report a major occupa-tion other than farming.3 The category also includes a small number of farms—8 percent of the group in 2007—whose operators are not in the labor force.
Farming-occupation farms. Small family farms whose operators report farm-ing as their major occupation.3
• Low-sales farms. Gross sales less than $100,000.
• Medium-sales farms. Gross sales between $100,000 and $249,999.
Large-scale family farms (gross farm sales of $250,000 or more)
Large family farms. Farms with gross sales between $250,000 and $499,999.
Very large family farms. Farms with gross sales of $500,000 or more.
Nonfamily farms
Any farm where the operator and persons related to t he operator do n ot own a majority of the business.
Note: Limited-resource farms are no longer a separate category in the classif cation, starting with the 2005 Agricultural Resource Management Survey.1USDA’s National Commission on Small Farms selected $250,000 in gross sales in a given year as the cutoff between small and large-scale farms (USDA, NCSF, 1998, p. 28).2A farm is def ned as any place that produced and sold—or normally would have produced and sold—at least $1,000 of agricultural products during a given year (USDA, NASS, 2008). 3Major occupation is def ned as the occupation at which operators spent the majority of their work time.
U.S. Department of Agriculture, National Commission on Small Farms (USDA, NCSF). A Time to Act: A Report of the USDA National Commission on Small Farms. Miscellaneous Publication 1545 (MP-1545). January 1998.
Farm Types

11Agricultural Income and Finance Outlook / AIS-90 / December 2010
Economic Research Service/USDA
Table 1.5 Distribution of net value added among resource owners, 2006-10
2006 2007 2008 2009 2010
Percent
Stakeholders: 44.3 35.1 40.0 44.9 38.1 Hired labor 21.9 16.9 20.0 22.8 19.6 Lenders 11.3 9.1 9.4 10.3 8.5 Nonoperator landlords 11.1 9.1 10.6 11.8 10.0
Equity holders 55.7 64.9 60.0 55.1 61.9 Family farm operators 34.4 44.6 44.1 40.8 43.3 Nonfamily farm operators 9.3 8.4 7.0 6.7 7.2 Contractors 12.0 11.9 8.9 7.6 11.4
Total 100.0 100.0 100.0 100.0 100.0Note: 2010 forecast.Source: USDA, Agricultural Resource Management Survey, NASS and ERS.
Figure 1.5
Regional distribution of value added, 2010
Note: 2010 forecast.
Source: USDA, Agricultural Resource Management Survey, NASS and ERS.
Heartland–26%
Northern Crescent–12%
Prairie Gateway9%
Mississippi Portal–4%
Eastern Uplands–5%
Northern Great Plains
6%
Basin and Range5%
Fruitful Rim–24%
Southern Seaboard–9%

12Agricultural Income and Finance Outlook / AIS-90 / December 2010
Economic Research Service/USDA
Government Payments Forecast at $12.4 Billion
Government payments paid directly to U.S. agricultural producers are expected to total $12.4 billion in 2010, a 1.5-percent increase from $12.3 billion paid out in 2009. This level would be 19 percent below the 5-year average for 2005-09. Direct payments under the Direct and Counter-cyclical Program (DCP) and the Average Crop Revenue Election Program (ACRE) are forecast at $4.81 billion for 2010. Direct payment rates are f xed in legislation and are not affected by the level of program crop prices. The 4-percent decline in direct payments forecast in 2010 relative to the 5-year average is due to producers, receiving revenue insurance payments from the ACRE program. Those payments are expected to be $430 million in 2010. Authorized under the 2008 Farm Act, ACRE provides revenue insurance to participating producers in exchange for a 20-percent reduction in producers’ annual direct-payment allotments beginning with the 2009 crop year. Low producer participation in the ACRE program—only about 1 in 11 direct-payment recipients signed up for ACRE by the August 2009 deadline—has led to this smaller than expected decrease in actual direct payments.
Counter-cyclical payments are forecast to decrease by 82 percent from $1.17 billion in 2009 to $210 million in 2010. Strong cotton prices are responsible for this projected decrease. Only producers of upland cotton and peanuts are expected to receive counter-cyclical payments in 2010.
Marketing loan benef ts—including loan def ciency payments, marketing loan gains, and certif cate exchange gains—are projected at $120 million in 2010, down 89 percent from 2009 levels. Because of the high durum-wheat loan rate, durum-wheat producers are expected to receive 93 percent of these benef ts, despite the recent rise in global wheat prices. Other wheat classes do not qualify for marketing loan benef ts. Prior to 2010, upland cotton producers received almost 91 percent of total marketing loan benef ts. However, strong 2010 cotton prices are expected to remain too high for cotton producers to qualify. Other commodities receiving marketing loan benef ts are barley, wool, mohair, and pelts.
The Milk Income Loss Contract Program (MILC) compensates dairy producers when domestic milk prices fall below a specif ed level. Milk prices declined in 2009 due to the global recession, leading to $880 million in MILC payments being made in 2009. For 2010, rebounding milk prices are expected to reduce MILC payments to $55 million.
Forecast at $820 million in 2010, Tobacco Transition Payment Program (TTP) payments are expected to continue a declining trend beyond 2010. Begun in 2005, this program provides annual payments over a 10-year period to eligible tobacco quota owners and producers of tobacco. Since the program’s start, lump-sum payments to individuals have been made through agreements with third parties in return for the producers’ and tobacco quota owners’ rights to the 10-year TTP payment stream. Payments for 2010 include both Commodity Credit Corporation (CCC) payments and lump-sum payments received by farm operators during the year (f g. 1.6).
Conservation programs operated by USDA’s Farm Service Agency (FSA) and Natural Resources Conservation Service (NRCS) provide direct payments to

13Agricultural Income and Finance Outlook / AIS-90 / December 2010
Economic Research Service/USDA
producers as well. Estimated conservation payments of $3.15 billion in 2010 ref ect programs being brought up toward funding levels authorized by the 2008 Farm Act.
Ad hoc and emergency-disaster program payments are forecast to be $2.82 billion in 2010, an increase of 335 percent over the $648 million paid out in 2009. The 2008 Farm Act created a permanent fund for disaster assis-tance, the Agricultural Disaster Relief Trust Fund. Supplemental Revenue Assistance Payments (SURE) from this fund and from the 2009 American Recovery and Reinvestment Act are expected to amount to $1.93 billion in 2010. Crop Assistance Program payments are expected to amount to $420 million in 2010. Other disaster programs aimed at agricultural producers include the Emergency Conservation Program, Livestock Forage Program, Livestock Indemnity Program, and Noninsured Assistance Program. Producers’ eligibility for f nancial help from these programs depends on the extent to which their crop or livestock losses meet a particular program’s threshold for payments, once a county is declared eligible for disaster relief.
Spatial Concentration and Program Coverage Overlap of Direct Payments and Crop Insurance Subsidies
USDA, congressional representatives, and farm organizations have held discussion forums with farmers around the country in 2009-10 to discuss the upcoming 2012 Farm Bill. One proposal that has been discussed would replace direct payments with a new system based on a “revenue assurance” program to provide insurance against crop and livestock losses. The impetus for this proposal is to address current Federal budget pressures and the criticism that direct payments are made to farmers even when commodity prices are high. Farmers’ level of support for this proposal varies by region (Good, 2010).
Figure 1.6
Government payments, 2000-10$ billion
Note: 2010 forecast.1Production flexibility contract payments and direct payments whereby payment rates are fixed by legislation.2Counter-cyclical payments, loan deficiency payments, marketing loan gains, certificate exchange gains, and ACRE payments whereby commodity payment rates vary with crop prices.3All other payments include disaster relief payments, tobacco transition payments, and dairy program payments.Source: USDA, Farm Service Agency, Natural Resources Conservation Service, and Commodity Credit Corporation.
Payments–fixed1
Payments–function of crop price2
Payments–conservation
Payments–all other3
2000 02 04 06 08 100
5
10
15
20
25
30
14Agricultural Income and Finance Outlook / AIS-90 / December 2010
Economic Research Service/USDA
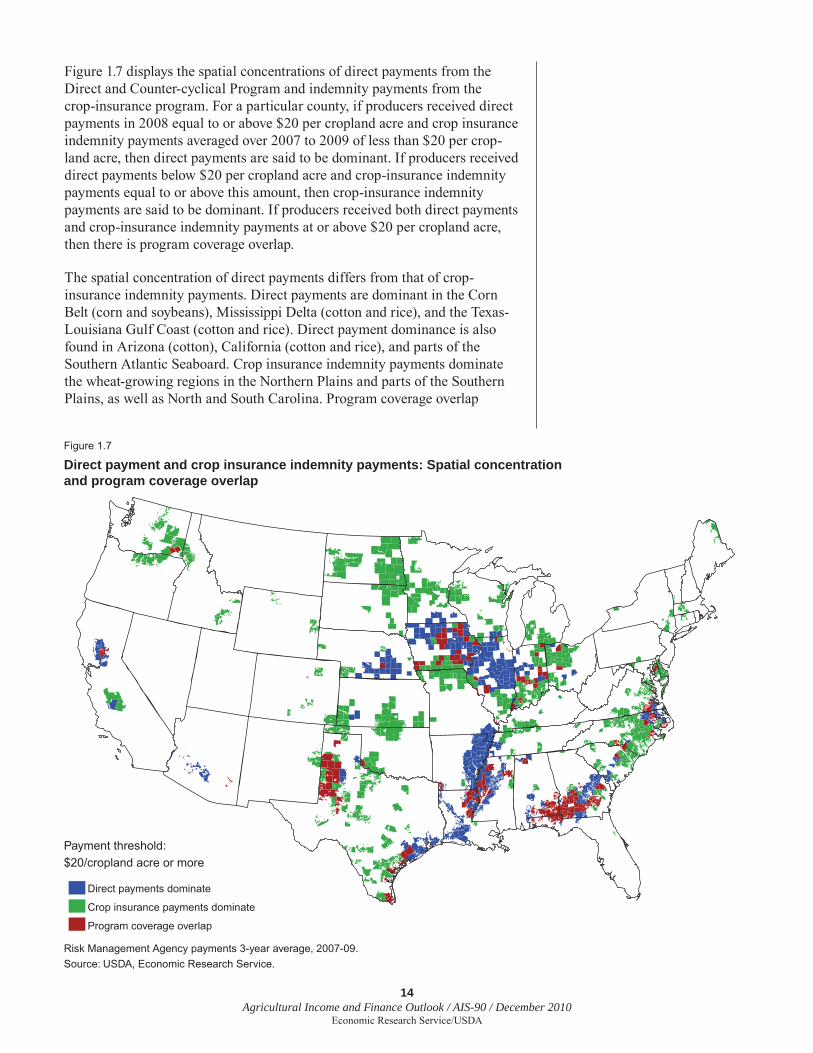
Figure 1.7 displays the spatial concentrations of direct payments from the Direct and Counter-cyclical Program and indemnity payments from the crop-insurance program. For a particular county, if producers received direct payments in 2008 equal to or above $20 per cropland acre and crop insurance indemnity payments averaged over 2007 to 2009 of less than $20 per crop-land acre, then direct payments are said to be dominant. If producers received direct payments below $20 per cropland acre and crop-insurance indemnity payments equal to or above this amount, then crop-insurance indemnity payments are said to be dominant. If producers received both direct payments and crop-insurance indemnity payments at or above $20 per cropland acre, then there is program coverage overlap.
The spatial concentration of direct payments differs from that of crop-insurance indemnity payments. Direct payments are dominant in the Corn Belt (corn and soybeans), Mississippi Delta (cotton and rice), and the Texas-Louisiana Gulf Coast (cotton and rice). Direct payment dominance is also found in Arizona (cotton), California (cotton and rice), and parts of the Southern Atlantic Seaboard. Crop insurance indemnity payments dominate the wheat-growing regions in the Northern Plains and parts of the Southern Plains, as well as North and South Carolina. Program coverage overlap
Figure 1.7
Direct payment and crop insurance indemnity payments: Spatial concentration and program coverage overlap
Risk Management Agency payments 3-year average, 2007-09.Source: USDA, Economic Research Service.
Payment threshold:$20/cropland acre or more
Direct payments dominate
Crop insurance payments dominate
Program coverage overlap

15Agricultural Income and Finance Outlook / AIS-90 / December 2010
Economic Research Service/USDA
occurs primarily in the Texas Panhandle (cotton and wheat) and across Alabama and Georgia (cotton and peanuts).
Why ARMS and Sector Accounts Estimates of Government Payments Differ1
The Economic Research Service uses two types of data on Government payments—data from administrative records maintained by USDA’s Farm Service Agency, Natural Resources Conservation Service, and Risk Management Agency, as well as survey data. Administrative data serves as a complete accounting of Government payments to program participants and are used to generate off cial estimates of Government payments by the State and program categories in ERS’s U.S. and State Farm Income data series (also known as the sector accounts). Sector accounts are preferable for under-standing the size and composition of Government payments made to the farm sector, but they cannot be linked to individual farm and farm-operator char-acteristics. The sector accounts also include payments made to nonoperator landlords who do not farm but receive Government payments associated with their farmland.
The Agricultural Resource Management Survey (ARMS) collects informa-tion directly from farmers. ARMS data are useful in understanding the farm and farm-operator characteristics of producers receiving various payments, but like all surveys, ARMS is subject to respondent error.
For 2006 to 2009, ARMS estimates of total Government payments are lower than the corresponding estimates from the sector accounts, on average by about $3.3 billion, or about 75 percent of the sector estimates of total Government payments (table 1.6). One reason for the difference is that ARMS excludes farm program payments made to nonoperator land-lords— approximately $2.3 billion per year over this period—while the
1For a more detailed comparison of the 2007 Government payments estimates, see appendix IV of Structure and Finances of U.S. Farms: Family Farm Report, 2010 Edition, http://www.ers.usda.gov/Publications/EIB66/EIB66.pdf.
Table 1.6Average estimates of Government payments by program for ARMS and the sector accounts, 2006-09
Farm typology
Total Government
paymentsDirect
payments
Counter-cyclical
payments
Marketing loan
benef ts1Conservation
Programs
OtherProgram
Payments2
Million dollarsAverage of annual ARMS estimates, 2006-09 9,722.1 4,202.9 1,372.5 260.4 2,314.5 1,571.7Average of annual sector accounts estimates, 2006-093 13,049.1 4,987.1 1,760.6 1,087.9 3,009.3 2,204.2
PercentAverage of annual ARMS capture rates, 2006-094 74.7 84.3 89.4 25.1 77.0 72.9Potential variability from year to year5 3.9 2.3 29.2 37.5 7.8 17.2Average shares by program of the sector accounts estimates of total Government payments not captured by ARMS, 2006-09 100.0 24.7 9.2 24.2 21.1 20.71 Loan def ciency payments, marketing loan gains, and net value of commodity certif cates.2 Disaster and market loss payments, peanut quota compensation, milk income loss contract payments, other Federal program payments, and State and local program payments.3 From the U.S. and State Farm Income Data series–the farm sector accounts–prepared by ERS.4 The ratio of ARMS estimates to the sector estimates, expressed as percentages.5 Coeff cient of variation of the ARMS capture rates, expressed as percentages.Sources: USDA, Agricultural Resource Management Survey, Phase III, NASS and ERS; USDA, ERS, U.S. and State Farm Income Data at www.ers.usda.gov/data/farmincome/finfidmu.htm.

16Agricultural Income and Finance Outlook / AIS-90 / December 2010
Economic Research Service/USDA
sector accounts estimates include such payments. If the ARMS estimates are compared only to the farm share of the sector accounts estimates, ARMS captures about 90 percent of payments in the administrative records.
For 2006 to 2009, ARMS estimates of Government payments by program category are close to the annual estimates, with average capture rates ranging from 73 percent for other programs to almost 90 percent for counter-cyclical payments (see table 1.6). The sole exception is marketing loan benef ts: ARMS estimates capture on average only 25 percent of the corresponding sector estimates. During this period, nearly all of those payments went to cotton producers who sold their output through cooperatives. Cotton coop-eratives in many States did not separate out marketing loan gains from other receipts when sending payments to member producers. This made it diff cult for those cotton farmers to provide accurate information on marketing loan benef ts in their survey responses.
ARMS capture rates for total Government payments, direct payments, and conservation programs are very stable. In any given year, these capture rates vary from their 4-year averages by 2 to 8 percent (see table 1.6).2 Direct payments depend on producers’ historical yields and acreages of given commodities, not current prices. Conservation payments are largely from the Conservation Reserve Program, paid as f xed rents through 10- or 15-year contracts.
In contrast, ARMS capture rates for counter-cyclical payments, marketing loan benef ts, and the miscellaneous category “other program payments” are much less stable and vary from their 4-year averages by 17 to 38 percent. During this period, the year-to-year variation in other programs was due to large swings in disaster relief and milk program payments. Variability in counter-cyclical payments, and to a lesser extent, in marketing loan benef ts, was inf uenced by signif cant changes in corn and cotton prices.
The sources of the $3.3 billion in sector estimates not accounted for by ARMS, that is, the missing 25 percent, are spread fairly evenly across the different programs. Direct payments and marketing loan benef ts each account on average for about one-fourth of the ARMS measurement error, while conserva-tion program and other program payments each account on average for about one-f fth. The only exception is counter-cyclical payments, which account on average for about 9 percent of the ARMS measurement error.
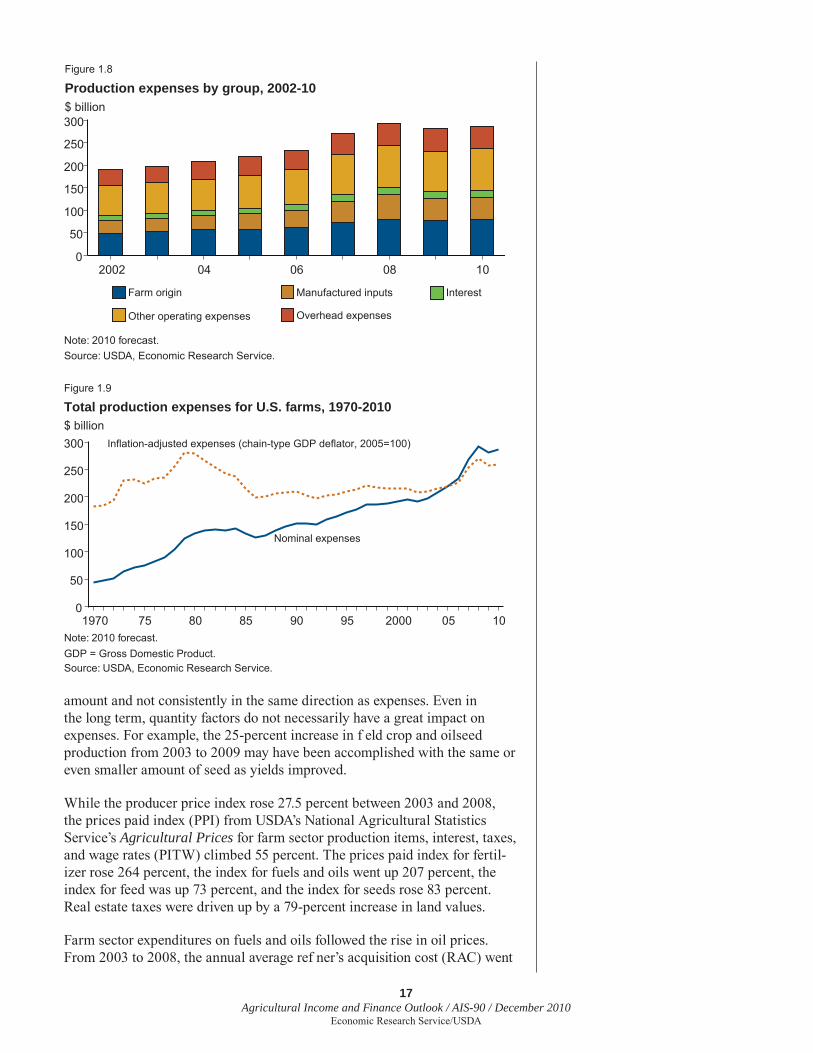
Moderate Rise Expected for U.S. Farm Production Expenses
Production expenses began to rise steeply in 2003 and continued that trend throughout 2004-08. Expenses then fell signif cantly in 2009 and are forecast to rise moderately in 2010 (f g. 1.8). Even at the high level reached in nominal production expenses in 2008, inf ation-adjusted expenses remained lower than the peaks they reached in 1979 and 1980 (f g. 1.9).
Table 1.7 shows how much a number of selected expenses grew from 2002 to 2008. The increases in expenses during the period were caused primarily by large increases in prices farmers paid for inputs. Quantity factors—such as annual output levels or acres planted—usually changed by only a small
2The coeff cient of variation [(/)*100] measures how much an ARMS capture rate for a particular year potentially may vary from the capture rate’s 4-year average. Small measures imply that year-to-year changes in the ARMS capture rate are likely to be minimal. Large measures imply that year-to-year changes in the ARMS capture rate may be signif cant, making the 4-year average ARMS capture rate a much less reliable measure.
17Agricultural Income and Finance Outlook / AIS-90 / December 2010
Economic Research Service/USDA
amount and not consistently in the same direction as expenses. Even in the long term, quantity factors do not necessarily have a great impact on expenses. For example, the 25-percent increase in f eld crop and oilseed production from 2003 to 2009 may have been accomplished with the same or even smaller amount of seed as yields improved.
While the producer price index rose 27.5 percent between 2003 and 2008, the prices paid index (PPI) from USDA’s National Agricultural Statistics Service’s Agricultural Prices for farm sector production items, interest, taxes, and wage rates (PITW) climbed 55 percent. The prices paid index for fertil-izer rose 264 percent, the index for fuels and oils went up 207 percent, the index for feed was up 73 percent, and the index for seeds rose 83 percent. Real estate taxes were driven up by a 79-percent increase in land values.
Farm sector expenditures on fuels and oils followed the rise in oil prices. From 2003 to 2008, the annual average ref ner’s acquisition cost (RAC) went
Figure 1.8
Production expenses by group, 2002-10$ billion
Note: 2010 forecast.Source: USDA, Economic Research Service.
Farm origin
Other operating expenses
InterestManufactured inputs
2002 04 06 08 100
50
100
150
200
250
300
Overhead expenses
Figure 1.9
Total production expenses for U.S. farms, 1970-2010$ billion
Note: 2010 forecast.GDP = Gross Domestic Product.Source: USDA, Economic Research Service.
Inflation-adjusted expenses (chain-type GDP deflator, 2005=100)
Nominal expenses
1970 75 80 85 90 95 2000 05 100
50
100
150
200
250
300

18Agricultural Income and Finance Outlook / AIS-90 / December 2010
Economic Research Service/USDA
from $23.63 to $94.68 per barrel. Since fuels, especially natural gas, are the major input for many fertilizers, the rise in RAC and natural gas prices were the primary reason for the increase in fertilizer expenses. During this period, the annual average wellhead price for natural gas went from $2.95 per 1,000 cubic feet (mcf) to $8.08 per mcf. Expenses did not rise as much as prices for these two inputs because farmers employed steps to hold down produc-tion costs. For example, with both inputs, operators reduced quantities used. To lessen fuel use, they reduced trips over f elds. To cut fertilizer use, they conducted soil tests to optimize applications.
Commercial production of red meats and poultry expanded 10 percent during this period, but the increase in feed expenses was due primarily to the increases in grain and oilseed prices. Prices received for feed grains rose 107 percent from 2003 to 2008 and prices received for oil crops rose 131 percent. Part of the upward push on corn prices came from the greater use of corn for ethanol production, resulting in historically high corn prices.
Seed expenses have risen, in part, because farmers have been making greater use of genetically modif ed seeds for corn, cotton, and soybeans, which are relatively expensive. For example, since NASS began collecting information on prices for biotechnology-derived corn seeds in 2001, seed expenses have risen 67 percent.
The increase in pesticide expenses was notable because the expense had been rising slowly through the early 2000s. In 2007-08, however, during that time, pesticide expenses jumped by $2.7 billion (30 percent), as prices paid rose 15.5 percent and producers increased their use of these materials.
This generalized rise in prices came to an abrupt halt in 2009, when total production expenses fell, then rebounded moderately in 2010. However, nominal total production expenses in 2010 and 2009 still constitute the second- and third-highest totals ever (f g. 1.9).
In 2009, production expenses dropped $12.0 billion (4.1 percent). Given the magnitude of the growth in costs experienced from 2003 to2008, the reduc-tion in 2009 was welcomed by farmers, especially since gross farm income fell nearly 10 percent during the year. The reason for the fall was again
Table 1.7Increase in selected production expenses, 2002-08
IncreaseExpense item Billion dollars Percent
Total production expenses 101.5 53.0 Cash expenses 92.3 54.5 Operating expenses 85.7 60.0 Purchased inputs 77.8 64.3 Farm origin expenses 31.5 65.3 Feed 22.0 88.3 Seed 6.2 69.4 Manufactured inputs 26.6 93.5 Fertilizer 12.9 134.3 Fuels and oil 9.6 146.0 Pesticides 3.4 40.9 Real estate taxes 3.9 57.3Source: USDA, Economic Research Service.

19Agricultural Income and Finance Outlook / AIS-90 / December 2010
Economic Research Service/USDA
mostly price-related. For the f rst time since 2002, the PITW index fell, drop-ping almost 3 percent.
In 2010, production expenses are forecast to rise $5.6 billion (2.0 percent), a modest movement following the many years of substantial changes. Again, the overarching PITW index correlates with the small increase, as it is fore-cast to rise 2.3 percent. In contrast with 2009, only four expense categories change more than $1 billion and three are positive. In 2009, seven categories changed by more than $1 billion, and six expense categories showed a decline (f g. 1.10).
Table 1.8 shows the movement in individual expenses along with their associ-ated prices-paid indexes for 2009 and the 2010 forecast. A number of large changes switch direction in 2010: livestock and poultry purchases, fuels and oils, labor, and miscellaneous expenses. Fertilizer and lime expenses fall signif cantly in both years.
Figure 1.10
Crop-related expenses, 1970-2010$ billion
Note: 2010 forecast.Source: USDA, Economic Research Service.
Fertilizer
Seeds
1970 75 80 85 90 95 2000 05 100
5
10
15
20
25
Pesticides
Table 1.8Changes in production expenses and associated prices paid indexes, 2009 and 2010
Production expenses Prices paid indexesExpense 2009 2010 2009 2010 2009 2010
Billion dollars ——— Percent ———Total production expenses1 -12.0 5.6 -4.1 2.0 -2.8 2.3Feed -1.9 -0.3 -4.1 -0.6 -3.9 -1.6Livestock and poultry -1.3 2.7 -7.1 16.5 -7.3 14.6Seeds 0.4 -0.8 2.6 -4.9 15.5 -3.9Fertilizer and lime -2.4 -2.0 -10.6 -10.1 -29.7 -11.5Fuels and oils -3.5 2.8 -21.7 22.0 -33.6 23.2Pesticides 0.2 -0.4 -1.7 -3.6 7.6 -2.7Hired and contract labor -1.0 0.5 -3.3 1.7 1.9 1.7Miscellaneous expenses -3.1 1.9 -8.8 6.1 na naCapital consumption 1.4 0.5 5.0 0.6 na na2010 forecast. na = not applicable.1Price index for total production expenses is the production items, interest, taxes, and wages (PITW) index.Source: USDA, Economic Research Service.
20Agricultural Income and Finance Outlook / AIS-90 / December 2010
Economic Research Service/USDA
CHAPTER 2
Farm Household Income, Net Worth, and Well-Being
• Average farm-operator household income is forecast to be $83,194 in 2010, up 7.8 percent from the 2009 estimate.
• Equity, o r ne t w orth, ca n re f ect ec onomic w ell-being be tter t han current i ncome. I n 20 09, t he a verage ne t w orth o f f arm-operator households was $915,019.
• Although operator households derive most of their wealth from farm assets, many farm households have nonfarm investments, including f nancial investments and nonfarm real estate.
Trends in Farm Household Income and Net Worth
Average farm household income of principal farm operators—from farm and off-farm sources—is forecast to be $83,194 in 2010, up 7.8 percent from 2009. This contrasts with the change from 2008 to 2009, when average farm household income declined by 3.3 percent (table 2.1). (See box, “How Does USDA Def ne Farm Operator Households?” p. 22.)
Both off-farm and farm income sources are forecast to increase in 2010. Average household income from farming activities is forecast to increase 58.0 percent between 2009 and 2010, from $6,866 to $10,850. This increase follows a 2008-09 decline of 29.7 percent in income from farming activi-ties. In 2010, household income from off-farm income sources is forecast to increase 2.9 percent to $72,344 (see box, “How Is Farm Household Income Def ned?” p. 23).
The average share of farm-household income from farming activities is fore-cast to increase from 8.9 percent in 2009 to 13.0 percent in 2010. About 60 percent of farm-operator households include either an operator and/or opera-tor’s spouse who work off the farm. The modest increase in off-farm income in 2009-10 ref ects economywide slow growth and weak labor markets. In 2008, the increase in off-farm income was less than 1 percent. Households that operate the largest 10 percent of farms (with sales of $250,000 or more) are the only U.S. farm households for which the average farm income is greater than off-farm income in a typical year.
For 2008 to 2009, average farm-household income declined by 3.3 percent while the median farm household had a slight increase of 1.6 percent, to $52,235. (Median household incomes are not available for 2010 until August 2011.) The median is the income level at which half of all house-holds have lower incomes and half have higher incomes. As a result, median incomes are less inf uenced by very high-income and very low-income households than are averages; median income is generally lower and less variable than average income.

21Agricultural Income and Finance Outlook / AIS-90 / December 2010
Economic Research Service/USDA
In discussing the importance of farming income to households, it is useful to consider what the indicator measures. The farm share of farm-operator household income captures the cash returns from farming after accounting for the depreciation of farm capital. The measure excludes in-kind income like the rental value of the farm dwelling. More than three-quarters of prin-cipal farm operators reside in households on their farming operation. So, in addition to the farm yielding cash earnings and capital gains from farmland appreciation—to the extent that the household owns the farmland—house-holds benef t by having their housing cost borne by the farm business. The typical U.S. household spends more than 20 percent of its expenditures (excluding principal payments on home loans) for housing. USDA’s net farm income measure includes an estimate of the rental value of farm dwellings;
Table 2.1 Farm operator household income and net worth, 2005-10Item 2005 2006 2007 2008 2009 2010
NumberNumber of family farms 2,034,048 2,021,903 2,143,398 2,129,869 2,131,007 n.a.
Average dollars per farm household1
Net earnings of the household from farming activities 14,227 8,541 11,364 9,764 6,866 10,850Off-farm income of the household 67,091 72,502 77,432 70,032 70,302 72,344Earned income 46,034 51,674 58,933 50,761 50,852 52,621Off-farm wages and salaries 34,876 38,481 48,947 42,606 43,852 n.a.Off-farm business income 11,158 13,193 9,986 8,155 7,000 n.a.
Unearned income 35,283 20,827 18,499 19,271 19,450 19,724Household income of farm operators 81,317 81,043 88,796 79,796 77,169 83,194U.S. household income 63,344 66,570 67,609 68,424 67,976 n.a.
Median dollarsHousehold income of farm operators 54,550 56,274 54,428 51,431 52,235 n.a.U.S. household income 46,326 48,201 50,233 50,303 49,777 n.a.
PercentFarm income as a percent of total farm household income 17.5 10.5 12.8 12.2 8.9 13.0
Average farm household income as a percent of U.S. household income 128.4 121.7 131.3 116.6 113.5 n.a.
Median farm household income as a percent of U.S. household income 117.8 116.7 108.4 102.2 104.9 n.a.
Dollars per farming operation1
Net cash business income of farming operation 19,891 15,611 21,099 21,449 18,526 n.a.Farming operation depreciation expenses 7,588 7,612 8,192 10,584 9,889 n.a.Ratio of depreciation expense to net income 0.38 0.49 0.39 0.49 0.53 n.a.
Balance sheet, dollars per householdTotal household assets, average 915,210 1,026,389 1,006,020 988,156 1,031,000 n.a.Farm assets 677,118 764,485 739,905 749,190 761,894 n.a.Non-farm assets 238,092 261,905 266,115 238,966 269,106 n.a.
Total household debt, average 99,345 99,766 106,874 112,705 115,981 n.a.Farm debt 54,855 59,731 56,859 61,131 66,149 n.a.Non-farm debt 44,491 40,035 50,015 51,574 49,832 n.a.
Household net worth, average 815,864 926,623 899,146 875,451 915,019 n.a.Farm net worth 622,264 704,754 683,046 688,059 695,745 n.a.Non-farm net worth 193,601 221,869 216,101 187,392 219,274 n.a.
Household net worth, median 496,719 558,710 534,727 525,879 541,544 n.a.Household debt to asset, ratio 0.11 0.10 0.11 0.11 0.11 n.a.Note: 2010 forecast1See box, “How Is Farm Household Income Def ned?” p. 23. Source: USDA, Agricultural Resource Management Survey, NASS and ERS; ERS forecast model.

22Agricultural Income and Finance Outlook / AIS-90 / December 2010
Economic Research Service/USDA
the imputed rental value of farm dwellings is expected to be 6 percent of gross income of the farm sector in 2009 and accounted for more than 25 percent of net farm income. This rather stable in-kind source of farm income helps farm families better manage their low-farm income years.
While income from farming activities excludes the noncash rental value of the farm dwelling, it does ref ect a farm expense for depreciation. Since farming is capital intensive, this expense can be sizable, especially for large farms. There are several ways to calculate depreciation. The approach ERS uses in estimating farm income is tax-based depreciation, which is affected by changes in tax laws. An alternative to tax-based depreciation is economic depreciation, which captures the value of capital consumed during the accounting period. While changes in tax laws can affect
The farm operator household population includes everyone who shares the dwell-ing unit with a pr incipal operator of a family farm. This includes students away at school who are supported by the principal operator household and, if not away at school, would be sharing a dwelling unit with the principal operator. A farm is def ned as any place from which $1,000 or more of agricultural products were produced and sold, or normally would have been sold, during the year.
Since the def nition allows farms to be included even if they did not have at least $1,000 in sales, but normally would have, USDA’s National Agricultural Statistics Service (NASS) developed a system for determining how much a farm normally would have sold in a given year. If a place does not have $1,000 in sales, a “point system” assigns dollar values for acres of various crops and head of various live-stock species to estimate a normal level of sales. “Point farms” are farms with less than $1,000 in sales but have points worth at least $1,000. More than one-quarter of farms have no sales in a typical year, and at least another 30 percent have posi-tive sales of less than $10,000.
The current def nition of a family farm (beginning with the 2005 estimates) is based on the Agricultural Resource Management Survey, and is a farm where the majority of the business assets are owned by individuals related by blood, mar-riage, or adoption. In 2009, 97.2 percent of U.S. farms were classif ed as family farms, and although the def nition has changed slightly over time, this share has been stable for at l east a de cade. The farm operator is t he person who runs the family farm, making the day-to-day management decisions. In the case of mul-tiple operators, the respondent for the farm survey identif es who the pr incipal farm operator is during the data collection process.
USDA provides f nancial information for principal farm operators of family farms and their households, referred to as farm-operator households in this publication. For farms where there are more than one operator and the multiple operators do not share a hous ing unit, det ailed household data and off-farm income a re not collected for the additional operators on either the NASS Census of Agriculture or the ARMS—household data are collected only for a single principal operator. However, for the family farms operated by more than one operator, the majority have two operators who a re husband a nd wife. I n 20 09, 42 percent of family farms had more than one pr incipal operator, of which 79 percent were operated by a h usband-wife t eam a lone. F or t he rem aining 21 p ercent o f f amily f arms with multiple operators, household information is not available for the secondary operators. In addition, USDA does not provide information on the f nancial posi-tion of farm-operator households who operate nonfamily farms.
How Does USDA Defi ne Farm Operator Households?

23Agricultural Income and Finance Outlook / AIS-90 / December 2010
Economic Research Service/USDA
economic depreciation by altering the incentives to buy capital goods, tax laws likely affect the tax-based measure more because, for a given farm size, only a certain amount of capital can be consumed in a single calendar year. In recent years, the tax code has increased incentives for farmers to invest in capital by increasing the amount of capital purchases that can be expensed against taxable income. In 2005, the maximum amount was $105,000. It then rose to $108,000 for 2006, $125,000 for 2007, and then doubled to $250,000 for 2008 through 2010. During this short period, the tax depreciation expense of family farm operations has increased by 30 percent (see table 2.1). Only the largest farms benef t from higher limits
USDA’s d ef nition of farm household i ncome pa rallels t hat of the U.S. Census Bureau’s def nition of household income for a ll U .S. househo lds i n t he C urrent P opulation S urvey (CPS). T he CPS def nition includes all cash income of the household, e xcept i n t he ca se o f se lf-employment i ncome (like farming) the def nition departs from a strictly cash con-cept by deducting depreciation, a noncash business expense, from the income of self-employed people. There are several factors that affect how much of the farm business income is earned by the household of the principal operator, including:
• Some farms have multiple op erators who do n ot share a single household. In such cases, household income is calculated only for the principal farm operator’s house-hold a nd i ncludes on ly t hat househo ld’s s hare o f f arm business income.
• Also, i f a f arm is or ganized a s a C- corporation, t he prof t that the f rm generates is retained by the business until the business pays out those earnings in the form of dividends. For C-corporations, farm business dividends paid to t he pr incipal op erator househo ld a re i ncluded in h ousehold f arm in come. (T he r emaining p rof t of C-corporations is retained by the farm business or paid to other shareholders and not ref ected in the pr incipal farm operator household income.)
• Operators of C- a nd S-corporations may a lso pay them-selves a wage for operating the farm and those payments are i ncluded both a s a n expense to t he business a nd a n income to the farm household when they are paid. In addi-tion, ot her farm-related ea rnings, such a s rental i ncome from a nother f arming op eration or t he net i ncome o f operating additional farms, are included as income in the calculation o f ea rnings o f t he op erator househo ld f rom farming activities.
• Earnings o f t he op erator househo ld f rom f arming activities as d ef ned i n t he U SDA mea sure a re n ot a complete measure of the returns provided by the farm. For example, depreciation is an expense deducted from income that may not actually be spent during the current year. I ncreases i n i nventories a re e xcluded f rom t he
earnings measure, but they could be sold to r aise cash. Nonmoney income, such as the rental value of a f arm-owned dwelling, represents a farm business contribution to household income, but is not considered cash income for the household.
• In order to ca lculate tot al op erator househo ld i ncome, the ea rnings o f t he op erator househo ld f rom f arming activities are added to the income from off-farm sources. Off-farm income may come f rom a v ariety of sou rces, including wages and salaries, off-farm self-employment, interest, dividends, private pensions, Social Security, or veterans’ benef ts.
• USDA’s mea sure o f f arm househo ld i ncome do es n ot account f or i ncome t axes pa id b y f arm househo lds. Numerous provisions of Federal i ncome t ax law a llow taxpayers to re duce their tax l iability if they undertake certain t ax-favored a ctivities. F armers b enef t from both g eneral t ax pro visions a vailable to a ll t axpayers and fr om p rovisions specif cally des igned for f armers. These tax benef ts generally accrue to those with higher incomes—generally househo lds w ith la rge f arms w ith high farm income and households with very small farms with high levels of off-farm income. Although very small farms do not generate enough farm income to support a family, most small farms benef t from farm losses for tax purposes because these losses reduce taxes on nonfarm income. At the same t ime, many farmers devoting full time to t he f arming op eration do n ot g enerate en ough taxable i ncome—either f arm or n onfarm—to f ully utilize a vailable t ax b enef ts. Exa mples o f s pecial t ax treatment f or f armers i nclude ca sh a ccounting, f arm income averaging, depreciation, the current deductibility of certain capital costs, and capital gains t reatment for certain a ssets use d i n farming. T hese a nd ot her provi-sions reduce the farm income tax base. Since 1980, IRS data indicate that farmers have reported negative aggre-gate net farm income for tax purposes. These farm losses reduce tax liabilities on taxable household income from nonfarm sources.
How Is Farm Household Income Defi ned?

24Agricultural Income and Finance Outlook / AIS-90 / December 2010
Economic Research Service/USDA
because the majority of family farms make capital investments below the permitted levels. With the current $250,000 limit, the vast majority of capital investments can be expensed in the year acquired, thereby lowering income from farming activities for that year.
Farm Household Net Worth
Current income can be an unreliable indicator of the f nancial well-being of farm operator households. Many farm households generate low earnings, or even losses, from the farm business in a given year, but may experience much better farm returns over the long run. Equity, or net worth, which is the differ-ence between assets and debts as of the last day of the year, ref ects this longer term performance, since a net worth position captures the accumulation of wealth over time. Moreover, depending on its liquidity or value as loan collat-eral, net worth can serve to sustain the household in years of lower income.
Average net worth of farm households increased 4.5 percent from 2008 to 2009, to $915,019, owing largely to an increase in nonfarm asset values and a decrease in nonfarm debt. However, farm assets also increased from 2008 to 2009. With the exception of 2008, farmland values have been increasing for more than 20 years, leaving the typical farm-operator household in a histori-cally strong f nancial position. (USDA does not forecast farm-operator house-hold net worth for 2010. The 2009 estimate is based on farm survey data collected in 2010 for the end of the calendar year 2009.) In 2009, the average farm operator household had $1.03 million in assets and $115,981 in debt.
About three-quarters of the value of assets owned by farm operator house-holds is associated with the farm, on average, including the household’s personal dwellings on the farm. In 2009, farm-owned operator dwellings represented 10 percent of the average household’s assets and all other farm assets represented 64 percent. The high share of value in dwellings shows that many farms are small and a major portion of their value is in the farm operator’s dwelling. Although operator households have most of their wealth in farm assets, farm households have a broad portfolio of nonfarm invest-ments, including f nancial investments and nonfarm real estate. The portion of household debt associated with the farm (57 percent) is smaller than the portion of assets associated with the farm (76 percent). There are likely a variety of reasons for this, including the fact that the major portion of farm assets, farmland, has been appreciating at a relatively consistent positive rate, compared to nonfarm assets in the general economy. The major source of nonfarm debt is from nonfarm personal dwellings. Mortgages on other real estate and nonfarm business loans are also major sources of household debt.
Household Income Sources and Financial Portfolios, by Farm Size
The farm-operator household population is economically diverse, in part because of the USDA’s encompassing def nition of a farm as any operation with the potential for at least $1,000 in sales of agricultural products in a year. One way to think about economic diversity is to distinguish households for whom agriculture makes important contributions to household income from those where it does not.
25Agricultural Income and Finance Outlook / AIS-90 / December 2010
Economic Research Service/USDA
Dividing farm households into categories based on the gross sales of their farms and calculating the average net income from farming activities for each category reveals that a household’s net income from farming is negative for sales catego-ries below $50,000, and so to simplify our presentation, we divide farm house-holds into two groups using a cutoff of $50,000 in annual farm sales. High-sales farm households (those operating farms with $50,000 or more in gross sales) accounted for 95 percent of the value of sales of family farms in 2009.
In 2009, the median income for both the low- and high-sales farm households was the second lowest over the period 2005 to 2009. However, low-sales farm households saw a 2-percent increase in median total income from 2008-09 while median income decreased by 6.7 percent for high-sales farm house-holds. The increase for low-sales farm households came from higher off-farm and farm income in contrast to high-sales farm households where off-farm income increased but farm income dropped substantially owing to broad decreases in commodity prices.
Table 2.2 reveals fundamental differences between low- and high-sales farm households. For one, high-sales farm households tend to have higher incomes. For 2005 to 2009, median total income for high-sales farm households ranged from 1.2 to 1.6 times greater than that of low-sales farm households. Another key difference is that median farm income is negative every year for low-sales farm households, though because of depreciation costs and the value of housing, this does not necessarily mean that farming is a drain on household f nances. It does highlight that households operating farms with modest gross sales depend on off-farm activities for their economic well-being. High-sales farm households, on the other hand, earn similar amounts from farm and off-farm sources.
As a farm’s gross sales increase, the operator’s total household income and dependence on farm income also tend to increase. High-sales farm house-holds, as a group, had a median income of $70,084 while those with farms having sales of at least $250,000 had a median total household income of $105,850. And while all high-sales farm households had a similar depen-dence on income from farm and off-farm sources, households with farms having at least $250,000 in sales had a farm income more than double its off-farm income (i.e., a median of $70,373, compared with $27,500).
Principal operators of low-sales farms with off-farm jobs tend to work in diverse industries. The top three industries providing employment are construction (15 percent), retail and other services (15 percent) and agricul-ture, forestry, f shing or mining (14 percent). In contrast, the share of opera-tors of high-sales farms who also work at off-farm jobs were far more likely to have an off-farm job in agriculture, forestry, f shing, or mining (28 percent did in 2009) than any other industry category. For both low- and high-sales households, the spouses of operators are most likely to work in the retail, education, or health care sectors, with each of the sectors responsible for a similar share of the jobs (f g. 2.1).
The median net worth of high-sales farm households is $1,075,460, almost 2.4 times the net worth of low-sales farm households, $452,650. (Average 2009 net worth of low- and high-sales farm households was $649,606 and $1.61 million, respectively).

26Agricultural Income and Finance Outlook / AIS-90 / December 2010
Economic Research Service/USDA
Figure 2.1
Distribution of asset holdings, 2009
Source: USDA, Agricultural Resource Management Survey, NASS and ERS.
51%
15%
7%
8%
6%
5%5% 3%
Farm assets, excluding dwellings
Farm dwellings
Financial assets in nonretirement accounts
IRA, Keogh, 401k, and other retirement accounts
Personal dwellings, not owned by operation
Other nonfarm real estate
Businesses not part of this farm
Vehicles and other assets
79%
6%
3%3%3%3%
2%1%
Low-sales farm households(less than $50,000 in gross sales)
High-sales farm households(at least $50,000 in gross sales)
Table 2.2Farm operator household income by gross farm sales, 2005-09
2005 2006 2007 2008 2009Dollars
Gross sales less than $50,000
Median1Farm -2,291 -3,357 -3,350 -4,633 -4,110
Off-farm 55,000 58,250 55,000 54,500 55,000Total Income 50,871 54,835 50,838 47,936 48,915
MeanFarm -2,302 -4,002 -6,349 -6,849 -7,607
Off-farm 72,408 76,656 81,697 74,218 74,652Total Income 70,106 72,654 75,348 67,368 67,045
Gross sales greater than or equal to $50,000
Median1Farm 32,736 23,673 29,596 28,551 23,729
Off-farm 29,250 33,000 34,000 32,750 34,002Total Income 73,507 67,089 76,528 74,781 70,084
MeanFarm 68,059 50,016 71,127 63,850 53,312
Off-farm 49,774 58,766 63,042 56,407 56,343Total Income 117,832 108,782 134,169 120,257 109,655
Gross sales greater than or equal to $50,000 and less than $250,000
Median1Farm 23,700 17,378 18,671 13,752 12,169
Off-farm 32,500 35,001 38,500 36,250 39,422Total Income 63,667 57,167 62,500 61,705 57,769
MeanFarm 23,690 16,167 16,543 11,670 9,887
Off-farm 53,910 58,213 75,833 62,098 60,837Total Income 77,600 74,381 92,376 73,768 70,724
Gross sales greater than or equal to $250,000
Median1Farm 91,433 60,281 74,851 77,071 70,373
Off-farm 22,500 27,750 27,500 28,458 27,500Total Income 119,725 100,552 115,600 115,723 105,850
MeanFarm 160,577 116,656 147,821 136,154 114,609
Off-farm 41,148 59,854 45,071 48,521 49,999Total Income 201,726 176,509 192,892 184,675 164,609
1The sum of median farm and off-farm income will generally not equal the median total income. Source: USDA, Agricultural Resource Management Survey, NASS and ERS.

27Agricultural Income and Finance Outlook / AIS-90 / December 2010
Economic Research Service/USDA
The distribution of a household’s wealth across asset types ref ects livelihood orientation and also the extent that changes in particular asset markets would affect a household’s net worth. For low-sales farm households, about half of household assets consist of farm assets, not including dwellings. Dwellings and f nancial assets (retirement and nonretirement) compose another 30 percent. As expected given the greater importance of farm income, house-holds associated with larger farms have a greater share of their assets (79 percent) in farm assets. Even though high-sales farm households have more than double the net worth of low-sales farm households, those with low sales have, on average, about $7,000 more in f nancial assets like stocks.
Farm Households Compared With the U.S. Population
For 2005 to 2009, the average and median household income for low-sales farm households were close to those for U.S. households. For 2009, in particular, low-sales farm households had slightly lower incomes than U.S. households. In contrast, high farm-sales households had signif cantly higher incomes than both U.S. households and low-sales farm households, regardless of the year.
Figure 2.2 shows the percent of low- and high-sales farm households in one of four wealth-income categories def ned by median U.S. household income and net worth. A household in the low income-low wealth group, for example, would have an income and net worth less than the median values for U.S. households. Only a small share of farm households falls into either of the low-wealth categories, regardless of farm sales. High-sales farm households are largely concentrated in the high income-high wealth category. In contrast, low-sales farm households are equally likely to be in either the low income-high wealth or the high income-high wealth categories. The former group of low-sales farm households have lower off-farm incomes, compared with the latter group with more signif cant off-farm incomes.
Figure 2.2
The income and wealth of low- and high-sales farm households, 2009Percent households
Note: The bars associated with the high-sales farm households represent percents based onall high-sales farms, not all farms in general.Source: USDA, Agricultural Resource Management Survey, NASS and ERS.
Low sales High sales
Low wealth High wealthLow wealth High wealth0
20
40
60
80
High incomeLow income

28Agricultural Income and Finance Outlook / AIS-90 / December 2010
Economic Research Service/USDA
CHAPTER 3
Earnings Differ Among Farm Businesses and Enterprises
• U.S. agriculture is a d iverse sector encompassing a co mplex mix of business enterprises.
• Income forecasts highlight the diversity of f nancial outcomes and are based on applying sector level forecasts, receipts, and expenses to the latest Agricultural Resource Management Survey (ARMS) data.
• Average net cash income for farm businesses is expected to increase throughout much of the country in 2010. The expected strong recovery in dairy, hog, and cattle receipts will result in much higher average net cash incomes for farm businesses in the Northern Crescent, Basin and Range, and Prairie Gateway regions.
Agriculture is a diverse sector represented by a complex mix of business enterprises. This section focuses on the 850,000 farm businesses that are responsible for the majority of economic activity in the sector (see box, “Def ning Farm Businesses,’ p. 29, for more detail). Results reported here are designed to highlight the diversity of f nancial outcomes. We apply sector-level forecasts of receipts and expenses to the latest ARMS data to forecast net cash farm income for various types of farms. Estimates of farm-level income reported by USDA from ARMS have been developed to ref ect both the contributions of factor providers, such as creditors and landlords, and the use of business arrangements such as contracts. The net cash income reported for farms is the income available to share among owners and operators who participate in the farm’s f nancing, production, and marketing outcomes. Cash f ow projections can be summarized across various groups of farms, based on regional location, commodity specialization, or size. The model is static and therefore does not account for changes in crop rotation, weather, and other local production impacts that occurred after the base year.
The livestock sector experienced the brunt of the f nancial downturn in 2009, with dairy farm businesses sustaining the most severe losses (table 3.1). During 2009, prices for livestock and dairy products declined much faster than for feed costs, which strained net earnings for livestock and dairy producers. The strengthening U.S. economy and lower levels of hog products in the marketplace have helped support hog prices in 2010. Milk prices have recovered from recent lows. More important, feed prices have fallen from the peaks of 2008 and export demand for livestock products looks stronger for 2010. Ref ecting this potential for an improved economic environment, average net cash income of hog farm businesses is forecast to rebound to almost $276,100. Dairy farm businesses are forecast to have average incomes of $214,000 which, like hogs, would represent an increase from average incomes earned during 2007 and could be the strongest percentage rebound from 2009 of any major commodity group. With inventories of breeding cattle at their lowest levels in decades, average net cash income of cattle farm businesses is forecast to increase 37 percent and would be at the highest level since 2007. Poultry farm businesses are expected to have the lowest increase in net cash income (17 percent). Poultry and turkey farm business
29Agricultural Income and Finance Outlook / AIS-90 / December 2010
Economic Research Service/USDA
are expected to show smaller percentage price increases than other major livestock groups. In addition, poultry farm businesses are projected to have the largest increase in cash expenses due to their greater intensity of energy-related input use.
In contrast to the outlook for a strong ($20 billion) recovery in livestock receipts, crop cash receipts are forecast to increase by half as much—$9.4 billion in 2010. Uncertainty regarding corn yields and production, continued demand for ethanol, and strong exports have contributed to signif cant price increases for corn, many feed grains, and soybeans in the second half of 2010. Crop farm businesses’ bottom lines also will be enhanced by continued reductions in input costs. Fertilizer expenses are forecast to decline by 10 percent in 2010, after declining by almost 11 percent in 2009. Farm busi-nesses that employ debt f nancing will benef t from relatively low interest rates, with interest expense forecast to be 1.4 percent lower in 2010. Higher expenses for fuel, labor, and taxes will likely offset some of the potential for lower total cash expenses in 2010. The projected increase in average income for corn, soybean, and wheat farm businesses ranges from 11-14 percent in 2010. Average incomes of cotton and rice farm businesses are forecast to increase by 33 percent on the strength of cotton price increases combined with modest increases in expenses.
Average net cash income for farm businesses is expected to increase throughout much of the country in 2010. The expected strong recovery in dairy, hog, and cattle receipts will result in much higher average net cash incomes for farm businesses in the Northern Crescent, Basin and Range, and Prairie Gateway regions. In the Northern Crescent, where dairy is a promi-nent commodity, average net cash income for farm businesses is forecast to increase by over 58 percent. Incomes are expected to be almost 50 percent higher in 2010 for farm businesses in the Basin and Range region, where cattle are an important commodity. This region had the largest percentage decline in average net cash income in 2009. Areas of the country where grain and oilseed production are prominent—such as the Heartland, Northern
The off cial USDA farm def nition (an operation with $1,000 of gross agricultural sales or t he potential to g enerate such sa les) encompasses a w idely d iverse 2 .1 million operations. Farms vary in their level of business activity, resource alloca-tion, goals, and a host of other attributes. ERS developed a typology of farms to categorize farms into more s imilar groups based on g ross sales, major occupa-tion o f t he farm op erator, a nd tot al househo ld ea rnings ( for more i nformation see Structure and Finances of U.S. Farms: Family Farm Report, 2007 Edition, www.ers.usda.gov/Publications/EIB24/). In order to concentrate analysis of busi-ness performance on those farms with signif cant labor allocation to farming and household dep endence on bus iness i ncome, several of t he farm t ypology c las-sif cations are excluded. These include limited-resource farms, retirement farms, and residential/lifestyle farms. A majority of these farms have negative business income a nd dep end on o ff-farm sou rces o f i ncome to s upport t heir household (see information in household income section). Farm businesses, for purposes of performance analysis in this chapter, include the more than 800,000 remaining family and nonfamily farms who indicated that farming was the primary activity of the operator.
Defi ning Farm Businesses

30Agricultural Income and Finance Outlook / AIS-90 / December 2010
Economic Research Service/USDA
Great Plains, and Mississippi Portal—are expected to have the smallest increases in average net cash farm business income ranging from 21-25 percent.
One way to gauge the relative strength of the income recovery across regions is to compare the 2010 forecast with the 2007-08 average. In all but four regions, average farm business income is projected to be higher than the 2007-08 average (f g. 3.1). Even among regions with improved earnings, there is disparity in the strength of the recovery. The Mississippi Portal has the highest average farm business income relative to 2007-08 (49 percent higher in 2010) compared with incomes higher than the 2007-08 average by 26 percent in the Northern Crescent, 18 percent in the Heartland, and 14 percent in the Northern Great Plains. Average incomes are projected to be 24 percent below the 2007-08 average in the Basin and Range region.
Table 3.1Change in net cash income by type of farm operation, 2010
Commodityspecialization
Percentchange innet cashincome Key determinants of change
Program crops
Mixed grain 17.0 Crop receipts 5.2% above 2009. Total cash expenses unchanged. Fuel up 22%, while fertilizer down 10% and seed down 5%.
Wheat 10.7Crop receipts up 4.7%. Cash expenses forecast to increase by 0.5%. Fuel and utilities had the largest increases. Seed and fertilizer expenses are forecast to decline.
Corn 14.3Crop receipts are forecast to increase by 4.8%. Cash expenses forecast to remain similar to 2009. Fuel and utilities were the expense items with the largest increases.
Soybeans and peanuts 13.0Crop receipts up 4.9%. Cash expenses forecast to decline by 0.3%. Seed and fertilizer, which together represent 42% of cash expenses decline by 5% and 8%, respectively.
Cotton and rice 32.5 Crop receipts up 15.5%. Government payments project to drop 14%. Cash expenses similar to 2009.
Nonprogram crops
Other f eld crops 18.7 Crop receipts forecast up by 7.4%. Cash expenses projected to increase by 1.7%. Fuel and utilities had the largest increases.
Specialty crops 7.5 Crop receipts up 3.8%. Cash expenses forecast to increase by 1.4%. Labor, which represents 40% of cash expenses, is projected up by 1.7%.
Livestock
Beef cattle 36.7 Livestock receipts up 11.9%. Cash expenses 6% higher. Fuel and utilities had the largest increasesfrom 2009. Feed costs similar to 2009.
Hogs 61.8 Livestock receipts up 22.3%. Cash expenses projected up by 2.6%. Feed similar to 2009 and interest expense down 1.4% from 2009.
Poultry 16.7 Livestock receipts up 16.7%. Cash expenses 4.2% higher. Other farm related income 3.7% lower than 2009.
Dairy 205.0Livestock receipts up 26.3%. Government payments up 38%. Cash expenses 1.3% higher. Feed which represents 42 percent of cash expenses is expected to decline by 0.6% from 2009.
Other livestock -61.9 Livestock receipts up 12.3%. Cash expenses 3.9% higher.Note: 2010 forecast.Source: USDA, Economic Research Service, farm-level forecast model.

31Agricultural Income and Finance Outlook / AIS-90 / December 2010
Economic Research Service/USDA
Figure 3.1
Change in average net cash income by resource region, 2010
Note: 2010 forecast. See ERS Resource Regions map, p.11.1The farm level forecasts are derived from partial budget modeling on the 2009 ARMS using parameters from the sector forecasts. The model is static and therefore does not account for changes in crop rotation, weather, and other local production impacts that occurred after the base year. Source: USDA, Agricultural Resource Management Survey, NASS and ERS.
2010 net cash income forecastcompared with 2007-08 average1
20% or greater reduction11% to 20% reduction10% or less reduction1% to 10% increase11% to 20% increaseMore than 20% increase

32Agricultural Income and Finance Outlook / AIS-90 / December 2010
Economic Research Service/USDA
CHAPTER 4
Farm Business Balance Sheet and Financial Performance
• Increases in farm asset and equity values, together with decreases in farm sector debt affect the overall solvency of the sector. Declining debt-to-asset and debt-to-equity ratios improve the ability of farmers and other investors to f nance purchases of farmland and other assets.
• Factors that have contributed to the rise in farm-asset values include farm investors’ higher expected future net returns, rising cash f ow, and generally favorable credit conditions for credit-worthy borrowers.
• Unused debt repayment capacity is expected to increase in 2010 due to a projected decrease in farm debt and increase in farm income.
Asset values and outstanding farm debt are fundamentally driven by expected returns on investments in farmland and other farm capital, and by interest rates. These factors vary across the country, ref ecting differences in expected net returns on the mix of crops and livestock produced locally, in credit market conditions, and in opportunities for off-farm employment and invest-ments. Forecasts of rising net returns on farm investments are primarily due to rising cash receipts for crops and livestock, and to low interest rates. As a result, the value of farm business sector assets is expected to rise in 2010.
Farm business sector assets and equity (assets minus debt) values are forecast to rise modestly in 2010, while farm debt is forecast to decline from 2009 levels (table 4.1). Farm sector asset values are expected to rise by about $63 billion to $2.12 trillion in 2010 (a 3.1-percent increase). The values of real estate, crop inventories, livestock and poultry inventories, purchased inputs, machinery and equipment, and f nancial assets are all expected to rise modestly in 2010.
Interest rates in 2010 have remained low and stable, and credit has generally remained available through major agricultural lenders. Nonetheless, some farm businesses could be facing tightened credit requirements in 2010 as a consequence of increased loan collateral requirements and/or decreased loan repayment time periods. While debt capital is likely to be available to highly qualif ed borrowers at relatively low costs, less qualif ed borrowers could be facing higher interest rates.
Farm sector debt is expected to fall from about $245 billion in 2009 to about $240 billion in 2010 (f g. 4.1). The decline in real-estate debt is expected to be about $2 billion (-1.7 percent) while the decline in nonreal-estate debt is forecast to be about $3 billion (-2.6 percent).
Farm business equity is expected to rise from $1.8 trillion in 2009 to $1.9 tril-lion in 2010 (a 3.8-percent increase), due to an expected 3.1-percent increase in the value of farm assets and a 2.1-percent decline in farm business debt (f g. 4.2). The farm business sector’s debt-to-asset ratio is expected to decline to 11.3 percent and debt-to-equity is expected to decline to 12.8 percent in 2010, indicating an overall increase in the farm sector’s solvency (f g. 4.3).

33Agricultural Income and Finance Outlook / AIS-90 / December 2010
Economic Research Service/USDA
Unused Debt Repayment Capacity Expected To Increase in 2010
A projected decrease in farm debt in 2010, combined with an increase in farm income, should increase the sector’s maximum feasible farm debt and unused debt repayment capacity in 2010 (f g. 4.4). Debt repayment capacity utilization (DRCU) is the ratio of actual farm debt outstanding relative to the maximum feasible farm debt in any given year. As farmers do not necessarily use all their debt repayment capacity, the DRCU is a measure of the extra cushion the farm sector has to repay farm debt over time solely through the production and sale of farm products and services (see box, “Components of Sectorwide DRCU Calculations,” p. 35). A DRCU estimate exceeding 100 percent indicates that debt payments must be made by drawing on additional cash sources, such as taking on additional debt, earning off-farm income, drawing down household assets, or selling farm business assets. By the end of
Table 4.1 Balance sheet of the U.S. farming sector, 2004-2010
Financial measures 2004 2005 2006 2007 20088/4/2010
200911/16/2010
2010$ million
Farm assets 1,588,033 1,779,376 1,923,596 2,055,276 2,023,302 2,057,140 2,120,117
Real estate 1,305,188 1,486,960 1,625,835 1,751,386 1,702,961 1,727,173 1,781,925Livestock and poultry 79,420 81,097 80,747 80,649 80,607 79,785 81,372+/- change in value of inv. adjust. Machinery and motor vehicles1 107,789 113,071 114,200 114,706 123,380 125,971 129,121 Crops stored2 24,435 24,291 22,699 22,703 27,610 32,887 35,595 +/- change in value of inv. adjust. Purchased inputs 5,701 6,491 6,460 7,019 7,167 7,217 7,243 Financial assets 65,500 67,465 73,656 78,812 81,577 84,106 84,862
Total farm debt3 181,917 196,377 203,581 214,063 242,677 245,360 240,265
Real estate 95,653 104,768 108,048 112,682 133,582 134,514 132,261 Farm Credit System 37,078 41,173 43,448 46,793 57,124 58,423 Farm Service Agency 2,395 2,453 2,374 2,281 2,313 2,343 Commercial banks 34,630 37,904 40,149 41,884 49,705 50,338 Life insurance companies 10,726 11,307 12,001 12,750 14,736 14,246 Individuals and others 10,598 11,682 9,790 8,657 9,552 8,695 Storage facility loans 226 250 285 316 151 469
Nonreal estate 86,265 91,609 95,533 101,382 109,096 110,846 108,004 Farm Credit System 22,040 24,279 27,811 31,622 37,290 39,883 Farm Service Agency 3,244 3,008 2,736 2,808 2,652 2,823 Commercial banks 45,849 48,405 51,253 54,129 57,313 57,027 Individuals and others 15,132 15,917 13,733 12,823 11,841 11,113
Farm equity 1,406,115 1,582,999 1,720,015 1,841,212 1,780,625 1,811,779 1,879,852
Selected ratios: Debt-to-equity 12.9 12.4 11.8 11.6 13.6 13.5 12.8 Debt-to-asset 11.5 11.0 10.6 10.4 12.0 11.9 11.3 Note: 2010 forecast and 2009 preliminary. Numbers may not add due to rounding. Balance sheet is as of December 31. 1Includes only farm share of value for trucks and automobiles. 2Non-CCC crops held on farms plus value above loan rates for crops held under CCC. 3Includes CCC storage and drying facilities loans but excludes debt on operator dwellings and for nonfarm purposes. The current forecast and historic information can always be found at http://www.ers.usda.gov/data/farmincome/finfidmu.htm Information contacts: For assets -- Ken Erickson, (202) 694-5565, e-mail: [email protected] and for debt -- Bob Williams, (202) 694-5053, e-mail: [email protected]

34Agricultural Income and Finance Outlook / AIS-90 / December 2010
Economic Research Service/USDA
2010, farm sector DRCU is expected to fall to about 45 percent, down from 59 percent in 2009 (f g. 4.5).
Net Cash Flow
The net cash f ow measure helps farm f nancial analysts to better understand the process of farm capital formation. It expands on the net cash income concept to account for internal and external sources of funds, and thus net cash f ow provides a broader indication of the resources available to farm businesses to invest in the sector, and to meet current debt obligations (see box, “Net Cash Flow (After Interest Expenses),” p. 36).
Net cash f ow after interest expenses fell by nearly $45 billion in 2009 but is expected to rise by nearly $11 billion in 2010. The debt-to-net cash f ow ratio is inversely related to the farm business sector’s ability to f nance farm invest-ments in land and other farm capital—a lower ratio shows a higher ability to do so. This ratio is expected to improve from 5.2 in 2009 to 4.1 in 2010 (f g. 4.6).
Figure 4.1
U.S. farm sector debt, 1984-2010$ billion
Note: 2010 forecast.Source: USDA, Economic Research Service.
Nonreal estateReal estate
1984 86 88 90 92 94 96 98 2000 02 04 06 08 100
50
100
150
200
250
Figure 4.2
Farm sector equity (net worth), 1980-2010$ trillion
Note: 2010 forecast.Source: USDA, Economic Research Service.
1980 82 84 86 88 90 92 94 96 98 2000 02 04 06 08 100
0.20.40.60.81.01.21.41.61.82.0

35Agricultural Income and Finance Outlook / AIS-90 / December 2010
Economic Research Service/USDA
Figure 4.3
U.S. farm sector debt-to-asset and debt-to-equity ratios, 1986-2010Percent
Note: 2010 forecast.Source: USDA, Economic Research Service.
1986 88 90 92 94 96 98 2000 02 04 06 08 100
5
10
15
20
25
30
Debt to assets
Debt to equity
Income for debt coverage = Net farm income + interest on capital debt
Debt repayment = Principal and interest on capital debt + capital lease payments
Total debt coverage ratio = Income for debt coverage / debt repayment
Debt coverage margin = Income for debt coverage – debt payment
Minimum debt coverage ratio = lender requirement; based on a coverage ratio of 1.25, which requires that no more than 80 percent of the loan applicant’s income be used for repayment of principal and interest on loans.
Maximum loan payment = Income for debt coverage / minimum debt coverage ratio
Debt repayment capacity = Ma ximum l oan pa yment x ( 1-(1+r)-n)/r, w here (1-(1+r)-n/r = present value of an annuity of $1, at r percent for n periods.
Debt repayment capacity utilization = Debt / debt repayment capacity.
Components of Sectorwide DRCU Calculations
Figure 4.4
Farm sector debt and repayment capacity, 1971-2010$ billion
Note: 2010 forecast.Source: USDA, Economic Research Service.
1971 74 77 80 83 86 89 92 95 98 2001 04 07 100
100
200
300
400
500
Farm business debt
Unused repayment capacity
Maximum feasible debt

36Agricultural Income and Finance Outlook / AIS-90 / December 2010
Economic Research Service/USDA
Profi tability of Farm Sector Investments Rising
Total return to farm assets includes both current income (returns to farm assets realized in the current year) and capital gains accruing to farm assets. Capital gains contributed the major share of total returns from 2003 through 2007. However, as the appreciation in farm asset values (principally farm-land) declined from 2004 to 2009, returns from current income (returns actually realized each year) have grown as a share of total returns to farm business assets.
Returns on farm assets and equity are indicators of the prof tability of farm sector investments. Total returns on farm business assets (from current income plus capital gains) are estimated at $60.3 billion in 2009 (with $26.4 billion from current income and $33.9 billion from capital gains) (f g. 4.7).
Figure 4.5
Sector debt repayment capacity utilization (DRCU), 1986-2010Percent
Note: 2010 forecast. DRCU for farm operators = actual debt / debt that could be repaid from current income.Source: USDA, Economic Research Service.
1986 88 90 92 94 96 98 2000 02 04 06 08 100
10
20
30
40
50
60
70
Net cash fl ow (after interest expenses) is def ned as:
= net cash income
+ change in loans outstanding
+ net rent to nonoperator landlords (excluding capital consumption)
+ net change in farmers’ currency and demand deposits
- capital expenditures (excluding operator and other dwellings)
- interest expenses (excluding operator and other dwellings)
Net Cash Flow (After Interest Expenses)

37Agricultural Income and Finance Outlook / AIS-90 / December 2010
Economic Research Service/USDA
Farms’ Net income and Solvency Position
Five percent of farms were classif ed as being in a vulnerable position on December 31, 2009, having both negative net cash income and a debt-to-asset ratio over 0.40 (see f g. 4.8 and box, “Def nition of Solvency Measures,” p. 38). More farms (27 percent) were classif ed as being in a marginal-income position as a result of having negative net cash incomes, but a debt-to-asset ratio of 0.4 or less.
The share of all U.S. farms classif ed as vulnerable has dropped since 1986 (the year when combined net farm income and balance sheet statements were f rst available for farm businesses), when nearly 12 percent of farms were in this f nancial position. The share of farms classif ed as being in a vulnerable position had a fairly sizable drop between 1986, when the 1980s farm crisis was ongoing, and the late 1980s and early 1990s, as debt was pared relative to asset values and incomes improved. More recently, the share of farms clas-sif ed as vulnerable has dropped in this decade to the lowest levels that ERS
Figure 4.6
Farm business debt to net cash flow, 1960-2010Ratio
Note: 2010 forecast. Source: USDA, Economic Research Service.
1960 65 70 75 80 85 90 95 2000 05 1002468
101214161820
Debt-to-net cash flow after interest
Figure 4.7
Total returns to U.S. farm business assets, 1960-2009$ billion
Source: USDA, Economic Research Service.
1960 65 70 75 80 85 90 95 2000 05-150-100-50
050
100150200250300
Returns to farm assets from current income
Returns to farm assets from capital gains
Total returns: current income plus capital gains

38Agricultural Income and Finance Outlook / AIS-90 / December 2010
Economic Research Service/USDA
has recorded, as a result of expanding income levels and shrinking debt in relation to asset values.
At the other extreme, about 62 percent of farms were in a favorable f nancial position entering 2010. These farms had both positive income and relatively low farm debt. For comparative purposes, 48 percent of farms were classif ed as favorable in 1986. In addition to a smaller share of farms being classif ed as vulnerable, another striking change has occurred in the share of farms with a high debt burden (over 40 percent of asset values) and positive net income (marginal solvency). This measure is down from 10 percent of farms in the mid-1980s to around 7 percent in 2009. This change in classif cation ref ects both the larger share of farms that report no yearend debt and the farms that do report debt use being in a less leveraged position. The substan-tial rise in asset values, particularly land, over the past two decades has contributed to the reduction in f nancial leverage borne by farms.
Figure 4.8
Share of farm businesses by overall financial performance position, 1996-2009 Percent
Source: USDA, Agricultural Resource Management Survey, NASS and ERS.
VulnerableMarginal solvencyMarginal incomeFavorable
1996 98 2000 02 04 06 080
20
40
60
80
Favorable: Net Farm Income > 0, Debt to Asset Ratio 40%
Marginal Income: Net Farm Income < 0, Debt to Asset Ratio 40%
Marginal Solvency: Net Farm Income > 0, Debt to Asset Ratio > 40%
Vulnerable: Net Farm Income < 0, Debt to Asset Ratio > 40%
Defi nition of Solvency Measures

39Agricultural Income and Finance Outlook / AIS-90 / December 2010
Economic Research Service/USDA
SPECIAL ARTICLE:
Low Levels of At-Risk Farm Business Collateral
Security and Debt• The n umber o f “ at r isk” ag ricultural l oans he ld b y f arm b usinesses
increased slightly from 2008 to 2009, while remaining at modest levels.
• Simulations s uggest t hat a s udden de valuation o f f arm a ssets o r a sudden increase in interest rates would have little effect on agricul-tural collateral security and the riskiness of farm debt in the short run.
Despite the recent global recession and continuing U.S. economywide credit problems, the f nancial health of the farm sector has been excellent in recent years. The farm sector’s f nancial stability has been largely unaffected by the global f nancial crisis despite unstable input prices and variable output prices. However, given the widespread impacts of the global economic crisis, there have been concerns raised about the debt repayment ability of farmers and the future stability of asset values—especially for livestock farmers, whose net farm incomes declined in 2009 due to higher feed costs and weakened domestic and international demand.
Questions about the impacts of changes in asset values and interest rates must take into account how they relate to farm business stress and debt at risk (see box, “Estimating Debt at Risk” for a description of how we measure such debt). A decline in farm asset values could raise concerns about f nancial stress since such assets represent the collateral security backing farm business loans. A rise in interest rates could raise concerns about the ability of borrowers to repay existing debt. Financial stress and debt repayment are intertwined since a common lender reaction to increasing f nancial stress or loan delinquencies is to tighten credit standards, including requiring greater collateral reserves. Thus far, while growing asset values (see chapter 4) have increased the value of collateral backing farm business loans, farm business debt at risk has been slowly rising since 2007. In this Special Article, we examine recent changes in various measures of troubled agricultural debt, the types of farm businesses currently experiencing f nancial stress, and the potential impact on debt repay-ment problems should farm businesses suddenly face decreases in the market value of farm assets or increases in interest rates.
Before simulating the impacts of potential declines in asset values or increases in interest rates, we examine recent trends in debt at risk. Three sources of data are used: data from the Farm Credit System (FCS) and commercial banks (which together account for more than 85 percent of farm debt), and data from the Agricultural Resource Management Survey (ARMS). Data for agricultural loans that are not paying their stated interest rate or are more than 90 days past due from the FCS, and delinquent and nonperforming loans from insured commercial banks show a 89-percent increase ($3.1 billion) in potential loan defaults in 2009 compared to 2008 (f g. 1). Since 2007, troubled farm debt reported by these two groups of lenders has more than triple, increasing by $4.6 billion. Nevertheless, the share of farm debt outstanding that is experiencing
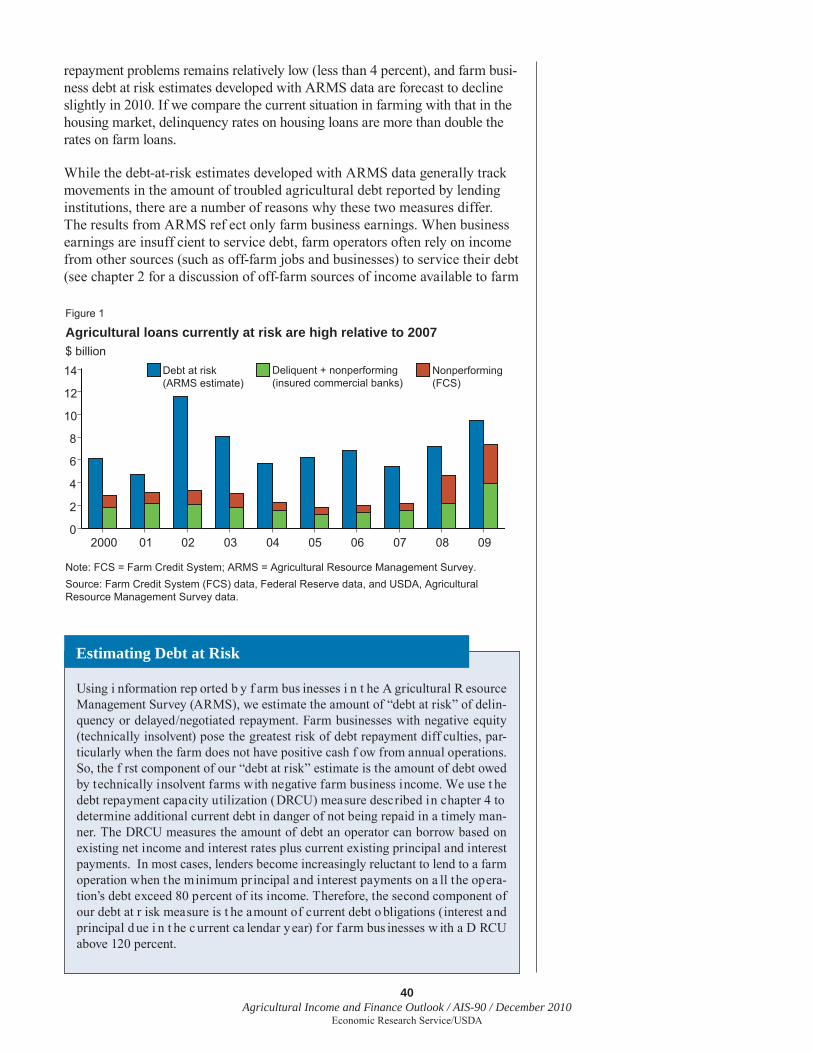
40Agricultural Income and Finance Outlook / AIS-90 / December 2010
Economic Research Service/USDA
repayment problems remains relatively low (less than 4 percent), and farm busi-ness debt at risk estimates developed with ARMS data are forecast to decline slightly in 2010. If we compare the current situation in farming with that in the housing market, delinquency rates on housing loans are more than double the rates on farm loans.
While the debt-at-risk estimates developed with ARMS data generally track movements in the amount of troubled agricultural debt reported by lending institutions, there are a number of reasons why these two measures differ. The results from ARMS ref ect only farm business earnings. When business earnings are insuff cient to service debt, farm operators often rely on income from other sources (such as off-farm jobs and businesses) to service their debt (see chapter 2 for a discussion of off-farm sources of income available to farm
Using i nformation rep orted b y f arm bus inesses i n t he A gricultural R esource Management Survey (ARMS), we estimate the amount of “debt at risk” of delin-quency or delayed/negotiated repayment. Farm businesses with negative equity (technically insolvent) pose the greatest risk of debt repayment diff culties, par-ticularly when the farm does not have positive cash f ow from annual operations. So, the f rst component of our “debt at risk” estimate is the amount of debt owed by technically insolvent farms with negative farm business income. We use t he debt repayment capacity utilization (DRCU) measure described in chapter 4 to determine additional current debt in danger of not being repaid in a timely man-ner. The DRCU measures the amount of debt an operator can borrow based on existing net income and interest rates plus current existing principal and interest payments. In most cases, lenders become increasingly reluctant to lend to a farm operation when the minimum principal and interest payments on a ll the opera-tion’s debt exceed 80 percent of its income. Therefore, the second component of our debt at r isk measure is t he amount of current debt o bligations (interest and principal d ue i n t he c urrent ca lendar year) for f arm bus inesses w ith a D RCU above 120 percent.
Estimating Debt at Risk
Figure 1
Agricultural loans currently at risk are high relative to 2007$ billion
Note: FCS = Farm Credit System; ARMS = Agricultural Resource Management Survey.Source: Farm Credit System (FCS) data, Federal Reserve data, and USDA, Agricultural Resource Management Survey data.
Nonperforming (FCS)
Deliquent + nonperforming (insured commercial banks)
Debt at risk (ARMS estimate)
2000 01 02 03 04 05 06 07 08 090
2
4
6
8
10
12
14

41Agricultural Income and Finance Outlook / AIS-90 / December 2010
Economic Research Service/USDA
households). Farm operators can also continue servicing their debt by liqui-dating current assets (or inventories). In addition, some of the discrepancy between the ARMS estimate of debt at risk and what is reported by commer-cial banks and the FCS may be attributed to other lenders (such as equipment dealers and input suppliers). There could also be a lag between when banks report delinquent loans and when we measure that potential based on annual survey data.
Financial stress is not evenly distributed among farm businesses. According to 2009 ARMS data, livestock farms held 55 percent of total farm business debt at risk. This included large shares held by dairy farms (24 percent) and beef cattle farms (18 percent). Dairy and beef farms (including feedlot activities) tend to have higher capital requirements than other types of farms. Among crop farms, specialty crop farms accounted for 17 percent and corn farms followed with 14 percent of total debt at risk (fi g. 2).
Fixed vs. Variable Rate Loans
In the current economic environment, the prospects for a signifi cant increase in interest rates at some point in the near future are rising, if for no other reason than they are currently at historically low levels. The farm enterprises under greatest short-term risk are those holding variable rate loans.
Figure 3 shows the number (and percent) of farm businesses that reported variable interest rate loans for 2009. Eighteen percent of farm businesses had a variable rate loan during the survey year compared with 59 percent of farms that had no loans. An additional 29 percent of farm businesses had fi xed rate loans. Some farm businesses can have fi xed and variable rate loans or several loans of the same type.
The average interest rate for all loan types was 5.6 percent in 2009. The lowest average interest rate was 4.6 percent for monthly adjustable loans and
Other cash grainWheat–2%
Corn
Soybean and peanuts–1%Cotton and rice–1%
Other crops
Specialty crops
Beef cattle
Hogs–3%Poultry
Dairy
Other livestock
Figure 2
Percent of total debt at risk is not uniformly distributed across farm types, 2009
Source: USDA, Agricultural Resource Management Survey, NASS and ERS.
14%6% 4%
24%
5%
18%
17%
5%
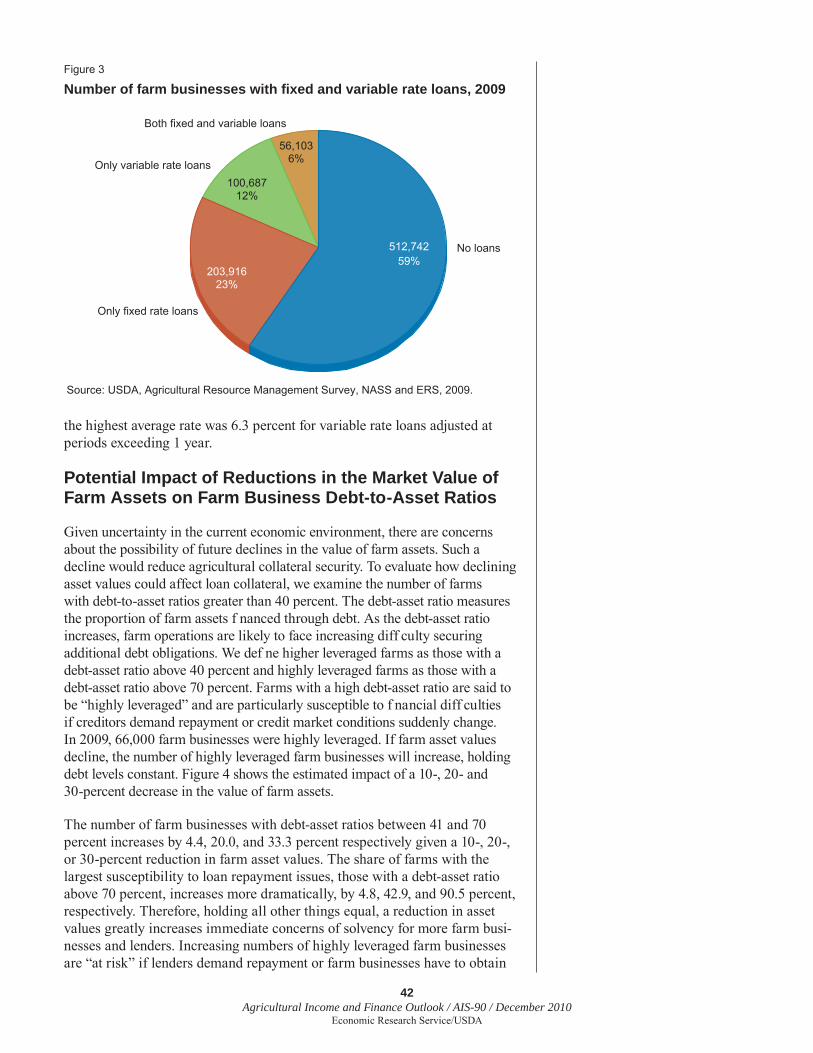
42Agricultural Income and Finance Outlook / AIS-90 / December 2010
Economic Research Service/USDA
the highest average rate was 6.3 percent for variable rate loans adjusted at periods exceeding 1 year.
Potential Impact of Reductions in the Market Value of Farm Assets on Farm Business Debt-to-Asset Ratios
Given uncertainty in the current economic environment, there are concerns about the possibility of future declines in the value of farm assets. Such a decline would reduce agricultural collateral security. To evaluate how declining asset values could affect loan collateral, we examine the number of farms with debt-to-asset ratios greater than 40 percent. The debt-asset ratio measures the proportion of farm assets f nanced through debt. As the debt-asset ratio increases, farm operations are likely to face increasing diff culty securing additional debt obligations. We def ne higher leveraged farms as those with a debt-asset ratio above 40 percent and highly leveraged farms as those with a debt-asset ratio above 70 percent. Farms with a high debt-asset ratio are said to be “highly leveraged” and are particularly susceptible to f nancial diff culties if creditors demand repayment or credit market conditions suddenly change. In 2009, 66,000 farm businesses were highly leveraged. If farm asset values decline, the number of highly leveraged farm businesses will increase, holding debt levels constant. Figure 4 shows the estimated impact of a 10-, 20- and 30-percent decrease in the value of farm assets.
The number of farm businesses with debt-asset ratios between 41 and 70 percent increases by 4.4, 20.0, and 33.3 percent respectively given a 10-, 20-, or 30-percent reduction in farm asset values. The share of farms with the largest susceptibility to loan repayment issues, those with a debt-asset ratio above 70 percent, increases more dramatically, by 4.8, 42.9, and 90.5 percent, respectively. Therefore, holding all other things equal, a reduction in asset values greatly increases immediate concerns of solvency for more farm busi-nesses and lenders. Increasing numbers of highly leveraged farm businesses are “at risk” if lenders demand repayment or farm businesses have to obtain
Figure 3
Number of farm businesses with fixed and variable rate loans, 2009
Source: USDA, Agricultural Resource Management Survey, NASS and ERS, 2009.
No loans
Only fixed rate loans
Only variable rate loans
Both fixed and variable loans
512,74259%
203,91623%
56,1036%
100,68712%

43Agricultural Income and Finance Outlook / AIS-90 / December 2010
Economic Research Service/USDA
new loans. However, for the 59 percent of farms that had no debt in 2009, there is no change in the value of their debt-to-asset ratio. Nonetheless, they could be affected by reduced equity and increased collateral requirements for future loans.
Potential Impacts of Changes in Interest Rates on Debt At Risk
Figure 5 shows the number of farm businesses with debt at risk, as measured by a debt repayment capacity utilization ratio exceeding 120 percent (see box, “Estimating Debt at Risk”). Figure 5 suggests that increasing interest rates on variable rate loans would have only a modest immediate impact on the number of farms experiencing f nancial stress (holding everything else constant). In the extreme case, if interest rates increased from 6 percent to 12 percent, the number of farms with “at risk debt” would increase by roughly 5 percent for farms that owe more than half of their current debt as variable rate loans. In essence, if interest rates on variable rate loans increase, higher principal and interest payments are required to service existing debt. This means that an increasing number of farm businesses would be unable to meet debt service requirements out of current business income, putting their debt “at risk.” The 59 percent of farm businesses with no debt in 2009 would not be affected immediately but could face higher interest rates for future loans. Farms with debt at f xed interest rates would also not be affected immediately but could face higher rates on new or consolidated loans.
Figure 4
A decrease in asset values may lead to increased financial leverage by farm businessesNumber of farms (thousands)
30% reduction20% reduction
10% reductionOriginal
Debt/asset ratio41-70% Above 70%
0
10
20
30
40
50
60
70
Source: USDA, Agricultural Resource Management Survey, NASS and ERS, 2009.

44Agricultural Income and Finance Outlook / AIS-90 / December 2010
Economic Research Service/USDA
Figure 5
An increase in interest rates yields modest short-term changes in farm debt repayment capacityNumber of farms (thousand)1
More than 50% of loan volume variable rate
Less than 50% of loan volume variable rate
6% adjustable 8% adjustable 10% adjustable 12% adjustable
1Farms in the "Above 120%" DRCU class at varying adjustable interest rate levels and variable loan volume packages.Source: USDA, Agricultural Resource Management Survey, NASS and ERS.
0102030405060708090

45Agricultural Income and Finance Outlook / AIS-90 / December 2010
Economic Research Service/USDA
References
Ahearn, M., and D. Newton. 2009. Beginning Farmers and Ranchers, EIB-53, USDA, Economic Research Service. Available at: www.ers.usda.gov/publications/EIB53/.
Ahearn, M., J. Johnson, and R. Strickland. 1985. “The Distribution of Income and Wealth of Farm Operator Households,” American Journal of Agricultural Economics, Vol. 67, No. 5, pp. 1087-1094.
Baffes, J., and T. Haniotis. 2010. Placing the 2006/08 Commodity Price Boom into Perspective, Policy Research Working Paper No. WPS 5371, World Bank, Washington, DC. Available at: http://go.worldbank.org/GLNNMUI3Q0/.
Good, K. 2010. FarmPolicy.com: A Summary of Farm Policy News. Available at: http://www.farmpolicy.com.
Harris, J.M., J. Johnson, J. Dillard, R. Williams, R. Dubman. 2009. The Debt Financing Landscape for U.S. Farming and Farm Businesses, AIS-87, USDA, Economic Research Service. Available at: http://www.ers.usda.gov/Publications/AIS87/AIS87.pdf.
Hoppe, R., and D. Banker. 2010. Structure and Finances of U.S. Farms: Family Farm Report, 2010 Edition, EIB-66, USDA, Economic Research Service. Available at: http://www.ers.usda.gov/Publications/EIB66/EIB66.pdf.
U.S. Department of Agriculture, National Commission on Small Farms (USDA, NCSF). A Time to Act: A Report of the USDA National Commission on Small Farms. Miscellaneous Publication 1545 (MP-1545). January 1998.

46Agricultural Income and Finance Outlook / AIS-90 / December 2010
Economic Research Service/USDA
Appendix: Forecast Methods and Accuracy
• USDA’s s hort-term farm-income forecast m odel had mea n forecast errors for cash receipts in 2009 ranging f rom 0.02 percent for crop receipts to 16.83 percent for livestock receipts.
• Forecast er rors f or t he f arm-level pa rtial-budgeting m odel, us ing ARMS data, decreased in magnitude from 7.3 percent in 2005 to 5.5 percent in 2009, showing a more accurate forecast.
• The 20 06-to-2008 co mmodity-price boo m pro bably a ffected f ore-casts in following years.
The USDA short-term farm-income forecast model forecasts receipts for indi-vidual commodities, Government payments, and production expenses. The model operates on individual farm-level data from the most recent NASS data available to ERS. Agriculture can be severely affected by many factors, as any farmer knows, and thus the difference between the initial forecast of annual income and the initial estimate, which are released 18 months apart, can be large. The model creates quarterly forecasts of individual commodity items and annual forecasts of various production expenses, noncommodity items, and Government payments. It also forecasts annual prices-paid indexes, used princi-pally in forecasting production expenses. To measure commodity output, it uses a Törnqvist output index model. See box, “The ERS Short-Term Farm Income Forecast Model” for a basic description of the forecast model. The model is explained in depth in “Forecasting Farm Income: Documenting USDA’s Forecast Model,” http://www.ers.usda.gov/Publications/TB1924/.
The purpose of reviewing forecasting accuracy is to determine and discuss trends and events that have inf uenced prices and quantities of agricultural inputs and outputs, such as economic or weather changes affecting produc-tion. The last review of forecast accuracy was completed for the Agricultural Income and Finance Outlook, 2006 Edition, http://usda.mannlib.cornell.edu/usda/ers/AIS//2000s/2006/AIS-11-30-2006.pdf.
Forecast performance in three areas—commodity items, production expenses, and farm-income measures—are examined from 2005 to 2009. Finally, the trends and events that have inf uenced variations between the initial forecast and the initial estimate are discussed.
Appendix table A-1 shows forecast percentage errors for the USDA short-term farm income forecast model. The mean forecast error for net cash income in 2009 was 8.21 percent but was lower than the mean forecast error for net farm income by about 3 percentage points. This may ref ect that net cash income includes only cash receipts and expenses and is generally less variable than net farm income. Mean forecast errors from 2005 to 2009 ranged in magnitude from $427 million for livestock cash receipts to -$61.6 billion for total gross income. Forecast percentage errors in 2009 ranged from 0.02 percent for crop cash receipts to -131.82 percent for the value of inventory adjustment. The large percentage forecast error for the value of inventory adjustment ref ects rela-tively smaller dollar amounts than smaller percentage errors in other categories corresponding to larger dollar amounts. The mean percentage error of -299.92

47Agricultural Income and Finance Outlook / AIS-90 / December 2010
Economic Research Service/USDA
Appendix table A-1Forecast error for USDA short-term farm income forecast model
Mean forecast
error2005-09
Forecast percentage error Mean percentage
error2005-09Income statement 2005 2006 2007 2008 2009
$ billion PercentCash income statement: 1. Cash receipts -54.537 -6.91 -3.16 -9.18 -7.56 7.13 -3.94 Crops1 -54.964 -8.25 -8.80 -9.16 -11.78 0.02 -7.60 Livestock 0.427 -5.68 2.51 -9.21 -2.08 16.83 0.48 2. Direct Government payments 1.601 -0.97 17.12 4.46 7.19 -18.57 1.85
3. Farm-related income2 -2.756 -4.61 3.25 12.45 -2.40 -18.70 -2.00
4. Gross cash income (1+2+3) -55.695 -6.25 -1.57 -7.52 -6.77 4.35 -3.55
5. Cash expenses3,4 -31.418 -7.22 -0.57 -1.49 -7.96 3.27 -2.79
6. NET CASH INCOME (4-5) -24.275 -3.85 -4.59 -23.09 -3.61 8.21 -5.39
Farm income statement: 7. Gross cash income (1+2+3) -55.695 -6.25 -1.57 -7.52 -6.77 4.35 -3.55 8. Nonmoney income5 -2.905 -27.49 -24.74 -0.79 5.91 28.81 -3.66 9. Value of inventory adjustment -3.023 -1059.86 -206.86 15.40 -116.49 -131.81 -299.92
10. Total gross income (7+8+9) -61.623 -8.81 -2.08 -6.79 -5.29 4.08 -3.78
11. Total expenses -38.225 -7.54 -1.40 -1.19 -7.58 2.52 -3.04
12. NET FARM INCOME (10-11) -23.398 -12.72 -4.77 -23.21 2.32 11.14 -5.45Note: Forecast error = (forecast-estimate)/estimate1Includes CCC loans.2Income from custom work, machine hire, recreational activities, forest product sales, and other farm sources. 3Excludes depreciation and perquisites to hired labor. 4Excludes farm households. 5Value of home consumption of farm products plus the imputed rental value of operator dwellings. Source: USDA, Economic Research Service.
The ERS model described in this report presents 5 calendar years of farm income data. W hen t he f orecast f or t he c urrent ca lendar y ear is f rst presen ted ea ch February, t he v alues for t he c urrent a nd i mmediately pre vious ca lendar years in the model are both forecasts and the values for the f rst 3 ca lendar years are estimates. At this point, the forecast for the fourth (i.e., previous) year is the base year for the f fth (i.e., current) year’s forecast. The model results are f rst updated in August. At this point, the model presents 4 years of estimates, releasing, for the f rst time, estimates of farm income for the fourth (i.e., previous) year and revi-sions to estimates for the previous 3 years.
The current year in the model is s till a f orecast, which has been updated with new data and revised, using the new estimates for the fourth year as its base. The forecast year i n t he mo del is ag ain updated i n November, us ing a ny d ata t hat have been revised since August. The f nal forecast is presented in February of the following year. By February 2011, the forecast for 2010 will include all the f nal information (production, trade, prices received) for 2009/10, plus the latest fore-casts for 2010/11. The 12-month average annual prices paid indexes published by USDA’s National Agricultural Statistics Service (NASS) will also be substituted for the forecasts in the model.
The ERS Short-Term Farm Income Forecast Model

48Agricultural Income and Finance Outlook / AIS-90 / December 2010
Economic Research Service/USDA
percent from 2005 to 2009 is associated with a $10-million forecast error for inventory adjustments, while the -7.60-percent forecast error for crop receipts is associated with a forecast error of $7.24 billion. The mean forecast errors from 2005 to 2009 were primarily plus or minus 5 percent compared with the estimate, with the exception of cash receipts from crops and value of inventory adjustment. These trends were not surprising as an unexpected commodity price boom occurred in the study period as investors increasingly speculated in commodities, and as fuel prices f uctuated greatly (Baffes and Haniotis, 2010).
Appendix table A-2 reports forecast errors for selected components of the farm business f nancial statements. The forecast error is based on a compar-ison (in percentage terms) of the February 2006 forecast and the actual 2005 ARMS results (as the base), and of the February 2010 forecast and the actual 2009 ARMS results (as the base). The estimates for farm business income
Appendix table A-2Forecast error for farm-level partial-budgeting model, comparing forecasts for 2005 and 2009 (from February 2006 and February 2010) to actual ARMS survey results (November 2006 and November 2010)
Net cash income
Livestock receipts
Crop receipts
Government payments
Cash operating expenses
Farm assets
Farm debt
Income statement 2005 2009 2005 2009 2005 2009 2005 2009 2005 2009 2005 2009 2005 2009
Percent differenceAll farms 6.5 3.5 -10.6 -6.6 3.6 -1.2 -9.2 4.0 -4.6 -2.3 4.5 -4.3 -3.2 -2.4
Commercial farms 6.5 2.2 -9.3 -6.0 7.4 0.7 -8.1 5.9 -0.9 -0.5 3.6 -5.3 5.1 -0.3Intermediate farms 26.3 23.3 3.9 -9.3 10.1 -15.1 -3.6 1.3 -0.1 -11.9 11.4 -6.1 -6.8 -16.3
All farm businesses 13.3 2.8 -2.7 -6.8 11.4 -1.4 -3.7 4.6 2.7 -2.7 8.9 -5.8 4.6 -4.2
Rural residence farms 10.5 4.5 -15.6 -12.3 -15.6 -9.2 -1.1 -1.7 -7.9 -4.5 4.4 -2.5 -8.6 2.1
Resource region: Heartland 0.8 -8.6 -26.1 -21.1 8.5 -8.8 -6.0 12.8 -4.3 -9.7 10.0 -7.1 5.7 0.9 Northern Crescent 12.6 -10.2 -8.9 4.4 -0.3 -0.8 -4.5 -42.2 -10.7 3.0 3.7 -6.1 -4.3 -5.3 Northern Great Plains 12.8 5.4 14.2 -11.7 16.6 4.6 16.1 10.8 11.5 -1.4 25.5 -1.3 4.2 -9.5 Prairie Gateway 21.0 -4.6 -13.3 -18.1 8.9 -18.9 -4.5 9.6 -11.6 -16.3 24.3 0.7 -10.2 -9.6 Eastern Uplands 23.0 -19.0 11.9 25.1 22.8 9.6 17.9 -41.9 13.3 11.6 5.1 -1.7 -17.2 -12.5 Southern Seaboard -48.0 27.8 11.1 21.5 -23.7 -8.7 0.1 20.8 3.5 -2.9 3.8 -12.1 7.0 -10.1 Fruitful Rim 30.1 23.0 18.4 4.3 23.6 22.2 -5.7 18.1 19.2 17.0 6.6 10.6 25.2 0.5 Basin and Range 64.9 126.6 31.7 22.1 36.0 57.6 1.7 -6.0 18.8 31.4 0.0 -22.7 4.9 62.8 Mississippi Portal -19.2 -13.2 42.6 -4.1 -18.4 -37.6 -57.5 -6.2 -6.4 -40.5 -29.6 -23.7 2.8 -40.6
Production specialty: Other cash grain 12.4 10.5 -26.6 -20.4 12.7 4.2 -2.1 41.1 2.9 0.4 1.4 -8.4 -3.0 8.9 Wheat 42.0 -13.3 41.7 4.8 -3.6 -7.5 -10.6 2.6 -17.5 -2.2 4.1 -7.9 -4.7 -7.0 Corn 12.9 8.1 -46.9 7.5 -2.6 -9.4 -8.5 19.1 -7.1 -12.4 -2.9 -0.2 -13.6 -4.6 Soybean and peanuts -55.6 -19.6 -1288.3 -27.0 -1.1 -27.2 -22.4 6.0 -17.8 -27.3 4.9 -23.1 -10.3 -20.4 Cotton and rice 9.8 32.9 55.2 -10.2 22.3 1.2 -16.8 30.6 20.3 -8.7 -6.3 -7.2 35.8 44.5 Other f eld crops 22.5 59.4 -14.0 -4.5 -1.8 9.5 23.4 15.0 -0.5 -1.9 31.9 2.3 24.7 12.3 Specialty crops 29.3 20.8 44.1 -26.9 19.4 11.8 34.0 -1.2 17.8 6.9 14.6 -4.1 7.8 -3.4 Beef cattle 19.6 -40.8 -5.9 -18.0 12.9 -9.4 -10.4 -8.8 -11.5 -10.8 1.8 -18.0 4.0 -5.5 Hogs -21.3 -74.0 7.3 -10.2 -9.6 4.5 -2.7 43.6 12.2 15.5 10.7 -6.8 -7.0 -12.4 Poultry -30.2 -2.6 -148.2 -34.5 49.2 -27.4 -25.2 -20.0 -60.6 -23.2 4.9 -11.3 -7.5 -17.9 Dairy -6.1 -65.3 -0.8 -13.8 14.5 8.4 -82.5 -56.9 -0.7 -7.3 3.8 -9.1 0.4 -26.7 Other livestock 70.9 -366.3 38.9 41.6 25.6 7.8 13.5 -22.4 22.8 13.9 13.3 38.6 3.2 6.4Note: Percentage differences are claculated as (forecast-actual)/actual.Source: USDA, Agricultural Resource Management Survey, NASS and ERS.

49Agricultural Income and Finance Outlook / AIS-90 / December 2010
Economic Research Service/USDA
are for intermediate and commercial farms. Across the selected components for all farm businesses in 2009, forecast errors ranged from 1.4 percent for crop receipts to 6.8 percent for livestock receipts. Forecast errors derive from two sources. First, they can result from different outcomes than the index ref ecting quantity and price changes predicts for the sector as a whole. They can also result from the static nature of the partial budgeting model where farms adapt and/or structural changes occur from one survey year to the next. The forecast model was more accurate in 2009 than in 2005, with the mean magnitude for forecast error for All Farms, Commercial Farms, Intermediate Farms, All Farm Businesses, and Rural Residence Farms decreasing from 7.3 percent in 2005 to 5.5 percent in 2009.
Appendix f gure A-1 shows the percentage error by resource region. The greatest percentage forecast errors occurred in resource regions with smaller shares of farms or businesses, such as the Mississippi Portal and Basin and Range regions, suggesting that a smaller sample survey size leads to greater forecast errors in those regions. The more accurate percentage forecast errors occurred in regions with greater shares of U.S. farms and farm businesses (and larger sample survey sizes), such as the Heartland, Northern Crescent, Fruitful Rim, and Prairie Gateway.
Appendix figure A-1
Forecast accuracy of farm-level partial-budgeting modelPercent difference
2009 Cash operating expenses
2005 Cash operating expenses
2009 Net cash income
2005 Net cash income
Note: See map, p. 11, for ERS Resource Regions.Source: USDA, Agricultural Resource Management Survey, NASS and ERS.
Heartland NorthernCrescent
NorthernGreat Plains
PrairieGateway
EasternUplands
SouthernSeaboard
FruitfulRim
Basin andRange
MississippiPortal
-60-40-20
020406080
100120140

50Agricultural Income and Finance Outlook / AIS-90 / December 2010
Economic Research Service/USDA
Information Contacts
Timothy ParkCoordinator and Farm Income Outlook(202) [email protected]
Mary AhearnEconomic Well-Being of Farm Operators and Households(202) [email protected]
Ted CoveyCash Receipts (202) [email protected]
Kenneth EricksonFinancial Performance of Farm Sector; Farm Assets, Farm Equity(202) [email protected]
J. Michael HarrisFinancial Performance of Farm Sector; Farm Debt(202) [email protected]
Todd KuetheLand Values(202) [email protected]
Chris McGathProduction Expenses and Farm Related Income(202) [email protected]
Andrew MortonBranch Chief, Farm & Rural Business(202) [email protected]
Mitch MorehartFinancial Performance of Farm Businesses(202) [email protected]

51Agricultural Income and Finance Outlook / AIS-90 / December 2010
Economic Research Service/USDA
Stephen VogelGovernment Payments(202) [email protected]
Jeremy WeberEconomic Well-Being of Farm Operators and Households(202) [email protected]
Robert WilliamsFarm Debt(202) [email protected]
Shawn WozniakLivestock Receipts(202) [email protected]