Defence Economic Outlook 2020 - FOI
88
Defence Economic Outlook 2020 December 2020 FOI-R--5048--SE Per Olsson, Alma Dahl and Tobias Junerfält An Assessment of the Global Power Balance 2010-2030
-
Upload
khangminh22 -
Category
Documents
-
view
0 -
download
0
Transcript of Defence Economic Outlook 2020 - FOI

Defence Economic Outlook 2020
December 2020
FOI-R--5048--SE
Per Olsson, Alma Dahl and Tobias Junerfält
An Assessment of the Global Power Balance 2010-2030
Defence Econom
ic Outlook 2020 Per O
lsson, Alma D
ahl and Tobias Junerfält

Per Olsson, Alma Dahl and Tobias Junerfält
Defence Economic Outlook 2020
An Assessment of the Global Power Balance 2010-2030

FOI-R--5048--SE
2 (86)
Title Defence Economic Outlook 2020 – An Assessment of the Global Power Balance 2010-2030
Titel Försvarsekonomisk utblick 2020 – En bedömning av den glo-bala maktbalansen 2010-2030
Rapportnr/Report no FOI-R--5048--SE
Månad/Month December
Utgivningsår/Year 2020
Antal sidor/Pages 86
ISSN 1650-1942
Customer/Kund Ministry of Defence/Försvarsdepartementet
Forskningsområde Försvarsekonomi
FoT-område Inget FoT-område
Projektnr/Project no A112007
Godkänd av/Approved by Malek Finn Khan
Ansvarig avdelning Försvarsanalys
Bild/Cover: FOI, Per Olsson via Mapchart
Detta verk är skyddat enligt lagen (1960:729) om upphovsrätt till litterära och konstnärliga verk, vilket bl.a. innebär att citering är tillåten i enlighet med vad som anges i 22 § i nämnd lag. För att använda verket på ett sätt som inte medges direkt av svensk lag krävs särskild över-enskommelse.
This work is protected by the Swedish Act on Copyright in Literary and Artistic Works (1960:729). Citation is permitted in accordance with article 22 in said act. Any form of use that goes beyond what is permitted by Swedish copyright law, requires the written permission of FOI.

FOI-R--5048--SE
3 (86)
Summary
The global military and economic power balance has changed significantly during
the past decade. While the US and its European allies still possess a clear military
advantage, major non-Western powers such as China and Russia have steadily nar-
rowed this gap. The past decade, China’s share of global military spending as well
as its share of the world economy has increased considerably. In recent years, the
US and several European countries have refocused their attention towards great
power rivalry and increased their military spending. This may slow, but is unlikely
to reverse, the observed trends of the past decade.
It is the assessment of this study that the US will continue to enjoy an overall
military advantage in 2030. However, the Chinese economy is likely to become
the world’s largest, and the Chinese navy will likely outnumber its US counterpart,
around the same time. Continued growth of European military expenditure is far
from certain, however, the Eurozone’s economic advantage over Russia seems set
to increase. Nevertheless, Russia is likely to retain and even strengthen its military
capabilities. These assessments are not predetermined, nor are they indisputable.
They are, however, based on detailed data as well as clearly defined and motivated
assumptions.
Keywords: Power balance, military expenditure, economy, equipment

FOI-R--5048--SE
4 (86)
Sammanfattning
Den globala militära och ekonomiska maktbalansen har förändrats avsevärt under
det senaste årtiondet. Medan USA och dess europeiska allierade fortsatt innehar
ett tydligt militärt övertag, har icke-västliga stormakter såsom Kina och Ryssland
stadigt minskat detta gap. Det senaste årtiondet har Kinas andel av världens mili-
tära utgifter såväl som dess andel av världsekonomin ökat betydligt. På senare år
har USA och flertalet europeiska länder lagt större fokus på stormaktsrivalitet och
ökat sina militära utgifter. Detta kan sakta ner, men kommer osannolikt vända, de
senaste årtiondets observerade trender.
Det är denna studies bedömning att USA kommer fortsätta inneha ett övergripande
militärt övertag år 2030. Däremot kommer den kinesiska ekonomin sannolikt bli
världens största och den kinesiska flottan sannolikt uppnå en större numerär än den
amerikanska, runt samma tid. Fortsatt tillväxt av Europas militära utgifter är långt
ifrån garanterad. Däremot förefaller Eurozonens ekonomiska övertag gentemot
Ryssland öka. Trots detta är det sannolikt att Ryssland kommer att bibehålla, till
och med stärka, sina militära förmågor. Dessa bedömningar är inte förutbestämda,
inte heller är de obestridliga. De är däremot baserade på detaljerad data såväl som
tydligt definierade och motiverade antaganden.
Nyckelord: Maktbalans, militära utgifter, ekonomi, materiel

FOI-R--5048--SE
5 (86)
Contents
1 Introduction ....................................................................................... 7
2 Methods and Delimitations .............................................................. 8
2.1 Method and Data ......................................................................... 8
2.2 Delimitations .............................................................................. 12
3 Global Power Balance .................................................................... 16
3.1 Military Expenditure ................................................................... 17
3.2 Macroeconomic Trends ............................................................. 19
3.3 Quantities of Military Equipment ................................................ 22
3.4 Quality of Military Equipment ..................................................... 28
4 Future Trends .................................................................................. 35
References .............................................................................................. 43
Appendix A: Military Expenditure ........................................................ 48
Appendix B: Macroeconomic Trends .................................................. 49
Appendix C: Equipment Quantities ...................................................... 50
Appendix D: Equipment Quality ........................................................... 64
Appendix E: Future Trends ................................................................... 81

FOI-R--5048--SE
6 (86)

FOI-R--5048--SE
7 (86)
1 Introduction The aim of Defence Economic Outlook 2020 is to assess the global power balance
in terms of military expenditure, macroeconomic trends, and quantities as well as
quality of military equipment among major world powers between 2010 and 2019.
The report also aims to provide a broad assessment of future trends with regard to
the same aspects from 2020 to 2030.
This report is the third in the biennial series Defence Economic Outlook (DEO),1
published by the Swedish Defence Research Agency (FOI). The long-term goal of
the DEO report series is to gain an increasingly nuanced and accurate picture of
the global power balance. This is done by gradually including additional aspects
to the assessment of military and economic power.
While DEO 2016 focused on input measures, such as military expenditure and
gross domestic product, DEO 2018 added the aspect of military equipment quan-
tities. The 2020 edition takes one additional step by assessing indicators of military
equipment quality. Although far from providing a complete analysis of the global
power balance, taken together, the included aspects should provide a fairly nu-
anced and hopefully accurate assessment of the broader international defence eco-
nomic trends.
The DEO report series is also part of a larger, ongoing, project which aims to de-
velop the methods used in the series and to complement existing well-established
databases, by collecting open source data. The project also involves developing
tools for assessing military equipment performance. Furthermore, it includes stud-
ies related to defence specific purchasing power, as well as country specific and
regional studies. Although much progress has been made for this edition of DEO,
methods and data will continue to be refined.
1 Previous reports include Olsson, Per; Alozious, Juuko & Ädel, Maria (2018) Defence Economic Outlook
2018 – Global Outlook with a Focus on the European Defence Industry, and Olsson, Per & Bäckström,
Peter (2016) Defence Economic Outlook 2016 – Global Outlook with a Focus on the Baltic Sea.

FOI-R--5048--SE
8 (86)
2 Methods and Delimitations The global power balance in this report is assessed from two perspectives, military
power and economic power. In the context of international relations, military
power can be used by countries as a means of achieving political goals through
conflict, coercion or deterrence. In this study military power is assessed in terms
of military expenditure, military equipment quantity and military equipment qual-
ity. Economic power provides countries with influence in terms of consumption,
production, investment, finance and trade. In this study, however, economic power
is limited to being assessed in terms of gross domestic product (GDP).
2.1 Method and Data This report focuses on the major world powers of the US, China, the four largest
military spenders in Europe (consisting of France, Germany, the UK, and Italy, in
this study referred to as the E4), and Russia.
Data on military expenditure, GDP and military equipment quantities, are col-
lected from well-established and often used data sources. Data on indicators of
equipment quality and complementary data on naval tonnage, have been collected
from a wide range of open sources. Estimates of future navy equipment quantities
are also based on data obtained from various open sources and collected in internal
databases at FOI. Data which have been collected by FOI from several open
sources are referred to collectively by the designation “FOI” in this report.
Military Expenditure
Military expenditure measures the resources allocated to defence and defence re-
lated items. It is, in other words, an input measure and should not be equated with
the output of military capability. However, expenditure is a key prerequisite for
capability building and as such provides insights into the global power balance. In
this report, military expenditure data are collected from Stockholm International
Peace Research Institute (SIPRI).2 It is worth noting that SIPRI’s definition of mil-
itary expenditure not only includes direct expenditure on armed forces, but all
spending related to military activities such as paramilitary forces, military space
activities, military pensions, as well as research and development.3
Military expenditure is usually expressed in terms of market exchange rates (MER)
USD, including SIPRI’s data. This measure, however, tends to fluctuate on a
yearly basis depending on the relative value of the local currency versus the USD.
2 SIPRI (2020a) SIPRI Military Expenditure Database. 3 For a more detailed description of SIPRI’s definition, see SIPRI (2020) SIPRI Military Expenditure Da-
tabase: Sources and Methods. (Accessed 29 October 2020).
FOI-R--5048--SE
9 (86)
Furthermore, MER does not account for differences in purchasing power. Gener-
ally, the amount of goods and services which can be bought by a certain amount
of USD varies between countries. Most often, a given amount of USD can buy
larger volumes in lower-income countries compared to high-income countries.
Purchasing power parity (PPP) aims to address this issue by comparing prices on
constructed “baskets” of comparable goods and services, thereby adjusting for dif-
ferences in costs between countries. This could be especially valid when compar-
ing high- and low-income countries which have large domestic defence industries.
Data on PPPs are collected from the Organisation for Economic Co-operation and
Development (OECD).4 However, using PPP estimates in the context of military
spending is by no means unproblematic. Military spending includes several costs,
both in terms of manpower and equipment, which are specific to defence and un-
likely to be reflected in the general PPP measures adapted to compare GDP. There-
fore, PPP is unlikely to be directly transferable to military expenditure without first
adjusting for these likely differences.5 This study does not imply that PPP is a pref-
erable method of estimating military expenditure. However, PPP does address
some of the issues with MER and consequently provides an alternative approach
to quantify military spending, which at the very least merits a discussion.
Macroeconomic Trends
Economic power, in this study is illustrated through macroeconomic trends and
expressed in terms of GDP, is in itself an important factor when assessing the
global power balance. In the context of defence economics, GDP can also be seen
as an important prerequisite for military expenditure.6 GDP data between 2000 and
2019 have been collected from the World Bank.7 In this report, GDP is expressed
in both MER and PPP. Even in the context of GDP, for which the PPP estimates
are adapted, PPP is still not unproblematic. The exact content of the “baskets” of
4 OECD (2020a) Purchasing power parities (PPP). (Accessed 29 October 2020). 5 For a detailed discussion concerning the benefits and problems with using purchasing power parities for
estimating military expenditure, see e.g. SIPRI (2020) Frequently Asked Questions – 12. Accessed 23
November 2020 and Kofman, Michael & Connolly, Richard (2019) “Why Russian Military Expenditure
Is Much Higher Than Commonly Understood (As Is China’s)”, War on the Rocks. For previous litera-ture estimating defence specific PPPs, see e.g. Robertson, Peter E. and Sin, Adrian (2017) “Measuring
hard power: China’s economic growth and military capacity”, Defence and Peace Economics, 28:1. 6 Apart from the general observation that economic size and military spending tend to correlate over time
and between countries, several studies point to a statistically significant positive correlation between de-
velopments in GDP and military expenditure even when other factors are accounted for, see e.g. Douch, Mohamed & Solomon, Binyam (2014) “Middle Powers and the Demand for Military Expenditure”, De-
fence and Peace Economics, 25:6, Wang, Yu (2013) “Determinants of Southeast Asian military spend-
ing in the post-cold war era: a dynamic panel analysis”, Defence and Peace Economics, 24:1, Niko-laidou, Eftychia (2008) “The demand for military expenditure: evidence from the EU15”, Defence and
Peace Economics, 19:4, Dunne, J. Paul; Nikolaidou, Eftychia & Mylonidis, Nikolaos (2003) “The de-
mand for military spending in the peripheral economies of Europe”, Defence and Peace Economics,
14:6. In similar “demand for defence” studies gross domestic product or gross domestic income are of-
ten used as control variables. 7 World Bank (2020a) GDP Constant 2010 US$. (Accessed 29 October 2020).

FOI-R--5048--SE
10 (86)
goods and services, on which these estimates are based, may vary somewhat be-
tween countries, as may the relative value of the included goods and services. In
other words, it can be difficult to find perfectly comparable “baskets”, and PPPs
therefore risk either to over- or undervalue a given country’s purchasing power.
Nevertheless, given the issues with MER that PPPs are meant to address, these
estimates are included in the assessment of the global economic power balance.
Military Equipment Quantities
In addition to looking at military expenditure, military equipment quantity offers
a complementary aspect when assessing and comparing military power. For the
naval equipment of major world powers, the numbers of surface combatants and
submarines are listed. These are presented according to vessel type, which may
have different roles and vary significantly in size. Therefore, total tonnage is pre-
sented as an alternative measure to assess fleet sizes. For army equipment, the
number of main battle tanks, infantry fighting vehicles and armoured personnel
carriers as well as artillery pieces and multiple launch rocket systems are included.
For air forces, the number of combat aircraft, transport aircraft and bombers are
listed. This study includes equipment classified as being “in active service” by the
International Institute for Strategic Studies (IISS), from which the data on military
equipment quantities have been collected.8 Note that the IISS definition “in active
service” generally does not account for availability. This implies that the numbers
of combat ready platforms are likely lower than the quantities presented in this
report. With regards to naval tonnage, the IISS data have been complemented by
open source data.9 For further details on classification and assumptions used in this
report regarding military equipment quantity, see Appendix C.
Military Equipment Quality
The analysis of military equipment quality in this report consists of an initial cat-
egorisation according to modernity, where the selected types of navy, army and air
force equipment are classified as either modern, intermediate or legacy. The basis
for this classification varies depending on type of equipment, but generally corre-
sponds with the age or the generation of the selected system. However, as the qual-
ity of modern equipment may vary significantly between countries and types of
equipment, the broad categorisation according to modernity is complemented by
outlining a series of quality indicators for key equipment within each service
branch; surface combatants, main battle tanks and combat aircraft. Focusing on
8 IISS (2020) The Military Balance 2020, IISS (2015) The Military Balance 2015, IISS (2010) The Mili-
tary Balance 2010, IISS (2005) The Military Balance 2005, and IISS (2000) The Military Balance 2000. 9 US tonnage is obtained from the Naval Registry (nvr.navy.mil), Russian tonnage from Russianships (rus-
sianships.info), French, German, UK and Italian tonnage from their respective official government or
navy homepages. Chinese tonnage is obtained from international institutes, such as Janes and IISS or
credible news outlets such as Navaltechnology.com and Military-today.com.
FOI-R--5048--SE
11 (86)
this limited number of performance indicators, this report does not claim to present
a complete assessment of the full complexity that is equipment quality.
Assessments of military equipment quality are based on data collected from a wide
range of open sources.10 Navy surface combatant performance is assessed by the
indicators number of missiles, maximum range and top speed of surface-to-air mis-
siles (SAMs) and anti-ship missiles (ASMs) respectively. The number of torpe-
does and helicopters carried is also included to give a broad assessment of anti-
submarine warfare (ASW) capabilities.11 Army main battle tank performance is
assessed through the indicators firepower, protection and mobility.12 Air force
combat aircraft performance is assessed through the number of hard points, i.e.
stations for missiles, bombs or additional fuel tanks, carried.13 For further details
on methods, data and assumption regarding equipment quality, see Appendix D.14
Future Trends
Assessments of future trends are based on a number of methods and open source
data, collected from a wide range of sources. As mentioned above, GDP data for
2000 to 2019 are obtained from the World Bank, while estimates for 2020 to 2025
are collected from the International Monetary Fund (IMF).15 The use of two dif-
ferent sources was necessary in order to construct a complete time series denoted
in constant GDP, i.e. adjusted for inflation. While the World Bank provides data
for constant GDP up until 2019, it does not provide future estimates of inflation
adjusted real growth rates. IMF, meanwhile, does provide future estimates of real
GDP growth rates from 2020 to 2025, but not historical GDP data in constant
prices. For GDP forecasts beyond 2025 additional open sources were needed. For
the US, forecasts beyond 2025 are based on estimates from the US Congressional
10 For surface combatants the number of missiles, torpedoes and helicopters are obtained from IISS (2020) The Military Balance 2020, complemented by missile ranges and speeds from institutes, such as CSIS,
or online sources such as Seaforces.org, Navaltechnology.com, Navyrecognition.com, and Armyrecog-
nition.com. Main battle tanks performance data are obtained from US Training and Doctrine Command
(2014) Worldwide Equipment Guide 2014, Vol. 1, as well as Steelbeast.com. Aircraft generations, num-
ber of hardpoints, range and speed, are obtained from online sources, such as Military-today.com, Air-
craft-technology.com, and manufacturer data. 11 For a more detailed discussion regarding estimates of surface combatant performance, see e.g. Arena,
Mark V.; Blickstein, Irv; Younossi, Obaid & Grammich, Clifford A. (2006) A Macroscopic Examination of the Trends in U.S. Naval Ship Costs Over the Past Several Decades.
12 For a more detailed discussion regarding estimates of main battle tank performance, see e.g. Olsson, Per
(2018) Towards a Tool for Measuring Military Performance. 13 For a more detailed discussion regarding estimates of combat aircraft performance, see e.g. Horowitz,
Stanley A.; Harmon, Bruce R. & Levine, Daniel B. (2016) “Inflation adjustments for defence acquisi-
tion”, Defence and Peace Economics. 14 Other methods when assessing military equipment quality includes evaluations by procurement agen-
cies, scenario based evaluations or simulations by operation analysts, as well as rankings by expert as-
sessments. For examples of studies utilising the latter method, see e.g. Middleton, Andrew; Bowns, Ste-
ven; Hartley, Keith & Reid, James (2006) “The Effect of Defence R&D on Military Equipment Qual-
ity”, Defence and Peace Economics. 15 IMF (2020a) World Economic Outlook Database. (Accessed 23 November 2020).

FOI-R--5048--SE
12 (86)
Budget Office (CBO).16 Meanwhile, Chinese real GDP growth rates after 2026 are
based on projections made by the World Bank in 2013.17 For the Eurozone, Russia
and India, GDP forecasts proved more difficult to obtain. Instead, the growth rates
of the past decade, as given by IMF data for 2010-2019, have been prolonged with
some adjustments to serve as rough estimates of future macroeconomic trends.18
Future military expenditure depends both on future GDP and the political priority
given to military expenditure. No exact estimates of future military expenditure
are presented in this report, but future military spending is discussed given the
assumption that military expenditure as share of GDP would remain the same in
2030 as in 2019.
Estimates of future quantities of military equipment focus on the naval equipment
of major world powers. This is not due to any maritime bias, but a consequence of
data availability. Hulls of ships and submarines are usually constructed several
years before being commissioned into active service and data of hulls in various
stages of construction are often obtainable. Meanwhile, it is far more difficult to
obtain data on the overall larger volumes of army and air force equipment, which
are consequently more difficult to estimate. In this study, surface combatants and
submarines launched by 2020 are assumed to be taken into active service by 2025.
Ships and submarines laid down or officially planned, but not yet launched, are
assumed to be commissioned by 2030.19 For the US, its officially stated plan of a
355-ship navy has been included as a benchmark.20 These estimates have also been
complemented by reasonable assumptions about future naval quantities. Future
quantities of army and air force equipment are discussed rather than estimated. A
detailed description of data and assumptions on future trends are presented and
motivated in Appendix E.
2.2 Delimitations This report focuses on quantifying and comparing resources which form the basis
for military and economic power.21 It does not strive to answer which country
would win an armed conflict or who will assume global leadership. Such assess-
ments would have to be context specific and take a wide range of additional factors
into account. The report’s focus on military and economic power means that other
important forms of power are excluded, such as political influence through soft
16 Congressional Budget Office (2020) An Update to the Economic Outlook: 2020 to 2030. 17 World Bank (2013) China 2030: Building a Modern, Harmonious, and Creative Society. 18 IMF (2020) IMF Data – Real GDP growth (Annual percent change). (Accessed 29 October 2020). 19 Data on future naval equipment are obtained from wide range of open sources, such as Janes, TheDiplo-
mat.com, Navaltechnology.com, Defensenews.com, and Navyrecognition.com. 20 Congressional Research Service (2020) Navy Force Structure and Shipbuilding Plans: Background and
Issues for Congress. 21 For a critical perspective on the limitations with measuring gross resources as inputs of power, see e.g.
Beckley, Michael (2018) “Power of Nations: Measuring What Matters”, International Security, 43:2, pp.
7-44.

FOI-R--5048--SE
13 (86)
power.22 This factor could be particularly important when discussing any coun-
try’s potential for political clout and leadership.
This study focuses on state actors. This risks missing the important role played by
international organisations and non-state actors in the current international security
environment. Furthermore, the focus on the major world powers as individual
countries risks missing the power of alliances and groups, such as the combined
military power of NATO or combined economic strength of ASEAN.
The European perspective within this report changes between the four largest mil-
itary spenders in Europe (E4) and the Eurozone, the E4 when assessing military
expenditure and equipment, and the latter when assessing macroeconomic trends.
This may cause confusion as the E4, although all of which are NATO members,
do not form a separate group or alliance. Preferably, the military perspective would
have included all European NATO allies, but collecting the necessary data for each
type of equipment for each individual country was not possible within the scope
of this report.
The macroeconomic assessment in this report focuses on GDP and does not assess
trade or investment patterns, nor does it assess productivity, nor investments in
research or technological sophistication of a given country’s industrial base. As-
sessing economic power by GDP alone provides a very narrow definition of eco-
nomic power. The motivation for this choice is to focus on the factor most relevant
for a defence economic analysis, and GDP is a prerequisite for military spending.
While military expenditure, equipment quantities and quality provide indications
about a given country’s relative strengths and weaknesses, these indicators remain
input measures and should not be equated with the far more complex concept of
military capability. Any comprehensive assessment of military capability should
include in-depth analyses of factors such as military doctrine, training, communi-
cations, logistics, leadership as well as political goals and geostrategic conditions.
However, these important aspects of assessing military power are beyond the
scope of this report.
The assessments of military equipment in this study is limited to conventional
weaponry, meaning that analyses of nuclear, space, cyber and intelligence capa-
bilities are not included. This limits the conclusions made in this report as nuclear
capabilities are important aspects of the global power balance. Cyber, space and
intelligence capabilities may act as complements to conventional military capabil-
ities during conflicts as well as providing non-military and asymmetric capabilities
in peace time, potentially yielding high results with limited resources. However,
these aspects are beyond the scope of this study.
22 For a global ranking of soft power, see e.g. McClory, Jonathan (2018) The Soft Power 30 – A Global
Ranking of Soft Power 2018. Portland.

FOI-R--5048--SE
14 (86)
Assessing military equipment quality is highly complex, as there are multitudes of
factors that any simplified analysis, by its very design, will omit. In a real world
situation, any piece of military equipment cannot be evaluated in isolation. Not
only will its operational availability depend on the degree of maintenance and
spare parts, its operational value will also depend on the skill of its crew, whether
it is being operated as designed, the availability of logistical support and its in-
teroperability with other types of equipment. The performance data presented in
this report are presented free of operational context and neither can nor is intended
to answer which country would win a war, a battle or a duel. Performance data do,
however, provide a broad idea of relative strengths given a limited number of qual-
ity indicators.
As explained in the previous section, estimates of future military equipment quan-
tities will focus on navies, due to the lack of available data regarding future army
and air force equipment. Similarly, due to lack of data, future military equipment
quality is only discussed in broad terms based on open source information. With
regards to future equipment quality, the report does not include an analysis of de-
fence industrial capabilities and features very limited assessments of future tech-
nological trends. This will limit the qualitative assessment of future equipment
trends in the global power balance. Although not included in this study, these
trends may very well feature in future editions of the DEO report series.
Note that all assessments of future trends in this study should be viewed as esti-
mations based on current trends and developments, rather than exact predictions.
These assessments are only relevant in the absence of major disruptive events such
as war between major world powers, economic or political collapse, or another
global pandemic.
Focusing on the previous ten and the coming ten years means that more long-term
trends will be omitted from this report. This may impact the assessments made
about the current and future power balance beyond the next decade. The study, for
instance, risks underestimating the future economic and military strength of
emerging economies other than China, such as India.23 And by excluding factors
such as demographics, the study also misses long-term trends such as Africa’s in-
creased share of world population.24
Lastly, focusing on great power competition and comparing military and economic
power may invite to deterministic thinking that great power rivalry will eventually
lead to conflict. However, political relationships and priorities may change quickly
23 India is estimated to become the world’s second largest economy in terms of GDP PPP in 2050, see e.g. PricewaterhouseCooper (2015) The World in 2050 – Will the shift in global economic power continue?
February 2015, p. 3. 24 The UN projects that the population of sub-Saharan Africa will increase from 1,066 million in 2019 (14
percent of world population) to 1,400 million in 2030 (16 percent) and 2,118 million by 2050 (22 per-
cent), see United Nations (2019) World Population Prospects 2019 – Highlights, United Nations De-
partment of Social and Economic Affairs, p. 6.

FOI-R--5048--SE
15 (86)
and rivalry does by no mean make conflict unavoidable.25 Neither does it exclude
cooperation in areas where great power interests align, such as combating climate
change or global poverty. Great power rivalry does, however, mean that continued
international tensions remain a possibility and in this context it is important to have
an informed picture of the global power balance.
25 While some historic great power rivalries, between an incumbent and emerging power, have led to con-
flict, other have led to compromise and eventually cooperation, see Allison, Graham (2017) Destined for
War – Can America and China Escape Thudydides’s Trap?, Scribe: London.

FOI-R--5048--SE
16 (86)
3 Global Power Balance During the past decade great power rivalry has become increasingly pronounced
in international affairs, most notably the heightened tensions between the US and
China, the world’s two largest economies and foremost military spenders. At the
same time, an increasingly multipolar world has emerged where China and Russia
have demonstrated increased willingness and ability to challenge the established
global dominance of the US. China has reinforced its claims on most of the dis-
puted South China Sea, including the construction of artificial islands.26 It has also
increased its military expenditure significantly between 2010 and 2019, supporting
efforts to modernise its armed forces. This development has been supported by
solid economic growth, albeit at lower rates than during previous decades.27 Rus-
sia for its part has repeatedly used military means to achieve its political goals,
such as the annexation of Crimea, subsequent war in Ukraine as well as military
intervention in Syria. After a period of rapid military modernisation, Russian mil-
itary spending has begun to decline. This is partly due to the harsher economic
realities facing the country, but also because past investments have yielded tangi-
ble results in the form of improved military capabilities.28
Faced with this changing international security environment, the US has begun to
refocus its vast military capability to better suit the purposes of great power com-
petition, increasing its military spending in recent years. Meanwhile, several Eu-
ropean countries have either begun to increase or stated an ambition to increase
their military spending. This is in large part due to Russia’s increased assertive-
ness, but also mounting pressure from the US to meet the NATO goal of spending
2 percent of GDP on defence by 2024. In recent years, steps towards a deepened
European defence integration have also been taken,29 although it remains to be
seen what the outcome of such initiatives will be.
The following sections of this chapter will assess the global power balance in terms
of military expenditure, macroeconomic trends, as well as the quantities and qual-
ity of military equipment. The next and concluding chapter will provide an assess-
ment of future trends regarding these aspects of global power.
26 For a more detailed discussion on the different positions regarding the South China Sea, see e.g. Hiebert, Murray; Nguyen, Phuong & Poling, Gregory B., eds. (2015) Examining the South China Sea Disputes.
27 China’s GDP grew 90 percent between 2010 and 2019, constant 2010 USD, which can be compared to
146 percent between 2000 and 2009, World Bank (2020a) GDP Constant 2010 US$. Meanwhile, mili-tary expenditure grew 85 percent between 2010 and 2019, constant 2018 USD, which can be compared
to 218 percent between 2000 and 2009, SIPRI (2020a) SIPRI Military Expenditure Database. 28 Oxenstierna, Susanne (2019) “The economy and military expenditure”, Westerlund, Fredrik & Oxen-
stierna, Susanne (eds.) Russian Military Capability in a Ten-Year Perspective – 2019, p. 110. 29 Most notably the Permanent Structured Cooperation (PESCO) and European Defence Fund (EDF) initi-
atives, both launched in 2018.

FOI-R--5048--SE
17 (86)
3.1 Military Expenditure In 2019, global military expenditure amounted to a total of USD 1,868 billion, a
sum which has increased by 5.7 percent during the past decade.30 On average, the
countries of the world spent 1.8 percent of their GDP on defence and defence re-
lated items in 2019. The largest geographical clusters of military spending can be
found in North America, Western Europe and East Asia, see Figure 3.1.
Figure 3.1: Global military expenditure, 2019 (current USD). Source: SIPRI (2020a)
The US remains the world’s largest military spender by far, with military expendi-
ture amounting to USD 732 billion in 2019. China, the world’s second largest mil-
itary spender, spent USD 261 billion or one-third of the US amount, the same year.
India, the world’s third largest spender, devoted USD 71 billion to military spend-
ing, nearly a third of China’s amount. Russia allocated USD 65 billion, and Saudi
Arabia USD 62 billion, towards military expenditure in 2019. For a detailed list of
global military spending and the world’s top 25 spenders, see Appendix A.
This illustration may seem like a familiar and long established description of the
global military power balance, but much has changed during the past decade, see
Figure 3.2. Despite its enduring dominance, the US share of global military ex-
penditure has decreased notably, from 44.6 percent in 2010 to 39.2 percent in 2019.
Meanwhile, China’s share of world military spending has doubled, from 7.0 per-
cent in 2010 to 14.0 percent in 2019. Russia has largely maintained its global share
at 3.5 percent, while India has increased its share from 2.8 to 3.8 percent and Saudi
Arabia its share from 2.8 to 3.3 percent. Meanwhile, the global share of military
30 Note that the sum of 1,868 billion is indicated in current prices, while the 5.7 percent increase is given in
constant 2018 prices, SIPRI (2020a) SIPRI Military Expenditure Database.
FOI-R--5048--SE
18 (86)
spending for the major European powers of France, the UK, Germany and Italy
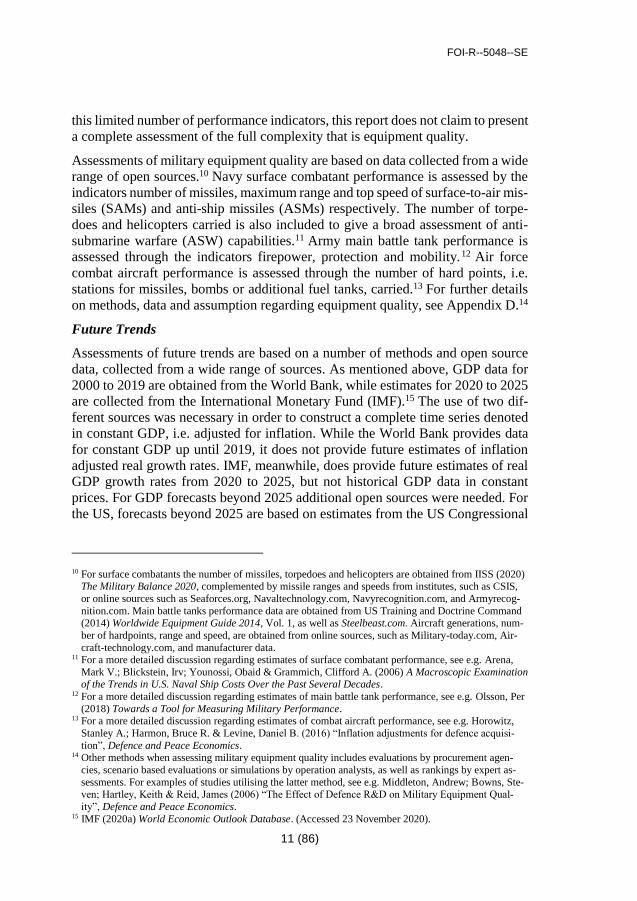
has decreased during the past decade, from a combined 11.3 percent to 9.3 percent.
Figure 3.2: Share of global military expenditure, 2010 and 2019 (current USD). Source: SIPRI (2020a)
Even though the US and western European countries have increased their military
spending in recent years, the overall trend for military expenditure between 2010
to 2019 has been a decreased global share for Western powers and an increased
share for major non-Western powers. This trend can to a large extent, albeit not
exclusively, be attributed to just one country, China.
Figure 3.3: Global military expenditure in terms of market exchange rate (MER) and pur-chasing power parity (PPP), 2019. Source: SIPRI (2020a), OECD (2020a).
It is worth noting that the above description of military expenditure is given in
USD market exchange rates (MER). However, this measure does not account for

FOI-R--5048--SE
19 (86)
potential differences in purchasing power between countries. When adjusting mil-
itary expenditure with purchasing power parities (PPP), as seen in Figure 3.3, the
relative size of China’s and Russia’s military expenditure increases significantly
in comparison to the amounts given in terms of market exchange rates. The US
level remains the same, as USD is the benchmark, while the combined expenditure
of France, Germany, the UK, and Italy (E4) increases slightly when adjusted for
purchasing power. This would imply that if military expenditure had a structure
similar to the overall economy, and if PPP actually reflected economic activity in
terms of comparable goods and services, the US global advantage in terms of mil-
itary expenditure would become less pronounced than indicated by MER.
It is important to remember that PPP is not directly transferable from GDP to mil-
itary expenditure, see discussion in Section 2.1. However, average wages, includ-
ing those for soldiers, officers and employees within the defence industry, are
lower in China and Russia compared to the US or the EU. Therefore, it would be
inadvisable to completely disregard purchasing power as a relevant aspect when
discussing military expenditure.
3.2 Macroeconomic Trends Economic strength, here measured in terms of GDP, is another measure of global
power. Not only does it provide economic influence in terms of consumption, pro-
duction, trade and investment, it also constitutes a key prerequisite for military
spending. For a detailed list of macroeconomic trends among the top 25 economies
worldwide, see Appendix B.
In 2019, the US still retained its century-old position as the world’s largest econ-
omy by some margin, followed by China, Japan, Germany and India. Even though
this ranking may seem stable, the past two decades have seen a significant change
in the global economic power balance. While the US accounted for a sizeable 24.4
percent of the world economy in 2019, the corresponding share was 30.5 percent
in 2000. Meanwhile, China’s share of global GDP reached 16.3 percent in 2019,
up from a mere 3.6 percent in 2000. The Eurozone’s share of the world economy
decreased 4 percentage points during the same period, while the shares of Russia
and India increased about 1 and 2 percentage points respectively.31
Ever since recovering from the 2008 financial crisis, major world powers such as
the US, the Eurozone, China and India have all seen sustained growth rates, see
Figure 3.4. Russia was the only major power to experience less stable growth rates
during the past ten years, due to falling oil prices and economic sanctions by the
US and the EU in the wake of the annexation of Crimea. While the world economy
had begun to show signs of slowing back in 2019, following heightened interna-
tional trade tensions, the coronavirus pandemic effectively ended an 11-year long
31 World Bank (2020b) GDP Current US$.

FOI-R--5048--SE
20 (86)
period of stable global economic growth. By the spring of 2020, the pandemic had
triggered the deepest economic downturn since the Great Depression of the 1930s.
Figure 3.4: GDP of major world powers in USD (constant 2010), 2000-2021. Sources: World Bank (2020a), IMF (2020a)
Ever since it first emerged in late 2019 in Wuhan, China, the novel coronavirus
has caused human suffering and wreaked economic havoc across the globe. The
coronavirus pandemic had spread to other East Asian countries by February. By
March the epicentre of the pandemic had gradually shifted to Europe and later to
the Americas. By summer, it had reached a truly global scale, severely affecting
countries in Latin America and South Asia. By November 2020, most countries
were still struggling against the coronavirus and several regions were witnessing a
renewed upsurge in the pandemic.
In its forecast from October 2020, the IMF predicts that global GDP will contract
by 4.4 percent in 2020. The US economy is expected to contract 4.3 percent in
2020, down from an average positive growth rate of 2.3 between 2010 and 2019.
Meanwhile, the Eurozone is anticipated to contract by 8.3 percent, down from 1.4
percent positive growth between 2010 and 2019. Emerging economies will not be
spared the global downturn. Russia’s economy is predicted to shrink by 4.1 percent
and India’s by 10.3 percent. China is the only major economy expected to grow in
2020, but 1.9 percent growth is still a historic low compared to the average 7.7
percent of the past decade.32
32 2020 growth rates are retrieved from IMF (2020a) World Economic Outlook Database. (Accessed 23
November 2020), average real GDP growth rates between 2010 and 2019 are collected from IMF (2020)
IMF Data – Real GDP growth (Annual percent change).

FOI-R--5048--SE
21 (86)
The IMF predicts a quick recovery in 2021, with a global economic growth of 5.2
percent. The US economy is expected to grow by 3.1 percent, the Eurozone by 5.2
percent, Russia by 2.8 percent, India by 8.8 percent, and China by 8.2 percent.
However, such predictions must be viewed with caution, especially given the many
uncertainties faced by the global economy.33 Many risks still remain, not least the
intertwined risks of a prolonged pandemic and prolonged economic recession.
While the long-term effects of the coronavirus pandemic remains to be seen, it
does so far not seem to have altered the overall trends observed during the past
decade. The economic power balance still seems to be shifting towards emerging
economies, China in particular.
Figure 3.5: GDP of major world powers in USD PPP, 2000-2019. Source: World Bank (2020c)
This development becomes even more pronounced when GDP is expressed in
terms of purchasing power. Explained above as accounting for price differences,
purchasing power parity (PPP) measures the size of an economy in terms of com-
parable goods and services. By this measure, China has already surpassed the US
to become the world’s largest economy in 2016, see Figure 3.5. India’s and Rus-
sia’s shares of the world economy also increases significantly. When adjusted for
purchasing power India becomes the world’s third largest economy, up from fifth
if terms of MER, overtaking Japan and Germany. Russia becomes the sixth largest
economy in terms of PPP, as opposed to the eleventh in terms of MER.34
33 IMF (2020) World Economic Outlook – A Long and Difficult Ascent, October 2020, pp. xiii-xiv. 34 World Bank (2020c) GDP PPP Current International US$ and World Bank (2020a) GDP Current US$.

FOI-R--5048--SE
22 (86)
As noted above, in the context of defence economics, GDP can be seen as a pre-
requisite for military expenditure. Military expenditure in turn is a prerequisite and
input value for military capability. Military equipment can be seen as an interme-
diary good of sorts, between expenditure and capability. This as equipment con-
stitutes an output of expenditure, but an input to capability. An assessment of mil-
itary equipment quantities and quality may therefore add further understanding
about the global power balance.
3.3 Quantities of Military Equipment The assessment of military equipment quantities in this report focuses on big ticket
items for navies, armies and air forces; such as surface combatants, submarines,
armoured vehicles and artillery as well as combat aircraft, bombers and transports.
The past two decades have seen a general trend of decreasing equipment quantities
over time. This is true even for countries where military expenditure has increased.
The most likely explanation is that fewer platforms are needed and afforded as
quality of individual weapon systems improves and unit costs increase. However,
there are some exemptions to this general trend, which will be illustrated in the
presentation of equipment quantities for major world powers below. For a detailed
description of data and assumption together with detailed graphs and tables on
military equipment quantities among major world powers, see Appendix C.
Quantities of Navy Equipment
Navy equipment quantities among the major world powers from 2000 to 2020 are
illustrated in Figure 3.6. The figure shows that the US Navy has largely maintained
its quantity of naval vessels during the past two decades. It has decreased its overall
numbers only slightly, while increasing the number of destroyers. Meanwhile, the
Chinese People’s Liberation Army (PLA) Navy has undergone drastic changes,
increasing the numbers of surface combatants and submarines by over 40 percent.
The introduction of a new class of corvettes helps explain a sizeable share of this
expansion. The E4 have decreased their combined quantity of surface combatants
and submarines over the past two decades, a reduction which has been evenly dis-
tributed among vessel types. The Russian Navy has also decreased its number of
naval platforms by about one fifth, mainly by reducing its large nuclear submarine
fleet and to a lesser extent the number of destroyers.

FOI-R--5048--SE
23 (86)
Figure 3.6: Quantity of surface combatants and submarines among major world powers. Source: IISS (2000, 2020)
While Figure 3.6 offers a comparison of the numbers of surface combatants and
submarines, it does not account for the differences in size of such vessels. Surface
combatants presented in the figure include everything from huge aircraft carriers
and amphibious assault ships to large cruisers, destroyers, smaller frigates and
even smaller corvettes. Submarines similarly include huge nuclear armed strategic
submarines with nuclear propulsion, large torpedo and missile armed tactical sub-
marines with nuclear propulsion, and smaller tactical submarines with conven-
tional propulsion. The relative size of each navy becomes radically different when
illustrating navy sizes in terms of tonnage instead of numbers of platforms.
When illustrated in terms of tonnage,35 the US naval advantage becomes clearly
visible, see Figure 3.7. The explanation for this sizeable advantage is quite straight
forward, the US has far more aircraft carriers and generally larger destroyers com-
pared to other major powers. Even though the number of US and Chinese naval
vessels differs only slightly, the US Navy tonnage is more than four times larger
than that of the PLA Navy. This would imply that the average US Navy vessel is
about four times larger than its Chinese counterpart. On the other hand, the Chinese
Navy has more than doubled its tonnage since 2000 and has roughly reached parity
35 The tonnage for maritime vessels is expressed in terms of displacement, i.e. the amount of water dis-
placed by the hull of any given vessel. In this report displacement tonnage for surface combatants is
given in fully loaded displacement and for submarines when fully submerged. Data on tonnage have
been collected from various open sources and are referred to collectively as “FOI” in Figure 3.7, see
Section 2.1 for details.

FOI-R--5048--SE
24 (86)
with the E4 and Russia in 2020. A greater increase in tonnage compared to increase
in numbers also implies that the average Chinese naval vessel has become larger.
Figure 3.7: Tonnage of surface combatants and submarines among major world powers. Source: IISS (2000, 2020), FOI
The E4 have increased their combined tonnage during the past two decades, even
as the number of vessels has decreased, implying that the average E4 navy vessel
has become larger. Meanwhile, Russia decommissioned several large surface com-
batants and nuclear submarines during the 2000s, causing naval tonnage to de-
crease sharper than the number of vessels during the past twenty years. Note, how-
ever, that a sizeable portion of this change is caused by the temporary inactivation
of the aircraft carrier Admiral Kuznetsov due to long-term overhaul. Tonnage may
be a crude measure, but not irrelevant with regard to naval capabilities, as larger
vessels provide more space for armament,36 sensors and other electronic hardware.
On the other hand, even smaller missile armed vessels can provide significant le-
thality to a navy. Therefore, neither the number of vessels nor the total tonnage
should be seen as the better measure, instead these aspects complement each other
when quantifying and comparing major world power navies.
Quantities of Army Equipment
Army equipment quantities have developed in different directions during the past
two decades. Generally, the quantity of main battle tanks (MBTs) and artillery
pieces and multiple launch rocket systems (MLRSs) has decreased among the ma-jor world powers. Meanwhile, the numbers of infantry fighting vehicles (IFVs)
36 Note that there seems to be a correlation between total tonnage and the number of missiles carried, see
e.g. Table E.6 in Appendix E of this report.

FOI-R--5048--SE
25 (86)
and armoured personnel carriers (APCs) have either increased in absolute terms or
been maintained to a higher degree than tanks and artillery. These trends are
clearly visible among the major world powers, see Figure 3.8. The figure also
shows that in 2020, the US had a numerical advantage in terms of IFVs and APCs,
while China had an advantage in terms of tanks and artillery.
Figure 3.8: Quantity of army equipment among major world powers. Source: IISS (2000, 2020)
The US Army has reduced its quantity of tanks in active service by two-thirds
between 2000 and 2020, but still maintains a sizeable amount in reserve. In 2020,
the Chinese PLA had the world’s largest number of main battle tanks in active
service. However, in spite of rapid modernisation, one-third of China’s tanks still
consists of outdated types. During the past two decades, the armies of France, Ger-
many, the UK, and Italy have decreased their tank numbers drastically. The E4 has
kept less than one-fifth of their combined tank force in active service in 2020 com-
pared to 2000. Russia has also decreased the number of tanks by seven-eighths
since 2000. Nevertheless, Russia still has more than three times the number of
tanks in active service compared to the E4 combined. Russia also maintains a huge
number of tanks in reserve, although it is unclear how many of these could actually
be made operationally available.
The numbers of IFVs and APCs have increased in the US Army, especially
wheeled APCs which were favoured in the 2000s and 2010s because of their lower
weight and easier deployment abroad. In 2020 the US had nearly twice the number
of IFVs and APCs than any other major power. China has also increased the num-
ber of IFVs and APCs in an effort to modernise its army, but still has relatively

FOI-R--5048--SE
26 (86)
few infantry support vehicles compared to the US.37 Both the E4 and Russia have
decreased their number of IFVs and APCs, but still maintain these vehicle types
to a much greater extent than tanks and artillery.
All major world powers have decreased the number of artillery pieces and MLRSs,
gradually phasing out towed artillery in favour of more capable self-propelled sys-
tems. The US Army has decreased its number of artillery pieces by almost half
between 2000 and 2020. While the reduction of artillery in China has been even
more pronounced, the PLA still has the largest quantity of artillery in active service
among the major world powers. The E4 had cut its number of artillery pieces in
2020 to one-third of their combined force in 2000. The reduction of artillery in
Russia was even more drastic, to less than one-sixth of its numbers in 2000 by
2020. Russia does maintain over 16,600 artillery pieces and MLRS in reserve, alt-
hough their exact availability is not clear.38 Although the reductions of artillery
quantities are comparatively large in China and Russia, these countries still possess
a numerical advantage over the US and the E4 respectively.
Quantities of Air Force Equipment
The quantities of combat aircraft have decreased among all major world powers
during the past two decades, see Figure 3.9.
Figure 3.9: Quantity of aircraft among major world powers. Source: IISS (2000, 2020)
37 While the US had 26,000 IFVs and APCs for an army of 481,750 men in 2020, China had 15,200 for an
army of 975,000 men, IISS (2020) The Military Balance 2020. 38 IISS (2020) The Military Balance 2020.

FOI-R--5048--SE
27 (86)
This trend could likely be attributed to the choice of quality over quantity as indi-
vidual platforms have become more advanced and more expensive. The US has
maintained a clear numerical advantage over other major world powers in terms
of combat aircraft. China has the second largest combat aircraft fleet. Meanwhile,
Russia fielded more combat aircraft in 2020 than the E4 air forces combined.
In terms of transport aircraft the US also maintains a significant advantage. And
although China has more bombers, most are of older designs and not equivalent in
terms of capability to their US counterparts. The E4 have no purpose-built bomb-
ers, instead relying completely on multirole combat aircraft. Similarly to China,
Russia still relies on older Soviet designs which have been upgraded, but not re-
placed, as of 2020. The US also has a numerical advantage in terms of transport
aircraft, which are generally larger than Russian, European or Chinese equivalents.
Quantities of Military Equipment, Overall
Overall, the US has maintained its quantitative edge in the air and at sea, while the
power balance on land remains more mixed. The US dominance in the air remains
solid. However, the Chinese PLA Navy has significantly narrowed the numerical
gap to the US, while overtaking the E4 and Russia by the same metric during the
past two decades. China has gained a numerical advantage in terms of tanks, but
the US has maintained and even widened its advantage in terms of IFVs and APCs.
Meanwhile, China still has a numerical advantage in artillery over the US and Rus-
sia over the E4, in spite of the fact that both China and Russia have reduced artil-
lery numbers more drastically between 2000 and 2020.
Although China only spent about one-third on its military in 2019 compared to the
US, it has almost 80 percent the number of combat aircraft and nearly the same
amount of naval vessels. Similarly, while Russia spends only slightly more than
France, it has more submarines, tanks and combat aircraft than the four major Eu-
ropean powers combined. This could indicate that there is some merit to the idea
that China and Russia have greater purchasing power even when it comes to mili-
tary hardware, and that they as a consequence get larger quantities of equipment
out of their military expenditure than for instance the US and the E4.
However, equipment quantities do not tell the whole story. As seen above, the US
Navy is still unrivalled in terms of tonnage. This allows for, among other things,
more space for weaponry and sensors, which in turn may differ in capability. Fur-
thermore, the average Chinese or Russian combat aircraft may not display the same
performance as its US counterpart. European equipment may also have a qualita-
tive edge over Chinese and Russian dittos. Therefore, in order to give a more com-
plete assessment of the current global power balance, there is a need to look closer
at quality indicators for military equipment.

FOI-R--5048--SE
28 (86)
3.4 Quality of Military Equipment The analysis of military equipment quality in this report begins with a categorisa-
tion according to modernity, where key navy, army and air force equipment are
classified as either modern, intermediate or legacy, or by generation. However, as
the quality of modern equipment may also vary quite significantly, this broad cat-
egorisation is complemented by a series of quality indicators for key equipment
within each service branch; surface combatants, main battle tanks and combat air-
craft. For a detailed description of methods and assumption together with more
detailed graphs and tables on equipment quality, see Appendix D.
Quality of Navy Equipment
Surface combatants are categorised on the basis of which year the lead or first ship
of the class was commissioned. The category modern includes all ship classes
which have been taken into active service from 1990 and onwards, intermediate
between 1970 and 1989, while legacy comprises classes taken into service before
1970. However, there are some exemptions to this general rule.39
Figure 3.10: Surface combatants by generation among major world powers. Source: IISS (2000, 2020)
According to the categorisation of this report the US Navy surface combatant fleet
in 2020 could be considered fully modernised, see Figure 3.10. Meanwhile, China
has added modern surface combatants at a rapid pace, from just one in 2000 to 99
39 The equipment of the Chinese PLA Navy is the main exemption. As China was late to develop an indig-
enous modern arms industry, vessels taken into active service from 2000 and onwards is classified as
modern, intermediate between 1980 and 1999, and legacy from before 1980.
FOI-R--5048--SE
29 (86)
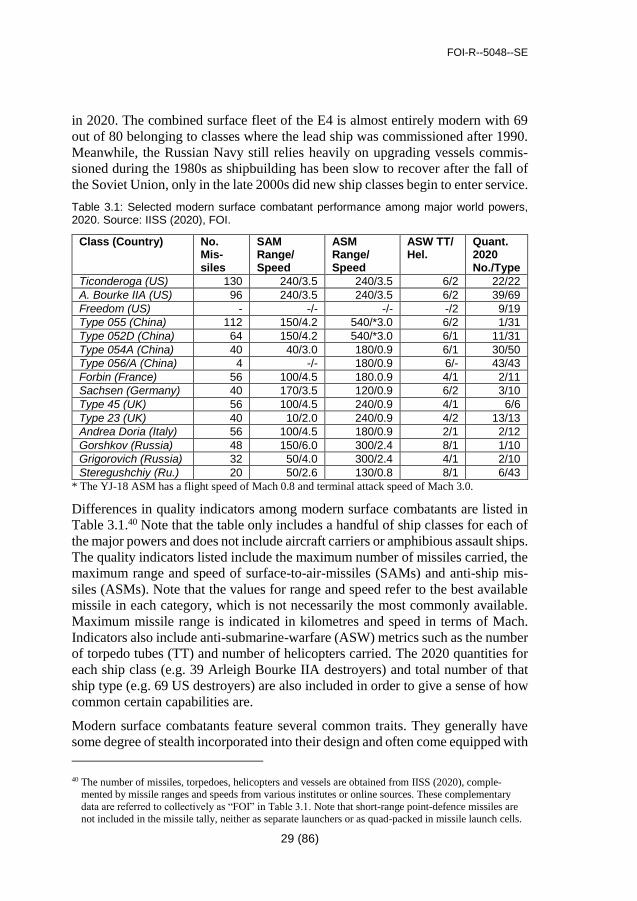
in 2020. The combined surface fleet of the E4 is almost entirely modern with 69
out of 80 belonging to classes where the lead ship was commissioned after 1990.
Meanwhile, the Russian Navy still relies heavily on upgrading vessels commis-
sioned during the 1980s as shipbuilding has been slow to recover after the fall of
the Soviet Union, only in the late 2000s did new ship classes begin to enter service.
Table 3.1: Selected modern surface combatant performance among major world powers, 2020. Source: IISS (2020), FOI.
Class (Country) No. Mis-siles
SAM Range/ Speed
ASM Range/ Speed
ASW TT/ Hel.
Quant. 2020 No./Type
Ticonderoga (US) 130 240/3.5 240/3.5 6/2 22/22
A. Bourke IIA (US) 96 240/3.5 240/3.5 6/2 39/69
Freedom (US) - -/- -/- -/2 9/19
Type 055 (China) 112 150/4.2 540/*3.0 6/2 1/31
Type 052D (China) 64 150/4.2 540/*3.0 6/1 11/31
Type 054A (China) 40 40/3.0 180/0.9 6/1 30/50
Type 056/A (China) 4 -/- 180/0.9 6/- 43/43
Forbin (France) 56 100/4.5 180.0.9 4/1 2/11
Sachsen (Germany) 40 170/3.5 120/0.9 6/2 3/10
Type 45 (UK) 56 100/4.5 240/0.9 4/1 6/6
Type 23 (UK) 40 10/2.0 240/0.9 4/2 13/13
Andrea Doria (Italy) 56 100/4.5 180/0.9 2/1 2/12
Gorshkov (Russia) 48 150/6.0 300/2.4 8/1 1/10
Grigorovich (Russia) 32 50/4.0 300/2.4 4/1 2/10
Steregushchiy (Ru.) 20 50/2.6 130/0.8 8/1 6/43
* The YJ-18 ASM has a flight speed of Mach 0.8 and terminal attack speed of Mach 3.0.
Differences in quality indicators among modern surface combatants are listed in
Table 3.1.40 Note that the table only includes a handful of ship classes for each of
the major powers and does not include aircraft carriers or amphibious assault ships.
The quality indicators listed include the maximum number of missiles carried, the
maximum range and speed of surface-to-air-missiles (SAMs) and anti-ship mis-
siles (ASMs). Note that the values for range and speed refer to the best available
missile in each category, which is not necessarily the most commonly available.
Maximum missile range is indicated in kilometres and speed in terms of Mach.
Indicators also include anti-submarine-warfare (ASW) metrics such as the number
of torpedo tubes (TT) and number of helicopters carried. The 2020 quantities for
each ship class (e.g. 39 Arleigh Bourke IIA destroyers) and total number of that
ship type (e.g. 69 US destroyers) are also included in order to give a sense of how
common certain capabilities are.
Modern surface combatants feature several common traits. They generally have
some degree of stealth incorporated into their design and often come equipped with
40 The number of missiles, torpedoes, helicopters and vessels are obtained from IISS (2020), comple-
mented by missile ranges and speeds from various institutes or online sources. These complementary
data are referred to collectively as “FOI” in Table 3.1. Note that short-range point-defence missiles are
not included in the missile tally, neither as separate launchers or as quad-packed in missile launch cells.

FOI-R--5048--SE
30 (86)
advanced radar and sonar. All of the ship classes included in Table 3.1 also carry
at least one multi-purpose main gun and a number of close-in-weapon-systems
(CIWS) for short range defence. Although the ships vary in range and endurance,
their top speeds are generally around 30 knots.
Modern US surface combatants, such as the Ticonderoga class cruisers and Ar-
leigh Bourke class destroyers, are generally larger and capable of carrying more
missiles than their international counterparts. Some of China’s most modern plat-
forms, such as the Type 055 and Type 052D destroyers, have reached similar sizes
and missile carrying capabilities as their US or E4 equivalents respectively. How-
ever, such destroyers do not make up the bulk of the PLA Navy’s modern inven-
tory, which instead largely consists of more lightly armed Type 054A frigates and
Type 056 corvettes.
The modern destroyers and frigates of the E4 navies are generally in the mid-to-
large range of surface combatants. UK Type 45 destroyers are small compared to
US ones but German Sachsen frigates are large compared to their Chinese coun-
terparts. Russian Admiral Gorshkov frigates are roughly the same size as their
German counterparts, while the Admiral Grigorovich class is smaller and has
fewer missiles. Meanwhile, the Steregushchiy class is relatively large and well-
armed compared to corvettes of other navies. There are several other factors in
assessing surface combatant performance than just armament, but this brief over-
view does give some insights.
US surface combatants seem to have a clear advantage in terms of anti-air with
longer ranged surface-to-air missiles and numbers of helicopters carried, providing
robust surveillance and ASW capabilities. By the same logic, China and Russia
have an advantage over the US and E4 in terms of surface warfare, possessing
longer ranged high-speed anti-ship missiles. However, it is worth noting that US
surface combatants often operate in carrier groups allowing carrier-based aircraft
to carry anti-ship missiles well beyond the range of any ship-launched missile.
France, the UK and Italy also operate carriers and could use similar tactics.
Quality of Army Equipment
Main battle tanks constitute the heavily armed and armoured spearhead of modern
mechanised army formations. In this section, tanks are categorised according to
modernity by generation. First generation main battle tanks were introduced in the
late 1940s, second generation in the 1960s and modern third generation tanks from
the 1980s and onwards. The US Army has reduced the size of its exclusively third
generation tank force to 2,414 Abrams tanks, but it keeps an additional 3,300
Abrams in reserve, see Figure 3.11. China has the world’s largest tank force in
active service, and the second largest inventory of third generation tanks, which
include the modern Type 99A and Type 96A. However, one-third of the PLA tank
force still consists of the obsolete Type 59 legacy tanks.

FOI-R--5048--SE
31 (86)
The E4 possess modern but very small tank forces, only around 200 per country.
These include the French Leclerc, German Leopard 2, the UK Challenger 2 and
the Italian Ariete. Russia has the world’s largest inventory of third generation tanks
which mainly consist of upgrades of Soviet era designs such as the T-72B3 or
modern derivatives such as the T-90. Russia also has the world’s largest tank re-
serve force, over 10,000 in storage, though availability may vary.
Figure 3.11: Main battle tanks by generation among major world powers. Source: IISS (2000, 2020)
Main battle tank performance can be described as a combination of firepower, pro-
tection and mobility. In Table 3.2 the firepower for a given tank is measured by
the penetration depth of the best available kinetic projectile from a distance of
2,000 metres, indicated in millimetres of rolled homogenous armour equivalents
(RHAe), i.e. steel equivalents. Similarly, armour is indicated by the protection
against kinetic penetrators at the front of the turret, usually the strongest protected
area of a tank, also in millimetres RHAe.41 Mobility values are measured by horse-
power through tonnes. Note that the values presented in the table have been col-
lected from open sources and should be seen as estimates rather than exact truths.
The quality indicators in Table 3.2 shows that the US M1A2 Abrams has a slight
edge in terms of firepower, compared to other third generation tanks. On paper,
China’s most modern tank, the Type 99A, is on par with its Western counterparts.
41 As modern main battle tank armour usually consists of composite armour, reactive armour or both, pro-
tection levels are usually converted into an expressed as millimetres of rolled homogenous steel equiva-
lents, i.e. how much steel the composite or reactive armour is equal to.

FOI-R--5048--SE
32 (86)
It also features a laser dazzler active protection system against anti-tank missiles.
However, the far more common Type 96A is less capable than its larger cousin.
Table 3.2: Selected modern main battle tank performance among major world powers, 2020. Source: US Training and Doctrine Command (2014), Steelbeast.com, IISS (2020).
Type (Country) Gen. Firepower (mm RHAe)
Armour (mm RHAe)
Mobility (HP/ tonne)
Quantity 2020
M1A2 Abrams (US) +3 840 950 23.1 1605
M1A1 Abrams (US) 3 750 600 25.9 775
ZTZ- 99A (China) +3 800 990 25.9 500
ZTZ-96A (China) -3 660 780 18.6 1500
Leclerc (France) 3 690 890 26.6 222
Leopard 2A6 (Ger.)* +3 750 970 24.0 225
Challenger 2 (UK) +3 610 1250 19.2 227
T-90A (Russia) 3 660 840 23.7 350
T-72B3 (Russia) -3 660 780 18.9 1350
* Data actually represent the older Leopard 2A5 version, exported to e.g. Denmark and Sweden.
European tanks generally perform well. The German Leopard 2A6 is a well-bal-
anced platform, versions of which have been exported to several countries. The
UK Challenger 2 is the world’s best protected tank. The French Leclerc is not as
heavily armed or armoured, but more mobile than the other two European tanks.
Modern Russian tanks, while not quite on par with US or German tanks, have un-
dergone several improvements, and the T-90A and T-72BM are far superior to, for
instance, the T-72Ms employed by Saddam Hussein’s Iraq during the Gulf War.
Furthermore, Russian third generation tanks feature both hard kill and soft kill ac-
tive protection systems which are not yet standard on US or European tanks.42
Quality of Air Force Equipment
The US Air Force’s advantage in terms of quantity becomes even more apparent
when accounting for modernity, see Figure 3.12. Having pioneered fifth-genera-
tion fighters back in the 1980s, the US has held a virtual monopoly on operating
such aircraft until the 2010s. China has come a long way during the past decades,
fielding over a thousand fourth generation combat aircraft and having begun to
introduce fifth generation aircraft. However, China still operates several types of
older aircraft and has yet to catch up to the other major powers in terms of aircraft
development, not least when it comes to developing strong domestic turbofan jet
engines. While the UK and Italy have bought American F-35s, the E4 have not
developed their own fifth generation fighters, instead choosing to upgrade fourth
generation aircraft. The E4 also operate several third generation aircraft. Russia is
set to introduce fifth generation combat aircraft in the near future, but these are not
42 See e.g. Olsson, Per (2018) Towards a Tool for Measuring Military Performance.

FOI-R--5048--SE
33 (86)
yet classified as being in active service and Russia currently relies heavily on var-
ious fourth generation combat aircraft. The Russian air force also operates several
third generation aircraft.
Figure 3.12: Combat aircraft by generation among major world powers. Source: IISS (2000, 2020)
Combat aircraft performance is assessed through the number of hard points, i.e.
stations for missiles, bombs or additional fuel tanks, combat range (in km) and
maximum speed (in km/h). The generation of the aircraft, fifth or fourth, is also
presented as a proxy performance indicator. Fifth generation combat aircraft com-
bine stealth, i.e. radar absorbent materials, minimised radar cross-section and IR-
signature, with high manoeuvrability and advanced avionics.
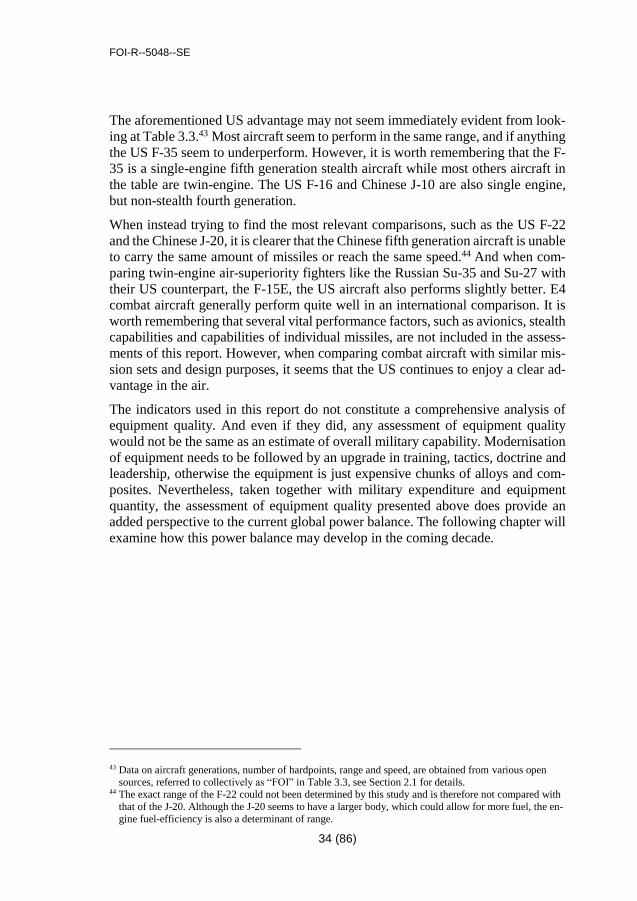
Table 3.3: Selected modern combat aircraft performance among major world powers, 2020. Source: IISS (2020), FOI.
Type (Country) Gen. No. Hard-points*
Range (Km)
Speed (Km/h)
Quant. 2020
F-35A (US) 5 10(4) 1667 1960 316
F-22 (US) 5 12(8) >3000 2470 159
F-16 (US) 4 11 3333 2205 553
F-15E (US) +4 11 3840 3018 210
J-20 (China) 5 10(6) 3400 2100 22
J-10 (China) 4 12 3000 2450 445
Rafale (France) +4 14 3125 2205 100
Eurofighter (UK/G/It) +4 13 3790 2470 377
Su-35 (Russia) +4 12 3600 2390 90
Su-27 (Russia) 4 10 3680 2879 119
* Number of missiles carried internally marked with parenthesis.
FOI-R--5048--SE
34 (86)
The aforementioned US advantage may not seem immediately evident from look-
ing at Table 3.3.43 Most aircraft seem to perform in the same range, and if anything
the US F-35 seem to underperform. However, it is worth remembering that the F-
35 is a single-engine fifth generation stealth aircraft while most others aircraft in
the table are twin-engine. The US F-16 and Chinese J-10 are also single engine,
but non-stealth fourth generation.
When instead trying to find the most relevant comparisons, such as the US F-22
and the Chinese J-20, it is clearer that the Chinese fifth generation aircraft is unable
to carry the same amount of missiles or reach the same speed.44 And when com-
paring twin-engine air-superiority fighters like the Russian Su-35 and Su-27 with
their US counterpart, the F-15E, the US aircraft also performs slightly better. E4
combat aircraft generally perform quite well in an international comparison. It is
worth remembering that several vital performance factors, such as avionics, stealth
capabilities and capabilities of individual missiles, are not included in the assess-
ments of this report. However, when comparing combat aircraft with similar mis-
sion sets and design purposes, it seems that the US continues to enjoy a clear ad-
vantage in the air.
The indicators used in this report do not constitute a comprehensive analysis of
equipment quality. And even if they did, any assessment of equipment quality
would not be the same as an estimate of overall military capability. Modernisation
of equipment needs to be followed by an upgrade in training, tactics, doctrine and
leadership, otherwise the equipment is just expensive chunks of alloys and com-
posites. Nevertheless, taken together with military expenditure and equipment
quantity, the assessment of equipment quality presented above does provide an
added perspective to the current global power balance. The following chapter will
examine how this power balance may develop in the coming decade.
43 Data on aircraft generations, number of hardpoints, range and speed, are obtained from various open
sources, referred to collectively as “FOI” in Table 3.3, see Section 2.1 for details. 44 The exact range of the F-22 could not been determined by this study and is therefore not compared with
that of the J-20. Although the J-20 seems to have a larger body, which could allow for more fuel, the en-
gine fuel-efficiency is also a determinant of range.

FOI-R--5048--SE
35 (86)
4 Future Trends The relationship between the US and China, which has been tense for years, dete-
riorated rapidly during 2020. The two countries, engaged in a trade war since 2018,
have exchanged harsh criticism of each other’s response to the coronavirus pan-
demic. The US has also criticised China’s human rights record and declared its
maritime claims in the South China Sea to be unlawful. China for its part has dis-
missed such critique as attempts to contain and vilify it. China has also accused
the US of protectionism and of destabilising the security environment in East Asia
by increasing its support for Taiwan. These developments could significantly
worsen the ongoing trade dispute between the world’s two largest economies and
the US has already implemented or threatened to implement a number of sanctions
against Chinese officials and entities. Further escalation of US-China tensions
could have repercussions far beyond the borders of the two countries and delay or
derail the global post-pandemic economic recovery. While currently centred on
specific political issues, the rivalry between the US and China also features more
structural elements. Most importantly, the changing global power balance of the
past decade, observed in the previous chapter.
Figure 4.1: GDP of major world powers in USD (constant 2010), 2000-2035. Sources: World Bank (2020a), IMF (2020a), CBO (2020), World Bank (2013)
Assuming that China’s economic growth will gradually slow to about 5 percent by
2030,45 while acknowledging that this is not predetermined in any way, China is
45 The assumption of Chinese growth rates gradually slowing to 5 percent is based on projections by the
World Bank (2013) China 2030: Building a Modern, Harmonious, and Creative Society. This estimate
FOI-R--5048--SE
36 (86)
set to surpass the US as the world’s largest economy in terms of nominal GDP
around 2030, see Figure 4.1. If realised, this development would likely put further
strain on the bilateral relationship between the world’s two most powerful nations,
increasing the risk of emboldened actions by China as well as an increasingly se-
vere response from the US. It could also increase the risk of misunderstandings
and miscalculations regarding each other’s intentions and capabilities.
In this report the assumed macroeconomic power shift is estimated to occur in
2033. However, as values are indicated in USD, the precision of this assessment is
vulnerable to changes in the relative currency value of the USD and the Chinese
RMB. It is also worth remembering that in terms of purchasing power parity the
shift already occurred in 2016, and forecasts by OECD estimate that China’s PPP-
adjusted GDP will be 67 percent larger than that of the US by 2030.46
The Eurozone is expected to start recovering from the pandemic from 2021 and
onwards.47 However, assuming that the growth rate of the previous decade will
continue into the next, the Eurozone is estimated to grow somewhat slower than
the US. Between 2022 and 2025, the economies of the Eurozone and Russia are
expected to increase by 1.6 and 2 percent respectively. If anything, this may seem
to be slightly advantageous for Russia. However, given that the size of the Euro-
zone economy is several times larger, the absolute economic gap between the Eu-
rozone and Russia is actually likely to increase in favour of former.
Similarly, India’s economic growth rate could very well surpass that of China in
the coming decade, as the Chinese growth rate gradually slows.48 But again, given
the differences in economic size between the Asian giants, the absolute gap will
persist during the coming decade. It is even likely to increase, as 5 percent growth
adds far more value to a USD 14 trillion economy than 7 percent does to a USD 3
trillion economy.
However, the future is not set in stone. Economic forecasting is difficult at the best
of times and the coronavirus pandemic has made predictions about the future even
more uncertain. For a detailed description of the data and assumptions concerning
future macroeconomic trends in this report, see Appendix E.
The future military expenditure among major world powers will depend on at least
two factors, the economic development of each country and the priority each coun-
try gives to military expenditure as share of GDP. Assuming for the moment,
is fairly mainstream, but not uncontested. Sceptics about China’s future growth prospects cite high debt,
a shrinking workforce and increasingly difficult productivity gains as reasons why China’s growth may
be significantly lower. Nevertheless, PricewaterhouseCooper (2015) The World in 2050 – Will the shift in global economic power continue?, estimate that China’s economy will surpass that of the US in terms
USD MER in 2027, p. 11. 46 OECD (2020) GDP Long-Term Forecast. (Accessed 29 October 2020). 47 IMF (2020a) World Economic Outlook Database. (Accessed 23 November 2020). 48 See e.g. PricewaterhouseCooper (2015) The World in 2050 – Will the shift in global economic power
continue?, p. 8.

FOI-R--5048--SE
37 (86)
though in reality unlikely, that the military expenditure share of GDP would re-
main the same for all countries in 2030 compared to 2019. In this hypothetical
scenario, the US would still devote 1.7 times more than China to military spending
even if their economies were to reach equal size in terms of MER. This as the US
spends a larger share of GDP on its military, 3.4 percent, compared to China’s 1.9
percent. In other words, if China wishes to close the military expenditure gap fur-
ther by the 2030s, it has to increase its military spending as share of GDP. Simi-
larly, if India were to continue spending 2.4 percent of its GDP on military spend-
ing it would spend one-third as much as China, even if the Chinese economy was
3.7 times larger in 2030. Furthermore, the Eurozone is likely to outpace Russia in
terms of military spending in the coming decade, given the differences in economic
size. This of course, provided that their respective military spending as share of
GDP does not alter significantly.
The future trends for military equipment will depend on both macroeconomic con-
ditions, level of military spending, what priority they give or can give to invest-
ments in equipment and what priority each country gives to the respective branches
of their armed forces. For a detailed list of future quantities and a description of
the underlying assumptions, see Appendix E.
Concerning the future quantities of major world power naval equipment, projec-
tions until 2025 are fairly straight forward. This as most of the ships likely to be in
service by then have either been launched or were in the final stages of construc-
tion in 2020. Projections until 2030, however, have required a higher degree of
estimation and sometimes informed guesswork based on reasonable assumptions.
Furthermore, estimates after 2025 are far more susceptible to revisions in the eco-
nomic aftermath of the coronavirus pandemic.
The US currently plans for a navy consisting of 355 ships by 2034, reaching 325
by 2030, counting all vessels including support ships. The US naval plan has been
subject to several revisions and the feasibility of the 355-plan is highly uncertain.
However, if assuming that these ambitions actually were to be realised, the plan
would translate into 163 surface combatants and 56 submarines by 2030. Accord-
ing to the latest version of the 355-ship plan, this force would include 10 aircraft
carriers, 104 cruiser and destroyers, 43 future frigates and littoral combat ships, 12
strategic and 44 attack submarines as well as several amphibious, logistical and
support ships.49 Regardless of the implementation of this exact plan, the US Navy
will still enjoy a quantitative advantage over other major powers in terms of air-
craft carriers and large surface combatants by 2030. Even though the number of
nuclear submarines are likely to decrease, the US current advantage is large
enough to keep it in a numerical lead with regard to these types of vessels.
49 Congressional Research Service (2020) Navy Force Structure and Shipbuilding Plans: Background and
Issues for Congress, September 2020, RL32665, pp. 6-7.

FOI-R--5048--SE
38 (86)
Figure 4.2: Future naval equipment among major world powers, 2020-2030. Source: IISS, FOI
The Chinese PLA Navy is almost certain to continue its rapid expansion during
the following decade, see Figure 4.2.50 By 2030, the Chinese navy is estimated to
have 180 surface combatants and 67 submarines. The majority of these vessels
have already been constructed and are likely to enter service by 2025. After 2025,
however, this study assumes that the rate of expansion will slow. This due to in-
creased maintenance costs, incurred by the larger and more modern fleet, coupled
with a likely slower growth in military expenditure. Nevertheless, China will put
increased emphasis on constructing large surface combatants in the coming dec-
ade, including two additional aircraft carriers, a number of amphibious assault
ships, several destroyers and a series of nuclear submarines. Taken together these
additions would significantly increase the PLA Navy’s ability to project power and
strengthen its regional advantage in East Asia. Furthermore, it will gain an overall
numerical advantage over the US Navy in the years leading up to 2030.
The navies of France, the UK, Germany and Italy are likely to expand slightly in
size until 2030. This would mean a reversal of the downward trend from previous
decades. The combined navies of the four European powers is estimated to consist
of 82 surface combatants and 37 submarines in 2030. However, the number of
large surface combatants are assumed to decrease slightly as older classes of
French and Italian destroyers are nearing the end of their life-cycle without any
immediate replacements planned to enter service before 2030. Furthermore, new
50 Data on future naval equipment are obtained from wide range of open sources and referred to collec-
tively as “FOI” in Figure 4.2, see Section 2.1 for details.

FOI-R--5048--SE
39 (86)
French, German, UK and Italian frigates will not fully replace older classes on a
one-to-one basis. The majority of the estimated increase can instead be attributed
to the growing number of German and Italian corvettes. The quantity of subma-
rines will also increase slightly as new French, German, UK and Italian submarines
replace older classes.
The Russian navy is estimated to increase its overall number of vessels. This study
estimates that the Russian Navy will have 89 surface combatants and 56 subma-
rines by 2030. This increase includes nearly every type of ship and submarine, but
most new ships will consist of smaller surface combatants. This may be difficult
to discern from Figure 4.2, but the stable number of corvettes hides the fact that a
large number of older vessels, will be replaced by new ones. Similarly, new frigate
classes are set to replace older ones. Larger surface combatants will continue to
consist of updated Soviet era cruisers, destroyers, and one refurbished aircraft car-
rier. The new class of large destroyers, previously planned, now seems to be post-
poned indefinitely.51 The only exception when it comes to new large surface com-
batants is a newly produced class of amphibious assault ships. The quantity of
submarines is likely to increase somewhat as older conventional submarines are
replaced by newer classes and further nuclear submarines are being introduced.
The number of strategic nuclear submarines is likely to increase slightly by 2030,
while older classes are replaced.
Figure 4.3: Future naval tonnage among major world powers, 2020-2030. Source: FOI
51 Trevithick, Joseph (2020) “Russia Has Abandoned Its Massive Nuclear Destroyer and Supersized Frig-
ate Programs”, The Drive, 21 April 2020. (Accessed 23 November 2020).

FOI-R--5048--SE
40 (86)
In terms of tonnage, the naval balance will also change during the coming decade,
see Figure 4.3. If the estimates above hold, the PLA Navy will continue to narrow
the tonnage gap, from one-fourth of total US Navy tonnage in 2020 to nearly half
by 2030. With 60 percent of the US Navy currently located to the Pacific theatre,
the tonnage of the US and Chinese navies could be nearing parity in the Pacific,
without any redistribution of US vessels. However, this does not imply that the
Chinese navy will reach parity in terms of quality and overall capability. By 2030,
the US Navy will still consist of on average larger and more capable ships, espe-
cially large aircraft carriers and highly capable nuclear attack-submarines.
Future naval power balance is of course not a mere numbers game. Potentially
disruptive technologies are constantly being conceptualised, developed and tested.
Unmanned surface and underwater vehicles and aircraft, lasers, railguns, nuclear
powered torpedoes, ballistic and hypersonic missiles anti-ship missiles, new gen-
erations of sonars and radars all have the potential to alter the naval power balance
in favour of one nation or the other. It could also give comparative advantages in
different areas, forcing navies to adapt their strategic thinking.
Estimating future quantities of army equipment is more difficult than for navies,
as quantities are larger. Furthermore, production plans are harder to track and can
be changed more quickly. However, continued modernisation and increased qual-
ity seems to be a more certain trend. China seems likely to continue replacing old
equipment, while maintaining large quantities. The PLA could very well complete
its modernisation, replacing its legacy systems, by 2030. By that time, however,
the US plans to replace its current Bradleys with a new generation of infantry
fighting vehicle and will likely have completed upgrading its Abrams tanks to a
new standard.52 The E4 would similarly have begun to replace infantry fighting
vehicles as well as some main battle tanks with new generations.53 Russia will
likely continue to focus on upgrading equipment, maintaining large quantities
while slowly introducing the next generation of army equipment based around the
Armata platform. All major world powers are in the process of introducing new
subsystems, such as active protection systems while also exploring new types of
systems altogether, such as unmanned and autonomous ground vehicles.
Future quantities of air force equipment are also quite difficult to estimate, for
much the same reason as army equipment. Trends from previous decades could
provide some clues. However, should defence spending actually increase as ad-
vertised, the downward trend of recent decades might be reversed or at least
slowed down. Modernisation efforts and qualitative improvements are easier to
52 For US Abrams upgrade, see Mizokami, Kyle (2019) “Here's How the U.S. Army Is Upgrading the
Abrams Tank for Its Fifth Decade in Service”, Japolnik. 4 Mar 2019. (Accessed 24 November 2020).
For US Bradley replacement, see Mehta, Aron (2020) “US Army releases draft RFP for Bradley vehicle
replacement“, DefenseNews, 17 Jul 2020. (Accessed 24 November 2020). 53 Defenseworld (2020) “Germany, France to Launch Architectural Study on Future European Tank Pro-
ject”, 24 February 2020. (Accessed 24 November 2020).

FOI-R--5048--SE
41 (86)
foresee, at least in the short run. The US will continue to acquire and introduce F-
35 throughout the 2020s, gradually replacing F-16s. In an attempt to keep up,
China and Russia will likely continue to develop and improve their nascent fifth
generation combat aircraft capabilities, currently consisting of the J-20 and Su-57
respectively. However, it remains to be seen to what degree those efforts will be
successful. The European picture will likely continue to vary somewhat, with some
countries having procured F-35 while others are aiming to replace fourth genera-
tion fighters with sixth generation. European countries are currently developing
two competing sixth generation projects, one UK-Swedish-Italian and one Franco-
German-Spanish initiative.54 Meanwhile, the US has decided on two sixth gener-
ation projects, one for the air force and one for the navy.55 Rumours are also cir-
culating about possible Chinese and Russian sixth generation aircraft.56 However,
it is unclear at what stage of development these are in as both countries are still in
the phase of developing fifth generation capabilities. Unmanned aerial vehicles
(UAVs) have been a part of air power for some time, but future developments may
also include unmanned “loyal-wingmen”, UAVs which can accompany and com-
plement manned combat aircraft.
Concluding Remarks on Future Trends
Well aware of the numerous uncertainties when trying to predict future trends, it
is nevertheless the assessment of this study that the next decade will likely see a
continued shift of economic power, away from the US towards China. Save for an
economic collapse or otherwise disruptive crisis, current trends indicate that China
could overtake the US to become the world’s largest economy in nominal terms
around 2030, while in terms of purchasing power this shift occurred in 2016.
Meanwhile, the US will most likely remain the largest military spender by 2030
and maintain its overall military advantage, even though the capability gap towards
near peer competitors may continue to narrow. China is likely to build a navy
which outnumbers its US counterpart by 2030. The average US vessel will still be
larger and more capable compared to other great powers, but China will narrow
the gap in terms of tonnage. The US advantage in the air and below the surface,
54 For the UK-Swedish-Italian project, see Defenseworld (2020) “Sweden & Italy to Collaborate in Devel-oping Future Combat Air Capabilities”, 22 July 2020. (Accessed 24 November 2020). For the Franco-
German-Spanish project, see Reuters (2020) “France, Germany sign contract to develop fighter jet pro-
totype”, 20 February 2020. (Accessed 24 November 2020). 55 For US Air Force project, see Pickrell, Ryan (2020) “The US Air Force secretly built and flew a proto-
type of its mysterious next-generation fight jet”, Businessinsider, 15 September 2020. (Accessed 24 No-
vember 2020). For US Navy project, see Mizokami, Kyle (2020) “The Navy Is Finally Creating Ameri-ca's Next Fighter Jet”, Popularmechanics. 20 August 2020. (Accessed 24 November 2020).
56 For possible Chinese future aircraft projects, see Zhen, Liu (2020) “China trails as US sixth-generation
jet project gets airborne”, South China Morning Post, 22 September 2020. (Accessed 24 November
2020). For possible Russian future aircraft projects, see Suciu, Peter (2020) “Is Russia Developing a
Sixth-Generation Stealth Fighter Jet?”, Nationalinterest, 3 September 2020. (Accessed 24 November
2020).

FOI-R--5048--SE
42 (86)
however, will likely remain or even expand. Both the US and Chinese army equip-
ment will likely be upgraded and to some extent replaced during the coming dec-
ade, while China will likely continue playing catch-up when it comes to the next
generation of combat aircraft.
The E4 have sought to increase military spending in recent years. While France
and the UK have stated that these efforts will continue,57 long-term European de-
fence funding will depend on the political priorities given to defence in the after-
math of the coronavirus pandemic. It is, however, likely that E4 navies will expand
somewhat until 2030, reversing the stagnant trend of past decade. Even with mod-
est economic growth rates, the size of the Eurozone economy makes it highly
likely that it will continue to widen the economic gap towards Russia. However,
this does not imply that Russia will become comparatively weak, especially not in
terms of military power. Russia will likely continue to develop its armed forces,
even if the resources at its disposal becomes more limited. The Russian navy is
likely to expand, while army and air force equipment are likely to continue being
upgraded. Both the E4 and Russia are simultaneously in the process of developing
new types of army equipment and new generations of combat aircraft.
Finally, the changing global power balance observed in this study does not imply
a definite power shift between the US and China. US power rests not only in its
GDP and military expenditure, but in its network of alliances, its soft power and
innovative technological edge. Nonetheless, the continued increase of China’s
economic and military power will have major implications, not only for the rela-
tions between the world’s two largest economies or their respective relationships
to Europe and Russia, but for the global community as a whole.
57 For France, see Mackenzie, Christina (2020) “Despite pressure from lawmakers and pandemic, French defense budget to remain unchanged”, Defensenews, 5 October 2020. (Accessed 24 November 2020).
For UK, see BBC (2020) “Defence funding boost ‘extends British influence’, 20 November 2020. (Ac-
cessed 24 November 2020).

FOI-R--5048--SE
43 (86)
References Allison, Graham (2017) Destined for War – Can America and China Escape
Thudydides’s Trap?. Scribe: London.
Arena, Mark V.; Blickstein, Irv; Younossi, Obaid & Grammich, Clifford A.
(2006) A Macroscopic Examination of the Trends in U.S. Naval Ship Costs Over
the Past Several Decades. RAND Corporation: Santa Monica, CA.
BBC (2020) “Defence funding boost ‘extends British influence’, 20 November
2020, https://www.bbc.com/news/uk-54988870. (Accessed 24 November 2020).
Beckley, Michael (2018) “Power of Nations: Measuring What Matters”, Interna-
tional Security, 43:2, pp. 7-44
Congressional Budget Office (2020) An Update to the Economic Outlook: 2020
to 2030. July 2020.
Congressional Research Service (2020) Navy Force Structure and Shipbuilding
Plans: Background and Issues for Congress, September 2020, RL32665.
Connolly, Richard & Sendstad, Cecilie (2017) “Russia’s Role as an Arms Ex-
porter – The Strategic and Economic Importance of Arms Exports for Russia”,
Research Paper, Chatham House, March 2017.
Defenseworld (2020) “Sweden & Italy to Collaborate in Developing Future
Combat Air Capabilities”, 22 July 2020. https://www.defense-
world.net/news/27483/UK__Sweden___Italy_to_Collaborate_in_Develop-
ing_Future_Combat_Air_Capabilities#.X70Bu-QV8yE. (Accessed 24 November
2020).
Defenseworld (2020) “Germany, France to Launch Architectural Study on Future
European Tank Project”, 24 February 2020. https://www.defense-
world.net/news/26398/Germany__France_to_Launch_Architec-
tural_Study_on_Future_European_Tank_Project#.X70mveQV8yF. (Accessed 24
November 2020).
Douch, Mohamed & Solomon, Binyam (2014) “Middle Powers and the Demand
for Military Expenditure”, Defence and Peace Economics, 25:6, pp. 605-618.
Dunne, J. Paul; Nikolaidou, Eftychia & Mylonidis, Nikolaos (2003) “The de-
mand for military spending in the peripheral economies of Europe”, Defence and
Peace Economics, 14:6, pp. 447-460.
Hiebert, Murray; Nguyen, Phuong & Poling, Gregory B., eds. (2015) Examining
the South China Sea Disputes, Papers from the Fifth Annual South China Sea
Conference, CSIS. Rowman & Littlefield: Lanham.

FOI-R--5048--SE
44 (86)
Horowitz, Stanley A.; R. Harmon, Bruce & Levine, Daniel B. (2016) “Inflation
adjustments for defence acquisition”, Defence and Peace Economics, 27:2, pp.
231-257.
IISS (2020) The Military Balance 2020. 120:1.
IISS (2015) The Military Balance 2015. 115:1.
IISS (2010) The Military Balance 2010. 110:1.
IISS (2005) The Military Balance 2005. 105:1.
IISS (2000) The Military Balance 2000. 100:1.
IMF (2020) World Economic Outlook – A Long and Difficult Ascent, October
2020.
IMF (2020) IMF Data – Real GDP growth (Annual percent change). https://www.imf.org/external/datamapper/NGDP_RPCH@WEO/AZE. (Ac-
cessed 29 October 2020).
IMF (2020a) World Economic Outlook Database. https://www.imf.org/en/Publi-
cations/WEO/weo-database/2020/October. (Accessed 23 November 2020).
Kofman, Michael & Connolly, Richard (2019) “Why Russian Military Expendi-
ture Is Much Higher Than Commonly Understood (As Is China’s)”, War on the
Rocks, 16 December 2019, https://warontherocks.com/2019/12/why-russian-mili-
tary-expenditure-is-much-higher-than-commonly-understood-as-is-chinas/. (Ac-
cessed 23 November 2020).
Mackenzie, Christina (2020) “Despite pressure from lawmakers and pandemic,
French defense budget to remain unchanged”, Defensenews, 5 October 2020.
https://www.defensenews.com/global/europe/2020/10/05/despite-pressure-from-
lawmakers-and-pandemic-french-defense-budget-to-remain-unchanged/. (Ac-
cessed 24 November 2020).
McClory, Jonathan (2018) The Soft Power 30 – A Global Ranking of Soft Power
2018. Portland.
Mehta, Aron (2020) “US Army releases draft RFP for Bradley vehicle replace-
ment“, DefenseNews, 17 Jul 2020, https://www.defense-
news.com/land/2020/07/17/army-drops-draft-rfp-for-bradley-replacement/. (Ac-
cessed 23 November 2020).
Middleton, Andrew; Bowns, Steven; Hartley, Keith & Reid, James (2006) “The
Effect of Defence R&D on Military Equipment Quality”, Defence and Peace
Economics, 17:2, pp. 117-139.

FOI-R--5048--SE
45 (86)
Mizokami, Kyle (2020) “The Navy Is Finally Creating America's Next Fighter
Jet”, Popularmechanics. 20 August 2020. https://www.popularmechan-
ics.com/military/aviation/a33646420/navy-new-fighter-jet-next-generation-air-
dominance/. (Accessed 24 November 2020).
Mizokami, Kyle (2019) “Here's How the U.S. Army Is Upgrading the Abrams
Tank for Its Fifth Decade in Service”, Japolnik, 4 Mar 2019, https://foxtrotal-
pha.jalopnik.com/heres-how-the-u-s-army-is-upgrading-the-abrams-tank-fo-
1832979607. (Accessed 23 November 2020).
Nikolaidou, Eftychia (2008) “The demand for military expenditure: evidence
from the EU15”, Defence and Peace Economics, 19:4, pp. 273-292.
OECD (2020a) Purchasing power parities (PPP), https://data.oecd.org/conver-
sion/purchasing-power-parities-ppp.htm. (Accessed 29 October 2020).
OECD (2020) GDP Long-Term Forecast, https://data.oecd.org/gdp/gdp-long-
term-forecast.htm. (Accessed 29 October 2020).
Olsson, Per (2018) Towards a Tool for Measuring Military Performance. FOI
Memo 6516. FOI: Stockholm.
Olsson, Per; Alozious, Juuko & Ädel, Maria (2018) Defence Economic Outlook
2018 – Global Outlook with a Focus on the European Defence Industry. FOI-R--
4631--SE. FOI: Stockholm.
Olsson, Per & Bäckström, Peter (2016) Defence Economic Outlook 2016 –
Global Outlook with a Focus on the Baltic Sea. FOI-R--4315--SE. FOI: Stock-
holm.
Oxenstierna, Susanne (2019) “The economy and military expenditure”, Wester-
lund, Fredrik & Oxenstierna, Susanne (eds.) Russian Military Capability in a Ten-Year Perspective – 2019. FOI-R--4758--SE SE. FOI: Stockholm, pp. 97-
111.
Pickrell, Ryan (2020) “The US Air Force secretly built and flew a prototype of
its mysterious next-generation fight jet”, Businessinsider, 15 September 2020.
https://www.businessinsider.com/us-air-force-secretly-builds-flies-next-genera-
tion-fighter-jet-2020-9?r=US&IR=T. (Accessed 24 November 2020).
PricewaterhouseCooper (2015) The World in 2050 – Will the shift in global eco-
nomic power continue? February 2015.
PricewaterhouseCooper (2014) Future of India – The Winning Leap.
Reuters (2020) “France, Germany sign contract to develop fighter jet prototype”,
20 February 2020, https://uk.reuters.com/article/uk-eu-defense-fighterjet-idUK-
KBN20E1J5. (Accessed 24 November 2020).

FOI-R--5048--SE
46 (86)
Robertson, Peter E. and Sin, Adrian (2017) “Measuring hard power: China’s eco-
nomic growth and military capacity”, Defence and Peace Economics, 28:1, pp.
91-111.
SIPRI (2020) Frequently Asked Questions – 12. https://www.sipri.org/data-
bases/milex/frequently-asked-questions#PPP. (Accessed 23 November 2020).
SIPRI (2020) SIPRI Military Expenditure Database: Sources and Methods.
https://www.sipri.org/databases/milex/sources-and-methods. (Accessed 29 Octo-
ber 2020).
SIPRI (2020a) SIPRI Military Expenditure Database.
Steelbeasts.com. http://www.steelbeasts.com/sbwiki/index.php/Main_Page. (Ac-
cessed 2020).
Suciu, Peter (2020) “Is Russia Developing a Sixth-Generation Stealth Fighter
Jet?”, Nationalinterest, 3 September 2020. https://nationalinter-
est.org/blog/buzz/russia-developing-sixth-generation-stealth-fighter-jet-168232.
(Accessed 24 November 2020).
Trevithick, Joseph (2020) “Russia Has Abandoned Its Massive Nuclear De-
stroyer and Supersized Frigate Programs”, The Drive, 21 April 2020,
https://www.thedrive.com/the-war-zone/33099/russia-has-abandoned-its-mas-
sive-nuclear-destroyer-and-supersized-frigate-programs. (Accessed 23 November
2020).
United Nations (2019) World Population Prospects 2019 – Highlights, United
Nations Department of Social and Economic Affairs
US Training and Doctrine Command (2014) Worldwide Equipment Guide 2014,
Vol. 1.
Wang, Yu (2013) “Determinants of Southeast Asian military spending in the
post-cold war era: a dynamic panel analysis”, Defence and Peace Economics,
24:1, pp. 73-87.
World Bank (2020a) GDP Constant 2010 US$. https://data.worldbank.org/indi-
cator/NY.GDP.MKTP.KD. (Accessed 29 October 2020).
World Bank (2020b) GDP Current US$. https://data.worldbank.org/indica-
tor/NY.GDP.MKTP.CD. (Accessed 29 October 2020).
World Bank (2020c) GDP PPP Current International US$.
https://data.worldbank.org/indicator/NY.GDP.MKTP.PP.CD. (Accessed 29 Oc-
tober 2020).
World Bank (2013) China 2030: Building a Modern, Harmonious, and Creative
Society. International Bank for Reconstruction and Development, the World
FOI-R--5048--SE
47 (86)
Bank and the Development Research Center of the State Council, P. R. China.
World Bank: Washington.
Zhen, Liu (2020) “China trails as US sixth-generation jet project gets airborne”,
South China Morning Post, 22 September 2020.
https://www.scmp.com/news/china/military/article/3102578/china-trails-us-sixth-
generation-jet-project-gets-airborne. (Accessed 24 November 2020).

FOI-R--5048--SE
48 (86)
Appendix A: Military Expenditure Table A.1: Top 25 Military Spenders in the World, 2019. Source: SIPRI (2020a).
Country Billion USD (current prices)
Share of the world (%)
Share of GDP (%)
Average change 2010-19 (%)
Average change 2017-19 (%)
US 731.8 39.2 3.4 -1.8 +4.2
China 261.1 14.0 1.9 +7.1 +5.7
India 71.1 3.8 2.4 +3.6 +4.7
Russia 65.1 3.5 3.9 +3.5 +0.5
Saudi Arabia 61.9 3.3 8.0 N/A -6.4
France 50.1 2.7 1.9 +0.4 -0.4
Germany 49.3 2.6 1.3 +1.7 +6.3
UK 48.7 2.6 1.7 -1.8 +0.5
Japan 47.6 2.5 0.9 +0.2 +0.0
South Korea 43.9 2.3 2.7 +3.5 +6.3
Brazil 26.9 1.4 1.5 +0.7 +3.1
Italy 26.8 1.4 1.4 -1.1 -0.2
Australia 25.9 1.4 1.9 +2.4 -0.2
Canada 22.2 1.2 1.3 +3.0 -1.2
Israel 20.5 1.1 5.3 +3.0 +0.9
Turkey 20.4 1.1 2.7 +7.4 +16.4
Spain 17.2 0.9 1.2 -0.6 +2.4
Iran 12.6 0.7 2.3 -3.9 -19.1
Netherlands 12.1 0.6 1.3 +1.2 +10.0
Poland 11.9 0.6 2.0 +4.9 +7.9
Singapore 11.2 0.6 3.2 +2.2 +3.6
Taiwan 10.4 0.6 1.7 +0.3 -0.5
Algeria 10.3 0.6 6.0 +8.3 +1.9
Pakistan 10.3 0.5 4.0 +6.1 +6.4
Colombia 10.1 0.5 3.2 +2.0 +2.4
Top 25 1679.4 89.9 2.3* +0.6 +3.2
World Total 1868.1 100.0 1.8* +0.5 +3.2
* Average
Military expenditure in 2019 is denoted in current prices while average changes in
military spending are given in 2018 constant prices. Note that SIPRI’s definition
of military expenditure not only includes direct expenditure on armed forces, but
also indirect military spending on e.g. paramilitary forces, military pensions and
R&D. Meanwhile, expenditure related to civil defence is excluded.58 SIPRI’s re-
porting method for Saudi Arabia changed in 2016. Data before 2016 included non-
paramilitary forces and likely overestimated Saudi military expenditure prior to
that year. The change between 2010 and 2019 for Saudi Arabia has therefore been
marked with N/A. Furthermore, the UAE is excluded, as estimates have not been
provided by the SIPRI since 2014.59
58 SIPRI (2020) SIPRI Military Expenditure Database: Sources and Methods. (Accessed 29 Oct. 2020). 59 SIPRI (2020a) SIPRI Military Expenditure Database.

FOI-R--5048--SE
49 (86)
Appendix B: Macroeconomic Trends Table B.1: Top 25 Economies in the World, 2019. Source: World Bank (2020a, 2020b).
Country Billion USD (current prices)
Share of the world 2019 (%)
Share of the world 2000 (%)
Average change 2010-19 (%)
Average change 2017-19 (%)
US 21,428 24.4 30.5 +2.3 +2.5
China 14,343 16.3 3.6 +7.7 +6.6
Japan 5,082 5.8 14.5 +1.3 +1.1
Germany 3,846 4.4 5.8 +2.0 +1.5
India 2,875 3.3 1.4 +7.0 +5.8
UK 2,827 3.2 4.9 +1.9 +1.5
France 2,716 3.1 4.1 +1.4 +1.8
Italy 2,001 2.3 3.4 +0.3 +0.9
Brazil 1,840 2.1 1.9 +1.4 +1.2
Canada 1,736 2.0 2.2 +2.2 +2.3
Russia 1,700 1.9 0.8 +2.0 +1.9
South Korea 1,642 1.9 1.7 +3.3 +2.6
Spain 1,394 1.6 1.8 +1.1 +2.4
Australia 1,393 1.6 1.2 +2.6 +2.3
Mexico 1,258 1.4 2.1 +2.7 +1.4
Indonesia 1,119 1.3 0.5 +5.4 +5.1
Netherlands 909 1.0 1.2 +1.5 +2.4
Saudi Arabia 793 0.9 0.6 +3.5 +0.7
Turkey 754 0.9 0.8 +5.9 +3.7
Switzerland 703 0.8 0.8 +1.9 +1.8
Poland 592 0.7 0.5 +3.6 +4.7
Thailand 544 0.6 0.4 +3.6 +3.6
Sweden 531 0.6 0.8 +2.5 +1.9
Belgium 530 0.6 0.7 +1.6 +1.6
Argentina 450 0.5 0.8 +1.4 -0.7
Top 25 69,667 83.2 87.0 +2.8* +2.4*
World Total 87,752 100.0 100.0 +3.8 +3.5
* Average
GDP for 2019 indicated in current prices while changes are given in 2010 constant
prices USD.60 Note that the World Bank excludes Taiwan and that data are missing
for Iran, which means that these are not included among the top 25 economies.
60 GDP in constant prices 2010 USD are collected from World Bank (2020a) GDP Constant 2010 US$,
while GDP in current prices are collected from World Bank (2020b) GDP Current US$.

FOI-R--5048--SE
50 (86)
Appendix C: Equipment Quantities The data on equipment quantities presented in the figures and tables of Appendix
C has been compiled from the 2000, 2005, 2010, 2015 and 2020 volumes of IISS
The Military Balance. It is important to note that IISS presents quantities of equip-
ment “in active service”, which is not the same as equipment readily available for
operational use. The data from IISS also feature some inconsistencies with regards
to the nomenclature and clustering of equipment into types, both over time and
between countries. When IISS indicates that a certain type of equipment is in ac-
tive service, but does not specify a quantity, the quantity is marked as “some”. IISS
also classifies some equipment as being kept in “storage” or “reserve”. This in-
cludes equipment which could be everything from near operational to only used
for spare parts, but such variations in status is not specified.
Surface combatants in this study include aircraft carriers, amphibious assault ships,
cruisers, destroyers, frigates and corvettes. The main rule of thumb has been to
include ships capable of carrying combat aircraft, missiles or both. However, mis-
sile boats and fast attack craft are excluded due to their limited size and capabili-
ties.61 Furthermore, the vast numbers of such vessels possessed by China and Rus-
sia would have skewed comparisons of ship quantities. Submarines include nu-
clear armed strategic submarines (SSBN), torpedo and missile armed tactical sub-
marines with nuclear propulsion (SSN) and tactical submarines with conventional
propulsion (SSK). Mini-submarines and special purpose submarines are excluded.
While IISS data generally do not account for availability, Russian naval vessels
kept in reserve or undergoing long-term overhaul are not included. This study has
not adjusted for this minor inconsistency, but it is worth noting that this may lead
to a slight underestimation of ships in active service for Russia. The exemption
also applies to three German submarines in 2020, undergoing long-term overhaul.
Also note that there is no internationally accepted classification of surface com-
batants, i.e. what actually distinguishes a small destroyer from a large frigate. IISS
sometimes attempts to adjust for changes in roles and capabilities. However, this
study has kept the national classifications. The consequences are generally limited,
but the use of national classifications means that the French European multi-mis-
sion frigates (FREMM) of the Aquitaine class are categorised as destroyers while
the Italian FREMM Bergamini class are categorised as frigates.
Main battle tanks are heavily armoured vehicles, armed with a powerful main gun
for direct fire. There is no widely accepted standard for what constitutes a main
battle tank and these can vary considerably in size. However, wheeled tanks are
usually not included in the definition and have also been excluded in this study.
61 The distinction between a coastal corvette and a missile attack craft is often not clearly defined. How-
ever, this study classifies coastal corvettes displacing less than 500 tonnes as missile attack craft, thereby
excluding them from the overall tally.

FOI-R--5048--SE
51 (86)
Infantry fighting vehicles (IFVs) provide infantry with armoured transportation
and fire support. Armoured personnel carriers (APCs) perform similar tasks but
are generally, though not always, more lightly armed. Both IFVs and APCs can be
either wheeled or tracked. Artillery and multiple rocket launch systems (MLRSs)
provide ground forces with indirect fire.
Combat aircraft perform both ground attack and air superiority missions, generally
armed with missiles and automatic cannons. In this study combat aircraft includes
multirole aircraft as well as more purpose-built fighters and attack aircraft. Mean-
while purpose-built large bombers have been given a separate category. Transport
aircraft provide troops the ability to deploy rapidly and over large distances. These
vary greatly in size, but all except light personal transport aircraft are included.

FOI-R--5048--SE
52 (86)
USA US Navy Surface Combatants and Submarines
Figure C.1: US Navy surface combatants and submarines, 2000-2020. Source: IISS
Classes of: Aircraft carriers: Gerald R. Ford, Nimitz, Enterprise, John F. Kennedy,
Kitty Hawk. Amphibious assault ships: America, Wasp, Tarawa. Cruisers: Ticon-
deroga. Destroyers: Zumwalt, Arleigh Bourke Flight I/II/IIA, Spruance. Frigates:
Oliver Hazard Perry. Littoral combat ships: Freedom, Independence. Strategic nu-
clear submarines: Ohio. Tactical nuclear submarines: Virginia Flight I/II/III, Sea-
wolf, Ohio (Mod), Los Angeles (Imp), Los Angeles, Sturgeon.
Table C.1: US Navy surface combatants and submarines, 2000-2020. Source: IISS.
Type/Year 2000 2005 2010 2015 2020
Aircraft Carriers 12 11 11 10 11
Amphibious Assault Ships 11 12 10 10 9
Cruisers 27 22 22 22 22
Destroyers 52 49 56 62 69
Frigates & LCSs 35 30 23 11 19
Strategic Nuclear Submarines 18 16 14 14 14
Tactical Nuclear Submarines 55 56 57 59 53
Total 210 196 193 188 197

FOI-R--5048--SE
53 (86)
US Army Equipment
Figure C.2: US Army equipment, 2000-2020. Source: IISS
Types of: Main battle tanks (MTBs): M1A2/C Abrams, M1A1 Abrams, M1
Abrams. Infantry fighting vehicles (IFVs): M7A3 Bradley, M2/A Bradley. Recon-
naissance vehicles: M3A2/A3 Bradley, M7A3 Bradley, M1127 Stryker, Tpz
Fuchs. Armoured personnel carriers (APCs): MRAP, M-ATV, LAV-25, JLTV,
M1117 Guardian, M1200 Armoured Knight, Stryker, M113. Artillery:
M109A1/A2/A6/A7, M777, M198, M119, M102. Multiple launch rocket systems
(MLRSs): M142 HIMARS, M270.
Table C.2: US Army equipment, 2000-2020. Source: IISS.
Type/Year 2000 2005 2010 2015 2020
Main Battle Tanks 7900 7620 5850 2338 2414
Infantry Fighting Vehicles 6710 6719 6452 4559 2834
Reconnaissance Vehicles 110 96 96 1435 1745
Armoured Personnel Carriers 15200 14900 19637 25674 21428
Artillery 4103 3634 3374 2211 2337
Multiple Launch Rocket Systems 1075 830 830 1205 600
MBTs (Reserve) - - - 3500 3500
IFVs (Reserve) - - - 2000 2000
Rec (Reserve) - - - - 800
APCs (Reserve) - - - 8000 8000
Artillery (Reserve) - - - 500 500

FOI-R--5048--SE
54 (86)
US Air Force, Navy and Marine Corp Aircraft
Figure C.3: US Air Force, Navy and Marine Corp aircraft, 2000-2020. Source: IISS
Types of: Combat aircraft: F-35B/C, F-35A, F-22, F-18E/F, F-18A/B/C/D, F-111,
F-16A/B/C/D, F-15E, F-15A/B/C/D, F-14A/B/D, OA-10A/A-10C, AV/TAV-8,
A-10A. Bombers: B-2, B-1B, B-52. Transports: C-5, C-17A, C-130, C-141, C-
135. Tankers: KC-46A, KC-10A, KC-135.
Table C.3: US Air Force, Navy and Marine Corp aircraft, 2000-2020. Source: IISS.
Type/Year 2000 2005 2010 2015 2020
Combat Aircraft 3847 2611 2810 2557 2524
Bombers 208 174 145 137 139
Transport 846 383 373 327 286
Tankers 605 314 241 226 237
Total 5506 3482 3569 3247 3186
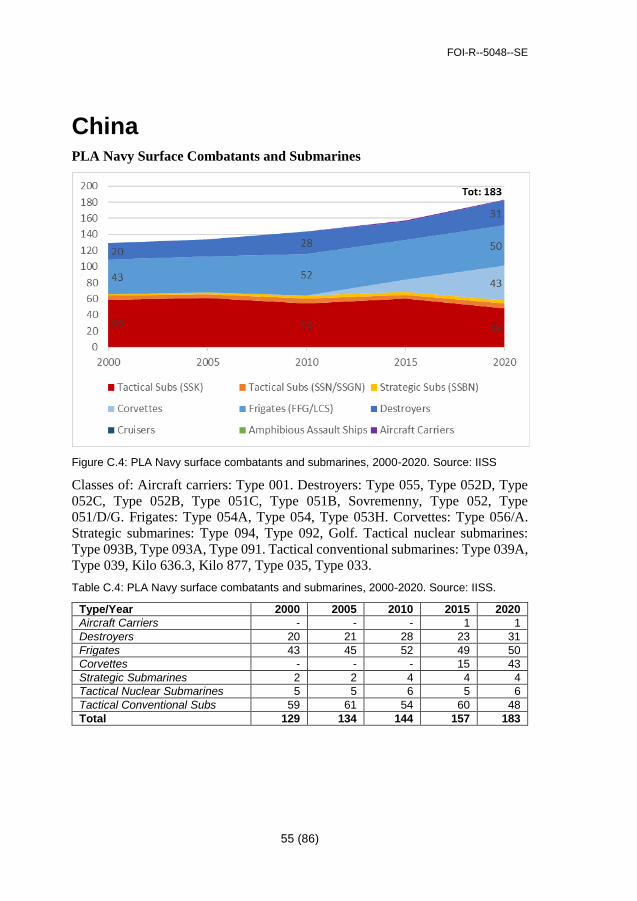
FOI-R--5048--SE
55 (86)
China PLA Navy Surface Combatants and Submarines
Figure C.4: PLA Navy surface combatants and submarines, 2000-2020. Source: IISS
Classes of: Aircraft carriers: Type 001. Destroyers: Type 055, Type 052D, Type
052C, Type 052B, Type 051C, Type 051B, Sovremenny, Type 052, Type
051/D/G. Frigates: Type 054A, Type 054, Type 053H. Corvettes: Type 056/A.
Strategic submarines: Type 094, Type 092, Golf. Tactical nuclear submarines:
Type 093B, Type 093A, Type 091. Tactical conventional submarines: Type 039A,
Type 039, Kilo 636.3, Kilo 877, Type 035, Type 033.
Table C.4: PLA Navy surface combatants and submarines, 2000-2020. Source: IISS.
Type/Year 2000 2005 2010 2015 2020
Aircraft Carriers - - - 1 1
Destroyers 20 21 28 23 31
Frigates 43 45 52 49 50
Corvettes - - - 15 43
Strategic Submarines 2 2 4 4 4
Tactical Nuclear Submarines 5 5 6 5 6
Tactical Conventional Subs 59 61 54 60 48
Total 129 134 144 157 183

FOI-R--5048--SE
56 (86)
PLA Army Equipment
Figure C.5: PLA Army equipment, 2000-2020. Source: IISS
Types of: Main battle tanks (MBTs): ZTZ-99/A, ZTZ-96/A, ZTQ-15, ZTZ-88,
ZTZ-79, ZTZ-69, ZTZ-59. Infantry fighting vehicles (IFVs): ZTL-11, ZTS-63A,
ZTD-05, ZBD-04/A, ZDB-86/A, BTR-50. Armoured personnel carriers (APCs):
ZSL-10, ZBL-08, ZSL-93, ZSL-92/A/B, ZSD-89, ZSD-63. Artillery: PLZ-07,
PLZ-05, PCL-18, PLC-09, PLL-09, PLZ-89, PLZ-83, PLZ-45, PL-96, PL-54/-59/-
66, Type-60, Type-56. Multiple launch rocket systems (MLRSs): PHZ-10/-11,
PHL-19, PHL-11, PHL-03, PHZ-89, PHZ-81/-90, PH-63.
Table C.5: PLA Army equipment, 2000-2020. Source: IISS.
Type/Year 2000 2005 2010 2015 2020
Main Battle Tanks 7060 7580 6550 6540 5850
Infantry Fighting Vehicles Some 1200 1100 2120 4300
Armoured Personnel Carriers 4800 4700 4400 8570 10900
Artillery 15800 17700 17700 13178 3374
Multiple Launch Rocket Systems 2500 2400 2400 1872 1570

FOI-R--5048--SE
57 (86)
PLA Air Force and Navy Aircraft
Figure C.6: PLA Air Force and Navy aircraft, 2000-2020. Source: IISS
Types of: Combat aircraft: J-20, J-16, J-15, J-10, Su-35, Su-30MKK/MK2, J-
11B/BS, J-11/Su-27, JH-7/A, J-8A/B/E, J-7, Q-5, J-6. Bombers: H-6, H-5. Trans-
ports & tankers: Y-20, Il-76, Y-9, Y-8, Y-12, Y-11, Y-7, Y-5, Il-18.
Table C.6: PLA Air Force and Navy aircraft, 2000-2020. Source: IISS.
Type/Year 2000 2005 2010 2015 2020
Combat Aircraft 3263 2769 1605 1787 1976
Bombers 320 222 82 106 160
Transport & Tankers 458 258 259 296 309
Total 4041 3249 1946 2189 2445

FOI-R--5048--SE
58 (86)
European Four French, German, UK and Italian Navy Surface Combatants and Submarines
Figure C.7: E4 Navy surface combatants and submarines, 2000-2020. Source: IISS
Classes of: Aircraft carriers: Charles de Gaulle, Clémenceau, Queen Elizabeth, In-
vincible (mod.), Invincible, Cavour, Guiseppe Garabaldi. Amphibious assault
ship: Mistral. Cruisers: Jeanne d’Arc, Vittorio Veneto. Destroyers: Aquitaine,
Forbin, Cassard, Georges Leygues, Tourville, Lütjens, Type 45, Type 42, Andrea
Doria, Durand de la Penne, Audace. Frigates: La Fayette, Floreal, Sachsen, Bran-
denburg, Bremen, Type 23, Type 22 Batch 2/3, Bergamini, Maestrale, Artiglieri,
Lupo. Corvettes: Braunschweig, Minerva. Strategic nuclear submarines: Van-
guard, Le Triumphant, Redoutable. Tactical nuclear submarines: Astute, Trafal-
gar, Swiftsure, Rubis. Tactical conventional submarines: Agosta, Type 212A,
Type 206/206A, Type 205, Todaro, Pelosi, Sauro.
Table C.7: E4 Navy surface combatants and submarines, 2000-2020. Source: IISS.
Class/Year 2000 2005 2010 2015 2020
Aircraft Carriers 5 4 5 3 4
Amphibious Assault Ships - 1 2 3 3
Cruisers 2 1 1 - -
Destroyers 29 26 24 21 21
Frigates 58 57 55 52 47
Corvettes 8 8 11 10 5
Strategic Nuclear Submarines 8 8 7 8 8
Tactical Nuclear Submarines 18 17 12 12 11
Tactical Conventional Subs 22 18 18 11 11
Total 150 140 135 120 110
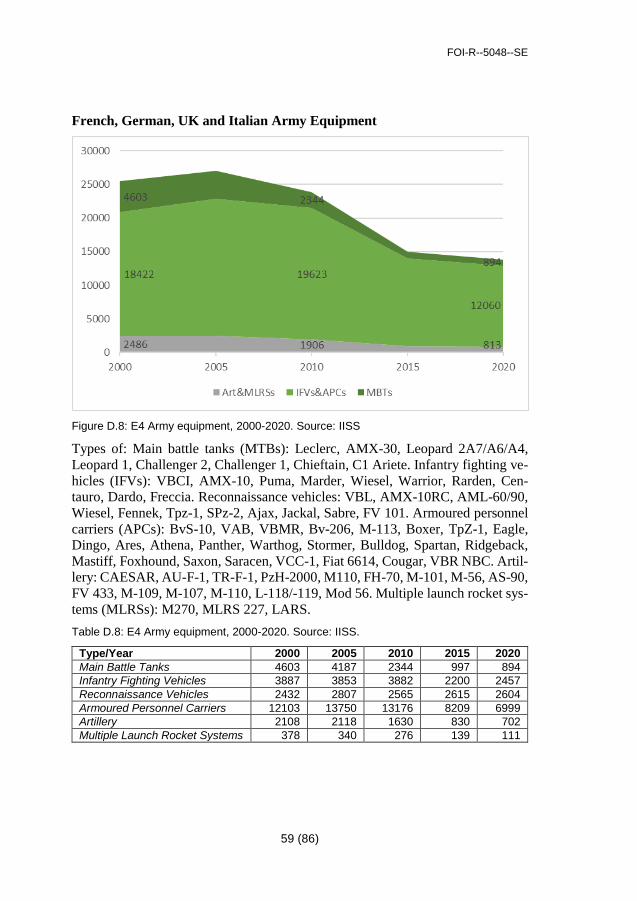
FOI-R--5048--SE
59 (86)
French, German, UK and Italian Army Equipment
Figure D.8: E4 Army equipment, 2000-2020. Source: IISS
Types of: Main battle tanks (MTBs): Leclerc, AMX-30, Leopard 2A7/A6/A4,
Leopard 1, Challenger 2, Challenger 1, Chieftain, C1 Ariete. Infantry fighting ve-
hicles (IFVs): VBCI, AMX-10, Puma, Marder, Wiesel, Warrior, Rarden, Cen-
tauro, Dardo, Freccia. Reconnaissance vehicles: VBL, AMX-10RC, AML-60/90,
Wiesel, Fennek, Tpz-1, SPz-2, Ajax, Jackal, Sabre, FV 101. Armoured personnel
carriers (APCs): BvS-10, VAB, VBMR, Bv-206, M-113, Boxer, TpZ-1, Eagle,
Dingo, Ares, Athena, Panther, Warthog, Stormer, Bulldog, Spartan, Ridgeback,
Mastiff, Foxhound, Saxon, Saracen, VCC-1, Fiat 6614, Cougar, VBR NBC. Artil-
lery: CAESAR, AU-F-1, TR-F-1, PzH-2000, M110, FH-70, M-101, M-56, AS-90,
FV 433, M-109, M-107, M-110, L-118/-119, Mod 56. Multiple launch rocket sys-
tems (MLRSs): M270, MLRS 227, LARS.
Table D.8: E4 Army equipment, 2000-2020. Source: IISS.
Type/Year 2000 2005 2010 2015 2020
Main Battle Tanks 4603 4187 2344 997 894
Infantry Fighting Vehicles 3887 3853 3882 2200 2457
Reconnaissance Vehicles 2432 2807 2565 2615 2604
Armoured Personnel Carriers 12103 13750 13176 8209 6999
Artillery 2108 2118 1630 830 702
Multiple Launch Rocket Systems 378 340 276 139 111

FOI-R--5048--SE
60 (86)
French, German, UK and Italian Air Force and Navy Aircraft
Figure C.9: E4 Air Force and Navy aircraft, 2000-2020. Source: IISS
Types of: Combat aircraft: Rafale, Mirage 2000, Mirage F-1, Super Etard, F-35,
Eurofighter, Tornado, F-16, Harrier, Jaguar, Ghibli, F-4, Su-22, F-104, MiG-29,
MiG-23, MiG-21. Transports: A310, A400M, C-17A, C-130, C-160, CN-235,
DHC-6-300, B-707-320C, TBM-700, C-27J, A-319, G-222, MB-339. Tankers:
A330, KC-135, KC-767A, KC-130J, C-135FR, C-160R, VC-10, TriStar.
Table C.9: E4 Air Force and Navy aircraft, 2000-2020. Source: IISS.
Type/Year 2000 2005 2010 2015 2020
Combat Aircraft 1543 1173 1087 891 849
Transports & Tankers 380 383 319 253 241
Total 1923 1556 1406 1144 1090

FOI-R--5048--SE
61 (86)
Russia Russian Navy Surface and Submarines Combatants
Figure C.10: Russian Navy surface combatants and submarines, 2000-2020. Source: IISS
Classes of: Aircraft carriers: Kuznetsov. Cruisers: Kirov, Slava, Kara, Kynda. De-
stroyers: Udaloy I/II, Sovremenny, Kashin mod., Kashin. Frigates: Gorshkov,
Krivak V, Gepard, Neustrashimyy, Krivak I/II. Corvettes: Steregushchiy,
Buyan/M, Parchim II, Grisha I/III/IV/V, Nanuchka III/IV. Strategic nuclear sub-
marines: Dolgorukiy, Typhoon, Delta I/III/IV, Yankee I/II. Tactical nuclear sub-
marines: Graney, Victory III, Sierra I/II, Akula I/II, Oscar II. Tactical conventional
submarines: Lada, Kilo 636.3, Kilo 877, Tango, Foxtrot.
Table C.10: Russian Navy surface combatants and submarines, 2000-2020. Source: IISS.
Class/Year 2000 2005 2010 2015 2020
Aircraft Carriers 1 1 1 1 -
Cruisers 7 6 5 5 4
Destroyers 17 15 14 15 12
Frigates 10 7 7 6 10
Corvettes 59 50 45 50 54
Strategic Nuclear Submarines 20 11 11 11 10
Tactical Nuclear Submarines 26 20 14 23 17
Tactical Conventional Subs 16 14 9 21 22
Total 156 124 106 132 129

FOI-R--5048--SE
62 (86)
Russian Army Equipment
Figure C.11: Russian Army equipment, 2000-2020. Source: IISS
Types of: Main battle tanks (MBTs): T-90/A, T-80BVM, T-80BV/U, T-
80/U/UD/UM, T-72B3, T-72B/BA, T-72/L/M, T-64A/B, T-62, T-55. Infantry
fighting vehicles (IFVs): BMP-3, BMP-2, BMP-1, BRM-1K, BMD, BDRM-2. Ar-
moured personnel carriers (APCs): BMO-T, MT-LB, BPM-97, BTR-D, BTR-
80/70/60/50. Artillery: Msta-SM, Msta-S, Malka, Pion, Giatsint-S, Akatsiya,
Gvozdika, Msta-B, Giatsint-B, D-30, D-20, D-1, BS-3, M-46, M-30, M-20. Mul-
tiple launch rocket systems (MLRSs): Tornado-S, Smerch, Uragan, BM-24, Grad,
TOS-1, BM-16, BM-13.
Table C.11: Russian Army equipment, 2000-2020. Source: IISS.
Type/Year 2000 2005 2010 2015 2020
Main Battle Tanks 21820 22800 22650 2600 2800
Infantry Fighting Vehicles 14700 15090 15180 4700 5760
Armoured Personnel Carriers 11275 9900 9900 7225 7100
Artillery 14770 18735 18735 1650 1760
Multiple Launch Rocket Systems 2606 3926 3576 850 862
MBTs (Reserve) 8900 - 350 17500 10200
IFVs (Reserve) - - - 8500 9500
APCs (Reserve) - - - 6000 6000
Artillery (Reserve) - - - 16695 16635
MLRSs (Reserve) - - - 3220 3220

FOI-R--5048--SE
63 (86)
Russian Air Force and Navy Aircraft
Figure C.12: Russian Air Force and Navy aircraft, 2000-2020. Source: IISS
Types of: Combat aircraft: Su-35S, Su-34, Su-30/M2/SM, Su-27/UB/SM2/SM3,
MiG-29, Su-25A/SM/UB, Su-24, MiG-31, MiG-25A/E. Bombers: Tu-160, Tu-95,
Tu-22. Transports & tankers: An-124, An-22, Il-76, An-12BK, An-26, An-72, An-
140, L-410, Tu-134, Il-78.
Table C.12: Russian Air Force and Navy aircraft, 2000-2020. Source: IISS.
Type/Year 2000 2005 2010 2015 2020
Combat Aircraft 1569 1902 1663 1031 1040
Bombers 241 203 195 141 138
Transports & Tankers 330 413 413 429 410
Total 2140 2518 2271 1601 1588

FOI-R--5048--SE
64 (86)
Appendix D: Equipment Quality The assessment of equipment quality presented in the figures of Appendix D is
based on two methods. First, by sorting the quantity data collected from the IISS
2000, 2005, 2010, 2015 and 2020 volumes of The Military Balance into three cat-
egories: Modern, Intermediate and Legacy. The purpose of this categorisation is
to broadly illustrate levels and trends of equipment modernisation among the ma-
jor world powers. Secondly, the categorisation according to modernity is comple-
mented by performance indicators for modern equipment presented in the tables
of this appendix. The purpose of these indicators is to form a basis for assessing
differences in quality among the modern equipment of major world powers.
The categorisation of surface combatants and submarines according to modernity
is based on the decade in which the lead ship of a given class was commissioned
into active service. Naval classes commissioned in the 1950s and 1960s are cate-
gorised as Legacy. Classes taken into service in the 1970s and 1980s are catego-
rised as Intermediate. Classes where the lead ship was commissioned after 1990
are categorised as Modern. There are some exemptions to this general rule. The
most notable is the surface combatants and submarines of China’s PLA Navy.
During the 1980s and 1990s China mainly copied or adapted older Soviet designs
and only during the 2000s did China begin to produce more modern vessels. There-
fore, the classification of Chinese naval vessels lags a decade behind the other
major world powers. It is also worth noting that naval vessels are usually upgraded
during their long life cycle. However, upgrades has not been taken into account in
this classification. This may underestimate the overall modernity of the Russian,
and to a lesser extent the Chinese, navies.
A conscious inconsistency is the Sovremenny class destroyers, which were bought
by China in the early 2000s, but are classified as Intermediate for the PLA Navy
as they were of older design and classified as Intermediate for the Russian navy.
Another exemption is the Ticonderoga class cruisers of the US Navy. These cruis-
ers were commissioned in the 1980s, but since it carries the advanced AEGIS com-
bat system and has few international equivalents it is classified as modern. A third
conscious inconsistency is the Russian aircraft carrier Kuznetsov, which is classi-
fied as Intermediate while its Chinese sister ship Liaoning is classified as modern.
The reason being that the Liaoning was upgraded by China prior to being commis-
sioned in 2012.
For main battle tanks the categorisation in this report corresponds with the gener-
ally accepted division into generations. Third generation main battle tanks are clas-
sified as Modern, while second generation tanks are classified as Intermediate, and
first generation tanks classified as Legacy. Third generation tanks entered service
from the 1980s, while second generation were introduced from the 1960. The first
generation main battle tanks entered service after the World War II. The identifi-
cation of generations has been based in a wide range of open sources. While the
FOI-R--5048--SE
65 (86)
exact classification presented in this appendix may not be universally accepted,
the category of each tank type is presented in detail.
Combat aircraft in this study includes multirole, fighter and attack aircraft, but
excludes bombers. Similarly to tanks, the categorisation corresponds with the clas-
sification into generations. Fifth and fourth generation combat aircraft are classi-
fied as Modern, while third generation are classified as Intermediate, and second
generation aircraft are classified as Legacy. Fifth and fourth generation combat
aircraft mainly entered service after the 1990s, while the third generation was in-
troduced in the late 1960s to the 1980s and second generation combat aircraft were
commissioned in the late 1950s and early 1970s. The identification according to
generation has been done by a wide variety of open sources. While there is no
generally accepted consensus on the exact classification of each aircraft type, this
appendix presents the categories in detail.
While the categorisation according to modernity can offer broader insights, there
may be quite significant differences in quality between the modern equipment of
one country compared to another. In order to address this issue, the categorisation
presented in the figures below has been complemented by tables containing a num-
ber of relevant performance indicators for selected modern surface combatants,
main battle tanks and combat aircraft for the major world powers.
Surface combatant performance is assessed by the indicators number of missiles,
maximum range (indicated in km) and top speed (indicated in Mach)62 of surface-
to-air missiles (SAMs) and anti-ship missiles (ASMs) respectively. The number of
missiles gives a broad sense of the lethality and endurance of a given ship. Note
that short-range point-defence missiles are not included in this tally. Maximum
missile range is a highly theoretical measure. A missile which can fly 200 km but
can only hit targets at 100 km will have a shorter effective range than a missile that
can both fly and hit targets at 150 km. However, exact efficiency is difficult to
obtain and even harder to verify using open sources. So while keeping this caveat
in mind maximum range should provide some understanding of relative perfor-
mance. Top speed, denoted here in terms of Mach, is relevant as higher speed
makes avoiding or intercepting an incoming missile more difficult. However, there
are several other factors at play for missile performance than just range and speed,
such as size of warhead, manoeuvrability and available countermeasures, which
are not included in this study. To estimate ASW capabilities, the number of heli-
copters and number of torpedo tubes are also indicated. Finally the number of ships
in active service by class in 2000 and 2020 is presented, in order to give a picture
of the trends and prevalence of the assessed capabilities. Several important quality
62 Mach is a measure indicating the speed of sound, sonic speed is defined as 1 Mach = 1225 km/h. Speeds
under 1 Mach are defined as subsonic and speeds over 1 Mach are defined as supersonic. Note that the
speed of sound, and therefore 1 Mach, varies depending on air temperature and flight altitude.
FOI-R--5048--SE
66 (86)
parameters for surface combatants are not included in this report, such as the per-
formance of radars, sonars and communications. The precision of weaponry is also
excluded. The main reason for these delimitations is the lack of open source data.
However, the vessel speed, range or endurance are also not included and here data
are available. While top speeds are fairly similar for large surface combatants,
around 30 knots, range and endurance varies. However, since these factors often
vary with ship size they were not prioritised in this edition of the report series.
Main battle tank performance is assessed through the indicators firepower, protec-
tion and mobility. Firepower is operationalised as the penetration depth of the best
available kinetic penetrator or armour-piercing fin-stabilised discarding sabot (AP-
FSDS) round from a distance of 2,000 metres, measured in millimetres of rolled-
homogenous-armour equivalents (RHAe).63 Similarly, protection is measured by
maximum armour depth against APFSDS at the front of the turret, usually the
strongest protected section of a tank, also measured in millimetres of RHAe. Mo-
bility is measured by engine horsepower (HP) through the weight of the tank, in
tonnes. Based on these indicators, modern third generation classification is then
nuanced by adding a plus or minus.64 The quantity of tanks in active service in
2000 and 2020 is also presented, in order to give a picture of the trends and prev-
alence of the assessed capabilities. There are several quality parameters which are
not included in this report, such as the precision of the main gun, quality of sensors,
communications and tank maintainability. The main reason for this delimitation is
the lack of open source data. However, if made available these metrics could be
included in future editions of this report.
Combat aircraft performance is assessed through the number of hard points, i.e.
stations for missiles, bombs or additional fuel tanks, carried. Although the perfor-
mance of each individual missile is not indicated, the number of hard points does
give a broad idea of the lethality of a certain aircraft. Combat range (indicated in
km) and maximum speed (indicated in kmn/h) are also presented as quality indi-
cators as they give some broad sense of the endurance and manoeuvrability of an
aircraft. The generation of the aircraft, fifth or fourth, is also presented as a proxy
performance indicator. Fifth generation combat aircraft combine stealth, i.e. min-
imised radar cross-section and radar absorbent materials, with high manoeuvrabil-
ity and advanced avionics. Meanwhile, late fourth generation combat aircraft lack
minimised radar cross-section but often share other stealth features with fifth gen-
eration, such as radar absorbent materials and reduced infra-red signature. As with
ships and tanks, the number of combat aircraft in active service is also presented,
in order to give a picture of the trends and prevalence of the assessed capabilities.
Important performance features, such as data on radar-cross section, performance
63 Note that this is a simplification as APFSDS-projectiles are often designed to defeat specific types of
armour and that the generalised RHAe-values should therefore be interpreted as rough approximations. 64 The original sources of tank performance data are the US Training and Doctrine Command (2014)
Worldwide Equipment Guide 2014 and Steelbeast.com.

FOI-R--5048--SE
67 (86)
of radar, IR-sensors, manoeuvrability and performance of weaponry are not in-
cluded in this report. The main reason for this is the lack of open data as well as a
proper methodological tools to account for these variables. However, given that
such data and tools can be provided, future editions of this report series may very
well include these metrics.
Data on performance indicators have been collected from a wide range of open
sources, such as government departments and agencies, international institutes or
online news outlets with a military focus. This data are referred to collectively as
“FOI” in the tables below, see Section 2.1 for details. Note that open source data
should be treated with degree of caution and viewed as publicly available estimates
rather than absolute truths.

FOI-R--5048--SE
68 (86)
USA US Navy Surface Combatants
Figure D.1: US Navy surface combatants by modernity, 2000-2020. Source: IISS
Modern include classes of aircraft carriers; Gerald R. Ford, Nimitz, Enterprise,
amphibious assault ships; America, Wasp, cruisers; Ticonderoga, destroyers;
Zumwalt, Arleigh Bourke Flight IIA, Arleigh Bourke Flight I/II, littoral combat
ships; Freedom and Independence. Intermediate includes aircraft carriers; John F.
Kennedy, Kitty Hawk, amphibious assault ships; Tarawa, destroyers; Spruance,
frigates; Oliver Hazard Perry. Legacy includes; none.
Table D.1: US Navy modern surface combatant performance, 2020. Source: IISS, FOI.
Class No. Mis-siles
SAM Range/ Speed
ASM Range/ Speed
ASW TT/ Hel.
Quant. 2000
Quant. 2020
Ticonderoga 130 240/3.5 240/3.5 6/2 22 22
Zumwalt 80 240/3.5 240/3.5 -/1 0 2
Arleigh Bourke IIA 96 240/3.5 240/3.5 6/2 0 39
Arleigh Bourke II 104 240/3.5 240/3.5 6/1 7 7
Arleigh Bourke I 104 240/3.5 240/3.5 6/- 21 21
Freedom - -/- -/- -/2 0 9
Independence - -/- -/- -/1 0 10
Total (Modern) 9,676 N/A N/A N/A 70 130
Total (All) 9,676 N/A N/A N/A 137 130
All US cruisers and destroyers are capable of carrying the SM-6 ERAM dual-use
surface-to-air missile (SAM) and anti-ship missile (ASM).

FOI-R--5048--SE
69 (86)
US Army Main Battle Tanks
Figure D.2: US Army main battle tanks by generation, 2000-2020. Source: IISS
3rd Generation include types; M1A2C Abrams, M1A2 Abrams, M1A1 Abrams,
M1 Abrams. 2nd Generation includes; none. 1st Generation includes; none. 3rd Gen-
eration in reserve includes; M1A2 Abrams, M1A1 Abrams.
Table D.2: US Army modern main battle tank performance, 2020. Source: IISS, FOI.
Type Gen Firepower (mm RHAe)
Armour (mm RHAe)
Mobility (HP/ tonne)
Quantity 2000
Quantity 2020
M1A2C Abrams +3 - - - 0 34
M1A2 Abrams +3 840 950 23.1 some 1605
M1A1 Abrams 3 750 600 25.9 some 775
M1 Abrams -3 - - - 7900 0
M1A1/A2 (Res) 3 - - - 0 3300
Total (Active) N/A N/A N/A N/A 7900 2414

FOI-R--5048--SE
70 (86)
US Air Force, Navy and Marine Corp Combat Aircraft
Figure D.3: US Air Force, Navy and Marine Corp combat aircraft by generation, 2000-2020. Source: IISS
5th Generation include types; F-35A/B/C, F-22. 4th Generation includes; F-18E/F,
F-18A/B/C/D, F-111, F-16A/B/C/D, F-15E, F-15A/B/C/D, OA-10A/A-10C. 3rd
Generation includes; F-14A/B/D, AV/TAV-8, A-10A. 2nd Generation includes;
none.
Table D.3: US Air Force, Navy and Marine Corp modern combat aircraft performance, 2000-2020. Source: IISS, FOI.
Type Gen No. Hard-points*
Range (Km)
Speed (Km/h)
Quant. 2000
Quant. 2020
F-35A Lightning II 5 10(4) 2200 1960 0 316
F-22 Raptor 5 12(8) >3000 2470 6 159
F-18E/F Super Hornet +4 11 3333 2205 14 584
F-18C/D Hornet 4 11 3333 2205 1005 314
F-16 Fighting Falcon 4 9 3222 2470 1420 553
F-15E Strike Eagle +4 11 3840 3018 210 211
F-15 Eagle 4 11 **5745 2470 494 105
OA-10A Thunderbolt 4 9 1287 676 109 143
Total (Modern) N/A N/A N/A N/A 3304 2035
Total (All) N/A N/A N/A N/A 3847 2524
* Number of missiles carried internally marked with parenthesis.
** Range of F-15 Eagle with external fuel tank.

FOI-R--5048--SE
71 (86)
China PLA Navy Surface Combatants
Figure D.4: PLA Navy surface combatants by modernity, 2000-2020. Source: IISS
Modern include classes of aircraft carrier; Type 001, destroyers; Type 055, Type
052D, Type 052C, Type 052B, Type 051C, Type 051B, frigates; Type 054A, Type
054, corvettes; Type 056/A. Intermediate includes destroyers; Sovremenny, Type
052, frigates; Type 053H3, Type 053H2G, Type 053H1G/H1Q. Legacy includes
destroyers; Type 051/D/G, frigates; Type 053H/H1/H2.
Table D.4: PLA Navy modern surface combatant performance, 2020. Source: IISS, FOI.
Class No. Mis-siles
SAM Range/ Speed
ASM Range/ Speed
ASW TT/ Hel.
Quant. 2000
Quant. 2020
Type 055 112 150/4.2 540/*3.0 6/2 0 1
Type 052D 64 150/4.2 540/*3.0 6/1 0 11
Type 052C 56 102/4.2 278/0.8 6/1 0 6
Type 052B 64 40/3.0 278/0.8 6/1 0 2
Type 051C 56 90/4.0 278/0.8 6/1 0 2
Type 051B 48 40/3.0 278/0.8 6/2 1 1
Type 054A 40 40/3.0 278/0.8 6/1 0 30
Type 054 16 15/2.3 278/0.8 6/1 0 2
Type 056/A 4 -/- 278/0.8 6/- 0 43
Total (Modern) 2,844 N/A N/A N/A 1 99
Total (All) 3,368 N/A N/A N/A 67 125
* The YJ-18 ASM has a flight speed of Mach 0.8 and terminal attack speed of Mach 3.0.
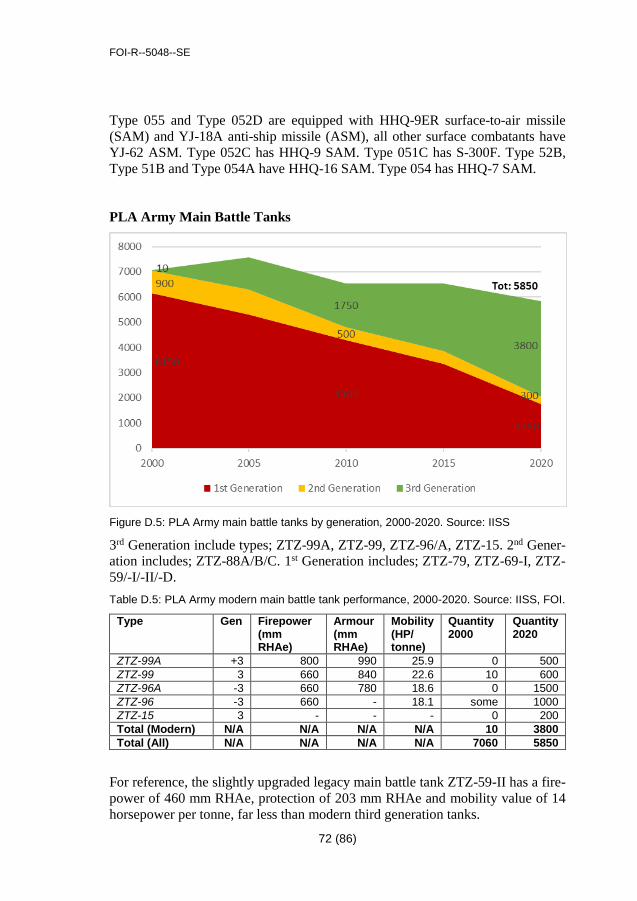
FOI-R--5048--SE
72 (86)
Type 055 and Type 052D are equipped with HHQ-9ER surface-to-air missile
(SAM) and YJ-18A anti-ship missile (ASM), all other surface combatants have
YJ-62 ASM. Type 052C has HHQ-9 SAM. Type 051C has S-300F. Type 52B,
Type 51B and Type 054A have HHQ-16 SAM. Type 054 has HHQ-7 SAM.
PLA Army Main Battle Tanks
Figure D.5: PLA Army main battle tanks by generation, 2000-2020. Source: IISS
3rd Generation include types; ZTZ-99A, ZTZ-99, ZTZ-96/A, ZTZ-15. 2nd Gener-
ation includes; ZTZ-88A/B/C. 1st Generation includes; ZTZ-79, ZTZ-69-I, ZTZ-
59/-I/-II/-D.
Table D.5: PLA Army modern main battle tank performance, 2000-2020. Source: IISS, FOI.
Type Gen Firepower (mm RHAe)
Armour (mm RHAe)
Mobility (HP/ tonne)
Quantity 2000
Quantity 2020
ZTZ-99A +3 800 990 25.9 0 500
ZTZ-99 3 660 840 22.6 10 600
ZTZ-96A -3 660 780 18.6 0 1500
ZTZ-96 -3 660 - 18.1 some 1000
ZTZ-15 3 - - - 0 200
Total (Modern) N/A N/A N/A N/A 10 3800
Total (All) N/A N/A N/A N/A 7060 5850
For reference, the slightly upgraded legacy main battle tank ZTZ-59-II has a fire-
power of 460 mm RHAe, protection of 203 mm RHAe and mobility value of 14
horsepower per tonne, far less than modern third generation tanks.
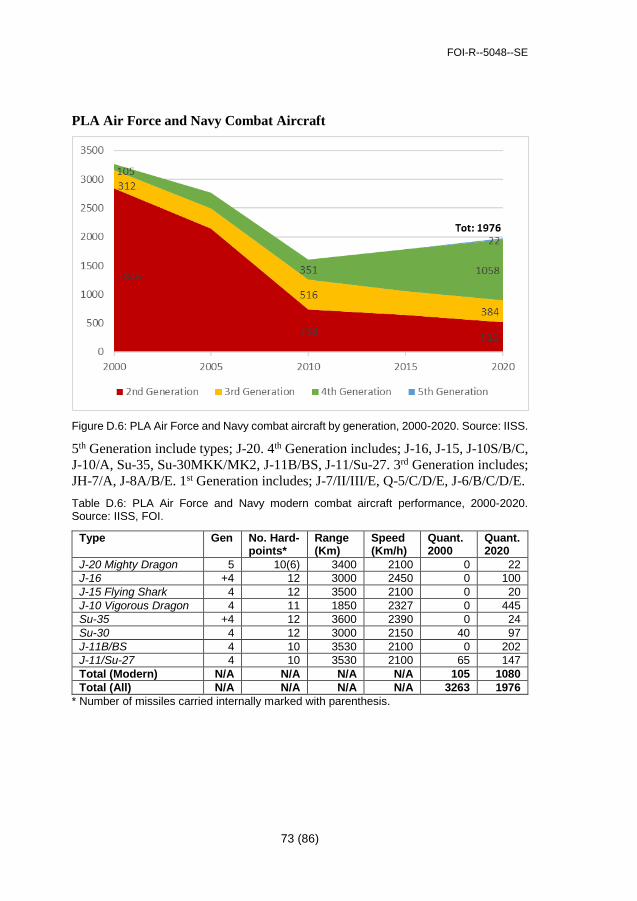
FOI-R--5048--SE
73 (86)
PLA Air Force and Navy Combat Aircraft
Figure D.6: PLA Air Force and Navy combat aircraft by generation, 2000-2020. Source: IISS.
5th Generation include types; J-20. 4th Generation includes; J-16, J-15, J-10S/B/C,
J-10/A, Su-35, Su-30MKK/MK2, J-11B/BS, J-11/Su-27. 3rd Generation includes;
JH-7/A, J-8A/B/E. 1st Generation includes; J-7/II/III/E, Q-5/C/D/E, J-6/B/C/D/E.
Table D.6: PLA Air Force and Navy modern combat aircraft performance, 2000-2020. Source: IISS, FOI.
Type Gen No. Hard-points*
Range (Km)
Speed (Km/h)
Quant. 2000
Quant. 2020
J-20 Mighty Dragon 5 10(6) 3400 2100 0 22
J-16 +4 12 3000 2450 0 100
J-15 Flying Shark 4 12 3500 2100 0 20
J-10 Vigorous Dragon 4 11 1850 2327 0 445
Su-35 +4 12 3600 2390 0 24
Su-30 4 12 3000 2150 40 97
J-11B/BS 4 10 3530 2100 0 202
J-11/Su-27 4 10 3530 2100 65 147
Total (Modern) N/A N/A N/A N/A 105 1080
Total (All) N/A N/A N/A N/A 3263 1976
* Number of missiles carried internally marked with parenthesis.

FOI-R--5048--SE
74 (86)
European Four French, German, UK and Italian Navy Surface Combatants
Figure D.7: E4 Navy surface combatants by modernity, 2000-2020. Source: IISS
Modern include classes of aircraft carrier; Charles de Gaulle, Queen Elizabeth,
Cavour, amphibious assault ship; Mistral, destroyers; Aquitaine, Forbin, Type 45,
Andrea Doria, Durand de la Penne, frigates; La Fayette, Floreal, Sachsen, Bran-
denburg, Type 23, Bergamini, corvettes; Braunschweig. Intermediate includes air-
craft carrier; Invincible, Guiseppe Garabaldi, destroyers; Cassard, Georges
Leygues, Tourville, Type 42, Audace, frigates; Bremen, Type 22, Maestrale, Ar-
tiglieri, Lupo, corvettes; Minerva. Legacy includes aircraft carrier; Clémenceau,
cruisers; Jeanne d’Arc, Vittorio Veneto, destroyers; Lütjens.
Table D.7: E4 Navy modern surface combatant performance, 2020. Source: IISS, FOI.
Class No. Mis-siles
SAM Range/ Speed
ASM Range/ Speed
ASW TT/ Hel.
Quant. 2000
Quant. 2020
Aquitaine (FREMM) 40 30/3.0 180/0.9 4/1 0 6
Forbin 56 100/4.5 180.0.9 4/1 2 2
Type 45 Daring 56 100/4.5 240/0.9 4/1 0 6
Andrea Doria 56 100/4.5 180/0.9 2/1 0 2
Durand de la Penne 16 25/3.7 180/0.9 6/2 2 2
La Fayette 12 16/3.5 180/0.9 -/1 4 5
Floreal 4 -/2.6 40/0.9 -/1 6 6
Baden-Württemberg 8 -/- 120/0.9 -/2 0 1
Sachsen 40 170/3.5 120/0.9 6/2 0 3
Brandenburg 20 50/4.0 40/0.9 4/2 4 4
Type 23 Duke 40 10/2.0 240/0.9 4/2 14 13

FOI-R--5048--SE
75 (86)
Bergamini (FREMM) 20 100/4.5 180/0.9 6/2 0 8
Braunschweig 4 -/- 200/0.9 -/- 0 5
Total (Modern) 1,880 N/A N/A N/A 32 69
Total (All) 1,956 N/A N/A N/A 102 80
Aquitaine is equipped with Aster 15 surface-to-air missile (SAM). Forbin, Daring,
Andrea Doria and Bergamini have Aster 30 SAM. Durand de la Penne has Aspide
SAM. La Fayette has Crotale SAM. Floreal has Mistral SAM. Sachsen has SM-2
Block III SAM. Brandenburg has Sea Sparrow SAM. Aquitaine, Forbin and La
Fayette have MM40 Exocet anti-ship missile (ASM). Sachsen has Harpoon Block
IB ASM. Floreal and Brandenburg have MM38 Exocet ASM. Daring and Duke
have Harpoon Block IC ASM. Andrea Doria, Durand de la Penne and Bergamini
have Otomat Mk2 ASM. Braunschweig has RBS15 Mk3 ASM.
French, German, UK and Italian Army Main Battle Tanks
Figure D.8: E4 Army main battle tanks by generation, 2000-2020. Source: IISS.
3rd Generation include types; Leclerc, Leopard 2A7/A6/A4, Challenger 2, Chal-
lenger 1, C1 Ariete. 2nd Generation includes; AMX-30, Leopard 1, Chieftain.
Table D.8: E4 Army modern main battle tank performance, 2020. Source: IISS, FOI.
Type Gen Firepower (mm RHAe)
Armour (mm RHAe)
Mobility (HP/ tonne)
Quantity 2000
Quantity 2020
Leclerc +3 690 890 26.6 199 222
Leopard 2A7 +3 - - - 0 20
Leopard 2A6* +3 750 970 24.0 0 225

FOI-R--5048--SE
76 (86)
Leopard 2A4 3 600 700 27.2 1782 0
Challenger 2 +3 610 1250 19.2 192 227
Challenger 1 3 - - - 410 0
C1 Ariete 3 - - - 105 200
Total N/A N/A N/A N/A 4603 894
* Data actually represent the older Leopard 2A5 version, exported to e.g. Denmark and Sweden.
French, German, UK and Italian Air Force and Navy Combat Aircraft
Figure D.9: E4 Air Force and Navy combat aircraft by generation, 2000-2020. Source: IISS.
5th Generation include types; F-35B. 4th Generation includes; Rafale B/C, Rafale
M, Mirage 2000D/N, Eurofighter, F-16, 3rd Generation includes; Mirage 2000B/C,
Mirage F-1, Super Etard, Jaguar, Tornado, MiG-29, Harrier, Ghibli. 2nd Genera-
tion includes; F-4, Su-22, F-104, MiG-23, MiG-21.
Table D.9: E4 Air Force and Navy modern combat aircraft performance, 2020. Source: IISS, FOI.
Type Gen. No. Hard-points*
Range (Km)
Speed (Km/h)
Quant. 2000
Quant. 2020
F-35B Lightning II 5 10(4) 1667 1960 0 18
Rafale B/C +4 14 3125 2205 0 100
Mirage 2000 D/N 4 9 3335 2530 120 66
Eurofighter Typhoon +4 13 3790 2470 0 377
Total (Modern) N/A N/A N/A N/A 120 616
Total (All) N/A N/A N/A N/A 1543 849
* Number of missiles carried internally marked with parenthesis.

FOI-R--5048--SE
77 (86)
Russia Russian Navy Surface Combatants
Figure D.10: Russian Navy surface combatants by modernity, 2000-2020. Source: IISS
Modern include classes of frigates; Gorshkov, Krivak V, Gepard, Neustrashimyy,
corvettes; Steregushchiy, Buyan/M. Intermediate includes aircraft carrier; Kuz-
netsov, cruisers; Kirov, Slava, destroyers; Udaloy I/II, Sovremenny, frigates;
Krivak II, Krivak I, corvettes; Parchim II, Grisha I/III/IV/V, Nanuchka III/IV. Leg-
acy includes cruisers; Kara, Kynda, destroyers; Kashin mod., Kashin.
Table D.10: Russian Navy modern surface combatant performance, 2020. Source: IISS, FOI.
Class No. Mis-siles
SAM Range/ Speed
ASM Range/ Speed
ASW TT/ Hel.
Quant. 2000
Quant. 2020
Gorshkov 48 150/6.0 300/2.4 8/1 0 1
Grigorovich 32 50/4.0 300/2.4 4/1 0 3
Gepard 18 -/- 300/3.0 4/1 0 2
Neustrashimiy 40 12/2.0 130/0.8 6/1 1 2
Kurakurt 8 -/- -/- -/- 0 1
Steregushchiy 20 50/2.6 130/0.8 8/1 0 6
Buyan-M 20 -/- 300/3.0 -/- 0 10
Total (Modern) 588 N/A N/A N/A 8 39
Total (All) 1,880 N/A N/A N/A 156 129
Gorshkov is equipped with 9M96 Poliment-Redut surface-to-air missile (SAM).
Grigorovich has 9M317E Shtil-1 SAM. Neustrashimiy has 3K95 Kinzhal SAM.

FOI-R--5048--SE
78 (86)
Steregushchiy has 9M96M Poliment-Redut SAM. Gorshkov and Grigorivich have
P-800 Onyx anti-ship missile (ASM). Gepard and Buyan-M have 3M54 Sizzler
ASM. Neustrashimiy and Steregushchiy have 3M24 Uran ASM. Karakurt cor-
vettes carry land-attack cruise Klub-missiles, so far not verified as ASM-capable.
Russian Army Main Battle Tanks
Figure D.11: Russian Army main battle tanks by generation, 2000-2020. Source: IISS.
3rd Generation include types; T-90/A, T-80BVM, T-80BV/U, T-72B3, T-72B/BA.
2nd Generation includes; T-80/U/UD/UM, T-72/L/M. 1st Generation includes; T-
64A/B, T-62, T-55. A large share of Russian main battle tanks are currently held
in reserve. 3rd Generation in reserve includes; T-90/A. 2nd Generation in reserve
includes; various versions of T-80, various versions of T-72. 1st Generation in re-
serve includes; T-64A/B, T-62, T-55.
Table D.11: Russian Army modern main battle tank performance, 2020. Source: IISS, FOI.
Type Gen Firepower (mm
RHAe)
Armour (mm
RHAe)
Mobility (HP/
tonne)
Quantity 2000
Quantity 2020
T-90A +3 660 840 23.7 100 350
T-80BVM 3 - - - 0 120
T-80BV/U 3 630 - 27.2 0 330
T-72B3/B3 mod. -3 660 780 18.9 0 1350
Total (Modern) N/A N/A N/A N/A 21820 2800
Total (All active) N/A N/A N/A N/A 21820 2800

FOI-R--5048--SE
79 (86)
Russian Air Force and Navy Combat Aircraft
Figure D.12: Russian Air Force and Navy combat aircraft by generation, 2000-2020. Source: IISS.
5th Generation include types; none. 4th Generation includes; Su-35S, Su-34, Su-
30/M2/SM, Su-27/UB/SM2/SM3, MiG-29. 3rd Generation includes; Su-
25A/SM/UB, Su-24, MiG-31. 2nd Generation includes; MiG-25A/E.
Table D.12: Russian Air Force and Navy modern combat aircraft performance, 2020. Source: IISS, FOI.
Type Gen. No. Hard-points
Range (Km)
Speed (Km/h)
Quant. 2000
Quant. 2020
Su-35S Flanker-E +4 12 3600 2390 0 90
Su-34 Fullback +4 10 *4500 1900 0 122
Su-33 Flanker-D 4 12 3000 2300 0 17
Su-30/M2/SM 4 12 3000 2150 0 133
Su-27/UB/SM2/SM3 4 10 3680 2879 392 119
MiG-29 4 7 2100 2400 260 142
Total (Modern) N/A N/A N/A N/A 652 623
Total (All) N/A N/A N/A N/A 1569 1040
* Range of Su-34 Fullback with external fuel tank.

FOI-R--5048--SE
80 (86)
The figures in this report differs from Russia’s own assessment of modern equip-
ment.65 The largest discrepancy between this report’s and Russia’s own assess-
ment is among surface combatants. This difference is likely due to different defi-
nitions of the term “modern”. While his report only includes new equipment, Rus-
sia may include upgraded equipment, but this has not been confirmed.
Russian Estimates of Modern Equipment
Table D.13: Reported share of modern equipment (2020 = Target).
Type/Year 2013 2015 2017 2020
Surface Combatants 41% 44% 54% 71%
Aircraft 23% 37% 55% 71%
Armoured Vehicles 20% 37% 56% 82%
Regarding armoured vehicles it is difficult to identify the cause of the discrepancy
since the Russian estimates on this type of system is not directly comparable to the
Main battle tanks categorised in this report. It is also worth noting that while the
Russian estimates on aircraft seem to correspond fairly well with this report’s es-
timates on combat aircraft, these estimates may still include different types of air-
craft.
65 Collected from Connolly, Richard & Sendstad, Cecilie (2017) “Russia’s Role as an Arms Exporter –
The Strategic and Economic Importance of Arms Exports for Russia”. Research Paper, Chatham House.

FOI-R--5048--SE
81 (86)
Appendix E: Future Trends Estimates of future trends presented in the tables of Appendix E includes macroe-
conomic trends and equipment quantities for major world power navies, between
2020 and 2030. The methods, assumptions and data which form the basis for these
estimates are described in detail in this appendix. Assessments of future military
expenditure, quantities of army and air force equipment as well as military equip-
ment quality are not quantified. Instead, these trends are discussed in terms of
likely developments and factors which may impact the direction of these develop-
ments between 2020 and 2030.
GDP for 2019 have been collected from the World Bank (2020), presented in con-
stant 2010 USD. Estimates for 2020 to 2025 have been collected from the latest
IMF projections.66 These project a sharp downturn in the world economy in 2020
followed by steady recovery from 2021 to 2025, see Table E.1
Table E.1: Future GDP and growth estimates, constant 2010 USD. Source: World Bank (2020a), IMF (2020a), CBO (2020), World Bank (2013).
Country GDP 2019 (Billion USD)
Change 2019-20 (%)
Change 2020-21 (%)
Average Change 2022-25 (%)
Average Change 2026-30 (%)
GDP 2030 (Billion USD)
US 18,319 -4.3 +3.1 +2.2 +2.1 21,898
China 11,537 +1.9 +8.2 +5.7 +5.0 20,227
Eurozone 14,179 -8.3 +5.2 +2.1 +1.6 16,090
Russia 1,762 -4.1 +2.8 +2.0 2.0 2,080
India 2,964 -10.3 +8.8 +7.6 7.0 5,428
World 84,990 -4.4 +5.2 +3.8 - -
US long-term GDP is based on a CBO report from July 2020 which estimates a
growth rate of 2.1 percent from 2026 to 2030.67 Meanwhile, Chinese GDP is based
on earlier projections made by the World Bank in 2013 and estimates growth rate
of 5 percent from 2026 to 2030.68 If these estimates were to be realised, China
would surpass the US to become the world’s largest economy in terms of market
exchange rate around 2033.69
For the Eurozone, Russia and India, macroeconomic forecasts proved more diffi-
cult to obtain. Instead, the growth rates of the past decade have been prolonged
66 IMF (2020a) World Economic Outlook Database. (Accessed 23 November 2020). 67 Congressional Budget Office (2020) An Update to the Economic Outlook: 2020 to 2030. June 2020, p.
3. 68 World Bank (2013) China 2030: Building a Modern, Harmonious, and Creative Society, p. 9. For esti-
mates on the Eurozone, Russia and India see historical data from the World Bank. 69 This assessment is supported by a report from PricewaterhouseCooper (2015) The World in 2050 – Will
the shift in global economic power continue? February 2015, p. 11. This projection assumes that China
will surpass the US by 2027.

FOI-R--5048--SE
82 (86)
with some adjustments to serve as rough estimates of future trends. Based on this
simplified assumption, this study expects the Eurozone to grow by 1.6 percent over
the whole period 2026-2030. By the same logic, Russia’s GDP is assumed to grow
by 2.0 percent from 2022 to 2030. India is estimated to grow by 7.0 percent from
2026 to 2030. Some estimates put this rate higher, but such predictions also depend
on the success of several reforms.70
Future military expenditure among major world powers depends on two factors,
the future GDP of each country and the priority each country gives to military
expenditure as share of GDP. No estimates of the future military expenditure are
presented in this report, but Chapter 4 discusses how future military spending for
major world powers would look if military expenditure as share of GDP would
remain the same in 2030 as in 2020.
Estimates of future quantities of military equipment is limited to the navies of ma-
jor world powers. Hulls of ships and submarines are usually constructed several
years before being commissioned into service. As a result, the method of estimat-
ing quantities of future naval vessels in active service is relatively straight forward.
Data on the number of launched ships are regularly updated in open sources. In
this study, ships and submarines launched by 2020 are assumed to be taken into
active service by 2025. Similarly, the ships and submarines laid down or officially
planned, but not yet launched, are assumed to be commissioned by 2030. The US
is one of few countries with an official plan for its future navy, the so called 355-
ship navy. This plan states that the US should have a fleet of 355 vessels, including
support ships, by 2034.71 Even though the feasibility of this ambitious plan has
come into question, this study still uses the 355-ship navy as a benchmark for es-
timating the future quantities of US naval vessels.
Given that the 355-ship ambition is actually realised, the US is expected to have
163 surface combatants and 56 submarines by 2030, see Table E.2. Most of the
increase in surface combatant will most likely be made up by Arleigh Burke Flight
IIA and III destroyers, Independence and Freedom littoral combat ships (LCSs)
and a future class of frigates, while the number of aircraft carriers and amphibious
assault ships will remain stable as the Ford class and the America class replace
older aircraft carriers and amphibious assault ships respectively. Meanwhile, the
number of US submarines is planned to decrease between 2020 and 2030, as the
Virginia class does not fully compensate for the decommissioning of older Los
Angeles submarines.
70 See e.g. PricewaterhouseCooper (2014) Future of India – The Winning Leap. 71 Note that the cited numbers are given for fiscal years, most likely at the end of a given year. In order to
make these numbers comparable with IISS data, which refer to quantities in the beginning of each year,
numbers for fiscal year 2029 (FY29) are used for the year 2030. Congressional Research Service (2020)
Navy Force Structure and Shipbuilding Plans: Background and Issues for Congress.

FOI-R--5048--SE
83 (86)
Table E.2: US Navy future surface combatants and submarines, 2020-2030. Source: IISS (2020), FOI.
Class/Year 2020 2025 2030
Aircraft Carriers 11 11 10
Amphibious Assault Ships 9 10 11
Cruisers 22 15 16
Destroyers 69 79 88
LCSs/Frigates 19 28 38
Strategic Nuclear Submarines 14 14 12
Tactical Nuclear Submarines 53 51 44
Total 197 208 219
The source for these data only provided the total number in service and the number
of ships delivered each year. The number of ships decommissioned could be esti-
mated by adding the number of new ships to the current quantity and subtracting
the number of future ships. Note that the data, which form the basis for these esti-
mates, only states whether the ship is a large or small surface combatant but does
not distinguish between cruisers, destroyers, frigates or littoral combat ships. The
future quantity of e.g. cruisers and destroyers in this study therefore had to be es-
timated using available open data on ship construction to discern which ships were
most likely to be commissioned, and information on age to discern which ships
were most likely to be decommissioned.
The Chinese PLA Navy seems set to continue the rapid expansion of previous
decades, see Table E.3. These estimates may seem high, but are not far-fetched,
since a vast majority of the vessels included in table estimates were already
launched by mid-2020 and will likely be taken into service by 2025.
Table E.3: PLA Navy future surface combatants and submarines, 2020-2030. Source: IISS (2020), FOI.
Class/Year 2020 2025 2030
Aircraft Carriers 1 2 4
Amphibious Assault Ships 0 2 3
Destroyers 31 48 59
Frigates 50 43 42
Corvettes 43 72 72
Strategic Nuclear Submarines 4 6 8
Tactical Nuclear Submarines 6 10 13
Tactical Conventional Subs 48 48 46
Total 183 232 247
After 2025, the pace of expansion for the PLA Navy is assumed to decrease, as
maintenance costs for the larger and more modern vessels increase and the growth of military expenditure likely slows as economic growth decelerates. Nonetheless,
this study estimates that the PLA Navy will consist of 180 surface combatant and
67 submarines by 2030. The increase in number of vessels includes all types of

FOI-R--5048--SE
84 (86)
surface combatant, but up until 2025 a large share is made up of corvettes. Given
that the production of the Type 056 corvettes and Type 054 frigates had stopped
by 2020, the focus will likely shift to larger surface combatants after 2025. These
include Type 75 amphibious assault ships, Type 055 and Type 052D destroyers as
well as two new aircraft carriers, larger and more capable than the ones currently
in service.72 China is also likely to increase the number of nuclear submarines,
both strategic and tactical, while the number of conventional submarines is likely
to remain more stable. However, the PLA Navy submarine force is one of the most
secretive parts of China’s Armed Forces and as a consequence, estimates of its
future size are highly uncertain.
Table E.4: E4 Navy future surface combatants and submarines, 2020-2030. Source: IISS (2020), FOI.
Class/Year 2020 2025 2030
Aircraft Carriers 4 4 4
Amphibious Assault Ships 3 4 4
Destroyers 21 18 18
Frigates 47 42 39
Corvettes 5 11 17
Strategic Nuclear Submarines 8 8 8
Tactical Nuclear Submarines 11 12 13
Tactical Conventional Subs 11 14 16
Total 110 113 119
The French, German, UK and Italian navies are likely to slow and even reverse the
trend over the past decades with falling quantities of naval vessels, see Table E.4.
This study estimates that the combined navies of the four European powers will
consist of 82 surface combatants and 37 submarines in 2030. However, the number
of large surface combatants are actually estimated to decrease slightly as older
classes of French and Italian destroyers are nearing the end of their life-cycle with-
out any immediate replacements. Meanwhile, the French Aquitaine, German Ba-
den-Württemberg and future MKS180, UK Type 26 and Type 31, and Italian frig-
ates taken will not fully replace older classes on a one-to-one basis.73 Most of the
increase is instead attributable to the growing number of German Braunschweig
and Italian Paolo Thaon di Revel corvettes. The quantity of submarines will in-
crease slightly as 6 new French Barracuda, 2 additional to the 6 existing German
Type 212, a total of 7 UK Astute, and 8 Italian Todaro submarines replace older
vessels.
72 The Chinese aircraft carrier Shandong was actually taken into active service, besides the Liaoning, in
late 2019, but not accounted for by IISS (2020). 73 New E4 frigate classes in this study include the French Frégates de taille intermediare (FTI), the German
future MKS 180, the Royal Navy Type 26 and Type 31 as well as the rest of the Italian Bergamini class
(FREMM) frigates. Older ships set to retire between 2020 and 2030 include the French La Fayette and
Floreal, German Bremen and Brandenburg, UK Type 23 and Italian Maestrale frigates.

FOI-R--5048--SE
85 (86)
Table E.5: Russian Navy future surface combatants and submarines, 2020-2030. Source: IISS (2020), FOI.
Class/Year 2020 2025 2030
Aircraft Carriers 0 1 1
Amphibious Assault Ships 0 1 2
Cruisers 4 4 5
Destroyers 12 10 10
Frigates 10 12 16
Corvettes 54 55 55
Strategic Nuclear Submarines 10 10 12
Tactical Nuclear Submarines 17 19 18
Tactical Conventional Subs 22 25 26
Total 129 137 145
The Russian navy is estimated to increase its overall quantity of vessels, see Table
E.5. In 2030, this study estimates that the Russian Navy have 89 surface combat-
ants and 56 submarines. This increase includes nearly every type of ship and sub-
marine, but most new ships will consist of smaller surface combatants. The stable
number of corvettes hides the fact that a large number of these older vessels, such
as Grisha and Nanuchka, will be replaced by new ones, such as Merkuriy and
Karakurt, until 2030. Similarly, Admiral Gorshkov and Admiral Grigorovich class
frigates are set to replace older Krivak I and II frigates. Larger surface combatants
will continue to consist of updated Soviet era Kirov and Slava class cruisers, Sov-
remenny and Udaloy destroyers, and the refurbished aircraft carrier Admiral Kuz-
netsov. The large Lider class destroyers seems to be postponed indefinitely. The
only exemption is the newly produced Priboy class amphibious assault ships. The
quantity of submarines is likely to increase somewhat as older Kilo 877 Paltus
conventional submarines are replaced by newer Kilo 636.3 Varshavyanka and fur-
ther Graney 885M Yasen nuclear submarines are introduced. The number of stra-
tegic nuclear Dolorukiy 955 Borey submarines are likely to increase to 12 by 2030,
from 10 in 2020, replacing older Delta IV and Delta III submarines.
Future navy tonnage and missiles capabilities may also shed additional light in
future power relations, see Table E.6. The data are derived from a number of open
sources including, but not limited to, various volumes of IISS The Military Bal-
ance. Note that aircraft carriers are not included in the overall missile count, as
their missile capabilities almost exclusively rest with the number of combat aircraft
carried. The estimates of this study shows that the US Navy surface tonnage and
missile capability will remain relatively stable, at between 2,400 to 2,600 and
9,600 to 10,600 missiles, between 2020 and 2030. As China focuses on larger sur-
face ships, both tonnage and missiles numbers will outpace the growth in ship
numbers, tonnage will more than double and missile capability increase by about
76 percent. If these estimates hold, then the PLA Navy is set to reach nearly half
the tonnage and over half the missile capability of the US Navy in 2030.

FOI-R--5048--SE
86 (86)
Table E.6: Future naval tonnage and missile capabilities among major world powers, 2020-2030. Sources: IISS (2020), FOI.
Country Factor 2020 2025 2030
US Total tonnage (1000 tonnes) 3,098 3,207 3,171
Surface tonnage (1000 tonnes) 2,421 2,529 2,608
Surface missiles (number of) 9,676 9,686 10,644
China Total tonnage (1000 tonnes) 733 1,219 1,506
Surface tonnage (1000 tonnes) 503 927 1,175
Surface missiles (number of) 3,368 5,000 5,920
E4 Total tonnage (1000 tonnes) 767 856 972
Surface tonnage (1000 tonnes) 574 644 735
Surface missiles (number of) 1,956 1,896 2,144
Russia Total tonnage (1000 tonnes) 671 735 967
Surface tonnage (1000 tonnes) 248 256 416
Surface missiles (number of) 1,880 2,100 2,564
While the French, German, UK and Italian fleets will increase marginally in terms
of ship numbers, those ships have an average greater tonnage, which is estimated
to increase by 28 percent between 2020 and 2030. However, since many of the
new ships taken into service during these period are lightly armed frigates and
corvettes, this increase in tonnage does not translate to a similar increase in mis-
siles. Similarly, while the Russian Navy is set to increase the number of surface
combatants only marginally by 2030, its tonnage and number of missiles will grow
far more substantially. However, these assertions rely heavily on the assumption
that both of the Kirov class battlecruisers and all three of the Slava class cruisers
will be in active service by that year.
Assumptions about future armies and air forces are more difficult than navies, as
ground equipment and aircraft quantities can shift more quickly compared to naval
platforms. No exact estimates are given in this study, instead a qualitative discus-
sion about plausible future trends in provided in Chapter 4.
Data on future economic and military trends have been collected from a wide range
of open sources, such as international institutes, government agencies or online
news outlets with a military focus. These data are referred to collectively as “FOI”
in the tables above, see Section 2.1 for details. Such open source data should be
treated with degree of caution and viewed as broad assessments rather than exact
predictions.

ISSN 1650-1942
This report is the third in the biennial series Defence Economic Outlook (DEO), published by the Swedish Defence Research Agency (FOI). Defence Economic Outlook 2020 provides an assessment of the global power balance in terms of military expenditure, macroeconomic trends, and quantities as well as quality of military equipment among major world powers between 2010 and 2019. The report also aims to provide a broad assessment of future trends with regard to the same aspects from 2020 to 2030.
The global military and economic power balance has changed significantly during the past decade. While the US and its European allies still possess a clear military advantage, major non-Western powers such as China and Russia have steadily narrowed this gap. The past decade, China’s share of global military spending as well as its share of the world economy has increased considerably. In recent years, the US and several European countries have refocused their attention towards great power rivalry and increased their military spending. This may slow, but is unlikely to reverse, the observed trends of the past decade.
It is the assessment of this study that the US will continue to enjoy an overall military advantage in 2030. However, the Chinese economy is likely to become the world’s largest, and the Chinese navy will likely outnumber its US counter-part, around the same time. Continued growth of European military expenditure is far from certain, however, the Eurozone’s economic advantage over Russia seems set to increase. Nevertheless, Russia is likely to retain and even strengthen its military capabilities. These assessments are not predetermined, nor are they indisputable. They are, however, based on detailed data as well as clearly defined and motivated assumptions.
www.foi.se