EU Biorefinery Outlook to 2030
398
Studies on support to research and innovation policy in the area of bio-based products and services Written by E4tech • WUR • BTG • FNR • ICONS Independent Expert Report EU Biorefinery Outlook to 2030 February 2021 Research and Innovation
-
Upload
khangminh22 -
Category
Documents
-
view
2 -
download
0
Transcript of EU Biorefinery Outlook to 2030

Studies on support to research and innovation policy in the area of bio-based products and services
Written by E4tech • WUR • BTG • FNR • ICONS Independent
Expert Report
EU BiorefineryOutlook to 2030
February 2021
Research and Innovation

EU Biorefinery Outlook to 2030 (Lot 3)
Studies on support to research and innovation policy in the area of bio-based products and services
European Commission Directorate-General for Research and Innovation Directorate B — Healthy Planet Unit B.1 — Circular Economy and Biobased Systems Email [email protected] European Commission B-1049 Brussels
Manuscript completed in February 2021
This document has been prepared for the European Commission, however it reflects the views only of the authors, and the European Commission is not liable for any consequence stemming from the reuse of this publication.
More information on the European Union is available on the internet (http://europa.eu).
PDF ISBN : 978-92-76-32156-9 doi:10.2777/103465 KI-05-21-050-EN-N
Luxembourg: Publications Office of the European Union, 2021
© European Union, 2021
The reuse policy of European Commission documents is implemented based on Commission Decision 2011/833/EU of 12 December 2011 on the reuse of Commission documents (OJ L 330, 14.12.2011, p. 39). Except otherwise noted, the reuse of this document is authorised under a Creative Commons Attribution 4.0 International (CC-BY 4.0) licence (https://creativecommons.org/licenses/by/4.0/). This means that reuse is allowed provided appropriate credit is given and any changes are indicated. The information and views set out in this Studies on support to R&I policy in the area of bio-based products and services, Lot 3 Biorefinery pathways and outlook for deployment Service Contract EC DG-RTD no. 2018/RTD/F2/OP/PP-07281/2018/LC-01369322 are those of the author(s) and do not necessarily reflect the official opinion of the Commission. The Commission does not guarantee the accuracy of the data included in this study. Neither the Commission nor any person acting on the Commission’s behalf may be held responsible for the use which may be made of the information contained therein For any use or reproduction of elements that are not owned by the European Union, permission may need to be sought directly from the respective rightholders. The European Union does not own the copyright in relation to the following elements: Image credits: Cover: © flashmovie, image #142647768. Source: stock.adobe.com

EUROPEAN COMMISSION
EU Biorefinery Outlook to 2030
Studies on support to research and innovation in the area of bio-based products and services
AUTHORS
Richard Platt, Ausilio Bauen, Patrick Reumerman, Cécile Geier, René Van Ree, Iris Vural Gursel, Lesly Garcia, Martin Behrens, Philipp von Bothmer, Jo Howes, Yamini Panchaksharam, Kaisa Vikla, Valerie Sartorius, Bert Annevelink
COMMUNICATION AND GRAPHIC DESIGN
Raffaella Moreschi, Ilaria Abbondanti Sitta, Niccolò Bertuzzi, Marcello Bardellini
Directorate-General for Research and Innovation 2021 Healthy Planet EN

2
Table of Contents
ABSTRACT ............................................................................................................ 4 EXECUTIVE SUMMARY (EN) .................................................................................... 5 RÉSUMÉ ............................................................................................................. 20 INTRODUCTION .................................................................................................. 36 Study context .................................................................................................................. 36 A focus on biorefining and the production of bio-based chemicals and materials ........................ 36 Study aim and objectives .................................................................................................. 38 Work package structure and interactions ............................................................................. 39 Policy Context .................................................................................................................. 40 Stakeholder engagement ................................................................................................... 41 1 WP1 – BIOREFINERY CLASSIFICATION ............................................................... 44 1.1 Objectives .............................................................................................................. 44 1.2 Approach ................................................................................................................ 44 1.3 Literature Review ..................................................................................................... 44 1.4 Biorefinery Classification System ................................................................................ 45 1.5 Application of the Biorefinery Classification System ...................................................... 55 1.6 Additional information relevant to Stakeholders ........................................................... 56 2 WP 2 – DRIVERS AND BARRIERS FOR BIOREFINERIES ......................................... 58 2.1 Introduction ............................................................................................................ 58 2.2 Activity A: Development of the barrier and driver categorisation .................................... 58 2.3 Activity B) Specific Barriers and Drivers ...................................................................... 61 2.4 Activity C) General Barriers and Drivers ...................................................................... 64 3 WP 3 – AVAILABLE AND EMERGING BIOREFINERY PATHWAYS AND RD&I NEEDS ..... 83 3.1 Introduction ............................................................................................................ 83 3.2 Aim and objectives ................................................................................................... 83 3.3 Approach ................................................................................................................ 84 3.4 Task 1 - Identification and description of available and emerging biorefinery pathways ...... 84 3.5 Task 2 - High-level assessment of the key advantages and disadvantages of biorefinery pathways compared to alternative pathways ....................................................................... 123 3.6 Task 3 - Identification of technical barriers & measures to overcome these barriers for market deployment of material and chemical based biorefineries ...................................................... 151 3.7 Task 4 - Identification of Research, Development and Innovation (RD&I) needs to overcome technical and non-technical barriers. .................................................................................. 158 4 WP 4 – EU AND GLOBAL BIOREFINERY DEPLOYMENT “DATABASE” ....................... 165 4.1 Objectives, scope and approach ................................................................................ 165 4.2 Define datafield headings ......................................................................................... 167 4.3 Selection of top 10 most relevant other countries ........................................................ 167 4.4 Review existing biorefinery databases ........................................................................ 168 4.5 Build database of biorefineries in EU and top 10 countries ............................................ 169 4.6 Analysis of EU (and top 10 other countries) planned biorefineries .................................. 170 4.7 WP 4 Conclusions .................................................................................................... 181 5 WP 5– MARKET PROSPECTS FOR BIOREFINERIES TO 2030 ................................. 182 5.1 Objectives ............................................................................................................. 182 5.2 Approach ............................................................................................................... 182 5.3 Growth scenarios .................................................................................................... 182 5.4 Potential demand .................................................................................................... 184

3
5.5 Potential supply ...................................................................................................... 224 5.6 Comparison of supply in the EU to supply in top 10 non-EU countries in database ............ 270 5.7 Comparison of EU demand vs EU supply .................................................................... 274 6 WP 6 – EU BIOREFINERY OUTLOOK AND ROADMAP FOR DEPLOYMENT ................. 276 6.1 Objective ............................................................................................................... 276 6.2 Approach ............................................................................................................... 276 6.3 Chemical and material driven biorefinery roadmaps ..................................................... 278 6.4 Biorefinery outlook for deployment in the EU .............................................................. 317 6.5 Identify and quantify GHG and socio-economic benefits ............................................... 327 ANNEX I - WP 1 LITERATURE REVIEW BIOREFINERY CLASSIFICATIONS SYSTEMS ..... 332 IEA Bioenergy Task 42 Biorefinery Classification & Bio-Based Chemicals Update (IEA 2009/2018/2020) ............................................................................................................ 332 Towards a common classification approach for biorefinery Systems (2009) .............................. 334 BioRefinery identification, classification and mapping (Euroview-2009) ................................... 334 European Biorefinery Strategy Road Map & Vision 2030 (Star-Colibri 2011) ............................. 335 ANNEX II - WP 1 CLASSIFICATION SYSTEM DEFINITIONS ...................................... 337 Feedstock ....................................................................................................................... 337 Conversion Processes ....................................................................................................... 338 Product Groups ............................................................................................................... 343 ANNEX III - WP 2 SPECIFIC DRIVERS AND BARRIERS FACTSHEETS ......................... 347 Drivers for, and barriers to, bio-based uptake of Propylene Glycol .......................................... 347 Drivers for, and barriers to, bio-based uptake in lubricants .................................................... 351 Drivers for, and barriers to, bio-based uptake in Solvents ..................................................... 356 Drivers for, and barriers to, bio-based uptake in surfactants .................................................. 360 Drivers for, and barriers to, market uptake of microfibrillated cellulose ................................... 364 Drivers for, and barriers to, bio-based uptake of polymers and plastics, specifically for thermoplastic starch 368 Drivers for, and barriers to, bio-based uptake of polymers and plastics, specifically for thermoplastic starch 372 Drivers for, and barriers to, bio-based uptake in Building Blocks (Lactic acid) .......................... 375 Drivers for, and barriers to, bio-based uptake in Building Blocks (Methanol) ............................ 381 Specific drivers for, and barriers to, Lignin-based resins market uptake .................................. 385 ANNEX IV - WP 4 ROADTOBIO TOP 120 CHEMICALS USES FOR DATABASE ............... 390 ANNEX V - WP 4 LIST OF KEYWORDS FOR MATERIAL BIOREFINERIES ...................... 393

4
ABSTRACT
EN
A circular bio-based economy is seen as an important element of a European low carbon economy, and is expected to increasingly contribute to GHG emission reductions, decreased dependence on fossil resources and drive economic growth over the next decades. This study presents scenarios on how demand and supply for bio-based chemicals and materials could grow to 2030, and provides roadmaps with actions required to increase the deployment of chemical and material driven biorefineries in the EU. The study also presents the key elements of the analysis which have supported the preparation of the scenarios and roadmaps. This includes a biorefinery classification system, a database of operational or announced biorefineries (developed in collaboration with the Joint Research Centre) for the EU and 10 non-EU countries, a detailed opportunities and barriers analysis and a market outlook to 2030 with a focus on eleven biorefinery pathways. The study was developed by E4tech (lead), BTG, Wageningen Research, FNR and ICONS with the support of over 100 stakeholders from the bio-based industry, the chemicals and materials industries, academia & research institutions, the investment community and policy makers through active participation in stakeholder workshops, meetings and interviews. The study will support policy-makers and industry in further developing strategies, policies and deployment plans for European biorefineries.
FR
La bioéconomie circulaire est vue comme élément clé dans le développement d’une économie à bas carbone dans l’Union européenne. Celle-ci offre le potentiel de contribuer à la réduction des émissions de gaz à effet de serre (GES), à la diminution de la dépendance aux ressources fossiles ainsi qu’à la croissance économique de l’UE au cours de la prochaine décennie. L’étude « Biorefinery Outlook 2030 » offre ainsi une analyse de l’évolution potentielle de l’offre et de la demande en produits chimiques et matériaux biosourcés (c’est-à-dire d’origine biologique) sur la base de scénarios à l’horizon 2030, ainsi que des feuilles de route comprenant une liste d’actions nécessaires pour accroitre le déploiement des bioraffineries en Europe. L’étude présente également les éléments clés de l’analyse sur laquelle se basent les scénarios et les feuilles de route. Sont inclus un système de classification des bioraffineries, une base de données des bioraffineries (développé en collaboration avec le Centre Commun de Recherche de l’UE ou « Joint Research Centre ») en activité ou en développement dans les pays membres de l’UE et dix pays tiers, une analyse détaillée des barrières et opportunités, ainsi qu’une analyse de marché axée sur onze filières de bioraffinerie. L'étude a été menée par E4tech (partenaire principal), BTG, Wageningen Research, FNR et ICONS. Le consortium a bénéficié de contributions de plus de 100 représentants de l’industrie chimique traditionnelle et biosourcée, de l’enseignement supérieur et de la recherche, de la communauté des investisseurs et des décideurs politiques, à travers une participation active à des ateliers, réunions et entretiens individuels. L’étude a pour but d’aider les décideurs politiques ainsi que les industriels à élaborer des stratégies, des politiques et des plans de déploiement pour une industrie européenne de la bioraffinerie.

5
EXECUTIVE SUMMARY
The circular bioeconomy can help build a sustainable future and help meet the European Green Deal's ambitious targets, including its plan to reduce EU greenhouse gas (GHG) emissions by at least 55% by 2030, compared to 1990 levels. It also contributes to other EU initiatives, including the Circular Economy Action Plan, the Biodiversity Strategy and the Farm to Fork Strategy1. The updated EU Bioeconomy Strategy published in 2018 contributes to the European Green Deal, as well as Industrial, Circular Economy and Clean Energy Innovation Strategies2. In light of the Bioeconomy Strategy, the European Commission Directorate General for Research and Innovation commissioned three studies to support the research and innovation policies regarding bio-based resources and products.
This study, EU Biorefinery Outlook to 2030 (Lot 3), is specifically in support of the EU Bioeconomy Strategy’s action to facilitate the development and deployment of new sustainable biorefineries and to estimate the potential deployment of different types of biorefineries.
Biorefining can be broadly defined as the processing of biomass into a portfolio of marketable bio-based products, which could include co-production of food and feed, chemicals and materials and bioenergy (power, heat/cold, fuels).3 The focus of the current study is on chemical and material4 driven biorefineries which include the production of innovative high value bio-based products. This includes integrated biorefineries that produce chemical and materials as major products, but could also co-produce food and feed as well as bioenergy. The tender study excludes bioenergy and biofuel driven biorefineries, i.e. biorefineries with energy or fuels as major products, and conventional biomass processing facilities focused on traditional bio-based products, such as paper and board.
Biorefineries producing bio-based chemical and material products are expected to be an important part of the circular bio-based economy, as well as the EU’s transition to a climate-neutral economy. Deployment of biorefineries that utilise domestic EU biomass can increase security of supply of raw materials, substituting fossil-based materials and products and their respective emissions, and create jobs and business opportunities, especially in rural areas. They increasingly complement processing of biomass in bioenergy and biofuels driven biorefineries, as well as other production routes to produce bio-based chemicals and materials, such as co-processing in existing facilities and those based on CO2 and recycled carbon.
Classification chemical and material driven biorefineries
A biorefinery classification system has been developed5 to communicate information about chemical and material driven biorefineries on the basis of four major full value chain categories important to biorefinery operations: feedstocks, conversion processes, platforms and products. The IEA Bioenergy Task 42 matrix classification has been used as a basis, and has been further developed and extended, especially in the bio-based chemicals and materials product group categories.
1 Bioeconomy & European Green Deal, https://knowledge4policy.ec.europa.eu/bioeconomy/bioeconomy-european-green-deal_en
2 Bioeconomy Strategy, https://ec.europa.eu/info/research-and-innovation/research-area/bioeconomy/bioeconomy-strategy_en
3 IEA Bioenergy Task 42 - Biomass can be crops, aquatic biomass, forestry, primary (agro/forest) – secondary (process) and tertiary (post-consumer) residues, etc. This framework therefore will be very useably for political decision making for upcoming R&I needed for the implementation of the Green Deal.
4 Bio-based chemicals and materials range from high-value added fine chemicals such as pharmaceuticals, cosmetics, food additives, etc., to high volume materials such as general bio-polymers or chemical feedstocks [i.e. building blocks].
5 WP1 – Biorefinery Classification – developed by Stichting Wageningen Research, Institute Wageningen Food & Bio-based Research

6
The classification system is focused on biorefineries producing chemicals and materials. The proposed product groups cover a broad spectrum of bio-based products, like the ones proposed in the EU Bioeconomy Strategy and the Statistical Classification of Economic Activities in the European Community (NACE) nomenclatures.
Table 1. Biorefinery Classification
1. Feedstocks 2. Conversion Processes
3. Platforms 4. Products
1.1. Primary biomass†: • Aquatic biomass • Lignocellulosic from
croplands and grasslands
• Lignocellulosic wood/forestry
• Oil crops • Starch crops • Sugar crops • *Other primary
biomass 1.2. Secondary Biomass†: • Microbial biomass • Residues from
agriculture • Residues from aquatic
biomass • Residues from forestry
and forest-based industry.
• Residues from nature and landscape management
• Residues from recycled bio-based products
• *Other organic residues
2.1. Biochemical: • Aerobic conversion • Anaerobic digestion • Enzymatic process • Fermentation • Insect-based
bioconversion • *Other biochemical
conversion 2.2. Chemical: • Catalytic • Esterification • Hydrogenation • Hydrolysis • Methanation • Chemical Pulping • Steam reforming • Water electrolysis • Water gas shift • *Other chemical
conversion 2.3. Mechanical and thermomechanical: • Blending • Extraction • Mechanical &
thermomechanical disruption & fractionation
• Mechanical pulping • Separation processes • Other mechanical and
thermomechanical conversion
2.4. Thermochemical: • Combustion • Gasification • Hydrothermal
liquefaction • Pyrolysis • Supercritical conversion • Torrefaction &
Carbonization • *Other thermochemical
conversion
• Biochar • Bio-Coal • Bio-Crude • Biogas • Bio-oils • Bio-hydrogen • Bio-Naphtha • C5/C6 sugars • Carbon dioxide • Lignin • Oils • Organic Fibres • Organic Juice • Protein • Pyrolytic Liquid • Starch • Syngas • *Other platform
4.1. Chemicals: • Additives • Agrochemicals • Building blocks6 • Catalysts & Enzymes • Colorants • Cosmeceuticals • Flavours & Fragrances • Lubricants • Nutraceuticals • Paints & Coatings • Pharmaceuticals • Solvents • Surfactants • *Other chemical
product
4.2. Materials: • Composites • **Fibres • Organic Fertilizers • Polymers • Resins • *Other material product 4.3. Food 4.4. Animal Feed 4.5. Energy: • Cooling agents • Fuels • Heat • Power • *Other energy product
* ‘Other’ is included to enable new concepts, technologies or product categories to be included. **’Fibres’ potentially can be further subdivided according to their application: textile fibres, paper and board fibres, carbon/specialty fibres and other fibres. †Primary biomass is a biomass originated via artificial or natural photosynthesis. Secondary biomass is produced during the processing, conversion or decomposition of primary biomass and organic material.
6 A building block is defined as a molecule which can be converted to various secondary chemicals and intermediates and turn into a broad range of different downstream products.

7
Chemical and material driven biorefinery pathways and their development status
Based on the classification system, eleven umbrella biorefinery pathways have been identified (A-K) that are at varying development and deployment levels7. Each pathway is a combination of one or more Feedstocks, Conversion Processes, Platforms and Products shown in Table 1. A-D represent commercially established biorefineries whilst pathways E-K are at earlier stages of development.
Table 2. Chemical and materials driven biorefinery pathways
Biorefinery pathway name
A. One platform (C6 sugars) biorefinery using sugar crops
B. One platform (starch) biorefinery using starch crops
C. One platform (oil) biorefinery using oil crops, wastesa and residues
D. Two-platform (pulp and spent liquor) biorefinery using wood
E. Three platform (C5 sugars, C6 sugars and lignin) biorefinery using lignocellulosic biomassc
F. Two-platform (organic fibres and organic juice) biorefinery using green biomassb
G. Two-platform (oil and biogas) biorefinery using aquatic biomass
H. Two-platform (organic fibres and oil) biorefinery using natural fibresb
I. One platform (syngas) biorefinery using lignocellulosic biomassc and municipal solid waste
J. Two platform (pyrolytic liquid and biochar) biorefinery using lignocellulosic biomass
K. One platform (bio-crude) biorefinery using lignocellulosic, aquatic biomass, organic residues
a. Waste/residue fats, oils and greases belong to category "Other organic residues"b. Green biomass and Natural fibres belong to category "Lignocellulosic from croplands and grasslands“c. Lignocellulosic biomass includes Lignocellulosic from croplands, wood/forestry and residues from agricultureand forestry
Current deployment status of biorefineries in Europe
Over 400 chemical and material driven biorefineries at commercial or demonstration scale have been identified in the EU8 and 10 non-EU countries9. Approximately 300 of these are located in the EU.
The respective interactive dashboards of the chemical and material driven biorefineries in the EU (non-EU) are available under the following links: https://datam.jrc.ec.europa.eu/datam/mashup/CHEMICAL_BIOREFINERIES_EU/index.html ( )
Of the operational chemical and material driven biorefineries, the C6 sugar and starch platform (Pathways A, B) and the oil platform (Pathway C) that utilise food and feed crop feedstocks (i.e. oil, sugar or starch crops) account for 56% of the total number of facilities.
7 WP3 – Available and emerging biorefinery pathways and RD&I needs – developed by Stichting Wageningen Research, Institute Wageningen Food & Biobased Research
8 WP4 – EU and global biorefinery deployment “database” – developed by B.T.G Biomass technology group BV based on the JRC biorefinery database: https://datam.jrc.ec.europa.eu/datam/mashup/BIOBASED_INDUSTRY/index.html
9 10 countries: USA, Canada, Australia, New Zealand, Japan, Brazil, China, India, Thailand, Norway, Switzerland, United Kingdom

8
The two platform pulp and spent liquor (Pathway D) accounts for nearly 20% of operational biorefineries and is based on pulping of wood feedstock (lignocellulosic wood/forestry). It is the pathway with the most biorefineries using secondary feedstocks (e.g. residues from forestry and forest-based industries). Pathways E-K make up the remainder with the three platform C5 sugars, C6 sugars and lignin (Pathway E) and the two platform natural fibres and oil (Pathway H) accounting for about 10% each.
For a long time, the forest-based biorefineries have been innovating and diversifying their product portfolio by processing pulp & paper mill side streams into differentiated materials and chemicals (other than traditional products such as paper and board), and these operations often include multiple pathways (e.g. D + E). They are a good example of how biorefineries can include a variety of processes, platforms, products and both virgin and recycled biomass feedstocks.
Figure 1. Distribution of identified bio-based chemicals and materials driven biorefineries in 2020 in the EU
Key drivers and barriers for further deployment
The most important general drivers were identified10 as: the EU Green Deal, governmental support for expansion and scale-up of biorefineries, the need to reduce dependence on fossil raw materials and products as well as their related greenhouse gas emissions, and the functional benefits that bio-based products are potentially able to provide.
The lack of economic viability was identified as the main non-technical barrier to bio-based chemicals and materials deployment, particularly for biorefineries producing large volume commodities. There is a large gap between the market’s willingness to pay for these bio-based products and their production costs in most cases. This is a result of very limited or no increased willingness to pay more for renewable/low carbon bio-based chemicals and materials, low costs of the fossil-derived equivalents, high production costs of bio-based
10 WP2 – Drivers and barriers for biorefineries – developed by B.T.G Biomass technology group BV with stakeholder input gathers in virtual workshops, meetings and interviews

9
products, and competition with biofuels markets. In addition, some EU biorefineries are less cost competitive than biorefineries in some other parts of the world due to higher energy costs, higher labour costs, higher taxes, and limited availability and accessibility of low-cost biomass feedstocks. Moreover, the Commission’s draft proposal for the Taxonomy Delegated Act on climate change mitigation and adaptation also excludes use of food and feed crops for bio-based chemicals and plastics (as well as for biofuels) from voluntary sustainable financing.
Achieving the scale up of new bio-based chemicals and materials production capacity is challenging, because of the level of investment required, coupled with technology and market risk hindering financing.
Achieving the scale up of new bio-based chemicals and materials production capacity is challenging, because of the level of investment required in plants, coupled with technology and market risk hindering financing.
All bio-based chemicals and materials driven biorefineries, to varying degrees, have immediate concerns about certified sustainable feedstock supply and mid- to long-term concerns over the sustainable feedstock mobilisation potential in a competitive circular bioeconomy. The EU biomass potential is large from primary crops and agricultural, process and post-consumer residues and wastes, but there will be demand for these feedstocks from various sectors. Furthermore, there are ethical concerns related to their use and also their proposed exclusion from the activities of voluntary sustainable financing that affect investments in respective installations and products. The main advantage of many bio-based chemicals and materials lies in their environmental benefits (e.g. substitution of fossil-based products leading to greenhouse gas emission reductions), and in some cases characteristics that outperform their fossil counterparts (e.g. biodegradability of some polymers). In order for these benefits to be valued, they need to be rewarded by appropriate policies being developed as part of the EU’s Green Deal and climate targets, and they need to be quantified and broadly understood. Currently, there is a lack of evidence on the full life-cycle sustainability benefits of bio-based products. Quantitative information on sustainability is needed over the full biomass-to-products life-cycle, including their end-of-life fate, to demonstrate their potential environmental and other advantages.
Today there is a very limited policy-based market pull. The European Commission will propose legislation on the Sustainable Product Policy Initiative extending the Eco-design Directive beyond energy aspects to a broad range of products and the making use of the Product Environmental Footprint method. However, additional policy-based market pull is expected to be required to overcome barriers to bio-based chemicals and materials.
Research, Development & Innovation (RD&I) activities needed to overcome technical barriers
Some of the biorefinery pathways are at low Technology Readiness Levels (TRLs). Therefore, supporting fundamental research, applied research and providing piloting, demonstration and commercial scale support (1st of a kind commercial application) will be required to scale-up chemicals and material driven biorefineries in the EU. The RD&I needs to address11 the most important technical barriers relate to the development of:
• Robust and flexible logistical systems (collection, transport, storage) able to process the diverse European biomass potential, especially as regards agricultural residues and various municipal waste streams;
11 WP3 – Available and emerging biorefinery pathways and RD&I needs – developed by Stichting Wageningen Research, Institute Wageningen Food & Biobased Research

10
• Pre-treatment technologies converting diverse and low-quality biomass feedstocks to higher quality bio-based commodities that meet the processing requirements of a variety of biorefining conversion processes for widescale use. This potentially can also decouple sustainable decentralised refining to produce bio-based commodities from more centralised processing of these into bio-based intermediates and products;
• Conversion processes (e.g. enzymatic processing, fermentation, esterification, hydrolysis, chemical pulping, gasification etc.) that are more energy efficient and sometimes product selective to increase market competitiveness;
• A clear approach to assessing the sustainability (incl. end-of-life strategies) of bio-based products.
In the new EC Horizon Europe Programme (2021-2027) significant budget will become available to tackle biorefinery related technical barriers, for example within Pillar2 "Global Challenges and European Industrial Competitiveness" - Cluster6 "Food, Bioeconomy, natural Resources, Agriculture and Environment". Also within the linked follow-up of the successful Bio-Based Industries Joint Undertaking (BBI-JU), i.e. the EU Partnership for a Circular Bio-based Europe (CBE), biorefinery technology development, demonstration and market introduction will be supported.
EU bio-based chemicals and materials market demand to 2030
Two scenarios to 2030 for the demand for bio-based chemicals and materials in the EU have been developed. The high growth scenario assumes: a favourable macro-economic environment and policy for bio-based products, including a strong recovery from the Covid-19 pandemic, a high oil price (increasing the competitiveness of bio-based products in some applications), a market pull policy put in place for bio-based chemicals and materials and there is widespread financial support for various types of biorefinery investments. These factors are contradictory or do not develop in the low growth scenario.
Using the JRC study “Insights into the European market for bio-based chemicals. Analysis based on 10 key product categories” 12 as a basis for today’s bio-based chemicals and materials consumption, the potential demand in 2030 (Figure 2) could grow significantly in the high growth scenario to ~16 million tonnes per year (Mtpa) growing at about 9.9% per year until 2030, but could reach approximately only half this amount in the low growth scenario growing at about 3.0% per year13.
12 Spekreijse, Jurjen; Lammens, Tijs; Parisi, Claudia; Ronzon, Tevecia; Vis, Martijn: Insights into the European market for bio-based chemicals. Analysis based on 10 key product categories. (2019) JRC Science Policy Report, source: https://ec.europa.eu/jrc/en/publication/insights-european-market-bio-based-chemicals
13 WP 5 – Market prospects for biorefineries to 2030 – demand scenarios developed by Fachagentur Nachwachsende Rohstoffe (FNR)

11
Figure 2. Demand for bio-based products 2019, and 2030 low- and high scenario14
EU supply outlook for bio-based chemicals and materials to 2030
The current bio-based chemicals and materials supply from EU biorefineries is estimated at 4.6 million tonnes (Figure 3). It is estimated that supply from new or expanded biorefineries could grow by an additional 3.1 million tonnes in the EU in 2030 in the high growth scenario, whilst in the low growth scenario this could be limited to an additional 1.1 million tonnes15.
These growth scenarios set the upper and lower bound of the biorefinery outlook deployment between 2020 and 2030 based on publicly available information on chemical and material driven biorefineries. These are growth scenarios, so they do not include the potential closure of existing biorefineries that are currently operational in the EU.
Figure 3. Demand vs. Supply of biochemicals and biomaterials in the EU in 2030.
14 The group “fibres” is limited to man-made bio-based fibres. The “additives” group additives includes bio-derived plasticisers only. The category “Other” consists of the product groups “Paints, coatings, inks and dyes” and “Cosmetics and personal care products”. Product categories (see Table 1) not included in the demand assessment are: agrochemicals, flavours and fragrances, nutraceuticals, pharmaceuticals, organic fFertilizers, amd composities. The production of paper and board is not included into the product groups.
15 WP 5 – Market prospects for biorefineries to 2030 – supply scenarios developed by E4tech

12
This additional supply has to be provided by expanding operational biorefineries, new demonstration scale plants, new commercial scale plants that have been announced or those that are expected to be announced based on pathways at demonstration scale today.
These pathways potentially could produce a wide range of bio-based products that are used across the product groups. A selection of some of these bio-based chemicals and materials have been developed into case studies considering the drivers and barriers to their development, competing pathways to produce them and their market prospects16.
There are several biorefinery pathways that produce products that can be used as biofuels or bio-based chemicals. Pathways A, B and E all can produce ethanol which is primarily used as a fuel today, and Pathways D and I may produce biomethanol. These are almost exclusively used as transport fuel today in the EU, although some bioethanol is already used for chemicals (e.g. as a solvent) or to produce ethylene outside of the region and fossil methanol is used in larger volumes for chemical applications. In addition, there are smaller scale activities currently under development for the use of pyrolysis oil fractions for chemicals and materials in conjunction with biofuel products.
A share of the production of these products has been considered to be sold for chemicals and materials, with the remainder for biofuels in the high scenario. This additional ‘advanced biofuels to bio-based chemicals’ supply represents a large potential for increasing the bio-based chemicals and materials, but is expected to require additional policy changes. It will be important to consider in developments to the Renewable Energy Directive (RED II), in Sustainable Aviation Fuels (SAF) and Smart Mobility strategies. Policy support for producing bio-based chemicals and materials via these pathways could not only bring about environmental benefits, such as lower greenhouse gas emissions. There is a risk of a decreasing market for liquid biofuels as a result of road transport electrification, particularly for ethanol (blending use with gasoline), and therefore there could be potential for “advanced biofuels” driven biorefineries to partially refocus on chemicals and downstream materials. In addition, policy support for bio-based chemicals and materials, as well as biofuels from these pathways, could reduce perceived investment risk for these biorefineries as they would have wider addressable markets.
For both growth scenarios, the EU demand is higher than the projected supply in 2030 (Figure 3). The shortfall could be met through imports from non-EU countries and/or supply from alternative ramp-up routes.
Alternative ramp-up routes could include biofuel-driven biorefineries using feed/food crop feedstocks switching focus to the chemicals market (e.g. existing ethanol plants could sell higher quantities into the chemicals market). One major route could be dehydrating ethanol to produce ethylene (the largest chemical building block/platform chemical), which Braskem in Brazil and Croda in the US operate at commercial scale. Co-processing is also an option that is already being done commercially in the EU, either through the production of chemicals or chemical feedstocks in petroleum refineries, co-processing of biomass/bio-based feedstocks in steam crackers or bio-methane in existing conventional methanol plants.
There is significant uncertainty surrounding both the technical feasibility of some co-processing routes, biomass availability, the potential use of the products produced for chemicals and materials compared to fuels, as well as policy (e.g. the Sustainable Finance Taxonomy Draft Act states that food or feed crops may not be used as bio-based feedstock for the production of chemicals) that may affect these developments. The study considers existing capacity of food/feed crop-based ethanol plants, petroleum refineries, steam crackers and methanol plants in the EU and their potential to co-process biomass to produce bio-based chemicals and materials. It is estimated that between 5.4 million tonnes of bio-based chemicals and materials in the low growth scenario and 11.7 in the high
16 Case study products: propylene glycol, 1,4-butanediol, lactic acid, methanol, fatty acid and PEG esters, acetic acid, fatty alcohol ethoxylate, micro-fibrillated cellulose, thermoplastic starch and lignin based phenolic resins.

13
growth scenario could be produced in these facilities by 2030. If scaled to this level, these alternative ramp-up routes, could help to balance the EU supply and demand by 2030.
Key actions needed to support EU bio-based chemicals and materials production
The outlook for biorefinery deployment could move towards the high growth scenario if actions proposed in the roadmaps below are implemented (Figure 7)17. The actions are focused on how to bring about the maximum benefits to the EU (e.g. largest greenhouse gas savings), and could also support developments beyond biorefining, supporting chemicals and materials produced from recycled or CO2-based processes as well.
Policy and regulation is essential to close the large gap between the market’s willingness to pay and bioproduct costs, addressing the economic barriers to deployment identified as the most important by stakeholders. Policy that supports chemicals and materials that provide environmental benefits such as greenhouse gas savings should be implemented. The types of policy actions included in the roadmap are GHG reduction targets, mandates (e.g. in public procurement), bans/reducing targets on use of fossil and non-recycled products, as well as taxes on some fossil products and carbon. These policies need to be developed and implemented in 5 years to have an impact on deployment by 2030.
The individual biorefinery pathways cannot be considered in isolation, or without considering policy and other changes that may influence the deployment rates of one or more of the pathways. Policy developments will help determine the overall and relative ramp-up of these pathways. Whilst the roadmaps suggest areas of policy that should be considered, they do not specify fixed policy actions including targets, and therefore the impact of policy actions on deployment will only become clear through additional investigation and modelling, and then once the policies are implemented.
One such policy action is to ensure that biorefinery projects are adequately classified under the EU’s Sustainable Finance Taxonomy18. The Taxonomy covers several areas related to biorefineries including agriculture and forestry, and the manufacture of chemicals and plastics. The Draft Act states that food or feed crops may not be used as bio-based feedstock for the manufacture of organic basic chemicals or of plastic in primary form under the Taxonomy, so the Taxonomy would support only non-food/feed pathways D-K. Overall, the requirements for financing need to be carefully considered to ensure sustainability without unnecessarily restricting biorefinery development.
In the outlook for biorefinery deployment developed the conditions for non-crop feedstocks for the production of chemicals and materials in the EU are assumed to be favourable. The outlook almost reaches the high scenario as the majority of the projects in the high scenario are expected to focus on the utilisation of secondary feedstocks.
17 WP 6 – EU biorefinery outlook and roadmap for deployment – developed by E4tech 18 European Commission. Sustainable finance – EU classification system for green investments. Draft regulation and
annexes for EU taxonomy for sustainable activities. 2020. Available online at: https://ec.europa.eu/info/law/better-regulation/have-your-say/initiatives/12302-Climate-change-mitigation-and-adaptation-taxonomy#ISC_WORKFLOW

14
Figure 4. Chemical and materials driven biorefinery outlook for deployment – additional biorefineries by 2030
Overall 42 new chemical and materials driven biorefineries, including 5 demonstration scale plants, could become operational by 2030 adding approximately 3.1 million tonnes of additional capacity, with a significant volumes coming from debottlenecking19/expansion of existing biorefineries (largely Pathways A-E) and new biorefineries allocated in Pathways D and E. All pathways are expected to see some new biorefineries by 2030 and it is noted that although in some cases biorefineries may be considered as combinations of pathways (e.g. D+E) or include some of the processes of just one pathway.
Small, medium and large scale commercial biorefineries are all included in the outlook ranging from 6 to over 220 kta product capacity, with the scale primarily dependent on the pathway, feedstock utilised and size/attractiveness of the markets for the products produced.
For pathway D, the volumes of bio-based chemicals and materials shown in the outlook for biorefinery deployment do not include pulp used for traditional applications. In addition, there are announced pulping biorefineries that will initially be focused on more traditional pulp and derivatives (e.g. paper and board). These more traditional products are not in the scope of this study, but these investments offer the future potential for valorisation of side streams to produce the bio-based chemicals and materials covered in this study. This could include the extraction and further conversion of crude tall oil, lignin and turpentine from black liquor and/or through the development of innovative cellulose based products. A wider selection of pulping biorefineries are detailed in the Confederation of European Paper Industries “Innovative bio-based products for a sustainable future: A Cepi study on pulp & paper industry biorefineries in Europe”20
19 Debottlenecking is the process of increasing production of existing plants and equipment by improving processes and/or revamping equipment.
20 CEPI, Innovative bio-based products for a sustainable future: A Cepi study on pulp & paper industry biorefineries in Europe (2021) https://www.cepi.org/innovative-bio-based-products-for-a-sustainable-future-a-cepi-study-on-pulp-paper-industry-biorefineries-in-europe/

15
Figure 5. Supply ramp up, additional supply from debottlenecking/expansion (Deb/Exp) of existing commercial scale biorefineries
Pathway D and E utilise lignocellulosic wood/forestry and developments are expected in Nordic countries where there are large sources of feedstock, well developed biomass supply chains and existing pulp and paper industries. Investment in biorefineries in the BIOEAST initiative countries has historically been lower, but these countries also have significant potential from these residues particularly Poland, Romania, Czech Republic and Latvia. Pathway E also utilises agricultural residues and the BIOEAST initiative countries include some of the countries with the largest agricultural residue potential (based on S2Biom) in the EU, with Poland (3rd highest), Romania (5th highest) and Hungary (6th highest) all with estimated nationwide potentials of over 10 million tonnes per year.
When comparing the outlook of 42 new chemical and materials driven biorefineries to previous biorefinery deployment outlooks, the definition of chemical and materials driven biorefineries is also important to consider. The European Commission’s Bioeconomy Strategy21 states the development of 300 new sustainable biorefineries by 2030. This target was first mentioned in a roadmap22 developed during the BIO-TIC project23 in 2015. The 42 biorefineries estimated in this outlook should not be compared to this 300 as:
• The current analysis only takes into account biorefineries producing chemical building blocks, plastics and, to some extent, advanced ethanol as well. However, it does not include biorefineries producing bio-based jet fuels as this is out of scope.
• BIO-TIC analysis spans the period 2008 to 2030, while the current analysis considers only the period 2020 to 2030.
• The BIO-TIC roadmap estimated the number of new biorefineries that need to be operating by 2030 in order to meet the estimated demand, while the current
21 European Commission. A sustainable bioeconomy for Europe - Strengthening the connection between economy, society and the environment: updated bioeconomy strategy. 2018. Available online at: https://op.europa.eu/en/publication-detail/-/publication/edace3e3-e189-11e8-b690-01aa75ed71a1/language-en/format-PDF/source-149755478
22 BIO-TIC. A roadmap to a thriving industrial biotechnology sector in Europe. 2015. Available online at: http://www.industrialbiotech-europe.eu/wp-content/uploads/2015/08/BIO-TIC-roadmap.pdf
23 The BIO-TIC project (2012-2015) was a FP7 funded project focusing on the industrial biotechnology sector in Europe.

16
analysis provides an estimate of the number of new biorefineries that can be realistically deployed by 2030
Capital investment required is in the range of Euro 3.4 billion to Euro 13.7 billion for the additional capacity. The capital investment required will depend on the investment type made (e.g. expansion, re-purposing/converted, new brownfield biorefineries etc…) as well as many other factors (process technology used, labour costs, materials costs, etc..). Some of these factors (e.g. process technology) are very related to the biorefinery pathways, whilst others will be more related to where the investment is planned, and if it is on a greenfield or brownfield site. The range of capital investment in Figure 6 can be considered, however not all of these investments are always possible. For example, there may not be mothballed24 plants suitable to be converted to a chemical and material driven biorefinery and further debottlenecking of existing biorefineries may not be possible.
Existing brownfield sites including pulp and paper mills, wood working manufacturing sites, sugar and starch processing facilities, chemical parks, petroleum refineries and steam crackers all offer shared infrastructure (including in some cases existing local port access) and supply chains, potentially lowering the capital investment and operating costs for biorefineries. Further, some of these locations can have underutilised land and infrastructure as a result of declining industry, however coupled with a local skilled labour force.
• New greenfield biorefinery
• New biorefinery on a brownfield site (lower capex from shared services such as steam, water, power, storage, logistics etc…)
• Re-purposing/conversion of a plant on existing brownfield site (highly project dependent as it only some equipment can be reused)
• Expansion of a biorefinery on a brownfield site (e.g. valorising a side stream) – capacity increase often limited
• Debottlenecking (improving processes, revamping or new equipment) to increase the capacity of existing biorefineries - capacity increase is limited however
• Co-processing / re-focus of existing plants from fuels to chemicals (drop-in such as methanol)
The financing of these biorefineries is expected to come from both public and private sources. For example, the recently (2020) agreed upon EU Recovery and Resilience facility25 - which provides significant (672.5 billion Euros) financial support in the form of loans and grants to EU Member States could help to support investment in biorefinery expansion, contributing to the realisation of the Green Deal objectives.
The biorefinery deployment outlook could result in significant benefits for the EU including the creation of regional local jobs, overall GHG savings and increased raw material security (reduced imports of fossil feedstocks from outside the EU). We estimate that 3.5 million tonnes of GHG saved relative to fossil comparators on a lifecycle basis. This is roughly equivalent taking 750 000 internal combustion engine passenger vehicles of the road for one year26. In addition, about 5.6 million tonnes of naphtha, a fraction of crude oil, could
24 Stopping the use of a plant but keeping it in good condition so that it can resused/started up again 25 The Recovery and Resilience Facility https://ec.europa.eu/info/business-economy-euro/recovery-
coronavirus/recovery-and-resilience-facility_en#the-recovery-and-resilience-facility 26 US EPA: United States Environmental Protection Agency https://www.epa.gov/energy/greenhouse-gas-
equivalencies-calculator
HIGHEST CAPEX
LOWEST CAPEX
Figure 6. Investment types to ramp-up bio-based chemical and material production

17
be substituted by 2030. Job creation through the development of full supply chains (from feedstock sourcing/production, through biorefining and then downstream processing and use) could contribute significantly to the target of 400,000 green jobs by 203527, especially if the feedstock is sourced from in the EU and the downstream processing also takes place region.
Realising the biorefinery deployment outlook could bring about significant benefits but this is only possible through action taken now and until 2030 by policy makers, the bio-based industry and its associations, the chemicals and materials industries and their associations, academia & research institutions, the investment community and NGOs. The roadmap (Figure 7) presents the key actions to take, with their importance categorised by barrier category (e.g. economic). Further details of these actions are provided in Section 6 ‘EU biorefinery outlook and roadmap for deployment28’, as well as further roadmap with specific actions for each biorefinery pathway.
27 The Strategic Innovation and Research Agenda (SIRA) https://biconsortium.eu/about/our-vision-strategy/sira 28 WP 6 – EU biorefinery outlook and roadmap for deployment – developed by E4tech

18
2020 2025 2030
EC
ON
OM
ICS
TR
AT
EG
ICD
IRE
CT
ION
• Clear market based policy in place • Sustainability framework in operation• 42 additional biorefineries across different pathways • Potential GHG savings of 3.5 million tonnes CO2eq
EX
PE
CT
ED
ST
AT
US
Consider all biomass and land-using activities when setting strategies for each. For example, on circular economy, bioeconomy and food
Policy design to enable non crop/ low land use impact routes
Set strategic objectives for the biorefinery sector overall including acceptable use of land and crops
Set EU sector targets for GHG reduction in EU chemicals production
Develop EU mandate for GHG reduction in chemicals sold in the EU
Develop EU mandate for bio/low GHG content for hard to recycle products
Implement increasing EU mandate for GHG reduction in chemicals sold in the EU
Implement EU mandate for bio/low GHG content for hard to recycle products
Ban sale of selected non-recycled fossil-based products and/or set a reducing target for fossil material used
Chemical producers and users set voluntary GHG reduction commitments
Develop MS public procurement standards specifying bio, recycled or CO2-based products
Implement MS public procurement standards specifying bio, recycled or CO2-based products
Tax fossil input to chemicals industry
Reform EU ETS to increase CO2 price
Develop Carbon Border Adjustment Mechanism
Implement Carbon Border Adjustment Mechanism
Support investigation of optimal use of EU biomass feedstock
Conduct R&D focusing on cost reduction across all biorefinery pathways through continuing activities such as Horizon Europe, Circular Bio-based Europe and MS support
Establish partnerships to develop biorefineries on existing industrial sites to reduce costs
Improve process economics by identifying connections between different pathways and other industries
Expand biomass/waste feedstock databases to identify low cost resources
Develop regional bioeconomystrategies
Consider CCU in the EU ETS
Harmonise bioproducts’ sustainability requirements with existing schemes
Stakeholder type
Policy makers
Bio industry & associations
Chemical/material industry & Industry associations
Academia & Research institutions
NGOs & Civil societies
Investment community Policy & regulation
Support for RD&D and scale up
Information and coordination
Type of actions

19
Figure 7. Roadmap with actions common to all pathways
2020 2025 2030
SC
ALE
UP
OF
NE
WT
EC
HN
OLO
GIE
SS
US
TA
INA
BIL
ITY
FEE
DS
TO
CK
MA
RK
ET
EN
TR
YContinue EU public co-financing for pilot/demonstration plants
Pilot plant data collection to help develop early stage TEAs and modelling
Reduce scaling up costs by making available/providing support for shared facilities
Ensure classification of biorefinery projects under the EU’s Sustainable Finance Taxonomy
Increase equity investment in companies
Implement grant/ loan scheme for feasibility studies
Additional support for new technologies such as sub-targets or subsidy for limited volumes of products from new pathways
Invest in enhancing the engineering know-how of academic research teams
R&D on European biomass resource potential
Provide funding for regional and local biomass resource assessments
Support more projects to develop tools/platforms to support biomass supply chains
Support establishment of biomass and waste supply companies
Include crops for biorefineries in GM crop policy
Enhance targets for collecting and recycling wastes
Develop policy to align material classification as waste, residue or coproduct in all MSs
Implement EU-level matchmaking programme for companies
Reduce REACH registration fee for sustainable chemicals
Develop a standard for bio-based products’ sustainability
Implement a standard for bio-based products’ sustainability
Support from EU/ MSs for SMEs to comply with sustainability standards
Provide EU funding to quantify risk of undegraded compostable plastic residues
Agree policy on biodegradable bioplastics
Organise information campaigns on GMMs used in bioprocesses
Develop bio-based product labels
Early adoption of labelled products in highly visible markets
Establish bio-based terminology for all products
Require publicly supported projects to assess sustainability impacts and communicate this transparently
Provide support for green hydrogen projects in biorefineries

20
RÉSUMÉ
Une bioéconomie circulaire a le potentiel de jouer un rôle important dans la construction d’un futur durable et peut contribuer à l’atteinte des objectifs ambitieux du pacte vert pour l’Europe (European Green Deal)29. Celui-ci inclut notamment l’objectif de réduire les émissions de gaz à effet de serre de l'UE d'au moins 55 % d'ici 2030, comparé aux niveaux de 1990. La bioéconomie circulaire contribue également à d'autres initiatives de l'UE, telles que le plan d'action pour l’économie circulaire (Circular Economy Action Plan), la stratégie de l’UE en faveur de la biodiversité (Biodiversity Strategy) et la stratégie "de la ferme à la table" (Farm to Fork strategy). Dans la même logique, la stratégie européenne pour la bioéconomie (Bioeconomy Strategy) publiée en 2018 contribue au pacte vert pour l’Europe, ainsi qu’aux stratégies pour l’innovation de l’industrie, l’économie circulaire et l’énergie propre30. Compte tenu de cette stratégie, la Direction Générale de la Recherche de de l’Innovation de la Commission Européenne (DG RTD) a commissionné trois études pour soutenir les politiques de recherche et d’innovation concernant les ressources et produits biosourcés.
Cette étude, « EU Biorefinery Outlook to 2030 (Lot 3) », s’inscrit dans le cadre de la stratégie Européenne pour la Bioéconomie, qui vise à faciliter le développement et le déploiement de nouvelles bioraffineries durables, ainsi qu’à estimer la capacité potentielle de différents types de bioraffineries.
Le bioraffinage peut être défini comme un procédé de transformation de la biomasse en produits dits « biosourcés » commercialisables. Des ingrédients biosourcés sont utilisés dans les secteurs de l’agro-alimentaire, de la chimie, des matériaux et de l’énergie (électricité, chaleur/froid, carburants).31 Cette étude se concentre sur les bioraffineries dont les produits principaux sont utilisables dans l’industrie chimique et des matériaux32 afin de produire des spécialités biosourcées à haute valeur ajoutée, tout en générant des co-produits alimentaires et énergétiques (chaleur, électricité ou carburant). L'étude exclut néanmoins les sites industriels dédiés à la production de bioénergie et de biocarburants ainsi que les installations conventionnelles de traitement de la biomasse (par ex. production de papier).
Les bioraffineries ciblant la production de produits chimiques et matériaux peuvent jouer un rôle important dans la bioéconomie ainsi que dans la transition de l’UE vers une économie à bas carbone. L’utilisation de biomasse en provenance de l'UE pourrait potentiellement augmenter la sécurité de l’approvisionnement en matières premières, substituer certains produits d’origine fossile permettant ainsi de réduire leurs émissions associées et aussi créer des emplois et des opportunités commerciales, en particulier dans les zones rurales. Leur activité vient compléter d’autres technologies qui contribuent au développement de la bioéconomie et de l’économie circulaire, telles que le traitement de biomasse dans les structures de raffinerie pétrolières, l’utilisation de la biomasse pour la production de biocarburants et de bioénergie, ainsi que d’autres voies de production émergentes basées sur le CO2 et le carbone recyclé.
Système de classification des bioraffineries
Dans un premier temps cette étude définit un système de classification pour les bioraffineries dont les produits principaux sont destinés au secteur de la chimie et des
29 Bioeconomy & European Green Deal https://knowledge4policy.ec.europa.eu/bioeconomy/bioeconomy-european-green-deal_en
30 Bioeconomy Strategy https://ec.europa.eu/info/research-and-innovation/research-area/bioeconomy/bioeconomy-strategy_en
31 IEA Bioenergy Task 42 - La biomasse peut être des cultures, de la biomasse aquatique, de la sylviculture, des résidus primaires (agroforesterie) - secondaires (processus) et tertiaires (post-consommation), etc. Ce cadre sera donc très utile pour la prise de décision politique pour les prochaines R&D nécessaires à la mise en œuvre du pacte vert pour l’Europe.
32 Les produits chimiques et matériaux biosourcés incluent des produits chimiques à haute valeur ajoutée, tels que les produits pharmaceutiques, les produits cosmétiques, les additifs alimentaires, etc., ainsi que les matériaux de base tels que les biopolymères ou les matières premières chimiques (c'est-à-dire les ingrédients chimiques de base).

21
matériaux33. Ce système de classification est structuré autour des quatre catégories principales de la chaîne de valeur. Ces catégories incluent : les matières premières, les procédés de conversion, les substances intermédiaires dites « plateformes » (« platform chemicals ») et les produits finaux. La classification se base sur le travail de la Tâche 42 de l’AIE (Agence Internationale de l’Energie), dont les catégories de produits chimiques et matériaux biosourcés ont été révisées et étendues.
Le système de classification se concentre sur les bioraffineries axées sur la production de produits chimiques et de matériaux. Les groupes de produits finaux considérés dans la classification proviennent de la stratégie européenne pour la bioéconomie et de la Nomenclature statistique des Activités économiques dans la Communauté Européenne (NACE).
Table 3. Classification des Bioraffineries
1. Matières premières 2. Procédés de conversion 3. Substances plateformes
4. Produits finaux
1.1 Biomasse primaire: • Biomasse aquatique • Biomasse
lignocellulosique agricole et de prairies
• Bois et biomasse ligneuse
• Cultures oléagineuses • Cultures sucrières • Cultures céréalières • *Autre biomasse
primaire
1.2 Biomasse secondaire: • Biomasse microbienne • Résidus agricoles • Résidus de biomasse
aquatique • Résidus forestiers et
industrie forestière • Résidus de gestion de
la nature et du paysage
• Résidus de bio-produits recyclés
• *Autres résidus organiques
2.1. Biochimique: • Fermentation aérobie • Digestion anaérobie • Hydrolyse enzymatique • Fermentation • Bioconversion • Autres conversions biologiques
2.2. Chimique: • Catalytique • Estérification • Hydrogénation • Hydrolyse (fermentation) • Méthanation • Production de pâte à papier • Vaporeformage • Electrolyse de l’eau • Conversion du gas à l’eau • *Autre conversion chimique
2.3. Mécanique et thermomécanique : • Mélang • Extraction • Fractionnement mécanique &
thermomécanique • Mise en pâte mécanique • Procédés de séparation • Autres conversions
mécaniques et thermomécaniques
2.4. Thermochimique: • Combustion • Gazéification • Liquéfaction hydrothermale • Pyrolyse • Extraction de
fluides supercritiques (SFE) • Torréfaction & Carbonisation • *Autres conversions
thermochimiques
• Biocharbon (biochar) • Biomasse torréfiée
(biocoal) • Huile pyrolytique (bio-
crude) • Biogaz • Huiles biologiques • Biohydrogène • Bio-Naphtha • Sucres pentoses (C5)
& hexoses (C6) • Dioxyde de Carbone • Lignine • Huiles • Fibres organiques • Jus biologique • Protéines • Liquide pyrolytique • Amidon • Gaz de synthèse • *Autre plateforme
4.1. Chimiques : • Additifs • Produits
phytosanitaires • Ingrédients
chimiques de base34 • Catalyseurs &
Enzymes • Colorants • Cosmétiques • Aromes & Parfums • Lubrifiants • Nutraceutiques • Peintures et
revêtements • Pharmaceutiques • Solvants • Tensioactifs • *Autres produits
chimiques
4.2. Matériaux: • Composites • **Fibres • Engrais biologiques • Polymères • Résines • *Autres matériaux
4.3. Nourriture
4.4. Nourriture animale
4.5. Energie : • Agents de
refroidissement • Carburants • Chaleur • Electricité • *Autres produits
énergétiques
* La rubrique "Autres" permet l’inclusion de nouveaux concepts, technologies ou catégories de produits. **Les ’Fibres’ peuvent être répartis selon leur application : fibres textiles, papier, panneaux de fibres, fibres de carbone, fibres spécialisées et autres. †La biomasse primaire est la matière première produite par la photosynthèse naturelle ou artificielle. La biomasse secondaire est produite pendant le traitement, la conversion ou la décomposition de la biomasse primaire et des matières organiques.
33 Module 1 – Système de classification de bioraffineries (« WP1 – Biorefinery Classification ») développé par Stichting Wageningen Research, Institute Wageningen Food & Biobased Research
34 Un ingrédient chimique de base est un terme utilisé pour définir un composé chimique qui peut être assemblé de façon modulaire pour former de larges structures moléculaires (buidling block en amglais)

22
Les filières de bioraffinerie considérées et leur statut de développement
A partir du système de classification, onze filières de bioraffinerie (A-K), à niveaux de développement technologique et de déploiement commercial variables, ont été identifiées35. Les voies A-D représentent les filières établies à échelle commerciale, tandis que les filières E-K sont à des stades de déploiements plus précoces.
Table 4. Filières de bioraffinerie à production destinée aux secteurs de la chimie et des matériaux
Filières de bioraffinerie
Bioraffinerie simple plateforme (sucres C6) à base de cultures sucrières
Bioraffinerie simple plateforme (amidon) à base de cultures amylacées
Bioraffinerie simple plateforme (huile) à base de cultures, déchets et résidus oléagineux
Bioraffinerie double plateforme (pulpes & liqueurs résiduaires) à base de biomasse ligneuse (bois)
Bioraffinerie triple plateforme (sucres C5/C6 & lignine) à base de biomasse lignocellulosique
Bioraffinerie double plateforme (fibres organiques and jus organiques) à base de biomasse verte
Bioraffinerie double plateforme (huile et biogaz) à base de biomasse aquatique
Bioraffinerie double plateforme (fibres organiques et huile) à base de fibres naturelles
Bioraffinerie simple plateforme (gaz de synthèse) à base de biomasse lignocellulosique et de déchets municipaux
Bioraffinerie double plateforme (liquide pyrolytique & biochar) à base de biomasse lignocellulosique
Bioraffinerie simple plateforme (bio-crude) à base de biomasse lignocellulosique, biomasse aquatique, résidus organiques
a. Déchets/résidus de graisses et d'huiles appartiennent à la catégorie « autres résidus organiques » b. La biomasse verte et les fibres naturelles appartiennent à la catégorie « biomasse lignocellulosique agricole et de prairies » c. La biomasse lignocellulosique inclut la biomasse lignocellulosique des prairies, bois et biomasse ligneuse, les résidus agricoles et les résidus forestiers/d’industrie forestière Statut actuel des bioraffineries en Europe
Plus de 400 bioraffineries axées sur la production à destination des secteurs chimiques et des matériaux à échelle commerciale ou de démonstration ont été identifiées. La base de données développée contient les bioraffineries situées dans l’UE36 et dans les dix pays tiers considérés dans l’étude37. La majorité, environ 300 d’entre elles, se trouvent dans l’UE.
Parmi les bioraffineries opérationnelles, les plateformes à sucres C6 (filières A, B) et la plateforme à huiles (filière C), qui utilisent des ressources agricoles (céréalières et oléagineuses), comptent pour 56% du nombre total d’installations. La filière D représente près de 20% des bioraffineries opérationnelles. Le procédé biochimique transforme les pulpes obtenues à partir de biomasse forestière et représente ainsi la filière avec la plus forte utilisation de biomasse secondaire (ex. résidus forestiers). Les filières E-K forment le reste des bioraffineries européennes, avec les filières E et H représentant chacune environ 10% du nombre de sites de bioraffinage.
35 Module 3 - Filières de bioraffinage existantes et émergentes et besoins de R&D (« WP3 – Available and emerging biorefinery pathways and RD&I needs ») – développé par Stichting Wageningen Research, Institute Wageningen Food & Biobased Research
36 Module 4 - Déploiement des bioraffineries dans l'UE et dans le monde, base de données (« WP4 – EU and global biorefinery deployment “database”») développe par B.T.G Biomass Technology Group BV basé sur la base de données de JRC: https://datam.jrc.ec.europa.eu/datam/mashup/BIOBASED_INDUSTRY/index.html
37 10 pays tiers: États-Unis, Canada, Australie, Nouvelle-Zélande, Japon, Brésil, Chine, Inde, Thaïlande, Norvège, Suisse, Royaume-Uni

23
Le secteur forestier a depuis longtemps su innover et diversifier sa gamme de produits. Dans un tel contexte, le bioraffinage transforme les principaux constituants de la biomasse forestière et valorise les flux secondaires dans le but de produire des produits chimiques de spécialité et matériaux biosourcés (autres que les produits conventionnels, par ex. papier ou panneaux). Ces opérations intègrent souvent plusieurs filières de bioraffineries (ex : D+E). Elles sont un bon exemple de la manière dont les bioraffineries peuvent inclure une variété de procédés, de substances intermédiaires « plateformes », de produits et de matières premières.
Figure 8. Répartition des bioraffineries axées sur les produits chimiques et les matériaux en 2020 dans l’UE
Moteurs et obstacles au déploiement commercial
Cette étude identifie les moteurs principaux du déploiement des bioraffineries dans l’UE38: l’accord européen pour un pacte vert, les soutiens gouvernementaux à l’extension des bioraffineries, la nécessité de réduire la dépendance aux matières premières et leurs émissions de gaz à effet de serre, ainsi que les potentiels avantages fonctionnels que les produits biosourcés peuvent fournir.
Le manque de rentabilité économique représente néanmoins l’obstacle principal au déploiement de produits chimiques et de matériaux biosourcés, en particulier pour les bioraffineries produisant de larges volumes de produits chimiques de base (« commodity chemicals »). On constate un écart considérable entre les coûts de production de produits biosourcés et les prix sur le marché de produits conventionnels équivalents. Cette situation résulte en partie de la réticence des utilisateurs intermédiaires et finaux à payer des produits chimiques et des matériaux renouvelables/bas carbone biosourcés plus chers que leurs équivalents fossiles. La concurrence des biocarburants se révèle également problématique, notamment pour l’approvisionnement en biomasse durable et bon marché. En outre, certaines bioraffineries en UE peuvent être moins compétitives, comparé à
38 Module 2 – Moteurs et obstacles pour les bioraffineries (« WP2 – Drivers and barriers for biorefineries ») développé par B.T.G Biomass technology group BV avec la contribution des parties prenantes dans le cadre d'ateliers, de réunions et d'entretiens individuels

24
d’autres régions du monde en raison du coût plus élevé de la consommation énergétique, de la main d’œuvre, des taxes et d'un accès limité aux matières premières à faible coût. De plus, le projet de loi de la Commission pour l'acte délégué de la taxonomie verte, qui vise à évaluer si une activité contribue bien à l'atténuation et/ou à l'adaptation au changement climatique, exclut la possibilité d’utiliser les mécanismes de financement durables volontaires (« voluntary sustainable financing ») pour soutenir la production de produits chimiques, plastiques ou biocarburants à base de cultures destinées à l'alimentation humaine et/ou animale. Cette mesure aura pour effet principal de limiter les filières de biomasse utilisables, réduisant d’autant les options possibles pour l’approvisionnement des bioraffineries.
La mise en place d’une capacité de production à grande échelle de nouveaux produits chimiques et matériaux biosourcés représente un défi financier important car il nécessite un haut niveau d’investissement. Ceci est dû aux risques technologiques et commerciaux associés à la construction de nouveaux sites de production.
Toutes les filières de produits biosourcés, à des degrés variables, sont soumises à des contraintes à court terme liées à l’approvisionnement immédiat en ressources durables, ainsi qu’à des contraintes à moyen et long terme liées au potentiel de mobilisation de ressources durables dans une bioéconomie circulaire et compétitive. L’UE a un large potentiel de production de biomasse primaire et agricole ainsi que de résidus de transformation et post-consommation. Pourtant ces ressources feront dans l’avenir l’objet d’une demande croissante de la part de divers secteurs. Les investissements dans les installations et des produits respectifs sont affectés également affectés par des préoccupations éthiques liées à leur utilisation ainsi qu’à leur exclusion proposée des activités de financement volontaire durable. De nombreux produits biosourcés présentent des avantages en matière environnementale (comme la réduction des émissions de gaz à effet de serre) et dans certains cas, des caractéristiques qui surpassent leurs homologues fossiles (par exemple, la biodégradabilité de certains polymères). Afin de maximiser ces bénéfices, les produits biosourcés durables doivent être avantagés par les schémas appropriés, développés dans le contexte du pacte vert européen. Les impacts environnementaux des produits biosourcés doivent toutefois être mieux compris et quantifiés. Actuellement, il existe un manque de données quant à ces impacts et les éventuels bénéfices des produits biosourcés sur leur cycle de vie complet. Les recherches doivent donc se concentrer sur les informations quantitatives sur la durabilité des produits biosourcés sur l’ensemble de leur cycle de vie, y compris en fin de vie, pour démontrer leur avantages environnementaux potentiels par rapport aux produits conventionnels. Aujourd'hui, les politiques publiques ne permettent pas d’améliorer l'attractivité du marché. La Commission européenne va proposer une législation « Sustainable Product Policy Initiative » qui étendra la directive sur l'écoconception (Ecodesign Directive en anglais) au-delà des aspects énergétiques à un large éventail de produits -y compris les produits biosourcés- et utilisera la méthode de l'empreinte environnementale des produits (Product Environmental Footprint method). Toutefois, des politiques incitatives supplémentaires pourraient s’avérer nécessaires pour surmonter les obstacles économiques au déploiement commercial des produits chimiques et aux matériaux biosourcés. Les activités de R&D nécessaires pour surmonter les obstacles techniques
• Certaines filières de bioraffinerie sont encore à un niveau bas de maturité technologique (TRL, pour Technology Readiness Level en anglais). Le soutien financier à la recherche fondamentale et appliquée, l’expérimentation, la démonstration et aux premières applications commerciales seront nécessaires au développement des bioraffineries

25
axées sur les produits chimiques et les matériaux dans l’UE. La R&D doit s’attaquer aux critères techniques les plus pertinents pour le développement39, ce qui inclut :
• Des systèmes logistiques robustes et flexibles (collecte, transport et stockage), adaptés à tout type de biomasse européenne ;
• Des technologies de prétraitement pouvant convertir un large spectre de ressources en biomasse de faible qualité en produits intermédiaires répondant aux exigences de qualité et densité énergétique permettant le traitement par divers procédés de conversion de bioraffinerie à grande échelle. Cela peut également permettre de décentraliser le raffinage de matière première en produits chimiques de base. La transformation en produits intermédiaires et finaux biosourcés pourra quant à elle être centralisée.
• Des procédés de conversion (p.ex. traitement enzymatique, fermentation, estérification, hydrolyse, production de pulpe à papier, gazéification, etc....) plus efficients énergétiquement afin d’accroître la compétitivité de certains produits spécifiques.
• Une approche claire pour évaluer la durabilité (y compris les stratégies de « fin de vie ») des produits biosourcés.
D’importants budgets doivent être mis à disposition au sein du nouveau programme Horizon (2021-2027) pour aider les bioraffineries à surmonter certains obstacles techniques. Les activités prévues au sein du deuxième pilier « Global Challenges and European Industrial Competitiveness – Cluster 6 Food, Bioeconomy, natural Resources, Agriculture and Environment » représentent un exemple de soutien financier important. En outre, la prolongation du programme de l’UE « Bio-Based Industries Joint Undertaking (BBI-JU) » par le nouveau programme de l’UE « Parternship for a Circular Bio-based Europe (CBE) » soutiendra le développement technologique, les projets de démonstration et l’entrée sur le marché.
Demande en produits chimiques et matériaux biosourcés dans l'UE à l’horizon 2030
Deux scénarios de croissance ont été développés pour estimer la demande en produits chimiques et matériaux biosourcés dans l’UE à l’horizon 2030. Le scénario de croissance élevée suppose un environnement macro-économique et politique favorable aux produits biosourcés. Cela comprend notamment une forte reprise économique suite à la pandémie de Covid-19, un prix du pétrole élevé (augmentant la compétitivité relative des produits d’origine biologique dans certaines applications), ainsi que la mise en place de politiques visant à renforcer l’attractivité des produits biosourcés et des soutiens financiers généralisés pour le développement de bioraffineries. Dans le cas du scénario de croissance basse, ces facteurs sont contradictoires ou alors ne sont pas conséquents.
L’étude “Insights into the European market for bio-based chemicals”40 publiée en 2019 par le JRC est par ailleurs utilisée comme référence de la consommation actuelle en produits chimiques et matériaux biosourcés. Ainsi, la demande potentielle pour 2030 pourrait croître de manière conséquente dans le scénario de croissance élevée à ~16 millions de tonnes par an (Mtpa), augmentant d’environ 9,9% par an jusqu’en 2030. Dans le cas du scénario
39 Module 3 - Filières de bioraffinage existantes et émergentes et besoins de R&D (« WP3 – Available and emerging biorefinery pathways and RD&I needs ») – développé par Stichting Wageningen Research, Institute Wageningen Food & Biobased Research
40 Spekreijse, Jurjen; Lammens, Tijs; Parisi, Claudia; Ronzon, Tevecia; Vis, Martijn: Insights into the European market for bio-based chemicals. Analysis based on 10 key product categories. (2019) JRC Science Policy Report, source: https://ec.europa.eu/jrc/en/publication/insights-european-market-bio-based-chemicals

26
de croissance basse, cette demande pourrait n’atteindre qu’environ la moitié de ce volume, avec une croissance annuelle de 3% 41.
Figure 9. Demande de marché pour les produits chimiques et matériaux biosourcés en 2019 et 2030 pour les deux scenarios analysés 42
Approvisionnement de produits chimiques et matériaux biosourcés à l’horizon 2030
L’offre actuelle de l’UE en produits biosourcés de bioraffineries est estimée à 4,6 millions de tonnes (Figure3). Le scénario de croissance élevée estime que le lancement de nouvelles bioraffineries et l’augmentation de la capacité de production des bioraffineries existantes pourrait accroitre l’approvisionnement de 3,1 millions de tonnes supplémentaires dans l’UE en 2030. Cette augmentation de la production se limiterait à 1,1 millions de tonnes supplémentaires dans le scénario de croissance basse43.
Ces scénarios se basent sur les informations disponibles au public et fixent les limites supérieures et inférieures des perspectives de déploiement des capacités de bioraffinage entre 2020 et 2030. Etant des scénarios de croissance, ils ne considèrent donc pas la fermeture potentielle des bioraffineries actuellement opérationnelles dans l'UE.
41 Module 5 - Perspectives de marché pour les bioraffineries à l'horizon 2030 (« WP 5 – Market prospects for biorefineries to 2030 – demand scenarios ») développé par Fachagentur Nachwachsende Rohstoffe (FNR)
42 Le groupe des "fibres" se limite aux fibres synthétiques d'origine biologique. Le groupe "additifs" inclut uniquement les plastifiants d'origine biologique. La catégorie "Autres" comprend les groupes de produits "Peintures, revêtements, encres et colorants" et "Produits cosmétiques et de soins personnels". Les catégories de produits (voir tableau 1) non incluses dans l'évaluation de la demande : produits agrochimiques, arômes et parfums, nutraceutiques, produits pharmaceutiques, engrais organiques et composites. La production de papier et de panneaux n'est pas incluse.
43 Module 5 - Perspectives de marché pour les bioraffineries à l'horizon 2030 - scénarios d'approvisionnement (« WP 5 – Market prospects for biorefineries to 2030 – supply scenarios ») développé par E4tech

27
Figure 10. Offre vs. demande en produits chimiques et matériaux biosourcés dans l’UE en 2030.
Cette offre supplémentaire en produits biosourcés provient de l’expansion et de l’amélioration des bioraffineries commerciales actuellement opérationnelles en UE, des nouveaux sites de démonstration, des nouvelles bioraffineries commerciales annoncées et de celles qui pourraient être annoncées à la suite des résultats des usines de démonstrations.
Les filières de bioraffinage pourraient potentiellement produire une large gamme de produits biosourcés pour diverses applications. Des études de cas ont été effectuées dans le cadre de ce projet sur une sélection de ces produits chimiques et matériaux afin d’examiner les moteurs et les obstacles à leur développement, les alternatives de production et les perspectives commerciales44.
Certaines filières de bioraffinage permettent de produire plusieurs types de produits tels que des produits chimiques, des matériaux et des biocarburants. Les voies A, B & E peuvent produire de l’éthanol, qui est principalement utilisé en tant que carburant aujourd’hui, bien qu’une partie du volume produit soit également utilisée pour des produits chimiques (par exemple comme solvant) ou pour produire de l'éthylène. Les filières D & I produisent du biométhanol qui est quasiment exclusivement utilisé en tant que carburant aujourd’hui en UE, bien qu’un large marché existe pour le méthanol fossile dans l’industrie chimique. Enfin, certaines activités à petite échelle tentent actuellement de développer l’utilisation d’huiles pyrolytiques pour la fabrication de produits chimiques et de matériaux en plus de leur utilisation pour la production de biocarburants.
Le scénario de croissance élevée projette qu’une fraction de la production de ces bioraffineries servent à la fabrication de produits chimiques et matériaux, et le reste en tant que biocarburant. Cette idée de transférer une partie de la production de biocarburants à l’industrie chimique présente un large potentiel pour accroitre la part de contenu biosourcé dans les produits chimiques et les matériaux. Néanmoins, elle nécessitera d’un soutien politique supplémentaire au sein de l’UE. Il conviendra donc d'en tenir compte dans l'élaboration et/ou la révision des directives sur les énergies renouvelables (RED II), sur le développement des carburants d’aviation durable (Sustainable Aviation Directive), de la mobilité intelligente (Smart Mobility Directive) ainsi que d’autres développements dans
44 Produits dans les études de cas : propylène glycol, 1,4-butanediol, acide lactique, méthanol, esters d'acide gras et PEG, acide acétique, éthoxylate d'alcool gras, cellulose microfibrillée, amidon thermoplastique et résines phénoliques à base de lignine.

28
l'UE. Le soutien politique à la production de produits chimiques et de matériaux biosourcés à travers ces filières pourrait contribuer aux objectifs environnementaux promus par ces directives, tels que la réduction des émissions de gaz à effet de serre. La tendance de l'électrification des transports routiers présente également un risque de diminution de la demande en biocarburants. Ceci pourrait avoir un impact en particulier pour l'éthanol (commercialisé en tant qu’essence-éthanol E10). Il sera donc possible pour les bioraffineries spécialisées dans les "biocarburants avancés" de se recentrer partiellement sur les produits chimiques et les matériaux. En outre, le soutien politique aux produits chimiques et aux matériaux biosourcés, ainsi qu'aux biocarburants issus de ces filières (en tant que sous-produit, par opposition aux bioraffineries dont les biocarburants sont le produit principal), réduirait le risque d'investissement perçu pour ces bioraffineries.
Dans les deux scénarios, l’étude révèle que la demande dans l’UE est supérieure à l’offre en produits biosourcés à l’horizon 2030. Le déficit de production domestique pourra potentiellement être comblé par des importations en provenance de pays hors UE, et/ou par des voies alternatives d’augmentation de la production domestique qui pourraient émerger (Figure 10).
Ces voies alternatives pourraient inclure des bioraffineries utilisant des cultures agricoles alimentaires actuellement utilisées pour la production de biocarburants, et qui pourraient se reconvertir vers les produits chimiques (ex : les usines d’éthanol existantes pourraient vendre une plus grande quantité à l’industrie chimique). La déshydratation de l’éthanol en éthylène (une molécule plateforme chimique majeure) pourrait représenter une des voies principales. Ce procédé est actuellement opéré à échelle commerciale par Braskem au Brésil et par Croda aux États-Unis.
Le principe de co-traitement (« co-processing ») de biomasse avec des ressources fossiles est également une option pratiquée à échelle commerciale dans l’UE. Trois approches existent pour le co-traitement : 1) la production de produits chimiques dans les raffineries pétrolières ; 2) l’utilisation de vapocraqueurs ; ou 3) par l’utilisation du biométhane dans les usines de biométhanol existantes.
De fortes incertitudes persistent et pourraient affecter le développement des bioraffineries, notamment la fiabilité technologique de certaines filières de co-traitement, la disponibilité de la matière première, la compétition avec la filière biocarburant et la politique énergétique dans l’UE.
L'étude évalue la capacité de production supplémentaire de produits biosourcés que pourraient amener les usines d'éthanol à base de cultures destinées à l'alimentation humaine ou animale et le co-traitement (raffineries de pétrole, vapocraqueurs et usines de méthanol) dans l'UE. On estime qu'entre 5,4 millions de tonnes de produits chimiques et de matériaux biosourcés dans le scénario de faible croissance et 11,7 dans le scénario de forte croissance pourraient être produites dans ces installations d'ici 2030. Si le niveau de production du scénario de forte croissance est atteint, ces filières alternatives pourraient contribuer à équilibrer l'offre et la demande de l'UE d'ici 2030.
Actions clés pour accélérer le développement des bioraffineries axées sur les produits chimiques et les matériaux dans l’UE
Les perspectives de déploiement devraient pouvoir évoluer vers le scénario de croissance élevée si les actions proposées dans la feuille de route ci-dessous sont mises en œuvre (Figure 14)45. Les actions proposées cherchent à apporter le maximum de bénéfices pour l’UE. Celles-ci favoriseront un développement au-delà des filières de bioraffinage considérées dans cette étude.
45 Module 6 – Perspectives et feuille de route pour le déploiement du bioraffinage dans l'UE (« WP6 - EU biorefinery outlook and roadmap for deployment») développé par E4tech

29
Lors des différentes séances participatives, les parties prenantes ont identifié les obstacles économiques les plus importants pour les bioraffineries européennes, notamment le manque de compétitivité du prix des produits biosourcés, au regard de leurs équivalents d’origine fossile. Le rôle des politiques publiques et de la réglementation est donc essentiel pour réduire l’écart entre le prix que les consommateurs sont disposés à payer (willingness to pay en anglais) et les coûts de production des produits biosourcés. Il convient ainsi de mettre en œuvre une politique qui soutienne les produits chimiques et les matériaux alternatifs aux produits fossiles conventionnels, et qui présentent des avantages environnementaux tels que la réduction des gaz à effet de serre. Il pourrait s'agir de produits chimiques et de matériaux biosourcés, mais aussi de produits recyclés ou à base de CO2. La feuille de route contient une liste d'actions politiques diverses, telles que des objectifs de réduction des GES, des quotas (par exemple dans les marchés publics), des interdictions/objectifs de réduction de l'utilisation des produits fossiles et non recyclés, ainsi que l’introduction de taxes sur certains produits fossiles et le carbone. Ces politiques doivent être élaborées et mises en œuvre sur une période de cinq ans afin d’avoir un impact sur le déploiement des bioraffineries d'ici 2030.
Dans le contexte du bioraffinage européen, le développement des filières individuelles identifiées dans cette étude ne peut pas être considéré de manière isolée mais dans le cadre d’un déploiement collectif de plusieurs filières. Le développement de ces politiques de soutien permettra d’ajuster le déploiement absolu et relatif de certaines filières par rapport à d’autres. Bien que les feuilles de route suggèrent les domaines dans lesquels les mesures politiques devraient être appliquées, celles-ci ne définissent pas d’objectifs précis. Comprendre l’impact de ces mesures politiques sur le déploiement des filières de bioraffinerie nécessitera des travaux de modélisation supplémentaire, ainsi que la mise en œuvre de ces mesures.
L'une de ces mesures consiste à veiller à ce que les bioraffineries soient correctement classées dans la taxinomie verte (Sustainable Finance Toxanomy) de l'UE46. Cette taxonomie couvre plusieurs domaines liés aux bioraffineries, notamment l'agriculture et la sylviculture ainsi que la fabrication de produits chimiques et de plastiques biosourcés.
La taxonomie verte ne reconnait pas l’utilisation de cultures destinées à l'alimentation humaine ou animale pour la fabrication de produits chimiques de base ou de plastique sous forme primaire. Ainsi, la taxonomie ne couvrirait que les filières non alimentaires, c’est-à-dire D à K. En général, le financement des bioraffineries doit être conditionné par la durabilité, sans pour autant restreindre inutilement le développement des bioraffineries.
Dans les perspectives de déploiement développées dans cette étude (Figure 11), les conditions dans l’UE sont supposées favorables au développement des ressources secondaires (non agricoles) pour la production de produits biosourcés. Dans la mesure où la majorité des projets considérés dans le scénario de haute croissance se concentrent sur l'utilisation de ressources secondaires, les perspectives de déploiement atteignent presque les résultats du scénario de haute croissance.
46 European Commission. Sustainable finance – EU classification system for green investments. Draft regulation and annexes for EU taxonomy for sustainable activities. 2020. Available online at: https://ec.europa.eu/info/law/better-regulation/have-your-say/initiatives/12302-Climate-change-mitigation-and-adaptation-taxonomy#ISC_WORKFLOW

30
Figure 11. Perspectives de déploiement pour les bioraffineries axées sur la production de produits chimiques et matériaux d’origine biologiques – nombre additionnel de bioraffineries en 2030.47
Au total, 42 nouvelles bioraffineries produisant des substances chimiques et des matériaux biosourcés (dont 5 à échelle de démonstration) pourraient devenir opérationnelles d’ici 2030. Ces nouvelles bioraffineries augmenteraient la capacité de production de 3.1 millions de tonnes, avec une quantité importante venant d’un accroissement des capacités de production48 des bioraffineries existantes (majoritairement filières A-C) et de nouvelles constructions provenant des filières D, E & I. Toutes les filières devraient voir apparaître de nouvelles bioraffineries d'ici 2030. Certaines bioraffineries pourront inclure plusieurs filières (par exemple D+E) ou se concentrer sur une seule filière.
La capacité des bioraffineries envisagées dans les perspectives de déploiement peut être à petite, moyenne ou grande échelle, allant de 6 à plus de 220 kta de capacité de production. L’échelle dépend principalement du procédé de conversion utilisé, du type de ressource et de la taille/attractivité des marchés pour les produits finaux.
Dans le cas précis de la filière D, les volumes de produits chimiques et de matériaux biosourcés indiqués dans les perspectives de déploiement n'incluent pas la production de produits traditionnels, tels que la pâte à papier. En outre l’annonce de nouvelles bioraffineries actives dans l’industrie papetière sont actuellement axées sur la pâte à papier et les dérivés plus traditionnels (par exemple, papier et panneaux). Ces produits traditionnels n'entrent pas dans le cadre de cette étude, mais ces investissements offrent le potentiel futur de valorisation des flux secondaires pour produire certains des produits chimiques et les matériaux biosourcés couverts par cette étude. Cela pourrait inclure l'extraction et la conversion ultérieure de l’huile de tall (tall oïl) brute, de la lignine et de la térébenthine à partir de la liqueur noire et/ou par le développement de produits innovants à base de cellulose. Une sélection plus large de bioraffineries centrées sur la production de pâte à papier est détaillée dans le document de la Confédération européenne des industries papetières intitulé "Des produits biosourcés innovants pour un futur durable: Une étude du Cepi sur les bioraffineries de l'industrie de la pâte et du papier en Europe"49.
47 Les filières B, G et K ont été omises car elles ne contribuent pas à l'augmentation générale de production. 48 L’accroissement des capacités de production est le phénomène qui consiste à augmenter la production des usines et
des équipements existants en améliorant les procédés et/ou en réorganisant les équipements. 49 CEPI, Innovative bio-based products for a sustainable future: A Cepi study on pulp & paper industry biorefineries in
Europe (2021) https://www.cepi.org/innovative-bio-based-products-for-a-sustainable-future-a-cepi-study-on-pulp-paper-industry-biorefineries-in-europe/

31
Figure 12. Accélération de l'approvisionnement et approvisionnement supplémentaire grâce à l'expansion des bioraffineries. Deb/Exp (debottlenecking/expansion en anglais) indique l’augmentation de la capacité de production des bioraffineries
existantes
Les filières D, E et I utilisent des ressources forestières lignocellulosiques. De nombreux développements sont attendus dans les pays nordiques dotés de ressources forestières abondantes, de chaînes logistiques bien établies et d’une industrie papetière solide. Historiquement, les investissements dans les bioraffineries des pays de l’initiative BIOEAST sont resté relativement bas. Néanmoins, ces pays recèlent un important potentiel en résidus forestiers, en particulier la Pologne, la Roumanie, la République Tchèque et la Lettonie. La filière E utilise également des résidus agricoles dont le potentiel est important dans les pays de l’initiative BIOEAST (données obtenues de S2biom) : la Pologne (3e plus haut potentiel en EU), la Roumanie (5e potentiel), et la Hongrie (6e potentiel) ont toutes une capacité nationale supérieure à 10 millions de tonnes par an.
La définition et la classification des bioraffineries dans l’UE doit être prise en compte afin de pouvoir comparer les perspectives de déploiement des bioraffineries dans l'UE établies dans cette étude et celles provenant d’études précédentes. La stratégie de bioéconomie de la Commission européenne (Bioeconomy Strategy)50 prévoit le développement de 300 nouvelles bioraffineries durables d'ici 2030. Cet objectif a été mentionné pour la première fois dans une feuille de route élaborée dans le cadre du projet BIO-TIC en 201551,52. Les 42 bioraffineries estimées dans la présente étude ne doivent cependant pas être comparées à ces 300 car :
• Cette étude considère seulement les bioraffineries produisant des produits chimiques des matériaux biosourcés et, dans une certaine mesure, de l'éthanol avancé. Ainsi, cette étude exclut les bioraffineries produisant principalement des biocarburants destinés à l'aviation.
50 European Commission. A sustainable bioeconomy for Europe - Strengthening the connection between economy, society and the environment: updated bioeconomy strategy. 2018. Available online at: https://op.europa.eu/en/publication-detail/-/publication/edace3e3-e189-11e8-b690-01aa75ed71a1/language-en/format-PDF/source-149755478
51 BIO-TIC. A roadmap to a thriving industrial biotechnology sector in Europe. 2015. Available online at: http://www.industrialbiotech-europe.eu/wp-content/uploads/2015/08/BIO-TIC-roadmap.pdf
52 Le projet BIO-TIC (2012-2015), financé par FP7, est axé sur le secteur de la biotechnologie industrielle en Europe.

32
• L'analyse BIO-TIC couvre la période 2008 à 2030, alors que cette étude ne considère que la période 2020 à 2030.
• La feuille de route BIO-TIC a pour but d'estimer le nombre de nouvelles bioraffineries nécessaires d'ici 2030 pour répondre à la demande estimée. A l’inverse, cette étude fournit une estimation du nombre de nouvelles bioraffineries qui peuvent être déployées de manière réaliste d'ici 2030 sur la base de l’offre actuelle et de scénarios de croissance.
Les capitaux à investir pour assurer un tel déploiement sont de l’ordre de 3.5 à 13.8 milliards d’euros. Un tel investissement dépendra du type d'investissement réalisé (bioraffineries existantes, converties ou nouvelles) ainsi que de nombreux autres facteurs (procédé de conversion utilisé, coûts de la main-d'œuvre, coûts des matériaux, etc.). Certains de ces facteurs (par exemple, la technologie des procédés) sont très liés aux filières mêmes de bioraffinage, tandis que d'autres seront davantage liés au site de l'investissement réalisé ainsi qu'au type d'installation (construction d’une nouvelle installation ou réaffectation d’une installation existante). Lors de la procédure de sélection d'un nouvel investissement, un ordre particulier (présenté dans la Figure 20) d'investissement en capital peut être envisagé. Pourtant, toutes les méthodes d’investissement ne sont pas toujours possibles : la reconversion de bioraffineries mises à l’arrêt en bioraffinerie chimique et matérielle ou l’augmentation des capacités de production des bioraffineries existantes pourraient s’avérer impossibles.
Le financement de ces bioraffineries devrait provenir à la fois de sources publiques et privées. Par exemple, le mécanisme européen pour la reprise et la relance économique (2020)53 fournit un soutien financier important (672,5 milliards d'euros) sous forme de prêts et de subventions aux États membres de l'UE. Ce plan pourrait ainsi contribuer à soutenir les investissements dans l'expansion des bioraffineries, et à la réalisation des objectifs du pacte vert européen.
• Nouvelle bioraffinerie sur site dédié
• Nouvelle bioraffinerie sur une friche industrielle (investissements inférieurs provenant de services partagés tels que la vapeur, l'eau, l'électricité, le stockage, la logistique, etc.)
• Réutilisation/conversion d'une usine sur une friche industrielle existante (dépend fortement du projet car seuls certains équipements peuvent être réutilisés)
• Expansion d'une bioraffinerie sur une friche industrielle (par exemple, valorisation d'un cours d'eau secondaire) - augmentation de la capacité souvent limitée
• Amélioration/augmentation des capacité de production (amélioration des processus, modernisation ou nouveaux équipements) des bioraffineries existantes - l'augmentation de la capacité est toutefois limitée
• Co-traitement / réorientation des installations existantes des combustibles vers les produits chimiques (en remplacement du méthanol, par exemple)
Figure 13. Types d'investissements requis pour accélérer la production de produits chimiques et de matériaux biosourcés
53The Recovery and Resilience Facility https://ec.europa.eu/info/business-economy-euro/recovery-coronavirus/recovery-and-resilience-facility_en#the-recovery-and-resilience-facility
HIGHEST CAPEX
LOWEST CAPEX

33
Les perspectives de déploiement de bioraffineries pourraient entrainer des avantages considérables pour l’UE : Cette étude estime la réduction de 3.5 millions de tonnes de gaz à effet de serre économisées par rapport au alternatives fossiles et environ 5.6 tonnes de naphta (fraction du pétrole brut) économisées en 2030. Les perspectives de déploiement présentées dans cette étude ont aussi le potentiel de créer de nouveaux emplois. La création d'emplois par le développement de chaînes d'approvisionnement complètes - c’est-à-dire de l'approvisionnement en matières premières à la production, en passant par le bioraffinage, puis la transformation en aval et finalement l'utilisation finale - pourrait fortement contribuer à l'objectif de 400 000 « emplois verts » d'ici 2035. Ceci sera surtout le cas si les matières premières proviennent de l'UE et que la transformation en aval a également lieu dans la région.
La réalisation de ces perspectives de déploiement de bioraffineries pourraient apporter de considérables avantages, mais cela ne sera possible que par le biais d’actions menées dès aujourd’hui et jusqu’en 2030 par toutes les parties prenantes : les décideurs politiques, les industries des produits biosourcés et leurs associations, les industries des produits chimiques et des matériaux et leurs associations, le milieu académique, les instituts de recherche, la communauté d'investissement et les ONG. La feuille de route (Figure 14) expose les principales actions à entreprendre en les classant par importance et catégorie (par exemple, économiques). Ces actions sont détaillées dans le module 6 du rapport « Perspectives et feuille de route pour le déploiement du bioraffinage dans l'UE54», ainsi que dans les feuilles de route qui identifient des actions spécifiques pour chaque filière de bioraffinage.
54 Module 6 – Perspectives et feuille de route pour le déploiement du bioraffinage dans l'UE (« WP6 - EU biorefinery outlook and roadmap for deployment») développé par E4tech

34
FINAL
2020 2025 2030
ÉC
ON
OM
IQU
ES
OR
IEN
TA
TIO
NS
TR
AT
ÉG
IQU
E Tenir compte de toutes les activités liées à la biomasse et à l'utilisation des terres lors de l’établissement des stratégies pour chacune d'entre elles. Par exemple, sur l'économie circulaire, la bioéconomie et l'alimentation
Mettre en œuvre des politiques permettant l’émergence et la montée en puissance de filières sans culture dédiée/à faible impact sur l'utilisation des terres
Fixer des objectifs stratégiques pour l'ensemble du secteur du bioraffinage, inclus une utilisation acceptable des terres et des cultures
Fixer des objectifs sectoriels pour la réduction des GES des produits chimiques et matériaux de l’UE
Élaborer un mandat européen pour la réduction des GES des produits chimiques et matériaux vendus dans l’UE
Élaborer un mandat européen pour une faible teneur en GES pour les produits difficiles à recycler
Mettre en œuvre le mandat européen croissant pour la réduction des GES dans les produits chimiques/matériaux vendus dans l’UE
Mettre en œuvre le mandat européen pour une faible teneur en GES pour les produits difficiles à recycler
Mettre en œuvre la vente de divers produits à base de matières premières fossiles non recyclées et/ou fixer un objectif de réduction des matériaux fossiles utilisés
Les producteurs et utilisateurs de produits chimiques fixent des engagements volontaires de réduction des GES
Élaborer des standards pour les marchés publics dans les états membres sur les produits biosourcés, recyclés ou à base de CO2
Mettre en œuvre des standards d'approvisionnements publics au sein de l'UE spécifiant les produits biologiques et recyclés ou des produits à base de CO2
Taxer les importations de matières premières fossiles dans les industries chimiques et des matériaux
Réformer le SCEQE pour augmenter leprix du CO2
Développer un mécanisme d’ajustement carbone aux frontières
Mettre en œuvre le mécanisme d’ajustement carbone aux frontières
Soutenir la recherche d'une utilisation optimale des matières premières de la biomasse européenne
Mener des activités de R&D pour réduire les coûts dans toutes les filières de bioraffinage grâce aux programmes continus tels que Horizon Europe, Circular Biobased Europe et le soutien des États membres
Établir des partenariats pour développer des bioraffineries sur des sites industriels existants afin de diminuer les coûts de développement
Améliorer la performance économique des procédés en identifiant les liens entre les différentes filières et les autres industries
Améliorer les bases de données sur les matières premières (biomasse et déchets) pour identifier les ressources à faible coût
Développer des stratégies régionales de bioéconomie
Envisager l’inclusion de la séquestration et l'utilisation du carbone dans le SCEQE
Aligner les exigences en matière de durabilité des produits biosourcés avec lesrégimes existants
Type de parties prenantes
Décideurs politiques
Bio-industrie et associations industrielles
Industrie chimique/matériaux et associations industrielles
Enseignement supérieur instituts de recherche
ONG et sociétés civiles
Investisseurs Politique et réglementation
Soutien à la R&D et changement d’échelle
Information et coordination
• Mise en place d'une politique de marché • Le cadre de durabilité en vigueur• 42 bioraffineries supplémentaires dans différentes filières• Potentielles économies de GES de 3,5 millions de tonnes de CO2eq
PERSPECTIVES DE DÉPLOIEMENT
Type d’actions

35
Figure 14. Feuilles de routes et actions correspondantes communes à toutes les filières.
FINAL
2020 2025 2030
CH
AN
GEM
EN
T D
’EC
HELL
E D
E N
OU
VELL
ES
TE
CH
NO
LOG
IES
DU
RA
BIL
ITÉ
MA
TIÈ
RE
PR
EM
IÈR
EA
CC
ÈS
AU
M
AR
CH
É
Poursuivre le cofinancement public de l'UE pour les installations pilotes/démonstration
Collecter des données sur les sites pilotes pour faciliter la mise au point d’évaluations techno-économiques et de modélisation en phases initiales du projet
Réduire les coûts de mise à l'échelle en mettant à disposition/en fournissant un soutien pour les installations partagées
Assurer la classification des projets de bioraffinage selon la taxonomie verte de l'UE
Augmenter les capitaux propres dans les entreprises
Appliquer un régime de subventions/prêts pour les études de faisabilité
Apporter un soutien supplémentaire pour les nouvelles technologies, p.ex. des sous-objectifs ou des subventions pour des volumes limités de produits issus de nouvelles filières
Investir dans le renforcement du savoir-faire en matière d'ingénierie des équipes de recherche universitaires
Soutenir la R&D sur le potentiel des ressources européennes en biomasse
Fournir un financement pour les évaluations régionales et locales des ressources en biomasse
Soutenir davantage de projets visant à développer des outils/plateformes pour soutenir les chaînes d'approvisionnement en biomasse
Soutenir la création d'entreprises de distribution de biomasse et de déchets
Inclure les cultures destinées aux bioraffineries dans la politique sur les cultures OGM
Renforcer les objectifs de collecte et de recyclage des déchets
Élaborer une politique pour uniformiser la classification des matériaux en tant que déchets, résidus ou coproduits dans tous les États membres
Instaurer un programme de rapprochement des entreprises au niveau de l'UE
Réduire les frais d'inscription à REACH pour les produits chimiques durables
Élaborer un standard pour la durabilité des produits biosourcés
Instaurer un standard pour la durabilité des produits biosourcés
Soutien de l'UE/des États membres aux PME pour qu'elles se conforment aux standards de durabilité
Fournir un financement de l'UE pour quantifier le risque lié aux résidus de plastique compostable non dégradés
Adoption d'une politique sur les bioplastiques biodégradables
Organiser des campagnes d'information sur les MGM utilisés dans les bioprocédés
Développer des labels pour les produits biosourcés
Adoption précoce de produits labellisés sur des marchés très visibles
Établir une terminologie commune pour les produits biosourcés
Exiger que les projets publics évaluent l'impact sur la durabilité et le communiquent de manière transparente
Soutenir le développement de projets d'hydrogène vert dans les bioraffineries

36
Introduction
Study context
The circular bioeconomy is key for building a sustainable future and meeting the European Green Deal's ambitious targets. In light of the EU Bioeconomy Strategy55, the European Commission DG RTD commissioned three studies to support the research and innovation policies regarding bio-based resources, products and services.
The overall objective is to provide a range of new information and analysis that will help identify future policy directions, emerging technologies, societal demands, challenges and opportunities in the fields of the bioeconomy related to bio-based products and the bio-based innovation.
The three studies are:
1. Carbon economy (lot 1)
2. Life and biological sciences and technologies as engines for bio-based innovation (lot 2)
3. Biorefinery pathways and outlook for deployment (lot 3)
This study is Lot 3 Biorefinery pathways and outlook for deployment or shortened title EU Biorefinery Outlook to 2030. The EU Bioeconomy Strategy noted an action to seek to facilitate the development of new sustainable biorefineries and confirm the type and estimated potential. This tender study is specifically related to this action and focuses on the production of chemicals and materials from biorefineries in the EU.
A focus on biorefining and the production of bio-based chemicals and materials
Definitions of both biorefineries and bio-based products differ between stakeholders and in the literature. It is important that the definitions used in this project are aligned with other EC work streams but are also fit for the purpose of this study. The definitions highlighted below are from the tender documents for this contract and these are supported by clarifications for each definition.
Biorefining can be broadly defined as the sustainable processing of biomass into a portfolio of marketable bio-based products, which could include co-production of food and feed, materials and chemicals and bioenergy (power, heat/cold, fuels)56. The focus of the current study are chemical and material driven biorefineries which include the production of innovative high value bio-based products57. Throughout this report bio-based products refer to bio-based chemicals and materials.
Further to this definition, we define chemical and material driven biorefineries as producing bio-based chemicals and materials as their main products. This means they produce primarily bio-based chemicals and/or materials with bioenergy as a side-product. This
55 A sustainable Bioeconomy for Europe: strengthening the connection between economy, society and the environment, Updated Bioeconomy Strategy European Commission Directorate-General for Research and Innovation Unit F – Bioeconomy (2018) https://ec.europa.eu/research/bioeconomy/pdf/ec_bioeconomy_strategy_2018.pdf#view=fit&pagemode=none
56 IEA Bioenergy Task 42 - Biomass can be crops, aquatic biomass, forestry, primary (agro/forest) – secondary (process) and tertiary (post-consumer) residues, etc. This framework therefore will be very useably for political decision making for upcoming R&I needed for the implementation of the Green Deal.
57 N° 2018/RTD/F2/OP/PP-07281/2018/ Support to R&I policy on biobased products & services TENDER SPECIFICATIONS STUDIES ON SUPPORT TO R&I POLICY IN THE AREA OF BIO-BASED PRODUCTS AND SERVICES (pg 27)

37
means that bioenergy (power, heat/cold, biofuels) focused facilities that produce chemical co-products are not included.
In this study, bio-based products refer to non-food products derived from biomass. Bio-based products may range from high-value added fine chemicals such as cosmetics, pharmaceuticals, food additives, etc., to high volume materials such as general bio-based polymers or chemical feedstocks (i.e. building blocks).
The sources of carbon and categories of routes to chemicals and materials are shown in Table 5 Using biorefining as defined above to produce chemicals and materials is one route to biochemicals and biomaterials. Co-processing of bio-based feedstocks in existing fossil-based production assets is also an alternative pathway. This study considers co-processing on a high-level. This study focuses on the routes to bio-based products that are more novel and therefore does not cover in any depth traditional bio-based products, such as pulp and paper, and wood products.
The circular bio-based economy is seen as an important element of a future European low fossil carbon economy, and is expected to increasingly contribute to GHG emissions reductions over the next decade, as well as increased security of supply of raw materials by using local resources, additional jobs and business opportunities created in rural areas.
Whilst bio-based products are expected to be an important part of the EU’s transition to a lower fossil carbon economy, there are other alternative sources and routes that will help achieve this, namely CO2-based and recycled carbon-based chemicals and materials. Whilst not being the focus of this tender study the interactions of these with biorefining, and in some cases future competition between the routes, are considered.
Table 5. Categories of routes to chemical and materials
Virgin fossil carbon Bio carbon CO2-based Recycled carbon
Source/ feedstocks
• Crude oil • Natural gas • Natural Gas Liquids • Coal
• Primary: crops, lignocellulosic, aquatic
• Secondary biomass residues
• Combustion emissions – fossil or bioenergy
• Process emissions – fossil (e.g. ammonia synthesis) or bio (e.g. fermentation)
• Air
• Plastic waste
Technology/ key value chain steps
• Upstream O&G • Downstream O&G • Chemical processing • Downstream
processing
• Primary producers
• Biorefineries • Downstream
processing
• CO2 capture • Green H2 • Downstream
processing
• Mechanical recycling • Purification • Depolymerisation • Thermochemical • Chemical processing • Downstream
processing
Interactions • Co-processing of bio or recycled fossil carbon
• Co-processing of virgin or recycled fossil carbon (e.g. MSW gasification)
• Green H2
• All CO2 sources • Chemical and downstream processing
Maturity High Varied Low Varied
Renewable No Yes Depends on carbon source
Depends on carbon source

38
Study aim and objectives
Aim:
To provide an outlook for integrated chemical and material biorefineries enabling stakeholders such as the scientific community, industry (primary producers and manufacturers), investors, policymakers, and NGOs to take the present-day decisions necessary to shape the future sustainable bioeconomy
Objectives:
• Describe, categorise and develop a robust classification system for different types of biorefineries and the products they could produce considering the needs of a range of stakeholders, including policy and decision makers in the EU and regional level (WP 1)
• Report on the status of biorefinery development and the markets for related bio-based products (WP 4 and 5)
• Determine the attractiveness of different bio-based products and their market potential (demand) based on drivers and benefits of chemical and material biorefineries, bio-based products and the applications and markets they could access (WP 2 and 5)
• Identify the technical and market challenges that need to be overcome to commercialise biorefineries (WP 2 and 3)
• Identify the R&D&I needs of biorefinery pathways and future policies that could incentivise their uptake (WP 3)
• Develop scenarios for the potential ramp up of biorefinery deployment in Europe to 2030 taking into consideration technology, market and resource considerations as well as considering the policy lines of the European Green Deal (WP 5)
• Develop a roadmap for biorefinery deployment in the EU to 2030 segmented by biorefinery pathways, including the number of biorefineries, installed capacity by volume and capital investment in new biorefinery construction, type of actions required by different actors, and impact in terms of sustainability and societal benefit (WP 6 using inputs from WP 1-5)
• Engage relevant stakeholders in activities aimed at meeting above objective (Stakeholder Engagement)
• Develop communication materials to effectively communicate the outputs of the study (WP 7)
Comments on the key success factors for the project from DG RTD - the study should:
• Understand how biorefining fits in the context of value chain and cross-value chain cascading of bio-materials and resource efficiency (WP 1)
• Assess the relevance of projections and recommendations on biorefinery growth from previous projects in view of the EU policy demands and the foreseeable changes in the markets of bio-based products (WP 5)
• Provide clarity on the barriers (economic, political, financial, market-based, environmental) surrounding biorefinery deployment (WP 2 and 3)
• Help communicate the project objectives and findings clearly to multiple stakeholders, importantly potential investors (e.g. EIB) (WP 7)

39
• Provide input to help form policy approach especially for regions which currently lack a bioeconomy strategy although produce considerable amounts of various potential biomass feedstock (all WPs)
• Help inform actions that will increase the number of small, medium and large scale biorefineries in the EU operating in industrial symbiosis and intensifying transition away from fossil-based and/or carbon-intensive products to bio-based ones (all WPs)
• Help guide national and regional development of bioeconomy strategies, with focus on rural areas and the deployment of small-scale biorefineries.
Work package structure and interactions
The work required for this study has been split into seven work packages (WP) as shown in Figure 15. The lead partner(s) of each work package are indicated (e.g. BTG is leading the work on drivers and barriers in WP 2).
Figure 15. “EU Biorefinery Outlook to 2030” study overview

40
WP 2-6 are dependent on earlier WPs and these interactions have been summarised in Table 6
Table 6. Major interactions and dependencies between work packages (WPs)
Policy Context
EU POLICY AND REGULATION
The following policies and regulations are considered to be very relevant to the development of biorefineries and the market potential of bio-based chemicals and materials. These have been defined and discussed in WP 2 and 6.
1. European Green Deal, with the following specific initiatives identified as having high importance:
a. Climate Law
b. Carbon Border Adjustment Mechanism (CBAM)
c. Just Transition Fund
d. Circular Economy Action Plan
e. Chemicals Strategy for Sustainability
f. Hydrogen strategy for a climate-neutral Europe
g. EU strategy to reduce methane emissions
h. Textile strategy
WP 2 WP 3 WP 4 WP 5 WP 6
WP 1
Classification Classification Classification Classification Classification
WP 2
Demand input – general drivers and barriers, fact sheets with specific drivers and barriers. Input to supply ramp up – general and specific drivers and barriers to biorefinery deployment to inform scenario development
General drivers and barriers, fact sheets with specific drivers and barriers.
WP 3
Input to supply ramp up – pathway definitions, TRL of pathways (Task 2), technical barriers / opportunities (Task 3) and ad-/disadvantages compared to alternatives (Task 2)
Technical barriers / opportunities (Task 3), RD&I needs (Task 4)
WP 4
Input to supply ramp up - capacity by operational plant (demonstration / commercial) and planned projects including project status.
WP 5
The supply ramp-up in the high and low scenarios

41
2. Circular Economy Package (CEP)
3. Renewable Energy Directive II (RED II)
4. Waste Framework Directive (WFD)
5. Registration, Evaluation, Authorisation and Restriction of Chemicals (REACH)
6. Common Agricultural Policy (CAP)
7. Council Regulation (EEC) No 2658/87 (Common Customs Tariff - CCT)
8. Genetically Modified Organisms Directive (2001/18/EC GMO)
9. EU Emissions Trading Scheme (EU ETS)
10. Energy Efficiency Directive (EED) and Energy Performance of Buildings Directive (EPBD)
11. Land Use and Land Use Change (LULUCF)
12. Sustainable Finance Taxonomy
13. Deforestation and forest degradation
14. Packaging and Packaging waste Directive
HORIZON EUROPE
The Horizon Europe programme including the BBI-JU (Bio-based Industries Joint Undertaking) programme is important for the development of chemical and material driven biorefineries. It is expected that the new EC Horizon Europe Programme (2021-2027) will continue to be important for their deployment including the potential follow-up of the very successful BBI-JU by means of the new EU Partnership Circular Bio-based Europe (CBE). These are further discussed in WP 2, 3 and 6.
REGIONAL ASPECTS
Regional aspects play an important role in the broader development of the bioeconomy, and more specifically in the development of biorefineries. Here, regional aspects can imply regions as in clusters of member states, national (member state) level, or the sub-national regional level.
This study gives particular focus to MS in Eastern Europe where some national bioeconomy strategies are less well developed. Regional aspects are considered throughout the study with particular focus in WP 2 (drivers and barriers), WP 5 (locations for deployment) and WP 6 (roadmaps).
Stakeholder engagement
A stakeholder engagement process was developed at the start of the project. Led by FNR the consortium collected stakeholder contacts and formed a Stakeholder Advisory Group (SAG), as well as a list of contacts to invite as participants to the workshops.
The purpose of the stakeholder engagement was to gather stakeholder input on the approach of the study, as well as validate findings from the work. This created buy-in from key stakeholders and increases the likelihood that the final roadmap is disseminated and implemented.

42
STAKEHOLDER ADVISORY GROUP (SAG)
The Stakeholder Advisory Group (SAG) was a direct connection of the project to the different stakeholder groups via 11 members. Multiple meetings were scheduled over the 14 month study .
Individual meetings focused on the results developed with the different WPs. Feedback from stakeholder was assessed and incorporated into the approach and findings of these WPs.
The SAG members are58:
• Dirk Carrez | Bio-Based Industry Consortium
• Patrick Klintbom | ETIP Bioenergy
• Constanze Ißbrücker & Christian Schulz | European Bioplastics
• Gianni Girotti | Cefic – The European Chemical Industry Council
• Barna Kovacs | BIOEAST Initiative
• Andrea Monti | EERA – European Energy Research Alliance
• Johan Elvnert | Forest Technology Platform
• Robert M'Barek & Edoardo Baldoni | JRC – Joint Research Centre
• Joško Bobanović | Sofinnova Partners
• Sverker Danielsson | Skogsindustrierna – confirmed to join from September meeting
• Viktoriya Sturm | Thünen Institute – joined for the last SAG-meeting
STAKEHOLDER ENGAGEMENT FORMATS
Two Stakeholder Workshops were planned to take place during the project. Due to the Covid19 pandemic, the workshop was held online and each workshop was split into two webinar events in order to allow shorter online formats. Through experience of similar events the consortium has found participants tended to be more willing to join and be attentive with these shorter format events.
To ensure interactivity and to receive input from as many participants as possible, four “interaction channels” were established.
1. Direct communication in a moderated online discussion
2. Online live-polls during the workshop
3. Online-surveys filled in after the workshop
4. Additional input/feedback by e-mail after the workshop
58 In addition to those SAG members listed above, others were contacted including the World Wide Fund for Nature (WWF), The European Consumer Organisation (BEUC) and Committee of Professional Agricultural Organisations-General Confederation of Agricultural Cooperatives (COPA-COGECA) however these stakeholders declined the invitation to be part of the SAG.

43
WP leaders designed questions suitable for the workshops and decided on the most appropriate engagement format dependent on the individual WP results. Participation to the Stakeholder Workshop was good. Adding participants from both parts of the 2 workshops (no double counting), 44 stakeholders participated in the first and 43 in the second workshop.
Interviews were used as individual approaches to receive deep insights from selected experts and specific subjects. Interviews have been conducted by WP 2 and 3. Further information on the approach to these interviews is provided in the WP chapters where relevant.
A list of the stakeholder comments received during the various engagement formats can be found in the annex to this final report including information on how feedback was incorporated or why incorporation was not possible i.e. for technical reasons or because it was beyond the scope of this study.
Table 7. Stakeholder Engagement Summary
Event Date Number of participants
Description/ comments
1st SAG Meeting 31-03-2020 Total: 15 SAG: 5
The 1st SAG meeting was dedicated to discussing the WPs 1 (Biorefineries classification) and 4 (EU and global biorefinery deployment).
2nd SAG Meeting 24-06-2020 Total: 20 SAG: 8
The 2nd SAG meeting was dedicated to discussing and verify outcomes of the Stakeholder Workshop in more depth.
1st Stakeholder Workshop Part I
27-05-2020 Total: 35 External: 26
The 1st Stakeholder Workshop Part I was dedicated to discuss the work of WPs 1 (Biorefineries classification) and 4 (EU and global biorefinery deployment) with a wider audience.
1st Stakeholder Workshop Part II
12-06-2020 Total: 42 External: 30
The 1st Stakeholder Workshop Part II was dedicated to discuss the work of WPs 2 (Drivers and Barriers) and 3 (Biorefinery Pathways) with a wider audience.
3rd SAG Meeting 21-09-2020 Total: 14 SAG: 7
The 3rd SAG meeting will be dedicated to discussing draft results of WPs 5 and 6.
2nd Stakeholder Workshop Part I
07-10-2020 Total: 39 External: 31
The workshop was dedicated to present draft results of WPs 5 and 6 as well as final results from WPs 1-4.
2nd Stakeholder Workshop Part II
28-10-2020 Total: 35 External: 22
The workshop was dedicated to present the market prospects for biorefineries as well as the potential demand/supply of biochemical and –materials under low and high scenario to 2030.
4th SAG Meeting 12-01-2021 Total: 24 SAG: 8
The 4th SAG meeting was dedicated to discuss the EU chemical and material driven biorefinery roadmaps to 2030.

44
1 WP1 – BIOREFINERY CLASSIFICATION
The report chapter for WP 1 (Biorefinery Classification) including the completed classification scheme led by WUR
1.1 Objectives
The objective of this work package is to develop a robust biorefinery classification scheme for chemical and material biorefineries, based on the analysis of current and emerging biorefinery models.
The biorefinery classification system aims to support the communication of information in relation to biorefineries (including its nomenclature) to relevant stakeholders (e.g. RD&I, policy makers, governmental organization, non-governmental organizations, the general public, industry, investors) in an understandable way.
1.2 Approach
The following approach was taken to build the biorefinery classification:
• Definition of target audiences and biorefinery characteristics.
• Literature review.
• Consulting of and linking with WP3 and WP4.
• Development of a draft biorefinery classification system.
• Stakeholder consultation.
• Development and definition of biorefinery classification system.
During the development of the biorefinery classification system, several literature sources were reviewed and partially taken into account when defining the different categories and subcategories. The base set-up of the classification system is taken from IEA Bioenergy Task 42. Further specification of and focusing on the chemicals and materials sectors took place by using the NACE classification (Statistical Classification of Economic Activities in the European Union), review of the PRODCOM classification (PRODuction COMmunautaire), as well as other relevant biorefinery classification approaches that are mentioned in the literature review in this section and Annex I.
1.3 Literature Review
Various descriptions and definitions of biorefining can be found in literature. For this study, biorefining is defined as the sustainable processing of biomass into a portfolio of marketable bio-based products, which could include co-production of food and feed, materials and chemicals and bioenergy (power, heat/cold, fuels).59
Based on the scope of the project (focus on chemicals and material products and the engagement of a wide variety of stakeholders), a different set of categories and further subdivision might be required. Different categorizations can be developed looking at the characteristics of the available and emerging feedstocks, final products or to the market/sector. As starting point, we have reviewed several classification approaches developed in nine European projects in the last years (2009-2022), aiming to get a deeper
59 IEA Bioenergy Task 42 - Biomass can be crops, aquatic biomass, forestry, primary (agro/forest) – secondary (process) and tertiary (post-consumer) residues, etc. This framework therefore will be very usable for political decision making for upcoming R&I needed for the implementation of the Green Deal.

45
understanding of different biorefinery classification. In this WP the following project reports were reviewed:
• IEA Bioenergy Task 42 Biorefinery Classification & Bio-Based Chemicals Update (IEA- 2009/2018/2020).
• Towards a common classification approach for biorefinery Systems (IEA-2009).
• BioRefinery identification, classification and mapping (Euroview-2009).
• European Biorefinery Strategy Road Map & Vision 2030 (Star Colibri-2011)
• Bio-economy and sustainability: a potential contribution to the Bio-economy Observatory. Institute for Environment and Sustainability (JRC-2013)
• Bio-based products and Services. Categories. (InnProBio-2015)
• Bio-based industries in Europe - focus on bio-based materials (Nova Institute-2017)
• Biorefinery Distribution in the EU (JRC-2018).
• Insight into the European market for bio-based chemicals (JRC-2019)
• RoadtoBio: Roadmap for the Chemical Industry in Europe towards a Bioeconomy (Bio-based Industries Joint-2019)
The literature review was performed during the project provided information to develop a classification system that allows the understanding of the overall concept of biorefining and facilitates the study and the comparison of biorefinery systems. Additionally, it uses product groups that include important products in subcategories that they are easier to be identified and recognized even for non-technical stakeholders.
The summary of the literature review on biorefinery classification approaches is presented in Annex I.
1.4 Biorefinery Classification System
The demand for developing a chemical and material focused biorefinery classification arises from the need better communicate information on biorefineries in the context of the evolution of the bio-based industries and sustainable climate-neutral circular bio-based products in the EU. It is important that the classification considers at some extent the existing EU nomenclatures.
From the literature review, it has been considered that the IEA Bioenergy Task 42 matrix classification (based on four criteria: platform type, product group, feedstock group, and conversion process) provides an approach that facilitates the understanding of the biorefinery concept. This classification system aims to be60:
‒ unambiguous for all stakeholders in the biorefinery field,
‒ explicit with regard to the feedstock, the platform and the final product and
‒ specific enough for categorising each biorefinery
The IEA Bioenergy Task 42 classification system is taken as reference because it provides a comprehensive overview of the main components of different biorefineries, like possible
60 E. Gnasounou; A. Pandey. Life-Cycle Assessment of Biorefineries. Chapter 1. Classification of Biorefineries Taking into Account Sustainability Potentials and Flexibility, Elsevier, 2017.

46
feedstocks that can be used, the most important intermediates and products that could contribute to the partial substitution of fossil or carbon-intensive products and the reduction of waste generation.
It is important to point out that within the biorefinery industry, secondary biomass feedstocks (residues), shall not be considered as waste. According to the European Waste Law61,the definition of waste essentially turns on the notion of ‘discard’. This means that if a material has potential for further use in the economy (in this case bioeconomy) it should not be considered a waste.
Definitions as by-product or secondary raw material have no legal meaning in the European Waste Law, materials are simply waste or not. Taking in account this legal definition all residues used as feedstocks in biorefineries are not considered waste and therefore in this project the European Waste Classification is not followed.
Additionally, using the European List of Waste will be very specific and not fit for the purpose of grouping biorefinery feedstocks but more useful for the study of waste management. For example, if the European waste classification wanted to be applied for recycled plastic there are 8 different codes that can be used but non of them will provide information on the bio-based content, which is needed to be selected as biorefinery feedstock.
Table 8. European List of Waste Codes
On the other hand, PRODCOM codes are specific to single products or product groups. It seems that PRODCOM codes are given only to product that are considered relevant and have large production volumes otherwise the product is grouped into a product category group, like in the case of lactic acid which is an important bio-based chemical to produce biopolymers. For some bio-based chemicals this can be a drawback as they are currently not produced in large quantities.
PRODCOM classification list, includes an important number of products and product groups (chemicals and materials) that can be easily identified as bio-based (fatty acids, sorbitol, glycerine, natural fibres) and although new codes has been recently added (2016) to be more specific on the renewable content of the product (e.g. lubricants with bio-based content, bio-based butanediol, and bio-based succinic acid); the introduction of new codes for important chemicals and materials (e.g. lactic acid, itaconic acid ethylene from bio-based origin, ethyl acetate from bio-based origin, epichlorohydrin from bio-based origin,
61 Communication from the Commission to the Council and the European Parliament on the Interpretative Communication on waste and by-products.
https://eur-lex.europa.eu/legal-content/EN/TXT/?uri=CELEX:52007DC0059
Code Chapter Description
020104 Plastic waste from agriculture, horticulture, aquaculture and fishing, food preparation and processing (except packing)
0702013 Plastic wastes from the MFSU of plastics, synthetic rubber and man-made fibres
120105 plastics shavings and turnings from shaping and physical and mechanical surface treatment of plastics,
150102 Plastic packaging
160119 Plastic end-of-life vehicles from different means of transport (including off-road machinery) and wastes from dismantling of end-of-life vehicles and vehicle maintenance.
170203 Plastic from construction and demolition wastes (including excavated soil from contaminated sites)
170204 glass, plastic and wood containing or contaminated with hazardous substances
191204 Plastic wastes from the mechanical treatment of waste (for example sorting, crushing, compacting, pelletising) not otherwise specified

47
bio-based resins) is still missing. Currently, for a high number of chemicals there is no clear distinction if they are fully or partially bio-based or fossil based.
In this project, the IEA Bioenergy Task 42 classification system is further modified according to recent developments identified in the literature review and according to insights provided by the Stakeholder Advisory Group (SAG), a wider stakeholder group during a workshop consultation, and the consortium members.
The classification system proposed is focused on biorefineries producing chemicals and materials either as a major output or as side-products. The proposed product groups are linked to a broad spectrum of bio-based products like the ones proposed in the Bioeconomy strategy, and the NACE nomenclatures.
From the NACE classification the following product group were taken as reference: Agrochemicals and Pesticides, Paints and coatings, Fertilizers, Pharmaceuticals fibre, Paints, inks, dye and pigments (colorants), Soap, detergents and cleaning preparations (surfactants), Pharmaceutical products, Textile fibres (fibres), Plastics in primary forms (polymers).
From the European new Circular Economy Action Plan 202062 similar product categories are considered: Plastics (included in polymers), Chemicals (are linked to applications as solvent, additives, building blocks, surfactants), Textiles (fibres); Construction materials (covered in this work by fibres, composites, resins).
Table 1 shows the proposed new biorefinery classification system to be used in this project. It is important to mention that the sub-group ‘other’ in each category is included to enable new feedstock concepts, technologies or product categories to be included in the future. Information for each category is provided below:
FEEDSTOCK
The feedstock category provides an indication on the type and/or the source of biomass that is processed in the biorefinery. The IEA Bioenergy Task 42 classification for feedstock is further modified to primary and secondary biomass feedstocks. A more detailed description and the definition of each type of feedstock for the new classification system is provided in Annex II.
One important modification is that the new subcategorization differentiates lignocellulosic biomass generated from woodlands (forestry) and from the one originated from croplands and grasslands. This is relevant information linked to concepts such as land use, land use change and forestry (LULUCF) as well as effective management of protected areas which contribute to the fight against climate change and increasing biodiversity, key pillars for the European Biodiversity Strategy 2030 and the European Green Deal.63,64
Additionally, the proposed classification emphasizes the importance of using secondary biomass by including more specific residue feedstocks. These streams are produced during the processing, conversion or decomposition of primary biomass, are relevant to Circular Economy Action Plan to support of waste prevention and circularity as well as the prioritisation of the funding of the implementation of the Bioeconomy strategy.
62 The new Circular Economy Action Plan 2020. Brussels, 11.3.2020 COM. 2020. 63 Factsheet: EU Biodiversity strategy 2030. 20 May 2020 64 Communication from the Commission. The European Green Deal COM/2019/640 final

48
New possible feedstock such aquaculture and microbial biomass are also included. The modification is done partially in accordance with the 2018 JRC study on building a database of biorefineries and several European projects (Biomass Futures65 and BioSustain66 ).
It is important to highlight that the proposed classification system does not consider within the scope the use of fossil-based carbon dioxide or fossil based recycled materials and products as feedstock. However, it does include recycled bio-feedstocks such as paper, bio-textiles, bio-CO2, bio-plastics, bio-ethanol. This is aligned to the definition of biorefineries in the introduction (i.e. bio-based feedstocks are considered whilst fossil feedstocks are not considered, recycled or not).
1 Primary biomass is a biomass originated via artificial or natural photosynthesis, capable to capture and store carbon during the growing period.67 This type of biomass may be produced for dedicated use or purpose and it is obtained from forest, agricultural land, aquatic systems or specialised bioreactors.
For the grouping of renewable feedstocks (specially crops), it is common to associate the biomass crop to the type of carbohydrate that is in higher concentration in the feedstock. The most important carbohydrate groups in crops are: oil, starch, sugars and lignocellulose.
• Aquatic biomass (aquatic plants, microalgae and aquaculture)
• Lignocellulosic from cropland (e.g. short rotation coppice and other crops) and grassland (e.g. Miscanthus, perennial grasses (e.g. alfalfa), reed)
• Lignocellulosic wood/forestry from woodland (round wood, sawn logs, fuelwood, softwood, hardwood).
• Oil crops (e.g. soya beans, coconut, olive tree, palm oil, castor beans, sunflower seed, rapeseed, sesame seed, tallow tree)
• Starch crops (grains, such as corn or wheat, and tubers such as (sweet) potatoes and cassava)
• Sugar crops (sugar cane, sugar beet and sweet sorghum)
• Other primary biomass
2 Secondary biomass: biomass produced during the processing, conversion or decomposition of primary biomass and organic material. This is a side-products and residues category, which include biomass that has already been part of current industrial ecosystems, production and consumption chains.
• Microbial biomass (biomass generated by e.g. enzymes, bacteria, protist, fungi)
• Residues from forest management and the forest-based industry (e.g. logging residues, sawdust, bark, brown and black liquor, fibre sludge, lignin and tall oil)
• Residues from agriculture (only from crop cultivation e.g. residues from harvesting e.g. straw, leaves, sugarcane residues on field, vineyard prunings, olive tree prunings, bagasse, rice husks, empty fruit bunch, mesocarp fibre, sugar beet pulp, soy hulls,
65 Elbersen B, Startisky I, Bottcher H,. Atals of EU biomass potentials Deliverable 3.3.February 2020 https://ec.europa.eu/energy/intelligent/projects/sites/ieeprojects/files/projects/documents/biomass_futures_atlasof_technical_and_economic_biomass_potential_en.pdf
66 https://ec.europa.eu/energy/sites/ener/files/documents/biosustain_report_final.pdf 67 https://www.marquard-bahls.com/en/news-info/glossary/detail/term/biomass.html

49
distiller`s dried grains with solubles (DDGS), potato peels, vegetable residues, nut shells)
• Residues from aquatic biomass cultivation, processing and consumption, (e.g. fisheries and aquaculture).
• Residues from nature and landscape management (green biomass from nature and landscape management)
• Residues from recycled bio-based products (e.g. recycled bio-plastics and bio-polymers, bio-based textiles, recycle paper)
• Other organic residues (e.g. organic fraction municipal solid waste (MSW), sewage and wastewater sludge, used cooking oil, animal fat, manure).
Table 9. Classification System
* ‘Other’ is included to enable new concepts, technologies or product categories to be included.
**’Fibres’ group can be extended to subgroups according to the application: textile fibres, paper and board fibres, carbon/specialty fibres and other fibres.
68 A building block is defined as a molecule which can be converted to various secondary chemicals and intermediates and turn into a broad range of different downstream products.
1. Feedstock 2. Conversion Process 3. Platform 4. Product
1.1. Primary biomass: • Aquatic biomass • Lignocellulosic from
croplands and grasslands
• Lignocellulosic wood/forestry
• Oil crops • Starch crops • Sugar crops • *Other primary
biomass 1.1. Secondary Biomass: • Microbial biomass • Residues from
agriculture • Residues from
aquatic biomass • Residues from
forestry and forest-based industry
• Residues from nature and landscape management
• Residues from recycled bio-based products
• *Other organic residues
2.1. Biochemical: • Aerobic conversion • Anaerobic digestion • Enzymatic process • Fermentation • Insect-based bioconversion • Other biochemical conversion 2.2. Chemical: • Catalytic • Esterification • Hydrogenation • Hydrolysis • Methanation • Chemical Pulping • Steam reforming • Water electrolysis • Water gas shift • *Other chemical conversion 2.3. Mechanical and thermomechanical: • Blending • Extraction • Mechanical &
thermomechanical disruption & fractionation
• Mechanical pulping • Separation processes • Other mechanical and
thermomechanical conversion 2.4. Thermochemical: • Combustion • Gasification • Hydrothermal liquefaction • Pyrolysis • Supercritical conversion • Torrefaction & Carbonization • *Other thermochemical
conversion
• Biochar • Bio-Coal • Bio-Crude • Biogas • Bio-oils • Bio-hydrogen • Bio-Naphtha • C5/C6 sugars • Carbon dioxide • Lignin • Oils • Organic Fibres • Organic Juice • Protein • Pyrolytic Liquid • Starch • Syngas • *Other platform
4.1. Chemicals: • Additives • Agrochemicals • Building blocks68 • Catalysts & Enzymes • Colorants • Cosmeceuticals • Flavours & Fragrances • Lubricants • Nutraceuticals • Paints & Coatings • Pharmaceuticals • Solvents • Surfactants • *Other chemical
product 4.2. Materials: • Composites • **Fibres • Organic Fertilizers • Polymers • Resins • *Other material
product 4.3. Food 4.4. Animal Feed 4.5. Energy: • Cooling agents • Fuels • Heat • Power • *Other energy product

50
CONVERSION PROCESS
The conversion process criterion provides information about the current and emerging technologies used to transform feedstock (biomass) and/or intermediates product streams into final products. In biorefinery systems, several technological processes can be applied to convert biomass feedstock into marketable products. The IEA Bioenergy Task 42 classification for the conversion process is used, with four main subcategories of processes: Mechanical, Chemical, Thermochemical and Biochemical.
A more detailed description and the definition of the different conversion processes for the new classification system is provided in Annex II.
Changes are implemented in some sub-groups. In the biochemical processes, the conversion of biomass using insects is included (this practice is also known as insect farming). This type of conversion process is mainly used to convert organic residues and waste to intermediates like protein and oil.
In the Mechanical processes, the sub-groups pressing-disruption & mechanical fractionation are merged due to the similarity of the technologies and overlapping of some of the processes and a new sub-group named “Mechanical and thermomechanical disruption and fraction”. Additionally, the blending process is included, because it is a relevant process often used in the conditioning of feedstock or process streams to reach certain specifications.
In the chemical processes the terms “Hydrothermal Liquefaction” instead of “Hydrothermal Upgrading” and “Supercritical Conversion” instead of “Supercritical Conditions” are used. Additionally, the sub-group “Torrefaction and carbonization processes” is included in the category thermochemical conversion in line with the STAR Colibri project.
1 Biochemical Conversion Processes:
• Aerobic conversion
• Anaerobic digestion (also known as methanization)
• Enzymatic Process
• Fermentation
• Insects-based bioconversion
• Other biochemical conversion
2 Chemical Conversion Processes:
• Catalytic
• Esterification
• Hydrogenation
• Hydrolysis
• Methanation
• Chemical Pulping
• Steam reforming
• Water electrolysis

51
• Water gas shift
• Other chemical conversion
3 Mechanical and Thermomechanical Conversion Processes:
• Blending
• Extraction
• Mechanical & thermomechanical disruption &fractionation
• Mechanical pulping
• Separation (e.g. filtration, distillation, absorption)
• Other mechanical and thermomechanical conversion
4 Thermochemical Conversion Processes:
• Combustion
• Gasification
• Hydrothermal liquefaction
• Pyrolysis
• Supercritical conversion
• Torrefaction & Carbonization
• Other thermochemical conversion
PLATFORM
Platforms are intermediate products that are generated from a variety of biomass feedstocks and can be further processed via the previously mentioned conversion process to obtain a broad range of final products. The platforms also provide information about the potential of integration of different facilities into more complex biorefineries.
The IEA Bioenergy Task 42 classification for the platforms is used and new platforms like, organic fibres, naphtha, protein, starch and carbon dioxide are added as they lead to several materials and chemical product outputs. In total, 16 platforms are proposed. A more detailed description and the definition of the different platforms for the new classification system is provided in Annex II.
• Biochar (very stable solid material also known as black carbon)69
• Bio-coal (solid material with a higher energy content compared to the original biomass feedstock produced via torrefaction)70
69 https://edis.ifas.ufl.edu/pdffiles/SS/SS58500.pdf 70 http://www.etipbioenergy.eu/value-chains/products-end-use/intermediates/torrefied-pellets

52
• Bio-crude (complex mixture of oxygenated organic compounds)
• Biogas (anaerobic digestion gas composed mainly of CH4 and CO2 and lower levels of impurities such as H2S)
• Bio-hydrogen (hydrogen produced from biomass in photoreactors or fermenters, mostly catalysed by enzymes. Biogenic hydrogen and carbon dioxide can be used to produce hydrocarbons or other chemicals.)
• Bio-naphtha (C5- C10 hydrocarbon compounds, without residual oxygenates)
• Bio-oils (vegetable oil, microalgae oil, tall oil, fatty, grease, used oil)
• C5/C6 sugars (C5-xylose, arabinose and C6-glucose, fructose, galactose)
• Carbon dioxide (biogenic CO2 conversion into intermediates)
• Lignin (intermediates from the processing of lignocellulosic biomass e.g. phenylpropane)71
• Organic fibres (press cake fibres, sugarcane bagasse, cellulose fibres)
• Organic juice (liquid mixture of valuable compounds: carbohydrates, proteins, free amino acids, organic acids, minerals, hormones and enzymes)72
• Protein (plant-based proteins and amino acids)
• Pyrolytic liquid (complex mixtures containing water, guaiacols, catechols, syringols, vanillin, isoeugenol, pyrenes, diverse carboxylic acids that can involve several hundreds of compounds)73
• Starch (modified and regular starch)
• Syngas (a mixture of mainly carbon monoxide and hydrogen, as well as methane, carbon dioxide and nitrogen)
• Other platform
PRODUCT
The term product refers to the products at the outlet of the biorefinery, and as such depends on the boundary of the biorefinery system74. In this proposal, the IEA Bioenergy Task 42 classification is modified, and the product criteria are re-arranged in five categories:
1. Chemicals
2. Materials
3. Food
71 F. Cherubini / Energy Conversion and Management 51,1412–1421, 2010 72 https://biorrefineria.blogspot.com/p/plataformas-de-biorrefineria.html 73 Gnansounou E., Pandey A., Life cycle assessment of biorefineries. Elsevier,2016 74 Sadhukhan J, Siew K, Martinez-Hernandez E, Biorefineries and Chemical Processes: Design Integration and
Sustainability,2014.

53
4. Animal Feed
5. Energy
The definitions of all chemical, materials, energy, food and animal feed sub-categories are discussed and explained in more detail in Annex II.
The main changes are proposed in the chemicals and material categories and are explained in the following sub-sections. Additionally, some examples per sub-category are included but the range of possible bio-based products per sub-category is broader and will be presented in the database developed in WP 4.
1 Chemicals
For the Chemicals category, the IEA Bioenergy Task 42 sub-classification based on the number of carbons in the chemical compound was considered highly specific, especially for stakeholders without technical background. Therefore, a more general sub-classification for a broader audience and based on different application markets of the chemical products is proposed. This is done in alignment to what is proposed in the ‘RoadtoBio Roadmap’ and the ‘Insight to the European market for bio-based chemicals’ report75,76.
• Additives (e.g. bio-based derived plasticizers, stabilizers, thickeners, fillers, inhibitors, flame retardants) some specific examples of chemical compounds with application as additives are: CMC (carboxymethylcellulose) and lignin.
• Agrochemicals: plant hormones (e.g. jasmonic acid, abscisic acid), naturally occurring steroid plant, bio-fungicides from plant extracts.
• Building blocks: starting materials used to mainly to manufacture other chemical compounds (e.g. ethylene, propylene, lactic acid, BTX (benzene, toluene, xylene)).
• Catalysts & Enzymes (e.g. catalyst produced from cellulosic agricultural waste and activated carbon, as well as enzymes produced from fungi or plants (e.g. amylase, papain, bromelin, ficin, malt diastase)77
• Colorants (including dyes, pigments and inks)78,79
• Cosmeceuticals: e.g. vitamins, antioxidants, botanical extracts, flavonoids, hyaluronic acid and other bioactive substance added to products that are intended to be applied to the human body with the purpose of cleaning, perfuming, protecting and keeping it in good condition.80
• Flavours & Fragrances (e.g. vanillin, geraniol, cinnamic acid, geranyl acetate, linalool)
• Lubricants (e.g. triglyceride esters derived from vegetable oils obtained from plants)
• Nutraceuticals: e.g. amino acids, vitamins, proteins, antioxidants, derived from food sources and used as additives for food and feed (e.g. hydroxytyrosol, lecithin).
75 https://www.roadtobio.eu/uploads/publications/roadmap/RoadToBio_action_plan.pdf 76 Spekreijse, J., Lammens, T., Parisi, C., Ronzon, T., Vis, M., Insights into the European market of bio-based
chemicals. Analysis based on ten key product categories, EUR 29581 EN, Publications Office of the European Union, Luxembourg, 2019.
77 B. Volesky, John H. T. Luong & Knud Aunstrup. Microbial Enzymes: Production, Purification, and Isolation, Critical Reviews in Biotechnology, 2:2, 119-146, 1984. DOI: 10.3109/07388558409082583
78 https://www.foodcolor.com/natural-pigments 79https://www.researchgate.net/publication/281113520_Extraction_of_natural_dye_Pomegranate_rind_and_its_fastne
ss_properties 80 Guidance document on the demarcation between the cosmetic products directive 76/768 and the medicinal products
directive 2001/83 as greed between the commission services and the competent authorities of member states.

54
• Paints & Coatings (paint and coating containing a vegetable fraction coming from bio-based materials such as vegetable oils, natural pigments or bio-based resins)
• Pharmaceuticals: Active Pharmaceutical Ingredients (API’s): e.g. insuline, N-acetyl glucosamine, L-lysine, artemisinic acid, caffeic acid, gallic acid, oleuropein, revastrol.
• Solvents: are chemicals that are used to dissolve other chemical substances e.g. methanol, ethanol, toluene, acetone, turpentine, ethyl acetate.
• Surfactants (mostly produced from vegetable oils, some examples: e.g. glycolipids, sopherolipids, esterquats and some starch derivates like carboxy methyl starch and sugar derivates like alkyl polyglucoside)81
• Other chemical product
Some chemicals can be categories under two or more of the categories above as they are used in multiple sectors. For example, methanol is a building block and is used to produce many downstream chemicals and materials (e.g. it is used to produce formaldehyde which is in turn used in the production of formaldehyde containing resins), but it also can be used as a solvent. Methanol could therefore be categories under either building blocks or solvents, depending on its use.
2 Materials
The materials category was re-arranged to clearly separate the chemical, energy and food & feed products from materials. Only two sub-categories from the IEA Bioenergy Task 42 classification remain in the materials section (polymers and resins) and other products like food, animal feed, fertilizers, chemicals, building blocks, bio-hydrogen and glycerine were re-assigned and into new product categories and in the case of bio-hydrogen it can be re-assigned as platform or product.
In the new classification system, the following five sub-categories are proposed in order to cover a broader range of applications of materials:
• Composites (natural composites: e.g. wood, mud bricks (mud+straw), bones and bio-based derived composites: contain synthetic fibres or synthetic polymers e.g. PLA/flax composites, paper, concrete).
• Fibres (natural fibres: e.g. wool, jute, hemp, sisal, abaca, silk and bio-based derived fibres: e.g. polycaprolactam (polyamide 6, Nylon 6), Poly(hexamethylene adipamide) (polyamide 66, Nylon 66), polyamid-11 (Nylon 11))
• Organic fertilizers (e.g. humic acid, guano, sewage sludge, compost, digest)
• Polymers (natural polymers: e.g. starch, natural rubber, cellulose, CMC carboxymethyl cellulose), lignin, chitin, pectin and bio-based derived polymers: e.g. polyethylene (PE), polyethylene terephthalate (PET), Polyethylene 2,5-furandicarboxylate (PEF), Polyhydroxyalkanoates (PHA), polylactic acid (PLA))
• Resins (natural resins: e.g. rosin, shellac, copal, respin and bio-based derived resins: polyurethane resins, epoxy resins, alkyd resins)
• Other material products
81 Spekreijse, J., Lammens, T., Parisi, C., Ronzon, T., Vis, M., Insights into the European market of bio-based chemicals. Analysis based on ten key product categories, EUR 29581 EN, Publications Office of the European Union, Luxembourg, 2019.

55
In the case of the fibres group, the Forest-based Sector Technology Platform (FTP) provided the advice to further finetune the ‘fibres’ group to subcategories that will be more understandable to their markets and stakeholders according to the application, such as: textile fibres, paper and board fibres, composite fibres and carbon/speciality fibres.
3 Energy
The energy category includes secondary energy carriers (transportation biofuels, power and heat). In this classification this category was slightly modified to differentiate the functionality of the energy product.
• Cooling agents (e.g. natural refrigerants like carbon dioxide and ammonia used in heat adsorption systems and refrigeration systems)
• Fuels (e.g. biodiesel, bioethanol, biomethane, biomethane, ethers, hydrogen)
• Heat (e.g. warming and heating services)
• Power (e.g. electricity production)
For the food and feed categories the main change is that they were moved out from the material category according to IEA Bioenergy Task 42 and were added as two separate categories. No further sub-classification is proposed because these products are not the main focus of this project.
1.5 Application of the Biorefinery Classification System
The following example shows the application of the biorefinery classification and was taken from the biorefinery database that is being developed in WP 4.
Biowert (Germany)
The core of the business of Biowert is the production of high-quality cellulosic fibres from grass (lignocellulosic from cropland and grassland). The fibre processing unit is a combination of mechanical and biochemical processes. The integration of the biochemical process (anaerobic fermentation) uses the organic juices to produce biogas which via a thermochemical conversion (combustion) delivers electricity and heat that is internally consume for the processing of the fibres.
• This biorefinery is integrated by 3 different platforms (organic fibres, organic juice and biogas) to produce three different materials (cellulosic fibres, organic fertilizer and composites). In the production of composites an additional polymeric raw material is required. The polymeric matrix of the composite can be fossil based, bio-based or a recycled polymer.82
82 Spekreijse, J., Lammens, T., Parisi, C., Ronzon, T., Vis, M., Insights into the European market of bio-based chemicals. Analysis based on ten key product categories, EUR 29581 EN, Publications Office of the European Union, Luxembourg, 2019.

56
Figure 16. Example of biorefinery classification use. Refinery Biowert (Germany)
1.6 Additional information relevant to Stakeholders
The proposed classification system is developed to provide a simple and straightforward way to describe current and future biorefineries and to allow their comparison taking into account the current available information in databases.
The classification system forms the basis of clearly naming of specific biorefinery plants. Taking the example of the Biowert Refinery in Germany, the description of the biorefinery using the proposed classification system would be:
An integrated biorefinery using food residues and grass silage to produce cellulosic fibres, organic fertilizers, composites, electricity & heat (through the biogas, organic juice and fibre platforms)
This naming could be made even more specific, replacing the general terms organic fertilizer, cellulosic fibres, composites and food residues to more specific ones if that information is available.

57
On top of the 4 characteristics being part of the classification system, there are more biorefinery based data that are important for the analysis and assessment activities within this project, such as:
‒ Feedstock origin and supply
‒ Technology Readiness Level (TRL)
‒ Size of installation
‒ Integrated plant (the plant is or not integrated to an existing plant)
‒ Biorefinery location (territorial dimension based on GPS coordinates)
These biorefinery specific data will be collected in WP 3 and WP 4 and will (together with the classification system data) be integrated in the biorefineries database (WP 4).
The additional information is not easy to obtain and in many cases the completion rate in the database is very low, nevertheless it can be useful for future assessments on the impact of biorefineries at different levels (economic, social, environmental).

58
2 WP 2 – DRIVERS AND BARRIERS FOR BIOREFINERIES
2.1 Introduction
The objective of WP 2 and the followed approach are detailed below.
Objective
The specific objective of work package 2 (WP 2) is to provide a comprehensive and structured analysis of the barriers and drivers that pertain to biorefineries as classified in WP 1.
The focus in WP2 is on the non-technical drivers and barriers to biorefinery development whilst WP3 focuses on the technical drivers and barriers. The results of WP 2 and WP 3 will feed into WP 5 which will assess the market prospects for biorefineries and develop an outlook for biorefinery deployment in the EU to 2030.
Approach
In this report we make a distinction between general drivers/barriers and specific drivers/barriers, where:
• General drivers/barriers are relevant for all/nearly all biorefineries.
• Specific drivers/barriers are relevant for one or only a few product groups (as defined in the classification in WP 1) or biorefinery pathways (as defined in WP 3).
For general as well as specific drivers/barriers, individual drivers/barriers will be determined first and then grouped into wider driver/barrier categories later. The work has been subdivided in the following activities:
Activity A: Development of the barrier and driver categorisation
Since chemical and material based biorefineries encompass many feedstocks, processes, platforms, and products (chemicals and materials), structuring barriers and drivers becomes very important. To this end a categorisation system is developed, based on several literature sources.
Activity B: Specific Barriers and Drivers
Specific barriers and drivers were determined for a limited set of product groups. These product groups were defined based on the Biorefineries Classification developed in WP 1, and in cooperation with Work packages 5 (Market Prospects for biorefineries to 2030) and 6 (EU Biorefinery Outlook and Roadmap for Deployment). Fact sheets for these product groups were developed, using the same categorisation defined in Activity A, and validated via interviews with companies that produce these types of products.
Activity C: General Barriers and Drivers
Based on the developed categorisation, general barriers and drivers were derived from several literature sources, interviews and meetings with stakeholders and from specific drivers and barrier factsheets These barriers and drivers were synthesised (combined) to capture them in a limited number of barriers and drivers, further refined and listed in a table format. Following that, a prioritisation was made by means of a Stakeholder meeting, several interviews with experts, and literature.
2.2 Activity A) Development of the barrier and driver categorisation
To derive a suitable categorisation system for general and specific drivers and barriers a practical approach was identified and adopted, which includes the following:

59
1. Develop an initial categorisation system for general barriers and drivers
2. Identify and collect relevant literature on general drivers and barriers
3. Extract and categorise general barriers and drivers
4. Refine the categorisation system and derive umbrella terms for barriers and drivers
DEVELOP INITIAL CATEGORISATION SYSTEM FOR GENERAL BARRIERS AND DRIVERS
As key starting point for the initial categorisation of drivers and barriers we built on recent EU-supported work that two consortium partners of the current assignment (BTG and/or E4tech) contributed to. This concerns on the one hand the Roadmap for the Chemical Industry in Europe towards a Bioeconomy, developed in the frame of the Horizon 2020 (BBI JU) RoadToBio project (GA No. 745623, www.roadtobio.eu) and on the other hand the report Insights into the European market for bio-based chemicals, a study commissioned by JRC83.
The RoadToBio project developed a roadmap for the chemical industry to show a way on how to increase the share of bio-based or renewable feedstock (to 25% of total volume of organic chemicals/raw materials/feedstock used by the chemical industry in 2030). In the roadmap84 a full chapter is dedicated to describing general barriers. In total 16 barriers are discussed, grouped into six categories: 1. Access to feedstock, 2. Competition with fossil fuels, 3. Policy and regulation, 4. Public perception and society, 5, Markets, finance and investment, 6. Research and Development.
The “Insights” study presents the outcome of research conducted jointly by BTG and the EC’s Joint Research Centre (in Sevilla, Spain). For the “Insights” study the authors built on a categorisation adopted from work lead by85, which had grouped drivers and barriers into four categories: 1. Innovation & technological readiness, 2. Economic and market potential, 3. Social and environmental impact, 4. Legal and regulatory factors.
IDENTIFY AND COLLECT RELEVANT LITERATURE ON GENERAL DRIVERS AND BARRIERS
In a desk study, documents discussing general drivers and barriers for the bioeconomy were identified and collected. Documents published or issued in recent years were prioritised. A mixture of sources was considered, including:
• Policy documents and the actions from the EC or from associated bodies or partners, such as the BIC SIRA 2030 , the BIC Vision document86, the JRC ‘Insights’ study1, the recent JRC report on the bioeconomy size87, and the Lot 3 Tender documents (2019)
• Deliverables for EC-supported projects, in particular Coordination and Support Actions (CSA) and CSA-like projects, such as BIOEAST (2020), BLOOM (Oct 2019), RoadToBio (April 2019), and Star-ProBio (2017)
• Conference presentations and papers such as from Chafiâ88
83 Spekreijse J, Lammens T, Parisi C, Ronzon T, Vis M. Insights into the European market for bio-based chemicals Analysis based on 10 key product categories. Published online 2019. doi:10.2760/549564
84 www.roadtobio.eu/uploads/publications/roadmap/RoadToBio_strategy_document.pdf 85 Mohannak K, Samtani L. A Criteria-based Approach for Evaluating Innovation Commercialisation A Criteria-based
Approach for Evaluating Innovation Commercialisation. DRUID Soc Conf 2014. Published online 2014 86 Bio based industries consortium. The Strategic Innovation and Research Agenda (SIRA 2030) for a Circular Bio-
based Europe. 2020;(March). https://biconsortium.eu/news/SIRA2030-consultation 87 JRC. How Big Is the Bioeconomy? Reflections from an Economic Perspective.; 2020. doi:10.2760/144526 88 Chafiâ D. Biomass and Waste to Value Products. G.I. Dynamics BV; 2020

60
• Scientific (peer-reviewed) papers such as Hassan et al.89 and Brunnhofer et al.90
The literature suggested by EC staff at the inception meeting (such as the EC Guidance for Impact Assessment and the EC Self-Assessment Tool (SAT) for regional bioeconomy projects) was also examined.
EXTRACT AND CATEGORISE GENERAL BARRIERS AND DRIVERS
Some tens of the earlier mentioned documents that discuss general drivers and barriers for the bioeconomy were assessed. From the documents a wide range of general barriers and/or drivers were extracted.
Using the initial two categorisations, we started filling a table with the extracted general drivers. Both due to the sheer number and variety of general drivers it appeared not possible to fit all of them in either of the initial categorisations. It became clear that the initial categorisation system would have to be refined.
REFINE THE CATEGORISATION SYSTEM AND DERIVE UMBRELLA TERMS FOR BARRIERS AND DRIVERS
For two distinct, but interacting, reasons it appeared useful to define a revised categorisation system, combining and adding on the two initial categorisations.
To reflect the different perspectives of various groups of stakeholders (e.g. private companies vs. policy makers) a distinction was made between micro-economic (company-level) and macro-economic (society-level) drivers. A similar distinction can be made regarding societal matters, to reflect the different viewpoints from the individual stakeholders and the full society.
To streamline the outcome of the above exercise and to reduce the large number of different terms used to describe individual general drivers and barriers, an effort was made to synthesise (combine) them, and to capture them in a limited number of overarching ( “umbrella”) terms and themes.
To ensure that for both drivers and barriers the same categorisation is applied a final streamlining step was implemented, yielding the following categories that can be applied for general drivers and barriers alike:
• Business drivers vs. Business barriers
• Innovation drivers vs. Innovation barriers
• Economic drivers vs. Economic barriers
• Access to feedstock drivers vs. Access to feedstock barriers
• Environmental drivers vs. Environmental barriers
• Societal drivers vs. Societal barriers
• Policy drivers vs. Policy barriers
89 Hassan SS, Williams GA, Jaiswal AK. Moving towards the second generation of lignocellulosic biorefineries in the EU: Drivers, challenges, and opportunities. Renew Sustain Energy Rev. 2019;101(November 2018):590-599. doi:10.1016/j.rser.2018.11.041
90 Brunnhofer M, Gabriella N, Schöggl JP, Stern T, Posch A. The biorefinery transition in the European pulp and paper industry – A three-phase Delphi study including a SWOT-AHP analysis. For Policy Econ. 2020;110(February 2019):101882. doi:10.1016/j.forpol.2019.02.006

61
The resulting driver and barrier categories are shown Table 10.
Table 10. Grouping drivers and barriers into umbrella terms and themes
2.3 Activity B) Specific Barriers and Drivers
For economic actors (e.g. biorefinery operators or investors) specific drivers and barriers may be of high, if not higher, relevance than general drivers and barriers. Such specific drivers and barriers will be determined for a limited number of (chemical and material) product groups. The selection of what product groups to consider will tie into a) the WP 1 biorefinery classification, b) the WP 3 pathways, and c) selection criteria of the consortium.
SELECTION OF PRODUCT GROUPS AND CHEMICALS
a) WP 1 Biorefinery classification system
WP 1 of the current assignment refined a classification system developed earlier by IEA Bioenergy Task 42 Biorefinery. The biorefinery classification system distinguishes the following product groups:
• 13 chemical product groups, as follows: Additives, Agrochemicals, Building blocks, Catalysts & Enzymes, Colourants, Cosmeceuticals, Flavours & Fragrances, Lubricants, Nutraceuticals, Paints & Coatings, Pharmaceuticals, Solvents, and Surfactants
Drivers (extracted from many sources) General barriers (based on RoadtoBio)
Business drivers / business perspective / new business models / cost reductions / market drivers Umbrella term “Business drivers”
Bio-based alternatives not cost-competitive/ Lower performance of bio-based alternatives Umbrella term “Business barriers”
Innovation / Advancing R&D / Functional benefits / Performance drivers Umbrella term “Innovation drivers”
Need for research and development / Limited guidance and direction in R&D / Limited understanding of ecological boundaries and innovation adaption and diffusion Umbrella term “Innovation barriers”
Economic growth; rural/community development / job creation / prosperity and employment / People and community / European competitiveness/independence Umbrella term “Economic drivers”
Limited availability of funding in the early stages / Limited support for scale-up / Limited access to finance for start-up & SME Umbrella term “Economic barriers”
Feedstock/Raw Material Flexibility/Security / Management of Natural Resources / Resource Efficiency / Circularity Umbrella term “Access to feedstock drivers”
Low availability of biomass / Non-level playing field Umbrella term “Access to feedstock barriers”
Climate change / Environment / Carbon Footprint / Ecological boundaries / Sustainable planet Umbrella term “Environmental drivers”
Umbrella term “Environmental barriers”
Personal Health / Lifestyle / Consumer awareness and concerns / new purchasing and consumption patterns / Technology acceptance “Societal drivers”
Lack of information, understanding and expertise / Low public acceptance of bio-based products / Unrealistic/High expectations Umbrella term “Societal barriers”
Policy and regulation Umbrella term “Policy drivers”
Lack of policy harmonisation / Limited long-term reliability / REACH - Registration, Evaluation, Authorisation and Evaluation of Chemicals Umbrella term “Policy barriers”

62
• 5 material product groups, as follows: Composites, Fibres, Organic Fertilisers, Polymers, and Resins
Also included in the proposed WP 1 classification, but beyond the scope of this study, are the following biorefinery products:
• energy products: cooling agents, fuels, heat, and power
• food
• animal feed
b) WP 3 Biorefinery pathways
WP 3 of the current assignment study has identified and studied a series of biorefinery pathways. For each pathway, several process variants exist regarding secondary refining and how co-products and residual materials are utilised. Two different approaches are recognised in how the biorefineries develop:
• bottom-up approach, considers the extension and/or upgrading of existing biomass processing facility (e.g. sugar, starch, oil, and pulp mill)
• top-down approach, considers new industrial value chains with newly developed, highly integrated systems
Combining the top-down and a bottom-up approaches, WP 3 identified the following 11 biorefinery pathways91:
A. One platform (C6 sugars) biorefinery using sugar crops
B. One platform (starch) biorefinery using starch crops
C. One platform (oil) biorefinery using oil crops
D. Two-platform (pulp and spent liquor) biorefinery using wood
E. Three platform (C5 sugars, C6 sugars and lignin) biorefinery using lignocellulosic biomass
F. Two-platform (organic fibres and organic juice) biorefinery using green biomass
G. Two-platform (oil and biogas) biorefinery using aquatic biomass
H. Two-platform (organic fibres and oil) biorefinery using natural fibres
I. One platform (syngas) biorefinery using lignocellulosic biomass and municipal solid waste
J. Two platform (pyrolytic liquid and biochar) biorefinery using lignocellulosic biomass
K. One platform (bio-crude) biorefinery using lignocellulosic biomass
91 The pathways do not represent a specific biorefinery facility, there could be several initiatives using this pathway or its variants in the world. Each of these “umbrella” biorefinery pathways encompasses the different process variations of this pathway described in literature. In each pathway a broad range of chemicals and materials may be generated.

63
c) Selection criteria for product groups
Considering the many configuration variants that can exist under each biorefinery “umbrella”’ pathway the number of candidate product groups for which specific drivers and barriers could be determined is high92. Available resources limit the number of product groups that can be assessed to 10. The selection was completed based on the following criteria:
• Both chemicals and materials shall be represented
• No domination of a single or just a few biorefinery pathways
• Market potential i.e. substantial market volume and/or market growth (CAGR)
• Stakeholder views and preferences
Product groups and chemicals selected
Based on the information listed earlier the following product groups and chemicals were selected:
Table 11. Selected product groups and chemicals for determining Specific Drivers and Barriers
FACTSHEETS SPECIFIC DRIVERS AND BARRIERS
In Annex III, 10 factsheets are given, one for each product group/chemical. These factsheets have been drafted and validated by an interview with one or more companies that produce that type of products.
FACTSHEET ANALYSIS TO EXTRACT GENERAL BARRIERS AND DRIVERS.
All factsheets have been analysed, to extract drivers and barriers and drivers that occur in more than one category. In that case it may not be a specific driver/barrier but a more general one. These occurrences have been tabulated in Table 12, and these have been
92 For example in commercial, demo, and pilot-scale facilities for biorefinery pathway A the following are produced: Sugar, ethanol, Ethylene glycols (MEG, DEG, TEG), Lactic acid, Polylactic acid, Lactide monomers, Microcellulose fibres, arabinose and galacturonic acid, animal feed, carbon dioxide, biogas, heat and electricity (source: WP3 status report, Table 3).
Product group Chemical/Material
Additives Propylene glycol
lubricants
Solvents
Surfactants
Fibres Microfibrillated cellulose
Polymers & Plastics Thermoplastic starch & Poly lactic acid
Building blocks 1,4-butanediol
Building blocks Lactic acid
Building blocks Methanol
Resins Lignin based phenolic resins

64
used in drafting the list of general drivers and barriers complemented by the literature review and the views of stakeholders, gathered in interviews.
In this table the number in parenthesis after the specific driver/barrier indicates how often a driver of barrier is listed in the factsheets, so 6/10 means that in six out of ten factsheets the barrier is mentioned.
Table 12. Occurrence of Specific drivers and barriers in the factsheets
2.4 Activity C) General Barriers and Drivers
Based on the developed categorisation, general barriers and drivers were derived from several literature sources, and the Specific Drivers and Barriers work. In Table 13 (page Table 13) a synthesised/combined table of the general barriers and drivers with respect to biorefineries in the EU is given. Per category a concise description alluding to the choices behind the groupings is given.
GENERAL DRIVER AND BARRIER DESCRIPTIONS
Business drivers and barriers
This is about the business-perspective, and the drivers and barriers individual biorefineries or those that seek to develop them are experiencing.
Category Drivers Barriers
1: Business 1. Many products have multiple applications (6/10)
2. Bio-based is an advantage for marketing, demand for bio-based increasing (7/10)
1. Cost competitiveness (7/10) 2. Poor performance (4/10) 3. Difficult to enter existing markets (4/10)
2: Innovation 1. Technology consolidated (3/10) 2. High investments in R&D or R&D is
widespread (2/10) 3. Improved properties (4/10)
1. Issues with IP (2/10)
3: Economy 1. Increasing EU competitiveness (2/10) 1. High investment costs for scale-up or production costs (3/10)
4: Feedstock 1. Most cases feedstocks are available from several sources (6/10)
2. Efficient extraction of lignocellulosic sugars creates more feedstock opportunity (2/10)
3. Possibility to use waste (4/10)
1. Security of supply now or when scaling up is required (6/10)
2. Food crop use/sustainability questions (3/10)
5: Climate change and environment
1. Offers GHG savings (10/10) 2. Biodegradability (6/10)
1. Lack of standardized, detailed studied information about environmental performance/difficulty proving it (5/10)
6: Citizen and Society
1. Growing consumer awareness (4/10) 2. Non-harmful to health, low toxicity
(6/10)
1. Lack of consumer awareness, lack of product labelling to increase awareness, bio-based not a selling argument or “fake products” (lack of knowledge) (2/10)
2. Confusing terminology (3/10)
7: Policy and regulation
1. Ban on plastics, regulations towards sustainable packaging (4/10)
1. Lack of regulatory push, regulations country/region dependent (6/10)
2. Some regulatory requirements (e.g. REACH) are costly and time consuming (3/10)
3. Lack of standards/labels (2/10)

65
The context here is that biorefineries seek to convert biomass into a portfolio of marketable bio-based products, as follows from the definition. Biorefineries are in development, and chemical and material products, many of fossil origin are to be replaced by biorefinery products. This leads already to several barriers and drivers that almost inevitably surface:
• Biorefinery products are often substituting fossil products in an established market, which means barriers due to established businesses with already optimised value chains, and tendencies to resist change need to be overcome.
• Biorefineries produce multiple products, for multiple markets, which means that market focus needs to be divided, and market demands may not align. The flip-side of this is that feedstocks are used more efficiently, leading to resource efficiency and cost advantages, and that companies are less dependent on one market.
In Table 13, the business barriers and drivers are grouped under Product properties and prices, and Markets and applications.
In the Table 13 part about product properties and prices, the advantages of bio-based products are listed: these can be functional advantages, lower life-cycle costs, and advantages because of green premiums or corporate social responsibility83. These ‘green premiums’ actually exists, both according to literature93, and it is mentioned for multiple product groups in the specific barriers and drivers. This ‘green premiums’ are however more easily accepted for ‘premium’ products. For more common products it is much more difficult to charge more94. The driver is furthermore not universally applicable, since it is also mentioned95 at the barriers that consumers are less willing to pay green premiums, especially when new bio-based ingredients are used in existing products. Besides these advantages, bio-based products also exhibit sometimes a lower, and/or less consistent quality, and higher costs83.
In the part on Markets and applications, benefits of bio-based products are related to their perceived environmental/sustainable benefits creating a market push via Corporate Social Responsibility programmes, and purchase policies of Brands, but also that these benefits can be used in promotions and are more in demand (market push)96. Besides that, the number of applications for bio-based products rise, and the bio-economy can provide a wider spectrum of products compared to the fossil industry1. Barriers in this part were discussed already earlier.
Innovation drivers and barriers
Innovation is very much related to biorefineries, since many products and process are relatively new, and still in development. From literature and expert interviews it’s clear that R&D is widespread, and that there are high investments in R&D, assisted by EU (e.g. BBI-JU), national and regional public funds. There is appetite for investments, helped by the same market push and pull effects discussed under business drivers and barriers83.
Flip-side of these drivers are the related barriers: Biorefineries are in many cases new plants, which are - also because of the innovative character – subject to the typical problems that start-ups have, such as difficulty to attract financing after the pilot phase (‘the Valley of Death’), and all other associated problems with trying to establish new and innovative enterprises83. To overcome the problems with scale-up of biorefineries, there are subsidy programmes (see the information the BBI-JU programme later in this
93 Carus M, Partanen A, Dammer L. Detailed evaluation of GreenPremium prices for bio-based products along the value chain. 2018;10(2013-03):1-20. https://bioforever.org/sites/default/files/publications/2018-03/Detailed-eval-GreenPremium-prices-for-bb-prod-along-value-chain.pdf
94 Expert opinion. Interview with an industry expert in the framework of this project, 2020 95 Pfau S, Vos J. Roadmap for the Chemical Industry in Europe towards a Bioeconomy - Deliverable 2.2.; 2017.
doi:10.2169/naika.106.contents 96 European Commission. Bio-Based Products – from Idea to Market.; 2019. doi:10.2777/305874

66
paragraph), and the EU is working towards streamlining financial resources and coordinating between various funding mechanism, and between different countries94.
Economy drivers and barriers
Economy drivers and barriers are less about the individual business perspective, and more about the larger benefits and issues related to biorefineries. Biorefineries use agricultural and forestry feedstocks, and the bioeconomy can thus offer a significant opportunity to grow and protect jobs and thereby stimulate economic development in rural (farming) communities. Europe is well-suited for biorefineries because of a skilled workforce and existing infrastructure. Other drivers for biorefineries are the price volatility of fossil (oil) feedstocks and instability of oil-producing countries is avoided. Conversely, low oil prices can also be a barrier if prices are particularly low. Biorefineries allow Europe to be more self-sufficient, with more resilient supply chains because of distributed feedstock supply and production83,97
In Europe, cost levels are relatively high compared to the rest of the world. Also, there is competition from non-EU produces that do not have to comply with CO2 emission reduction requirements such as ETS. The Carbon Border Adjustment Measure (CBAM) is a policy initiative that could compensate this (see the section under Policy and regulation)94.
Feedstock drivers and barriers
Biorefineries use biomass as feedstock, which is relatively abundant, though it can - because of the intensive use for food, feed, materials, and energy - also be viewed as scarce, also because the amount of arable land is limited. Biomass use for chemicals and materials is generally viewed as high value, but the (perceived) biomass availability in case of a full roll-out of biorefineries can be viewed as limited, and hence characterised as a potential barrier. Given that many biorefineries use oil crops, sugar and/or starch crops, as shown in WP 4 of this project, the scarcity of biomass and competition with food/feed is an issue. Quantitatively, the German IfBB has projected98 that the global land area to be used for bioplastics in 2023 will be 913 700 ha, or 0.007% of the total global arable land. This can be compared to the use for materials (0.79% of arable land), biofuels (0.39% of arable land) and food & feed (9.25% of arable land). Other studies99100, note the issue and offer various solutions for sustainable use of biomass. Policy drivers and barriers related to this issue are discussed under ‘Policy and regulations’.
Using biomass as feedstock can also for other reasons be problematic, such as high and fluctuating prices, single-feedstock dependency and pollution through fertilisers used when growing plants.
One potential barrier is the view by some that the current European/Nordic model of sustainable forest management, which combines forest management with below-increment harvesting and – extensive – economic valorisation of forest products, should be reviewed101. Coupled with the recent scientific debate on whether the sustainable
97 Farai Chireshe and Tjaša Bole-Rentel. The bio-economy can create thousands of jobs and boost our supply chains – here’s how. https://www.dailymaverick.co.za/article/2020-08-18-the-bio-economy-can-create-thousands-of-jobs-and-boost-our-supply-chains-heres-how/
98 IfBB- Institute for Bioplastics and Biocomposites. Biopolymers facts and statistics 2019. Biopolym facts Stat. Published online 2019:3-46. https://www.ifbb-hannover.de/en/facts-and-statistics.html
99 Rijksoverheid. Biomassa 2030. Published online 2016:32. https://www.rijksoverheid.nl/documenten/rapporten/2015/12/01/biomassa-2030
100 IEA. IEA Bioenergy 28th Update. Vol 31.; 2014. doi:10.1016/s0961-9534(07)00064-5 101 European Wilderness Society. Forest experts demanding change in forest management. Published 2020.
https://wilderness-society.org/more-than-70-leading-forest-experts-warn-against-actionism-in-the-german-forest-crisis-and-demand-end-of-wood-factories/

67
harvesting level in the EU is reached or even exceeded102, this could lead to less woody feedstock for biorefineries in the future.
Drivers for using biomass as feedstock are the diversity of feedstocks that can be used that can create supply chain flexibility83. Surplus lands, or marginal lands can be used for growing crops, and it is in many cases possible to combine growing biomass with other desirable land use functions103. Especially forests have multiple functions and values, such as enhancing biodiversity, recreation, cultural values, and carbon storage104. Lastly, the increasing availability of source-separated waste is beneficial for biorefineries that use this type of feedstock105.
Climate change and environment drivers and barriers
The use of biomass for chemicals and materials is driven by the need to reduce fossil dependency, and to decarbonise the economy. The bioeconomy, of which biorefineries are an essential part, contributes to many Sustainable Development Goals106, such as Good Health and Well-being, Sustainable Cities and Communities, Responsible Consumption and Production, and Climate Action. More specifically related to the environment, biorefinery products can also offer one or more of benefits, such as biodegradability, low ecotoxicity, recyclability, and low human toxicity107. Biorefinery products can also replace high energy intensive materials like steel, and thus lower the carbon footprint.
Given that there are many bio-based products on the market, proving their environmental or climate benefits is problematic – and thus a barrier. Via instruments like a Life Cycle Analysis (LCA) the specific benefits of one product – thus on the product level - can be determined, but LCA’s are costly and time consuming. Furthermore, although there is standardisation in LCA’s (e.g. the ISO norm 14040), there is still quite some unclarity on how to conduct these LCA’s for bio-based products and processes. Especially for new companies/SMEs and for biorefineries that produce many products, this constitutes a barrier. One recent development is the broader focus on circularity, as opposed to the exclusive focus of using bio-based materials83,95.
In addition to the barriers above, there is not a level playing field between bio-based materials and fossil materials. In an open letter to the JRC, Nova explained that fossil-sources polymers are subject to less stringent demands regarding LCA and sustainability as compared to bio-based polymers, which means that bio-based and fossil-based polymers are not scrutinised on an equal footing. Secondly, bio-based processes are often new and in development, as opposed to well-established value chains for fossil products108 but still need to show they are sustainable from day one94.
102 Korhonen K. A new article in the journal Nature overestimates the increase of forest harvesting in Europe. Published 2020. https://www.luke.fi/en/blog/a-new-article-in-the-journal-nature-overestimates-the-increase-of-forest-harvesting-in-europe/
103 Farai Chireshe and Tjaša Bole-Rentel. The bio-economy can create thousands of jobs and boost our supply chains – here’s how. https://www.dailymaverick.co.za/article/2020-08-18-the-bio-economy-can-create-thousands-of-jobs-and-boost-our-supply-chains-heres-how/
104 Orazio C, Kies U, Edwards D. Handbook for wood mobilisation in Europe. Published online 2017:116. http://simwood.efi.int
105 Favoino E, Giavini M. Bio-Waste Generation in the EU: Current Capture Levels and Future Potential.; 2020. https://zerowasteeurope.eu/wp-content/uploads/2020/07/2020_07_06_bic_zwe_report_bio_waste.pdf
106 Anand M. Brief for GSDR – 2016 Update Innovation and Sustainable Development: A Bioeconomic Perspective. Published online 2016:1-4
107 Panchaksharam Y, Kiri P, Bauen A, et al. Roadmap for the Chemical Industry in Europe towards a Bioeconomy.; 2019. https://www.roadtobio.eu/uploads/publications/roadmap/RoadToBio_strategy_document.pdf
108 Carus M, vom Berg C, Scharf A, Puente Á. How can the environmental effects of bio-based polymers be compared with those of petrochemical polymers on equal footing ? 2019;(Ilcd):1-6. https://www.european-bioplastics.org/nova-institute-published-open-letter-to-jrc-on-comparability-of-bio-based-and-petrochemical-polymers/

68
It should be noted that, although this letter only pertains to bio-based polymers, there is no reason to expect that the situation is any differed in any other case where bio-based products compete with their fossil counterparts.
One specific issue for bioplastics is that recycling of bio compostable plastics is not in line with current composting practices. Because of that, bio compostable plastics are treated like regular plastics and utilised in e.g. Refuse-Derived-Fuel and similar lower valued applications83.
Citizen and Society drivers and barriers
The use of bio-based products by consumers is arguably a driver for biorefineries. A growing consumer preference for ‘green’ products is observed, coupled with a growing awareness on the need for action regarding carbon emission reduction96. Many people have a positive attitude towards bio-based products, and increasingly prefer bio-based, or ‘natural’ products, especially those related to skin contact, and personal health83109. Bio-based products can also in some cases contribute to occupational health and safety, for example by being less toxic, such as with biolubricants.
Drawbacks for biorefineries are the poor terminology. Bio-based is a poor marketing term, and terms like biodegradability versus bio-based can be confusing. Added to that is the low public awareness of biorefinery products, and the association that some consumers have with bio-based as low-quality and/or high-priced. For some stakeholders, the term ‘bio-based’ in itself is not a fully convincing vision.
A more general emerging barrier for biorefinery products is that some stakeholders are casting doubt on all use of biomass for products, which has led to negative perceptions by some. This is intertwined with the ‘food versus fuel’ discussion110 which pertains mainly to biofuels and bioenergy, and the – earlier mentioned – discussion on sustainable management of forests. Because biorefineries – also those producing chemicals and materials – are closely linked to bioenergy, biofuels, and forestry, it is realistic to assume that the sector will also be affected by this discussion. One example showing this influence is that biolubricant producers have to prove that their products are not produced using palm oil94.
Labels can be used to highlight the benefits of bio-based products, but strict requirements, combined with the fact that many bio-based products also contain non-bio-based components, mean that some labels (such as labelling cosmetics products are ‘natural’ only if 100% bio-based) mean that many bio-based products do not qualify).
Policy and regulation drivers and barriers
Regulatory incentives and barriers can be particularly strong drivers/barriers and impact a wide range of biorefinery pathways. They are likely to rank high in the prioritisation.
There are different ways in which governments can regulate, influence behaviour, and alter incentives111. Each of these instruments has its advantages and disadvantages, strengths, and weaknesses:
109 Sijtsema SJ, Onwezen MC, Reinders MJ, Dagevos H, Partanen A, Meeusen M. Consumer perception of bio-based products - An exploratory study in 5 European countries. NJAS - Wageningen J Life Sci. 2016;77:61-69. doi:10.1016/j.njas.2016.03.007
110 Bioenergy E. Food versus Fuel. https://etipbioenergy.eu/sustainability/food-vs-fuel-debate 111 Wageningen University and Research. An overview of suitable regional policies to support bio-based business
models - Power4BIO deliverable 4.2. 2020. Accessed July 15, 2020. https://www.wur.nl/en/show/Biobased-resins.htm

69
1. regulation – a command and control approach using obligatory standards and licenses that require companies/market players to change their behaviour and punishes them if they are detected to be non-compliant.
2. economic instruments – includes all instruments changing price incentives (taxes, subsidies, feed-in tariffs), but also quantity constraints ((tradable) quota, tariff rate quota), and charges.
3. voluntary approaches – could be codes of good practice, self-regulation and other industry-led initiatives. Financial incentive schemes could be part of these instruments. These approaches typically encourage rather than force people or businesses to show the desired behaviour.
4. information and advice sharing systems – policies aimed at raising the awareness and facilitating changes in behaviour.
5. market-based signalling approaches – labelling, traceability, voluntary certification schemes and farm assurance schemes. These approaches are often related to informational problems (lack of information about product quality and food safety) hindering the proper functioning of markets.
6. other measures/instruments not in the categories above such as vision documents, road maps, strategies.
The last four types of instruments are all examples of so-called “soft measures”. Mirroring this terminology, the first two types of instruments could be referred to as “hard measures”.
Regulatory incentives and barriers that apply specifically for bio-based chemicals and materials were studied in the first year of the earlier mentioned RoadToBio project by Nova-institute with support from BTG. From some tens of European policies and regulations the most relevant ones were selected. The following were considered the most relevant the development of biorefineries and the market potential of bio-based chemicals and materials:
1. Renewable Energy Directive II (RED II)
2. Waste Framework Directive (WFD)
3. Registration, Evaluation, Authorisation and Restriction of Chemicals (REACH)
4. Common Agricultural Policy (CAP)
5. Council Regulation (EEC) No 2658/87 (Common Customs Tariff - CCT)
6. Genetically Modified Organisms Directive (2001/18/EC GMO)
7. EU Emissions Trading Scheme (EU ETS)
8. Energy Efficiency Directive (EED) and Energy Performance of Buildings Directive (EPBD)
9. Land Use and Land Use Change (LULUCF)
10. European Green Deal
11. Circular Economy Package (CEP)
12. Packaging and Packaging waste Directive

70
13. Sustainable Finance Taxonomy
14. Deforestation and forest degradation
Below, the relevance of each of these policies with respect to biorefineries is described.
The revised renewable energy directive 2018/2001/EU (“RED II”)112 is a set of policy initiatives by the European Commission with the overarching aim of making Europe climate neutral in 2050. To this end, the overall EU target for Renewable Energy Sources consumption by 2030 has been raised to 32%, and a transport sub-target has been included of minimum of 14% of the energy consumed in road and rail transport by 2030 as renewable energy.
One effect of the RED II on biorefineries and bio-based products is that of a non-level playing field: The RED II, and many national programmes provide incentives for bioenergy and biofuels and consequently the use of feedstocks for that purpose. This creates higher prices for biomass, and thus higher costs for biorefineries. So, the limited biomass supply is favoured to be used for energy purposes, which directly contradicts the circular economy idea because it reduces the cascading use of biomass and instead promotes direct, final use for energy generation. For certain types of biomass – those types that are not considered to carry the risk of Land Use Change – an even stronger competition is created, since these feedstocks can be ‘double-counted’, meaning that they can receive additional benefits. Also, these are not subject to the gradual phase-out of First-Generation biofuels. This effect is especially occurring for residual oils, Crude Tall Oil, glycerol and animal fats113. It should however be noted that many biorefineries also produce bioenergy in the form of heat, power and/or biofuels, so the incentives of the RED II will in many cases also support biorefineries development.
Positive effects on the availability of biomass are the sustainability and GHG criteria that were introduced in the RED and the RED II. For biofuels this means for example that minimum amounts of GHG savings need to be achieved, ranging from 50% for older plants (before October 2015) to 65% for the newest plants (after January 2026). Also for forestry feedstocks sustainability criteria are mandated, and GHG criteria for solid and gaseous biomass are defined. All these criteria will have the effect that biomass will be used more efficiently, and that more energy, chemicals, and materials can be generated with the same amount of feedstock.
The Waste Framework Directive (WFD) has been established in 2008, and was updated in 2018114. The goals of this update were to ensure that waste management systems of member states would be improved regarding sustainable materials, increase efficiency of resource use and to make sure that waste is valued as a resource115. Similarly, to the Circular Economy Package, this update is mainly focused on non-biomass, finite resources. However, the waste reduction aimed for can be beneficial for biorefineries since many bio-based products are biodegradable and compostable. Also allowing biodegradable and compostable packaging to be collected with the bio-waste and recycled in industrial composting and anaerobic digestion will be a driver for biorefineries. Another measure that can be beneficial is the obligation of member states to set up separate collection systems for bio-waste, since this means a higher availability of separated biowaste streams as feedstocks for biorefineries.
112 European Commission. renewable energy directive 2018/2001/EU. Published online 2018. https://eur-lex.europa.eu/legal-content/EN/TXT/?uri=uriserv:OJ.L_.2018.328.01.0082.01.ENG&toc=OJ:L:2018:328:TOC
113 Vom Berg C, Dammer L, Vos J, Pfau S. Roadmap for the Chemical Industry in Europe towards a Bioeconomy - Deliverable 2.1.; 2018. https://www.roadtobio.eu/
114 European Commission. Waste Framework Directive 2018/851. Published 2018. https://eur-lex.europa.eu/legal-content/EN/TXT/?uri=celex:32018L0851
115 Latham & Watkins LLP. The EU Adopts Four Directives to Solidify Europe’s Leading Position in Waste Management. Published 2018

71
A barrier for the use of waste streams in biorefineries is the sometimes non-uniform classification of materials as waste, residue, or coproduct, which leads to loopholes that cannot be addressed by national legislation alone. Feedstocks are classified differently in the Member States, so that a feedstock can be seen as a co-product in one country while being labelled as a residue in another. This ambiguity in classification of a material as being a “product” or “waste” can result in situations where a material has to comply with both product and waste legislations, depending on the regions it is marketed in.
This can result in problems with end-of-life treatment, how the biorefinery is characterised (as waste treatment facility or production facility), and whether the final products can be classified as ‘product’ or ‘waste’113. In most countries (e.g. AT, FR, UK, NL), individual companies can apply for an end-of-waste status of their products in a standardised procedure. In some countries (DE, IT), this option seems not to be available. In those cases, only the legislator can start such a procedure 116.
It used to be the case that use of gasification, pyrolysis and other processes such as industrial biotechnology to produce new chemical materials from waste was not counted as recycling; but this has been chanced in the 2018 update of the WFD.
REACH is the European Regulation on Registration, Evaluation, Authorisation and Restriction of Chemicals117. It entered into force in 2007. REACH aims to improve the protection of human health and the environment through the better and earlier identification of the intrinsic properties of chemical substances. This is done via four key processes, namely the registration, evaluation, authorisation, and restriction of chemicals. Manufacturers and importers are required to gather information on the properties of their chemical substances, allowing safe handling. The information must be registered in a central database in the European Chemicals Agency (ECHA) in Helsinki (https://echa.europa.eu/). REACH ensures that new substances, once registered can be freely used and traded in the EU. REACH also provides for a level playing field with non-EU producers, by also requiring registration of imported chemicals that are placed on the EU market.
For biorefineries and bio-based products REACH implies that for new chemical substances – often the case in innovative biorefineries – registration is required. This registration is progressively more elaborate and expensive when the amount of product that is placed on the market increases. This is especially difficult for small and medium-sized enterprises (SMEs) that do not have sufficient internal know-how. ECHA has introduced reduced fees for SMEs which reduces this burden, which helps to lessen that part of the barrier.
The Common Agricultural Policy (CAP) is a set of policies, defined at EU level that wants to ensure the stable supply of affordable food in the EU, safeguard farmers income, and contribute to climate change mitigation, and supporting rural development and landscapes. Support for EU farmers was in 2018 about 1/3 of the EU budget118. A side benefit for biorefineries is that a stable supply of food also means availability of crops and residues for biorefining.
An effect on biorefineries and bio-based products is that costs of feedstock produced in Europe are generally high compared to other regions, though it should be mentioned that other factors, like scarcity of land, and relatively high farming incomes will likely also be important. These high costs of feedstock mean that bio-based products, that in many cases compete on a global scale, are at a disadvantage. These high costs are related to quota and tariffs, and the generally higher costs because of demonstration of the necessary
116 Vis M, Toussaint A, Houser H, Probst M, Insam H. Guidelines on Legal and Pre-Normative Issues in the Focus Regions - Residue2Heat Deliverable 6.7.; 2019. www.residue2heat.eu
117 European Commission. REACH. Published online 2007. https://eur-lex.europa.eu/legal-content/EN/TXT/?uri=CELEX:32006R1907R(01)
118 European Commission. The common agricultural policy at a glance. Published online 2020. https://ec.europa.eu/info/food-farming-fisheries/key-policies/common-agricultural-policy/cap-glance_en

72
environmental sustainability standards by farmers, which requires complex and time-consuming procedures to demonstrate the biomass’ sustainability113.
The Common Customs Tariff (CCT) is the common European set of customs tariffs that apply to goods imported in the EU Single Market119. In 1987 legislation was introduced to set up a database (TARIC) in which all tariffs, agricultural measures, trade defence measures, prohibitions and restrictions are combined. The tariffs and quota are the same in every Member State, but differ significantly per goods category, with generally higher tariffs for agricultural goods.
The effect of this is generally higher prices for agricultural goods in the EU. This leads to increased costs for biorefineries. Though the products of the biorefineries themselves may be protected by these import tariffs, this decreases competitiveness outside the EU. As a consequence, this is an incentive for producers to look for site locations outside of Europe. Another consequence of the CCT is that many petrochemicals are exempt from import tariffs or fall under specific agreements that lower the import tariff rate. As a general trend, petrochemicals often have import tax advantages over bio-based feedstock, resulting in competitive disadvantages for bio-based chemicals and materials113. High import tariff can also lead to uncertainty regarding investments, since policy changes, e.g. through Free Trade Agreements (FTAs) – of which the EU has a large number and is working on more - can have a large effect.
The EU has a number of regulations in place to regulate the development and use of Genetically Modified Organisms (GMO) of which the first one was legislated in 2001120. The main goals of the strict regulations are ensuring the protection of humans and the environment, in accordance with the precautionary principle. The regulations are enforced at the point where GMOs are placed on the market, and at the point where they are released in the environment.
Currently, when the level of approved GMO exceeds 0.9% clear labelling is required. For non-approved GMO this threshold is zero. Some genetic modification techniques are exempted because of a proven track record, but many techniques are subject to this regulation. These thresholds limit the use of new biotechnologies and slow the EU scientific progress on this area.
EU legislation makes a distinction between (1) contained use of genetically modified micro-organisms (GMM), which falls under Directive 2009/41/EC and (2) deliberate release, which is basically any activity with GMOs that is not contained use, and falls under Directive 2001/18/EC. Generally speaking, contained use of GMM has less risk of releasing GMM in the environment, which normally means less risks, and therefore less cumbersome approval procedures.
For the other option (deliberate release), risks are perceived to be higher, and consequently the approval process is slow and expensive. According to a report from Ernst & Young published in 2014121, it takes on average around 4 years for a GMO import to be approved in Europe and for GMO cultivation applications it tends to take even longer. Costs for the applicants are estimated at between €7m and €15m, mostly due to the necessity of many studies. New and improved crops therefore face long periods of insecurity before they become accessible as feedstock for the chemical industry and their products. This means that GM improved crops, with possibly higher yields, do not become available in the EU.
119 European Commission. Council Regulation (EEC) No 2658/87 of 23 July 1987 on the tariff and statistical nomenclature and on the Common Customs Tariff. Published online 1987. https://eur-lex.europa.eu/legal-content/en/ALL/?uri=CELEX:31987R2658
120 European Commission. GMO legislation. Published online 2001. https://ec.europa.eu/food/plant/gmo/legislation_en 121 E&Y. Biotechnology in Europe The Tax , Finance and Regulatory Framework And.; 2014.
http://www.europabio.org/sites/default/files/report/ey-europabio_report_final_1.pdf

73
The European Union Emissions Trading Scheme (EU ETS) represents a common system that caps the total CO2 emission from all larger installations in the EU. It provides an – adjustable – absolute cap, and allows companies to trade their surpluses, thereby ensuring that CO2 emission reduction are carried out in a cost-effective and economically efficient way122.
The EU ETS allows for the capture of CO2 to be included. However, the use of CO2 in further processes and products (Carbon Capture and Utilisation, CCU) is not recognised in the current (third period) EU ETS. This also effects the chemical utilisation of CO2 emitted from green carbon sources. This is a barrier for products, also produced in biorefineries, made from CO2.
The amended Energy Performance in Buildings Directive (EPBD)123 has as one of the objectives to create a clear path towards a decarbonised building stock in the EU by 2050. One of the measures is that all new buildings must be nearly zero-energy buildings (NZEB) from 31 December 2020, whereby only the ‘use-phase’ of the building is taken into account, not the production of the building materials. The Energy Efficiency Directive (EED)124 mandates energy efficiency improvements, setting an energy efficiency target for 2030 of at least 32.5%, relative to the 2007 modelling projections for 2030.
Effects of the measures with respect to biorefineries are not well understood, also because the EPBD and the EED are not uniformly applied because of differences between Member States. However, it is reported that Insulation performance / thermal conductivity of natural fibre materials is not evaluated fairly. These materials can buffer moisture without function loss, but the standard evaluation applies a correction factor, leading to worse results. In some Member States these materials are not allowed at all. The more general barrier is lack of fair standardisation and regulation for bio-based construction materials.
The European Green Deal125 is a set of policy initiatives by the European Commission with the overarching aim of making Europe climate neutral in 2050. Though many of the initiatives are not yet fully worked out, the set of initiatives is likely to influence the development of biorefineries in several ways:
• It is to be expected that the actions to reduce CO2 emissions via a Climate Law126 and promote a circular economy will be beneficial, as well as actions to reduce pollution from chemicals. The BIC (Bio-based Industries Consortium) has put out a statement supporting the Climate Law, while urging the EU to also include CO2 emissions from materials and manufactured products (22% of total CO2 emissions in the EU) in the Climate Law127.
• Another element in the Green Deal is a Carbon Border Adjustment Mechanism (CBAM). This would mean that non-EU trading partners that are less strict on emission would pay a carbon tax when they put products on the EU Market. This way, carbon leakage would be avoided. Recently (June 2020) the EU launched a consultation on this. Such a measure would make it easier for the EU to mandate or stimulate biorefinery products while maintaining a level playing field. It is however not clear if and how fast this
122 European Commission. EU Emissions Trading System (EU ETS). Published online 2018. https://ec.europa.eu/clima/policies/ets_en#tab-0-1
123 European Commission. Directive (EU) 2018/844 of the European Parliament and of the Council of 30 May 2018 amending Directive 2010/31/EU on the energy performance of buildings and Directive 2012/27/EU on energy efficiency. Published online 2018. https://eur-lex.europa.eu/legal-content/EN/TXT/?uri=uriserv%3AOJ.L_.2018.156.01.0075.01.ENG
124 European Commission. Directive (EU) 2018/2002 of the European Parliament and of the Council of 11 December 2018 amending Directive 2012/27/EU on energy efficiency. Published online 2018. https://eur-lex.europa.eu/legal-content/EN/TXT/?uri=uriserv%3AOJ.L_.2018.328.01.0210.01.ENG
125 European Commission. The European Green Deal : Questions & Answers. Published 2020. https://ec.europa.eu/commission/presscorner/detail/en/QANDA_19_6690
126 European Commission. European Climate Law. Published 2020. https://ec.europa.eu/clima/policies/eu-climate-action/law_en#
127 BIC. BIC supports EU in achieving climate neutrality by 2050 in joint statement on Climate Law. Published 2020. https://biconsortium.eu/Climate-Law

74
measure will become relevant for biorefineries, since the EU has stated in its Inception Impact Assessment that this mechanism will be targeted to selected sectors, namely those that are most at risk of carbon leakage. It is unclear if chemical and material biorefineries fall under such a sector128.
• Financing biorefinery initiatives will likely be stimulated, via the 100 billion Euro Just Transition Fund. A policy initiative to make agriculture more sustainable (from farm to fork), could have an indirect impact through the valorisation of organic residues.
• Part of the EU Green Deal is a Circular Economy Action Plan that is considered by the EU to be at the core of the EU Green Deal129. The EC notes that half of total greenhouse gas emissions come from resource extraction and processing, and that it is not possible to achieve climate neutrality without the transition to a fully circular economy. Included in this new Action Plan is the drafting of a Sustainable Product Policy Framework. Such a framework – when established – would be beneficial for biorefineries, because it would address challenges related to bio-based plastics. Another initiative is the use of the Product and Organisation Environmental Footprint methods. With respect to these last two methods transition projects are currently carried out130. The PEF involves a simplified method of determine the environmental impact of products. This could be beneficial for bio-based products, given the various problems with proving the sustainability detailed elsewhere in this paragraph. Current proposals are however not considered entirely appropriate for bioplastics by the industry itself94
• To ensure that the EU tackles tackle pollution from all sources and moves towards a toxic-free environment, a Chemicals Strategy for Sustainability Communication has been adopted by the EC. This strategy contains a set of measures, such as related to the development of safe and sustainable-by-design criteria for chemicals, establish a sustainable-by-design network, financial support for safe substances, legislation, etc. Included in the strategy is to explore regulatory tools to drive and reward the development of sustainable bio-based chemicals131.
• A hydrogen strategy for a climate-neutral Europe focuses on renewable hydrogen, as it has the biggest decarbonisation potential and is therefore the most compatible option with the EU's climate neutrality goal132. Green hydrogen (i.e. the production of hydrogen via electrolysis of water using renewable electricity is the focus) but there is the potential bio-based hydrogen from syngas via biomass gasification or upgrading and reforming of biogas from anaerobic digestion. These biogenic processes are often found as part of biorefinery configurations however the hydrogen strategy only mentions this in for the longer term (after 2030), which is after the scope of the study. Green hydrogen is itself also being implemented as part of biorefinery complexes, for example it can be used to provide supplementary hydrogen in the production of methanol via gasification of biomass. The green hydrogen increases the hydrogen in the syngas mixture to the necessary ratio for methanol synthesis.
• The EU strategy to reduce methane emissions focuses on focuses on addressing anthropogenic methane emissions (i.e. emissions associated with human activity)133.There is a clear link for the biorefinery pathways that are based on anaerobic digestion of wastes (e.g. manure, sewage sludge) to produce biogas. This processes
128 European Commission. EU Green Deal (carbon border adjustment mechanism). 2020. https://ec.europa.eu/info/law/better-regulation/have-your-say/initiatives/12228-Carbon-Border-Adjustment-Mechanism
129 European Commission. Questions and Answers: A New Circular Economy Action Plan for a Cleaner and More Competitive Europe. Published 2020. https://ec.europa.eu/commission/presscorner/detail/en/QANDA_20_419
130 European Commission. The Environmental Footprint transition phase. Published 2020. https://ec.europa.eu/environment/eussd/smgp/ef_transition.htm
131 European Commission. Chemicals – strategy for sustainability (toxic-free EU environment). 2020. https://ec.europa.eu/info/law/better-regulation/have-your-say/initiatives/12264-Chemicals-strategy-for-sustainability-
132 https://ec.europa.eu/energy/sites/ener/files/hydrogen_strategy.pdf 133 https://ec.europa.eu/energy/sites/ener/files/eu_methane_strategy.pdf

75
reduces methane emissions as the methane is used either for combustion (and therefore converted to CO2, a less potent greenhouse gas), or converted to chemicals (e.g. through reforming to syngas and conversion to methanol).
• The EU is currently working on a textile strategy which is expected to be published in 2021. This is expected to be relevant to bio-based fibres produced from biorefineries that have advantages over synthetic PET fibres (that are largely imported) and are a leading cause of microplastics pollution.
The Green Deal could possibly be detrimental to the availability of feedstocks for biorefineries when other use of biomass e.g. for bioenergy and biofuels is overstimulated.
The recently (2020) agreed upon EU Recovery and Resilience facility134 - which provides significant (672.5 billion Euro) financial support in the form of loans and grants to EU Member States - is also expected to contribute to the realisation of the Green Deal objectives. Each national recovery and resilience plan will have to contain a minimum of 37% of the budget related to climate.
The EU Circular Economy Package (CEP) 135has as goal to stimulate Europe's transition towards a circular economy. There are overlaps with the bioeconomy and/or biorefineries, but the focus is different136. The Circular Economy Package mainly focuses on non-biomass, finite resources, and how to use, re-use and recycle these. There are however measures included for biorefineries/bio-based products. Measures that will act as drivers for bio-refineries are a target for recycling wood packaging, an obligation to collect biowaste separately, and a reference to food waste reduction targets. A more general driver is that the EU Circular Economy Package sets as goal to make better and more efficient use of biomass resource, while a divergence is that the value of biodegradable products does not sit well with the goal of preserving value for the longest time possible.
One element of the Package is the Single-use plastics Directive (SUPD) of 2019137. This directive constitutes a ban on the 10 single-use plastic items most found in marine litter. In total 70% of all marine litter constitutes of one of these items. The directive bans these plastics when alternatives are readily available. Guidance to implementation of this directive is currently being developed, although some member states (e.g. France) have already adopted legislation. It is unclear yet how the SUPD precisely will affect bioplastics, and by extension biorefineries that produce these. According to the sector itself, the EU should stronger acknowledge the benefits of bioplastics in this directive138. Stakeholders also mention that companies are currently pausing development work on bioplastics because of the uncertainty related to the ban94.
The Packaging and Packaging waste Directive has been established in 2004 and was updated in 2018139. In this legislation, it is made clear that bio-based plastics can help to reduce environmental impacts of plastic packaging and reduce Europe’s dependence on imported raw materials. Bio-based and recycled materials are recognised as equally viable solutions to make packaging more sustainable. Also, Member States are encouraged to
134 https://ec.europa.eu/info/business-economy-euro/recovery-coronavirus/recovery-and-resilience-facility_en#the-recovery-and-resilience-facility
135 European Commission. Circular Economy Package : Questions & Answers. Published 2015. https://ec.europa.eu/commission/presscorner/detail/en/MEMO_15_6204
136 European Environment Agency. The Circular Economy and the Bioeconomy - Partners in Sustainability.; 2018. doi:10.2800/02937
137 European Commission. Single-use plastics: New EU rules to reduce marine litter. 2020. https://ec.europa.eu/commission/presscorner/detail/en/MEMO_18_3909
138 European Bioplastics. Guidance on single-use plastics directive: European Commission to stick to its timeline. 2020. https://www.european-bioplastics.org/guidance-on-single-use-plastics-directive-european-commission-to-stick-to-its-timeline/
139 European Commission. Packaging and Packaging Waste Directive. Published 2018. https://eur-lex.europa.eu/legal-content/EN/TXT/?uri=uriserv:OJ.L_.2018.150.01.0141.01.ENG&toc=OJ:L:2018:150:TOC

76
promote the use of bio-based packaging that can be recycled or composted. The proposal contains no ‘hard measures’ however140.
The Regulation on the inclusion of greenhouse gas emissions and removals from land use, land use change and forestry (LULUCF)141, has been adopted in 2018. The central idea behind this regulation is that Member States have to ensure that greenhouse gas emissions from land use, land use change or forestry are offset by at least an equivalent removal of CO₂ from the atmosphere in the period 2021 to 2030. This means for example that when a Member States remove a forest (deforestation), the resulting CO2 emissions need to be compensated, e.g. by planting new forests. Also, emissions from the use of biomass for energy are recorded.
With respect to biorefineries and the LULUCF several factors will likely play a role. Recognising the role of forests as carbon sinks could lead to more forest in the EU, and subsequently more feedstock for biorefineries. The effect on the use of biomass for energy seems limited142, so it is expected that the indirect effects of that particular issue (biomass for energy) on biorefineries is also limited. Theoretically, when the deployment of biorefineries increases significantly, and when the use of food crops in biorefineries stays the same or becomes larger, there might be an effect on feedstock prices for these biorefineries.
The EU has recently adopted a Sustainable Finance Taxonomy143. This involves the establishment of an EU classification system for sustainable activities. Technical screening criteria have been developed, identifying 70 climate change mitigation and 68 climate change adaptation activities. Additionally, criteria that must ensure that no significant harm is being done (do no significant harm, or DNSH) have been developed144.
Biorefineries would certainly benefit from the taxonomy, if it is clear they can fulfil the technical screening criteria. This could be the case for the production of bioplastics, which would fall under the heading C21 (Manufacturing of plastics in primary form). Also, the manufacturing of other bio-based chemicals could qualify under the heading of C20 (Manufacture of other organic basic chemicals). It is not possible to determine at this moment of all products for biorefineries could qualify, given the very wide spectrum of bio-based products. It is clear, however, that this taxonomy could facilitate the increased availability for financial instruments for many biorefineries.
An upcoming EU initiative is the deforestation and forest degradation initiative145. This initiative aims to minimise the EU’s contribution to deforestation and forest degradation worldwide and promote the consumption of products from deforestation-free supply chains in the EU. The initiative complements existing EU regulations on the banning of illegal logging, and the Renewable Energy Directive which sets sustainability criteria for bioenergy from biomass. The initiative is particularly relevant for agricultural commodities; approximately 70 percent of deforestation is connected to agricultural commodity
140 BiofuelsDigest. New European legislation highlights benefits of bioplastics. Published 2018. https://www.biofuelsdigest.com/bdigest/2018/03/07/new-european-legislation-highlights-benefits-of-bioplastics/
141 European Commission. Land use and forestry regulation for 2021-2030. Published 2018. https://ec.europa.eu/clima/policies/forests/lulucf_en#tab-0-0
142 abuurs GJ, Arets EJMM, Lesschen J-P, Schelhaas MJ. Effects of the EU-LULUCF regulation on the use of biomass for bio-energy. Published online 2018. https://www.wur.nl/en/Publication-details.htm?publicationId=publication-way-353338333338
143 European Commission. REGULATION (EU) 2020/852 OF THE EUROPEAN PARLIAMENT AND OF THE COUNCIL of 18 June 2020 on the establishment of a framework to facilitate sustainable investment, and amending Regulation (EU) 2019/2088. Published online 2020. https://eur-lex.europa.eu/legal-content/EN/TXT/PDF/?uri=CELEX:32020R0852&from=EN
144 European Commission. Taxonomy : Final Report of the Technical Expert What Is the EU Taxonomy ?; 2020. https://ec.europa.eu/info/sites/info/files/business_economy_euro/banking_and_finance/documents/200309-sustainable-finance-teg-final-report-taxonomy_en.pdf
145 European Commission. Deforestation and forest degradation – reducing the impact of products placed on the EU market. Published 2020. https://ec.europa.eu/info/law/better-regulation/have-your-say/initiatives/12137-Minimising-the-risk-of-deforestation-and-forest-degradation-associated-with-products-placed-on-the-EU-market

77
production146. For EU biorefineries this initiative will be beneficial as it will be one additional step towards a level playing field with non-EU biorefineries. The public consultation is expected to be finished end of 2020, with the initiative to be completed in 2021.
Regional aspects play an important role in the broader development of the bioeconomy, and more specifically in the development of biorefineries. Here, regional aspects can imply regions as in clusters of member states, national (member state) level, or the sub-national regional level.
One first aspect is that there are stark regional differences regarding policy development. A study by the IEA on the availability of national bioeconomy strategies, showed that the policy development level was relatively high in North-Western Europe, and less in Eastern Europe147.
A second issue is the bioeconomy status in the Central and Eastern European countries. This has been the focus of the Bioeast project (www.bioeast.eu), supplemented by JRC work148. Their work shows that the bioeconomy sector in CEE countries employs a large number of people – 40% of the total bioeconomy sector in the EU – but only 9% of the bioeconomy turnover in the EU. This partly reflects differences in labour productivity, but the JRC points to a relatively low number of biorefineries as evidence of an untapped potential, particularly as many CEE countries can be characterised as having a relative abundance of biomass149. identified as main barriers with respect to the bioeconomy in CEE countries is the insufficient infrastructure, missing links between industries, such as agriculture and the petrochemical industry and the regional abundance of fossil resources.
Besides regulations, another ‘hard’ instrument is subsidies. Many subsidies exist to bring the development of biorefineries further, at EU level and at national and regional level. One EU-level programme that is well-known and actively used is – next to the regular Horizon 2020 programme and the Horizon Europe programme - the BBI-JU (Bio-based Industries Joint Undertaking) programme. This programme was mentioned by several stakeholders that were interviewed in the framework of this project. It is a public/private cooperation between the EC and a consortium of bio-based industries, that provides funding for research, development, and demonstration. Of particular interest are the BBI-JU Flagship projects150. These are Innovation Actions, where financial support is given for larger scale demonstration projects; in many cases innovative biorefineries.
By way of a summary a list of the regulatory drivers and barriers on EU level is given in Table 13:
146 Chain reaction research. The Chain: EU Proposals for Deforestation-Free Supply Chains Another Step in the Transformation of Agricultural Commodity Trade. Published 2019. https://chainreactionresearch.com/eu-proposals-for-deforestation-free-supply-chains-another-step-in-the-transformation-of-agricultural-commodity-trade/
147 Motola V, De Bari I, Pierro N, Giocoli A. Bioeconomy and Biorefining Strategies in the EU Member States and beyond - Reference Year 2018.; 2018. https://www.ieabioenergy.com/wp-content/uploads/2018/12/Bioeconomy-and-Biorefining-Strategies_Final-Report_DEC2018.pdf
148 Ronzon T, Gurria P, Parisi C, Philippidis G, M’Barek R. Socio-economic insights into the bioeconomy in BIOEAST countries. Research Brief. 2018;1:1-22. doi:10.2760/560977
149 Piotrowski S, Dammer L. State of Play of Central and Eastern Europe’s Bioeconomy. Published online 2018 150 BBI-JU. BBI-JU project overview. 2020. https://www.bbi-europe.eu/projects

78
Table 13. Drivers and barriers related to policies and regulations
Category Drivers Barriers
RED II 1. Bioenergy produced by biorefineries is supported
2. Sustainability criteria, meaning more biomass available
1. Higher demand and higher prices for biomass
2. Non-level playing field for biochemicals and biomaterials with bioenergy and biofuels
3. Additional incentives for certain low-ILUC biomass types
WFD 1. Waste reduction aims do benefit biodegradable products
2. Allowing biodegradable and -compostable materials collection with bio-waste
3. Obligations to set-up separate collection for biowastes
1. Non-uniform classification of materials as waste, residue or coproduct.
2. Usage of waste for chemicals requires regulatory work
REACH 1. Stable framework, one registration for all EU
2. Level playing field with non-EU chemicals benefits EU producers since unsafe products are banned in EU
3. Some support for SMEs
1. Difficult & expensive procedure of admitting new chemicals
2. Lack of knowledge by SMEs
CAP 1. Availability of crops and residues for biorefining
1. High costs of bio-based feedstock
CCT 1. Protection of products against world market prices
1. Global price disadvantage 2. Competitive disadvantage vs.
petrochemicals 3. Uncertainty for long-term investments
GMO 1. Mandatory labelling of GMO products 2. Slow and expensive approval procedure
EU ETS 1. CCU processes not eligible for ETS credits
EED & EBPD 1. General lack of fair regulation & standardisation for new bio-based options,
European Green Deal
1. Benefits expected from climate change action, the Climate Law and circular economy initiatives like the Sustainable Product Policy Framework, Chemicals strategy for sustainability; unclear if Carbon Border Adjustment Mechanism will be beneficial

79
2.4.1 SUMMARY TABLE GENERAL DRIVERS AND BARRIERS
Below the drivers and barriers of all seven categories are summarised.
Table 14. Overview table of general drivers and barriers
Category Drivers Barriers
1: Business Product properties and prices Bio-based products can offer various functional benefits e.g. biodegradability, foaming properties or solubility, high lubricity and adhesivity, high strength, weight reduction etc83. Bio-based products achieve Green Premium prices in many applications94 Bio-based products (e.g. bio-lubricants) may cost less over the product lifecycle owing to lower maintenance, storage, and disposal requirements. Markets and applications Corporate Social Responsibility (CSR) policies and favourable purchase policies of large brands and buyer, as result of ‘greening of society’ trend97; Rising demand/market and promotional benefits for 'chemical-free' products e.g. greener surfactants, and/or ‘biodegradable’ or ‘natural‘ products83 Increasing number of bio-based applications83 The bio-economy offers the opportunity of flexibility through a wider range of products than the conventional petrochemical processes98
Product properties and prices Lower quality vis-à-vis fossil-based equivalents; Difficulty in maintaining consistent product quality and purity83; High (production) costs, need to compete against very efficient fossil value chains83; Most consumers are only willing to pay little or no more for bio-based products96, in particular for commodities (e.g. lubricants). Existing products can only claim extra when rebranded83 Markets and applications Multiple products that serve multiple markets requires divided focus of biorefineries, though business can be more robust If priced higher, bio-based products should offer better properties/ functionalities Difficult to enter existing markets due to competition, and for customers to change suppliers83
2: Innovation Appetite for investment in ‘green’ innovations83; in particular investments targeting the UN Sustainable Development Goals (SDGs), as result of ‘greening of society’ trend97 Widespread R&D activity83 EU, national and regional support for RD&D, and increasingly for scale-up
Lack of investment (e.g. for pilots, demos, large-scale production plants) 83 Difficulty to attract finance for scale-ups
3: Economy Volatile oil/petrochemical prices Political instability of oil-producing countries Because a significant portion of bio-based feedstocks come from the agricultural sector, the bio-economy offers a significant opportunity to grow and protect jobs and thereby stimulate economic development in rural farming communities98 Presence of skilled workforce and physical infrastructure in EU83 Appetite for investment in bio-based production83 The bio-economy builds resilience in supply chains by being based on a distributed and decentralised model in contrast to vertically integrated, centralised fossil-based industries98
Volatile oil/petrochemical prices Higher cost level in EU

80
4: Feedstock Diverse feedstock use, which creates flexibility in the supply chain83 Industry crops can be grown on surplus land. Some crops can be grown on abandoned or degraded land, contributing to the rehabilitation of these areas98 Especially forests have many other functions besides feedstock supply, such as biodiversity, recreation, cultural values and carbon storage105 Widespread and growing availability of source-separated bio-waste106
Increased land use83 (Perceived) biomass availability in case of full rollout83 Biomass prices: high/ fluctuating / increasing83 Highly dependency on a single type of feedstock83 Perceived competition with food and/or energy supply83 land diverted from food production151
5: Climate change and environment
The bioeconomy is at the centre of sustainable development strategies worldwide and contributes to many SDGs107 Need to reduce fossil dependence83 Beyond being produced from renewable resources, bio-based products offer one or more/all of the following environmental benefits, namely Biodegradability, Low ecotoxicity, Lower GHG emissions, Recyclability, Low human toxicity108
Broader consideration of products sustainability; less exclusive focus on using bio-based materials A problem of bio-based products in general is the lack of evidence of their specific environmental, social and economic sustainability Environmental sustainability may be proven through a life cycle assessment (LCA). This has to be carried out at the product level, making this an expensive instrument in case of many products96 Environmental sustainability requirements are more stringent for bio-based than for fossil products. In particular for SMEs, providing formal proof of environmental sustainability/superiority (through LCA, product standard, ecolabel, etc.) is very costly Recycling issues (bio-plastics production and plastic recycling sectors are not in harmony)
83
6: Citizen and Society
1. Growing consumer preference for green products, as result of ‘greening of society’ trend98
2. Growing awareness of the impact of fossil products on the environment83
3. People assume that bio-based production is aimed at finding environmentally friendlier solutions. This results in a positive attitude towards bio-based products
4. An increase in personal health concerns; people are particularly concerned what they wear on the body and/or apply to the body (skin-contact products)
110 5. Bio-based products can contribute to
occupational health and safety (e.g. the use of bio-based lubricants produces a cleaner, less toxic working environment and not cause skin problems for those working with engines and hydraulic systems); They offer increased employee safety due to higher flashpoints, constant viscosity and less oil mist and vapour emissions
6. Preference for natural fibres for applications with skin contact83
7. Promotional benefits (e.g. of marketing cosmetics as 'natural')96
Bio-based is a poor marketing term83 There is low public awareness of biorefinery products Terminology (e.g. “bio-based”, “biodegradable”) used can be confusing for consumers: e.g. “biolubricant” can refer to products derived from renewable sources or to a biodegradable lubricant derived from petroleum-based sources); less confusing terms are not picked up; Some customers associate “bio-based” with having a lower quality and/or a higher price For producers and consumers (and certain environmental policy makers) alike, being bio-based is (in itself) not or no longer a fully convincing sale argument some stakeholders are casting doubt on all use of biomass, and/or on wood harvesting
151 National geographic. What you need to know about plant-based plastics. 2018. https://www.nationalgeographic.com/environment/2018/11/are-bioplastics-made-from-plants-better-for-environment-ocean-plastic/

81
7: Policy and regulation
Forthcoming EU legislation, such as the European Green Deal and the Sustainable Finance Taxonomy is expected to give biorefinery products a boost Several current EU regulations, such as the Circular Economy Package, the updated Waste Framework Directive, and the updated Packaging and Packaging Waste Directive include measures that are beneficial for biorefineries. Several EU regulations such as Sustainable Finance Taxonomy, and the Deforestation in iterative contain measures that could be beneficial when enacted upon further. For some bio-based products relevant standards and workable eco-labels exists (e. g for bio-based lubricants, and for compostable bioplastics)
There is no financial support for chemical and material products from biorefineries, nor is there generic financial support for investments yet. EU legislation supporting biomass use for biofuels and energy (e.g. RED II) result in a lack of level playing field for other chemical/material biorefinery products114 For many bio-based products there are no relevant product standards; / eco-labels; many existing ones were developed without keeping bio-based options in mind The REACH requirement to register new chemical substances manufactured or imported in quantities of 1 tonne or more per year is a significant barrier for innovative biorefinery products Registration procedures are both time consuming and costly Several other EU regulations, such as the Common Agriculture policy, Common Customs Tariffs, GMO regulations, the EPBD and LULUCF contain aspects that can hinder biorefineries products Need for stable and long-term regulations, providing certainty for investors95.
2.4.2 PRIORITISATION GENERAL DRIVERS AND BARRIERS
To develop a prioritisation of the General Drivers and Barriers derived in the previous paragraphs, a stakeholder workshop was held to define these. In this workshop, held on 7 October 2020, the General Barriers and Drivers were presented and ranked, using an on-line voting tool (Mentimeter). Added to the seven categories, was an extra category to account for technical barriers.
31 External stakeholders took part in the workshop. An additional 13 people participated, who were either part of the Consortium (12) or representative of the principal (the EU) (1). In advance it was agreed that consortium member would also vote, because of their expertise. Not all participants voted on all subjects.
The voting was carried out as follows:
1. Firstly, for every category all drivers were presented after which stakeholders were requested to vote on 2 or 3 options (dependent on the number of options presented). The same was done for the barriers for every category
2. In a second segment – as part of the same workshop – the stakeholders were asked to rank – from the top choices of each category – the most important drivers. The same was done with the barriers
Results are shown in Figure 17. and Figure 18 In these figures the results of the votes are shown as percentages.

82
Figure 17. Ranking of the General Drivers for biorefineries
Figure 18. Ranking of the General Barriers for biorefineries
Workshop participants expected that the Green Deal will give a significant boost for biorefineries. Government support for RD&D and scale-up is also considered very important, as is the need to reduce fossil dependency.
Top barriers are considered to be the costs, and – as a second cost related item – that consumers are not willing to pay more for bio-based. A barrier that cannot be remedied by (government or other) action, is the complex nature of biomass. Proof of sustainability issues, and perceived competition with food is also deemed important, which fits with the information gathered in the stakeholder interviews, and the information gathered from various literature sources.

83
3 WP 3 – AVAILABLE AND EMERGING BIOREFINERY PATHWAYS AND RD&I NEEDS
This section includes a chapter of available and emerging technologies and RD&I needs (WP 3). It was led by WUR.
3.1 Introduction
In this Work Package 3 (WP 3), available and emerging biorefinery technologies and pathways will be identified and described in line with the Biorefinery Classification System developed in WP 1 and linking with the WP 4 Biorefinery Database with a focus on chemical and material products. It is expected that chemicals and materials focused biorefineries will compete with fossil-based pathways for producing equal, similar, functionally comparable or dedicated chemicals and materials. Technical feasibility of the substitution at the level of chemicals, materials or functional roles need to be taken into account. So, understanding the advantages and disadvantages of biorefinery pathways relative to these fossil-based pathways is important in understanding their prospects and their needs.
Technical and non-technical barriers affecting the biomass-to-products value chains have to be tackled to achieve a successful market deployment of biorefineries in a European Circular Bioeconomy and in line with the EU policy objectives agreed for 2030 and 2050. Amongst others, they strive for an effective utilisation of residues and waste for climate-neutral circular products and implementation of strategies on Biodiversity and Farm to Fork for 2030. This includes stepping up actions to avoid or minimize, products associated with deforestation or forest degradation to be placed on the market. The deforestation may relate to several food-based feedstocks such as palm oil, soya, sugar cane, cassava and some other grains.
WP 2 focuses on identification of the non-technical barriers, whereas in this WP 3 the technical barriers (as well as opportunities) are identified. This WP 3 will also deal with the identification of the main research, development and innovation (R&D&I) needs to address the technical and non-technical barriers and opportunities that influence biorefinery market deployment.
3.2 Aim and objectives
The aim of WP 3 is to assess available and emerging biorefinery technologies and pathways, compare them with competing pathways (e.g. fossil and CO2 based), and identify technical barriers and research, development and innovation needs for the successful market deployment of biorefineries. Specific objectives are:
• to identify and describe available and emerging biorefinery technologies and pathways;
• to identify alternative/competing pathways and to qualitatively assess key advantages and disadvantages of biorefinery pathways compared to alternative/competing pathways;
• to identify technical barriers and research actions to overcome these barriers for market deployment of biorefineries;
• to identify major research, development and innovation needs for biorefineries to overcome technical and non-technical barriers to become competitive with alternative fossil-based and sustainable pathways for the production of chemicals and materials.

84
3.3 Approach
This WP 3 begins by identifying and describing available and emerging biorefinery technologies and pathways in line with the Biorefinery Classification System developed in WP 1. Together with WP 4 (biorefinery database) commercial examples for these pathways are identified. Emerging pathways that include demos, pilots and main applied R&D&I initiatives are identified through literature review and based on the extensive knowledge of the project partners in the area as well as information from the SAG and stakeholder workshops.
Competing pathways for the production of chemicals and materials are identified that include using fossil and CO2 as feedstock. A high-level assessment of the advantages and disadvantages of biorefinery pathways relative to the alternative pathways is performed.
Several criteria are used, such as: sustainability of biomass feedstock, climate-neutrality and circularity of products, (potential) product performance, cost competitiveness, and social acceptance, as far as these could be extracted from existing literature (i.e. the project is not including own system modelling/assessment activities).
WP 3 further analyses the technical barriers hindering the deployment of biorefineries and uses them and the non-technical barriers identified in WP 2 to identify R&D&I needs that could address both types of barriers. In 2011 the EU StarColibri project delivered a Biorefinery Vision Document, and a Biorefinery Joint Strategic Research Roadmap for biorefineries in the EU.152,153 The information from the StarColibri project is taken as a starting point for the analysis. Detailed technical barriers and R&D&I needs assessments from other projects and literature are used. These include outcomes/publications of major EU-projects (H2020/BBI), and Strategic Research and Innovation Agendas of major European, international and national organizations (i.e. ETIP Bioenergy, EERA Bioenergy, Bio-based Industries Consortium (BIC)/BBI-JU, Europabio, IEA Bioenergy Task42, and other that are relevant) that consider chemicals & materials driven biorefineries.
This WP 3 is accordingly broken down into four tasks:
1. Identification and description of available and emerging biorefinery pathways;
2. High-level assessment of the key advantages and disadvantages of biorefinery pathways in the light of the EU policy goals and compared to alternative pathways;
3. Identification of technical barriers and opportunities for market deployment of biorefineries;
4. Major research, development and innovation needs to overcome technical and non-technical barriers to biorefinery market deployment.
3.4 Task 1 - Identification and description of available and emerging biorefinery pathways
BIOREFINERY PATHWAY
A biorefinery pathway (see Figure 19 ) consists essentially of the pre-treatment and preparation of the biomass, separation of biomass components into intermediates/ platforms (primary refining) and further conversion and processing of the intermediates
152 Luguel, C., Annevelink, EB., Burel, C. and Gosse, G. Joint European Biorefinery Vision for 2030. Star-COLIBRI project. 2011.
153 Luguel, C., Annevelink, EB., Burel, C. and Gosse. G. European Biorefinery Joint Strategic Research Roadmap. Star-COLIBRI project. 2011.

85
into more intermediate products and semi-finished or finished products (secondary refining).
Figure 19. Biorefinery process chain
A biorefinery is composed of four structural elements: ‘Feedstocks’, ‘Platforms’, ‘Conversion processes’ and ‘Products’. These four elements are combined in a biorefinery pathway (see Figure 2). The generic example of a biorefinery depicted here starts with a feedstock, which is converted to one (or more) platform(s) from which chemical, material and energy products are produced; whereas side-streams are used as (food/feed) co-products. ‘Platforms’ are short-hand descriptions of important intermediates in biorefineries, such as C6 sugars, oils, lignin etc. that serve as basis for many subsequent products. Figure 20 also gives the legend which shows the different shapes used to represent the four structural elements of a biorefinery pathway. Furthermore, colours are used to differentiate between the different type of processes used in conversion and the different types of products produced. For primary refining, green arrows are used in connecting the elements and for secondary refining black arrows are used.
Figure 20. Schematic representation of a biorefinery pathway

86
APPROACH FOR IDENTIFYING THE BIOREFINERY PATHWAYS
As mentioned before, the classification system described in WP 1 is composed of four structural elements: Feedstocks, Conversion Processes, Platforms and Products, each featuring numerous sub-elements. This opens up many options for different biorefinery pathways, all being composed of a variety of linked biorefinery technologies.
For identification of the pathways the most notable examples currently existing or emerging have been selected where the focus is on chemical and material products in line with the objectives of the project. It is seen that chemical and material-products can arise from expansion/upgrading of conventional biorefineries by new secondary refining processes (enhancing the effective use of residues and waste for new chemicals or materials). There are also biorefineries specifically designed for the conversion of the feedstock to chemical and/or material products.
The goal is to identify the pathways for bio-based chemical and/or material products with their possible combination with energy, biofuels, food and feed products in a biorefinery system. This was done by reviewing the biorefineries already existing today (linking to WP 4) as well as considering developments that are already in progress (at demo, pilot scale or by applied research activities) by conducting a literature review. For this, apart from the database of commercial biorefineries developed in WP 4, reports from the StarColibri project83,84, a selection of IEA Bioenergy Task42 publications (reports and papers154,155,156,157, country reports158 and factsheets159), Biorefineries Roadmap of the German Federal Government160, ongoing BBI JU projects161 and selected publications by nova-Institute162,163,164, were taken into consideration. From this review of the existing and emerging facilities, the ones producing chemicals and materials were identified and they were grouped in a number of umbrella of biorefinery pathways. So, the pathways do not represent a specific biorefinery facility; there could be several initiatives using this pathway or its variants in the world. Each of these umbrella biorefinery pathways encompasses the different process variations of this pathway described in literature.
APPROACH FOR CATEGORIZING THE PATHWAYS
In order to categorize the pathways there are different approaches that can be used focusing on different aspects:
• Feedstock (e.g. sugar crop biorefinery, grass biorefinery, straw biorefinery, algae biorefinery, whole crop biorefinery, lignocellulosic feedstock biorefinery);
154 Jungmeier, G., Hingsamer, M. and van Ree, R. Biofuel-driven Biorefineries. IEA BioenergyTask42 Biorefining. 2013. 155 Bell, G., Schuck, S., Jungmeier, G., Wellisch, M., Felby, C., Jørgensen, H., .Spaeth, J. Sustainable and synergetic
processing of biomass into marketable food & feed ingredients, chemicals, materials and energy (fuels, power, heat). IEA Bioenergy Task42 Biorefining. 2014.
156 Cherubini, F., Jungmeier, G., Wellisch, M., Willke, T., Skiadas, I., van Ree, R., de Jong, E. Toward a common classification approach for biorefinery systems. Biofpr. 3 (5): 534–546. 2009.
157 Wenger, J., Stern, T., Schöggl, JP., van Ree, R., de Corato, U., de Bari, I., Bell, G., Stichnothe, H. Natural Fibres and Fibre-based Materials in Biorefineries. IEA Bioenergy Task42 Biorefining. 2018.
158 IEA Bioenergy Task 42 Country Reports, http://task42.ieabioenergy.com/document-category/country-reports/ 159 IEA Bioenergy Task42 Factsheets, http://task42.ieabioenergy.com/document-category/factsheets/ 160 The Federal Government. Biorefineries Roadmap as part of the German Federal Government action plans for the
material and energetic utilisation of renewable raw materials. May 2012. 161 BBI JU projects, https://www.bbi-europe.eu/projects 162 De Beus, N., Carus, M., Barth, M. Carbon Footprint and Sustainability of Different Natural Fibres for Biocomposites
and Insulation Material - Study providing data for the automotive and insulation industry. nova-Institute. 2019. 163 Nova-Institut. Bio-based Building Blocks and Polymers in the World – Capacities, Production and Applications:
Status Quo and Trends towards 2020. 2015. 164 Piotrowski, S. et al. Sustainable Biomass Potential for Biofuels in Competition to Food, Feed, Bioenergy and
Industrial Material – a Global Analysis of Biomass Supply and Demand. 2015.

87
• Process (e.g. thermochemical biorefinery, biochemical biorefinery, liquid phase catalytic processing biorefinery, combined thermo- and biochemical conversion biorefinery);
• Platform (e.g. syngas platform biorefinery, C6 and/or C5 sugar-platform biorefinery, lignin-platform biorefinery, vegetable oil or oleochemical platform biorefinery, biogas platform biorefinery, two-platform biorefinery);
• Product (e.g. energy-driven biorefinery, material-driven biorefinery)
In accordance with the classification system described in WP 1 and classification approach defined by IEA Bioenergy Task42, the platform is the central element of the system and most important feature in specifying the type of biorefinery. Therefore, in this project the platforms (intermediates) that arise from primary refining are used in defining and distinguishing the biorefinery pathways. Each pathway can have as feedstock one or more types of biomass. Different types of technological processes can be applied to convert the biomass feedstocks into platforms, and to finally convert these platforms to a spectrum of products. Therefore, the set of platforms produced from primary refining processes are considered the distinguishing element for the pathways. It should be noted that in secondary refining, meaning the further processing of platforms into products, additional intermediates/platforms can arise. These downstream platforms will not be taken into the naming of the biorefinery pathway as other variants could be possible from the primary platforms to end-products.
HOW DO THE BIOREFINERY PATHWAYS EXPAND, EMERGE AND DEVELOP?
Two different approaches exist for the development of biorefineries: ‘bottom-up’ and ‘top-down’83.
• If the biorefinery concerns the extension and/or upgrading of conventional biomass processing facility (e.g. sugar, starch, oil and pulp mill), it is referred to as a bottom-up approach. Here the aim is to achieve an expanded range of products and/or an increased valorisation of biomass fractions through the connection of additional processes and new technologies in an integrated way. An example is the Roquette Lestrem biorefinery which was a simple starch mill that was gradually developed, and the product spectrum increased to native and modified starches, proteins, polyols, organic acids and specialty chemicals.
• If the biorefinery develops as part of new industrial value chains with newly developed, highly integrated systems, it is referred to as top-down approach. It typically considers specifically developed new processes to convert various biomass fractions and zero-waste generation of a broad variety of products for different markets. Systems for primary and secondary refining are specifically developed for the conversion of the feedstock into a range of products. An example is the Biowert refinery producing high-quality fibres from grass for biomaterials such as composites. The integration of the anaerobic digestion process uses the remaining organic juices to produce biogas which delivers electricity and heat. Organic fertilizer is attained as a by-product.
The bottom-up approach is always a brownfield approach, i.e. an existing facility is upgraded/extended to a biorefinery facility at the same site. The top-down approach can be either a brownfield or greenfield approach. In the first case, a new separate biorefinery (pathway) will be realized at the same site of an already existing facility where the new biorefinery will take advantage of the already existing industrial infrastructure (biomass supply, use of auxiliaries, use of downstream processing facilities) and or regulations/ permits. This potentially will reduce deployment time because of multiple factors, such as lower overall investments required, shared facilities, existing environmental permits etc.

88
In the second case a new biorefinery pathway will realized from scratch, potentially requiring higher investments, new permits etc., significantly increasing the time-to-market. Examples of both cases can be found in the bioethanol sector. There are several plans to build advanced lignocellulosic biorefineries at the same site of already existing conventional ethanol plants using sugar/starch crops with the aim to use existing biomass supply infrastructure, experienced personnel, existing auxiliaries, the ability to plug-in existing waste water treatments and/or distillation facilities etc. On the other hand there are also demo plants to produce advanced bioethanol realized at new stand-alone sites, i.e. the greenfield approach, for example within the feedstock cultivation area.
Various biorefinery pathways can be synergistically combined for optimal business case deployment from both an socio-economic and sustainable point-of-view. In the pulp & paper sector both the bottom-up approach (i.e. expanding the downstream products portfolio of conventional pulp mills) and top-down approach (i.e. valorising bark and forest residues in parallel with new biorefinery concepts at the same site) are used to create the highest value from wood and the related forestry residues. This synergistic combination provides an attractive business case from both an socio-economic and environmental point of view.
Development and/or expansion of a biorefinery pathway usually proceeds incrementally. A number of products can be expanded by separating and upgrading residues. Furthermore, various biomass conversion technologies can be integrated optimising the valorisation of feedstock into range of products co-producing combination of chemicals, materials, fuels, energy, food and feed. The integrated biorefineries offer possibilities to completely new chemicals and materials to be produced.
Furthermore, in accordance with the recent policy ambitions, transition in biorefinery developments could take place in the near future. This considers a transition from a more energy focus towards more chemicals and materials focus in biorefineries. Currently, the European biorefineries are mostly energy-driven owing to the existing biofuel-related policy targets supporting the use of biomass for biofuels production. No such directive exists yet for the use of biomass for chemicals/materials. But, the principles of the circular economy and of the waste hierarchy (Directive 2008/98/EC, Article 4) favour the use as a material over energy use. One of the actions in the Circular Economy Action Plan is the development of the Sustainable Products Policy legal framework that will make use of the Products’ Environmental Footprint (PEF).
With the increased electrification of the transport sector (mainly in road and rail transport), on the longer-term, biofuel demand may decline. For the short-term potential declining biofuel use in road/rail transport will be compensated for by an increased demand for advanced biofuels in the heavy duty road, aviation and shipping transport sectors. On the mid/longer-term some of the advanced biofuel biorefining infrastructures potentially can be used to produce chemicals/materials instead of fuels. The transition from a fuel to chemicals focus could for example be achieved in existing biorefineries by diverting bioethanol from fuel use towards chemical use, and the use of C6 sugars for the production of other chemicals through chemical conversion or fermentation. Similarly, also using fatty acid methyl esters for production of fatty alcohols for example in the production of surfactants instead of using FAME as biodiesel fuel. It has to be noted that the biofuel sector is a factor larger than the chemicals sector, so only a portion of existing biofuel assets could transition to focusing on chemicals and materials. This leaves enough capacity to meet the future market requests for biofuels in aviation and shipping transport sectors.
The second transition with respect to recent policy ambitions is the transition towards use of residues and waste materials as feedstock and limiting the use of food crops as feedstock in biorefineries. The sustainability of the biomass used in biorefineries is an important consideration. This transition is already being supported in the production of fuels from biomass. There is a dedicated target for advanced biofuels produced from feedstocks listed in Part A of Annex IX of the Renewable Energy Directive (EU/2018/2011). Furthermore, there is a cap for fuels produced from food and feed crops for which a significant expansion

89
of the production area into land with high-carbon stock is observed. The ILUC Directive (EU/2015/1513) further limits the use of food-based biofuels.
Expansion in agricultural production, results in adverse direct and indirect changes to land use which leads to deforestation and has a negative climate and biodiversity impacts. The “food first” principle, which considers that the food and feed crops production must be first directed towards meeting the world’s food and nutritional needs before supplying raw materials for energy or industrial purposes, is a way to answer to these potential adverse effects. The use of food crops as a feedstock for biorefineries should not decrease the availability of food crops for food production. As part of the Biodiversity for 2030 Strategy and Farm to Fork Strategy, the Commission will present in 2021 a legislative proposal and other measures to avoid or minimise products associated with deforestation or forest degradation.
OVERVIEW OF THE IDENTIFIED BIOREFINERY PATHWAYS
In the sections below the identified biorefinery pathways are described divided into two categories, i.e. bottom-up and top-down, as defined above.
The naming of the pathways includes platforms (intermediates) that arise from primary refining and the feedstocks used: A <number of> platform biorefinery (<names specific platforms from primary refining>) using <names specific feedstocks>. The downstream platforms and name of the products are not included into the naming of the biorefinery pathway as several variants are possible from the primary platforms to end-products for each biorefinery pathway.
For each biorefinery pathway, first a description is provided, followed by information in general terms regarding the four elements of the classification system: ‘Feedstocks’, ‘Platforms’, ‘Conversion processes’ and ‘Products’. There are several process variants for all the biorefinery pathways regarding secondary refining and how co-products and residual materials are utilized. These process variants existing for each pathway are then described. The platforms are marked red and the products are made bold in the description of these process variants. Examples of commercial plants (linking to WP 4 Biorefinery Database) and examples of demos, pilots and major applied research activities (based on literature review) in relation to the identified biorefinery pathways are provided. It is important to note that the aim is not to provide a database for all the initiatives available for each pathway, but to provide illustrative examples for the different process variants in each pathway.

90
Table 15. Overview
of the biorefinery pathways
Nam
e
Feed
stock
s C
on
versio
n P
roce
sses
Pla
tform
s P
rod
ucts
Bottom-up approach
A
One platform
(C6 sugars) biorefinery using
sugar crops Sugar crops
Extraction, fermentation, (chem
ical conversions)
C6 sugars
Chem
icals, polymers, food, anim
al feed, ethanol (building block or fuel), C
O2 , pow
er and heat
B
One platform
(starch) biorefinery using starch crops
Starch crops
Extraction, fermentation,
(hydrolysis, chemical conversions)
Starch
Chem
icals, (modified) starches, polym
ers, food, anim
al feed, ethanol (building block or fuel) and CO2
C
One platform
(oil) biorefinery using oil crops, w
astes and residues O
il crops, waste/residue
fats, oil and greasesa
Pressing, transesterification, (hydrolysis, chem
ical conversions) O
il Chem
icals (fatty acids, fatty alcohols, glycerol), food, anim
al feed, fuels (biodiesel and renewable
diesel)
D
Two-platform
(pulp and spent liquor) biorefinery using w
ood Lignocellulosic crop, w
ood/forestry, residues from
agriculture and forestry
Mechanical processing, pulping,
combustion, (separation,
extraction, gasification)
Pulp, spent liquor
Materials (pulp and paper, specialty fibres),
chemicals (turpentine, tall oil, acetic acid, furfural,
ethanol, methanol, vanillin), lignin, pow
er and heat
Top-down approach
E Three platform
(C5 sugars, C
6 sugars and lignin) biorefinery using lignocellulosic biom
ass G
reen biomass
b Pre-treatm
ent, hydrolysis, ferm
entation, combustion,
(thermo-/
chemical conversions)
C5 sugars,
C6 sugars,
lignin
Chem
icals, lignin products (materials, arom
atics, pyrolytic liquid, syngas), ethanol (building block or fuel), pow
er and heat
F Tw
o-platform (organic fibres and organic juice)
biorefinery using green biomass
Aquatic biom
ass Pressing, fibre separation, anaerobic digestion, com
bustion, (upgrading, separation)
Organic
fibres, organic juice
Materials, chem
icals (lactic acid, amino acid),
animal feed, organic fertilizer, fuels (biom
ethane, ethanol), pow
er and heat
G
Two-platform
(oil and biogas) biorefinery using aquatic biom
ass N
atural fibres (e.g. hem
p, flax)b
Extraction, anaerobic digestion, com
bustion, esterification, (hydrolysis, chem
ical conversions)
Oil, biogas
Chem
icals (fatty acids, fatty alcohols, glycerol), nutraceuticals, food, organic fertilizer, biodiesel, pow
er and heat
H
Two-platform
(organic fibres and oil) biorefinery using natural fibres
Lignocellulosic biom
assc, M
SW
Fibre separation, extraction, (chem
ical conversions) O
rganic fibres, oil
Materials, chem
icals (fatty acids, fatty alcohols, glycerol), nutraceuticals, cannabinoids, food and biodiesel
I O
ne platform (syngas) biorefinery using
lignocellulosic biomass and m
unicipal solid waste
Lignocellulosic biomass
c Pretreatm
ent, gasification, gas conditioning, chem
ical conversions Syngas
Chem
icals (methanol, hydrogen, olefins), w
axes and fuels (F-T biofuels, gasoline, LN
G, m
ixed alcohols)
J Tw
o platform (pyrolytic liquid and biochar)
biorefinery using lignocellulosic biomass
Lignocellulosic biom
assc, organic
residues, aquatic biom
ass
Pyrolysis, separation, combustion,
(gasification, cracking, extraction) Pyrolytic liquid, biochar
Pyrolysis oil (for materials, chem
icals, food flavourings, syngas, biofuels), biochar, pow
er and heat
K
One platform
(bio-crude) biorefinery using lignocellulosic, aquatic biom
ass, organic residues Lignocellulosic crop, w
ood/forestry, residues from
agriculture and forestry
Hydrotherm
al liquefaction, upgrading
Bio-crude
Chem
icals and fuels
a. Waste/residue fats, oils and greases belong to category "O
ther organic residues" b. G
reen biomass and N
atural fibres belong to category "Lignocellulosic from croplands and grasslands“
c. Lignocellulosic biomass includes Lignocellulosic from
croplands, wood/forestry and residues from
agriculture and forestry

91
BIOREFINERY PATHWAYS FOLLOWING BOTTOM-UP APPROACH
The biorefinery pathways following the bottom-up approach concern the extension and/or upgrading of conventional existing industries/facilities of a sugar mill, starch mill, oil mill or paper mill.
A. One platform (C6 sugars) biorefinery using sugar crops
Description: This pathway uses sugar crops such as sugarcane and sugar beet as feedstock and during primary refining sucrose (C6 sugars) is extracted from them. Thus, C6 sugars constitute the platform for this biorefinery pathway. In secondary refining the C6 sugars are then typically used as fermentation raw material for bioethanol synthesis. Bioethanol can be used as a fuel or used as a chemical building block to produce other chemicals like bioethylene. Furthermore, there is diversification of products from C6 sugars towards other chemicals produced through fermentation and/or chemical conversions. These chemical products can be used as chemical intermediates for further processing into finished products, such as fine chemicals and bioplastics. Figure 21 illustrates how the C6 sugars (glucose) can be used in the synthesis of many chemicals and plastics. It also shows that ethanol serves as a platform chemical that can be used for further synthesis of other chemicals and bioplastics.
There are by-products produced during primary refining (i.e. molasses, sugarcane bagasse, sugar beet pulp). Molasses are mostly used for feed or utilized as fermentation raw material. Sugarcane bagasse is used mostly for internal energy purposes whereas sugar beet pulp is mostly used as animal feed.
Fermentation during secondary refining also results in by-products of vinasse and in fuel oils. The fuel oils separated during bioethanol purification are used as raw material for the chemical industry for example in obtaining esters. Vinasse is used for animal feed and fertirrigation, i.e. utilizing it as a liquid fertilizer for crops. It can also be used for biogas production through anaerobic digestion where the by-product digestate after crystallisation of struvite finds use as a fertilizer. The biogas can be used to produce heat and electricity in a combined heat and power (CHP) plant or upgraded and fed into the natural gas system or used as biofuel. Also, the by-product carbon dioxide generated during the fermentation process can be conditioned and attained as an additional value stream which can be used by the food and beverage industry. Moreover, using carbon dioxide as a raw material for chemicals and plastics using renewable energy is increasingly researched.
Feedstock: Sugar crops such as sugarcane and sugar beet
Platform: C6 sugars, (biogas)
Processes: Extraction, fermentation, (chemical conversions, combustion, anaerobic digestion, conditioning)
Products: Chemicals, polymers, food, animal feed ethanol (building block or fuel), CO2, power and heat

92
Figure 21.Illustration of the diversity of bio-based plastics and their chemical pathways from sugars. Source:
adapted from nova-Institut 2015165
Figure 22 provides a schematic representation of the One platform (C6 sugars) biorefinery pathway using sugar crops showing the different process variants. Because the side streams arising from primary refining of sugar beet and sugar cane are valorised in different ways, two separate schemes are provided for each in this pathway.
165 Nova-Institut. Bio-based Building Blocks and Polymers in the World – Capacities, Production and Applications: Status Quo and Trends towards 2020. 2015

93
Figure 22. One platform (C6 sugars) biorefinery pathway, using sugar beet (top) and from sugar cane (bottom)
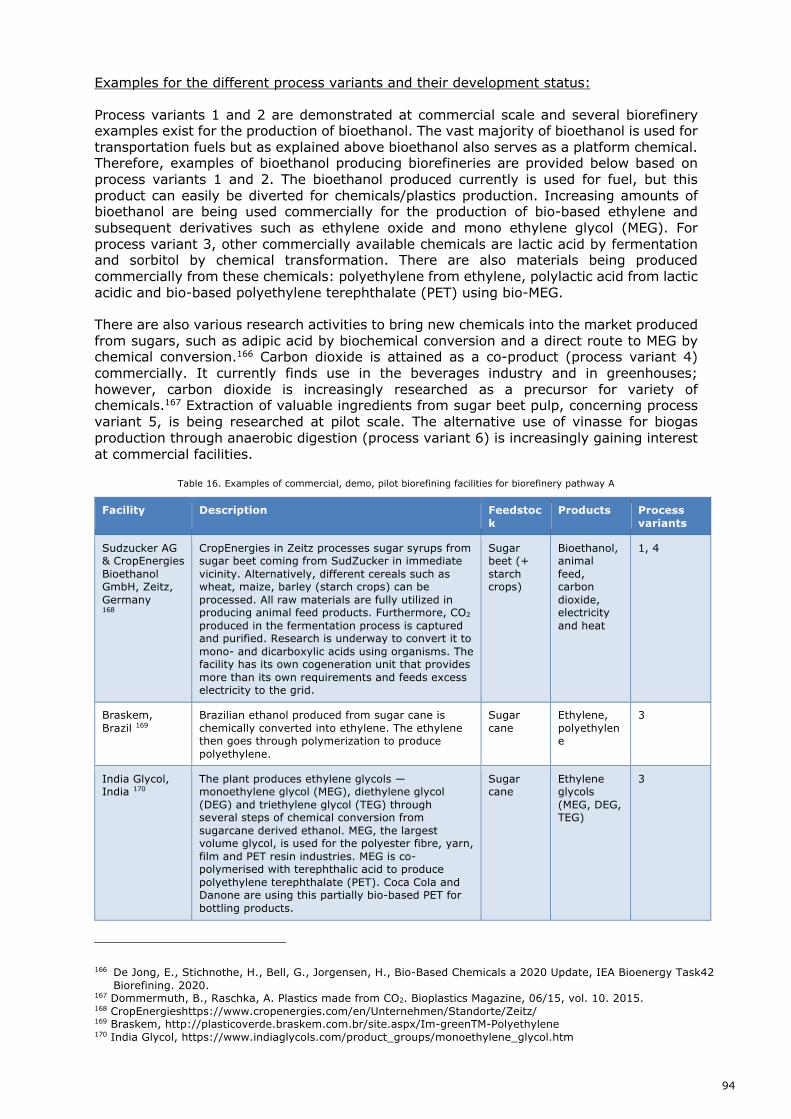
94
Examples for the different process variants and their development status:
Process variants 1 and 2 are demonstrated at commercial scale and several biorefinery examples exist for the production of bioethanol. The vast majority of bioethanol is used for transportation fuels but as explained above bioethanol also serves as a platform chemical. Therefore, examples of bioethanol producing biorefineries are provided below based on process variants 1 and 2. The bioethanol produced currently is used for fuel, but this product can easily be diverted for chemicals/plastics production. Increasing amounts of bioethanol are being used commercially for the production of bio-based ethylene and subsequent derivatives such as ethylene oxide and mono ethylene glycol (MEG). For process variant 3, other commercially available chemicals are lactic acid by fermentation and sorbitol by chemical transformation. There are also materials being produced commercially from these chemicals: polyethylene from ethylene, polylactic acid from lactic acidic and bio-based polyethylene terephthalate (PET) using bio-MEG.
There are also various research activities to bring new chemicals into the market produced from sugars, such as adipic acid by biochemical conversion and a direct route to MEG by chemical conversion.166 Carbon dioxide is attained as a co-product (process variant 4) commercially. It currently finds use in the beverages industry and in greenhouses; however, carbon dioxide is increasingly researched as a precursor for variety of chemicals.167 Extraction of valuable ingredients from sugar beet pulp, concerning process variant 5, is being researched at pilot scale. The alternative use of vinasse for biogas production through anaerobic digestion (process variant 6) is increasingly gaining interest at commercial facilities.
Table 16. Examples of commercial, demo, pilot biorefining facilities for biorefinery pathway A
Facility Description Feedstock
Products Process variants
Sudzucker AG & CropEnergies Bioethanol GmbH, Zeitz, Germany 168
CropEnergies in Zeitz processes sugar syrups from sugar beet coming from SudZucker in immediate vicinity. Alternatively, different cereals such as wheat, maize, barley (starch crops) can be processed. All raw materials are fully utilized in producing animal feed products. Furthermore, CO2 produced in the fermentation process is captured and purified. Research is underway to convert it to mono- and dicarboxylic acids using organisms. The facility has its own cogeneration unit that provides more than its own requirements and feeds excess electricity to the grid.
Sugar beet (+ starch crops)
Bioethanol, animal feed, carbon dioxide, electricity and heat
1, 4
Braskem, Brazil 169
Brazilian ethanol produced from sugar cane is chemically converted into ethylene. The ethylene then goes through polymerization to produce polyethylene.
Sugar cane
Ethylene, polyethylene
3
India Glycol, India 170
The plant produces ethylene glycols — monoethylene glycol (MEG), diethylene glycol (DEG) and triethylene glycol (TEG) through several steps of chemical conversion from sugarcane derived ethanol. MEG, the largest volume glycol, is used for the polyester fibre, yarn, film and PET resin industries. MEG is co-polymerised with terephthalic acid to produce polyethylene terephthalate (PET). Coca Cola and Danone are using this partially bio-based PET for bottling products.
Sugar cane
Ethylene glycols (MEG, DEG, TEG)
3
166 De Jong, E., Stichnothe, H., Bell, G., Jorgensen, H., Bio-Based Chemicals a 2020 Update, IEA Bioenergy Task42 Biorefining. 2020.
167 Dommermuth, B., Raschka, A. Plastics made from CO2. Bioplastics Magazine, 06/15, vol. 10. 2015. 168 CropEnergieshttps://www.cropenergies.com/en/Unternehmen/Standorte/Zeitz/ 169 Braskem, http://plasticoverde.braskem.com.br/site.aspx/Im-greenTM-Polyethylene 170 India Glycol, https://www.indiaglycols.com/product_groups/monoethylene_glycol.htm

95
Corbion & Total-Corbion PLA, Thailand 171
C6 sugars from sugarcane are fermented to produce lactic acid by Corbion, which in turn is converted to lactide monomers and polylactic acid at Total Corbion PLA located at the same site.
Sugar cane
Lactic acid, Polylactic acid, Lactide monomers
3
Cosun, Netherlands 172
In order to increase the value of its side stream sugar beet pulp from sugar production from sugar beet, Cosun developed multiple extraction techniques to isolate valuable products: Microcellulose fibres, arabinose and galacturonic acid can be isolated as high value product. BBI-JU Demonstration project
Sugar beet
Microcellulose fibres, arabinose and galacturonic acid
5
Covestro 173 The newly developed process uses a microorganism as a catalyst to first convert the industrial sugar into a precursor. The aniline is then produced by means of chemical catalysis in a second step. Proof of principle has been done and they are planning on scaling up.
Raw sugar
Aniline 3
B. One platform (starch) biorefinery using starch crops
Description: This biorefinery pathway uses starch crops such as cereals (e.g. corn and wheat) and potatoes as feedstock, and with primary refining (native) starch is extracted from them. Thus, starch constitutes the platform for this biorefinery. In secondary refining the native starch can be used to produce bioethanol following saccharification and fermentation. It can alternatively be hydrolysed into C6 sugars which can be used as precursor to produce chemicals through fermentation and/or chemical conversions. These chemical products can be used as chemical intermediates for further processing into finished products as described also in pathway A. Native starch can also be chemically or physically modified for the production of modified starches which find use in food, paper, textile and cosmetics industry. Starch also finds use in producing bioplastics (starch blends).
There are by-products arising from starch extraction that contain fibres and proteins; these are used as animal feed. These are gluten and bran from wheat; germ, gluten feed and gluten meal from corn; and protein meal and protamylase (which can be used as fertilizer) from potato. Corn oil from corn is used in the food industry.
Bioethanol fermentation delivers as by-product so-called dried distillers grains with solubles (DDGS) which is used as animal feed.
Feedstock: Starch crops such as cereals (e.g. corn and wheat) and potatoes
Platform: Starch, (C6 sugars)
Processes: Starch extraction, fermentation, hydrolysis, chemical or physical modifications
Products: Chemicals, (modified) starches, polymers, food, animal feed, ethanol (building block or fuel) and CO2 Figure 23 provides a schematic representation of the One platform (starch) biorefinery pathway using starch crops showing the different process variants.
171 Total-Corbion PLA, https://www.total-corbion.com/ 172 Pulp2Value, http://pulp2value.eu/ 173 Covestro, https://www.covestro.com/en/sustainability/lighthouse-projects/bio-anilin

96
Figure 23. One platform (starch) biorefinery pathway using starch crops

97
Examples for the different process variants and their development status:
All the process variants are demonstrated at commercial scale. Examples are provided in Table 17.
Table 17. Examples of commercial biorefining facilities for biorefinery pathway B.
Facility Description Feedstock Products Process variants
Cargill, Krefeld, Germany 174
Production of high-quality starches and sweeteners from the raw material maize for the food and technical industries.
Corn Native and modified starches, sorbitol, sweeteners, animal feed
1, 3, 4
Roquette, Lestrem, France175
Produces a multitude of products from starch crops including native and modified starches, proteins, polyols, organic acids and specialty chemicals following chemical and/or biochemical processes.
Corn, wheat
Native and modified starches, polyols, proteins, sweeteners, specialty food/feed products, pharmaceutical ingredients
1, 3, 4, 6
Novamont, Terni, Italy 176
Corn starch is used as feedstock in production of biodegradable and compostable bioplastics (MATER-BI)
Corn Starch bioplastics 4
Bioamber, France177
Production of succinic acid from wheat derived glucose
Wheat Succinic acid 4
Novamont, Adria, Italy 178
Using direct sugars fermentation route developed and licensed by Genomatica to produce 1,4-butanediol (MATER-BIOTECH). Sugars produced from corn are supplied from Cargill.
Corn 1,4-butanediol 4
Cargill + Natureworks, Blair, USA179
At Cargill corn is processed into sugars are further fermented to produce ethanol and lactic acid. Furthermore, corn oil and animal feed are attained as side-products. Lactic acid is further converted to polylactic acid (PLA) at Natureworks that is used in biodegradable plastic applications.
Corn Native and modified starches, corn oil, polyols, sweeteners, animal feed, bioethanol, lactic acid, PLA
1, 2, 3, 4
C. One platform (oil) biorefinery using oil crops, wastes and residues
Description: This pathway uses oil crops. Oil can be attained from oil seeds, such as: rapeseed, soybeans, sunflower seeds, and from fruits, such as: oil palm, coconut and olives. The oils are separated by pressing in primary refining. Alternatively, oil can be attained from waste/residues fats, oils and greases. Oil constitutes the platform for this biorefinery. Meal extract or presscake is attained as by-product from oil pressing. They are used as animal feed.
In secondary refining, oil is typically converted to fatty acid methyl esters (FAME, biodiesel) and glycerol by transesterification. Oil also serves as a valuable starting material for the oleochemical industry and the production of lubricants. Alternatively, via hydrolysis, cleavage of oil results in fatty acids and glycerol. Fatty acids, after chemical modifications can find application in cosmetics, surfactants, dyes among other products. The FAME can be used to produce fatty alcohols through catalytic hydrogenation. Commonly the fatty alcohols are ethoxylated (i.e. reacted with ethylene oxide) to produce surfactants. The ethylene oxide for this can be derived from dehydration of bioethanol from pathways A and B to produce 100% bio-based surfactants. This has been done commercially by Croda in
174 Cargill, Krefel biorefinery, https://www.cargill.de/en/krefeld-location 175 Roquette, https://www.roquette.com/ 176 Novamont, MATER-BI, https://novamont.it/eng/mater-bi 177 Bioamber, https://www.a-r-d.fr/en/bioamber 178 Novamont, MATER-BIOTECH, https://www.novamont.com/public/zip/factsheet_materbiotech_EN_web.pdf 179 Natureworks, Ingeo, https://www.natureworksllc.com/What-is-Ingeo/How-Ingeo-is-Made

98
the US.180 Fatty alcohols can also be further processed into fatty amines through hydrogenation of fatty nitriles.
The by-product crude glycerol attained from biodiesel production or from hydrolysis, has a range of applications. It can be further processed into pharmaceutical grade glycerol and via chemical reactions into range of specialty chemicals.
Feedstock: Oil crops such as rapeseed, soybean, sunflower seeds, palm, and waste/residue fats, oil and greases
Platform: Oil
Processes: Oil pressing, transesterification, (hydrolysis, chemical conversions)
Products: Chemicals (fatty acids, fatty alcohols, glycerol), food, animal feed, fuels (biodiesel and renewable diesel)
Figure 24. One platform (oil) biorefinery pathway using oil crops, wastes and residues
180 Croda, https://www.crodapersonalcare.com/en-gb/sustainability/sustainable-manufacturing/eco-plant

99
Examples for the different process variants and their development status:
Figure 24 provides a schematic representation of the One platform (oil) biorefinery pathway using oil crops, waste and residues showing the different process variants.
Table 18. Examples of commercial biorefining facilities for biorefinery pathway C
Facility Description Feedstock Products Process variants
Matrica Biorefinery, Italy (Novamont and Versalis) 181
Integration of chemical and biochemical process to produce chemicals using multiple feedstocks from local areas showing agro-industrial integration, such as thistle low-input dry crop suited to the Mediterranean climate and which grows on wild, abandoned land
Thistle seed
Plasticizers for polymers, additives for rubber, lubricants, glycerol, cosmetic ingredients
2,3
Croda182 Production of chemical intermediates by oleochemical biorefining for bio-based polymers, lubricants, coatings, and personal care products
Oil crops, residual oils
Oleochemicals (Distilled and partly hardened fatty acids, Polymerised fatty acids, Oleic acids, isostearic acid, Stearic fatty acids, glycerol)
2
KLK OLEO183 KLK OLEO process vide range of oleochemicals used in diverse end-use applications, including home & personal health care, cosmetics & toiletries, food, flavours & fragrances, lubricants and industrial chemicals
Palm oil Oleochemicals (fatty acids, glycerol, fatty alcohols and fatty esters, sulphonated methyl esters, surfactants and phytonutrients)
2, 3, 4
D. Two-platform (pulp and spent liquor) biorefinery using wood
Description: Pathway D is based on existing pulping processes and innovations that are directly linked to them to upgrade them into even more economically feasible and sustainable biorefineries with a wider product portfolio.
This biorefinery pathway uses wood, most typically wood chips residues from saw mills and thinning residues from forest management, as feedstock and with the pulping process the two platforms pulp and spent liquor are produced. The two most typical pulping processes are Kraft and sulphite pulping, but the use of ionic liquids is also under development for speciality fibres for high quality textiles.184 The spent liquor from Kraft process is called black liquor. Pulp can be used for papermaking and in the production of cellulose derivatives. Dissolving pulp is produced from sulphite pulping or the Kraft process with an acid prehydrolysis step to remove hemicelluloses. It finds application in textiles and nonwoven products. Nanocrystalline cellulose can be produced through acid hydrolysis of the pulp. It is possible to recover methanol from off-gas generated in pulp production.
Chemicals such as tall oil and turpentine as well as lignin can be recovered from black liquor and spent liquor is usually combusted to generate heat and electricity that can be used internally and externally. Tall oil and turpentine products find use for example in tires, asphalt, perfumes, adhesives and paints. Tall oil can also be used in biodiesel production, but it has nine times higher returns when used as chemical. Spent liquor can also be used
181 Matrica, http://www.matrica.it/default.asp?ver=en 182 Croda, https://www.croda.com/en-gb/products-and-markets/oleochemicals 183 KLK OLEO, https://www.klkoleo.com/ 184 Hummel M. et al. Ionic Liquids for the Production of Man-Made Cellulosic Fibres: Opportunities and Challenges.
Rojas O. (eds) Cellulose Chemistry and Properties: Fibres, Nanocelluloses and Advanced Materials. Advances in Polymer Science, vol 271. 2015.

100
for syngas production through gasification. See pathway I for many potential options for syngas valorisation (Fischer-Tropsch synthesis to biofuels, conversion to hydrogen, conversion to methanol and its derivatives such as methanol to olefins (MTO) route to biochemicals and biofuels, or chemical conversion towards acetic acid or formaldehyde for example). Alternatively, spent liquor can be processed to produce lignin oil which can be further processed into chemicals. Lignosulphonates can be recovered from the spent sulphite liquor which find most use in concrete and cement production. Furthermore, vanillin can be produced from oxidation of lignosulfonates that find use in foods and fragrances. Lignin can be extracted from black liquor and used for variety of chemical and material applications as described in pathway E.
The pulping process generates a waste gas stream (steam stripper off-gas) from which methanol can be recovered. Methanol can be used as a solvent, antifreeze, fuel or precursor for further chemical products production.
Feedstock: Lignocellulosic wood/forestry
Platform: Pulp and spent liquor (heat and electricity, lignin, syngas)
Processes: Mechanical processing, pulping, combustion, papermaking, (separation, extraction, chemical conversions, gasification)
Products: Materials (pulp and paper, specialty fibres), chemicals (turpentine, tall oil, acetic acid, furfural, ethanol, methanol, vanillin), lignin, power and heat
Figure 25 representation of the Two-platform (pulp and spent liquor) biorefinery using wood showing the different process variants. Because the Kraft pulping and sulphite pulping result in different co-product possibilities, two separate schemes are provided for this pathway D.

101

102
Examples for the different process variants and their development status:
All the process variants are demonstrated at commercial scale. Examples are provided in Table 19. Significant activities are taking place to widen the product portfolio and offer innovative bio-based products.
Table 19. Examples of commercial facilities for biorefinery pathway D.
Facility Description Feedstock Products Process variants
Lenzing, Austria185
Wood is processed through sulphite pulping into dissolving wood pulp and marketed under several brands for textile, nonwoven and industrial applications. Through vapor condensate extraction process acetic acid and furfural are separated from the spent liquor. In cooperation with the company DuPont / Danisco, xylose is extracted on site from the spent sulphite liquor (high-purity crystalline powder), which is used as sweetener. Residual liquor is burnt for energy.
Beech wood
Dissolving pulp, acetic acid, furfural, xylose, lignosulfonate, sodium sulphate, soda ash, heat and electricity
1, 2, 4
Borregaard, Norway186
The conversion of the old sulphite pulp mill to the biorefinery of today has been accomplished through specialization and continuous innovation. By using the different components of wood, Borregaard produces lignin products, speciality cellulose, vanillin, bioethanol and microfibrillar cellulose for a variety of applications in sectors such as agriculture and fisheries, construction, pharmaceuticals and cosmetics, foodstuffs, batteries and biofuels.
Spruce wood, woodchips
Specialty cellulose, microfibrillated cellulose, lignosulfonates, vanillin, ethanol, chemicals (e.g. acetic acid), heat and electricity
1, 2, 3, 4, 5
185 Lenzing, https://www.lenzing.com/sustainability/production/biorefinery 186 Borregaard, https://www.borregaard.com/
Figure 25. Two-platform (pulp and spent liquor) biorefinery pathway using wood, for Kraft pulping (top) and for Sulphite pulping (bottom)

103
Stora Enso, Sunila Mill, Finland187
Offers a variety of pulp grades to meet the demands of paper, board and tissue producers. Tall oil and turpentine are also produced. Largest Kraft lignin producer based on the LignoBoost™ technology, LineoTM product. A pilot facility is built for producing bio-based carbon materials based on lignin for example, to replace fossil-based components in phenols for adhesives.
Softwood Pulp, lignin, tall oil, turpentine, heat and electricity
1, 2, 4
Domtar, USA 188, CelluForce189
In the Kraft pulp mills pulp is produced for a variety of end uses, many with specific technical requirements. Their lignin separation facility at its Plymouth mill is the first commercial-scale installation of the LignoBoost™ technology. Tall oil and turpentine are attained as byproducts. With its joint venture CelluForce producing nanocrystalline cellulose. They are also researching into converting sugars into chemicals and fuels.
Pine wood Pulp and paper, fluff pulp, specialty pulp, nanocrystalline cellulose, tall oil, turpentine, lignin, heat and electricity
1, 2, 3, 4
Alberta Pacific Forest Industries, Canada190
Steam stripper off gas, a by-product stream from the chemical recovery area of the Kraft pulping process is converted into high purity methanol. Plant exports excess electricity to grid.
Wood (aspen, poplar, spruce, pine)
Pulp, methanol, heat and electricity
1, 6
Spinnova191 The pulp undergoes a mechanical treatment to produce micro fibrillated cellulose. No chemical is used in producing the fibres and only by-product is water which is recycled. The fibre is suitable as-is for spinning into yarn and knitting or weaving into fabric or non-wovens elsewhere.
Pulp (from FSC certified wood)
Textile fibre 3
Kraton192 Crude tall oil, by-product from Kraft process, is processed in Kraton CTO biorefinery into four different fractions: tall oil fatty acid (TOFA), tall oil rosin (TOR), distilled tall oil (DTO) and pitch. These fractions can be upgraded into bio-based chemicals and find applications such as surfactants, alkyd resins, and adhesives.
Crude tall oil
TOFA (SYLFAT™), TOR (SYLVAROS™) and DTO (SYLVATAL™)
2
BIOREFINERY PATHWAYS FOLLOWING TOP-DOWN APPROACH
The biorefinery pathways following the top-down approach are specifically developed new processes to convert various biomass fractions at zero-waste generation to a broad variety of products for different markets. Typically, a type of biomass feedstock is used that is not handled in conventional biomass facilities (e.g. aquatic biomass, green biomass, various residues and wastes, like bark) with typically new technologies used in primary refining (such as lignocellulosic biomass pretreatment technologies, pyrolysis, hydrothermal upgrading or torrefaction). They can be built either near an existing bottom-up facility, to make use of both the existing industrial infrastructure (i.e. feedstock handling, auxiliaries, waste water treatment) and existing permits etc. (brown-field approach), or at a new site (green-field approach).
Two types of top-down biorefinery pathways can be distinguished with the first focusing on separating the biomass into its functional components and then utilization of all the different functionalised components of the biomass into spectrum of products. The second type focuses on direct thermochemical conversion of biomass followed by further refining into end products.
187 Stora Enso, https://www.storaenso.com/en/about-stora-enso/stora-enso-locations/sunila-mill 188 Domtar, https://www.domtar.com/en/who-we-are/all-locations/plymouth-mill 189 CelluForce, https://www.celluforce.com/ 190 Alberta Pacific Forest Industries Inc., https://alpac.ca/index.php/about/products 191 Spinnova, https://spinnova.com/our-method/fibre/ 192 Kraton, https://kraton.com/innovation/talloil.php

104
Pathways based on separation of biomass into its components:
E. Three platform (C5 sugars, C6 sugars and lignin) biorefinery using lignocellulosic biomass
Description: Pathway E considers full new innovative biorefinery approaches for fractionation of lignocellulosic biomass to produce C5 & C6 sugars and lignin and valorisation of these platforms, to a portfolio of bio-based products.
This pathway uses lignocellulosic biomass which includes a variety of sources as possible feedstock, such as: lignocellulosic short rotation coppice (i.e. willow and poplar), other wood, forestry residues, and agricultural residues (such as straw). The primary refining includes a pre-treatment stage which can be done using variety of methods: physical (such as milling), chemical (such as acid or alkali pretreatment, organosolv), physicochemical (such as steam explosion, ammonia fibre explosion) and biological (fungal enzymes) depending on the type of biomass feedstock and the targeted products. Typically, this is followed by hydrolysis which results in C5&C6 sugars and lignin as the platforms. After that, fermentation is carried out to produce bioethanol from C5&C6 sugars. Lignin can be separated before fermentation or following fermentation from the remaining solution depending on the type of pretreatment process.
Additional value can be created from lignin by utilising lignin’s macromolecular structure in chemicals/materials, such as in production of asphalt, binder, adhesives, carbon fibres and polymer composites. Alternatively, lignin can go through depolymerisation to produce chemicals, such as aromatics. For this, different methods exist, such as: hydroprocessing, liquid phase reforming, acid/base catalysis and oxidation.193 Additionally, thermochemical conversions of lignin can also take place, like gasification to produce syngas or fast-pyrolysis to produce pyrolytic liquid. In order to use the lignin for these material applications, it is important to tailor the pretreatment process and achieve good separation of the lignin from the cellulose and hemicellulose without changing it chemically or physically. Lignin that is separated can be also combusted for heat and electricity.
Alternatively, based on the method of pretreatment and separation processes that follow, the three fractions (cellulose, hemicellulose and lignin) can be isolated and processed separately. The ratios of the three fractions of lignocellulose differ depending on the type and origin of the biomass. The cellulose and hemicellulose fractions thereby can be processed separately to different type of chemicals.
There is a possibility to integrate this biorefinery pathway into existing sugar/starch crop refineries (pathway A or B) e.g. straw processing integrated into wheat processing facility. This is also referred to as the whole crop biorefinery approach. There is also possibility to integrate this pathway into existing pulp mill based biorefineries e.g. bark or forestry residues processing to sugars, taking place on the same site as advanced pulp mill based biorefineries of pathway D. With this brownfield approach, the new biorefinery takes advantage of the already existing industrial infrastructure (biomass supply, use of auxiliaries, use of downstream processing facilities) and or regulations/ permits.
Feedstock: Lignocellulosic crop, wood/forestry, residues from agriculture and forestry
Platform: C5 sugars, C6 sugars, lignin
Processes: Pre-treatment, hydrolysis, fermentation, combustion, (chemical and thermochemical conversions)
Products: Chemicals, lignin products (materials, aromatics, pyrolytic liquid, syngas), ethanol (building block or fuel), power and heat
193 Shutyser et al. Chem. Soc. Rev.47, 852. 2018.

105
Figure 26 provides a schematic representation of the Three platform (C5 sugars, C6 sugars and lignin) biorefinery using lignocellulosic biomass showing the different process variants.
Figure 26. Three platform (C5 sugars, C6 sugars and lignin) biorefinery pathway using lignocellulosic biomass
Examples for the different process variants and their development status:
For the process variants 1 and 5 commercial scale examples exist as well as several demo plants; process variant 2 is yet at demo stage. Examples of bioethanol producing biorefineries are provided below based on process variant 1. The bioethanol produced currently is used for fuel, but this platform chemical can easily be diverted for chemicals/plastics production. Several initiatives exist for the process variant 3 to produce chemicals. Process variant 4 concerning gasification and pyrolysis of lignin mostly in research phase; bench and pilot scale experiments exist. Furthermore, several material applications of lignin are researched and tested. Examples are provided in Table 20. First commercial plants with a focus on advanced biofuels (cellulosic ethanol) are currently not very successful; however, current developments to advanced chemicals (e.g. Avantium, Biorizon) seem to be very promising.

106
Table 20. Examples of commercial, demo, pilot biorefining facilities for biorefinery pathway E.
Facility Description Feedstock Products Process variants
Fraunhaufer CBP, Leuna, Germany194
In the pilot plant wood-chips (beech, poplar) processed using organosolv process. Lignin and hemicellulose are dissolved and separated from cellulose. Thereafter lignin is precipitated and separated from hemicellulose. The clean lignin can be used for material applications. The cellulose is hydrolysed enzymatically to C6 sugars and hemicellulose is hydrolysed to C5 sugars which can be used for further processing.
Wood C5 sugars, C6 sugars, Lignin
2
Clariant, Germany and Romania195,196
Clariant is currently building a first-of-its-kind commercial-scale flagship plant for the production of cellulosic ethanol from agricultural residues such as straw based on the sunliquid® technology. The plant with an annual capacity of 50,000 tons of cellulosic ethanol will be located in the southwestern part of Romania. This technology was already demonstrated in Straubing plant with a production capacity of 1,000 t of ethanol per year. The process involves simultaneous fermentation of C5&C6 sugars to ethanol. Stillage is utilized in a nearby biogas plant. Lignin is used for process energy.
Straw (other agricultural residues)
Bioethanol, heat and electricity. biogas
1, 5
Avantium, Netherlands197
Pilot plant operating, plans for flagship underway. High acid/low temperature hydrolysis to provide glucose for bio-based chemical applications. The resulting C6 sugars can be used in other routes studied at Avantium to product bio-MEG and FDCA (for PEF).
Wood, forest and agricultural residues
Glucose (for MEG, FDCA, lactic acid), C5/C6 sugars, Lignin
1, 3
Cellulac, Ireland198
A combined chemical and process engineering technology to produce lactic acid by pretreatment and fermentation of sugars from lignocellulosic biomass
Straw, spent brewers grains, DDGS
Lactic acid 3
Fibria Innovations, Canada199
Acquired the technology and pilot facility of Lignol Innovations based on Alcell organosolv process. Research into innovative material applications for lignin
Wood Lignin, bioethanol, acetic acid, furfural, cellulose
2, 4
Biorizon, LignoValue200
European project works on the development of technology for the isolation, depolymerization and fractionation of the lignin fraction of biomass into bio-aromatics. In the LignoValue pilot installation scale up production of bio-aromatics will take place.
Lignin Aromatics 4b
194 Fraunhofer Center for Chemical-Biotechnological Processes (CBP) in Leuna, Lignocellulose biorefinery, https://www.cbp.fraunhofer.de/en/reference-projects/lignocellulose-biorefinery.html
195 Clariant Sunliquid®, https://www.clariant.com/en/Solutions/Products/2014/10/16/16/16/sunliquid 196 LIGNOFLAG project, https://www.lignoflag-project.eu/ 197 Avantium Dawn TegnologyTM, https://www.avantium.com/technologies/dawn/ 198 Cellulac, http://cellulac.co.uk/en/main/process-diagram/ 199 Fibria Innovations, http://r2017.fibria.com.br/en/our-production-processes/research-and-development/ 200 Biorizon, LignoValue Pilot project, https://www.biorizon.eu/news/lignovalue-pilot-launched-flanders-first-and-only-
pilot-line-of-bio-aromati/

107
F. Two-platform (organic fibres and organic juice) biorefinery using green biomass
Description: This pathway uses green nature-wet biomass such as grass as feedstock. During primary refining, green biomass is pressed, and the liquid is separated. This results in organic fibres and organic juice as the platforms for this biorefinery pathway. The organic fibres are further processed into materials, such as boards, composites, insultation material and fibre reinforced polymers. Alternatively, they can be used as fermentation raw material to produce biofuels and chemicals following pre-treatment and hydrolysis.
The organic juice contains valuable ingredients, such as lactic acid, proteins, and amino acids which can be separated off before sending the remainder into a biogas plant. Organic juice is fed to anaerobic digestion, typically coupled with other organic residues, to produce biogas and digestate. In turn, the digestate is used as fertilizer and biogas can be upgraded to biomethane to be injected in the natural gas grid, to bio-LNG for transport purposes, or directly used to produce heat and electricity. Additionally, organic juice can be used as a fermentation raw material.
Feedstock: Green wet biomass such as grass, clover, alfalfa (+ in combination with organic residues)
Platform: Organic fibre, organic juice, (biogas)
Processes: Pressing, fibre separation, anaerobic digestion, combustion, (upgrading, separation)
Products: Materials, chemicals (lactic acid, amino acid), animal feed, organic fertilizer, fuels (biomethane, ethanol), power and heat Figure 27 provides a schematic representation of the Two-platform (organic fibres and organic juice) biorefinery using green biomass showing the different process variants

108
Figure 27. Two-platform (organic fibres and organic juice) biorefinery pathway using green biomass

109
Examples for the different process variants and their development status:
The process variants 1 and 2 are demonstrated at commercial scale, several demo initiatives exist for the process variant 3. Process variants 4 and 5 are in the research phase. Examples are provided in Table 21.
Table 21. Examples of commercial, demo, pilot biorefining facilities for biorefinery pathway F.
Facility Description Feedstock Products Process variants
Biowert GmbH, Germany (commercial)201
Biowert produces green electricity and innovative materials, namely composites, insulation materials and fertilizers. Anaerobic digestion of organic juice is done together with regional organic residues/wastes.
Grass Organic fibres for biomaterials, fertilizer, biogas, heat and electricity
1
Green Biorefinery, Austria (demo)202
A demonstration facility based in Utzenaich produces fibre derived products, fertilizer, electricity and heat. Additionally, lactic acid and amino acids are produced.
Grass Organic fibres for biomaterials, fertilizer, biogas, lactic acid, amino acids, heat and electricity
1, 3
Grassa, Netherlands203
Mobile, small-scale modular process installation has been built to produce fibres and protein concentrate as well as minerals.
Grass, leaves (tomato, sugarbeet)
Organic fibres for animal feed, protein, minerals (fertilizer)
1, 3
G. Two-platform (oil and biogas) biorefinery using aquatic biomass
Description: This pathway uses aquatic biomass, such as micro-algae. The oil is extracted most typically using solvents. Oil and de-oiled biomass are attained after primary refining.
In secondary refining, oil can be cleaved by hydrolysis to produce fatty acids and glycerol which form valuable starting materials for oleochemicals, lubricants, and surfactants. The oil contains valuable ingredients, such as carotenoids, phytosterols, omega-3 and 6 fatty acids that can be extracted in secondary refining. These find use in food additive, health supplement, and pharmaceutical products. Alternatively, the oil can be converted to fatty acid methyl esters (FAME, biodiesel) and glycerol by transesterification.
De-oiled biomass can be converted into digestate and biogas through anaerobic digestion. The digestate by-product from this process can be used as fertilizer.
Feedstock: Aquatic biomass
Platform: Oil, biogas
Processes: Extraction, hydrolysis, anaerobic digestion, combustion, transesterification, (separation, hydrolysis, chemical conversions)
Products: Chemicals (fatty acids, fatty alcohols, glycerol), nutraceuticals, food, organic fertilizer, biodiesel, power and heat
201 Biowert GmbH, https://biowert.com/ 202 Green Biorefinery Utzenaich, Austria, https://nachhaltigwirtschaften.at/de/fdz/projekte/demonstrationsanlage-
gruene-bioraffinerie-utzenaich.php 203 Grassa, https://grassa.nl/en/about-grassa/

110
Figure 28 provides a schematic representation of the Two-platform (oil and biogas) biorefinery using aquatic biomass showing the different process variants.
Figure 28. Two-platform (oil and biogas) biorefinery pathway using aquatic biomass
Examples for the different process variants and their development status:
For this biorefinery pathway from aquatic biomass several initiatives exist mostly in research and pilot stage. Examples are provided in Table 22.
Table 22. Examples of demo and pilot biorefining facilities for biorefinery pathway G.
Facility Description Feedstock Products Process variants
Ecoduna, Austria204
Develop and research on future applications and effects of microalgae and their ingredients
Microalgae Cosmeceuticals, nutraceuticals, pigments, energy and fuels
1, 3
AlgaePARC, the Netherlands205
Research at laboratory and pilot scale to develop new production chains towards high quality products. Mild recovery, extraction and fractionation of high value components and research for product development.
Microalgae Proteins, oils, omega 3 and 6, carbohydrates, pigments
1, 3
204 Ecoduna, https://www.ecoduna.com/en/ 205 AlgaePARC, http://www.algaeparc.com/

111
H. Two-platform (organic fibres and oil) biorefinery using natural fibres
Description: Various types of natural fibres exist. Flax and hemp are grown predominantly in Europe, whereas jute, kenaf and sisal mostly available in Asia. The properties of natural fibres depend on their composition, growing conditions and harvesting techniques.
The seeds are separated from the stem by threshing. The fibres are located within the stem/stalk. They are first treated with microbes or chemicals to loosen and then later on mechanically to separate from the woody inside (shives). The fibres are used mostly in the production of natural fibre composites by mixing with plastics. They find use in high-performance applications such as in automobiles and aircrafts due to their low density and attractive mechanical properties. Other applications include geotextiles, textiles, building and construction. The shive left after fibre separation is normally not utilized but uses such as animal bedding is possible and applications such as particle boards and plastic composites are being developed.
The seeds and its oil can be used for food and as nutraceuticals. Additionally, oil can be extracted for use in production of oleochemicals and biodiesel in analogy with oil crop based biorefinery. The seed oil can contain valuable oils such as linoleic (omega-6) and linolenic (omega-3) acid that can be isolated.
Furthermore, the leaves/threshing residues can contain cannabinoids. A large number of studies have shown health promoting and medicinal properties of cannabinoids with cannabidiol (CBD) being the most known.
Feedstock: Natural plant fibres including bast (e.g. hemp, flax, jute, kenaf), leaf (sisal, abaca), stalk (e.g. rice, wheat, maize)
Platform: Organic fibres and oil
Processes: Fibre separation, extraction, physical processing, (chemical conversions)
Products: Materials, chemicals (fatty acids, fatty alcohols, glycerol), nutraceuticals, cannabinoids, food and biodiesel
Figure 29 provides a schematic representation of the Two-platform (organic fibres and oil) biorefinery using natural fibres showing the different process variants.

112
Figure 29. Two-platform (organic fibres and oil) biorefinery pathway using natural fibres

113
Examples for the different process variants and their development status:
The natural fibres find use commercially in the production of composites. For the biorefinery concept yielding multiple products from natural fibres, several initiatives exist mostly in research and pilot stage. Examples are provided in Table 23.
Table 23. Examples of commercial, demo, pilot biorefining facilities for biorefinery pathway H.
Facility Description Feedstock Products Process variants
VeLiCa, Italy206
VeLiCa is a pilot project looking at growing hemp and flax in northern Italy and biorefining into fibre-based green composite building materials and oil. Oil will be used for bio-diesel, lubricants and polyols to produce bio-based polymers. Additionally, valuable oils will be obtained for the nutraceutical market.
Hemp and flax
Organic fibre for composites, oil for biodiesel, lubricants and polyols and valuable oils for nutraceuticals
1, 2
GRACE207 The GRACE (GRowing Advanced industrial Crops on marginal lands for biorEfineries) project led by the University of Hohenheim is focused on exploiting the advantageous characteristics of Miscanthus and hemp. From hemp, the project looks at using fibres for composites and directly in building materials. Extraction of oil for production of chemicals (pelargonic acid, azelaic acid). Separated shives use in building materials. Furthermore, extraction of cannabinoids such as cannabidiol from threshing residues.
Hemp Organic fibre for composites and building materials, Oil for chemicals, Shive for building materials, Cannabinoids (e.g. CBD)
1, 2, 3, 4
Ecotechnilin, France and Poland208
Ecotechnilin provides natural fibre (flax, hemp, jute, kenaf) for many industrial applications. Specializes in the production of non-woven composite materials using natural fibres. The automotive industry moulds them into car parts like wheel housings, trunk floors, arm rests, door panels, dashboards etc.
Natural fibres (flax, hemp, jute, kenaf)
Natural fibre composites
1
Kanesis, Italy209
HempBioPlastic (HBP®) is a natural bio-composite, developed and created from shive of industrial hemp which is usually just wasted. PLA is used to produce the composite, so it is biodegradable.
Shrive of hemp
Hemp Bioplastic 3
HempFlax, the Netherlands210
HempFlax considers utilization of the hemp plant as a whole for various market applications. Their products include animal bedding, building materials, materials for industrial applications. As well as seeds, oil, CBD and protein powder.
Hemp Biomaterials (fibre for industrial applications, insulation, composites), seeds, oil, CBD and protein powder
1, 3, 4
Pathways based on direct thermochemical conversion of biomass:
Instead of processing of components attained from the biorefineries, the pathways described below directly feed the whole biomass to thermochemical conversion for further processing into chemicals and/or fuels.
206 Ravasio, Nicoletta & Galasso, Incoronata & Ottolina, Gianluca & Sacchi, Maria & Speranza, Giovanna & Tonin, Claudio. A Biorefinery Model Based on Flax and Hemp Crops. La Chimica e l'Industria. 95. 113. 2013.
207 GRACE, https://www.grace-bbi.eu/ 208 Ecotechnilin, https://eco-technilin.com/en/ 209 Kanesis, https://www.kanesis.it/products/ 210 HempFlax, https://www.hempflax.com/en/

114
I. One platform (syngas) biorefinery using lignocellulosic biomass and municipal solid waste
Description: In this biorefinery pathway there is no component separation, all the biomass is gasified to produce syngas. Dry biomass is considered as feedstock. It is possible to feed many different types of biomass, such as energy crops like Miscanthus and switchgrass, short rotation coppice (i.e. willow and poplar), wood, forestry residues, agricultural residues (such as straw), as well as municipal solid waste and wood waste. In primary refining, the biomass is pre-treated and dried followed by gasification to produce crude synthesis gas which is the platform for this biorefinery pathway. Depending on the heating process the pre-treatment could also be torrefaction or pyrolysis which is followed by gasification. The syngas composition depends on a range of process parameters. The syngas then goes through gas cleaning and conditioning since each downstream process requires a specific syngas composition (CO:H2 ratio) as well as limits to certain contaminants (such as sulphur). The syngas then can be chemically converted into a spectrum of chemicals and fuels. It can go through Fischer-Tropsch synthesis to produce synthetic biofuels. It can be chemically converted into methanol which serves as precursor for other chemicals (such as dimethyl-ether, formaldehyde, acetic acid). Methanol can alternatively go through methanol to olefin (MTO) conversion to produce chemicals. Syngas can also be used for production of hydrogen or in production of methane following methanation (for feeding into the natural gas grid (synthetic natural gas, SNG) and/or bio-LNG for transport).
Black liquor and lignin are also potential feedstocks for gasification, as covered under biorefinery pathways D and E respectively.
Feedstock: Lignocellulosic crops, wood/forestry biomass, forestry residues, agricultural residues and municipal solid waste
Platform: Syngas
Processes: Pre-treatment, gasification, gas cleaning and conditioning, chemical conversions
Products: Chemicals (methanol, hydrogen, olefins), waxes and fuels (F-T biofuels, gasoline, LNG, mixed alcohols)
Figure 30 provides a schematic representation of the One platform (syngas) biorefinery using lignocellulosic biomass and municipal solid waste showing the different process variants.

115
Figure 30. One platform (syngas) biorefinery pathway using lignocellulosic biomass and municipal solid waste

116
Examples for the different process variants and their development status:
Several initiatives exist at pilot, demo and commercial scale using straw, wood or MSW as feedstock. Examples are provided in Table 24.
Table 24. Examples of commercial, demo and pilot biorefining facilities for biorefinery pathway I.
Facility Description Feedstock Products Process variants
LanzaTech211 LanzaTech ferments gases (industrial off-gas or syngas from waste) and produces ethanol and a variety of chemicals using a naturally occurring bacteria. They have demonstration facilities in China, Japan, USA and New Zealand.
MSW, organic industrial waste, agricultural waste
Bioethanol, chemical building blocks
3
Karlruhe Institute of Technology, Germany212
In the bioliq® pilot plant biomass is densified with fast pyrolysis de-centrally. The resulting slurry is used to produce syngas centrally by entrained gasification. The syngas is cleaned and conditioned followed by methanol or dimethyl ether synthesis. DME can further be converted to biofuels.
Wheat straw Methanol, DME, biofuels 1
Enerkem213 First commercial waste to biofuels and chemicals company in Edmonton, Canada. Two projects under way to produce methanol from waste in the Netherlands and Spain. The proprietary thermochemical process includes feedstock preparation, gasification, syngas cleaning and conditioning and catalytic conversion to produce methanol and ethanol.
MSW Methanol, ethanol 1, 3
J. Two platform (pyrolytic liquid and biochar) biorefinery using lignocellulosic biomass
Description: Similar to the biorefinery pathway with the syngas platform, in this biorefinery pathway lignocellulosic, dry biomass is thermochemically converted without separation into its components. There is the possibility to feed many different types of biomass but most typically, wood is used.
Pyrolysis is the thermal degradation/decomposition process that occurs in the absence of oxygen, which results in production of pyrolytic liquid (pyrolysis oil), biochar and gas. Biochar and gas are combusted to provide the process heat requirements. Biochar can also be attained as co-product and is used for soil-amendment. Pyrolysis oil is the main product and can be utilized in different ways. It can be gasified to syngas and further converted to various chemicals and fuels as described in the pathway for syngas platform, pathway I. Pyrolysis oil can alternatively be co-fed into petroleum oil refineries, and following hydrotreating or cracking, it will result in the production of biofuels, chemical feedstocks (e.g. naphtha) and chemical building blocks (e.g. propylene). Production of food flavouring (liquid smoke) is a commercialized product from pyrolysis. Pyrolysis oil can also be fed into a combined heat and power plant to produce heat and electricity.
Pyrolysis oil can find use in adhesives/resins where a phenolic rich fraction can be extracted and used in phenol formaldehyde resins. Another application considered is the addition in asphalt that can be used in roofing and roads. For this also the lignin fraction of pyrolysis oil can be separated and used for bitumen replacement. Oil fractions can be used for wood modification. Finally, extraction of levoglucosan which is present in the pyrolytic sugar
211 LanzaTech, https://www.lanzatech.com/ 212 Karlsruhe Institute of Technology, bioliq® Process, https://www.bioliq.de/english/55.php 213 Enerkem, https://enerkem.com/

117
phase (from cellulose) is researched which can be hydrolysed and converted to multitude of chemicals.214
Feedstock: Lignocellulosic crop, wood/forestry, residues from agriculture and forestry
Platform: Pyrolytic liquid, biochar, (syngas)
Processes: Fast-pyrolysis, separation, combustion, (gasification, cracking, extraction)
Products: Pyrolysis oil (for materials, chemicals, food flavourings, syngas, biofuels), biochar, power and heat
Figure 31. Two platform (pyrolytic liquid and biochar) biorefinery pathway using lignocellulosic biomass
Figure 31 provides a schematic representation of the Two platform (pyrolytic liquid and biochar) biorefinery using lignocellulosic biomass showing the different process variants.
214 IEA Bioenergy Task 34, Materials and Products, http://task34.ieabioenergy.com/materials-and-products/

118
Examples for the different process variants and their development status:
Process variant 1 is demonstrated at commercial scale. Process variant 2 is covered within the biorefinery pathway I and example of bioliq® pilot plant is given for that. For process variant 3 commercial plant is being built which will be linked to an existing petroleum refinery. Process variant 4 is mostly in research phase. Examples are provided in Table 25.
Pyrolysis oil can be used for energy (combustion), chemicals and materials (via fractionation) or fuels and chemicals via co-processing in oil refineries.
Table 25. Examples of commercial, demo and pilot biorefining facilities for biorefinery pathway J.
Facility Description Feedstock Products Process variants
Empryro, Twence, the Netherlands215
Commercial facility in Hengelo using fast pyrolysis technology of BTG-BTL. The plant uses woodchips to produce pyrolysis oil. From the rest streams heat and electricity is produced. Pyrolysis oil is co-fired with natural gas producing process steam for dairy company FrieslandCampina.
Woodchips pyrolysis oil, heat and electricity
1
Lieksa, Green Fuel Nordic Oy, Finland216
Prefab facilities will be built in Netherlands and then assembled in Liekska pyrolysis plant which will be located next to a sawmill and will use sawdust from the mill as feedstock.
Sawdust pyrolysis oil, heat and electricity
1
CHIMAR Hellas, SA217
Studied the potential use pyrolysis oil, the part comprising of phenolic compounds, for replacing part of the phenol needed in the formulation of phenol-formaldehyde resin. Phenol substitution levels of up to 50% were achieved.
Pyrolysis oil
Phenol-formaldehyde resin
4
BTG, The Netherlands 218
BTG is actively exploring and developing different new products by using pyrolysis oil as the raw material in pilot set-ups. Examples are: • Pyrolytic lignin as a substitute for
fossil phenol in phenol-formaldehyde resins
• Pyrolytic lignin as a replacement for fossil bitumen in e.g. asphalt
• Recovery of organic acids • Production of mono-phenolics • Pyrolytic sugars as a renewable
feedstock for platform chemicals and fuels e.g. bio-ethanol levulinic acid, polyols.
Pyrolysis oil
Biomaterials and chemicals (such as resin, asphalt, organic acids, phenolics, ethanol)
4
215 Twence, https://www.twence.nl/energie/wat-leveren-wij.html 216 Green Fuel Nordic Oy, https://www.greenfuelnordic.fi/en 217 Nakos P, Tsiantzi S, Athanassiadou E. Wood adhesives made with pyrolysis oils. Proceedings of the 3rd European
wood-based panel symposium, 12–14 September 2001. 218 BTG, https://www.btgworld.com/en/rtd/technologies/bio-materials-chemicals

119
K. One platform (bio-crude) biorefinery using lignocellulosic biomass, aquatic biomass and organic residues
Description: There are essentially two main classes of thermochemical processes able to produce a liquid fuel directly from solid biomass: fast pyrolysis and hydrothermal liquefaction. Pyrolysis oil resulting from fast pyrolysis generally has a relatively high oxygen content, requiring further upgrading for most applications. Furthermore, it is usually required to dry the biomass to make it suitable for pyrolysis. Whereas, in hydrothermal liquefaction, it is possible to get a high viscosity liquid product with a considerably lower oxygen content, and it can work also with wet biomass.219 This allows also aquatic biomass and organic residues to be considered as potential feedstock besides lignocellulosic biomass. Also low/negative-cost but also low-quality feedstocks like sludge and manure potentially can be processed by means of hydrothermal liquefaction. Hydrothermal liquefaction (HTL) involves the reaction of the feedstock in the presence of water at hydrothermal conditions (temperature 250-370 °C and pressure 4-22 MPa) where the water is kept in liquid state.220 It is currently being studied mostly at lab scale with batch setups. Several continuous pilot setups have also been built. An example is the one built at the Pacific Northwest National Laboratories (PNNL) intended for the processing of different types of biomass (such as algae and agricultural residues).221 Although HTL can still be considered as an emerging technology, there are already some companies that are active in its commercialization (see Table 15). The company Genifuel is looking at commercial development of the technology developed by PNNL.222 Licella Pty Ltd., has developed the so-called Cat-HTR™ (Catalytic Hydrothermal Reactor) process mainly considering the use of agricultural and industrial residues and wastes as feedstock.223 Steeper Energy developed the Hydrofaction™ process in collaboration with Aalborg University, Denmark. A demonstration plant is built in Norway by Silva Green Fuels.224 The bio-crude produced from HTL can be burned for fuel or upgraded to produce fuels or chemicals. This is usually done by hydrotreating. Currently very few works have looked at this downstream upgrading of bio-crude. An option considered is the co-processing of bio-crude in existing petroleum refineries (hydrotreatment followed by FCC). Feedstock: Lignocellulosic crop, wood/forestry, residues from agriculture and forestry, aquatic biomass and organic residues and wastes Platform: Bio-crude Processes: Hydrothermal liquefaction, upgrading Products: Chemicals and fuels Figure 32 provides a schematic representation of the One platform (bio-crude) biorefinery using lignocellulosic biomass, aquatic biomass and organic residues.
219 Castello, D., Pedersen, T.H., Rosendahl, L.A. Continuous Hydrothermal Liquefaction of Biomass: A Critical Review. Energies , 11, 3165. 2018.
220 IEA Bioenergy Task 34, Solvent Liquefaction, http://task34.ieabioenergy.com/solvent-liquefaction/ 221 Elliott, D.C., Hart, T.R., Schmidt, A.J., Neuenschwander, G.G., Rotness, L.J.;,Olarte, M.V., Zacher, A.H., Albrecht,
K.O., Hallen, R.T., Holladay, J.E. Process development for hydrothermal liquefaction of algae feedstocks in a continuous-flow reactor. Algal Res. , 2, 445–454. 2013.
222 Genifuel, http://www.genifuel.com/ 223 Licella, https://www.licella.com.au/ 224 Steeper Energy and Silva Green Fuel, Hydrofaction™ technology, https://ec.europa.eu/easme/en/news/steeper-
energy-builds-industrial-scale-plant-worth-506-million

120
Figure 32. One platform (bio-crude) biorefinery pathway using lignocellulosic biomass, aquatic biomass and organic residues
Examples and their development status:
Several companies are building demonstration scale plants to bring the technology towards commercialization. The production currently ends at bio-crude level that needs to be further upgraded to produce chemicals and/or biofuels. Examples are provided in Table 26
Table 26. Examples of commercial, demo and pilot biorefining facilities for biorefinery pathway K.
Facility Description Feedstock Products
Genifuel, USA222
Genifuel pilot facilities in operation. The system was developed by the Pacific Northwest National Laboratory, (PNNL), part of the US Department of Energy. The process has been tested with variety of feedstocks, most typically wet wastes.
e.g. wastewater solids, food processing wastes, animal wastes and algae
Bio-crude
Licella Pty Ltd., Australia223
Licella developed the Cat-HTR™ process and tested in large scale continuous-flow pilot plant. They are working with its strategic partners to build commercial-scale hydrothermal upgrading plants. Also, being studied as chemical recycling to convert end-of-life plastics to oil.
Variety of organic residues and wastes
Bio-crude
Steeper Energy, Silva Green Fuels224
Steeper Energy license its proprietary Hydrofaction™ technology to Silva, who will build the demonstration plant. It will use woody residues as feedstock that are converted to renewable crude oil and, in turn, will be upgraded to renewable diesel, jet or marine fuel.
Lignocellulosic residues (forestry, agri-business, food processing residues)
Biofuels (renewable diesel, jet, marine fuel)

121
OVERVIEW OF DEVELOPMENT STATUS AND SCALE OF THE 11 BIOREFINERY PATHWAYS
Development Status of Biorefinery Pathways
While the biorefinery pathways based on the bottom-up approach (A-D) are demonstrated at commercial scale (TRL9), the biorefinery pathways based on the top-down approach (E-L) are at a lower degree of maturity for the production of chemicals and/or materials. Figure 33 shows development status of biorefinery pathways focusing on the production of chemicals and/or materials. For pathway E, production of ethanol from lignocellulosic biomass has been achieved at a (pre)commercial phase and several flagships exist also for the production of other chemicals. Pathway F, biorefinery using grass, has been demonstrated at commercial scale. For biorefinery pathways G and H, that utilise aquatic biomass and natural fibres, the biorefinery concepts currently are at pilot stage. Regarding, biorefinery pathway I, first commercial examples are emerging for the production of methanol through syngas. Although the biorefinery pathways J and K, that consider thermochemical routes of fast pyrolysis and hydrothermal liquefaction respectively, the production of the platforms of pyrolytic liquid and bio-crude has been demonstrated at commercial (for J) or at demo scale (for K); research at laboratory scale is in progress for the production of chemicals and materials from these platforms. Therefore, this latter development status is indicated in Figure 33.
It should be noted that the biorefinery pathways contain several process variants involving a variety of process and technology concepts, and that the development status for the resulting variations can deviate within a single pathway. The Biorefinery Roadmap (Federal Government of Germany, 20129) estimated the development status of the different biorefinery pathways at the time of publication. The figure presented in this roadmap was adapted to include also the other pathways described in this project and the progress that has been made from 2012 till now.
Figure 33. Development status of biorefinery pathways for production of chemicals/materials in a biorefinery (adapted from Biorefineries Roadmap, 20129)

122
Scale of Biorefinery Pathways
Small-scale biorefinery processes are specifically favourable for the efficient and sustainable valorisation for relatively wet biomass (such as grass), agricultural and food processing residues and aquatic biomass. To prevent the costly transportation of this wet or low density biomass, the production facilities are located in rural areas using local biomass. It is considered that through highly automated modular and transportable units, they can be easily implemented in these areas and allow higher contribution of biomass suppliers to the bio-economy. These local systems also allow unused nutrients to be easily returned to the farm. Accordingly, these small-scale biorefineries will contribute to rural and coastal diversification and regeneration.225
Large-scale biorefinery processes are especially important for capital intensive processes. For example, thermochemical processes (such as gasification) benefit from economy of scale; whereas low-temperature biochemical processes benefit most from economy of duplication. Large scale processing is also preferred when large volumes of products are demanded such as biofuels (bioethanol, biodiesel) and bulk chemicals. These are generally located near a port to allow continuous feed of large volumes of mainly imported biomass. However, further downstream processing of for example chemical building blocks to fine and specialty chemicals can take place in small to medium scale in separate processing plants.
It is also conceivable to decentralise the components of primary refining (e.g. biomass pre-treatment and conditioning), giving rise to a hybrid structure (combination of small and large scale production). The intermediates produced in the small decentralised facilities (i.e. high energy density in case of upstream pyrolysis or torrefaction, and high quality in case deashing/demineralisation is part of the primary refinery) are linked to a large-scale central processing facility to upgrade the intermediate to final value-added products. This allows combining the advantages of small systems (i.e. lower feedstock transportation costs) with the advantages of economies of scale of larger systems (of intensive technologies).
Table 27. Scale of biorefinery pathways
225 Bruins, M.E. and Sanders, J.P. Small-scale processing of biomass for biorefinery. Biofuels, Bioprod. Bioref., 6: 135-145. 2012.
Size of biorefineries Characteristics
Small-scale biorefineries
• Attractive for wet biomass • Located in rural or coastal areas • Use of mobile units
Large-scale biorefineries
• Attractive for capital-intensive processing such as thermo-chemical conversion
• For production of large volumes • Potential integration in existing (petro)chemical complexes at harbour areas
Integrated decentralized small-scale processing with centralized large-scale upgrading
• Combine the advantages of small-scale and large-scale systems • Small-scale primary refining to increase biomass density and potentially the
quality • Separate nutrients close to source and recycle closing the loop • Efficient transport • Efficient secondary refining

123
3.5 Task 2 - High-level assessment of the key advantages and disadvantages of biorefinery pathways compared to alternative pathways
Task 2 provides a high-level assessment of biorefinery pathways with respect to the market competition with alternative fossil and CO2-based competing production pathways. This high-level assessment is carried out for a selection of bio-based chemicals (4) and materials (3) covering various biorefinery production pathways. This selection was carried out in collaboration with WP 2 which uses these selected product groups/ products as case studies when assessing specific non-technical barriers and WP 5 where market evaluations are carried out. Task 2 includes identification of the fossil alternatives and other renewable alternative pathways using CO2 and renewably produced power for water electrolysis to produce H2.
The goal of the high-level assessment is to get an overall indication on the advantages/disadvantages that biorefinery pathways deliver compared with their alternatives considering different criteria such as technical product performance, cost competitiveness and climate impact, as far as these could be extracted from existing literature (i.e. the project is not including own system modelling/assessment activities).
Furthermore, regarding the bio-based pathways, the sustainability of biomass feedstock, valorisation of residues and waste and material vs. energy use are considered.
SELECTION OF REPRESENTATIVE BIO-BASED CHEMICALS AND MATERIALS FOR ANALYSIS
Selecting the representative chemicals and materials is important to take up in the analysis. This selection was done considering the chemical and material sub-categories described in WP 1 Classification system and in alignment with WPs 2 and 5. For the selection the following criteria were applied:
• Both chemicals and materials shall be represented
• A single or just a few biorefinery pathways shall not dominate
• Products with substantial market share and/or market growth shall be prioritized
• Products with specific functionality and/or sustainability benefits compared to fossil-based alternatives shall be prioritized
• Data should be available for the different criteria used in the assessments
• Products with a production base in the EU shall be prioritised considering also planned operations
For this, recent studies from the BBI project RoadToBio (2019) and the JRC Report on Biobased chemicals (2019) were taken as a starting point. They cover the relevant products in the market, selected under similar assumptions (i.e. market attractiveness, 2030 time horizon). Furthermore, the products described in WP 3 Task 1 biorefinery pathways and the products listed in the database developed in WP 4 were considered.
With the selection according to these criteria not all the biorefinery pathways are represented. Also, not all the sub-categories under chemicals and materials are covered. The selected representative chemicals and materials are provided below under sub-categories described in WP 1 Classification System (in brackets the corresponding biorefinery pathways for their production are indicated).

124
Chemicals:
• Building blocks/additives: propylene glycol (B/C/E)
• Building blocks: Drop-in – 1,4 BDO (A/B/E) and methanol (D/I), Dedicated – lactic acid + poly lactic acid (A/B/E)
• Solvents: acetic acid (A/B/D/E/I)
• Surfactants: fatty alcohol ethoxylate (C + A/B/E)
• Materials:
• Fibres: microfibrillated cellulose (D)
• Resins: lignin based phenolic resins (D/E/J)
In the following sections, for each of these selected chemicals and materials, the following are described: the production route and major examples; biorefinery and alternative pathways (fossil and CO2-based); advantages/disadvantages with respect to the fossil-based counterpart; and any other important aspects (sustainability of biomass feedstock, valorisation of residues and waste, material vs. energy use).
BUILDING BLOCKS/ADDITIVE: PROPYLENE GLYCOL
Production route and major examples
ADM is one of the major producers of bio propylene glycol (PG).226 They use glycerol which is attained as a by-product from the transesterification of vegetable oils. They use primarily soybeans and canola as feedstock. The crude glycerol is processed through several evaporation and distillation steps into a pharmaceutical grade glycerol. This glycerol is either sold into the market or processed into PG through a catalytic conversion process of hydrogenolysis. The reaction between glycerol and hydrogen takes place at high temperature and pressure over a catalyst to produce PG and water. The PG is further distilled into a technical grade or a pharma grade PG to be sold in the market. Technical grade finds applications in unsaturated polyester resins, coolants and antifreeze, hydraulic and brake fluid, and paint and coatings. The pharmaceutical grade finds use in food and flavourings, cosmetics, pharmaceuticals and pet food among others.
In 2011, ADM built a commercial production facility for PG at its Decatur, Illinois facility. Currently, ADM is producing 100,000 metric tonnes of bio PG per year and employing 140 people at the Decatur facility.227 Bio PG has a 100 percent bio-based renewable carbon content. It is sold with a USDA Certified Biobased Product Label.228
In 2012, chemical conglomerate BASF partnered with Oleon to open a bio-based PG conversion facility in Belgium also by a glycerol-based process.229 Ashland also tied up with Cargill to produce bio-based propylene glycol from glycerol in Europe.230
Also, UPM plans to build a biorefinery in Leuna, Germany, with an annual capacity of 220,000 metric tonnes that will convert wood into sugars and lignin. The sugar will be
226 ADM Propylene glycol, https://www.adm.com/products-services/industrials/propylene-glycol 227 http://ethanolproducer.com/articles/14960/adm-partners-with-pnnl-to-produce-biobased-propylene-glycol 228 https://www.adm.com/products-services/industrials/propylene-glycol/faqs 229 https://www.chemeurope.com/en/news/138616/basf-and-oleon-celebrate-grand-opening-of-propylene-glycol-
production-plant.html 230 https://cen.acs.org/articles/85/i20/Ashland-Cargill-Plan-Biobased-Chemical.html

125
further converted through an efficient one-step process to renewable monoethylene glycol (BioMEG) and propylene glycol. The plant is due to start up by 2023.
Biorefinery pathway
The production route described above is under pathway C and is depicted below. Alternatively, it is possible to obtain glycerol from hydrolysis of oil into fatty acids and glycerol (see Figure 24 process variant 2). It is also possible to produce fatty alcohols (instead of biodiesel) and glycerol from transesterification (see Figure 34 process variant 4). These are indicated with dashed lines in Figure 24. Apart from oil crops such as soy and canola, waste fats and oils can be used in this pathway.
Figure 34. One platform (oil) biorefinery pathway using soy/canola for propylene glycol
In addition to manufacturing propylene glycol from glycerol, ADM has the capability to manufacture propylene glycol from its self-produced sorbitol, a corn-derived sugar alcohol, following the same chemical conversion route226. This falls under pathway B described under process variant 4 (see
Figure 23). It is also possible to use sugars derived from sugar crops (pathway A) and from lignocellulosic biomass (pathway E) as feedstock.
Alternative pathways
The alternative to bio propylene glycol is the fossil-based propylene glycol. Fossil-based propylene glycol is produced through hydration of propylene oxide that is derived from propylene. The alternative pathways for the production of propylene glycol using either biomass or fossil feedstock are depicted in Figure 35.

126
Figure 35. Alternative pathways for propylene glycol production using biomass or fossil feedstock
It should be noted here that propylene used as the feedstock in the fossil-based route can also be attained commercially from biomass. Neste produces and sells renewable propane attained as a by-product from its proprietary NEXBTL™ technology to Borealis, which the company can steam crack or process via propane dehydrogenation to produce renewable propylene.231
Assessment with respect to fossil-based propylene glycol – Advantages/disadvantages bio-PG
Technical performance: Bio propylene glycol is a drop-in chemical – it is identical to fossil-based propylene glycol (i.e. has the same molecular structure). ADM’s propylene glycol meets the same USP, EP, JP (the three prime regional Pharmacopoeia organisations) and FCC specifications (for food) as petroleum-based PG.228
Environmental performance: Life Cycle Analyses (LCA) studies, reviewed and endorsed by third parties, show that propylene glycol produced by ADM provides a 60% reduction in greenhouse gas emissions when compared to PG derived from petrochemical production.232 In addition, ADM USP-PG was certified by the USDA as a 100% bio-based product when tested by ASTM D6866. 228
Cost performance: ADM is able to produce bio PG on a commercial scale which is cost competitive with fossil-based PG227. Use of waste and residual oils and fats as feedstock could positively influence the cost competitiveness.
Other important considerations
Sustainability of biomass feedstock: As part of the Biodiversity Strategy for 2030 and the Farm to Fork Strategy, the Commission will present in 2021 a legislative proposal and other
231 https://www.neste.com/releases-and-news/circular-economy/borealis-producing-certified-renewable-polypropylene-nestes-renewable-propane-own-facilities-belgium
232 https://www.adm.com/products-services/industrials/propylene-glycol/life-cycle-analysis

127
measures to avoid or minimise the products associated with deforestation or forest degradation. The deforestation relates to several food-based feedstocks especially oil crops. The feedstock crude glycerol used in the production of PG is derived from oil crops predominantly from soybean and canola. They don’t use palm oil derived glycerol. ADM has set forth several sustainability commitments and sources certified biomass. ADM sources RTRS certified soybeans in Argentina and Brazil and ISCC certified canola, corn and soy in Australia, Brazil, Canada, Europe and Paraguay.233 Furthermore, following the UPM example use of lignocellulosic biomass can replace use of crops as feedstock for propylene glycol productions.
Valorisation of residues and wastes: Crude glycerol is currently available in high volumes as a processing residue or by-product from biodiesel production. It contains impurities that needs to be removed to bring it into utilization. The bioproduct derived need to be of high value and needs to be attained in high yields/concentrations to cover the downstream processing costs to be economically viable. The production of propylene glycol presents a good example where science and industry expertise were brought together to refine the catalyst and operation to produce a valuable chemical on a commercial scale.
The crude glycerol feedstock currently derived from oil crops for the production of bio PG, could also be derived from the transesterification of waste fats and oils.
Material vs energy use: The principles of the circular economy and of the waste hierarchy (Directive 2008/98/EC, Article 4) favour the material use over energy. However, the existing biofuel-related targets (RED II, EU/2018/2011) support the use of biomass for biofuels production. There is a dedicated target for advanced biofuels produced from feedstocks listed in Part A of Annex IX of the Renewable Energy Directive which are wastes and residues. This is supportive of the transition towards use of residues and waste materials instead of food crops as feedstock. However, materials/chemicals that rely on the same feedstock do not yet have such supportive mechanism in place. This results in distorted competition for feedstock between energy and material use – a situation often called as a non-level playing field. This puts pressure on availability and price of biomass for material/chemical use and causes market distortion. Crude glycerol, which is the feedstock for producing bio PG, is also one of the items in the Annex IX of RED II.
BUILDING BLOCK: DROP-IN – 1,4-BUTANEDIOL (BDO)
Production route and major examples
1.4-Butanediol (BDO) is a chemical building block for the production of plastics, elastic fibres and polyurethanes for a wide range of applications, such as: textiles, electronics, automotive and consumer goods.234 It is an example of drop-in chemicals, which are a bio-based version of existing fossil-based chemicals that have established markets. Novamont has invested in a production facility that produces BDO from glucose syrup through an innovative single-step fermentation, thanks to bioengineering technology that Novamont successfully licensed from Genomatica and integrated into its production process. 235 Glucose syrup is derived from the hydrolysis of starch. The resulting product, bio-BDO, is a 100 % bio-based drop-in replacement for the fossil-based BDO on the market. The company uses the product as an input for its own downstream bioplastic products, which constitute the company’s main business. This allowed them to increase the renewable carbon content of their bioplastics to more than 60%. They call it a 4th generation bioplastic (Mater-Bi) that is biodegradable and compostable.236
Commercial production started in 2016 in the Mater-Biotech plant in Italy. The plant has a production capacity of 30,000 metric tonnes of bio-BDO per year and employs 75
233 https://www.adm.com/sustainability/responsible-sourcing 234 https://www.novamont.com/public/zip/factsheet_materbiotech_EN_web.pdf 235 https://bioplasticsnews.com/bio-bdo-bio-butanediol-novamont/ 236 https://www.novamont.it/eng/materbiotech/

128
employees235. Novamont converted a decommissioned industrial plant designed for a different fermentation process to the production of bio-BDO. This contributed to territorial regeneration. 235
Other companies, including BASF, DSM and Tate&Lyle, also announced a licence agreement with Genomatica to use their process for producing bio-BDO.237 BASF also markets bio-based PolyTHF produced using bio-BDO.238
Bio Amber and Myriant are working on the development of bio-BDO through a two-step process consisting of the initial glucose fermentation into bio based succinic acid and subsequent conversion to BDO through conventional hydrogenation.239
Biorefinery pathways
The production route described above is under pathway B and is depicted in Figure 36. Alternatively, it is possible to use the sugars derived from sugar crops (pathway A) or from lignocellulosic biomass (pathway E) for fermentation into bio-BDO. There is also the two-step route including fermentation into succinic acid followed by hydrogeneration to BDO.
Figure 36. One platform (starch) biorefinery pathway using maize for 1,4 BDO
Alternative pathways
The alternative to bio-BDO is the fossil-based BDO. Fossil-based BDO is produced from different fossil feedstocks, including: acetylene, butadiene, maleic anhydride and propylene.240 Over 40% of fossil based BDO is still produced via the Reppe process where acetylene is reacted with formaldehyde to form butynediol which then undergoes high
237 E4tech, RE-CORD and WUR. From the Sugar Platform to biofuels and biochemicals. Final report for the European Commission, contract No. ENER/C2/423-2012/SI2.673791. 2015.
238 https://www.basf.com/global/en/media/news-releases/2015/03/p-15-163.html 239 RoadToBio.D1.2 Case studies on potentially attractive opportunities for bio-based chemicals in Europe. 2018. 240 https://thinking.nexant.com/sites/default/files/report/field_attachment_abstract/201304/2012_3_abs.pdf

129
pressure hydrogenation to form BDO238. It is produced using the Mitsubishi process from butadiene which is a multi-step synthesis based on the acetoxylation of butadiene to 1,4-diacetoxy-2-butene followed by hydrogenation to produce BDO. Fossil-based BDO is also manufactured on an industrial scale from maleic anhydride in the Davy process, which is first converted to the methyl maleate ester, then hydrogenated. LyondellBasell, leading producer in Europe, uses the ARCO process from propylene oxide to BDO technology239.
The alternative pathways for the production of BDO using either biomass or fossil feedstock are depicted in Figure 37.
Figure 37. Alternative pathways for BDO production using biomass or fossil feedstock
Assessment with respect to fossil-based BDO – Advantages/disadvantages of bio-BDO
Technical performance: Bio-BDO is identical to fossil-based bio-BDO (i.e. has the same molecular structure). It offers direct drop-in replacement for fossil BDO.
Environmental performance: Novamont’s internal LCA studies show that bio-BDO results in approximately 60% greenhouse gas emission reduction when compared to fossil-BDO234. The plant has been designed to use by-products for its own energy purposes, thus reducing net energy consumption and waste production233.
Cost performance: Bio-BDO product of Novamont is currently used internally for the production of their biopolymers and not sold to external customers. It is not cost competitive with the fossil equivalent product. It is reported that the costs are less than double compared to published fossil-BDO prices234. Due to the relatively low capacity of production, the production of bio-BDO does not yet benefit from economies of scale to the

130
same extent that competing, fossil-based BDO do.241 The price difference has been reduced as a result of cost reduction measures in the production process.
Bio-BDO replaces fossil-based chemicals in producing Novamont’s bioplastic products. Although, there is a price difference with the conventionally used fossil-based plastics in the blend, the use of bio-BDO allows increase in the renewable carbon content of their bioplastics (from about 35% to about 60%) and further reduction of their fossil dependence and climate impact.235 This is increasingly gaining importance with the legislative requirements on minimum bio-based content criteria for lightweight plastic carrier bags and sustainability commitments. With the integration of bio-BDO in its bioplastics, Novamont is able to meet these minimum requirements, which gives them a competitive advantage in the market.242
Since bio-BDO provides a drop in replacement for a product with an established supply chain there is the opportunity for the future deployment of bio-BDO by external customers especially committed to sustainability, and thus an increase in volume of production would be possible. BDO is in high demand for a wide range of applications besides plastics, e.g. in sectors such as: textiles, automotive and consumer goods. Furthermore, there is a growing trend for BDO (fossil+bio) with the market growing 5-8% CAGR per year240. This is partly owing to the growing demand of spandex in textiles and the bio-BDO derived PTMEG used for this.
Other important considerations
Sustainability of biomass feedstock:
The feedstock currently used for the production of bio-BDO is sugars (glucose) derived from the hydrolysis of starch – the so-called glucose syrup, commonly used in industrial fermentation processes. The glucose syrup is supplied from a local Italian production plant that uses starch sourced in Europe. According to company estimates, the current demand for glucose syrup is assessed to not significantly influence the market for these raw materials240.
Looking into the future, and to address possible future concerns with respect to feedstock competition with food, Novamont has been conducting research on obtaining sugars from lignocellulosic biomass (that corresponds to pathway E). Novamont pilot-tested this technology, which has proven to be technologically feasible. 234
BUILDING BLOCK: DROP-IN – METHANOL
Production route and major examples
Methanol is one of the largest volume chemicals in the world and serves as a building block for various other chemicals, e.g. formaldehyde, acetic acid, olefins, MTBE and DME. Biomethanol is a drop-in chemical, chemically identical to fossil-based methanol. Currently, almost all methanol is produced from synthesis gas (syngas). Bio-based syngas (biosyngas) can be produced from gasification of various biomass sources, such as: lignocellulosic crops (e.g. energy crops like Miscanthus and switchgrass and short rotation coppice, such as: willow and poplar), wood, forestry residues, agricultural residues (such as straw), as well as municipal solid waste (MSW), black liquor, wood waste and manure.
The first commercial scale plants have been built based on the MSW gasification by Enerkem213. One is situated in Edmonton, Canada. Other projects are underway to produce methanol from MSW, for example in the Netherlands, Spain and China. The proprietary
241 https://www.ecologic.eu/sites/files/publication/2019/3513-bio-based-products-15-success-stories-2019.pdf 242 https://www.industryarc.com/PressRelease/1760/Bio-BDO-Market-Research-Analysis.html

131
thermochemical process includes feedstock preparation, gasification, syngas cleaning and conditioning and catalytic conversion to produce methanol and ethanol. 213
Methanol can also be produced from biogas which is upgraded to biomethane and then reformed to produce biosyngas. This route produces the largest volumes of biomethanol today but does not fall under the definition of a biorefinery. BioMCN formerly produced biomethanol from glycerol in the Netherlands. In 2015, BioMCN was acquired by OCI N.V. and continued producing renewable methanol from biogas with a capacity about 60,000 metric tonnes per year.243 The biogas has to be cleaned to obtain a gas with high methane content which is then supplied to the natural gas grid. BioMCN uses gas from the grid and converts to methanol. They purchase green gas certificates and the methanol produced is on a mass balance basis certified as bio-methanol.244
Alternatively, methanol is commercially produced as a side-stream from Kraft mills by separating and purifying methanol from the waste gas (steam stripper off-gas) which can contain up to 70% methanol.245 This gas is conventionally incinerated. Alpac (Alberta-Pacific Forest Industries Inc.) was the first company to valorise this waste gas to attain methanol as a by-product. They produce 4,000 metric tonnes of methanol per year.246 They use a portion of the methanol they produce to make a pulp whitening agent required for the production of pulp and sells any surplus commercially.247
Biorefinery pathways
The production route described above through syngas is under pathway I and is depicted below:
Figure 38. One platform (syngas) biorefinery pathway using lignocellulosic biomass and MSW for methanol
Alternatively, methanol is generated as a by-product in Kraft mills covered under pathway D, process variant 6 (see Figure 25).
Furthermore, methanol can also be generated by steam reforming of biomethane to biosyngas and methanol synthesis to biomethanol. Biomethane is produced from upgrading of biogas which arises from anaerobic digestion of organic residues (see pathway F).
Figure 27 provides a schematic representation of the Two-platform (organic fibres and organic juice) biorefinery using green biomass showing the different process variants.
Alternative pathways
The alternatives to biomethanol are the fossil-based methanol and the CO2-based methanol. The methanol produced from all these different options is chemically identical.
243 https://www.methanol.org/wp-content/uploads/2019/01/MethanolReport.pdf 244 https://brintbranchen.dk/wp-content/uploads/2017/10/Paul-Compagne_BioMCN.pdf 245 IEA Bioenergy Task42 Biorefining. Sustainable and synergetic processing of biomass into marketable food & feed
ingredients, products (chemicals, materials) and energy (fuels, power, heat). August 2014. 246 IEA Bioenergy Task 42, Country Report, https://www.iea-bioenergy.task42-
biorefineries.com/upload_mm/d/9/3/21c2be95-41c5-41a9-ab99-b6762e912c2a_Canada_2015_Country_Report_IEA_Bioenergy_Task42_MW_Final.pdf
247 https://alpac.ca/index.php/about/products

132
Similar to the pathway of biomass, fossil-based methanol is also produced through syngas. But the syngas is produced from gasification of coal or from steam reforming of natural gas.
Methanol can also be produced by reacting CO2 with hydrogen produced from the electrolysis of water using renewable electricity. There are three options for the source of CO2: fossil CO2, biogenic CO2 and direct air capture.248 Fossil CO2 is mostly obtained from manufacturing (e.g. cement, steel) or power plants. Biogenic CO2 is mostly produced during fermentation of sugars and from conditioning of biogas to biomethane. Biogenic CO2 can also arise from other biomass conversion facilities mainly from combustion units. CO2 can alternatively be directly captured from air via Direct Air Capture (DAC).
The alternative pathways for the production of methanol using biomass, CO2 or fossil feedstock are depicted in Figure 39.
Figure 39. Alternative pathways for methanol production using biomass, CO2 or fossil feedstock
In 2011, Carbon Recycling International (CRI) started operation of the George Olah Renewable Methanol Plant242. It uses waste CO2 from the nearby geothermal power plant. and currently produces 4,000 metric tonnes of renewable methanol per year. There is a planned expansion to a larger plant. The other reagent hydrogen is produced by water electrolysis fed by hydro and geothermal energy. The methanol product is used currently for blending with gasoline. It has been reported that in comparison to fossil-fuel based methanol, renewable (CO2-based) methanol reduces GHG emissions by 90%.242
248 Carus, M. et al. .Renewable Carbon is Key to a Sustainable and FutureOriented Chemical Industry, 2018.

133
Additionally, SABIC has a facility to capture and purify CO2 from its ethylene glycol plant in Saudi Arabia, which is liquified and piped to associated plants at the site to produce methanol and urea. Currently 4.2 million tonnes of CO2 per year is utilised with a scope to increase further.249
Assessment with respect to fossil-based methanol – Advantages/disadvantages bio-methanol
Production of methanol through MSW gasification by Enerkem (pathway I) is considered as reference for comparison with fossil-based methanol here.
Technical performance: Bio-methanol is identical to fossil-based methanol (i.e. has the same molecular structure). It offers direct drop-in replacement for fossil-based methanol. Enerkem meets the highest international quality standards set by IMPCA (International Methanol Producers and Consumers Association).250
Environmental performance: The production of biomethanol using waste results in significant GHG emission reduction compared to fossil-based methanol (estimated as 40% compared with natural gas251, without taking into account avoided emissions from the diversion of waste from landfilling or incineration). In 2016, the facility obtained certification from the International Sustainability and Carbon Certification (ISCC) system.252
There is no land use impact as readily available and abundant wastes and residues are used as feedstock. It is claimed that the diversion of this waste to gasification resulted in 2.5 times reduction in GHG emissions compared to the previous waste management system.253
Cost performance: Low or no cost feedstock, i.e. wastes and/or residues are used. The Enerkem plant in Edmonton processes 100,000 dry tonnes of waste per year and produces 38 million litres combined methanol and ethanol per year250. Production costs are competitive with those derived from fossil feedstock.254 It is reported to generate 65 million CAN$/year in net economic benefits in the region and creation of jobs251. This success resulted in new projects with one planned in Rotterdam. A waste-to-methanol plant is planned with Enerkem partnering with Air Liquide, Nouryon, the Port of Rotterdam, and Shell. The planned facility will convert up to 360,000 tons of waste into 220,000 tons (270 million litres) of bio-methanol.255
Other important considerations
Sustainability of biomass feedstock: Biomethanol can be produced from gasification of any carbon source and allows utilisation of for example municipal solid waste, agricultural or forestry residues. Biogas, obtained through anaerobic digestion, from landfills, wastewater treatment plants, organic or animal wastes can also be used as a feedstock for methanol production. Therefore, biomethanol can be produced without any demand on agricultural land and thus its production does not have a negative effect on the availability and price of food and does not lead to deforestation. Another advantage is the flexibility of the gasification and anaerobic digestion units to feed and process different types of feedstock.
249 http://www.methanol.org/wp-content/uploads/2016/06/Hans-Vander-Velpen-CO2-Potential-in-the-Methanol-Business.pdf
250 https://enerkem.com/products/methanol/ 251 http://www.sciencedirect.com/science/article/pii/S0960852417310763 252 https://enerkem.com/company/facilities-projects/ 253 https://enerkem.com/company/about-us/ 254 https://www.bio.org/sites/default/files/legacy/bioorg/docs/1500%20McConnell.pdf 255 https://www.biofuelsdigest.com/bdigest/2019/03/01/shell-joins-air-liquide-nouryon-in-enerkem-waste-to-
chemicals-project-in-rotterdam-the-complete-story/

134
Valorisation of residues and wastes: Biomethanol production through gasification or anaerobic digestion allows creating value from waste and residual streams. Enerkem focuses on the use of non-recyclable and non-compostable solid waste as feedstock.256 It also allows diverting waste from landfills and thereby avoiding associated environmental problems and methane emissions. This is supportive of the waste hierarchy and the circular economy. It allows recycling carbon molecules in waste into added-value products.
Material vs energy use: Similar to the discussion presented for glycerol in the PG case, MSW is listed under REDII, Annex IX and accordingly double counted in meeting targets of minimum share of biofuels. Thereby, renewable fuels mandates around the world favour the blending of biomethanol in fuels instead of use for chemicals. The principles of the circular economy on the other hand favour the use of waste as feedstock for value-added chemicals/materials. One of the actions in the Circular Economy Action Plan is the development of the Sustainable Products Policy legal framework that will make use of the Products’ Environmental Footprint (PEF).
BUILDING BLOCK: DEDICATED – LACTIC ACID + POLYMER: POLY LACTIC ACID (PLA)
Production route and major examples
Lactic acid is an example of dedicated bio-based chemicals which are chemicals produced via a dedicated pathway that do not have an identical fossil-based chemical.257 As such, they “can be used to produce products that cannot be obtained through traditional chemical reactions. These products potentially offer unique and superior properties that are unattainable with fossil-based alternatives”.258
Lactic acid is a chemical building block produced from fermentation of sugars. It is used in the food and beverage sector as a preservative and pH adjusting agent. It is used in the pharmaceutical and chemical industries as a solvent and a starting material in the production of lactate ester. The biodegradable polymer polylactic acid (PLA) is produced from polymerisation of lactic acid. It is 100% bio-based. PLA is gaining increasing interest due to growing demand for bio-based and sustainable plastics. It finds applications in a wide range of markets, notably packaging, consumer goods, 3D printing, textiles, electronics and automotive.259
Dutch company Corbion is the global market leader in lactic acid and its derivatives, with manufacturing facilities in the USA, Thailand, Brazil, Netherlands, and Spain.260 Through its joint venture with Total it also has a PLA polymerization plant in Thailand with a 75,000 metric tonnes of production capacity of PLA per year.261 The global leader in PLA production is NatureWorks. They produce 150,000 metric tonnes of PLA per year in their manufacturing facility located in Blair, Nebraska, USA. Other companies active in PLA production include Galactic, Henan Jindan and BBCA in China166.
Biorefinery pathways
Lactic acid is produced from fermentation of sugars that can come from sugar crops or starch crops. At Total-Corbion PLA, the biomass used for lactic acid production is sugarcane.262 Sugar produced from the sugar mill is fermented to produce lactic acid. In the case of NatureWorks, maize is used as feedstock. The harvested maize goes through wet milling where dextrose is produced via enzymatic hydrolysis. Dextrose is sent to the
256 https://enerkem.com/process-technology/environmental-and-social-acceptability/ 257 https://www.roadtobio.eu/uploads/publications/articles/17-12-18-RoadToBio-Drop-in-paper.pdf 258 BIO-TIC.Overcoming hurdles for innovation in industrial biotechnology in Europe, Biobased Chemical Building
Blocks. 2014. 259 https://www.total.com/energy-expertise/projects/bioenergies/pla-bioplastic 260 http://www.corbion.com/ 261 https://www.total-corbion.com/ 262 http://www.corbion.com/about-corbion/sustainability/life-cycle-assessment

135
fermentation unit to produce lactic acid.263 Lactic acid exists as two optically active types referred to as L lactic acid and D lactic acid, where L lactic acid is the dominating route commercially. For production of PLA, lactic acid is converted to lactide which goes through open ring polymerization to produce PLA.
The production route for lactic acid and PLA is under pathway A using sugar crops and pathway B using starch crops and is depicted below:
Figure 40. One platform (C6 sugars) biorefinery pathway using sugar or starch crop for lactic acid and PLA
Alternatively, it is possible to use the sugars derived from lignocellulosic biomass (pathway E) for fermentation into lactic acid.
Alternative pathways
As lactic acid is a dedicated bio-based chemical as explained above, an identical fossil-based product doesn’t exist. PLA produced from lactic acid, based on the different applications (e.g. drinking cups, food containers), can replace fossil-based plastics polypropylene (PP), polystyrene (PS) and polyethylene terephthalate (PET). These can be considered as fossil-based counterparts or benchmarks for PLA. They are primarily derived in Europe from chemicals produced via the steam cracking of naphtha. PP is produced from the polymerization of propylene. PET is produced from esterification of two intermediate products monoethylene glycol (MEG) and purified terephthalic acid (PTA), followed by polymerization. PS is produced from polymerization of styrene which is primarily attained from ethylbenzene that is made by catalytic alkylation of benzene with ethylene. The major alternative pathways for the production of PLA using biomass or fossil feedstock are depicted in Figure 41.
263 https://www.natureworksllc.com/What-is-Ingeo/How-Ingeo-is-Made

136
Figure 41. Alternative pathways for PLA production using biomass or fossil feedstock264
Assessment with respect to fossil-based counterparts – Advantages / disadvantages of LA / PLA
Technical performance: PLA is one of the first renewable polymers able to compete with existing polymers, combining unique functional properties like transparency, glossy appearance, durability (scratch and impact resistance) and stiffness. It has good processability (shape, mold, print). These special characters make PLA a perfect fit for some market sections, such as: fibres, disposable cups, salad boxes, and cold food packaging. Good breathability and moisture vapor permeability allows it to be used for packaging for vegetables, fruits, and bread. It is approved for food contact. Its lower density compared to PET allows lower weight to be used for the same application.265
However, it has relatively poor barrier properties, hence PLA as is not good for packaging water sensitive products. The higher water permeability of PLA makes it not suitable to replace PET in long shelf life applications. This is solved by blending with other polymers or with the use of additives for example a new generation of high barrier PLA based flexible substrates from Natureworks and Metalvuoto.266 PLA has also faced problems related to
264 For the production of benzene and xylene another source for catalytic reforming is pygas produced from naphtha cracking. For simplicity this is omitted in Figure 23.
265 https://www.natureworksllc.com/~/media/News_and_Events/NatureWorks_TheIngeoJourney_pdf.pdf 266 https://www.natureworksllc.com/News-and-Events/Press-Releases/2016/03-17-16-Metalvuoto-Ingeo-PLA-barrier-
film

137
heat resistance. New type of resins was accordingly developed with higher heat resistance based on stereochemically pure lactides by Total-Corbion.267 Natureworks has also developed new formulations to enhance properties.268
Environmental performance: Compared to conventional fossil-based plastics, PLA offers additional end-of-life options of biodegradability and composability.269 This allows organic recycling and supports circular economy goals by diverting organic waste from landfill. PLA conforms to the EN 13432 standard for industrial composting. Additionally, it is possible to mechanically recycle PLA using near-infrared sorting, however this is currently not performed as it requires a separate large-scale stream to be economical for the waste processors. The EU Waste Directive can support in bringing this into practice. Furthermore, it is possible to chemically recycle PLA back to its monomer lactic acid using hydrolysis268. The lactic acid then can be converted back into PLA.
Compared to the fossil-based counterparts, it was estimated that PLA offers about a 70% reduction in GHG emissions and 50% reduction in non-renewable energy use.270 Land use change is an important consideration for climate impact. On request of Corbion, GRAS GmBH conducted satellite imaging of the sugarcane plantation areas which was combined with the mapping of high carbon stock and biodiversity protected areas. 271 This study lead to the conclusion that Corbion’s sourcing areas did not show significant land transformation.
Cost performance: PLA is not cost competitive with the conventional fossil-based plastics. It will benefit from economy of scale with larger scale production and from further optimization of the process. With the increased policy ambitions towards reducing dependence on fossil resources and reducing the climate impact there is a growing demand for PLA. Cost competitive availability of lignocellulosic biomass derived sugars will further support this transition.
Other important considerations
Sustainability of biomass feedstock:
Corbion predominantly produces PLA bioplastic from raw sugar from sugarcane in Thailand. NatureWorks produces PLA from corn in USA. Natureworks estimated that their PLA production uses currently less than 0.05% of the annual global corn crop production, and as such contributes little to no impact on international or local food chains. Similarly, Corbion estimated that 0.12% of the Thai available arable land is used annually for the sugarcane used in their plant270.
Corbion, is a member of both SEDEX- ensuring an ethical supply chain, and Bonsucro - a global non-profit initiative dedicated to reducing the environmental and social impacts of sugar cane production.272 Natureworks has a ISCC Plus certification - 3rd party certification scheme certifying the sustainable production of renewable raw materials including the certification of the chain of custody, and Working Landscapes Certificate - an independent third-party scheme certifying sustainable agricultural production for emerging biomaterials sectors, including the bioplastics industry.273
Lactic acid can be made from fermenting sugar from any sugar source. Looking into the future, and to address possible future concerns with respect to feedstock competition with food, both Natureworks and Total-Corbion has been conducting research on using sugars
267 https://www.total-corbion.com/about-pla/performance/ 268 https://www.natureworksllc.com/Products/3-series-for-injection-molding/High-Heat-PLA-Technology 269 https://www.natureworksllc.com/What-is-Ingeo/Where-it-Goes 270 https://www.natureworksllc.com/What-is-Ingeo/Why-it-Matters 271 http://www.corbion.com/media/550170/corbion_whitepaper_feedstock_sourcing_11.pdf 272 https://www.total-corbion.com/about-pla/raw-material-sources/ 273 https://www.natureworksllc.com/What-is-Ingeo/Where-Ingeo-Comes-From/Feedstock-Certifications

138
from lignocellulosic biomass (that corresponds to pathway E). Natureworks is also now assessing using cutting-edge concepts for turning CO2 or CH4 directly into lactic acid.274
Biomass utilization efficiency:
Different types of bioplastics, produced using different production processes, require different amounts of feedstock. In terms of feedstock efficiency, PLA is one of the most efficient biopolymers: yielding 1 kg of PLA polymer per 1.6 kg of fermentable sugar feedstock. Other bioplastics can require 2 – 3 times more sugar feedstock to produce the same amount (1 kg) of plastic270. Feedstock efficiency has a positive impact on land use and, in addition, all environmental impacts related to agriculture.
BUILDING BLOCK: DEDICATED – LACTIC ACID + POLYMER: POLY LACTIC ACID (PLA)
Production route and major examples
Acetic acid is widely used as a raw material in the production of industrial chemicals & solvents. It is also used in food, pharmaceutical, textile, and cosmetics industry. It is a drop-in chemical, chemically identical to fossil-based acetic acid. The market of acetic acid is expected to expand owing to growing demand for applications like purified terephthalic acid (PTA) and vinyl acetate monomer (VAM). PTA is used in the production of PET which is used in packaging and textile industries. VAM is utilised in the production of chemicals for solvents, paints and coatings and adhesives.275
There are diverse ways of producing acetic acid. It can be produced from ethanol derived from fermentation or methanol derived from syngas. Godavari Biorefineries Ltd. restarted its production of bio acetic acid at its Sakarwadi facility in Maharashtra from August 2018. It is produced by oxidation of molasses-based ethanol.276 It is also possible to convert sugars into acetic acid directly using acetogens (naturally occurring bacteria). ZeaChem in USA works on this fermentation process using lignocellulosic biomass such as wood, straw and corn stover as feedstock.277 This enables 100% carbon conversion.
Alternatively, acetic acid can be attained as a side-product from wood pulping. It can be extracted from spent sulphite liquor from sulphite pulping and attained after several purification steps. Lenzing produces acetic acid in this way.278
Biorefinery pathways
Different biorefinery pathways can lead to the production of acetic acid as depicted in Figure 42. It can be produced from fermentation of sugars. It is possible to use the sugars derived from sugar crops (pathway A), starch crops (pathway B) or from lignocellulosic biomass (pathway E). The sugars are used for production of ethanol which then can be directly oxidized to acetic acid or oxidized to acetaldehyde first and then converted to acetic acid. As explained above, alternatively sugars can be converted to acetic acid directly by acetogens.
Alternatively, acetic acid can be extracted from spent sulphite liquor from sulphite pulping of wood (pathway D).
274 https://www.natureworksllc.com/What-is-Ingeo/Where-Ingeo-Comes-From 275 https://www.grandviewresearch.com/press-release/global-acetic-acid-market-
analysis#:~:text=The%20global%20acetic%20acid%20market,revenue%2C%20from%202020%20to%202027.&text=VAM%20is%20the%20largest%20application%20market%20of%20acetic%20acid
276 http://news.bio-based.eu/re-startingproduction-of-bio-based-acetic-acid-from-august-2018/ 277 https://www.biofuelsdigest.com/bdigest/2015/03/02/zeachem-biofuels-digests-2015-5-minute-guide/ 278 https://www.lenzingindustrial.com/Application/the-lenzing-biorefinery

139
It is also possible to produce acetic acid through methanol (see section on methanol above). Methanol is most typically generated from synthesis gas from pathway I attained by gasification of lignocellulosic biomass, residues and wastes. Methanol is converted to acetic acid through a catalytic carbonylation process.
Figure 42. Biorefinery pathways for acetic acid production
Alternative pathways
The alternatives to bio acetic acid are the fossil-based acetic acid and the CO2-based acetic acid. Acetic acid produced from all these different options is chemically identical.
For the production of fossil-based acetic acid three chemical routes exist: methanol carbonylation, acetaldehyde oxidation and alkane oxidation.279 Methanol carbonylation has become the dominant fossil-based acetic acid production technology, accounting for over 65% of global capacity.280 This involves a liquid phase reaction between methanol and carbon monoxide in the presence of catalyst. In the acetaldehyde oxidation route acetaldehyde is first prepared by oxidation of ethylene followed by further oxidation to form acetic acid. In the alkane oxidation route alkanes derived from petroleum, such as butane and ethane, are catalytically oxidized to generate acetic acid (with several other by-products)278.
Methanol can also be produced from CO2 as described in Figure 39 which then can be converted to acetic acid using the same carbonylation step.
The alternative pathways for the production of acetic acid using CO2 or fossil feedstock are depicted in Figure 43.
279 https://www.intechopen.com/online-first/production-pathways-of-acetic-acid-and-its-versatile-applications-in-the-food-industry
280 https://www.icis.com/explore/resources/news/2007/10/31/9074780/acetic-acid-production-and-manufacturing-process/

140
Figure 43. Alternative pathways for acetic acid production using CO2 or fossil feedstock
Assessment with respect to fossil-based counterpart –Advantages/disadvantages bio acetic acid
Technical performance: Bio acetic acid is 100% bio-based and it is identical to fossil-based acetic acid (i.e. has the same molecular structure). It thereby offers direct drop-in replacement for fossil-based acetic acid.
Environmental performance: Lenzing estimated its acetic acid (produced as a side-product from sulphite pulping of wood, pathway D) to have a carbon footprint which is 85% lower than that of fossil-based acetic acid.281 Looking at the fermentation routes it is seen that GHG results are very sensitive to the choice of purification steps used in attaining the required purity, if close to significantly better performance is required in comparison to fossil-based acetic acid.282
Cost performance: Bio acetic acid production has higher production costs due to low productivity of the route via methanol and ethanol. The direct fermentation to acetic acid with 100% carbon efficiency would therefore be interesting. The production of acetic acid from sulphite pulping has also high purification and separation requirements to extract it from the spent liquor and bring it to the required specs.
Other important considerations
Sustainability of biomass feedstock: Acetic acid can be made from fermenting sugars. For this sugar crops and starch crops are used. Looking into the future, and to address possible
281 https://lenzing-industrial.cdn.prismic.io/lenzing-industrial%2F1ca29763-5bd6-4e7c-a4fd-b1d2383a4341_lenzing+for+biorefinery+products_acetic+acid_leaflet_output_rgb_preview_v1.0_20181012.pdf
282 https://biotechnologyforbiofuels.biomedcentral.com/articles/10.1186/s13068-020-01784-y

141
future concerns with respect to feedstock competition with food, research on using sugars from lignocellulosic biomass is ongoing. Also to increase the carbon efficiency and thereby reduce feedstock conversion, direct fermentation routes from sugars to acetic acid (not via ethanol) are investigated for example by ZeaChem276.
The production route of acetic acid by extraction from spent sulphite liquor does not have any demand on agricultural land as it is derived from a residual stream used for energy. For the production route through methanol derived from syngas, the biomass feedstock considered is lignocellulosic biomass, residues or wastes with minimal or no competition with food.
Valorisation of residues and wastes: Bio acetic acid production through extraction from spent sulphite liquor allows creating value from residual streams. In most sulphite pulp mills, the spent liquor is concentrated using multiple effect evaporators and then burned for energy production. Lenzing looks at creating as much value as possible by converting wood into spectrum of products including acetic acid, furfural, xylose, lignosulfonate, sodium sulphate and soda ash besides their main product dissolving pulp277. Then the remaining spent liquor is used for creation of heat and electricity.
Material vs energy use: Bio acetic acid can be produced through ethanol and methanol. Renewable fuel mandates around the world favour the blending of biomethanol and ethanol in fuels instead of use for chemicals. The principles of the circular economy on the other hand favour the use for value-added chemicals/materials.
SURFACTANT: FATTY ALCOHOL ETHOXYLATE
Production route and major examples
Fatty alcohol ethoxylates are non-ionic surfactants widely used in process industries, such as: personal care, household care, cosmetics, agrochemicals, textiles and paper. They are used in a wide range of products, including: dishwashing liquids, laundry detergents, cleaning agents, shampoos and shower gels.
They are produced from ethoxylation process where ethylene oxide is reacted with fatty alcohols. In this ethoxylation process the fatty alcohol groups, like lauryl alcohol, stearyl alcohol, behenyl alcohol, oleyl cetyl alcohol etc., are made to react with ethylene oxide thereby leading to the formation of fatty alcohol ethoxylates, like lauryl alcohol ethoxylate, stearyl alcohol ethoxylate, behenyl alcohol ethoxylate etc. All of these ethoxylate products vary in physical appearance and have different properties, like pour point, cloud point, density, viscosity, and flash point, depending on the level of ethoxylation process from which they are formed.283
Fatty alcohols are derived from vegetable oils (and waste oils and fats) or from petrochemical sources. Ethylene oxide used is typically obtained from petrochemical sources. However, Croda made 100% bio-based fatty alcohol ethoxylate by producing bio-ethylene oxide at its Atlas Point manufacturing site in the US and using bio-based fatty alcohol180. The bioethylene oxide is produced from ethanol derived from corn or sugar cane. The fatty alcohol is derived from palm oil, palm kernel oil or coconut oil.284
Biorefinery pathways
Fatty alcohol ethoxylates are produced from the reaction of fatty alcohols with ethylene oxide. Fatty alcohols are produced under pathway C, process variant 4, as depicted in Figure 24. The process involves the transesterification of the oil to give methyl esters which
283 https://www.rimpro-india.com/articles1/surfactants-widely-used-in-industrial-processes-fatty-alcohol-ethoxylate,-fatty-acid-ethoxylate.html
284 https://www.crodahomecare.com/en-gb/products-and-applications/product-finder/product/4302/ECO_1_Brij_1_C10

142
are then hydrogenated to give the fatty alcohols. If bio-based ethylene oxide is used, they are produced under pathway A using sugar crops, and pathway B using starch crops by dehydration of ethanol into ethylene followed by oxidising the ethylene into ethylene oxide.
The biorefinery pathway for the production of 100% bio-based fatty alcohol ethoxylate is depicted below:
Figure 44. Biorefinery pathway for the production of 100% bio-based fatty alcohol ethoxylate
Alternatively, it is possible to use the sugars derived from lignocellulosic biomass (pathway E) for fermentation.
Alternative pathways
Fatty alcohol ethoxylates surfactants are produced via ethoxylation of fatty alcohol with ethylene oxide. The source of fatty alcohol (FA) could be either oil crops, waste oils and fats or petrochemicals. The physical properties of the final product is the same (provided that they have the same carbon chain length and ethoxylate distribution).285 For petrochemical FA production two main options exist; the Oxo process and the Ziegler process. The Oxo process involves using syngas for hydroformylation of long chain olefins. The Ziegler process involves hydrogenation, ethylation, growth reaction, oxidation and hydrolysis of ethylene284. The Oxo process is the dominant route for fossil-based FA production.
285 https://link.springer.com/article/10.1007/s11743-016-1867-y

143
Figure 45. Alternative pathways for fatty alcohol ethoxylate production using biomass or fossil feedstock286
Fatty alcohol ethoxylates can replace other non-ionic surfactants of alkyphenol epoxylates with nonylphenol epoxilates being the major example. Nonylphenol ethoxylates are produced by reaction of nonylphenol with ethylene oxide. Production of nonylphenols is based on the reaction of phenols with isononene at elevated temperatures and in presence of a catalyst.287 Nonylphenol ethoxylates discharged in wastewater after use are converted to nonylphenols as a consequence of biological degradation. Nonylphenol has attracted attention due to its persistence in the aquatic environments, its bioaccumulation and its potential role as an endocrine disruptor (disrupt the natural balance of hormones in affected organisms).288 In Europe, due to environmental concerns, the production and use of nonylphenol and nonylphenol ethoxylates is prohibited. Alcohol ethoxylates are less problematic for the environment due to their ability to degrade more quickly than nonylphenols, and more and more products have been substituted over the years.289
286 For the production of olefins ethylene and propylene there is also input of ethane and propane as feedstock to steam cracker. These are omitted in Figure 45 for simplicity.
287 https://edepot.wur.nl/174304 288 https://www.scielo.br/scielo.php?script=sci_arttext&pid=S0001-37652018000501903 289 https://www.sciencedirect.com/science/article/pii/S0160412008000081?via%3Dihub

144
Assessment with respect to fossil-based counterpart – Advantages/disadvantages bio fatty alcohol ethoxylate
Technical performance: Fatty alcohol ethoxylates are non-ionic, biodegradable and have low toxicity. They provide identical performance to fossil-based counterparts290.
Environmental performance: Croda - offering 100% bio-based fatty alcohol ethoxylate - reports that a lower carbon footprint is achieved but the percentage of reduction is not reported. It is indicated that renewable energy is used in manufacturing. The palm oil used is RSPO certified. The product allows reduced reliance on fossil naphtha and natural gas as raw materials.
An LCA study comparing palm oil derived fatty alcohol and fossil-based fatty alcohol shows that the results are very much dependent on the agricultural practices in palm plantations and palm oil mill operation. Land use change, POME end-of-life treatment and EFB end-of-life treatment are key parameters that have an effect on the overall results and that will determine environmental sustainability of the product284.
Cost performance: It is possible to produce partially bio-based fatty alcohol ethoxylates cost competitively using fatty alcohols derived from vegetable oils.
Croda offers 100% bio-based fatty alcohol ethoxylate with the ethylene oxide derived from corn-based ethanol. The resulting 100% bio-based surfactants are more expensive but supported by USDA’s BioPreferred Program that establishes minimum bio-based content in different product categories. The expansion of Croda’s Atlas Point facility generated additional employment in the region.
Other important considerations
Sustainability of biomass feedstock: Fatty alcohol ethoxylates are produced from the reaction of fatty alcohols with ethylene oxide. Fatty alcohol is produced using oil crops which are associated with indirect changes to land use which leads to deforestation and has a negative climate and biodiversity impacts. However, it is possible to derive fatty alcohol using waste/residue fats, oil and greases which do not have indirect land use effects. Furthermore, if the ethylene oxide is generated from sugar and starch crop based ethanol via ethylene, this causes concern with respect to feedstock competition with food. To address this concern the sugars can be extracted from lignocellulosic biomass (pathway E).
FIBRE: MICROFIBRILLATED CELLULOSE
Production route and major examples
Microfibrillated cellulose (MFC) is produced from cellulose. For this usually wood pulp is used. However, it is possible to use other sources of cellulose, such as agricultural residues (sugar beet pulp), hemp and flax. Through a fibrillation process the cellulose fibres are separated with shear forces into a network of fibrils which consists of long and thin fibres.291 This allows increase in surface area. When the MFC solution is concentrated, it forms a gel. There are different methods used for producing MFC. They involve mechanical treatment of the pulp with or without the use of enzymes or chemicals.292
Its use provides increased tensile strength and improved barrier properties.293 The unique properties of MFC make it suitable for a wide variety of applications. MFC is currently being
290 Croda, https://www.crodapersonalcare.com/en-gb/sustainability/sustainable-manufacturing/eco-plant 291 https://weidmannfibretechnology.com/what-is-mfc/ 292 https://www.exilva.com/blog/microfibrillated-cellulose-or-nanocellulose 293 https://www.sciencedirect.com/science/article/pii/S014486171200447X

145
tested, among others, for paper and packaging (such as milk carton294), composites, paints and coatings, food, cosmetics and textiles (Spinnova191 example). It is also gaining interest in other domains such as electronics and medicine. Given the various (potential) applications of MFC, it is experiencing strong growth.
The traditional pulp and paper producers have been expanding their product offerings and becoming advanced biorefineries with a range of bioproducts. They have also recently added MFC to their products list. Leading examples include: Borregaard Sarpsborg plant in Norway295, Stora Enso Imatra plant in Finland296, and UPM in Finland297. There are also several companies working on the development of MFC using pulp such as Weidmann Fibre Technology298 in Switzerland and FibreLean technologies299 in UK. For the MFC production these companies mostly use wood pulp as feedstock. CelluComp300 is an interesting example in this regard because they produce MFC using sugar beet pulp in their plant in Scotland.
Biorefinery pathway
Microfibrillated cellulose is produced under pathway D, process variant 3, as depicted in Figure 46
Figure 46. Biorefinery pathway for the production of microfibrillated cellulose using wood
Alternative pathways
For its application in packaging, MFC can replace fossil-based plastic films and aluminium foil used as barrier layer in paperboard packaging. MFC also competes with alternatives produced from cellulose fibres. By converting a small portion of wood pulp to MFC and mixing it into the mass, you can make paperboard with the same strength, opacity and brightness but use less fibre293. It was seen 2% of MFC could replace 15% of conventional fibre.301
294 https://www.storaenso.com/en/products/bio-based-materials/mfc-for-packaging 295 https://www.exilva.com/about/production 296 https://www.storaenso.com/en/products/bio-based-materials 297 https://www.upm.com/SysSiteAssets/documents/responsibility/certificate-finder/statements/upm-nano-statement-
pulp.pdf 298 https://weidmannfibretechnology.com/ 299 https://www.fibrelean.com/ 300 https://www.cellucomp.com/ 301 https://www.cellucomp.com/blog/article/curran-a-microfibrillated-cellulose-mfc-wonder-product-1

146
Assessment with respect to alternatives – Advantages/disadvantages of MFC
Technical performance: MFC is finding increased use, as a performance enhancer in paints and coatings, personal care, and construction owing to its specific characteristics like improve rheology, stability, water holding capacity, robustness in harsh environments.302 This allows green replacement for non-organic performance additives.
It is shown that with MFC it is possible to produce lighter packaging products that are durable and of high-quality. It provides strong packaging with effective barrier against oxygen and grease293. MFC cross-links with fibres in paper and cardboard packaging and tissue, making them stronger, stiffer and lighter300.
Environmental performance: MFC is a non-toxic product, safe for food contact. It is biodegradable. Studies assessing the environmental performance of MFC with respect to reference products are ongoing. The preliminary results show that lower GHG emissions can be achieved.303
It was also shown that it is possible to reduce the raw material usage with MFC while maintaining the technical performance requirements.304 This is supportive of the circular economy. Furthermore, it is stated that aluminium film in paperboard packaging has a significant impact on the overall environmental footprint (about 50%) and its replacement with MFC could lower the footprint. 305
Cost performance: It is claimed that MFC offers paper makers the opportunity to become more cost competitive with the possibility of cost savings and production of innovative end products.306 This is especially owing to the possibility to provide the same performance using less raw material. There are good market prospects for MFC with a wide range of applications. Production in larger volumes will lower unit costs through economy of scale.
Other important considerations
Sustainability of biomass feedstock: MFC is commonly derived from wood. Companies are paying attention to source wood from forests that are managed in sustainable manner. They are ensuring this with third-party systems and forest certifications such FSC and PEFC.307
CelluComp succeeded in producing MFC using sugar beet pulp. They can extract the cellulose from the root vegetables with a significantly less energy intensive process than that normally used on wood.308 The MFC product produced offers as much strength as wood based MFC product. The possibility to use agricultural residues for MFC is also interesting from a price point of view.
RESIN: LIGNIN BASED PHENOLIC RESINS
Production route and major examples
Lignin-based phenolic resins, also called phenol formaldehyde resins, are a group of very versatile polymers with excellent physical characteristics (e.g. low flammability, high
302 https://www.exilva.com/application-areas 303https://www.researchgate.net/publication/320035990_Life_cycle_assessment_of_microfibrillated_cellulose_from_sp
ruce 304 https://www.storaenso.com/en/newsroom/news/2019/6/new-natura-enhanced-with-mfc 305 https://www.storaenso.com/en/newsroom/news/2017/2/a-future-for-mfc 306 https://fibrelean.com/microfibrillated-cellulose-proven-to-create-value-in-full-scale-papermaking-2/ 307 https://www.storaenso.com/en/sustainability/environmental/forests-plantations-and-land-use 308 https://www.cellucomp.com/blog/article/when-is-an-mfc-a-unique-mfc

147
temperature resistance and low humidity absorption).309 Main applications include adhesives, composites and insulation.
The feedstock used is lignin. Lignin replaces fossil phenol and formaldehyde in phenolic resins. The replacement level of phenol by lignin can be up to 50%. Currently commercially available lignin in industrial scale for this is the Kraft lignin from wood (from pathway D). With the further development of biorefinery concepts using a variety of lignocellulosic biomass (such as short rotation coppice, agricultural and forestry residues) other lignin types will become available. It is important to tailor the pretreatment process and achieve good separation of the lignin from the cellulose and hemicellulose without changing it chemically or physically (from pathway E).
UPM is producing on a commercial scale 100% lignin based phenolic resin. With their WISA BioBond bonding solution fossil-based phenol is replaced with bio-based lignin in the adhesive used in the production of plywood.310 They have been using lignin based phenolic resins in their plywood production since 2017.311 They also offer UPM BioPiva™ lignin (softwood Kraft lignin) for resin producers in combination with their proprietary, industrially proven resin technology.312 They deliver to many of the biggest resin producers worldwide, for example to Prefere Resins in Europe, one of the frontrunners for lignin-based plywood-adhesives manufacturing.313
Arpa Industriale launched Bloom, a new core technology for Arpa HPL (high-pressure laminate) and FENIX NTM® product lines used for interior design, in May 2019.314 They are made of paper and thermosetting resins based on phenol. The replacement level of phenol by lignin can be up to 50% in these products with Bloom.
StoraEnso produces refined Kraft lignin in their Sunila Mill in Finland and it is sold with the name Lineo™.315 They are working on developing lignin-based resin since 2017 in very close collaboration with Latvijas Finieris, a global leading developer, producer and supplier of birch plywood products.316
Companies are searching for increasing the replacement percentage of phenol with lignin more than 50% and in the future achieve a fossil-free resin.
Biorefinery pathways
The commercial production route of lignin based phenolic resin is using Kraft lignin as feedstock. Kraft lignin is produced from black liquor which is a side product attained from Kraft pulping of wood. Lignin can be recovered from black liquor through the addition of an acidifying agent such as carbon dioxide and sulfuric acid, followed by filtration and washing. LignoBoost317 is a two-stage process where after precipitating with CO2 and filtering, the filter cake is redissolved with spent wash water and sulfuric acid. The resulting slurry is once again dewatered and washed, with acidified wash water, to produce virtually pure lignin cakes. In the LignoForce process, black liquor is oxidized before the acidification step.318 This process is under pathway D and is depicted below:
309 https://www.ecologic.eu/sites/files/publication/2018/3513-top-emerging-bio-based-products.pdf 310 https://www.wisaplywood.com/campaigns/wisa-biobond/ 311 https://www.upm.com/about-us/for-media/releases/2017/10/upm-plywood-starts-using-a-new-sustainable-wisa-
biobond-gluing-technology/ 312 https://www.upmbiochemicals.com/products/lignin/resin-industry-solutions/ 313 https://prefere.com/en/company/news/biopolymers-put-to-industrial-use-at-phenolic-resin-producer-prefere-resins 314 https://www.fenixforinteriors.com/de/news/fenix-ntm-bloom-beyond-surface 315 https://www.storaenso.com/en/products/lignin/lineo 316 https://www.storaenso.com/en/newsroom/news/2020/6/developing-a-lignin-based-resin-for-plywood 317 https://www.valmet.com/pulp/other-value-adding-processes/lignin-separation/lignoboost-process/ 318 https://pubs.acs.org/doi/abs/10.1021/acssuschemeng.6b00907

148
Figure 47. Two platform (pulp and black liquor) biorefinery pathway using wood for lignin-based phenolic resin
Alternatively, lignin can be generated with different isolation methods (e.g. organosolv, enzymatic pretreatment, dilute acid pretreatment) from different sources of lignocellulosic biomass (such as short rotation coppices, agricultural and forestry residues). This is under pathway E. Potential of using the lignin derived from this pathway for resin was studied at lab scale. Lignin produced from dilute acid pretreatment of corn stover was used to replace 100% of phenol in the adhesive formulation.319
Recently, it has also been investigated to use pyrolytic oil produced from pyrolysis (pathway J). Lignin fraction of pyrolysis oil is separated and used as a substitute for fossil phenol in phenol-formaldehyde resins.320
Alternative pathways
The conventional phenolic resin is produced using 100% fossil-based phenol in formulation. Currently only partial phenol substitution (typically up to 50%) is achieved in commercial lignin-based phenolic resin products. Lignin is not a drop-in substitute for phenol, formulations need to be redeveloped for lignin. There are currently technical challenges (solubility, viscosity) that prevent reaching higher substitution levels. There are studies ongoing to tackle these challenges, such as looking at further upgrading of lignin used as feedstock in resin production.
Assessment with respect to fossil-based phenolic resins – Advantages/disadvantages lignin-based phenolic resins
Technical performance: Tests confirmed by the producers show that the products manufactured with the lignin based phenolic resins have the same technical properties with the 100% fossil-based phenolic resins. At UPM, rigorous field tests have proven that
319 https://onlinelibrary.wiley.com/doi/pdf/10.1002/app.45124 320 https://bio4products.eu/process/

149
plywood manufactured with the new lignin-based WISA BioBond bonding solution meets all the technical performance requirements (such as strength, durability and water resistance) for industrial-use plywood309. The properties of the resin can be adjusted according to the purpose of use (interior vs. exterior use etc.). Results of industrial production trials by Latvijas Finieris show that all technical properties of RIGA Plywood remain unchanged when the environmentally friendly glue RIGA ECOlogical is applied, containing Stora Enso’s kraft lignin Lineo™.321 Arpa also confirms that the quality and features (resistant to scratches, abrasion, dry heat, acid-based solvents and household reagents) are maintained with the replacement of phenol with lignin.322
Environmental performance: Substituting fossil-based phenol with lignin allows reducing dependence on fossil resources and reduce climate impact. Arpa estimated that with the substitution of 50% fossil-based phenol with lignin, about 45% reduction in GHG emissions and 40% reduction in primary energy use can be achieved compared to conventional 100% fossil-based phenolic resin.322
The efficient use of wood raw material is an important factor affecting the carbon footprint of wood-based products. Valorising lignin to its full potential in material applications is supportive of this and of the circular economy.
Cost performance: Due to the use of lower cost feedstock lignin rather than fossil-based phenol allows it to have a lower price than the conventional product. Process improvements in the production of the resin and in the production of the lignin feedstock give an opportunity to further increase cost competitiveness.
Other important considerations
Sustainability of biomass feedstock: No food crops are used as feedstock thus its production doesn’t have a negative effect on the availability and price of food. Currently, the feedstock lignin is derived from wood from forests. It is important that the forests are sustainably managed, and no deforestation occurs. The key objectives of sustainable forestry are efficient production of high-quality wood, maintaining and enhancing biodiversity and protection of water and the recreational and various other uses of forests. The forests and plantations owned by UPM are 100% certified by credible, third-party verified schemes including forest certification schemes of FSC and PEFC.323 Also Lineo of StoraEnso is made from sustainably sourced wood with FSC and PEFC certifications314. This verifies that the wood supplied to their mills is sustainably sourced, legally logged and procured according to the requirements of international forest certification schemes.
Valorisation of residues and wastes: It is also possible to produce lignin from lignocellulosic residues such as agricultural and forestry residues. Biorefinery developments are taking place for this as explained in pathway E. The Dawn Technology of Avantium is an example for this197. Also from pathway J, lignin fraction of pyrolysis oil produced from lignocellulosic sources can be utilized in the production of the resin.
Material vs. energy use: Currently lignin is derived from Kraft pulp mills from the side-stream black liquor which is conventionally burned for energy. However, much more is available than needed to cover own energy requirements. Lignin is valuable as feedstock for materials. It has already found its way into a rapidly growing number of industrial applications such as resins, adhesives, asphalt, carbon fibres, and polyurethanes. The lignin based phenolic resins showcases the innovative use of industrial side streams in a circular economy.
321 https://www.finieris.com/en/products/riga-ecological 322 https://www.arpaindustriale.com/sites/default/files/doc_micro/arpa_bloom-hr.pdf 323 https://www.upm.com/responsibility/forests/our-promise/

150
Table 28. High-level assessm
ent
Bio
-base
d
chem
ical/
mate
rial
D
rop
-in o
r D
ed
icate
d
B
iore
finery p
ath
ways
A
ltern
ative
(fossil o
r CO2 b
ase
d)
path
ways
Ad
van
tag
es/
disa
dva
nta
ges to
fossil a
ltern
ative
s O
ther co
nsid
era
tion
s T
ech
nica
l p
erfo
rman
ce
En
viron
men
tal
perfo
rman
ce
Eco
no
mic
perfo
rman
ce
Bio
-base
d ch
em
icals
Additive
Propylene glycol (PG
) D
rop-in C
glycerol hydrogenolysis
Fossil hydration of propylene oxide
Identical about 60%
GH
G
reduction (pathway C
); 100%
bio-based
Cost
competitive
(CC)
• Use of oil crops (deforestation), need to
switch to w
aste fats
A/B
/E sugar hydrogenolysis
• Com
petes with the energy use of
residue crude glycerol
Building
block 1,4 B
utanediol (1,4 B
DO
) D
rop-in A/B
/E ferm
entation of sugars
Fossil via acetylene, butadiene, m
aleic anhydride and propylene
Identical about 60%
GH
G
reduction (pathway B
); 100%
bio-based
Not C
C (less
than double)
• Use of sugar or starch crops (now
), need to sw
itch to lignocellulosic biom
ass
Building
block M
ethanol D
rop-in
D
purification of side-stream
Fossil
coal gasification & natural
gas + steam
reforming
Identical
about 40% G
HG
reduction com
pared to N
G (pathw
ay I from
MSW
); 100% bio-based
Cost
competitive
(CC)
• Allow
valorisation of residues and w
astes, support waste hierarchy and
the circular economy
• MSW
- use for energy supported, com
pete with m
aterial use I
gasification, chem
ical conv. CO2
reaction with hydrogen
from electrolysis
Building
block Lactic acid (LA
) +
PLA
Dedicated
A/B
/E ferm
entation of sugars
Fossil PP/PS
/PET, derived from
steam cracking of naphtha
Unique, both
pos. & neg.
about 70% G
HG
reduction (pathw
ay A or
B); 100%
bio-based N
ot CC
• Biodegradable &
recyclable • H
igh biomass utilization efficiency
• Use of sugar or starch crops, need to
switch to lignocellulosic
Solvent
Acetic acid
Drop-in
A/B
/E ferm
entation of sugars
Fossil via m
ethanol, acetaldehyde and alkane
Identical about 85%
GH
G
reduction (pathway D
); 100%
bio-based N
ot CC
• Direct ferm
entation route will increase
efficiency for A/B
/E • Pathw
ay D option allow
s creating value from
residual stream
• Use of m
ethanol or ethanol for chemical
instead of energy use
D
Extract from
spent liquor CO2
via methanol
I carbonylation of m
ethanol
Surfactant
Fatty alcohol ethoxylate
Drop-in
C +
A/B
/E
reaction of fatty alcohol from
oils +
ethylene oxide from
sugars
Fossil
fatty alcohol by Oxo or
Ziegler process +
ethylene oxide derived from
steam
cracking of naphtha
Identical
lower environm
ental footprint (pathw
ay A/B
+C); 100%
bio-based w
ith bio- ethylene oxide use
Not C
C
• Biodegradable and low
toxicity • U
se of oil crops (deforestation), need to sw
itch to waste fats
• Use of sugar or starch crops, need to
switch to lignocellulosic
Bio
-base
d m
ate
rials
Fibre M
icrofibrillated cellulose (M
FC)
Dedicated
D
fibrillation of cellulose
Fossil plastic film
s and alum
inium foil
Unique,
performance
enhancer
lower G
HG
emissions;
100% bio-based
Good prospect • Provide the sam
e performance using
less raw m
aterial • Possibility to use agricultural residues
beside wood pulp
Resin
Lignin based phenolic resins
Dedicated
D
recovery from
black liquor
Fossil Phenol-based
Unique, sam
e perform
ance
about 45% G
HG
reduction (pathw
ay D);
up to 50% phenol
substitution
Cost
competitive
• Reduced toxicity of resin
• Allow
material use of lignin
• Possibility to use lignocellulosic residues rather than w
ood
E pretreatm
ent lignocellulose
J pyrolysis oil lignin fraction

151
3.6 Task 3 - Identification of technical barriers & measures to overcome these barriers for market deployment of material and chemical based biorefineries
INTRODUCTION
In Task 3, both technical barriers & measures to overcome these barriers that could potentially hinder or support the development of material and chemical based biorefineries are identified. The general technical barriers for biorefineries will be presented following the main elements of classification system proposed in WP 1 (feedstock, conversion process, platform and product). On the other hand, specific examples of technical barriers are presented for the 11 pathways mentioned in WP 3- Task 1. During the second SAG (Stakeholder Advisory Group) meeting that took place on the 24th of June 2020, the following question was posed to the stakeholders: What specific technical barriers of biorefineries would you like to be considered in this project? This information has been taken into consideration in the compilation of technical barriers. The comments received were:
• Consider aspects of learning curves and its impact on process improvement.
• Required connection (business and spatial) between biorefineries and chemical industries as buyers of semi-final products.
• Setting up a supply chain that ensures regular collection of feedstocks and their delivery to the biorefineries is crucial.
• How to move on from one input-one output biomass conversion processes to multi-entry and multi-output biorefinery systems?
• More focus on technology that is economically feasible and that can be implemented within the current markets/regulations.
As starting point several documents discussing technical barriers & measures to overcome the barriers for the biorefineries were reviewed. A mixture of sources was considered, including:
• Star COLIBRI. European Biorefinery Joint Strategic Research Roadmap for 2020, C. Luguel, 2011
• Star COLIBRI. Joint European Biorefinery Vision 2030, C. Luguel, 2011.
• Bioenergy: Biorefineries Roadmap as part of the German Federal Government action plans for the material and energetic utilisation of renewable raw materials, 2012.
• ETIP Bioenergy: Opportunities and Challenges for Broadening Biomass Feedstock in Europe, November 2019.
• JCR: Biomass production, supply, uses and flows in the European Union. First results from an integrated assessment, EUR 28993 EN, 2018.
• IEA Task 42: Natural Fibres and Fibres-based material biorefineries. Status Report 2018.
• IEA Task 42: Bio based chemicals Update, February 2020.
• Bio-based products -from idea to market- 15 EU success stories. February 2019

152
• BIOTIC: A roadmap to a thriving industrial biotechnology sector in Europe, 2015
• Recent scientific publications: K. Kirtania. Ch.4 Thermochemical Conversion Processes for Waste Biorefinery, Waste Biorefinery, Elsevier, 2018.
GENERAL BARRIERS & MEASURES
This section describes barriers and measures to overcome these related to:
• Feedstock
• Conversion process
• Platform and Product
Feedstock-related technical barriers & measures
In any conversion process, securing sustainable feedstock is crucial for the operation and economic viability. In the case of biorefineries, enough quality biomass feedstocks should be made available at the right time and at the right place for successful large-scale market deployment. The EU is an overall net importer of biomass. European exports of animal and processed products, as well as solid wood products and paper and paperboard, are outweighed by imports of plant-based food, solid biofuels, fish, seafood, and algae.324 The availability of biomass in Europe is one of the main barriers that could hinder the large-scale market deployment of biorefineries. An integrated feedstock supply system is required in order to provide feedstock in a sustainable way at reasonable cost. The technical barriers for using biomass as a feedstock are often associated to the nature of the raw materials. The very complex mixture of organic compounds (poor in hydrogen and rich in oxygen), presence of inorganics and vast amount of water in the biomass require the use of different pre-treatment/valorisation processes.325 Basic and applied research to prevent the decomposition, extend the storage life and facilitate its conversion is still under development and improvement. In addition to these technical challenges, there are also significant infrastructural barriers that are associated with the development of the European agricultural infrastructure for the harvesting, collection and storage of the biomass and for residues/wastes management. Considering that biomass availability is relatively limited in Western Europe, strengthening the biomass availability in countries of Central and Easter Europe (CEE) region to improve the sustainable biomass production and supply by increasing infrastructure and implementing innovative solutions should be considered. In a recent report326, regarding 15 EU success stories on the development of bio-based products from idea to market , it is mentioned that for several bio-based products there is a medium-long term feedstock strategy available that includes the possibility to shift to secondary biomass feedstocks to avoid food competition and to reduce production cost. The following table summarises the identified technical barriers & measures to overcome the barrier that exist related to the feedstock cultivation, harvesting, mobilisation, and the barriers for the use of secondary biomass and residues.
324 https://ec.europa.eu/jrc/en/science-update/biomass-production-supply-uses-and-flows-european-union 325 The Federal Government. Biorefineries roadmap as part of the German Federal Government action plans for the
material and energetic utilisation of renewable raw materials. May 2012. 326 Bio-based products -from idea to market- 15 EU success stories.European Comission Directorate Bioeconomy.
February 2019.

153
Table 29. Feedstock related technical barriers.
Conversion process related technical barriers & measures
The conversion processes are the core steps for the transformation of biomass into goods or services (these are shown in the Biorefinery Classification for chemical and materials focused biorefineries developed in WP 1). The development and optimization of these processes (from the pre-treatment, primary refining, secondary refinery, purification, product conditioning and recovery and re-use of by-product streams) is very important to exploit the potential of biomass for added value applications in this case of biomaterials and biochemicals.
327 BIOEAST. Vision paper. 2018. 328 STAR-COLIBRI. Strategic Targets for 2020 - Collaboration Initiative on Biorefineries. 2011. 329 IEA Bioenergy Task 43. Dry matter losses during biomass storage Measures to minimize feedstock degradation.
2019. 330 Source: October workshop part 1 331 ICT-BIOCHAIN. ICT Tools in Efficient Biomass Supply Chains for Sustainable Chemical Production. 2019. 332 IEA Bioenergy Task 42. Bio-based chemicals. A 2020 update. 2020.
Technical Barrier Measures to overcome the barrier
Limited biomass cultivation due to restricted land availability for non-food uses in Europe
Develop efficient and sustainable biomass production: sustainable intensification of crop/forest/grassland by improvement yield, nutrients, efficient harvesting. Support and exploit the bioeconomy potential of rural areas in Central and Eastern Europe (CEE).327 CEE region requires innovation, technology and infrastructure to increase the biomass productivity in a sustainable way. Implement the conditioning (afforestation) and use of marginal European land.
Limited biomass cultivation due to climate changes that lead to drier circumstances.
Consider the use of resilient species to cold winter, long heat waves summer, severe drought, diseases and look for species that can grow on marginal land with lower input needs.328
Inefficient biomass harvesting methods. Adopt harvesting technologies to access difficult terrains (especially in Central and Southern Europe). Use Information Communication Technologies (ICT) to provide relevant information regarding optimal time for harvesting.
Degradation and loss of biomass quality due to storage problems.
Improve storage management and technology. Different types of biomass required different storage alternatives.329
Complex nature of the biomass feedstocks. Leading to problems like low product concentration, multiple side products and energy intensive and expensive downstream processes.
Implement the use of multiple and more advance pre-treatments and conversion processes. Investigate the potential role of biocommodities with standardised properties, e.g. pyrolysis oil, pellets.330
Unstable biomass supply. Biomass supply can be limited by seasonality, poor infrastructure of (limitations on biomass imports, storage and mobility), low quality and cost.
Implement systems for continuous supply. Biorefineries near to the harbour for imported biomass and near to rural areas to optimize storage and transportation. Use Information Communication Technologies (ICT) to provide relevant knowledge regarding biomass in the entire European supply chain.331
Limited and non-optimised secondary (residual) biomass management and poorly developed supply chain for the use of residues and recycling (collection, transport and processing)
Develop a strong and sustainable residues management network to increase utilisation of residual streams and by-products as feedstock. Enhance data availability for the identification, tracking and current uses residual biomass streams. Consider European recycling sites with optimized technology
Uncertainty regarding the guarantee of lower environmental impact (not only GHG).
Promote the evaluation and development of integrated pathways to increase overall efficiency and lower environmental (considering residual streams and recycled products).
Uncertainty regarding real cost of processing secondary feedstocks (residues and recycled bio-based materials).332
Evaluate the real (extra) cost of collecting, sorting, cleaning and processing of secondary biomass.

154
Biorefinery conversion processes still have a significant optimisation potential which is needed to be able to compete with current fossil refineries and chemical plants, many of which employ mature technology. Biorefinery conversion processes must overcome significant costs and productivity barriers. The shift in raw materials (from fossil to renewables) requires the development of a new set and combinations of conversion pathways, processes, and reaction media to promote the development and design of novel catalytic processes.
Although, an important number of conversion processes are currently being investigated for all sorts of biorefineries (e.g. lignin biomass fractionation approaches and the chemo catalytic upgrading of biomass-derived building blocks, like furfural or hydroxy methyl furfural HMF), many of them are still in a very early stage of development. Challenges such as product selectivity, stability, or technological scalability remain important topics of research.
Table 30. Conversion Process related technical barriers & measures.
333 J. Fernández-Rodríguez, et al. Chapter 7 - Lignin Separation and Fractionation by Ultrafiltration, Separation of Functional Molecules in Food by Membrane Technology. 2019.
334 Source: October workshop part 1 335 V. Aristizabal -Marulanda , et al. Biofuels, Bioprod. Bioref. 13:789-808, 2019. 336 Star-COLIBRI. European Biorefinery Joint Strategic Research Roadmap. 2020. 337 P. Chattopadhyay, G. Banerjee and S. K. Sen , J. Cleaner Prod., 182 , 272-279. 2018. 338 Tramontina R. et al. Consolidated production of coniferol and other high-value aromatic alcohols directly from
lignocellulosic biomass. Green Chem., 22,144, 2020.
Technical Barrier Measures to overcome the barrier
Constricted pre-treatment and conversion processes exclusive to produce a single product, reducing the possibility of other outlets (e.g. development of sulphur free lignin to preserve the native structure of lignin for its use in different applications).333
Focus on improving the pre-treatment and primary conversion processes to extract a larger amount of usable material fractions toward diverse products to increase the bio-based product portfolio. Establish decentralised pretreatment processes (close to the biomass production) suitable for multiple biorefineries to produce chemicals and materials.334
Limited development of catalyst for thermochemical processes towards biomass upgrading.
Develop R&D strategies for catalysts with high yields, selectivity and stability towards relevant products335 to increased feedstock flexibility in the conversion processes.
Biochemical processes with low product concentration and multiple side products production leading to energy intensive and expensive downstream processes (recovery and purification steps).
Develop and enhance the use of biotechnology to improve enzymatic pathways (biocatalyst) in biochemical processes.336
Limited development of out the box biotechnology for simultaneous biodegradation and biotransformation of biomass (e.g. aromatic acids from insoluble lignocellulose, vanillin, coniferol (a chemical building from sugar cane bagasse)337
Promote R&D towards hybrid processes that look for integrated conversion (biodegradation–biotransformation) to minimize environmental waste and add value to agro-industrial residues via production of valuable chemicals 338
Bottlenecks towards scale-up of new technology such as: validation of technologies at demonstration and pre-commercial scale is expensive. research teams with limited engineering know-how for scale-up. Limited biomass quality and availability for the scale-up.
Enhance R&D investments for the research and engineering teams and extend the collaboration with expertise that is complementary to in-house know-how. Collect reliable information or data from pilot scale to generate rules of thumb or develop Early Stage Techno-economic Analysis and modelling which can be disseminated to help commercial scale up. Make available enough public money for co-financing pilot/demonstration plants. Continue with flagship initiatives for public-private partnerships projects (e.g. BBI JI projects).
Economically unfavourable thermochemical processes to convert secondary biomass (residues) to added value products.
Integrate thermochemical processing with other conversion technologies (i.e., biochemical), and evaluate more economic alternatives.
Limited integration of primary and secondary conversion processing to exploit process integration (improve energy efficiency, water use and reduce waste generation).
Consider the integration of conversion processes in existing industrial facilities or industrial complexes (bottom-up or brownfield approach, see Task1).

155
Platform and Product related technical barriers
We have grouped the platform and product categories of the Biorefinery Classification developed in WP 1 because platform also refers to the “intermediate” product. These intermediates are subsequently processed in the secondary refining process to finished or semi-finished products. Bio-based products are perceived to be environmentally friendly products with the potential to contribute to the reduction of GHG emissions and to reduce the fossil resource demand. The main concerns regarding the use of bio-based products are related to the balance between their technical performance, price and assurance of real environmental benefits. Technical developments in the biorefinery sector will continue to generate new knowledge and to improve products performance. Price competitiveness is also expected to improve via economies of scale, when the products are produced at large scale, leading to lower production cost for biorefinery products in the future.
Table 31. Platform (intermediate product) and Product related technical barriers.
PATHWAY SPECIFIC TECHNICAL BARRIERS & MEASURES
Examples of technical barriers for the specific pathways described in Task 3.1, are mentioned, in the following Table. It is important to mention that in order to develop flexible, resilient and efficient biorefineries, a connection between the different Pathways is sometimes required.
Pathways A-D are bottom-up pathways of a high TRL level and are widely commercialised. Although they are commercial, still some technical barriers are identified that can be
339 The Federal Government. Biorefineries roadmap as part of the German Federal Government action plans for the material and energetic utilisation of renewable raw materials. May 2012.
340 Bio-based products -from idea to market- 15 EU success stories. February 2019. 341 CMI is a building block for the production of antiscale agents with applications in detergents and water treatment
obtained from inulin that is not suitable for human consumption develop by Cosun Biobased Product.
Technical Barrier Measures to overcome the barrier
Relative low diversification of intermediate products into new products due to loss of functionalities or properties during the processing.
Improve separation and extraction processes for valuable ingredients. Find milder operational conditions during pre-treatment and primary conversion process to prevent the loss of relevant functionalities and properties in the intermediate products and to reduce energy inputs.
Bio-based products sometimes have a lower quality and lower performance compared to conventional alternatives (mostly fossil based).
Perform (mechanical or chemical) modifications/treatments to improve product properties/functionalities and broader the applications to other markets (e.g. modified starches for food, paper, textile & cosmetics applications)339. Modification of conversion processes to prevent excessive biomass damage that could affect product properties and hinder getting new added value (e.g. proteins denaturalisation).
Lack of cost competitiveness when providing the same functionally can only be achieved at higher cost (e.g. bio-based acetic acid).
Optimisation and integration of the conversion processes and upgrade of biomass side-streams to high value products. In some cases, like the case of PLA increasing capacity of the plant is required to reduce cost by reducing the capital portion of the production costs (on a per tonne basis).340
Difficulties to demonstrate the bio-based product performance or new functionalities (costly and lengthy testing) (e.g. carboxy Methyl Inulin (CMI) from chicory roots). 341
Involve external partners downstream in the value chain at an early stage of the product development. Implement an EU-level matchmaking programme matching companies in different parts of the value chain with each other.
Lack of recognition of bio-based content in products.
Certification and standardisation for bio-based products including the measure of the bio-based content in products.
Lack of information and recognition of environmental benefits.
Development of instruments to communicate about the benefits of bio-based products to public procurers and consumers.

156
tackled to further optimize their overall business cases and environmental footprint. For pathways A-C, similar barriers and measures to overcome the barrier were identified. These pathways are group in one group.
Platforms E-K are top-down pathways mostly still at a pre-commercial, i.e. lower TRL, level. Here technical barriers are identified that need to be tackled before commercial deployment can be achieved.
Table 32. Pathway specific technical barriers and measures to overcome these.
Pathway Name Barriers Measures to overcome the barrier
A, B, C TRL 9
One platform (C6 sugars) biorefinery using sugar crops One platform (starch) biorefinery using starch crops One platform (oil) biorefinery using oil crops and other organic /residues (fats, oil and greases)
Low European production of important raw materials (soybean oil, palm oil, coconut oil, sugar cane, cassava, corn). High imports from tropical-subtropical countries increasing the environmental concerns of the primary feedstock. Limited integration (optimization) between primary and secondary processing. This is not always possible because the primary processing for imported raw material is done outside Europe. Insufficient diversification of by products and intermediates products like glycerol, sugar beet residues, bagasse,), into added value secondary products causes large by-product generation and oversupply. (e.g. glycerol during biodiesel production or high production of DDGS during ethanol production) 342
Look for unexploited or new sources of biomass in Europe to avoid food and fuel competition and decrease biomass imports. (e.g. local crops, local residues) Identify connections between different pathways (pathways A-B starch are easily converted to sugars) or (pathway C-G integration of the oil platform) can significantly improve the overall process economics and compensate products demands.343 Implement the biorefinery concept to use by-products and intermediated and develop added value secondary products (e.g. glycerol to chemicals, sugar beet pulp or DGGD or to food additives, chemicals or materials).
D TRL 9
Two-platform (pulp & spent liquor) biorefinery using wood.
Limited revalorisation of spend liquor & pulp using advanced thermochemical and biochemical processes (e.g. thermochemical conversion black liquor from pull mill to produce chemicals). Need of new pulping and fractionation systems for the mill system to have better utilization of wood components and their by-products, depending on the biorefinery strategy. 19
Develop advanced & flexible pulp mills biorefineries, capable to provide energy materials and chemicals in one site. Future pulp mills provide an opportunity to serve new markets for materials and value-added chemicals with the integration to pathway E and by using broader variety of forest-based feedstocks.
E TRL 7-8
Three platform (C5, C6 sugars & lignin) biorefinery using lignocellulosic biomass.
Untapped potential of lignin (2nd most abundant polymers currently used for energy generation). The complex chemistry of lignin is a limitation to obtain high purity lignin.344 Limited technologies for optimum separation of cellulose, hemicellulose & lignin. 345 Lignin utilization strategies are challenging because the pre-treatment and conversion processes aim for sugars production and not for high quality lignin, which require milder conditions346
Develop fundamental and applied research to understand how different chemical structures affect lignin processability and reactivity.347 Develop robust catalysts for lignin conversion with high catalytic selectivity. Generate knowledge on use of suitable solvents and reaction conditions.
F TRL 5-7
Two-platform (organic fibres & organic juice) biorefinery using green biomass.
Limited time for biomass processing. A fast-primary processing or preservation methods (silage, drying) is necessary for the raw material and primary products High cost of downstream processing.348 Improve pre-treatments & and fractionation processes to keep biomass functionalities and diversify to products with higher added value (e.g. proteins, chemicals and minerals).
Establish green biomass biorefineries at a regional level due to the limited time for processing and low transportability. Develop more understanding on the pre-treatments and conservation methods of biomass to keep the functionalities for new applications (e.g. avoid protein denaturalization of proteins, damage in organic fibres).
342 Cognet, P., Aroua, M. K., eds. From Glycerol to Value-Added Products. Lausanne: Frontiers Media SA. 2020. 343 Klanarong Sriroth and Kuakoon Piyachomkwan. The Outlook of Sugar and Starch Crops in Biorefinery.
Bioprocessing Technologies in Biorefinery for Sustainable Production of Fuels, Chemicals, and Polymers. July 2013. 344 V. Aristizabal -Marulanda , et al.Biofuels, Bioprod. Bioref. 13:789-808, 2019. 345 IEA Bioenergy Task 42. Natural Fibres and fibre-based Materials in Biorefineries. Status report 2018. 2018. 346 Johnson, M. A., and Hart, P. W. Integrating a biorefinery into an operating Kraft mill. BioRes. 11(4), 10677-10710.
2016. 347 H. Wang, et al. From lignin to valuable products-strategies, challenges, and prospects, Bioresource Technology,
271,449-461. 2019. 348 Clean, 37 (1), 27 – 30. Biorefining of Green Biomass – Technical and Energetic Considerations, 2009

157
G TRL 5-6
Two-platform (oil & biogas) biorefinery using aquatic biomass
Complex and costly downstream processing: the dewatering step, the biomass pre-treatment, the isolation and purification process. 349 Need of advanced isolation processes if the combined production of oils, carbohydrates and proteins is desired (e.g. ion exchange, chromatography or crystallization) make the process less economically feasible.
Develop of more research and development is required to exploit the potential of aquatic biomass towards high added value products. Explore aquatic biomass as a resource to produce biomass independently of the arable land. 350
H TRL 4
Two-platform (organic fibres & oil) biorefinery using natural fibres.
Limited feedstock production due to the relative low yield of the plants and competition for cultivation areas with energy crops.26The crops provide both natural fibres & oil (e.g. flax, hemp) most varieties are rich in fibres and low in seed production. Currently seeds (oil) are economically more important to produce high-value additives for food, feed and cosmetics.351 Seeds production can delay harvest and lead to deterioration in fibre quality.352
Explore plant breeding as an alternative to improve plant genotypes and make them suitable for diverse cultivation environments. Improve feedstock for innovative end products. targeted improvements.353 (e.g. breeding of new hemp varieties to get high yield for fibre and low content of narcotic compounds, or flax varieties for dual purposes with a balance yield for fibre and seed).354
I TRL 7-8
One platform (syngas) biorefinery using lignocellulosic biomass & municipal solid waste.
Complex chemistry involved in this pathway has slow down the maturity of process development. Gasification is very sensitive to process parameters, char morphology and presence of the inorganics (potassium, sodium, silicon) in the biomass.
Increase research to explore emerging concepts in gasification for the use diverse feedstocks (residues and waste) to produce chemicals (e.g. flexible gasifier designs such as plasma, high temperature syngas clean-up technologies, smaller downstream equipment). Financial support for pilot/demo facilities to investigate new gasification in addition to programmes in place today, given the benefits of this route in converting mixed feedstocks.
J TRL 4-5
Two platform (pyrolytic liquid and biochar) biorefinery using lignocellulosic biomass.
Difficulties to upgrade of fast pyrolytic oil due to its high oxygen content and presence of inorganics. To upgrade pyrolysis oil catalytic processes are needed. 355 However, the sensitivity of the catalyst to minerals/inorganics present in the pyrolysis oil is the main barrier. For low grade lignocellulosic biomass catalytic pyrolysis is an alternative to avoid biomass pre-treatment (remove the inorganics) and to increase the selectivity towards specific chemicals.
Develop new biomass pre-treatments to reduce inorganics, more resilient catalysts or technologies to protect the catalyst (e.g. development of new concepts like Integrated Cascading Catalytic Pyrolysis (ICPP) from Bio-BTX (benzene, toluene, xylene)).
K TRL 5
One platform (bio-crude) biorefinery using lignocellulosic, aquatic biomass, organic residues.
Limitations on process optimization and significant techno-economic barriers to scale up the technology. The upgrading of bio-crude requires improvement in the recovery of the catalyst and the valorisation of organic and inorganic components in residual process streams (e.g. waste water processing and recycling).356 Further development needed hydrothermal liquefaction (HTL) oil upgrading processes and routes to biochemicals and materials. This technology is at an earlier stage than for pyrolysis oils. Additionally, the process needs special material equipment for high pressure which increases the cost (CAPEX).
Further RD&I of this pathway to solve the catalyst recovery opens the opportunity to have a process suitable for a diverse biomass feedstock including wet and dry low-quality biomass towards the production of chemicals. Further support to scale up the upgrading and downstream processing of HTL oils (e.g. of HyFlexFuel HTL project running under EU H2020)
349 Khan M.I., Shin J.H., Kim J.D. Promising future of microalgae: current status, challenges, and optimization of a sustainable & renewable industry for biofuels, feed, and other products. Microb Cell Fact.;17(1):36. 2018.
350 The Federal Government. Biorefineries roadmap as part of the German Federal Government action plans for the material and energetic utilisation of renewable raw materials, May 2012.
351 Beus N., Carus M., Carbon footprint and sustainability of different natural fibres for biocomposites and isulation material. Nova Intitute.April 2019.
352 ADAS Centre for Sustainable Crop Management. UK Flax and Hemp production:The impact of changes in support measures on the competitiveness and future potential of UK fibre production and industrial use. June 2005.
353 https://www.biobasedpress.eu/2013/10/the-comeback-of-flax-and-hemp/ 354 Foster, R., Pooni, H. S., and Mackay, I. J. Quantitative analysis of Linum usitatissimum crosses for dual-purpose
traits. J. Agric. Sci. 131, 285–292. 1998. 355 K. Kirtania , Ch.4 Thermochemical Conversion Processes for Waste Biorefinery. 2018. 356 https://www.hyflexfuel.eu/wp-content/uploads/2018/06/HyFlexFuel_Flyer.pdf

158
3.7 Task 4 - Identification of Research, Development and Innovation (RD&I) needs to overcome technical and non-technical barriers.
In Task 4, we will identify the RD&I needs to overcome the technical and non-technical barriers of the 8 bio-based chemicals and 2 materials selected in WP 2 and assessed in Task 2 of this WP 3 (see table).
Table 33. Bio-based chemicals and materials evaluated in this study
*Indication TRL-level BR-pathway for production bio-based product
A summary of the most important general barriers (technical and non-technical barriers) are presented in the following Table.
Table 34. Summary of the most important general barriers
Generic barriers applicable to all BR pathways and related chemicals/materials
Non-technical barriers (WP 2 & fact sheets) Technical barriers (WP 3, Task3)
Business related: Lower or the same quality to conventional products, high production cost, consumers not willing to pay more, difficult to enter new markets.
Feedstock-related: Limited stable sustainable and cost-effective biomass mobilisation potential (amounts, qualities) of both primary (crops) and secondary (residues) feedstocks for non-food use due to suboptimal cultivation, and inefficient harvesting, storage and logistical systems. Complex nature of the biomass feedstocks.
Innovation related: Lack of investment for innovation, difficult to attract finance for scale-up.
Economy related: Low prices of petrochemical feedstocks.
Conversion process related: Enabling innovative biorefining technologies (pre-treatment, conversion, downstream processes) and catalytic, chemical and biotechnological processes, mostly still at too low TRL level for market deployment. Scale-up and further process integration needed to come-up with market competitive and sustainable integrated biorefinery technologies.
Feedstock related: High dependency on few feedstocks (in some cases imported feedstock), feedstocks in competition with food.
Climate change and environmental related: Lack of evidence on sustainability of the product, sustainability proof is costly, no clear strategies concerning end of life (recycling, composting).
Citizen and society related: Low public awareness, terminology confusing.
Platform and product related: Cost competitiveness and sustainability of bio-based products over fossil-based alternatives and lack of proven added-value functionality & performance.
Policy and regulation related: No financial support for bio-based products and no clear regulations and standards.
Product group Chemical/Material Link biorefinery pathways
TRL level combi BR pathway – product*
1 Chemical: Additives Propylene glycol C/B 9
2 Chemical: Building blocks 1,4-butanediol A/B/C drop-in 9
3 Chemical: Polymers PLA A/B dedicated 9
4 Chemical: Building blocks Methanol D/I drop-in 9/7-8
5 Chemical: Lubricants Fatty acid and PEG esters C 9
6 Chemical: Solvents Acetic acid A/B/D/I 9/9/9/7-8
7 Chemical: Surfactants Fatty alcohol ethoxylate C 9
8 Material: Fibres Micro-fibrillated cellulose D 9
9 Chemical: Polymers Thermoplastic starch B 9
10 Material: Resins Lignin based phenolic resins D/E 9/7-8

159
The following table presents a sum
mary of the bio-based product specific technical and non-technical barriers concerning the 10 different bio-
based chemicals and m
aterials, as well as needs to overcom
e these barriers, with a focus on R
D&
I.
Table 35. Sum
mary of product group specific barriers and suggested needs to overcom
e these barriers.
Pro
du
ct gro
up
specific b
arrie
rs
no Product group
Chem
ical/Material
(Pathway)
Non- Technical B
arriers Technical B
arriers N
eeds to overcome the barriers
1 Chem
ical Additives
Propylene glycol PG
(C
/B)
• Lack of sustainability of primary
feedstock (palm oil &
soy) due to deforestation, fertilisers use, im
ports. • C
ompetition of oil crops w
ith food. • S
trong dependency to biodiesel production (glycerol as feedstock).
• Policies towards palm
oil phase out and reduction of biodiesel as transport fuel could destabilize the PG
market due to
the strong dependency of PG to this
feedstock and side product. 357
• Low sustainable feedstocks im
port & lacking
integration primary and secondary
biorefining. • Large volum
es of residues production. • R
elative low sustainability of PG
due to the use of fossil fuels in the conversion process (hydrogenation and hydrocracking).
• Improve and develop new
routes to second generation feedstock (lignocellulosic w
oody material or oil residues).
• Improve sustainability of hydrogen. R
eview the options for
renewable/ green hydrogen production.
2 Chem
ical B
uilding blocks
1,4-butanediol 1,4 -B
DO
(A
/B/C
drop in)
• No cost com
petitive product due to low
prices of natural gas and high production cost of bio-based alternative.
• Unexploited potential in other
applications (e.g. automotive) due to
the lack of regulation of bio-based m
aterials.
• Low sustainability of the prim
ary feedstock (sugar crop).
• Unexploited lignocellulosic and secondary
potential. • Low
cost competitive product due to low
efficiency, energy intensive processes for bio-based route, and low
cost of fossil feedstock.
• Unlock feedstock potential (lignocellulose and residual
feedstocks). • Im
prove the efficiency of the process for costs com
petitiveness (use of engineered microorganism
in ferm
entation and more efficient dow
nstream processing).
• Enhance strategic partnerships to improve cost
competitiveness.
3 Chem
ical Building
blocks &
Polymers
Lactic acid & PLA
(A
dedicated) • Lim
ited market application of PLA
(especially food &
packaging) due to low
er performance com
pared to other polym
ers. • Lim
ited implem
entation of end of life options for PLA
(composting and
recycling).
• Low sustainability of prim
ary feedstock (sugar or starch crops) for LA
production and feedstock com
petition with food.
• PLA exhibits low
er mechanical and physical
stability compare to conventional
thermoplastics.
• Large volumes of residues production for
PLA (gypsum
- CaS
O4 ).
• Improve existing technologies to unlock second generation
feedstock (agricultural by-products and lignocellulosic residues) to avoid food com
petition. • D
iversify LA application for production of chem
icals (e.g. acrylic acid, ethyl lactate).
• Increase product development and innovation to im
prove perform
ance of PLA and product diversification (e.g. resins,
coatings). • S
tudied the possible end of life options of PLA quantify the
risk that undegraded compostable plastic residues in
compost has, to help determ
ine the policy developments
required on biodegradable bioplastics. 358
357 WP2 Fact S
heet PG
358 Relevance of biodegradable and com
postable consumer plastic products and packaging in a circular econom
y.https://op.europa.eu/en/publication-detail/-/publication/3fde3279-77af-11ea-a07e-01aa75ed71a1

160
4 Chem
ical Building
blocks
Methanol
(D, I drop-in)
• Not cost com
petitive due to the low
price of natural gas based syngas com
pared to biosyngas production from
biomass gasification.
• Fair competition w
ith biofuels hindered due to pro-fuel policies.
• Incomplete understanding of the com
plex chem
istry involved in the gasification process (e.g. presence of the inorganics in the biom
ass). •
• Improve the gasification process for diverse feedstocks
(e.g. secondary biomass &
even in combination w
ith fossil feedstocks).
• Develop and im
prove current catalysts used in the gasification and D
SP to reduce costs.
5 Chem
ical Lubricants
Fatty acid and PEG
esters (C
)
• High dependency on a single type of
feedstock (vegetable oils & fats).
• Slightly lim
ited to applications where
properties like biodegradability and non-toxicity is required by law
, due to the high cost com
pared to fossil base lubricants.
• Poor performance im
age of bio-based lubricants com
pared to fossil.
• Low sustainability of feedstocks (oil crops
import), and lacking integration prim
ary and secondary biorefining.
• New
product development and innovation to
design bio-lubricants with im
proved properties is costly.
• Low recyclability because of its high
degradation degree.
• Look for unexploited sources of biomass in Europe (e.g.
local crops, local residues) and decrease biomass im
ports. • C
reate and fund partnerships between players (additives
producers, new potential custom
ers) to develop new- bio-
based lubricants to improve product properties and broader
the applications to other markets.
6 Chem
ical Solvents
Acetic acid
(A, B
, D, I)
• Not cost com
petitive. • N
ot enough feedstock to replace fossil-based solvents com
pletely.
• Limited scale-up due to the requirem
ent of high am
ounts of feedstock. • Low
sustainability of primary feedstock
(sugar and starch crops) and feedstock com
petition with food.
• R&
D on separation and purification processes to increase of
economic viability (e.g. im
proving industrial separation and purification from
fermentation broths).
• Developm
ent and implem
entation of new routes w
ith secondary biom
ass or low value stream
s.
7 Chem
ical Surfactants
Fatty alcohol ethoxylate (C
)
• Not cost com
petitive with fossil-based
alternative. • H
igh dependency on palm oil, coconut
oil as feedstock. • H
igh fluctuations on feedstock price due to availability and quality of biom
ass.
• Low sustainability of prim
ary feedstocks (oil and sugar crops) and issues w
ith com
petition with food.
• Expensive process: fermentation (costly
enzymes, low
yields, high by-product toxicity) m
ake the downstream
process is com
plicated.
• Innovation to unlock feedstock dependency. Evaluate the potential of residual (secondary biom
ass) and lignocellulosic feedstock.
• Develop integrated processes using advance biotechnology
enzymes in the ferm
entation and improve efficiency of the
downstream
process to reduce production costs.
8 M
aterial Fibres
Micro-fibrillated
cellulose M
FC
(D)
• H
igh costs limit large-scale
applications, but it is also considered that larger volum
es production will
lower unit costs through econom
y-of-scale.
• Lim
ited knowledge on long term
health risk (e.g. exposure to dust and fine particles).
Limited initiatives for environm
ental regulation of m
aterials.
• Strict feedstock physical properties are
required for the production of MFC
. High
purity raw m
aterial, pure cellulose mainly
from w
ood pulp (softwoods and hardw
oods being preferred) is required.
• High m
anufacturing cost due to high-energy consum
ption during its production and use of expensive grinding equipm
ent results in high capex/capacity ratio.
• Poor thermal stability for new
applications. • Lim
ited revalorisation of side streams spent
liquor & residual pulp.
Evaluate the possible use of other cellulose sources (e.g. agricultural residues, plant residues). 359 D
evelop new m
ore economically pretreatm
ents (pulping and fractionation) system
s to reduce cost. Analysis of health and environm
ental impact of M
FC.
Create partnerships w
ith new potential custom
ers to increase product portfolio and share product developm
ent costs.
359 A.M
. Adel et al. Industrial C
rops and Products 93,161–174. 2016

161
9 Chem
ical Polym
ers Therm
oplastic starch (B
)
Feedstock in competition w
ith food application (starch crops like corn, w
heat potato). Packaging sector focusses on recycling over bio-based. Lack of strong regulation to boost the bio-based applications.
Thermo starch exhibits poor perform
ance com
pare to conventional thermoplastics for
some applications.
Know
ledge of environmental perform
ance of TPS
containing products is lacking.
Joint innovation to improve properties of therm
oplastic starch creating new
formulations (betw
een producers &
possible users). Create a m
arket-pull for bio-based plastics in specific added-value m
arkets (similar strategy of advanced biofuels;
increase consumer aw
areness). U
se residues instead of food crops as feedstocks. Em
phasize the circularity advantages (recyclable, com
postable, biodegradable).
10 M
aterial Resins
Lignin based phenolic resins (D
, E)
Markets dom
inated by large pulp and paper com
panies. N
o security of feedstock supply and quantities not know
n well enough.
IP can be an issue with business
development.
Lignin-based resins have small but
emerging m
arkets. Product approval procedures (e.g. REA
CH
) are expensive and time
consuming.
Large variability of types and qualities of lignin. Lim
ited to partial substitution fossil alternatives in end-products possible due to quality requirem
ents. Low
er technical performances in com
parison to other resins. Environm
ental impacts are not know
n well
enough.
Assessm
ent of current and future sustainable lignin potential, quantities and qualities, including and beyond the pulp and paper sector (incl. advanced biofuels sector) and securing of supply. Increase of technical perform
ance lignin-based resins. Analysis of environm
ental impact lignin-based resins.

162
Bio-based chemicals and materials are important bio-based products, potentially driving the transition to a more circular European Bio(based) Economy. A portfolio of biorefinery pathways at various Technology Readiness Levels (TRLs) exist that will be able to efficiently and sustainably produce the bio-based products needed. However, as shown in the table above, several technical and non-technical needs exist, and need to be overcome to support large-scale market deployment in Europe.
Summary most important barriers identified:
• Low cost competitiveness of the bio-based product versus fossil based products, especially for drop-in chemicals or materials that do not offer additional functionalities. In this case the RD&I needs are to decrease production cost either by improving the conversion processes or by trying to use low cost raw materials (switching to secondary feedstock).
• Limitation of primary feedstocks availability which also is competition with food crops. In order to overcome this barrier, scientific and industrial communities are trying to evaluate the technical feasibility of using secondary biomass (strong focus on lignocellulosic materials) and benefit of the “lower” cost and “more abundant” feedstocks. However, the main attention points in order to handle this diversification are to assess the potential (quantities, collection and mobilization) and to identify the inefficiencies in the different value chains (e.g. low conversions in the pre-treatment or conversion processes).
• Limited product development and diversification of product portfolios of bio-based chemicals and materials. In some cases, product improvement and development are hindered by high cost and lack of knowledge to penetrate new markets and/or applications. In this case cross -sectoral collaborative projects and strategic partnerships are relevant.
• It is important to visualize that in some cases, the whole supply chain must be developed, from biomass production, modify conversion processes, implement product development, up to market introduction. In that case new market players and major investments may be necessary.
Potential policy measures to overcome the barriers (see also WP 6 where these measures are developed into actions):
• Bio-based products in most cases are more expensive than their fossil-based alternatives. In case they also have a better quality and /or functionality, customers might be wiling to pay a premium price. In case of similar quality/functionality – and even at a better sustainability – policy measures will be necessary to force the large-scale market introduction of bio-based products.
• Biorefineries producing a portfolio of bio-based products from a variety of biomass feedstocks need a close and efficient cooperation of stakeholders to develop successful business concepts (agro-sector, logistics sector, chemicals/materials sector, energy sector, etc.). Therefore, policy measures applied should be focussed on a multi-sector approach, rather than meeting the single sector needs.
• A CO2-tax should be introduced for fossil-based alternatives making bio-based products, and products produced from other alternative renewable sources, more market competitive.
• Sustainable biomass cultivation, mobilisation and supply should be supported for both food and non-food (bio-based) applications.
• Because biorefinery investments are often classified as risk investments, due to uncertainties with sustainable feedstock supply, innovative technologies used, new or

163
highly competitive markets entered etc., external financing conditions are often not very attractive. New ways of EC supported financial support should be made available to support market deployment.
• Regional circular developments should be supported combining sustainable biomass cultivation to small-scale refining to bio-based products with recovery of nutrients to be fed back onto the fields.
• Clear regulations, standards and product approval procedures for bio-based products should be (further) developed to support market deployment.
Potential Research, Development and Innovation (RD&I) support to overcome the barriers:
• Because of the relatively low TRL of enabling innovative biorefining technologies that will be necessary to produce bio-based products, i.e. chemicals and materials, as part of various promising biorefinery pathways, in a sustainable and market competitive way, financial support will be necessary over the full RD&I-trajectory, so both supporting fundamental research, applied research and piloting, demonstration and market support (1st of a kind commercial application).
• Robust, feedstock flexible, biorefining technologies and logistical systems (transport, storage) should be developed to be able to process the full European available biomass potential, which is very diverse, being able to meet a varying feedstock market demand (volumes over time and place, right quality).
• Primary biorefinery (pre-treatment) technologies should be developed converting various and low-quality biomass feedstocks in higher quality and energy dense biocommodities (pellets, oil) that meet the processing requirements of a variety of biorefining technologies for widescale use. This potentially can also decouple decentral primary refining from more central secondary processing in bio-based products.
• Secondary biorefinery processes (fermentation, gasification, incl. DSP) should become more energy efficient and product selective to increase market competitiveness.
• The overall sustainability (incl. end-of-life strategies) of the bio-based products and their advantages over competing fossil and other renewable alternatives are still unclear for some products. This is partially due to the very complicated assessment methodologies (only easy to follow for those who are experts) being used hindering market deployment. Development of a more clear and understandable assessment approach, linked to an efficient communication strategy, will enhance market acceptance and consumer awareness, supporting market deployment.

164
It is expected that within the new EC Horizon Europe Programme (2021-2027) significant budget will become available by means of both RAIs360, IAs361 and CSAs362 to tackle (part of) these RD&I barriers. Specifically, in Pillar II “Global Challenges and Industrial Leadership”, Cluster 6 “Bioeconomy, Food, Natural Resources, Agriculture and Environment”, financing opportunities will be made available to support these types of activities. Also, the potential follow-up of the very successful BBI-JU by means of the new EU Partnership Circular Bio-based Europe (CBE)363, will be part of this Pillar II, making available significant public-private budget to support the technology development, demonstration and market introduction needed. More fundamental knowledge building364 will be tackled by Pillar I “Excellence Science”; whereas the link to market introduction will be laid by respectively Pillar III “Innovative Europe” and the Structural, Social and Investment Funds.
360 RIA: Research and innovation actions(RIAs) are research and development activities to establish new knowledge or explore the feasibility of a new or improved technology, product, process, service or solution (including basic and applied research, technology development and integration, testing and validation on a small-scale prototype in a laboratory or simulated environment). Applied R&D: work undertaken primarily for the advancement of scientific knowledge, with a specific practical aim to direct the introduction of useful materials, devices, products, systems and processes, or the improvement of existing ones. Pilot projects: small-scale implementation used to prove the viability of a project idea. This could involve the exploration of a novel new approach, the application of a standard approach. This enables to manage the risk of a new idea and identify deficiencies.
361 IA: Innovation actions (IAs) are innovation activities directly aiming at producing plans and arrangements or designs for new, altered or improved products, processes or services (including prototyping, testing, demonstrating, piloting, large-scale product validation and market replication). Demonstration projects: used to prove technical and environmental feasibility, facilitate the learning curve and knowledge formation, reduce risk associated with innovations (e.g. materials, operating and maintenance cost) and contribute to public acceptance and awareness. Flagship projects: large collaborative research and development projects which involve several consortium partners and have a substantial impact on one or several economic sectors.
362 CSA: Actions consisting primarily of accompanying measures such as standardisation, dissemination, awareness-raising and communication, networking, coordination or support services, policy dialogues and mutual learning exercises and studies, including design studies for new infrastructure and may also include complementary activities of strategic planning, networking and coordination between programmes in different countries.
363 Inception impact assessment, https://ec.europa.eu/info/law/better-regulation/have-your-say/initiatives/11903-European-Partnership-for-a-Circular-bio-based-Europe
364 Fundamental research: Basic scientific research with the aim of improving scientific theories for better understanding and prediction of natural or other phenomena.

165
4 WP 4 – EU AND GLOBAL BIOREFINERY DEPLOYMENT “DATABASE”
This section includes a report chapter on global biorefinery deployment “database” led by BTG. The respective interactive dashboards of the chemical and material driven biorefineries in the EU (non-EU) are available under the following links365:
https://datam.jrc.ec.europa.eu/datam/mashup/CHEMICAL_BIOREFINERIES_EU/index.html
(https://datam.jrc.ec.europa.eu/datam/mashup/CHEMICAL_BIOREFINERIES_NON_EU/index.html)
4.1 Objectives, scope and approach
4.1.1 OBJECTIVES
The objectives of this work package (WP 4) are to:
• Provide an analysis of European Union (and global) biorefinery construction and planned development based on the biorefinery classification (WP 1).
• Construct a database – in close coordination with the JRC - in line with the classification system, populated using literature and stakeholder/network knowledge and subsequently analysis.
4.1.2 SCOPE
The scope regarding WP 4 is defined in the inception report. In short this means:
• Biorefining can be broadly defined as the sustainable processing of biomass into a portfolio of marketable bio-based products, which could include co-production of food and feed, algae, wood and woody biomass-based materials, products and bioenergy (power, heat/cold, fuels).
• Focus of the current study are chemical and material driven biorefineries (incl. also uses of biogenic effluent gases, such as CO2 and CO for biochemicals etc.) that include the production of innovative high value bio-based products.
• These chemical and material-driven biorefineries produce bio-chemicals and/or biomaterials as main products i.e. on a mass basis their bio-based chemicals and materials output exceeds the output of bioenergy, including fuels. Biofuel production plants that produce biochemicals as co-products are not included.
• For the purpose of the assignment traditional bio-based products such as pulp, paper and wood products as well as biomass used for energy production will not be focused on.
Technology Readiness Levels (TRLs) are indicators of the maturity level of particular technologies. The highest TRL level is 9. In the biorefineries database only facilities that are at TRL 8 or TRL 9 will be included. This includes commercial, first-of-a-kind (FOAK) and demo plants but not pilot plants.
365 Baldoni, Edoardo; Reumerman, Patrick; Parisi, Claudia; Platt, Richard; Gonzalez Hermoso, Hugo; Vikla, Kaisa; Vos, John; M'barek, Robert; European Commission, Joint Research Centre (2021): Chemical and material biorefineries in the EU. European Commission, Joint Research Centre (JRC) [Dataset] PID: http://data.europa.eu/89h/ee438b10-7723-4435-9f5e-806ab63faf37"

166
4.1.3 APPROACH
The work was divided into five steps, namely:
1. Definition of datafield headings
2. Selection of top 10 most relevant other countries outside the EU
3. Review existing biorefinery databases
4. Build database of biorefineries in the EU and in top 10 other countries
5. Analysis of EU (and top 10 other countries) planned biorefineries
In the next paragraphs the progress of WP 4 is further detailed based on these steps.
JRC database on bio-based industries and biorefineries
Over several years (see textbox), the JRC has worked on a database on bio-based industries and refineries. Based on discussions with the JRC and the principal, the consortium gained access to the raw data (MS-Excel sheet) used by the JRC to populate the database on bio-based industries and biorefineries366
Initiated in 2015 (under the BISO project), the JRC database brings together information on bio-based plants in EU Member States, collected from a broad range of existing overviews and targeted surveys, and further refined using expert information.
Over the years both DG-RTD and the Joint Research Centre devoted significant resources to develop the database to its current advanced state. As of early 2020, it contains >2500 biomass processing plants in the EU28 Member States. The JRC database – although likely not exhaustive - is considered the most complete overview of the sector. Since a few months it can be consulted free of charge by the public. For this purpose, a user-friendly interface was developed (see screenshot).
It was agreed that the consortium would build on and improve this raw data to build its database on biorefineries. This approach avoids duplication and enhances the result. The decision to cooperate closely with the JRC shaped several subsequent choices. It had a
366 https://datam.jrc.ec.europa.eu/datam/mashup/BIOBASED_INDUSTRY/index.html

167
clear impact on the choice of data platform (MS-Excel) and on the definition of data fields. When the biorefineries database was finalised, the raw data was made available to the JRC. A meeting was lined up to inform JRC about the expansions and improvements made.
4.2 Define datafield headings
Datafield headings have been defined in accordance with the preliminary list from the Inception Report, and the existing JRC datafield headings.
The list contains 39 entries. These entries partly originate from the JRC database and are partly added due to specific requirements for this Biorefineries database. These datafields have been used in the subsequent populating and analysis of the biorefineries database. In general, the new datafields reflect the priorities defined for this project. For example, to be able to fill the database in conformity with the biorefineries classification developed in WP 1, several data fields were added, as follows:
• Conversion Process
• Platform
• Product
Further new data fields include information on:
• Geography (EU or non-EU) – since the JRC database only considers EU Member States this field had to be added
• Size class of production – to make an easy subdivision based on size class
• Capital expenditure of the biorefineries – to get an insight in investment levels
Besides that, there are also some data fields added to facilitate analysis, and to enable the JRC to quickly select new or changed data field entries. (“BTG analysis”, “New or changed”, and “Description of changed data”).
4.3 Selection of top 10 most relevant other countries
The assignment required the consortium to also consider biorefineries established outside the EU. To keep this task manageable, it was proposed and agreed to zoom in on a maximum of 10 countries deemed the most relevant. As a first step, these countries had to be identified. For his process, the following methodology was adopted:
• Since 2007, during each triennium IEA Task 42 Biorefining367 has been publishing Countries Report that cover the status of biorefining initiatives in its participating countries. Task member countries have changed over the years. In the fourth triennium (2016-2018), non-EU members included Australia, Canada, Japan, New Zealand, and United States. It was an obvious choice to include these five countries.
• Other countries were selected based on a combination of biomass availability, GDP, expert knowledge on national bioeconomy support policies and level of existing bio-based production capacity. Based on this, Brazil, China, India, and Thailand were selected. This country selection was communicated to the EU in the Inception Report.
• Lastly, several countries were selected because of geographical proximity. These countries are Norway, Switzerland, and the United Kingdom.
367 http://task42.ieabioenergy.com

168
This methodology was approved by the EC. In the next table the selected Non-EU countries are listed:
Table 36. List of Non-EU countries considered for the biorefineries database
4.4 Review existing biorefinery databases
This task consisted of two subtasks:
• Filtering JRC database
• Identifying additional biorefineries in EU and in the selected non-EU countries
These will be described in order.
Filtering the JRC database
The JRC database on bio-based industries and biorefineries covers 2,362 facilities. The JRC database includes biorefineries that produce chemicals and materials (our focus) but also includes many other bio-based plants that produce exclusively or mainly bioenergy.
To select the biorefineries that fit the scope of the current study, a set of selection criteria was developed and applied, as follows:
• Biorefineries not at TRL 8 or TRL 9 (Technology Readiness Level) were not retained.
• To identify the chemical biorefineries, use was made of the list of the top 120 biochemicals produced in the EU, developed in the RoadToBio project (See Annex I). For these bio-based chemicals, the corresponding biorefineries were selected from the JRC database. This approach has the advantage that it is clear that all or nearly all chemical biorefineries are included in the database.
• To identify the material biorefineries, a list of keywords for bio-based materials were defined (See Annex II) by drafting selected ‘word clouds’ from the JRC database. Biorefineries in which these biomaterials were listed as products were selected from the JRC database.
All in all, about 300 chemical and material biorefineries were in conformity with our criteria and selected for further analysis.
Identifying additional biorefineries in EU and selected non-EU countries
To update and expand the resulting collection of biorefineries a literature search was conducted. The initial focus of this literature search was on identifying biorefinery overviews. It was established that the comprehensive JRC database might be unique in the world. No similar overview listing biorefineries in non-EU countries was found. Not even IEA Task 42 that has a clear focus on biorefining had generated such an overview. Consequently, a database on non-EU biorefineries had to be developed from scratch. Therefore, the focus of the literature search was shifted to identifying key literature sources that could help build up such database. From many candidates sources the following appeared to be the most useful:
Region Countries
OECD countries USA, Canada, Australia, New Zealand, Japan
BRIC countries Brazil, China, India
(Other) Asian countries Thailand
Non-EU European countries Norway, Switzerland, United Kingdom

169
• “Map of biorefineries in Europe” BIC/NOVA 2017 (http://bio-based.eu/graphics/ )
• E4tech database for the sugar platform
• Niaounakis, M. Biopolymers: Processing and Products, 2015 http://dx.doi.org/10.1016/B978-0-323-26698-7.00001-5
• IEA Task 42 Biorefining country reports (https://www.iea-bioenergy.task42-biorefineries.com/en/ieabiorefinery/Country-Reports.htm )
• De Jong, Bio-based chemicals: a 2020 status update. IEA Task 42 Webinar presentation. (https://www.ieabioenergy.com/ieaevent/iea-bioenergy-webinar-bio-based-chemicals-a-2020-status-update/ )
• Rosales-Calderon and Arantes, “A review on commercial-scale high-value products that can be produced alongside cellulosic ethanol”, Biotechnology Biofuels (2019) 12:240, https://doi.org/10.1186/s13068-019-1529-1
• Spekreijse et al., “insights into the European market for bio-based chemicals”, JRC report, 2019, http://publications.jrc.ec.europa.eu/repository/handle/JRC112989
To collect up-to-date information on latest developments with regard to existing and in particular planned biorefineries, (professional) websites and social media were inspected. The most recent 2.5 years (since January 2018) were considered. Media that were inspected include:
• Bio-based News, http://news.bio-based.eu/
• Bioplastics News, https://bioplasticsnews.com/top-bioplastics-producers/
• Biofuelsdigest (https://www.biofuelsdigest.com/ )
• Greenchemicalsblog (https://greenchemicalsblog.com/ )
• List of Flagship projects BBI https://www.bbi-europe.eu/projects
4.5 Build database of biorefineries in EU and top 10 countries
Having developed an up-to-date overview of relevant biorefineries in the EU and beyond, the final step was to prepare and/or updating the description of all biorefineries. To this end hundreds of websites and webpages were inspected. Those that offered new(er) information are mentioned directly in the database and are not repeated here.
Based on the data sources listed above, the JRC database was updated and expanded. The new database currently contains 445 entries, including both existing and planned biorefineries. It should be noted that this updated database still might not contain all innovative chemical and material biorefineries in the EU (and in the selected non-EU countries), because of various reasons such as non-availability of information, new developments, etc. When populating the database, it became clear that for many biorefineries it is difficult to find information regarding plant size, employees, and CAPEX. In many cases it is even difficult to determine production volumes. Expected reason for this is that it is often not in the interest of the company to give this information. Also, many bio-based products are part of complex international supply chains that are difficult to discern.
The above underlines the difficulty of collecting and maintaining reliable biorefinery plant information that is time sensitive and/or commercially sensitive. This is hardly surprising and a common problem that anyone building a database for any kind of economic sector is experiencing.

170
4.6 Analysis of EU (and top 10 other countries) planned biorefineries
Given that the database construction is practically complete –only the biorefineries classification remains to be finalized - it is now possible to analyse the data.
Firstly, the issue of completeness of the data is highlighted, since this impacts the analysis, and the interpretation of the results. Subsequently, general characteristics are discussed, followed by specifics such as feedstocks, platforms, processes, and products.
Data completeness
The level of completeness of the data is highlighted for the relevant datafields in Figure 48.
Figure 48. Level of completeness of the Biorefineries database per data field
This figure shows the completeness percentage of a given data field for all biorefineries. So, if the figure shows 50% data completeness, it means that data from half of the biorefineries on a given data field is contained in the database. For some datafields the figure is practically meaningless, such as the data field ‘parent company’. Since many Biorefineries do not have a parent company the completeness figure does not say a lot.
Data completeness is quite high (95% -100%) on data related to the technical characteristics of the biorefinery such as feedstock type, process, platform, and product. Also, quite general data such as country and location are known for a relatively high percentage of the biorefineries.
Data completeness is less on economic/business parameters, such as capacity, number of employees, turnover and capital expenditure. This is not surprising, since this may be

171
sensitive data, which companies do not want to disclose because of their competitive position.
One specific point needs to be made regarding the data on the capacity of the biorefineries. It would have helped if more would be known about this, since the capacity can vary widely, and it can therefore be an important parameter to characterize the biorefineries. However, data completeness is about 45%. On top of that, there are two further reasons why this production capacity data is even less suitable for analysis:
• Often, only the total capacity of a biorefinery is known, even though biorefineries can also produce non-bio-based (fossil) products.
• Many bio-based products are not 100% bio-based, but also contain fossil feedstocks. This is not shown in the biorefinery production capacity data.
Given these uncertainties, further analysis will not take the production capacities into account.
General aspects
In Figure 49, the geographical distribution of the EU biorefineries are shown. This graph also includes the planned EU biorefineries. This graph shows – as expected - that many biorefineries are located in France, Germany, Netherlands and Belgium. Besides that, it’s also clear that Nordic countries like Sweden and Finland also home to many biorefineries.
Further analysis on the territorial dimension of biorefineries is very well possible. When available, GPS coordinates of the biorefineries have been included, with a 95% completion ration. This enables to pin-point most biorefineries and select these for territorial analysis.
As discussed earlier in this paragraph, the link between the number of biorefineries and the total bio-based production capacity is tenuous. However, given the earlier stated reasons it is not practically possible to obtain a more accurate review of the total bio-based production capacity using data from the Biorefineries database.
The geographical distribution of all identified biorefineries outside of the EU is shown in Figure 50. It should be noted that only the number of biorefineries in the selected countries (see Table 36) are shown. However, during the research no other non-EU countries with many biorefineries were identified. From the data its quite clear that the USA and China are major players, with India, Japan, and Brazil behind these first two.
In Figure 51 a graph is given that shows the foundation year of the biorefineries for which that data is known. On the right of this graph, future years are given (2021-2023); this represents planned biorefineries with a start-up year located in the future.
Given that the data completion percentage of this data field entry is 72%, results should be interpreted very cautiously. However, what is clear from the data is that many installations are quite old; meaning that the majority of installations are older than 10 years. This can be so because one common type of biorefinery is an existing plant that diversifies into bio-based products, and the foundation year reflects the foundation of the original – non-biorefinery - plant. It also reflects however that chemical/material biorefineries are not a very recent phenomenon but are part of a development that has been going on for quite a while now.

172
Figure 49. Distribution of chemical/material biorefineries in the EU
Figure 50. Number of chemical/materials biorefineries in selected countries outside of the EU
Figure 51. Year of establishment of the biorefineries

173
Other general aspects that were determined were the number of planned biorefineries and biorefineries under construction. In total 13 ‘new’ biorefineries were identified, that are either planned or under construction. Most of the biorefineries (93%) are commercial (TRL9); the remaining 6% (in numbers: 26) are demonstration plants. Obviously, there are also many biorefinery pilot plants. These were however out of scope and have not been included in the database.
Feedstock
The use of feedstock by the biorefineries is known for many of them (completeness percentage 97%), which makes this data field suitable for analysis. In Figure 52 the use of feedstock type is shown for all EU biorefineries in the database. The six feedstock types to the right are all primary biomass. Three quarters of all the feedstock types used is primary biomass. The five biomass types shown at the right-hand side of the graph are all secondary biomass and residues.
Figure 52. use of feedstock types for the EU biorefineries in the database
This graph shows that sugar and oil crops are most widely used in the EU biorefineries, followed by starch crops and lignocellulosic biomass. This graph also shows that a quite large part of the EU biorefineries use only a single feedstock. For each feedstock type, the biorefineries that only uses that feedstock type (the ‘single-feedstock biorefineries’) are shown separately. A minority of the biorefineries (in total: 35%) of the biorefineries use more than one feedstock.
For the non-EU biorefineries – see Figure 53– the pattern is similar, except for oil crops. These are used not as much. Also, residues are used to a lesser extent. About 30% of the non-EU biorefineries use more than one feedstock.

174
Figure 53. use of feedstock types for the non-EU biorefineries in the database
Figure 54. Use of feedstock types for the new biorefineries in the database

175
In Figure 54 the feedstock types for new biorefineries are shown. In total 15 biorefineries that were either under construction or planned were identified. From the graph its clear they use especially lignocellulosic biomass residues, and oil crops as feedstock. Two of these plants are non-EU. They use both oil crops.
Process and platform
The top-level subdivision of the processes used in the chemical and material biorefineries are shown in Figure 54and Figure 55. The dominance of the biochemical and chemical processes is clear. It is also clear that there are only a few biorefineries that mainly rely on thermochemical processes.
Below the top-level division, it is also possible to distinguish the different sub-level processes. These show – regarding the biochemical processes – the dominance of fermentation, and regarding the chemical processes the dominance of catalytic and esterification processes.
With respect to the platforms, results are shown in Figure 57 and
Figure 58. In the classification developed in this project, several more platforms were identified, such as the Biochar, bio-coal, bio-crude, and hydrogen platform. No biorefineries using these platforms have been identified however, and these are now shown in the graph.
The total number of platforms identified exceeds the number of biorefineries, which reflects that there are many multi-platform biorefineries. Results are consistent with the information on feedstock and processes. The C5/C6 sugars platform is most prevalent, followed by the oil platform. Outside of the EU the sugars platform is even more prevalent than in the EU biorefineries.
Figure 55. Top-level processes identified in the selected EU biorefineries

176
Figure 57. Platforms identified in the Biorefineries database (EU only)
Figure 58. Platforms identified in the Biorefineries database (non-EU only)
Figure 56. Top-level processes identified in the selected non-EU biorefineries

177
Products
Just as for many other technical parameters, the products that are produced by biorefineries have been identified with a high completion factor (99%), which means certainly that further analysis is warranted.
The top-level categorisation is shown in Figure 59 and Figure 60 . These figures show that biorefineries produce both a lot of chemicals and materials, and to a lesser extent food and animal feed. It is also clear that energy remains an important by-product, even though we pre-selected the biorefineries that produced mainly chemicals and/or materials.
If we look further towards the chemical products (see Figure 61 and Figure 62), we see a wide spectrum of products. There are only a few products that are not produced in multiple biorefineries. This goes both for the EU and for the non-EU biorefineries. Besides that, it should be noted that the largest category (by number of biorefineries) - building blocks - will likely contain several chemicals that could just as easily be named as additives and/or solvents.
Regarding materials (see Figure 63 and Figure 64), no clear pattern emerges. As expected, many biorefineries produce polymers and resins, but the number of composite and fibre products is also substantial. Non-EU-biorefineries produce more polymers and resins, and less composites and fibres compared to EU biorefineries.
With respect to energy products (see Figure 65 and Figure 66), it’s clear that fuels dominate. It should however be noted that this category is quite broad, since it includes bioethanol, biodiesel, and biomethane. Furthermore, it is considered likely that many biorefineries produce heat and/or electricity for their own processes, in which case it might not be listed as a separate product. Non-EU biorefineries listed in the database report only fuel as energy product. Also, here heat and/or electricity are likely produced as well, but not reported.
Figure 59. Top level product categories identified in all EU biorefineries

178
Figure 60. Top level product categories identified in all non-EU biorefineries
Figure 61. Chemicals products produced in the EU biorefineries of the Biorefineries database
Figure 62. Chemicals products produced in the non-EU biorefineries of the Biorefineries database

179
Figure 63. Materials produced in the EU biorefineries identified in the database
Figure 64. Materials produced in the non-EU biorefineries identified in the database
Figure 65. Energy products produced in the biorefineries (EU) listed in the database. The category ‘Cooling agents’ is not listed as it has no entries.
0
5
10
15
20
25
30
Fuels Heat Power

180
Figure 66. Energy products produced in the biorefineries (non-EU) listed in the database. The category ‘Cooling agents’ is not listed as it has no entries.
Besides the absolute number of distinct products produced in biorefineries, it is also of interest what the position in the value chain is for the chemical products produced. In this respect the distinction between drop-ins, smart drop-ins and dedicated products is useful:
• Drop-in products are produced as direct replacement of fossil chemicals early in the value chain.
• Smart-drop ins are chemical products that can also directly replace chemical products, but in this case, it meant that these are introduced in the value chain at a further stage, closer to the end-product.
• Dedicated products are in this context chemical bio-based products that have distinct functionalities, that make them superior to fossil products, so as to ensure a unique market advantage over the fossil alternative.
In the pie charts of Figure 67, the division between drop-ins, smart drop-ins and dedicated chemicals is shown. More precise, it shows the percentage of biorefineries that produce a certain type of product. This pie chart shows the largest percentage of products to be dedicated chemicals (43% EU, 47% non-EU). However, there are also a significant number of drop-ins (7% EU, 19% non-EU) and smart drop-ins (9% EU, 15% non-EU). Besides that, there are also a notable amount of biorefineries that produce combinations of these (called ‘mixed’) in the figure.
What is clear from this pie chart is that biorefineries produce all three types of products, which implies that all three types of products are produced by a number of biorefineries, leading to the expectation that all three types of products have found business/market conditions on which they can operate. This does however not say much about the general competitiveness of biorefinery products. The factors to improve the competitiveness are elaborated in WP 6.
0
1
2
3
4
5
6
7
8
Fuels Heat Power

181
4.7 WP 4 Conclusions
Based on the analysis presented, and the work carried out regarding identification of chemical and material refineries and the building of the database, several conclusions can be drawn. Besides many observations that can be made related to the use of certain feedstock, product types, geographical aspects, the following - more general - conclusions can be drawn: • There are many chemical and material focused biorefineries operational inside and
outside of the EU, producing a multitude of chemical and material products. However, the lack of data on the production volumes and capacity does not allow any estimations of their importance as regards the total production in the EU.
• The currently operational biorefineries do not constitute a recent development, since many are already older than 10 years. Rather, this point towards an interwoven landscape of installations that produce both fossil and bio-based products and/or produce traditional biomass product in combination with innovative/advanced bio-based products.
• Many biorefineries use primary biomass, of which sugar and starch form a very large part. The dominance of the C5/C6 sugar platform and the oil platform is clearly distinguishable in the database analysis, both for the EU and the non-EU biorefineries
• The biorefineries that use secondary biomass use mostly residues from forestry’, followed by other residues and wastes, and agricultural residues. This last category is more prevalent in the non-EU biorefineries, compared to the EU biorefineries.
• Biorefineries that produce materials in the EU, produce mainly polymers and fibres, and to a lesser extent composites and resins. For non-EU biorefineries polymers and resins are produced to a greater extent; composites and fibres less so.
• From the biorefineries that produce chemical products, most produce dedicated bio-based chemicals. However, there are also a lot of biorefineries that produce drop-in, smart drop-in or a combination. This means that for all three product options (drop-in, smart drop-in and dedicated) there are multiple biorefineries that have found business/market conditions on which they can operate.
Figure 67. The percentage of biorefineries that produce a certain type of product (left: EU biorefineries, right: non-EU biorefineries
34%
7%
9%
43%
7%
Dedicated Drop-in commoditysmart drop-in materialsmixed
47%
19%
15%
12%
7%
Dedicated Drop-in commoditysmart drop-in materialsmixed

182
5 WP 5– Market prospects for biorefineries to 2030
WP 5 provides the outlook for biorefinery deployment as well as an outlook for bio-based chemicals and materials demand in the EU to 2030 under two growth scenarios. This WP was co-developed by FNR and E4tech with the demand section led by FNR and the supply section led by E4tech
5.1 Objectives
The objectives of this work package are:
• to develop a bio-based chemicals and materials demand outlook in the EU to 2030 under two growth scenarios.
• to develop an outlook for biorefinery deployment to 2030 under two growth scenarios
5.2 Approach
This work builds on WP 2 considering the drivers and barriers for biorefineries, WP 3 available and emerging biorefinery pathways and RD&I needs, and on WP 4’s deployment status of biorefineries.
It includes assessing the potential markets and regions for the deployment of biorefineries in the EU. The two deployment scenarios form the basis of the ‘biorefinery outlook for the EU’ developed in WP 6.
The following steps have been carried out:
1. Setting of assumptions for two growth scenarios (high and low)
2. Assessment of the potential demand (under the two scenarios) for the main bio-based products derived from biorefineries, split by product classification categories, to establish the potential markets available in the EU.
3. Development of complementary case studies aligned to those covered in WP 2 and 3
4. Forecast the potential supply of bio-based products from biorefineries by assessing biorefinery ramp-up rates368 (under the two growth scenarios) within the EU to 2030.
5. Focus on the ramp-up rates of the more novel pathways (as identified in WP 3)
6. Identification of potential locations of biorefinery deployment in the EU based on resource potential and existing industrial activity.
7. High-level outlook to 2030 for alternative biochemical and biomaterial ramp-up routes
8. Comparison of supply in the EU to supply in top 10 non-EU (as considered in WP 4).
9. Comparison of EU demand vs EU supply
5.3 Growth scenarios
The two growth scenarios shown below are a combination of demand and supply side factors. The low scenario represents low increases in demand for bio-based chemicals and materials in the EU and mixed success in future deployment of biorefineries. It can be considered that there is limited additional actions taken by stakeholders as today. The high
368 Rate of the capacity increase for biorefineries

183
case represents higher support and deployment for biorefineries and increased market share as a result of stronger drivers (i.e. significant growth in the demand for bio-based chemicals and materials). The high scenario considers the policy lines of the European Green Deal and other policy that is supportive of bio-based products (see WP 2 and 6 for more details).
Figure 68. Demand and supply scenarios
Macroeconomic and policy factors under each growth scenario were determined jointly between E4tech and FNR. These factors were then validated during a stakeholder advisory group meeting and the October 2020 stakeholder workshop part 2. The major focus of the stakeholder feedback was around the impact of COVID 19 pandemic on planned projects and the current demand for bioproducts.
These high-level factors are shown below and developed into assumptions in the subsequent sub-sections. The GDP growth factors are relevant to both the recovery from the COVID 19 pandemic over the coming years and overall economic activity to 2030.
The crude oil price factors are important as for many of the bioproducts being developed are substitutes for products produced from crude oil (i.e. fossil-based products). Fossil-based products prices are in part aligned to the crude oil price (e.g. polyethylene price has historically being lower when the oil price is low). Therefore, the competitiveness of biorefineries is expected to be higher when the oil price is higher – especially when they sell products that are in direct competition with existing fossil-based products. However, according to the Forest Technology Platform the oil price does not have a direct influence to the competitiveness of all biorefineries of the forest-based industries.
Policy support for bioproducts is also a key driver of demand and biorefinery deployment. In the high scenario there is new policy support expected to be put in place in the EU (as well as the sub-sections below this is also discussed in WP2 and WP6), whilst in the low scenario no additional policy is put in place compared to today.
As well as economic growth demand for products is aligned to population growth. This is assumed to remain the same in the high and low scenarios until 2030 and based on the EU outlook369.
369 The EU’s population projected up to 2100. European Commission, eurostat, 2019-07-10, https://ec.europa.eu/eurostat/web/products-eurostat-news/-/DDN-20190710-1

184
Table 37. Macroeconomic and policy high-level factors to 2030
5.4 Potential demand
5.4.1 POTENTIAL DEMAND INTRODUCTION
This section on the potential demand for bio-based chemicals and materials that could be but not necessarily have to be produced from biorefineries provides a demand side assessment of 10 selected product groups. Within these product groups, specific products are presented as case studies.
Each of the ten product groups described in this report has been subject to development of a high and low scenario.
Resulting from the scenarios, a demand side outlook is presented before going into the specific product groups and their case studies. The outlook presents the EU consumption of bio-based products in 2019 in total and per product group. This is completed with the scenario-based total numbers and numbers for each product group for 2030 for the low and the high scenario.
All baseline numbers are from the JRC Study “Insights into the European market for bio-based chemicals. Analysis based on 10 key product categories.” published in 2019370, which is an analysis also based on 10 key product categories. These include total production per product group, bio-based production and bio-based consumption. As the report was published in 2019, all numbers are from 2018 or earlier. Referring to this report in the text, it will be called the “JRC study” from here on.
The product group specific section consists of:
1. A description of the composition of the product group as some products could be in one or more categories. This will make sure that no double counting will happen.
2. Presentation of current data for the product group consisting of total production, bio-based production, bio-based production share of the total production, and bio-based consumption.
3. Listing of scenario factors for the high and the low scenario.
4. An estimation of the demand CAGR for each scenario including total numbers for EU bio-based consumption for each scenario.
370 Spekreijse, Jurjen; Lammens, Tijs; Parisi, Claudia; Ronzon, Tevecia; Vis, Martijn, Insights into the European market for bio-based chemicals, Analysis based on 10 key product categories, JRC Science Policy Report, 2019, https://ec.europa.eu/jrc/en/publication/insights-european-market-bio-based-chemicals, last viewed: 2020-12-03.
Scenario GDP growth Crude oil price Policy H
igh
sc
enar
io Stronger recovery
from the COVID 19 pandemic and average growth than forecast
Demand recovers and grows - road fuels continue to see increases in demand (low electrification etc..), continued demand growth for petrochemicals feedstocks
Market pull policy put in place for bio-based chemicals and materials. Widespread financial support for biorefinery development
Low
sc
enar
io Weaker recovery
from COVID 19 pandemic and average growth than forecast
Remains low based on weak demand for road fuels (high electrification etc..), lower demand growth for petrochemicals feedstocks
No additional policy put in place compared to today

185
5. Case studies for specific products being part of the product group.
The selection of the 10 product groups for this part of the study is different from the 10 key product categories of the JRC study and it also does not reflect all product groups defined in WP 1 of this study for the biorefinery classification. It is a selection, which was made for identifying the general and specific drivers and barriers for biorefineries in WP 2. Since in this section on the potential demand for bio-based chemicals and materials the scenarios are amongst others based on drivers and barriers identified for product groups in WP 2, this section on demand will also develop scenarios for these 10 product groups only. The selection of the 10 product groups used in WP 2, WP 3 and now also WP 5 is based on the following criteria:
1. Both chemicals and materials shall be represented
2. No domination of a single or just a few biorefinery pathways
3. Market potential i.e. substantial market volume and/or market growth (CAGR)
4. Stakeholder views and preferences
It has to be acknowledged that these 10 product groups do not represent the total market for bio-based chemicals and materials. This is specifically true for the fibre product group. First of all composite materials containing natural bio-based fibres are not produced in biorefineries typically. The product group “fibres” is limited to man-made bio-based fibres.
The selection of the bio-based chemicals’ case studies was based on the list of the RoadToBio project371 including 122 products, which we used as a long list. This list was reduced to a shortlist by applying three criteria to select specific products that have a relevance for the demand side outlook. The three criteria used are:
1. Exclusion of products that are not expected to be commercialised by 2030 (based on WP 3 and the supply ramp up in this WP)
2. Exclusion of products with identified functional or sustainability deficits (i.e. high human toxicity or allergic potential)
3. Prioritisation of specific functional or sustainability related features compared to fossil alternatives (i.e. feedstock base, toxicity, greenhouse gas emissions and end of life options, i.e. biodegradability)
4. Prioritisation of products with a high market share potential in the bio-based segment
The work resulted in a shortlist of 10 representative products (chemicals and materials) with promising market attractiveness, which can be directly traced back to specific biorefinery types and pathways.
The case studies are structured using the following categories:
1. Functionality and application area
2. Sustainability – Describing the products environmental sustainability performance
3. Market value – Describing policy and consumer related market pull measures and regional specifics
371 Lammens, Tijs; Spekreijse, Jurjen; Puente Ángel; Chinthapalli, Raij; Crnomarkovic, Mladen, Bio-based opportunities for the chemical feedstocks and intermediates in the chemical industry, Deliverable 1.1 to the RoadtoBio project, 2017, https://www.roadtobio.eu/index.php?page=publications, last viewed: 2020-12-03.

186
4. Market size and market price - Data on the market volume and market price have been collected through the Prodcom database. Furthermore, information related to the price and market volume has been collected from publicly available market reports and studies, as well as through expert judgment from stakeholder interviews. Results were discussed and adapted according to the feedback of stakeholders, which have been consulted in semi-structured interviews and through the stakeholder workshops and stakeholder advisory group meetings.
The aim of presenting specific case studies is to help stakeholders to understand which exemplary specific products could be produced by the different biorefineries described in WP 3. Putting this together with the identified barriers and drivers it presents a complete picture, hence this can help support stakeholders to decide which biorefineries provide the highest opportunities for their constituencies. Nonetheless, as it is not possible to present all biorefinery pathways in detail or define specific barriers and drivers for all of them, it is also not feasible to analyse the full portfolio of products produced by them. The description of demand-side scenarios for selected product groups and specific case studies of products within the product group form a picture of how demand can develop under different scenarios.
Whilst the above approach explores the market attractiveness for 10 bio-based chemicals and materials that can be produced from chemical and material biorefineries there are many others and looking at all of these to the level described above is out of scope of this study. However, an understanding of the overall market potential for bio-based chemicals and materials will be developed. This will be based upon market outlook for the product sub-groups until 2030 and the potential demand for these groups will be provided.
Table 38. Overview product groups, case studies and related biorefinery pathways
Note: In WP 3 Propylene glycol was listed under the product group additives. The chemical can be listed in different categories due to its various applications.
Scenario development
Two scenarios were developed for each product group named in table 2 above. The two 2030 scenarios will cover a high demand scenario 2030 and a low demand scenario 2030.
As mentioned already above, we used the available study on Bio-Based Chemicals by JRC372 and the estimated Compound Annual Growth Rate (CAGR) of the different product
372 Spekreijse, Jurjen; Lammens, Tijs; Parisi, Claudia; Ronzon, Tevecia; Vis, Martijn, Insights into the European market for bio-based chemicals, Analysis based on 10 key product categories, JRC Science Policy Report, 2019, https://ec.europa.eu/jrc/en/publication/insights-european-market-bio-based-chemicals, last viewed: 2020-12-03 .
Product group Products Pathway
Building blocks Propylene glycol 1-4 BDO Lactic acid Biomethanol
B,C,E A,B,C drop-in A,B, dedicated D,I drop-in
Lubricants Fatty acid PEG esters C
Solvents Acetic acid A,B,D,I
Surfactants Fatty alcohol ethoxylate C
Fibres Microfibrillated cellulose D
Polymers Thermoplastic starch B
Resins Lignin based phenolic resins D,E
Additives

187
markets as a basis. We checked the estimated CAGR for the different product groups against current market trends and considered the results of WP 2 on barriers and drivers to test if assumptions are still valid and how the market could react if certain barriers would be removed.
The macro-economic factors presented in table 1 on page 3 have been taken into account. These are mostly not product group specific but have an effect on the demand across all product groups. Macro-economic effects include the impact of the Covid-19 situation, development of the crude oil price and development of GDP, purchasing power and disposable income of consumers. These factors are not directly and immediately controllable by policy makers. However, the policy factor is addressed as well with relating scenario assumptions. These are described in more detail below.
Methodology for developing the product group outlook growth scenarios
The demand outlook for the product groups is based on the numbers for EU bio-based consumption per product group derived from the JRC 2019 report373. This forms the baseline for the scenario building. It is important to note that we are providing the two scenarios based on the assumptions described and using the JRC 2019 report baseline to show how market demand could evolve. Nonetheless, this should not be interpreted as a demand market forecast, which would require a different methodology and is out of scope for this tender study.
High Scenario
For the High Scenario it is assumed that the following general key factors come into place until 2030:
1. A sustained high crude oil price between 2020 and 2030
2. Policy incentives are introduced that:
o price carbon (e.g. via a tax on carbon, reform of EU ETS or Carbon Border Adjustment Mechanism (CBAM)) or
o introduce new other environmental or health related regulations (e.g. regulation on toxicity, migration of substances or volatile organic compounds (VOCs)), bans of traditional products
3. Relative inelastic price reducing effect on demand for bio-based chemicals and materials e.g. through green price premiums
4. An above average economic development including a fast recovery from the Covid-19 crisis and increasing GDP, purchasing power and disposable income
The policy related high scenario factors and assumptions are partly takes up actions developed in WP 6 to address identified barriers for biorefinery deployment.
Further specific assumptions have been included into the high scenario on a case basis where relevant for a product group. These could be a high replacement potentials for direct substitution of traditional products or drivers and barriers related to product performance beyond environmental considerations.
It is assumed that the high scenario will overcompensate rising feedstock prices which are due to increased biomass demand. It is also assumed that a high price for crude oil alone
373 Spekreijse, Jurjen; Lammens, Tijs; Parisi, Claudia; Ronzon, Tevecia; Vis, Martijn, Insights into the European market for bio-based chemicals, Analysis based on 10 key product categories, JRC Science Policy Report, 2019, https://ec.europa.eu/jrc/en/publication/insights-european-market-bio-based-chemicals, last viewed: 2020-12-03.

188
would only lead to a very moderate increase of demand for bio-based chemicals and materials. Only the policy incentives and some product group specific actions will help to increase demand sharply as soon as they are implemented.
High Scenario assumptions
High Scenario assumptions independent from policy making:
High replacement potential: Some bio-based products have a high potential for replacing traditional fossil-based products. This is the case when a bio-based product covers only a small share of the total consumption of a traditional product until now and it is in particular the case for drop-in and dedicated solutions with identical properties of traditional products.
High crude oil price: A high oil price would lead to increased cost competitiveness of bio-based chemicals and materials that are directly competing with traditional products based on crude oil. It has to be considered however, that advantages of a higher oil price can be limited, since increasing demand for alternatives will also increase the price of biomass feedstock.
Purchasing power and/or disposable income increase: The general Purchasing Power describes the disposable income of households and is the most commonly used indicator for a region’s potential. The Purchasing Power however is not necessarily the most appropriate planning indicator for all providers of goods and services, as for a lot of products the consumers’ spending behaviour does not exclusively relate to the disposable income. Still, increasing purchasing power can lead to higher consumption in general having an effect on bio-based products. Coupled with the following scenario assumptions of increasing public awareness and acceptance of bio-based products as a more environmentally friendly alternative and a resulting willingness to pay premium for that, this would give an extra boost in demand.
Consumers/buyers willing to pay price premium: This category is already included in the assumptions about increasing purchasing power and awareness raising. However, its effect is stronger for intermediate products where material cost percentages are highest. Towards the end of the supply chain the price premium percentage decreases typically.374
High Scenario assumptions dependant on policy making
GHG relevant measures/regulation: Demand for some bio-based products can increase once GHG related measures are implemented which e.g. give a price to lifecycle GHG emissions for all products. This would help to level out price differences to traditional products in case a bio-based product can prove it has significantly less GHG-emissions over its live cycle. Measures could consist of e.g. GHG-tax, GHG sector targets, reforming the EU ETS scheme, Carbon Border Adjustment Mechanisms (CBAM).
Relevant regulation relating to environmental standards, health standards, bans: Demand for bio-based chemicals and materials can increase when environmental and health standards are implemented. Environmental regulations can relate to issues regarding concerns about plastic waste and microplastic littering. Measures can be bans for plastic bags. Health related measures could be regulations regarding migration of substances in food packaging or volatile organic compounds that are toxic for human health.
Public awareness and marketing: Increased public awareness about bio-based products as a more environment friendly alternative can lead to higher demand and consumers may be willing to pay premium. The effect could be stronger if this goes along
374 Michael Carus, Asta Eder, Janpeter Beckmann, Green Premium Prices Along the Value Chain of Bio-based Product, 2014, https://news.bio-based.eu/greenpremium_prices_along_the_value_chain/, last viewed: 2020-12-11.

189
with increasing purchasing power. It is also assumed that the feedstock base for bio-based chemicals and materials is sustainable, which is a challenge for some product groups.
Low Scenario
For the Low Scenario the following factors are assumed:
1. The crude oil price remains low until 2030
2. Policy incentives are not introduced
3. Relatively elastic prices for bio-based chemicals and materials leading to a sharp drop in demand when prices increase; Leading to unwillingness to pay green price premium
4. A below average economic development with slower recovery from the Covid-19 pandemic effects and stalling GDP, purchasing power and disposable incomes
The Low Scenario can be considered as a business as usual development.
Further explanations on the scenario factors and assumptions of their dependencies are given below. Some of the assumptions are independent from policy making such as for example the development of the crude oil price. Others are depending on active policy making such as the introduction of new or adjusted incentives that provide an extra push to bio-based chemicals and materials beyond existing incentives.
Low Scenario assumptions
Low scenario assumptions independent from policy making
Oil price remaining low: Assuming the oil price will remain low, price competitiveness of bio-based products that could substitute traditional fossil-based products will not increase from this side.
No increase in purchasing power: No substantial increase or even a decrease in purchasing power will lead to less consumption overall and to less willingness to pay price premiums for bio-based products.
Consumers not willing to pay premium: Weak developments in purchasing power will lead to less willingness to pay price premiums. However, also missing awareness raising and/or lack of acceptance of bio-based products can decrease the willingness to pay price premiums. This could be the case for example resulting from the sustainability of bio-based alternatives e.g. if the feedstock base is not sustainable and consumers will decide to not buy the product.
Low scenario assumptions dependant on policy making
Missing/late measures/regulations: The strongest impact in the high scenario is coming from measures and regulations related to GHG pricing and environmental standards, health standards and bans of products competing with bio-based substitutes. If these measures are not implemented in time or not at all, their effect will not come into place leading to less increase in demand, meaning demand will remain in a business as usual range.
Strong increase in recycling rates: Increasing recycling rates for non-biogenic materials e.g. plastic waste is a top goal of European and EU policy currently (Circular Economy Action Plan). Products made from recycled and CO2 based materials are already increasingly entering the market and consumer awareness is high. Also, increasing recycling rates are not only competing on product level with bio-based products. It will additionally lead to less demand for virgin materials, be they bio-based or not.

190
5.4.2 EU DEMAND OUTLOOK
High Scenario:
Applying the high scenario assumptions described above to the product groups and adding some product group specific considerations in the scenarios will turn out in in a considerable growth overall. In the high scenario, EU consumption of bio-based products increases from 5.5 Mtpa375 in 2019 to almost 17 Mtpa in 2030. This is an increase of 209 % and corresponds to an average annual growth rate of 9.9% for all bio-based products considered in the demand outlook.
Strongest growth will occur for building blocks, solvents and resins. This is because we assume that policy incentives will contribute to place drop-in and dedicated solutions with identical properties of traditional fossil-based products in a competitive position. Their advantage is easy downstream integration into e.g. plastic applications.
The market for bio-based lubricants is an example of a product group which has a high maturity and many products which can replace traditional ones regarding functionality and even economics. However, many products of this product group suffer from being dependant on manufacturer specifications. Manufacturers of equipment and engines will consider adapting specifications once the bio-based product in question has a market share of 10 %. This creates a chicken or the egg dilemma. In the high scenario this has been solved, creating high growth in demand for bio-based lubricants e.g. in applications such as hydraulics.
Even under the high scenario, surfactants will not experience much growth, as their position in the market is quite strong already. They have a market share of 50% and EU production is able to cover 83% of EU consumption.
Low Scenario:
When applying the low scenario assumptions to the product groups, EU-consumption growth will follow more a business as usual development. Total EU-consumption of bio-based chemicals and materials will increase from 5.5 Mtpa in 2019 to 7.8 Mtpa in 2030. This equals an increase of 43% with an annual average growth of 3%.
Highest growth under the low scenario assumptions can be expected for Biopolymers with an annual growth rate in demand of 7.2%. This higher growth rate compared to other product groups is based on the assumption that the current momentum of big brand owners introducing bio-based plastics and possibly CO2-based materials into their products (e.g. packaging, furniture, toys) will meet an increasing awareness about sustainability of plastics. This will push through to create higher demand for bio-based polymers and CO2-based materials.
375 Spekreijse, Jurjen; Lammens, Tijs; Parisi, Claudia; Ronzon, Tevecia; Vis, Martijn, Insights into the European market for bio-based chemicals, Analysis based on 10 key product categories, JRC Science Policy Report, 2019, https://ec.europa.eu/jrc/en/publication/insights-european-market-bio-based-chemicals, last view: 2020-12-03.

191
Table 39. Growth in EU-Consumption per product group until 2030 – Low and High Scenario
Table 40. WP 1 Product Groups, JRC Study Product Groups and how they have been used in the demand outlook
WP1 Classification Product Groups JRC Study WP 5 Demand Outlook Product Groups based on JRC study
Additives (plasticisers, stabilisers, fillers, inhibitors, flame retardants)
Plasticiser (and stabilisers for rubber and plastics)
Additives is identical with JRC category Additives consisting of plasticisers only. It does not include remaining sub-categories listed under WP1
Agrochemicals (plant hormones, naturally occurring steroid plant, bio-fungicides from plant extracts)
- Not included in the demand outlook
Building Blocks (starting materials used to mainly to manufacture other chemical compounds e.g. ethylene, ethylene glycol, propylene, propylene glycol, lactic acid)
Platform chemicals
Building blocks is identical with platform chemicals category from JRC. However “building blocks” and “platform chemicals” categories are seen to be including the same type of products.
Catalysts & Enzymes (catalyst produced from cellulosic agricultural waste and activated carbon, as well as enzymes produced from plants: amylase, papain, bromelin, ficin, malt diastase)
- Not included in the demand outlook
Colorants (including dyes, pigments and inks) - Other includes
Cosmeceuticals (vitamins, antioxidants, botanical extracts, flavonoids, hyaluronic acid and other bioactive substance added to products that are intended to be applied to the human body with the purpose of cleaning, perfuming, protecting and keeping it in good condition.)
- Other includes cosmetics from the JRC study
Flavours & Fragrances (e.g. vanillin, geraniol, cinnamic acid, geranyl acetate, linalool)
- Not included in the demand outlook
Lubricants (e.g. triglyceride esters derived from vegetable oils obtained from plants)
Lubricants Lubricants category is identical with JRC Group and WP 1 Classification
Nutraceuticals (amino acids, vitamins, proteins, antioxidants, derived from food sources and used as additives for food and feed (e.g. hydroxytyrosol, lecithin))
- Not included in the demand outlook
Product Group EU bio-based consumption 2018 (kta)
EU bio-based consumption (kta) 2030 high scenario
CAGR high (2019-2030)
EU bio-based consumption (kta) 2030 low scenario
CAGR low (2019-2030)
Additives 117 437 11,6% 189 4,1%
Building blocks 197 1,687 19,6% 319 4,1%
Lubricants 220 821 11,6% 289 2,3%
Solvents 107 917 19,6% 141 2,3%
Surfactants 1,800 2,915 4,1% 2,365 2,3%
Fibres 630 2,351 11,6% 1,020 4,1%
Polymers 247 1,308 14,9% 569 7,2%
Resins 320 2,216 21,4% 518 4,9%
Other 1,851 4,317 8,8% 2,435 2,8%
Total 5,489 16,969 9,9% 7,845 3,0%

192
Paints & Coatings (paint and coating containing a vegetable fraction coming from bio-based materials such as vegetable oils, natural pigments or bio based resins)
Other Other includes paints and coatings from the JRC study.
Pharmaceuticals (Active Pharmaceutical Ingredients (API’s) like insuline, N-acetyl glucosamine, L-lysine, artemisinic acid, caffeic acid, gallic acid, oleuropein, revastrol.)
- Not included in the demand outlook
Solvents (are chemicals that are used to dissolve other chemical substances e.g. methanol, ethanol, toluene, acetone, turpentine, ethyl acetate.)
Solvents Solvents category is identical with JRC Group and WP 1 Classification
Surfactants (mostly produced from vegetable oils, some examples: glycolipids, sopherolipids, esterquats and some starch derivates like carboxy methyl starch and sugar derivates like alkyl polyglucoside)
Surfactants Surfactants category is identical with JRC Group and WP 1 Classification
Composites (natural composites: wood, mud bricks (mud+straw), bones and bio-based derived composites: contain synthetic fibres or synthetic polymers e.g. PLA/flax composites, paper, concrete)
- Not included in the demand outlook
Fibres (natural fibres: wool, jute, hemp, sisal, abaca, silk and bio-based derived fibres: polycaprolactam (Nylon 6), Poly(hexamethylene adipamide) (Nylon 66), polyamid-11 (Nylon 11))
Man-made fibres
Man-made fibres is identical with JRC category and does not include natural fibres which are part of this group in the WP 1 classification
Organic Fertilizers (humic acid, guano, sewage sludge, compost, digest)
- Not included in the demand outlook
Polymers (natural polymers: starch, natural rubber, cellulose, chitin, pectin and bio-based derived polymers: polyethylene (PE), polyethylene terephthalate (PET), Polyethylene 2,5-furandicarboxylate (PEF), Polyhydroxyalkanoates (PHA), polylactic acid (PLA))
Polymers for plastics
Polymers is identical with the JRC category ‘Polymers for plastics’. It does not include natural polymers
Resins (natural resins: rosin, shellac, copal, respin and bio-based derived resins: polyurethane resins, epoxy resins, alkyd resins)
Adhesives Resins is identical with the Adhesive category from JRC.

193
Figure 69. Demand for bio-based products 2019, and 2030 low- and high scenario
As already mentioned above, it has to be acknowledged that the 10 product groups to which the growth scenarios are applied do not represent the total market for bio-based chemicals and materials. This is specifically true for the fibre product group. First of all composite materials containing natural bio-based fibres are not produced in biorefineries typically. The product group “fibres” is limited to man-made bio-based fibres.
Also, the JRC report does not look at the whole product group additives but focuses on bio-derived plasticisers and stabilisers. Plasticizers account for a major share of the plastic additives market (51.7% in 2014) 376 as they are extensively used to process polymers and are less expensive than other additives.
For the scenarios developed in the frame of this study, we consider that plasticisers are the main drivers of the product category additives and will focus on their development for practical reasons.
The production of paper and board is not included into the product groups, as these traditional biorefineries are not within the scope of the study.
The specific description of the composition of the product group analysed can be found below in each section relating to the product group.
Building Blocks/Platform chemicals
Composition of product group:
Also called "platform chemicals", chemical building blocks are starting materials used mainly to manufacture other chemical compounds (e.g. ethylene, propylene, lactic acid, BTX (benzene, toluene, xylene)).
376 Grand View Research. Plastic Additives Market Size, Share & Trends Analysis Report By Function (Stabilizers, Processing Aids), By Product (Plasticizers, Flame Retardants), By Region, And Segment Forecasts, 2015 – 2022. March 2016, https://www.grandviewresearch.com/industry-analysis/plastic-additives-market, last viewed: 2020-12-15 .

194
The JRC 2019 report analysed them using the term “platform chemicals” but excluded platform chemicals which are typically used in other product categories (e.g. lauryl alcohol). These products were accounted for in the other product groups. Methanol for instance was excluded. Overall, as building blocks form a large group, coverage is difficult. Therefore, in this report, the JRC selection of nine representative products has been followed with one exception. For the scenarios we include biomethanol as this could become an important platform chemical if its use in the chemical industry becomes more attractive assuming it becomes more competitive to use for chemicals against its uses for fuels based on new policy support and market drivers.
Four of the nine products selected by the authors of the JRC 2019 report are derived from ethanol (ethylene, ethylene glycol, acetic acid and acetic anhydride). This is expected as ethanol has significant potential to be used as a building block for chemicals, as well as fuels. However, to ensure full representation, five products that are not derived from ethanol were included as well (Propylene glycol (1,2-propanediol), 1,3-Propanediol, Sebacic acid, Lactic Acid and Epichlorohydrin).377
Finally, about 90% of the global bio-based production capacity for platform chemicals is accounted for by seven chemicals: lactic acid, epichlorohydrin, ethylene glycol, ethylene, sebacic acid, 1,3-propanediol and propylene glycol.378 These products have been taken into account be the JRC study, which thus has a good coverage.
377Spekreijse, Jurjen; Lammens, Tijs; Parisi, Claudia; Ronzon, Tevecia; Vis, Martijn, Insights into the European market for bio-based chemicals, Analysis based on 10 key product categories, JRC Science Policy Report, 2019, https://ec.europa.eu/jrc/en/publication/insights-european-market-bio-based-chemicals, last view: 2020-12-03.
378 Aeschelmann et al. (2017). 379 The mass-balance approach from BASF: https://www.basf.com/gb/en/who-we-are/sustainability/we-drive-
sustainable-solutions/circular-economy/mass-balance-approach.html, last viewed: 2020-12-14. 380 Neste Cooperation, https://www.neste.com/releases-and-news/plastics/next-milestone-strategic-cooperation-
neste-borealis-and-covestro-use-alternative-raw-materials, last viewed: 2020-12-14. 381 NNFCC, https://www.nnfcc.co.uk/files/mydocs/Mass%20Balance.pdf, last viewed: 2020-12-14.
Bio-based building blocks
Basic market data for bio-based building blocks
Total EU production: 60,791 kta EU bio-based production: 181 kta
EU bio-based share of production: 0.3% EU bio-based consumption: 197 kta
Scenarios
High Low
High replacement potential: Building blocks are a bulk market with only a small share of bio-based production (0.3% with 181 kta output). Drop-in bio-based solutions thus have potentially a large market. Wider acceptance and practice of mass-balance approaches in B2B business relations.379 380 381 GHG related measures will be implemented in the near future (e.g. sector targets, ETS adjustment, carbon tax, CBAM) Biomethanol demand will increase sharply from 0 to about 500 kta
High replacement potential cannot be exploited due to Missing measures related to GHG emission, no level playing field with fuels/energy – leading to inferior cost competitiveness Oil price remaining low Missing recycling/composting options in downstream markets for dedicated bio-based solutions Biomethanol will not be used as a building block
EU CAGR: 20% EU CAGR: 4%
EU Consumption in 2030: 1,182 kta EU Consumption in 2030: 295 kta

195
Case study: Propylene glycol
PG is largely produced as site product from biodiesel production. Currently especially first-generation biofuels are less favoured through regulation and policies while alternative renewable fuels such as green hydrogen or electric cars are supported. Feedstocks such as palm oil or soy are phased will be phased out under RED II, which will further decrease biodiesel production. The use of PG as sustainable bio-based coolant might drive the demand for PG in this specific sector. Estimations for the CAGR for PG are between 4-7% (see case study) for the global market, which is within the line of the low scenario for the building block product group.
Functionality and application area
Propylene glycol (PG) or 1,2-propanediol is a clear, colourless, slightly syrupy liquid at room temperatures. It is odourless and tasteless. It is used by the chemical, pharmaceutical and food industry. It is applied as anti-freezing agent when leakage might lead to food contact, since it is generally recognized as safe for use in food. In food products it is used as anti-caking agent, antioxidant, carrier, dough strengthened, emulsifier, moister preserver, processing aid, stabilizer and thickener and texturizer. In Europe it is only allowed in food as solvent for colours, emulsifiers, antioxidants and enzymes. It is mostly used in packaged food, i.e. drink mixes, dried soup, cake mix, food colouring, fast-food and dairy products.382 In tabaco industry it functions as moisturiser in cigarettes and tobacco it is furthermore a main component in e-cigarette liquids.383 384 Its ability to absorb water and maintain moisture is a relevant characteristic used in medicines and cosmetics. It is further applied as solvent in food colours and by paint and plastic industries.385 In automotive industry it is used as coolant due to its low freezing point. It helps to prevent corrosion and to carry away waste heat in cooling systems.386 The main application for PG is in unsaturated polyester resins, as de-icers and antifreeze agent.387
Sustainability
Due the availability of glycerol and its low price using the glycerol route remains to be the most preferred one to produce bio-based PG.388 The environmental sustainability of bio-based PG production would be significantly improved if the hydrogen used originates from renewable sources. Bio-based PG can be produced 100% bio-based by using oil-based or starch-based crops. The feedstock use is regionally specific, along with vegetable oils389,
382 Mandl, Elise, Propylene Glycol in Food. Is this additive safe? Healthline blog, 2018, https://www.healthline.com/nutrition/propylene-glycol, last viewed: 2020-10-26.
383 Chemiekontor (n.y.), Propylenglycol, https://www.chemiekontor.de/kuehlmittel/propylenglycol-1-2-propandiol-technisch-mind.-99.5/, last viewed: 2020-10-23.
384 Deutsches Krebsforschungszentrum (n.y.), Erhöhtes Gesundheitsrisiko durch Tabakzusatzstoffe, Propylenglykol, https://www.dkfz.de/de/tabakkontrolle/download/PITOC/PITOC_Zusatzstoffe_Tabakprodukte_Propylenglykol.pdf, last viewed: 2020-10-26.
385 PubChem (n.y.), Propylene glycol, Compound summary, National Library of Medicine, National Center for Biotechnology Information, https://pubchem.ncbi.nlm.nih.gov/compound/Propylene-glycol, last viewed: 2020-10-23.
386 Coherent Market Insights, Bio-based propylene glycol market analysis, 2020, https://www.coherentmarketinsights.com/ongoing-insight/bio-based-propylene-glycol-market-2583, last viewed: 2020-10-26.
387 Joshi, Sachin, GT-ProG: Green Technology to Produce Propylene Glycol from Glycerine derived from Bio-diesel Process, 2016, https://www.linkedin.com/pulse/gt-prog-green-technology-produce-propylene-glycol-from-sachin-joshi/, last viewed: 2020-10-23.
388 Rosales-Calderon, O ; Arantes, V., A review on commercial-scale high-value products that can be produced alongside cellulosic ethanol, Biotechnol Biofuels, 2019, 12(1):240, https://doi.org/10.1186/s13068-019-1529-1, last viewed: 2020-10-27.
389 UFOP, Rapeseed oil remains primary feedstock for German biodiesel, Biodiesel Magazine, 2020, http://www.biodieselmagazine.com/articles/2517088/rapeseed-oil-remains-primary-feedstock-for-german-biodiesel, last viewed: 2020-10-27.

196
palm oil and soy oil are the cheapest, but controversies are related to their production.390 The use of palm and soy oil comes with environmental challenges and can lead to deforestation, danger to biodiversity, reduction of soil quality and increased use of fertilizers. Additionally, palm oil production has high land usage requirements.391 Besides the environmental sustainability issues, the use of palm oil is controversial due to a possible competition with food, potential human rights violations (illegal land grabbing displacement of communities, human trafficking and child labour)392 and health issues (due to forest-burning related smog).393
Life Cycle Analysis shows a 61% reduction of GHG emissions comparing bio-based with fossil based PG, according to the US company ADM, which is producing 100% bio-based propylene glycol.394 The most sustainable route is using certified palm oil, via the oleochemical route which leads to a reduction of CO2–emissions with approximately 40%. For the biodiesel route CO2-emissions can be reduced to 60% compared to the fossil counterpart. The production of the feedstock counts for most of the impacts related to climate change.395
PG provides a good alternative for environmentally sensitive antifreeze, coolant/heat transfer and secondary refrigerant applications.396 397 The toxicity of propylene glycol is very low. It has not been found to cause cancer, damage genes or interfere with fertility or reproduction. Moreover, there are no reported deaths caused by PG. For people with kidney and liver disease, drug alternatives without PG may be preferred, since the breaking down process might be less efficient for these cases. There might also be a risk for infants and pregnant women or people with heart disease if exposed to high dosages i.e. through medication. However, there is no evidence that dietary amounts are cause of concern. Between 0.8 and 3.5% of people are estimated to have a skin allergy to PG.398
Cigarettes produces and sold in the EU contain up to 2.4 percent PG which is used as moisturiser. If smoked almost the entire amount will be transferred to the smoke which can irritate eyes. Burning PG leads to propylene oxide which is classified as possible cancer risk.399
Market value
PG is largely produced as site product from biodiesel production but policy and regulation for sustainable transportation focus on green hydrogen and electrification rather than biodiesel. Under RED II high iLUC feedstocks like palm oil and soy will be phased out, which will lead to a reduced availability of biodiesel associated glycol. There are also market studies which predict a high growth in the automobile sector were PG is mixed with coolant.
390 Buffet, L., High & low ILUC risk biofuels - Policy recommendations for the EU delegated act, 2019, https://www.transportenvironment.org/sites/te/files/publications/2019_01_High_low_ILUC_TE_briefing_final.pdf, last viewed: 2020-10-27.
391 Nachtergaele, P.; De Meester, S.; Dewulf, J., Environmental sustainability assessment of renewables-based propylene glycol at full industrial scale production, J Chem Technol Biotechnol, Jun 1;94(6):1808–15, 2019, https://doi.org/10.1002/jctb.5951, last viewed: 2020-10-27.
392 Book&Claim Ltd – GreenPalm (n.y.), The social and environmental impact of palm oil, https://greenpalm.org/about-palm-oil/social-and-environmental-impact-of-palm-oil, last viewed: 2020-12-01.
393 Spott Org, Sustainability Policy Transparency Toolkit. Palm oil - Social impacts, 2016, https://www.spott.org/palm-oil-resource-archive/impacts/social/, last viewed: 2020-12-01.
394 ADM, Propylene Glycol. Life Cycle Analysis, 2020 https://www.adm.com/products-services/industrials/propylene-glycol/life-cycle-analysis, last viewed: 2020-10-23.
395 Nachtergaele, P.; De Meester, S.; Dewulf, J., Environmental sustainability assessment of renewables-based propylene glycol at full industrial scale production, J Chem Technol Biotechnol, Jun 1;94(6):1808–15, 2019, https://doi.org/10.1002/jctb.5951, last viewed: 2020-10-27.
396 Orison (n.y.), Biobased Propylene Glycol, https://orisonmarketing.com/pg.html, last viewed: 2020-10-23. 397 Belico Derma Concept (n.y.), What is propylene glycol?, https://www.belico.de/service-en-
gb/faq/konsreveriungsstoffe-2-en-gb/, last viewed: 2020-10-26. 398 Mandl, Elise, Propylene Glycol in Food. Is this additive safe?, healthline blog; 2018,
https://www.healthline.com/nutrition/propylene-glycol, last viewed: 2020-10-26. 399 Deutsches Krebsforschungszentrum (n.y.), Erhöhtes Gesundheitsrisiko durch Tabakzusatzstoffe, Propylenglykol,
https://www.dkfz.de/de/tabakkontrolle/download/PITOC/PITOC_Zusatzstoffe_Tabakprodukte_Propylenglykol.pdf, last viewed: 2020-10-26.

197
Drivers are the objectives to reduce GHG emissions and to avoid using fossil feedstocks.400 A major driving force is the increased demand for eco-friendly methods of manufacturing, reduced usage of petrochemical feedstocks and reduced emission gases.401
Market size and price
Most of the bio-based PG is produced outside Europe, in the US and in China.402 North America, followed by Europe is the largest revenue-generating segment due to increasing adoption of eco-friendly methods.403 UPM sees a CAGR of 5% and a market demand for PG of >2mio tonnes.404 However there are also recent estimations for global CAGR of 7% between 2017-2027.405 In 2018, the global PG market was estimated between 2 and 2.5 million tonnes from which bio-based PG was 5% (100 kt – 125 kt)406 The CAGR is estimated at 4.4%.407 The European share in bio-based PG is estimated at 3% with 20 kt production from glycerol while the fossil production is 633 kta. Production of bio-based PG is considerable more expensive than fossil based PG.408
Case study: 1,4-Butanediol
The production of bio-based and biodegradable plastics used e.g. used as agricultural mulch films can be a major driver for BDO, especially if supported by policy and regulation. There is a review of the EU fertilizer directive in 2024, which provides a window of opportunity to add such mulching films to the list of accepted polymers for soil improvement. A recent analysis, which already considered the implications of the COV19 pandemic, estimates the global CAGR for BDO with 6.2% and within Europe forecasts a 4.4% CAGR. Which is currently in line with the low scenario estimated for the building block product group.
Functionality and application area
1,4 – Butanediol is an industrial chemical used as solvent and building block to produce plastics, elastic fibres and polyurethanes. BDO is biodegradable and mostly produced through fossil-based pathways. Bio-Based 1,4 BDO is a drop-in product which could replace
400 Comserve, Impact of Covid-19 on Biobased Propylene Glycol Market 2020, Business Scenario, Future Demand and Forecast to 2027, 2020, https://www.comserveonline.com/news-releases/impact-of-covid-19-on-biobased-propylene-glycol-market-2020-business-scenario-future-demand-and-forecast-to-2027/10006872, last viewed: 2020-10-27.
401 Allied Market Research, World Bio-Based Propylene Glycol Market. Opportunities and Forecasts, 2020-2027, 2020, https://www.alliedmarketresearch.com/bio-based-propylene-glycol-market, last viewed: 2020-10-23.
402 de Guzman, D., Oleochemicals: Oleon enters glycerin-based propylene glycol, 2012, https://www.icis.com/explore/resources/news/2012/07/16/9577645/oleochemicals-oleon-enters-glycerin-based-propylene-glycol/, last viewed: 2020-10-27.
403 Allied Market Research, World Bio-Based Propylene Glycol Market. Opportunities and Forecasts, 2020-2027, 2020, https://www.alliedmarketresearch.com/bio-based-propylene-glycol-market, last viewed: 2020-10-23.
404 UPM, Aiming higher with Biofore, Investor presentation, October 2017, 2017, https://www.upm.com/siteassets/asset/investors/2017/10-17-roadshow-presentation_final.pdf, last viewed: 2020-10-23.
405 Comserve, Impact of Covid-19 on Biobased Propylene Glycol Market 2020, Business Scenario, Future Demand and Forecast to 2027, 2020, https://www.comserveonline.com/news-releases/impact-of-covid-19-on-biobased-propylene-glycol-market-2020-business-scenario-future-demand-and-forecast-to-2027/10006872, last viewed: 2020-10-27.
406 Nachtergaele, P., De Meester, S.; Dewulf, J., Environmental sustainability assessment of renewables-based propylene glycol at full industrial scale production, J Chem Technol Biotechnol, Jun 1;94(6):1808–15, 2019, https://doi.org/10.1002/jctb.5951, last viewed: 2020-10-27.
407 Markets and Markets, Propylene Glycol Market by Source (Petroleum-based, Bio-based), Grade (Industrial, Pharmaceutical), End-use Industry (Transportation, Building & Construction, Food & Beverage, Pharmaceuticals, Cosmetics & Personal Care), Region - Global Forecast to 2024, 2020, https://www.marketsandmarkets.com/Market-Reports/propylene-glycol-market-264488864.html#:~:text=%5B176 Pages Report%5D, last viewed: 2020-10-27.
408 Spekreijse, Jurjen; Lammens, Tijs; Parisi, Claudia; Ronzon, Tevecia; Vis, Martijn, Insights into the European market for bio-based chemicals, JRC Science Policy Report, 2019, https://ec.europa.eu/jrc/en/publication/insights-european-market-bio-based-chemicals, last viewed: 2020-09-28.

198
fossil 1,4 BDO since it is chemically identical. Major users of fossil BDO are China, North America and the European Union (2016, 2 Mtpa).409 410
Sustainability
BDO can be produced through two commercial routes, from corn though the sugar pathway and from lignocellulosic feedstocks. The main European producer Novamont uses sugar as feedstock and produces 1,4 – Butanediol using a biotechnological route licenced by Genomatica.411 The lignocellulosic route might be considered as preferable from a feedstock perspective, since no agricultural biomass would be needed hence no competition to farm land for food and feed would occur. (see WP 3) Bio-Based BDO can be produced 100% bio-based.
BDO is toxic and BDO derivatives such as THF come with health and safety issues. (WP 2) There are concerns of using BDO and its derivates as drugs so that the European Community and its Member States have taken voluntary measures to prevent this diversion.412 BDO is sedative when ingested and can cause feelings of intoxication.413
BDO will break down in air by reaction with hydroxyl radicals. It will not volatize into air from soil and water surfaces. BDO is biodegradable and does not accumulate in nature.414 Fermentation of bio-based BDO is an energy intensive process. According to a LCA conducted by Novamont on bio-based BDO GHG emissions can be reduced by 60% across the life cycle compared to fossil-based BDO.415
Market value
Apart from the general market pull measures supportive for bio-based products, there are a few specific measures which are relevant for BDO and the BDO derived plastic polymers. One example is the market pull through regulations which aim to reduce the amount of plastics in the environment. This for examples impacts the use of agricultural mulching films which although being made of PE and therefore not being biodegradable are often not collected from the fields sufficiently after their use. The demand to use biodegradable films for these applications does create a clear pull for BDO being an important building block for biodegradable plastic films.416 417 During the revision of the EU fertilizer regulation affords have been undertaken to add biodegradable mulching films into the regulation with a clear reference to the European Standard for biodegradable plastic mulching films in soil (EN 17033).418 However the final regulation does not contain more than a provision to
409 COWI, Bio-Based World News, Ecologic Institute, Bio-Based Products from idea to market, Study for the European Commission, 2019, http://news.bio-based.eu/media/2019/03/KI0718113ENN.en_.pdf, last viewed: 2020-09-21, p.11.
410n.A. (n.y.), Factsheet Mater Biotech, novamont, https://www.novamont.com/public/zip/factsheet_materbiotech_EN_web.pdf, last viewed: 2020-09-23.
411 n.A. (n.y , last viewed: 2020-09-21. , What is Bio-BDO?, Bioplastics News, https://bioplasticsnews.com/bio-bdo-bio-butanediol-novamont/ , last viewed: 2020-09-21.
412 World Health Organization Expert Committee on Drug Dependence, 1,4-Butanediol (I,4 BD) Critical Review Report, 2014, https://www.who.int/medicines/areas/quality_safety/4_4_Review.pdf, last viewed: 2020-12-01.
413PubChem (n.y.), 1,4-Butanediol. Use and Manufacturing, https://pubchem.ncbi.nlm.nih.gov/compound/1%2C4-butanediol#section=Use-and-Manufacturing, last viewed: 2020-09-23.
414PubChem (n.y.), 1,4-Butanediol. Use and Manufacturing, https://pubchem.ncbi.nlm.nih.gov/compound/1%2C4-butanediol#section=Use-and-Manufacturing, last viewed: 2020-09-23.
415 COWI, Bio-Based World News, Ecologic Institute, Bio-Based Products from idea to market, Study for the European Commission, 2019, http://news.bio-based.eu/media/2019/03/KI0718113ENN.en_.pdf, p. 14, last viewed: 2020-09-21.
416Novamont, Mater-Bi Soil Biodegradable for Mulching Film. Certified for Organic Farming by AIAB, press release , 2020, https://www.novamont.com/eng/read-press-release/mater-bi-soil-biodegradable-for-mulching-film-certified-for-organic-farming-by-aiab/, last viewed: 2020-09-24.
417OWS, Expert Statement (Bio)Degradable Mulching Films, 2017, https://www.docs.european-bioplastics.org/publications/OWS_Expert_statement_mulching_films.pdf, last viewed: 2020-09-24.
418 European Bioplastics, Biodegradable mulch films supported in revision of EU Fertilisers Regulation, 2017, https://www.european-bioplastics.org/biodegradable-mulch-films-supported-in-revision-of-eu-fertilisers-regulation/; last viewed: 2020-09-24.

199
review by July 2024 the possibility of adding such mulching films in the future to the list of polymers relevant to support soil improvement.419
Looking at the application of BDO derived plastics in the automobile industry there seems to be a need to clearly show the environmental advantage of using such bio-based materials to consumers. According to Wuster/Ladu 2019 potentials of the automotive industry are not realised due to a lack of standardisation. Furthermore, an environmental label to certify the sustainability of various automobile components would further support consumer communication.420
However, BDO is mainly produced in Asia, where also the down-stream end-user industries are located.421 Therefore any efforts to improve standardisation and certification in this respect need to be focused on these markets or carried out at a global level.
Market size and price
The production of bio-BDO and fossil based BDO is tied to the oil and natural gas price. Currently the prospects to be used as drop-in chemical are low. Estimations suggest that production costs would be competitive at a low oil price of 45 USD/bbl range. (see WP 2) According to Prodcom in 2018 35.000 t Bio-BDO were produced.422 Major companies producing bio-BDO include DSM, BASF SE, Novamont, Ashland and Mitsubishi Chemical Corporation.423 A recent analyses, which already considered the implications of the COV19 pandemic, estimates the global CAGR for BDO with 6.2% and within Europe forecasts a 4.4% CAGR.424
Case study: Biomethanol
The production costs for Biomethanol are higher than for fossil-based methanol which is a clear technical barrier. Incentives to use biomethanol in the chemistry sector instead of the fuel market which is currently the case can become a clear driver for biomethanol demand. The EU market has predicted a growth rate of 3.72% that is slightly below the growth rate of the entire building block market in the low scenario.
Functionality and application area
Biomethanol is chemically identical with fossil derived methanol. It is a light, clear, flammable liquid chemical that is water soluble and readily biodegradable. Its formula CH3OH is often abbreviated with MeOH. It is a simple alcohol also known as methyl alcohol or wood alcohol as it was produced from wood in the beginning.
419 Regulation (EU) 2019/1009 of the European Parliament and of the Council of 5, June 2019 laying down rules on the making available on the market of EU fertilising products and amending Regulations (EC) No 1069/2009 and (EC) No 1107/2009 and repealing Regulation (EC) No 2003/2003Article 50 Biodegradability review, Official Journal of the European Union, L170/36, 2019-06-25.
420 BDO has markets in the automotive industry, however, this industry has not yet developed an eco-labelling system that would stimulate markets and enable more informed purchasing behaviour in terms of environmentally friendly materials, See Wuster/Ladu 2020.
421 COWI, Bio-Based World News, Ecologic Institute, Bio-Based Products from idea to market, Study for the European Commission, 2019, http://news.bio-based.eu/media/2019/03/KI0718113ENN.en_.pdf, p. 14, last viewed: 2020-09-21.
422 Prodcom, 2018. 423 n.A., Bio-Based 1,4-Butandiol Market Growth, Trends and Forecast 2020-2025, Mordor Intelligence, 2019,
https://www.mordorintelligence.com/industry-reports/bio-based-1-4-butanediol-market, last viewed: 2020-09-23. 424 Global Industry Analysts, Global 1,4 Butanediol Industry, Market Impact Survey, COVID 19 & Looming Recession,
July, 2020, https://www.reportlinker.com/p05898913/Global-1-4-Butanediol-Industry.html?utm_source=GNW, last viewed: 2020-12-02.

200
Today, methanol is mostly produced from natural gas as feedstock. Methanol is used to produce chemical derivatives, which are used to produce various products of daily lives (e.g. building materials, foams, resins, plastics, paints, polyester, pharmaceuticals).
The largest share of methanol is processed into formaldehyde, which is further processed into resins, glues and various plastics. It is also used to produce acetic acid as a precursor of polyester fibres and PET.
Methanol is also used as a transport fuel.
Sustainability
Biomethanol can be produced from a range of biomass feedstocks i.e. municipal solid waste (MSW), agricultural waste and forestry residues. These are some of the largest sources but not the only ones. Further to biomethanol, under the term “renewable methanol” more feedstock and production pathways are being developed (e.g. from CO2-capture and hydrogen produced via renewable electricity).
Agricultural waste is a feedstock for biomethanol that does not food prices or leads to negative direct and indirect land use change effects. Estimations are that around 998 million tons of agricultural waste are produced every year. In Europe, estimations are that a potential amount of residues of 146,000 kta of dry matter could be collected in EU-27 without impacting the current Soil Organic Carbon stocks.425
A large amount of residual biomass, such as leaves, branches, needles and woodchips, is produced in the process of harvesting trees. These by-products can be used as a feedstock for producing biochemicals such as renewable methanol.
Using Municipal Solid Waste (MSW) to produce waste-based methanol creates value from unrecyclable garbage and relieves pressure on landfill sites.
Every year 1.3 billion metric tonnes of MSW are produced globally and this is expected to increase to 2.2 billion metric tonnes by 2025. Managing such volumes of waste poses great challenges for municipalities and governments.
Globally two thirds of MSW are either dumped in landfills or incinerated. A significant portion of this waste could be diverted towards producing sustainable chemicals, including renewable methanol.
Biochemical company Enerkem estimates that up to 420 million metric tonnes of unrecyclable waste could be turned into biochemicals, using their technology. Enerkem is building a plant in Rotterdam, which will turn 350,000 metric tonnes of waste, including plastic matter, into 270 million litres of methanol every year.426
Methanol can be very toxic for humans if ingested. However, this naturally occurring molecule has a very low impact when released into the environment because it biodegrades quickly.
Making and using renewable methanol does not only reduce carbon dioxide emissions, it also reduces other harmful air pollutants including nitrogen and sulphur oxides (NOx and SOx), volatile organic compounds (VOCs), particulate matter and other toxic pollutants.
Estimates of CO2 emissions from biomethanol production vary widely in the literature, depending on different assumptions. A study from the German Biomass Research Centre,
425 Monforti, Lugato; Motola, Bodis; Scarlat, Dallemand, Optimal energy use of agricultural crop residues preserving soil organic carbon stocks in Europe, 2015, https://www.sciencedirect.com/science/article/pii/S1364032114010855; last viewed 2020-12-14.
426 Hobson, Charlie, Márquez, Carlos, Renewable Methanol Report, 2018, https://www.methanol.org/wp-content/uploads/2019/01/MethanolReport.pdf, last viewed 2020-12-15.

201
DBFZ from 2010 estimated 0.64 tCO2eq/t methanol for a production based on short rotation coppice, and 0.56 tCO2eq/t for forest residues as feedstock, compared to methanol from natural gas at 0.84 tCO2eq/t methanol. Taking the higher emission value as a conservative assumption this corresponds to 0.2 t CO2eq/t methanol or 24% emission reduction. In addition, the biogenic carbon sequestered in methanol corresponds to 1.37 tCO2, yielding an avoidance potential of 1.57 tCO2/t methanol.427 428
Market value
In 2018 the European Parliament, Council and Commission agreed on the Renewable Energy Directive II (RED II), requiring 14% renewable energy to be used in transport by 2030. RED II has created new markets for conventional biofuels like ethanol and biodiesel and for alternative biofuels such as renewable methanol, especially when made from wastes, residues or renewable electricity (Renewable Energy Directive II, Annex IX Part A). Other European policies also impact the potential uptake of renewable methanol: the Fuel Quality Directive, the Alternative Fuel Infrastructure Directive, and the Air Quality Directive, among others.
Due to these policies, biomethanol is almost exclusively used for fuel applications currently.
Market size and price
The global demand for methanol in 2018 was at 78,900 kta with 19,100 kta going into fuels.429 In Europe, methanol (not biomethanol) is predominately produced from natural gas via steam reforming, to a very small extent also from heavy oil. Production volume is at 1.5 million tonnes. For the traditional use of methanol, i.e. not considering additional demands based on the technologies described in this study, production is expected to increase to 2.17 million tonnes in 2050.
Future development of (bio)methanol production will depend on different factors, such as the development of the crude oil price, natural gas price and prices for coal. In IEA projections to 2025, methanol production capacity additions are highly concentrated in North America and the Asia-Pacific region owing to the availability of low-cost gas (in the United States) and coal (in China) for feedstock.430
According to a market report from the Methanol Institute, biomethanol is commercially produced by several companies in Europe with several more operating on a demonstration scale. BASF, and BioMCN are operating commercial scale plants which rely on different feedstocks and production processes. Enerkem is producing biomethanol in Canada using municipal solid waste as a feedstock. New Fuel and Nordic Green seem to be dealing with biomethanol without having own production.431
For basic chemicals, the raw material costs usually represent 60–70% of the production costs. Hence production cost of biomass-derived methanol is largely dominated by the relatively high costs of agricultural and forestry biomass in comparison to fossil feedstocks. The costs of methanol production from biomass has been quantified in many studies and
427 S. Majer, A. Gröngröft, Environmental and economic assessment of for biodiesel production, Deutsches Biomasse Forschungszentrum, Leipzig, Germany, 2010, https://www.ufop.de/files/4613/3940/7473/20101026_DBFZ_Kurzstudie_Biomethanol_eng.pdf; last viewed 2020-12-14.
428 Bazzanella, Alexis Michael; Ausfelder, Florian, Low carbon energy and feedstock for the European chemical industry, DECHEMA e.V. 2017, https://dechema.de/dechema_media/Downloads/Positionspapiere/Technology_study_Low_carbon_energy_and_feedstock_for_the_European_chemical_industry.pdf; last viewed: 2020-11-04.
429 Argu, Argus Global Methanol Demand in 2018, 2018, https://www.argusmedia.com/-/media/Files/brochures-and-downloads/global-methanol-demand-2018-flow-chart.ashx?la=en&hash=090F0C06A6A396546B3698F913E6A1AC54DEAE8E; last viewed: 2020-12-14.
430 IEA, Chemicals, IEA, Paris, 2020, https://www.iea.org/reports/chemicals; last viewed: 2020-12-14. 431Hobson et al, Methanol Report, 2018, https://www.methanol.org/wp-content/uploads/2019/01/MethanolReport.pdf,
last view: 2020-12-18.

202
ranges from 160 €/t methanol up to 940 €/t, very much depending on plant setups and local conditions. Cost estimates at a higher annual production capacity are on the lower end, indicating economy of scale effects. Production costs for biomethanol from waste streams are slightly lower compared to wood, i.e. between 200-500 €/t. Compared to cheapest fossil fuel based production, biomethanol production costs are at least 1.5 times higher, capital cost per unit of capacity is at least 3.4 times higher than the capital cost of natural gas based plants. It was also estimated that biomethanol plants are about 1.8 times more expensive than bio-ethanol facilities on the basis of the same energy output.432
During 2017, BioMCN produced nearly 60,000 tonnes of renewable methanol which was primarily sold as a biofuel in the European transportation sector. Today, BioMCN consumes more than half of all the biogas produced in the Netherlands and has begun to source biogas from neighbouring EU countries. As the number of digesters and availability of biogas grows in the future, BioMCN expects its production of renewable methanol will grow and its reliance on conventional natural gas will decrease.433
Additionally to the companies named by the Methanol Institute, the pulp and paper company Södra has started its first commercial biomethanol plant in 2020 using crude methanol from its production process to produce as much as 5,250 tonnes of forest based biomethanol per year.434
BASF is a producer of Biomethanol, too, with production volumes not known to the authors.435 Since it is produced using the mass balance approach it is possible that BASF uses regular natural gas from the grid and buys green gas certificates to pay for upgraded biogas injected into the grid. The same is true for BioMCN after their acquisition by OCI. This would disqualify them as a biorefinery as defined within this study.
Case study: Lactic Acid
Increased use of bio-based polylactic acid (PLA) or PLA composites in packaging, textiles, agriculture, cosmetics and pharmaceuticals drive the lactic acid market. In 2019 Grand View Research predicted a market growth of 18.7% until 2025. However, a recent report estimates the global CAGR for LA between 2021-2026 with 2.5% taking the impact of the current pandemic into account.
Functionality and application area
Lactic acid (LA) is extensively used in the food industry as a food preservative, flavouring agent and pH regulator.436 437 LA also finds diverse applications in cosmetics, pharmaceuticals and the polymer industries where it is used as an antimicrobial agent, flavouring agent, moisturizer, green solvent and cleaning agent. LA has the potential to be further converted in other chemicals, for example propylene glycol, acetaldehyde, acrylic
432 Ibidem. 433 Ibidem. 434 Södra, Refueling the Future, n.y., https://www.sodra.com/en/global/Bioproducts/biomethanol/: last viewed: 2020-
11-04. 435 BASF, BASF produces methanol according to the biomass balance approach, n.y,
https://www.basf.com/global/en/media/news-releases/2018/11/p-18-370.html; last view: 2020-11-04. 436 Aeschelmann, F., Baltus, W., Blum, H., Busch, R., Carrez, D., Carus, M., Dammer, L., Dommermuth, B., Eder, A.,
Essel, F., Ißbrücker, C., Käb, H., Lange, K., Liptow, C., Philp, J., Raschka, A., Ravenstijn, J., Pogrell, von P., Zepnik, S., Bio-based Building Blocks and Polymers in the World. Capacities, Production and Applications: Status Quo and Trends towards 2020. nova-Institut GmbH, Hürth, Germany, 2015, p. 12.
437 Manandhar, A., Shah, A., Techno-Economic analysis of bio-based lactic acid production utilizing corn grain as feedstock. Department of Food, Agricultural and Biological Engineering, The Ohio State University, Wooster, OH 44691, USA. 2020, 8(2), 199; https://doi.org/10.3390/pr8020199.

203
acid, polymers etc.438 The primary application of lactic acid is however as a monomer in the production of the bio-based plastic polylactic acid.
Sustainability
There are various different ways, which can be used to synthesise lactic acid, such as the fermentation of glycose using bacteria, fungi or yeast. Food waste, agricultural residues, sugar cane and starch-based biomass are part of the broad range of feedstock available for synthesising LA.439
Lactic acid can further be converted into the monomer lactide, which then is polymerized to polylactic acid (PLA). The production of PLA is 100% bio-based. PLA has a similar performance compared with conventional polymers though it is 3-times less carbon intensive. Through industrial compositing or depolymerisation, lactic acid (the initial monomer) can be recycled for the production of PLA.440 Due to its non-toxicity, lactic acid is important for the production of polylactic acid which has various applications such as food packaging.441
The production of LA by the biological conversation of wheat as compared to traditional chemical synthesis was observed to increase the energy efficiency by 47% while decreasing the total costs by 17%, thereby making it economically viable.442
Market value
The production of bio-based lactic acid is strongly influenced by the crude oil prices. The demand for bio-based lactic acid often decreases when the price of oil drops even though customers prefer a sustainable product with higher performance.443
The production of lactic acid itself is expected to increase with the application of polylactic acid in packaging, textiles, agriculture, car parts as well as 3D printing.444 445 The demand for lactic acid in the cosmetic and pharmaceutical industry is expected to rise because LA does not only enhances skin lightening but also has the ability to renew cells. High expectations are placed above all on the personal care products.446
Asia is predicted to be the leading producer of PLA due to better access to feedstock along with a favourable political scenario. The demand for lactic acid is high in Asia due to the fast industrialization of personal care products on the Asian continent.447
438 Juodeikiene, G., Vidmantiene, D., Basinskiene, L., Cernauskas, D., Bartkiene, E., Cizeikiene, D., Green metrics for sustainability of biobased lactic acid from starchy biomass vs chemical synthesis. In: Catalysis Today. Volume 239, 1 January 2015, p. 11-16. Published by Elsevier. https://doi.org/10.1016/j.cattod.2014.05.039.
439 Manandhar, A., Shah, A., Techno-Economic analysis of bio-based lactic acid production utilizing corn grain as feedstock. Department of Food, Agricultural and Biological Engineering, The Ohio State University, Wooster, OH 44691, USA. 2020, 8(2), 199, 2020, https://doi.org/10.3390/pr8020199
440 Total, Total carbon PLA. A market leader in bio plastics, n.y., https://www.total.com/energy-expertise/projects/bioenergies/pla-bioplastic, last viewed: 2020-12-01.
441 Ibidem. 442 Juodeikiene, G., Vidmantiene, D., Basinskiene, L., Cernauskas, D., Bartkiene, E., Cizeikiene, D., Green metrics for
sustainability of biobased lactic acid from starchy biomass vs chemical synthesis. In: Catalysis Today. Volume 239, 1 January 2015, p. 11-16. Published by Elsevier. https://doi.org/10.1016/j.cattod.2014.05.039.
443 Chemical & Engineering News, Is clarity coming for biobased chemicals?, 2020, https://cen.acs.org/environment/sustainability/clarity-coming-biobased-chemicals/98/i26?referral=930AA653-F007-43FB-95BC-6ECEFAA4A560, last viewed: 2020-12-01.
444 Nattrass, L., Biggs, C., Bauen, A., Parisi, C., Rodríguez-Cerezo, E., Gómez-Barbero, M., The EU bio-based Industry: Results from a survey, European Union. EUR 27736 EN; 2016, doi:10.2791/806858.
445 Grand View Research, Lactic Acid Market Size, Share & Trend Analysis Report By Raw Material (Corn, Sugarcane), By Application (Industrial, Food & Beverages, Polylactic Acid), By Region, And Segment Forecasts, 2019–2025, 2017 source: http://www.grandviewresearch.com/industry-analysis/lactic-acid-and-poly-lactic-acid-market, last viewed: 2020-12-01.
446 Ibidem. 447 Ibidem.

204
Market size and price
An analysis from Nexant (2019) estimated a lactic acid production capacity of around 800 kta globally, whereas the main producers are located in Thailand and the United States.448 The main producers of lactic acid in Europe are located in Spain, Belgium and Ireland. PLA is mainly produced in the Netherlands, Belgium, UK, Swiss and Germany.449 450 The annual turnover of lactic acid with the EU-28 was estimated with 95 € million. The price per kg is estimated with 1460 €/t (ranging from 1170 €/t – 2070 €/t).451
The production costs associated with the production of bio-based lactic acid is highly sensitive to sugar-to-lactic-acid conversion rates, feedstock price, plant size and annual operation hours.452 In 2019 Grand View Research predicted a market growth of 18.7% until 2025. However, a recent report estimates the global CAGR for LA between 2021-2026 with 2.5%.453
Lubricants
Product group composition
Lubricant is a collective term for substances that reduce friction and (mechanical) stress on counteracting or moving machine parts. Lubrication reduces energy consumption and material wear and acts as a coolant454. There are different application areas for lubricants, like hydraulic fluids, engine oils, gear oils, lubricating greases, chain saw oils, moulding oils, engine oils, metalworking fluids etc. Thus, it is necessary to adjust the lubricants for each application separately.
448 Nexant. Markets & Profitability. Market Insights: Polylactic Acid – 2019. 2019, https://www.nexantsubscriptions.com/file/140196/download?token=YG3CnZhQ, last viewed: 2020-12-14.
449 Ibidem. 450 Production price from expert interview conducted in the context of JRC study: Spekreijse, Jurjen; Lammens, Tijs;
Parisi, Claudia; Ronzon, Tevecia; Vis, Martijn, Insights into the European market for bio-based chemicals, Analysis based on 10 key product categories, JRC Science Policy Report, 2019, https://ec.europa.eu/jrc/en/publication/insights-european-market-bio-based-chemicals, last view: 2020-12-03.
451 Grand View Research, Lactic Acid Market Size, Share & Trend Analysis Report By Raw Material (Corn, Sugarcane), By Application (Industrial, Food & Beverages, Polylactic Acid), By Region, And Segment Forecasts, 2019–2025, 2017 source: http://www.grandviewresearch.com/industry-analysis/lactic-acid-and-poly-lactic-acid-market, last viewed: 2020-12-01.
452 Total, Total carbon PLA. A market leader in bio plastics, n.y., https://www.total.com/energy-expertise/projects/bioenergies/pla-bioplastic, last viewed: 2020-12-01.
453 Wallstreet Online, Lactic Acid Market Size USD 1156.5 Million by 2026 at a CAGR 2.5%, 2020, https://www.wallstreet-online.de/nachricht/13193337-lactic-acid-market-size-usd-1156-5-million-by-2026-at-a-cagr-2-5-valuates-reports/all, last viewed: 2020-12-02.
454 University of Bologna and Fraunhofer ISI, 2018, p.170 https://op.europa.eu/en/publication-detail/-/publication/15135e98-81c2-11e9-9f05-01aa75ed71a1.

205
Case study: Fatty acid PEG esters
Functionality and application area
PEGs and PEG derivatives are no definite chemical entities, but mixtures of compounds varying in polymer chain lengths.455 PEGs with low molecular weights are viscous, colourless liquids at room temperature, while PEGs with higher molecular weights are white waxy solids with melting points below 67°C. PEGs are amphiphilic and soluble in water as well as in many organic solvents. They are non-volatile, stable and no-hydrolysable compounds.456 PEG cannot be exposed under direct sunlight or heat and have a limited storage time (generally one year).457
455 Creative PEG Works, PEG products, n.y, https://www.creativepegworks.com/product.php?cid=8, last view: 2020-09-30.
456 Casiraghi, Antonella; Selmin, Francesca; Minghetti, Paola; Cilurzo, Francesco; Montanari, Luisa, Nonionic Surfactants. Polyethylene Glycol (PEG) Ethers and Fatty Acid Esters as Penetration Enhancers, in: Dragicevic, Nina; Maibach, Howard I. (ed.): Percutaneous penetration enhancers. Chemcial methods in penetration enhancement. Modification of the Stratum Corneum, Berlin; Heidelberg; New York; Dordrecht; London, 2015, p. 251f.
457 PR-Inside, PEG and PPG esters market to make great impact in near future by 2026, 2017, https://www.pr-inside.com/peg-and-ppg-esters-market-to-make-great-impact-in--r4587241.htm, last viewed: 2020-09-28.
Bio-based lubricants
Basic market data for bio-based lubricants
Total EU production: 6,764 kta EU bio-based production: 237 kta
EU bio-based share of production: 3.5% EU bio-based consumption: 220 kta
Scenarios
High Low
The high replacement potential will be realised substituting traditional lubricants with bio-based lubricants. Bio-based lubricants are developed and could work in 90 of all applications Where performance is poor compared with fossil lubricants, R&D efforts and new partnerships between producers and potential customers have helped to improve product properties Legislator commit/incentives automobile/engine/equipment producers to include bio-based lubricants into specifications Legislator makes it mandatory to use bio-based lubricants in more ecologically environments vulnerable to leakage (e.g. hydraulic fluids, lubricants used in marine areas e.g. wind turbines) Cost competitiveness is increased vs fossil lubricants via GHG related measures (sector targets, ETS adjustment, taxation) High crude oil price High availability of sustainable feedstock for bio-based lubricants
Regulatory measures are not put in place so replacement potential will remain unexploited Cost competitiveness will not be improved due to missing Environmental regulation Vegetable oils cannot be recycled so easily, because of degradation (polymerization) and other irreversible changes Current feedstock base is competing with food and feed use
EU CAGR: 11% EU CAGR: 2%
EU Consumption in 2030: 660 kta EU Consumption in 2030: 275 kta
One driver for PEG is the need to substitute nonylphenol ethoxylates. Relevant applications are in cosmetics, personal care, textiles and the lubricant industry. The global Fatty Acid Ester Market has a predicted CAGR of 4.5%. There are no specific estimations for PEG available. This is within the range of the current low scenario for the lubricants product group.

206
PEGs are used as emulsifiers, skin conditioner and humectants. They are save for human health, as they are not expected to be absorbed into systemic circulation when applied to the skin.458 PEGs and PEG derivatives are applied in different areas including the food industry, pharmaceutical and biomedical field. In pharmaceuticals they are used as excipients for liquid, solid and semisolid dosage forms for human and veterinary drugs.459
PEGs and corresponding ethers and fatty acid esters produce little or no irritation at ocular or dermal level and have extremely low acute and chronic toxicities, they are mild on skin, even at high concentrations and long-term exposure. They should not be applied to damaged skin though460 461
Additionally, PEGs are used as surfactant and cleansing agent due to their excellent water/oil emulsifying properties; e.g. as lubricants in textile processing, cutting oils, metalworking fluids. Other applications use wetting/dispersing properties e.g. as pigment dispersants for both organic and inorganic pigments in aqueous and non-aqueous systems.462 PEG are also used as resin plasticizers463 and additive during polymer production464.
Sustainability
PEG ester are manufactured by reacting a polyethylene glycol with a fatty acid.465 Feedstocks used to produce PEG esters include palm oil, sunflower oil and other edible oils.466 PEG could replace Nonylphenol Ethoxylates467 which were used in cleaning agents and are widely restricted in the EU due to their negative environmental effects (eco-toxicity and high bioaccumulation potential). PEG esters are readily biodegradable (up to PEG 1500), however this ability is decreasing with growing molecular weight. PEGs are considered to be low hazardous to water.468
Market value
The Asian-Pacific region represents the large market for production and consumption of PEGs (i.e. India and China). However, applications in cosmetics and personal care increase demand in developed regions. Further markets driving the consumption include textiles
458 Ibidem. 459 Casiraghi, Antonella; Selmin, Francesca; Minghetti, Paola; Cilurzo, Francesco; Montanari, Luisa, Nonionic
Surfactants. Polyethylene Glycol (PEG) Ethers and Fatty Acid Esters as Penetration Enhancers, in: Dragicevic, Nina; Maibach, Howard I. (ed.): Percutaneous penetration enhancers. Chemcial methods in penetration enhancement. Modification of the Stratum Corneum, Berlin; Heidelberg; New York; Dordrecht; London, 2015, p. 251f.
460 Cosmetic Ingredient Review Expert Panel concluded in 2016 that the caveat for PEG propylene glycol derivatives as used in cosmetics to not use them on demanded skin should be removed and that PEG are safe as used. See: Cosmetic Ingredient Review, Amended Safety Assessment of PEG Propylene Glycol Esters as used in cosmetics, 2016, https://www.cir-safety.org/sites/default/files/propylene_glycol_esters.pdf, last viewed: 2020-09-30.
461 Fruijtier-Pölloth, Claudia, Safety assessment on polyethylene glycols (PEGs) and their derivates as used in cosmetic products, in: Toxicology, 2005, https://www.sciencedirect.com/science/article/abs/pii/S0300483X05002696, last view: 2020-09-28.
462 FACI Group, PEG esters, n.y., https://echem-group.com/product/peg-esters, last viewed: 2020-09-28. 463 PR-Inside, PEG and PPG esters market to make great impact in near future by 2026, 2017, https://www.pr-
inside.com/peg-and-ppg-esters-market-to-make-great-impact-in--r4587241.htm, last viewed: 2020-09-28. 464 Rohnstock, Falk (2018): Über den Wirkmechanismus von Polyethylenglykol als Additiv zur Gefügeverdichtung im
Rotationsformverfahren, Schriftenreihe Kunststoff-Forschung 82, TU Berlin, source: https://depositonce.tu-berlin.de/bitstream/11303/6746/3/rohnstock_falk.pdf, last view: 2020-10-02.
465 FACI Group, PEG esters, n.y., https://echem-group.com/product/peg-esters, last viewed: 2020-09-28. 466 PR-Inside, PEG and PPG esters market to make great impact in near future by 2026, 2017, https://www.pr-
inside.com/peg-and-ppg-esters-market-to-make-great-impact-in--r4587241.htm, last viewed: 2020-09-28. 467 Umweltbundesamt, Nonylphenol und seine Ethoxylate, 2016, https://www.umweltbundesamt.de/nonylphenol-
seine-ethoxylate, last viewed: 2020-09-28. 468 GESTIS-Substance Database: Polyethylene glycol, molecular weight 200-600, source: http://gestis-en.itrust.de,
last view: 2020-09-30 as well as GESTIS-Substance Database: Polyethylene glycol, molecular weight > 600 source: http://gestis-en.itrust.de, last viewed: 2020-09-30.

207
and the lubricant industry. North America holds the biggest share in terms of consumption followed by Europe and other regions.469
Market size and price
The EU production of PEG ester was estimated with 50kta for the EU28 in the 2019 JRC study.470 The annual turnover with the EU-28 was estimated with 117 € million.471 The price per kg is estimated with 2350 €/t ranging from 1700 €/t to 3000 €/t.472 There are no specific CAGR estimations for PEG available. However, the global Fatty Acid Ester Market has a predicted CAGR of 4.5%.473
Solvents
Composition of product group
Solvents are compounds that are able to dissolve other substances without chemically changing them. Organic solvents can be divided into three main groups: oxygenated, hydrocarbon, and halogenated solvents. Multiple bio-based solvents exist, like: acetic acid, methanol, ethyl acetate, acetone, lactic acid, propylene glycol, ethyl lactate, glycerol.
As this section is based on the JRC 2019 study474 the following limitation has to be made. Isoalkanes are commonly used as lubricants and were therefore included in the lubricant category in the JRC 2019 report.
469 PR-Inside, PEG and PPG esters market to make great impact in near future by 2026, 2017, https://www.pr-inside.com/peg-and-ppg-esters-market-to-make-great-impact-in--r4587241.htm, last viewed: 2020-09-28.
470 Spekreijse, Jurjen; Lammens, Tijs; Parisi, Claudia; Ronzon, Tevecia; Vis, Martijn, Insights into the European market for bio-based chemicals, Analysis based on 10 key product categories, JRC Science Policy Report, 2019, https://ec.europa.eu/jrc/en/publication/insights-european-market-bio-based-chemicals, last view: 2020-12-03.
471 PR-Inside, PEG and PPG esters market to make great impact in near future by 2026, 2017, https://www.pr-inside.com/peg-and-ppg-esters-market-to-make-great-impact-in--r4587241.htm, last viewed: 2020-09-28.
472 Production price from expert interview conducted in the context of JRC study: Spekreijse, Jurjen; Lammens, Tijs; Parisi, Claudia; Ronzon, Tevecia; Vis, Martijn, Insights into the European market for bio-based chemicals, Analysis based on 10 key product categories, JRC Science Policy Report, 2019, https://ec.europa.eu/jrc/en/publication/insights-european-market-bio-based-chemicals, last view: 2020-12-03.
473 Grand View Research, Fatty Acid Ester Market Size, Share & Trends Analysis Report by Product (Glyceryl Monostearate, MCTs), by Application (Personal Care & Cosmetics, Food Processing), and Segment Forecasts, 2020 – 2027, 2020, https://www.researchandmarkets.com/reports/3640164/fatty-acid-ester-market-size-share-and-trends?utm_source=CI&utm_medium=PressRelease&utm_code=dd8c32&utm_campaign=1440761+-+Global+Fatty+Acid+Ester+Markets%2c+2016-2019+%26+2020-2027%3a+Focus+on+Personal+Care+%26+Cosmetics%2c+Food+Processing%2c+Surfactants+%26+Detergents+and+Pharmaceuticals+&utm_exec=chdo54prd, last view : 2020-12-02.
474 Spekreijse, Jurjen; Lammens, Tijs; Parisi, Claudia; Ronzon, Tevecia; Vis, Martijn, Insights into the European market for bio-based chemicals, Analysis based on 10 key product categories, JRC Science Policy Report, 2019, https://ec.europa.eu/jrc/en/publication/insights-european-market-bio-based-chemicals, last view: 2020-12-03.

208
Case study: Acetic acid
Introducing incentives to use biomethanol and ethanol not only in fuels but also in the chemical sector can become a major driver for this market, which has currently an estimated share of 4% until 2024. This is currently clearly below the CAGR estimations for the entire solvent product group.
Functionality and application area
Acetic acid is widely used as a raw material in the production of industrial chemicals & solvents. It is also used in food, pharmaceutical, textile, and cosmetics industry. It is a drop-in chemical, chemically identical to fossil-based acetic acid. The market of acetic acid is expected to expand owing to growing demand for applications like purified terephthalic acid (PTA) and vinyl acetate monomer (VAM). PTA is used in the production of PET which is used in packaging and textile industries. VAM is utilised in the production of chemicals for solvents, paints and coatings and adhesives.
There are diverse ways of producing acetic acid. It can be produced from ethanol derived from fermentation or methanol derived from syngas. Godavari Biorefineries Ltd. restarted its production of bio-based acetic acid at its Sakarwadi facility in Maharashtra from August 2018. It is produced by oxidation of molasses-based ethanol. It is also possible to convert sugars into acetic acid directly using acetogens (naturally occurring bacteria). ZeaChem in the USA works on this fermentation process using lignocellulosic biomass such as wood, straw and corn stover as feedstock. This enables 100% carbon conversion.
Bio-based solvents
Basic market data for bio-based solvents
Total EU production: 5,000 kta EU bio-based production: 75 kta
EU bio-based share of production: 1.5% EU bio-based consumption: 104 kta
Scenarios
High Low
The high replacement potential will be realised substituting traditional solvents with bio-based solvents. Bio-based is a marketing advantage and industry interest is high. Due to successful R&D, performance is similar to fossil-alternatives. Relevant regulation relating to environmental standards, health standards, bans will realise potential for bio-based solvents as recyclability is sometimes better effecting end-of-life options and economy and substituting fossil-based alternatives with higher toxicity EU introduces GHG relevant measures (sector targets, ETS adjustment, tax) in near future which will bring up competitiveness of bio-based solvents High crude oil price High R&D intensity to improve performance
GHG related measures are not introduced (in time), thus bio-based solvents cannot take advantage of high replacement potential Oil price remains low R&D expenditure stalls thus performance does not improve
EU CAGR: 19% EU CAGR: 2%
EU Consumption in 2030: 642 kta EU Consumption in 2030: 133 kta

209
Alternatively, acetic acid can be attained as a side-product from wood pulping. It can be either from the kraft process or extracted from spent sulphite liquor from sulphite pulping and attained after several purification steps. Lenzing produces acetic acid in this way.475
Bio acetic acid is 100% bio-based and it is identical to fossil-based acetic acid (i.e. has the same molecular structure). It thereby offers direct drop-in replacement for fossil-based acetic acid.
Sustainability
Acetic acid can be made from fermenting sugars. For this sugar crops and starch crops are used. Looking into the future, and to address possible future concerns with respect to feedstock competition with food research on using sugars from lignocellulosic biomass is ongoing. Also to increase the carbon efficiency and thereby reduce feedstock conversion direct fermentation routes from sugars to acetic acid (not via ethanol) are investigated.
Considering the production route of acetic acid from kraft pulping and by extraction from spent sulphite liquor, this does not have any demand on agricultural land as it is derived from a residual stream. For the production route through methanol derived from syngas, the biomass feedstock considered is lignocellulosic woody biomass, residues or wastes with minimal or no competition with food.
Bio acetic acid production through extraction from spent sulphite liquor allows creating value from residual streams. In most sulphite pulp mills, the spent liquor is concentrated using multiple effect evaporators and then burned for energy production. Lenzing looks at creating as much value as possible by converting wood into spectrum of products including acetic acid, furfural, xylose, lignosulfonate, sodium sulphate and soda ash besides their main product dissolving pulp for textile fibres.278 The remaining spent liquor is used for creation of heat and electricity.
Bio-based acetic acid has enormous benefits over conventional acetic acid, such as low toxicity, biodegradability and sustainability. Lenzing estimated its acetic acid (produced as a side-product from sulphite pulping of wood) to have a carbon footprint which is 85% lower than that of fossil-based acetic acid.476 Looking at the fermentation routes it is seen that GHG results are very sensitive to the choice of purification steps used in attaining the required purity where close to significantly better performance is seen in comparison to fossil-based acetic acid.477
Market value
Bio acetic acid can be produced through ethanol and methanol. Renewable fuel mandates around the world favour the blending of biomethanol and ethanol in fuels instead of use for chemicals. The principles of the circular economy on the other hand favour the use for value-added chemicals/materials.
Market size and price
Bio acetic acid production has higher production costs due to low productivity of the route via methanol and ethanol. The direct fermentation to acetic acid with 100% carbon efficiency would therefore be interesting. The production of acetic acid from sulphite
475 LenzingTM for Biorefinery Products, https://www.lenzingindustrial.com/Application/the-lenzing-biorefinery, last view: 2020-12-02.
476 LenzingTM for Biorefinery Products,The origin of solutions, smart solutions from botanic origins, acetic acid biobased, 2018, https://lenzing-industrial.cdn.prismic.io/lenzing-industrial%2F1ca29763-5bd6-4e7c-a4fd-b1d2383a4341_lenzing+for+biorefinery+products_acetic+acid_leaflet_output_rgb_preview_v1.0_20181012.pdf, Lenzing, Austria, last viewed 2020-12-02.
477 Budsberg, Erik, Morales-Vera, Rodrigo, Crawford, Jordan T, Bura, Renata, Gustafson, Rick, Production routes to bio-acetic acid: life cycle assessment, in: BMC Biotechnology to Biofuels, n.y., https://biotechnologyforbiofuels.biomedcentral.com/articles/10.1186/s13068-020-01784-y; last viewed: 2020-12-15

210
pulping has also high purification and separation requirements to extract it from the spent liquor and bring to the required specs.
The bio-acetic acid market is a consolidated market, where few major players hold significant share of the market demand. Some of the major players in the market include Zea2, Godavari Biorefineries Ltd., Sucroal SA, Novozymes AS, and Wacker Chemie AG, amongst others.
In 2019, the market for bio-acetic acid was at 1,567 kt according to Mordor Intelligence.478 Production in Europe was at 24.5 kt.479
The major factors driving the growth of the market studied are the rising crude oil prices, increasing demand for Vinyl Acetate Monomer (VAM) market, and stringent government regulations. On the flip side, the scarcity & social constraints for raw materials, and environmental concerns regarding the harmful effects are some of the factors hampering growth.
The bio-acetic acid market is a consolidated market, where few major players hold significant share of the market demand. Some of the major players in the market include Zea2, Godavari Biorefineries Ltd., Sucroal SA, Novozymes AS, and Wacker Chemie AG, amongst others.480 481 482 483
Regarding price, the JRC study 2019 estimates the price of bio-acetic acid to be 0.56 Eur/kg which is lower than the price of fossil based acetic acid (0.68 Eur/kg) according to the JRC study.484.
Surfactants
Composition of product group
Surfactants are compounds that lower the surface tension between fluids – gases, liquids - or fluids and solids. Surfactants are widely used in cosmetics, personal and home care products as dispersing agents and emulsifiers. Surfactants are produced from fossil and/or bio-based raw materials. Actually, the first surfactant made by humans -soap- was already completely bio-based.
The JRC 2019 study analysed specifically sophorolipids, glycolipids (other than sophorolipids), esterquats, APG and carboxy methyl starch. According to the JRC 2019 study, these five surfactants add up to an EU production of 265 kta. Considering the global market is 350-460 kta, it could well be due to the allocation of these surfactants’ production only to the surfactant category, although they are also used in other application categories. However, the biosurfactants market (biosurfactants wholly or partly bio-based) is difficult to quantify using the open literature. Few data on production are available and many estimates need to be made. Only the production volume of APG — 50 kta by Cognis in Germany — is publicly available.485
478 Mordor Intelligence, Sample Global Bio-Acetic Acid Market (2020-2025). 479 Spekreijse, Jurjen; Lammens, Tijs; Parisi, Claudia; Ronzon, Tevecia; Vis, Martijn, Insights into the European market
for bio-based chemicals, Analysis based on 10 key product categories, JRC Science Policy Report, 2019, https://ec.europa.eu/jrc/en/publication/insights-european-market-bio-based-chemicals, last view: 2020-12-03.
480 Godavari Biorefineries Ltd: https://www.somaiya.com/biobased-acetic-acid; last viewed: 2020-12-15 481 BioCorn Products, n.y., http://www.biocorn.co.ke/products, last viewed: 2020-12-15. 482 ZeaChem, n.y.,http://zeachem.squarespace.com/project-development; last viewed: 2020-12-15. 483 Energyworld.com, World Bio Fuel Day. IOC and Lanzatech set-up carbon dioxide to high-value lipids pilot plant,
2018, https://energy.economictimes.indiatimes.com/news/oil-and-gas/world-bio-fuel-day-ioc-and-lanzatech-set-up-carbon-dioxide-to-high-value-lipids-pilot-plant/65356858, last viewed: 2020-12-15.
484 Spekreijse, Jurjen; Lammens, Tijs; Parisi, Claudia; Ronzon, Tevecia; Vis, Martijn, Insights into the European market for bio-based chemicals, Analysis based on 10 key product categories, JRC Science Policy Report, 2019, https://ec.europa.eu/jrc/en/publication/insights-european-market-bio-based-chemicals, last view: 2020-12-03.
485 Ibidem.

211
The global biosurfactants market demand was 344.06 kilotons in 2013.486
Case study: Fatty alcohol ethoxylate (FAE)
The need to remove nonylphenol ethoxylates from the market creates a clear driver for the FAE market. CAGR are estimated with 4% until 2027, which is in line with the high scenario CAGR of the surfactant product group.
Functionality and application area
Fatty alcohol ethoxylate are non-ionic environmentally friendly surfactants mostly utilized in detergents, personal care products (i.e. shampoos) as well as textile and leather processing.489 Furthermore, they are applied in fibre finish, crop protection, water treatment, paints and coatings and lubricants.490 They can be hydrophilic or lipophilic
486 Grand View Research, Biosurfactants Market analysis by product (rhamnolipids, sophorolipids, MES, APG, sorbitan esters, sucrose esters) and segment forecast to 2020; Biosurfactants Market Size & Share; Industry Growth Report, 2020, 2015, https://www.grandviewresearch.com/industry-analysis/biosurfactants-industry, last viewed: 2020-12-15.
487 Unilever, Unilever to eliminate fossil fuels in cleaning products by 2030, Unilever to eliminate fossil fuels in cleaning products by 2030, News/Unilever global company website; last viewed: 2020-12-15.
488 Croda, Turning the World’s Products Green: 100% Renewable, 100% Bio-Based ECO Range of Surfactants. https://www.crodapersonalcare.com/en-gb/sustainability/sustainable-manufacturing/eco-plant; last viewed: 2020-12-15.
489 Gujchem Chemicals, Ethoxylated Surfactants, n.y., https://gujchem.wordpress.com/2014/11/29/fatty-alcohol-ethoxylates-uses/, last viewed: 2020-10-09.
490 Grand View Research, Alcohol Ethoxylates Market Size, Share & Trends Analysis Report By Product (Fatty Alcohol, Lauryl Alcohol, Linear Alcohol), By Application (Emulsifier, Dispersing Agent, Wetting Agent), By End-use, And Segment Forecasts, 2018 – 2025, 2017, https://www.grandviewresearch.com/industry-analysis/alcohol-ethoxylate-market, last viewed: 2020-10-09.
Bio-based surfactants
Basic market data for bio-based surfactants
Total EU production: 3,000 kta EU bio-based production: 1,500 kta
EU bio-based share of production: 50% EU bio-based consumption: 1,800 kta
Scenarios
High Low
Increasing demand based on advanced/improved properties. New products entering the market as producers successfully developed 100% bio-based surfactants (e.g. bio-ethylene oxide)487 488 surfactants are very close to the consumer market, thus brand owners are willing to pay a premium Production and use of bio-based surfactants generate less GHG emissions and the carbon footprint can be lower with bio-based than conventional (depending on the process). EU level sector targets for GHG reduction in EU chemicals production have been introduced until 2025, ETS scheme has stronger impact on chemical production, Carbon tax levels gap to fossil alternatives, help demand for 100% fossil free surfactants High oil price Increasing purchasing power/net-income
Oil prices remain low Purchasing power/net-income not increasing Consumers not willing to pay price premium GHG related regulations are not implemented/not implemented in time
EU CAGR: 4% EU CAGR: 2%
EU Consumption in 2030: 2,700 kta EU Consumption in 2030: 2,250 kta

212
depending on the composition and their specific hydrophilic-lipophilic balance (HLB-value). They are used as emulsifier for oil in water or water in oil emulsions. Furthermore, they are utilized as solubilize oils to improve wetting. 491 Based on the specific type lauryl alcohol ethoxylates and ceto stearyl alcohol ethoxylates together account for the largest market share since they are widely applied in household cleaning and personal care products.492 FAE can differ from clear or misty, crystal clear liquids to white objects, dependent on the type of ethoxylation.493 494
Sustainability
Fatty alcohols are derived from vegetable oils or from petrochemical sources. Ethylene oxide used is typically obtained from petrochemical sources. However, Croda made 100% bio-based fatty alcohol ethoxylate by producing bio-ethylene oxide using bio-based fatty alcohol. The bioethylene oxide is produced from ethanol derived from corn or sugar cane. The fatty alcohol is derived from palm oil, palm kernel oil or coconut oil.495 The bio-based share of fatty alcohols has been considered to be 60%. The same is estimated for ethoxylated fatty alcohols.496
Fatty alcohol ethoxylates are produced from the reaction of fatty alcohols with ethylene oxide. Fatty alcohol is produced using oil crops which are associated with indirect changes to land use which leads to deforestation and has negative climate and biodiversity impacts. LCA studies have shown that palm kernel oil as feedstock for fatty alcohols leads to higher GHG emissions than petroleum. However, LCA studies also reported that sustainability metrics are quite variable depending on land use, farming methods, type of purification used in palm mills and that the difference between fossil and bio-based under best practice circumstances is minimal.497 498 Nonetheless, it is possible to derive fatty alcohol using waste/residue fats, oil and greases which do not have indirect land use effects. Furthermore, the ethylene oxide is most typically generated using sugars derived from sugar and starch crops. This causes concern with respect to feedstock competition with food. To address this issue the sugars can be extracted from lignocellulosic biomass (pathway E).
FAE are highly metabolizable and therefore exhibit a low potential to bioaccumulate in aquatic organisms. They can be aquatic toxic depending on the type of ethoxylate.499 500
491 Coda Home Care, ECO Brij C10, n.y., https://www.crodahomecare.com/en-gb/products-and-applications/product-finder/product/4302/ECO_1_Brij_1_C10, last viewed: 2020-10-09.
492 Kahidilkar, Nikhil, Fatty alcohol ethoxylates market sees moderate growth, 2019, https://communalnews.com/fatty-alcohol-ethoxylates-market-sees-moderate-growth/, last viewed: 2020-10-09.
493 Million Insights, Fatty Alcohol Ethoxylates Market Insights, Forecast to 2025, 2017, https://www.millioninsights.com/industry-reports/fatty-alcohol-ethoxylates-fae-market, last viewed: 2020-10-09.
494 Sasol, Alcohol ethoxylates. Versatile alternatives for technical applications, n.y., http://www.sasoltechdata.com/MarketingBrochures/Alcohol_Ethoxylates.pdf, last viewed: 2020-10-09.
495 Coda Home Care, ECO Brij C10, n.y., https://www.crodahomecare.com/en-gb/products-and-applications/product-finder/product/4302/ECO_1_Brij_1_C10, last viewed: 2020-10-09.
496 Spekreijse, Jurjen; Lammens, Tijs; Parisi, Claudia; Ronzon, Tevecia; Vis, Martijn, Insights into the European market for bio-based chemicals, Analysis based on 10 key product categories, JRC Science Policy Report, 2019, https://ec.europa.eu/jrc/en/publication/insights-european-market-bio-based-chemicals, last view: 2020-12-03.
497 Hayes DG, Smith GA. Chapter 1 - Biobased Surfactants: Overview and Industrial State of the Art [Internet]. Hayes DG, Solaiman DKY, Ashby RDBT-BS (Second E, editors. AOCS Press; 2019 [cited 2020 Aug 7]. p. 3–38, http://www.sciencedirect.com/science/article/pii/B9780128127056000010.
498 Shah, Jignesh; Arslan, Erdem; Circucci, John; O’Brien, Julie; Moss, David, Comparison of Oleo- vs. Petro-Sourcing of Fatty Alcohols via Cradle-to-Gate Life Cycle Assessment, in: Journal of Surfactants and Detergents, 19, p.1333-1351, 2016, https://link.springer.com/article/10.1007/s11743-016-1867-y, last viewed: 2020-10-05.
499 Bragin, Gail E.; Davis, Craig Warren; Kung, Ming H.; Kelley, Barbara A.; Sutherland, Cary A.; Lampi, Mark A., Biodegradation and Ecotoxicity of Branched Alcohol Ethoxylates. Application of the target lipid model and implications for environmental classification, in: Journal Surfactants Deterg. 23 :383-403, 2020, https://aocs.onlinelibrary.wiley.com/doi/epdf/10.1002/jsde.12359, last view: 2020-10-09.
500 Lechuga, M.; Fernández-Serrano, M. ; Jurado, E.; Núnez-Olea; Rios, F., Acute toxicity of anionic and non-ionic surfactance to aquatic organisms, in: Ecotoxicology and Environmental Safety, Vol. 125, March, 2016, https://www.sciencedirect.com/science/article/abs/pii/S014765131530172X, last viewed: 2020-10-09.

213
The production and use of FAE generates less CO2 and GHG emission compared to surfactants derived from fossil fuels.501
FAE are biodegradable. The usual disposal way is through the sewage systems. Depending on the chain length the time of biodegradation differs. Biodegradation is higher for FAE with longer alkyl chains and higher degree of ethoxylation. Furthermore, the initial concentration of the substances influences biodegradability. The greater the concentration, the lower the biodegradability.502 FAE are highly metabolizable and therefore exhibit a low potential to bioaccumulate in aquatic organisms. They can be aquatic toxic depending on the type of ethoxylate.503
Market value
Fatty alcohol ethoxylates can replace other non-ionic surfactants of alkyphenol epoxylates with nonylphenol epoxilates being the major example. Nonylphenol ethoxylates discharged in wastewater after use are converted to nonylphenols as a consequence of biological degradation. Nonylphenol has attracted attention due to its persistence in the aquatic environments, its bioaccumulation and its potential role as an endocrine disruptor (disrupt the natural balance of hormones in affected organisms).504 In Europe, due to environmental concerns, the production and use of nonylphenol and nonylphenol ethoxylates is prohibited. Alcohol ethoxylates are less problematic for the environment due to their ability to degrade more quickly than nonylphenols, and more and more products have been substituted over the years.505
Market size and price
The market share of FAE is high in Asia due to the growing industry such as textiles, agriculture and paper in that region. It is expected to increase at a higher growth rate compared to other regions such as North America, Europe, Latin America or Middle East and Africa.506 Europe is a lucrative market by means of price and capacity next to Asia Pacific. England, Italy, France and Germany control the demand in the European market.507 However the market is matured and limited growth is expected.508
501 Hayes DG, Smith GA. Chapter 1 - Biobased Surfactants: Overview and Industrial State of the Art [Internet]. Hayes DG, Solaiman DKY, Ashby RDBT-BS (Second E, editors. AOCS Press; 2019 [cited 2020 Aug 7]. p. 3–38, http://www.sciencedirect.com/science/article/pii/B9780128127056000010.
502 Jurado, Encarnación ; Fernández-Serrano, Mercedes ; Rios, Francisco ; Lechuga, Manuela (2013) : Aerobic Biodegradation of surfactants, in : Chamy, Rolando ; Rosenkranz, Francisca : Biodegradation – Life of Science, Rijeka, source : https://books.google.de/books?hl=en&lr=&id=rRKaDwAAQBAJ&oi=fnd&pg=PA63&dq=Fatty+alcohol+ethoxylate+(FAE)&ots=jAsCw4B9fp&sig=qB9ps7rUzIojW6Cv-3JyGzHgmZw#v=onepage&q=Fatty%20alcohol%20ethoxylate%20(FAE)&f=false, last view : 2020-10-09, p.64.
503 Bragin, Gail E.; Davis, Craig Warren; Kung, Ming H.; Kelley, Barbara A.; Sutherland, Cary A.; Lampi, Mark A., Biodegradation and Ecotoxicity of Branched Alcohol Ethoxylates. Application of the target lipid model and implications for environmental classification, in: Journal Surfactants Deterg. 23 :383-403, 2020, https://aocs.onlinelibrary.wiley.com/doi/epdf/10.1002/jsde.12359, last view: 2020-10-09.
504 de Araujo, Frederico G.; Bauerfeldt, Glauco F.; Cid, Yara Peluso, Nonylphenol. Properties, legislation, toxicity and determination, 2017, https://www.scielo.br/scielo.php?script=sci_arttext&pid=S0001-37652018000501903, last viewed: 2020-10-09.
505 Soares, A. ; Guieysse, B. ; Jefferson, B. ; Carmell, E. ; Lester, J.N., Nonylphenol in the environment. A critical review on occurrence, fate, toxicity and treatment in wastewater, in : Environment International, Vol. 34, Issue 7, October, p. 1033-1049, 2008, https://www.sciencedirect.com/science/article/pii/S0160412008000081?via%3Dihub, last viewed: 2020-10-09.
506 Kahidilkar, Nikhil, Fatty alcohol ethoxylates market sees moderate growth, 2019, https://communalnews.com/fatty-alcohol-ethoxylates-market-sees-moderate-growth/, last viewed: 2020-10-09.
507 Million Insights, Fatty Alcohol Ethoxylates Market Insights, Forecast to 2025, 2017, https://www.millioninsights.com/industry-reports/fatty-alcohol-ethoxylates-fae-market, last viewed: 2020-10-09.
508 Grand View Research, Alcohol Ethoxylates Market Size, Share & Trends Analysis Report By Product (Fatty Alcohol, Lauryl Alcohol, Linear Alcohol), By Application (Emulsifier, Dispersing Agent, Wetting Agent), By End-use, And Segment Forecasts, 2018 – 2025, 2017, https://www.grandviewresearch.com/industry-analysis/alcohol-ethoxylate-market, last viewed: 2020-10-09.

214
The global ethoxylates market is expected to grow to reach USD 17.9 billion (around 15 € billion) by 2027 with an estimated CAGR of 4% from 2020-2027.509 According to JRC the European market accounts for 34.7% of the global market. The average price is estimated to be 1.77 € and the EU-28 market for FAE estimated at 548 kta. The global market value for fatty alcohol ethoxylates is 4,662 € million.510
Man-made bio-based fibres
Composition of product group
Fibres are classified in 2 groups; natural fibres and man-made fibres (MMF).
Natural fibres are fibres made by nature. Typical examples are cotton and wool, which are mainly used in textile clothing but there are many often natural fibres produced in smaller quantities such as e.g. silk, flax or hemp.
Man-made fibres (MMF) are fibres made by man. MMF can be organic or inorganic. Organic MMF can be made from natural materials like wood, or are made from synthetic polymers. This category is quite diverse, with traditional and novel bio-based fibres and with dedicated and drop-in chemicals. JRC 2019 captured the diversity of the group by selecting traditional bio-based fibres, such as rayon and cellulose acetate, together with a drop in chemical (i.e. polytrimethylene terephthalate (PTT)) and two dedicated bio-based fibres (i.e. polyamide-11 and polyamide-4,10). These five selected products cover the market well and have very different chemical characteristics, being a polyester, a polysaccharide, a polyether and two polyamides.511
Currently, considering the biorefinery approach, mostly bio-based man-made fibres are or could be produced in biorefineries whereas natural fibres are mostly used in non-integrated production. Man-made fibres account for 75% of all fibres produced worldwide, and for circa 80% in Europe, including Turkey.512 513
Therefore, for this study we will also focus on bio-based man-made fibres.
509 Research and Markets (2020): Worldwide Ethoxylates Industry to 2027. Players featured include AkzoNobel, Akema & BASF Among others, source: https://www.prnewswire.com/news-releases/worldwide-ethoxylates-industry-to-2027---players-featured-include-akzonobel-arkema--basf-among-others-301100166.html, last view: 2020-10-09.
510 Spekreijse, Jurjen; Lammens, Tijs; Parisi, Claudia; Ronzon, Tevecia; Vis, Martijn, Insights into the European market for bio-based chemicals, Analysis based on 10 key product categories, JRC Science Policy Report, 2019, https://ec.europa.eu/jrc/en/publication/insights-european-market-bio-based-chemicals, last view: 2020-12-03.
511 Spekreijse, Jurjen; Lammens, Tijs; Parisi, Claudia; Ronzon, Tevecia; Vis, Martijn, Insights into the European market for bio-based chemicals, Analysis based on 10 key product categories, JRC Science Policy Report, 2019, https://ec.europa.eu/jrc/en/publication/insights-european-market-bio-based-chemicals, last viewed: 2020-12-03.
512 European Man-Made Fibres Association, About Man-Made Fibres. https://www.cirfs.org/man-made-fibres/man-made-fibres; last viewed: 2020-12-15.
513 European Man-Made Fibres Association, Renewable Raw Material. https://www.cirfs.org/sustainability/sustainability-elements/renewable-raw-material; last viewed: 2020-12-15.

215
Case study: Micro fibrillated cellulose
A general driver for MFC is the demand for environmentally friendly products and regulation aiming to reduce the use of fossil-based and hazardous chemicals. The use in aviation and transport is also driving this market. The market is valued to grow with a 13.6% CAGR until 2026. The nanocellulose market, which is including MFC is expected to grow even with 21% until 2026 and it is assumed that this trend will continue until 2030. MFC is a highly growing product, therefore CAGR are above the estimated CAGR for the entire fibre product group.
Functionality and application area
Microfibrillated cellulose is produced by mechanical treatment with or without the use of enzymes or chemicals for pre-treatment. It consists of long and thin fibres which form a three-dimensional network with a large surface. The size of MFC varies (10-100 nm).514 Some fibres have diameters in nanoscale.515
Due to its web-like structure and large surface, MFC have very high water holding capacity and can form strong gels at low concentrations used to control drying time of coatings, concrete and stabilising water-based or wetting formulations. The long and thin structure of the material make it high strength and useful to reinforce composites, films and barriers. The material is not soluble in water, it is stable over the whole pH-range, at high salt concentrations and temperature stable in a range of 20-90°C.516 Within packaging MFC can
514 Transparency Market Research, Micro-fibrillated Cellulose Market - Global Industry Analysis, Size, Share, Growth, Trends, and Forecast, 2020 – 2030, n.y., https://www.transparencymarketresearch.com/micro-fibrillated-cellulose-market.html, last viewed: 2020-10-16.
515 Karppinen, Anni, Microfibrillated cellulose, cellulose fibrils or nanocellulose?, Exilva Blog, 2018, https://www.exilva.com/blog/microfibrillated-cellulose-or-nanocellulose, last viewed: 2020-10-16.
516 Karppinen, Anni, Temperature stability of cellulose fibrils, Exilva blog, 2018, https://www.exilva.com/blog/temperature-stability-of-cellulose-
Man-made bio-based fibres
Basic market data for man-made bio-based fibres
Total EU production: 4,500 kta EU bio-based production: 600 kta
EU bio-based share of production: 13% EU bio-based consumption: 630 kta
Scenarios
High Low
Companies exploit marketing benefit of product characteristics such as natural and/or biodegradable Consumer awareness about micro plastic pollution creates demand for non-toxic/less-toxic/biodegradable fibres (e.g. in textiles) Consumer awareness about sustainability and health issues in living environments (e.g. carpets) Consumer awareness about need to reduce use of cotton New environmental standards implemented will drive demand for bio-based man-made fibres (e.g. on degradation, migration of toxic substances, exposure to substances harming health, VOCs). Strong demand for innovative materials with new or superior functionality (e.g. micro fibrillated cellulose (MFC))
Lack of health and/or environmental regulation Consumers not willing to pay premium Increased recycling results in less demand for virgin materials/demand can in parts be covered through recycling
EU CAGR: 12% EU CAGR: 4%
EU Consumption in 2030: 1,890 kta EU Consumption in 2030: 945 kta

216
strengthen and lighten materials while keeping the same performance. Furthermore, it has excellent oxygen and moister barrier properties and can be applied in films, coatings and nanocomposites for packaging.517 518 Given these key functionalities MFC finds applications across multiple sectors including pulp & paper, paint & coatings, adhesives, cement & concrete, cosmetics, oil & gas, homecare and agro-chemicals.519 Pulp & paper is currently the most extensive application. MFC fibres provide benefits in these industries due to increased (wet and dry) tensile strength, less porosity, improved barrier properties, preservation of food flavour or scent, higher printing quality, smoother surfaces, less transparency and more. The packaging industry is expected to be one of the largest application sector in the future.520
Sustainability
MFC can be derived from non-food and non-land use competing materials. Normally wood or wood pulp is used as feedstock, however it can be extracted from plant-waste521 and be also produced by bacteria522. MFC is biocompatible, meaning it is not harmful or toxic to living tissue and usable in applications like surgical equipment or prosthesis. MFC is a safer alternative to e.g. bisphenol A and phthalates.523 The material is safe for food contact.524
MFC has the potential to substitute plastics525 and aluminium in packaging materials, which would reduce CO2 emissions (e.g. aluminium films carry as much as 50% of CO2 footprint of their primary packaging material)526 Used in papermaking MFC can lead to a reduction of fibres used while keeping the same performance which is estimated to reduce cost by as high as USD 149 per tonne (134.31 €/t) and a fibre reduction of up to 20%.527
MFC is also biodegradable, offering an environmentally friendly option in e.g. the packaging sector.528
fibrils#:~:text=Cellulose%20fibrils%20and%20cellulose%20in%20general%20are%20stable,fibrils%20in%20the%20temperature%20range%20of%2020-90%20%C2%B0C., last viewed: 2020-10-19.
517 Jovic, Marija, Microfibrillated cellulose: A new material with high potential in the packaging industry, Prescouter webpage, 2017, https://www.prescouter.com/2017/11/microfibrillated-cellulose-packaging/, last viewed: 2020-10-16.
518 StoraEnso, Microfibrillated cellulose (MFC) – A natural performance enhancer for bio-based packaging materials, n.y., https://www.storaenso.com/en/products/bio-based-materials/mfc-for-packaging, last viewed: 2020-10-16.
519 Future Bridge, Microfibrilliated cellulose (MFC). An emerging structural material, n.y., https://www.futurebridge.com/blog/microfibrillated-cellulose-mfc/, last viewed: 2020-10-16.
520 Fact.MR, Microfibrillated Cellulose (MFC) Fibre Market Forecast, Trend Analysis & Competition Tracking - Global Market Insights 2020 to 2030, 2020, https://www.factmr.com/report/1710/microfibrillated-cellulose-fibre-market, last viewed: 2020-10-19.
521 Curran, Curran® - A Microfibrillated Cellulose (MFC) Wonder Product?, n.y., https://www.cellucomp.com/blog/article/curran-a-microfibrillated-cellulose-mfc-wonder-product-1, last viewed: 2020-10-19.
522 Peneder, N., Not seeing the woods for the trees in the world of nanocellulose?, 2017, https://weidmannfibretechnology.com/the-world-of-nanocellulose-how-not-to-lose-sight-of-the-wood-for-the-trees/#:~:text=As, last viewed: 2020-10-19.
523 StoraEnso, Microfibrillated cellulose (MFC) – A natural performance enhancer for bio-based packaging materials, n.y., https://www.storaenso.com/en/products/bio-based-materials/mfc-for-packaging, last viewed: 2020-10-16.
524 Ibidem. 525 Borhauer, Scott, Is Microfibrillated cellulose the future of barrier packaging?, 2016,
https://minipakr.com/blogs/news/is-microfibrillated-cellulose-the-future-of-barrier-packaging, last viewed: 2020-10-16.
526 StoraEnso, Microfibrillated cellulose (MFC) – A natural performance enhancer for bio-based packaging materials, n.y., https://www.storaenso.com/en/products/bio-based-materials/mfc-for-packaging, last viewed: 2020-10-16.
527 Zambrano, F., Starkey, H., Wang, Y., Abbati de Assis, C., Venditti, R., Pal, L., Jameel, H., Hubbe, M. A., Rojas, O. J., and Gonzalez, R., Using micro- and nanofibrillated cellulose as a means to reduce weight of paper products. A review, BioRes. 15(2), 4553-4590, 2020, https://bioresources.cnr.ncsu.edu/wp-content/uploads/2020/03/BioRes_15_2_4553_Zambrano_SWAVPJHRG_Review_Micro_Nanofibrillated_Cellulose_Reduce_Product_Weight_16324.pdf, last viewed: 2020-10-16.
528 StoraEnso, Microfibrillated cellulose (MFC) – A natural performance enhancer for bio-based packaging materials, n.y., https://www.storaenso.com/en/products/bio-based-materials/mfc-for-packaging, last viewed: 2020-10-16.

217
Market value
The growth of Microfibrilliated Cellulose is driven by the demand for more sustainable and environmentally friendly products. MFC offers a way to replace fossil-sourced materials, e.g. plastics, and consequently GHG emissions.529 Increasing regulation on the usage of fossil based products and a rise in restrictions on the use of hazardous chemicals are anticipated to increase the demand for MFC.530 Requirement for lowering emissions for aviation/transportation vehicles would drive MFC application.531 One constrain for MFC is a lack of standardisation to ensure consistent quality of the material.532
Market size and price
The global MFC market is valued to grow with a 13.6% CAGR between 2020-2026.533 Europe represents the biggest market and with the biggest grow for MFC.534 It is difficult to find numbers for volumes of microfibrillated cellulose sold. Borregaard-owned Exilva produces 1000 tpa (5.6) and Scotland-based CelluComp produce their Curran-product in quantities of 500 tpa.535 The value of the Nanocellulose market, that includes micro fibrillated cellulose, is estimated in 2019 to be 147 million USD (approximately 132 million Euros). This is expected to increase with 21% CAGR to 418 million USD (approximately 376 million Euros) in 2026.536 Spinnova is an example for a company scaling up their production of MFC-based fibres to industrial pilot scale. Spinnova is using a purely mechanical process to refine pulp raw material into spinning-ready fibre. The company claims to use 99% less water compared to cotton, and the process is free from harmful chemicals and dissolving. CO2 emissions are supposed to be minimal.537
Bio-based polymers for plastics
Composition of product group
The JRC 2019 report states that packaging is the main application for bio-based plastics and, therefore, the packaging market was used as a guide to covering a significant proportion of the polymers for plastics category. Here, the products with the largest share are PET, PE, PHA, PLA and starch used for plastics. It should be noted that specifically ‘starch used for plastics’ was chosen, and not ‘starch blends’, in order to choose a product at the same point in the value chain as the other polymers. When looking at the numbers about bio-based production and consumption, it has to be noted that these exclude bio-
529 Exilva, TODAY’S CHALLENGES, Exilva project, n.y., http://www.h2020-exilva.com/todays-challenges/, last viewed: 2020-10-19.
530 Transparency Market Research, Micro-fibrillated Cellulose Market - Global Industry Analysis, Size, Share, Growth, Trends, and Forecast, 2020 – 2030, n.y., https://www.transparencymarketresearch.com/micro-fibrillated-cellulose-market.html, last viewed: 2020-10-16.
531 Hjørnevik, M., The future of Aerospace, and its demand for new materials, Exilva Blog, 2017: https://www.exilva.com/blog/the-future-of-aerospace-and-its-demand-for-new-materials, last viewed: 2020-10-19.
532 Accesswire, Analyzing the Coronavirus Impact: Microfibrillated Cellulose (MFC) Fibre Manufacturers Find Opportunities in Food Packaging Industry, 2020, https://www.accesswire.com/596085/Analyzing-the-Coronavirus-Impact-Microfibrillated-Cellulose-MFC-Fibre-Manufacturers-Find-Opportunities-in-Food-Packaging-Industry, last viewed: 2020-10-19.
533 Dataintelo, Global Microfibrillated Cellulose Market Analysis by Application (Performance Enhancer, Barrier Films), End-Use (Paper, Packaging, Personal Care), Region and Segment, Forecasts 2020 ─ 2026, n.y., https://dataintelo.com/report/microfibrillated-cellulose-mfc-market/, last viewed: 2020-10-16.
534 Accesswire, Analyzing the Coronavirus Impact: Microfibrillated Cellulose (MFC) Fibre Manufacturers Find Opportunities in Food Packaging Industry, 2020, https://www.accesswire.com/596085/Analyzing-the-Coronavirus-Impact-Microfibrillated-Cellulose-MFC-Fibre-Manufacturers-Find-Opportunities-in-Food-Packaging-Industry, last viewed: 2020-10-19.
535 COWI, Bio-Based World News, Ecologic Institute, Bio-Based Products from idea to market, Study for the European Commission, 2019, http://news.bio-based.eu/media/2019/03/KI0718113ENN.en_.pdf, last viewed: 2020-09-21, p.11.
536 Global Market Insights (2020): Nanocellulose Market Size by Product (Nano fibrillated Cellulose, Nanocrystalline Cellulose), by Application (Composites, Paper Processing, Food & Beverages, Paints & Coatings, Oil & Gas, Personal Care), Industry Analysis Report, Regional Outlook, Growth, source: https://www.gminsights.com/industry-analysis/nanocellulose-market, last view: 2020-10-19.
537 Spinnova. n.y, https://spinnova.com; last viewed: 2021-01-27

218
based polyurethane even though it is an important product in the construction sector, in consumer goods and in transport. The authors of JRC 2019 decided to exclude it and include it under the category coatings as it is used in many applications there as well.538
Case study: Thermoplastic starch
A lack of knowledge and communication about the environmental benefits of TPS is constraining the market growth. However, if awareness raising and communication campaigns succeed applications which require the functionalities such as biodegradability and recyclability along with GHG savings provide market drivers. The CAGR is currently predicted above 7%, which is in line with the low scenario for the entire product group.
Functionality and application area
Thermoplastic starch is made from starch. It is a biopolymer obtained from renewable plant resources, such as maize, wheat, cassava, and potato harvests. Starch consists of two component polymers, amylose (AM) and amylopectin (AP). When starch is mixed with water or other plasticizer, like glycerol or sorbitol, and heated, the crystalline structure of starch is disrupted. It forms bonds (hydrogen bonds) with the plasticizer and gelatinizes. Shear force is often required for gelatinization, thus extruders or mixers are used to homogenize and process the material for the suitable moulding application. Consequently, the formed thermoplastic starch can be moulded at elevated temperatures.539
As such thermoplastic starch is a brittle material, but blended with other polymers, fillers or fibres the properties can be improved. Thermoplastic starch can be blended with polymers, like polyethylene, polypropylene, polystyrene, polyvinyl alcohol and polylactic
538 Spekreijse, Jurjen; Lammens, Tijs; Parisi, Claudia; Ronzon, Tevecia; Vis, Martijn, Insights into the European market for bio-based chemicals, Analysis based on 10 key product categories, JRC Science Policy Report, 2019, https://ec.europa.eu/jrc/en/publication/insights-european-market-bio-based-chemicals, last viewed: 2020-12-03.
539 Shanks R, Kong I., Thermoplastic Starch. In: Thermoplastic Elastomers, 2012.
Bio-based polymers for plastics
Basic market data for bio-based polymers for plastics
Total EU production: 60,791 kta EU bio-based production: 268 kta
EU bio-based share of production: 0.4% EU bio-based consumption: 247 kta
Scenarios
High Low
The packaging industry as a demand driving sector grows during the forecast period Increasing applications of biodegradable plastics Europe dominate the market across the world, with the largest consumption of bio-based plastics EU level sector targets for GHG reduction in EU chemicals production have been introduced until 2025 Demand is reinforced strongly due to developing regions, like Asia-Pacific, South America, and the Middle East, improving (food) packaging standards in the near future
Higher price compared to petroleum-based polymers is expected to hinder growth demand No EU level sector targets for GHG reduction in EU chemicals production have been introduced until 2025 Purchasing power stagnates No further health and/or environmental regulations Oil price stays low Higher recycling rates reduces need for virgin material However, momentum of current developments (use of bio-based plastics by big brands, increasing consumer awareness) remains and increases demands for bio-based polymers
EU CAGR: 15% EU CAGR: 7%
EU Consumption in 2030: 988 kta EU Consumption in 2030:494 kta

219
acid (PLA).540 Some of these polymers can be produced using biomaterials, however, PLA is currently the only 100% bio-based polymer on the market. TPS is an attractive material for sustainable packaging and films, especially for food packaging.
Bioplastics are used in an increasing number of markets, from packaging, catering products, consumer electronics, automotive, agriculture/horticulture, and toys to textiles and a number of other segments. Packaging remains the largest field of application for bioplastics with more than 53 percent (1.14 million tonnes) of the total bioplastics market in 2019. However, the portfolio of applications continues to diversify with segments, such as automotive & transport or building & construction, significantly increasing their share.
Sustainability
TPS is made from starches, such as corn, wheat or potato. These are available materials that, however, are also suitable for food production. According to a European Bioplastics estimation, bioplastics feedstocks in total use less than 0.02% of the global agricultural land. Despite the forecasted growth, this is still expected to stay around 0.02%.541
The processing of TPS is simple and since it is a bio-based material its environmental performance in terms of Greenhouse Gas (GHG) emissions is lower than fossil alternatives. However, as TPS is often processed with other plastics to achieve the production material, the environmental impact is highly dependent on the material the composite material is made of.542 According to a Life Cycle Analysis (LCA) study of Broeren et al.543, some grades of starch composites offer 85% of GHG reduction and others an increase of 80% on the same weight-basis. Additives in the starch-based plastics are often necessary and they can count for 40% of the emissions. Especially, when starch is sourced from wastes and is not “virgin” material the environmental impacts are much lower. Especially, eutrophication and land use impacts are then minimized. In summary, the drivers in this category are biodegradability, compostability and recyclability along with GHG saving when starch is sustainably sourced.
A barrier from environmental point of view is the lack of knowledge and communication of environmental benefits of TPS containing products. With a standardized Life Cycle Analysis one could offer comparable results of the environmental performance which helps to understand the benefits of the products and dispel any misconception of bioplastics.
Market value
Several policies are in place to support bio-based plastics. EU legislation mandating separate collection of bio-waste as of 1 Jan 2024 will enhance the use of biodegradable and compostable plastics, such as TPS544. Some countries in Europe have banned the use of non-compostable single use plastic bags, like France and Italy.545 These kinds of policies will support bio-based product demand and usage and is likely to influence TPS uptake too.
540 Oever M van den, Molenveld K, Zee van der M, Bos H.,Bio-based and biodegradable plastics – Facts and Figures [Internet]. 2017, https://www.wur.nl/upload_mm/1/e/7/01452551-06c5-4dc3-b278-173da53356bb_170421 Report Bio-based Plastic Facts.pdf, last viewed: 2020-12-18.
541 European Bioplastics, Facts and Figures Bioplastics, n.y., https://docs.european-bioplastics.org/publications/EUBP_Facts_and_figures.pdf, last viewed: 2020-12-18.
542 Broeren MLM, Kuling L, Worrell E, Shen L., Environmental impact assessment of six starch plastics focusing on wastewater-derived starch and additives, in: Resources, Conservation and Recycling [Internet]. 2017; 127:246–55. http://www.sciencedirect.com/science/article/pii/S0921344917302793, last view: 2020-12-18.
543 Ibidem. 544 Favoino E, Giavini M., Bio-waste generation in the EU: Current capture levels and future potential [Internet]. 2020,
https://zerowasteeurope.eu/wp-content/uploads/2020/07/2020_07_06_bic_zwe_report_bio_waste.pdf, last viewed: 2020-12-18.
545 News B-BW, COWI, Institute E, Innovation ECD-G for R and. Bio-based Products: From Idea to Market “15 EU Success Stories”. [Internet]. Publications Office of the European Union; 2019. https://books.google.nl/books?id=4XJeyQEACAAJ.

220
A barrier to bio-based product uptake is lack of a strong regulatory push from EU. With regulations, such as quota of bio-based materials, it would be possible to ensure that bio-based products are used in increasing amounts.
Usage of bio-based plastics is highly driven by the demand for sustainable, biodegradable packaging by consumers and brand owners.546 According to European Bioplastics, approximately 80% of the European consumers wish to buy products which have minimal impact on the environment. This is a strong driver for TPS- based products as well. Furthermore, TPS based films are transparent, colourless, tasteless, and odourless. Therefore, they are highly suitable for packaging of goods that are sensitive to smells and colours, such as food, offering a material that does not interfere with the product.
A barrier to the use of bioplastics is that consumer expectations and terminology of bioplastics are not always clear.547 Wrong expectations can cause misunderstanding about the nature of the products and this causes issues for acceptance of bioplastics. Therefore, more education is needed with clear labelling of products to increase the awareness and consequent market uptake. This requires both the industry and brands to work together.
Market size and price
The global thermoplastic starch market stood at 179 kt in 2019.548
The market for global thermoplastic starch is expected to register a CAGR of greater than 7% during the forecast period. The primary factors driving the growth of the market studied are favourable government policies promoting bioplastics and increasing demand from the packaging industries.549
Multiple technological constraints and exploitation of food sources as raw materials are expected to hinder market growth.
Currently, Europe dominates the global thermoplastic starch market. However, over the forecast period, Asia-Pacific is likely to take over as the global leader in the thermoplastic starch market.550
Companies producing TPS are Novamont, Rodenburg Biopolymers, Biotec, Agrana Stärke GmbH, Indochine Bio Plastiques (ICBP), Japan Corn Starch, Zhejiang Wafa, Ecota, SECOS Group, Yantai Sunshine Aozhou, Jiangsu Longjun.
546 European Bioplastics. Frequently asked questions on bioplastics, Internet, 2020, https://docs.european-bioplastics.org/publications/EUBP_FAQ_on_bioplastics.pdf, last viewed: 2020-12-18.
547 Ibidem. 548Mordor Intelligence, Thermoplastic Starch (TPS) Market-Growth, Trends, Forecasts (2020-2025).
https://www.mordorintelligence.com/industry-reports/global-thermoplastic-starch-market; last viewed 2020-12-15.
549 Ibidem. 550 Aeschelmann, F., Baltus, W., Blum, H., Busch, R., Carrez, D., Carus, M., Dammer, L., Dommermuth, B., Eder, A.,
Essel, F., Ißbrücker, C., Käb, H., Lange, K., Liptow, C., Philp, J., Raschka, A., Ravenstijn, J., Pogrell, von P., Zepnik, S., Bio-based Building Blocks and Polymers in the World. Capacities, Production and Applications: Status Quo and Trends towards 2020. nova-Institut GmbH, Hürth, Germany, 2015, p. 12.

221
Resins
Composition of product group
Resins are soft solid or highly viscous materials, usually containing prepolymers with reactive groups. It is a wide group of synthetics that are used in composites, binders (for plate materials), adhesives, inks, paints, and coatings. Bio-based resins can be “drop-in” solutions that can replace the fossil counterparts, such as epoxy, acrylic and unsaturated polyester resins. New building blocks from bio-based sources are epoxidized vegetable oils for epoxy resins, lignin derived phenols for formaldehyde resins or polyols from sugars for polyurethane resins.551
Case study: Lignin based phenolic resins
Technical barriers related to the low reactivity and the additional energy need to modify lignin hindering wider industrial application were LPR could substitute phenolic resins with lignin hence increase sustainability of various applications. The phenolic resins market is expected to grow by a CAGR of 5.5% until 2025. There are no specific CAGR for Lignin based phenolic resins available. This number is within the lower part of the high/low scenario for the resins product group.
Functionality and application area
Resins are typically viscose and convert into rigid polymers through a curing process. They constitute a wide class of today mostly synthetic substances used in composites, binders, adhesives, inks, paints and coatings. Well-known resins include polyester resins, epoxy resins, phenol formaldehyde resins and polyurethane resins. Bio-based resins can potentially substitute a large part of traditional building blocks with identical bio-based drop-in resins. However, it is also possible to develop dedicated bio-based resins including phenols from lignin used in phenol formaldehyde resins.552
Phenolic resins are thermosetting resins. They are strong, heat and impact resistant and have a high tolerance to chemical corrosion and moisture penetration. They can be
551 Wageningen University and Research. Bio-based resins https://www.wur.nl/en/show/Biobased-resins.htm; last viewed: 2020-12-15.
552 Wageningen University and Research, Bio-based resins, n.y., https://www.wur.nl/en/show/Biobased-resins.htm; last viewed: 2020-11-11.
Bio-based resins Basic market data for bio-based resins
Total EU production: 2,680 kta EU bio-based production: 237 kta
EU bio-based share of production: 9% EU bio-based consumption: 320 kta
Scenarios
High Low
The increase in Europe is driven by high demand from packaging, electronics, consumer goods, agriculture, construction/building sector, etc. Demand for eco-friendly solutions is high. Further regulation (health/environment) will increase demand for bio-based resins Increasing oil prices will support competitiveness Increasing purchasing power of consumers will help paying higher prices for consumer products
Higher price compared to petroleum-based resins is expected to hinder growth No EU level sector targets for GHG reduction in EU chemicals production have been introduced until 2025 Purchasing power stagnates Economic development in emerging economies does not allow to implement further health and/or environmental regulations Oil price stays low Higher recycling rates reduces need for virgin material
EU CAGR: 17% EU CAGR: 4%
EU Consumption in 2030: 1,600 kta EU Consumption in 2030: 480 kta

222
machined easily. This type of resin is used for resin impregnation, brake linings553, electrical components, laminate, adhesives for cement, bonded adhesives and moulds.554 They are used with fibreglass and carbon fibre enforcement and in combination with various fillers and additives tailored to specific industry requirements, i.e. batteries, aerospace and transportation industry.555 Products further include cookware and stove handles, automotive ashtrays, motor brush holders and bottle caps.556
Sustainability
There are three main motivations to substitute the phenol and formaldehyde, which are to move to more sustainable bio-based raw materials, to improve health and safety during manufacturing and use and to enhance performance of the resin (i.e. mechanical properties and higher thermal stability).557
Lignin is said to be one of the most abundant natural aromatic polymers in the world and has exceptional capacity to substitute fossil-based phenol within the resin.558 However, currently large amounts of lignin are incinerated.559 Substitution in phenolic resins is done up to a level of 50% (also depending on the lignin type used) without hampering the desired properties.560 Studies even show the possibility to increase this up to 100% for some applications.561 562 Recently UPM has announced a 100% lignin-based phenolic resin production on a commercial scale based on the WISA BioBond technology.563 564 WISA BioBond is used in the adhesive used in the production of plywood. The lignin used is obtained as by-product generated during a kraft pulping process.565
According to UPM their BioPiva based phenolic resins are designed for reduced formaldehyde content and low formaldehyde emissions.566 Formaldehyde is an important material for the chemical industry used in the production of glues and impregnating resins for wood-based materials. The EU produces approximately 10 million tonnes per year (47
553Sumitomo Bakelite Co., Phenolic Resins for Friction Materials, n.y., https://www.sumibe.co.jp/english/product/hpp/phenolic/brake/index.html, last viewed: 2020-11-11.
554 Thomasnet, Types of resins and their uses, n.y., https://www.thomasnet.com/articles/plastics-rubber/types-of-resins/, last viewed: 2020-11-11.
555 Polymer Database, Phenolic resins (phenoplasts), 2013, https://polymerdatabase.com/polymer classes/Phenolic type.html, last viewed: 2020-11-11.
556 Thomasnet, All about phenolic resins. Properties and uses, n.y., https://www.thomasnet.com/articles/plastics-rubber/all-about-phenolic-resins/ , last viewed: 2020-11-11.
557 Sarika, P.R.; Nancarrow, Paul; Khansaheb, Abdulrahman; Ibrahim, Taleb, Bio-based alternatives to phenol and formaldehyde for the production of resins, in MDPI Polymers, 12 2237, 2020, https://www.mdpi.com/2073-4360/12/10/2237, last viewed: 2020-11-12.
558 Kalami, Somayyeh; Arefmanseh, Maryam; Master, Emma; Nejad, Mojgan, Replacing 100% of phenol in phenolic adhesive formulations with lignin, in: Applied Polymer Science, Vol. 134, Issue 30; 2017, https://onlinelibrary.wiley.com/doi/full/10.1002/app.45124, last viewed: 2020-11-12.
559 Prefere resins, Biopolymers put to industrial use at phenolic resin producer Prefere Resins, 2017, https://prefere.com/en/company/news/biopolymers-put-to-industrial-use-at-phenolic-resin-producer-prefere-resins, last viewed: 2020-11-12.
560 Ghorbani, Marmar; Liebner, Falk Wolfgang; van Herwijnen, Hendrikus Wihelmus Gerardus, Lignin phenol formaldehyde resins. The impact of lignin type on adhesive properties, 2016, https://www.researchgate.net/publication/304626018_Lignin_Phenol_Formaldehyde_Resins_The_Impact_of_Lignin_Type_on_Adhesive_Properties, last viewed: 2020-11-12.
561 Kalami, Somayyeh; Arefmanseh, Maryam; Master, Emma; Nejad, Mojgan, Replacing 100% of phenol in phenolic adhesive formulations with lignin, in: Applied Polymer Science, Vol. 134, Issue 30; 2017, https://onlinelibrary.wiley.com/doi/full/10.1002/app.45124, last viewed: 2020-11-12.
562 Sarika, P.R.; Nancarrow, Paul; Khansaheb, Abdulrahman; Ibrahim, Taleb, Bio-based alternatives to phenol and formaldehyde for the production of resins, in MDPI Polymers, 12 2237, 2020, https://www.mdpi.com/2073-4360/12/10/2237, last viewed: 2020-11-12.
563 Fabbri, Paola; Viaggi, Davide; Cavani, Fabrizio; Bertin, Lorenzo; Michetti, Melania; Carnevale, Erika, Velasquez Ochoa, Juliana; Martinez, Gonzalo Agustin; Degli Piret, Esposti Micaela; Fischer, Kukk; Wydra, Sven; Schwarz, Alexander; Marscheider-Weidemann, Frank, 2018.
564 Hübsch, Christian; Markessini, Charles, Lignin based resins. Recent developments, presentation, UPM, Chimar, 2017, https://donar.messe.de/exhibitor/ligna/2017/D148872/lignin-based-resins-eng-498610.pdf, last viewed: 2020-11-11.
565 WISA Plywood, WISA Bond, 2020, https://www.wisaplywood.com/campaigns/wisa-biobond, last viewed: 2020-11-11.
566UPM Biochemicals, Resin industry solutions, n.y., https://www.upmbiochemicals.com/products/lignin/resin-industry-solutions/, last viewed: 2020-11-11.

223
million tpa are produced globally).567 Formaldehyde is made of methanol and phenol. Fluctuation in price of phenol as a result of changes in oil price and concerns about exposing workers during manufacturing let to intensive investigations on how to replace phenol with bio-based alternatives.568 According to the European Chemical Agency both phenol and formaldehyde are mutagenic, carcinogenic and reprotoxic. Besides the increased safety requirements during manufacturing, residual formaldehyde can remain in phenolic formaldehyde resin products, leading to long-term, low-level exposure to end-users.569
Using lignin as replacement for phenolic resins helps to reduce the environmental impact of the final product. It is estimated that every tonne of lignin substituted in phenolic resins production prevents the generation of a tonne of CO2.570 The CO2 footprint of lignin is approximately 20% of phenol.571 However the lower reactivity and additional energy and costs required to modify the lignin to increase its reactivity constitute a barrier for its wider industrial application.572
Market value
Since phenolic formaldehyde resins are used in glues in wood-based applications, coatings, mouldings and insulation materials, they are coming under increasing restrictions through environmental legislation since they are not biodegradable. Therefore lignin-based alternatives are becoming more attractive for resin producers and end-users.573 Environmental benefits are seen as crucial sales argument among consumers, especially with wood-based products where fossil-based adhesives hamper the green image.574
Market size and price
6 million ton per year of phenolic resins are produced on global level, with a price range between 1100 t/USD – 2300 t/USD, depending on the purity, quality and application of the final material.575 Main actors include UPM-biofore (Finland), StoraEnso (Finland), VTT (Finland), Prefere Resins (Germany), Avalon Industries (Switzerland), WestFraser (Canada) and Hexion (USA). The phenolic resins market is expected to grow by a CAGR of 5.5% until 2025.576 There are no specific CAGR for Lignin based phenolic resins available.
567 European Coatings, Formaldehyde-free adhesive for industrial use in the wood-processing industry, 2017, https://www.european-coatings.com/Raw-materials-technologies/Raw-materials/Formaldehyde-free-adhesive-for-industrial-use-in-the-wood-processing-industry, last viewed: 2020-11-11.
568 Kalami, Somayyeh; Arefmanseh, Maryam; Master, Emma; Nejad, Mojgan, Replacing 100% of phenol in phenolic adhesive formulations with lignin, in: Applied Polymer Science, Vol. 134, Issue 30; 2017, https://onlinelibrary.wiley.com/doi/full/10.1002/app.45124, last viewed: 2020-11-12.
569 Sarika, P.R.; Nancarrow, Paul; Khansaheb, Abdulrahman; Ibrahim, Taleb, Bio-based alternatives to phenol and formaldehyde for the production of resins, in MDPI Polymers, 12 2237, 2020, https://www.mdpi.com/2073-4360/12/10/2237, last viewed: 2020-11-12.
570 Fabbri, Paola; Viaggi, Davide; Cavani, Fabrizio; Bertin, Lorenzo; Michetti, Melania; Carnevale, Erika, Velasquez Ochoa, Juliana; Martinez, Gonzalo Agustin; Degli Piret, Esposti Micaela; Fischer, Kukk; Wydra, Sven; Schwarz, Alexander; Marscheider-Weidemann, Frank, 2018.
571Chemistry Views, Lignin instead of phenol formaldehyde resins, 2017, https://www.chemistryviews.org/details/news/10468312/Lignin_Instead_of_Phenol_Formaldehyde_Resins.html, last viewed: 2020-11-12.
572 Sarika, P.R.; Nancarrow, Paul; Khansaheb, Abdulrahman; Ibrahim, Taleb, Bio-based alternatives to phenol and formaldehyde for the production of resins, in MDPI Polymers, 12 2237, 2020, https://www.mdpi.com/2073-4360/12/10/2237, last viewed: 2020-11-12.
573 Borregaard, Resin extension, n.y., https://lignotech.com/Industrial-Applications/Resin-extension, last view: 2020-11-12.
574Storaenso, Developing a lignin-based resin for plywood, 2020, https://www.storaenso.com/en/newsroom/news/2020/6/developing-a-lignin-based-resin-for-plywood, last viewed: 2020-11-12.
575 Fabbri, Paola; Viaggi, Davide; Cavani, Fabrizio; Bertin, Lorenzo; Michetti, Melania; Carnevale, Erika, Velasquez Ochoa, Juliana; Martinez, Gonzalo Agustin; Degli Piret, Esposti Micaela; Fischer, Kukk; Wydra, Sven; Schwarz, Alexander; Marscheider-Weidemann, Frank, 2018.
576 Grand View Research, Phenolic Resins Market Size, Share & Trends Analysis Report By Product (Novolac, Resol), By Application (Wood Adhesives, Molding, Insulation, Laminates, Paper Impregnation, Coatings), And Segment Forecasts, 2019 – 2025, 2019, https://www.grandviewresearch.com/industry-analysis/phenolic-resins-market, last viewed: 2020-12-02.

224
Additives: bio-based plasticisers
Composition of product group:
The JRC 2019 report does not look at the whole product group additives but focuses on bio-derived plasticisers and stabilisers. Plasticizers account for a major share of the plastic additives market (51.7% in 2014) 577 as they are extensively used to process polymers and are less expensive than other additives.
For the scenarios developed in the frame of this study, we consider that plasticisers are the main drivers of the product category additives and will focus on their development for practical reasons. Important bio-based plasticisers are: Epoxidized vegetable oils such as soybean oil (ESBO), linseed oil (ELO), Castor oil, Palm oil, but also succinic acid and azelaic acid.
Other additives are also used in plastic applications and as additives for other applications. We assume they will be underlying similar trends.
The numbers for EU-bio-based production and consumption are based on the numbers given by the JRC 2019 report.578
5.5 Potential supply
5.5.1 POTENTIAL SUPPLY INTRODUCTION
The focus of this study is chemical, and material driven biorefineries which include the production of innovative high value bio-based products. These innovative products are
577 Grand View Research, https://www.grandviewresearch.com/industry-analysis/plastic-additives-market ; last viewed: 2020-12-15.
578 Spekreijse, Jurjen; Lammens, Tijs; Parisi, Claudia; Ronzon, Tevecia; Vis, Martijn, Insights into the European market for bio-based chemicals, Analysis based on 10 key product categories, JRC Science Policy Report, 2019, https://ec.europa.eu/jrc/en/publication/insights-european-market-bio-based-chemicals, last viewed: 2020-12-03.
Bio-based plasticisers
Basic market data for bio-based plasticisers
Total EU production: 1300 kta EU bio-based production: 67 kta
EU bio-based share of production: 9% EU bio-based consumption: 117 kta
Scenarios
High Low
The high replacement potential of bio-based plasticisers to replace traditional counterparts will be exploited (EU bio-based share being 9% in 2019) Further regulation (health/environment) in (emerging) economies will increase demand for bio-based plasticisers. Increasing consumer awareness will increase demand for bio-based plasticisers Performance of bio-based plasticisers will increasing rapidly. Performance of e.g. ESBO, azelaic acid and succinic acid is already competitive Pricing of GHGs (e.g. tax) will help competitiveness. High crude oil prices will support competitiveness Increasing purchasing power of consumers will help paying higher prices for consumer products
Slow recovery from COVID-19 crisis Plastic markets not growing Oil prices remain low No further regulations (health/environment) are introduced Recycling rates increase Purchasing power declining/not increasing making it difficult for consumers to pay green premium even in case awareness increases.
EU CAGR: 11% EU CAGR: 4%
EU Consumption in 2030: 351 kta EU Consumption in 2030:175 kta

225
largely expected to be produced from biorefinery pathways that are yet to reach widespread commercial maturity (novel pathways). This supply ramp-up therefore focuses on the potential deployment of these novel pathways in the EU until 2030. Mature biorefinery pathways are also covered in this section, but at a higher level than the novel pathways. The potential locations of biorefinery deployment in the EU are then identified based on resource potential and existing industrial activity.
New or expanded chemical and material driven biorefineries are not the only supply source for bio-based chemicals and materials, co-processing in fossil-based production facilities (petroleum refineries and chemical production plants) and re-focusing of fuel-based biorefineries to the chemicals and materials markets are also potential sources. These are explored in the alternative bio-based chemicals and materials ramp-up routes section, but at a higher level than the novel pathways.
Further, one of the major overarching drivers for biorefineries is to reduce the dependence on non-renewable fossil feedstocks for the production of chemicals, materials, food and fuels. In the context of chemicals and materials, this can also be achieved through bio-based content (as described in this study), recycled fossil material (e.g. plastic waste recycling) or through CO2-based chemicals. The latter two are not the focus of this tender study but are discussed in WP 3 and 6.
5.5.2 CHEMICALS AND MATERIALS DRIVEN BIOREFINERIES RAMP-UP
The potential supply of chemicals and materials from EU biorefineries will be determined by assessing the bottom-up supply ramp-up of the biorefinery pathways previously identified. This means the model assesses the potential growth in bio-based chemicals and materials but does not include potential closures existing biorefineries and assumes that all existing biorefineries continue to operate at similar rates.
This has been developed in a supply ramp-up model under two growth scenarios: the high scenario and the low scenario, both aligned with the macro-economic and policy assumptions described previously. These will define the bounds of what is possible by 2030 for biorefinery deployment in the EU. The output presents the incremental increase in production capacity of bio-based chemicals and materials by year to demonstrate the progressive ramp-up EU biorefinery capacity between 2020 and 2030. The capacity will be analysed by individual pathway, as defined in WP 3, to identify those with the biggest ramp-up potential for the considered timeline.
Following the output of the ramp-up model, WP 6 develops one outlook for deployment of biorefineries to 2030 that sits between the low and high scenarios. We then define the actions that stakeholders should take to overcome barriers so that the biorefinery deployment is more likely to reach this outlook.
Database integration and analysis
The biorefinery database developed as part of WP 4 of this tender study serves as basis for the supply ramp-up model. This means that the current biorefinery deployment is used as baseline to determine the potential growth within the next 10 years. The database aggregates a wide range of information such as the location, feedstocks, products, production capacity of existing or new announced plants, as well as operational year. The outcome of the model is only based on biorefinery information publicly available at the time this WP was conducted. Availability of data may present a limitation to our modelling approach. More information on the database including the level of completion of this information can be found in WP 4.
The final outcomes of the supply model will be discussed in terms of ramp-up potential by year, by pathway and by biorefinery type (i.e. demonstration or commercial). The information provided in the database (WP 4) acts as input data for the ramp-up supply

226
model. It only includes biorefineries focused on producing bio-based chemicals and materials.
In a first step, two key criteria have been added to the entries of the database in order to categorise the data collected in WP 4:
• Biorefinery pathway - The ramp-up model aims to provide deployment outlooks for all biorefinery pathways addressed. For this, a systematic approach was used to match all entries in the database with a specific biorefinery pathway (A-K as shown in Table 41), according feedstock, process, conversion platform and products (see Table 15 in WP 3 for more details). In some cases, biorefineries operate only parts of the pathway, referred to as a process variant. If so, the entry is matched with the pathway it shares most properties with. For example, pathway E is a three-platform pathway, relying on C5/C6 sugars and lignin. Some biorefineries may be classified as pathway E, although they only produce products through the lignin platform and not through the C5/C6 sugars.
• Plant type - a ‘plant type’ identifier was added to every entry in the database (Table 42). The plant type is linked to the technical maturity of the pathway (commercial or demonstration) and status (operational, announced, closed) and consequently affects the capacity contribution of the pathway to the overall biorefinery deployment.
Table 41. Biorefinery Pathways
Biorefinery pathway name
L. One platform (C6 sugars) biorefinery using sugar crops
M. One platform (starch) biorefinery using starch crops
N. One platform (oil) biorefinery using oil crops, wastesa and residues
O. Two-platform (pulp and spent liquor) biorefinery using wood
P. Three platform (C5 sugars, C6 sugars and lignin) biorefinery using lignocellulosic biomassc
Q. Two-platform (organic fibres and organic juice) biorefinery using green biomassb
R. Two-platform (oil and biogas) biorefinery using aquatic biomass
S. Two-platform (organic fibres and oil) biorefinery using natural fibresb
T. One platform (syngas) biorefinery using lignocellulosic biomassc and municipal solid waste
U. Two platform (pyrolytic liquid and biochar) biorefinery using lignocellulosic biomass
V. One platform (bio-crude) biorefinery using lignocellulosic, aquatic biomass, organic residues
a. Waste/residue fats, oils and greases belong to category "Other organic residues" b. Green biomass and Natural fibres belong to category "Lignocellulosic from croplands and grasslands“ c. Lignocellulosic biomass includes Lignocellulosic from croplands, wood/forestry and residues from agriculture and forestry
All biorefineries considered in this model are located in the EU either at commercial or demonstration scale, and for each the distinction between operational, closed and announced is made (Table 42). Only demonstration scale and larger biorefineries (i.e. TRL 8-9) are expected to have an impact on the biorefinery deployment levels / supply ramp-up by 2030. This means that new demonstration biorefineries for low TRL pathways which have yet to be announced but could potentially start-up before 2030 are not considered in the ramp up model. This assumption was validated by stakeholders in the October stakeholder workshop part 2. Lower TRL pathways and

227
activities are covered in WP 3 and actions to enhance RD&I efforts on these are included in the roadmaps.
Table 42. Description of biorefinery types with criteria applied to determine the output capacity used in the ramp-up model.
Closed plants refer to large scale commercial biorefineries which have announced closure or stopped operating (i.e. mothballed). These biorefineries are excluded from further analysis and do not appear in the ramp-up outputs. Yet, they are not deleted from the database as some could potentially be restarted or retrofitted in the future.
Demonstration and commercial biorefineries are classified as operational if they are currently active, but assumptions for future developments differ.
The amount of biochemicals and/or biomaterials produced from existing commercial biorefineries is expected increase between now and 2030. A debottlenecking / expansion factor is applied to the current estimated commercial production to account for the increase in future industrial production. This factor accounts for the expansion of operational biorefineries in reaction to growing demand of their products. It also considers process optimisation aspects, such as increased storage infrastructure or the utilisation of side streams, currently used for other uses than chemicals and materials (e.g. energy). Existing demonstration scale biorefineries have a limited operational lifetime and are expected to be closed once RD&I activities are complete. While the shutdown is likely to be permanent, successful demonstration biorefineries could lead to the development of commercial scale plants. These scaled up plants are referred to as “New Commercial” biorefineries in the ramp-up model. A multiplication factor is applied to the current production capacity of the demonstration biorefineries to account for increased production potential. For biorefineries where the production capacity is unknown a proxy value is used to estimate the deployment potential579. A development timeline is used as benchmark to estimate how long it will take for existing demonstration biorefineries to be to be commercialised. It should be noted that pathways with lower technical maturity (TRL below 7) are not expected to reach commercial scale by 2030. Hence, the conversion process of demonstration to commercial plants does not apply to emerging pathways with lower TRLs (G, K).
Finally, announced plants denote planned biorefinery projects which have been publicly announced. The year of start-up announced by the project developers is used to forecast the start-up date, or a project development timeline is used to forecast the number of years required for an announced plant to become operational. The method used depends on the scenario – see following sub-section.
579 For demonstration biorefineries the capacity is estimated based on other demonstration biorefineries of the same pathway and/or platform.
Plant type Description
Com
mer
cial
Operational Current active commercial biorefineries.
Closed Closed commercial biorefineries that are not considered in the model.
Announced Publicly announced commercial biorefinery projects.
Dem
onst
ration
Operational Current operational demonstration biorefineries which could be scaled up to “New Commercial” biorefineries.
Closed Unsuccessful demonstration projects are closed down and not considered further.
Announced Publicly announced demonstration biorefinery projects.

228
This overall project timeline (Figure 70) usually considers different stages such as planning, construction, commissioning before operation of the biorefinery can start. It is only after successful commissioning and start-up of a biorefinery that another project using a similar conversion process, and involving the same project partners, is expected to be developed. Major elements of a project development timeline for a dedicated plant are shown below for a first commercial scale plant below (Figure 70).
Figure 70. Example project development timeline for a first commercial-scale plant.
The projects considered in the database can be at different stages (construction, commissioning, etc) of the development timeline. The current status of the development process is acknowledged to estimate the remaining years until the operational start-up of the biorefinery.
Growth scenarios for the supply ramp-up
Two growth scenarios set the upper and lower bound of the biorefinery outlook deployment between 2020 and 2030. The assumptions applied in the high and low growth scenarios, as outlined below, were validated with stakeholders during the October workshop part 2 (Table 43).
Different sources were used to determine the current European supply potential including the data published in the JRC 2019 report on “Insights into the European market for bio-based chemicals”, the Nova Institute study on European Bioeconomy, and the Roadmap for the Chemical Industry in Europe towards a Bioeconomy published in 2019580,581,582. This means that the total “commercial operational” production is estimated for the European market as opposed to the capacity by specific pathway. This total current EU production is used as an indicator of the total current capacity. In reality the capacity will be higher than production however the operating rates of the existing biorefineries are not in the public domain and therefore the actual capacity cannot be estimated. Similarly, debottlenecking and expansion factors are applied to the overall EU biorefinery supply potential.
580 Joint Research Centre (JRC) European Commission, Insights into the European market for bio-based chemicals, Luxembourg: Publications Office of the European Union (2019) available at: https://ec.europa.eu/jrc/en/publication/insights-european-market-bio-based-chemicals
581 RoadToBio project consortium, Roadmap for the Chemical Industry in Europe towards a Bioeconomy, (2019) available at: https://www.roadtobio.eu/uploads/publications/roadmap/RoadToBio_action_plan.pdf
582 RoadToBio project consortium, Roadmap for the Chemical Industry in Europe towards a Bioeconomy, (2019) available at: https://www.roadtobio.eu/uploads/publications/roadmap/RoadToBio_action_plan.pdf

229
Table 43. Summary of modelling approach followed for high and low scenario.
High growth scenario:
The high growth case forecasts biorefinery deployment assuming the maximum technical potential the in the EU in 2030. This scenario assumes that all planned projects and developments go ahead, and the deployment is only constrained by technology readiness. Where technology is not mature enough, i.e. below TRL8 it is not expected to be possible to reach commercial scale by 2030.
A series of macroeconomic factors are considered to ensure the assumptions made in the demand section of this WP align with the supply ramp-up (Table 37). Favourable economic conditions are expected to speed up the development of new projects. Newly announced biorefineries (at demonstration and commercial scale) are assumed to become operational at the developer’s publicised year. That information is sourced from the biorefinery database developed in WP 4. Similarly, the existing commercial capacity is expected to benefit from the favourable macroeconomic climate. A debottlenecking factor of 10% is applied to account for process improvements, increased product demand and expansion of existing utilities.
The current context of the COVID 19 pandemic causes major uncertainties in terms of investment in new biorefinery projects. Stakeholders confirmed in the October stakeholder workshop part 2 that the development of most new projects has been put on hold. For this reason, a one-year delay is applied for all announced projects in the high scenario.
583 Joint Research Centre (JRC) European Commission, Insights into the European market for bio-based chemicals, Luxembourg: Publications Office of the European Union (2019) available at: https://ec.europa.eu/jrc/en/publication/insights-european-market-bio-based-chemicals
584 A share of advanced biofuels supplying the chemicals market of 50% is assumed in most cases. This assumption is revised and adapted depending on the pathway used. See the analysis of individual pathways for further information.
PLANT TYPE RAMP-UP MODEL ASSUMPTIONS
Basis High Growth Scenario Low Growth Scenario
Commercial Operational
Top-down approach to estimate the total operational production for bio-based chemicals from EU biorefineries583.
Commercial deployment estimated by applying a 10% debottlenecking factor to the yearly production capacity and assuming 50% of advanced biofuels produced from biorefineries in the EU will supply biochemicals by 2030584.
Commercial deployment estimated by applying a 2.5% debottlenecking factor to the yearly operational capacity.
Commercial Announced
Expected start-up year as announced by project (obtained from the database).
Add 1-year delay due to COVID 19 pandemic to announced start-up years.
Apply the project development timeline with regards to current development stage and add 1-year delay due to COVID 19 pandemic.
New commercial Current operational demonstration biorefineries are expected to be commercialised.
Demonstration biorefineries are scaled up to commercial plants within 5.5 years from 2021.
50% of demonstration plants are scaled up to commercial biorefineries within 8 years from 2021.
Demonstration Operational
Production capacity obtained from the database.
Account for capacity until the start-up year of new commercial biorefineries.
Account for capacity until the start-up year of new commercial biorefineries.
Demonstration Announced
Expected start-up year as announced by project developer (obtained from the database).
Add 1-year delay due to COVID 19 pandemic to publicised start-up year.
Apply the project development timeline and add 1 year delay due to COVID 19 pandemic.

230
However, depending on the forthcoming Recovery and Resilience Plans from the Member States, the prioritisation of biorefinery investments may also speed up some investment decisions on biorefineries as they have a strong potential to boost regional growth, jobs and new economic activities. The potential closure of already operational biorefineries is not considered, only potential delay of new announced projects is taken into account for the supply ramp up model.
New commercial capacity by pathway is estimated by factoring in the scale up of operational demonstration biorefineries to commercial refineries. In the high scenario, favourable techno-economic and technology maturity progress are considered. Hence, demonstration plants are assumed to scale up in 5.5 years. A factor of 10 is applied to account for the increase in biochemical and biomaterial supply (i.e. a commercial plant is 10x the scale of a demonstration plant)585. In practice the scaling factor between a demonstration and commercial plant can vary depending on many factors including the processes employed, feedstock availability, market demand.
In the EU growing interest is observed for pathways relying on secondary feedstocks (non-crop). These have applications in several industries including the chemicals, materials, and fuels sectors. For example, pathway E generates ethanol from lignocellulosic crops. While this product can be a building block for the chemical industry (e.g. to produce ethylene and its derivatives, directly as a solvent, to produce acetic acid etc..), it is widely used as transportation fuel currently. Given this link between the chemical and fuel industries, the high scenario assumes that a share of the production capacity of European advanced biofuel biorefineries contributes to the operational bio-based chemicals and materials supply ramp up. A separate database developed internally at E4tech was used to forecast the potential additional supply from advanced biofuels biorefineries586. This database is not limited in scope and contains any planned and existing projects which qualify for “advanced biofuels” as defined in RED II annex IX.
Depending on the pathway analysed (D, E, I, J), this factor can significantly increase the overall bio-based chemicals and materials supply capacity. Additional supply potential is only considered for pathways where the product can be directly used as fuel or as platform chemical, such as ethanol, methanol, or fractionation of pyrolysis oil (D, E, I, J). However, pathways which require an additional upgrading step of the product are not included in the ramp-up analysis (e.g. co-processing of bio-crude from pathway K in a crude oil refinery to produce fuels, chemical feedstocks and chemicals).
In terms of capacity attributed to demonstration or new commercial plants, advanced biofuel biorefineries are treated like biochemical focused biorefineries. New policy is expected to be needed to encourage biorefineries to supply the chemicals and materials markets, as well as the fuels market. The time to set up such a policy is approximated at five years. Hence, under the high scenario, additional capacity from the advanced biofuels is only considered from 2025587 onwards. More details on actions related to policy are provided in WP 6.
The use of novel pathways is more mature for applications in the fuels sector compared to the chemicals and materials market. Some developers have already announced or already operate first commercial and even second commercial plants for these pathways. For this reason, demonstration biorefineries outside of the EU are also considered in the ramp-up model as it is assumed that developers’ first and second commercial scale biorefineries will be based in the EU.
585 Biofuels international, 6(9), pp. 44-46, Scaling up step by step (2012) Available at: https://www.zeton.com/wp-content/uploads/2019/10/Zeton_Scaling_Up.pdf.
586 The data of existing advanced biofuel biorefineries in the EU is sourced from a database developed internally at E4tech. It includes all pathways to biofuels that do not use crop-based feedstocks.
587 This year is adapted to the pathway analysed.

231
Low growth scenario:
The low scenario sets the lower boundary of the potential growth of biorefinery production by 2030. The gap between the deployment obtained in the high and the low scenarios depends on a set of barriers and drivers which all impact the success of projects to varying extents. This growth scenario considers limited action by stakeholders (including no new policy e.g. under the direction of the Green Deal) to overcome the identified barriers to deployment. These barriers were identified and developed in WP 2 and 3, and then have been summarised and further developed by pathway in WP 6.
The possibility of new biorefineries being announced in the next few years, and which could be operational by 2030, needs to be considered as well. Similar to the high scenario, this potential increase in capacity supply is considered by applying an expansion factor to the existing operational production. Yet, poor macroeconomic conditions are expected to limit the impact of debottlenecking / expansions. For this reason, the low scenario assumes only a quarter of the expansion potential applied to the high scenario.
Since the study proposal was written in 2019, an economic crisis as a result of the COVID 19 pandemic has developed as well as volatile and lower oil prices. Stakeholders noted these as important factors when considering the ability to finance new and currently planned projects. Hence, for announced biorefinery projects a more conservative development timeline is applied. Overall, the time from initial project announcement to operational plant start-up is expected to take 9 years including 1-year delay to account for uncertainties caused by the COVID 19 pandemic. The timeline is adapted on a case-by-case basis depending on the project’s current development stage. A similar approach is used for announced demonstration projects, with a total of 7 years (including 1-year delay due to the pandemic) until operational start-up of a new demonstration plant once announced. Whilst the high growth scenario assumes that all demonstration plants scale up to commercial scale and all announced projects go ahead with some delay, the low scenario considers a failure rate (Table 43).
Poor technoeconomic conditions affect the rate of success of demonstration projects. As a result, the number of successful demonstration projects scaled up to commercial biorefineries (i.e. new commercial plants) is assumed to be only half of those considered in the high growth scenario. Additionally, poor macro-economic conditions extend the development timeline by 2.5 years and delay the start of the scale up process.
Outlook to 2030
The focus of this study is on novel biorefinery pathways as opposed to mature and established pathways. However, it is important to note that currently commercial biorefineries may contribute significantly to bio-based chemicals and materials supply increases through debottlenecking / expansion.
Figure 71 shows the current distribution of EU biorefineries in terms of number of commercial operational biorefineries by pathway. Pathways A, B, C and D largely rely on more mature technologies than other pathways and represent most of today’s operational capacity. Most of the production increases from debottlenecking/expansion is expected to come from these existing facilities. Although this approach is valid for mature pathways, the particularities of specific industries need to be observed. Pathway D, for example, depends on trends observed in the forest-based sector. For several years now, this sector has been innovating and diversifying their product portfolio by processing pulp & paper mill side streams into bio-based chemicals and materials.

232
Figure 71. Current number of bio-based chemicals and materials operational commercial refineries by pathway in the EU.
The priority put on the deployment of secondary feedstocks for the production of bio-based chemicals and materials favours innovation for pathways D-K. This also explains the small number of demonstration plants for pathways A-C which rely on crop-based feedstocks (Figure 72). Yet, some operational demonstration projects have been identified in the database. These investigate processes which differ from conventional procedures and are therefore considered to be novel. Aligned with the trends observed in the forest-based sector, more demonstration biorefineries have been identified for pathway D compared to pathways A-C. Further details are given in the outlook by pathway section.
Figure 72. Current number of operational bio-based chemicals and materials focused demonstration refineries by pathway in the EU.588
Lower TRL pathways (F, I, J) are currently at research stage and are therefore likely to contribute to the ramp-up of demonstration biorefineries in the EU for both the high and low growth scenarios (shown as ‘Demonstration’ in Figure 73 and Figure 74).
The ramp up model only considers biorefinery pathways which could reach commercials scale by 2030, this means pathways currently at TRL 8 or above. For this reason, deployment potential from pathways currently at pilot scale (G and K) does not contribute to the ramp up of biorefineries in the EU by 2030. This is valid for both additional capacity at demonstration and commercial scale.
While pathways I and J are at low TRL, they share properties with advanced biofuels. Hence, after the establishment of a policy framework as assumed under the high scenario, parts of the capacity of advanced biofuels produced could be used to produce bio-based chemicals and materials (referred to as ‘Adv. Biofuels to chemicals’ in Figure 73).
As introduced in the assumptions, additional capacity from advanced biofuels only contributes to the overall ramp up from 2025 onwards. This is due to the assumption that
588 These numbers are based on today’s operational demonstration bio-based chemicals and materials refineries in the EU. Pathways C, I, J and K are not included as no demonstration biorefineries were identified in the database.

233
a specific policy framework supporting this this developed prior to the contribution of advanced biofuels to the bio-based chemicals and materials market. The significant increase in ramp up from ‘Adv. Biofuels to chemicals’ observed in 2027 can be explained by the assumptions made regarding the scale up of demonstration plants (Table 43). Existing demonstration biorefineries are expected to become operational at commercial scale (i.e. new commercial plants) by 2027. Given the applied scale up factor of 10x (Table 43) this results in the additional deployment observed in Figure 73.
Figure 73. Overall ramp-up by biorefinery type, high growth scenario
Emerging pathways with successful demonstration scale projects (TRL 7+) are assumed to benefit from techno-economic progress and macroeconomic conditions and therefore to reach commercial maturity by 2030. A higher rate of deployment is expected for pathways E, D and H. In both scenarios, they contribute significantly to the capacity of New Commercial biorefineries (i.e. demonstration plants scaling to commercial scale).
Announced biorefineries will contribute to the overall capacity, but only towards the end of the decade.
Figure 74. Overall ramp-up by biorefinery type, Low growth scenario.
The output of the high growth scenario results in a progressive ramp-up impacted by announced commercial and demonstration biorefineries, expansion of existing commercial plants, the emergence of new commercial plants in 2027 and additional capacity from advanced biofuel biorefineries for non-crop pathways from 2025.
The low growth scenario takes a more conservative approach to simulate the overall ramp up. New demonstration biorefineries, debottlenecking of announced commercial

234
biorefineries, new commercial plants and announced commercial plants all contribute to an increase in supply capacity. The most significant increase is observed from 2028 onwards, when announced commercial biorefineries are expected to become operational. Figure 75 displays the overall ramp-up of EU biorefinery capacity by 2030 and allows to compare the high to the low scenario.
Figure 75. Overall EU bio-based chemicals and materials focused refinery ramp up, high and low scenario.
Outlook of novel biorefineries by pathway
This section describes the ramp-up by pathway focusing on novel routes, rather than an increase in existing capacity through debottlenecking/expansion. This means that for the commercial and mature routes A-C there the ramp-up potential described is rather limited. This does not mean that these pathways will not see expansion, but this has been captured in the debottlenecking/expansion category for all pathways described above. The next section describes the expected supply ramp up coming from Announced commercial or demonstration biorefineries or from “New Commercial” biorefineries only.
The ramp-up model focuses on supply potential by pathway as opposed to a specific product, since biorefineries tend to develop a range of products. However, specific biorefineries producing the case study products, introduced in the previous sections (WP 2,3 and above in the demand section of this WP), are highlighted where appropriate.

235
Pathway A - One platform (C6 sugars) biorefinery using sugar crops
Figure 76. Overview Pathway A - One platform (C6 sugars) biorefinery using sugar crops
Pathway A relies on sugar crops as feedstocks such as sugarcane and sugar beet. During primary refining sucrose (C6 sugars) is produced from pathway A. This biorefinery pathway is technically mature and widely practiced at commercial scale primarily to produce bioethanol for fuel applications (Figure 76). These existing biorefineries in the EU could refocus to sell ethanol into chemicals applications and this is explored further in the alternative bio-based chemicals and materials ramp-up routes section.
Bioethanol and downstream derivatives such as bioethylene and other bioplastics are commercially produced from pathway A, but currently not widely in the EU. As seen in the previous section (Figure 71), pathway A is already widely established in today’s biorefinery landscape, especially in Western and Central Europe. For this reason, pathway A presents limited capacity for increase of novel biorefineries even under high scenario terms.

236
Table 44. European demonstration biorefineries using pathway A.
The limited ramp-up potential of this pathway is emphasised by the small number of demonstration projects contained in the database. Although the conventional conversion process applied in this type of biorefineries is commercially mature, some innovative activity is observed in the EU. For example, Wacker Chemie AG started an acetic acid demonstration biorefinery near Munich in Germany in 2009 (Table 44).
Also, the strategic partnership between Braskem and Haldor Topsøe has led to the start-up of a sugar-to-biochemicals demonstration plant in Denmark590. The biorefinery produces monoethylene glycol (MEG), an intermediate used to produce polyethylene terephthalate (PET), from sugar since March 2019 and thereby demonstrates the potential diversification of products from pathway A.
The favourable macroeconomic conditions assumed under in the high scenario mean that the announced commercial biorefineries will become operational 5 years earlier compared to the low scenario. For example, Avantium is constructing a commercial plant in Delfzijl (NL). The company aims to produce furandicarboxylic acid (FDCA) which can be further processed into Polyethylene-furanoate (PEF), a 100% bio-based polyester591. In the low scenario a more conservative timeline is applied, and the start-up is delayed by 5 years. IBN-One, a subsidiary of Cristal Union and Global Bioenergies, aims to become the first commercial plant producing iso-butene from sugar592. L’Oréal is collaborating on the project by testing batches ultimately destined to the cosmetics market593.
Total and Corbion have recently announced a new poly lactic acid (PLA) bioplastics plant594. The Total Corbion PLA joint venture is not a biorefinery but only focuses on the downstream processing of biochemicals (i.e. lactic acid). Lactic acid is already produced at commercial scale with for example Ireland based Cellulac and Corbion operating several biorefineries in the EU. Yet, this initiative could encourage further development of biorefineries producing lactic acid from sugars.
589 Svend Ravn, Braskem and Haldor Topsoe start up demo unit for developing renewable MEG (2019) Available at: https://blog.topsoe.com/braskem-and-haldor-topsoe-start-up-demo-unit-for-developing-renewable-meg.
590 Braskem, Braskem and Haldor Topsoe achieve first production of bio-based MEG from sugar (2020) Available at: https://www.prnewswire.com/news-releases/braskem-and-haldor-topsoe-achieve-first-production-of-bio-based-meg-from-sugar-301178199.html.
591 Lubben M., Deep Dive Renewable Polymers: Path to Flagship Plant, Amsterdam: Avantium (2019), Available at: https://www.avantium.com/wp-content/uploads/2019/11/AVT_Technology-Day_RNP_final.pdf
592 Global Bioenergies, Global Bioenergies: IBN-One awards front-end engineering design to Technip and IPSB for the first plant converting renewable resources into isobutene (2016) Available at: https://www.global-bioenergies.com/global-bioenergies-ibn-one-awards-front-end-engineering-design-to-technip-and-ipsb-for-the-first-plant-converting-renewable-resources-into-isobutene/?lang=en.
593 Global Bioenergies, Global Bioenergies, IBN-One, Cristal Union and L’Oréal launch a new bioeconomy project (2016) Available at: https://ilbioeconomista.com/2016/06/07/global-bioenergies-ibn-one-cristal-union-and-loreal-launch-a-project-focused-on-the-first-bio-isobutene-plant/.
594 Page Bailey, Mary, Corbion And Total To Build First World-Scale Pla Plant In Europe (2020) Available at: https://www.chemengonline.com/corbion-and-total-to-build-first-world-scale-pla-plant-in-europe/.
Project name/ company
Type Scale (tpa) Feedstock Products Start-up year
Wacker Chemie AG Demonstration 500 Straw, sugar-based biomass
Acetic acid 2009
Braskem & Haldor Topsøe 589
Demonstration 100 C6 sugars Monoethylene glycol (MEG)
2019

237
Figure 77. Total incremental ramp-up for pathway A, showing additional capacity but excluding potential ramp-up of existing commercial biorefineries.
The ramp-up is expected to be mostly driven by debottlenecking / expansion of existing commercial biorefineries, as discussed in the overall outlook section. Development projects focusing on the utilisation of residues from the sugar industry present also a strong ramp up potential. Figure 77 demonstrates additional capacity originating from the start-up of the new announced commercial plant and the scale up of existing demonstration biorefineries for the high scenario. In the low scenario, the scale up of successful demonstration projects and the start-up of announced commercial biorefineries will take place at a later date. The additional capacity (Figure 77) is expected to come from chemicals such as lactic acid rather than from conventional bioethanol produced from sugar crops.
Figure 78. Deployment results for pathway A by number of biorefineries.
Figure 79 summarises the additional number of biorefineries expected by 2030 in both the high and low growth scenarios. The number of additional plants expected for pathway A by 2030 is relatively small but goes in line with the maturity level of the process and hence the limited innovative activity.

238
Pathway B – One platform (starch) biorefinery using starch crops
Figure 79. Overview Pathway B - One platform (starch) biorefinery using starch crops.
Pathway B shares a lot of similarities with pathway A in terms of technology and deployment (i.e. commercial biorefineries to produce bioethanol for fuel are widespread). This biorefinery pathway is also mature and widely used at commercial scale. It uses starch crops such as cereals (e.g. corn and wheat) and potatoes as feedstock to extract starch during primary refining (Figure 79). Bioethanol and lactic acid are key products of this pathway and is used as chemical intermediate for further processing into other derivative products. Several commercial biorefineries are operational in Western and Central Europe.
Similar to pathway A, limited research activity is observed for pathway B. The database identified only one demonstration plant relying on starch crops as feedstock to produce a range of products, including PLA produced from case study product lactic acid595. Thyssenkrupp Industrial Solutions AG596 has been operating a demonstration plant in Leuna (Germany) since 2013 (Table 2).
595ThyssenKrupp, ThyssenKrupp investing in industrial biotechnology (2013) Available at: https://www.thyssenkrupp.com/en/newsroom/press-releases/thyssenkrupp-investing-in-industrial-biotechnology-3218.html.
596 ThyssenKrupp, ThyssenKrupp investing in industrial biotechnology (2013) Available at: https://www.thyssenkrupp.com/en/newsroom/press-releases/thyssenkrupp-investing-in-industrial-biotechnology-3218.html.

239
Table 45. European demonstration biorefineries using pathway B.
No announced commercial biorefineries have been identified for the timeline and geography considered. Hence, the majority of biorefinery deployment for pathway B is expected to originate from debottlenecking / expansion of existing commercial plants. Under the conditions of the high scenario, an additional capacity of 10kta is expected in 2030 from the commercialisation of the demonstration plant. For the low scenario, an additional capacity of 5kta is estimated from the scale up of the demonstration plant.
Pathway C – One platform (oil) biorefinery using oil crops
Figure 80. Overview of pathway C - One platform (oil) biorefinery using oil crops.
Project name/ company
Type Scale (tpa)
Feedstock Products Start-up year
ThyssenKrupp Industrial Solutions AG
Demonstration 1000 Corn, sorghum PLA, succinic acid, polybutylene succinate (PBS), platform chemicals
2013

240
The feedstocks used in this pathway are oil crops from oil seeds, from fruits, or from waste fats, oils and greases (Figure 80). During secondary refining the oil is converted into a range of products including fatty acid methyl esters (FAME, biodiesel), glycerol, lubricants, cosmetics, surfactants and dyes.
While pathway C is commercially mature, some specific production routes require further research and development. For example, fatty alcohol ethoxylates and PEG esters are widely produced and consumed but these are only partially bio-based, made from vegetable oils and fossil ethylene oxide. While Croda has developed a 100% bio-based production of surfactants from fatty alcohol ethoxylates in the US597, no such initiatives have been identified in the EU.
In terms of operational biorefineries, the database contains only commercial plants for pathway C, with most of the activity happening in France and Germany. Only one announced commercial biorefinery has been identified. In 2016, METabolic EXplorer (METEX)598 announced a new commercial project in Carling St Avold in France. The biorefinery will produce bulk chemical PDO (1,3-Propanediol) and derivative polymer PTT (Polytrimethylene Terephthalate).
Given the maturity level of pathway C and the limited innovation taking place in terms of oil crops, the deployment of this pathway will be influenced by the debottlenecking of existing commercial biorefineries as well as the start-up of the announced commercial biorefinery. Both scenarios are expected to achieve the same additional supply capacity, 6kta from the METEX biorefinery, with shifted timelines.
Pathway D – Two-platform (pulp and spent liquor) biorefinery using wood
As described in WP 3, pathway D mostly relies on the existing pulping processes. For this reason, all innovations are directly linked to the ongoing activity of upgrading pulping biorefineries to more efficient biorefineries with a wider product portfolio. The scope of the ramp up model is restricted to innovative bio-based chemicals and materials, this excludes traditional pulp and paper products including their derivatives. Yet, announced projects currently focused on traditional pulp products could, in the future, present opportunities and feedstock potential for bio-based chemicals and materials. This could be through the extraction and further conversion of crude tall oil, lignin and turpentine from black liquor599 and/or through the development of innovative cellulose products. If these biorefineries decide to switch their focus, it could represent a considerable increase in supply capacity for the chemicals and materials sector. Figure 71 presents a snapshot of today’s European biorefinery activity in the chemicals sector. Pathway D is widely established with a high number of operational commercial biorefineries, particularly in Scandinavian countries. Woody biomass residues, either wood chips residues from sawmills or thinning residues from forest management activities are used as feedstock. The pulp or spent liquor obtained after primary reforming can be converted into a wide range of end products including micro fibrillated cellulose, acetic acid and lignin.
597 To produce surfactants, fatty alcohols are widely ethoxylated (i.e. reacted with ethylene oxide). 598 Metabolic Explorer, METabolic EXplorer and Technip sign agreement to evaluate combined PDO/PTT technology
(2016) Available at: https://www.metabolic-explorer.com/wp-content/uploads/2017/01/PR_METEX_Technip_evaluation_PDO_PTT_23.08.2016.pdf.
599 The main by-product obtained from the Kraft pulping process is black liquor which is traditionally has been used for heat and power purposes. However, energy efficiency of the existing kraft mills has improved so more of this black liquor could be used for chemicals and materials production without a requirement for net import of energy to the process. Chemicals (turpentine, crude tall oil, lignin) can be recovered from the black liquor and allow to produce a large variety of bio-based materials and chemicals such as paints and adhesives. In addition to increase the potential supply of bio-based chemicals and materials, this process provides major resource efficiency gains for the pulp-paper industry.

241
Although pathway D is already at commercial scale (TRL 9), innovative activity, driven by the diversification of the pulp & paper industries, is observed in these types of biorefineries. For this reason, the deployment outlook is influenced by a range of factors.
The database notes 8 demonstration projects using forest residues in the EU. This includes 6 announced projects and two operational plants (Table 46). BBI JU project Ecohelix600 has received funding under a H2020 grant agreement to construct a demonstration plant in Örnsköldsvik, Sweden. The demonstration plant aims to value the side streams of pulp mill processes by establishing 9 novel value chains for polymers, chemical building blocks and compostable polyesters601. Another example includes the MI Demo project established through the Metsä Spring and Itochu Corporation joint venture. This demonstration scale biorefinery is operational in Äänekoski, Finland since 2020602. The biorefinery applies an innovative production process to convert Metsä Group’s paper-grade pulp into textile fibres603.Finnish fibre producer, Spinnova, has been operating a new pilot scale facility in Jyväskylä, Finland. In this process, the pulp undergoes a mechanical treatment to produce micro fibrillated cellulose (MFC). Further details about the process used in the pilot scale biorefinery are provided in WP 3.
Figure 81. Overview of pathway D – Two-platform (pulp and spent liquor) biorefinery using wood (Kraft)
600 Vehicle Project, Available at: https://vehicle-project.com/. 601Vehicle, Available at: https://vehicle-project.com/the-project. 602 Mestä Srping (2020) Available at: https://metsaspring.com/production-started-at-unique-textile-fibre-demo-plant/ 603 Mestä Srping (2020) Available at: https://metsaspring.com/production-started-at-unique-textile-fibre-demo-plant/
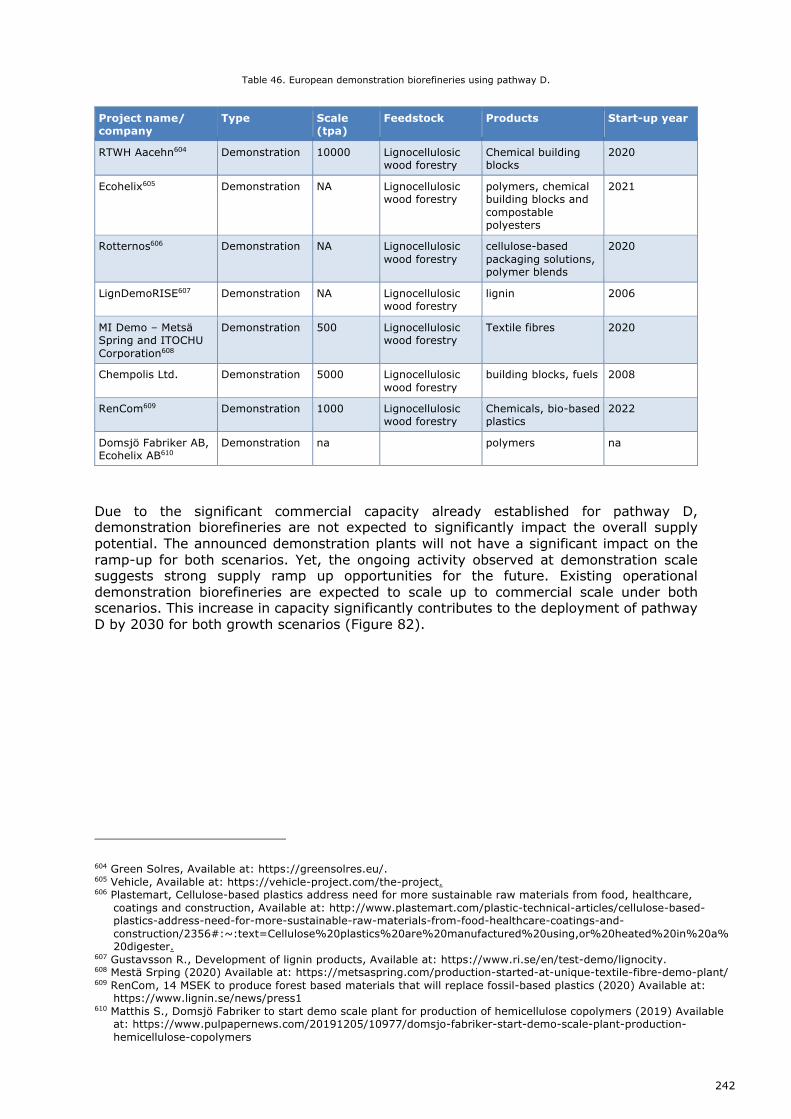
242
Table 46. European demonstration biorefineries using pathway D.
Due to the significant commercial capacity already established for pathway D, demonstration biorefineries are not expected to significantly impact the overall supply potential. The announced demonstration plants will not have a significant impact on the ramp-up for both scenarios. Yet, the ongoing activity observed at demonstration scale suggests strong supply ramp up opportunities for the future. Existing operational demonstration biorefineries are expected to scale up to commercial scale under both scenarios. This increase in capacity significantly contributes to the deployment of pathway D by 2030 for both growth scenarios (Figure 82).
604 Green Solres, Available at: https://greensolres.eu/. 605 Vehicle, Available at: https://vehicle-project.com/the-project. 606 Plastemart, Cellulose-based plastics address need for more sustainable raw materials from food, healthcare,
coatings and construction, Available at: http://www.plastemart.com/plastic-technical-articles/cellulose-based-plastics-address-need-for-more-sustainable-raw-materials-from-food-healthcare-coatings-and-construction/2356#:~:text=Cellulose%20plastics%20are%20manufactured%20using,or%20heated%20in%20a%20digester.
607 Gustavsson R., Development of lignin products, Available at: https://www.ri.se/en/test-demo/lignocity. 608 Mestä Srping (2020) Available at: https://metsaspring.com/production-started-at-unique-textile-fibre-demo-plant/ 609 RenCom, 14 MSEK to produce forest based materials that will replace fossil-based plastics (2020) Available at:
https://www.lignin.se/news/press1 610 Matthis S., Domsjö Fabriker to start demo scale plant for production of hemicellulose copolymers (2019) Available
at: https://www.pulpapernews.com/20191205/10977/domsjo-fabriker-start-demo-scale-plant-production-hemicellulose-copolymers
Project name/ company
Type Scale (tpa)
Feedstock Products Start-up year
RTWH Aacehn604 Demonstration 10000 Lignocellulosic wood forestry
Chemical building blocks
2020
Ecohelix605 Demonstration NA Lignocellulosic wood forestry
polymers, chemical building blocks and compostable polyesters
2021
Rotternos606 Demonstration NA Lignocellulosic wood forestry
cellulose-based packaging solutions, polymer blends
2020
LignDemoRISE607 Demonstration NA Lignocellulosic wood forestry
lignin 2006
MI Demo – Metsä Spring and ITOCHU Corporation608
Demonstration 500 Lignocellulosic wood forestry
Textile fibres 2020
Chempolis Ltd. Demonstration 5000 Lignocellulosic wood forestry
building blocks, fuels 2008
RenCom609 Demonstration 1000 Lignocellulosic wood forestry
Chemicals, bio-based plastics
2022
Domsjö Fabriker AB, Ecohelix AB610
Demonstration na polymers na

243
Figure 82. Total incremental ramp-up for pathway D, showing additional capacity but excluding potential ramp-up of existing commercial biorefineries.
Three announced commercial projects were identified in the database for the 2030 timescale. Metsä Group has announced a new commercial plant at the firms’ current mill site in Kemi 611. The company will use softwood and hardwood pulp to produce a range of bioproducts. Another example includes Boreal Bioref’s announced commercial project in Kemijärvi, Finland. The commercial biorefinery will source feedstock from local sawmills to produce a range of bio-based chemicals and products including microcrystalline cellulose (MCC)612. Under both scenarios, the production capacity of the announced commercial biorefineries contributes to the overall pathway deployment by 2030. Other announced activity is observed in the forest-based industry such as KaiCell’s planned new biorefinery in Paltamo, Finland. It is understood that this biorefinery will initially focuses on the production of traditional pulp and paper products, not covered by the scope of this study, but investments such as these do offer the potential for valorisation of side streams in the future to produce the bio-based chemicals and materials covered in this study. The biorefineries covered above and others that are currently focused on more traditional pulp derivatives are detailed in the Confederation of European Paper Industries “Innovative bio-based products for a sustainable future: A Cepi study on pulp & paper industry biorefineries in Europe”613
Contrary to all three pathways presented previously, there is a strong link between advanced biofuel conversion processes from non-crop feedstocks, and bio-based chemicals and materials produced from pathway D. The pulping process generates a waste gas stream (steam stripper off-gas) from which methanol can be recovered. Methanol is platform chemical widely used for gasoline blending, to produce formaldehyde, acetic acid, solvents and many other chemicals614. The majority of conventional fossil methanol (75%) is sold into the chemicals market, this presents a potential opportunity for bio-based chemicals and materials focused biorefineries. Given the established market and versatile
611 Metsa Fibre, Investments for future growth , Available at: https://www.metsafibre.com/en/projects/Pages/default.aspx.
612 Boreal Bioref granted environmental permit the biorefinery (2019), Available at: https://www.lesprom.com/en/news/Boreal_Bioref_granted_environmental_permit_the_biorefinery_89835/
613 CEPI, Innovative bio-based products for a sustainable future: A Cepi study on pulp & paper industry biorefineries in Europe (2021) https://www.cepi.org/innovative-bio-based-products-for-a-sustainable-future-a-cepi-study-on-pulp-paper-industry-biorefineries-in-europe/
614 Argus Media Media Ltd, Argus Global Methanol Demand 2018 (2019) Available at: https://www.argusmedia.com/-/media/Files/brochures-and-downloads/global-methanol-demand-2018-flow-chart.ashx?la=en&hash=090F0C06A6A396546B3698F913E6A1AC54DEAE8E.

244
use of methanol as chemical building block, the high scenario assumes that 50% of advanced biofuel volumes produced in 2030 could be sold as chemical.
Often the waste stream of pathway D is used to produce bioenergy. Bioprocess company AustroCel Hallein615, for example, produces textile pulp from forest residues and converts the side stream, methanol, into bioenergy. Swedish company Södra established a commercial value chain producing biomethanol from wood chips616. Growing activity to diversify the products processed using principles of the pulp & paper industries, suggest ramp-up potential for pathway D.
Figure 83. Deployment results for pathway D by number of biorefineries.
Pathway D presents many opportunities for growth of the pulp industry. In both the high and the low scenario, the deployment is driven by the capacity of new commercial, demonstration and announced commercial biorefineries (Figure 83). The high scenario also accounts for additional capacity from advanced biofuel processes.
615 OMV Group, First delivery: AustroCel Hallein supplies OMV with advanced bioethanol (2020) Available at: https://biorrefineria.blogspot.com/2020/12/AustroCel-and-OMV-start-cooperation-on-2G-ethanol.html
616 Södra, Refuelling the future, Available at: https://www.sodra.com/en/global/Bioproducts/biomethanol/.

245
Pathway E - Three platform (C5 sugars, C6 sugars and lignin) biorefinery using lignocellulosic biomass
Figure 84. Overview of pathway E - Three platform (C5 sugars, C6 sugars and lignin) biorefinery using lignocellulosic biomass.
Pathway E is an emerging pathway where lignocellulosic biomass is broken down into C5 & C6 sugars and lignin to produce a large portfolio of bio-based products including chemical building blocks, fibres and polymers (Figure 84). Lignocellulosic ethanol one of the key products obtained from the fermentation of C5/C6 sugars. It is a versatile chemical which has already benefitted from RD&I activities in several other industries such as the fuel sector. Besides ethanol, pathway E is used to produce a wide range of bio-based chemicals and materials including microfibrillated cellulose, acetic acid (via ethanol) and lignin.

246
The different process variants applicable to pathway E are presented in Figure 84. Some biorefineries may choose to perform only one specific process variant as opposed to a fully integrated biorefinery. Yet as long as parts of the flow of operation corresponds to the process (or one of the process variants) defined in pathway E, the biorefinery is attributed the label of this pathway.
Existing commercial biorefineries for pathway E make up 10% of the total operational capacity of biochemical focused biorefineries in the EU in 2020. However, pathway E is still considered as emerging pathway (TRL 8) and due to its applications, it presents significant deployment potential.
Figure 85 shows the overall incremental supply ramp-up of pathway E for the period of 2020 to 2030. The deployment of this pathway is influenced by many elements.
Figure 85. Total incremental ramp-up for pathway E, showing additional capacity but excluding potential ramp-up of existing commercial biorefineries.
Currently, the commercial applications in the chemical market are centred around two main areas, Western Europe and Scandinavia. As an emerging pathway, continued development at this scale is necessary to allow the pathway to reach a higher maturity level. The database contains a series of demonstration projects either planned or already operational. Under both scenarios, current demonstration biorefineries are expected to contribute to the new commercial capacity at the end of the decade. Details about the biorefineries are provided in the table below (Table 47). Norske Skog is currently developing a demonstration plant in Golbey France under a BBI JU agreement617. The biorefinery explores a new integrated value chain of “wood-to-food” to produce sustainable feed for aquaculture from forest biomass618. Additional research projects at lab or pilot scale are mentioned in WP 3.
617 Bio-based Industries Joint Undertaking, SYLFEED (2020) Available at: https://www.bbi-europe.eu/projects/sylfeed. 618 Sylfeed, Arbiom led consortium receives €10.9M funding from the Bio-Based Industries Joint Undertaking (BBI-JU)
to demonstrate the production of sustainable feed for aquaculture from forestry material (2017) Available at: http://sylfeed.eu/2017/09/25/442/.

247
The growing commercial capacity for pathway E is demonstrated through announced commercial projects in the EU. For example, Afterbiochem, funded by Bio Based Industries Joint Undertaking (BBI JU), aims to develop a chemical platform to process the by-products of the chemical industry into a range of bio-based chemicals and materials619. Similarly, the AgriChemWhey project (also funded by Bio Based Industries Joint Undertaking (BBI JU)) aims to scale up the existing demonstration biorefinery to commercial scale. Start-up is planned for 2022 with an annual output of 25kta to produce a range of biochemicals including acetic acid, polylactic acid, minerals for human nutrition and bio-based fertilisers620.
UPM has announced a new demonstration plant the industrial chemical site in Leuna, Saxony-Anhalt in Germany621. The biorefinery will produce several chemical building blocks and additives including 220,000 tonnes of glycols622. In this process the hydrolysis of hemicellulose and cellulose allows to produce sugars which are directly converted to glycols (mono ethylene glycol and mono-propylene glycol). While this biorefinery was classified under pathway E, it is located at the same sites as biorefineries following conversion processes from pathway D623.
Table 47. European demonstration biorefineries using pathway E.
The primary conversion of lignocellulosic biomass into C5/C6 sugars has already received a lot of interest to produce bioethanol as transportation fuel. For example, global speciality chemical company Clariant announced the development of a lignocellulosic ethanol biofuel
619 Bio-based Industries Joint Undertaking, Afterbiochem (2020) Available at: https://www.bbi-europe.eu/projects/afterbiochem.
620 European Commission CORDIS, An integrated biorefinery for the conversion of dairy side streams to high value bio-based chemicals (2020) Available at: https://cordis.europa.eu/project/id/744310.
621 UPM, The construction of UPM’s innovative biochemicals facility starts in Germany (2020) Available at: https://www.upm.com/about-us/for-media/releases/2020/10/the-construction-of-upms-innovative-biochemicals-facility-starts-in-germany
623 The nature of the process performed was confirmed during the stakeholder interview with UPM as part of the work performed in WP3.
624 Global Bioenergies, First production of isobutene from wheat straw at demo scale (2017) Available at: https://www.global-bioenergies.com/first-production-of-isobutene-from-wheat-straw-at-demo-scale/?lang=en.
625 This project is receiving funding under the Bio Based Industries Joint Undertaking (BBI JU) under the EU Horizon 2020 research and innovation programme, https://www.agrichemwhey.com/about/
Project name/ company
Type Scale (tpa)
Feedstock Products Start-up year
LPX Group Demonstration 500 Lignocellulosic Cellulose, lignin, biogas
2009
Global Bioenergies (BBI JU)
Demonstration 100 Wheat Straw624 Isobutene 2017
Norske Skog Gobley
Demonstration 5475 Lignocellulosic wood/ forestry
Polymers, food 2021
Chempolis Ltd. Demonstration 5000 Lignocellulosic crops, forestry residues
Chemicals, liquid biofuels, composites and fibres
2008
Sweetwood Graanul Biotech
Demonstration 26,280 Hardwood biomass Wood derived chemicals (sugars and lignin)
2020
AgriChemWhey625 Demonstration 75 Excess whey permeate (WP) and delactosed whey permeate (DLP)
lactic acid, polylactic acid, minerals for human nutrition and bio-based fertilisers
2018

248
refinery in Romania626. The strong technical link between both industries explains why some chemical companies may choose to develop projects based on pathway E but supply into the transportation initially as there is policy support to do so. The establishment of a policy allowing promoting the use of bioethanol for chemicals as well as fuels could considerably contribute to the overall ramp-up of the pathway. The speed this could be achieved would also be related to the downstream processing of ethanol for chemicals627. For example, if ethylene (building block for many other chemicals and materials) was produced, ethanol dehydration biorefineries would need to be build. Or alternatively ethanol could be used directly to produce other chemicals such as acetic acid if facilities to do so were developed.
Figure 86. Deployment results for pathway E by number of biorefineries.
As seen on Figure 86, the deployment outlook for pathway E is influenced by several factors. Announced demonstration plants have a limited impact on the overall supply potential. Yet exiting demonstration biorefineries will scale up to commercial plants before 2030 and thereby contribute to the total ramp up. Announced commercial biorefineries add the same capacity independent of the scenario analysed, the only difference lies in the shifted timeline.
Finally, pathway E is already utilised to produce bioethanol for fuels. A share of advanced biofuels capacity could add significant deployment potential to the bio-based chemicals and materials production. A 50% share of the bioethanol produced could be used to produce biochemicals. About 1.8 tonnes of ethanol is required per tonne of ethylene produced.628 Ethylene is the largest building block chemical globally and installed capacity to produce ethylene from steam crackers (the largest conventional source of fossil ethylene) in the EU is ~23 million tonnes.629 Therefore if all this ethanol assumed here was used to produce ethylene it would produce ~1.4 million tonnes of ethylene by 2030 (~6% of current capacity in the EU). The ethanol could also be used for other chemical applications including solvents such as ethyl acetate (already commercially produced), or drop-in bio-based products not currently produced in the EU such as acetic acid etc..
626 Clariant, Clariant to build flagship Sunliquid® cellulosic ethanol plant in Romania, Available at: https://www.clariant.com/en/Corporate/News/2017/10/Clariant-to-build-flagship-sunliquid-cellulosic-ethanol-plant-in-Romania.
627 Robert A. Dagle, Austin D. Winkelman, Karthikeyan K. Ramasamy, Vanessa Lebarbier Dagle, and Robert S. Weber, Ethanol as a Renewable Building Block for Fuels and Chemicals, American Chemical Society, 59(11), pp. 4843–4853 (2020) Available at: https://pubs.acs.org/doi/10.1021/acs.iecr.9b05729.
628 Denise Fan, Der-Jong Dai and Ho-Shing Wu, Ethylene Formation by Catalytic Dehydration of Ethanol with Industrial Considerations, Materials (2013) 6, 101-115; doi:10.3390/ma6010101
629 Petrochemicals Europe, Cracker capacity (2019) Available at: https://www.petrochemistry.eu/about-petrochemistry/petrochemicals-facts-and-figures/cracker-capacity/.

249
Pathway F – Two-platform (organic fibres and organic juice) biorefinery using green biomass
Figure 87. Overview of pathway F - Two-platform (organic fibres and organic juice) biorefinery using green biomass.
Pathway F is an emerging pathway, with operational demonstration plants and some operational commercial biorefineries. The main feedstocks used are nature-wet biomass such as grass (Figure 80 ). After primary refining organic fibres are obtained, these can be further processed into materials, such as boards, composites, insultation material and fibre reinforced polymers. They can also be used as fermentation raw material to produce biofuels and chemicals following pre-treatment and hydrolysis.
Organic juice is the second product obtained after primary refining. It can be further processed into lactic acid, proteins, and amino acids. The remainder can be used to produce biogas which can be upgraded to biomethane for use in gas grid or in transport. Biomethane can be further processed into a range of chemicals, this is addressed in the alternative ramp-up section.
The database contains a small number of commercial biorefineries in the EU. These contribute to the overall ramp of the pathway by applying debottlenecking and expansion

250
factors. Overall, limited deployment potential is expected from debottlenecking of existing commercial plants for pathway F.
Table 48. European demonstration biorefineries using pathway F.
Activity at demonstration scale is rather limited in the EU, only one operational demonstration plant was identified (Table 48). Bioenergy 200+ GmbH operates one plant which produces organic fertilisers in Tulln, Austria630. In both the high and the low scenarios, this plant is expected to scale up to commercial scale before 2030 (Figure 88).
Figure 88. Total incremental ramp-up for pathway F, showing additional capacity but excluding potential ramp-up of existing commercial biorefineries.
The model predicts a limited deployment of new biorefineries by 2030 for pathway F, with only one new commercial plant expected in both scenarios. The additional capacity from scaling up existing demonstration plants is a main driver in the overall ramp up.
630 Petrochemicals Europe, Cracker capacity (2019) Available at: https://www.petrochemistry.eu/about-petrochemistry/petrochemicals-facts-and-figures/cracker-capacity/.
Project name/ company
Type Scale (tpa) Feedstock Products Start-up year
Bioenergy 200+ GmbH
Demonstration N/A Agricultural residues
Organic fertilisers, biogas
2003

251
Pathway G – Two-platform (oil and biogas) biorefinery using aquatic biomass
Figure 89. Overview of pathway G - Two-platform (oil and biogas) biorefinery using aquatic biomass.
In biorefinery pathway G oil is extracted from aquatic biomass using solvents during primary refining (Figure 89). Oil can subsequently be used to produce fatty acids and glycerol which form valuable starting materials for oleochemicals, lubricants, and surfactants.
To date market opportunities for algae-based products are restricted to high value products. The database contains some commercial biorefineries using algal biomass to supply the food and the cosmetics industry. These companies, however, do not operate all biorefinery processes as defined in Figure 89. They cultivate aquatic biomass and perform the primary recovery step followed by selective separation of the biomass to produce high value chemicals such as active ingredients, cosmeceuticals, pharmaceuticals. Remaining residues after cell disruption are sold as feed.
The use of aquatic biomass to produce conventional chemical products remains limited and is only practiced at pilot scale. Pathway G is classified as emerging and currently at TRL 4. The hydrolysis and transesterification of algal biomass are novel approaches to produce biochemicals. Initiatives for this processing route exist mostly in research and pilot scale, hence they are not included in the database as they will not contribute to the ramp-up by 2030. For example, several BBI JU pilot scale projects explore cascading biorefinery

252
techniques to optimise the utilisation of the algal biomass631, or perform research activities for the use of algae in the production of bio-plastics632633.
To date, producing bio-based chemicals and materials from algae is not economically viable unless high value speciality chemicals are produced (e.g. cosmeceuticals, pharmaceuticals). Ongoing research activity, especially when considering broader environmental aspects, could lead to algae based biorefineries in the future. For example, processing aquatic biomass into bio-based chemicals and materials presents a valuable option to mitigate the high levels of eutrophication on European coasts634. Performing tertiary wastewater treatment with algal biomass has been widely researched. It is a way to remove inorganic nutrients (nitrogen and phosphorous) from effluent streams while providing a cheap growth medium for aquatic biomass635. Further information on research activities of pathway G can be found in WP 3 and WP 6.
Pathway H – Two-platform (organic fibres and oil) biorefinery using natural fibres
Figure 90. Overview of pathway H - Two-platform (organic fibres and oil) biorefinery using natural fibres
631 Bio-based Industries Joint Undertaking, Macro cascade (2020) Available at: https://www.bbi-europe.eu/projects/macro-cascade.
632 Bio-based Industries Joint Undertaking, Nenu2phar (2020) Available at: https://www.bbi-europe.eu/projects/nenu2phar.
633 Bio-based Industries Joint Undertaking, Newpack (2020) Available at: https://www.bbi-europe.eu/projects/newpack.
634 European Commission, Our Oceans, Seas and Coasts (2020) Available at: https://ec.europa.eu/environment/marine/good-environmental-status/descriptor-5/index_en.htm.
635 Abdel-Raoufa N., Al-HomaidanbI A. A., Ibraheembc B.M., Microalgae and wastewater treatment, Saudi Journal of Biological Sciences, 19(3), pp. Pages 257-275 (2012) Available at: https://www.sciencedirect.com/science/article/pii/S1319562X12000332.

253
Pathway H uses natural fibres such as flax or hemp as feedstock to produce biomaterials, chemicals (fatty acids, fatty alcohols, glycerol), nutraceuticals, cannabinoids, food and biodiesel. This is a two-platform pathway, where fibre separation is performed to produce organic fibres and oil is extracted from the biomass seeds (Figure 90). While the use of organic fibres is widely applied at commercial scale, especially in France, the extraction of oil is still a novel practice. Hence, both platforms need to be distinguished when analysing the potential deployment of pathway H.
The ramp-up of pathway H when relying on organic fibres as main platform (without the utilisation of the oils via extraction), will be driven by the expansion and debottlenecking of today’s commercial activity. This represents the established route of pathway H, hence little innovation is expected to be reflected in the deployment.
Table 49. European demonstration biorefineries using pathway H
The process conversions applied for oil extraction together with fibres are novel and still at demonstration scale. Two demonstration projects were identified in the EU (Table 49). The University of Hohenheim in Stuttgart leads to consortium of the GRACE (GRowing Advanced industrial Crops on marginal lands for biorEfineries) project.637 The aim of the work is to demonstrate the large-scale production and optimise the value chains of natural fibres such as hemp and miscanthus638. The idea is to process the biomass into a portfolio of bio-based chemicals and materials.
Figure 91. Total incremental ramp-up for pathway H, showing additional capacity but excluding potential ramp-up of existing commercial biorefineries.
636 Agrobiobase, CoDEM – Le BATLAB, Available at: http://www.agrobiobase.com/en/database/suppliers/building-civil/codem-le-batlab.
637 Biobased Industries Joint Undertaking, Grace, Available at: https://www.grace-bbi.eu/project/. 638 Biobased Industries Joint Undertaking, Grace, Available at: https://www.grace-bbi.eu/project/.
Project name Company
Type Scale (tpa)
Feedstock Products Start-up year
CoDEM – Le BATLAB636
Demon- stration
N/A Oil seed, rape straw, flax, hemp, miscanthus, rapeseed
Low density sandwich panel, insulating blocks, composite materials, expanded foams
NA
GRACE (GRowing Advanced industrial Crops on marginal lands for biorEfineries)
Demon-stration
N/A Hemp Organic fibre for composites and building materials, Oil for chemicals, Shive for building materials, Cannabinoids
2017

254
The additional capacity, in addition to debottlenecking of existing biorefineries, is expected to originate from the scale up of demonstration plants producing bio-based chemicals and materials from oil extraction. Operational demonstration biorefineries are expected to scale up to commercial scale by 2030, hence the deployment outlook for pathway H assumes the addition of two new commercial plants for both scenarios.
Pathway I – One platform (syngas) biorefinery using lignocellulosic biomass and municipal solid waste
Figure 92. Overview of pathway I - One platform (syngas) biorefinery using lignocellulosic biomass and municipal solid waste
Dry biomass, which represents a wide range of feedstocks, is gasified to produce syngas in pathway I. The syngas then can be chemically converted into a spectrum of chemicals and fuels. For example, the chemical conversion of syngas produces methanol which serves as building block to produce chemicals and materials (Figure 92).

255
Pathway I is currently at demonstration scale (TRL 7), hence it is expected to be a commercialised conversion process by 2030. Yet, to this date there is limited operational and planned initiatives in the biochemicals sector. Only one commercial plant, operated by Varmlands Metanol AB in Sweden, was identified in the database.
Figure 93. Total incremental ramp-up for pathway I, showing additional capacity but excluding potential ramp-up of existing commercial biorefineries.
The biosyngas is widely used to produce biomethanol, a biochemical which finds many applications in the fuel sector. Recent activity of methanol as advanced biofuel suggests strong ramp-up potential for pathway I under the high scenario assumptions (Figure 93). As introduced earlier approximately 75% of fossil methanol is sold in the chemicals market639. The current market size of methanol supports the assumption made in the high scenario. The production of biomethanol according to pathway I presents a high opportunity for the chemicals market.
The syngas can be produced using a range of feedstocks including biomass and waste (MSW). Enerkem is an active player and operates several methanol demonstration biorefineries. Similarly, the company is also involved in the W2C (waste-to-chemicals) project at the Port of Rotterdam along with industrial partners operating in the chemicals sector (i.e. Nouryon and Air Liquide)640. This specific initiative reflects increasing interest for pathway I and therefore a strong deployment potential of pathway I for applications across many sectors.
Figure 94. Deployment results for pathway I by number of biorefineries.
639 Nextant, Market Analytics: Methanol and derivatives, webinar (June 2020) 640 W2C-Rotterdam (2020) Available at: https://w2c-rotterdam.com/about-us.

256
The evidence of growing activity for pathway I is echoed by the ramp-up potential observed in the high scenario. A total of 4 new commercial biorefineries are possible by 2030, this is significant given the novel nature of the pathway (Figure 94). The deployment of pathway I could be driven by the versatile use of methanol in various industries. Under high scenario assumptions, a 50% share of advanced biofuels produced could therefore contribute to the ramp-up of pathway I by 2030.
Gasification of dry biomass has gained attention of many large players, although pathway I currently mainly supplies the fuels sector, growing activity suggests strong ramp-up opportunities for bio-based chemicals and materials.
Pathway J – Two platform (pyrolytic liquid and biochar) biorefinery using lignocellulosic biomass
Figure 95. Overview of pathway J - Two platform (pyrolytic liquid and biochar) biorefinery using lignocellulosic biomass
In pathway J the pyrolysis process is performed on dry biomass. Although, forest residues are generally chosen as main feedstocks, any lignocellulosic or dry biomass can be used in this process. Three product streams are obtained: pyrolytic liquid (pyrolysis oil), biochar and gas (Figure 88).
Pyrolytic liquid is the main product and can be further processed into biofuels, chemical feedstocks (e.g. naphtha), chemical building blocks (e.g. propylene), food flavourings and heat and power. The pyrolysis oil can find use in adhesives/resins where a phenolic rich fraction can be extracted and used in phenol formaldehyde resins.

257
The fractionation of pyrolysis liquid to produce bio-based chemicals and materials is a novel technology. Only one existing commercial plant, Lambiotte located in Belgium641, was identified in the database. This biorefinery performs the process of slow pyrolysis, conventionally used to produce charcoal and a series of low value by-products. Lambiotte, however, is an exception. They are a bio-based chemicals and materials producer and generate energy (charcoal) as by-product. since the main product of the biorefinery is a range of chemicals (e.g. and charcoal is the produced as waste stream of the process.
Some further research initiatives have been described in WP 3, however, this will not contribute to the deployment of this pathway for biochemical and biomaterial biorefineries.
While the pyrolysis conversion process allows to produce a range of bio-based chemicals and materials, it also receives growing interest in the bioenergy sector. Growing initiatives, especially in Scandinavian countries, demonstrate a ramp-up potential under the assumptions made in the high scenario. Existing and planned projects could contribute to the ramp-up of pathway J (Figure 96). However, the assumptions made for other pathways (D, E and I) sharing properties with the fuels sector are too ambitious for the novel principles applied in pathway J. Therefore, the high scenario assumes a reduced share of advanced biofuels (1.5%) to be sold into the chemicals market starting 2029 as opposed to the more ambitious target of 2025. The attribution of additional time will allow to compensate for the time needed to set up a policy as well as the time needed to scale up the pathway. There is an existing market of acids produced from pyrolysis oil, however the use of pyrolysis oil for bio-based chemicals and materials remains small. Assuming further growth and development of pyrolysis processes, an additional capacity of 20kta is projected by 2030 in the EU (Figure 96).
Figure 96. Total incremental ramp-up for pathway J, showing additional capacity but excluding potential ramp-up of existing commercial biorefineries.
Overall, limited activity is observed in the chemical industry (see WP 3 for details of lower TRL activities), hence no deployment could be modelled in the low scenario. Under the conditions assumed in the high scenario, a moderate ramp-up of pathway J is possible at the end of the decade, as existing advanced biofuel plants could contribute to the supply potential by adding 1 new demonstration biorefinery (Figure 97).
641 Lambiotte, Available at: https://www.lambiotte.com/carbonization/.

258
Figure 97. Deployment results for pathway J by number of biorefineries.
Pathway K – One platform (bio-crude) biorefinery using lignocellulosic, aquatic biomass, organic residues
Pathway K presents an alternative thermochemical process producing liquid fuel directly from solid biomass. In this pathway hydrothermal liquefaction (HTL) is applied. Similarly, to pathway J, a range of feedstocks can be used in this conversion process. This includes aquatic biomass and organic residues in addition to lignocellulosic biomass. Hydrothermal liquefaction is a novel technology and still tested at lab scale.
As of today, activity in the chemical sector is very limited, only a few pilot and research projects were identified in WP 3. Yet, with no projects at demonstration scale, no deployment outlook could be determined for this pathway for the low scenario.
There is growing interest for HTL in the fuels sector. However, no advanced biofuel supply potential is considered in the high scenario, since the bio-crude oil needs to be upgraded (e.g. co-processing in a crude oil refinery to produce fuels, chemical feedstocks and chemicals). The link between biochemicals and materials and advanced biofuels is not as straight forward compared to the link in pathway I.
Figure 98 - Overview of pathway K - One platform (bio-crude) biorefinery using lignocellulosic, aquatic biomass, organic residues

259
5.5.3 POTENTIAL LOCATIONS OF BIOREFINERY DEPLOYMENT IN THE EU
In this section, the potential for future biorefinery deployment in the EU is analysed. Firstly, regional secondary biomass feedstock potentials were gathered from S2Biom642 for different categories of feedstocks, in order to determine whether there are favourable regions with high biomass potential that could support the deployment of a biorefinery. The maps make use of the base potentials (kta dry matter) from the S2Biom Project (2016)643. The base potential is described as the sustainable technical potential, taking into account sustainability standards for agricultural forestry and land management, such as those found in the Common Agricultural Policy and in agreed national and regional forestry management plans. It is important to note that these potentials do not take into consideration competing uses of feedstocks.
In this report, feedstock is considered first on an EU-wide scale, before focusing on the potential of BIOEAST initiative countries for supporting biorefinery development, where investment has historically been lower.
Secondly, a study of the potential for existing sites to locate biorefineries was conducted, where infrastructure and supply chains may already be in place, in turn reducing the burden of investment. Using the JRC Bio-based industry visualiser644, three categories were selected as potential candidate sites: pulp and paper mills, wood working industries sites, and sugar and starch processing facilities. Further sites were then mapped from multiple sources, to account for chemical parks, crude oil refineries and steam crackers, that could potentially support biorefineries and start-ups which drive the uptake of innovative pathways. This support may be in the form of land access, and shared infrastructure and utilities.
Availability of agricultural residues
Agricultural residue potential is an estimate of the material left behind after a crop has been harvested, such as straws and stalks, and can be processed through Pathways E, F, H, I, J and K. Figure 99shows the estimated agricultural residue potential in the EU by NUTS 3 region, with the total residue potential for each country listed in the right-hand table. The north-east of France has significant agricultural residue potential and contains the region of Aisne (NUTS 3 code FRE21), which is the region with the largest potential in the EU of 1,602 kta. The second highest potential region is the Central Bohemian region of the Czech Republic (code CZ020), with 1,595 kta.
642 S2biom (2016) Available at : https://www.s2biom.eu/en/. 643 Dees, M., et al., A spatial data base on sustainable biomass cost-supply of lignocellulosic biomass in Europe-
methods & data sources. (2017). 644 Parisi, C., Baldoni, E., M'barek, R., European Commission, Joint Research Centre (2020): Bio-based industry and
biorefineries. European Commission, Joint Research Centre (JRC) [Dataset] PID: http://data.europa.eu/89h/ee438b10-7723-4435-9f5e-806ab63faf37

260
Figure 99. Map of agricultural residue potential in the European Union (kta dry matter)645
The BIOEAST initiative countries include some of the countries with the largest agricultural residue potential in the EU (Figure 92), with Poland (3rd highest), Romania (5th highest) and Hungary (6th highest) all with estimated nationwide potentials of over 10 million tonnes per year. Promising regions from the perspective of agricultural residue availability include the Vysočina (CZ063) and South Moravian (CZ064) regions of the Czech Republic, Bács-Kiskun in Hungary (HU331) and Chełmsko-zamojski in Poland (PL812).
Figure 100. Map of agricultural residue potential in BIOEAST initiative countries (kta dry matter)646
645 S2biom, Tools for biomass chains, Available at: https://s2biom.wenr.wur.nl/web/guest/home. 646 S2biom, Tools for biomass chains, Available at: https://s2biom.wenr.wur.nl/web/guest/home.

261
Availability of forestry residues
Forestry residue potential includes all by-products from the forestry industry, including branches, roots, leaves, etc, and is of relevance to Pathways D, E, F, I, J and K. Figure 101 shows regional forestry residue potential on an EU-wide scale. A significant portion of EU forestry residue potential is concentrated in Sweden and Finland: Sweden contains the five NUTS 3 regions with the highest forestry residue potential, while Sweden and Finland exclusively contain the highest 15 regions. Germany and France additionally have significant forestry residue potentials, with high potential found in the south-west of France: however, NUTS 3 regions for both countries are considerably smaller by area.
Figure 101. Map of forestry residue potential in the European Union (kta dry matter)647
There is also significant potential from forestry residues in BIOEAST countries, particularly Poland, Romania, Czech Republic and Latvia as shown in Figure 102. Latvia especially has a number of high potential regions, such as Vidzeme (LV008, 2,837 kta), Kurzeme (LV003, 2,445 kta) and Latgale (LV005, 2,075 kta). Other regions with high potential include the Central Bohemian (CZ020, 2,185 kta) and South Moravian (CZ064, 2,240 kta) regions of the Czech Republic; the Lõuna-Eesti region of Estonia (EE008, 2,451 kta); and the northern regions of Romania, in particular Suceava County (RO215, 1,490 kta).
647 S2biom, Tools for biomass chains, Available at: https://s2biom.wenr.wur.nl/web/guest/home.

262
Figure 102. Map of forestry residue potential in BIOEAST initiative countries (kta dry matter)648
Availability of grass residues
Grass residues are an often underutilised biogenic resource, which is of relevance to Pathways E, F, H, I, J and K. Of EU countries (Figure 103), Ireland has an extremely significant regional grass residue potential, and has a national potential second only to France. Outside of Ireland, the most significant regions with potential are found in central France, the south of Czech Republic, and north Romania.
Figure 103. Map of grass residues potential in the European Union (kta dry matter)649
648 S2biom, Tools for biomass chains, Available at: https://s2biom.wenr.wur.nl/web/guest/home. 649 S2biom, Tools for biomass chains, Available at: https://s2biom.wenr.wur.nl/web/guest/home.

263
Only six countries have a potential of 1 million tonnes of grass residues or more, with three of the six (Romania, Poland and Czech Republic) being members of BIOEAST. These three countries have significantly more potential from grass residues than all other countries in the region (Figure 104), with Romania and Czech Republic showing significant concentrations in the north and south of each country respectively. Prominent regions in Romania include Mureș County (RO124, 259 kta), Caraș-Severin County (RO422, 211 kta) and Cluj County (RO113, 178 kta). The highest potential regions in the Czech Republic are South Bohemia (CZ031, 242 kta) and Plzeň (CZ032, 170 kta).
Figure 104. Map of grass residues in the BIOEAST initiative (kta dry matter)650
Potential locations based on existing infrastructure
The EU has a number of pre-existing bio-based industries with which future biorefineries could find synergy, harnessing the existing infrastructure, supply chains and relevant expertise to increase the financial and logistic viability of a new biorefinery. The JRC Bio-based industry visualiser651 is an interactive dashboard illustrating an extensive database of EU facilities producing different categories of bio-based products. From this, three industries have been filtered:
• Pulp and paper mills: The integration of biorefineries with pulp and paper mills is an ongoing and promising development652,653,654,655. Both pulp and paper mills produce significant waste in the form of rejects, liquor sludge and wastewater treatment sludge, at a rate of 100-600 kg/air dry tonne (Adt) depending upon the
650 S2biom, Tools for biomass chains, Available at: https://s2biom.wenr.wur.nl/web/guest/home. 651 Parisi, C., Baldoni, E., M'barek, R., European Commission, Joint Research Centre (2020): Bio-based industry and
biorefineries. European Commission, Joint Research Centre (JRC) [Dataset] PID: http://data.europa.eu/89h/ee438b10-7723-4435-9f5e-806ab63faf37
652 Gottumukkala, Lalitha Devi, et al. "Opportunities and prospects of biorefinery-based valorisation of pulp and paper sludge." Bioresource technology 215 (2016): 37-49.
653 Rafione, Tatiana, et al. "The green integrated forest biorefinery: an innovative concept for the pulp and paper mills." Applied thermal engineering 73.1 (2014): 74-81.
654 Mongkhonsiri, Ghochapon, et al. "Integration of the biorefinery concept for the development of sustainable processes for pulp and paper industry." Computers & Chemical Engineering 119 (2018): 70-84.
655 Consonni, Stefano, Ryan E. Katofsky, and Eric D. Larson. "A gasification-based biorefinery for the pulp and paper industry." Chemical Engineering Research and Design 87.9 (2009): 1293-1317.

264
end product656. This waste can be utilised as a feedstock for butanol, ethanol, fuels or chemicals production via fermentation (Pathway D), gasification (Pathway I), pyrolysis (Pathway J) as discussed in detail by Gottumukkala et al657, or via HTL (Pathway K)658. Figure 105 shows the significant pulp and paper industry throughout Europe, with existing mills present in all EU countries. There are a significant number of mills in the central Europe area, across Italy, Germany, Austria, Slovenia and Poland. Many of the BIOEAST countries have multiple pulp and paper mills present, although Latvia and Estonia have a limited pulp and paper industry despite both having significant forestry residue potential.
Figure 105. Pulp and Paper mills in the European Union651
• Wood working industries: a significant growth in wood working industry would be expected to correlate with high woody biomass residue potential, and therefore represent opportunities for the development of Pathways D, E, F, I, J and K. Stafford et al estimate there to be 129 possible pathways producing 78 different unique products, between the biorefineries of pulp and paper, and wood working industries659. Figure 106 illustrates the location of wood working industries in the EU, with significant concentrations of facilities in central Europe and Scandinavia. Latvia and Estonia, which were noted to have a limited pulp and paper industry, have a significant wood working industry, indicating that waste wood and woody biomass residues from pulping may not currently be utilised for other purposes and that opportunities for woody biomass residues valorisation through biorefining may exist as a result. Romania has a wood working industry concentrated in the north of the country, where the country’s feedstock potential is greatest. Wood working industries in the south of Europe is notably limited, with few opportunities for synergy in countries such as Bulgaria and Croatia.
656 Monte, M. Concepcion, et al. "Waste management from pulp and paper production in the European Union." Waste management 29.1 (2009): 293-308.
657 Gottumukkala, Lalitha Devi, et al. "Opportunities and prospects of biorefinery-based valorisation of pulp and paper sludge." Bioresource technology 215 (2016): 37-49.
658 Qian, Lili, Shuzhong Wang, and Phillip E. Savage. "Fast and isothermal hydrothermal liquefaction of sludge at different severities: Reaction products, pathways, and kinetics." Applied Energy 260 (2020): 114312.
659 Stafford, W., et al. "Forestry biorefineries." Renewable Energy (2020).

265
Figure 106. Wood working industries in the European Union651
• Sugar and starch processing facilities: Sugar refineries and starch biorefineries also produce a significant amount of both solid and liquid waste, relevant for Pathways E, F, I, J and K. Figure 107 shows that sugar and starch processing sites tend to be more sparse and spread across northern and central Europe. Of the BIOEAST countries, processing facilities are overwhelmingly situated in Poland, Czech Republic, Slovenia and Hungary, with very few sites available in the northern countries of Latvia, Lithuania and Estonia, or Romania and Bulgaria in the south, indicating that there are fewer opportunities for biorefinery synergy based on sugar platforms in these regions.
Figure 107. Sugar and starch processing facilities in the European Union651

266
Finally, the locations of existing industrial fuel and/or chemical sites were investigated, as these are sites that could potentially support biorefineries and start-ups that can drive the uptake of innovative pathways. These complexes are often situated also at important EU ports/harbours which will give the opportunity to efficiently import biomass feedstocks from in/out-site Europe for potential processing of bio-based processing, i.e. decoupling of the feedstock potential to the biorefinery processing facilities.
A list of operational crude oil refineries was sourced from a combination of databases, namely the Oil&Gas Journal Database660, and Enerdata Refinery Database661. A list of steam crackers was available from Petrochemicals Europe662, while a list of chemical parks is publicly available from the European Chemical Site Promotion Platform663. These three site categories were combined and mapped, shown in Figure 108.
Figure 108 shows that the northern and central regions of Europe have well-developed refinery infrastructure and supply chains, with numerous sites from all three categories situated in close proximity. Some countries, such as Spain, Romania and Croatia, have a significant refinery presence without corresponding chemical or steam cracking facilities, indicating that further investment may be required when compared to countries with all three, such as Germany, Poland or Austria. In the case of Romania, its refineries are further situated in the east of the country away from its high feedstock potential in the north, which may further impede biorefinery development.
When focusing on BIOEAST countries, industrial sites are scarce in the northern countries of Latvia, Estonia and Lithuania, and in Bulgaria: although all of these countries have feedstock potential and existing industries where wastes could be sources, infrastructure and supply chain investment may be required for the successful implementation of biorefineries in these countries. Countries such as Czech Republic, Hungary and Slovenia may experience fewer barriers to realising a biorefinery industry, as both countries have feedstock potential from multiple sources and an existing, varied infrastructure already in place spanning refining and chemicals. Romania has a significant feedstock potential, and both Romania and Croatia have operating refineries.
Figure 108. Map of chemical parks, steam crackers and crude refineries in the European Union (multiple sources – see text above)
660 Oil & Gas Journal Research, Available at: https://www.ogj.com/ogj-survey-downloads/worldwide-refining 661 Enerdata World Refinery Database (2020), Available at: https://www.enerdata.net/research/world-refineries-
database.html 662 Petrochemicals Europe, Available at: https://www.petrochemistry.eu/about-petrochemistry/petrochemicals-facts-
and-figures/cracker-capacity/ 663 Chemical Parks, Available at: https://chemicalparks.eu/

267
5.5.4 ALTERNATIVE BIO-BASED CHEMICALS AND MATERIALS RAMP-UP ROUTES
The production of bio-based chemicals and materials can be achieved through other production routes than chemical and material focused biorefineries. Four alternative routes for production have been identified and the current and future production in the high and the low scenarios has been projected for each of these.
The four routes are:
Food and feed crop based fuel-focused biorefineries switching focus to the chemicals market – crop based bioethanol biorefineries currently focus mainly on the fuels market (i.e. gasoline blending of ethanol). In the EU, these biorefineries do already sell some bioethanol for chemicals but this is estimated at less than 5% of today production664. Outside the EU, there are some producers dehydrating ethanol to produce ethylene, for example Braskem in Brazil and Croda in the US. Ethylene is the largest chemical building block globally and installed capacity to produce ethylene from steam crackers (the largest conventional source of fossil ethylene) in the EU is ~23 million tonnes665. About 1.8 tonnes of ethanol is required per tonne of ethylene produced666. It is unlikely by 2030 that ethanol dehydration would replace operational steam crackers as a major source of ethylene, but ethanol use for ethylene could however capture a proportion of the future growth ethylene by 2030 however. The following is assumed under each scenario:
• High – 50% of the incremental ethylene production in the EU by 2030 is met by ethanol rather than from conventional fossil sources such as steam cracking of naphtha667.
• Low – 10% growth in ethylene production until 2030 is met by ethanol rather than from conventional fossil sources.
This is an important option to consider especially if electrification of passenger cars increases rapidly, reducing the requirement for gasoline and therefore the requirement for ethanol blending in gasoline. The level of electrification as well as the blending levels, ethanol’s use as a sustainable aviation fuel (SAF) and availability and cost of Brazilian and US ethanol imports are also major factors here. Forecasting this outlook is not part of this study, but if the fuel market for existing ethanol biorefineries in the EU diminishes, then chemicals could be another market that to support these plants and maintain some of the GHG savings they provide.
Co-processing in petroleum refineries to produce chemicals (e.g. olefins) or chemical feedstocks (naphtha, BTX, LPG) – Concawe estimate that, as of 2017, there was approximately 800 Mt/year of existing refining capacity in the EU668. As of 2020, there is an estimated 600 kt/year of co-processing capacity in the EU, which is almost exclusively from co-processing of lipids in refinery diesel hydrotreaters. Co-processing of pyrolysis oil in an FCC has been demonstrated in the past to be technically feasible, most notably by Ensyn and Petrobras669, and will be carried out commercially by Preem (TRL 7-8) in its Lysekil refinery (Sweden) in 2021670, where 25kt/year of pyrolysis oil will be produced from
664 ePURE (2020) Available at: https://www.epure.org/resources/statistics-and-infographics/ 665 Petrochemicals Europe, Available at: https://www.petrochemistry.eu/about-petrochemistry/petrochemicals-facts-
and-figures/cracker-capacity/ 666 Denise Fan, Der-Jong Dai and Ho-Shing Wu, Ethylene Formation by Catalytic Dehydration of Ethanol with Industrial
Considerations, Materials (2013) 6, 101-115; doi:10.3390/ma6010101 667 The assumed consumption growth of ethylene is 3.5% CAGR. Ethylene is not widely traded between regions and
therefore consumption is assumed to equal production. The production in 2020 is estimated based on the steam cracker capacity for ethylene with an assumed operating rate of 80%.
668 Concawe, Refinery sites in Europe. (2020) Available at: https://www.concawe.eu/refineries-map/ (Accessed November 2020)
669 de Rezende Pinho, Andrea, et al., Co-processing raw bio-oil and gasoil in an FCC Unit. Fuel Processing Technology 131 (2015): 159-166.
670 Preem (2019) Available at: https://www.preem.com/in-english/investors/corral/renewable-fuel-projects/

268
sawdust at Setra Kastet sawmill671. Honeywell UOP and Ensyn through their Envergent Technologies joint venture also claim to have multiple full-scale installations scheduled in Europe, Asia and USA672.
However, other co-processing routes have yet to reach commercialisation, and remain at TRL 5-6 or below. This is because in addition to being a technically complex process, co-processing entails technical risks to a low-margin high-volume industry and requires significant amounts of feedstock due to the size of a typical refinery. Co-processing today has been demonstrated up to 30% by Haldor Topsøe but is likely to be limited to between 5-10% due to catalyst and metallurgy limitations673. However, a number of large refining companies have committed to installing additional significant co-processing capacity in the coming years, including Total674, OMV Petrom675 and Neste676, and this trend is expected to continue. As such, the following is assumed under each scenario:
• High – 5% of current refinery capacity in the EU is used for co-processing by 2030: this rate is chosen as, although refineries may be capable of higher co-processing rates, not all refineries and hydrotreaters may be suitable.
• Low – 2.5% of current refinery capacity in the EU is used for co-processing by 2030.
It is further assumed that refineries will continue to favour fuel production over chemical production. Using Concawe “Max Low-Carbon Feedstock” scenario estimates for chemicals co-processing from lipids and biomass677, 25% of refinery output will be in the form of chemicals: assuming a 52% conversion efficiency from the same scenario, this gives ~13% bio-based content in chemical feedstocks or chemicals produced. This factor is applied to both the high and low scenarios in order to estimate total biochemical feedstocks and biochemicals production.
Co-processing in steam crackers to produce chemicals. Steam crackers produce ethylene, propylene and C4+ streams and are the major route to the production of chemicals globally. These biorefineries conventionally process naphtha or other liquids sourced primarily from petroleum refineries, or gases such as ethane, propane or butane (i.e. LPG). Some European steam cracker operators are co-processing bio-based feedstocks as well as these conventional fossil feedstocks. A mass balance approach is then being pursued to allocate this feedstock to various steam cracker products. For example:
• LyondellBasell’s steam cracker flexibility allowed it to introduce a new renewable feedstock at its Wesseling, Germany site, which was converted directly into bio-polyethylene and bio-polypropylene.678
671 Preem (2020) Available at: https://news.cision.com/preem-ab/r/sweden-s-first-pyrolysis-oil-plant-for-biofuels-under-construction,c3136758
672 Mahajan D., Refinery Coprocessing Options for Advanced Biofuels Production, Honeywell UOP (2019) Available at: https://ec.europa.eu/info/sites/info/files/33_dharmesh_mahajan.pdf
673 Concawe, Refinery 2050: Conceptual Assessment. Exploring opportunities and challenges for the EU refining industry to transition towards a low-CO2 intensive economy (2019) Available at: https://www.concawe.eu/wp-content/uploads/Rpt_19-9-1.pdf
674 Porter A., Total eyes out for further HVO expansion, Argus Media (2020) Available at: https://www.argusmedia.com/en/news/2145882-total-eyes-further-hvo-expansion
675 OMW, Biogenic oil co-processing (2020) Available at: https://reports.omv.com/en/sustainability-report/2019/focus-areas/innovation/biogenic-oil-co-processing.html
676 Neste Corporation, Neste plans to restructure its refinery operations in Finland and starts co-operation negotiations (2020) Available at: https://www.neste.com/releases-and-news/oil-products/neste-plans-restructure-its-refinery-operations-finland-and-starts-co-operation-negotiations
677 Concawe, Refinery 2050: Conceptual Assessment. Exploring opportunities and challenges for the EU refining industry to transition towards a low-CO2 intensive economy (2019) Available at: https://www.concawe.eu/wp-content/uploads/Rpt_19-9-1.pdf
678 Bioplastics, Neste and LyondellBasell produce bio-PP and bio-LDPE at commercial scale (2019) Available at: https://www.bioplasticsmagazine.com/en/news/meldungen/20190618Neste-and-LyondellBasell-produce-bio-PP-and-bio-LDPE-at-commercial-scale.php

269
• SABIC is also processing some waste oils and fats at its Geleen facility in the Netherlands.679
• BASF is processing some bio-based feedstocks at its Ludwigshafen Verbund site and the company appears to be focused on producing speciality bioproducts (e.g. bio-polyamides) rather than commodity polyolefins.680
The quantities currently being processed are not known but indicative estimates for 2030 are based on the following assumptions to estimate the quantity of steam cracker chemical products produced (primarily ethylene, propylene):
• High – 5% of current steam cracker capacity in the EU is used for co-processing by 2030.
• Low – 2.5% of current steam cracker capacity in the EU is used for co-processing by 2030.
Co-processing in existing methanol biorefineries. As well as producing methanol via the biorefinery pathways described in this study, methanol can also be produced from biogas which is upgraded to biomethane and then reformed to produce biosyngas and co-processed in existing methanol plants with fossil natural gas. This route produces the largest volume of biomethanol today but does not fall under the definition of a biorefinery used in this study.
BioMCN formerly produced biomethanol from glycerol in the Netherlands. In 2015, BioMCN was acquired by OCI N.V. and continued producing renewable methanol from biogas with a capacity about 60,000 metric tonnes per year. The biogas has to be cleaned to obtain a gas with high methane content which is then supplied to the natural gas grid. BioMCN uses gas from the grid and converts to methanol. They purchase green gas certificates and the methanol produced is on a mass balance basis certified as bio-methanol. 681 This has been used as the current estimate for biomethanol production via this route in the EU. It is understood that other methanol plant operators in the EU also used this route but the volumes produced are not known. For the outlook to 2030 the following assumptions have been made:
• High – 30% of current methanol production capacity in the EU is used for co-processing by 2030.
• Low – 5.0% of current methanol production capacity in the EU is used for co-processing by 2030.
These routes could produce very significant quantities of bio-based chemicals and materials by 2030 in the EU. These routes will be both in competition and supportive of the biorefinery pathways discussed in the previous section. They are supportive as they could help develop biomass supply chains and develop markets for bio-based products. However, they are also in competition in some cases with biorefinery pathways as they can in some cases produce the same products (e.g. biomethanol) or substitute products (e.g. PLA vs biopolypropylene).
In the outlook for deployment and roadmaps developed in WP 6, the actions are focused on how to bring about the maximum benefits to the EU (GHG reduction, replacement of fossil carbon with renewable carbon, GHG reductions, local jobs in rural economies etc..).
679 Beacham, W., Special report: SABIC takes first steps into renewable polyolefins (2014) Available at: https://www.icis.com/explore/resources/news/2014/06/23/9793016/special-report-sabic-takes-first-steps-into-renewable-polyolefins/
680 BASF, BASF recognized for its contribution to sustainable development (updated 2020) Available at: https://www.basf.com/global/en/media/news-releases/2019/06/p-19-245.html
681 Compagne P., COO BioMCN, Bio-methanol production at BioMCN (2017) Available at: https://brintbranchen.dk/wp-content/uploads/2017/10/Paul-Compagne_BioMCN.pdf

270
The actions are therefore not solely in favour or producing bio-based chemicals and materials from the pathways described in this study or these alternative pathways, and may support or hinder the ramp up of each.
Table 50. Alternative bio-based chemicals and materials supply ramp-up
*Current co-processing of bio-based feedstocks in steam crackers is unknown and not all co-processing in methanol plants has been captured in the 2020 estimate.
5.6 Comparison of supply in the EU to supply in top 10 non-EU countries in database
In order to supplement the potential supply ramp-up assessment, this section compares regions within the EU in terms of their likelihood of biorefinery deployment by 2030. This comparison is performed qualitatively and considers current and planned biorefinery activity as well as feedstock availability (analysed in the sub-section above). The aim is to identify regions that could be the host for clusters or act as pioneer regions particularly for pathways with the strongest ramp-up potential.
In a next step we aim to position the role of EU chemical and material driven biorefineries on a global scale. For this we are comparing supply for individual pathways in the EU to 10 other countries. The database developed in WP 4 used as basis for this ramp-up model contains information about biorefineries located in Australia, Brazil, Canada, China, India, Japan, Norway, Thailand, the UK, and the USA. The methodology and reasoning applied to select these non-EU countries is addressed in WP 4.
Routes Scenario Input, % of asset capacity used for biochemical or biomaterial production
Output, biochemical and biomaterial capacity, Mtpa
Crop based fuel-focused biorefineries switching focus to the chemicals market
Current (2020 estimate)
4.8% 0.37
High (2030) 50.0% 3.90
Low (2030) 22.8% 1.78
Co-processing in petroleum refineries to produce chemicals (e.g. olefins) or chemical feedstocks (naphtha, BTX, LPG)
Current (2020 estimate)
0.0% 0.00
High (2030) 5.0% 5.11
Low (2030) 2.5% 2.56
Co-processing in steam crackers to produce chemicals (e.g. olefins)
Current (2020 estimate)
not known not known
High (2030) 5.0% 1.96
Low (2030) 2.5% 0.98
Co-processing in methanol biorefineries
Current (2020 estimate)
2.5% 0.06
High (2030) 30.0% 0.72
Low (2030) 5.0% 0.12
Current (2020 estimate) 0.4*
High growth (2030) 11.7
Low growth (2030) 5.4

271
Figure 109. Distribution of bio-based chemicals and materials focused biorefineries in 2020 in the EU.
Chemicals and materials driven biorefineries are widely distributed across the European continent, particularly Western and Central Europe. The database contains approximately 300 biorefineries located in the EU (Figure 109).
The ramp-up model estimates between 27 and 44 new biorefineries by 2030 depending on the scenario considered. Figure 110 displays the number of additional plants to be built by the end of the decade, with pathways D and E showing the strongest ramp-up potential for both scenarios. Pathways I also shows strong supply deployment when applying the high scenario assumptions. Although it is not possible to predict the exact location of the new builds, the assessment of feedstock potential and existing industrial sites described in the previous sub section give an indication of possible sites. As discussed above, BIOEAST regions present a lot of potential in terms of feedstock availability, but these resources are not exploited yet for bio-based chemicals and materials focused refineries.
Figure 110. Ramp-up of additional plants by 2030, high and low scenario.

272
The supply ramp up model concludes limited deployment potential for the mature pathways (A-C) relying on first generation crops. Yet, when applicable, the model highlights initiatives of industries switching to integrated biorefineries and diversifying their product portfolio. For example, in the sugar industry (pathway A), some innovative activity of processing sugar residues into bio-based chemicals and materials was identified. The observed diversification from traditional products could contribute to the ramp of this pathway in the EU. However, compared to the other world regions with more resources and larger surface areas, the EU shows limited competitive advantage for the processing of crop-based biomass.
Figure 111. Distribution of pathways by region (%), EU vs. Non-EU
The mature pathways A-D make up over 80% of non-EU biorefineries identified in the database (Figure 111). Bio-based chemicals and materials produced from food and feed crops are widely distributed around the Americas and Asia (Figure 112).

273
Figure 112. Share of biorefineries using pathways A-D in non-EU countries.
Brazil is a major producer of sugarcane ethanol at global. Biorefineries using pathway A therefore dominate the deployment in Brazil. Braskem, for example, is an active player and operates several commercial plants in the country. The company processes sugar crops (sugar cane) into a range of products including bioethanol and its derivatives bioethylene and polyethylene. The bioethanol goes through a two-step conversion process. First the chemical process converts the ethanol into ethylene which is then further polymerized into polyethylene.
The biorefinery deployment in North America shows ongoing activity in all mature pathways (A-C). The high feedstock availability gives this region a major cost competitive advantage to process first generation crops into a range of bio-based chemicals and materials. For example, US-based CAGRill processes corn into C6 sugars which are fermented into bioethanol and lactic acid. The obtained lactic acid can be further processed into polylactic acid (PLA) for use in biodegradable plastic applications682.
China shows a diverse scene of bio-based chemicals and materials focused refineries, activities in all mature pathways (A-C) were identified in the database. Biorefineries producing lactic acid and derivatives from pathways A and B represent the majority of the identified activity in China.
Vegetable oil, such as palm oil, is widely available in Asia. KLK OLEO, based in Malaysia processes a wide range of oleochemicals from palm oil683. Other notable activity in the South East Asian region include the Total Corbion PLA joint venture in Thailand. In a first step Corbion ferments C6 sugars from sugar cane into lactic acid. The product is then converted into lactide monomers and polylactic acid at the Total Corbion PLA (poly lactic
682 Natureworks, Ingeo, Available at: https://www.natureworksllc.com/What-is-Ingeo/How-Ingeo-is-Made 683 KLK OLEO, Available at: https://www.klkoleo.com/

274
acid) refinery. The continuous flow of operations is possible since both plants are located at the same site.
Bio-based chemicals and materials focused refinery development in India is largely dominated by sugar-based processes. Godavari Biorefineries Ltd produces acetic acid from sugar crops at its Sakarwadi facility in Maharashtra684.
Under both scenarios developed, pathways D and E present the strongest ramp-up potential in the EU for the timeline considered. This comes as a result of several favourable conditions including feedstock availability, relatively high maturity of the processes, strong link to the biofuels industry and for pathway D the diversification of forest-based industries, widely present across the continent.
Today, biorefineries using pathway D are mainly located in Scandinavia, France and Germany, yet high availability of woody biomass residues and wood working industries sites in BIOEAST regions suggest deployment potential in these parts of the EU (see sub section above). Outside of the EU, the database identifies Japan and the East of the US as regions with a strong forest-based industry and activity for pathway D. There is also a lot of ongoing activity of the forest-based sector in China and Russia, these are however not captured in the database.
The conversion of lignocellulosic crops as defined in pathway E is expected to ramp-up significantly by 2030 in the EU. While existing and planned biorefineries are mainly located in France and Germany, the previous section highlights lignocellulosic biomass availability in BIOEAST regions. Outside of the EU, activities in North America present a strong potential for the deployment of this pathway.
The EU dominates initiatives and projects for emerging pathways F – K. Support for these pathways is prompted by availability of agricultural, grass and forest residues in the EU. The database notes no biorefineries for these pathways in the 10 non-EU countries analysed. This suggests that the EU leads the work of early-stage development of bio-based chemicals and materials focused biorefineries. While the commercial application of more mature pathways maybe more cost competitive outside of the EU, in countries with larger resource availability.
5.7 Comparison of EU demand vs EU supply
The third objective of WP 5 is to define scenarios for development and deployment of biorefineries to 2030 based on the potential demand for biorefinery products and the potential supply of these products. The first section of WP 5 analyses the potential demand of bio-based chemicals and materials in the EU under different sets of assumptions forming the high and the low scenario. The second section of this WP assesses the potential supply from EU biorefineries by 2030. The table shows the low and high demand and supply outlooks are compared to provide an assessment of the proportion of the market that is likely to be supplied by EU biorefineries (Figure 113).
684 http://news.bio-based.eu/re-startingproduction-of-bio-based-acetic-acid-from-august-2018/

275
Figure 113. Demand vs. Supply of bio-based chemicals and materials in the EU in 2030.
For both scenarios the demand side estimates are higher than the projected supply ramp up from EU biorefineries. The supply figures determine how much of the potential EU demand can be met by EU biorefineries (Figure 113). The gap between the EU production from biorefineries and the EU consumption (shown in grey in Figure 113) can be filled in different ways.
For example, the remaining EU demand could be met through imports from the global market depending on the EU’s relative strength in the technology, geographic location and specific characteristics of the product’s supply chains. The EU’s position on the bio-based chemicals and materials focused refineries at global scale is discussed in the comparison of supply in the EU to supply in top 10 non-EU countries in database.
Alternatively, the projections developed in the alternative bio-based chemicals and materials ramp-up routes could be another way to supply the EU demand. However, the ramp up of alternative routes may introduce some feedstock competition with the supply ramp up of some pathways. For example, the alternative route utilising crop-based fuel-focused biorefineries switching focus to the chemicals market directly compete with pathways A and B both relying on crop as feedstock. This should be acknowledged when attributing remaining demand to the alternative ramp up routes.
These high-level estimates are open to a degree of uncertainty. The underlying assumptions were validated with relevant stakeholders during the second stakeholder workshop.

276
6 WP 6 – EU BIOREFINERY OUTLOOK AND ROADMAP FOR DEPLOYMENT
This section includes i) roadmaps to help ramp-up chemical and material driven biorefineries, ii) an outlook for deployment of biorefineries in the EU to 2030 and the associated capital required as well as EU level benefits. It was led by E4tech.
6.1 Objective
The objectives of WP 6 are:
Objective 1: to develop a roadmap with the actions needed to ramp-up chemical and material driven biorefineries, and highlight the EU wide benefits that could be achieved.
Objective 2: to develop an outlook for deployment of biorefineries in the EU to 2030, based on potential ramp up per pathway, potential production capacities, and capital required.
6.2 Approach
The following approach has been taken:
1. Summarise barriers and identify actions
2. Map actions on timeline and attribute actions by stakeholder group
3. Develop the biorefinery outlook for deployment in the EU
4. Quantify EU GHG reduction and local jobs creation potential
To summarise barriers and identify actions firstly all relevant information developed in previous WPs was collected, this included:
• Barriers from WP 2 and 3 (including the findings from the stakeholder workshops)
• Research needs from WP 3
• Policy drivers from WP 2
We further developed this work by clarifying/adding to the barriers from these WPs, rearranging them by pathway (as defined in WP 3), adding more barriers from literature, developing actions for them and adding comments/questions where some discussion on these is required. These draft results were then developed further in three 2 hour virtual workshops ran by E4tech with partners from WUR, FNR and BTG.
In these workshops we:
• reviewed the barriers and actions for each pathway, and made sure we have a complete and correct agreed list of actions for each pathway, to form the basis of the roadmaps.
• discussed the impact of these barriers and actions on EU biorefineries. This helped to develop an outlook for deployment i.e. given these barriers and actions, what is deployment likely to be compared with the high and low scenarios developed in WP 5 (see the following section – outlook for deployment).
Once all the barriers and actions were developed, these were mapped on a timeline and then each action was attributed to one or more stakeholder groups.

277
The barriers and actions, as well as the roadmaps are provided in the following sub-section ‘Chemical and material driven biorefinery roadmaps’.
Figure 114. Roadmap example and keys685
The categories (e.g. economic) are aligned with the sub-headings within the ‘barriers and actions common to all pathways’ and pathway-specific sections. The actions are summarised in the roadmaps and are described provided in more detail in these sub-sections.
The stakeholder types represented are:
• Policy makers (P)
• Bio industry & associations (B)
• Chemical/material industry & Industry associations (C)
• Academia & Research institutions (A)
• NGOs & Civil societies (N)
• Investment Community (I)
The draft roadmaps were presented to the Stakeholder Advisory Group in early January 2021 to assess whether all actions needed to overcome barriers have been identified and characterised correctly.
The next part was to develop the outlook for deployment which estimates the number of additional biorefineries to be built by 2030, the total additional installed capacity for chemicals and materials by pathway by 2030 and the capital investment required for this level of deployment. This level of deployment is, as far as possible, the level of deployment to be expected if all of the actions were completed according to the roadmaps.
The outlook for deployment then forms the basis of the estimation of the potential EU benefits including GHG reduction potential versus fossil comparators, local jobs creation and increased raw material security.
685 For this pre-final report the by pathway roadmaps are shown in a different format that the roadmap common with actions common to all pathways.
2020 2025 2030
EC
ON
OM
ICS
TR
AT
EG
ICD
IRE
CT
ION
• Clear market based policy in place • Sustainability framework in operation• 42 additional biorefineries across different pathways • Potential GHG savings of 3.5 million tonnes CO2eq
EX
PE
CT
ED
ST
AT
US
Consider all biomass and land-using activities when setting strategies for each. For example, on circular economy, bioeconomy and food
Policy design to enable non crop/ low land use impact routes
Set strategic objectives for the biorefinery sector overall including acceptable use of land and crops
Set EU sector targets for GHG reduction in EU chemicals production
Develop EU mandate for GHG reduction in chemicals sold in the EU
Develop EU mandate for bio/low GHG content for hard to recycle products
Implement increasing EU mandate for GHG reduction in chemicals sold in the EU
Implement EU mandate for bio/low GHG content for hard to recycle products
Ban sale of selected non-recycled fossil-based products and/or set a reducing target for fossil material used
Chemical producers and users set voluntary GHG reduction commitments
Develop MS public procurement standards specifying bio, recycled or CO2-based products
Implement MS public procurement standards specifying bio, recycled or CO2-based products
Tax fossil input to chemicals industry
Reform EU ETS to increase CO2 price
Develop Carbon Border Adjustment Mechanism
Implement Carbon Border Adjustment Mechanism
Support investigation of optimal use of EU biomass feedstock
Conduct R&D focusing on cost reduction across all biorefinery pathways through continuing activities such as Horizon Europe, Circular Bio-based Europe and MS support
Establish partnerships to develop biorefineries on existing industrial sites to reduce costs
Improve process economics by identifying connections between different pathways and other industries
Expand biomass/waste feedstock databases to identify low cost resources
Develop regional bioeconomystrategies
Consider CCU in the EU ETS
Harmonise bioproducts’ sustainability requirements with existing schemes
Stakeholder type
Policy makers
Bio industry & associations
Chemical/material industry & Industry associations
Academia & Research institutions
NGOs & Civil societies
Investment community Policy & regulation
Support for RD&D and scale up
Information and coordination
Type of actions

278
6.3 Chemical and material driven biorefinery roadmaps
In the following sub-sections the barriers and actions are described. These are separated into barriers and actions relevant to all pathways, and those relevant to each pathway. The barriers and actions are listed in order of importance as indicated by stakeholders in the first virtual stakeholder workshop held in October 2020, and categorised by type (e.g. economic). It is also important to note that:
• Some barriers are common to all pathways, and so are introduced first.
• Some barriers are common to several of the pathways, and so are repeated in each pathway section. However, one barrier may be critical for one pathway, but less important for others, and so its description may vary between pathways.
• Many barriers require multiple actions to overcome them. Similarly, one action may help to overcome multiple barriers for one or more pathways. For completeness, this section sets out all barriers and actions for each pathway. In the later tasks which develop roadmaps for each pathway, actions that address multiple barriers and pathways are highlighted.
• Technical development needs are given for each pathway in WP 3, and so are not repeated here unless they result in the need for an action beyond R&D or further deployment e.g. the need to encourage organisations to work together.
• The actions shown in bold are shown on the roadmap infographic. If not bolded, no separate chevron is shown as these actions are linked with the common actions already. The infographics are provided to provide an overview of the roadmap actions only.
BARRIERS AND ACTIONS COMMON TO ALL PATHWAYS
Economic
The main barrier to bio-based chemicals and materials deployment is economic: there is a large gap between the market’s willingness to pay for these products and their production costs in most cases. This is a result of no increased willingness to pay for renewable/low carbon/bio chemicals and materials, low costs of the fossil-derived equivalents, competition with biofuels markets, and high production costs of bioproducts. In addition, EU biorefineries are likely to have higher costs than those outside the EU. This barrier was seen in all the case studies in WP 3.

279
2020 2025 2030
EC
ON
OM
ICS
TR
AT
EG
ICD
IRE
CT
ION
• Clear market based policy in place • Sustainability framework in operation• 42 additional biorefineries across different pathways • Potential GHG savings of 3.5 million tonnes CO2eq
EX
PE
CT
ED
ST
AT
US
Consider all biomass and land-using activities when setting strategies for each. For example, on circular economy, bioeconomy and food
Policy design to enable non crop/ low land use impact routes
Set strategic objectives for the biorefinery sector overall including acceptable use of land and crops
Set EU sector targets for GHG reduction in EU chemicals production
Develop EU mandate for GHG reduction in chemicals sold in the EU
Develop EU mandate for bio/low GHG content for hard to recycle products
Implement increasing EU mandate for GHG reduction in chemicals sold in the EU
Implement EU mandate for bio/low GHG content for hard to recycle products
Ban sale of selected non-recycled fossil-based products and/or set a reducing target for fossil material used
Chemical producers and users set voluntary GHG reduction commitments
Develop MS public procurement standards specifying bio, recycled or CO2-based products
Implement MS public procurement standards specifying bio, recycled or CO2-based products
Tax fossil input to chemicals industry
Reform EU ETS to increase CO2 price
Develop Carbon Border Adjustment Mechanism
Implement Carbon Border Adjustment Mechanism
Support investigation of optimal use of EU biomass feedstock
Conduct R&D focusing on cost reduction across all biorefinery pathways through continuing activities such as Horizon Europe, Circular Bio-based Europe and MS support
Establish partnerships to develop biorefineries on existing industrial sites to reduce costs
Improve process economics by identifying connections between different pathways and other industries
Expand biomass/waste feedstock databases to identify low cost resources
Develop regional bioeconomystrategies
Consider CCU in the EU ETS
Harmonise bioproducts’ sustainability requirements with existing schemes
Stakeholder type
Policy makers
Bio industry & associations
Chemical/material industry & Industry associations
Academia & Research institutions
NGOs & Civil societies
Investment community Policy & regulation
Support for RD&D and scale up
Information and coordination
Type of actions

280
Figure 115. Roadmap with actions common to all pathways
Barrier: Little willingness to pay for bio-content - Most consumers are willing to pay little or no more for bio-based products, in particular for commodities (source: WP 2 (2020). There has yet been any EU-level demand side policy support that would create a higher willingness to pay.
2020 2025 2030
SC
ALE
UP
OF
NE
WT
EC
HN
OLO
GIE
SS
US
TA
INA
BIL
ITY
FEE
DS
TO
CK
MA
RK
ET
EN
TR
YContinue EU public co-financing for pilot/demonstration plants
Pilot plant data collection to help develop early stage TEAs and modelling
Reduce scaling up costs by making available/providing support for shared facilities
Ensure classification of biorefinery projects under the EU’s Sustainable Finance Taxonomy
Increase equity investment in companies
Implement grant/ loan scheme for feasibility studies
Additional support for new technologies such as sub-targets or subsidy for limited volumes of products from new pathways
Invest in enhancing the engineering know-how of academic research teams
R&D on European biomass resource potential
Provide funding for regional and local biomass resource assessments
Support more projects to develop tools/platforms to support biomass supply chains
Support establishment of biomass supply companies
Include crops for biorefineries in GM crop policy
Enhance targets for collecting and recycling wastes
Develop policy to align material classification as waste, residue or coproduct in all MSs
Implement EU-level matchmaking programme for companies
Reduce REACH registration fee for sustainable chemicals
Develop a standard for bio-based products’ sustainability
Implement a standard for bio-based products’ sustainability
Support from EU/ MSs for SMEs to comply with sustainability standards
Provide EU funding to quantify risk of undegraded compostable plastic residues
Agree policy on biodegradable bioplastics
Organise information campaigns on GMMs used in bioprocesses
Develop bio-based product labels
Early adoption of labelled products in highly visible markets
Establish bio-based terminology for all products
Require publicly supported projects to assess sustainability impacts and communicate this transparently
Provide support for green hydrogen projects in biorefineries

281
Action: Set EU level sector targets for GHG reduction in EU chemicals and materials production to set a trajectory for reduction e.g. adopt CEFIC target for net zero by 2050 in EU law, with interim years’ targets.
Action: Develop and implement increasing EU level mandate for GHG reduction in chemicals and materials sold in the EU that could be met through use of bio-based, recycled686, CO2-derived or otherwise lower lifecycle GHG content. Note that this is preferable to a bio-based mandate only as it leaves it open to companies to innovate to find the lowest cost GHG reduction options, which in some cases may not be bio-based. This could be for volumes above 1 tonne as defined by REACH. The obligation could be set at a company level, so that companies would have flexibility to comply through reduction in some products first, rather than mandating equal reductions across all products.
Action: Develop and implement an EU level mandate for bio-based/lower lifecycle GHG emissions for hard to recycle products sold in the EU e.g. coating, solvents, surfactants, lubricants.
Action: Ban sale of selected non-recycled fossil based products, in particular those with short lifetime, to encourage bio-based, CO2-derived and recycled products, as has been done with plastic bags in many countries and regions worldwide. Could be set in the future to give time for the industry to ramp up. Alternatively set a reducing target for the volume of fossil material used by the sector (though this may be difficult to assess for imported products).
Action: Coordinated voluntary commitments from product users/brand owners/chemicals and materials producers to use a specified renewable content or achieve a minimum GHG reduction from the chemicals and materials they use (which would also incentivise recycled and CO2-based content, but not be limited to recycling as with some current commitments). This could build on the Renewable Carbon Initiative687. This has the potential to be introduced faster than an EU mandate, so could be encouraged while a mandate was in development, and used to build experience with certification.
Action: Member State public procurement standards specifying only low GHG products (e.g. achieved through use of bio-based, recycled or CO2-based content) e.g. for use by public organisations. This also has the advantages of demonstrating and publicising performance and use.
Action: improved labelling of bio-based products to encourage consumer demand (see sustainability actions later in the text).
Barrier: Low cost of fossil equivalents – fossil chemicals and materials producers benefit from economies of scale, commoditised low cost feedstocks and mature technology. In addition, non-EU fossil-based producers can have low production costs as they do not have to pay for CO2 emissions (source: WP 2 (2020))
Action: Tax fossil inputs to the chemicals and materials industry to encourage biomass, CO2 and recycled input at EU or MS level.
Action: Reform the EU ETS so that fossil based chemicals and materials producers pay more for the CO2 they emit.
686 Planned policy for recycled plastics is already expected as a result of the Plastic Strategy in 2018 - a levy on non-recycled plastic waste (estimated to be EUR 0.8 per kg) if implemented in 2021. This is expected to increase recycling rates. Source: European Commission. EU Plastics Strategy. 2018. Available online at : https://ec.europa.eu/environment/waste/plastic_waste.htm
687 Renewable Carbon Initiative. nova-Institut GmbH. n.d. Available online at: https://renewable-carbon-initiative.com/

282
Action: Develop and implement a Carbon Border Adjustment Mechanism (CBAM) at EU level.
Barrier: Competing EU policy support for biofuels and biomass heat and power means they can outcompete the bio-based products sector for products (e.g. methanol, ethanol) and biomass feedstocks.
Action: A range of types of policy support for bio-based products and other low lifecycle GHG alternatives, as described under the above barrier, to ensure that they can compete with fossil based products. Note, however that this does not mean setting policies for bio-based products such that they have the same premium in biofuels/energy and bio-based chemicals and materials markets: if the cost of GHG saving in the bio-based chemicals and materials sector is lower (for example if recycling is a cheaper option) then the biofuels/energy market may always outcompete the bio-based chemicals and materials market.
Action: Further investigate the optimal use of EU biomass feedstock in terms of sustainability (e.g. highest economy wide GHG savings), taking into account environmental and social impacts, cascading uses, food and non-food applications.
Barrier: Bioproduct production costs are expected to be higher than those for fossil equivalents in the long term, and actions are needed to minimise these
Action: R&D on all pathways to bring cost savings through more efficient processes and/or larger scale, optimisation and integration and upgrading of biomass side-streams to high value products. Specific technology development needs are given in WP 3. There are many R&D support activities already underway and planned, as discussed in WP 3, and listed below. This should include increasing funding levels for these activities, ensuring increased financial contributions from the private sector, and ensuring that both open calls and more directed activities are maintained.
• Horizon Europe - covering fundamental and applied R&D, pilot projects, demonstration and flagship projects and accompanying actions.
• Potential follow-up of the BBI-JU by the new EU Partnership Circular Bio-based Europe (CBE), making available significant public-private budget to support technology development, demonstration and market introduction.
• MS level R&D support through grants, networks, encouraging R&D in industry e.g. through tax breaks.
Barrier: Limited integration of processing steps – limited integration of bioproduct process steps (e.g. oil extraction and oleochemical production) or between bioprocesses and other industries limits improved energy efficiency, reduced water use and reduced waste generation. Note that this is not always possible because the primary processing for imported raw material is done outside Europe (source: WP 3 Task3 (2020)).
Action: Decrease the CAPEX and OPEX of new biorefineries by developing these on existing industrial sites where they can share existing (operational or mothballed) infrastructure such as pipelines, storage facilities, buildings etc. (source: October workshop part 1). This could be done through funded programme by national and regional governments to identify and form relationships between biorefinery technology developers/start-ups and industrial complexes owners/operators to help promote the integration of conversion processes into brownfield existing industrial sites. (source: WP 3 Task3 (2020)). This could speed up discussions between these parties compared with the approach today involving multiple bilateral pitches between developers and site owners. See WP 5 for details of locations of existing industrial sites in the EU.

283
Action: Bio-based materials and chemical industries to work together to identify connections between different pathways (e.g. pathways A and B starch can be converted to sugars, pathway C and G integration of the oil platform) and with other industries to improve overall process economics (WP 3 Task3 (2020)).
Barrier: Lack of cost competitiveness for some EU biorefineries - due to higher labour costs affecting CAPEX and OPEX, higher taxes, higher energy costs, and limited low-cost biomass feedstocks compared to some other regions in the world (source: October workshop part 1). Costs of feedstock produced in Europe are generally high compared to other regions, related to scarcity of land, relatively high farming incomes, quota and tariffs, and demonstration of the necessary environmental sustainability standards by farmers, which requires complex and time-consuming procedures to demonstrate biomass sustainability (WP 2). This is particular relevant for biorefineries producing larger volume commodities, whilst those producing innovative, often lower volume and higher products are less effected. Some actions have already been taken such as valorising protein sales, but limited actions are possible here related to imported products, given the need to avoid barriers to trade. Nevertheless, actions are possible to help EU biorefineries to produce at the lowest cost:
Action: Support identification of low cost feedstock resources and facilitate industrial symbiosis e.g. further develop EU feedstock databases (e.g. JRC-ENSPRESO, S2BIOM) to provide information on waste streams (e.g. manure, sewage sludge, tallow, waste wood etc..) from all major sectors at a local level that could be low cost feedstock for chemicals and materials and energy.
Action: Develop regional bioeconomy strategies that can bring lower costs and boost rural deployment of biorefineries through identifying industrial sites, feedstock availability, shared infrastructure, enabling skills development. For example, this has been the focus of the BIOEAST project (www.bioeast.eu), supplemented by JRC work.
Action: Harmonisation of sustainability requirements developed for bioproducts (see below) with existing standards and schemes as far as possible to reduce compliance costs e.g. biofuels/bioenergy sustainability requirements and certification in RED II, woody biomass-based industries management schemes.
Barrier: Inability to valorise carbon storage in materials - The EU ETS allows for the capture of CO2 to be included. However, the use of CO2 in further processes and products (Carbon Capture and Utilisation, CCU) is not recognised in the current (third period) EU ETS. This also affects the chemical utilisation of CO2 emitted from renewable carbon sources. This is a barrier for products produced in biorefineries, made from CO2. (source: WP 2 (2020))
Action: Consider allowing CO2 use in further processes and products (Carbon Capture and Utilisation, CCU) to be recognised in the current (third period) EU ETS.
Strategic direction
Whilst the barriers to each pathway have been considered separately, there are some barriers to which the solution is to focus more effort in terms of policy support or RD&D on another pathway with lower impacts. Similarly, there may be a need for prioritisation between uses of land or biomass between multiple end use sectors where resources are scarce and/or shared.
Barrier: Lack of strategic direction covering all areas affecting bioproducts – although there are many existing strategies and policies, for example on biofuels, bioeconomy, circular economy and Farm to Fork strategy, renewable energy, these can

284
overlap and conflict, rather than always considering bioproducts alongside other biomass and land uses.
Action: Consider all biomass and land-using activities when setting strategies for each, rather than focusing on one area.
Barrier: Lower environmental impacts are achievable via pathways that are generally more expensive and at an earlier stage of commercialisation - pathways using non-food/feed competing biomass can have lower environmental impacts, but are generally more expensive and at an earlier stage of commercialisation. This means that policies put in place to support bioproducts in general may be met by increasing supply of pathways A-C, with lower costs but higher associated impacts, rather than bringing other routes to commercialisation.
Actions: Consideration of strategic objectives for the biorefinery sector overall, including agreement on acceptable levels of use of land and crops and the interaction of this demand with other sectors.
Actions: Policy design to enable non crop/ low land use impact routes, enabling secondary feedstocks. See other actions on non-food/feed pathways.
Scale up of new technologies
Achieving scale up of new bioproduct conversion technologies is challenging, because of the level of investment required in plants, coupled with technology and market risk hindering financing. The high production cost from early plants at sub-commercial scale is also even higher than from commercial plants, exacerbating the economic barriers above. In addition, there is a lack of skills in some areas.
Barrier: Validation of new technologies at demonstration and pre-commercial scale is expensive. It is difficult for biorefineries to attract investment for these plants. This is a major bottleneck in commercialisation of new technologies. (source: WP 2 (2020), WP 3 Task3 (2020))
Action: EU level public co-financing for pilot/demonstration plants through continued initiatives for public-private partnerships projects (e.g. new EU Partnership Circular Bio-based Europe (CBE)), with increased budgets. (source: WP 3 Task3 (2020)). This should facilitate partnerships between large players with access to capital and project development experience and earlier stage bioproduct conversion technology developers, to give confidence to other investors that a technology has been validated, and showing that there is interest from the market.
Action: Validate techno-economic modelling using data from pilot plants, to generate empirical rules of thumb688 which can be disseminated to facilitate learning and understanding on scale up and inform the market on prospective costs of scale up plants for different pathways to help with commercial scale up. (source: WP 3 Task3 (2020))
Action: Maintain opportunities for/provide support for shared facilities to enable reduced costs of scale up steps, such as the Bio Base Europe Pilot Plant, shared gasification facilities.
688 See for example: Antal et al. Rules of Thumb (Empirical Rules) for the Biomass Utilization by Thermochemical Conversion. Journal of the Japan Institute of Energy, 93, 684-702. 2014. Available online at: https://pdfs.semanticscholar.org/ee89/6e67cb2bfa5c623c18ef675343f8687821e0.pdf

285
Action: Ensure that biorefinery projects are adequately classified under the EU’s Sustainable Finance Taxonomy689. The Taxonomy covers several areas related to biorefineries including agriculture and forestry, and manufacture of chemicals and plastics. Within these, restrictions are set for each activity, such as avoidance of use of high carbon stock land, the need for farm sustainability plans and forest management plans, and for third-party verified GHG saving requirements for chemicals compared with their fossil equivalents. Note that the Draft Act also states that food or feed crops may not be used as bio-based feedstock for the manufacture of organic basic chemicals or of plastic in primary form under the Taxonomy, so the Taxonomy would support only non-food/feed pathways D-K. Overall, the requirements for financing need to be carefully considered to ensure sustainability without unnecessarily restricting biorefinery development.
Barrier: Technology developers’ lack of access to funding for plant feasibility studies. In order to attract investment to projects, site identification, feedstock assessment and pre-feasibility studies are needed, which can be expensive.
Action: Increased equity investment, for example through the EC and EIB European Circular Bioeconomy Fund (ECBF)690
Action: Grant or loan scheme for feasibility studies for projects to developers to identify sites and feedstocks and attract investment, at EU or MS level.
Barrier: High bioproduct production costs today due to earlier stage of technology development than fossil routes and many plants operating at below their commercial scale. Bringing down these costs would help close the gap between production cost and the market’s willingness to pay. (source: WP 3 Task3 (2020)). In addition to the actions to overcome long term economic barriers above, additional time limited actions are needed to support near term development
Action: Additional support for new technologies within any market based policy, such as sub-targets for less commercialised and/or more sustainable technologies.
Action: Subsidy for limited volumes of products from new pathways from projects including the producer and end user (e.g. plastic end user agrees to use new bioplastic which costs 1.5x the incumbent. Subsidy covers all or a proportion of the increased cost for the first 10 years.)
Action: Support for projects (as above)
Barrier: Academic research teams have limited engineering know-how required for scale-up (source: WP 2 (2020), WP 3 Task3 (2020))
Action: Continue funding collaboration between research and engineering teams and industry players through the R&D actions set out in the economic barriers section (source: WP 3 Task3 (2020))
Barrier: Challenges in financing commercial scale projects related to uncertainty around policy and technology risk. Biorefineries have a 20+ year lifetime and financing of projects is likely to include ~10 year payback period. Venture capital, private equity or
689 European Commission. Sustainable finance – EU classification system for green investments. Draft regulation and annexes for EU taxonomy for sustainable activities. 2020. Available online at: https://ec.europa.eu/info/law/better-regulation/have-your-say/initiatives/12302-Climate-change-mitigation-and-adaptation-taxonomy#ISC_WORKFLOW
690 European Circular Bioeconomy Fund (ECBF). N.d. Available online at: https://www.ecbf.vc/ and Tg. EIB and EC launch circular bioeconomy fund. European Biotechnology. 2020. Available online at: https://european-
biotechnology.com/up-to-date/latest-news/news/eib-and-ec-launch-circular-bioeconomy-fund.html

286
strategic investors will not make significant investments without policy certainty. If there is uncertainty around policy then projects are perceived as more risky.
Action: Any of the new policies presented as Actions here should have a 10+ year time horizon. Sustainability aspects should have a pre-announced review periods.
Action: Increased equity investment and loans, for example through the EC and EIB European Circular Bioeconomy Fund (ECBF)691
Sustainability
The main advantage of bio-based chemicals and materials lies in their environmental benefits (such as GHG emissions reductions). In order for these benefits to be valued, they need to be measured and broadly understood.
Barrier: Lack of evidence on the sustainability benefits of bioproducts – information on sustainability is needed for every bioproduct to demonstrate value and avoid sustainability impacts. Some bioproducts may have low GHG savings or even GHG increases compared with fossil products depending on the feedstocks and pathways used. Uncertainty over this performance was seen as a barrier in case studies, for example for thermoplastic starch (WP 2 & WP 3). There is also concern over the impact of bio-based products on the recyclability of waste streams. Establishing where benefits exist is essential where public support is given, but would also be important in building end user and consumer confidence in the absence of policy support. As this evidence requirement is more stringent than for fossil equivalents, this adds to the cost differential between them, and fulfilling this requirements could be a particular burden for SMEs. (source: WP 3 Task3 (2020), WP 2 (2020) p.14)
Action: Develop and implement a common EU level standard for assessing, verifying and communicating on environmental sustainability of bio-based products including, as a minimum, lifecycle GHG savings and environmental sustainability, as in RED II for biomass feedstocks for fuels, heat and power. This would consist of methodology and standard development, identification of certification bodies, and guidance on communication e.g. labelling. The standard could cover bio-based products alone, or could include other lower GHG options. It would build on previous activities in this area such as the work of CEN/TC 411 on bio-based products, which developed standards developed a series of horizontal standards692, including addressing sustainability, lifecycle assessment, labelling and terminology, which cover many of these areas but do not yet include aspects such as assessment methods and thresholds that would be needed to make claims or underpin a policy mechanism, and have not had broad multistakeholder input. It could also build on Product Environmental Footprints (PEF) which have been piloted and are now in a transition phase with methodologies and product category rules being further developed693. This action should consider other existing standards that have already been developed such as the Roundtable on Sustainable Biomaterials’ Advanced Products standard which require at least a 10% GHG saving.
Action: EU or MSs to provide support for SMEs to comply with the standards above, for example to carry out LCAs, such as subsidised provision of LCA studies, development of simplified LCA tools for ongoing use in-house, access to training.
691 European Circular Bioeconomy Fund (ECBF). N.d. Available online at: https://www.ecbf.vc/ and Tg. EIB and EC launch circular bioeconomy fund. European Biotechnology. 2020. Available online at: https://european-
biotechnology.com/up-to-date/latest-news/news/eib-and-ec-launch-circular-bioeconomy-fund.html 692 CEN/TC 411 - Bio-based products. Available online at: https://standards.cen.eu/dyn/www/f?p=204:32:0:::: FSP_ORG_ID,FSP_LANG_ID:874780,25&cs=1D63BAA7EABE56EB230DDAA05D6F2CE70 693European Commission. The Environmental Footprint transition phase. 2019. Available online at:
https://ec.europa.eu/environment/eussd/smgp/ef_transition.htm

287
Action: EU funding for a study to quantify the risk that undegraded compostable plastic residues in compost or digestate. This will help determine whether and further policy should be agreed on biodegradable bioplastics.694
Action: Organise information campaigns to raise awareness and clarify misconceptions of GMMs used in bioprocesses, given that there is existing EU legislation covering their use, and they can increase product yield, ability to use different feedstocks and to generate a larger portfolio of products. (source: WP 2 (2020))
Barrier: Lack of visibility of the benefits of bio-based products - the concept of “bio-based” is perceived as poor marketing term. Some customers associate “bio-based” with having a lower quality and/or a higher price. For producers and consumers (and some policy makers) alike, being bio-based is (in itself) not or no longer a fully convincing sale argument (source: WP 2 (2020)). Terminology (e.g. “bio-based”, “biodegradable”) used can be confusing for consumers: e.g. “biolubricant” can refer to products derived from renewable sources or to a biodegradable lubricant derived from petroleum-based sources.
Action: Develop bio-based product labels or other instruments to communicate the benefits of bio-based products to public procurers and consumers, based on the standards above (source: WP 3 Task3 (2020)).
Action: Early adoption of labelled products in highly visible markets such as through public procurement, marketing by end-users in high profile products.
Action: Establish an agreed terminology within/alongside the standards above, which covers all products, making these protected terms (such as with the label ‘organic’ within EU food policy) so that they cannot be incorrectly applied.
Action: Ensure that any publicly supported projects assess sustainability impacts fully, and communicate transparently about sustainability performance, to increase publicly available information and policymaker and investor confidence.
Barrier: Fossil hydrogen and derivatives use in several pathways limits the GHG reduction potential of these biorefinery pathways - Fossil hydrogen is used in several pathways, for example to produce propylene glycol, giving lower GHG benefits than would be achieved using green hydrogen.
Action: Quantify, regulate and communicate the benefits of lower GHG hydrogen use through the actions on sustainability standards and communication set out above.
Action: Support for green hydrogen projects at biorefineries, for example through the Innovation Fund, which is expected to support other hydrogen projects and policy developed from the EU’s ‘A hydrogen strategy for a climate-neutral Europe’.
Feedstock
Barrier: Concern over biomass supply potential. All bio-based product pathways, to varying degrees, have near-term concerns about feedstock supply and mid-long term concerns over feedstock availability (source: WP 2 (2020), WP 3 Task3 (2020)). In the near term, identification of locations for plants based on feedstock availability can be time consuming, in particular assessing competition from other demands, and before plants are
694 European Commission. Relevance of biodegradable and compostable consumer plastic products and packaging in a circular economy. 2020. Available online at: https://op.europa.eu/en/publication-detail/-/publication/3fde3279-77af-11ea-a07e-01aa75ed71a1

288
built it is essential to secure reliable supplies. In the mid-long term, all biomass feedstocks have resource limits, and the uncertainty over these limits is in itself a barrier to policymaker action and investor confidence in bioproducts. As these barriers, and the actions to overcome them are specific to the different pathways, they are covered in the pathway-specific sections. However, there are some actions that could benefit all pathways:
Action: Further research and information provision on biomass resource potential across Europe, including identifying areas of high feedstock density or potential, and in particular sources that have low competition with food/feed (source: WP 2 (2020)). This is needed so that overall regional potential and impacts can be assessed, alongside other biomass uses.
Action: Funding for consistent regional and local biomass resource assessments, including all feedstock types, so that regions can identify local resources that could be used for bioproducts, including supply chain flexibility options, and attract projects on this basis. This should take into account existing competing uses, which are difficult to identify in projects with a wider geographical scope, and are crucial to determining where potential exists.
Action: Continue support for projects supporting biomass supply chains such as the EU project Enabling695, which is working on a biomass trade platform, tools and methodologies for collaboration and knowledge transfer, creation of spaces for sharing best practices, brokering innovation and providing stakeholders with coaching and guidance.
Action: Support establishment of biomass and waste supply companies. This entity would work with technology developers and/or resource holders to find suitable sites, and guarantee feedstock supply and quality, serving bioproduct, fuel and energy industries.
Action: Consider crops for biorefineries when considering the regulation of GM crops in general, to establish whether there are opportunities with acceptably low risks. (source: WP 2 (2020))
Barrier: The availability of secondary biomass feedstocks and economics of using these are unclear. The Waste Framework Directive (WFD) was established in 2008, and was updated in 2018. However, sometimes non-uniform classification of materials as waste, residue, or coproduct, which leads to loopholes that cannot be addressed by national legislation alone. This can result in problems with end-of-life treatment, how the biorefinery is characterised (as waste treatment facility or production facility), and whether the final products can be classified as ‘product’ or ‘waste’.
Action: increase the availability and reduce costs of secondary biomass feedstocks through the EU Circular Economy Package (CEP) by supporting and enhancing targets for recycling wood packaging, an obligation to collect biowaste separately, food waste collection and bioplastics collection and recycling.
Action: develop policy to align the classification of materials as waste, residue or coproduct in all MSs that support the use of secondary biomass feedstocks for pathways D-K.
695 ENABLING - Enhance New Approaches in Bio-based Local Innovation Networks for Growth. H2020. N.d. Available online at: https://www.enabling-project.com/

289
Market entry
Biorefineries products are diverse and used in multiple markets, some of these have high barriers to entry.
Barrier: Difficulties entering multiple markets - Multiple products that serve multiple markets requires a divided focus of biorefineries, though increases the robustness of the business model. It is difficult to enter existing markets due to competition, and for customers to change suppliers (source: WP 2 (2020))
Action: Implement an EU-level matchmaking programme matching companies in different sectors and parts of the value chain with each other (e.g. technology developers with conventional chemical/materials companies).
Barrier: Complicated and costly procedures for bioproducts approval – The REACH requirement to register new chemical substances manufactured or imported in quantities of 1 tonne or more per year is a significant barrier for innovative biorefinery products. Registration procedures are both time consuming and costly.
Action: REACH registration fee reduction and fast-tracked procedure for chemicals that deliver GHG or other environmental benefits.
Technical performance of products
The technical performance of bio-based chemicals and materials can be different from and in some cases lower than the fossil products they are substituting. It is also costly and takes significant time to prove the performance of new products. This is addressed in WP 3, with the actions needed being covered elsewhere i.e. continued RD&D support, including collaborations between private and public players.
PATHWAY SPECIFIC ROADMAPS
A. One platform (C6 sugars) biorefinery using sugar crops
This pathway operates at commercial scale today for production of some products in and outside the EU (bioethanol and bio-based ethylene, ethylene oxide, mono ethylene glycol (MEG), lactic acid and sorbitol). Barriers to increased production from this pathway, of these products and of more novel options, are principally those relevant to all pathways: in particular overcoming the economic barrier to greater demand. Nevertheless, there are other actions that could further support this pathway specifically: technical improvements for particular products that could reduce costs or increase potential markets. In addition, whilst feedstock supply chains are well established, actions are needed to overcome continued concerns over feedstock availability and impacts.

290

291
Figure 116. Pathway A roadmap

292
Economic
Barrier: Lack of diversification of by-products - Insufficient diversification of by products and intermediate products like sugar beet residues and bagasse, into added value secondary products. Need to develop added value secondary products (e.g. sugar beet pulp or DDGS to food additives, chemicals or materials, use of CO2) (source: WP 3 Task3 (2020),common to pathways A, B, C)
Action: Joint action between industry players to increase the visibility of by products and secondary products to potential users in other market sectors, through a platform coordinated by industry bodies.
Feedstock
Barrier: Limited availability of sugar feedstock from domestic EU production – concern over the impacts of use of sugar crops for bioproducts and biofuels as a result of competition for feedstock and land with food production. Some concern over indirect land use impacts. As a result, continued uncertainty over the amount of sugar feedstock that can be used sustainably for bioproducts and biofuels. (source: BIO TIC (2015), p.10, (related to case study products lactic acid and PLA and acetic acid (pathway A) common to pathways A, B, C, Source WP 3 Task 4)
Action: Consideration of the potential demands of the biochemicals sector for sugars in agricultural policy and EU sugar market policy.
Action: Consideration of the potential demands of the biochemicals sector for sugars alongside use for biofuels, when assessing impacts of non-food sugar use, such as indirect land use change.
Action: Assess the potential for use of sugar beet production and ethanol plants currently dedicated to biofuels production in the EU for biochemicals production, based on declining gasoline demand696, and develop targeted action plans to enable transition of these crops and/or facilities to biochemicals. This could include developing dehydration plants to produce ethylene that could be integrated into the European ethylene pipeline network.
B. One platform (starch) biorefinery using starch crops
As with pathway A, this pathway operates at commercial scale today for production of some products (bioethanol, starches, polyols, acids). Barriers to increased production from this pathway, of these products and of more novel options, are principally those relevant to all pathways: in particular overcoming the economic barrier to greater demand. Nevertheless, there are other actions that could further support this pathway specifically: technical improvements for particular products that could reduce costs or increase potential markets. In addition, whilst feedstock supply chains are well established, actions are needed to overcome continued concerns over feedstock availability and impacts.
696 The level of electrification as well as the blending levels, ethanol’s use as a sustainable aviation fuel (SAF) and availability and cost of Brazilian and US ethanol imports are also major factors here

293

294
Figure 117. Pathway B roadmap

295
Economic
Barrier: Lack of diversification of by-products - Insufficient diversification of by products and intermediate products, into added value secondary products. Need to
develop added value secondary products (e.g. DDGS to food additives, chemicals or materials) (source: WP 3 Task3 (2020),common to pathways A, B, C).
Action: Joint action between industry players to increase the visibility of by products and secondary products to potential users in other market sectors, through a platform coordinated by industry bodies.
Feedstock
Barrier: Limited availability of starch feedstock from domestic EU production – concern over the impacts of use of starch crops (grains, potatoes) for bioproducts and biofuels as a result of competition for feedstock and land with food production. Some concern over indirect land use impacts. As a result, continued uncertainty over the amount of starch feedstock that can be used sustainably for bioproducts and biofuels. (source: related to case study acetic acid (chemical solvent), product thermoplastic starch (chemical polymers), pathway B only, WP 3 Task 4 (2020)).
Action: Consideration of the potential demands of the bio-based chemicals and materials sector for starch in agricultural policy.
Action: Consideration of the potential demands of the bio-based chemicals and materials sector for starch alongside use for biofuels, when assessing impacts of non-food starch use, such as indirect land use change.
Action: Assess the potential for use of starch currently dedicated to biofuels production in the EU for bio-based chemicals and materials production, based on declining gasoline demand, and develop targeted action plans to enable transition of these crops and/or facilities to biochemicals.
C. One platform (oil) biorefinery using oil crops, wastes and residues
As with pathways A and B, this pathway operates at commercial scale today. However the main barrier to continued or increased production from this pathway is feedstock sustainability and availability, as well as sustainability of the alkoxylation agent used if surfactants are produced (although this is largely fossil ethylene oxide and not included in this analysis). Oils have a more limited supply than feedstocks for most other pathways and increasing competition from food and fuel, as well as the potential for significant environmental impacts in some cases. Currently, fossil ethylene oxide is the most widely used alkoxylation agent therefore only a proportion of the surfactants produced via this pathway are bio-based.

296

297
Figure 118. Pathway C roadmap

298
Barrier: Environmental impacts of oil crop cultivation – direct and indirect impacts of oil crop cultivation such as deforestation and other land use changes with high GHG and biodiversity impacts, as well as cultivation impacts such as fertiliser use, in particular for oils produced outside the EU. (source: related to case study product propylene glycol (chemical additive), WP 3 Task 4 (2020)).
Action: Clarify the policy position on use of crop oils for bioproducts, and consider restriction of use of feedstocks with high direct and/or indirect impacts in bioproducts sold in the EU, analogous to the phase out of high ILUC crops in RED II for biofuels and bioenergy697, the proposed EU restriction on deforestation698, or the proposed UK ban on large businesses using commodities with forest risk (those that have not been produced in accordance with relevant laws in the country where they are grown)699. It is important to make sure that the same policies are used across all bio-based products rather than only covering some. Action: Promote voluntary commitments from producers and end users to avoid oil crops with high impacts, in particular in the interim before any other measures considered above are introduced. Action: Sustainability criteria and certification for bioproducts sold in the EU, as described under actions common to all pathways. A similar or harmonised approach could be taken to that used under RED II for biofuels. This would include a GHG savings threshold and land and woody biomass from forest-based industries management related criteria, and a certification system.
Feedstock
Barrier: Strong competition for oils with the food and biofuels industries – leading to feedstock supply and price uncertainty, potential for fraud in waste oils supply chains, and indirect environmental impacts, as above.
Action: Consideration of the potential demands of the biochemicals sector for oils in agricultural policy
Action: Support or mandate waste oils and fats collection at a local level to maximise availability of the resource
Action: Further develop EU databases to provide information on waste oils and fats from all major sectors at a local level that could be low cost feedstocks for chemicals and materials and energy
Action: Further investigate the potential for crops which do not lead to additional land demand, in parallel with work done on this area for biofuels700, such as intermediate crops
697 European Commission. Commission Delegated Regulation (EU) 2019/807 of 13 March 2019 on the determination of high ILUC-risk feedstock [..] and the certification of low ILUC risk biofuels, bioliquids and biomass fuels. 2019. Available online at: https://eur-lex.europa.eu/legal-content/EN/TXT/PDF/?uri=CELEX:32019R0807&from=EN and
European Commission. Report on the status of production expansion of relevant food and feed crops worldwide. 2019. Available online at: https://ec.europa.eu/transparency/regdoc/rep/1/2019/EN/COM-2019-142-F1-EN-MAIN-PART-1.PDF
698 European Parliament. Legislation with binding measures needed to stop EU-driven global deforestation. 2020. Available online at: https://www.europarl.europa.eu/news/en/press-room/20201016IPR89560/legislation-with-binding-measures-needed-to-stop-eu-driven-global-deforestation
699 DEFRA. Due diligence on forest risk commodities. 2020. Available online at: https://consult.defra.gov.uk/eu/due-diligence-on-forest-risk-commodities/
700 As above

299
Economic
Barrier: Few biorefineries have optimised process integration - Primary refining (oil extraction from crops) is generally separated from secondary refining, but there has been a recent trend towards integrated systems (BMFM (2018), p.82)
Action: Oleochemical and surfactant producers to further develop integrated biorefinery sites at existing sites in the EU vegetable and waste oils/fats processing industry. Aim to make integrated systems the standard for new installations (BMFM (2018), p.82)
D. Two-platform (pulp and spent liquor) biorefinery using wood
This pathway is in commercial operation today, centred around existing pulping processes mainly using wood chip residues from saw mills and thinning residues from forest management, and producing a wide range of products. Barriers and actions relate to increasing the product portfolio to improve profitability, ensuring a market for all forestry wood-based products to enable increased volumes of cascading uses to enable bioproduct deployment at scale, and process improvement to improve sustainability.

300

301
Figure 119. Pathway D roadmap

302
Feedstock
Barrier: Large scale increases in the production of high-value bio-based chemicals and biomaterials from the forest can be limited by the demand for other applications, including forestry products, bioenergy and biofuels. By-product chemicals and materials such as acetic acid and methanol from forest -based biorefineries account for a small share of the overall supply for these markets, while the materials from hemicellulose, crude tall oil, various solvents, lignin, resins, various microfibrillated cellulose and other fibres provide important input to their related market sectors already compensating some maturing core business areas. The feedstock (wood chips, pulpwood) for biorefineries to produce these is limited by the demand for saw logs used for construction, furniture, panel and wood packaging industry in Europe and globally. It is also dependent on the demand for pulp products such as paper, board and textile fibres.
Action: Supportive EU and national policy and design guidance for other woody biomass from wood-based industries products with GHG benefits, in particular increased use of wood in construction to give carbon storage, whilst creating more feedstock for bio-based products through a cascading use principle.
Action: Support the use of sustainable bio-based textile fibres from forest wood-based biorefineries (e.g. lyocell, cellulose acetate, microfibrillated cellulose fibres, new regenerative fibres etc..) through the Textile Strategy which is expected to be published in 2021.
Barrier: Supply chains for all woody biomass from forest-based industries products are not well established in some regions, meaning that the full potential of these feedstocks is not realised. This includes the BIOEAST region where in several countries (e.g. Lithuania) have large woody biomass from forest-based industries resources but lack “smart, value-adding sustainable value-chains and between their components a bioeconomy strategy”.701 Fragmentation of forest management across different bodies (e.g. state, large companies, cooperatives, individuals) can make it difficult to establish supply chains due to differences in priorities and motivations.
Action: Continued promotion of and knowledge sharing in sustainable wood from forest-based industries management practices between governments, private forest owners and NGOs
Action: Continued knowledge sharing on cascading uses of woody biomass from forest-based industries products
Action: R&D in technology for collection and pre-processing (e.g. densification), as well as funding for demonstration/early commercial projects, as described in WP 3, which would be supported by the R&D actions covered in the common economic barriers section.
Economic
Barrier: Bio-based acetic acid is currently not cost competitive – as with many products considered here, acetic acid from bio routes is currently not cost competitive. However, there is the potential to use acetic acid to produce cellulose acetate and acetylated wood MDF panels, both of which use other woody biomass from forest-based industries sector products. This combined offering could improve overall economics. New markets for cellulose acetate are needed, given the declining demand from cigarette filters.
701 Piotrowski, S., Dammer, L. State of play of central and eastern Europe’s bioeconomies. nova-Institute GmbH. 2018. Available online at: https://scar-europe.org/images/SCAR-Documents/Reports_outcomes_studies/BSW2_18-11-22_State-of-play-of-central-and-eastern-Europes-bioeconomies.pdf

303
(related to case study product acetic acid (chemical solvent), common to pathways A, B, D, I, WP 3 Task 4 (2020))
Action: Market study by the woody biomass from forest-based industries sector on acetic acid applications that also use woody biomass-based products, including assessing sustainability performance
Sustainability
Barrier: Chemicals and materials used in woody biomass-based biorefineries are consumed in large volumes and are primarily fossil based. Hydrogen peroxide (bleaching chemical) is primarily produced from fossil hydrogen and caustic soda (used in pulp production and to produce viscose fibres) is produced by the chloralkali process from electricity.
Action: Use lower carbon hydrogen to produce hydrogen peroxide (e.g. green hydrogen) – see common actions. Note: there are also electrochemical based routes direct to hydrogen peroxide under development (e.g. HPNow).
Action: Introduce policy to ensure that all chloralkali production (chlorine and caustic soda production) in the EU is produced using renewable electricity. This should be implemented with the CBAM to maintain competitiveness of the European chloralkali industry.
Action: Support the use of sustainable textile fibres from woody biomass-based biorefineries (e.g. lyocell, cellulose acetate microfibrillated cellulose fibres, new regenerative fibres etc..) through the Textile Strategy which is expected to be published in 2021.
Barrier: Existing knowledge gap on the issues related to health and safety of micro-fibrillated cellulose - Limited knowledge on long term health risk (e.g. exposure to dust and fine particles) and limited initiatives for environmental regulation of materials. (source: related to case study product Micro-fibrillated cellulose MFC (materials fibres), pathway D only, WP 3 Task 4 (2020))
Action: Research on health and environmental impacts of MFC.
Barrier: Continued uncertainty over the sustainable rate of removal for forestry residues, and their quality varies significantly, meaning re-processing may be required.
Action: Agree standard approaches to sustainable use of forestry residues that help forest managers to choose suitable harvesting methods702.
E. Three platform (C5 sugars, C6 sugars and lignin) biorefinery using lignocellulosic biomass
Parts of this pathway are at commercial scale, and there are a very small number of first commercial plants producing ethanol primarily for fuel globally. Production of other chemicals and materials is at demonstration stage, and utilisation of lignin for chemicals and materials at research stage. Important barriers and actions are therefore related to:
702 See for example forest harvesting guidelines for the Netherlands that helps forest managers to choose suitable harvesting methods. Source: de Vries, W., de Jong, J.J., Kros, J., Spijker, J., H. Het effect van houtoogst op nutrientenbalansen in bossen op zandgronden. Onderbouwing van een adviessysteem. Wageningen, Wageningen Environmental Research, Rapport 2923, 2019. Available online at: https://edepot.wur.nl/470548

304
• creating a market for products from this pathway, in particular with additional support/targets for products that compete with those produced from C6 sugars from sugar and starch crops as defined in the actions for all pathways
• achieving cost reduction through both process efficiency improvement (pre-treatment, fermentation and downstream processing) and further scale up and learning by doing, which requires investment in further plants
• identifying and increasing supply of sustainable feedstocks, and continued RD&D on new products.

305

306
Figure 120. Pathway E roadmap

307
Scale up
Barrier: Technology risk deters investors in commercial scale plants – recent high profile project failures in this pathway for fuels have added to the perceived technology risk by investors, which, coupled with high capex for these plants, makes financing difficult. Potential investors or licensees may wait until a plant has been built and operated for a sufficient period of time in order to de-risk investment, slowing ramp up. The presence of co-investors is key in giving additional confidence, given that these existing investors will have already carried out their own technical and commercial due diligence, and are comfortable with the risks identified.
Action: Encourage partnerships between established technology companies and new market entrants to give assurance of technology performance (e.g. this could be supported by activities by clusters of companies such as the World Economic Forum’s Low Low-Carbon Emitting Technologies in the Chemical Industry703).
Action: Establish insurance schemes for new technologies704 which assess technology performance, projected financial performance and risk.
Action: Technology validation by trusted organisations, for example through equity investment through the European Circular Bioeconomy Fund launched by the EC and EIB705.
Barrier: Policy uncertainty deters investors in commercial scale plants - Investors in this pathway for fuels are concerned over the potential for demand reduction in fuels as a result of decrease in gasoline demand with vehicle electrification. A clear pathway to increased use in other markets, such as chemicals and materials, would help to strengthen their investment case, and ensure that overall this pathway is more widely commercialised.
Action: Define clear market based policies for bioproducts in the EU, including additional support for pathways like this one (based on non-food/feed feedstocks and at an earlier stage of commercialisation) as defined in the actions for all pathways.
Action: Consider the ethanol output from plants planned for biofuels production alongside ethanol from pathway A and B when developing targeted action plans to enable transition of these crops and/or facilities to biochemicals and aviation fuel (see pathway A and B). This could include developing dehydration plants to produce ethylene that could be integrated into the European ethylene pipeline network.
Feedstock
Barrier: Uncertainty over the potential for cellulosic energy crops in Europe – whilst this pathway can use other feedstocks in the near term, such as agricultural residues and wood, the deployment potential would be increased considerably by the ability to use cellulosic non-food crops such as short rotation coppice willow, and grasses such as miscanthus. The potential for sustainable cultivation of these crops in Europe with low land use impacts is uncertain, with this hindering further deployment which in itself would bring more evidence on yields and impacts and reduce the uncertainty. There is also further potential for cost reduction in cultivation and harvesting of these crops.
703 World Economic Forum. Collaborative Innovation for Low-Carbon Emitting Technologies in the Chemical Industry. N.d. Available online at: https://www.weforum.org/projects/collaborative-innovation-for-low-carbon-emitting-technologies-in-the-chemical-industry
704 E.g. analogous to New Energy Risk. Source: New Energy Risk. About us. 2021. Available online at: https://newenergyrisk.com/about/
705 European Commission. European Circular Bioeconomy Fund. 2020. Available online at: https://european-biotechnology.com/up-to-date/latest-news/news/eib-and-ec-launch-circular-bioeconomy-fund.html

308
Action: Further RD&D on crop breeding for cellulosic non-food crops to improve yields, improve resistance to weeds and pests, improve water efficiency and drought tolerance, and ability to grow on marginal lands (WP 2 (2020)). Seed based planting could also lower the cost of miscanthus production.
Action: Continue studies to identify land suitable for non-food crop cultivation in Europe, alongside land suitable for afforestation. Support and exploit the bioeconomy potential of rural areas in Central and Eastern Europe (CEE).4 CEE region requires innovation, technology and infrastructure to increase biomass productivity in a sustainable way (source: WP 3 Task3 (2020), p.19).
Barrier: Lack of established supply chains for some feedstocks and regions - supply chain logistics and required quality of feedstocks dictates infrastructure investment requirements (also feedstock handling, e.g. issues with baling, etc.). Some supply chains for lignocellulosic material already exist (e.g. wheat straw supply to power plants) but in some areas supply chains may need to be developed from scratch (e.g. non-food crops). Biomass supply can be limited by seasonality, poor infrastructure of (limitations on biomass imports, storage and mobility), low quality and cost (WP 3 Task 3 (2020)).
Action: See common actions: support supply chain companies e.g. originators, aggregators, and biomass supply companies and continue support for projects supporting biomass supply chains.
F. Two-platform (organic fibres and organic juice) biorefinery using green biomass
Use of green biomass for fibres and biogas via AD of the juice is demonstrated at commercial scale, whilst other options for using the fibres and juice are at demonstration or research stage. Actions to overcome economic barriers and scale up barriers to all pathways would benefit this pathway significantly, in particular through providing revenue to companies active in the commercial scale routes that can be invested in product diversification. This can also be achieved through further supported R&D on these products. As this pathway can use dedicated biomass crops, as well as residues, it is particularly important to ensure feedstock sustainability.
The barriers to this pathway will be addressed through the actions set out in the common barriers and actions section, and so no separate roadmap is given.
G. Two-platform (oil and biogas) biorefinery using aquatic biomass
This pathway is at the research and pilot stage, with actions primarily related to further R&D to better characterise the whole pathway, improve performance, and progress to larger scale demonstration, as described in WP 3. This can be achieved through further supported R&D as described in the common actions, including support for scaling up, for example the BBI JU SpiralG project706. The potential for production in Europe is unclear until the requirements of these systems are better understood.
The barriers to this pathway will be addressed through the actions set out in the common barriers and actions section, and so no separate roadmap is given.
706 SpiralG Production of phycocyanin from the spirulina arthrospira sp. BBI JU. 2021. Available online at: https://www.bbi-europe.eu/projects/spiralg

309
H. Two-platform (organic fibres and oil) biorefinery using natural fibres
This pathway is commercial today for use of fibres in the production of composites, but at research and pilot stage for the biorefinery concept yielding multiple products. Actions common to all pathways will be important to increase the market pull for the composites, which will also support R&D and scale up in the biorefinery approaches. As will all pathways, and in particular those based on crops, careful attention to sustainability is required.
The barriers to this pathway will be addressed through the actions set out in the common barriers and actions section, and so no separate roadmap is given.
I. One platform (syngas) biorefinery using lignocellulosic biomass and municipal solid waste
Several initiatives exist for this gasification-based pathway at pilot, demonstration and commercial scale using straw, wood or MSW as feedstock. The primary barriers and actions relate to:
• cost reduction through scale up and further plant roll out, which requires significant investment given the high capex of the scale needed for these plants and additional capacity to license projects.
• to creating a market for products from this pathway, in particular with additional support/targets for products that compete with those produced from food/feed crop? based pathways as defined in the actions for all pathways.
• identifying and increasing supply of sustainable feedstocks, in particular assessing and verifying the potential for and sustainability of use of MSW.

310

311
Figure 121. Pathway I roadmap

312
Scale up
Barrier: Limited number of players slows deployment – there are very few players with high TRL technologies in this pathway. Their current deployment model involves designing, building and operating the plants themselves, which takes time. Moving to a licensing model, and helping these companies to expand their licensing capability would speed roll out, as well as supporting technology developers who are at an earlier stage.
Action: Matchmaking programme to help technology developers find more licensees, public investment in technology developers to help expand their licensing capability, promotion of partnership with technology licensing businesses.
Barrier: Technology risk in gasification deters investors in commercial scale plants – high profile project failures in gasification based routes to fuels have led to high perceived technology risk by investors, which, coupled with high capex for these plants, makes financing difficult. Potential investors or licensees may wait until a plant has been built and operated for a sufficient period of time in order to de-risk investment, slowing ramp up.
Action: Encourage partnerships between established technology companies and new market entrants to give assurance of technology performance.
Action: Establish insurance schemes for new technologies707 which assess technology performance, projected financial performance and risk.
Action: Technology validation by trusted organisations, for example through equity investment through the European Circular Bioeconomy Fund launched by the EC and EIB708.
Action: Ensure that projects funded through public schemes such as those in the common actions section are funded at a high enough level to ensure construction at a suitable scale for the scale up pathway, and take the project through to reliable operation.
Feedstock
Same woody biomass from forest-based industries barriers and actions as for pathway D
Same non-food crop barriers and actions as for pathway E
Additional barriers related to use of MSW:
Barrier: Time and cost of identifying suitable sources of MSW feedstock - sourcing feedstock of the right quality is critical to ensuring the viability of this value chain. Assessing the real costs of this material is also complex.
Action: Grant funding for studies to identify suitable sources of MSW/RDF and improved data provision on identification, tracking and current uses residual biomass streams. (source: WP 3 Task 3 (2020)).
Action: Further studies to evaluate the cost of collecting, sorting, cleaning and processing MSW to achieve purer streams which could processed by
707 E.g. analogous to New Energy Risk. Source: New Energy Risk. About us. 2021. Available online at: https://newenergyrisk.com/about/
708 European Commission. European Circular Bioeconomy Fund. 2020. Available online at: https://european-biotechnology.com/up-to-date/latest-news/news/eib-and-ec-launch-circular-bioeconomy-fund.html

313
separate routes, and the benefits of this versus mixed processing. (source: WP 3 Task3 (2020).
Action: Support establishment of MSW/RDF supply companies for bio-based chemicals and materials projects as described in the common actions. This entity would work with technology developers and/or resource holders to find suitable sites, guarantee feedstock supply and quality.
Action: Support from the EU or MSs for establishment of European sites with optimized technology to manage the whole range of waste products rather than export of European wastes to other countries. (source: WP 3 Task 3 (2020))
Action: Establishment of standards for refuse derived fuel (RDF) and develop RDF processing technologies to improve quality of feedstock.
Sustainability
Barrier: Unclear sustainability performance of use of MSW for energy and chemicals and materials. The assessment of sustainability is critical for all bioproducts, as explained in the common barriers and actions section. Whilst use of MSW for materials, rather than energy, is favoured by the waste hierarchy (see WP 3), assessing sustainability involves additional considerations that are not present for other feedstocks, such as consideration of the treatment of non-biogenic content in the feedstock. This can have a large impact on GHG emissions, depending on the end of life fate of the bio-product. In addition, some studies consider the counterfactual fate of the MSW, which can vary considerably by location.
Action: Further research on sustainability of MSW value chains, which will need to be ongoing given changing waste volume, composition and disposal options.
Action: Project-level LCA is required for MSW projects under any sustainability scheme developed, as described under common actions, to take account of counterfactuals and the specific situation in that region.
J. Two platform (pyrolytic liquid and biochar) biorefinery using lignocellulosic biomass
Fast pyrolysis is demonstrated at commercial scale, but conversion to biomaterials and chemicals is mostly at the research stage. The priority for use in biomaterials and chemicals is therefore further RD&D, whilst other barriers and actions relate to enabling fast pyrolysis as a whole for all applications.

314

315
Figure 122. Pathway J roadmap

316
Scale up
Barrier: High technology risk is a barrier to investment in demonstration plants, as well as uncertainty over competing options. Fast pyrolysis has lower technology risk as multiple plants have been built, but standalone upgrading is at pilot scale. Catalytic pyrolysis has higher technology risk.
Action: Encourage partnerships between established technology companies and new market entrants to give assurance of technology performance.
Action: Establish insurance schemes for new technologies709 which assess technology performance, projected financial performance and risk
Action: Technology validation by trusted organisations, for example through equity investment through the European Circular Bioeconomy Fund launched by the EC and EIB710.
Market entry
Barrier: Variable properties of raw and upgraded pyrolysis oils could limit the ability to assess and trade oils from different producers.
Action: Development of standards/specifications for raw and upgraded bio-oils and HTL oils to ensure that bio-oil producers and upgraders have a ‘common language’, which would ultimately facilitate faster uptake and trading of raw bio-oils.
Action: Facilitate pyrolysis oil and HTL oil trading and encourage competition through establishment of trading networks and centres.
Feedstock
Same woody biomass from forest-based industries barriers and actions as for pathway D
Same energy crop barriers and actions as for pathway E
K. One platform (bio-crude) biorefinery using lignocellulosic, aquatic biomass, organic residues
In this pathway, several companies are building demonstration scale plants to bring the technology towards commercialization. This currently ends at bio-crude level that would need to be further upgraded to produce chemicals and materials and/or biofuels. As with pathway J, the priority for use in chemicals and materials is therefore further RD&D, whilst other barriers and actions relate to enabling HTL as a whole for all applications.
The barriers to this pathway will be addressed through the actions set out in the common barriers and actions section as well as those in pathway J (see Figure 122), and so no separate roadmap is given.
Scale up
Same action as for pathway J
709 E.g. analogous to New Energy Risk. Source: New Energy Risk. About us. 2021. Available online at: https://newenergyrisk.com/about/
710 European Commission. European Circular Bioeconomy Fund. 2020. Available online at: https://european-biotechnology.com/up-to-date/latest-news/news/eib-and-ec-launch-circular-bioeconomy-fund.html

317
Market entry
Same standards action as for pathway J
Feedstock
Same woody biomass from forest-based industries barriers and actions as for pathway D
Same energy crop barriers and actions as for pathway E
6.4 Biorefinery outlook for deployment in the EU
Approach to the outlook for deployment
An outlook for deployment to 2030 is developed for each pathway. For each biorefinery pathway, this considers:
• the number of additional biorefineries to be built by 2030;
• the total additional installed capacity for chemicals and materials by 2030;
• the capital investment required for this additional level of biorefinery deployment.
The two deployment scenarios developed in WP 5 form the basis of the ‘biorefinery outlook for deployment in the EU’ developed in this WP. These growth scenarios set the upper and lower bound of the biorefinery outlook deployment between 2020 and 2030, whereas the outlook for deployment aims to project what could be achieved if all of the actions in the roadmaps are completed. The methodology applied in the ramp up model developed in WP 5 is limited by the quantity and quality of publicly available data. This may create uncertainties around the estimations outlook for deployment of bio-based chemicals and materials refineries in the EU by 2030.
The results of some actions will not influence the deployment to 2030 as they will not be implemented in time and so the results will not be seen over the next 10 years. These actions are still important and, may have a significant impact on biorefinery deployment after 2030.
The approach to determine the outlook for deployment for each pathway cannot be developed by considering each pathway in isolation, or without considering policy changes that may influence the deployment rates of one or more of the pathways.
Policy developments will help determine the overall and relative ramp-up of these pathways. Whilst the roadmaps suggest areas of policy that should be considered, they do not specify fixed policy actions including targets, and therefore the impact of policy actions on deployment is not clear from the roadmaps. For example:
• If the policy direction is in support of lignocellulosic biomass rather than food and feed crop-based feedstocks for both fuels and chemicals and materials, then pathway E is likely to see a more rapid growth than A and B711. In contrast, if there is support for both food and feed crop-based pathways (e.g. A and B) and non-crop-based pathways (e.g. E) for chemicals and materials, a higher total ramp up with plants being deployed or expanded in all three pathways is possible.
711 A, B and E share the same conversion process (fermentation) and produce some of the same products (e.g. ethanol), but whilst A and B are based on food/feed crops, pathway E uses lignocellulosic biomass.

318
Table 51. Description of biorefinery types with criteria applied to determine the output capacity used in the ramp-up model.
Plant type Description C
omm
erci
al Operational Current active commercial biorefineries.
Closed Closed commercial biorefineries that are not considered in the model.
Announced Publicly announced commercial biorefinery projects.
Dem
onst
ration
Operational Current operational demonstration biorefineries which could be scaled up to “New Commercial” biorefineries.
Closed Unsuccessful demonstration projects are closed down and not considered further.
Announced Publicly announced demonstration biorefinery projects.
In order to develop an outlook for deployment the following assumptions have been made. These assumptions are not aligned with the actions assigned to policy makers (P) in the roadmaps as these are not specific enough. Rather, these assumptions assume a direction for the pathways that is a result of multiple factors including actions on the roadmaps and external market factors.
• Favourable conditions for secondary feedstocks (non-crop) to produce chemicals and materials in the EU must be fostered. This is why stronger support is expected for the ramp up of pathways A-C (where residues are used) as well as pathways D,E, I and J. For these pathways, the analysis assumes that the advanced biofuels projects are built, commissioned and started up as per the high scenario. This implies the following percentage of their output to chemicals and materials:
‒ Pathway D: 50% (largely methanol to chemicals and derivative materials)
‒ Pathway E: 50% (largely ethanol to chemicals and derivative materials)
‒ Pathway I: 50% (largely syngas or methanol to chemicals and derivative materials)
‒ Pathway J: 1.5% (largely pyrolysis oil fractionation to chemicals and materials)
• Pathways based on crop-based feedstocks (A,B,C, F and H) continue to grow at a similar rate to that seen previously. These pathways account for the largest number of plants in the EU and the majority of the ramp up is expected to be from debottlenecking / expansion of these existing facilities.
• For all pathways:
All of the announced commercial and demonstration plants (Table 51) are built, commissioned and started up. The scenario used depends on the pathway analysed. Further details are given below in the specific pathway section.
Demonstration plants are scaled up to new commercial biorefineries (see Table 51).
The scenario used is adapted depending on the properties of the pathway analysed. Further details are given below in the pathway specific section.
Overall outlook for deployment
Bringing the results of the model developed in WP 5 and the roadmaps developed in WP 6 together, allows the overall ramp up potential of chemicals and materials-driven biorefineries in the EU to 2030 to be estimated. Approximately 3.1 million tonnes of additional capacity could be possible in the EU by the end of the decade (Figure 123). Most

319
of the additional capacity is expected to be from pathways D, E and I (for further details see WP 5).
The additional capacity includes the supply from the expansion / debottlenecking of existing commercial plants under high growth scenario assumptions. It also considers the contribution of demonstration, new commercial and announced commercial biorefineries. The outlook for deployment does not consider the additional bio-based chemicals and materials supply that could come from the alternative bio-based chemicals and materials ramp-up routes described in WP 5712.
Figure 123. Supply ramp up, additional supply from debottlenecking/expansion of existing commercial scale biorefineries, demonstration, new commercial and announced commercial plants by pathway. The debottlenecking factor was estimated for
bio-based chemicals (Deb/Exp = debottleneck/expansion)
Analysing the outlook for deployment by number of plants allows to obtain a broader picture of the potential ramp up since the scale of biorefineries can differ depending on the conversion processes and feedstocks used. Depending on the pathway the scale of demonstration and commercial biorefineries is estimated to range between 8-20 kta and 4 to 103 kta respectively (Table 53, Table 54). Approximately 42 new plants, including 7 at demonstration scale, could be built in the EU by the end of the decade (Figure 124). While the ramp up is clearly dominated by pathways D, E and I, initiatives in pathways A, C, F, H and J could also lead to new biorefineries.
As addressed in WP 5, the production of bio-based chemicals and materials can be achieved through other production routes than chemical and material focused biorefineries. Four routes, referred to as alternative bio-based chemicals and materials ramp-up routes were assessed in WP 5. The future production in the high and the low growth scenarios were projected for each of these. While the production capacity from alternative routes was not considered when developing the outlook for deployment, it should be noted that they have the potential to significantly contribute to the supply ramp up of bio-based chemicals and materials in the EU.
712 Alternative ramp up routes addressed in WP5: Crop based fuel-focused biorefineries switching focus to the chemicals market, Co-processing in petroleum refineries to produce chemicals (e.g. olefins) or chemical feedstocks (naphtha, BTX, LPG), Co-processing in steam crackers to produce chemicals, Co-processing in existing methanol biorefineries.

320
Figure 124. Additional number of plants from demonstration, new commercial and announced commercial plants by pathway. Here, the expansion and debottlenecking factor is not considered, since it was calculated for bio-based chemicals and materials
overall
Comparison with Bioeconomy Strategy new biorefineries target
The European Commission’s Bioeconomy Strategy713 states the development of 300 new sustainable biorefineries by 2030. This target was first mentioned in a roadmap714 developed during the BIO-TIC project715 in 2015. The roadmap considered the following product groups that had high future market potential:
• advanced biofuels (bioethanol and bio-based jet fuel)
• biochemical building blocks
• bio-based plastics
• biosurfactants derived from fermentation
For each of these product groups, except biosurfactants, the demand for the bio-based fuel or product was first estimated. This was followed by the selection of individual plant capacity figures, which were used to arrive at the number of biorefineries that would have to be deployed by 2030 to meet the demand estimated. Table 52 lists the estimates provided in the BIO-TIC roadmap.
.
713 European Commission. A sustainable bioeconomy for Europe - Strengthening the connection between economy, society and the environment: updated bioeconomy strategy. 2018. Available online at: https://op.europa.eu/en/publication-detail/-/publication/edace3e3-e189-11e8-b690-01aa75ed71a1/language-en/format-PDF/source-149755478
714 BIO-TIC. A roadmap to a thriving industrial biotechnology sector in Europe. 2015. Available online at: http://www.industrialbiotech-europe.eu/wp-content/uploads/2015/08/BIO-TIC-roadmap.pdf
715 The BIO-TIC project (2012-2015) was a FP7 funded project focusing on the industrial biotechnology sector in Europe.

321
Table 52. Number of biorefineries and total capacity estimated in 2030 (BIO-TIC roadmap)
Biofuel/ bioproduct Number of new biorefineries between 2008-2030
Total capacity (million tonnes per year)
Advanced ethanol 185 13
Bio-based jet fuels 50 2
Biochemical building blocks 30 1.5
Bio-based plastics 45 2.2
TOTAL 310 ~19
The current analysis takes into account biorefineries producing biochemical building blocks, bio-based plastics and, to some extent, advanced ethanol as well. However, it does not include biorefineries producing bio-based jet fuels as this is out of scope. Furthermore, there may be overlaps between the biorefineries producing biochemical building blocks and bio-based plastics. In terms of the analysis timeframe, the BIO-TIC analysis spans the period 2008 to 2030, while the current analysis considers only the period 2020 to 2030. However, the main reason for the wide variation in biorefinery estimates is the difference in the methodology adopted. While the BIO-TIC roadmap estimated the number of new biorefineries that need to be operating by 2030 in order to meet the estimated demand, the current analysis provides an estimate of the number of new biorefineries that can be realistically deployed by 2030 taking into account multiple factors mentioned in the previous sections.
In conclusion, it is difficult to compare the BIO-TIC roadmap biorefinery estimates with the current analysis due to variation in the methodologies adopted, product groups considered and the analyses timeframes.
Comparison with previous ramp-up rates
In order to sense check the proposed ramp up rate, the outlook for deployment is compared with the historic ramp up in corn-based ethanol production in the US. The situation in the US is a historical example of a time during which biorefineries have been ramped up significantly over a similar duration as considered in this study. It can therefore be used as proxy to validate the assumptions made in this study.
The production of bioethanol began in the late 1970s. This scale up was encouraged by the tax credit implemented by the Deficit Reduction Act of 1984716 reflecting Congress’ efforts to promote energy self-sufficiency. Ethanol fuel production increased steadily throughout the 1980s and 1990s, when its use was encouraged to replace methyl tert-butyl ether (MTBE) in gasoline blending (directly or via ETBE). Figure 125 shows the progressive ramp up of bioethanol in the US. A sharp increase in production can be observed in 2001. This was provoked by a series of factors including concerns over energy security, high oil prices, the phase out of MTBE717 and the introduction of legislative incentives.
While the deployment of bioethanol in the US will not necessarily act as blueprint for the bio-based chemicals and materials focused refinery ramp-up in the EU, the upturn of the industry post 2001 in the US gives a good indication of what is technically possible if there
716 Joint Committee on Taxation. General explanation of the revenue provisions of the Deficit Reduction Act of 1984. 1984. Available online at: http://www.jct.gov/jcs-41-84.pdf. See Section IX.C (p1078) .
717 ICIS. A very short history of MTBE in the US. 2006. Available online at : https://www.icis.com/explore/resources/news/2006/07/05/1070674/timeline-a-very-short-history-of-mtbe-in-the-us/

322
are strong incentives (political and financial). In the 10-year period, between 2005 and 2015, 114 new bioethanol plants were built in the US718.
Provided the needed policy and financial support is given, the ramp up rates developed as part of the outlook for deployment are considered feasible for the considered timescale. The outlook for deployment estimates about 40 additional biorefineries by 2030 in the EU and this is significantly below the ramp-up achieved in the US for bioethanol. However, there are several differences that may mean the ramp-up of chemical and materials driven biorefineries is more challenging. These include the need to develop in some cases supply chains that do not currently exist (the US had this in place with corn feedstock to an extent already), the regulatory differences in the EU compared with the US (REACH, environmental permitting etc..), the market size of chemicals and materials versus fuels, and the varying level of TRL of the different pathways. Ramp up rates are heavily influenced by the technical maturity level, as they determine when and how quickly new biorefineries can be deployed. The production of corn-based ethanol was already mature in the early 2000s. Developers already had the required know-how to build new biorefineries and were not facing technology related bottlenecks in the development timeline.
This study, however, focuses on emerging pathways to produce bio-based chemicals and materials. Although several are expected to reach commercial maturity by 2030, some of the pathways considered are not at TRL9 today. The EU market for bio-based chemicals and materials is at a less mature stage than the US bioethanol industry was at the beginning of the ramp up process in 2005.
Figure 125. Bioethanol fuel production in the USA 1981- 2016719
718 USDoE. Alternative Fuels Data Center. Updated 2020. Available online at: https://afdc.energy.gov/data/widgets/10342
719 EIA, Fuel Ethanol Overview, Available online at: https://www.eia.gov/totalenergy/data/browser/index.php?tbl=T10.03#/?f=A&start=1981&end=2016&charted=7-18

323
Outlook for deployment by pathway
The supply ramp up model is used as a basis to determine the potential deployment outlook by individual pathway. A high and low scenario was developed for each pathway in WP 5. These serve as upper and lower boundary of the potential deployment outlook. However, as described above, the deployment of a specific pathway is influenced by different factors. The deployment outlook is therefore treated on a case-by-case basis and adapted to the particularities of the specific pathway. Depending on the pathway this may translate into a projection equal to the high or low scenario, or a projection in between these figures.
• Pathway A – The outlook for deployment is based on the assumptions made in the low scenario. This means that the additional capacity from demonstration plants, new commercial plants and announced commercial plants is conservative for this pathway/ The outlook for deployment favours pathways relying on secondary feedstocks. For this reason, the ramp up of pathway A is driven by new developments which are focused on sugar residues. Overall, 3 new commercial plants are expected for this pathway by 2030. This corresponds to an additional capacity of 58kta.
• Pathway B – This pathway uses starch-based crops to produce a wide range of products. Given the high maturity of the pathway, the model projects limited ramp up potential for this type of biorefineries. Development activities focusing on processing residues of the starch industry would contribute to the potential ramp up of this pathway. However, the only demonstration plant identified in the database relies on corn as main feedstock. Aligned with the assumptions described above (see Outlook for deployment approach) built according to assumptions made in the low scenario, the outlook projects no additional new capacity from pathway B by the end of 2030.
• Pathway C – This pathway largely relies on oil-based crops, hence the low scenario is used as basis for the deployment. The one announced commercial plant is expected to be built according to the scale and development timeline assumptions made in the low scenario. Overall, 1 additional commercial plant with an annual capacity of 6kta is envisaged for pathway C.
• Pathway D – Initiatives to innovate in pathway D are driven by activities observed in the forest-based sector as well as by the strong link to the biofuels sector. The forest-based sector is diversifying their product portfolio to include bio-based materials (fibres, resins, lignin etc.) and chemicals (solvents, pharmaceuticals, plastics etc.). For this reason, new announced projects in this industry could potentially represent strong future opportunities for pathway D. While the additional supply from the diversification of pulp and paper side streams into bio-based chemicals and materials presents strong potential, it has not been considered in the outlook for deployment since at this stage this switch remains only a future possibility. The outlook for deployment is expected to achieve the levels described in the high scenario. This results in the addition of 12 new biorefineries by 2030, totalling to an additional capacity of 800 kta. . Most additional biorefineries will be at commercial scale (either announced commercial plants or scaled up demonstration plants). The ramp up also estimates as well as 4 additional demonstration plants. Pathway E – The outlook for deployment favours pathways relying on secondary feedstocks, such as lignocellulosic biomass in pathway E. The ambitious ramp up potential described in the high scenario is assumed to be possible for this pathway. This results in the addition of 19 new chemicals and materials focused biorefineries. These are made up of 17 commercials plants (announced and scaled up demonstration plants, i.e. new commercial plants) and 2 demonstration scale biorefineries. The addition of 1400kta is mainly driven by the strong connection between the use of lignocellulosic biomass in the advanced biofuels and chemical industries.

324
• Pathway F – Green biomass is the main feedstock used for pathway F, which may be affected by indirect land use change (iLUC) impact policies on crops using agricultural land but depending on the source could be from landscape care biomass. The deployment obtained in the low scenario is therefore used as basis for additional supply potential for pathway F. One new commercial plant could contribute to an additional capacity of 5kta.
• Pathway G – The use of aquatic biomass for conventional biochemicals and biomaterials is currently at low maturity level and under both scenarios no ramp up is expected from this pathway. Further information on the ongoing research activities is given in WP 3 and WP 5.
• Pathway H – The situation for the ramp up potential of pathway H is very similar to pathway H. Natural fibres such as hemp or flax are the main feedstock used. The ramp up of this pathway could be affected by indirect land use change (iLUC) impact policies on crops using agricultural land. The deployment obtained in the low scenario is therefore used as basis for additional supply potential for pathway H. Two new commercial plants could contribute to an additional capacity of 15kta in 2030.
• Pathway I –Growing activity in this pathway in the fuels sector suggests strong associated ramp up opportunities for bio-based chemicals and materials. The outlook for deployment of this pathway assumes that the results displayed in the high scenario can be achieved by 2030. This entails the addition of 4 new commercial plants, amounting to 281kta.
• Pathway J – Similarly to pathways D, E and I, this pathway has strong links to the bioenergy sector. Progress made in pyrolysis oil production for bioenergy purposes accelerates the potential use of pyrolysis oil fractioning into bio-based chemicals and materials. Hence, the outlook aligns with the results obtained in the high scenario. By 2030, 1 new demonstration biorefinery is expected, with a total capacity of 20kta.
• Pathway K – Hydrothermal liquefaction (HTL) for the processing of bio-based chemicals and materials is currently at low maturity level. For both the high and low scenarios no ramp up is expected from this pathway. Further information on ongoing research activities is given in WP 3 and WP 5.
Capital required
Different sources were used to estimate the capital investment (capex) required for the level of deployment of the different biorefinery pathways. These include reference plant details from the database (WP 4) and estimated the capital required to be invested today at the average capacity in the outlook for deployment of each pathway. This estimation was completed using the Chemical Engineering Plant Cost Index720 and using a scale factor of 0.65.
On this basis, it is estimated that a total of over Euro 0.16 billion (2019) is required as capital for the additional demonstration scale plants across different pathways; while around Euro 6.70 billion (2019) is required as capital for the additional commercial scale plants across different pathways. Note: Capex estimation considers the average plant scale and number of additional plants for each of the pathways, which were estimated in the previous section on the outlook for deployment.
The capex estimates are subject to large variations since the pathways represent different types of additional biorefineries. This level of estimate therefore aligns with the AACE’s cost estimate classification system ‘Class 5’ where the cost estimate accuracy levels are
720 Chemical Engineering Plant Cost Index.

325
considered to be very low721. The estimates can vary from as high as +100% to as low as -50%. On that basis, we estimate a capital cost range of Euro 81 million (2019) to over Euro 0.32 billion (2019) for the additional demonstration scale plants (5 in total); and a capital cost range of Euro 3.33 billion to Euro 13.34 billion (2019) for the additional commercial scale plants (34 in total). We have tried to compare these estimates with those arrived at in previous studies, however, we note that the assumptions behind the estimates may vary. For example, the BIO-TIC project roadmap suggested that Euro 500 million would suffice to mobilize 20 to 30 biorefinery projects with a total value of around Euro 4 billion, “with a capital leverage of 5x, and an interest rate able to cope with a failure rate of 10%”722. The plant scale was not defined here and so it is difficult to conclude whether the 20-30 biorefinery projects considered were demo scale or commercial. However, since the roadmap refers to them as ‘biorefinery projects’ these may be assumed to be demo scale. In that case the upper limit of the demo scale capex cost (Euro 0.32 billion) estimated in this project comes close to the figure estimated in the BIO-TIC roadmap.
The capital costs estimated for demonstration plants by pathway are provided in Table 53. Similarly, the capital costs estimated for commercial plants by pathway are provided in
Table 54.
Table 53. Estimated capital costs for average scale demonstration plants in different pathways
Note: As per the biorefinery deployment analysis, no demonstration plants associated with the remaining pathways are expected to be built by 2030. Therefore, these are not covered in Table 53.
721 AAEC. Cost estimate classification system – as applied in engineering, procurement, and construction for the process industries. 2005. Available online at: https://www.costengineering.eu/Downloads/articles/AACE_CLASSIFICATION_SYSTEM.pdf
722 BIO-TIC. A roadmap to a thriving industrial biotechnology sector in Europe. 2015. Available online at: http://www.industrialbiotech-europe.eu/wp-content/uploads/2015/08/BIO-TIC-roadmap.pdf
723 AuroCel Hallein. Construction of the new bio-ethanol plant in Hallein has started. 2019. Available online at: https://austrocel.com/wp-content/uploads/2018/04/AC_Bio-Ethanol_Baubeginn_Pressetext_20191003_EN_final.pdf
724 E4tech biofuels database 725 BTG Bioliquids. Empyro Hengelo, NL. N.d. Available online at: https://www.btg-bioliquids.com/plant/empyro-
hengelo/
Pathway Average plant scale (kta)
Additional demonstration plants (2030)
Reference plant details Total estimated capex for demonstration plants (2019, Euro mn)
D 8 4 AustroCel Hallein's commercial plant (under construction) that will use wood sugar to produce bioethanol. Planned start in 2021.723
52 Range: 26 to 105
E 16 2 Chempolis's plant in Oulu, Finland which uses straw, reed, empty fruit bunches, bagasse, corn stalks, as well as wood residues as feedstock to produce ethanol and various chemicals.724
90 Range: 45 to 180
J 20 1 Empyro plant in the Netherlands producing fast pyrolysis bio oil (FPBO) using wood biomass and/or residues.725
20 Range: 10 to 40
TOTAL > 162 Range: 81 to 325

326
Table 54. Estimated capital costs for commercial plants in different pathways
Note: As per the biorefinery deployment analysis, no commercial scale plants associated with pathway B are expected to be built by 2030. Therefore this pathway is not covered in Table 54.
Capital investment is not only pathway specific. Many other factors are important to consider including the type of investment. When considering a particular investment the following order of capital investment can be considered, however not all investments are possible under all of these types. For example, there may not be mothballed plants suitable to be converted to a chemical and material driven biorefinery, further debottlenecking of existing biorefineries may not be possible etc…
726 Corbion. Raw material sources. N.d. Available online at: https://www.corbion.com/feedstocks 727 It has been assumed that European capex costs are 1.2x costs in Thailand 728 WP4 - JRC/Biorefinery Outlook database 729 E4tech biofuels database 730 St1. Major bioethanol plant slated for Jakobstad, sawdust raw material. 2016. Available online at:
https://yle.fi/uutiset/osasto/news/major_bioethanol_plant_slated_for_jakobstad_sawdust_raw_material/9295099 731 Verbio. VERBIO commissions straw-to-biogas facility in Germany. 2015. Available online at:
http://biomassmagazine.com/articles/11866/verbio-commissions-straw-to-biogas-facility-in-germany 732 ACN. Advanced biofuel plant planned to open in 2022. 2018. Available online at:
http://www.catalannews.com/business/item/advanced-biofuel-plant-planned-to-open-in-2022
Pathway Average plant scale (kta)
Additional commercial plants (2030)
Reference plant details Total estimated capex for commercial plants (2019, Euro mn)
A 19 3 Total Corbion’s PLA plant in Thailand using sugar and starch crops as feedstock (sugar beet and sugar cane)726,727
91 Range: 46 to >180
C 6 1 METabolic EXplorer (METEX) plant under construction in France that will produce 1,3-PDO and butyric acid using vegetable oil and residual oils.728
37 Range: 19 to 75
D 103 8 Planned Aemetis plant in the US that will use agricultural waste to produce ethanol729
2,174 Range: ~1,090 to ~4,350
E 73 17 Planned St1 Cellunolix® ethanol plant in Norway that will produce ethanol and biogas using sawdust.730
3,848 Range: >1,920 to ~7,700
F 5 1 Verbio's straw to biomethane plant in Germany.731
15 Range: 8 to >30
H 7.50 2 Pathway C used as proxy given no information on an actual biorefinery for pathway H. Part of pathway C is similar to that of pathway H.
75 Range: 37 to ~ 150
I 70 4 Planned Enerkem plant in Spain that will produce methanol using MSW.732
425 Range: >210 to 850
TOTAL 6,665 Range: >3,330 to ~13,335

327
• New greenfield biorefinery
• New biorefinery on a brownfield site (lower capex from shared services such as steam, water, power, storage, logistics etc…) e.g. UPM Leuna, Germany
• Re-purposing/conversion of a plant on existing brownfield site (highly project dependent as it only some equipment can be reused) – e.g. Green Biologics to converted a US ethanol plant to n-butanol and acetone facility in 2015, which has now closed
• Expansion of a biorefinery on a brownfield site (e.g. valorising a side stream) – capacity increase often limited
• Debottlenecking (improving processes, revamping or new equipment) to increase the capacity of existing biorefineries - capacity increase is limited however
• Co-processing / refocus of existing plants from fuels to chemicals (drop-in such as methanol)
6.5 Identify and quantify GHG and socio-economic benefits
Estimates were made of the EU-wide benefits that could be realised through the fulfilment of the roadmap:
• Overall GHG savings
• Creation of local jobs
• Increased raw material security (reduced imports of fossil feedstocks from outside the EU)
OVERALL GHG SAVINGS DELIVERED
GHG emissions reduction is one of the identified benefits of biorefinery deployment for the production of low carbon and circular products. This is especially important now as the EU recently proposed a higher target733 for GHG emissions reduction by 2030, which will have a large impact on energy-intensive industries like chemicals and materials734. This section focuses on estimating GHG reductions associated with different biorefinery pathways.
For each of the analysed pathways, a bio-based product was selected as a reference and the associated GHG savings (%) were found in literature or calculated. Further, the fossil counterparts for these bio-based products were identified and their GHG emissions were noted. The total additional capacity estimated for the associated pathway was then used along with the bio-based product GHG savings (%) to calculate GHG savings in tonnes CO2eq.. Finally, total GHG savings associated with the deployment of biorefineries in different pathways were calculated.
733 To reduce emissions by 55%, compared with 1990 levels, up from the previous target of 40%. 734 Lopez, J. EU proposes tougher 2030 emissions target, will impact chemicals. 2020. Available online at:
https://www.icis.com/explore/resources/news/2020/09/16/10552969/eu-proposes-tougher-2030-emissions-target-will-impact-chemicals
HIGHEST CAPEX
LOWEST CAPEX
Figure 126. Investment types to ramp-up bio-based chemical and material production

328
We estimate over 3.51 million tonnes of GHG savings, assuming that all the additional biorefinery capacity (demonstration and commercial) estimated for 2030 is realised. The highest savings are attributed to pathway E, followed by pathway D. Details are provided in Table 55. Regarding pathway E, it should be noted that the French wheat-based ethanol GWP (Global Warming Potential) figure was used for the analysis as it is EU-related. However, there is large variation in GWP of 1G ethanol depending on the feedstock and geography, that is, where the feedstock is grown. For example, imported 1G ethanol derived from sugarcane (Brazil) or maize (US) has GWP of 1.6 kg CO2e/kg ethanol, while ethanol produced from sugar beets grown in the EU has a GWP of 1.3 kg CO2e/kg ethanol. Sugarcane derived ethanol is already being processed into bio ethylene and polymerised into polyethylene by Braskem in Brazil, under the trademark I'm GreenTM735. I’m GreenTM
HDPE has a GWP of -3.1 kg CO2e/kg I’m GreenTM HDPE which is much lower compared to 1.9 kg CO2e/kg fossil HDPE.736
Table 55. GHG savings by pathway
735 Braskem. Where it is produced. 2020. Available online at: http://plasticoverde.braskem.com.br/site.aspx/Where-it-is-produced
736 Braskem. I’m Green PE - Life Cycle Assessment. 2017. Available online at: http://plasticoverde.braskem.com.br/Portal/Principal/Arquivos/Download/Upload/GreenPE-LCASummary2017-CarbonTrust_v.2_230.pdf
737 WP3 report 738 PlasticsEurope. Eco-Profile. N.d. Available online at: https://www.plasticseurope.org/en/resources/eco-profiles 739 Bartolini, N., et al. Environmental and Economic Impact of the Antifreeze Agents in Geothermal Heat Exchangers.
Energies, 13, 5653; doi:10.3390/en13215653. 2020. Available online at: https://www.mdpi.com/1996-1073/13/21/5653/pdf
740 LENZINGTM. Acetic acid bio-based. 2018. Available online at: https://bit.ly/3m5Jigw 741 Clariant. The potential of sunliquid®. 2018. Available online at : https://www.clariant.com/FY_2017_sunliquid 742 Muñoz, I., et al. Life cycle assessment of bio-based ethanol produced from different agricultural feedstocks. Int J
Life Cycle Assess. 2013. Available online at: https://www.unilever.com/Images/life-cycle-assessment-of-bio-based-ethanol-produced-from-different-agricultural-feedstocks_tcm244-423775_en.pdf
743 Sanders, J. Grassa - Biorefining of grass will contribute to a sustainable rural development in Europe. 2020. Available online at: https://cbio.au.dk/fileadmin/DJF/CBIO/Johan_Sanders_final.pdf
744 Adom, F., et al. Regional carbon footprint analysis of dairy feeds for milk production in the USA. The International Journal of Life Cycle Assessment. 2012. Available at: https://www.researchgate.net/publication/257680036_Regional_carbon_footprint_analysis_of_dairy_feeds_for_milk_production_in_the_USA#pf11
745 Nova Institute. Carbon Footprint and Sustainability of Different Natural Fibres for Biocomposites and Insulation Material. 2019. Available online at : http://bio-based.eu/download/?did=167568&file=0
746 Nova Institute. Natural fibres show outstandingly low CO2 footprint compared to glass and mineral fibres. 2019. Available online at: https://news.bio-based.eu/natural-fibres-show-outstandingly-low-co2-footprint-compared-to-glass-and-mineral-fibres/
747 Śliwińska, A., et al. Environmental life cycle assessment of methanol and electricity co-production system based on coal gasification technology. Science of The Total Environment. 2017. Available online at: https://www.researchgate.net/publication/308019165_Environmental_life_cycle_assessment_of_methanol_and_electricity_co-production_system_based_on_coal_gasification_technology
748 E4tech calculation 749 Biograce. Harmonised Calculations of Biofuel Greenhouse Gas Emissions in Europe. N.d. Available online at:
https://biograce.net/app/webroot/files/file/BioGrace_information_leaflet_EN.pdf
Pathway Additional capacity, 2030 (kta)
GHG savings associated with bio reference (%)
Fossil reference (kg CO2 eq./kg fossil)
GHG savings (kt CO2eq)
A 58 70 (PLA)737 1.63 (PP)738 ~66
C 6 60 (Propylene glycol)51 4.67 (Propylene glycol)739 ~17
D 739 85 (Acetic acid)51 1.45 (Acetic acid)740 ~911
E 1,197 95 (Ethanol)741 2.07(1G ethanol from wheat grown in France)742
~2,354
F 5 75 (Grass)743 0.72 (Soybean meal)744 ~3
H 15 75 (Hemp)745 2.50 (Glass fibre)746 28
I 281 40 (Methanol)51 0.74 (Methanol)747 83
J 20 83 (Pyrolysis oil)748 3.03 (Natural gas)749 50
3,512

329
Note: As per the biorefinery deployment analysis, no demonstration/commercial scale plants associated with pathway B are expected to be set up by 2030. Therefore this pathway is not covered in Table 55.
Note that this approach only considers only one product as a reference in each pathway, when in reality there will be a wide range of products, conversion technologies and feedstocks. GHG savings will vary considerably depending on the type of bio-based product, the production process, as well as the fossil comparator.
6.5.1 CREATION OF LOCAL JOBS
For each of the analysed pathways, a reference plant was selected that had a capacity comparable with the average scale of demonstration or commercial plant, and for which there was information on local jobs750 that were created once the plant became operational. These data were used with the estimated number of additional plants (demonstration and commercial) in 2030 to calculate the number of local jobs that could be created as a result. On this basis, we estimate a total of over 1,900 local jobs, assuming that all the additional biorefinery capacity (demonstration and commercial) estimated for 2030 is realised. Maximum jobs are attributed to pathway E, followed by pathway D. Details provided in Table 56.
As before, note that this is based on the information available for one reference plant per pathway. In addition, only the jobs created at the plant once it was operational have been considered, rather than including those in construction. Indirect jobs have not been calculated. Such jobs may or may not be local as they can be created along the supply chain. Furthermore, it is beyond the scope of the project to consider the impacts of importing bio-based chemicals and materials/ products or those of biorefineries on existing fossil industry jobs.
Finally, as observed by the IEA751, “biomass production and processing to produce biofuels can benefit rural communities by increasing employment opportunities and expanding the tax base that supports community services. Expansion of the bioeconomy could provide jobs in rural areas where unemployment is often high.”
750 We consider direct jobs (i.e. the permanent jobs created at the biorefinery) to be the same as local jobs. 751 IEA Bioenergy. Mobilizing Sustainable Bioenergy Supply Chains. 2015. Available at:
https://www.ieabioenergy.com/wp-content/uploads/2015/11/IEA-Bioenergy-inter-task-project-synthesis-report-mobilizing-sustainable-bioenergy-supply-chains-28ot2015.pdf

330
Table 56. Local jobs created
Path
way No. of local jobs
due to reference plant (commercial/ demonstration)
Reference plant details No. of additional demonstration/commercial plants by 2030
Total no. of local jobs that could be created by 2030
A 39 (commercial)64 FKuR Kunststoff’s bioPE plant in Germany that uses sugar/starch/lignocellulosic feedstock.
3 (commercial) 117
C 35 (commercial)752 Spiga Nord plant in Italy producing polyglycerols and glycerine using vegetable oil
1 (commercial) 35
D 65 (demonstration + commercial)64
Demonstration plant reference: Beologic’s plant in Belgium which produces compounds for wood polymer composites production (WPC). Commercial plant reference: 50 direct jobs for estimated based on several sources that suggest that direct jobs for such biorefineries can range from 20 to 200, depending on the plant capacity. These biorefineries are often on integrated sites with other P&P related operations so therefore estimating jobs can be difficult.
12 (demonstration + commercial)
780
E 40 (demonstration + commercial)753,754
Demonstration plant reference: St 1 Kajaani facility in Finland using sawdust to produce ethanol biogas, lignin, turpentine, furfural, and CO2 Commercial plant reference: Planned St1 Cellunolix® ethanol plant in Norway for producing ethanol and biogas using sawdust
19 (demonstration + commercial)
760
F 10 (commercial)755 4-platform (biogas, green juice, green fibres, electricity & heat) biorefinery using grass silage and food residues for bioplastic, insulation material, fertilizer and electricity
1 (commercial) 10
H 16 (commercial)64 APM (Automotive Performance Materials) plant in France that focuses on compounding of natural fibres in thermoplastics (hemp / wood / sisal / kenaf / linen).
2 (commercial) 32
I 50 (commercial)756 Advanced 'waste to chemicals' plant being developed by Air Liquide, Enerkem, Nouryon, the Port of Rotterdam and Shell in Rotterdam.
4 (commercial) 200
J 8 (demonstration)757
Empyro plant in the Netherlands producing pyrolysis oil using wood biomass and/or residues
1 (demonstration)
8
TOTAL 1,942
Note: As per the biorefinery deployment analysis, no demonstration/commercial scale plants associated with pathway B are expected to be set up by 2030. Therefore, this pathway is not covered in Table 56.
752 JRC/Biorefinery Outlook database 753 Lane, J. St1 completes waste-to-ethanol Etanolix project in Sweden. 2015. Available online at:
https://www.biofuelsdigest.com/bdigest/2015/06/06/st1-completes-waste-to-ethanol-etanolix-project-in-sweden/ 754 St1. Major bioethanol plant slated for Jakobstad, sawdust raw material. 2016. Available online at:
https://yle.fi/uutiset/osasto/news/major_bioethanol_plant_slated_for_jakobstad_sawdust_raw_material/9295099 755 IEA Bioenergy. 4-platform biorefinery – factsheet. 2017. Available at:
https://task42.ieabioenergy.com/publications/4-platform-biogas-green-juice-green-fibres-electricityheat-biorefinery-using-grass-silage-food-residues-bioplastic-insulation-material-fertilizer-electricity/
756 W2C Rotterdam. About us. N.d. Available online at: https://w2c-rotterdam.com/about-us 757 E4tech internal information

331
6.5.2 INCREASED RAW MATERIAL SECURITY (REDUCED IMPORTS OF FOSSIL FEEDSTOCKS FROM OUTSIDE THE EU)
Increased use of EU biomass (see WP 5 for details of biomass resource potential in the EU) resulting in reduced imports of fossil feedstocks from outside the EU could be a major benefit from the deployment of chemical and material driven biorefineries. This could increase the EU’s raw material security, as well as develop domestic jobs in the rural economy as biomass supply chains are further developed and provide GHG reduction benefits.
Today the majority organic chemicals and many materials (e.g. polymers) are produced from crude oil that has been imported, processed in crude oil refineries and then further processed (e.g. via steam cracking) to chemicals. The EU dependency on imported oil is high - the EU relied on net imports (imports minus exports) for 94.6 % of the petroleum and oil products consumed in 2018758. In 2018, total imports of crude oil to the EU amounted to 513 million tonnes. Non-energy759 use of all the oil used in the EU accounted for 14.1% in the same year. In addition, significant quantities of chemicals and materials are also imported into the EU.
The displacement of crude oil imports will depend on the biorefinery pathway, the scale of deployment, which products are substituted and to the extent they are substituted. Commodity polymers such as polyethylene terephthalate (PET) and polyolefins (polyethylene (PE) and polypropylene (PP)) could all partially be substituted by one or more of the biorefinery products or their downstream derivatives. For example, poly lactic acid (PLA) derived from sugars can substitute PE, PP and PET in different applications760,761. It is available on a commercial scale and can be converted into foam, film, moulded plastic parts and fibre762. It is biodegradable and can be subjected to industrial composting. Note: There is an ongoing debate regarding the impact of bioplastics like PLA on the current recycling of plastics.
Polyolefins (PE and PP) are primarily produced from naphtha steam cracking in Europe. About 1.8 tonnes of naphtha is required to produce 1 tonne of polyolefins.763 The overall outlook for deployment estimated that 3.1 million tonnes of additional capacity could be brought online by 2030. Using polyolefins as a proxy764, about 5.6 million tonnes of naphtha, a fraction of crude oil, could be substituted.
Whilst the increase in energy security through increased domestic production of renewable energy will remain the major driver for the EU to reduce its dependency on imported crude oil, the deployment of chemicals and materials could also help drive this change.
758 Eurostat. Oil and petroleum products - a statistical overview. 2020. Available online from : https://ec.europa.eu/eurostat/statistics-explained/index.php/Oil_and_petroleum_products_-_a_statistical_overview#Oil_imports_dependency
759 Non-energy consumption includes, for example, bitumen for road surfaces, the use of lubricants for reducing friction as well as the use of oil products in the chemical industry for chemical properties rather than energy content (combustion).
760 Alaerts, L., Augustinus, M., van Acker, K. Impact of Bio-Based Plastics on Current Recycling of Plastics. Sustainability 10(5):1487. 2018. Available online at: https://www.researchgate.net/publication/325062434_Impact_of_Bio-Based_Plastics_on_Current_Recycling_of_Plastics
761 Wrap. Understanding plastic packaging and the language we use to describe it. N.d. Available online at: https://wrap.org.uk/sites/files/wrap/Understanding%20plastic%20packaging%20FINAL.pdf
762 Corbion Purac. PLA Bioplastics. 2013. Available online at: https://www.corbion.com/media/75646/corbionpurac_bioplastics_brochure.pdf
763 Ren, T., Patel, M., Blok, K. Olefins from conventional and heavy feedstocks: Energy use in steam cracking and alternative processes. Energy 31(4):425-451. 2006. Available online at: https://www.researchgate.net/deref/http%3A%2F%2Fdx.doi.org%2F10.1016%2Fj.energy.2005.04.001
764 This is a high-level estimate - some of the biorefinery products would not substitute polyolefins, some fossil products are not produced from crude oil (they are produced from coal or natural gas etc..) and some biorefinery products could substitute existing bio-based products.

332
Annex I - WP 1 Literature Review Biorefinery Classifications Systems
IEA Bioenergy Task 42 Biorefinery Classification & Bio-Based Chemicals Update (IEA 2009/2018/2020)
The basic idea of this classification approach is that each individual biorefinery system can be classified using the following four main features:
1. Platforms 2. Products 3. Feedstock 4. Processes
A biorefinery system is described as a conversion pathway from feedstock to products, via platforms and processes. Each feature consists of several subgroups, which are listed below:
1. Platforms
‒ Biogas (a mixture of mainly CH4 and CO2), from anaerobic digestion.
‒ Syngas (a mix of CO and H2), from gasification.
‒ Hydrogen (H2), from water-gas shift reaction, steam reforming, water electrolysis and fermentation.
‒ C6 sugars (glucose, fructose, galactose), from hydrolysis of sucrose, starch, cellulose and hemicellulose.
‒ C5 sugars (xylose, arabinose), from hydrolysis of hemicellulose and food and feed side streams.
‒ Lignin (phenylpropane building blocks), from the processing of lignocellulosic biomass.
‒ Pyrolysis liquid (a multicomponent mixture of different size molecules), from pyrolysis.
‒ Oil (triglycerides) from oilseed crops, algae and oil based residues.
‒ Organic juice (made of different chemicals), which is the liquid phase extracted after pressing of wet biomass (e.g., grass).
‒ Electricity and heat, which can be internally used to meet the energy needs of the biorefinery or sold to the grid.
2. Products
‒ Energy: biodiesel, bioethanol, biomethane, synthetic biofuels, electricity and heat
‒ Materials: food, feed, fertilizer, glycerin, biomaterials, chemicals and building blocks, polymers & resins, biohydrogen.
3. Feedstock
Dedicated feedstocks
‒ Sugar crops (sugar beet, sugarcane)
‒ Starch crops (wheat, corn, sweet sorghum)
‒ Lignocellulosic crops (wood, short rotation poplar, switchgrass and Miscanthus)
‒ Oil-based crops (rapeseed, soya, palm oil, Jatropha curcas)

333
‒ Grasses (green plant materials, grass silage, immature cereals and plant shoots)
‒ Marine biomass (micro and macro algae, seaweed)
Residues
‒ Oil-based residues (animal fat from food industries, used cooking oil from restaurants, households and others)
‒ Lignocellulosic residues (crop residues, sawmill residues etc.)
‒ Organic residues and others (e.g., organic urban waste, manure, wild fruits and crops)
4. Processes
‒ Mechanical/physical (pressing, pre-treatment, milling, separation, distillation)
‒ Biochemical (anaerobic digestion, aerobic and anaerobic fermentation, enzymatic conversion)
‒ Chemical (hydrolysis, transesterification, hydrogenation, oxidation, pulping)
‒ Thermochemical (pyrolysis, gasification, hydro-thermal upgrading, combustion)
For bio-based chemicals and building blocks, a sub-categorization was provided in 2020 by the IEA Bioenergy Task 42.765 This is based on the number of carbon contained in the molecule: C1, C2, C3, C4, C5, C6 and Cn containing compounds.
In 2018, the IEA Bioenergy Task 42 report on Natural Fibres and Fibre-materials in Biorefineries, presented the following classification for fibres.766
Natural Fibres: produced from plants (cellulose and lignocellulose), animals and from mineral origin. This type of fibres does not go through chemical modification or man-made polymerization process. The subcategories of natural fibres are:
‒ Seed fibres (e.g. cotton)
‒ Bast fibres (e.g. ramie, hemp, flax, jute)
‒ Leaf fibres (e.g. sisal, albaca)
‒ Fruit fibres (e.g. coir)
‒ Stalk fibres from agricultural residues (e.g. stalks from wheat, rice, corn)
‒ Soft and hardwoods (engineered wood fibres, wood fibre board, pulp)
‒ Cane, grasses and reed ( e.g. switch grass, sugarcane, bamboo, fresh grass)
Man-made fibres: These fibres are significantly modified natural fibres (so-called regenerates, mostly cellulose) or synthetic fibres (from man-made monomers that are
polymerized and process into fibres). The following sub-categorization was made for man-made fibres:
765 IEA Task 42, Bio-based Chemicals, https://www.ieabioenergy.com/wp-content/uploads/2013/10/Task-42-Biobased-Chemicals-value-added-products-from-biorefineries.pdf
766 Natural Fibres and Fibre-based Materials in Biorefineries IEA Bioenergy Task 42. Status Report 2018

334
‒ Modified natural polymers-man -made cellulose fibres (e.g. viscose, lyocell, cellulose acetate)
‒ Modified natural polymers-non-cellulosic man -made cellulose fibres (e.g. chitosan, alginate)
‒ Inorganic man-made fibres (e.g. glass fibres, carbon fibre)
‒ Synthetic fibres (e.g. fibres from PLA)
Towards a common classification approach for biorefinery Systems (2009)
Cherubini et al. (2009) considered that bio-based material products include fine chemicals (such as amino acids, organic acids and extracts) used in the food, chemical or pharmaceutical industry, and animal feed and fibre products, among others. The selected subgroups of bio-based material products presented there are767:
‒ Fertilizers
‒ Biohydrogen
‒ Glycerin (from the transesterification of triglycerides)
‒ Chemicals and building blocks (e.g., fine chemicals, aromatics, amino acids, xylitol, polyols, succinic-, lactic-, levulinic- and itaconic acid, phenols, furan dicarboxylic acid, furfural, etc.).
‒ Polymers and resins (produced by (bio)chemical conversion of biomass via monomeric intermediates (e.g., PHA, resins, PLA).
‒ Food
‒ Animal feed
‒ Biomaterials (fibre products, polysaccharides, pulp and paper, panels)
BioRefinery identification, classification and mapping (Euroview-2009)
The Euroview consortium studied the bio-refinery classification and mapping of existing and future biorefineries in the EU. In this project 2800 industrial stakeholders were consulted from nine different sectors in sixteen EU countries plus Norway, Switzerland, and the USA768. The biorefineries are classified by country, by type of biorefinery and type of product.
For the criterion ‘type of biorefinery’ five categories were identified:
‒ Green Biorefinery: Uses wet biomass (green grass lucerne clover)
‒ Cereal & Whole crop Biorefinery: uses cereals, maize, starch, sugar crops.
‒ Oilseed Biorefinery: uses oil crops (rape, sunflower, etc.)
‒ Forest-based and lignocellulose Biorefinery: uses lignocellulosic biomass (wood, straw, corn, waste)
‒ Multiple feed/integrated Biorefinery: second generation feedstock and biomass no further specified.
767 Cherubini, Francesco; Jungmeier, Gerfried; Wellisch, Maria; Willke, Thomas; Skiadas, Ioannis; Van Ree, René; de Jong, Ed. "Toward a common classification approach for biorefinery systems". Modeling and Analysis. 3 (5): 534–546, 2009.
768 Biorefinery Euroview Project 044275-FP-2005-SSP-5. https://cordis.europa.eu/docs/results/44/44275/123655621-6_en.pdf

335
Alternatively, a categorization was made considering the type of product. The Euroview project used a five-product type classification:
‒ Food and Feed
‒ Biofuels
‒ Heat and Power
‒ Biomaterials
European Biorefinery Strategy Road Map & Vision 2030 (Star-Colibri 2011)
The European Biorefinery Joint Strategic Research Roadmap769 shows the challenges and strategic research areas that must be developed in order to accelerate the biorefinery vision and bio based economy in Europe by 2030. This study points out that the manufacture of bulk and specialty chemicals, biofuels, materials and other bio-based derived products will depend heavily on the efficiency of the pretreatment process to fractionate, separate and purify the biomass.
Regarding product development a lot is mentioned on the need to develop bio-based products with specific functionalities and high added value. This type of products can take advantage of the native properties of biomass and can provide at least the same level of quality as the fossil-based counterparts.
The Star Colibri project, also uses as reference the classification system from IEA Bioenergy Task 42. The schematic representation in the roadmap and the vision showed that product classification has the following sub-categories:
‒ Food and Feed
‒ Energy products
‒ Materials and Chemicals
The Joint European Biorefinery Vision 2030770 also refers to a more general classification by industry:
‒ Agro-industry
‒ Forest-based industry
‒ Chemical Industry
‒ Biofuels industry
According to the biorefinery concepts 2030, new biorefinery types that are envisage to be used are:
‒ Starch & Sugar Biorefineries: Processing starch and sugar crops (cereals, potatoes, sugar cane and beet)
‒ Oilseed Biorefinery: Producing mainly food, feed, biodiesel and oleochemicals from oilseed such as rape, sunflower and soybean.
769 Luguel, C, Annevelink E, Laurmaa J, von Weymarn N. European Biorefinery Joint Strategic Research Roadmap to 2020, Start-Colibri, Deliverable D, 2011
770 Luguel, C, Annevelink E, Burel C, Gosse G. Joint European Biorefinery Vision 2030, Start-Colibri, Deliverable D, 2011.

336
‒ Green Biorefinery: Processing wet biomass such as, grass, clover, Lucerne or alfalfa to produce nutrients as proteins, amino acids, organic acids, minerals, hormones and enzymes.
‒ Lignocellulosic Biorefinery: Processing a wide range of lignocellulose biomass to separate it in: cellulose, hemicellulose and lignin for the production of alcohols, organic acid and solvent from the cellulose; xylose, gelling agents, furfural and other chemicals to nylon binders and adhesives.
‒ Aquatic (marine) Biorefinery: processing micro- algae and seaweed to end products ranging from fuels, bulk chemicals, food and feed.
The Star-Colibri 2030 vision mentions that specific opportunities in the chemical sector for 2030 will lie in: having bio-based molecular structures similar to bulk chemicals from fossil origin and the development of new molecules with new functionalities and applications. It also presented the projected values of world chemicals production by 2025 (bio-based & fossil-based) according to USDA/OECD figures, which divide the chemical sector in four categories: Commodity, Specialty, Fine and Polymer.

337
Annex II - WP 1 Classification System Definitions
Feedstock
Primary biomass refers to the new biomaterial (biomass) produced via photosynthesis and capable to capture and store carbon during the growing period.771
‒ Aquatic biomass: Aquatic biomass is composed of diverse species of micro and macroalgae, cyanobacteria and aquatic plants. It has high oil and biomass yields, widespread availability, absent (or very reduced) competition with agricultural land, high quality and versatility of the by-products.772
‒ Lignocellulosic from croplands and grasslands: plant biomass containing cellulose with varying amounts of lignin. These crops are grown in cropland areas include short rotation coppice, (e.g. poplar, willow, birch, eucalyptus, etc), frutal trees and vegetables as well as, all type of grasses (e.g. Miscanthus, ryegrass, switchgrass, reed canary grass, rye, and giant reed grass) and other, grass-like plants and herbaceous plants.
‒ Lignocellulosic wood/forestry: This is lignocellulosic biomass like round wood, sawn logs, fuelwood, softwood, hardwood produced in woodland areas.
‒ Oil Crops: are plants whose seeds, fruits or mesocarp and nuts are valued for the extraction of the edible or industrial oils that are extracted from them. Besides the most known oil crops (palm, soybean, rapeseed and sunflower, olive ), many other crops such as, canola, mustard, flax, jatropha, coconut, hemp, and pennycress are good resources of oil. 773
‒ Starch crops: Starch-based feedstock include edible grains, such as corn or wheat, and tubers such as (sweet) potatoes and cassava. These feedstocks contain long complex chains of sugar molecules. The starch can easily be converted to fermentable sugars.29
‒ Sugar crops: There are two major sugar crops: sugar beets and sugar cane which are use for the production of chemicals and materials. However, sugar and syrups are also produced from the sap of certain species of maple trees, from sweet sorghum when cultivated explicitly for making syrup and from sugar palm.774
On the other hand, we set a new category called secondary biomass.775 The secondary biomass is formed during the processing, conversion of biomass or decomposition of organic matter. It is a category of side-products, residues. These include:
‒ Microbial biomass: The microbial biomass is generated mostly by some bacteria, protist and fungi, which decompose plant and animal residues, as well as organic matter in soil and substrates.776
‒ Residues from agriculture: by-products of the processing of agricultural products (residue from cotton ginning, olive pits, fruit pits, etc.).
‒ Residues from forestry and forest-based industries: material cleared from forests to protect them from forest fires, as well as by-products, residues wells as recycled products from woody biomass industries.
771 https://www.marquard-bahls.com/en/news-info/glossary/detail/term/biomass.html 772 P. Biller, Hydrothermal liquefaction of aquatic Feedstocks. Direct Thermochemical Liquefaction for Energy
Applications, Woodhead Publishing, Pages 101-125, 2018. 773 http://www.etipbioenergy.eu/value-chains/feedstocks/agriculture/starch-crops 774 http://www.fao.org/es/faodef/fdef03e.HTM#3.01 775 https://www.marquard-bahls.com/en/news-info/glossary/detail/term/biomass.html 776 http://soilquality.org.au/factsheets/microbial-biomass

338
‒ Residues from nature and landscape management (green biomass from nature and landscape management)
‒ Other organic residues include: biodegradable fraction of municipal waste, animal fat from slaughterhouse and food industry, residues generated during grazing and livestock operations (manure).
Conversion Processes
The biochemical conversion summarizes processes that use biological processes that involve microorganisms, which occur at mild conditions (lower temperature and pressure).
‒ Aerobic conversion: Aerobic process is the process that relies on microorganisms that thrive under aerobic conditions i.e. where plenty of oxygen is available and a sufficient amount of food is present.777
‒ Anaerobic digestion: also known as methanization is a series of biological processes in which microorganisms break down biodegradable material in the absence of oxygen. The end products of anaerobic digestion are a digestate (for biological fertilizer production) and a biogas778, that roughly consist of methane (CH4), carbon dioxide (CO2) and small amounts of hydrogen sulphide (H2S), water and siloxanes.779
‒ Enzymatic Process: Enzymes are biocatalysts, therefore any chemical reaction or series of reactions catalysed by an enzyme is described as an enzymic or enzymatic process.780 An enzyme is a protein which acts as a highly selective catalyst permitting reactions to take place rapidly in living cells under physiological conditions. This type of process play a key role in biorefineries for the biochemical/biological conversion. First generation and second generation biofuel production processes use enzymes for conversion of structural polymers to monomers so that these can then be fermented to the desired fuel by yeast or bacteria. 781
‒ Fermentation: is an anaerobic process that breaks down the glucose within organic materials. It is a series of biochemical reactions that convert sugars to alcohol or acid. Yeast or bacteria are added to the biomass material, which feed on the sugars to produce ethanol and carbon dioxide.782
‒ Insect-based bioconversion: also known as insect farming is based on the selection of insect species e.g. Black Soldier Fly (BSF) larvae, house fly maggots, mealworms, and grasshoppers-crickets and different rearing substrates. The main benefits of this conversion process are reduction of waste by producing high quality protein (mainly for animal feed) and the extraction of by-products such as oil, natural fertilizer, chitin.783
Chemical processes are those processes which cause a change in the chemical structure of a molecule by reacting with other substances. (e.g., hydrolysis, transesterification, hydrogenation, oxidation, pulping).784
777 Waste Management Series . Chapter 8 - Biological Processes. Volume 5,Pages 171-218, 2006. 778 https://americanbiogascouncil.org/resources/what-is-anaerobic-digestion/ 779 https://www.biofit-h2020.eu/publications-reports/BioFitHandbook-2020-03-18.pdf 780 T.S.S. Dikshith.Hazardous Chemicals: Safety Management and Global Regulations, CRC Press.
782 https://www.eubia.org/cms/wiki-biomass/fermentation/ 783 H. P. S. Makkar, G. Tran, V. Heuzé, and P. Ankers,“State-of-the-art on use of insects as animal feed,”Anim. Feed
Sci. Technol., vol. 197, pp. 1–33, Nov. 2014. 784 Francesco Cherubini, The biorefinery concept: Using biomass instead of oil for producing energy and chemicals,
Energy Conversion and Management, Volume 51, Issue 7,2010.

339
‒ Catalytic: a chemical process control by the use of catalysts, to selectively increase the rate of chemical reactions. The action of catalysts serve to decrease the energy needed to perform certain chemical reactions, as well as to selectively breakdown certain chemicals.
‒ Esterification: mainly the reaction between alcohols and carboxylic acids or acyl chlorides or acid anhydrides to make esters.785 Esters can have different applications like: solvents, flavours, fragrances, pharmaceuticals and agricultural, plasticizer.786
‒ Hydrogenation: is a reaction in which hydrogen atoms are added to an unsaturated compound to reduce the double and triple bonds. Molecular hydrogen and other transfer hydrogenation compounds are used as hydrogen source in the reaction.787 This process is relevant to upgrade bio-intermediates to chemical building blocks.788
‒ Hydrolysis: is a chemical reaction in which water is used to break down the bonds of a particular substance. In practical terms, hydrolysis means the act of separating chemicals when water is added. There are three main types of hydrolysis: salt, acid, and base hydrolysis.789
‒ Methanation: is the chemical reaction by which carbon oxides and hydrogen are converted to methane and water with the aid of a catalyst. In industry, there are two main uses for methanation, to purify synthesis gas (i.e. remove traces of carbon oxides) and to manufacture methane.790
‒ Chemical pulping: is the process to separate cellulose fibres from biomass (mainly wood) and can be done by mechanical, chemical or thermomechanical/chemical processes.791 Several chemical pulping processes exist, the most common is using sodium sulphate (kraft) and the secondly one using sodium sulphite, while the processes e.g. using ionic solvents, supercritical CO2 are upcoming as more environmentally friendly ones. The Kraft process dominates the chemical pulping process due to the superior pulp strength properties and its applicability to all wood species.792
‒ Steam reforming: is a widely used process for the generation of hydrogen-rich synthesis gas from light carbohydrates (including biomass and biomass-derived compounds). The steam reforming of biomass derived compounds is a promising strategy for bio-hydrogen production. The main challenges of this technology is the identification of catalysts and operating conditions for each feed material to produce the highest yield of hydrogen.793
‒ Water electrolysis: During the electrolysis, electricity is used to split water into oxygen and hydrogen. The hydrogen can be used as a fuel or it can be combined with carbon dioxide from biogenic origin in order to further convert the hydrogen to hydrocarbons through synthesis processes. This process is commonly integrated in gasification and pyrolysis processes to produce hydrogen.794
‒ Water gas shift: The water gas shift process enables adjustment of the CO/H2 ratio of the syngas obtained in gasification processes by reacting the syngas with steam. The water is broken down into hydrogen and oxygen, the latter reacting with some of the CO in the syngas stream to produce CO2. Thus the H2/CO ratio is adjusted, although excess CO2 may need to be separated from the gas stream. There are two
785 https://www.chemguide.co.uk/organicprops/alcohols/esterification.html 786 https://science.jrank.org/pages/2572/Ester.html 787 Kohli, K.; Prajapati, R.; Sharma, B.K. Bio-Based Chemicals from Renewable Biomass for Integrated Biorefineries.
Energies 2019, 12, 233,2019. 788 Energies, 12(2), 233, 2019. 789 https://www.thoughtco.com/what-is-hydrolysis-375589 790https://matthey.com/en/products-and-services/chemical-processes/chemical-catalysts/methanation-catalysts. 791 http://www.cepi.org/node/22334 792 Best Available Techniques (BAT) Reference Document for the Production of Pulp, Paper and Board,” pp. 195, 369,
487,2015. 793 https://www.nrel.gov/docs/legosti/old/36262.pdf 794 https://www.biofit-h2020.eu/publications-reports/BioFitHandbook-2020-03-18.pdf

340
main configurations of the gas shift reaction; the clean gas shift and the raw gas shift.795
In the thermochemical processes, feedstock usually undergoes extreme conditions (high temperature and/or pressure, with or without a catalyst).
‒ Combustion: is a chemical reaction of a fuel in presence of an oxidizer (commonly oxygen) and heat. The fuel and the oxidizer react together to form new chemical substances, often gaseous products.796
‒ Gasification: Gasification process converts carbon-based raw material into fuel gas(also known as syngas). The process occurs, generally at high temperature/pressure in presence of controlled amount of oxygen (or air) and steam. Syngas is composed of carbon monoxide and hydrogen and can be burned directly or be used as a starting point to manufacture fertilizers, pure hydrogen, methane or liquid transportation fuels such gasoline and diesel. 797
‒ Hydrothermal liquefaction (HTL) is a process to increase the energy content of wet organic containing streams, through this process biomass can be converted into a heavy oil (biocrude) product without drying. Black liquor, lignin, sawdust sludge or other organic containing feedstock can be converted into a bio crude by HTL and from the hydrogenation of this heavy fuel oil, products like diesel, kerosene, or other (chemical) end-products are made.798
‒ Pyrolysis: is a process, where in the absence of oxygen (dried) organic material is thermally cracked at temperatures between 400 °C and 600 °C producing a combustible gas, pyrolysis oil and char. There are roughly three different types of pyrolysis with a different ratio of the three products: slow (mainly char), medium (both char and pyrolysis oil) and fast (mainly pyrolysis oil), thought slow pyrolysis also called carbonization.799
‒ Supercritical conversion: The supercritical conversion processes take place at temperatures and pressures above the critical point of water.800 Main super critical conversion processes of biomass are: supercritical water gasification (SCWG) and the supercritical water oxidation. Supercritical water oxidation is used particularly for degradation of harmful and toxic materials. 801 On the other hand SCWG of biomass is a promising conversion route for wet biomass and waste streams into hydrogen and/or methane.58
‒ Torrefaction & Carbonization: are thermal process to convert biomass into a coal-like material, with higher energy density and hydrophobic characteristics compare the original biomass.802
Mechanical processes do not change the chemical structure of the biomass, but only the morphology and composition. e.g. a size reduction, densification change (density and size and shape) or separation of feedstock components. Mechanical processes are important
795 D.J. Roddy, C. Manson-Whitton, Biomass Gasification and Pyrolysis, Comprehensive Renewable Energy, Elsevier,2012.
796 Biorefinery: Integrated Sustainable Processes for Biomass Conversion to Biomaterials, Biofuels, and Fertilizers. Bastidas-Oyanedel J.R, Schmidt J. Springer, 15 Apr. 2019.
797 https://netl.doe.gov/research/Coal/energy-systems/gasification/gasifipedia/intro-to-gasification 798 https://www.biofit-h2020.eu/publications-reports/BioFitHandbook-2020-03-18.pdf 799 Annevelink, E., Bos, H & Meesters, K., Van den Oever, M. Circular Solutions Part IV from Waste to Resource
February 2016. 800 https://research.utwente.nl/en/publications/on-the-gasification-of-wet-biomass-in-supercritical-water-over-de 801 Akgül, G. Supercritical Conversion of Biomass. In Transformation of Biomass, A., 2014. 802 https://www.btgworld.com/en/rtd/technologies/

341
for feedstock to meet the quality requirements for prior biochemical and thermochemical conversion or further processing of biomass fibres.
‒ Blending or mixing: is used to modify the specification of streams for different purposes. For instance blending feedstocks in order to meet required emission or to aminimize ash production during power generation or in the animal feed industry, when a variety of feedstocks are blended to meet the desired nutritional requirements for a specific animal. 803
‒ Extraction: is a recovery and purification technology. It includes liquid-liquid extraction and solid phase extraction. Impurities or valuable compounds are extracted and /or concentrated from a bulk phase by using a solvent that has an affinity with desired compound. This technology is often used with compounds that have a are higher boiling point than water, resulting in lower energy requirement than distillation.804
‒ Fibre Separation: is the process of separation of fibres from non-fibrous cellular tissues and the woody part of the stem through dissolution and decomposition of pectins, gums and other mucilaginous substance. The process may employ e.g. bacteria and moisture to dissolve or rot away the cellular tissues and other substances surrounding bast-fibre bundles, through their enzymatic action loosens the fibre strands and facilitates the separation of the fibre from the stem. The fibres are then mechanically extracted, washed, dried and marketed and the whole process is known as retting. Improper retting may lead to bad or inferior quality of fibre in spite of good crop.805
‒ Mechanical and thermomechanical disruption & fractionation: are processes to modify the shape, particle size, bulk density and/or moisture of biomass. Theses process use mechanical energy to separate the primary raw samples into a liquid fraction, green juice and a solids fraction.806,.807 Mechanical pressing for the industrial extraction of seed oils, screw press, biomass spraying and steam explosion are also included.
‒ Separation: Separation processes involve the separation of a substrate into its components, e.g. distillation, evaporation, crystallization and filtration, membrane separation.
Platforms
‒ Biochar: Biochar is a solid material obtained from the carbonization and thermochemical conversion of biomass in an oxygen-limited environments and temperatures <700°C. 808 Biochar primary application is use as a soil amendment with the intention to improve soil functions; contrary charcoal which main use is as a fuel. Biomass waste materials are appropriate for biochar production include crop residues (both field residues and processing residues such as nut shells, fruit pits, bagasse, etc.), as well as yard, food and forestry wastes, and animal manures.
‒ Bio-coal: Biocoal is a material with a higher energy content per unit volume produced via torrefaction and usually converted into pellets to facilitate transport and avoid problems associated with decomposition during storage. The common raw material is wood, but it is also possible to use bark.809
803https://www.intechopen.com/books/biomass-volume-estimation-and-valorisation-for-energy/biomass-blending-and-densification-impacts-on-feedstock-supply-and-biochemical-conversion-performanc
804 https://kochmodular.com/liquid-liquid-extraction/industrial-applications/ 805 https://gauravkanaujia.webs.com/documents/R%20N%20Meena.pdf 806http://resolver.tudelft.nl/uuid:50100136-e393-47be-be19-d25bc4f5d27e 807 Yoshida, T., Sasaki, H., Takano, T., & Sawabe, O. “Dewatering of high-moisture wood chips by roller compression
method”. Biomass and bioenergy,34(7), 1053-1058, 2010. 808 https://biochar-international.org/faqs/ 809 http://www.etipbioenergy.eu/value-chains/products-end-use/intermediates/torrefied-pellets

342
‒ Bio-crude: Bio-crude is a thickened liquid that that can be solid at room temperature. It is produced by biomass hydrothermal liquefaction (HTL) or hydrothermal upgrading (HTU). Bio-crude is closer in properties to petroleum than bio-oils but it is not a direct analogous to crude petroleum. The remaining oxygen from the biomass contributes chemical functionality of the bio-crude that is not present in petroleum.810,811
‒ Biogas: Biogas (mainly CH4 and CO2 and impurities such as H2S) is produced from anaerobic digestion of organic residues. After purification it can be used for heat and power generation. Biogas has between 50-70% CH4 but it can be upgraded to 97-99% purity to be used as potential substitute of natural gas. The digestate associate to the anaerobic digestion can be used for biological fertilizer production e.g. through crystallisation process of struvite within the digestate thus replacing the demand for fossil-based fertilisers.
‒ Bio-naphtha: is a mixture of C5- C10 hydrocarbon compounds which are volatile and flammable and can substitute naphtha from petroleum refining due its similar physical and chemical properties. Diverse biomass feedstock such as: palm oil, rapeseed oil, soybean oil, jatropha oil, camelina oil, waste animal fat and vegetable oil residues can be used for bio-naphtha production. The conversion process catalytically converts fatty acids and / or glycerides into waste greases and vegetable oils and algae into paraffinic hydrocarbon fractions without residual oxygenates. This process can convert long-chain hydrocarbons into hydrocarbons with shorter chains with the help of a catalyst.812,813
‒ Bio-oil: Bio-oils mean oils derived from biomass. They include a variety of organic products such as vegetable oil, microalgae oil, tall oil, fatty, grease, used oil. Thus, their naming should depend on the biomass from which they derive and the technique of production. The main constituents of bio-oils are in the group of lipids. Oil and fat are esters formed between glycerol and fatty acids.
‒ C5 /C6 Sugars: C5 (e.g. xylose, arabinose) and C6 (e.g. glucose, fructose, galactose) sugars are present in different feedstock and are relatively easy to extract. Theses sugars are released from hydrolysis of sucrose, starch, cellulose, hemicellulose and food and feed side streams. Extraction is easier from sugar crops such as sugarcane, sugar beet, and sweet sorghum.
‒ Carbon dioxide: Carbon dioxide generated (fully or partially) from biomass that is capture and treated for further processing into higher added value products like chemicals.814
‒ Hydrogen: Biohydrogen can be obtained from water-gas shift reaction, steam reforming, water electrolysis and fermentation. It might be used either as raw material (chemical reactant) for hydrotreatment of oils, hydrogenation of sugars and ammonia production or as an energy source.
‒ Lignin: Lignin is produced from fractionation of lignocellulosic biomass and is the second most abundant fraction behind cellulose. Lignin is mostly combusted for process steam and electricity generation in the wood processing installations. Only a marginal part of the lignin produced worldwide is yet valorised into other products such as dispersant in cement and gypsum, emulsifier and chelating agent in treatment of industrial effluents, tyre additive, resins and chemicals like vanillin and phenolic based aromatic compounds.815
810 https://task34.ieabioenergy.com/bio-crude/ 811 https://www.ce.nl/en/publications/352/the-htu-process-as-part-of-the-energy-transition 812 Bio-Naphtha as Alternative for Olefins Feedstock in Indonesia International Journal of Chemical Engineering and
Applications, Vol. 10, No. 3, June 2019 813 https://www.greencarcongress.com/2012/10/neste-20121029.html 814 https://www.agro-chemistry.com/news/bioreco2ver-turning-co2-chemicals-using-bioconversion/ 815 Sun Y, Cheng J. Hydrolysis of lignocellulosic materials for ethanol production. A review. Bioresour Technol;83:1–11,
2002.

343
‒ Organic Fibre: Fibres are produced during the processing of biomass, (e.g., lignocellulose, press cake and hulls). For example press cake fibres can be utilized as green feed pellets, processed to fibre products or potentially used as raw material for other platforms (e.g. grass juice, sugarcane bagasse). Fibres can be used to make material for building, insulation, and packaging applications, biocomposites, biofuel feedstock and other products.816
‒ Organic Juice: Organic juice is a liquid mixture produced after the pressing of wet biomass. Processing fresh wet biomass (grass, alfalfa, immature cereals) involves dewatering to obtain two separate intermediates: a nutrient-rich juice organic solution and a press cake. Both intermediates are starting points for various valorisation pathways. The organic juice can contain valuable compounds: carbohydrates, proteins, free amino acids, organic acids, minerals, hormones and enzymes.817
‒ Protein: Plant based proteins can be extracted from various crops, agro-residues, press cakes, algae and grass. Proteins are essential for animal and human diets. After further processing and purification the production protein isolates and concentrates (containing essential amino acids) are feasible for new class of formulated foods.818 Additionally, proteins are used for other industrial applications such as adhesives, coatings, surfactants and plastics.819
‒ Pyrolysis Liquid: Pyrolysis liquid results from the thermochemical decomposition of solid biomass in partial or complete absence of oxygen in order to avoid combustion. Pyrolysis liquids are complex mixtures of water, guaiacols, catechols, syringols, vanillin, isoeugenol, pyrenes, diverse carboxylic acids and heterogeneous product that can involve several hundreds of compounds.
‒ Starch: Starch is used as intermediate products for further used in the food and drinks industry.820 Modified and regular starch finds diverse application such in cosmetics, pharmaceutical, adhesives, bioplastics.
‒ Syngas: Synthesis gas (syngas) is mixture of carbon monoxide, hydrogen, methane, carbon dioxide and nitrogen produced from biomass gasification. After cleaning the gas cleaning it can be used as a fuel for heat and power generation. Depending on the gasification conditions the gas can also be conditioned. During this process mainly the ratio H2/CO is adjusted, followed by thermal or biochemical processing for the production of chemicals and liquid biofuels. Syngas can also be fermented to produce methanol, ethanol and ammonia and potentially other building blocks.821
Product Groups
Chemicals: The sub-category groups for chemicals is related to the market applications.
‒ Additives: are chemical substances that are added in small quantities to another product or chemical substance to improve its properties or impart other desirable properties.822 Some examples include: epoxidized vegetable oils and epoxidized fatty acid esters.
‒ Agrochemicals: chemicals used in agriculture to aid plants and crops growth, to protect agricultural crops from pests and for augmenting crop yields.823 These
816 Natural Fibres and Fibre-based Materials in Biorefineries IEA Bioenergy Task 42. Status Report 2018 817 https://biorrefineria.blogspot.com/p/plataformas-de-biorrefineria.html 818 https://www.slideshare.net/abhishekindurkar/protein-isolates-and-concentrates 819 Proteins for Food, Feed and Biobased Applications Biorefining of protein containing biomass 820 https://www.ieabioenergy.com/wp-content/uploads/2014/09/IEA-Bioenergy-Task42-Biorefining-Brochure-
SEP2014_LR.pdf 821 Jong E., IEA Bioenergy Task 42. Biobased chemicals, 2020 822 Lee C.C., Environmental Engineering Dictionary. 4th Edition, 2005. 823 https://www.worldofchemicals.com/629/chemistry-articles/agrochemicals-types-and-their-effects.html

344
chemicals are also produced under Good Manufacturing Practice (cGMP) to avoid contamination.
‒ Building blocks: also known as platform chemicals, are starting materials use to manufacture other chemical compounds and a broad range products.
‒ Colorants: Colorants include dyes, pigments or inks. Dyes are water soluble compounds, usually applied to textiles. Pigments are insoluble in water used in paints, ceramics and plastics. They are applied by dispersion in a suitable medium.824 Inks are more complex liquids or pastes containing dyes or pigments.825 Some examples are dyes from pomegranate rind, acacia tree, anthocyanins, flavines, indigonoids 826,827
‒ Cosmeceuticals: are chemical substances such as essential oils, vitamins, antioxidants, hormones, alpha-hydroxy acids (AHAs), intended to be in contact with the external parts of the human body or with the teeth. Cosmeceuticals have exclusively or mainly functions to cleaning, perfume or change the appearance of externa body parts and protecting them or keeping them in good condition.828
‒ Flavours & Fragrances: are chemical compounds that have a smell, odor or flavour. They must be sufficiently volatile to be transported to the olfactory and gustatory systems. The chemicals structures of these compounds can be diverse and include: esters, terpenes, aromatics, amines and alcohols that can be found in can be found in food, wine, spices, floral scent, perfumes, fragrance oils, and essential oils.829
‒ Lubricants: are substances (liquids, but also solids or semi-solids) used to facilitate the motion of solid bodies by minimizing friction and wear between interacting surfaces.830 Bio-based lubricants are usually triglyceride esters (fats obtained from plants) and can be derived from vegetal oils include high oleic canola oil, castor oil, palm oil, sunflower seed oil, rapeseed oil, and tall oil from tree sources. The vegetable oils are often hydrolysed to yield the acids which are selectively combined to form specialist synthetic esters.831
‒ Nutraceuticals: Nutraceuticals are substances derived from food sources with extra health benefits in addition to the basic nutrition. They are used for preventing health and wellbeing in human beings or animal. Nutraceuticals are sold in the form of pills, or powder or other medicinal forms, not usually associated with foods.832
‒ Paints & Coatings: The four main constituents of paints and coatings are solvents, binders, pigments and additives. Bio based paints and coatings contain at least some bio-based elements. A minimum bio-based share of about 12.5%-60% is required to categorized a paint and coating as bio based product depending on the type of paint.833,834
‒ Pharmaceuticals: is chemical substance or a combination of substances administer to human beings to restore, correct or modify physiological functions and to treat a
824 https://www.essentialchemicalindustry.org/materials-and-applications/colorants.html 825 http://www.chemistryislife.com/the-chemistry-of-ink 826 https://www.foodcolor.com/natural-pigments 827https://www.researchgate.net/publication/281113520_Extraction_of_natural_dye_Pomegranate_rind_and_its_fastn
ess_properties 828 Guidance document on the demarcation between the cosmetic products directive 76/768 and the medicinal
products directive 2001/83 as greed between the commission services and the competent authorities of member states.
829 https://en.wikipedia.org/wiki/Aroma_compound 830 Bart J.C, Gucciardi E., Cavallaro S., 3 - Lubricants: properties and characteristics, In Woodhead Publishing Series in
Energy, Biolubricants, Woodhead Publishing, Pages 24-73. 2013. 831 Syahir A.Z., N.W.M. Zulkifli, H.H. Masjuki, A review on bio-based lubricants and their applications, Journal of
Cleaner Production, Volume 168, Pages 997-1016, 2017. 832 Das L, Bhaumik E, Raychaudhuri U, Chakraborty R. Role of nutraceuticals in human health. J Food Sci
Technol;49(2):173-83, 2012. 833 https://www.biopreferred.gov/BioPreferred/faces/pages/ProductCategories.xhtml 834 https://biobasedprocurement.eu/wp-content/uploads/2016/02/Biobased-Coating.pdf

345
medical condition.835 Pharmaceuticals must contain, Active pharmaceutical ingredients (APIs) and are produced under Good Manufacturing Practice (cGMP).
‒ Solvents: are compounds that are able to dissolve other substances without modify their chemical structure.
‒ Surfactants: is a substance formed by organic compounds that contain hydrophobic groups and hydrophilic groups which lowers the surface tension of the medium in which it is dissolved, and/or the interfacial tension with other phases.836 This sub-category includes soaps, wetting agents and detergents.
‒ Catalysts & Enzymes: A catalyst is a substance that increases the rate of a reaction without being consumed in the reaction.837 Enzymes are highly specific biological catalysts. Plant-derived enzymes include amylase, invertase, papain, bromelain, ficin and lipoxygenas have played an important part in food production, such as, syrups, bakery products, alcoholic beverages, dairy products.838 Additionally new bio based catalyst like activated carbon can be produce from renewable biomass.839
Materials:
‒ Composites: are a combination of two or more components (materials) from natural or synthetic origin that together provide better properties.840 Composites are usually a fibre or particulate material in a matrix or continue phase that is commonly a polymer, metal, or ceramic 841. Examples of composites are: Natural composites (e.g. wood, mud bricks (mud+straw), bones) and bio-based derived composites manufactured with natural fibres and synthetic fossil-derived polymers or vice versa (PLA/flax composites, paper).
‒ Fibres: are natural or man-made substance with a thread like body aspect that is significantly longer than it is wide (diameter< 1 mm).842 Examples of fibres are: Natural Fibres (e.g. wool, jute, hemp, sisal, abaca, coir fibres, silk, microfibrillated cellulose) and bio-based derived fibres (e.g. polycaprolactam (Nylon 6), Poly(hexamethylene adipamide) (Nylon 66), polyamid-11 (Nylon11))
‒ Organic fertilizers: are materials derived from animal products and plant residues containing sufficient nitrogen.843 Naturally occurring organic fertilizers include: (green) manure, slurry, worm castings, peat, seaweed, greensand (anaerobic marine deposits), humic acid, guano, sewage sludge, compost, bloodmeal, bone meal, digest.844
‒ Polymers: are natural or synthetic substances composed of macromolecules with high relative molecular mass and with a structure that comprises the multiple repetition of units.845 Examples of polymers are: Natural polymers (e.g. starch, natural rubber, lignin, cellulose, chitin, pectin) and bio-based derived polymers (e.g. polyethylene (PE), polyethylene terephthalate (PET), Polyethylene 2,5-furandicarboxylate (PEF), Polyhydroxyalkanoates (PHA), polylactic acid (PLA), Polybutylene succinate (PSB)).
835 https://www.pharmaguideline.com/2011/09/terminology-definitions-in.html 836 Compendium of Chemical Terminology, 2nd ed. (the "Gold Book") Online version created by S. J. Chalk. 2019 ISBN
0-9678550-9-8. 837 https://goldbook.iupac.org/terms/view/C00876 838 Enzymes in Food Biotechnology Production, Applications, and Future Prospects, Chapter 28 - Plant-Derived
Enzymes: A Treasure for Food Biotechnology. Pages 483-502, 2019. 839 Emrani J, Shahbazi A. A Single Bio-based Catalyst for Bio-fuel and Bio-diesel. J Biotechnol Biomaterial 2:124, 2012. 840 http://compositeslab.com/composites-101/what-are-composites/ 841 F.C. Campbell , Structural Composite Materials Copyright ©, ASM International®, 2010. 842 Griffith E, Phosphate Fibres, Springer US.1995. 843 https://stats.oecd.org/glossary/detail.asp?ID=1921 844http://www.fao.org/tc/exact/sustainable-agriculture-platform-pilot-website/nutrients-and-soil-fertility-
management/organic-fertilizers-including-manure-and-compost/en/ 845 https://iupac.org/polymer-edu/what-are-polymers/

346
‒ Resins: are defined as a solid or high viscous substance (complex mix of organic compounds) of natural or synthetic origin, practically insoluble in water.846 The material or substance is uncured (no chemical or physical action has occurred in order to make the material harder, tougher or more stable).847 Examples of natural resins are: rosin, shellac, copal, respin and bio-based derived resins: bio-based polyurethane resins, epoxy resins, alkyd resins.
846 https://www.fs.fed.us/wildflowers/ethnobotany/resins.shtml 847 NEN-EN 16245-2:2013 en

347
Annex III - WP 2 Specific drivers and barriers factsheets
Drivers for, and barriers to, bio-based uptake of Propylene Glycol
Category Drivers Barriers
1: Business PG used in variety of products and is in high demand Available raw materials
Most bio-based PG produced outside EU PG production tied to biodiesel production Covid-19
2: Innovation
Existing technology to convert glycerol to PG Green hydrogen can improve GHG balance New technologies like UPM’s offering alternative pathways to PG
IP can be an issue when companies decide to expand to new areas
3: Economy Adding value to glycerol waste streams Ethylene glycol as side product
Dependency on volatile biodiesel markets for feedstock
4: Feedstock Glycerol readily available from biodiesel production Certified palm oil (low-iLUC) Traceability of feedstock Wood offering an alternative
Soy and palm oil are not produced in Europe creating non-EU dependency. Food competition when using oil crops
5: Climate change and environment
Bio-based PG 40-60% lower GHG emissions than with fossil-based Low-iLUC palm oil.
Deforestation due oil crop plantations and consequential effects High land usage requirement and fertilizers Using animal fats increase the use of lands via animal husbandry Hydrogen needed (fossil origin) Legislation does not consider the true cost of carbon emission
6: Citizen and Society
ISCC certified woody biomass as raw material. This certification also covers social aspects
Human rights violations Health issues Use of toxic methanol in biodiesel production
7: Policy and regulation
Biodiesel industry drivers Funding/policies supporting 3rd generations biofuels and green hydrogen Possible introduction of sustainable purchasing policies Possible support for non-food oil crops. Lift CO2-price on the level of the effects of GHG emissions Future increase of policy support for chemicals and materials from biomass
Phasing out palm oil via RED2 Limitations for diesel cars Requirement for higher fuel efficiencies Increase in electric and hydrogen mobility
Business drivers and barriers
The bio-based version of Propylene glycol (PG) is a drop-in commodity chemical used in multiple industries. It finds it use in chemicals, cosmetics, paints and coatings industry, agri-food industry, and pharmaceutical industry 848,849. It can be used as a surfactant, moisturizer, antifreeze agent, solvent and as preservative848. Main applications of PG are in manufacturing of unsaturated polyester resins and as de-icers and antifreeze agents849.
In 2018, the global PG market was estimated between 2 and 2.5 million tonnes from which bio-based PG was 5% (100 ktonnes – 125 ktonnes) 850. The compound annual growth rate
848 Biddy, Mary J., Scarlata, Christopher, and Kinchin C. Chemicals from Biomass: A Market Assessment of Bioproducts with Near-Term Potential.; 2016. doi:10.2172/1244312
849 Joshi S. GT-ProG: Green Technology to Produce Propylene Glycol from Glycerin derived from Bio-diesel Process. https://www.linkedin.com/pulse/gt-prog-green-technology-produce-propylene-glycol-from-sachin-joshi/ . Published 2016. Accessed July 27, 2020
850 Nachtergaele P, De Meester S, Dewulf J. Environmental sustainability assessment of renewables-based propylene glycol at full industrial scale production. J Chem Technol Biotechnol. 2019;94(6):1808-1815. doi:10.1002/jctb.5951

348
is estimated at 4.4% 851. The European share in bio-based PG is estimated at 3% with 20 ktonnes production from glycerol while the fossil production is 633 kta 852. Most of the bio-based PG is produced outside Europe, in the US and in China 853.
It is considerably more expensive to produce PG via a bio-based based route. In 2018 the costs of producing bio-based PG (from glycerol) was estimated at 1.68 €/kg, compared to 1.01 €/kg for the fossil-based PG 852. The price of fossil-based PG is tied to propylene prices and consequently to crude oil prices, whereas bio-based PG prices are related to crude glycerol prices. The price of propylene was before Covid-19 approximately 68 cents /kg 854 while crude glycerol was 18 cents/kg 855. Effect of the Covid-19 pandemic and associated lower mobility resulted in reduced biodiesel production and consequently reduced the availability of crude glycerol. A barrier for bio-based PG on the market is that the glycerol price and availability is linked to the biodiesel-market. This market is volatile and under influence of oil prices and policies.
Innovation drivers and barriers
PG can be produced refining petroleum via propylene or via four different ways from bio-based sources848,850,854. One bio-based route is known as the oleochemical route in which animal fats or vegetable oils are hydrolysed to produce fatty acids. As a side-product glycerol is formed which can be then hydrogenolysed to PG. Another bio-based route is known as the biodiesel route in which vegetable oils are esterified to biodiesel also forming glycerol as a side product. PG is then produced, like in the oleochemical route, via hydrogenolysis. Approximately, 1kg of glycerol is produced per 10kg of biodiesel or fatty acid. As a third bio-based option PG can also be produced from corn starch via hydrogenation to sorbitol and consequential hydrocracking to PG. The bio-based routes to PG produce minor amounts of ethylene glycol (EG) as a side product 848,856. EG can be sold to create additional value. It should be noted that both fossil-based and bio-based PG production requires hydrogen, currently predominantly produced from fossil-sources by steam reforming of methane. Another bio-based route to produce PG is from woody biomass where the sugars of the lignocellulosic material are fermented to PG. UPM has ongoing project in Leuna (Germany) to start production of EG with PG as major side product 857, 858.
Currently due the availability of glycerol and its low-cost price it remains to be the most preferred bio-based route to PG 859. The environmental sustainability of bio-based PG production would be significantly improved if the hydrogen used would originate from
851 MarketsandMarkets. Propylene Glycol Market. https://www.marketsandmarkets.com/Market-Reports/propylene-glycol-market-264488864.html#:~:text=%5B176 Pages Report%5D The propylene,market during the forecast period. Accessed August 4, 2020
852 Spekreijse J, Lammens T, Parisi C, Ronzon T, Vis M. Insights into the European market for bio-based chemicals Analysis based on 10 key product categories. 2019. doi:10.2760/549564
853 de Guzman D. Oleochemicals: Oleon enters glycerin-based propylene glycol. https://www.icis.com/explore/resources/news/2012/07/16/9577645/oleochemicals-oleon-enters-glycerin-based-propylene-glycol/. Published 2012. Accessed July 27, 2020
854 Hall K. Ethylene and Propylene Prices in 2020: Two Market Stories. http://blog.opisnet.com/ethylene-propylene-prices-2020 . Published 2020. Accessed July 27, 2020
855 Wright S. INSIGHT: Europe glycerine spot prices post triple-digit rises on fears of further biodiesel output cuts. https://www.icis.com/explore/resources/news/2020/04/03/10490229/europe-glycerine-spot-prices-post-triple-digit-rises-on-fears-of-further-biodiesel-output-cuts . Published 2020. Accessed July 27, 2020
856 ADM. Frequently Asked Questions EVO-100TM USP-NF/FCC Propylene Glycol (Excipient/Food Use Only). https://www.adm.com/products-services/industrials/propylene-glycol/faqs . Accessed July 27, 2020
857 Scott A. Paper firm UPM will spend $600 million to make chemicals from wood. Chem Eng News. 2020. https://cen.acs.org/business/biobased-chemicals/Paper-firm-UPM-spend-600/98/i6 . Accessed October 22, 2020
858 UPM-Biofore. New German Biorefinery in the pipeline. UPM Communications Papers. https://www.upmpaper.com/sustainability/articles/new-german-biorefinery-in-the-pipeline/ . Accessed October 22, 2020
859 Rosales-Calderon O, Arantes V. A review on commercial-scale high-value products that can be produced alongside cellulosic ethanol. Biotechnol Biofuels. 2019;12(1):240. doi:10.1186/s13068-019-1529-1

349
renewable sources. The future development of green hydrogen production will aid with this.
In research and innovation intellectual property (IP) rights are important factor. New fields that have a large patent coverage may seem too risky for companies to get into. This is something to consider as a barrier with bio-based chemicals, like PG that have new technologies emerging 860.
Economic drivers and barriers
Production of PG from glycerol adds value to the waste streams from biodiesel and fatty acid production. In addition, ethylene glycol is formed as a side product during PG production from some bio-based sources. It can be sold to create additional income. This of course depends on the volumes produced and the EG markets that are typically moving large volumes.
Feedstock drivers and barriers
The four bio-based routes for PG production make use of oil-based crops (2x) and starch-based crops. Feedstocks currently being used are region-specific. Among vegetable oils palm oil and soy oil are the cheapest to produce, but many controversies are related to their production 861, and this calls for traceability of feedstocks to enable sustainable production (see below). In Germany rapeseed is the main source of vegetable oils for biodiesel production 862. Starch-based crops, like corn, are produced globally and are readily available. Production in Europe is more expensive than in most other parts of the world. An alternative feedstock to controversial oil-based feedstocks is woody biomass. New technologies that coming to the field to offer alternatives, like UPM’s technology. Woody biomass offers therefore an option. There are well-established systems in place to monitor sustainable forestry, which exclude discussions about indirect land use and competition with food.
The drawback, and a barrier of using palm and soy-based feedstocks are that they are grown outside Europe. This increases the dependency of imported goods.
Climate change and environmental drivers and barriers
Sustainability of PG production from fossil and oil-based crops has been studied and the most sustainable route was production of PG via biodiesel production involving certified palm oil usage850. Via the oleochemical route reduction of CO2–emissions were approximately 40% and in the biodiesel route 60% compared to fossil counterpart. This is the main driver in this category. Production of the feedstock counts for most of the impacts related to climate change 850. Low-iLUC palm oil also offer more sustainable oil feedstock, however, it is unsure how this is reflected in the new regulations regarding palm oil. PG itself is biodegradable and causes no harm to the environment as such. However, it should be noted that PG is often used in product formulations in which the end-product is often no longer biodegradable. In case of woody biomass as a feedstock, certifications like RST, ICC, FCS, PEFC, ensure that the wood is sustainably sourced and impacts on the climate are taken into account. These certifications also help communications along the value chain.
860 Expert Opinion. Interview with an industry expert in the framework of this project. 861 Buffet L. High & Low ILUC Risk Biofuels - Policy Recommendations for the EU Delegated Act.; 2019.
https://www.transportenvironment.org/sites/te/files/publications/2019_01_High_low_ILUC_TE_briefing_final.pdf 862 UFOP. Rapeseed oil remains primary feedstock for German biodiesel. Biodiesel Magazine.
http://www.biodieselmagazine.com/articles/2517088/rapeseed-oil-remains-primary-feedstock-for-german-biodiesel . Published 2020. Accessed July 29, 2020

350
Usage of palm oil and soy oil includes many challenging issues. They compete with land usage for food. Furthermore, environmentally they are having issues such as deforestation, danger to biodiversity, reduction of soil quality and increased use of fertilizers. Palm oil production has also high land usage requirements850 and the plantations are often started by forest removal through burning causing emissions to the atmosphere 863. Furthermore, using animal fats as feedstock increases the land use required for animal husbandry 850. It is expected that with the Europe’s advance biofuel strategy the feedstocks these types of conventional feedstocks will also be phased out. Furthermore, PG production requires hydrogen; to become more sustainable the hydrogen should be produced from renewable resources. This is likely to get boost within the next years through the strategy boos of EU 864.
Citizen and Society drivers and barriers
There are some barriers in this category related to the use of oil-based feedstocks, like soy and palm. Palm oil plantations in general suffer from bad public image. Beyond the environmental challenges, the use of palm oil for energy purposes is controversial for the following reasons: competition with food, potential human rights violations (illegal land grabbing displacement of communities, human trafficking and child labour)861 and health issues (due to forest-burning related smog) 865.
In addition to this, biodiesel production uses methanol as a solvent, since it is a cheaper alternative to other solvents, like ethanol. Methanol is a toxic chemical and switching to ethanol-based solvent would cause less potential harm to health.
Policy and regulation drivers and barriers
With a significant share of PG feedstock coming as side product from biodiesel production, policies and regulations on transport and renewable transportation fuels are acting as drivers for PG. Usage of oil-crops as a feedstock can be made more sustainable by introducing sustainable purchasing polices, like BioPreferred. Furthermore, if bio-based PG manufacturing from oil-crops remains as the main route, supporting the use of non-food oil crops can lower the undesired effects of land use competition. To introduce more measures for less sustainable production routes, the price of CO2 could also be adjusted to the level of the cost for greenhouse gas emissions860. If there would be more policy support for new technologies that enable chemicals and materials from biomass rather than fuels and energy it would help to bring new alternatives to the markets 860.
The barriers in this category are related to the oil-crops. EC policies on sustainable transport and green hydrogen promote zero emission vehicles that are powered by electricity or by (green) hydrogen fuel cells, rather than by diesel. Under RED II (Renewable Energy Directive) high-iLUC feedstocks like palm and soy will be phased out. Both groups of policies would lead to a reduced availability of biodiesel-associated glycerol, thus a feedstock for PG.
863 Book&Claim Ltd - GreenPalm. The social and environmental impact of palm oil. https://greenpalm.org/about-palm-oil/social-and-environmental-impact-of-palm-oi l
864 European Commission. Questions and answers: A Hydrogen Strategy for a climate neutral Europe. https://ec.europa.eu/commission/presscorner/detail/en/QANDA_20_1257 . Published 2020. Accessed November 5, 2020
865 Sustainability Policy Transparency Toolkit. Palm oil - Social impacts. https://www.spott.org/palm-oil-resource-archive/impacts/social/ . Accessed July 27, 2020

351
Drivers for, and barriers to, bio-based uptake in lubricants
Table 57. Drivers for, and barriers to, bio-based lubricants market uptake
Category Drivers Barriers
1: Business Bio-based lubricants have various advantages Demand for bio-based lubricants is increasing High-performance, environmentally friendly lubricants are highly sought after, and represent a distinct opportunity Bio-based lubricants may cost less over the product lifecycle owing to lower maintenance, storage, and disposal requirements The emergence of oleochemical derivates contributes to improving performance in specific industrial applications Bio-based drop-in chemicals provide an opportunity to increase the bio-based content of lubricants
The high cost of bio-based lubricants Lubricants are a commodity market, so a price premium is unlikely to be achieved Low market share of bio-lubricants means that engine manufacturers do not take bio-lubricants into account when developing specifications
2: Innovation Functional benefits e.g. high lubricity lower volatility, and lower flammability Some R&D activity
Lower performance of “traditional” bio-based lubricants Difficulty to obtain desired properties
3: Economy Growth in industrial, aviation and marine sectors are expected to drive the global demand for lubricants Market for bio-lubricants can be stimulated along with the one for biofuels Volatile petrochemical prices
4: Feedstock Feedstock options include a variety of unmodified vegetable oils, such as rapeseed, palm, canola, and sunflower oils
Some lubricants highly dependent on a single feedstock; mainly based on well-developed oils and fats platform Feedstock prices can be high because low quantities needed
5: Climate change and environment
All five sustainability characteristics (biodegradability, low human toxicity, low ecotoxicity, reduction of GHG emissions, recyclability) are required for bio-based lubricants Bio-based lubricants have superior biodegradability characteristics compared to conventional alternatives Environmental concerns are a leading driver for bio-based lubricants Bio-based lubricants produce fewer emissions
It is difficult to prove the sustainability, because main advantages occur at the use-phase of the product Bio-lubricants are not always seen by the regulators as being good for the environment, due to the possibility of use of palm oil, and the link with agriculture Vegetable oils cannot be recycled so easily, because of degradation (polymerization) and other irreversible changes
6: Citizen and Society
The use of bio-based lubricants produces a cleaner, less toxic working environment. Bio-based lubricants offer increased employee safety Low aquatic toxicity Low bioaccumulation
1. Low public awareness 2. Consumers do not ‘see’
lubricants, so no selling argument for producers
Terminology can be confusing for consumers
7: Policy and regulation
The bio-based lubricants market is driven by a mix of regulatory schemes on total-loss applications and industry standards Public procurement programmes can help to create a usage history and serve as a model for the private industry to emulate In several EU Member States, the use of bio-based lubricants is compulsory for use in total-loss applications in environmentally sensitive areas Marine vessels operating in North American waters need to have a Vessel General Permit (VGP), which mandates the use4 of biodegradable substances Increasingly high emission standards in marine transport applications
Differing regional regulations Lack of actual legislation Non-uniform labels and definitions Many different applications, so less suitable for labels, etc.

352
Introduction
Lubricants are formulations designed to separate moving parts, thereby minimising friction and reducing wear. Lubricants consists mostly of a base oil. The properties of the base oil are modified by adding small amounts of different additives 866. Lubricants are used in various applications in the industrial, automotive, marine and aerospace sectors. The largest consumption of lubricants is in transportation i.e. the automotive, aerospace and marine sectors 867, 868. The increasing number of passenger and commercial vehicles, and growth in the aviation and marine sectors are expected to drive the global demand for lubricants 869.
Feedstocks for bio-based lubricants (also referred to as bio-lubricants) include a variety of unmodified vegetable oils, such as rapeseed, pal, canola, and sunflower oils; tall oil fatty acids (TOFA), fatty acid methyl esters (FAME), and fatty acid (FA) polyethylene glycol (PEG) esters. The vegetable oils are often chemically modified, mixed together, or extracted from genetically enhanced seed oils with higher build-in stability to arrive at a vegetable oil blend or mixture with enhanced properties852. The best applications for bio-lubricants are found in machinery that loses oil directly into the environment during use (referred to as total loss, lost-in-use or used-once lubricants), and in machinery used in any sensitive areas, such as in or near water 870, 871.
Unmodified vegetable oils are mainly used in chainsaw bars and chains and unmoulding applications, while TOFA and the esters are used as engine oils, compressor oils, cooling fluids, aviation fluids and hydraulic fluids 848, 872.
Bio-lubricants have long suffered from a poor image, with shortcomings in performance and higher prices among the factors limiting them to a few niche applications in forestry and agriculture, to be used only when required by law 873. But prices have come down. For example, in the US bio-based rail curve greases are priced below their mineral oil-based counterparts when just 15 years ago the bio-based versions were twice as expensive853.
The bio-lubricants market is evolving, due to the increased supply of a new generation of high-quality bio-lubricants based on oleochemical derivates, notably synthetic esters, that offer superior performance, improved energy efficiency and prolonged lifetime for lubricants and machinery855. Bio-based lubricants are a very small part of the overall lubricant markets and are at present predominantly used in Europe and the US 874,
866 Kuo JAC da SE-C-H. Biodegradable Lubricants and Their Production Via Chemical Catalysis. In: Rijeka: IntechOpen; 2011:Ch. 7. doi:10.5772/24845
867 Grand View Research. Lubricants Market Size, Share & Trends Analysis Report By Application (Industrial, Automotive, Marine, Aerospace), By Region (North America, Europe, APAC, CSA, MEA), Competitive Landscape, And Segment Forecast, 2018 – 2025. https://www.grandviewresearch.com/industry-analysis/lubricants-market . Published 2018. Accessed August 7, 2020.
868 MarketsandMarkets. Lubricants Market by Type (Mineral Oil, Synthetic Lubricants, Bio-Based, and Greases), by Application (Transportation and Industrial Machinery & Equipment), and by Region (APAC, EU, NA, MEA, AND SA) - Global Forecast to 2021. https://www.marketsandmarkets.com/Market-Reports/lubricants-market-182046896.html . Accessed March 29, 2020
869 Paola Fabbri, Davide Viaggi, Fabrizio Cavani, Lorenzo Bertin MM, Erika Carnevale, Juliana Velasquez Ochoa, Gonzalo Agustin Martinez, Esposti Micaela Degli Piret, Kukk Fischer, Sven Wydra Schwarz, Alexander FM-W. Top Emerging Bio-Based Products, Their Properties and Industrial Applications.; 2018
870 Honary LA. Biobased- Biodegradable – Environmentally aware lubricants. Lube Mag No 147. October 2018:35-39. http://www.lube-media.com/wp-content/uploads/Lube-Tech-118-Biobased -–-Biodegradable-–-Environmentally-aware-lubricants-min-1.pdf
871 Gajera J. Bio-lubricants slideshow. https://www.slideshare.net/JalpaGajera/bio-lubricants . Accessed August 7, 2020.
872 Spekreijse J, Lammens T, Parisi C, Ronzon T, Vis M. Insights into the European market for bio-based chemicals Analysis based on 10 key product categories. 2019. doi:10.2760/549564
873 Luzuriaga S, Marioni M. The key market drivers of bio-lubricants. Lube Mag No 143. February 2018:20-22. https://www.panolin.com/pdf/Lube-magazin-143.pdf
874 Tsagaraki E, Karachaliou E, Delioglanis I, Kouzi E. D2.1 Bio-Based Products and Applications Potential.; 2017. http://www.bioways.eu/download.php?f=150&l=en&key=441a4e6a27f83a8e828b802c37adc6e1

353
although use in Asia-Pacific is on the rise. The need for biodegradable lubricants that are non-toxic has caused the market share of bio-lubricants to increase. The market value of bio-lubricants has increased from EUR 1.6 billion in 2011 to EUR 2.3 billion in 2017 and is expected to grow further to EUR 3.0 billion in 2024. The growth is mainly expected in applications in transportation and manufacturing856. Besides in bio-lubricants specifically, synthetic esters are also used in small quantities (5-10%) in many synthetic machine oils
875.
The total lubricant market in 2013 comprised around 39.4 Mt, 1.5 % of which (approx. 0.6 Mt) consisted of bio-based lubricants (12). A EC study853 expects the market share of bio-based lubricants to grow from 0.7 Mt (1.6 % of total market) in 2017 via 0.95 Mt (1.65 % of total market) in 2025 to 1.15 Mt (1.7 % of total market) in 2030. The market size of bio-based lubricants will grow from USD 3,255 million in 2013 via USD 5,150 million in 2025 to USD 6,200 million in 2030.
Business drivers and barriers
The bio-based lubricants market is driven by regulations on total-loss applications or by improved performance (improved energy efficiency and prolonged lifetime for lubricants and machinery) for certain applications. High-performance, environmentally friendly lubricants are highly sought after, and represent a distinct opportunity856. The emergence of oleochemical derivates contributes to improving performance855.
Bio-based lubricants have various advantages, such as longer life span, reduction in energy usage, increased machine life, and increased production. Demand for bio-based lubricants is increasing, encouraging vendors to manufacture them853, 855,876. Bio-based lubricants may cost less over the product lifecycle owing to lower maintenance, storage, and disposal requirements 877. However, their higher initial costs – compared to conventional lubricants – limits their appeal elsewhere851, 878. As lubricants are a commodity market, a price premium is unlikely to be achieved 879.
Bio-based drop-ins, such as succinic acid, adipic acid, propylene oxide, ethylene oxide building blocks provide an opportunity to increase the bio-based content of lubricants860.
Bio-based lubricants must meet the performance requirement of the application 856., 860. Vegetable oils offer many inherently advantageous properties when used as lubricants, but they also have inherent limitations when compared with mineral or synthetic oils 852.
The biggest barrier in using these bio-based derived, chemically modified oils are that they are 3-5 times more expensive than the vegetable oils used to synthesise them 852.
The current low market share of bio-lubricants (3% in Germany, 1.5% in EU) means that engine manufacturers do not take bio-lubricants into account when developing specifications. With a market share of 10% this would become better857.
875 Expert opinion. Interview with an industry expert in the framework of this project. 876 Newswire G. The market for bio-lubricants is anticipated to register a CAGR of 4.25%, during the forecast period.
https://www.globenewswire.com/news-release/2020/02/26/1991481/0/en/The-market-for-bio-lubricants-is-anticipated-to-register-a-CAGR-of-4-25-during-the-forecast-period-2019.html . Published 2019. Accessed August 7, 2020.
877 Technavio Research. Global Lubricants Market 2019-2023| Emergence of Bio-Based Lubricants to Boost Growth. https://www.businesswire.com/news/home/20191008005597/en/Global-Lubricants-Market-2019-2023-Emergence-Bio-Based-Lubricants . Published 2019. Accessed August 7, 2020.
878 Panchaksharam Y, Kiri P, Bauen A, et al. Roadmap for the Chemical Industry in Europe towards a Bioeconomy.; 2019. https://www.roadtobio.eu/uploads/publications/roadmap/RoadToBio_strategy_document.pdf
879 Expert interviews implemented in the scope of Insights into the European market for bio-based chemicals-study (2019).

354
Innovation drivers and barriers
Functional benefits of bio-lubricants can be high lubricity, lower volatility, and lower flammability 856,880. However, there are also reports of lower quality of “traditional” bio-based lubricants, such as low temperature stability, unpleasant odour, and incompatibility with other ingredients860.
It is reported to be difficult to obtain desired properties; the properties required for bio-based lubricants to be biodegradable lead to a low resistance to oxidation. This can be solved by additives, but these must also be bio-based and biodegradable860. There is some R&D activity on bio-lubricants857,862.
Economic drivers and barriers
The increasing number of passenger and commercial vehicles, and growth in the aviation and marine sectors are expected to drive the global demand for lubricants852, 861. The Market for bio-based lubricants can be stimulated along with the one for biofuels861.
Feedstock drivers and barriers
Feedstock options include a variety of unmodified vegetable oils, such as rapeseed, palm, soy, canola, and sunflower oils. Some large-scale producers can be dependent on a single feedstock (mainly based on well-developed oils and fats platform). This reduces flexibility.
Due to the relatively small quantity of feedstock that is needed by lubricant producers, the price can be high857.
Climate change and environmental drivers and barriers
All five sustainability characteristics (biodegradability, low human toxicity, low ecotoxicity, reduction of GHG emissions, recyclability) are required for bio-based lubricants860. Bio-based lubricants have superior biodegradability characteristics compared to conventional alternatives 860.
Bio-based lubricants are environmentally friendly whereas conventional lubricants are not853. Bio-based lubricants lead to less environmental impact upon leakage856. Environmental concerns are thus a leading driver for bio-based lubricants860. The CO2-eq. emissions are 1.3 kg/l for bio-based lubricants and 4.8 kg/l for fossil-based lubricants851. Bio-based lubricants produce also fewer emissions due to higher boiling temperature ranges of esters 853. Also, low aquatic toxicity862 and low bioaccumulation856 are reported.
Bio-lubricants are not always seen by the regulators as being good for the environment, due to the possibility of use of palm oil, and the link with agriculture857.
A barrier is that it is difficult to prove the sustainability, because main advantages – such as lower wear/tear, lower emissions, and longer lifetime of after-treatment components - occur at the use-phase of the product857.
One specific problem is recyclability. Vegetable oils cannot be recycled so easily, because of degradation (polymerization) and other irreversible changes857.
880 Grandview Research. Biolubricants market analysis by raw material (vegetable & animal oil), by application (automotive (automotive engine oils, gear oils, hydraulic oils, transmission fluids, greases, chainsaw oils), industrial (process oils, demolding oils, industrial gear . https://www.grandviewresearch.com/industry-analysis/biolubricants-industry . Published 2016. Accessed August 7, 2020.

355
Citizen and Society drivers and barriers
The use of bio-based lubricants produces a cleaner, less toxic working environment for those working with engines and hydraulic systems. They do not cause skin problems, such as skin inflammation, which is generally caused by petroleum-based lubricants 853,858 ,859.
Bio-based lubricants offer an increased employee safety due to higher flashpoints, constant viscosity and less oil mist and vapour emissions 853, 858 , 859.
There is low public awareness of bio-based lubricants. Terminology used can be confusing for consumers: sometimes terms such as “bio-lubricant” can refer to products derived from renewable sources or to a biodegradable lubricant derived from petroleum-based sources860. Related to this is that many bio-lubricants are used in industry to manufacture products. Because of this, the visibility of lubricants for consumers is low, so switching to bio-lubricants is not a selling argument for producers 857.
One specific problem is that in some cases, namely when bio-lubricants are used in the food industry, there can be a need to verify that that the production of bio-lubricants is occurring kosher and/or halal. This means that external verification is required that no feedstock from animal origin is used 857.
Policy and regulation drivers and barriers
The bio-based lubricants market is driven by a mix of regulatory schemes on total-loss applications and industry standards855. In several EU Member States, the use of bio-based lubricants is compulsory for use in total-loss applications in environmentally sensitive areas 881.
Also outside of Europe there are regulations that mandate bio-based lubricants: Marine vessels operating in North American waters need to have a Vessel General Permit (VGP), which mandates the use of biodegradable substances 855, and there are Increasingly high emission standards in marine transport applications 882.
A complicating factor (barrier) are however the differences between regional regulations856. Also, current labels like Ecolabel and Blue Angel (Germany) do not require a minimum bio-based content. Low toxicity and biodegradability are enough. This is not in agreement with the current standard for bio-based lubricants (the EN16807).
Another complicating factor is that many lubricants have a lot of different applications, which make them less suitable for standardisation. This makes it also difficult to develop appropriate labels 857.
A further barrier is that the EU lacks actual legislation mandating the use of bio-based lubricants. That should be enacted for systems with environmental impact (like greater leakages), such as hydraulic systems, just as the VGP in the USA does.
881 Commission Expert Group. Commission Expert Group on Bio-Based Products - Final Report.; 2017. https://ec.europa.eu/knowledge4policy/news/report-commission-expert-group-bio-based-products-includes-recommendations-jobs-growth-through_en
882 Grand View Research. Marine lubricants market size, share & trends analysis report by product (engine oil, hydraulic oil, gear oil, turbine oil, greases), by region (North America, Europe, APAC), competitive landscape, and segment forecasts, 2018-2025. 2015d. https://www.grandviewresearch.com/industry-analysis/marine-lubricant-market . Accessed August 25, 2020.

356
Drivers for, and barriers to, bio-based uptake in Solvents
Table 58. Drivers for, and barriers to bio-based uptake on solvents.
Category Drivers Barriers
1: Business Medium market size Bio-based is a marketing advantage Industry interest is high
Low oil price High costs of bio-based solvents Competitive markets Poor performance compared to fossil-based
2: Innovation Drop-in chemicals have similar performance than fossil-alternative. Increased funding for R&D Recyclability is sometimes better
Requirement for change of properties or processes for product formulations
3: Economy Drop-in chemicals do not need changed formulations or procedures Wider advantages of bio-based solvents for agriculture and forestry Investors see non-SDG investments as a risk
Lack of performance may increase costs
4: Feedstock Wide range of feedstocks Waste and non-food competing feedstocks are sought for
Some made from food-competing feedstock May not be enough feedstock to replace all fossil ones
5: Climate change and environment
Biodegradability Possible GHG reduction Recyclability of solvent wastes Low/no phytotoxicity
Lack of knowledge of impacts of switching to bio-based Toxicity and biodegradability testing is slow and expensive
6: Citizen and Society
Less health risks, low toxicity Lower work exposure Public demand for bio-based
Not all bio-based solvents are non-toxic Bio-based is not a selling argument in some business areas
7: Policy and regulation
Anti-toxins and pro-biodegradability regulations REACH Financial support for SME for approval procedures.
Slow and expensive approval procedures Lack of regulatory push for the industry
Introduction
Solvents are substances that dissolve other components. Most typically these are liquids, but a solvent can also be a gas, solid or a supercritical fluid. The requirement for being a solvent is that it can dissolve other compounds to it at certain temperatures and concentrations.
Multiple bio-based solvents exist, such as acetic acid, methanol, acetone, lactic acid, propylene glycol, ethyl lactate, glycerol.
Business drivers and barriers
Solvents production in EU was reported at 5000 kt/year (2019) in a recent study 883 and the bio-based share at 1.5% (75kton/year). This can be characterised as a medium-sized market (smaller than e.g. polymers, but larger than many other chemicals. The Road to Bio study in 2019 884 reported that 40% of the solvents used are consumed by the paints
883 Spekreijse J, Lammens T, Parisi C, Ronzon T, Vis M. Insights into the European market for bio-based chemicals Analysis based on 10 key product categories. 2019. doi:10.2760/549564
884 Panchaksharam Y, Kiri P, Bauen A, et al. Roadmap for the Chemical Industry in Europe towards a Bioeconomy.; 2019. https://www.roadtobio.eu/uploads/publications/roadmap/RoadToBio_strategy_document.pdf

357
industry. The estimated growth of bio-based solvents is small (1% CAGR)848. Industry interest is high, not so much because of the bio-based aspects, but mainly because of safety 885.
Bio-based solvents have multiple applications, therefore, there are multiple opportunities to increase the bio-based share. Certain industries have set ambitious sustainability goals, such as the furniture and flooring industry 886. It is a marketing advantage to sell renewable or bio-based products with a low environmental footprint. The companies who distinguish themselves with innovative and sustainable products have an advantage on the markets; they can serve the needs of their existing customers who demand for more sustainable products and also increase their business with a better image.
Bio-based drop-in solvents cannot compete economically with the fossil ones at current oil prices. Together with performance, the cost factor is a very important barrier850. However, the use of bio-based components has a strategic advantage, thus the use of bio-based components is not always cost-driven851. Solvent markets are competitive and bio-based solvents must perform at least the same or even better than fossil counterparts to be able enter the markets 887, 888. Lately, there has been a movement away from drop-ins to dedicated bio-based solvents. Main driver for this is that companies want ‘better’ solvents (safer, environmentally friendly, less VOC, etc.), and that cannot be accomplished with drop-ins 850. Innovation drivers and barriers
Bio-based solvents need to meet the functional requirements of the fossil equivalents that they intend to replace in different applications. Drop-in solvents, e.g. in paint formulations, have an advantage that the formulation does not need to be changed as the chemical is the same regardless of the origin851. However, the barriers to bio-based uptake in paints and coatings lead to performance issues; the replacement of VOC solvents with a different bio-based solvent usually results in shorter drying times, meaning less time to work with the products849. Thus, in paints and coatings, R&D with major focus on application testing as performance is the first requirement of a bio-based solvent to potentially replace a fossil-based alternative. R&D should also focus on formulations, as once one component is changed, the whole formulation may need adjusting 849, 851.
Furthermore, only a few bio-based solvents are available for agrochemicals that fulfil the required functionality like solvency and compatibility with wide range of active ingredients. This requires also further investments in R&D and innovation to create solvents for agrochemicals with superior functionality849. Funding schemes or establishment of technology platforms for the development of new formulations are actions that could help companies to drive the R&D and further increase bio-based uptake 849.
Industries are taking as many steps as possible to remain competitive, by reducing waste and recycling spent solvents. Solvents are also used in recycling processes to enable recovery of valuable materials 889. Recyclability and reuse of the solvent in extraction processes is very important for producers. Extraction or distillation is a common processing step used in chemical, food, pharmaceutical and mining industry. In some cases, bio-based solvents are not as durable as their fossil-based counter parts. They may degrade under higher temperatures, which results in increased use as the chemical needs to be replaced
885 Expert opinion. Interview with an industry expert in the framework of this project. 886 European Coatings. "The cost-performance-sustainability triange needs to be considered. Focus Top - Bio-based
coatings. 2019:1-3 887 European Coatings Journal. Growth worldwide. European coatings Journal.
https://www.dsm.com/content/dam/decovery/Documents/Bio_Based_Coatings_Market_Report_Growth_Worldwide_EuropeanCoatingsJournal_April_2018.pdf . Published 2018. Accessed August 13, 2020
888 Pennakem. Bio-based solvents & fine chemicals. https://pennakem.com/core-business/bio-based-solvents-chemistry/ . Accessed August 13, 2020
889 de Guzman D. Growing bio-based solvent market. Green Chemicals Blog. https://greenchemicalsblog.com/2019/08/02/growing-bio-based-solvent-market/ . Published 2019. Accessed August 13, 2020

358
by adding fresh solvent and consequently, it increases the cost of the production 890. Another problem with recyclability is that bio-based solvents may be more difficult to recover due to otherwise beneficial properties, like low VOC850.
Economic drivers and barriers
As mentioned in business drivers it is strategically beneficial to sell bio-based products. By using drop-in solvents instead of new (dedicated), bio-based chemicals can enable cost-savings from qualifications and in R&D851. An economic driver is that when companies do not take the Sustainable Development Goals into account, investors see that as a risk. This is a big shift from the past850. Bio-based solvents have other wider – upstream - advantages because of feedstock use. There are benefits for agriculture and rural economy and increased waste utilization 850.
The production costs of bio-based solvents are high, which is a drawback 848. The low oil price makes it difficult to compete in the drop-in chemicals market. Also, poorly performing solvents, e.g. in extraction, can increase costs due to need to replace recycled solvent with fresh one.
Feedstock drivers and barriers
Solvents represent a large group of chemicals. Therefore, the feedstocks vary as well. Some companies have already started to make sure that they use only non-food biomass feedstocks, e.g. waste streams851. It will be a driver for companies to promote themselves in terms of renewability, circularity, or sustainability if their product would come from utilizing wastes or other low value streams. However, given the volumes of solvents used and given that part of them are produced from sources requiring agricultural land, it is unreasonable to assume that these types of solvents could replace fossil ones completely since the land requirements are too high for the volumes needed 848. There is however a movement away from scarce feedstocks, and many companies/customer want this utilization of abundant lignocellulose instead850. Climate change and environmental drivers and barriers
Biodegradability is an important factor especially for products that would end-up in the environment. These kind of products are, for instance, cleaning products (household cleaners, personal care) or agrochemicals849. Some bio-based solvents are biodegradable. It should be noted that even when the chemical is bio-based it may not biodegradable or non-toxic for the environment. Recyclability is also an important environmental driver, however, as mentioned in the innovation-category, the technical performance of recyclability of bio-based solvents is an issue for their feasibility.
In terms of products used by consumers, education of the general public about bio-based products is essential. There is a need to educate about the differences between bio-based and biodegradability in order to avoid misconception about the products and their afterlife. Bio-based should not only be used as a marketing advantage, but also as a way to educate consumers.
In agro-chemicals the bio-based alternatives must be compatible with the plants and show low or no phytotoxicity depending on the application849.
VOC regulations are drivers for “greener” bio-based solvents. However, these VOC regulations have sometimes been seen by the industry as a more pressing issue than reducing greenhouse gas emissions. More incentives are needed for industry to move to bio-based solvents848. Also, estimations of environmental impacts of bio-based solvents
890 PRIsystems. Understanding the ROI and Efficacy of Bio-Based Solvents. https://prisystems.com/news/understanding-the-roi-and-efficacy-of-bio-based-solvents /. Accessed August 13, 2020

359
are needed to show the impacts of replacing fossil ones. Some reports show identified bio-based solvents with less GHG emissions compared to fossil equivalents849.
A barrier is the toxicity and biodegradability testing, which is difficult to do rapidly and at low costs 850.
Citizen and Society drivers and barriers
Bio-based chemicals are sometimes considered as non-harmful, non-toxic since they originate from nature. Some bio-based solvents are non-toxic and harmless. However, also toxic ones exist. The definite driver here is non-toxicity and safety to human health, e.g. due lower worker exposure, that most fossil counter parts do not fulfil 891.
In cosmetics, solvents such as acetone and ethanol are key in their formulations849. Increasing their bio-based share is possible as these are bio-based chemicals that are readily available. However, in cosmetics bio-based is often not a marketing argument, but labels like, organic, vegan or Eco-certified are more advantageous. Bio-based is in itself not a selling argument. Companies see the advantage, but often not decisive (compared to safety, cost and performance) 850.
Policy and regulation drivers and barriers
The uptake of bio-based solvents is supported by the EU policy on VOC emissions and by REACH849. Those bio-based alternatives which meet the criteria of low toxicity and low VOC, compared to the fossil-based counterpart, are likely to be considered as valid alternative, provided that they meet the functionally requirements of the solvent in specific applications. More in general, regulations that ban toxins or increase biodegradability are normally beneficial for bio-based solvents850.
As bio-based solvents are more expensive than the fossil counterparts their uptake can be enhanced by regulations. Subsidizing bio-based products, while adding a carbon tax to fossil-based products would help to enhance the uptake of bio-based solvents849.
The European chemicals industry is strictly regulated. Use of new ingredients in products is subject to long and often expensive approval procedures. Having more affordable approval procedures would help the industry. This can be an issue for small companies that want to bring their product to the markets. Subsidies or other means of financing is needed for them to be able to apply to the certificates849.
Specifically, in the case of agrochemicals industry, exploring options of shorter and more affordable approval procedures would be beneficial to the market uptake of bio-based solvents. Legislation 1107/2009 that places plant protection products on the market has been adapted for speedier approval of bio-based pesticides.
Support for the gradual uptake of bio-based solvents could be done by a policy instrument which would require solvent producers to reach a quota for solvents that are bio-based and meet sustainability criteria849. Based on the estimated low CARG the industry needs more push for switching to bio-based by regulatory means.
891 Helwande S. Bio-based solvents on the rise. Bio Based Press. https://www.biobasedpress.eu/2018/07/bio-based-solvents-on-the-rise/ . Published 2018. Accessed August 13, 2020

360
Drivers for, and barriers to, bio-based uptake in surfactants
Table 59. Drivers for, and barriers to bio-based surfactants market uptake.
Category Drivers Barriers
1: Business Rising demand for greener surfactants Advanced product properties/ opportunities for new product properties (niche markets) Multiple end-uses High-value products Potential demand highest in affluent economies Brand owners may be willing to pay a premium for bio-based products they provide marketing advantages
Limited cost competitiveness compared to conventional products Uncertainty of secured steady supply of bio-based surfactants due to the limited number of large-scale producers The actual use of bio-based surfactants is often limited to niche products
2: Innovation New product formulations entail more flexibility in composition, if a certain performance can be ensured Enzyme assisted production improves selectivity and allows lower production temperatures Recently a 100% bio-based surfactant was introduced into the market
Bio-based surfactants are usually dedicated chemicals, thus new product formulation is often required in end-products Enzymes are costly and the production process is slower. Production yields of microbial biosurfactants are low and toxic by-products are still a problem Downstream processing of microbial derived biosurfactants is complicated and requires innovation
3: Economy Higher investment cost for product formulations Feedstock price fluctuations due to availability and quality of biomass feedstocks
4: Feedstock Bio-based surfactants will be produced from a variety of feedstocks including traditional biomass sources, but also algae and waste streams
Raw material cost and availability will likely be an issue in the future Future progress may be hindered by the lack of biosurfactant suppliers as customers cannot afford the risks associated with a single supplier Sustainability discussions about raw materials, customers do not consider palm oil as sustainable raw material
5: Climate change and environment
Bio-based surfactants required a lower critical concentration compared to chemical surfactants Production and use of bio-based surfactants generate less GHG emissions Carbon footprint lower with bio-based than conventional (depending on the process)
6: Citizen and Society
Growing consumer awareness of the environmental hazards resulting from the use of conventional surfactants Biological activity (antibacterial, antifungal, antiviral, anticancer and immunomodulation activities) Development of products through industrial biotechnology offer safer production for personal care applications
Customers may not be aware of what a bio-based surfactant is and where they can be used for Lack of clear labelling, that would allow consumers to increasingly buy products using bio-based alternatives
7: Policy and regulation
A standard definition of bio-based surfactant is available now Detergent regulation No 648/2004 for biodegradability
EU legislative requirements are time consuming and costly, especially for new products Regulatory requirements are country dependent

361
Introduction
Surfactants are compounds that lower the surface tension between fluids – gases, liquids - or fluids and solids. Surfactants are widely used in cosmetics, personal and home care products as dispersing agents and emulsifiers. Surfactants are produced from fossil and/or bio-based raw materials. Actually, the first surfactant made by humans -soap- was already completely bio-based. The last decades have seen the emergence of new bio-based raw materials for surfactants 892, and their share of the market is growing (approx. 25%, per a 2017 estimate), due to increased demand by consumers and users 893.
Europe is currently the largest consumer and producer of bio-based surfactants and expected to remain so in 2030 894. EU production of bio-based surfactants amounts to approx. 1500 kta in 2019 with the total volume about 3000 kta 895. This high bio-based share of 50% is because surfactants are often made from fatty acids, e.g. vegetable oils. The EU market value of bio-based surfactants reached € 800 million in 2013 and is expected to grow to € 1800 million in 2030 896. Demand for bio-based surfactants will depend strongly on household spending and industrial activity in detergents and cosmetics where environmental concerns are more evident 897.
Fatty acyl groups from oilseeds (e.g., palm, palm kernel and coconut, other oils, and algae), animal fats, and their derivatives (e.g., fatty alcohols and amines); carbohydrates, proteins, extractives, and their derivatives; and other biorefinery co-products (e.g. glycerol and extractives) are major components of bio-based surfactants849. Today the most widely used biomass feedstock for the manufacture of bio-based surfactants is palm oil 898. Bio-based surfactants are e.g. methyl ester sulfonates (MES) made by sulfonating saturated fatty acid methyl esters, alkyl polyglycosides (APG) raw materials used are typically starch derived glucose and fat derivatives, and microbial biosurfactants, such as Rhamno- or Sophorolipids produced via microbial fermentation 899.
The use of bio-based surfactants is possible in a wide range of product applications, including foods, cosmetics, household detergents, personal care products, pharmaceuticals, paints and coatings, textiles, agrochemicals, and other industrial sectors. In household detergents the share of bio-based surfactants reached 45% globally based on estimations in 2019. Because of their applications all surfactants (whether fossil-based or bio-derived) need to have three key characteristics: biodegradability, low human toxicity and low ecotoxicity855.
The term “bio-based surfactant” or biosurfactant shall only be used if at least three rules are respected: (a) a high level of biodegradability, (b) absence of impacts on human and animal health, and (c) minimal negative impact in the environment 849
892 Tropsch JG. A journey to standardization of bio-based surfactants in Europe. Inform Magazine Digital. http://www.informmagazine-digital.org/informmagazine/june_2017/MobilePagedArticle.action?articleId=1116630#articleId1116630 . Accessed August 7, 2020.
893 Hayes DG, Smith GA. Chapter 1 - Biobased Surfactants: Overview and Industrial State of the Art. doi:https://doi.org/10.1016/B978-0-12-812705-6.00001-0
894 BIO-TIC. Overcoming Hurdles for Innovation in Industrial Biotechnology - Research and Development Roadmap. http://www.industrialbiotech-europe.eu/wp-content/uploads/2015/10/RD-Roadmap-BIO-TIC.pdf.
895 Spekreijse J, Lammens T, Parisi C, Ronzon T, Vis M. Insights into the European market for bio-based chemicals Analysis based on 10 key product categories. 2019. doi:10.2760/549564
896 EuropaBio. BIO-TIC Biobased Surfactants – Summary.; 2014. http://industrialbiotech-europe.eu/wp-content/uploads/2014/07/Biosurfactant-Summary_final.pdf
897 BAUER C. Clean and Green. Evonik elements. https://elements.evonik.com/wp-content/uploads/2020/06/ELEMENTS_0220_EN_biosurfactants.pdf. Accessed August 24, 2020.
898 REDON A. Bio-Based Surfactants - Present and Future.; 2019. https://www.adebiotech.org/tebio/images/TEBIO_AR.pdf.
899 Panchaksharam Y, Kiri P, Bauen A, et al. Roadmap for the Chemical Industry in Europe towards a Bioeconomy.; 2019. https://www.roadtobio.eu/uploads/publications/roadmap/RoadToBio_strategy_document.pdf.

362
Business drivers and barriers
There are multiple end-uses for biosurfactants and these many market opportunities in bioremediation, oil recovery, agriculture, processing etc. can create a critical mass, making biosurfactants an established player in the entire surfactants market852. Rising consumer awareness towards eco-friendly product will increase the demand and create opportunities for companies to enter the surfactants markets 900. This the strongest driver in this category 901.
The main advantages of bio-based surfactants are possible antimicrobial properties; better performance compared to fossil equivalents which allows to use smaller quantities of surfactants; better foaming properties; higher selectivity for application at lower temperatures, higher pH and salinity, and the ability to achieve regulatory compliances with regard to (environmental) safety and use of low-cost feedstocks (i.e. fats and oils, sugars)855. Market differentiation could also help bio-surfactants to penetrate niche markets857. Thankfully due to the advanced product properties the use of bio-based surfactants is possible in a broad range of product applications.
In terms of barriers, in some applications limited cost competitiveness compared to conventional products limits the actual use. This puts bio-based surfactants in niche products of which only small quantities are required, such as personal care and home care products855. Potential demand is highest in affluent economies where environmental concerns are more evident 902.
Innovation drivers and barriers
Bio-based surfactants are usually utilized in end-product formulations where the modification of one component has an impact on the overall composition and performance. This increases the development costs of the products. One-to-one substitutions of conventional surfactants are unlikely and new product formulation development is often required852. This offers flexibility in composition, but only as long as a certain performance can be ensured855.
Another new development is the use of enzymes. Using enzymes reduces need for strong acids, allows lower process temperatures and leads to fewer side reactions. This saves energy and increases the yield. Using selective enzymes leads to fewer by-products, thus less downstream cleaning is needed.
Recently Croda has brought a 100% renewable bio-based surfactant on the market. The surfactant is an ethoxylated surfactant from vegetable oils. This is likely to increase the market uptake of bio-based surfactants owning to the advances of marketing with fully bio-based component and GHG savings perspectives 903.
In terms of barriers, the fact that bio-based surfactants are often dedicated chemicals, and their usage may require new formulations reflect on the development time of a new product and consequently on the price of the product. Furthermore, when enzymes are used in production, they increase costs and have more specific operating conditions, e.g., sensitivity to other compounds in the vegetable oils (like peroxide or heavy metals). The
900 Ahuja K, Singh S. Supportive regulatory norms should propel biosurfactants industry growth. Global Market Insights. https://www.gminsights.com/industry-analysis/biosurfactants-market-report . Published 2020. Accessed August 24, 2020.
901 Expert Opinion. Interview with an industry expert in the framework of this project. 902 Market Research Future. Bio-based surfactants market research report — forecast to 2023.
https://www.marketresearchfuture.com/reports/bio-based-surfactants-market-3907 . Published 2018. Accessed August 20, 2020.
903 CRODA. Turning the World’s Products Green: 100% Renewable, 100% Bio-Based ECO Range of Surfactants. Croda’s webpage. https://www.crodapersonalcare.com/en-gb/sustainability/sustainable-manufacturing/eco-plant . Accessed October 22, 2020.

363
production process is also slower 904. Microbial-derived biosurfactants are being developed, but production yields are low and toxic by-products are still a problem. Downstream processing is complicated and requires innovation852.
Economic drivers and barriers
Most of the bio-based surfactants are dedicated chemicals. This means that their adaptation in formulations replacing fossil-counterparts requires investments in research, development, and innovation. According to the industry expert interviewed in the framework of this project, use of bio-based surfactants may not only result in re-deign of the product formulation, but also of the entire production process857. While these chemicals are not challenged by the fluctuating crude oil prices, they face other price fluctuations from feedstock availability and quality. On the other side this could also be a driver as biomass prices may not be as volatile as oil prices 857. High manufacturing costs of biosurfactants can in some cases hinder their market growth. Furthermore, industrial scale production of biosurfactants has not been established in some cases due to high investment costs856.
Feedstock drivers and barriers
Bio-based surfactants are produced from a variety of feedstocks including traditional plant oils, fats and sugar biomass, but also algae and waste streams852. Some of the feedstocks are available as by-products from biodiesel production (fatty acid groups)860, which entails a dependency on the biodiesel market, that can fluctuate due to policy changes. Raw material cost and availability are expected to be an issue in the future 852.
Due to the limited number of large-scale producers a secured steady supply of bio-based surfactants is uncertain which creates risk for suppliers like personal and home care producers855. Future progress may therefore be hindered as customers cannot afford the risks associated with one single supplier 852. A third barrier stems from the sustainability discussions involving oil crops, like palm. Customers do not consider these as sustainable, thus this is a barrier to use them857.
Climate change and environmental drivers and barriers
Bio-based surfactants usually require a lower critical concentration compared to chemical surfactants, which has a beneficial effect on costs. Production and use of bio-based surfactants generate less carbon dioxide, a greenhouse gas (GHG) attributable to climate change855. However, the relatively low efficiencies in industrial biotechnology may still lead to a high carbon footprint852.
Citizen and Society drivers and barriers
One of the main market success factors for bio-based surfactants could be increased environmental awareness e.g. environmental hazards resulting from the use of conventional surfactants852,856. Bio-based surfactants offer biological activity (antibacterial, antifungal, antiviral, anticancer and immunomodulation activities) and positive impact on personal health. Alkyl polyglycoside (APG) has an added advantage of not causing skin irritations855.
Due to the importance of safety in the cosmetics industry, developing products through industrial biotechnology is an advantage because it is more secure than via chemical pathways852. Furthermore, another driver is the lower carbon footprint with bio-based surfactants compared to conventional. This of course depend on the process 857.
904 Louzada K. Een opkomende sector - biosurfactanten. Agentschap NL. https://www.rvo.nl/sites/default/files/Biobased surfactanten.pdf . Accessed August 7, 2020.

364
The barriers in this category are related to awareness and knowledge. Customers may not be aware of what a bio-based surfactant is and where they can be used for852. There is lack of clear labelling that would allow consumers to increasingly buy products using bio-based alternatives855.
Policy and regulation drivers and barriers
Mandate (M/491) to CEN/TC-276 has been set to define biosurfactants for boosting the markets856. CEN/TS 17035:2017 “Surface Active Agents - Bio-based surfactants - Requirements and test methods” sets requirements for bio-based surfactants in terms of properties, limits, application classes and test methods. It lays down the characteristics and details for assessment of bio-based surfactants. A bio-based content between 50 and 95% is classified as a majority bio-based surfactant848 ,905. Chemicals in EU are registered in REACH and the detergent regulation No 648/2004 states that surfactants used in detergents must be biodegradable under aerobic conditions 856.
EU legislative requirements are time consuming and costly, especially for new products 852
.Regulatory requirements are country-to-country dependent 906.
Drivers for, and barriers to, market uptake of microfibrillated cellulose
Table 60. Specific drivers for, and barriers to, bio-based uptake of microfibrillated cellulose.
Category Drivers Barriers
1: Business Large variety of application fields Growing packaging markets Green movements
High cost of manufacturing Application in oil and gas hindered due to Covid-19 Some target markets are conservative and hard to penetrate
2: Innovation Future alternative to plastics and aluminium in packaging Superior performance in packaging. Improved properties in several application fields High amount of investments in R&D
Poor thermal stability Compatibility in composites Hydrophilicity is a challenge in packaging Standards need to be developed
3: Economy Europe is a leading regional market of MFC-fibres Europe counts for biggest growth
Scale-up of processes are challenging due high initial investment costs
4: Feedstock Non-food and non-land use competing feedstock
5: Climate change and environment
Offers a way to replace fossil-sourced materials, e.g. plastics, and consequently GHG emissions VOC- free to use in coatings Biodegradable
Proof of sustainability with LCA is complex and difficult to understand
6: Citizen and Society
Non-harmful to health in applications; alternative to bisphenol A and phthalates Biocompatible
Lack of knowledge of long-term and low exposure of cellulose nanomaterials to human health
7: Policy and regulation
Government regulations banning non-biodegradable packaging. Requirements for lowering emissions for aviation/transportation vehicles would drive application of MFC
1. Lack of regulatory push
Introduction
Microfibrillated cellulose (MFC) is obtained from cellulose, occurring in wood or plant material. Using mechanical shearing, cellulose fibres are separated into a three-
905 CEN/TS 17035:2017 - Surface Active Agents - Bio-Based Surfactants - Requirements and Test Methods. 906 Tsagaraki E, Karachaliou E, Delioglanis I, Kouzi E. D2.1 Bio-Based Products and Applications Potential.; 2017.
http://www.bioways.eu/download.php?f=150&l=en&key=441a4e6a27f83a8e828b802c37adc6e1.

365
dimensional network or web-like structure, which results in many beneficial material properties.
Microfibrillated cellulose is often called nanocellulose. However, nanocellulose is an umbrella term for a family of materials that Microfibrillated cellulose is a part of 907,908. The confusion is due that fact that the fibrils are only a couple of nanometres thick, but they are micrometres in length848,849. Microfibrillated cellulose (MFC) has been present in the academic sector since the 1980’s, and in the last decade is becoming commercially available on an industrial scale. Commercial production only started in 2010, mainly due to the high energy consumption and costs of production 909. Commercialisation started in 2014 when Borregaard announced to construct the world’s first MFC producing plant in Sarpsborg, Norway 910. Many forms of production optimisation have been developed in the last few years. Current MFC producers in Europe are e.g. Weidmann (Germany), StoraEnso (Finland), Borregaard (Norway), FibreLean (UK), Cellucomp (Scotland), and Lenzing (Austria) 911.
Business drivers and barriers
MFC is a unique material that has large variety of applications in multiple industries. Based on application, the MFC market is segmented as pulp & paper; composites & packaging; home care; personal care; construction; and coatings 912,913,914,915. Pulp & paper currently is the most extensive application854. MFC fibres provide benefits in these industries due increased (wet and dry) tensile strength, less porosity, improved barrier properties, preservation of food flavour or scent, higher printing quality, smoother surfaces, less transparency and more. Packaging industry is expected to be one of the largest application sectors in the future 854. Overall, the growth of microfibrillated cellulose is driven by green movements, and the demand for more sustainable and environmentally friendly products. For instance, providing greener packaging for consumers is a market advantage and a way to distinguish oneself.
The limitations currently for MFC growth are high cost of manufacturing, which slows down large-scale application850. Furthermore, the market leaders are Pulp & Paper companies, that can provide larger quantities and set competitive prices. This can be a challenge for smaller companies to enter the markets. One of the e merging markets for MFC is as a
907 Karppinen A. Microfibrillated cellulose, cellulose fibrils or nanocellulose? Exilva Blog. https://www.exilva.com/blog/microfibrillated-cellulose-or-nanocellulose . Published 2018. Accessed August 27, 2020.
908 Peneder N. Not seeing the woods for the trees in the world of nanocellulose? Weidman webpage. https://weidmannfibretechnology.com/the-world-of-nanocellulose-how-not-to-lose-sight-of-the-wood-for-the-trees/#:~:text=As the name already says,bacteria (i.e Gluconacetobacter Xylinus).&text=Often microfibrillated cellulose (MFC)%2C,refer to the same mat. Published 2017. Accessed August 27, 2020.
909 Lindström T, Aulin C. Market and technical challenges and opportunities in the area of innovative new materials and composites based on nanocellulosics. Scand J For Res. 2014;29(4):345-351. doi:10.1080/02827581.2014.928365
910 TODAY’S CHALLENGES. Exilva webpage. http://www.h2020-exilva.com/todays-challenges/ . Accessed August 26, 2020.
911 University of Bologna, Fraunhofer ISI. Top 20 Innovative Bio-Based Products - Task 3 of “Study on Support to R&I Policy in the Area of Bio-Based Products and Services.”; 2019. https://www.biosc.de/lw_resource/datapool/systemfiles/elements/files/5a3d53e0-eb5f-11e9-b1c5-dead53a91d31/current/document/Top20_biobasierte_Produkte.pdf
912 Exilva – agility and flexibility giving you a unique opportunity to improve rheology and endurance. Exilva webpage. https://www.exilva.com/application-areas. Accessed August 27, 2020.
913 Microfibrillated Cellulose (MFC) Fibre Market Forecast, Trend Analysis & Competition Tracking - Global Market Insights 2020 to 2030. Fact.MR webpage. https://www.factmr.com/report/1710/microfibrillated-cellulose-fibre-market . Published 2020. Accessed August 27, 2020.
914 Curran® - A Microfibrillated Cellulose (MFC) Wonder Product? Curran webpage. https://www.cellucomp.com/blog/article/curran-a-microfibrillated-cellulose-mfc-wonder-product-1. Accessed August 25, 2020.
915 StoraEnso. Microfibrillated cellulose (MFC) – A natural performance enhancer for bio-based packaging materials. StoraEnso Website. https://www.storaenso.com/en/products/bio-based-materials/mfc-for-packaging . Accessed August 31, 2020.

366
“green” flooding agent in oil and gas industries 916,917. This segment is likely to be affected by the Covid-19 pandemic as oil consumption has dropped due travel restrictions858. In some applications, the target markets are conservative, and it can take time and effort to penetrate the markets 918.
Innovation drivers and barriers
MFC is obtained through a fibrillation process of cellulose fibres. Normally wood pulp is used as feedstock, however it can be extracted from plant-waste855,919 and it can be also produced by bacteria849. Using mechanical shearing, the cellulose fibres are separated into a three-dimensional network of microfibrils with a large surface area. The obtained fibrils are much smaller in diameter compared to the original fibres and can form a network or a web-like structure860.
Benefits of MFC include increased strength, barrier properties, biodegradability, very high-water holding capacity, rheology modification (=viscosity modification). These superior properties are not found in other materials 920 and make it attractive for a wide variety of industries and applications849,851 ,855.
MFC fibres provide a wide range of benefits specifically for paper making, such as increased tensile strength, improved barrier properties, smoother surfaces 921. In packaging applications, it offers a great future alternative for aluminium and conventional plastics856. The MFC property of high-water holding capacity and ability to bond strongly as gel at low concentrations enabling stabilizing water-based formulations or keeping surfaces longer wetted. This is beneficial in coatings and concrete applications. This MFC fibres are thin and when bonding together this creates strength that is useful in composite materials, films and barriers 860,862. Investments to R&D by companies and governments to boost MFC innovations is high.
A barrier for applicability of MFC is its poor thermal stability. Research is ongoing how the properties change when subjected to higher temperatures and how they could be improved 922,923. In complex formulations (composites) compatibility is an issue. The barrier in innovation is to connect the unique properties of the material to the desired formulation to benefit the end-product. Especially in plastic packaging hydrophilicity of MFC is an issue and a challenge 861.
The lack of standardization is currently a challenge to ensure consistent quality of material to the markets 924. Therefore, setting up industry standards can help to set up security of
916 Rønneberg HG. Can Microfibrillated cellulose (MFC) boost Enhanced Oil Recovery? Exilva Blog. https://www.exilva.com/blog/can-microfibrillated-cellulose-mfc-boost-enhanced-oil-recovery. Published 2016. Accessed August 31, 2020.
917 Global Market Insights. Nanocellulose Market Size by Product (Nano fibrillated Cellulose, Nanocrystalline Cellulose), by Application (Composites, Paper Processing, Food & Beverages, Paints & Coatings, Oil & Gas, Personal Care), Industry Analysis Report, Regional Outlook, Growth . Global Market Insights website. https://www.gminsights.com/industry-analysis/nanocellulose-market. Published 2020. Accessed August 31, 2020.
918 News B-BW, COWI, Institute E, Innovation ECD-G for R and. Bio-Based Products: From Idea to Market “15 EU Success Stories”. Publications Office of the European Union; 2019. https://books.google.nl/books?id=4XJeyQEACAAJ.
919 Jovic M. Microfibrillated cellulose: A new material with high potential in the packaging industry. Prescouter webpage. https://www.prescouter.com/2017/11/microfibrillated-cellulose-packaging/ . Published 2017. Accessed August 25, 2020.
920 Expert opinion. Interview with an industry expert in the framework of this project. 921 Valmet. Microfibrillated Cellulose. Valmet Website. https://www.valmet.com/board-and-paper/stock-
preparation/microfibrillated-cellulose/ . Accessed August 31, 2020 922 Hiltunen S, Koljonen K, Niemelä K, Heiskanen I, Johansson L-S, Backfolk K. Hydrothermally induced changes in the
properties of MFC and characterization of the low molar mass degradation products. Cellulose. 2019;26(16):8589-8605. doi:10.1007/s10570-019-02603-w
923 Accesswire. Analyzing the Coronavirus Impact: Microfibrillated Cellulose (MFC) Fibre Manufacturers Find Opportunities in Food Packaging Industry. Website. https://www.accesswire.com/596085/Analyzing-the-Coronavirus-Impact-Microfibrillated-Cellulose-MFC-Fibre-Manufacturers-Find-Opportunities-in-Food-Packaging-Industry. Published 2020. Accessed August 25, 2020.
924 Soidinsalo O, Holtan S, Moosavifar A. Microfibrillated Cellulose A Novel and Renewable Multifunctional Additive for Waterborne Coatings. Coatingsworld. 2019;06(01). https://www.coatingsworld.com/issues/2019-06-

367
supply. These standards have not been developed yet and constitute an innovation barrier 861.
Economic drivers and barriers
Europe is the leading regional market for MFC and nanocellulose, which is due the large R&D efforts of Pulp & Paper companies and governments864. Europe is also expected to continue as a leader in the markets as it is the location of the main manufacturers854. It is expected that CARG from 2020 to 2030 will be 13% 854. It is difficult to find numbers for volumes of microfibrillated cellulose sold, however. Borregaard-owned Exilva produces 1000 tonne/year852,853 and Scotland-based CelluComp produce their Curran-product in quantities of 500 tonne/year859. The value of the Nanocellulose market, that includes micro fibrillated cellulose, is estimated in 2019 to be 147 million USD (approximately 132 million Euros). This is expected to increase with 21% CARG to 418 million USD (approximately 376 million Euros) in 2026858.
A barrier for scale-up of operations is the high initial investments859. This can be an issue for larger scale production of MFC products.
Feedstock drivers and barriers
Advantage of MFC is that it can be derived from non-food and non-land use competing materials. Any materials with cellulose suffice. The main feedstock source of MFC is from pulp and paper, however, it can be derived from plan-based wastes as well855.
Feedstock challenges for large-scale application, especially for non-forestry biomass, is a steady supply of seasonal biomass859, though it is normally expected that MFC production will be linked to a steady supply of feedstock861.
Climate change and environmental drivers and barriers
The fact that MFC has such a wide range of applications and that it offers superior performance in many applications enables it to replace fossil-sourced materials. E.g. in coatings applications it offers a VOC-free alternative as a binding agent865 924. MFC is also biodegradable, offering an environmentally friendly option in e.g. the packaging sector856.
A barrier is the sustainability proof. LCA systems are complicated and difficult to understand, which is a barrier in communication of the results. It is also difficult to relate it to energy. Furthermore, many companies do not want to disclose this data in the same manner. This is a challenge and a barrier for progress861.
Citizen and Society drivers and barriers
MFC is non-harmful, and therefore, available to use in cosmetics, pharma and other healthcare and personal care applications. Specifically, MFC is biocompatible, meaning it is not harmful or toxic to living tissue and usable in applications like surgical equipment or prosthesis. MFC is a safer alternative to e.g. bisphenol A and phthalates856.
Possible barrier for MFC uptake is the unknown effects due long-term and low-level exposure to human health. This is especially important for worker exposure, like exposure to dust or fine particles when handling the material 925.
01/view_technical-papers/microfibrillated-cellulose-a-novel-and-renewable-multifunctional-additive-for-waterborne-coatings/
925 Ede JD, Ong KJ, Goergen M, Rudie A, Pomeroy-Carter CA, Shatkin JA. Risk Analysis of Cellulose Nanomaterials by Inhalation: Current State of Science. Nanomater . 2019;9(3). doi:10.3390/nano9030337

368
Policy and regulation drivers and barriers
As MFC has large opportunities in packaging applications, the government regulations that ban the use of non-biodegradable packaging is a clear driver.
MFC also provides improved strength in applications, like aviation and other transportation vehicle material development where lower emissions and better fuel efficiency can be achieved with light-weight materials 926. Regulations that would promote the use of bio-based materials in these sectors and consequently drive the markets even further. REACH is a clear driver here861.
Politics should be more firm usage of polluting industries and habits and be brawer in initiating regulations. Of course, these involve risks when banning things, but it is a way of doing this. Lack of push/view for regulation is a barrier861.
Drivers for, and barriers to, bio-based uptake of polymers and plastics, specifically for thermoplastic starch
Table 61. Summary table for driver for, and barriers to market uptake of thermoplastic starch.
Category Drivers Barriers
1: Business Inexpensive raw material Quests for sustainable plastics and packaging by consumers and brand owners Growing markets of bioplastics
Consolidated markets with 5 main players TPS is poor material as such, need to be blended with other materials, competes with other bio-based plastics Low price and established markets of fossil alternatives
2: Innovation
Highly suitable for flexible packaging, and odour and taste sensitive packaging like food. Simple processing and blending with other plastics, suitable for injection moulding with conventional equipment
Poor performance by itself
3: Economy Bioplastics contribute significantly to the European bioeconomy, e.g. creating jobs
4: Feedstock Available raw materials, such as corn, wheat, potato. Available from waste sources
Food crops need to be used as raw material
5: Climate change and environment
TPS can offer GHG emission saving, however this is dependent on the product is it combined with Biodegradable Compostable Recyclable
Knowledge of environmental performance of TPS containing products is sometimes lacking
6: Citizen and Society
Customers wish to buy products that are environmentally friendly TPS is also odourless and tasteless making it acceptable for packaging of sensitive goods.
Consumer awareness and knowledge of bioplastics is not very high, e.g. some wrong expectations can cause barriers for market uptake
7: Policy and regulation
EU legislation mandating separate collection of bio-waste as of 1 Jan 2024 Ban on the use of non-compostable single use plastic bags in selected geographies/countries Starch-based bioplastics meets European standard UNI EN17033 for soil-biodegradable mulching films eligible for organic farming
Lack of strong regulatory push for bio-based products in Europe
926 Hjørnevik M. The future of Aerospace, and its demand for new materials. Exilva Blog. https://www.exilva.com/blog/the-future-of-aerospace-and-its-demand-for-new-materials . Published 2017. Accessed August 31, 2020.

369
Introduction
Bio-based polymers and plastics are various biomass sourced materials. This analysis will focus on thermoplastic starch (TS) which is 100% bio-based, readily biodegradable, easily modified both physically and chemically, and available in bulk in all parts of the world at low cost 927.
Thermoplastic starch is made from starch. It is a biopolymer obtained from renewable plant resources, such as maize, wheat, cassava, and potato harvests. Starch consists of two component polymers, amylose (AM) and amylopectin (AP). When starch is mixed with water or other plasticizer, like glycerol or sorbitol, and heated, the crystalline structure of starch is disrupted. It forms bonds (hydrogen bonds) with the plasticizer and gelatinizes. Shear force is often required for gelatinization, thus extruders or mixers are used to homogenize and process the material for the suitable moulding application. Consequently, the formed thermoplastic starch can be moulded at elevated temperatures 928.
As such thermoplastic starch is a brittle material, but blended with other polymers, fillers or fibres the properties can be improved. Thermoplastic starch can be blended with polymers, like polyethylene, polypropylene, polystyrene, polyvinyl alcohol and polylactic acid (PLA) 929. Some of these polymers can be produced using biomaterials, however, PLA is currently the only 100% bio-based polymer on the market. TPS is an attractive material for sustainable packaging and films, especially for food packaging.
Bioplastics are used in an increasing number of markets, from packaging, catering products, consumer electronics, automotive, agriculture/horticulture, and toys to textiles and several other segments. Packaging remains the largest field of application for bioplastics with more than 53 percent (1.14 million tonnes) of the total bioplastics market in 2019. However, the portfolio of applications continues to diversify with segments, such as automotive & transport or building & construction, significantly increasing their share.
Business drivers and barriers
Thermoplastic starch is a relatively simple material to produce and therefore inexpensive. In 2016, the price of starch blended plastics was estimated between 2-4 EUR/kg. For comparison, other bio-based plastics (PHA, PBS) were estimated at 4-5 EUR/kg and conventional PE and PP were priced at 1-1.5 EUR/kg850. TPS is mainly used for packaging and film applications 930. According to a European Bioplastics-report for 2019 930 the global TPS production capacity was approximately 428 ktonnes from which 370 ktonnes in flexible packaging, approximately 30 ktonnes in rigid packaging and another 30 ktonnes in agri and horticulture. TPS had the highest production capacity of global bioplastics production with a share of 21.3% in 2019. The expected growth for global total bioplastics production according to the study in the next 5 year (until 2024) is expected to be 14.7%. However, the global share of TPS is expected to drop due to competition with other bio-based plastics. Especially PHA is expected to grow significantly in the next years. The forecasted share of TPS in 2024 is 18.5% 931 owing to a growth in production capacity of 20 ktonnes in the next 5 years resulting in approximately 5% growth.
927 Gotro J. Thermoplastic Starch: A Renewable, Biodegradable Bioplastic. Polymer Innovation Blog. https://polymerinnovationblog.com/thermoplastic-starch-a-renewable-biodegradable-bioplastic/ . Published 2013. Accessed September 10, 2020.
928 Shanks R, Kong I. Thermoplastic Starch. In: Thermoplastic Elastomers. ; 2012. doi:10.5772/36295 929 Oever M van den, Molenveld K, Zee van der M, Bos H. Bio-Based and Biodegradable Plastics – Facts and Figures.;
2017. https://www.wur.nl/upload_mm/1/e/7/01452551-06c5-4dc3-b278-173da53356bb_170421 Report Bio-based Plastic Facts.pdf
930 European Bioplastics, nova-Institute. Bioplastics Market Data.; 2019. https://docs.european-bioplastics.org/publications/market_data/Report_Bioplastics_Market_Data_2019.pdf
931 European Bioplastics. BIOPLASTICS MARKET DEVELOPMENT UPDATE 2019.; 2019. https://docs.european-bioplastics.org/publications/market_data/2019/Report_Bioplastics_Market_Data_2019_short_version.pdf

370
According to Mordor Intelligence Market Snapshot 932 for TPS, the global CAGR is expected to come to more than 7% in the forecast period of 2020 – 2025. They report that the market is consolidated and mainly operated by 5 major players, such as Novamont SpA, BIOTEC, Plantic (Kuraray), Biome Bioplastics Limited, and AGRANA Beteiligungs-AG. The largest market is in Europe, which is driven by the governments and European policies supporting sustainable packaging. However, Asia is expected to grow significantly over the next years. Especially in China and India, the use of agricultural films is increasing due to increase in population and consequent food production, and also due to the rise of the food processing industry. Furthermore, India is going to phase out usage of single-use packaging by 2022, which will provide opportunities for bio-based plastics to increase market shares.
The main drivers of TPS are increased demand of sustainable, bio-based and biodegradable plastics by consumers and brands owners 933. Usage of TPS provides additional advantages for the product, such as lower carbon footprint and biodegradability. The business barriers for TPS are the consolidated markets by the main players853, which might present challenges for newcomers to enter the field. In addition, the packaging industry is highly focused on recyclability over bio-based, which might hinder the drive for the demand of TPS. Furthermore, as TPS is as such a poor material and requires further processing to yield a useable end-product, it can expect to experience competition from other bio-based plastics that have better properties and performance in applications. Furthermore, fossil-based plastics are cheaper and have established markets which is a challenge for TPS and other bio-based plastics to achieve strong market standing.
Innovation drivers and barriers
TPS has favourable set of mechanical properties, and products made of it have good dimensional stability in application conditions for carrier bags, non-fibre bags, waste-bags, vegetable bags, mulch film and so on 850, 853. Processing of TPS is simple and it can be blended with other plastics with extrusion.
However, several drawbacks in their technical performance compared to other polymers are related to their hydrophilic character and poor mechanical property.
Economic drivers and barriers
Bioplastics are important part of the European bioeconomy. Approximately 25% of bioplastics is produced in Europe852. The bioplastics industry offered 23 000 jobs in Europe in 2013 854. It is expected that this number could reach up to 300 000 in 2030 if favourable conditions for bio-based plastics are in place 854. Increase in employment is one of the biggest economic impacts of bioplastics. This will also favour the prospects of TPS, which is currently the most produced bio-based plastics material.
Feedstock drivers and barriers
TPS is made from starches, such as corn, wheat or potato. These are available materials that, however, are also suitable for food production. According to a European Bioplastics estimation852, bioplastics feedstocks in total use less than 0.02% of the global agricultural land. Despite the forecasted growth, this is still expected to stay around 0.02%. However, politically this is a challenging topic that is under scrutiny 934. Therefore, the fact that TPS is made from food sources is a major barrier.
932 Mordor Intelligence. THERMOPLASTIC STARCH (TPS) MARKET - GROWTH, TRENDS, AND FORECASTS (2020 - 2025). Mordor Intelligence website. https://www.mordorintelligence.com/industry-reports/global-thermoplastic-starch-market . Accessed September 9, 2020
933 European Bioplastics. FREQUENTLY ASKED QUESTIONS ON BIOPLASTICS.; 2020. https://docs.european-bioplastics.org/publications/EUBP_FAQ_on_bioplastics.pdf
934 nova-Institute. The state of the European bio-based economy is very mixed, the market is in a critical phase. Pressrelease. http://news.bio-based.eu/michael-carus-ceo-of-nova-institute-in-an-interview-with-bio-based-news-

371
Climate change and environmental drivers and barriers
The processing of TPS is simple and since it is a bio-based material its environmental performance in terms of Greenhouse Gas (GHG) emissions is lower than fossil alternatives. However, as TPS is often processed with other plastics to achieve the production material, the environmental impact is highly dependent on the material the composite material is made of 935. According to a Life Cycle Analysis (LCA) study of Broeren et al. 856, some grades of starch composites offer 85% of GHG reduction and others an increase of 80% on the same weight-basis. Additives in the starch-based plastics are often necessary and they can count for 40% of the emissions. Especially, when starch is sourced from wastes and is not “virgin” material the environmental impacts are much lower. Especially, eutrophication and land use impacts are then minimized. In summary, the drivers in this category are biodegradability, compostability and recyclability along with GHG saving when starch is sustainably sourced.
A barrier from environmental point of view is the lack of knowledge and communication of environmental benefits of TPS containing products. With a standardized Life Cycle Analysis one could offer comparable results of the environmental performance which helps to understand the benefits of the products and dispel any misconception of bioplastics.
Citizen and Society drivers and barriers
Usage of bio-based plastics is highly driven by the demand for sustainable, biodegradable packaging by consumers and brand owners854. According to European Bioplastics, approximately 80% of the European consumers wish to buy products which have minimal impact on the environment. This is a strong driver for TPS- based products as well. Furthermore, TPS based films are transparent, colourless, tasteless, and odourless. Therefore, they are highly suitable for packaging of goods that are sensitive to smells and colours, such as food, offering a material that does not interfere with the product.
A barrier to the use of bioplastics is that consumer expectations and terminology of bioplastics are not always clear854. Wrong expectations can cause misunderstanding about the nature of the products and this causes issues for acceptance of bioplastics. Therefore, more education is needed with clear labelling of products to increase the awareness and consequent market uptake. This requires both the industry and brands to work together.
Policy and regulation drivers and barriers
Several policies are in place to support bio-based plastics. EU legislation mandating separate collection of bio-waste as of 1 Jan 2024 will enhance the use of biodegradable and compostable plastics, such as TPS 936. Some countries in Europe have banned the use of non-compostable single use plastic bags, like France and Italy 937. These kinds of policies will support bio-based product demand and usage and is likely to influence TPS uptake too.
A barrier to bio-based product uptake is lack of a strong regulatory push from EU. With regulations, such as quota of bio-based materials, it would be possible to ensure that bio-based products are used in increasing amounts.
on-the-european-bio-based-economy-and-a-shift-towards-a-renewable-carbon-economy/ . Published 2019. Accessed September 10, 2020
935 Broeren MLM, Kuling L, Worrell E, Shen L. Environmental impact assessment of six starch plastics focusing on wastewater-derived starch and additives. Resour Conserv Recycl. 2017;127:246-255. doi:https://doi.org/10.1016/j.resconrec.2017.09.001
936 Favoino E, Giavini M. Bio-Waste Generation in the EU: Current Capture Levels and Future Potential.; 2020. https://zerowasteeurope.eu/wp-content/uploads/2020/07/2020_07_06_bic_zwe_report_bio_waste.pdf
937 News B-BW, COWI, Institute E, Innovation ECD-G for R and. Bio-Based Products: From Idea to Market “15 EU Success Stories”. Publications Office of the European Union; 2019. https://books.google.nl/books?id=4XJeyQEACAAJ

372
Drivers for, and barriers to, bio-based uptake of polymers and plastics, specifically for thermoplastic starch
Table 62. Summary for specific drivers and barriers for 1,4-BDO.
Introduction - Drop-in building block - 1,4-butanediol (BDO)
Building blocks are chemicals and starting materials used in the formulation of a broad range of products. They are also often referred as platform chemicals and they form, by definition, a large group and are very diverse in nature.
Category Drivers Barriers
1: Business 1. At present (May 2020) slow uptake for bio-based 1,4 BDO
2. Growing demand for sustainable fibre and biopolymers in Europe and US are like to favour the production of bio-based 1,4-BDO
3. Novel markets 4. Similar technical characteristics
than fossil BDO
Limited market in EU For European production of bio-based 1,4-BDO the biggest challenges are end-use industry saturation and low oil price 1,4-BDO price is still affected by the market
2: Innovation At industrial scale bio-based 1,4-BDO is cost competitive Process improvement Two commercial routes: sugars from corn and from lignocellulosic feedstock Alternative routes from butane and benzene could provide additional production pathways
Efficient extraction of sugars from lignocellulosic material challenging and costly Succinic acid is barely being made, this route is likely not feasible 1. Succinic acid is a higher value product,
rendering it not suitable as a starting material
3: Economy
New (fossil/bio) 1,4-BDO capacities are mainly built in Asia as home of most end-use industries e.g. textile, automotive, footwear Lack of downstream integration with the end-use industry Lack of end-policies to allowing to valorise sludges from bio-BDO production as fertilizers
4: Feedstock Suitable feedstocks for producing glucose syrup (raw material for fermentation), are widely available
1. Agricultural land is needed Risks associated with an increase in demand for biomass feedstock need to be considered
5: Climate change and environment
Bio-based route has significant reduction of GHG emissions compared to fossil route - above 50%
1. Low selectivity conversion and energy intensive downstream processing process
6: Citizen and Society
Consumer concern about plastic waste pollution
1. Toxicity 2. THF (BDO derivative) health and safety
issues 3. Potential use as a drug 4. “Fake” bio-based plastic products on the
market with misleading claims Paradox between environmental appeal and disposal behaviour of consumers
7: Policy and regulation
Ban on the use of non-compostable single use plastic bags in selected geographies/countries BDO-derived bioplastics meets European standard UNI EN17033 for soil-biodegradable mulching films eligible for organic farming EU legislation mandating separate collection of bio-waste as of 1 Jan 2024 Legislations are being implemented to promote increasing percentage of bio-based content in bioplastics
Lack of strong regulatory push for bio-based products in Europe Potential of automotive industry not realized due lack of standardization and regulation of bio-based materials

373
To tackle this broad group, it has been divided in drop-in and dedicated chemicals. Drop-in chemicals are bio-based versions of existing fossil-based chemicals which have established markets. Chemically they are identical to existing fossil-based chemicals.
Dedicated bio-based chemicals cannot be produced from fossil sources. They have their own dedicated pathway and they do not have a fossil-sourced counterpart. As a bio-based drop-in building block 1,4-Butanediol was chosen as a representative.
Business drivers and barriers
1,4-Butanediol (BDO) is commercially produced from fossil feedstock and from renewable (bio-based) feedstock. Fossil-based production is dominating the market although bio-based production is established in Europe, US and Asia 938,939. Fossil based BDO is produced from acetylene or propylene oxide and has a market size of nearly 1 million tonnes 939. Novamont owned Mater-Biotech is producing bio-based BDO in Adria, Italy in quantities of up to 30 kta, which they use for production of bio-based plastics 940.
The largest fossil consumption (40%) 849 of BDO is for tetrahydrofuran (THF) used as a monomer in the production of polytetramethylene ether glycol (PTMEG), which is used in the manufacturing of polyurethane fibres (Spandex), cast and TPU elastomers, and high-performance copolyester-polyether elastomers. These materials are used in various sectors such as clothes, sportswear, automotive, aviation, pharmaceutical, etc. 848,849.
Other important derivatives of BDO are: gamma-butyrolactone (GBL) used as solvent in paint strippers, circuit board cleaning products, and the production of herbicides and pharmaceutical products; polybutylene terephthalate (PBT) used for production of electrical and automotive components and polybutylene succinate (PBS) used for biodegradable packaging 941.
Production of fossil and bio-based BDO is tied to the cost of oil and natural gas. At current low oil and natural gas prices the prospects of drop-in chemicals are low (July 2020: oil 39.75 USD/bbl, NG 1.71 USD/MMBtu). Earlier estimation has suggested that production of bio-based BDO is cost competitive at low oil prices of 45 USD/bbl and a natural gas price of 3.50 USD/MMBtu. The cost of production via fermentation would be 15-30% lower than production from fossil sources (6). Currently, bio-based BDO has not reached its expectations 942.
However, Novamont uses BDO for entirely different bioplastic applications in which conventional plastics are not competitive. The markets for Mater-Bi plastics from BDO, where compostability and biodegradability is key, are e.g. compostable plastic shopping bags, soil-biodegradable mulching films and organic waste collection bags850,943. Furthermore, a growing market for sustainable fibres and films in Europe and US can help to drive BDO markets further848,.
The barriers for BDO development are limited markets in the EU as mentioned above. The saturated end-use market and low oil prices are the biggest threats. BDO production via fermentation requires distillation, which is an energy intensive process and improving the
938 Crnomarkovic M, Panchaksharam Y, Spekreijse J, Vom Berg C, Puente A, Chinthapalli R. Road to Bio Business Cases: Case Studies on Potentially Attractive Opportunities for Bio-Based Chemicals in Europe Consortium.; 2018
939 Stichnothe H, Bell G, Jørgensen H, et al. Bio-Based Chemicals A 2020 Update Bio-Based Chemicals A 2020 Update With Input from: (Pdf Version) Published by IEA Bioenergy.; 2020
940 Novamont. Mater-Biotech-factsheet. https://www.novamont.com/public/zip/factsheet_materbiotech_EN_web.pdf. Accessed July 6, 2020.
941 Hulea V. Toward Platform Chemicals from Bio-Based Ethylene: Heterogeneous Catalysts and Processes. ACS Catal. 2018;8(4):3263-3279. doi:10.1021/acscatal.7b04294
942 de Guzman D. Bio-based Building Blocks 2020: Commercialisation update. In: 13th International Conference on Bio-Based Materials. Online; 2020
943 Novamont. MATER-BI SOIL-BIODEGRADABLE FOR MULCHING FILM, CERTIFIED FOR ORGANIC FARMING BY AIAB. Pressrelease. https://www.novamont.com/eng/read-press-release/mater-bi-soil-biodegradable-for-mulching-film-certified-for-organic-farming-by-aiab/ . Accessed July 14, 2020.

374
efficiency of this process would cut costs and thus enhance the competitiveness of bio-based BDO production Furthermore, improving the selectivity of fermentation will help. 848,.
Innovation drivers and barriers
Estimations have shown that at industrial scale BDO production could be cost competitive848,. BDO can be produced from sugars or lignocellulosic materials. Improvement of sugar extraction from lignocellulosic material would represent an opportunity for further cost-competitiveness848,. Realization of alternative chemical routes from butane or benzene could also provide additional pathways. BDO has been previously produced from succinic acid, however, it has proven not to be a feasible route 848,944 as succinic acid is suffering from bad market uptake and is also a higher value product than BDO848.
Economic drivers and barriers
Currently BDO development in Europe is hindered by development of industries in Asia. This goes for both fossil and bio-based BDO production as the end-use industries are also more focused in that region 848. Furthermore, the lack of down-stream integration with the end-user industry is inhibiting BDO development 848,945. BDO utilization in Europe is done by the chemical manufacturer themselves855. In addition, lack of end-waste policies to allowing to valorise sludges from bio-BDO production as fertilizers 946.
Feedstock drivers and barriers
BDO can be produced by sugar-based feedstock which is readily available. This requires the use of agricultural land, which possess a risk for demand for biomass feedstock848. In the future more efficient conversion of lignocellulosic biomass can provide an alternative feedstock for BDO.
Climate change and environmental drivers and barriers
Bio-based BDO production has above 50% savings of Greenhouse gas emissions848, 850. Despite this, the process of BDO production is still energy intensive848. Process development may provide solutions to improve this.
Citizen and Society drivers and barriers
Specific barriers related to BDO comes from its toxicity and possible usage as a recreational drug 947. BDO metabolizes in human body quickly to GHB (gamma hydroxybutyrate) which causes feelings of euphoria and can also lead to unconsciousness or coma and possible death. In addition, one of the main applications of BDO, Tetrahydrofuran (THF), has been related to several health and safety concerns848. Compostability of BDO-based plastics are drivers for its market, however, a recent study revealed that there lies a paradox in the consumer behaviour of environmentally friendly appealing products. Most consumers do not know how to properly dispose these items thus the full environmentally beneficial potential is not achieved 948. BDO has markets in
944 McCoy M. Succinic acid, once a biobased chemical star, is barely being made. Chemical & Engineering News. https://cen.acs.org/business/biobased-chemicals/Succinic-acid-once-biobased-chemical/97/i12 . Published February 20, 2019.
945 News B-BW, COWI, Institute E, Innovation ECD-G for R and. Bio-Based Products: From Idea to Market “15 EU Success Stories”. Publications Office of the European Union; 2019. https://books.google.nl/books?id=4XJeyQEACAAJ
946 Expert comment on the factsheet within the scope of this project. 947 World Health Organization Expert Committee on Drug Dependence. 1,4-Butanediol (I,4 BD) Critical Review Report
(2014).; 2014. https://www.who.int/medicines/areas/quality_safety/4_4_Review.pdf 948 Taufik D, Reinders MJ, Molenveld K, Onwezen MC. The paradox between the environmental appeal of bio-based
plastic packaging for consumers and their disposal behaviour. Sci Total Environ. 2020;705:135820. doi:https://doi.org/10.1016/j.scitotenv.2019.135820

375
the automotive industry, however, this industry has not yet developed an eco-labelling system that would stimulate markets and enable more informed purchasing behaviour in terms of environmentally friendly materials 949 . In addition to this, the bio-based plastic bags markets contain also “fake” products that do not meet the standards and take away market share from the genuinely bio-based products855.
Policy and regulation drivers and barriers
BDO development in Europe has been driven by the regulations in France and Italy to ban the use of single-use plastic bags 855. In addition, BDO-derived bioplastics meet European standard UNI EN17033 for soil-biodegradable mulching films eligible for organic farming, which enhances the production as well. BDO is currently used for manufacturing of compostable plastic bags and EU legislation mandating separate collection of bio-waste as of 1st January 2024 will improve this even further 950. Yet, a strong regulatory push for usage of bio-based products within EU is needed to enhance the developments of BDO 855 and in general drop-in chemicals, which suffer from low oil prices. According to expert opinion gathered in the scope of this project, legislations are being implemented to promote increasing percentage of bio-based content in bioplastics856.
BDO-derived materials have market potential in automotive industry that must reach stricter standards in a more critical climate regarding CO2-emissions. These materials are interesting option for the industry due the fact that the environmental footprint of the product itself will decrease but can also reduce the footprint in the usage phase. Bio-based plastics are lighter in weight which contributes to lower fuel consumption and therefore to lower emissions as well. Unfortunately, the full potential is hindered due the fact that there is lack of knowledge in the industry itself about bio-based materials, especially at the end of life. Also, internal standardization and regulations regarding bio-based materials do not exist yet859.
Drivers for, and barriers to, bio-based uptake in Building Blocks (Lactic acid)
Table 63. Summary for specific drivers for, and barriers to Lactic Acid market uptake
Category Drivers Barriers
1: Business Multiple markets for LA: in chemical industry and as a building block, food, cosmetics, and pharmaceuticals Derivatives of lactic acid have multiple application fields and markets LA demand is driven by “green” movements Improvements of PLA properties and processing offer new market opportunities PLA has a lower price than other biodegradable polymers Unstable petroleum prices Increasing demand from developing countries Customers willing to pay higher price for PLA in return of marketing advantage and achievement of sustainability goals Ethyl lactate has better performance than some fossil-based solvents
PLA applications are focused mainly in two groups: food and packaging PLA uses in other applications than plastic still low Poor performance compared to conventional plastic
949 Wurster S, Ladu L. Bio-Based Products in the Automotive Industry: The Need for Ecolabels, Standards, and Regulations. Sustainability. 2020;12(4):1623. doi:10.3390/su12041623
950 Favoino E, Giavini M. Bio-Waste Generation in the EU: Current Capture Levels and Future Potential.; 2020. https://zerowasteeurope.eu/wp-content/uploads/2020/07/2020_07_06_bic_zwe_report_bio_waste.pdf

376
2: Innovation Ethyl lactate to replace fossil-based traditional solvents LA offers a new route to acrylic acid, however this requires more resources than other synthesis routes
PLA needs industrial composting and high temperature to degrade, however industries would prefer shorter than standard times Capital investments for improvement of the available technologies are high Recycling of PLA is limited with current technology and current usage
3: Economy Bioplastics, like PLA, are improving European bioeconomy, creating employment opportunities, and increasing Europe’s competitiveness PLA demand is high, which drives the industry, however this requires knowledge to make LA first
Production of LA requires knowledge and capital, which is a barrier for smaller companies to enter the field Two producers cover 43% of the (European) PLA production Asia Pacific, not Europe, is the fastest-growing region for the PLA market, both in terms of revenue and volume
4: Feedstock LA is produced using naturally occurring raw materials such as corn, sugarcane, cassava, and others Availability of lignocellulosic sugars would offer more options for feedstocks Agricultural waste potentially a source
1. Agricultural land is needed to produce feedstock for LA
2. Data is needed for chemical composition, regional and seasonal availability of agricultural residues, wastes and by-products to provide predictable and effective combining for LA production
5: Climate change and environment
Lactic acid and its derivatives (PLA and ethyl lactate) are biodegradable or compostable in nature GHG reduction of PLA packaging compared to fossil equivalents (30-70%) PLA is a chemically recyclable polymer Ethyl lactate was listed as part of the EPA’s SNAP as a solvent that meets the ozone protection provisions of the Clean Air Act (EPA 2015b, EIA 2014)
PLA needs a separate recycling stream No established recycling stream for PLA yet
6: Citizen and Society
Rising environmental concerns Quest for sustainability in packaging Changing to bio-based packaging is often easier than changing product formulation LA has low toxicity to humans
7: Policy and regulation
Favourable regulations toward the use of bio-based materials, are expected to give an impetus to the market over the forecast period EU Packaging and Packaging Waste Directive drives for more sustainable packaging Policy support for utilization 2nd and 3rd generation feedstock would stimulate research, developed and faster deployment of larger scale production of LA-derived polymers
Lack of strong regulatory push for bio-based products, currently packaging directives are focused on recyclability and not on bio-based
Introduction - Dedicated building block – Lactic acid
Building blocks are chemicals and starting materials used in the formulation of a broad range of products. They are also often referred as platform chemicals and they form, by definition, a large group and are very diverse in nature.
To tackle this broad group, it has been divided in drop-in and dedicated chemicals. Drop-in chemicals are bio-based versions of existing fossil-based chemicals which have established markets. Chemically they are identical to existing fossil-based chemicals.

377
Dedicated bio-based chemicals cannot be produced from fossil sources. They have their own dedicated pathway and they do not have fossil-sourced counterpart. As a bio-based dedicated building block lactic acid was chosen as a representative.
Business drivers and barriers
Lactic acid (LA) has multiple markets. It is used in the chemical industry as a building block, in food applications, cosmetics, and in pharmaceuticals 951, 952. The largest segment of LA is in manufacturing of Poly Lactic Acid (PLA), which counts for 28.3% of LA market849. The second largest application of LA is in food and beverages (28.0 %) and the 3rd largest application field is as solvent which counts for 22.0 % 953. Ethyl lactate is one of the novel and important solvents produced from LA. Many LA derived bio-based chemicals are biodegradable and non-toxic which acts as driver for LA production 954,955.
The largest driver for LA demand increase is expected to be from PLA. PLA is used in multiple industries, such as: food packaging, medical, textile, automotive, and the agricultural sector. Growing use of bioplastics in flexible packaging is expected to drive the market for PLA as well852. Recent advancements in PLA properties, such as heat resistance, co-polymer production that enables increased strength is providing more market opportunities for PLA 956,957. The medical segment is evaluated to be the fastest growing segment in the foreseeable future (until 2028) 958. In addition, PLA-derived coatings are also expected to show large growth. In growing economies, like China, India and Indonesia utilization of PLA in the products in various industries including packaging, agriculture, transport, electronics, and textiles is increasing852. PLA, starch blends, cellulose, and other bioplastics achieve significantly higher growth rates than conventional standard plastics 959. The unstable petroleum prices are also acting as a driver for PLA market uptake855. LA is not sourced from fossil raw materials; thus, it is not affected by fluctuating oil prices.
The majority of the PLA is used by the food industry for packaging of sensitive food products and in general, the packaging sector is considered to be the most contributing sector of the PLA market in both volume and revenue855. Globally, one third of the market is covered by packaging852. Packaging is in general the largest sector for bioplastics; more than 60% of the bioplastics produced were processed in the packaging industry 856.
PLA-based engineering plastics and microwaveable containers, including food containers and disposable cutlery, feature several beneficial properties, such as better aesthetic appeal, good resistance to oil and grease, and better printability, which has resulted in significant use of PLA for manufacturing food packaging products852. PLA is not cost-competitive with conventional plastics; however, this is not an issue regarding its market prospects. Customers using PLA are willing to pay premium prices to achieve sustainability goals and a marketing advantage by using bio-based alternative854. Thus, another driver for PLA and consequently for LA are “green movements”.
Lactic acid is also used for the production of ethyl lactate, which is a novel bio-based solvent. Ethyl lactate is chemically an ester of lactic acid and ethanol and it is primarily
951 Crnomarkovic M, Panchaksharam Y, Spekreijse J, Vom Berg C, Puente A, Chinthapalli R. Road to Bio Business cases: Case studies on potentially attractive opportunities for bio-based chemicals in Europe Consortium. 2018.
952 Ata R, Aladdin A, Othman N, Malek RA, Leng O, Aziz R, et al. Lactic acid applications in pharmaceutical and cosmeceutical industries. J Chem Pharm Res. 2015 Oct 1;2015:729–35
953 Stichnothe H, Bell G, Jørgensen H, Bari I, Haveren J, Lindorfer J, et al. Bio-Based Chemicals A 2020 Update Bio-Based Chemicals A 2020 Update With input from: (pdf version) Published by IEA Bioenergy. 2020
954 Grandview Research. PLA Market Size to Reach $4.1 Billion by 2025 | CAGR 19.8%. Grandview Research. 2019 955 Biddy, Mary J., Scarlata, Christopher, and Kinchin C. Chemicals from Biomass: A Market Assessment of Bioproducts
with Near-Term Potential. 2016 956 Corbion. PLA riding high [Internet]. [cited 2020 Jul 7]. Available from: https://www.total-corbion.com/about-
pla/performance/ 957 Interview with an industry expert within the scope of this project. 958 Inkwood Reserach. GLOBAL POLYLACTIC ACID MARKET FORECAST 2019-2028 [Internet]. 2020 [cited 2020 Jul 7].
Available from: https://www.inkwoodresearch.com/reports/polylactic-acid-market/ 959 Ceresana. Bioplastics Market Report [Internet]. 2020 [cited 2020 Jul 7]. Available from:
https://www.ceresana.com/en/market-studies/plastics/bioplastics/

378
used as an industrial solvent. The properties and performance of ethyl lactate have been found to meet or exceed those of traditional solvents like toluene, methyl ethyl ketone, and N-methyl-pyrrolidone in many applications851. Estimated demand for solvents in US (2016) was approximately 5 million metric tonnes. Ethyl lactate is a competitive, economically viable and environmentally attractive solvent to replace traditional solvents851, 960.
Barriers for LA come from PLA developments. Currently, PLA markets have been focused mainly on food and packaging. Its use in other application is still low. PLA has also poorer performance than conventional plastics which is a barrier for business development.
Innovation drivers and barriers
LA is a chemical produced from sugars by fermentation. Biochemical processing is in general a selective method to produce chemicals and recently, Corbion has improved the LA technology to produce pure stereoisomers further improving the usage of PLA853.
Ethyl lactate has the opportunity to replace traditional fossil-based solvents with further improvement of the production process. At the moment the solvent potentially has trace amounts of other chemicals from the manufacturing process which is an issue in certain applications, like food and pharma 961.
Recently, Cargill - a global leader of LA production - has patented a new technology for acrylic acid production from LA. Acrylic acid is an important platform chemical, especially for the plastics and coatings industry increasing the interest for LA production 962. However, it should be noted that producing acrylic acid from LA is currently more costly than conventional process854.
End-of-life processing of PLA is currently limited and requires industrial scale composters at high temperatures 963,964. Despite that PLA fulfils the standards, the composting industry wishes to process their raw materials faster. This creates issues with composting PLA. Furthermore, recycling of PLA is currently also limited as it is not compatible to be composted with PET. PLA must be separately recycled from other plastics. It is expected that once PLA volumes increase, the recycling industry will also improve their operations and enable better recycling of PLA854.
Furthermore, a barrier for LA production from waste and lignocellulosic materials is related to the required large capital investments to improve the existing technologies to enable feasible production yields. 965. The issues here are efficient extraction of sugars from the raw materials and purity levels of the feedstock that can jeopardize the fermentation process.
960 Paul S, Pradhan K, Das A. Ethyl Lactate as a Green Solvent: A Promising Bio-Compatible Media for Organic Synthesis. Curr Green Chem. 2015 Dec 3;03:1
961 Li X, Zhang X, Jian H, Xu X, Xi Y. Biocycle Fermentation Based on Lactic Acid Bacteria and Yeast for the Production of Natural Ethyl Lactate. ACS Omega [Internet]. 2019 Oct 1;4(14):16009–15. Available from: https://doi.org/10.1021/acsomega.9b02121
962 Bomgardner MM. Is clarity coming for biobased chemicals? [Internet]. Chemical & Engineering News. 2020. Available from: https://cen.acs.org/environment/sustainability/clarity-coming-biobased-chemicals/98/i26?referral=930AA653-F007-43FB-95BC-6ECEFAA4A560
963 Panchaksharam Y, Kiri P, Bauen A, Berg C vom, Puente Á, Chinthapalli R, et al. Roadmap for the Chemical Industry in Europe towards a Bioeconomy [Internet]. 2019. Available from: https://www.roadtobio.eu/uploads/publications/roadmap/RoadToBio_strategy_document.pdf
964 Tullo AH. Plastic has a problem; is chemical recycling the solution? [Internet]. Chemical & Engineering News. 2020 [cited 2020 Jul 7]. Available from: https://cen.acs.org/environment/recycling/Plastic-problem-chemical-recycling-solution/97/i39?utm_source=mostread&utm_medium=mostread&utm_campaign=CEN
965 Djukić-Vuković A, Mladenović D, Ivanović J, Pejin J, Mojović L. Towards sustainability of lactic acid and poly-lactic acid polymers production. Renew Sustain Energy Rev [Internet]. 2019;108:238–52. Available from: http://www.sciencedirect.com/science/article/pii/S136403211930190X

379
Economic drivers and barriers
Bioplastics have a large impact on the European bioeconomy. PLA is the 2nd most produced bio-based plastic, with the share of 13.9% of production capacity in Europe in 2019 966. Increased production of bioplastics, like PLA, create job opportunities and increase the European competitiveness. There is a high demand for PLA which welcomes new players in the field854.
However, currently, most of LA is produced in Asia. Two companies (Corbion and Galactic) in Europe are mainly responsible for LA production at larger scale and contribute to 19% of the global production volume848. LA production requires knowledge of the fermentation process and investments on the appropriate technology. This is barrier for small companies to enter the markets. A large share of LA market is for PLA and its growth is concentrated in Asia Pacific and not in Europe862.
Feedstock drivers and barriers
LA is produced from natural occurring materials, such as corn, sugarcane, cassava and others855, 967. More efficient and cost-competitive extraction of lignocellulosic sugars would offer more options for feedstock851. Furthermore, future availability of agricultural wastes would improve this even more.
As a barrier, the current feedstocks used in LA production require agricultural land and crops that could be used as food. This will be a barrier with European policy. Currently, LA takes up 0.002% of agricultural land and if the production volumes would increase to 60 – 100 million tons, the share would be increased to 1-2%. Compared to production of ethanol from food sources, that is about 4% this is still lower854. Many bio-based materials and chemicals are produced from food-based crops and this needs further investigation to ensure security of supply in the future. For instance, data on chemical composition, regional and seasonal availability of agricultural residues, wastes and by-products are lacking to provide predictable and effective combining of feedstocks for LA production 862.
Climate change and environmental drivers and barriers
Several drivers in terms of climate change and environment for LA exists. Lactic acid derivatives, such as PLA and ethyl lactate that are high in bio-based content and are biodegradable or compostable in nature 848, 851, 852. PLA packaging offer Green House Gas saving of 30-70% compared to fossil counter parts 860 PLA is also chemically recyclable polymer, which increases the opportunities for end-of-life usage. Ethyl lactate is used in industrial applications to replace volatile organic petroleum-derived compounds 851. It is biodegradable, non-corrosive, non-carcinogenic, low in volatile organic compounds, and it is inexpensive to recover and recycle 851. It is listed as part of the EPA’s SNAP as a solvent that meets the ozone protection provisions of the Clean Air Act (EPA 2015b, EIA 2014) 851
Barriers for environmental point of view is that PLA requires a separate recycling stream 860 and industrial composting units to degrade. Currently this is not utilized due low levels of usage of PLA. Therefore, PLA end-of-life applications are limited. Furthermore, there are no established large scale recycling streams 848,861 for PLA as there are for other plastics.
Citizen and Society drivers and barriers
LA and PLA offer “greener alternatives” in their field of applications and therefore are more attractive also from the consumer point of view. This is linked to the rising environmental concerns855. PLA markets and consequently LA markets are driven by the quest for
966 European Bioplastics. BIOPLASTICS MARKET DEVELOPMENT UPDATE 2019 [Internet]. 2019. Available from: https://docs.european-bioplastics.org/publications/market_data/2019/Report_Bioplastics_Market_Data_2019_short_version.pdf
967 de Guzman D. Bio-based Building Blocks 2020: Commercialisation update. In: 13th International Conference on Bio-based Materials. Online; 2020

380
sustainable packaging852. Companies can reduce their environmental footprint easier by switching to sustainable packaging rather than changing the product formulation itself. Furthermore, increasing concern for the environment has spread the awareness for use of PLA plastics as an alternative for fossil-based plastics. Another driver is that LA has low toxicity to humans and therefore, it can be used applications that have high safety standards, such as food, pharma, and personal care.
Policy and regulation drivers and barriers
Several policy drivers could improve the prospects of LA and PLA. Such as, favourable regulations towards the use of bio-based materials are expected to drive PLA markets, and therefore would increase the LA production as well. The use of PLA is encouraged across the globe because of its biodegradability and being an environmentally better alternative for conventional plastic products in many applications where is it feasible 855.
The EU Packaging and Packaging Waste Directive drives for recovery and recycling targets and deadlines for EU Member States oblige them to address the recovery and recycling of used packaging, which can acts as enhancement of PLA usage and further development of recycling of PLA 968.
To improve feedstock opportunities, the use of 2nd and 3rd generation feedstocks with policy support for LA-derived polymers would stimulate research, developed and faster deployment of larger scale production862.
Currently, a barrier is that packaging directives are focused on recyclability rather than bio-based content. A strong regulatory push for increased bio-based material use is needed 854.
968 EUROPEN. EU Packaging and Packaging Waste Directive [Internet]. [cited 2020 Jul 14]. Available from: https://europen-packaging.eu/policy/5-eu-packaging-and-packaging-waste-directive.html

381
Drivers for, and barriers to, bio-based uptake in Building Blocks (Methanol)
Table 64. Summary for specific drivers for, and barriers to Methanol market uptake
Category Drivers Barriers
1: Business Methanol has a large market volume and is a flexible platform chemical with many downstream uses and as well a highly useful solvent for the synthesis of a huge portfolio of chemicals Drop-in: no change in processing is necessary at downstream processing The technologies used in the production of methanol from biomass are relatively well known since they are comparable with the coal gasification technology
Bio-based methanol production in most cases is not cost competitive with today’s fossil methanol price Bio-based methanol is used mainly as a fuel, not for chemicals or materials
2: Innovation Gasification technology from Enerkem becoming more commercial The future possibility to use waste-CO2 and green hydrogen to produce methanol
3: Economy A potentially economic option is co-processing Strong competition by natural gas and CO2 -based methanol
4: Feedstock Multiple feedstock options when produced via biomass gasification to syngas No direct land use when produced from wastes
Biomass availability constraint when upscaling to conventional size Competition for biogas that has fuel and energy applications
5: Climate change and environment
GHG reduction when used as a chemical or material building block
Volatile organic compound (VOC) emissions
6: Citizen and Society
Poisonous chemical
7: Policy and regulation
Bio-based methanol production is driven by fuel policies and can increase production of bio-based methanol Principles or circular economy and Circular Economy Action Plan drive the utilization of wastes for chemicals and materials
Pro-fuel policies that support biofuels are hindering bio methanol use for chemicals and materials
Introduction
Methanol is a liquid chemical with the formula CH3OH (often abbreviated MeOH). It is one of the simplest alcohols and shares similar characteristics with the slightly larger molecule Ethanol (C2H5OH). Methanol is colourless, volatile, flammable, and – contrary to ethanol - poisonous. It is one of the largest volume chemicals in the world (world demand 75 million metric tons in 2015 969 and serves as a building block for various other chemicals, e.g. formaldehyde, acetic acid, olefins, MTBE and DME. Bio-based methanol is a drop-in chemical which means that it is identical to fossil-based methanol. Bio-based methanol can also be utilised as biofuel.
Methanol is produced from bio-based syngas (bio-syngas), which can be produced by gasification of various biomass sources, such as: lignocellulosic crops (e.g. energy crops like miscanthus, switchgrass and short rotation coppice, such as willow and poplar), wood, forestry residues, agricultural residues (such as straw), as well as municipal solid waste (MSW), black liquor, wood waste and manure. Methanol can be manufactured at widely
969 Methanol Institute. METHANOL PRICE AND SUPPLY/DEMAND. Methanol Institute webpage. https://www.methanol.org/methanol-price-supply-demand/ . Published 2020. Accessed October 13, 2020

382
varying scales, ranging from small-scale units, producing a few hundred gallons or litres per day, to very large plants making 1.6 million gallons/6 million litres each day 970.
The first commercial scale plants have been built based on the MSW gasification by Enerkem. One is situated in Edmonton, Canada. Other projects are underway to produce methanol from MSW, for example in the Netherlands, Spain, and China. In the Netherlands, Enerkem is involved building a plant with a capacity of 220 kta methanol. The plant will utilize 360 kta of residual non-recyclable waste 971. The proprietary thermochemical process of Enerkem includes feedstock preparation, gasification, syngas cleaning and conditioning and catalytic conversion to produce methanol and ethanol. Methanol produced by Enerkem is directly used in adhesives and solvents, polyester fabrics, and drinks bottles. It is further processed to create ethanol, acrylic acid, n-Propanol, n-Butanol, olefins and acetic anhydride; chemicals that are used to make thousands of industrial and consumer products.
Methanol can also be produced from biogas which is upgraded to biomethane and then reformed to produce biosyngas. An example of how this could be done is BioMCN, though they use gas from the natural gas grid.
BioMCN formerly produced biomethanol from glycerol in the Netherlands. In 2015, BioMCN was acquired by OCI N.V. and continued producing renewable methanol from biogas with a capacity about 60,000 metric tonnes per year. The biogas must be cleaned to obtain a gas with high methane content which is then supplied to the natural gas grid. BioMCN uses gas from the grid and converts it to methanol. They purchase green gas certificates and the methanol produced is on a mass balance base certified as bio-methanol. This methanol is primarily sold as a biofuel in the European transportation sector.
Alternatively, methanol is commercially produced as a side-stream from Kraft pulp mills by separating and purifying methanol from the waste gas (steam stripper off-gas), which can contain up to 70% methanol. This gas is conventionally incinerated. Alpac (Alberta-Pacific Forest Industries Inc.) was the first company to valorise this waste gas to attain methanol as a by-product. They produce 4,000 metric tonnes of methanol per year. They use a portion of the methanol to make a pulp whitening agent required to produce pulp and sell any surplus commercially.
Business drivers and barriers
One of the main drivers for methanol production is that it is a versatile chemical building block as well as a fuel. It is also used as a solvent in many chemical applications. As mentioned before, methanol is one of the largest volume chemicals in the world and the market for methanol is growing. According to Methanol Institute 848, methanol is expected to register a CAGR (Compound Annual Growth Rate) of around 5% during 2015 - 2020. This concerns all methanol produced, not only bio-methanol. The 3 main products responsible for the methanol demand are MTO, formaldehyde and alternative fuels, such as gasoline blending and combustion, biodiesel and DME. Methanol demand is increasing due to the increase of alternative fuels. With respect to other products from methanol, MTO and formaldehyde dominated the market and are expected to grow during the forecast period, owing to the increasing application in the construction, automotive, and personal care industry. The key regional methanol markets are in United States Gulf Coast, Rotterdam, and Coastal China.
In case of bio-methanol the fact that it is a drop-in has benefits. Any application that switches from fossil methanol to bio-methanol does not need modifications but can utilize the molecule directly. This is another driver. Furthermore, the technologies used in bio-
970 Crnomarkovic M, Panchaksharam Y, Spekreijse J, Vom Berg C, Puente A, Chinthapalli R. Road to Bio Business Cases: Case Studies on Potentially Attractive Opportunities for Bio-Based Chemicals in Europe Consortium.; 2018
971 Nieuwhof M. Waste-to-Chemicals, Rotterdam – Implementing the Circular Economy. Powerpoint presentation. https://tu-freiberg.de/sites/default/files/media/institut-fuer-energieverfahrenstechnik-143/EVT/Schulungen/2019_bht_06_nieuwhof.pdf. Published 2019. Accessed October 20, 2020

383
methanol production are relatively well-known and developed as they are comparable with coal gasification technologies.
A barrier for bio-methanol is that it is, as for many drop-ins, not cost competitive with today’s fossil alternatives. Enerkem’s process that utilizes wastes is reported to be an exception. The Road2Bio-project (finished in 2019) estimated that bio-methanol production costs from wood is ranging between 160 – 940 EUR/ton. For fossil methanol the costs range 75-250 EUR/ton from natural gas and 150 – 300 EUR/ton for coal. This data is based on estimations from 2017 972. The fossil methanol price in August 2020 was approximately 230 EUR/ton (275 USD/metric ton, Europe MMSA Contract FOB Rotterdam T2) indicating that it is still on the lower side compared to the estimated bio-methanol production costs. Unfortunately, the development of bio-methanol has mainly been driven for fuel applications due to policy support. This is a barrier for bio-methanol production and market uptake for chemicals and materials.
Innovation drivers and barriers
Gasification technology developed by Enerkem is becoming more widely applied. Multiple projects are underway to build more units globally. This will be a driver to increase bio-based methanol production from wastes, since more plants means technology development, and lower costs. In addition, the possibility to utilize waste CO2 e.g. from pulp and paper, and to combine it with green hydrogen from electrolysis opens other possibilities to produce renewable methanol 973.
Economic drivers and barriers
As bio-based methanol production is costly, a potentially economic option is to mix renewable and fossil feedstocks (co-processing), e.g. like in BioMCN production. This can gradually make methanol production environmentally friendly and increase the expertise in biomass-based methanol production. Bio-methanol produced from biogas is considered to be also the lowest cost route.
The economic barrier for bio-based methanol production is a strong competition of fossil sourced methanol. Natural gas-based methanol and CO2-based methanol are, in most cases, currently offering more economically viable production routes.
Feedstock drivers and barriers
Methanol production via biomass gasification is an attractive option since the technology is already quite developed and can utilize many feedstocks, including non-food feedstocks and wastes. This is a driver in this category. Furthermore, there is no land use impact when readily available and abundant wastes and residues are used as feedstock. It is claimed that the diversion of this waste to gasification resulted in 2.5 times the reduction in GHG emissions compared to a normal waste management system.
Larger plants - similar to those used for natural gas-based methanol - might not be possible due to biomass availability and transport constraint. The amount of biomass needed for these types of installations is high and its sourcing is restricted by locally available biomass and available logistics. Efficient and sustainable import from abroad and brow-field conversion in a port could be an option to overcome this. Furthermore, competition for biogas is another barrier. Biogas is upgraded to methane and is supported by policies when used in transportation. In addition, it is used for heating when supplied via the natural gas grid.
972 Vom Berg C. Roadmap for the Chemical Industry in Europe towards a Bioeconomy - Deliverable 2.1.; 2018 973 Jannasch A-K. Pulp and paper industry can produce large quantities of green fuels through electro-fuel processes.
2019. https://www.ri.se/en/press/pulp-and-paper-industry-can-produce-large-quantities-green-fuels-through-electro-fuel

384
Climate change and environment
Using wastes to produce bio-methanol results in significant GHG emission reduction compared to fossil-based methanol (estimated as 40% compared with natural gas, without taking into account avoided emissions from the diversion of waste from landfilling or incineration).
A possible barrier for methanol uptake is the concern of volatile organic compounds (VOC) emissions. For example, formaldehyde is a methanol derivative and there is interest in the chemical industry to replace formaldehyde in applications were emissions occur. This is also driven by regulation, for example concerning work-place safety. Since bio methanol is a drop-in bio-based chemical, it suffers the same drawbacks as normal methanol.
Citizen and Society drivers and barriers
A possible barrier in this category is that methanol is a poisonous chemical. However, as it is used mainly as a building block in chemical industry, it will not come into contact directly with citizens. However, extra measures are required in facilities handling methanol.
Policy and regulation drivers and barriers
Bio-based methanol production is currently driven by biofuel policies. This is a driver for bio-methanol in general. The principles of the circular economy are favouring utilization of wastes as feedstock for value added products. In the framework of the Circular Economy Action Plan a Sustainable Products Policy legal framework is being developed that will make use of a Products’ Environmental Footprint. This can drive the use of methanol for chemicals and materials as well.
As a barrier, the pro-fuel policies are hindering methanol use for chemicals and materials, since fuel applications are more encouraged When it is more beneficial to produce fuels than chemicals or materials, the industry will not develop to enable this.

385
Specific drivers for, and barriers to, Lignin-based resins market uptake
Table 65. Summary table of specific drivers for, and barriers to lignin-based resins market uptake.
Category Drivers Barriers
1: Business Large market opportunities Reduces cost for end-user in some cases when lignin is used as such Can be used directly to substitute fossil raw materials for up to 50%, however, excluding phenolic resins
Needs modification to be used 100% Markets are dominated by large pulp and paper companies Cost of raw material is not known well-enough
2: Innovation
Innovation diffusion (B2B collaboration) Process optimization In foam applications excellent flame retardance Milder cross-linking temperatures and reduced use of solvents From FPBO fractionation also a resin for moulding compounds In some cases, improved properties in application
Lignin qualities vary Technical performance as such lack in comparison to other resins IP can be an issue with business development Covid-19 will delay new innovations and product reach to the markets
3: Economy Lignin based resins have small markets and they are not expected to result in significant economic developments, like offering employment in the near future Approval procedures (e.g. REACH) are expensive and time consuming which can prevent SMEs for entering the markets without financial support
4: Feedstock Available in all lignocellulosic biomass and also in waste sources which is an important driver for product developers No agricultural land needed Potential increased by 2G Biorefinery Lignin from fast pyrolysis
Security of supply Available quantities and type-ranges not known well enough
5: Climate change and environment
Prevents the use of large amount of fossil-based solvents GHG savings Raw material of natural origin -> biodegradability of the end-product possible
Environmental impacts are not known well enough (LCAs needed) Unsustainable forestry
6: Citizen and Society
Health risks of formaldehyde and phenolic resins offer a marketing benefit when part of the fossil-based is substituted with lignin Low toxicity of lignin itself, however it may change after it is modified for the application Demand for bio-based products
7: Policy and regulation
Policy drivers for lignocellulosic biorefinery will increase the availability of lignin Policy/innovation funds for material development from 2nd Generation biomass supplies will boost lignin availability Policies to support 2nd Generation plants to use sustainable energy if lignin is valorised to materials. REACH drivers for usage of chemicals that are green and non-harmful
Approval procedures (e.g. REACH) are expensive and time consuming
Introduction
Resins are soft solid or highly viscous materials, usually containing prepolymers with reactive groups. It is a wide group of synthetics that are used in composites, binders (for plate materials), adhesives, inks, paints, and coatings. Bio-based resins can be “drop-in”

386
solutions that can replace the fossil counterparts, such as epoxy, acrylic and unsaturated polyester resins. New building blocks from bio-based sources are epoxidized vegetable oils for epoxy resins, lignin derived phenols for formaldehyde resins or polyols from sugars for polyurethane resins 974, 975 .
There are many types of bio-based resins in development-phase and on the market. However, often the bio-based resin replaces only part of the fossil resin in the end product. To our knowledge, a product with 100% bio-based resin has not yet entered the market. We have decided to focus this review of specific drivers and barriers to lignin-based resins. Lignin is a material abundantly available mainly from the pulp and paper industry, where it is often considered a waste. It is presented as the most challenging biomass component to utilize in value-added products due to its structure and the way it has been obtained. There are emerging markets for lignin-based resins, especially as a replacement for phenol-formaldehyde resins and as a resin for polyurethane 976, 977. UPM-Biofore has marketed resins with a bio-based content of up to two thirds while one third remains fossil-sourced, and they aim at resins that can be made fully lignin-based 851, 978. The drivers for and barriers to increased market penetration of lignin-based resins are summarized in the table and further explained below.
Business drivers and barriers
Lignin-based resins can be used to partially replace the fossil resins in their applications, such as phenolic resins or polyurethane resins in polyurethane-based foams. Phenolic resins are used in coatings, composites, adhesives, and in moulded parts 979. The phenol used in the fossil-based resins is obtained from petroleum-derived materials. Lignin-based phenolic resins are being used in wood-based panels850, and in wood-based fibre laminates 980.
Polyurethanes are produced by reacting isocyanate resins with a polyol. The resin structure used in polyurethane varies depending on its application. One of the isocyanates used is fossil-based toluene-tri-isocyanate, which has an aromatic ring structure and functionalities. Lignin-based resins can replace toluene in polyurethane rigid foams. These are used for insulation and structural materials for construction or transportation850.
The market size of bio-based resins is not known, which makes it difficult to estimate their volumes used. However, some indication for current fossil markets can be derived. Phenolic resins are being produced in quantities of 6 million tonnes annually and their price ranges from 990 EUR-ton - 2070 €/tonne depending on the quality and application of the resin851. In some cases, it is possible to replace 50% of the resins used with lignin before the properties suffer significantly 850. Application to phenolic resins will be suitable with substitution of phenol with 10-30% of lignin 981, 982. Based on the market size and the price
974 Wageningen University and Research. Bio-based resins. https://www.wur.nl/en/show/Biobased-resins.htm . Accessed July 15, 2020
975 Thomasnet. Types of Resins and Their Uses. https://www.thomasnet.com/articles/plastics-rubber/types-of-resins/ . Accessed July 22, 2020
976 Lettner M, Hesser F, Hedeler B, Schwarzbauer P, Stern T. Barriers and incentives for the use of lignin-based resins: Results of a comparative importance performance analysis. J Clean Prod. 2020;256:120520. doi:https://doi.org/10.1016/j.jclepro.2020.120520
977 Paola Fabbri, Davide Viaggi, Fabrizio Cavani, Lorenzo Bertin MM, Erika Carnevale, Juliana Velasquez Ochoa, Gonzalo Agustin Martinez, Esposti Micaela Degli Piret, Kukk Fischer, Sven Wydra Schwarz, Alexander FM-W. Top Emerging Bio-Based Products, Their Properties and Industrial Applications.; 2018
978 UPM-Biofore. Lignin is here to stay. UPM News & Stories. https://www.upm.com/news-and-stories/articles/2019/11/lignin-is-here-to-stay/ . Published 2019. Accessed July 21, 2020
979 Phenolic resins (phenoplasts). In: Polymer Database. https://polymerdatabase.com/polymer classes/Phenolic type.html
980 Hildebrandt J, Budzinski M, Nitzsche R, et al. Assessing the technical and environmental performance of wood-based fibre laminates with lignin based phenolic resin systems. Resour Conserv Recycl. 2019;141:455-464. doi:https://doi.org/10.1016/j.resconrec.2018.10.029
981 Expert Opinion. Interview with an industry expert in the framework of this project. 982 Melike Bayram. Resins and moulding compound from pyrolytic lignin. 2020. http://pyrowebinar.pyroknown.eu/

387
of (fossil based) resins, substituting 30% of the total resins would be worth approximately 1.8 billion – 3.7 billion. UPM-Biofore estimates that 1 Mtonne of phenolic resins alone can be substituted by lignin852. Lignin is used mainly in pulp and paper to create energy and the price of lignin as energy source is 63-135 €/tonne 983. The possibility of achieving a higher profit as a material is acting a push for the companies to develop novel materials.
There are 7 commercial producers of lignin globally. Kraft lignin, which is the major type of lignin from pulp and paper is being produced at 130 million tonnes annually (2016); out of this only 2% is being used in products, like binders857. This presents a huge potential and the current sellers of lignin-based resins, Borregaard, UPM-Biofore and Stora Enso, each claim that using lignin based resins provides cost-reductions for the user 984, 985. How the savings are achieved, or what the level of the cost reductions is, is not listed in detail though.
Considering PU foams, their global estimated market (2020) is 28.6 Mtonne annually 986. Lignin-based resins have application in the rigid PU foams that comprise approximately 30% of the PU market (thus 9.5 Mtonne) 850. It is possible to substitute 10-30% of the foam with lignin-based material. Therefore, the possible volumes that could be supplied are approximately 3.2 Mtonne annually. Price of PU foam is 1760 €/tonne (Alibaba, PU foam market price, read 20th July), which is worth of 5.6 billion euros.
As summary the drivers for lignin-based resins are large market opportunities in different applications. In some applications, reduced costs for the end-user and substitution of up to 50% of fossil raw material potentially exist. This is mainly in plywood where lignin is used a glue material.
The barriers are the fact that lignin cannot be used as such, and either not at 100% to replace the fossil-based resins. It needs modification, which increases the costs of the material and as consequence decreases its competitiveness with conventionally used materials with consolidated markets. Furthermore, lignin markets are dominated by large pulp and paper companies, which can offer the material at low price and high volumes. Furthermore, the cost of lignin as raw material is not known well enough, which can be an issue when planning business operations. It can be a challenge for small companies to enter the markets with these uncertainties.
Innovation drivers and barriers
Lignin’s competitiveness is increased by business to business collaboration. So called innovation diffusion, that enables the innovation to answer market demands directly, has been identified as one of the main drivers for lignin-based resins market uptake.
Lignin cannot be used as a drop-in solution for resins. They need to be modified in order to use them. Lignin-based resins are less reactive than fossil-based resins, therefore, modification of the material is needed to obtain compatible performance compared to fossil-based materials. Development of lignin-based phenolic resins have already reached a status were 100% of the resin was replaced by this bio-based material as wood adhesive 987. This material enables lower curing temperatures compared to conventional materials and replaced the use of toxic solvents in the material. Insulation materials, such as foams, need to have certain flame retardance properties and in this application lignin-based foams
983 Bruijnincx P, Weckhuysen B, Gruter G-J, Westenbroek A, Engelen-Smeets E. Lignin Valorisation - The Importance of a Full Value Chain Approach.; 2016
984 Borregaard. Sustainable lignin products. https://lignotech.com/Industrial-Applications/Resin-extension . Published 2020. Accessed July 15, 2020
985 StoraEnso. Developing a lignin-based resin for plywood. News. https://www.storaenso.com/en/newsroom/news/2020/6/developing-a-lignin-based-resin-for-plywood. Published 2020. Accessed July 20, 2020
986 Hicks D, Austin A. A review of the global PU industry in 2016 and outlook for 2017. PU Mag Gupta Verlag. 2017;Vol 14
987 Jedrzejczyk M, Bernaerts K. Formaldehyde-free, ligninbased resins development for wood adhesives application. In: InSciTe Annual Meeting 2018. ; 2018

388
have shown better performance than conventional materials850. Furthermore, replacing phenolic resins (10%) with fast pyrolysis bio-oil (FPBO) extracted lignin-based in insulation foams resulted in better performance than the market product856. Improved properties are an important driver for lignin application in foams. In addition, FPBO lignin can also be used as resin for moulding compounds with excellent mechanical properties. The dark colour of FBPO lignin also reduces the use of dyes as some moulding compounds have a desired dark colour856. Further research and development can enable the usage of FPBO lignin also in coatings and paints. Using lignin-based resins can also result in milder cross-linking temperatures and reduced use of solvents in wood adhesive applications 861. Several companies, such as UPM, Stora Enso, Arpa Industriale, are developing their commercial lignin-based resins portfolio to match the technical qualities required. UPM and Stora Enso are currently focused on application regarding plywood852,859 and Arpa Industriale are focusing on high-pressure laminates 988.
The barriers that lignin-based resins face in this category is that their quality varies depending on the process that produced it, but as well the structure of lignin itself is a challenge for some applications. Lignin’s unique chemical reactivity, the presence of various organic and inorganic impurities and a non-uniform structure makes the usage of it as such a challenge 989. The current technical challenges (solubility, viscosity) prevent reaching higher substitution levels. Technical properties lack in comparison to other resins and multiple process steps are required to make lignin-based resins fully compatible with the end-product. Process optimization and cost-effective valorisation methods are therefore a key to bring more of these materials to the markets850. Furthermore, intellectual property (IP) rights can also cause barriers for development of new lignin-based materials. Based on expert interview in this project, Covid-19 pandemic will slow down innovations and collaborations with stakeholders and delay new products to the markets.
Economic drivers and barriers
Lignin based resins are still a small market and will be a niche product in the near future855. Therefore, in terms of economic development lignin-based resins will not offer large economic opportunities, like job creation. Another barrier in this category is that development of new materials from lignin, like modification to create a functional resin, requires REACH registration. It is often not clear enough that this is needed855, and furthermore the registration requires resources and time. It can be a barrier for SMEs to enter the business without financial support to cover the costs of the registrations.
Feedstock drivers and barriers
The feedstock drivers come mainly from the fact that lignin is a highly abundant material. Lignin makes up about 20-30% of plants and trees. Considering that multiple bio-based products are competing with agricultural land usage, lignin from forest industry has no issues with that. Furthermore, it is available also from waste sources, which is one of the required properties of brand owners using lignin-based resins in their products 855. The most abundant type of lignin is Kraft lignin from pulp and paper mills, however, 2nd generation biorefineries are expected to increase this availability even more857. Development of fast pyrolysis oil fractionation potentially will further enable an additional source for lignin that possibly can solve the issue with quality variation.
The main barrier is security of supply, concerning both availability and quality. It is not known exactly how much lignin is available for materials production, and within the available materials the type and quality ranges vary.
988 Fenix for interiors. FENIX NTM BLOOM | BEYOND THE SURFACE. https://www.fenixforinteriors.com/de/news/fenix-ntm-bloom-beyond-surface . Accessed November 5, 2020
989 Bajwa DS, Pourhashem G, Ullah AH, Bajwa SG. A concise review of current lignin production, applications, products and their environmental impact. Ind Crops Prod. 2019;139:111526. doi:https://doi.org/10.1016/j.indcrop.2019.111526

389
Climate change and environmental drivers and barriers
Usage of lignin-based resins, e.g. as replacing phenolic resins, helps to cut down the environmental impact of the product. However, one should be aware that in phenolic resins, only the phenol is substituted. Therefore, Green House Gas (GHG) reductions can be achieved, but only to a certain extent. E.g., substituting 10% of phenol in the resin, enables the bio-based content of 5% in the resin as phenol requires curing agent as well. Furthermore, using 100% bio-based raw materials like lignin resins would enable composting of the end-products like wood-based panels 990.
The exact environmental benefits of replacing fossil with lignin resins is not known and that should be thoroughly estimated by means of e.g. Life Cycle Analysis. This knowledge would give a better understanding for users of these materials about the environmental benefits. It is estimated that 1 tonne of lignin substituted in phenolic resins would prevent generation of 1 tonne of CO2. The source does not say what is included in this estimation, thus, further claims are not possible with this figure. This is a barrier as clear knowledge of the environmental impacts, with standardized methods, would help to provide proper understanding of the benefits of these materials.
Lignin is mostly available from side streams of pulp and paper. Many directives for sustainable forestry exist, but there are still countries were these policies are not followed and usage of wood is unsustainable. This needs to be considered when using lignocellulosic material for bio-based products.
Citizen and Society drivers and barriers
Health risk associated with the use of formaldehyde and phenolic resins act as drivers in the industry to replace these materials with non-toxic ones. Lignin has a low toxicity thus it answers to the demand and helps to provide better image for the products. The low toxicity of lignin, however, is only known when the material is used as such. Once the properties are modified, this might change as well. Another driver for lignin-based resins is that there is an incentive from the application industry and brand owners to provide more environmentally friendly, sustainable, biodegradable and recyclable products855.
Policy and regulation drivers and barriers
Lignin availability potentially will be increased by policies that support 2nd generation biorefineries development. Subsidies that can enhance the competitiveness of material development from these biorefineries can further improve this. Furthermore, lignin is used as biofuel for energy recovery in these facilities and it is crucial to ensure that these facilities can maintain using this energy from biomass or any other RES, even if a solution for lignin utilization in larger scale is developed. In addition to these drivers, REACH is acting as a driver to replace materials of high concern with less harmful nature and comply with principles of green chemistry.
990 Ang AF, Ashaari Z, Lee SH, Md Tahir P, Halis R. Lignin-based copolymer adhesives for composite wood panels – A review. Int J Adhes Adhes. 2019;95:102408. doi:https://doi.org/10.1016/j.ijadhadh.2019.102408

390
Annex IV - WP 4 RoadToBio Top 120 chemicals uses for database
Chemical Classification
Acetaldehyde drop-in commodity
Acetic acid smart drop-in
Acetic anhydride smart drop-in
Poly(vinyl chloride) - PVC drop-in commodity
Acetone drop-in commodity
Alkanes (iso-) drop-in commodity
Alkyl polyglucosides (APG) dedicated chemical
Azelaic acid (aka nonanedioic acid) dedicated chemical
Bio-'Naphtha' drop-in commodity
Butadiene drop-in commodity
Butanediol (1,2-) smart drop-in
Butanediol (2,3-) smart drop-in
Butanol (iso-) drop-in commodity
Butanol (n-) drop-in commodity
Sorbitan dedicated chemical
Capric acid (aka decanoic acid) dedicated chemical
Poly(tetrahydrofuran) - PTHF (aka PTMEG) smart drop-in
Caproic acid (aka hexanoic acid) dedicated chemical
Caprylic acid (aka octanoic acid) dedicated chemical
Carboxymethyl cellulose dedicated chemical
Cellulose dedicated chemical
Phenol formaldehyde resin smart drop-in
Cetylic alcohol dedicated chemical
Chitin/Chitosan dedicated chemical
Citric acid dedicated chemical
Dimethyl isosorbide dedicated chemical
Docosahexaenoic acid dedicated chemical
Epichlorohydrin smart drop-in
Epoxy resins smart drop-in
Esterquats (group dedicated chemical
Ethanol smart drop-in
Ethyl acetate drop-in commodity
Ethyl lactate dedicated chemical
Ethyl tert-butyl ether (ETBE) drop-in commodity
Butene (iso-) drop-in commodity
Ethylene drop-in commodity
Isoprene drop-in commodity
Farnesene dedicated chemical
Ethylene glycol drop-in commodity
Fatty Alcohols dedicated chemical
Fatty amines dedicated chemical

391
Furfural dedicated chemical
Ethylene chloride (aka vinyl chloride) drop-in commodity
Furfuryl alcohol dedicated chemical
Glucaric acid / Sodium glucarate dedicated chemical
Glycerol dedicated chemical
Heptanoic acid (aka enanthic acid) dedicated chemical
Heptanol smart drop-in
Hyaluronic acid dedicated chemical
Isosorbide dedicated chemical
Itaconic acid dedicated chemical
Lactic acid dedicated chemical
Lactide dedicated chemical
Lauric acid (aka dodecanoic acid) dedicated chemical
Butanediol (1,4-) smart drop-in
Lauryl alcohol dedicated chemical
Limonene dedicated chemical
Dodecanedioic acid dedicated chemical
Methane drop-in commodity
Methanol drop-in commodity
Methyl tert-butyl ether (MTBE) drop-in commodity
Octadecanedioic acid (1,18-) dedicated chemical
Octanol (2-) dedicated chemical
Oleic acid dedicated chemical
Palmitic acid (aka hexadecanoic acid) dedicated chemical
Pelargonic acid (aka nonanoic acid) dedicated chemical
Poly(butylene adipate-co-terephthalate) - PBAT smart drop-in
Poly(butylene succinate) - PBS (aka 'Bionolle') smart drop-in
Butyric acid smart drop-in
Poly(butylene terephthalate) - PBT drop-in commodity
Poly(ethylene furanoate) - PEF dedicated chemical
Poly(ethylene glycol) - PEG drop-in commodity
Poly(ethylene terephthalate) - PET drop-in commodity
Poly(ethylene) - PE drop-in commodity
Acrylic acid smart drop-in
Methyl methacrylate (MMA) smart drop-in
Poly(hydroxyalkanoate) - PHA dedicated chemical
Poly(hydroxybutyrate) - PHB smart drop-in
Poly(isosorbide) dedicated chemical
Fumaric acid smart drop-in
Poly(lactic acid) - PLA dedicated chemical
Malic acid smart drop-in
Poly(methyl methacrylate) - PMMA smart drop-in
Adipic acid smart drop-in
Poly(propiolactone) - PPL dedicated chemical

392
Poly(propylene) - PP drop-in commodity
Levulinic acid dedicated chemical
Poly(trimethylene terephthalate) - PTT drop-in commodity
Poly(urethane) - PUR drop-in commodity
Hydroxypropionic acid (3-) dedicated chemical
Propane drop-in commodity
Propanediol (1,3-) smart drop-in
Acrylonitrile drop-in commodity
Propylene drop-in commodity
Propylene glycol (aka 1,2-propanediol) drop-in commodity
Tetrahydrofuran (THF) smart drop-in
Hydroxymethylfurfural (5-) (HMF) dedicated chemical
Furandicarboxylic acid (2,5-) (FDCA) dedicated chemical
Furan dedicated chemical
Tetrahydrofuran (methyl-) smart drop-in
Rayon dedicated chemical
Ricinoleic acid (aka 12-Hydroxyoctadec-9-enoic acid) dedicated chemical
Dimethyl ether (DME) drop-in commodity
Sebacic acid (aka decanedioic acid) dedicated chemical
Sophorolipids dedicated chemical
Ethylene oxide drop-in commodity
Propylene oxide drop-in commodity
Sorbitol dedicated chemical
Squalene dedicated chemical
Starch dedicated chemical
Stearic acid (aka octadecanoic acid) dedicated chemical
Guayule dedicated chemical
Glycolipids dedicated chemical
Succinic acid smart drop-in
Glycerol carbonate dedicated chemical
Terpenes dedicated chemical
Turpentine (mixture --> pinene) dedicated chemical
Undecanoic acid (aka undecylic acid) dedicated chemical
Alkyl polypentosides (C5 surfactants) dedicated chemical
Xylene (para-) drop-in commodity

393
Annex V - WP 4 List of keywords for material biorefineries
1 Absorbents 2 accessories 3 active 4 Actives 5 additive 6 adhesive 7 adsorbent 8 agent 9 alcohol 10 aroma 11 aromatherapy 12 automotive products 13 biodegradable 14 blend 15 cable 16 care product 17 cellulose 18 cellulosic material 19 Chemical intermediates 20 cleaner 21 cleaners 22 cleaning products 23 Coating 24 component 25 Composite 26 compound 27 compounding 28 container 29 cosmetics 30 de-icer 31 detergent 32 dye 33 elastomer 34 emollient 35 emulsion 36 enzyme 37 equipment 38 extract 39 fabric 40 feedstock 41 fertilizer 42 Fibre 43 fill and batt 44 film 45 filter 46 floor 47 floor panel 48 foam 49 gel 50 grease 51 herbiside 52 ink 53 Insulation 54 Insulator 55 intermediate 56 lining 57 material

394
58 medical 59 oil 60 packaging 61 Paint 62 panel 63 paper 64 personal care ingredient 65 personal hygiene products 66 pharmaceutical 67 plastisizer 68 polymer 69 protection 70 relief 71 repellent 72 resin 73 roofing 74 roving 75 Rovings, yarns 76 sanitary product 77 sealant 78 soap 79 solvent 80 stain 81 surfactant 82 Textile 83 Thermoplastic 84 tires 85 tissue 86 toiletry 87 treatment 88 Treatment products 89 varnish 90 Vitamin 91 wax 92 wire 93 yarn

Getting in touch with the EU
IN PERSON All over the European Union there are hundreds of Europe Direct information centres. You can find the address of the centre nearest you at: https://europa.eu/european-union/contact_en ON THE PHONE OR BY EMAIL Europe Direct is a service that answers your questions about the European Union. You can contact this service: – by freephone: 00 800 6 7 8 9 10 11 (certain operators may charge for these calls), – at the following standard number: +32 22999696, or – by email via: https://europa.eu/european-union/contact_en
Finding information about the EU
ONLINE Information about the European Union in all the official languages of the EU is available on the Europa website at: https://europa.eu/european-union/index_en EU PUBLICATIONS You can download or order free and priced EU publications from: https://op.europa.eu/en/publications. Multiple copies of free publications may be obtained by contacting Europe Direct or your local information centre (see https://europa.eu/european-union/contact_en). EU LAW AND RELATED DOCUMENTS For access to legal information from the EU, including all EU law since 1952 in all the official language versions, go to EUR-Lex at: http://eur-lex.europa.eu OPEN DATA FROM THE EU The EU Open Data Portal (http://data.europa.eu/euodp/en) provides access to datasets from the EU. Data can be downloaded and reused for free, for both commercial and non-commercial purposes.

This study presents scenarios on how demand and supply for bio-based chemicals and materials could grow to 2030, and provides roadmaps with actions required to increase the deployment of chemical and material driven biorefineries in the EU. The study also presents the key elements of the analysis which have supported the preparation of the scenarios and roadmaps. This includes a biorefinery classification system, a database of operational or announced biorefineries (developed in collaboration with the Joint Research Centre) for the EU and 10 non-EU countries, a detailed opportunities and barriers analysis and a market outlook to 2030 with a focus on eleven biorefinery pathways. The study was developed by E4tech (lead), BTG, Wageningen Research, FNR and ICONS with the support of over 100 stakeholders from the bio-based industry, the chemicals and materials industries, academia & research institutions, the investment community and policy makers through active participation in stakeholder workshops, meetings and interviews. Studies and reports
[Catalogue num
ber]