U.S. Propane Market Update & Outlook
21
Copyright © 2022 RBN Energy, LLC RBN U.S. Propane Billboard U.S. Propane Market Update & Outlook For questions, please email [email protected]; Follow on Twitter @RBNEnergy TABLE OF CONTENTS Summary p. 1 Inventories p. 2 Markets p. 3 Demand p. 5 Exports p. 6 Production p. 8 Infrastructure Map p. 9 PADD Analysis p. 10 Prices p. 15 International p. 17 Appendix p. 18 May 6, 2022
-
Upload
khangminh22 -
Category
Documents
-
view
0 -
download
0
Transcript of U.S. Propane Market Update & Outlook

Copyright © 2022 RBN Energy, LLC
RBN U.S. Propane Billboard
U.S. Propane Market Update & Outlook
For questions, please email [email protected]; Follow on Twitter @RBNEnergy
TABLE OF CONTENTS Summary p. 1 Inventories p. 2 Markets p. 3 Demand p. 5 Exports p. 6 Production p. 8 Infrastructure Map p. 9 PADD Analysis p. 10 Prices p. 15 International p. 17 Appendix p. 18
May 6, 2022

Copyright © 2022 RBN Energy, LLC May 6, 2022 | Page 1
RBN U.S. PROPANE BILLBOARD SUMMARY
U.S. PROPANE SUPPLY & DEMAND
* Inventories are shown in billion gallons and million barrels respectively.
MONTHLY HIGHLIGHTS Ø It hardly feels like a bearish market with prices in the $1.30/gal range, but propane continued to lag crude prices with the ratio to WTI Cushing falling below
50% for the first time since early July 2020. Ø Weekly EIA inventory stats came in strong for the month of April with most of the stock gains occurring in PADD 3. Total U.S. inventories for April are
estimated at almost 40 MMbbls, which is 4.2 MMbbl above the 5-year minimum and a significant improvement from the 1 MMbbl deficit last month. Ø PADD 2 did not contribute much to the strong inventory gains in April leaving the Conway market in a historically tight position. April ending inventories in
PADD 2 are estimated at 8.8 million barrels, little changed from March, and at the lowest level on record for the month. Ø EIA monthly propane production from gas processing once again came in below our model projections, with February volumes increasing by only 16 Mb/d
compared to our estimate of 38 Mb/d. Initially we attributed the lackluster production growth to weather related curtailments in January, but we are concerned with the latest EIA weekly stats which have been choppy. For now, we remain cautiously bullish on propane supply growth, but we will monitor the market data closely in the weeks and months to come.
Ø Propane exports out of the Marcus Hook terminal soared to a record high rate of 215 Mb/d in April, up 90% from March and last year. We expect East Coast exports to remain strong for the rest of the year supported by healthy European demand and the completion of full capacity capabilities of the Mariner East 2 pipeline.
MARKET OVERVIEW Ø Unlike last year, we broke out of the starting gate like a rocket to start the 2022 injection fill season. But with extremely low PADD 2 inventories clearly an
issue, disappointing recent production growth and Asian export demand concerns stemming from the China COVID lockdowns, market uncertainty abounds. The next big question is what will happen to the rate of storage fill for the remainder of the injection season. Will we continue to replenish inventories at a strong pace like in April or will stocks build more slowly like last year? Not surprisingly, the keys to the question are production growth and exports. One data point does not make a trend, but at least we are off good start rebuilding inventories.
Table A:
Jan-22 Feb-22 Mar-22 Apr-22 May-22 Jun-22 Jul-22 Jan-22 Feb-22 Mar-22 Apr-22 May-22 Jun-22 Jul-22Production 2,612 2,378 2,723 2,666 2,784 2,718 2,831 2,006 2,022 2,092 2,116 2,138 2,158 2,175
Gas Plants 2,262 2,062 2,344 2,302 2,408 2,351 2,450 1,737 1,753 1,800 1,827 1,849 1,866 1,882 Refinery 350 316 380 364 376 367 381 269 269 292 289 289 292 293
Imports 214 221 163 133 92 81 92 164 188 125 106 71 64 71 TOTAL SUPPLY 2,825 2,599 2,887 2,799 2,876 2,799 2,924 2,170 2,210 2,217 2,222 2,209 2,222 2,246 Demand (Prod. Supplied) 1,719 1,602 1,179 690 743 641 653 1,320 1,362 906 547 571 509 502 Exports 1,747 1,470 1,878 1,841 1,867 1,817 1,854 1,342 1,250 1,442 1,461 1,434 1,442 1,424 Stock Change (642) (473) (169) 269 266 342 416 (493) (402) (130) 214 205 271 320 TOTAL DISPOSITION 2,824 2,599 2,888 2,799 2,876 2,799 2,924 2,169 2,210 2,218 2,222 2,209 2,222 2,246
TOTAL INVENTORY* 2.0 1.6 1.4 1.7 1.9 2.3 2.7 48.4 37.1 33.1 39.5 45.9 54.0 63.9
M bbl / dayMM gal / monthFORECASTEIA MONTHLY ESTIMATEDFORECASTESTIMATEDEIA MONTHLY

Copyright © 2022 RBN Energy, LLC May 6, 2022 | Page 2
RBN U.S. PROPANE BILLBOARD INVENTORIES
U.S. PROPANE INVENTORIES
Figure 1.1
Source: EIA
Table B:FORECAST FORECAST
Jan-22 Feb-22 M/M Mar-22 Apr-22 May-22 Jan-22 Feb-22 M/M Mar-22 Apr-22 May-22PADD 1 (East Coast) 227 159 (68) 161 145 187 5,412 3,783 (1,629) 3,839 3,446 4,445 PADD 2 (Midwest) 650 439 (211) 348 368 517 15,469 10,456 (5,013) 8,288 8,766 12,299 PADD 3 (Gulf Coast) 1,006 840 (165) 787 1,038 1,086 23,948 20,011 (3,937) 18,739 24,715 25,867 PADD 4 (Rocky Mountains) 103 90 (14) 61 70 81 2,464 2,136 (328) 1,450 1,676 1,918 PADD 5 (West Coast) 45 31 (14) 33 38 56 1,064 742 (322) 786 904 1,322 TOTAL PROPANE 2,031 1,559 (472) 1,390 1,659 1,926 48,357 37,128 (11,229) 33,102 39,507 45,851 Propylene 51 50 (1) 54 55 55 1,208 1,181 (27) 1,274 1,304 1,304 TOTAL INVENTORIES 2,082 1,609 (473) 1,444 1,714 1,981 49,565 38,309 (11,256) 34,376 40,811 47,155
MM gal M bblMONTHLY EIA ESTIMATEDMONTHLY EIA ESTIMATED
19
29
39
49
59
69
79
89
99
0.8
1.2
1.6
2.0
2.4
2.8
3.2
3.6
4.0
4.4
MM
bbl
Bgal
Monthly EIA Propane Inventories
5-Year Range 2021 2022 Estimate 2022 Forecast 2022
ANALYSIS & INSIGHTS Total U.S. propane inventories surged higher by 6.4 MMbbl in April to 39.5 MMbbl (1.7B/gal). Stocks are now comfortably above the 5-year minimum by 4.2 MMbbl after ending March almost 1 MM bbl below that range. Inventories are still under 2021 by 2.6 MMbbl, but the gap closed from last month’s 6.2 MMbbl deficit. PADD 3 accounted for most of April’s increase in propane stocks. Gulf Coast inventories grew strongly by 6.0 MMbbl up to 24.7 MMbbl at months end. Stocks are at parity with 2021 levels and are over the 5-year minimum by 3.9 MMbbl. PADD 2 (Midwest) inventories had a small build during the month with stocks ending at 8.8 MMbbls. Midwest inventories remain below 2021, which is also the 5-year minimum, by 1.4 MMbbl. INVENTORY OUTLOOK After a robust start to the injection season, May inventories are forecast to increase by 6.3 MMbbl which is below the 5-year average build of 7.5 Mbbl. The increase would bring May ending inventories to 46 MMbbl (1.9 B gal), which is above the 5-year minimum by 2.1 MMbbl but 2.8 MMbbl lower than last year. Our propane model projects that inventories will stay near the bottom of the 5-year range throughout the injection season. We expect total U.S. stocks to build by 40 MM bbl during the injection season leaving September ending inventory at 73 MM bbl which is 4.7 MMbbl higher than last year (5-year minimum) but 9.0 MMbbl below the 5-year average.
Previous five-year range (2017 - 2021)

Copyright © 2022 RBN Energy, LLC May 6, 2022 | Page 3
RBN U.S. PROPANE BILLBOARD MARKETS
PROPANE MARKET UPDATE
Figure 1.2 Figure 1.3
20%
30%
40%
50%
60%
70%
80%
90%
100%
110%Propane to WTI Ratio
5 Year Range 5 Year Average 2021 2022
$0.95
$1.05
$1.15
$1.25
$1.35
$1.45
$1.55LST Propane Forward Curve
Mar-2022 Apr-2022 May-2022
U.S. PROPANE PRICES WEAKEN RELATIVE TO WTI During April and into early May, crude, natural gas and NGL markets were continuously rocked by the Russia-Ukraine war chaos and the prospects for new European Union sanctions, while at the same time prices were dampened by reports of new Chinese COVID lockdowns. In this market environment, crude was able to eke out a small gain of 5% in April, closing at $102/bbl on May 3. U.S. propane was unable to keep pace with crude prices in April as propane inventories built above market expectations. Propane prices ended the month down 5%, pushing the ratio to WTI Cushing down from 58% on April 1 to 49% on May 2, the lowest level since early July 2020. The propane and WTI forward curves anticipate that the ratio to gradually increase over the summer months and then peak at a high of 57% in December. Non-LST (Enterprise) propane prices averaged 130.0 c/gal for April closing at 129.2 c/gal down 5.6% for the month. LST propane prices averaged 131.4 c/gal for April closing at 130.7 c/gal down 4.8% for the month. The Non-TET vs. TET price spread widened from 0.6 c/gal on April 1 to 1.5 c/gal on April 29. Conway prices averaged 126.9 c/gal during April, which represented a 3.1 c/gal discount to the average non-LST price. As shown in Figure 1.3, the May forward curve for LST propane flattened (less backwardation) relative to the April curve as future price moved slightly higher while the front of the curve was flat.

Copyright © 2022 RBN Energy, LLC May 6, 2022 | Page 4
RBN U.S. PROPANE BILLBOARD MARKETS
CONWAY SPOT PROPANE PRICE BELOW MONT BELVIEU Figure 2.5
Figure 2.6
(15)
(10)
(5)
-
5
10
15
c/ga
l
MB Non-TET vs. Conway Propane Spread
2019 2020 2021 2022
(5)
(3)
(1)
1
3
5
100
105
110
115
120
125
130
135
140
Diff
eren
tial (
c/ga
l)
Forw
ard
Curv
e (c
/gal
)
MB Non-TET vs. Conway Propane Forward Curve
Difference Conway Mont Belvieu
CONWAY DISCOUNT TO BELVIEU WIDENS In April, Conway propane traded at a 2.9 c/gal average discount to Mont Belvieu compared to a 2.1 c/gal discount in March and a 1.6 c/gal discount in February. On May 2, the Conway discount to Belvieu widened further to 4.5 c/gal. Although the Conway discount has been increasing lately, it is still well below recent historical levels for the month of April. The Conway discount in April 2021 averaged 8.4 c/gal while in 2018 it was 14.1 c/gal. The 5-year average Conway discount for the month is 6.8 c/gal, still well above current levels. We believe the lower discount this year reflects the market concerns regarding tight Midwest inventory levels.
CONWAY PROPANE SPREAD - FORWARD CURVE ANALYSIS Figure 2.6 shows the propane forward price curves for Conway (blue line) and Mont Belvieu (red line) on the left-hand axis. The grey area is the differential on the right axis. The Mont Belvieu - Conway price spread is a good indicator whether the market is incenting barrels to flow from PADD 2 to PADD 3 or keep barrels in the Midwest.
The current forward curves expect Mont Belvieu to trade at a small premium over Conway prices through end of the injection season and then flip to a small discount during October - January. The forward Mont Belvieu premium (Conway discount) for the injection season narrowed by about 1 c/gal during April. We now expect Conway to trade close to parity with Mont Belvieu later in the summer in order to keep more barrels in PADD 2 and replenish inventories like last year.

Copyright © 2022 RBN Energy, LLC May 6, 2022 | Page 5
RBN U.S. PROPANE BILLBOARD DEMAND
U.S. PROPANE DEMAND
* EIA reports purity propane product supplied in monthly data, while weekly data includes propylene. ** “Total Demand” is the equivalent of product supplied as reported by the EIA. *** Monthly product supplied from EIA through January, weekly through the week of April 29, 2022.
Figure 3.1
Table C:FORECAST FORECAST
Jan-22 Feb-22 M/M Mar-22 Apr-22 May-22 Jan-22 Feb-22 M/M Mar-22 Apr-22 May-22ResCom 913 727 (186) 618 487 325 701 618 (83) 475 387 249 Crop Drying 78 57 (21) 14 15 40 60 49 (11) 11 12 31 Industrial 133 111 (22) 107 92 94 102 95 (8) 82 73 72 Petrochemicals 268 231 (37) 260 252 254 206 196 (10) 200 200 195 PDH 117 106 (11) 117 113 117 90 90 - 90 90 90 Balancing 209 370 161 62 (270) (87) 160 314 154 48 (214) (67) TOTAL PROPANE 1,719 1,602 (117) 1,179 690 743 1,320 1,362 42 906 547 571 Propylene 388 346 (42) 378 368 398 298 294 (4) 290 292 306 TOTAL DEMAND ** 2,107 1,947 (159) 1,557 1,058 1,141 1,618 1,656 38 1,196 840 877 Weekly*** 2,582 2,214 (368) 1,778 1,267 1,983 1,883 (101) 1,365 1,006 Variance 475 266 (209) 220 209 365 227 (139) 169 166
ESTIMATEDMONTHLYMONTHLY ESTIMATEDMM gal / month M bbl / day
130
230
330
430
530
630
730
830
2
4
6
8
10
12
14
Mbb
l/d
Bgal
/yr
Monthly ResCom Propane Demand
Previous 5 Year Range 2021 2022 Forecast 2022
APRIL RESCOM DEMAND Figure 3.1 shows our current forecast for ResCom demand through the end of the year. Residential and commercial propane demand dropped by 88 Mb/d in April to 387 Mb/d (487 MMgal/m). April ResCom demand was 8% higher than last year and 15% above the 5-year average demand. May ResCom demand is forecast to decline further to 249 Mb/d (325 MMgal/m) as we move into summer. For additional propane HDD weather related information see the Appendix (Page 19). PROPANE STEAM CRACKER MARGINS April propane demand as a steam cracker feedstock continued to be relatively weak at 200 Mb/d. We expect propane cracking to stay at weak levels in May as margins for propane as feedstocks to crackers remain low in early May and ethane remains the preferred feedstock. April PDH plant operating rates and propane demand are expected to stay close to maximum at the current propylene – propane price spreads.

Copyright © 2022 RBN Energy, LLC May 6, 2022 | Page 6
RBN U.S. PROPANE BILLBOARD EXPORTS
U.S. PROPANE EXPORTS
*Monthly data from EIA through January, weekly through the week of April 29, 2022. See RBN’s NGL Voyager Report for additional details on propane exports.
Figure 4.1
Table D:FORECAST
Jan-22 Feb-22 M/M Mar-22 Apr-22 May-22Gulf Coast 1,240 1,092 (148) 1,292 1,217 1,240 East Coast 80 123 43 117 215 160 West Coast 18 30 12 29 24 27 Other 4 5 1 4 5 7 TOTAL EXPORTS 1,342 1,250 (92) 1,442 1,461 1,434 Weekly 1,150 1,110 (40) 1,249 1,318 Variance (192) (140) 52 (194) (143)
(Mbbl/d)MONTHLY EIA ESTIMATED
U.S. Propane Exports Monthly and Weekly*
0.0
0.2
0.4
0.6
0.8
1.0
1.2
1.4
1.6
1.8
0
5
10
15
20
25
30
MM
bbl/
d
Bgal
/yr
U.S. Oceangoing Propane Exports
PADD 3 PADD 1 PADD 5 PADD 3 Forecast
PADD 1 Forecast PADD 5 Forecast RBN NGL Voyager
still 45 Mb/d higher than last year. There were no PADD 1 waterborne imports in April, however, we do expect imports to resume in the winter months like last year, with the possibility of one or two small import cargos to fill tank capacity this summer. GULF COAST EXPORTS Total propane exports from Gulf Coast terminals fell by 75 Mb/d in April to 1,217 Mb/d as volumes to Europe and Latin America fell sharply. For May, we expect PADD 3 exports to strengthen slightly to 1,240 Mb/d. As shown in Figure 4.1, Gulf Coast exports are forecast to stay at healthy levels in 2022 averaging 1,262 Mb/d, up 132 Mb/d from last year. WEST COAST EXPORTS On the U.S. West Coast, propane exports declined by 5 Mb/d in April to 24 Mb/d. PADD 5 exports are expected to move higher in May to 27 Mb/d and average 27 Mb/d for the year, up 3 Mb/d from 2021. All West Coast exports are destined for Asia (via Ferndale, Washington terminal) or Mexico (railcars/trucks).
EAST COAST EXPORTS East Coast propane exports from Marcus Hook soared to a record high of 215 Mb/d in April, up almost 90% from March. We believe the recent ramp-up of the Mariner East 2 pipeline to full capacity was a significant factor driving exports higher in April. PADD 1 exports are forecast to decline to a more sustainable level of 160 Mb/d in May, which is

Copyright © 2022 RBN Energy, LLC May 6, 2022 | Page 7
RBN U.S. PROPANE BILLBOARD EXPORTS
INTERNATIONAL PROPANE
Figure 4.2
Figure 4.3
1.0
1.1
1.2
1.3
1.4
1.5
1.6
1.7
1.8
1.9
2.0
2.1
2.2
-
100
200
300
400
500
600
700
800
900
1,000
MM
bbl/
d
$/M
T
Propane ARB vs. Exports
Terminal & Freight Rates LST Propane MB FEI Propane RBN U.S. Propane Exports
80%
90%
100%
110%
120%
130%
140%
150%FEI Propane to Naphtha Ratio
LPG Cracking Range
U.S. - ASIA ARB NARROWS Saudi Aramco reduced its May LPG contract price (CP) for propane by $90/MT (17c/gal) to $850/MT (163 c/gal) marking the first monthly decline in four months. The price differential between Mont Belvieu Lone Star (LST) propane and the Far East Index (FEI) propane widened slightly during April. On April 1, the differential was $156/MT, or 29.9 c/gal. By May 2, the differential had increased to $166/MT, or 31.9 c/gal (Figure 9.1). Figure 4.2 compares the Asian ARB to U.S. propane exports. The ARB is open (economic) when the forward month of FEI propane (black line) is higher than the sum of the terminal and freight rates (green area) and the price of Lone Star (LST) propane at Mont Belvieu (blue area). On May 2, the Asian ARB for May-June was $138/MT, or 26.6 c/gal. Considering terminal fees and freight costs, the May-June Asian ARB was closed (positive, and thus non-economic) at $11/MT, or 2.1 c/gal. The spot LPG chartering market for Very Large Gas Carriers (VLGCs) continued to be tight in April and is expected to remain strong throughout May. Spot freight rates continued to move higher in April with the key Houston to Chiba route increasing by $15/mt to $125/mt. Figure 4.3 shows the ratio of the Asian FEI propane price to naphtha in the same region, which is an important factor to consider when looking at Asian propane demand. When the ratio rises above 90%, steam crackers typically find it less economical to crack LPG as opposed to using naphtha as the primary feedstock. On May 2 the ratio sat at 91%, down from 95% on April 1. The current price relationship indicates that Asian steam crackers will start to switch to more propane in place of naphtha volumes.

Copyright © 2022 RBN Energy, LLC May 6, 2022 | Page 8
RBN U.S. PROPANE BILLBOARD PRODUCTION
U.S. PROPANE PRODUCTION Figure 5.1
* EIA reports purity propane production separately in monthly data, while weekly data includes propylene. ** Monthly production from EIA through January, weekly through the week of April 29, 2022.
Figure 5.2
Table E: U.S. Propane Production Monthly and Weekly*FORECAST
Jan-22 Feb-22 M/M Mar-22 Apr-22 May-22Gas Plant 1,737 1,753 16 1,800 1,827 1,849 Refinery 269 269 - 292 289 289 TOTAL PROPANE 2,006 2,022 16 2,092 2,116 2,138 Propylene 278 279 1 278 280 289 TOTAL PRODUCTION 2,284 2,301 17 2,370 2,396 2,427 Weekly** 2,412 2,376 (36) 2,350 2,417 Variance 128 75 (53) (20) 21
ESTIMATED(Mbbl/d)
MONTHLY EIA
1.0
1.2
1.4
1.6
1.8
2.0
2.2
15171921232527293133
MM
bbl/
d
Bgal
/yr
U.S. Gas Plant Propane Production
Current Estimate / Forecast
200
225
250
275
300
325
350
3.1
3.3
3.6
3.8
4.1
4.3
4.6
4.8
5.1
5.3M
bbl/
d
Bgal
/yr
U.S. Refinery Propane Production
Current Estimate / Forecast
FEBRUARY GAS PLANT PRODUCTION BELOW EXPECTATIONS According to the EIA’s monthly report released last week, propane gas plant production for February increased by only 16 Mb/d, well short of our 38 Mb/d projection. Initially we attributed the lackluster production growth to weather related curtailments in January, but we are concerned with the latest EIA weekly stats which have been volatile. At this point it is not possible to confirm one way or the other if we are returning to strong supply trendline growth, but hopefully the data can be reconciled over the next few weeks. Based upon the latest EIA weekly data, we estimate that April gas plant production increased by 24 Mb/d to 1,827 Mb/d, slightly above the all-time high set in November 2021. Our forecast model projects gas plant production to increase by 22 M/b/d in May to 1,849 Mb/d and average 1,869 Mb/d for the year, up 137 Mb/d from 2021. REFINERY PRODUCTION UNCHANGED April refinery propane production declined by 3 Mb/d to 289 Mb/d as refinery utilization slipped to 90%, down 1% from last month. We forecast May refinery production to be flat at 289 Mb/d as capacity utilization remains around 90%. For 2022, we expect refinery propane production to average 289 Mb/d, up 12 Mb/d from 2021, as refinery capacity utilization averages 89%, up 3% from 2021.

Copyright © 2022 RBN Energy, LLC May 6, 2022 | Page 9
RBN U.S. PROPANE BILLBOARD INFRASTRUCTURE MAP
U.S. PROPANE INFRASTRUCTURE MAP Figure 6.1
US Propane Infrastructure Map
Click on link above for RBN's US Propane Infrastructure Map fits together all the pieces of an opaque and regionally fragmented propane market, to reveal the extensive domestic propane network into a clear concise map.
0.000.050.100.150.20
Rockies (PADD 4)
0.00
0.05
0.10West Coast (PADD 5)
0.00.10.20.30.40.5
Midwest (PADD 2)
0.00.20.40.60.81.01.2 Gulf Coast (PADD 3)
0.000.050.100.150.200.25
East Coast (PADD 1)
PROPANE PRODUCTION (MM bbl/day)
GAS PLANT
REFINERY

Copyright © 2022 RBN Energy, LLC May 6, 2022 | Page 10
RBN U.S. PROPANE BILLBOARD PADD ANALYSIS
PADD 1: PROPANE SUPPLY & DEMAND
Figure 7.1
Table F:
Jan-22 Feb-22 Mar-22 Apr-22 May-22 Jun-22 Jul-22 Jan-22 Feb-22 Mar-22 Apr-22 May-22 Jun-22 Jul-22Production 293 265 300 302 315 305 317 225 225 231 240 242 242 243
Gas Plants 277 250 284 286 296 287 298 213 213 218 227 227 228 229 Refinery 16 14 16 16 19 18 19 12 12 12 13 14 14 15
Imports 91 96 52 41 27 18 25 70 82 40 32 21 15 19 Net Inter-PADD Transfers 283 238 252 205 199 183 197 217 202 194 163 153 145 151 TOTAL SUPPLY 667 599 605 548 541 507 538 512 509 465 435 415 402 413 Demand (Prod. Supplied) 652 522 450 294 290 255 286 501 444 346 233 223 202 220 Exports 104 145 152 271 208 214 221 80 123 117 215 160 170 170 Stock Change (89) (68) 2 (17) 42 38 30 (68) (58) 2 (13) 32 30 23 TOTAL DISPOSITION 668 599 605 548 541 507 538 513 509 465 435 415 402 413
TOTAL INVENTORY 227 159 161 145 187 224 255 5,412 3,783 3,839 3,446 4,445 5,344 6,065
FORECASTMM gal / month M bbl / day
EIA MONTHLY ESTIMATEDEIA MONTHLY ESTIMATED FORECAST
0
50
100
150
200
250
0.0
0.5
1.0
1.5
2.0
2.5
3.0
3.5
Mbb
l/d
Bgal
/yr
PADD 1 Propane Exports
Monthly Annual Estimate/Forecast
INSIGHTS & ANALYSIS PADD 1 East Coast) was the only region to post a decline in propane inventories for April. Record high exports pushed stocks lower by 394 Mbbl to 3.5 MMbbl. The draw leaves PADD 1 inventory slightly below the 5-year average and 617 Mbbl lower than 2021 levels. Gas plant production in April increased 9 Mb/d to 227 Mb/d. This could be due to a blip in the weekly data. PADD 1 OUTLOOK Our propane model projects PADD 1 inventories to build by 1 million barrels in May to 4.5 MMbbl (187 MMgal) leaving stocks at the 5-year average. As shown in Figure 7.1, East Coast exports are expected to decline by 55 Mb/d in May to 160 Mb/d and average 150 Mb/d for 2022, 10 Mb/d higher than last year. PADD 1 production is expected to be unchanged in May at 240 Mb/d and stay between 230 Mb/d – 240 Mb/d for the year. For the 2022 injection season, we estimate PADD 1 inventories to grow by 3.6 MMbbl to 7.1 MMbbl which is 0.7 MMbbl below the 5-year average.

Copyright © 2022 RBN Energy, LLC May 6, 2022 | Page 11
RBN U.S. PROPANE BILLBOARD PADD ANALYSIS
PADD 2: PROPANE SUPPLY & DEMAND
Figure 7.2
Table G:
Jan-22 Feb-22 Mar-22 Apr-22 May-22 Jun-22 Jul-22 Jan-22 Feb-22 Mar-22 Apr-22 May-22 Jun-22 Jul-22Production 566 510 578 553 577 564 586 435 434 444 439 443 448 450
Gas Plants 466 422 478 458 484 471 490 358 359 367 364 371 374 376 Refinery 100 88 100 95 94 93 96 77 75 76 75 72 74 74
Imports 72 69 55 44 33 32 33 55 59 42 35 25 25 25 Net Inter-PADD Transfers (366) (308) (465) (454) (440) (413) (433) (281) (262) (357) (360) (338) (328) (333) TOTAL SUPPLY 838 782 745 696 747 747 772 644 665 572 553 574 593 593 Demand (Prod. Supplied) 518 476 253 117 13 20 16 398 405 194 93 10 16 13 Exports 5 6 6 6 9 7 7 4 5 4 5 7 5 5 Stock Change (251) (211) (91) 20 148 157 162 (193) (179) (70) 16 114 124 125 TOTAL DISPOSITION 272 272 168 143 170 183 186 209 231 129 114 131 145 143
TOTAL INVENTORY 650 439 348 368 517 673 836 15,469 10,456 8,288 8,766 12,299 16,028 19,894
M bbl / dayMM gal / monthEIA MONTHLY ESTIMATED EIA MONTHLY ESTIMATED FORECASTFORECAST
7
10
13
16
19
22
25
28
0.30.40.50.60.70.80.91.01.11.21.3
MM
bbl
Bgal
PADD 2 Monthly EIA Propane Inventories
Previous 5 Year Range 20212022 Estimate 2022 Forecast 2022
INSIGHTS & ANALYSIS PADD 2 (Midwest) inventories had a small build of 0.5 MMbbls in April moving stocks up to 8.8 MMbbls. Total inventories remain below 2021, which was the 5-year minimum, by 1.4 MMbbl. April ending inventories are at the lowest level on record for the month which has tightened up the Conway prompt market. PADD 2 production dropped by 5 Mb/d in April to 439 Mb/d but remains rangebound around 440 Mb/d, averaging 438 Mb/d year-to date. Net inter-PADD transfers were strong in April at 362 Mb/d, up from 3 M b/d from March and the year to average of 315 Mb/d. PADD 2 OUTLOOK May inventories are forecast to increase by 3.5 MMbbl compared to the 5-year average build of 3.2 MMbbl and 2.2 MMbbl last year. This brings May ending inventories to 12.3 MMbbl (0.52 B gal), which is at parity with last year (5-year minimum) but 2.1 MMbbl below the 5-year average. Our propane model projects that inventories will stay near the bottom of the 5-year range throughout the injection season. We project stocks to build by 15.8 MM bbl bringing September ending inventory to 24.1 MM bbl, slightly below last year (5-year minimum) and 2.0 MMbbl below the 5-year average.
Previous five-year range (2017 - 2021)

Copyright © 2022 RBN Energy, LLC May 6, 2022 | Page 12
RBN U.S. PROPANE BILLBOARD PADD ANALYSIS
PADD 3: PROPANE SUPPLY & DEMAND
Figure 7.3
Source: EIA
Table H:
Jan-22 Feb-22 Mar-22 Apr-22 May-22 Jun-22 Jul-22 Jan-22 Feb-22 Mar-22 Apr-22 May-22 Jun-22 Jul-22Production 1,462 1,338 1,545 1,519 1,584 1,551 1,620 1,123 1,138 1,187 1,206 1,217 1,231 1,245
Gas Plants 1,275 1,169 1,331 1,310 1,372 1,345 1,406 979 994 1,022 1,040 1,054 1,067 1,080 Refinery 187 169 214 209 213 206 214 144 144 164 166 163 164 165
Imports - - - - - - - - - - - - - - Net Inter-PADD Transfers 263 240 400 443 401 402 426 202 204 307 351 308 319 327 TOTAL SUPPLY 3,187 2,916 3,490 3,481 3,570 3,504 3,667 2,448 2,480 2,681 2,762 2,742 2,781 2,817 Demand (Prod. Supplied) 370 460 316 177 323 271 256 284 391 243 141 248 215 196 Exports 1,614 1,284 1,682 1,533 1,614 1,544 1,595 1,240 1,092 1,292 1,217 1,240 1,225 1,225 Stock Change (260) (166) (53) 251 48 138 196 (200) (141) (41) 199 37 110 151 TOTAL DISPOSITION 1,724 1,578 1,945 1,962 1,986 1,953 2,047 1,324 1,342 1,494 1,557 1,525 1,550 1,572
TOTAL INVENTORY 1,006 840 787 1,038 1,086 1,225 1,421 23,948 20,011 18,739 24,715 25,867 29,161 33,832
EIA MONTHLY ESTIMATED EIA MONTHLY ESTIMATED FORECASTFORECASTMM gal / month M bbl / day
10
20
30
40
50
60
0.4
0.8
1.2
1.6
2.0
2.4
MM
bbl
Bgal
PADD 3 Monthly EIA Propane Inventories
Previous 5 Year Range 20212022 Estimate 2022 Forecast 2022
INSIGHTS & ANALYSIS PADD 3 accounted for 94%, or 6 MMbbls, of the April increase in total U.S. propane inventory. The strong build brought Gulf Coast inventories up to 24.7 MMbbl at months end, which is only slightly below last year and 3.9 MMbbls above the 5-year minimum. We estimate that April PADD 3 gas plant production set an all-time high of 1,040 Mb/d, 17Mb/d higher than the December 2021 record high. Propane exports from Gulf Coast terminals fell by 75 Mb/d in April to 1,217 Mb/d as volumes to Europe and Latin America fell sharply. PADD 3 OUTLOOK May inventories are forecast to increase by 1.2 MMbbl compared to the 5-year average build of 2.8 MMbbl and 2.5 MMbbl last year. This brings May ending inventories to 25.9 MMbbl (1.1 B gal), which is 1.6 MMbbl lower than last year but 1.8 MMbbl above the 5-year average. Our propane model projects that inventories will stay in the bottom part of the 5-year range, but above the 5-year minimum, throughout the injection season. We project stocks to build by 18.3 MM bbl bringing September ending inventory to 37.0 MMbbl, 5.9 MMbbl above last year (5-year minimum) and 6.8 MMbbl below the 5-year average.

Copyright © 2022 RBN Energy, LLC May 6, 2022 | Page 13
RBN U.S. PROPANE BILLBOARD PADD ANALYSIS
PADD 4: PROPANE SUPPLY & DEMAND
Figure 7.4
Table I:
Jan-22 Feb-22 Mar-22 Apr-22 May-22 Jun-22 Jul-22 Jan-22 Feb-22 Mar-22 Apr-22 May-22 Jun-22 Jul-22Production 243 223 249 245 253 245 254 187 190 191 194 195 195 195
Gas Plants 233 215 240 236 244 237 245 179 183 184 187 188 188 188 Refinery 10 8 9 9 9 9 9 8 7 7 7 7 7 7
Imports 21 21 15 13 10 9 14 16 18 12 10 8 7 11 Net Inter-PADD Transfers (199) (198) (222) (205) (178) (188) (203) (153) (168) (171) (163) (136) (149) (156) TOTAL SUPPLY 65 47 42 53 86 66 64 50 40 32 42 66 53 49 Demand (Prod. Supplied) 81 62 71 43 76 63 56 62 53 54 34 58 50 43 Exports - - - - - - - - - - - - - - Stock Change (16) (14) (29) 9 10 4 8 (12) (12) (22) 8 8 3 6 TOTAL DISPOSITION 65 48 42 53 86 66 64 50 41 32 42 66 53 49
TOTAL INVENTORY 103 90 61 70 81 84 92 2,464 2,136 1,450 1,676 1,918 2,004 2,194
EIA MONTHLY ESTIMATED EIA MONTHLY ESTIMATEDFORECAST FORECASTMM gal / month M bbl / day
150
160
170
180
190
200
210
2.32.42.52.62.72.82.93.03.13.2
Mbb
l/d
Bgal
/yr
PADD 4 Gas Plant Production
Current Estimate / Forecast
INSIGHTS & ANALYSIS PADD 4 (Rocky Mountain) inventories increased by 226 Mbbl in April to 1.7 MMbbl (70 MMgal), which is 121 Mbbl below last year and 224 Mbbl above the 5-year average. Gas production inched higher by 3 Mb/d during April to 187 Mb/d, but remains rangebound between 280 – 290 Mb/d. PADD 4 OUTLOOK Our propane model projects PADD 4 inventories to build by 242 Mbbl in May to 1.9 MMbbl (81 MMgal) keeping stocks above the 5-year average by 324 MMbbl. For the 2022 injection season, we estimate PADD 4 inventories to grow by 1.3 MMbbl to 2.7 MMbbl which is 567 Mbbl above the 5-year average and 490 Mbbl below the 5-year maximum. As shown in Figure 7.4, PADD 4 gas plant production is expected to remain flat in May at 188 Mb/d and average 186 Mb/d for the year, unchanged from 2021.

Copyright © 2022 RBN Energy, LLC May 6, 2022 | Page 14
RBN U.S. PROPANE BILLBOARD PADD ANALYSIS
PADD 5: PROPANE SUPPLY & DEMAND
Figure 7.5
Table J:
Jan-22 Feb-22 Mar-22 Apr-22 May-22 Jun-22 Jul-22 Jan-22 Feb-22 Mar-22 Apr-22 May-22 Jun-22 Jul-22Production 47 41 51 46 54 52 54 36 35 39 37 41 41 42
Gas Plants 10 5 11 12 12 11 12 8 4 8 9 9 9 9 Refinery 36 36 41 35 42 41 42 28 31 31 28 32 32 32
Imports 30 34 41 36 23 22 21 23 29 31 28 18 18 17 Net Inter-PADD Transfers 20 29 36 12 17 16 13 15 25 28 9 13 13 10 TOTAL SUPPLY 96 105 128 94 94 90 89 74 89 98 74 72 72 68 Demand (Prod. Supplied) 98 81 89 58 41 33 38 75 69 68 46 32 26 30 Exports 23 35 38 30 35 52 31 18 30 29 24 27 42 24 Stock Change (26) (14) 2 5 18 5 19 (20) (12) 1 4 13 4 15 TOTAL DISPOSITION 95 102 128 94 94 90 89 73 87 98 74 72 72 68
TOTAL INVENTORY 45 31 33 38 56 61 80 1,064 742 786 904 1,322 1,451 1,910
EIA MONTHLY ESTIMATED EIA MONTHLY ESTIMATED FORECASTFORECASTMM gal / month M bbl / day
20
25
30
35
40
0.310.330.350.370.390.410.430.450.470.490.510.530.550.570.590.61
Mbb
l/d
Bgal
/yr
PADD 5 Refinery Propane Production
Current Estimate / Forecast
INSIGHTS & ANALYSIS PADD 5 (West Coast) built by 118 Mbbl in April, keeping stocks 171 Mbbl above the 5-year average but 150 M bbl below the 5-year maximum (2021). Refinery production in PADD 5 was down 3 Mb/d in April to 28 Mb/d as capacity utilization fell to 82%. Imports declined by 3 Mb/d in April to 28 Mb/d while West Coast exports fell 5 Mb/d to 24 Mb/d. PADD 5 OUTLOOK Our propane model projects PADD 5 inventories to build by 359 Mbbl in May to 1.3 MMbbl (56 MMgal) leaving stocks above the 5-year average but slightly below the 5-year maximum where we expect them to stay for the rest of the year. As shown in Figure 7.5, refinery production in PADD 5 is expected to increase by 4 Mb/d in May to 32 Mb/d as capacity utilization moves up to 88%. Imports are forecast to decline sharply in May to 18 Mb/d and average 24 Mb/d for the year, down 4 Mb/d from 2021. PADD 5 exports are expected to stay strong in May at 27 Mb/d and average 27 Mb/d for the year, up 3 Mb/d from 2021.

Copyright © 2022 RBN Energy, LLC May 6, 2022 | Page 15
RBN U.S. PROPANE BILLBOARD PRICES
KEY ENERGY PRICES
* The Edmonton price is a 3-day rolling average.
Figure 8.1 Figure 8.2
Table K:Current
Product Units 1-May-22 24-Apr-22 W/W W/W % 1-Apr-22 M/M M/M % 1-May-21 Y/Y Y/Y %Brent Crude $/bbl 109.3 106.7 2.7 2.5% 104.4 5.0 4.7% 67.3 42.1 62.6%WTI Cushing Crude $/bbl 104.7 102.1 2.6 2.6% 99.3 5.4 5.5% 64.0 40.7 63.7%Henry Hub Natural Gas $/MMbtu 7.24 6.53 0.71 10.9% 5.72 1.52 26.6% 2.93 4.31 147.2%
PropaneMont Belvieu Non-TET c/gal 129.2 127.3 1.9 1.5% 136.8 (7.5) -5.5% 87.9 41.3 47.0%Mont Belvieu TET c/gal 130.7 130.2 0.6 0.4% 137.3 (6.6) -4.8% 81.7 49.0 60.0%Conway c/gal 124.8 125.9 (1.2) -0.9% 132.6 (7.9) -5.9% 75.9 48.9 64.5%Edmonton* c/gal 103.0 99.3 3.8 3.8% 112.7 (9.7) -8.6% 53.1 49.9 94.0%European (ARA) $/MT 770.8 771.8 (1.0) -0.1% 800.5 (29.7) -3.7% 483.7 287.1 59.3%Asian (FEI) $/MT 850.5 854.5 (4.1) -0.5% 871.1 (20.6) -2.4% 534.8 315.7 59.0%Saudi CP $/MT 835.7 864.9 (29.2) -3.4% 850.9 (15.1) -1.8% 495.5 340.2 68.6%
Prior Week Prior Year Prior Month Prices
30
50
70
90
110
130
150
170
c/ga
l
Mont Belvieu Non-TET Propane
HistoryForward
90
100
110
120
130
140
150
160
170
c/ga
l
Mont Belvieu Non-TET Daily Propane Price

Copyright © 2022 RBN Energy, LLC May 6, 2022 | Page 16
RBN U.S. PROPANE BILLBOARD PRICES
MONTHLY PROPANE PRICE TRENDS Figure 8.3 Figure 8.4
Figure 8.5
(20)
(15)
(10)
(5)
-
5
10
15
20
25
30
c/ga
l
Non-TET vs. Conway Propane Spread
(10)
(5)
-
5
10
15
20
25
30
35
40
c/ga
l
Conway vs. Edmonton Propane Spread
Table L: % 2019 2020 2021 2022 Y/Y %
Feb 51.5% 32.8% 65.0% 60.4% -7.1%Mar 48.3% 45.3% 62.0% 55.6% -10.3%Apr 42.3% 67.6% 56.5% 54.2% -4.0%Q1 51.5% 36.6% 65.8% 58.3% -11.3%Q2 39.0% 60.5% 55.5% 54.2% -4.0%Q3 33.3% 50.6% 69.2%Q4 36.9% 56.0% 67.7%
Year 40.1% 51.0% 64.6% 58.3% -9.6%
MB TET Propane / WTI Cushing
20%
30%
40%
50%
60%
70%
80%Non-TET Propane to WTI Cushing
History Forward

Copyright © 2022 RBN Energy, LLC May 6, 2022 | Page 17
RBN U.S. PROPANE BILLBOARD INTERNATIONAL
INTERNATIONAL PROPANE PRICE SPREADS
Figure 9.1
Figure 9.2
Table M: $/MT 2019 2020 2021 2022 Y/Y %Feb 97.6 174.1 96.5 115.0 19.1%Mar 118.9 151.8 102.4 181.7 77.5%Apr 157.8 125.8 112.7 175.1 55.3%Q1 105.0 192.9 129.5 151.5 17.0%Q2 159.0 97.6 106.1 175.1 55.3%Q3 156.5 91.0 101.1 Q4 211.5 175.0 163.6
Year 158.3 139.1 125.1 151.5 21.1%
Asian FEI / MB TET Spread
-6
4
14
24
34
44
54
64
-30105090
130170210250290330
c/ga
l
$/M
T
International Propane Spreads
Asian (FEI) European (ARA)
Table N: $/MT 2019 2020 2021 2022 Y/Y %Feb 64.4 110.5 46.5 44.4 -4.7%Mar 77.6 72.0 56.6 134.5 137.8%Apr 102.7 60.1 60.6 99.3 63.7%Q1 66.0 121.6 53.5 90.5 69.3%Q2 102.7 44.8 50.7 99.3 63.7%Q3 91.9 49.8 48.3 Q4 139.0 89.5 111.3
Year 100.1 76.4 66.0 90.5 37.1%
European ARA / MB TET Spread
- 20 40 60 80 100 120 140 160 180
- 100 200 300 400 500 600 700 800 900
1,000
c/ga
l
$/M
T
Saudi CP
MB TET / CP Spread Saudi CP Futures Saudi CP Settled
Table O: $/MT 2019 2020 2021 2022 Y/Y %Feb 98.6 197.3 116.7 112.8 -3.3%Mar 143.9 97.1 95.5 150.8 57.8%Apr 177.7 123.5 65.2 174.7 167.8%Q1 105.8 189.7 118.4 136.5 15.3%Q2 150.5 103.4 74.8 174.7 167.8%Q3 132.7 107.5 77.5 Q4 183.2 150.0 144.3
Year 143.3 137.6 103.7 136.5 31.6%
Saudi CP / MB TET Spread

Copyright © 2022 RBN Energy, LLC May 6, 2022 | Page 18
RBN U.S. PROPANE BILLBOARD APPENDIX
U.S. PROPANE SUPPLY & DEMAND BALANCE DETAIL
* Inventories are shown in billion gallons and million barrels respectively.
Table P:
Jan-22 Feb-22 Mar-22 Apr-22 May-22 Jun-22 Jul-22 Jan-22 Feb-22 Mar-22 Apr-22 May-22 Jun-22 Jul-22Gas Processing 2,262 2,062 2,344 2,302 2,408 2,351 2,450 1,737 1,753 1,800 1,827 1,849 1,866 1,882 Refinery Propane 350 316 380 364 376 367 381 269 269 292 289 289 292 293 Imports 214 221 163 133 92 81 92 164 188 125 106 71 64 71 TOTAL SUPPLY 2,825 2,599 2,887 2,799 2,876 2,799 2,924 2,170 2,210 2,217 2,222 2,209 2,222 2,246 Product Supplied 1,719 1,602 1,179 690 743 641 653 1,320 1,362 906 547 571 509 502
ResCom 913 727 618 487 325 268 269 701 618 475 387 249 213 206 Crop Drying 78 57 14 15 40 40 40 60 49 11 12 31 32 31 Industrial 133 111 107 92 94 92 96 102 95 82 73 72 73 74 Petrochemicals 268 231 260 252 254 252 273 206 196 200 200 195 200 210 PDH 117 106 117 113 117 113 117 90 90 90 90 90 90 90 Balancing 209 370 62 (270) (87) (125) (142) 160 314 48 (214) (67) (99) (109)
Exports 1,747 1,470 1,878 1,841 1,867 1,817 1,854 1,342 1,250 1,442 1,461 1,434 1,442 1,424 Stock Change (642) (473) (169) 269 266 342 416 (493) (402) (130) 214 205 271 320 TOTAL DISPOSITION 2,824 2,599 2,888 2,799 2,876 2,799 2,924 2,169 2,210 2,218 2,222 2,209 2,222 2,246 TOTAL INVENTORY 2,031 1,559 1,390 1,659 1,926 2,267 2,684 48,357 37,128 33,102 39,507 45,851 53,988 63,895 Last Year Inventory 2,261 1,731 1,651 1,767 2,042 2,233 2,563 53,842 41,218 39,303 42,066 48,630 53,164 61,017 Stock M/M ∆ (642) (473) (169) 269 266 342 416 (15,283) (11,256) (4,026) 6,405 6,344 8,136 9,908 Last Year Stock M/M ∆ (698) (530) (81) 116 275 192 329 (16,616) (12,628) (1,922) 2,760 6,541 4,560 7,843
FORECASTMM gal / month M bbl / day
EIA MONTHLY ESTIMATEDEIA MONTHLY ESTIMATED FORECAST

Copyright © 2022 RBN Energy, LLC May 6, 2022 | Page 19
RBN U.S. PROPANE BILLBOARD APPENDIX
PADD AVERAGE HEATING DEGREE DAYS (HDD’s) Figure 10.1 Figure 10.2
Figure 10.3
-
5
10
15
20
25
30
35
40
HDD
PADD 1
5 Yr Range
Normal
2021
2022
2022 Forecast
- 5
10 15 20 25 30 35 40 45 50 55
HD
D
PADD 2
5 Yr Range
Normal
2021
2022
2022 Forecast
-
5
10
15
20
25
30
35
40
HD
D
PADD 3
5 Yr Range
Normal
2021
2022
2022 Forecast
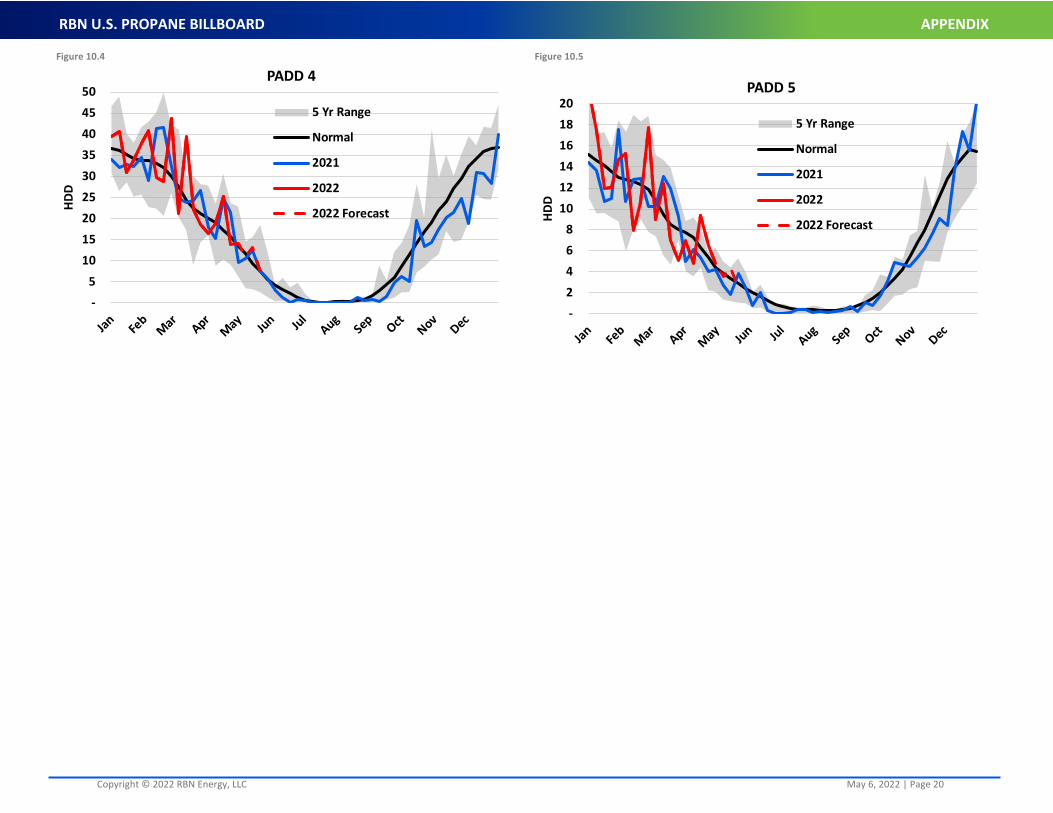
INSIGHTS & ANALYSIS As shown in Figures 10.1-10.5, our weather data shows April HDD’s were higher than in 2021 (up 8%) and the 5-year average (up 18%). As a result, ResCom demand for April was 24 Mb/d higher than last year and 53 Mb/d above the 5-year average. PADD 2 was the key region with colder weather in April relative to last year, and the 5-year average, as reflected by the increase in ResCom demand.
Copyright © 2022 RBN Energy, LLC May 6, 2022 | Page 20
RBN U.S. PROPANE BILLBOARD APPENDIX
Figure 10.4 Figure 10.5
- 5
10 15 20 25 30 35 40 45 50
HDD
PADD 4
5 Yr Range
Normal
2021
2022
2022 Forecast
- 2 4 6 8
10 12 14 16 18 20
HDD
PADD 5
5 Yr Range
Normal
2021
2022
2022 Forecast