Cape Verde - African Economic Outlook
15
www.africaneconomicoutlook.org Cape Verde 2012
-
Upload
khangminh22 -
Category
Documents
-
view
0 -
download
0
Transcript of Cape Verde - African Economic Outlook
www.africaneconomicoutlook.org
Cape Verde2012
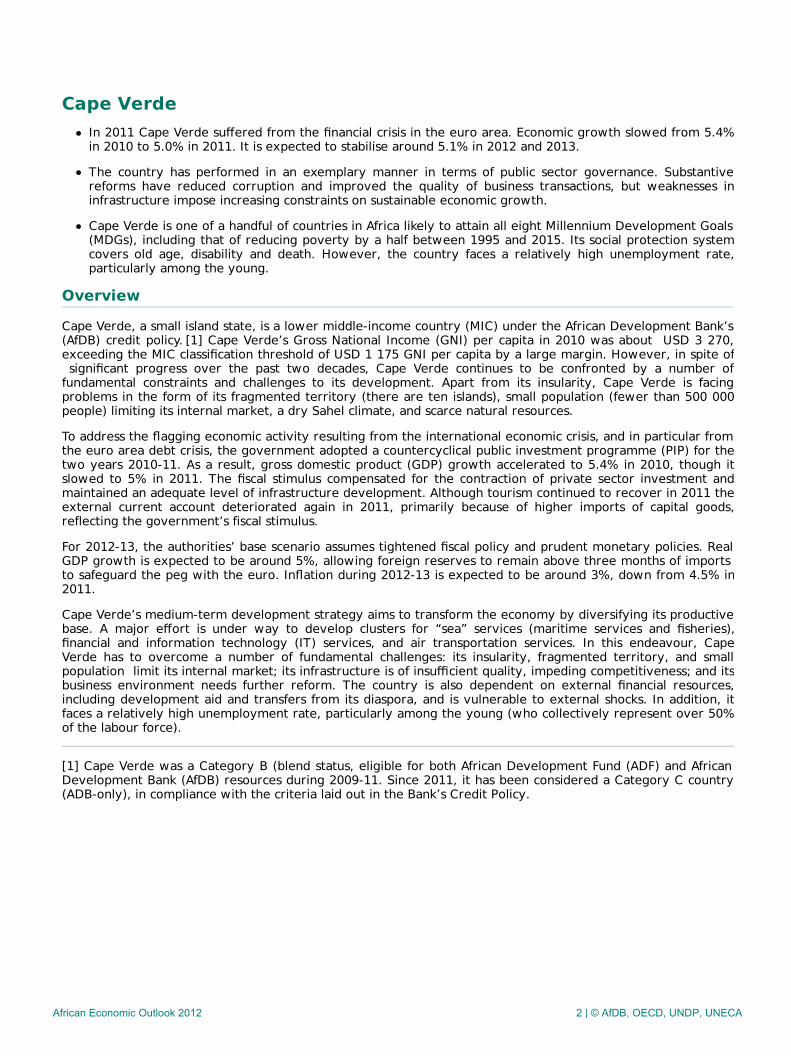
Cape VerdeIn 2011 Cape Verde suffered from the financial crisis in the euro area. Economic growth slowed from 5.4%in 2010 to 5.0% in 2011. It is expected to stabilise around 5.1% in 2012 and 2013.
The country has performed in an exemplary manner in terms of public sector governance. Substantivereforms have reduced corruption and improved the quality of business transactions, but weaknesses ininfrastructure impose increasing constraints on sustainable economic growth.
Cape Verde is one of a handful of countries in Africa likely to attain all eight Millennium Development Goals(MDGs), including that of reducing poverty by a half between 1995 and 2015. Its social protection systemcovers old age, disability and death. However, the country faces a relatively high unemployment rate,particularly among the young.
Overview
Cape Verde, a small island state, is a lower middle-income country (MIC) under the African Development Bank’s(AfDB) credit policy. [1] Cape Verde’s Gross National Income (GNI) per capita in 2010 was about USD 3 270,exceeding the MIC classification threshold of USD 1 175 GNI per capita by a large margin. However, in spite of significant progress over the past two decades, Cape Verde continues to be confronted by a number offundamental constraints and challenges to its development. Apart from its insularity, Cape Verde is facingproblems in the form of its fragmented territory (there are ten islands), small population (fewer than 500 000people) limiting its internal market, a dry Sahel climate, and scarce natural resources.
To address the flagging economic activity resulting from the international economic crisis, and in particular fromthe euro area debt crisis, the government adopted a countercyclical public investment programme (PIP) for thetwo years 2010-11. As a result, gross domestic product (GDP) growth accelerated to 5.4% in 2010, though itslowed to 5% in 2011. The fiscal stimulus compensated for the contraction of private sector investment andmaintained an adequate level of infrastructure development. Although tourism continued to recover in 2011 theexternal current account deteriorated again in 2011, primarily because of higher imports of capital goods,reflecting the government’s fiscal stimulus.
For 2012-13, the authorities’ base scenario assumes tightened fiscal policy and prudent monetary policies. RealGDP growth is expected to be around 5%, allowing foreign reserves to remain above three months of imports to safeguard the peg with the euro. Inflation during 2012-13 is expected to be around 3%, down from 4.5% in2011.
Cape Verde’s medium-term development strategy aims to transform the economy by diversifying its productivebase. A major effort is under way to develop clusters for “sea” services (maritime services and fisheries),financial and information technology (IT) services, and air transportation services. In this endeavour, CapeVerde has to overcome a number of fundamental challenges: its insularity, fragmented territory, and smallpopulation limit its internal market; its infrastructure is of insufficient quality, impeding competitiveness; and itsbusiness environment needs further reform. The country is also dependent on external financial resources,including development aid and transfers from its diaspora, and is vulnerable to external shocks. In addition, itfaces a relatively high unemployment rate, particularly among the young (who collectively represent over 50%of the labour force).
[1] Cape Verde was a Category B (blend status, eligible for both African Development Fund (ADF) and AfricanDevelopment Bank (AfDB) resources during 2009-11. Since 2011, it has been considered a Category C country(ADB-only), in compliance with the criteria laid out in the Bank’s Credit Policy.
African Economic Outlook 2012 2 | © AfDB, OECD, UNDP, UNECA
http://dx.doi.org10.1787/888932618633
http://dx.doi.org/10.1787/888932602008
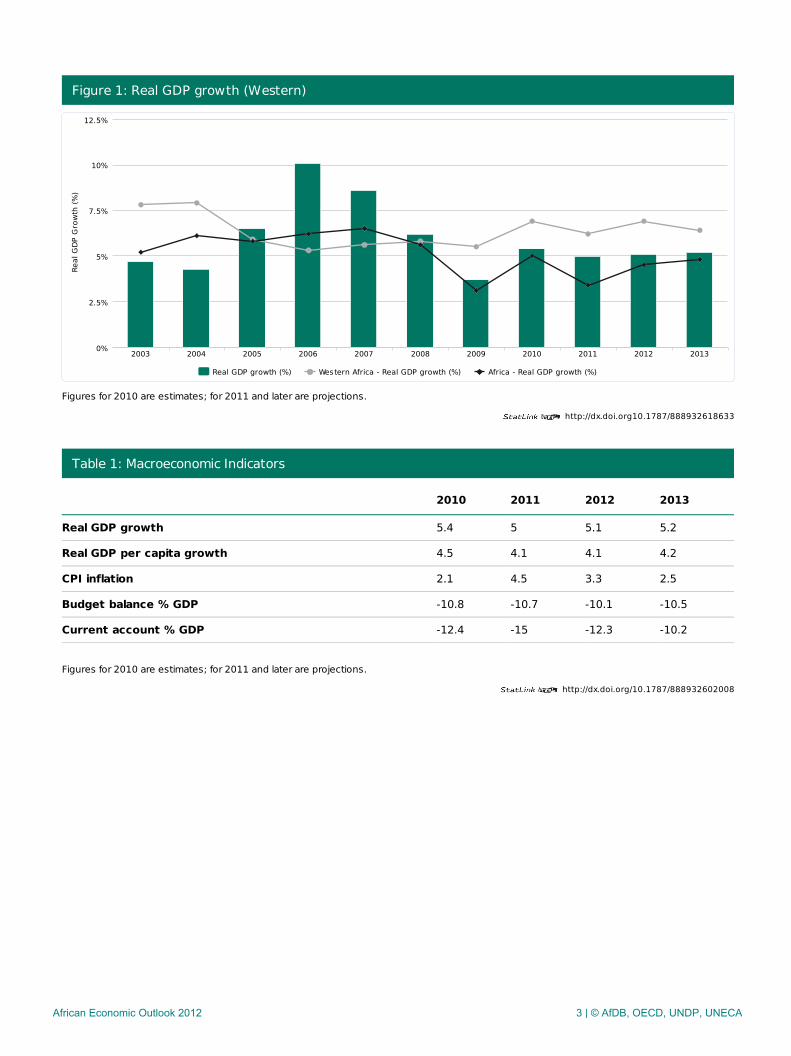
Figure 1: Real GDP growth (Western)
Figures for 2010 are estimates; for 2011 and later are projections.
Table 1: Macroeconomic Indicators
2010 2011 2012 2013
Real GDP growth 5.4 5 5.1 5.2
Real GDP per capita growth 4.5 4.1 4.1 4.2
CPI inflation 2.1 4.5 3.3 2.5
Budget balance % GDP -10.8 -10.7 -10.1 -10.5
Current account % GDP -12.4 -15 -12.3 -10.2
Figures for 2010 are estimates; for 2011 and later are projections.
Real GDP growth (%) Western Africa - Real GDP growth (%) Africa - Real GDP growth (%)
2003 2004 2005 2006 2007 2008 2009 2010 2011 2012 20130%
10%
2.5%
5%
7.5%
12.5%
Real
GDP
Gro
wth
(%)
African Economic Outlook 2012 3 | © AfDB, OECD, UNDP, UNECA
http://dx.doi.org10.1787/888932620609
Recent Developments & Prospects
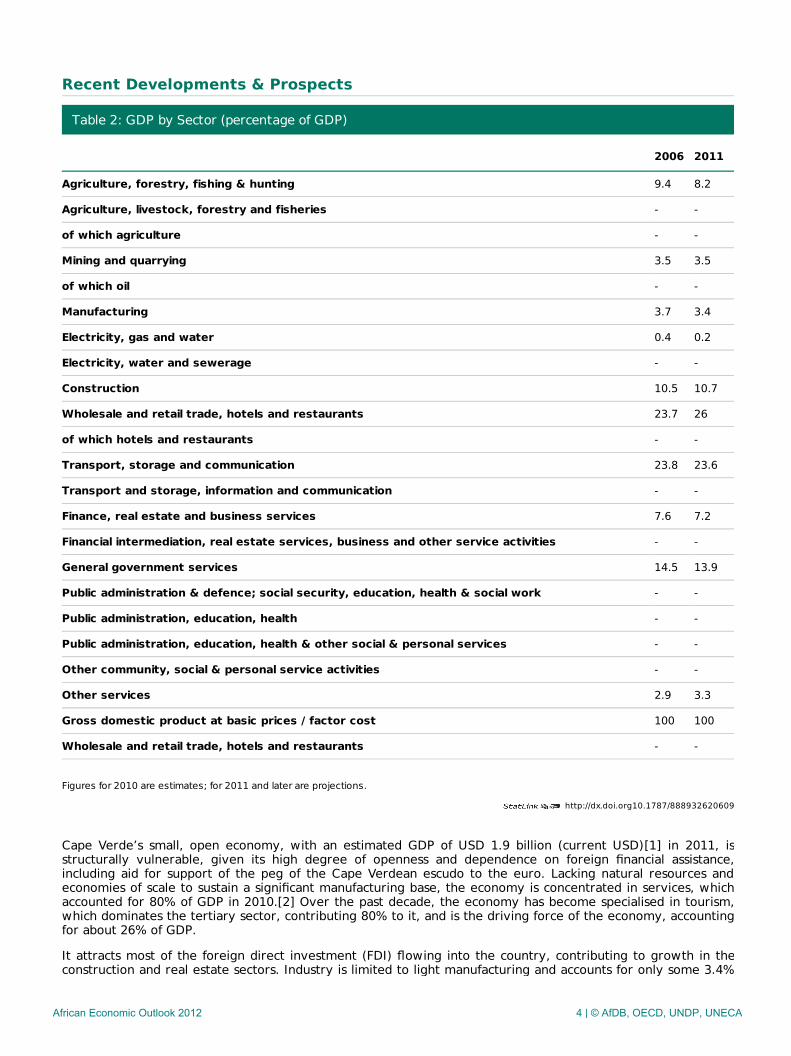
Table 2: GDP by Sector (percentage of GDP)
2006 2011
Agriculture, forestry, fishing & hunting 9.4 8.2
Agriculture, livestock, forestry and fisheries - -
of which agriculture - -
Mining and quarrying 3.5 3.5
of which oil - -
Manufacturing 3.7 3.4
Electricity, gas and water 0.4 0.2
Electricity, water and sewerage - -
Construction 10.5 10.7
Wholesale and retail trade, hotels and restaurants 23.7 26
of which hotels and restaurants - -
Transport, storage and communication 23.8 23.6
Transport and storage, information and communication - -
Finance, real estate and business services 7.6 7.2
Financial intermediation, real estate services, business and other service activities - -
General government services 14.5 13.9
Public administration & defence; social security, education, health & social work - -
Public administration, education, health - -
Public administration, education, health & other social & personal services - -
Other community, social & personal service activities - -
Other services 2.9 3.3
Gross domestic product at basic prices / factor cost 100 100
Wholesale and retail trade, hotels and restaurants - -
Figures for 2010 are estimates; for 2011 and later are projections.
Cape Verde’s small, open economy, with an estimated GDP of USD 1.9 billion (current USD)[1] in 2011, isstructurally vulnerable, given its high degree of openness and dependence on foreign financial assistance,including aid for support of the peg of the Cape Verdean escudo to the euro. Lacking natural resources andeconomies of scale to sustain a significant manufacturing base, the economy is concentrated in services, whichaccounted for 80% of GDP in 2010.[2] Over the past decade, the economy has become specialised in tourism,which dominates the tertiary sector, contributing 80% to it, and is the driving force of the economy, accountingfor about 26% of GDP.
It attracts most of the foreign direct investment (FDI) flowing into the country, contributing to growth in theconstruction and real estate sectors. Industry is limited to light manufacturing and accounts for only some 3.4%
African Economic Outlook 2012 4 | © AfDB, OECD, UNDP, UNECA
of GDP. The primary sector likewise contributes only some 6% to GDP, in spite of providing employment tonearly 40% of the population.
The country’s poor natural endowments, in particular limited arable land and a drought-stricken arid climate,diminish the prospect that agriculture will ever be able to feed the country or provide much additionalemployment: the country imports nearly 90% of its food needs and virtually everything else it consumes,including 97% of its energy needs. Imports, therefore, account for over 60% of GDP, and the country’s balanceof payments is chronically in deficit. In spite of the enormous potential of its marine resources and extensiveexclusive economic zone, fisheries remain small scale and artisanal. A recent positive trend in the primary sectorhas been the rapid growth of drip irrigation which has spawned a vibrant commercially focused production offruit and vegetables.[3]
In 2011 Cape Verde was confronted by a more difficult external environment. In spite of the growth of tourism,fish exports and private remittances, the rise in capital imports, linked to the government’s fiscal stimulus, led toa sizeable widening of the current account deficit. At the same time, the 2011 fiscal deficit was lower thanbudgeted. Tax revenues held up well, and shortfalls in non-tax revenue were offset by controlling expenditures.
Nonetheless, the near-term outlook is subject to risks from the increased possibility of recession in the euroarea. In anticipation, the authorities need to contain credit expansion and minimise domestic borrowing tofinance the budget. Under such a scenario, import growth would slow and the balance of payments wouldimprove.
Enhanced monetary and fiscal policy co-ordination would help in finding the right balance between fiscalrestraint and interest rate increases to contain credit growth, while ensuring that reserves are built up over themedium term above the current three months of import coverage. If the euro area slowdown turns out to beprotracted, foreign investment and growth in Cape Verde are likely to be muted over the medium term.
On the production side, the medium-term scenario assumes continued weakness in the tourism sector, mainlyreflecting conditions abroad, that translate into a real GDP growth rate hovering just above 5% in 2012-13.Furthermore, weaknesses in infrastructure pose increasing constraints to sustainable economic growth. Inparticular, investment in the transport and power generation sectors is required to avoid bottlenecks for privatesector activity, where current levels meet present demand but need to be expanded to accommodate futuredemand. Barring any unusual weather patterns, agriculture will continue to grow at the rates of recent years.
On the demand side, Cape Verde’s growth prospects are being supported by increases in private sectoractivities. On average in 2012-13, private sector gross capital formation (GCF) is projected to be boosted by FDIat a time when public sector GCF is contracting, and private sector consumption is accelerating again comparedto 2008‑10. These growth prospects need to be encouraged by intensifying the envisaged reforms of thebusiness environment. In this context, realising the importance of supporting the economy during the currentdifficult economic environment, the government is preparing a new Poverty Reduction and Growth Strategy(PRGS) III 2012-15.[4]
[1] IMF, IMF Country Report 12/29, February 2012.
[2] Banco de Cabo Verde (BCV), 2012.
[3] Reliable output data on drip irrigation agriculture are lacking, and the ministry of agriculture is unable toestimate the primary sector’s true weight in the economy.
[4] Its pillars are:(i) good governance; (ii) effectiveness and equity; (iii) human capital; (iv) competitiveness forprivate sector led growth; (v) infrastructure and land use management; and (vi) social cohesion.
African Economic Outlook 2012 5 | © AfDB, OECD, UNDP, UNECA
http://dx.doi.org10.1787/888932621597
Macroeconomic Policy
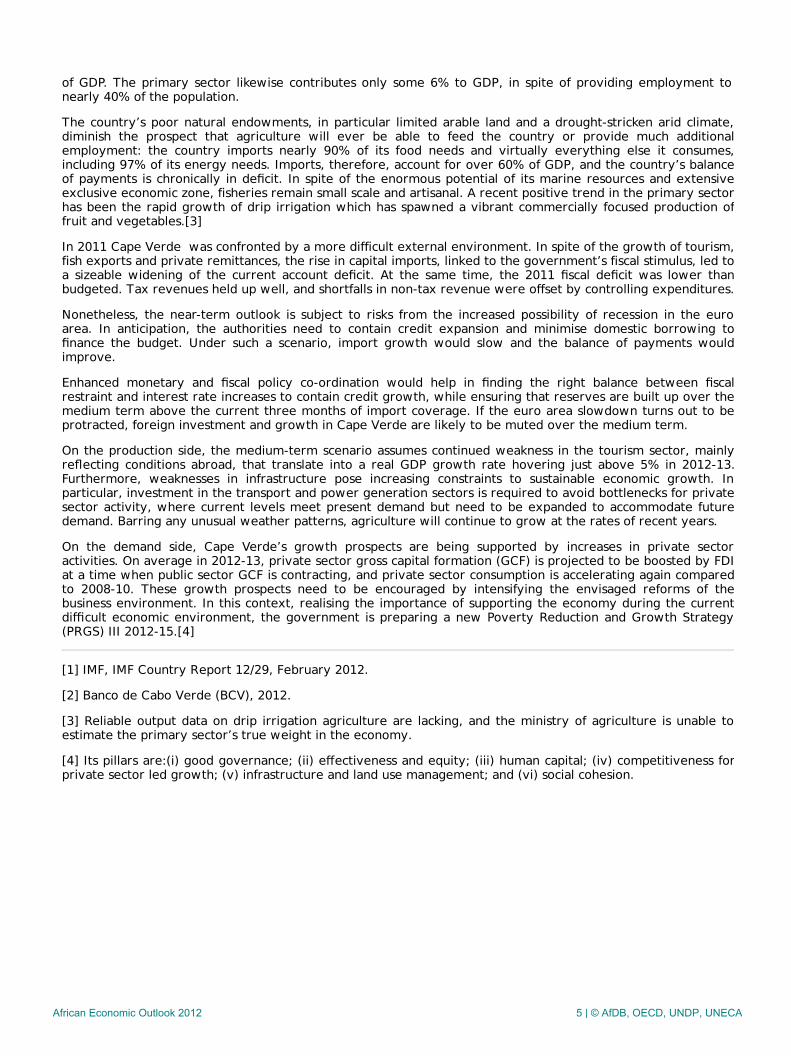
Fiscal PolicyIn the current more difficult economic context, the government is scaling back the policy of countercyclicalcapital expenditures it adopted in 2010 to offset declines in private sector activity. As a result, the fiscal targetfor calendar year 2011 was met: tax revenues held up well, although there were shortfalls in non-tax revenue,and spending was held below the budget to offset lower revenues.
Further fiscal tightening in 2012-13 is needed to ensure a sustainable fiscal position. The authorities’ aim is tobring about a decline in net domestic financing of the central government to avoid crowding out private sectorcredit and lessen pressure on the balance of payments. Accordingly, the 2012 budget foresees capitalexpenditures of some 15% of GDP, compared to an average of 18% of GDP in 2010-11. Current expenditure inthe 2012 budget also declined, compared to 2011, including the wages and salaries component. The impact ofthis decreased fiscal stimulus is to lower the overall fiscal deficit to 10.1% of GDP (compared to 10.7% in 2011).
With such policies (notably the government’s scaling back of its fiscal stimulus), the overall fiscal balance isprojected to improve. Therefore, even though grants recorded in the budget are expected to be only abouthalf of what they were in earlier years because of Cape Verde’s increasing transition to a MIC, the deficit willdecline. On the revenue side, the authorities intend to undertake revenue reforms in 2013 ( through, amongother things, a streamlined tax and customs code) to stabilise the tax-to-GDP ratio at 18% of GDP. Currentexpenditure is projected to average some 19.3% (compared to 20.3% in 2011), while capital expenditure isprojected to average 15%, compared to 18% in 2011. If maintained, this will contribute to maintainingsustainable fiscal policies over the medium term. Given the authorities’ strong concern to maintain socialcohesion, care will be taken to implement austerity measures in consultation with social partners, with a view tosustaining economic growth and securing further progress toward poverty reduction.
Nonetheless, these projections are subject to several risks, related especially to how the euro area debt crisis isresolved. Foreign demand for Cape Verde’s exports (including tourism) could fall, resulting in a furtherslowdown of economic activity, and depressing domestic revenue. That same risk could, nonetheless, result in alower than projected level of domestic inflation, if import prices fall as a result of lower global demand.
Table 3: Public Finances (percentage of GDP)
2003 2006 2007 2008 2009 2010 2011 2012 2013
Total revenue and grants 27.8 29.1 32.3 33.8 29.3 28 26.6 23.6 24.2
Tax revenue 19 21.6 24.4 25.6 20.6 19.1 18.8 18.4 18.1
Oil revenue - - - - - - - - -
Grants 6.1 5.5 5.2 4.9 5.9 6.3 5.2 2.5 3.5
Total expenditure and net lending (a) 32.2 33.9 33.5 35.2 35.7 38.7 37.4 33.7 34.7
Current expenditure 22 21.8 21.9 21.1 21.4 20 20.5 19.4 19.8
Excluding interest 19.5 20.0 20.1 19.5 19.9 18.4 18.7 17.4 17.8
Wages and salaries 10.7 10.9 11.6 11.7 11.9 9.6 9.2 8.9 8.7
Interest 2.5 1.8 1.8 1.6 1.5 1.6 1.9 2.1 2
Primary balance -2 -3.0 0.5 0.3 -4.8 -9.2 -8.9 -8.1 -8.5
Overall balance -4.5 -4.8 -1.3 -1.4 -6.3 -10.8 -10.7 -10.1 -10.5
Figures for 2010 are estimates; for 2011 and later are projections.
Monetary Policy
African Economic Outlook 2012 6 | © AfDB, OECD, UNDP, UNECA
The Central Bank of Cape Verde (BCV) implements a prudent monetary policy in order to maintain the peg ofthe Cape Verde escudo (CVE) with the euro. This peg has made it possible to mitigate the impact of higherinternational prices for foodstuffs and oil products on domestic inflation. Consumer price inflation, after peakingin 2011, reacted to the BCV’s monetary policies is projected to fall to some 3%, albeit helped by declininginternational prices of commodities.
The main target of the BCV’s monetary policy is to steer domestic credit growth toward maintaining its foreignreserve target of at least three months of imports, thereby safeguarding the currency peg. In this endeavour,monetary policy employs a mixture of interest rate policy, based on maintaining a premium over Euribor ratesin order to attract foreign funds; measures to limit credit of the private sector; and reserve requirements ondeposit liabilities.
In respect of interest rate policy, the BCV could not avoid during 2011 a decline in the inflow of foreign funds,since that was related to non-monetary factors. In particular FDI fell by a third, to CVE 6.1 billion,[1] from CVE 9.3 billion in 2010, related to a decline in construction. This was partially offset by workers’ remittances,which increased by some 20%. As a result, official foreign exchange reserves fell in 2011, from some fourmonths of imports in 2010 to around three months at the end of 2011. This decline resulted in part from anincrease in domestic credit, which grew by 11.4% in 2011, compared to an average of 7.4% during 2009-11.
In terms of measures to limit credit, the BCV’s monetary policy is focused on ensuring the financial soundness ofcommercial banks through tight supervision. As a result, Cape Verde has largely escaped the internationalfinancial and banking crisis, helped by the fact that it is dominated by Portuguese private capital, which, in CapeVerde, has been conservative in its operations. Consequently the financial soundness of commercial banks inCape Verde has improved recently. In particular, the proportion of non-performing loans to total loans fell as aresult of these precautionary monetary policy measures to about 5.5% in 2010-11, after averaging 12.5% in2007-08. To help further in steering the growth of credit, as well as reserve and broad money in particular, theBCV resumed open market operations.
In respect of reserve requirements, the BCV is concerned that, if the Eurozone crisis worsens, reductions inexternal current account earnings (notably tourism and trade) could lead to a decline in reserves. To counteractthe declining trend of foreign exchange, the BCV decided in July 2011 to increase the coverage of banks’reserve requirements to include 50% of public sector deposits. As a result estimates for the end of 2011 showthat reserve losses were contained, and the growth of net domestic assets of the central bank was significantlycurtailed.
Economic Cooperation, Regional Integration & TradeIn 2011, the current account deficit returned to a level of 15.0% of GDP, similar to 2008-09, after narrowing to12.4% in 2010. A slight improvement in exports and factor income was offset by a decline in service income(tourism) and current transfers, as was seen in the fiscal accounts. Exports of goods are marginal in Cape Verde,but their growth reflects increases in textile and fish exports; the country’s textiles benefit mainly from theAfrica Growth and Opportunity Act (AGOA).
Imports were stable during 2011, with Portugal remaining the major source (with some 60% of importsoriginating there). Traditional imports, which include food, mineral fuels and lubricants, chemicals and chemicalproducts, as well as machinery and equipment, dominated Cape Verde’s import bill in 2011.
In 2012 and 2013, the current account balance is expected to improve, primarily as a continued recovery oftourism receipts. The trade balance is also forecast to improve marginally, reflecting somewhat lower importsand higher exports.
Cape Verde is focusing its attention on those geographical areas where it tends to obtain the greatest benefits,given its trade relations. Most of its trade is with the European Union (EU), which represents some 85% of totalCape Verdean exports of goods, and over 95% of exports of services (tourism).
Cape Verde has engaged in negotiations with the EU for a special partnership agreement (SPA) that would allowthe country to preserve its privileged access to the European market and benefit, amongst other areas, fromincreased labour mobility. On December 9, 2011 the EU granted "Generalised System of Preferences (GSP)+"status to Cape Verde—the first African country to receive this status (16 non-African countries have qualified).[1]
The current GSP scheme will expire on 31 December 2013 at the latest. Under the new GSP proposal,additional export opportunities would be provided to those countries most in need, in particular least developedcountries (LDCs). In addition, it has been proposed to enhance the attractiveness of GSP+, while ensuring bettercompliance with the 27 core international conventions via strengthened monitoring and withdrawal provisions.
African Economic Outlook 2012 7 | © AfDB, OECD, UNDP, UNECA
http://dx.doi.org10.1787/888932622585
[1] When Cape Verde graduated from the "Least Developed Country" (LDC) UN status in December 2007, itwas granted a transition period, which expired on 31 December 2011, to allow market operators to adjust tothe new tariff regime. The GSP+ is an SPA that provides enhanced access to EU markets for Cape Verdeangoods and services under a commitment to effectively implement 27 core international conventions on therespect of human and labour rights, the environment, and good governance.
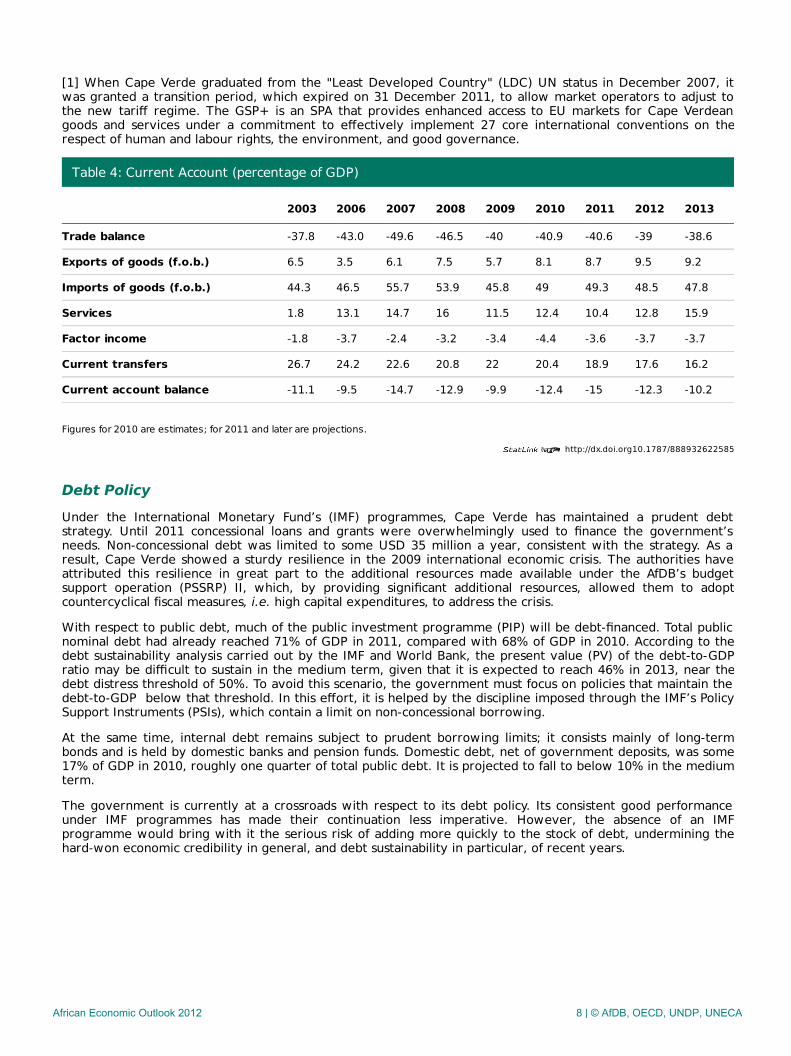
Table 4: Current Account (percentage of GDP)
2003 2006 2007 2008 2009 2010 2011 2012 2013
Trade balance -37.8 -43.0 -49.6 -46.5 -40 -40.9 -40.6 -39 -38.6
Exports of goods (f.o.b.) 6.5 3.5 6.1 7.5 5.7 8.1 8.7 9.5 9.2
Imports of goods (f.o.b.) 44.3 46.5 55.7 53.9 45.8 49 49.3 48.5 47.8
Services 1.8 13.1 14.7 16 11.5 12.4 10.4 12.8 15.9
Factor income -1.8 -3.7 -2.4 -3.2 -3.4 -4.4 -3.6 -3.7 -3.7
Current transfers 26.7 24.2 22.6 20.8 22 20.4 18.9 17.6 16.2
Current account balance -11.1 -9.5 -14.7 -12.9 -9.9 -12.4 -15 -12.3 -10.2
Figures for 2010 are estimates; for 2011 and later are projections.
Debt PolicyUnder the International Monetary Fund’s (IMF) programmes, Cape Verde has maintained a prudent debtstrategy. Until 2011 concessional loans and grants were overwhelmingly used to finance the government’sneeds. Non-concessional debt was limited to some USD 35 million a year, consistent with the strategy. As aresult, Cape Verde showed a sturdy resilience in the 2009 international economic crisis. The authorities haveattributed this resilience in great part to the additional resources made available under the AfDB’s budgetsupport operation (PSSRP) II, which, by providing significant additional resources, allowed them to adoptcountercyclical fiscal measures, i.e. high capital expenditures, to address the crisis.
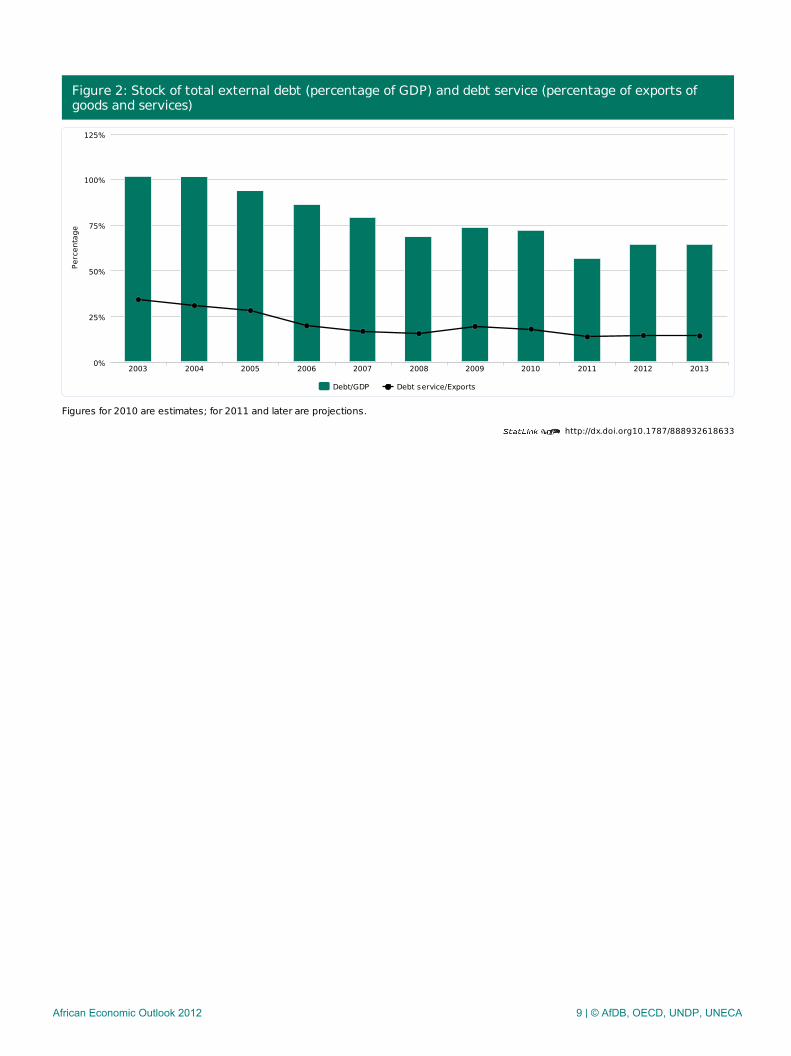
With respect to public debt, much of the public investment programme (PIP) will be debt-financed. Total publicnominal debt had already reached 71% of GDP in 2011, compared with 68% of GDP in 2010. According to thedebt sustainability analysis carried out by the IMF and World Bank, the present value (PV) of the debt-to-GDPratio may be difficult to sustain in the medium term, given that it is expected to reach 46% in 2013, near thedebt distress threshold of 50%. To avoid this scenario, the government must focus on policies that maintain thedebt‑to‑GDP below that threshold. In this effort, it is helped by the discipline imposed through the IMF’s PolicySupport Instruments (PSIs), which contain a limit on non-concessional borrowing.
At the same time, internal debt remains subject to prudent borrowing limits; it consists mainly of long-termbonds and is held by domestic banks and pension funds. Domestic debt, net of government deposits, was some17% of GDP in 2010, roughly one quarter of total public debt. It is projected to fall to below 10% in the mediumterm.
The government is currently at a crossroads with respect to its debt policy. Its consistent good performanceunder IMF programmes has made their continuation less imperative. However, the absence of an IMFprogramme would bring with it the serious risk of adding more quickly to the stock of debt, undermining thehard-won economic credibility in general, and debt sustainability in particular, of recent years.
African Economic Outlook 2012 8 | © AfDB, OECD, UNDP, UNECA
http://dx.doi.org10.1787/888932618633
Figure 2: Stock of total external debt (percentage of GDP) and debt service (percentage of exports ofgoods and services)
Figures for 2010 are estimates; for 2011 and later are projections.
Debt/GDP Debt service/Exports
2003 2004 2005 2006 2007 2008 2009 2010 2011 2012 20130%
100%
25%
50%
75%
125%
Perc
enta
ge
African Economic Outlook 2012 9 | © AfDB, OECD, UNDP, UNECA
Economic & Political Governance
Private SectorCape Verde owes its remarkable economic development since 1991 in part to the implementation of successivereform programmes[1]. However, owing to the financial crisis that began in 2008, private sector activity hasbeen contracting (especially in the construction and tourism sectors); as mentioned above, this wascounteracted in part by the government’s fiscal stimulus. For its part, the AfDB supported the development ofthe private sector in Cape Verde through a Private Sector Profile (PSP), completed in 2011. The PSP gauges thescope of, and challenges to, the private sector and its environment and assesses the possibility of implementinga more proactive development strategy to accelerate the contribution of the private sector to the economy.The PSP proposes a new strategy based on agricultural development, renewable energy, diversified tourism(beyond the current basic “beach” tourism), and taking advantage of Cape Verde’s geographic position, namely,its proximity to Europe and the African continent, giving it a strategic role as regards shipping routes, security,and economic interactions.
In spite of the improvement in the business climate, it has risen from a rather low level so that its presentranking is not yet satisfactory. Inflexible business and labour market policies still result in the country beingranked in the lowest quartile in the World Bank’s Doing Business reports (DBRs). Nonetheless, the PSP alsoidentified areas for improvement in the country’s business climate, and actions have been stepped up since2008. As a result, Cape Verde’s rankings in the reports have steadily improved and in 2010 the country wasnamed one of the top ten most dynamic reformers in the world. Additionally, in 2011 the country was featuredas a lead reformer worldwide.[2]
These achievements in turn resulted in important progress in the DBR ranking: Cape Verde was able to moveup to 119th position in the DBR in 2012, from 129th position in 2011. Its weakest scores remain in resolvinginsolvency (183rd of 183 countries) and protecting investors (133rd), while its strongest rankings are inenforcing contracts (37th) and trading across borders and registering property (both 61st). Closing a businessremains a cumbersome process, mainly as a result of the lack of a regulatory system and judicial recourse, aswell as the non-existence of a specific framework for bankruptcy or liquidation of assets. Nevertheless, this legalvacuum is expected to improve in 2012 because of the recently adopted decree-law on the closure ofenterprises, which was adopted following dialogue with the AfDB.
Cape Verde’s economic development is also making it more attractive to public-private partnerships (PPPs). TheAfDB and the European Investment Bank (EIB) have financed a renewable energy project (the Cabeolica windpower project), the first in Africa in the energy sector. This is a first step for Cape Verde’s public and privatesectors to benefit from leveraging and to mobilise additional funding, e.g. from third party private investors forPPP projects.
Financial SectorThe banking sector in Cape Verde has witnessed significant growth in the last decade. It has largely escaped thefinancial and banking crisis so far, reflecting fairly sound supervision. Over the years there have beenimprovements in product and service offerings, taking Cape Verde into the forefront of high-tech bankingpractices, including mobile banking. Dominated by Portuguese private capital, Cape Verde’s banking sector isconservative in its operations and external links. This helps explain its ability to have escaped the worst of theglobal financial crisis of 2008.
The January 2012 IMF staff report on the Second Review under the Policy Support Instrument analyses in detailthe financial soundness of commercial banks in Cape Verde. It notes in particular a major improvement in theproportion of non-performing loans to total loans that fell to some 5.5% in 2010-11, the result of precautionarymeasures, after averaging 12.5% in 2007-08.
Nonetheless, the sector needs to become more competitive and increase its contribution to economic growth.Until now, the preoccupation of the financial sector, i.e., the banks, has been on managing liquidity, which hasresulted in an asymmetrical distribution across the sector. This has unnecessarily penalised the productivesectors, by making credits difficult to obtain, at rates that are higher than they need to be. An encouragingsignal towards an improvement was the healthy increase shown in operations on the interbank market during2011 over 2010—a first step toward reducing distortions in the extending and costing of credit to the economy.
As Cape Verde continues its economic development in the context of a decline in cheap international financing,the domestic financial sector will need to play a more prominent role in financing economic activity throughadaptive mechanisms (including syndication) and public investment, through more efficient open marketoperations. Given the close trade and FDI ties between Portugal and Cape Verde, and with the limited scope ofthe BCV as regards monetary policy, the peg remains the preferred exchange rate arrangement.
African Economic Outlook 2012 10 | © AfDB, OECD, UNDP, UNECA
Public Sector Management, Institutions & ReformCape Verde has an exemplary record in terms of public sector governance. Aside from the push to improve thebusiness climate by targeting government regulations through the UCR (Unit for Coordinating GovernmentReforms), the government also modernised its operations by making effective its Operational Nucleus for theInformation Society (NOSI), which has made much progress since 2009. In particular, it has expanded usage ofthe Integrated Government Financial Management System (IGFMS/SIGOF), with all modules, including the onefor debt, now fully operational. This has allowed better budget planning and implementation, more consistentimplementation of administrative procedures, and online availability of most permits and certificates, includingthose needed to create an enterprise.
The substantive reforms have lowered corruption and improved the quality of business transactions. As a result,Cape Verde has been obtaining high marks in international governance indicators. The 2010 Mo Ibrahim Indexof African Governance (covering 2008-09) gave Cape Verde the fourth highest ranking out of the 48 sub-Saharan countries.[1] With regard to corruption, Transparency International’s 2010 Corruption PerceptionsIndex ranked Cape Verde 45th out of 178 countries, making it the third best performer in sub-Saharan Africa.The World Bank governance indicators have confirmed these achievements. Also, with a score of 4.50 forgovernance, the AfDB’s Country Policy and Institutional Assessment (CPIA) for 2010 designated the country asthe best performer amongst the 40 African Development Fund (ADF)-eligible countries. Finally, the 2008 PublicExpenditure and Financial Accountability (PEFA) indicators showed that Cape Verde’s fiduciary environment isgenerally robust.
In spite of progress by the government in addressing the weaknesses identified by the 2008 PEFA, there are stilla number of public financial management (PFM) areas that require reform, in particular tax collection, whichneeds to be simplified and strengthened through a new tax and customs code; a stronger role for the Court ofAuditors; and a more effective inspectorate general of finance (IGF). These weaknesses have been addressedsince 2009 under the AfDB’s PRSSP II and will receive special attention during the update of the PEFA,scheduled for 2012.
Natural Resource Management & EnvironmentCape Verde is a country already feeling the impact of climate change. Since the 1960s, according to the UnitedNations Development Programme (UNDP), its temperature has increased on average by 6 degrees Celsius.Projections point to further temperature increases. At the same time, average annual precipitation has fallen (to230 mm/year, below the sub-Saharan average), while the length of the rainy season has shortened. The sealevel is also expected to rise between 0.13 and 1.4 metres by the end of the century. This will have significantimplications for the livelihood of the population and all economic sectors.
The Second National Environmental Action Plan (PANA II) has a 10-year horizon (2004-2014). The plan’s generalobjective is to provide the country with a strategy that promotes a rational use of natural resources and asustainable management of economic activities. The PANA has progressed well with its implementation withpolicy and regulatory work being improved on issues relating to the environment, natural resources, industry,tourism, water, etc. An eco-tax bill on non-biodegradable packaging is being prepared for approval.
Nonetheless, the issue of water and sanitation should receive more attention, especially in the context of asector-wide approach. Some 50% of the population do not have access to sanitation (10% do not even haveaccess to latrines). One problem in addressing this issue more forcefully is that policies for the sector have beenfragmented among several entities (housing, agriculture, hydraulic resources, etc.). The absence of a centralisedstructure makes it difficult to optimise the expenditure of different uncoordinated institutions. Hence, thegovernment should produce a specific institutional analysis for the water and sanitation sector, with a carefulreview of the criteria for allocation of responsibilities.
The medium-term outlook for the water and sanitation sector is positive, particularly in terms of increasingaccess and implementing much-needed institutional reforms. In February 2012, the United States awarded CapeVerde USD 67 million under its Second Compact under the Millennium Challenge Account (MCA), and most ofthe grant will be devoted to this sector. It is expected that Cape Verde will meet MDG Goal 7 (Ensureenvironmental sustainability, which includes the subcomponent 7C of “halving, by 2015, the proportion ofpeople without sustainable access to safe drinking water and basic sanitation.”)
Political ContextThe 2010 Freedom House report ranked Cape Verde as the leading African country for civil liberties and politicalrights and stability. The rule of law and the fundamental principle of separation of powers between theexecutive, legislature and judiciary are comparable to those of developed countries, confirming Cape Verde as
African Economic Outlook 2012 11 | © AfDB, OECD, UNDP, UNECA
one of Africa’s models for democracy and good governance. The media are free, and the absence of ethnic,political and religious conflicts has encouraged sociocultural cohesion.
A particular feature of Cape Verde’s open political environment is the casa do cidadão (citizen’s house). Havingboth agencies around the country and online accessibility, the casa do cidadão provides broad access togovernment information, both as regards its operations (such as fiscal data), administration (hiring policies), andspecific transactions (such as opening a business or obtaining a driver’s licence).
Over the last decade, the country has conducted five presidential and legislative elections. They were allmarked by a peaceful changeover in power, which now has become entrenched in the country’s politicalculture. The last legislative elections took place on 6 February 2011 in an atmosphere of overall calm. Thegoverning Partido Africano da Independência de Cabo Verde (PAICV) was returned to power for another fiveyears, with the opposition, the Movimento para a Democracia (MPD), publicly acknowledging defeat.Presidential elections were held on 7 August 2011, with a run-off election on August 23. The winner was JorgeCarlos Fonseca, from the MPD. The municipal elections of February 2012 followed electoral campaigns thatwere conducted peacefully, as in the past.
African Economic Outlook 2012 12 | © AfDB, OECD, UNDP, UNECA

Social Context & Human Development
Building Human ResourcesThe underlying drivers of building human resources have been the poverty reduction strategies formalised since1997, currently in the form of the Growth and Poverty Reduction Strategy (GPRS), whose third rendering isbeing presented to stakeholders in 2012. It was built on a comprehensive approach to poverty reduction,cutting across sectors and activities.
Cape Verde has posted good progress towards reaching the MDGs. It may be one of only four African countriesto meet all MDG targets by 2015. Significant strides were particularly made on MDG 1 (eradicating extremepoverty and hunger) with a lowering of poverty from 39% in 2000 to 26% in 2009; MDG 4 (reduce childmortality) with infant mortality for children under five being reduced from 39% in 2000 to 20% in 2009 , andMDG 7 (ensure environmental sustainability), with access to water supply increasing from 24% in 2000 to 42%in 2009.
Having chosen tourism as a key source of growth and hence employment, the government was aware of theneed adequately to train the labour force, given that proper interactions at the personal level were essential tomaking this policy a success. To that end, it provided programmes to increase professional training. In so doingit was pursuing its underlying objective of training human resources by 2015 that were capable of contributing,in the education sector, to the schooling of the population (MDG 2: achieve universal primary education) with anenrolment rate above 90%. Furthermore, in the health sector the government is aiming to train humanresources to increase the availability of diagnostic services as well as hands-on assistance for reducing theincidence of disease (such as dengue fever). In respect of MDG 5 (improve maternal health) the maternalmortality rate fell from 86 per thousand in 2000 to 15 per thousand in 2008.
Cape Verde has one of the highest adult literacy rates on the continent (84.8%), trailing Mauritius (87.9%) butfar above the sub-Saharan Africa average (61.6%). The country ranks well in terms of total mean schoolingyears (school life expectancy) from primary to tertiary levels, estimated at 12 years in 2009, being among thetop in Africa. While its education index is modest under the UNDP’s new methodology, expected years ofschooling (11.6) are among the highest on the continent, and the index compares well worldwide with countriessuch as the Dominican Republic (11.9), Botswana (12.2), Mauritius (13.6), Nigeria (8.9), and is ahead of theregional average (9.2). With over 100 000 students enrolled in primary and secondary schools, Cape Verdelikewise performs well in terms of the regional average of combined gross enrolment. Its combined grossenrolment of 68.1 is lower than those of Mauritius (76.9) and Botswana (70.6) but much higher than those ofGhana (56.5), Nigeria (53.0) and the region (53.5). There is a rough parity in the gender balance in schooling,with female enrolment constituting 48% and 54% of primary and secondary enrolment respectively in the 2009-10 school year.
Poverty Reduction, Social Protection & LabourCape Verde has made great strides in reducing poverty (one of the MDGs). To underpin the successes inpoverty reduction, the government has been paying special attention to social protection, which has been usedas a major tool to improve the living conditions of the most vulnerable groups. To that end, the government hasbeen designing targeted programmes for the rural and urban areas. In the countryside the government iscurrently implementing its National Poverty Reduction Programme for Rural Areas.
Nonetheless, Cape Verde needs to improve its social indicators. The Human Development Index (HDI) in 2010was 0.534, ranking the country 118th among 169 countries. During 2000-10, the index rose by 7%, equivalentto an average increase of only 0.6% per year. This slow rise shows that the government should intensify itsefforts in the social sectors to improve the standard of living.
Besides poverty, unemployment is Cape Verde’s key social challenge. While the government’s fiscal stimulus in2010-11 helped safeguard jobs, and the unemployment rate fell from 13.1% in 2009 to 10.7% in 2010, it hasnot helped resolve the underlying issue of creating jobs for young people entering the job market. The young(aged from 15 to 24) account for 50% of the labour force, and had an unemployment rate of 20.1% in 2010.Given the international environment, which will limit Cape Verde’s economic growth rate in the medium term,the government is facing an uphill battle to create jobs and mitigate possible social tensions arising from arestive young population looking for work.
In facing the challenge of unemployment, the government will be aided by a relatively solid social securitysystem. Cape Verde’s social protection system covers old age, disability and death. Contributions amount to 3%of gross monthly income of workers and 7% for employers, or 10% for non-unionised workers, while thegovernment pays all its employees’ contributions. Eligibility requires at least 15 years of contributions. Old agepensions begin at 65 for men and 60 for women, and can be paid abroad. Workers’ compensation has also been
African Economic Outlook 2012 13 | © AfDB, OECD, UNDP, UNECA
paid since 1978, and, since 2004, family allowances have been paid for those in employment. This structure hasallowed the social security fund to run a surplus of about 2% to 3% of GDP per year. The significant assets it hasaccumulated are held mostly in bank deposits and government securities, and the authorities are aware that theframework for managing these assets needs to be strengthened in the near future. It is important that loopholeswhich encourage inefficient shifting of money between the fund and commercial banks be closed.
Gender EqualityThe status of Cape Verdean women, especially in educational and legislative positions, has improved with theimplementation of the National Plan for Gender Equality and Equity (PNEEG) that started in 2005. The PNEEGaims for a greater cohesion among the various entities promoting gender equality, especially targeting civilsociety organisations; a monitoring and evaluation system; and studies on the social dynamics giving rise toinequalities between men and women.
The most relevant progress has been achieved in the social area, particularly health and education, as well asrepresentation in the executive branch of government. The constitution and various codes (penal, electoral,labour and family) proclaim the equality of the genders, and in the executive branch of the government since2008 there have been as many women as men. In recent years, women have also increased their participationin productive activities, notably tourism, cottage industries and microenterprises.
As a result significant progress has been achieved over the last 15 years, with the gender-related developmentindex (GDI) rising to 0.723 in 2010 from 0.705 in 2008, demonstrating a convergence between men and womenas regards core capabilities. Women represent 51.6% of the total population and 46% of the active population;they run about 46% of households.
However, literacy among adult women is lower than that among men, and there are still impediments forwomen in terms of access to positions of responsibility in both the public and private sectors.
African Economic Outlook 2012 14 | © AfDB, OECD, UNDP, UNECA
Thematic analysis: Promoting Youth Employment
Cape Verde’s national unemployment statistics mask a serious situation in respect of young people. While in2010 the national rate was 10.7%, among men and women aged between 15 and 24 it was 20.1%, while forwomen aged 15-24 it was 25.5%.[i] Aside from this intergenerational distortion, there is also a substantial intra-regional disparity: the two biggest urban centres (Praia and Mindelo) registered rates of 14.8% and 11.3% respectively, while tourism-intensive Boa Vista recorded only 5.7% in 2010.[ii] In that context it is worrying thatunemployment rates have not shown significant decreases in spite of strong growth performance since 2001. Asnoted below, mismatches in the labour market are the major explanation for this sluggish performance.
While young job seekers in Cape Verde can benefit from a number of support programmes that make findingjobs only a moderate obstacle, the real obstacles are the current slow economic growth and low domesticsavings. Furthermore, there is a significant undersupply of specialised labour skills. This is exemplified by a higheconomic growth rate during past two decades without unemployment falling pari passu, especially among theyoung. Instead specialised labour is being imported from abroad (the West Africa region, Portugal, even SouthAsia), especially in sectors such as construction and engineering services. Therefore, efforts need to focus onrevising the curricula for tertiary education as well as on targeted training programmes to reduce skillsmismatches and shortages.
This lack of information for job seekers (not only affecting the young) is a major obstacle in guiding youngpeople in preparing for the job market in the medium term. For the young, it prevents an optimisation of thechoice of the fields of study and/or training, and leads to firms preferring to maintain their flexibility by nothiring full-time workers. Firms tend to hire first-time job seekers as interns for a probationary period beforeoffering them a contract.
Both the government and development partners are engaged in programmes to improve the situation for youthemployment, but the coverage has been very small. The five main entities promoting youth employment are:
i. The Programme for Youth Training and Employment (since 1993) is mostly aimed at young people (aged14-24) who have not attended school regularly..
ii. The National Programme for Professional Internships aims to improve the ability of first-time job seekerswho have just finished school.
iii. The Qualified Employment Exchange is an online service to help match the demand for, and supply of,labour in the private and the public sectors (not restricted to the young).
iv. The National Programme for Professional Internship in the Public Sector aims to improve the ability of jobseekers who have a university or high school degree.
v. The Business Bureau programme seeks to provide support to young people by instructing them on how toopen and operate a business.
A sixth initiative, the Cape Verde School for Hospitality and Tourism, became operational in 2011, with theexplicit goal of specialised training for young people to enter the tourism industry.
In summary, the information available to the government is still too limited to be of much help to most first-time job seekers. At the same time, the entities in existence have only small coverage of the market relevant toyoung people.
[i] Source: National Institute of Statistics (INE), Inquérito ao Emprego 2009.
[ii] National Institute of Statistics (INE), Os Dois Extremos de Desemprego, 6 July 2011.
African Economic Outlook 2012 15 | © AfDB, OECD, UNDP, UNECA