Cape Verde Islands geophysical network - Natural Hazards ...
36
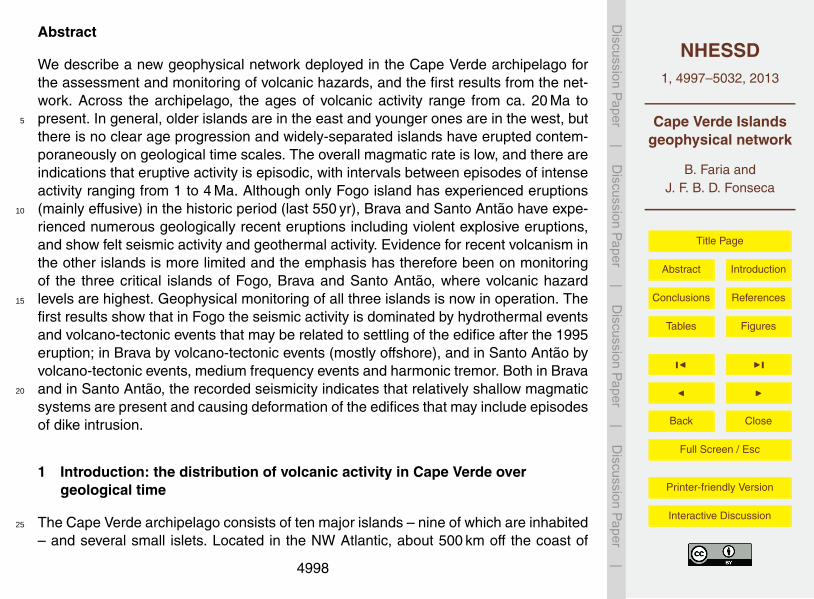
NHESSD 1, 4997–5032, 2013 Cape Verde Islands geophysical network B. Faria and J. F. B. D. Fonseca Title Page Abstract Introduction Conclusions References Tables Figures Back Close Full Screen / Esc Printer-friendly Version Interactive Discussion Discussion Paper | Discussion Paper | Discussion Paper | Discussion Paper | Nat. Hazards Earth Syst. Sci. Discuss., 1, 4997–5032, 2013 www.nat-hazards-earth-syst-sci-discuss.net/1/4997/2013/ doi:10.5194/nhessd-1-4997-2013 © Author(s) 2013. CC Attribution 3.0 License. Natural Hazards and Earth System Sciences Open Access Discussions This discussion paper is/has been under review for the journal Natural Hazards and Earth System Sciences (NHESS). Please refer to the corresponding final paper in NHESS if available. Investigating volcanic hazard in Cape Verde Islands through geophysical monitoring: network description and first results B. Faria 1 and J. F. B. D. Fonseca 2 1 Instituto Nacional de Meteorologia e Geofísica, Delegação de S. Vicente, Monte CP. 15, Mindelo, Cape Verde 2 Physics Department, Instituto Superior Técnico, Av. Rovisco Pais, 1049-001 Lisbon, Portugal Received: 30 July 2013 – Accepted: 20 August 2013 – Published: 25 September 2013 Correspondence to: B. Faria ([email protected]) Published by Copernicus Publications on behalf of the European Geosciences Union. 4997
-
Upload
khangminh22 -
Category
Documents
-
view
2 -
download
0
Transcript of Cape Verde Islands geophysical network - Natural Hazards ...

NHESSD1, 4997–5032, 2013
Cape Verde Islandsgeophysical network
B. Faria andJ. F. B. D. Fonseca
Title Page
Abstract Introduction
Conclusions References
Tables Figures
J I
J I
Back Close
Full Screen / Esc
Printer-friendly Version
Interactive Discussion
Discussion
Paper
|D
iscussionP
aper|
Discussion
Paper
|D
iscussionP
aper|
Nat. Hazards Earth Syst. Sci. Discuss., 1, 4997–5032, 2013www.nat-hazards-earth-syst-sci-discuss.net/1/4997/2013/doi:10.5194/nhessd-1-4997-2013© Author(s) 2013. CC Attribution 3.0 License.
Natural Hazards and Earth System
Sciences
Open A
ccess
Discussions
This discussion paper is/has been under review for the journal Natural Hazards and EarthSystem Sciences (NHESS). Please refer to the corresponding final paper in NHESS if available.
Investigating volcanic hazard in CapeVerde Islands through geophysicalmonitoring: network description and firstresultsB. Faria1 and J. F. B. D. Fonseca 2
1Instituto Nacional de Meteorologia e Geofísica, Delegação de S. Vicente, Monte CP. 15,Mindelo, Cape Verde2Physics Department, Instituto Superior Técnico, Av. Rovisco Pais, 1049-001 Lisbon, Portugal
Received: 30 July 2013 – Accepted: 20 August 2013 – Published: 25 September 2013
Correspondence to: B. Faria ([email protected])
Published by Copernicus Publications on behalf of the European Geosciences Union.
4997
NHESSD1, 4997–5032, 2013
Cape Verde Islandsgeophysical network
B. Faria andJ. F. B. D. Fonseca
Title Page
Abstract Introduction
Conclusions References
Tables Figures
J I
J I
Back Close
Full Screen / Esc
Printer-friendly Version
Interactive Discussion
Discussion
Paper
|D
iscussionP
aper|
Discussion
Paper
|D
iscussionP
aper|
Abstract
We describe a new geophysical network deployed in the Cape Verde archipelago forthe assessment and monitoring of volcanic hazards, and the first results from the net-work. Across the archipelago, the ages of volcanic activity range from ca. 20 Ma topresent. In general, older islands are in the east and younger ones are in the west, but5
there is no clear age progression and widely-separated islands have erupted contem-poraneously on geological time scales. The overall magmatic rate is low, and there areindications that eruptive activity is episodic, with intervals between episodes of intenseactivity ranging from 1 to 4 Ma. Although only Fogo island has experienced eruptions(mainly effusive) in the historic period (last 550 yr), Brava and Santo Antão have expe-10
rienced numerous geologically recent eruptions including violent explosive eruptions,and show felt seismic activity and geothermal activity. Evidence for recent volcanism inthe other islands is more limited and the emphasis has therefore been on monitoringof the three critical islands of Fogo, Brava and Santo Antão, where volcanic hazardlevels are highest. Geophysical monitoring of all three islands is now in operation. The15
first results show that in Fogo the seismic activity is dominated by hydrothermal eventsand volcano-tectonic events that may be related to settling of the edifice after the 1995eruption; in Brava by volcano-tectonic events (mostly offshore), and in Santo Antão byvolcano-tectonic events, medium frequency events and harmonic tremor. Both in Bravaand in Santo Antão, the recorded seismicity indicates that relatively shallow magmatic20
systems are present and causing deformation of the edifices that may include episodesof dike intrusion.
1 Introduction: the distribution of volcanic activity in Cape Verde overgeological time
The Cape Verde archipelago consists of ten major islands – nine of which are inhabited25
– and several small islets. Located in the NW Atlantic, about 500 km off the coast of
4998

NHESSD1, 4997–5032, 2013
Cape Verde Islandsgeophysical network
B. Faria andJ. F. B. D. Fonseca
Title Page
Abstract Introduction
Conclusions References
Tables Figures
J I
J I
Back Close
Full Screen / Esc
Printer-friendly Version
Interactive Discussion
Discussion
Paper
|D
iscussionP
aper|
Discussion
Paper
|D
iscussionP
aper|
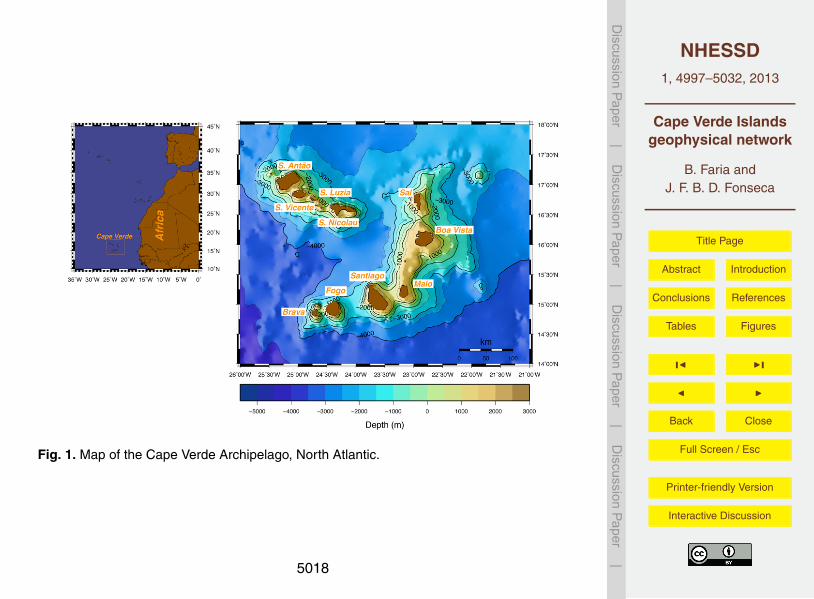
Senegal (Fig. 1), the islands are volcanic, and form a broadly horseshoe-shaped array,opened towards the west and containing two diverging chains with older islands in theeast and younger islands in the northwest and southwest. It sits over a ca. 2 km bathy-metric swell of about 1000 km in diameter, which is correlated with other anomaliesin sea-floor heat flow (Courtney and White, 1986), gravity (Ali and Watts, 2003; Pim5
et al., 2008) and the geoid (Monnereau and Cazenave, 1990). It has therefore beeninferred that the magmatism is due to a hotspot. However, it is not clear whether theroot of the plume that sustains the hotspot is deep-seated (Montelli et al., 2006; Pim etal., 2008; Doucelane et al., 2003; Vinnik et al., 2012) or is in the upper mantle (Helf-frich et al., 2010). In contrast to other hotspot oceanic island volcano archipelagoes,10
in Cape Verde there is no clear age progression with geographic location, and widelyseparated islands erupted simultaneously in the geological time scale (Plesner et al.,2002). The geological and geochronological evidence also shows that volcanic activityin the islands tends to be intermittent, with long periods of quiescence (up to a fewmillion years) separating eruptive phases (Holm et al., 2005; Holm et al., 2006; Duprat15
et al., 2007).In the historic period since the first settlement around 1460 AD, and perhaps for some
thousand of years prior, eruptions have occurred only in Fogo island. However, freshvolcanic vents, lavas and pyroclastic deposits indicate geologically-recent activity inother islands, and signs of geological unrest such as island uplift occur in many parts20
of the archipelago (Ramalho, 2009; Ramalho et al., 2010). Brava and Santo Antãoislands display major sequences of morphologically fresh and geologically recent vol-canic rocks, including evidences of infrequent but sometimes violently explosive erup-tions (Plesner et al., 2002; Mortensen et al., 2009; Tarff and Day, 2013; Day, 2009;Madeira et al., 2010) and important seismicity. In view of these features, it is difficult25
to exclude a priori the possibility of a reawakening of the activity in any of the islands,but the probability of such an event is likely to be much lower in the eastern islands– where the main sequences of volcanic rocks are deeply eroded and more recentvolcanic events are infrequent and small in volume – than in the western islands.
4999

NHESSD1, 4997–5032, 2013
Cape Verde Islandsgeophysical network
B. Faria andJ. F. B. D. Fonseca
Title Page
Abstract Introduction
Conclusions References
Tables Figures
J I
J I
Back Close
Full Screen / Esc
Printer-friendly Version
Interactive Discussion
Discussion
Paper
|D
iscussionP
aper|
Discussion
Paper
|D
iscussionP
aper|
The National Institute for Meteorology and Geophysics (INMG) deployed recently aseismic and geodetic network for the assessment and mitigation of volcanic hazard,with special emphasis on real-time monitoring in Fogo, Brava and Santo Antão. Fifteenseismic stations are currently in operation, covering five islands – Santo Antão, S.Vicente, Sal, Fogo and Brava. In this paper we review the structures of the volcanoes5
and what is known about volcanic hazards in the Cape Verde islands, describe the newmonitoring network, and present some of the data already recorded, with a preliminarydiscussion of the implications for volcanic hazard.
2 Geological setting and main volcanic hazards of Fogo Brava and Santo Antão
2.1 Fogo island10
Located in the SW of the Cape Verde Archipelago (Fig. 1), Fogo Island is an active stra-tovolcano, rising over 6 km from the 4000 m-deep seafloor to the Pico do Fogo summitat 2829 m above sea level (m a.s.l.). With an area of 471 km2, Fogo has a populationof ∼37 000 inhabitants. With mean diameter of 30 km at a roughly circular base, theisland has a nearly conical shape truncated at ∼1700 m a.s.l. by a 9 km wide lateral15
collapse scar (Day et al., 1999) opened to the east. Partial infilling of the collapse scarhas produced a nearly horizontal flat plateau known as Chã das Caldeiras, enclosedon the north, west and south by the collapse scar cliff – the Bordeira – which reaches1000 m above the plain. A population of about 700 farmers lives in Chã das Caldeiras,and 11 000 live on the eastern coast, unprotected by the Bordeira cliff. On the eastern20
side of Chã das Caldeiras rises the summit cone, Pico do Fogo (Fig. 2). In additionto onshore evidence for the lateral collapse (Day et al., 1999), Masson et al. (2008)reported results of multibeam bathymetric survey to the east of Fogo which were in-terpreted as the avalanche debris of the lateral collapse. Foeken et al. (2009) datedpre-collapse and post-collapse flows at 123 Ma and 62 Ma, respectively, providing a25
time window for the lateral collapse.
5000

NHESSD1, 4997–5032, 2013
Cape Verde Islandsgeophysical network
B. Faria andJ. F. B. D. Fonseca
Title Page
Abstract Introduction
Conclusions References
Tables Figures
J I
J I
Back Close
Full Screen / Esc
Printer-friendly Version
Interactive Discussion
Discussion
Paper
|D
iscussionP
aper|
Discussion
Paper
|D
iscussionP
aper|
The flanks of Fogo outside the lateral collapse scar display numerous volcanic vents,concentrated in radial zones which according to Day et al. (1999) form a modifiedtriple-arm rift geometry. The distribution of dikes in the Bordeira cliff replicates thesepreferential directions: NNE, SSE and a broader sector towards the West. Activity inthe southwest of the island ceased about 11 ka ago (Foeken et al., 2009), but erup-5
tions in the east of the island have continued especially within the collapse scar. Sincesettlement in the 15th Century, 27 eruptions were identified through analysis of in-complete written records (Ribeiro, 1960), with average time intervals of 20 yrs and av-erage duration of two months. According to Ribeiro (1960), until 1725 most historic(i.e. post-dating 1500) eruptions occurred through the Pico do Fogo summit, although10
more recent mapping (S. Day, personal communication, 2013) indicates that some ofthese also involved eruptions on flank fissures in the northwest and southeast. In con-trast, from after 1785 eruption until now the summit of Pico do Fogo has been inactive.The six subsequent eruptions occurred inside the collapse scar, mainly through N–Strending fissures, that are arranged in a pattern that suggests that the feeding dikes15
follow the trends of the NNE and SSE rift zones at greater depths. The exception isthe most recent eruption, in 1995, which was fed by the western rift zone (Day et al.,1999; Heleno, 2001). The composition of erupted rocks varied through time, but themost common are ankaramites, nephelinites, basanites, tephrites and scarce phono-litic rocks (Foeken et al., 2009; Hildner et al., 2011; Hildner et al., 2012). The eruptions20
were mostly effusive (Hawaiian to Strombolian), with rare occurrences of highly ex-plosive episodes including phreatomagmatic events (Day et al., 1999; Foeken et al.,2009).
Ash, lapilli, bombs and lava flows are the most frequent volcanic products in Fogoisland (Torres et al., 1997), and the most significant hazard is associated with lava flows25
(Ribeiro, 1960; Torres et al., 1997), especially inside the collapse scar and on the verysteep eastern coast, which hosts ∼30 % of the island’s population. In 1951 a villagewas totally destroyed by lava flows on the eastern coast, and in 1995 another smallvillage was destroyed by lava flows, this time inside Chã das Caldeiras. The 1995 lava
5001

NHESSD1, 4997–5032, 2013
Cape Verde Islandsgeophysical network
B. Faria andJ. F. B. D. Fonseca
Title Page
Abstract Introduction
Conclusions References
Tables Figures
J I
J I
Back Close
Full Screen / Esc
Printer-friendly Version
Interactive Discussion
Discussion
Paper
|D
iscussionP
aper|
Discussion
Paper
|D
iscussionP
aper|
flows also covered an economically important agricultural area with some of the bestsoils of the island. Lava flows hazard can be regarded as high in the caldera floor andvery high in the eastern coast, in view of the high speeds that the flow can reach onthe steep slopes (Day and Faria, 2009).
2.2 Brava5
Brava, located to the west of Fogo and separated from it by an 18 km-wide channel, isthe smallest inhabited island of the archipelago, with an area of 62.5 km2 and a popula-tion of ∼6000 inhabitants. It has a broadly circular shape and steep coastal slopes, cutby deep erosional valleys. The island has a central summit plateau, where it reachesthe maximum amplitude of 976 m a.s.l. at the Fontainhas peak. Day (2009) proposed10
that this plateau was produced by the infilling with pyroclastic rocks of a wide cen-tral collapse caldera (7 km×5 km), formed during a catastrophic explosive eruption.Phreatomagmatic craters are widespread in the summit plateau, perhaps due to inter-action of rising magmas with a major aquifer in the postulated caldera fill sequence(Day, 2009). Some phonolitic lava domes are also found, both on the plateau and on15
the outer flanks of the island (Machado, 1968; Madeira et al., 2010; Day, 2009), as arerare subaerial carbonatite lavas and pyroclastic deposits (Madeira et al., 2010).
Rock dating (Hoernle et al., 2002, Madeira et al., 2010) and the juvenile aspect ofseveral craters (Day, 2009; Mourão et al., 2010; Madeira et al., 2010) suggest that themost recent eruptive activity of Brava is Holocene in age. Volcanic hazards are mainly20
associated with phreatomagmatic eruptions, surge and pyroclastic deposits, and to alesser extend with lava flows (Machado et al., 1968; Day, 2009; Madeira et al., 2010).The geologically recent volcanic activity appears to have been very explosive, andphreatomagmatic craters are distributed densely on the central plateau, where 82 %of the population lives. Since there have been no historic eruptions in Brava, volcanic25
hazard awareness among the population and the authorities is very low.
5002

NHESSD1, 4997–5032, 2013
Cape Verde Islandsgeophysical network
B. Faria andJ. F. B. D. Fonseca
Title Page
Abstract Introduction
Conclusions References
Tables Figures
J I
J I
Back Close
Full Screen / Esc
Printer-friendly Version
Interactive Discussion
Discussion
Paper
|D
iscussionP
aper|
Discussion
Paper
|D
iscussionP
aper|
2.3 Santo Antão
Santo Antão, located in the northwest of the archipelago and with an area of 784 km2,is the second largest island of Cape Verde, with a population of about 44 000 inhab-itants spread widely across the island. The economy is based on cattle-raising andagriculture, which account for 35 % of the total food production in Cape Verde. It is5
shaped roughly like a triangular prism, whose arcuate crest, at the mean altitude of1400 m a.s.l., but rising to 1800 m in places, is formed by two plateaus (Fig. 3). One,the Planalto Leste, makes up the central part of the island, and the other, the PlanaltoNorte in the southwestern end of the island, hosts numerous scoria cones and the high-est peak of the island, the strato-volcano Topo de Coroa (1982 m a.s.l.). The slopes of10
the island are made of thick lava flows covered by sediments and pyroclastics rocks,and have been deeply dissected by erosion that has formed deep canyons, valleys andbasins (Tarff and Day, 2013, their Supplementary file 1; Plesner et al., 2002; Holm etal., 2006).
Plesner et al. (2002) established the first timeline for the evolution of the island,15
and the results suggest that the older rocks are at least 7.5 Ma old. After a hiatus of4.3 Ma the eruptive activity resumed at a lower eruption rate, and the last eruptionoccurred about 90 ka ago. Based on rock distribution, age and geochemistry, Holm etal. (2006) divided the evolution of Santo Antão in three main phases: from 7.5 to 2 Ma,composed mainly of basanite and phonolite rocks; from 2 to 0.3 Ma, composed mostly20
of basanite-phonolite, but also some incidence of nephelinite-phonolite, and from 0.4 to0.1 Ma, composed mainly of nephelinite-phonolite rocks. Tarff and Day (2013) inferredthe existence of three overlapping volcanic centres: Ribeira das Patas, Cova de Paúland Topo de Coroa and proposed that Ribeira das Patas centre is the oldest, andlargely extinct, whilst the other two are younger and both still active. Correlation of the25
distributions of rocks of these three centres with the dated rock location of Plesner etal. (2002) suggest that the activities of these three volcanic centers overlapped in time.
5003

NHESSD1, 4997–5032, 2013
Cape Verde Islandsgeophysical network
B. Faria andJ. F. B. D. Fonseca
Title Page
Abstract Introduction
Conclusions References
Tables Figures
J I
J I
Back Close
Full Screen / Esc
Printer-friendly Version
Interactive Discussion
Discussion
Paper
|D
iscussionP
aper|
Discussion
Paper
|D
iscussionP
aper|
Ribeira das Patas volcano, which is roughly in the center of the island (Fig. 3), ispresently a basin produced by the erosion of hydrothermally-altered lavas, opened tothe south, about 6 km in diameter and bounded by an arcuate cliff 900 m to 1000 mhigh (Tarff and Day, 2013; Plesner et al., 2002). The ages of Ribeira das Patas volcanolava flows range from 7.5 Ma to 1.1 Ma (Plesner at al., 2002). A particular feature of this5
volcano is a post-erosional scoria cone that formed inside the basin and whose lava is0.22 Ma old, meaning that the eruption occurred about 1 Ma after the last eruption ofRibeira das Patas volcano and after it had been completely eroded. This feature high-lights the intermittent eruptive activity in this island, with long periods of quiescence.
Cova de Paúl volcano, which forms most of the eastern half of Santo Antão, produced10
thick lava flows that overlap Ribeiras das Patas sequences (possibly infilling an east-facing collapse scar; Tarff and Day, 2013), and are now eroded by valleys up to 500 mdeep. Tarff and Day (2013) argue that the activity of this volcano occurred along threerift zones, with WSW, NE and SE directions, respectively, extending radially from asummit area with many phonolite domes (Fig. 3). A prominent feature of this volcano15
is a 300 m deep crater at the western end of the summit area with a diameter of 1 km,caused by a violent phreatomagmatic explosive eruption that produced pyroclastic flowand surge deposits (Tarff and Day, 2013). Plesner et al. (2002) give an age of 1.35 Mafor the oldest dated lava in this volcano, and 90 ka to the youngest flows.
Topo de Coroa volcanic center corresponds to 20 % of the surface of the island,20
towards its SW end (Fig. 3). It consists of numerous young fresh to very fresh sco-ria cones, phonolitic lava domes and spines. This volcanic center features a strato-volcano, also called Topo de Coroa (1982 m a.s.l.). According to Tarff and Day (2013)much of the activity of this volcano occurred along two rift zones both running from theeast end of the Planalto Norte to the northwest and to the southwest, respectively. The25
Planalto Norte plateau was built by the infilling with young volcanic rocks of two escarp-ments opened to the southwest, which Tarff and Day (2013) attribute to two successivelateral collapses. Masson at al. (2008) used multibeam and acoustic backscatter im-ages to map areas of blocky bathymetry offshore the island, which they interpreted
5004

NHESSD1, 4997–5032, 2013
Cape Verde Islandsgeophysical network
B. Faria andJ. F. B. D. Fonseca
Title Page
Abstract Introduction
Conclusions References
Tables Figures
J I
J I
Back Close
Full Screen / Esc
Printer-friendly Version
Interactive Discussion
Discussion
Paper
|D
iscussionP
aper|
Discussion
Paper
|D
iscussionP
aper|
as two different submarine debris avalanche deposits originating from Topo de Coroa.Airfall pumice deposits of phonolitic composition are found almost everywhere in theisland, but are especially thick (up to 8 m) in the Planalto Norte plateau. The vents ofat least two pumice explosions were inferred to belong to the Topo de Coroa volcaniccenter (Mortensen et al., 2009; Tarff and Day, 2013), which according to Plesner et al.,5
(2002) was active for about 3 Ma, from 3.24 Ma to 0.17 Ma.The potential volcanic hazards in Santo Antão are associated with lava flows, sco-
ria lapilli, pumice airfalls, pyroclastic flows and phreatomagmatic ash and surge de-posits. Lahars cannot be ruled out, since flash floods are very common in the deeplyincised valleys where non-volcanic but perhaps earthquake-triggered rockfalls and rock10
avalanches also occur. Earthquakes are felt very often, mainly near Topo de Coroa Vol-cano, where they frequently reach intensity IV (MMI), but also in the northeast of theisland in Cova de Paúl volcano. Thermal waters are common in Santo Antão, withreservoir temperatures reaching 78 ◦C and high CO2 concentration, up to 100 mg l−1
(Costa et al., 2001). Together with the seismicity, this geothermal activity indicates that15
the magmatic systems of the volcanic centres may still be active.
3 The network
The network is composed of fifteen seismic stations, in the islands of Santo Antão, S.Vicente, Sal, Fogo and Brava. It can be sub-divided into the Fogo-Brava and SantoAntão sub-networks. The additional stations in Sal and São Vicente islands help con-20
strain locations of more distant earthquakes, while providing limited monitoring of lo-cal events. All stations are equipped with analogue three-component broadband seis-mometers (Guralp CMG-3ESPC, with flat response between 60 s and 50 Hz) and 24 bitanalogue-to-digital converters (CMG-DM24). The data are sampled continuously at 50samples per second per component, and transmitted in real time to INMG in Mindelo25
(São Vicente island). Three tilt stations, equipped with Applied Geomechanics AGI-701-2A instruments, were installed in Fogo island, and the recorded data are also
5005
NHESSD1, 4997–5032, 2013
Cape Verde Islandsgeophysical network
B. Faria andJ. F. B. D. Fonseca
Title Page
Abstract Introduction
Conclusions References
Tables Figures
J I
J I
Back Close
Full Screen / Esc
Printer-friendly Version
Interactive Discussion
Discussion
Paper
|D
iscussionP
aper|
Discussion
Paper
|D
iscussionP
aper|
received at INMG in real time (see Fonseca et al., 2013, for the details on the strategyadopted for the telemetry of Fogo and Brava data).
The data received at INMG office in São Vicente are handled by a Guralp CMG-NAM computer and stored on a network-attached storage (NAS) with 2 TB capacity.Some automatic data processing procedures, such RSAM calculation (Endo and Mur-5
ray, 1991), are in place, and more detailed analysis including volcanic event classi-fication, source location and spectral analysis, performed with the SEISAN package(Ottemoller et al., 2012) and Matlab.
So far, a warning system is established only for Fogo, which is based on the fivelevels alert table developed by Faria (2010). In case of any anomaly, warning is trans-10
mitted to the National Civil Protection Service, which has the responsibility of risk man-agement in Cape Verde. As far as the others islands are concerned, the main goal ofthe network is to study the local seismicity, investigate whether there is any magmaticprocess, and then if necessary establish warning systems.
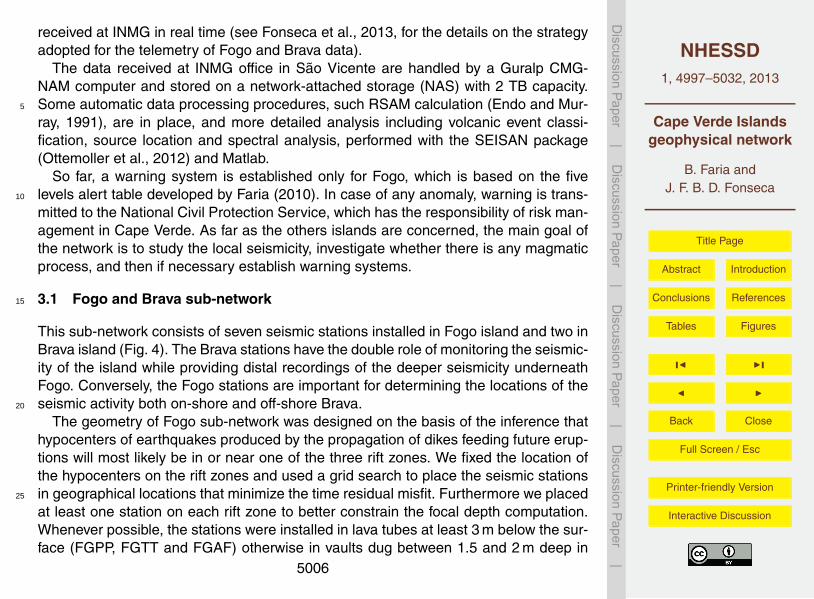
3.1 Fogo and Brava sub-network15
This sub-network consists of seven seismic stations installed in Fogo island and two inBrava island (Fig. 4). The Brava stations have the double role of monitoring the seismic-ity of the island while providing distal recordings of the deeper seismicity underneathFogo. Conversely, the Fogo stations are important for determining the locations of theseismic activity both on-shore and off-shore Brava.20
The geometry of Fogo sub-network was designed on the basis of the inference thathypocenters of earthquakes produced by the propagation of dikes feeding future erup-tions will most likely be in or near one of the three rift zones. We fixed the location ofthe hypocenters on the rift zones and used a grid search to place the seismic stationsin geographical locations that minimize the time residual misfit. Furthermore we placed25
at least one station on each rift zone to better constrain the focal depth computation.Whenever possible, the stations were installed in lava tubes at least 3 m below the sur-face (FGPP, FGTT and FGAF) otherwise in vaults dug between 1.5 and 2 m deep in
5006

NHESSD1, 4997–5032, 2013
Cape Verde Islandsgeophysical network
B. Faria andJ. F. B. D. Fonseca
Title Page
Abstract Introduction
Conclusions References
Tables Figures
J I
J I
Back Close
Full Screen / Esc
Printer-friendly Version
Interactive Discussion
Discussion
Paper
|D
iscussionP
aper|
Discussion
Paper
|D
iscussionP
aper|
hard rock. The tilt stations were installed in the seismic stations beside the seismome-ters (FGTT, FGMB and FGPP, Fig. 4) to take advantage of the infrastructure.
The locations of Brava seismic stations were chosen taking into account previousseismicity results from temporary networks (Heleno, 2001; Helffrich et al., 2006; Faria,2010; Grevemeyer et al., 2010), the local geology and the requirement of line-of-sight5
to the radio repeaters installed in Fogo (see Fonseca et al., 2013).
3.2 Santo Antão sub-network
This sub-network, deployed in July 2010, consists of four stations (Fig. 5). Its geometryresulted mainly from the information obtained by questioning of the population, be-tween 2000 and 2002, about felt earthquakes. This revealed the existence of intense10
seismic activity in the southwest and in the northeast, perhaps associated, respectivelywith the Topo de Coroa and Cova de Paúl volcanoes. The station vaults were dug 1.5 mdeep in hard rock.
Line-of-sight requirements for data transmission were also a constraint in the networkgeometry. Data are transmitted using two RS-232 links (Fig. 5), each one consisting15
of three spread spectrum radios (FreeWave FGR-115RC): one in the acquisition lab,configured as master, one in the station/repeater (SACO and SAMO) configured asslave/repeater, which transmits data of two stations; and finally one at the “hidden”stations (SAAJ, SATA), configured as slave.
3.3 Sal and São Vicente20
These two islands have a single seismic station each. The seismic station of Sal isinstalled in a 2 m deep well dug in a thick limestone layer. The data are recorded by anembedded computer in the station, which broadcasts the data using an ADSL Interntetconnection to a gateway in Santiago island (see Fonseca et al., this issue). In SãoVicente, the seismic station is installed almost in the middle of the island, on the slop25
of a hill over a ∼1 m thick basaltic dike. The data is telemetred using a RS-232 link,
5007

NHESSD1, 4997–5032, 2013
Cape Verde Islandsgeophysical network
B. Faria andJ. F. B. D. Fonseca
Title Page
Abstract Introduction
Conclusions References
Tables Figures
J I
J I
Back Close
Full Screen / Esc
Printer-friendly Version
Interactive Discussion
Discussion
Paper
|D
iscussionP
aper|
Discussion
Paper
|D
iscussionP
aper|
similar to those used in Santo Antão. This station has a particular relevance to thelocal seismic activity of Santo Antão as it provides key constraints on the locations ofthe larger recorded earthquakes.
4 First results and discussion
No seismic activity has been recorded to date from beneath the islands of Sal and São5
Vicente, so this discussion will focus on the activity in and near Fogo, Brava and SantoAntão.
4.1 Fogo
A variety of different classes of volcanic seismic events are recorded in Fogo. Themost frequent are: cigar-shaped (Fig. 6), hybrid, long-period, volcano-tectonic events10
and spasmodic tremor (Fig. 7).Since the deployment of the Fogo island stations (April 2011), the seismic rate of
cigar-shaped, hybrid and long-period events and spasmodic tremor has shown a sea-sonal variation. It peaks between September and November, the rainy season, andthen decreases to the background level (Fig. 8). This is similar to the pattern previously15
reported by Faria (2010) for data recorded in Fogo between 2001 and 2003. Theseevents are characterized by a lack of clear phases, and as a result it is not possibleto locate them by classical methods. To overcome this difficulty, the wavelet transforms(Vandergheynst et al., 2001) of the recorded seismograms were used to determineP phase arrival time, and by means of a grid search an approximate location of their20
source could be found. These locations are mostly below the crater of the 1995 erup-tion at focal depths ranging from 300 to 400 m below the surface of Chã das Caldeiras.Faria (2010) hypothesized that this seismicity, including the long-period events, is pro-duced by the hydrothermal activity resulting from percolation of rainwater down to hotrocks in and around the conduit that fed the 1995 eruption. More recently (May 2012),25
5008
NHESSD1, 4997–5032, 2013
Cape Verde Islandsgeophysical network
B. Faria andJ. F. B. D. Fonseca
Title Page
Abstract Introduction
Conclusions References
Tables Figures
J I
J I
Back Close
Full Screen / Esc
Printer-friendly Version
Interactive Discussion
Discussion
Paper
|D
iscussionP
aper|
Discussion
Paper
|D
iscussionP
aper|
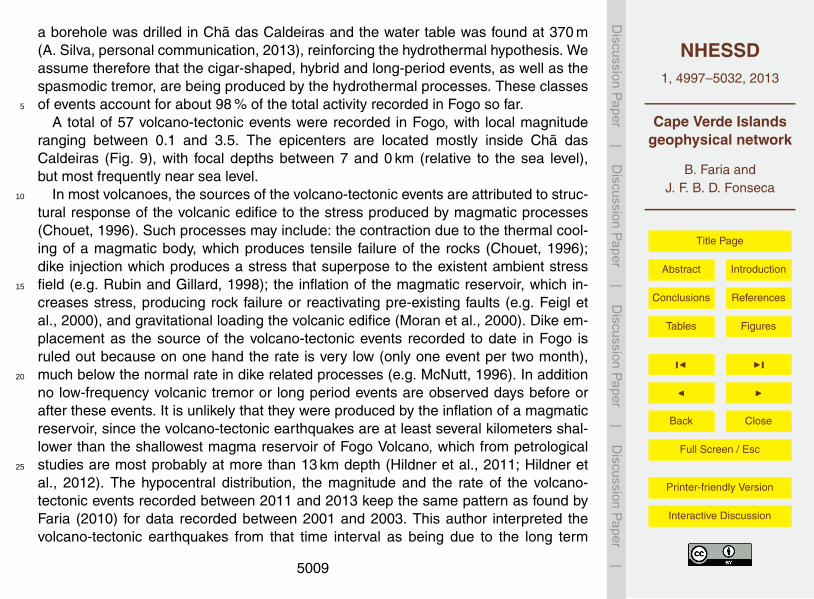
a borehole was drilled in Chã das Caldeiras and the water table was found at 370 m(A. Silva, personal communication, 2013), reinforcing the hydrothermal hypothesis. Weassume therefore that the cigar-shaped, hybrid and long-period events, as well as thespasmodic tremor, are being produced by the hydrothermal processes. These classesof events account for about 98 % of the total activity recorded in Fogo so far.5
A total of 57 volcano-tectonic events were recorded in Fogo, with local magnituderanging between 0.1 and 3.5. The epicenters are located mostly inside Chã dasCaldeiras (Fig. 9), with focal depths between 7 and 0 km (relative to the sea level),but most frequently near sea level.
In most volcanoes, the sources of the volcano-tectonic events are attributed to struc-10
tural response of the volcanic edifice to the stress produced by magmatic processes(Chouet, 1996). Such processes may include: the contraction due to the thermal cool-ing of a magmatic body, which produces tensile failure of the rocks (Chouet, 1996);dike injection which produces a stress that superpose to the existent ambient stressfield (e.g. Rubin and Gillard, 1998); the inflation of the magmatic reservoir, which in-15
creases stress, producing rock failure or reactivating pre-existing faults (e.g. Feigl etal., 2000), and gravitational loading the volcanic edifice (Moran et al., 2000). Dike em-placement as the source of the volcano-tectonic events recorded to date in Fogo isruled out because on one hand the rate is very low (only one event per two month),much below the normal rate in dike related processes (e.g. McNutt, 1996). In addition20
no low-frequency volcanic tremor or long period events are observed days before orafter these events. It is unlikely that they were produced by the inflation of a magmaticreservoir, since the volcano-tectonic earthquakes are at least several kilometers shal-lower than the shallowest magma reservoir of Fogo Volcano, which from petrologicalstudies are most probably at more than 13 km depth (Hildner et al., 2011; Hildner et25
al., 2012). The hypocentral distribution, the magnitude and the rate of the volcano-tectonic events recorded between 2011 and 2013 keep the same pattern as found byFaria (2010) for data recorded between 2001 and 2003. This author interpreted thevolcano-tectonic earthquakes from that time interval as being due to the long term
5009
NHESSD1, 4997–5032, 2013
Cape Verde Islandsgeophysical network
B. Faria andJ. F. B. D. Fonseca
Title Page
Abstract Introduction
Conclusions References
Tables Figures
J I
J I
Back Close
Full Screen / Esc
Printer-friendly Version
Interactive Discussion
Discussion
Paper
|D
iscussionP
aper|
Discussion
Paper
|D
iscussionP
aper|
gravitational re-adjustment of the collapse scar fill to inflation of the whole island pro-duced by the 1995 eruption, which produces shearing failure between fossil dikes andunconsolidated material at the collapse scar. This is also consistent with the structuralreconstruction of Fogo by Day et al. (1999), who proposed that the basal surface ofthe collapse scar was lined with an unconsolidated debris layer, approximately at sea5
level. We therefore attribute the volcano-tectonic events recorded since 2011 to thesame mechanism of shearing at the base of the collapse scar.
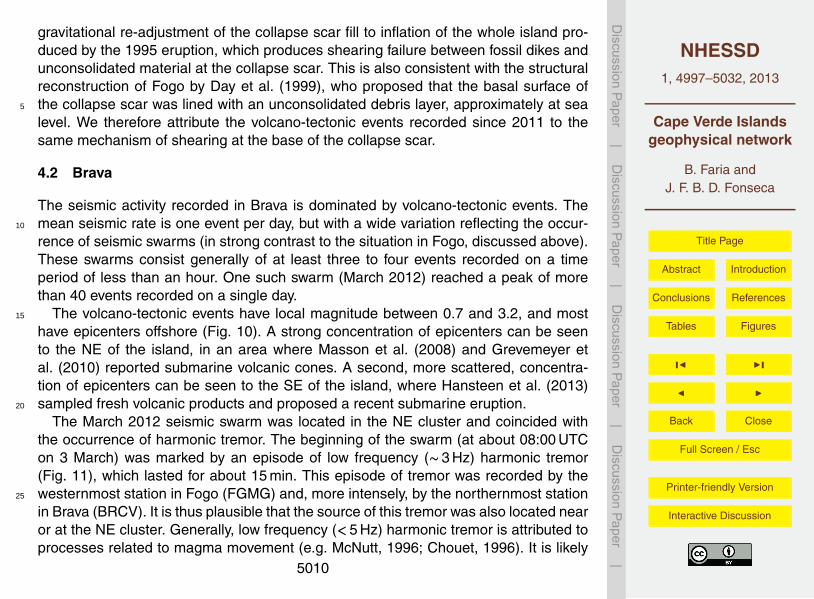
4.2 Brava
The seismic activity recorded in Brava is dominated by volcano-tectonic events. Themean seismic rate is one event per day, but with a wide variation reflecting the occur-10
rence of seismic swarms (in strong contrast to the situation in Fogo, discussed above).These swarms consist generally of at least three to four events recorded on a timeperiod of less than an hour. One such swarm (March 2012) reached a peak of morethan 40 events recorded on a single day.
The volcano-tectonic events have local magnitude between 0.7 and 3.2, and most15
have epicenters offshore (Fig. 10). A strong concentration of epicenters can be seento the NE of the island, in an area where Masson et al. (2008) and Grevemeyer etal. (2010) reported submarine volcanic cones. A second, more scattered, concentra-tion of epicenters can be seen to the SE of the island, where Hansteen et al. (2013)sampled fresh volcanic products and proposed a recent submarine eruption.20
The March 2012 seismic swarm was located in the NE cluster and coincided withthe occurrence of harmonic tremor. The beginning of the swarm (at about 08:00 UTCon 3 March) was marked by an episode of low frequency (∼3 Hz) harmonic tremor(Fig. 11), which lasted for about 15 min. This episode of tremor was recorded by thewesternmost station in Fogo (FGMG) and, more intensely, by the northernmost station25
in Brava (BRCV). It is thus plausible that the source of this tremor was also located nearor at the NE cluster. Generally, low frequency (<5 Hz) harmonic tremor is attributed toprocesses related to magma movement (e.g. McNutt, 1996; Chouet, 1996). It is likely
5010

NHESSD1, 4997–5032, 2013
Cape Verde Islandsgeophysical network
B. Faria andJ. F. B. D. Fonseca
Title Page
Abstract Introduction
Conclusions References
Tables Figures
J I
J I
Back Close
Full Screen / Esc
Printer-friendly Version
Interactive Discussion
Discussion
Paper
|D
iscussionP
aper|
Discussion
Paper
|D
iscussionP
aper|
that the swarm and harmonic tremor episodes were produced by magma intrusionunderneath a submarine volcano. This hypothesis is reinforced by the previous occur-rence of several high-frequency (> 5 Hz) harmonic tremor episodes recorded in Fogoand Brava between 1999 and 2002, which were interpreted as related to submarinevolcanic processes (Heleno et al., 2006).5
Day (2009), Madeira et al. (2010) and Ramalho (2009) propose that Brava is expe-riencing sustained uplift, which may be caused by crustal magmatic intrusions in formof sills or laccoliths. It is possible that part of the volcano-tectonic events, with focaldepths between 5 km and 10 km, are produced by these processes.
4.3 Santo Antão10
During the first three years of operation of the network on Santo Antão the seismicactivity observed consists mainly of volcano-tectonic events, medium-frequency eventsand harmonic volcanic tremor episodes. The local magnitudes range from 0.1 to 4.5.The mean rate is 3 events per day, but as is the case with Brava the rate varies widely,mainly due to frequent seismic swarms.15
The epicenters (Fig. 12) show a diffuse pattern, covering most of the island and ex-tending offshore to the NW and SW. Despite the diffuseness of the picture defined bythe offshore epicenters, Fig. 12 indicates that they are grouped in two main zones: oneto the NW and the other to the SW of Santo Antão. The NW group is geographicallycorrelated with Nola Seamount, and the SW with Charles Darwin Volcanic field, which20
was discovered recently (Masson et al., 2008). More recently, both Nola Seamount andCharles Darwin volcanic field were investigated in detail, by multibeam sonar bathymet-ric mapping and dredging (Hansteen et al., 2013). Charles Darwin volcanic field consistof a myriad of volcanic cones at more than 3000 m deep. Nola Seamount comprisestwo submarine peaks separated by a plateau at about 100 m deep. Young volcanic25
products were dredged from both, but no evidences of Holocene volcanic activity werefound on these submarine volcanic structures (Hansteen et al., 2013). However, the
5011

NHESSD1, 4997–5032, 2013
Cape Verde Islandsgeophysical network
B. Faria andJ. F. B. D. Fonseca
Title Page
Abstract Introduction
Conclusions References
Tables Figures
J I
J I
Back Close
Full Screen / Esc
Printer-friendly Version
Interactive Discussion
Discussion
Paper
|D
iscussionP
aper|
Discussion
Paper
|D
iscussionP
aper|
occurrence of frequent seismic swarms may indicate that the activity is associated withintrusive processes.
An important feature of the seismic activity onshore Santo Antão, with focal depthsbetween 3 and 13 km, is the frequent occurrence of swarms. A prominent one hap-pened in December 2011, which lasted for the whole month (Fig. 13a), and reached5
a peak of more than 70 volcanic-tectonic events in one day. Between 18:40 and 20:00(UTC) of 13 December, more than 30 events (Fig. 14) were observed. It was onlypossible to locate the first of these, on the SW rift zone of Topo de Coroa Volcano(Fig. 12). All the stations recorded a low frequency (∼2 Hz) harmonic volcanic tremorepisode (Fig. 14), beginning about 10 min before the start of this swarm, and lasting for10
at least 10 min. Towards the end of this seismic swarm, the medium-frequency eventrate increased and reached a local maximum in the first days of January 2012, when itdecreased exponentially back to the background level (Fig. 13b).
The sequence: (1) low-frequency (< 5 Hz) volcanic tremor episodes, (2) volcano-tectonic events located on the volcanic rift zones and finally (3) medium-frequency15
events, suggests that the seismic activity recorded in the December 2011–January2012 episode in Santo Antão, may have been associated with magmatic intrusion inthe SW rift zone of Topo de Coroa.
5 Conclusions
The distribution of seismic activity recorded by the Cape Verde Geophysical Network20
in its first few years of operation is consistent with previous geological studies thatindicate that, whilst infrequent volcanic activity may occur anywhere in the archipelagoand may show long-term cyclicity, volcanic activity and volcanic hazards are presentlyconcentrated in the western islands of Fogo, Brava and Santo Antão. In addition tosignificant numbers of events under these islands, offshore seismic activity probably25
related to submarine seamounts and volcanic fields was also recorded, indicating thatthese structures may be still active or are frequently subject to magmatic intrusions.
5012

NHESSD1, 4997–5032, 2013
Cape Verde Islandsgeophysical network
B. Faria andJ. F. B. D. Fonseca
Title Page
Abstract Introduction
Conclusions References
Tables Figures
J I
J I
Back Close
Full Screen / Esc
Printer-friendly Version
Interactive Discussion
Discussion
Paper
|D
iscussionP
aper|
Discussion
Paper
|D
iscussionP
aper|
Amongst the three western islands, Fogo displays the highest seismic rate, but itis dominated by seasonally-varying very shallow hydrothermal activity and by persis-tently low levels of volcano-tectonic earthquake activity, not associated with seismicswarms, that are linked to structural readjustments following the recent 1995 eruption.The seismic activity onshore and nearshore Brava and Santo Antão does occur in dis-5
crete swarms and is probably associated with magmatic intrusions either within thedeeper parts of the edifices or in underlying oceanic crust. This raises the possibility oferuptions on these islands in the near future. However, quantification of the probabilityof such eruptions as well as the assessment of the hazards that may result, requiresfurther investigation. Continued and extended monitoring, geophysical surveys of the10
subsurface structures of the volcanoes, and most especially detailed geological map-ping and absolute age dating of the younger volcanic sequences, are required to estab-lish the frequencies of occurrence of different types of volcanic activity on the differentislands and hence the probabilities of occurrence of different volcanic hazards.
Acknowledgements. Fogo seismic stations and telemetry were funded partially by the MIA-15
VITA project under Work Packages 3 and 6. The MIA-VITA project was financed by the Euro-pean Commission under the 7th Framework Programme for Research and Technological De-velopment, Area “Environment”, Activity 6.1 “Climate Change, Pollution and Risks”. INMG ac-knowledges CVTELECOM for hosting the repeaters in its facilities (Monte Tchota and AchadaFurna) and for providing technical support for the data transmission. Garantia (insurance)20
funded the solar panels of the stations of Santo Antão. The Municipalities of Santo Antãohave founded partially the network of that island. VIVO Energy (Shell, Cape Verde) is also ac-knowledged for the permanent availability to transport our equipment to Fogo. The support ofMinistry of Agriculture office in Santo Antão, particularly of Mr. Orlando Freitas, was crucial forthe deployment of the seismic stations in Santo Antão. The authors are grateful to S. Day for25
his careful review of the manuscript, comments and suggestion, and the provision of geologicalinformation for Brava, which was fundamental for the seismic stations site selection there.
5013

NHESSD1, 4997–5032, 2013
Cape Verde Islandsgeophysical network
B. Faria andJ. F. B. D. Fonseca
Title Page
Abstract Introduction
Conclusions References
Tables Figures
J I
J I
Back Close
Full Screen / Esc
Printer-friendly Version
Interactive Discussion
Discussion
Paper
|D
iscussionP
aper|
Discussion
Paper
|D
iscussionP
aper|
References
Ali, M. Y. and Watts, A. B.: A seismic reflection profile study of the lithospheric flexurein the vicinity of the Cape Verde Islands, J. Geophys. Res., Vol. 108, No. B5, 2239,doi:10.1029/2002JB002155, 2003.
Chouet, B. A.: New Methods and future trends in seismological volcano monitoring, in: Monitor-5
ing and mitigation of volcano hazards, edited by: Scarpa, R. and Tilling, R., Springer-Verlag,Berlin, 1996.
Costa, A., Atalaya, S., Reis, P., Pires, S., Monteiro, C., Fonseca, J., Alves, L., Miranda, V., GraçaCarvalho, M.: Análise do mercado energético e potencial de penetração de tecnologias eu-ropeias de energias renováveis em Cabo Verde, Relatório final, THERMIE type B action No10
STR/1938/98/PT, 2001.Courtney, R. C. and White, R. S.: Anomalous heat flow and geoid across the Cape Verde Rise:
evidence for dynamic support from a thermal plume in the mantle, Geophys. J. Astr. Soc.,87, 815–867, 1986.
Day, S. J.: Field Excursion to Brava, 24–25 June, MIA-VITA Workshop, São Filipe, Fogo, 2009.15
Day, S. and Faria, B.: A geological hazard map of the Island of Fogo showing broad distributionof volcanic and other hazards, MIA-VITA Workshop, São Filipe, Fogo, 2009.
Day, S. J., Heleno da Silva, S. I. N., and Fonseca, J. F. B. D.: A past giant lateral collapse andpresent-day flank instability of Fogo, Cape Verde Islands, J. Volcanol. Geotherm. Res., 94,191–218, 1999.20
Doucelance, R., Escrig, S., Moreira, M., Gariépy, C., and Kurz, M.: Pb-Sr-He isotope andtrace element geochemistry of the Cape Verde Archipelago, Geochim. Cosmochim. Acta,67, 3717–3733, 2003.
Duprat, H. I., Friis, J., Holm, P. M., Grandvuinet, T., and Sørensen, R. V.: The volcanic andgeochemical development of São Nicolau, Cape Verde Islands: constraints from field and2540Ar/39Ar evidence, J. Volcanol. Geotherm. Res., 162, 1–19, 2007.
Endo, E. T. and Murray, T.: Real-time Seismic Amplitude Measurement (RSAM): a volcanomonitoring and prediction tool, Bull. Volcanol., 53, 533–545, 1991.
Faria, B, Monitorização Geofísica do Vulcão do Fogo e Níveis de Alerta, Ph.D thesis, Universi-dade Técnica de Lisboa, 2010. (in Portuguese)30
5014

NHESSD1, 4997–5032, 2013
Cape Verde Islandsgeophysical network
B. Faria andJ. F. B. D. Fonseca
Title Page
Abstract Introduction
Conclusions References
Tables Figures
J I
J I
Back Close
Full Screen / Esc
Printer-friendly Version
Interactive Discussion
Discussion
Paper
|D
iscussionP
aper|
Discussion
Paper
|D
iscussionP
aper|
Feigl, K., Gasperi, J., Sigmundsson, F., and Rigo, A.: Crustal deformation near Hengill volcano,Iceland 1993-1998: Coupling between magmatic activity and faulting inferred from elasticmodeling of satellite radar interferograms, J. Geophys. Res. 105, 25 655–25 670, 2000.
Foeken, J., Day, S., and Stuart, F.: Cosmogenic 3He exposure dating of the Quaternary basaltsfrom Fogo, Cape Verdes: Implications for rift zone and magmatic reorganisation, Quaternary5
Geochron., 4, 37–49, doi:10.1016/j.quageo.2008.07.002, 2009.Fonseca J. B. D., Faria, B., Lima, N. P., Heleno, S. I. N., Lazaro, C., d’Oreye, N. F., Ferreira, A.
M. G., Barros, I. J. M., Santos, P., Bandomo, Z., Day, S., Osorio, J. P., Baio, M., and Matos,J. L. G.: Multiparameter monitoring of Fogo Island, Cape Verde, for volcanic risk mitigation,J. Volcanol. Geotherm. Res. 125, 39–56, 2003.10
Grevemeyer I., Helffrich, G., Faria, B., Booth-Rea, G., Schnabel, G., and Weinrebe, W.: Seismicactivity at Cadamosto seamount near Fogo Island, Cape Verdes – formation of a new oceanisland?, Geophys. J. Int., 180, 552–558, 2010.
Hansteen, T. H., Kwasnitschka, T., Klügel, A. (Eds.): Cape Verde Seamounts – R/V Meteorcruise No. 80 Leg 3, 29 December–1 February 2010, unpublished report, 2013.15
Heleno, S. I. N., Estudo Sismológico do Vulcão do Fogo, Ph.D thesis, Universidade Técnica deLisboa, 2001 (in Portuguese).
Heleno, S. I. N., Faria, B. V. E., Bandomo, Z., and Fonseca, J. F. B. D.: Observations of high-frequency narmonic tremor in Fogo, Cape Verde Islands, J. Volcanol. Geotherm. Res., 158,361–379, 2006.20
Helffrich, G., Heleno, S. I. N., Faria, B., and Fonseca, J. F. B. D.: Hydroacoustic detection ofvolcanic ocean-island earthquakes, Geophys. J. Int., 167, 1529–1536, 2006.
Helffrich, G., Faria, B., Fonseca, J., Lodge, A., and Kaneshima, S.: Transition zone structureunder a stationary hot spot: Cape Verde, Earth Planet. Sci. Lett., 289, 156–161, 2010.
Hildner, H., Klügle, A., and Hauff, F.: Magma storage and ascent during the 1995 eruption of25
Fogo, Cape Verde Archipelago, Contrib. Mineral Petrol, 162, 751–772, 2011.Hildner, H., Klügle, A., and Hansteen, T.: Barometry of lavas from 1951 eruption of Fogo, Cape
Verde Islands: Implications for historic and prehistoric magma plumbing system, J. Volcanol.Geotherm. Res., 217–218, 73–90, 2012.
Hoernle, K., Tilton, G., Le Bas, M. J., Duggen, S., and Garbe-Schönberg, D.: Geochemistry of30
oceanic carbonatites compared with continental carbonatites: mantle recycling of oceaniccrustal carbonate, Contrib. Mineral. Petrol., 142, 520–542, doi:10.1007/s004100100308,2002.
5015

NHESSD1, 4997–5032, 2013
Cape Verde Islandsgeophysical network
B. Faria andJ. F. B. D. Fonseca
Title Page
Abstract Introduction
Conclusions References
Tables Figures
J I
J I
Back Close
Full Screen / Esc
Printer-friendly Version
Interactive Discussion
Discussion
Paper
|D
iscussionP
aper|
Discussion
Paper
|D
iscussionP
aper|
Holm, P. M., Wilson, J. R., Kokfelt, T. F., Grandvuinet, T., Friis, J., and Plesner, S.: The agedistribution of volcanism on the Cape Verde Islands, Sal2005 International Workshop onOcean Island Volcanism, Ilha do Sal, 2–8 April, 2005.
Holm, P. M., Wilson, J. R., Christensen, B. P., Hansen, L., Hansen, S. L., Hein, K. M.,Mortensen, A. K., Pedersen, R., Plesner, S., and Runge, M. K.: Sampling the Cape Verde5
mantle plume: evolution of melt compositions on Santo Antão, Cape Verde Islands, J. Petrol.,47, 145–189, doi:10.1093/petrology/egi071, 2006.
Machado, F., Leme, J. A., and Monjardino, J. L.: Carta Geológica da Ilha Brava e dos IlhéusSecos, J. Inv. Ultramar, Lisboa, 1968.
Madeira, J., Mata, J., Mourão, C., Brum da Silveria, A., Martins, S., Ramalho, R., and Hoffmann,10
D. L.: Volcano-stratigraphic and structural evolution of Brava Island (Cape Verde) based on40Ar-39Ar, U-TH and field constrains, J. Volcanol. Geotherm. Res., 196, 219–235, 2010.
Masson, D. G., Le Bas, T. P., Grevemeyer, I., and Weinrebe, W.: Flank collapse and large-scalelandsliding in the Cape Verde Islands, off West Africa, Geochem. Geophys. Geosyst., 9,Q07015, doi:10.1029/2008GC001983, 2008.15
McNutt, S. R.: Seismic Monitoring and Eruption Forecasting of Volcanoes: A Review of theState-of-the-Art and Case Histories, in: Monitoring and Mitigation of Volcanic Hazards, editedby: Scarpa, R. and Tilling, R., Springer-Verlag, Berlin, 1996.
Monnereau, M. and Cazenave, A.: Depth and geoid anomalies over oceanic hotspots swells: Aglobal survey, J. Geophys. Res., 95, 15 429–15 438, 1990.20
Montelli, R., Nolet, G., Dahlen, F. A., and Masters, G.: A catalogue of deep mantle plumes:New results from finite-frequency tomography, Geochem. Geophys. Geosyst., 7, Q11007,doi:10.1029/2006GC001248, 2006.
Moran, S. C., Zimbelman, D. R., and Malone, S. D.: A model from the magmatic-hydrothermalsystem at Mount Rainer, Washington, for seismic and geochemical observations, Bull. Vol-25
canol., 61, 425–436, 2000.Mortensen, A. K., Wilson, J. R., Holm, P. M., The Cão Grande phonolitic fall deposit on Santo
Antão, Cape Verde Islands, J. Volcanol. Geortherm. Res., 179, 120–132, 2009.Mourão C., Mata, J., Doucelance, R., Madeira, J., Brum da Silveira, A., Silva, L. C.,
and Moreira, M.: Quaternary extrusive calciocarbonatite volcanism on Brava Island30
(Cape Verde): A nephelinite-carbonatite immiscibility product, J. African Earth Sci., 56,doi:10.1016/j.jafrearsci.2009.06.003, 59–74, 2010.
5016

NHESSD1, 4997–5032, 2013
Cape Verde Islandsgeophysical network
B. Faria andJ. F. B. D. Fonseca
Title Page
Abstract Introduction
Conclusions References
Tables Figures
J I
J I
Back Close
Full Screen / Esc
Printer-friendly Version
Interactive Discussion
Discussion
Paper
|D
iscussionP
aper|
Discussion
Paper
|D
iscussionP
aper|
Ottemöller L., Voss, P., and Havskov, J. (Eds.): SEISAN: The Earthquakes Analysis Software,Version 9.1, 2012.
Pim, J., Peirce, C., Watts, A. B., Grevemeyer, I., and Krabbenhoeft, A.: Crustal structure andthe origin of the Cape Verde Rise, Earth Planet. Sci. Lett., 272, 422–428, 2008.
Plesner, S., Holm, P. M., and Wilson, J. R.: 40Ar-39Ar geochronology of Santo Antão, Cape5
Verde Islands, J. Volcanol. Geotherm. Res., 120, 103–121, 2002.Ramalho, R.: Building the Cape Verde Islands, Ph.D. thesis, University of Bristol, 2009.Ramalho, R., Helffrich, G., Shimdt, D. N., and Vance, D.: Tracers of uplift and subsidence in
Cape Verde Archipelago, J. Geol. Soc. London, 167, 519–538, 2010.Ribeiro, O.: A ilha do Fogo e as suas erupções, 12a edição, Memórias, Série Geográfica, J. Inv.10
Ultramar, 1960.Rubin, A. M. and Gillard, D.: Dike-Induced earthquakes: Theoretical consideration. J. Geophys.
Res., 103, 10017–10030, 1998.Torres, P. C., Madeira, J., Silva, L. C., Brum da Silveira, A., Serralheiro, A. and Mota Gomes,
A.: Carta Geológica das erupções da ilha do Fogo: Revisão e actualização, in: A Erupção15
Vulcânica de 1995 na Ilha do Fogo, Cabo Verde, edited by: Rafega, A., Figueiredo, M. O.,Silva, L. C., Costa, F. L., Mendes, M. H., Torres, P. C., da Silva T. P., and Correia, E., Institutode Investigação Científica Tropical, Lisboa, 1997.
Tarff, R. W. and Day, S. J.: Chilled margin fragmentation as a trigger for transition from Strombo-lian to phreatomagmatic explosive activity at Cova de Paul Crater, Santo Antão, Cape Verde20
Islands, Bull. Volcanol., 75, 735, doi:10.1007/s00445-0130735-0, 2013.Vandergheynst, P., Antoine, J.-P., Van Vyve, E., Goldberg, A., and Doghri, I.: Modeling and
simulation of an impact test using wavelets, analytical solution and finite elements, Int. J.Sol. Struct., 38, 5481–5508, 2001.
Vinnik, L., Graça Silveira, S., Kiselev, V., Farra, M., Weber, M., and Stutzmann, E.: Cape Verde25
hotspot from the upper crust to the top of the lower mantle, Earth Planet. Sci. Lett., 319–320,259–268, 2012.
5017
NHESSD1, 4997–5032, 2013
Cape Verde Islandsgeophysical network
B. Faria andJ. F. B. D. Fonseca
Title Page
Abstract Introduction
Conclusions References
Tables Figures
J I
J I
Back Close
Full Screen / Esc
Printer-friendly Version
Interactive Discussion
Discussion
Paper
|D
iscussionP
aper|
Discussion
Paper
|D
iscussionP
aper|
Fig. 1. Map of the Cape Verde Archipelago, North Atlantic.
5018

NHESSD1, 4997–5032, 2013
Cape Verde Islandsgeophysical network
B. Faria andJ. F. B. D. Fonseca
Title Page
Abstract Introduction
Conclusions References
Tables Figures
J I
J I
Back Close
Full Screen / Esc
Printer-friendly Version
Interactive Discussion
Discussion
Paper
|D
iscussionP
aper|
Discussion
Paper
|D
iscussionP
aper|
Fig. 2. Right: perspective of Fogo from the South. Left: Fogo topographic map (STRM model),with its main morphologic features; contour lines are in meters. Adapted from Day et al. (1999)and Fonseca et al. (2003).
5019

NHESSD1, 4997–5032, 2013
Cape Verde Islandsgeophysical network
B. Faria andJ. F. B. D. Fonseca
Title Page
Abstract Introduction
Conclusions References
Tables Figures
J I
J I
Back Close
Full Screen / Esc
Printer-friendly Version
Interactive Discussion
Discussion
Paper
|D
iscussionP
aper|
Discussion
Paper
|D
iscussionP
aper|
Fig. 3. Topographic map (STRM model) and the main morphologic features of Santo Antão;contour lines are in meters. The locations of the volcanic rift zones are adapted from Tarff andDay (2013).
5020

NHESSD1, 4997–5032, 2013
Cape Verde Islandsgeophysical network
B. Faria andJ. F. B. D. Fonseca
Title Page
Abstract Introduction
Conclusions References
Tables Figures
J I
J I
Back Close
Full Screen / Esc
Printer-friendly Version
Interactive Discussion
Discussion
Paper
|D
iscussionP
aper|
Discussion
Paper
|D
iscussionP
aper|
Faria and Fonseca: Cape Verde Islands Geophysical Network 11
24˚45'W 24˚30'W 24˚15'W
14˚45'N
15˚00'N
0 5 10
km
0 500 1000 1500 2000 2500 3000
Height (m)
Broadband seismic stationBroadband seismic station
FGMAFGMA
FGMBFGMBFGTTFGTT
FGPPFGPP
FGMGFGMG
FGMVFGMV
BRCVBRCV
BRBLBRBL
FGAFFGAF
BravaBrava
FogoFogo
Fig. 4. Location of seismic stations of Fogo and Brava sub-network.Fig. 4. Location of seismic stations of Fogo and Brava sub-network.
5021

NHESSD1, 4997–5032, 2013
Cape Verde Islandsgeophysical network
B. Faria andJ. F. B. D. Fonseca
Title Page
Abstract Introduction
Conclusions References
Tables Figures
J I
J I
Back Close
Full Screen / Esc
Printer-friendly Version
Interactive Discussion
Discussion
Paper
|D
iscussionP
aper|
Discussion
Paper
|D
iscussionP
aper|
12 Faria and Fonseca: Cape Verde Islands Geophysical Network
!"!!!#$%&'
!"!!!#$%&'
!"!("#%%&'
!"!("#%%&'
!"!%)#$%&'
!"!%)#$%&'
!"!%%#%%&'
!"!%%#%%&'
!*!"!#$%&'
!*!"!#$%&'
(+!*"#%%&, (+!*"#%%&,
(+!"!#$%&, (+!"!#$%&,
()!%%#%%&, ()!%%#%%&,
()!%)#$%&, ()!%)#$%&,
% )-" ("
./
% (%% !%% $%% *%% "%% +%% )%% 0%% 1%% (%%% ((%% (!%% ($%% (*%% ("%% (+%% ()%% (0%% (1%% !%%%
23456789/:
;<=>;<=>
;<?<;<?<
;<@>;<@> ;<<A;<<A
B,@C!D;EB,@C!D;E;E@E;E@E
;E@<;E@<
FGHIJKILJ8M34M/4N8M7I74HLFGHIJKILJ8M34M/4N8M7I74HL
?3O3/37GP8O4L.?3O3/37GP8O4L.
;IL7H8<L7QH;IL7H8<L7QH
;QH8E4N3L73;QH8E4N3L73
Fig. 5. The seismic sub-network of Santo Antao and its telemetry. Also shown is the location of the station of Sao Vicente - SVMA.INMG-DSV stands for the INMG Laboratory in Sao Vicente.
Fig. 5. The seismic sub-network of Santo Antão and its telemetry. Also shown is the location ofthe station of São Vicente – SVMA. INMG-DSV stands for the INMG Laboratory in São Vicente.
5022

NHESSD1, 4997–5032, 2013
Cape Verde Islandsgeophysical network
B. Faria andJ. F. B. D. Fonseca
Title Page
Abstract Introduction
Conclusions References
Tables Figures
J I
J I
Back Close
Full Screen / Esc
Printer-friendly Version
Interactive Discussion
Discussion
Paper
|D
iscussionP
aper|
Discussion
Paper
|D
iscussionP
aper|
Faria and Fonseca: Cape Verde Islands Geophysical Network 13
Fig. 6. Example of a seismogram and spectrogram of a cigar-shaped event recorded in Fogo on the October 18 2011 at 07h30.Fig. 6. Example of a seismogram and spectrogram of a cigar-shaped event recorded in Fogoon the 18 October 2011 at 07:30 UTC.
5023

NHESSD1, 4997–5032, 2013
Cape Verde Islandsgeophysical network
B. Faria andJ. F. B. D. Fonseca
Title Page
Abstract Introduction
Conclusions References
Tables Figures
J I
J I
Back Close
Full Screen / Esc
Printer-friendly Version
Interactive Discussion
Discussion
Paper
|D
iscussionP
aper|
Discussion
Paper
|D
iscussionP
aper|
14 Faria and Fonseca: Cape Verde Islands Geophysical Network
Fig. 7. Example of a seismogram and spectrogram of a spasmodic tremor episode recorded few minutes after the cigar-shaped event of thefigure 6 and which lasted for about 2 hours.
Fig. 7. Example of a seismogram and spectrogram of a spasmodic tremor episode recordedfew minutes after the cigar-shaped event of the Fig. 6 and which lasted for about 2 h.
5024

NHESSD1, 4997–5032, 2013
Cape Verde Islandsgeophysical network
B. Faria andJ. F. B. D. Fonseca
Title Page
Abstract Introduction
Conclusions References
Tables Figures
J I
J I
Back Close
Full Screen / Esc
Printer-friendly Version
Interactive Discussion
Discussion
Paper
|D
iscussionP
aper|
Discussion
Paper
|D
iscussionP
aper|
Faria and Fonseca: Cape Verde Islands Geophysical Network 15
0
10
20
30
40
50
60
70
80
Eve
nts
pe
r d
ay
1 1 1 1 1 1 1 1 1
September October November December January February March April May
Days
Fig. 8. Evolution of the seismic activity rate recorded in Fogo, between September 2011 and May 2012.Fig. 8. Evolution of the seismic activity rate recorded in Fogo, between September 2011 andMay 2012.
5025

NHESSD1, 4997–5032, 2013
Cape Verde Islandsgeophysical network
B. Faria andJ. F. B. D. Fonseca
Title Page
Abstract Introduction
Conclusions References
Tables Figures
J I
J I
Back Close
Full Screen / Esc
Printer-friendly Version
Interactive Discussion
Discussion
Paper
|D
iscussionP
aper|
Discussion
Paper
|D
iscussionP
aper|
16 Faria and Fonseca: Cape Verde Islands Geophysical Network
Fig. 9. Location of the epicentres of the volcano-tectonic events of Fogo.Fig. 9. Location of the epicentres of the volcano-tectonic events of Fogo.
5026

NHESSD1, 4997–5032, 2013
Cape Verde Islandsgeophysical network
B. Faria andJ. F. B. D. Fonseca
Title Page
Abstract Introduction
Conclusions References
Tables Figures
J I
J I
Back Close
Full Screen / Esc
Printer-friendly Version
Interactive Discussion
Discussion
Paper
|D
iscussionP
aper|
Discussion
Paper
|D
iscussionP
aper|
Faria and Fonseca: Cape Verde Islands Geophysical Network 17
−4000
−3500
−3000
−300
−2500
−2500
−2000−1500
−1000−500
0
500
24˚30'W
15˚00'N
0 5 10
km
−4000 −3000 −2000 −1000 0
Depth (m)
Cadamosto SeamountCadamosto Seamount
BravaBrava
Fig. 10. Epicentral geographic distribution of the seismic events onshore and offshore of Brava. Cadamosto seamount is in the SW off Brava.Fig. 10. Epicentral geographic distribution of the seismic events onshore and offshore of Brava.Cadamosto seamount is in the SW off Brava.
5027

NHESSD1, 4997–5032, 2013
Cape Verde Islandsgeophysical network
B. Faria andJ. F. B. D. Fonseca
Title Page
Abstract Introduction
Conclusions References
Tables Figures
J I
J I
Back Close
Full Screen / Esc
Printer-friendly Version
Interactive Discussion
Discussion
Paper
|D
iscussionP
aper|
Discussion
Paper
|D
iscussionP
aper|
18 Faria and Fonseca: Cape Verde Islands Geophysical Network
Fig. 11. Spectrogram (left) of 15 min windows of vertical component of ground velocity of a harmonic tremor episode recorded on March 32012 at 08h00 UTC by BRCV (top) and FGMG (bottom) and the power spectra (right).
Fig. 11. Spectrogram (left) of 15 min windows of vertical component of ground velocity of aharmonic tremor episode recorded on 3 March 2012 at 08:00 UTC by BRCV (top) and FGMG(bottom) and the power spectra (right).
5028

NHESSD1, 4997–5032, 2013
Cape Verde Islandsgeophysical network
B. Faria andJ. F. B. D. Fonseca
Title Page
Abstract Introduction
Conclusions References
Tables Figures
J I
J I
Back Close
Full Screen / Esc
Printer-friendly Version
Interactive Discussion
Discussion
Paper
|D
iscussionP
aper|
Discussion
Paper
|D
iscussionP
aper|
Faria and Fonseca: Cape Verde Islands Geophysical Network 19
!!"##
!!### !$"##
!$"##
!$###
!$###
!$###
!%"##
!%"##
!%"##
!%###
!%###!%###
!"##
!"##
!"##
!"##
#
#
"##
"##
%###
%###
%"##
$"!!#&' $"!##&'
%(!##&)
%(!!#&)
# " %#
*+
!,### !!### !$### !%### #
-./0123+4
51678.92-67:;<2=>8?6<;?2@;.8A51678.92-67:;<2=>8?6<;?2@;.8A
)>862B.6+>C<0
)>862B.6+>C<0
BD2E<0F>
BD2E<0F>
Fig. 12. Geographic distribution of the epicentres of the seismic events located both onshore and offshore of Santo Antao (red dots) and theepicentre of the first VT event of the December 13 2011 crises (black dot).
Fig. 12. Geographic distribution of the epicentres of the seismic events located both onshoreand offshore of Santo Antão (red dots) and the epicentre of the first VT event of the 13 Decem-ber 2011 crises (black dot).
5029

NHESSD1, 4997–5032, 2013
Cape Verde Islandsgeophysical network
B. Faria andJ. F. B. D. Fonseca
Title Page
Abstract Introduction
Conclusions References
Tables Figures
J I
J I
Back Close
Full Screen / Esc
Printer-friendly Version
Interactive Discussion
Discussion
Paper
|D
iscussionP
aper|
Discussion
Paper
|D
iscussionP
aper|
20 Faria and Fonseca: Cape Verde Islands Geophysical Network
0
10
20
30
40
50
60
70
Events
per
day
1 1 1 1 1 1 1 1 1
September October NovemberDecember January February March April May
0
1
2
3
4
5
6
7
8
9
Events
per
day
1 1 1 1 1 1 1 1 1
September October NovemberDecember January February March April May
Days
a)
b)
Fig. 13. Evolution of the seismic activity rate of Santo Antao: for volcano-tectonic events (a) and for medium frequency events (b).Fig. 13. Evolution of the seismic activity rate of Santo Antão: for volcano-tectonic events (a)and for medium frequency events (b).
5030

NHESSD1, 4997–5032, 2013
Cape Verde Islandsgeophysical network
B. Faria andJ. F. B. D. Fonseca
Title Page
Abstract Introduction
Conclusions References
Tables Figures
J I
J I
Back Close
Full Screen / Esc
Printer-friendly Version
Interactive Discussion
Discussion
Paper
|D
iscussionP
aper|
Discussion
Paper
|D
iscussionP
aper|
Faria and Fonseca: Cape Verde Islands Geophysical Network 21
Fig. 14. Spectrogram (top) of 1 hour windows of vertical component of ground velocity of seismic swarm recorded on December 13 2011between 18h40 and 20h00 UTC, and the power spectra (bottom) of 10 minutes time window before the swarm. It is visible a peak around 2Hz.
Fig. 14. Spectrogram (top) of 1 h windows of vertical component of ground velocity of seismicswarm recorded on 13 December 2011 between 18:40 and 20:00 UTC, and the power spectra(bottom) of 10 min time window before the swarm. It is visible a peak around 2 Hz.
5031

NHESSD1, 4997–5032, 2013
Cape Verde Islandsgeophysical network
B. Faria andJ. F. B. D. Fonseca
Title Page
Abstract Introduction
Conclusions References
Tables Figures
J I
J I
Back Close
Full Screen / Esc
Printer-friendly Version
Interactive Discussion
Discussion
Paper
|D
iscussionP
aper|
Discussion
Paper
|D
iscussionP
aper|
22 Faria and Fonseca: Cape Verde Islands Geophysical Network
Fig. 15. Spectrogram (left) of vertical component of ground velocity of a medium frequency event recorded on January 1 2012 at 00h12UTC by SATA (top) and SAMO (bottom) and the power spectra (right) of the signal.
Fig. 15. Spectrogram (left) of vertical component of ground velocity of a medium frequencyevent recorded on 1 January 2012 at 00:12 UTC by SATA (top) and SAMO (bottom) and thepower spectra (right) of the signal.
5032