The "Hazards" of Extrapolating Survival Curves
12
The ‘‘Hazards’’ of Extrapolating Survival Curves Charlotte Davies, PhD, Andrew Briggs, DPhil, Paula Lorgelly, PhD, Go ¨ran Garellick, PhD, MD, Henrik Malchau, MD Background. It is widely recommended that health tech- nology appraisals adopt a lifetime horizon to assess the relative costs and benefits of an intervention. However, most trials or clinical studies have relatively short fol- low-up periods, with the event of interest not occurring before the end of the study for many subjects. In such cases, survival analysis using parametric models can be used to extrapolate into the future. Objective. To assess the accuracy of survival analysis in projecting future events beyond the sample estimation period. Design. Using a previously published comparison of 2 alternative hip replacement prostheses based on 8 years of data as a case study, we extend the data set to include 8 years more data. Using the new data, the parametric assump- tions of the previous study and its success in predicting the outcomes are assessed. Results. The extended data set casts doubt on the previous study’s findings. The failure curves of the 2 prostheses now cross, and the proportional hazards assumption no longer holds. Ex- trapolations from the original data set yielded very good predictions for one prosthesis for the full 16 years but were much poorer for the other, even when the pro- portionality assumption was relaxed. Conclusions. Care should be taken when extrapolating treatment benefits for new technologies early in their life cycle based on observational or randomized controlled trial data sour- ces. This case study reveals that predictions of prosthesis failure based on a short follow-up period were inaccurate compared with those after a longer period of follow-up. Key words: survival analysis; prediction; hip prostheses; economic evaluation. (Med Decis Making XXXX;XX: XXX–XXX) E conomic evaluation is widely used to inform policy decisions regarding which new health care technologies should be adopted given the avail- able resources. 1 The National Institute for Health and Clinical Excellence (NICE) provides guidance to the National Health Service (NHS) in England and Wales on the clinical and cost-effectiveness of new and already developed technologies and, within this, provides recommendations on the prin- ciples and methods of health technology appraisal. 2 In its guidance, NICE recommends that a lifetime horizon should normally be used to assess the rela- tive costs and benefits of the intervention. However, most randomized controlled trials or clinical studies have a relatively short follow-up period, with the event of interest often not occurring before the end of the study. This article highlights the difficulty of balancing the need for imminent decisions against inadequate follow-up data to inform those decisions. Survival analysis, which is concerned with the time until the occurrence of an event, is widely used in medical research to predict when an outcome of interest, such as death or failure, may occur for a given intervention 1 and in other academic disci- plines for analogous purposes, such as in economics for analyzing duration of unemployment. However, at any point in time, many patients in the data set have not had the event of interest: this is known as right censoring of the data. 3 Standard nonparametric survival analysis methods can be used to handle this, such as the Kaplan-Meier survivor function, Received 30 July 2010 from Health Economics Group, Norwich Medical School, University of East Anglia, United Kingdom (CD); Section of Pub- lic Health and Health Policy, University of Glasgow, United Kingdom (AB); Centre for Health Economics, Monash University, Australia (PL); Department of Orthopaedics, Sahlgrenska University Hospital, Swe- den, Swedish Hip Arthroplasty Register, Go ¨ teborg, Sweden (GG); and Harvard Medical School, Boston, Massachusetts, Swedish Hip Arthro- plasty Register, Go ¨ teborg, Sweden (HM). Presented at the Health Eco- nomics Study Group meeting, July 2009, Sheffield, England. Grants: Charlotte Davies receives an Arthritis Research UK foundation fellow- ship in Health Economics. Revision accepted for publication 31 October 2012. Address correspondence to Charlotte Davies, Health Economics Group, Norwich Medical School of Medicine, University of East Anglia, Norwich, NR4 7TJ, UK; e-mail: [email protected]. DOI: 10.1177/0272989X12475091 MEDICAL DECISION MAKING/MON–MON XXXX 1 by guest on June 2, 2016 mdm.sagepub.com Downloaded from
-
Upload
independent -
Category
Documents
-
view
0 -
download
0
Transcript of The "Hazards" of Extrapolating Survival Curves

The ‘‘Hazards’’ of ExtrapolatingSurvival Curves
Charlotte Davies, PhD, Andrew Briggs, DPhil, Paula Lorgelly, PhD,Goran Garellick, PhD, MD, Henrik Malchau, MD
Background. It is widely recommended that health tech-nology appraisals adopt a lifetime horizon to assess therelative costs and benefits of an intervention. However,most trials or clinical studies have relatively short fol-low-up periods, with the event of interest not occurringbefore the end of the study for many subjects. In suchcases, survival analysis using parametric models can beused to extrapolate into the future. Objective. To assessthe accuracy of survival analysis in projecting futureevents beyond the sample estimation period. Design.Using a previously published comparison of 2 alternativehip replacement prostheses based on 8 years of data asa case study, we extend the data set to include 8 yearsmore data. Using the new data, the parametric assump-tions of the previous study and its success in predictingthe outcomes are assessed. Results. The extended data
set casts doubt on the previous study’s findings. Thefailure curves of the 2 prostheses now cross, and theproportional hazards assumption no longer holds. Ex-trapolations from the original data set yielded verygood predictions for one prosthesis for the full 16 yearsbut were much poorer for the other, even when the pro-portionality assumption was relaxed. Conclusions. Careshould be taken when extrapolating treatment benefitsfor new technologies early in their life cycle based onobservational or randomized controlled trial data sour-ces. This case study reveals that predictions of prosthesisfailure based on a short follow-up period were inaccuratecompared with those after a longer period of follow-up.Key words: survival analysis; prediction; hip prostheses;economic evaluation. (Med Decis Making XXXX;XX:XXX–XXX)
Economic evaluation is widely used to informpolicy decisions regarding which new health
care technologies should be adopted given the avail-able resources.1 The National Institute for Healthand Clinical Excellence (NICE) provides guidanceto the National Health Service (NHS) in Englandand Wales on the clinical and cost-effectiveness of
new and already developed technologies and,within this, provides recommendations on the prin-ciples and methods of health technology appraisal.2
In its guidance, NICE recommends that a lifetimehorizon should normally be used to assess the rela-tive costs and benefits of the intervention. However,most randomized controlled trials or clinical studieshave a relatively short follow-up period, with theevent of interest often not occurring before the endof the study. This article highlights the difficultyof balancing the need for imminent decisions againstinadequate follow-up data to inform those decisions.
Survival analysis, which is concerned with thetime until the occurrence of an event, is widelyused in medical research to predict when an outcomeof interest, such as death or failure, may occur fora given intervention1 and in other academic disci-plines for analogous purposes, such as in economicsfor analyzing duration of unemployment. However,at any point in time, many patients in the data sethave not had the event of interest: this is known asright censoring of the data.3 Standard nonparametricsurvival analysis methods can be used to handlethis, such as the Kaplan-Meier survivor function,
Received 30 July 2010 from Health Economics Group, Norwich MedicalSchool, University of East Anglia, United Kingdom (CD); Section of Pub-lic Health and Health Policy, University of Glasgow, United Kingdom(AB); Centre for Health Economics, Monash University, Australia (PL);Department of Orthopaedics, Sahlgrenska University Hospital, Swe-den, Swedish Hip Arthroplasty Register, Goteborg, Sweden (GG); andHarvard Medical School, Boston, Massachusetts, Swedish Hip Arthro-plasty Register, Goteborg, Sweden (HM). Presented at the Health Eco-nomics Study Group meeting, July 2009, Sheffield, England. Grants:Charlotte Davies receives an Arthritis Research UK foundation fellow-ship in Health Economics. Revision accepted for publication 31 October2012.
Address correspondence to Charlotte Davies, Health EconomicsGroup, Norwich Medical School of Medicine, University of East Anglia,Norwich, NR4 7TJ, UK; e-mail: [email protected].
DOI: 10.1177/0272989X12475091
MEDICAL DECISION MAKING/MON–MON XXXX 1
by guest on June 2, 2016mdm.sagepub.comDownloaded from
whereas semi-parametric methods, such as the Coxproportional hazards model, can be employed toallow survival to depend on patient characteristics.3
For descriptive purposes, these are entirely satisfac-tory, but they are of limited use for extrapolationand prediction because they leave the baseline haz-ard function unspecified.1 Instead, parametric mod-els that assume a baseline hazard can be fitted tothe data and then used to extrapolate into the future.There are a range of alternative parametric distribu-tions that vary in how the baseline hazard is modeled.More recent developments in this field have addedflexibility to survival models in the form of piecewiseconstant models,4 as well as flexible 3- and 4-param-eter survival models,5 both of which seek to improvethe predictive ability of survival analysis.
In this article we use a case study, total hip replace-ment (THR) surgery, to explore the potential difficultiesof extrapolating survival curves over a lifetime horizon.THR provides a demanding example because there isoften a long period from implantation until revisionoccurs, usually from around 10 years onwards.6 Weuse a previous well-known study7,8 as an example(which in its earlier stages contributed to the NICE guid-ance on hip prostheses in 2000).9 We have extended theoriginal data set used in that study to include 8 yearsmore data and therefore are able to assess the accuracyof predictions that would have been made in 2000, inthe light of a longer time series, up to 2007.
The aim of this article is to assess the accuracy ofsurvival analysis in projecting future revision ratesbeyond the sample estimation period. Specifically,we consider how well extrapolations of the originalestimated parametric curves predict the outcomesover the subsequent years, and if they do poorly(which is the case here), we attempt to understandthe causes of the inaccurate predictions. We consider3 possible explanations: 1) the proportionalityassumption is inappropriate for modeling differencesbetween prostheses, 2) the failure curves do not fol-low the Weibull distribution, and 3) the Weibullmay be appropriate, but its parameters cannot be esti-mated accurately with so little early data.
METHODS
The purpose of the study by Briggs and others7,8
was to construct a probabilistic Markov cost-effectiveness model for primary THR. An importantrequirement for this model is information on thetransition probabilities between states of the model.Briggs and others derive these by estimating survival
functions for 2 prostheses, the Charnley and Spec-tron. It is these estimated survival functions that arethe focus of this article—we examine how well theypredict the subsequent survival of the prostheses forthe period 2000–2007.
Briggs and others8 model the risk of revision usingthe Weibull survival function, and to compare the 2prostheses, they make the common proportionalityassumption with respect to the effect of prosthesistype. That is, they assume that the survival of eachprosthesis could be described by a Weibull distribu-tion with the same gamma parameter (g) but allowingthe lambda (l) parameter to differ between the pros-theses. To aid interpretation, recall that the Weibulldistribution is characterized by 2 parameters—l
(scale) and g (shape)—with a hazard function: h(t) =gltg–1, where g . 1 (the slope of the hazard is increas-ing), g \ 1 (the hazard is decreasing), and g =1 (thehazard rate is constant), and the Weibull reduces tothe exponential distribution.
Briggs and others8 make a distinction between‘‘early’’ and ‘‘late’’ failures: early failures are identi-fied with reasons such as primary deep infectionand dislocation, whereas late failures are due to fail-ure of the prosthesis itself (general ‘‘wear and tear’’).They employ data on late failures from the SwedishNational Hip Arthroplasty Register (SR) to estimatesurvival, and it is these estimates that they use along-side health outcomes (quality-adjusted life years[QALYs]) and cost data to assess the relative cost-effectiveness of the 2 prostheses.
The SR contains information on prosthesis type(cemented, cementless, and hybrid), surgical proce-dure, patient characteristics, time to event data (pros-thesis failure and revision surgery), and reasons forrevision. Briggs and others8 employ data from SRfor the period 1992–1999. For this study, we haveaccess to 8 years of subsequent data, extending theperiod to 2007. As a first step, we recover from this16-year extended data set those patients who wouldhave appeared in the original Briggs et al. data set—that is, having had their primary surgery before2000. We then add updated information on the fateof those original cohort patients who did not revisepre-2000—that is, whether they revised, survived,or died in the following 8 years. Note that in the data-base, joint failure is defined as the decision to haverevision surgery (although problems with this defini-tion are acknowledged10).
Using this replication data, our analysis is under-taken sequentially in 6 stages. First, we confirm thatthe initial 8 years (1992–1999, hereafter denoted bySHORT) of our extended data appropriately replicate
DAVIES AND OTHERS
2 � MEDICAL DECISION MAKING/MON–MON XXXX
by guest on June 2, 2016mdm.sagepub.comDownloaded from
the original sample by Briggs and others8: in terms ofpatient characteristics and results (that is the failurecurves and the Cox proportional hazards model).We confirm that this replication is successful: ourdata set includes 98% of the participants reportedin Briggs and others.
Second, we apply the same nonparametric meth-ods to the extended 16-year data set, 1992–2007(hereafter denoted by LONG), which includes thosesame patients who appeared in the initial samplefrom Briggs and others.8 The extended data set(LONG), therefore, does not include any additionalpatients, just additional information regarding theoutcomes for patients who received revisions post-1999. Those who had not revised post-1999 remainrecorded as survivors until the date of censoring(end 2007) or their death. Using this extended dataset, we examine Briggs and others’ assumption of pro-portionality with respect to prosthesis type.
The third stage turns to the parametric methodsused by Briggs and others8 on the late failures. Theyfitted 6 alternative distributions (Weibull, exponen-tial, Gompertz, log-logistic, lognormal, and g) to thedata and compared the goodness of fit using the AIC(Akaike’s information criterion) and Cox-Snell resid-ual plots. Their preferred alternative was the Weibulldistribution, and thus we fit the Weibull distributionto our extended data (LONG) and compare the esti-mated parameters (we also test the fit of other distribu-tions in our extended data). This reveals considerabledifferences for the Weibull when estimated on theextended data set compared with the short timeperiod; the next 2 stages explore this in more detail.
In the fourth stage, we drop the assumption of pro-portional hazards for prosthesis type and reestimatethe Weibull model for each prosthesis separately forthe initial period and the extended data set.
In the fifth stage, we assess the predictive perfor-mance of the original estimated model by Briggsand others8 in terms of the outcomes for 2000–2007.In principle, the extrapolations (predictions) fromthe model by Briggs and others should be assessedagainst the actual survival rates for 2000–2007,but in practice, this is infeasible given that predic-tions depend on the characteristics of patients andwill therefore vary across patients in the sample.Our alternative approach is to compare the within-estimation period predictions for the years 9 to 16from the Weibull equations for an illustrative patient(woman aged 70 years old without a fracture). Wecompare the predictions using the initial 8-yeardata set (SHORT) against the LONG data set in 2 alter-native ways. First, we assume proportionality, as did
Briggs and others. Next, we relax the proportionalityassumption (i.e., use the original model specifica-tion) but estimate this separately for the Charnleyand Spectron. The former assesses the predictiveperformance of Briggs and others’ original estimatedequations, whereas the second assesses what their pre-dictions would have been had they not assumed propor-tionality. We also consider the effect that these newpredictions have on the resulting cost-effectivenessestimates by rerunning the Markov model with thenew failure estimates.
In the sixth stage, we extend the analysis beyondthat employed by Briggs and others,8 to further assessthe accuracy of both theirs and our findings. We allowfor more flexibility in the model by first relaxing theassumption that the relationship between age andtime until revision is linear. Second, we includeoperation date as an explanatory variable. Third, weconsider whether there might be multiplicative rela-tionships between the covariates and time and thusrun the model with interaction covariates. We alsorerun the model for alternative subperiods to furtherassess the robustness of the g parameter. Finally, weextend our parametric analysis beyond the Weibulldistribution, to assess whether the conclusions areaccurate, by rerunning the model using the Gompertzdistribution (assuming nonproportional hazards).
All statistical analysis was carried out usingSTATA SE version 11 (StataCorp, College Station,Texas) and Microsoft Excel 2007 (Microsoft Corpora-tion, Redmond, Washington) (for the cost-effectivenessmodel described in the Results section).
This study received no external funding.
RESULTS
Matching Data and Replicating Results byBriggs et al.8
Although we had access to Briggs and others’ orig-inal data,8 we were unable to merge in the new infor-mation on outcomes post-1999, so it was necessary tore-create their sample from the updated data set. Indoing so, we were able to identify 98.3% of allpatients in Briggs and others’ original data. The miss-ing 1.7% (n = 350) appear to be due to minor codingdiscrepancies. In all such cases, we erred on theside of caution and omitted these patients. Table 1presents the sample size, patient characteristics,and number of revisions as reported by Briggs et al.and for our replication data set. The descriptive sta-tistics show that the 2 samples are virtually identical
THE ‘‘HAZARDS’’ OF EXTRAPOLATING SURVIVAL CURVES
3
by guest on June 2, 2016mdm.sagepub.comDownloaded from

in terms of patient characteristics, age, and sex. How-ever, there is some variation in the initial diagnoses; itwould appear that the SR had some early issues withpoor-quality coding of diagnoses, which have nowbeen corrected.11
With comparability of the 2 data sets confirmed,we next replicate the nonparametric survival analysisby Briggs and others.8 Figure 1 shows the Kaplan-
Meier (KM) failure curves by prosthesis as in Briggsand others8 (cf. Figure 2, p. 28) for the replicationdata, confirming that nothing appears to have beenlost by excluding the 350 unmatched patients. Cru-cially, in Figure 1, as found by Briggs and others,there is a clear separation of the 2 failure curves.The significance of this separation is confirmed usinga log-rank test for equality of survivor functions,
Table 1 Summary Statistics Compared with the Replicated Data
Briggs and Othersa (1992–1999) Replication Data (1992–2007)Charnley Spectron Charnley Spectron
Patients 18,505 1990 18,178 1967Age, mean (SD) 72 (9.2) 74 (8.1) 71 (9.2) 74 (8.1)Age distribution, No. (%)
\40 years 70 (0.4) 5 (0.3) 66 (0.4) 5 (0.3)40–50 years 264 (1.4) 16 (0.8) 251 (1.4) 15 (0.8)50–60 years 1418 (7.7) 60 (3.0) 1389 (7.7) 60 (3.0)60–70 years 4836 (26.1) 391 (19.7) 4753 (26.1) 385 (19.6)70–80 years 8090 (43.7) 1014 (51.0) 7945 (43.7) 1000 (51.0)80–90 years 3630 (19.6) 481 (24.2) 3581 (19.6) 479 (24.3).90 years 197 (1.1) 23 (1.2) 193 (1.1) 23 (1.2)
Sex, No. (%)Female 12,337 (66.7) 1472 (74.0) 12,108 (66.7) 1453 (73.9)Male 6168 (33.3) 518 (26.0) 6070 (33.3) 514 (26.1)
Initial diagnosis, No. (%)Osteoarthritis 12,970 (70.1) 1348 (67.7) 12,826 (79.5) 1329 (69.8)Fracture 1692 (9.1) 319 (16.0) 1662 (10.3) 317 (16.6)Other 3843 (20.8) 323 (16.2) 1628 (10.1) 258 (13.5)
Revisions, No. (%)1992–1999 552 (2.98) 22 (1.10) 528 (2.90) 21 (1.07)1992–2007 1255 (6.90) 98 (4.98)
aSource: Briggs and others (Table 2, p. 42).8
Spectron
Charnley
0.00
0.01
0.02
0.03
0.04
0.05
0 2 4 6 8Time (years)
(1-S
(t))
Figure 1 Kaplan-Meier failure curves for replication sample,1992–1999 (SHORT).
Charnley
Spectron
0.00
0.05
0.10
0.15
0 5 10 15Time (years)
(1-S
(t))
Figure 2 Kaplan-Meier failure curves for replication sample,
1992–2007 (LONG).
DAVIES AND OTHERS
4 � MEDICAL DECISION MAKING/MON–MON XXXX
by guest on June 2, 2016mdm.sagepub.comDownloaded from
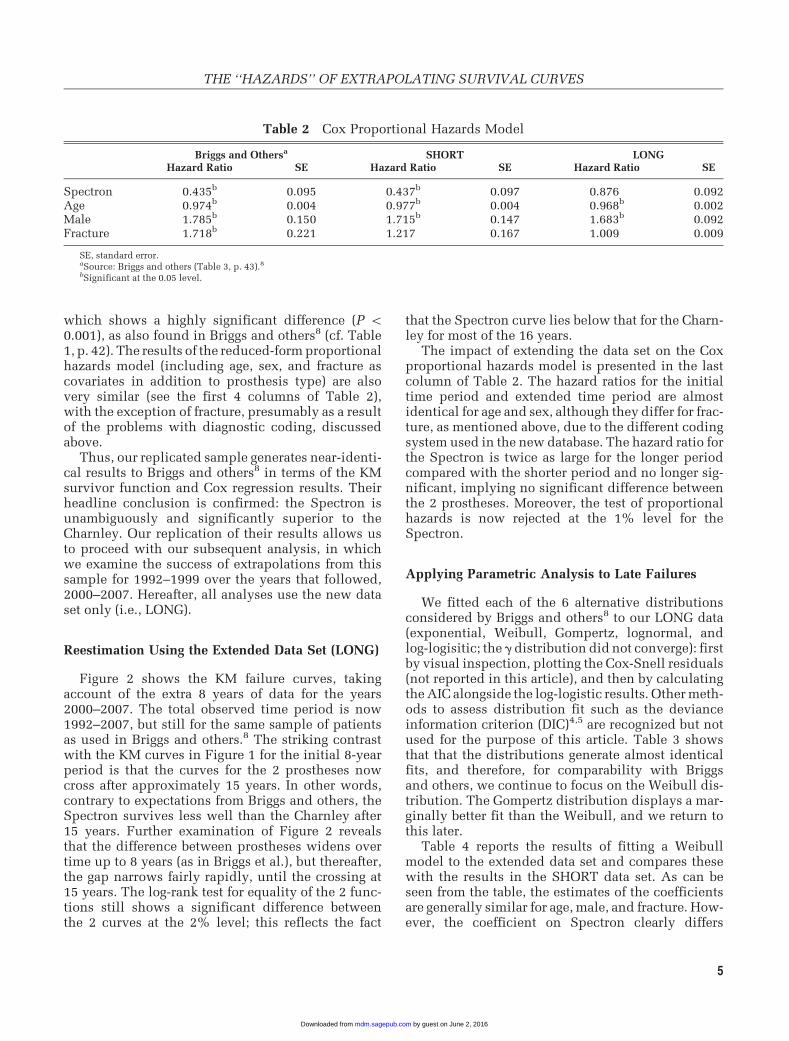
which shows a highly significant difference (P \0.001), as also found in Briggs and others8 (cf. Table1, p. 42). The results of the reduced-form proportionalhazards model (including age, sex, and fracture ascovariates in addition to prosthesis type) are alsovery similar (see the first 4 columns of Table 2),with the exception of fracture, presumably as a resultof the problems with diagnostic coding, discussedabove.
Thus, our replicated sample generates near-identi-cal results to Briggs and others8 in terms of the KMsurvivor function and Cox regression results. Theirheadline conclusion is confirmed: the Spectron isunambiguously and significantly superior to theCharnley. Our replication of their results allows usto proceed with our subsequent analysis, in whichwe examine the success of extrapolations from thissample for 1992–1999 over the years that followed,2000–2007. Hereafter, all analyses use the new dataset only (i.e., LONG).
Reestimation Using the Extended Data Set (LONG)
Figure 2 shows the KM failure curves, takingaccount of the extra 8 years of data for the years2000–2007. The total observed time period is now1992–2007, but still for the same sample of patientsas used in Briggs and others.8 The striking contrastwith the KM curves in Figure 1 for the initial 8-yearperiod is that the curves for the 2 prostheses nowcross after approximately 15 years. In other words,contrary to expectations from Briggs and others, theSpectron survives less well than the Charnley after15 years. Further examination of Figure 2 revealsthat the difference between prostheses widens overtime up to 8 years (as in Briggs et al.), but thereafter,the gap narrows fairly rapidly, until the crossing at15 years. The log-rank test for equality of the 2 func-tions still shows a significant difference betweenthe 2 curves at the 2% level; this reflects the fact
that the Spectron curve lies below that for the Charn-ley for most of the 16 years.
The impact of extending the data set on the Coxproportional hazards model is presented in the lastcolumn of Table 2. The hazard ratios for the initialtime period and extended time period are almostidentical for age and sex, although they differ for frac-ture, as mentioned above, due to the different codingsystem used in the new database. The hazard ratio forthe Spectron is twice as large for the longer periodcompared with the shorter period and no longer sig-nificant, implying no significant difference betweenthe 2 prostheses. Moreover, the test of proportionalhazards is now rejected at the 1% level for theSpectron.
Applying Parametric Analysis to Late Failures
We fitted each of the 6 alternative distributionsconsidered by Briggs and others8 to our LONG data(exponential, Weibull, Gompertz, lognormal, andlog-logisitic; the g distribution did not converge): firstby visual inspection, plotting the Cox-Snell residuals(not reported in this article), and then by calculatingthe AIC alongside the log-logistic results. Other meth-ods to assess distribution fit such as the devianceinformation criterion (DIC)4,5 are recognized but notused for the purpose of this article. Table 3 showsthat that the distributions generate almost identicalfits, and therefore, for comparability with Briggsand others, we continue to focus on the Weibull dis-tribution. The Gompertz distribution displays a mar-ginally better fit than the Weibull, and we return tothis later.
Table 4 reports the results of fitting a Weibullmodel to the extended data set and compares thesewith the results in the SHORT data set. As can beseen from the table, the estimates of the coefficientsare generally similar for age, male, and fracture. How-ever, the coefficient on Spectron clearly differs
Table 2 Cox Proportional Hazards Model
Briggs and Othersa SHORT LONGHazard Ratio SE Hazard Ratio SE Hazard Ratio SE
Spectron 0.435b 0.095 0.437b 0.097 0.876 0.092Age 0.974b 0.004 0.977b 0.004 0.968b 0.002Male 1.785b 0.150 1.715b 0.147 1.683b 0.092Fracture 1.718b 0.221 1.217 0.167 1.009 0.009
SE, standard error.aSource: Briggs and others (Table 3, p. 43).8bSignificant at the 0.05 level.
THE ‘‘HAZARDS’’ OF EXTRAPOLATING SURVIVAL CURVES
5
by guest on June 2, 2016mdm.sagepub.comDownloaded from
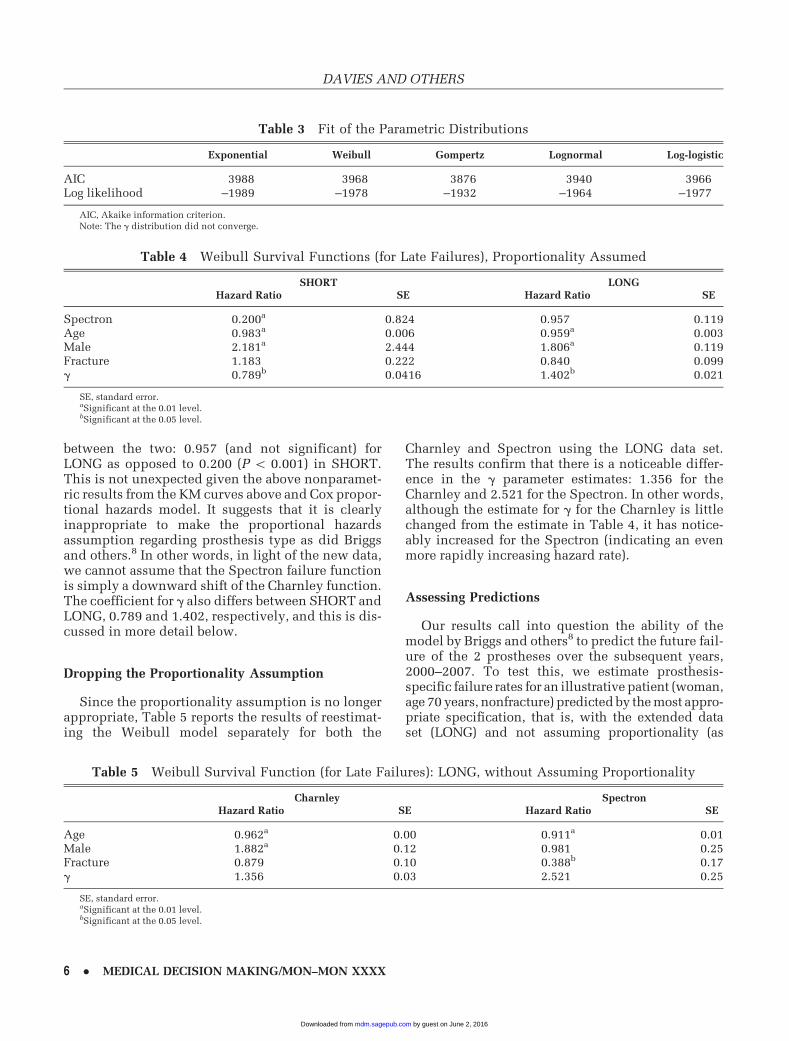
between the two: 0.957 (and not significant) forLONG as opposed to 0.200 (P \ 0.001) in SHORT.This is not unexpected given the above nonparamet-ric results from the KM curves above and Cox propor-tional hazards model. It suggests that it is clearlyinappropriate to make the proportional hazardsassumption regarding prosthesis type as did Briggsand others.8 In other words, in light of the new data,we cannot assume that the Spectron failure functionis simply a downward shift of the Charnley function.The coefficient for g also differs between SHORT andLONG, 0.789 and 1.402, respectively, and this is dis-cussed in more detail below.
Dropping the Proportionality Assumption
Since the proportionality assumption is no longerappropriate, Table 5 reports the results of reestimat-ing the Weibull model separately for both the
Charnley and Spectron using the LONG data set.The results confirm that there is a noticeable differ-ence in the g parameter estimates: 1.356 for theCharnley and 2.521 for the Spectron. In other words,although the estimate for g for the Charnley is littlechanged from the estimate in Table 4, it has notice-ably increased for the Spectron (indicating an evenmore rapidly increasing hazard rate).
Assessing Predictions
Our results call into question the ability of themodel by Briggs and others8 to predict the future fail-ure of the 2 prostheses over the subsequent years,2000–2007. To test this, we estimate prosthesis-specific failure rates for an illustrative patient (woman,age 70 years, nonfracture) predicted by the most appro-priate specification, that is, with the extended dataset (LONG) and not assuming proportionality (as
Table 3 Fit of the Parametric Distributions
Exponential Weibull Gompertz Lognormal Log-logistic
AIC 3988 3968 3876 3940 3966Log likelihood –1989 –1978 –1932 –1964 –1977
AIC, Akaike information criterion.Note: The g distribution did not converge.
Table 4 Weibull Survival Functions (for Late Failures), Proportionality Assumed
SHORT LONGHazard Ratio SE Hazard Ratio SE
Spectron 0.200a 0.824 0.957 0.119Age 0.983a 0.006 0.959a 0.003Male 2.181a 2.444 1.806a 0.119Fracture 1.183 0.222 0.840 0.099g 0.789b 0.0416 1.402b 0.021
SE, standard error.aSignificant at the 0.01 level.bSignificant at the 0.05 level.
Table 5 Weibull Survival Function (for Late Failures): LONG, without Assuming Proportionality
Charnley SpectronHazard Ratio SE Hazard Ratio SE
Age 0.962a 0.00 0.911a 0.01Male 1.882a 0.12 0.981 0.25Fracture 0.879 0.10 0.388b 0.17g 1.356 0.03 2.521 0.25
SE, standard error.aSignificant at the 0.01 level.bSignificant at the 0.05 level.
DAVIES AND OTHERS
6 � MEDICAL DECISION MAKING/MON–MON XXXX
by guest on June 2, 2016mdm.sagepub.comDownloaded from

presented in Table 5). These within-estimation periodpredictions can be interpreted as a proxy for the actualvalues or, less speculatively, simply as ‘‘better’’ predic-tions because they are based on 16 years of data andwithout the inappropriate proportionality assump-tion. These predictions are then compared with therates produced using SHORT, first assuming (as Briggsand others did) proportionality and then relaxing thisassumption.
Figure 3 show the results of the first approach(using SHORT, assuming proportionality) at assess-ing the predictive ability over 30 years. A projectionperiod of 30 years was chosen as it is sufficientlylong to cover the natural life expectancies of mostpatients and prostheses. For example, if a patient is70 years old when she undergoes revision surgery,then one might expect that the maximum age for revi-sion surgery would be no later than 100 years (due tooverall mortality and age-related comorbiditiesaffecting appropriateness for surgery). Note that inthe present database, the oldest patient undergoingrevision surgery is 99 years. Ideally, the choice ofthe most appropriate extrapolation period would bebased on the reported failure rates for the Charnleyand Spectron in the literature. However, most jointregistries (Swedish and the National Joint Registryfor England and Wales included) and the literature
only report up to 10-year failure rates by prosthesistype.11,12
These projected results are compared with LONG,which are within-period predictions estimated fromthe results presented in Table 5 without proportional-ity up to 16 years, whereas years 17 to 30 are predic-tions beyond this period. For SHORT, years 1 to 8 arewithin-period (derived from Table 4, first column)and years 9 to 30 are beyond-period extrapolationsas estimated from the equations. As can be seen, theWeibull for the Charnley (Figure 3) predicts futurefailure fairly accurately; the difference is nevermore than 0.02. For the Spectron, however, a differ-ence of nearly 0.03 has already emerged by year 8,and this then increases dramatically as we moveinto the extrapolation period (see Figure 3). By year16, the SHORT model predicts failure at 0.02, com-pared with 0.13 when employing the revised LONGWeibull without proportionality.
Further simulations find that there are similarorders of magnitude in the error for alternative illus-trative patients. For example, for a 60-year-old femalepatient, at 16 years, the SHORT model predicts fail-ure at 0.024 for a Spectron; this compares with a pre-dicted failure of 0.300 using the revised equation forLONG.
To compare predictions relaxing the proportional-ity assumption, we need to first reestimate theWeibull using the SHORT data without making theproportionality assumption. These results are shownin Table 6. Figure 4 shows the predictions fromSHORT, as Briggs and others8 would have derivedhad they not assumed proportionality. The predic-tions are almost unchanged from Figure 3; the Wei-bull continues to predict without noticeable errorsfor the Charnley but underpredicts substantially forthe Spectron. For instance, the ‘‘error’’ by year 16 isapproximately the same as that presented in Figure 3.To assess the effect of illustrative patient choice, thesame failure curves were again reproduced for
0
.1
.2
.3
.4
.5
0 10 20 30Time (years)
Spectron (long) Spectron (short)Charnley (long) Charnley (short)
1-S
(t)
Figure 3 Estimated Weibull failure curves: SHORT, assumingproportionality (as in Briggs and others8), compared with LONG
without proportionality. Estimate is for late failure, woman, aged
70 years, nonfracture. Fitted values are within-period estimates
for LONG up to 16 years and extrapolated for years 17 to 20, aswell as within-period extrapolations for years 1 to 8 but beyond-
period extrapolations for SHORT for years 9 to 20. Estimated
curves up to the 8-year vertical are fitted within period for SHORTdata. Estimated curves up to the 16-year vertical are fitted within
period for LONG data.
Table 6 Weibull Survival Functions (for Late Fail-ures): SHORT Reestimated without Proportionality
Charnley SpectronHazard Ratio SE Hazard Ratio SE
Age 0.970a 0.00 0.966 0.05Male 2.101a 0.23 2.192 1.81Fracture 1.072 0.20 1.339 1.50g 1.471 0.07 1.629 0.55
SE, standard error.aSignificant at the 0.01 level.
THE ‘‘HAZARDS’’ OF EXTRAPOLATING SURVIVAL CURVES
7
by guest on June 2, 2016mdm.sagepub.comDownloaded from
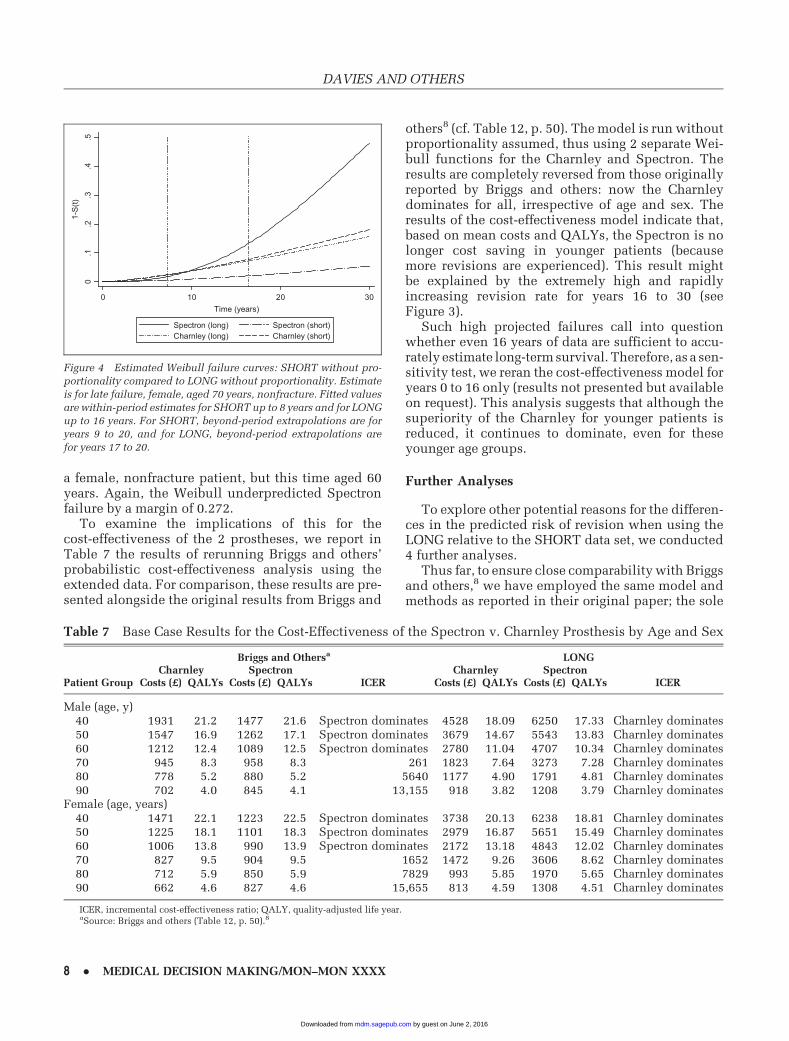
a female, nonfracture patient, but this time aged 60years. Again, the Weibull underpredicted Spectronfailure by a margin of 0.272.
To examine the implications of this for thecost-effectiveness of the 2 prostheses, we report inTable 7 the results of rerunning Briggs and others’probabilistic cost-effectiveness analysis using theextended data. For comparison, these results are pre-sented alongside the original results from Briggs and
others8 (cf. Table 12, p. 50). The model is run withoutproportionality assumed, thus using 2 separate Wei-bull functions for the Charnley and Spectron. Theresults are completely reversed from those originallyreported by Briggs and others: now the Charnleydominates for all, irrespective of age and sex. Theresults of the cost-effectiveness model indicate that,based on mean costs and QALYs, the Spectron is nolonger cost saving in younger patients (becausemore revisions are experienced). This result mightbe explained by the extremely high and rapidlyincreasing revision rate for years 16 to 30 (seeFigure 3).
Such high projected failures call into questionwhether even 16 years of data are sufficient to accu-rately estimate long-term survival. Therefore, as a sen-sitivity test, we reran the cost-effectiveness model foryears 0 to 16 only (results not presented but availableon request). This analysis suggests that although thesuperiority of the Charnley for younger patients isreduced, it continues to dominate, even for theseyounger age groups.
Further Analyses
To explore other potential reasons for the differen-ces in the predicted risk of revision when using theLONG relative to the SHORT data set, we conducted4 further analyses.
Thus far, to ensure close comparability with Briggsand others,8 we have employed the same model andmethods as reported in their original paper; the sole
0.1
.2.3
.4.5
0 10 20 30Time (years)
Spectron (long) Spectron (short)Charnley (long) Charnley (short)
1-S
(t)
Figure 4 Estimated Weibull failure curves: SHORT without pro-portionality compared to LONG without proportionality. Estimate
is for late failure, female, aged 70 years, nonfracture. Fitted values
are within-period estimates for SHORT up to 8 years and for LONG
up to 16 years. For SHORT, beyond-period extrapolations are foryears 9 to 20, and for LONG, beyond-period extrapolations are
for years 17 to 20.
Table 7 Base Case Results for the Cost-Effectiveness of the Spectron v. Charnley Prosthesis by Age and Sex
Briggs and Othersa LONGCharnley Spectron Charnley Spectron
Patient Group Costs (£) QALYs Costs (£) QALYs ICER Costs (£) QALYs Costs (£) QALYs ICER
Male (age, y)40 1931 21.2 1477 21.6 Spectron dominates 4528 18.09 6250 17.33 Charnley dominates50 1547 16.9 1262 17.1 Spectron dominates 3679 14.67 5543 13.83 Charnley dominates60 1212 12.4 1089 12.5 Spectron dominates 2780 11.04 4707 10.34 Charnley dominates70 945 8.3 958 8.3 261 1823 7.64 3273 7.28 Charnley dominates80 778 5.2 880 5.2 5640 1177 4.90 1791 4.81 Charnley dominates90 702 4.0 845 4.1 13,155 918 3.82 1208 3.79 Charnley dominates
Female (age, years)40 1471 22.1 1223 22.5 Spectron dominates 3738 20.13 6238 18.81 Charnley dominates50 1225 18.1 1101 18.3 Spectron dominates 2979 16.87 5651 15.49 Charnley dominates60 1006 13.8 990 13.9 Spectron dominates 2172 13.18 4843 12.02 Charnley dominates70 827 9.5 904 9.5 1652 1472 9.26 3606 8.62 Charnley dominates80 712 5.9 850 5.9 7829 993 5.85 1970 5.65 Charnley dominates90 662 4.6 827 4.6 15,655 813 4.59 1308 4.51 Charnley dominates
ICER, incremental cost-effectiveness ratio; QALY, quality-adjusted life year.aSource: Briggs and others (Table 12, p. 50).8
DAVIES AND OTHERS
8 � MEDICAL DECISION MAKING/MON–MON XXXX
by guest on June 2, 2016mdm.sagepub.comDownloaded from
exception has been to relax the assumption of propor-tional hazards. In this final set of results, we extendtheir framework to consider whether the apparentinstability of the Spectron failure function might bethe result of 1) misspecification of the model, 2) aninappropriate choice of distribution, 3) the timeperiod, or 4) the sample size. Due to space considera-tions, the specific details of the results summarizedbelow are not shown but are available from theauthors on request.
Allowing for More Flexibility in the FunctionalSpecification of the Model. The model was reesti-mated by allowing for nonlinearity in the age vari-able by including it in a quadratic form, adding thedate of operation as an explanatory variable, andintroducing multiplicative relationships betweenthe covariates and time (i.e., including time andcovariate interaction terms).
None of these extensions was found to add to theexplanatory power of the model, as judged by insig-nificant log-likelihood ratio tests. Most important,the headline result remains for all of these experi-ments: the estimated Weibull g parameter is stablebetween SHORT and LONG for the Charnley, butfor the Spectron, it increases from 1.6 to 2.1 forSHORT to 2.52 to 2.74 for LONG (depending onwhich precise combination of these new variables isused).
Replacing the Weibull with the Gompertz Distribu-tion. As described earlier, the Gompertz distributiondisplayed a marginally better fit than the Weibull(see Table 3). Therefore, to test the effect of distribu-tional choice, we reran the original model using theGompertz distribution, without assuming propor-tional hazards. Comparisons between SHORT andLONG in the estimated shape parameter (g) pro-duced similar unsatisfactory results as found forthe Weibull. The g estimate is insignificant whenestimated on SHORT for the Spectron, and it wouldappear that the instability between SHORT andLONG is not just confined to the Weibull distribution.
Rerunning the Model for Different Subperiods. Asan alternative to the methods used above to assessthe predictive power of the model, we reran theequation for a series of different, successively longersubperiods within the overall period (patientsreceiving the implant 1992–1993, 1992–1994,1992–1995, etc.), for Charnley and Spectron, LONGand SHORT, all without proportionality assumed.This allowed us to assess the accuracy of the g
parameter across different cohorts of patients. For
the Charnley, as for the full period, the estimated g
remained stable between SHORT and LONG foreach alternative subperiod. But for the Spectron, g
was always unstable between SHORT (in the range1.6–2.0, depending on the subperiod) and LONG(in the range 2.4–2.7).
Exploring the Impact of the Different SampleSizes for Charnley and Spectron. One potentialexplanation for the unsatisfactory results for theSpectron is that the sample of patients is muchsmaller (only about 10% the size of the sample) forthe Charnley. Although we were unable to increasethe Spectron sample, we were able to explore theimpact of reducing the Charnley sample to a sizesimilar to that of the Spectron. To do this, random10% subsamples of the Charnley sample were takento assess whether the estimated g parameter for theCharnley (between LONG and SHORT) mightbecome similarly unstable when estimated usinga small sample size. These analyses confirm thatthe g parameter for the Charnley persistently retainsits stability between LONG and SHORT. This sug-gests, albeit indirectly, that the instability of the g
parameter for the Spectron is unlikely to be a samplesize problem but rather may reflect some aspect ofthe prosthesis itself—for example, the fact that, atthe time of study, it was a relatively young prosthe-sis. We return to this possibility in the Discussion.
DISCUSSION
Summary of Main Findings
Our analysis finds that, with the addition of 8 yearsmore data, the Spectron remains superior to theCharnley in the early years, but at a declining rate,such that the failure rate of the Charnley becomessimilar and then better than the Spectron after 15years. This revised result is broadly consistent withthe data recently published in the SR annual report,11
in which the 10-year survival rate for the Charnley isreported as 92.6% for 1992–2000 (n = 20,368). For theSpectron, the SR reports a 14-year survival rate of97.5% for an older design, but this deteriorates to95% at an 11-year survival for a newer design (seebelow for a brief discussion of the technologicaldevelopment of the Spectron).
In terms of the original methodology by Briggs andothers,8 we find that the assumption of proportional-ity by prosthesis for the Charnley and Spectron is vio-lated and that the original estimate by Briggs andothers of the key parameter, g, is substantially revised
THE ‘‘HAZARDS’’ OF EXTRAPOLATING SURVIVAL CURVES
9
by guest on June 2, 2016mdm.sagepub.comDownloaded from
upwards for the Spectron. Our analysis shows that,even when the proportionality assumption is relaxed,this model would still have significantly underpre-dicted Spectron failure rates. We find that extrapola-tions of the estimated Weibull curve (as given inBriggs et al.) yield very poor predictions for the fail-ure of the Spectron in the 8 years after the originalestimation period. In turn, this means that the resulton relative cost-effectiveness is reversed in favor ofthe Charnley.
Explanation
The further analyses conducted above have failedto explain the instability of the Spectron failurecurve; thus, we return to the 3 possible explanationsset out earlier. First, it is now clear that the assump-tion by Briggs and others8 of a proportional impactof the prosthesis type proved to be inappropriate.Although modeling with proportional hazards is rel-atively common in survival models,4 our findingsdemonstrate that it is not necessarily justified.Despite this, we have shown that, in itself, thisassumption was not the cause of the poor predictionsfor the Spectron because the problem remains whentheir model is reestimated without assuming propor-tionality. Nevertheless, our finding implies thatsuch a specific assumption should probably not beemployed in future comparative studies of thistype, although this in itself does not invalidate theuse of survival analysis.
Second, we consider the performance of the Wei-bull distribution. We find no evidence that any ofthe alternative distributions suggested by Briggs andothers8 would have performed any better. Indeed,for the Charnley prosthesis, the Weibull ‘‘predicts’’remarkably accurately (Figures 3 and 4); the problemis confined to the Spectron.
Third is the possibility that although the Weibulldistribution may be appropriate, its estimated param-eters are unstable—in the sense that their magnitudesare sensitive to the addition of more data. For theCharnley, this is not the case: without assuming pro-portionality, the estimated g and other coefficientsappear to be fairly robust between the 8- and 16-year data: g = 1.471 (SHORT) and g = 1.356 (LONG)(Tables 6 and 5, respectively). However, for the Spec-tron, the g estimate rises substantially from 1.629 forSHORT to 2.521 for LONG. This appears to be thecrux of the matter—such a substantial shift in the g
parameter would inevitably lead to large revisionsin predicted values. This also explains why theassumption of proportionality was acceptable with
only 8 years, as in Briggs and others,8 but thenrejected in light of 16 years of data.
Implications for Practice and Policy
Our main purpose in using the Charnley and Spec-tron prostheses in this study was to assess the accu-racy of survival analysis in projecting future eventsbeyond the sample estimation period. More specifi-cally, we were interested in whether extrapolationsof original estimated parametric curves could suc-cessfully predict future outcomes.
For this specific case per se, our results raise somedoubts about the relative longer term failure of theSpectron cementless prosthesis. The Spectron wasa relatively new prosthesis at the time of the studyby Briggs and others,8 so it is possible that the pros-thesis itself was experiencing some problems duringthis period and that high failure rates post-1999reflect some unforeseen deterioration in the prosthe-sis itself. However, Spectron prostheses for a latercohort of patients (those receiving prosthesesbetween 2000 and 2007)—that is, after the Briggset al. estimation period—have shown even worse fail-ure rates (not shown). We can only speculate as to thecauses, and we stress that this has no direct bearingon the results of the present article—all of whichrelate to the original Briggs et al. cohort for 1992–1999. However, these results suggest that as the useof Spectron has increased, the outcomes have deteri-orated. This would imply that relatively new prosthe-ses (and, more generally, any new intervention wherethe event of interest occurs at a point far into thefuture) should be viewed more cautiously thanmore established prostheses (and interventions), forwhich both clinical learning and effectiveness maybe more established. For example, it is possible thatdevelopments in technical features,13 such as compo-nent (head and socket) size, finish, coating, and com-position of the Spectron (all of which may varyaccording to the patient’s anatomical requirements),may affect the failure rate. In fact, the most recentannual report for the SR11 reports that the ‘‘moderni-zation’’ undergone by the Spectron EF during themid-1990s actually worsened performance. Thenew designs of the Spectron have a narrower andshorter stem, which have subsequently been foundto increase the risk of loosening.
Limitations
Generalization of these results should be qualifiedby emphasizing that this analysis focuses only on
DAVIES AND OTHERS
10 � MEDICAL DECISION MAKING/MON–MON XXXX
by guest on June 2, 2016mdm.sagepub.comDownloaded from
data from 1 country, Sweden, and only on 2 brands ofprostheses, with a relatively small data set for one ofthem. It should also be acknowledged that, becauseour data set replicated the original data by Briggsand others,8 it could include only those explanatoryvariables that were available and used in their origi-nal analysis. The inclusion of further variables toallow for differences between both patients and pro-viders could provide a more accurate treatment ofany potential confounding in the analysis. For exam-ple, since 2002, patient-reported outcome measures(PROMs), specifically the EQ-5D and patient satisfac-tion, have been collected in the SR.11
More recently, researchers have started to recom-mend the use of external data and/or clinical validityfor assessing the plausibility of the extrapolated por-tion of survival models.4,5 We acknowledge that suchfurther analysis would have added to the complete-ness of the model.4 However, in the context of hipprostheses, external data on long-term prosthesis sur-vival are lacking, particularly on the newer prosthesistypes.14
Directions for Future Work
It is obvious that future research will require morelong-term follow-up data, and the recent introductionof the National Joint Registry (NJR) in 2003–2004 toEngland and Wales will provide an invaluable sourceof data to conduct future economic evaluations ofalternative prostheses. However, as we have shown,in the meantime, predicting prosthesis survival basedon data from a registry of 8 or 9 years is unlikely to besufficient to provide accurate predictions.
Although our analysis relates directly to extrapola-tion of failure rates for hip prostheses, the issueapplies to all interventions for which we need to esti-mate lifetime effects based on short-term data. Theaim of this article was to consider the original find-ings by Briggs and others8 in light of new extendeddata using the same parametric form (the Weibulldistribution). However, future work should considermethods for assessing the sensitivity of the cost-effectiveness decision to the different parametricforms of the survival models such as that discussedby Jackson et al.5 and by Gerdtham and Zethraeus.15
Cost-effectiveness analysis requires a long-termtime horizon for the intervention of interest, andinterventions with a delayed outcome of interest areclearly more complex to analyze. Extrapolation usingshort-term data should be as accurate as possible toavoid inconsistent estimates of the cost-effectivenessof the intervention. In the context of this article,
however, even if a shorter time horizon had beenadopted, the extrapolations still would have beeninaccurate due to the contrast between the successfulearly performance of the Spectron and its subsequentdeterioration in revision rates. We argue that withouta long-term panel of follow-up data on the outcomeof interest, such extrapolations may be highlyuncertain.
Alternative approaches to the one favored in thisarticle include fitting a piecewise constant hazardfunction4 and a flexible parametric approach devel-oped by Royston,16 which involves using naturalcubic splines to model a baseline survival functionusing the Aranda-Ordaz family of link functions.17
However, we do not believe that using either of theseapproaches would have helped in addressing the fun-damental issue concerning this article, which is thatthe shape of the failure curve changed significantlyoutside the initial period of observation.
In summary, this article highlights the difficulty ofbalancing the need for imminent decisions on adop-tion of new technologies against the lack of long-term follow-up data. This is a particularly pertinentproblem facing decision makers regarding the adop-tion of new medical devices (such as hip prostheses),where few randomized controlled trials exist due tothe length of time until the event of interest takesplace (in this case, failure of the prostheses). Untilfurther long-term data become available, we recom-mend a conservative approach to extrapolation ofsurvival curves, involving fitting and testing a rangeof survival models, which are then assessed by theirinternal and external validity. Latimer’s ‘‘survivalmodel selection process’’ algorithm4 suggests a sys-tematic approach for such an analysis.
ACKNOWLEDGMENTS
We thank the participants at the Health Economics StudyGroup meeting, July 2009, Sheffield, UK—in particular,Susan Griffin for her helpful discussion of the article and3 anonymous referees.
REFERENCES
1. Briggs A, Claxton K, Sculpher M. Decision Modelling for Health
Economic Evaluation. Oxford, UK: Oxford University Press; 2006.
2. National Institute for Clinical Excellence (NICE). Guide to the
Methods of Technology Appraisal. London, UK: NICE; 2008.
3. Cleves M, Gould W, Gutierrez R, Marchenko Y. An Introduction
to Survival Analysis Using Stata. 2nd ed. College Station, TX:
STATA Press; 2008.
THE ‘‘HAZARDS’’ OF EXTRAPOLATING SURVIVAL CURVES
11
by guest on June 2, 2016mdm.sagepub.comDownloaded from

4. Latimer N. NICE DSU Technical Support Document 14:
Survival Analysis for Economic Evaluations alongside Clinical
Trials—Extrapolations alongside Clinical Trials—Extrapolations
with Patient-Level Data. Sheffield: Report by the Decision Support
Unit; 2011.
5. Jackson CH, Sharples LD, Thompson SG. Survival models in
health economic evaluations: balancing fit and parsimony to
improve prediction. Int J Biostat. 2010;6(1):34.
6. Hardoon SL, Lewsey JD, van der Meulen JHP. Continuous mon-
itoring of long-term outcomes with application to hip prostheses.
Stat Med. 2007;26(28):5081–99.
7. Briggs A, Sculpher M, Dawson J, Fitzpatrick R, Murray D,
Malchau H. The use of probabilistic decision models in technology
assessment: the case of total hip replacement. Appl Health Econ
Health Policy. 2004;3(2):79–89.
8. Briggs A, Sculpher M, Dawson J, Fitzpatrick R, Murray D,
Malchau H. Modelling the cost-effectiveness of primary hip
replacement: how cost-effective is the Spectron compared to the
Charnley prosthesis? CHE Technical Paper 28. York, UK: Univer-
sity of York; 2003.
9. National Institute for Clinical Excellence (NICE). Full Guidance
on the Selection of Prostheses for Primary Total Hip Replacement.
London, UK: NICE; 2000.
10. Carr AJ, Morris RW, Murray DW, Pysent PB. Survival analysis
in joint replacement surgery. J Bone Joint Surg Br. 1993;75(2):
178–82.
11. Garellick G, Karrholm J, Rogmark C, Herberts P. Annual report
2010. Goteborg, Sweden: Swedish Hip Arthoplasty Register; 2010.
12. National Joint Registry. 7th Annual Report. London, UK:
National Joint Registry; 2010.
13. Issack PS, Botero HG, Hiebert RN, et al. Sixteen-year follow-up
of the cemented Spectron femoral stem for hip arthroplasty. J
Arthroplasty. 2003;18(7):925–30.
14. Davies C, Lorgelly P, Shemilt I, Mugford M, Tucker K, Macgre-
gor A. Can choices between alternative hip prostheses be evidence
based? A review of the economic evaluation literature. Cost Eff
Resour Alloc. 2010;8:20.
15. Gerdtham U-G, Zethraeus N. Predicting survival in cost-effec-
tiveness analyses based on clinical trials. Int J Technol Assess
Health Care. 2003;19(3):507–12.
16. Royston P. Flexible parametric alternatives to the Cox model:
update. Stata J. 2004;4(1):98–101.
17. Royston P. Flexible parametric alternatives to the Cox model,
and more. Stata J. 2001;1(1):1–28.
DAVIES AND OTHERS
12 � MEDICAL DECISION MAKING/MON–MON XXXX
by guest on June 2, 2016mdm.sagepub.comDownloaded from