Environmental Hazards, Migration, and Race
17
Environmental Hazards, Migration, and Race Lori M. Hunter University of Colorado at Boulder Michael J. White Brown University Jani S. Little Jeannette Sutton University of Colorado at Boulder This study contributes to our understanding of the association between internal mi- gration patterns and environmentally hazardous facilities, with a focus upon race- specific outmigration at the county-level, nationwide. Among research suggesting inequalities with regard to the social distribution of environmental risk, selective migration is often implied to be a key dynamic leading to differential exposure to proximate environmental hazards. Nonetheless, the models presented here provide no evidence of differential migratory response by race to environmentally hazard- ous facilities, net of a wide array of socioeconomic controls for labor force opportu- nity, climate, and demographic structure. Future research should consider these associations at more precise geographies and/or at the individual level. KEY WORDS: environmental hazards; migration; race. Most theory and much empirical research acknowledge that contextual characteristics matter in decisions about internal migration. For instance, as models of migration expanded beyond simple wage (cost) differential mod- els, the migration decision has been seen to be responsive to a variety of locational social characteristics, such as ethnic composition. Still, only a Please address correspondence to Lori Hunter, Program on Environment and Behavior, Institute of Behavioral Science, Department of Sociology, Campus Box 468, Boulder, CO 80309-0468; e-mail: [email protected]. Population and Environment, Vol. 25, No. 1, September 2003 2003 Human Sciences Press, Inc. 23
Transcript of Environmental Hazards, Migration, and Race

Environmental Hazards, Migration, and Race
Lori M. HunterUniversity of Colorado at Boulder
Michael J. WhiteBrown University
Jani S. LittleJeannette Sutton
University of Colorado at Boulder
This study contributes to our understanding of the association between internal mi-gration patterns and environmentally hazardous facilities, with a focus upon race-specific outmigration at the county-level, nationwide. Among research suggestinginequalities with regard to the social distribution of environmental risk, selectivemigration is often implied to be a key dynamic leading to differential exposure toproximate environmental hazards. Nonetheless, the models presented here provideno evidence of differential migratory response by race to environmentally hazard-ous facilities, net of a wide array of socioeconomic controls for labor force opportu-nity, climate, and demographic structure. Future research should consider theseassociations at more precise geographies and/or at the individual level.
KEY WORDS: environmental hazards; migration; race.
Most theory and much empirical research acknowledge that contextualcharacteristics matter in decisions about internal migration. For instance, asmodels of migration expanded beyond simple wage (cost) differential mod-els, the migration decision has been seen to be responsive to a variety oflocational social characteristics, such as ethnic composition. Still, only a
Please address correspondence to Lori Hunter, Program on Environment and Behavior,Institute of Behavioral Science, Department of Sociology, Campus Box 468, Boulder, CO80309-0468; e-mail: [email protected].
Population and Environment, Vol. 25, No. 1, September 2003 2003 Human Sciences Press, Inc. 23
24
POPULATION AND ENVIRONMENT
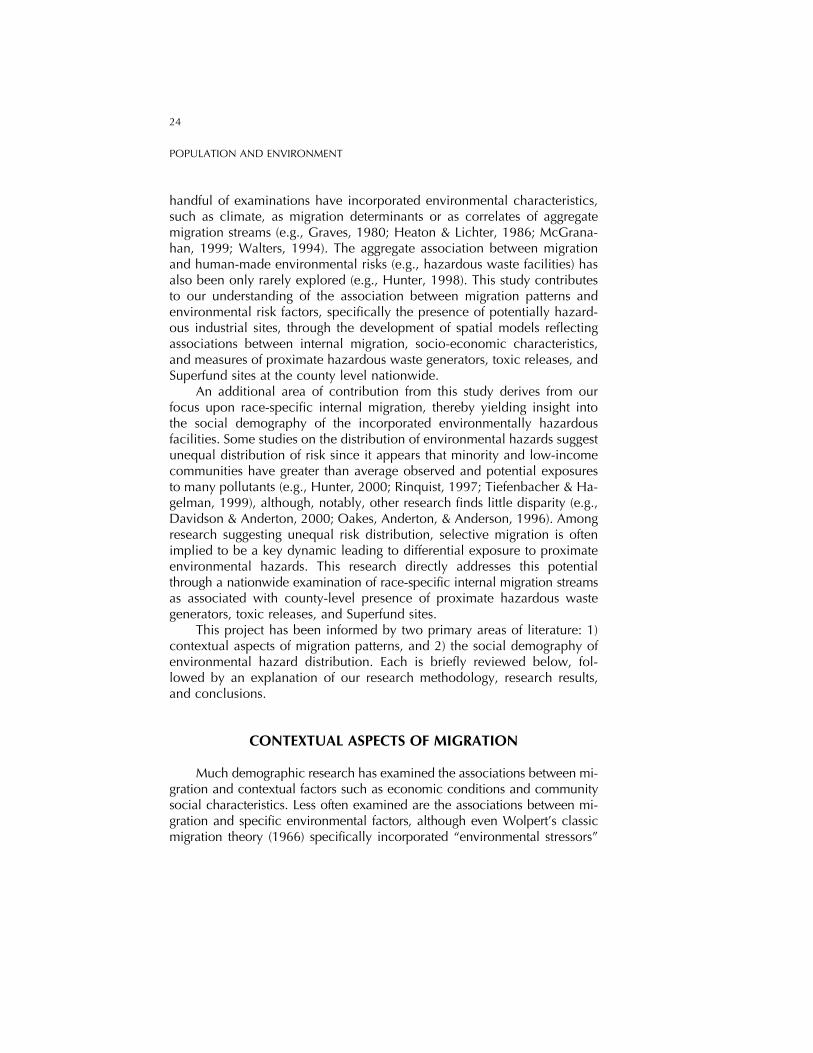
handful of examinations have incorporated environmental characteristics,such as climate, as migration determinants or as correlates of aggregatemigration streams (e.g., Graves, 1980; Heaton & Lichter, 1986; McGrana-han, 1999; Walters, 1994). The aggregate association between migrationand human-made environmental risks (e.g., hazardous waste facilities) hasalso been only rarely explored (e.g., Hunter, 1998). This study contributesto our understanding of the association between migration patterns andenvironmental risk factors, specifically the presence of potentially hazard-ous industrial sites, through the development of spatial models reflectingassociations between internal migration, socio-economic characteristics,and measures of proximate hazardous waste generators, toxic releases, andSuperfund sites at the county level nationwide.
An additional area of contribution from this study derives from ourfocus upon race-specific internal migration, thereby yielding insight intothe social demography of the incorporated environmentally hazardousfacilities. Some studies on the distribution of environmental hazards suggestunequal distribution of risk since it appears that minority and low-incomecommunities have greater than average observed and potential exposuresto many pollutants (e.g., Hunter, 2000; Rinquist, 1997; Tiefenbacher & Ha-gelman, 1999), although, notably, other research finds little disparity (e.g.,Davidson & Anderton, 2000; Oakes, Anderton, & Anderson, 1996). Amongresearch suggesting unequal risk distribution, selective migration is oftenimplied to be a key dynamic leading to differential exposure to proximateenvironmental hazards. This research directly addresses this potentialthrough a nationwide examination of race-specific internal migration streamsas associated with county-level presence of proximate hazardous wastegenerators, toxic releases, and Superfund sites.
This project has been informed by two primary areas of literature: 1)contextual aspects of migration patterns, and 2) the social demography ofenvironmental hazard distribution. Each is briefly reviewed below, fol-lowed by an explanation of our research methodology, research results,and conclusions.
CONTEXTUAL ASPECTS OF MIGRATION
Much demographic research has examined the associations between mi-gration and contextual factors such as economic conditions and communitysocial characteristics. Less often examined are the associations between mi-gration and specific environmental factors, although even Wolpert’s classicmigration theory (1966) specifically incorporated “environmental stressors”

25
L. M. HUNTER, M. J. WHITE, J. S. LITTLE, AND J. SUTTON
as components of evaluation of place utility within the migration decision-making process. Proximate environmentally hazardous facilities may repre-sent “stressors” and act to lessen the attractiveness of particular locales.Research does, indeed, suggest that individuals exhibit partiality towardspollution-free residential surroundings (e.g., Blackwood & Carpenter, 1978;Greenwood et al., 1997). Further evidence for these types of preferences isprovided by the public protest often surrounding proposals for new environ-mental hazards, “locally-unwanted land uses” (LULUs) (e.g., Lober, 1995).The link between migration and these environmental concerns was exam-ined by McAuley and Nutty (1982), who found that although housing costsrank consistently among the most important local factors, “healthiness ofthe local environment (clean air, water, etc.)” ranked second or third inimportance among those in earlier stages of the life cycle. Hsieh and Liu(1983) also note that environmental quality is an important factor explain-ing short-run (across 1–2 year periods) interregional migration.
While environmental pollution or other risks may represent negativelocational characteristics, positive environmental attributes increase desti-nation attractiveness. Econometric migration models have revealed associa-tions with locational amenities (e.g., Knapp & Graves, 1989) and somesuggest that an indication of the societal value placed upon such amenitiesis reflected in wage differentials across locations (Knapp & Graves, 1989).Certainly in the conventional economic model, population movement actsas an equilibrating mechanism reducing geographic wage differentials (Da-Vanzo, 1981), yet these wage differentials are, themselves, often due tovariation in location-specific amenities (e.g., Graves, 1983; Graves & Mueser,1993; Knapp & Graves, 1989; Mathur et al., 1988; von Reichert & Rudzitis,1994). The existence of location-specific amenities (or disamenities) is im-portant, because migration is the only way to consume (or avoid) them. Tobe more specific, individuals might accept somewhat lower pay to residein a location with an attractive climate or other environmental amenities;conversely, individuals might have to receive higher compensation to con-tinue to live in an environmentally unattractive locale.
As such, as an alternative to the notion of “flight” from environmentallyrisky areas, we might think of the tradeoffs that households consider intheir quest for a satisfactory residential environment. The earliest economicframeworks posited that migrants tend to choose destinations that offer thehighest level of benefits. As defined by Graves (1983, p. 542), these benefitsare, “at the most general level, the variations in utility that result from occu-pying alternative locations.” As an example, Nelson (1978) quantifies thevalue of air quality as the impact of air pollution on residential propertyvalues, and suggests that households more sensitive to the tangible and

26
POPULATION AND ENVIRONMENT
intangible effects of air pollution will take up residence in areas with rela-tively clean air. These types of arguments suggest that socioeconomicallydisadvantaged households may be more willing to accept proximate envi-ronmental risk in order to achieve affordable housing.
MIGRATION AND THE SOCIAL DISTRIBUTIONOF ENVIRONMENTALLY HAZARDOUS FACILITIES
Related to the view that disamenities may play a role in tradeoffs inproximate environmental quality, several recent studies on the social distri-bution of environmental hazards suggest minority and low-income commu-nities have greater than average observed and potential exposures to manypollutants (e.g., Hunter, 2000; Rinquist, 1997; Tiefenbacher & Hagelman,1999), although other studies have notably found no such inequalities (e.g.,Oakes, Anderton, & Anderson, 1996). These cross-sectional studies werefollowed by longitudinal investigations of the timing of facility placementas related to community socioeconomic factors, in order to better examinethe processes that may potentially lead to unequal risk exposure. Manystudies have implied, either directly or indirectly, that selective migrationis a key dynamic leading to environmental inequalities, where market dy-namics lead to lowered property values and socioeconomically “advan-taged” populations move out, while those unable to leave remain behind.
As examples of such studies, Shaikh and Davis (1999) found that,within the Denver metropolitan area, hazardous facility siting appears re-lated to income, rent, and unemployment. They explored migration pat-terns in relation to market dynamics, finding that communities with one ormore hazardous facilities experienced more rapid declines in white popula-tions relative to communities without such hazards. Lowered property val-ues as related to the social distribution of hazards are also mentioned byBrooks and Sethi (1997), as their cross-sectional analyses suggests thatblack communities experience higher pollution levels due to (1) inequitablesiting practices that specifically target politically vulnerable communities;and (2) a housing market that selectively prevents members of such com-munities from escaping exposure through migration to less-exposed areas.Boer et al. (1997) echo these findings within a Los Angeles County casestudy finding that communities most affected by facilities that treat, store,or dispose of hazardous waste are working-class communities of color. Mi-gration patterns as related to areas of environmental risk are seen as directlyrelated to a lack of choice over a broader residential market, leading tomore minorities moving into areas with potential hazards than even Anglosof similar income levels. They argue that as hazardous waste facility place-

27
L. M. HUNTER, M. J. WHITE, J. S. LITTLE, AND J. SUTTON
ment drives down local property values, housing becomes increasingly oc-cupied by households of lower socioeconomic status. As a final example,Mitchell et al. (1999) compared community population composition at thetime of siting with present compositions, finding increased socioeconomicdisadvantage surrounding facility locations across time. The researchers at-tribute community contextual changes to housing market dynamics andselective migration patterns.
RESEARCH QUESTION AND HYPOTHESIS
We test the proposition that socioeconomically disadvantaged popula-tions are less responsive to proximate environmentally hazardous facilitiesfrom the perspective that lower SES populations possess less ability to “votewith their feet” by relocating to areas posing lower levels of risk. Fromanother perspective, it is possible that socioeconomically disadvantagedgroups may make tradeoffs, in the sense that housing prices tend to declineas housing quality and neighborhood amenities decrease. By contrast, thepresence of environmentally hazardous facilities should act as a substantialneighborhood disamenity, “pushing” socioeconomically advantaged groupsfrom such risky locales. To be clear, our work examines aggregate associa-tions through modeling of the correlates of demographic patterns acrossgeographic units. Our analyses do not, therefore, specifically explore house-hold-level migration decision-making processes, but rather the aggregateoutcome of many such processes as reflected in internal migration flows.
Linking this expectation specifically to race, existing socioeconomicdifferentials by race and demonstrable racial differentials in basic migrationpatterns suggest that ethnic differentials will be manifest in migration pat-terns. Further, lack of information about proximate environmental hazardsin lower SES communities, and increasing sensitivity to environmental ame-nities and disamenities in advantaged and majority communities would fur-ther serve to produce and maintain inequalities in the social distribution ofenvironmentally hazardous facilities. As such, our central hypothesis statesthat we expect counties with higher levels of the incorporated indicators ofenvironmental risk factors to lose relatively greater numbers of white resi-dents relative to minorities.
METHODS
Our analyses are conducted with a nationwide, county-level datasetreflecting race-specific migration streams, socioeconomic characteristics,

28
POPULATION AND ENVIRONMENT
and the presence of three specific environmental indicators of proximatehazardous industrial sites. The choice of a study design which emphasizesthe relationship between county-level environmental risks and aggregateout-migration is not meant to deny that more precise consideration of prox-imity of environmental risk may play an important role in household mobil-ity decisions. Instead, it stems from the need to establish, with a compre-hensive data source, a baseline relationship between environmental riskfactors and long-distance movement of race-specific populations, while ad-equately controlling for other social and economic contextual factors thatare reported to impact out-migration.
Hazardous Waste
The hazardous waste data relate to the reporting year, 1991, and aretaken from the LandView II database. LandView II is a data product createdthrough collaboration between the EPA, the Bureau of the Census, and theNational Oceanic and Atmospheric Administration. The measure reflectsthe number of large quantity hazardous waste generators (LQGs), with“large quantity” defined as facilities generating over 100 kg of hazardouswaste in any calendar month. Four indicators of large quantity hazardouswaste facilities are included: those counties with one such facility, thosewith 2–4, those with 5–20 and those over, 20. These classifications arebased upon logical breaks in the data and those counties with no largequantity hazardous waste generators act as the reference category.
Toxic Releases
The county-level toxic release data are from the Toxic Release Inven-tory database obtained via the Right-to-Know Network (RTK-NET). The in-corporated measure reflects average annual toxic releases, by county, forthe years, 1988 through 1990. Data from the first TRI reporting year, 1987,have been deemed unreliable by the EPA and are therefore not included inthe analysis. Categories based upon quantiles of toxic release levels areincluded in the regression estimations. Those counties with no toxic re-leases act as the reference category.
Superfund Sites
The county-level Superfund data used in this research are from theEPA’s CERCLIS database also obtained via RTK-NET. The data incorporatedhere reflect the number of sites, within a particular county, which were

29
L. M. HUNTER, M. J. WHITE, J. S. LITTLE, AND J. SUTTON
proposed for National Priority List (NPL) status during the time period,1985–1990.1 NPL (Superfund) sites are those inactive hazardous waste sitesthat have been deemed to pose significant potential public health risks.Three categories of proposed Superfund sites are included in the regressionestimates: those counties with one such site, those with two, and those withmore than two. These classifications are based upon logical breaks in thedata. Those counties with no Superfund sites therefore act as the referencecategory.
Socioeconomic Characteristics
Independent variables representing economic and social factors asso-ciated with migration are also included. In order to better reflect pre-migra-tion conditions, the socio-economic variables reflect 1980 characteristics,with some indicators of change over the decade, 1980–1990. We incorpo-rate the log of total population (1980) in order to control for scale, with ametropolitan county dummy variable also included to capture some of thesepopulation effects. In addition, economic conditions are measured throughmedian household income (1980) and change in median household in-come (1980–1990), percentage unemployed (1980) and change in percent-age unemployed (1980–1990), percentage employed in manufacturing in-dustries (1980) and change in manufacturing employment (1980–1990).The proportion of owner-occupied housing units within a county (1980)indicates the prevalence of homeownership, while measures of age compo-sition (1980) are included to capture the employment-related migration ofthe 18–34 age group and the retirement-related migration of those overage 65. Finally, environmental amenities are measured through the USDA’sEnvironmental Amenities index, a composite measure (18 point scale) ofcounty physical characteristics (climate, typography, and water area) thatare presumed to enhance area attractiveness (McGranahan, 1999). Table 1provides further descriptive information for all variables incorporated in thefollowing analyses, including the measures of proximate environmentallyhazardous facilities.
Table 1 reveals the significant dispersion in outmigration numbers bycounty, reflecting both aggregate ethnic group size in the county (whichwill be controlled statistically) and the wide geographic variation in migra-tory experience. Review of the socioeconomic traits points to moderatevariation in most of the characteristics, with maximum values indicatingthat some counties experience an extremely strong impact of, say, unem-ployment or elderly population. A review of the table’s lower portion indi-cates that substantial numbers of counties have zero or one of the environ-

30
POPULATION AND ENVIRONMENT
TABLE 1
Descriptives of Included Variablesa
Mean Min Max S.D. Obs
Outmigrants by Race, 1985–1990
White (non-hispanic) 11834 1 918043 33371 3065Black 1233 0 138691 5986 3065Asian 356 0 92042 2510 3065Hispanic 885 0 279288 6585 3065
Population Characteristics1980 population 72570 0 7477503 236968 30651980 white population 71859 90 5607021 200582 30651980 black population 9792 0 1316564 50754 30651980 asian population 2290 0 979894 22167 30651980 hispanic population 7207 0.00 3215235 70236 3065Proportion population lessthan age 18, 1980 0.29 0.00 0.53 0.04 3065
Proportion population age65 and over, 1980 0.13 0.00 0.34 0.04 3065
Proportion population (age25+) college graduates,1980 0.11 0.00 0.48 0.05 3065
Proportion foreign-born,1980 0.02 0.00 0.37 0.03 3065
Change in proportion for-eign-born, 1980–1990 0.00 −0.05 0.13 0.01 3065
Economic CharacteristicsMedian household income,1980 14231 2499 30011 3315 3065
Change in median house-hold income, 1980–1990 −558 −30513 11751 3879 3065
Proportion civilian laborforce unemployed, 1980 0.07 0.00 0.28 0.03 3065
Change in proportion CLFunemployed, 1980–1990 0.00 −0.12 0.14 0.03 3065
Proportion employed inmanufacturing, 1980 0.21 0.00 0.62 0.12 3065
Change in proportion em-ployed in manufacturing,1980–1990 −0.02 −0.24 0.20 0.04 3065
Housing CharacteristicsProportion housing unitsowner-occupied, 1980 0.68 0.08 1.00 0.11 3065

31
L. M. HUNTER, M. J. WHITE, J. S. LITTLE, AND J. SUTTON
TABLE 1 (continued )
Mean Min Max S.D. Obs
Change in proportion hous-ing units owner-occupied,1980–1990 0.10 −0.25 1.78 0.17 3065
Median housing value, 1980 34910 10600 200001 13656 3065Change in median housingvalue, 1980–1990 (dol-lars) 18306 −16700 394300 22337 3065
Geographic CharacteristicsLand Area 2498087 63923 52000000 3385798 3065Metropolitan county N = 697New England N = 65Mid Atlantic N = 149East North Central N = 437West North Central N = 618South Atlantic N = 552East South Central N = 364West South Central N = 470Mountain N = 280
Environmental AmenitiesUSDA Amenity Scale 0.06 −6.40 11.17 2.29 3065
Environmental Risk CategoriesToxic Releases (log million
pounds released)Zero toxic releases N = 855Quartile 1 N = 559Quartile 2 N = 555Quartile 3 N = 547Quartile 4 N = 549
Proposed Superfund SitesZero proposed Superfunds N = 2488One proposed Superfund N = 340Two proposed Superfunds N = 108Greater than 2 proposed Su-perfunds N = 129
Hazardous Waste Large Quan-tity Generators (LQGs)
Zero LQGs N = 1276One LQG N = 4902–4 LQGs N = 5495–20 LQGs N = 546
Greater than 20 LQGs N = 204aUnit of Analysis: U.S. counties within 48 contiguous states.

32
POPULATION AND ENVIRONMENT
mental risks (not necessarily zero on all); the zero value will form ourreference category.
Analytical Strategy
Each race-specific model incorporates independent variables that rep-resent previously outlined explanations for internal out-migration, and inaddition, variables that measure environmental risks. The dependent vari-able, for each race-specific model, is the natural logarithm of the numberof outmigrants between, 1985 and 1990 reported in the 1990 U.S. Census.To control for the association between number of outmigrants and size ofpopulation, the natural logarithm of the race-specific county populationreported in 1980 is included as an explanatory variable. A more conven-tional form of the model might use the natural logarithm of the race-specificout-migration rate as the dependent variable. This form is equivalent to theform chosen here except the former constrains the coefficient on the naturallogarithm of population size to be unity. The more general form we havechosen allows each race group to be differentially responsive to aggregatesize of the population in the county. Another advantage of this form is thateach estimated coefficient can be interpreted as the expected percentagechange in the number of outmigrants per unit change in the regressor.
In order to clearly interpret the migration effects of the proximate envi-ronmentally hazardous facilities, we specify them as categories, with zeroas the reference group. We do this for two reasons. First, as Table 1 shows,these indicators take the value zero for many counties. The choice of theparticular categories for each of the three environmental risks was deter-mined after careful review of the distributions of the risk variables them-selves and some exploratory multivariate work under alternative specifica-tions. Again the functional form has a distinct interpretation: the coefficientrepresents the percentage change in county outmigration for the presenceof an environmental risk in that category. Such effects are, of course, net ofpopulation size in the county.
Estimation of the models deviated from classical regression techniqueson three counts. First, in ordinary least squares (OLS) estimation there is anassumption of equal error variances across all observations. In this situa-tion, counties with small race-specific populations are necessarily more un-stable in reported outmigration than those with a larger representation of arace group. Consequently, these counties should be devalued relative to thecounties with larger race-specific populations. For this reason, we weightedcounties in increasing proportion to the size of the race-specific population,using a weighted least squares (WLS) approach. Second, significant unex-

33
L. M. HUNTER, M. J. WHITE, J. S. LITTLE, AND J. SUTTON
plained spatial correlation was found in all four race-specific models. Thiswas true for adjacent counties as well as for counties within a 100-mileradius. Spatially correlated errors were confirmed by LaGrange Multipliertests and other procedures available in SpaceStat, A Software Program forthe Analysis of Spatial Data, Version 1.80 (Anselin, 1995). Third, significantcorrelation was also found in the residuals across the race-specific models.Each of these three conditions violates the classical OLS assumptions, and,if ignored, will still produce unbiased estimates. However, the estimatesof standard errors will be inefficient and will invalidate hypothesis testing(Anselin, 1988; Zellner, 1962; Greene, 2000).
The strategy used to gain reliable standard errors of the estimates (i.e.not influenced by the heterogeneity of error variances, the spatially corre-lated errors, or the correlated errors across models) was to use WLS toobtain the estimated effects of the explanatory variables and then to usebootstrapping techniques to generate the standard errors for each of theWLS regression parameter estimates. Ten thousand samples were drawnfrom the 3065 counties with replacement. As a result of the bootstrappinganalysis there was confirmation that the WLS estimates are unbiased andthat the WLS standard errors are generally smaller than those revealed bythe empirical distributions. The WLS coefficients are reported in Table 2along with the results of the hypothesis tests based on the standard errorsgenerated from the bootstrapped distributions.
RESULTS
As reflected in Table 2, county population characteristics contributesubstantially to the prediction of outmigration of all racial groups, with onlyslight variation across racial categories.2 In addition, and as would be ex-pected, the total population of racial groups within a county contributessignificantly to prediction of outmigration of that racial group for all catego-ries considered. Counties with younger and older age structures tend toexperience lower levels of black outmigration, while areas of immigrantconcentration tend to lose relatively fewer Asians.
Economic factors demonstrate anticipated associations, although theseassociations are not consistent across racial groups. Unemployment levelsexhibit the most consistent associations, being positively associated withBlack, Asian, and Hispanic outmigration. Also as anticipated, homeowner-ship typically dampens outmigration. As for the geographic control vari-ables, New England and the Mid-Atlantic Census Divisions lose relativelyless population than do Western counties, while the West, South, Central,

34
POPULATION AND ENVIRONMENT
TABLE2
MultivariateEstimationsofOutmigrationbyRace,U.S.Counties,1985–1990
Model1
Model2
Model3
Model4
White
Black
Asian
Hispanic
Outmigrants
Outmigrants
Outmigrants
Outmigrants
PopulationCharacteristics
Log1980population
0.0057
0.0570*
0.0043
0.1090*
Log1980whitepopulation
0.9222*
——
—Log1980blackpopulation
—0.8202*
——
Log1980asianpopulation
——
0.8724*
—Log1980hispanicpopulation
——
—0.7609*
Proportionpopulationlessthanage18,1980
−0.5489
−1.0201*
−1.2540
−1.2029
Proportionpopulationage65andover,1980
−0.5722
−1.7215*
−1.7767*
−1.3604*
Proportionpopulation(age25
+)collegegraduates,1980
0.7033*
0.3203
0.4201
0.4443
Proportionforeign-born,1980
−1.0686*
0.6576
0.5350
−0.0248
Changeinproportionforeign-born,1980–1990
0.9328
0.6909
−2.3480*
0.0748
EconomicCharacteristics
Medianhouseholdincome,1980(inthousands)
0.0131
−5.27E-06
9.74E-06
6.07E-06
Changeinmedianhouseholdincome,1980–1990(thousands)
0.0009
−2.00E-05*
9.15E-06
−6.64E-06
Proportioncivilianlaborforceunemployed,1980
1.5559
4.2271*
2.5113*
1.3640
ChangeinproportionCLFunemployed,1980–1990
1.7045
3.2084*
3.3495*
2.4990*
Proportionemployedinmanufacturing,1980
0.8386*
−0.4169*
−0.2986
−0.6613*
Changeinproportionemployedinmanufacturing,1980–1990
−0.6786*
−0.1007
−0.7964
−0.2884
HousingCharacteristics
Proportionhousingunitsowner-occupied,1980
1.1421*
−0.5214*
−0.0945
−1.0032*
Changeinproportionhousingunitsowner-occupied,1980–1990
−0.6713*
−0.4564*
−0.5405*
−0.5939*
Medianhousingvalue,1980(dollars)
9.91E-07*
−2.66E-07
1.60E-06
−4.97E-06*
Changeinmedianhousingvalue,1980–1990(dollars)
1.14E-06*
1.36E-06*
1.59E-06
3.18E-06*
35
L. M. HUNTER, M. J. WHITE, J. S. LITTLE, AND J. SUTTON
GeographicCharacteristics
Landarea
−1.84E-09
−8.90E-10
8.88E-10
−3.06E-09
Metropolitancounty
0.0031
0.0313
0.1238*
−0.0328
New
England
−0.1811*
−0.2818*
−0.0253
−0.6622*
MidAtlantic
−0.1222*
−0.1331
−0.0108
−0.2707*
EastNorthCentral
0.0292
−0.1080
0.0384
−0.2786*
WestNorthCentral
0.0909*
0.1776
0.1938*
−0.2191*
SouthAtlantic
0.0159
−0.0479
0.1579
−0.2855*
EastSouthCentral
−0.0512
−0.1790
0.0588
−0.2096*
WestSouthCentral
0.1320*
0.0459
0.3215*
0.0214
Mountain
0.1616*
0.1876
0.2499*
0.0801
EnvironmentalAmenities
USDAAmenityScale
0.0022
−0.0047
−0.0146*
−0.0110
EnvironmentallyHazardousFacilityIndicators
ToxicReleases(logmillionpoundsreleased)(zero
=refcategory)
Quartile1
−0.0165
−0.0361
−0.2444*
−0.0422
Quartile2
0.0435*
−0.0135
−0.1577
−0.0253
Quartile3
0.0288
−0.0051
−0.1686
0.0430
Quartile4
0.0301
−0.0187
−0.2196*
0.0125
ProposedSuperfundSites(zero
=refcategory)
OneproposedSuperfund
0.0113
−0.0490
0.0479
0.0279
2proposedSuperfunds
0.0032
−0.0542
0.1355*
0.0784
Greaterthan2proposedSuperfunds
−0.0019
−0.0734
−0.0024
0.0359
HazardousWasteLargeQuantityGenerators(LQGs)(zero
=refcategory)
OneLQG
0.0091
0.0240
0.0287
0.0140
2–4LQGs
−0.0053
0.0615*
−0.0117
0.0691
5–20LQGs
−0.0258
0.0158
0.0418
−0.0352
Greaterthan20LQGs
−0.0280
−0.0162
0.1475
−0.0616
Constant
−0.3206*
−0.4840*
−0.1077
0.2910*
R2
0.9920
0.9865
0.9902
0.9925
*Coefficientismorethan1.65timesitsstandarderror.

36
POPULATION AND ENVIRONMENT
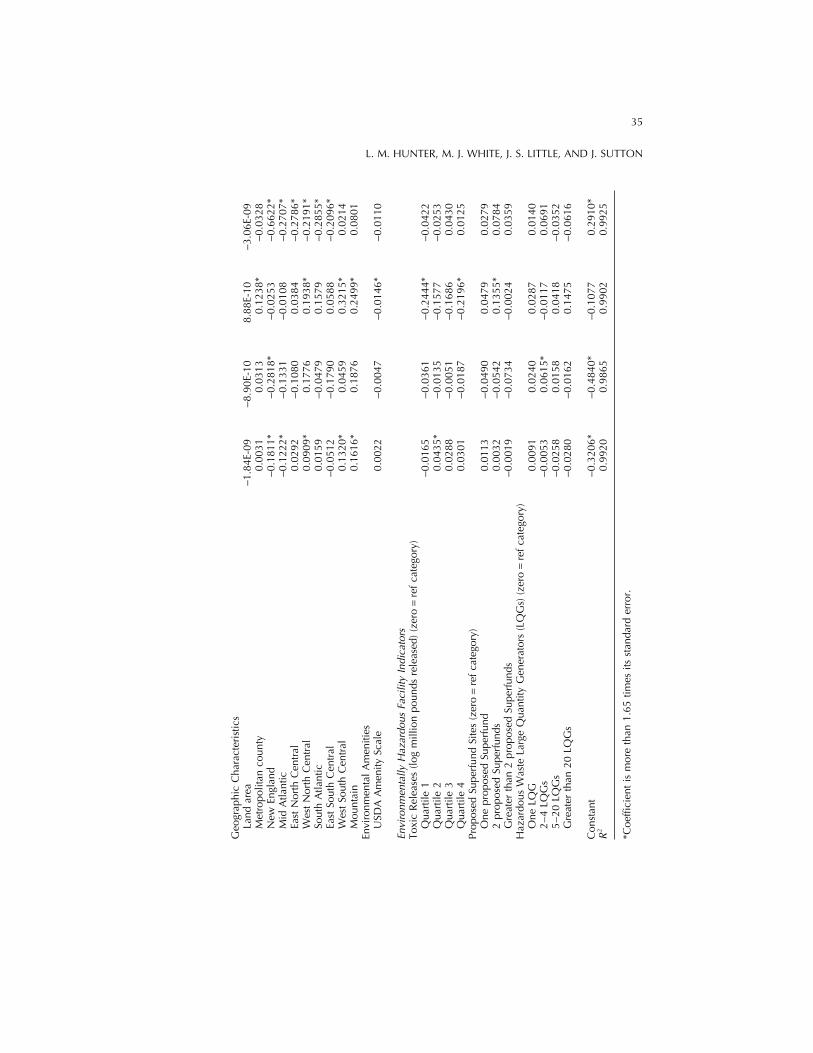
and Mountain regions tend to lose more. The environmental amenitiesscale exhibits a statistically significant association only with Asian outmi-grants, with the coefficient suggesting higher amenity areas lose relativelyfewer Asians as compared to areas lacking desirable natural features.
Environmentally Hazardous Facilities
Our key variables of interest demonstrate little statistical significancein the prediction of race-specific outmigration streams. In fact, of the 44“risk” coefficients (4 toxic release categories, 3 Superfund categories, and4 hazardous waste facility categories for each racial group), only 5 coeffi-cients achieve statistical significance. In addition, no clear patterns emergewith regard to the direction of the coefficients.
Indeed, the most striking finding with regard to our hypothesis is oneof non-significance. We anticipated that counties with higher levels of theincorporated indicators of environmental risk factors would lose relativelygreater numbers of white residents relative to minorities. This hypothesis isnot supported. Instead, we find that net of population, economic, housing,and geographic characteristics, no clear patterns emerge with regard to dif-ferential loss of race-specific populations as associated with county pres-ence of environmentally hazardous facilities.
DISCUSSION
This study has examined the association between race-specific outmi-gration and environmental risk levels with the intention of contributing toour understanding of the environmental context of migration and the dy-namics underlying the social distribution of environmental hazards. Theresults yield one key finding: net of a wide array of socioeconomic controlsfor labor force opportunity, climate, and demographic structure, we candetect no substantial differential migratory response by race to environmen-tally hazardous facilities.
There are several reasons to expect that segments of the populationmight be less likely to respond to proximate environmental risk throughrelocation. First, migration has costs. As such, only those willing and ableto pay such costs will see outmigration as a potential answer to concernwith community characteristics. Second, environmentally-risky facilities of-ten offer economic benefits. As stated by Yandle and Burton (1996, p. 490),there have been situations in which communities “would welcome heavy

37
L. M. HUNTER, M. J. WHITE, J. S. LITTLE, AND J. SUTTON
industry, and the accompanying waste disposal problems, in return forgrowth and high-paying industrial jobs.” As such, the economic benefitsaccompanying some environmental risk may act to retain those segmentsof the population most directly accruing these benefits.
Regardless, the results presented here do not provide evidence of se-lective migration patterns as a factor in the social distribution of environ-mentally hazardous facilities. Nonetheless, two key potentially related limi-tations should be noted.
First, on a methodological level, the results suggest that the geographicscale used in this study may be inappropriate for examination of the hypothe-ses dealing with differential migration patterns as related to the facilitiesincluded here. That is, if the anticipated relationships exist at a more pre-cise geographic level, aggregating data to the county-level may maskwithin-county relationships (e.g., short distance residential moves within acounty may be sufficient to relocate from some types of proximate hazards).Indeed, as reviewed above, several studies undertaken at the communityand/or metropolitan level have implied migration and market dynamicsplay a role in unequal environmental burden (e.g., Boer et al., 1997; Mitch-ell et al., 1999; Shaikh & Davis, 1999).
Another possible explanation for the lack of movement from environ-mentally hazardous facilities may be related to public knowledge and/orconcern with proximate hazards. Specifically, we have no guarantee thatcounty residents are aware of the risks incorporated here. This is particu-larly relevant in geographically large counties in which environmental con-texts may vary greatly.
Still, the study presented here represents an important baseline exami-nation of the degree to which county-level, migration patterns of variousracial groups nationwide appear sensitive to the level of environmentallyhazardous facilities in local areas. Future work in this area could enhanceour understanding of these important social dynamics through explorationof more precise geographic levels, as well as individual-level data. Indeed,future research on demographic processes will likely be central in the con-tinually evolving work on the social distribution of environmental condi-tions.
ACKNOWLEDGMENT
This research was supported by NICHD and NIEHS Grant R01-HD-95-002.

38
POPULATION AND ENVIRONMENT
ENDNOTES
1. Sites proposed for Superfund status are included in the present analysis as opposed tothose for which status was confirmed. This decision was based on the fact that the pro-posal of Superfund status tends to garner media and community attention, thus represent-ing the time at which the public may become aware of the proximate hazard(s) and outmi-gration might be expected.
2. An indicator of metropolitan county status is the better predictor of the number of Asianoutmigrants.
REFERENCES
Anselin, L. (1995). SpaceStat, A Software Program for the Analysis of Spatial Data, Version1.80. Morgantown, WV: Regional Research Institute, West Virginia University.
Blackwood, L. G., & Carpenter, E. H. (1978). The Importance of Anti-Urbanism in DeterminingResidential Preferences and Migration Patterns. Rural Sociology, 43, 31–47.
Boer, J.T., Pastor, M., Sadd, J. L., & Snyder, L. D. (1997). Is There Environmental Racism? TheDemographics of Hazardous Waste in Los Angeles County. Social Science Quarterly, 78,793–810.
Brooks, N., & Sethi, R. (1997). The Distribution of Pollution: Community Characteristics andExposure to Air Toxics. Journal of Environmental Economics and Management, 32, 233–250.
Brown, P., & Mikkelsen, E. J. (1990). No Safe Place: Toxic Waste, Leukemia, and CommunityAction. Berkeley: University of California Press.
DaVanzo, J. (1981). Microeconomic Approaches to Studying Migration Decisions. In G. F.DeJong & R.W. Gardner (Eds), Migration Decision Making, pp. 90–129. New York: Per-gamon Press.
Davidson, P., & Anderton, D. L. (2000). Demographics of dumping II: a national environmen-tal equity survey and the distribution of hazardous material handlers, Demography, 37,461–466.
Environmental Protection Agency. (1992). Environmental Equity: Reducing Risk for All Com-munities, EPA230-R-008, June.
Graves, P. E. (1980). Migration and Climate. Journal of Regional Science, 20, 227–237.Graves, P. E. (1983). Migration with a Composite Amenity: The Role of Rents. Journal of
Regional Science, 23, 541–546.Graves, P.E., & Mueser, P. R. (1993). The Role of Equilibrium and Disequilibrium in Modeling
Regional Growth and Decline: A Critical Reassessment. Journal of Regional Science 33,69–84.
Greenwood, M. J. (1985). Human Migration: Theory, Models, and Empirical Studies, Journalof Regional Science, 25, 521–544.
Greenwood, M. J., McClelland, G. H., & Schulze, W. D. (1997). The effects of perceptions ofhazardous waste on migration: a laboratory experimental approach, Review of RegionalStudies, 27, 143–61.
Heaton, T. B., & Lichter, D. T. (1986). The environment and migration: effects of mild climatechange, bodies of water, and recreational development. Sociology and Social Research,71, 68–70.
Hsieh, C., & Ben-Chieh, L. (1983). The Pursuance of Better Quality of Life: In the Long Run,Better Quality of Social Life is the Most Important Factor in Migration. American Journalof Economics and Sociology, 42, 431–440.
Hunter, L. M. (1998). The Association between Environmental Risk and Internal MigrationFlows. Population and Environment, 19, 247–277.

39
L. M. HUNTER, M. J. WHITE, J. S. LITTLE, AND J. SUTTON
Hunter, L. M. (2000). The Spatial Association between U.S. Immigration Residential Concen-tration and Environmental Hazards. International Migration Review, 34, 460–88.
Knapp, T. A., & Graves, P. E. (1989). On the Role of Amenities in Models of Migration andRegional Development. Journal of Regional Science, 29, 71–87.
Lee, E. S. (1966). A Theory of Migration, Demography, 3, 47–57.Lober, D. J. (1995). Why protest? Public behavioral and attitudinal response to siting a waste
disposal facility. Policy Studies Journal, 23(Fall), 499–518.Mathur, V.K., Stein, S. H., & Kumar, R. (1988). A Dynamic Model of Regional Population
Growth and Decline. Journal of Regional Science, 28, 379–395.McAuley, W. J., & Nutty, C. L. (1982). Residential Preferences and Moving Behavior: A Family
Life-cycle Analysis. Journal of Marriage and the Family, 44(May), 301–309.McGranahan, D. (1999). Agricultural Economic Report No. 781, 92–102.Mitchell, J. T., Thomas, D. S. K., & Cutter, S. L. (1999). Dumping in Dixie Revisited: The
Evolution of Environmental Injustices in South Carolina. Social Science Quarterly, 80,229–243.
Nelson, J. P. (1978). Residential Choice, Hedonic Prices, and the Demand for Urban Air Qual-ity. Journal of Urban Economics, 5, 357–369.
Oakes, J. M., Anderton, D. L., & Anderson, A. B. (1996). A Longitudinal Analysis of Environ-mental Equity in Communities with Hazardous Waste Facilities. Social Science Research,25, 125–148.
Rinquist, E. J. (1997). Equity and the distribution of environmental risk: the case of TRI facili-ties. Social Science Quarterly, 78, 811–829.
Shaikh, S. L., & Loomis, J. B. (1999). An Investigation into the Presence and Causes of Environ-mental Inequity in Denver, Colorado. The Social Science Journal, 36, 77–92.
Sjaastad, L. (1962). The Costs and Returns of Human Migration, Journal of Political Economy,70, 80–93.
Tiefenbacher, J. P., & R.R. Hagelman. (1999). Environmental equity in urban Texas: race,income, and patterns of acute and chronic toxic air releases in metropolitan counties.Urban Geography, 20, 516–533.
von Reichert, C., & Rudzitis, G. (1994). Rent and Wage Effects on the Choice of AmenityDestinations of Labor Force and Nonlabor Force Migrants: A Note. Journal of RegionalScience, 34, 445–455.
Walters, W. H. (1994). Climate and U.S. elderly migration rates. Papers in Regional Science,73, 309–329.
Wolpert, J. (1966). Migration as an Adjustment to Environmental Stress. Journal of Social Is-sues, 22, 92–102.
Yandle, T., & Burton, D. (1996). Reexamining Environmental Justice: A Statistical Analysis ofHistorical Hazardous Waste Landfill Siting Patterns in Metropolitan Texas. Social ScienceQuarterly, 77, 477–492.