Migration Trends and Migration Policy in Europe
29
Published by Blackwell Publishers Ltd., 108 Cowley Road, Oxford OX4 1JF, UK, and 350 Main Street, Malden, MA 02148, USA. © 2002 IOM International Migration Vol. 40 (5) SI 2/2002 ISSN 0020-7985 * The author is a writer based in Oxford, UK, who works as a consultant to UN agencies. His most recent books are Workers Without Frontiers: The Impact of Globalization on International Migration, and The No-nonsense Guide to International Migration. Migration Trends and Migration Policy in Europe Peter Stalker* ABSTRACT This paper summarizes the latest information on both stocks and flows of migrants in Europe, focusing specifically on arrivals from developing countries. It starts out by setting this into its historical context by showing how flows of labour migrants were followed by flows of family members, and later by asylum seekers and refugees. Then it looks more closely at recent migration data, though it finds these to be frequently incomplete and inconsistent. The most comparable cross-national data come from the OECD and Eurostat, which indicate that Germany had the largest flows of migrants in the 1990s followed by the United Kingdom. In addition to these arrivals there are probably between 2 and 3 million undocumented immigrants in Europe – accounting for 10 to 15 per cent of the total population of foreigners. The paper also traces the countries from where immigrants are leaving. Sources vary considerably from one immigration country to another, reflecting a number of factors, of which the most important are former colonial links, previous areas of labour recruitment, and ease of entry from neighbouring countries. In recent years, however, immigrants have been coming from a wider range of countries and particularly from lower- income countries. The paper also examines changes in immigration policy. National policies were fairly liberal during the 1950s and 1960s, before becoming more
-
Upload
independent -
Category
Documents
-
view
0 -
download
0
Transcript of Migration Trends and Migration Policy in Europe

Published by Blackwell Publishers Ltd.,108 Cowley Road, Oxford OX4 1JF, UK, and350 Main Street, Malden, MA 02148, USA.
© 2002 IOMInternational Migration Vol. 40 (5) SI 2/2002
ISSN 0020-7985
* The author is a writer based in Oxford, UK, who works as a consultant to UN agencies. Hismost recent books are Workers Without Frontiers: The Impact of Globalization onInternational Migration, and The No-nonsense Guide to International Migration.
Migration Trendsand Migration Policy in Europe
Peter Stalker*
ABSTRACT
This paper summarizes the latest information on both stocks and flows ofmigrants in Europe, focusing specifically on arrivals from developingcountries. It starts out by setting this into its historical context by showinghow flows of labour migrants were followed by flows of family members,and later by asylum seekers and refugees. Then it looks more closely atrecent migration data, though it finds these to be frequently incompleteand inconsistent.
The most comparable cross-national data come from the OECD and Eurostat,which indicate that Germany had the largest flows of migrants in the 1990sfollowed by the United Kingdom. In addition to these arrivals there areprobably between 2 and 3 million undocumented immigrants in Europe –accounting for 10 to 15 per cent of the total population of foreigners.
The paper also traces the countries from where immigrants are leaving.Sources vary considerably from one immigration country to another,reflecting a number of factors, of which the most important are formercolonial links, previous areas of labour recruitment, and ease of entryfrom neighbouring countries. In recent years, however, immigrants havebeen coming from a wider range of countries and particularly from lower-income countries.
The paper also examines changes in immigration policy. National policieswere fairly liberal during the 1950s and 1960s, before becoming more

152 Stalker
restrictive from the 1970s on. Recently, however, a number of governmentshave been revising their policies to take better account of employment anddemographic needs. The paper also traces the emergence of a cross-nationalEuropean response to immigration, as European Union (EU) countries havebecome more concerned about their common external frontier.
Thus far European countries have done little to try to control migrationthrough cooperation with sending countries. They could, for example, directOfficial Development Assistance to those countries most likely to sendimmigrants, though few appear to have done so in a deliberate fashion.
The paper concludes that in the future immigration to the EU is likely toincrease, both as a result of the demand for labour and because of low birthrates in the EU. In the short and medium term many of these requirements arelikely to be met by flows from Eastern Europe, particularly following theeastward expansion of the EU. But, the longer-term picture will probablyinvolve greater immigration from developing countries.
MIGRATION TRENDS AND MIGRATION POLICY IN EUROPE
If it were possible, an aerial snapshot of migrant flows across Western Europein the early years of the twenty-first century would offer a complex andconfusing picture. For the purposes of international comparison, the simplestform of classification of these diverse flows is by four broad categories of entry.First, labour migration, which would include long- and short-term immigrantsand seasonal workers. Second, family reunification, which usually consists ofclose relatives of those with long-term settlement rights. Third, undocumentedworkers or “illegal immigrants” who have either entered the country illegally orhave entered on tourist visas and have overstayed, usually in order to work.Fourth, asylum seekers who, once granted asylum, are classified as refugees.
To track these different flows and set the context for modern migration, aconvenient starting point is the end of World War II. Since then, Europe has hadfour main phases of immigration.
Late 1940s and early-1950s – mass refugee flows
The end of World War II saw dramatic population shifts as around 15 millionpeople transferred from one country to another, many of whom were forced torelocate as a result of boundary changes, particularly between Germany, Poland,and the former Czechoslovakia. By 1950, refugees made up 30 per cent of thepopulation of West Germany (Borrie, 1970). From the mid-1950s these flowsstarted to slow, though they continued at lower levels until the building of theBerlin wall in 1961.
153Migration trends and migration policy in Europe
Early-1950s to 1973 – recruitment of contract workersThe reconstruction of Europe ushered in an economic boom. Between 1950and 1973 the economies of the OECD countries grew on average by 5 per centper year. This created a huge new demand for workers, and Germany, France,and the UK started to run short of labour. At first they were able to recruitmany of those displaced during the war. Then they looked to other Europeancountries that had been slower to industrialize, including Italy, Portugal, andSpain. But as these countries too became more prosperous recruiters had tolook further afield. Some countries drew on their colonial ties. France turned toNorth Africa, and the UK to the Caribbean and the Indian subcontinent.Germany, without a colonial reservoir instead recruited short-term contractworkers from countries adjacent to Western Europe, notably the formerYugoslavia and Turkey. Over this period net immigration for Western Europereached around 10 million (compared with net outflows of 4 million for theperiod 1914 to 1949) (Stalker, 1994).
1974 to mid-1980s – the doors closeOpposition to the arrival of large numbers of immigrants had already beengrowing in the late 1960s. In the 1960s this caused the UK, for example, to cutback the number of people who could come from the British Commonwealth. Butit was the recession following the oil shock of 1973 that signalled a more generalreversal across Europe and all governments effectively closed the doors tofurther labour immigration and expected guest workers to leave. These workershad, however, by now put down roots and preferred to stay. Even so, mostgovernments shied away from the kind of punitive measures it would have takento expel them and allowed family members of existing immigrants to join them.Before and during this period migrants had also started to choose from a widerrange of destinations including Italy and other countries of southern Europe. Theeconomic stimulus of joining the European Community also made Greece,Portugal, and Spain more attractive to immigrants.
Mid-1980s to 2001 – asylum seekers, refugees, and illegal immigrantsThis was a period of political upheaval, particularly in Eastern Europe during andafter the collapse of communism. Eastern Europeans, with more freedom totravel, started to join the thousands of people fleeing conflict elsewhere in theworld and sought asylum in Western Europe. But others who formerly mighthave travelled as contract workers were also deflected to the “asylum door”.This phenomenon had been evident as far back as 1980 when some 108,000Turkish citizens applied for asylum in West Germany. From 1989-1998, morethan 4 million people applied for asylum in Europe, 43 per cent of whom camefrom elsewhere in Europe, 35 per cent from Asia, and 19 per cent from Africa(Salt, 2000). As the pressure grew, however, Western European governmentsstarted to tighten up on asylum applications, and more people tried to enterillegally, either travelling on their own initiative or with the help of smugglers.

154 Stalker
Measuring migrant flows
Each country has developed a system of migration measurement based on itsown particular requirements. This can make it difficult to aggregate data acrossEurope or make valid cross-country comparisons. The most up-to-date infor-mation typically comes from those countries that maintain full populationregisters – requiring that both nationals and foreigners register with the localauthorities. But even these registers are not exactly comparable since they canbe based on a different duration for the minimum length of stay required to qualifyas an immigrant rather than as a visitor – three months in Belgium and Italy, forexample, but 12 months in Ireland.
Moreover, some countries classify asylum seekers as immigrants while othersdo not. Data for Germany, for example, include some asylum seekers, but notall. Those countries that do not maintain population registers have to rely onother sources.
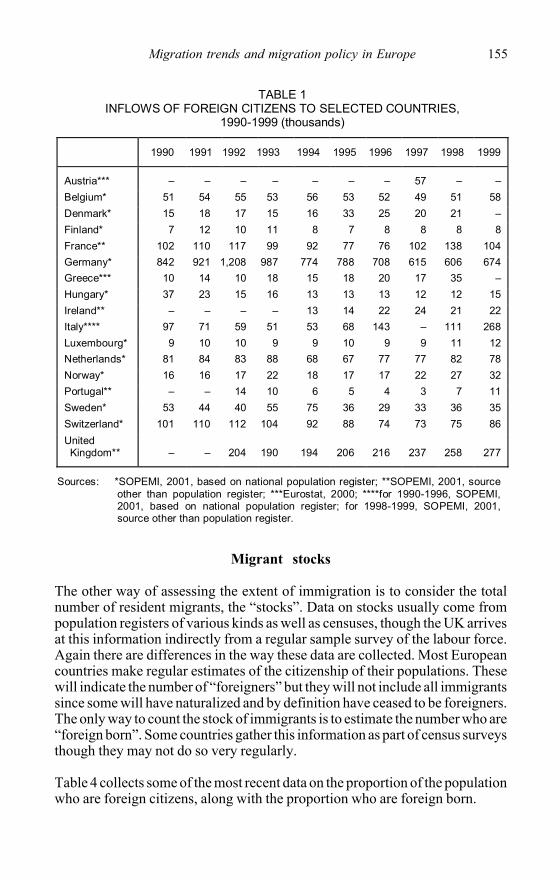
With this in mind, Table 1 combines the latest data available from the OECD’scontinuous reporting system on migration, SOPEMI, and from Eurostat(Eurostat, 2000), showing the extent of migrant inflows during the 1990s. AsTable 1 indicates, Germany occupies first place, partly because of the inclusionof some asylum seekers, and has a peak in 1992. The United Kingdom is next,though it follows a different pattern with a steady overall rise.
Data on emigration are sparser and even less reliable than those on immigration;some countries, including France, do not collect such information at all. The latestavailable information on emigration is collected in Table 2. Again Germanyaccounts for the bulk of the flows, and comparison with Table 1 shows that in1997 and 1998 emigration exceeded immigration.
To complete the picture, since these data may not include flows of asylumseekers and refugees, is it also useful to present these as a separate category.In the earlier years, Germany was the main destination but by the end of thedecade the United Kingdom had taken the lead (see Table 3).
Combining outflows and inflows should give net migration, which will be positiveif immigration exceeds emigration. But since emigration data can be missing orunreliable it may be better to arrive at net migration from another direction. Oneoption is to monitor changes in overall population size, treating net migration asa residual. So the difference between the population at the beginning and end ofthe year minus the difference between births and deaths can be taken as netmigration. Eurostat uses this approach to estimate net migration rates for the 15countries of the European Union (EU) (Eurostat, 2002). These are shown inFigure 1, which shows that net migration for this group of countries peaked in1992, fell until 1997, and then started to rise again.
155Migration trends and migration policy in Europe
TABLE 1 INFLOWS OF FOREIGN CITIZENS TO SELECTED COUNTRIES,
1990-1999 (thousands)
1990 1991 1992 1993 1994 1995 1996 1997 1998 1999
Austria*** – – – – – – – 57 – – Belgium* 51 54 55 53 56 53 52 49 51 58 Denmark* 15 18 17 15 16 33 25 20 21 – Finland* 7 12 10 11 8 7 8 8 8 8 France** 102 110 117 99 92 77 76 102 138 104 Germany* 842 921 1,208 987 774 788 708 615 606 674 Greece*** 10 14 10 18 15 18 20 17 35 – Hungary* 37 23 15 16 13 13 13 12 12 15 Ireland** – – – – 13 14 22 24 21 22 Italy**** 97 71 59 51 53 68 143 – 111 268 Luxembourg* 9 10 10 9 9 10 9 9 11 12 Netherlands* 81 84 83 88 68 67 77 77 82 78 Norway* 16 16 17 22 18 17 17 22 27 32 Portugal** – – 14 10 6 5 4 3 7 11 Sweden* 53 44 40 55 75 36 29 33 36 35 Switzerland* 101 110 112 104 92 88 74 73 75 86 United Kingdom** – – 204 190 194 206 216 237 258 277
Sources: *SOPEMI, 2001, based on national population register; **SOPEMI, 2001, source other than population register; ***Eurostat, 2000; ****for 1990-1996, SOPEMI, 2001, based on national population register; for 1998-1999, SOPEMI, 2001, source other than population register.
Migrant stocks
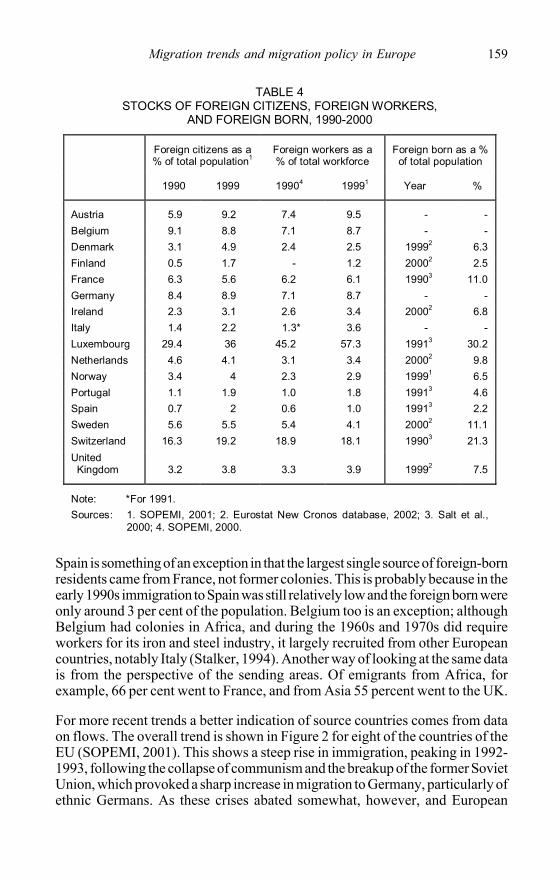
The other way of assessing the extent of immigration is to consider the totalnumber of resident migrants, the “stocks”. Data on stocks usually come frompopulation registers of various kinds as well as censuses, though the UK arrivesat this information indirectly from a regular sample survey of the labour force.Again there are differences in the way these data are collected. Most Europeancountries make regular estimates of the citizenship of their populations. Thesewill indicate the number of “foreigners” but they will not include all immigrantssince some will have naturalized and by definition have ceased to be foreigners.The only way to count the stock of immigrants is to estimate the number who are“foreign born”. Some countries gather this information as part of census surveysthough they may not do so very regularly.
Table 4 collects some of the most recent data on the proportion of the populationwho are foreign citizens, along with the proportion who are foreign born.

156 Stalker
TABLE 2 OUTFLOWS OF FOREIGN CITIZENS FROM SELECTED COUNTRIES,
1990-1999 (thousands)
1990 1991 1992 1993 1994 1995 1996 1997 1998 1999
Austria*** – – – – – – – 50 – – Belgium* 27 35 28 31 34 33 32 35 36 36 Denmark* 5 5 5 5 5 5 6 7 8 – Finland* 1 1 2 2 2 2 3 2 2 2 Germany* 466 498 615 710 622 561 559 637 639 556 Italy*** 7 6 7 – – – 8 8 – – Luxembourg* 6 6 6 5 5 5 6 6 7 7 Netherlands* 21 21 23 22 23 22 22 22 21 21 Norway* 10 8 8 11 10 9 10 10 12 13 Sweden* 16 15 13 15 16 15 15 15 14 14 Switzerland* 60 66 80 71 64 68 68 63 59 58 United Kingdom** 95 102 94 89 82 74 77 94 88 130
Sources: *SOPEMI, 2001, based on national population register; **SOPEMI, 2001, source other than population register; ***Eurostat, 2000.
Although the data are not for matching years, they do confirm the expected resultthat there are more foreign born than foreign citizens. This difference will begreater in countries where it is easier to gain citizenship – as in France wherethe proportion of the population who are foreign born is 11 per cent but theproportion who are foreign citizens is only around 6 per cent. For most countriesthere were no significant changes between 1990 and 1999. The largest increasesseem to have been in Austria and Denmark. Elsewhere the proportion of peoplewho are foreigners has been static or falling, though this could also reflect acombination of high levels of immigration combined with high levels ofnaturalization. The data in the middle two columns show the citizenship of theworkforce. These roughly parallel the patterns in the first two columns.
Illegal immigrants
In addition to these immigrants there are also millions of other undocumentedworkers – whose numbers are thought to have increased substantially during the1980s and 1990s. Since illegal immigrants tend to avoid being registered, anyestimates of the total number in Europe are necessarily guesstimates. One of thebest indications comes from regularizations when a country declares an amnestyfor certain categories of illegal immigrants who then have an incentive to comeforward. Italy, for example, has had a series of regularization programmes. Thelatest of these, in 1998, attracted 350,000 applicants, which combined with dataon legal immigrants, indicated a total foreign population of 1.6 million, of whomaround 20 per cent were there illegally (SOPEMI, 2000). Spain’s regularization

157Migration trends and migration policy in Europe
programme in 2000 attracted 245,000 applicants which would indicate a totalforeign population of 1 million, of whom around 25 per cent were there illegally(SOPEMI, 2001). Italy and Spain probably have higher proportions of illegalworkers than other countries because they form part of Europe’s southernborder, are easier to enter, and are seen as transit countries for people headingfurther north. For Europe as a whole, the stock of illegal immigrants has beenassumed to be between 2 and 3 million – which would constitute between 10 and15 per cent of the total population of foreigners (IOM, 2000).
If stocks of illegal immigrants are difficult to count it is even more difficult toestimate the rate they are flowing into Europe. One of the most commonly quotedflow estimates was made in 1994 by Jonas Widgren of the Vienna-basedInternational Centre for Migration Policy and Development. He started from thefact that, in 1993, 60,000 undocumented immigrants were apprehended atEuropean borders. After talking to many border control authorities he estimatedthat perhaps four to six times as many people were not caught. This would meanthat some 250,000 to 350,000 were getting through each year (Widgren, 1994).
TABLE 3 INFLOWS OF ASYLUM SEEKERS INTO SELECTED COUNTRIES,
1991-2000 (thousands)
1991 1992 1993 1994 1995 1996 1997 1998 1999 2000
Austria 27.3 16.2 4.7 5.1 5.9 7.0 6.7 13.8 20.1 18.3 Belgium 15.4 17.6 26.5 14.7 11.7 12.4 11.8 22.1 35.8 42.7 Denmark 4.6 13.9 14.3 6.7 5.1 5.9 5.1 5.7 6.5 10.1 Finland 2.1 3.6 2.0 0.8 0.8 0.7 1.0 1.3 3.1 3.2 France 47.4 28.9 27.6 26.0 20.4 17.4 21.4 22.4 30.9 38.6 Germany 256.1 438.2 322.6 127.2 127.9 116.4 104.4 98.6 95.1 78.6 Greece 2.7 2.0 0.8 1.3 1.4 1.6 4.4 2.6 1.5 3.1 Ireland - - 0.1 0.4 0.4 1.2 3.9 4.6 7.7 10.9 Italy 26.5 6.0 1.6 1.8 1.7 0.7 1.9 11.1 33.4 18.0 Luxembourg 0.2 0.1 0.2 0.2 0.2 0.3 0.4 1.6 2.9 0.6 Netherlands 21.6 20.3 35.4 52.6 29.3 22.9 34.4 45.2 42.7 43.9 Norway 4.6 5.2 12.9 3.4 1.5 1.8 2.3 8.5 10.2 10.8 Portugal 0.2 0.5 1.7 0.6 0.3 0.2 0.3 0.3 0.3 0.2 Spain 8.1 11.7 12.6 12.0 5.7 4.7 5.0 6.8 8.4 7.2 Sweden 27.4 84.0 37.6 18.6 9.0 5.8 9.6 12.5 11.2 16.3 Switzerland 41.6 18.0 24.7 16.1 17.0 18.0 24.0 41.3 46.1 17.6 United Kingdom 73.4 32.3 28.0 42.2 55.0 37.0 41.5 58.0 91.2 97.9
Total 559.2 698.5 553.3 329.7 293.3 254.0 278.1 356.4 447.1 418.0
Sources: SOPEMI, 2001.

158 Stalker
2.8 2.9
3.7
2.9
2.1 2.22.0
1.31.6
1.9 1.8
0.0
0.5
1.0
1.5
2.0
2.5
3.0
3.5
4.0
4.5
1990 1991 1992 1993 1994 1995 1996 1997 1998 1999 2000
Net
mig
ratio
n ra
te p
er th
ousa
nd in
habi
tant
s
Sources of immigrants
The data indicate the destinations of migrants to Europe in recent years. But,from where have they been coming? The national composition of the immigrantpopulation varies considerably from one destination country to another andreflects a number of factors, the most important of which are former coloniallinks, former areas of labour recruitment, and ease of entry from neighbouringcountries.
The simplest snapshot of source countries comes from data on the foreignborn. For this group of countries, 47 per cent of the foreign born came fromother European countries, 27 per cent from Africa, 10 per cent from theAmericas, 14 per cent from Asia, and 2 per cent from elsewhere.
There are significant differences, however, between the proportions forindividual countries. Switzerland, Ireland, and Luxembourg, which have the high-est proportions of EU nationals, did not have colonies, so they are a less obviouschoice for immigrants from Asia or Africa. At the other end of the scale areformer colonizing countries: France, the Netherlands, the UK, and Portugal. InFrance, for example, 32 per cent of the foreign born came from Algeria andMorocco; in the Netherlands, 26 per cent came from Indonesia and Suriname;in the UK, more than 20 per cent came from the Indian subcontinent; and inPortugal, 49 per cent came from Angola and Mozambique (Salt, 2000).
FIGURE 1NET MIGRATION RATE PER THOUSAND INHABITANTS,
EUROPEAN UNION, 1990-2000
Source: Eurostat, 2002.
159Migration trends and migration policy in Europe
TABLE 4 STOCKS OF FOREIGN CITIZENS, FOREIGN WORKERS,
AND FOREIGN BORN, 1990-2000
Foreign citizens as a % of total population1
Foreign workers as a % of total workforce
Foreign born as a % of total population
1990 1999 19904 19991 Year %
Austria 5.9 9.2 7.4 9.5 - - Belgium 9.1 8.8 7.1 8.7 - - Denmark 3.1 4.9 2.4 2.5 19992 6.3 Finland 0.5 1.7 - 1.2 20002 2.5 France 6.3 5.6 6.2 6.1 19903 11.0 Germany 8.4 8.9 7.1 8.7 - - Ireland 2.3 3.1 2.6 3.4 20002 6.8 Italy 1.4 2.2 1.3* 3.6 - - Luxembourg 29.4 36 45.2 57.3 19913 30.2 Netherlands 4.6 4.1 3.1 3.4 20002 9.8 Norway 3.4 4 2.3 2.9 19991 6.5 Portugal 1.1 1.9 1.0 1.8 19913 4.6 Spain 0.7 2 0.6 1.0 19913 2.2 Sweden 5.6 5.5 5.4 4.1 20002 11.1 Switzerland 16.3 19.2 18.9 18.1 19903 21.3 United
Kingdom 3.2 3.8 3.3 3.9 19992 7.5
Note: *For 1991. Sources: 1. SOPEMI, 2001; 2. Eurostat New Cronos database, 2002; 3. Salt et al.,
2000; 4. SOPEMI, 2000.
Spain is something of an exception in that the largest single source of foreign-bornresidents came from France, not former colonies. This is probably because in theearly 1990s immigration to Spain was still relatively low and the foreign born wereonly around 3 per cent of the population. Belgium too is an exception; althoughBelgium had colonies in Africa, and during the 1960s and 1970s did requireworkers for its iron and steel industry, it largely recruited from other Europeancountries, notably Italy (Stalker, 1994). Another way of looking at the same datais from the perspective of the sending areas. Of emigrants from Africa, forexample, 66 per cent went to France, and from Asia 55 percent went to the UK.
For more recent trends a better indication of source countries comes from dataon flows. The overall trend is shown in Figure 2 for eight of the countries of theEU (SOPEMI, 2001). This shows a steep rise in immigration, peaking in 1992-1993, following the collapse of communism and the breakup of the former SovietUnion, which provoked a sharp increase in migration to Germany, particularly ofethnic Germans. As these crises abated somewhat, however, and European

160 Stalker
countries became more restrictive, overall immigrant numbers started to fall,particularly for Germany. In the last few years, however, the total has been risingagain. Table 1 also confirms that for a number of countries, including the Nether-lands, Finland, and Sweden, immigration has remained fairly stable. Although theinflows appeared to fall in 1999, this is thought to be the result of a “technicaladjustment”. But other European countries have seen significant increases from1998-1999, including Germany, Italy, and the UK. In Portugal immigration hasalso been rising, though from a lower base.
0
200
400
600
800
1,000
1,200
1,400
1,600
1,800
2,000
1984 1986 1988 1990 1992 1994 1996 1998 2000
Thou
sand
s
Migrants to Europe now seem to be entering via most of the immigrantcategories, though the largest numbers are family members, followed by labourmigrants and asylum applicants.
Family reunification – This is often the largest category of legal arrivals. InDenmark, for example, around 66 per cent of those given residence permits in1999 for more than 1 year were family members, while 16 per cent were workers,and 8 per cent were refugees. In Sweden the proportion of inflows of non-Nordicor European Economic Area (EEA)1 citizens arriving for family reunificationwas nearer 80 per cent. In Portugal 47 per cent of official arrivals werefamily members, a similar proportion arrived on work visas, and the rest wererefugees. In the UK, however, the proportion of family members is lower –
Note: Inflows of foreign citizens into Belgium, Denmark, Germany,France, Luxembourg, the Netherlands, Sweden, and theUnited Kingdom.
Source: SOPEMI, 2001.
FIGURE 2MIGRATION TO SELECTED EUROPEAN COUNTRIES,
1984-1999

161Migration trends and migration policy in Europe
around 43 per cent of non-EEA citizens (SOPEMI, 2001). The nationality of thenewly arriving family members naturally follows the pattern of previousimmigration. In Germany and Switzerland, therefore, most of the joining familymembers come from Turkey and the former Yugoslavia. In France and to alesser degree in Belgium and the Netherlands, they come from North Africa, andin the UK they come most from India, Pakistan, and Bangladesh.
Labour migration – After several years of economic expansion, Europe hasseen a notable increase in labour migration. Some countries have actively beenrecruiting again at the higher end of the jobs market, yet they have also startedto take on more unskilled workers, usually on a short-term or seasonal basis,particularly in agriculture, construction, and manufacturing, and also in servicessuch as hotels and catering. For Europe as a whole, the majority of non-EU short-term workers come either from Eastern Europe or from Africa (IOM, 2000).
Refugees and asylum seekers – This is the most volatile category, ebbing andflowing, according to political and economic conditions. The largest flows inrecent years were of refugees escaping the Kosovo crisis. Hundreds ofthousands of Kosovans fled to the West in 1999, though by mid-2000 most ofthese had returned home. Table 3 shows the destination countries for asylumseekers in Europe. In 2000 the largest number of requests in Europe were goingto the UK, followed by Germany, the Netherlands, and Belgium. Where areasylum seekers coming from? Table 5 shows the main sources of close to1.8 million asylum applications in Europe during the years 1994 to 1999(UNHCR, 2001). Despite the violence in Europe in 1999 the largest number ofapplications over this period came from Asia. A similar pattern is also evident inmore recent data. For October and November 2001 the top four source countriesof asylum in Europe were Iraq, Afghanistan, the formerYugoslavia, and Turkey.
Diversity of immigrants
Another trend in recent years is that migration flows have become more diverse.Although the main destination countries continue to receive the bulk of theirimmigrants from traditional sources, they are also seeing people arrive from abroader array of countries. To some extent this is the result of political instabilityin many source countries, combined with falling costs of travel. One measure ofthis is to consider what proportion of the foreign population is accounted for bythe top five immigrant groups. For most countries this proportion has tended tofall over the past decade. This is seen in Figure 3, which ranks countries accord-ing to the diversity of immigrant inflows in 1999. Of this group, the most diverseis the Netherlands where only 27 per cent of the 78,400 arrivals in 1999 camefrom the top five countries – in this case the UK, Germany, Morocco, Turkey,and the US. At the other end of the scale is Luxembourg where 55 per cent camefrom the top five countries: France, Portugal, Belgium, Germany, and the US.Ireland ranks in the middle of this figure, but in this case the proportion refers toonly two countries: the UK and the US.

162 Stalker
TABLE 5 SOURCE COUNTRIES OF ASYLUM SEEKERS TO EUROPE, 1995-1999
Origin 1995 1996 1997 1998 1999 Total
Yugoslavia, FR 51,759 38,451 48,401 98,270 120,614 357,495 Iraq 18,198 26,288 40,434 40,821 35,129 160,870 Turkey 41,385 38,416 33,106 21,762 19,723 154,392 Afghanistan 11,669 12,513 16,343 18,633 24,220 83,378 Sri Lanka 12,765 13,084 14,118 12,345 12,785 65,097 Iran 10,994 11,644 10,148 10,315 16,157 59,258 Somalia 12,290 8,091 8,963 12,129 14,272 55,745 Romania 14,537 9,757 10,630 8,786 8,657 52,367 Bosnia and Herzegovina
17,231 6,484 8,226 10,207 6,679 48,827
Pakistan 9,825 7,838 8,270 6,596 8,163 40,692 Democratic Republic of Congo
7,761 7,847 8,726 6,959 7,249 38,542
Algeria 8,678 5,218 6,860 8,228 8,027 37,011 India 9,131 7,393 5,833 4,792 6,606 33,755 Armenia 5,746 6,957 6,086 5,345 8,645 32,779 Russian Federation 4,740 4,900 5,480 5,847 11,495 32,462 China 3,924 4,269 6,902 6,020 10,780 31,895 Nigeria 8,901 6,354 5,281 5,659 4,698 30,893 Albania 1,263 1,482 7,880 6,651 4,058 21,334 Stateless 3,120 3,550 3,650 3,661 4,227 18,208 Georgia 3,150 3,102 4,410 4,117 3,422 18,201 Africa 71,854 55,631 58,950 64,040 72,862 323,337 Asia 143,835 148,108 165,216 150,294 171,771 779,224 Europe 107,347 76,361 97,784 146,865 175,289 603,646 Latin American and Caribbean
3,131 4,018 4,820 3,874 4,975 20,818
Other/unknown 7,679 8,701 6,013 5,864 38,940 67,197
Total 333,846 292,819 332,783 370,937 463,837 1,794,222
Source: UNHCR, 2001.
For the majority of countries the proportion represented by the top five countrieshas tended to fall in recent years. The most striking difference in this figure is forthe Netherlands, down from 49 per cent to 27 per cent, much of which isaccounted for by declining numbers coming from Morocco and especially fromTurkey, which was the leading source of immigrants in 1990 but had dropped tofourth place by 1999. Portugal too has seen a decline in immigration from Angolaand Guinea-Bissau. Yet, some countries seem to have seen a greater con-

163Migration trends and migration policy in Europe
centration in the immigrant population. In Norway, for example, the 1999 figureswere affected by a large inflow of refugees from Kosovo, though there has alsobeen a notable increase in the number of people moving in from Sweden.
Apart from an increase in diversity, there has also been a tendency for the foreignpopulation in Europe to come from lower-income countries. In the mid-1980s themajority of the foreign populations from EU and EFTA countries came fromother high-income countries, and generally from other European states. Themain exceptions were Germany and the Netherlands, which already had highnumbers from Turkey, and Portugal which had many immigrants from its formercolonies in Africa. But during the mid-1990s most countries that previouslyreceived a majority of their immigrants from high-income countries increased theproportion coming from lower-income countries. Even these are usually from thelower-middle income countries (per capita income in 1995 $766 to $3,035),rather than the very poorest countries in sub-Saharan Africa or elsewhere.Italy’s increase, for example, included many more people from Morocco,Tunisia, and the Philippines (Salt, 2000).
IMMIGRATION POLICY
Patterns of immigration are also shaped by government policy which attemptsto control immigration flows in the national interest. At its simplest this can beseen as an attempt to balance two conflicting objectives. On the one handgovernments welcome immigrants as a valuable labour force, either as workerswhose skills are in short supply, or as unskilled workers who are prepared to dosome of the jobs that native workers shun. On the other hand they also try todissuade immigrants if they believe they will bring social and political problemsand they usually restrict immigration on the grounds of preserving “nationalidentity” or maintaining social stability.
Similarly there are two main conflicting factors when it comes to acceptingrefugees. The main reasons for accepting are social and political – respondingto humanitarian impulse to create a safe haven for those who have a “well-founded fear of persecution”. The primary reason for trying to limit the flows ofrefugees is usually economic, since refugees can be seen as a drain on publiclyfunded welfare services, though there are also concerns about social stability.In reality, of course the situation is far more complex, and these and many otherfactors interact and mutate. In the receiving countries, governments have torespond to pressures from many different interest groups, some in favour ofliberal immigration policies and others demanding stricter controls. Thusemployers can be expected to be in favour of immigration which gives them alarger pool of potential employees. Workers’ groups, on the other hand, mayobject to competition from immigrants who are prepared to accept lowerwages. Nevertheless during times of economic expansion even workers’

164 Stalker
representatives tend not to oppose immigration very strongly. Germany’s guestworker programme, for example, was worked out in close cooperation with tradeunions (Hollifield, 1992).
0% 20% 40% 60% 80%
Luxembourg
Finland
Norway
UK
Portugal
Ireland
Switzerland
Belgium
France
Germany
Sweden
Denmark
Netherlands
Proportion from top five countries
Early 1990s
Late 1990s
A further factor likely to favour more positive immigration policies isdemographic change. In the EU, the total fertility rate, the average number ofchildren a women bears in her lifetime, is now down to 1.4, far below the figureof 2.1 required to maintain a stable population. As a result there have beensuggestions in recent years that European countries should encourageimmigration to offset the ageing of their populations, though the scale ofimmigration required to achieve this is dramatic. To maintain a stable population,
FIGURE 3PROPORTION OF INFLOWS OF FOREIGNERS FROM TOP
FIVE COUNTRIES, EARLY AND LATE 1990s
Notes: Data are for inflows for 1990 and 1999, except Denmark(1992 and 1998), Finland and the UK (1992 and 1999), andBelgium (1991 and 1999). For Ireland they are 1994 and1999 and the proportion is for the top two countries.
Source: Data from SOPEMI, 2001.

165Migration trends and migration policy in Europe
the UN estimates that from 1995-2000 the EU would need to boost its annualinflows by a factor of five, to around 1.6 million. And if it wanted to maintain aconstant “support ratio”, the number of working people for each person olderthan 65, the EU would need to achieve net annual migration of 13 million(UN Population Division, 2000).
There are similar fluctuations in attitudes to refugees. In principle the numberof asylum claims that are accepted should be determined only by the number ofpeople who have a well-founded fear of persecution. In practice, however,the proportion admitted also depends on the overall number of claimants sincethe stringency with which claims are tested tends to rise with the prospect ofmore arrivals.
National policies on immigration
Ultimately immigration in Europe is controlled by national governments. Thesepolicies can be quite diverse but during the 1950s and 1960s they were fairlyliberal. The countries of northern Europe that had colonial histories needed moreworkers and were happy to accept them from their former colonies. In the 1950sthe United Kingdom, for example, allowed people from the former British Empireto come to the “mother country” and accorded them the same rights as any othercitizen, though it curtailed these settlement rights from 1962 on. France,concerned about falling birth rates, also gave citizenship rights to people not justfrom parts of the Caribbean that were administratively part of France, but alsoto arrivals from some former colonies in North Africa. The Netherlands andBelgium also had colonial links but actually recruited more guest workers fromsouthern Europe, Morocco, and Turkey. West Germany also allowed freeimmigration to some extent, notably for “ethnic Germans” either from EastGermany or from other countries in Eastern Europe or the Soviet Union. Thenduring the 1960s, West Germany started actively to promote the temporaryimmigration of young male workers through inter-governmental agreementswith other West European countries as well as with Turkey, Morocco, Tunisia,and the former Yugoslavia. Switzerland also recruited guest workers over thisperiod but always on a strictly controlled basis.
The position of the Nordic countries was somewhat different. From 1954,Sweden, Denmark, Finland, and Norway had established a common labourmarket, and from 1957 a common passport union, allowing people to work freelyin each other’s countries. This allowed Sweden, for example, to draw in workersfrom Finland, though later it also established a controlled system for foreignlabour from other countries, including the former Yugoslavia, Greece, andTurkey. Here the first main attempt at control was from 1965 when workers hadto obtain a work permit before arrival. Denmark also used guest workers duringthis period. Norway, during the 1950s and 1960s, had relatively little immigration.

166 Stalker
Immigration policies that had been diverse suddenly converged after the oil crisisof 1973-1974. Most countries passed legislation to restrict further primaryimmigration. And countries with guest workers also encouraged them to returnhome. But such policies had little success. Many guest workers in Germany andelsewhere had already put down roots and started families.
Although Switzerland did deport some workers, other countries were reluctantto take measures that could be seen to infringe human rights. A similar concernfor human rights also ensured that immigrants already in place would be allowedto bring in close family members. The effect of the controls was therefore to shiftinflows from labour immigration to family reunification.
The European dimension
This period also saw the slow emergence of a cross-national European responseto immigration. Initially this was limited to agreements between members of theEU on travel and labour issues within European countries. But from the mid-1980s the countries of the EU became more concerned about their commonexternal frontier and struggled to develop a common policy on non-EUimmigrants. Some of the stages in this process are listed in Table 6.
One of the most significant moves was the adoption of the Schengen accords,originally signed in 1985. In 1990 these were formalized into the SchengenConvention which moved the EU closer to a borderless union and tocommon policies on immigration and asylum. This involves removingborder controls between EU countries while hardening external frontiers,creating what is popularly referred to as “fortress Europe”. This has not yet beenimplemented completely.
Denmark, for example, will decide on a case-by-case basis whether toparticipate. And the UK and Ireland are not parties but can, with the approvalof the EU Council, apply the Schengen Convention in whole or in part andparticipate in its further development. On the other hand two non-EU countries,Iceland and Norway, are now part of the agreement. Schengen also offers somefreedom for non-EU nationals who can move between signatory countries if theyhave the appropriate visa or residence permit.
In the case of asylum seekers the most significant effort at establishing commonfrontiers has been the 1997 Dublin Convention which requires asylum seekersto apply in the first EU country in which they land. In practice this has provedvery difficult to implement and relatively few people have yet been transferred(DRC, 2001). One of the most dramatic indications of its failure to work asplanned is the gathering of asylum seekers at the French end of the ChannelTunnel hoping to gain asylum in the UK.

167Migration trends and migration policy in Europe
TABLE 6 MIGRATION POLICY IN THE EUROPEAN UNION
Year* Event Outcome
1958 Treaty of Rome Set up the European Economic Community and established that a citizen of one member country could travel to another country to work or seek work.
1976 Trevi Group
A meeting of ministers to promote cooperation on issues of law and order (”Trevi” now stands for Terrorisme, Radicalisme, Extremisme, et Violence Internationale). After 1986 this becomes an ad hoc group of ministers responsible for considering immigration questions, particularly illegal immigration, among other things.
1985 Schengen Accords
An agreement to remove all border controls while attempting to strengthen the common external frontier. Originally signed by six countries in 1985, the current signatories are Austria, Belgium, Denmark, Finland, France, Germany, Greece, Iceland, Italy, Luxembourg, the Netherlands, Norway, Portugal, Spain, and Sweden.
1987 Single European Act
The member states of the EU declared their intention to create a unified market. The Act also amended earlier treaties to ensure further cooperation on foreign policy.
1993 Treaty on EU The “Maastricht treaty” extended cooperation to political activities, including foreign policy. This treaty also lifted the remaining restrictions on migration from Spain and Portugal to other EU countries (SOPEMI, 1999).
1997 Dublin Convention
An attempt to harmonize policy by requiring asylum seekers to apply in the first EU country they enter; still not in effect.
1999 Treaty of Amsterdam
Placed issues relating to immigration and asylum under the jurisdiction of the EC and incorporated the Schengen Accords into the EU; included an agreement to achieve minimum standards in asylum policies and practices by 2004.
1999 European Council
meeting in Tampere
Established the need for a common European policy on asylum and immigration and asked the European Commission to draw up proposals on asylum, refugees, and immigration.
2000 Nice Treaty This included a Charter of Fundamental Rights that says that non-EU nationals with residence or work permits should eventually have the same freedom of movement as EU nationals.
2001 European Council
meeting in Laeken
Failed to agree on greater cooperation on immigration or asylum policies.
Note: *In the case of treaties this refers to the year in which they came into force.

168 Stalker
As far as immigration from outside the EU is concerned, governments still prefernational policies to supranational ones and have proved reluctant to transferauthority to European bodies such as the European Parliament or the EuropeanCourt of Justice (Koslowsky, 1998). This determination to retain sovereigncontrol over immigration was confirmed at a meeting of the European Council(heads of government) meeting at Laeken in December 2001 which, whilecalling for closer cooperation to protect external frontiers, rejected a proposal tocreate a common European border patrolled by EU border guards.
There was a similar impasse at this meeting when it came to policies on asylum.The UK, for example, was pressing for common standards on accepting asylumapplications but Austria and Germany opposed such measures which wouldprobably require them to accept higher numbers. The European Commissiondoes now have more authority to propose laws on immigration and asylum, butstill has to present these to the Council of Ministers where they are subject toclose national scrutiny.
National policies
At the national level the current trend seems to be for governments to make amore realistic assessment of the need, both economic and demographic, forimmigrants while also trying to manage immigration more efficiently. Nationallevel policies on immigration involve efforts to: control immigration, which includemeasures to tighten up border controls and to simplify and speed up the processesfor dealing with asylum applications; combat illegal immigration, which typicallyinclude sanctions against airlines or other travel operators, as well as heavy finesfor employers of illegal immigrants – a number of countries have also hadregularization programmes for current illegal immigrants; and better integrateimmigrants, which include, for example, training for local authorities to makethem more sensitive to the needs of immigrants, training and language classes forimmigrants, systems of sponsorship to help immigrants settle, and specialreception classes for children.
The following are some recent measures taken by individual countries:
Denmark – In 2000 the Government enacted legislation to deter any immigrantyounger than 25 from bringing a foreign spouse to Denmark. And in 2001 thenew-elected Government introduced measures to make the country lessattractive to refugees and immigrants. Now refugees can be sent home up toseven years after being granted asylum if their home countries are by thendeemed safe. And they must also wait seven years before being grantedpermanent residence permits.
France – In 1997 the new Government instituted a regularization programmethat has granted residence to 75,600 foreigners. Three-quarters of these came

169Migration trends and migration policy in Europe
from Africa, with similar numbers from the Maghreb and sub-Saharan Africa.In 2001 France signed a bilateral agreement with Algeria on the status ofAlgerians in France.
Germany – In 2001 the Minister of the Interior said that “Germany is animmigration country”, a significant shift from the previous official stance.Germany is also considering a new immigration bill that would allow highly skilledpeople to qualify for permanent residence as soon as they arrive, and alsointroduced measures to integrate foreigners and tighten the asylum system.However the bill has met with some opposition from parties opposed toimmigration and may not be accepted by the upper house of parliament.
Ireland – The situation here is somewhat different. Ireland, which hasonly recently become a country of immigration, and had the fastest-growingeconomy in Europe, was happy to welcome more workers. Here around three-quarters of immigrant workers are unskilled. Now Ireland is becoming morerestrictive. Faced with rising unemployment it is tightening up on work permits.Employers now have to show that reasonable efforts have been made to recruitEU nationals.
Italy – So far Italy has granted residence permits to foreigners who have enteredlegally or illegally and found work. Early in 2002, however, there were plans fora tougher immigration law that would permit non-EU immigrants to remain in thecountry only for as long as they have a contract of employment, and also makeit simpler to expel illegal immigrants.
Sweden – Sweden has always made efforts to integrate its foreign labour forceand has never operated under the assumption that contract workers would gohome. Here it is relatively easy to gain citizenship and around half the foreign-born are citizens. In 1998 the Government introduced a new policy on integrationand in 2001 enacted a new citizenship law that recognizes dual nationality.
United Kingdom – During 2001 British policy on labour immigration shiftedsignificantly in favour of allowing more foreign workers. From the beginning of2002 a “Highly Skilled Migrant Programme” will use a points scheme based oneducational attainment and salary to admit foreign professionals who do not havea pre-arranged job. And the opportunities for “working holiday makers” andseasonal workers have been widened. At the same time the penalty forsmuggling or trafficking people has been increased from a ten to 14 year prisonsentence (Koslowsky, 1998).
INTERNATIONAL COOPERATION
Thus far, European countries have pursued most of their migration policies withintheir own national borders by controlling the entry of foreigners and supervising

170 Stalker
the integration of existing immigrants. They have done relatively little to try tocontrol immigration through cooperation with the sending countries. In earliereras, when the aim was to encourage labour immigration, Germany set uprecruitment bureaus in the formerYugoslavia and Turkey, and France and theUK at various times established systems to encourage immigration from theirformer colonies.
Even today, a number of European countries have bilateral quota agreementswith sending countries for unskilled workers, usually for temporary or seasonallabour. Germany has the largest number of seasonal workers, most of whomcome from Poland, and France has bilateral agreements with Morocco, Poland,Senegal, and Tunisia (IOM, 2000).
There are also bilateral arrangements – “readmission agreements” – for therepatriation of various types of migrants, usually failed asylum seekers. Althoughmost such arrangements are bilateral, some are multilateral. Most of the latterare through the International Organization for Migration (IOM), which amongother activities, helps people who have to return home – rejected asylum seekers,trafficked migrants, stranded students, and some labour migrants. One project,for example, concerns the “Reintegration and Emigration of Asylum Seekersfrom Germany” which in 2000 assisted some 70,000 people to return to Bosnia,Kosovo, and elsewhere (IOM, 2002).
Aid in place of migration?
Could the receiving countries also do more to prevent migration by addressingthe causes of unwanted immigration rather than simply trying to control it? Attimes there have indeed been suggestions that the richer countries might targetsome of their development aid in this direction, using it to defuse potentialconflicts that could trigger flows of refugees, for example, or to alleviate thepoverty that causes people to seek work overseas.
Conflict prevention and resolution came to be seen as a more urgent taskduring the 1990s following a surge of internal conflicts in Europe andelsewhere. The European Community, for example, when preparing CountryStrategy Papers for the countries to which it gives aid now assessesthe potential for conflicts – looking at such issues as the balance of politicaland economic power, the nature of the security forces, the ethnic compositionof the government, the representation of women, and the extent of environ-mental degradation.
There have also been efforts to focus on countries that have produced a largenumber of emigrants. In 1998 the EU created a High-Level Working Group(HLWG) on Asylum and Migration which has now developed Action Plansfor Sri Lanka, Somalia, Albania, Afghanistan, Iraq, and Morocco, aimed at

171Migration trends and migration policy in Europe
comprehensively addressing the roots of displacement (European Commission,2001). In what are always very complex situations, however, it will be difficultto prove whether such interventions really do have a significant impacton emigration.
It is equally difficult to judge the impact on emigration of aid given to reducepoverty. This was an issue raised explicitly at several international conferencesin the early 1990s, and still remains largely unresolved (Böhning and Schloeter-Pareses, 1994). Many of the doubts concern whether aid can indeed reducepoverty – a much larger question beyond the scope of this paper. But even ifdevelopment cooperation did reduce poverty it is questionable whether thiswould then immediately stem emigration. A number of studies have concludedthat when people’s incomes and aspirations rise as their countries industrializethey will become more mobile both nationally and internationally and have theresources to emigrate.
Only later, when the labour market at home offers sufficient remunerativeemployment,will the more ambitious people be content to remain at home. Thisproduces what has been called a “migration hump” as migration first rises andthen falls (Martin and Taylor, 1996). How rich do people have to be before theydo not feel impelled to emigrate? Some studies in the mid-1990s suggested thatthe transition occurred at an average real per capita income of around $4,000.This is illustrated in Figure 4 which suggests that the transition occurs first fornational migration, then for international unskilled migration, and finally formigration of the highly skilled (Fisher and Straubhaar, 1996).
Nevertheless it could also be argued that even if this is the case it might be usefulto try more targeted interventions to boost employment, specifically in countriesand areas that send large numbers of migrants. The evidence here is not verypositive. The International Labour Organization (ILO), for example, has beeninvolved with such activities in high-emigration areas in the Maghreb countries,which do have per capita incomes of around $4,000. These have included “micro-level” targeted interventions such as support to small enterprise development.The ILO has concluded, however, that such interventions usually have noperceptible impact on migration pressure and argues that a more fruitful optionwould be for the richer countries to open their markets so as to enable the poorermigrant-sending countries to pursue the kind of export-led growth that could givea more substantial boost to both wages and employment (Abella, 2002).
The empirical evidence
Do European countries, in practice, try to direct aid to reduce migrationpressures? One indication would be if European ODA flows were concentratedon migrant-sending countries. Table 7 compares, for the countries with both setsof data available, the main developing-country destinations of ODA with the

172 Stalker
main developing-country sources of immigrants (DAC, 2001). The developingcountries listed here are the leading three, though countries that also figure highlyin the top 12 or 15 in the other category are also asterisked. Thus for Belgium,Morocco is the leading source of immigrants, and is also ranked highly as an aiddestination (number 15).
This table does indeed suggest a degree of correlation. However, in most casesthis is because both immigration and aid flows reflect colonial ties. For the UK,India is the leading destination of ODA primarily because of a long historicalassociation, rather than from an attempt to dampen emigration. The strongestcolonial correlation is for Portugal, almost all of whose assistance goes to formercolonies. Turkey also figures highly on the ODA lists, though again there areprobably other reasons for this, since Turkey, particularly during the Cold War,was strategically important to Europe. On the other hand, Tanzania figuresstrongly as an aid recipient, though it is not a significant source of migrants. Thelack of any clear connection between aid policies and migration is also impliedfrom the published policies of donors. The DAC guidelines on poverty reduction,for example, do mention migration but only in the broader contextof the ways in which development assistance could contribute to povertyreduction with the implication that this in turn might reduce emigration pressures.
THE NEXT PHASES OF EUROPEAN IMMIGRATION
In the past most European countries have not considered themselves countriesof immigration. Their first instinct has been to resist large numbers of newarrivals. Recent developments, however, suggest possible changes of direction.Although in the short term there can be switches in immigration policy in responseto immediate political pressures, in the longer term immigration is likely to grow.This is partly because of labour demand, since even at times of slow economicgrowth, most European countries find themselves short of skilled workers andalso of people prepared to do jobs that national workers shun. The longer-termpicture will also be affected by demographic changes and the greying of thepopulation. Immigration is not the answer to falling birth rates, since counteringthis would require immigration on a vast scale. What demographic shifts couldeventually do, however, is erode popular resistance to immigration andencourage governments to accept more people, even if in a closely controlledfashion tailored as precisely as possible to national needs.
For the EU in the short and medium term many of these labour demands are likelyto be met from the East, rather than from the South. As the EU expands eastwardit will gain access to new sources of migrant labour, similar to those provided inthe 1950s and 1960s by Italy, Portugal, and Spain. Yet, given the low birth ratesin most of these countries too, the longer-term picture, even for an expanded EU,is likely to involve greater use of workers from developing countries.

173M
igration trends and migration policy in Europe
0 1 2 3 4 5 6 7 Average real income per capita ($)
Mig
ratio
n pr
open
sity
National migration
International unskilled
International high skilled
FIGURE 4MIGRATION PROPENSITY AND DEVELOPMENT
Source: Fischer and Straubhaar, 1996.

174 Stalker
TABLE 7 LEADING SOURCES OF FLOWS OF IMMIGRANTS, AND LEADING
DEVELOPING-COUNTRY DESTINATIONS OF OFFICIAL DEVELOPMENT ASSISTANCE (ODA), SELECTED COUNTRIES, 1998-1999
Top Three Sources of Migrants, 1999
Top Three Destinations of ODA, 1998-1999
Belgium Morocco* Turkey Malawi Tanzania Congo Rwanda
Denmark Iraq Somalia Turkey Tanzania Uganda Mozambique
Finland Iraq* Iran China* Mozam- bique
Nicaragua China*
France Morocco* Algeria* Turkey Fr. Polynesia
New Caledonia
Côte d’Ivoire
Germany Turkey* - - China Indonesia Turkey*
Greece Egypt* Philippines Turkey* Palestine Egypt* Turkey*
Italy Morocco China* Senegal Madagascar Mozam-bique
Haiti
Netherlands Morocco Turkey Suri- name*
Neth. Antilles
Tanzania India
Norway Iraq* Somalia Iran Tanzania Mozam- bique
Palestine
Portugal Brazil * Guinea-Bissau*
Cape Verde*
Mozam- bique*
East Timor Cape Verde*
Sweden Iraq Iran China Tanzania Mozam- bique
S. Africa
Switzerland Turkey - - Bangladesh Mozam- bique
India
UK S. Africa* India* Pakistan* India* Tanzania Bangladesh*
Notes: *Also a leading source of migrants, or also a leading destination of ODA, though not necessarily in the top three.
This does not include European countries such as Bosnia and Herzegovina and the former Yugoslavia, which are major immigrant sources, as well as destinations for ODA.
Sources: SOPEMI, 2001; Development Assistance Committee, 2000.

175Migration trends and migration policy in Europe
NOTE
1. The European Economic Area includes the 15 members of the European Union plusIceland, Liechtenstein, and Norway.
REFERENCES
Abella, M.2002 Personal communication with Manolo Abella, Chief of the ILO International
Migration Branch.Böhning, W., and M. Schloeter-Paredes
1994 Aid in Place of Migration?, International Labour Organization, Geneva.Borrie, W.
1970 The Growth and Control of World Population, Weidenfeld and Nicolson,London: 94.
DAC2001 The DAC Journal: Development Assistance, 2000 Report, OECD, Paris.
DRC2001 The Dublin Convention: Study on its Implementation in the 15 Member
States of the European Union, Danish Refugee Council/EuropeanCommission, Copenhagen.
European Commission2001 Communication from the Commission on Conflict Prevention, European
Commission, Brussels.Eurostat
2000 European Social Statistics: Migration, Eurostat, Luxembourg.2002 Collection: key indicators; Theme: Population and Social Conditions,
Eurostat website, http://europa.eu.int.Fischer, P., and T. Straubhaar
1996 “Is Migration into EU countries demand based?”, in D. Corry (Ed.),Economics and European Union Migration Policy, Institute for PublicPolicy Research, London.
Hollifield, J.1992 Immigrants, Markets and States: The Political Economy of Postwar
Europe, Harvard University Press, Cambridge.International Organization for Migration (IOM)
2000 World Migration Report, IOM, Geneva.2002 http://www.iom.int/en/what/main_heading_reag.shtml.
Koslowsky, R.1998 “European Union migration regimes, established and emergent”, in C.
Joppke (Ed.) Challenge to the Nation-state: Immigration in WesternEurope and the United States, Oxford University Press, Oxford.
Martin, P., and J. Taylor1996 “The anatomy of a migration hump”, Development Strategies, Employment
and Migration: Insights from Models, OECD, Paris.

176 Stalker
Salt, J., J. Clarke, and S. Smith2000 Patterns and Trends in International Migration in Western Europe,
Eurostat, Luxembourg.SOPEMI
1999 Trends in International Migration, OECD, Paris.2000 Trends in International Migration, OECD, Paris.2001 Trends in International Migration, OECD, Paris.
Stalker, P.1994 The Work of Strangers: A Survey of International Labour Migration,
International Labour Organization, Geneva.Travis, A.
2002 “Permits, quotas and tests of allegiance”, Guardian, London: 8 February.UNHCR
2001 Asylum Applications in Industrialized Countries: 1980-1999, UNHCR,Geneva.
UN Population Division2000 Replacement Migration: Is it a Solution to Declining and Ageing
Population?, United Nations, New York.Widgren, J.
1994 “International Response to Trafficking in Migrants and the Safeguarding ofMigrant Rights”, paper presented at the 11th IOM seminar on Migration,Geneva.

177Migration trends and migration policy in Europe
TENDANCES ET POLITIQUES MIGRATOIRES EN EUROPE
L’auteur de cet article propose une synthèse des dernières données en date surle nombre de migrants et les flux migratoires en Europe, en insistant surl’immigration en provenance des pays en développement. Replaçant toutd’abord ce phénomène dans son contexte historique, il rappelle comment l’affluxinitial de travailleurs immigrés a été suivi de l’afflux des membres de leursfamilles puis, ultérieurement, par les arrivées de réfugiés et de demandeursd’asile. Après quoi il examine de plus près les données migratoires récentes,lesquelles, relève-t-il toutefois, sont souvent hétérogènes et lacunaires.
Les données statistiques transnationales les plus facilement comparables, duesà l’OCDE et à Eurostat, indiquent que dans les années 90, c’est l’Allemagne quia reçu le plus grand nombre d’immigrants, suivie du Royaume-Uni. En outre, ilse trouve probablement en Europe de trois à quatre millions d’immigrants donton ne sait rien – soit 10 à 15 pour cent de toute la population étrangère.
Il est aussi question dans cet article des pays d’émigration. Très diversifiée d’unpays à l’autre, la provenance de l’immigration dépend de plusieurs facteurs dontles principaux sont les antécédents coloniaux, une tradition de recrutement de lamain-d’œuvre dans certaines régions, la facilité d’entrée depuis des payslimitrophes. On observe cependant depuis quelques années que les immigrantsproviennent de pays bien plus nombreux, et notamment de pays à très faiblerevenu.
L’évolution des politiques migratoires y est par ailleurs examinée. Dans lesannées 50 et 60, les politiques nationales étaient relativement tolérantes – ellesne se sont durcies qu’après 1970. Or, les autorités de plusieurs pays s’emploientdepuis quelque temps à les remanier dans le sens d’une meilleure prise en comptedes nécessités de l’emploi et des besoins démographiques. L’auteur évoque à cepropos l’apparition d’une réponse transnationale européenne coordonnée àl’immigration, les pays de l’Union se souciant désormais davantage de leursfrontières extérieures communes.
À ce jour, les pays européens n’ont pas fait grand-chose pour tenter de maîtriserl’immigration avec le concours des pays de provenance. Pourtant, alors qu’ilspourraient par exemple octroyer une aide au développement aux pays de forteémigration, peu ont opté délibérément pour cette formule.
L’auteur conclut qu’on doit s’attendre à une augmentation de l’immigration enEurope, résultant à la fois d’un renforcement de la demande de main-d’œuvreet de la faiblesse du taux de natalité dans ce continent. À court et moyen termes,c’est d’Europe orientale que viendront les migrants, surtout en conséquence del’élargissement de l’Union européenne. En revanche, plus tard, ils viendrontprobablement en plus grand nombre des pays en développement.
178 Stalker
TENDENCIAS DE LA MIGRACIÓNY POLÍTICA MIGRATORIA EN EUROPA
Este documento resume la más reciente información sobre contingentes y flujosde migrantes en Europa, centrándose concretamente en las llegadas a partir depaíses en desarrollo. Empieza por colocar el problema en su contexto históricomostrando cómo los flujos de migrantes laborales acarrearon flujos de familiaresy, más adelante, de demandantes de asilo y refugiados. A continuación, seexamina con más detalle los datos más recientes sobre migración, encontrandoque éstos son con frecuencia incompletos e incoherentes.
Los datos transnacionales más comparables son los procedentes de la OCDE yde Eurostat, según los cuales en los años noventa Alemania recibió el mayor flujode migrantes, seguida de Reino Unido. Además de esas llegadas, en Europaexisten probablemente entre dos y tres millones de inmigrantes indocumentados,constituyendo entre el 10 y el 15 por ciento del total de la población extranjera.
El artículo se ocupa también de los países de procedencia de los inmigrantes. Losorígenes varían considerablemente de unos países de inmigración a otros, comoconsecuencia de diversos factores entre los cuales los más importantes son losvínculos coloniales previos, los lugares anteriores de reclutamiento de trabaja-dores y la facilidad de ingreso a partir de países limítrofes. Pero en estos últimosaños los inmigrantes proceden de un número cada vez mayor de países, y, enparticular, de los países de más bajos ingresos.
El artículo se ocupa también de los cambios experimentados por la políticainmigratoria. Las políticas nacionales fueron bastante liberales en el curso de losaños cincuenta y sesenta, antes de hacerse más restrictivas a partir de lossetenta. Y recientemente cierto número de gobiernos han revisado sus políticasde manera que se tomen en consideración las necesidades laborales ydemográficas. Se hace asimismo referencia al hecho de que a medida que lospaíses de la Unión Europea (UE) van teniendo más en cuenta la existencia defronteras externas comunes, va apareciendo una respuesta europea trans-nacional a la inmigración.
Hasta ahora los países europeos apenas habían tratado de controlar la migracióncooperando con los países de partida. Así, por ejemplo, a veces dirigían suasistencia oficial al desarrollo hacia los países que probablemente les iban aenviar más migrantes, aunque muy pocos parecían hacerlo de maneradeliberada.
El artículo llega a la conclusión que en el futuro lo más probable es que lainmigración a la UE vaya en aumento como resultado tanto de la demanda detrabajadores como de los escasos índices de natalidad de los países europeos. Acorto y mediano plazo muchas de estas necesidades probablemente se satisfarán

179Migration trends and migration policy in Europe
mediante flujos procedentes de Europa oriental, sobre todo a raíz de la expansiónhacia el Este de la UE. Pero a largo plazo lo más probable es que se produzcauna mayor inmigración procedente de países en desarrollo.