Greenhouse gas emission trends and projections in Europe
76
Greenhouse gas emission trends and projections in Europe Are the EU and the candidate countries on track to achieve the Kyoto Protocol targets? Prepared by: Bernd Gugele, Bernd Strobel, Peter Taylor European Topic Centre on Air and Climate Change Project manager: André Jol European Environment Agency Environmental issue report No 33
-
Upload
khangminh22 -
Category
Documents
-
view
0 -
download
0
Transcript of Greenhouse gas emission trends and projections in Europe

1
Greenhouse gas emission trends and projections in EuropeAre the EU and the candidate countries on track
to achieve the Kyoto Protocol targets?
Prepared by:Bernd Gugele, Bernd Strobel, Peter Taylor
European Topic Centre on Air and Climate Change
Project manager:André Jol
European Environment Agency
Environmental issue report No 33

2 Greenhouse gas emission trends and projections in Europe
Layout: Brandenborg a/s
Legal notice
The contents of this report do not necessarily reflect the official opinion of the European Commission or other European Communities institutions. Neither the European Environment Agency nor any person or company acting on behalf of the Agency is responsible for the use that may be made of the information contained in this report.
All rights reserved
No part of this publication may be reproduced in any form or by any means electronic or mechanical, including photocopying, recording or by any information storage retrieval system without the permission in writing from the copyright holder. For rights of translation or reproduction please contact EEA project manager Ove Caspersen (address information below).
A great deal of additional information on the European Union is available on the Internet.It can be accessed through the Europa server (http://europa.eu.int)
©EEA, Copenhagen, 2002
ISBN: 92-9167-525-3
European Environment AgencyKongens Nytorv 6DK-1050 Copenhagen KTel. (45) 33 36 71 00Fax (45) 33 36 71 99E-mail: [email protected]: http://www.eea.eu.int

Contents 3
Contents
Foreword . . . . . . . . . . . . . . . . . . . . . . . . . . . . . . . . . . . . . . . . . . . . . . . . . . . . . . . . 5
Summary . . . . . . . . . . . . . . . . . . . . . . . . . . . . . . . . . . . . . . . . . . . . . . . . . . . . . . . . 7
1. Introduction . . . . . . . . . . . . . . . . . . . . . . . . . . . . . . . . . . . . . . . . . . . . . . . . . . . 13
2. Which targets have to be achieved and what is the progress on ratification of the Kyoto Protocol? . . . . . . . . . . . . . . . . . . . . . . . . . . . . . . . . . . . . . . . . . . . 15
2.1. ‘Burden sharing’ within the EU to fulfil the Kyoto Protocol 15
2.1. The Kyoto Protocol targets of candidate countries 16
3. What is the actual progress of the EU and candidate countries in limitinggreenhouse gas emissions? . . . . . . . . . . . . . . . . . . . . . . . . . . . . . . . . . . . . . . . 18
3.1. Progress in reaching EU targets between 1990 and 2000 . . . . . . . . . . . 18
3.2. Progress of the Member States in 2000 towards reaching their burden-sharing targets . . . . . . . . . . . . . . . . . . . . . . . . . . . . . . . . . . . . . . 19
3.3. Sectors and gases responsible for EU emission trends between 1990 and 2000 . . . . . . . . . . . . . . . . . . . . . . . . . . . . . . . . . . . . . . . . . . . . . . . . . 20
3.3.1. Key emission trends . . . . . . . . . . . . . . . . . . . . . . . . . . . . . . . . . . . . . . 20
3.3.2. Energy supply and use (excluding transport). . . . . . . . . . . . . . . . . . . . 22
3.3.3. Transport . . . . . . . . . . . . . . . . . . . . . . . . . . . . . . . . . . . . . . . . . . . . . . . 24
3.3.4. Agriculture . . . . . . . . . . . . . . . . . . . . . . . . . . . . . . . . . . . . . . . . . . . . . . 26
3.3.5. Industry (non-energy-related). . . . . . . . . . . . . . . . . . . . . . . . . . . . . . . . 28
3.3.6. Waste management . . . . . . . . . . . . . . . . . . . . . . . . . . . . . . . . . . . . . . 28
3.4. Progress of candidate countries in reaching their targets . . . . . . . . . . . 29
4. Is the projected progress of EU and candidate countries sufficient to achievetargets in 2010? . . . . . . . . . . . . . . . . . . . . . . . . . . . . . . . . . . . . . . . . . . . . . . . . 31
4.1. Projected progress of the EU with existing policies and measures . . . . . 31
4.2. Projected progress of the EU with additional policies and measures . . . 32
4.3. Projected progress of candidate countries with existing and additionalpolicies and measures . . . . . . . . . . . . . . . . . . . . . . . . . . . . . . . . . . . . . . . 35
5. What are the effects of policies and measures in the EU to reduce greenhouse gas emissions by 2010? . . . . . . . . . . . . . . . . . . . . . . . . . . . . . . . . 37
5.1. Common and coordinated policies and measures of the EU . . . . . . . . . . 37
5.2 Main savings from existing and additional policies and measures of the EU Member States . . . . . . . . . . . . . . . . . . . . . . . . . . . . . . . . . . . . . . 39
5.3. Comparison of national ‘with existing measures’ projections with EU-wide projections . . . . . . . . . . . . . . . . . . . . . . . . . . . . . . . . . . . . . . . . 40

4 Greenhouse gas emission trends and projections in Europe
5.4. Sectoral projections and policies and measures . . . . . . . . . . . . . . . . . . . 42
5.4.1. Energy supply and use (excluding transport) . . . . . . . . . . . . . . . . . . . 42
5.4.2. Transport . . . . . . . . . . . . . . . . . . . . . . . . . . . . . . . . . . . . . . . . . . . . . . . 47
5.4.3. Agriculture . . . . . . . . . . . . . . . . . . . . . . . . . . . . . . . . . . . . . . . . . . . . . . 50
5.4.4. Industry (non-energy-related) . . . . . . . . . . . . . . . . . . . . . . . . . . . . . . . 51
5.4.5. Waste management . . . . . . . . . . . . . . . . . . . . . . . . . . . . . . . . . . . . . . . 53
6. Is the reporting scheme of the EU sufficient for assessing the progress ofgreenhouse gas emissions reduction? . . . . . . . . . . . . . . . . . . . . . . . . . . . . . . . 55
6.1. State of current reporting . . . . . . . . . . . . . . . . . . . . . . . . . . . . . . . . . . . . 55
6.1.1. Reporting of greenhouse gas inventories by EU Member States . . . . 55
6.1.2. Reporting of greenhouse gas inventories by candidate countries . . . 55
6.1.3. Reporting of projections and policies and measures . . . . . . . . . . . . . 56
6.2. Sensitivity (range) in emissions projections . . . . . . . . . . . . . . . . . . . . . . . 56
6.3. Improvement needs . . . . . . . . . . . . . . . . . . . . . . . . . . . . . . . . . . . . . . . . 57
Annex 1: What are the actual and projected greenhouse gas emissions by EU Member States? . . . . . . . . . . . . . . . . . . . . . . . . . . . . . . . . . . . . . . . . 59
Annex 2: What are the actual and projected greenhouse gas emissions by candidate countries? . . . . . . . . . . . . . . . . . . . . . . . . . . . . . . . . . . . . . . . . 67
Annex 3: EU greenhouse gas emissions by sector and projections by Member State . . . . . . . . . . . . . . . . . . . . . . . . . . . . . . . . . . . . . . . . . . . . . 73
References . . . . . . . . . . . . . . . . . . . . . . . . . . . . . . . . . . . . . . . . . . . . . . . . . . . . . . . 75
Glossary . . . . . . . . . . . . . . . . . . . . . . . . . . . . . . . . . . . . . . . . . . . . . . . . . . . . . . . . . 76

Foreword 5
Foreword
Addressing climate change and the activities causing climate change is a key challenge for the 21st century, for both developed and developing countries, if sustainable development is to be attained. Sustainable development and integrating environmental considerations into European Community policies are key EU goals, expressed in the EU Sustainable Development Strategy and the 6th Environmental Action Programme. The ministerial Councils responsible for sectors covered by the ‘Cardiff Process’ (energy, transport, agriculture, etc.) have called for strategies and indicators for integration to be elaborated.
At the global level, the ultimate objective of the UN Framework Convention on Climate Change (UNFCCC) is to limit atmospheric concentrations of greenhouse gases to a level that prevents dangerous anthropogenic interference with the climate system while allowing sustainable economic development. This objective would require substantial (50 to 70 %) reductions in global greenhouse gas emissions. The Kyoto Protocol targets, including the burden-sharing targets for EU Member States and individual targets for candidate countries, are only a modest first step towards the longer-term sustainability goals.
The EU wants to see ratification of the Kyoto Protocol by those industrialised countries that have not yet done so, to ensure the Protocol enters into force in 2003. Other important EU objectives are the realisation by 2005 of demonstrable progress towards achieving the Kyoto targets and to cut emissions significantly in the longer term, moving towards a globally equitable distribution of greenhouse gas emissions. Policies and measures to reduce emissions have been or are being implemented in the EU and in candidate countries, in particular for the sectors energy supply and use, transport, industry, waste management and agriculture.
One key tool for measuring the implementation of environmental integration is the regular assessment of progress provided by the EU greenhouse gas monitoring mechanism. The European
Commission prepares an annual evaluation report to the Council and European Parliament assessing the actual and projected progress of the EU, and from this year also of candidate countries, towards fulfilling their Kyoto targets. This report, prepared by the EEA and its European Topic Centre on Air and Climate Change, serves to support and complement the Commission’s analysis. The report follows the same model as other recent EEA indicator-based reports (Energy and environment in the EU and Paving the way for enlargement: Indicators of transport and environment integration).
The report is based on national programmes provided by countries. The monitoring mechanism provides an early warning of the extent to which additional policies and measures are needed. The added value provided by the Agency is in the balanced assessment of this information, benchmarking and comparing countries in a transparent and consistent way and analysing the effectiveness of policies and measures. The information on greenhouse gas emissions is also used in the annual ‘Synthesis’ report, which includes information on progress towards sustainable development, and is prepared by the Commission for the European Council meeting each spring.
The EEA report shows a mixed picture. After an initial decrease in the early 1990s, EU greenhouse gas emissions more or less stabilised until 2000. However this apparently favourable situation is misleading because reductions occurred in only a few EU Member States and under special circumstances, some of which will not be repeated. Total EU emissions are currently projected, on the basis of national projections, to decrease slightly more than they have to date but by nothing like enough to achieve the Kyoto target. A recent independent EU-wide projection of carbon dioxide emissions from energy supply and use, prepared for the Commission, shows an even less optimistic picture.
The contribution of the transport sector is especially worrying, with EU greenhouse gas emissions projected to increase by almost

6 Greenhouse gas emission trends and projections in Europe
30% between 1990 and 2010. Substantial increases in emissions of hydrofluorocarbons, powerful greenhouse gases that are being used to replace chlorofluorocarbons that damage the ozone layer, are also of concern.
Potentially the gap between projected emissions and the Kyoto targets could be filled by proposed additional national and EU-wide common and coordinated policies and measures. However, much effort will be needed to ensure that these will actually be adopted and implemented in time.
The report also shows several positive developments. These include strong growth in renewables (wind and solar energy), although growth needs to increase further to reach the EU’s renewables targets; ongoing improvements in energy efficiency in the energy supply sector and in industry; and continuing reduction of emissions from landfills.
For central and eastern European candidate countries fewer data are available, and in addition their different economic situation needs to be recognised. After the beginning of the transition to market economies, in the early 1990s, these countries experienced an economic downturn. Over the past decade total greenhouse gas emissions have declined substantially, mainly due to changes in, or the closure of, heavily polluting and energy-intensive industries. However, emissions from transport increased in the second part of the 1990s. A concern is that high economic growth in future risks causing a strong rise in
emissions from transport. Total greenhouse gas emissions in six candidate countries are however projected to decrease further, and all candidate countries have policies and measures in place to reduce them.
There is still a way to go to ensure fully transparent, comparable, consistent, complete and reliable information on both greenhouse gas inventories and projections. A further challenge will be the collection and reporting of additional information required under the Kyoto Protocol, including on emissions and removals by land-use change and forestry (‘carbon sinks’), on internal EU emissions trading and on the Kyoto mechanisms (international emissions trading, joint implementation and the clean development mechanism). Proposals for improvements in data within the EU are being developed, as part of the process of revising the EU monitoring mechanism. Implementation of these will help to achieve the quality of the information needed for conducting proper assessments of progress.
The European Environment Agency will continue to support the development of this information and maintain the official record of progress by the EU, current and future Member States in meeting their emission obligations under the UNFCCC, the Kyoto Protocol, the 6th environmental action programme and the SDS, thus contributing to the move towards more sustainable development.
Gordon McInnesInterim Executive Director

Summary 7
Summary
1. Which targets have to be achieved and what is the progress on ratification of the Kyoto Protocol?
Climate change, and avoiding its potential consequences, is addressed by the United Nations Framework Convention on Climate Change (UNFCCC) and remains a high priority in the EU. Achieving ‘sustainable’ atmospheric greenhouse gas concentrations, avoiding dangerous interference with the climate system but allowing economic development, would require substantial (50 to 70 %) global reductions in total greenhouse gas emissions. To take the first steps towards stabilisation of the world’s climate, or at least a moderate sustainable climate change, Parties adopted the Kyoto Protocol, which requires by 2008–12 a 5 % reduction from 1990 levels of developed countries’ emissions of six greenhouse gases. The Kyoto Protocol sets the EU a target of an 8 % reduction from the 1990 level by 2008–12. The EU and its Member States agreed in 2002 on different emission limitation and reduction targets for each Member State, called the ‘burden sharing’ agreement. In 2001 agreement was reached within the UNFCCC on many of the rules and guidelines for use of the Kyoto mechanisms (joint implementation, clean development mechanism, international emissions trading) and of ‘carbon sinks’ for meeting the Kyoto targets, thereby allowing countries to ratify the Protocol.
The European Commission has acknowledged the need for further emission reductions beyond 2012, by suggesting an EU target to reduce emissions by an average of 1 % per year up to 2020 and a global target of 20 to 40 % reduction by 2020, both from 1990 levels.
Candidate countries have different targets under the Kyoto Protocol. Bulgaria, the Czech Republic, Estonia, Latvia, Lithuania, Romania, Slovakia and Slovenia have reduction targets of 8 % from the base year, while Hungary and Poland have reduction targets of 6 %.
!!!! The EU, its Member States and several candidate countries have ratified the Kyoto Protocol.
"""" The Protocol has not yet entered into force because not enough other industrialised countries have ratified, including countries with economies in transition such as Russia.
2. What is the actual progress of the EU and candidate countries in limiting greenhouse gas emissions?
2.1.Progress in reaching EU and Member States ‘burden-sharing’ targets from 1990 to 2000
After an initial decrease of total greenhouse gas emissions in the early 1990s, emissions were more or less stabilised in the second half of the 1990s. Less positive, however, is the fact that emissions increased from 1999 to 2000.
The favourable situation in the 1990s was largely a result of considerable cuts in emissions in Germany and the United Kingdom. The main reasons for this favourable trend in Germany were increasing efficiency in power and heating plants and the economic restructuring of the five new federal states following German reunification. The reduction of greenhouse gas emissions in the United Kingdom was partly a result of the liberalisation of the energy market and subsequent changes in the choice of fuel used in electricity production from oil and coal to gas, and partly due to significant reductions in emissions of non-carbon dioxide greenhouse gas emissions, including implementation of nitrous oxide abatement measures in the chemical industry. In both Member States the special circumstances mentioned above accounted for about half of the emission reductions for all six greenhouse gases, whilst specific policies and measures account for the remaining half.
!!!! Between 1990 and 2000, greenhouse gas emissions in the EU were reduced by 3.5 %, nearly half the greenhouse gas emission target.

8 Greenhouse gas emission trends and projections in Europe
!!!! In the second half of the 1990s, EU carbon dioxide emissions stabilised, with emissions in 2000 being slightly (0.6 %) below 1990 levels. This means that the aim of stabilising carbon dioxide emissions at 1990 levels by 2000 was achieved.
!!!! In 2000, six Member States (Finland, France, Germany, Luxembourg, Sweden and the United Kingdom) were on track towards reaching their burden-sharing target.
"""" In 2000, nine Member States (Austria, Belgium, Denmark, Greece, Ireland, Italy, the Netherlands, Portugal and Spain) were not on track towards reaching their burden-sharing target.
2.2.Sectors and gases responsible for EU emission trends between 1990 and 2000
Over the last decade emission decreases in most sectors, in particular energy industries (power and heat generation), industry and waste management were offset by substantial emission increases in transport, with road transport being the largest source.
!!!! Over the last decade greenhouse gas emissions in the EU decreased in most sectors (industry, energy supply, agriculture, waste management and households).
"""" EU emissions from transport showed an increase in emissions of nearly 20 % in the same period.
Energy supplyDuring the 1990s carbon dioxide emissions from energy industries (mainly electricity production) declined, while at the same time electricity production and consumption increased. This decoupling was due to several factors. Almost half of the reduction was due to shifts in fuel use in power production from coal to natural gas whilst larger shares of electricity generation from renewable energy sources and nuclear power accounted for about one third of the reduction. Improved efficiency due to a switch to high-efficiency gas-turbine combined-cycle technology was responsible for the remaining reductions.
!!!! Between 1990 and 2000, EU carbon dioxide emissions from energy industries declined by 5 %, while final electricity consumption increased by 19 %, showing
a decoupling of electricity consumption and environmental pressure.
TransportThe largest increase in emissions during the 1990s was from transport, with road transport being by far the largest transport emission source. Emissions increased due to large increases in both passenger and freight transport carried out by road. Carbon dioxide emissions from international aviation are also growing rapidly, but are currently not addressed in the Kyoto Protocol or in EU policies and measures. Nitrous oxide emissions from transport account for only a small part of the total EU greenhouse gas emissions but emissions increased substantially due to an increase in transport carried out by petrol cars equipped with catalysts, which generate emissions of nitrous oxide. This is a negative aspect of an overall effective policy for improving air quality in Europe.
"""" Between 1990 and 2000, EU carbon dioxide emissions from transport (mainly road) increased by 18 %.
"""" EU carbon dioxide emissions from international aviation and navigation were 6 % of total emissions in 2000, growing by almost 50 % from 1990 levels.
AgricultureBetween 1990 and 2000, nitrous oxide emissions from agricultural soils declined slightly, mainly because of a decrease in the use of nitrogen fertiliser. This was a consequence of the reform of the common agricultural policy (CAP) of the EU and the implementation of the nitrate directive, aimed at reducing water pollution. Methane emissions from enteric fermentation (by cattle) also declined, mainly due to a decrease in the number of cattle, which also arose through the CAP reform.
!!!! Between 1990 and 2000, EU nitrous oxide emissions from agricultural soils declined by 4 % and EU methane emissions from enteric fermentation (by cattle) declined by 9 %.
IndustryDuring the early 1990s carbon dioxide emissions from manufacturing industries decreased, mainly due to fuel efficiency improvements, economic restructuring in Germany and relatively low economic growth in the EU. The substantial reduction in

Summary 9
nitrous oxide emissions was due to emission reduction measures in the adipic acid production industry in France, Germany and the United Kingdom. The very large increase in hydrofluorocarbon emissions is due to replacement of chlorofluorocarbons, which are being phased out to protect the ozone layer. This is a negative side-effect of an overall effective policy to protect the ozone layer.
!!!! Between 1990 and 2000 EU carbon dioxide emissions from manufacturing industries and nitrous oxide emissions from chemical industries decreased by 8 % and 56 %, respectively.
"""" Between 1990 and 2000, EU hydrofluorocarbon emissions, accounting for 0.7% of total EU greenhouse gas emissions, grew by a factor of 80.
Waste managementDuring the last decade methane emissions from landfills decreased. The decrease is mainly due to the (early) implementation of the landfill waste directive and similar national legislation by reducing the amount of untreated biodegradable waste disposed of in landfills and installing landfill gas recovery at all new sites.
!!!! Between 1990 and 2000, EU methane emissions from landfills declined by 26 %.
HouseholdsCarbon dioxide emissions from households decreased slightly from 1990 to 2000, although the number of dwellings increased. The reductions were due to fuel switches to natural gas, increase in district heating using biomass, energy efficiency improvements though thermal insulation and increased use of solar thermal for heating.
#### Carbon dioxide emissions from households decreased by 3 % from 1990 to 2000 although the population as well as the number of dwellings increased.
2.3.Progress of candidate countries in reaching their targets from 1990 to 1999
Although candidate countries have to reach their Kyoto targets individually, for
comparison with the EU, the overall aggregated trends in these countries are also presented in this report. Over the past decade total emissions have declined substantially in almost all candidate countries, mainly due to the restructuring process towards market economies, which led to changes in or the closure of heavily polluting and energy-intensive industries. Emissions from transport increased in the second part of the 1990s, although their level in 1999 was still below the 1990 level. The experience from the EU cohesion states (Greece, Ireland, Portugal, Spain) shows that starting from relatively low transport levels, high economic growth can lead to strong growth in greenhouse gas emissions from transport. This may also occur in candidate countries in future. There is a need to improve emission data and energy and transport statistics in several candidate countries because these are not currently consistent.
!!!! In the 10 candidate countries total greenhouse gas emissions declined by 34 % between the base year and 1999.
!!!! All candidate countries except Slovenia were on track in 1999 to meet their Kyoto targets.
#### Transport carbon dioxide emissions decreased by 19 % between 1990 and 1995, but increased afterwards.
3. Is the projected progress of the EU and candidate countries sufficient to achieve targets in 2010?
3.1.Projected progress of the EU with existing and additional policies and measures
The comparison of projections based on existing domestic (1) policies and measures (also sometimes called ‘baseline’) reported by Member States for the year 2010 with their EU burden-sharing commitments reveals the gap between what current domestic policies and measures are expected to deliver and the commitments.
Existing measures will not be sufficient for the EU to reach its Kyoto target. Additional, planned policies and measures would achieve
(1) The extent to which Member States are prepared to use the flexible mechanism of the Kyoto Protocol to fulfil their commitments is not included in the reporting under the monitoring mechanism and could therefore not be assessed in this report. Also the extent to which Member States intend to make use of carbon sinks to fulfil their commitments is not assessed in this report, due to lack of information and because methods for data collection are not yet internationally agreed.

10 Greenhouse gas emission trends and projections in Europe
the target, but would rely on over-delivery by several Member States, which cannot be taken for granted.
"""" With existing policies and measures, projections for the EU show total greenhouse gas emissions decreasing by 4.7 % between 1990 and 2010. This leaves a shortfall of 3.3 % to reach the EU target of an 8 % reduction.
!!!! Germany, Sweden and the United Kingdom project that existing policies and measures will be sufficient to meet their burden-sharing targets.
"""" Austria, Belgium, Finland, Ireland, Italy, the Netherlands, Portugal and Spain are all projected to be significantly above their burden-sharing targets by 2010.
#### Savings from additional measures being planned by Member States would result in further emissions reductions sufficient to cover the shortfall and thus meet the target. However, this relies on over-delivery by some Member States (Finland, France, Germany, Ireland, Italy, Sweden and the United Kingdom) compared with their burden-sharing targets.
3.2.Comparing national projections with EU-wide projections
Because the national projections are not fully comparable between Member States, due to different underlying assumptions, the aggregated national projections have also been compared with recent EU-wide emission projections. Preliminary EU-wide energy-related carbon dioxide projections (European Commission’s new Primes energy baseline scenario, September 2002), covering about 80% of total emissions, show a difference from national projections. Aggregate Member States ‘with measures’ projections are for a slight decrease of energy-related carbon dioxide emissions (energy supply and use, including transport) by 2010, while the EU-wide projections show a small increase in these emissions. A small part of the difference is due to the inclusion of international transport in the EU-wide projections. The main explanation is the substantially larger decrease in the national ‘with measures’ projection of Germany compared to the projection for Germany in the EU-wide study. There is a need for further analysis of the reasons for the differences.
"""" Aggregate Member States ‘with existing measures’ projections for 2010 are for a slight decrease by 2 % of energy-related carbon dioxide emissions (energy supply and use, including transport), while the EU-wide projections show an increase in these emissions of 4 %.
3.3.Projected progress of candidate countries with existing policies and measures
Greenhouse gas emissions in five candidate countries are projected to decrease further with existing policies and measures. In part, these projected reductions are the result of the economic restructuring that has already occurred in these countries. However, a recent strong increase of emissions from transport is a cause of concern for the future. All countries have policies and measures in place to reduce greenhouse gas emissions and four countries have identified additional policies and measures.
!!!! Greenhouse gas emissions in six candidate countries are projected to decrease by 2010 with existing policies and measures, sufficient to meet their Kyoto targets.
4. What are the effects of policies and measures in the EU to reduce greenhouse gas emissions by 2010?
Common and coordinated policies and measures of the EUThe Commission has identified additional common and coordinated policies and measures which would have to be implemented by Member States. Some of these are included in the Member States’ projections. Policies and measures in the energy sector, targeted at moving to cleaner and more efficient energy production and use, account for the majority of the total expected savings by 2010 (75 %). Transport policies and measures account for only a small part of the total expected savings (16 %), although transport is the most rapidly growing source of greenhouse gases.
!!!! The Commission has identified additional common and coordinated policies and measures that would result in additional emission reductions, potentially covering the gap between the projection with existing measures and the EU target, mainly in energy-related

Summary 11
carbon dioxide emissions but also in emissions of fluorinated gases.
Energy supply and use in industry and households (excluding transport)Emissions from energy supply and use (excluding transport) are projected to decrease further by 2010, due to policies and measures in heat and power generation, industry and the commercial/services sector. Renewable energy is projected to increase its share, but the current growth rate of renewables will need to double to attain the EU target of 22 %, assuming the share of large hydropower plants remains stable. Several national policies and measures have been successful, including ‘feed-in’ arrangements that guarantee a fixed favourable price for renewable electricity producers, suggesting that growth of the renewables share could be accelerated. Combined heat and power (CHP) is projected to increase its share, although the current rate of increase in CHP is not sufficient to achieve the EU target of 18 % by 2010. Continuing improvements in energy intensity (ratio of energy use and value added) in industry are expected, as well as further energy savings by households, due to implementation of the directives on the energy performance of buildings, the appliances labelling scheme and schemes for energy efficiency standards.
!!!! Emissions from energy supply and use (excluding transport) are projected to be 16 and 20 % below 1990 levels by 2010 in, respectively, the ‘with existing measures’ projections and ‘with additional measures’ projections.
"""" Renewable energy targets for the EU (of 22 %) and Member States for 2010 are unlikely to be met under current trends.
"""" In the EU, the current rate of increase in combined heat and power (CHP) is not sufficient to achieve the EU target of 18 % by 2010.
TransportEmissions from transport are projected to continue to increase up to 2010, due to continued increases in both passenger and freight transport carried out by road, despite policies and measures aimed at achieving the EU objective of shifting traffic from road to rail and inland waterways. A key EU policy is the agreement between the European Commission and the European, Japanese
and Korean car industries to reduce carbon dioxide emissions from new passenger cars, by setting a target for 2008. These emissions were reduced between 1995 and 2000, due to fuel efficiency improvements, mainly in diesel, and a shift in fleet composition from petrol to diesel passenger cars, which are more energy efficient but emit more air pollutants than petrol-fuelled cars. This suggests that the EU target for carbon dioxide emissions from new passenger cars is achievable.
"""" Emissions from transport are projected to increase by 28 % from 1990 levels by 2010 in the ‘with existing measures’ projections.
!!!! Average carbon dioxide emissions of new passenger cars were reduced by 7.5 % from 1995 to 2000, suggesting that the target, under the agreement with the car industry, of 120 g carbon dioxide/km (by 2005 or 2010 at the latest) is achievable.
"""" Nitrous oxide emissions from transport currently account for only 0.6 % of total EU greenhouse gas emissions, but emissions are projected to increase sharply due to the projected increase in transport carried out by petrol cars equipped with catalysts.
AgricultureGreenhouse gas emissions in agriculture are projected to decrease further up to 2010, mainly due to continuing reform of the common agricultural policy and the implementation of the nitrate directive resulting in reductions in fertiliser use and the number of cattle.
!!!! EU-wide greenhouse gas emissions in agriculture are projected to decrease to 7 % below the 1990 level in 2010 in the projection based on existing measures.
Industry (emissions of fluorinated gases and nitrous oxide)EU emissions of fluorinated gases and nitrous oxide from industrial processes are projected to further decrease up to 2010. This is mainly due to significant abatement of nitrous oxide emissions in the manufacture of adipic acid in a few Member States including France, Germany and the United Kingdom. These reductions in nitrous oxide emissions offset substantial projected increases in hydrofluorocarbon emissions (72 % from the base year to 2010), due to

12 Greenhouse gas emission trends and projections in Europe
continuing replacement of chlorofluorocarbons being phased out to protect the ozone layer.
!!!! EU greenhouse gas (fluorinated gases and nitrous oxide) emissions from industrial processes are projected to decrease by 2010 by 10 % from 1990 with existing measures and by 43 % with additional measures.
WasteEU-wide greenhouse gas emissions in the waste sector are projected to further decrease up to 2010, mainly due to the implementation of the landfill directive.
!!!! EU-wide greenhouse gas emissions in the waste sector are projected to decrease by about 60 % from 1990 by 2010.
5. Is the reporting scheme of the EU sufficient for assessing the progress of greenhouse gas emission reductions?
Reporting of greenhouse gas inventories has improved, but needs to be more complete and include all gases, especially for candidate countries. A future challenge will be the reporting of additional information required under the Kyoto Protocol, including
information on emissions and removals from land-use change and forestry after methods have been agreed internationally (2003). The quality of reporting of emission projections and policies and measures has improved, but further improvements are needed regarding completeness, comparability, consistency and transparency.
!!!! Under the EU monitoring mechanism most Member States provided greenhouse gas inventory data for 1990 to 2000 for all gases. Two Member States did not provide data on fluorinated gases (Ireland, Luxembourg).
"""" Several candidate countries did not provide greenhouse gas inventory data for 1990 to 2000 for all gases. Most candidate countries did not provide data on fluorinated gases.
!!!! The quality of reporting of emission projections and policies and measures has improved for most Member States.
#### Further improvements in reporting of inventories, projections and policies and measures are still needed and proposals are being developed, as part of the process of revising the monitoring mechanism during 2002 and 2003.

Introduction 13
1. Introduction
The purpose and scope of this report
This report is an indicator-based assessment of European Community and candidate countries’ (2) greenhouse gas emission trends, emission projections and existing and proposed policies and measures to reduce greenhouse gas emissions by 2010.
The report presents an assessment of the actual (1990 to 2000) and projected progress (by 2010) of the European Community (EC) and its Member States and of candidate countries towards fulfilling their commitments under the UN Framework Convention on Climate Change (UNFCCC) and the Kyoto Protocol.
The assessment is designed to provide policy-makers with the information necessary to identify the countries that are on track towards the targets, the socio-economic sectors that are contributing most, the effectiveness of existing policies and measures – both national and Community-wide – in reducing or limiting emissions, and the extent to which additional policies and measures might be required. The report focuses on trends and policies and measures in the main sectors (energy supply, transport, industry, agriculture, waste management).
The report, prepared by EEA and its European Topic Centre on Air and Climate Change (ETC/ACC), serves to support and complement the annual evaluation report of the European Commission to the Council and European Parliament, which is required under the Council Decision 1999/296/EC for a monitoring mechanism of Community carbon dioxide (CO2) and other greenhouse gas emissions (3) (European Commission, 2002a). The EEA report provides additional analyses to the Commission’s annual report, and it follows the same model as other recent EEA indicator-based reports, in particular Energy and environment in the EU (EEA, 2002d) and in the draft transport and environment
reporting mechanism (TERM) 2002 report (EEA, 2002e).
The monitoring mechanism is an instrument to assess accurately and regularly the extent of progress being made towards the Community’s commitments under the UNFCCC and the Kyoto Protocol. Progress is evaluated by the Commission, in consultation with the Member States, and is based on national programmes supplied by the Member States and on other relevant information. The national programmes should include (a) information on actual progress and (b) information on projected progress, including policies and measures, in line with the guidelines under the Decision.
Member States are required by 31 December each year to submit inventory data for the two previous years and any updates of previous years (including the base year 1990) and their most recent projected emissions for the years 2005, 2010, 2015 and 2020. Any updates to the national programmes, e.g. new policy measures, should also be reported to the Commission by 31 December each year.
Reporting under the monitoring mechanism is voluntary for candidate countries, but will be mandatory after joining the EU. The central and eastern European candidate countries are, however, already required to report greenhouse gas emissions and national programmes to the UNFCCC and this report uses this information.
Assessment approach
The evaluation of progress towards the targets has two main components:
1. evaluation of actual progress from 1990 to 2000, based on an analysis of contributions by sectors and countries to greenhouse gas emission trends provided in the report (EEA, 2002a);
(2) This report covers the ten central and eastern European candidate countries (Bulgaria, Czech Republic, Estonia, Hungary, Latvia, Lithuania, Poland, Romania, Slovakia and Slovenia), which are in this report further referred to as ‘candidate countries’. The report does not cover the other three candidate countries: Cyprus, Malta and Turkey.
(3) OJ L 117, 5.5.1999, p. 35.

14 Greenhouse gas emission trends and projections in Europe
2. evaluation of projected progress up to 2010, based on an analysis of adopted and future (planned, or currently under discussion) domestic policies and measures at both national and Community levels: this evaluation is based on emission projections provided by Member States in their national programmes and on additional Community-wide projections provided in the report (EEA, 2002b).
A third element is a limited comparison, for energy-related carbon dioxide emissions, between information on greenhouse gas emission projections (in 2010) from the Member States and recent EU-wide assessments (for 2010).
The extent to which Member States are prepared to use the flexible mechanism of the Kyoto Protocol to fulfil their commitments is not included in the reporting under the monitoring mechanism and could therefore not be assessed in this report. Also the extent to which Member States intend to make use of land-use change and forestry (‘carbon sinks’) to fulfil their commitments is not assessed in this report, due to lack of information and because methods of data collection are not yet internationally agreed. This means all emission and emission projections data in this report are excluding emissions and removals from land-use change and forestry. The analysis in this report therefore focuses on domestic (national or common and/or coordinated) policies and measures.
The report uses a number of indicators, which are grouped according to the following key questions, which are similar to those used in other EEA indicator-based reports.
1. Which targets have to be achieved and what is progress on ratification of the Kyoto Protocol?
2. What is the actual progress of the EU and candidate countries in limiting greenhouse gas emissions?
3. Is the projected progress of the EU and candidate countries sufficient to achieve targets by 2010?
4. What are the effects of policies and measures taken in the EU to reduce greenhouse gas emissions by 2010?
5. Is the reporting scheme of the EU sufficient for assessing the progress of greenhouse gas emissions reduction?
The report includes indicators that have been developed specifically for this report. In addition some indicators are presented that are also reported in Environmental signals 2002 (EEA, 2002c), in Energy and environment in the EU (EEA, 2002d) and in the draft TERM 2002 report (EEA, 2002e).
The ‘smiley’ faces for each indicator or group of indicators aim, in this report, to provide the following assessment:
! positive trend, moving towards the Kyoto or burden-sharing target;
# some positive development, but either insufficient to reach the Kyoto or burden-sharing target or a mixed trend within the indicator;
" unfavourable trend, moving away from the Kyoto or burden-sharing target.
This approach can be applied in a transparent way for the overall assessment of trends of total greenhouse gas emissions. However, for the assessment of trends in emissions from sectors this is not as straightforward due to the lack of clear sectoral targets at the EU level, although some countries have set national sectoral emission targets. Therefore, for the assessment of sectors, the ‘smiley’ faces are used to assess the relative contribution of the specific sector to the trend. In some cases it is impossible to evaluate the trend because of data gaps. In those situations this is explained in the evaluation. Another difficulty is the assessment of trends in candidate countries. For these countries fewer data are available, but in addition the different economic situation needs to be recognised. After the beginning of the transition to market economies, in the early 1990s, candidate countries experienced an economic downturn, although in various degrees. Countries that were advanced in bringing about economic reform recovered earlier than other countries. In most candidate countries economic growth was restored in the second half of the 1990s.

Which targets have to be achieved and what is the progress on ratification of the Kyoto Protocol? 15
2. Which targets have to be achieved and what is the progress on ratification of the Kyoto Protocol?
2.1. ‘Burden sharing’ within the EU to fulfil the Kyoto Protocol
!!!! The EU and its Member States have ratified the Kyoto Protocol.
"""" The Protocol has not yet entered into force because not enough other industrialised countries have ratified, including countries with economies in transition, such as Russia.
Climate change, and avoiding its potential consequences, is addressed by the United Nations Framework Convention on Climate Change (UNFCCC) and remains a high priority in the EU. Achieving ‘sustainable’ atmospheric greenhouse gas concentrations would require substantial (50 to 70 %) global reductions in greenhouse gas emissions (IPCC, 2001).
To take the first steps towards stabilisation of the world’s climate, or at least a moderate sustainable climate change, the third Conference of the Parties (COP3) to the UNFCCC, held in Kyoto in December 1997, adopted different binding targets of greenhouse gas emissions for industrialised (called ‘Annex 1’) Parties, including the European Community (EU), in the Kyoto Protocol. The Kyoto Protocol requires a 5 % reduction of developed countries’ emissions from 1990 levels by 2008–12 (4) of six greenhouse gases (carbon dioxide (CO2), methane (CH4), nitrous oxide (N2O), hydrofluorocarbons (HFCs), perfluorocarbons (PFCs) and sulphur hexafluoride (SF6)). Under the Kyoto Protocol the EU agreed to reduce its greenhouse gas emissions by 8 % by 2008–12, from 1990 levels (5).
The European Commission has acknowledged the need for further emission reductions beyond 2012 by proposing an EU target to reduce emissions by an average of 1 % per year up to 2020 and a global target of 20 to 40 % reduction by 2020, both from 1990 levels (European Commission, 2001a and 2001b).
According to Council Decision 2002/358/EC (6), the EU and its Member States agreed in 2002 on different emission limitation and/or reduction targets for each Member State according to economic circumstances, called the ‘burden-sharing’ agreement. Eight Member States agreed to reduction targets by 2008–12 (Austria, Belgium, Denmark, Germany, Italy, Luxembourg, the Netherlands and the United Kingdom). Two Member States (Finland and France) agreed to stabilise greenhouse gas emissions by 2008–12, whereas five Member States (Greece, Ireland, Portugal, Spain, Sweden) agreed to limit their increases by 2008–12. The targets range from a reduction of 28 % for Luxembourg to allowed but limited increases of greenhouse gas emissions of 27 % for Portugal. The largest absolute emission reduction has to be achieved by Germany, of about 250 million tonnes CO2-equivalent (Mt CO2-eq.) (7) (Figure 1).
Earlier the UNFCCC had agreed that industrialised countries to this convention, including the EU, its Member States and the candidate countries, had to adopt policies and measures with the aim of returning their anthropogenic CO2 and other greenhouse gas emissions, individually or jointly (applying to the EU), by the year 2000 to 1990 levels.
(4) As an estimate for the commitment period 2008 to 2012, projections for the year 2010 are presented later in this report.
(5) For the EU-15, France, Finland and Greece, the base year is 1990 for emissions of all six greenhouse gases. For the other Member States the base year is a combination of 1990 emissions of CO2, CH4 and N2O and 1995 emissions of HFCs, PFCs and SF6 (the ‘F-gases’).
(6) Council Decision of 25 April 2002 concerning the approval, on behalf of the European Community, of the Kyoto Protocol to the United Nations Framework Convention on Climate Change and the joint fulfilment of commitments thereunder (2002/358/CE), OJ L 130, 15.5.2002, p. 1.
(7) All emission data provided in this report are in million tonnes CO2-equivalent.

16 Greenhouse gas emission trends and projections in Europe
8
At the seventh Conference of Parties (November 2001) of UNFCCC, agreement was reached on many of the rules and guidelines for use of the Kyoto mechanisms (joint implementation, clean development mechanism, international emissions trading) and of carbon sinks (9) for meeting the Kyoto targets. By November 2002 the EU, all Member States (MS), a number of candidate countries (Bulgaria, Czech Republic, Estonia, Hungary, Latvia, Romania, Slovakia, and Slovenia) and Japan had ratified the Kyoto Protocol. The Protocol will, however, only enter into force when it has been ratified by at least 55 Parties to the Convention, including developed countries accounting for at least 55 % of CO2 emissions from this group in 1990. In practice this means that Russia needs to ratify, which is expected towards the end of 2002 or early 2003.
2.1. The Kyoto Protocol targets of candidate countries
!!!! Several candidate countries have ratified the Kyoto Protocol.
Candidate countries belong, within UNFCCC, to the group of countries undergoing the process of transition to a market economy, but are also Annex I Parties. They have different targets under the Kyoto Protocol (Figure 2). Bulgaria, Czech Republic, Estonia, Latvia, Lithuania, Romania, Slovakia and Slovenia have a target of a reduction by 8 % from the base year (10) while Hungary and Poland have a target of a reduction by 6 %.
Figure 1 Greenhouse gas emission targets of EU Member States for 2008–12 under the EU burden-sharing decision (8)
(8) In the Council decision on the approval by the EC of the Kyoto Protocol the different commitments of the Member States are expressed as percentage changes from the base year. In 2006 the respective emission levels will be expressed in terms of tonnes of CO2- equivalent. In this connection, the Council of Environment Ministers and the Commission have in a joint statement agreed to take into account inter alia the assumptions in Denmark’s statement to the Council Conclusions from 16–17 June 1998 relating to base year emissions.
Finland 0 %
France 0 %
Sweden + 4.0 %
Ireland + 13.0 %
Portugal + 27.0 %
Greece + 25.0 %
Spain + 15.0 %
Austria – 13.0 %
Luxembourg – 28.0 %
Belgium – 7.5 %
Netherlands – 6.0 %
Denmark – 21.0 %
Italy – 6.5 %
United Kingdom – 12.5 %Germany – 21.0 %
– 300 – 250 – 200 – 150 – 100 – 50 0 50 100
GHG emissions (million tonnes CO -eq.)2
Source: EEA 2002a; EEA 2002b.
(9) Carbon sinks are officially called ‘emissions and removals from land use, land-use change and forestry’. This report does not include an assessment of carbon sinks, because insufficient data are currently available from countries in line with the new UNFCCC agreements. Furthermore, methods for calculating carbon sinks are still under development by the Intergovernmental Panel on Climate Change (IPCC).
(10) Countries with base years other than 1990 are Bulgaria (1988), Hungary (average 1985–87) and Poland (1988).

Which targets have to be achieved and what is the progress on ratification of the Kyoto Protocol? 17
Greenhouse gas emission targets of candidate countries for 2008–12 under the Kyoto Protocol Figure 2
Latvia 8.0 %–
Slovenia 8.0 %–
Lithuania 8.0 %–
Estonia 8.0 %–
Slovakia 8.0 %–
Hungary 6.0 %–
Bulgaria 8.0 %–
Czech Republic 8.0 %–
Romania 8.0 %–
Poland 6.0 %–
– 40 – 35 – 30 – 25 – 20 – 15 – 10 – 5 0
GHG emissions (million tonnes CO -eq.)2
Source: EEA, 2002a.

18 Greenhouse gas emission trends and projections in Europe
3. What is the actual progress of the EU and candidate countries in limiting greenhouse gas emissions?
3.1. Progress in reaching EU targets between 1990 and 2000
!!!! Between 1990 and 2000, greenhouse gas emissions in the EU were reduced by 3.5 %, nearly half the greenhouse gas emission target. After an initial decrease of total greenhouse gas emissions in the early 1990s, emissions stabilised in the second half of the 1990s.
!!!! In the second half of the 1990s, EU carbon dioxide emissions stabilised, with emissions in 2000 being slightly (0.6 %) below 1990 levels. This means that the aim of stabilising carbon dioxide emissions at 1990 levels by 2000 was achieved.
Total greenhouse gas emissions in the European Community (11) decreased by 3.5 % between 1990 and 2000. This is nearly halfway towards the EU greenhouse gas emission target of an 8 % reduction by the period 2008–12 (Figure 3).
After an initial decrease in total greenhouse gas emissions in the early 1990s, emissions
more or less stabilised in the second half of the 1990s, with a small increase of 0.3 % between 1999 and 2000. The most significant cause of this increase in emissions in 2000 was the rise of coal use in electricity production. Strong economic growth in 2000 also led to increased energy use, whereas the relatively mild winter in most EU MS partially counteracted this development.
In the Kyoto Protocol, the EU agreed to reduce its greenhouse gas emissions by 8 % from 1990 levels between 2008 and 2012. Assuming a linear target path from 1990 to 2010, total EU greenhouse gas emissions were 0.5 index points (distance-to-target indicator (DTI)) above this target path in 2000 (Figure 3).
Carbon dioxide is by far the most significant greenhouse gas, accounting for 82 % of total EU emissions in 2000. In the second half of the 1990s, EU CO2 emissions stabilised, with emissions in 2000 being slightly (0.5 %) below 1990 levels. This means that the EU aim of stabilising CO2 emissions at 1990 levels by 2000 was achieved (Figure 3).
Note: The target path is used to analyse how close 2000 emissions were to a linear path of emission reductions or allowed increases from the base year to the Kyoto Protocol target, assuming domestic measures are used. In this report 1990 is assumed to be the base year for the EU for all Kyoto Protocol greenhouse gases. Data exclude emissions and removals from land-use change and forestry.
(11) Total GHG emissions for the EU are calculated by the aggregation of national GHG emissions reported by Member States (MS) and are referred to as EU-15 or EU emissions later in this report.
Figure 3 Actual EU greenhouse gas emissions compared with targets for 2000 and 2008–12
96.5
92.0
99.5
100.0
80
90
100
110
120
1990 1992 1994 1996 1998 2000 2002 2004 2006 2008 2010 2012
Ind
ex (1
990
= 1
00)
Greenhouse gas emissions Target path 2010
GHG target 2010 CO2 emissions CO target 20002
Source: Source: EEA, 2002a.

What is the actual progress of the EU and candidate countries in limiting greenhouse gas emissions? 19
Other gases contributing to EU greenhouse gas emissions are:
• methane (CH4, share of 8 % in total EU greenhouse gas emissions) from agriculture (cattle and manure management), waste (waste disposal in landfill sites) and fugitive emissions from fuel (e.g. in gas distribution networks);
• nitrous oxide (N2O, share of 8 % in total EU greenhouse gas emissions) from agriculture (soils and fertiliser use), industrial processes (mainly adipic and nitric acid production) and as a by-product of passenger car catalysts;
• industrial fluorinated gases (hydrofluorocarbons (HFCs), perfluorocarbons (PFCs), sulphur hexafluoride (SF6), share of 2 % in total EU greenhouse gas emissions), mainly from replacement of ozone-depleting substances.
3.2. Progress of the Member States in 2000 towards reaching their burden-sharing targets
!!!! In 2000, six Member States (Finland, France, Germany, Luxembourg, Sweden and the United Kingdom) were on track towards reaching their burden-sharing targets.
"""" In 2000, nine Member States (Austria, Belgium, Denmark, Greece, Ireland, Italy, the Netherlands, Portugal and Spain) were not on track towards reaching their burden-sharing targets.
In 2000, six Member States (Finland, France, Germany, Luxembourg, Sweden and the United Kingdom) were on track towards reaching their Kyoto targets, i.e. they were below their Kyoto target paths (Figure 4) (12). Nine Member States were well above their Kyoto target paths (Ireland, Portugal and Spain by more than 10 index points) and were thus heading towards failing to meet their burden-sharing target in 2000: Austria, Belgium, Denmark, Greece, Ireland, Italy, the Netherlands, Portugal and Spain.
Notes: The distance-to-target indicator (DTI) measures the deviation of actual emissions in 2000 from the (hypothetical) linear burden-sharing target path between 1990 and 2010. A positive value suggests an under-achievement and a negative a value an over-achievement in 2000. The DTI gives an indication of progress towards the Kyoto and Member States’ burden-sharing targets. It assumes that the Member States meet their target entirely on the basis of domestic measures. The Danish DTI is 0.7 index points, if Danish greenhouse gas emissions are adjusted for electricity trade in 1990. This method is used by Denmark to monitor progress towards its national target under the EU burden-sharing agreement. For the total EU emissions non-adjusted Danish data have been used.
(12) In some Member States activities under the flexible mechanisms have already started, but the effects of these do not appear in the MS greenhouse gas inventories.
Distance-to-target (Kyoto Protocol burden-sharing targets) for EU Member States in 2000 Figure 4
0.5
31.1–
8.6–6.7–
4.1–– 3.9
– 1.75.6
7.28.7
8.8
9.210.0
16.6
17.526.2
40.0– 30.0– 20.0– 10.0– 0.0 10.0 20.0 30.0
EU-15
LuxembourgGermany
United KingdomFinland
SwedenFrance
Netherlands
ItalyGreece
Denmark
AustriaBelgium
PortugalIreland
Spain
�
�
Source: EEA, 2002a.

20 Greenhouse gas emission trends and projections in Europe
The favourable situation for EU emissions in 2000 was largely a result of considerable cuts in emissions in Germany and the United Kingdom, which together accounted for around 40 % of total EU greenhouse gas emissions. The main reasons for this favourable trend in Germany were increasing efficiency in power and heating plants and the economic restructuring of the five new federal states following German reunification. The reduction of greenhouse gas emissions in the United Kingdom was partly the result of the liberalisation of the energy market and subsequent changes in the choice of fuel used in electricity production from oil and coal to gas, and partly due to significant reductions in emissions of non-CO2 greenhouse gas emissions, including implementation of N2O abatement measures in the chemical industry. In both Member States the special circumstances mentioned above account for about 50 % of emission reductions for all six greenhouse gases, whilst specific policies and measures account for the remaining 50 % (Eichhammer et al., 2001).
In 2000, there was a further slight decrease in greenhouse gas emissions in Germany, whereas in the United Kingdom there was a small increase due to a rise in coal use for power production.
Italy and France are the third and fourth largest emitters with a share of 13 % each. In
2000, Italy’s greenhouse gas emissions were 0.7 % above 1999 and 4 % above 1990 levels with increases primarily in the transport sector and electricity production. France reduced greenhouse gas emissions by 1.1 % in 2000, compared with 1999 levels, and was 2 % below 1990 levels. France also achieved large reductions in N2O emissions from the chemical industry, but CO2 emissions from transport increased considerably between 1990 and 2000.
As the fifth largest emitter in the EU, Spain accounts for 10 % of total EU greenhouse gas emissions. Between 1990 and 2000, emissions rose by 34 % and in 2000 they were 4 % higher than in 1999. As in Italy, the main causes of these increases were transport and electricity production.
3.3. Sectors and gases responsible for EU emission trends between 1990 and 2000
3.3.1. Key emission trends!!!! Over the last decade greenhouse gas
emissions in the EU decreased in most sectors (industry, energy supply, agriculture, waste management and households).
"""" Emissions from transport showed an increase in emissions of nearly 20 %.
13
Notes: The sector 'Other (energy)' includes use of energy by households, small commercial businesses and services.
Figure 5 EU-15 greenhouse gas emissions by sector in 2000 (13)
(13) The sectors are defined according to UNFCCC guidelines for emission inventories.
Source: EEA 2002a; EEA 2002b.
Energy industries27 %
Industry (energy)15 %
Industry (processes)6 %
Other (energy)16 %
Agriculture10 %
Waste3 %
Other0.3 %
Transport21 %
Fugitive emissions2 %

What is the actual progress of the EU and candidate countries in limiting greenhouse gas emissions? 21
The contributions to total EU greenhouse gases emissions in 2000 by the following sectors (Figure 5) were:
• energy industries (electricity sector and refineries), 27 %;
• industry (fossil fuel combustion and processes), 21 %;
• transport (mainly CO2 from fossil fuel combustion, but also N2O), 21 %.
Looking at trends in the main greenhouse gases from 1990 to 2000, methane and N2O emissions decreased significantly by 20 % and 16 %, respectively. However emissions of fluorinated gases increased drastically (36 %).CO2 emissions decreased only slightly by a half per cent.
Sectors with large increases in emissions (14)Emissions from transport (Figure 6), excluding international transport, have risen rapidly since 1990. CO2 emissions increased by 128 million tonnes or 18 %. This is mainly due to the growth in road transport in almost all Member States (but in particular in the cohesion states Greece, Ireland, Portugal and Spain). N2O emission increases from transport are mainly due to the increased use of catalytic converters, which reduce emissions of air pollutants but emit N2O as a by-product.
The second source category with substantially increasing emissions is industrial HFC emissions, which increased by a factor of 80 or 29 million tonnes. This is mainly due to the increased use of some HFCs as substitutes for ozone-depleting chlorofluorocarbons (CFCs), which were gradually phased out in the 1990s.
Sectors with reductions in emissionsThe largest reductions in absolute terms were achieved in nitrous oxide emissions from the chemical industry, mainly in France, Germany and the United Kingdom, due to specific measures in adipic acid production in these countries. Emissions decreased by 59 million tonnes or 56 %.
Second largest were reductions of CO2 emissions from fossil fuel combustion in manufacturing industries, mainly due to economic restructuring, fuel switching and efficiency improvements in the German manufacturing industry after German reunification. Emissions decreased by 55 million tonnes or 8 %.
Third largest reductions were achieved for CO2 emissions in the energy sector (electricity and heat production), mainly due to fuel shifts from coal to gas in several Member States (above all in the United Kingdom) and efficiency improvements (above all in Germany). Emissions decreased by 55 million tonnes or 5 %. Furthermore, an increase in
Change in EU-15 emissions of greenhouse gases by sector and gas 1990–2000 Figure 6
Source: EEA, 2002a.
– 34 %
– 5 %
19 %
– 21 %
– 2 %
– 20 %
– 16 %
36 %
– 5 %
– 6 %
– 9 %
– 15 %
– 0.5 %
– 50 % – 40 % – 30 % – 20 % – 10 % 0 10 % 20 % 30 % 40 %
CO2
CH4
N O2
HFC, PFC & SF6
Energy industries
Fugitive emissions
Industry (energy)
Industry (processes)
Other (energy)
Transport
Agriculture
Waste
Other
� �
(14) Detailed analysis of trends of emissions of the six greenhouse gases by sector is provided in Annex 3 of this report and in the EEA topic report on emission trends in Europe (EEA, 2002a).

22 Greenhouse gas emission trends and projections in Europe
wind power generation in Denmark, Germany and Spain was also a contributing factor, together with a larger share of nuclear power.
Substantial methane reductions were achieved from solid waste disposal on land (landfilling) and fugitive emissions from solid fuels. These reductions are mainly due to measures related to the implementation of the European landfill waste directive and the decline of coal mining after cuts in coal subsidies mainly in France, Germany and the United Kingdom. The cuts in CO2 emissions from small combustion installations (mainly households) occurred mostly in Germany. The reduced emissions of methane from enteric fermentation are due to falling cattle numbers in various EU Member States.
Sectoral changes are discussed in more detail in the next sections.
Main driving forces of CO2 emissions from fossil fuelsCO2 emissions from fossil fuel combustion account for 77 % of total EU greenhouse gas emissions. The impact of the main driving forces can be shown by considering emissions against five factors (Figure 7): population; GDP per capita; energy intensity of GDP; the share of fossil fuels in energy consumption; and the shift within fossil fuels towards lower carbon fuels (CO2 intensity of fossil fuels).
CO2 emissions from fossil fuel combustion decreased by 0.8 % between 1990 and 1999. GDP growth is an important driving force, but improvements in the energy intensity of GDP and the shift within fossil fuels towards lower carbon fuels offset emission increases. In addition, the share of fossil fuels reduced, thereby contributing to lower CO2 emissions.
A comparison between the first and the second half of the 1990s shows that the pattern of driving forces has changed: the reduction of CO2 emissions from fossil fuel combustion was only achieved in the first half of the 1990s; in the second half emissions increased. GDP growth was a larger driving force in the second half of the 1990s. The opposite development took place for population growth.
3.3.2. Energy supply and use (excluding transport) (15)
!!!! Between 1990 and 2000, carbon dioxide
emissions from energy industries declined by 5 %, while final electricity consumption increased by 19 %, showing a decoupling.
!!!! About half the reduction was due to shifts in fuel use in power production from coal to natural gas whilst larger shares of electricity generation from renewable energy sources and nuclear power accounted for 34 %. Improved efficiency due to a switch to high-efficiency gas-turbine combined-cycle technology was responsible for the remaining 20 %.
Figure 7Percentage change of CO2 emissions from fossil fuel combustion and the contribution of main driving forces (population, GDP per capita, energy intensity of GDP, share of fossil fuels, CO2 intensity of fossil fuels) in the 1990s
Source: EEA, 2002a.
10 %
5 %
0 %
5 %
10 %
15 %
1990–99 1990–95 1995–99
PopulationEnergy intensity of GDP
Total CO2 from fuel combustionGDP per capitaShare of fossil fuels Fossil fuel shift
(15) This sector includes energy supply and use, except energy use by transport. This means the sector ‘1. Energy’, except ‘1.A.3 transport’, according to UNFCCC guidelines for greenhouse gas inventories.

What is the actual progress of the EU and candidate countries in limiting greenhouse gas emissions? 23
!!!! Carbon dioxide emissions from manufacturing industries decreased by 8 % and thus decoupled from an increase in gross value added (from 1990 to 1999).
#### Carbon dioxide emissions from ‘small combustion’ (mainly households) decreased slightly from 1990 to 1999, while the number of dwellings increased.
Energy industries are an important source of CO2 emissions, accounting for 27 % of the EU total. Energy industries include public electricity and heat production, petroleum refining and the manufacture of solid fuels.
Between 1990 and 2000, CO2 emissions from energy industries declined by 5 % in the EU. The main driving force of CO2 emissions from energy industries is production and consumption of electricity. Final electricity consumption increased by 19 % between 1990 and 1999 (Figure 8). CO2 emissions from energy industries decoupled considerably from electricity consumption (Figure 8). This was mainly due to fuel shifts in power production from coal to natural gas (46 % of the reduction), and larger shares of electricity generation from renewable energy sources and nuclear power (34 % of the reduction), as well as efficiency improvements due to a switch to high-efficiency gas-turbine combined-cycle technology (20 % of the reduction) (EEA, 2002d). In 2000, CO2 emissions from energy industries increased by 2 % compared to
1999, which was mainly due to increased use of coal for power production.
Emissions decreased significantly in Germany, Luxembourg and the United Kingdom. In the energy industries this is largely explained by improved efficiency in Germany’s coal-fired power plants and the fuel switch from coal to gas in power production in the United Kingdom. On the other hand, there was a considerable rise in emissions from energy industries in Greece, Ireland, Portugal and Spain.
CO2 emissions from fossil fuel use in manufacturing industries accounted for 15 % of total EU greenhouse gas emissions in 2000. Between 1990 and 2000, CO2 emissions from manufacturing industries declined by 8 %. The emission reductions were already achieved in 1993, which was mainly due to efficiency improvements and structural change in Germany after reunification and low economic activity in the EU (Figure 9). Between 1990 and 1999, industrial output in terms of gross value added increased by 8 %. Therefore, CO2 emissions from manufacturing industries decoupled from gross value added.
The decoupling of CO2 emissions from value added occurred in several industrial sectors (iron and steel; glass, pottery and construction; chemical) to different extents (EEA, 2002a).
EU CO2 emissions from energy industries compared with electricity consumption Figure 8
60
70
80
90
100
110
120
130
140
1990 1991 1992 1993 1994 1995 1996 1997 1998 1999 2000
Ind
ex (1
990=
100)
Electricity consumption
CO2 emissions from energy industries
Source: EEA, 2002a.

24 Greenhouse gas emission trends and projections in Europe
CO2 emissions from fossil fuel use in small commercial businesses, public institutions, small agricultural business and households (‘small combustion’) accounted for 15 % of total EU greenhouse gas emissions in 2000. Households are by far the largest source in this category.
Between 1990 and 2000, CO2 emissions from small combustion decreased by 3 % in the EU. For households, heating largely produces CO2 emissions and therefore emissions are to a great extent directly related to outdoor temperatures (Figure 10). The coldest years in the decade showed the highest CO2 emissions, while the warmest years showed the lowest.
In 2000, the winter was mild with relatively high temperatures in most Member States compared with 1999 and 1998, and CO2 emissions were correspondingly low in that year.
The stock of permanently occupied dwellings increased by 11 % between 1990 and 1999 and therefore there appears to be a decoupling between CO2 emissions and number of dwellings.
Improved energy efficiency through thermal insulation of buildings, fuel switches, mostly
in German households, solar thermal energy production and biomass district heating were largely responsible for CO2 reductions in the small combustion sector.
Another important development is the rapid growth of electricity consumption in households (about 10% between 1990 and 1999).
3.3.3. Transport (16)"""" Between 1990 and 2000, carbon dioxide
emissions from transport increased by 18 % in the EU. Road transport is by far the largest emission source from transport. Emissions increased due to large increases in road transport volume (passenger and freight).
"""" Carbon dioxide emissions from international aviation and navigation were 6 % of total emissions in 2000, growing by almost 50 % from 1990 levels.
"""" Nitrous oxide emissions from transport currently account for only a small part of total EU greenhouse gas emissions but increased by 100 % from 1990 to 2000 due to an increase in transport volume of petrol cars equipped with catalysts. This is a negative consequence of an overall effective policy for improving air quality in Europe.
Figure 9 Driving forces for energy consumption in industry (value added) compared with CO2 emissions
Source: EEA, 2002a.
60
70
80
90
100
110
120
130
140
1990 1991 1992 1993 1994 1995 1996 1997 1998 1999 2000
Ind
ex (1
990=
100)
CO manufacturing industries2 emissions from
Gross value added
(16) This sector includes domestic transport (or sector ‘1.A.3 transport’) but excludes international transport, according to UNFCCC guidelines for greenhouse gas inventories.

What is the actual progress of the EU and candidate countries in limiting greenhouse gas emissions? 25
17
Transport is the second largest source of greenhouse gas emissions, in particular CO2
and N2O emissions, in the EU. Transport causes CO2 emissions mainly through fossil fuel combustion in road transportation, national civil aviation, railways, national navigation and other transportation (18), accounting for 20 % of total greenhouse gas emissions in 2000. Between 1990 and 2000, CO2 emissions from transport increased by 18 % in the EU (Figure 11). Emissions increased steadily in the 1990s; the year 2000 was the first year in the decade when emissions from transport did not increase. Road transport is by far the largest emission source from transport (84 % in 1999). The main driving forces of CO2 emissions from transport are transport volumes by road (passenger-kilometres and freight transport tonne-kilometres). Passenger transport in cars increased by 17 % between 1990 and 1999; freight transport grew by 42 %.
CO2 emissions from transport increased in almost all Member States, due to strong growth in transport demand, particularly road, which is primarily driven by economic growth. Only Finland achieved slight emission reductions, while Sweden and the United Kingdom showed an emission growth of less than 10 %. These lower growth rates are due to high starting points in 1990 (high per capita CO2 transport emissions) and rapidly growing road fuel prices. For the cohesion countries (for example, Ireland and Portugal increased their CO2 emissions from transport by 75 % between 1990 and 2000 (19)), the opposite is true: low starting points in terms of per capita emissions and low road fuel prices. These countries have a strong growth in transport demand, particularly road, driven by economic growth, and therefore also strong increases in CO2 emissions.
CO2 emissions from small combustion, number of permanently occupied dwellings and heating degree days (17)
Figure 10
(17) Heating degree days are a measure of the need for heating due to cold temperatures.
60
70
80
90
100
110
120
130
140
1990 1991 1992 1993 1994 1995 1996 1997 1998 1999 2000
Ind
ex (1
990=
100)
Stock of permanently occupied dwellings
CO2 emissions from small combustion
Heating degree days
Source: EEA, 2002a.
(18) Note that, in accordance with UNFCCC guidelines, these emissions do not include CO2 emissions from international aviation and navigation, which were 232 Mtonne in 2000 or 6 % of total EU greenhouse gas emissions. Total EU CO2 emissions from international aviation and navigation grew by 76 Mtonne or 49 % between 1990 and 2000.
(19) For some countries the assessment of these emissions is difficult because substantial amounts of fuel sold in the country might be consumed outside that country.

26 Greenhouse gas emission trends and projections in Europe
N2O emissions from transport account for only 0.6 % of total EU greenhouse gas emissions but are closely linked to fuel consumption of petrol cars equipped with catalysts. N2O emissions are mostly formed during the warm-up phase. EU-wide, N2O emissions from transport increased sharply (103 %) between 1990 and 2000.
3.3.4. Agriculture!!!! Between 1990 and 2000, EU nitrous
oxide emissions from agricultural soils declined by 4 %, mainly due to a decrease in the use of nitrogen fertiliser. This was a consequence of the reform of the common agricultural policy (CAP) of the EU and the implementation of the nitrate directive, aimed at reducing water pollution.
!!!! Between 1990 and 2000, EU methane emissions from enteric fermentation (by cattle) declined by 9 % mainly due to a decrease in the number of cattle (10 %), which was also due to CAP reform.
N2O emissions from agricultural soils are the largest source of N2O emissions and accounted for about 5 % of total EU greenhouse gas emissions in 2000. N2O emissions from agricultural soils occur from
the application of mineral nitrogen fertilisers and from organic nitrogen from animal manure.
Between 1990 and 2000, N2O emissions from agricultural soils declined by 4 % in the EU. In 2000, emissions were stable, compared with 1999. The main driving force of N2O emissions from agricultural soils is the use of nitrogen fertiliser, which was 2 % below 1990 levels in 1999 (Figure 12).
The decrease in fertiliser use is partly due to the effects of the 1992 reform of the common agricultural policy and the resulting shift from production-based support mechanisms to direct area payments in arable production. This has tended to lead to an optimisation and overall reduction in fertiliser use. In addition, reduction in fertiliser use is also due to directives such as the nitrate directive and to the extensification measures included in agro-environment programmes.
N2O emission trends from agricultural soils vary considerably in the Member States; the largest reductions occurred in Denmark (–20 %), Finland (– 20 %), Germany (– 12 %)
and the United Kingdom (– 12 %), whereas the Netherlands and Spain had increases of more than 10 %.
Figure 11CO2 emissions from transport and transport volumes (passenger transport in cars and freight transport by road)
80
90
100
110
120
130
140
150
1990 1991 1992 1993 1994 1995 1996 1997 1998 1999 2000
Ind
ex (1
990=
100)
CO2 emissions from transport
Passenger transport in cars
Freight transport by road

What is the actual progress of the EU and candidate countries in limiting greenhouse gas emissions? 27
Enteric fermentation of animal feeds in the stomach of cattle is the largest single source of CH4 emissions in the EU, accounting for 3.2 % of total greenhouse gas emissions in 2000. Between 1990 and 2000, CH4 emissions from enteric fermentation declined by 9 % in the EU. In 2000, they decreased by 2 %, compared with 1999. The main driving force
of CH4 emissions from enteric fermentation is the number of cattle (Figure 13), which reduced as a result of CAP reform.
All Member States except Ireland and Spain managed to reduce emissions. Emission decreases of 20 % or more were reported by Germany (25 %), the Netherlands (21 %) and Austria (20 %).
N2O emissions from agricultural soils, compared with nitrogen fertiliser use Figure 12
60
70
80
90
100
110
120
130
140
1990 1991 1992 1993 1994 1995 1996 1997 1998 1999 2000
Ind
ex (1
990=
100)
Use of nitrogenous fertiliser
N2O emissions from agricultural soils
Source: EEA, 2002a.
CH4 emissions from enteric fermentation, compared with cattle population Figure 13
Source: EEA, 2002a.
60
70
80
90
100
110
120
130
140
1990 1991 1992 1993 1994 1995 1996 1997 1998 1999 2000
Ind
ex (
19
90
=1
00
)
Cattle population
CH4 emissions from enteric fermentation
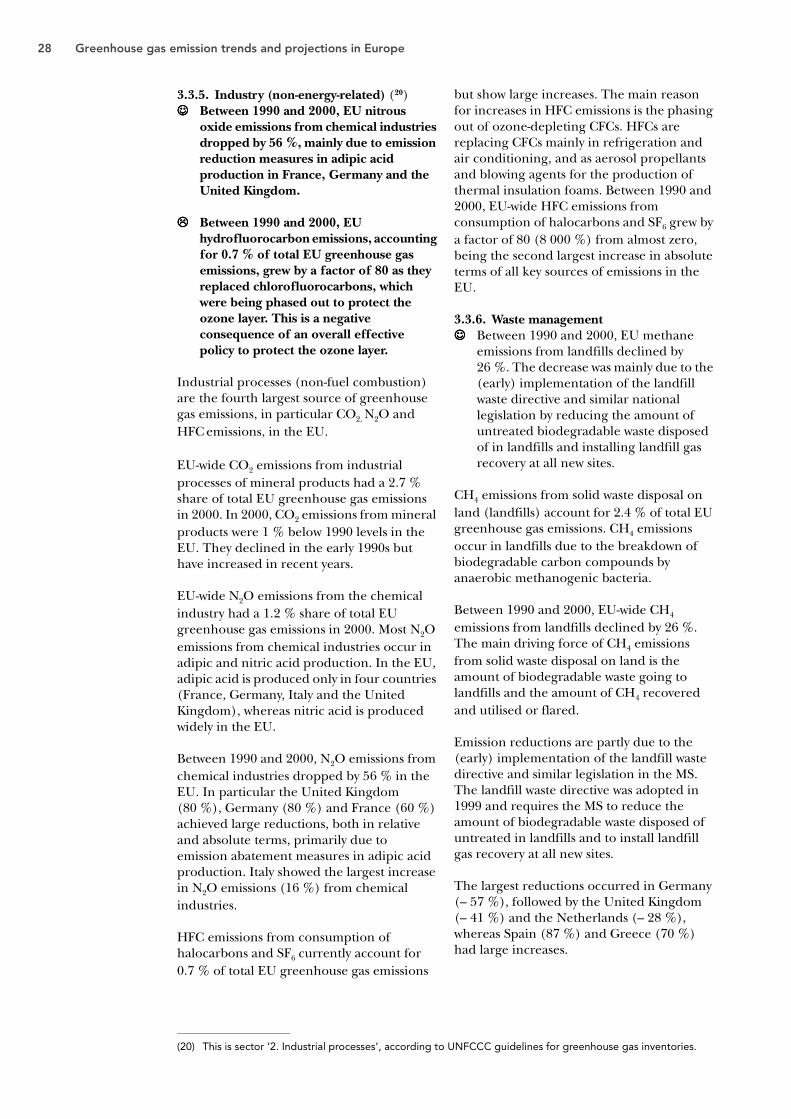
28 Greenhouse gas emission trends and projections in Europe
3.3.5. Industry (non-energy-related) (20)!!!! Between 1990 and 2000, EU nitrous
oxide emissions from chemical industries dropped by 56 %, mainly due to emission reduction measures in adipic acid production in France, Germany and the United Kingdom.
"""" Between 1990 and 2000, EU hydrofluorocarbon emissions, accounting for 0.7 % of total EU greenhouse gas emissions, grew by a factor of 80 as they replaced chlorofluorocarbons, which were being phased out to protect the ozone layer. This is a negative consequence of an overall effective policy to protect the ozone layer.
Industrial processes (non-fuel combustion) are the fourth largest source of greenhouse gas emissions, in particular CO2, N2O and HFC emissions, in the EU.
EU-wide CO2 emissions from industrial processes of mineral products had a 2.7 % share of total EU greenhouse gas emissions in 2000. In 2000, CO2 emissions from mineral products were 1 % below 1990 levels in the EU. They declined in the early 1990s but have increased in recent years.
EU-wide N2O emissions from the chemical industry had a 1.2 % share of total EU greenhouse gas emissions in 2000. Most N2O emissions from chemical industries occur in adipic and nitric acid production. In the EU, adipic acid is produced only in four countries (France, Germany, Italy and the United Kingdom), whereas nitric acid is produced widely in the EU.
Between 1990 and 2000, N2O emissions from chemical industries dropped by 56 % in the EU. In particular the United Kingdom (80 %), Germany (80 %) and France (60 %) achieved large reductions, both in relative and absolute terms, primarily due to emission abatement measures in adipic acid production. Italy showed the largest increase in N2O emissions (16 %) from chemical industries.
HFC emissions from consumption of halocarbons and SF6 currently account for 0.7 % of total EU greenhouse gas emissions
but show large increases. The main reason for increases in HFC emissions is the phasing out of ozone-depleting CFCs. HFCs are replacing CFCs mainly in refrigeration and air conditioning, and as aerosol propellants and blowing agents for the production of thermal insulation foams. Between 1990 and 2000, EU-wide HFC emissions from consumption of halocarbons and SF6 grew by a factor of 80 (8 000 %) from almost zero, being the second largest increase in absolute terms of all key sources of emissions in the EU.
3.3.6. Waste management!!!! Between 1990 and 2000, EU methane
emissions from landfills declined by 26 %. The decrease was mainly due to the (early) implementation of the landfill waste directive and similar national legislation by reducing the amount of untreated biodegradable waste disposed of in landfills and installing landfill gas recovery at all new sites.
CH4 emissions from solid waste disposal on land (landfills) account for 2.4 % of total EU greenhouse gas emissions. CH4 emissions occur in landfills due to the breakdown of biodegradable carbon compounds by anaerobic methanogenic bacteria.
Between 1990 and 2000, EU-wide CH4 emissions from landfills declined by 26 %. The main driving force of CH4 emissions from solid waste disposal on land is the amount of biodegradable waste going to landfills and the amount of CH4 recovered and utilised or flared.
Emission reductions are partly due to the (early) implementation of the landfill waste directive and similar legislation in the MS. The landfill waste directive was adopted in 1999 and requires the MS to reduce the amount of biodegradable waste disposed of untreated in landfills and to install landfill gas recovery at all new sites.
The largest reductions occurred in Germany (– 57 %), followed by the United Kingdom (– 41 %) and the Netherlands (– 28 %), whereas Spain (87 %) and Greece (70 %) had large increases.
(20) This is sector ‘2. Industrial processes’, according to UNFCCC guidelines for greenhouse gas inventories.

What is the actual progress of the EU and candidate countries in limiting greenhouse gas emissions? 29
Note: The target path is used to analyse how close current (1999) emissions are to a linear path of emission reductions or allowed increases from the base year to the Kyoto Protocol target, assuming domestic measures will be used, excluding emissions of fluorinated gases and emissions and removals from LUCF.LUCF = land-use change and forestry.
3.4. Progress of candidate countries in reaching their targets
!!!! In the 10 candidate countries total greenhouse gas emissions declined by 34 % between the base year and 1999, primarily due to the economic restructuring transition process towards market economies.
!!!! All candidate countries except Slovenia were on track in 1999 to meet their Kyoto targets.
#### Transport CO2 emissions decreased by 19 % between 1990 and 1995, but increased afterwards.
The 10 central and eastern European candidate countries for the EU (21) do not have a common target for emission reductions. All countries have to reach their targets individually as defined in the Kyoto
Protocol, and all candidate countries aimed to stabilise emissions by 2000 within UNFCCC. Nevertheless, an aggregate analysis is performed in this section for information purposes and in order to compare the overall trends in these countries with trends in the EU.
Total greenhouse gas emissions for the 10 candidate countries declined by about 34 % between the base year (22) and 1999 (Figure 14). This means the group of 10 candidate countries was (in 1999) well on track towards their Kyoto Protocol targets.
CO2 is by far the most important greenhouse gas (about 80 %); second comes methane and third is N2O. Fluorinated gas emissions are not yet reported consistently in most of the candidate countries, but in general they do not contribute more than 1 % to national totals.
Candidate countries’ greenhouse gas emissions compared with Kyoto target for 2008–12 (excl. fluorinated gases and LUCF) Figure 14
Source: EEA, 2002a.
66.3
92.9
65.5
30
40
50
60
70
80
90
100
110
120
130
1990 1992 1994 1996 1998 2000 2002 2004 2006 2008 2010 2012
Ind
ex (1
990
= 1
00)
Greenhouse gas emissions
Target path 2010
GHG target 2010
CO2 emissions
(21) For Bulgaria, Czech Republic, Estonia, Hungary, Latvia, Lithuania, Poland, Romania, Slovakia and Slovenia third national communications under UNFCCC are available.
(22) The emissions in the base year for this group of countries were assumed to be the sum of the emissions in the base years of the individual candidate countries. Countries with base years other than 1990 are Bulgaria (1988), Hungary (average 1985-87) and Poland (1988).

30 Greenhouse gas emission trends and projections in Europe
Note: The distance-to-target indicator (DTI) measures the deviation of actual emissions in 1999 (except for Lithuania 1998, Romania 1994, Slovenia 1996) from the (hypothetical) linear target path between 1990 and 2010. For Lithuania, Romania and Slovenia a data gap-filling procedure was followed in order to have a complete estimate for CC-10. A positive value suggests an under-achievement by 1999 and a negative a value an over-achievement in 1999. The DTI gives an indication on progress towards the Kyoto targets. It assumes that the countries meet their target entirely on the basis of domestic measures. The target for all 10 candidate countries together was calculated for analysis for this report only, but does not have any legally binding implication.
The performance of the candidate countries varies considerably. In 1999 nine countries had emissions below their Kyoto target path, and the largest distance to the target, meaning the best performance, was for Latvia (– 59.7 index points) and the lowest for Hungary (– 13 index points). Only in Slovenia were emissions somewhat above the target path (+ 2.9 index points) (Figure 15).
The restructuring or closure of heavily polluting and energy-intensive industries led to a significant decline in total greenhouse gas emissions.
The sector showing increases in greenhouse gas emissions was transport, counteracting partly the decreases that had occurred in other sectors. CO2 emissions from transport decreased by 19 % between 1990 and 1995, but increased afterwards. However, the level in 1999 was still some 6.5 % below the 1990 level (EEA, 2002e). As in the EU, road transport is a small but rapidly growing
source of N2O emissions, due to the penetration of three-way catalysts.
Future economic growth combined with a continued shift towards road transport will increase greenhouse gas emissions from the transport sector. It can therefore be expected that the 1990 emission level will soon be surpassed (if this has not already happened). The experience from the EU cohesion states (Greece, Ireland, Portugal and Spain) shows that, starting from relatively low transport levels, dynamic economic growth can lead to strong growth in greenhouse gas emissions from transport. A similar situation might occur in the candidate countries.
Inconsistent data on trends of greenhouse gas emissions and on energy consumption by transport make the analysis difficult and uncertain. There is a strong need to improve the quality of transport statistics and transport CO2 emissions estimates.
Figure 15 Distance-to-target indicators (in index points) for the Kyoto Protocol of candidate countries
Source: EEA, 2002a.
– 30.2
– 60.0
– 51.2
– 50.1
– 47.0
– 34.5
– 26.4
– 25.6
– 23.6
– 13.0
2.9
– 70.0 – 60.0 – 50.0 – 40.0 30.0– – 20.0 – 10.0 0.0 10.0 20.0
CC-10
Latvia
Estonia
Lithuania
Bulgaria
Romania
Poland
Slovakia
Czech Republic
Hungary
Slovenia
� �

Is the projected progress of EU and candidate countries sufficient to achieve targets in 2010? 31
4. Is the projected progress of EU and candidate countries sufficient to achieve targets in 2010?
4.1. Projected progress of the EU with existing policies and measures
"""" Projections for the EU based on existing policies and measures show total greenhouse gas emissions decreasing by 4.7 % between 1990 and 2010. This leaves a shortfall of 3.3 % to reach the EU’s Kyoto target of an 8 % reduction in emissions.
#### Germany, Sweden and the United Kingdom project that existing policies and measures will be sufficient to meet
their burden-sharing targets. Emissions in Austria, Belgium, Finland, Ireland, Italy, the Netherlands, Portugal and Spain are projected to be significantly above their burden-sharing targets by 2010.
The current trend of a 3.5 % reduction of emissions by 2000 is projected not to continue and the aggregate projections for 2010 with existing policies and measures (23) show only a further small fall to 4.7 % below 1990 levels. This leaves a shortfall of 3.3 % to reach the EU’s Kyoto commitment of an 8 % reduction in emissions in 2010 compared with 1990 levels (Figure 16).
(23) Policies and measures in this report include only domestic national and EU common and coordinated policies and measures. Countries are also allowed to make use of the Kyoto mechanisms to achieve their UNFCCC and EU burden-sharing targets. Furthermore countries can make use of carbon sequestration in soils, through changes in agricultural practices, and in forests, through forestry activities, to achieve the targets. However for many countries the extent to which they intend to use either the Kyoto mechanisms or carbon sinks for achieving their targets is not clear from the currently available information. Existing policies and measures are those for which one or more of the following applies: (a) national legislation is in force; (b) one or more voluntary agreements have been established; (c) financial resources have been allocated; (d) human resources have been mobilised; (e) an official government decision has been made and there is a clear commitment to proceed with implementation.
Greenhouse gas emission trends and projections for EU-15 Figure 16
110
100
90
80
TrendsWith existing measures projectionsWith additional measures projectionsTarget (Kyoto)
1990
GH
G e
mis
sio
ns (b
ase
year
= 1
00)
1995
2000
2005
2010
Source: EEA, 2002a; EEA, 2002b.

32 Greenhouse gas emission trends and projections in Europe
A comparison of the ‘with existing measures’ projections provided by Member States for the year 2010 with their EU burden-sharing commitments is useful to reveal the gap between what existing policies and measures are expected to deliver and the commitment under the Kyoto Protocol of Member States and the EU.
A ‘with existing measures’ projection encompasses currently implemented and adopted policies and measures. This is also
sometimes called a baseline projection. However, the ‘with existing measures’ scenarios are not fully comparable between Member States, for various reasons including different cut-off dates for inclusion of existing policies and measures, different underlying assumptions of the model, e.g. regarding energy price developments, and assumptions on the effectiveness of policies and measures. Therefore it is useful to compare the projections for the EU aggregated from Member States’ projections with the results of Community-wide emission projections (See Section 5.3). Problems that occur in general when aggregating national projections to an EU total were described in a previous EEA report (EEA, 2002e).
The United Kingdom, Sweden and Germany project that existing policies and measures will be sufficient to meet their burden-sharing targets (Figure 17). Their relative gaps are about – 1 %, – 3 % and – 13 % respectively, meaning that these countries may even overdeliver on the target. Emissions in Austria, Belgium, Finland, Ireland, Italy, the Netherlands, Portugal and Spain are all projected to be significantly above their commitments on the basis of their ‘with measures’ projections. The relative gaps for these MS range between more than + 30 % for Spain and Portugal to about + 12 % for the Netherlands.
Apart from the relative gaps, the absolute gaps (in million tonnes CO2-equivalent) are important in order to assess the total absolute and relative gap for the EU.
The absolute gaps are the highest for Italy (+ 79 Mt CO2-eq.), followed by Spain (+ 69 Mt CO2-eq.) and France (+ 49 Mt CO2-eq.).
4.2. Projected progress of the EU with additional policies and measures
#### Savings from additional policies and measures being planned by Member States would result in further emissions reductions sufficient to cover the shortfall and thus meet the target. However, this relies on over-delivery by some Member States (Finland, France, Germany, Ireland, Italy, Sweden and the United Kingdom) compared with their burden-sharing targets.
Box — Kyoto mechanisms
In addition to domestic action by industrialised countries, the Kyoto Protocol also provides three ways in which action taken abroad can help countries to meet their own targets for greenhouse gas emissions reductions. The three Kyoto mechanisms comprise two project-based mechanisms — joint implementation and the clean development mechanism — and international emissions trading.
Joint implementationJoint implementation (JI) is provided for under Article 6 of the Kyoto Protocol. It enables industrialised countries to work together to meet their emission targets. A country with an emissions reduction target can meet part of that target through a project aimed at reducing emissions in any sector of another industrialised country’s economy. Any such projects need to have the approval of the countries involved and must result in emission reductions that would not otherwise have occurred in the absence of the JI project. The use of carbon sinks (e.g. forestry projects) is also permitted under JI.
Clean development mechanismArticle 12 of the Kyoto Protocol sets out a clean development mechanism (CDM). This is similar to joint implementation, but project activities must be hosted by a developing country. As with JI, CDM projects must result in reductions that are additional to those that would have been achieved in the absence of the project. They also have the additional aim of promoting sustainable development in the host developing country. The CDM is supervised by an Executive Board, which approves projects. CDM projects have been able to generate credits since January 2000 and these can be banked for use during the first commitment period (2008–12). The rules governing CDM projects allow only certain types of sinks projects (afforestation and reforestation), and countries will not be able to use credits generated by nuclear power projects towards meeting their Kyoto targets. To encourage small-scale projects, special ‘fast-track’ procedures are being developed.
Emissions tradingArticle 17 of the Kyoto Protocol allows countries that have achieved emissions reductions over-and-above those required by their Kyoto targets to sell the excess to countries finding it more difficult or expensive to meet their commitments. In this way, it seeks to lower the costs of compliance for all concerned.

Is the projected progress of EU and candidate countries sufficient to achieve targets in 2010? 33
"""" If no over-delivery of Member States is considered, the EU as a whole will achieve only a 0.6 % greenhouse gas emission reduction with existing policies and measures and a 6.2 % reduction with additional policies and measures projections. This leads to a shortfall of 7.4 % and 1.8 %, respectively, in 2010, taking into account domestic policies and measures only.
Most Member States have also reported planned (additional) policies and measures that they are developing to achieve further reductions in greenhouse gas emissions. The effects of these additional policies and measures are shown (Figure 18) under the
assumption that these effects can be added to the effect of the existing policies and measures, as previously described. In this report these projections are called ‘with additional measures’ projections. (24)
Savings from additional policies and measures being planned by Member States would result in total emission reductions of 12.4 % from 1990 (Figure 18), more than sufficient to meet the shortfall for the EU mentioned above. This would, assuming that all additional policies and measures will actually be implemented and will have the expected effect, lead to an over-delivery of 4.4 percentage points compared with the target of – 8 %.
Relative gap (over-delivery or shortfall) between ‘with measures’ projections and targets for 2010 for EU-15 and Member States Figure 17
EU-15 (no over-delivery)
EU-15
Germany
Sweden
United Kingdom
Denmark
Greece
Luxembourg
France
Netherlands
Italy
Finland
Belgium
Austria
Ireland
Portugal
Spain
– 20 – 10 0 + 10 + 20 + 30 + 40
Percent points over-delivery ( ) or short-fall (+) from respective emission target–
Source: EEA, 2002b.
(24) Additional (planned) policies and measures are options under discussion and having a realistic chance of being adopted and implemented in future.

34 Greenhouse gas emission trends and projections in Europe
Finland, France, Germany, Ireland, Italy, Sweden and the United Kingdom project that their additional measures can either meet or exceed their burden-sharing target.
Denmark has identified savings from additional measures that almost meet the shortfall between the ‘with measures’ projection and their commitment.
For Austria, Belgium, the Netherlands and Spain the savings identified from planned policies and measures are not sufficient to achieve their burden-sharing targets and these countries have indicated they will use the Kyoto mechanisms help meet their targets. The Netherlands has reported that it has taken many initiatives to purchase emission reduction abroad via JI and CDM and therefore assesses that it is on track to meet its Kyoto target.
Greece, Luxembourg and Portugal have not yet reported quantified savings from any additional policies and measures that they are considering. The largest relative effect of
additional policies and measures is for Ireland (gap decreases from + 26 % to –1 %). To assess the achievement of the target
by the EU, the absolute reduction of the gaps is important. These absolute reductions, by means of additional policies and measures, are the largest for Italy, United Kingdom, France and Spain ranging from 81 to 42 Mt CO2-eq.
Some MS are projected not to achieve their targets while others would exceed their targets even under the ‘with measures’ projections (Germany, Sweden, United Kingdom). If it is assumed that these MS would exactly meet, but not exceed, their targets, in the ‘with measures’ projection this would result in only a slight decrease of emissions for the EU of about 0.6 % in 2010 compared with 1990. Thus, the gap for the EU would be about 7.4 % with regard to the EU target of 8 % emission reduction (Figure 17).
Under the ‘with additional measures’ projections several other MS are projected to
Figure 18 Relative gap (over-delivery or shortfall) between ‘with additional measures’ projections and targets for 2010 for EU-15 and Member States
Source: EEA, 2002b.
EU-15 (No over-delivery)
Spain
Portugal
Ireland
Austria
Belgium
Finland
Italy
Netherlands
France
Luxembourg
Greece
Denmark
United Kingdom
Sweden
Germany
EU-15
– 20 – 10 0 + 10 + 20 + 30 + 40
Percent points over-delivery ( ) or short-fall (+) from respective emission target–
Gap with existing and additionalpolicies and measures
Gap with existing policies and measures for thoseMS which also report additional policies andmeasures

Is the projected progress of EU and candidate countries sufficient to achieve targets in 2010? 35
Note: ‘With measures’ reduction for Poland is for the energy sector only.
exceed their targets (Finland, France, Ireland, Italy) in addition to those that already exceeded the target in the ‘with measures’ projection (Germany, Sweden, United Kingdom). If all these MS are assumed to meet, but not to exceed, their targets in the ‘with additional measures’ projection this would mean for the EU a reduction below 1990 emissions of 6.2 % and thus a 1.8 % shortfall of the EU target (Figure 18).
4.3. Projected progress of candidate countries with existing and additional policies and measures
!!!! Greenhouse gas emissions in five candidate countries are projected to decrease, with existing policies and measures, sufficient to meet their Kyoto targets.
!!!! Policies and measures in most sectors are in place and for some countries additional policies and measures have been identified.
Candidate countries do not report formally to the EU monitoring mechanism, so this section is based on third national communications to UNFCCC. Six countries (Czech Republic, Estonia, Hungary, Latvia, Poland and Slovakia) had submitted third
national communications by August 2002. Figure 19 shows the relative gap between projections based on existing policies and measures, and with additional policies and measures, and the Kyoto commitments.
The Czech Republic presents two projections, a reference scenario (labelled base in the figure above) and a scenario assuming high economic growth. All ‘with measures’ projections are for emissions in 2010 to be lower than the Kyoto commitments. For Estonia and Latvia, the emissions are projected to be significantly lower than in 1990.
In part, the projected reductions are the result of the economic restructuring that has already occurred in these countries. However, all countries have policies and measures in place to reduce greenhouse gas emissions. These are primarily aimed at energy use and waste management but there are a limited number of policies and measures in other sectors. A whole range of types of policies and measures is used, although the use of voluntary agreements is limited. Policies and measures implemented or proposed in most countries include:
• clean air legislation to reduce air pollution — this generally has a beneficial effect on greenhouse gas emissions;
Relative gap (over-delivery or shortfall) between projections and targets for 2010 for candidate countries Figure 19
– 60 – 50 – 40 – 30 – 20 – 10 0
Poland
Czech Republic — high
Slovakia
Czech Republic — base
Estonia
Latvia
Percent points over-delivery (–) of respective emission target
Gap with existing policies and measures Gap with existing and additional policies and measures
Source: EEA, 2002b.

36 Greenhouse gas emission trends and projections in Europe
• energy market liberalisation;
• changes in building regulations to improve energy efficiency;
• harmonisation with EU environmental legislation;
• measures to reduce traffic growth;
• limits on the disposal of biodegradable waste to landfills.
Although these candidate countries project that they will meet their Kyoto commitments with existing policies and measures, four countries identified additional policies and measures.

What are the effects of policies and measures in the EU to reduce greenhouse gas emissions by 2010? 37
5. What are the effects of policies and measures in the EU to reduce greenhouse gas emissions by 2010?
5.1. Common and coordinated policies and measures of the EU
!!!! The Commission has identified additional common and coordinated policies and measures that would result in additional emissions reductions, potentially covering the gap between the ‘with measures’ projection and the EU target, mainly in energy-related carbon dioxide emissions but also in emissions of fluorinated gases.
In the European Union policies and measures that address climate change are implemented both at the national level and at the Community level. Those developed by the European Union and applying across the Community are called common and coordinated policies and measures (CCPMs). Common and coordinated measures are a central part of the EU’s climate strategy and supplement to the national strategies.
Common policies and measures refer to actions that are adopted at EU level, usually in the form of a directive or other legal instrument, and have to be implemented by the Member States.
Coordinated policies and measures are national actions, for which added value is provided by means of coordination at EU level.
The European Commission has taken many climate-related initiatives since 1991, when it issued the first Community strategy to limit CO2 emissions and improve energy efficiency. However, it is clear that action by both Member States and the Community needs to be reinforced if the EU is to succeed in cutting its greenhouse gas emissions to 8 % below 1990 levels by 2008–12 as the Kyoto Protocol requires.
Responding to that, in June 2000 the Commission launched the European climate change programme (ECCP), whose goal is to identify and develop all the necessary elements of a EU strategy to implement the Protocol. The ECCP prepared a range of additional EU-level policies and measures to cut greenhouse gas emissions as well as an emissions trading scheme. The work to develop further policies and measures is focusing on the energy, transport, industry and agriculture sectors. There are no additional policies and measures foreseen in the waste sector in the context of the ECCP.
A key new proposal by the Commission is for a directive on emission trading (25) that is currently under negotiation by the Council and the European Parliament. The proposed scheme would apply to most of the significant emitting activities already covered by the integrated pollution prevention and control (IPPC) directive as well as some others. The only gas covered by the proposal is CO2.
In October 2001, the Commission published a communication on the implementation of the first phase of the ECCP (26). The Communication highlighted a package of policies and measures to be addressed in the Commission’s work programme during the coming two years. The measures are grouped in four sections: cross-cutting, energy, transport and industry. They represent a cost-effective reduction potential of some 122-178 Mt CO2 eq., potentially covering the gap between the ‘with measures’ projection and the EU Kyoto Protocol target. Greenhouse gas concerns need also to be addressed in the agriculture sector, although there they will not be the main driving force. Table 1 provides a full overview of the existing and additional (new) EU common and coordinated policies and measures to reduce greenhouse gas emissions in the sectors of energy supply and use, and energy use in
(25) Proposal for a directive establishing a scheme for greenhouse gas emission allowance trading within the Community and amending Council Directive 96/61/EC, COM(2001) 581 final, 23 October (2001)
(26) Communication on the implementation of the first phase of the European climate change programme, COM(2001) 580 final, 23 October 2001.

38 Greenhouse gas emission trends and projections in Europe
Table 1 Common and coordinated policies and measures most of which are included in the national projections (‘with measures’ and ‘with additional measures’)
Sectors Existing policies and measures Additional policies and measures
Energy supply
• Directive on the promotion of biofuels (adopted by European Commission 7 November 2001)
• Public awareness campaign and ‘Campaign for Take-Off’ (implemented)
• Directive for promotion of renewable energies in electricity generation (adopted) COM (2000) 279
• Directive on full liberalisation of electricity and gas markets by 2005 (proposal adopted by European Commission March 2001) COM (2001) 125 final
• Programme – ALTENER (implemented 1998–2002)
• Programme – CARNOT (implemented 1998–2002)
• Green Paper on the security of energy supply COM (2000) 769
• Initiative on the promotion of heat production from renewable energy sources (planned for 2002)
• Communication – CHP policy action (directive planned 2002)
• CO2 capture and sequestration 1)
• Encouragement of energy industry reduction of methane (planned)
• Programme – ALTENER (planned 2003–06)• EU-wide emission trading scheme (proposed
2001) (also valid for the energy use sector)
Energy use (excl. transport)
• Action plan for improved energy efficiency in the Community COM (2000) 247
• Revision of the guidelines on state aid for environmental protection 2001/C37/03
• Proposal for a directive restructuring the Community framework for the taxation of energy products COM (1997) 30 final
• Agreement with lamp manufacturers to increase sales of compact fluorescent lamps (CFLs) by 2005 (adopted)
• Energy star programme and code of conduct for digital TV services (adopted)
• Audit schemes, best practice initiative and voluntary agreements (implemented)
• Directive on energy performance of buildings COM (2001) 226 final (adopted, implementation by Member States by 2004)
• EU Boiler Directive 92/42/EEC (implemented)
• Labelling and minimum energy efficiency requirements for household appliances (implemented)
• Negotiated agreements stand-by losses televisions/video recorders; washing machines (implemented)
• Programme – SAVE I and II (implemented 1998–2002)
• Minimum efficiency requirements for end-use equipment (proposal planned for 2002)
• Energy demand management directive (proposal planned for 2002)
• Energy-efficient public procurement (planned)• Framework directive for minimum efficiency
requirement of electrical and electronic end-use equipment (planned for 2002)
• Revision of the Energy Labelling Directive 92/75/EC (planned for 2003)
• Adoption of EEE directive (environmental impact of electrical and electronic equipment) (planned 2003 – effective on market 2008)
• EU recommendations or guidelines for Member States supporting action
• Motor challenge programme (planned for 2002)
• Programme – SAVE I and II (planned 2003–2006)
• Industrial processes:Long-term agreements with energy-intensive industries (planned)Comprehensive energy audit and management scheme (E2MAS) (planned for 2001–02)Adapting existing IPPC directive (planned for 2001–03)Active energy services for small and medium-sized enterprises(SMEs) (planned for 2002)
Energy use in the transport sector
• Revision of the trans-European network guidelines
• Voluntary agreements with European, Japanese and Korean car manufacturers (implemented)
• Air quality legislation, e.g. Auto-Oil I and II (implemented)
• Air quality legislation, Directive 98/70/EC (implemented)
• Car labelling, Directive 1999/94/EC (adopted)
• Communication ‘Air transport and the environment’ (adopted)
• Fiscal measures (planned)• Environmental agreement with car industry on
reductions of CO2 emissions from light commercial vehicles (planned)
• Infrastructure charging (planned)• Technological improvements in passenger
cars and fuels• Modal shift (planned)• Promotion of biofuels (planned)• Revision of common transport policy (planned)• Communication on clean urban transport
(planned)• Motor challenge programme initiative 1)
Agriculture • CAP (market policies) (implemented)• CAP (rural development policy)
(implemented)• Forestry strategy (implemented)• Other forestry measures (implemented)
Source: EEA, 2002b.

What are the effects of policies and measures in the EU to reduce greenhouse gas emissions by 2010? 39
1) Identified as a measure for possible further Community action under the second phase of the ECCP.
transport, agriculture, industrial processes and waste, and is largely based on the EU’s third national communication (27).
Apart from emission trading, the main new (additional) common policies and measures are proposals for directives on:
• biofuels• promotion of renewable energy sources• energy performance in buildings• energy-efficient public procurement• fluorinated gases.
Other recent Commission efforts that are also expected to reduce greenhouse gas emissions include an action plan for improved energy efficiency in the Community, a Green Paper on the security of energy supply and a White Paper on a common transport policy (including aims to shift the balance from road to rail and water transport).
In addition there is an older Commission’s proposal for an energy/ CO2 tax. National CO2 taxes are in place in seven Member States (Denmark, Finland, Germany, Italy,
the Netherlands, Sweden and the United Kingdom).
5.2 Main savings from existing and additional policies and measures of the EU Member States
#### Policies and measures in the energy sector, targeted at moving to cleaner and more efficient energy production and use, account for the majority of the total expected savings (63 % of savings from existing measures and 75 % of savings from additional policies and measures).
"""" Transport policies and measures account for only a small part of the total expected savings (18 % of existing measures savings and 16 % of additional policies and measures savings), although transport is the most rapidly growing source of greenhouse gases.
Member States have provided information on which policies or measures are included in their ‘with measures’ projections and in their ‘with additional (planned) measures’ projections (EEA, 2002b). The type of
Industrial processes
• Policy action – IPPC directive (being implemented by Member States)
• Policy action – EMAS (implemented)
• Fluorinated gases:Framework directive for improved containment of F-gases (planned for 2002)Links to other EU legislation (IPPC, WEEE, end-of-life vehicles) (planned for 2001–02)Voluntary agreements (planned for 2002)Development of alternative fluids and not-in-kind technologies (planned for 2002)Sector-specific recommendations (planned)
• Renewable raw materials (RRM):Secure supply through inclusion of RRM in development of CAP (planned)Promote research and fiscal incentives (planned)Help commercialisation through EU standards and public procurement policy (planned)Include RRM in EU ECO-labelling scheme to boost consumer awareness (planned)Develop political strategy with White Paper and benchmarking scheme (planned)Include RRM in emissions trading (planned)
• Voluntary agreementsFramework guidelines for good practice (planned guidelines 2002)Framework for voluntary agreements at EU level (possibly a directive, planned for 2003)
• Policy action – voluntary agreements (planned)
Waste • Landfill directive (to be implemented by Member States 2000/01)
• Directive on waste packaging (implemented)
• Directive on end-of-life vehicles (implemented)
• Directive on waste packaging (revision planned)
• Directive on waste electrical and electronic equipment (WEEE) (planned)
• Revision of sewage sludge directive (planned)
Sectors Existing policies and measures Additional policies and measures
(27) Third communication from the European Community under the UN Framework Convention on Climate Change (UNFCCC), SEC (2001) 2053, 20.12.2001.

40 Greenhouse gas emission trends and projections in Europe
Note: All Member States, except Greece and Portugal, provided sectoral breakdowns. Seven Member States provided information on the savings from at least some existing (implemented) policies and measures and nine Member States reported quantified savings from planned policies and measures.
policies and measures can be either common and coordinated policies and measures (see Table 1) or specific national policies and measures. In most, but not all, cases this distinction is clear from the reported information by the MS.
The projected savings are shown (Figure 20) for existing measures (those included in the ‘with measures’ projection) and planned policies and measures (those in the ‘with additional measures’ projection).
Policies and measures in the energy supply and use sector, excluding transport, account for 63 % of the total savings from existing measures and 75 % of the additional measures savings for the EU as a whole (Figure 20). The high contribution of this sector is because the majority of both existing and additional policies and measures are targeted at moving to cleaner and more efficient energy production or making energy use more efficient. Transport measures are expected to deliver the second highest savings, closely followed by the effect of measures in the waste sector. As transport is the most rapidly growing source of greenhouse gases, the measures implemented and planned by Member States go only a small way to addressing this, providing 18 % and 16 % of the total savings from implemented and planned policies and measures respectively. Finally, savings from measures in the agriculture sector are
expected to be small over the period in question.
5.3. Comparison of national ‘with existing measures’ projections with EU-wide projections
"""" Aggregate Member States ‘with measures’ projections for 2010 are for a slight decrease by 2 % of energy-related carbon dioxide emissions (energy supply and use, including transport), while the EU-wide projections show an increase in these emissions of 4 %. The main reason is a significant difference in Germany’s expected reductions of emissions, which are projected to be much larger in the national projection.
Because projections are not fully comparable between Member States, due to different underlying assumptions, it is useful to compare these with information from EU-wide projections. The aggregated national projections for CO2 emissions related to fuel combustion (including transport), with existing measures, for 14 Member States that provided these data were compared with recent preliminary Community-wide emission projections for CO2 emissions related to fuel combustion (European Commission, 2002b) (Figure 21). The EU-wide projections were compiled using the Primes model. These projections are based
Figure 20 EU-15 projected greenhouse gas savings by sector by 2010
Source: EEA, 2002b.
0
50
100
150
200
250
300
350
400
Energy Transport Agriculture Waste
Car
bo
n sa
ving
(M
tCO
) 2
Implemented measures Planned measures

What are the effects of policies and measures in the EU to reduce greenhouse gas emissions by 2010? 41
Note: The comparison is for CO2 emissions from all fossil fuel combustion activities including transport. The aggregated national projections are for 14 MS, because these were not available for Greece.
on updated assumptions (e.g. energy import prices, GDP, industrial production by branch) and also take into account the most recent statistical data.
The preliminary EU-wide projections for 2010 (Primes model) show a projected increase in energy-related CO2 emissions of 4 % between 1990 and the year 2010, while the aggregate national ‘with measures’ projections show a slight decline of CO2 emissions of 2 %. This difference of six percentage points is considerable. According to a preliminary analysis the reason for this difference lies to some extent in the inclusion of emissions from international aviation (also including flights between Member States) in the EU-wide Primes projection, which are not included in the national projections. However the main reason is a significant difference in the expected reductions of emissions in Germany, which are projected to be much larger in the national projection. For other Member States there are only minor differences between their national projections and the Primes results for their country.
To examine the reasons for these differences further, additional information is needed (e.g. breakdown of CO2 emissions by sector and underlying assumptions for all Member States). Such data are not currently available for all Member States from their national projections, while detailed EU-wide projections (by sector and country) are also not yet available. These are expected to be published by the Commission by the end of 2002 or early 2003.
The key factors which influence the development of CO2 emissions in the EU-wide projection (Primes model) are presented as indicators (Figure 22). These can be compared with similar indicators that are presented in Figure 7 for the past trends (1990 to 2000). CO2 emissions are decreasing slightly until 1995 but start to increase again thereafter and are projected to be 4 % above 1990 levels in 2010. This result is the product of several trends. All factors that can be influenced by energy or climate policy are projected to improve.
• Carbon intensity will decline by 13 % due inter alia to the increasing share of renewable energies.
Comparison of the aggregated national ‘with measures’ projections for CO2 emissions from fossil fuels(including transport) with EU-wide projections (Primes model)
Figure 21
99.5100101
104
100
98
100
75
80
85
90
95
100
105
110
1990 2000 2010
GH
G e
mis
sio
ns(b
ase
year
= 1
00
)
‘With measures’ projections (EU-15)Emissions from national inventories (2000)
Primes (preliminary baseline, 2002)
Source: EEA 2002a; EEA 2002b; European Commission 2002b.

42 Greenhouse gas emission trends and projections in Europe
Notes: The results from the new Primes run are preliminary and may be subject to change. TPES = Total primary energy supply, TFC= Total final consumption.
• Conversion efficiency measured in unit of total primary energy needed for the consumption of one unit of final energy is also projected to improve by 5 %.
• Overall energy intensity measured by the units of final energy needed to produce one unit of GDP is projected to improve most, by almost 19 %, due to efficiency measures in final consumption.
However, not all these improvements are a result of specific energy and climate policy; some developments would have occurred anyway, without any policy interventions.
Despite these improvements, CO2 emissions are projected to increase by 4 % by 2010 because both population and GDP will grow. GDP per head will grow by 2.2 % per year and be almost 50 % higher in 2010 than in 1990. One of the major reasons for increasing CO2 emissions is the growing demand for transport services. Transport demand will grow by 2.0 % per year (passenger transport 1.8 % per year, freight transport 2.6 % per year). According to the still preliminary new Primes run, transport demand will be almost 50 % higher in 2010 than in 1990.
The results show the challenges which climate policy faces: climate mitigation targets have to be met although underlying socio-economic trends result in increasing CO2 emissions. Climate policy, therefore, has to be so effective that it can compensate for the underlying growth trends in CO2 emissions.
5.4. Sectoral projections and policies and measures
5.4.1. Energy supply and use (excluding transport)
!!!! Emissions from energy supply and use (excluding transport) are projected to be 16 % and 20 % below 1990 levels by 2010 in the ‘with measures’ projections and ‘with additional measures’ projections, respectively, mainly due to policies and measures in heat and power generation, industry and the commercial/services sector.
"""" Renewable energy targets for the EU (of 22 %) and Member States for 2010 are unlikely to be met under current trends. The current growth rate will need to double to attain the EU target .
Figure 22Driving forces of CO2 emissions in the new Primes baseline projection (comparable to the ‘with measures’ projections)
Source: European Commission, 2002b.
104106
147
95
81
87
80
90
100
110
120
130
140
150
1990 1995 2000 2005 2010
CO2 emissions
Population
Economic development (GDP per capita)
Conversion efficiency (TPES/TFC)
Energy intensity (TFC/GDP)Carbon intensity (CO /2 TPES)

What are the effects of policies and measures in the EU to reduce greenhouse gas emissions by 2010? 43
Note: EU-10 emissions and projections are given only for those MS which have reported projections (B, D, DK, E, FIN, IRL, I, NL, S, UK)
!!!! Several national policies and measures, however, have been successful, including ‘feed-in’ arrangements that guarantee a fixed favourable price for renewable electricity producers, suggesting that growth of the renewables share can be accelerated.
"""" In the EU, the current rate of increase in combined heat and power (CHP) is not sufficient to achieve the EU’s target of 18 % by 2010.
!!!! Continuing improvements in energy intensity (ratio of energy use value added) in industry are expected.
!!!! Energy savings by households are expected to continue due to implementation of the directive on the energy performance of buildings, the appliances labelling scheme and schemes for energy efficiency standards.
Projections of emissions from energy supply and useFor the EU, aggregated greenhouse gas emissions projections for energy (excluding transport) for 2010 cannot be given with any certainty because only 10 Member States
have reported separate emissions projections for the energy sector (excluding transport) (Figure 23).
With respect to those 10 countries, the aggregated total greenhouse gas emissions for the EU are projected to decline by 2010 by 16 % and 20 % below 1990 levels in the ‘with measures’ projections and ‘with additional measures’ projections, respectively. By far the largest reductions, with existing measures, are projected for Germany (42 %). Belgium, Finland, Ireland, the Netherlands and Spain project increasing emissions, even with additional measures.
Policies and measures applied to the end-use industry, commercial and services sectors are projected to have the largest effect on EU greenhouse gas emissions (Figure 24). In the EU there are many zero or low-cost improvements in energy efficiency that can be made in industry and commerce, stimulated by economic instruments and voluntary agreements, which make businesses more competitive. Savings from policies and measures acting on energy supply are also significant, with countries continuing to move to cleaner fuels and renewable energy.
Greenhouse gas emission projections from energy supply and use, excluding transport(changes from 1990 to 2010) Figure 23
Ireland
Spain
Finland
Belgium
Netherlands
Sweden
Denmark
Germany
EU-10*
United Kingdom
Italy
– 50 – 40 – 30 – 20 – 10 0 + 10 + 20 + 30 + 40 + 50percent points change (decrease (–), increase (+))
2010 Projections with additional policies and measures 2010 Projections with existing policies and measures
Source: EEA, 2002a; EEA, 2002b.

44 Greenhouse gas emission trends and projections in Europe
Note: For projections countries often do not use exactly the same source sectors as for inventories. However the following equivalence with UNFCCC sectors for inventories broadly exists. Energy supply is largely equivalent to ‘1.A.1 Energy industries’; Industry, commercial and services is partly ‘1.A.2 Manufacturing industries and construction’ and partly ‘1.A.4. Commercial and residential’; Built environment is mainly 1.A.4.
Two key policies aimed at reducing greenhouse gas emissions in energy supply are further analysed in the next section:
• renewable energy sources (RES)• combined heat and power (CHP)
technologies.
How rapidly will renewable energy technologies be implemented up to 2010?The share of renewable energy (wind energy, solar power, biomass and hydropower) in the EU’s electricity consumption grew slightly from 13.4 % to 14 % between 1990 and 1999 (Figure 25). This was achieved through an average annual growth in output of 2.8 % per year over the 1990–99 period (EEA, 2002d). In 1999, Austria and Sweden were by far the largest users of renewables for their national electricity production with about 70 % and 50 %, respectively.
Renewable electricity was dominated by large hydropower, which had a 74 % share of output in 1999, followed by small hydro (11 %) and biomass/waste (10 %). Large hydro is an established technology, but its capacity is not expected to increase substantially because of concerns linked to its impact on the environment through the loss of land and the resultant destruction of natural habitats and ecosystems.
For 2010, the EU has proposed indicative targets for Member States and agreed to an overall indicative target of 22.1 % for the EU for the contribution of renewable energy sources to gross electricity consumption (28).
Growth in ‘renewable’ electricity is expected to come from increases in wind energy, solar power, biomass and small hydro (EEA, 2002d). The target for 2010, therefore, is very ambitious because the current growth rate of wind, solar, bio and small hydro has to double between 1999 and 2010, assuming the share of large hydropower plants remains stable. Wind energy is playing a leading role in renewable energy sources.
Member States have implemented a number of policies and measures (EEA, 2002d) that are expected to lead to further increases in the share of renewables. For example, the rapid expansion of wind power (38 % per year across the EU in the period 1990–99) was driven by Denmark, Germany and Spain, and was the result of support measures including ‘feed-in’ arrangements that guarantee a fixed favourable price for renewable electricity producers. Similarly, the rapid expansion of solar (photovoltaic) electricity was driven by Germany and Spain, mainly as a result of a combination of ‘feed-in’ arrangements and high subsidies.
Figure 24 Projected greenhouse gas emission savings in energy supply and use
Source: EEA, 2002b.
0
20
40
60
80
100
120
140
160
180
Energy supply Industry, Commercialand Services
Built environmentand residential
Car
bo
n sa
ving
(M
tCO
) 2
Implemented measures Planned measures
(28)Directive 2001/77/EC on the promotion of electricity produced from renewable energy sources in the internal electricity market, September 2001.

What are the effects of policies and measures in the EU to reduce greenhouse gas emissions by 2010? 45
Notes: Industrial and municipal waste (IMW) includes electricity from both biodegradable and non-biodegradable energy sources, as there are no separate data available for the biodegradable part. The EU 22.1 % indicative target for the contribution of renewable electricity to gross electricity consumption by 2010 only classifies biodegradable waste as renewable. The share of renewable electricity in gross electricity consumption is therefore overestimated by an amount equivalent to the electricity produced from non-biodegradable IMW.National indicative targets shown here are reference values that Member States agreed to take into account when setting their indicative targets by October 2002, according to the EU renewable electricity directive.
Biomass/waste resources have also expanded rapidly, at a rate of over 9 % per year, and have the added benefit that they can be used in high-efficiency combined heat and power plants. Finland and Sweden contributed about 60 % of new electricity production from biomass-fuelled power stations. Both countries provided considerable research and development support and subsidies to the biomass power industry. In Sweden, the introduction of CO2 and energy taxes from which biomass is exempted also helped the expansion of biomass power plants.
How rapidly will energy efficiency be improved through increasing the share of combined heat and power (CHP) by 2010?Combined heat and power (CHP) technology uses fossil fuels, biomass or waste to generate a mix of heat and electricity. In so doing it avoids much of the waste heat losses associated with normal electricity production: CHP utilises over 80 % of the energy in the fuel rather than the average of about 36 % in current plants producing only electricity (EEA, 2002d). In the EU, CHP increased its share in electricity production from 9 % to almost 11 % between 1994 and 1998. The EU has set an indicative target of 18 % of all electricity production from CHP
by 2010 (European Commission, 1997a). The current rate of increase is not sufficient to achieve the EU target of 18 % by 2010 (Figure 26).
Growth was highest in Member States with ambitious programmes and targets for the technology such as Denmark, Finland, Italy, the Netherlands and Spain. However, progress in other countries with ambitious targets, such as Germany (20 % of power by 2010) and the United Kingdom (increase capacity from 3 to 10 GW, 1994–2010) was less.
Concern is raised by preliminary information for 2001, which suggests that CHP production has declined since 1998. This reverse is spread across the EU, but most severe indications were noted in Germany, the Netherlands and the United Kingdom. This decline has been caused by a combination of factors (EEA, 2002d).
• Increasing natural gas prices (gas is the preferred fuel for new CHP) have reduced the cost competitiveness of CHP.
• Falling electricity prices, resulting from market liberalisation and increased
Targets for 2010 and share of electricity consumption met by renewable energy sources in 1999 Figure 25
0
10
20
30
40
50
60
70
80
90
%
Indicative targetsLarge hydropower
All other renewables (excluding IMW)Industrial and municipal waste
EU 15
Austri
a
Swed
en
Finlan
d
Portugal
Italy
Fran
ce
Denm
arkSp
ain
Greec
e
Germ
any
Irelan
d
Nethe
rland
sUK
Luxe
mbour
g
Belgium
Source: Eurostat ; EEA, 2002d.

46 Greenhouse gas emission trends and projections in Europe
competition, have also hit the cost competitiveness of CHP.
• Uncertainty over the evolution of electricity markets as liberalisation is progressively extended is making companies reluctant to invest in CHP.
• Aggressive pricing has been used by electricity utilities to protect their markets.
Key existing policies and measures to reduce CO2 emissions from industryCO2 emissions from manufacturing industries have decoupled from gross value added over the past decade.
These trends are due to an improvement in energy intensity (ratio of energy use and value added) in industry of about 1 % per year over the last decade (EEA, 2002d). Many factors contributed to this, including structural changes in favour of higher value-added products, changes in some industries to less energy-intensive processes, improvements in the energy efficiency of processes and import substitution. National policies and measures, aimed to enhance improvements in energy intensity in the future, include voluntary agreements with individual industry sectors in several MS. Also the promotion of CHP (see above) in
industry is expected to improve energy intensity. Additional measures are mainly focused on reducing process emissions, with more action on energy efficiency in some Member States.
Key existing policies and measures to reduce CO2 emissions from householdsThere appears to be a decoupling of CO2 emissions with the number of dwellings. This trend is due to efficiency improvements through thermal insulation of buildings, fuel switch (mostly in Germany) and increases in solar thermal energy production and biomass district heating.
Energy savings by households are expected up to 2010 through the implementation of the directive on the energy performance of buildings, which includes minimum standards for new buildings and for existing buildings when they are renovated, and the requirement for all buildings to have energy performance certificates. The EU appliances labelling scheme and schemes for energy efficiency standards are also expected to help reduce emissions. In Member States similar policies and measures exist or are planned, i.e. improvement of thermal performance through building regulations and promotion of energy efficiency in electrical appliances.
Figure 26 Target for 2010 of the EU and share of gross electricity production from combined heat and power plants
Source: Eurostat; EEA, 2002d.
1.92.12.54.15.26.07.58.411.2
17.3
22.524.8
35.8
52.6
62.3
10.9
0
10
20
30
40
50
60
70
80
EU
-15
Den
mar
k
Net
herl
and
s
Finl
and
Aus
tria
Luxe
mb
our
g
Ital
y
Spai
n
Po
rtug
al
Ger
man
y
Swed
en UK
Bel
giu
m
Fran
ce
Gre
ece
Irel
and
%
1994 1998
EUtargetof 18 %
by2010

What are the effects of policies and measures in the EU to reduce greenhouse gas emissions by 2010? 47
29
Notes: Imp = implemented (existing); Add = additional.
Figure 27 shows that in most Member States fiscal and regulatory policies are projected to have the greatest impact on emissions in the energy sector (excluding transport). Economic instruments are also used to significant effect. In the future, voluntary agreements seem to be preferred as additional policies by some Member States. Research, education and information are predicted to have a low impact on future emissions in the energy supply and use sector.
5.4.2. Transport"""" Greenhouse gas emissions from
transport are projected to increase by 28 % from 1990 levels by 2010 in the ‘with measures’ projections.
!!!! Average specific carbon dioxide
emissions of new passenger cars were reduced by 7.5 % from 1995 to 2000 due to fuel efficiency improvements, mainly in diesel, and a shift in fleet composition from petrol to diesel passenger cars. This suggests that the target, under the agreement with the car industry, of 120 g
CO2/km (by 2005 or 2010 at the latest) is achievable.
"""" Nitrous oxide emissions from transport currently account for only 0.6 % of total EU greenhouse gas emissions but emissions are projected to increase sharply due to the projected increase in transport carried out by petrol cars equipped with catalysts.
Projections of emissions from transportFor the EU, aggregated transport greenhouse gas emissions projections for 2010 cannot be given with any certainty because only 10 Member States have reported separate emissions projections for the transport sector. With respect to those 10 countries, aggregated EU transport emissions are projected to increase by 28 % compared with 1990 in the ‘with measures’ projections (Figure 28).
Most Member States project growth or stabilisation at a high level, indicating that policies and measures are not sufficient. Belgium, Ireland and Spain project strong
Types of policies and measures by Member States for energy supply and use (excluding transport) (29) Figure 27
Economic Fiscal Volun-tary/
negotia-ted
Regula-tory
Informa-tion
Educa-tion
Research Other
Imp Add Imp Add Imp Add Imp Add Imp Add Imp Add Imp Add Imp Add
Austria !! ! ! ! !! !! ! !!! !! !
Belgium !!! !! !!! ! !!! !! !! !!! ! !!!
Denmark !!! !! ! !!! ! ! !
Finland !! ! !! !! ! !! ! !! !! !! !! ! !
France !!! ! ! ! ! !! !! ! ! ! ! !
Germany ! ! !!! ! !!! !!! ! ! ! !!
Greece ! ! !
Ireland ! ! ! ! !!!
Italy ! ! ! !!! ! ! ! ! !!!
Luxembourg ! !!! !! ! ! !! !
Netherlands !! !!! !!! !!! !!
Portugal !!! ! !!! !
Spain !!! ! !!! !!! ! ! !!! !!!
Sweden !!! !!! ! ! ! !! ! !
UK ! ! !!! ! !!! !!!
(29) For most Member States, the number of ticks relates to the magnitude of the contribution of the policy instrument to the country’s total carbon saving. For example, for the Netherlands, policies instruments saving less than 1 Mt CO2 receive one tick, 1 to 2 Mt CO2 receive two ticks and more than 2 Mt CO2 receive three ticks. The size of these bands varies between countries depending on the magnitude of savings. For countries that provide only qualitative details of policies (indicated by italics), the number of policies of each type is scored; for example Belgium has two implemented regulatory policies for energy and thus has two ticks. Portugal has not provided information on the types of policy instruments used.
Source: EEA, 2002b.

48 Greenhouse gas emission trends and projections in Europe
Note: EU-10 emissions and projections are given only for those MS that report projections (B, D, DK, E, FIN, IRL, I, NL, S, UK)
growth, with Ireland projecting that emissions will more than double by 2010. Ireland, Spain and the United Kingdom expect that additional measures will significantly reduce the projected growth in emissions. For the other Member States, any additional measures are regarded as having less effect. Unfortunately, Member States with high increases in 2000 over 1990 (EEA, 2002a), such as Austria, Luxembourg and Portugal but also including France and Greece, did not report any projections.
For those Member States where both the projections and transport growth rates are available, the ‘with measures’ projections are largely in line with the growth rate assumed for passenger transport. Only in Sweden does the ‘with measures’ projection show a growth in emissions that is significantly less than the increase in transport (13 % compared to 25 %). In Sweden, a number of policies and measures are in place to decrease the energy or emissions intensity of road transport, including promotion of economical driving and less fuel-consuming cars. Other Member States are applying or considering similar policies and measures.
Key existing policies and measures to reduce CO2 emissions from transportCO2 emissions from road transport contribute substantially to the total greenhouse gas emissions from transport (see Section 3.3.3) and measures to reduce these emissions are therefore important.
As regards passenger cars, the EU aims at reducing the average specific CO2 emissions of new cars to 120 g CO2/vehicle-km by 2005, and by 2010 at the latest. In order to meet these targets, voluntary agreements between the European Commission and the European, Japanese and Korean automobile manufacturers’ associations (ACEA, JAMA, KAMA (30)) have been concluded. In these voluntary agreements the automobile industry commits itself to aim at average specific CO2 emissions of 140 g CO2/ vehicle-km for new passenger cars by 2008 (ACEA) and 2009 (JAMA/KAMA).
According to the second annual report on the effectiveness of the strategy to reduce CO2 emissions from cars (European Commission, 2001c), the average specific CO2 emissions of new passenger cars fell by
Figure 28 Greenhouse gas emission projections from transport (changes from 1990 to 2010)
Source: EEA, 2002a; EEA, 2002b.
Ireland
Spain
Belgium
Netherlands
Denmark
Germany
Italy
Finland
EU-10*
Sweden
United Kingdom
0 + 20 + 40 + 60 + 80 + 100 + 120 + 140 + 160 + 180 + 200
Percentage points change (decrease (–), increase (+))
2010 Projections with additional policies and measures 2010 Projections with existing policies and measures
(30) ACEA: European Automobile Manufacturers Association; JAMA: Japan Automobile Manufacturers Association; KAMA: Korea Automobile Manufacturers Association.

What are the effects of policies and measures in the EU to reduce greenhouse gas emissions by 2010? 49
Notes: Imp = implemented (existing); Add = additional.
7.5 % from 186 g CO2/ vehicle-km in 1995 to 172 g CO2/ vehicle-km in 2000 (Figure 29). However, it should be noted that transport carried out by passenger cars increased substantially in the same period, thereby offsetting the average specific efficiency improvements. The car-labelling directive (1999/94/EC) that came into force in 2001, but still has to be implemented by several countries, will complement the ACEA
agreement with important information to car buyers
One of the reasons for the specific emission reductions between 1995 and 2000 was the technological development in diesel cars, leading to improved fuel efficiency, and a shift in fleet composition from petrol to diesel passenger cars. All associations increased the diesel share of their fleets: in
Average specific CO2 emissions of new passenger cars per fuel type Figure 29
100
110
120
130
140
150
160
170
180
190
200
1995 1996 1997 1998 1999 2000 2001 2002 2003 2004 2005 2006 2007 2008 2009 2010
CO
em
issi
ons
(g
/km
)2
Gasoline Diesel
All fuels Target JAMA/KAMA
Target ACEA
Source: European Commission 2001b
Types of policies and measures by Member States for transport Figure 30
Economic Fiscal Volun-tary/
negotia-ted
Regula-tory
Informa-tion
Educa-tion
Research Other
Imp Add Imp Add Imp Add Imp Add Imp Add Imp Add Imp Add Imp Add
Austria ! ! ! ! ! !! ! ! ! !
Belgium ! !!! !! ! ! !!! ! !!! !!
Denmark ! ! ! !
Finland ! !! ! ! !! ! ! !! ! !!
France ! ! ! ! ! ! !! ! ! ! !! !
Germany !! ! !!! ! !
Greece ! !
Ireland ! ! ! !
Italy ! ! !! ! ! !
Luxembourg ! !
Netherlands ! !! ! ! !
Portugal
Spain ! ! ! ! ! ! !
Sweden ! ! !!
UK ! ! !!
Source: EEA, 2002b.

50 Greenhouse gas emission trends and projections in Europe
2000, one third of cars sold in the EU were diesel cars. The increased share of diesel cars in sale, raises concerns regarding higher emissions of particulates and nitrogen oxides.
Currently road freight transport is not included in any EU strategy to reduce its carbon dioxide emissions. EU policies still need to address other transport modes. There have been no improvements in the energy efficiency of rail, but this remains the most energy-efficient mode. Despite improvements during the 1990s, aviation is generally the least energy-efficient mode. (EEA, 2002e).
Most EU Member States expect large greenhouse gas savings in transport by implemented/existing as well as additional fiscal, voluntary and regulatory policies and measures (Figure 30). In particular, voluntary/negotiated agreements are regarded as important to address the issue, whereas not much attention is given to research.
5.4.3. Agriculture!!!! EU-wide greenhouse gas emissions in
agriculture are projected to decrease to 17 % below the 1990 level by 2010 in the ‘with measures’ projection. Reductions in emissions are expected primarily from
continuing reform of the common agricultural policy and the implementation of the nitrate directive, resulting in reductions in fertiliser use and the number of cattle.
Projections of emissions from agricultureFor the EU, aggregated greenhouse gas emissions projections for 2010 cannot be given with any certainty because only 11 Member States have reported separate emissions projections for agriculture. For those 11 countries, aggregated total greenhouse gas emissions for the EU are projected to have declined by 2010 by 17 to 19 % below 1990 levels in the ‘with measures’ projections and ‘with additional measures’ projections, respectively (Figure 31).
For most Member States, total greenhouse gas emissions in agriculture are expected to decrease by 2010 compared to 1990 in both the ‘with measures’ and ‘with additional measures’ projections. Denmark, Finland, Germany and the Netherlands project significant decreases of more than 25 %. In Ireland, however, emissions are projected to increase in ‘with measures’ projections but additional measures are identified to limit their growth. Unfortunately, Spain with a high increase in 2000 from 1990 levels (EEA, 2002a) did not report any projections.
Note: EU-11 emissions and projections are given only for those MS that report projections (A, B, D, DK, F, FIN, IRL, I, NL, S, UK)
Figure 31 Greenhouse gas emission projections from agriculture (changes from 1990 to 2010)
Source: EEA, 2002a; EEA, 2002b.
Ireland
Austria
Finland
EU-11*
Germany
Netherlands
Denmark
United Kingdom
Sweden
Belgium
France
Italy
– 50 – 40 – 30 – 20 – 10 0 + 10
Percentage points change (decrease (–), increase (+))
2010 Projections with additional policies and measures
2010 Projections with existing policies and measures
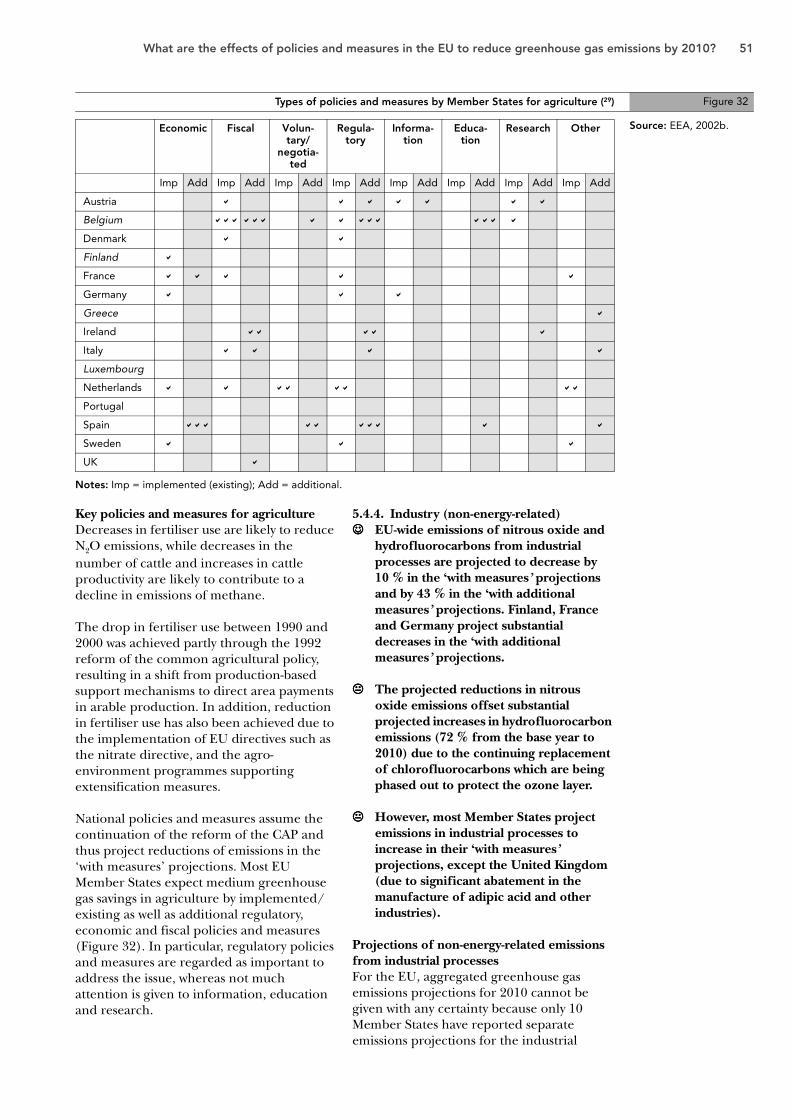
What are the effects of policies and measures in the EU to reduce greenhouse gas emissions by 2010? 51
Notes: Imp = implemented (existing); Add = additional.
Key policies and measures for agricultureDecreases in fertiliser use are likely to reduce N2O emissions, while decreases in the number of cattle and increases in cattle productivity are likely to contribute to a decline in emissions of methane.
The drop in fertiliser use between 1990 and 2000 was achieved partly through the 1992 reform of the common agricultural policy, resulting in a shift from production-based support mechanisms to direct area payments in arable production. In addition, reduction in fertiliser use has also been achieved due to the implementation of EU directives such as the nitrate directive, and the agro-environment programmes supporting extensification measures.
National policies and measures assume the continuation of the reform of the CAP and thus project reductions of emissions in the ‘with measures’ projections. Most EU Member States expect medium greenhouse gas savings in agriculture by implemented/ existing as well as additional regulatory, economic and fiscal policies and measures (Figure 32). In particular, regulatory policies and measures are regarded as important to address the issue, whereas not much attention is given to information, education and research.
5.4.4. Industry (non-energy-related)!!!! EU-wide emissions of nitrous oxide and
hydrofluorocarbons from industrial processes are projected to decrease by 10 % in the ‘with measures’ projections and by 43 % in the ‘with additional measures’ projections. Finland, France and Germany project substantial decreases in the ‘with additional measures’ projections.
#### The projected reductions in nitrous oxide emissions offset substantial projected increases in hydrofluorocarbon emissions (72 % from the base year to 2010) due to the continuing replacement of chlorofluorocarbons which are being phased out to protect the ozone layer.
#### However, most Member States project emissions in industrial processes to increase in their ‘with measures’ projections, except the United Kingdom (due to significant abatement in the manufacture of adipic acid and other industries).
Projections of non-energy-related emissions from industrial processesFor the EU, aggregated greenhouse gas emissions projections for 2010 cannot be given with any certainty because only 10 Member States have reported separate emissions projections for the industrial
Types of policies and measures by Member States for agriculture (29) Figure 32
Economic Fiscal Volun-tary/
negotia-ted
Regula-tory
Informa-tion
Educa-tion
Research Other
Imp Add Imp Add Imp Add Imp Add Imp Add Imp Add Imp Add Imp Add
Austria ! ! ! ! ! ! !
Belgium !!! !!! ! ! !!! !!! !
Denmark ! !
Finland !
France ! ! ! ! !
Germany ! ! !
Greece !
Ireland !! !! !
Italy ! ! ! !
Luxembourg
Netherlands ! ! !! !! !!
Portugal
Spain !!! !! !!! ! !
Sweden ! ! !
UK !
Source: EEA, 2002b.

52 Greenhouse gas emission trends and projections in Europe
Note: EU-10 emissions and projections are given only for those MS that report projections (A, B, D, DK, F, FIN, IRL, P, S, UK)
processes sector. For those 10 countries the aggregated total greenhouse gas emissions for the EU are projected to decline by 10 % in the ‘with measures’ projections and more significantly by more than 43 % in 2010 below 1990 levels in the ‘with additional measures’ projections (
Figure 33). The projected reductions in N2O emissions offset substantial projected increases in hydrofluorocarbon emissions (72 % from the base year to 2010) due to continuing replacement of chlorofluorocarbons which are being phased out to protect the ozone layer.
However, for most Member States total greenhouse gas emissions from industrial processes are expected to increase by 2010 compared to 1990 in the ‘with measures’ projections. In particular Belgium, Denmark, Finland, Ireland and Portugal project strong growth. But Finland and Ireland expect that additional measures will significantly reduce the projected growth in emissions. Only in the United Kingdom are emissions projected to decrease significantly, by 65 % in the ‘with measures’ projection, due to improved abatement in the manufacture of adipic acid
and other industries. Germany and France project similar decreases by 77 % and 43 %, respectively, in their ‘with additional measures’ projections. Unfortunately Greece and Spain, with high increases in 2000 from 1990 levels (EEA, 2002a), did not report any projections.
Key policies and measures for non-energy-related industrial processesPolicies and measures are mainly aimed at abatement measures in adipic and nitric acid production (to reduce N2O emissions) and on alternatives (substitutes) for HFCs in refrigeration and air conditioning. Measures aimed at adipic acid production are mainly in the ‘with measures’ projections for Member States, but for the other process emissions there is a mixture of existing and new measures. Most EU Member States did not report any policies and measures. The few reporting Member States expect a medium magnitude of greenhouse gas savings in industrial processes by implemented/ existing as well as additional regulatory policies and measures, whereas little attention is given to information, education and research (Figure 34).
Figure 33 Greenhouse gas emission projections from non-energy-related industrial processes (changes from 1990 to 2010)
Source: EEA, 2002a; EEA, 2002b.
Denmark
Ireland
Portugal
Belgium
Finland
Austria
France
United Kingdom
EU-10*
Germany
Sweden
– 100 – 80 – 60 – 40 – 20 0 + 20 + 40 + 60 + 80 + 100
Percentage points change (decrease (–), increase (+))
2010 Projections with additional policies and measures
2010 Projections with existing policies and measures

What are the effects of policies and measures in the EU to reduce greenhouse gas emissions by 2010? 53
Notes: Imp = implemented (existing); Add = additional.
5.4.5. Waste management!!!! EU-wide greenhouse gas emissions in the
waste sector are projected to decrease by about 60 % by 2010, mainly due to implementation of the EU landfill directive.
Projections of emissions from waste management (landfills)For the EU, aggregated greenhouse gas emissions projections for 2010 cannot be given with any certainty because only 10 Member States have reported separate emissions projections for waste. For those 10 countries the aggregated total greenhouse gas emissions for the EU are projected to decline significantly to more than 60 % below 1990 levels by 2010 both in the ‘with measures’ projections and in the ‘with additional measures’ projections (Figure 35).
For most Member States, total greenhouse gas emissions from waste processes are expected to decrease from 1990 levels by 2010 in ‘with measures’ projections. By far the largest reductions, of about 80 %, are projected for Finland and Germany.
Unfortunately Greece, Portugal and Spain, with high increases in 2000 from 1990 levels, did not report any projections.
Key policies and measures for waste management (landfills)The emission reductions up to 2000 were partly achieved due to the (early) implementation of the landfill waste directive and similar legislation of the Member States. The landfill waste directive was adopted in 1999 and obligates Member States to reduce the amount of biodegradable waste disposed untreated in landfills, and to install landfill gas recovery at all new sites. The ‘with measures’ and ‘with additional measures’ projections assume that the implementation of the landfill directive will occur according to the required time schedules. Many Member States did not report any policies and measures. Most of the reporting EU Member States expect a medium magnitude of greenhouse gas savings in waste by implemented/existing as well as additional regulatory policies and measures, whereas little attention is given to information, education and research (Figure 36).
Types of policies and measures by Member States in non-energy-related industrial processes (29) Figure 34
Economic Fiscal Volun-tary/
negotia-ted
Regula-tory
Informa-tion
Educa-tion
Research Other
Imp Add Imp Add Imp Add Imp Add Imp Add Imp Add Imp Add Imp Add
Austria ! ! ! !
Belgium ! !!
Denmark ! !
Finland
France ! ! !!! ! ! ! !
Germany ! !!! ! ! !
Greece
Ireland !
Italy
Luxembourg
Netherlands !!! !!! !!! !!! !!!
Portugal ! !
Spain ! !
Sweden !
UK
Source: EEA, 2002b

54 Greenhouse gas emission trends and projections in Europe
Note: EU-10 emissions and projections are given only for those MS that report projections (A, B, D, DK, F, FIN, IRL, I, S, UK)
Notes: Imp = implemented (existing); Add = additional.
Figure 35 Greenhouse gas emission projections from waste management (changes from 1990 to 2010)
Source: EEA, 2002a; EEA, 2002b.
Finland
United Kingdom
EU-10*
Germany
Sweden
Belgium
France
Italy
Ireland
Denmark
Austria
– 90 – 80 – 70 – 60 – 50 – 40 – 30 – 20 – 10 0
Percentage points change (decrease (–), increase (+))
2010 Projections with additional policies and measures
2010 Projections with existing policies and measures
Figure 36 Types of policies and measures by Member States in waste management (29)
Economic Fiscal Volun-tary/
negotia-ted
Regula-tory
Informa-tion
Educa-tion
Research Other
Imp Add Imp Add Imp Add Imp Add Imp Add Imp Add Imp Add Imp Add
Austria ! ! ! ! ! ! !! ! ! ! ! ! !
Belgium ! !!! !! ! !
Denmark ! !
Finland ! !!! !! !!!
France !! !
Germany ! !!! !!! !
Greece
Ireland !
Italy ! ! ! ! ! !
Luxembourg
Netherlands !
Portugal !
Spain ! !
Sweden ! !!!
UK ! !
Source: EEA, 2002b

Is the reporting scheme of the EU sufficient for assessing the progress of greenhouse gas emissions reduction? 55
6. Is the reporting scheme of the EU sufficient for assessing the progress of greenhouse gas emissions reduction?
!!!! Under the monitoring mechanism most Member States provided greenhouse gas inventory data for 1990 to 2000 for all gases. Two Member States (Ireland and Luxembourg) did not provide data on fluorinated gases.
"""" Several candidate countries did not provide greenhouse gas inventory data for 1990 to 2000 for all gases. Most candidate countries did not provide data on fluorinated gases.
!!!! The quality of reporting of emission projections and policies and measures has improved for most Member States.
#### Further improvements in reporting of inventories, projections and policies and measures are still needed and proposals are being developed, as part of the process of revising the monitoring mechanism during 2002 and 2003.
6.1. State of current reporting
6.1.1. Reporting of greenhouse gas inventories by EU Member States
For the preparation of this report, EU greenhouse gas inventories as compiled under the EU monitoring mechanism and submitted by the European Commission to the UNFCCC (April 2002) have been used.
All Member States provided data for the most recent years. Seven Member States submitted their greenhouse gas inventories in time to the European Commission, i.e. by 31 December 2001. Ten Member States submitted all or almost all (i.e. more than 90 %) of the common reporting format (CRF) tables for 1990–2000, while the other five provided summary tables for 1990–2000.
Two Member States (Ireland and Luxembourg) did not provide information on F-gases. A data gap-filling procedure was applied in accordance with the guidelines of the monitoring mechanism for Luxembourg (CO2, CH4 and N2O for 1991–93) and
Belgium and Portugal (fluorinated gases for 1990–94).
Greenhouse gas emission data in this report do not include emissions and removals from land-use change and forestry (LUCF) mainly because Member States have not provided up-to-date data. Member States are waiting for the IPCC good practice guidance for the LUCF sector to become available; this will be published in 2003. The IPCC guidance will assist countries to compile LUCF data in line with the UNFCCC decisions at COP7 (Marrakech, November 2001).
Some of the indicators presented in the report contain sectoral driving force data. Two main data sources have been used:
• data supplied by 12 Member States under the monitoring mechanism in the CRF tables;
• data from Eurostat (New Cronos database).
The geographical coverage of emission data and Eurostat statistics is not fully consistent (i.e. inclusion of overseas territories in emission data). However, this is not expected to distort overall trends and main conclusions.
6.1.2. Reporting of greenhouse gas inventories by candidate countries
The completeness of the data sets reported under the UNFCCC and Council Decision 296/1999/EC (for candidate countries on a voluntary basis) differs among the parties. Some parties reported emissions for the whole period 1990–2000 in consistent time series. Several countries still need to remove gaps and inconsistencies in order to fulfil the requirements of the UNFCCC and the Kyoto Protocol. No emission data are available for Cyprus, Malta and Turkey. The following problems were identified for some countries.
• New gases are not reported at all, or only incomplete time series are reported; the base year for fluorinated gases is not reported.

56 Greenhouse gas emission trends and projections in Europe
• Estimation methods are not consistently applied for the whole period.
• Emissions are not reported for all gases and years from 1990 to 2000.
• Sector emissions are not reported consistently.
• 2000 year emissions are not reported in the last submission (2002).
For the preparation of this report and for the calculation of the indicators, a data gap-filling procedure (interpolation, extrapolation) was applied in accordance with standard rules developed under the EU monitoring mechanism: national totals were interpolated for the Czech Republic (N2O, 1991–95) and Lithuania (CO2 and CH4, 1991–94; N2O, 1991–97). The last reported values are for Lithuania (1998 values for all gases in 1999), Romania (1994 values for all gases 1995–99) and Slovenia (1996 values for all gases 1997–99). Gaps in sectoral data were not filled.
The data availability of fluorinated gas emissions is very limited; therefore, these emissions were not included in total greenhouse gas emissions in Annex 2. Greenhouse gas emission data in this report do not include emissions and removals from land-use change and forestry (LUCF) for the same reasons as mentioned above for EU MS.
6.1.3. Reporting of projections and policies and measures
The quality of reporting for most Member States has improved in 2002 either through the provision of a third national communication to the UNFCCC or through improved reports to the monitoring mechanism.
The reporting of projections has been enhanced but is still facing some challenges. There are a number of inconsistencies and actions are needed to remove these. Disaggregation of the projections by gas and sector has improved and consequently more analysis has been possible than in previous
years. Reporting of underlying parameters has also improved although there is still a limited number that can be compared between Member States.
Reporting of policies and measures is more comprehensive, including more consistent data on the type of measure and status of implementation. However, quantification of individual policies and measures for some Member States is still not available.
6.2. Sensitivity (range) in emissions projections
A number of Member States have provided information on the sensitivity of the projections to changes in some of the key assumptions in the underlying socio-economic scenarios as well as in the effect of (packages of) policies and measures. However, at the moment there is not sufficient information from all Member States to draw firm conclusions about the sensitivity to key assumptions in the aggregated EU projections.
One way of quantifying the sensitivity in the EU emissions projections is to compare previous projections with the actual current trend.
This section shows the results of such a comparison between earlier Member State projections of CO2 for the year 2000 and actual emissions in 2000. The earlier projections are ‘with measures’ projections that were available in 1997–98. (31)
The results show that approximately half the Member State ‘with measures’ projections underestimated emissions in 2000 while a similar proportion overestimated actual emissions. While there were large differences in the Member State emissions projections, for the EU the previous (1997–98) aggregated ‘with measures’ projection was 1.6 % below actual emissions for 2000.
(31) Typically the latest national programmes and/or second national communications to the UNFCCC dating from 1997 or 1998 (see EEA, 1999).

Is the reporting scheme of the EU sufficient for assessing the progress of greenhouse gas emissions reduction? 57
6.3. Improvement needs
Under the monitoring mechanism two working groups consisting of representatives of the Commission (DG ENV), MS and EEA are addressing possible further improvements in the quality of the reported information, both for greenhouse gas inventories and for projections and policies and measures. The Commission has prepared a proposal for revision of the EU greenhouse gas monitoring mechanism, and its guidelines, to incorporate requirements for reporting under the Kyoto Protocol, agreed at the seventh (2001) and eighth (2002) conferences of the Parties to UNFCCC, and requirements under the future EU emission trading directive. This includes for example requirements for national greenhouse gas inventory systems.
In support of the work on projections EEA prepared a report comparing national (MS) projections with projections using EU-wide models (EEA, 2002f).
The report recommended improvements in the following aspects of quality of emission projections:
• completeness (inclusion of all important source and sink categories);
• comparability (harmonisation of definitions, in particular for sectors, and of
methods for preparing sectoral projections and of assumptions such as GDP development);
• consistency (use of the same methodologies for the base year of the projection and for the target year, usually 2010);
• transparency (providing all necessary background and underlying information, especially for the national projections – much of this information is lacking, in particular on the assumed effectiveness of packages of policies and measures).
Following up this work, in February 2002 a workshop on energy-related national and EU-wide projections of greenhouse gas emissions was held with the aim of improving the quality of reporting. At the workshop current practice for reporting was discussed and suggestions made for improvements, aimed primarily at improving the transparency and the comparability of the information.
Small working groups of projections experts involved in the monitoring mechanism have been set up to develop:
1. a proposal for a sectoral breakdown for reporting on projections based on IPCC CRF sectoral categories and taking into account the lower level of disaggregation
Difference between actual CO2 emissions in 2000 and the ‘with existing measures’ projections Figure 37
Source: EEA, 2002b.
1.6
– 8.8
– 8.4
– 3.5
– 3.5
– 2.6
– 1.4
– 1.0
– 0.2
2.7
3.7
8.2
13.8
20.9
25.1
36.8
– 20.0 – 10.0 0.0 10.0 20.0 30.0 40.0
Percentage point difference between CO emissions 2000 and projected emissions 2000 (‘with measures’)2
EU-15
Sweden
Netherlands
Germany
Denmark
Luxembourg
Finland
United Kingdom
Belgium
France
Italy
Greece
Austria
Spain
Ireland
Portugal
Projections overestimating actual emissions Projections underestimating actual emissions

58 Greenhouse gas emission trends and projections in Europe
used for projections compared with annual inventories;
2. a proposal for a list of mandatory and suggested parameters for projections to be reported;
3. a proposal for reporting of projected energy balances;
4. a paper on sensitivity analysis and robustness of projections.
It was also considered that a good practice manual on evaluation of policies and measures, to be developed in the future, would be helpful. These proposals will be further elaborated in guidelines under the revised monitoring mechanism.

Annex 1: What are the actual and projected greenhouse gas emissions by EU Member States? 59
Annex 1: What are the actual and projected greenhouse gas emissions by EU Member States?
Actual greenhouse gas emissions:!!!! In 2000, six Member States (Finland,
France, Germany, Luxembourg, Sweden, the United Kingdom) were on track towards reaching their burden-sharing targets.
"""" In 2000, nine Member States (Austria, Belgium, Denmark, Greece, Ireland, Italy, the Netherlands, Portugal and Spain) were heading towards missing their burden-sharing targets.
Projected greenhouse gas emissions:!!!! Germany, Sweden and the United
Kingdom project that existing policies and measures will be sufficient to meet their burden-sharing targets.
"""" Austria, Belgium, Finland, Ireland, Italy, the Netherlands, Portugal and Spain project that with existing measures their emissions will be significantly above their burden-sharing targets by 2010.
!!!! Finland, France, Italy and Ireland project that with additional policies and measures they are going to meet their burden-sharing targets by 2010.
"""" Austria, Belgium, the Netherlands and Spain project that they will stay considerably above their burden-sharing targets by 2010 even with additional policies and measures. Portugal did not report any additional policies and measures.
Greenhouse gas emission trends and projections for Austria Figure A 38
80
90
100
110
120
130
1990
1995
2000
2005
2010
GH
G e
mis
sio
ns(b
ase
year
= 1
00
)
Trends
With existing measures projections
With additional measures projections
Target
Source: EEA 2002a; EEA 2002b.

60 Greenhouse gas emission trends and projections in Europe
Note: For Denmark, data that reflect adjustments for electricity trade (import and export) in 1990 are not provided in this graph but are presented in EEA , 2002a. When 1990 greenhouse gas emissions are adjusted for electricity trade, emissions in 2000 were 9.8 % below 1990 levels.
Figure A 39 Greenhouse gas emission trends and projections for Belgium
Source: EEA 2002a; EEA 2002b.
80
90
100
110
120
130
1990
1995
2000
2005
2010
GH
G e
mis
sio
ns(b
ase
year
= 1
00
)
Trends
With existing measures projectionsWith additional measures projections
Target
Figure A 40 Greenhouse gas emission trends and projections for Denmark
70
80
90
100
110
120
130
1990
1995
2000
2005
2010
GH
G e
mis
sio
ns (
bas
e ye
ar =
100
)
Trends
With existing measures projections
With additional measures projections
Target
Source: EEA 2002a; EEA 2002b.

Annex 1: What are the actual and projected greenhouse gas emissions by EU Member States? 61
Greenhouse gas emission trends and projections for Finland Figure A 41
Source: EEA 2002a; EEA 2002b.
80
90
100
110
120
130
1990
1995
2000
2005
2010
GH
G e
mis
sio
ns(b
ase
year
= 1
00)
Trends
With existing measures projections
With additional measures projections
Target
Greenhouse gas emission trends and projections for France Figure A 42
80
90
100
110
120
130
1990
1995
2000
2005
2010
GH
G e
mis
sio
ns(b
ase
year
= 1
00
)
Trends
With existing measures projections
With additional measures projections
Target
Source: EEA 2002a; EEA 2002b.

62 Greenhouse gas emission trends and projections in Europe
Figure A 43 Greenhouse gas emission trends and projections for Germany
60
70
80
90
100
110
1990
1995
2000
2005
2010
GH
G e
mis
sio
ns(b
ase
year
= 1
00
)
Trends
With existing measures projectionsWith additional measures projections
Target
Source: EEA 2002a; EEA 2002b.
Figure A 44 Greenhouse gas emission trends and projections for Greece
80
90
100
110
120
130
1990
1995
2000
2005
2010
GH
G e
mis
sio
ns
(bas
e ye
ar =
10
0)
Trends
With existing measures projections
Target
Source: EEA 2002a; EEA 2002b.

Annex 1: What are the actual and projected greenhouse gas emissions by EU Member States? 63
Greenhouse gas emission trends and projections for Ireland Figure A 45
90
100
110
120
130
14019
90
1995
2000
2005
2010
GH
G e
mis
sio
ns (
bas
e ye
ar =
10
0)
Trends
With existing measures projections
With additional measures projections
Target
Source: EEA 2002a; EEA 2002b.
Greenhouse gas emission trends and projections for Italy Figure A 46
80
90
100
110
120
130
1990
1995
2000
2005
2010
GH
G e
mis
sio
ns (
bas
e ye
ar =
10
0)
Trends
With existing measures projections
With additional measures projections
Target
Source: EEA 2002a; EEA 2002b.

64 Greenhouse gas emission trends and projections in Europe
Figure A 47 Greenhouse gas emission trends and projections for Luxembourg
50
60
70
80
90
100
110
120
1990
1995
2000
2005
2010
GH
G e
mis
sio
ns
(bas
e ye
ar =
10
0)
Trends
With existing measures projections
Target
Source: EEA 2002a; EEA 2002b.
Figure A 48 Greenhouse gas emission trends and projections for the Netherlands
80
90
100
110
120
130
1990
1995
2000
2005
2010
GH
G e
mis
sio
ns(b
ase
year
= 1
00
)
Trends
With existing measures projections
With additional measures projections
Target
Source: EEA 2002a; EEA 2002b.

Annex 1: What are the actual and projected greenhouse gas emissions by EU Member States? 65
Greenhouse gas emission trends and projections for Portugal Figure A 49
100
110
120
130
140
150
160
1990
1995
2000
2005
2010
GH
G e
mis
sio
ns(b
ase
year
= 1
00
)
Trends
With existing measures projections
Target
Source: EEA 2002a; EEA 2002b.
Greenhouse gas emission trends and projections for Spain Figure A 50
100
110
120
130
140
150
1990
1995
2000
2005
2010
GH
G e
mis
sio
ns(b
ase
year
= 1
00
)
Trends
With existing measures projections
With additional measures projections
Target
Source: EEA 2002a; EEA 2002b.

66 Greenhouse gas emission trends and projections in Europe
Figure A 51 Greenhouse gas emission trends and projections for Sweden
80
90
100
110
120
130
1990
1995
2000
2005
2010
GH
G e
mis
sio
ns(b
ase
year
= 1
00
)
Trends
With existing measures projections
Target
Source: EEA 2002a; EEA 2002b.
Figure A 52 Greenhouse gas emission trends and projections for United Kingdom
70
80
90
100
110
120
1990
1995
2000
2005
2010
GH
G e
mis
sio
ns(b
ase
year
= 1
00
)
Trends
With existing measures projections
With additional measures projections
Target
Source: EEA 2002a; EEA 2002b.

Annex 2: What are the actual and projected greenhouse gas emissions by candidate countries? 67
Annex 2: What are the actual and projected greenhouse gas emissions by candidate countries?
Actual greenhouse gas emissions:#### In 1999 most candidate countries except
Slovenia were on track to meet their Kyoto targets.
Projected greenhouse gas emissions:#### Five candidate countries (Czech
Republic, Estonia, Latvia, Poland and Slovakia) project that existing policies and measures will be sufficient to meet
their Kyoto targets by 2010, while the other candidate countries did not provide such projections.
#### Although these candidate countries project that they will meet their Kyoto commitments with existing policies and measures, several countries identified additional measures.
Greenhouse gas emission trends for Bulgaria (excl. fluorinated gases and LUCF) Figure B 53
Source: EEA 2002a; EEA 2002b.
20
30
40
50
60
70
80
90
100
1990
1995
2000
2005
2010
GH
G e
mis
sio
ns(b
ase
year
= 1
00
)
Trends Target
68 Greenhouse gas emission trends and projections in Europe
Figure B 54 Greenhouse gas emission trends and projections for the Czech Republic (excl. fluorinated gases and LUCF)
Source: EEA 2002a; EEA 2002b.
0
20
40
60
80
100
120
1990 1995 2000 2005 2010
GH
G e
mis
sio
ns (
bas
e ye
ar =
10
0)
Trends
With existing measures projections
Target
Figure B 55 Greenhouse gas emission trends and projections for Estonia (excl. fluorinated gases and LUCF)
Source: EEA 2002a; EEA 2002b.
20
30
40
50
60
70
80
90
100
1990
1995
2000
2005
2010
GH
G e
mis
sio
ns(b
ase
year
= 1
00)
Trends
With measures projections
With additional measures projections
Target

Annex 2: What are the actual and projected greenhouse gas emissions by candidate countries? 69
Greenhouse gas emission trends for Hungary (excl. fluorinated gases and LUCF) Figure B 56
Source: EEA 2002a; EEA 2002b.
20
30
40
50
60
70
80
90
10019
90
1995
2000
2005
2010
GH
G e
mis
sio
ns(b
ase
year
= 1
00
)
Trends Target
Greenhouse gas emission trends and projections for Latvia (excl. fluorinated gases and LUCF) Figure B 57
Source: EEA 2002a; EEA 2002b.
10
20
30
40
50
60
70
80
90
100
1990
1995
2000
2005
2010
GH
G e
mis
sio
ns(b
ase
year
= 1
00)
Trends
With measures projections
Target

70 Greenhouse gas emission trends and projections in Europe
Figure B 58 Greenhouse gas emission trends for Lithuania (excl. fluorinated gases and LUCF)
Source: EEA 2002a; EEA 2002b.
10
20
30
40
50
60
70
80
90
100
1990
1995
2000
2005
2010
GH
G e
mis
sio
ns(b
ase
year
= 1
00
)
Trends Target
Figure B 59 Greenhouse gas emission trends and projections for Poland (excl. fluorinated gases and LUCF)
Source: EEA 2002a; EEA 2002b.
20
30
40
50
60
70
80
90
100
1990
1995
2000
2005
2010
GH
G e
mis
sio
ns(b
ase
year
= 1
00)
Trends
With measures projections
With additional measures projections
Target

Annex 2: What are the actual and projected greenhouse gas emissions by candidate countries? 71
Greenhouse gas emission trends for Romania (excl. fluorinated gases and LUCF) Figure B 60
Source: EEA 2002a; EEA 2002b.
20
30
40
50
60
70
80
90
10019
90
1995
2000
2005
2010
GH
G e
mis
sio
ns(b
ase
year
= 1
00
)
Trends Target
Greenhouse gas emission trends and projections for Slovakia (excl. fluorinated gases and LUCF) Figure B 61
Source: EEA 2002a; EEA 2002b.
20
30
40
50
60
70
80
90
100
1990
1995
2000
2005
2010
GH
G e
mis
sio
ns(b
ase
year
= 1
00
)
Trends
With existing measures projections
With additional measures projections
Target

72 Greenhouse gas emission trends and projections in Europe
Figure B 62 Greenhouse gas emission trends and projections for Slovenia (excl. fluorinated gases and LUCF)
Source: EEA 2002a; EEA 2002b.
40
50
60
70
80
90
100
110
120
1990
1995
2000
2005
2010
GH
G e
mis
sio
ns(b
ase
year
= 1
00
)
Trends
Target

Annex 3: EU greenhouse gas emissions by sector and projections by Member State 73
Annex 3: EU greenhouse gas emissions by sector and projections by Member State
Absolute and relative (percentage) change from 1990 to 2000 of EC key source emissions (in million tonnes of CO2 equivalents and percent respectively) Figure C 63
Source: EEA (2002a), excluding emissions and removals from LUCF.
– 150 – 120 – 90 – 60 – 30 0 30 60 90 120 150
2.B. Chemical Industry (N O)2
1.A.2. Manufacturing Industries and Construction (CO )2
1.A.1. Energy Industries (CO )2
6.A. Solid Waste Disposal on Land (CH )4
1.B.1. Fugitive Emissions from Solid Fuels (CH )4
1.A.4. Other Sectors (CO )2
4.A. Enteric Fermentation (CH )4
1.A.5. Other (CO )2
4.D. Agricultural Soils (N O)2
2.C. Metal Production (PFC)
1.B.2. Fugitive Emissions from Oil and Natural Gas (CH )4
4.B. Manure Management (N O)2
2.E. Production of Halocarbons and SF (HFC)6
1.A.4. Other Sectors (N O)2
1.A.4. Other Sectors (CH )4
2.B. Chemical Industry (HFC)
2.C. Metal Production (CO )2
2.A. Mineral Products (CO )2
4.B. Manure Management (CH )4
1.A.3. Transport (N O)2
2.F. Consumption of Halocarbons and SF (HFC)6
1.A.3. Transport (CO )2
Absolute change in million tonnes of CO equivalents2
– 125 % – 100 % – 75 % – 50 % – 25 % 0 % 25 % 50 % 75 % 100 % 125 %
Percentage change
Absolute change
Relative change
8112 %
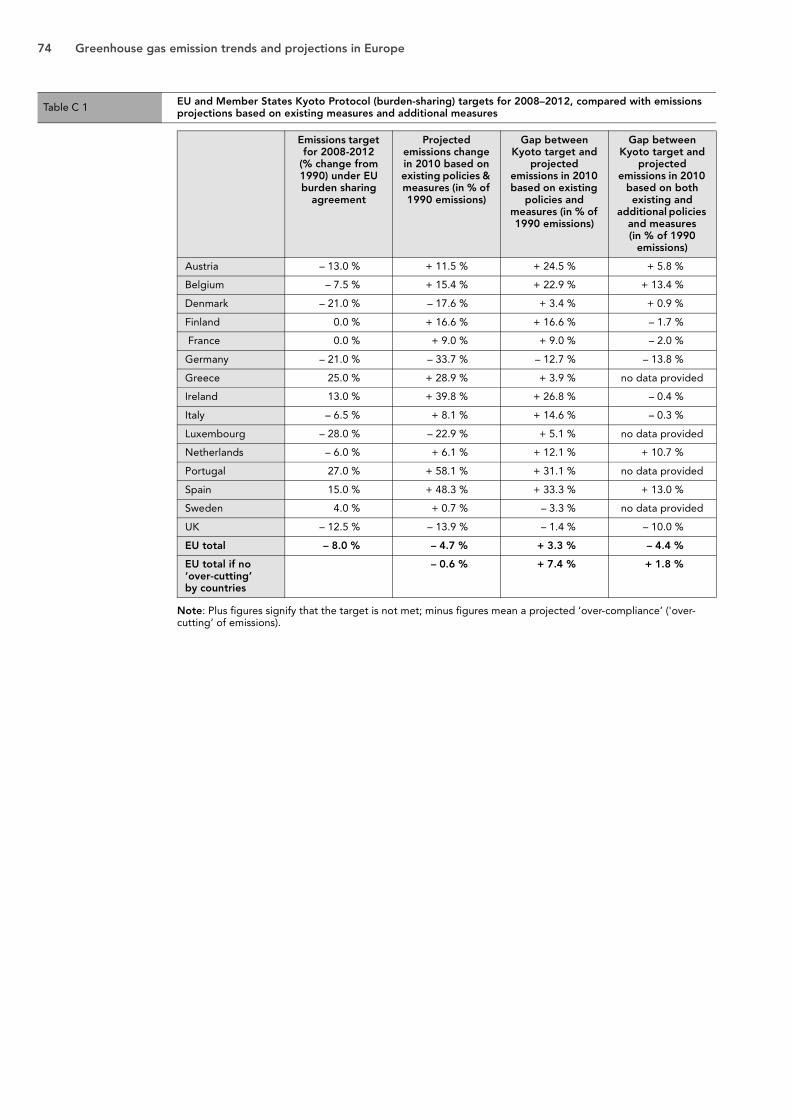
74 Greenhouse gas emission trends and projections in Europe
Note: Plus figures signify that the target is not met; minus figures mean a projected ‘over-compliance’ ('over-cutting’ of emissions).
Table C 1 EU and Member States Kyoto Protocol (burden-sharing) targets for 2008–2012, compared with emissions projections based on existing measures and additional measures
Emissions target for 2008-2012
(% change from 1990) under EU burden sharing
agreement
Projected emissions change in 2010 based on existing policies & measures (in % of 1990 emissions)
Gap between Kyoto target and
projected emissions in 2010 based on existing
policies and measures (in % of 1990 emissions)
Gap between Kyoto target and
projected emissions in 2010
based on both existing and
additional policies and measures(in % of 1990
emissions)
Austria – 13.0 % + 11.5 % + 24.5 % + 5.8 %
Belgium – 7.5 % + 15.4 % + 22.9 % + 13.4 %
Denmark – 21.0 % – 17.6 % + 3.4 % + 0.9 %
Finland 0.0 % + 16.6 % + 16.6 % – 1.7 %
France 0.0 % + 9.0 % + 9.0 % – 2.0 %
Germany – 21.0 % – 33.7 % – 12.7 % – 13.8 %
Greece 25.0 % + 28.9 % + 3.9 % no data provided
Ireland 13.0 % + 39.8 % + 26.8 % – 0.4 %
Italy – 6.5 % + 8.1 % + 14.6 % – 0.3 %
Luxembourg – 28.0 % – 22.9 % + 5.1 % no data provided
Netherlands – 6.0 % + 6.1 % + 12.1 % + 10.7 %
Portugal 27.0 % + 58.1 % + 31.1 % no data provided
Spain 15.0 % + 48.3 % + 33.3 % + 13.0 %
Sweden 4.0 % + 0.7 % – 3.3 % no data provided
UK – 12.5 % – 13.9 % – 1.4 % – 10.0 %
EU total – 8.0 % – 4.7 % + 3.3 % – 4.4 %
EU total if no ‘over-cutting’ by countries
– 0.6 % + 7.4 % + 1.8 %

References 75
References
EEA, 1999. Overview of national programmes to reduce greenhouse gas emissions. EEA Topic report 8/1999.
EEA, 2002a. Greenhouse gas emission trends in Europe 1990–2000. EEA Topic report 7/2002.
EEA, 2002b. Greenhouse gas emission projections for Europe. EEA Technical report 95/2002.
EEA, 2002c. Environmental signals 2002. Benchmarking the millennium. EEA Environmental assessment report No 9.
EEA, 2002d. Energy and environment in the EU. EEA Environmental issues report 31, 2002.
EEA, 2002e. Paving the way for EU enlargement (TERM 2002). EEA Environmental issues report /2002.
EEA, 2002f. Analysis and comparison of national and EU-wide projections of greenhouse gas emissions. EEA Topic report 1/2002.
Eichhammer, W. et al. 2001. Greenhouse gas reductions in Germany and the United Kingdom — Coincidence or policy induced? An analysis for international climate policy. Study for the German Federal Ministry of the Environment (BMU) and the German Federal Environmental Agency (UBA) by the Fraunhofer-Institute Systems and Innovation Research (ISI, Germany), Deutsches Institut für Wirtschaftsforschung (DIW, Germany) and Science Policy and Technology Policy Research (SPRU, UK), June 2001.
European Commission, 1997a. A Community strategy to promote combined heat and power (CHP) and to dismantle barriers to its
development. COM (1997) 514 final. Brussels, Commission of the European Communities.
European Commission, 2001a. Environment 2010: Our future, our choice. Communication from the Commission to the Council, the European Parliament, the Economic and Social Committee and the Committee of the Regions. COM (2001) 31 final. Brussels, Commission of the European Communities.
European Commission, 2001b. A sustainable Europe for a better world: A European Union strategy for sustainable development. Communication from the Commission to the Council and the European Parliament. COM (2001) 264 final. Brussels, Commission of the European Communities.
European Commission, 2001c. Implementing the Community strategy to reduce CO2 emissions from cars. Second annual report on the effectiveness of the strategy. COM (2001) 643 final. Brussels, Commission of the European Communities.
European Commission, 2002a. Report under the Council Decision 1999/296/EC for a monitoring mechanism of Community CO2 and other greenhouse gas emissions. Brussels, Commission of the European Communities.
European Commission, 2002b. Preliminary EU-wide energy baseline scenario, prepared with the Primes model by NTUA for the European Commission, September 2002.
IPCC, 2001. Climate change 2001. Third assessment report, WMO/UNEP/IPCC.
76 Greenhouse gas emission trends and projections in Europe
Glossary
ACEA European Automobile Manufacturers Association (EU-wide agreement with ACEA and similarly also with Japanese (JAMA) and Korean (KAMA) automobile manufacturing industries)
CCPMs Common and coordinated policies and measures at EU level
CFCs Chlorofluorocarbons
CHP Combined heat and power generation
CH4 Methane
CO2 Carbon dioxide
ECCP European climate change programme
EEA European Environment Agency
ETC/ACC European Topic Centre on Air and Climate Change
GDP Gross domestic product
GHG Greenhouse gases
HFCs Hydrofluorocarbons
IEA International Energy Agency
IPCC Intergovernmental Panel on Climate Change
JAMA Japanese Automobile Manufacturers Association
KAMA Korean Automobile Manufacturers Association
KP Kyoto Protocol
LUCF Land-use change and forestry
MS Member States
Mt CO2-eq. Mega (million) tonnes of CO2 equivalent
N2O Nitrous oxide
PFC Perfluorocarbons
RES Renewable energy sources
SF6 Sulphur hexafluoride
UNFCCC United Nations Framework Convention on Climate Change