Greenhouse gas emission in West Siberia
11
Greenhouse Gas Emission in West Siberia M. V. Glagolev a , E. A. Golovatskaya b , and N. A. Shnyrev a a Lomonosov Moscow State University, Vorob’evy Gory, Moscow, 119992 Russia b Institute of Monitoring of Climatic and Ecological Systems (IMCES), Siberian Branch of the RAS, Akademicheskii prosp. 10/3, Tomsk, 634055 Russia Abstract—The major gases contributing to the greenhouse effect are carbon dioxide and methane (60 and 15–18%, respectively). The former Soviet Union area accounts for 11% of the global methane flux on the average. However, virtually no records of methane flux were kept in Russia in the late 1980s-early 1990s. Inventories of methane emission in Russia were reported in the middle 1990s, but those data were confined to measurements performed by the early 1990s. This paper presents generalized data on methane and carbon dioxide emission from the surfaces of marsh ecosystems in West Siberia in the 1990s, when the majority of measurements were carried out. DOI: 10.1134/S1995425508010165 At present, the greenhouse effect is contributed mainly by methane and carbon dioxide: 60 and 15–18%, respectively [1, 2]. According to the Conven- tion on Climate Change adopted in 1992, each country should produce its own balance of greenhouse gases, first of all, carbon dioxide and methane [3]. The carbon balance in terrestrial ecosystems is determined primar- ily by carbon accumulation during photosynthesis and release of carbon dioxide and methane during organic matter decay [4]. Many papers [e.g., 5–8] were dedicated to attempts to summarize all global information on various types of methane sources. Unfortunately, the data on methane emission from Russian soils are omitted from these pa- pers, although the Soviet Union contributed 4 to 17% of the global methane flux [2]. The mean evaluation re- ported in [9], 11%, can be tentatively admitted. The lack of data is largely related to the fact that few mea- surements of methane flux were done in Russia in the late 1980s–early 1990s. As far as we know, two at- tempts of methane flux inventory in Russia were done in the mid-1990s [10, 11]. These reports comprised in- formation on measurements done before and during the early 1990, but the majority of measurements were done in the next decade; therefore, the inventory should be updated. Emphasis is placed on methane emission, because it has been studied much less than carbon dioxide fluxes. RECORDS OF METHANE EMISSION IN WEST SIBERIA Tomsk Oblast Early studies of methane emission in West Siberia date to 1992. They were performed at a station of the Sukachev Institute of Forest, Siberian Branch of the Russian Academy of Sciences, near the village of Vo- sem’desyat Shestoi Kvartal, Tomsk oblast. This station is located on the southern periphery of the West Sibe- rian Plain (56°22 ¢ N, 84°40 ¢ E). The following types of bogs were studied: ombrotrophic sphagnous peatlands wooded by low pinery; mesotrophic bogs; exposed sedge-sphagnous bogs bordered by forest belts; minerotrophic swamps covered by high-site mixed for- est dominated by the Siberian pine [12]. Measurements of methane and carbon dioxide fluxes reported in [13] were performed in July–August of 1993 and 1994, at three localities of the Tomsk oblast: (1) the floodplain of the Iksa River (a 2–3 to 50 m wide bog in a narrow band along the main river- bed); (2) the Bakchar bog between the Bakchar and Iksa rivers, 20 ´ 15 km in size; (3) the Iksa bog: ombrotrophic and mesotrophic bogs of the total area 15 ´ 180 km in the plain divide between the Iksa and Shegarka rivers. In these studies, the methane flux and the dark car- bon dioxide flux were measured using static dark cham- bers (base area 0.16 m 2 , height 0.3 m, volume 48 l, exposure time 30 to 45 min). Other parameters mea- sured: dissolved methane concentration, air and peat temperatures at depths of 2–5 cm, pH and Eh at the watertable level (WTL) [12, 13], and rates of methane production and oxidation [12]. The coefficients of variation in the methane flux measurements were within 80–240%. Methane emis- sion rate varied from –20 to 2400 mg CH 4 /(m 2 ×day) depending on ambient conditions. The confidence in- terval for the Bakchar bog at p = 0.95 was 144– 323 mg CH 4 /(m 2 × day) [13]. Rates of methane and carbon dioxide emission were determined in the Siberian Terrestrial Ecosystem-At- mosphere-Cryosphere Experiment (STEACE) in 1994. The resulting methane emission rate was 5.2 mg C/(m 2 ×h) at std = 4.1 mg C/(m 2 × h); i.e., the coefficient of variation was 80% [14]. ISSN 1995-4255, Contemporary Problems of Ecology, 2008, Vol. 1, No. 1, pp. 136–146. © Pleiades Publishing, Ltd., 2008. Original Russian Text © M.V. Glagolev, E.A. Golovatskaya, N.A. Shnyrev, 2007, published in Sibirskii Ekologicheskii Zhurnal, 2007, Vol. 14, No. 2, pp. 197–210. 136
-
Upload
moscowstate -
Category
Documents
-
view
0 -
download
0
Transcript of Greenhouse gas emission in West Siberia
Greenhouse Gas Emission in West Siberia
M. V. Glagoleva, E. A. Golovatskaya
b, and N. A. Shnyrev
a
a
Lomonosov Moscow State University, Vorob’evy Gory, Moscow, 119992 Russiab
Institute of Monitoring of Climatic and Ecological Systems (IMCES), Siberian Branch of the RAS,
Akademicheskii prosp. 10/3, Tomsk, 634055 Russia
Abstract—The major gases contributing to the greenhouse effect are carbon dioxide and methane (60 and
15–18%, respectively). The former Soviet Union area accounts for 11% of the global methane flux on the
average. However, virtually no records of methane flux were kept in Russia in the late 1980s-early 1990s.
Inventories of methane emission in Russia were reported in the middle 1990s, but those data were confined to
measurements performed by the early 1990s. This paper presents generalized data on methane and carbon
dioxide emission from the surfaces of marsh ecosystems in West Siberia in the 1990s, when the majority of
measurements were carried out.
DOI: 10.1134/S1995425508010165
At present, the greenhouse effect is contributed
mainly by methane and carbon dioxide: 60 and
15–18%, respectively [1, 2]. According to the Conven-
tion on Climate Change adopted in 1992, each country
should produce its own balance of greenhouse gases,
first of all, carbon dioxide and methane [3]. The carbon
balance in terrestrial ecosystems is determined primar-
ily by carbon accumulation during photosynthesis and
release of carbon dioxide and methane during organic
matter decay [4].
Many papers [e.g., 5–8] were dedicated to attempts
to summarize all global information on various types of
methane sources. Unfortunately, the data on methane
emission from Russian soils are omitted from these pa-
pers, although the Soviet Union contributed 4 to 17% of
the global methane flux [2]. The mean evaluation re-
ported in [9], 11%, can be tentatively admitted. The
lack of data is largely related to the fact that few mea-
surements of methane flux were done in Russia in the
late 1980s–early 1990s. As far as we know, two at-
tempts of methane flux inventory in Russia were done
in the mid-1990s [10, 11]. These reports comprised in-
formation on measurements done before and during the
early 1990, but the majority of measurements were
done in the next decade; therefore, the inventory should
be updated. Emphasis is placed on methane emission,
because it has been studied much less than carbon
dioxide fluxes.
RECORDS OF METHANE EMISSION
IN WEST SIBERIA
Tomsk Oblast
Early studies of methane emission in West Siberia
date to 1992. They were performed at a station of the
Sukachev Institute of Forest, Siberian Branch of the
Russian Academy of Sciences, near the village of Vo-
sem’desyat Shestoi Kvartal, Tomsk oblast. This station
is located on the southern periphery of the West Sibe-
rian Plain (56°22�N, 84°40�E). The following types of
bogs were studied: ombrotrophic sphagnous peatlands
wooded by low pinery; mesotrophic bogs; exposed
sedge-sphagnous bogs bordered by forest belts;
minerotrophic swamps covered by high-site mixed for-
est dominated by the Siberian pine [12].
Measurements of methane and carbon dioxide
fluxes reported in [13] were performed in July–August
of 1993 and 1994, at three localities of the Tomsk
oblast: (1) the floodplain of the Iksa River (a 2–3 to
50 m wide bog in a narrow band along the main river-
bed); (2) the Bakchar bog between the Bakchar and Iksa
rivers, 20�15 km in size; (3) the Iksa bog: ombrotrophic
and mesotrophic bogs of the total area 15�180 km in the
plain divide between the Iksa and Shegarka rivers.
In these studies, the methane flux and the dark car-
bon dioxide flux were measured using static dark cham-
bers (base area 0.16 m
2
, height 0.3 m, volume 48 l,
exposure time 30 to 45 min). Other parameters mea-
sured: dissolved methane concentration, air and peat
temperatures at depths of 2–5 cm, pH and Eh at the
watertable level (WTL) [12, 13], and rates of methane
production and oxidation [12].
The coefficients of variation in the methane flux
measurements were within 80–240%. Methane emis-
sion rate varied from –20 to 2400 mg CH
4
/(m
2
�day)
depending on ambient conditions. The confidence in-
terval for the Bakchar bog at p = 0.95 was 144–
323 mg CH
4
/(m
2
�day) [13].
Rates of methane and carbon dioxide emission were
determined in the Siberian Terrestrial Ecosystem-At-
mosphere-Cryosphere Experiment (STEACE) in 1994.
The resulting methane emission rate was 5.2 mg
C/(m
2
�h) at std = 4.1 mg C/(m
2
�h); i.e., the coefficient of
variation was 80% [14].
ISSN 1995-4255, Contemporary Problems of Ecology, 2008, Vol. 1, No. 1, pp. 136–146. © Pleiades Publishing, Ltd., 2008.
Original Russian Text © M.V. Glagolev, E.A. Golovatskaya, N.A. Shnyrev, 2007, published in Sibirskii Ekologicheskii Zhurnal, 2007, Vol. 14, No. 2, pp. 197–210.
136

In addition to the pointwise chamber method, the
distributed inversion trap method (giant chamber
method) was used for measuring emission from bogs
near Plotnikovo Village (57°85�N, 83°08�E) on August
3, 5, and 6, 1994 [15]. Results of airborne measure-
ments during temperature inversion are reported in
Table 1 [16].
The land and airborne measurements carried out in
STEACE allowed calculation of the flux by the gradi-
ent method described in [15, 17]. The data were ar-
ranged as temporal methane and carbon dioxide
concentration series at an elevation 5 m above the
ground and horizontal fields of these concentrations at
elevations from 100 to 2000 m obtained from a flying
laboratory early in the morning [14]. The measure-
ment was carried out southwest of Plotnikovo Village
[13, 14]. The methane flux value was measured to be
0.1 g/(m
2
�day). This value was close to that obtained by
Tohjima et al. [16] by the inversion trap method but
lower than the values obtained by the conventional
chamber method. This difference may be related to the
fact that the concentrations measured from a tower, bal-
loon, or an aircraft are influenced by not only the
nearby bog but also distant areas, which emit no meth-
ane or even absorb it. Circadian emission variations can
be another cause of the difference between the results of
different measurement methods, but the current quan-
titative knowledge of this variation is insufficient [14].
In 1995, regular methane flux studies were com-
menced in the Bakchar bog near the Plotnikovo Station
of the Institute of Soil Science and Agrochemistry, Si-
berian Branch of the RAS. In addition to methane flux,
soil temperatures and water levels were recorded [19].
Significant (twofold) temporal flux variations were
observed [20]. The mean values of fluxes above various
plant associations are presented in Table 2, column
“1995”.
In 1997, fluxes were measured with an automated
system [21]. Chambers were placed along wooden
gangways in plant associations (chamber numbers in
parentheses): (1) Sphagnum, (2) Carex, (3) Menyan-
thes, (4) Equisetum, (5) Carex, and (6) Eriophorum.
The results are shown in Table 2, column “1997”.
The data on methane flux in the Bakchar bog
(Tomsk oblast, Plotnikovo station) reported in [22]
were obtained by the conventional portable chamber
method in July and August, 1997. The fluxes were vir-
tually identical in these months: (4.1�0.4) mg C/(m
2
�h)
in July and (4.4�0.6) mg C/(m
2
�h) in August. In addi-
tion, data for several past years are shown. In 1997, a
large body of attendant data were obtained for four sites
dominated by (1) Eriophorum vaginatum, (2) Carex,
(3) Menyanthes, and (4) Equisetum: vertical profiles of
soil temperature, pH, redox potential, organic acid con-
centrations, dissolved methane concentrations, and
methane production rates [23].
Since 1998, the observation has been made at two
stations, described in detail in [24] and in brief, in [19].
Test ground O is an oligotrophic hummocky-water
hole-lakelet wetland, whose vegetation is represented
by mosses and, on the hummocks, dwarf pines with
shrubs. Test ground E is an open, heavily moistened
area of a bog with small tussocks and water holes [19],
4 km north of test ground O. Test ground E can be con-
sidered mesotrophic [26]. Equipment for automatic re-
cord of methane emission was installed on each test
ground [19]. Also, an independent weather station
(Unidata Australia, model 6508) with a sensor measur-
ing WTL was installed. Soil temperatures were re-
corded with termistors and LM35 semiconductor-based
temperature sensors (National Semiconductor) accu-
rate to 0.1 °C. In 1998, water levels and soil tempera-
ture profiles were recorded throughout the warm
season, starting from snow melting late in April till the
beginning of November [19].
The rates of methane emission averaged over the
season were 12.7 mg/(m
2
�h) on test ground E and
2.1 mg/(m
2
�h) on test ground O (Table 3). One of the
explanations of this great difference is different soil
temperatures at a depth of 25 cm. In turn, the low sum-
mer soil temperatures on test ground O may be related
to deep freezing in winter.
In addition to these data, a great body of weather
data (with emphasis placed on heat balance measure-
ments) was obtained in the Bakchar bog from April 20
to November 2, 1998. These data were reported in part
in [25, 26].
CONTEMPORARY PROBLEMS OF ECOLOGY Vol. 1 No. 1 2008
GREENHOUSE GAS EMISSION IN WEST SIBERIA 137
Table 1. Aircraft measurements of methane flux [16, 18]
Date
Methane
accumulation,
mg/m
2
Accumu-
lation
time, h
Methane
flux,
mg/(m
2
�day)
03.08.1994 55 13 (15) 102 (88)
05.08.1994 20 12 (14) 40 (34)
06.08.1994 79 13 (15) 146 (126)
Data from [18] are parenthesized
Table 2. Dependence of methane flux on vegetation type
Plant association
Methane flow,
mg C/(m
2
�h)
1995 1997
Hummock ridge (Pinus
sylvestris)
3.7
not recorded
Shrub-cotton
grass-sphagnum
12.8 7.7
Shrub-sedge-sphagnum 18.1 11.3, 21.4
Sedge-shamrock-sphagnum 15.1 7.7
Sedge-equisetum-sphagnum 6.5 8.7
Sphagnum spp.
not recorded

In the summer of 2000 (June–August), flux mea-
surements were continued in the hummock-water hole
complex on the periphery of the upland Bakchar bog
(test ground E). Round-the-clock measurements were
performed on July 5–6 and August 19–20. Five cham-
bers were placed along the transect across the sedge–
sphagnum association: C1 and C2, tussocks covered by
Sphagnum magellanicum, S. angustifolium, Carex li-
mosa, and dwarf shrubs; C3 and C5 at a lower level
(Sphagnum majus); C4 is a water hole partly covered
with water with partially decayed plant remains and oc-
casional living Sphagnum majus plants. The mean rate
of methane emission from peat was 1.22 mg C/(m
2
�h),
std = 1.43 mg C/(m
2
�h) (Table 4), the emission from
water holes being greater than from positive microrelief
elements. Methane emission constituted 2 to 4% of the
total carbon emission [27].
In September, 2000, measurements were performed
by the chamber method (base area 0.152 m
2
, height
0.43 m, volume 65.4 l) on test ground B in a birch forest
(56°52�N, 83°17�E). The land vegetation included
shrubs (Ledum palustre, Chamedaphne calyculata, and
Rubus chamaemorus) and grasses. Typical soils of the
forest had an approximately 90 cm thick organic hori-
zon, originating from peat overlying a muddy mineral
horizon [28]. Gas concentration variation in the cham-
ber was practically linear, but Nakano et al. [28] calcu-
lated flux from even more complicated models. The
following values � std were obtained: –165�
17.0 �g C/(m
2
�h) for the Nakano et al. exponential
model, –161�16.7 �g C/(m
2
�h) for the Hutchinson–
Mosier nonlinear model, and –136�8.42 �g C/(m
2
�h)
for the linear model.
Khanty-Mansi National District
Methane flux measurements in the Khanty-Mansi
National District were reported in 1993 [29]. Gas con-
centrations and turbulence parameters were measured
from an IL-18 flying laboratory. Measurements were
performed by the gradient method at various times of
day, from 8.00 to 15.00, at heights of 0.1, 0.5, and
1.0 km along horizontal routes 100–120 km in length.
Methane concentrations and turbulent fluctuations of
the vertical wind component were measured with a gas
chromatograph with a flame ionization detector [30]
and an aircraft anemoclinometer [31]. The spatial reso-
lution of methane concentration measurements was
350 m. Horizontal averaging allowed fourfold reduc-
tion of the concentration measurement error in compar-
ison with the error of individual measurements. The
standard error of the calculated turbulent diffusion co-
efficient was 20%. The lowest vertical concentration
gradients and fluxes were observed above unforested
bogs devoid of trees occurring on flat divides. The larg-
CONTEMPORARY PROBLEMS OF ECOLOGY Vol. 1 No. 1 2008
138 GLAGOLEV et al.
Table 3. Plant association compositions and methane fluxes, mg/(m
2
�h)
Test ground Chamber Flux Association, bog type: M, mesotrophic; O, oligotrophic
E 1 12.8 Equisetum, Sphagnum fallax (M)
E 2 18.1 Menyanthes, Sphagnum majus (M)
E 3 17.9 Carex, Sphagnum balticum (OM)
E 4* 15.7 Dwarf shrubs, Carex, Sphagnum magellanicum (MO)
E 5** 5.27 Dwarf shrubs, Carex, Sphagnum magellanicum (MO)
E 6 5.9 Pines, dwarf shrubs, Carex, Sphagnum magellanicum (O)
O 1 1.8 Menyanthes, Sphagnum fallax (M)
O 2 4.1 Carex, Sphagnum papillosum (MO)
O 3 2.0 Eriophorum, Carex, Sphagnum angustifolium (MO)
O 4 2.1 Eriophorum, Carex, Sphagnum angustifolium (MO)
O 5 1.5 Eriophorum, Carex, Sphagnum angustifolium (MO)
O 6 0.5
Rare pines, dwarf shrubs, S. fuscum, lichen ridges
* Site more humid than under chamber 5.
** Site drier than under chamber 4.
Table 4. Methane emission on test ground E of the Bakchar
bog (cited from [27]) in 2000.
Date
Emission, mg C/(m
2
�h)
mean std
25.06.2000 1.02 0.61
5–6.07.2000 0.85 0.47
13.07.2000 2.23 3.14
20.07.2000 0.94 1.22
19–20.06.2000 1.47 0.63
26.08.2000 0.83 0.77
Mean 1.22 1.43
est methane fluxes were recorded in valleys of large or
medium rivers: Ob’, Irtysh, and Konda. The flux values
above the Irtysh valley exceeded those above forested
or unforested bogs by 30–100% (Table 5). The same ef-
fect, although less pronounced, was observed above
valleys of minor rivers. The mean flux value within the
height range 100–500 m was 2.8 mg/(m
2
�h).
Measurements from the flying laboratory were con-
tinued on July 31, 1994 above bogs near Khanty-Man-
siisk (61°05�N, 69°00�E). Both forested and unforested
bogs were studied. The results calculated on the as-
sumption that the methane accumulation time in the
capping inversion layer was the same as in measure-
ments near Plotnikovo Village [27] are presented in
Table 5.
Yamal-Nenets Autonomous District
Measurements were performed near the town of
Noyabr’sk (northern taiga subzone) in the daytime,
July-September 1999 by the portable chamber method
(base area 0.01 m
2
, height 0.2 m, volume 2 l). Gas sam-
ples were taken three times during the exposure time of
20 to 30 min. The chambers were covered with light-re-
flecting coating. Chamber bases were buried into the
soil to a depth of 10 cm. They remained at the same sites
throughout the field work time. Chromatographic anal-
ysis of gas samples was carried out with a Kristall 5000
chromatograph [27].
The following grounds were tested [27]: P1 is an
upland bog with hummock–water hole–lakelet com-
plexes at the periphery of a dividing bog area, distant
from industrial enterprises and inhabited sites, 62°58�N,
71°11�E; P2 is an upland bog with flat hummock-water
hole complexes over permafrost, located in a local low-
land near an oil recovery area, 63°17�N, 75°29�E; P3 is
an upland bog with flat mound–water hole complexes
over permafrost, distant from industrial enterprises and
inhabited sites, 63°12�N, 75°40�E; and P4 is a meso-
trophic lake, minerotrophic sedge-sphagnous marsh in
the valley of a small river 750 m from an oil recovery
area, 63°16�N, 75°29�E.
The vegetation was the same at P2 and P3. Perma-
frost was absent from P1, and the hummocks were cov-
ered by sparse Pinus sylvestris trees. Test ground P4
was located in a marsh within a river valley, 30–50 m
from the riverbed [27].
The mean rate of methane emission from peat was
0.57 mg C/(m
2
�h) (std = 0.36 mg C/(m
2
�h)). The lowest
emission rates were recorded at P4, where the perma-
frost table occurred at depths of 0.4–0.5 m (Table 6).
Emission from water holes showed no significant dif-
ference from that from hummocks except for P1.
SOME GENERAL RESULTS OF METHANE
EMISSION MEASUREMENTS
Methane Content Within the Peat Deposit
In peat deposits, methane is produced by anaerobic
microorganisms degrading organic matter [32]. As esti-
mated in [33], only 0.5% of the annual overall primary
production of a bog phytocenosis is converted to meth-
ane. Other scientists assume that the carbon released
with methane constitutes 2–7% of the primary bog pro-
duction [6, 34]. Nevertheless, bogs are considered to be
the main methane supplier to the atmosphere [34]. The
contribution of bog ecosystems to the global methane
emission is estimated by some scientists at 16% [35].
Concerning methane emission from bogs, some sci-
entists believe that oligotrophic bogs produce less
methane than eutrophic ones [36, 37]. However, Za-
varzin et al. think that lowland bogs with high mineral-
ization degrees and intense biological turnover make a
minor contribution to the methane balance and, in con-
CONTEMPORARY PROBLEMS OF ECOLOGY Vol. 1 No. 1 2008
GREENHOUSE GAS EMISSION IN WEST SIBERIA 139
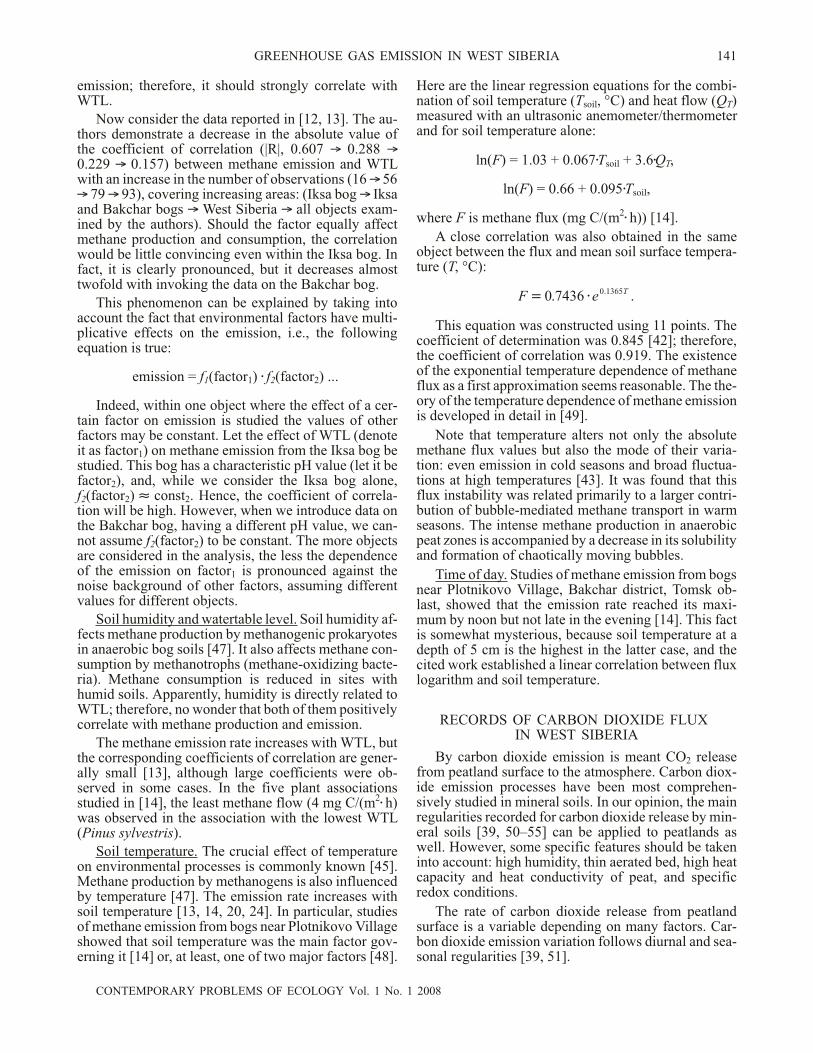
Table 5. Airborne measurement of methane flux
Ecosystem Accumulated CH
4
, mg/m
2
Accumulation time, h CH
4
flux, mg/(m
2
�h)
Unforested bogs 38 12.5 3.1
Forested bogs 26 11.5 2.3
Table 6. Microrelief dependence of methane emission (mg C/(m
2
· h)) near Noyabr’sk [27]
Month Microrelief
Test grounds
Mean
P1 P2 P3 P4
August Hummock 0.49 0.39 0.20 0.93 0.59
Water hollow 1.01 0.54 0.97 0.87 0.85
September Hummock 0.41 0.02 0.01 0.65 0.27
Water hollow 0.67 0.72 0.17 0.42 0.49
Mean 0.65 0.42 0.34 0.78 0.57

trast, upland bogs with low matter conversion rates are
a more significant methane source [38].
Methane is produced as a result of anaerobic degra-
dation of organic matter. Its content in a peat deposit in-
creases with depth, which is related to living conditions
of methane-producing bacteria. Also, it is known that
30 to 80% of the produced methane is oxidized to car-
bon dioxide on its way to the surface [39]. As bogs are
assigned to major methane sources on the Earth, deter-
mination of the profile of methane content in sections of
peat deposits is of great importance for evaluation of
the carbon balance and prediction of its emission
(Table 7).
We believe that the knowledge of methane content
in a peat deposit and conditions of methane production
would allow prediction of methane emission from bog
surface and understanding of the correlation between
the volumes of carbon dioxide and methane release.
Mechanisms of Methane Emission
Three mechanisms are known to form the total
methane emission: diffusion, plant-mediated transfer,
and bubble-mediated transfer. Data obtained in June-
August, 1995 and 1996 within the above-described test
ground are presented in [40]. This test ground is an
open heavily moistened area of a bog with small tus-
socks and water holes [19]. Later it was designated as
test ground E. It was shown that the diffusion methane
flux from soil did not exceed 1% of the total emission in
all plant associations listed in Table 2 except for “Hum-
mock ridge”. Bubble-mediated flux constituted less
than 30% of the total emission. As shown by the Mos-
cow team headed by M.V. Glagolev, the flux reaches up
to 0.11 mg C/(h�g dry plant weight) depending on plant
species. Plant-mediated flux also varied with season. It
increased from 40 to 60% by the end of summer and
then decreased virtually to zero late in October. Thus,
the value successfully supplements the diffusion and
bubble-mediated flow values determined in 1996–97.
With allowance for measurement error, all these values
add up to 100%. The cited series of papers takes into
account all mechanisms of methane transport from soil
[41, 42].
The distribution of methane production rate with
depth was also studied by Russian scientists. It was
found that the production rate reached its maximum at
depths close to 20 cm [42].
The relationship between methane emission, pro-
duction, and consumption was elucidated in [43]. The
data were obtained in eight chambers installed in a
200 m catena crossing a series of plant associations. It
was found that methane was produced at all sites of the
bog at approximately equal rates: 9 to 13 mg C/(m
2
�h),
whereas methane consumption changed dramatically at
the interface between the anaerobic and aerobic zones.
It increased with plant material density: probably,
owing to better aeration of the root layer.
In 1999, the amount of methane oxidized within the
bog thickness was determined by the stable-isotope
method. Methane oxidation rate was measured at
depths of 0, 20, and 60 cm below sedge or 50 cm below
water shamrock, equisetum, or cotton grass. Depending
of vegetation type, 30 to 80% of the produced methane
was oxidized [41, 42, 44]. By the time considered, few
measurements of this sort had been done by this
method, and none of them in the Bakchar bog [42].
Effect of Environmental Factors on Methane Emission
The multiplicative effect of factors. Basically, the
number of possible environmental factors has no limit.
However, they differ in the degree of action, and some
factors are considered to be more significant in ecosys-
tems of different types [45]. The results cannot be rea-
sonably extended to the key area or the whole region
without clear understanding of the landscape and struc-
ture of peat deposits in the bogs [46]. Multiple measure-
ments are required to obtain reliable information,
overcome fluctuations, and recognize the systematic
correlation between methane flux and environmental
factors [14].
The dependence of methane emission on air and soil
temperature, WTL, pH, Eh, atmospheric pressure, and
plant matter reserves was studied in [13]. For different
ecosystems, 177 flux measurements were done in the
same seasons (second half of July) over three years,
1991–93. It was found that one-parameter dependences
were of low predictive value. To explain this fact, it was
suggested that some factors had similar degrees of ef-
fect on methane production and consumption [12, 13].
Nevertheless, many studies demonstrate clear ef-
fects of some factors on methane emission, including
the cited paper [13] itself, contradicting the mentioned
suggestion. For example, WTL elevation expands the
anaerobic zone in the soil profile and thereby increases
methane production. On the other hand, water elevation
reduces the aerobic zone and thereby reduces the rate of
methane oxidation. Both processes increase methane
CONTEMPORARY PROBLEMS OF ECOLOGY Vol. 1 No. 1 2008
140 GLAGOLEV et al.
Table 7. Methane concentrations over the profile of the peat
deposit in the Bakchar bog (West Siberia)
Depth, cm CH
4
concentration, �M Reference
0–10 0.1–100 [23]
10–20 10–450
20–30 10–650
0–100 0–0.4 [40]
100–200 0.4–0.7
0–15 0.3 [20]
20–120 0.3–0.7
120–160
0.3–0.8
emission; therefore, it should strongly correlate with
WTL.
Now consider the data reported in [12, 13]. The au-
thors demonstrate a decrease in the absolute value of
the coefficient of correlation (|R|, 0.607 � 0.288 �
0.229 � 0.157) between methane emission and WTL
with an increase in the number of observations (16 �56
� 79 � 93), covering increasing areas: (Iksa bog � Iksa
and Bakchar bogs � West Siberia � all objects exam-
ined by the authors). Should the factor equally affect
methane production and consumption, the correlation
would be little convincing even within the Iksa bog. In
fact, it is clearly pronounced, but it decreases almost
twofold with invoking the data on the Bakchar bog.
This phenomenon can be explained by taking into
account the fact that environmental factors have multi-
plicative effects on the emission, i.e., the following
equation is true:
emission = f1(factor
1
)�f2(factor
2
) ...
Indeed, within one object where the effect of a cer-
tain factor on emission is studied the values of other
factors may be constant. Let the effect of WTL (denote
it as factor
1
) on methane emission from the Iksa bog be
studied. This bog has a characteristic pH value (let it be
factor
2
), and, while we consider the Iksa bog alone,
f2(factor
2
) � const
2
. Hence, the coefficient of correla-
tion will be high. However, when we introduce data on
the Bakchar bog, having a different pH value, we can-
not assume f2(factor
2
) to be constant. The more objects
are considered in the analysis, the less the dependence
of the emission on factor
1
is pronounced against the
noise background of other factors, assuming different
values for different objects.
Soil humidity and watertable level. Soil humidity af-
fects methane production by methanogenic prokaryotes
in anaerobic bog soils [47]. It also affects methane con-
sumption by methanotrophs (methane-oxidizing bacte-
ria). Methane consumption is reduced in sites with
humid soils. Apparently, humidity is directly related to
WTL; therefore, no wonder that both of them positively
correlate with methane production and emission.
The methane emission rate increases with WTL, but
the corresponding coefficients of correlation are gener-
ally small [13], although large coefficients were ob-
served in some cases. In the five plant associations
studied in [14], the least methane flow (4 mg C/(m
2
�h)
was observed in the association with the lowest WTL
(Pinus sylvestris).
Soil temperature. The crucial effect of temperature
on environmental processes is commonly known [45].
Methane production by methanogens is also influenced
by temperature [47]. The emission rate increases with
soil temperature [13, 14, 20, 24]. In particular, studies
of methane emission from bogs near Plotnikovo Village
showed that soil temperature was the main factor gov-
erning it [14] or, at least, one of two major factors [48].
Here are the linear regression equations for the combi-
nation of soil temperature (Tsoil
, °C) and heat flow (QT)
measured with an ultrasonic anemometer/thermometer
and for soil temperature alone:
ln(F) = 1.03 + 0.067�Tsoil
+ 3.6�QT,
ln(F) = 0.66 + 0.095�Tsoil
,
where F is methane flux (mg C/(m
2
�h)) [14].
A close correlation was also obtained in the same
object between the flux and mean soil surface tempera-
ture (T, °C):
F eT
�0 7436
0 1365
.
.
.
This equation was constructed using 11 points. The
coefficient of determination was 0.845 [42]; therefore,
the coefficient of correlation was 0.919. The existence
of the exponential temperature dependence of methane
flux as a first approximation seems reasonable. The the-
ory of the temperature dependence of methane emission
is developed in detail in [49].
Note that temperature alters not only the absolute
methane flux values but also the mode of their varia-
tion: even emission in cold seasons and broad fluctua-
tions at high temperatures [43]. It was found that this
flux instability was related primarily to a larger contri-
bution of bubble-mediated methane transport in warm
seasons. The intense methane production in anaerobic
peat zones is accompanied by a decrease in its solubility
and formation of chaotically moving bubbles.
Time of day. Studies of methane emission from bogs
near Plotnikovo Village, Bakchar district, Tomsk ob-
last, showed that the emission rate reached its maxi-
mum by noon but not late in the evening [14]. This fact
is somewhat mysterious, because soil temperature at a
depth of 5 cm is the highest in the latter case, and the
cited work established a linear correlation between flux
logarithm and soil temperature.
RECORDS OF CARBON DIOXIDE FLUX
IN WEST SIBERIA
By carbon dioxide emission is meant CO
2
release
from peatland surface to the atmosphere. Carbon diox-
ide emission processes have been most comprehen-
sively studied in mineral soils. In our opinion, the main
regularities recorded for carbon dioxide release by min-
eral soils [39, 50–55] can be applied to peatlands as
well. However, some specific features should be taken
into account: high humidity, thin aerated bed, high heat
capacity and heat conductivity of peat, and specific
redox conditions.
The rate of carbon dioxide release from peatland
surface is a variable depending on many factors. Car-
bon dioxide emission variation follows diurnal and sea-
sonal regularities [39, 51].
CONTEMPORARY PROBLEMS OF ECOLOGY Vol. 1 No. 1 2008
GREENHOUSE GAS EMISSION IN WEST SIBERIA 141
The CO
2
emission from peatland surface depends on
hydrothermal parameters: peat deposit temperature, air
temperature, soil humidity, and bog water level (BWL).
It has been shown that the emission correlated posi-
tively and most closely with peat deposit temperature.
Carbon dioxide emission also depends strongly on
BWL, and weaker positive correlations were observed
with air temperature and peat humidity [51]. Kurets et
al. [56] studied open areas of an oligotrophic bog and
found that the main factor defining carbon dioxide
emission was peat temperature, followed by BWL,
moss humidity, and air temperature.
The study performed in the Bakchar bog (Polynya-
nka Village), a native oligotrophic area, showed a gen-
eral decrease in the rate of carbon dioxide release from
high mossland (phytocenosis with pine, shrubs, and
bog moss) to open sedge-sphagnous marsh in the center
of the bog area. The mean rates of carbon dioxide re-
lease over four years (mg/(m
2
�h) were: 133 in the high
mossland, 77 in the low mossland, and 59 in the open
marsh [57–59].
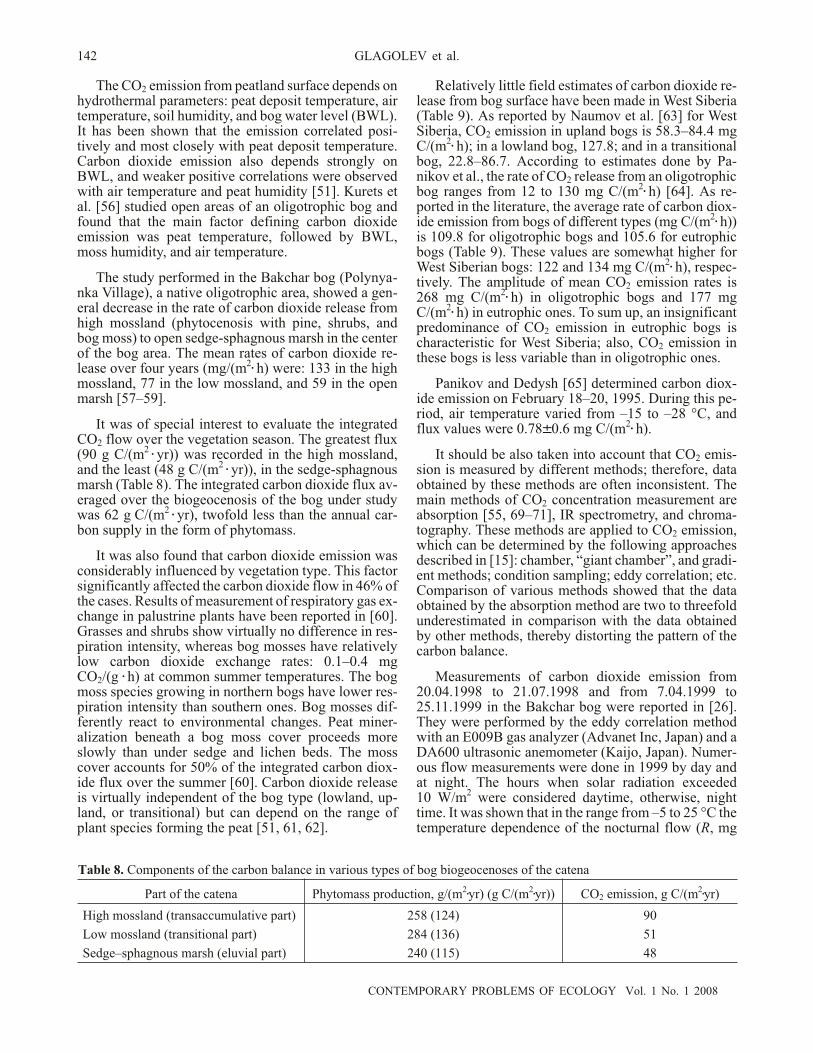
It was of special interest to evaluate the integrated
CO
2
flow over the vegetation season. The greatest flux
(90 g C/(m
2
�yr)) was recorded in the high mossland,
and the least (48 g C/(m
2
�yr)), in the sedge-sphagnous
marsh (Table 8). The integrated carbon dioxide flux av-
eraged over the biogeocenosis of the bog under study
was 62 g C/(m
2
�yr), twofold less than the annual car-
bon supply in the form of phytomass.
It was also found that carbon dioxide emission was
considerably influenced by vegetation type. This factor
significantly affected the carbon dioxide flow in 46% of
the cases. Results of measurement of respiratory gas ex-
change in palustrine plants have been reported in [60].
Grasses and shrubs show virtually no difference in res-
piration intensity, whereas bog mosses have relatively
low carbon dioxide exchange rates: 0.1–0.4 mg
CO
2
/(g�h) at common summer temperatures. The bog
moss species growing in northern bogs have lower res-
piration intensity than southern ones. Bog mosses dif-
ferently react to environmental changes. Peat miner-
alization beneath a bog moss cover proceeds more
slowly than under sedge and lichen beds. The moss
cover accounts for 50% of the integrated carbon diox-
ide flux over the summer [60]. Carbon dioxide release
is virtually independent of the bog type (lowland, up-
land, or transitional) but can depend on the range of
plant species forming the peat [51, 61, 62].
Relatively little field estimates of carbon dioxide re-
lease from bog surface have been made in West Siberia
(Table 9). As reported by Naumov et al. [63] for West
Siberia, CO
2
emission in upland bogs is 58.3–84.4 mg
C/(m
2
�h); in a lowland bog, 127.8; and in a transitional
bog, 22.8–86.7. According to estimates done by Pa-
nikov et al., the rate of CO
2
release from an oligotrophic
bog ranges from 12 to 130 mg C/(m
2
�h) [64]. As re-
ported in the literature, the average rate of carbon diox-
ide emission from bogs of different types (mg C/(m
2
�h))
is 109.8 for oligotrophic bogs and 105.6 for eutrophic
bogs (Table 9). These values are somewhat higher for
West Siberian bogs: 122 and 134 mg C/(m
2
�h), respec-
tively. The amplitude of mean CO
2
emission rates is
268 mg C/(m
2
�h) in oligotrophic bogs and 177 mg
C/(m
2
�h) in eutrophic ones. To sum up, an insignificant
predominance of CO
2
emission in eutrophic bogs is
characteristic for West Siberia; also, CO
2
emission in
these bogs is less variable than in oligotrophic ones.
Panikov and Dedysh [65] determined carbon diox-
ide emission on February 18–20, 1995. During this pe-
riod, air temperature varied from –15 to –28 °C, and
flux values were 0.78�0.6 mg C/(m
2
�h).
It should be also taken into account that CO
2
emis-
sion is measured by different methods; therefore, data
obtained by these methods are often inconsistent. The
main methods of CO
2
concentration measurement are
absorption [55, 69–71], IR spectrometry, and chroma-
tography. These methods are applied to CO
2
emission,
which can be determined by the following approaches
described in [15]: chamber, “giant chamber”, and gradi-
ent methods; condition sampling; eddy correlation; etc.
Comparison of various methods showed that the data
obtained by the absorption method are two to threefold
underestimated in comparison with the data obtained
by other methods, thereby distorting the pattern of the
carbon balance.
Measurements of carbon dioxide emission from
20.04.1998 to 21.07.1998 and from 7.04.1999 to
25.11.1999 in the Bakchar bog were reported in [26].
They were performed by the eddy correlation method
with an E009B gas analyzer (Advanet Inc, Japan) and a
DA600 ultrasonic anemometer (Kaijo, Japan). Numer-
ous flow measurements were done in 1999 by day and
at night. The hours when solar radiation exceeded
10 W/m
2
were considered daytime, otherwise, night
time. It was shown that in the range from –5 to 25 °C the
temperature dependence of the nocturnal flow (R, mg
CONTEMPORARY PROBLEMS OF ECOLOGY Vol. 1 No. 1 2008
142 GLAGOLEV et al.
Table 8. Components of the carbon balance in various types of bog biogeocenoses of the catena
Part of the catena Phytomass production, g/(m
2
�yr) (g C/(m
2
�yr)) CO
2
emission, g C/(m
2
�yr)
High mossland (transaccumulative part) 258 (124) 90
Low mossland (transitional part) 284 (136) 51
Sedge–sphagnous marsh (eluvial part) 240 (115) 48

CO
2
/(m
2
�s), summarizing the respiration of plants and
soil, obeyed the following equation:
R T � �0 0202 0 0836. ( . )exp
air
,
where Tair is air temperature, °C. The highest R values
(15 g CO
2
/(m
2
�day) were equal to gross primary produc-
tion (GPP). Seasonal variation of diurnal flows was
clearly pronounced, unlike that of nocturnal ones. Also,
GPP broadly varied from season to season. Seasonal net
ecosystem production (NEP) variation was observed
from the middle of June to the middle of July. The val-
ues of this index were less than –7 g CO
2
/(m
2
�day).
Generally, negative NEP values were observed from
early June to the beginning of September. This indi-
cates that the bog served as a carbon sink in this time in-
terval. In other seasons, NEP values were within
0–5 g CO
2
/(m
2
�day).
A flat-hummocked bog with sphagnous water holes
was studied in the northern taiga of West Siberia (cen-
tral areas of the Sibirskie Uvaly) [72]. The microrelief
of the hummocks included two components: tussocks
and space between them. The values of net primary pro-
duction are shown in Table 10. In [72], the results are
compared with those obtained by N.P. Kosykh in the
same region, where the production on hummocks was
560 g/(m
2
�yr), and in water holes, 354 g/(m
2
�yr). Data on
the same locality are also reported in [73].
Generally, the productivity of swampy forests and,
particularly, more waterlogged unforested bogs in the
humid zone is notably less than in natural drained for-
ests. In the taiga zone, bog productivity varies within
400–1000 g/(m
2
�yr), whereas forests produce approxi-
mately half as much again [34].
It is worth noting that the annual production of
oligotrophic bogs is less than that of mesotrophic and,
especially, eutrophic ones independent of their geo-
graphic location (Table 11).
As reported in the literature, net primary produc-
tion is determined by the geographic zone, climate,
bog type, and vegetation composition. Therefore, it is
broadly variable: from 210 to 3400 g/(m
2
�yr).
Death of plants produces mortmass (dead organic
matter). Part of it is degraded to yield carbon dioxide,
and the remainder produces humus with simultaneous
mineralization.
The bulk of the carbon bound in the organic matter
of plants is released by heterotrophic microorganisms
under anoxic conditions to generate the main CO
2
flow
from bog surface. In eutrophic bogs, leaf fall is mineral-
ized by no more than 60%, and in oligotrophic ones,
only by 20–30%.
Estimates of the contribution of bog ecosystems to
the global carbon circulation made on the base of the
available data on greenhouse gas flows are often insuf-
ficiently reliable. Thus, the carbon balance of bogs
presents a topical problem. In spite of the increasing
number of works dedicated to greenhouse gas emission
from bogs of West Siberia and whole Russia, this prob-
lem is still little understood. This is particularly true for
West Siberia, where bogs occupy about 50% of the
area.
Therefore, we think that stationary studies of green-
house gas flows should be conducted and other carbon
flow components should be evaluated: biologic produc-
CONTEMPORARY PROBLEMS OF ECOLOGY Vol. 1 No. 1 2008
GREENHOUSE GAS EMISSION IN WEST SIBERIA 143
Table 9. Release of carbon dioxide from bogs
Bog type
CO
2
emission, mg
C/(m
2
�h)
Reference
Northern taiga
Oligotrophic 66–225 [66]
Mesoligotrophic 44.5–128.5
West Siberia
Oligotrophic 14.4–283.0 [64]
Mesotrophic 30.4–118.1
Eutrophic 47.8–225.1
Southern Vasyugan region
Oligotrophic 58.3–84.4 [63]
Mesotrophic 86.7
Eutrophic 127.8
West Siberia
Oligotrophic 75.8–216.2 [67]
West Siberia
Mesotrophic 45.6–66.6 [68]
Table 10. Net primary production, g/(m
2
�yr)
Production
Hummock
Water hole
Tussock
Space between
tussocks
Average over the area
Aerial 102�32 29�21 47 18�2
Moss 308�70 — 77 159�121
Underground 1362�481 218�47 504 489�90
Total 1772 247 628 667

tion, carbon removal with bog waters, carbon content in
the peat deposit, and modern rate of peat accumulation.
Moreover, the effect of external factors on particular
components of the carbon balance and the whole car-
bon balance, as well as the industrial influence on bog
ecosystems should be studied in more detail. The regu-
larities established in these studies would allow predic-
tion of the carbon balance under altered environmental
conditions in particular bogs. Also, the possibility of
extending these regulations to the whole territory of
Russia should be analyzed.
In our opinion, comprehensive analysis of green-
house gas emission demands construction of a general-
ized database that would store all currently available
information on CH
4
and CO
2
flows, including details
concerning measurement methods, sites, conditions,
literature references, etc. As fluxes of greenhouse
gases, particularly, methane, are very heterogeneous,
depending on a large set of ambient conditions, the con-
struction of this database would allow estimation of the
actual contribution of bog ecosystems to the carbon bal-
ance of the biosphere. Moreover, analysis of current
knowledge of methane and carbon dioxide emission
and its dependence on climatic, geographic, biotype,
and other factors would predict the change of the
emission after climatic changes, bog drainage, or
permafrost thawing.
Authors are grateful to T.A. Pankratov, worker of
the Institute of Microbiology, Russian Academy of Sci-
ences, for reading the manuscript and making valuable
remarks.
REFERENCES
1. H. Rodhe, Science 248, 1217 (1990).
2. N. M. Bazhin, Sorosovskii Obrazovatel’nyi Zh. 6 (3), 52
(2000).
3. G. A. Zavarzin, Priroda, No. 6, 3 (1995).
4. L. I. Inisheva and E. A. Golovatskaya, Ekologiya, No. 4,
242 (2002).
5. E. Matthews and I. Fung, Global Biogeochem. Cycles 1,
61 (1987).
6. I. Aselmann and P. J. Crutzen, J. Atmospheric Chemistry
8, 307 (1989).
7. E. Matthews, I. Fung, and J. Lerner, Global Biogeochem.
Cycles 5, 3 (1991).
8. K. B. Bardett and R. C. Harriss, Chemosphere 26, 261
(1993).
9. N. G. Andronova and I. L. Karol, Chemosphere 26
(1–4), 111 (1993).
10. A. B. Rozanov, Methane Emission from Forest and Agri-
cultural Land in Russia, WP-95-31 (Int. Inst. Applied
Systems Analysis, Laxenburg, Austria, 1995).
11. V. V. Zelenev, Assessment of the Average Annual Meth-
ane Flux from the Soils of Russia, WP-96-51 (Int. Inst.
Applied Systems Analysis, Laxenburg, Austria, 1996).
12. N. S. Panikov, in Proceedings of the ISGCAGG (Sendai,
1994), pp. 100–112.
13. G. Inoue, S. Maksyutov, and N. Panikov, in Proceedings
of the Third SJSPSJR, Sapporo, 1994 (iWORD, 1995),
pp. 37–43.
14. S. Maksyutov, A. Dorofeev, G. Makhov, et al., in Pro-
ceedings of the Fourth SJSPSJR, Sapporo, 1995 (Koh-
soku Printing Center, 1999), pp. 125–131.
15. M. V. Glagolev and N. A. Shnyrev, in Proceedings of the
Sixth Siberian Conference on Climate-Environmental
Monitoring, Tomsk, 2005 (Tomsk, 2005), pp. 434–438.
16. Y. Tohjima, S. Maksyutov, T. Machida, and G. Inoue, in
Proceedings of the Third SJSPSJR, Sapporo, 1994
(iWORD, 1995), pp. 50–57.
17. A. V. Smagin and M. V. Glagolev, in Bogs and the Bio-
sphere. Proceedings of the Third Scientific School, Sep-
tember 13–16, 2004, Tomsk (Tomsk. Tsentr Nauch.-
Tekhn. Inf., Tomsk, 2004), pp. 53–63 [in Russian].
18. M. Tamura and Y. Yasuoka, in Proceedings of the Fourth
SJSPSJR, Sapporo, 1995 (Kohsoku Printing Center,
1999), pp. 133–138.
19. M. Sorokin, S. Maksyutov, and G. Inoue, in Proceedings
of the Seventh SJSPSJR, Tsukuba, 1998 (Isebu, 1999),
pp. 90–98.
20. G. Inoue, Y. Takahashi, S. Maksyutov, et al., in Proceed-
ings of the Fifth SJSPSJR, Tsukuba, 1996 (Isebu, 1997),
pp. 34–39.
21. M. Sorokin, S. Maksyutov, G. Inoue, and T. Nakano, in
Proceedings of the Sixth SJSPSJR, Tsukuba, 1997
(Isebu, 1998), pp. 207–210.
22. M. V. Glagolev, in Global Environment Research Fund:
Eco-Frontier Fellowship (EFF), Tokyo, 1997 (Environ-
ment Agency, Global Environment Department Re-
search & Information Office, 1998), pp. 79–111.
23. M. Utsumi, H. Uchiyama, N. S. Panikov, and G. Inoue,
in Proceedings of the Sixth SJSPSJR, Tsukuba, 1997
(Isebu, 1998), pp. 196–200.
24. S. Maksyutov, G. Inoue, M. Sorokin, et al., in Proceed-
ings of the Seventh SJSPSJR, Tsukuba, 1998 (Isebu,
1999), pp. 115–124.
25. K. Shimoyama, G. Inoue, and T. Nakano, in Proceedings
of the Seventh SJSPSJR, Tsukuba, 1998 (Isebu, 1999),
pp. 168–174.
26. K. Shimoyama, G. Inoue, Y. Fukushima, and T. Hiyama,
in Proceedings of the Eighth SJSPSJR, Tsukuba, 1999
(Isebu, 2000), pp. 171–175.
27. S. V. Vasiliev and A. V. Naumov, in FGUU Scientific Re-
ports 2001-1 “Carbon Storage and Atmospheric Ex-
change by West Siberian Peatlands,” Ed. by W. Bleuten
and E. D. Lapshina (Utrecht University Physical Geog-
raphy, Utrecht, 1955), pp. 79–87.
28. T. Nakano, T. Sawamoto, T. Morishita, et al., Soil Biol.
Biochem. 36, 107 (2004).
CONTEMPORARY PROBLEMS OF ECOLOGY Vol. 1 No. 1 2008
144 GLAGOLEV et al.
Table 11. Net primary production of bogs according to
[74–84]
Bog type Net primary production, g/(m
2
�yr)
Oligotrophic 210–600
Mesotrophic 330–1000
Eutrophic 720–3400
29. A. Postnov, E. Stulov, M. Strunin, et al., in Proceedings
of the ISGCAGG (Sendai, 1994), pp. 30–33.
30. Y. Tohjima, H. Wakita, T. Machida, et al., in Proceedings
of the Second ISGCAGG, Tsukuba, 1993 (Isebu, 1994),
pp. 61–76.
31. M. A. Strunin and S. M. Shmeter, in Proceedings of the
ISGCAGG (Sendai, 1994), pp. 26–29.
32. B. Eilrich, Formation and Transport of CH4 and CO2 in
Deep Peatland (Switzerland, 2002).
33. A. Brown, S. P. Mathur, and D. Y. Kushener, Global
Biogeochem. Cycles 3 (3), 205 (1989).
34. S. E. Vomperskii, in Biogenocenotic Features of Bogs
and Their Exploitation (Nauka, Moscow, 1994), pp. 5–37
[in Russian].
35. N. M. Bazhin, Khimiya v Interesakh Ustoichivogo Raz-
vitiya 1, 331 (1993).
36. T. Moore, N. Roulet, and R. Knowles, Global Biochem.
Cycles 4, 29 (1990).
37. B. N. Svensson and T. Rosswall, Oikos 43, 389 (1984).
38. G. A. Zavarzin and L. V. Vasil’ev, in Carbon Cycle in the
Territory of Russia (Moscow, 1999), pp. 202–233 [in
Russian].
39. A. V. Smagin, The Gaseous Phase of Soils (Mosk. Gos.
Univ., Moscow, 1999) [in Russian].
40. M. V. Glagolev, S. E. Belova, A. V. Smagin, et al., in Pro-
ceedings of the Seventh SJSPSJR, Tsukuba, 1998 (Isebu,
1999), pp. 132–142.
41. M. V. Glagolev, H. Uchiyama, V. Lebedev, et al., in Pro-
ceedings of the Eighth SJSPSJR, Tsukuba, 1999 (Isebu,
2000), pp. 143–149.
42. M. V. Glagolev and T. D. Egnatashvili, in Combined
“Vacation” Program. Collection of Material on the Ex-
perience of the Moscow Municipal Center for Junior Art,
issue 2, Summer-2001 (Moscow Municipal Center for
Junior Art, Moscow, 2004), p. 88.
43. N. S. Panikov, in Selected Lectures of All-Russia Schools
I–VII (ONTI, Pushchino Research Center, Russian Aca-
demy of Sciences, Pushchino, 1998), Vol. 1, pp. 171–184.
44. M. Glagolev, V. Lebedev, O. Glagoleva, et al., Quebec
2000: Millenium Wetland Event. Program with Abstracts
of VI International Wetland Symposium (Quebec, 2000).
45. V. D. Fedorov and T. G. Gil’manov, Ecology (Mosk.
Gos. Univ., Moscow, 1980) [in Russian].
46. E. D. Lapshina, N. N. Pologova, E. Ya. Mouldyarov,
et al., in Proceedings of the Eighth SJSPSJR, Tsukuba,
1999 (Isebu, 2000), pp. 211–128.
47. T. Nakayama, in Proceedings of the Third SJSPSJR, Sap-
poro, 1994 (iWORD, 1995), pp. 31–36.
48. T. Nakano, G. Inoue, S. Maksyutov, and M. Sorokin, in
Proceedings of the Seventh SJSPSJR, Tsukuba, 1998
(Isebu, 1999), pp. 211–215.
49. M. V. Glagolev, in Bogs and the Biosphere. Proceedings
of the Third Scientific School, September 13–16, 2004,
Tomsk (Tomsk. Tsentr Nauch.-Tekhn. Inf., Tomsk, 2004),
pp. 39–52 [in Russian].
50. K. I. Kobak, Biological Components of the Carbon Cy-
cle (Gidrometeoizdat, Leningrad, 1988).
51. V. N. Kudeyarov, in Carbon Cycle in the Territory of
Russia (Moscow, 1999), pp. 165–202 [in Russian].
52. L. A. Ivannikova and N. A. Semenova, Pochvovedenie
No. 1, 134 (1988).
53. M. M. Landina, Soil Air (Nauka, Siberian Branch, Novo-
sibirsk, 1992) [in Russian].
54. B. N. Makarov, Agrokhimiya, No. 3, 94 (1993).
55. I. N. Sharkov, Pochvovedenie, No. 7, 136 (1984).
56. V. K. Kurets, E. N. Ikkonen, Yu. Alm, et al., Ekologiya,
No. 1, 14 (1988).
57. E. A. Golovatskaya, T. V. Dement’eva, et al., in Proceed-
ings of the International Field Symposium, 2001,
pp. 82–84.
58. E. A. Golovatskaya and E. V. Belova, in Proceedings of
the Fourth Siberian Conference on Climate–Environ-
mental Monitoring (Tomsk. Tsentr Nauch.-Tekhn. Inf.,
Tomsk, 2001), pp. 60–61.
59. L. I. Inisheva and E. A. Golovatskaya, in Great Vasyugan
Bog. Modern State and Development (Inst. Optiki Atmo-
sfery, Tomsk, 2002), pp. 123–133 [in Russian].
60. A. V. Naumov, Soil Respiration: Components, Environ-
mental Functions, and Geographical Regularities, Doc-
toral Dissertation in Biology (Tomsk, 2004) [in Rus-
sian].
61. T. V. Glukhova, A. G. Kovalev, M. V. Smagina, et al., in
Bogs and Swamped Forests in the Context of Stable Ex-
ploitation (GEOS, Moscow, 1999), pp. 218–219 [in Rus-
sian].
62. L. I. Inisheva and T. V. Dement’eva, Pochvovedenie,
No. 2, 196 (2000).
63. A. V. Naumov, T. T. Efremova, et al., Sibirskii Ekolo-
gicheskii Zh., No. 3, 269 (1994).
64. N. S. Panikov, A. A. Titlyanova, et al., Dokl. Akad. Nauk
330 (3), 388 (1993).
65. N. S. Panikov and S. N. Dedysh, Global Biogeochem.
Cycles 14, 1071 (2000).
66. A. V. Naumov, in West Siberian Peatland and Carbon
Cycle: Past and Present (Novosibirsk, 2001), pp. 110–112
[in Russian].
67. L. I. Inisheva, T. V. Dement’eva, E. V. Belova, and
N. G. Inishev, in Bogs and Swamped Forests in the Con-
text of Stable Exploitation (GEOS, Moscow, 1999),
pp. 188–191 [in Russian].
68. A. V. Naumov, T. T. Efremova, and S. P. Efremov, in
Bogs and Swamped Forests in the Context of Stable Ex-
ploitation (GEOS, Moscow, 1999), pp. 218–219 [in Rus-
sian].
69. V. I. Shtatnov, Dokl. Vseross. Akad. Sel’skokhoz. Nauk,
No. 6, 27 (1952).
70. B. N. Makarov, in Methods of Stationary Soil Study (Na-
uka, Moscow, 1977), pp. 55–87 [in Russian].
71. L. A. Ivannikova, Pochvovedenie, No. 4, 101 (1992).
72. N. G. Koronatova, in Bogs and the Biosphere. Proceed-
ings of the Fourth Scientific School (Tomsk. Tsentr Na-
uch.-Tekhn. Inf., Tomsk, 2005), pp. 225–228 [in Rus-
sian].
73. N. P. Kosykh and N. P. Mironycheva-Tokareva, in Bogs
and the Biosphere. Proceedings of the Fourth Scientific
School (Tomsk. Tsentr Nauch.-Tekhn. Inf., Tomsk, 2005),
pp. 228–232 [in Russian].
74. N. I. Bazilevich, in Biological Productivity of North Eur-
asian Ecosystems (Nauka, Moscow, 1993) [in Russian].
CONTEMPORARY PROBLEMS OF ECOLOGY Vol. 1 No. 1 2008
GREENHOUSE GAS EMISSION IN WEST SIBERIA 145

75. N. I. Bazilevich, Rastitel’nye Resursy 3(4), 567 (1967).
76. N. I. P’yavchenko, Lesovedenie 3, 23 (1967).
77. N. I. P’yavchenko, Peatlands: Natural and Industrial
Significance (Nauka, Moscow, 1985) [in Russian].
78. A. A. Khramov and V. I. Valutskii, in Forest and Bog
Phytocenoses of the Eastern Vasyugan Region (Nauka,
Siberian Branch, Novosibirsk, 1977) [in Russian].
79. A. A. Khramov and V. I. Valutskii, in Readings in Memo-
riam Yu. A. L’vov (1995), pp. 59–63 [in Russian].
80. F. Z. Glebov and L. S. Toleiko, Botan. Zh. 60, 1336
(1975).
81. A. A. Titlyanova, Sibirskii Ekologicheskii Zh. 3, 253
(1994).
82. A. A. Titlyanova, N. P. Kosykh, and N. P. Mirony-
cheva-Tokareva, in Readings in Memoriam Yu. A. L’vov
(1995), pp. 59–63 [in Russian].
83. N. P. Mironycheva-Tokareva, in West Siberian Peatlands
and Carbon Cycle: Past and Present (Novosibirsk, 2001),
pp. 186–107 [in Russian].
84. N. P. Kosykh, in West Siberian Peatlands and Carbon
Cycle: Past and Present (Novosibirsk, 2001), pp. 94–96
[in Russian].
CONTEMPORARY PROBLEMS OF ECOLOGY Vol. 1 No. 1 2008
146 GLAGOLEV et al.