
A comparison of the life-cycle greenhouse gas emission ...
58
MARCH 2022 WHITE PAPER MORE BANG FOR THE BUCK: A COMPARISON OF THE LIFE-CYCLE GREENHOUSE GAS EMISSION BENEFITS AND INCENTIVES OF PLUG-IN HYBRID AND BATTERY ELECTRIC VEHICLES IN GERMANY Georg Bieker, Cornelius Moll, Steffen Link, Patrick Plötz, Peter Mock BEIJING | BERLIN | SAN FRANCISCO | SÃO PAULO | WASHINGTON www.theicct.org [email protected] twitter @theicct
-
Upload
khangminh22 -
Category
Documents
-
view
2 -
download
0
Transcript of A comparison of the life-cycle greenhouse gas emission ...

MARCH 2022
WHITE PAPER
MORE BANG FOR THE BUCK: A COMPARISON OF THE LIFE-CYCLE GREENHOUSE GAS EMISSION BENEFITS AND INCENTIVES OF PLUG-IN HYBRID AND BATTERY ELECTRIC VEHICLES IN GERMANYGeorg Bieker, Cornelius Moll, Steffen Link, Patrick Plötz, Peter Mock
B E I J I N G | B E R L I N | S A N F R A N C I S C O | S Ã O PA U LO | WA S H I N G TO N
www.theicct.org
twitter @theicct
AUTHOR CONTRIBUTIONSAll authors contributed to the assessment of the life-cycle greenhouse gas emissions. The assessment of financial incentives and policy recommendations, as well as their discussion, originate from the ICCT.
ACKNOWLEDGMENTSThe authors thank all internal and external reviewers of this report, with special thanks to Martin Wietschel (Fraunhofer ISI), Jan Dornoff (ICCT), Sandra Wappelhorst (ICCT), Chang Shen (ICCT), Zifei Yang (ICCT), Hussein Basma (ICCT), Carl-Friedrich Elmer (Agora Verkehrswende), Benjamin Fischer (Agora Verkehrswende), and three anonymous individuals. Their review does not imply an endorsement, and any errors are the authors’ own. In addition, the authors thank the ADAC for kindly providing data from the ADAC Ecotest.
Edited by Amy Smorodin
For additional information:ICCT – International Council on Clean Transportation EuropeFasanenstraße 85, 10623 Berlin
[email protected] | www.theicct.org | @TheICCT
© 2022 International Council on Clean Transportation
Funding for this work was generously provided by the European Climate Foundation and the Climate Imperative Foundation.

i ICCT WHITE PAPER | GHG BENEFITS AND INCENTIVES OF PHEVS AND BEVS IN GERMANY
EXECUTIVE SUMMARYThe Federal Government of Germany aims to achieve climate neutrality by 2045, which includes a full decarbonization of the passenger car fleet. The German government supports the automotive industry in achieving this goal via fiscal incentives for plug-in hybrid electric vehicles (PHEVs) and battery electric vehicles (BEVs). Although the European Union’s CO2 emission standards are already expected to result in increasing PHEV and BEV registration shares, these incentives can help to steer their uptake in the most environmentally beneficial direction. Therefore, they should reflect the greenhouse gas (GHG) emissions benefit of the supported PHEV and BEV models in a comprehensive and realistic way.
This study presents a life-cycle assessment (LCA) of the GHG emissions of PHEVs and BEVs in comparison to gasoline and diesel internal combustion engine vehicles (ICEVs). It covers the emissions during fuel and electricity production and consumption, as well as battery and vehicle manufacturing and recycling. Building on a study of the real-world usage of PHEVs in Germany, it assesses the life-cycle GHG emissions for nine PHEV models and nine BEV models across the lower medium, medium, and sport utility vehicle (SUV) segments. The study further estimates the climate impact of PHEVs and BEVs registered in 2030. In a second step, the study compares the life-cycle GHG emissions benefit of the selected PHEV and BEV models over segment average gasoline ICEVs with the national level fiscal incentives in Germany. These include the national purchase subsidy, the benefit in the vehicle ownership tax, and the benefit in the company car taxation.
The analysis arrives at the following findings:
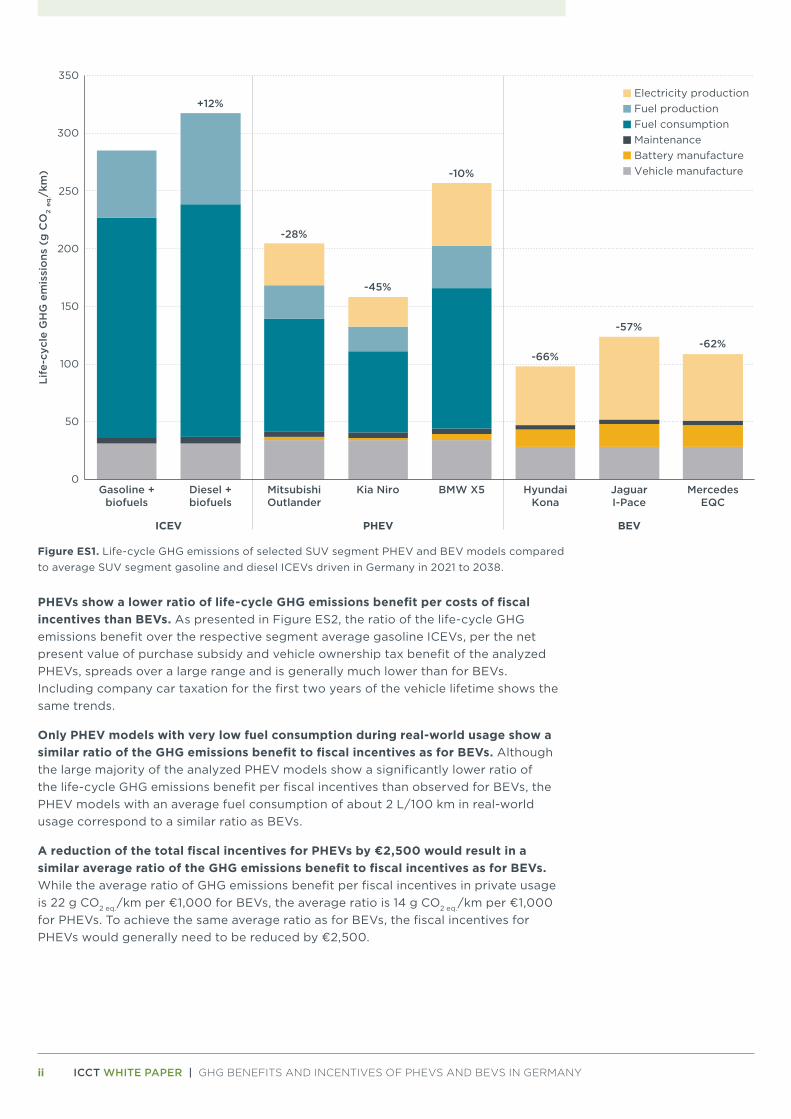
The life-cycle GHG emissions of the analyzed BEV models are, on average, 63% lower than respective segment average new gasoline ICEVs. With values ranging between 57% and 67%, the GHG emissions benefit of the BEV models is relatively similar. As presented for SUV segment vehicles in Figure ES1, they are mostly determined by the electric energy consumption. With a large variety in battery capacities, the emissions from battery manufacturing also contribute to the differences in GHG emissions between the BEV models.
For PHEVs, the life-cycle GHG emissions are, on average, 34% lower than respective segment average new gasoline ICEVs. Differing from BEVs, these values show a relatively large variation of between 10% and 52%. In addition to different electric drive shares in average real-world usage, the large differences in the life-cycle GHG emissions of the analyzed PHEV models correspond to a variety of vehicle configurations and designs. These differences result in a large range of fuel and electric energy consumption values, even when the electric drive share is observed to be similar for many models.
For vehicles registered in 2030, PHEVs correspond to 40%–63% lower emissions than for today’s segment average gasoline cars, while BEVs show a reduction of 74%–80%. The increasing GHG emissions benefit results from more renewables in the electricity mix. For future PHEVs, the higher emissions reduction also results from assuming 1.3 times higher electric drive shares than realized today.
ii ICCT WHITE PAPER | GHG BENEFITS AND INCENTIVES OF PHEVS AND BEVS IN GERMANY
0
50
100
150
200
250
300
350
Gasoline +biofuels
Diesel +biofuels
MitsubishiOutlander
Kia Niro BMW X5 HyundaiKona
JaguarI-Pace
MercedesEQC
ICEV PHEV BEV
Life
-cyc
le G
HG
em
issi
ons
(g
CO
2 eq
./km
)
Electricity productionFuel productionFuel consumptionMaintenanceBattery manufactureVehicle manufacture
+12%
-28%
-45%
-10%
-66%
-57%-62%
Figure ES1. Life-cycle GHG emissions of selected SUV segment PHEV and BEV models compared to average SUV segment gasoline and diesel ICEVs driven in Germany in 2021 to 2038.
PHEVs show a lower ratio of life-cycle GHG emissions benefit per costs of fiscal incentives than BEVs. As presented in Figure ES2, the ratio of the life-cycle GHG emissions benefit over the respective segment average gasoline ICEVs, per the net present value of purchase subsidy and vehicle ownership tax benefit of the analyzed PHEVs, spreads over a large range and is generally much lower than for BEVs. Including company car taxation for the first two years of the vehicle lifetime shows the same trends.
Only PHEV models with very low fuel consumption during real-world usage show a similar ratio of the GHG emissions benefit to fiscal incentives as for BEVs. Although the large majority of the analyzed PHEV models show a significantly lower ratio of the life-cycle GHG emissions benefit per fiscal incentives than observed for BEVs, the PHEV models with an average fuel consumption of about 2 L/100 km in real-world usage correspond to a similar ratio as BEVs.
A reduction of the total fiscal incentives for PHEVs by €2,500 would result in a similar average ratio of the GHG emissions benefit to fiscal incentives as for BEVs. While the average ratio of GHG emissions benefit per fiscal incentives in private usage is 22 g CO2 eq./km per €1,000 for BEVs, the average ratio is 14 g CO2 eq./km per €1,000 for PHEVs. To achieve the same average ratio as for BEVs, the fiscal incentives for PHEVs would generally need to be reduced by €2,500.

iii ICCT WHITE PAPER | GHG BENEFITS AND INCENTIVES OF PHEVS AND BEVS IN GERMANY
BMW 225xe
Hyundai Ioniq PHEV
Toyota Prius
Nissan Leaf
BMW 330e VW Passat Variant GTE
Kia Optima Sportswagon
Tesla Model 3long range
Tesla Model 3std. range plus
GasolineICEV
Mitsubishi Outlander
Kia Niro
BMW X5
Hyundai Kona
Jaguar I-Pace
Mercedes EQC
0
50
100
150
200
250
0 2,000 4,000 6,000 8,000 10,000
Life
-cyc
le G
HG
em
issi
ons
ben
efit
(g C
O2
eq./
km)
Net present value of fiscal incentives, private usage for 18 years (€)
Average ratio
HyundaiIoniq BEVVW e-Golf
Polestar 2
BEVs
Gasoline ICEVPHEVs
Lower medium segmentMedium segmentSUV segment
Figure ES2. Life-cycle GHG emissions benefit when compared to a segment average gasoline ICEV versus net present value of the fiscal incentives for the PHEV and BEV models in private usage in 2021 to 2038.

iv ICCT WHITE PAPER | GHG BENEFITS AND INCENTIVES OF PHEVS AND BEVS IN GERMANY
RECOMMENDATIONSBased on our findings, we recommend the following:
Reduce fiscal incentives for PHEVs. A reduction of the national purchase subsidy for PHEVs by €2,500 would, on average, result in a similar ratio of the life-cycle GHG emissions benefit to the cost of fiscal incentives as for BEVs. An increase of the company car taxation rates for PHEVs could further help to adjust this ratio for company cars. Considering that, in contrast to BEVs, PHEVs are not able to meet the long-term requirements for a climate neutral passenger car fleet, the long-term climate benefit of supporting the upscaling of their production is much lower than for BEVs. Therefore, a further reduction of the fiscal incentives for PHEVs, e.g., by fully abolishing the purchase subsidy for PHEVs, could also be considered.
Limit incentives to PHEVs with a low fuel consumption. Alternatively, the life-cycle GHG emissions benefit of PHEVs can be improved by limiting incentives to vehicles with an average fuel consumption of about 2 liters per 100 km in real-world operation:
» On a vehicle model level, fiscal incentives should focus on PHEV models with a high electric range in combination with a low fuel consumption in both charge-sustaining and charge-depleting mode. Due to the large differences in the fuel consumption of individual PHEV models for a given electric drive share, the electric range alone is not a sufficient proxy.
» On an individual user level, fiscal incentives could be tied to demonstrating a low average fuel consumption in real-world usage. All PHEV models registered in the European Union from January 2021 are equipped with on-board fuel consumption meters (OBCFM) that detect the average fuel consumption and the share of driving in charge-depleting mode with the combustion engine off. These data can be made available to users or collected during regular technical inspections.
Focus incentives for BEV on models with a low electricity consumption and prioritize BEVs with low battery production emissions. For BEVs, electricity consumption is found to be the primary factor in the life-cycle GHG emissions. Binding fiscal incentives to an electricity consumption threshold would help to further reduce their life-cycle GHG emissions. In addition, the life-cycle GHG emissions of BEVs can be reduced by prioritizing incentives for BEVs with a lower battery capacity and/or less carbon intensive battery production.
Phase out the registration of new PHEVs by around 2030. Even when assuming that the electric drive share would be 1.3 times higher than observed today, future PHEV models will still rely on the combustion of 2 to 4 liters of fossil fuel per 100 km. Therefore, PHEVs are not able to meet the GHG emission reductions required for a climate neutral passenger car fleet. With useful vehicle lifetimes of 18 years, achieving climate neutrality in the German passenger car fleet by 2045 requires a phase out of the registration of new PHEVs by around 2030.

v ICCT WHITE PAPER | GHG BENEFITS AND INCENTIVES OF PHEVS AND BEVS IN GERMANY
TABLE OF CONTENTS
Executive summary ................................................................................................................... i
List of acronyms ....................................................................................................................... vi
1. Introduction ...........................................................................................................................1
2. Data and methodology ....................................................................................................... 2
2.1. Goal and scope .................................................................................................................................2
2.2. Life-cycle GHG emissions: Vehicle cycle ................................................................................4
2.3. Life-cycle GHG emissions: Fuel cycle ...................................................................................... 7
2.4. Fiscal incentives.............................................................................................................................. 14
3. Results ................................................................................................................................. 18
3.1. Life-cycle GHG emissions ........................................................................................................... 18
3.2. Fiscal incentives..............................................................................................................................27
3.3. Comparison of life-cycle GHG emissions and fiscal incentives .................................30
3.4. Summary .......................................................................................................................................... 35
4. Discussion ...........................................................................................................................38
5. Policy recommendations................................................................................................. 40
References ...............................................................................................................................43
Appendix ................................................................................................................................. 46

vi ICCT WHITE PAPER | GHG BENEFITS AND INCENTIVES OF PHEVS AND BEVS IN GERMANY
LIST OF ACRONYMSADAC Allgemeiner Deutscher Automobil-Club
BEV Battery electric vehicle
CD Charge-depleting
CS Charge-sustaining
CH4 Methane
CO2 Carbon dioxide
CO2 eq. Carbon dioxide equivalent
FCEV Fuel cell electric vehicle
HEV Hybrid electric vehicle
HVO Hydrogenated vegetable oil
GHG Greenhouse gas
ICEV Internal combustion engine vehicle
ILUC Indirect land use change
IPCC Intergovernmental Panel on Climate Change
LCA Life-cycle assessment
N2O Nitrous oxide
NCA Lithium nickel cobalt aluminum oxide
NEDC New European Driving Cycle
NMC Lithium nickel manganese cobalt oxide
NOx Nitrogen oxide
OBFCM On-board fuel consumption meters
PHEV Plug-in hybrid electric vehicle
RED Renewable Energy Directive
SUV Sport utility vehicle
TTW Tank to wheel
VAT Value added tax
WLTP Worldwide Harmonized Light Vehicles Test Procedure
WTT Well to tank
WTW Well to wheel
ZLEV Zero- and low-emission vehicle

1 ICCT WHITE PAPER | GHG BENEFITS AND INCENTIVES OF PHEVS AND BEVS IN GERMANY
1. INTRODUCTIONThe Federal Government of Germany aims to limit the purchase incentives and company car taxation benefits for battery electric vehicles (BEVs) and plug-in hybrid electric vehicles (PHEVs) to those vehicles that correspond to a “positive climate effect” (SPD, Bündnis 90/Die Grünen, FDP, 2021). As BEVs and PHEVs can fully or partly be driven on electricity instead of fossil fuels, they indeed have the potential to reduce greenhouse gas (GHG) and air pollutant emissions from road transport, at least when compared to solely internal combustion engine vehicles (ICEVs). In theory, providing fiscal incentives to compensate for the currently higher production costs of PHEVs and BEVs can thus help to reduce the negative impact of road transport on global warming, the environment, and human health.
In practice, however, when considering the overarching system of the European Union’s CO2 standards for new passenger cars, fiscal incentives for PHEVs and BEVs in a country such as Germany do not necessarily result in GHG emission savings. In fact, more PHEV and BEV registrations in Germany allow manufacturers to sell less PHEVs and BEVs in the other Member States. Moreover, a higher share of PHEVs and BEVs can allow manufacturers to sell even more high emitting ICEVs while still maintaining compliance with the CO2 emission standards. This so-called waterbed effect fully negates the emissions benefit of the registration of more PHEVs and BEVs in Germany. It is considered likely, as none of the manufacturer pools were found to significantly over-comply with the standards in 2020 (Tietge et al., 2021). Furthermore, the real-world tailpipe CO2 emissions of PHEVs are two to three times higher than the official type-approval values (Plötz et al., 2020). A higher share of PHEV registrations thereby, on average, results in even higher real-world emissions instead of reducing them. Government incentives for the purchase of new PHEVs and BEVs can thus be considered primarily an industrial policy that supports car manufacturers in achieving the CO2 emission standards, rather than an effective measure to help reduce real-world emissions across Europe.
However, in the mid to long term, supporting the automotive industry in scaling up the production of PHEVs and BEVs can help BEVs to reach production cost parity with ICEVs sooner, and thereby accelerate the full transition to electric vehicles. To steer this transition in an environmentally beneficial direction, fiscal incentives should reflect the full life-cycle climate impact of the supported vehicles as much as possible.
This study is a life-cycle assessment (LCA) of the GHG emissions of PHEVs and BEVs in comparison to gasoline and diesel ICEVs. In addition to tailpipe emissions from the fuel consumption in the vehicles, it includes the emissions during fuel and electricity production, as well as battery and vehicle manufacturing and recycling. Differing from analyses solely based on official type-approval CO2 emission values, this study builds on data on the real-world usage of PHEVs in Germany (Plötz et al., 2020). It assesses the life-cycle GHG emissions for nine PHEV models and nine BEV models in the lower medium, medium, and sport utility vehicle (SUV) segments. To estimate the climate impact of PHEVs and BEVs registered in 2030, the study further assesses the life-cycle GHG emissions of hypothetical future model variants with higher electric ranges and higher electric drive shares.
In parallel, the study assesses national level fiscal incentives of the selected PHEV and BEV models in Germany. These include the governmental share of the national purchase subsidy (Innovationsprämie) and the difference of the vehicle ownership tax compared to segment average new gasoline cars, accumulated over a vehicle lifetime. The benefit in company car taxation over a typical company car usage period is also assessed.
As the analysis of life-cycle GHG emission benefits and fiscal incentives is performed for nine PHEV models and nine BEV models individually, it allows for the evaluation of how the costs of fiscal incentives reflect the GHG emissions benefit on an individual vehicle basis. Thereby, the analysis identifies which key characteristics of the model design and user behavior determine the life-cycle GHG emission benefits of PHEVs and BEVs and how these can be better reflected in future incentive schemes.
2 ICCT WHITE PAPER | GHG BENEFITS AND INCENTIVES OF PHEVS AND BEVS IN GERMANY
2. DATA AND METHODOLOGY
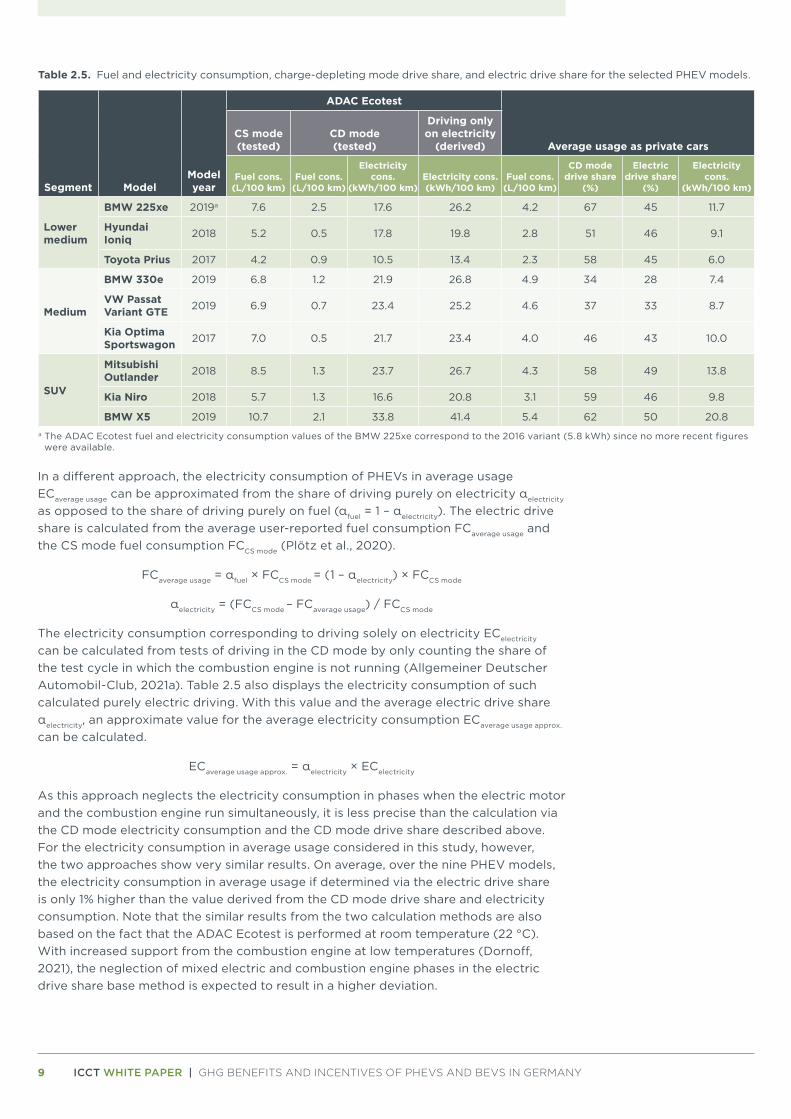
2.1. GOAL AND SCOPEThe life-cycle GHG emissions of PHEVs, BEVs, diesel ICEVs, and gasoline ICEVs in Germany are assessed for vehicles across the lower medium (compact), medium, and SUV segments. For each of these segments, the emissions of three PHEV and BEV models are compared to sales-weighted average new gasoline and diesel cars. Table 2.1 presents the selection of the PHEV and BEV models, as well as their individual and combined share of the PHEV and BEV registrations in the respective segments in Germany in 2019. The selection is based on the share of the PHEV and BEV models in new vehicle registrations (Díaz et al., 2020) and the availability of real-world fuel consumption data (see Section 2.3). As this study compares the life-cycle GHG emissions with purchase subsidies and tax benefits, only those PHEV and BEV models eligible for the national purchase subsidy and tax benefits are considered.
Depending on the powertrain type and segment, the selection of PHEV and BEV models covers 53% to 95% of the PHEV registrations and 51% to 99% of the BEV registrations in the considered segments in 2019. For an estimation of the life-cycle GHG emissions for PHEVs and BEVs potentially registered in future, the study assumes hypothetical 2030 versions of the selected models with a larger battery and a larger electric range, which is assumed to result in a higher electric drive share.
Table 2.1. Selection of PHEV and BEV models in the lower medium, medium, and SUV segments.
Powertrain type Segment Model name
Share of the models in new PHEV or BEV registrations in respective segment in Germany in 2019 (%)
individual share combined share
PHEV
Lower medium
BMW 225xe 74
95Hyundai Ioniq PHEV 14
Toyota Prius PHEV 6
Medium
BMW 330e 29
57VW Passat Variant GTE 20
Kia Optima Sportswagon 8
SUV
Mitsubishi Outlander 44
53Kia Niro 7
BMW X5 2
BEV
Lower medium
VW e-Golf 62
99Nissan Leaf 23
Hyundai Ioniq BEV 14
Medium
Tesla Model 3 long range 43
56Tesla Model 3 standard range plus 13
Polestar 2 -
SUV
Hyundai Kona 36
51Jaguar I-Pace 10
Mercedes EQC 6
Note: The different variants of the Tesla Model 3 (long range, standard range plus, and performance) were the only BEVs registered in the medium segment in 2019. For more variety, this study also considers the Polestar 2, which entered the market in 2020.
The assessment of life-cycle GHG emissions is based on the same scope and methodology of a recent assessment of the life-cycle GHG emissions of passenger cars in the European Union, the United States, China, and India by Bieker (2021). The scope covers the 100-year global warming potential (in CO2 eq.) of the GHG emissions during

3 ICCT WHITE PAPER | GHG BENEFITS AND INCENTIVES OF PHEVS AND BEVS IN GERMANY
the production, maintenance, and recycling of the vehicles (vehicle cycle), as well as the GHG emissions correlating to the fuel and electricity production and consumption (fuel cycle). For the vehicle cycle, it covers emissions from raw material extraction and processing, component manufacturing and assembly, as well as the recycling of the vehicle. For the batteries in PHEVs and BEVs, the analysis further includes emissions from the extraction and processing of the raw material, cell production, and pack assembly. The vehicle cycle also covers the use of consumable and the in-service replacement of parts of the vehicle.
In the fuel cycle, the scope considers fossil fuels with crude oil extraction (including flaring), processing and transport, as well as fuel refining and distribution, all associated methane leakage, and the final combustion of the fuels in the vehicle. For the average share of biofuels, it covers the emissions of indirect land use change of plant cultivation, the emissions of plant cultivation or waste collection itself, processing, and transport, as well as emissions from biofuel production and distribution. The life-cycle emissions of electricity cover the upstream and direct emissions of electricity generation, new power plant infrastructure for renewable energies, as well as energy losses of transmission and distribution in the grid. The carbon intensity of the consumed fuel and electricity considers the current fuel and electricity mix as well as projections of their improvement during the vehicles’ lifetime.
Fuel consumption information is taken from a real-world empirical dataset, i.e., user-reported values. To also reflect realistic driving conditions for electricity consumption (incl. charging losses), values are based on independent laboratory tests provided by the ADAC (Allgemeiner Deutscher Automobil-Club, 2021a).
The assessment generally follows an attributional approach, in which the average GHG emissions attributed to the vehicle and fuel pathways are considered. For some values, e.g., for the indirect land use change emissions of biofuel production, numbers from studies with a consequential approach are also integrated. These correspond to the changes the production of biofuels cause in the broader economy. The GHG impact of the production and use of the vehicles are combined into a single value based on the functional unit of g CO2 eq./km traveled during their lifetime. Emissions corresponding to the construction and maintenance of vehicle production and recycling infrastructure, fueling or charging infrastructure, and road infrastructure are not covered in this study. These are considered similar for the different powertrain types or of small influence on the overall life-cycle GHG emissions.
The financial incentives for PHEVs and BEVs cover the governmental share of the national German purchase subsidy of the Innovationsprämie, which enhances the former Umweltbonus as of June 2020, and reduced vehicle ownership tax. In a sensitivity analysis, the difference in fiscal income from the company car taxation over a typical company car usage period of the first two years is also assessed. For all three incentives, the assessment considers the rates that apply to a vehicle acquisition in 2021, which remain the same in 2022. Fiscal spending on public charging and fueling infrastructure, as well as the lower energy tax revenue from switching from fuel to electricity consumption, are not considered in the scope of this study.
The comparison of the life-cycle GHG emission benefits of the individual PHEV and BEV models with the corresponding financial incentives is based on the hypothesis that, due to these incentives, private consumers or companies in Germany will purchase a PHEV or BEV instead of a comparable new gasoline ICEV. This approach requires defining what gasoline cars are considered comparable to the respective PHEV and BEV models. In this study, the emissions and incentives for the PHEV and BEV models are compared to 2019 segment average new gasoline cars, because the selected models correspond to the majority of PHEV and BEV sales in the respective segments in 2019 (see Table 2.1). Note that the choice of the gasoline car comparator

4 ICCT WHITE PAPER | GHG BENEFITS AND INCENTIVES OF PHEVS AND BEVS IN GERMANY
has a significant impact on both the difference in life-cycle GHG emissions and the relative financial benefit. Finally, the assessment of the life-cycle GHG emissions and the vehicle ownership tax assumes the vehicles are used in Germany for their full useful vehicle lifetime of 18 years. The export of used cars and their continued usage in other countries is thus excluded.
2.2. LIFE-CYCLE GHG EMISSIONS: VEHICLE CYCLEIn the vehicle cycle, the assessment of the life-cycle GHG emissions considers the production, maintenance, and recycling of the vehicles. As described in the following section, the vehicle production and recycling emissions distinguish between the batteries and the rest of the vehicle—the latter is typically denoted as “glider and powertrain.” To translate these emissions into the functional unit of g CO2 eq./km traveled, they are divided by the lifetime mileage.
Glider and powertrainThe GHG emissions of the production and recycling of the glider and powertrain in Table 2.2 are calculated with powertrain type-specific factors (in t CO2 eq./t vehicle weight) from Bieker (2021) and the average weight of vehicles registered in the lower medium (1.415 t), medium (1.635 t), and SUV (1.698 t) segments in Germany in 2019 (Díaz et al., 2020).
Table 2.2. GHG emissions of the production and recycling of the glider and powertrain of vehicles registered in Germany in 2019.
Powertrain type
GHG emissions (t CO2 eq.)
Lower medium Medium SUV
Gasoline ICEV 7.4 8.5 8.3
Diesel ICEV 7.4 8.5 8.3
PHEV 8.1 9.3 9.1
BEV 6.7 7.7 7.5
For the estimation of life-cycle GHG emissions of hypothetical PHEV and BEV models potentially registered in 2030, as well as for the respective gasoline and diesel ICEVs, the GHG emissions of the production and recycling of the vehicle’s glider and powertrain are assumed to be 15% lower than for cars produced today. This assumption reflects the projected decarbonization of the industry and power sectors (Hill, 2020).
BatteryFor the GHG emissions from producing the batteries in current PHEV and BEV models, this study considers an average carbon intensity of 60 kg CO2 eq./kWh and the battery capacities of the models specified in Table 2.3. As described in Bieker (2021), this factor is based on the carbon intensity of producing NMC622 (lithium nickel manganese cobalt oxide)-based lithium-ion batteries (Argonne National Laboratory, 2020) adjusted to production in Europe, the United States, China, South Korea, and Japan (Kelly et al., 2019) and weighted by the mix of batteries from these five regions in BEVs and PHEVs registered in Europe in 2019 (data from EV-Volumes). The carbon intensity of 60 kg CO2 eq./kWh corresponds to the production of batteries from raw material sources of lithium, cobalt, and nickel. As discussed in Bieker (2021), using recycled lithium, cobalt, and nickel can lower the production GHG emissions by up to 25%, depending on their share and the recycling process.
Table 2.3 provides the manufacturer-declared battery capacity values of the latest variants of the considered PHEV and BEV models available in 2019 (Allgemeiner Deutscher Automobil-Club, 2021a). The battery capacities of these models are similar

5 ICCT WHITE PAPER | GHG BENEFITS AND INCENTIVES OF PHEVS AND BEVS IN GERMANY
to other PHEV and BEV models in these segments, including more recent models.1 In 2019, variants of the Tesla Model 3 were the only medium segment BEVs registered in Germany. For more variety, this study thus also includes the Polestar 2, which was available only from 2020.
For some of the models, the manufacturer-declared battery capacity values correspond to the total capacity of the batteries, while for others the values reflect the battery capacity that is usable. For the production emissions, the total battery capacity needs to be considered. Based on data sources that provide both total and useable battery capacity values (Allgemeiner Deutscher Automobil-Club, 2021a; Pod Point, 2021; EV Database, 2021), it is thus determined where the manufacturer-declared values correspond to the usable instead of the total battery capacity. For these, the total battery capacity values were added.
Table 2.3. Manufacturer-declared and total battery capacity, as well as the battery production GHG emissions for the selected PHEV and BEV models in the lower medium, medium, and SUV segments.
Segment ModelModel year
Declared battery
capacity (kWh)
Total battery
capacity(kWh)
GHG emissions(t CO2 eq.)
PHEV
Lower Medium
BMW 225xe 2019 8.8 9.7 0.6
Hyundai Ioniq PHEV 2018 8.9 8.9 0.5
Toyota Prius 2017 8.8 8.8 0.5
Medium
BMW 330e 2019 10.4 12.0 0.7
VW Passat Variant GTE 2019 13.0 13.0 0.8
Kia Optima Sportswagon 2017 11.3 11.3 0.7
SUV
Mitsubishi Outlander 2018 13.8 13.8 0.8
Kia Niro 2018 8.9 8.9 0.5
BMW X5 2019 21.6 24.0 1.4
BEV
Lower Medium
VW e-Golf 2017 32.0 35.8 2.1
Nissan Leaf 2019 56.0 62.0 3.7
Hyundai Ioniq BEV 2019 38.3 40.4 2.4
Medium
Tesla Model 3 long range 2019 75.0 80.5 4.8
Tesla Model 3 std. range plus 2019 58.0 68.3 4.1
Polestar 2 2020 72.5 78.0 4.7
SUV
Hyundai Kona 2018 64.0 67.5 4.1
Jaguar I-Pace 2018 84.7 90.0 5.4
Mercedes EQC 2019 80.0 85.0 5.1
Starting in 2025, PHEVs will have to provide an official all-electric range of at least 80 km to qualify for the German purchase subsidy (Bundesministerium für Wirtschaft und Energie, 2021). According to the coalition contract of the new Federal Government, this range could be required as of August 2023 (SPD, Bündnis 90/Die Grünen, FDP, 2021). Therefore, we assume that hypothetical 2030 versions of the PHEV models would have batteries with a 50% larger capacity than today’s models, and that this directly translates into a 50% higher all-electric range, which is 80 km or higher for almost all selected models. For 2030 versions of the BEV models, we assume that expected decrease in the battery production costs will result in about 20% higher battery capacities. In parallel, the carbon intensity of battery production in kg CO2 eq. per kWh battery capacity is estimated to decrease to 43 kg CO2 eq./kWh
1 PHEV models like the Volvo XC40, Ford Kuga, Volvo XC60, and Audi Q5, and BEV models like the VW ID.3, Audi e-tron,VW ID.4, and Opel Mokka have similar battery capacities as the models selected in this study.

6 ICCT WHITE PAPER | GHG BENEFITS AND INCENTIVES OF PHEVS AND BEVS IN GERMANY
for PHEVs and BEVs registered in 2030 (Bieker, 2021). The GHG emissions of the battery production for each of the 2030 versions of the PHEVs and BEVs models is displayed in Table A1 in the Appendix.
We expect that no battery replacement during the vehicle lifetime will be required. Although we acknowledge that battery life varies with the electrode materials used and with usage conditions, such as charge and discharge rate, storage time, and temperature, we expect that the useful life of currently used lithium-ion batteries will generally exceed the vehicle lifetime. This assumption is based on long-term charge and discharge experiments for NMC532-graphite cells that show 90%–95% of the initial capacity after 3,000 full charge and discharge cycles (Harlow et al., 2019). For BEVs with ranges of 200 km to 400 km, 3,000 full cycles correspond to a mileage of 600,000 km to 1,200,000 km, several times more that the passenger car’s lifetime mileage of 243,000 km to 270,000 km discussed below. We expect that the batteries could be used in second-life applications, such as for the integration of renewable energies in the power grid, which would reduce the battery production GHG emissions accounted for in the vehicle cycle by a certain share. However, due to uncertainties about the battery lifetime, second-life is not considered in this study.
Lifetime mileageThe majority of cars first registered in Germany are exported as second-hand cars after being deregistered in Germany (Bundesministerium für Umwelt, Naturschutz und Reaktorsicherheit, 2020). Therefore, the average age of deregistration in Germany, which was 13 years in 2005–2009 (Kraftfahrt-Bundesamt, 2011), does not cover the whole useful lifetime of the vehicles. In fact, the average age of passenger cars driven in countries like Greece, Romania, Estonia, and Lithuania is 16–17 years (European Automobile Manufacturers Association, 2019). For cars that reach their end of life in Germany, the average age was 17–18 years in 2014–2016 (Bundesministerium für Umwelt, Naturschutz und Reaktorsicherheit, 2020). In France, Portugal, and Poland, vehicles are recycled at an average age of 19–20 years (Taszka, S., & Domergue, S., 2019; Mehlhart et al., 2018). This study thus considers an average vehicle lifetime of 18 years. Since cars have become more durable over the last decades, this is considered a conservative estimate for the current generation of vehicles.
During their lifetime, the annual mileage of average cars in Germany decreases by about 5% per year (Bäumer et al., 2017). Accordingly, the annual mileage of an 18-year-old car is less than half the annual mileage of a new car. Over 18 years, the average annual mileage per vehicle age accumulates to 240,000 km. Similarly, the average annual mileage of 13,500 km for lower medium segment cars (Bäumer et al., 2017), multiplied by a lifetime of 18 years, results in a lifetime mileage of 243,000 km. For the medium and SUV segments, the average annual mileage of 15,500 km and 15,000 km, respectively, considered over a lifetime of 18 years, amounts to 279,000 km and 270,000 km.
MaintenanceThe GHG emissions corresponding to the use of consumables like coolant, oil, and in case of diesel cars also urea, as well as replacement of vehicle components like tires or parts of the exhaust-aftertreatment system are considered with 5 g CO2 eq./km for gasoline-powered ICEVs and PHEVs, 7 g CO2 eq./km for diesel ICEVs, and 4 g CO2 eq./km for BEVs (Bieker, 2021).

7 ICCT WHITE PAPER | GHG BENEFITS AND INCENTIVES OF PHEVS AND BEVS IN GERMANY
2.3. LIFE-CYCLE GHG EMISSIONS: FUEL CYCLE
Average real-world fuel and electricity consumptionTable 2.4 summarizes the fuel and electricity consumption values for the segment average gasoline and diesel cars, as well as for the specific PHEV and BEV models. For the gasoline and diesel cars, the fuel consumption values are based on the sales-weighted average New European Driving Cycle (NEDC) type-approval value of new cars registered in Germany in 2019 (Díaz et al., 2020). The values are adjusted to real-world usage conditions by considering an, on average, +37% and +44% higher fuel consumption for gasoline and diesel cars, respectively, reported by private users of the website spritmonitor.de (Dornoff et al., 2020). As the fuel consumption of average new diesel and gasoline cars registered in Germany in 2020 remained on the same level as in 2019 (Wappelhorst et al., 2021), these values are considered to be representative of the 2020 new ICEV fleet in Germany.
Table 2.4. Real-world average fuel and electricity consumption of BEV and PHEV models and the segment average new gasoline and diesel cars.
SegmentPowertrain
type ModelModel year
Fuel consumption(L/100 km)
Electricity consumption
(kWh/100 km)
Lower medium
Gasoline ICEV average 7.6
Diesel ICEV average 6.3
PHEV
BMW 225xe 2019 4.2a 11.7
Hyundai Ioniq PHEV 2018 2.8b 9.1
Toyota Prius 2017 2.3c 6.0
BEV
VW e-Golf 2017 17.3
Nissan Leaf 2019 22.7
Hyundai Ioniq BEV 2019 14.7
Medium
Gasoline ICEV average 8.8
Diesel ICEV average 6.8
PHEV
BMW 330e 2019 4.9a 7.4
VW Passat Variant GTE 2019 4.6a 8.7
Kia Optima Sportswagon 2017 4.0b 10.0
BEV
Tesla Model 3 long range 2019 20.9
Tesla Model 3 std. range plus 2019 19.5
Polestar 2 2020 29.2
SUV
Gasoline ICEV average 8.5
Diesel ICEV average 8.1
PHEV
Mitsubishi Outlander 2018 4.3a 13.8
Kia Niro 2018 3.1b 9.8
BMW X5 2019 5.4a 20.8
BEV
Hyundai Kona 2018 19.5
Jaguar I-Pace 2018 27.6
Mercedes EQC 2019 22.1a Source: Fisch und Fischl GmbH (2021), users with a reported mileage of at least 1,500 km; BMW 225xe, model year ≥ 2019, n = 43;
BMW 330e, model year 2019-2020, n = 65; VW Passat Variant GTE, model year ≥ 2019, n = 113; Mitsubishi Outlander, model year > 2019, n = 217; BMW X5, model year ≥ 2019, n = 19. b Source: Plötz et al. (2020); Hyundai Ioniq, n = 97; Kia Optima Sportwagon, n = 33; Kia Niro, n = 100. c Source: database used in Plötz et al. (2020); Toyota Prius, model year ≥ 2017, n = 38.
The electricity consumption values of the BEV models are derived from the ADAC Ecotest (Allgemeiner Deutscher Automobil-Club, 2021a) and should resemble real-world driving conditions. These values are typically about 30%–40% higher than the respective NEDC values.

8 ICCT WHITE PAPER | GHG BENEFITS AND INCENTIVES OF PHEVS AND BEVS IN GERMANY
For PHEVs, the average fuel and electricity consumption is determined by how much they are driven in charge-depleting (CD) and charge-sustaining (CS) mode. As found in Plötz et al. (2020), the average fuel consumption of privately owned PHEVs in Germany is two to three times higher than the NEDC or Worldwide Harmonized Light Vehicles Test Procedure (WLTP) type-approval values. This deviation is found to originate from a lower charging frequency, a higher electricity consumption, and thus a lower share of driving on electricity than considered in the type-approval values. The higher electricity consumption in real-world driving conditions partly corresponds to the use of auxiliaries, such as heating and air conditioning, at high and low ambient temperature (Dornoff, 2021). Table 2.4 displays the average real-world fuel consumption values of the selected PHEV models in private usage, as reported on spritmonitor.de (Fisch und Fischl GmbH, 2021).2
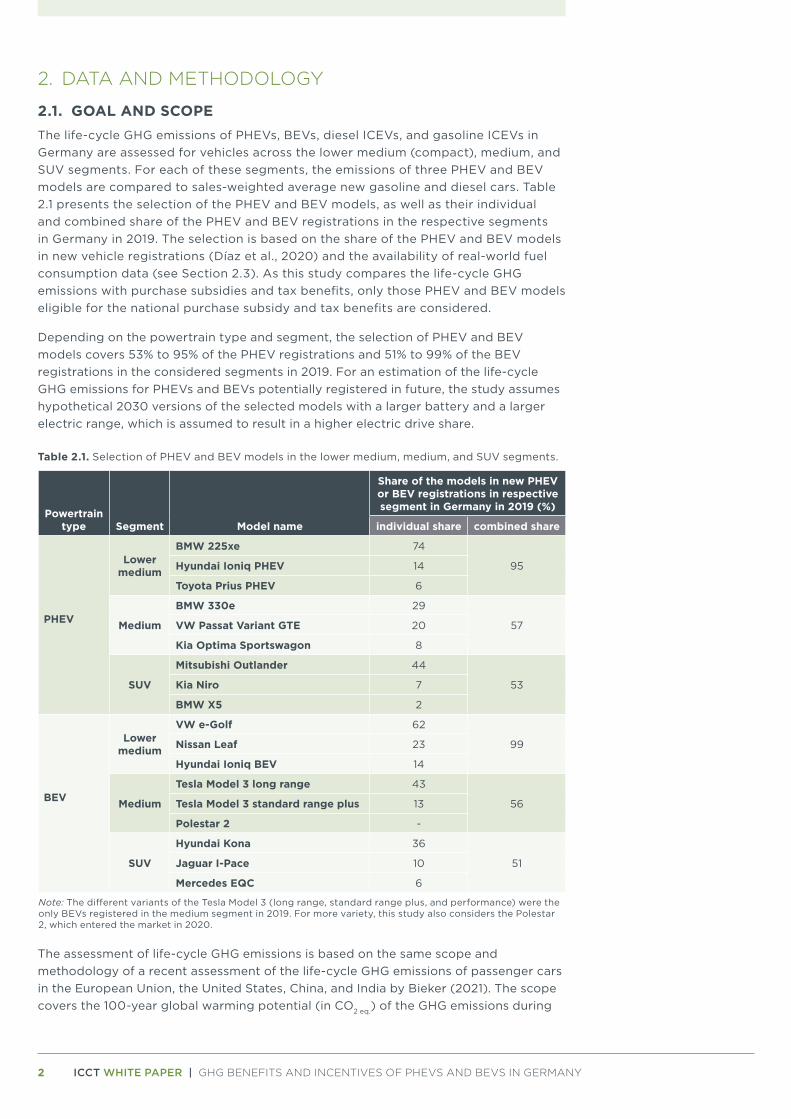
Drive shares and average electricity consumption of PHEVsIn a second step, the average electricity consumption of the PHEV models is determined. As presented in the following, this can be derived from (1) the average CD mode drive share and the CD mode electricity consumption or (2) the average electric drive share and the electricity consumption when driving only on electricity. For the former, as presented in Table 2.5 the fuel consumption in the CS mode FCCS mode and in the CD mode FCCD mode are used to estimate how the user-reported average fuel consumption FCaverage usage spreads over an average share of driving in the CD mode αCD mode and in the CS mode (αCS mode = 1 – αCD mode). Therefore, the CS and CD mode fuel consumption values as determined by the ADAC Ecotest are considered (Allgemeiner Deutscher Automobil-Club, 2021a).
FCaverage usage = αCD mode × FCCD mode + αCS mode × FCCS mode
αCD mode = (FCaverage usage – FCCS mode) / (FCCD mode – FCCS mode)
With the CD mode drive share αCD mode the respective proportion of the CD mode electricity consumption ECCD mode is considered as the average usage electricity consumption ECaverage usage.
ECaverage usage = αCD mode × ECCD mode
In the ADAC Ecotest, which expands the Worldwide harmonized Light-Duty Vehicle Test Cycle by an additional highway cycle, PHEVs usually show a significant fuel consumption in the CD mode. The CD mode is thus not a purely electric mode, but rather a mixed combustion engine and electric mode. As presented here, however, the amount of fuel consumed in the CD mode differs largely between models. For the BMW 225xe, for instance, it is five time higher than for the Hyundai Ioniq. In milder test conditions, such as in those used during NEDC and WLTP type approval, driving in CD mode may correspond to lower or no fuel consumption (Dornoff, 2021).
2 For individual PHEV models, these values may differ from Plötz et al. (2020) because this present study considers only the latest model variants and uses more recent data.
9 ICCT WHITE PAPER | GHG BENEFITS AND INCENTIVES OF PHEVS AND BEVS IN GERMANY
Table 2.5. Fuel and electricity consumption, charge-depleting mode drive share, and electric drive share for the selected PHEV models.
Segment ModelModel year
ADAC Ecotest
Average usage as private carsCS mode (tested)
CD mode (tested)
Driving only on electricity
(derived)
Fuel cons.(L/100 km)
Fuel cons.(L/100 km)
Electricity cons.
(kWh/100 km)Electricity cons.(kWh/100 km)
Fuel cons.(L/100 km)
CD mode drive share
(%)
Electric drive share
(%)
Electricity cons.
(kWh/100 km)
Lower medium
BMW 225xe 2019a 7.6 2.5 17.6 26.2 4.2 67 45 11.7
Hyundai Ioniq 2018 5.2 0.5 17.8 19.8 2.8 51 46 9.1
Toyota Prius 2017 4.2 0.9 10.5 13.4 2.3 58 45 6.0
Medium
BMW 330e 2019 6.8 1.2 21.9 26.8 4.9 34 28 7.4
VW Passat Variant GTE 2019 6.9 0.7 23.4 25.2 4.6 37 33 8.7
Kia Optima Sportswagon 2017 7.0 0.5 21.7 23.4 4.0 46 43 10.0
SUV
Mitsubishi Outlander 2018 8.5 1.3 23.7 26.7 4.3 58 49 13.8
Kia Niro 2018 5.7 1.3 16.6 20.8 3.1 59 46 9.8
BMW X5 2019 10.7 2.1 33.8 41.4 5.4 62 50 20.8a The ADAC Ecotest fuel and electricity consumption values of the BMW 225xe correspond to the 2016 variant (5.8 kWh) since no more recent figures
were available.
In a different approach, the electricity consumption of PHEVs in average usage ECaverage usage can be approximated from the share of driving purely on electricity αelectricity as opposed to the share of driving purely on fuel (αfuel = 1 – αelectricity). The electric drive share is calculated from the average user-reported fuel consumption FCaverage usage and the CS mode fuel consumption FCCS mode (Plötz et al., 2020).
FCaverage usage = αfuel × FCCS mode = (1 – αelectricity) × FCCS mode
αelectricity = (FCCS mode – FCaverage usage) / FCCS mode
The electricity consumption corresponding to driving solely on electricity ECelectricity can be calculated from tests of driving in the CD mode by only counting the share of the test cycle in which the combustion engine is not running (Allgemeiner Deutscher Automobil-Club, 2021a). Table 2.5 also displays the electricity consumption of such calculated purely electric driving. With this value and the average electric drive share αelectricity, an approximate value for the average electricity consumption ECaverage usage approx. can be calculated.
ECaverage usage approx. = αelectricity × ECelectricity
As this approach neglects the electricity consumption in phases when the electric motor and the combustion engine run simultaneously, it is less precise than the calculation via the CD mode electricity consumption and the CD mode drive share described above. For the electricity consumption in average usage considered in this study, however, the two approaches show very similar results. On average, over the nine PHEV models, the electricity consumption in average usage if determined via the electric drive share is only 1% higher than the value derived from the CD mode drive share and electricity consumption. Note that the similar results from the two calculation methods are also based on the fact that the ADAC Ecotest is performed at room temperature (22 °C). With increased support from the combustion engine at low temperatures (Dornoff, 2021), the neglection of mixed electric and combustion engine phases in the electric drive share base method is expected to result in a higher deviation.

10 ICCT WHITE PAPER | GHG BENEFITS AND INCENTIVES OF PHEVS AND BEVS IN GERMANY
Figure 2.1 illustrates the electric drive share and the CD mode drive share for the selected PHEV models when based on the fuel consumption in CS and CD mode as determined by the ADAC Ecotest. As indicated on the right panel, this difference is especially high for models where the fuel consumption in the CD mode (blue) is relatively high in comparison to the fuel consumption in the CS mode (grey). Taking the BMW 225xe as an example, the average fuel consumption of 4.2 L/100 km and a CS mode fuel consumption of 7.6 L/100 km result in a combustion engine drive share of 55%, and thus an electric drive share of 45%. For the CD mode drive share, in contrast, the fuel consumption in the CD mode is also considered. With a CD mode fuel consumption of 2.5 L/100 km, as determined by the ADAC Ecotest, the average fuel consumption of 4.2 L/100 km spreads over a share of 33% of driving with 7.6 L/100 km in CS mode and 67% of driving with 2.5 L/100 km in CD mode (Table 2.5). In contrast, for models where the contribution of the combustion engine in the CD mode is relatively low, such as the Kia Optima Sportswagon, the CD mode drive share of 46% is similar to the electric drive share of 43%.
BMW225xe
HyundaiIoniq PHEV
ToyotaPrius
BMW330e
VW PassatVariant GTE
Kia OptimaSportswagon
MitsubishiOutlander
KiaNiro
BMWX5
0% 20% 40% 60% 80% 100%
Estimated real-world drive share
electric drive share CD mode drive share
0 5 10
Fuel consumption [L/100 km]
CS mode CD mode
Lowermediumsegment
Mediumsegment
SUVsegment
Figure 2.1. Estimated electric and CD mode drive shares of the selected PHEV models (left), and fuel consumption in CS and CD mode (right).
Note that in addition to a CD and CS mode, several PHEV models have a charge-increasing mode, in which the battery can be charged from the combustion engine. Naturally, this drive model corresponds to extraordinary high fuel consumption (Transport & Environment, 2020; Dornoff, 2021). Describing the real-world usage of PHEVs only by a CD and CS mode drive share, or by a combustion engine and electric drive share neglects this drive mode.
Understanding charge-depleting mode drive share in WLTP vs. electric drive share in NEDCIn WLTP type-approval, the fuel and electricity consumption in the CD mode is determined over multiple test cycles, starting with a fully charged battery and ending when the battery reaches its minimum state of charge.3 Thereby, the range of driving in CD mode is determined. The fuel and electricity consumption of the CD and CS mode
3 From this point onwards, the electric motor only uses brake recuperation energy to contribute to the propulsion.
11 ICCT WHITE PAPER | GHG BENEFITS AND INCENTIVES OF PHEVS AND BEVS IN GERMANY
are then weighted by a CD mode range-dependent utility factor (Riemersma & Mock, 2017). The WLTP thus follows the logic of the CD mode drive share approach.
In the NEDC procedure, in contrast, the fuel and electricity consumption in CD mode can be determined over a single cycle only. As the tested PHEV model usually complete this one cycle (about 11 km) by solely driving on electricity, the fuel consumption of driving in the CD mode for a longer period, as in the WLTP, is not detected. In a separate test, a hypothetical all-electric range is determined by driving consecutive NEDC test cycles, starting with a fully charged battery and ending when the battery reaches its minimum state of charge, but only counting those parts of the cycle in which the combustion engine was not supporting. In the end, the fuel and electricity consumption values in the CD and CS mode are weighted by an all-electric range-dependent utility factor (Riemersma & Mock, 2017). In effect, the NEDC thus follows an electric drive share approach.
Fuel and electricity consumption of PHEVs in company car usagePHEVs used as company cars are found to be driven longer distances and be charged less frequently than privately owned PHEVs. Therefore, while the real-world fuel consumption of privately used PHEV is two to three times higher than official test values, the fuel consumption of PHEVs used as company cars is three to four times higher than the test values (Plötz et al., 2020). For a given NEDC electric range, the electric drive share of PHEVs being used as company cars in Germany is found to be less than half as for PHEVs with the same range in private usage. When comparing individual PHEV models used as private or as company cars, such as the Audi A3 e-tron or the Mercedes C 350e, the electric drive share of vehicles being used as company cars are found to be even six times lower. Due to relatively few datapoints on such a direct comparison, we assume that the electric drive share of the selected PHEV models when being used as company cars is 50% of the electric drive share when being used as private cars. As presented in Table A2 in the Appendix, this results in higher fuel and lower electricity consumption.
Fuel and electricity consumption of hypothetical 2030 carsFor the 2030 versions of the PHEV models, this study assumes the same fuel and electricity consumption in the CS and CD mode as reported by the ADAC Ecotest (Table 2.5). Following the increase in the battery capacities of the PHEV models by 50%, as described for the battery production emissions in Section 2.1, we assume that the all-electric range would increase accordingly. Therefore, the average share of driving in the CD mode, and thus the electric drive share, is assumed to increase. In an earlier study, we investigated the relation between the NEDC all-electric range and the share of driving on electricity in real-world usage (Plötz et al., 2020). Based on that relation, we estimate that with an increase in the all-electric range by 50%, the real-world electric drive share would be 1.3 times higher. As presented in Table A3, this results in a significantly lower average fuel consumption than for the current versions of the models.
The real-world fuel consumption of average new gasoline and diesel cars registered in Germany in 2030 are expected to remain at a similar level as new cars registered in 2019. This is based on the following considerations. The current version of the CO2 emission standards of the European Union contains a zero- and low-emission vehicle (ZLEV) sales target of 35%. PHEVs are only partially counted towards that number, with a factor varying between 0.3 and 1. To incentivize car manufacturers to increase the PHEV, BEV, and fuel cell electric vehicles (FCEV) shares in their fleets, the regulation rewards manufacturers that outperform this target with a relaxation of their individual CO2 threshold values. The maximum relaxation of the limit values by 5% is granted to manufacturers that outperform the ZLEV sales target by 5%, reaching ZLEV sales target of 40%. This target could be achieved with 40% BEVs,

12 ICCT WHITE PAPER | GHG BENEFITS AND INCENTIVES OF PHEVS AND BEVS IN GERMANY
but also with about 27% PHEVs and 27% BEVs, for example, as PHEVs are only partially counted towards the ZLEV sales target. We expect that manufacturers will aim to maximize the relaxation of their CO2 threshold values. With this relaxation, the corresponding PHEV and BEV shares, and an expected increase of the difference between real-world and WLTP fuel consumption values, no further reduction of the average real-world fuel consumption of the new combustion engine car fleet would be required (Mock & Díaz, 2021).
The electricity consumption of the 2030 versions of the BEV models is assumed to remain the same as for the current models.
Carbon intensity of gasoline and dieselThe life-cycle GHG emissions of gasoline and diesel correspond to the average mix of fossil and biogenic fuel pathways in the European Union, as described more detailed in Bieker (2021). Based on Prussi et al. (2020) and other sources, they include the GHG emissions corresponding to the fuel production and transport, or well to tank (WTT), and the emissions during the fuel consumption in the vehicle, or tank to wheel (TTW). For biofuels, the WTT emissions also include the indirect land use change (ILUC) emissions as provided by Valin et al. (2015).
During the useful lifetime of a vehicle registered in 2021, the average biofuel mix, and thereby the carbon intensity of the gasoline and diesel blends, are expected to change. Therefore, the carbon intensity of the 2020 average fuel blends and projected 2030 fuel blends that are aligned with the requirements of Renewable Energy Directive (RED II) are assessed (European Parliament & Council of the European Union, 2018). Between these years, the carbon intensity is assumed to develop linearly from the 2020 to the 2030 values. After 2030, the carbon intensity of the average gasoline and diesel mix is assumed to remain constant.
Table A4 in the Appendix presents the WTT, TTW, and the overall well to wheel (WTW) GHG emissions of fossil gasoline and diesel, the average ethanol, biodiesel (fatty acid methyl ester), and hydrogenated vegetable oil (HVO) mix, and the final average gasoline and diesel blends in 2020 and in 2030 (Bieker, 2021). The gasoline blend considers a volumetric share of 5% ethanol, while the average diesel blend contains a 7% share of biodiesel and HVO. Due to an increasing share of ethanol from cellulosic feedstocks and a decreasing share of biodiesel and HVO from palm oil, the carbon intensity of the average gasoline and diesel blends slightly decrease between 2020 and 2030. Due to the decrease of the annual mileage of 5% per year (Bäumer et al., 2017), the carbon intensity of the fuel in the first years is accounted for with a higher share than the carbon intensity in the later years. Over an 18-year lifetime of cars registered in 2021, this results in vehicle lifetime average WTT and TTW emissions of 0.68 kg CO2 eq./L and 2.24 kg CO2 eq./L, respectively, for the average E5 gasoline blend and 0.98 kg CO2 eq./L and 2.44 kg CO2 eq./L, respectively, for the average B7 diesel blend. As the study assumes no change in the carbon intensity of the fuel mix after 2030, cars registered in 2030 would use the 2030 carbon intensity values for their whole lifetime.
For the TTW fuel consumption, these emissions consider a full oxidation of the fuels to CO2. In reality, however, this reaction is not always complete, leaving some methane (CH4), other hydrocarbons, and particulate matter in the exhaust emissions. In addition, the combustion of gasoline and diesel is related to nitrous oxide (N2O) emissions. As described more detailed in Bieker (2021), methane and nitrous oxide emissions accumulate additional TTW GHG emissions of about 1 g CO2 eq./km for gasoline and 4 g CO2 eq./km for diesel cars. For PHEVs, the same emissions as for gasoline cars are considered.

13 ICCT WHITE PAPER | GHG BENEFITS AND INCENTIVES OF PHEVS AND BEVS IN GERMANY
Carbon intensity of electricityThe average carbon intensity of the electricity used for charging of PHEVs and BEVs is based on the life-cycle GHG emissions of net electricity generation from different technologies and their projected mix in net electricity generation during the lifetime of the vehicles. The resulting average carbon intensity of net electricity generation is adjusted to net electricity consumption at the plug by considering transmission and distribution losses in the electric grid of 5.5% (Statistisches Bundesamt, 2021).
Table A5 in the Appendix presents the considered life-cycle carbon intensities of the different electric energy sources. They are based on Intergovernmental Panel on Climate Change (IPCC)’s global average values (Moomaw et al., 2011) and supplemented with EU-specific values for stationary biomass combustion (Christensen & Petrenko, 2017). For renewable energies sources, the life-cycle GHG emissions mostly correspond to the production of the power plants. With continuous decarbonization of the industry, these can be expected to decrease for future power plants (Pehl et al., 2017).
The current electricity mix in Germany and the projection of its future development is based on the “carbon-neutral by 2045” scenario by Prognos et al. (2021). This scenario is roughly consistent with GHG emissions reduction targets in the 2021 version of the federal Climate Protection Law (Bundesregierung, 2021a). As presented in Table A6 and in Figure A1, this scenario considers the share of net electricity generation from renewable energies to increase from 40% in 2020 to 100% in 2045.4
The resulting development of the life-cycle carbon intensity of net electricity consumption at the plug is presented in Figure 2.2.
0
100
200
300
400
500
2020 2025 2030 2035 2040 2045 2050
Life
-cyc
le G
HG
em
issi
ons
(g
CO
2 eq
./kW
h)
Figure 2.2. Development of the life-cycle GHG emission intensity of electricity consumption in Germany in the carbon neutral 2045 scenario.
With a useful vehicle lifetime of 18 years and a 5% p.a. decrease of the annual mileage (see Section 2.2), the lifetime average carbon intensity of electricity consumption for cars registered in 2021 is 261 g CO2 eq./kWh, while for cars registered in 2030, the lifetime average carbon intensity of electricity consumption is 96 g CO2 eq./kWh.
4 The import and export of electricity, electricity generation from storage, from hydrogen and from “other” energy sources are neglected. Furthermore, curtailment is assumed to equally affect all renewable electricity generation technologies.

14 ICCT WHITE PAPER | GHG BENEFITS AND INCENTIVES OF PHEVS AND BEVS IN GERMANY
Marginal electricity mix or average electricity mixThe approach of considering the average electricity mix for the GHG emissions of the electricity consumed by PHEVs and BEVs has been questioned by some studies (Koch & Böhlke, 2021). These studies argue that the usage of additional PHEVs and BEVs results in an increased electricity demand. By assuming that the available capacities in renewable energies are constant, these studies argue that the electricity consumed by PHEVs and BEVs would only be covered by the electricity from additional capacities of fossil power plants, i.e., by turning on a peaking gas powerplant. This approach results in a significantly higher carbon intensity of the electricity accounted to the usage of PHEVs and BEVs than the average electricity mix.
This short-term marginal electricity mix approach is useful for modeling the short-term impacts of additional electricity consumption. As current targets and policies in the expansion of renewables already consider the increasing electricity demand, however, this approach is not suitable to assess the long-term effects of PHEV and BEV adoption. Contrary to the electricity from peaking gas power plants that would be considered in the short-term marginal electricity mix, the additional power plants that are built to meet the increasing demand are more likely to be renewables.
For PHEVs and BEVs being used in the European Union, the short-term marginal electricity mix approach further neglects that the European emission trading system sets absolute emission limits to the power and industry sectors. An additional electricity demand would thereby not lead to higher emissions.
In addition, the economy-wide demand in electricity increases not only because of PHEVs and BEVs, but also because of heat pumps, information and communication technology, or an increasing demand for electricity in the industry sector. At the same time, the energy demand for certain applications, such as lights and household uses, decreases. In this dynamic system, it is fully arbitrary to assign the marginal electricity mix to PHEVs and BEVs while assuming that other applications are powered by the average mix.
For these reasons, but also to cover the changes of the electricity mix during the lifetime of the vehicles, this study follows the established approach of considering the average electricity mix for the electricity consumption of PHEVs and BEVs. In fact, the scenarios of the future development of the electricity mix considered in this study account for that increasing electricity demand. Furthermore, some studies already show that a large share (about 30%) of private BEV users in Germany own a home photovoltaic system (Scherrer et al., 2019).
Note that in the longer term, PHEVs and BEVs can be used to support, and thereby accelerate, the integration of renewables in the electricity grid, either by charging when a surplus of renewable is available or by using the vehicles’ batteries as storage units that can be charged and discharged to stabilize the grid.
2.4. FISCAL INCENTIVESIn parallel to the life-cycle GHG emissions, this study assesses the total amount of fiscal incentives for PHEVs and BEVs over a useful vehicle lifetime of 18 years. Thereby, it covers the governmental share of the national purchase subsidy and vehicle ownership tax benefits. As a large number of the new PHEVs and BEVs in Germany are first registered by companies (49% in 2020) (Wappelhorst & Bieker, 2021), the study further assesses the additional company car tax benefits. Any other differences in taxation, such as the different taxation of fuel and electricity, are not considered.
Following the hypothesis that the PHEV and BEV incentives result in the purchase of the PHEV or BEV models instead of a comparable gasoline car (see Section 2.1), the

15 ICCT WHITE PAPER | GHG BENEFITS AND INCENTIVES OF PHEVS AND BEVS IN GERMANY
car ownership and company car tax benefit of the selected PHEV and BEV models correspond to the difference of the respective taxation of the 2019 average gasoline vehicles in the respective segment. The assessment is based on stated policies and considers a vehicle acquisition in 2021.
For each of the PHEV and BEV models, all relevant fiscal incentives compared to segment average gasoline ICEVs are cumulated over a useful vehicle lifetime of 18 years. As for the assessment of the life-cycle GHG emissions, this scenario considers that the cars are used in Germany for their full useful vehicle lifetime. This is a simplified scenario, because passenger cars that are first registered in Germany are typically exported as second-hand cars and used in other European or non-European countries (Bundesministerium für Umwelt, Naturschutz und Reaktorsicherheit, 2020; United Nations Environment Programme, 2020). As a sensitivity, the study thus also discusses the impact over the typical 13-year service life of passenger cars in Germany (Kraftfahrt-Bundesamt, 2011). The net present value of the fiscal incentives at the point of purchase are calculated with an annual discount rate of 4%, following the European Commission’s recommended social discount rate.
Purchase subsidy For BEVs and PHEVs registered in between June 2020 and December 2022, the Federal Government of Germany grants a purchase subsidy specified in the Innovationsprämie. During this period, the Innovationsprämie doubles the purchase subsidy outlined in the Umweltbonus (Bundesministerium für Wirtschaft und Energie, 2021). The total subsidy of the Innovationsprämie amounts to €6,000 for BEV models with a net list price (excluding value added tax, VAT) of up to €40,000, and €5,000 for BEVs with a net list price of up to €65,000. More expensive models are not eligible for the subsidy. For PHEVs, the national subsidy is €4,500 for models with a net list price of up to €40,000 and €3,750 for models with a net list price of up to €65,000. To be eligible for the purchase subsidy in 2022, PHEV models further need to either have an official WLTP CO2 emissions value of up to 50 g/km, or an electric range of at least 60 km. The subsidy further requires the car manufacturer to reduce the price of the vehicles by half of the amount of the respective governmental subsidy. Vehicle leases of a period of 6 to 11 months and 12 to 23 months are only eligible to a certain share of the Innovationsprämie. From 24 months onwards, which is considered for company cars in this study, leased vehicles are fully eligible.
Table A7 in the Appendix shows whether the net list prices of the least expensive version of the considered PHEV and BEV models are up to €40,000 or up to €65,000, as well as the corresponding amount of the purchase subsidies. The net list prices of the PHEV and BEV models are determined from the gross list prices in the ICCT European Vehicle Market Statistics pocketbook (Díaz et al., 2020).
Vehicle ownership taxFor gasoline ICEVs and PHEVs, the annual vehicle ownership tax is based on an engine displacement component and the type-approval CO2 emissions value (Bundesregierung, 2020). While the former is €2.00 per 100 ccm engine displacement for vehicles running on gasoline, the CO2 emissions-based component depends on the WLTP CO2 emission levels and follows a stepwise increase of the rate. For cars with CO2 emissions of up to 95 g/km, the CO2 component is €0, and in the first five years, the engine displacement component is reduced by up to €30 per year. For cars with CO2 emissions between 95 g/km and 115 g/km, the tax rate increases by €2.00 per g/km with every additional g/km. Starting at 116 g/km, this rate gradually increases up to €4.00 per g/km for CO2 emissions above 195 g/km.
BEVs are exempt from the vehicle ownership tax for 10 years, or until 2030 at the latest. Afterwards, taxation depends on gross vehicle weight rating and uses

16 ICCT WHITE PAPER | GHG BENEFITS AND INCENTIVES OF PHEVS AND BEVS IN GERMANY
increments of 200 kg. For BEVs, the tax level is only 50% compared to conventional vehicles. In result, this means that for BEVs with a gross vehicle weight rating of up to 2,000 kg, the tax rate is €5.625 per 200 kg, while it is €6.01 per 200 kg between 2,001 kg and 3,000 kg.
Table A8 in the Appendix presents the engine displacement, WLTP CO2 emissions value, and the corresponding annual vehicle ownership tax rate for the considered models. The WLTP CO2 emission values of the reference gasoline ICEVs are derived from the segment average NEDC CO2 emission values of new gasoline ICEVs registered in Germany in 2019 (Díaz et al., 2020) and the average ratio of WLTP to NEDC CO2 value of 1.21 (Dornoff et al., 2020). After the tax exemption for BEVs in the first 10 years and the tax reductions for vehicles with WLTP CO2 values below 95 g/km in the first five years, the annual vehicle ownership tax rates range from €57 to €85 for BEVs and €28 to €60 for PHEVs. For the respective segment average gasoline ICEVs, the vehicle ownership tax rates range from €164 to €249.
Company car taxWhen driving a company car, the taxable income of employees is increased by what is considered as a non-monetary benefit of using it for private purposes. This non-monetary benefit is either based on the usage of the vehicle according to the driver̀ s logbook or by 1% of the vehicle’s list price plus special equipment (including VAT) per month (Bundesregierung, 2021b). In this assessment, the second method is applied. For BEV company cars with a list price (including VAT and excluding special equipment) of up to €60,000, only 25% of the vehicle purchase price is accounted for the tax rate, while 50% is considered for more expensive BEV models. For PHEVs with a WLTP electric range of at least 40 km or a WLTP CO2 emissions value of up to 50 g/km, 50% of the purchase price is considered.
If the company car is used for journeys between home and workplace, employees must declare another 0.03% of the vehicle’s list price plus special equipment (including VAT) per month for each kilometer of the one-way distance. In the case of BEVs and PHEVs, this rate only applies to 25% or 50% of that price, following the same categories stated above. With an average distance to work of 20 km (Ecke et al., 2020), this results in an additional increase of the taxable income by 0.15% to 0.3% of the vehicles’ prices per month for eligible BEVs and PHEVs, and 0.6% for ICEVs.
To calculate the income tax, we consider a gross income of €90,000 per year to represent a reasonable proportion of vehicle prices and income, in particular for the more expensive SUV models. According to Compensation Partner (2019), the salary of employees driving company cars with an average purchase price of €50,000 is between €90,000 and €110,000.
Table A9 in the Appendix presents the calculation of the company car tax benefit of the individual PHEV and BEV models in relation to segment average gasoline cars. The ‘vehicle prices’ in this table correspond to the vehicle’s list prices plus special equipment (including VAT). They are based on the average list prices (including VAT) of the selected PHEV and BEV models, and of the average gasoline cars in the respective segments, as provided by the database underlying Díaz et al. (2020).5 The additional cost of special equipment is considered by adding 10% of the list price. This simplified markup results from an evaluation of the ADAC car cost calculator (Allgemeiner Deutscher Automobil-Club, 2021c) that indicates mean additional costs from 5% to roughly 20%. Note that the vehicle’s list price plus special equipment does not consider the price reduction the car manufacturers provide to qualify for the governmental part
5 For the Polestar 2 (72.5 kWh variant), the list price is taken from the ADAC Autokatalog (Allgemeiner Deutscher Automobil-Club, 2021b).

17 ICCT WHITE PAPER | GHG BENEFITS AND INCENTIVES OF PHEVS AND BEVS IN GERMANY
of the Innovationsprämie. For the selected PHEV and BEV models, the actual purchase price is thus lower than the price considered for the company car tax.
If the company car tax rates would apply to the full list price plus special equipment (including VAT) for all vehicles, which is denoted as “w/o benefit” in Table A9, the higher prices of PHEV and BEV models would effectively result in a higher company car taxation than for average gasoline cars. By accounting for only 25% to 50% of the price, this effect is generally overcompensated, resulting in a significantly lower increase in the taxable income as for average gasoline cars. For disproportionally expensive PHEV and BEV models in the SUV segment, however, the taxable income still increases by a similar amount as for average gasoline cars.
The German income tax is considered with the rates for 2021 adopted from finanz-tools.de (2021), and ranges from 32.0% to 32.8% for the considered company car benefit adjusted income levels. As a result, driving the selected PHEV and BEV models instead of the respective segment average gasoline cars ranges between a €2,017 lower and a €657 higher taxation for PHEVs and between a €3,014 lower and a €934 higher taxation for BEVs. On average, the company car taxation is about €1,100 lower for PHEVs and €1,600 lower for BEVs.
Wallbox subsidyIn the context of the PHEV and BEV incentives, this study also considers the national subsidy for the purchase and installation of a home charging point for private usage, a so-called wallbox (Kreditanstalt für Wiederaufbau, 2020). Since the purchase of a PHEV or BEV does not necessarily require the purchase of a wallbox, it is regarded separately. The subsidy of €900 is only granted if the purchase and installation costs of a wallbox exceed that level. Prices for eligible wallboxes typically range between about €600 and €1100, with total costs including installation of about €2,000 (Bamberg et al., 2020; Ulrich et al., 2019). Therefore, the subsidy is generally considered to be granted.

18 ICCT WHITE PAPER | GHG BENEFITS AND INCENTIVES OF PHEVS AND BEVS IN GERMANY
3. RESULTS
3.1. LIFE-CYCLE GHG EMISSIONSFigures 3.1 to 3.3 present the determined life-cycle GHG emissions of the selected PHEV and BEV models in the lower medium, medium, and SUV segments compared to respective segment average new gasoline and diesel ICEVs in Germany. For the vehicle production emissions, these figures distinguish between the manufacturing of the battery and the rest of the vehicle. For the vehicle use phase, they present the GHG emissions during the fuel consumption in the vehicles, as well as the life-cycle emissions of the fuel and electricity production. The GHG emissions of maintenance include the replacement of consumables, such as tires, oil, coolant, and, in the case of diesel cars, urea. The use phase corresponds to a registration of the vehicles in 2021 and a useful vehicle lifetime of 18 years in Germany. Accordingly, the figures cover the changes in the average electricity mix and fuel blend that are expected from stated policies. As the annual mileage of passenger cars decreases during the lifetime of the vehicles, the carbon intensity of the fuel and electricity mix in the first years have a higher impact than in the later years. Note that the fuel and electricity consumption of the vehicles correspond to usage as private cars.
Life
-cyc
le G
HG
em
issi
ons
(g
CO
2 eq
./km
)
0
50
100
150
200
250
300
Gasoline +biofuels
Diesel +biofuels
BMW 225xe HyundaiIoniq PHEV
ToyotaPrius
VWe-Golf
NissanLeaf
HyundaiIoniq BEV
ICEV PHEV BEV
-1%
-25%
-43%
-52%
-67%
-59%
-69%
Electricity productionFuel productionFuel consumptionMaintenanceBattery manufactureVehicle manufacture
Figure 3.1. Life-cycle GHG emissions of selected lower medium segment PHEV and BEV models compared to average lower medium segment gasoline and diesel ICEVs driven in Germany in 2021 to 2038.

19 ICCT WHITE PAPER | GHG BENEFITS AND INCENTIVES OF PHEVS AND BEVS IN GERMANY
Life
-cyc
le G
HG
em
issi
ons
(g
CO
2 eq
./km
)
0
50
100
150
200
250
300
Gasoline +biofuels
Diesel +biofuels
BMW 330e VW PassatVariant GTE
Kia OptimaSportswagon
Tesla Model 3long range
Tesla Model 3std. range plus
Polestar 2
ICEV PHEV BEV
-7%
-30% -32%
-37%
-65%-67%
-58%
Electricity productionFuel productionFuel consumptionMaintenanceBattery manufactureVehicle manufacture
Figure 3.2. Life-cycle GHG emissions of selected medium segment PHEV and BEV models compared to average medium segment gasoline and diesel ICEVs driven in Germany in 2021 to 2038.
0
50
100
150
200
250
300
350
Gasoline +biofuels
Diesel +biofuels
MitsubishiOutlander
Kia Niro BMW X5 HyundaiKona
JaguarI-Pace
MercedesEQC
ICEV PHEV BEV
Life
-cyc
le G
HG
em
issi
ons
(g
CO
2 eq
./km
)
Electricity productionFuel productionFuel consumptionMaintenanceBattery manufactureVehicle manufacture
+12%
-28%
-45%
-10%
-66%
-57%-62%
Figure 3.3. Life-cycle GHG emissions of selected SUV segment PHEV and BEV models compared to average SUV segment gasoline and diesel ICEVs driven in Germany in 2021 to 2038.

20 ICCT WHITE PAPER | GHG BENEFITS AND INCENTIVES OF PHEVS AND BEVS IN GERMANY
Gasoline and diesel ICEVsIn all three segments, average gasoline and diesel ICEVs show similar life-cycle GHG emissions. While in the lower medium segment, the emissions of 256 g CO2 eq./km for gasoline and 258 g CO2 eq./km for diesel ICEVs are at the same level, the emissions of diesel ICEVs in the medium segment are, at 273 g CO2 eq./km, about 7% lower than the 293 g CO2 eq./km for gasoline ICEVs. In the SUV segment, in contrast, the emissions of 317 g CO2 eq./km for diesel ICEVs are 12% higher than the 285 g CO2 eq./km for gasoline ICEVs.
Hybrid electric vehicles (HEVs) are considered as part of the gasoline ICEV fleet. If this fleet is split into conventional ICEVs and HEVs, as assessed for lower medium and SUV segment cars in the European Union (Bieker, 2021), the life-cycle GHG emissions of HEVs can be considered to be about 20% lower than for conventional gasoline ICEVs.
PHEVsThe life-cycle GHG emissions of PHEVs are found to vary greatly between the individual models. For the three lower medium segment models, they range from 124 g CO2 eq./km for the Toyota Prius, to 147 g CO2 eq./km for the Hyundai Ioniq PHEV, and 195 g CO2 eq./km for the BMW 225xe. These emission levels correspond to 52%, 43%, and 24% lower emissions than the comparable segment average gasoline cars, respectively. In the medium segment, the life-cycle GHG emissions of the three PHEV models are comparatively similar, at 204 g CO2 eq./km for the BMW 330e, 199 g CO2 eq./km for the VW Passat, and 185 g CO2 eq./km for the Kia Optima, which corresponds to 30%–37% lower levels than for average medium segment gasoline ICEVs. The three models in the SUV segment show a wide range of life-cycle GHG emissions, with 257 g CO2 eq./km for the BMW X5, 204 g CO2 eq./km for the Mitsubishi Outlander, and 158 g CO2 eq./km for the Kia Niro. These values range between only 10% and up to 45% lower emissions than the average SUV segment gasoline car.
As displayed in Figures 3.1 to 3.3, the wide range of life-cycle GHG emissions of the PHEV models is determined by the emissions related to the fuel and electricity consumption. The emissions of the manufacturing of the batteries, in contrast, are low and very similar for the individual PHEV models.
Figure 3.4 helps to better illustrate what drives the differences in the fuel and electricity consumption. For each of the lower medium, medium, and SUV segment PHEV models, it presents the life-cycle GHG emissions as a function of the electric drive share. The figure highlights the emissions of solely driving in the CS mode on one side and in the CD mode on the other side, both as reported by the ADAC Ecotest. Due to the significant fuel consumption in the CD mode (compare Table 2.5 and Figure 2.1), only a share of the distance driven in that mode corresponds to driving on electricity. With the fuel consumption in CD and CS mode, it is determined that solely driving in the CD mode corresponds to an electric drive share of only 67% for the BMW 225xe and up to 93% for the VW Passat.

21 ICCT WHITE PAPER | GHG BENEFITS AND INCENTIVES OF PHEVS AND BEVS IN GERMANY
BMW X5
Mitsubishi Outlander
Kia Niro
BMW 330e
VW Passat Variant GTE
Kia Optima Sportswagon
BMW 225xe
Hyundai Ioniq PHEV
Toyota Prius
Charge-sustaining mode(ADAC Ecotest)
Charge-depletingmode(ADAC Ecotest)
Average usage SUV segment:
Medium segment:
Lower medium segment:
0
50
100
150
200
250
300
350
400
0% 20% 40% 60% 80% 100%
Life
-cyc
le G
HG
em
issi
ons
(g
CO
2 eq
./km
)
Electric drive share
Figure 3.4. Life-cycle GHG emissions of selected SUV (solid), medium (dashed) and lower medium segment (dotted) PHEV models as a function of the electric drive share. The emissions corresponding to the average usage of private cars, solely driving in charge-sustaining mode, and solely driving in charge-depleting mode are highlighted.
The figure further presents the life-cycle GHG emissions corresponding to the average usage, based on the average fuel consumption reported by the users of the website spritmonitor.de. As discussed in Section 2.3, the corresponding electricity consumption of average usage is derived via the average drive share and electricity consumption of driving in CD mode but can also be expressed by the average drive share and electricity consumption of driving only on electricity. Figure 3.4 presents the latter. For most of the models, the average electric drive share is between 43% and 50%, while the BMW 330e and the VW Passat are found to be driven on electricity for only 28% and 33% of the distance, respectively.
In Figure 3.4, it can be further be seen that for the three lower medium segment and the three SUV segment PHEV models, the electric drive share in average usage is comparatively similar. Hence, the wide range in the life-cycle GHG emissions of these models merely corresponds to the fuel and electricity consumption when driving in the respective drive modes rather than only to the share of driving in these modes. In other words, the difference in the life-cycle GHG emissions between these models is determined by their greatly differing energy efficiency.
For the three medium segment PHEV models, in contrast, Figure 3.4 shows that their life-cycle GHG emissions for the same electric drive share would be very similar. Here, it is the low average electric drive share of 28% for the BMW 330e compared to the higher electric drive share of 43% for the Kia Optima that determines the difference in the life-cycle GHG emissions.
BEVsAs presented in Figures 3.1 to 3.3, the life-cycle GHG emissions benefit of BEVs compared to average gasoline ICEVs is generally found to be significantly higher than

22 ICCT WHITE PAPER | GHG BENEFITS AND INCENTIVES OF PHEVS AND BEVS IN GERMANY
for PHEVs. In the lower medium segment, the life-cycle GHG emissions range from 80 g CO2 eq./km for the Hyundai Ioniq BEV, to over 85 g CO2 eq./km for the VW e-Golf, and 106 g CO2 eq./km for the Nissan Leaf. These correspond to 59%–69% lower levels than for a segment average gasoline car. In the medium segment, the life-cycle GHG emissions are 97 g CO2 eq./km for the Tesla Model 3 standard range plus, 103 g CO2 eq./km for Tesla Model 3 long range, and 124 g CO2 eq./km for Polestar 2, which corresponds to 58%–67% lower emissions than the gasoline ICEV comparator. The SUV segment models have life-cycle GHG emissions of 98 g CO2 eq./km for the Hyundai Kona, 108 g CO2 eq./km for the Mercedes EQC, and 124 g CO2 eq./km for the Jaguar I-Pace. These emission levels are 57% to 66% lower than those of an average SUV segment gasoline car.
Across the segments, the BEV models with the lowest electric energy consumption correspond to a life-cycle GHG emissions benefit of 66%–69%, while the BEV models with the highest energy consumption only provide a benefit of 57%–59%. Of course, the life-cycle GHG emissions of the individual BEV models also depend on the emissions of battery manufacturing. Although these emissions are three to five times lower than the GHG emissions corresponding to the electric energy consumption, they vary greatly between the selected BEV models. With a capacity of 90 kWh, for instance, the battery of the Jaguar I-Pace corresponds to emissions of 5.4 t CO2 eq., which is more than twice as high as the 2.4 t CO2 eq. considered for the 40-kWh battery of the Hyundai Ioniq (compare Table 2.3). As this study only considers a market average carbon intensity per kWh of battery production, these values may vary when considering the manufacturer-specific carbon intensities of battery production, but they help to illustrate that the battery capacity plays a significant role in the life-cycle GHG emissions of BEVs.
Accumulation of life-cycle GHG emissions during the vehicle lifetimeFigures 3.5 to 3.7 present how the life-cycle GHG emissions of the selected BEV and PHEV models, as well as the respective segment average gasoline and diesel cars, accumulate over the useful vehicle lifetime. Due to differences in the average annual mileage, the considered useful vehicle lifetime of 18 years spreads over a lifetime mileage of 243,000 km for lower medium segment, 279,000 km for medium segment, and 270,000 km for SUV segment cars.
0
10
20
30
40
50
60
70
0 40,000 80,000 120,000 160,000 200,000 240,000
Cum
ulat
ive
life-
cycl
e G
HG
em
issi
ons
(t
CO
2 eq
.)
Cumulative mileage (km)
Gasoline ICEVDiesel ICEV
BMW 225xe
Hyundai Ioniq PHEV
Toyota Prius
Nissan Leaf
VW e-GolfHyundai Ioniq BEV
Figure 3.5. Cumulative life-cycle GHG emissions over the lifetime of selected PHEV and BEV models compared to average lower medium segment gasoline and diesel ICEVs driven in Germany in 2021 to 2038.

23 ICCT WHITE PAPER | GHG BENEFITS AND INCENTIVES OF PHEVS AND BEVS IN GERMANY
10
0
20
30
40
50
60
70
80
90
0 40,000 80,000 120,000 160,000 200,000 240,000 280,000
Cum
ulat
ive
life-
cycl
e G
HG
em
issi
ons
(t
CO
2 eq
.)
Cumulative mileage (km)
Gasoline ICEV
Diesel ICEV
BMW 330eVW Passat Variant GTE
Kia Optima Sportswagon
Polestar 2
Tesla Model 3 long rangeTesla Model 3 std. range plus
Figure 3.6. Cumulative life-cycle GHG emissions over the lifetime of selected PHEV and BEV models compared to average medium segment gasoline and diesel ICEVs driven in Germany in 2021 to 2038.
0
10
20
30
40
50
60
70
80
90
Cum
ulat
ive
life-
cycl
e G
HG
em
issi
ons
(t
CO
2 eq
.)
Diesel ICEV
Gasoline ICEV
BMW X5
Mitsubishi Outlander
Kia Niro
Jaguar I-Pace
Mercedes EQCHyundai Kona
0 40,000 80,000 120,000 160,000 200,000 240,000 280,000Cumulative mileage (km)
Figure 3.7. Cumulative life-cycle GHG emissions over the lifetime of selected PHEV and BEV models compared to average SUV segment gasoline and diesel ICEVs driven in Germany in 2021 to 2038.
The cumulative life-cycle GHG emissions for these lifetime mileages, displayed in tonnes of CO2 eq., directly correspond to the emissions displayed in Figure 3.1 to 3.3 in gram of CO2 eq. per vehicle kilometer. In the lower medium segment, the cumulative

24 ICCT WHITE PAPER | GHG BENEFITS AND INCENTIVES OF PHEVS AND BEVS IN GERMANY
life-cycle GHG emissions of gasoline and diesel ICEVs are 62 t CO2 eq. and 61 t CO2 eq., respectively, while they are 30–47 t CO2 eq. for the three PHEV models and 19–26 t CO2 eq. for the three BEVs. In the medium segment, the cumulative emissions for gasoline and diesel ICEVs are at 82 t CO2 eq. and 75 t CO2 eq., respectively, while the PHEV models are 51–57 t CO2 eq., and the BEV models 27–35 t CO2 eq. For SUVs, average gasoline and diesel ICEVs have life-cycle GHG emissions of 77 t CO2 eq. and 85 t CO2 eq., respectively, while the emissions of the PHEV models range between 42 t CO2 eq. and 69 t CO2 eq., and the BEV models range between 26 CO2 eq. and 33 t CO2 eq.
As the carbon intensity of the average fuel mix is expected to remain relatively constant (compare Table A4), the emissions corresponding to gasoline and diesel cars accumulate almost linearly over the lifetime mileage. For PHEVs and BEVs, in contrast, the rate of the accumulation of life-cycle GHG emissions over the cumulative vehicle mileage continuously decreases, as the carbon intensity of the average electricity mix is projected to decrease significantly during the vehicle lifetime.
While the battery and vehicle manufacture emissions of PHEVs and BEVs are higher than the vehicle manufacture emissions of gasoline ICEVs, both electric powertrain types correspond to lower emissions during the use phase. Figures 3.5 to 3.7 also indicate at which cumulative mileage the higher manufacturing emissions of PHEVs and BEVs are compensated. For the PHEVs in the lower medium segment, this point is reached at about 10,000 km to 20,000 km, while it is reached at 20,000 km for the models in the medium segment. In the SUV segment, this point is reached at about 10,000 km and 20,000 km for the Kia Niro and the Mitsubishi Outlander, respectively. As the high fuel and electricity consumption of the BMW X5 only corresponds to a relatively low GHG emissions benefit over average gasoline SUVs during the usage phase, it takes about 150,000 km to compensate for the higher production emissions. For BEVs, this point is 10,000 km to 20,000 km for the models in the lower medium segment, 20,000 km to 30,000 km for the models in the lower medium segment, and 20,000 km to 40,000 km for the models in the SUV segment. Most PHEV and BEV models thus make up for their higher vehicle and battery manufacturing emissions within the first one to two years of usage.
Trends of life-cycle GHG emissions for future vehiclesDue to the continuously decarbonizing average electric mix in Germany, the life-cycle GHG emissions of PHEVs and BEVs potentially produced in 2030 are expected to be lower than for vehicle registered today. In addition, we assume the battery capacity of potential 2030 variants of the selected PHEV models to be 50% higher than for today’s models. As the electric drive share is found to correlate with the electric range, we estimate that the electric drive share of future PHEV models would increase by the factor of 1.3 compared to today’s models. This increase is considered to also reflect the potential impact of a higher availability of public charging infrastructure. For the 2030 variants of the selected BEV models, we estimate that the decreasing battery production costs would result in an increase of the average battery capacity by 20%. For average gasoline and diesel ICEVs, the real-world fuel consumption is expected to remain similar to today’s levels. More details regarding the considered decrease in the carbon intensity of the vehicle and battery manufacture are discussed in Sections 2.1 and 2.2.
Figures 3.8 to 3.10 present the life-cycle GHG emissions of potential 2030 variants of the selected PHEV and BEV models in the lower medium, medium, and SUV segment. With vehicle lifetimes of 18 years, these are considered to be in use from 2030 to 2047.

25 ICCT WHITE PAPER | GHG BENEFITS AND INCENTIVES OF PHEVS AND BEVS IN GERMANY
Life
-cyc
le G
HG
em
issi
ons
(g
CO
2 eq
./km
)
0
50
100
150
200
250
300
Gasoline +biofuels
Diesel +biofuels
FutureBMW 225xe(14.6 kWh)
Future HyundaiIoniq PHEV(13.4 kWh)
FutureToyota Prius(13.2 kWh)
FutureVW e-Golf(43.0 kWh)
FutureNissan Leaf(74.4 kWh)
Future HyundaiIoniq BEV
(48.5 kWh)
ICEV PHEV BEV
-1%
-43%
-57%
-63%
-80%-75%
-80%
Electricity productionFuel productionFuel consumptionMaintenanceBattery manufactureVehicle manufacture
Figure 3.8. Life-cycle GHG emissions of hypothetical future versions of the selected lower medium segment PHEV and BEV models compared to average lower medium segment gasoline and diesel ICEVs driven in Germany in 2030 to 2047.
Life
-cyc
le G
HG
em
issi
ons
(g
CO
2 eq
./km
)
0
50
100
150
200
250
300
Gasoline +biofuels
Diesel +biofuels
FutureBMW 330e(18.0 kWh)
FutureVW Passat
Variant GTE(19.5 kWh)
FutureKia Optima
Sportswagon(17.0 kWh)
FutureTesla Model 3
long range(96.6 kWh)
FutureTesla Model 3std. range plus
(82.0 kWh)
FuturePolestar 2
(93.6 kWh)
ICEV PHEV BEV
-7%
-40%-44%
-51%
-78% -80%-76%
Electricity productionFuel productionFuel consumptionMaintenanceBattery manufactureVehicle manufacture
Figure 3.9. Life-cycle GHG emissions of hypothetical future versions of the selected medium segment PHEV and BEV models compared to average medium segment gasoline and diesel ICEVs driven in Germany in 2030 to 2047.

26 ICCT WHITE PAPER | GHG BENEFITS AND INCENTIVES OF PHEVS AND BEVS IN GERMANY
Life
-cyc
le G
HG
em
issi
ons
(g
CO
2 eq
./km
)
0
50
100
150
200
250
300
350
Gasoline +biofuels
Diesel +biofuels
FutureMitsubishiOutlander
(20.7 kWh)
FutureKia Niro
(13.4 kWh)
FutureBMW X5
(36.0 kWh)
FutureHyundai Kona
(81.0 kWh)
FutureJaguarI-Pace
(108.0 kWh)
FutureMercedes EQC(102.0 kWh)
ICEV PHEV BEV
+11%
-49%
-58%
-37%
-79%
-74%-77%
Electricity productionFuel productionFuel consumptionMaintenanceBattery manufactureVehicle manufacture
In the lower medium segment, the life-cycle GHG emissions of the potential 2030 variants of the selected PHEV models are estimated to be 94–144 g CO2 eq./km. This is 43%–63% lower than the 253 g CO2 eq./km for segment average gasoline cars expected to be registered in 2030. With emissions of only 50–62 g CO2 eq./km, however, the 2030 variants of the lower medium segment BEV models would correspond to 75%–80% lower emissions than average gasoline ICEVs. In the medium segment, average gasoline ICEVs registered in 2030 are estimated to have life-cycle GHG emissions of 288 g CO2 eq./km. Future variants of the PHEV models in that segment would have emissions of 140–173 g CO2 eq./km, which correspond to 40%–51% lower levels than gasoline ICEVs. The life-cycle GHG emissions of BEVs would be 59–70 g CO2 eq./km, which would correspond to a GHG emissions benefit of 76%–80%. Finally, the life-cycle GHG emissions of SUV segment average gasoline ICEVs is estimated to be 280 g CO2 eq./km, while the future variants of the PHEV models would be 116–177 g CO2 eq./km. This corresponds to a GHG emissions benefit of 37%–58%. For future BEVs, the emission levels of 59–71 g CO2 eq./km would be 74%–79% lower than for average gasoline ICEVs.
The relatively high life-cycle GHG emissions for PHEVs illustrate that future PHEV models would still correspond to a significant fuel consumption of 2 L/100 km to 4 L/100 km (compare Table A3 in the Appendix), even when assuming average electric drive shares 1.3 times higher than observed in average usage today. As the availability of e-fuels and low carbon biofuels for road transport is expected to remain limited, PHEVs would need to consume substantial amounts of fossil fuels in the long term. A carbon neutral passenger car fleet thus requires phasing out the registration of new PHEVs, just as it
Figure 3.10. Life-cycle GHG emissions of hypothetical future versions of the selected SUV segment PHEV and BEV models compared to average SUV segment gasoline and diesel ICEVs driven in Germany in 2030 to 2047.

27 ICCT WHITE PAPER | GHG BENEFITS AND INCENTIVES OF PHEVS AND BEVS IN GERMANY
is required for HEVs and purely combustion engine ICEVs. With useful vehicle lifetimes of 18 years, of which at least 13 years are in Germany, achieving carbon neutrality in Germany by 2045 requires phasing out the registration of new PHEVs by around 2030.
3.2. FISCAL INCENTIVESThe fiscal incentives for PHEVs and BEVs are presented for two scenarios. In a private use scenario, the fiscal incentives correspond only to a privately used vehicle. They include the vehicle purchase subsidy and the difference in vehicle ownership tax when compared to an average gasoline ICEV in the respective segment. In a combined scenario, we consider that the vehicles are used as company cars for the first two years and then diffused into the private fleet for the remaining useful vehicle life. For this scenario, the difference in the company car taxation compared to an average gasoline ICEV is assessed. Note that the potential effect of the different vehicle purchase and operational costs on the expenditures of a company, and thereby on the taxes on its profits, is not considered within the scope of this study. In both scenarios, the vehicles are assumed to remain in Germany for the full useful vehicle lifetime of 18 years. The wallbox subsidy for private households is discussed separately, as an acquisition of a PHEV or BEV does not necessarily imply the installation of a new home charging point.
Lower medium segmentFigure 3.11 presents the net present value of the fiscal incentives for the PHEV and BEV models in the lower medium segment. As all selected models have a net list price below €40,000, all of them qualify for the highest levels of purchase subsidies of €4,500 for PHEVs and €6,000 for BEVs. In the private usage scenario, which also considers the car ownership tax difference to the segment aver gasoline ICEVs, the net present value of the fiscal incentives at the point of purchase cumulate to around €6,400 for the PHEV models and around €7,900 for BEVs. This yields a delta of about €1,500.
In the combined usage scenario, which further includes the company car tax benefit of around €1,700 for the PHEV models and €3,500 for the BEV models, the net present value of the fiscal incentives accumulates to about €8,000 for PHEV and €11,300 for BEVs. Here, the delta between the average of the PHEV and the BEV models is €3,300.
€7,859€8,603
€8,052
€11,624€11,024
€11,358
€6,403 €6,377 €6,324
€7,866 €7,866 €7,890
0
2,000
4,000
6,000
8,000
10,000
12,000
14,000
16,000
Gasoline BMW225xe
HyundaiIoniqPHEV
ToyotaPrius
VWe-Golf
NissanLeaf
HyundaiIoniqBEV
ICEV PHEV BEV
Net
pre
sent
val
ue o
f fi
scal
ince
ntiv
es (
€)
Purchase subsidyVehicle ownership tax di�erence
Company car tax di�erenceTotal combined usage
Total private usage
Figure 3.11. Net present value of the fiscal incentives for selected lower medium segment PHEV and BEV models for a purchase in 2021. The difference in the vehicle ownership tax (over 18 years) and company car taxation (over 2 years) corresponds to a segment average gasoline ICEV.

28 ICCT WHITE PAPER | GHG BENEFITS AND INCENTIVES OF PHEVS AND BEVS IN GERMANY
Medium segmentThe fiscal incentives for medium segment PHEV and BEV models are presented in Figure 3.12. Here, the selected models show a higher variance in net list prices than in the lower medium segment, which results in different levels of purchase subsidies. While for the PHEV models, two out of the three are eligible for the highest level of purchase subsidy of €4,500, only one of three BEV models is eligible for the highest level of €6,000. The vehicle ownership tax difference for the PHEV and BEV models in the medium segment is generally higher than in the lower medium segment, mostly due to the higher vehicle ownership tax rate for the segment average gasoline ICEV comparator. In total, the fiscal incentives for the private usage scenario range from around €6,600 to €7,500 for the PHEV models and from €7,900 to €9,000 for the BEV models. The simple, not sales-weighted average is €7.200 for PHEVs and €8,300 for BEVs, which yields a mean delta of around €1,100.
In the medium segment, the difference in company car taxation compared to a segment average gasoline ICEV is significantly higher than in the lower medium segment, with average values of around €3,600 for the PHEV models and €5,700 for the BEV models. These higher values for the medium segment directly result from the generally higher vehicle prices than in the lower medium segment. With higher vehicle prices, the reduced company car tax rate generally has a higher absolute impact. Moreover, the benefit of the lower company car tax rates for PHEVs and BEVs compared to the segment average gasoline ICEV is weakened when the PHEV and BEV models are more expensive than this comparator. In the lower medium segment, the vehicle price of the selected PHEV models is 13%–43% higher than the price of the segment average gasoline ICEV, and is 8%–54% higher for the BEV models (compare Table A9). In the medium segment, in contrast, the vehicle price of the PHEV models ranges from 1% lower to 21% higher than the price of the segment average gasoline ICEV, while the vehicle price of the BEV models ranges from a 3% lower to a 15% higher vehicle price. In the lower medium segment, the relatively higher vehicle price of the PHEV and BEV models thus reduces the company car tax benefit, while this is less the case in the medium segment. In total, the fiscal incentives for the combined usage scenario amount to average values of around €10,800 for the PHEV models and €14,000 for the BEV models in total. Here, the delta of the means of the PHEV and BEV models is €3,200.
0
2,000
4,000
6,000
8,000
10,000
12,000
14,000
16,000
Net
pre
sent
val
ue o
f fi
scal
ince
ntiv
es (
€)
Gasoline
ICEV
€9,726
€6,641
BMW330e
€11,407
€7,539
VWPassat
Variant GTE
PHEV
€11,347
€7,391
Kia OptimaSportswagon
€13,521
€7,957
TeslaModel 3
long range
€14,897
€8,985
TeslaModel 3 std.range plus
BEV
€13,515
€7,933
Polestar 2
Purchase subsidyVehicle ownership tax di�erence
Company car tax di�erenceTotal combined usage
Total private usage
Figure 3.12. Net present value of the fiscal incentives for selected medium segment PHEV and BEV models for a purchase in 2021. The difference in the vehicle ownership tax (over 18 years) and company car taxation (over 2 years) corresponds to a segment average gasoline ICEV.

29 ICCT WHITE PAPER | GHG BENEFITS AND INCENTIVES OF PHEVS AND BEVS IN GERMANY
SUV segmentThe fiscal incentives for the selected PHEV and BEV models in the SUV segment are presented in Figure 3.13. They show a high variance in vehicle prices compared to the medium segment. Just as for the medium segment, two out of the three PHEV models are eligible for the highest purchase subsidy level, while only one of the BEV models is eligible. The vehicle ownership tax difference when compared to a segment average gasoline ICEV is similar as for the medium segment. In total, the fiscal incentives in the private usage scenario range from around €6,000 to €7,100 for the PHEV models and from €7,500 to €8,600 for the BEV models. The simple, not sales-weighted averages for the selected models are €6,700 for PHEVs and €7,900 for BEVs, which yields a delta of €1,200.
For the combined usage scenario, the difference in company car taxation when compared to an average SUV segment gasoline ICEV does not always correspond to a benefit. As discussed for the medium segment above, the company car tax difference is based on the vehicle price, so if the PHEV and BEV models are significantly more expensive than the average gasoline ICEV comparator, the effect of the lower tax rates for PHEVs and BEVs is weakened. For PHEVs, the company car tax rate is reduced by 50% for the selected models in the SUV segment. As the BMW X5, however, is more than twice as expensive as the average SUV segment gasoline ICEV, the company car taxation for that model is still higher than for the gasoline comparator. For the BEV models in the SUV segment, only the Hyundai Kona is eligible for the reduction of the company car taxation to 25%, while the more expensive Jaguar I-Pace and the Mercedes EQC are only eligible for the 50% discount rate. As these two models are more than twice as expensive as the gasoline ICEV comparator, their company car taxation is higher. As a result, the fiscal incentives for the BMW X5, the Jaguar I-Pace, and the Mercedes EQC are lower in the combined usage scenario than they are in the private usage scenario. In total, the fiscal incentives in the combined usage scenario range from around €4,700 to €9,600 for the PHEV models and from €5,700 to €12,400 for the BEV models. The not sales-weighted average is €7,700 for the PHEV models and €8,200 for BEV models, which yields a mean delta of around €500.
€8,777€9,622
€4,721
€12,396
€5,705
€6,579€6,918 €7,129
€6,010€8,618
€7,537 €7,509
-2,000
0
2,000
4,000
6,000
8,000
10,000
12,000
14,000
16,000
Gasoline MitsubishiOutlander
KiaNiro
BMWX5
HydunaiKona
JaguarI-Pace
MercedesEQC
ICEV PHEV BEV
Net
pre
sent
val
ue o
f fi
scal
ince
ntiv
es (
€)
Purchase subsidyVehicle ownership tax di�erence
Company car tax di�erenceTotal combined usage
Total private usage
Figure 3.13. Net present value of the fiscal incentives for selected SUV segment PHEV and BEV models for a purchase in 2021. The difference in the vehicle ownership tax (over 18 years) and company car taxation (over 2 years) corresponds to a segment average gasoline ICEV.
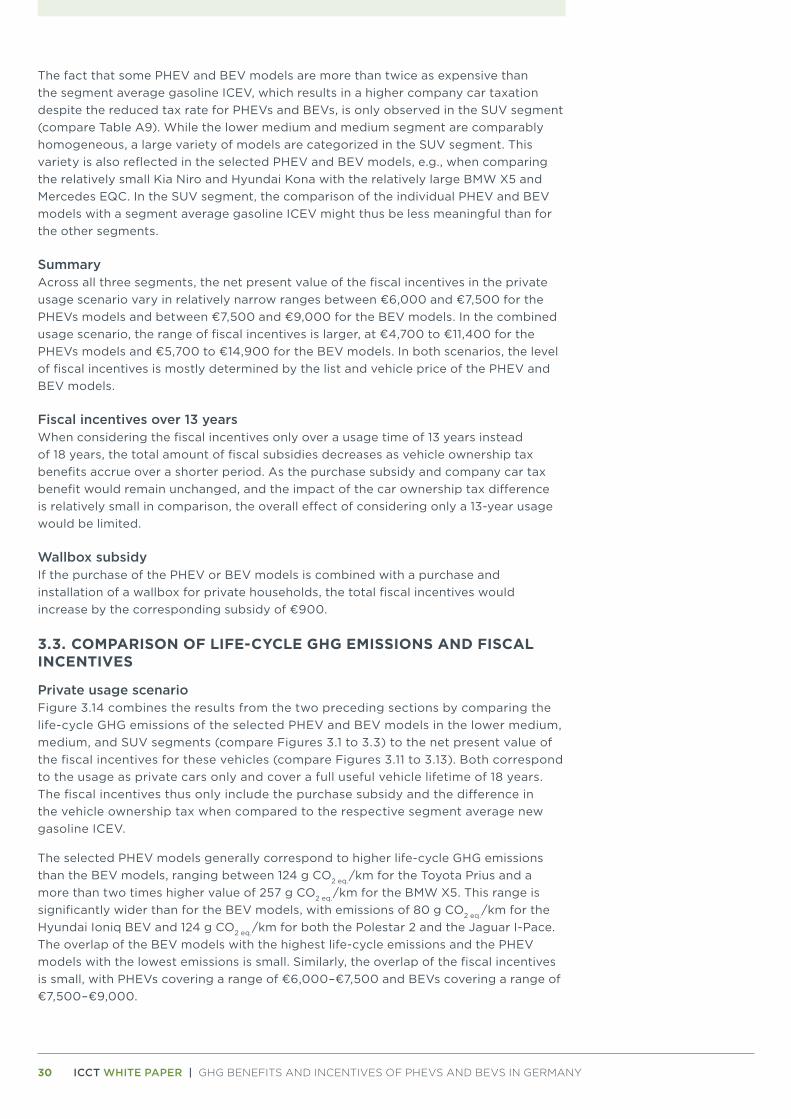
30 ICCT WHITE PAPER | GHG BENEFITS AND INCENTIVES OF PHEVS AND BEVS IN GERMANY
The fact that some PHEV and BEV models are more than twice as expensive than the segment average gasoline ICEV, which results in a higher company car taxation despite the reduced tax rate for PHEVs and BEVs, is only observed in the SUV segment (compare Table A9). While the lower medium and medium segment are comparably homogeneous, a large variety of models are categorized in the SUV segment. This variety is also reflected in the selected PHEV and BEV models, e.g., when comparing the relatively small Kia Niro and Hyundai Kona with the relatively large BMW X5 and Mercedes EQC. In the SUV segment, the comparison of the individual PHEV and BEV models with a segment average gasoline ICEV might thus be less meaningful than for the other segments.
SummaryAcross all three segments, the net present value of the fiscal incentives in the private usage scenario vary in relatively narrow ranges between €6,000 and €7,500 for the PHEVs models and between €7,500 and €9,000 for the BEV models. In the combined usage scenario, the range of fiscal incentives is larger, at €4,700 to €11,400 for the PHEVs models and €5,700 to €14,900 for the BEV models. In both scenarios, the level of fiscal incentives is mostly determined by the list and vehicle price of the PHEV and BEV models.
Fiscal incentives over 13 yearsWhen considering the fiscal incentives only over a usage time of 13 years instead of 18 years, the total amount of fiscal subsidies decreases as vehicle ownership tax benefits accrue over a shorter period. As the purchase subsidy and company car tax benefit would remain unchanged, and the impact of the car ownership tax difference is relatively small in comparison, the overall effect of considering only a 13-year usage would be limited.
Wallbox subsidyIf the purchase of the PHEV or BEV models is combined with a purchase and installation of a wallbox for private households, the total fiscal incentives would increase by the corresponding subsidy of €900.
3.3. COMPARISON OF LIFE-CYCLE GHG EMISSIONS AND FISCAL INCENTIVES
Private usage scenarioFigure 3.14 combines the results from the two preceding sections by comparing the life-cycle GHG emissions of the selected PHEV and BEV models in the lower medium, medium, and SUV segments (compare Figures 3.1 to 3.3) to the net present value of the fiscal incentives for these vehicles (compare Figures 3.11 to 3.13). Both correspond to the usage as private cars only and cover a full useful vehicle lifetime of 18 years. The fiscal incentives thus only include the purchase subsidy and the difference in the vehicle ownership tax when compared to the respective segment average new gasoline ICEV.
The selected PHEV models generally correspond to higher life-cycle GHG emissions than the BEV models, ranging between 124 g CO2 eq./km for the Toyota Prius and a more than two times higher value of 257 g CO2 eq./km for the BMW X5. This range is significantly wider than for the BEV models, with emissions of 80 g CO2 eq./km for the Hyundai Ioniq BEV and 124 g CO2 eq./km for both the Polestar 2 and the Jaguar I-Pace. The overlap of the BEV models with the highest life-cycle emissions and the PHEV models with the lowest emissions is small. Similarly, the overlap of the fiscal incentives is small, with PHEVs covering a range of €6,000–€7,500 and BEVs covering a range of €7,500–€9,000.

31 ICCT WHITE PAPER | GHG BENEFITS AND INCENTIVES OF PHEVS AND BEVS IN GERMANY
Gasoline ICEV
BMW 225xe
Hyundai Ioniq PHEV
Toyota Prius
VW e-Golf
Nissan Leaf
Hyundai Ioniq BEV
Gasoline ICEV
BMW 330eVW Passat Variant GTE
Kia Optima Sportswagon
Tesla Model 3long range
Tesla Model 3std. range plus
Polestar 2
Gasoline ICEV
MitsubishiOutlander
Kia Niro
BMW X5
Hyundai Kona
Jaguar I-Pace
Mercedes EQC
0
50
100
150
200
250
300
0 2,000 4,000 6,000 8,000 10,000
Life
-cyc
le G
HG
em
issi
ons
(g
CO
2 eq
./km
)
Net present value of fiscal incentives, private usage for 18 years (€)
BEVs
Gasoline ICEVPHEVs
Lower medium segmentMedium segmentSUV segment
Figure 3.14. Life-cycle GHG emissions versus net present value of the fiscal incentives for the PHEV and BEV models in private usage in 2021 to 2038.
Note that in the overarching system of the European Union’s CO2 emission standards, increasing PHEV and BEV shares in Germany allows car manufacturers to sell less PHEVs and BEVs in other Member States and sell more high emitting ICEVs in Germany. In fact, the fiscal incentives for PHEVs and BEVs in Germany thus do not result in GHG emission savings when considering the European Union as a whole.
Nonetheless, this analysis allows a comparison of how far the fiscal incentives correlate with the life-cycle GHG emissions benefit for PHEV and BEV models on an individual vehicle basis. Figure 3.15 presents the difference in life-cycle GHG emissions of the individual PHEV and BEV models when compared to a respective segment average gasoline ICEV. As the fiscal incentives are also defined by the difference in the taxation compared to a gasoline ICEV comparator, this relative life-cycle GHG emissions benefit allows a more direct comparison to the incentives than the total emission values. For BEVs, fiscal incentives of €7,500 to €9,000 correspond to life-cycle GHG emission benefits between 150 g CO2 eq./km and 200 g CO2 eq./km. For PHEVs, fiscal incentives of €6,000 to €7,500 correspond to an emissions benefit of 30-130 g CO2 eq./km. As for the absolute life-cycle GHG emissions shown in Figure 3.14, it is thus observed that for the emissions benefit over a segment average gasoline ICEV, the selection of PHEV models shows a much larger range than for the BEV models.

32 ICCT WHITE PAPER | GHG BENEFITS AND INCENTIVES OF PHEVS AND BEVS IN GERMANY
BMW 225xe
Hyundai Ioniq PHEV
Toyota Prius
Nissan Leaf
BMW 330e VW Passat Variant GTE
Kia Optima Sportswagon
Tesla Model 3long range
Tesla Model 3std. range plus
GasolineICEV
Mitsubishi Outlander
Kia Niro
BMW X5
Hyundai Kona
Jaguar I-Pace
Mercedes EQC
0
50
100
150
200
250
0 2,000 4,000 6,000 8,000 10,000
Life
-cyc
le G
HG
em
issi
ons
ben
efit
(g C
O2
eq./
km)
Net present value of fiscal incentives, private usage for 18 years (€)
Average ratio
HyundaiIoniq BEVVW e-Golf
Polestar 2
BEVs
Gasoline ICEVPHEVs
Lower medium segmentMedium segmentSUV segment
Figure 3.15. Life-cycle GHG emissions benefit when compared to a segment average gasoline ICEV versus net present value of the fiscal incentives for the PHEV and BEV models in private usage in 2021 to 2038.
In Figure 3.15, the selected BEV models show an almost linear correlation of life-cycle GHG emissions benefit compared to the fiscal incentives, with models like the Jaguar I-Pace having a relatively low life-cycle GHG emissions benefit and relatively low incentives, and models like the Tesla Model 3 standard range plus having a relatively high emissions benefit and relatively high incentives. For a more detailed evaluation, Figure 3.16 directly presents this ratio. For the BEV models, it ranges between 19 g CO2 eq./km and 24 g CO2 eq./km life-cycle GHG emission benefits over a comparable gasoline ICEV per €1,000 of fiscal incentive, with the Nissan Leaf corresponding to the lower and the Tesla Model 3 long range corresponding to the higher end of that range. The average value is 22 g CO2 eq./km per €1,000.
0.0 5.0 10.0 15.0 20.0 25.0
BMW X5
Mitsubishi OutlanderVW Passat Variant GTE
BMW 330eKia Optima Sportswagon
Kia Niro
Nissan LeafPolestar 2
Jaguar I-PaceHyundai Kona
Tesla Model 3 std. range plusVW e-Golf
Hyundai Ioniq BEVMercedes EQC
Tesla Model 3 long range
Life-cycle GHG emissions benefit per net present valueof fiscal incentives (g CO2 eq./km per €1,000)
BMW 225xe
Hyundai Ioniq PHEV
Toyota Prius
Lower medium segmentMedium segmentSUV segment
Figure 3.16. Ratio of the life-cycle GHG emissions benefit to the net present value of the fiscal incentives of the PHEV (blue) and BEV models (green) in private usage, both compared to a segment average gasoline ICEV.

33 ICCT WHITE PAPER | GHG BENEFITS AND INCENTIVES OF PHEVS AND BEVS IN GERMANY
For the PHEV models, the ratio of the GHG emissions benefit to fiscal incentives is spread over a wide range of below 5 g CO2 eq./km per €1,000 for the BMW X5 to 21 g CO2 eq./km per €1,000 for the Toyota Prius. The non-market share weighted average across the nine PHEV models is at 14 g CO2 eq./km per €1,000, which is only about half as high as for the BEV models. As the Mitsubishi Outlander and the BMW 225xe correspond to 44% and 74% of the PHEV registrations in the SUV and lower medium segment in Germany in 2019, respectively, a sales-weighted value for the average ratio of the GHG emissions benefit and fiscal incentives is expected to be lower.
To achieve the same ratio of the GHG emissions benefit per fiscal incentives as for BEVs, the fiscal incentives for PHEVs could generally be reduced by €2,500, resulting in an average value of 22 g CO2 eq./km per €1,000.
In parallel, the ratio of GHG emissions benefit per fiscal incentives could be increased by limiting the incentives to PHEVs with a higher life-cycle GHG emissions benefit, which is mainly determined by the average fuel consumption. As discussed in Section 3.1, almost all of the selected PHEV models show a similar electric drive share of 43%–50%. Only the BMW 330e and the VW Passat correspond to exceptionally low electric drive shares of only 28% and 33%, respectively. Hence, the large range in life-cycle GHG emissions for the selected PHEV models mostly corresponds to their variety in energy efficiency, irrespective of the drive mode (compare Figure 3.4). The two extreme cases of the Toyota Prius and the BMW X5 help to illustrate this point. While the 50% electric drive share of the BMW X5 is a bit higher than the 45% electric drive share of the Toyota Prius, the average fuel consumption of the BMW X5 is 5.4 L/100 km, more than twice as high as the 2.3 L/100 km for the Toyota Prius (compare Table 2.4).
Nevertheless, as also presented in Figure 3.4, increasing the electric drive share to substantially higher levels than observed in average usage today would decrease the life-cycle GHG emissions for all models. The electric range of all selected PHEV models corresponds to NEDC values of around 50 km. Therefore, this analysis cannot derive a correlation of the electric range and the life-cycle GHG emissions. In an earlier evaluation of the real-world electric drive share and the electric range on a broader variety of PHEV models, it was found that the electric drive share increases with the electric range (Plötz et al., 2020). As presented for hypothetical 2030 variants of the current PHEV models in Section 3.1, an 50% increase in the electric range is considered to increase the electric drive share by the factor of 1.3 (compare Figures 3.8 to 3.10).
Combined private and company car usage scenarioIn the combined usage scenario, the PHEV and BEV models are assumed to be used as company cars in the first two years and continue to be used as private cars for the remainder of their useful vehicle lifetime. For these first two years, the fiscal incentives further include the difference in the company car tax compared to a segment average gasoline ICEVs (compare Figures 3.11 to 3.13). In addition, the life-cycle GHG emissions are slightly adjusted. For the PHEV models, they consider the first two years of company car usage to have a lower electric drive share than for private usage.6
6 For PHEVs, the average fuel consumption of company cars is found to be substantially higher than for PHEVs used as private cars (Plötz et al., 2020). This is mostly based on a lower charging frequency, a higher fuel consumption when driving in combustion engine mode, and a higher share of long-distance travels. To reflect these differences, the electric drive share of the PHEV models in company car usage is assumed to be only half as high as observed in average private usage. This results in a higher fuel consumption and a lower electricity consumption (compare Table A3). For being used as company cars for a full vehicle lifetime, this would result in a 9% to 20% increase in the life-cycle GHG emissions for PHEV models in private usage. While this increase is higher for the PHEV models with a relatively high electric drive share in private usage, it is lower for models that are mostly driven on fuel also in private usage. As the vehicles are considered to be driven as company cars only in the first 2 years, the overall life-cycle GHG emissions of the PHEV models in the combined usage scenario is only 2-5 g CO2 eq./km higher than in the solely private usage scenario.

34 ICCT WHITE PAPER | GHG BENEFITS AND INCENTIVES OF PHEVS AND BEVS IN GERMANY
As presented in Figure 3.17, the life-cycle GHG emissions benefit of the BEV models over the respective segment average gasoline cars remain unchanged in the combined usage scenario, while the emissions benefit of the PHEV models decreases slightly by 2–5 g CO2 eq./km. For the fiscal incentives, in contrast, considering two years of the company car tax difference to the respective segment average gasoline ICEV has a significant contribution. For all lower medium and medium segment PHEV and BEV models, the company car taxation is lower than for the ICEV comparator, resulting in an additional fiscal benefit. In the lower medium segment, this benefit is €1,700 for the PHEV models and €3,500 for the BEV models, while it is €3,600 and €5,700, respectively, in the medium segment. As discussed in Section 3.2, however, the company car tax for the BMW X5, Jaguar I-Pace, and the Mercedes EQC, is higher than for the SUV segment average gasoline ICEV. Here, the reduction of the tax rate by 50% cannot compensate for the more than two times higher vehicle price of these models. As this effect is considered an artifact from the large variety of models in the SUV segment, the following discussion focuses on the lower medium and medium segment PHEV and BEV models.
BMW 225xe
HyundaiIoniq PHEV
Toyota Prius
VW e-GolfNissan Leaf
Hyundai Ioniq BEV
BMW 330eVW Passat Variant GTEKia Optima Sportswagon
Tesla Model 3long range
Tesla Model 3std. range plus
Polestar 2
GasolineICEV
Mitsubishi Outlander
Kia Niro
BMW X5
Hyundai Kona
Jaguar I-Pace
Mercedes EQC
0
50
100
150
200
250
0 2,000 4,000 6,000 8,000 10,000 12,000 14,000 16,000
Life
-cyc
le G
HG
em
issi
ons
ben
efit
(g C
O2
eq./
km)
Net present value of fiscal incentives, combined private and company car usage for 18 years (€)
Average ratio
BEVs
Gasoline ICEVPHEVs
Lower medium segmentMedium segmentSUV segment
Figure 3.17. Life-cycle GHG emissions benefit when compared to a segment average gasoline ICEV versus net present value of the fiscal incentives for the PHEV and BEV models in combined company car and private usage in 2021 to 2038.
Once again, it is observed that the BEV models correspond to a comparatively high life-cycle GHG emissions benefit and comparatively high fiscal incentives, while the PHEV models correspond to a lower emissions benefit and lower incentives. Furthermore, the ratio of life-cycle GHG emissions benefit vs. net present value of the fiscal incentives is similar among the BEV models, at least when focusing on the lower medium and medium segment models, while it is spread over a larger range for the PHEV models. For the lower medium and medium segment BEV models, the values range between 13 g CO2 eq./km per €1,000 for the Polestar 2 and 16 g CO2 eq./km per €1,000 for the Hyundai Ioniq. The average value across the six BEV models is 14 g CO2 eq./km per €1,000. The PHEV models show a range of 7 g CO2 eq./km per €1,000 for the BMW 225xe and 16 g CO2 eq./km per €1,000 for the Toyota Prius. The average value of 10 g CO2 eq./km per €1,000 is again significantly lower than for the BEV models. As for the private usage scenario, reducing the financial incentives by €2,500 would increase this value to the same level as for BEVs, at 14 g CO2 eq./km per €1,000.

35 ICCT WHITE PAPER | GHG BENEFITS AND INCENTIVES OF PHEVS AND BEVS IN GERMANY
Note that the results for the combined private and company car scenario are sensitive to the period they are used as company cars. A longer company car usage period than the two years considered in this study would increase the life-cycle GHG emissions of the PHEV models and thereby reduce their emissions benefit over the gasoline car comparator. As for most of the selected PHEV models, a longer usage period as company cars would also increase the fiscal incentives, meaning the cost to benefit ratio of the fiscal incentives for PHEVs would be reduced twofold.
In conclusion, many of the same trends are seen in the combined usage scenario as in the private usage scenario. The ratio of life-cycle emissions benefit and fiscal incentives is generally higher for the BEV models than for the PHEV models. However, some PHEV models, like the Toyota Prius, show a relatively high ratio while other models, like the BMW 225xe, show a relatively low ratio. A general reduction of the fiscal incentives for PHEVs by €2,500 or their limitation to PHEV models with comparatively low life-cycle GHG emissions would increase the ratio of the GHG emissions benefit to fiscal incentives.
Wallbox subsidyIncluding the subsidy for the purchase and installation of a home charging point for private households would not have a significant influence on the cost effectiveness of the considered fiscal incentives for the PHEV and BEV models in reducing the life-cycle GHG emissions when compared to a segment average gasoline ICEV. Compared to the high levels of fiscal incentives already considered for both the private usage and the combined usage scenario, the impact of an additional wallbox subsidy of €900 is relatively low.
3.4. SUMMARYThe key results of this study can be summarized as follows:
Life-cycle GHG emissions benefit of BEVs » The life-cycle GHG emissions of the analyzed BEV models if registered in 2021 are
57%–67% lower than respective segment average new gasoline ICEVs. On average, they are 63% lower. This range of results for the individual models is very similar across the three segments, at 59%–69% in the lower medium segment, 58%–67% lower in the medium, and 57%–66% lower in the SUV segment.
» The differences in the life-cycle GHG emissions of the BEV models are found to be mostly determined by their electric energy consumption, with the most efficient models in the respective segments showing a life-cycle GHG emissions benefit of 66%–69% and the least efficient showing a benefit of only 57%–59%.
» Although corresponding to three to five times lower life-cycle GHG emissions than the electricity consumption, the emissions of the battery manufacturing significantly vary between the analyzed BEV models. Due to large differences in the battery capacity, ranging from 40 kWh for the Hyundai Ioniq to 90 kWh for the Jaguar I-Pace, the emissions for producing these batteries are estimated to vary from 2.4 t CO2 eq. to 5.4 t CO2 eq. As this study considers market-average carbon intensity of battery production, manufacturer-specific values may differ.
» For BEV models registered in Germany in 2030, the life-cycle GHG emissions benefit compared to today’s segment average new gasoline ICEVs is estimated to increase to 75%–80% for the lower medium segment models, 76%–80% in the medium segment, and 74%–79% in the SUV segment.
Life-cycle GHG emissions benefit of PHEVs » On average, the life-cycle GHG emissions of the analyzed PHEVs are 34% lower than
for the respective new gasoline ICEVs. This value, however, varies greatly between

36 ICCT WHITE PAPER | GHG BENEFITS AND INCENTIVES OF PHEVS AND BEVS IN GERMANY
individual PHEV models, and ranges between 25%–52% in the lower medium segment, 30%–37% in the medium segment, and 10%–45% in the SUV segment.
» One factor explaining the variation between PHEVs in their life-cycle GHG emissions are the different electric drive shares, with mean electric drive shares varying between private and company car usage but also between some of the models. A higher electric drive share would reduce the life-cycle GHG emissions of all investigated PHEV models.
» Another factor contributing to the differences in the life-cycle GHG emissions between PHEV models is the large variety of vehicle configuration and design. Some vehicles with large combustion engines and low-power electric motors tend to make more use of the combustion engine. Even when the electric drive share is observed to be similar for many models, these differences result in a large range of fuel and electric energy consumption values, also when comparing PHEV models in the same segment.
» Assuming that with higher battery capacities, the electric drive share of hypothetical future PHEV models would be higher than for today’s models, it is estimated that the life-cycle GHG emissions of PHEV registered in 2030 would be reduced. Compared to today’s average gasoline ICEVs, they would correspond to 43%–63% lower emissions for the lower medium segment models, 40%–51% lower emissions in the medium segment, and 37%–58% lower emissions in the SUV segment. Still, these PHEVs would correspond to two to three times higher life-cycle GHG emissions than BEVs registered in 2030.
» As future PHEV models would also correspond to a significant lifetime fuel consumption, and since the availability of e-fuels and low-carbon biofuel for road transport are expected to remain limited, a carbon neutral passenger car fleet cannot be realized with PHEVs.
Comparison of life-cycle GHG emissions and fiscal incentives » In the overarching system of the European Union’s CO2 emission standards, higher
PHEV and BEV shares in Germany allow car manufacturers to sell less PHEVs and BEVs in the other Member States and sell more ICEV models with higher CO2 emissions. In effect, the fiscal incentives for PHEVs and BEVs in Germany thus do not necessarily reduce GHG emissions.
» For PHEVs, the real-world fuel consumption is two to three times higher than considered by the official values. Therefore, incentivizing manufacturers to meet their CO2 emission targets with a higher share of PHEV registrations results in higher real-world emissions. The environmental impact of the fiscal incentives is even worse if they result in an additional demand for vehicles.
» On an individual vehicle basis, however, all of the evaluated PHEV and BEV models are found to correspond to lower life-cycle GHG emissions than a segment average gasoline ICEV. When comparing the ratio between the corresponding life-cycle GHG emissions benefit and the net present value of the fiscal incentives, BEVs generally show significantly higher values than PHEVs. In a solely private usage scenario, which only considers the purchase subsidy and the vehicle ownership tax, the average ratio across the models is 22 g CO2 eq./km per €1,000 for BEVs and 14 g CO2 eq./km per €1,000 for PHEVs.
» This ratio is found to be comparably similar for the individual BEV models, ranging from 19 g CO2 eq./km to 24 g CO2 eq./km per €1,000, while it is found to vary greatly for the PHEV models, between 5 g CO2 eq./km and 21 g CO2 eq./km per €1,000. Only the PHEV models with an average fuel consumption of about 2 L/100 km also in real-world usage have a ratio of life-cycle GHG emissions benefit per fiscal incentives similar to BEVs, at 21 g CO2 eq./km per €1,000 for the Toyota Prius.

37 ICCT WHITE PAPER | GHG BENEFITS AND INCENTIVES OF PHEVS AND BEVS IN GERMANY
» In a combined private and company car usage scenario, which further considers the company car taxation for the first two years of the vehicle lifetime, the same trends are observed.
» A general reduction of the fiscal incentives for PHEVs by €2,500 or their limitation to PHEV models with an average fuel consumption of about 2 L/100 km in real-world usage would result in a similar ratio of the GHG emissions benefit to fiscal incentives as found for BEVs.

38 ICCT WHITE PAPER | GHG BENEFITS AND INCENTIVES OF PHEVS AND BEVS IN GERMANY
4. DISCUSSIONThis study compares the fiscal incentives for PHEVs and BEVs with the life-cycle GHG emissions benefit of PHEVs and BEVs over gasoline ICEVs on an individual vehicle basis. To cover a representative share of the PHEV and BEV market, and also to identify differences between models, the study focuses on nine popular PHEV and BEV models across three different segments and compares their life-cycle GHG emissions, as well as the fiscal incentives with respective segment average new gasoline ICEVs. This approach, and thus also the results, come with limitations and uncertainty that require some reflection.
Regarding the scope of the benefits, the climate benefit of PHEVs and BEVs is accompanied with a significant environmental, human health, and thereby also economic benefit of reducing air pollution by supporting the exchange of ICEVs with PHEVs and BEVs. This benefit is higher for BEVs. Incentivizing the purchase of PHEVs could be helpful to attract more risk averse vehicle buyers to full electric driving. With the current increase of the electric range of BEVs and the improvement in fast charging infrastructure, however, this contribution is declining.
Regarding the scope of the costs to society, our analysis only covers part of the financial framework conditions under federal rule. For example, it does not capture differences in the taxation of gasoline and electricity. Moreover, apart from discussing the national subsidy for the purchase and installation of wallboxes in private households, the analysis does not assess the subsidies the government grants to support public charging points.
For the representativeness of the results, it should be noted that the study covered only small number of models but showed large difference in life-cycle GHG emissions even for models within the same segment and with similar electric drive share. This is a result of general vehicle configuration, design, and efficiency. This is consistent with the empirical observation on a larger number of PHEV models in an earlier study (Plötz et al., 2020). PHEV models with higher total system power have higher real-world fuel consumption for fixed electric range. Additionally, the differences in fuel consumption can be attributed to the vehicle configuration with respect to acceleration, frontal area, drag coefficients, engine size, and other technical parameters.
From a methodological point of view, the comparison of the fiscal incentives with the life-cycle GHG emissions benefit of PHEVs and BEVs, both in comparison to a new gasoline ICEV, includes the hypothesis that the without the fiscal incentives, a similar gasoline ICEV would have been purchased. As discussed in Section 1, this hypothesis neglects the potential waterbed effect that higher shares of PHEVs and BEVs in Germany allow manufacturers to sell more high-emitting ICEVs and less PHEVs and BEVs in other Member States, and still comply with the European Union’s CO2 emission standards. Moreover, this hypothesis neglects potential windfall profits of PHEV and BEV purchases that would have also happened without or with less fiscal incentives. Also, the hypothesis neglects a potential increase in the demand for vehicles. This increased demand could result from the fact that the fiscal PHEV and BEV incentives generally result in PHEVs and BEVs having a lower total cost of ownership than comparable gasoline ICEVs.
Furthermore, as discussed in Section 3.2, assuming that the similar gasoline ICEV that would have been purchased in absence of the fiscal incentives is a segment average gasoline ICEV allows more solid results for the relatively homogenous lower medium and medium segments but can be critical in the relatively heterogeneous SUV segment.
We chose nine popular PHEV and BEV models that cover a noteworthy share of the PHEV and BEV registrations in their respective vehicle segment. As discussed in

39 ICCT WHITE PAPER | GHG BENEFITS AND INCENTIVES OF PHEVS AND BEVS IN GERMANY
Section 2.2, the battery capacities of the selected models are further found to be representative for other more recent models, such as the PHEV models of the Volvo XC40, Ford Kuga, Volvo XC60, and Audi Q5, or the BEV models of the VW ID.3, Audi e-tron, VW ID.4, and Opel Mokka. Our results already indicate a spread in the life-cycle GHG emissions, especially for PHEVs, such that further models will not generally change the qualitative findings. For future models, it can be expected that the electric ranges will be higher than for today’s models. For PHEVs especially, this development can be expected from the fact that the German purchase subsidy will require minimum electric ranges of 60 km from 2022 and 80 km from 2025 (Bundesministerium für Wirtschaft und Energie, 2021) or already from 2023 (SPD, Bündnis 90/Die Grünen, FDP, 2021). As estimated for hypothetical models to be registered in Germany in 2030, however, future PHEV models are expected to still drive a noteworthy share of their annual mileage using the combustion engine. In the mid-term, our findings are not strongly affected by this increase in range as the models considered here already have above market average ranges.
This analysis covers only Germany. As the carbon intensity of the electricity mix in other large vehicle markets, such as the United Kingdom, France, Italy, and Spain is lower than in Germany, the GHG benefit of BEVs is even more pronounced (Bieker, 2021).

40 ICCT WHITE PAPER | GHG BENEFITS AND INCENTIVES OF PHEVS AND BEVS IN GERMANY
5. POLICY RECOMMENDATIONSPHEVs and BEVs correspond to lower life-cycle GHG emissions when compared to average gasoline ICEVs. As the GHG emissions benefit of PHEVs is significantly lower than for BEVs, and since PHEVs are not able to meet the reduction of GHG emissions required for a climate neutral passenger car fleet, the immediate and long-term climate benefit of supporting the uptake of PHEVs is lower than for BEVs. We find that the current fiscal incentives do not sufficiently reflect these differences. In fact, the ratio of GHG emissions benefit per fiscal incentives is significantly lower for PHEVs than for BEVs.
In any case, however, the assessed ratios of the GHG emissions benefit and the fiscal incentives for PHEVs and BEVs do not correspond to a cost efficiency in reducing the life-cycle GHG emissions of passenger cars. In the overarching system of the European Union’s CO2 emission standards, increased PHEVs and BEVs registration shares in Germany allow manufacturers to sell less PHEVs and BEVs in other Member States and more high-emitting ICEVs in Germany. As the real-world fuel consumption of PHEVs is two to four times higher than their official test values, fiscal incentives for PHEVs eventually result in increased GHG emissions.
In the mid- to long-term, however, supporting the automotive industry in scaling up the production of PHEVs and BEVs may allow BEVs to reach production cost parity with ICEVs earlier, and thereby accelerate the full electrification of passenger cars. Fiscal incentives that reflect the life-cycle GHG emissions benefit of the supported vehicles allow this transition to be steered in the most environmentally beneficial direction. In addition to the ratio of fiscal incentives to the GHG emissions benefit for current vehicles, the long-term decarbonization potential of PHEVs and BEVs should be considered.
Based on our findings, we recommend the following:
Fiscal incentives for PHEVs » Reduce the national purchase subsidy for PHEVs. A general reduction of the
national purchase subsidy by €2,500 would, on average, result in a similar ratio of life-cycle GHG emissions benefit to the cost of fiscal incentives as for BEVs. For PHEVs with a high fuel consumption in real-world operation, the incentives would need to be reduced more, and they would need to be reduced less for those with a lower fuel consumption. Considering that, in contrast to BEVs, PHEVs are not able to meet the requirements of a climate neutral passenger car fleet, the long-term climate benefit of supporting the up-scaling of their production is much lower than for BEVs. Therefore, a further reduction of the fiscal incentives for PHEVs, such as fully abolishing the purchase subsidy, could be considered.
» Increase the company car taxation rates for PHEVs. An increase of the company car taxation rates for PHEVs could further help to adjust the fiscal incentives to the GHG emissions benefit ratio for company cars.
» Limit incentives to PHEVs with a low fuel consumption in real-world usage. Alternatively, the life-cycle GHG emissions benefit of PHEVs can be improved by limiting incentives to vehicles with an average fuel consumption of about 2 liters per 100 km in real-world operation:
» On a vehicle model level, this means fiscal incentives should focus on PHEV models with a high electric range in combination with a low fuel consumption in both CS and CD mode. As found in an earlier study, a 10 km higher type-approval range correlates with a reduction of the average fuel consumption of 8%–14%. Due to the large differences in the fuel consumption of individual PHEV models and for a given electric drive share, the electric range alone is not a sufficient

41 ICCT WHITE PAPER | GHG BENEFITS AND INCENTIVES OF PHEVS AND BEVS IN GERMANY
proxy. In addition, to facilitate a more frequent charging, fiscal incentives should be limited to PHEV models that allow fast charging.
» On an individual user level, fiscal incentives could be tied to a low average fuel consumption. Due to large differences in the fuel consumption of individual PHEV models for a given electric drive share, the realized electric drive share is not a sufficient proxy. All PHEV models registered in the European Union from January 2021 are equipped with on-board fuel consumption meters (OBFCMs) that detect both the average fuel consumption and the share of driving in CD mode with the combustion engine off. These data can be made available to users or collected during regular technical inspections. The PHEV purchase subsidy and other fiscal incentives could ideally be tied to demonstrating a low average fuel consumption or, if this is not possible, a high electric drive share.7
Fiscal incentives for BEVs » Focus incentives for BEVs on models with a low electricity consumption. For
BEVs, the electricity consumption is found to be the primary factor in the life-cycle GHG emissions. Binding fiscal incentives to an electricity consumption threshold would help to further reduce their life-cycle GHG emissions.
» Prioritize BEVs with low battery production emissions and/or a low battery capacity. Although of lower importance than the electricity consumption, the life-cycle GHG emissions of BEVs are influenced by the battery production emissions. This could be improved by generally prioritizing BEVs with a lower battery capacity and incentivizing less carbon intensive battery production.
Bonus-malus taxation system » Disincentivize the purchase of high emitting ICEVs with a CO2 emissions-based
registration tax. The positive climate impact of fiscal incentives for PHEVs and BEVs is effectively offset by the fact that high shares of PHEVs and BEVs allow manufacturers to sell more high emitting ICEVs and still comply with the European Union’s CO2 emission standards. In order to sustain the climate benefit from incentivizing BEVs and PHEVs, the purchase of new ICEVs should be simultaneously disincentivized. As the upfront costs are more transparent to consumers than the costs of ownership and operation, this disincentive should be placed at the point of purchase, such as by the introduction of a CO2 emissions-based taxation for the registration of new ICEVs.
» Balance fiscal spending on PHEV and BEV incentives by a higher taxation of ICEVs. With the continuously increasing PHEV and BEV shares in Germany, the fiscal incentives for PHEVs and BEVs, and especially the national purchase subsidy, correspond to increasing fiscal spending. In addition, as PHEVs and BEVs are mostly purchased by companies and higher-income households, these incentives have a regressive effect. To reduce this social imbalance and develop the current purchase subsidies into a fiscal neutral bonus-malus system, we recommend introducing a CO2 emissions-based taxation for the registration of new combustion engine vehicles. Following a polluter pays principle, a bonus-malus taxation system would disincentive the purchase of new high emitting combustion engine vehicles, while further increasing the relative incentives for the purchase of PHEVs and BEVs.
Phase out of new PHEVs by around 2030 » Phase out the registration of new PHEVs by around 2030. In the long-term,
even assuming the electric drive share of future PHEV models would be 1.3 times
7 This documentation could be implemented via the yearly income tax declaration, for instance. PHEV owner that voluntary want to benefit from the purchase incentives and lower tax rates could be asked to state their realized fuel consumption and/or electric drive share. The financial offices could then ask for proof from a local vehicle repair shop that reads out the on-board diagnostics.

42 ICCT WHITE PAPER | GHG BENEFITS AND INCENTIVES OF PHEVS AND BEVS IN GERMANY
higher than observed for average private usage today, PHEVs will correspond to an average fuel consumption of 2 to 4 liters per 100 km. As the availability of e-fuels and low-carbon waste- and residues-based biofuels for road transport is expected to remain very limited, they will be dependent on fossil fuels also in future. With useful vehicle lifetimes of 18 years, of which at least 13 years are in Germany, achieving climate neutrality in the German passenger car fleet by 2045 requires a phase out of the registration of new PHEVs by around 2030.

43 ICCT WHITE PAPER | GHG BENEFITS AND INCENTIVES OF PHEVS AND BEVS IN GERMANY
REFERENCESAllgemeiner Deutscher Automobil-Club. (2021a, October). ADAC Ecotest. https://www.adac.de/
rund-ums-fahrzeug/tests/ecotest/.
Allgemeiner Deutscher Automobil-Club. (2021b, October). ADAC Autokatalog [Car catalog]. https://www.adac.de/rund-ums-fahrzeug/autokatalog/.
Allgemeiner Deutscher Automobil-Club. (2021c, October). ADAC Autokostenrechner [Car costs calculator]. https://www.adac.de/rund-ums-fahrzeug/auto-kaufen-verkaufen/autokosten/.
Argonne National Laboratory. (2020). The Greenhouse gases, Regulated Emissions, and Energy use in Transportation Model (GREET) (Version 2020). Retrieved from https://greet.es.anl.gov/index.php.
Bamberg, C., Lackner, J., Siegemund, S., & Auf der Maur, A. (2020). Privates Ladeinfrastrukturpotenzial in Deutschland [Private charging infrastructure potential in Germany]. Retrieved from Deutsche Energie-Agentur (dena) and Prognos https://www.dena.de/newsroom/publikationsdetailansicht/pub/dena-studie-privates-ladeinfrastrukturpotenzial-in-deutschland/.
Bäumer, M., Hautzinger, H., Pfeiffer, M., Stock, W., Lenz, B., Kuhnimhof, T., & Köhler, K. (2017). Fahrleistungserhebung 2014 – Inländerfahrleistung [Vehicle mileage survey 2014 – Domestic vehicle kilometers travelled]. Retrieved from Bundesanstalt für Straßenwesen https://bast.opus.hbz-nrw.de/frontdoor/index/index/docId/1774.
Bieker, G. (2021). A global comparison of the life-cycle greenhouse gas emissions of combustion engine and electric passenger cars. Retrieved from the International Council on Clean Transportation https://theicct.org/publications/global-LCA-passenger-cars-jul2021.
Bundesministerium für Umwelt, Naturschutz und Reaktorsicherheit. (2020). Altfahrzeug-Verwertungsquoten in Deutschland im Jahr 2018 [End-of-life vehicle recycling rates in Germany in 2018]. Retrieved from https://www.bmuv.de/download/jahresberichte-ueber-die-altfahrzeug-verwertungsquoten-in-deutschland/.
Bundesministerium für Wirtschaft und Energie. (2021). Änderung der Richtlinie zur Förderung des Absatzes von elektrisch betriebenen Fahrzeugen (Umweltbonus) [Amendment to the Directive for Promoting the Sale of Electrically Powered Vehicles (Environmental Bonus)]. Retrieved from https://www.bundesanzeiger.de/pub/de/amtlicher-teil.
Bundesregierung. (2020). Kraftfahrzeugsteuergesetz [Motor Vehicle Tax Act]. Retrieved from https://www.gesetze-im-internet.de/kraftstg/BJNR005090927.html.
Bundesregierung. (2021a). Klimaschutzgesetz [Climate Change Act]. Retrieved from https://www.gesetze-im-internet.de/ksg/BJNR251310019.html.
Bundesregierung. (2021b). Einkommenssteuergesetz [Income Tax Act]. Retrieved from https://www.gesetze-im-internet.de/estg/BJNR010050934.html.
Christensen, A., & Petrenko, C. (2017). CO2-based synthetic fuel: Assessment of potential European capacity and environmental performance. Retrieved from the International Council on Clean Transportation https://theicct.org/publications/co2-based-synthetic-fuel-assessment-EU.
Compensation Partner. (2019). Firmenwagenmonitor 2019 [Company car monitor 2019]. Retrieved from https://www.compensation-partner.de/de/news-und-presse/firmenwagenmonitor-2019.
Díaz, S., Mock, P., Bernard, Y., Bieker, G., Pniewska, I., Ragon, P.-L., Rodríguez, F., Tietge, U., & Wappelhorst, S. (2020). European vehicle market statistics 2020/21. Retrieved from the International Council on Clean Transportation https://theicct.org/publications/european-vehicle-market-statistics-202021.
Dornoff, J. (2021). Plug-in hybrid vehicle CO2 emissions: How they are affected by ambient conditions and driver mode selection. Retrieved from the International Council on Clean Transportation https://theicct.org/publications/phev-co2-emissions-ambient-conditions-dec2021.
Dornoff, J., Tietge, U., & Mock, P. (2020). On the way to ‘real-world’ CO2 values: The European passenger car market in its first year after introducing the WLTP. Retrieved from the International Council on Clean Transportation https://theicct.org/publications/way-real-world-co2-values-european-passenger-car-market-its-first-year-after.
Ecke, L., Chlond, B., Magdolen, M., & Vortisch, P. (2020). Deutsches Mobilitätspanel (MOP) – Wissenschaftliche Begleitung und Auswertungen Bericht 2019/2020: Alltagsmobilität und Fahrleistung [German Mobility Panel (MOP) – Scientific monitoring and evaluation report 2019/2020: Everyday mobility and mileage]. Retrieved from Karlsruher Institut für Technologie (KIT) https://doi.org/10.5445/IR/1000126557.
European Automobile Manufacturers Association. (2019). ACEA Report: Vehicles in use – Europe 2019. Retrieved from https://www.acea.be/uploads/publications/ACEA_Report_Vehicles_in_use-Europe_2019.pdf.
European Parliament, & Council of the European Union. (2018). Directive (EU) 2018/2001 of the European Parliament and of the Council of 11 December 2018 on the promotion of the use of energy from renewable sources. http://data.europa.eu/eli/dir/2018/2001/oj.

44 ICCT WHITE PAPER | GHG BENEFITS AND INCENTIVES OF PHEVS AND BEVS IN GERMANY
EV Database. (2021, October). EV Database. https://ev-database.org.
Finanz-tools.de. (2021, October). Einkommenssteuer-Grundtabelle 2021 [Income tax basic table 2021]. https://einkommensteuertabellen.finanz-tools.de/grundtabelle/2021.
Fisch und Fischl GmbH. (2021, October). Spritmonitor.de. https://www.spritmonitor.de/.
Harlow, J. E., Ma, X., Li, J., Logan, E., Liu, Y., Zhang, N., … Dahn, J. R. (2019). A Wide Range of Testing Results on an Excellent Lithium-Ion Cell Chemistry to be used as Benchmarks for New Battery Technologies. Journal of The Electrochemical Society, 166(13), A3031. https://doi.org/10.1149/2.0981913jes.
Hill, N., Amaral, S., Morgan-Price, S., Nokes, T., Bates, J., Helms, H. … Bauen, A. (2020). Determining the environmental impacts of conventional and alternatively fuelled vehicles through LCA. Ricardo-AEA, ifeu, and E4tech report for the European Commission. Retrieved from https://op.europa.eu/en/publication-detail/-/publication/1f494180-bc0e-11ea-811c-01aa75ed71a1.
Kelly, J. C., Dai, Q., & Wang, M. (2019). Globally regional life cycle analysis of automotive lithium-ion nickel manganese cobalt batteries. Mitigation and Adaptation Strategies for Global Change. https://doi.org/10.1007/s11027-019-09869-2.
Koch, T., & Böhlke, T. (2021). The averaging bias—A standard miscalculation, which extensively underestimates real CO2 emissions. ZAMM - Journal of Applied Mathematics and Mechanics / Zeitschrift Für Angewandte Mathematik und Mechanik, 101(8), e202100205. https://doi.org/10/gm3hdq.
Kraftfahrt-Bundesamt. (2011). Fahrzeugalter [Vehicle age]. Retrieved from https://www.kba.de/SharedDocs/Downloads/DE/Statistik/Fahrzeuge/Fachartikel/alter_20110415.pdf.
Kreditanstalt für Wiederaufbau. (2020, November). Ladestationen für Elektroautos – Wohngebäude [Charging stations for electric cars – residential buildings]. Retrieved from https://www.kfw.de/inlandsfoerderung/Privatpersonen/Bestehende-Immobilie/F%C3%B6rderprodukte/Ladestationen-f%C3%BCr-Elektroautos-Wohngeb%C3%A4ude-(440)/.
Mehlhart, G., Möck, A., & Goldman, D. (2018). Effects on ELV waste management as a consequence of the decisions from the Stockholm Convention on decaBDE (p. 104). Retrieved from Öko-Institut https://www.oeko.de/fileadmin/oekodoc/ACEA-DecaBDE-final-report.pdf.
Mock, P., & Díaz, S. (2021). Pathways to decarbonization: The European passenger car market, 2021–2035. Retrieved from the International Council on Clean Transportation https://theicct.org/publications/decarbonize-EU-PVs-may2021.
Moomaw, W., P. Burgherr, G. Heath, M. Lenzen, J. Nyboer, A. Verbruggen, (2011). Annex II: Methodology. In IPCC Special report on renewable energy sources and climate change mitigation [O. Edenhofer, R. Pichs-Madruga, Y. Sokona, K. Seyboth, P. Matschoss, S. Kadner, T. Zwickel, P. Eickemeier, G. Hansen, S. Schlömer, C. von Stechow (eds)], Cambridge University Press, Cambridge, United Kingdom and New York. Retrieved from https://www.ipcc.ch/site/assets/uploads/2018/03/Annex-II-Methodology-1.pdf.
Pehl, M., Arvesen, A., Humpenöder, F., Popp, A., Hertwich, E. G., & Luderer, G. (2017). Understanding future emissions from low-carbon power systems by integration of life-cycle assessment and integrated energy modelling. Nature Energy, 2(12), 939–945. https://doi.org/10.1038/s41560-017-0032-9.
Plötz, P., Moll, C., Li, Y., Bieker, G., & Mock, P. (2020). Real-world usage of plug-in hybrid electric vehicles: Fuel consumption, electric driving, and CO2 emissions. Retrieved from the International Council on Clean Transportation https://theicct.org/publications/phev-real-world-usage-sept2020.
Pod Point. (2021, October). Pod Point Electric Vehicle Guides. https://pod-point.com/guides/vehicles?.
Prognos, Öko-Institut, & Wuppertal-Institut. (2021). Klimaneutrales Deutschland 2045. Wie Deutschland seine Klimaziele schon vor 2050 erreichen kann [Climate-neutral Germany in 2045. How Germany can achieve its climate targets before 2050]. Long version commissioned by Stiftung Klimaneutralität, Agora Energiewende, and Agora Verkehrswende. Retrieved from https://www.agora-energiewende.de/veroeffentlichungen/klimaneutrales-deutschland-2045-vollversion/.
Prussi, M., Yugo, M., De Prada, L., Padella, M., Edwards, R., & Lonza L. (2020). JEC Well-to-Tank report V5. Publications Office of the European Union. Retrieved from https://data.europa.eu/doi/10.2760/959137.
Riemersma, I., & Mock, P. (2017). Too low to be true? How to measure fuel consumption and CO2 emissions of plug-in hybrid vehicles, today and in the future. Retrieved from the International Council on Clean Transportation https://theicct.org/publications/too-low-be-true-how-measure-fuel-consumption-and-co2-emissions-plug-hybrid-vehicles.
Scherrer, A., Burghard, U., Wietschel, M., & Dütschke, E. (2019). Early Adopter von E-Fahrzeugen: Ladeleistungen, Eigenerzeugung und Einstellungen zum Lademanagement [Early adopters of electric vehicles: Charging behavior, own electricity generation, and charging management attitudes]. Energiewirtschaftliche Tagesfragen, 69(11), 23–26. https://www.energie.de/et/aktuell/uebersicht/.

45 ICCT WHITE PAPER | GHG BENEFITS AND INCENTIVES OF PHEVS AND BEVS IN GERMANY
SPD, Bündnis 90/Die Grünen, FDP. (2021). Koalitionsvertrag 2021—2025 [Coalition Agreement 2021–2025]. Retrieved from https://www.bundesregierung.de/breg-de/service/gesetzesvorhaben/koalitionsvertrag-2021-1990800.
Statistisches Bundesamt. (2021, June). Bilanz—Monatsbericht über die Elektrizitätsversorgung [Balance sheet—Monthly report on electricity supply]. Retrieved from https://www.destatis.de/DE/Themen/Branchen-Unternehmen/Energie/Erzeugung/Tabellen/bilanz-elektrizitaetsversorgung.html.
Taszka, S., & Domergue, S. (2019). Prime à la conversion des véhicules particuliers en 2018 [Conversion premium for private vehicles in 2018]. Retrieved from Ministère de la Transition écologique et solidaire https://www.actu-environnement.com/media/pdf/news-34355-prime-vehicule-2018.pdf.
Tietge, U., Mock, P., Díaz, S., & Dornoff, J. (2021). CO2 emissions from new passenger cars in Europe: Car manufacturers’ performance in 2020. Retrieved from the International Council on Clean Transportation https://theicct.org/publications/eu-co2-pvs-performance-2020-aug21.
Transport & Environment. (2020). Plug-in hybrids: Is Europe heading for a new dieselgate? Retrieved from https://www.transportenvironment.org/discover/plug-hybrids-europe-heading-new-dieselgate/.
Ulrich, B., Nicolai, S., Zerhusen, J., Monsalve, C., Kharboutli, S., Michalski, J., Ruhe, S., & Albrecht, U. (2019). Infrastrukturbedarf E-Mobilität [Infrastructure requirements for e-mobility]. Ludwig-Bölkow-Systemtechnik and Fraunhofer IOSB. Retrieved from https://lbst.de/referenzprojekte/infrastrukturbedarf-e-mobilitaet/.
United Nations Environment Programme. (2020). Used vehicles and the environment. Retrieved from https://wedocs.unep.org/handle/20.500.11822/34175.
Valin, H., Peters, D., van den Berg, M., Frank, S., Havlik, P., Forsell, N., & Hamelinck, C. (2015). The land use change impact of biofuels consumed in the EU. Ecofys, IIASA and E4tech report for the European Commission. Retrieved from https://energy.ec.europa.eu/land-use-change-impact-biofuels-consumed-eu_en.
Wappelhorst, S., & Bieker, G. (2021, April 20). The uptake of plug-in hybrid electric vehicles in Europe’s company car fleets: Trends and policies. ICCT Staff Blog. https://theicct.org/blog/staff/phev-europe-company-cars-apr2021.
Wappelhorst, S., Tietge, U., Bieker, G., & Mock, P. (2021). Europe’s CO2 emission performance standards for new passenger cars: Lessons from 2020 and future prospects. Retrieved from the International Council on Clean Transportation https://theicct.org/publications/eu-ev-pv-co2-emission-performance-sept21.

46 ICCT WHITE PAPER | GHG BENEFITS AND INCENTIVES OF PHEVS AND BEVS IN GERMANY
APPENDIX
0%
20%
40%
60%
80%
100%
2020 2025 2030 2035 2040 2045 2050
Shar
e o
f el
ectr
icit
y g
ener
atio
n te
chno
log
ies nuclear power
lignite
black coal
natural gas
photovoltaic
wind power o�shore
wind power onshore
biomass
hydropower
Figure A1. Projected shares of the electricity generation technologies in net electricity generation in Germany.
Table A1. Total battery capacity and battery production GHG emissions of the hypothetical 2030 versions of the selected PHEV and BEV models.
Segment ModelModel year
Total battery capacity
(kWh)
GHG emissions(t CO2 eq.)
PHEV
Lower Medium
BMW 225xe 2030 14.6 0.6
Hyundai Ioniq 2030 13.4 0.6
Toyota Prius 2030 13.2 0.6
Medium
BMW 330e 2030 18.0 0.8
VW Passat Variant GTE 2030 19.5 0.8
Kia Optima Sportswagon 2030 17.0 0.7
SUV
Mitsubishi Outlander 2030 20.7 0.9
Kia Niro 2030 13.4 0.6
BMW X5 2030 36.0 1.5
BEV
Lower Medium
VW e-Golf 2030 43.0 1.8
Nissan Leaf 2030 74.0 3.2
Hyundai Ioniq 2030 48.5 2.1
Medium
Tesla Model 3 long range 2030 96.6 4.2
Tesla Model 3 std. range plus 2030 82.0 3.5
Polestar 2 2030 93.6 4.0
SUV
Hyundai Kona 2030 81.0 3.5
Jaguar I-Pace 2030 108.0 4.6
Mercedes EQC 2030 102.0 4.4

47 ICCT WHITE PAPER | GHG BENEFITS AND INCENTIVES OF PHEVS AND BEVS IN GERMANY
Table A2. Electric drive share and average fuel and electricity consumption of the selected PHEVs in private and in company car usage.
Segment ModelModel year
Average usage as private
carsAverage usage
as company cars
Electric drive share
(%)
Electric drive share
(%)Fuel cons.
(L/100 km)
Electricity cons.
(kWh/100 km)
Lower medium
BMW 225xe 2019 45 22 5.9 5.9
Hyundai Ioniq 2018 46 23 4.0 4.6
Toyota Prius 2017 45 23 3.3 3.0
Medium
BMW 330e 2019 28 14 5.9 3.7
VW Passat Variant GTE 2019 33 17 5.8 4.2
Kia Optima Sportswagon 2017 43 21 5.5 5.0
SUV
Mitsubishi Outlander 2018 49 25 6.4 6.6
Kia Niro 2018 46 23 4.4 4.7
BMW X5 2019 50 25 8.1 10.3
Table A3. Total battery capacity, electric drive share, as well as average fuel and electricity consumption of hypothetical 2030 versions of the selected PHEVs models in private usage.
Segment Model
Current modelsHypothetical 2030 models
Total battery capacity (kWh)
Electric drive share (%)
Total battery capacity (kWh)
Electric drive share (%)
Fuel cons.(L/100 km)
Electricity cons.
(kWh/100 km)
Lower medium
BMW 225xe 9.7 45 14.6 58 3.2 15.3
Hyundai Ioniq 8.9 46 13.4 60 2.1 11.9
Toyota Prius 8.8 45 13.2 59 1.7 7.9
Medium
BMW 330e 12.0 28 18.0 36 4.3 9.7
VW Passat Variant GTE 13.0 33 19.5 43 3.9 10.9
Kia Optima Sportswagon 11.3 43 17.0 56 3.1 13.0
SUV
Mitsubishi Outlander 13.8 49 20.7 64 3.0 17.2
Kia Niro 8.9 46 13.4 59 2.3 12.3
BMW X5 9.7 50 36.0 64 3.8 26.7
Table A4. WTT, TTW and total WTW GHG emissions of fossil gasoline and diesel, the average ethanol, biodiesel and HVO mix, as well as the European Union average gasoline (5% ethanol, E5) and diesel (7% biodiesel and HVO, B7) blends in 2020 and in 2030.
WTT (kg CO2 eq./L)
TTW (kg CO2 eq./L)
WTW (kg CO2 eq./L)
2020 2030 2020 2030 2020 2030
Gasoline
Fossil 0.64 0.64 2.36 2.36 2.99 2.99
Ethanol 1.56 1.36 - - 1.56 1.36
E5 0.68 0.67 2.24 2.24 2.92 2.91
Diesel
Fossil 0.79 0.79 2.62 2.62 3.41 3.41
Biodiesel 4.21 3.25 - - 4.21 3.25
HVO 5.14 2.71 - - 5.14 2.71
B7 1.04 0.95 2.44 2.44 3.48 3.39

48 ICCT WHITE PAPER | GHG BENEFITS AND INCENTIVES OF PHEVS AND BEVS IN GERMANY
Table A5. Life-cycle GHG emissions of electricity generation technologies.
g CO2 eq./kWh
Non-renewable
Coal 1001
Natural gas 469
Nuclear power 16
Renewable
Biomass 230
Photovoltaic 46
Wind power 12
Hydropower 4
Table A6. Projected shares of the electricity generation technologies in net electricity generation in Germany in the carbon neutral 2045 scenario.
Electricity generation technology 2020 2030 2040 2050
Non-renewable
Lignite 22% 1% 0% 0%
Black coal 12% 2% 0% 0%
Natural gas 15% 23% 6% 0%
Nuclear power 11% 0% 0% 0%
Renewable
Wind power onshore 17% 26% 32% 33%
Wind power offshore 4% 15% 25% 27%
Photovoltaic 9% 24% 32% 37%
Biomass 7% 6% 2% 1%
Hydropower 3% 4% 2% 2%
Table A7. Net list prices (excl. VAT) and national purchase subsidies for the considered PHEV and BEV models.
Segment ModelPowertrain
typeNet list price
(€)
National purchase
subsidy (€)
Lower medium
BMW 225xe PHEV ≤ 40,000 4,500
Hyundai Ioniq PHEV ≤ 40,000 4,500
Toyota Prius PHEV ≤ 40,000 4,500
VW e-Golf BEV ≤ 40,000 6,000
Nissan Leaf BEV ≤ 40,000 6,000
Hyundai Ioniq BEV ≤ 40,000 6,000
Medium
BMW 330e PHEV ≤ 65,000 3,750
VW Passat Variant GTE PHEV ≤ 40,000 4,500
Kia Optima Sportswagon PHEV ≤ 40,000 4,500
Tesla Model 3 long range BEV ≤ 65,000 5,000
Tesla Model 3 std. range plus BEV ≤ 40,000 6,000
Polestar 2 BEV ≤ 65,000 5,000
SUV
Mitsubishi Outlander PHEV ≤ 40,000 4,500
Kia Niro PHEV ≤ 40,000 4,500
BMW X5 PHEV ≤ 65,000 3,750
Hyundai Kona BEV ≤ 40,000 6,000
Jaguar I-Pace BEV ≤ 65,000 5,000
Mercedes EQC BEV ≤ 65,000 5,000

49 ICCT WHITE PAPER | GHG BENEFITS AND INCENTIVES OF PHEVS AND BEVS IN GERMANY
Table A8. Engine displacement, WLTP CO2 emissions value, as well as annual vehicle ownership tax in the years 1-5, 6-10 and after 10 years of registration for the considered PHEV and BEV models and the respective segment average new gasoline cars registered in Germany in 2019 (Díaz et al., 2020).
Segment Model namePowertrain
type
Engine displ. (ccm)
WLTP CO2 (g/km)
Annual tax rate
(year 1-5) (€)
Annual tax rate
(year 6-10) (€)
Annual tax rate
(after year 10) (€)
Lower medium
average gasoline ICEV 1,482 155 164 164 164
BMW 225xe PHEV 1,499 39 0 30 30
Hyundai Ioniq PHEV 1,580 26 2 32 32
Toyota Prius PHEV 1,798 29 6 36 36
VW e-Golf BEV - - - - 62
Nissan Leaf BEV - - - - 62
Hyundai Ioniq BEV - - - - 57
Medium
average gasoline ICEV 1,941 180 249 249 249
BMW 330e PHEV 1,998 32 10 40 40
VW Passat Variant GTE PHEV 1,395 28 0 28 28
Kia Optima Sportswagon PHEV 1,999 34 10 40 40
Tesla Model 3 long range BEV - - - - 68
Tesla Model 3 std. range plus BEV - - - - 62
Polestar 2 BEV - - - - 73
SUV
average gasoline ICEV 1,598 174 221 221 221
Mitsubishi Outlander PHEV 2,360 40* 18 48 48
Kia Niro PHEV 1,580 31 2 32 32
BMW X5 PHEV 2,998 29 30 60 60
Hyundai Kona BEV - - - - 62
Jaguar I-Pace BEV - - - - 79
Mercedes EQC BEV - - - - 85
* This is the NEDC CO2 emissions value. As found for other PHEV models, the WLTP CO2 emissions value is expected to be similar.

50 ICCT WHITE PAPER | GHG BENEFITS AND INCENTIVES OF PHEVS AND BEVS IN GERMANY
Table A9. Vehicle prices (list price plus special equipment, incl. VAT), increase in annual taxable income due to private company car usage without and with reduced rates for PHEVs and BEVs, annual income tax for an income of €90,000 plus private company car usage, and the difference in the income tax for using the PHEV and BEV models compared to average gasoline cars in the respective segments.
Segment Model namePowertrain
typeVehicle
price (€)
Increase of taxable
income, w/o benefit (€)
Increase of taxable
income, with benefit (€)
Annual income tax with benefit
(€)
Difference to annual
income tax of ICEVs (€)
Lower medium
average gasoline ICEV 32,530 6,246 6,246 31,286 0
BMW 225xe PHEV 46,650 8,957 4,479 30,544 -742
Hyundai Ioniq PHEV 36,920 7,088 3,544 30,151 -1,135
Toyota Prius PHEV 43,190 8,293 4,147 30,405 -881
VW e-Golf BEV 35,090 6,737 1,684 29,370 -1,916
Nissan Leaf BEV 50,240 9,646 2,412 29,676 -1,610
Hyundai Ioniq BEV 42,440 8,149 2,037 29,518 -1,768
Medium
average gasoline ICEV 49,300 9,466 9,466 32,639 0
BMW 330e PHEV 59,590 11,442 5,721 31,066 -1,573
VW Passat Variant GTE PHEV 49,710 9,544 4,772 30,667 -1,972
Kia Optima Sportswagon PHEV 48,580 9,327 4,664 30,622 -2,017
Tesla Model 3 long range BEV 56,530 10,854 2,713 29802 -2,837
Tesla Model 3 std. range plus BEV 47,730 9,164 2,291 29,625 -3,014
Polestar 2 BEV 56,070 10,765 2,691 29,793 -2,846
SUV
average gasoline ICEV 36,120 6,935 6,935 31,576 0
Mitsubishi Outlander PHEV 48,750 9,361 4,680 30,628 -948
Kia Niro PHEV 40,720 7,818 3,909 30,305 -1,271
BMW X5 PHEV 88,550 17,002 8,501 32,233 657
Hydunai Kona BEV 48,950 9,398 2,350 29,650 -1,926
Jaguar I-Pace BEV 95,410 18,319 9,160 32,510 934
Mercedes EQC BEV 83,999 16,128 8,064 32,050 474