EOR Greenhouse Gas Life-Cycle Analysis of 22 Years of ...
26
1 What it All Means: CO 2 -EOR Greenhouse Gas Life-Cycle Analysis of 22 Years of Class II UIC Field Operations and Monitoring Joel Sminchak, Sanjay Mawalkar, Neeraj Gupta Battelle, Columbus, Ohio, USA Ground Water Protection Council Underground Injection Control Conference February 16-19, 2020, San Antonio, Texas
-
Upload
khangminh22 -
Category
Documents
-
view
0 -
download
0
Transcript of EOR Greenhouse Gas Life-Cycle Analysis of 22 Years of ...

1
What it All Means: CO2-EOR Greenhouse Gas Life-Cycle Analysis of 22 Years of Class II UICField Operations and Monitoring
Joel Sminchak, Sanjay Mawalkar, Neeraj GuptaBattelle, Columbus, Ohio, USA
Ground Water Protection Council Underground Injection Control ConferenceFebruary 16-19, 2020, San Antonio, Texas

Disclaimer• This work was completed for the United States Government by Battelle. In no event shall
either the United States Government or Battelle have any responsibility or liability for any consequences of any use, misuse, inability to use, or reliance on the information contained herein, nor does either warrant or otherwise represent in any way the accuracy, adequacy, efficacy, or applicability of the contents hereof.
• Battelle does not engage in research for advertising, sales promotion, or endorsement of our clients’ interests including raising investment capital or recommending investments decisions, or other publicity purposes, or for any use in litigation. Battelle endeavors at all times to produce work of the highest quality, consistent with our contract commitments. However, because of the research and/or experimental nature of this work Battelle, its employees, officers, or Trustees have no legal liability for the accuracy, adequacy, or efficacy thereof.
2

3
Outline1. Background2. Objectives3. MRCSP Project4. Integration with UIC5. Greenhouse Gas
Emissions Life Cycle Analysis
6. Results/Conclusions

4
Acknowledgements• This project was part of the Midwest Regional Carbon
Sequestration Partnership supported by U.S. Department of Energy National Energy Technology Laboratory Contract DE FC26 05NT42589 Andrea McNemar (PM).
• Battelle’s MRCSP Contributors – Mark Kelley, Srikanta Mishra, Matt Place, Lydia Cumming, Priya Ravi Ganesh, Autumn Haagsma, Samin Raziperchikolaee, Amber Conner, Glen Larsen, Joel Main, Jacob Markiewicz, Ashwin Pasumarti, Manoj Kumar Valluri, Andrew Burchwell, Jackie Gerst, and numerous others.
• Core Energy (Bob Mannes, Kathy Dungey, Rick Pardini).
• USEPA Region 5 UIC Program.• Michigan EGLE.• PCOR/EERC (Nick Azzolina).• DOE-NETL LCA program.
5
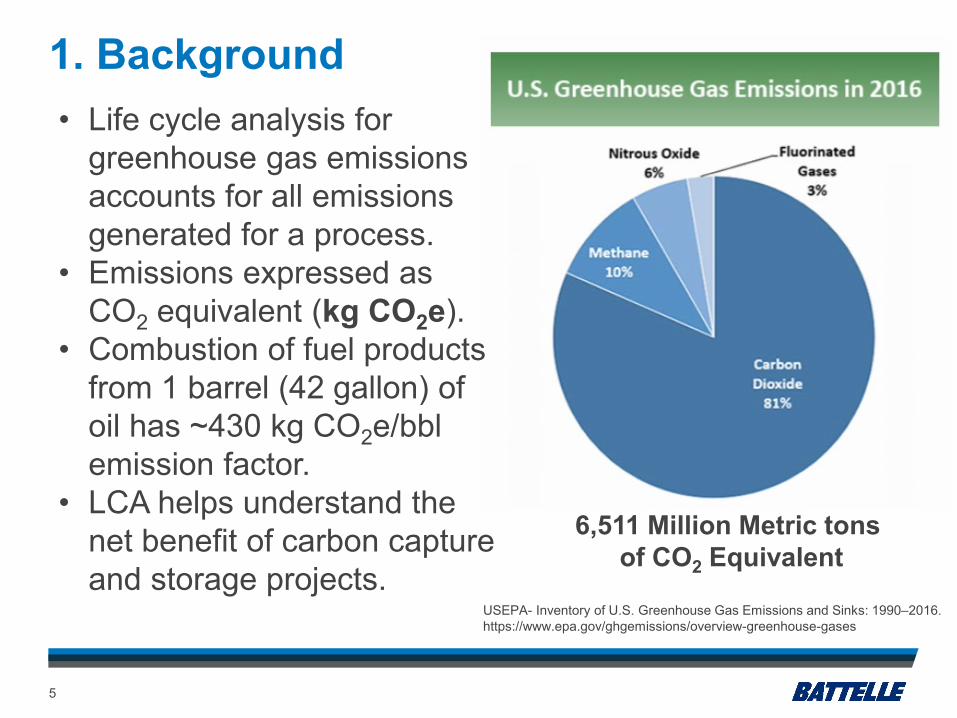
1. Background• Life cycle analysis for
greenhouse gas emissions accounts for all emissions generated for a process.
• Emissions expressed as CO2 equivalent (kg CO2e).
• Combustion of fuel products from 1 barrel (42 gallon) of oil has ~430 kg CO2e/bblemission factor.
• LCA helps understand the net benefit of carbon capture and storage projects.
USEPA- Inventory of U.S. Greenhouse Gas Emissions and Sinks: 1990–2016.https://www.epa.gov/ghgemissions/overview-greenhouse-gases
6,511 Million Metric tons of CO2 Equivalent

6
2. Carbon Storage LCA Objectives• How much greenhouse
gas emissions were emitted through Carbon Capture Utilization and Storage operations?
• capture, compression, pipeline transport, drilling, injection fugitive emissions, embodied emissions, etc.
• How CO2 much was left in the ground?
• What is the net carbon balance?
Nagabhushan and Waltzer, 2016, The emission reduction benefits of carbon capture utilization and Storage using CO2 EOR, clean air task force fact sheet.
Example: CO2 EOR GHG Emissions
Net0.51 tons CO2
0.54 – 0.30 = net 0.24 tons CO2
7
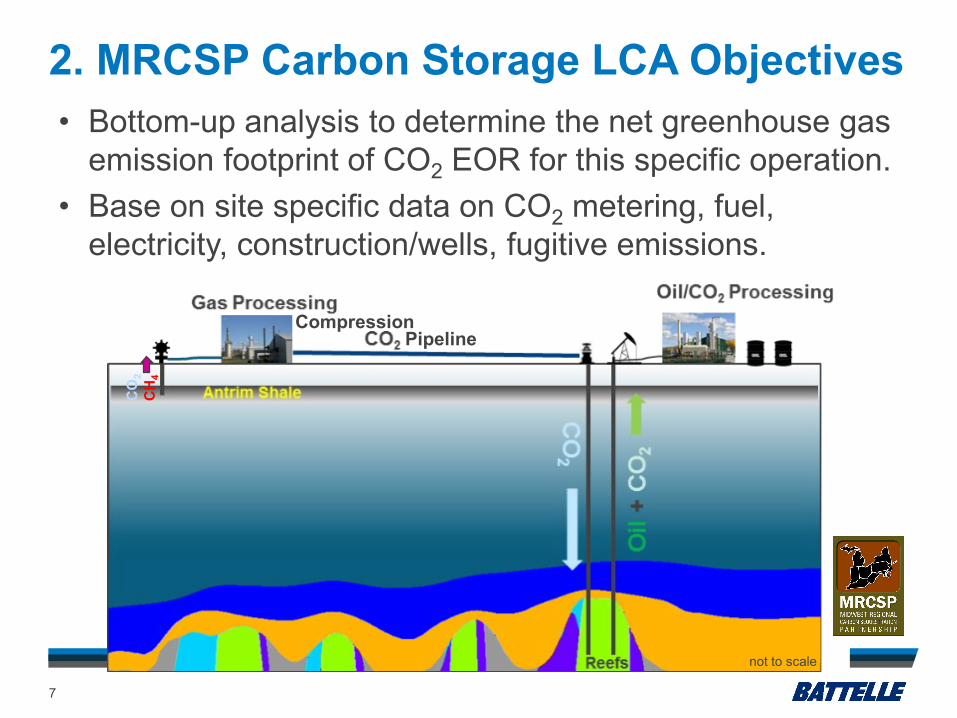
2. MRCSP Carbon Storage LCA Objectives• Bottom-up analysis to determine the net greenhouse gas
emission footprint of CO2 EOR for this specific operation.• Base on site specific data on CO2 metering, fuel,
electricity, construction/wells, fugitive emissions.
Antrim Shale
Reefs
CO2
Gas Processing Oil/CO2 Processing
CO
2
Oil
+ C
O2
not to scale
CO
2C
H4
CompressionPipeline

3. Midwest Regional Carbon Sequestration Partnership Phase III Demonstration
8
Primary goal: To execute a large-scale scale CO2 injection test to evaluate best practices and technologies required to implement carbon sequestration.
3. MRCSP Phase III Large Scale CCUS Demonstration
9
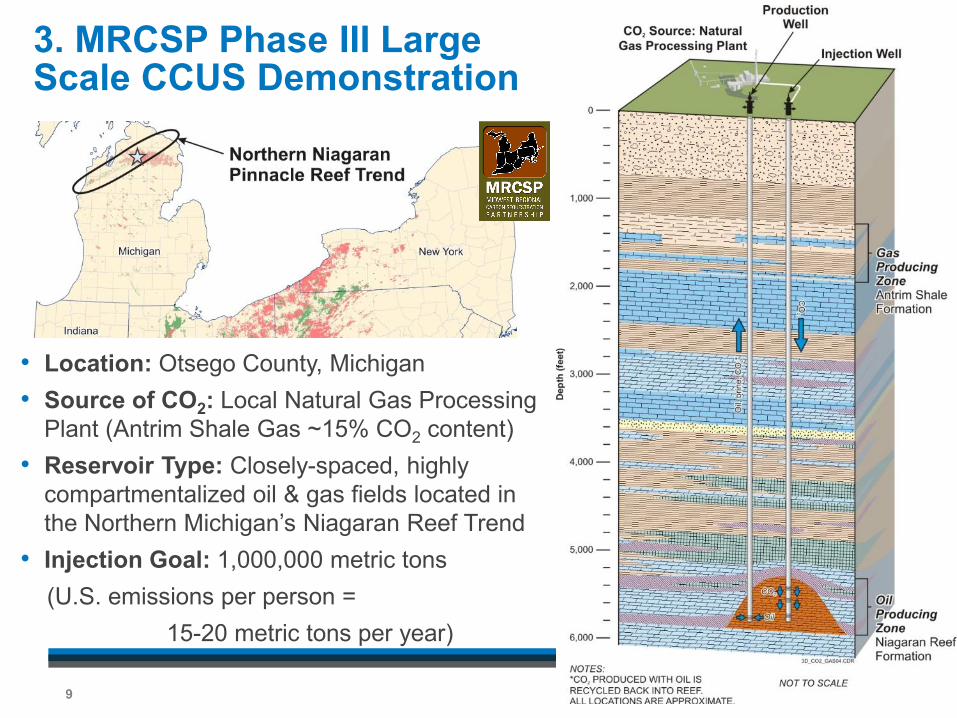
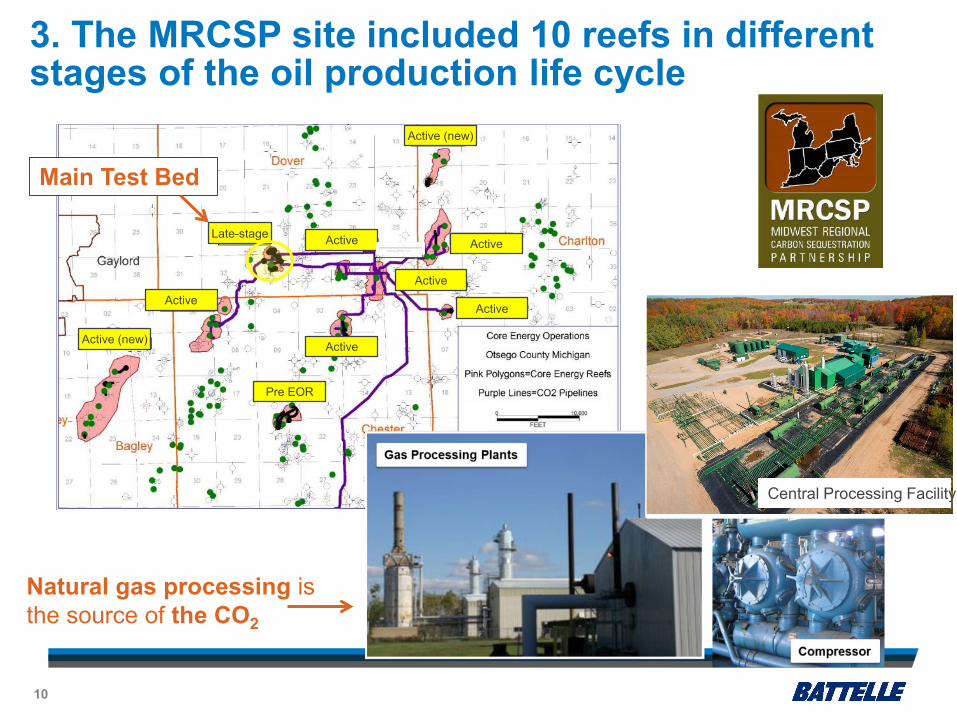
• Location: Otsego County, Michigan• Source of CO2: Local Natural Gas Processing
Plant (Antrim Shale Gas ~15% CO2 content)• Reservoir Type: Closely-spaced, highly
compartmentalized oil & gas fields located in the Northern Michigan’s Niagaran Reef Trend
• Injection Goal: 1,000,000 metric tons (U.S. emissions per person =
15-20 metric tons per year)
ActiveLate-stage
Active (new)
Active
Active
Active
Active (new)
Active
Active
Pre EOR
3. The MRCSP site included 10 reefs in different stages of the oil production life cycle
10
Natural gas processing is the source of the CO2
Main Test Bed
Central Processing Facility

11
4. Integration with UIC• CO2 injection wells were permitted
through USEPA Class II regulations Region 5/Michigan EGLE (more than 10 Class II wells over 22 years).
• EPA Monitoring Reporting & Verification plan prepared for CO2 accounting and metering for 45Q credits (monitoring, leakage, mass balance calculations).
• EPA Greenhouse Gas Report, subpart W, calculations for petroleum and natural gas systems fixed systems.
• EPA Greenhouse Gas Report, subpart C, General Stationary Fuel Combustion.
12
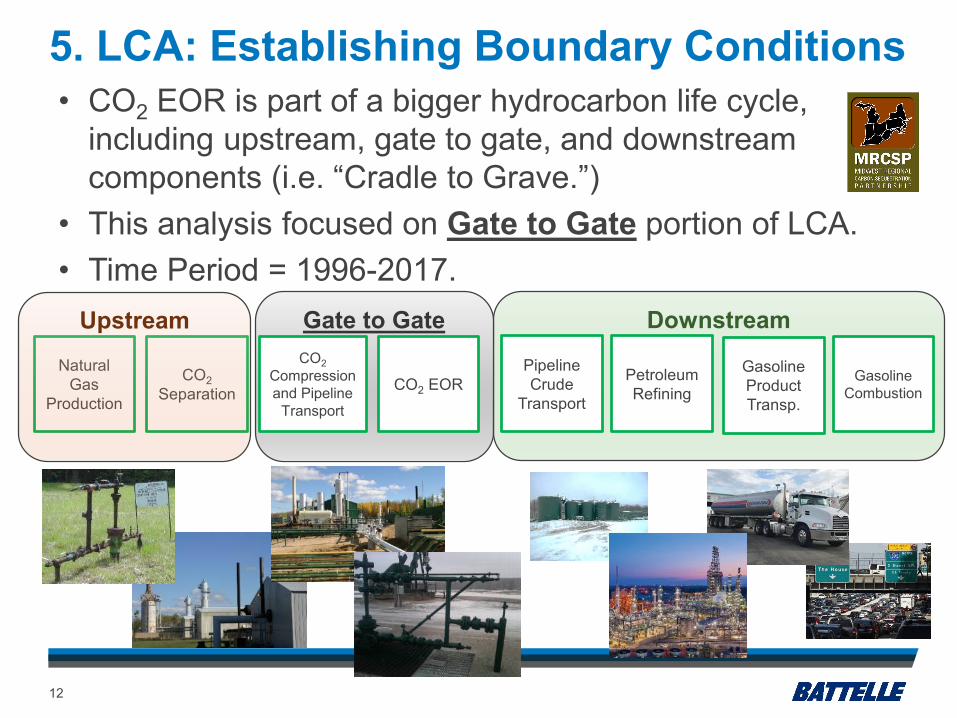
DownstreamGate to GateNatural
Gas Production
CO2Compression and Pipeline
Transport
CO2 EORPipeline Crude
Transport
Petroleum Refining
Gasoline Product Transp.
Gasoline Combustion
CO2Separation
Upstream
• CO2 EOR is part of a bigger hydrocarbon life cycle, including upstream, gate to gate, and downstream components (i.e. “Cradle to Grave.”)
• This analysis focused on Gate to Gate portion of LCA.• Time Period = 1996-2017.
5. LCA: Establishing Boundary Conditions

13
5. LCA: Establishing Boundary Conditions
Chester 10 CO2Compression
White FrostCO2 Pipeline
Dover 36 HydrocarbonProcessing Facility
Niagaran Reefs
TransportRefining
POS TransportCombustion
Oil/CO2 separation,Dehydration,Compression
Injection-Production
UPSTREAM
DOWNSTREAM
GATE to GATE
Chester 10 Gas ProcessingCO2 Capture
Methane to market
Antrim Gas Wells

14
5. Life Cycle Assessment of CO2-EOR
1996-Dover 33
1997-Dover 36
2004-Dover 35
2005-Charlton 30-31
2006-Charlton 6
2009-Chester 2
2011-Chester 5-6
2015-Bagley
2017-Chester 16
2015-Charlton 19
BAGLEY
CHESTER 5-6
DOVER 33 DOVER 35DOVER 36
CHESTER 2
CHESTER 16
CHARLTON 6
CHARLTON 30-31
CHARLTON 19
INDEX MAP OF REEFS NET CO2 IN REEFS (metric tons)
• Niagaran Reefs CO2 EOR operations in place since 1996.• CO2 EOR expanded to 10 reefs over ~22 years.• 2.2 million metric tons net CO2 in reefs thru 2018. • 2.3 million barrels oil produced (294,326 metric tons).

15
5. LCA: Gate-to-Gate Operations Data• Detailed Gate-to-Gate data from MRCSP, Core Energy CO2 injected, CO2 recycle, new CO2, oil produced, brine produced
• Emission Sources Compression natural gas use (MCF), facility electricity use (kWhr),
fugitive emissions (CO2 & methane), venting/flaring, facility construction, new wells, produced water/brine injection, land use.
CO O
CHH
H H
H H
O
CO O
CO2 CompressionFuelElectricity

16
0
100,000
200,000
300,000
400,000
500,000
600,000
700,000
Met
ric T
ons
25,040
615,184
310,549 317,174
Total CO2Injected
New CO2Injected
CO2Recycle
OilProduced(194,861 bbl)
0
400000
800000
1200000
1600000
2000000
MC
F G
as
KW
H E
550,734
1,712,958
CompressionNatural Gas
(MCF)
FacilityElectricity
(KWH)
New Wells(2)
530 12,539
Fugitive Emissions CH
4 CO
2
5. LCA: Gate-to-Gate Operations Key Input• Example- snapshot of 2017 key input.
CO OCO O
2017 CO2 Inventory 2017 Operations
Met
ric to
ns C
O2e

17
5. LCA: Gate-to-Gate Operations Data
• Operations trends reflect CO2-EORcycles and additional reefs.
1996 1998 2000 2002 2004 2006 2008 2010 2012 2014 2016 2018
0
100,000
200,000
300,000
400,000
Met
ric to
ns C
O2,
Oil
0
400,000
800,000
1,200,000
1,600,000
2,000,000
Faci
lity
Elec
trici
ty (K
WH
) and
Com
pres
sion
Gas
(MC
F)
Legend*Natural Gas UsageElectricity UsageRecycleCO2PureCO2EOR Oil (metic tons)
*Chester 10 Fulel estimated 1996-2009 based on pure CO2 Chester 10 electricity estimated 1996-2010 based on pure CO2 Dover 36 fuel usage estimated 1996-2004 based on CO2 Recycle Dover 36 electricity usage estimated 1996-2010 based on CO2 Recycle Pure CO2 estimated for 1998-2011 based on mass balance

18
5. CO2 EOR LCA Model• Modified version of Azzolina/EERC (2016) CO2 EOR LCA
model framework used to calculate GHG emissions factors• Direct measurements entered from CO2 EOR system
monitoring, operations, and new reef developments.
Azzolina, N.A., Peck, W.D., Hamling, J.A., Gorecki, C.D., Ayash, S.C., Doll, T.E., Nakles, D.V., and Melzer, L.S., 2016, How green is my oil? A detailed look at greenhouse gas accounting for CO2-enhanced oil recovery (CO2-EOR) sites: International Journal of Greenhouse Gas Control, v. 51,p. 369–379.

19
5. CO2 EOR LCA Model Results
Pipeline Transport0.03
Land Use & Construction0.86 Compression
183.3
EOR Processing Electricity5.8 Venting & Flaring
7.4 Crude oil transport4
Crude oil refining46
Fuel transport5
Fuel combustion415 kg CO2e/bbl oil
kg CO2e/bbl oil
kg CO2e/bbl oil
kg CO2e/bbl oil
kg CO2e/bbl oil
kg CO2e/bbl oil
• Highest emission factors from compression & downstream.
2017
Category
2017 Emisson
FactorkgCO2e/bbl
Gate to Gate 198
Downstream 470
Total 668
CO2 Storage -1529
Net -862

20
5. LCA Model Output- “Gate to Gate”• Large amount of variability in gate to gate EF over 20 years.
0
50,000
100,000
1994 1996 1998 2000 2002 2004 2006 2008 2010 2012 2014 2016 2018
300,000
250,000
200,000
150,000
100,000
50,000
0
Total Oil Production(metric tons)
Total CO2 Storage (metric tons)
Met
ric to
ns
Annual Oil Production and CO2 Associated Storage

21
• “Gate to Gate” EOR EF = 163 kgCO2e/bbl GHG life cycle emissions factor (371,576,000 kg CO2 / 2,290,473 BBL).
5. LCA Model Output-“Gate to Gate”
0 50 100 150 200 250Gate-to-Gate Greenhous Gas Emissions Factor (kg CO2e/bbl oil)
PCOR EOR Model Low*
Natural Dome EOR-Adv
Canadian Oil Sands
Natural Dome EOR-Conv
Niagaran Reef EOR
PCOR EOR Model High*
After Marriot (2013)*Azzolina et al., (2017)
22
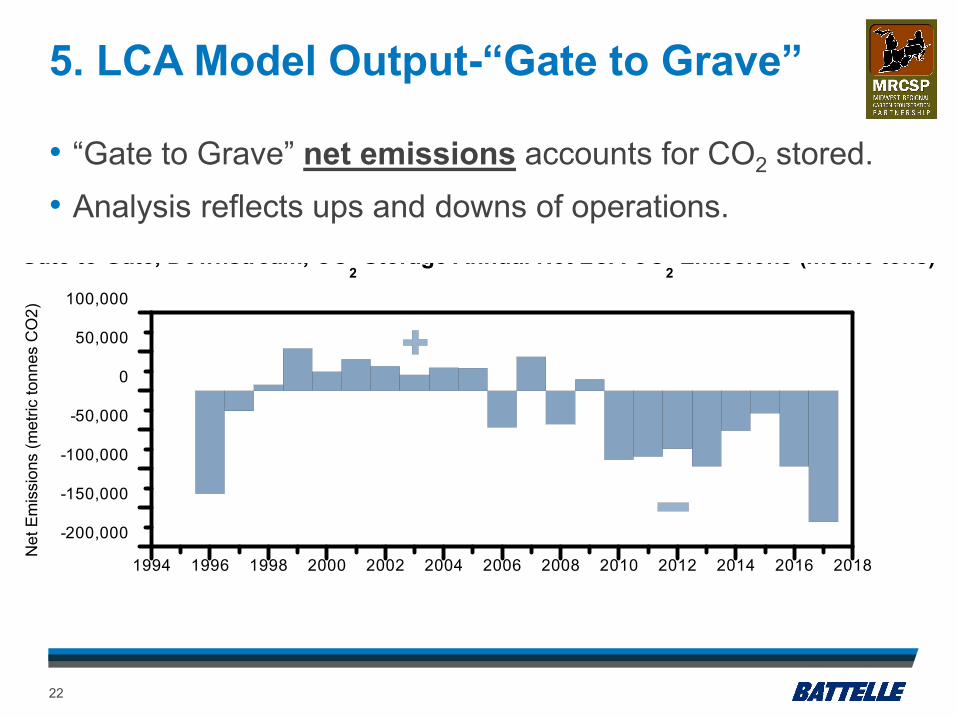
• “Gate to Grave” net emissions accounts for CO2 stored.• Analysis reflects ups and downs of operations.
5. LCA Model Output-“Gate to Grave”
1994 1996 1998 2000 2002 2004 2006 2008 2010 2012 2014 2016 2018
-200,000
-150,000
-100,000
-50,000
0
50,000
100,000
Net
Em
issi
ons
(met
ric to
nnes
CO
2)
Gate to Gate, Downstream, CO2 Storage Annual Net LCA CO
2 Emissions (metric tons)

Year
Upstream Capture
Emissions* (metric tonnes)
Gate to Gate total
Emssions (metric tons)
Downstream Total
Emissions (Metric tons)
Total CO2 Associated
Storage (metric tonnes)
Net CO2e Emissions
(metric tonnes)1996 22,872 7,166 47 139,037 -108,9521997 14,142 10,511 60,767 97,026 -11,6061998 38,543 19,554 86,924 98,763 46,2571999 1,289 12,025 48,312 5,941 55,6842000 2,061 9,786 30,084 15,259 26,6732001 - 8,759 31,757 -12 40,5292002 72 8,237 24,005 665 31,6492003 1,174 9,397 22,580 11,585 21,5662004 528 9,521 24,859 4,728 30,1802005 175 4,697 26,011 1,500 29,3832006 19,916 13,308 27,620 87,763 -26,9182007 5,574 10,042 47,732 14,079 49,2692008 30,986 18,472 59,543 120,595 -11,5942009 23,417 17,449 54,040 56,505 38,4022010 32,682 18,740 47,226 154,237 -55,5892011 36,195 24,530 57,638 166,463 -48,1002012 35,879 26,342 59,147 159,857 -38,4892013 40,759 26,118 59,495 182,417 -56,0452014 32,740 26,908 66,357 144,313 -18,3092015 34,280 27,971 91,614 148,202 5,6642016 40,759 26,118 59,495 182,417 -56,0452017 64,433 38,495 91,614 298,010 -103,468
Total 478,476 374,147 1,076,867 2,089,350 -159,860
23
5. LCA Model Output- “Cradle to Grave”
• “Cradle to Grave” results suggest there is a net negative CO2emissions of -159,860 metric tons.
24
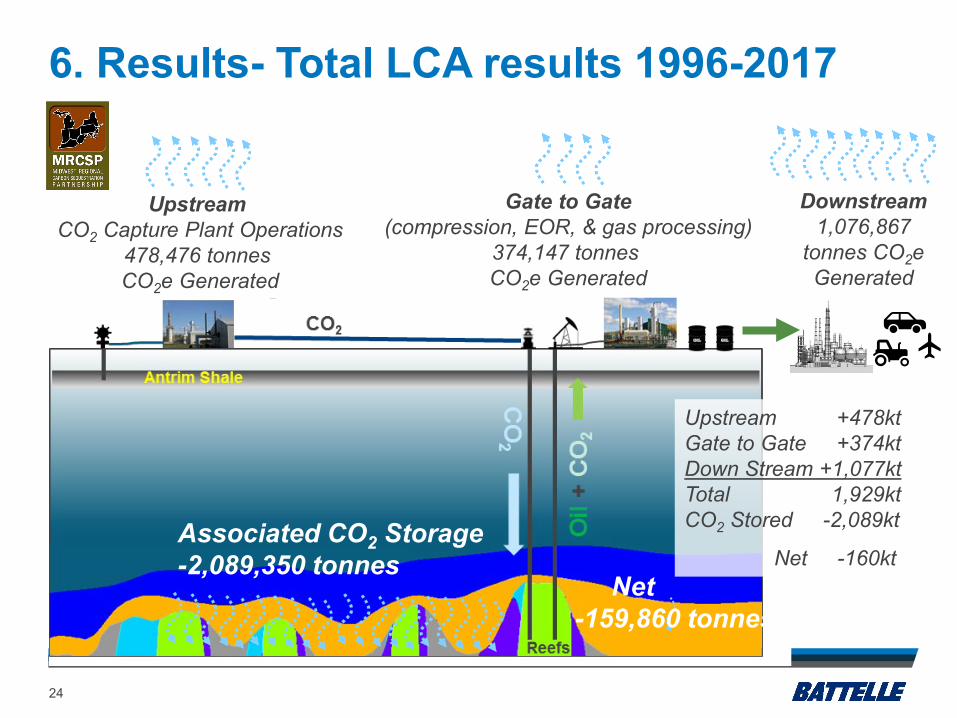
6. Results- Total LCA results 1996-2017
UpstreamCO2 Capture Plant Operations
478,476 tonnesCO2e Generated
Gate to Gate(compression, EOR, & gas processing)
374,147 tonnesCO2e Generated
Associated CO2 Storage-2,089,350 tonnes
Downstream1,076,867
tonnes CO2eGenerated
Net-159,860 tonnes
Upstream +478ktGate to Gate +374ktDown Stream +1,077ktTotal 1,929ktCO2 Stored -2,089kt
Net -160kt
6. Conclusions
25
• Greenhouse gas emissions life cycle analysis helps us understand the benefits of carbon capture and storage.
• The greenhouse gas life cycle analysis highlights the value of integrating Class II UIC operations and site-specific data over a long period of CO2-EOR operations.
• The system benefited from a ready source of CO2, short pipeline system, natural gas fueled compression, highly contained reservoir, and basic oil processing system.
• Analysis of 22 years of CO2-EOR operations and monitoring shows it is possible to have negative net emissions if you store a large amount of CO2 in association with EOR operations.
(Marriot/DOE-NETL, 2013)

26
Thanks!
Questions?