
The Captain EOR Stage 2 Phase II Project - GOV.UK
270
The Captain EOR Stage 2 Phase II Project Environmental Statement BEIS Reference No. ES/2022/007 August 2022
-
Upload
khangminh22 -
Category
Documents
-
view
0 -
download
0
Transcript of The Captain EOR Stage 2 Phase II Project - GOV.UK

The Captain EOR Stage 2 Phase II Project
Environmental Statement
BEIS Reference No. ES/2022/007
August 2022

[This page is intentionally left blank]

Captain EOR Stage 2 Phase II Stage 2 Project Environmental Statement
i
Project Name Captain EOR Stage 2 Phase II Project.
Development
Location Block 13/22a
Licence No P.324
OPRED Reference No ES/2022/007
Type of Project Enhanced Oil Recovery
Undertaker Ithaca Energy Limited, Hill of Rubislaw, Aberdeen, AB15 6XL.
Licensees/Owners
Co-venturers % Holding
Ithaca Energy 85
Dana Petroleum (E&P) 15
Short Description Ithaca Energy are progressing the Captain field Enhanced Oil Recovery (EOR)
strategy which was detailed in the original Field Development Plan. The Project
involves the injection of a polymer into the reservoir to enhance recover of
hydrocarbons. The EOR project has been split over a number of stages (including an
initial pilot study and two further stages: Stage 1 and Stage 2). Stage 2 has been
further split into two phases and this Environmental Statement covers the second of
these phases. As part of the proposed Captain EOR Stage 2 Phase II Project, six new
subsea polymer injection wells will be drilled across two new dr ill centres. Polymer
injection flowlines and control umbilicals will be installed (jet trenched and buried)
between the existing Captain Bridge Linked Platform (BLP) and the new wells . An
additional production well will also be drilled. The proposed Captain EOR Stage 2
Phase II Project can be summarised as follows:
• Drilling of six new polymer injection wells across two new drill centres;
• Drilling of one new production well at an existing drill centre;
• The installation and commissioning of the required subsea infrastructure;
• Ongoing modifications to the three Captain installations; and
• Increased production rates.
Key Dates
Activities Date
Drilling of wells Q1 2023 – Q2 2024
Subsea installation Q2-Q3 2023
First injection Q1 2024
First production from new well Q2 2024
Significant
Environmental
Effects Identified
The Environmental Statement (ES) assesses the worst-case impact of the project on
the environment and is therefore very conservative. Even then applying the mitigation
measures identified it is the conclusion of this ES that the current proposal for the
proposed Captain EOR Stage 2 Phase II Project can be completed without causing
any significant long term environmental impacts or cumulative or transboundary
effects.
Statement Prepared
by
Ithaca Energy Limited and Genesis Energies
Company Job Title Relevant Qualifications/Experience
Ithaca Energy
Genesis Energies
Ltd.

Captain EOR Stage 2 Phase II Stage 2 Project Environmental Statement
ii
[This page is intentionally blank]

Captain EOR Stage 2 Phase II Stage 2 Project Environmental Statement Table of Contents
iii
TABLE OF CONTENTS
INFORMATION SHEET………………………………………………………………………………………..i
TABLE OF CONTENTS……………………………………………………………………………………….iii
NON-TECHNICAL SUMMARY…………………………………………………………………………….....vi
ACRONYMS ………………………………………………………………….……………………………...xvii
1. INTRODUCTION .....................................................................................................1-1
1.1 Overview of the Captain Field ....................................................................................1-2
1.2 Overview of the Captain Field Enhanced Oil Recovery ..................................................1-3
1.3 Purpose of Environmental Statement ..........................................................................1-5
1.4 Scope of Environmental Statement.............................................................................1-6
1.5 Document Layout ....................................................................................................1-6
1.6 Legislative Overview ................................................................................................1-7
1.7 Ithaca Energy Management System ......................................................................... 1-11
1.8 Areas of Uncertainty............................................................................................... 1-13
1.9 Consultation Process ............................................................................................. 1-13
2. PATHWAY TO NET ZERO .......................................................................................2-1
2.1 Ithaca Energy Climate Targets...................................................................................2-1
2.2 Environmental Management System...........................................................................2-4
2.3 Environmental Stewardship .......................................................................................2-6
2.4 Ithaca Environmental Initiatives..................................................................................2-7
2.5 Emissions Reduction Performance and Commitment .................................................. 2-11
3. PROJECT DESCRIPTION ........................................................................................3-1
3.1 Project Overview .....................................................................................................3-1
3.2 Status of Existing Captain Field .................................................................................3-1
3.3 Nature of Reservoir ..................................................................................................3-2
3.4 Option Selection ......................................................................................................3-5
3.5 Schedule of Activities ...............................................................................................3-7
3.6 Drilling ...................................................................................................................3-7
3.7 Subsea Inf rastructure ............................................................................................. 3-15
3.8 Topsides Modif ications ........................................................................................... 3-19
3.9 Production ............................................................................................................ 3-20
3.10 Key Permits and Consents ...................................................................................... 3-22
3.11 Decommissioning .................................................................................................. 3-23
4. ENVIRONMENTAL BASELINE .................................................................................4-1
4.1 Introduction.............................................................................................................4-1
4.2 Environmental Baseline Surveys ................................................................................4-1
4.3 Physical Environment ...............................................................................................4-3
4.4 Biological Environment ........................................................................................... 4-10

Captain EOR Stage 2 Phase II Stage 2 Project Environmental Statement Table of Contents
iv
4.5 Conservation ........................................................................................................ 4-23
4.5 Socio-Economic Environment .................................................................................. 4-24
5. ENVIRONMENTAL IMPACT ASSESSMENT METHODOLOGY.....................................5-1
5.1 Introduction.............................................................................................................5-1
5.2 Receptors and Aspects.............................................................................................5-1
5.3 ESIA for Planned Activities........................................................................................5-2
5.4 ESRA for Unplanned Events .....................................................................................5-5
5.5 Assessment of Significance of Environmental and Socio-economic Risks.........................5-7
6. PHYSICAL PRESENCE ...........................................................................................6-1
6.1 Presence of Vessels and the Drilling Rig .....................................................................6-1
6.2 Presence of Subsea Inf rastructure .............................................................................6-3
6.3 Decommissioning Phase ..........................................................................................6-4
6.4 Cumulative and Transboundary Effects .......................................................................6-4
6.5 Mitigation Measures .................................................................................................6-5
7. ATMOSPHERIC EMISSIONS....................................................................................7-1
7.1 Sources .................................................................................................................7-1
7.2 Emissions Increases Associated with Captain Production ..............................................7-2
7.3 Aggregated Emissions............................................................................................ 7-11
7.4 Impact on Air Quality .............................................................................................. 7-14
7.5 Impact on Climate Change ...................................................................................... 7-15
7.6 Mitigation Measures ............................................................................................... 7-21
8. DISCHARGES TO SEA............................................................................................8-1
8.1 Drilling Phase..........................................................................................................8-1
8.2 Subsea Installation and Commissioning Phase ............................................................8-4
8.3 Production Phase ....................................................................................................8-4
8.4 Decommissioning Phase ..........................................................................................8-5
8.5 Cumulative and Transboundary Effects .......................................................................8-5
8.6 Mitigation Measures .................................................................................................8-5
9. SEABED DISTURBANCE ........................................................................................9-1
9.1 Drilling Phase..........................................................................................................9-1
9.2 Installation Phase ....................................................................................................9-2
9.3 Production Phase ....................................................................................................9-3
9.4 Assessment of Seabed Disturbance ...........................................................................9-3
9.5 Decommissioning Phase ..........................................................................................9-7
9.6 Cumulative and Transboundary Effects .......................................................................9-7
9.7 Mitigation Measures .................................................................................................9-8
10. UNDERWATER NOISE.......................................................................................... 10-1
10.1 Introduction........................................................................................................... 10-1
10.2 Noise Sources Associated with the Proposed Project .................................................. 10-1

Captain EOR Stage 2 Phase II Stage 2 Project Environmental Statement Table of Contents
v
10.3 Impacts of Noise Sources ....................................................................................... 10-1
10.4 Cumulative and Transboundary Effects ..................................................................... 10-5
10.5 Mitigation Measures ............................................................................................... 10-6
11. WASTE GENERATION .......................................................................................... 11-1
11.1 Vessel Waste ........................................................................................................ 11-1
11.2 Drilling Waste........................................................................................................ 11-2
11.3 Installation and Commissioning................................................................................ 11-2
11.4 Production Phase .................................................................................................. 11-2
11.5 Decommissioning Phase ........................................................................................ 11-2
11.6 Mitigation Measures ............................................................................................... 11-3
12. ACCIDENTAL EVENTS ......................................................................................... 12-1
12.1 Overview of Potential Hydrocarbon Releases............................................................. 12-1
12.2 Assessment of a Well Blow-Out ............................................................................... 12-3
12.3 Major Environmental Incident Assessment............................................................... 12-13
12.4 Natural Disasters ................................................................................................. 12-14
12.5 Mitigation Measures ............................................................................................. 12-14
13. CONCLUSIONS .................................................................................................... 13-1
13.1 Environmental Effects ............................................................................................ 13-1
13.2 Minimising Environmental Impact ............................................................................. 13-1
13.3 Commitments........................................................................................................ 13-1
13.4 Overall Conclusion................................................................................................. 13-5
14. REFERENCES...................................................................................................... 14-1
A APPENDIX A – SCOTLAND’S NATIONAL MARINE PLAN ......................................... A-1
A.1 Scotland’s National Marine Plan................................................................................ A-1
A.2 Marine Strategy Framework Directive (MSFD) ............................................................ A-3
A.3 Oil and Gas Marine Planning Policies ........................................................................ A-5
B APPENDIX B – CAPTAIN EOR STAGE 2 PHASE II PROJECT ENVID ......................... B-1
C APPENDIX C – DRILL CUTTINGS MODELLING........................................................ C-1
D APPENDIX D – UNDERWATER NOISE MODELLING FOR PILING .............................. D-1
E Appendix E- SUPPORTING INFORMATION……………………………………………….…..E-1

Captain EOR Stage 2 Phase II Stage 2 Project Environmental Statement Non-Technical Summary
vi
NON-TECHNICAL SUMMARY
Background
The Captain f ield lies in UKCS Block 13/22a (Licence No. P.324) c. 145 km northeast of Aberdeen, in
the Outer Moray Firth (Figure 1). The f ield is operated by Ithaca Energy (UK) Limited (Ithaca Energy)
who has 85% interest equity, whilst Dana Petroleum (E&P) Limited holds a 15% non-operated working
interest in the f ield.
Since early f ield life, production at the Captain field has been supported with water injection, whilst the
original Field Development Plan (FDP) referenced an Enhanced Oil Recovery (EOR) strategy using the
injection of polymers. After initial trials at the Captain f ield a staged EOR development approach was
adopted in 2016. This Environmental Statement Report (ES) supports a number of the activities to be
carried out as part of the second stage the EOR strategy, which is currently being progressed by Ithaca
Energy.
Figure 1: Location of Captain Field.
Overview of the Captain Field
The Captain f ield was discovered in 1977 and has been producing since 1997. The f ield was initially
developed with a Wellhead Protection Platform (WPP) and the Captain Floating Production Storage and Off loading (FPSO) vessel. The WPP supports a self -contained drilling rig, personnel
accommodation, helideck and all utility, ancillary and emergency systems.
In 2001 the second stage of the Captain Field Development was completed. This included the
installation of a Bridge Linked Platform (BLP) bridge linked to the WPP. It is also connected to an 18-slot Unitised Template Manifold (UTM) at a subsea drill centre referred to as Area B. The Area B UTM

Captain EOR Stage 2 Phase II Stage 2 Project Environmental Statement Non-Technical Summary
vii
is linked to the BLP by two production flowlines, injection and test f lowlines and various communications and chemical umbilicals.
The third stage of the Captain Field Development was completed in 2006 and comprised the development of an additional drill centre referred to as Area C. Area C is tied back to the Area B UTM
by means of one production flowline and several other lines for control and well fluids. Area A, Area B and Area C f luids flow to the BLP for processing then onto the FPSO via the WPP for further processing
and storage.
Captain crude oil is of floaded f rom the FPSO vessel to a dynamically positioned shuttle tanker and
transported to onward sales point. Captain gas is exported and imported via a subsea pipeline connecting to the Frigg U.K. gas transportation system and then on to the St Fergus gas terminal.
Figure 2 shows the layout of the Captain Field Development.
Figure 2: Indicative layout of the Captain Field Development.
Overview of the Captain Field Enhanced Oil Recovery Project
Since early f ield life, produced water has been injected at Captain to maintain reservoir pressure and
provide reservoir sweep. Polymer solution injection was proposed in the original Captain FDP and the
concept was included as part of the original facilit ies design to enable a field trial to take place. As part
of a pilot EOR project, pilot polymer mixing and injection facilities were installed on the Captain FPSO
and the WPP.
Following the pilot study, the Captain EOR Project was split into two further stages: Stage 1 and Stage
2. The second stage of the Captain EOR Project (the Captain EOR Stage 2 Project) includes some
brownf ield modifications across the three Captain installations (WPP/BLP/FPSO), as well as a
significant expansion in the subsea area. The Captain EOR Stage 2 Project can be considered to be
split into two phases (Phase I and Phase II) based on the schedule of activities and requirements under
the Offshore Oil and Gas Exploration, Production, Unloading and Storage (Environmental Impact
Assessment) Regulations 2020 (hereafter referred to as the 2020 Offshore EIA Regulations).
The ES details the activities associated with Stage 1 and with Stage 2 Phase I, whilst this summary
focuses on the activities covered by the ES i.e. Captain EOR Stage 2 Phase II Project which includes:

Captain EOR Stage 2 Phase II Stage 2 Project Environmental Statement Non-Technical Summary
viii
• Drilling of six new polymer injection wells across two new drill centres (Area D and Area E);
• Drilling of one new production well at Area B (an existing drill centre);
• The installation and commissioning of the required subsea infrastructure;
• Ongoing modifications to the three Captain topsides; and
• Increased production rates.
Figure 3 summarises the drilling and installation activities associated with the Captain EOR Stage 2
Phase II Project.
Figure 3: Representative schematic of the proposed Captain EOR Stage 2 Phase II Project activities.
Environmental Statement Scope
The scope of the Environmental Impact Assessment (EIA) and resultant (ES) includes the following activities:
• Drilling of the six polymer injection wells across two new drill centres (Area D and Area E)
• Drilling of one new production well at Area B (an existing drill centre);
• The installation and commissioning of the required subsea infrastructure;
• Modifications to the topsides of the BLP and the WPP platforms and the Captain FPSO and;
• Additional production (relative to operation without the Captain EOR Stage 2 Phase II project);
and
• Decommissioning.
This document provides details of the EIA that has been undertaken to support Ithaca Energy and their
Co-Venturer’s application for consent to undertake the proposed project. This process includes a public consultation followed by a comprehensive review by various bodies including the Offshore Petroleum
Regulator for Environment and Decommissioning (OPRED).

Captain EOR Stage 2 Phase II Stage 2 Project Environmental Statement Non-Technical Summary
ix
In line with the 2020 Offshore EIA Regulations, the EIA sets out to describe and evaluate the impacts of any emissions to air, discharges to sea, seabed disturbance, underwater noise, waste production
and resource use resulting f rom the proposed development on a range of receptors including f lora, fauna, water, air, climate, and material assets. In addition, the potential interactions with other users of
the sea are considered. These aspects are considered for planned activities and unplanned (i.e. accidental) events.
Option Selection
The ES details the options considered for the following facets of the Captain EOR Stage 2 Phase II
Project:
• Use polymer injection or continue with produced water/water injection;
• Type of polymer;
• Number and location of the polymer injection wells;
• Type of well;
• Number of flowlines and method of installation;
• Use of piled or gravity based Subsea Umbilical Distribution Structures (SUDS) at each drill
centre.
In the absence of the new polymer injection wells there will be a reduction in the recovery factor from
the f ield, whilst the type of polymer being used has been chosen based on its ability to provide high solution viscosity, while maintaining good injectivity in the injection wells.
Determining the optimal injection well number and spacing is a function of: (1) the polymer viscosity required to meet the optimal displacement ratio; (2) the reservoir thickness and properties; (3) oil
saturation at that location; and (4) the desired phasing of oil production. Taking these factors into account, it was determined that six polymer injection wells across two drill centres is the optimal
approach.
As jet trenching and burying of lines has been successful across the Captain field, this approach has been selected for the installation of the f lowlines and umbilicals. Based on previous reports of fishing
gear interacting with subsea inf rastructure within existing 500 m exclusion zones at the f ield it was determine that the SUDS should be piled to minimise impact of any future interactions that may occur.
Captain Stage 2 Phase II Development Project
The inf rastructure to be installed as part of the proposed Captain EOR Stage 2 Phase II Project is summarised in Table 1.

Captain EOR Stage 2 Phase II Stage 2 Project Environmental Statement Non-Technical Summary
x
Table 1: Subsea infrastructure associated with the proposed Captain EOR Stage 2 Phase II Project.
Item No. Description
1 Seven Xmas trees: one each for the polymer injection wells and one for the new production
well which will be located within the existing UTM at Area B.
2 Two piled SUDS, one at Area D and one at Area E, plus one gravity based SUDS at the BLP
riser base location.
3 Three 6.6" (internal diameter) polymer injection flowlines from the BLP to Area D: c. 4,728 m in
length with an external diameter of 228 mm.
4 A 4,709 m EH umbilical (110 mm outer diameter) from the BLP to Area D.
5 Three 6.6" (internal diameter) polymer injection flowlines from the BLP to Area E: c. 5,718 m in
length with an external diameter of 228 mm.
6 A 5,757 m EH umbilical (110 mm outer diameter) from the BLP to Area E.
7 A 326 m EH riser umbilical (203 mm outer umbilical) from BLP topsides to the Riser base
SUDS structure.
8 Three EH umbilical jumpers at Area D laid between the SUDS and the three wells: each one
measuring 80 m.
9 Three EH umbilical jumpers at Area E laid between the SUDS and the three wells: each one
measuring 80 m.
Schedule of Activities
The activities associated with the drilling, installation and commissioning of the Captain Field are
scheduled to take place in 2023 and 2024 as shown in Table 2.
Table 2: Indicative schedule for the proposed Captain EOR Stage 2 Phase II activities.
Activity
2023 2024
Q1 Q2 Q3 Q4 Q1 Q2 Q3 Q4
Drilling of the polymer injection wells at Area D, and
Area E and the production well at Area B
Installation of subsea infrastructure
First injection at Area D
First injection at Area E
First oil from new production well at Area B
Baseline Environment
The Captain Field is situated in Block 13/22 c. 145 km north-east of Aberdeen and c. 188 km f rom the UK/Norway median line. The Field is situated in a water depth of approximately 105 m.
A number of environmental surveys have been commissioned at the Captain f ield, with sampling locations illustrated in Figure 4. The data f rom these surveys has been used to inform the impact
assessment. The information available from these surveys was deemed sufficient to inform the impact assessment carried out in support of this ES.

Captain EOR Stage 2 Phase II Stage 2 Project Environmental Statement Non-Technical Summary
xi
Figure 4: Extent of environment surveys used to support this ES.
The main sediment type over the survey area as sandy mud/muddy sand, which is classified as the EUNIS biotope complex ‘Deep circalittoral mud’ (A5.37). Small, localised areas of high reflectivity were also observed and interpreted to comprise sandy mud with pebbles, cobbles, and boulders and to be representative of ‘Deep circalittoral mixed sediments’. The ‘Deep circalittoral mud’ observed across the Captain f ield is considered to be representative of the Priority Marine Feature (PMF) broad habitat ‘Burrowed mud’ and ‘Offshore deep-sea muds’ and the priority habitat ‘Mud habitats in deep water’. It is recognised that these habitats are widely distributed within the North Sea. The area is also considered representative of the OSPAR listed threatened and/or declining habitat ‘sea pen and burrowing megafauna communities’ habitat. The Annex II species, Arctica islandica was also found to occur in the area.
Spawning and nursery grounds for fish species including anglerfish, blue whiting, cod, European hake,
haddock, herring, lemon sole, ling, mackerel, Nephrops, Norway pout, sandeel, spotted ray, sprat, spurdog and whiting have been identified in the area.
A number of seabirds are known to occur in the area including northern gannet, great skua, razorbill, northern fulmar, black legged kittiwake, guillemot etc. Based on the Seabird Oil Sensitivity Index (SOSI)
the sensitivity of seabirds to surface oil pollution is generally medium throughout the year within Block 13/22a, but it is recorded as either High or Very High in December, February and March.
The most abundant cetacean species in the Captain Field area is the Atlantic white-beaked dolphin. Other species known to occur there include the harbour porpoise, killer whale and the minke whale.
For management purposes the International Council for the Exploration of the Sea (ICES) collates f isheries information for area units termed ICES rectangles. The importance of an area to the f ishing
industry is assessed by measuring the fishing effort within each ICES rectangle. The proposed project area is located within ICES rectangle 45E8. UK commercial fishing ef fort within this rectangle varies

Captain EOR Stage 2 Phase II Stage 2 Project Environmental Statement Non-Technical Summary
xii
throughout the year and is considered to be moderate with an average f ishing effort of 779 days in 2020 which constitutes 0.7% of the overall UK fishing effort in days.
Shipping in the area is considered low and there are no military exercise areas in the vicinity of the field.
Environmental Impact Assessment
In order to determine the impact that the proposed Captain EOR Stage 2 Phase II Project may have on the environment an ENVironmental and socio-economic impact IDentification (ENVID) was undertaken
following a structured methodology. The purpose of the ENVID was to identify the significance of the environmental and socio-economic risks associated with the planned activities and any possible
unplanned events and to identify appropriate mitigation measures, controls and safeguards to minimise this risk.
For each of the planned activities an environmental and/or socio-economic impact significance is assigned for the relevant aspects (e.g. emissions to air, discharges to sea, underwater noise etc.) by
taking into account the sensitivity of the receptors and the magnitude of the effect.
For unplanned events the environmental and/or socio-economic significance of risk ranking also takes
into account the likelihood of the event occurring. A summary of the key f indings of the ENVID and supporting impact assessment is presented here.
Physical Presence
The physical presence of the project vessels, the drilling rig and the subsea infrastructure has the
potential to be a navigational hazard, to restrict f ishing operations in the area and / or to cause disturbance to wildlife. However, taking account of the mitigation measures outlined in Table 3, which
includes early consultation with the Scottish Fisheries Federation (SFF), and notification to other users of the sea regarding the project’s activities, the socio-economic impact significance is considered low
and is therefore acceptable when managed within the mitigation measures described.
Emissions to Air
Gaseous emissions can contribute to global atmospheric concentrations of greenhouse gases, regional acid loads and ozone depletion. The main greenhouse gases are carbon dioxide (CO2), methane (CH4)
and nitrous oxide (N2O) all of which will be produced during the drilling, installation, commissioning and operational phases of the proposed Captain EOR Stage 2 Phase II Project.
It is anticipated that, as a worst-case scenario, the average annual CO2 emissions associated with the drilling rig and the drilling and installation vessels represents c. 0.4 % of the annual total UK shipping
emissions (UK figures for 2019).
In the context of UKCS oil and gas production, the Captain f ield with the proposed project offers
relatively low GHG emission per barrel of oil equivalent. In addition, the proposed project lowers the forecasted GHG intensities at the Captain f ield relative to the estimated intensities in the absence of
the proposed project.
A range of mitigation measures to minimise emissions to air is proposed, as outlined in Table 3. These
include optimisation of vessel use, vessel assurance and compliance with UK legislation. When
compared against other emission sources on the UKCS and taking the mitigation measures into consideration, the overall risk f rom emissions to air resulting f rom the proposed project is considered
low and is therefore acceptable when managed within the mitigation measures described.
Discharges to Sea
There will be a number of planned discharges to sea associated with the proposed project. Planned and permitted discharges to sea during drilling include mud and entrained drill cuttings and seawater
with bentonite sweeps, cement and associated chemicals.

Captain EOR Stage 2 Phase II Stage 2 Project Environmental Statement Non-Technical Summary
xiii
Planned and permitted discharges to sea during the installation and commissioning phase are primarily associated with testing the pipelines and infrastructure. All associated chemicals will be risk assessed
and permitted in accordance with the Offshore Chemicals Regulations 2002 (as amended).
The BLP platform operates 100% Produced Water (PW) reinjection such that there will be no PW
discharges to sea. Following implementation of the proposed project, the field will continue to inject all produced water.
The significance of the environmental impacts of all planned discharges associated with the proposed Captain Field Development are considered to be low and are therefore considered acceptable when
managed within the additional controls and mitigation measures identified.
Seabed Disturbance
A number of activities will be carried out which have the potential to impact on the seabed and its
associated benthic communities. These include the laydown of the anchor system for the drilling rig, the discharge of drill cuttings from the upper sections of the wells, the discharge of cement from the top
hole sections and the impacts associated with the subsea installation activities. Seabed impacts have been divided into permanent impacts and temporary impacts. The former are associated with the long
term installation of new infrastructure and its associated stabilisation features e.g. the SUDS, flowlines, umbilicals and stabilisation material. Although some of these features will be removed upon f inal
decommissioning, for the purposes of this EIA they have been classed as permanent. Temporary impacts include those associated with the drill rig anchor system, which will be recovered once the
drilling campaign has been completed and the resettlement of suspended solids.
The significance of the environmental impacts on the is considered to be low and are therefore
considered acceptable when managed within the controls and mitigation measures identified.
Underwater Noise
The main sources of underwater sound associated with the proposed Captain Field Development will result f rom the piling of the SUDS, vessel use and drilling operations.
Many marine organisms use sound for navigation, communication and prey detection. Therefore, the introduction of man-made sources of underwater noise has the potential to impact marine animals if it
interferes with their ability to receive and use sound. Types of impact include temporary avoidance or behavioural changes, the masking of biological sounds as well as auditory and other injuries.
Although the sound from the proposed project does have the potential to cause disturbance to marine animals it is not expected to have a significant impact on any cetacean or fish species. Taking this into
account and considering the mitigation measures outlined in Table 3, the significance of the environmental impact of the underwater sound associated with the vessels and the piling is considered
low and is therefore acceptable when managed within the mitigation measures described.
Waste
Ithaca Energy is committed to applying the waste management hierarchy and managing all produced waste using approved methods. Waste will only be disposed of if it cannot be prevented, reclaimed or
recovered. Waste produced will be correctly documented, transported, processed and disposed of in accordance with applicable legislation. The overall impact significance of waste generation is therefore
considered to be low and is therefore acceptable when managed within the mitigation measures described.
Unplanned Hydrocarbon Releases
Modelling of a worst-case unplanned hydrocarbon release was carried out using the Oil Spill
Contingency and Response (OSCAR) model. There is a potential risk to several environmental receptors f rom such releases, including internationally protected areas, the magnitude of which is
dependent on the size of the release. Worst-case releases are rare in the industry and the likelihood of

Captain EOR Stage 2 Phase II Stage 2 Project Environmental Statement Non-Technical Summary
xiv
an unplanned hydrocarbon release reaching its full effect potential is such that the overall risk is reduced to as low as reasonably practicable. However, should an uncontrolled release occur there will be robust
measures in place to ensure a co-ordinated and co-operative response.
Overall Conclusion
The proposed Captain EOR Stage 2 Phase II Project will be developed using proven technology incorporating the current best practices. A robust design, strong operating practices and a highly trained
workforce will ensure the proposed project does not result in any significant long-term environmental, cumulative or transboundary ef fects. Additional measures will be in place during operations to
ef fectively respond to unplanned events.
Table 3: Captain EOR Stage 2 Phase II Project commitments.
Aspect Commitments
Physical
presence • Drilling rig routes will be selected in consultation with other users of the sea, with the aim
of minimising interference to other vessels and the risk of collision;
• Vessel use will be optimised by minimising the number of vessels required and length
of time vessels are on site;
• A post installation survey will be carried out following jetting of the flowlines and
umbilicals to ensure the lines are over trawlable and to ensure there are no clay berms;
• Consultation with the Scottish Fishermen’s Federation (SFF) for all phases and
operations;
• Notice to Mariners will be circulated prior to rig mobilisation;
• As required by HSE Operations Notice 6 (HSE, 2014), a rig warning communication will
be issued at least 48 hours before any rig movement. Notice will be sen t to the Northern
Lighthouse Board (NLB) of any drilling rig moves and vessel mobilisation associated
with the mobilisation and demobilisation of the drilling rig;
• A Vessel Traffic Survey will inform a Consent to Locate application for the drilling rig;
• A Collision Risk Management Plan will be produced, if required;
• All vessels engaged in the project operations will have markings and lightings as per the
International Regulations for the Prevention of Collisions at Sea (COLREGS) (IMO,
1972);
• The drilling rig will be equipped with navigational aids and aviation obstruction lights
system, as per the Standard Marking Schedule for Offshore Installations for example
fog lights, aviation obstruction lights, helideck lighting and radar beacons;
• The drilling rig will have a statutory 500 m safety zone to mitigate any collision risk;
• An ERRV will patrol the area;
• All subsea infrastructure out with the 500 m zones will be over-trawlable;
• The use of pipeline stabilisation features (e.g. mattresses and rock cover) will be
minimised through project design and will be installed in accordance with industry best
practice and SFF recommendations.

Captain EOR Stage 2 Phase II Stage 2 Project Environmental Statement Non-Technical Summary
xv
Aspect Commitments
Emissions
to air • The drilling rig and other project vessels will be subject to audits ensuring compliance
with UK legislation and the Ithaca Marine Operations and Vessel Assurance Standard;
• Vessel use will be optimised where possible by minimising the number of vessels
required, and their length of time on site;
• Vessels will be operated where possible in modes that allow for economical fuel use;
and
• Minimise flaring during well clean-up operations by sending fluids to BLP for
processing as the base case and preferred option.
• In accordance with the revised NSTA strategy, and associated Stewardship Expectation
11, as well as with the industry commitments within the NSTD, Ithaca Marine Operations
and Vessel Assurance Standard will incorporate the impact of the Captain field
production within developing controls including:
• Asset GHG Emission Reduction Action Plans;
• Flaring and venting reviews to identify/action zero routine flaring by 2030;
• Active flare reduction strategy;
• Active vent reduction strategy;
• Emission key performance indicators and targets; and
• Industry level benchmarking of flaring and venting.
• These will ensure that opportunities for efficiency and reduction of atmospheric
emissions, where not in conflict with safe operations, are identified, actioned as
appropriate and reviewed.
Discharges to sea • The drilling rig has been audited under Ithaca Energy’s marine assurance standards and
subject to rig recertification audits;
• All vessels used will be MARPOL compliant;
• Where technically feasible Ithaca Energy will prioritise the selection of chemicals which
are PLONOR (Pose Little Or No Risk), or have the lowest RQ; and
• The discharges of any water based hydraulic fluids, sand or chemicals are regulated by
the OPPC and/or OCR regulations and reported thro ugh the EEMS. As such, Ithaca
Energy will ensure that sampling, analysis and reporting are undertaken in line with the
regulations and permit conditions.
Seabed disturbance • Pre-deployment surveys will be undertaken to identify suitable locations for the d rilling
rig anchors;
• Wells at Area D and Area E will be drilled in close proximity such that the anchors will
only require to be laid once at each drill centre and the drilling rig can be skidded
between wells;
• Production well at Area B will use top hole sections from a suspended well;
• Jet trenching rather than ploughing of flowlines and umbilicals; and
• The use of mattresses, rockdump and grout bags will be minimised through optimal
project design.
Underwater
noise • A qualified, trained and equipped marine mammal observer (MMO) will be present. The
MMO will carry out a pre-piling survey of a 500 m mitigation zone and, if an animal is

Captain EOR Stage 2 Phase II Stage 2 Project Environmental Statement Non-Technical Summary
xvi
Aspect Commitments
detected, the piling will be delayed until all marine mammals vacate the 500 m mitigation
zone;
• A soft-start/ramp-up of hammer energy will be employed where the hammer will
commence at a low energy at the start of piling. The soft start will be such that maximum
hammer energy will not be reached until after a period of 20 minutes;
• Passive Acoustic Monitoring (PAM) will be employed during periods of low visibility to
detect marine mammal presence; and
• Avoiding commencing piling at night or in poor visibility when marine mammals cannot
reliably be detected. If this cannot be avoided, then Passive Acoustic Monitoring (PAM)
will be used
Waste • Ithaca Energy will apply the principles of the Waste Management Hierarchy during all
activities i.e. Reduce, Reuse, Recycle;
• Existing asset and vessel WMPs will be followed;
• Only permitted disposal yards / landfill sites will be used.
Accidental
events • Activities will be carried out by trained and competent offshore crews and supervisory
teams;
• An approved OPEP will be in place prior to any activities being undertaken;
• Records will be kept of oil spill training and exercises as required by the OPEP;
• Process Safety Assurance Processes will be identified and adhered to;
• A co-ordinated industry oil spill response capability will be available;
• Enhanced sharing of industry best practices via the Oil Spill Response Forum (OSRF) will
continue for Company personnel;
• A robust BOP pressure and functional testing regime will be in place; and
• Appropriate mud weights will be used to ensure well control is maintained.
• In case of an emergency, arrangements will be in place with a well capping provider to
provide specialist advice and support; and
• Oil spill control measures will be followed as outlined in the OPEP.

Captain EOR Stage 2 Phase II Stage 2 Project Environmental Statement Acronyms
xvii
ACRONYMS
˃ More Than
% Percentage
% wt Percentage Weight
‰ Per thousand
(H) Height
(L) Length
(W) Width
‘ Minutes
ʺ Seconds/Inches
< Less Than
≥ More than or equal to
° Degrees
°C Degrees Celsius
°F Degrees Fahrenheit
µg/g Micrograms per Gram
µg/l Micrograms per Litre
µm Micrometres
µPa Micropascal
AEL Associated Emission Level
AHV Anchor Handling Vessel
AIS Automatic Identification System
ALARP As Low As Reasonably Practicable
ANP National Agency of Petroleum, Natural Gas and Biofuels
API American Petroleum Institute
AQS Air Quality Standards
Ba Barium
BAC Background assessment concentration
BAP Biodiversity Action Plan
BAT Best Available Techniques
BAT Best Available Technology
bbls Barrels of Oil
BEIS (the Department of) Business, Energy and Industrial Strategy
BLP Bridge Linked Platform
BOP Blowout Preventer
BPEOC BP Exploration Operating Company
CA Comparative Assessment
CCS Carbon Capture and Storage

Captain EOR Stage 2 Phase II Stage 2 Project Environmental Statement Acronyms
xviii
CEFAS Centre for Environment, Fisheries and Aquaculture Science
CH4 Methane
CHARM Chemical Hazard Assessment and Risk Management
cm Centimetre
CMAPP The Corporate Major Accident Prevention Policy
CMID Common Marine Inspection Documents
CNS Central North Sea
CNSE Central North Sea Electrification
CO Carbon Monoxide
CO2 Carbon Dioxide
CO2e Carbon Dioxide Equivalents
CO2e/mboe Carbon Dioxide Equivalents per…
COLREGS Collision Regulations
CoP Cessation of Production
COSHH Control of Substances Hazardous to Health
COT Cargo Oil Tank
cP centiPoise
CSIP Cetacean Stranding Investigation Programme
CSV Construction Support Vessel
CtL Consent to Locate
CIP Communication & Interface Plan
D Disclosive
dB Decibels
dB re 1 μPa Decibels relative to 1 mico Pascal
dB re 1 μPa2s Decibels relative to 1 squared mico Pascal second
DECC Department of Energy and Climate Change
DEFRA Department for Environment Food and Rural Affairs
DepCon Deposit Consent
DHSV Down Hole Safety Valve
DP Dynamic Positioning
DREAM Dose-related Risk and Effect Assessment Model
DSV Dive Support Vessel
DTI Department of Trade and Industry
DUKES Digest of UK Energy Statistics
EC European Commission
ED European Datum
EEMS Environmental Emissions
Monitoring System
EH Electro-Hydralic

Captain EOR Stage 2 Phase II Stage 2 Project Environmental Statement Acronyms
xix
EIA Environmental Impact Assessment
ELV Emission Limit Value
EMODnet European Marine Observation and Data Network
EMS Environmental Management System
ENVID Environmental and socio-economic Impact Identification
EOR Enhanced Oil Recovery
EPS European Protected Species
ERAP Emissions Reductions Action Plans
ERL Effects Range Low
ERRV Emergency Response and Rescue Vessel
ES Environmental Statement
ES Environmental Stewardship
ESAS European Seabirds at Sea
ESIA Environmental and Socio-Economic Impact Assessment
ESRA Environmental and Socio-Economic Risk Assessment
ETAP Eastern Trough Area Project
ETS Emissions Trading Scheme
EU European Union
EU ETS European Union Emissions Trading Scheme
EUNIS European Nature Information System
EUR Estimated Ultimate Recovery
FARAM Faunal Acoustic Risk Assessment Model
FeAST Feature Activity Sensitivity Tool
FEPA Food and Environmental Protection Act
FDP Field Development Plan
FPSO Floating Production Storage and Offloading
ft Feet
g/kg Grams per Kilogram
g/m2 Grams per Metre Squared
GEBCO General Bathymetric Chart of the Oceans
GEN National Marine Plan General Policies
GHG Greenhouse Gases
GTG Gas Turbine Generator
GWP Global Warming Potential
HAB Harmful Algal Blooms
HES Health, Environment and Safety
HC Hydrocarbon
HF High Frequency

Captain EOR Stage 2 Phase II Stage 2 Project Environmental Statement Acronyms
xx
HP High Pressure
HPAM Hydrolysed polyacrylamide
HQ Hazard Quotient
HSE Health Safety and Environment
HSE Health and Safety Executive
HVO Hydrotreated Vegetable Oil
Hz Hertz
IAMMWG Inter-Agency Marine Mammal Working Group
ICES International Council for the Exploration of the Sea
ICUN
IMO International Maritime
Organisation
INTOG Innovation and Targeted Oil and Gas
IOGP International Association of Oil & Gas Producers
IPCC Intergovernmental Panel on Climate Change
IPIECA International Petroleum Industry Environmental Conservation Association
IPPC Integrated Pollution Prevention and Control
ISO International Standards
Organisation
ITOPF International Tanker Owners Pollution Federation
IUCN International Union for Conservation of Nature
JNCC Joint Nature Conservation Committee
JV Joint Venture
kg Kilogram
Kg/bbl Kilogram per barrel of oil
kg/m2 Kilogram per Metre Squared
kg/m3 Kilogram per Metre Cubed
kHz Kilohertz
kJ Kilo Joules
km Kilometre
km2 Squared Kilometres
KPI Key Performance Indicator
kt Kilotonnes
KW Kilowatts
KW/m Kilowatts per metre
LAT Lowest Astronomical Tide
LCP Large Combustion Plant
LCS Lower Captain Sandstone
LF Low Frequency
LP Low Pressure

Captain EOR Stage 2 Phase II Stage 2 Project Environmental Statement Acronyms
xxi
LSA Low Specific Activity
LTOBM Lox Toxicity Oil Based Mud
m Metre
m/s Metres per Second
m2 Square Metres
m3 Cubic Metres
MAH Major Accidents and Hazards
MARPOL Maritime Pollution
MAT Master Application Template
MCAA Marine and Coastal Access Act
MCZ Marine Conservation Zone
MEI Major Environmental Incident
MER Maximise Economic Recovery
MF Mid Frequency
mg/kg Milligrams per Kilogram
mg/l Milligrams per Litre
MGO
mm Millimetre
mm3/day Cubic millimetres per day
MMBBL Million Barrels of Oil
mmboe Million Barrels of Oil Equivalent
MMO Marine Mammal Observer
MMO Marine Management Organisation
MoD Ministry of Defence
MODU Mobile Offshore Drilling Unit
MOL Main Oil Line
MPA Marine Protected Area
ms Milliseconds
MSS Marine Scotland Science
MTe Million Tonnes
mTVDss Metres True Vertical Depth Subsea
MU Management Unit
MW(th) Mega Watt (thermal)
N North
N/A Not Applicable
NAOI North Atlantic Oscillation Index
N2O Nitrous Oxide
NCMPA Nature Conservation Marine Protected Area

Captain EOR Stage 2 Phase II Stage 2 Project Environmental Statement Acronyms
xxii
NLB Northern Lighthouse Board
nm Nautical Miles
NMFS National Marne Fisheries Service
NMP National Marine Plan
NMPi National Marine Plan Interactive
NNS Northern North Sea
N2O Nitrous Oxide
NOAA National Oceanic and Atmospheric Administration
NORM Naturally Occurring Radioactive Material
NOx Nitrogen Oxides
NSS North Sea Standard
NSTA North Sea Transition Authority
NSTD North Sea Transition Deal
NTG Net-to-Gross
OCR Offshore Chemicals Regulations
OEUK Offshore Energies UK
OGA Oil and Gas Authority
OGOC Original Gas Oil Contact
OGUK Offshore Energies UK (formerly Oil & Gas UK)
OMFE Outer Moray Firth Electrification
OMS Operating Management System
OOWC Original Oil Water Contact
OPEP Oil Pollution Emergency Plan
OPOL Offshore Pollution Liability Association Ltd
OPPC Oil Pollution Prevention and Control
OPRED Offshore Petroleum Regulator for Environment and Decommissioning
OSCAR Oil Spill Contingency and Response
OSPAR Oslo/Paris Convention
OSRF Oil Spill Response Forum
OSRL Oil Spill Response Limited
PAH Polycyclic Aromatic Hydrocarbons
PAM Passive Acoustic Monitoring
Pb Bubble Point Pressure
PCB Polychlorinated Biphenyl
PETS Portal Environmental Tracking System
PEXA Practice and Exercise Area
PiP Pipe in Pipe
PLONOR Posing Little or No Risk

Captain EOR Stage 2 Phase II Stage 2 Project Environmental Statement Acronyms
xxiii
PMF Priority Marine Features
PPC Pollution Prevention and Control
PSD Particle size distribution
psia Pounds per square inch absolute
PTS Permanent Threshold Shift
PW Produced Water
PWA Pipeline Works Authorisation
PWRI Produced Water Re-injection
Q1, Q2, Q3, Q4 First quarter of the year, second quarter of the year etc.
RAM Range-dependent Acoustic Model
RBA Risk Based Approach
RHC Rapid Hardening Cement
rms Root Mean Squared
ROV Remotely Operated Vehicle
RQ Risk Quotient
Rs Solution Gas-Oil Ratio
RSD Relative Standard Deviation
SAC Special Areas of Conservation: cSAC, candidate; pSAC, possible; dSAC, draft
SACFOR Super-abundant, Abundant, Common, Frequent, Occasional and Rare
SAT Subsidiary Application Template
SCANS Small Cetacean Abundance in the North Sea
SCF Standard Cubic Feet
SCR Safety Case Regulations
SDS Safety Data Sheet
SE Stewardship Expectations
SEL Sound Exposure Level
SFF Scottish Fisheries Federation
SIMOPS Simultaneous Operations
SINTEF Stiftelsen for industriell og teknisk forskning
SMRU Sea Mammal Research Unit
SNH Scottish Natural Heritage (now NatureScot)
SO2 Sulphur Dioxide
SOPEP Shipboard Oil Pollution Emergency Plan
SOSI Seabird Oil Sensitivity Index
SOx Sulphur Oxides
SPA Special Protection Area
SPL Sound Pressure Level
SSS Side Scan Sonar

Captain EOR Stage 2 Phase II Stage 2 Project Environmental Statement Acronyms
xxiv
stb Stock tank barrel
SUCS Southern Upper Captain Sandstone
SUDS Subsea Umbilical Distribution Structure
SUDS Seaside Umbilical Distribution Structures
te Tonne
te/m3 Tonnes per Metre Cubed
te/day(d) Tonnes per day
Te/hr Tonnes per hour
Te/yr Tonnes per year
TeOE Tonnes of Oil Equivalent
THC Total Hydrocarbon Concentration
TOC Total Organic Carbon
TOM Total Organic Matter
TOOPEP Temporary Operation Oil Pollution Emergency Plan
TVDss True Vertical Depth subsea
UHB Upheaval Buckling
UCS Upper Captain Sandstone
UK United Kingdom
UKBAP UK Post-2010 Biodiversity Framework
UKCCC UK Committee for Climate Change
UKCS United Kingdom Continental Shelf
UKETS United Kingdom Emissions Trading Scheme
UKHO United Kingdom Hydrographic Office
UKNIR UK National Inventory Report
UKOOA UK Offshore Operators Association
US EPA United States Environmental Protection Agency
USNEL United States Naval Electronic Laboratory
UTM Universal Transverse Mercator/Unitised Template Manifold
VOC Volatile Organic Compounds
WBM Water Based Mud
WF Water Flood
WMP Waste Management Plan
WONS Well Operation Notifications System
WPP Wellhead Protection Platform

Captain EOR Stage 2 Phase II Project Environmental Statement
Section 1 Introduction
1-1
1. Introduction
The Captain f ield lies in UKCS Block 13/22a (Licence No. P.324) c. 145 km northeast of Aberdeen, in the
Outer Moray Firth (Figure 1-1). The f ield is operated by Ithaca Energy who has 85% interest equity, whilst
Dana Petroleum (E&P) Limited holds a 15% non-operated working interest in the field.
Since early f ield life, production at the field has been supported with water injection, whilst the original Field
Development Plan (FDP)1 referenced an Enhanced Oil Recovery (EOR) strategy using the injection of
polymers2. After initial trials at the Captain field a staged EOR development approach was adopted in 2016.
An overview of the Captain f ield is provided in Section 1.1 whilst Section 1.2 gives further details on the
polymer injection trials carried out and the different stages of the Captain EOR strategy. This Environmental
Statement Report (ES) supports a number of the activities to be carried out as part of the second stage the
EOR strategy, which is currently being progressed by Ithaca Energy (UK) Limited (Ithaca Energy).
Figure 1-1: Location of the Captain Field Development.
1 The development of, and production from, oil and gas fields in the United Kingdom’s territorial waters and on the United
Kingdom Continental Shelf (‘UKCS’) is subject to a licensing regime overseen by the North Sea Transition Authority
(NSTA). Under the applicable seaward production licence, Licensees require the NSTA’s consent to erect or carry out
permanent works for the purpose of getting or conveying petroleum from a licensed area or to get petroleum from such
an area. Such consent is referred to as a ‘Development and Production Consent’, and the document submitted in support
of such a consent is referred to as the FDP. The original FDP for the Captain Field was submitted in Q1 1995. 2 Sections 2.4.1 and 2.4.2 provide more details on polymer EOR.

Captain EOR Stage 2 Phase II Project Environmental Statement
Section 1 Introduction
1-2
1.1 Overview of the Captain Field
The Captain field was discovered in 1977 and has been producing since 1997. The field was developed over
a number of stages. It was initially developed with a Wellhead Protection Platform (WPP) and the Captain
Floating Production Storage and Offloading (FPSO) vessel. The WPP installation is a four-legged steel jacket
structure supporting a self-contained drilling rig, personnel accommodation, helideck and all utility, ancillary
and emergency systems. The location of the WPP wells is referred to as Area A.
In 2001 the second stage of the Captain Field Development was completed. This included the installation of
a Bridge Linked Platform (BLP) bridge linked to the WPP. It is also connected to an 18-slot Unitised Template
Manifold (UTM) at a subsea drill centre referred to as Area B. The bridge carries piping, interconnecting
power and control cables and facilitates personnel access. There is no accommodation or drilling facilities
on the BLP. The installation of the BLP de-bottlenecked the existing system to increase total field production
capacity by separation of excess gas and produced water so that the total fluids sent to the FPSO are within
its design capacity. The Area B UTM is linked to the BLP by two 16" production flowlines, a 12" power water,
injection and test flowlines and various communications and chemical umbilicals.
The third stage of the Captain Field Development was completed in 2006 and comprised the development
of an additional drill centre referred to as Area C. Area C is tied back to the Area B UTM by means of one
production flowline and several other lines for control and well f luids. Area A, Area B and Area C f luids flow
to the BLP for processing then onto the FPSO via the WPP for further processing and storage.
Captain crude oil is of floaded f rom the FPSO vessel to a dynamically positioned shuttle tanker and
transported to onward sales point. Captain gas is exported and imported via a subsea pipeline connecting
to the Frigg U.K. gas transportation system and then on to the St Fergus gas terminal.
Figure 1-2 shows the layout of the Captain Field Development and Figure 1-3 shows the installations
associated with the field. Further details on the Captain field are provided in Section 2.
Figure 1-2: Indicative layout of the Captain Field Development.

Captain EOR Stage 2 Phase II Project Environmental Statement
Section 1 Introduction
1-3
Figure 1-3: Captain field showing WPPA (left foreground), BLP (right foreground), Captain FPSO (centre
background) and shuttle tanker (left background).
1.2 Overview of the Captain Field Enhanced Oil Recovery Project
Since early f ield life, produced water has been injected at Captain to maintain reservoir pressure and provide
reservoir sweep3. Polymer solution injection was proposed in the original Captain FDP and the concept was
included as part of the original facilities design to enable a f ield trial to take place4. As part of a pilot EOR
project, pilot polymer mixing and injection facilities were installed on the Captain FPSO and the WPP.
First injection of polymer solution to an existing water injection well in Area A was achieved in the autumn of
2010. Af ter continuing to pilot polymer f lood at Captain f rom 2010 through to 2017, a staged EOR
development approach was adopted in 2016 whereby the Captain EOR Project aims to extend the pilot
polymer solution injection scheme to the full field through a phased development.
Following the pilot study, the Captain EOR Project was split into two further stages: Stage 1 and Stage 2.
The f irst stage (referred to as the Captain EOR Stage 1 Project) is still ongoing and three producers and one
EOR injector well have been drilled from the WPP between 2018 and 2019. The Captain EOR Stage 1
3 The term ‘sweep’ refers to the displacement of a hydrocarbon fluid from a reservoir rock by a flooding fluid e.g. water
or polymers. 4 The polymer solution acts as a displacing fluid at a higher viscosity than the normal Produced Water Re-injection
(PWRI) water. The polymer solution works by displacing the fluid mobility ratio to the oil resulting in a much more efficient
displacement of the oil to the adjacent production wells and thus allowing for EOR.

Captain EOR Stage 2 Phase II Project Environmental Statement
Section 1 Introduction
1-4
project was subsequently extended with two additional production wells and one injection well being drilled
at the WPP between 2021 and 2022.
The second stage of the Captain EOR Project (the Captain EOR Stage 2 Project) includes some brownfield
modifications across the three Captain installations (WPP/BLP/FPSO), as well as a significant expansion in
the subsea area. The Captain EOR Stage 2 Project can be considered to be split into two phases (Phase I
and Phase II) based on the schedule of activities and requirements under the Offshore Oil and Gas
Exploration, Production, Unloading and Storage (Environmental Impact Assessment) Regulations 2020
(hereaf ter referred to as the 2020 Offshore EIA Regulations).
Captain EOR Stage 2 Phase I involves: the drilling of a new production well at Area C; the conversion of an
existing water injection well at Area B to a polymer injection well; and the installation of a polymer injection
f lowline between the BLP and the converted polymer injection well at Area B. Other activities include topside
modifications and the installation of a large riser caisson on the BLP. The riser caisson will accommodate all
the risers associated with the EOR Stage 2 Phase II project. The offshore activities associated with Phase I
are being undertaken in 2022. Under the 2020 Offshore EIA Regulations, the activities associated with EOR
Stage 2 Phase I are considered to represent a Schedule 2 Project such that their environmental impacts
have been captured under a number of permit applications including screening directions, chemical permit
applications, Consent to Locate (CtL) etc.5 The impacts of these Schedule 2 activities are generally not
considered in detail in this ES, exceptions include the cumulative impacts on atmospherics during the
production phase.
The Captain EOR Stage 2 Phase II Project (also referred to in this ES Report as the ‘proposed project’)
which is covered by this ES Report involves:
• Drilling of six new polymer injection wells across two new drill centres (Area D and Area E);
• Drilling of one new production well at Area B (an existing drill centre);
• The installation and commissioning of the required subsea infrastructure;
• Ongoing modifications to the three Captain topsides; and
• Increased production rates.
Figure 1-4 summarises the drilling and installation activities associated with the Captain EOR Stage 2 Phase
II Project. Further details are provided in Section 2.
5 These activities have been captured in permits submitted under the following Master Application Templates (MAT):
DRA/926, WIA/1313 and PLA/921.

Captain EOR Stage 2 Phase II Project Environmental Statement
Section 1 Introduction
1-5
Figure 1-4: Representative schematic of the proposed Captain EOR Stage 2 Phase II Project activities.
1.3 Purpose of the Environmental Statement
Under the 2020 Offshore EIA Regulations, the proposed Captain EOR Stage 2 Phase II Project requires an
Environmental Impact Assessment (EIA) and ES to be submitted to the Offshore Petroleum Regulator for
Environment and Decommissioning (OPRED) for approval. This requirement is due to the anticipated
increased volumes of hydrocarbons to be produced such that consent is being sought for the ‘Extraction of
oil and natural gas for commercial purposes where the amount extracted exceeds 500 tonnes per day in the
case of oil and 500,000 cubic metres per day in the case of natural gas’.
The purpose of this ES is to report on the EIA process undertaken to meet both statutory and Ithaca Energy
internal project requirements. The ES provides a public consultation document which supports consultees in
the decision-making process and is therefore required to be a comprehensive report. The ES provides an
opportunity to reassure the Regulator and consultees that Ithaca Energy is informed and understands:
• the likely consequences of the activities, emissions, discharges, and physical presence of the
project;
• the local environment; and
• the nature of the environmental and commercial issues arising for other users of the sea.
The ES has been prepared in accordance with the 2020 Offshore EIA Regulations and guidance from
OPRED (OPRED, 2021).

Captain EOR Stage 2 Phase II Project Environmental Statement
Section 1 Introduction
1-6
1.4 Scope of the Environmental Statement
The scope of the EIA and resultant ES includes the following activities:
• Drilling of the six polymer injection wells across two new drill centres (Area D and Area E)
• Drilling of one new production well at Area B (an existing drill centre);
• The installation and commissioning of the required subsea infrastructure;
• Modifications to the topsides of the BLP and the WPP platforms and the Captain FPSO and;
• Additional production (relative to operation without the Captain EOR Stage 2 Phase II project); and
• Decommissioning.
In line with the 2020 Offshore EIA Regulations, the EIA sets out to describe and evaluate the impacts of any
emissions to air, discharges to sea, seabed disturbance, underwater noise, waste production and resource
use resulting f rom the proposed development on a range of receptors including f lora, fauna, water, air,
climate, and material assets. In addition, the potential interactions with other users of the sea are considered.
These aspects are considered for planned activities and unplanned (i.e. accidental) events.
1.5 Document Layout
To determine the environmental and socio-economic impacts of the proposed Captain EOR Stage 2 Phase
II Project, an understanding of the regulatory context, stakeholder concerns, the proposed activities and the
environmental and socio-economic baseline is required. Table 1-1 details the structure of the ES report.

Captain EOR Stage 2 Phase II Project Environmental Statement
Section 1 Introduction
1-7
Table 1-1: Structure of the ES.
Section
No. Title Contents
Non-Technical
Summary A summary of the ES Report.
1 Introduction
Introduction to the project and scope of the ES. This section also includes
a summary of applicable legislation, Ithaca Energy Management System,
areas of uncertainty and the consultation process to date.
2 Green House Gas
Emissions Approach
Ithaca Energy’s approach to reducing greenhouse gas emissions across
their portfolio.
3 Project Description
A description of the drilling and subsea installation operations, an
overview of the topside modifications and the anticipated production
profiles.
4
Environmental and
Socio-Economic
Baseline
A description of the environmental and socio-economic receptors in the
area.
5 Risk Assessment
Methodology
Description of the methodology used to determine the significance of the
environmental and social risk of the proposed activities.
6 to 11 Assessment of Aspects
Detailed assessment of Physical Presence (Section 6); Emissions to Air
(Section 7); Discharges to Sea (Section 8); Seabed Disturbance (Section
9); Underwater Noise (Section 9); and Waste (Section 11) aspects of the
development.
12 Accidental Events Details of accidental events identified during the ENVironmental and
socio-economic Impact IDentification (ENVID).
13 Conclusions Key findings including a register of commitments.
14 References Lists sources of information drawn upon throughout the ES.
Appendix
A
Scotland’s National
Marine Plan Assessment of the project against Scotland’s National Marine Plan.
Appendix
B ENVID Results Results of the ENVID.
Appendix
C
Drill Cuttings Discharge
Modelling Modelling of the impacts associated with the discharge of drill cuttings.
Appendix
D
Underwater Noise
Modelling Modelling of impacts of piling activities associated with the new manifold.
Appendix
E Supporting Information Production profiles to supplement Section 3.
1.6 Legislative Overview
This section provides a summary of the current environmental legislation applicable to the project.
1.6.1 Environmental Impact Assessment
Offshore environmental control has developed significantly over the past thirty years and is continuing to
evolve in response to increasing awareness of potential environmental impacts. Strands of both primary and

Captain EOR Stage 2 Phase II Project Environmental Statement
Section 1 Introduction
1-8
secondary legislation, voluntary agreement, and conditions in consents granted under the petroleum
licensing regime and international conventions have all contributed to the current legislative framework.
The main controls for new oil and gas projects are EIAs, which became a legal requirement of offshore
developments in 1998. Current requirements are set out in the 2020 Offshore EIA Regulations and
accompanying Guidance Notes for Industry (BEIS, 2021).
Schedule 1 of the 2020 Offshore EIA Regulations identifies those projects that require an ES to be prepared.
As described previously, the proposed Captain EOR Stage 2 Phase II Project requires an ES due to the
anticipated production profiles.
1.6.2 Protected Sites and Species
The EIA needs to consider the impact on the surrounding environment including any protected areas. Many
protected areas have been designated in the UK under the European Union (EU) Nature Directives, in
particular the Habitats Directive (92/43/EEC) and the Birds Directive (2009/147/EC). Since January 2021
these are now maintained and designated under the Habitats Regulations for England and Wales, Scotland,
and Northern Ireland. Amendments to the Habitats Regulations mean that the requirements of the EU Nature
Directives continue to apply to how European sites (Special Areas of Conservation (SACs) and Special
Protection Areas (SPAs)) are designated and protected. The Habitats Regulations also provide a legal
f ramework for species requiring strict protection, e.g. European Protected Species (EPS). All offshore
projects or developments must demonstrate that they are not “likely to have a significant impact on the
integrity of the conservation objectives for the protected site” or “significantly disturb European Protected
Species (EPS)” either alone or in combination with other plans and projects.
1.6.3 Discharges to Sea
Oil Discharges
In accordance with the Oslo/Paris Convention (OSPAR) Recommendation (2001/1), the UK through OPRED
has introduced regulatory requirements which reduce the permitted average monthly oil concentration in
produced water discharged overboard f rom oil and gas installations to a maximum of 30 mg/l. OSPAR
Recommendation 2001/1 also required contracting parties to reduce the total discharge of o il in produced
water (PW) by 15% by 2006 measured against a 2000 baseline. The permits replaced the granting of
exemptions under the Prevention of Oil Pollution Act 1971 and are issued under the Offshore Petroleum
Activities (Oil Pollution Prevention and Control) Regulations 2005 (as amended). The original design of the
Captain FPSO included provision for discharge of produced water, however this system has not been used
since 1998 and all produced water at the Captain f ield is now reinjected; this will remain the case following
implementation of the proposed project.
Chemical Discharges
In June 2000, the OSPAR Convention for the Protection of the Marine Environment in the North East Atlantic
made a decision requiring a mandatory system for the control of chemicals (OSPAR Decision 2000/2 on a
Harmonised Mandatory Control System for the Use and Reduction of the Discharge of Offshore Chemicals).
This decision operates in conjunction with two OSPAR Recommendations:
• OSPAR Recommendation 2000/4: The application of a Harmonised Pre-Screening Scheme for
Of fshore Chemicals to allow authorities to identify chemicals being used offshore; and
• OSPAR Recommendation 2000/5: The application of a Harmonised Offshore Chemical Notification
Format for providing data and information about chemicals to be used and discharged offshore.

Captain EOR Stage 2 Phase II Project Environmental Statement
Section 1 Introduction
1-9
OPRED implemented OSPAR Decision 2000/2 on the control of chemical use offshore, through the Offshore
Chemicals Regulations (OCR) 2002 (as amended). The regulations require offshore Operators to apply for
permits for the use and / or discharge of chemicals during all relevant offshore energy activities, including
well operations, production operations, pipeline operations, and decommissioning operations. The 2011
Amendment Regulations extended the provisions to take enforcement action in the event of any unintentional
of fshore chemical release.
Risk Based Approach
OSPAR Recommendation 2012/5 for a Risk-Based Approach (RBA) to the Management of PW Discharges
f rom Offshore Installations aims to produce a method for prioritising mitigation actions for those discharges
and substances that pose the greatest risk to the environment. As all PW is reinjected at the Captain field,
this is not applicable to the proposed project.
1.6.4 Atmospheric Emissions
Combustion installations on oil and gas platforms with a rated thermal input, including f laring of 20 MW(th)
or more require permitting under the UK’s Emissions Trading Scheme (UK ETS). The UK ETS replaced the
UK’s participation in the European Union ETS system on 1 January 2021. The EU ETS is based on Directive
2003/87EC establishing a scheme for Greenhouse Gas (GHG) emission allowance trading within the
Community (the EU ETS Directive) and the UK ETS broadly aligns with the Directive. The UK ETS is
implemented by the GHG Emissions Trading Scheme Order 2020 (as amended). The relevant provisions of
the Order include the requirement to monitor and report carbon dioxide (CO2) emissions, surrender
allowances and to notify of any changes affecting the allocation of allowances.
Combustion installations on oil and gas platforms with a rated thermal input of 50 MW(th) or more require
permitting under the Offshore Combustion Installations (Pollution Prevention and Control) Regulations 2013
(as amended). This includes conditions limiting releases notably for carbon monoxide (CO), oxides of
nitrogen (NOx), oxides of sulphur (SOx), methane (CH4) and volatile organic compounds (VOCs) and the
demonstration of the use of Best Available Technique (BAT). Combustion installations with a rated thermal
input of 1 MW(th) to 50 MW(th) also require permitting under Pollution Prevention and Control (PPC)
regulations to comply with the Emission Limit Values (ELV’s) as stipulated in the Medium Combustion Plant
directive EU 2015/2193 of 25th November 2015 for sulphur dioxide (SO2), NOx and dust.
The revised North Sea Transition Authority (NSTA)6 Strategy (February, 2021) retains a binding obligation
to secure that the maximum value of economically recoverable petroleum is recovered f rom the strata
beneath relevant UK waters. The Strategy also states that in doing so, appropriate steps must be taken to
reducing GHG emissions and assist in meeting the UK net zero target. The Strategy is supported by
Stewardship Expectations (SE). The NSTA ‘Stewardship Expectation 11 – Net Zero’ (March 2021) (SE 11)
sets out the NSTAs expectations of the steps that should be taken across the exploration and production
lifecycle, to reduce emissions and promote Carbon Capture and Storage (CCS) and hydrogen.
1.6.5 Marine and Coastal Access Act
The Marine and Coastal Access Act (MCAA) came into force in November 2009. The Act covers all UK
waters except Scottish internal and territorial waters which are covered by the Marine (Scotland) Act (2010),
which mirrors the MCAA powers. The MCAA provides the legal mechanism to help ensure clean, healthy,
safe, productive, and biologically diverse oceans and sea by putting in place a new system for improved
management and protection of the marine and coastal environment. It replaces and merges the requirements
6 NSTA was formerly the Oil and Gas Authority (OGA)

Captain EOR Stage 2 Phase II Project Environmental Statement
Section 1 Introduction
1-10
of the Food and Environmental Protection Act 1985 (FEPA) Part II (environment) and the Coastal Protection
Act 1949 (navigation). The MCAA has enabled:
• Establishment of the Marine Management Organisation (MMO) to operate as the competent
marine planning authority in English territorial waters and UK of fshore waters (for matters that
are not devolved) such as marine licensing and enforcement of marine legislation;
• A strategic marine planning system to agree marine objectives and priorities and establish a
series of marine plans to implement marine policy;
• A new marine licensing system for marine activities; and
• Powers enabling the designation of Marine Conservation Zones (MCZ) in the territorial waters
adjacent to England and Wales and UK offshore waters.
However, the following are exempt from the MCAA as they are regulated under different legislation:
• Activities associated with exploration or production / storage operations that are authorised under
the Petroleum Act 1998; and
• Additional activities authorised solely under the OPRED environmental regime, e.g. chemical and
oil discharges.
Some oil and gas activities, which are not regulated by the Petroleum Act 1998 or under the OPRED
environmental regime, require an MCAA licence.
1.6.6 National Marine Plan
The Scottish National Marine Plan (NMP) comprises plans for Scotland’s inshore (out to 12 nm) and offshore
waters (12 to 200 miles) as set out under the Marine (Scotland) Act 2010 and the Marine and Coastal Access
Act 2009. The NMP represents a f ramework of Scottish Government policies for the sustainable development
of marine resources. The NMP is underpinned by the following strategic objectives:
• Achieving a sustainable marine economy;
• Ensuring a strong, healthy, and just society;
• Living within environmental limits;
• Promoting good governance; and
• Using sound science responsibly.
These objectives are to be achieved through the application of 21 ‘General Planning Principles’.
Development projects should take these principles into account in order to support the overall NMP
objectives for sustainable development of Scotland’s marine environment.
The NMP sets out specific key issues for the oil and gas sector in supporting the objectives of the plan:
• Maximise extraction;
• Re-use inf rastructure;
• Transfer of skills to renewables and CCS;
• Co-operation with the fishing industry;
• Noise impacts to sensitive species;
• Chemical and oil contamination of water, sediments, and fauna;
• Habitat changes.
The NMP also sets out general policies and objectives as part of the UK’s shared framework for sustainable
development. The proposed operations as described in this ES have been assessed against all NMP
objectives (Appendix A) and policies, but specifically GEN 1, 4, 5, 9, 12, 14 and 21:

Captain EOR Stage 2 Phase II Project Environmental Statement
Section 1 Introduction
1-11
GEN 1- General Planning and Principle
Development and use of the marine area should be consistent with the Marine Plan, ensuring activities are
undertaken in a sustainable manner that protects and enhances Scotland’s natural and historic marine
environment.
GEN 4 - Co–existence
Where conflict over space or resource exists or arises, marine planning should encourage initiatives between
sectors to resolve conflict and take account of agreements where this is applicable.
GEN 5 - Climate Change
Marine planners and decision makers should seek to facilitate a transition to a low carbon economy. They
should consider ways to reduce emissions of carbon and other GHGs.
GEN 9 - Natural Heritage
Development and use of the marine environment must:
• Comply with legal requirements for protected areas and protected species.
• Not result in significant impact on the national status of Priority Marine Features (PMF) (see
Section 4).
• Protect and, where appropriate, enhance the health of the marine area.
GEN 12 – Water Quality and Resource
Developments and activities should not result in a deterioration of the quality of waters to which the Water
Framework Directive, Marine Strategy Framework Directive or other related Directives apply.
GEN 14 – Air Quality
Development and use of the marine environment should not result in the deterioration of air quality and
should not breach any statutory air quality limits. Some development and use may result in increased
emissions to air, including particulate matter and gases. Impacts on relevant statutory air quality limits must
be taken into account and mitigation measures adopted, if necessary, to allow an activity to proceed within
these limits.
GEN 21 – Cumulative Impacts
Cumulative impacts affecting the ecosystem of the marine plan area should be addressed in decision making
and plan implementation.
These NMP policies and objectives have been considered during the development of the proposed project
and when undertaking the EIA.
1.7 Ithaca Energy Management System
Ithaca Energy are committed to conducting activities in compliance with all applicable legislation and in a
manner that minimises impacts on the environment. The proposed Captain EOR Stage 2 Phase II Project
will be delivered in compliance with Ithaca Energy Environmental Management System (EMS) which has
been developed in line with the principles of the International Standard for Environmental Management
Systems (ISO14001:2015).

Captain EOR Stage 2 Phase II Project Environmental Statement
Section 1 Introduction
1-12
Figure 1-5: Ithaca Energy's HSE Policy.

Captain EOR Stage 2 Phase II Project Environmental Statement
Section 1 Introduction
1-13
1.8 Areas of Uncertainty
This ES was prepared during the Optimise Phase of the proposed project. As a result, some assumptions
have been made in order to undertake the EIA Where assumptions have been made, the environmental
worst-case option was assessed. Assumptions and uncertainties are outlined below.
1.8.1 Rock Cover, Mattresses, and Grout Bags
Maximum anticipated quantities of rock cover, mattresses and grout bags are presented in the ES to assess
the worst-case scenario in terms of impacts on the seabed. The requirements for stabilisation/protection
material will be further assessed and confirmed in later PWA (Pipeline Work Authorisation) and associated
environmental permit applications.
1.8.2 Production Profiles
Production profiles based on models have a certain degree of uncertainty associated with them. The
production profiles presented in this ES are based on a high case and are an annualised average of the
projected production from the Captain field.
1.9 Consultation Process
Consulting with stakeholders is an important part of the impact assessment process as it allows any concerns
or issues which stakeholders may have, to be communicated and addressed. In June 2022, as part of the
informal stakeholder engagement process, Ithaca Energy issued a Scoping Report to stakeholders. The
Scoping Report provided an overview of The Project and the impacts to be assessed in the ES Report.
Stakeholders were invited to comment on the Scoping Report with respect to any concerns they may have.
In addition to issuing the Scoping Report Ithaca Energy held a Stakeholder Engagement Workshop in June
2022. Comments received on the Scoping Report and issue raised during the workshop are summarised in
Table 1-2 and Table 1-3. The process of consultation will continue throughout the project.
As required by the 2020 Offshore EIA Regulations, a copy of the ES and the public notice has been made
publicly available on the Company’s website at the time of submission.
Table 1-2: Comments received on the Scoping Report.
Comments / issues / concerns raised on Scoping Report Response
Marine Scotland Science (MSS) – received on 14/6/2022
• MSS requests that the ES demonstrates how the project aligns with the general
policies outlined in Chapter 4 of the National Marine Plan and the sector specific
oil and gas policies outlined in Chapter 9.
Captured in Appendix A.
• MSS advise the ES demonstrates that the technology used in drilling of the wells
represents the Best Available Technology (BAT). They ask that the ES consider
whether the sediment type at the site lends itself to new technologies for the
conductor sections that would reduce the amount of cuttings and discharge of
cement to the seabed.
Addressed in Section 3.4.4.
• MSS advise that impacts associated with cement discharges are assessed.
Cement discharges are described
in Section 3.6.7 and impact of
discharges are considered in
Section 8.1 and Section 9.1.
• MSS preference would be for pipelines to be routed together in common
trenches in order to minimise seabed disturbance, and request that robust
justification for individual trenches and the installation method is provided in the
ES.
Justification for installation method
is provided in Section 3.4.
• MSS advise reference to analogous studies when considering sediment
disturbance and water column impacts associated with jet trenching activities
Worst case impacts have been
assessed in Section 9.4.

Captain EOR Stage 2 Phase II Project Environmental Statement
Section 1 Introduction
1-14
Comments / issues / concerns raised on Scoping Report Response
and where this is not possible specific modelling may be appropriate.
Cumulative impacts associated with jet trenching activities should also be
considered.
• MSS request that the pipeline material is included in the ES and that the
likelihood of upheaval buckling is discussed in the ES. In addition, MSS ask that
a robust worst-case assessment for protective materials is provided in report.
Schematic showing components of
the flowlines is presented in
Section 3.7.3. Likelihood of
upheaval buckling is considered
low and is noted in Section 3.
Worst case protection material has been captured (Section 3.7.4).
• MSS request that the ES discusses how the sampling stations were selected for
the environmental baseline survey.
Section 4.2 describes the survey
sampling strategy.
• MSS advise that the chosen options for the various elements of the project are
fully justified, and it is demonstrated that these represent Best Available
Technology (BAT) and Best Environmental Practice (BEP) and take account of decommissioning.
Section 3.4 provides options
considered for various elements of
the proposed project. Selected option for each element is
considered to represent BAT and
BEP.
• MSS request that details of how other adjacent pipelines and cables are laid are
included.
All existing flowlines to the to the
existing drill centres are trenched
and buried. Existing lines between
the platforms and FPSO are
surface laid lines and for the most
part are laid within the existing
500 m zones.
• MSS requested that a local scale bathymetry map for the project area is
included, highlighting any significant seabed features
Bathymetry map is presented in
Section 4.3.
• MSS provided a number of very helpful references to support the description of
the environmental and socio-economic baseline descriptions.
References used where applicable
in Section 4.
Joint Nature Conservation Committee (JNCC) – received on 22/7/22
• JNCC advised they were p leased to see that cuttings dispersion modelling and
underwater noise modelling has been carried out to support the ES.
General comment
• JNCC advised that the existing surveys are sufficient to inform the ES. General comment
Other consultees that received the Scoping Report
Scottish Fishermen’s Federation (SFF), Offshore Petroleum Regulator for Environment and Decommissioning (OPRED)
Note: at the time of writing, feedback on the Scoping Report had not been received from these consultees, though SFF
and OPRED did attend the stakeholder engagement workshop (Table 1-3).

Captain EOR Stage 2 Phase II Project Environmental Statement
Section 1 Introduction
1-15
Table 1-3: Comments from Stakeholder Engagement Workshop.
Stakeholder Engagement Workshop (7/6/2022) Response
Stakeholders/consultees represented
Attendees Apologies
• Scottish Fishermen’s Federation (SFF) • Joint Nature Conservation Committee (JNCC)
• Offshore Petroleum Regulator for Environment and
Decommissioning (OPRED)
• Marine Scotland Science (MSS)
Comments / Issues / Concerns
• OPRED advised the ES should include a chapter capturing the Company’s
Net Zero targets, policies, and emissions reduction strategy.
Captured in Section 2
• SFF advised they are aware of clay mounds being created during installation
of existing Captain infrastructure. In addition, the advised that Nephrops are
a prominent species in the area.
Section 9 captures Ithaca Energy’s
commitment to ensuring a safe seabed
(including mitigation of any clay berms that
may result from the installation activities).
• SFF advised that Nephrops are a prominent species in the area. The presence of Nephrops in the area is
captured in Section 4.

Captain EOR Stage 2 Phase II Project Environmental Statement
Section 2 Pathway to Net Zero
2-1
2. PATHWAY TO NET ZERO
This section discusses Ithaca Energy’s GHG emissions strategy, policy and targets and how these are
embedded in the Company’s management systems. The section also summarises some of the progress
Ithaca Energy has made and the opportunities which are still under evaluation.
2.1 Ithaca Energy Climate Targets
Ithaca Energy’s objective is to provide a safe and healthy working environment for all its employees and
contractors, while simultaneously minimising the environmental impact of the Company’s operations by
working to operate in an ever-cleaner manner. The control and management of these issues lies at the centre
of the policies and procedures that constitute the health, safety and environmental management system and
the culture of the business.
Ithaca Energy strives for industry leading levels of environmental performance. Key to this ambition is the
Company’s commitment to significantly reducing GHG emissions from our operations in line with the global
transition to a low carbon economy and the UK Government’s Net Zero Targets.
Ithaca Energy has a Greenhouse Gas Emissions Policy that is endorsed by the Executive Leadership Team
and signed by the Chief Executive Officer (Figure 2-1). The policy sets our expectations and aligns them with
those of the North Sea Transition Authority (NSTA) and Offshore Energies UK (OEUK) and outlines the
targets of the organisation.
Decisions on emissions management are taken utilising industry best practice, expertise and
recommendations such as:
• Energy White Paper which sets out how the UK will clean up its energy system and reach net zero
by 2050.
• The World Bank Zero Routine Flaring commits governments and oil companies to end routine
f laring by no later than 2030,
• Methane Guiding Principles which focus on areas of action to reduce methane emissions.
• North Sea Transition Deal which seeks to maximise the UK’s oil and gas sector advantages to the
shif t to clean growth.
• NSTA Stewardship Expectation 11 gives clarity on expected behaviours and good practices on
GHG emissions reductions, reductions through entire lifecycle and collaboration throughout the
industry.
• OEUK Roadmap to 2035 which of fers a route to help the industry reduce emissions, improve
operations’ sustainability and deliver low carbon solution at scale.

Captain EOR Stage 2 Phase II Project Environmental Statement
Section 2 Pathway to Net Zero
2-2
Figure 2-1: Ithaca Energy’s GHG Emissions Policy.

Captain EOR Stage 2 Phase II Project Environmental Statement
Section 2 Pathway to Net Zero
2-3
Our Emissions Policy is a commitment to reduce the company’s emissions and it provides a f ramework to
develop and progress emissions reductions opportunities.
Ithaca Energy Targets
Ithaca Energy’s targets with respect to GHGs are to:
• Reduce all our scope 1 and 2 Carbon Dioxide (CO2) and Carbon Dioxide Equivalent (CO2e) emissions
of our operated assets by 25% from 2019 levels by 2025;
• Achieve 0.20% methane intensity of our operated assets by 2025;
• Zero routine flaring on our operated assets by 2030; and
• A Net Zero company by 2050.
Strong Leadership
Ithaca Energy’s leadership team have set ambitious company targets and asset specific emissions reduction
Key Performance Indicators (KPIs). Performance is reviewed by leadership monthly. Our leadership team
regularly communicates reductions and performance at townhalls.
Realising Key Operational Improvements
Using our existing Environmental Management System process (see Section 2.3 on Environmental
Stewardship) Ithaca Energy regularly assess emissions abatement opportunities. Using these processes,
we have seen a net reduction in f laring and venting emissions across all our assets since 2019. As
responsible joint venture (JV) partners, we are also encouraging and supporting large emissions abatement
projects, such as electrification, on our non-operated assets.
Embracing Digitalisation and New Technology
We are an active member of working groups to develop and test innovative technologies at pace. We are
using digital technology to visualise and communicate our performance.
Measure and Control
We ensure transparency through our emissions management and reporting processes and are enhancing
this process using digitalisation.
Set High Standard of Environmental Performance
GHG abatement is considered during the full life cycle asset management. Training and awareness are key
to ensure that we have a working environment that encourages best practices. Educational sessions take
place f requently at all levels of the Company as are awareness sessions where external parties share their
experiences of emissions reductions with the Company.
Ithaca Energy has a dedicated Energy Transition Team, who together with the assets, are responsible for
delivering the Company’s GHG targets and ensuring the Company does its part to align with the
commitments set out in the North Sea Transition Deal. The Energy Transition Team:
• meet with the executive leadership team monthly;
• have a series of objectives in 2022 to align Ithaca Energy with the NSTA Stewardship Expectation 11;
• has a hopper of reduction projects (see Section 2.4) which cover short-, medium- and long-term
emission reduction opportunities across CO2, methane and other emissions with global warming
potential, including a lookback and continuous improvement process to ensure reduction opportunities
are achieved and sustained.

Captain EOR Stage 2 Phase II Project Environmental Statement
Section 2 Pathway to Net Zero
2-4
2.2 Environmental Management System
Ithaca Energy’s Management System into which the Environmental Management System (EMS) is
integrated, is certif ied to ISO 14001:2015 standard. The EMS was last verif ied as meeting the ISO
14001:2015 standard in April 2021. It is designed to implement the environmental policy of Ithaca Energy. It
demonstrates a commitment to compliance with environmental legislation for all of Ithaca Energy’s
processes, activities, and objectives associated with hydrocarbon exploration and production.
Ithaca Energy’s policy for protecting people and the environment is the primary aim of Ithaca Energy’s
expectations for health, safety, and environmental management, and provides a shared understanding
throughout the Company of environmental performance expectations.
Our vision is to be the highest performing UK North Sea independent oil and gas company, focused on
sustainably growing value.
We take pride in:
• Having a relentless focus on high performance;
• Continuously reducing the health, environment and safety impact of our operations;
• Developing an engaged workforce, in an inclusive, dynamic workplace; and
• Striving for efficiency and simplicity in all that we do.
The Ithaca Energy vision is reflected in the Company’s Health, Environment and Safety (HES) Policy which
meets the requirements of The Corporate Major Accident Prevention Policy (CMAPP) required by The
Offshore Installations (Offshore Safety Directive) (Safety Case etc.) Regulations 2015; The Safety Policy
required by the Health & Safety at Work etc. Act 1974; and The Environmental Policy required by ISO 14001
environmental management standard (Figure 2-2).
The HES Policy is endorsed by the Chief Executive Officer of Ithaca Energy on behalf of the Board of
Directors and is a commitment to assess and manage the risks and impacts associated with our operations;
and a commitment to comply with legislative requirements and corporate policies.

Captain EOR Stage 2 Phase II Project Environmental Statement
Section 2 Pathway to Net Zero
2-5
Figure 2-2: HES Policy and Company Management System Commitment.

Captain EOR Stage 2 Phase II Project Environmental Statement
Section 2 Pathway to Net Zero
2-6
2.3 Environmental Stewardship
Ithaca Energy’s Environmental Stewardship process identifies and addresses significant environmental
aspects relating to our operations, driving continuous improvement in environmental performance and
reducing our environmental impact. It is applied across the life cycle of an asset and is used to identify,
assess and manage potential environmental impacts and benef its. To achieve this, the Company has
implemented a step wise process to be followed on an annual basis. First, an inventory of all emissions,
releases, wastes and potentially impacted natural resources is prepared. This is followed by a procedure to
identify, assess, mitigate and manage any significant risks and impacts to the environment associated with
our operations which generate atmospheric emissions, aquatic releases and wastes. The outcome is an
annually updated ES plan. The management system is independently certified to the international standard
ISO 14001:2015 and requires Ithaca Energy to engage independent auditors who verify that our onshore
and offshore operations meet requirements of the standard. All Ithaca Energy operated assets are included
in the ISO 14001:2015 certif ication.
The Environmental Stewardship plan includes objectives and targets for environmental performance, such
as stretch targets for reduced f laring, reducing CO2 intensity and no releases of Ozone Depleting
Substances. The plan also includes details of improvement implementation programmes and the process for
tracking progress in meeting environmental objectives. The Environmental Stewardship plan is approved by
management and is aligned with other business priorities and the HES plans.
All Ithaca Energy activities have the potential to impact on the environment and are all subject to strict
environmental regulatory controls which require Ithaca Energy to prepare and submit regulatory applications
to gain approval both before activities begin and during the ongoing operational activi ties. We monitor and
report our ongoing emissions, discharges and waste streams to ensure we meet regulatory requirements
and do not cause significant impact on the environment. In the event of an unplanned release/spill to sea, or
a non-compliance with regulatory requirements, notification would be made to the appropriate regulatory
authorities and action taken to respond to any threat of or actual pollution. Investigations of incidents are
conducted to gain any learnings or actions to prevent recurrence.
The Environmental Stewardship process is used to help provide assurance that we are protecting the
environment and meeting our internal and regulatory requirements and obligations.
The Company’s environment stewardship process includes a commitment to analysing and reducing GHG
emissions, both direct and indirect, to contribute towards Ithaca Energy’s goal of a 25% emissions reduction
f rom 2019 level across our operated assets in 2025.
2.3.1 Environmental Stewardship Improvement Program
As part of the preparation of the annual Environmental Stewardship plan, improvement opportunities are
identified by Ithaca Energy. These actions were grouped into improvement plans for Ithaca Energy’s UK
producing assets and for activities associated with drilling, including the use of a mobile offshore drilling unit
(MODU) and the office.
The improvement opportunities centred around strengthening arrangements associated with prevention of,
and response to, incidents and releases; produced water management; reduction of air emissions and
management of waste. Progress in completing these actions is tracked throughout the year and is used as
a leading measure of continual environmental performance improvement.
In 2021 the annual ES programme was expanded to run quarterly to give greater focus on emissions
reduction opportunities, this has continued through 2022. Workshops take place with each operated asset
including onshore and offshore engineers, Environmental Advisors and Energy Transition Advisors.

Captain EOR Stage 2 Phase II Project Environmental Statement
Section 2 Pathway to Net Zero
2-7
2.4 Ithaca Environmental Initiatives
Through Environmental Stewardship workshops and engagement Ithaca has identified several projects and
opportunities to reduce CO2e emissions and the intensity of our operations, the completed initiatives include:
• reducing weather induced extinguished flare events, thus reducing emissions of methane;
• operating the FPF-1 semi-submersible production platform (located at the Greater Stella Area) on a
single gas turbine, improving power generation fuel efficiency and reducing atmospheric emissions;
• reducing Alba (the platform at the Alba f ield) and Captain f lare rates through operational
improvements, reducing atmospheric emissions, and optimising the use of the gas for power
generation;
• enabling return to full flare recovery through the reparation of the FPF-1 flare ignition package;
• as part of the Jacky field late life asset management and associated decommissioning programme
a renewable power module was installed to power the Jacky installation entirely from wind and solar
through to the end of the asset life cycle.
To further reduce emissions, Ithaca Energy has a hopper of projects to consider which are in an early
feasibility phase. These include:
• Platform flare recovery;
• Cargo tank vent vapour recovery;
• Replace hydrocarbon blanket gas with nitrogen;
• Additional compression equipment to improve reliability and reduce flaring;
• Right size equipment to fit its duty and avoid waste;
• Control logic improvements to reduce likelihood of trips and flaring events;
• An alternative fuel to replace diesel used offshore;
• Platform electrification from UK grid or offshore wind power; and
• Solar panels on the office.
2.4.1 Low Power Carbon
Ithaca Energy could significantly reduce GHG emissions by sourcing electrical power for its UKCS platforms
f rom onshore or offshore renewables. As a leading member of the Outer Moray Firth Electrification (OMFE)
group and as a co-venturer in Elgin-Franklin, part of the Central North Sea Electrification (CNSE) group,
Ithaca Energy has been actively evaluating all the alternatives for low carbon power. These are significant
and complex infrastructure project which bridges both the Petroleum Act and the Electricity Act 1989. There
are several options being evaluated, ranging from power from shore, connection to Innovation and Targeted
Oil and Gas (INTOG) leased wind farms, Scotwind leased wind farms, and local off-grid solutions.
The INTOG leasing round opened in August 2022, and Ithaca Energy has submitted letters of intent to wind
developers in support of this ‘first of its kind’ seabed leasing round.
Engineering assessments have been undertaken to understand the platform modifications required to accept
these sources of low carbon power. Depending on the extent of the electrification and existing operations,
these modifications can include both electrical system changes and modifications to processing facilities.
2.4.2 Alternative Fuels
With the exception of the Captain FPSO, electrical power generation on our operated assets is predominately
f rom fuel gas. Although there is some low-pressure fuel gas available, the Captain FPSO depends on
imported diesel. Therefore, the Captain FPSO would be an ideal candidate to benefit f rom an alternative,
low carbon fuel source. Although replacing diesel would not have the same magnitude of carbon abatement
as full electrification projects, it could result in significant CO2e reductions.

Captain EOR Stage 2 Phase II Project Environmental Statement
Section 2 Pathway to Net Zero
2-8
Alternative fuels include biodiesel, Hydrotreated Vegetable Oil (HVO), ammonia, and e-methanol. Replacing
diesel with these alternative fuels present significant challenges such as safety implications, availability of
supply and delivery logistics, making them non-viable at present. However, as a key member of the OEUK
sustainable fuels group, Ithaca Energy continues to regularly review alternative fuels in the UKCS.
2.4.3 Action Plans
Ithaca has developed Emissions Reduction Action Plans (ERAP) for Methane, Carbon, and F-Gas (Figure
2-3). These have been developed with five shared Abatement Goals:
Goal 1 - Continually Reduce Our Emissions.
Goal 2 - Improve Accuracy of our Emissions Data.
Goal 3 - Increase Transparency.
Goal 4 - Advocacy for Policy and Regulation.
Goal 5 - Improve Industry Performance.
Each ERAP compliments the asset focused Environmental Stewardship process described above by
ensuring the supporting EMS and business processes are updated to support ongoing emissions reduction.
Figure 2-3: Illustration showing Goal 1 breakdown on ERAP.

Captain EOR Stage 2 Phase II Project Environmental Statement
Section 2 Pathway to Net Zero
2-9
2.4.4 ISO50001 Energy Management System Certification
ISO 50001 is the international standard for EMS. It is designed to enable organisations to establish systems
and processes necessary to improve energy performance, including efficiency, use and consumption.
Ithaca Energy has a mature ISO14001 EMS and is using that as a basis to develop its energy management
process. The Company has a target to achieve ISO50001 certification during 2023.
Within the ISO50001 is a f ramework of requirements for organisations:
• Develop a policy for more efficient use of energy; • Fix targets and objectives to meet the policy; • Use data to better understand and make decisions about energy use; • Measure the results;
• Review how well the policy works, and
• Continually improve energy management.
Ithaca Energy has engaged an external company to complete a gap analysis with aim of certification to the
standard.
2.4.5 Asset Emissions Reduction Action Plans
In 2020 ERAP were created for each asset which set out a summary of field CO2e emissions sources and
opportunities for reduction through both operational improvements or capex investments. These
opportunities targeted both carbon dioxide and methane emissions. Execution of some of these opportunities
have resulted in a 10% reduction in CO2e versus the baseline. Considerable reductions in f laring and venting
have been realised. Larger scale, longer term projects that were identified are continuing to be progressed
with engineering studies and asset planning.
As part of continual improvement, and with the guidance of the NSTA’s Stewardship 11 expectations, the
ERAPs will be revisited in Q3/Q4 2022 to ref resh the status of the assets and explore further emissions
reduction improvements.
2.4.6 Asset ERAP Opportunities
Table 2-1 summarises the emissions reduction opportunities identified in the 2020 Captain Development
ERAP whilst Table 2-2 summarises the opportunities at other Ithaca Energy operated assets (Alba and
FPF1).

Captain EOR Stage 2 Phase II Project Environmental Statement
Section 2 Pathway to Net Zero
2-10
Table 2-1: Captain Emissions Reduction Action Plan.
Opportunity Name Opportunity Description Emissions
Source
Potential Annual
Emissions Saving
(te CO2e/year)
Captain Solar Availability
Maximise power generated across the Captain field
through use of fuel gas. Reduce power generated
through diesel burn in either Solar turbines or Wartsila
engines.
Power
Generation 5,000
Fuel Gas Compressor
Control
Fuel gas compressor control modification to allow fuel
gas and import fuel gas use simultaneously. Gas 1,000
Solar Engine A Upgrade
Replace Solar A 15 kbhp with to 16 kbhp model. This
additional power will replace generation on diesel from
FPSO.
Power
Generation 1,200
BLP Flare Gas Recovery Flare gas recovery. Flare 17,600
FPSO P-4401 right sizing FPSO P-4401 water return pump resizing to reduce
recycle. Diesel 600
Fuel Gas Compressor
Start-up Review fuel gas compressor start up consistency. Flare 500
Recommission Fuel Gas
Supply
Investigate potential on recommissioning fuel gas
supply to FPSO fire heaters. Diesel 500
Captain B Export Compressor Reinstatement
Opportunity to reduce our flaring in mid -2024
onwards, following EOR (Enhanced Oil Recovery)
stage 2, by having the B export compressor available
as a stand-by unit to provide effective sparing within
gas export compression system.
Power Generation
11,000
FPSO COT (Cargo Oil
Tank) Vapour Recovery
Recapture vented methane from cargo tanks and
send to flare or re-use. Venting 6,000
Captain Power
Management Strategy
Evaluate different strategy for running power on
Captain. May be scope for hybrid battery. Diesel 500
Captain Waste Heat
Recovery Unit (WHRU)
Logic
Investigate replacing Logic on WHRU to stop trips. Power
Generation 500
FPSO Flare Gas Recovery Flare gas recovery. Flare 1,300
Add 3rd Solar Install 3rd Solar Mars 100, and replace diesel power
generation with lower carbon intensity fuel gas.
Power
Generation 10,000
Alternative fuel for FPSO
Replace marine gasoil with bio-diesel blend or HVO.
Lowering CO2 footprint and reducing ETS carbon
costs.
Power Generation
76,000

Captain EOR Stage 2 Phase II Project Environmental Statement
Section 2 Pathway to Net Zero
2-11
Table 2-2: Emission Reduction Action Plans for other Ithaca Energy operated assets in the UKCS.
Opportunity Name Opportunity Description Emissions
Source
Annual Emissions
Saving
(te CO2e/year)
Alba ERAP
Alba Unlit Flare Reduction Reduce the duration of unlit flaring which
occurs during high winds offshore. Flare 14,000
Alba Flare Reduction
Improve control system on balancing Alba
and Britannia gas. Improvements in
compressor control logic and valves.
Results in better pressure management and
no need to flare.
Flare 28,000
Performance Testing
Optimisation
Investigate Pump/Generator efficient test
run time to minimum requirement.
Opportunity to make efficiencies.
Power
Generation 100
ANP Flare Recovery Recapture base flaring from low pressure
(LP) and high pressure (HP) flares. Flare 16,000
Alba Turbine warmup
recirculation
Evaluate recycle line for turbine warm-ups
and Britannia gas supply to Solar.
Power
Generation 1,000
Replace water injection pumps
with more efficient models
Water injection is a high-power user,
modern motors and pumps could be more
efficient.
Power
Generation 6,600
FPF1 ERAP
Single GTG (Gas Turbine
Generators) Operation
Operate on single GTG at higher efficiency
than two.
Power
Generation 11,500
FPF1 Flare Gas Recovery
Return FPF1 to a normally non-flaring
installation as per the original design,
allowing safe recovery of the gas that would normally be flared.
Flare 14,750
Reduce Hydrocarbon Purging
Replace purge gas with nitrogen and
prevent venting methane from oily water
sump and purge on atmospheric vent
header.
Venting 14,000
Venting Survey
Reduce Scale of Venting and Flaring -
Asset level atmospheric vent study, to
include single valve isolation.
Venting 500
FPF1 Main Oil Line (MOL)
Pump speed control
Switch MOL pump/ LP separator level
control logic to speed control. Use less
pump power consumption.
Power
Generation 350
2.5 Emissions Reduction Performance and Commitment
Ithaca’s 2021 CO2e intensity was 24 CO2e/mboe generating approximately 498 ktCO2e per year (as per the
year ended December 31, 2021). This represents approximately a 10% CO2e emissions reduction as
compared to its 2019 emissions baseline. We reduced CO2e f rom flaring by 15% and CO2e f rom extinguished
f laring by 60% for the year ended December 31, 2021, as compared to the year ended December 31, 2019.
Emissions from power generation remain our main source of emissions. Ithaca Energy continues to review
opportunities to achieve our ambitious aim of a 25% reduction in 2025 and supports the OEUK Roadmap
2035 contribution to the UK Government’s mandatory target of net zero GHG emissions by 2050.
The Captain EOR project is an opportunity to reduce GHG intensity, on average over f ield life (see Section
7), through increased production with a limited increase in energy consumption and f laring. This will be
improved further by realising opportunities listed in Table 2-1. A number of those opportunities would likely

Captain EOR Stage 2 Phase II Project Environmental Statement
Section 2 Pathway to Net Zero
2-12
not be possible without realising the value within the Captain field due to EOR. Whilst reduction opportunities
would be reviewed without EOR, offsetting of emissions though reduction opportunities would be achieved
sooner by progressing the project.

Captain EOR Stage 2 Phase II Environmental Statement
Section 3 Project Description
3-1
3. PROJECT DESCRIPTION
3.1 Project Overview
As described in Section 1.2 the Captain EOR strategy, has been split into different stages: the initial pilot study
(completed), Stage 1 (completed) and Stage 2 (ongoing). Section 1.2 details the further split of the Captain
EOR Stage 2 Project into two phases – Phase I and Phase II and how this ES covers those activities
associated with EOR Stage 2 Phase II, execution of which is planned to commence in 2023 (see indicative
schedule presented in Section 3.5).
As part of Captain EOR Stage 2 Phase II Project, the activities detailed in this section includes:
• Drilling of the six polymer wells across two new drill centres (Area D and Area E)
• Drilling of one new production well at Area B (an existing drill centre);
• The installation and commissioning of the required subsea infrastructure;
• Modifications to the topsides of the BLP and the WPP platforms and the Captain FPSO and;
• Additional production (relative to operation without the Captain EOR Stage 2 Phase II project); and
• Decommissioning.
3.2 Status of the Existing Captain Field
Section 1.1 provides an overview of the Captain field whilst Table 3-1 summaries the total number of wells at
the f ield by the end of 2022 (which includes Captain EOR Stage 2 Phase I wells) and following drilling of the
wells captured in this ES.

Captain EOR Stage 2 Phase II Environmental Statement
Section 3 Project Description
3-2
Table 3-1: Total well counts associated with Captain at the end of 2022 and following completion of the EOR
Stage 2 Phase II Project.
Well type Number of wells before the Captain
EOR Stage 2 Phase II activities*
Number of wells after the Captain
EOR Stage 2 Phase II activities
Platform wells (Area A)
Production wells 18 18
Aquifer production well 1 1
Water injection well 4 4
Polymer injection wells 5 5
Area B
Production wells 14 14
Water injection well 3 3
Polymer injection wells 1 1
Area C
Production wells 3 (1 new plus 1 existing plugged) 3 (1 new plus 1 existing plugged)
Water injection well 0 0
Polymer injection wells 0 0
Area D and E
Production wells 0 0
Water injection well 0 0
Polymer injection wells 0 6 in total (3 at each drill centre)
*Note the total well counts includes wells drilled as part of Stage 2 Phase I (i.e. the wells to be drilled/converted in
2022).
3.3 Nature of the Reservoir
Hydrocarbons at the Captain Field are produced from three main reservoirs referred to as:
• the Upper Captain Sandstone (UCS);
• the Lower Captain Sandstone (LCS, including a compartment named Southern Upper Captain
Sandstone or SUCS); and
• the Jurassic/ Ross Sandstone.
The UCS is a Lower Cretaceous deep water turbidite reservoir. It is a high NTG1 (97%) sheet like sandstone
deposited in an unconfined turbidite setting. The UCS oil is a moderately heavy biodegraded crude of an
average API gravity of 19.7 degrees.
The LCS is a Lower Cretaceous deep water turbidite reservoir. It is a high NTG (90-95%) channelised turbidite
sandstone. Despite a high NTG, local baffles between channels are present. Within the LCS, the oil is trapped
in a complex stratigraphic and structural closure. The LCS oil is more biodegraded than the UCS oil and has
viscosity of around 112cP. The oil API gravity is 18.63 degrees at Pb @ Tres of 957 psia. LCS oil is slightly
more viscous than UCS oil at around 112cP.
1 NTG: Net-to-Gross refers to the fraction of reservoir volume occupied by hydrocarbon-bearing rocks.

Captain EOR Stage 2 Phase II Environmental Statement
Section 3 Project Description
3-3
The Ross sandstone is a f luvio-deltaic Jurassic (Oxfordian) faulted reservoir located near the Captain Ridge.
Oil is trapped in a complex faulted and stratigraphic closure. Average porosity is 26% and the NTG is 80 to
90%. In this area of the Field, oil is also trapped in the Burns sandstone (Lower quality sandstone – age
Volgian), but to date it is unclear if the Burns sandstone contributes to production.
Characteristics of the Captain reservoir are summarised in Table 3-2. Figure 3-1 shows the UCS elevation
whilst Figure 3-2 shows the existing wells and the proposed new wells at the Captain field.
Table 3-2: Reservoir Properties.
UCS (Area A+B)
UCS (Area A) LCS Jurassic/
Ross
Original Oil Water Contact (OOWC) (ft tvdss*) -2,982 -2,967 -2,992 -3,028
Original Gas Oil Contact (OGOC) (ft tvdss*) -2,799 -2,723 N/A NA
NTG 97% 97% 90-95% 80-90%
API Gravity (degrees) 19.7 19.7 18.8 20.26
Oil Viscosity (cP) 80 60 112 40
Temperature (°F) 87 87 87 87
Solution gas/oil ratio (Rs in SCF/stb at Pb) 132 132 98 155
*ft TVDss – feet True Vertical Depth subsea
Figure 3-1: Top UCS (P50) reservoir elevation (ft tvdss). Area A, EOR Stage 1 Development, is highlighted with the
white, square polygon. Area B&C, EOR Stage2 Development, is the area outside the square white polygon.

Captain EOR Stage 2 Phase II Environmental Statement
Section 3 Project Description
3-4
Figure 3-2: Captain structure map showing well stock prior to EOR Stage 2 Phases I and II Development (for note the proposed Stage 2 producer tied back to the C
template and the conversion of Well B28 from water to polymer injection are both part of EOR Stage 2 Phase I and therefore are not considered in this ES).

Captain EOR Stage 2 Phase II Environmental Statement
Section 3 Project Description
3-5
3.3.1 Anticipated Recoverable Volumes
The estimated total recoverable volumes of oil from the Captain Field are anticipated to be 470 million barrels
(MMBBL).
3.4 Option Selection
This sub section summarises the options considered for the following facets of the Captain EOR Stage 2
Phase II Project:
• Use polymer injection or continue with produced water/water injection;
• Type of polymer;
• Number and location of the polymer injection wells;
• Type of well;
• Number of flowlines and method of installation;
• Use of piled or gravity based Subsea Umbilical Distribution Structures (SUDS) at each drill centre.
3.4.1 Polymer Injection v’s Use of Water Injection
If the new polymer injection wells are not drilled, there will be a c. 4% reduction in the recovery factor from
the Captain field. The new polymer injection wells will inject a polymer solution, which acts as displacing fluid
at a higher viscosity than the normal PWRI water. This changes the displacing fluid mobility resulting in much
more ef ficient displacement of the oil to the adjacent production wells. The improved displacement of the oil
f rom the polymer solution vs the PWRI water results in the EOR.
3.4.2 Type of Polymer
Captain uses a water soluble polymer to increase the viscosity of the injected water. There are two main
types of water soluble polymer used in industry, namely Xantham and partially hydrolysed polyacrylamide
(HPAM). Of these HPAM is the most widely used and easiest to manufacture in large quantities. Captain has
been using a HPAM product since the first pilot, which was chosen based on its ability to provide high solution
viscosity, while maintaining good injectivity in the injection wells. HPAM is commercially available in a solid
powder form, and a liquid emulsion form. Captain uses HPAM in the liquid emulsion form, which significantly
improves the ability to transport, store and mix the polymer product in an of fshore location. The HPAM
products used at Captain have undergone continuous development since the f irst pilot in 2011 with an aim
to improve product performance, in particular the viscosity yield for a given concentration and the injection
performance. The polymer product that will be injected into the EOR Stage 2 wells will be the same product
that is currently being injected into the existing Stage 1 wells. Continuous technical optimisation of this
product is expected to continue throughout the operational life of the Stage 2 wells, however the basic
chemistry described above is not currently expected to change significantly.
3.4.3 Number and Location of the Polymer Injection Wells
Determining the optimal injection well number and spacing is a function of: (1) the polymer viscosity required
to meet the optimal displacement ratio; (2) the reservoir thickness and properties; (3) oil saturation at that
location; and (4) the desired phasing of oil production. In essence, the well spacing is a technical decision
based on pore volume swept and injectivity decline, and an economic decision.
Given the target pore volumes to be swept at the Captain f ield by the polymer solution, a full field polymer
f lood requires the addition of the six new injectors and two infill producers (one of which is being drilled in
2022 at Area C and the second will be drilled at Area B as detailed in this ES).
In summary, the location of the injection and production wells allow the optimal reservoir pore volume to be
swept. For note the original water injection well locations were peripheral and therefore not optimal for
conversion to polymer injection wells.

Captain EOR Stage 2 Phase II Environmental Statement
Section 3 Project Description
3-6
Within each drill centre, the location of the wells has been selected to minimise the drilling effort and the
length of the f lowline and Electro-Hydraulic (EH) umbilical routes. It will be possible to skid the drilling rig
between the wells within Area D and Area E such that the anchors will only be required to be placed once at
each drill centre.
3.4.4 Type of Well
Selection of well technology included a review of the available geotechnical information for the area and a
review of all available technologies. The review indicated that suction can based technologies may be
suitable for Captain and Ithaca Energy engaged with the main provider of these technologies (NeoDrill
CANDuctor) providing them with all available geotechnical information. Following evaluation of the existing
geotechnical data, NeoDrill CANDuctor concluded that there was insufficient information to be able to
engineer a suitable system. Schedule constraints, additional cost and emissions associated with a dedicated
survey to obtain further geotechnical information was considered to be unlikely to offset the time, cost and
environmental impact of drilled and cemented conductors. Given these constraints combined with the fact
that to date the Captain f ield has been developed with drilled and cemented conductors it was determined
to use this tried and tested approach for the proposed wells. To minimise the critical path rig time, and
associated emissions, Ithaca Energy has elected to deploy the innovative Deltatek inner string conductor
cement technology, Quickcure, which entails the pumping of heated seawater to speed up the cement setting
process and minimise time “waiting on cement”. This technology provides the opportunity to minimise excess
cement to the seabed if returns are observed. This Deltatek “inner string” approach has also been used on
the surface casing where cement returns are to the seabed to provide opportunities to minimise excess
cement on the sea f loor. The selected well technology is therefore considered to represent Best Available
Technology (BAT).
3.4.5 Number of Flowlines and Flowline Installation Method
The polymer solution will be mixed topsides on the BLP and will f low to each of the polymer injection wells
via individual flowlines. The nature of the polymer means it is not possible to utilise a single flowline to each
drill centre as the performance of the polymer would be severely degraded. Utilising a single flowline to each
drill centre would require a manifold to be installed at each drill centre to distribute the polymer to each
injection well. Within the manifold pipework, valves would be required, including a choke valve to manage
the distribution of the polymer flows to each well. Flowing the shear sensitive polymer through a choke valve
and the various tees etc. within the manifold pipework would generate significant turbulence to the flow
stream2. This turbulence would degrade the performance of the polymer to the point that it becomes
inef fective, hence the requirement to lay a separate polymer flowline to each injection well.
The f lowlines and EH umbilicals will be trenched their full lengths apart from on the approaches to the BLP,
SUDS or wells. At these approaches the lines will transition out of the trench and be surface laid and
protected with a combination of mattresses and 25 kg grout bags.
Given the small size of the flowlines and umbilicals, laying the lines exposed on the seabed was not a feasible
option, whilst burying the lines was considered preferable to adding rock berms along the full line lengths.
Jet trenching has been selected over ploughing and backfilling due to the soil in the Captain field area, past
trenching performance in the field and as a way of minimising the seabed disturbance.
The f lowlines will be pressurised on the seabed before being jet trenched individually to ‘lock-in’ the
expansion that the f lowline experiences as a result of being pressurised. This helps to mitigate the
requirement for subsequent rockdump to alleviate any buckling co ncerns. Should there be any issues
encountered during the trenching operation (e.g. boulders causing large deformations, etc) then the risk of
2 Shear sensitive liquids change viscosity when under stress or pressure.

Captain EOR Stage 2 Phase II Environmental Statement
Section 3 Project Description
3-7
upheaval buckling may still exist however, and it is on this basis that, what is considered to be a worst case,
contingency volume of rockdump has been allowed for (see Section 3.7.4).
The option to lay 2+ lines in a single trench was explored, however it was not considered technically feasible
as it would rule out the option of pressurising the flowlines prior to trenching. Given the nature of the flexible
f lowlines if multiple lines were to be laid within a single trench, without being pressurised, then the likelihood
would be that the entire length would require to be rockdumped to mitigate buckling risks.
3.4.6 Subsea Umbilical Distribution Structures: Piled v’s Gravity Based
Piled and gravity-based structure designs were initially considered for the three SUDSs. Whilst 500 m
exclusion zones will be applied, Ithaca Energy has previously experienced fishing vessel incurs ions into the
existing subsea drill centres at the Captain f ield and have had to remove nets f rom existing subsea trees.
Therefore, a piled structure has been selected for the SUDS to be located at Area D and Area E. Utilising a
piled design gives the advantage of providing a guaranteed foundation. Fishing vessel incursions have not
occurred within the 500 m exclusion zones associated with the Captain platforms/FPSO, such that a gravity-
based design has been selected for the third SUDS which will be located in close proximity to the BLP.
3.5 Schedule of Activities
Table 3-3 provides an indicative schedule for the offshore activities associated with the Captain EOR Stage
2 Phase II activities.
Table 3-3: Indicative schedule for the proposed Captain EOR Stage 2 Phase II activities.
Activity
2023 2024
Q1 Q2 Q3 Q4 Q1 Q2 Q3 Q4
Drilling of the polymer injection wells at Area D, and Area E and the production well at Area B
Installation of subsea infrastructure
First injection at Area D
First injection at Area E
First oil from new production well at Area B
Note: as described previously the topside modifications required for the Captain EOR Stage 2
project commenced in 2021 and will be completed in 2023.
3.6 Drilling
3.6.1 Drilling Rig
The COSLPioneer semi-submersible drilling rig will be used to drill the six new polymer injection wells and
the new production well. This drilling rig is also being used to drill the Captain EOR Stage 2 Phase I
production well and any lessons learned f rom this well will be applied to the wells to be drilled as part of
Captain EOR Stage 2 Phase II.
3.6.2 Drilling Locations
The location of the top holes for each well are shown in Figure 3-3 and provided in Table 3-4. At Area D and
Area E the polymer injection wells (three at each drill centre) will be located within 65 m of the new SUDS to
be installed at each drill centre. The production well at Area B will be drilled at the existing UTM.

Captain EOR Stage 2 Phase II Environmental Statement
Section 3 Project Description
3-8
Figure 3-3: Location of new wells and subsea infrastructure associated with the Captain EOR Stage 2 Phase II project.
Table 3-4: Proposed locations of the six polymer injection wells and the production well.
Well Co-ordinates (ED 1950 UTM Zone 30N)
Area D – D1 58°19’ 50.30” N
01°42’ 38.50” W
Area D – D2 58°19’ 50.76” N
01°42’ 39.34” W
Area D – D3 58°19’ 49.84” N
01°42’ 37.65” W
Area E – E1 58°18’ 28.62” N
01°41’ 25.47” W
Area E – E2 58°18’ 28.18” N 01°41’ 26.35” W
Area E – E3 58°18’ 29.07” N
01°41’ 24.60” W
UC02P production well (Area B) Slot HH on the UTM

Captain EOR Stage 2 Phase II Environmental Statement
Section 3 Project Description
3-9
3.6.3 Positioning and Anchoring of the MODU
The COSLPioneer will self-propel to the first drilling location and will be held in position using eight anchors
(maximum dimensions 6.4 m (W) x 7.1 m (L) each). The three polymer wells at each drill centre will be
located c. 25 m apart such that the drilling rig can be skidded between the well locations within each drill
centre. Therefore, the anchors will only be laid three times as part of the total campaign: i.e. once at Area D,
once at Area E and once at Area B. The close proximity of the wells within each drill centre also allows the
wells to be batch drilled and batch completed for maximum efficiency and therefore minimising the duration
of the drilling campaign.
The anchors will be deployed using up to two Anchor Handling Vessels (AHVs). The precise anchor mooring
spread for the drilling rig will be defined by a mooring analysis at each drill centre. The mooring analysis will
be undertaken prior to bringing the drilling rig onto location at each drill centre and will take into account the
water depth, currents, tides, prevailing wind conditions and any seabed features at the drilling locations.
Details of the placement of the anchors will be provided in the CtL permit applications which will be submitted
before the drilling rig is mobilised to each drill centre.
Whilst in position, and in accordance with the Petroleum Act 1998, a statutory 500 m safety exclusion zone
will be automatically established around the COSLPioneer. Unauthorised vessels, including fishing vessels,
are not permitted to enter this 500 m zone. Note, at the time of writing Ithaca Energy had applied for a 500
m exclusion zone at Area D and Area E.
Once on location, the COSLPioneer will be serviced by supply vessels which will transport drilling equipment,
supplies, water, fuel and food and will backload wastes and surplus equipment to shore. Helicopters will also
be used to transport personnel to and from the drilling rig. A dedicated Emergency Response and Rescue
Vessel (ERRV) will be present in the f ield during drilling operations at Areas D and E. When drilling at Area
B the Captain Platform ERRV may be shared, subject to risk assessment. Section 3.6.10 details the number
of vessel days, and helicopter trips associated with the drilling campaign.
3.6.4 Blowout Preventer and Well Control Equipment
The drilling rig will be equipped with a Blowout Preventer (BOP) which is rated for pressures beyond the
maximum pressure anticipated for the wells being drilled.
The function of the BOP will be to prevent uncontrolled flow f rom the wells to the surface during drilling by
positively closing in the well in the event of an uncontrolled release from the reservoir into the well bore. The
BOP is made up of a series of hydraulically operated rams that can be closed in an emergency from the drill
f loor, or from a safe location elsewhere on the rig. The BOP could also be operated subsea from a Remotely
Operated Vehicle (ROV).
The integrity of the BOP will be tested prior to usage and periodically during the drilling. Inspection and
testing of the BOP will be undertaken in line with the operator, Ithaca Energy procedures and UK legislation.
3.6.5 Well Design
The Captain wells will be drilled and completed in accordance with Ithaca Energy’s Wells Standard and
associated Well Delivery Process. The basic polymer injection well design is summarised in Table 3-5 and
illustrated in Figure 3-4, whilst the basic production well design is summarised in Table 3-6 and illustrated in
Figure 3-5. These well designs are similar to the wells drilled at the Captain field to date. Detailed well design
specifics are still under analysis but will be provided in future drilling permit applications.

Captain EOR Stage 2 Phase II Environmental Statement
Section 3 Project Description
3-10
Table 3-5 – Polymer injection well design and programme.
Well section
diameter
(inches)
Length of
section (m) Mud System
Weight of
mud (te)
Estimated weight
of cuttings (Te)
Cuttings
handlings
36" 58 - 79 Seawater and viscous
sweeps.
500 91 - 124 Discharged at the
seabed 17½" 328 - 352 300 122 - 131
12¼" 684 - 968 WBM
676 137 - 194 Discharged at sea
surface 8½" 1,161 – 2,114 205 112 - 204
Total 2,231 – 3,513 - 1,681 462 - 653
Table 3-6 –Production well design and programme.
Well section
diameter
(inches)
Length of
section (m) Mud System
Weight of
mud (te)
Estimated weight
of cuttings (te) Fate of cuttings
36" The new production well to be drilled at the Area B UTM will be drilled as a side-track to a
previously abandoned well. The two top hole sections from the previously abandoned well will be
used for the new well such that there will be no cuttings associated with these sections. 20"
14 ¾" 540
WBM
296 156
Discharged at
sea surface 12 ¼" 1,800 509 358
8 ½" 1,200 211 115
Total 3,540 - 1,017 629

Captain EOR Stage 2 Phase II Environmental Statement
Section 3 Project Description
3-11
Figure 3-4: Example schematic of the polymer injection well.

Captain EOR Stage 2 Phase II Environmental Statement
Section 3 Project Description
3-12
Figure 3-5: Example schematic of the production well.

Captain EOR Stage 2 Phase II Environmental Statement
Section 3 Project Description
3-13
3.6.6 Drilling Mud and Cuttings
Drilling fluids are required for a number of reasons including:
• Managing hydrostatic pressure and primary well control;
• Transportation of drill cuttings to the surface;
• Preservation of the wellbore to facilitate casing / completion installation; and
• Cooling and lubrication of the drill bit.
During drilling, fluids are continuously pumped down the drill string to the drill bit and returns to the surface
through the annular space between the drill string and the sides of the well. Different mud formulations are
required at different stages in the drilling operation because of variations in pressure, temperature and the
physical characteristics of the rock being drilled.
As detailed in Table 3-5 and Table 3-6 all well sections will be drilled with either seawater and viscous sweeps
or with Water Based Muds (WBM). The mud and entrained drill cuttings will be discharged to the marine
environment for all sections. Table 3-5 and Table 3-6 summarises the maximum anticipated mud volumes
and mass of cuttings associated with each well section. Full details of the mud composition and volumes will
be provided in separate drilling permit applications prior to drilling commencing at each well.
3.6.7 Cementing Chemicals
Cement is used to secure the steel conductor and casings in the well bore, whilst cementing chemicals are
used to modify the technical properties of the cement slurry. During cementing operations the majority of
these chemicals are lef t downhole but a small quantity of cement may be discharged onto the seabed around
the top of the 30ʺ conductor and 20” casing while filling the annulus between them and the host rock formation
with cement. This excess over the annulus volume is required to give confidence that the cement has
completely filled the conductor annulus and displaced all the mud present to provide a strong bond, on which
the entire well is secured. It is estimated that approximately 20 te of cement could be discharged on the
seabed immediately adjacent to each well location. The ES assumes that at each well location the resultant
cement patio will have a radius of 7.5 m. Subsequent use of cement is contained downhole as further casings
do not require the cement to be pumped into the annulus all the way up to the surface.
Discharges of other cementing chemicals such as cement mix water and spacers may occur when cleaning
out the cement mixing and pumping equipment. Cement mix water is the term used to describe the f luids
used to mix the cement, whilst spacers are the f luids used to aid the removal of drilling f luids before
cementing.
At the time of writing the detailed cement design has yet to be finalised, however, estimates of the type and
volume of cement are provided in Table 3-7.

Captain EOR Stage 2 Phase II Environmental Statement
Section 3 Project Description
3-14
Table 3-7: Estimated cement requirements per well.
Cement job Volumes Cement type
Polymer inject well
36" 100 bbls spacer + 440 bbls cement RHC
17½" 150 bbls spacer + 470 bbls cement RHC
12¼" 80 bbls spacer + 100 bbls cement Class G
8½" N/A N/A
Production well at the UTM in Area B
36" The new production well to be drilled at the Area B UTM will be drilled as a side-track to a
previously abandoned well . The two top hole sections from the previously abandoned well
will be used for the new well such that there is no requirement for cement for these two
sections. 20"
14 ¾" 80 bbls spacer + 100 bbls cement Class G
12 ¼" 80 bbls spacer + 100 bbls cement Class G
8 ½" N/A N/A
All cementing chemicals to be used will be selected based on their technical specifications and environmental
performance. Class G cements have no additions other than calcium sulphate and/or water and are intended
for use as a basic well cement. Chemicals with substitution warnings (i.e. chemicals that are considered to
be harmful to the environment) will be avoided where technically possible. The cementing chemicals to be
used have not yet been determined but will be detailed in subsequent drilling permit applications.
Similar to the drilling and cementing chemicals, the chemicals associated with the completions operations
will be captured in the subsequent drilling permit applications.
3.6.8 Well Clean-up and Testing
No well f luids will be f lowed to surface for the six polymer injection wells. In addition, there will be no f laring
associated with the completion/clean-up of the new production well to be drilled at Area B.
3.6.9 Relief Well Location
A plan will be put in place for the drilling of a relief well to intersect the Captain wells in the event of a well blowout and will include a proposed drilling rig location f rom which a relief well could be drilled. Any well planned that is capable of flow to surface has a relief well planning package developed ahead of operations. In addition, the site survey will cover a minimum of one relief well location which is reviewed to confirm feasibility and trajectories are developed to ensure that it is feasible to drill, intersect and dynamically kill.
3.6.10 Drill Rig Support Activity
Various support vessels will be associated with the drilling operations such as AHVs, supply vessels etc.
Table 3-8 summarises the estimated duration that each vessel will be on site and their estimated fuel use.
Estimates provided are based on batch drilling the three polymer wells on each drill centre to maximise
ef f iciency. The production well is estimated to take 100 days to drill. Due to the proximity of the wells at each
drill centre, the rig will be skidded between the wells without having to relocate its anchors so as to minimise
seabed disturbance.

Captain EOR Stage 2 Phase II Environmental Statement
Section 3 Project Description
3-15
Table 3-8: Fuel consumption of vessels associated with the drilling of the Captain wells.
Vessel type Days on transit/on site* Fuel
consumption
(te/d)**
Total fuel
use (te)
Drilling rig
395 days
Allows 141 days to drill the three wells at Area D,
154 days to drill the three wells at Area E and
100 days to drill production well at Area B
15 5,925
AHV
(mob/demob/transit) x 2
24 days
Two AHV and assumes four days transit per AHV for
positioning of anchors at each site (i.e. at Area B, D and E)
27 648
AHV (working) x 2 24
Allows four days per AHV for positioning, connection and
recovery of the anchors at each site (i.e. at Area B, D and E).
27 648
ERRV*** 395
Assumes dedicated ERRV on site whilst drilling rig is on site 6 2,370
ERRV crew changes
(crew changes every 28
days, 1 day allowed per
change.
15 days
Crew changes every 28 days, 1 day allowed per change. 10 150
Supply Vessel
(mob/demob transit)**** 197.5 days 10 1,975
Supply Vessel
(working) **** 197.5 days 6 1,185
Helicopter (te/hr) Four trips per week (226 trips – 1.5 hours round trip) = 339
hours flying
0.7 te per
hour 237
Total fuel use 13,138
* Drilling schedule still being developed, duration presented is the maximum anticipated.
**Source: The Institute of Petroleum, 2000.
*** As described in Section 3.6.3, it is possible that when drilling at Area B, the Captain Platform ERRV may be shared,
however as a worst case the ES assumes that it will not be shared.
**** Assumes supply vessel for 125% of time rig is on location, allowing for 25% spot hire of a second supply vessel. Also
assumes for total hire, half time is spent in mob/transit and half time working.
Note the relatively low fuel use associated with the drilling rig (see Table 3-8) is a result of COSL’s continuous
investment in reducing emissions. COSL Drilling Europe is ISO 14001 “Environmental Management System”
and ISO 50001 “Energy Management System” certif ied. COSL continuously invests in technology and
competence that improve energy performance. A major contributor to this philosophy has been the
installation of COSL’s Energy Control System on board the COSLPioneer; a system previously installed and
proven on two sister vessels. This system monitors the energy consumption and delivers substantial
reductions in CO₂ and NOₓ by optimising operations and engine utilisation. Since installation on board the
COSLPioneer the system calculated fuel savings of 1,661 MT in just over f ive months. This equates to a
reduction over the same period of 5,267 MT in CO₂ and 88 MT in NOₓ emissions respectively.
3.7 Subsea Infrastructure
As with the existing Captain f ield infrastructure, the subsea facilities for the Captain EOR Stage 2 Phase II
Project will be designed in accordance with all statutory requirements for offshore facilities in the UK territorial
waters using all relevant industry codes. Table 3-9 summaries the subsea inf rastructure to be installed in
support of the EOR Stage 2 Phase II Project. Figure 1-4 illustrates the new infrastructure to be installed and
Figure 3-3 shows its location relative to the existing field infrastructure. The design life of the subsea facilities
is 20 years.

Captain EOR Stage 2 Phase II Environmental Statement
Section 3 Project Description
3-16
Table 3-9: Subsea infrastructure associated with the captain EOR Stage 2 Phase II Project.
Item No. Description
1 Seven Xmas trees: one each for the polymer injection wells and one for the new production
well which will be located within the existing UTM at Area B.
2 Two piled SUDS, one at Area D and one at Area E, plus one gravity based SUDS at the BLP
riser base location.
3 Three 6.6" (internal diameter) polymer injection flowlines from the BLP to Area D: c. 4,728 m in
length with an external diameter of 228 mm.
4 A 4,709 m EH umbilical (110 mm outer diameter) from the BLP to Area D.
5 Three 6.6" (internal diameter) polymer injection flowlines from the BLP to Area E: c. 5,718 m in
length with an external diameter of 228 mm.
6 A 5,757 m EH umbilical (110 mm outer diameter) from the BLP to Area E.
7 A 326 m EH riser umbilical (203 mm outer umbilical) from BLP topsides to the Riser base
SUDS structure.
8 Three EH umbilical jumpers at Area D laid between the SUDS and the three wells : each one
measuring 80 m.
9 Three EH umbilical jumpers at Area E laid between the SUDS and the three wells : each one
measuring 80 m.
3.7.1 Xmas Trees
Section 3.4.3 details why the project requires six polymer injection wells across two drill centres. The Xmas
trees associated with the polymer injection wells will comprise a modified design of the Captain subsea tree
used for existing production wells. Each polymer injector well will have its own dedicated flowline and topside
f low meter to enable individual injection rate monitoring. The injection pressures will also be monitored in
each of the new injection wells. The Xmas trees for the polymer injection wells will have wellhead protection
structures associated with them and will measure c. 4.92 m (L) x 4.89 m (W) x 5.8 m (H).
The production well will be drilled at one of the slots on the UTM and therefore the new Xmas tree for this
well will be installed within the UTM.
3.7.2 Subsea Umbilical Distribution Structure
At Area D and Area E the EH umbilicals will tie into a SUDS. A piled SUDS will be installed at each drill
centre as part of the EOR Stage 2 Phase II Project. EH umbilical jumpers will connect the SUDs to each of
the wells within each location. The SUDS will each measure c. 6 m (L) x 6 m (W) x 3 m (H) and will weigh
c. 50 te. The structures will be f ishing f riendly and will be located within the drill centre 500 m exclusion
zones. Justification for using piled SUDS at the two new drill centres is provided in Section 3.4.6.
Four piles measuring around 25 m in length and 24" (c. 0.61 m) in diameter will be required for each SUDS.
It is expected that it will take one hour to install each pile with the four piles at each structure being installed
in a single day. The piling activities will start with a soft start and based on previous piling activities at the
Area C, it is expected a maximum hammer energy of 20 kJ will be sufficient to install all piles. However, as
a worst-case scenario, a maximum hammer energy of 90 kJ has been considered in the underwater noise
modelling carried out to support the impact assessment (Appendix D).

Captain EOR Stage 2 Phase II Environmental Statement
Section 3 Project Description
3-17
A third SUDS structure will be installed at the BLP riser base location to distribute the functions f rom the
single riser umbilical from the BLP topsides to the two umbilicals that serve Areas D and E. As this structure
is located within the 500 m safety zone associated with the WPP and BLP platforms it does not require to be
designed for f ishing interaction and can therefore be gravity based. The size of the structure is anticipated
to be 8 m (L) x 7 m (W) x 3 m (H) and weight around 70 te.
3.7.3 Flowlines, Umbilicals, Tie-In Spools and Jumpers3
As described in Section 3.4.5 separate 6.6” ID polymer flowlines to each polymer injection well are required.
The f lowlines will be of a f lexible type construction with a cross-section as shown in Figure 3-6, where it will
comprise a combination of metallic and polypropylene layers.
Figure 3-6: Schematic showing cross section of flowlines to be installed.
In addition to the flowlines each drill centre is served by a single EH umbilical which provides the control and
monitoring of the Xmas trees. The EH umbilicals will be a combination of electrical cables, and hydraulic
hoses, to effectively control and monitor the trees. There are no chemical lines within the umbilicals. At each
drill centre, the EH umbilical will tie into the SUDS whist the polymer flowlines will tie directly into the polymer
injection wells. The lengths of the flowlines and EH umbilicals are provided in Table 3-9.
The routing of the f lowlines and umbilicals has been designed to minimise the route as far as practicable
between the BLP and the drill centres taking accounting of:
• existing facilities in particular the existing FPSO mooring arrangement;
• Anchor patterns for locating the drilling rig at the drill centres;
• Approach angles at the drill centres to minimise the length of laydown loops required; and
• Avoidance of existing drilling locations.
3 As part of the 2022 activities a new riser caisson will be installed on one o f the legs of the BLP, through which the risers
and dynamic umbilicals associated with the polymer injection wells will pass.

Captain EOR Stage 2 Phase II Environmental Statement
Section 3 Project Description
3-18
The selected route also avoids any crossing with other infield lines or with any third-party infrastructure.
Subsea f lowlines will be supplied to the installation vessel on installation reels and surface laid in the f ield
along the pre-determined routes. The flowlines will then be pressurised prior to jet trenching them to a depth
of lowering of 1.0m from top of flowline/EH umbilical to mean seabed level. Given the nature of the soils in
the area, it is anticipated that this depth of burial can be achieved, however the ES does capture some
contingency rock cover if required (see Section 3.7.4). After the f lowlines and umbilical have been laid on
the seabed, a dedicated guard vessel will be on site until the jet trenching activities have been completed.
The aim of the guard vessel is to advise any fishing vessels in the area of the presence of the temporarily
exposed lines on seabed. Once trenched the f lowlines will be depressurised down to ambient pressure to
allow the tie-ins by diver to be carried out.
Once the f lowlines and umbilicals have been installed and jet trenched, post lay surveys will be undertaken
to determine if depth of burial has been achieved and to identify the presence of any excessive f ree-spans
(areas where the f lowlines bridge depressions or hollows in the seabed) that may need to be mitigated. The
as-trenched survey will also check to ensure that there are no clay berms or spoil heaps left on the seabed
following the trenching, which is considered unlikely given the jet trenching methodology. The f lowlines and
EH umbilical to each drill centre will be laid c. 15 m apart.
3.7.4 Subsea Infrastructure Protection
Whilst the f lowlines and umbilicals will be trenched and buried along the majority of their length, mattresses
and 25 kg grout bags will be used to provide stabilisation/protection to the f lowline and umbilical ends as
they exit the trenches at the line ends within the 500 m safety zones. In addition, it is possible that some rock
cover may be required out with the exclusion zones to mitigate spanning and upheaval buckling risk. Table
3-10 summarises the maximum quantity of stabilisation features expected to be required for the proposed
project.
Table 3-10: Anticipated quantities of protection features.
Item Total Approach to BLP Area D Area E
Mattresses
6 m (L) x 3 m (W) x 0.15 m (H) 412* 208 109 95
25 kg grout bags (biodegradable) 7,000* 3,000 2,000 2,000
Rock cover 20,000 te contingency only
*Includes 20% contingency
Prior to laying any rockdump, mattresses or grout bags, Ithaca Energy will submit a Deposit Consent
application to the NSTA and the supporting environmental permit applications to OPRED.
All mattresses and grout bags will be laid within either the existing 500 m safety zones at the BLP or within
the new 500 m zones that will be applied for at the Area D and Area E. All grout bags will utilise biodegradable
hessian sacks.
3.7.5 Pipeline Testing and Commissioning
Following installation and hook-up pressure-testing operations will be performed to ensure system integrity,
to test for any leaks and to prove the integrity of the tie-in connection points, and to prepare the system for
the introduction of the polymer. Testing and commissioning operations may either be performed f rom the
BLP or the installation vessel.
The pipelines will be pressurised in accordance with design codes to pressures above the maximum
operating pressure. On completion of the testing programme the pressurisation f luid is expected to be
discharged to the sea

Captain EOR Stage 2 Phase II Environmental Statement
Section 3 Project Description
3-19
The permitted discharge of chemicals to the marine environment is a routine part of subsea installation
operations. The quantities of chemicals to be used and whether or not they are to be discharged to sea will
be determined during the project detailed design stage and will be subject to a chemical permit application
under the OCR. A risk assessment will be carried out as per the OCR for the relevant chemicals, profiles
and associated application.
3.7.6 Subsea Installation Support Vessels
Various support vessels will be associated with the subsea installation activities. Typical vessel use, duration
and fuel usage by vessels during installation are provided in Table 3-11.
Table 3-11: Vessel type and anticipated fuel usage during the installation of subsea infrastructure.
Vessel type Days Fuel consumption (te/d)1 Total fuel use (te)
Construction Support Vessel (CSV)
(mob/demob/transit) 9 28 252
CSV (working) 22 25 550
Jet trenching vessel
(mob/demob/transit) 3 18 54
Jet trenching vessel (working) 19 18 342
Rock dumping vessel
(mob/demob/transit) 5 20 100
Rock dumping vessel (working) 2 20 40
Dive Support Vessel (DSV)
(mob/demob/transit) 9 20 180
DSV (working) 32 20 640
Guard vessel (mob/demob/transit) 8 3.5 28
Guard vessel (working) 60 0.8 48
Total fuel use 2,243
Note: activities to be carried out by the CSV will include the pre-lay route surveys (hence why a separate line item has
not been added for survey vessels). 1 Source: The Institute of Petroleum (2000).
3.8 Topsides Modifications
The Captain EOR Stage 2 Project includes a number of topside modifications. These modifications are being
completed under the Captain EOR Stage 2 Phase I and therefore are not described in detail here. In
summary the modifications commenced in 2021 and will be completed in 2023:
• Addition of new polymer pumping and mixing facilities on the BLP;
• A new water injection manifold on the BLP;
• A new riser casion at the BLP through which the Captain EOR Stage 2 Phase II risers and the
dynamic umbilical will pass;
• An additional polymer transfer pump on the Captain FPSO;
• New polymer transfer pumps on the WPP;
• Modifications to existing infrastructure to tie‐in the new facilities on the WPP, BLP and the FPSO.
It should be noted that the topside modifications to the BLP, WPP and FPSO do not require a f lotel and do
not include increases to the footprint of the existing topsides or to the existing power generation equipment.

Captain EOR Stage 2 Phase II Environmental Statement
Section 3 Project Description
3-20
3.9 Production
The target injection rate for each individual well is 30,000 bbls/day. The polymer will be stored on the FPSO
and transferred to the WPP for mixing. From the WPP it will pass to the BLP for onward transport to the wells
via the new f lowlines.
The Captain f ield operates 100% reinjection such that there will be no PW discharges to sea. Increased
inputs of PW resulting from the EOR Project will not result in exceedance of the existing PWRI system
capacity.
Chemicals are used during the production of hydrocarbons to maintain process efficiency, for example:
demulsifiers improve the separation of oil and water; scale inhibitors slow down the build‐up of scale in
pipework and valves and biocides reduce microbial growth.
Chemical usage and discharge will be captured in an update to the BLP/WPP production chemical permit
prior to production commencing. Anticipated chemical requirements associated with the production of
hydrocarbons from the Stage 2 Project are not expected to differ to those being used already at the Captain
Field. As the Captain Field operates 100% reinjection there will be no PW discharges to sea as a
consequence of the Captain EOR Stage 2 Project (both Phase I and Phase II).
Production profiles have been developed for the purpose of the Captain EOR Stage 2 Project. These forecast
the likely volumes of oil and gas that will be produced. Anticipated high case volumes of oil and gas are
presented here as the environmental impacts associated with the production of these volumes are likely to
be greatest with respect to, for example, atmospheric emissions, discharges to sea etc.
Note as all PW will be reinjected, such that there will be no environmental impacts associated with their
‘disposal’, PW profiles are not presented here.
3.9.1 High Case Oil Production Profiles
Table 3-12 and Figure 3-7 show the anticipated high case oil production rates f rom the Captain f ield, assuming start-up in 2024. Maximised annual oil production for the f ield is anticipated in 2025 at a rate of c. 2,639 te/day. The mid- and low-case oil profiles are presented in Appendix E (Table E-1).
Table 3-12: High case oil production rate.
Year
Oil Production Rate (te/day)
Without Stage 2 project Increase rate associated
with Stage 2 Project
Total with Stage 2
project
2023 3,386 441 3,827
2024 3,643 1,165 4,808
2025 3,822 2,859 6,681
2026 3,892 2,555 6,447
2027 4,025 1,461 5,486
2028 3,374 1,198 4,572
2029 2,314 1,464 3,778
2030 1,933 675 2,608
2031 1,566 10 1,576
2032 1,335 0 1,335
2033 1,141 0 1,141
2034 1,041 0 1,049
2035 958 0 958

Captain EOR Stage 2 Phase II Environmental Statement
Section 3 Project Description
3-21
Figure 3-7: Captain field high case oil production rate alone and with Stage 2 Project high case production
rate.
3.9.2 High Case Gas Production Profiles
Table 3-13 and Figure 3-8 show the anticipated high case gas production rates from the Captain Field,
assuming start-up in 2023. Maximised annual gas production for the f ield is anticipated in 2025 at a rate of
c. 289,657 m3/day. The mid- and low-case gas profiles are presented in Appendix E (Table E-2).
Table 3-13: High case gas production rate.
Year
Gas Production Rate (m3/day)
Captains Field without Stage 2
project
Stage 2 Project Captains Field with Stage
2 project
2023 127,426 30,083 157,509
2024 135,922 67,012 202,934
2025 144,417 145,240 289,657
2026 147,248 135,080 282,328
2027 150,080. 93,294 243,374
2028 127,426 75,351 202,777
2029 87,783 79,939 167,722
2030 73,624 40,751 114,375
2031 59,466 7,785 67,251
2032 50,971 2,976 53,947
2033 42,475 574 43,049
2034 39,644 0 39,644
2035 36,812 0 36,812
0
1,000
2,000
3,000
4,000
5,000
6,000
7,000
8,000
2021 2022 2023 2024 2025 2026 2027 2028 2029 2030 2031 2032 2033
Oil
(to
nn
es/
day)
Year
Captain Field without Stage 2 Project Stage 2 Project

Captain EOR Stage 2 Phase II Environmental Statement
Section 3 Project Description
3-22
Figure 3-8: Captains field high case gas production rate alone and with Stage 2 Project high case production
rate.
3.9.3 Vessel Use During Production
During production, the proposed Captain EOR Stage 2 Phase II project will not result in an increase to the
ERRV, supply vessels or helicopters trips currently associated with the Captain Field. From 2024, the number
of offloads increases f rom 20 to 31 in 2026 af ter which it begins to decline again. Table 7-7 presents the
anticipated number of offloads through to end of field life and the associated fuel use.
Currently polymer is delivered to the Captain field once a week. From 2024 to 2029, this will increase to two
deliveries per week, and from 2030 it will reduce to one trip per week. Table 7-8 shows the number of polymer
of floads per year and the associated fuel use.
3.10 Key Permits and Consents
The Portal Environmental Tracking System (‘PETS’) is OPREDs environmental permitting system accessed
via the UK Energy Portal. PETS integrates permits and consents under one centralised Master Application
Template (MAT). There are six types of MAT available on the PETs system:
• Drilling Operations;
• Pipeline Operations;
• Production Operations;
• Decommissioning Operations;
• Well Intervention Operations; and
• A Standalone application.
Once a MAT has been created it can support various types of permit applications (referred to as Subsidiary
Application Templates (SATs)).
Note that Oil Pollution Emergency Plans (OPEPs) and EU ETS Permits are not available on the PETS
system.
0
50,000
100,000
150,000
200,000
250,000
300,000
350,000
2023 2024 2025 2026 2027 2028 2029 2030 2031 2032 2033 2034 2035
Ga
s (m
3 /d
ay)
Year
Captain Field without Stage 2 Project Stage 2 Project

Captain EOR Stage 2 Phase II Environmental Statement
Section 3 Project Description
3-23
3.10.1 Pollution Prevention and Control (PPC) Permit
It should be noted that the Captain EOR Stage 2 Phase II Project will require a slight increase in power
demand on the platform. The existing PPC Permit will therefore be reviewed and any changes to fuel use as
a result of the wells will be captured in a variation.
3.10.2 UK Emissions Trading Scheme (UKETS)
No new GHG Permit under the UK ETS Trading Scheme will be required; however, the description of the
installation in the existing permit application will be updated to reflect the polymer injection wells and the new
production well coming online.
3.10.3 Oil Pollution, Prevention and Control (OPPC)
Discharges of oil to sea are controlled under The Petroleum Activities (Oil Pollution, Prevention and Control)
Regulations 2005. The existing BLPA Oil Discharge Life Permit will be updated to capture Captain Stage 2
Phase II coming online. In addition, Oil Discharge Term Permits will be required for the drilling activities.
3.10.4 Chemical Use and Discharges to Sea
The relevant permits to use and discharge chemicals offshore will be applied for in accordance with the OCR.
All of fshore activities are covered by the Regulations including oil and gas production, drilling of wells,
discharges from pipelines and discharges made during decommissioning.
3.10.5 Oil Pollution Emergency Plan (OPEP)
To support the Captain EOR Stage 2 project, Ithaca Energy has submitted a Temporary Operation Oil
Pollution Emergency Plan (TOOPEP) which interfaces with the existing approved Production Installation
OPEP for the Captain Platform and the Non-Production Installation (NPI) OPEP for the COSLPioneer. The
Captain OPEP will subsequently be updated to incorporate production f rom the Captain EOR Stage 2 project.
3.10.6 Consent to Drill
Ithaca Energy on behalf of their Co-Venturers will submit a Consent to Drill in the Well Operations
Notif ications (WONS) system to apply for consent to carry out drilling at the proposed project.
3.10.7 Consent to Locate (CtL)
Where applicable, Ithaca Energy will apply for the following CtLs:
• Mobile Installation, e.g. drilling rig;
• Permanent / f ixed structure, e.g. Xmas trees; and
• Pipeline or cable system, e.g. polymer injection flowlines, and control umbilicals.
3.10.8 Pipeline Works Authorisation (PWA) and Deposit Consent (DepCon)
Ithaca Energy will submit an application for a PWA detailing the pipelines, structures and umbilical to be
installed whilst an application for a DepCon will be submitted providing the location of any rockdump, grout-
bags and mattresses required on the pipeline route.
3.11 Decommissioning
At Cessation of Production (CoP) the Captain infrastructure will be decommissioned in line with legislation
in force at that time. In 2022 this would constitute the following:
• The Petroleum Act 1998 (as amended) and other relevant Regulations at the time of
decommissioning;

Captain EOR Stage 2 Phase II Environmental Statement
Section 3 Project Description
3-24
• OPRED Decommissioning Guidance (November 2018);
• The UK Guidelines for Suspension and Abandonment of Wells;
• The Pipeline Safety Regulations 1996 requiring the safe decommissioning of pipelines;
• Any additional applicable legislation in place at the time of decommissioning; and
• Any other agreements with OPRED and relevant regulatory bodies.
Nearer the time of CoP, a full decommissioning plan will be developed in consultation with the relevant
statutory authorities. The plan will be designed to ensure that potential effects on the environment resulting
f rom the decommissioning of the facilities are considered and minimised.
3.11.1 Pipeline and Subsea Infrastructure
In line with current guidelines and legislation the decommissioning of the subsea pipelines would be subject
to a CA and Decommissioning Programme. It is expected that the subsea structures will be removed from
the seabed and returned to shore for reuse / recycling / disposal and a seabed clearance campaign
conducted, however, this would be subject to future legislative requirements and guidance.
3.11.2 Wells
All well programmes will be subject to a Well Notification assessed by the Health and Safety Executive (HSE)
under the Offshore Installations (Of fshore Safety Directive) (Safety Case etc). Wells will be plugged and
permanently abandoned in accordance with Offshore Energy UK (OEUK) well decommissioning guidelines
(OGUK, June 2018) (or applicable guidance at that time). All well programmes will have been reviewed by
the HSE Offshore Safety Department as required under the Design and Construction Regulations.
On completion of the well abandonment programme each conductor and internal tubing will thereafter be cut
below the seabed. The subsea wellheads will then be recovered at location which could be conducted using
either a DSV or semi‐submersible drilling rig.

Captain EOR Stage 2 Phase II Environmental Statement
Section 4 Environmental Baseline
4-1
4. ENVIRONMENTAL BASELINE
4.1 Introduction
An understanding of the baseline environment is required to identify the potential environmental impacts of the proposed project and to provide a basis for assessing the potential interactions of the intended activities with the environment. The environmental receptors considered include seabed / sediments, plankton, benthos, birds, fish, marine mammals, cultural heritage and other sea users.
The Captain f ield lies in the Outer Moray Firth area of the UKCS Block 13/22, c. 70 km off the Moray coast and c. 188 km west of the UK/Norway median line. Water depths in the area range between c. 95 and 130 m (Figure 4-1).
4.2 Environmental Baseline Surveys
A number of environmental surveys have been carried out at the Captain. Where relevant this section draws on the f indings of the three environmental surveys detailed in Table 4-1. Grab sample locations associated with these surveys are shown in Figure 4-1.
Table 4-1: Summary details of environmental surveys at the Captain field used to support the ES.
Survey Details Report Reference
2021 Captain Site Survey. Survey Period 13th to 21 June 2021.
Site survey including geophysical and environmental data acquisition.
A habitat assessment was required to describe all habitats within the survey area and to
identify the presence and extent of any Annex I habitats, as well as any other habitats or
species of conservation interest. The aim of the environmental survey was to characterise
the seabed sediment, existing contamination status and faunal community type. The
survey also provides baseline information against which any future survey results can be compared and will be reported in the environmental baseline survey report.
Grab samples were taken from 11 locations, eight of which covered sites previously
sampled by Fugro in 2015. Samples were taken for physico-chemical and faunal analysis.
Samples were taken using a 0.25 m² United States Naval Electronic Laboratory (USNEL)
box core.
Digital photographic stills and footage were taken at the grab sample locations and at
three transect locations.
Habitat Assessment
Report (Fugro 2021a)
Environmental Baseline
Report (Fugro 2021b)
2015 Captain Site Survey. Survey Period 16th March to 8th April 2015.
Site survey including a geophysical, shallow geotechnical and environmental survey. Grab samples were taken from 29 locations using a dual van Veen 0.1 m2 sampler.
Digital photographic stills and footage were taken at the grab sample locations and at
28 transect locations. Samples were taken for physico-chemical and faunal analysis.
Habitat Assessment Report (Fugro 2015a)
Environmental Baseline
Survey (Fugro, 2015b)
Environmental Field
Results Report (Fugro,
2015c)
2014 Captain Site Survey. Survey Period 15th May to 12th June 2014
Site survey including a geophysical, shallow geotechnical and environmental survey.
The survey was carried out to allow Chevron to assess the expansion opportunities of the
Captain field through the Captain EOR Project.
Samples were taken from 21 locations. Digital photographic stills and footage were taken
at the sampling locations and at six transect locations. Samples were taken for physico-
chemical and faunal analysis.
Environmental Baseline
Survey and Habitat
Assessment Report
(Fugro, 2014).

Captain EOR Stage 2 Phase II Environmental Statement
Section 4 Environmental Baseline
4-2
Figure 4-1: Survey sampling stations and transects.

Captain EOR Stage 2 Phase II Environmental Statement
Section 4 Environmental Baseline
4-3
4.3 Physical Environment
This section describes the current nature and status of the environment in the vicinity of the Captain field.
4.3.1 Hydrology and Meteorology
4.3.1.1 Bathymetry
Depths across the 2021 survey area ranged from 89.2 m LAT to 124.1 m (Figure 4-2; Fugro, 2021a). Across the 2021 survey area topographic highs were evident within the site predominantly in the north and south of the survey area. Seabed spurs extended f rom these topographic highs. The tops of these spurs were associated with an increase in acoustic reflectivity, and within these areas numerous boulders were observed. The 2015 survey identified several large mounds around the Area D drill centre which are thought to be associated with outcropping sediments (Fugro, 2015a).
Figure 4-2: Bathymetry and environmental sampling stations across the 2021 survey area (Fugro, 2021a).

Captain EOR Stage 2 Phase II Environmental Statement
Section 4 Environmental Baseline
4-4
4.3.1.2 Water masses, currents and tides
Water masses, local current speeds and direction inf luence the transport, dispersion and ultimate fate of marine discharges, nutrients, plankton and larvae (OSPAR, 2010). The anti-clockwise movement of water through the North Sea and around the Central North Sea (CNS) region originates from the inf lux of Atlantic water, via the Fair Isle Channel and around the north of Shetland, and the main outflow northwards along the Norwegian coast (BEIS, 2016; Figure 4-3). Against this background of tidal flow, the direction of residual water movement in the CNS is generally to the southeast (DTI, 2001; BEIS, 2016). Offshore tidal current velocities in the region are between 0.01-1.0 m/s during mean spring tide (BEIS, 2016). The mean residual currents surrounding the Captain field are approximately 0.25-0.51 m/s (Wolf et al., 2016).
Figure 4-3: General circulation in the North Sea (Turrell, 1992).
4.3.1.3 Waves
Mean significant wave heights in the area are 1.9 m (Data Explorer, 2018) and as can be seen from Figure 4-4a around 50% of the waves in the area originate from a north and southeast direction and around 15% from a south / southwest direction (Data Explorer, 2018).

Captain EOR Stage 2 Phase II Environmental Statement
Section 4 Environmental Baseline
4-5
Figure 4-4: a) Wave rose and b) wind rose for the Captain area (Data Explorer, 2018).
4.3.1.1 Winds
Over the open CNS, wind direction varies considerably. Dominant directions range from southeast to northwest through southwest. North to northwest winds dominate in spring and summer (UKHO, 2013). Wind direction and speed directly influence the transport and dispersion of atmospheric emissions from an installation. These factors are also important for the dispersion of marine discharges, including oil releases, inf luencing the movement, direction and break up of substances on the sea surface. Mean wind speed in the area is 8.6 m/s and as can be seen f rom Figure 4-4b winds in the area originate from all directions though primarily from the northeast / east / southeast and south (Data Explorer, 2018).
4.3.1.2 Temperature and salinity
The temperature of the sea affects both the properties of the seawater and the fate of discharges and spills to the environment. Seawater temperatures vary with season, depth and proximity to land. The mean annual mean surface temperature in the area is approximately 9.5°C whilst the annual mean seabed temperature is approximately 8.5°C (Berx & Hughes, 2009).
Fluctuations in salinity are largely caused by the addition or removal of freshwater to or from seawater through natural processes such as rainfall and evaporation. Salinity in the area of the Captain field shows little variation with season and water depth. The annual mean surface and near bed salinity in the area is approximately 34.8‰ (Berx & Hughes, 2009).
4.3.2 Seabed Sediments
4.3.2.1 Sediment type
Seabed sediments comprising mineral and organic particles occur commonly in the form of mud, sand or gravel and are dispersed by processes driven by wind, tides and currents. The distribution of seabed sediments within the North Sea results from a combination of hydrographic conditions, bathymetry and sediment supply. The characteristics of the local sediments and the amount of sediment transport within a project area are important factors in determining the potential ef fects of possible developments (drill cuttings, installation of pipelines, anchor scouring) on the local seabed environment.
A modelled distribution of seabed sediments in the area of the Captain field is shown in Figure 4-5 (EMODnet, 2020). The data suggests that the main sediment types in Block 13/22 are of fshore circalittoral mud and of fshore circalittoral sand.

Captain EOR Stage 2 Phase II Environmental Statement
Section 4 Environmental Baseline
4-6
Figure 4-5: Modelled distribution of sediments in the CNS (EMODnet, 2020).
Data f rom surveys identified in Table 4-1 and Figure 4-1 showed the sediment characteristics to be indicative of a relatively homogenous sediment type across the survey area stations. The 2014, 2015, and 2021 surveys identified the main sediment type over the survey area as sandy mud/muddy sand, which is classified as the EUNIS biotope complex ‘Deep circalittoral mud’ (A5.37) (Fugro, 2014; Fugro, 2015a; and Fugro 2021a). Small, localised areas of high ref lectivity were also observed and interpreted to comprise sandy mud with pebbles, cobbles, and boulders and to be representative of ‘Deep circalittoral mixed sediments’ (A5.45) (Fugro, 2015a and Fugro, 2021a).
This classification was also supported by particle size distribution (PSD) analysis of the sediment collected f rom grab samples. For example the PSD analysis of the 2021 samples confirmed that all stations were dominated by the sand f raction (mean 64.47%) with lower proportions of mud and gravel (mean 35.51% and 0.01%, respectively). Table 4-2 summarises the hierarchy of the assigned EUNIS classifications, and equivalent JNCC (2015) classifications, based on the video and photographic data. Figure 4-6 shows seabed photographs from the different surveys. The associated habitats are discussed further in Section 4.4.2.
Table 4-2: Habitat classifications (Fugro, 2021a).
EUNIS (EEA, 2019) Habitat Classification Equivalent JNCC
(2015) Classification Environment Level
1
Broad Habitat Level
2
Habitat Level 3 Biotope Complex
Level 4
A
Marine
A5
Sublittoral sediment
A5.3
Sublittoral mud
A5.37
Deep circalittoral
mud
SS.SMu.Omu
Offshore circalittoral
mud
A5.4
Sublittoral mixed
sediments
A5.45
Deep circalittoral
mixed sediments
SS>SMx.OMx
Offshore circalittoral
mixed sediments
EUNIS = European Nature Information System

Captain EOR Stage 2 Phase II Environmental Statement
Section 4 Environmental Baseline
4-7
Figure 4-6: Example seabed photographs from the different surveys identified in Table 4-1

Captain EOR Stage 2 Phase II Environmental Statement
Section 4 Environmental Baseline
4-8
4.3.2.2 Sediment chemistry
Deep-water marine environments generally show relatively low levels of contamination compared to coastal waters and industrial estuaries.
Exposure of marine organisms to contaminants can occur either through uptake of dissolved fractions across the gills or skin, or direct ingestion of the pollutant. Organisms spending the majority of their lifecycle in the water column are likely to receive the highest exposure to contaminants that remain in solution, though some will also accumulate sediment-bound contaminants indirectly through their diet (i.e. digestion of animals that have accumulated the contaminants in their tissues). Organisms associated with the seabed (benthic organisms) are more exposed to particle-bound contaminants with the main exposure route being either directly through ingestion of contaminated sediments or through their diet. Benthic organisms can also absorb contaminants through the surface membranes as a result of contact with interstitial water.
Hydrocarbons
Across the samples collected as part of the 2015 survey the Total Hydrocarbon Content (THC) were generally low and consistently lower than the UKOOA regional mean (9.5 μg/g for the CNS) (Fugro, 2015a). The 2014 survey reported THC concentrations varied considerably across the survey area being low (1.1 μg/g to 5.6 μg/g) at the majority of stations. However at the stations closest to the WPP, THC were elevated and ranged f rom 4.1 μg/g to 694 μg/g. These higher concentrations were expected to be the result of previous drilling activities at the WPP (Fugro, 2015a).
The gas chromatographic profiles obtained from the sediments collected as part of the 2021 survey shared a common underlying hydrocarbon distribution typical of low-level weathered petroleum residues commonly found in CNS sediments (Fugro, 2021b). Total organic matter (TOM) and total organic carbon (TOC) content were low throughout the 2021 survey area, with mean values of 3.71% (RSD1 6%) and 0.50% (RSD 16%) respectively. The results indicated that the THC across the survey area were below the CNS mean background concentration. The mean THC value f rom this survey were comparable to the values obtained previously in the Captain f ield (outwith the WPP area) and the wider Outer Moray Firth region.
The reports associated with the 2021 survey concluded that there were no spatial trends in THC were apparent and the observed THC distribution is most likely a result of the natural heterogeneity of the sediment within the Captain survey area. Hence, THC levels sampled within the 2021 Captain survey area suggested that the concentrations recorded can be considered background and are unlikely to have a negative impact on the benthic community (Fugro, 2021b and Figure 4-7).
1 RSD = Relative Standard Deviation

Captain EOR Stage 2 Phase II Environmental Statement
Section 4 Environmental Baseline
4-9
Figure 4-7: Spatial distribution of THC values across the 2021 environmental survey samples (Fugro, 2021b).
Heavy/Trace metals
The 2015 survey reported higher concentrations of heavy metals in the deeper muddier sediments towards the east of the survey site, which was further evidenced by significant positive correlations between the majority of metals and both mud and depth. Aluminium levels in the 2015 samples were higher and more varied than those recorded during the 2014 survey, ref lecting the higher mud content in the 2015 survey area (Fugro, 2015b). When compared to UKOOA average value for the CNS, levels of copper and zinc were elevated at most of the 2015 sample sites, an observation that could not be explained through association with mud and organic matter content. The 2015 survey reported that all heavy and trace metals, except barium, showed a significant positive correlation (p-value<0.01) with depth, mud proportion, TOC and TOM. Only two stations f rom the 2015 survey showed elevated barium levels above UKOOA mean background levels and overall the 2015 results showed considerably lower barium concentrations than the 2014 survey (Fugro, 2015b).

Captain EOR Stage 2 Phase II Environmental Statement
Section 4 Environmental Baseline
4-10
Samples taken as part of the 2021 survey showed the mean concentrations of bioavailable metals reported across the survey area were comparable to previous surveys carried out in the Captain f ield, and the wider Outer Moray Firth (Fugro, 2021b). The mean concentrations of chromium, copper, iron, nickel, and zinc exceeded their CNS mean background concentration. All metals concentrations (aqua regia digest2) were below their respective effects range low (ERL) thresholds at all stations, suggesting that metals concentrations are of no obvious environmental concern.
4.4 Biological Environment
4.4.1 Plankton
Plankton are drifting organisms that inhabit the pelagic zone of a body of water and include single celled organisms such as bacteria as well as plants (phytoplankton) and animals (zooplankton). Phytoplankton are primary producers of organic matter in the marine environment and form the basis of marine ecosystem food chains. They are grazed upon by zooplankton and larger species such as fish, birds and cetaceans. Therefore, the distribution of plankton directly inf luences the movement and distribution of other marine species. Meroplankton includes the eggs, larvae and spores of non-planktonic species (fish, benthic invertebrates and algae).
The composition and abundance of plankton communities vary throughout the year and are inf luenced by several factors including depth, tidal mixing, temperature stratification, nutrient availability and the location of oceanographic fronts. Species distribution is directly influenced by temperature, salinity, water inf low and the presence of local benthic communities (Robinson, 1970; Colebrook, 1982).
Over the past 30 years, rising sea temperatures have been accompanied by a rise in the North Atlantic Oscillation Index (NAOI) (OSPAR, 2010). The NAOI is a measure of the pressure gradient between the relatively high subtropical surface pressure of the ‘Azores High’ and the relatively low surface pressure further north, the ‘Icelandic Low’. An increase in the NAOI tends to result in higher temperatures in northern Europe (Met Of f ice, 2019). The seasonal timing of phytoplankton and zooplankton production has altered in recent decades with some species present up to four to six weeks earlier than 20 years before. This directly affects their availability to predators such as fish (OSPAR, 2010).
Seasonal stratification also occurs as the water column is heated by solar radiation and wind and convection induced heat exchange. Stratification affects the vertical distribution of nutrients and has a major impact on the production and succession of phytoplankton. Phytoplankton blooms in spring are followed by depletion of nutrients and waning of phytoplankton in summer and autumn. Re-mixing of the water column and regeneration of nutrients occur during the winter. This cycle affects the structure of the food web throughout the year (Ruardij et al., 1998; Vidal et al., 2017).
The phytoplankton community in the area of the Captain field is dominated by the dinoflagellate genus Tripos (T. fusus, T. furca, T. lineatus), with diatoms such as Thalassiosira spp. and Chaetoceros spp. also abundant. Harmful Algal Blooms (HABs) observed in the region in recent years include the diatom Pseudo-nitzschia, a cause of amnesic shellf ish poisoning, and the dinoflagellate Alexandrium tamarense (BEIS, 2016). Zooplankton communities in the North Sea are dominated by copepods, such as Calanus spp. Acartia spp. and Metridia lucens, occurring during the summer peak period (Nielsen and Richardson, 1989).
4.4.2 Seabed Habitat and Benthic Communities
Bacteria, plants and animals living on or within the seabed sediments are collectively referred to as benthos. Species living on top of the sea f loor may be sessile (e.g. sea anemone) or f reely moving (e.g. starfish). Animals living within the sediment are termed infaunal (e.g. tubeworms and burrowing clams) while animals living on the surface are termed epifaunal (e.g. crabs, starfish). Semi-infaunal animals, including sea pens, lie partially buried in the sediment. The majority of marine benthic invertebrates exhibit a life cycle that includes a planktonic larval phase from which the bottom dwelling juvenile and adult phases recruit.
Benthic organisms display a variety of feeding methods. Suspension and filter feeders capture particles which are suspended in the water column (e.g. sea pens) or transported by the current (e.g. mussels). Deposit
2 Aqua regia microwave digestion is an acid mixture that allows a partial dissolution of metals, predominantly releasing those associated with fine sediments.

Captain EOR Stage 2 Phase II Environmental Statement
Section 4 Environmental Baseline
4-11
feeders (e.g. sea cucumbers) ingest sediment and digest the organic material contained within it. Other benthic species can be herbivorous (e.g. sea urchins), carnivorous (e.g. crabs) or omnivorous (e.g. starfish).
Sessile infaunal species are particularly vulnerable to external influences that may alter the physical, chemical or biological characteristics of the sediment as they are unable to avoid unfavourable conditions. Each species has its own response and degree of adaptability to changes in the physical and chemical environment. Consequently, the species composition and relative abundance in a particular location provide a ref lection of the immediate environment, both current and historical (Clark, 1996).
4.4.2.1 Seabed Habitats
To assess the habitats present across the field, detailed analysis of video and still photographic data collected across the three surveys referenced in Table 4-1, was undertaken noting the locations of any observed changes in sediment type and/or associated faunal community.
As described in Section 4.3.2.1 the main sediment type across the Captain f ield is sandy mud/muddy sand, classified as the EUNIS biotope complex ‘Deep circalittoral mud’ while small, localised areas of ‘Deep circalittoral mixed sediments’ also occur (Fugro, 2015a and Fugro, 2021a).
In Scotland, habitats and species of conservation interest, termed Priority Marine Features (PMFs), are protected through the designation of Nature Conservation Marine Protected Areas (NCMPAs) under the Marine and Coastal Access Act (2009) and the Marine (Scotland) Act (2010). These features incorporate habitats and species included on the Oslo and Paris Commission (OSPAR) List of threatened and/or declining species and habitats (OSPAR, 2008) and Priority Species and Habitats recognised under the UK Post-2010 Biodiversity Framework (UKBAP).
The ‘Deep circalittoral mud’ observed across the Captain field are considered to be representative of the PMF broad habitat ‘Burrowed mud’ and ‘Of fshore deep-sea muds’ and the priority habitat ‘Mud habitats in deep water’. It is recognised that these habitats are widely distributed within the North Sea.
Sea pen and burrowing megafauna communities
A full assessment was carried out to determine whether the OSPAR listed threatened and/or declining habitat ‘sea pen and burrowing megafauna communities’ habitat was present. The habitat is defined as plains of fine mud which are heavily bioturbated with burrowing megafauna. Burrows and mounds may form a prominent feature of the sediment surface with populations of sea pens, Virgularia mirabilis and Pennatula phosphorea.
For each survey, counts of sea pens and burrowing megafauna were converted to the superabundant, abundant, common, f requent, occasional, rare (SACFOR) abundance scale used by the Marine Nature Conservation Review and JNCC to semi-quantitatively record the abundance and density of marine benthic f lora and fauna (JNCC, 2015).
The JNCC (2014) habitat guidelines state that the seabed must be ‘heavily bioturbated by burrowing megafauna with burrows and mounds forming a prominent feature of the sediment surface’ (JNCC, 2014). Guidelines also state that burrows should be at least ‘f requent’ on the SACFOR scale to be classified as a ‘Sea pens and burrowing megafauna community’. Across the 2021 grab sample and transect locations, sea pen densities ranged f rom occasional to f requent, and burrow densities were considered to range from common to abundant; however, mounds were not recorded at any station (see Table 4-3: note the location of each of the samples can be seen in Figure 4-8) (Fugro, 2021a). Though mounds were not observed, sea pens and burrows were observed in suf ficient density to potentially comprise the habitat ‘sea pen and burrowing megafaunal communities’. Results from the earlier 2014 and 2015 surveys also indicated the presence of this habitat across the area (Fugro, 2014, and Fugro 2015a). Figure 4-9 shows sea pens and burrowing megafaunal at one of the 2021 sampling locations.

Captain EOR Stage 2 Phase II Environmental Statement
Section 4 Environmental Baseline
4-12
Table 4-3: SACFOR assessment for sea pens and burrowing megafauna across the 2021 sample and transect
locations (Fugro, 2021a).

Captain EOR Stage 2 Phase II Environmental Statement
Section 4 Environmental Baseline
4-13
Figure 4-8: Location of sampling stations listed in Table 4-3.
Figure 4-9: Sea pen and faunal burrows at a 2021 sampling station CAP-ST02 (Fugro 2021a).
Using criteria set out by Irving (2009) and ref ined by Golding et al. (2020), an area of cobbles and boulders was assessed to determine if they are representative of ‘stony reefs’ (Fugro, 2021a). This potential area of

Captain EOR Stage 2 Phase II Environmental Statement
Section 4 Environmental Baseline
4-14
stony reef was identified north east of the Area D drilling centre at transect location TR03 as shown in Figure 4-8. The composition of cobbles and boulders was classified as being of low resemblance to a stony reef. However, areas of denser cobbles and boulders were morphologically heterogeneous, and small sections of boulders and cobbles consistent with ‘medium reef ’ were observed in patches < 5 m in length. Either side of this, interspersed sections of soft sediment were observed that had composition representative of 'Not a reef'. Only one key reef species (Alcyonium digitatum) as described in Golding et al. (2020) was present across the assessed area. Authors of the survey report concluded that it is possible that the area represents an unstable stony reef.
No other Annex I habitats were identified.
4.4.2.2 Benthic Communities
Epibenthic fauna was observed to be relatively sparse across the Captain field area (Fugro, 2021b). The dominant epifauna observed were phosphorescent sea pens (Pennatula phosphorea), with sparse Virgularia sp.. Other taxa observed included a Norway lobster (Nephrops norvegicus), starfish (Asteroidea), possible brittlestars (Ophiuroidea), polychaetes (Oxydromus sp.), gastropods (Euspira catena, possible burrowing anemone (Ceriantharia), bivalve siphons (Bivalvia), a curled octopus Eledone cirrhosa) and faunal turf Hydrozoa/Bryozoa (Fugro, 2021b). At the start and end of transect TR03 (unstable stony reef area described above) were occasional scattered pebbles, cobbles or boulders were available for epibenthic attachment, taxa also included spoon worms (Echiura, Maxmuelleria sp.), possible anemone (Actiniaria), crab (Cancer pagurus), squat lobsters (Galatheoidea), possible brittlestars (Ophiuroidea), bryozoan crust (Bryozoa), hydroids (Hydrozoa, including Tubularia sp.) and Norway pout (Trisopterus esmarkii). This section likely represents a transitional area between mud habitats and coarser sediments (Fugro, 2021b).
Mixed sediment types usually comprise diverse epifaunal communities with a high number of infaunal polychaetes and bivalve species. The main infaunal species found in the area in terms of abundance were polychaetes broadly similar to those reported by Van Dalfsen (2007) and included Sosane wahrbergi, Galathowenia (Myriochele) oculata and Owenia fusiformis, together with A. catherinae, Spiophanes kroyeri, Paramphinome jeffreysii and D. glaucus (Fugro, 2014; 2015b). Across Area E, a very similar range of characterising species was also present, but the most abundant were S. wahrbergi, A. catherinae, and Prionospio dubia, together with D. glaucus and Prionospio cirrifera (Fugro, 2015b). The three dominant species recorded in the 2015 survey were P. dubia, P. jeffreysii and G. oculata (Fugro, 2015b).
Further benthic fauna associated with the mixed sediment habitat included starfish (Asteroidea, including Asterias rubens), cushion star (Hippasteria phrygiana), crab (Cancer pagurus), squat lobsters (Galatheoidea, including Munida sp.), soft coral (Alcyonium digitatum), sponges (Porifera), cup corals (Caryophyllia smithii), hydroids (Hydrozoa including Tubularia sp.), possible brittlestars (Ophiuroidea) and faunal turf (Hydrozoa/Bryozoa). Sea pens (Pennatula phosphorea), faunal tracks and burrows also occurred within in patches of soft sediment.
The dominant macrofaunal species in the surf icial 10 cm sediment layer of the area were the polychaetes Aricidea (Acmira) catherinae, Tharyx killariensis, Chaetozone setosa, Galathowenia oculata and Diplocirrus glaucus, whereas the polychaete Peresiella clymenoides was the most abundant species within the deeper (>10 cm) sediment layer (Van Dalfsen, 2007). In terms of visible fauna (i.e. a mix of larger epifaunal and infaunal forms observed in washed samples) around the Captain WPP, Van Dalfsen (2007) noted the burrowing brittle stars Amphiura spp., burrowing mud shrimps Callianassa spp., (mainly C. subterranea) burrowing sea cucumbers, burrowing sea urchins, various bivalve mollusc species as well as a number of polychaete tubes.
Sea pens, mostly the phosphorescent sea pen P. phosphorea, were observed over the majority of the survey area, including around the platforms in the Captain field, although their abundance was low (Fugro, 2015b and Fugro 2021b). The slender sea pen Virgularia mirabilis was also observed but in much lower numbers; this was only recorded on seabed video footage at seven stations and with only two individuals identified in the seabed photographs.
There was no evidence of Arctica islandica in the stills or video footage taken as part of the 2015 and 2021 surveys (Fugro, 2015b and Fugro, 2021b). However, the majority of grab samples taken across both surveys did have evidence of A. islandica shells. A. islandica is on the OSPAR List of threatened and/or declining species and habitats. In addition, within Scottish waters A. islandica is considered a PMF.

Captain EOR Stage 2 Phase II Environmental Statement
Section 4 Environmental Baseline
4-15
4.4.3 Finfish and Shellfish
More than 330 f ish species are thought to inhabit the shelf seas of the UKCS (BEIS, 2016). Pelagic species (e.g. herring (Clupea harengus), mackerel (Scomber scombrus), blue whiting (Micromesistius poutassou), and sprat (Sprattus sprattus) are found in mid-water and typically make extensive seasonal movements or migrations. Demersal species (e.g. cod (Gadus morhua), haddock (Melanogrammus aeglefinus), sandeels (Ammodytes marinus), sole (Solea solea) and whiting (Merlangius merlangus) live on or near the seabed and similar to pelagic species, many are known to passively move (e.g. drifting eggs and larvae) and / or actively migrate (e.g. juveniles and adults) between areas during their lifecycle.
Fish occupying areas near offshore oil and gas installations will be exposed to aqueous discharges and may accumulate hydrocarbons and other contaminating chemicals in their body tissues (Bakke et al., 2013). The most vulnerable stages of the life cycle of fish, to general disturbances such as disruption to sediments and oil pollution, are the egg and larval stages. Hence, recognition of spawning and nursery times and areas within a development region is important when considering potential disturbance caused by drilling and installation activities and when responding to accidental releases during operations.
The Captain f ield lies within International Council for the Exploration of the Sea (ICES) rectangle 45E8 and is a spawning and nursery ground for several commercially important species (Table 4-4 and Figure 4-10).
Table 4-4: Spawning grounds and nursery areas of some commercially and ecologically important fish species
in the Captain field area (Coull et al., 1998; Ellis et al., 2012; Aires et al., 2014).
Species Jan Feb Mar Apr May Jun Jul Aug Sep Oct Nov Dec
Anglerfish NJ NJ NJ NJ NJ NJ NJ NJ NJ NJ NJ NJ
Blue whiting N N N N N N N N N N N N
Cod SN S*N S*N SN N N N N N N N N
European hake NJ NJ NJ NJ NJ NJ NJ NJ NJ NJ NJ NJ
Haddock NJ NJ NJ NJ NJ NJ NJ NJ NJ NJ NJ NJ
Herring N N N N N N N SN SN N N N
Lemon sole N N N SN SN SN SN SN SN N N N
Ling N N N N N N N N N N N N
Mackerel (North
Sea) N N N N N N N N N N N N
Nephrops SN SN SN S*N S*N S*N SN SN SN SN SN SN
Norway Pout SN S*N S*N SN N N N N N N N N
Plaice S* S* S S
Sandeel SN SN N N N N N N N N SN SN
Spotted ray N N N N S*N S*N S*N N N N N N
Sprat N N N N S*N S*N SN SN N N N N
Spurdog N N N N N N N N N N N N
Whiting NJ SNJ SNJ SNJ SNJ SNJ NJ NJ NJ NJ NJ NJ
Key:
S = spawning S* = peak spawning (2) N = nursery J = juveniles (i.e. 0 group fish) (3)
Blue highlighting indicates high intensity nursery grounds (1)

Captain EOR Stage 2 Phase II Environmental Statement
Section 4 Environmental Baseline
4-16
Figure 4-10: Fish spawning and nursery areas in the proximity of the Captain project area (Coull et al.,1998; Ellis
et al., 2012).
Spawning and nursery areas tend to be transient and therefore cannot be def ined with absolute accuracy (Coull et al., 1998; Ellis et al., 2012). In addition, the mapped spawning areas represent the widest known

Captain EOR Stage 2 Phase II Environmental Statement
Section 4 Environmental Baseline
4-17
distribution given current knowledge and should not be seen as rigid unchanging descriptions of presence or absence (Coull et al., 1998).
ICES rectangle 45E8 is located in an area of high intensity nursery ground for both anglerfish (Lophius piscatorius) and whiting (Merlangius merlangus) (Ellis et al., 2012). González-Irusta and Wright (2016) reported that the Captain field is located in an “occasional” cod spawning area with seabed habitat preference for the species being strongly towards coarse sediments. As described in Section 4.3.2 the seabed at Captain is sandy mud/muddy sand, and therefore is considered an unfavourable habitat for cod spawning. Herring spawning areas defined by Coull et al (1998) overlap ICES rectangle 45E8 to the north and are located to the south in ICES rectangle 44E8, while a more recent study (Boyle and New, 2018) also demonstrate that herring spawning areas overlap with the Captain field.
Maps of the juvenile presence for each species identified in Aires et al., (2014) are shown in (Figure 4-11).
Figure 4-11: Fish juvenile presence in the proximity of Captain development area (Aires et al., 2014).
Whilst most species spawn into the water column of moving water masses over extensive areas, benthic spawners (e.g. herring, plaice and sandeel) have very specific habitat requirements, and therefore their spawning grounds are relatively limited and potentially vulnerable to seabed disturbance and change. Of the species identified above, herring, plaice, sandeel and Nephrops are among the species that may use the seabed for spawning in the area of the Captain f ield. Sandeels burrow at the seabed surface and so disturbance by means of increased siltation or surface abrasion can cause burrows to be inf illed thereby af fecting population density (Wright et al., 2000). Herring is also a demersal spawner and with the proposed operational period falling within the spawning period of this species they may be impacted.
Water depths at the Captain f ield range f rom 89.2 m LAT to 124.1 m LAT (see Section 4.3.1.1) and the sediment regime comprises approximately 30% f ine sediments. Sandeels prefer spawning substrate with a low clay silt fraction (<10%) in water depths between 20 and 100 m, and so they are unlikely to use the area for spawning. Plaice are unlikely to use the area as they prefer coastal/protected areas; therefore, they are unlikely to be found in great numbers at the offshore Captain location. Nephrops are likely to be present and due to the nature of the sediment, are likely to spawn in the area.

Captain EOR Stage 2 Phase II Environmental Statement
Section 4 Environmental Baseline
4-18
The following species present in ICES rectangle 45E8 are listed as Scottish PMFs: anglerfish (Lophius piscatorius), blue whiting (Micromesistius poutassou), cod (Gadus morhua), herring (Clupea harengus), ling (Molva molva), mackerel (Scomber scombrus), Norway pout (Trisopterus esmarkii), sandeels (several members of the family Ammodytes), spurdog (Squalus acanthias) and whiting (Merlangius merlangus) (Marine Scotland, 2022).
4.4.4 Marine Mammals
Marine mammals include pinnipeds (seals) and cetaceans (whales, dolphins and porpoises). Marine mammals are vulnerable to the direct ef fects of oil and gas activities such as noise, contaminants and oil spills. They may also be affected indirectly by activities that affect prey availability.
4.4.4.1 Pinnipeds
Two species of seals live and breed in the UK, namely the grey seal (Halichoerus grypus (Phoca vitulina). Both grey and harbour seals are listed under Annex II of the EU Habitats Directive and are considered PMFs in Scottish waters. Approximately 36% of the world’s grey seals breed in the UK (81% of these breed at colonies in Scotland with the main concentrations in the Outer Hebrides and in Orkney). Approximately 32% of harbour seals are found in the UK, however, this proportion has declined from approximately 40% in 2002. Harbour seals are widespread around the west coast of Scotland and throughout the Hebrides and Northern Isles (Special Committee on Seals, 2020). On the east coast, the distribution is more restricted with concentrations in the major estuaries, including the Moray Firth in Scotland.
Grey and harbour seals will feed both in inshore and offshore waters depending on the distribution of their prey, which changes both seasonally and yearly. Both species tend to be concentrated close to shore, particularly during the pupping and moulting season. Seal tracking studies from the Moray Firth have indicated that the foraging movements of harbour seals are generally restricted to within a 40–50 km range of their haul-out sites (Special Committee on Seals, 2020). The movements of grey seals can involve larger distances than those of the harbour seal and tracking of individual seals has shown that most foraging probably occurs within 100 km of a haul-out site although they can feed up to several hundred kilometres offshore (Special Committee on Seals, 2020).
Distribution maps based on telemetry data (1991 – 2016), count and effort data (scaled to the estimated population size in 2015) indicate that harbour seals are unlikely to occur in the vicinity of the Captain f ield though grey seals may be present at a density of 5-10 individuals per 5 km2 (SMRU and Marine Scotland, 2017) (Figure 4-12).

Captain EOR Stage 2 Phase II Environmental Statement
Section 4 Environmental Baseline
4-19
Figure 4-12: Harbour and grey seal distribution in relation to the Captain field (Russell et al., 2017).
4.4.4.2 Cetaceans
The CNS and Northern North Sea (NNS) have a moderate to high diversity and density of cetaceans, with a general trend of increasing diversity and abundance with increasing latitude. Harbour porpoise (Phocoena phocoena) and white-beaked dolphin (Lagenorhynchus albirostris) are the most widespread and f requently encountered species, occurring regularly throughout most of the year. Minke whales (Balaenoptera acutorostrata) are regularly recorded as frequent seasonal visitors. Coastal waters of the Moray Firth and the east coast of Scotland support an important population of bottlenose dolphins (Tursiops truncates), while killer whales (Orcinus orca) are sighted with increasing f requency towards the north of the area. Atlantic white-sided dolphin (Lagenorhynchus acutus), Risso’s dolphin (Grampus griseus) and long-f inned pilot whale (Globicephala melas) can be considered occasional visitors, particularly in the north of the area (BEIS, 2016).
Many activities associated with the offshore oil and gas industry have the potential to impact on cetaceans by causing physical injury, disturbance or changes in behaviour. Activities with the potential to cause disturbance or behavioural effects include: drilling, seismic surveys, vessel movements, construction work including piling and decommissioning.
The distribution of cetacean species in UK waters has been compiled by the JNCC in the Atlas of Cetacean Distribution in North-West European Waters (Reid et al., 2003), which gives an indication of the monthly occurrence of cetacean species in the Captain area. The data suggest that minke whale (Balaenoptera acutorostrata), long finned pilot whale (Globicephala melas), bottlenose dolphin (Tursiops truncatus), Atlantic white-sided dolphin (Lagenorhynchus acutus), white-beaked dolphin (Lagenorhynchus albirostris), harbour porpoise (Phocoena phocoena) and killer whale (Orcinus orca) occur in the CNS at moderate densities (Table 4-5), with white beaked dolphin the most common species.

Captain EOR Stage 2 Phase II Environmental Statement
Section 4 Environmental Baseline
4-20
Table 4-5: Marine mammal seasonal abundance in the vicinity of Captain (Reid et al., 2003).
SPECIES J F M A M J J A S O N D
Minke Whale1 3 3 3
Long Finned Pilot Whale 3
Killer Whale 3
Bottlenose Dolphin 3
White-beaked Dolphin1 3 2 3 2 1 2 3 1
Atlantic White-sided Dolphin1 2 3 3
Harbour Porpoise1 2 2 2 2 1 2 2 2 2
Key 1 = High 2 = Moderate 3 =Low Blank = No sightings
Source: 1: Reid et al., 2003.
A series of Small Cetacean Abundance in the North Sea (SCANS) surveys have been conducted to obtain an estimate of cetacean abundance in North Sea and adjacent waters, the most recent of which is SCANS-III (Hammond et al., 2017).
The Captain f ield is located within SCANS-III Block ‘T’. Aerial survey estimates of animal abundance and densities (animals per km2) within this area are provided in Table 4-6. The data confirm that some of those species identified by Reid et al., (2003), frequent Block T (Hammond et al., 2017).
Table 4-6: Cetacean Abundance in SCANS-III Survey Block T.
SCANS-III Block T Species Animal
Abundance1
Density
(animals/km2)1
Management
Units (MU)
Population2
Minke Whale 2,068 0.032 20,118
White-beaked
Dolphin 2,417 0.037 43,951
Atlantic white-
sided dolphin 1,366 0.021 18,128
Harbour
Porpoise 26,309 0.402 346,601
1 Hammond et al., (2017) 2 Inter-Agency Marine Mammal Working Group (IAMMWG) (2021)
4.4.5 Seabirds
The North Sea is an internationally important area for breeding and feeding seabirds. Using seabird density maps f rom European Seabirds at Sea (ESAS) data collected over 30 years, Table 4-7 identifies a number of the bird species (and their predicted maximum monthly abundance) known to occur in the Captain area (Kober et al., 2010). The data indicate that a number of seabird species are likely to occur in the area over the summer breeding season and winter months. For all species combined, up to 17 seabirds are predicted to occur per

Captain EOR Stage 2 Phase II Environmental Statement
Section 4 Environmental Baseline
4-21
km2 during the breeding season (April to October), whilst during the winter months (November to March) a maximum of 12 seabirds are predicted to occur per km2.
Table 4-7: Predicted seabird density (maximum number of individuals per km2) in the Captain project area
(Kober et al., 2010).
Species Season
Jan
Feb
Mar
Ap
r
May
Ju
n
Ju
l
Au
g
Sep
Oct
No
v
Dec
Northern Fulmar Breeding
Winter
Sooty Shearwater Summer
Manx Shearwater Additional
European Storm Petrel Breeding
Northern Gannet Breeding
Winter
Arctic Skua Breeding
Great Skua Breeding
Winter
Black Legged Kittiwake Breeding
Winter
Great black-backed gull Breeding
Winter
Leach’s storm petrel Breeding
Lesser black-backed
gull
Breeding
Winter
Herring Gull Breeding
Winter
Glaucous gull Winter
Common Guillemot
Breeding
Additional
Winter
Razorbill
Breeding
Additional
Winter
Little Auk Winter
Atlantic Puffin Breeding
Winter
ALL species
combined
Breeding
Summer
Winter
Key Not recorded ≤1.0 1.0 – 5.0 5.0 – 10.0 10.0 - 20.0 >20.0

Captain EOR Stage 2 Phase II Environmental Statement
Section 4 Environmental Baseline
4-22
Seabirds are generally not at risk from routine offshore oil and gas production operations. However, they may be vulnerable to pollution f rom less regular of fshore activities such as well testing and f laring, when hydrocarbon dropout to the sea surface can occasionally occur, or from unplanned events such as accidental hydrocarbon spills.
The Seabird Oil Sensitivity Index (SOSI) identifies areas where seabirds are likely to be most sensitive to oil pollution by considering factors that make a species more or less sensitive to oil-related impacts. The index combines the seabird survey data with individual seabird species sensitivity index values. These values are based on a number of factors which are considered to contribute towards the sensitivity of seabirds to oil pollution, and include:
• habitat flexibility (the ability of a species to locate to alternative feeding grounds);
• adult survival rate;
• potential annual productivity; and
• the proportion of the biogeographical population in the UK (classified following the methods developed by Certain et al., (2015).
The combined seabird data and species sensitivity index values are summed at each location to create a single measure of seabird sensitivity to oil pollution. The mean sensitivity SOSI data for the area is shown in Table 4-8. For blocks with ‘no data’, an indirect assessment has been made (where possible) using JNCC guidance (JNCC, 2017). The sensitivity of birds to surface oil pollution in the Captain f ield area is generally medium throughout the year. Exceptions are February and December when it is regarded as Extremely High and Very High respectively.
Table 4-8: SOSI data (and indirect assessment) for Block 13/22 (including adjacent Blocks; JNCC, 2017).
Block Jan Feb Mar Apr May Jun Jul Aug Sep Oct Nov Dec
13/16 5 5 5 3* 3 3 4 5 3 3* 5* 5
13/17 5 5 5 3* 3 3 5 5 3 3* 5 5
13/18 5 5 5 3* 3 3 5 5 4 4* 5 5*
13/21 5 1 5 5* 5 3 4 5 4 2* 2 1
13/22 5 1 5 3* 3 3 5 5 4 4* 5 2
13/23 5 1 5 4* 4 3 5 5 4 4* 5 3
13/26 5 3 5 1 1* 1 4 5 4 2* 2 1
13/27 5 1 5 1 5 2 4 5 4 2* 2 2
13/28 5 1 5 5* 4* 4 4 5 4 3 2 2
Key 1 Extremely High 2 Very High 3 High 4 Medium 5 Low
Indirect Assessment – data gaps have been populated following guidance provided by the JNCC (JNCC, 2017).
* Data gap filled using data from the same Block in adjacent months.

Captain EOR Stage 2 Phase II Environmental Statement
Section 4 Environmental Baseline
4-23
4.5 Conservation
4.5.1 Designated Sites
A network of Marine Protected Areas (MPAs) are in place to aid the protection of vulnerable and endangered species and habitats through structured legislation and policies. These sites include Special areas of Conservation (SACs) and Special Protection Areas (SPAs), which were designated in the UK under the EU Nature Directives (prior to January 2021) and are now maintained and designated under the Habitats Regulations for England and Wales, Scotland and Northern Ireland. Amendments to the Habitats Regulations mean that the requirements of the EU Nature Directives continue to apply to how European sites (SACs and SPAs) are designated and protected. The Habitats Regulations also provide a legal f ramework for species requiring strict protection, e.g. EPS. Nature Conservation Marine Protected Areas (NCMPAs) are designated under the Marine (Scotland) Act 2010 and the Marine and Coastal Access Act 2009.
The closest area of conservation interest is the Southern Trench NCMPA, which lies approximately 47 km to the south (Figure 4-13). The site is designated for protection due to the presence of a variety of biodiversity and geological features, including, shelf deeps, fronts, burrowed mud, minke whale, sub-glacial tunnel valleys and moraines and slide scars from submarine mass movement (NatureScot, 2022). As discussed in Section 4.4.4, minke whale have been observed in the vicinity of the Captain field. Similarly, the waters surrounding the Captain f ield are important nursery grounds for various fish species (Section 4.4.3). The Southern Trench also acts as a nursery for juvenile fish, contains megafauna commonly found in mud and attracts the prey of minke whale – herring, cod and mackerel (JNCC, 2012).
Figure 4-13: Protected sites in the vicinity of the Captain field.

Captain EOR Stage 2 Phase II Environmental Statement
Section 4 Environmental Baseline
4-24
4.5.2 Designated Species and Habitats
Four Annex II species occur in UK waters, harbour seals, grey seals, bottlenose dolphin and harbour porpoise3. As discussed in Section 4.4.4, harbour seals are unlikely to occur in the project area whilst grey seals have been recorded at a density of 5-10 individuals per 5 km2. There is a resident population of bottlenose dolphins in the Moray Firth and despite their transient nature they tend to remain in coastal waters away f rom the Captain area (though they have been recorded in low numbers in January), whilst harbour porpoise have been recorded at moderate to high densities throughout the year (Table 4-5).
Under the Habitats Directive, all cetaceans recorded within the Captain area (Table 4-5) are listed as Annex IV European Protected Species (EPS)4. They are also identified as being of conservation importance in Scotland and are therefore considered to be PMFs.
The following fish species are also listed as PMF; anglerfish, blue whiting, cod, herring, ling, mackerel, Norway pout, sandeels, spurdog (also known as spiny dogfish) and whiting (Marine Scotland, 2022). Cod are also listed on the OSPAR List of Threatened and/or Declining Species (OSPAR, 2008).
As described in Section 4.4.2 the sediment in the area are representative of the PMF broad habitat ‘Burrowed mud’ and ‘Offshore deep-sea muds’ and the priority habitat ‘Mud habitats in deep water and the Annex II habitat ‘sea pens and burrowing megafauna’.
4.5.3 National Marine Plan
The NMP covers the management of both Scottish inshore waters (out to 12 nautical miles) and offshore waters (12 to 200 nautical miles). The aim of the NMP is to help ensure the sustainable development of the marine area through informing and guiding regulation, management, use and protection of the Marine Plan areas. The NMP principals are identified in Appendix A (Table A-1) along with an assessment of compliance against relevant policies through the impact assessment in Section 5.
4.6 Socio-Economic Environment
This section describes the socio-economic activities in the vicinity of the Captain field, which primarily include f ishing, shipping and oil and gas operations.
4.6.1 Commercial Fisheries
The Captain f ield occurs within ICES rectangle 45E8. (Marine Scotland, 2021). Fishing effort statistical data for 2016 to 2020 (Table 4-9) shows that UK fishing effort within this rectangle varies both monthly and annually with f ishing occurring at all times of the year. ICES rectangle 45E8 contributed, on average, 0.7% of the total number of days fished by UK fishing vessels between 2016 and 2020 (Marine Scotland, 2021) suggesting that 45E8 is of low to moderate importance to the UK fishing industry (Table 4-9 and Figure 4-14).
3 Annex II species are species of community interest whose conservation requires the designation of special areas of
conservation. 4 EPS species have full protection under The Conservation of Habitats and Species Regulations 2017. It is an offence to deliberately capture, injure or kill or deliberately disturb an EPS.

Captain EOR Stage 2 Phase II Environmental Statement
Section 4 Environmental Baseline
4-25
Table 4-9: Fishing effort (days) taken from ICES rectangle 45E8 (2016-2020) (Marine Scotland, 2021).
Year Monthly Fishing Effort (days)
Total UK Total 45E8 as
% of UK J F M A M J J A S O N D
2016 60 74 20 101 94 205 59 132 65 46 54 47 958 131,590 0.7
2017 88 26 43 68 33 159 81 30 24 51 51 49 703 125,831 0.6
2018 44 40 55 101 21 46 73 103 35 91 126 107 843 124,844 0.7
2019 73 34 42 21 150 108 66 22 31 71 81 98 797 126,353 0.6
2020 75 77 70 14 52 68 54 45 74 75 107 68 779 103,918 0.7
Mean 60 74 20 101 94 205 59 132 65 46 54 47 816 122,507 0.7
Notes:
Monthly effort data are shown where five or more UK vessels over 10 m undertook fishing activity in a given year.
The fishing effort data includes the time spent travelling to fishing grounds as well as the time spent fishing.
Figure 4-14: Fishing effort (days) (2016-2020) (Marine Scotland, 2021).

Captain EOR Stage 2 Phase II Environmental Statement
Section 4 Environmental Baseline
4-26
The annual weight (te) of landings for fish and shellfish in ICES rectangle 45E8 and the surrounding rectangles for the years 2016-2020 is shown in Figure 4-15. Demersal species made up the majority of the catch (by value and weight) in this area (Marine Scotland, 2021).
Figure 4-15: Landings (te) in 44F1 between 2016 and 2020 for demersal, pelagic, and shellfish catches (Marine
Scotland, 2021).
The weight (te) and value (£) of landings f rom UK vessels for demersal, pelagic and shellfish species from ICES rectangle 45E8 are shown in Table 4-10. These landings equate to 1.5% (by weight) and 1.4% (by value) of total UK reported landings in 2020, also suggesting that this area is of high importance to the UK f ishing industry. In addition, it demonstrates that bottom trawl gear is used emphasising the importance of ensuring a safe seabed as part of the proposed project.
Table 4-10: Landings (by species type) from ICES rectangle 45E8 (2020) (Marine Scotland, 2021).
Species
Type
Weight (te) Value (£)
UK Total 45E8 % of UK UK Total 45E8 % of UK
Demersal 115,898 1,465 1.3 184,520,801 2,051,407 1.1
Pelagic 329,965 0 0.0 283,309,285 460 0.0
Shellfish 72,518 191 0.3 176,825,552 448,575 0.3
Total 518,381 1,656 1.5 644,655,638 2,500,442 1.4
4.6.2 Shipping Activities
The North Sea contains some of the world’s busiest shipping routes, with significant traffic generated by vessels trading between ports at either side of the North Sea and the Baltic. North Sea oil and gas f ields

Captain EOR Stage 2 Phase II Environmental Statement
Section 4 Environmental Baseline
4-27
generate moderate vessel traf f ic in the form of support vessels, principally operating f rom Peterhead, Aberdeen, Montrose and Dundee in the north and Great Yarmouth and Lowestoft in the south (BEIS, 2016).
Shipping density for the Captain field (Block 13/22) has been classed a low by the Oil and Gas Authority (2016; Figure 4-16). The shipping density corresponds to an average of six vessels per day. The closest route passes 3.1 nautical miles to the east and, is used primarily by cargo vessels travelling to and from Faroe Islands and Humber ports (Anatec, 2015).
Figure 4-16: Shipping density as categorised by OGA (OGA, 2016).
4.6.3 Surrounding Oil and Gas Infrastructure
The Captain Development lies west of a relatively mature oil and gas area (Figure 4-17). The only surface installation with 40 km of the drilling location is the Ross FPSO located c. 27 km southeast of the proposed drilling location.

Captain EOR Stage 2 Phase II Environmental Statement
Section 4 Environmental Baseline
4-28
Figure 4-17: Nearby oil and gas infrastructure.
4.6.4 Military Activity
The Captain development is not located within any military practice and exercise areas (PEXA), nor are there any Ministry of Defence (MoD) related block restraints on Block 13/22. The nearest MoD practice and exercise area is c. 6 km to the west of the Captain platforms (Figure 4-18). At this distance the proposed drilling activities are not expected to be a concern for the MoD.

Captain EOR Stage 2 Phase II Environmental Statement
Section 4 Environmental Baseline
4-29
Figure 4-18: Proximity to MoD sites and wrecks.
4.6.5 Submarine Cables
According to the NMPi there are no aggregate extraction areas or subsea telecommunication cables within the vicinity of Block 13/22. The closest active cable to the Captain Development area is the KIS-ORCA cable (Caithness High Voltage Direct Current power cable), located ca. 44 km f rom the Block 13/22 (Scottish Government NMPI, 2022).
4.6.6 Offshore Wind farms
Block 13/22 intersects with the proposed NE6 one of the Scotwind programme proposed windfarm sites (NE6) however the proposed project location is 10 km northeast of the area (Figure 4-19). At this distance the proposed project activities will not impact on the NE6 floating wind farm project.

Captain EOR Stage 2 Phase II Environmental Statement
Section 4 Environmental Baseline
4-30
Figure 4-19: Location of the Captain field in relation to Scotwind sites and INTOG areas.
4.6.7 Wrecks
As shown in Figure 4-18 the closest wreck to the proposed project location is c. 0.9 km northeast of the well location and therefore will not be impacted by the mooring system.
4.6.8 Aquaculture and Shellfish Water Protection Areas
As can be seen in Figure 4-20 there are no aquaculture sites or shellfish protected areas within the immediate vicinity of the Captain f ield. The closest aquaculture sites and shellfish protected areas are the Dornoch Firth and Cromarty Bay, c. 142 km and 154 km respectively (Scottish Government NMPi, 2022).

Captain EOR Stage 2 Phase II Environmental Statement
Section 4 Environmental Baseline
4-31
Figure 4-20: Location of aquaculture and shellfish water protection areas.

Captain EOR Stage 2 Phase II Project Environmental Statement
Section 5 Environmental Impact Assessment Methodology
5-1
5. ENVIRONMENTAL IMPACT ASSESSMENT METHODOLOGY
5.1 Introduction
This section presents the Environmental and Socio -Economic Impact Assessment (ESIA) and the Environmental and Socio-Economic Risk Assessment (ESRA) matrices used to determine the impact of the planned and unplanned activities (respectively) associated with the Captain EOR Stage 2 Phase II project.
5.2 Receptors and Aspects
5.2.1 Environmental and Socio-Economic Receptors
Receptors considered in the ESIA and ESRA include:
Environmental receptors:
• Resource availability;
• Air quality;
• Water quality;
• Sediment quality;
• Plankton;
• Benthic communities (including
f lora and fauna);
• Fish;
• Marine mammals;
• Seabirds;
• Designated areas.
Socio-economic receptors:
• Landf ill resources;
• Fisheries;
• Shipping.
5.2.2 Identification of Aspects
Aspects considered include:
• Energy use and emissions to air;
• Physical presence of vessels and drilling
rig;
• Physical presence of inf rastructure installed;
• Discharges to sea;
• Disturbance to the seabed;
• Underwater noise;
• Waste generation;
• Resource use; and
• Unplanned events.
The aspects associated with each activity were assessed in terms of their impact on the receptors in the area. For example, the use of vessels will result in emissions to air, discharges to sea, underwater noise, physical use of space and, if anchored, disturbance to the seabed. Receptors potentially impacted by these aspects include air quality, marine mammals, seabirds, other users of the sea, seabed sediments and benthic communities (if anchored).

Captain EOR Stage 2 Phase II Project Environmental Statement
Section 5 Environmental Impact Assessment Methodology
5-2
5.3 ESIA for Planned Activities
The signif icance of the environmental/socio-economic impact of planned activities on each of the susceptible receptors is derived by considering the ‘Receptor Sensitivity’ in relation to the ‘Magni tude of Effect’ of the aspect.
5.3.1 Receptor Sensitivity
Four categories of Receptor Sensitivity are applied ranging from ‘Low’ to ‘Very High’ as shown in Table 5-1.
Table 5-1 Receptor Sensitivity to a planned activity and an unplanned event.
Category Environmental / Societal Definition
(a) Low
Flora/Fauna/Habitats - within the impacted area:
• Population sizes are considered to be of little to no geographical importance.
• Species do not have designated conservation status and are of IUCN ‘Least Concern’.
• No designated habitat/sites.
• Impacted species are widespread in the North East Atlantic region.
Air quality: Emissions may impact on other nearby installations.
Water quality: Open offshore water body.
Cultural heritage sites: Site integrity is already compromised.
Resource availability: (e.g. landfill sites, diesel use) Renewable and/or abundant.
Third party users: have capacity to absorb change without impact.
(b) Medium
Flora/Fauna/Habitats – within the impacted area:
• Significant numbers of at least one receptor of national importance (e.g. PMFs).
• Significant numbers of a species which is listed as IUCN1 ‘Near Threatened’.
• Nationally designated habitat/sites (e.g. PMFs).
• Species may be of regional value.
Air quality: Populated areas nearby.
Water quality: Semi-enclosed water body with good flushing.
Cultural heritage sites: Site is of local heritage importance.
Resource availability: (e.g. landfill sites, diesel use) Renewable and/or available.
Third party users: have capacity to absorb change without significant impact.
(c) High
Flora/Fauna/Habitats – within the impacted area:
• Significant numbers of at least one receptor of regional (European) importance (e.g.
Annex II / IV species and OSPAR designations).
• Significant numbers of a species which are listed as IUCN ‘Vulnerable’.
• Regionally designated habitats/sites (e.g. OSPAR designations and Annex I habitats:
SACs and SPAs).
• Locally distinct sub-populations of some species may occur.
Air quality: Densely populated areas nearby.
Water quality: Semi-enclosed water body with limited flushing.
Cultural heritage sites: Site is of regional heritage importance.
Resource availability: (e.g. landfill sites, diesel use) Not renewable and/or limited
availability.
Third party users: have low capacity to absorb change and significant impact is likely to
occur.
1 International Union for Conservation of Nature

Captain EOR Stage 2 Phase II Project Environmental Statement
Section 5 Environmental Impact Assessment Methodology
5-3
Category Environmental / Societal Definition
(d) Very
High
Flora/Fauna/Habitat – within the impacted area:
• Significant numbers of at least one receptor of international importance.
• Significant numbers of a species which are listed as IUCN ‘Endangered’ or ‘Critically
Endangered’.
• Internationally designated habitats/sites (e.g. Ramsar sites).
• At least one receptor is endemic (unique) to the area.
Air quality: Very densely populated area with sensitive receptors such as schools and
hospitals.
Water quality: Enclosed water body with no flushing.
Cultural heritage sites: Site is of international heritage importance.
Resource availability: (e.g. landfill sites, diesel use) Not renewable and/or scarce availability.
Third party users: have no capacity to absorb change e.g. unemployment due to long term
closure of fisheries.
5.3.2 Climate Change
With respect to the emission of greenhouse gases, climate is considered a global receptor rather than a local receptor. The categories identified in Table 5-1 do not capture definitions for climate change. This is because the sensitivity status of climate is considered to be ‘Very High’ in line with the 2021 Climate Change Report produced by the Intergovernmental Panel on Climate Change (IPCC, 2021).
5.3.3 Magnitude of Effect
Def initions for the Magnitude of Effect on the receptors are presented in Table 5-2. Prior to determining the Magnitude of Effect, industry recognised ‘base case’ mitigation measures were assumed to be applied. For example, only MARPOL compliant vessels will be used. These industry recognised mitigations are considered prior to identifying the residual impact.
Table 5-2 Magnitude of Effect.
Magnitude Level
Description
Environmental Impact Socio-economic Impact
0
Positive/No
effect
Regulatory
compliance or
Company goals
are not a
concern.
No environmental concerns
• Positive environmental impact e.g. retaining a 500 m safety zone resulting
in a ‘protected area’.
• No significantly negative environmental
effects.
No public concerns
• Possible enhancement in the availability of a resource benefitting the persons utilising the area
e.g. removal of 500 m safety zones results in
return of access to fishing grounds.
• No impacts on sites or features of cultural heritage.
• No impact on resource or landfill availability.
1
Negligible
Regulatory
compliance or
Company goals
are not
breached.
Negligible environmental effects
• Any effects are unlikely to be discernible
or measurable and will reverse
naturally.
• No beaching or transboundary impacts.
Limited local public awareness and no concerns
• An intermittent short-term decrease in the
availability of a resource which is unlikely to be
noticed e.g. vessels working out-with existing
500 m safety zones could temporarily impact on a
shipping route or fishing area.
• Undiscernible changes to a site or feature of
cultural heritage that do not affect key
characteristics and are not above background changes.
• Undiscernible use of a resource (e.g. diesel, rock
cover or landfill).

Captain EOR Stage 2 Phase II Project Environmental Statement
Section 5 Environmental Impact Assessment Methodology
5-4
Magnitude Level
Description
Environmental Impact Socio-economic Impact
2
Minor
Regulatory
compliance is
not breached.
Minor, localised, short term, reversible
effect
• Any change to the receptor is
considered low, would be barely
detectable and at same scale as
existing variability.
• Recover naturally with no Company
intervention required.
• No beaching or transboundary impacts.
Some local public awareness and concern
• A temporary (<1 year) decrease in the availability
or quality of a resource e.g. access to fishing grounds may temporarily be inhibited due to
presence of vessels.
• Minor changes to a site or feature of cultural
heritage that do not affect key characteristics.
• Minor use of a resource (e.g. diesel, rock cover
or landfill).
3
Serious
Possible minor
breach of
regulatory
compliance.
Detectable environmental effect within
the project area
• Medium localised changes to the
receptor are possible.
• Localised Company response may be
required.
• No beaching or transboundary
impacts.
Regional / local concerns at the community or
stakeholder level which could lead to complaints
• Medium decrease in the short-term (1-2 years)
availability or quality of a resource affecting usage
e.g. bring a rig on site for 1-2 years.
• Nuisance impacts e.g. marine growth odour coming from yards.
• Partial loss of a site or feature of cultural heritage.
• Moderate use of a resource (e.g. diesel, rock
cover or landfill).
4
Major effect
Possible major
breach of
regulatory
compliance.
Severe environmental damage extending
beyond the project area
• High, widespread mid-term (2-5 years)
degradation of the receptor.
• Company response (with Corporate
support) required to restore the
environment.
• Possible beaching and / or
transboundary impacts.
National stakeholder concerns leading to
campaigns affecting the Company’s reputation
• High mid-term (2-5 year) decrease in the
availability or quality of a resource affecting usage
e.g. closure of fishing grounds.
• Substantial loss or damage to a site or feature of
cultural heritage.
• High use of a resource (e.g. diesel, rock cover or
landfill).
5
Critical effect
Major breach of
regulatory
compliance
resulting in
project delays
and
prosecution.
Persistent severe environmental damage
• Very high, widespread long-term (>5
years) degradation to the receptor that
cannot be readily rectified.
• Major impact on the conservation
objectives of internationally/nationally
protected sites.
• Full Corporate response required.
• Major beaching and/or transboundary
impacts.
International public concern and media interest
affecting the Company’s reputation
• Very high decrease in availability of a resource and
potentially livelihood of users for > 5 years e.g.
hydrocarbons on beaches affecting tourism or
tainting of fish resulting in the long-term closure of
fishing grounds.
• Total loss of a site or feature of cultural heritage.
• Significant use of a resource (e.g. diesel, rock
cover or landfill).

Captain EOR Stage 2 Phase II Project Environmental Statement
Section 5 Environmental Impact Assessment Methodology
5-5
5.3.4 Cumulative Impacts
The EIA sets the activities and potential impacts in the context of all other activities taking place in the Captain Field area to determine the additional cumulative effects of the new activities. The potential cumulative effects are discussed in the impact assessment chapters.
5.3.5 Environmental / Socio-Economic Impact Significance
The ‘Receptor Sensitivity’ and the ‘Magnitude of Effect’ were combined using the matrix presented in Table 5-3 to determine the level of impact for planned activities.
Table 5-3: Impact significance matrix.
Receptor Sensitivity
(a) Low (b) Medium (c) High (d) Very High
Mag
nit
ud
e o
f E
ffect (0) Positive/No Effect
(1) Negligible
(2) Minor
(3) Serious
(4) Major
(5) Critical
Definition of categories of risk significance
(i) Positive / No
Effect significance
• Positive or no environmental or socio-economic impact
• No public interest or positive public support
(ii) Low
significance
• No/negligible environmental and socio-economic impact
• No concerns from consultees
(iii) Moderate
significance
• Discernible environmental and socio-economic impacts
• Requirements to identify project specific mitigation measures
• Concerns by consultees which can be adequately addressed by the Company
(iv) High
significance
• Substantial environmental and socio-economic impacts
• Serious concerns by consultees requiring Corporate support
• Alternative approaches should be identified
5.3.6 Transboundary Impacts
Where relevant, transboundary impacts of each aspect on the receptors is discussed in the impact
assessment chapters e.g. the impact of emissions on climate change.
5.4 ESRA for Unplanned Events
To determine the environmental and socio-economic risk of an unplanned event (e.g. dropped object or well
blowout), the following approach considers f irstly the significance of the environmental or socio-economic
impacts of an event should it occur and secondly the likelihood of the event occurring.
5.4.1 Environmental and Socio-economic Significance of an Unplanned Event
The ESIA approach described in Section 5.3 for determining the environmental and socio-economic impacts
of planned activities was also used to determine the significance of impacts that may result from unplanned
events.

Captain EOR Stage 2 Phase II Project Environmental Statement
Section 5 Environmental Impact Assessment Methodology
5-6
5.4.2 Likelihood of an Unplanned Event
Five categories of ‘likelihood’ have been identified as presented in Table 5-4.
Table 5-4: Likelihood of an unplanned event.
Likelihood Category Definition
Extremely Remote Has never occurred within industry or similar industry but theoretically possible.
Remote Similar event has occurred elsewhere but unlikely to occur with current practices.
Unlikely Event has occurred in the industry during similar activities
Possible Event could occur during project activities.
Likely Event is likely to occur more than once during the project.
5.4.3 Environmental Risk of an Unplanned Event
Combining the significance of the environmental/socio-economic impact with the ‘likelihood of the unplanned
event occurring’ allows the level of environmental risk to be determined using the matrix presented in Table
5-5. Note the potential for a beneficial impact significance has been removed as it is not expected that an
unplanned event would lead to a beneficial environmental or socio-economic impact.
Table 5-5: ESRA matrix for unplanned activities.
Environmental Significance of Unplanned Event*
(ii) Low (iii) Moderate (iv) High
Lik
elih
oo
d o
f E
ven
t
Extremely Remote Low Low Low
Remote Low Low Medium
Unlikely Low Medium Medium
Possible Low Medium High
Likely Low High High
*Note the numbers associated with each significance level range from (ii) to (iv) in keeping with
assignment in Table 5-3.
Low risk • Negligible environmental and socio-economic risks.
• Mitigation measures are industry standard and no project specific
mitigation required.
• No consultee concerns.
Medium risk • Discernible environmental and socio-economic risks.
• Consultee concerns can be adequately resolved.
• Local public interest.
High risk • Significant environmental and socio-economic risks.
• Serious consultee concerns.
• Media interest and reputational impacts.

Captain EOR Stage 2 Phase II Project Environmental Statement
Section 5 Environmental Impact Assessment Methodology
5-7
5.5 Assessment of Significance of Environmental and Socio-Economic
Risks
Using the information provided in Sections 3 and 4 and the criteria set out above, Appendix B (ENVID table)
identifies all activities associated with the proposed project and their potential environmental risk.
The ENVID table is split into five nodes:
• Vessel Use;
• Drilling Phase;
• Subsea Installation Phase;
• Topside Modifications;
• Production Phase.
The assessment showed that with the application of industry standard mitigation measures the majority of
the planned activities are expected to have a low environmental/socio-economic significance of impact.
Exceptions include:
• The impact of atmospheric emissions from different activities were identified as potentially having a
Moderate impact significance on climate change.
• Disturbance to the seabed associated with the jet trenching of the six polymer injection flowlines and
the two umbilicals. The impact of this disturbance was also identified as potentially having a
Moderate impact significance.
Sections 6 – 11 further assess the impacts of the aspects/activities that:
• Are subject to regulatory control; • Were found to have a moderate significance impact (for planned events) or a Medium environmental
risk (in the event of accidental events); • Were raised during the consultation phase; or
• Were identif ied as areas of public concern.
Section 12 presents the results of modelling carried out to determine the impact of a major hydrocarbon loss.

Captain EOR Stage 2 Phase II Project Environmental Statement
Section 6 Physical Presence
6-1
6. PHYSICAL PRESENCE
This section discusses the potential impacts associated with:
• the presence of the vessels and drilling rig during the proposed drilling, installation, commissioning and production activities; and
• the permanent presence of the new subsea infrastructure and associated stabilisations,
on other sea users and animals (other than the benthic species) using the impact assessment methodology
presented in Section 5. The impacts on the seabed and the local benthic communities are discussed in
Section 9 ‘Seabed Disturbance’.
6.1 Presence of Vessels and the Drilling Rig
Vessels associated with the drilling, installation (and commissioning) and production phases of the proposed
project are summarised in Table 3-8, Table 3-11, Table 7-7 and Table 7-8.
It is expected the COSLPioneer semi-submersible drilling rig will be on site for around 395 days. Anchor
vessels will be required before the drilling rig is set down at each drilling location whilst an EERV, and supply
vessel will be required throughout the drilling campaign.
The subsea installation and associated pipeline commissioning activities are anticipated to require around
169 vessel days as detailed in Table 3-11. Installation and commissioning activities will require a CSV, a jet
trenching vessel, a DSV, a guard vessel and possibly a rock dumping vessel. Some activities will require
more than one vessel on site at any one time e.g. the guard vessel will be on site whilst the CSV and jet
trenching vessels are present.
Increased production, as a result of the Captain EOR Stage 2 Phase II Project, is not anticipated to require
an increase in the f requency of supply vessels, ERRV vessels o r helicopters serving the Captain f ield.
However, there will be an increase in shuttle tanker offloads (i.e. offload of oil from the FPSO to the shuttle
tanker) and polymer supply vessel transits (see Tables 7-7 and 7-8). Shuttle tanker of floads will increase
f rom c. 20 per year to up to 31 per year in 2026. After 2026, the number of offloads will decrease such that
in 2030 it is estimated to be 10 of floads/year and in 2034 it is estimated to be 3 of floads/year. Following
commencement of polymer injection at the six new injection wells (in 2024), polymer supply vessel transits
will increase f rom one to two per week. It will remain at two per week until 2029 af ter which time it will drop
back to one transit per week.
The physical presence of the drilling rig and the vessels at the Captain f ield could result in navigational
hazards and a restriction to fishing operations. Lighting associated with the drilling rig and vessels may
results in disturbance to birds whilst vessel noise may disturb marine mammals.
6.1.1 Impact of Vessels and Drilling Rig on Other Sea Users
When compared to shipping levels throughout the North Sea, shipping levels in the area of the Captain field
are considered low (see Section 4.6.2). The Captain f ield is located within ICES rectangle 45E8. The
information presented in Section 4.6.1 suggests that fishing effort within this rectangle is high when compared
to other ICES rectangles across the UKCS.
To minimise navigation hazards, all vessels engaged in the project operations will have markings and
lightings as per the International Regulations for the Prevention of Collisions at Sea (COLREGS)
(International Maritime Organisation (IMO), 1972) and vessel use will be optimised where possible.

Captain EOR Stage 2 Phase II Project Environmental Statement
Section 6 Physical Presence
6-2
The COSLPioneer will be equipped with marine navigational aids and an aviation obstruction lights system,
as per the Standard Marking Schedule for Offshore Installations (HSE, 2009), to warn ships and aircraft of
their position. The systems comprise:
• Marine navigation lights; • Foghorns;
• Fog-lights; • Fog detector;
• Aviation obstruction lights; • Helideck lighting;
• Helideck beacons (helideck status light system);
• Radar beacons.
As required by HSE Operations Notice 6 (HSE, 2014), a rig warning communication will be issued at least
48 hours before any rig movement. The COSLPioneer routes will be selected with the aim of minimising
interference to other vessels and the risk of collision. At each drilling location, a 500 m safety zone will be in
place before the drilling rig is brought on location. In addition, a CtL permit application will be submitted to
OPRED which will be supported with a vessel traffic survey and if required a co llision risk assessment. An
ERRV will also be on location and will warn other sea users of the presence of the drilling rig.
As the activities are taking place at the existing Captain field the increase in vessel traffic is not anticipated
to result in a significant change to existing levels.
Though f ishing effort in the area is deemed relatively high, as a receptor the sensitivity of the f ishing is
considered Low (A) as it is considered to have the capacity to absorb any change associated with the
presence of the vessels and drilling rig. Similarly the sensitivity of shipping as a receptor is considered Low
(A). Given: the use of navigational aids; the presence of an ERRV and 500 m safety zones; the submission
of a CtL; Ithaca Energy’s commitment to submitting statutory notifications of any drilling rig moves and
potential schedule changes; and the Company’s commitment to only using vessels adhering to the
COLREGS, the magnitude of effect of the physical presence of the drilling rig and vessels on other sea users
is deemed Minor (2). Given the Low sensitivity and the Minor magnitude of effect, the impact significance is
considered Low such that any social impacts associated with the presence of the drilling rig and vessels are
thought to be negligible.
6.1.2 Impact of Vessels and Drilling Rig on Marine Mammals
Note the impacts of underwater noise associated with vessels and drilling activities are discussed in Section
10, whilst this section focuses on the physical presence of the vessels and COSLPioneer drilling rig. From
Section 4.4.4 it can be seen that a number of marine mammals occur in the area which could be disturbed
by the increase in vessel traffic. In addition, there could be an increased risk of injury to marine mammals
through vessel strikes. Given that all cetaceans are EPS and harbour porpoise and bottle nose dolphins, are
Annex II species, receptor sensitivity is considered Medium (B).
Marine mammals may be attracted to installations due to increased prey abundance (Todd et al. 2009);
however, no evidence of impacts of installations on marine mammals on the UKCS have been reported. As
the proposed activities will take place within a well-developed oil and gas area, it is likely that marine
mammals have been habituated to vessel activity in the area. In addition, the evidence for lethal injury from
boat collisions with marine mammals suggests that collisions with vessels are very rare (Cetacean Stranding
Investigation Programme (CSIP), 2011). Out of 478 post-mortem examinations of harbour porpoise in the
UK carried out between 2005 and 2010, only four (0.8 %) were attributed to boat collisions.
Cetaceans are therefore anticipated to quickly adapt to the presence of the drilling rig and vessels, which
will occupy a very small proportion of their overall available habitat such that the magnitude of effect of the
presence of the drilling rig and vessels is deemed to be Minor (2). Given the Medium receptor sensitivity and

Captain EOR Stage 2 Phase II Project Environmental Statement
Section 6 Physical Presence
6-3
the Minor magnitude of effect, the impact significance is considered Low such that any impacts of the vessels
and drilling rig on marine mammals are thought to be negligible.
6.1.3 Impact of Vessels and Drilling Rig on Birds
As described in Section 4.4.5 a number of bird species are found in the Captain f ield area. Given that may
of the birds are likely associated with SPAs, the sensitivity of birds as a receptor is considered Medium (B).
The vessels and drilling rig have the potential to cause displacement of seabirds from foraging habitat and
may cause f lying birds to detour from their flight routes. For example, auk species (e.g. guillemot, little auk)
are believed to avoid vessels by up to 200 to 300 m but gull species (e.g. kittiwake, herring gull and great
black-backed gull) are attracted to the presence of them (Furness and Wade, 2012). Seabird densities in the
North Sea are reported to be seven times greater within 500 m of a platform. Lights are known to attract
seabirds, however, increased food availability at the installation and the availability of roost sites may also
be a factor (Weise et al. 2001).
Though evidence suggests that the presence of vessels and the drilling rig could cause some bird species
to be displaced f rom their foraging area, the very small proportion of their overall available habitat that will
be occupied by the vessels and drilling rig means the impact is not considered to be noticeable. In addition,
given the existing oil and gas vessel activity in the area, including the existing Captain installations, it is
expected that the impact of the vessels and drilling rig on bird migration routes will not to be significant.
Therefore, the magnitude of impact of the physical presence of the vessels and drilling rig on birds is
considered Minor (2). Given the Medium sensitivity and the Minor magnitude of effect, the impact significance
is considered Low such that any impacts of the vessels and drilling rig on seabirds are thought to be
negligible.
6.2 Presence of Subsea Infrastructure
All subsea infrastructure including the wellheads, Xmas trees, manifolds, pipelines, spools, umbilical jumpers
and pipeline protection materials (e.g. rock dump, concrete mattresses, and grout bags) have the potential
to impact fishing operations and wildlife as a result of their physical presence.
6.2.1 Impact of Subsea Infrastructure on Other Sea Users
Subsea infrastructure will be installed as part of the Captain EOR Stage 2 Phase II project. Fisheries in the
area are dominated by demersal landings with a large portion of shellfish species also being taken (see
Section 4.6.1). Fishing gear used to target these species is towed along the seabed, and therefore may
interact with subsea structures (including stabilisation material) that it comes into contact with. Interactions
between f ishing gear and inf rastructure may result in damage to f ishing gear, loss of f ishing gear, loss of
f ishing time, spoilt catches and injuries/fatalities to f ishermen (Rouse et al., 2018). Damage to subsea
inf rastructure may also occur as a result of snagging and dropped anchors.
The new pipelines and umbilicals will be trenched and buried such that infrastructure laid out with any 500 m
safety zones is not expected to interact with f ishing gear. On the approach to the BLP and the two drill
centres, the untrenched length of the lines will be minimised and limited to within the 500 m safety zones. At
the time of writing the use of rock dump to mitigate spans along the lines was not expected, though the ES
does capture a contingency volume of 20,000 te (see Table 3-10). Should this rock be required, it will be laid
in a profile that is over trawlable.
The two new drill centres (Area D and Area E) will have 500 m zones associated with them, within which the
SUDS and wells will be located. To mitigate the potential for fishing gear to encroach on these safety zones,
the SUDS at each of these two drill centres will be piled (see Section 3.4.6).

Captain EOR Stage 2 Phase II Project Environmental Statement
Section 6 Physical Presence
6-4
The SUDS to be installed at the BLP will be located well within the existing 500 m zone, whilst the new
production well will be drilled within the existing 500 m zone at Area B.
Prior to installing the subsea infrastructure, the project will apply for a Pipeline Works Authorisation (PWA),
including a Deposit Consent to deposit materials; and the development will comply with any notification
requirements associated with the PWA approval. In addition, the project will submit a CtL application to
OPRED and the location of all infrastructure to be installed will be submitted for inclusion on the admiralty
charts. Taking cognisance of the addition of two new 500 m exclusion zones (in an area with relatively high
f ishing activity) and Ithaca Energy’s adherence to the mitigation measures identified means the magnitude
of impact of the new inf rastructure on fishing activity is considered Minor (2).
Given that receptor sensitivity is considered Low (A) (see Section 6.1.1) and the magnitude of effect is
considered Minor (2), the impact significance is considered Low such that any impacts of the subsea
inf rastructure on fishing activity is thought to be negligible.
6.2.2 Impact of Subsea Infrastructure on Marine Mammals and Fish
With respect to the impact of subsea infrastructure on fish and cetacean’s receptor sensitivity is considered
Medium (B) due to the presence of designated species e.g. PMFs (such as cod, mackerel and sandeel) and
EPS (cetaceans). Marine mammals and f ish in the area are anticipated to adapt to the presence of the
subsea inf rastructure, which will occupy a very small proportion of their overall available habitat such that
the magnitude of effect is deemed Negligible (1). The impact significance is therefore considered Low such
that the impact of the subsea infrastructure on marine mammals and fish is thought to be negligible.
Note, the impact on the benthic communities is discussed separately in Section 9 ‘Seabed Disturbance’.
6.3 Decommissioning Phase
At CoP the Captain infrastructure will be decommissioned as part of a Decommissioning Programme. At the
commencement of the decommissioning activities, vessel activity in the area will increase relative to the
number of vessels typically present in the area of the development during the production phase.
It is expected that at end of field life it will be technically feasible to recover the Xmas trees, spools, umbilical
jumpers, manifold, mattresses and grout bags. In line with current OPRED guidance (BEIS, 2018), a
comparative assessment (CA) will be carried out to determine the fate of the flowlines and umbilicals.
Should the CA determine that the pipeline should be decommissioned in situ, Ithaca Energy will agree an
ongoing monitoring plan with the relevant authority (currently this is OPRED).
6.4 Cumulative and Transboundary Effects
The proposed activities will result in a modest increase in activity as a result of additional vessel movements.
Given that these activities will occur within a well-established area for oil and gas activity and for the most
part (i.e. drilling, installation and commissioning phases) will be short term in nature, significant cumulative
impacts are not expected.
The Captain Field is located c. 188 km f rom the UK/Norway median line and therefore no transboundary
impacts associated with the physical presence of the drilling rig or vessels are expected.

Captain EOR Stage 2 Phase II Project Environmental Statement
Section 6 Physical Presence
6-5
6.5 Mitigation Measures
The following industry standard mitigation measures will be undertaken to minimise the impacts associated
with the physical presence of the vessels, drilling rig, and subsea infrastructure associated with the Captain
EOR Stage 2 Phase II project.
Proposed Mitigation Measures
• Drilling rig routes will be selected in consultation with other users of the sea, with the aim
of minimising interference to other vessels and the risk of collision;
• Vessel use will be optimised by minimising the number of vessels required and length of
time vessels are on site;
• A post installation survey will be carried out following jetting of the flowlines and umbilicals
to ensure the lines are over trawlable and to ensure there are no clay berms;
• Consultation with SFF for all phases and operations;
• Notice to Mariners will be circulated prior to rig mobilisation;
• As required by HSE Operations Notice 6 (HSE, 2014), a rig warning communication will be
issued at least 48 hours before any rig movement. Notice will be sent to the Northern
Lighthouse Board (NLB) of any drilling rig moves and vessel mobilisation associated with
the mobilisation and demobilisation of the drilling rig;
• A Vessel Traffic Survey will inform a Consent to Locate application for the drilling rig;
• A Collision Risk Management Plan will be produced, if required;
• All vessels engaged in the project operations will have markings and lightings as per the
International Regulations for the Prevention of Collisions at Sea (COLREGS) (IMO, 1972);
• The drilling rig will be equipped with navigational aids and aviation obstruction lights
system, as per the Standard Marking Schedule for Offshore Installations for example fog
lights, aviation obstruction lights, helideck lighting and radar beacons;
• The drilling rig will have a statutory 500 m safety zone to mitigate any collision risk;
• An ERRV will patrol the area;
• All subsea infrastructure out with the 500 m zones will be over-trawlable;
• The use of pipeline stabilisation features (e.g. mattresses and rock cover) will be minimised
through project design and will be installed in accordance with industry best practice and
SFF recommendations.
Applying the risk assessment methodology described in Section 5 and taking account of the mitigation
measures listed above, the impact significance of the physical presence of the vessels, drilling rig and subsea
inf rastructure associated with the proposed project is considered Low. In addition, the environmental impact
significance in relation to marine mammals, and birds is considered low (the environmental impact
significance in relation to benthic species in considered separately in Section 9). The environmental and
socio-economic impacts are therefore considered acceptable when managed within the additional controls
and mitigation measures described. The proposed project will be conducted in compliance with all NMP
policies; an assessment against the relevant NMP objectives is given in Appendix A.

Captain EOR Stage 2 Phase II Project Environmental Statement
Section 7 Atmospheric Emissions
7 - 1
7. ATMOSPHERIC EMISSIONS
This section identifies the various sources of atmospheric emissions associated with project activities and
subsequent hydrocarbon production operations. The quantity of atmospheric emissions is estimated, and
their impacts assessed using the assessment methodology presented in Section 5.
Following the adoption of appropriate control and mitigation measures, residual effects and impacts are
assessed in the context of the sensitivity of, and the dispersive capacity of, the receiving environment.
7.1 Sources
The general use of vessels (including the drilling rig), and the production of hydrocarbons have been
identified as warranting further assessment in terms of the impact of their atmospheric emissions. As
described in Section 3.6.8 there will be no flaring associated with clean-up and completion of any of the wells
to be drilled as part of the proposed project.
7.1.1 Vessel Use During Drilling and Installation
Vessels required in support of the proposed drilling and subsea installation activities will release atmospheric
emissions.
Anticipated vessel use for drilling and subsea installation activities are summarised in Table 3-8 and Table
3-11 respectively. Topside modifications associated with the Captain EOR Stage 2 Project (both Phase I and
Phase II) have commenced and will be completed in 2023. As described in Section 3.8 these modifications
do not require a f lotel and have not required an increase to the existing support/supply vessel activity at the
Captain f ield. Therefore, emissions related to vessels supporting topside modifications are not considered
further.
While contracts securing the services of named vessels have not yet been established, the fuel consumption
of generic vessel types (e.g. AHV, CSV etc.) are well understood. Table 7-1 shows the expected vessel
emissions based on predicted vessel requirements. Emissions factors used were taken f rom the
Environmental Emissions Monitoring System (EEMS) Atmospheric Emission Calculations guidance (EEMS,
2008).

Captain EOR Stage 2 Phase II Project Environmental Statement
Section 7 Atmospheric Emissions
7 - 2
Table 7-1: Fuel use and emissions associated with vessel use.
Source Fuel Use
(Te)
Emissions From Fuel Use (Te)
CO2 NOx N2O SO2 CO CH4 VOC
EEMS Emissions Factor1 3.2 0.0594 0.00022 0.002 0.0157 0.00018 0.002
Vessel use associated with the
proposed drilling activities
(see Table 3-8)
13,138 42,043 780 3 26 206 2 26
Vessel use associated with the subsea installation activities
(see Table 3-11)
2,234 7,148.8 133 0.5 4 35 0.4 4
Total 15,372 49,191 913 3 31 241 3 31
UK shipping emissions 2019
(UKCCC, 2020) 13,680,000
Total vessel emissions as % of 2019 UK
shipping emissions 0.4
1 Emissions calculated using EEMS emission factors (EEMS, 2008).
7.1.2 Production of Hydrocarbons
The principal atmospheric emissions that will arise during production are associated with power generation,
compression, flaring and fugitive emissions at the Captain host.
Modifications to the Captain FPSO, BLP and WPP process heating and flaring systems are required as part
of Captain EOR Stage 2 project (both Phase I and Phase II). These topside modifications include the
installation of new polymer mixing and pumping facilities. The Captain FPSO will also require additional
polymer transfer pumps. All the new equipment to be installed as part of the topside modification are
electrically powered and will tie into the existing power supply on the respective installations.
The additional power requirements and resulting emissions increases f rom the topside modifications are
discussed in Section 7.2.
7.2 Emissions Increases Associated with Captain Production
For emissions during production, quantities of emitted gases have been calculated on the basis of the high
case production profiles and the high case forecasted fuel gas, f lare gas and diesel consumption f igures
associated with the proposed Captain EOR Stage 2 Phase II Project. Equivalent values for the low- and mid-
case production profiles and production profiles without the proposed project, using the corresponding case
fuel gas, f lare gas and diesel consumption figures are given in places for comparison. Other contributors to
the Captain Field’s total emissions during production which are not dependent on the low-, mid-, high-
production profile cases including fugitive emissions, whilst shuttle tanker emissions and polymer transport
emissions are also presented.
The high production profile case presented in Section 3 represents an optimistic estimate of the exported
product. For determining the GHG intensity (emissions per barrel of oil equivalent) for the f ield, the high-case
prof ile f requently provides a lower GHG intensity f igure than for the low- and mid-case production profile.
The low case production profile is used in this section to determine the GHG intensity figures to present the
higher, less favourable GHG intensity.

Captain EOR Stage 2 Phase II Project Environmental Statement
Section 7 Atmospheric Emissions
7 - 3
Increased oil production associated with the proposed Captain EOR stage 2 Phase II project is currently
planned to be achieved in Q2 2024. The production profiles presented in Section 3, and the emission
estimates presented in this section for 2024 are based on achieving this date.
7.2.1 Power Generation and Heating
Power for the Captain field BLP/WPP installations can be provided by two dual fuel gas turbine generators
(GTG). Electrical power can be exported from the FPSO to BLP/WPP via an existing subsea cable when
power requirements exceed the capacity of the turbine generators. Power for the Captain FPSO is provided
by f ive fuel generators which can operate on a variety of fuel (diesel, fuel gas and crude oil); however, the
generators primarily operate on diesel due to insufficient fuel gas. Process heating is provided on the FPSO
via three dual fuel process heaters which currently operate on diesel due to insufficient fuel gas. The FPSO
process heaters will run on fuel gas following the implementation of proposed project. As described in Section
7.1.2, additional equipment including polymer injection pumps and additional transfer pumps will be installed
on the respective Captain f ield installations leading to additional electrical demand. Additional process
heating requirements due to increased production may be required which will increase the load on the
existing dual fuel process heaters.
Power requirements are not directly proportional to the production throughput. The Captain f ield operates
with a typical baseline power load of 28 MW. The additional total installed power requirements from the new
equipment required for the Captain Stage 2 project is ~ 2.7 MW. The net power requirement for the EOR
Stage 2 Phase II expansion will increase by approximately 10%. There is no anticipated change in fuel gas
and diesel use on the BLP/WPP; however, diesel use is forecasted to increase on the FPSO from 2024 to
provide the additional 10% power required. The timing of the additional load is 2024 onwards in line with the
anticipated schedule for first injection of polymer at area D and E, and the first oil of the new production well.
The only difference between the low- and mid- production case fuel use, which are equivalent, and the high
case production case fuel use with EOR Stage 2 Phase II is increased diesel use on the FPSO required to
support the anticipated increase in gas processing.
The proposed Captain EOR Stage 2 Phase II Project will result in an incremental increase in produced gas
which will result in a reduction in the requirement for import gas. The additional produced gas will be utilised
in the process heaters.
The total emissions across the three Captain installations without and with the proposed Captain EOR Stage
2 Phase II Project are presented in Table 7-2 and illustrated in Figure 7-1. The calculated emissions in Table
7-2 are based on the EEMS emissions factors for GTGs, except for fuel gas CO2 emissions factors which
are derived f rom fuel gas sample analysis. Figure 7-1 also shows the total diesel use without and with the
proposed project (as noted above diesel use is anticipated to only increase on the FPSO). After 2023, the
increase in fuel use and emissions due to the proposed Captain EOR Stage 2 Phase II Project over the
Captain f ield life is relatively consistent as illustrated in Figure 7-1.

Captain EOR Stage 2 Phase II Project Environmental Statement
Section 7 Atmospheric Emissions
7 - 4
Table 7-2: Total emissions for fuel use at the Captain installations without/with the proposed Project.
Year
With/without
proposed
EOR Stage
2 Phase II
Fuel Use
(Te)
Emission from power generation and heating diesel use (Te)
CO2 NOx N2O SO2 CO CH4 VOC
2023 Without 52,263 152,875 1,461 11 52.69 494 28 44
2023 With 52,263 152,875 1,461 11 52.69 494 28 44
2024 Without 56,068 164,059 1,571 12 56.72 530 30 48
2024 With 61,494 181,422 1,863 14 67.57 607 31 57
2025 Without 54,598 157,750 1,371 12 47.99 491 32 40
2025 With 61,095 178,540 1,720 13 60.99 583 33 52
2026 Without 58,298 168,515 1,470 13 51.52 525 34 43
2026 With 63,220 184,265 1,735 14 61.36 595 35 52
2027 Without 53,637 155,204 1,365 12 47.98 485 31 40
2027 With 60,134 175,994 1,714 13 60.98 578 32 52
2028 Without 55,023 161,288 1,565 12 56.71 524 29 48
2028 With 60,448 178,651 1,856 13 67.56 601 30 57
2029 Without 52,088 152,624 1,476 11 53.46 495 27 45
2029 With 57,514 169,986 1,768 13 64.31 572 28 55
2030 Without 54,059 158,480 1,539 12 55.78 515 28 47
2030 With 59,484 175,843 1,830 13 66.63 592 29 57
2031 Without 51,649 151,460 1,474 11 53.45 492 27 45
2031 With 57,075 168,823 1,765 13 64.30 570 28 55
2032 Without 54,498 159,644 1,541 12 55.78 518 29 47
2032 With 59,924 177,007 1,833 13 66.63 595 30 57
2033 Without 51,649 151,460 1,474 11 53.45 492 27 45
2033 With 57,075 168,823 1,765 13 64.30 570 28 55
2034 Without 54,059 158,480 1,539 12 55.78 515 28 47
2034 With 59,484 175,843 1,830 13 66.63 592 29 57
2035 Without 55,301 161,984 1,563 12 56.56 525 29 47
2035 With 60,727 179,347 1,855 13 67.41 602 30 57

Captain EOR Stage 2 Phase II Project Environmental Statement
Section 7 Atmospheric Emissions
7 - 5
Figure 7-1: CO2e and diesel use at the Captain installations with and without Captain EOR Stage 2 Phase II.
7.2.2 Flaring
On the Captain BLP/WPP and FPSO installations, produced gas is used as fuel gas and in periods of gas
def iciency, import gas is blended with produced gas. Under normal operating conditions neither blended gas
nor import gas are flared and only produced gas is flared.
On the FPSO f lare gas is process gas (produced gas and import gas).
Flaring at the Captain f ield is only occurs during start-up and optimisation operations, process system
reliability and unplanned events. Any increase in produced gas will be used in the fuel gas system on the
WPP/BLP for power generation and on the FPSO in the process heaters, thereby reducing the requirement
for gas import and diesel consumption. The increase in produced gas is not anticipated to result in an
increase in current f laring rates.
Flaring emissions f rom the Captain f ield with and without the Captain EOR Stage 2 Phase II Project are
shown in Table 7-3. There is a single set of f laring f igures as Captain EOR Stage 2 Phase II is not anticipated
to lead to increased flaring. All emissions apart f rom the CO2 emissions were calculated using the default
EEMS emission factors. The f lared gas declines over the course of the Captain field life in line with the
decline in production from the field.
0
10,000
20,000
30,000
40,000
50,000
60,000
70,000
80,000
90,000
100,000
0
20,000
40,000
60,000
80,000
100,000
120,000
140,000
160,000
180,000
200,000
2023 2024 2025 2026 2027 2028 2029 2030 2031 2032 2033 2034 2035
Te (
die
sel)
Te C
O2e
Year
CO2e Without EOR Stage 2 CO2e With EOR Stage 2 - High Case
Fuel use (diesel) without EOR Stage 2 Fuel use (diesel) with EOR Stage 2 - High Case

Captain EOR Stage 2 Phase II Project Environmental Statement
Section 7 Atmospheric Emissions
7 - 6
Table 7-3: Emissions from flaring at Captain field with and without EOR Stage 2.
Year
Calculated
Flare gas
(Te)
Calculated emission from flaring (Te)
CO2 NOx N2O SO2 CO CH4 VOC
2023 11,525 30,625 13.55 0.91 0.14 75.67 203.30 22.59
2024 10,948 29,093 12.88 0.87 0.14 71.89 193.13 21.46
2025 10,401 27,639 12.23 0.83 0.13 68.29 183.47 20.39
2026 9,881 26,257 11.62 0.78 0.12 64.88 174.30 19.37
2027 9,387 24,944 11.04 0.75 0.12 61.63 165.59 18.40
2028 8,918 23,697 10.49 0.71 0.11 58.55 157.31 17.48
2029 8,472 22,512 9.96 0.67 0.11 55.63 149.44 16.60
2030 8,048 21,386 9.46 0.64 0.10 52.84 141.97 15.77
2031 8,048 21,386 9.46 0.64 0.10 52.84 141.97 15.77
2032 8,048 21,386 9.46 0.64 0.10 52.84 141.97 15.77
2033 8,048 21,386 9.46 0.64 0.10 52.84 141.97 15.77
2034 8,048 21,386 9.46 0.64 0.10 52.84 141.97 15.77
2035 8,048 21,386 9.46 0.64 0.10 52.84 141.97 15.77
7.2.3 Venting
As the crude oil is not completely stabilised prior to storage in the cargo tanks, the Captain FPSO utilises a
diesel f ired inert gas generator to provide inert gas to fill the tank vapour space during offloading operations
and to safeguard against any possibility of creating a hazardous atmosphere during tank operations. Venting
of gases f rom the cargo tank vent is directly proportional to production rate. There will be an increase in
venting f rom the FPSO cargo tanks during offloading activities as a result of increased production from the
Captain f ield in the early years after the implementation of proposed Captain EOR Stage 2 Phase II Project
in line with the production profiles. The venting rate due to production is estimated as 0.045 kg/bbl with an
average of 1.2 tonnes/day.
The venting rate for the low-, mid- and high production cases for Captain EOR Stage 2 Phase II and the rate
f rom without the Captain EOR Stage 2 Phase II are presented in Table 7-4. Over the course of the Captain
f ield life the high production profile case results in the higher venting rate.

Captain EOR Stage 2 Phase II Project Environmental Statement
Section 7 Atmospheric Emissions
7 - 7
Table 7-4: Captain FPSO Venting Rate.
Year
Without Captain
EOR Stage 2
Phase II (Te)
With Captain EOR Stage 2 Phase II
Low case
production (Te)
Mid case
Production (Te)
High case
production (Te)
2023 425 464 458 461
2024 434 537 577 580
2025 447 694 819 804
2026 375 646 742 776
2027 257 462 553 661
2028 215 358 434 552
2029 174 265 326 455
2030 148 192 261 314
2031 127 155 182 190
2032 116 115 124 154
2033 106 97 102 125
2034 100 90 91 92
2035 98 88 85 82
The emissions due to venting for high case production presented in Table 7-5 are calculated using the
estimated figures and the EEMS emission factors for venting. The CH4 and VOC venting emissions peak in
2025 before declining over the rest of the Captain field life. Figure 7-2 illustrates the CH4 and VOC venting
emissions for the case without EOR Stage 2 Phase II and the high production case.
Table 7-5: Emissions from venting at Captain field over field life (High Case).
Year Vent gas
(Te/)
Emission (Te/)
CO2 NOx N2O SO2 CO CH4 VOC
2023 461 n/a n/a n/a n/a n/a 415 46
2024 580 n/a n/a n/a n/a n/a 522 58
2025 804 n/a n/a n/a n/a n/a 724 80
2026 776 n/a n/a n/a n/a n/a 699 78
2027 661 n/a n/a n/a n/a n/a 594 66
2028 552 n/a n/a n/a n/a n/a 497 55
2029 455 n/a n/a n/a n/a n/a 409 45
2030 314 n/a n/a n/a n/a n/a 283 31
2031 190 n/a n/a n/a n/a n/a 171 19
2032 154 n/a n/a n/a n/a n/a 139 15
2033 125 n/a n/a n/a n/a n/a 112 12
2034 92 n/a n/a n/a n/a n/a 82 9
2035 82 n/a n/a n/a n/a n/a 74 8

Captain EOR Stage 2 Phase II Project Environmental Statement
Section 7 Atmospheric Emissions
7 - 8
Figure 7-2: Captain Field Venting Emissions for High Production and without Captain EOR Stage 2 Phase II.
7.2.4 Fugitive Emissions
Fugitive emissions are reported annually via EEMS for the Captain field from the WPP only. For the purposes
of the impact assessment, the 2019 EEMS fugitive emissions have been assumed to hold constant each
year over life of field and used to calculate total fugitive emissions. The 2019 fugitive emission are presented
in Table 7-6.
Table 7-6: EEMS fugitive emission at Captain field (WPP) in 2019.
Source (Te/yr) Emission (Te/yr)
CO2 NOx N2O SO2 CO CH4 VOC
Fugitive
emissions 11.48 0.32 0.00 0.00 0.00 0.00 11.14 0.02
7.2.5 Shuttle Tanker Emissions
Increased production at the Captain field is not anticipated to require an increase in the frequency of supply
vessels or helicopters servicing the Captain installations during operational life of field.
The emissions associated with shuttle tankers fuel use during loading activities and transit to and from the
Captain f ield with the implementation of the Captain EOR Stage 2 project is assessed in this section. Due to
the increased production based on the high production case, an increase in the number of annual shuttle
tankers for oil loading is anticipated in the early years following the implementation of Captain EOR Stage 2.
To quantify the historic emissions associated with shuttle tankers diesel use during loading, the maximum
loading duration over the period of 2017-2021 is derived.
The associated emission during loading is calculated using the forecasted number of annual offloads, the
maximum historic duration of loading and vessel fuel consumption rate. The emissions associated with
shuttle tanker transit are calculated based an appropriate vessel fuel consumption rate and the conservative
0
10
20
30
40
50
60
70
80
90
100
0
100
200
300
400
500
600
700
800
2023 2024 2025 2026 2027 2028 2029 2030 2031 2032 2033 2034 2035
Te V
OC
Te C
H4
Year
CH4 (High production case) CH4 (without EOR Stage 2)
VOC (High production case) VOC (Without EOR Stage 2)

Captain EOR Stage 2 Phase II Project Environmental Statement
Section 7 Atmospheric Emissions
7 - 9
assumption that the total time to transit to and from the Captain field is 24 hours. The derived total emissions
associated with shuttle tanker transit to the Captain field and loading activities are shown in Table 7-7.
Table 7-7: Captain Field EOR Stage 2 Emissions from Shuttle Tanker Loading and Transit.
Year Number of
offloads
Vessel
fuel use
(Te)
Emission from fuel use (Te)
CO2 NOx N2O SO2 CO CH4 VOC
2017-2021 191 2041 6531 121 0.041 0.411 3.211 0.041 0.411
2023 16 170 542 10.07 0.04 0.34 2.66 0.03 0.34
2024 20 220 704 13.07 0.05 0.44 3.45 0.04 0.44
2025 28 305 977 18.14 0.07 0.61 4.80 0.05 0.61
2026 31 332 1,061 19.69 0.07 0.66 5.20 0.06 0.66
2027 24 258 826 15.33 0.06 0.52 4.05 0.05 0.52
2028 19 203 650 12.06 0.04 0.41 3.19 0.04 0.41
2029 13 144 459 8.53 0.03 0.29 2.25 0.03 0.29
2030 10 109 350 6.49 0.02 0.22 1.72 0.02 0.22
2031 7 74 237 4.39 0.02 0.15 1.16 0.01 0.15
2032 5 50 161 3.00 0.01 0.10 0.79 0.01 0.10
2033 4 40 127 2.36 0.01 0.08 0.62 0.01 0.08
2034 3 37 118 2.18 0.01 0.07 0.58 0.01 0.07
2035 3 37 118 2.18 0.01 0.07 0.58 0.01 0.07
1Historic average (2017-2021)
The emissions from shuttle tanker loadings diesel use from 2023-2028 are predicted to be above the historic
average in line with the increase in shuttle tanker loading. Emissions are predicted to decrease below the
historic average in line with the reduction in number of annual shuttle tanker offloads from 2028 onwards as
shown in Figure 7-3.

Captain EOR Stage 2 Phase II Project Environmental Statement
Section 7 Atmospheric Emissions
7 - 10
Figure 7-3: Captain Field Shuttle Tanker CO2e.
7.2.6 Polymer Transport Emissions
The proposed Captain EOR Stage 2 Phase II Project is reliant on increased supply of polymer for injection
to accelerate production of hydrocarbons. The impact of the polymer transport due to the proposed project
on emissions is assessed in this section.
The transportation of the polymer to the Captain Field without EOR Stage 2 requires one delivery per week
deliveries. The frequency of polymer vessel sailings is expected to remain at one per week until 2024 – 2029
where two sailings per week will be required to meet the demand for polymer injection for EOR Stage 2.
From 2030 to the end of field life, the frequency of polymer vessel sailing will reduce to one per week due to
a decline in the polymer demands for EOR Stage 2 Phase II.
The emissions from polymer transport are calculated using the polymer vessel diesel fuel consumption rate
of 10 Te/day. Each delivery is conservatively assumed to require a day for a roundtrip to transit between
shore and the Captain FPSO. The emission due to polymer vessel transport are presented in Table 7-8
below.
1084
668
744
0
200
400
600
800
1000
1200
2023 2024 2025 2026 2027 2028 2029 2030 2031 2032 2033 2034 2035
Te C
O2
e
Year
EOR Stage 2 Average Historic CO2e (2017-2021) Maximum Without EOR Stage 2 (2017-2021)

Captain EOR Stage 2 Phase II Project Environmental Statement
Section 7 Atmospheric Emissions
7 - 11
Table 7-8: EOR Stage 2 Polymer transport emissions.
Year
No. of sailings
per
year
Vessel fuel consumption
transit per
year (Te)
Emission from polymer vessel transport (Te)
CO2 NOx N2O SO2 CO CH4 VOC
2019 52 520 1,664 31 0.114 1.04 8.16 0.094 1.04
2020 52 520 1,664 31 0.114 1.04 8.16 0.094 1.04
2021 52 520 1,664 31 0.114 1.04 8.16 0.094 1.04
2022 52 520 1,664 31 0.114 1.04 8.16 0.094 1.04
2023 52 520 1,664 31 0.114 1.04 8.16 0.094 1.04
2024 104 1,040 3,328 62 0.229 2.08 16.33 0.187 2.08
2025 104 1,040 3,328 62 0.229 2.08 16.33 0.187 2.08
2026 104 1,040 3,328 62 0.229 2.08 16.33 0.187 2.08
2027 104 1,040 3,328 62 0.229 2.08 16.33 0.187 2.08
2028 104 1,040 3,328 62 0.229 2.08 16.33 0.187 2.08
2029 104 1,040 3,328 62 0.229 2.08 16.33 0.187 2.08
2030 52 520 1,664 31 0.114 1.04 8.16 0.094 1.04
2031 52 520 1,664 31 0.114 1.04 8.16 0.094 1.04
2032 52 520 1,664 31 0.114 1.04 8.16 0.094 1.04
2033 52 520 1,664 31 0.114 1.04 8.16 0.094 1.04
2034 52 520 1,664 31 0.114 1.04 8.16 0.094 1.04
2035 52 520 1,664 31 0.114 1.04 8.16 0.094 1.04
7.3 Aggregated Emissions
Of interest to the impact assessment are:
• The maximum emission levels for substances that reduce air quality; and
• The aggregated emissions of GHGs over the field life.
7.3.1 Emission Gases Impacting Air Quality
Section 3.5 presents an indicative schedule for the proposed drilling, installation and commissioning activities
For the consideration of realistic worst-case impacts, it has been assumed that all drilling, installation and
commissioning activities will occur in 2023.
Based on the data presented in Sections 7.1 and 7.2, total emissions relating to the high production case at
the Captain f ield in 2023 are presented in Table 7-9. This includes all emissions f rom drilling, installation,
well completions, flaring, shuttle tanker loading and polymer transport for Captain field production in 2023.
Table 7-9: Total emissions relating to Captain field in 2023 (High production case).
Total Emission 2023 Hydrocarbons
use (Te)
Emission from fuel flare and venting (Te)
CO2 NOx N2O SO2 CO CH4 VOC
Installation, completion,
and operation with EOR
Stage 2 Phase II
79,861 234,897 2,428 16 85 821 660 145

Captain EOR Stage 2 Phase II Project Environmental Statement
Section 7 Atmospheric Emissions
7 - 12
The peak year for total emission and CO2e based on the high production case attributed to the Captain field,
following the drill and installation activities in 2023, has been identif ied as 2026. Table 7-10 presents the
aggregated emissions for the high production case f rom Section 7.2.1, Section 7.2.2, Section 7.2.3 and
Section 7.2.4 for 2026. The emissions for the case without the proposed Captain EOR Stage 2 Phase II
Project and the low- and mid-production cases are presented for comparison.
Table 7-10: Production emissions attributed to Captain field for peak year of CO2e (occurring in 2026).
Peak Year for Captain
Field
Hydrocarbons
use (Te)
Emission from fuel flare and venting (Te)
CO2 NOx N2O SO2 CO CH4 VOC CO2e
Power Generation and
heating 63,220 184,265 1,735 14 61 595 35 52 -
Flaring 9,881 26,257 12 0.78 0.12 65 174 19 -
Shuttle Tanker 332 1,061 20 0.07 0.66 5 0.06 0.66 -
Polymer Transport Vessel 1,040 3,328 62 0.23 2.08 16 0.19 2.08 -
Venting 776 n/a n/a n/a n/a n/a 699 78 -
Fugitive 11 0.32 0.00 0.00 0.00 0.00 11.14 0.02 -
Total
(High Production case) 75,260 214,911 1,828 15 64 682 919 152 242,354
Total
(Mid Production Case) 75,225 214,911 1,828 15 64 682 888 149 241,579
Total
(Low Production Case) 75,129 214,911 1,828 15 64 682 802 139 239,419
Total without Captain
EOR Stage 2 Phase II 69,289 197,090 1,525 14 53 602 557 102 215,116
7.3.2 GHG Emissions
To consider the impacts f rom the least favourable case, GHG intensity f igures are presented for the low case
production profiles during production field life along with estimates for emissions during the installation and
completion.
Table 7-11 presents the CO2e for the Captain f ield without the proposed Captain EOR Stage 2 Phase II
Project and with the low-, mid- and high-production profile cases over the Captain f ield life. The values for
CO2e are derived using Global Warming Potential (GWP) for the 100-year time horizon values for CO2,
methane and nitrous oxide f rom the Intergovernmental Panel on Climate Change (IPCC) 4th Assessment
Report (IPCC, 2007).

Captain EOR Stage 2 Phase II Project Environmental Statement
Section 7 Atmospheric Emissions
7 - 13
Table 7-11: Total installation and operation CO2e emissions by year.
Year
Captain Field Emission (Te CO2e)
without EOR
Stage 2 Phase II
with EOR Stage 2
Phase II (Low Case)
with EOR Stage 2
Phase II (Mid Case)
with EOR Stage 2
Phase II High Case)
2023 205,178 205,949 205,828 205,880
2024 215,063 236,875 237,791 237,863
2025 207,305 236,144 238,944 238,617
2026 215,116 239,419 241,579 242,354
2027 197,231 221,458 223,514 229,429
2028 200,948 223,601 225,319 227,961
2029 189,734 211,015 212,403 215,296
2030 193,845 212,258 213,807 215,002
2031 186,149 204,098 204,716 204,879
2032 194,320 211,529 211,742 212,421
2033 185,691 202,691 202,784 203,304
2034 192,762 209,723 209,740 209,760
2035 196,313 213,291 213,215 213,162
Total Operations 2,579,655 2,828,054 2,841,381 2,855,928
Installation,
Completions and
Start-up (2023)
0 50,268 50,268 50,268
Total Development 2,579,655 2,878,322 2,891,649 2,906,196
The CO2e f igures presented in Table 7-11 are used in conjunction with production profiles to generate
estimates for the GHG intensity of the product as kg CO2e per barrel of oil equivalent (boe). Table 7-12
present the GHG intensities and over field life (including pre-production emissions) for the case without the
proposed Captain EOR Stage 2 Phase II Project and with the proposed project for the different production
prof iles.
Table 7-12: Total installation and operation GHG emissions by year.
Year
GHG intensity (Kg CO2e/ boe)
without EOR
Stage 2 Phase II
with EOR Stage 2
Phase II (Low Case)
with EOR Stage 2
Phase II (Mid Case)
with EOR Stage 2
Phase II High Case)
2023 21.0 24.0 24.3 24.2
2024 21.7 19.3 18.0 17.9
2025 20.2 14.8 12.7 12.9
2026 25.0 16.1 14.1 13.6
2027 33.4 20.8 17.5 15.1
2028 40.8 27.2 22.6 18.0
2029 47.5 34.7 28.3 20.5
2030 56.9 48.1 35.6 29.7
2031 63.9 57.3 48.8 46.9
2032 73.1 80.4 74.4 60.0
2033 75.9 90.6 86.9 70.9
2034 83.7 101.6 100.8 99.8
2035 87.4 105.3 109.5 112.6

Captain EOR Stage 2 Phase II Project Environmental Statement
Section 7 Atmospheric Emissions
7 - 14
7.4 Impact on Air Quality
Increased concentrations of NOx, SO2 and VOCs in the atmosphere can result in the formation of
photochemical pollution in the presence of sunlight, comprising mainly low level ozone, but by-products may
include nitric acid, sulphuric acid and nitrate-based particulate. The formation of acid and particulates
contributes to acid rainfall and the dry deposition of particulates. If such deposition occurs at sea, it is possible
that the substances will dissolve in seawater. The ultimate fate of emitted pollutants can often be difficult to
predict owing to the dependence on metocean conditions (especially wind), which may be highly variable
and lead to wide variations in pollutant fate over short timescales.
7.4.1 Drilling, Installation and Commissioning Phases
Vessel emissions, summarised in Table 7-1 will be of localised extent, of relatively short duration, and take
place a substantial distance (c. 70 km) from the nearest coastline. They are expected to disperse rapidly and
dilute to background concentrations, resulting in localised and short-term impacts to air quality.
Given the of fshore location of the proposed project, the sensitivity of air quality as a receptor is considered
Low (A). As the emissions will disperse rapidly the magnitude of effect of the emissions produced during the
drilling, installation and commissioning phases is considered Minor (2). The impact significance is therefore
considered Low such that any environmental impacts are regarded as negligible.
7.4.2 Production Phase
As part of the PPC permit application for the Captain FPSO an atmospheric emissions dispersion modelling
study was performed which assessed emissions from the Captain FPSO and the cumulative impacts from
the Captain complex which included the Captain WPP/BLP under worst case operating scenarios of all
turbines and Wartsila engines operating at full load. The result of the assessment indicated that all predicted
concentrations at receptor locations are substantially below long-term and short-term air quality objectives,
and they were no predicted exceedance of any air quality objective at receptor locations.
The maximum NO2 short-term concentration on the modelled grid is predicted to exceed the short-term air
quality objective for a worst-case scenario where all the Wartsila engines on the FPSO are operating at full
load simultaneously. In this scenario, 97.6% of the contribution to the NO2 concentration is from the Wartsila
engines on the FPSO.
However, this breach does not occur in an area of relevant public exposure and as such does not pose a
risk to human health. Therefore, the impact from atmospheric emissions is not predicted to be significant.
As detailed in Section 7.3.1, there is an increase in the quantities of hydrocarbons combusted at the Captain
f ield due to the proposed project. The peak emission year for the high production case shown in Table 7-10
shows the increase in NOx, SO2, CO and VOC emission of 20%, 21%, 13% and 49% respectively compared
with the case without the Captain EOR Stage 2 Phase II Project. This increase in emissions is anticipated to
be within the worst-case scenario modelled as part of the atmospheric emission dispersion modelling study.
As described in Section 7.4.1, the sensitivity of air quality as a receptor is considered Low (A). As the
emissions will disperse rapidly the magnitude of ef fect of the increase in emissions during the production
phase considered Minor (2). The impact significance is therefore considered Low such that any
environmental impacts are regarded as negligible.
7.4.3 Decommissioning Phase
A range of specialist and support vessel types will be required at various times, and for various durations, to
undertake the decommissioning activities at the end of field life. This will lead to an increase in vessel activity
relative to that associated with production. The extent, magnitude and duration of impact on air quality from

Captain EOR Stage 2 Phase II Project Environmental Statement
Section 7 Atmospheric Emissions
7 - 15
the of fshore decommissioning activities are anticipated to be less than those for the drilling, installation and
commissioning phases. This will be conf irmed during the preparation of the decommissioning programme
and supporting documents.
7.4.4 Transboundary and Cumulative Impacts to Air Quality
The Captain field is located approximately 188 km from the UK/Norway median line. Given this distance and
the localised nature and low level of air quality impacts expected, no transboundary impacts are anticipated.
The emissions reported for the UK, and for the UKCS offshore oil and gas industry, in 2019 are presented
in Table 7-13 in units of thousand tonnes per year. It should be noted that UKCS EEMS emission data do
not account for emission due to vessel transit. The emissions from shuttle tanker and polymer transport in
transit have been included as part of the emission assessment presented in Section 7.2. Therefore, the
comparison of the Captain field emission against the UKCS EEMS emissions will be conservative.
The contribution that the proposed Captain EOR Stage 2 Phase II Project will make to the cumulative
emissions across the UKCS, and to UK emissions as a whole can be seen f rom comparison of the data in
Table 7-13 with that in Table 7-10.
By way of example, the NOx emissions f rom production at the Captain f ield in 2026 (the year of highest
emissions) would be approximately 3.6% of the annual emissions from the UKCS offshore industry in 2019,
and approximately 0.2% of the annual UK emissions in 2019.
Table 7-13: Emissions from the UK, and from the UKCS, in 2019.
Year Emissions (Thousand Te/Yr)
CO2 NOx N2O SO2 CO CH4 VOC
UK Emissions (2019)1 369,700 852 68 167 1,653 1,980 814
UKCS Emissions (2019)2 13,683 51 1 2 31 40 47
1 UK Greenhouse Gas Inventory, 1990 to 2019 from the Annual Report for submission under the
Framework Convention on Climate Change (UK NIR, 2021). 2 UKCS EEMS emissions data (EEMS, 2021).
7.5 Impact on Climate Change
In isolation the GHG emissions f rom the Captain f ield would not cause a change to the global climate,
however it is their contribution to the cumulative impact of total global emissions that is of relevance in
assessing the impact of the development. As such, the Captain field GHG emissions detailed in Section 7.2
are considered in the context of the UK emissions and the UK commitments to emissions reductions.
7.5.1 Captain GHG Emissions in the Present National and Sector-Wide Context
The total GHG emissions for 2019 across the UK were reported in the UK National Inventory Report (UKNIR,
2021) as 453 MTeCO2e. The UK of fshore oil and gas sector accounted for 14.9 MTeCO2e (EEMS, 2021),
approximately 3% of the UK total.
The incremental additional GHG emissions resulting from high production of Captain field with the proposed
Captain EOR Stage 2 Phase II Project peak in 2026 at 0.24 MTeCO2e, which is 0.05 % of the UK total in
2019 and 1.62 % of the UKCS oil and gas total in 2019. Table 7-14 presents the Captain field GHG emissions
without the proposed project and with the peak year of emission with the proposed Captain EOR Stage 2
Phase II Project.

Captain EOR Stage 2 Phase II Project Environmental Statement
Section 7 Atmospheric Emissions
7 - 16
Table 7-14: Captain field incremental GHG emissions in the context of total UK and UKCS.
GHG Source Emission MTe CO2e
% UK Total % UKCS
Total
UK Emission (2019)1 453 - -
UKCS Emissions (2019)2 15 - -
Captain field without EOR stage 2 0.22 0.05 1.44
Captain field with EOR stage 2 maximum
year (High production case) 0.24 0.05 1.62
1 UK Greenhouse Gas Inventory, 1990 to 2019 from the Annual Report for submission under the
Framework Convention on Climate Change (UK NIR, 2021) 2 UKCS EEMS emissions data (EEMS, 2021)
7.5.2 Captain Field GHG Emissions in the Future National Context
The Climate Change Act 2008, which committed the UK government by law to reducing greenhouse gas
emissions by at least 80% of 1990 levels by 2050, was amended in 2019 to commit to achieving 100%
reduction (net zero) by 2050. The Climate Change (Scotland) Act (2019) establishes an accelerated target
for achieving net zero emissions by 2045 in Scotland.
The Climate Change Act requires the government to set legally-binding ‘carbon budgets’ to act as stepping
stones towards the 2050 target. A carbon budget is a cap on the amount of greenhouse gases emitted in the
UK over a f ive-year period.
Table 7-15 shows the UK Carbon Budgets allocation set under the UK Climate Change Act alongside the
projected additional emissions from the development of the Captain f ield without and with the proposed
project.
Under the high production case, the Captain field (with the proposed Captain EOR Stage 2 Phase II Project)
spans the 4th, 5th and 6th Carbon Budget periods, with the drilling, installation, start-up of polymer injection
(at Area D and Area E) and the first four years of operation with the proposed EOR expansions occurring in
the 4th budget period. The subsequent 5 years of operation will occur in the 5th budget period, and the final
three years of production will occur in the 6th budget period. The total future GHG emissions from the Captain
f ield with the proposed Captain EOR Stage 2 Phase II Project within each budget period are presented within
Table 7-15 as million tonnes of CO2 equivalent and as a percentage of the UK budget allocations. The CO2e
emissions from the Captain field with EOR Stage 2 Phase II represent a small proportion of the UK 4th, 5th
and 6th Carbon Budget allocations.
Table 7-15: Captain field GHG emissions in the context of UK Carbon Budgets.
Carbon Budget Budget Period
UK Budget
Allocation
Captain field without EOR
Stage 2 Phase II
Captain field with EOR
Stage 2 Phase II
MTe CO2e MTe CO2e % of Budget
Allocation MTe CO2e
% of Budget
Allocation
1 2008 - 2012 3,018 - -
2 2013 - 2017 2,782 - -
3 2018 - 2022 2,544 - -
4 2023 - 2027 1,950 1.04 0.05 1.15 0.06
5 2028 - 2032 1,725 0.96 0.06 1.08 0.06
6 2033 - 2037 965 0.57 0.06 0.63 0.06
1 UK Committee for Climate Change Sixth Carbon Budget Report (UKCCC, 2020)

Captain EOR Stage 2 Phase II Project Environmental Statement
Section 7 Atmospheric Emissions
7 - 17
7.5.3 Captain Field GHG Emissions in the Future Oil & Gas Sector Context
In October 2017 the UK Government published its Clean Growth Strategy (UK Government, 2017) setting
out policies and proposals for meeting future carbon budgets, together with pathways to the 2050 target
(then of 80% reduction). In keeping with the Net Zero pathway, the UK Government and offshore oil and gas
industry established a North Sea Transition Deal (NSTD) in 2021 which, among other actions, agreed targets
for staged reductions in GHG emissions from the UKCS as presented in the first two columns of Table 7-16.
Based on the recorded UKCS GHG emissions for 2018, the third column of the table shows the target
emissions for subsequent years stipulated in the NSTD. The f inal two columns of the table present the
proportion of the NSTD budget that incremental GHG emissions from the Captain f ield would account for
under case without EOR Stage 2 and with EOR Stage 2.
Table 7-16 Captain field GHG emissions in the context of the North Sea Transition Deal
Year
North Sea Transition Deal Captain field
(High production case)
% of 2018 MTe CO2e without Captain EOR
Stage 2 Phase II (%)
with Captain EOR
Stage 2 Phase II (%)
2018 100 14.54 -
2025 90 13.09 1.58 1.82
2027 75 10.90 1.81 2.07
2030 50 7.27 1.78 1.97
2050 0 0 - -
1 North Sea Transition Deal (BEIS, 2021)
The GHG emissions f rom the Captain f ield with the proposed project represent a small proportion of the
UKCS and UK annual totals and make up a small proportion of the 4th, 5th and 6th Carbon Budget allocations
and of the total UKCS emissions targets established for 2025, 2027 and 2030 under the NSTD.
7.5.4 Captain GHG Emissions Relative to Production
The proposed Captain EOR Stage 2 Phase II Project will accelerate the production of recoverable
hydrocarbons from the Captain field.
The low-, mid- and high-case production f rom the Captain f ield with the proposed Captain EOR Stage 2
Phase II Project will result in an increase in GHG emissions. The CO2e emissions increase in 2023 for all
the production profile cases is 25%, however the 2023 emissions increase includes the additional emissions
f rom drilling and installation activities.
The maximum increase in high-production case CO2e emissions from 2024-2035 is 16% compared to the
base case without EOR Stage 2 occurring in 2027. The total increase in CO2e emissions over the f ield life
for the high production case is 11% with the proposed project compared to the CO2e emissions without the
proposed Captain EOR Stage 2 Phase II Project, while the total increase in production (boe) is c. 74%.
The maximum increase in mid-production case CO2e emissions f rom 2024-2035 is 15% compared to the
base case without EOR Stage 2 occurring in 2025. The total increase in CO2e emissions over the f ield life
for the mid production case is 10% with the proposed project compared to the CO2e emissions without the
proposed Captain EOR Stage 2 Phase II Project while the total increase in production (boe) is c. 58%.
The maximum increase in low-production case CO2e emissions f rom 2024-2035 is 14% compared to the
base case without EOR Stage 2 occurring in 2025. The total increase in CO2e emissions over the f ield life
for the low production case is 10% with the proposed project compared to the CO2e emissions without the
proposed Captain EOR Stage 2 Phase II Project while the total increase in production (boe) is c. 38%.
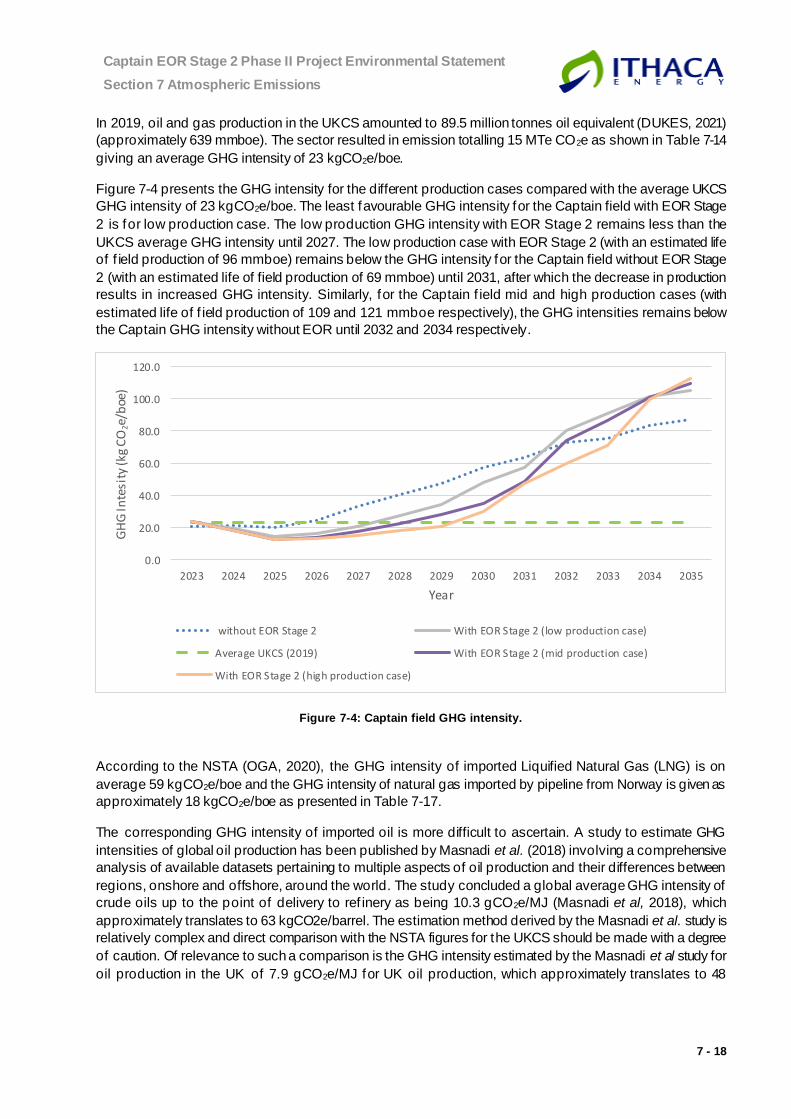
Captain EOR Stage 2 Phase II Project Environmental Statement
Section 7 Atmospheric Emissions
7 - 18
In 2019, oil and gas production in the UKCS amounted to 89.5 million tonnes oil equivalent (DUKES, 2021)
(approximately 639 mmboe). The sector resulted in emission totalling 15 MTe CO2e as shown in Table 7-14
giving an average GHG intensity of 23 kgCO2e/boe.
Figure 7-4 presents the GHG intensity for the different production cases compared with the average UKCS
GHG intensity of 23 kgCO2e/boe. The least favourable GHG intensity for the Captain field with EOR Stage
2 is for low production case. The low production GHG intensity with EOR Stage 2 remains less than the
UKCS average GHG intensity until 2027. The low production case with EOR Stage 2 (with an estimated life
of f ield production of 96 mmboe) remains below the GHG intensity for the Captain field without EOR Stage
2 (with an estimated life of field production of 69 mmboe) until 2031, after which the decrease in production
results in increased GHG intensity. Similarly, for the Captain f ield mid and high production cases (with
estimated life of f ield production of 109 and 121 mmboe respectively), the GHG intensities remains below
the Captain GHG intensity without EOR until 2032 and 2034 respectively.
Figure 7-4: Captain field GHG intensity.
According to the NSTA (OGA, 2020), the GHG intensity of imported Liquified Natural Gas (LNG) is on
average 59 kgCO2e/boe and the GHG intensity of natural gas imported by pipeline from Norway is given as
approximately 18 kgCO2e/boe as presented in Table 7-17.
The corresponding GHG intensity of imported oil is more difficult to ascertain. A study to estimate GHG
intensities of global oil production has been published by Masnadi et al. (2018) involving a comprehensive
analysis of available datasets pertaining to multiple aspects of oil production and their differences between
regions, onshore and offshore, around the world. The study concluded a global average GHG intensity of
crude oils up to the point of delivery to ref inery as being 10.3 gCO2e/MJ (Masnadi et al, 2018), which
approximately translates to 63 kgCO2e/barrel. The estimation method derived by the Masnadi et al. study is
relatively complex and direct comparison with the NSTA figures for the UKCS should be made with a degree
of caution. Of relevance to such a comparison is the GHG intensity estimated by the Masnadi et al study for
oil production in the UK of 7.9 gCO2e/MJ for UK oil production, which approximately translates to 48
0.0
20.0
40.0
60.0
80.0
100.0
120.0
2023 2024 2025 2026 2027 2028 2029 2030 2031 2032 2033 2034 2035
GH
G In
tesi
ty (k
g C
O2e
/boe
)
Year
without EOR Stage 2 With EOR Stage 2 (low production case)
Average UKCS (2019) With EOR Stage 2 (mid production case)
With EOR Stage 2 (high production case)

Captain EOR Stage 2 Phase II Project Environmental Statement
Section 7 Atmospheric Emissions
7 - 19
kgCO2e/barrel roughly twice the estimate derived directly f rom BEIS data. The GHG intensity estimates for
the Captain f ield production cases and other sources of oil and gas relevant to meeting the future UK demand
are presented in Table 7-17.
Table 7-17: GHG Intensity estimated for Captain field and other sources.
Oil and/or gas source GHG Intensity
kgCO2e/boe
UKCS Oil and Gas (2019 Production (2019) 23
UKCS Gas Production (2019) 22
UK Oil Production (2015) 48
Global Average Oil Production (2015) 63
UK imported LNG (2019) 59
UK imported Norwegian LNG (2019) 18
Captain Field Base Case (Without the Captain EOR Stage 2 Phase II Project) 37
Captain Field Low Production Case (with the Captain EOR Stage 2 Phase II Project) 30
Captain Field Mid Production Case (with the Captain EOR Stage 2 Phase II Project) 26
Captain Field High Production Case (with the Captain EOR Stage 2 Phase II Project) 24
The GHG intensity of the Captain field for oil and gas production is c. 37 kgCO2e/boe over the field life. The
implementation of the proposed Captain EOR Stage 2 Phase II Project results in a GHG intensity to
30 kgCO2e/boe for the low-production case, 26 kgCO2e/boe for the mid-production case and 24 kgCO2e/boe
for the high-production case over the Captain field life. Therefore, even in the low-production case, there is
a reduction of the Captain f ield GHG intensity by 19% compared to the production without the proposed
Captain EOR Stage 2 Phase II Project.
Further consideration has been given to whether the Captain f ield would still provide GHG value in the
context of reductions required under the NSTD, there are no equivalent forecasts for hydrocarbon production
in the basin beyond 2024. Table 7-18 presents the Captain production without EOR Stage 2 and with EOR
Stage 2 for the low, mid and high production cases for the target years of the NSTD.
Table 7-18: Captain field production.
Year Without Captain EOR
Stage 2 Phase II (mmboe)
With Captain EOR Stage 2 Phase II (mmboe)
Low case Mid case High case
2019 0.00 0.00 0.00 0.00
2025 10.27 15.98 18.85 18.52
2027 5.90 10.63 12.74 15.22
2030 3.41 4.42 6.01 7.23
2050 0.00 0.00 0.00 0.00
Table 7-19 presents the Captain field production detailed in Table 7-18 as a percentage of the UKCS 2019
total.

Captain EOR Stage 2 Phase II Project Environmental Statement
Section 7 Atmospheric Emissions
7 - 20
Table 7-19: Captain field production in the context of the UKCS.
Captain field production as % UKCS total for 2019
Year Without Captain EOR
Stage 2 Phase II (%)
With Captain EOR Stage 2 Phase II (%)
Low case Mid case High case
2019 - - - -
2025 1.61 2.50 2.95 2.90
2027 0.92 1.66 1.99 2.38
2030 0.53 0.69 0.94 1.13
2050 - - - -
The demand in the UK for oil and gas is predicted to decline significantly over the next 30 years to 2050,
although the UK Government forecasts show that oil and gas will remain an important part of the UK energy
mix for the foreseeable future, including under net zero (OGA, 2021). As production f rom existing fields
naturally depletes, meeting the continued demand will require a combination of either the development of
new f ields within the UKCS and/or imports.
7.5.5 Climate Change Impact Conclusion
Impacts from GHG emissions are difficult to assess in isolation because they derive from all cumulative
emissions, rather than from any one activity. Nevertheless, GHG emissions from Captain Field are low in the
context of current UK and UKCS emissions and in the context of projected targets for future emissions
reductions. Ithaca Captain EOR Stage 2 Phase II would therefore contribute to achieving the goals for
emissions reduction in the UKCS established by the NSTD.
The sensitivity of climate change as a receptor is considered Very High (D). As (1) the GHG emissions from
the Captain f ield are considered relatively low in the context of the UK and UKCS emissions and (2) the
proposed project reduces the GHG intensity at the Captain field, the magnitude of effect is considered Low
(1) such that the impact significance of the emissions associated with the proposed Captain EOR Stage 2
Phase II Project is Low.

Captain EOR Stage 2 Phase II Project Environmental Statement
Section 7 Atmospheric Emissions
7 - 21
7.6 Mitigation Measures
The following measures will be adopted to ensure that the impacts associated with energy use and
atmospheric emissions during the drilling, installation, commissioning and production phases are minimised
to ‘as low as reasonably practicable’.
Proposed Mitigation Measures:
• The drilling rig and other project vessels will be subject to audits ensuring compliance with UK legislation and the Ithaca Marine Operations and Vessel Assurance Standard;
• Vessel use will be optimised where possible by minimising the number of vessels required, and their length of time on site;
• Vessels will be operated where possible in modes that allow for economical fuel use; and
• Minimise flaring during well clean-up operations by sending fluids to BLP for processing as the base case and preferred option.
• In accordance with the revised NSTA strategy, and associated Stewardship Expectation 11, as well as with the industry commitments within the NSTD, Ithaca Marine Operations and Vessel Assurance Standard will incorporate the impact of the Captain field production within developing controls including:
• Asset GHG Emission Reduction Action Plans;
• Flaring and venting reviews to identify/action zero routine flaring by 2030;
• Active flare reduction strategy;
• Active vent reduction strategy;
• Emission key performance indicators and targets; and
• Industry level benchmarking of flaring and venting.
These will ensure that opportunities for efficiency and reduction of atmospheric emissions, where not in conf lict with safe operations, are identified, actioned as appropriate and reviewed.
The impact of the emissions associated with the proposed project on air quality will be localised, short term
and will mainly occur c.70 km f rom the nearest shoreline. The significance of impact to the local ecological
receptors is therefore considered to be low.
The emission of exhaust gases that impact air quality at the Captain f ield are anticipated to be higher
following the introduction of the proposed Captain EOR Stage 2 Phase II Project; the NOx, SO2 and CO up
to 21% at it’s peak. However, the total emissions for the Captain field will remain within the levels previously
modelled that show environmental impact to be low. The significance of impact on air quality over the life of
f ield for Captain is therefore considered to be low.
The Captain EOR Stage 2 Phase II Project will result in a small increase in GHG emissions (an average of
increase of CO2e emissions 13% annually) compared to the case without the proposed EOR Stage 2 Phase
II Project, while accelerating the recovery of hydrocarbons and increasing the hydrocarbon production. In
the context of UKCS oil and gas production, the Captain f ield with the proposed project offers relatively low
GHG emission per barrel of oil equivalent. In addition, the proposed project lowers the forecasted GHG
intensities at the Captain field relative to the estimated intensities in the absence of the proposed project.
The proposed project will be conducted in compliance with all NMP policies; an assessment against the
relevant NMP objectives is given in Appendix A.

Captain EOR Stage 2 Phase II Project Environmental Statement
Section 8 Discharges to Sea
8-1
8. DISCHARGES TO SEA
This section assesses the planned and permitted marine discharges from the proposed Captain EOR Stage
2 Phase II Project using the impact assessment methodology presented in Section 5. All phases will involve
the discharge of sewage and food waste f rom vessels; however, these discharges will be in line with
MARPOL requirements such that the environmental impact significance of different routine vessel discharges
are considered low and are not assessed further.
8.1 Drilling Phase
8.1.1. Sources of Discharges Associated with the Drilling Phase
As described in Section 3.6, it is proposed to drill six new polymer injection wells and one new production
well as part of the proposed project. Apart from routine vessel discharges (under MARPOL) there will be two
main planned (and permitted) sources of discharges associated with the drilling activities:
• Discharge of drill cuttings and associated drilling fluids; and
• Discharge of cement and associated chemicals.
8.1.1.1 Discharge of Drill Cuttings and Associated Drilling Fluids
As described in Section 3.6.5 the top hole sections will be drilled using seawater and viscous sweeps and
the lower sections using WBMs. All cuttings will be discharged to the marine environment , with cuttings from
the top hole sections being discharged at the seabed and those from the lower sections being discharged
f rom the drilling rig to the water column (see Table 3-5 and Table 3-6 for estimates of drill cuttings produced
and discharged).
8.1.1.2 Cement and Cementing Chemicals
As described in Section 3.6.7, when drilling a well, cement is used to secure the steel conductor and casings
in the well bore, whilst cementing chemicals are used to modify the technical properties of the cement slurry.
The discharges associated with these cementing operations are described briefly here and will be detailed
in the drilling permit applications submitted to OPRED prior to commencement of drilling. These include:
• Discharge of residual mixed cement from the rig following a cementing operation;
• Discharge of cement as a result of an aborted cementing job;
• Discharge of cement spacers, mix-waters and cement unit washings; and
• Discharge onto the seabed of excess cement pumped down the well.
Residual mixed cement, aborted cement jobs, cement spacers, mix-waters, and cement unit
washings
Prior to carrying out the cementing job, dry cement is mixed in a cement unit on board the drilling rig before
being pumped into the wellbore. Cement mix-water1 is pre-mixed in pits onboard the drilling rig before being
mixed with cement solids to form a slurry which is pumped into the well. Prior to cementing the top hole
section, cement spacer2 will be pumped directly into the annulus to ensure that any cement placed there
gels up to maintain the structural integrity. The top hole cement spacer is discharged at the seabed. Following
a cement job the cement unit is washed to remove any residual chemical additives and / or cement slurry
f rom the lines as any cement slurry lef t in the lines will set and block the line rendering the cement unit
1 Water with soluble and suspended additives required to ensure that the cement has the correct properties 2 A spacer is a fluid used to separate the drilling fluids and cement mixes.

Captain EOR Stage 2 Phase II Project Environmental Statement
Section 8 Discharges to Sea
8-2
incapable of performing the next job until this blockage is removed. The water and residual cement are
discharged overboard.
The need to abort a cement job could arise for a number of reasons including a total failure of the pumping
equipment, a blockage (either on surface or down the wellbore) in the pipes through which the cement is
pumped, or due to changing downhole well conditions (i.e., wellbore collapse, losses, or well control
scenarios). In these instances, the consequences of not discharging mixed cement would be severe with the
potential for cement to settle in the pumps, pits and lines on the rig, rendering the equipment unusable until
the hardened cement is removed f rom surface equipment. This could in turn result in major workscopes
associated with disconnecting, removing and cleaning the lines before reconnecting them in order to return
the equipment to operational status.
Excess cement returned to seabed
Once injected, the majority of the cementing material remains down hole, although with the top hole sections
some discharge to the seabed is anticipated when the annulus is f illed with cement and casings are
cemented back to the seabed. Any cement returns (estimated at a maximum of 20 te per well) will be
discharged in the immediate vicinity of the wellhead and will likely impact on an area already impacted by
the drill cuttings.
The cement mixture is designed to set rapidly, and the majority of the slurry will set into masses of inert solid
cement, smothering a small area of seabed near to the casing, and ultimately will behave similar to inert hard
substrate. Discharges to the seabed are at a density of around 1.9 te/m3 in a semi-cohesive state and as
mentioned are expected to flow onto the area already disturbed by cuttings f rom drilling the top hole sections,
with some dispersion into the water column. The majority of the slurry will set into a thin diluted crust of
weakened, inert solid cement and smother a small area of seabed near to the casing, and ultimately will
behave as an inert hard substrate.
Large cement deposits on the seabed are not expected. Should they occur, they will be addressed in the
mandatory debris survey at the decommissioning stage at the end of field life. It is not expected any deposits
would be capable of posing a hazard to towed f ishing gear in the area. However, if any large deposits are
identified during the decommissioning stage, relevant measures will be taken to mitigate any potential
dangers in the area.
8.1.2. Impacts of Discharges Associated with the Drilling Phase
The impacts associated with the deposition of drill cuttings on the seabed and the return of cement to the
seabed are discussed in Section 9 (Seabed Disturbance), whilst this section focuses on the discharges to
the water column.
Modelling of the fate of the drill cuttings f rom the three polymer injection wells to be drilled at Area D was
carried out using Dose-related Risk and Effect Assessment Model (DREAM) to predict environmental risks
to the seabed and the water column as a result of the discharge of drill cuttings (full details of the scenario
modelled, assumptions made, results and uncertainties are provided in Appendix C). With respect to the
impact on the water column, the results indicated that the volume of the water column where there is a risk
to over 5% of sensitive species varies over time and that the volume at risk reduces rapidly after each
discharge stops and disappears completely within 24 hours of the last discharge from each well.

Captain EOR Stage 2 Phase II Project Environmental Statement
Section 8 Discharges to Sea
8-3
The primary risk to the water column over this period was from the barite and bentonite particles (combined
contribute to c. 70% of the risk) whilst the chemicals and reservoir oil3 contribute c. 30% of the risk.
Any discharges of cement to the water column (e.g. from planned f lushing operations of the cement unit or f rom an aborted cement job) are expected to disperse rapidly in the upper water column. Stark and Mueller (2003) concluded that at North Sea temperatures, cement particles that have been diluted will not increase significantly in particle size due to their hydration reaction and will remain in the range 10-30 microns or smaller which is controlled by their manufacture and specification. Such particles will take many days to settle through the water column and will be in an inert reacted state once on the seabed. The initial discharge may af fect plankton in the localised area of the plume, with rapid recovery expected similar to a discharge of drilling solids.
Suspended sediments in the water column resulting f rom the discharge of the drill cuttings or cement washes have the potential to impact on the flora and fauna associated with the water column.
Primary production by phytoplankton may be impacted by reduced light penetration and nutrient availability, however given the short duration of the discharges, and their dilution following discharge, any potential impacts on primary production are not considered measurable. Argendt et al. (2011) found that some species of copepods (species of zooplankton) were found to feed at lower rates in the presence of high concentrations of suspended sediments. Their f indings also suggest that in the presence of ongoing high levels of elevated sediments, egg production rates by some zooplankton could be reduced. Again as the discharges are short term and will be diluted immediately, any potential impacts on zooplankton are expected to be at an individual level (e.g. particle may clog f ilter feeding structures) and not a population level such that any impacts on zooplankton of these discharges are also not considered measurable.
Todd et al. (2015) carried out a review of the potential impacts of marine dredging activities on marine
mammals. The authors concluded that there was no evidence of significant impacts on marine mammals of
suspended sediments. Therefore it is expected that any impacts f rom the discharged drill cuttings and
cement f luids will not be measurable.
The sensitivity of fish to suspended sediments varies greatly between species and their life history stages
and depends on sediment composition (particle size and angularity), concentration and the duration of
exposure (Newcombe and Jensen, 1996). Being the major organ for respiration and osmoregulation, gills
are directly exposed to, and affected by, suspended solids in the water. If sediment particles are caught in
or on the gills, gas exchange with the water may be reduced leading to oxygen deprivation (Essink 1999;
Clarke and Wilber 2000). This ef fect is greatest for juvenile fish as they have a higher oxygen demand and
small gills at higher risk of clogging (FeBEC 2010). As some f ish species in the area are considered to be
PMFs (Section 3.5.2) including sandeel, mackerel and cod, receptor sensitivity is considered Med ium (b).
However, given the relatively small volume of water expected to be impacted by sediments, and the relatively
short time period that the sediments will be in the water column, the magnitude of impact is considered
Negligible. The overall impact significance is therefore considered Low such that any impacts of the
suspended drill cuttings is considered negligible.
Given that a number of fish species in the area of the Captain field are considered to be PMFs (see Section 4.4.3), and t that all cetaceans are considered Annex IV species and harbour porpoise are Annex II species, the sensitivity of receptors in the water column is considered Medium (B). The results of the drill cuttings discharge modelling indicate that any potentially significant impacts on the water column will disappear within 24 hours. In addition, it is expected that over a period of hours, the cement discharges to the water column (e.g. following the washing of the cement unit or as a result of an aborted cement job) will be indistinguishable f rom background suspended solids concentrations. The Magnitude of Effect of these discharges on the water
3 Any reservoir oil that may be discharged will be associated with the cuttings f rom the 8½" section (lowest hole section). The modelled assumed 0.688 te of reservoir oil per well. This volume of oil represents 0.34 % of the weight of cuttings from the 8½" section and aligns with the average volumes of oil associated with the cuttings from other wells drilled at the Captain field.

Captain EOR Stage 2 Phase II Project Environmental Statement
Section 8 Discharges to Sea
8-4
column is therefore considered Negligible (1). The overall impact significance is therefore considered Low such that any impacts of the suspended drill cuttings and cement discharges are thought to be negligible. Note the impacts on benthic species is considered in Section 9 (Seabed Disturbance).
8.2 Subsea Installation and Commissioning Phase
As described in Section 3.7.5, following installation and hook-up of the flowlines, testing and commissioning
operations will be required to test the integrity of the lines.
These discharges could contain chemicals including oxygen scavengers and biocides to mitigate the risks
of corrosion or bacterial growth whilst an ultraviolet-fluorescent dye may be added to assist in leak detection.
Ithaca Energy aims to minimise the ef fect of the chemicals used/discharged during its operations and as
such, wherever possible, chemicals will be chosen which are PLONOR (Pose Little Or No Risk) or are of a
Hazard Quotient (HQ) <1. All CHARMable (Chemical Hazard Assessment and Risk Management) chemicals
discharged will be further assessed by calculating a Risk Quotient (RQ). Where chemical use and discharge
results in a RQ value >1, thus indicating a possible risk of the discharge causing harm to the marine
environment, further investigation of the product will be carried out to determine if there is an alternative
product that can be used which produces a lower RQ.
There is also the possibility of some hydraulic fluids being released during subsea valve operation and
maintenance. However given the use of water based hydraulic fluids, any environmental impacts will be
limited.
All chemicals used during pipeline testing and commissioning will be risk assessed within the relevant
Chemical Permit applications. The testing will be carried out over a short timescale and the amount of
chemicals discharged to the marine environment will be minimised.
Marine f lora and fauna may be affected on a localised level but given Ithaca Energy’s commitment to prioritise
the use of chemicals which are PLONOR, or are of a HQ <1, the rapid dilution that will occur on discharge
means that the magnitude of effect is considered Negligible (1). Combined with a receptor sensitivity of
Medium (B) the impact of significance is considered Low such that any impacts of the chemicals discharged
during commissioning are thought to be negligible.
8.3 Production Phase
8.3.1 Water Discharges
Formation water is naturally trapped in oil and gas reservoirs and despite efforts to produce the hydrocarbons
selectively, a fraction of this water is brought to the surface mixed with oil and gas. This produced water may
comprise dispersed oil, metals and organic compounds such as dissolved hydrocarbons, organic acids and
phenols.
The PWRI system at the Captain Field is designed such that 100 % of the PW is reinjected. Therefore, there
will be no PW discharges to sea and as such, PW is not discussed further within this section.
Discharges of cooling water and drainage water at the Captain installations are not anticipated to change as
a result of the Captain EOR Sage 2 Phase II Project and are therefore not discussed further.

Captain EOR Stage 2 Phase II Project Environmental Statement
Section 8 Discharges to Sea
8-5
8.4 Decommissioning Phase
Some planned discharges to sea are likely to occur during the decommissioning of the Captain Field,
including the inf rastructure installed as a result of the proposed Captain OER Stage 2 Phase I Project . These
may include the following:
• Routine MARPOL compliant discharges f rom vessels associated with the decommissioning activities;
• Discharges associated with well abandonment; and • Discharges resulting f rom the disconnection / cutting and recovery (where applicable) of the
umbilicals, flowlines etc.
Discharges to sea resulting f rom the decommissioning activities will be described in the Environmental
Appraisal submitted in support of the Decommissioning Programme.
All discharges that may be contaminated with hydrocarbons will be treated to below minimum levels required
at the time of decommissioning or shipped to shore for treatment and disposal.
8.5 Cumulative and Transboundary Effects
The cumulative impact of drill cuwttings and cement on the seabed are discussed in Section 9. In relation to
all other discharges, given the proposed mitigation measures no signif icant cumulative impacts are
anticipated.
The Captain Field is located c. 188 km f rom the UK/Norway median line and therefore no transboundary
impacts are anticipated f rom the discharges associated with the proposed drilling, installation,
commissioning, production or decommissioning activities.
8.6 Mitigation Measures
The following industry standard mitigation measures will be undertaken to minimise the impacts of any
discharges to sea associated with the proposed Captain EOR Stage 2 Phase II Project.
Proposed Mitigation Measures
• The drilling rig has been audited under Ithaca Energy’s marine assurance standards and
subject to rig recertification audits;
• All vessels used will be MARPOL compliant;
• Where technically feasible Ithaca Energy will prioritise the selection of chemicals which are
PLONOR, or have the lowest RQ; and
• The discharges of any water based hydraulic fluids, sand or chemicals are regulated by the
OPPC and/or OCR regulations and reported through the EEMS. As such, Ithaca Energy will
ensure that sampling, analysis and reporting are undertaken in line with the regulations and
permit conditions.
Applying the risk assessment methodology described in Section 5 and taking account of the mitigation
measures listed above, the impact significance associated with the discharges to sea (other than those
associated with the accumulation of drill cuttings or cement on the seabed, which are discussed in Section
9, Seabed Disturbance) is considered low. The impacts are therefore considered acceptable when managed

Captain EOR Stage 2 Phase II Project Environmental Statement
Section 8 Discharges to Sea
8-6
within the additional controls and mitigation measures described. The proposed activities will be conducted
in compliance with all NMP policies; an assessment against the relevant NMP objectives is given in Appendix
A.

Captain EOR Stage 2 Phase II Project Environmental Statement
Section 9 Seabed Disturbance
9-1
9. SEABED DISTURBANCE
A number of activities will be carried out during the proposed project which have the potential to impact the
seabed and the associated benthic communities in the area. This section quantifies the area of potential seabed
disturbance and assesses the impact of the disturbance using the risk assessment methodology presented in
Section 5.
The extent to which the benthic habitats will be impacted depends on the size of the area that will be affected
and the temporal extent of the impact e.g. positioning of the mooring anchors associated with the semi -
submersible rig can have a temporary impact in the vicinity of the anchors whilst the area of seabed beneath
the inf rastructure to be installed can be considered a permanent impact. In addition, species sensitivity and the
habitat type in the area, and whether they are unique to the area or of significant conservation importance, are
important in determining the overall impact of the proposed project.
9.1 Drilling Phase
During the drilling phase the seabed will be disturbed as a result of:
• The laying of the anchors and anchor lines required for the drilling rig (see Section 3.6.3);
• Discharge of drill cuttings (see Section 3.6.5, and Appendix C);
• Return of cement to the seabed during cementing of the top hole section of the polymer injection wells
(see Section 3.6.7); and
• Installation of the Xmas trees (see Section 3.7.1).
The anticipated area of disturbance associated with each of these sources are presented in Table 9-1.
As described in Section 8.1.2 cuttings discharge modelling was carried out in support of the ES (Appendix C). The scenario modelled was the release of cuttings from the three wells to be drilled at Area D. Figure 9-1 shows the cuttings thickness expected following completion of the drilling of the three wells. For the three wells, the area showing a burial depth of > 6.5 mm occurs within 15 to 180 m of the wells and covers an area of 0.019 km2. The area where sediment thickness is > 6.5 mm reduces from 0.019 km2 to 0.0087 km2 after 10 years. Note 6.5 mm is the depth that in the absence of any other stressors there is a risk to more than 5% of the species most sensitive to change. The > 6.5 mm threshold for burial thickness is based on the probability that a specific species will escape a given depth of burial with both exotic (e.g. drill cuttings) and native sediments. The threshold was derived f rom the burial sensitivity of 33 species (Smit et al., 2006 and Kjeilen Eilersten et al., 2004). With respect to drill cuttings, Table 9-1 allows for the same area of impact at the Area B, D and E drill centres and therefore represents a worst case as only one well will be drilled at Area B.

Captain EOR Stage 2 Phase II Project Environmental Statement
Section 9 Seabed Disturbance
9-2
Figure 9-1: Depositional thickness around the drilling location at the end of drilling (Genesis, 2022, Appendix C).
9.2 Installation Phase
During the installation phase the seabed will be disturbed as a result of:
• Jet trenching of the flowlines and umbilicals (see Section 3.7.3);
• Installation of the tie-in spools and jumpers at Area D and Area E (see Section 3.7.3);
• Installation of the three SUDS (see Section 3.7.2); and
• Installation of the stabilisation features (see Section 3.7.4).
Table 3-9 and Table 3-10 summarise the subsea infrastructure and stabilisation features to be installed as part
of the proposed project. Table 9-1 summarises the seabed areas anticipated to be temporarily and permanently
impacted by the proposed installation activities. It should be noted, the area of disturbance presented represents
a worst case, for example of the area impacted by the grout bags will likely also be impacted by the mattresses
and inf rastructure. Rock dump was assessed based on the worst case estimate. The f lowlines and EH umbilicals
will be trenched their full lengths apart from on the approaches to the BLP, SUDS or wells. At these approaches
the lines will transition out of the trench and be surface laid and protected with a combination of mattresses and
25 kg grout bags.
Given the small size of the flowlines and umbilicals, laying the lines exposed on the seabed was not a feasible
option, whilst burying the lines was considered preferable to adding rock berms along the full line lengths. Jet
trenching has been selected over trenching and burying due to the soil in the Captain field area, past trenching
performance in the field and as a way of minimising the seabed disturbance.
Whilst the flowlines and umbilical's will be trenched and buried along the majority of their length, mattresses and
25 kg grout bags will be used to provide stabilisation/protection to the ends as they exit the trenches at the line
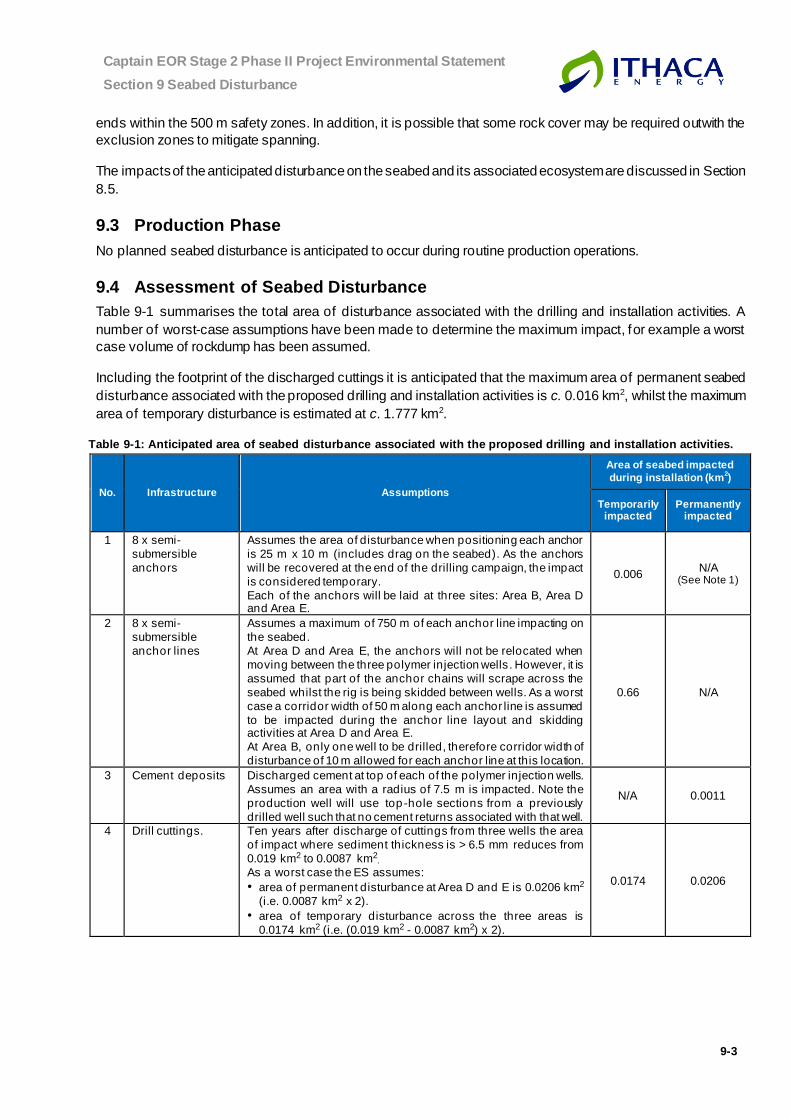
Captain EOR Stage 2 Phase II Project Environmental Statement
Section 9 Seabed Disturbance
9-3
ends within the 500 m safety zones. In addition, it is possible that some rock cover may be required outwith the
exclusion zones to mitigate spanning.
The impacts of the anticipated disturbance on the seabed and its associated ecosystem are discussed in Section
8.5.
9.3 Production Phase
No planned seabed disturbance is anticipated to occur during routine production operations.
9.4 Assessment of Seabed Disturbance
Table 9-1 summarises the total area of disturbance associated with the drilling and installation activities. A
number of worst-case assumptions have been made to determine the maximum impact, for example a worst
case volume of rockdump has been assumed.
Including the footprint of the discharged cuttings it is anticipated that the maximum area of permanent seabed
disturbance associated with the proposed drilling and installation activities is c. 0.016 km2, whilst the maximum
area of temporary disturbance is estimated at c. 1.777 km2.
Table 9-1: Anticipated area of seabed disturbance associated with the proposed drilling and installation activities.
No. Infrastructure Assumptions
Area of seabed impacted
during installation (km2)
Temporarily impacted
Permanently impacted
1 8 x semi-
submersible
anchors
Assumes the area of disturbance when positioning each anchor
is 25 m x 10 m (includes drag on the seabed). As the anchors
will be recovered at the end of the drilling campaign, the impact
is considered temporary.
Each of the anchors will be laid at three sites: Area B, Area D and Area E.
0.006 N/A
(See Note 1)
2 8 x semi-
submersible
anchor lines
Assumes a maximum of 750 m of each anchor line impacting on
the seabed.
At Area D and Area E, the anchors will not be relocated when
moving between the three polymer injection wells . However, it is
assumed that part of the anchor chains will scrape across the
seabed whilst the rig is being skidded between wells. As a worst
case a corridor width of 50 m along each anchor line is assumed
to be impacted during the anchor line layout and skidding activities at Area D and Area E.
At Area B, only one well to be drilled, therefore corridor width of
disturbance of 10 m allowed for each anchor line at this location.
0.66 N/A
3 Cement deposits Discharged cement at top of each of the polymer injection wells.
Assumes an area with a radius of 7.5 m is impacted. Note the
production well will use top-hole sections from a previously
drilled well such that no cement returns associated with that well.
N/A 0.0011
4 Drill cuttings. Ten years after discharge of cuttings from three wells the area
of impact where sediment thickness is > 6.5 mm reduces from
0.019 km2 to 0.0087 km2.
As a worst case the ES assumes:
• area of permanent disturbance at Area D and E is 0.0206 km2
(i.e. 0.0087 km2 x 2).
• area of temporary disturbance across the three areas is
0.0174 km2 (i.e. (0.019 km2 - 0.0087 km2) x 2).
0.0174 0.0206

Captain EOR Stage 2 Phase II Project Environmental Statement
Section 9 Seabed Disturbance
9-4
No. Infrastructure Assumptions
Area of seabed impacted during installation (km
2)
Temporarily
impacted
Permanently
impacted
Note as the production well are Area B, is being drilled as a side
track well, there will be no cuttings discharged at the seabed at
this location.
5 Xmas trees
associated with
the six polymer
injection wells
Dimensions: c. 4.92 m (L) x 4.89 m (W).
A worst case of temporary disturbance of 2 m on each side of
each Xmas tree has been allowed for. As mentioned in Section
3.7.1, the Xmas tree associated with the production will be
installed within the existing UTM.
0.00033 0.00014
6 Jet trenching of
four lines to Area D
Calculation assumes the EH umbilicals and polymer injection
flowlines to Area D are all 4,728 m in length (see Table 3-9 for
actual lengths).
Target is to lay the flowlines 15 m apart, however, to allow for
any jet trenching difficulties, it is assumed the lines wil l be laid
20 m apart. Corridor width of temporary disturbance where
suspended sediments may settle out to a depth of > 0.6 mm
across the four lines is assumed to be 100 m (see Figure 9-2).
0.4728 N/A
7 Jet trenching of
four lines to Area E
Calculation assumes the EH umbilicals and polymer injection
flowlines to Area D are all 5,757 m in length see Table 3-9 for
actual lengths).
Assumptions made are as for Row 5.
0.5757 N/A
8 2 x piled SUDS (one at Area D and
one at Area E)
Dimensions: c. 6 m (L) x 6 m (W) x 3 m (H). To assess the temporary area of disturbance a worst case of
2 m on either side of each structure is assumed. 0.000144 0.000096
9 1 x gravity-based
SUDS (at BLP riser
base)
Dimensions: 8 m (L) x 7 m (W).
To assess the temporary area of disturbance a worst case of
2 m on either side of the structure is assumed. 0.000076 0.000056
10 Mattresses Anticipated up to 412 mattresses will be required (measuring 6
m (L) x 3 m (W)). As a worst case it is assumed that an additional
area of 2 m on each side of each mattress will be temporarily
impacted during installation.
0.021424 0.007416
11 Grout bags 175 te of grout bags (7,000 x 25 kg) to be used. Assessment assumes 1 te of grout bags permanently impacts on 1 m2 of
seabed. See Note
2. 0.000175
12 Rockcover
(contingency)
ES allows for 20,000 te of continency rock. Assessment
assumes 1 te of rock permanently impacts on 1 m2 of seabed
and also temporarily impacts on 1 m2 of seabed. 0.02 0.02
Total 1.7771 0.0163
Note:
1. As the flowlines and umbilicals are to be jet trenched, they will only exhibit temporary disturbance to the seabed prior
to burial, hence a permanent area of impact has not been included.
2. Temporary area of disturbance associated with the 25 kg grout bags is expected to overlap with the temporary area of
disturbance associated with the mattresses and therefore has not been calculated separately.
3. As the spools and umbilical jumpers will be protected by mattresses and grout bags, the area of seabed impacted by
these items is captured within the footprint of that covered within line items 10 and 11. Therefore, separate rows for the
tie-in spools and umbilicals have not been added. A similar approach has been taken for the umbilical that will connect
to the SUDS to be located at the base of the BLP.

Captain EOR Stage 2 Phase II Project Environmental Statement
Section 9 Seabed Disturbance
9-5
Figure 9-2: Illustration showing how corridor of disturbance of 100 m was selected to determine footprint of
disturbance from jetting of lines to Area D and Area E (see row item 5 in Table 9-1).
The physical disturbance resulting from the placement of the drilling rig’s anchors and associated anchor lines,
and the installation of the subsea infrastructure and accompanying stabilisation features can cause mortality or
displacement of mobile benthic species in the impacted area, direct mortality of sessile seabed organisms that
cannot move away from the contact area and direct loss of habitat. In addition, disturbance f rom sediment re-
suspension will occur in the immediate area when the structures are initially positioned.
Mattresses, rockdump and grout bags have similar impacts in terms of loss of habitat and smothering of the
benthos. In addition to causing mortality or displacement of benthic animals the stabilisation features may also
create habitats for benthic organisms that live on hard substrates e.g. sponges, soft corals and tubeworms, sea
slugs, hermit crabs and brittle stars (Coolen et al., 2018).
The installation of the anchors associated with the drilling rig will likely cause some scars on the seabed. The anchors will, however, be subsequently recovered such that the substrate in the area will not change. The f lowlines and umbilicals are to be jet trenched and buried, which will temporarily reduce the sediment quality, however, this will recover due to the backfilling of the trenches.
The cuttings from the top-hole sections of the wells and the cement deposits following cementing of the top-hole sections will result in a change in composition of the seabed in a small area in close proximity to the wells. The drilling activities will result in small pieces of rock (‘cuttings’) being returned to the seabed.
As described in Section 9.1 cuttings modelling was undertaken using DREAM to predict environmental risks to
the seabed and the water column as a result of the discharge of cuttings during drilling of the three polymer
injection wells at Area D.
The discharge of drill cuttings is expected to result in a very localised temporary reduction in water quality in the
lower part of the water column (approximately 10 m above the seabed), primarily due to an increase in
suspended solids (barite and bentonite). On the seabed, discharged cuttings will change the grain size in the
immediate vicinity of the wells and is expected to result in a burial thickness that could be a risk to some of the

Captain EOR Stage 2 Phase II Project Environmental Statement
Section 9 Seabed Disturbance
9-6
animals in the area. In addition, some benthic animals may be impacted by chemical concentrations and oxygen
depletion.
The modelling predicted that the maximum estimated deposited sediment thickness (cuttings pile height) was
1.51 m, in the immediate vicinity of one of the wells, reducing rapidly with distance. The modelling outputs
indicate that the deposited cuttings could result in a combined risk to seabed sediment > 5% in a maximum area
of 0.1098 km2 c. 237 days af ter drilling commences. This footprint reduces over time, to 0.0285 km2 af ter 10
years though in reality re-colonisation by benthic organisms would result in a faster seabed recovery. Note the
combined risk takes account of burial thickness, grain size change, oxygen deletion and toxicity whilst the area
of impact presented in Table 9-1 relates to the area over which depth of burial is > 0.6 cm.
Across the Captain field numerous cobbles and boulders have been observed (Fugro, 2015a; and Fugro, 2021a) such that though the seabed in the area primarily comprises deep circalittoral mud’, there are existing natural features and subsea infrastructure (associated with the Captain field) that provide a substrate for benthic species to inhabit (see Figure 4-6 for growth of benthic species on existing boulders). Therefore though the drill cuttings, cement discharges, stabilisation features and SUDs may be laid on muddy sediments, rather than introducing hard substrates for new benthic species to attach to, they will increase the footprint of the existing hard substrates on which species may settle.
It is possible that disturbed sediment particles may be transported via tidal currents for re-settlement over
adjacent seabed areas. This may have indirect negative effects on the benthic ecology in the vicinity, including
smothering and scour of seabed communities causing a loss of species diversity, abundance and biomass in
ef fected areas. Sessile epifaunal species may be particularly affected by increases in suspended sediment
concentrations as a result of potential clogging or abrasion of sensitive f eeding and respiratory apparatus
(Nicholls et al., 2003). Larger, more mobile animals, such as crabs and fish, are expected to be able to avoid
any adverse suspended solid concentrations and areas of deposition. Re-suspended sediments could have a
negative impact on suspension feeding organisms such as sea pens and bivalves including A. islandica, both
of which are known to occur in the area (see Section 4.4.2). Within Marine Scotland’s Feature Activity Sensitivity
Tool (FeAST) A. islandica are described as having a high sensitivity to sub-surface abrasion and siltation
changes although damage is related to body size with larger specimens being more vulnerable. A. islandica
burrow into the sediment and use a short inhalant siphon which sits above the sediment surface for feeding and
respiration (Taylor, 1976). Surface abrasion and siltation may therefore damage/clog the inhalant siphon;
however it should be noted that following smothering/burial (up to 40 cm), they are able to burrow to the surface
(Powilleit et al., 2009). A. Islandica is therefore not considered sensitive to smothering of up to 30 cm of material
added to the seabed in a single event (Tyler-Walters & Sabatini, 2017). Given the widespread distribution of A.
islandica across the CNS, any mortality caused to individual specimens as a result of the proposed activities is
not considered significant given the relatively limited area of impact.
Recovery times for faunal communities following disturbance resulting from the installation activities are difficult to predict, although some studies have attempted to quantify timescales. Collie et al. (2000) examined impacts on benthic communities f rom bottom towed f ishing gear and concluded that, in general, sandy sediment communities were able to recover rapidly, although this was dependent upon the spatial scale of the impact. It was estimated that recovery f rom a small-scale impact, such as a f ishing trawl, could occur within about 100 days. It was assumed that recolonisation was through immigration into the disturbed area rather than from settlement or reproduction within the area.
Where avoidance by fish is not possible the sensitivity to suspended sediments varies greatly between species and their life history stages, dependent upon sediment composition (particle size and angularity), concentration and the duration of exposure (Newcombe and Jensen, 1996). Being the major organ for respiration and osmoregulation, gills are directly exposed to and affected by suspended solids in the water. If sediment particles are caught in or on the gills, gas exchange with the water may be reduced leading to oxygen deprivation (Essink

Captain EOR Stage 2 Phase II Project Environmental Statement
Section 9 Seabed Disturbance
9-7
1999; Clarke and Wilber 2000). This ef fect is greatest for juvenile f ish as they have small easily clogged gills and higher oxygen demand (FeBEC 2010).
IOGP report 543 (IOGP, 2016) examines evidence relating to the ef fect of cuttings discharges on early-stage f ish life and concludes that they generally have a low toxicity to pelagic invertebrates and early life stages of f ish. Studies on early life stages of sea scallops, lobsters and haddock (Cranford et al., 1998) showed a slight reduction in survival of haddock and fed (but not unfed) lobster after 96 hours exposure at 100 mg/l of drilling f luid suspension and no effect on fertilisation, survival or growth of sea scallops.
The ability for organisms including fish species to detect predators may be reduced as a result of low visibility associated with suspended sediments. In instances of persistent and widespread suspended sediments there is the possibility of reduced feeding success among juvenile f ish which may inf luence survival, year-class strength, recruitment and overall condition (Clarke and Wilber, 2000). However, as the proposed activities are relatively short term any impacts f rom low visibility are expected to be temporary and are not considered significant.
Given the presence of designated species in the area e.g. A. islandica which is considered an OSPAR
threatened and or declining species and a number of PMFs (see Section 4.5.2), receptor sensitivity in the area
is considered Medium (B). Any changes to the receptors impacted are not considered significant. Most receptors
are expected to be impacted at an individual level rather than a population level and once drilling and installation
activities are completed, recovery of the ecosystem is expected to commence such that the long term magnitude
of effect of disturbance to the seabed from all activities is considered Minor (2). Combining a Medium sensitivity
with a Minor magnitude of effect, the impact significance is considered Low such that any environmental impacts
are considered to be negligible.
9.5 Decommissioning Phase
The decommissioning activities at Captain will result in some temporary disturbance to the seabed. Sources of disturbance could include:
• Seabed sampling for pre-decommissioning survey work; • Localised dredging or jetting to allow access for cutting; • Recovery of subsea infrastructure; • Potential temporary wet storage of items following disconnection and prior to recovery;
• Temporary positioning of baskets for recovery of tie-in spools etc.; and
• Anchoring of drilling rig during well abandonment.
The environmental appraisal submitted in support of the Decommissioning Programme will capture the impacts
associated with the disturbance of the seabed. The activities will be further detailed in the relevant permit
applications prior to commencement of offshore campaigns. It is anticipated that the area disturbed by the
decommissioning activities will mostly be within the area disturbed by the installation activities.
9.6 Cumulative and Transboundary Effects
The drilling activities and infrastructure to be installed as part of the proposed Captain EOR Stage 2 Phase II project will increase the footprint of the infrastructure associated with the Captain Area including the footprint of rock should it be necessary to use the contingency rock. However, the increase in impacts have been minimised where possible, e.g. use of jet trenching as opposed to ploughing, using existing top hole sections for the production well, locating the polymer injection wells at Area D and E in close proximity such that the anchors can be laid once at each drill centre, ensuring the overall cumulative effect is kept to a minimum.
The Captain field is located c. 188 km from the UK/Norway median line and therefore no transboundary impacts

Captain EOR Stage 2 Phase II Project Environmental Statement
Section 9 Seabed Disturbance
9-8
are anticipated from the seabed impacts associated with the proposed activities.
9.7 Mitigation Measures
The following mitigation measures are proposed to minimise the impacts associated with disturbance to the
seabed resulting from the proposed project.
Proposed Mitigation Measures
• Pre-deployment surveys will be undertaken to identify suitable locations for the drilling rig anchors;
• Wells at Area D and Area E will be drilled in close proximity such that the anchors will only require to be laid once at each drill centre and the drilling rig can be skidded between wells;
• Production well at Area B will use top hole sections from a suspended well;
• Jet trenching rather that ploughing of flowlines and umbilicals; and
• The use of mattresses, rockdump and grout bags will be minimised through optimal project design.
Applying the risk assessment methodology described in Section 5 and taking account of the mitigation measures
listed above, the significance of impact of the seabed disturbance resulting f rom the proposed activities is
considered low.
The proposed project will be conducted in compliance with all NMP policies; an assessment against the relevant
NMP objectives is given in Appendix A.

Captain EOR Stage 2 Phase II Project Environmental Statement
Section 10 Underwater Noise
10-1
10. UNDERWATER SOUND
This chapter assesses the impact of sound associated with the proposed Captain project, using the risk
assessment methodology outlined in Section 5.
10.1 Introduction
Marine fauna use sound for navigation, communication and prey detection (Southall et al., 2007; Richardson,
et al., 1995). Therefore, the introduction of anthropogenic underwater sound has the potential to impact on
marine animals by interfering with the animal’s ability to use and receive sound (OSPAR, 2009). Offshore
exploration and production activities invariably generate underwater sound; for example, during geophysical
exploration, during drilling activities or piling operations and f rom the vessel operations. The level and
f requency range of sound generated varies with the type of activity.
It is generally accepted that exposure to anthropogenic sound can induce a range of adverse ef fects on
marine life (e.g. OSPAR, 2009). The type and extent of potential impact associated with sound on an animal
depends on many factors including the level and frequency characteristics of the sound, hearing sensitivity
and behaviour of the species, propagation characteristics of the operational area and whether or not marine
species are using the areal extent of the sound f ield. Potential impacts can vary from insignificant impacts
such as temporary avoidance or small changes in behaviour to significant impacts such as auditory and
physical injury (Southall et al., 2007; Southall et al., 2019; National Marine Fisheries Service (NMFS), 2018;
Richardson et al., 1995).
The Offshore Marine Regulations 2007 (as amended, 2010) make it an of fence to injure or disturb EPS
(including all marine mammals), where disturbance has a likelihood of impairing their ability to survive, to
breed or reproduce, to rear or nurture their young, or to migrate. It also includes the likelihood of significantly
af fecting the local distribution or abundance of the species. New projects must assess if their activity, either
alone or in combination with other activities, is likely to cause an offence involving an EPS.
10.2 Noise Sources Associated with the Proposed Project
Activities associated with the proposed Captain Stage 2 Phase II Project, resulting in the generation of
underwater sound, include:
• Drilling activities;
• Rock dumping activities (contingency);
• Vessel operations; and
• Piling of the SUDSs to be installed at Area D and Area E.
These underwater noise sources are discussed in more detail in the next Section.
10.3 Impacts of Noise Sources
10.3.1 Drilling Activities
Rotating equipment such as generators and pumps all result in underwater noise during drilling operations.
In general, noise f rom drilling operations has been found to be predominantly low f requency (< 1,000 Hz)
with relatively low source levels (Greene, 1987; Nedwell and Edwards, 2004; McCauley, 1998). Furthermore,
a study by Greene (1987) found that the noise generated by drilling activities from a semi-submersible drilling
rig did not exceed local ambient levels beyond 1 km. Noise associated with the drilling activities is therefore
considered to be of a relatively low level and is not considered further in the ES.

Captain EOR Stage 2 Phase II Project Environmental Statement
Section 10 Underwater Noise
10-2
10.3.2 Rock Dumping Activities
It is not expected that rockdump will be required, however the ES captures a contingency of 20,000 te spot
rockdump to mitigate UHB (see Section 3.7.4). Nedwell and Edwards (2004) reported the sound f rom the
Rollingstone, a vessel with a specialised underwater chute to position rock on the seabed. The vessel used
dynamic positioning and was powered by two main pitch propellers, two bow thrusters and two azimuth
thrusters. It was concluded that the sound levels were dominated by the vessel and not the rock dumping
activities. Noise associated with the rock dumping activities is therefore considered to be of a relatively low
level and is not considered further in the ES.
10.3.3 Vessel Operations
Within the UKCS, vessel traffic is a substantial contributor to general anthropogenic underwater noise with
the primary sources of sound coming f rom the propellers, propulsion and other machinery (Ross, 1976;
Wales and Heitmeyer, 2002). Tables 3-8, Table 3-11, Table 7-7 and Table 7-8 summarise the total vessel
requirements for each phase of the project.
Richardson et al. (1995) reviewed the effects of sound from vessels on marine mammals. They noted that it
is not always possible to distinguish between effects due to the sound, sight or even smell of a vessel to an
animal but there is evidence that sound from vessels has an impact on marine mammals. Animals have been
reported to display a range of reactions from ignoring to avoiding the sound. The latter can lead to temporary
displacement from an area. Vessel sound can mask communication calls between cetaceans, reducing their
communication range (Jensen et al., 2009). It is not obvious whether temporary behavioural reactions
translate into long-term ef fects on an individual or population. Exposure to low f requency shipping sound
may be associated with chronic stress in whales; Rolland et al. (2012) reported a decrease in baseline levels
of stress-related faecal hormones concurrent with a 6 dB reduction in underwater sound along the shipping
lane in the Bay of Fundy, Canada, when traffic levels decreased.
Anthropogenic sound has the potential to interfere with acoustic communication, predator avoidance, prey
detection, reproduction and navigation in f ish. The ef fects of "excessive” sound on f ish include avoidance
reactions and changes in shoaling behaviour (Slabbekoorn et al., 2010). Prolonged avoidance of an area
may interfere with feeding or reproduction or cause stress-induced reduction in growth and reproductive
output. Fish exhibit avoidance reactions to vessels and it is likely that radiated underwater sound is the
cause; for example, sound from research vessels has the potential to bias f ish abundance surveys by causing
f ish to move away (de Robertis and Handegard, 2013; Mitson and Knudsen, 2003). Reactions include diving,
horizontal movement and changes in tilt angle (de Robertis and Handegard, 2013). Popper et al. (2014)
reviewed the ef fects of vessel sound on f ish. They noted that there is no direct evidence of mortality or
potential mortality to fish from vessel sound or other continuous sound sources The authors concluded that
the likelihood of sound f rom vessels causing mortality or injury to f ish was remote, even for f ish in close
proximity to vessels, however, it is possible sound f rom vessels may cause some behavioural disturbance
to f ish.
As receptors to underwater sound, marine mammals and fish receptor sensitivity is considered Medium (B)
due to a number of the species being designated (e.g. as Annex II species, or PMFs; see Section 4.5.2).
The area around the Captain f ield presents many background sound sources associated with vessel
movements to which marine mammals and fish are exposed. As the marine mammals and fish in the area
are accustomed to the presence of vessels, such that any impacts from vessel noise are typically behavioural
impacts, the magnitude of effect of the increased vessel noise on these receptors is considered Minor (2).
Given the Medium receptor sensitivity and the Minor magnitude of effect, the impact significance of the
increased vessel noise in the area is considered Low such that any environmental impacts are thought to be
negligible.

Captain EOR Stage 2 Phase II Project Environmental Statement
Section 10 Underwater Noise
10-3
10.3.4 Piling Activities
Piling requires a hydraulic hammer to forcibly drive tubular steel piles into the seabed, resulting in s ubstantial
levels of pulsed underwater sound being generated. The level of this sound depends on numerous factors
such as the size and operating energy level of the hammer, the diameter and length of the piles, the sub-
surface depth of pile, number of hammer strikes, and the physical factors that will inf luence sound
propagation (such as bathymetry, type of seabed substrate, water temperature and salinity).
Four piles measuring around 25 m in length and 24" (c. 0.61 m) in diameter will be required for each SUDS.
It is expected that it will take one hour to install each pile with the four piles at each structure being installed
in a single day. The piling activities will start with a soft start and based on previous piling activities at the
Area C, it is expected a maximum hammer energy of 20 kJ will be sufficient to install all piles. However, as
a worst-case scenario, a maximum hammer energy of 90 kJ has been considered in the underwater noise
modelling carried out to support the impact assessment.
Piling of the SUDSs will be the loudest sound source associated with the proposed project and will be the
activity that results in the largest extent of potential injury or behavioural disturbance to marine mammals
and f ish. Therefore, underwater sound propagation modelling has been conducted to estimate the potential
impacts of piling the SUDSs (Appendix D).
10.3.4.1 Marine Mammals
Section 4.4.4 describes the abundance, distribution and seasonal occurrence of marine mammals known to
occur in the Captain area. Marine mammals have been grouped by the National Oceanic and Atmospheric
Administration (NOAA) according to the hearing range for the species (Table 10-1; NMFS, 2018) indicating
which activities present during the development may produce sounds within the hearing range of the various
hearing groups. In many species sensitive to underwater sound, sensitivity is related to their use of high
f requency sound for echolocation.
Table 10-1: Marine mammal known to occur in the Captain area and hearing group.
Functional hearing group Generalised hearing range Species known to occur in the
Captain area
Low-frequency (LF) cetacean 7 Hz to 35 kHz Minke whale
Mid-frequency (MF) cetacean 150 Hz to 160 kHz Atlantic white-sided dolphin,
white-beaked dolphin
High-frequency (HF) cetacean 275 Hz to 160 kHz Harbour porpoise,
other species while echolocating
Phocid pinnipeds 50 Hz to 86 kHz Grey seal
* The frequency bands distinguish between very broad categories of sensitivity and sound sources
Offshore piling has been recognised as an activity that could, under certain conditions, cause disturbance
and/or injury to marine mammals (JNCC, 2010). The potential impact of underwater sound on the marine
mammal receptors has been assessed using the recommended JNCC guidance (JNCC, 2010). To support
the assessment of the impact of piling, underwater sound propagation modelling was carried out. Full details
of the modelling are available in Appendix D.

Captain EOR Stage 2 Phase II Project Environmental Statement
Section 10 Underwater Noise
10-4
The predicted sound levels f rom piling have been compared with the NOAA (NMFS, 2018) precautionary
thresholds for permanent threshold shift (PTS) to marine mammals. These thresholds are based on a
comprehensive review of evidence for impacts of underwater sound on marine mammals and are now widely
applied as appropriate precautionary criteria for assessing the impact of underwater sound on marine
mammals (JNCC, 2010a).
As discussed in detail in Appendix D predicted sound levels from the proposed piling at Captain have been
compared to the NOAA zero-to-peak sound pressure level (SPL) and cumulative sound exposure level (SEL)
thresholds for PTS onset. The predicted distances to the NOAA PTS thresholds are summarised in
Table 10-2. As the distances shown in Table 10-2 are less than the nominal 500 m mitigation zone radius
include in the JNCC Guidelines (JNCC, 2010), implementation of JNCCs standard mitigation measures (see
Section 10.5) will further reduce the likelihood of PTS occurring for all marine mammal groups.
Table 10-2: Predicted maximum distances from the piling location where sound levels decrease to below the
NOAA zero-to-peak SPL and cumulative SEL thresholds for potential PTS onset using a 90 kJ hammer energy.
Marine Mammal
Hearing Group
Predicted Maximum Distance to Threshold 1
NOAA unweighted zero-to-peak SPL
thresholds for potential PTS onset
NOAA unweighted cumulative SEL
thresholds for potential PTS onset 2
LF Cetaceans 10 m Threshold not exceeded
MF Cetaceans 10 m Threshold not exceeded
HF Cetaceans 50 m Threshold not exceeded
Phocid Pinnipeds 10 m Threshold not exceeded
1 Predicted distances have been rounded up to the nearest 10 m. 2 Estimated for marine mammals swimming away from the piling location at 2 m/s
Table 10-3 presents the results of the modelling for predicting the distance associated with any marine
mammal behavioural disturbance due to piling at the Captain f ield area. The predicted disturbance is
consistent with observations made during piling activities at other developments. The piling activities at each
SUDS are expected to be completed within one day of commencement, such that any marine mammals
disturbed are expected to return to the area af ter cessation of activities. Any disturbance experienced is
therefore considered to be temporary.
Table 10-3: Predicted distances where sound levels decrease to below the adopted marine mammal
behavioural disturbance thresholds and areas of potential disturbance for a 90 kJ hammer energy.
Criterion SEL Behavioural Disturbance Threshold
(dB re 1 μPa2s) Distance 1
Tougaard (2016) criteria for behavioural
disturbance to all marine mammals 145 8 km
1 Predicted distance has been rounded up to the nearest 1 km.
With the application of JNCC guidance any impacts of the proposed piling activities on marine mammals are
considered to be short term behavioural impacts rather than resulting in injury such that the magnitude of
ef fect is considered Minor (2). Given the Medium receptor sensitivity (see Section 10.3.3) and the Minor
magnitude of effect the impact significance of piling noise on marine mammals is considered Low such that
any environmental impacts are thought to be negligible.

Captain EOR Stage 2 Phase II Project Environmental Statement
Section 10 Underwater Noise
10-5
10.3.4.2 Fish
The f ish species associated with the project area are identified in Section 4.4.3. Fish species differ in their
hearing capabilities depending on the presence of a swim bladder, which acts as a pressure receiver
(McCauley, 1994). Most fish can hear within the range of 100 Hz to 1 kHz, with some able to detect lower
f requencies. Within this range, the hearing threshold varies from approximately 50 dB re 1 µPa for hearing
specialists to 110 dB re 1 µPa for non-specialists. Fish with a connection between the swim bladder and
otolith system have more sensitive hearing and may detect f requencies up to 3 kHz (Popper et al., 2003).
Many species of fish produce sounds for communication that are typically emitted at frequencies below 1 kHz
(Montgomery et al., 2006).
Table 10-4: Fish groupings with respect to presence/absence of swim bladder.
Fish group Species
Fishes with no swim bladder Mackerel
Fishes with swim bladder involved in hearing Herring
Fishes with swim bladder not involved in hearing Anglerfish, blue whiting, cod, Norway pout,
sandeel, spurdog and whiting
Potential impacts to fish species were also assessed by comparing the underwater sound modelling results
presented in Appendix D to the Popper et al. (2014) f ish injury thresholds. The results summarised in
Table 10-5 predicts that any injury to f ish will be limited to distances up to a maximum of 20 m f rom the
location of the piling activities.
Table 10-5: Predicted distances from the piling location where sound levels decrease to below the Popper
zero-to-peak SPL thresholds for injury/potential mortality using a 90 kJ hammer energy.
Fish Group Predicted Maximum Distance
to Threshold Exceedance *
Fishes with no swim bladder 10 m
Fishes with swim bladder involved in hearing 20 m
Eggs, larvae, and fishes with swim bladder not involved in hearing 20 m
* Predicted distances have been rounded up to the nearest 10 m.
With the implementation of a piling soft-start procedure it is expected that any fish in the area would disperse
to areas where injury or mortality would not occur, therefore any occurrence of injury to fish would be low.
Furthermore, if fish are disturbed by sound, evidence suggests they will return to an area once the activity
causing the disturbance has ceased (Slabbekoorn et al., 2010). Therefore the magnitude of effect of
underwater sound associated with the piling activities on f ish is considered Minor (2). Given the Medium
receptor sensitivity (see Section 10.3.3) and the Minor magnitude of effect, the impact significance of piling
noise on fish is considered Low such that any environmental impacts are thought to be negligible.
10.4 Cumulative and Transboundary Effects
The additional vessels will cause a modest increase in underwater noise in the area. However, as the vessels
will be located within a well-developed oil and gas area and piling activities will be relatively short term in
nature, any cumulative impacts of underwater sound are not considered significant. Similarly, given the short
time period associated with the piling activities, any cumulative impacts of underwater sound f rom these
activities are not considered significant.

Captain EOR Stage 2 Phase II Project Environmental Statement
Section 10 Underwater Noise
10-6
The Captain f ield is located c. 188 km f rom the UK/Norway median line and therefore no transboundary
impacts associated with the underwater sound from the vessels or piling activities are expected.
10.5 Mitigation Measures
The following industry standard mitigation measures will be undertaken to minimise the impacts of the
underwater noise sources associated with the Captain EOR Stage 2 Phase II project.
Proposed Mitigation Measures
• A qualif ied, trained and equipped marine mammal observer (MMO) will be present. The MMO
will carry out a pre-piling survey of a 500 m mitigation zone and, if an animal is detected, the
piling will be delayed until all marine mammals vacate the 500 m mitigation zone;
• A sof t-start/ramp-up of hammer energy will be employed where the hammer will commence
at a low energy at the start of piling. The soft start will be such that maximum hammer energy
will not be reached until after a period of 20 minutes;
• Passive Acoustic Monitoring (PAM) will be employed during periods of low visibility to detect
marine mammal presence; and
• Avoiding commencing piling at night or in poor visibility when marine mammals cannot reliably
be detected. If this cannot be avoided, then PAM will be used.
Applying the risk assessment methodology described in Section 5 and taking account of the mitigation
measures listed above, the impact significance of the various underwater noise sources associated with the
proposed project is considered Low. The impacts are therefore considered acceptable when managed within
the additional controls and mitigation measures identified. The proposed project will be conducted in
compliance with all NMP policies; an assessment against the relevant NMP objectives is given in Appendix
A.

Captain EOR Stage 2 Phase II Project Environmental Statement
Section 11 Waste Generation
11 - 1
11. WASTE GENERATION
This section discusses the types of waste likely to be generated as a result of the proposed Captain EOR
Stage 2 Phase II Project, and the waste management procedures that will be implemented to minimise and
monitor the volumes produced and disposed to landfill. Waste will be generated during all phases of the
project.
Ithaca Energy is committed to reducing waste production and to managing all produced waste, by applying
approved and practical methods and by adhering to a waste hierarchy similar to that shown in Figure 11-1
(Scotland’s Environment, accessed 2020). Waste will only be disposed of if it cannot be prevented, reclaimed
or recovered. All wastes will be managed in accordance with Ithaca Energy’s Waste Management Procedure
and via the existing waste contract. The procedure establishes the controls required to manage the hazards
associated with the transportation and disposal of waste f rom offshore sites and the processes, and
verif ication activities necessary to ensure legal obligations are satisfied.
Figure 11-1: Representative schematic of Scotland’s Environment waste hierarchy (Scotland’s Environment, 2020).
Consent to transfer to the United Kingdom shore is not required but Duty of Care (under the Environment
Protection Act 1990) makes it the waste producer’s responsibility to ensure that waste is only transferred to
an appropriately licensed carrier who should have a Waste Carrier Registration. Transfer of Controlled Waste
requires a Transfer Note to be completed (or Consignment Note in the case of Special Waste). The Transfer
Note details the type and quantity of waste, f rom whom and to whom the waste has been transferred, the
category of authorised person to whom the waste has been consigned, relevant licence numbers, time, place
and date of transfer.
11.1 Vessel Waste
Waste will be generated from a number of vessels associated with the proposed activities including AHVs,
supply, DSVs, CSV, jet trenching vessels etc. (Tables 3-8, 3-11, 7-7 and 7-8) identify anticipated vessel
requirements). Waste f rom these vessels will be managed in line with the individual vessel Waste
Management Plan (WMP) in accordance with MARPOL requirements, which regulate discharges of waste
to sea f rom ships.

Captain EOR Stage 2 Phase II Project Environmental Statement
Section 11 Waste Generation
11 - 2
11.2 Drilling Waste
Drilling rigs generate various waste products during routine operations including contaminated cuttings,
waste oil, chemical and oil contaminated water and scrap metal. Wastes will be minimised by use of
appropriate procurement controls, and all wastes will be properly segregated for recycling / disposal /
treatment. The appointed waste management contractor will supply monthly reports of waste sent to shore
and will complete Controlled Waste Transfer Notes as required, and records of monthly disposals will be
maintained. Waste Management Duty of Care audits will also be carried out.
11.3 Installation and Commissioning
Installation activities will routinely generate a number of wastes including scrap metal, wooden crates etc. All
wastes will be properly segregated for recycling/disposal/treatment in accordance with Ithaca Energy’s
Waste Management Procedure and Controlled Waste Transfer Notes will be completed.
11.4 Production Phase
The Captain installations comply with Ithaca Energy’s waste management procedures. Controlled waste
transfer notes will continue to be completed as required and records on monthly waste disposal activities will
be maintained. The proposed project is not expected to result in a change to the current waste streams
occurring at the Captain installations.
11.4.1 General Waste
The Captain installation’s general waste streams are segregated by personnel at the source of generation,
and manually handled to the appropriate labelled waste receptacle until transferred onshore for disposal. All
waste is segregated in accordance with waste management procedures and controlled waste transfer notes
will be completed. Waste Management Duty of Care audits will also be carried out. Production of general
waste on the Captain installations are not expected to change as a result of the proposed Captain Stage 2
EOR Project.
11.4.2 Laboratory Waste
The Captain installations adhere to 100% reinjection and so there are no PW discharges. Any other
chemicals are segregated on site and sent to shore for disposal via a licensed contractor. As for g eneral
waste streams, a WMP is in place to minimise laboratory waste. Production of laboratory waste on Captain
installations is not expected to change as a result of the proposed project.
11.4.3 Special Waste
The Captain installations ship to shore a number of hazardous solid and liquid waste streams which may
include Naturally Occurring Radioactive Material (NORM) / Low Specific Activity (LSA) scale. The types of
hazardous wastes handled on the Captain installations will not change as a result of the proposed project.
11.5 Decommissioning Phase
The waste generated as a part of the decommissioning activities will be a combination of both hazardous
(special) and non-hazardous wastes. As operator, Ithaca Energy will have in place a WMP developed to
identify, quantify (where possible) and discuss available disposal options for waste resulting f rom the
decommissioning activities. Where possible, materials will be recycled or sold and reused taking into account
a waste hierarchy similar to that shown in Figure 11-1.
It is intended that recovered inf rastructure will be returned to shore and transferred to a decommissioning
facility, which will have all necessary approvals and licences in place and possess the capability to reuse or

Captain EOR Stage 2 Phase II Project Environmental Statement
Section 11 Waste Generation
11 - 3
recycle the majority of recovered material. The minimisation of waste is a factor considered at every stage
of the project.
11.5.1 Cumulative and Transboundary Effects
Waste will be managed in line with existing procedures and significant cumulative or transboundary impacts
are not expected.
11.6 Mitigation Measures
The following mitigation measures are proposed to minimise the waste produced from the proposed Captain
EOR Stage 2 Phase II project.
Proposed Mitigation Measures
• Ithaca Energy will apply the principles of the Waste Management Hierarchy during all
activities i.e. Reduce, Reuse, Recycle;
• Existing asset and vessel WMPs will be followed;
• Only permitted disposal yards / landfill sites will be used.
As a receptor, landf ill sites can be considered a f inite resource, such that applying the assessment
methodology presented in Section 5, the sensitivity of landfill sites as a receptor is considered Medium (B).
With the application of the above control measures the magnitude of effect of waste generated throughout
the project is deemed to be Negligible (1). Given the Medium sensitivity and the Negligible magnitude of
ef fect, the impact significance is considered Low such that any environmental impacts associated with waste
production are thought to be negligible.
The proposed project will be conducted in compliance with all NMP policies; an assessment against the
relevant NMP objectives is given in Appendix A.

Captain EOR Stage 2 Phase II Project Environmental Statement
Section 12 Accidental Events
12-1
12. ACCIDENTAL EVENTS
In line with OPRED Guidance (BEIS, 2021) this ES assesses in detail the impact of a worst-case hydrocarbon
release i.e. a subsea well blowout at the Captain f ield. However, it is acknowledged that other spills could
occur during the dif ferent project phases. These other spill sources are summarised before detailing the
environmental risks associated with an accidental hydrocarbon release from a subsea well blowout.
The Captain f ield has an approved Oil Pollution Emergency Plan (OPEP) in place, and this will be amended
to capture the proposed Captain wells including details on the flowrate and interface with the drilling rig. The
likelihood of an accidental event at the Captain installations is not considered to change as a result of the
proposed Captain EOR Stage 2 Phase II Project.
12.1 Overview of Potential Hydrocarbon Releases
12.1.1 Drilling Phase
Loss of contaminated discharges
During drilling, in addition to a potential subsea well blowout (see below), accidental releases of
contaminated discharges could include the loss of cleaning chemicals, mud inventory, other oily slops etc.
There is also a risk of an accidental spillage of mud or diesel during bunkering operations.
These releases could result in toxic or sub-lethal ef fects on sensitive organisms and ecosystems. The
resultant impacts depend on spill size, prevailing wind, sea state, temperature and sensitivity of
environmental receptors affected (e.g. benthic species, fish, marine mammals, birds and protected areas).
Approved operational procedures will be adhered to in order to mitigate the likelihood of such accidental
events and to minimise their impact should they occur. For example, the quantities of chemicals stored on
the drilling rig will be optimised. Control of Substances Hazardous to Health (COSHH) assessments will be
completed and Safety Data Sheets (SDS) will be made available. Where possible given technical
requirements, chemicals that are PLONOR, have a RQ < 1, or do not carry substitution warnings will be
prioritised. Spill kits will be located in close proximity to chemical and oil storage areas to enable a quick
response.
Procedures, in line with best industry practice guidelines will be in place to minimise the risk of an accidental
spill f rom bunkering. These will include, for example, regular checks of the integrity of the hose and
competence of operators. Trained personnel will undertake bunkering operations in accordance with
approved procedures. Containment facilities and drains will be inspected as part of marine assurance
standards.
An approved OPEP will be in place to respond to an accidental hydrocarbon release. Ithaca Energy is a
member of Oil Spill Response Limited (OSRL) and the Offshore Pollution Liability Association Ltd. (OPOL).
Local access to dispersant will be available via the ERRV. OPPC permit requirements will be adhered to.
Any accidental hydrocarbon release from a drilling rig at the Captain field will be responded to in accordance
with arrangements set out in the Captain installations OPEPs.
The environmental impact is considered to vary between the different accidental discharges identified. For
example, the severity of impact (Table 5-2) associated with a release of hydrocarbons during bunkering
operations is considered Minor (2) whilst the impact associated with a loss of fuel inventory is considered
Serious (3). However, when the likelihood of these accidental events taking place is taken into account most

Captain EOR Stage 2 Phase II Project Environmental Statement
Section 12 Accidental Events
12-2
are considered a low risk. Any risk will be reduced to As Low As Reasonably Practicable (ALARP) and
managed under the mitigation measures described such that it is considered acceptable.
Well blowout
A well blowout refers to the uncontrolled release of hydrocarbons f rom a well af ter the pressure control
systems have failed. Primary well control is achieved by maintaining a hydrostatic pressure in the wellbore
greater than the pressure of the f luids in the formation being drilled, but less than the formation f racture
pressure. In a worst-case scenario, there can be insufficient pressure in the wellbore fluids (i.e. the drilling
mud or completion f luids) to resist formation pressure and an inf lux occurs. Wellbore f luids are carefully
designed, monitored and actively managed to prevent such occurrences.
Well blowouts are most likely to occur during drilling operations. In the event of an influx, the flow of reservoir
f luids into the well is stopped by closing the BOP which is the initial stage of secondary well control. The
BOP has multiple sets of rams that can close off the well bore in an emergency. Secondary well control is
completed by circulating the well with kill weight fluid and displacing the influx out of the well. A blowout can
occur if primary and secondary well control fails.
Down hole safety valves (DHSVs) are in place to seal wells should an unplanned well event occur during
production. These DHSVs complement valves contained within the tree. Wells are plugged with cement and
decommissioned when production has ceased.
The International Association of Oil & Gas Producers (IOGP) has issued datasheets (IOGP, 2019) on well
blowout frequencies for drilling operations of a North Sea Standard (NSS), where the operation is performed
with a BOP installed and the “two barrier” principle is followed (Table 12-1). The dataset is derived from the
SINTEF well blowout database where a blowout is defined as an incident where formation f luid flows out of
the well or between formation layers af ter all the predef ined technical well barriers or the activation of the
same have failed. Well blowout frequencies have been calculated per well drilled in the North Sea and are
not an annual f requency. Note that well blowout frequency per total wells drilled is very low, indicating that
the likelihood of a well blowout occurring is very remote. The likelihood of a blowout occurring at a maximum
f low rate, or for an extended period of time, is lower still.
Table 12-1: Well blowout frequencies for North Sea offshore operations (IOGP, 2019).
Operation Gas Oil Unit
Development drilling (oil)* 4.2 × 10⁻⁵ 3.4 × 10⁻⁵
Per well drilled Development drilling (HP/HT) 2.6 × 10⁻⁴ 2.1 × 10⁻⁴
Development drilling shallow gas (topside) 1.7 × 10⁻³ -
Development drilling shallow gas (subsea) 1.0 × 10⁻³ -
* This figure is relevant to the proposed Captain EOR Stage 2 Phase II Project. Other types of well are shown
for comparison.
The impacts of a well blow-out are considered in Section 12.2. Given the offshore location a detailed
assessment of a loss of diesel inventory has not been included. However, modelling of a spill of 3,500 m3
diesel has previously been carried out using OSCAR1 to support the drilling permit application (DRA/926). In
summary the model predicted a low probability of diesel reaching the surrounding coastlines and a low
probability of the diesel reaching the UK/Norway median line (<5% for both surface water and water column).
1 Further details on the OSCAR model are provided in Section 12.2.1.

Captain EOR Stage 2 Phase II Project Environmental Statement
Section 12 Accidental Events
12-3
12.1.2 Installation and Commissioning Phase
During the installation and commissioning phase, there is a risk of accidental discharges of water-based
hydraulic fluids or treated seawater. This release could result in short-term localised effects on water quality,
f lora and fauna. To mitigate the potential of such releases occurring, containment facilities will be inspected
as part of the vessels HSE Management System audit, and a chemical risk assessment will be undertaken
as part of the Pipelines MAT application. Industry standard operating procedures and checks will be carried
out to prevent such a release where possible. Chemicals that are PLONOR, have a RQ < 1 and/or do not
carry substitution warnings will be prioritised where technically possible.
With the above mitigation measures in place the magnitude of effect of accidental discharges of water-based
hydraulic fluids or treated seawater is considered Minor (2) whilst the environmental risk is considered low
(likelihood ranked as remote). The risk is therefore considered acceptable when managed within the
additional mitigation measures described.
12.1.3 Production Phase
The potential for accidental events associated with the production phase is not considered to differ to the
current potential of such events at the Captain field.
Mitigation measures include the pre-existing 500 m safety zones at the Captain installations and at Area B
as well as the application of 500 m zones to be located at the two new drill centres (Area D and Area E).
Further mitigation measures include, optimal material selection, operating procedures in place and
preference for the use of water-based hydraulic f luids. With these mitigation measures in place the
environmental risk of an accidental event is considered low (likelihood of remote) and therefore acceptable
when managed within the mitigation measures described.
12.1.4 Decommissioning Phase
During decommissioning activities, the impact of any accidental events are anticipated to be within the range
of impacts discussed in the previous sections.
12.2 Assessment of a Well- Blowout
12.2.1 Modelled Scenario and Results
In support of the existing approved Captain OPEP, stochastic (probability) modelling using the SINTEF Oil
Spill Contingency and Response (OSCAR) modelling package was carried out for a well blow-out scenario
at the f ield (Ithaca Energy, 2022). The model using a declining release rate from 1,808.52 m3 / day to 512.86
m3 / day by day (resulting in a worst-case volume discharge of 88,615.6 m3)2. This scenario represents a
worst-case blow-out at the Captain field and therefore has been used to support this ES.
2 OSCAR supports two different types of simulations: stochastic (probabilistic) and deterministic. The stochastic
simulation feature of OSCAR allows for a spill scenario to be simulated multiple times over different weather conditions,
with the results from each individual stochastic simulation being aggregated, and a number of stati stical parameters
computed. To analyse a single spill scenario, the deterministic mode of OSCAR allows for a spill scenario to be simulated
over a single specified time interval and outputs can be presented in terms of key parameters such as oil thickness on
the sea surface, concentrations on the shoreline, in the sediment and in the water column.

Captain EOR Stage 2 Phase II Project Environmental Statement
Section 12 Accidental Events
12-4
The stochastic model outputs included:
• the probability (>10%) of surface oil meeting or exceeding 0.3 µm;
• the probability (>1%) and shortest time of surface oil crossing a median line; and
• the probability (>1%) and shortest time for shoreline oiling along UK and Member State coastlines
respectively.
Note as the oil spill modelling described here has previously been approved by OPRED (in the exiting OPEP
and in various drilling permit applications), only a summary of the results is provided here.
Outputs of the stochastic modelling results for each season are presented in Figure 12-1 (probability of surface oiling > 0.3 µm) and Figure 12-2 (arrival times). Table 12-2 summarises the time taken to cross various median lines and to arrive at the shore.
The modelling predicted a 90-100% probability of surface oil crossing the UK/Norway median line at any time during the year. There is also up to a 90-100% chance of shoreline oiling at the north-east Scottish coastline depending on the time of year. It should be noted that the modelling assumes no intervention/response methods in order to determine the environmentally worst -case. In reality, Temporary Of fshore Oil Pollution Emergency Plan (TOOPEP) would be implemented to respond to the spill.

Captain EOR Stage 2 Phase II Project Environmental Statement
Section 12 Accidental Events
12-5
Figure 12-1: Probability of surface oiling meeting or exceeding 0.3 µm.

Captain EOR Stage 2 Phase II Project Environmental Statement
Section 12 Accidental Events
12-6
Figure 12-2: Arrival time of surface oil.

Captain EOR Stage 2 Phase II Project Environmental Statement
Section 12 Accidental Events
12-7
Table 12-2: Probability (≥1%) and shortest time of surface oil crossing median line

Captain EOR Stage 2 Phase II Project Environmental Statement
Section 12 Accidental Events
12-8
12.2.2 Assessment of the Environmental Impact of a Well Blow-Out
The environmental impact of a hydrocarbon spill depends on various factors which include:
• Location and time of the spill;
• Spill volume;
• Hydrocarbon properties;
• Prevailing weather and metocean conditions;
• Environmental sensitivities; and
• Spill response strategy.
12.2.3 Impact on Water Quality
When a hydrocarbon enters the marine environment, it will become exposed to numerous ‘weathering’
processes which will impact the behaviour and fate of the hydrocarbon. As each hydrocarbon has its own
specific properties each one will weather differently. Captain Crude is an ITOPF Category Group III oil. The
specific gravity of oil is its density in relation to pure water, which has a specific gravity of 1. Captain Crude
has a specific gravity of 0.93 indicating that the oil is likely to remain on the sea surface during calmer
conditions, however; there is the potential for this oil to suspend below the sea surface during rougher
weather conditions.
The fate and ef fect of a spill is also dependent upon the chemical and physical properties of the
hydrocarbons. Due to the asphaltene content of Captain crude, the oil may emulsify (the oils’ ability to absorb
water) in the marine environment. Based on this alone it is unclear if Captain crude will readily form a stable
mousse in the marine environment. Under laboratory conditions, Captain crude has been shown to form a
stable mousse with a maximum water uptake of 51% at 20°C. However, experience during a previous
incident indicated that little emulsification occurred on that occasion.
12.2.4 Sediment Quality
Captain crude may suspend below the sea surface during rougher weather conditions and it is anticipated
that the magnitude of effect on seabed sediments could be Serious (3). Given the presence of habitats
identified as PMFs and Annex I (see Section, 4.4.2) the receptor sensitivity is considered Medium (B). The
impact significance is therefore considered Moderate and as the likelihood of a spill is considered Remote,
the environmental risk of a well blow-out on sediment quality is considered Low.
12.2.5 Plankton
The planktonic community is composed of a range of microscopic plants (phytoplankton) and animals
(zooplankton) that drift with the oceanic currents. As hydrocarbons can f loat on the water’s surface and
disperse within the ocean as it weathers, plankton may be exposed to both floating hydrocarbon slicks and
to small, dissolved droplets of hydrocarbon in the water column (Cormack, 1999; Almeda et al., 2013).
Changes in the patterns of distribution and abundance of phytoplankton can have a significant impact on the
entire ecosystem (Ozhan et al., 2014). Both oil and oil biodegradation can impact phytoplankton in the
immediate vicinity of a spill. Hydrocarbon slicks can inhibit air-sea gas exchange and reduce sunlight
penetration into the water, both essential to photosynthesis and phytoplankton growth (González et al.,
2009).
Zooplankton at the surface are thought to be particularly sensitive to oil spills due to their proximity to high
concentrations of dissolved hydrocarbon and to the additional toxicity of photo-degraded hydrocarbon

Captain EOR Stage 2 Phase II Project Environmental Statement
Section 12 Accidental Events
12-9
products at this boundary (Bellas et al., 2013). Following an oil spill, zooplankton may suffer f rom loss of food
resources in addition to the toxic effects from direct exposure, resulting in mortality or impaired feeding,
growth, development, and reproduction (Blackburn et al., 2014 and references therein).
The distribution of plankton across the UKCS is generally uniform and widespread such that it is likely that
plankton numbers would recover after the impact of an oil spill and most studies have found that there is a
rapid return to normal densities and community compositions once oil in water background levels have
returned (IPIECA-IOGP, 2015). Given the widespread distribution of plankton in the North Sea, receptor
sensitivity is considered Low (A) whilst the magnitude of effect is considered Minor (2) such that the impact
significance is considered Low. As the likelihood of a spill is considered Remote, the environmental risk of a
well blow-out on plankton is considered Low.
12.2.6 Habitats and Benthic Species
Seabed habitats and associated benthic species may potentially be impacted by a well blowout where
hydrocarbons are present in the water column or in the seabed sediment.
In response to hydrocarbon exposure, benthic fauna can either move, tolerate the pol lutant
(with associated impacts on the overall health and f itness), or die (Gray et al., 1988; Lee and Page, 1997).
The response to hydrocarbons by benthic species dif fers depending on their life history and feeding
behaviour, as well as the ability to metabolise toxins, especially PAH compounds. However, severe oil
pollution typically causes initial massive mortality and lowered community diversity, followed by extreme
f luctuations in populations of opportunistic mobile and sessile fauna (Suchanek, 1993).
As described in Section 4.4.2 seabed surveys carried out in the area of the Captain field identified a number
of benthic species in the area including f ilter feeders (e.g. sea pens and A. islandica). Filter feeders are
vulnerable to ingesting oil during feeding. Generally, infaunal polychaetes are particularly affected by oil
pollution (Suchanek, 1993), however, their recolonisation of ef fected areas varies with some species
decreasing after an oil spill whilst others may be the first colonisers (Blackburn et al., 2014 and references
therein). Burrowing bivalves and small crustaceans called amphipods can be sensitive to even brief
exposures of relatively low hydrocarbon concentrations (IPIECA-IOGP, 2015; Suchanek, 1993), possibly
because of their low dispersal rate and limited mobility. P. jeffreysii is known to be highly tolerant of
hydrocarbon contamination (MarLIN, 2016 and references therein) and intolerant of elevated heavy metal
concentrations such as copper (Rygg, 1985).
According to FeAST (Marine Scotland, 2020), oil from spills would have to be dispersed deep into the water
column to affect a burrowed mud feature. Information on the impacts of hydrocarbons on sea pens is limited
(Hill and Wilson, 2000), however, a study on the impact of oil on deep-sea megafauna (McClain et al., 2019)
notes that at the Deepwater Horizon oil spill site in 2017 (seven years af ter the spill incident), there was
lowered species diversity and sessile fauna such as sea pen were absent. This may reflect low resiliency to
pollution, especially in cnidarians.
Given the presence of habitats and species identified as PMFs and Annex II/Annex I (see Section, 4.4.2) the
receptor sensitivity is considered Medium (B) whilst the magnitude of effect is considered Serious (3). The
impact significance is therefore considered Moderate, however as the likelihood of a spill is considered
Remote, the environmental risk of a well blow-out on sediment quality is considered Low.
12.2.7 Fish
Exposure of fish to hydrocarbons can occur either through uptake across the gills or skin or by direct ingestion

Captain EOR Stage 2 Phase II Project Environmental Statement
Section 12 Accidental Events
12-10
of the pollutant through contaminated prey. Pelagic species, which spend the majority of their life cycle in
the water column, are likely to receive the highest exposure to contaminants that remain near the surface,
whereas demersal fish species, associated with the seabed, are more likely to be exposed to particle-bound
contaminants.
The likelihood of adult f ish mortality due to open water hydrocarbon spills is small (IPIECA-IOGP, 2015).
Significant ef fects on wild stocks have seldom been detected and f ish are thought to actively avoid
hydrocarbons (ITOPF, 2014). However, hydrocarbons have been detected in f ish bile over one year after
the Deepwater Horizon oil spill (Murawski et al., 2014), suggesting that adult f ish may accumulate
hydrocarbons after a large hydrocarbon spill event. A spill could have the potential to impact f ish spawning
success because the eggs and larvae of many species are very sensitive to pollution. Joye et al. (2016)
reported an estimated 2–5 trillion fish larvae were killed as a consequence of the Deepwater Horizon oil spill
(2010) and while that was a deep-sea oil blowout, it gives a sense of scale on the potential impacts of a
blowout to fish populations.
The Captain field is located within ICES rectangle 45E8 and a number of fish spawning and nursery grounds
occur there (see Section 4.4.3). Several of these are PMF including anglerfish, blue whiting, cod, herring,
mackerel, ling, Norway pout, sandeels, spurdog and whiting. The eggs and larvae of broadcast spawners,
such as Norway pout, which are widely dispersed, could be exposed to oil in the water column. The
contamination of the water column above the threshold of 10 µg/l, at probabilities of 90 to 100%, is restricted
to a relatively small area in comparison to the size of spawning grounds in the North Sea (all species that
spawn in the Captain area spawn over extensive areas of UK waters) and sediment contamination is not
anticipated.
Given the presence of f ish species identified as PMFs the receptor sensitivity is considered Medium (B)
whilst the magnitude of ef fect is considered Serious (3). The impact significance is therefore considered
Moderate, however as the likelihood of a spill is considered Remote, the environmental risk of a well blow-
out on f ish is considered Low.
12.2.8 Seabirds
Seabirds are particularly sensitive to the effects of surface oil pollution, and some oil pollution incidents have
resulted in mass mortality of seabirds (e.g. Munilla et al., 2007; Votier et al., 2005). Mortality occurs from the
ingestion of oil, which results in liver and other organ failure, as well as contamination of plumage, which
destroys the insulating properties, leading to hypothermia (Alonso-Alvarez et al., 2007). The impact of oil
pollution on seabird populations depends on the numbers of seabirds at sea around the pollution incident
and on the seabird species present. Diving seabirds such as seaducks (Anatidae), divers (Gaviidae),
cormorants (Phalacracoracidae), grebes (Podicepididae) and auks (Alcidae) are more susceptible than more
aerial species such as gulls (Laridae) (Webb et al., 2016).
Susceptible species tend to spend a greater proportion of their time at sea and have limited ability to locate
alternative feeding sites. At population level, species with small or geographically limited populations, a low
potential reproductive rate (productivity) and low adult survival rates are particularly sensitive due to their
limited ability to recover (Webb et al., 2016). Seabird sensitivity to surface oil pollution in the Captain f ield
area is generally medium throughout the year. Exceptions are February and December when it is regarded
as Extremely High and Very High respectively (see Section 4.4.5).
Given the potential vulnerability of seabirds to surface oil pollution and fact that many of the species in the
area will be associated with coastal SPAs, the receptor sensitivity is considered High (C) whilst the magnitude
of ef fect is considered Major (4). The impact significance is therefore considered High, however as the

Captain EOR Stage 2 Phase II Project Environmental Statement
Section 12 Accidental Events
12-11
likelihood of a spill is considered Remote, the environmental risk of a well blow-out on seabirds is considered
Medium.
12.2.9 Marine Mammals
Marine mammals may be exposed to hydrocarbons either internally (swallowing contaminated water,
consuming prey containing oil-based chemicals, or inhaling of volatile hydrocarbon related compounds); and
externally (swimming in hydrocarbon or dispersants contacting the skin).
The ef fects of hydrocarbons on marine mammals are dependent upon species but may include:
• Hypothermia due to conductance changes in skin or fur;
• Toxic effects and secondary organ dysfunction due to ingestion of oil;
• Congested lungs;
• Damaged airways;
• Interstitial emphysema due to inhalation of o il droplets and vapour;
• Gastrointestinal ulceration and haemorrhaging due to ingestion of oil during grooming and feeding;
• Eye and skin lesions form continuous exposure to oil;
• Decreased body mass due to restricted diet; and
• Stress due to oil exposure and behavioural changes.
There is little documented evidence of cetacean behaviour being af fected by hydrocarbon spills. The
available evidence suggests they do not necessarily avoid slicks. In the months following the Exxon Valdez
spill there were observations of harbour porpoises swimming through light to heavy crude oil sheens.
Stressed or panicking cetaceans tend to move faster, breathe more rapidly and therefore surface more
f requently into oil and increase exposure (Harvey and Dahlheim, 1994).
Cetaceans have smooth skins with limited areas of pelage (hair covered skin) or rough surfaces.
Hydrocarbon tends to adhere to rough surfaces, hair or calluses of animals, so contact may cause only minor
adherence. However, cetaceans can be susceptible to inhaling hydrocarbon and hydrocarbon vapour when
they surface to breathe. This may lead to damaging of the airways, lung ailments, mucous membrane
damage or even death.
The likelihood that a feeding cetacean would ingest a sufficient quantity of hydrocarbon to cause sublethal
damage to its digestive system, or to present a toxic body burden, is low (IPIECA-IOGP, 2015). Ingestion of
subtoxic quantities may have chronic ef fects and there is potential for PAHs to accumulate in tissues of
whales before they are eventually metabolized, and for contaminants to be passed to juveniles through the
mother’s milk.
Several cetacean species are known to occur in the vicinity of the Captain field (Section 4.4.4) with sightings
of harbour porpoise, minke whale, white-beaked dolphin and killer whale throughout the year. Therefore, it
is possible that a hydrocarbon spill at Captain could impact cetaceans.
Seals are vulnerable to hydrocarbon pollution because they spend much of their time near the surface and
regularly haul out on beaches. Stochastic oil modelling of the well blow-out scenario identified a potential for
significant adverse impact on seals because of predicted oil beaching. Seals have been seen swimming in
hydrocarbon slicks during several documented spills (Geraci and St. Aubins, 1990). Most seals scratch
themselves vigorously with their f lippers but do not lick or groom themselves, so are less likely to ingest
hydrocarbon f rom skin surfaces. However, a seal mother trying to clean an oiled pup may ingest
hydrocarbon, and it is pups that are most vulnerable to hydrocarbon spills when they reach breeding colonies

Captain EOR Stage 2 Phase II Project Environmental Statement
Section 12 Accidental Events
12-12
on the shoreline. Furthermore, seals use smell to identify their young in a large colony. If the mother cannot
identify its pup because its scent has been masked by hydrocarbons, this can result in abandonment and
starvation.
Given that the marine mammals in the area include PMFs, and Annex II and Annex IV species the receptor sensitivity is considered High (C) whilst the magnitude of ef fect is considered Major (4). The impact significance is therefore considered High, however as the likelihood of a spill is considered Remote, the environmental risk of a well blow-out on seabirds is considered Medium.
12.2.10 Offshore Protected Areas
The stochastic modelling predicts that several protected areas could potentially be affected by a hydrocarbon
spill at Captain. The extent of surface contamination and condensate in the water column for the blowout
scenario, in relation to the offshore protected areas is shown in Figure 12-1 and Figure 12-2 and as can be
seen f rom Figure 4-13, there are multiple offshore designated areas that would be impacted. These offshore
areas tend to be designated for seabed features i.e. habitat types and associated benthic animals. As
described previously (Section 12.2.4) it is anticipated that the magnitude of effect on seabed sediments could
be Serious (3). Given the presence of habitats and species identified as PMFs and Annex I/Annex II within
the of fshore designated areas the receptor sensitivity is considered Medium (B), whilst the magnitude of
ef fect is considered. The impact significance is therefore considered Moderate and as the likelihood of a spill
is considered Remote, the environmental risk of a well blow-out on offshore protected areas is considered
Low.
12.2.11 Coastal / Near Shore Protected Areas
Considering the location of the protected areas shown in Figure 4-13, and the probability of beaching (Figure
12-1 and Table 12-2) it is possible that the oil from a blow-out at the Captain field could impact on the water
column in the location of a number of near shore and coastal protected areas. Given the presence of habitats
and species identified as PMFs and Annex I/Annex II/Annex IV within the coastal and nearshore designated
areas the receptor sensitivity is considered High (C), and the magnitude of effect is considered Major (4).
The impact significance is therefore considered High, however as the likelihood of a spill is considered
Remote, the environmental risk of a well blow-out on seabirds is considered Medium.
12.2.12 Fisheries, Aquaculture and Shellfish Protected Areas
Localised mortality of eggs and larvae which may occur following a spill rarely impacts wider fish stocks, and
adult f ish are relatively resilient to hydrocarbon spills. More significant impacts may be found near shore,
where hydrocarbons can accumulate and exposure, particularly of intertidal and shallow subtidal benthos,
caged animals and seafood products that are cultivated in f ixed locations (ITOPF, 2014).
Fishing effort by UK vessels in the Captain area is moderate when compared to other areas of the UKCS
(Section 4.6.1).
There are no aquaculture sites or shellfish protected areas within the immediate vicinity of the Captain field,
though it is recognised that a blow-out could impact on such sites (see Figure 12-1 and Figure 4-20).
The sensitivity of commercial f isheries, aquaculture sites and shellfish protection waters as receptors is
considered Medium (B) as there may be some short-term availability of f isheries resources whilst af ter a
period of time the aquaculture and shellfish protection waters would reopen. However given the commercial
impact, the magnitude of effect is considered Serious (3) such that the impact significance is considered
Moderate, however as the likelihood of a spill is considered Remote, the environmental risk of a well blow-

Captain EOR Stage 2 Phase II Project Environmental Statement
Section 12 Accidental Events
12-13
out on f isheries, aquaculture and shellfish protection areas is considered Low.
12.2.13 Transboundary and Cumulative Impacts
Probabilities of crude on the surface and in the water column, and arrival times are discussed earlier in
Section 5.2. The probability of crude crossing international UK/Norway median line in as a result of a well
blowout is high throughout the year.
In the unlikely event of a well blowout, a large volume of gas containing methane, ethane and CO2 could
potentially be released contributing to localised poor air quality and cumulatively to global climate change
(as noted following the Deepwater Horizon event, see for example Middlebrook et al., 2012).
12.3 Major Environmental Incident Assessment
Under the Offshore Safety Directive (2013/30/EC) and the implementing UK regulations, the Offshore
Installations (Offshore Safety Directive) (Safety Case) Regulations 2015, operators are required to identify
in their well notif ications where any Major Accident Hazards (MAHs) associated with the operations has the
potential to cause a Major Environmental Incident (MEI). A MEI is defined by the OSCR as an incident which
results, or is likely to result, in significant adverse ef fects on the environment in accordance with the
Environmental Liability Directive (2004/35/EC) of the European Parliament and of the Council on
environmental liability with regard to the prevention and remedying of environmental damage”.
“Environmental damage” is defined in Directive 2004/35/EC as:
• Damage to protected species and natural habitats, which is any damage that has significant adverse
ef fects on reaching or maintaining the favourable conservation status of such habitats or species.
The significance of such effects is to be assessed with reference to the baseline condition, taking
account of the criteria set out in Annex I”;
• “Water damage, which is any damage that significantly adversely affects the ecological, chemical
and/or quantitative status and/or ecological potential, as defined in Directive 2000/60/EC, of the
waters concerned, with the exception of adverse effects where Article 4(7) of that Directive applies”;
and
• “Land damage, which is any land contamination that creates a significant risk of human health being
adversely affected as a result of the direct or indirect introduction, in, on or under land, of substances,
preparations, organisms or micro-organisms”.
Diesel and chemicals will not be present in any volume that, if spilled, would result in a significant
environmental impact, or an MEI. A diesel spill is not considered to be a significant threat to the marine
environment, due to the characteristics of diesel and subsequent behaviour upon release. Diesel has very
high levels of light ends, evaporating quickly on release. Evaporation is more rapid in higher wind speeds,
warmer water and air temperatures. The low asphaltene contents prevents emulsification, reducing its
persistence in the marine environment.
A well blow-out scenario during the proposed drilling activities is considered to be a MAH. The impact of a
well blowout on various receptors is considered in Section 12.2. Hydrocarbon spilled during a well blow out
may impact protected features of several protected conservation sites in the area by increasing the level of
hydrocarbons in the water column. Thus, the release can either directly af fect protected species of these
sites or impact the environmental quality of the habitats supporting them, that may affect their ability to
maintain or reach favourable conservation status. The area affected by the worst-case spill may overlap with
spawning and nursery grounds of a number of fish species which are of conservation concern either at
national Scottish, OSPAR, European or International Red list. Adult and juveniles may become exposed and

Captain EOR Stage 2 Phase II Project Environmental Statement
Section 12 Accidental Events
12-14
become affected by the condensate in the water column although with moderate significance. The potential
extent of the surface sheen area in the blowout event, may increase the exposure of various protected bird
species and some marine mammals. Based on the assessment presented in Section 12.2, it is concluded
that a well blowout at the Captain f ield location could lead to significant impacts that could af fect the
favourable conservation status of seabirds and marine mammals. Therefore such a release is considered to
qualify as a MEI as defined in the Safety Case Regulations 2015.
12.4 Natural Disasters
Some natural disasters could increase the risk of a major pollution event occurring at the Captain f ield. For
example, an earthquake could lead to damage to the subsea infrastructure and potential loss of well control.
The likelihood of an earthquake of sufficient magnitude on the UKCS to impact seabed infrastructure is
extremely remote.
Climate change ef fects, such as sea level change and extreme weather events, are not considered to
significantly alter the range of ef fects considered. Extreme weather may make accidents to the drilling rig
more likely, but the rig has procedures in place for making safe and shutting down operations during extreme
weather, along with emergency procedures in the case of rig damage, and a full loss of fuel inventory has
been considered in the Captain platform OPEP.
12.5 Mitigation Measures
The mitigation measures associated with potential accidental events are captured in Sections 5 to 10. More
specifically the mitigation measures associated with preventing a subsea well blowout are summarised here.
Proposed Mitigation Measures
• Activities will be carried out by trained and competent offshore crews and supervisory teams;
• An approved OPEP will be in place prior to any activities being undertaken;
• Records will be kept of oil spill training and exercises as required by the OPEP;
• Process Safety Assurance Processes will be identified and adhered to;
• A co-ordinated industry oil spill response capability will be available;
• Enhanced sharing of industry best practices via the Oil Spill Response Forum (OSRF) will continue for Company personnel;
• A robust BOP pressure and functional testing regime will be in place; and
• Appropriate mud weights will be used to ensure well control is maintained.
• In case of an emergency, arrangements will be in place with a well capping provider to provide specialist advice and support; and
• Oil spill control measures will be followed as outlined in the OPEP.
All wells in the UK are subject to well examination schemes as per the Offshore Safety Directive 2015. The
purpose is to provide assurance that the well is designed and constructed properly and is maintained
adequately. This provides a scheme of quality control and quality assurance and incorporates current
industry guidance. It is essential for the examination to demonstrate that the pressure boundary of the well
is controlled throughout the well’s life cycle and that the pressure containment equipment that forms part of
the well is suitable for this purpose. Examination of planned well programmes and operations must be carried

Captain EOR Stage 2 Phase II Project Environmental Statement
Section 12 Accidental Events
12-15
out by an independent and competent person. Independent examination ensures that ‘Good Oilfield Practice’
and company standards are incorporated during drilling and well intervention operations. This contributes to
risk reduction and prevention of loss of containment through application of the ‘as low as reasonably
practicable’ (ALARP) principle.
Ithaca Energy’s commitment to ensuring protection of the environment are set out in the corporate HES
policy (a copy of which is provided in Section 1.7). Ithaca Energy follow the International Standards
Organisation (ISO) 14001 standard and has an externally verif ied EMS. The Company’s EMS covers
activities including exploration, drilling and production and will be applied to the proposed Captain EOR Stage
2 Phase II Project. The EMS governs those aspects of the operations that can be controlled, such as
discharges, and establishes a subsequent auditing process.
The activities associated with the proposed development are also covered in a project specific HES plan
which ensures that the project is managed in such a way that all of Ithaca Energy’s HES policies are adhered
to throughout all phases of the proposed project. Particular emphasis will be paid to having a robust design,
quality equipment, quality construction and operational best practices.
Oil spills can occur at any phase of a project, including drilling, completion, production and export. The
following provides a high-level overview of proposed areas of planning and preparation that either reduce
the probability and/or consequence of a spill/release, including failure of well control.
Ithaca Energy will take measures to minimise the risk of a blowout through well design and well control
measures. These include a well control barrier and BOP equipment.
In the event of a blowout, the drilling rig will try to disconnect from the well and move away from location. A
second rig or intervention vessel would be mobilised to the location with the intention of placing a second
BOP or a capping device on the flowing well or by drilling a relief well and re-establishing well control.
As a member of OSRL, Ithaca Energy will have access to well capping devices to contain the well.
If primary and secondary well control is lost by way of a blowout and oil flows uncontrollably from the well to
the environment a relief well may be required to stop the flow of oil and bring the well back under control. A
suitable rig would be sourced from the UK market. An inventory is maintained by Ithaca Energy and their
contractors to ensure that stocks of all materials required for a relief well are available at short notice. Ithaca
Energy has insurance provisions in place to cover well control/re-drill situations as well as legal liabilities,
and the Company is a member of OPOL which provides rapid compensation to parties directly affected by
an oil spill.
Ithaca Energy’s oil spill contingency plans will be fully documented in the OPEPs that will accompany the
development and operational phases.
It is recognised that a well blow-out could result in a major impact of some receptors, however with the
application of the mitigation measures identified, the likelihood of such an event occurring at the Captain field
is considered Remote such that the environmental risk is considered ALARP.

Captain EOR Stage 2 Phase II Project Environmental Statement
Section 13 Conclusions
13-1
13. CONCLUSIONS
A detailed assessment of the potential environmental impacts associated with the proposed Captain EOR
Stage 2 Phase II project has been carried out. The identification of the potential impacts is based on the
nature of the proposed activities and was informed by available literature and guidance documents, industry
specific experience and consultation with OPRED and their consultees. The commitments made in this ES
will be incorporated into environmental management plans for the drilling, installation, commissioning and
operations phases of the proposed project.
13.1 Environmental Effects
The potential impacts to the environment from all phases of the project were assessed. The environmental aspects of each of the key activities for each phase of the project were identified and quantified in terms of their ef fect on receptors and their magnitude of this effect. The results were assessed on the basis of the impact significance (for planned activities) or the risk posed to the environment (for unplanned), and were summarised as being either low, medium or high significance.
The environmental impact assessment considered both planned activities and unplanned events. The assessment showed that with the application of the mitigation measures identified, the impacts of the planned activities are of low significance whilst a well blowout was found to result in a medium environmental risk.
13.2 Minimising Environmental Impact
Following identification of suitable mitigation and control measures, additional assessment was undertaken
for the activities initially identified as medium or high risk. This includes quantification of seabed disturbance
and oil spill modelling. Following implementation of identified mitigation and control measures, all residual
risks to the environment are considered to be ALARP.
The execution of the proposed Captain EOR Stage 2 Phase II project, incorporating the control measures
identified in this ES, is not expected to have a significant impact on the environment.
Routine discharges to sea would be expected to disperse within a limited distance from the development. It
is therefore unlikely that planned discharges will have a transboundary impact given that the nearest median
line (UK/Norway median line) is c. 182 km from the Captain field. Hence no significant transboundary impacts
were identified as a result of planned activities. There is a risk of transboundary impacts associated with an
accidental release of oil, as discussed in Section 12. Such releases are rare, and measures will be in place
to minimise the likelihood of such an event occurring. However, should an unplanned release occur, there
will be measures in place to ensure a co-ordinated and co-operative response.
The emissions to air associated with the proposed project will have a transboundary impact on terms of
contributing to climate change. However this contribution is considered relatively low, whilst the proposed
project actually reduces the GHG intensity over the remainder of f ield life, when compared against the values
should the project not progress.
13.3 Commitments
Project specific commitments and mitigation measures to minimise the impact of the proposed project on the
environment have been highlighted throughout the ES and are summarised in Table 13-1.

Captain EOR Stage 2 Phase II Project Environmental Statement
Section 13 Conclusions
13-2
Table 13-1: Captain EOR Stage 2 Phase II project commitments.
Aspect Commitments
Physical presence • Drilling rig routes will be selected in consultation with other users of the sea, with the
aim of minimising interference to other vessels and the risk of collision;
• Vessel use will be optimised by minimising the number of vessels required and length
of time vessels are on site;
• A post installation survey will be carried out following jetting of the flowlines and
umbilicals to ensure the lines are over trawlable and to ensure there are no clay
berms;
• Consultation with SFF for all phases and operations;
• Notice to Mariners will be circulated prior to rig mobilisation;
• As required by HSE Operations Notice 6 (HSE, 2014), a rig warning communication
will be issued at least 48 hours before any rig movement. Notice will be sent to the
Northern Lighthouse Board (NLB) of any drilling rig moves and vessel mobilisation
associated with the mobilisation and demobilisation of the drilling rig;
• A Vessel Traffic Survey will inform a Consent to Locate application for the drilling rig;
• A Collision Risk Management Plan will be produced, if required;
• All vessels engaged in the project operations will have markings and lightings as per
the International Regulations for the Prevention of Collisions at Sea (COLREGS)
(IMO, 1972);
• The drilling rig will be equipped with navigational aids and aviation obstruction lights
system, as per the Standard Marking Schedule for Offshore Installations for example
fog lights, aviation obstruction lights, helideck lighting and radar beacons;
• The drilling rig will have a statutory 500 m safety zone to mitigate any collision risk;
• An ERRV will patrol the area;
• All subsea infrastructure out with the 500 m zones will be over-trawlable;
• The use of pipeline stabilisation features (e.g. mattresses and rock cover) will be
minimised through project design and will be installed in accordance with industry
best practice and SFF recommendations.

Captain EOR Stage 2 Phase II Project Environmental Statement
Section 13 Conclusions
13-3
Aspect Commitments
Emissions to air • The drilling rig and other project vessels will be subject to audits ensuring
compliance with UK legislation and the Ithaca Marine Operations and Vessel
Assurance Standard;
• Vessel use will be optimised where possible by minimising the number of vessels
required, and their length of time on site;
• Vessels will be operated where possible in modes that allow for economical fuel
use; and
• Minimise flaring during well clean-up operations by sending fluids to BLP for
processing as the base case and preferred option.
• In accordance with the revised NSTA strategy, and associated Stewardship
Expectation 11, as well as with the industry commitments within the NSTD, Ithaca
Marine Operations and Vessel Assurance Standard will incorporate the impact of the
Captain field production within developing controls including:
• Asset GHG Emission Reduction Action Plans;
• Flaring and venting reviews to identify/action zero routine flaring by 2030;
• Active flare reduction strategy;
• Active vent reduction strategy;
• Emission key performance indicators and targets; and
• Industry level benchmarking of flaring and venting.
These will ensure that opportunities for efficiency and reduction of atmospheric emissions,
where not in conflict with safe operations, are identified, actioned as appropriate and
reviewed.
Discharges to sea • The drilling rig has been audited under Ithaca Energy’s marine assurance standards
and subject to rig recertification audits;
• All vessels used will be MARPOL compliant;
• Where technically feasible Ithaca Energy will prioritise the selection of chemicals
which are PLONOR, or have the lowest RQ; and
• The discharges of any water based hydraulic fluids, sand or chemicals are regulated
by the OPPC and/or OCR regulations and reported through the EEMS. As such,
Ithaca Energy will ensure that sampling, analysis and reporting are undertaken in line
with the regulations and permit conditions.
Seabed disturbance • Pre-deployment surveys will be undertaken to identify suitable locations for the
drilling rig anchors;
• Wells at Area D and Area E will be drilled in close proximity such that the anchors will
only require to be laid once at each drill centre and the drilling rig can be skidded
between wells;
• Production well at Area B will use top hole sections from a suspended well;
• Jet trenching rather that ploughing of flowlines and umbilicals; and
• The use of mattresses, rockdump and grout bags will be minimised through optimal

Captain EOR Stage 2 Phase II Project Environmental Statement
Section 13 Conclusions
13-4
Aspect Commitments
project design.
Underwater noise • A qualified, trained and equipped marine mammal observer (MMO) will be present.
The MMO will carry out a pre-piling survey of a 500 m mitigation zone and, if an
animal is detected, the piling will be delayed until all marine mammals vacate the 500
m mitigation zone;
• A soft-start/ramp-up of hammer energy will be employed where the hammer will
commence at a low energy at the start of piling. The soft start will be such that
maximum hammer energy will not be reached until after a period of 20 minutes;
• Passive Acoustic Monitoring (PAM) will be employed during periods of low visibility
to detect marine mammal presence; and
• Avoiding commencing piling at night or in poor visibility when marine mammals
cannot reliably be detected. If this cannot be avoided, then Passive Acoustic
Monitoring (PAM) will be used
Waste • Ithaca Energy will apply the principles of the Waste Management Hierarchy during
all activities i.e. Reduce, Reuse, Recycle;
• Existing asset and vessel WMPs will be followed;
• Only permitted disposal yards / landfill sites will be used.
Accidental events • Activities will be carried out by trained and competent offshore crews and supervisory
teams;
• An approved OPEP will be in place prior to any activities being undertaken;
• Records will be kept of oil spill training and exercises as required by the OPEP;
• Process Safety Assurance Processes will be identified and adhered to;
• A co-ordinated industry oil spill response capability will be available;
• Enhanced sharing of industry best practices via the Oil Spill Response Forum
(OSRF) will continue for Company personnel;
• A robust BOP pressure and functional testing regime will be in place; and
• Appropriate mud weights will be used to ensure well control is maintained.
• In case of an emergency, arrangements will be in place with a well capping provider
to provide specialist advice and support; and
• Oil spill control measures will be followed as outlined in the OPEP.

Captain EOR Stage 2 Phase II Project Environmental Statement
Section 13 Conclusions
13-5
13.4 Overall Conclusion
Ithaca Energy on behalf of itself and its Co-Venturer, Dana Petroleum (E&P), is proposing to further enhance
recover of hydrocarbons at the Captain f ield via the proposed Captain EOR Stage 2 Phase II project. The
f ield is well understood and the Captain EOR Stage 2 Phase II project will use proven technology
incorporating current best practices and latest generation equipment. A robust design, strong operating
practices and a highly trained workforce will ensure the proposed project does not result in any significant
long-term environmental, cumulative or transboundary effects. Existing measures at the f ield will remain in
place during the operating phase to effectively respond to potential emergency scenarios.
The ES assesses the worst-case impact of the project on the environment and is therefore very conservative.
Even then, applying the mitigations measures identified it is the conclusion of this ES that the current
proposal for the Captain EOR Stage 2 Phase II project can be completed without causing any significant
long term environmental impacts or cumulative or transboundary effects.

Captain EOR Stage 2 Phase II Project Environmental Statement
Section 14 References
14 - 1
14. REFERENCES
Aires, C., Gonzaluz-Irusta, J. M. and Watret, R. (2014). Updating Fisheries Sensitivity Maps in British Waters.
Scottish Marine and Freshwater Science Report. Vol 5 No 10, Updating Fisheries Sensitivity Maps in British
Waters.
Almeda, R., Wambaugh, Z., Wang, Z., Hyatt, C. Liu, Z. and Buskey, E.J. (2013). Interactions between
zooplankton and crude oil: toxic effects and bioaccumulation of polycyclic aromatic hydrocarbons. PloS ONE
8(6): e67212.
Alonso-Alvarez, C., Perez, C. and Velando, A. (2007). Effects of acute exposure to heavy fuel oil from the
Prestige spill on a seabird Aquatic Toxicology 84: 103–110. Available at
https://doi.org/10.1016/j.aquatox.2007.06.004.
Anatec (2015). Consent to Locate-Captain B30 & B13 wells (Technical Note) Ref: A3613-CNS-CR-1
Arendt, K. E., Dutz, J., Jónasdóttir, S. H., Jung-Madsen, S., Mortensen, J., Møller, E.F., Nilsen, T. (2011)
Ef fects of suspended sediments on copepods feeding in a glacial inf luenced sub-Arctic f jord. Journal of
Plankton Research. Volume 33. No 10. Pages 1536-1537.
Bakke, T., Klungsøyr, J., Sanni., Steinar, s (2013). Environmental impacts of produced water and drilling
waste discharges f rom the Norwegian offshore petroleum industry. Marine Environmental Research 92
(2013) 154-169.
BEIS (2016). Of fshore Energy Strategic Environmental Assessment 3 (OESEA3). Available at:
https://www.gov.uk/government/consultations/ukoffshore‐energy‐strategic‐environmental‐assessment‐3‐
oesea3
BEIS (2019). Upstream Oil and Gas in the UK – Production and trade. Upstream oil and gas in the UK -
GOV.UK (www.gov.uk)
BEIS (2021). Energy transition Deal. March 2021. Available for download at:
https://assets.publishing.service.gov.uk/government/
Bellas, J., Saco-Álvarez, L., Nieto, Ó., Bayona, J.M., Albaigés, J. and Beiras, R. (2013). Evaluation of
artif icially-weathered standard fuel oil toxicity by marine invertebrate embryogenesis bioassays.
Chemosphere, 90(3), pp.1103-1108.
Berx, B. and Hughes, S. (2009). Climatology of Surface and Near-bed Temperature and Salinity on the
North-West European Continental Shelf for 1971–2000 dataset. DOI: 10.7489/1900-1
Blackburn M., Mazzacano C.A.S., Fallon C., Black S.H. (2014). Oil in Our Oceans. A Review of the Impacts
of Oil Spills on Marine Invertebrates. 152 pp. Portland OR: The Xerces Society for Invertebrate Conservation.
Boyle, G. and New, P. (2018). ORJIP Impacts f rom Piling on Fish at Of fshore Wind Sites: Collating
Population Information, Gap Analysis and Appraisal of Mitigation Options. Final report – June 2018. The
Carbon Trust. United Kingdom. 247 pp.
Certain, G., Jørgensen, L.L., Christel, I., Planque, B. and Bretagnolle, V. (2015). Mapping the vulnerability
of animal community to pressure in marine systems: disentangling pressure types and integrating their
impact from the individual to the community level. ICES Journal of Marine Science 75: 1470-1482.

Captain EOR Stage 2 Phase II Project Environmental Statement
Section 14 References
14 - 2
Cetacean Stranding Investigation Programme (CSIP). (2011). UK Cetacean Strandings Investigation
Programme. Final Report for the period 1st January 2005 – 31st December 2010. 98pp. Cetaceans
Strandings Investigation Programme.
Clark, R. (1996). Oil Pollution. In Marine Pollution Third Edition, pp. 28-51.
Clarke, D.G. and Wilber, D.H. (2000). Assessment of potential impacts of dredging operations due to
sediment resuspension. DOER Technical Notes Collection (ERDC TN-DOERE9), US Army Engineer
Research and Development Centre, Vicksburg, MS. 2000. Available at: http://www.dtic.mil/get-tr-
doc/pdf?AD=ADA377325.
Clarke, D.G. and Wilber, D.H. (2000). Assessment of potential impacts of dredging operations due to
sediment resuspension. DOER Technical Notes Collection (ERDC TN-DOERE9), US Army Engineer
Research and Development Centre, Vicksburg, MS. 2000. Available at: http://www.dtic.mil/get-
trdoc/pdf?AD=ADA377325
Colebrook, J.M. (1982). Continuous plankton records: seasonal variations in the distribution and abundance
of plankton in the North Atlantic Ocean and the North Sea. Journal of plankton research. 4: 435-462.
Collie, J.S., Hall, S.J., Kaiser, M.J., and Poiner, I.R. (2000). A quantitative analysis of f ishing impacts on
shelf -sea benthos. Journal of Animal Ecology, 69: 785-799.
Coolen, J.W.P., Jak, R.G., van der Weide, B.E., Cuperus, J., Luttikhuizen, P., Schutter, M., Dorenbosch, M.,
Driessen, F., Lengkeek, W., Blomberg, M. and van Moorsel, G. (2018). RECON: Reef ef fect structures in
the North Sea, islands or connections?: Summary report (No. C074/17A). Wageningen Marine Research.
Available at:
https://www.researchgate.net/profile/Joop_Coolen/publication/323285938_RECON_Reef_effect_structures
_in_the_North_Sea_islands_or_connections_Summary_Report/links/5a8c2709458515b8af97f16a/RECON
-Reef-ef fect-structures-in-the-North-Sea-islands-or-connections-Summary-
Report.pdf?origin=publication_detail
Cormack, D. (1999). Response to Marine Oil Pollution- Review and Assessment (Vol 2).Dordecht: Springer
Kluwer Academic.
Coull, K.A., Johnstone, R. and Rogers, S.I. (1998). Fisheries Sensitivity Maps in British Waters. UKOOA Ltd.
Cranford, P., Querbach, K., Maillet, G., Lee, K., Grant, J. and Taggart, C. (1998). Sensitivity of larvae to
drilling wastes [Part A]: effects of water-based drilling on early life stages of haddock, lobster and sea
scallop. Report to the Georges Bank Review Panel, Halifax, Nova Scotia, Canada.
Data Explorer (2018). ABPmer. Available for download from: https://www.seastates.net. Accessed: 1st
February 2022.
de Robertis, A. and Handegard, N. O. (2013). Fish avoidance of research vessels and the efficacy of noise-
reduced vessels: a review. ICES Journal of Marine Science. 70: 34-45.
DTI (2001). Strategic Environmental Assessment of the Mature Areas of the Offshore North Sea. SEA 2
September 2001. Department of Trade and Industry.
DUKES (2021) Digest of UK Energy Statistics. Energy balances (sources, production and consumption)
EEMS (2021). Atmospheric EEMS Returns UKCS Data. Oil and gas: EEMS database - GOV.UK
(www.gov.uk)

Captain EOR Stage 2 Phase II Project Environmental Statement
Section 14 References
14 - 3
Ellis, J., Milligan S., Readdy, L., Taylor, N. and Brown, M. (2012). Spawning and nursery grounds of selected
f ish Species in UK water. CEFAS Technical Report 147.
EMODnet, (2020). Seabed habitats project. http://www.emodnet-seabedhabitats.eu.
Essink, K. (1999). Ecological effects of dumping of dredged sediments; options for management. Journal of
Coastal Conservation. 1999. 5: 69-80.
FeBEC. (2010). Sediment Dose Response Study. Technical Report. Prepared for Femern A/S. Doc. No. E4-
TR-036. 147 pp.
Fugro EMU Ltd (2014). Captain EOR Project, UKCS Block 13/22a: WE8b Environmental Baseline Survey
and Habitat Assessment Report. Volume 2: Captain D & BLPB to Area D Routes Habitat Assessment.
J35025-RES8bV2(0).
Fugro EMU Ltd (2015a). Captain EOR Project, UKCS Block 13/22a: WE8b Environmental Baseline Survey
and Habitat Assessment Report. Volume 6: Captain BLPB Habitat Assessment. J35025-RES8bV6(1).
Fugro EMU Ltd (2015b). Captain EOR Project, UKCS Block 13/22a: WE8b Environmental Baseline Survey
and Habitat Assessment Report. Volume 5: Captain BLPB Environmental Baseline Survey. J35025-
RES8bV5(0).
Fugro EMU Ltd (2015c). Captain EOR Project, UKCS Block 13/22a: WE3b Offshore Environmental Field
Results Report. J35035-RES3b(1).
Fugro (2021a). Site survey Captain UKCS Block 13/22a. Fugro report No. 210272, Habitat Assessment
Report
Fugro (2021b). Site Survey Captain UKCS Block 13/22a. Fugro report No. 210272, Environmental Baseline
Report.
Furness, R., and Wade, H. (2012). Vulnerability of Scottish Seabirds to offshore wind turbines. Macarthur
Green ltd.
Geraci, J.R. and St. Aubins, D.J. (1990). Sea Mammals and Oil. Confronting the Risks, Academic Press.
ISBN-0-12-280600-X.
Golding. N., Albrecht. J., & McBreen. F. (2020). Refining criteria for defining areas with a ‘low resemblance’
to Annex I stony reef; Workshop Report. JNCC Report No. 656.
González, J., Figueiras, F.G., Aranguren-Gassis, M., Crespo, B.G., Fernández, E., Morán, X.A.G. and Nieto-
Cid, M., 2009. Ef fect of a simulated oil spill on natural assemblages of marine phytoplankton enclosed in
microcosms. Estuarine, Coastal and Shelf Science, 83(3), pp.265-276.
González-Irusta J.M., Wright; P.J., 2016. Spawning grounds of Atlantic cod (Gadus morhua) in the North
Sea, ICES Journal of Marine Science, Volume 73, Issue 2, 1 February 2016, Pages 304-315,
https://doi.org/10.1093/icesjms/fsv180
Gray, J.S., Aschan, M., Carr, M.R., Clarke, K.R., Green, R.H., Pearson, T.H., Rosenberg, R. and Warwick,
R.M. (1988). Analysis of community attributes of the benthic macrofauna of Frierfjord/Langesundfjord and in
a mesocosm experiment. Marine Ecology Progress Series, pp.151-165.
Greene, C. R. (1987). Characteristics of oil industry dredge and drilling sounds in the Beaufort Sea. Journal
of the Acoustical Society of America. 82: 1315-1324.

Captain EOR Stage 2 Phase II Project Environmental Statement
Section 14 References
14 - 4
Hammond, P.S., Lacey, C., Gilles, A., Viquerat, S., Börjesson, P., Herr, H., Macleod, K., Ridoux, V., Santos,
M., Scheidat, M. and Teilmann, J. (2017). Estimates of cetacean abundance in European Atlantic waters in
summer 2016 from the SCANS-III aerial and shipboard surveys. Wageningen Marine Research.
Harvey J.T. and Dahlheim M.E. (1994). Cetaceans in oil. In: Loughlin TR (ed) Marine mammals and the
‘Exxon Valdez’. Academic Press, San Diego, CA, p 257–264.
Health and Safety Executive (HSE) (2014). HSE Operations Notices. Available for download at:
http://www.hse.gov.uk/offshore/notices/on_index.htm
Health and Safety Executive. (HSE) (2009). Of fshore Installations and Pipeline Works (Management and
Administration) Regulations 1995: Guidance on Identif ication of Of fshore Installations. Available at:
http://www.hse.gov.uk/offshore/notices/on_39.htm.
Hill, J.M. and Wilson, E. (2000). Virgularia mirabilis Slender sea pen. In Tyler-Walters H. and Hiscock K.
Marine Life Information Network: Biology and Sensitivity Key Information Reviews, [online]. Plymouth: Marine
Biological Association of the United Kingdom. [cited 10-08-2022]. Available f rom:
https://www.marlin.ac.uk/species/detail/1396
IAMMWG. 2021. Updated abundance estimates for cetacean Management Units in UK waters. JNCC Report
No. 680, JNCC Peterborough, ISSN 0963-8091.
International Maritime Organisation (IMO) (1972). Convention on the International Regulations for Preventing
Collisions at Sea, 1972 (COLREGs). Further information available at:
http://www.imo.org/about/conventions/listofconventions/pages/colreg.aspx
International Petroleum Industry Environmental Conservation Association (IPIECA)-IOGP (2015). Impacts
of oil spills on marine ecology – Good practice guidelines for incident management and emergency response
personnel. Available for download at:
http://www.oilspillresponseproject.org/wpcontent/uploads/2017/01/Impacts_on_marine_ecology_2016.pdf
Institute of Petroleum (IoP) (2000). Guidelines for the calculation of estimates of energy use and gaseous
emissions in the decommissioning of offshore structures. Institute of Petroleum. London.
Intergovernmental Panel on Climate Change (IPCC) (2007). Ar4 Climate Change 2007: Synthesis Report.
IPCC (2021). Climate Change 2021: The Physical Science Basis. Contribution of Working Group | to the
Sixth Assessment Report of the Intergovernment Panel on Climate Change. e [Masson-Delmotte, V., P. Zhai,
A. Pirani, S. L. Connors, C. Péan, S. Berger, N. Caud, Y. Chen, L. Goldfarb, M. I. Gomis, M. Huang, K.
Leitzell, E. Lonnoy, J.B.R. Matthews, T. K. Maycock, T. Waterfield, O. Yelekçi, R. Yu and B. Zhou (eds.)].
International Association of Oil & Gas Producers (IOGP) (2016). Environmental fates and effects of ocean
discharge of drill cuttings and associated drilling fluids from offshore oil and gas operations. Report number
543.
International Association of Oil & Gas Producers (IOGP) (2019). Blowout frequencies. Report 434-02.
Irving, R. (2009). The identification of the main characteristics of stony reef habitats under the Habitats
Directive. Summary report of an inter-agency workshop 26-27 March 2008 (Report No. 432). Joint Nature
Conservation Committee [JNCC]. http://data.jncc.gov.uk/data/21693da5-7f59-47ec-b0c1-
a3a5ce5e3139/JNCC-Report-432-FINAL-WEB.pdf
Ithaca Energy (2022). Of fshore Oil Pollution Emergency Plan Captain Field. Document Number: ITH-CX-
111-005.

Captain EOR Stage 2 Phase II Project Environmental Statement
Section 14 References
14 - 5
ITOPF (2014). Available at: http://www.itopf.com/knowledge-resources/documents-guides/fate-of-oil-spills/
Jensen, F. H., Bejder, L., Wahlberg, M., Aguilar Soto, N., Johnson, M. and Madsen, P. T. (2009). Vessel
noise effects on delphinid communication. Marine Ecology Progress Series. 395: 161-175.
Joint Nature Conservation Committee (JNCC). (2010). Statutory Nature Conservation Agency Protocol for
Minimising the Risk of Injury to Marine Mammals from Piling Noise.
JNCC. (2010a). The protection of Marine European Protected Species f rom Injury and Disturbance:
Guidance for the Marine Area in England and Wales and the UKI Offshore Marine Area.
JNCC (2012). Priority Marine Features in Scottish offshore waters. Joint Nature Conservation Committee
Report 462. ISSN 0963 8091
JNCC. (2014). JNCC clarif ications on the habitat definitions of two habitat FOCI. Peterborough, UK.
JNCC. (2015). SACFOR abundance scale used for both littoral and sublittoral taxa f rom 1990 onwards.
http://www.jncc.defra.gov.uk/page-2684
JNCC. (2017). Using the seabird Oil Sensitivity Index to inform contingency planning. Available at:
http://jncc.defra.gov.uk/page-7373
Joye, S. et al (2016). The Gulf of Mexico Ecosystem, six years af ter the Macondo Oil Well Blowout. Deep
Sea Research Part II: Topical Studies in Oceanography. 129(1): 4–19. Available at
https://doi.org/10.1016/j.dsr2.2016.04.018
Kjeilen-Eilertsen, G., Trannum, H., Jak, R., Smit, M., Neff, J. and Durell G. (2004). Literature report on burial:
derivation of PNEC as component in the MEMW model tool. Akvamiljø Report no. AM-2004/024.
Kober, K., Webb, A., Win, I., Lewis, M., O'Brien, S, Wilson, L.J, and Reid, J.B. (2010), An analysis of the
numbers and distribution of seabirds within the British Fishery Limit aimed at identifying areas that qualify as
possible marine SPAs, JNCC Report 431, ISSN 0963-8091. Available at: http://jncc.defra.gov.uk/page-5622
Lee, R.F. and Page, D.S. (1997). Petroleum hydrocarbons and their ef fects in subtidal regions after major
oil spills. Marine Pollution Bulletin 34:928–940.
Masnadi et al, 2018. Global Carbon Intensity of Crude Oil Production Science Vol 362, Issue6405, pp 851-
853 and supplementary material
Maddock, A. (2008). UK Biodiversity Action Plan Priority Habitat Descriptions. Updated 2011.
http://jncc.defra.gov.uk/PDF/UKBAP_PriorityHabitatDesc-Rev2011.pdf
Marine Scotland. (2020). Feature Activity Sensitivity Tool. Available at:
https://www.marine.scotland.gov.uk/FEAST/FeatureReport.aspx
Marine Scotland (2022). Priority Marine Features. Available at:
https://marine.gov.scot/sma/assessment/case-study-priority-marine-features
Marine Scotland (2021). 2020 Scottish Sea Fisheries Statistics - Fishing Effort and Quantity and Value of
Landings by ICES Rectangles. DOI: 10.7489/12338-1. [Online] Available at:
https://data.marine.gov.scot/dataset/2020-scottish-sea-fisheries-statistics-fishing-ef fort-and-quantity-and-
value-landings-ices
MarLIN. (2016). Paramphinome jeffreysii, Thyasira spp. and Amphiura filiformis in offshore circalittoral sandy
mud. Available at:

Captain EOR Stage 2 Phase II Project Environmental Statement
Section 14 References
14 - 6
https://www.marlin.ac.uk/habitats/detail/1109/paramphinome_jeffreysii_thyasira_spp_and_amphiura_filifor
mis_in_offshore_circalittoral_sandy_mud
McCauley, R. D. (1994). “Seismic surveys” in Environmental Implications of Of fshore Oil and Gas
Development in Australia – The Findings of an Independent Scientific Review, edited by J. M. Swan, J. M.
Nef f , and P. C. Young. Australian Petroleum Exploration Association, Sydney, pp. 19–122.
McCauley, R. D. (1998). Radiated Underwater Noise Measured f rom the Drilling Rig Ocean General, Rig
Tenders Pacif ic Ariki and Pacific Frontier, Fishing Vessel Reef Venture and Natural Sources in the Timor
Sea, Northern Australia, Report to Shell Australia.
McClain, C.R., Nunnally, C. and Benfield, M.C., 2019. Persistent and substantial impacts of the Deepwater
Horizon oil spill on deep-sea megafauna. Royal Society Open Science, 6(8), p.191164.
Met Of f ice (2019). The North Atlantic Oscillation. Available at:
https://www.metoffice.gov.uk/research/climate/seasonal-to-decadal/gpc-outlooks/ens-mean/nao-
description
Middlebrook, A.M., Murphy, D.M., Ahmadov, R., Atlas, E.L., Bahreini, R., Blake, D.R., Brioude, J., De Gouw,
J.A., Fehsenfeld, F.C., Frost, G.J. and Holloway, J.S., 2012. Air quality implications of the Deepwater Horizon
oil spill. Proceedings of the National Academy of Sciences , 109(50), pp.20280-20285.
Mitson, R. B. and Knudsen, H. P. (2003). Causes and ef fects of underwater noise on f ish abundance
estimation. Aquatic Living Resources. 16: 255-263.
Montgomery, J. C., Jeffs, A., Simpson, S. D., Meekhan, M., and Tindle, C. (2006). Sound as an orientation
cue for the pelagic larvae of reef fishes and decapod crustaceans. Advances in Marine Biology. 51: 143-196.
Munilla, I., Arcos, J.M., Oro, D., Álvarez, D., Leyeda, P.M. and Velando, A. (2011). Mass mortality of seabirds
in the af termath of the Prestige oil spill Ecosphere. 2(7): art83. Available at doi:10.1890/ES11-00020.1
Murawski, S. A. et al. (2014) ‘Prevalence of External Skin Lesions and Polycyclic Aromatic Hydrocarbon
Concentrations in Gulf of Mexico Fishes, Post-Deepwater Horizon’. Transactions of the American Fisheries
Society. 143(4) 1084–1097. Available at 10.1080/00028487.2014.911205.
NatureScot. (2022) Southern Trench MPA (NC). Available at: https://sitelink.nature.scot/site/10477
Nedwell, J.R. and Edwards, B. (2004). A review of underwater man-made noise. Subacoustech Report
534R0109.
Newcombe, CP and Jensen, JOT. (1996). Channel suspended sediment and f isheries: A synthesis for
quantitative Assessment of Risk and Impact. North American Journal of Fisheries Management. (1996). Vol.
16, 4, pp. 693-727.
Nicholls, P., Hewitt, J. and Haliday, J. (2003). Effects of Suspended Sediment Concentrations on Suspension
and Deposit Feeding Marine Macrofauna. NIWA Client Report ARC03267.
Nielsen, T. G. and Richardson, K. (1989). Food chain structure of the North Sea plankton communities:
seasonal variations of the role of the microbial loop. Marine Ecology Progress Series. 56: 75-87
NMFS (National Marine Fisheries Service) (2018). 2018 Revision to: Technical guidance for assessing the
ef fects of anthropogenic sound on marine mammal hearing: underwater acoustic thresholds for onset of
permanent and temporary threshold shifts (Version 2.0). U.S. Dept. of Commer. NOAA. NOAA Technical
Memorandum NMFS-OPR-55, 178 pp.

Captain EOR Stage 2 Phase II Project Environmental Statement
Section 14 References
14 - 7
OGA (2016). Information on levels of shipping activity.
OGA (2020). Natural Gas Carbon Footprint Analysis. Available at Oil and Gas Authority: Natural gas carbon
footprint analysis - Net zero benchmarking and analysis - The move to <br/>net zero (ogauthority.co.uk)
OSPAR (2008). Background Document on CEMP assessment criteria for the QSR 2010. Available
at:http://qsr2010.ospar.org/media/assessments/p00390_supplements/p00461_Background_Doc_CEMP_A
ssessmt_Criteria_Haz_Subs.pdf
OSPAR. (2009). Overview of Impact of anthropogenic underwater sound in the marine environment.
Biodiversity Series, OSPAR Commission.
OSPAR (2010). The Quality Status Report 2010. OSPAR Commission. Available at:
http://qsr2010.ospar.org/en/ch01.html.
Ozhan, K., Parsons, M.L. and Bargu, S., 2014. How were phytoplankton affected by the Deepwater Horizon
oil spill?. BioScience, 64(9), pp.829-836.
Popper, A. N., Fay, R. R., Platt, C. and Sand, O. (2003). Sound detection mechanisms and Capabilities in
Teleost f ishes In: Collin, S.P. and Marshall N.J. (eds). Sensory Processing in Aquatic Environments. New
York: Springer, pp 3-38.
Popper, A. N., Hawkins, A. D., Fay, R. R., Mann, D., Bartol, S., Carlson, T., Coombs, S., Ellison, W. T.,
Gentry, R., Halvorsen, M. B., Lokkeborg, S., Rogers, P., Southall, B. L., Zeddies, D. G., Tavolga, W. N.
(2014). Sound Exposure Guidelines for Fishes and Sea Turtles: A Technical Report by ANSI-Accredited
Standards Committee S3/SCI and registered with ANSI. Springer Briefs in Oceanography.
Powilleit, M., Graf , G., Kleine, J., Riethmuller, R., Stockmann, K., Wetzel, M.A. & Koop, J.H.E. (2009).
Experiments on the survival of six brackish macro-invertebrates f rom the Baltic Sea af ter dredged spoil
coverage and its implications for the field. Journal of Marine Systems, 75 (3-4), 441-451.
Reid J, Evans PGH & Northridge S. (2003). An atlas of cetacean distribution on the northwest European
continental shelf. Joint Nature Conservation Committee, Peterborough, UK, 77pp. [online] Available at:
http://jncc.defra.gov.uk/page-2713 [Accessed May 2019].
Richardson, J., Greene C. R., Malme C. I. and Thomson, D. H. (1995). Marine Mammals and Noise. San
Diego California: Academic Press.
Robinson, G. (1970). Continuous plankton records: Variations in the seasonal cycle of phytoplankton in the
North Atlantic. Bulletin of Marine Ecology. 6: 33-345.
Rolland, R. M., Parks, S. E., Hunt, K. E., Castellote, M., Corkeron, P. J., Nowacek, D. P., Wasser, S. K. and
Kraus, S. D. (2012). Evidence that ship noise increases stress in right whales. Proceedings of the Royal
Society B. doi:10.1098/rspb.2011.2429.
Ross, D. (1976). Mechanics of underwater noise. Pergamon, New York. 375 pp.
Rouse, S., Hayes, P., and Wilding T.A. (2018). Commercial f isheries losses arising f rom interactions with
of fshore pipelines and other oil and gas infrastructure and activities. ICEs Journal of Marine Science, Volume
77, Issue 3. Pages 1148-1156.
Ruardij, P., Van Haren, H. and Ridderinkhof, H. (1998). The impact of thermal stratification on phytoplankton
and nutrient dynamics in shelf seas: a model study. Abstract available at:
https://www.sciencedirect.com/science/article/abs/pii/S1385110197000427 [accessed September 2019]

Captain EOR Stage 2 Phase II Project Environmental Statement
Section 14 References
14 - 8
Rygg, B. (1985). Effect of sediment copper on benthic fauna. Marine Ecology Progress Series. 25:83–89
Scotland’s Environment. (accessed 2020). Waste. Available at:
https://www.environment.gov.scot/media/1169/people-and-the-environment-waste.pdf
Scottish Government NMPi. National Marine Plan Interactive (NMPi) Map. (2022) Available f rom:
http://www.gov.scot/Topics/marine/seamanagement/nmpihome
Sea Mammal Research Unit (SMRU) and Marine Scotland (2017). Estimated at-sea Distribution of Grey and
Harbour Seals - updated maps 2017. Available at: https://data.marine.gov.scot/dataset/estimated-sea-
distribution-grey-and-harbour-seals-updated-maps-2017
Slabbekoorn, H., Bouton, N., van Opzeeland, I., Coers, A., ten Cate, C. and Popper, A. N. (2010). A noisy
spring: the impact of globally rising underwater sound levels on f ish. Trends in Ecology and Evolution. 25:
419-427.
Smit, M. G. D., Tamis, J. E., Jak, R. G., Karman, C. C., Kjeilen-Eilersten, G., Trannum, H. and Nef f, J. (2006).
ERMS Report No. 5 Threshold levels and risk functions for non-toxic sediment stressors: burial, grain size
changes and hypoxia. Summary. Available at:
http://citeseerx.ist.psu.edu/viewdoc/download?doi=10.1.1.499.8584&rep=rep1&type=pdf
Southall, B. L., Bowles, A. E., Ellison, W. T., Finneran, J. J., Gentry, R. L., Greene, C. R. Jr., Kastak, D.,
Ketten, D. R., Miller, J. H., Nachtigall, P. E., Richardson, W. J., Thomas, J. A. and Tyack, P. L. (2007). Marine
mammals noise exposure criteria: initial scientific recommendations. Marine Mammals. 33(4).
Southall, B. L., Bowles, Finneran, J. J., Reichmuth, C., Nactigall, P.E., Ketten, D.R., Bowles, A.E., Ellison,
W.T., Nowacek, D.P. and Tyack, P.L. (2019). Marine mammal noise exposure criteria : Updated scientific
recommendations for residual hearing effects. Aquatic Mammals 45(2) : 125-232.
Special Committee on Seals. (2020). Scientific Advice on Matters Related to the Management of Seal
Populations: 2020. [online] Available at: http://www.smru.st-andrews.ac.uk/research-policy/scos/.
Stark, U. and Mueller, A. (2003). Particle Size Distribution of Cements and Mineral Admixtures - Standard
and Sophisticated Measurements. Proceedings of the 11th International Congress on the Chemistry of
Cement (ICCC) 11 - 16 May 2003, Durban, South Africa.
Suchanek, T. (1993). Oil Impacts on Marine Invertebrate Populations and Communities. American Zoologist,
Volume 33, Issue 6, December 1993, Pages 510–523, https://doi.org/10.1093/icb/33.6.510.
Taylor, A.C. (1976). Burrowing behaviour and anaerobiosis in the bivalve Arctica islandica (l.). Journal of the
Marine Biological Association, 56:95-109.
Todd, V. L. G., Pearse, W. D., Tregenza, N. C., Lepper, P. A., and Todd, I. B. (2009). Diel echolocation
activity of harbour porpoises (Phocoena phocoena) around North Sea of fshore gas installations. ICES
Journal of Marine Science. 66: 734–745.
Todd, V. L. G., Ian B. Todd, I. B., Gardiner, J. C., Morrin, E. C. N., MacPherson, N. A., DiMarzio, N. A., and
Thomsen, F. (2015). A review of impacts of marine dredging activities on marine mammals. ICES Journal
of Marine Science, 72 (2), 328-340.
Turrell, W.R., 1992. New hypotheses concerning the circulation of the northern North Sea and its relation to
North Sea f ish stock recruitment. ICES Journal of Marine Science, 49(1), pp.107-123.

Captain EOR Stage 2 Phase II Project Environmental Statement
Section 14 References
14 - 9
Tyler-Walters, H. and Sabatini, M. (2017). Arctica islandica Icelandic cyprine. In Tyler-Walters H. and Hiscock
K. (eds) Marine life information network: Biology and sensitivity key information reviews [online]. Marine
Biological Association of the United Kingdom. Available at: http://www.marlin.ac.uk/species/detail/1519
UKCCC (UK Committee for Climate Change) (2020). Reducing UK emissions: 2020 Progress Report to
Parliament - Climate Change Committee (theccc.org.uk)
UK Government (2017). The Clean Growth Strategy, Leading the way to a low carbon future. Available for
download at: Clean Growth Strategy (publishing.service.gov.uk)
UKHO (2013). North Sea (West) Pilot. Ninth Edition. The United Kingdom Hydrographic Office, 332pp.
United Kingdom Offshore Operators Association [UKOOA]. (2001). An analysis of UK offshore oil and gas
environmental gas surveys 1975-95. The United Kingdom Offshore Operators Association.
UK NIR (2021). National Inventory Report. UK Greenhouse Gas Inventory, 1990 to 2019. Annual Report
under the Framework Convention on Climate Change.
Van Dalfsen, J. A. (2007). Environmental Seabed survey Captain WPPA location, UK, 2007. Captains
Cuttings Pile Seabed Environmental Survey. Concept report. Wakening IMARES.
Vidal, T., Calado, A.J., Moita, M.T. and Cunha, M.R. (2017). Phytoplankton dynamics in relation to seasonal
variability and upwelling and relaxation patterns at the mouth of Ria de Aveiro (West Iberian Margin) over a
four-year period. Available at: https://journals.plos.org/plosone/article?id=10.1371/journal.pone.0177237
[accessed September 2019].
Votier, S.C., Hatchwell, B.J. and Beckerman, A. (2005). Oil pollution and climate have widescale impacts on
seabird demographics Ecology letters 8: 1157–1164. Available at https://doi.org/10.1111/j.1461-
0248.2005.00818.x
Wales, S. C. and Heitmeyer, R. M. (2002). An ensemble source spectra model for merchant ship-radiated
noise. Journal of the Acoustical Society of America. 111: 1211-1231.
Webb, A., Elgie, M., Irwin, C., Pollock, C. and Barton, C. (2016). Sensitivity of offshore seabird concentrations
to oil pollution around the United Kingdom: Report to Oil & Gas UK. Document No HP00061701.
Weise, F. K., Montevecchi, W. A., Davoren, G. K., Huettmann, F., Diamond, A. W. and Linke, J. (2001).
Seabirds at risk around offshore oil platforms in the North-west Atlantic. Marine Pollution Bulletin Vol. 42: 12.
1285–1290.
Wentworth, C. (1922). A scale of grade and class terms for clastic sediments. Journal of Geology 30, no 5 p
377-392
Wolf J, Yates N, Brereton A, Buckland H, De Dominicis, A Gallego M, O’Hara Murray R (2016). The Scottish
Shelf Model. Part 1: Shelf -Wide Domain. Scottish Marine and Freshwater Science Vol 7 No 3, 151pp.
Available online at http://data.marine.gov.scot/sites/default/files//SMFS%20Vol%207%20No%203.pdf

Captain EOR Stage 2 Phase II Project Environmental Statement
Appendix A Scotland’s National Marine Plan
A - 1
APPENDIX A – SCOTLAND’S NATIONAL MARINE PLAN
A.1 Scotland’s National Marine Plan
Scotland’s NMP (Marine Scotland, 2015) covers the management of both Scottish inshore waters (out to
12 nm) and of fshore waters (12 to 200 nm). The aim of the NMP is to help ensure the sustainable
development of the marine area through informing and guiding regulation, management, use and protection
of the NMP areas. The activities associated with the proposed Captain EOR Stage 2 Phase II project have
been assessed against each of the NMP objectives, details of which can found in Table A-1.
Table A-1: The proposed Captain EOR Stage 2 Phase II Project assessed against Scotland’s NMP principles.
Scotland’s National Marine Plan Principle Number Applicable? Assessment Against Principle
GEN 1 General planning principle
There is a presumption in favour of sustainable
development and use of the marine environment when
consistent with the policies and objectives of this Plan. ✓
The proposed project is an expansion to
an existing field. The EIA assesses
potential impacts to the environment and
to other sea users.
GEN 2 Economic benefit
Sustainable development and use which provides
economic benefit to Scottish communities is encouraged
when consistent with the objectives and policies of this
Plan.
✓ The proposed project will provide jobs
and tax revenues to the economy.
GEN 3 Social benefit
Sustainable development and use which provides social
benefits is encouraged when consistent with the objectives
and policies of this Plan. ✓
The EIA considers impacts to other sea
users in decision making e.g. fisheries
and pipelines. Lifecycle of the project is
assessed for environmental and
economic implications.
GEN 4 Co-existence
Proposals which enable coexistence with other development sectors and activities within the Scottish
marine area are encouraged in planning and decision
making processes, when consistent with policies and
objectives of this Plan.
✓ The EIA process involved consultation
with other sea users (SFF).
GEN 5 Climate change
Marine planners and decision makers must act in the way
best calculated to mitigate, and adapt to, climate change. ✓
Fuel use associated with vessel
movements and the drill rig will be
minimised. No flaring associated with well
clean up and testing.
GEN 6 Historic environment
Development and use of the marine environment should
protect and, where appropriate, enhance heritage assets in
a manner proportionate to their significance.
✓
A number of surveys have been carried
out and used to support the EIA. EIA
takes cognisance of the wrecks in the
area.
GEN 7 Landscape/seascape
Marine planners and decision makers should ensure that
development and use of the marine environment take
seascape, landscape and visual impacts into account.
Subsea infrastructure only being installed.
GEN 8 Coastal process and flooding
Developments and activities in the marine environment
should be resilient to coastal change and flooding, and not
have unacceptable adverse impact on coastal processes or
contribute to coastal flooding.
Offshore Development.

Captain EOR Stage 2 Phase II Project Environmental Statement
Appendix A Scotland’s National Marine Plan
A - 2
Scotland’s National Marine Plan Principle Number Applicable? Assessment Against Principle
GEN 9 Natural heritage
Development and use of the marine environment must: a) Comply with legal requirements for protected areas
and protected species.
b) Not result in significant impact on the national status of
Priority Marine Features.
c) Protect and, where appropriate, enhance the health of
the marine area.
✓
Environmental surveys undertaken in the
area. Design and installation method of
the subsea infrastructure informed by
these surveys.
GEN 10 Invasive non-native species
Opportunities to reduce the introduction of invasive non-
native species to a minimum or proactively improve the
practice of existing activity should be taken when decisions
are being made. ✓
All vessels will follow IMO regulations. All
vessels, including the drilling rig, will be
regulatory compliant, e.g. the
International
Convention for the Control and
Management of Ships’ Ballast Water and
Sediments, and subject to audit prior to
contract award.
GEN 11 Marine litter
Developers, users and those accessing the marine
environment must take measures to address marine litter
where appropriate. Reduction of litter must be taken into
account by decision makers.
✓
Contractor management plans will be in
place. All vessels will follow IMO
requirements.
GEN 12 Water quality and resource
Developments and activities should not result in a deterioration of the quality of waters to which the Water
Framework Directive, MSFD or other related Directives
apply.
✓
Discharges to sea have been identified and assessed. The proposed project will
not result in any measurable deterioration
of water quality in the area.
GEN 13 Noise
Development and use in the marine environment should
avoid significant adverse effects of man-made noise and
vibration, especially on species sensitive to such effects.
✓
Impacts of the noise generated from the
piling of the SUDS have been assessed.
Results show that with the
implementation of JNCCs standard
mitigation measures the likelihood of a
permanent threshold shift occurring is low
for all the marine mammal hearing
groups. The appropriate mitigation
measures will be adopted in relation to
the piling as well as vessel and drill rig
noise.
GEN 14 Air quality
Development and use of the marine environment should not
result in the deterioration of air quality and should not
breach any statutory air quality limits. ✓
Emissions to air quantified in the EIA.
Assessment concludes that they will
present a low environmental risk to air
quality the duration of which will be minimised as far as possible.
GEN 15 Planning alignment A
Marine and terrestrial plans should align to support marine
and land-based components required by development and
seek to facilitate appropriate access to the shore and sea.
Offshore project.
GEN 16 Planning alignment B
Marine plans should align and comply where possible with
other statutory plans and should consider objectives and
policies of relevant non-statutory plans where appropriate
to do so.
Applies to inshore waters only.

Captain EOR Stage 2 Phase II Project Environmental Statement
Appendix A Scotland’s National Marine Plan
A - 3
Scotland’s National Marine Plan Principle Number Applicable? Assessment Against Principle
GEN 17 Fairness
All marine interests will be treated with fairness and in a transparent manner when decisions are being made in the
marine environment.
Competent Authority responsibility.
GEN 18 Engagement
Early and effective engagement should be undertaken with
the general public and all interested stakeholders to
facilitate planning and consenting processes. ✓
The EIA is subject to public and informal
consultations. A copy of the ES and the
public notice has been made publicly
available. A Scoping Document was
issued and engagement meetings were
held with SFF and OPRED.
GEN 19 Sound evidence
Decision making in the marine environment will be based
on sound scientific and socio–economic evidence. ✓
Environmental baseline prepared with
reference to available literature and site-
specific survey data.
GEN 20 Adaptive management
Adaptive management practices should take account of
new data and information in decision making, informing
future decisions and future iterations of policy. ✓
Ithaca Energy’s decision making takes
into account best understanding of the
marine environment through surveys and
using latest available scientific data.
GEN 21 Cumulative impacts
Cumulative impacts affecting the ecosystem of the marine
plan area should be addressed in decision making and plan
implementation.
✓ Cumulative impacts are considered in the
EIA and are considered proportionate to
the size of the project.
A.2 Marine Strategy Framework Directive (MSFD)
The aim of the European Union's MSFD is to protect more effectively the marine environment across Europe.
The MSFD outlines a transparent, legislative f ramework for an ecosystem-based approach to the
management of human activities which supports the sustainable use of marine goods and services. The
overarching goal of the Directive is to achieve ‘Good Environmental Status’ (GES) by 2020 across Europe’s
marine environment. Note following Brexit, the UK has made amendments to the Marine Strategy
Regulations 2010, which transpose the requirements of the EU's Marine Strategy Framework
Directivehttps://www.gov.scot/publications/eu-exit-marine-environmental-legislation-scotland-
2/pages/10/ into domestic law, so that they continue to be effective now that the UK is no longer part of
the EU.
The MSFD does not state a specific programme of measures that Member States should adopt to achieve
GES, except for the establishment of MPAs. The MSFD does however outline 11 high level descriptors of
GES in Annex I of the Directive. The activities associated with the proposed Captain EOR Stage 2 Phase II
Project have been assessed against each of the GES descriptors details of which can be found in Table A-
2.

Captain EOR Stage 2 Phase II Project Environmental Statement
Appendix A Scotland’s National Marine Plan
A - 4
Table A-2: The proposed Captain EOR Stage 2 Phase II Project assessed against the MSFD GES descriptors.
Marine Strategy Framework Directive: Good
Environmental Status Objectives Applicable? Assessment Against Objective
GES 1
Biological diversity is maintained and recovered where
appropriate. The quality and occurrence of habitats and
the distribution and abundance of species are in line with
prevailing physiographic, geographic and climatic
conditions.
✓
Linked to GEN 9. Environmental
surveys undertaken in the project
area. Design and installation method
of the subsea infrastructure informed
by these surveys.
GES 2
Non-indigenous species introduced by human activities
are at levels that do not adversely alter the ecosystems.
✓
Linked to GEN 10. All vessels will
follow IMO regulations. All vessels,
including drilling rig, will be regulatory
compliant, e.g. the International
Convention for the Control and
Management of Ships’ Ballast Water
and Sediments, and subject to audit prior to contract award.
GES 3
Populations of all commercially exploited fish and shellfish
are within safe biological limits, exhibiting a population age
and size distribution that is indicative of a healthy stock. ✓
Linked to GEN 9. Environmental
surveys undertaken in the project
area. Design and installation method
of the subsea infrastructure informed
by these surveys.
GES 4
All elements of the marine food webs, to the extent that
they are known, occur at normal abundance and diversity
and levels capable of ensuring the long-term abundance
of the species and the retention of their full reproductive
capacity.
✓
Linked to GEN 9. Environmental
surveys undertaken in the project
area. Design and installation method
of the subsea infrastructure informed
by these surveys.
GES 5
Human-induced eutrophication is minimised, especially
adverse effects thereof, such as losses in biodiversity,
ecosystem degradation, harmful algal blooms and oxygen
deficiency in bottom waters.
✓
Linked to GEN 9. Environmental
surveys undertaken in the project
area. Design and installation method
of the subsea infrastructure informed
by these surveys.
GES 6
Sea-floor integrity is at a level that ensures that the
structure and functions of the ecosystems are
safeguarded and benthic ecosystems, in particular, are
not adversely affected.
✓
Linked to GEN 9. Environmental
surveys undertaken in the project
area. Design and installation method
of the subsea infrastructure informed by these surveys.
GES 7
Permanent alteration of hydrographical conditions does
not adversely affect marine ecosystems. ✓
Linked to GEN 12. Seabed
disturbance and potential impact on
marine ecosystems assessed in EIA.
GES 8
Concentrations of contaminants are at a levels not giving
rise to pollution effects. ✓
Linked to GEN 12. The proposed
project will not result in the
deterioration of water quality in the
Captain field area.
GES 9
Contaminants in fish and other seafood for human
consumption do not exceed levels established by
Community legislation or other relevant standards. ✓
Linked to GEN 12. The proposed
project will not result in the
deterioration of water quality in the
project area.
GES 10

Captain EOR Stage 2 Phase II Project Environmental Statement
Appendix A Scotland’s National Marine Plan
A - 5
Marine Strategy Framework Directive: Good
Environmental Status Objectives Applicable? Assessment Against Objective
Properties and quantities of marine litter do not cause harm to the coastal and marine environment.
✓
Linked to GEN 11. Contractor management plans will be in place.
All vessels will follow IMO
requirements.
GES 11
Introduction of energy, including underwater noise, is at
levels that do not adversely affect the marine environment.
✓
Linked to GEN 13. Piling of the SUDS
was identified as a significant source
of marine noise, and therefore this
was modelled and the severity was
assessed. Results show that with the
implementation of JNCCs standard
mitigation measures the likelihood of
a permanent threshold shift occurring
is low for all the marine mammal
hearing groups. The appropriate
mitigation measures will be adopted.
A.3 Oil and Gas Marine Planning Policies
Objectives and policies for the Oil and Gas sector should be read subject to those set out in the NMP and
the MSFD. It is recognised that not all of the objectives can necessarily be achieved directly through the
marine planning system, but they are considered important context for planning and decision making. The
proposed project activities have been assessed against the oil and gas marine planning policies, details of
which can be found in Table A-3.
Table A-3: The proposed Captain EOR Stage 2 Phase II Project assessed against the Oil and Gas Marine Planning Policies.
Oil and Gas Marine Planning Policies Applicable? Assessment Against Policy
Oil & Gas 1
The Scottish Government will work with BEIS, the new Oil
and Gas Authority and the industry to maximise and prolong oil and gas exploration and production whilst
ensuring that the level of environmental risks associated
with these activities are regulated. Activity should be
carried out using the principles of Best Available
Technology (BAT) and Best Environmental Practice.
Consideration will be given to key environmental risks
including the impacts of noise, oil and chemical
contamination and habitat change.
✓ Environmental risks
addressed/assessed where
necessary in the EIA.
Oil & Gas 2
Where re-use of oil and gas infrastructure is not
practicable, either as part of oil and gas activity or by other
sectors such as carbon capture and storage,
decommissioning must take place in line with standard
practice, and as allowed by international obligations. Re-
use or removal of decommissioned assets from the
seabed will be fully supported where practicable and
adhering to relevant regulatory process.
The project is an expansion of the
existing Captain Field with all wells
being tied back to existing topsides
facilities.
Oil & Gas 3
Supporting marine and coastal infrastructure for oil and
gas developments, including for storage, should utilise the minimum space needed for activity and should take into
account environmental and socio-economic constraints.
✓
The Captain field is an offshore
development. Seabed disturbance and physical presence of the
infrastructure have been assessed.
Oil & Gas 4
All oil and gas platforms will be subject to 9 nautical mile
consultation zones in line with Civil Aviation Authority
guidance.
No new surface installations being
installed.

Captain EOR Stage 2 Phase II Project Environmental Statement
Appendix A Scotland’s National Marine Plan
A - 6
Oil and Gas Marine Planning Policies Applicable? Assessment Against Policy
Oil & Gas 5
Consenting and licensing authorities should have regard
to the potential risks, both now and under future climates,
to oil and gas operations in Scottish waters, and be
satisfied that installations are appropriately sited and
designed to take account of current and future conditions.
✓
Existing Captain OPEP and Safety
Case will be updated to incorporate
the proposed project. A drilling OPEP
will be in place during drilling
operations.
Oil & Gas 6
Consenting and licensing authorities should be satisfied
that adequate risk reduction measures are in place, and that operators should have sufficient emergency response
and contingency strategies in place that are compatible
with the National Contingency Plan and the Offshore
Safety Directive.
✓
Existing Captain OPEP and Safety
Case will be updated to incorporate
the proposed project. A drilling OPEP
will be in place during drilling
operations.

Row Aspect Source/ Activity Receptors and Potential impacts Standard Industry Mitigation
Re
ce
pto
r
Se
ns
itiv
ity
Ma
gn
itu
de
of
Eff
ect
Imp
ac
t
Sig
nif
ica
nc
e
Lik
eli
ho
od
(U
)
En
vir
on
me
nta
l
Ris
k (
U) Comments on Scoring
1.1 Receptor: Other sea users.
Navigation hazard, and restriction of fishing
operations.
Shipping density in the area of the Captain Field is
considered to be relatively low.
The Captain field occurs within ICES rectangle
45E8, with the area targeted for pelagic, demersal
and shellfish species. Relative to other ICES
rectangles across the UKCS, fishing activity is
considered moderate in the area.
Optimise vessel use.
Ongoing consultation with SFF for all operations including surveys.
Notice to mariners prior to operations starting.
A vessel traffic survey/collision risk assessment will be undertaken (as
required).
Guard vessel on site during installation of the flowlines and umbilicals. A 2
Lo
w
N/A N/A
Fishing and shipping activities in the area are considered to have the capacity to absorb any change
associated with the presence of other vessels such that the Sensitivity of the fishing and shipping activities in
the area is considered Low(A).
The Magnitude of Effect of the presence of the vessels on current shipping and fishing activities is
considered Minor (2) due to the relatively short period of time the vessels will be on location and the fact that
the project is an extension of an existing development.
Overall lmpact Significance of vessels on other sea users is therefore considered Low.
1.2 Receptors: Birds and marine mammals.
Possible behavioural changes in marine
mammals e.g. could be attracted to the vessel or
may move away from the area. The vessels also
have the potential to cause displacement of
seabirds from foraging habitat and may cause
migrating birds to detour from their flight routes.
Optimise vessel use.
B 2
Lo
w
N/A N/A
Marine mammals sighted in the Captain area include harbour porpoise, Atlantic white-beaked dolphin, white
beaked dolphin, minke whale (PMF), killer whale (PMF), long finned pilot whale, and bottle nose dolphin.
Given the presence of these PMFs and the fact that marine mammals are considered a European Protected
Species (EPS) their Sensitivity is considered to be Medium (B).
The North Sea is a busy shipping area and has well developed fishing and oil and gas industries, such that
marine mammals in the region are habituated to the presence of vessels. In addition, the evidence for lethal
injury from boat collisions with marine mammals suggests that collisions with vessels are very rare (Cetacean
Stranding Investigation Programme, 2011). The Magnitude of Effect on marine mammals is therefore
considered Minor (2) such that the Impact Significance of vessels on marine mammals is considered Low.
Though evidence suggests that the presence of the vessels could cause some bird species to be displaced
from their foraging area, the very small proportion of their overall available habitat that will be occupied by the
vessels means the impact is not considered to be noticeable. In addition, given the existing oil and gas vessel
activity in the area, it is expected that the impact of the vessels on bird migration routes (e.g. they could be
attracted to the vessel lights at night)is not significant. Therefore, the Magnitude of Effect on birds is
considered Minor (2) such that the Impact Significance of vessels on birds is considered Low.
1.3 Receptor: Climate change.
Emissions to atmosphere result in a minor
contribution to global warming, acidification and
photochemical smog (compared to overall activity
in the North Sea).
D 2
Mo
de
rate
N/A N/A
The assessment methodology does not easily lend itself to assessing climate change, with the Sensitivity of
climate change as a receptor being considered Very High (D) in line with 2014 Climate Change Report
produced by the Intergovernmental Panel on Climate Change (IPCC, 2014). Ithaca Energy, acknowledges
that the atmospheric emissions associated with the use of vessels will contribute to climate change, however
the relatively short duration of the vessel campaigns, means the Magnitude of Effect of the incremental
increase in emissions to the atmosphere as a result of the vessel activities is considered Minor (2) such that
the Impact Significance is considered Moderate.
1.4 Receptor: Air quality.
Possible reduction in local air quality. A 2
Lo
w
N/A N/A
As the installation activities will take place offshore the Sensitivity of air quality as a receptor is considered
Low (A). The relatively short duration of the vessel campaigns, means the Magnitude Effect of the vessel
emissions on air quality is considered Minor (2) such that the overall Impact Significance on air quality is
considered Low.
1.5 Discharges to Sea Vessel sewage/ food waste,
ballast water and biofouling.
Receptor: Water quality.
Water quality in immediate vicinity of discharge
may be reduced (deoxygenation), but effects are
usually minimised by rapid dilution in receiving
body of water and non-continuous discharge.
Minimise use of vessels, through efficient journey planning.
Ithaca Energy will review vessel CMID as part of vessel assurance and
all vessels will be compliant with the Company’s MAS.
Vessels will be MARPOL compliant.
All contracted vessels will originate from countries adhering to the
International Maritime Organisation (IMO) Convention.
Ithaca Energy’s audit procedures will ensure that the contracted vessels
ballasting procedures are in line with IMO Convention aimed at
preventing associated harmful effects.
All discharges of ballast water will be monitored, and records
maintained.
As part of the Company’s auditing process, only vessels adhering to the
IMO 2011 Guidelines for the Control and Management of Ships'
Biofouling to Minimize the Transfer of Invasive Species will be used. All
member states of IMO are signed up to these guidelines.
A 1
Lo
w
N/A N/A
Given the open nature of the North Sea, the Sensitivity of water quality as a receptor is considered Low (A).
As all vessels will be IMO and MARPOL compliant the Magnitude of Impact of any discharges is considered
Negligible (1) such that the overall Impact Significance is considered Low.
1.6 Seabed Disturbance Interaction of vessels with the
seabed.
Re-settlement of sediment
plumes, inducement of tidal
scour etc.
Receptor: Benthic flora and fauna
In shallow waters, increased turbidity caused by
vessel propellers can cause disturbance to the
seabed.
All vessels used will maintain their position using Dynamic Positioning
(DP).
B 1
Lo
w
N/A N/A
The Captain field does not occur within any designated area, however it is recognised that there are sea pens
and burrows in the area in sufficient density to potentially comprise the OSPAR listed threatened and/or
declining species and the habitat ‘Sea pen and burrowing megafauna communities’. In addition, subtidal
sands and gravels, a priority habitat within UK waters, also occur in the area. Receptor Sensitivity is therefore
considered Medium (B).
However as all vessels will be on DP and given that the water depths across the Captain field are > 90 m
(such that suspension of sediments due to the thrusters is not expected) the Magnitude of Effect of any
disturbance to the seabed as a result of the vessels is considered Negligible (1) such that the Impact
Significance is considered Low.
Emissions to Air Use of low-sulphur fuel.
Minimise use of vessels, through efficient journey planning and potential
use of hybrid supply vessels.
Review vessel Common Marine Inspection Documents (CMID) as part
of vessel assurance (evidence of maintenance).
UK Air Quality Standards not exceeded.
Vessels will be MARPOL compliant.
Optimise helicopter transfers.
Appendix B: Captain EOR Stage 2 Phase II ENVID
Node 1: Vessels for the drilling, installation, and topside modifications
Physical presence AHVs, ERRVs, CSVs, jet
trenching vessel, rock dumping
vessel, DSV and guard vessel.
Note: The presence of the drilling
rig is considered under Node 2
whilst the presence of vessels
associated with the production
phase are covered under Node
5.

Row Aspect Source/ Activity Receptors and Potential impacts Standard Industry Mitigation
Re
ce
pto
r
Se
ns
itiv
ity
Ma
gn
itu
de
of
Eff
ect
Imp
ac
t
Sig
nif
ica
nc
e
Lik
eli
ho
od
(U
)
En
vir
on
me
nta
l
Ris
k (
U) Comments on Scoring
1.7 Underwater Noise General vessel noise including
DP.
Receptors: Marine mammals and fish.
Noise from DP has the potential to cause
disturbance to marine mammals and fish in the
form of temporary displacement from the area.
Minimise use of vessels, through efficient journey planning and potential
use of hybrid supply vessels.
B 1
Lo
w
N/A N/A
As described above (Row 1.2), a number of marine mammals are known to occur in the area, and their
Sensitivity is considered to be Medium (B).
Some of the fish species in the area are considered to be PMFs (e.g. anglerfish, herring, mackerel, ling, blue
whiting, cod, ling, sandeels, whiting and spur dog) such that their Sensitivity as a receptor is also considered
Medium (B).
The North Sea is a busy shipping area and has well developed fishing and oil and gas industries, such that
marine mammals and fish in the region are habituated to the presence of vessels. Any impacts from vessel
noise on these receptors is expected to be behavioural rather than physical, such that they may cause
marine mammals or fish to vacate the area, however they would be expected to return once the vessels have
left the location. The Magnitude of Effect of underwater noise on marine mammals and fish is therefore
considered to be Negligible (1) such that the Impact Significance is considered Low.
1.8 Waste General operational waste. Receptor: Landfill take.
Waste to landfill.
Compliance with MARPOL requirements.
Ithaca Energy will look to vessel owner to minimise all wastes during the
project (monthly reporting of waste sent to shore; Waste Management
Plan and Waste Record Book; Waste Management Duty of Care audit).
Waste minimisation and supply chain management.
Waste will be managed in line with the waste hierarchy.
A 1
Lo
w
N/A N/A
Sensitivity of landfill as a receptor is considered Low (A) as landfill options are considered abundant.
MARPOL Annex V applies to all ships/vessels and generally prohibits the discharge of all garbage into the
sea (there are some exceptions which relate for example to food waste and cleaning agents). As vessels will
be compliant with MARPOL, there will be no significant impact offshore.
Ithaca Energy recognise landfill sites as a finite resource, however as the vessels will have WMPs in place
that will adhere to the waste hierarchy principle of reduce, reuse recycle, the Magnitude of Effect of any vessel
waste is considered Negligible (1) and the Impact Significance is considered Low.
1.9 Use of Resources Fuel for power generation. Receptor: Resource use
Energy use.
MARPOL compliant.
Ithaca Energy will review vessel CMID as part of vessel assurance
(evidence of maintenance)
Optimise vessel use.A 1
Lo
w
N/A N/A
Sensitivity of fuel availability as a receptor is considered Low (A).
Ithaca Energy recognise that hydrocarbon-based fuel is a finite resource, however given the relatively short
duration of the proposed vessel activities and the use of MARPOL compliant vessels the Magnitude of Effect
of fuel use on total fuel supply is considered Negligible (1) such that the Impact Significance is considered
Low.
1.10 Helicopter crash. Loss of helifuel
to sea.
Receptor: Water quality and Marine flora and
fauna.
Water quality deterioration impacting on marine
flora and flora.
Auditing of company to ensure helicopter maintenance etc.
B 1
Lo
w
Re
mo
te
Lo
w
A number of marine mammals are known to occur in the area, many of which are PMFs (See Row 1.2).
Similarly many of the fish species in the Project area are considered to be PMFs (Row1.7). Receptor
Sensitivity is therefore considered Medium (B).
Given the relatively small volume of diesel that would be released and that spilled diesel would be expected to
evaporate and disperse quickly (see Row 1.12) the Magnitude of Effect of a spill is considered Negligible (1).
With the application of standard industry mitigation the likelihood of a helicopter crash occurring is considered
Remote therefore the environmental risk is considered to be Low.
1.11 Minor chemical / hydrocarbon
spill from vessels.
Receptor: Water quality.
Water quality deterioration.
Vessel SOPEPs in place.
Optimised quantities of chemicals procured & stored on board.
COSHH, Task Hazard Assessments are completed and MSDS sheets
are available.
Design features including drip pans, bunded areas, process and
hazardous drains.
Procedures in place for secondary containment should bunding fail. Spill
kits located in close proximity to chemical storage areas.
Best practise bunkering procedures.
Ithaca Energy auditing vessels to ensure all above are in place.
A 2
Lo
w
Un
like
ly
Lo
w
Given the open nature of the North Sea, the Sensitivity of water quality as a receptor is considered Low (A).
Any impact on water quality from a spill is considered to be localised and have a short term, reversible effect
therefore the Magnitude of Effect of a minor spill is considered Minor (2). With the application of standard
industry mitigation the likelihood of a spill occurring is considered Unlikely and the environmental risk is
considered to be Low.
1.12 Loss of diesel inventory (e.g.
resulting from a vessel collision
and subsequent loss of
containment).
Receptor: Water quality and flora and fauna on
the water column.
Water quality deterioration.
Exclusion zone in place.
Emergency response plans in place including vessel SOPEPs.
B 3
Mo
de
rate
Re
mo
te
Lo
w
Diesel has very high levels of light ends, and as a result will evaporate and naturally disperse quickly if
released into the marine environment. The low asphaltene content prevents emulsification from occurring,
therefore, reducing its persistence in the marine environment. Modelling of a diesel spill (3,500 m3) to support
the drilling permit for well UB05P (DRA/926) suggested that only around 3 m3 would beach with probability of
beaching at each of the sites range from 3 % to 13 %. Given low anticipated volumes of diesel expected to
beach, and the potential to impact on designated species (e.g. marine mammals) receptor Sensitivity is
considered Medium (B). As a loss of diesel inventory will result in a breach of regulatory compliance,
localised changes to water quality and possibly behavioural changes to marine mammals, the Magnitude of
Effect is considered Serious (3) with the resultant Impact Significance considered to be Moderate. With the
application of standard industry mitigation the likelihood of a spill occurring is considered Remote such that
the environmental risk is considered Low.
Unplanned Events

Row Aspect Source/ Activity Receptors and Potential impacts Standard Industry Mitigation
Re
ce
pto
r
Se
ns
itiv
ity
Ma
gn
itu
de
of
Eff
ect
Imp
ac
t
Sig
nif
ica
nc
e
Lik
eli
ho
od
(U
)
En
vir
on
me
nta
l
Ris
k (
U) Comments on Scoring
2.1 Physical presence of the drilling
rig and associated anchors.
Receptor: Other sea users.
Navigation hazard, and restriction of fishing
operations.
Anchors will be located outwith the 500 m
exclusion zones associated with the drilling rig.
Ithaca Energy will inform the Hydrographic Office, Northern Lighthouse
Board, Kingfisher/FishSafe and the MoD prior to rig mobilisation.
The drilling rig will have marking and lighting as per the Standard
Marking Schedule for Offshore Installations.
Ithaca Energy will apply for 500 m exclusion zones whilst the drilling rig
is on each location.
Notice will be sent to the Northern Lighthouse Board of any drilling rig
moves.
The ERRV will act as a guard vessel warning over sea users of the
presence of the anchors.
Anchor location will be reported to FishSAFE.
A 2
Lo
w
N/A N/A
UK fishing industry and vessels in the area are expected to have the capacity to absorb change without
noticeable impact therefore their Sensitivity is considered to be Low (A). The drilling rig will operate within the
500 m exclusion zone and the ERRV will act s a guard vessel such that any impacts on other sea users are
considered Minor (2) and the Impact Significance is considered Low.
2.2 Receptors: Birds and marine mammals.
Possible behavioural changes in marine
mammals e.g. could be attracted to the drilling rig
or may move away from the area. The drilling rig
also have the potential to cause displacement of
seabirds from foraging habitat and may cause
migrating birds to detour from their flight routes.
Efficient drilling schedule (e.g. batch drilling where possible to minimise
duration of drilling).
B 2
Lo
w
N/A N/A
See Row 1.2 for justification for ranking.
2.3 Receptor: Climate change.
Emissions to atmosphere result in a minor
contribution to global warming, acidification and
photochemical smog (compared to overall activity
in the North Sea).D 2
Mo
de
rate
N/A N/A
The Sensitivity of climate change as a receptor is considered Very High (D) (see Row 1.3). Ithaca Energy,
acknowledges that the atmospheric emissions associated with the use of the drilling rig will contribute to
climate change, however the relatively short duration of the drilling campaign and the maximisation of drilling
efficiency, means the Magnitude of Effect of the incremental increase in emissions to the atmosphere as a
result of the drilling activities is considered Minor (2) such that the overall Impact Significance is considered
Moderate and therefore should be assessed in further detail in the ES.
2.4 Receptor: Air quality.
Possible reduction in local air quality. A 2
Lo
w
N/A N/A
As the drilling activities will take place offshore the Sensitivity of air quality as a receptor is considered Low
(A). The duration of the drilling campaign, means the Magnitude of Effect of the rig emissions on air quality is
considered Minor (2) such that the overall Impact Significance is considered Low.
2.5 Flaring resulting in release of
CH4, CO2, SOx, NOx, VOC, NOx
and particulates.
2.6 Deliberate discharge to sea from
drilling operations.
During the drilling phase, drill
cuttings and associated drilling
fluids (sea water and bentonite
sweeps and WBM), brine,
cementing chemicals & clean up
chemicals will be discharged to
sea. In addition, there will be
small quantities of reservoir oil
associated with drill cuttings from
the lower section of each well.
Receptor: Water quality and marine flora and
fauna.
Disturbance to seabed is discussed below under
'Seabed Disturbance'.
Chemical selection process will aim to select the lowest toxicity
chemicals for a given technical requirement.
No oil based drilling fluids to be used.
Chemical use and discharge will be assessed in drilling operations MAT.
Cement use will be minimised by good operating practice.
B 2
Lo
w
N/A N/A
Given the marine mammals, birds and fish species known to occur in the area, the Sensitivity of receptors
that may be impacted by the discharges associated with the drilling activities is considered to be Medium (B).
Taking account of the proposed mitigation measures and the results of the cuttings dispersion modelling
carried out in support of the ES, the Magnitude of Effect on the water column of these discharges to sea is
considered to be Minor such that the Impact Significance is considered Low.
2.7 Food waste and domestic
sewage from the drilling rig.
Receptor: Water quality.
Water quality in immediate vicinity of discharge
may be reduced (deoxygenation), but effects are
usually minimised by rapid dilution in receiving
body of water and non-continuous discharge.
Semi submersible rig will be MARPOL compliant.
A 1
Lo
w
N/A N/A
Given the open nature of the North Sea, the Sensitivity of water quality as a receptor is considered Low (A).
As the drilling rig will be I MARPOL compliant the Magnitude of Impact of food waste and domestic sewage
discharges is considered Negligible (1) such that the overall Impact Significance is considered Low.
2.8 Discharge of hydrocarbons/
chemicals to sea i.e. from
machinery space drainage.
Receptor: Water quality. Adherence to OPPC Regulations.
A 2
Lo
w
N/A N/A
Given the open nature of the North Sea, the Sensitivity of water quality as a receptor is considered Low (A).
Discharges will be in line with permitted limits and regulated and therefore the Magnitude of Effect is
considered Minor (2) and the Impact Significance of the discharge of hydrocarbons/ chemicals on water
quality is considered Low.
Node 2: Drilling
Physical Presence
Emissions to Air Exhaust emissions from drilling
operations (i.e. burning of
diesel).
A rig Health, Safety and Environment Management System audit will be
carried out as part of awarding contract (including planned maintenance
system implementation).
UK Air Quality Standards not exceeded.
The six polymer injection wells will be batch drilled to maximise
efficiency and reduce carbon footprint.
The rig is currently being modernised with an Energy Control System,
converting the unit into a low emission sixth-generation drilling unit.
Not appliable as there will be no flaring associated with the well clean-up for the polymer injection wells or for the new production well.
Discharges to Sea

Row Aspect Source/ Activity Receptors and Potential impacts Standard Industry Mitigation
Re
ce
pto
r
Se
ns
itiv
ity
Ma
gn
itu
de
of
Eff
ect
Imp
ac
t
Sig
nif
ica
nc
e
Lik
eli
ho
od
(U
)
En
vir
on
me
nta
l
Ris
k (
U) Comments on Scoring
2.9 Impacts of anchors and
associated anchor lines on
seabed habitat and water
column.
Receptor: Seabed habitat due to direct
disturbance and water quality due to temporarily
suspended sediments.
Pre-rig site surveys.
Pre-lay anchor handling plans.
The polymer injection wells are located such that at drill centre D and
drill centre E, it will not be necessary to re-position the rig for each well.
That is to say the rig will only require to be positioned once at each of
these two drill centres (and once at Area B for the drilling of the
production well).
B 2
Lo
w
N/A N/A
See Row 1.6 for justification for ranking of receptor Sensitivity.
The anchors and associated lines will require to be laid three times, and could impact on the designated
habitats known to occur in the area. However, these habitats are widespread in the CNS area such that the
Magnitude of Impact is considered Minor (2) and the Impact Significance is considered Low.
2.10 Discharge of drill cuttings and
associated drilling fluids directly
onto the seabed.
Receptor: Seabed habitat and associated benthic
species.
Water column due to temporarily suspended
sediments.
Drilling fluids for each well section will be seawater and viscous sweeps
or water based muds, no oil base muds will be used.
B 2
Lo
w
N/A N/A
See Row 1.6 for justification for ranking of receptor Sensitivity.
The Magnitude of Effect is considered Minor (2) such that the Impact Significance is considered Low. Note the
results of a cuttings discharge modelling study were used to support the ranking.
2.11 Cement plateau on seabed as
result of cementing the top holes
sections.
Receptor: Marine flora and fauna.
Disturbance to seabed impacting on benthic
species.
Visual monitoring of cement operations.
B 2
Lo
w
N/A N/A
See Row 1.6 for justification for ranking of receptor Sensitivity. The cement plateaus will occur on an area of
seabed that will likely also be impacted by the drill cuttings. The Magnitude of Effect is considered Minor (2)
give that the volume of discharged cement will ne minimised with the application of dye to the cement and the
use of ROV to visualise when the cement has reached the seabed.
2.12 Underwater Noise Noise and vibration from rig
engines and machinery.
Receptor: Marine mammals and fish
Noise from DP has the potential to cause
disturbance to marine mammals and fish in the
form of temporary displacement from the area and
behavioural changes.
Disturbances to the animal communities may
occur within a range of several km. Potential
injury to fauna (e.g. cetaceans) by short range
exposure.
Minimise rig movements through pre-lay anchors.
Minimise drilling schedule where possible for example through batch
drilling of the polymer injection wells at Area D and Area E.
B 1
Lo
w
N/A N/A
See Row 1.7 for justification for ranking of receptor Sensitivity.
Rotating equipment such as generators and pumps all result in underwater noise during drilling operations. In
general, noise from drilling operations has been found to be predominantly low frequency (< 1,000 Hz) with
relatively low source levels (Greene, 1987; Nedwell and Edwards, 2004; McCauley, 1998). Furthermore, a
study by Greene (1987) found that the noise generated by drilling activities from a semi-submersible drilling
rig did not exceed local ambient levels beyond 1 km
Underwater noise associated with drilling activities is therefore considered Negligible (1) such that the Impact
Significance is considered Low.
2.13 Waste General rig waste. Drilling rigs
generate a number of wastes
during routine operations
including waste oil, chemical and
oil contaminated water, scrap
metal, etc.
Receptor: Use of landfill.
Land take from use of landfill.
Wastes will be minimised by use of appropriate procurement controls.
All wastes to be properly segregated for recycling / disposal / treatment.
Waste will be dealt with in accordance with regulatory requirements.
Monthly reporting of waste sent to shore; Waste Management Plan and
Waste Record Book; Waste management Duty of Care audit.
Targets and KPIs.
Adhere to waste hierarchy.
Ithaca Energy auditing contractors to ensure all of the above.
A 1
Lo
w
N/A N/A
Sensitivity of landfill as a receptor is considered Low (A) as landfill options are considered abundant.
Ithaca Energy recognise landfill sites as a finite resource, however as the majority of waste will be recycled
and the rig will have a WMP in place that will adhere to the waste hierarchy principle of reduce, reuse recycle,
the Magnitude of Effect is considered to be Negligible (1) and the Impact Significance is considered Low.
2.14 Use of Resources Fuel used for power generation.
Use of potable water
Use of materials for well
construction and drilling an clean-
up
Receptor: Resource use including fuel, fresh
water, steel, chemicals and cement.
Having the semi-submersible drilling rig anchored will use less fuel than
having it on DP.
Well design optimisation.
Materials selection.
Chemical use minimised where possible.A 1
Lo
w
N/A N/A
Sensitivity of the resources identified is considered to be Low (A) and given their general abundance and the
relatively small volumes to be used for this project, the Magnitude of Effect is considered Negligible (1) such
that the Impact Significance is considered Low.
2.15 Deck drains. Discharge of
hazardous drainage water.
Receptor: water quality. Spill kit availability, premobilisation audits or drill rig audits, bunding and
containment for chemical storage.
A 1
Lo
w
Po
ssib
le
Lo
w
See Row 1.5 for justification for ranking of receptor Sensitivity. The Magnitude of Effect on water quality of
small discharges is considered to be Negligible (1) given that they will be rapidly dispersed by currents, any
effects are unlikely to be measurable and will reverse naturally such that the Impact Significance is
considered Low. The likelihood of a discharge of hazardous drainage water occurring is considered Possible
and the environmental risk is considered to be Low.
2.16 Loss of containment of fuel or
WBM or chemicals during
bunkering.
Receptor: water quality. Good hose management.
Spill kit availability, premobilisation audits or drill rig audits, bunding.
Bunkering procedures will be developed in line with Best Practice
Guidance.
Maintenance and procedures.
Approved TOOPEP in place.
A rig Health, Safety and Environment Management System audit
ensured contractor has procedure in place to deal with a spill. For local
response, dispersant available on board standby vessel.
Bunkering procedures will be developed in line with Best Practice
Guidance.
Continuous monitoring during bunkering.
A 1
Lo
w
Re
mo
te
Lo
w
See Row 1.5 for justification for ranking of receptor Sensitivity. Given the open nature of he North Sea, it is
expected that any discharges would be dispersed rapidly such that no significant impact would be expected
on the fauna in the water column. With te application of the mitigation measures identified, The Magnitude of
Effect on water quality of discharges associated with bunkering is considered to be Negligible (1) given that
volumes released would be minimised as a result of continuous monitoring. In addition, any discharges will be
rapidly dispersed by currents, and any effects are unlikely to be measurable and will reverse naturally such
that the Impact Significance is considered Low. With the application of standard industry mitigation the
likelihood of a spill occurring during bunkering is considered Remote therefore the environmental risk is
considered to be Low.
Seabed Disturbance
Unplanned Events

Row Aspect Source/ Activity Receptors and Potential impacts Standard Industry Mitigation
Re
ce
pto
r
Se
ns
itiv
ity
Ma
gn
itu
de
of
Eff
ect
Imp
ac
t
Sig
nif
ica
nc
e
Lik
eli
ho
od
(U
)
En
vir
on
me
nta
l
Ris
k (
U) Comments on Scoring
2.17 Major loss of drilling rig fuel
inventory e.g. following vessel
collision.
Receptor: Water quality and flora and fauna on
the water column.
Water quality deterioration.
Exclusion zone in place.
Standby vessels on site.
Drilling rig will have marking and lighting as per the Standard Marking
Schedule for Offshore Installations.
Notice will be sent to the Northern Lighthouse Board of any drilling rig
moves and vessel mobilisation associated with the mobilisation and
demobilisation of the semi submersible rig.
Approved TOOPEP in place.
B 3
Mo
de
rate
Re
mo
te
Lo
w
Diesel has very high levels of light ends, and as a result will evaporate and naturally disperse quickly if
released into the marine environment. The low asphaltene content prevents emulsification from occurring,
therefore, reducing its persistence in the marine environment. Modelling of a diesel spill (3,500 m3) to support
the drilling permit for well UB05P (DRA/926) suggested that only around 3 m3 would beach with probability of
beaching at each of the sites range from 3 % to 13 % . Given low anticipated volumes of diesel expected to
beach, and the potential to impact on designated species (e.g. marine mammals) receptor Sensitivity is
considered Medium (B). As a loss of diesel inventory will result in a breach of regulatory compliance,
localised changes to water quality and possibly behavioural changes to marine mammals, the Magnitude of
Effect is considered Serious (3) with the resultant Impact Significance considered to be Moderate. With the
application of standard industry mitigation the likelihood of a spill occurring is considered Remote such that
the environmental risk is considered Low.
2.18 Blowout. Uncontrolled
hydrocarbon flow to surface.
Receptor: marine mammals, birds and fish
Water quality deterioration impacting on marine
flora and flora.
Well design & planning.
Drill contractor/ Ithaca Energy procedures.
Well examination schemes. Compliance with Regulations & Best
Practice.
Regular BOP testing.
Rig designed to be in accordance with IP17
Planning relief well.
Crew competence.
Audit of drilling contractor.
Approved TOOPEP in place.
Containment and drainage facilities inspected as part of rig Health,
Safety and Environment Management System audit.
Member of OSRL and OPOL.
Access to dispersant via the Emergency Response and Rescue Vessel
(ERRV).
C 4
Hig
h
Re
mo
te
Me
diu
m
Modelling of a well blowout scenario ( total release of 88,615 m3) suggests that depending on the time of
year, the probability of beaching could be up to 100% on UK coastlines. In addition, beaching on international
coastlines e.g. Norway could be up to 90%. Given the presence of designated habitats and species along the
UK coastline, receptor Sensitivity is considered High (C).
Maximum volume of shoreline oiling is estimated at c. 4,553 m3. Given the estimate volume of oiling and the
potential impact on marine mammals, fish, seabirds, benthic habitats etc., the Magnitude of Effect is
considered Major (4) such that the Impact Significance is considered High.
With the application of standard industry mitigation the likelihood of a blowout occurring is considered Remote
therefore the environmental risk is considered to be Medium.
2.19 Dropped object resulting in
interaction with seabed.
Receptor: marine flora and fauna.
Loss of seabed habitat, smothering of benthic
organisms.
Risk assessment prior to equipment transfer.
Expected that the dropped object would be recovered.
B 1
Lo
w
Po
ssib
le
Lo
w
See Row 1.6 for justification for ranking of receptor Sensitivity. The Magnitude of Impact of a dropped object
is considered Negligible (1) such that the Impact Significance is considered Low. Likelihood of an object
being dropped during drilling activities is considered Possible, however when considered with the low Impact
Significance the environmental risk is considered Low.
3.1
3.2 Physical presence of subsea
infrastructure.
Receptor: Fisheries.
Navigation hazard, restriction of fishing
operations, snagging risk to fishing nets.
Early consultation with SFF.
Minimisation of footprint through design.
Will comply with PWA notification requirements.
Consent to Locate will be submitted.
Flowline will be surface laid and jet trenched to a depth of lowering of
1.0m from top of flowline to mean seabed level.
Guard vessel on site whilst the lines are temporarily laid exposed on the
seabed and before they are jet trenched.
If contingency rock is required it will be laid in a profile that is over
trawlable.
Confirmation of safe seabed for fishing trawlability.
Tree system design is fishing friendly and allows for backing off of
fishing gear.
Slab sided structure design for SUDS is fishing friendly and allows for
backing off of fishing gear.
A 2
Lo
w
N/A N/A
See Row 1.1 for justification for ranking of receptor Sensitivity.
The long-term permanent presence of the new infrastructure outwith any 500 m zones should not cause a
nuisance to fishers as it will be trenched to a minimum depth of 1 m.
Access to fishing grounds will be temporarily inhibited during the installation activities but this will be relatively
short term, such that the Magnitude of Effect on fisheries is considered Minor (2) and the overall Impact
Significance is considered Low.
3.3 Emissions to Air
3.4
3.5 Hydro/ leak testing. Potential
discharge of chemicals during
leak testing of flowlines.
Receptor: Water quality.
Water quality deterioration.
Chemical selection process will aim to select the lowest toxicity
chemicals for a given technical requirement.
Discharge of fluids, will follow procedures which will minimise
environmental impact.A 1
Lo
w
N/A N/A
See Row 1.6 for justification for ranking of receptor Sensitivity.
Given the aim to select te lowest toxicity chemicals, the Magnitude of Impact of any discharges is considered
Negligible (1) such that the overall Impact Significance is considered Low.
3.6 Disturbance to the seabed
associated with installation of the
polymer injection flowlines and
umbilicals.
Receptor: Seabed habitat and marine flora and
fauna.
Seabed disturbance, loss of habitat, temporary
suspended solids, loss of benthic organisms.
Seabed disturbance in area possessing benthic
PMF species including Arctica islandica .
Pre lay pipeline route surveys.
Minimising flowline and umbilicals lengths.
Vessels associated with installation activities will all be DP vessels.
Jet trenching selected over plough and backfill. The former has a
smaller footprint of disturbance.
Rock cover will only be used as a contingency such that maximum
anticipated volume to be used is estimated at 20,000 te.
Fall pipe will be used to lay rock if required.
B 3
Mo
de
rate
N/A N/A
See Row 1.6 for justification for ranking of receptor Sensitivity.
Flowlines and umbilicals will be jet trenched. Seabed will recover naturally once activities are finished. There
is the potential for spot rock dumping on the flowline routes should sufficient depth of burial not be possible
from the trench and bury operations.
Jet trenching will result on sediment being suspended in the water column and subsequent settlement over
an ara that extends beyond the footprint of the trenches.
Taking cognisance of the number and length of lines to be installed, the possible use of rock cover and the
settling of disturbed sediment over a wider area, the Magnitude of Effect on seabed habitats and associated
benthic communities is considered Serious (3) and the Impact Significance is considered Moderate.
3.7 Disturbance to the seabed
associated with installation of the
three SUDS, jumpers,
mattresses and 25 kg grout
bags.
Receptor: Seabed habitat and associated benthic
communities.
Introduction of hard substrates to the seabed.
Considered a permanent impact due to being on
location to end of field life.
Lifting procedures in place.
Expected that the SUDS, jumpers, mattresses and 25 kg grout bags will
be recovered at end of field life.
All items identified will be laid within 500 m exclusion zones. B 2
Lo
w
N/A N/A
See Row 1.6 for justification for ranking of receptor Sensitivity. Given the relatively small area of impact
associated with the installation of the items identified, the Magnitude of Effect is considered Minor (2) and the
Impact Significance is considered Low.
Unplanned Events
Node 3: Subsea Installation Activities
Physical Presence of
Subsea Infrastructure
Presence of installation vessels is covered under Node 1 Vessel Use.
Atmospheric emissions associated with the subsea infrastructure installation vessels including helicopters are covered under Node 1 Vessel Use.
Discharges to Sea Discharges to sea associated with the subsea infrastructure installation vessels are covered under Node 1 Vessel Use.
Seabed Disturbance

Row Aspect Source/ Activity Receptors and Potential impacts Standard Industry Mitigation
Re
ce
pto
r
Se
ns
itiv
ity
Ma
gn
itu
de
of
Eff
ect
Imp
ac
t
Sig
nif
ica
nc
e
Lik
eli
ho
od
(U
)
En
vir
on
me
nta
l
Ris
k (
U) Comments on Scoring
3.8 Disturbance of features of
archaeological interest.
Receptor: Wrecks
Suspended sediments settling over the wrecks.
Anchor pattern will be developed to avoid wreck.
B A
Lo
w
N/A N/A
Due to the presence of wrecks within the Captain field, receptor Sensitivity is ranked as Medium (B).
Given the location of the wrecks relative to the activities associate d with the proposed installation activities,
the wrecks are not expected to be directly impacted. Similarly any suspended sediments are not expected to
settle over the wrecks at any measurable depth such that the Magnitude of Effect is considered Negligible
and the Significance of Impact is considered Low.
3.9 Underwater Noise Underwater noise resulting from
piling of the SUDS at Drill
Centres D and E.
Note: Underwater noise
associated with vessels is
considered in Row 1.7.
Receptor: Fish and marine mammals.
Generates elevated sound levels which can affect
the behaviour of fish and marine mammals in the
area.
Compliance with JNCC protocol for minimising the risk of injury to
marine mammals from piling noise: use of soft start, Marine Mammal
Observers (MMOs) and passive acoustic monitoring (PAM).
B 2
Lo
w
N/A N/A
See Row 1.7 for justification for ranking of receptor Sensitivity.
A modelling study has been carried out and the results show that with the application of the mitigation
measures there is no physical damage expected to marine mammals and fish in the area. Some temporary
displacement of marine mammals from the area would be expected, such that the Magnitude of Effect is
considered Minor (2) and the Significance of Impact is considered Low.
3.10
3.11 General waste from pipelay and
installation of infrastructure.
Pipelay and installation generate
a number of wastes during
routine operations including
scrap metal, wooden crates etc.
Receptor: Use of landfill.
Land take from use of landfill.
All wastes to be properly segregated for recycling / disposal onshore.
Waste will be dealt with in accordance with regulatory requirements.
Contractors will be audited to ensure above.
A 1
Lo
w
N/A N/A
Sensitivity of landfill as a receptor is considered Low (A) as landfill options are considered abundant.
Ithaca Energy recognise landfill sites as a finite resource, however as the majority of waste will be recycled
and the installation vessels will have a WMP in place that will adhere to the waste hierarchy principle of
reduce, reuse recycle, the Magnitude of Effect is considered to be Negligible (1) and the Impact Significance
is considered Low.
3.12
3.13 Construction of flowlines,
umbilicals and other subsea
infrastructure.
Receptor: Resource use.
Resource use such as steel, plastic inners,
polyethylene structures.
Scrap metal wastes to be properly segregated for recycling / disposal
onshore.
Company policy to minimise materials use. A 1
Lo
w
N/A N/A
3.14 Chemical use including seawater
inhibitors during flowline
commissioning.
Receptor: Resource use
Use of chemicals.
Chemical use minimised where possible.
A 1
Lo
w
N/A N/A
3.15
3.16 Failure of installation equipment
connection. Loss of water-based
hydraulic fluid to sea.
Receptor: Water quality.
Water quality deterioration.
Contractor selection.
Follow standard operating procedures and checks.
A 1
Lo
w
Un
like
ly
Lo
w
Given the open nature of the North Sea, the Sensitivity of water quality as a receptor is considered Low (A).
The hydraulic fluids will be water-based and will disperse rapidly in the water column to undetectable levels
therefore the Magnitude of Effect is considered Negligible (1). With the application of standard industry
mitigation the likelihood of a failure of equipment is considered unlikely such that the Environmental Risk is
considered Low.
4.1
5.1 Receptor: Fisheries.
Navigation hazard, restriction of fishing
operations.A 1
Lo
w
N/A N/A
See Row 1.1 for justification for ranking of receptor Sensitivity.
As the only increase in vessels during production will be limited to additional shuttle tanker offloads and
polymer transport vessels, any impact will be intermittent and short term. The Magnitude of Effect on
fishermen is therefore considered Negligible (1) such that the Impact Significance is considered Low.
5.2 Receptor: Birds and marine mammals.
Disturbance from vessel presence. B 2
Lo
w
N/A N/A
See Row 1.2 for justification for ranking of receptor Sensitivity and Magnitude of Effect.
5.3 Receptor: Climate change.
Emissions to atmosphere result in a minor
contribution to global warming, acidification and
photochemical smog (compared to overall activity
in the North Sea).
D 2
Mo
de
rate
N/A N/A
See Row 1.3 for justification for ranking of receptor Sensitivity.
Ithaca Energy, acknowledges that the atmospheric emissions associated with the increased tanker offloads
will contribute to climate change, however the relatively short duration of each vessel trip, and small number
of increased offloads means the Magnitude of Effect of the incremental increase in emissions to the
atmosphere as a result of the vessel activities during production is considered Negligible (1) such that the
overall Impact Significance is considered Low.
5.4 Receptor: Air quality.
Possible reduction in local air quality. A 2
Lo
w
N/A N/A
See Row 1.4 for justification for ranking of receptor Sensitivity. Given the small increase in vessel during
production as a result of the proposed project, the Magnitude of Effect of the increased vessel emissions on
air quality is considered Negligible (1) such that the overall Impact Significance is considered Low.
5.5Helicopter movements.
Node 4: Topside Modifications
Seabed Disturbance
Waste General vessel waste is covered under Node 1 Vessel Use.
Use of Resources Fuel use associated with subsea infrastructure installation vessels is covered under Node 1 Vessel Use.
Sensitivity of the use of materials (e.g. steel) and chemicals as a receptor is considered Low (A) as all are
considered abundant. Given the abundance of these resources the Magnitude of Effect of materials and
chemicals use is considered Negligible (1) such that the Impact Significance of resource use during drilling is
considered Low.
Unplanned Events Unplanned events impacting on the subsea infrastructure after production has commenced are considered under Node 5 Operations.
Topside modifications to support the Captain EOR Stage 2 (Phases I and II) project commenced in 2021 and are due to be completed in 2023. The activities have not required the use of walk to work vessels or additional supply vessels. Seabed disturbance is limited to impacts associated with a new riser caisson installed in 2022 (captured in
PLA/921 and therefore outwith the scope of the ES). The topside modifications are not considered to result in any significant impacts requiring further assessment in the ES.
Node 5: Production Phase
Physical Presence ERRV, and supply vessels and
offloading shuttle tanker.
Optimise vessel use.
ERRV requirements will not change to current requirements during the
production.
Supply vessel transits are not expected to increase as a result of the
increased production associated with the proposed project.
There will be an increase in tanker offloads and vessel transits
associated with the polymer.
Emissions to Air Vessel emissions Only change to vessels will be increase in number of tanker offloads and
delivery of polymer.
No anticipated increase in helicopter trips during production as a result of the proposed project.

Row Aspect Source/ Activity Receptors and Potential impacts Standard Industry Mitigation
Re
ce
pto
r
Se
ns
itiv
ity
Ma
gn
itu
de
of
Eff
ect
Imp
ac
t
Sig
nif
ica
nc
e
Lik
eli
ho
od
(U
)
En
vir
on
me
nta
l
Ris
k (
U) Comments on Scoring
5.6 Receptor: Climate change.
Emissions to atmosphere result in a minor
contribution to global warming, acidification and
photochemical smog (compared to overall activity
in the North Sea). D 2
Mo
de
rate
N/A N/A
See Row 1.3 for justification for ranking of receptor Sensitivity.
Additional equipment including polymer injection pumps and extra transfer pumps will be installed on the
Captain installations leading to additional electrical demand. Additional process heating requirements due to
increased production may also be required which will increase the load on the existing duel fuel process
heaters. Power requirements are not directly proportional to the production throughput. There is no
anticipated increase change in fuel gas and diesel use on the BLP or WPP platforms however, diesel use is
forecasted to increase on the FPSO from 2024 to provide the additional 10% power required.
With respect to climate change, the Magnitude of Effect of the incremental increase in emissions to the
atmosphere as a result of the forecasted increase on the FPSO is considered Minor (2) such that the overall
Impact Significance is considered Moderate.
5.7 Receptor: Air quality.
Possible reduction in local air quality. A 1
Lo
w
N/A N/A
See Row 1.4 for justification for ranking of receptor Sensitivity.
Due to the relatively small increase in diesel use and the offshore location of the Captain field the Magnitude
of Effect of the incremental increase in emissions to the atmosphere as a result of power generation is
considered Negligible (1) such that the overall Impact Significance is considered Low.
5.8 Flaring during production.
5.9
5.10
5.11 Discharge of domestic sewage,
food waste & drainage water.
5.12 Produced water
5.13 Seabed Disturbance
5.14 Underwater Noise Increase in vessels Receptor: Marine mammals and fish.
Noise from DP has the potential to cause
disturbance to marine mammals and fish in the
form of temporary displacement from the area.
Optimise use of vessels through efficient journey planning.
B 1
Lo
w
N/A N/A
See Row 1.7 for justification for ranking of receptor Sensitivity.
The proposed project will result in a small increase in vessels in the area
The North Sea is a busy shipping area and has well developed fishing and oil and gas industries, such that
marine mammals and fish in the region are habituated to the presence of noise. Therefore, the Magnitude of
Effect of the underwater noise resulting from the increased vessels during production is considered
Negligible (1) such that the Impact Significance is considered Low.
5.15 Waste
5.16 Fuel use for increase in vessel
numbers
Receptor: Resource use
Resource use e.g. energy use for power
generation.
MARPOL compliant.
Ithaca Energy will review vessel CMID as part of vessel assurance
(evidence of maintenance)
Optimise vessel and helicopter use. A 1
Lo
w
N/A N/A
Sensitivity of fuel availability as a receptor is considered Low (A)
Ithaca Energy recognise that hydrocarbon-based fuel is a finite resource, however given that during the
production phase the only increase in vessels relative to existing vessel activity is an increase in shuttle
tanker offloads and vessel transits for the polymer (All of which will be MARPOL compliant) , the Magnitude
of Effect of fuel use is considered Negligible (1) such that the Impact Significance is considered Low.
5.17 Materials for routine
maintenance operations.
5.18 Production chemicals and
polymer
Receptor: Resource use.
Use of chemicals.
Chemical use minimised where possible.
A 2
Lo
w
N/A N/A
At Captain, specific employees have been assigned responsibility for managing chemicals at designated
portions of the supply and use chain. These employees are responsible for ensuring that chemicals used in
their specific areas are covered by a chemical permit and that use and discharge is tracked adequately to
ensure it remains within permitted quantities. Sensitivity of chemical availability as a receptor is considered
Low (A). The use of chemicals will be minimised as far as practicable such that the Magnitude of Effect is
considered Minor (2) and the Impact Significance Low.
5.19 Unplanned Events
N/A N/A
Power generation from essential
systems diesel generator.
Receptor: Climate change.
Emissions to atmosphere result in a minor
contribution to global warming, acidification and
photochemical smog (compared to overall activity
in the North Sea).
No venting during drilling.
UK Air Quality Standards not exceeded.
Asset GHG Emissions Reduction Action Plans.
Methan Action Plan.
D 2
Mo
de
rate
Use of Resources
No change from existing maintenance activities.
Potential for unplanned events and type of unplanned events during production are generally not expected to change relative to existing.
See Row 1.3 for justification for ranking of receptor Sensitivity.
As the crude oil is not completely stabilised prior to storage in the cargo tanks, the Captain FPSO utilises a
gas/diesel fired inert gas generator to provide inert gas to fill the tank vapour space during offloading
operations and to safeguard against any possibility of creating a hazardous atmosphere during all tank
operations. Venting of gases from the cargo tank vent is directly proportional to production rate. Therefore
given the increase in tank offloads, there will be a small increase in venting of VOCs resulting from the
proposed project. Venting would be occasional and any gases would be rapidly dispersed offshore. Given
this, the Magnitude of Effect of any venting emissions on air quality is considered Minor (2) such that the
overall Impact Significance is considered Moderate.
Discharges to Sea No difference to current discharges.
Not applicable as all produced water is reinjected at the Captain field.
No planned additional seabed disturbance associated with production.
Production of general waste at the Captain assets is not expect to increase above existing levels. Waste will continue to be managed in line with the waste hierarchy
Emissions to Air
Small increase in fuel use at the Captain FPSO.
Asset GHG Emission Reduction Action Plans
No anticipated increase in flaring at the Captain field during production as a result of the proposed Captain Stage2 Phase II project.
Venting of cargo storage tanks
on the FPSO. Release of VOCs.

J75662B
REPORT
Captain Development - Drill Cuttings Modelling
Prepared for: Ithaca Energy (UK) Ltd
Prepared by: Genesis Pavilion 3, Aspect 32, Prospect Road, Arnhall Business Park, Westhill, AB32 6FE, UK
www.genesisoilandgas.com
Project Title: Captain Development EOR Project Environmental Statement
Client Doc No: CER-PGEN-HES-RPT-GOG-0000-00005-00
Genesis Doc No: 203937C-000-RT-6200-0005 /0
Genesis Job No: J75662B
Date: May, 2022
Rev Date Description Issued
by
Checked
by
Approved
by
Client
Approval
1A 19/04/2022 Inter discipline check
A 25/0420/22 Issued for client review
B 01/05/2022 Re-issued for client review (having
addressed formatting issues)
0 18/05/2022 Issued for client use

Document Title: Captain Development - Drill Cuttings Modelling
Genesis Doc No: 203937C-000-RT-6200-0005/0
Date: May, 2022
Page 2 of 27
Contents ABBREVIATIONS .............................................................................................................. 4
1.0 INTRODUCTION ....................................................................................................... 6
2.0 OVERVIEW OF THE MODELLING METHODOLOGY ................................................ 7
2.1 DREAM/ParTrack .............................................................................................. 7
2.2 Risk Assessment Method................................................................................... 8
3.0 MODEL INPUT DATA .............................................................................................. 10
3.1 Metocean Data ................................................................................................ 10
3.1.1 Currents and Winds ................................................................................ 10
3.1.2 Temperature and Salinity ........................................................................ 10
3.2 Bathymetry ...................................................................................................... 10
3.3 Seabed Sediments .......................................................................................... 10
3.4 Well Design and Drilling Discharges................................................................. 10
3.4.1 Well and Discharge Location ................................................................... 11
3.4.2 Well Design............................................................................................. 11
3.4.3 Mud Components.................................................................................... 11
3.4.4 Added Chemicals and Reservoir Oil ........................................................ 11
3.4.5 Particle Size Distribution.......................................................................... 13
3.4.6 Drilling Schedule ..................................................................................... 13
3.5 Model Configuration......................................................................................... 14
4.0 RESULTS ................................................................................................................ 15
4.1 Terminology .................................................................................................... 15
4.2 Cuttings Thickness .......................................................................................... 15
4.3 Risk to the Seabed Sediment ........................................................................... 17
4.4 Risk to the Water Column ................................................................................ 21
4.5 Summary of Outputs ........................................................................................ 24
5.0 MODEL UNCERTAINTIES ....................................................................................... 25
5.1 Metocean Data ................................................................................................ 25
5.2 Sediment Grain Size and Burial Thickness ....................................................... 25
5.3 Chemical Uncertainty....................................................................................... 25
6.0 CONCLUSIONS ...................................................................................................... 26
7.0 REFERENCES ........................................................................................................ 27

Document Title: Captain Development - Drill Cuttings Modelling
Genesis Doc No: 203937C-000-RT-6200-0005/0
Date: May, 2022
Page 3 of 27
Figures & Tables Figures
Figure 2-1: Processes involved in the DREAM model. ......................................................... 7 Figure 4-1: Deposition thickness around the drilling location at the end of drilling. .............. 16 Figure 4-2: NE to SW cross section of deposition thickness at the end of drilling (53 days). 16 Figure 4-3: Predicted total combined risk to sediments (swept path). ................................. 17 Figure 4-4: Predicted total risk contributions from individual seabed stressors (swept path). ........................................................................................................................................ 18 Figure 4-5: Weighted contributions to time-averaged risk................................................... 18 Figure 4-6: Contribution to area where there is risk to more than 5% of sensitive species over whole model period for each sediment stressor. ................................................................ 19 Figure 4-7: Predicted combined risk to the sediment over time. ......................................... 20 Figure 4-8: Total risk to the water column (swept path). ..................................................... 21 Figure 4-9: Northwest to southeast cross section of total risk. ............................................ 21 Figure 4-10: Instantaneous risk to the water column after 21 days. .................................... 22 Figure 4-11:West to east cross sections of instantaneous risk after 21 days. ..................... 22 Figure 4-12: Time-averaged contributions to risk in the water column. ............................... 23 Figure 4-13: Volume of water where there is risk to over 5% of species over time. ............. 23
Tables
Table 3-1: Coordinates of wells and discharge location. .................................................... 11 Table 3-2: Well design. ..................................................................................................... 11 Table 3-3: Mud components modelled for each well. ......................................................... 11 Table 3-4: Drilling chemicals used in each well section. ..................................................... 12 Table 3-5: Completion chemicals released as a batch at the end of each well section. ....... 12 Table 3-6: Physical, chemical and toxicological properties. ................................................ 12 Table 3-7: Cuttings PSD (model default). .......................................................................... 13 Table 3-8: Modelled drilling sequence and schedule.......................................................... 14 Table 3-9: Model configuration.......................................................................................... 14 Table 4-1: Predicted combined risk over time. ................................................................... 20 Table 4-2: Summary of model outputs............................................................................... 24

Document Title: Captain Development - Drill Cuttings Modelling
Genesis Doc No: 203937C-000-RT-6200-0005/0
Date: May, 2022
Page 4 of 27
ABBREVIATIONS
' Minute
" Second/Inch
% Percent
‰ Parts per thousand
< Less Than
> More Than
° Degrees
°C Degrees centigrade
µm Micrometre
CFSR Climate Forecast System Reanalysis
DREAM Dose-related Risk and Effects Assessment Model
E East
ED European Datum
EOR Enhanced Oil Recovery
ES Environmental Statement
HYCOM Hybrid Coordinate Ocean Model
kg/m3 Kilogram per cubic metre
km Kilometre
km2 Square kilometre
km3 Cubic kilometre
Koc Organic carbon-water partition co-efficient
m Metre
MEMW Marine Environmental Modelling Workbench
mm Millimetre
N North
NCEP National Centre for Environmental Prediction
NMPi National Marine Plan interactive
PEC Predicted Environmental Concentration
PECsed Predicted Environmental Change
PNEC Predicted No Effect Concentration
PNECsed Predicted No Effect Change

Document Title: Captain Development - Drill Cuttings Modelling
Genesis Doc No: 203937C-000-RT-6200-0005/0
Date: May, 2022
Page 5 of 27
Pow Octanol/water partition coefficient
ppb Parts per billion
PSD Particle Size Distribution
S South
t Tonnes
UTM Universal Transverse Mercator
W West
WBM Water-Based Mud
WGS84 World Geodetic System 1984

Document Title: Captain Development - Drill Cuttings Modelling
Genesis Doc No: 203937C-000-RT-6200-0005/0
Date: May, 2022
Page 6 of 27
1.0 INTRODUCTION
As part of the Captain Development Enhanced Oil Recovery (EOR) project, Ithaca Energy are proposing to drill six polymer injection wells across two new drill centres at the Captain field using a semi-submersible drilling rig. The two new drill centres are referred to drill centre D and drill centre E and three wells will be drilled at each location.
To support the Environmental Statement (ES) for the Captain Development Enhanced Oil Recovery (EOR) project (Genesis, 2022) modelling of the discharge of drill cuttings from the three wells at drill centre D has been carried out using the Dose-related Risk and Effect Assessment Model (DREAM).
As the two drill centres are only 2.8 km apart, the metocean conditions are similar at both locations, therefore the results of the modelling at drill centre D are expected to be representative of what would happen to the discharged drill cuttings at drill centre E. In addition, the drill centres are sufficiently far apart that there is no overlap of the main cuttings piles, although finer material from both drill centres would potentially accumulate in the same locations but not in any significant thicknesses.
Anticipated section lengths and associated cuttings volumes for each of the wells were reviewed and modelling is based on the largest discharge of cuttings (referred to as well UCO2i which is located at drill centre D). Modelling assumed the same well design for each well.
Drill cuttings modelling was used to predict the fate of discharged cuttings from the wells in terms of:
• Depositional thickness on the seabed;
• Environmental risk to the seabed resulting from burial thickness, grain size change, toxicity and pore water oxygen depletion; and
• Environmental risk in the water column resulting from toxicity and particle stresses.
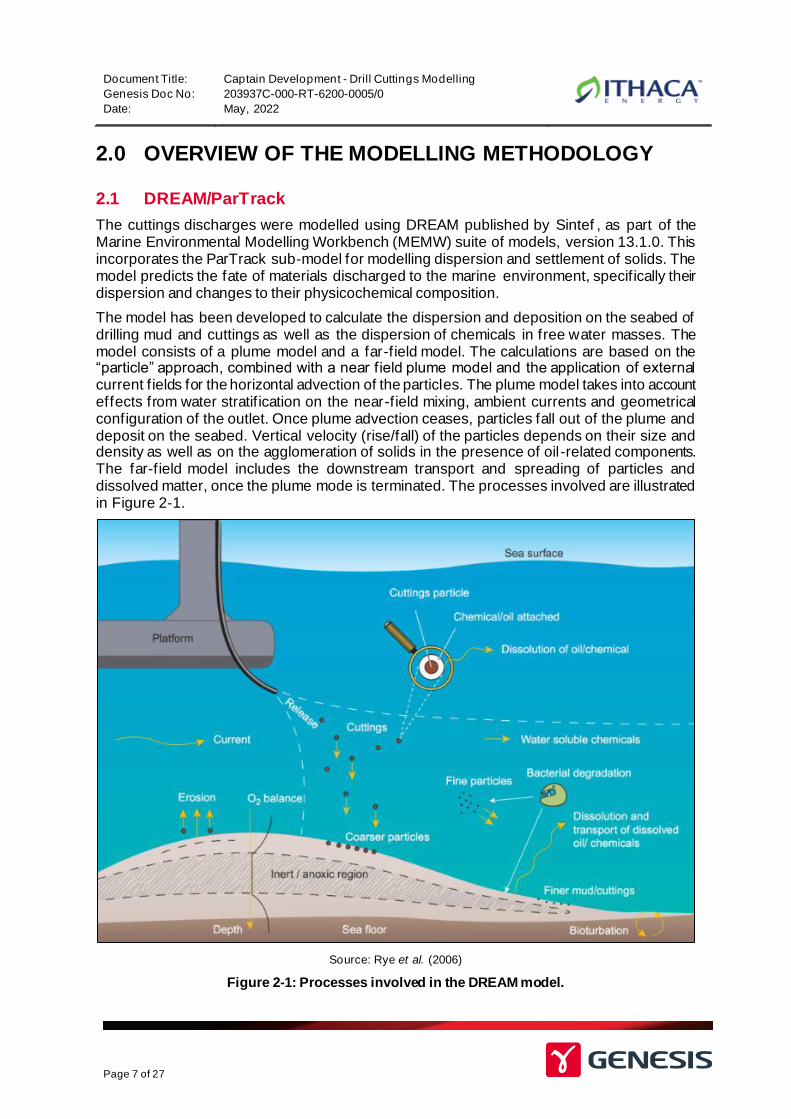
Document Title: Captain Development - Drill Cuttings Modelling
Genesis Doc No: 203937C-000-RT-6200-0005/0
Date: May, 2022
Page 7 of 27
2.0 OVERVIEW OF THE MODELLING METHODOLOGY
2.1 DREAM/ParTrack
The cuttings discharges were modelled using DREAM published by Sintef , as part of the Marine Environmental Modelling Workbench (MEMW) suite of models, version 13.1.0. This incorporates the ParTrack sub-model for modelling dispersion and settlement of solids. The model predicts the fate of materials discharged to the marine environment, specifically their dispersion and changes to their physicochemical composition.
The model has been developed to calculate the dispersion and deposition on the seabed of drilling mud and cuttings as well as the dispersion of chemicals in free water masses. The model consists of a plume model and a far-field model. The calculations are based on the “particle” approach, combined with a near field plume model and the application of external current fields for the horizontal advection of the particles. The plume model takes into account effects from water stratif ication on the near-field mixing, ambient currents and geometrical configuration of the outlet. Once plume advection ceases, particles fall out of the plume and deposit on the seabed. Vertical velocity (rise/fall) of the particles depends on their size and density as well as on the agglomeration of solids in the presence of oil-related components. The far-field model includes the downstream transport and spreading of particles and dissolved matter, once the plume mode is terminated. The processes involved are illustrated in Figure 2-1.
Source: Rye et al. (2006)
Figure 2-1: Processes involved in the DREAM model.

Document Title: Captain Development - Drill Cuttings Modelling
Genesis Doc No: 203937C-000-RT-6200-0005/0
Date: May, 2022
Page 8 of 27
Model predictions have been validated through field measurements at the Troll -A field in the Norwegian Sea, where reasonably good correspondence was obtained between measured and simulated deposition of the cuttings on the sea floor (Rye, 2010; Jødestøl and Furuholt, 2010).
2.2 Risk Assessment Method
The risk assessment method was initially developed for assessing impacts due to the discharge of toxic stressors (i.e. chemicals) to the marine environment or particle stressors (e.g. barite and bentonite) and was primarily intended for the assessment of produced water and other chemical discharges.
The methodology is based on a comparison of modelled concentrations of chemicals in the water column (termed the Predicted Environmental Concentration, (PEC)) and the highest theoretical concentration of the same chemicals at which harmful effects are not expected to occur in marine organisms (termed the Predicted No Effect Concentration, (PNEC)). In cases where the ratio PEC:PNEC exceeds 1, a risk to at least 5% of the most sensitive species occurs. This methodology is used by the DREAM/ParTrack model to calculate the risk to the water column due to toxicity from chemicals in drill cuttings discharges.
The protocol for assessing risks from drill cuttings discharges was further developed by the Environmental Risk Management System joint industry project to include the assessment of risk to seabed sediment and was founded on well-established scientific studies such as those in Smit et al. (2006), Trannum (2004), Kjeilen-Eilertsen et al. (2004) and Neff (2005). The assessment methodology for sediments is similar to that for the water column and is based on a combined risk approach using the PECsed:PNECsed ratio. However, for sediments PECsed represents the Predicted Environmental Change (as opposed to predicted environmental concentration used for water column), and PNECsed is the Predicted No Effect Change (as opposed to Predicted No Effect Concentration used for water column). Where PEC sed: PNECsed exceeds 1, a risk to at least 5% of the most sensitive species occurs. Where there is a risk to less than 5% of the most sensitive species, this is considered a tolerable risk level.
Trannum (2004), Kjeilen-Eilertsen et al. (2004) and Neff (2005) established that in the absence of any other stressors sediment risk would exceed 5% when:
• Chemical concentrations in pore water exceeded the PNEC;
• Burial thickness exceeded 6.5 mm;
• Median grain size change exceeded 52.7 µm; and
• Oxygen content was depleted by more than 20%.
The effects of burial include mortality of organisms, reduced growth of some species, reduced larval settlement and changed fauna composition. Effects can be short-term and mainly on an individual level, or they can be more long-term and affecting whole populations (Kjeilen-Eilertsen et al., 2004). In general, the effect of burial mainly depends on the mobility of organisms in the sediment matrix and on the settling rate of particles. Sedentary organisms, which have no or very limited abilities to move, such as attached barnacles or mussels, are very sensitive (Smit et al., 2006).
Following the settlement of drilling particles, benthic communities have been observed to be dominated by opportunistic species which generally are small, with short life spans and high population growth rates. There is considerable variability in species responses to specific sediment characteristics. The factors ultimately controlling infauna distributions may not be sediment grain size per se or factors linked to grain size such as organic content, but rather

Document Title: Captain Development - Drill Cuttings Modelling
Genesis Doc No: 203937C-000-RT-6200-0005/0
Date: May, 2022
Page 9 of 27
interactions between hydrodynamics, sediments and infauna and how these affect sediment distribution, larval supply, particle flux and pore water chemistry (Smit et al., 2006). DREAM uses the change in median grain size to represent the overall changes in sediment characteristics.

Document Title: Captain Development - Drill Cuttings Modelling
Genesis Doc No: 203937C-000-RT-6200-0005/0
Date: May, 2022
Page 10 of 27
3.0 MODEL INPUT DATA
3.1 Metocean Data
3.1.1 Currents and Winds
The study draws on one year of three-dimensional water column current data (daily resolution) obtained from the Hybrid Coordinate Ocean Model (HYCOM), spanning March 2009 – March 2010. The earliest planned drilling date for this project is March 2023, therefore a model start date of 1st March 2009 was selected.
The study draws on one year of two-dimensional wind data obtained from the National Centre for Environmental Prediction (NCEP) Climate Forecast System Reanalysis (CFSR), spanning March 2009 – March 2010.
The wind data is used to generate wave height predictions within the model that feed into surface dispersion and resurfacing calculations.
3.1.2 Temperature and Salinity
Water column temperature and salinity profile information is used in the modelling. Local salinity and temperature data for surface and bottom waters was obtained from National Marine Plan Interactive (NMPi) maps (Scottish Government, 2022). As the drilling campaign will begin in March, Spring (March-May) averages for the area were used.
Spring average sea temperature varies from 6.83°C at the seabed to 7.18°C at the sea surface. Salinity variation in the water column is minimal and an average value of 34.91‰ was used at the surface and the seabed.
3.2 Bathymetry
Bathymetry data used in the DREAM model is based on the Sea Topo 8.2 database (Jakobsson et al., 2008).
3.3 Seabed Sediments
DREAM requires an average grain size of surrounding sediments to evaluate the change in grain size distribution as a result of the drill cutting discharge. The sediments around the well are predominantly fine sand (Fugro, 2021), with a median background sediment grain size of 0.188 mm.
3.4 Well Design and Drilling Discharges
Cuttings are discharged from each drilled section in the wells. The model inputs include:
• The well locations;
• The well design and geometry of each section;
• The mass of the mud components discharged from each section; and
• An assumed drilling schedule showing the likely drilling durations per section.

Document Title: Captain Development - Drill Cuttings Modelling
Genesis Doc No: 203937C-000-RT-6200-0005/0
Date: May, 2022
Page 11 of 27
3.4.1 Well and Discharge Location
The wells will be drilled from a semi-submersible rig the coordinates of which are shown in Table 3-1.
Table 3-1: Coordinates of wells and discharge location.
Well name Latitude Longitude
UB04i 58°18'25.793" -1°41'32.522"
UC01i 58°18'26.681" -1°41'30.769"
UC02i 58°18'26.237" -1°41'31.646"
Note: Coordinate reference system is World Geodetic System 1984 (WGS 84)
3.4.2 Well Design
The well design comprises four sections as summarised in Table 3-2. Seawater and bentonite sweeps will be used during the first two sections of each well and the cuttings will be discharged directly at the seabed. Subsequent sections will be drilled using Water Based Mud (WBM) and will be discharged at the sea surface from the drilling rig. The same design is assumed for all wells.
Table 3-2: Well design.
Section Diameter (inches) Section Length (m) Mud Type Release Depth
36 76 Seawater and Sweeps Seabed
17.5 330 Seawater and Sweeps Seabed
12.25 879 Glydril WBM - KCl Sea surface
8.5 2,117 FloPro WBM Sea surface
3.4.3 Mud Components
A summary of mud compositions and the discharged components is shown in Table 3-3. All three wells assume the same design.
Table 3-3: Mud components modelled for each well.
Section Diameter (inches) Rock Cuttings (t) Barite (t) Bentonite (t)
36 120 100 25
17.5 123 50 25
12.25 176 250 0
8.5 205 0 0
Total 624 400 50
3.4.4 Added Chemicals and Reservoir Oil
Table 3-4 and 3-5 summarise the chemicals used for each well section and Table 3-6 summarises the key physico-chemical and toxicological properties of those chemicals.

Document Title: Captain Development - Drill Cuttings Modelling
Genesis Doc No: 203937C-000-RT-6200-0005/0
Date: May, 2022
Page 12 of 27
Table 3-4: Drilling chemicals used in each well section.
Chemical (t) Section
1 2 3 4 Total
DUO-VIS 1.139 1.169 1.678 1.946 5.932
CONQOR 404 EH 0.142 0.146 0.210 0.243 0.741
GLYDRIL MC 1.709 1.753 2.517 2.919 8.898
LUBE 776 1.495 1.534 2.202 2.554 7.785
FLO-VIS PLUS 1.139 1.169 1.678 1.946 5.932
THRUCARB 1.709 1.753 2.517 2.919 8.898
THRUCARB 20 1.709 1.753 2.517 2.919 8.898
THRUCARB 40 1.709 1.753 2.517 2.919 8.898
THRUTROL 1.139 1.169 1.678 1.946 5.932
Reservoir Oil - - - 0.688 0.688
Table 3-5: Completion chemicals released as a batch at the end of each well section.
Chemical (t) Section
1 2 3 4 Total
FLO-VIS PLUS 1.138 1.168 1.676 1.944 5.926
SAFE-COR 0.427 0.438 0.629 0.729 2.222
SAFE-SURF* EU 2.495 2.561 3.676 4.263 12.995
THRUTROL 1.138 1.168 1.676 1.944 5.926
Table 3-6: Physical, chemical and toxicological properties.
Chemical name Drilling (D) and/or
Completion (C) Density (kg/m3)
Solubility 1, 2
Biodegradation (% (days))
Log Pow3
PNEC (ppb)
DUO-VIS D 1.5 823,900 49 (28) -0.67 207
CONQOR 404 EH D 1.4 1,000,000 20.6 (28) -4.94 143
GLYDRIL MC D 1.012 1,000,000 70 (28) - 310
LUBE 776 D 1 557,300 79 (7) -0.1 11
FLO-VIS PLUS D/C 1.5 873,700 49 (28) -0.84 207
THRUCARB D 2.5 557,300 99.99 (28) -0.1 1,000
THRUCARB 20 D 2.5 1,000,000 64.8 (15) - 980
THRUCARB 40 D 2.7 1,000,000 64.8 (14) - 980
THRUTROL D/C 1.5 557,300 66.5 (28) -0.1 232
SAFE-COR C 1.1 981,300 69 (28) -1.72 433
SAFE-SURF* EU C 0.99 1,000,000 73 (28) - 13
Reservoir Oil D 0.8225 0.000001 6.184 5
Notes:
1-Vapour pressure assumed to be 0.000001 for all chemicals (not shown in table)
2-Where no solubility data is available but chemicals are classed as soluble in water a high solubility (1,000,000)
has been assumed
3-LogPow – log of the octanol-water partition coefficient, Koc – organic carbon-water partition coefficient
Where no LogPow data was available, it was derived from a Koc of 0.00, in line with guidance in Annex 4 of the
Risk Based Approach Guidelines (BEIS, 2020).
4-The LogPow for the reservoir oil is based on a Koc of 1,510,000
5- It is likely that all the THRUCARB chemicals, could be replaced with SAFE-CARB chemicals (which are
PLONOR) and THRUTROL with FLOTROL (also PLONOR).

Document Title: Captain Development - Drill Cuttings Modelling
Genesis Doc No: 203937C-000-RT-6200-0005/0
Date: May, 2022
Page 13 of 27
Reservoir oil has been included in the model for the 8½" section of each well, where drilling passes through the reservoir. The mass of oil was determined based on an average percentage (0.34%) of oil on cuttings from the last 15 wells drilled at the Captain field. This was multiplied by the volume of the 8½" section to produce a mass of reservoir oil of 0.688 tonnes.
3.4.5 Particle Size Distribution
The model has a default particle size distribution (PSD) for drill cuttings that was obtained from a review of data from drilling in Norwegian waters during the development of the DREAM/ParTrack model (Saga, 1994). PSDs for barite and bentonite in the model are based on industry standard distributions.
Table 3-7 summarises the cuttings PSD used in the model.
Table 3-7: Cuttings PSD (model default).
Approximate% In Each Size Class1
Size Interval (µm)
Fraction (%)
Cumulative Fraction (%)
Fines (silt/clay) Up to 62.5 µm
~50%
1–10 10 10 10–20 10 20 20–30 10 30 30– 45 10 40 45–60 10 50
Sand 62.5 µm to 2000 µm
~35%
60–100 10 60 100–400 10 70 400–1000 10 80
Gravel 2000 to 6000 µm
~15% Cobbles >6000 µm
(% included in gravel)
1000–4000 10 90
4000–7000 10 100
Notes: 1 Wentworth Scale (Wentworth, 1922) – note that size intervals used do not exactly match the divisions on the
Wentworth scale therefore percentage within each size class is approximate.
3.4.6 Drilling Schedule
Each well takes approximately 16 days to drill, including time in between sections for running and cementing casing.
The modelled drilling schedule is shown in Table 3-8 and is compressed to optimise model run time. The modelled schedule is based on the following assumptions:
• Completion chemicals are released as a one hour batch release within 24 hours of the completion of drilling at each section;
• A 24-hour time gap has been allowed between sections;
• A three day time gap has been allowed between wells; and
• The model runs for a further five days after drilling is completed to allow for dispersion in the water column.
This gives an overall model run duration of 53 days.

Document Title: Captain Development - Drill Cuttings Modelling
Genesis Doc No: 203937C-000-RT-6200-0005/0
Date: May, 2022
Page 14 of 27
Table 3-8: Modelled drilling sequence and schedule.
Section Days (from the start of the model)
UB04i Batch 1 UC01i Batch 2 UC02i Batch 3
1 0 1 17 18 34 35
2 2 3 19 20 36 37
3 4 9 21 26 38 43
4 10 14 27 31 44 48
Extra days 3 3 5
Model ends 53
The well will take longer to be drilled in reality than in the model and allow more time for dispersion between discharges from individual sections. The model set up is conservative in that it will potentially result in slightly greater impacts in the water column because there is less time for dispersion between the discharges. Impacts on the seabed are unlikely to be significantly different as a result of the shorter modelled discharge timings, given that seabed recovery takes place over much longer timescales.
3.5 Model Configuration
A range of grid sizes and model timesteps have been used in order to optimise specific outputs, whilst not resulting in unmanageable model run times.
Two grid sizes were used to evaluate particle dispersion:
• Larger, coarser grid to evaluate risk of impacts to the water column; and
• A smaller, f iner grid to evaluate impacts on the seabed.
This reflects the likely extent of particle dispersion. Water column dispersion of dissolved and suspended particles occurs over a wide area, whereas deposition of drill cuttings is a more localised event.
Different timesteps and overall model durations were used to allow short-term and long-term impacts to be investigated. A description of each configuration used is summarised in Table 3-9.
Table 3-9: Model configuration.
Aspect Domain Size Cell Size Time Step
Model Duration Sediment Model?
Water column
30 km × 30 km 100 m × 100 m 3 hours 53 days Not included
Seabed 1 km × 1 km 10 m × 10 m 15 mins 53 days plus
10 years1 Included
1 Main DREAM model run for 53 days using timestep shown, followed by the sediment model which was run for 10 years using a 24-hour timestep.

Document Title: Captain Development - Drill Cuttings Modelling
Genesis Doc No: 203937C-000-RT-6200-0005/0
Date: May, 2022
Page 15 of 27
4.0 RESULTS
4.1 Terminology
The results of the modelling runs are presented in the following sections in relation to seabed sediment impacts and water column impacts.
The following terms are used throughout:
• The maximum instantaneous risk is the area (in the case of seabed sediment) or the volume (in the case of the water column) where the risk to over 5% of the most sensitive species is greatest at a specific point in time during the simulation;
• The total risk is the overall area (seabed) or volume (water column) where there has been a risk to over 5% of the most sensitive species at any point in time during the simulation. This can also be referred to as the cumulative risk or swept path; and
• The maximum instantaneous risk and the total risk can be computed for individual stressors or for all stressors combined. Thus, combined sediment risk is the sum of the individual risks resulting from burial thickness, grain size change, oxygen depletion and toxicity of the cuttings.
4.2 Cuttings Thickness
The model predicts a maximum estimated thickness of cuttings around the wells of 1.51 m (1,510 mm), adjacent to well UC01i (Figure 4-1 and Figure 4-2). Significant thicknesses (over 6.5 mm) are predicted to occur over an area of 0.019 km2 (up to approximately 175 m from the discharge location in south easterly direction, but significantly less in north and west directions). Materials of grain size greater than 0.5 mm will spread further, covering a predicted area of 0.2716 km2. To put this into context, a typical exclusion zone around a platform of 500 m radius is equivalent to an area of 0.785 km2. Over time the area where thickness is greater than 6.5 mm gradually reduces, this is discussed in Section 4.3.
Very fine particles (<0.5 mm grain size) will spread over much larger distances, extending beyond the model domain. The distribution of these very fine particles does not change significantly over time.
If only one well was drilled significant thicknesses (over 6.5 mm) are predicted to occur over an area of 0.0056 km2.

Document Title: Captain Development - Drill Cuttings Modelling
Genesis Doc No: 203937C-000-RT-6200-0005/0
Date: May, 2022
Page 16 of 27
Figure 4-1: Deposition thickness around the drilling location at the end of drilling.
Note: Coordinates of cross section: start point (1°41’29”W, 58°18’28”N) and end point (1°41’34”W, 58°18’25”N)
Figure 4-2: NE to SW cross section of deposition thickness at the end of drilling (53 days).

Document Title: Captain Development - Drill Cuttings Modelling
Genesis Doc No: 203937C-000-RT-6200-0005/0
Date: May, 2022
Page 17 of 27
4.3 Risk to the Seabed Sediment
Risk to the sediment has been modelled for the duration of drilling and over a 10 -year period post drilling. The following sections summarise the predicted risk around the well locations as well as the components making up that risk.
As noted in Section 2.2, combined risk to the seabed sediment is made up of risk contributions resulting from the following stressors:
• Burial thicknesses greater than 6.5 mm;
• A median grain size change greater than 52.7 μm;
• Oxygen content depletion greater than 20%; and
• Toxicity (where reservoir oil and/or chemical concentration exceeds the PNEC).
A risk of less than 5% to the most sensitive species is considered to be tolerable. Figure 4-3 shows the total combined risk around the drilling location.
Figure 4-3: Predicted total combined risk to sediments (swept path).

Document Title: Captain Development - Drill Cuttings Modelling
Genesis Doc No: 203937C-000-RT-6200-0005/0
Date: May, 2022
Page 18 of 27
The contribution to the combined risk can be broken down to establish which stressors are the
key contributors. This is shown in Figure 4-4.
Figure 4-4: Predicted total risk contributions from individual seabed stressors (swept path).
Time-averaged contributions to risk are summarised in Figure 4-5 and Figure 4-6. The main contributor to the risk is oxygen depletion (53.9%). Grain size contributes 27.8%, reservoir oil 10.0% and thickness 8.3%. There is no contribution from toxicity of the chemicals due to most chemicals having a relatively high PNEC, along with high solubility in water and not readily adsorbing to the sediment particles (negative logPow). In contrast the reservoir oil adsorbs strongly onto the cuttings and the sediment and has a low solubility in water.
Figure 4-5: Weighted contributions to time-averaged risk.
53.9%
27.8%
10.0%
8.3%
Oxygen depletion
Grain size change
Reservoir oil toxicity
Thickness

Document Title: Captain Development - Drill Cuttings Modelling
Genesis Doc No: 203937C-000-RT-6200-0005/0
Date: May, 2022
Page 19 of 27
Figure 4-6: Contribution to area where there is risk to more than 5% of sensitive species over whole model period for each sediment stressor.
The evolution of predicted combined risk (at the end of drilling, 237 days, five years and ten years after the end of drilling) is shown in Figure 4-7 and summarised in Table 4-1. Risk at 237 days is shown as this corresponds to the maximum extent.
0
0.02
0.04
0.06
0.08
0.1
0.12
0 1 2 3 4 5 6 7 8 9 10 11
Are
a (k
m2)
Time (years)
Oxygen Grain size Captain Reservoir Oil
Thickness Total

Document Title: Captain Development - Drill Cuttings Modelling
Genesis Doc No: 203937C-000-RT-6200-0005/0
Date: May, 2022
Page 20 of 27
Figure 4-7: Predicted combined risk to the sediment over time.
The area where there is a risk to more than 5% sensitive species is 0.0785 km2 when drilling discharges end (at 53 days), reducing to 0.362 km2 after 5 years and 0.0285 km2 after 10 years as shown in Table 4-1.
Table 4-1: Predicted combined risk over time.
Time period
Units Description Area where combined
risk is >5% (km2) Reduction in
area (%)
53 days End of drilling discharge 0.0785 -
237 days Maximum extent of risk 0.1098 -39.87
5 years 5 years post drilling 0.0362 53.89
10 years 10 years post drilling 0.0285 63.69
As noted above the main risk stressors as a result of the modelled drilling discharges are oxygen depletion and grain size. The maximum extent of risk occurs 237 days after drilling commences and is driven by an increase in oxygen depletion (the most dominant stressor) after the end of drilling. This is a result of oxygen being consumed as the reservoir oil breaks down.
It is worth noting that the model calculates the risk resulting from burial thickness based on the areas of the seabed where the thickness of cuttings exceeds 6.5 mm (see Section 4.2). This thickness reduces over time because of bioturbation and re-suspension. Both these processes are included in the model. However, the model does not account for recolonization of the sediment over time. Therefore, the area where there is a risk to over 5% of the species

Document Title: Captain Development - Drill Cuttings Modelling
Genesis Doc No: 203937C-000-RT-6200-0005/0
Date: May, 2022
Page 21 of 27
is likely to reduce faster than shown and the areas shown in Table 4-1 are conservative. Overall, the area at risk is localised, extending approximately 350 m from the wells.
4.4 Risk to the Water Column
The total risk in the water column is shown in Figure 4-8. Although the area where the risk to the most sensitive species exceeds 5% appears relatively extensive (2.377 km3), it should be noted that this plot shows the swept path (that is all areas where risk is greater than 5% at any point in time during the entire model run). In practice the area where risk exceeds 5% at any instance in time would be much smaller than that shown in Figure 4-8. The area of 5% risk and above occurs in the lower half of the water column and at the surface , as shown in the cross section in Figure 4-9. This is because the discharge changes from being at the seabed for the top two sections to the sea surface for the remaining sections.
Figure 4-8: Total risk to the water column (swept path).
Figure 4-9: Northwest to southeast cross section of total risk.

Document Title: Captain Development - Drill Cuttings Modelling
Genesis Doc No: 203937C-000-RT-6200-0005/0
Date: May, 2022
Page 22 of 27
Figure 4-10 and Figure 4-11 show a snapshot of risk in the water column at 21 days from the start of drilling. The maximum instantaneous volume where there is a risk to more than 5% of sensitive species is 0.3296 km3. This occurs at 21 days, after the second section of the second well has been drilled. As can be seen in the figures there is one large plume at that point in time at depth resulting from the seabed discharge of cuttings from the top two sections, just before the surface discharge of the third section begins.
Figure 4-10: Instantaneous risk to the water column after 21 days.
Figure 4-11:West to east cross sections of instantaneous risk after 21 days.
The primary contributors to the water column risk are from barite (48.5%) and bentonite (21.7%) and SAFE-SURF* EU (19.0%) as shown in Figure 4-12.
All chemicals and the reservoir oil combined contribute 29.8% of the risk.

Document Title: Captain Development - Drill Cuttings Modelling
Genesis Doc No: 203937C-000-RT-6200-0005/0
Date: May, 2022
Page 23 of 27
Note: “Other” comprises of chemicals for which contribution to risk was less than 1%
Figure 4-12: Time-averaged contributions to risk in the water column.
The volume of water column where there is a risk to over 5% of sensitive species varies over time (Figure 4-13). There is a peak, shortly after drilling each section. The volume at risk reduces rapidly after each discharge stops and disappears completely within 24 hours of the last discharge for each well.
Figure 4-13: Volume of water where there is risk to over 5% of species over time.
48.46%
21.73%
18.98%
7.80%
3.03%
Barite
Bentonite
SAFE-SURF* EU
LUBE 776
Other

Document Title: Captain Development - Drill Cuttings Modelling
Genesis Doc No: 203937C-000-RT-6200-0005/0
Date: May, 2022
Page 24 of 27
4.5 Summary of Outputs
The model outputs are summarised in Table 4-2. The potential impact to the seabed covers a relatively small area. The key contributors to risk in sediments were oxygen depletion and grain size change. The risk to the seabed is reduced to an area of 0.0285 km2 after 10 years from the end of drilling.
Table 4-2: Summary of model outputs.
Model output Criteria Value
Cuttings deposition
Thickness Maximum thickness - end of drilling (m) 1.51
Area where thickness >6.5 mm - end of drilling (km2)
0.019
Risk to sediment
Thickness (%) >6.5 mm 8.34
Grain size (%) >52 µm 27.80
Oxygen depletion (%) >20% 53.88
Reservoir oil toxicity (%) Toxicity (PNEC exceeded) 9.98
Chemical Toxicity (%) Toxicity (PNEC exceeded) 0
Area where there is a total combined risk (>5%) to the most sensitive species (km2)
End of drilling 0.0785
237 days 0.1098
5 years 0.0362
10 years 0.0285
Risk to water column
Bentonite (%) Physical effect of particles 21.73
Barite (%) Physical effect of particles 48.46
Cuttings (%) Physical effect of particles 0.01
Toxicity of added chemicals and/or reservoir oil (%)
Toxicity (PNEC exceeded) 29.8
Volume where combined risk to >5% most sensitive species (km3)
Maximum instantaneous volume 0.3296
Total volume (swept path) 2.377
Note: 500 m safety zone area is equivalent to 0.785 km2

Document Title: Captain Development - Drill Cuttings Modelling
Genesis Doc No: 203937C-000-RT-6200-0005/0
Date: May, 2022
Page 25 of 27
5.0 MODEL UNCERTAINTIES
5.1 Metocean Data
The Metocean data used was for the year 2009, starting in March to match the likely start date of the drilling. Use of a different start date or a different set of current data would result in small changes to the precise pattern of cuttings deposition but the predicted extent of risk is likely to be of a similar magnitude.
5.2 Sediment Grain Size and Burial Thickness
Grain size change is an important parameter and it should be noted that the thresholds for this parameter within the risk assessment are based on the analysis of environmental monitoring data from the Dutch section of the North Sea, the Norwegian Sea and the Barents Sea covering 300 species (Smit et al., 2006). There may be regional differences in prevailing fauna that would give different thresholds for the drilling location. However, the basis of the threshold is considered to represent the best available data and covers a wide range of benthic fauna.
The threshold for burial thickness is based on the probability that a specific species will escape a given depth of burial with both exotic (e.g. drill cuttings) and native sediments. The threshold was derived from the burial sensitivity of 33 species (Smit et al., 2006 and Kjeilen Eilersten et al., 2004).
5.3 Chemical Uncertainty
Several the chemicals entered in the model did not have solubility data available so were entered as fully soluble in water. This is effectively a worst case with respect to the water column but results in there being no chemical toxicity contribution to the sediment risk. If actual solubility data was available, there could be some chemical contribution to risk seen in the sediment. However, given that most of the discharge takes place at the sea surface, depositional thickness is limited, and it is unlikely that there would be a significant impact on the sediment.

Document Title: Captain Development - Drill Cuttings Modelling
Genesis Doc No: 203937C-000-RT-6200-0005/0
Date: May, 2022
Page 26 of 27
6.0 CONCLUSIONS
The cuttings modelling was undertaken using DREAM to predict environmental risks to the seabed and the water column as a result of the discharge of cuttings during drilling of three wells (UB04i, UC01i and UC02i) in Block 13/22 using WBM.
The maximum estimated deposited sediment thickness (cuttings pile height) was 1.51 m, in the immediate vicinity of the well, reducing rapidly with distance;
The following risks were predicted:
• The model predicted that the deposited cuttings from drilling could result in a risk to seabed sediment of greater than 5% in a maximum area of 0.1098 km2 237 days after drilling commences. This represents a small area of seabed, which reduces over time, to 0.0362 km2 after 5 years and 0.0285 km2 after 10 years; though in reality re-colonisation by benthic organisms would result in a faster seabed recovery.
• The risk to the sediment mainly results from oxygen depletion (53.88%) and change to grain size (27.8%).
• The volume of the water column where there is a risk to over 5% sensitive species reaches up to 0.3296 km3 at any one point in time but is transient in time and space. The risk to the water column disappears within 24 hours of the cessation of drilling.
• The primary contributors to the water column risk are f rom barite (48.46%), bentonite (21.73%) and SAFE-SURF* EU (18.98%).
• Overall, the risk to the sediment and the water column is low and unlikely to result in significant environmental impacts. Environmental impacts are discussed in Chapter 4 of the ES.

Document Title: Captain Development - Drill Cuttings Modelling
Genesis Doc No: 203937C-000-RT-6200-0005/0
Date: May, 2022
Page 27 of 27
7.0 REFERENCES
BEIS (2020). The United Kingdom Risk Based Approach Programme. A risk-based approach to the management of produced water discharges from offshore installations. Version 3.1.
Fugro (2021). Site survey Captain UKCS Block 29/10. Fugro report No. 210272, Habitat Assessment Report
Genesis (2022). Captain Development EOR Stage 2 Phase 2 Environmental Statement. Genesis doc no: 203937C-000-RT-6200-0003
Jakobsson, M., Cherkis, N. Z, Woodward, J., Macnab, R. and Coakley, B. (2008). New grid of Arctic bathymetry aids scientists and mapmakers; Eos, Transactions. American Geophysical Union. 81: 89, 93, 96.
Jødestøl, K. and Furuholt, E. (2010). Will drill cuttings and drill mud harm cold water corals? SPE126468.
Kjeilen-Eilertsen, G., Trannum, H., Jak, R., Smit, M., Neff, J. and Durell, J. (2004). Literature report on burial: derivation of PNEC as component in the MEMW model tool. ERMS Report no. 9B.
Neff, J.M. (2005). Composition, environmental fates, and biological effects of water based drilling muds and cuttings discharged to the marine environment: A Synthesis and Annotated Bibliography.
Rye, H., Johansen, Ø., Durgut, I., Reed, M., & Ditlevsen, M. (2006). Restitution of an impacted sediment. Sintef.
Rye. H. (2010). Calculation of stresses (depositions and water column concentrations) at the sea floor caused by drilling discharges. Presentation at the 2010 OLF cold -water coral workshop, held at IRIS, Stavanger.
Saga (1994). MiljØprogram I forbindelse med brØnn 7219/8-1s I Barentshavet”. Report prepared by Saga Petroleum A.S., Division for Teknologi og utbygging datert 10. Mars 1994, Saga rapport R-TIY-0003. Written in Norwegian.
Saha, S., et al. (2010). NCEP Climate Forecast System Reanalysis (CFSR) Selected Hourly Time-Series Products, January 1979 to December 2010. Research Data Archive at the National Center for Atmospheric Research, Computational and Information Systems Laboratory. https://doi.org/10.5065/D6513W89. Accessed† 29 03 2022.
Scottish Government (2022). National Marine Plan Interactive (NMPi) Map. Available from: http://www.gov.scot/Topics/marine/seamanagement/nmpihome
Smit, M.G.D., Jak R.G., Rye, H. and Frost T.K. (2006). Framework for the Environmental Impact Factor for drilling discharges. ERMS Report no. 3.
Trannum, H.C. (2004). Calculation of PNEC for changed grain size based on data from MOD. ERMS Report no. 9A.
Wentworth, C. (1922). A scale of grade and class terms for clastic sediments. Journal of Geology 30, no 5 p 377-392

J75662B
REPORT
Captain EOR ES: Underwater Noise Modelling for Piling
Prepared for: Ithaca Energy (UK) Ltd
Prepared by: Genesis Pavilion 3, Aspect 32, Prospect Road, Arnhall Business Park, Westhill, AB32 6FE, UK
Tel:
Fax:
www.genesisoilandgas.com
Document Title: Underwater noise modelling for piling
Client Doc. No.: CER-PGEN-HES-RPT-GOG-0000-00004-00
Genesis Doc. No.: 203937C-000-RT-6200-0004
Genesis Job No. J75662B
Date: May, 2022
Rev Date Description Issued
by
Checked
by
Approved
by
Client
Approval
1A 06/04/2022 Issued for internal review
A 06/04/2022 Issued for client comment
0 09/05/2022 Issued for client use

Document Title: Underwater noise modelling for piling
Genesis Doc. No.: 203937C-000-RT-6200-0004
Date: May, 2022
Page 2 of 35
Contents ABBREVIATIONS .............................................................................................................. 5
1.0 INTRODUCTION ....................................................................................................... 7
2.0 MODELLING METHODOLOGY ................................................................................. 9
2.1 Piling Source Characterisation ........................................................................... 9
2.2 Noise Propagation Modelling ........................................................................... 10
2.2.1 Parabolic Equation Algorithm................................................................... 11
2.2.2 Ray Tracing Algorithm ............................................................................. 11
2.2.3 Environmental Data................................................................................. 12
3.0 NOISE IMPACT ASSESSMENT METHODOLOGY .................................................. 15
3.1 Marine Mammals ............................................................................................. 15
3.1.1 PTS ........................................................................................................ 15
3.1.2 Disturbance............................................................................................. 17
3.2 Fish ................................................................................................................. 18
3.2.1 Injury ...................................................................................................... 18
3.2.2 Behavioural Disturbance ......................................................................... 18
4.0 MODELLING RESULTS AND IMPACT ASSESSMENT ............................................ 19
4.1 Marine Mammals ............................................................................................. 19
4.1.1 PTS ........................................................................................................ 19
4.1.2 Disturbance............................................................................................. 22
4.2 Fish ................................................................................................................. 27
4.2.1 Injury ...................................................................................................... 27
4.2.2 Disturbance............................................................................................. 30
5.0 MITIGATION MEASURES ....................................................................................... 31
6.0 CONCLUSIONS ...................................................................................................... 32
REFERENCES................................................................................................................. 33

Document Title: Underwater noise modelling for piling
Genesis Doc. No.: 203937C-000-RT-6200-0004
Date: May, 2022
Page 3 of 35
Figures & Tables Figures
Figure 1-1: Location of piling activities................................................................................. 7 Figure 2-1: Third octave band SEL spectra used in the piling modelling. .............................. 9 Figure 2-2: Bathymetry in the region of the piling locations. ............................................... 12 Figure 2-3: Sediments in the region of the piling locations. ................................................ 13 Figure 2-4: Example temperature, salinity, and sound speed depth profiles used in the modelling. ........................................................................................................................ 14 Figure 3-1: Auditory weighting functions for different marine mammal hearing groups. ....... 16 Figure 4-1: Predicted zero-to-peak SPL received by marine mammals during piling with the hammer operating at 20 kJ (most likely maximum hammer energy). .................................. 19 Figure 4-2: Predicted zero-to-peak SPL received by marine mammals during piling with the hammer operating at 90 kJ (worst-case maximum hammer energy)................................... 20 Figure 4-3: Predicted unweighted single-pulse SEL received by marine mammals during piling at a single location with the hammer operating at 20 kJ (most likely maximum hammer energy). ........................................................................................................................................ 23 Figure 4-4: Predicted unweighted single-pulse SEL received by marine mammals during piling at a single location with the hammer operating at 90 kJ (worst-case maximum hammer energy)............................................................................................................................. 23 Figure 4-5: Predicted unweighted single-pulse SEL received by marine mammals for the installation of all eight piles with the hammer operating at 20 kJ (most likely maximum hammer energy)............................................................................................................................. 25 Figure 4-6: Predicted unweighted single-pulse SEL received by marine mammals for the installation of all eight piles with the hammer operating at 90 kJ (worst-case maximum hammer energy)............................................................................................................................. 25 Figure 4-7: Predicted zero-to-peak SPL received by fish during piling with the hammer operating at 20 kJ (most likely maximum hammer energy)................................................. 28 Figure 4-8: Predicted zero-to-peak SPL received by fish during piling with the hammer operating at 90 kJ (worst-case maximum hammer energy). ............................................... 28
Tables
Table 1-1: Details of piling. ................................................................................................. 8 Table 2-1: Piling procedures and broadband source levels assumed in the modelling for the installation of single piles. ................................................................................................. 10 Table 2-2: Geo-acoustic parameters of the seabed that have been used in the modelling. . 13 Table 3-1: Marine mammals commonly sighted in the North Sea and in the region of the project location categorised by hearing group. .............................................................................. 15 Table 3-2: NOAA (NMFS, 2018) and Southall et al. (2019) thresholds for PTS to marine mammals. ........................................................................................................................ 16 Table 3-3: Marine mammal behavioural disturbance thresholds. ........................................ 17 Table 3-4: Thresholds for potential injury to fish, and fish eggs and larvae. ........................ 18 Table 4-1: Predicted maximum distances from the piling location where the zero-to-peak SPL thresholds for PTS onset to marine mammals are exceeded. ............................................ 21 Table 4-2: Predicted maximum distances that marine mammals must be from the piling location at the start of piling in order to not be exposed to cumulative SEL exceeding the PTS thresholds when they swim away. ..................................................................................... 22 Table 4-3: Predicted maximum distances where the adopted marine mammal behavioural disturbance threshold is exceeded. ................................................................................... 24

Document Title: Underwater noise modelling for piling
Genesis Doc. No.: 203937C-000-RT-6200-0004
Date: May, 2022
Page 4 of 35
Table 4-4: Estimated number of marine mammals and percentages of MU populations that may be disturbed by the piling at Captain. ......................................................................... 26 Table 4-5: Predicted maximum distances from the piling location where the zero-to-peak SPL thresholds for injury to fish and fish eggs and larvae are exceeded. ................................... 29 Table 4-6: Predicted maximum distances that fish species and fish eggs and larvae must be from the piling location at the start of piling in order to not be exposed to cumulative SEL exceeding injury thresholds when they swim away. ........................................................... 30

Document Title: Underwater noise modelling for piling
Genesis Doc. No.: 203937C-000-RT-6200-0004
Date: May, 2022
Page 5 of 35
ABBREVIATIONS
dB Decibels
dB re 1 µPa Decibels relative to one micropascal
dB re 1 µPa2s Decibels relative to one micropascal square second
dB re 1 µPa2s-m Decibels relative to one micropascal square second at one metre
dB re 1 µPa-m Decibels relative to one micropascal at one metre
deg. C Degrees Celsius
ED European Datum
EMODnet European Marine Observation Data Network
FARAM Faunal Acoustic Risk Assessment Model
g/kg Grams per kilogram
HF High Frequency
Hz Hertz
IAMMWG Inter-Agency Marine Mammal Working Group
JNCC Joint Nature Conservation Committee
kg/m3 Kilograms per cubic metre
kJ Kilojoules
km Kilometres
km2 Square kilometres
LF Low Frequency
m Metres
m/s Metres per second
MF Mid Frequency
MMO Marine Mammal Observer
MU Management Unit
NMFS National Marine Fisheries Service
NOAA National Oceanographic and Atmospheric Administration

Document Title: Underwater noise modelling for piling
Genesis Doc. No.: 203937C-000-RT-6200-0004
Date: May, 2022
Page 6 of 35
PAM Passive acoustic Monitoring
PE Parabolic Equation
PTS Potential Threshold Shift
RAM Range-dependent Acoustic Model
SCANS Small Cetaceans Abundance Surveys
SEL Sound Exposure Level
SPL Sound Pressure Level
SUDS Subsea Umbilical Distribution Structures
UTM Universal Transverse Mercator
VHF Very High Frequency
WOA World Ocean Atlas

Document Title: Underwater noise modelling for piling
Genesis Doc. No.: 203937C-000-RT-6200-0004
Date: May, 2022
Page 7 of 35
1.0 INTRODUCTION
As part of the Captain Stage 2 Project, piling will be required for the installation of two Subsea Umbilical Distribution Structures (SUDSs), one each at the Area D and Area E drill centres (see Figure 1-1). The SUDSs are separated by approximately 2.8 km and will require four piles for installation, resulting in a total of eight piles being installed. It is expected that it will take one hour to install each pile with the four piles at each SUDS being installed in a single day. Based on experience of piling at Captain Area C, it is expected that a maximum hammer energy of 20 kJ will be sufficient to install the piles (after a soft start hammer energy of 10 kJ).However, as a worst-case scenario, a maximum hammer energy of 90 kJ (also with a soft-start of 10 kJ) is also considered. Details of the piling that will be conducted at Captain Area D and Area E are summarised in Table 1-1.
This report presents underwater noise modelling results for assessing potential impacts that the piling of the two SUDSs may have on marine mammals and fish.
Figure 1-1: Location of piling activities.

Document Title: Underwater noise modelling for piling
Genesis Doc. No.: 203937C-000-RT-6200-0004
Date: May, 2022
Page 8 of 35
Table 1-1: Details of piling.
Parameter Value
Number of piles to be installed 8 (4 at each SUDS location)
Duration to install a single pile 1 hour
Maximum number of piles installed in any 24-hour period*
8
Pile length 26 m
Pile penetration depth 22 m
Sof t-start hammer energy 10 kJ
Maximum hammer energy Most likely maximum hammer energy: 20 kJ
Worst-case maximum hammer energy: 90 kJ
* The modelling assumes that the two SUDS will be piled in a single 24 hour period, though it is possible there may be a few days ‘break’ before the second SUDS is installed.

Document Title: Underwater noise modelling for piling
Genesis Doc. No.: 203937C-000-RT-6200-0004
Date: May, 2022
Page 9 of 35
2.0 MODELLING METHODOLOGY
This section discusses the modelling methodology adopted to estimate potential impacts from piling associated with the Captain Stage 2 Project. The characterisation of the piling noise source is firstly discussed before details of the noise propagation model are presented.
2.1 Piling Source Characterisation
A pile under percussive driving is a complex underwater acoustic source. The noise levels generated during piling depend on many factors, such as hammer energy, mechanical properties and dimensions of the pile, water depth, and seabed properties. The hammer energy has the biggest influence on the noise levels generated, with higher energy hammers generating higher noise levels (Robinson et al., 2007).
Based on previous experience of piling at Captain Area C, it is expected that piling of the SUDSs will be conducted using an impact hammer with a capacity of 90 kJ. It is anticipated that a maximum hammer energy of 20 kJ will be sufficient to install all piles for the SUDSs and this has been considered in the modelling as the most likely maximum hammer energy required. However, a worst-case scenario involving a maximum hammer energy of 90 kJ has also been considered.
To derive source levels for use in the piling modelling, a representative third octave band sound exposure level (SEL) frequency spectrum measured during piling with an 800 kJ hammer (Ainslie et al., 2012) has been scaled to different hammer energies used in the modelling of piling at Captain. It has been assumed that the source SEL scales linearly with hammer energy, which has been demonstrated by measurements made throughout the soft-start and energy ramp-up during piling (Robinson et al., 2007). The scaled third octave band SEL spectra for the different hammer energies that have been used in the modelling are shown in Figure 2-1. The piling soft-start/ramp-up procedures and zero-to-peak sound pressure level (SPL) and SEL source levels assumed in the modelling for the installation of single piles are shown in Table 2-1.
Figure 2-1: Third octave band SEL spectra used in the piling modelling.

Document Title: Underwater noise modelling for piling
Genesis Doc. No.: 203937C-000-RT-6200-0004
Date: May, 2022
Page 10 of 35
Table 2-1: Piling procedures and broadband source levels assumed in the modelling for the installation of single piles.
Hammer
Energy (kJ)
Duration
(minutes)
Strike Rate
(blows/minute)
Source Level
Zero-to-peak SPL
(dB re 1 μPa-m)
SEL
(dB re 1 μPa2s-m)
Maximum hammer energy of 20 kJ (most likely maximum hammer energy)
10 20 46 222.5 196.5
20 40 46 225.5 199.5
Maximum hammer energy of 90 kJ (worst-case maximum hammer energy)
10 10 46 222.5 196.5
30 10 46 227.2 201.2
50 10 46 229.4 203.4
70 10 46 230.9 204.9
90 20 46 232.0 206.0
2.2 Noise Propagation Modelling
There are various algorithms that can be used for underwater noise propagation modelling e.g. parabolic equation, ray tracing, normal mode, wavenumber integration, energy flux density and semi-empirical algorithms (Jensen et al., 2011). The Genesis in-house modelling software FARAM (Faunal Acoustic Risk Assessment Model) has been used in this study. FARAM employs the parabolic equation (PE) and ray tracing algorithms developed by Collins (1993) and Porter and Liu (1994), respectively, for estimating received noise levels from various sources. When estimating received noise levels, FARAM incorporates:
• A site-specific bathymetric grid to account for the influence of varying bathymetry on noise propagation;
• Site-specific range and depth dependent water column temperature, salinity, and sound speed profiles based on modelled hydrological conditions;
• Acoustic properties of the predominant seabed sediments in the modelling area;
• Frequency dependent propagation effects (e.g. volume attenuation, reflection, scattering at different frequencies);
• Specific properties of the piling noise source under consideration (e.g. spectral content, hammer energy, strike rate);
• Auditory weighting functions that characterise the hearing ability of different marine mammal hearing groups;
• Movement of mobile marine receptors (e.g. swim speed, depth and trajectory) when calculating received cumulative SEL; and
• The most up-to-date thresholds for assessing potential impacts to marine fauna.

Document Title: Underwater noise modelling for piling
Genesis Doc. No.: 203937C-000-RT-6200-0004
Date: May, 2022
Page 11 of 35
2.2.1 Parabolic Equation Algorithm
PE models approximate the wave equation, allowing a solution to be found computationally (Jensen et al., 2011). This is one of the most popular wave-theory techniques for modelling sound propagation in spatially varying environments (Jensen et al., 2011). The computational scheme used in FARAM is based on the Range-dependent Acoustic Model (RAM) implementation of the PE (Collins, 1993). The RAM PE algorithm incorporates acoustic propagation effects resulting from varying bathymetry, range dependent sound speed depth profiles, and geo-acoustic properties.
The PE algorithm is best suited to calculation of low frequency sound propagation since the computational complexity and implementation time of the PE method significantly increases with frequency. The PE algorithm is therefore generally restricted to modelling the propagation characteristics of low frequency sound sources, since modelling of high frequencies becomes prohibitively time consuming. Given this restriction, the PE model has been used for computation of low frequency sound propagation (<500 Hz).
2.2.2 Ray Tracing Algorithm
For modelling propagation of higher frequencies (>500 Hz), the Bellhop Gaussian beam ray tracing algorithm (Porter and Liu, 1994) has been used. Bellhop is an efficient ray tracing program that is well suited for the modelling of higher frequency sound sources. However, it can also provide accurate results for low frequency propagation in certain circumstances. Similar to the RAM PE algorithm discussed previously, Bellhop also incorporates acoustic propagation effects resulting from varying bathymetry, range dependent sound speed depth profiles, and geo-acoustic properties. Bellhop also accounts for increased sound attenuation due to volume absorption. This type of sound attenuation becomes more prominent at higher frequencies and cannot be neglected without overestimating received levels at large distances from the sound source.

Document Title: Underwater noise modelling for piling
Genesis Doc. No.: 203937C-000-RT-6200-0004
Date: May, 2022
Page 12 of 35
2.2.3 Environmental Data
The implemented noise propagation model accounts for various site-specific environmental properties including a bathymetric grid, geographically and depth varying sound speed profiles and geo-acoustic properties of the sediment. To model the effects of these properties, input data is required that describes the surrounding environment.
2.2.3.1 Bathymetry
Accurate bathymetry data is important for sound propagation modelling since the seabed strongly influences the propagation characteristics of sound. In shallow water regions, there is significant interaction of the sound with the seabed through reflections and scattering effects, and strong attenuation may occur as sound penetrates the seabed. In deep water regions, there is typically less interaction of sound with the seabed and attenuation due to bottom loss is small, which can result in longer propagation distances.
The bathymetry data that has been used in the noise model (Figure 2-2) is provided by EMODnet, which is a high-resolution digital terrain model for European Seas (EMODnet, 2022a). The EMODnet bathymetry is based on almost 10,000 datasets obtained from bathymetric surveys, with bathymetric data provided at a spatial resolution of 1/16 arc minutes. The water depth at the piling locations are approximately 105 m and 110 m, respectively.
Figure 2-2: Bathymetry in the region of the piling locations.

Document Title: Underwater noise modelling for piling
Genesis Doc. No.: 203937C-000-RT-6200-0004
Date: May, 2022
Page 13 of 35
2.2.3.2 Seabed Properties
The implemented propagation model accounts for attenuation effects due to interactions with the seabed. Sediments in the region of the piling locations are shown in Figure 2-3 (EMODnet, 2022b). The main sediment types in the region are offshore circalittoral muds and sands. However, the FARAM propagation model is limited to modelling a single seabed substrate. A sandy seabed has been assumed in the model. This is likely to be conservative since harder sediments such as sands and gravels typically result in longer range propagation compared to softer sediments such as muds and silts (Jensen et al., 2011). The geo-acoustic properties associated with the seabed that have been used in the modelling are shown in Table 2-2 (Jensen et al., 2011).
Figure 2-3: Sediments in the region of the piling locations.
Table 2-2: Geo-acoustic parameters of the seabed that have been used in the modelling.
Parameter Value
Sediment type Sand
Sound speed in sediment 1,650 m/s
Sound attenuation in sediment 0.8 dB/wavelength
Sediment density 1,900 kg/m3

Document Title: Underwater noise modelling for piling
Genesis Doc. No.: 203937C-000-RT-6200-0004
Date: May, 2022
Page 14 of 35
2.2.3.3 Sound Speed
A major factor that influences sound propagation in water is the speed of sound through the water column, which influences how sound refracts as it propagates through the water. FARAM allows for geographically and depth varying sound speed profiles. Sound speed data can be derived from water column temperature and salinity data (Jensen et al., 2011). Sound speed profiles for the model location were derived from temperature and salinity profiles taken from the World Ocean Atlas (WOA) from 2013 (WOA, 2013). Example temperature, salinity, and sound speed profiles used in the modelling are shown in Figure 2-4.
Figure 2-4: Example temperature, salinity, and sound speed depth profiles used in the modelling.

Document Title: Underwater noise modelling for piling
Genesis Doc. No.: 203937C-000-RT-6200-0004
Date: May, 2022
Page 15 of 35
3.0 NOISE IMPACT ASSESSMENT METHODOLOGY
Sound is important to marine mammals and fish for navigation, communication, predator avoidance and prey detection. Underwater noise generated by human activities can have an adverse impact on marine mammals and fish (Richardson et al., 1995; Southall et al., 2007, 2019, 2021; National Marine Fisheries Service (NMFS), 2018; Popper et al.,). The thresholds adopted in this report for assessing potential impacts to marine mammals and fish are based on a comprehensive review of evidence of underwater noise impacts.
3.1 Marine Mammals
Potential impacts to marine mammals have been assessed in this report using thresholds for permanent threshold shift (PTS) and behavioural disturbance. PTS is a permanent change in a marine mammal’s hearing sensitivity, whilst behavioural disturbance can vary from low level disturbance such as small changes in normal behaviour to higher levels of disturbance such as displacement from a favourable area.
3.1.1 PTS
PTS thresholds for marine mammals have been suggested by the National Oceanic and Atmospheric Administration (NOAA) (NMFS, 2018) and Southall et al. (2019) based on the most recent studies and are recognised as the appropriate criteria for assessing impacts to marine mammals from underwater noise. NOAA (NMFS, 2018) and Southall et al. (2019) proposed grouping marine mammals into functional hearing groups for assessing potential impacts. NOAA proposed grouping marine mammals into low frequency (LF) cetaceans, mid frequency (MF) cetaceans, high frequency (HF) cetaceans, otariid pinnipeds, phocid pinnipeds and sirenians. Southall et al. (2019) proposed equivalent hearing groups but renamed the MF cetacean and HF cetacean hearing groups as HF cetaceans and very high frequency (VHF) cetaceans, respectively. Table 3-1 shows marine mammal species that have been sighted in the North Sea and the Captain project area (Hammond et al., 2021; Waggitt et al., 2019; Russell et al., 2017) categorised according to these hearing groups.
Table 3-1: Marine mammals commonly sighted in the North Sea and in the region of the project location categorised by hearing group.
Hearing Group
Species 1 NOAA (NMFS, 2018)
Southall et al. (2019)
LF cetaceans LF cetaceans Minke whale
MF cetaceans HF cetaceans
White-beaked dolphin, white-sided dolphin, bottlenose dolphin, Risso’s dolphin, striped dolphin, pilot whale,
beaked whale, common dolphin, killer whale
HF cetaceans VHF cetaceans Harbour porpoise
Phocid pinnipeds Phocid pinnipeds Grey seal, harbour seal
1 Species listed are the most sighted marine mammal species in the North Sea (Hammond et al.,
2021; Waggitt et al., 2019; Russell et al., 2017). Species highlighted in bold are those that are more likely to be present in the region of the Captain project area.
The PTS thresholds proposed by NOAA (NMFS, 2018) and Southall et al. (2019) are shown in Table 3-2. As dual-metric criteria, the onset of PTS is considered to potentially occur when

Document Title: Underwater noise modelling for piling
Genesis Doc. No.: 203937C-000-RT-6200-0004
Date: May, 2022
Page 16 of 35
noise levels exceed either the zero-to-peak SPL or cumulative SEL thresholds (NMFS, 2018; Southall et al., 2019). The zero-to-peak SPL thresholds are unweighted and do not take into consideration the hearing range of any marine mammals. In contrast, the cumulative SEL thresholds are weighted and account for the hearing capabilities of marine mammals by frequency weighting received SELs using generalised auditory weighting functions. The auditory weighting functions proposed by NOAA and Southall et al. (2019) are shown in Figure 3-1 (note that the Southall et al., (2019) nomenclature is used in this figure).
Table 3-2: NOAA (NMFS, 2018) and Southall et al. (2019) thresholds for PTS to marine mammals.
Hearing Group PTS Threshold
NOAA (NMFS, 2018)
Southall et al. (2019)
Zero-to-peak SPL (dB re 1 µPa)
Cumulative SEL (dB re 1 µPa2s)
LF cetaceans LF cetaceans 219 183
MF cetaceans HF cetaceans 230 185
HF cetaceans VHF cetaceans 202 155
Phocid pinnipeds Phocid pinnipeds 218 185
Figure 3-1: Auditory weighting functions for different marine mammal hearing groups.
In the remainder of this report, the Southall et al. (2019) nomenclature is used when referring to different marine mammal hearing groups. However, it is important to note that the Southall

Document Title: Underwater noise modelling for piling
Genesis Doc. No.: 203937C-000-RT-6200-0004
Date: May, 2022
Page 17 of 35
et al. (2019) threshold values and auditory weighting functions are the same for the comparative groups as those proposed by NOAA (NMFS, 2018). Therefore, the adoption of the Southall et al. (2019) guidance or NOAA (NMFS, 2018) guidance provides the same estimated impacts to marine mammals.
3.1.2 Disturbance
Thresholds for behavioural disturbance to marine mammals are less well defined compared to PTS thresholds. Numerous studies on marine mammal behavioural responses to sound exposure have not resulted in consensus regarding the appropriate metric or thresholds for assessing behavioural reactions. Southall et al. (2007; 2021) concluded that the available data on marine mammal behavioural responses were too variable and context-specific to justify proposing single value disturbance criteria. This is because dif ferent marine mammal species and even different individuals from the same species can exhibit a wide range of responses to the same sound (Southall et al., 2007, 2021; NMFS, 2018).
Thompson et al. (2013) showed that harbour porpoises exhibited avoidance from a seismic survey at unweighted SELs between 145 - 151 dB re 1 μPa2s. Lucke et al. (2009) also reported that a captive harbour porpoise consistently showed behavioural responses at unweighted SELs exceeding 145 dB re 1 μPa2s. Based on these results, and given the lack of evidence of specific disturbance thresholds for other species, Tougaard (2016) suggested that behavioural disturbance to all marine mammal species should be assessed using an unweighted SEL threshold of 145 dB re 1 μPa2s. This threshold is adopted in this report for estimating potential behavioural disturbance to all marine mammals (Table 3-3).
This threshold suggested by Tougaard (2016) was derived based on measurements of harbour porpoise disturbance from airgun arrays (Thompson et al., 2013; Lucke et al., 2009). However, this threshold is also thought to be relevant to piling (Tougaard, 2016). Brandt et al. (2016) analysed the effect of piling on harbour porpoise from the construction of eight offshore wind farms within the German North Sea between 2009 and 2013. Harbour porpoise monitoring data from using porpoise detectors was combined with aerial survey and noise level data. The results showed that detections of harbour porpoise during piling declined by less than 20% at SELs below 145 dB re 1 µPa2s and that displacement of harbour porpoise at SELs below 145 dB re 1 µPa2s could not clearly be related to the noise from the piling.
The adoption of the threshold in Table 3-3 may overestimate behavioural disturbance impacts to marine mammal species other than harbour porpoise (Tougaard, 2016). This is because it is thought that harbour porpoises are more sensitive to underwater noise than many other species. This is supported by the fact that the PTS thresholds for VHF cetaceans (the hearing group which harbour porpoise belong to) are significantly lower than the thresholds for all other hearing groups (see Table 3-2), suggesting that they are more sensitive to underwater noise than other species.
Table 3-3: Marine mammal behavioural disturbance thresholds.
Criteria SEL Behavioural Disturbance Threshold
(dB re 1 μPa2s)
Tougaard (2016) criteria for behavioural disturbance to all marine mammals
145

Document Title: Underwater noise modelling for piling
Genesis Doc. No.: 203937C-000-RT-6200-0004
Date: May, 2022
Page 18 of 35
3.2 Fish
3.2.1 Injury
Popper et al. (2014) have defined criteria for injury to fish based on a comprehensive review of publications related to impacts from various high-energy sources including piling. Injury thresholds are derived in Popper et al. (2014) for:
• Fishes with no swim bladder or other gas chamber;
• Fishes with swim bladders in which hearing involves a swim bladder or other gas volume;
• Fishes with swim bladders in which hearing does not involve the swim bladder or other gas volume; and
• Fish eggs and larvae.
The thresholds for potential injury to fish species, eggs and larvae, and sea turtles proposed in Popper et al. (2014) are shown in Table 3-4.
Table 3-4: Thresholds for potential injury to fish, and fish eggs and larvae.
Fish Group
Potential Mortal Injury Thresholds
Zero-to-peak SPL (dB re 1 μPa)
Cumulative SEL (dB re 1 μPa2s)
Fishes with no swim bladder 213 219
Fishes with swim bladder involved in hearing 207 207
Fishes with swim bladder not involved in hearing 207 210
Eggs and larvae 207 210
3.2.2 Behavioural Disturbance
Documented disturbance effects of underwater noise on fish behaviour are variable, ranging from no discernible effect (Wardle et al., 2001) to startle reactions followed by immediate resumption of normal behaviour (Wardle et al., 2001; Hassel et al., 2004). Avoidance of airgun noise has also been observed (Hassel et al., 2004).
Despite some documented behavioural disturbance effects, there are no well -established criteria or thresholds for assessing behavioural disturbance to fish from underwater noise. In fact, it was concluded in Popper et al. (2014) that there lacked sufficient evidence to recommend specific thresholds that correspond to behavioural disturbance for fish. Therefore, a quantitative assessment of behavioural disturbance to fish and fish eggs and larvae is not considered in this report.
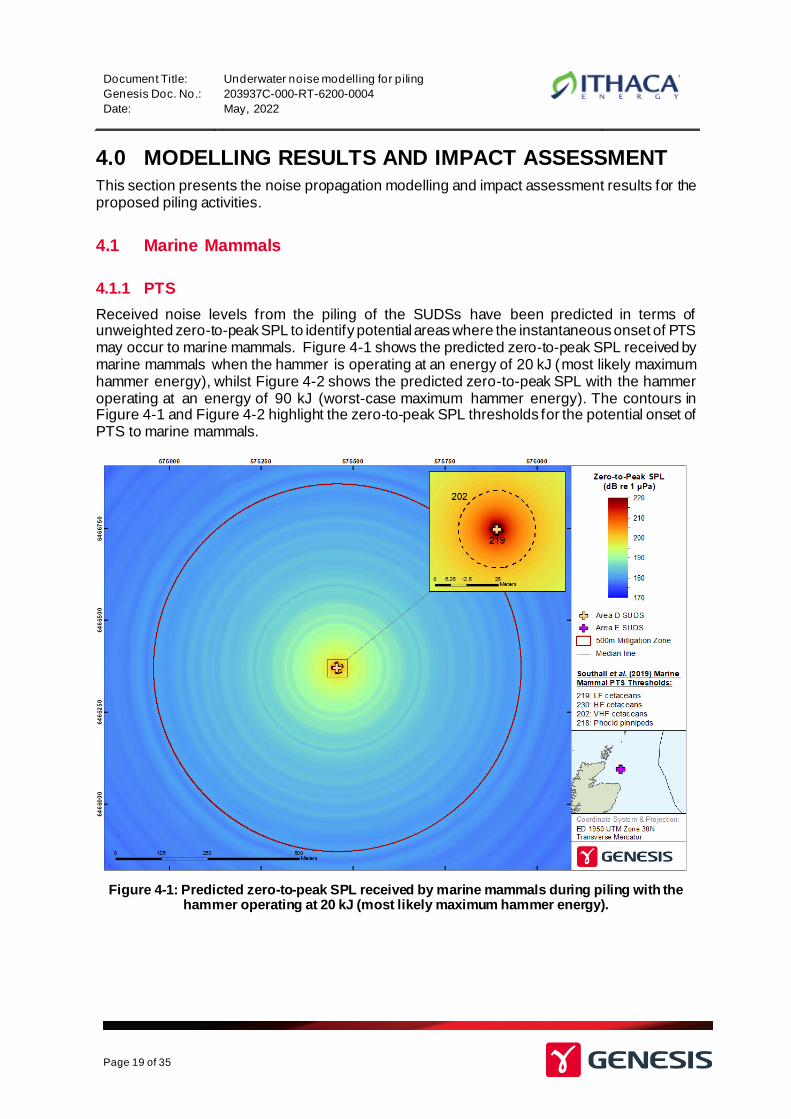
Document Title: Underwater noise modelling for piling
Genesis Doc. No.: 203937C-000-RT-6200-0004
Date: May, 2022
Page 19 of 35
4.0 MODELLING RESULTS AND IMPACT ASSESSMENT
This section presents the noise propagation modelling and impact assessment results for the proposed piling activities.
4.1 Marine Mammals
4.1.1 PTS
Received noise levels from the piling of the SUDSs have been predicted in terms of unweighted zero-to-peak SPL to identify potential areas where the instantaneous onset of PTS may occur to marine mammals. Figure 4-1 shows the predicted zero-to-peak SPL received by marine mammals when the hammer is operating at an energy of 20 kJ (most likely maximum hammer energy), whilst Figure 4-2 shows the predicted zero-to-peak SPL with the hammer operating at an energy of 90 kJ (worst-case maximum hammer energy). The contours in Figure 4-1 and Figure 4-2 highlight the zero-to-peak SPL thresholds for the potential onset of PTS to marine mammals.
Figure 4-1: Predicted zero-to-peak SPL received by marine mammals during piling with the
hammer operating at 20 kJ (most likely maximum hammer energy).

Document Title: Underwater noise modelling for piling
Genesis Doc. No.: 203937C-000-RT-6200-0004
Date: May, 2022
Page 20 of 35
Figure 4-2: Predicted zero-to-peak SPL received by marine mammals during piling with the
hammer operating at 90 kJ (worst-case maximum hammer energy).
The predicted maximum distances where the zero-to-peak SPL thresholds for PTS onset are exceeded during the piling are summarised in Table 4-1. It is predicted that the zero-to-peak SPL noise levels generated during the piling will not exceed the PTS thresholds for any marine mammal hearing group outside the standard 500 m mitigation zone that will be employed during piling operations. If any marine mammals are observed or detected in the 500 m mitigation zone before the start of piling, the piling will be delayed until all marine mammals have vacated the mitigation zone. With this mitigation measure in place, the probability of zero-to-peak SPL noise levels generated during the piling causing PTS to marine mammals is predicted to be low.

Document Title: Underwater noise modelling for piling
Genesis Doc. No.: 203937C-000-RT-6200-0004
Date: May, 2022
Page 21 of 35
Table 4-1: Predicted maximum distances from the piling location where the zero-to-peak SPL
thresholds for PTS onset to marine mammals are exceeded.
Marine Mammal Hearing Group
Zero-to-peak SPL PTS Threshold (dB re 1 µPa)
Maximum Distance to Threshold Exceedance (m) 1
Maximum hammer energy of 20 kJ (most likely maximum hammer energy)
LF cetaceans 219 10
HF cetaceans 230 10
VHF cetaceans 202 20
Phocid pinnipeds 218 10
Maximum hammer energy of 90 kJ (worst-case maximum hammer energy)
LF cetaceans 219 10
HF cetaceans 230 10
VHF cetaceans 202 50
Phocid pinnipeds 218 10
1 Predicted distances have been rounded up to the nearest 10 m.
The cumulative SEL received by marine mammals over a full day of piling has been predicted and compared to the PTS thresholds. In the cumulative SEL modelling scenarios it is assumed that 8 piles will be installed in a single day with each pile taking one hour to install (see Table 1-1). Both the most likely maximum energy and worst-case maximum energy piling procedures shown in Table 2-1 have been modelled for the installation of each pile.
Following the guidance of Southall et al. (2019), the cumulative SELs received by marine mammals have been calculated by weighting the received SELs from each pile strike using the auditory weighting functions shown in Figure 3-1 and integrating the sound exposure over the full piling duration. Marine mammals have been simulated as swimming away from the piling location at the onset of piling, which has been observed during piling activities (Brandt et al., 2011, 2016, 2018; Carstensen et al., 2006; Dahne et al., 2013). The received cumulative SEL has been calculated for marine mammals swimming away from the piling location at a constant swim speed of 2 m/s. Results are presented showing the furthest distance that marine mammals must be from the piling location at the start of the piling in order to not be exposed to cumulative SEL exceeding the PTS threshold when they swim away.
The predicted initial distances that marine mammals must be from the piling location at the start of piling in order to not be exposed to cumulative SELs exceeding the PTS thresholds after they swim away are shown in Table 4-2. The modelling predicts that the PTS thresholds will not be exceeded for any marine mammals when they swim away from the piling location. Therefore, the probability of cumulative SELs causing PTS to marine mammals is predicted to be low.

Document Title: Underwater noise modelling for piling
Genesis Doc. No.: 203937C-000-RT-6200-0004
Date: May, 2022
Page 22 of 35
Table 4-2: Predicted maximum distances that marine mammals must be from the piling location at the start of piling in order to not be exposed to cumulative SEL exceeding the PTS
thresholds when they swim away.
Marine Mammal Hearing Group
Cumulative SEL Threshold for PTS
(dB re 1 μPa2s)
Swim Speed (m/s)
Maximum Distance to Threshold Exceedance
(m) 1
Maximum hammer energy of 20 kJ (most likely maximum hammer energy)
LF cetaceans 183 2 Threshold not exceeded
HF cetaceans 185 2 Threshold not exceeded
VHF cetaceans 155 2 Threshold not exceeded
Phocid pinnipeds 185 2 Threshold not exceeded
Maximum hammer energy of 90 kJ (worst-case maximum hammer energy)
LF cetaceans 183 2 Threshold not exceeded
HF cetaceans 185 2 Threshold not exceeded
VHF cetaceans 155 2 Threshold not exceeded
Phocid pinnipeds 185 2 Threshold not exceeded
1 Predicted distances have been rounded up to the nearest 10 m.
4.1.2 Disturbance
Behavioural disturbance to all marine mammal species has been estimated based on comparison of single-pulse SELs with the threshold of 145 dB re 1 µPa2s suggested by Tougaard (2016). Figure 4-3 shows the maximum predicted unweighted single-pulse SEL during piling at a single location with the hammer operating at maximum hammer energy of 20 kJ (most likely maximum hammer energy), whilst Figure 4-4 shows the corresponding maximum predicted unweighted single-pulse SEL with the hammer operating at maximum hammer energy of 90 kJ (worst-case maximum hammer energy). The contours highlighted in these figures signify the adopted threshold for assessing potential disturbance to all marine mammals.

Document Title: Underwater noise modelling for piling
Genesis Doc. No.: 203937C-000-RT-6200-0004
Date: May, 2022
Page 23 of 35
Figure 4-3: Predicted unweighted single-pulse SEL received by marine mammals during piling at a single location with the hammer operating at 20 kJ (most likely maximum hammer energy).
Figure 4-4: Predicted unweighted single-pulse SEL received by marine mammals during piling at a single location with the hammer operating at 90 kJ (worst-case maximum hammer energy).

Document Title: Underwater noise modelling for piling
Genesis Doc. No.: 203937C-000-RT-6200-0004
Date: May, 2022
Page 24 of 35
Table 4-3 summarises the predicted distances from the piling locations where behavioural disturbance might occur to marine mammals during the piling at Captain. The modelling predicts that disturbance to marine mammals could potentially occur at a distance of 3 km if the hammer operates at a maximum energy of 20 kJ, and at a distance of 8 km if the hammer operates at a maximum energy of 90 kJ.
Aerial surveys conducted during piling with a 500 kJ hammer at the Alpha Ventus Offshore Wind Farm (Dahne et al., 2013) showed that significant displacement of harbour porpoise occurred at approximately 10 km from the piling location, although some harbour porpoise could be displaced at distances of up to 25 km. Using noise measurements and harbour porpoise monitoring data from the piling of eight offshore wind farms in the German North Sea, Brandt et al. (2016) showed that detections of harbour porpoise during piling declined by less than 20% at distances of 10 to 15 km from the piling location where the SEL was below 145 dB re 1 µPa2s (the threshold for disturbance adopted in this assessment). The predicted distances where disturbance may occur to marine mammals for piling at Captain (3 – 8 km) are lower than those reported in Dahne et al. (2013) and Brandt et al. (2016). This is because the piling at Captain will be conducted using a relatively small maximum hammer energy (20 – 90 kJ) and will generate lower noise levels compared to the hammers used during piling of the offshore wind farms examined by Dahne et al. (2013) and Brandt et al. (2016).
Table 4-3: Predicted maximum distances where the adopted marine mammal behavioural disturbance threshold is exceeded.
Criteria SEL Behavioural
Disturbance Threshold (dB re 1 μPa2s)
Maximum Distance to Threshold Exceedance (km) 1
Maximum hammer energy of 20 kJ (most likely maximum hammer energy)
Tougaard (2016) criteria for behavioural disturbance to all marine mammals
145 3
Maximum hammer energy of 90 kJ (worst-case maximum hammer energy)
Tougaard (2016) criteria for behavioural disturbance to all marine mammals
145 8
1 Predicted distance have been rounded up to the nearest 1 km.
The combined maximum unweighted single-pulse SEL has been predicted for the installation of all eight piles (four at Area D and four at Area E). Figure 4-5 shows the predicted combined unweighted single-pulse SELs for the installation of all piles with the hammer operating at maximum hammer energy of 20 kJ (most likely maximum hammer energy), whilst Figure 4-6 shows the corresponding maximum predicted combined unweighted single-pulse SELs with the hammer operating at maximum hammer energy of 90 kJ (worst-case maximum hammer energy).

Document Title: Underwater noise modelling for piling
Genesis Doc. No.: 203937C-000-RT-6200-0004
Date: May, 2022
Page 25 of 35
Figure 4-5: Predicted unweighted single-pulse SEL received by marine mammals for the
installation of all eight piles with the hammer operating at 20 kJ (most likely maximum hammer energy).
Figure 4-6: Predicted unweighted single-pulse SEL received by marine mammals for the
installation of all eight piles with the hammer operating at 90 kJ (worst-case maximum hammer energy).

Document Title: Underwater noise modelling for piling
Genesis Doc. No.: 203937C-000-RT-6200-0004
Date: May, 2022
Page 26 of 35
Based on the predicted disturbance areas shown in Figure 4-5 and Figure 4-6, the number of marine mammals that may be disturbed during piling at Captain have been predicted using the Small Cetaceans Abundance Surveys (SCANS)-III densities (Hammond et al., 2021) and seal densities from Russel et al. (2017). The estimated number of marine mammals that could potentially be disturbed during the piling are shown in Table 4-4. The predicted number of harbour porpoises, white-beaked dolphins, white-sided dolphins, minke whales and grey seals that could potentially be disturbed during piling at Captain are relatively small compared to the management unit (MU) populations (Inter-Agency Marine Mammal Working Group (IAMMWG), 2021).
Table 4-4: Estimated number of marine mammals and percentages of MU populations that may be disturbed by the piling at Captain.
Species Disturbance Area (km2)
Density (animals/km2) 1
Number of Mammals Disturbed
MU Population 2
Percentage of MU Population Disturbed (%)
Maximum hammer energy of 20 kJ (most likely maximum hammer energy)
Harbour porpoise
40 0.402 17 346,601 0.005
White-beaked dolphin
40 0.037 2 43,951 0.005
White-sided dolphin
40 0.0209 1 18,128 0.006
Minke whale 40 0.032 2 20,118 0.010
Grey seal 40 0.04 – 0.2 2 – 8 N/A N/A
Maximum hammer energy of 90 kJ (worst-case maximum hammer energy)
Harbour porpoise
196 0.402 79 346,601 0.023
White-beaked dolphin
196 0.037 8 43,951 0.018
White-sided dolphin
196 0.0209 5 18,128 0.028
Minke whale 196 0.032 7 20,118 0.035
Grey seal 196 0.04 – 0.2 8 – 40 N/A N/A
1 Cetacean densities are f rom SCANS-III data (Hammond et al., 2021) and seal densities are from Russell et al. (2017).
2 MU populations are from IAMMWG (2021).

Document Title: Underwater noise modelling for piling
Genesis Doc. No.: 203937C-000-RT-6200-0004
Date: May, 2022
Page 27 of 35
Studies based on impacts arising from piling noise have indicated that displaced marine mammals return to the area within relatively short periods of time, usually within three days once the piling has ceased (Brandt et al., 2011, 2016, 2018; Carstensen et al., 2006). It has been demonstrated that even long-term piling over several months or years (e.g. during the construction of wind-farms) is unlikely to have a significant long-term impact on marine mammal populations levels (Nabe-Nielsen et al., 2018; Nabe-Nielsen, 2020).
The piling at Captain is expected to be completed within a single day and it is expected that any marine mammals disturbed will return to the area within a short period of time after the piling has finished. Given the small estimated number of marine mammals that may be disturbed and the short duration of the piling at Captain, it is concluded that the piling at Captain will not have a significant adverse effect on any marine mammal population.
4.2 Fish
4.2.1 Injury
To quantitatively assess any potential injury to fish and fish eggs and larvae from the proposed piling at Captain, received noise levels in terms of unweighted zero-to-peak SPL and unweighted cumulative SEL have been predicted and compared to the Popper et al. (2014) thresholds for injury (Table 3-4).
Figure 4-7 shows the predicted zero-to-peak SPL received by fish species and fish eggs and larvae when the hammer is operating at an energy of 20 kJ (most likely maximum hammer energy), whilst Figure 4-8 shows the predicted zero-to-peak SPL with the hammer operating at an energy of 90 kJ (worst-case maximum hammer energy). The contours in these figures highlight the Popper et al. (2014) zero-to-peak SPL thresholds for potential injury to fish species and fish eggs and larvae.
The predicted distances where the zero-to-peak SPL thresholds for injury to fish species and fish eggs and larvae are exceeded are shown in Table 4-5. It is predicted that injury to the most sensitive fish species and eggs and larvae will be limited to a maximum distance of 20 m from the piling locations.

Document Title: Underwater noise modelling for piling
Genesis Doc. No.: 203937C-000-RT-6200-0004
Date: May, 2022
Page 28 of 35
Figure 4-7: Predicted zero-to-peak SPL received by fish during piling with the hammer
operating at 20 kJ (most likely maximum hammer energy).
Figure 4-8: Predicted zero-to-peak SPL received by fish during piling with the hammer
operating at 90 kJ (worst-case maximum hammer energy).

Document Title: Underwater noise modelling for piling
Genesis Doc. No.: 203937C-000-RT-6200-0004
Date: May, 2022
Page 29 of 35
Table 4-5: Predicted maximum distances from the piling location where the zero-to-peak SPL thresholds for injury to fish and fish eggs and larvae are exceeded.
Fish Group Zero-to-peak SPL Injury Threshold (dB re 1 µPa)
Maximum Distance to Threshold Exceedance (m) 1
Maximum hammer energy of 20 kJ (most likely maximum hammer energy)
Fishes with no swim bladder 213 10
Fishes with swim bladder involved in hearing
207 10
Fishes with swim bladder not involved in hearing
207 10
Eggs and larvae 207 10
Maximum hammer energy of 90 kJ (worst-case maximum hammer energy)
Fishes with no swim bladder 213 10
Fishes with swim bladder involved in hearing
207 20
Fishes with swim bladder not involved in hearing
207 20
Eggs and larvae 207 20
1 Predicted distances have been rounded up to the nearest 10 m.
The cumulative SEL received by fish species and fish eggs and larvae has also been calculated. In the cumulative SEL modelling it is assumed that mobile fish will swim away from the piling location at 0.5 m/s, whilst f ish eggs and larvae are assumed to remain stationary throughout the piling. The predicted minimum initial distances that fish must be from the pile sound source at the start of pile driving operations (i.e. safety distances) in order not to be exposed to cumulative SELs above the Popper et al. (2014) thresholds for potential injury are summarised in Table 4-6. The modelling predicts that the cumulative SEL injury thresholds will not be exceeded if f ish swim away from the piling location at 0.5 m/s. It is predicted that fish eggs and larvae that cannot move away from the piling may potentially be injured at distances of up to 10 m from the piling location. However, given the small impact area compared to the large spawning grounds in the North Sea, it is not expected that the piling operations at Captain will have a significantly adverse effect on any spawning fish.

Document Title: Underwater noise modelling for piling
Genesis Doc. No.: 203937C-000-RT-6200-0004
Date: May, 2022
Page 30 of 35
Table 4-6: Predicted maximum distances that fish species and fish eggs and larvae must be from the piling location at the start of piling in order to not be exposed to cumulative SEL
exceeding injury thresholds when they swim away.
Fish Group Cumulative SEL Injury Threshold (dB re 1 µPa2s)
Swim Speed (m/s)
Maximum Distance to Threshold Exceedance
(m) 1
Maximum hammer energy of 20 kJ (most likely maximum hammer energy)
Fishes with no swim bladder
219 0.5 Threshold not exceeded
Fishes with swim bladder involved in hearing
207 0.5 Threshold not exceeded
Fishes with swim bladder not involved in hearing
210 0.5 Threshold not exceeded
Eggs and larvae 210 Stationary 10
Maximum hammer energy of 90 kJ (worst-case maximum hammer energy)
Fishes with no swim bladder
219 0.5 Threshold not exceeded
Fishes with swim bladder involved in hearing
207 0.5 Threshold not exceeded
Fishes with swim bladder not involved in hearing
210 0.5 Threshold not exceeded
Eggs and larvae 210 Stationary 10
1 Predicted distances have been rounded up to the nearest 10 m.
4.2.2 Disturbance
A quantitative assessment of behavioural disturbance to fish could not be conducted since there are no well-established disturbance thresholds for fish. However, if f ish are disturbed by noise, evidence suggests they will return to an area once the activity generating the noise has ceased (Slabbekoorn et al., 2010). The piling at Captain is expected to be completed in a single day. Any disturbance to fish is expected to be of a short duration and therefore i t is concluded that the piling at Captain will not have a significant impact on any fish species.

Document Title: Underwater noise modelling for piling
Genesis Doc. No.: 203937C-000-RT-6200-0004
Date: May, 2022
Page 31 of 35
5.0 MITIGATION MEASURES
To minimise the risk of potential impacts of noise from the piling, the following mitigation measures recommended by the Joint Nature Conservation Committee (JNCC) ‘Guidelines for minimising the risk of injury to marine mammals from piling noise’ (JNCC, 2010) will be adhered to:
• A qualif ied, trained and equipped marine mammal observer (MMO) will be present. The MMO will carry out a pre-piling survey of a 500 m mitigation zone and, if an animal is detected, the piling will be delayed until all marine mammals vacate the 500 m mitigation zone;
• A soft-start/ramp-up of hammer energy will be employed where the hammer will commence at a low energy at the start of piling. The soft-start will be such that maximum hammer energy will not be reached until after a period of 20 minutes; and
• Passive Acoustic Monitoring (PAM) will be employed during periods of low visibility to detect marine mammal presence.

Document Title: Underwater noise modelling for piling
Genesis Doc. No.: 203937C-000-RT-6200-0004
Date: May, 2022
Page 32 of 35
6.0 CONCLUSIONS
This report has presented underwater noise propagation modelling results for assessing the potential impacts that piling of the SUDSs may have on marine mammals and fish species and fish eggs and larvae. The modelling results were used to assess any potential impacts to marine mammals based on a comparison of estimated received noise levels with the Southall et al. (2019) thresholds for potential PTS onset and relevant thresholds for behavioural disturbance. Potential injury to fish species and fish eggs and larvae was also assessed by comparing predicted noise levels to the injury thresholds established by Popper et al. (2014).
The modelling results indicate that the likelihood of marine mammals being exposed to noise levels that may cause PTS during the piling is low and will be minimised to negligible levels when the standard JNCC (2010) ‘Guidelines for minimising the risk of injury to marine mammals from piling noise’ are followed.
The modelling predicts that behavioural disturbance to marine mammals could potentially occur at 3 – 8 km from the piling locations. However, any behavioural disturbance that may occur will only be temporary since the piling is expected to be completed within a single day. If any marine mammals are disturbed, they will likely return to the area within a short period of time (one to three days) once the piling has finished. Therefore, it is not expected that the piling at Captain will have any long-term significant effects on any marine mammal populations.
The modelling results indicate that injury to fish species and fish eggs and larvae during the piling will be localised to the immediate vicinity of the piling locations (within 20 m). Given the small predicted areas where fish eggs and larvae may suffer injury relative the large spawning areas across the North Sea it is not expected that the piling at Captain will have a significant effect on spawning fish.
It is concluded that the piling of the SUDSs will not have a significant impact on marine mammals, fish, and fish eggs and larvae.
Document Title: Underwater noise modelling for piling
Genesis Doc. No.: 203937C-000-RT-6200-0004
Date: May, 2022
Page 33 of 35
REFERENCES
Ainslie, M. A., de Jong, C. A. F., Robinson, S. P. and Lepper, P. A. (2012) What is the source level of pile driving noise in water? The Effects of Noise on Aquatic Life: Advances in Experimental Medicine and Biology, 730, pp. 445-448.
Brandt, M., Diederichs, A., V., Betke, K. and Nehls, G. (2011). Responses of harbour porpoises to pile driving at the Horns Rev II offshore wind farm in the Danish North Sea. Mar Ecol Prog Ser 421:205-216. https://doi.org/10.3354/meps08888.
Brandt, M., Dragon, A., Diederichs, A., Schubert, A., Kosarev, V., Nehls, G., Wahl, V., Michalik, A., Braasch, A., Hinz, C., Ketzer, C., Todeskino, D., Gauger, M., Laczny, M. and Piper, W. (2016). Effects of Offshore Pile Driving on Harbour Porpoise Abundance in the German Bight: Assessment of Noise Effects. Report by BioConsult SH, IBL Umweltplanung GmbH, and Institute of Applied Ecology (IfAO). pp. 262.
Brandt, M.; Dragon, A.; Diederichs, A.; Bellmann, M.; Wahl, V.; Piper, W.; Nabe-Nielsen, J.; Nehls, G. (2018). Disturbance of harbour porpoises during construction of the first seven offshore wind farms in Germany. Marine Ecology Progress Series, 596, 213-232. DOI: 10.3354/meps12560
Carstensen, J.; Henriksen, O.; Teilmann, J. (2006). Impacts of Offshore Wind Farm Construction on Harbour Porpoises: Acoustic Monitoring of Echolocation Activity using Porpoise Detectors (T-PODs). Marine Ecology Progress Series, 321, 295-308. DOI: 10.3354/meps321295
Collins, M .D. (1993). A split-step Padé solution for the parabolic equation method. Journal of the Acoustical Society of America. 93: 1736–1742.
Dahne, M., Gilles, A., Lucke, K., Peschko, V., Adler, S., Krugel, K., Sundermayer, J. and Siebert, U. (2013). Effects of Pile-driving on Harbour Porpoises (Phocoena phocoena) at the First Offshore Wind Farm in Germany. Environmental Research Letters 8, 025002.
EMODnet (2022a). EMODnet Bathymetry Portal Data. Available at: http://portal.emodnet-bathymetry.eu/
EMODnet (2022b). European Seabed Habitat Maps. Available at: http://www.emodnet.eu/seabed-habitats
Hammond, P. S., Lacey, C., Gilles, A., Viquerat, S., Börjesson, P., Herr, H., Macleod, K., Ridoux, V., Santos, M. B., Scheidat, M., Teilmann, J., Vingada, J., Øien, N. (2021). Estimates of cetacean abundance in European Atlantic waters in summer 2016 from the SCAN-III aerial and shipboard surveys. Available at: https://synergy.st-andrews.ac.uk/scans3/category/researchoutput/
Hassel, A., T. Knutsen, J. Dalen, K. Skaar, S. Løkkeborg, O. Misund, Ø. Østensen, M. Fonn, and Haugland, E. K. (2004). Influence of seismic shooting on the lesser sandeel (Ammodytes marinus). Journal of Marine Science. 61:1165-1173.
IAMMWG (2021). Updated abundance estimates for cetacean Management Units in UK waters (May, 2021). JNCC Report No. 680, JNCC, Peterborough.
Jensen, F. B., Kuperman, W. A., Porter, M. B. and Schmidt, H. (2011). Computational Ocean Acoustics. Second edition. Springer. Modern Acoustics and Signal Processing. pp. 794.
JNCC (2010). Statutory Nature Conservation Agency Protocol for Minimising the Risk of Injury to Marine Mammals from Piling Noise.

Document Title: Underwater noise modelling for piling
Genesis Doc. No.: 203937C-000-RT-6200-0004
Date: May, 2022
Page 34 of 35
JNCC (2017). JNCC guidelines for minimising the risk of injury to marine mammals from geophysical surveys. April 2017.
Lucke, K., Siebert, U., Lepper, P. A. and Blanchet, M. A. (2009). Temporary shift in masked hearing thresholds in a harbour porpoise (Phocoena phocoena) after exposure to seismic airgun stimuli, J. Acoust. Soc. Am., 125 (6), pp. 4060-4070.
Nabe-Nielsen, J., (2020). Impacts of wind farm construction and the importance of piling order for harbour porpoises in the German Exclusive Economic Zone of the North Sea. Scientific note from DCE – Danish Centre for Environment and Energy Vol. 2020 No. 73. https://dce.au.dk/fileadmin/dce.au.dk/Udgivelser/Notatet_2020/N2020_73.pdf
Nabe‐Nielsen, J., van Beest, F.M., Grimm, V., Sibly, R.M., Teilmann, J. and Thompson, P.M. (2018). Predicting the impacts of anthropogenic disturbances on marine populations. Conservation Letters. 2018; 11:e12563. https://doi.org/10.1111/conl.12563
NMFS (2018). 2018 Revision to: Technical guidance for assessing the effects of anthropogenic sound on marine mammal hearing: underwater acoustic thresholds for onset of permanent and temporary threshold shifts (Version 2.0). U.S. Dept. of Commer. NOAA. NOAA Technical Memorandum NMFS-OPR-55, pp. 178.
Popper, A. N., Hawkins, A. D., Fay, R. R., Mann, D., Bartol, S., Carlson, T., Coombs, S., Ellison, W. T., Gentry, R., Halvorsen, M. B., Lokkeborg, S., Rogers, P., Southall, B. L., Zeddies, D. G., Tavolga, W. N. (2014). Sound Exposure Guidelines for Fishes and Sea Turtles: A Technical Report by ANSI-Accredited Standards Committee S3/SCI and registered with ANSI. Springer Briefs in Oceanography.
Porter, M. B. and Liu, Y-C. (1994). Finite-Element Ray Tracing. In Theoretical and Computational Acoustics, Vol. 2, World Scientif ic Publishing Co.
Richardson, W. J., Greene, C. R. Jr., Malme, C. and Thomson, D. H. (1995). Marine mammals and noise. Academic Press, California. pp. 576.
Robinson, S. P., Lepper, P. A., and Ablitt, J., (2007). The measurement of the underwater radiated noise from marine piling including characterisation of a “soft -start” period, IEEE Oceans – Europe 2006.
Russell, D. J. F., Jones, E. L. and Morris, C. D. (2017) Updated Seal Usage Maps: The Estimated at-sea Distribution of Grey and Harbour Seals. Scottish Marine and Freshwater Science Vol 8 No 25, 25pp. DOI: 10.7489/2027-1.
Slabbekoorn, H., Bouton, N., van Opzeeland, I., Coers, A., ten Cate, C. and Popper, A. N. (2010). A noisy spring: the impact of globally rising underwater sound levels on fish. Trends in Ecology and Evolution. 25(7): 419-427.
Southall, B. L., Bowles, A. E., Ellison, W. T., Finneran, J. J., Gentry, R. L., Greene, C. R. Jr., Kastak, D., Ketten, D. R., Miller, J. H., Nachtigall, P. E., Richardson, W. J., Thomas, J. A. and Tyack, P. L. (2007). Marine mammals noise exposure criteria: initial scientific recommendations. Marine Mammals 33(4).
Southall, B. L., Bowles, Finneran, J. J., Reichmuth, C., Nactigall, P.E., Ketten, D.R., Bowles, A.E., Ellison, W.T., Nowacek, D.P. and Tyack, P.L. (2019). Marine mammal noise exposure criteria : Updated scientif ic recommendations for residual hearing effects. Aquatic Mammals 45(2) : 125-232.
Southall, B. L., Nowacek, D.P., Bowles, A.E., Senigaglia, V., Bejder, L. and Tyack, P.L. (2021). Marine mammal noise exposure criteria : Assessing the severity of marine mammal behavioural responses to human noise. Aquatic Mammals 47(5).

Document Title: Underwater noise modelling for piling
Genesis Doc. No.: 203937C-000-RT-6200-0004
Date: May, 2022
Page 35 of 35
Thompson, P.M., Brookes, K.L., Graham, I.M., Barton, T.R., Needham, K., Bradbury, G. and Merchant, N.D. (2013). Short term disturbance by a commercial two-dimensional seismic survey does not lead to long-term displacement. Proceeding of the Royal Society B, Biological Sciences. http://rspb.royalsocietypublishing.org/content/280/1771/20132001.
Tougaard, J. (2016). Input to revision of guidelines regarding underwater noise from oil and gas activities – effects on marine mammals and mitigation measures. Aarhus University, DCE – Danish Centre for Environmental and Energy, 52 pp. Scientif ic Report from DCE – Danish Centre for Environment and Energy No. 202. http://dce2.au.dk/pub/SR202.pdf.
Waggitt, J.J., Evans, P.G.H., Andrade, J., Banks, A.N., Boisseau, O., Bolton, M., Bradbury, G., Brereton, T., Camphuysen, C.J., Durinck, J., Felce, T., Fijn, R.C., Garcia-Baron, I., Garthe, S., Geelhoed, S.C.V., Gilles, A., Goodall, M., Haelters, J., Hamilton, S., Hartny-Mills, L., Hodgins, N., James, K., Jessopp, M., A.S. Kavanagh, Leopold, M., Lohrengel, K., Louzao, M., Markones, N., Martínez-Cedeira, J., Cadhla, O.O., Perry, S.L., Pierce, G.J., Ridoux, V., Robinson, K.P., Begoña Santos, M., Saavedra, C., Skov, H., Stienen, E.W.M., Sveegaard, S., Thompson, P., Vanermen, N., Wall, D., Webb, A., Wilson, J., Wanless, S., and GeertHiddink, J. (2019). Distribution maps of cetacean and seabird populations in the North ‐East Atlantic. Journal of Applied Ecology. (57) pp. 253-269.
Wardle, C. S., Carter, T. J., Urquhart, G. G., Johnstone, A. D. F., Ziolkowski, A. M., Hampson, G. and Mackie, D. (2001). Effects of seismic air guns on marine fish. Continental Shelf Research 21:1005-1027.
WOA (2013). World ocean database and world ocean atlas series. Data available at: https://www.nodc.noaa.gov/OC5

Captain EOR Stage 2 Phase II Project Environmental Statement
Appendix E Additional Supporting Material
E - 1
APPENDIX E – ADDITIONAL SUPPORTING MATERIAL
Section 3.9.1 presents the high-case oil production profiles associated with the proposed Captain EOR Stage 2 Phase II Project, whilst Table D-1 also includes
the profiles for the mid- and low-case profiles.
Table: D- 1: High-, low- and mid- case oil profiles associated with the proposed Captain EOR Stage 2 Phase II Project.
Year
Base Case (without the
proposed Captain EOR Stage
2 Phase II Project)
With Captain EOR Stage 2 Phase II
High Case Mid Case Low Case
bbl/d tonnes/d bbl/d tonnes/d bbl/d tonnes/d bbl/d tonnes/d
2021 22.9000 3385.95 22,901.62 3,386,191 22,901.62 3,386,191 22,901.62 3,386,191
2022 24.6400 3643.23 25,961.44 3,838,612 25,157.76 3,719,780 25,804.33 3,815,382
2023 25.8500 3822.13 28,053.10 4,147,881 27,912.64 4,127,112 28,241.87 4,175,792
2024 26.3200 3891.63 35,243.96 5,211,108 35,049.86 5,182,409 32,579.02 4,817,074
2025 27.2200 4024.70 48,971.31 7,240,809 49,857.08 7,371,778 42,280.52 6,251,521
2026 22.8200 3374.12 47,254.20 6,986,920 45,158.47 6,677,050 39,311.67 5,812,553
2027 15.6500 2313.98 40,215.40 5,946,176 33,685.44 4,980,668 28,122.45 4,158,135
2028 13.0700 1932.51 33,510.81 4,954,847 26,378.91 3,900,337 21,744.83 3,215,151
2029 10.5900 1565.82 27,689.75 4,094,157 19,860.94 2,936,602 16,106.11 2,381,420
2030 9.0300 1335.16 19,115.79 2,826,427 15,882.15 2,348,306 11,692.15 1,728,780
2031 7.7200 1141.47 11,550.68 1,707,862 11,110.59 1,642,791 9,439.44 1,395,699
2032 7.0400 1040.92 9,375.17 1,386,196 7,541.19 1,115,026 6,968.58 1,030,362
2033 6.4800 958.12 7,592.13 1,122,558 6,185.62 914,595 5,934.36 877,444
2034 6.1000 901.93 5,574.88 824,291 5,519.56 816,113 5,474.36 809,429
2035 5.9500 879.76 5,022.14 742,565 5,165.10 763,703 5,370.99 794,145

Captain EOR Stage 2 Phase II Project Environmental Statement
Appendix E Additional Supporting Material
E - 2
Section 3.9.2 presents the high-case gas production profiles associated with the proposed Captain EOR Stage 2 Phase II Project, whilst Table D-2 also includes
the profiles for the mid- and low- case profiles.
Table D-2: High-, low- and mid- case gas profiles associated with the proposed Captain EOR Stage 2 Phase II Project.
Year
Base Case (without the
proposed Captain EOR Stage
2 Phase II Project)
m3/day
With Captain EOR Stage 2 Phase II (m3/day)
High Case Mid Case Low Case
2021 127,427 127,106 127,106 127,106
2022 135,922 144,173 140,053 154,174
2023 144,417 158,711 156,614 157,509
2024 147,248 185,955 201,697 202,934
2025 150,080 247,028 295,301 289,657
2026 127,427 231,724 268,976 282,328
2027 87,783 166,326 201,770 243,374
2028 73,624 127,812 157,337 202,777
2029 59,466 93,919 117,842 167,772
2030 50,971 67,077 93,772 114,375
2031 42,476 53,800 64,447 67,251
2032 39,644 38,614 42,262 53,947
2033 36,812 32,487 34,088 43,049
2034 33,980 29,866 30,154 30,507
2035 33,980 29,332 28,021 27,110