Strategies for Advancing CO2 EOR in the Illinois Basin, USA
15
Energy Procedia 63 (2014) 7694 – 7708 Available online at www.sciencedirect.com ScienceDirect 1876-6102 © 2014 The Authors. Published by Elsevier Ltd. This is an open access article under the CC BY-NC-ND license (http://creativecommons.org/licenses/by-nc-nd/3.0/). Peer-review under responsibility of the Organizing Committee of GHGT-12 doi:10.1016/j.egypro.2014.11.803 GHGT-12 Strategies for Advancing CO 2 EOR in the Illinois Basin, USA James R. Damico a *, Charles C. Monson a , Scott Frailey a , Yaghoob Lasemi a , Nathan D. Webb a , Nathan Grigsby a , Fang Yang a , and Peter Berger a a Illinois State Geological Survey, Prairie Research Institute, University of Illinois at Urbana-Champaign, Champaign, IL, 61820 Abstract Storage of carbon dioxide (CO 2 ) through enhanced oil recovery (EOR) activities offers the dual benefit of increased oil production and storage of anthropogenic CO 2 . In the Illinois Basin, USA (the Basin), there are no commercial-scale CO 2 EOR projects due to a number of obstacles, including the absence of a large-scale demonstration in the region and an economic supply of CO 2 . To address these issues, the Illinois State Geological Survey (ISGS) conducted a study to assess the potential for CO 2 EOR at three strategically positioned fields in the Basin. The three fields—Assumption, Mattoon, and Forsyth—are located near two possible future sources of commercial CO 2 . The CO 2 EOR of the three fields was evaluated through characterization of the reservoir architecture and simulation of CO 2 EOR scenarios along with laboratory experiments to estimate the minimum miscibility pressure (MMP). The project provides site-specific estimates of CO 2 EOR application and could serve as an impetus for larger demonstration projects in the near future. Keywords: CO2 EOR, Illinois Basin 1. Introduction Carbon dioxide enhanced oil recovery (CO 2 EOR) has been used commercially in West Texas, USA, and other areas for many years. This recovery method has been driven by low costs and availability of naturally occurring CO 2 sources; however, in areas of the Midwestern United States, such as the Illinois Basin (the Basin), only anthropogenic sources of CO 2 are available. Application of CO 2 EOR to fields in the Basin could increase oil production in mature fields and provide storage of anthropogenic CO 2 [1]. The main challenges to implementation in * Corresponding author. Tel.: 217-244-6229; fax: +0-000-000-0000 . E-mail address: [email protected] © 2014 The Authors. Published by Elsevier Ltd. This is an open access article under the CC BY-NC-ND license (http://creativecommons.org/licenses/by-nc-nd/3.0/). Peer-review under responsibility of the Organizing Committee of GHGT-12
Transcript of Strategies for Advancing CO2 EOR in the Illinois Basin, USA
Energy Procedia 63 ( 2014 ) 7694 – 7708
Available online at www.sciencedirect.com
ScienceDirect
1876-6102 © 2014 The Authors. Published by Elsevier Ltd. This is an open access article under the CC BY-NC-ND license (http://creativecommons.org/licenses/by-nc-nd/3.0/).Peer-review under responsibility of the Organizing Committee of GHGT-12doi: 10.1016/j.egypro.2014.11.803
GHGT-12
Strategies for Advancing CO2 EOR in the Illinois Basin, USA
James R. Damicoa*, Charles C. Monsona, Scott Fraileya, Yaghoob Lasemia, Nathan D. Webba, Nathan Grigsbya, Fang Yanga, and Peter Bergera
aIllinois State Geological Survey, Prairie Research Institute, University of Illinois at Urbana-Champaign, Champaign, IL, 61820
Abstract
Storage of carbon dioxide (CO2) through enhanced oil recovery (EOR) activities offers the dual benefit of increased oil production and storage of anthropogenic CO2. In the Illinois Basin, USA (the Basin), there are no commercial-scale CO2 EOR projects due to a number of obstacles, including the absence of a large-scale demonstration in the region and an economic supply of CO2. To address these issues, the Illinois State Geological Survey (ISGS) conducted a study to assess the potential for CO2 EOR at three strategically positioned fields in the Basin. The three fields—Assumption, Mattoon, and Forsyth—are located near two possible future sources of commercial CO2. The CO2 EOR of the three fields was evaluated through characterization of the reservoir architecture and simulation of CO2 EOR scenarios along with laboratory experiments to estimate the minimum miscibility pressure (MMP). The project provides site-specific estimates of CO2 EOR application and could serve as an impetus for larger demonstration projects in the near future. © 2013 The Authors. Published by Elsevier Ltd. Selection and peer-review under responsibility of GHGT.
Keywords: CO2 EOR, Illinois Basin
1. Introduction
Carbon dioxide enhanced oil recovery (CO2 EOR) has been used commercially in West Texas, USA, and other areas for many years. This recovery method has been driven by low costs and availability of naturally occurring CO2 sources; however, in areas of the Midwestern United States, such as the Illinois Basin (the Basin), only anthropogenic sources of CO2 are available. Application of CO2 EOR to fields in the Basin could increase oil production in mature fields and provide storage of anthropogenic CO2 [1]. The main challenges to implementation in
* Corresponding author. Tel.: 217-244-6229; fax: +0-000-000-0000 .
E-mail address: [email protected]
© 2014 The Authors. Published by Elsevier Ltd. This is an open access article under the CC BY-NC-ND license (http://creativecommons.org/licenses/by-nc-nd/3.0/).Peer-review under responsibility of the Organizing Committee of GHGT-12
James R. Damico et al. / Energy Procedia 63 ( 2014 ) 7694 – 7708 7695
the Basin include lack of demand from operators, absence of a CO2 supply, and lack of infrastructure [2]. The low demand partly stems from the unproven application of the technology at the commercial scale within the Basin. Concerns about old wellbore conditions and misunderstanding of Basin CO2 EOR conditions also play a role.
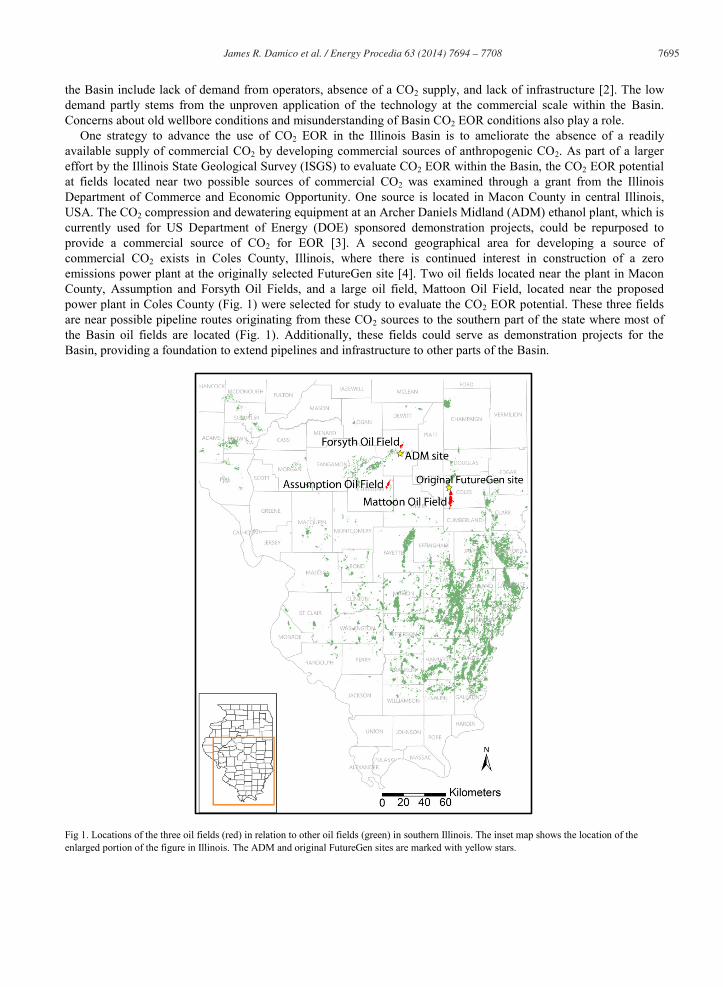
One strategy to advance the use of CO2 EOR in the Illinois Basin is to ameliorate the absence of a readily available supply of commercial CO2 by developing commercial sources of anthropogenic CO2. As part of a larger effort by the Illinois State Geological Survey (ISGS) to evaluate CO2 EOR within the Basin, the CO2 EOR potential at fields located near two possible sources of commercial CO2 was examined through a grant from the Illinois Department of Commerce and Economic Opportunity. One source is located in Macon County in central Illinois, USA. The CO2 compression and dewatering equipment at an Archer Daniels Midland (ADM) ethanol plant, which is currently used for US Department of Energy (DOE) sponsored demonstration projects, could be repurposed to provide a commercial source of CO2 for EOR [3]. A second geographical area for developing a source of commercial CO2 exists in Coles County, Illinois, where there is continued interest in construction of a zero emissions power plant at the originally selected FutureGen site [4]. Two oil fields located near the plant in Macon County, Assumption and Forsyth Oil Fields, and a large oil field, Mattoon Oil Field, located near the proposed power plant in Coles County (Fig. 1) were selected for study to evaluate the CO2 EOR potential. These three fields are near possible pipeline routes originating from these CO2 sources to the southern part of the state where most of the Basin oil fields are located (Fig. 1). Additionally, these fields could serve as demonstration projects for the Basin, providing a foundation to extend pipelines and infrastructure to other parts of the Basin.
Fig 1. Locations of the three oil fields (red) in relation to other oil fields (green) in southern Illinois. The inset map shows the location of the enlarged portion of the figure in Illinois. The ADM and original FutureGen sites are marked with yellow stars.
7696 James R. Damico et al. / Energy Procedia 63 ( 2014 ) 7694 – 7708
2. Geologic background and reservoir geology
Reservoir geology was characterized by ISGS geologists to develop a conceptual geologic model. The development, production history, and geologic setting of the three fields were researched. Isopach and structure maps and cross sections were created from available geophysical well logs, which included spontaneous potential, induction, gamma ray, density, and sidewall neutron. Cores, cuttings, and thin sections were studied to understand the lithology and interpret depositional environment.
2.1. Assumption Consolidated Field
Assumption Consolidated covers 1,299 ha (3,210 ac) and is located in north-central Christian County (Fig. 1), northwest of the town of Assumption. The field is located on a northeast-trending anticline which probably formed in the Pennsylvanian or later [5, 6]. Production began in 1948 from the Middle Devonian Lingle Formation. Current production is mostly from the Mississippian Yankeetown Sandstone with significant historical production from the Spar Mountain Sandstone as well (Bill Bandy, personal communication, 2013). However, the Lingle is considered to be responsible for the majority of production over the life of the field, so it was the target of study. Waterflooding began in 1950, and many of the wells have commingled production. Cumulative production from the field to the end of 2009 was 1.86 million m3 (11.7 million bbl; ILOIL, http://www.isgs.illinois.edu/iloil). An updated estimate is not available, but Bandy [6] reported production of 7.95 m3/d (50 bopd) as of October 1, 2012. This study estimated that the original oil in place (OOIP) for the Lingle was 2.86 million m3 (18 MMstb).
Argillaceous or shaly limestones are major constituents of the Lingle in the Illinois Basin, although the formation may contain subordinate lithologies such as oolite beds, siltstone or sandstone [7], and some dolomitization is common. Broadly speaking, the Lingle represents a shelf carbonate depositional environment at Assumption Field. The field is located near the northern limit of deposition for the Lingle, which unconformably overlies the Middle Silurian Racine Formation in this area. Reservoir intervals are fossil grainstones, with shallow marine bioclasts and reworked mudstone lithoclasts. Porosity is largely intergranular, but intragranular porosity occurs in some intervals as well. The reservoir intervals are somewhat compartmentalized, with localized areas of high porosity, high permeability grainstone separated by less porous and permeable packstone, or by grainstone in which calcite overgrowths have occluded porosity.
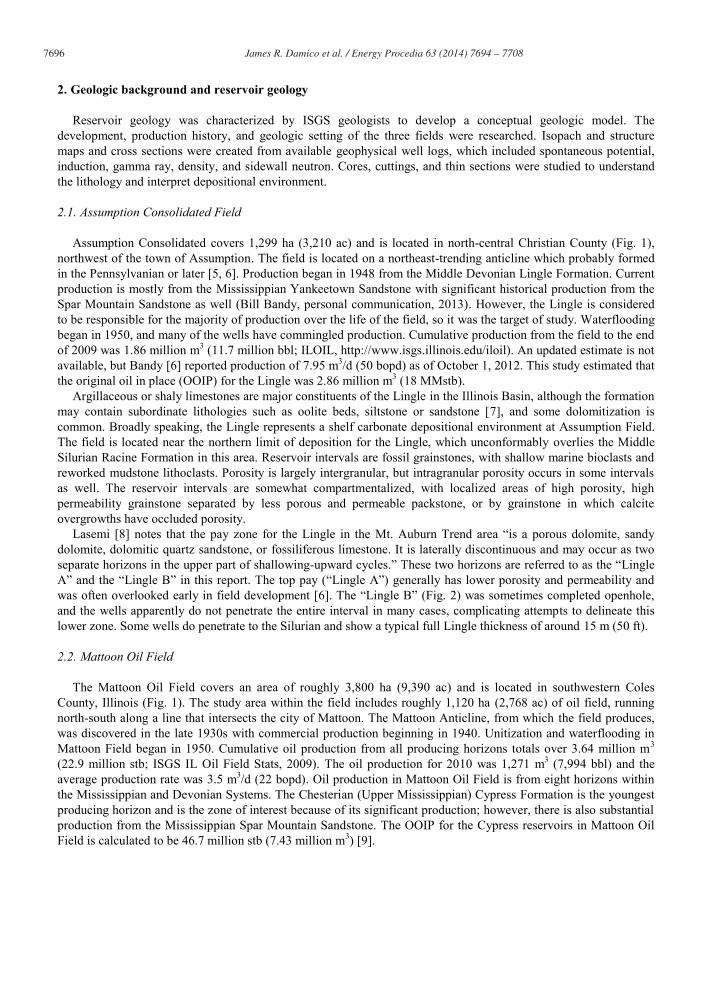
Lasemi [8] notes that the pay zone for the Lingle in the Mt. Auburn Trend area “is a porous dolomite, sandy dolomite, dolomitic quartz sandstone, or fossiliferous limestone. It is laterally discontinuous and may occur as two separate horizons in the upper part of shallowing-upward cycles.” These two horizons are referred to as the “Lingle A” and the “Lingle B” in this report. The top pay (“Lingle A”) generally has lower porosity and permeability and was often overlooked early in field development [6]. The “Lingle B” (Fig. 2) was sometimes completed openhole, and the wells apparently do not penetrate the entire interval in many cases, complicating attempts to delineate this lower zone. Some wells do penetrate to the Silurian and show a typical full Lingle thickness of around 15 m (50 ft).
2.2. Mattoon Oil Field
The Mattoon Oil Field covers an area of roughly 3,800 ha (9,390 ac) and is located in southwestern Coles County, Illinois (Fig. 1). The study area within the field includes roughly 1,120 ha (2,768 ac) of oil field, running north-south along a line that intersects the city of Mattoon. The Mattoon Anticline, from which the field produces, was discovered in the late 1930s with commercial production beginning in 1940. Unitization and waterflooding in Mattoon Field began in 1950. Cumulative oil production from all producing horizons totals over 3.64 million m3 (22.9 million stb; ISGS IL Oil Field Stats, 2009). The oil production for 2010 was 1,271 m3 (7,994 bbl) and the average production rate was 3.5 m3/d (22 bopd). Oil production in Mattoon Oil Field is from eight horizons within the Mississippian and Devonian Systems. The Chesterian (Upper Mississippian) Cypress Formation is the youngest producing horizon and is the zone of interest because of its significant production; however, there is also substantial production from the Mississippian Spar Mountain Sandstone. The OOIP for the Cypress reservoirs in Mattoon Oil Field is calculated to be 46.7 million stb (7.43 million m3) [9].
James R. Damico et al. / Energy Procedia 63 ( 2014 ) 7694 – 7708 7697
Fig. 2. Isopach map of the Lingle B layer at Assumption Consolidated in T14N, R1E and T13N, R1E of Christian County, IL. Bold contour lines are 0.6 m (2 ft).
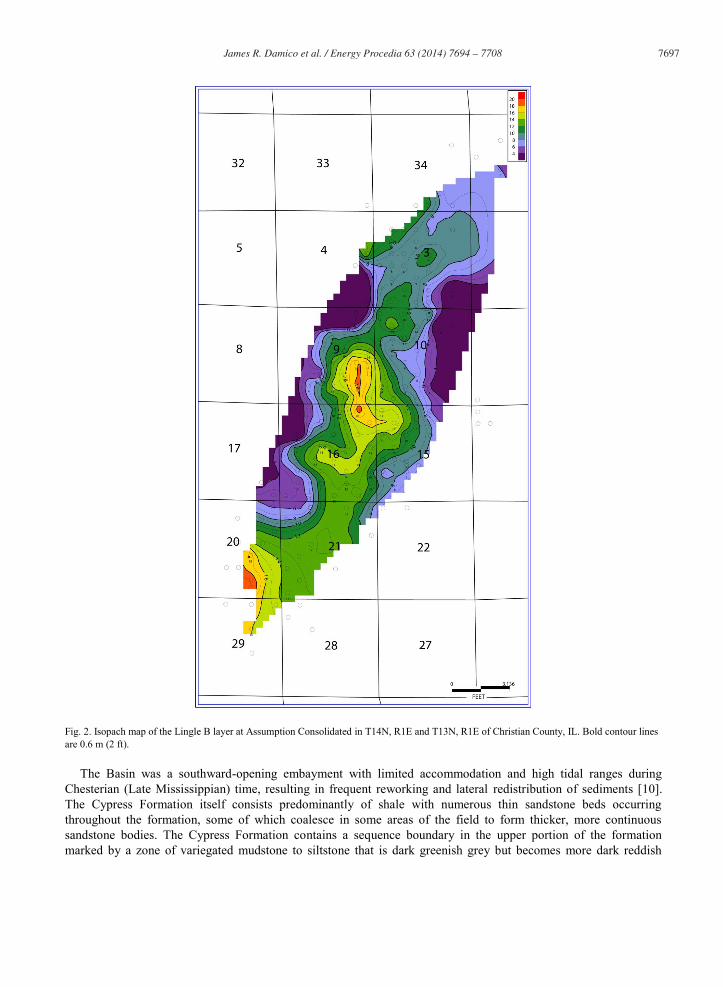
The Basin was a southward-opening embayment with limited accommodation and high tidal ranges during Chesterian (Late Mississippian) time, resulting in frequent reworking and lateral redistribution of sediments [10]. The Cypress Formation itself consists predominantly of shale with numerous thin sandstone beds occurring throughout the formation, some of which coalesce in some areas of the field to form thicker, more continuous sandstone bodies. The Cypress Formation contains a sequence boundary in the upper portion of the formation marked by a zone of variegated mudstone to siltstone that is dark greenish grey but becomes more dark reddish
7698 James R. Damico et al. / Energy Procedia 63 ( 2014 ) 7694 – 7708
brown with depth, especially along fracture surfaces. This sequence boundary is documented throughout the Basin [11].
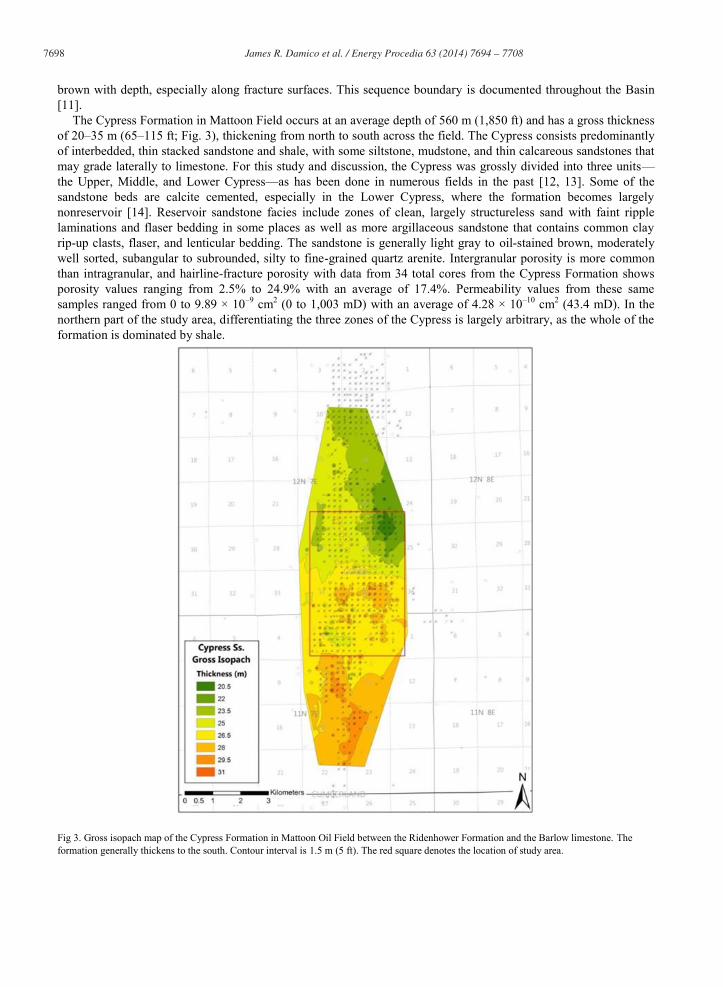
The Cypress Formation in Mattoon Field occurs at an average depth of 560 m (1,850 ft) and has a gross thickness of 20–35 m (65–115 ft; Fig. 3), thickening from north to south across the field. The Cypress consists predominantly of interbedded, thin stacked sandstone and shale, with some siltstone, mudstone, and thin calcareous sandstones that may grade laterally to limestone. For this study and discussion, the Cypress was grossly divided into three units—the Upper, Middle, and Lower Cypress—as has been done in numerous fields in the past [12, 13]. Some of the sandstone beds are calcite cemented, especially in the Lower Cypress, where the formation becomes largely nonreservoir [14]. Reservoir sandstone facies include zones of clean, largely structureless sand with faint ripple laminations and flaser bedding in some places as well as more argillaceous sandstone that contains common clay rip-up clasts, flaser, and lenticular bedding. The sandstone is generally light gray to oil-stained brown, moderately well sorted, subangular to subrounded, silty to fine-grained quartz arenite. Intergranular porosity is more common than intragranular, and hairline-fracture porosity with data from 34 total cores from the Cypress Formation shows porosity values ranging from 2.5% to 24.9% with an average of 17.4%. Permeability values from these same samples ranged from 0 to 9.89 × 10⁻⁹ cm2 (0 to 1,003 mD) with an average of 4.28 × 10⁻¹⁰ cm2 (43.4 mD). In the northern part of the study area, differentiating the three zones of the Cypress is largely arbitrary, as the whole of the formation is dominated by shale.
Fig 3. Gross isopach map of the Cypress Formation in Mattoon Oil Field between the Ridenhower Formation and the Barlow limestone. The formation generally thickens to the south. Contour interval is 1.5 m (5 ft). The red square denotes the location of study area.
James R. Damico et al. / Energy Procedia 63 ( 2014 ) 7694 – 7708 7699
2.3. Forsyth Oil Field
Forsyth Oil Field covers 809 ha (2,000 ac) and is located in Macon County, 8.17 km (5.08 mi) northeast of the town of Decatur (Fig. 1). It was discovered in 1963 when an old well was re-entered. The field has produced mainly from a dolomite reservoir that occurs in the upper part of the Middle Silurian succession. The discovery well had an initial production of 26.7 m3/d (168 bopd) from the Silurian reservoir, the top of which was reached at 646 m (2,118 ft). Following early development of the field in the 1960s and 1970s, a second phase of development took place in the early 1980s when a large number of wells were drilled, resulting in a sharp increase in production. In all the wells, casing was set through the formation, followed by perforation of the porous zones, acid treatment, and hydraulic fracturing. A total of 82 oil wells were completed; 40 wells are currently producing at a rate of approximately 3.2 m3/d (20 bopd) and the field has accumulated over 117,660 m3 (740,000 bbl), 105,180 m3 (661,500 bbl) of which are attributed to the Silurian.
During the Silurian, a gently sloping shallow marine carbonate ramp covered central Illinois and a broad northeast-southwest trending structure, the Sangamon Arch, existed in west-central Illinois. A group of oil fields, referred to as the Mt. Auburn trend, are located on the southeastern flank of the Sangamon Arch and produce chiefly from the dolomitized nonreef carbonate reservoirs in the upper part of the Middle Silurian Racine Formation [15, 16, 17]. Forsyth Field is located in the extreme northeast part of the Mt. Auburn trend in the southern flank of the Arch. The Middle Silurian rocks in Forsyth Field area are over 76.2 m (250 ft) thick and include the Racine and underlying Joliet Formation. The Racine and its time-equivalent Moccasin Springs Formation in southern Illinois are characterized mostly by layers of limestone, dolomite, silty argillaceous limestone/dolomite, and shale that vary in thickness from place to place. In the Sangamon Arch, the Lower and Middle Devonian deposits are absent [7, 18], and Silurian carbonates are overlain by the Upper Devonian to lowermost Mississippian organic-rich New Albany Shale Group. A prominent unconformity subdivides the Racine into two sequences [15, 16], the upper part of which may contain dolomitized reservoirs. The formation may comprise several compartmentalized permeability pinch-out zones at different horizons, which include dolomitized skeletal wackestone to grainstone facies in the upper Racine sequence and dolomitized coral patch reef or reef rudstone facies in the lower Racine sequence [16, 17]. Cores and well samples are absent in the entire area of Forsyth Field. Therefore, geophysical log signatures and correlation with equivalent intervals in other Mt. Auburn trend fields are the only means available for reservoir characterization. In the Forsyth Field, except for two wells in the extreme northwest of the field, the producer is a dolomite reservoir in the upper sequence of the Racine Formation that is equivalent to combined nonreef reservoir units B and C of Lasemi et al. [17].
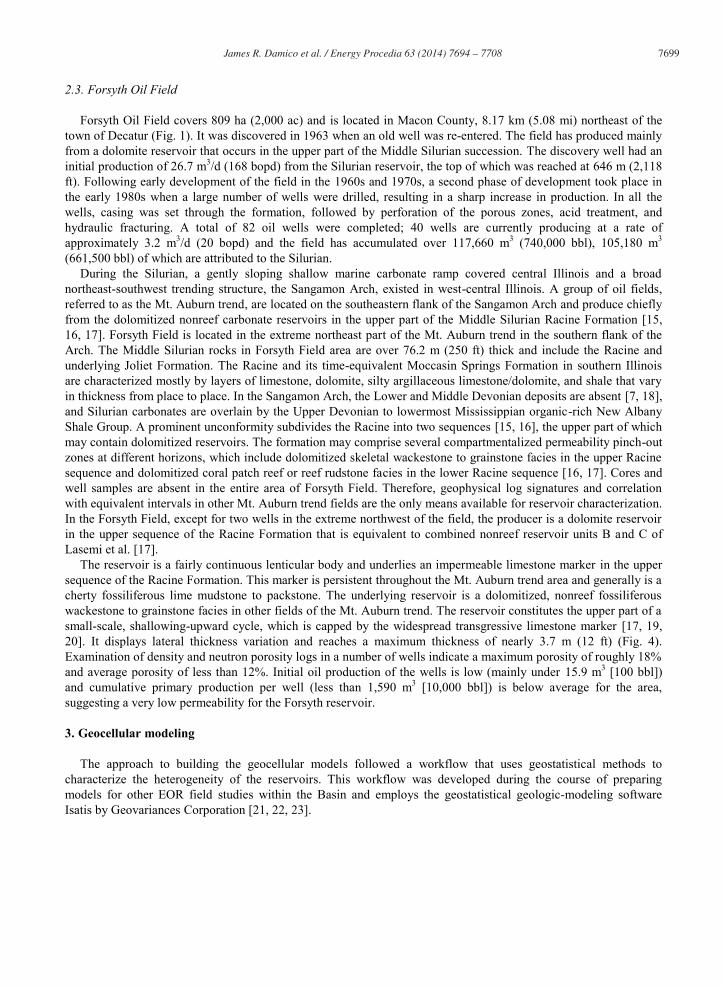
The reservoir is a fairly continuous lenticular body and underlies an impermeable limestone marker in the upper sequence of the Racine Formation. This marker is persistent throughout the Mt. Auburn trend area and generally is a cherty fossiliferous lime mudstone to packstone. The underlying reservoir is a dolomitized, nonreef fossiliferous wackestone to grainstone facies in other fields of the Mt. Auburn trend. The reservoir constitutes the upper part of a small-scale, shallowing-upward cycle, which is capped by the widespread transgressive limestone marker [17, 19, 20]. It displays lateral thickness variation and reaches a maximum thickness of nearly 3.7 m (12 ft) (Fig. 4). Examination of density and neutron porosity logs in a number of wells indicate a maximum porosity of roughly 18% and average porosity of less than 12%. Initial oil production of the wells is low (mainly under 15.9 m3 [100 bbl]) and cumulative primary production per well (less than 1,590 m3 [10,000 bbl]) is below average for the area, suggesting a very low permeability for the Forsyth reservoir.
3. Geocellular modeling
The approach to building the geocellular models followed a workflow that uses geostatistical methods to characterize the heterogeneity of the reservoirs. This workflow was developed during the course of preparing models for other EOR field studies within the Basin and employs the geostatistical geologic-modeling software Isatis by Geovariances Corporation [21, 22, 23].
7700 James R. Damico et al. / Energy Procedia 63 ( 2014 ) 7694 – 7708
Fig. 4. Isopach map of the main dolomite reservoir in Forsyth Field showing two northeast-southwest trending juxtaposed bodies that were formed as ramp margin shoal facies parallel to shoreline during deposition. Contour interval is 0.6 m (2 ft).
3.1. Geocellular Model Data
Geocellular models require the data distribution of geophysical logs to produce representations of the reservoir architecture. As a result of the differences in the reservoir lithologies and log suites present at the three fields, the data used and the process of calculating reservoir properties for the respective geocellular models was unique to each field.
3.1.1. Assumption and Mattoon: Spontaneous potential log suite At both Assumption and Mattoon fields, the spontaneous potential (SP) log suite was chosen to provide the basis
of the geocellular model. Spontaneous potential was selected as an indicator of reservoir quality because of its availability and correlation with actual permeability.
To account for well-to-well variation in SP logs caused by fluid chemistry or other borehole conditions, each well’s SP log was normalized by transforming the measured SP into a sandstone-shale ratio (SPnorm). Normalizing the SP log for a specific well was done by selecting the maximum and minimum measured SP from formations near the zone of interest in that well. The minimum value represents a shale baseline (SPshale), which was from in an overlying shale. The maximum represents a sandstone baseline (SPsand), which was from a thick, brine-saturated, shale-free sandstone.
The following equation was used to convert the observed values from the raw SP log to SPnorm:
Eq. 1
For the purpose of this study, the normalization does not necessarily represent an absolute ratio of the sandstone-shale composition of the formation; instead, it is designed to create a consistent scale for comparing the reservoir quality of the formations between wells. The actual values of the normalized SP are relative to each oil field.
To convert normalized SP into the desired petrophysical properties, equations relating the different properties were developed. For the Mattoon model, horizontal permeability and porosity values from core analysis
James R. Damico et al. / Energy Procedia 63 ( 2014 ) 7694 – 7708 7701
measurements from the Cypress in Mattoon were correlated with the normalized SP. The equations resulting from regression of SP with porosity and permeability were the following:
= -0.157SP + 7.00; Eq. 2
k = 4.876e-0.0403SP Eq .3
where k is the permeability and is the porosity. At Assumption, a different approach was taken due to the small amount of core analysis data available. The SP
was related to porosity measured from neutron/density suites from more modern logs. The normalized SP values were converted to porosity by picking the high and low SP and porosity values from the logs for each zone and projecting a line through them. Two separate transforms were developed for the two different Lingle subintervals present at Assumption to reflect the differences in lithology. To estimate permeability from porosity, equations developed by Jennings and Lucia [24] were used. The method relies on geologic descriptions of particle size and sorting, referred to as rock fabric, to dictate the form of the equation relating permeability and porosity. Based on small samples of the reservoir, the Lingle was classified as a Class 1 rock fabric. The rock fabric parameter was adjusted to produce permeability values in line with historical production data and the geologist’s expectations regarding the reservoir characteristics. The resulting transform equation used a rock fabric number of 1.1:
k = e21.401 8.328. Eq. 4
3.1.2 Forsyth: Casedhole conversion to openhole porosity
At Forsyth Field, openhole density and neutron porosity logs calibrated for limestone porosity ( ls) were corrected to dolomite ( dol) for assessing porosity in the Silurian. Other wells have casedhole neutron logs without a scale that were part of the well perforation process. To use the casedhole logs, a correlation is required to remove the effect of the casing and cement between the casing and drilled wellbore face.
Eight wells in Forsyth had openhole porosity logs and casedhole neutron logs without scales. Five of the eight wells had openhole neutron logs, two had density, and one had both logs. A semilog relationship between porosity and uncalibrated openhole neutron logs has traditionally been used, but casedhole neutron logs require a different approach, so a correlation to the openhole porosity for dolomite was developed.
The value of the bulk density and neutron porosity calibrated for limestone was read directly from the openhole log for the Devonian and Silurian. The uppermost Silurian was identified based on its low shale content—as indicated by low gamma ray, SP and conductivity—relative to the surrounding formations. The values for the Silurian were corrected to dolomite.
For the openhole sidewall neutron porosity log, the following equation was used:
dol = 0.00384 × ls + 0.824 × ls – 1.24. Eq. 5
The ls was taken directly from the sidewall neutron porosity (SNP) log calibrated for limestone as a percent. For the openhole density log, the following equation was used:
dol = (ρmatrix – ρbulk) / (ρmatrix – ρfluid). Eq. 6
The ρmatrix and ρfluid were 2.82 and 1.0 g/cm3 (176 and 62 lb/ft3) for density of dolomite and freshwater, respectively. The ρbulk was obtained directly from the openhole density log. The casedhole neutron values (N) in the Silurian were measured by counting the number of divisions on the log from a baseline established in the overlying New Albany Shale. The porosity values from the openhole logs were plotted vs. the casedhole neutron log values, and the following best-fit equation was used to estimate porosity of the Silurian ( dol):
7702 James R. Damico et al. / Energy Procedia 63 ( 2014 ) 7694 – 7708
dol = –1.9445N + 19.335. Eq. 7
No core data were available for the Silurian at Forsyth, so core analysis from the Mt. Auburn Consolidated Field (about 31 km [19 mi] away) was used to develop a porosity-to-permeability transform equation. The paucity of data resulted in reliance on historical production data and the geologist’s experience regarding the reservoir characteristics commonly found in other Illinois Basin reservoirs to fit the curve to the data points. The resulting equation was as follows:
k = 1.005e0.1282 dol. Eq. 8
3.2. Geostatistical analysis and geocellular model results
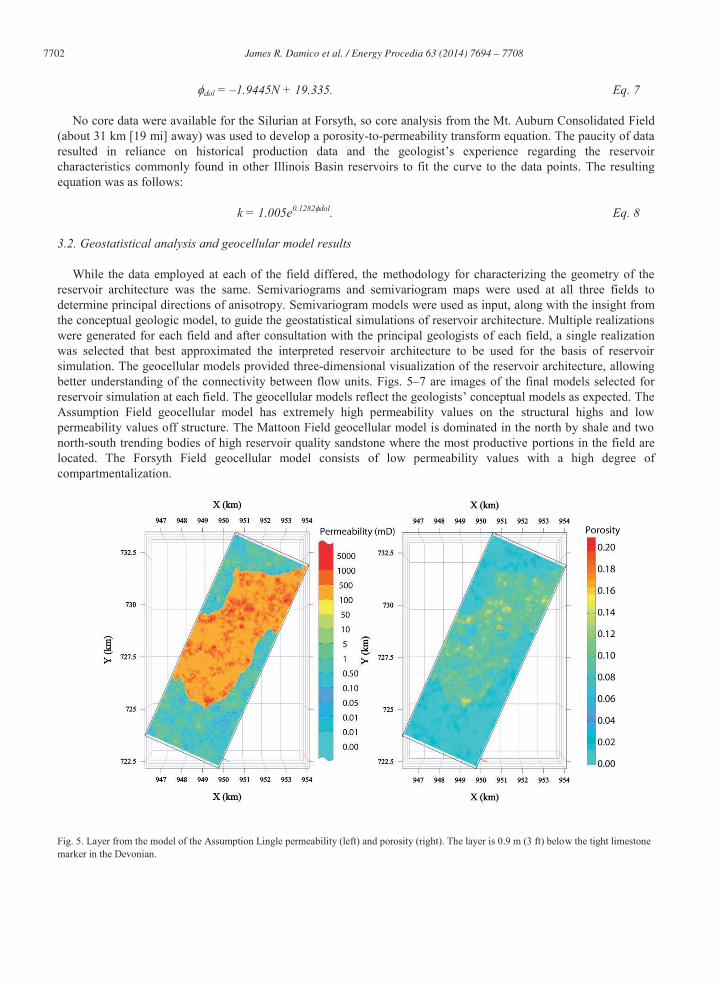
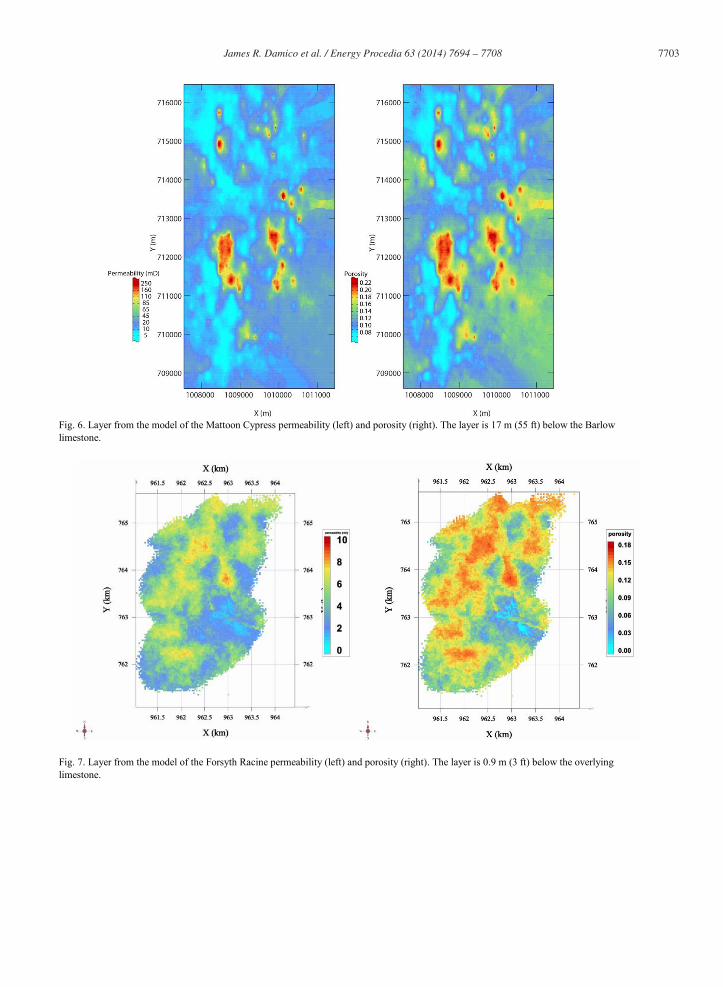
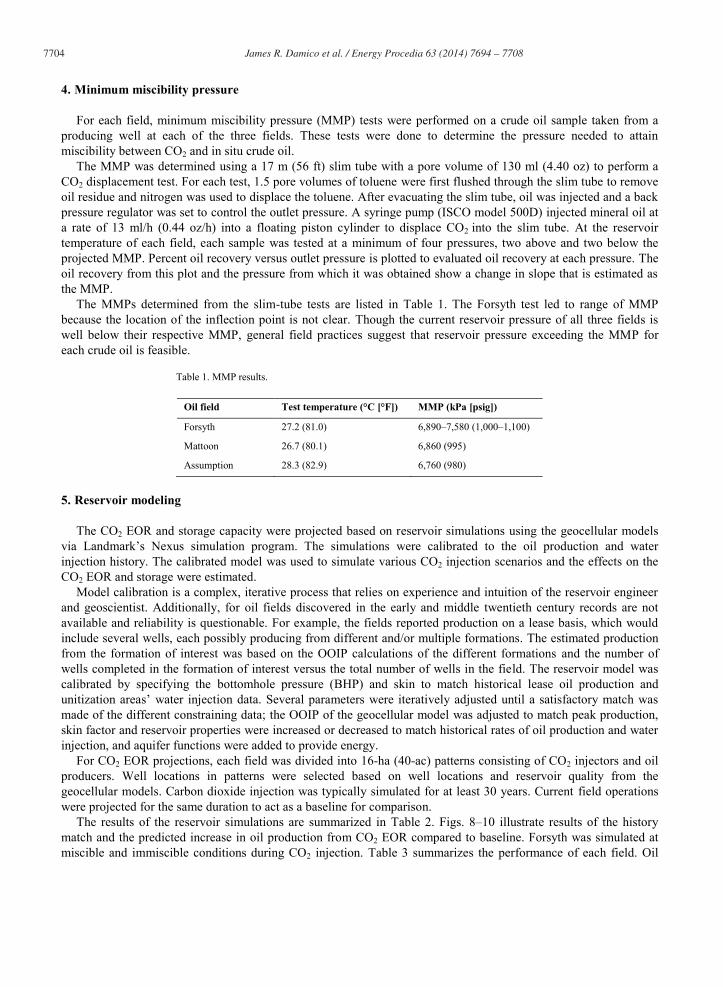
While the data employed at each of the field differed, the methodology for characterizing the geometry of the reservoir architecture was the same. Semivariograms and semivariogram maps were used at all three fields to determine principal directions of anisotropy. Semivariogram models were used as input, along with the insight from the conceptual geologic model, to guide the geostatistical simulations of reservoir architecture. Multiple realizations were generated for each field and after consultation with the principal geologists of each field, a single realization was selected that best approximated the interpreted reservoir architecture to be used for the basis of reservoir simulation. The geocellular models provided three-dimensional visualization of the reservoir architecture, allowing better understanding of the connectivity between flow units. Figs. 5–7 are images of the final models selected for reservoir simulation at each field. The geocellular models reflect the geologists’ conceptual models as expected. The Assumption Field geocellular model has extremely high permeability values on the structural highs and low permeability values off structure. The Mattoon Field geocellular model is dominated in the north by shale and two north-south trending bodies of high reservoir quality sandstone where the most productive portions in the field are located. The Forsyth Field geocellular model consists of low permeability values with a high degree of compartmentalization.
Fig. 5. Layer from the model of the Assumption Lingle permeability (left) and porosity (right). The layer is 0.9 m (3 ft) below the tight limestone marker in the Devonian.
James R. Damico et al. / Energy Procedia 63 ( 2014 ) 7694 – 7708 7703
Fig. 6. Layer from the model of the Mattoon Cypress permeability (left) and porosity (right). The layer is 17 m (55 ft) below the Barlow limestone.
Fig. 7. Layer from the model of the Forsyth Racine permeability (left) and porosity (right). The layer is 0.9 m (3 ft) below the overlying limestone.
7704 James R. Damico et al. / Energy Procedia 63 ( 2014 ) 7694 – 7708
4. Minimum miscibility pressure
For each field, minimum miscibility pressure (MMP) tests were performed on a crude oil sample taken from a producing well at each of the three fields. These tests were done to determine the pressure needed to attain miscibility between CO2 and in situ crude oil.
The MMP was determined using a 17 m (56 ft) slim tube with a pore volume of 130 ml (4.40 oz) to perform a CO2 displacement test. For each test, 1.5 pore volumes of toluene were first flushed through the slim tube to remove oil residue and nitrogen was used to displace the toluene. After evacuating the slim tube, oil was injected and a back pressure regulator was set to control the outlet pressure. A syringe pump (ISCO model 500D) injected mineral oil at a rate of 13 ml/h (0.44 oz/h) into a floating piston cylinder to displace CO2 into the slim tube. At the reservoir temperature of each field, each sample was tested at a minimum of four pressures, two above and two below the projected MMP. Percent oil recovery versus outlet pressure is plotted to evaluated oil recovery at each pressure. The oil recovery from this plot and the pressure from which it was obtained show a change in slope that is estimated as the MMP.
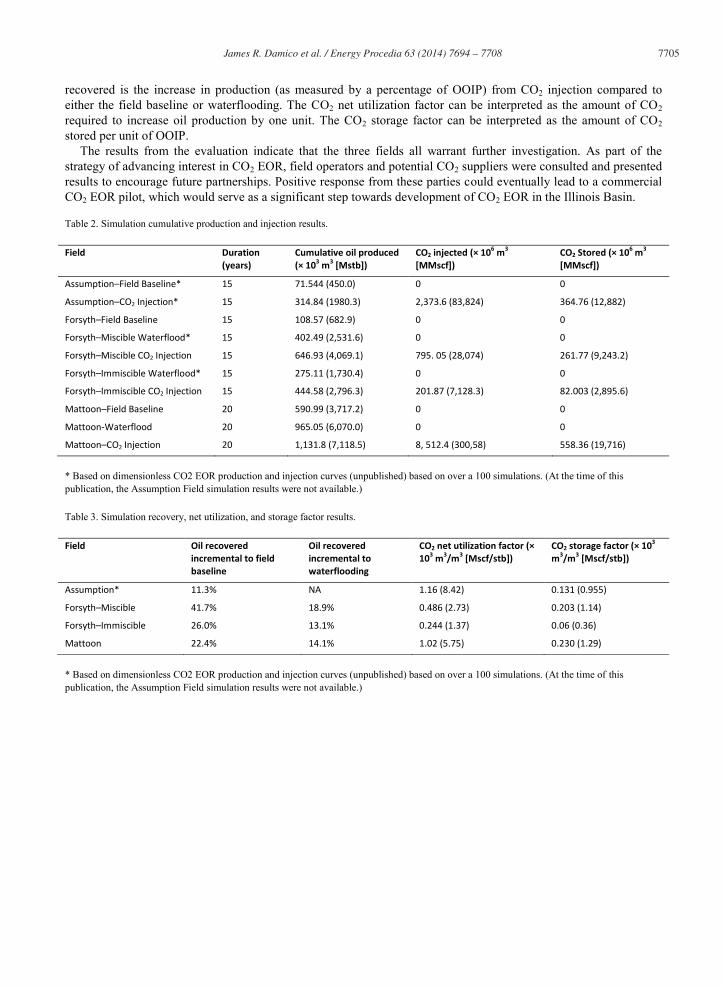
The MMPs determined from the slim-tube tests are listed in Table 1. The Forsyth test led to range of MMP because the location of the inflection point is not clear. Though the current reservoir pressure of all three fields is well below their respective MMP, general field practices suggest that reservoir pressure exceeding the MMP for each crude oil is feasible.
Table 1. MMP results.
Oil field Test temperature (°C [°F]) MMP (kPa [psig])
Forsyth 27.2 (81.0) 6,890–7,580 (1,000–1,100)
Mattoon 26.7 (80.1) 6,860 (995)
Assumption 28.3 (82.9) 6,760 (980)
5. Reservoir modeling
The CO2 EOR and storage capacity were projected based on reservoir simulations using the geocellular models via Landmark’s Nexus simulation program. The simulations were calibrated to the oil production and water injection history. The calibrated model was used to simulate various CO2 injection scenarios and the effects on the CO2 EOR and storage were estimated.
Model calibration is a complex, iterative process that relies on experience and intuition of the reservoir engineer and geoscientist. Additionally, for oil fields discovered in the early and middle twentieth century records are not available and reliability is questionable. For example, the fields reported production on a lease basis, which would include several wells, each possibly producing from different and/or multiple formations. The estimated production from the formation of interest was based on the OOIP calculations of the different formations and the number of wells completed in the formation of interest versus the total number of wells in the field. The reservoir model was calibrated by specifying the bottomhole pressure (BHP) and skin to match historical lease oil production and unitization areas’ water injection data. Several parameters were iteratively adjusted until a satisfactory match was made of the different constraining data; the OOIP of the geocellular model was adjusted to match peak production, skin factor and reservoir properties were increased or decreased to match historical rates of oil production and water injection, and aquifer functions were added to provide energy.
For CO2 EOR projections, each field was divided into 16-ha (40-ac) patterns consisting of CO2 injectors and oil producers. Well locations in patterns were selected based on well locations and reservoir quality from the geocellular models. Carbon dioxide injection was typically simulated for at least 30 years. Current field operations were projected for the same duration to act as a baseline for comparison.
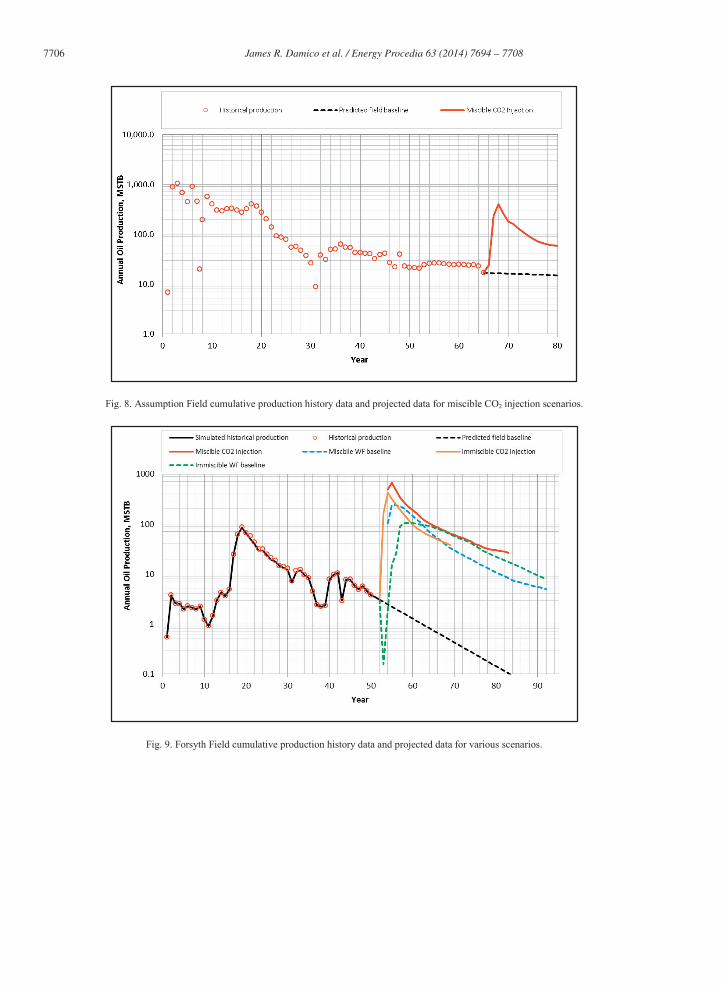
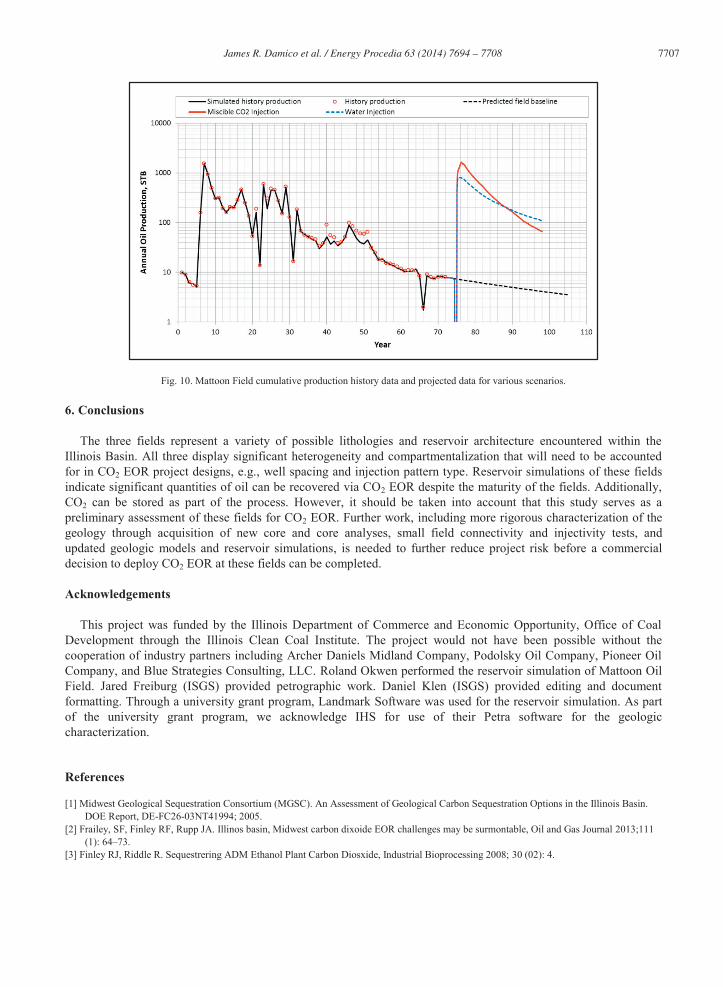
The results of the reservoir simulations are summarized in Table 2. Figs. 8–10 illustrate results of the history match and the predicted increase in oil production from CO2 EOR compared to baseline. Forsyth was simulated at miscible and immiscible conditions during CO2 injection. Table 3 summarizes the performance of each field. Oil
James R. Damico et al. / Energy Procedia 63 ( 2014 ) 7694 – 7708 7705
recovered is the increase in production (as measured by a percentage of OOIP) from CO2 injection compared to either the field baseline or waterflooding. The CO2 net utilization factor can be interpreted as the amount of CO2 required to increase oil production by one unit. The CO2 storage factor can be interpreted as the amount of CO2 stored per unit of OOIP.
The results from the evaluation indicate that the three fields all warrant further investigation. As part of the strategy of advancing interest in CO2 EOR, field operators and potential CO2 suppliers were consulted and presented results to encourage future partnerships. Positive response from these parties could eventually lead to a commercial CO2 EOR pilot, which would serve as a significant step towards development of CO2 EOR in the Illinois Basin.
Table 2. Simulation cumulative production and injection results.
Field Duration (years)
Cumulative oil produced (× 103 m3 [Mstb])
CO2 injected (× 106 m3 [MMscf])
CO2 Stored (× 106 m3 [MMscf])
Assumption–Field Baseline* 15 71.544 (450.0) 0 0
Assumption–CO2 Injection* 15 314.84 (1980.3) 2,373.6 (83,824) 364.76 (12,882)
Forsyth–Field Baseline 15 108.57 (682.9) 0 0
Forsyth–Miscible Waterflood* 15 402.49 (2,531.6) 0 0
Forsyth–Miscible CO2 Injection 15 646.93 (4,069.1) 795. 05 (28,074) 261.77 (9,243.2)
Forsyth–Immiscible Waterflood* 15 275.11 (1,730.4) 0 0
Forsyth–Immiscible CO2 Injection 15 444.58 (2,796.3) 201.87 (7,128.3) 82.003 (2,895.6)
Mattoon–Field Baseline 20 590.99 (3,717.2) 0 0
Mattoon-Waterflood 20 965.05 (6,070.0) 0 0
Mattoon–CO2 Injection 20 1,131.8 (7,118.5) 8, 512.4 (300,58) 558.36 (19,716)
* Based on dimensionless CO2 EOR production and injection curves (unpublished) based on over a 100 simulations. (At the time of this publication, the Assumption Field simulation results were not available.)
Table 3. Simulation recovery, net utilization, and storage factor results.
Field Oil recovered incremental to field baseline
Oil recovered incremental to waterflooding
CO2 net utilization factor (× 103 m3/m3 [Mscf/stb])
CO2 storage factor (× 103 m3/m3 [Mscf/stb])
Assumption* 11.3% NA 1.16 (8.42) 0.131 (0.955)
Forsyth–Miscible 41.7% 18.9% 0.486 (2.73) 0.203 (1.14)
Forsyth–Immiscible 26.0% 13.1% 0.244 (1.37) 0.06 (0.36)
Mattoon 22.4% 14.1% 1.02 (5.75) 0.230 (1.29)
* Based on dimensionless CO2 EOR production and injection curves (unpublished) based on over a 100 simulations. (At the time of this publication, the Assumption Field simulation results were not available.)
7706 James R. Damico et al. / Energy Procedia 63 ( 2014 ) 7694 – 7708
Fig. 8. Assumption Field cumulative production history data and projected data for miscible CO2 injection scenarios.
Fig. 9. Forsyth Field cumulative production history data and projected data for various scenarios.
James R. Damico et al. / Energy Procedia 63 ( 2014 ) 7694 – 7708 7707
Fig. 10. Mattoon Field cumulative production history data and projected data for various scenarios.
6. Conclusions
The three fields represent a variety of possible lithologies and reservoir architecture encountered within the Illinois Basin. All three display significant heterogeneity and compartmentalization that will need to be accounted for in CO2 EOR project designs, e.g., well spacing and injection pattern type. Reservoir simulations of these fields indicate significant quantities of oil can be recovered via CO2 EOR despite the maturity of the fields. Additionally, CO2 can be stored as part of the process. However, it should be taken into account that this study serves as a preliminary assessment of these fields for CO2 EOR. Further work, including more rigorous characterization of the geology through acquisition of new core and core analyses, small field connectivity and injectivity tests, and updated geologic models and reservoir simulations, is needed to further reduce project risk before a commercial decision to deploy CO2 EOR at these fields can be completed.
Acknowledgements
This project was funded by the Illinois Department of Commerce and Economic Opportunity, Office of Coal Development through the Illinois Clean Coal Institute. The project would not have been possible without the cooperation of industry partners including Archer Daniels Midland Company, Podolsky Oil Company, Pioneer Oil Company, and Blue Strategies Consulting, LLC. Roland Okwen performed the reservoir simulation of Mattoon Oil Field. Jared Freiburg (ISGS) provided petrographic work. Daniel Klen (ISGS) provided editing and document formatting. Through a university grant program, Landmark Software was used for the reservoir simulation. As part of the university grant program, we acknowledge IHS for use of their Petra software for the geologic characterization.
References
[1] Midwest Geological Sequestration Consortium (MGSC). An Assessment of Geological Carbon Sequestration Options in the Illinois Basin. DOE Report, DE-FC26-03NT41994; 2005.
[2] Frailey, SF, Finley RF, Rupp JA. Illinos basin, Midwest carbon dixoide EOR challenges may be surmontable, Oil and Gas Journal 2013;111 (1): 64–73.
[3] Finley RJ, Riddle R. Sequestrering ADM Ethanol Plant Carbon Diosxide, Industrial Bioprocessing 2008; 30 (02): 4.

7708 James R. Damico et al. / Energy Procedia 63 ( 2014 ) 7694 – 7708
[4] FutureGen Alliance. FutureGen Alliance Selects Mattoon, Illinois as the Final Site for the First-of-a-kind, Near-Zero Emissions Coal-fueled Power Plant 2007; press release issued December 18, 2007.
[5] Nelson, WJ. Structural features in Illinois. Champaign: Illinois State Geological Survey, Bulletin 100; 1995. [6] Bandy, WF. Geologic report: Assumption Field, sections 3, 4, 9, 10, 15, 16, 20 and 21, T13N, R1E, Christian Co., Illinois. Report, National
Energy Corporation (unpublished); 2012. [7] North, WG. The Middle Devonian Strata of Southern Illinois. Champaign: Illinois State Geological Survey, Circular 441; 1969. [8] Oltz, DF. Improved and enhanced oil recovery in Illinois through reservoir characterization: US Department of Energy; 1994. [9] Lasemi Y. Central Illinois shows Siluro-Devonian oil potential. Oil & Gas Journal 2014; 112 (3): 49–60. [10] Seyler B, Grube JP, Morse DG. The Cypress Sandstone in Illinois. In: Petroleum Technology Transfer Council Workshop; 2000. [11] Nelson, WJ, Smith LB, Treworgy JD, Furer LC, Keith BD. Sequence stratigraphy of the Lower Chesterian (Mississippian) Strata of the
Illinois Basin. Champaign: Illinois State Geological Survey, Bulletin 107; 2002. [12] McDurmitt N. Oil accumulation in the Cypress Sandstone in the Herald Pool, White and Gallatin Counties, Illinois. Champaign: Illinois
State Geological Survey, Circular 151; 1949, p. 65–84. [13] Grube JP. Reservoir characterization and improved oil recovery from multiple bar sandstones, Cypress Formation, Tamatoa and Tamaroa
South Fields, Perry County, Illinois. Champaign: Illinois State Geological Survey, Illinois Petroleum 138; 1992. [14] McGee K. Mattoon Oil Field., Coles County. In: Improved and enhanced oil recovery in Illinois through reservoir characterization, Oltz D,
editor. Final report prepared for US Department of Energy under Contract No. DE-FG@22-89BC14250, Champaign: Illinois State Geological Survey; 1994, p. 61–72.
[15] Lasemi Y. Carbonate sequence stratigraphy and reservoir development: The Middle Silurian Racine Formation in the Sangamon Arch, West-Central Illinois. AAPG Eastern Section Meeting Program and Abstracts; 2009, p. 42–43.
[16] Lasemi Y. Oil potential seen in Silurian Reef-related reservoirs in Illinois Sangamon Arch. Oil and Gas Journal 2009; 107 (29): 36–40. [17] Lasemi Y, Seyler B, Lasemi Z, Khorasgani ZA. Sedimentology and reservoir characterization of the Silurian Deposits in the Mt. Auburn
Trend of the Sangamon Arch, West-Central Illinois. Champaign: Illinois State Geological Survey, Circular 577; 2010. [18] Whiting,LL, DL Stevenson. The Sangamon Arch. Champaign: Illinois State Geological Survey, Circular 383; 1965. [19] Lasemi Y. Sea level and diagenetic controls on dolomite reservoir compartmentalization: Evidence from the Niagaran Racine Formation of
the Sangamon Arch, West-Central Illinois. AAPG Eastern Section Meeting Program and Abstracts; 2010, p. 44. [20] Lasemi Y. Sequence stratigraphic control on reservoir development: The Middle Silurian Racine Formation in the Sangamon Arch, west-
central Illinois. AAPG Annual Convention and Exhibition Abstracts (AAPG Search and Discovery Article #50694); 2012, p. 254. [21] Midwest Geological Sequestration Consortium (MGSC). Enhanced Oil Recovery I: Loudon Single-Well Huff 'n' Puff: DOE Contract DE-
FC26-03NT41994; 2009. [22] Frailey SM, Krapac IG, Damico JR, Okwen RT, McKaskle RW. CO2 storage and enhanced oil recovery: Bald Unit test site, Mumford Hills
Oil Field, Posey County, Indiana. JH Goodwin and Monson CC, editors. Illinois State Geological Survey, Open File Series 2012-5; 2012. [23] Frailey SM, Parris TM, Damico JR, Okwen RT, McKaskle RW. CO2 storage and enhanced oil recovery: Sugar Creek Oil Field test site,
Hopkins County, Kentucky. CC Monson and Goodwin JH, editors. Illinois State Geological Survey, Open File Series 2012-4; 2012. [24] Jennings JW, Lucia JF. Predicting permeability from well logs in carbonates with a link to geology for interwell permeability mapping. SPE
Reservoir Evaluation and Engineering 2003 (SPE Paper 84942); 6 (4): 215–225.