investigationofn55mccl.pdf - IDEALS @ Illinois
142
is im llllil
-
Upload
khangminh22 -
Category
Documents
-
view
7 -
download
0
Transcript of investigationofn55mccl.pdf - IDEALS @ Illinois

is
im
I
'
llllil

L I B R.AFLYOF THE
UNIVERSITYOf ILLINOIS
6Z1.3G51 1 G55teno. 50-51cop. 2


Westinghouse Electric Corporation
Air Arms DivisionAttn; Librarian (Antenna Lab)
P 0, Box 746
Wheeler LaboratoriesAttn: Librarian (Antenna Lab)
Box 561
Smithtown, New York
Electrical Engineering ResearchLaboratory
University of Texas
Box 8026. Univ. StationAustin, Texas
University of Michigan ResearchInstitute
Electronic Defense GroupAttn: Dr„ J. A„ M„ LyonsAnn Arbor, Michigan
Dr Harry Letaw, Jr„Raytheon CompanySurface Radar and Navigation
OperationsState Road WestWayland, Massachusetts
Dr Frank Fu FangIBM Research LaboratoryPoughkeepsie, New York
Mr. Dwight Isbell1422 11th WestSeattle 99, Washington
Dr e A. K„ ChatterjeeVice PrincipalBirla Engineering CollegePilani, RajasthanIndia
New Mexico State UniversityHead Antenna DepartmentPhysical Science LaboratoryUniversity Park, New Mexico
Bell Telephone Laboratories, Inc.
Whippany LaboratoryWhippany, New JerseyAttn; Technical Reports Librarian
Room 2A-165
Robert C HansenAerospace CorporationBox 95085Los Angeles 45, California
Dr c D E„ RoyalRamo-Wooldndge, a division of
Thompson Ramo Wooldridge Inc„8433 Fall brook AvenueCanoga Park, California
Dr„ S Das gup t
a
Government Engineering CollegeJabalpur, M PI ndi a
Dr„ Richard C Becker10829 BerkshireWestchester., Illinois

Antenna Laboratory
Technical Report No. 55
AN INVESTIGATION OF THE NEAR FIELDS ON THE CONICALEQUIANGULAR SPIRAL ANTENNA
by
0. L, McClelland
Contract AF33 (657 ) -8460
Project No. 6278, Task No. 40572
May 1962
Sponsored by:
AERONAUTICAL SYSTEMS DIVISION
Electrical Engineering Research LaboratoryEngineering Experiment Station
University of IllinoisUrbana, Illinois

Digitized by the Internet Archive
in 2013
http://archive.org/details/investigationofn55mccl

ACKNOWLEDGEMENT
The author wishes to thank all the members of the Antenna Laboratory
Staff for their assistance and encouragement. He is particularly indebted
to his advisor, Dr John D. Dyson, whose interest and supervision have
made this report possible. Appreciation is extended to Dr, R. Mittra for
the many helpful discussions and for his continued interest in the investi-
gation.


S5tc
55
ABSTRACT
The current distribution has been measured on a conical equiangular
spiral antenna. A correlation between the operation of the conical log-
spiral antenna and the operation of the uniform circular bifilar helix is
established by utilizing a general theory of backward wave radiation from
periodic structures. Operation beyond the normal frequency limits has been
explored and discussed. The arms of the antenna were constant diameter
conductors. The effects of this deviation from the ideal design, which
calls for a linearly increasing diameter, have been observed. The far
field measurements, giving for example the center of phase location, agrees
with the near field probing.


iii
CONTENTS
Page
1. Introduction 1
2. The Basic Antenna 2
3. Backward Wave Radiation from the Conical Log-Spiral 5
4. Physical Construction Considerations 8
5. Measurement Considerations 12
5.1 Relative Amplitude Measurements 14
5.2 Relative Phase Measurements 14
6. Experimental Results 22
6.1 The Current Distribution 22
6.2 Electric Field Radiation Patterns and SWR Measurements 41
7. Conclusion 47
Bibliography 48


IV
ILLUSTRATIONS
Figure Page
1. A conical log-spiral antenna with its associated coordinatesystem 3
2a. Typical k-P diagram for bifilar helix when considering operationalong the cylinder surface 6
2b. Typical k-P diagram for bifilar helix when considering operationalong the conductor 6
3. Physical dimensions of the test antennas 9
4. Photograph of the small test antenna 10
5. The feed region of the test antenna 11
6. Detail of the probe used for the near field measurements 13
7. Block diagram of the amplitude measuring circuit 15
8. Block diagram of the phase measuring circuit 16
9. Balanced detection phase measuring system nulls and phasorrelationships 18
10. Photograph of the large antenna mounted in the measurement site 21
11. The current amplitude along the arm at 200 mc 23
12. The current amplitude along the arm at 300 mc 24
13. The current distribution along the arm at 400 mc 25
14. The current distribution along the arm at 500 mc 26
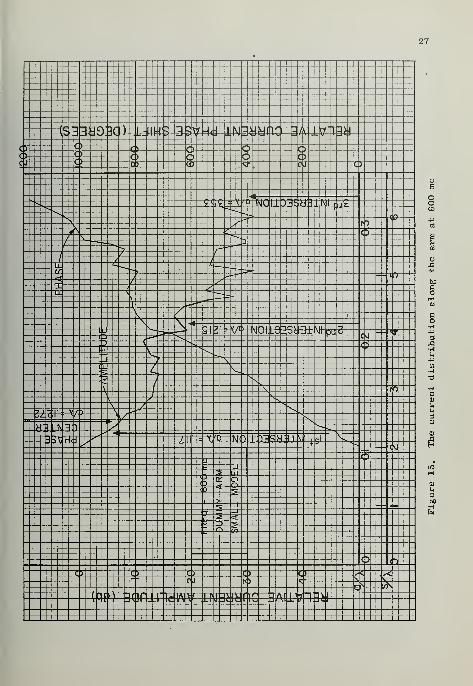
15. The current distribution along the arm at 600 mc 27
16. The current distribution along the arm at 700 mc 28
17. The current distribution along the arm at 800 mc 29
18. Composite curve of current amplitude along the arm as a
function of frequency 30
19. Composite curve of current phase shift along the arm as a
function of frequency 31
20. Comparison of current amplitude along both arms of the log-
spiral at a low frequency 33


ILLUSTRATIONS (Continued)
Figure Page
21. Comparison of the current amplitude along the dummy armsof both antennas at 400 mc 34
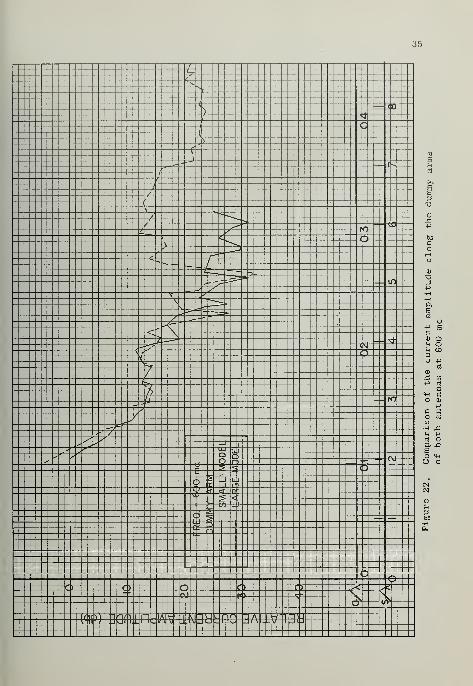
22 Comparison of the current amplitude along the dummy armsof both antennas at 600 mc 35
23. Comparison of the current amplitude along the dummy armsof both antennas at 800 mc 36
24. End effect at 800 mc on the small antenna 37
25 The current amplitude and location of the tip truncationsuperimposed on the k-P diagram 39
26. Average composite current distribution along the arm 40
27. Electric field radiation patterns of the small antenna 43
28. Electric field radiation patterns of the small antenna 44
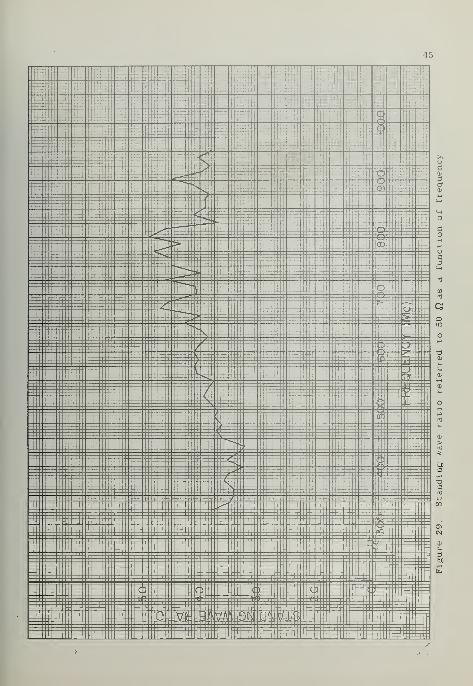
29. Standing wave ratio referred to 50 Q as a function of frequency 45
30. Relative distances of the phase center and tip truncationto the apex as a function of frequency 46


1. INTRODUCTION
The introduction in 1954 of the concept of frequency independent antennas
led to an important breakthrough in the antenna field . Many versions of
these antennas have been studied since that time. Of these, possibly the two
most practical versions from simplicity of construction are the log-periodic
2 3 4dipole array ' and the wire-arm version of the conical log-spiral .
In an effort to provide information that would lead to a better under-
standing of the operation of the conical log-spiral antenna, an experimental
investigation was made of the amplitude and phase of the near fields on one
antenna. The purpose of this paper is to present this data and to indicate
how it correlates with a general theory of backward wave radiation from
periodic structures .

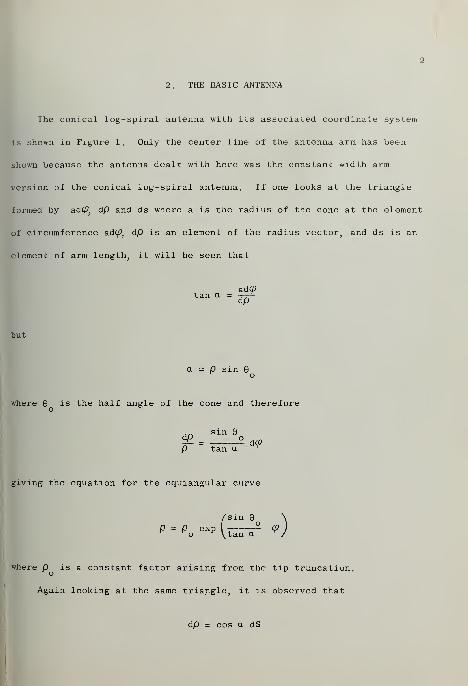
2. THE BASIC ANTENNA
The conical log-spiral antenna with its associated coordinate system
is shown in Figure 1. Only the center line of the antenna arm has been
shown because the antenna dealt with here was the constant width arm
version of the conical log-spiral antenna. If one looks at the triangle
formed by ad<£>, dp and ds where a is the radius of the cone at the element
of circumference ad(p}
dp is an element of the radius vector, and ds is an
element of arm length, it will be seen that
ad(ptana=dp
but
a - p sin
where 9 is the half angle of the cone and therefore
,_ sin 9
^ = ___£ d(/?
P tan a r
giving the equation for the equiangular curve
P = P„ exp/sin 9
q\
V tan a ^ /
where p is a constant factor arising from the tip truncation.
Again looking at the same triangle, it is observed that
dp = cos a dS


E^
^ Y
Figure 1. A conical log-spiral antennawith its associated coordinatesystem


P = S cos a + constant
In the case where there is no truncation, i.e., when S - for p = 0, the
constant is zero yielding
P = S cos a
If the cone has been truncated, S = but Q = D . Then the constant = O ando o
p = S cos a + po
It will be convenient later to speak in terms of pitch angle as commonly
defined for the cylindrical helix. The pitch angle % is the complement of
the constant spiral angle a which the curve makes with a radius vector of
the cone. To summarize the results and add a few obvious relationships, we
have
In terms of spiral angle a In terms of pitch angle I
[sin G 1_-J> cp\tan a j
P = P^ expI7^7-^— <P
|P = P exp [ (sin tan %)<P]
P = S cos a p = S sin %
and for both cases
a = p sin 9 D = p sin 9o max o
d = 2 p sin 9 C = 277ao o


3. BACKWARD WAVE RADIATION FROM THE CONICAL LOG-SPIRAL
In the spring of 1961 Mayes, Deschamps, and Patton indicated that fre-
quency independent antennas could be analyzed by considering them to be
locally periodic structures whose period varies slowly, increasing with
distance from the apex. At any given frequency there is a region on the
spiral where the current is phased properly to produce radiation toward
the apex and hence produce backward wave radiation. It was postulated that
this region on the conical log-spiral antenna could be approximated by a
bifilar helix with parameters equal to the average conical spiral parameters
over this region.
In an effort to apply this idea to the conical antenna, it is instruc-
tive to consider some of the techniques which have been useful in the
analysis of helices. The Brillouin diagram, relating the propagation constant
h on the surface of the helix to the frequency 00 or to k= oo/ c the propagation
constant in free space, has been a convenient tool in the analysis of periodic
structures and in particular the helix .
In the derivation of the Brillouin or k-P for the helix, it has been
7 8shown ' that h is real in the regions defined by the boundaries
ka . ha ^ kam + ——-g- < ——-5- < m - ——7
cot 5 cot 5 cot ?
m is a positive real integer. A consequence of this is that for h to be real
ka/cot £ < 1 for the bifilar helix. The unshaded areas in Figure 2 designate
7the regions where h is real. Sensiper has shown that the solutions of the
determinantal equation can be approximated by the line ka/cot £ = ha/ cot %
sin 5, which can be interpreted as a wave progressing at the speed of light


""
c -1.0
V\-— ska -<«SV<r —"^ VW-/ ^- \cotC
'oj^ \
\\
c) i
ha2 3
cotC
Figure 2a. Typical k-P diagram for bifilar helix when consideringoperation along the cylinder surface
cos£
Figure 2b. Typical k-P diagram for bifilar helix when consideringoperation along the conductor


7
along the thin tape, and the m=l boundaries of the regions discussed above as
are shown in Figure 2a. As Sensiper has indicated, for many practical purposes,
these roots are the only ones which may need to be considered on the cylinder
surface. It was felt, since the data were taken along the conductor, that a
k-P diagram as shown in Figure 2b was more applicable for this presentation.
This diagram is essentially the same as Figure 2a, where P - h sin % the pro-
pagation constant along the conductor is used as the variable. It should be
noted here that the relation shown in this diagram should be applicable only
to an infinite, thin-tape helix. When the tape is not thin, the current,
progression will deviate from the speed of light. It has been demonstrated,
however, that experimental data taken on a finite helix agrees quite well with
7the diagram .
The locus of the propagation constant in Figure 2b will give a value of
Pa real for each value of ka. In the case of the helix, the radius a and
pitch angle % are constants. As the frequency is increased, the value of P
scans as the diagram predicts. In the case of the log-spiral, the pitch angle
% is constant, but the radius a increases linearly with distance from the tip.
Since P is a function of a at any particular frequency, P changes with distance
from the apex.

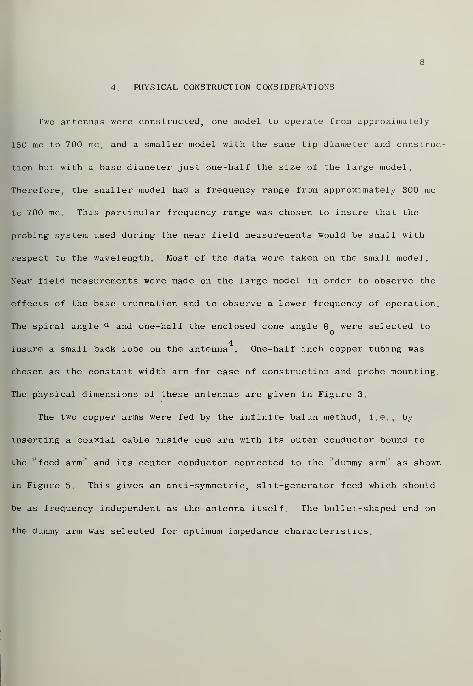
4. PHYSICAL CONSTRUCTION CONSIDERATIONS
Two antennas were constructed, one model to operate from approximately
150 mc to 700 mc, and a smaller model with the same tip diameter and construc-
tion but with a base diameter just one-half the size of the large model.
Therefore, the smaller model had a frequency range from approximately 300 mc
to 700 mc. This particular frequency range was chosen to insure that the
probing system used during the near field measurements would be small with
respect to the wavelength, Most of the data were taken on the small model.
Near field measurements were made on the large model in order to observe the
effects of the base truncation and to observe a lower frequency of operation.
The spiral angle a and one-half the enclosed cone angle Q were selected to
4insure a small back lobe on the antenna . One-half inch copper tubing was
chosen as the constant width arm for ease of construction and probe mounting.
The physical dimensions of these antennas are given in Figure 3,
The two copper arms were fed by the infinite balun method, i.e... , by
inserting a coaxial cable inside one arm with its outer conductor bound to
the "feed arm" and its center conductor connected to the "dummy arm" as shown
in Figure 5, This gives an anti-symmetric?slit-generator feed which should
be as frequency independent as the antenna itself. The bullet-shaped end on
the dummy arm was selected for optimum impedance characteristics.


APEX OF ANTENNA SURFACE
T
d=4-
SPIRAL ANGLE a = 73PITCH ANGLE £ = 17°
BASE TRUNCATIONOF SMALL ANTENNA
Figure 3 t Physical dimensions of the test antennas


10
Figure 4. Photograph of the small test antenna

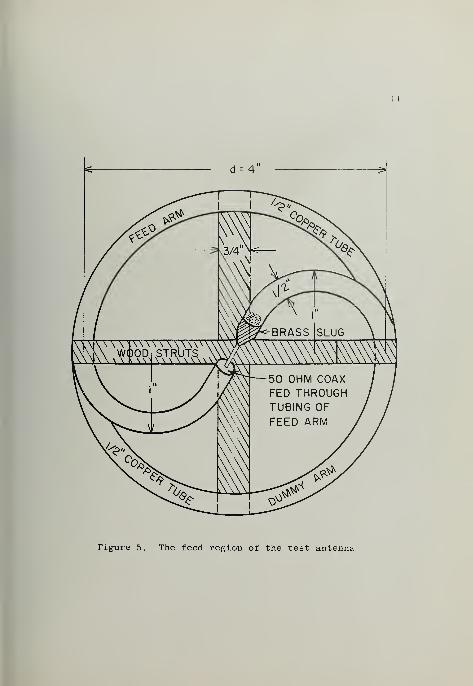
Figure 5. The feed region of the test antenna

12
5, MEASUREMENT CONSIDERATIONS
Throughout the entire experimental program no attempt was made to prove
that the wire version of the conical log-spiral antenna was a "frequency mde-
„ 4pendent antenna since Dyson has already established this fact. A definition
of frequency independence is given by R. L. Carrel. "By frequency independence
as applied to an antenna, it is meant that the observable characteristics of
the antenna such as the field pattern and input impedance vary negligibly over
a band of frequencies within the design limits of the antenna, and that this
band may be made arbitrarily wide merely by properly extending the geometry
of the antenna structure. The ultimate band limits of a given design are
determined by non-electrical restrictions: size governs the low frequency
3limit, and precision of construction governs the high frequency limit." The
antenna was designed to have essentially constant impedance and patterns over
a two to one band, Measurements were made over a four to one band in order
to investigate the operation beyond the normal limits.
The near field measurements consisted of measuring the relative amplitude
and relative phase of the current flowing along the conductor of the antenna,
A signal proportional to this current was received from a small shielded
9current loop probe shown in Figure 6, The loop probe was placed on the end
of a sufficiently long piece of .050 inch microdot cable which was allowed to
follow the surface of the antenna arm. The loop itself was mounted on a
beryllium copper clip which provided a means of fastening the probe to the
one-half inch copper tube arms of the antenna. Calibrated positions were
inscribed on the arms to facilitate accurate positioning of the probe.
It was necessary to determine if the presence of the microdot cable was


13
PROBE ORIENTED
PERPENDICULAR
TO THE AXIS OFTHE CONDUCTOR
AND THE SURFACE
OF CONE
1/2 COPPER TUBE
ANTENNA ARM
.050 MICRODOT COAX
3/16 SOLID
COPPER ROD
BERYLLIUMCOPPER CLIP
Figure 6. Detail of the probe used for the near field
measurements

14
disturbing the near fields on the antenna arms. Only negligible deviations
in the signal level could be determined when a piece of microdot cable was
placed in various locations on the arm around the loop. Also, no deviation
occurred when an additional shield was placed around the microdot cable indi-
cating negligible leakage from the cable. All data was recorded relative to
the same initial position on the antenna arm. No attempt was made to approach
the slit-generator feed beyond the point where the antenna arm left the true
equiangular curve,. Data were taken at approximately O.lA intervals along the
arm progressing down the antenna. To minimize flexing, the microdot cable
was allowed to droop down in a large loop.
5.1 Relative Amplitude Measurements
A block diagram of the circuit used for the amplitude measurements is
shown in Figure 7. The output of the RF power oscillator, delivering a con-
tinuous wave;
was padded and filtered before delivery to the antenna. Two
signal taps were provided to allow both frequency and amplitude monitoring.
The stubs were tuned to a maximum probe signal level when the probe was placed
in the reference position discussed previously. The addition of the 100 mc
low pass filter was found to be necessary since the filter provided in the
crystal mixer was not adequate to block the RF signal from passing through the
mixer to the 30 mc IF amplifier. It was found that a power output of several
watts was needed in order to achieve an adequate dynamic range
5.2 Relative_Phase Measurements
The relative phase measuring circuit is diagrammed in Figure 8. The input
system to the antenna was similar to the system used for magnitude measurements
except the power was not monitored. If the power had drifted, both the reference
signal level and the probe signal level would have drifted together and would


15


L6


17
not have disturbed the measurement.
The theory of the measurement was as follows. The probe signal was
externally modulated and fed into either the series or shunt arm of the
coaxial hybrid junction. Likewise, the CW reference signal, the phase of
which could be adjusted by means of a matched slotted line, was inserted
into the remaining shunt or series arm of the hybrid. The outputs of the
hybrid, one of the RF phasor sum and the other the RF phasor difference,
were independently matched and detected. The two detected audio signals, one
the magnitude of the sum, and the other the magnitude of the difference, were
subtracted in the balanced input adapter. The difference of these two magni-
tudes was applied to the audio amplifier and read out on the Ballentme VTVM
As can be seen by the phasor relationships in Figure 9, a sharp null
should be observed when the two input signals are in phase quadrature. The
phase measurement was somewhat insensitive to the difference in amplitude
between the two input signals. A precise null was always present, no matter
how large the difference in the amplitudes. Of course, keeping the null above
noise was a problem when either the two signals were both small or the difference
was great. In either case, the entire standing wave could have been engulfed
in the noise. For these particular measurements it was found that the null
position could be located with a reasonable degree of accuracy when the
relative difference between the probe signal and the reference signal increased
to 25 db.
In this measurement, only the probe signal was modulated to provide a
sharper null at R, The only error due to the unmodulated reference signal was
a leakage through the hybrid junction. Even though the unmodulated signal


L8
90 180
$ DEGREES
Figure 9„ Balanced detection phase measuring system nulls andphasor relationships


L9
which at times was much larger than the modulated probe signal, was pre. n1
at the detectors. only a DC component was present at the transformer In a
well balanced system the isolation between inputs is in the order of 60 to
70 db
The following procedure was used to balance the hybrid junction after
each change in frequency. Refer again to Figure 8„ The external modulator
was applied to a signal taken from the 10 db directional coupler. This
modulated signal was used throughout the balance procedure. This method was
used, as opposed to modulating the source, in order that the frequency used
during the balancing procedure would be the same as the frequency used during
the phase measurement. Modulation applied directly to the source will shift
the frequency The line stretcher in the modulator was adjusted for maximum
deflection on SW amplifier No. 1. At this maximum the distance from the
crystal to the probe line was some multiple of a quarter wavelength allowing
an optimum switching action to be applied to the RF signal. The hybrid
junction and the stubs T were removed from the circuit. Each arm, attached
to the outputs of the hybrid, was balanced individually. The modulated signal
was applied to one of the detection arms with the resistor R placed for maxi-
mum signal observed on the Ballentine VTVM The stubs in the detection arms
were also adjusted for a maximum on this meter The same procedure was carried
out on the other detection arm. In this particular circuit the difference in
detected signal from the two arms was less than 0.5 db.
The balanced arms were connected to the hybrid junction and the stubs T.
The modulated signal was then increased in amplitude and applied to one input
of the hybrid through a 6 db pad The other input was monitored with SW ampli-
fier No. 2 through a detector and a 6 db pad. The stubs were then adjusted


20
for a minimum on this meter which was measuring directly any leakage through
the hybrid due to unbalance on the output arms. When a minimum was observed,
the stubs T were in such a position as to have balanced out any difference in
impedance seen by the two output arms. The previous step only insured that
the sensitivity of both detectors was the same and did not insure balanced
input impedances. Next, the output, which was monitored, was then terminated
in a matched load. The resistance R was adjusted for a minimum deflection on
the Ballentine VTVM. These last two steps were repeated to insure the highest
degree of balance. This completed the balancing procedure and the circuit in
Figure 8 was then reassembled and ready for measurements.
The system was checked by two methods. The first was to measure a known
phase shift and the second to observe distances between null positions. The
first check was performed on the system by measuring a calibrated delay line
which was inserted into the probe line. The balancing procedure was continued
until the error in measuring the delay line was less than one percent. The
maximum error measured after a set of data was taken was less than two percent.
The increase in error was accountable to a drift in frequency during the
measurement on the antenna. The second check depends upon the fact that if
the hybrid junction was perfectly balanced, the distance between consecutive
null points would be one-half of one free-space wavelength. Therefore, during
the measurement, the distances between nulls were tabulated and compared as
the phase was shifted and successive nulls were followed. If the distance
between nulls began to deviate, one from another, it was an indication that
the hybrid was becoming unbalanced. If the hybrid was unbalanced, the sum of
the distances among three consecutive nulls was equal to a free-space wave-
length; but the distance between two consecutive nulls was not one-half of one
free-space wavelength.


21
Figure 10. Photograph of the large antenna mounted in themeasurement site


22
6, EXPERIMENTAL RESULTS
6.1 The Current Distribution
The relative magnitude of the current distribution has been measured at
six frequencies, from 300 mc to 800 mc, on the small model and at four fre-
quencies, from 200 mc to 800 mc, on the large model. The relative phase of
the current was measured at five frequencies from 400 mc to 800 mc on the
small model only This data is displayed in Figures 11 through 23 inclusive.
Figures 11 through 17 indicate two items of interest;:
(1) A rapid decay in the amplitude over the first portion of the structure,
The rate of decay over this first portion tended to be frequency dependent,
i.e., increasing rate with increasing frequency. This indicated that the rate
10of decay was a function of arm width in wavelengths as was noted by Dyson on
the planar structure,
(2) The average phase velocity along the arms in the initial region was
always that of the speed of light or greater indicating a fast wave progressing
along the arm from tip to base. The phase velocity also tended to be a function
of arm width in wavelengths,
Figure 18 is a composite curve of the relative amplitude curves shown in
Figures 11 through 17 and Figure 19 is a composite curve of the relative phase
curves, These two graphs were formed by referencing the initial amplitudes and
phases such that the first regions of the curves were practically coincident.
It must be admitted that this was rather arbi trary> but it did give an indication
of the amount of energy which was being dissipated in the quasi dipole feed
previously shown in Figure 5. Radiation from the feed section will be discussed
later.


23
ii::ii:i:::iiz 1 T 1
0o
-
.-,--- d"M I
s1
*" ._ ._
<" . -< v>
^j^^«=::'
.
7 __ f>_Tr ^~S ""-
z/
T~ ZIP- S2E RTjn 'TacirgiBQ HJe i
/ =;_=: *r-J "uz t^. . $
*' c 2E LjJ
r q.cc^ci
v ir 'Sh 2r2 ii -3-
,jf ] t UT-- _- — —
.J ji ^> c>- :^ h£' "^ Q'
ii q <i_r " r*jr~
..___ ± ^ _ = [___ "V
ex ex ex ex ex ^ •£*
C* f<X ^ - {;£ 0^,
ttitt 1CH t- tfl^t 1 5 I>3££CD i^d 3 I-llJ


24
....
«J-
112
i „ ~XDTtn
— ID
— .st(V "*
,-^ ~^ "~
' i-n
5 -H- r-r-7- C
5T>s ,, ____ _ ___
; ZR-iiT KcimasaaiKr^ : :
* ~ — -- CsJ
^ «-i-3
r- S- J-
5 X A- %4 -+- ClIC ££3 -. s^f c£
--S sJ(
r >__ ii ^: j. — ±
-ii-^£ +-I-P-5S ;£xCIr <t-j!' - 3 2»± j| IH gj.
. „„ "_£ X3
CI CI CI CI CI *£ ^S
(3 w '
HC'l If H 1 11^ l\ W ilL\n^ "1 A 1 IW "3S.
, iH .JLIIJ.1 lc l\ V .. NJJ-cJ IJ ::l.'\ll.v .jcX X: x ±__ _ __


25
:ee|;I[ -TTTrir I - IIl+lTi T~~:--"--|
-][[;;:! jj^W T "'l ][, 1
£-3^-0. i-IHS -SVHd lN =H^nO -iAUV Jt
O ^ v <"* CX oo 5C )=s n - ^££ cr p o qSi 0) <j> . s: CJ . O
_i_
_
--IE J-43 -
— P'!" "
i:
^ f ^ „,.; . ;
:::::::::::::::::::::3-:::::||:;=e:::::::::E:::::_:::---"<5::::::::
C f£«= ~"~-^^ -t-
\ ^--" i£— *v *r>/ \ ~ -
EE J J ?fc
s7 ^^
-I „ -- %SEE =^2°3, N
adiPi^^l-db^l-t:^-^ tH - t^ —.^DD^^^ijasiticd
3* \. -- -sitJ *^ ""v 4D** \ c *s
i-^ "uj:5
.:» i " NI rL C J* = --^"II 1*
"**" 5
i^ a U : -
Si V ")- BSI ^ * it sI **"
t;
-_„ + _i?.__P_ o
CI CI II CI CI '? *:£CJ rO ;" ^ v v *
Iliijt^Esiii-kizra fiik,3i" 7'f "csrisf^ra
-t- J


26
~ f&'J-M^)"^ "0 £_j iitc- qcwHj
| N|t
d>4^|n rl TAIIt/HlH\o_d_ cj»-/_j Vt * x^inu .jo \ \\\J j_ i nj_jc j o i i^ _j f \ ij_ v i _j cj
£* o a ex exX o o o q>-
s* ci ± ££ s- ei _i2
i -.r*" tr
Q
I„ ._,_H *«- „ — CL* "
i.i('
nt v*.
°t 5s[I -^
?F *S 51?" i! // 3
"^j^ ^""~ * MAI 1 'Yt3CU"3 1 Ml . .. yv* _, ^**~ l> v) J.Jjaa. j.UNi [)ij o __ ri
""•«.,<" * IV
'S / rv - / HT *3*v
* *•,X Zt_l_ ^r--^ ^-s7 i
j \, *./ -\ H ff'
/ V^ ^-* c x„7 s s? N
.:_=_^ft=^^^:;;^::-::::::::::__:_ -::_:J>::_-:_----: : :: ::
3^di3C ^dt^Est^^ £r=^ c scm^GJSsii::*!!:^ N s s : :_ :
j :: ^^ __ - zz~i*tS VS^ A~
' ^l 1 ^ --«.
= - •> ^z "•£ ^C '* ^£
-X 1 - . " •
-
5 J£ -J -- -- --+4 - •% 'I3- !_:*<£
if .D « Lf ' 3 -^i
m ^ : z -= j i 1
11 CL CI Zl. CI '? *Z01 m -c- V V** G^ u£
bici "icninrrnji/nr s'loicin 't?i^3"C : ll

27
± . ._.._._._.. . ... .
(S3^y0:3ci) -liirtp :ifevHd lilipwd i/^.J'iiu
cs C> r>_ o C) C)
; + f£ € * $t- ° c! ,.»--
Si si si ci s* r cj ct
—>s + " S3£E :: f^^Jastta-fajiitfct^s : ':s ^_ -i
-fcU^~ \ ± -> (Q
\ V_ __ f Z*r\ .> <>X y__S_ -
31
xxxzxxxzx^xxxxxxxx^xxx :::::::: ::17 fi 7 X 1
IIl -=.„ *---_:::::^::::::::::::^::::::::::::::;Ef'!::: i::~:z::~:="::~==i3~:
^p X ^ -^.C y • '
IL \ *=--._
I ^^»""*
^vl C-
\ \ .*_1 W ^; =^--§+2^fl>--Wetb3 = S*Kl:b\|-n[it ==if—
j^___,,« 3 N ^_^J_^ 1 ii^ifc^iiLi:!: "!_^UL^ ^^ J?E
— \ "^ O3- \ ^ -
-= \»_ ^--.-^ v %Q- / \^ s .. ^'* 1 vI r \ ._. X^-ra-\ \ __ :
V / ~ s-
V =Z v XZJvi'tY/J 4 *.- -
vv
::JCtts:CJ yS~ :: : ::: : : _ ::s-^ :: :: :
~J5unr ?-! " lx =^/lr -Nii—:*yg«:-rr^ri S r'N -
c>j ^r I
_._ _. _,~_2 E iiL . .. .... X° c n(3 <r r >
<D ^ 5Li
>- ^,_•- i r _r,-v *A -i
du " r <^H£ -1 3:
t3 3^
£1 EI 11 CI CI -^£ ^£PlS 1/^.
<
n
cm zip "l^iviv iM =MHfp pian^t^m


- (S33U930) IdlHS 3SVHd lNBddflO 3ALLV~Gid° t tl rn -n. 1-1
::::;::::^: :&! 1 ft! i ! fc !i
! V o S> « « $>|£! flV ! £»i • • AT" i : «J O iJ H C> C>ci H; fi:l (2.i if Si o) o? v cj! C)
„_ ___ L j_ j 1 _L
—|- CDIl ! : ,+,j. 1.
._ ._ __ _ .... i r n-j- v
L ^ ._ _.. T^ \ ± t2\l ^Z -i»
: 1 _.5_,__f_1
-'
i
__i-_ t .+ . ___s
. :::L:::Z- ^ j 3^^ - cnr £cni'Li?E~niirR+£
ir % f^L ^b^=:' SV? : S\-\ w2 - $ * ~«9
V S ^ -.* ^--S ^»^ __ 1rj_- -^ — _
r r -*J
^t n \^ ^^ V it*" t-^i*s
SS
=-* % --11.**"- - X_/ i
"^^ ^A""' 5ID /A
^,
_G -s „,k-v
i \ iik = v u ISIJI.L JdbcLLJVII a jc \ — sh-- -- "^ W —^
-f -t-^t I -O
'- P it it V<3 j tA JV \
Sr
S \ 5^ J^' \ *QT
s, ^' \ _ "I^tt i : 3Z D fc* X $
c-pj^ <r \-"
: .^dEzs K!n2;ci>a-a3f i*3
'S--llJ
G 1—r^--0X5" <r -I*" .2
ii J-- ~-Zi
z<Z~Z zsr-=^22 -;£ 1x XT 5
sn
__~j~ i3 XD»— — *
11 Zl Zl II ZL *Z 'Z
rS J*C lJr
jjrM
:/i" AA*i 3]3"33Sp5 ?"i- :ju [iEnn~G3
, 4r , r\j ..Crn / i1g^x3Cni%. h Z7V.t\ 1^N3
i_


29
(S33d930) ldlHS 3SVHd 1N3UUD0 3AllV13do ZT XT cr cr cr
C) Q g> o ~ - ------o ° ° ° ° 91 o o o oci 2> *> Y. £1 9 c) u> v cj o
i-*- (0^
,J...
1 -»' 31 _ ? <JC «^*~ J
2 £ v *v J 2 ,z £/ ^3 - __j^
:: it "=*^ : r<2^2«:tt!3L:3;Sai!lfett-]Lui ~ "^ ^ ^ ^^ ~./_ H^
?: y \
3 : ^"5' ""n
-r--* \TV — -<9^ V - -in—-i&
V % 1*1
^> s 43A*7 A^ V^ £
3 3*-* s
3 -" >^3, S^ < —13
=, r _ ^
* 4± r ^ 4
i -^: c ^ ^=^ # 3-
fc
1v »- 'rr7.y/n k\i\ 'VICV'll \l "' *^
§L. " "*«>». X J " r T^- ? ^ <3c. ;> -,
,J
5 -s£ ZtA
=?• -/ Tv=»
::: ;:::::::fc:^::::::;: ^=:::::::::::::::::::^:::i;::::::::::::::
:j3H:e:5i::^£--"" - :::::::::::::::::::::::::::::^J:::::^:::audita* 3
J S VHr
zi;=^2t isox^KE^itt ^i
_<3
j:* H» j.
C>--£- 2 •
ii 1-1
.~" > — - —
zr^zui :; aOLj: su i:j 5
-
, ^s- 45££ ce ce n cr •? ^
CJ- Pl 5 " ^ * ^
rHH-^3tfl4irl~R3l?fQ-^^l^h34haffi--d?^r^-+3 :eJ x___


30
r
< — it^ —*t* r^y <ps
s: __ _ 2&*___ :__ "
:: :::St/•v
' .'
_ _ __: :_£-. : _ __i j --------z~ **
_J>- ~ — *
** *--.,_
\i -^ "" •>
X ^ ' ^^ - -(£
_ _ _ -i^ST ,^_ __TOZ V : * «1 „£ "*..
i^ -x^l ^—
"
'-^ £.-• fi -*. -/
4 --£ 1---^ 3* ==3 j *:»..», *- —
^
_ _ _ _____7____* r _ ^ _ _ _ _ __
**-'^d ^-^s^=,-2~- -=- * ?
zfc^-r ,7 _^<"±£ 3^ X
**-r-^ <- •$*?3 _^^! _ = __
: :::::: ::: : :: ^*ilh^ : :: : : : _:« ::!_ :^£ 1 :<* o^ y •••" >-*-,< ? ** w1^ "• '~-=»jr ^-.^ it
____, a^____ 5SJ*===-
:::::::::::: :::5£":::2CfE-:: : :::::::: ::^: :I *2 ? A* *££^ -+-* 22-^
-|3 r^2f'2%* *
4***i\
^Z** - ^\,f
v
_,£* 3 * : £ S-a a aiS Ed^"c:::j s cari^x3 >-»
<L- %1 - S . | .
"V _ 5 "" t • 7 :
"' — -q B-»
• ' i I5 = * • Z i :
K
m „„_» :i2 , = _
ct ci C£ h zz ^*z _*£
IHIl 3C3331 E3BlE r~ ^lECSCE!] ~I5in32~ 3JT


31
_______________ __________________ ____________________________
— CO-4.f
-F -F-
LX - -»..
l _. _ :V N _- - .V \
"< % T -
: **"•-.
- V^_ X % - 46
-^ V _*________w \ ox 5 _^- \ -•;-vr "5
3:T"~-v
^_>_. --in
4_,_ _ • _ _\Za?<\ v'-
1 -4^ 3-\ ^-»-\ S
'.V,-1
. CJv.^l. o\\ AN *'*^_c
aJ A
fc£Svs_ PO-
T t^\*k§%+ 4r>
Sr-'S
. 'hz1 YW
v fS_ u <J O O 1 y
-? EJ__ £ E ^IJ-:T5S:CII_ (3X1 ±-E^lC OC'O J_
+ 2- - _ __ -=-- _-J_>
4?_-- ' 1^ S L- ' T-£in ' 1-- ;- I
*^J""
CI CI CI CI CI CI CI CI CI CI ^£ _^££>- £i- Ci- £i- C>- Ci- Ci- CJ- Ci- Ci- s \et
t^iii'jcTjrr: -l- x l z<T-iim i f~r_iirrz5 ^iaii^?~r:3r


32
In feeding the structure by the infinite balun method, at was evident
that for operation at the lower frequencies the feed arm would have a dif-
ferent termination than the dummy arm,, This gave a natural method to observe
the base end effect on the current distribution at a low frequency. The
relative magnitude was measured on both arms at 400 mc and is shown in
Figure 20 The effects of the termination on the current distribution was
rather obvious. It is interesting to note the rapidity with which the effect
died out This end effect is also demonstrated by comparing the data taken
from both structures as was done in Figures 21, 22, and 23 In Figure 23,
the end effect was not very evident, because both structures were, at 800 mc,
rather large. The end effect at 800 mc was investigated by adding a 3/8\
extension to the dummy arm. It was felt that the small standing wave appearing
m Figure 23 was not due to end effect as can be seen in Figure 24,
It was interesting to note, though, that the small standing wave had
approximately the same period as the frequency of operation, i.e., half wave
length nulls along the arm. Since this small standing wave was not due to a
reflection, it was postulated that it was due to an interference between two
different waves progressing in the same direction. This same phenomenon was
observed by Marsh when he measured the current distribution on a monofilar
helical antenna. Marsh also demonstrated that a distribution similar to that
shown in Figure 23 could be produced by a sum of four waves, two waves with
different phase constants and their reflections. One of these waves had a
phase constant equal to k, the phase constant of a free space wave, and the
other had a phase constant approximately 1.4 k, The wave traveling at the
speed of light was attenuated while the other was not. As was stated previously


33
-- <c
'T
-,*,-
—
iCIf !-
Q
— in
_-r ^----- - 1-«, c— 5 - - - - -- ,n£= j * -
y .--=
y —
^
T j.--*"
. . J.3 — __
-v^~ "~" = -^ -=-
? = — -tQ.*-
' zu--1
^''"%H .* -+-
-A^r s
-<V t ^- -.-/kH^ S 3l _ __j-_"^-/"' *- j- Q- -j = '^ 5 3^S
<r"
-i y = ;j s CL4^ ^ 25^ S-ui-
ii + " u "
5' .3" "' "1 __ ---; -zr 1 - ._ _
1 -2 : " 3
"1
j
__± :.^__43n n zi zi ci _*£ ^*z
CJ- PX 5" S v^«5:ji:5V ;j5"l.
1,5_i\vy lKi_: 5rLlJ"l3J cTI"'3v */ zij ._ i^iAir .trritr.tt^ ,3r^..w t:t3


:; i
-"
. . . _ —......... — I'
o1 1 1 [ 1 1 1 1 1 1 1 1
1 1 1 N 1 —M-M— —H— -i
1
f.
v^ c ^___4_.
^
:: : :::::::: : ;^::: : : _:; fr :___ + ^ ?___
^~ X J
;*-
::::::::::::::::::::::::::::::^::::::::::::::::::::=:::::::::i-:=:::y :
1
^l --:cl__
^**-w
^, .
EEEEEEEEEEEEEEEEEEEEEEEEEEEEEEEEEE^EEEEEEEEEEEEEEEEEEEEEEEEE.E.EEEEaEEE
::::::::::::::::::::::::::::::=3;;=?5:::: ::::::: ::::::::: :«::::::::
I:::::::::::::::::::::::: ::£::::;=—::::::: I::::::::::::::::::::
:::::::::::::::::::::::^':::::::::::::::::::::::::::::::::::::::^^:::-4—,-
::::::::::::::::^-^:::::::::::::::::::::::::z-:=:::::::::::::::::::::, £L 3-tiJ --
2 Crtr
::::::::::==^====~
::=:=:==i:==|::=a r 3 r: === :: =:=: : ======== : 53
~:::= ::
:::::::::-;<!_:::::::: :~~::::_, 3:s^:de:~::::~::~~"~::::~:::::::::::::: i::::::::::::::::::::^:!:^ ::::::::::::::::::::::::::::::
,c 1
—
5^<;it_|_y,_ = j_
2 i
js_ = El 1
fc _ = 1
_ 1 ^1 Id 4^—
CC ZL Zl Zl _ Zl ^ *S-•_ _C ^ p^ ---^ ^ v
:S t £
4 L^y- =HjLhbM3V^0-^J\£H3GW4 c -£lAULW--l^3-

35
L '*
c
rj
.'1
•
^
v.-? -*
-a.
* «=- -ifi(D
^ j:^ ^
- ^---'/
-*., t
— =._".-' =«.-- ~>C^* 1 = =1ft
._/ y"\~~ ^Z""'
v^ £ .—
7" _ -- °"
., - ^:: ::::::: > _s: = - -- -^ -
--^2= = _^— =- E—V ""-<-ES„T
~~L
-itit±fr -to
97
"/**.r /_ - ^ - ~- -±_
^- ^ - J_
,.' S i ijj_" ' = Ci. __^
-Hi " CL — 'Z * -^ 1 2*- -<-
^s _ U LSt-\Z ci-St <i a qixr * ^ "rHH "i- § £HI- . tf _*-
Ai-^%x^l 4- H - _ -= --1^5+ " -ii
^j=___ .o
CE CI CI CI CI ^s< ^r^ U*
2ui\- 'icriirn.iiir' u -3.ik-Z5o ia c "1"34^?rK .:JcTttri_v\r\/ _jxtzxj_ttJ _7\b.t/ I-tj
1


36
~. H
s-
_. ._._ ..... ,---" . _- :J ^
"
<_.__...? 1
!->- 3)
> .'•" ^ 1
>r / ^
J /
7> _,' - s.
/
i 'y
sK.'i ^>
/""**'
ITT" " """
"~
~
tJ"""--^ ~ -- ^ ~ S)s - — * n^2^ . . . . . x5
-,«^± 2*-- _ ._ _*z^-' ~ X
jr-y --^ u^--^« s *
:,-• I -- rr
Tr * r -
-----X T-- *
- 4> X+S _ _ _
X " ^ S•; SX * ^ X,' ""*..
i / 1-- "t
""5* <" ""-QY
*> - -- -
"\ ~--.=_
— :^v,_i— "" — — " w
_ -+-. - j_ — -,«5
,'
_ -T -j. UJ_" ri
JVH £ ri -- K
**-:- ^ %'t-'*'i 1 £41J: 7 -F _
££ '|
"I 5 " -£1 - -j -- -
1
i '
»
___; 4_ ^___ H -
£i £r C5" o~ ::r ^ ^*
.jz:il ~/i" 'rayin v~rj5;n;5'"L_ ia ='1-51- 4 * "**' v *\ Z\i -. U3/JW .. \ JjIjCII Iv. 1 Z'\\--\J lie!
1


37
] I
""".
..
-
- - -4-
-- -O
»<
:::::::::::::::::: ::: ::::::::^:::::::::::::::::::::::::::::::: ::s AV s ^,.s s :-:::::::::::""::::~~~~:::^^-:~~:~:~:" ="::~~:::~~~:*t
^^ _ _L^_ . .
— -y '*'•' *'
h- i ^^::::::::: ::::::i::::::^-:::::::::::::=::::::::::::::::::::::::::::::::":":i=^~:~ =:~~5k;::~:::~::::::~~~~:::~::~~2!~:
in -. __ H___ 7___
:::::: : : : : ^:: ::::::: _ _ _,<*
:::::: : : : : ^"i :: : :: ± _ ± ±+: _ __ _ _ ^ _ ,_^^ _ _
K- c
\
^£~~~'~jr. ::_::^
JZ ^p <=>:
-U - - ^39 -H*=-(J "J
i
°-' ii Lxl
' l
**" 3 ji ir 'I
" " *£ 1 Zt it"5 " It ""1T^r 1 ^f 2LJ1L - = XT 4
1 A..1 *S.
iG^-ifH^irf:T:H\^^-bSF^^Jfl^ : }7M-b^-:
}::^ '


38
in Section 3, the fundamental wave had a phase cons lain approximately equal
to k. The second wave could be explained as corresponding to a rool following
the 1 + ka/cot I boundary line on the Brillouin diagram By observing Figure 25,
ii is possible to see that at 800 mc the right hand root has an initial phase
constant approximately 1.3 k. Therefore, it was quite reasonable to assume that
there were two waves traveling in the same direction and that the second was
being excited with sufficient amplitude such that its effects on the distribution
were no longer negligible. By assuming the existence of this second wave, it
is possible to explain the general nature of the amplitude curves . It was
felt that if only the fundamental wave, having a phase constant approximately
equal to 27T/\}
was present, that the amplitude curve would appear as in
Figure 11, If the antenna was short enough in terms of wavelengths to allow
reflections from the base, the fundamental wave and its reflection would yield
a resultant as shown in Figure 13. If the two waves and small reflections from
each were allowed, the distribution would appear as in Figures 14 through
17. By observing these five curves, it is possible to see the increasing effect
of the second wave predicted by the k-P diagram.
In Figure 25 the amplitude measured at 400 mc has been plotted with the
ka/cot 9 axis as its abscissa. This plot gives an opportunity to observe the
variation in the current amplitude and the variation in P, both as a function
of ka„ Also on this chart, the location of the tip truncation has been plotted
along the k = P line as a function of frequency. At these frequencies, no
values of P could exist which were below and to the left of these marks since
these values indicate the location of the excitation.
Figure 26 is an average curve taken from the two composite curves shown m
Figures 18 and 19. In Figure 26, the locations of the first, second, and third


39
oHpCIS
oc3fH4-1
a
o p
<frsip
^-^ m.0 o
T3 £-*' O
o LUP Ea3 nS
ro Q O M3 r-t nS
h-•H
_lPi
Q_ 1
^< 3 CD
*j sio H *J
CVJ h- i-t
z. s oLU cd
orT3
*-> QJ
or3
C en
CD o
OO ho LU CD
> XI 3H W
1-
<_J lO
LUrg
cr CD


40
;s:i=H!d:i]) ..-iihs :jev-i<j J.IOJMnO 3AI.LV13fc:
<-) C) O C) Zr t^ ?£ O b C) O C) £oj S> w !I £^ £> o
* o c> c>> c o a> <l> S* CI o
*t (- (Vi
_: ^\ £:: ___%--- _ _ _ 1 i^-V/* *?.: '- -
:::^::::::::::::::::::::::-:- .Jt3ttDrfSl:!:tStp J.e-g " -~-%
\\i£*y ^ / _/3
t \ t ^ --,3h \ ^^ -- 1 3S% j n iJ S,- /UJ- S L o£ \ /
2E s v3" \ 7a v'
*:., __I5 : ^
z \ O — g - _;__ ^ V __rtf __
tV ^ -ID^\ —
5- -I»- ^ |_ EEJ^EilLit -. v__ -..-__ ^_-
Ja^J-L^-X^ii IKII "L ,,„, ^3-~ t \ iv Jrt JztrtriirHirt^-' O __"
- - 4- t V „*d It ._- T S
J \ OhS £ N-1 ' -/ 5 _zs 2 s o^5 £^ 7^ ^ + V v»l i3^ z S ± 4^ __^5 "ijV - z 5s
--- -t3s ^ ^ ^3
N *=»
5iL^Ci LJiL V „? ^S
^ (_j.=vyo -£m2-Sz.tZlLZrS^+ ± . iA3-3tt!Il 7 ^'"I="
,
!zt ^EKtJ^XI a£ -L^SCmP \ " -**^ \ o *ZJ3VTKb \ __i^. -:^l1 _\ -4$
z s ± ** i#^2 s
v« , - ^r \ 33 O
/ \ " ~-t*t
H ^ V3
j zFz"- tTi O
:
— >___ »__ _ _
££ CI CI IIX CI _.,>< ^>C ei- S^'^ «r- * S 1^ ^
^ »^ 5r-<»i^
tZit\- "P3fn:i~*i2 :cr kc: xCbij" " :jl rECirrt,. <y
\w r' _P Jl I.LI w'Uv . -rh. Ch. Tt»,

41
intersections of the k = P line and the boundary lines have been plotted
i Also the location of the phase center measured at 400 mc has been plotted
6It should be expected from observing Sensiper s work that the structure
should have begun to radiate before the first intersection was reached.
This radiation, due to the phase constant P being complex, should have
continued beyond the second intersection. Somewhere between the second and
third intersections the phase constant should have again become real meaning
that the wave would only propagate along the arm until the radius expanded
to correspond to the third intersection where the phase constant again
becomes complex.
From observing Figure 26 there seems to be a good correlation between
the regions where P is complex and the regions where the amplitude decays
rapidly, possibly indicating the physical regions which contribute appreciably
to the radiation. This correlation is also confirmed by the fact that the
phase center appears approximately in the middle of the region which has the
highest rate of amplitude decay, Dyson has shown that the phase centers for
wire arm conical equiangular spiral antennas consistently lie in this region
and has developed a quasi-empirical formula for the position of the phase
12,13center '
In order to confirm that this initial region of decay was the only one
contributing appreciably to radiation it would be necessary to calculate the
far field radiation pattern using only the current distribution over this
initial region and compare this pattern to one calculated using the complete
i data,
i
6^2__ Electric Field Radiat ion Patterns and SWR Measurements
The electric field radiation patterns and the SWR referred to 50 ohms have


42
been measured on the small model. This data appears in Figures 27, 28, and 29.
It is interesting to note the frequency range where the SWR is essentially
constant. This appears to be from approximately 350 mc to 500 mc This was
the same region where only the fundamental wave and its reflection existed as
was indicated by the current distribution curves This same region can be
observed in the patterns, (note the broadening of the beamwidth above 600 mc).
The lower frequency patterns are modified by reflections from the surroundings
but they do not indicate any appreciable sidelobes. At frequencies above 800 mc,
it was obvious that the quasi dipole feed was radiating appreciably. According
to the k-P diagram in Figure 25, at frequencies above 800 mc, the radiation
should have been broadside, endfire, or a combination of these two. As can be
seen, there was still a major lobe in the backfire direction. The most likely
reason for this backward directed radiation was that the dipole feed section
was radiating since it was greater than 3/8 X at these frequencies. The measured
distance, from the apex of the cone to the phase center, in wavelengths has
I been shown in Figure 30, Superimposed upon this same chart is a plot of the
distance, from the apex to the tip truncation, in terms of wavelengths. In
. order to have frequency independent operation, it is believed that the phase
center should have remained essentially a constant distance, in wavelengths,
' from the apex, it can be seen though, that the tip truncation was influencing
12the location of the phase center as low as 600 mc . Again this is approximately
the same frequency at which the rest of the data began to deviate from that
which one might associate with normal operation, i.e., one attenuated wave
j
traveling approximately at the speed of light from the feed along the arm
; toward the base.


<f>
=90°
^-*- -~-N
t1
\\
rv\ bf = 300 M< H"
/-~P^r
1/-"O,(
\i y
f = 400 Mc
/C-0\,7 A]\ yK y
f = 500 Mc
f = 600 Mc
//^-^[f NX
\\ l)
\\ y
— E0
-E<*>
Figure 27. Electric field radiation patterns of the
small antenna


4>--so'
f = 700 Mc
s"~ ~~X
h^.—
^
£ I1r
f = 800 Mc
J^' X// V)
/ )
\v
f = 900 Mc
f = 1000 Mc
E0
Figure 28. Electric field radiation patterns of the
small antenna


46
*m-i
w <j>
:£!:! as
0)
fflffl^ff: ire
CS-
I ^SIM
Ol
ee-
--(£-

47
7. CONCLUSION
It was the purpose of these investigations to lead to a better understanding
of the operation of the conical equiangular spiral antenna. The investigation
was conducted by measuring the current distribution below, throughout, and
above the normal frequency independent operating range. The phase center, far
field patterns, and standing wave ratio were also measured, The results con-
firm the possibility of applying the general theory of backward wave radiation
from periodic structures to the analysis of the radiation characteristics of
the conical log-spiral antenna.


BIBLIOGRAPHY
1. Rumsey, V H,
'Frequency Independent Antennas," I.R.E. National Con-vention Record, Pt . I, pp., 114-118, 1957. Also Technical Report No. 20,
Contract AF33 (616 ) -3220, Antenna Laboratory, University of Illinois,
Urbana, Illinois, October, 1957.
2. Isbell, D. E., 'Log Periodic Dipole," IRE Transactions, Vol. AP-8 , No. 3,
May 1960, pp. 260-267. Also Technical Report No. 39, Contract AF33C616)-6079, Antenna Laboratory, University of Illinois, Urbana, Illinois,June, 1959.
3. Carrel^ R. L. , 'Analysis and Design of the Log-Periodic Dipole Antenna,"Technical Report No. 52, Contract AF33 (616)-6079, Antenna Laboratory,University of Illinois, Urbana, Illinois, October, 1961.
4. Dyson, J. D. , "Recent Developments in Spiral Antennas," Proc. IRE NationalAero. Elect. Conf
,, pp 617-625, May, 1959
5. Mayes, P. E,, Deschamps, G A., and Patton, W. T. , "Backward -Wave Radiation
from Periodic Structures and Applications to the Design of Frequency-Independent Antennas," Proc. IRE
,Vol. 49, No. 5, pp 962-963, May, 1961.
6. Brillouin, Leon, Wave Propagation in Periodic Structures, McGraw-Hill BookCompany, Inc, , 1946 or Dover Publications, Inc., 1953
.
7. Sensiper, S„, "Electromagnetic Wave Propagation on Helical Conductors,"Technical Report No. 194, Res. Lab. of Elect., MIT, May 16, 1951.
8. Kogan, S. Kh. , "The Propagation of Waves along an Endless Helix," C R.
Acad Sci. U.R.S.S., 66, No. 5, p 867, June 11, 1949.. Referred to in
Eiilil£££_EBIiil££I? XXVIII, p„ A. 3, Item 30, January, 1951.
9. Renolds, D. K„ , "Surface-Current and Charge Measurements on Flat MetalSheets," Technical Report No. 53, Contract N50R1-76, Task Order No. 1,
Nr-078-011, Cruft Laboratory, Harvard University, Cambridge, Massachusetts,August 1, 1948,
10. Dyson, J„ D, , "The Equiangular Spiral Antenna," I RE Transae ti,ons, Vol. AP-7,
April, 1959, pp. 181-187. Also Technical Report~No. 21, Contract AF33(616)-3220, Antenna Laboratory, University of Illinois, Urbana, Illinois, September,1957.
11. Marsh, J r A,, "Current Distributions on Helical Antennas," Proc„ IRE,
Vol. 39, pp 668-675, Project Report No. 339-10 from the 0h7o~StateUniversity Research Foundation, a portion of a S„S.C. Thesis, Ohio StateUniversity, 1949.
12 Dyson, J. D„ , "On the Radiation from the Conical Log-Spiral Antenna,"Internal. Technical Memorandum 62-1, Antenna Laboratory, Univ of 111.,
January 22, 1962 (Unpublished).


49
BIBLIOGRAPHY (Continued)
13. Dyson, J. D.;"The Coupling and Mutual Impedance between Conical Log-
Spiral Antennas in Simple Arrays/' IRE International Convention RecordPart I, March, 1962.


AF3j(657 )-8460
DISTRIBUTION LIST
One copy each unless otherwise indicated
Armed Services Technical Information
AgencyAttn TIP-DRArlington Hall StationArlington 12, Virginia (10 copies)
Aeronuatical Systems DivisionAttn: (ASRNRE-4)Wright-Patterson Air Force Base
Ohio (3 copies)
Aeronautical Systems DivisionAttn: ASDSED, Mr. MulliganWright-Patterson Air Force BaseOhio
Aeronautical Systems DivisionAttn: AFCIN-4B1AWright-Patterson Air Force BaseOhio
Air Force Cambridge ResearchLaboratory
Attn: CRRDLaurence G. Hanscom FieldBedford, Massachusetts
Commander
Air Force Missile Test Center] Patrick Air Force BaseFlorida
CommanderAir Force Missile Development CenterAttn: Technical Library
I Holloman Air Force BaseNew Mexico
Air Force Ballistic Missile DivisionAttn: Technical Library, Air Force
Unit Post Office!
Los Angeles California
DirectorBallistics Research LaboratoryAttn: Ballistics Measurement Lab.
Aberdeen Proving Ground, Maryland
National Aeronautics & Space Adm.
Attn: LibrarianLangley Field, Virginia
Rome Air Development CenterAttn: RCLTMGriffiss Air Force BaseNew York
Research & Development CommandHq. USAF (ARDRD-RE)Washington 25, D. C.
Office of Chief Signal OfficerEngineering & Technical DivisionAttn: SIGNET-
5
Washington 25, D. C.
CommanderU. S. Army White Sands Signal AgencyAttn: SIGWS-FC-02White Sands, New Mexico
DirectorSurveillance DepartmentEvans AreaAttn: Technical Document CenterBelman, New Jersey
CommanderU. S. Naval Air Test CenterAttn: WST-54, Antenna SectionPatuxent River, Maryland
Material Laboratory, Code 932
New York Naval ShipyardBrooklyn 1, New York


Command i ng OfficerDiamond Ordnance Fuse LaboratoriesAttn: 240
Washington 25, D. C.
Director
U. S. Navy Electronics LaboratoryAttn; LibrarySan Diego 52, California
Adams-Russell Company200 Sixth StreetAttn: Library (Antenna Section)Cambridge, Massachusetts
Aero Geo AstroAttn: Security Officer1200 Duke StreetAlexandria, Virginia
NASA Goddard Space Flight CenterAttn: Antenna Section, Code 523Creenbelt, Maryland
Airborne Instruments Labs.
, Inc.
Attn: Librarian (Antenna Section)Walt Whitman RoadMelville, L. I
., New York
American Electronic LabsBox 552 (Antenna Section)Lansdale, Pennsylvania
Andrew Alfred Consulting EngineersAttn: Librarian (Antenna Section)299 Atlantic Ave.
Boston 10, Massachusetts
Ampheol-Borg Electronic CorporationAttn: Librarian (Antenna Section)2801 S. 25th AvenueBroadview, Illinois
Bell Aircraft CorporationAttn: Technical Library
(Antenna Section)Buffalo 5, New York
Boeing Airplane CompanyAero Space DivisionAttn: Technical Library
M/F Antenna & Radomes UnitSeattle, Washington
Boeing Airplane CompanyAttn: Technical Library
M/F Antenna Systems Staff UnitWichita, Kansas
Chance Vought Aircraft Inc.
THRU: BU AER RepresentativeAttn: Technical Library
M/F Antenna SectionP. 0. Box 5907Ballas 22, Texas
Collins Radio CompanyAttn: Technical Library (Antenna
Section)Dallas, Texas
ConvairFt. Worth DivisionAttn: Technical Library (Antenna
Section)Grants LaneFort Worth, Texas
ConvairAttn: Technical Library (Antenna
Section)P. 0. Box 1050San Diego 12, California
Dalmo Victor CompanyAttn: Technical Library (Antenna
Section)1515 Industrial WayBelmont, California
Dome & Margolin, Inc.
Attn: Technical Library (AntennaSection)
30 Sylvester StreetWestbury L. I. New York
Bendix Radio Division ofBendix Aviation Corporation
Attn: Technical Library(For Dept. 462-4)
JBaltimore 4, Maryland
Dynatronics Inc.
Attn: Technical Library (AntennaSection)
Orlando, Florida


Electronic Communications, Inc.
Research Division
Attn: Technical Library
1830 York RoadTimonium, Maryland
Fairchild Engine & Airplane CorporationFairchild Aircraft & Missiles DivisionAttn: Technical Library (Antenna
Section)Hagerstown 10, Maryland
Georgia Institute of TechnologyEngineering Experiment StationAttn: Technical Library
M/F Electronics DivisionAtlanta 13, Georgia
General Electric CompanyElectronics LaboratoryAttn: Technical LibraryElectronics ParkSyracuse, New York
General Electronic Labs., Inc.
Attn: Technical Library (AntennaSection)
18 Ames StreetCambridge 42, Massachusetts
General Precision Lab., Division of
General Precision Inc.
Attn: Technical Library (Antenna
Section)63 Bedford RoadPleasantville, New York
Grumman Aircraft Engineering Corp,Attn: Technical Library
M/F Avionics EngineeringBethpage, New York
The Hallicraf ters CompanyAttn: Technical Library (Antenna
Section)4401 W. Fifth AvenueChicago 24, Illinois
Hoffman Laboratories Inc.
Attn: Technical Library (AntennaSection)
Los Angeles 7, California
John Hopkins UniversityApplied Physics Laboratory8621 Georgia AvenueSilver Springs, Maryland
Hughes Aircraft CorporationAttn: Technical Library (Antenna
Section)Florence & Teal StreetCulver City, California
ITT LaboratoriesAttn: Technical Library (Antenna
Section)500 Washington AvenueNutley 10, New Jersey
U. S. Naval Ordnance Lab.
Attn: Technical LibraryCorona, California
Goodyear Aircraft CorporationAttn: Technical Library
M/F Dept. 4741210 Massilon RoadAkron 15, Ohio
Lincoln LaboratoriesMassachusetts Institute of TechnologyAttn: Document RoomP. 0. Box 73
Lexington 73, Massachusetts
Granger AssociatesAttn: Technical Library (Antenna
Section)974 Commercial StreetPalo Alto, California
Litton IndustriesAttn: Technical Library (Antenna
Section)4900 Calvert RoadCollege Park, Maryland


Lockheed Missile & Space Division\iin: Technical Library (M/F Dept-
58-40, Plant 1, Bldg. 130)
Sunnyvale, California
The Martin Company
Attn: Technical Library (AntennaSection)
P. 0. Box 179
Denver 1, Colorado
The Martin CompanyAttn: Technical Library (Antenna
Section)
Baltimore 3, Maryland
The Martin CompanyAttn: Technical Library (M/F
Microwave Laboratory)
Box 5837
Orlando, Florida
W. L. Maxson CorporationAttn: Technical Library (Antenna
Section)460 West 34th StreetNew York 1, New York
McDonnell Aircraft CorporationAttn: Technical Library (Antenna
Section)Box 516
St. Louis 66, Missouri
Melpar, Inc.
Attn: Technical Library (AntennaSection)
3000 Arlington Blvd.Falls Church, Virginia
University of Michigan
J
Radiation Laboratory
\Willow Run201 Catherine StreetAnn Arbor, Michigan
Mitre CorporationAttn: Technical Library (M/F Elec-
tronic Warfare Dept. D-21)Middlesex TurnpikeBedford, Massachusetts
North American Aviation Inc.
Attn: Technical Library (M/F
Engineering Dept.)4300 E. Fifth AvenueColumbus 16, Ohio
North American Aviation Inc.
Attn: Technical Library(M/F Dept. 56)
International AirportLos Angeles, California
Northrop CorporationNORAIR Division1001 East BroadwayAttn: Technical Information (3924-3)Hawthorne, California
Ohio State University ResearchFoundation
Attn: Technical Library(M/F Antenna Laboratory)
1314 Kinnear RoadColumbus 12, Ohio
Philco CorporationGovernment & Industrial DivisionAttn: Technical Library
(M/F Antenna Section)4700 Wissachickon AvenuePhiladelphia 44, Pennsylvania
Westinghouse Electric CorporationAir Arms DivisionAttn: Librarian (Antenna Lab)
P. 0. Box 746
Baltimore 3, Maryland
Wheeler LaboratoriesAttn: Librarian (Antenna Lab)
Box 561Smithtown, New York
Electrical Engineering ResearchLaboratory
University of Texas
Box 8026, Univ. StationAustin, Texas
University of Michigan ResearchInstitute
Electronic Defense GroupAttn: Dr. J. A. M. Lyons
Ann Arbor, Michigan


Radio Corporation of America
RCA Laboratories Division
Attn: Technical Library(M/F Antenna Section)
Princeton, New Jersey
Radiation, Inc.
Attn: Technical Library (M/F)
Antenna SectionDrawer 37
Melbourne, Florida
Radioplane CompanyAttn: Librarian (M/F Aerospace Lab)
8000 Woodly AvenueVan Nuys, California
H. R. B. Singer CorporationAttn; Librarian (Antenna Lab)State College, Pennsylvania
Sperry Microwave Electronics CompanyAttn: Librarian (Antenna Lab)P. 0. Box 1828Clearwater, Florida
Sperry Gyroscope CompanyAttn: Librarian (Antenna Lab)Great Neck, L. I., New York
Stanford Electronic LaboratoryAttn: Librarian (Antenna Lab)Stanford, California
Ramo-Wooldridge CorporationAttn: Librarian (Antenna Lab)Conoga Park, California
Stanford Research InstituteAttn: Librarian (Antenna Lab)Menlo Park, California
Rand CorporationAttn: Librarian (Antenna Lab)1700 Main StreetSanta Monica, California
Rantec CorporationAttn: Librarian (Antenna Lab)23999 Ventura Blvd.Calabasas, California
Raytheon Electronics CorporationAttn: Librarian (Antenna Lab)1089 Washington StreetNewton, Massachusetts
Republic Aviation CorporationApplied Research & Development
DivisionAttn: Librarian (Antenna Lab)Farmingdale, New York
Sanders AssociatesUtn: Librarian (Antenna Lab)35 Canal StreetNashua, New Hampshire
Southwest Research InstituteAttn: Librarian (Antenna Lab)$500 Culebra RoadSan Antonio, Texas
Sylvania Electronic SystemAttn: Librarian (M/F Antenna &
Microwave Lab)100 First StreetWaltham 54, Massachusetts
Sylvania Electronic SystemAttn: Librarian (Antenna Lab)P. 0. Box 188Mountain View, California
Technical Research GroupAttn: Librarian (Antenna Section)2 Aerial WaySyosset, New York
Ling Temco Aircraft CorporationTemco Aircraft DivisionAttn: Librarian (Antenna Lab)Garland, Texas
Texas Instruments, Inc.
Attn: Librarian (Antenna Lab)
6000 Lemmon Ave.Dallas 9, Texas
A. S. Thomas, Inc.
Attn: Librarian (Antenna Lab)
355 Prpvidence HighwayWestwood, Massachusetts


New Mexico State University Aeronautical Systems DivisionHead Antenna Department Attn: ASAD - LibraryPhysical Science Laboratory Wright-Patterson Air Force BaseUniversity Park, New Mexico Ohio
Bell Telephone Laboratories, Inc. National Bureau of StandardsWhippany Laboratory Department of CommerceWhippany, New Jersey Attn: Dr. A. G. McNishAttn: Technical Reports Librarian Washington 25, D. C.
Room 2A-165
Robert C. HansenAerospace CorporationBox 95085
Los Angeles 45, California
Dr. Richard C. Becker10829 BerkshireWestchester, Illinois
Dr. Harry Letaw, Jr.
Raytheon CompanySurface Radar and Navigation
OperationsState Road WestWayland, Massachusetts
Dr. Frank Fu FangIBM Research LaboratoryPoughkeepsie, New York
Mr. Dwight Isbell1422 11th WestSeattle 99, Washington
Dr. Robert L. CarrelCollins Radio CorporationAntenna SectionDallas, Texas
Dr. A. K. ChatterjeeVice Principal & Head of the Department
of ResearchBirla Institute of TechnologyP. 0. MesraDistrict-Ranchi (Bihar) India


ANTENNA LABORATORYTECHNICAL REPORTS AND MEMORANDA ISSUED
ont rftct AF33 (616) -310
Synthesis of Aperture Antennas/" Techn ical Report No, 1 „ C„T.A„ Johnk,
ctober 1954.*
K Synthesis Method for Broad- band Antenna Impedance Matching Networks,"
echni cal Report No. 2, Nicholas Ya.ru,, 1 February 1955 * AD 61049
.
The As symaa©trieally Excited Spherical Antenna,," Technical Report No, 3 ,
Dbert C Hansen, 30 April 1955.*
\nalysis of an Airborne Homing System,," Technical Report No. 4 , Paul E.
lyes, 1 June 1955 (CONFIDENTIAL)
.
Itoupling of Antenna Elements to a Circular Surface Waveguide/ Technical;port No, 5, Ho E. King and 1„ H. DuHamel, 30 June 1955 „*
bcially Excited Surface Wave Antennas/ Technical Report No. 7, D. E. Royal,
) October 1955 .*
loming Antennas for the F-86F Aircraft (450-2500 mc) 00 '' Technical Report No. 8,
Eo Mayes s R. F, Kyneman, and R. C. Becker, 20 February 1957, (CONFIDENTIAL),
iround Screen Pattern Range/ Technical Memorandum No. 1, Roger R. Trapp,l July 1955.*
oatract AF33 (616) -3220
'iffective Permeability of Spheroidal Shells/' Technical Report No. 9, E. J.
fott and R. H. DuHamel, 16 April 1956.
Vn Analytical Study of Spaced Loop ADF Antenna Systems/ Technical Report1
!
. 10 , D. G. Berry and J. B. Kreer, 10 May 1956, AD 98615
Technique for Controlling the Radiation from Dielectric Rod Waveguides/Tchnical Report No. 11, J. W. Duncan and R. H. DuHamel, 15 July 1956.*
"J
Virectional Characteristics of a U-Shaped Slot Antenna, n Technical Report>,. 12,, Richard C. Becker, 30 September 1956.**
"mpedamce of Ferrite Loop Antennas/ Technical Report No. 13 , V. H. Rumsey»d W. L. Weeks, 15 October 1956 . AD 119780
"jlosely Spaced Transverse Slots in Rectangular Waveguide," Technical Report1* 14, Richard F. Hyneman, 20 December 1956.


/Distributed Coupling to Surface Wave Antennas/ Technical Report No,, 15,
jUlph Richard Hodges, Jr.„ 5 January 1957,
"Tbe Characteristic Impedance of the Fin Antenna of Infinite Length," Technical
Uport Wo. 16,, Robert L. Carrel 15 January 1957.*
"On the Estimation of Fe.rrite Loop Antenna impedance,"' Technical Report No. 17,
falter L. Weeks,, 10 April 1957 * AD 143989
'A Note Concerning a Mechanical Scanning System for a Flush Mounted Line SourceVntenna," Technical Report No, 18 ,, Walter L„ Weeks,, 20 April 1957.
"Broadband Logarithmically Periodic Antenna Structures/' Technical Report No. 19,
t, H, DuHamel and Do E» Isbell, 1 May 1957, AD 140734
"Frequency Independent Antennas/' Technical Report No. 20 ,, V. H. Rumsey, 25
Ktober 1957.
'The Equiangular Spiral Antenna/ Technical Report No. 21, J. D. Dyson, 15
ieptember 19S7 AD 145019
'Experimental Investigation of the Conical Spiral Antenna," Technical Report
to. 22 , R. L. Carrel, 25 May 1957.** AD 144021
'Coupling between a Parallel Plate Waveguide and a Surface Waveguide/" Technicalteport No. 23 , E. J. Scott,, 10 August 1957.
'Launching Efficiency of Wires and Slots for a Dielectric Rod Waveguide/'ecfanical Report No. 24 , J. W. Duncan and R„ H, DuHamel, August 1957.
'The Characteristic Impedance of an Infinite Biconical Antenna of Arbitrarytoss Section/' Technical Report No. 25, Robert L, Carrel, August 1957.
'Cavity-Backed Slot Antennas,"- Technical Report No. 26, R. J„ Tector, 30
October 1957.
Coupled Waveguide Excitation of Traveling Wave Slot Antennas," Technicalepcrt No. 27, W. L. Weeks, 1 December 1957.
Phase Velocities in Rectangular Waveguide Partially Filled with Dielectric/"echnlcal Report No. 28, W. L. Weeks, 20 December 1957.
'Measuring the Capacitance per Unit Length of Biconical Structures of ArbitraryToss Section/ Technical Report No. 29 , J. D. Dyson, 10 January 1958.
Non-Planar Logarithmically Periodic Antenna Structure/* Technical Report No. 30 ,
|. 1. Isbell, 20 February 1958. AD 156203
Electromagnetic Fields in Rectangular Slots," Technical Report No. 31, N. J.
;uhn and P. E. Mast, 10 March 1958.


"The Efficiency of Excitation of a Surface Wave on a Dielectric Cylinder,'
Technical Report No,. 32,, J„ W. Duncan, 25 May 1958,
"A Unidirectional Equiangular Spiral Antenna," Techni cal Report No. 33,
J, D.. Dyson, 10 July 1958 . AD 201138
"Dielectric Coated Spheriodal Radiators," Technical Report No,, 3 4, W„ L
,
Weeks, 12 September 1958 . AD 204547
"A Theoretical Study of the Equiangular Spiral Antenna/' Technical Report
No. 35, P. Eo Mast, 12 September 1958. AD 204548
Contract AF33(616)-6079
"Use of Coupled Waveguides in a Traveling Wave Scanning Antenna/' TechnicalReport No. 36, R. H. MacPhie, 30 April 1959. AD 215558
"On the Solution of a Class of Wiener-Hopf Integral Equations in Finite andInfinite Ranges/" Technical Report No. 37
,, Raj Mittra, 15 May 1959.
"Prolate Spheroidal Wave Functions for Electromagnetic Theory/' TechnicalReport No. 38 , W. L. Weeks, 5 June 1959.
"Log Periodic Dipole Arrays/' Technical Report No. 39 , D. E. Isbell, 1 June 1959.
\D 220651
"A Study of the Coma-Corrected Zoned Mirror by Diffraction Theory," Technicaliteport No. 40 , S. Dasgupta and Y. T. Lo, 17 July 1959.
'The Radiation Pattern of a Dipole on a Finite Dielectric Sheet/* Technicalteport No. 41 , K. G. Balmain, 1 August 1959.
The Finite Range Wiener-Hopf Integral Equation and a Boundary Value Problem.n a Waveguide/' Technical Report No. 42, Raj Mittra, 1 October 1959.
Impedance Properties of Complementary Multiterminal Planar Structures t ?echnical Report No. 43 , G. A. Deschamps, 11 November 1959.
'On the Synthesis of Strip Sources/ Technical Report No. 44 , Raj Mittra,I December 1959.
'Numerical Analysis of the Eigenvalue Problem of Waves in Cylindrical Waveguides,'echnical Report No. 45, C. H. Tang and Y. T. Lo, 11 March 1960.
'New Circularly Polarized Frequency Independent Antennas with Conical Beam orUnidirectional Patterns/ Technical Report No. 46, J. D. Dyson and P. E, Mayes,
June 1960. AD 241321
Logarithmically Periodic Resonant-V Arrays," Technical Report No. 47 , P. E. Mayes,nd R. L. Carrel, 15 July 1960. AD 246302


*A Study of Chromatic Aberration of a Coma-Corrected Zoned Mirror," Technical
leport No. 48, Y. T. Lo, June 1960
'Evaluation of Cross-Correlation Methods in the Utilization of Antenna Systems,"technical Report No. 49 , R. H. MacPhie, 25 January 1961
'Synthesis of Antenna Product Patterns Obtained from a Single Array," Technical
ieport No. 50 , R. H. MacPhie, 25 January 1961.
'On the Solution of a Class of Dual Integral Equations," Technical Report No. 51,
I. Mittra, 1 October 1961. AD 264557
'Analysis and Design of the Log-Periodic Dipole Antenna," Technical Report No. 52,
lobert L. Carrel, 1 October 1961,* AD 264558
*A Study of the Non-Uniform Convergence of the Inverse of a Doubly-InfiniteUtrix Associated with a Boundary Value Problem in a Waveguide," Technical Report
Jo. 53.. R. Mittra, 1 October 1961. AD 264556
1 Copies available for a three-week loan period
•* Copies no longer available.