Fasanella_Nicholas.pdf - IDEALS @ Illinois
56
MECHANICAL CHARACTERIZATION OF ADVANCED POLYACRYLONITRILE DERIVED CARBON FIBERS REINFORCED WITH CARBON NANOTUBES BY NICHOLAS FASANELLA THESIS Submitted in partial fulfillment of the requirements for the degree of Master of Science in Aerospace Engineering in the Graduate College of the University of Illinois at Urbana-Champaign, 2012 Urbana, Illinois Adviser: Associate Professor Ioannis Chasiotis, Director of Research
-
Upload
khangminh22 -
Category
Documents
-
view
0 -
download
0
Transcript of Fasanella_Nicholas.pdf - IDEALS @ Illinois

MECHANICAL CHARACTERIZATION OF ADVANCED POLYACRYLONITRILE
DERIVED CARBON FIBERS REINFORCED WITH CARBON NANOTUBES
BY
NICHOLAS FASANELLA
THESIS
Submitted in partial fulfillment of the requirements
for the degree of Master of Science in Aerospace Engineering
in the Graduate College of the
University of Illinois at Urbana-Champaign, 2012
Urbana, Illinois
Adviser:
Associate Professor Ioannis Chasiotis, Director of Research

ii
ABSTRACT
This research focused on the mechanical characterization of individual carbon
fibers reinforced with carbon nanotubes (CNTs) which were dispersed in the
polyacrylonitrile (PAN) precursor. The carbon nanofibers were obtained from the
Georgia Institute of Technology and were fabricated in bundles by the “islands-in-a-sea”
method. The fiber test specimens, with roughly 1 µm in diameter and 50 or 100 µm in
gauge length, were tested in tension by specially designed MEMS devices that provided
independent measurement of fiber force and extension with the aid of digital image
correlation (DIC). The fiber extension and force data were used to derive stress vs. strain
plots for a large number of individual fibers. The two parameter Weibull distribution was
used to analyze the mechanical strength data. Due to variability in the fiber cross-section
and the two different gauge lengths, a volume corrected Weibull analysis was applied.
Fibers isolated from three different bundles, all subject to the same manufacturing
conditions, were tested. The first fiber bundle yielded an average tensile strength of
3.41±0.93 GPa, Young's modulus of 228±45 GPa, and Weibull characteristic strength of
4.3 GPa. The second data set, comprised of fibers from the third bundle, resulted in
average tensile strength of 4.55±1.35 GPa, Young's modulus of 254±36 GPa, and
Weibull characteristic strength of 5.07 GPa. A third data set was generated with carbon
fibers from bundles #2 and #3 by using compliant gripping that prevented failure at the
specimen grips resulted in an average tensile strength of 5.59±1.24 GPa. The strongest
fibers from the first, second and third data sets had tensile strengths 5.66 GPa, 7.24 GPa,
and 7.31 GPa, respectively. All fiber bundles provided strength values that were
significantly higher than those reported for the control carbon fiber manufactured under
the same conditions but without CNTs.

iii
ACKNOWLEDGEMENTS
I am very grateful to my advisor, Prof. Chasiotis, for his guidance, support, and
for giving me the opportunity to work on this project. I would like to thank DARPA and
the Army Research Office Grant #W911NF-10-1-0098 for providing me the necessary
funding to conduct this research. I would also like to thank Prof. Kumar and his group at
the Materials Science and Engineering Department of the Georgia Institute of
Technology for providing the samples researched in this study. I also extend my thanks to
the entire staff of the Aerospace Engineering Department at UIUC for their invaluable
assistance in any administrative issues.
I would like to express a very special thanks to Mr. Korhan Şahin, who was my
colleague on this project and acted as a friend and mentor throughout the study. I would
also like to extend my thanks to my colleagues in the Nanomechanics Research Lab,
namely Tanil, Ankit, Pavan, Nikhil, Siva, Jan and Debashish, for their assistance,
support, and friendship throughout the duration of this study. I gratefully acknowledge
the staff members at MRL who trained and assisted me on the FEI Dual Beam 235 FIB
and SEM instruments. Finally, I am extremely thankful for my parents and the rest of my
family and friends. Without their constant love and support I could have never had the
opportunity to write this thesis.

iv
TABLE OF CONTENTS
CHAPTER 1 1
INTRODUCTION .............................................................................................................. 1
1.1 Nanotube Reinforced Carbon Fibers ..................................................................... 5
1.2 Objectives of this Dissertation Research ............................................................... 9
CHAPTER 2 10
MECHANICAL PROPERTIES OF CARBON FIBERS REINFORCED WITH CNTS .. 10
2.1 Materials and Specimen Preparation ................................................................... 10
2.2 MEMS Devices for Microscale Carbon Fiber Testing ........................................ 13
2.3 Experimental Procedures ..................................................................................... 20
2.4 Post-experimental Analysis ................................................................................. 22
2.5 Conclusions .......................................................................................................... 23
CHAPTER 3 24
STATISTICAL DESCRIPTION OF FIBER STRENGTH ............................................... 24
3.1 Weibull Statistics Applied to Mechanical Strength Data..................................... 24
3.2 Calculation of Weibull Parameters for Individual Carbon Fibers ....................... 27
3.3 Conclusions .......................................................................................................... 44
CHAPTER 4 45
CONCLUSIONS............................................................................................................... 45
REFERENCES ................................................................................................................. 47

1
CHAPTER 1
INTRODUCTION
Carbon fibers are among the most highly researched materials for aerospace
applications due to their outstanding properties. They have higher specific strength and
stiffness than other reinforcement fibers [1-3], they exhibit good fatigue resistance [4]
and thermal expansion properties [5], they possess good electrical conductivity [6], and
they are chemically inert [7]. Carbon fibers can be derived from a number of precursors,
the most common being polyacrylonitrile (PAN), petroleum derived pitch, and the
cellulose fiber rayon [1,2,6-8], and are widely used in commercial applications [9]. Pitch
comes in two types, isotropic pitch and mesophase pitch. PAN is known for its high
strength properties, while mesophase pitch is known for its high modulus [10]. Vapor
grown carbon fibers (VGCF)s are another type of carbon fiber, with nanoscale radii and
very good thermal and electrical properties [11,12].
The highly anisotropic nature of the graphite crystal is in part responsible for the
outstanding properties of carbon fibers which can be graphitic, amorphous or turbostratic
[13]. In graphite, carbon atoms are arranged in planar layers of hexagonal, honeycomb-
like, ABAB stacking [14], as shown in Figure 1.1. The in-plane bond length between
atoms is 0.1421 nm and the interplanar separation is 0.3354 nm [15]. The large spacing
between graphene planes is responsible to a weaker, van der Waals type interaction rather
than covalent bonding [7], which leads to large property anisotropy. In plane atoms are
held together by covalent bonds with strength of 400 kJ/mol due to sp2 hybridization of
the electron orbitals [1]. When loaded in the direction labeled “a” in Figure 1.1, which is
parallel to the honeycomb planes, a theoretical tensile modulus of 1060 GPa and strength

2
of 106 GPa have been estimated [16]. However, due to weak van der Waals forces in the
out of plane direction, labeled “b” in Figure 1.1, the modulus in this direction is only 36.5
GPa [15]. The extremely high in-plane mechanical stiffness of graphite has made carbon
fibers the subject of intensive research.
Figure 1.1 Structure of graphite.
The first carbon fibers were produced by Thomas Edison in the late 1800’s.
Edison intended these fibers for incandescent light bulbs and manufactured them first by
carbonizing bamboo and then from regenerated cellulose, or rayon. In the 1950s carbon
fibers made from rayon were used for thermal insulation [8]. The first commercial carbon
fibers were produced in the 1960s by the Union Carbide Corporation [16]. Through the
use of stress graphitization, the microcrystalline structure of rayon was converted from
random to oriented turbostratic carbon [17]. The fibers dubbed VYB and WYB were both
created from rayon but subjected to different heat treatments at 1000°C and 2500°C
respectively [1]. Due to the relatively low temperature, VYB contained small amounts of
non-carbon elements with carbon being isotropic and non-graphitizing [18]. WYB fibers
were heated at sufficiently high temperatures to result in pure carbon. Notably, WYB was

3
incorrectly marketed as a “graphite fiber” to indicate its pure carbon content, despite the
fact it did not have a graphitic structure [16].
In the 1960s carbon fibers derived from PAN were developed. Shindo first
reported the use of PAN as precursor for carbon fibers [19]. The fibers showed a
moderately high modulus of 170 GPa, but low strength values of 550-700 MPa. These
low mechanical properties were partially attributed to poor molecular orientation [16].
Phillips, Watt and Johnson developed the first commercial process successfully
converting PAN precursor fibers into carbon fibers [20]. It was found that high strength
and modulus could be achieved from oriented PAN precursor by applying tension in
order to elongate the fibers or prevent shrinkage [21,22]. These fibers were
commercialized by Morganite, Ltd. and Courtaulds Ltd. and in 1966 became the first
high performance carbon fibers [7]. These PAN-based carbon fibers were designated as
type I for high modulus, and type II for high strength.
Since PAN’s introduction, other commercial carbon fibers have been developed.
In the mid-1960’s Kureha Chemical Industry Co. Ltd. in Japan began investigating
asphaltic, or pitch, materials to use in graphite filaments [23]. The discovery that fibers
with true graphitic structure could be created using pitch led to research on pitch as a
carbon fiber precursor [24]. Pitch fibers can have extremely high tensile modulus
approaching 1,000 GPa [25] which is very close to the aforementioned theoretical
modulus for a graphitic fiber. VGCFs are another common type of carbon fiber,
manufactured by decomposing a hydrocarbon gas in the presence of a transition metal
filament on a heated substrate. The transition metal filament is nucleated by a catalyst
and the fiber grows away from the heated substrate [26-28]. Koyama and Endo
introduced a continuous process for creating VGCFs, which, after modification, yields
fibers with submicron diameters and lengths up to 100 μm [29,30]. Since they are
relatively inexpensive, VGCFs have been used as reinforcement in polymer composites
[31].

4
This dissertation focuses on carbon fibers derived from PAN. PAN-based carbon
fibers have high carbon yield, as well as good tensile and compressive strength [12].
While the modulus of PAN derived carbon fibers is not as high as those from mesophase
pitch, the former have superior strength [25]. Additionally, production of carbon fibers
from mesophase pitch is more expensive than from PAN [32]. The first step in producing
carbon fibers from PAN is to manufacture the polymer precursor which consists of highly
polar nitrile groups, and, therefore, is rarely used as a carbon fiber precursor [25]. In
practice, PAN precursor fibers contain 6-9% of other monomers [33,34]. Once the
precursor is prepared, PAN fibers can be spun by wet, melt, dry, gel and dry-jet wet
spinning [32]. Wet spinning is the most common method and involves polymer extrusion
directly in the coagulation bath where the fiber is then drawn [35,36].
The general process for fabricating carbon fibers from various precursors is
similar. Here, the process for creating a carbon fiber from PAN precursor is described,
but fibers derived from pitch or rayon do not vary greatly. The first step is stabilization at
200-300°C, often done under tension [7,37]. Stabilization converts the polymer precursor
to a thermally stable and condensed structure [22,38]. The next step is carbonization in
nitrogen atmosphere and at temperatures 1000-1700°C [39] where most of the non-
carbon elements are removed. During carbonization, the tensile strength can increase to
~3 GPa, and the tensile modulus to ~250 GPa [40] due to an increase in the degree of
crystallinity and improved molecular orientation. A graphitization step can follow in inert
atmosphere between 2,000-3,000°C to form a graphitic structure aligned in the fiber
direction [7]. It is important to note that the elastic modulus continues to increase with
heat treatment, but the maximum strength is reached at ~1500-1600°C [41]. The loss of
strength can be attributed to the reduction in nitrogen and, therefore, the formation of
flaws [42]. The strength reaches a minimum at ~1800°C when the nitrogen content is
virtually zero. After nitrogen is fully removed the lattice defects can rearrange, leading to
a second tensile strength peak at ~2400°C, though not as high as the initial peak at
~1500°C [43]. The microstructure of graphitized PAN fibers has graphite layers oriented
in the fiber direction that fold over one another by 180° in a hairpin fashion in the

5
transverse direction [44]. The fibers exhibit a “skin-core” structure where the planes have
a circumferential orientation around the cross-section of the fiber [45].
1.1 Nanotube Reinforced Carbon Fibers
CNTs have been researched extensively in the last 20 years due to their
outstanding mechanical [46,47], electrical [48-50] and thermal properties [51,52]. CNTs
come in various forms, such as single wall carbon nanotubes (SWCNT), double wall
carbon nanotubes (DWCNT) and multi-wall carbon nanotubes (MWCNT). As the name
indicates, SWCNT are an atom thick single layer of graphene with a cylindrical structure
and a diameter of ~1.4 nm [53], although SWCNT with diameter as small as 0.4 nm have
been produced [54]. The tensile strength of SWCNT has been cited as 37 GPa, or higher,
[55] and the axial elastic modulus as 640 GPa or higher [56]. DWCNT have two layers of
concentric cylindrical graphite, with outer diameter of 2-5 nm [57]. MWCNTs consist of
many of these graphite layers, and typically range from 5-50 nm in diameter [58].
Fullerenes, or molecules made entirely of carbon, were discovered by Kroto et. al
in 1985 [59]. In 1991, Iijima of the NEC Laboratory in Japan made the first discovery of
MWCNTs [60], which started extensive research on CNTs due to their unique structure.
SWCNTs were discovered by Iijima [61] and Betheune et. al at the IBM Almaden
laboratory [62], while Smalley et. al. manufactured aligned bundles of SWCNTs [53].
More recently, the dispersion of CNTs in carbon fiber precursors to act as mechanical
reinforcements has been pursued [63]. CNTs were dispersed in a solution of
dimethylacetamide by simultaneous stirring and sonication. The solution of PAN and
CNTs was spun using dry-jet-wet spinning at room temperature [63]. Figure 1.2 shows
the dispersion of various types of CNTs: when the CNTs were well dispersed and aligned
with the fiber axis the resulting carbon fibers demonstrated high strength.

6
Figure 1.2 Alignment of nanotubes in PAN/CNT composite fibers. (a) SWCNTs. (b)
DWCNTs. (c) MWCNTs. (d) VGCNTs [63]. Reprinted from Polymer, 46 (24) with
permission from Elsevier.

7
Composite gel spun PAN fibers containing 0.5% wt and 1% wt SWCNTs have
been fabricated [64] with diameters of 12-13 µm, and 6 µm, respectively. The carbonized
(1100°C) PAN/SWNT displayed higher orientation and larger crystallite size than the
control. Graphitic structure was present in the vicinity of the CNTs in the PAN/SWNT
fibers as shown in Figure 1.3(a-f). On the other hand, the control carbon fibers were
comprised of disordered carbon. The 6 µm in diameter PAN/SWNT fibers with 1% wt
CNTs displayed 64% increase in tensile strength and 49% increase in the elastic modulus
compared to the control. The average tensile strength was 3.2 GPa and the average
modulus was 450 GPa [64]. This ability to attain graphitic structure at low temperatures
should theoretically allow for high-strength fibers. With the addition of CNTs, substantial
and efficient load transfer to the CNTs may further aid in increasing the tensile strength
of the composite carbon fibers.
Figure 1.3 (a)-(f) TEM images and schematics of PAN/SWNT composite fiber [64]. (g)
TEM image of control PAN [64]. Reprinted from Polymer, 48 (13) with permission from
Elsevier.

8
Smaller diameter fibers have been known to result in higher strength due to a
smaller probability of defects. Carbon fibers with diameters as small as 1 μm have been
produced by electrospinning [65]. However, gel spinning PAN precursor polymer fibers
have shown better mechanical properties when compared to other methods [66]. In order
to reduce the fiber diameter, an island-in-a-sea bicomponent geometry was applied in
combination with gel spinning [67] to produce PAN/CNT composite fibers and control
PAN fibers. An image of the island-in-a-sea geometry is shown in Figure 1.4(a) with
PMMA being the “sea” component. PMMA was removed during stabilization and the
PAN/CNT composite fiber and the control PAN were carbonized at 1200°C. Figure
1.4(b) shows separated fibers where the PMMA “sea” component was dissolved by
nitromethane for observation purposes. The resulting carbon fibers had an average tensile
strength of 4.5 GPa and an average elastic modulus of 463 GPa [67]. However, the
particular strength and modulus values were obtained from tests performed on bundles
and not individual fibers.
Figure 1.4 (a) Islands-in-a-sea configuration [67]. (b) Separated islands-in-a-sea
PAN/CNT fibers [67]. Reprinted from Composites Science and Technology, 69 (3-4)
with permission from Elsevier.

9
The high strength values of the composite carbon fibers have been attributed to
the combination of the graphitic structure along with the load transfer ability of the
nanotubes. Although processed at low temperature, 1200°C, their strength and Young’s
modulus compare well to the commercial fiber Torayca T-300, whose tensile strength
and Young’s modulus are 3.5 GPa and 230 GPa, respectively [68]. The mechanical
strength, however, is a defect dependent property and commercial fibers such as the
Torayca T-300 have been tested at much larger gauge lengths and were manufactured
with the goal to minimize critical defects.
1.2 Objectives of this Dissertation Research
The focus of this dissertation was to measure the tensile strength of individual
carbon fibers isolated from bundles, so that definitive conclusions for their properties
could be drawn. Specifically, the objectives of this study were to:
Develop the necessary methodologies to isolate and test a single carbon fibers without
inducing damage
Determine the distribution of the mechanical strength values and use statistical means
to obtain the probability to attain high strength values.
Fibers were isolated from three different bundles and were placed on specially
designed MEMS devices for microscale tensile testing. To fix the fiber onto a MEMS
device, two different approaches were used; rigid grips made from Pt, and compliant
grips made of epoxy. Digital Image Correlation (DIC) was applied to derive the stress vs.
strain curves for the fibers tested. The Young’s modulus was computed only from the
tensile tests conducted with rigid Pt grips. The data for each bundle were analyzed by
using the Weibull distribution to obtain the characteristic strength and the Weibull
modulus.

10
CHAPTER 2
MECHANICAL PROPERTIES OF CARBON FIBERS
REINFORCED WITH CNTS
PAN is the most commonly used precursor for high strength carbon fibers. In
order to further increase the mechanical strength of PAN based carbon fibers, the latter
have been reinforced with CNTs [67]. In this Chapter, the experiments carried out to
determine the mechanical properties of CNT-reinforced PAN-based carbon fibers are
described and discussed.
2.1 Materials and Specimen Preparation
Individual fibers were isolated from carbon fiber bundles derived from PAN,
Figure 2.1 (a,b), with CNTs of various diameters dispersed within each individual fiber.
The fibers were fabricated by the group of Professor Satish Kumar of the Material
Science and Engineering Department at the Georgia Institute of Technology according to
a method they developed in the past [67]. The individual fiber cross-section was not
circular and was the equivalent of a circular fiber with ~1 μm diameter, as shown in
Figure 2.2, where protruding CNTs can be seen. The fibers tested contained 1% wt
SWCNTs and MWCNTs with respect to the precursor polymer. The CNTs were
manufactured by Continental Carbon Nanotechnologies Inc., lot #X0122UA. The fibers
tested were taken from 3 different bundles. Bundle #1 was received in January of 2011
and consisted of two long filaments that were ~6 cm in length. Bundles #2 and #3 were
received in July of 2011. Bundle #2 was labeled as 2(412611) and was approximately 2.5

11
cm in length, and Bundle #3 was labeled 1(419111) and was ~5 cm in length. Large
portion of each bundle was consumed to determine the best method to isolate individual
carbon fibers without causing damage to the fiber gauge section.
(a)
(b)
Figure 2.1 As-received bundle (bundle #1) of carbon fibers showing the cross-sections of
individual fibers.

12
Figure 2.2 Cross-section of a tested carbon fiber showing protruding CNTs.
A total of 55 specimens were tested successfully in collaboration with Mr. Korhan
Şahin. The results are presented in Chapter 3 and the order number for each experiment is
presented in a cumulative manner: First experiments from bundle #1 are discussed, then
experiments from bundle #3 and, finally, experiments with fibers from bundles #2 and #3
where compliant epoxy/Pt tabs were used.
Individual carbon fibers that were either 50 μm or 100 μm long were isolated for
testing. This step proved challenging and a number of methods were attempted. Among
the first attempts to separate fibers from a bundle involved the use of Dimethylformamide
(DMF) which is effective in suspending CNTs [69,70]. The basic nature of DMF allowed
for fiber dispersion [71] but it was suspected that long exposure of the carbon fibers to
DMF could induce surface defects. Alternatively, the use of surfactant, dish detergent
(Palmolive), in water had moderate success, but it proved impractical to pick up carbon
fibers from the surfactant solution. In a different method, a piece of the fiber bundle was
attached to the membrane of a speaker run at the estimated resonance frequency of the
fiber bundle, at ~5.2 kHz. An input file for this purpose was created in Matlab. The tone

13
was played repeatedly for hours with the fiber attached to the speaker membrane using
adhesive. Although the method did show moderate success, attaching and removing the
fiber bundle from the speaker membrane proved to be impractical.
In an alternate approach, a piece of carbon fiber bundle of a few millimeters in
length was cut from the main bundle using an exact-o knife attached to a probe stage.
When cut, the fiber ends were somewhat frayed which made possible to pull fibers from
the bundle using the frayed end. This approach was precise and ensured that the fiber was
only handled by its ends while the gauge section remained pristine. Originally, this
process was applied in water as the cut fiber broke away. After multiple iterations,
however, it became possible to carry out this process in air, as shown in Figure 2.3.
Figure 2.3 Single fiber pulled from a bundle by a tungsten probe.
2.2 MEMS Devices for Microscale Carbon Fiber Testing
MEMS devices for nanofiber testing were employed due to the small size of the
carbon fibers (1 μm in diameter and 50-100 μm in length). The devices were designed by
Mr. Korhan Şahin and Mr. David Grossman of Professor Chasiotis’ research group and
were fabricated at Sandia National Laboratories in Albuquerque, NM. The device design

14
was based on previous works by this group [72-76]. A 3×4 mm2
chip contained MEMS
devices with loadcells of 3 nominal stiffnesses: 500 N/m, 2,000 N/m and 4,000 N/m.
Most of the experiments were run using the 500 N/m devices, which were calibrated by
Mr. Korhan Şahin to have an actual stiffness of 322 N/m. A close up image of a 500 N/m
stiff device is shown in Figure 2.4. Devices of 2,000 N/m stiffness with some of the
loadcell beams cut, as shown in Figure 2.5, were used due to shortage of the lower
stiffness devices. The 2,000 N/m stiff MEMS devices, reduced to half the nominal
stiffness (1,000 N/m), were calibrated to have an actual stiffness of 447 N/m. Due to
concern that a very strong fibers could break the lowest stiffness MEMS devices, 2,000
N/m stiff MEMS devices with half of their loadcell beams cut were preferable.
The basic components of the aforementioned MEMS devices are labeled in Figure
2.4(a). Sections labeled I and II are the fixed and the moving grip, respectively, with the
fiber being firmly mounted between the two sections. Section III is a folded beam
loadcell comprised of two components separated in the middle of the section and attached
by parallel beams on each side. The device shown in Figure 2.4(a,b) has 500 N/m
stiffness. Higher stiffness devices have more beams and/or larger thickness. The beams
deflect as the fiber is loaded so that the two components of section III move apart. The
right hand portion of section III is fixed to an external glass probe attached to the pedal in
section V, as shown later in Figure 2.9. The movement in the left hand side of Section III
is due solely to the load applied on the fiber. The 3 staples shown in Section IV ensured
that the fiber in Section I was subjected to a purely axial load resulting in tensile stresses
in the fiber. Finally, the 4 tethers shown in Section V are used to keep the device
suspended and are broken before testing.
The carbon fibers were held in place on the device by an optical adhesive cured
by UV light. The adhesive was placed on the device at both ends of the fiber in very
small amounts using a probe with ~1 μm diameter tip. The carbon fiber was then placed
in the adhesive and was left to cure. In later experiments, a layer of adhesive was first
applied to the surface and cured. More adhesive was then applied on top of the cured

15
layer, and the carbon fiber was then placed. This process prevented direct contact of the
carbon fiber with the potentially abrasive surface of the polysilicon MEMS device.
(a)
(b)
Figure 2.4 (a) Low stiffness MEMS device showing the individual components: (I)
stationary grip, (II) moving grip, (III) load cell, (IV) staples, (V) pedal (b) Detail of load
cell and mounted carbon fiber. SEM images were acquired by Mr. Korhan Şahin.
(I) (II) (III)
(IV)
(V)

16
Figure 2.5 Medium stiffness device with cut beams to reduce its stiffness. Image was
taken after an experiment was completed.
The UV adhesive was strong enough to keep the fiber temporarily in place, but it
would yield during a tension experiment. For this reason, the FEI Dual Beam 235 FIB
located in the Materials Research Lab at UIUC was used to deposit platinum (Pt) tabs on
both ends of the fiber via the ion beam. This process was done in two steps to ensure full
coverage. First, Pt was deposited on either side of the carbon fiber with small overlap as
shown in Figure 2.6(a). The height of the two depositions was approximately 0.5 µm.
Next, a Pt bridge was deposited on the fiber as shown in Figure 2.6(b). The height of Pt
deposited on the bridge was 0.75-1 μm depending on the fiber diameter. The ion beam
was used to deposit Pt at a current of 50 pA. The low current prolonged the mounting
process but also minimized damage to the fiber due to the ion beam. Care was taken to
ensure that the gauge section of the carbon fiber was not exposed to the ion beam during
patterning. If properly done, the grips were strong enough to hold the fiber in place
during a tension test.

17
(a)
(b)
Figure 2.6 (a) Initial 0.5 μm deposition to ensure full coverage of Pt around the fiber, (b)
bridge to fix the fiber onto the MEMS device.

18
Despite the fact that no damage was visible on the carbon fibers fixed with the aid
of Pt tabs, there was reason to believe the ion beam could still cause damage to the fiber.
As the fiber ruptured at the end of each experiment, it shattered and the fragments flew
away. In order to collect the broken pieces, tests were carried out in glycerin. These
experiments revealed that in most cases the fibers probably broke at the Pt tabs.
Furthermore, SEM images, e.g. see later Figure 3.11, showed that deposition of Pt
created a very thin amorphous region on the outer layer of the carbon fiber near the grip
region, which opens the possibility for ion beam induced defects near the grips, which
would compromise the fiber strength. However, no visible signs of fiber damage were
detected in SEM images near the Pt tabs. In order to elucidate this potential issue,
experiments were carried out by gripping the fibers using an epoxy. The latter is
inherently compliant and, therefore, does not allow for accurate calculation of the fiber’s
Young’s modulus. However, the strength values yielded from these experiments
eliminate concerns arising from Pt damage at the grips.
Bonding only via an epoxy adhesive is not strong enough and the fiber eventually
pulled out from the grips. To address this problem, a combination of epoxy and Pt was
applied which resolved this problem. Pt was deposited far away from the point of fiber
attachment to the grips. Additionally, Pt patches of 1-μm thickness were deposited on the
surface of the fiber and sufficiently far away from the tip of the grips. Because of the use
of the compliant epoxy adhesive at the tip of the grips, the clamping force on the fiber
during axial loading was reduced. Furthermore, as the interfacial shear stress between the
fiber and the epoxy decreased away from the tip of the grips, the Pt tabs shared part of the
force transmitted from the grip to the fiber serving as mechanical slip locks. The
arrangement of the Pt tabs is shown in Figure 2.7(a-b). Once the Pt tabs were deposited,
the entire fiber on the grips was covered with epoxy.

19
(a)
(b)
Figure 2.7 (a) Pt tabs deposited far away from the gauge section on the fixed and moving
grips, (b) close up of fixed grip.
20
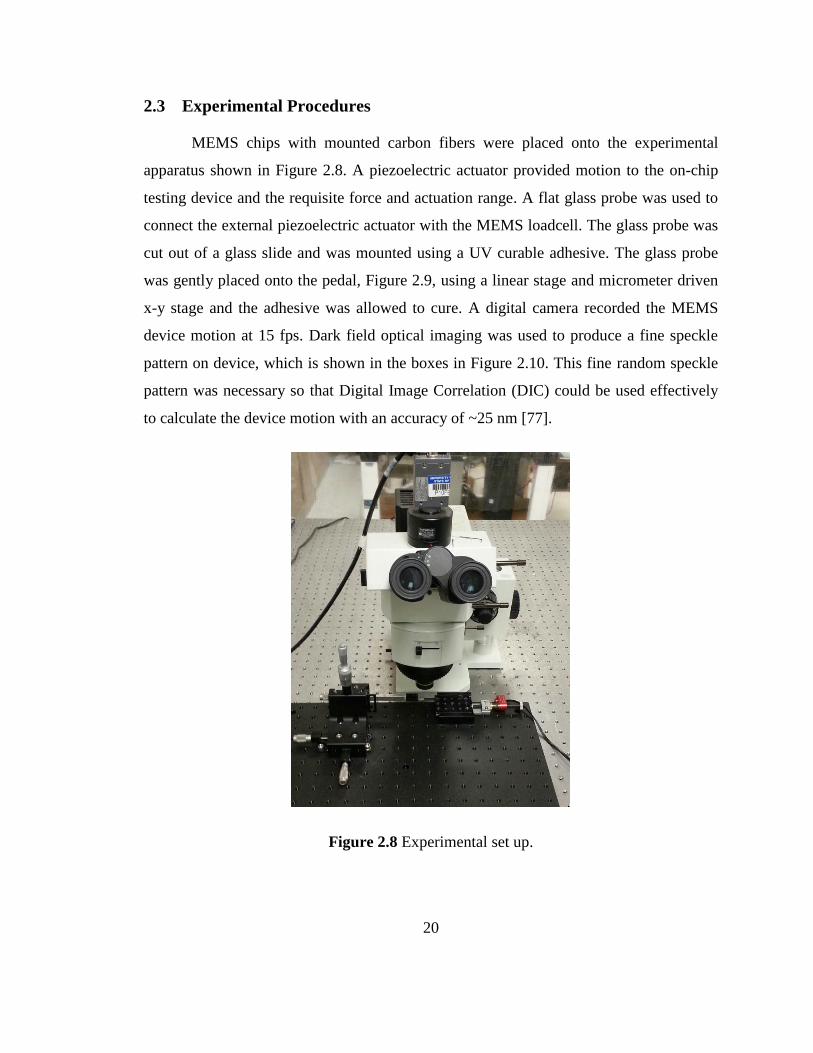
2.3 Experimental Procedures
MEMS chips with mounted carbon fibers were placed onto the experimental
apparatus shown in Figure 2.8. A piezoelectric actuator provided motion to the on-chip
testing device and the requisite force and actuation range. A flat glass probe was used to
connect the external piezoelectric actuator with the MEMS loadcell. The glass probe was
cut out of a glass slide and was mounted using a UV curable adhesive. The glass probe
was gently placed onto the pedal, Figure 2.9, using a linear stage and micrometer driven
x-y stage and the adhesive was allowed to cure. A digital camera recorded the MEMS
device motion at 15 fps. Dark field optical imaging was used to produce a fine speckle
pattern on device, which is shown in the boxes in Figure 2.10. This fine random speckle
pattern was necessary so that Digital Image Correlation (DIC) could be used effectively
to calculate the device motion with an accuracy of ~25 nm [77].
Figure 2.8 Experimental set up.

21
Figure 2.9 Glass probe placed onto the MEMS device pedal.
Figure 2.10 Fine speckle pattern generated by dark field optical imaging to facilitate the
application of DIC.

22
2.4 Post-experimental Analysis
DIC (VIC-2D 2009) was applied to extract a stress vs. strain curve for each fiber.
The strain in a fiber was calculated from the displacement between the two red boxes
labeled "A" in Figure 2.11. The difference in the motion of the device and the movement
due to the load cell opening is equal to the elongation of the carbon fiber. Since the length
of the fiber gauge section was known, strain could be calculated. Similarly, the stress
could be calculated from the motion of the two regions labeled "B" in Figure 2.11. The
blue box on the left moved with the opening of the load cell, and the blue box on the right
was stationary due to the glass probe attached to the pedal. Therefore, the difference in
the motion of these two regions provided the opening of the load cell. The stiffness of the
load cell was determined by direct calibration. The product of the loadcell opening with
its stiffness provided the force applied to the carbon fiber. The stress was then calculated
by dividing the applied force by the fiber’s measured cross-sectional area.
Figure 2.11 Correlation areas used in the calculation of the motion of the device
components by DIC.
(
B
A
100 μm

23
DIC is a full-field displacement/strain measurement method, which, in this work
was used to compute the in-plane rigid body motions by comparing surface patterns on
components of the MEMS during fiber loading [72-76]. Large subset sizes are generally
desirable as they provide “smoothing” of the displacement field which is acceptable in
the absence of displacement gradients. The speckle pattern generated on the surface of
MEMS devices using dark field imaging have been shown by this group to provide
displacement resolution on the order of 25 nm [77].
2.5 Conclusions
In this Chapter, the experimental methods for isolating and testing individual
carbon fibers isolated from bundles were discussed. Due to their minute size, the fibers
were tested with specially designed MEMS devices. Two methods were used to assure a
robust fiber attachment. The first used Pt tabs deposited by a FIB. The second method
employed a polymer adhesive in conjunction with Pt mechanical locks. The use of Pt tabs
guaranteed the correct measurement of the elastic modulus of the carbon fibers, while the
use of combined Pt/epoxy tabs reduced the risk of fiber failure at the grips. Results from
each gripping method are described in Chapter 3. Measurements of the applied force and
the fiber extension were carried out with the use of DIC which guaranteed independent
and high resolution data for each quantity.

24
CHAPTER 3
STATISTICAL DESCRIPTION OF FIBER STRENGTH
Mechanical property experiments were run with single carbon fibers to determine
their tensile strength and elastic modulus. Due to their brittle nature, there is no unique
value for their mechanical strength and, therefore, the failure strength data must be
analyzed in terms of probability of survival, or failure, at a given stress. The statistical
distribution function that accurately describes the failure of brittle materials has been
developed by Waloddi Weibull in 1939 [78] and was applied to the results of this
research.
3.1 Weibull Statistics Applied to Mechanical Strength Data
In the Weibull probability density function the survival probability of a specimen,
Ps(σ, V0), is defined as the fraction of samples with volume, V0, that survive a uniform
stress, σ. Specifically, Ps(V0) is given by,
( ) [ (
)
] (1)
where σ0 and m are “material” constants. It is clear from this equation that Ps(σ,V0) =1
when σ=0, meaning that no samples will fail. The parameter m is the Weibull modulus: a
lower value of m indicates higher variability in tensile strength of a component [79]. If
σ=σ0, it can be easily seen from Equation (1) that Ps(σ,V0) = 1/e, which is ~0.37. Thus, σ0,
the Weibull characteristic strength, is the stress at which 37% of the samples will survive.

25
The values of σ0 and m are determined using experimental data along with
Equation (1). The strength of each sample with volume V0 is plotted against a probability
estimator function to determine the percentage of survival. The probability estimator
function used for the present experimental data was:
( ) (2)
Here n and j are defined by ordering the strength values as σ1≤σ2≤…≤σj≤…≤σn. The
probability estimator in Equation (2) was chosen because it gives the most accurate
results when the sample size n≥20 [80]. The value of m is determined from the following
form of Equation (1):
[
( ) ] (
)
(3)
or the more convenient expression:
{ [
( ) ]} (
)
(4)
Equations (1), (3), (4) are valid for specimens that have the same volume. The
fibers tested in this work had different cross-sections and gauge lengths 50 or 100 μm.
Therefore, Equation (1) must be written to account for volume variations:
( ) [
(
)
] (5)
where V is the volume of a specimen and V0 is a reference volume. The volume of a
given specimen can be defined by some multiple, k, of the reference volume; V=kV0.
Thus, Equation (5) can be rewritten as
( ) [ (
)
] (6)

26
From this expression, k and σ can be combined to form a reduced stress that takes the
specimen volume into account [81] and is defined as
⁄ (7)
Putting Equation (6) in terms of the reduced strength we obtain
( ) [ (
)
]. (8)
Equation (8) makes use of stress values that have been corrected for the volume of each
specimen and yields a more consistent and “the true” value of m. Similarly to Equations
(1) and (4), the volume corrected Equation (8) can be written as:
{ [
( ) ]} (
)
(9)
in order to calculate easily the Weibull modulus.
It should be noted that the three parameter Weibull probability density function is often
used:
( ) [
(
)
], (10)
where σu is a threshold stress at which the probability of failure is zero and is taken as
equal to zero in all previous equations. When σu=0, Ps in Equation (10) is equal to one
only when σ=0, thus, yielding a conservative estimation. However, since it is very
difficult to guarantee a minimum strength value for brittle materials, it is often
recommended that σu is taken as zero [82].

27
3.2 Calculation of Weibull Parameters for Individual Carbon Fibers
The Weibull probability density function was used to statistically describe the
tensile strength results obtained in this study. The results from experiments conducted on
fibers from bundle #1 are listed in Table 3.1. In the first column, the strength data are
ordered in increasing value without accounting for variations in the specimen volume.
Calculations that used the strength data in this column resulted in m = 4.16. If Equation
(9) is applied it emerges that the order of the newly calculated “volume corrected
strength” data is not in ascending any longer, as verified by the last column in Table 3.1.
The Weibull analysis was then run again using the values of measured strength ordered
according to the ascending order of the data in the last column of Table 3.1. The entire
analysis was repeated, and the true value of m was found to be equal to 4.4 using the
graph in Figure 3.1, while σ0 was found to be equal to 4.13 GPa according to Equation
(9). The volume corrected analysis was carried out with respect to a reference fiber with 1
μm effective diameter and 50 μm gauge section.
Given the calculated Weibull probability density function values, the volume
corrected reduced strength was obtained from Equation (7). Table 3.2 presents the
strength values in the correct order after accounting for the fiber volume, and the
resulting volume corrected reduced strength. In Figure 3.2, the probability estimator
function calculated by Equation (2) is plotted against the reduced strength values, shown
as the blue discrete points. The probability function from Equation (8) is then fitted
against the data points, showing excellent agreement. A close fit is expected, since the
results of Equation (8) are a function of m and σ0 which are output by the probability
estimator function in Equation (2). The fact that the data closely follow a Weibull plot
and the probability function calculated with Equation (8) is in good agreement support
the validity of the present analysis and the use of an appropriate probability estimator for
the given sample size.
SEM images of the cross-sections of fibers from bundle #1 showed various shapes
categorized as elliptical, rectangular and irregular. Specifically, nine fibers with elliptical

28
cross-section from bundle #1 had average strength of 3.65±1.07 GPa, three fibers with
approximately rectangular cross-section had average strength of 2.99±0.51 GPa, and nine
fibers with irregular cross-section, had average strength of 3.30 ± 0.96 GPa. Examples of
fibers with elliptical, rectangular and irregular cross-sections are provided in Figures
3.3(a-c), Figure 3.4(a-c) and Figure 3.5(a-c), respectively. Given the limited number of
samples, it is difficult to draw general conclusions. However, it appears that fibers with
elliptical cross-sections resulted in the highest average strength due to the lack of ridges,
corners, cusps and other forms of stress concentrations.
Table 3.1 Experimental strength data from bundle #1 ordered according to the measured
values of tensile strength.
Strength (σ)
(GPa)
Young's
Modulus (GPa)
Gauge
Length (μm)
Effective
Diameter (μm)
ln((V/V0)1/m
*σ)
1.91 159 50 0.82 0.56
2.16 184 50 1.22 0.86
2.54 223 50 1 0.93
2.65 209 100 1 1.13
2.86 167 50 1.07 1.085
2.88 264 50 1.6 1.27
3.16 237 50 1.36 1.29
3.25 247 100 0.95 1.31
3.31 261 100 1.09 1.39
3.36 131 50 1 1.21
3.43 231 50 0.81 1.14
3.54 260 100 1.08 1.46
3.55 259 100 1 1.42
3.76 220 100 0.99 1.48
3.97 170 50 0.99 1.37
4.03 269 100 0.85 1.48
4.31 240 100 0.97 1.60
4.47 289 50 0.96 1.48
4.88 232 50 0.98 1.58
5.66 300 50 1.03 1.75

29
Table 3.2 Experimental strength values ordered after volume correction and reduced
strength values for fibers from bundle #1.
Strength
(GPa)
Gauge
Length (μm)
Effective
Diameter (μm)
ln((V/V0)1/m
*σ) Reduced
Strength (GPa)
1.91 50 0.82 0.56 1.75
2.16 50 1.22 0.86 2.36
2.54 50 1 0.93 2.54
2.86 50 1.07 1.08 2.95
3.43 50 0.81 1.14 3.12
2.65 100 1 1.13 3.10
3.36 50 1 1.21 3.36
2.88 50 1.6 1.27 3.57
3.16 50 1.36 1.29 3.63
3.25 100 0.95 1.31 3.72
3.97 50 0.99 1.37 3.95
3.31 100 1.09 1.39 4.03
3.55 100 1 1.42 4.16
3.54 100 1.08 1.46 4.29
4.47 50 0.96 1.48 4.39
4.03 100 0.85 1.48 4.38
3.76 100 0.99 1.48 4.38
4.88 50 0.98 1.58 4.84
4.31 100 0.97 1.60 4.98
5.66 50 1.03 1.75 5.74

30
Figure 3.1 Equation (9) plotted for the data from bundle #1.
Figure 3.2 Weibull probability function (red curve) plotted with reduced strength values
(blue points) for data from bundle #1.
y = 4.39x - 6.2 R² = 0.99
-5
-4
-3
-2
-1
0
1
2
0 0.5 1 1.5 2
m*ln
[(V
/V0)*
(σ/σ
0)]
ln(ln(1/(1-p)))
0
0.2
0.4
0.6
0.8
1
1.2
0 2 4 6 8
Pro
ba
bil
ity
of
Fa
ilu
re
Reduced Strength (GPa)

31
(a)
(b)
(c)
Figure 3.3 Fibers with elliptical cross-sections from bundle #1 and experiments (a) #9,
(b) #13, and (c) #4. SEM images were acquired by Mr. Korhan Şahin.

32
(a)
(b)
(c)
Figure 3.4 Fibers with rectangular cross sections from bundle #1 and experiments (a)
#19, (b) #15, and (c) #16. SEM images were acquired by Mr. Korhan Şahin.

33
(a)
(b)
(c)
Figure 3.5 Fibers with irregular cross-sections from bundle #1 and experiments (a) #8,
(b) #21, and (c) #5. SEM images were acquired by Mr. Korhan Şahin.

34
The experimental data from bundle #3 were analyzed in a similar manner as those
from bundle #1. The data were initially ordered according to measured strength values, as
shown in the first column of Table 3.3. After fitting an initial m=3.97, the data were
reordered in ascending order following Equation (9), and are listed in the rightmost
column of Table 3.3. The strength data of the first column of Table 3.3 were re-ordered
with a correction for specimen volume according to the ascending order of the values in
the last column in Table 3.3, and this new order is given in the first column on Table 3.4.
The volume corrected analysis was done with respect to a reference fiber with 1 μm
effective diameter and 50 μm gauge section. The analysis was repeated to compute
m=4.13, as shown in Figure 3.6, and σ0 =5.07 GPa by using Equation (9). The volume
corrected reduced strength values calculated by Equation (7) are given in the right-most
column of Table 3.4. The probability estimator function from Equation (2) is plotted
against reduced strength data and is shown as the blue discrete points in Figure 3.7. The
probability function from Equation (8) is also plotted in red in Figure 3.7 and is in good
agreement with the discrete data points. As discussed for the case of bundle #1, the close
fit and the good Weibull trend indicate a good choice for the probability estimator, and
the appropriateness of the aforementioned procedure for statistical analysis.
Similarly to bundle #1, SEM images of the failure cross-sections of fibers from
bundle #3 were obtained. They were also categorized as elliptical, rectangular, and
irregular. Examples of such cross-sections are shown in Figure 3.8(a-c), Figure 3.9(a-c)
and Figure 3.10(a-c), respectively. Ten fibers with elliptical cross-sections had average
tensile strength of 4.23±1.26 GPa, three fibers with rectangular cross-section had average
strength of 4.14±1.53 GPa, and twelve fibers with irregular cross-section had average
strength of 4.92±1.46 GPa. Similarly, to bundle #1, carbon fibers with rectangular cross-
sections had the lowest tensile strength, although not significantly lower than fibers with
elliptical cross-sections. In bundle #3 fibers with irregular cross-section had the highest
strength. However, given the close average strength values for the 3 cross-sectional
geometries, it appears that none of them can be definitively associated with a higher
probability for high strength.

35
Table 3.3 Experimental strength data from bundle #3 ordered according to the measured
values of tensile strength.
Strength
(σ)
Young's
Modulus (GPa)
Gauge
Length (μm)
Effective
Diameter (μm)
ln((V/V0)1/m
*σ)
1.87 227 100 0.9 0.75
2.45 192 100 0.99 1.07
2.92 294 100 0.68 1.05
3.28 226 50 0.94 1.16
3.36 251 50 0.95 1.19
3.41 272 100 0.83 1.31
3.48 263 50 0.85 1.17
3.48 298 100 0.95 1.40
3.63 254 100 0.96 1.44
3.96 284 100 0.94 1.52
4.32 266 50 0.88 1.40
4.5 229 50 0.94 1.47
4.5 264 100 1.02 1.69
4.58 207 50 0.99 1.52
4.78 179 50 1.05 1.59
4.97 256 50 0.99 1.60
5.16 247 50 0.79 1.52
5.19 289 100 0.8 1.71
5.82 212 50 1 1.761
5.83 298 50 1 1.761
5.86 224 50 0.88 1.701
6.05 303 100 0.88 1.911
6.21 234 50 0.93 1.79
6.88 248 50 0.91 1.88
7.24 323 50 0.96 1.96

36
Table 3.4 Experimental strength values ordered after volume correction and reduced
strength values for fibers from bundle #3.
Strength
(GPa)
Gauge
Length (μm)
Effective
Diameter (μm)
ln((V/V0)1/m
*σ) Reduced
Strength (GPa)
1.87 100 0.9 0.74 2.10
2.92 100 0.68 1.05 2.87
2.45 100 0.99 1.06 2.88
3.28 50 0.94 1.16 3.18
3.48 50 0.85 1.17 3.22
3.36 50 0.95 1.19 3.28
3.41 100 0.83 1.30 3.68
3.48 100 0.95 1.39 4.01
4.32 50 0.88 1.40 4.06
3.63 100 0.96 1.437 4.21
4.5 50 0.94 1.47 4.37
3.96 100 0.94 1.51 4.54
4.58 50 0.99 1.52 4.56
5.16 50 0.79 1.53 4.60
4.78 50 1.05 1.59 4.89
4.97 50 0.99 1.60 4.95
4.5 100 1.02 1.68 5.37
5.19 100 0.8 1.71 5.51
5.86 50 0.88 1.71 5.51
5.82 50 1 1.76 5.82
5.83 50 1 1.76 5.83
6.21 50 0.93 1.79 6.00
6.88 50 0.91 1.88 6.57
6.05 100 0.88 1.91 6.73
7.24 50 0.96 1.96 7.10

37
Figure 3.6 Equation (9) plotted for the data from bundle #3 to obtain the Weibull
modulus.
Figure 3.7 Weibull probability function (red curve) plotted against the reduced
strength values (blue points) for fibers from bundle #3.
y = 4.13x - 6.7 R² = 0.97
-4.5
-4
-3.5
-3
-2.5
-2
-1.5
-1
-0.5
0
0.5
1
0 0.5 1 1.5 2
m*ln
[(V
/V0)*
(σ/σ
0)]
ln(ln(1/(1-P)))
0
0.1
0.2
0.3
0.4
0.5
0.6
0.7
0.8
0.9
1
0 2 4 6 8 10
Pro
ba
bil
ity
of
Fa
ilu
re
Reduced Strength (GPa)

38
(a)
(b)
(c)
Figure 3.8 Fibers with elliptical cross-sections from bundle #3 and experiments (a) #40,
(b) #38, and (c) #45. SEM images were acquired by Mr. Korhan Şahin.

39
(a)
(b)
(c)
Figure 3.9 Fibers with rectangular cross-sections from bundle #3 and experiments (a)
#46, (b) #27, and (c) #28. SEM images were acquired by Mr. Korhan Şahin.

40
(a)
(b)
(c)
Figure 3.10 Irregular cross-sections of fibers from bundle #3 and experiments (a) #47,
(b) #31, and (c) #37. SEM images were acquired by Mr. Korhan Şahin.

41
Although bundles #1 and #3 were manufactured under the same conditions, the
fibers from bundle #3 had better mechanical properties. The 20 experiments from bundle
#1 resulted in tensile strength of 3.41±0.93 GPa, Young's modulus of 228±45 GPa and
Weibull characteristic strength of 4.3 GPa. The strongest fiber from bundle #1 was from
experiment #12 with tensile strength of 5.66 GPa and Young's modulus of 300 GPa. The
25 experiments from bundle #3 gave an average tensile strength of 4.55±1.35 GPa, elastic
modulus of 254±36 GPa, and Weibull characteristic strength of 5.07 GPa. The strongest
fiber from bundle #3 was from experiment #41 with tensile strength of 7.24 GPa and a
Young's modulus of 323 GPa. Overall, bundle #3 showed 33% improvement in tensile
strength compared to bundle #1, and 13% increase in the value of the Young's modulus.
The majority of specimens shattered and flew away from the grips upon failure
and could not be recovered to image their original fracture surfaces. The SEM images
shown in Figures 3.3-3.5 and Figures 3.8-3.10 were obtained at the fiber grip. To resolve
the issue of potential failure at the fiber grip, tests on fibers from bundle #3 were
performed in glycerin to gather the fragments of the specimen gauge section. These
experiments showed that indeed failure occurred near the Pt tabs at the specimen grip.
The fused Pt layer on the fiber surface, which was present only at the specimen grip, is
shown after fiber failure in Figure 3.11. The arrows in Figure 3.11(a) point to a thin dark
layer on the fiber surface which was potentially the result of Pt diffusion into the carbon
fiber. The matching side of the fiber which remained on the grip is shown in Figure
3.11(b). This thin (dark) layer for Pt/carbon could result in a small reduction in the
measured tensile when Pt tabs were used. As shown in the next section, the strength
measurements using epoxy gripping resulted in the same value for the highest tensile
strength, but a higher average value (over a smaller set of experiments). This implies that
the thin diffused Pt shell on the surface of the carbon fibers at the Pt tabs could have
reduced the value of the true tensile strength and the average values for strength
presented in Tables 3.1-3.4 represent a lower bound. The elastic moduli reported in
Tables 3.1 and 3.3 are considered as quite accurate, within the accuracy of the loadcell
calibration and the determination of the fiber cross-sectional area.

42
(a)
(b)
Figure 3.11 Matching cross-sections carbon fiber tested in glycerin. (a) Fiber side that
was captured in glycerin showing the surrounding Pt tab as the mirror surface without
CNTs. The white arrows point to a thin dark layer on the fiber surface which was
potentially the result of Pt diffusion into the carbon fiber (b) Matching fracture section at
the Pt tab near its fixation point to the MEMS device. The red outline shows the fiber
cross-section used in the calculation of fiber strength. SEM images were acquired by Mr.
Korhan Şahin.

43
As described in Chapter 2, more compliant epoxy/Pt grips were used to prevent
damage during Pt deposition. The fibers tested by this method were isolated from bundles
#2 and #3. Bundle #2 was received together with bundle #3 and, for the limited
experiments that were run for this bundle, average strength and Young’s modulus values
were similar to those from bundle #3. The results for the fibers tested with compliant
epoxy grips are given in Table 3.5. Due to the compliance of the grips, it was not
meaningful to calculate the Young's modulus value from these experiments. While this
data set is too small to run a Weibull analysis, the results are promising giving and
average tensile strength of 5.59±1.24 GPa. In the majority of these tests the fibers did not
break at the grips.
Table 3.5 Experimental results using compliant epoxy/Pt grips.
Experiment Tensile Strength (GPa) Gauge Length (μm) Diameter (μm)
1 5.82 50 0.92
2 3.76 100 0.98
3 4.29 50 0.86
4 6.52 50 0.93
5 6.66 50 1.02
6 6.07 50 0.84
7 4.18 50 1.06
8 5.67 50 1.08
9 7.31 100 0.96
As a final comparison, control carbon fibers fabricated under similar conditions
from pure PAN were reported to have an average strength of 3.2±0.7 GPa [67].
Experiments with single fibers from bundles #1 and #3 with rigid Pt tabs gave average
strengths of 3.41±0.93 GPa and 4.55±1.35 GPa, respectively. The (limited) experiments
run with compliant grips using specimens from bundles #2 and #3 resulted in an average
strength of 5.59±1.24 GPa and similar maximum values as the experiments run with Pt

44
tabs. The CNTs clearly had a positive effect on the strength of the PAN derived carbon
fibers.
3.3 Conclusions
In this Chapter, a volume corrected Weibull analysis was conducted to provide a
statistical description of two sets of mechanical strength values for carbon fibers, namely
20 samples from bundle #1, and 25 samples from bundle #3. For bundle #1, the Weibull
modulus and the characteristic strength are m=4.4, and σ0 =4.13, respectively. For bundle
#3, m=4.13 and σ0 =5.07. Both sets of data followed ideal Weibull distributions for the
probability estimator used in the calculations. Experiments conducted in glycerin pointed
to a biasing effect of the Pt grips on the measured average strength. Such experiments
revealed a thin region on the perimeter of the fibers where Pt diffusion might have
occurred and caused fiber failure at the grips.
Additional experiments were run using compliant epoxy/Pt grips that prevented
failure at the grips. While the number of these experiments was limited, the average
tensile strength was 5.59±1.24 GPa, which is quite higher than that measured from fibers
from bundle #3 using Pt grips. The largest value of strength recorded using compliant
grips was 7.31 GPa, which is very comparable to the highest value measured using Pt
grips. Thus, the use of Pt grips may have influenced the average value of the measured
mechanical strength, but the values recorded at the high tail end of the strength
distribution are quite representative of the high quality of the particular carbon fibers.

45
CHAPTER 4
CONCLUSIONS
The mechanical properties of PAN derived carbon fibers reinforced with CNTs
were investigated. Microscale uniaxial tension tests were conducted using specially
designed load cells on MEMS devices. Fibers from three different bundles, all fabricated
under the same conditions were tested. Techniques were developed to isolate and test
individual fibers from the bundles. Rigid grips made from Pt deposition via an FEI Dual
Beam 235 FIB were used to fix the fibers onto MEMS devices for the majority of the
tests that were carried out. Compliant grips made from a combination of epoxy and Pt
tabs were used in experiments carried out towards the end of this study to elucidate
experimental uncertainties. The mechanical strength data were analyzed using a volume
corrected two-parameter Weibull probability distribution function.
The 20 experiments from bundle #1 yielded an average tensile strength of 3.41
0.93 GPa, Young's modulus of 228±45 GPa, and Weibull characteristic strength of 4.3
GPa. The 25 experiments from bundle #3 provided a tensile strength of 4.55±1.35 GPa,
modulus of 254±36 GPa, and Weibull characteristic strength of 5.07 GPa. On average,
bundle #3 showed a 33% improvement in strength and 13% improvement in Young's
modulus over bundle #1. The strongest fibers tested from bundles #1 and #3 had tensile
strengths of 5.66 GPa and 7.24 GPa, respectively. The fibers tested had an assortment of
cross-sectional geometries. Inspection of the mechanical strength data did not highlight a
particular geometry that resulted in consistently higher strength values.
A novel type of compliant grips made by a combination of epoxy and Pt
mechanical locking tabs were used to test fibers from bundles #2 and #3 and reduce the

46
propensity for fiber failure at the grips. While the number of these experiments was
limited, the average tensile strength was 5.59±1.24 GPa, which is quite higher than that
measured from fibers from bundle #3 using Pt grips. The largest value of strength
recorded using compliant grips was 7.31 GPa, which is very comparable to the highest
value measured using Pt grips. Thus, the use of Pt grips may have influenced the average
value of the measured mechanical strength, but the values recorded at the high tail end of
the strength distribution are quire representative of the high quality of the particular
carbon fibers.
When compared to control carbon fibers from pure PAN manufactured under the
same conditions and tested at other labs that reported an average strength of 3.2±0.7 GPa,
all carbon fibers tested in this work demonstrated higher average strengths than the
control, thus showing that CNTs have a very positive effect on the tensile strength of
carbon fibers.

47
REFERENCES
[1] E. Fitzer. "Pan-based carbon fibers-present state and trend of the technology from
the viewpoint of possibilities and limits to influence and to control the fiber
properties by the process parameters”, Carbon, 27 (5), pp. 621-645, 1989.
[2] W.B. Hillig. Proceedings of the International Conference on Reinforced
Materials and Composite Technologies, Wiesbaden, Germany, 1988.
[3] M.S. Dresselhaus, G. Dressselhaus, K. Sigihara, I.L Spain, H.A. Goldberg.
Graphite Fibers and Filaments, Springer-Verlag, Berlin, 1988.
[4] J.L. Figneiredo et. al. Carbon Fibers, Filament and Composite. Kluwer Academic
Publications, Boston, 1990.
[5] C. Pradere, C. Sauder. “Transverse and longitudinal coefficient of thermal
expansion of carbon fibers at high temperatures”, Carbon, 46 (14), pp. 1874-
1884, 2008.
[6] G. Savage. Carbon-carbon Composites, Chapman & Hall, 1993.
[7] J.B. Donnet, O.P. Bahl, Roop C. Bansal, T.K. Wang, Carbon Fibers,
Encyclopedia of Physical Science and Technology, Academic Press, New York,
2003.
[8] D.J. O’neil. “Precursors for Carbon and Graphite Fibers”, International Journal of
Polymeric Materials, 7 (3-4), pp. 203-218, 1979.
[9] J.R. White et. al. Fibre Reinforcements for Composite Materials, Elsevier Science
Publishers, Amsterdam, 1988.
[10] J.B. Donnet et. al. Carbon Fibers, Marcel Dekker, New York, 1998.
[11] G.G. Tibbetts. “Carbon fibers produced by pyrolysis of natural gas in stainless
steel tubes”, Appl Phys Lett, 42 (8), pp. 666–668, 1983.
[12] J.S. Speck, M. Endo and M.S. Dresselhaus. “Structure and intercalation of thin
benzene derived carbon fibers”, J Cryst Growth, 94, pp. 834–848, 1989.
[13] C.R. Thomas, E.J. Walker. Proceedings of the 5th
Conference on Ind. Carbon and
Graphite, Society of Chemical Industry, London, p. 520, 1978.
[14] B.H. Mahin. University Chemistry, Addison-Wesely, Reading, Massachusetts,
1969.
[15] B.T. Kelly. “Outstanding problems in the bonding of the graphite lattice and the
theory of the thermal properties of graphite”, High temperatures - High pressures,
13 (3), pp. 245-250, 1980.
[16] E. Fitzer, L. Manocha. Carbon Reinforcements and Carbon/carbon composites,
Springer-Verlag, Berlin, 1998.

48
[17] R. Bacon, W.H. Smith. Proceedings of the 2nd
Conference on Ind. Carbon and
Graphite, Society of Chemical Industry, London, p. 203, 1965.
[18] R. Bacon. “Carbon Fibers from Rayon Precursors”, Chemistry and Physics of
Carbon, 9, p.1, 1973.
[19] A. Shindo. Report no. 217, Government Ind. Res. Inst., Osaka, Japan, 1961.
[20] L.N. Phillips, W. Watt, and W Johnson. British Patent 1110791, 1965.
[21] W. Watt and W. Johnson. Proceedings of the 3rd
Conference on Industrial
Carbon and Graphite, Society of Chemical Industry, London, p. 417, 1971.
[22] O.P. Bahl, L.M. Manocha. “Characterization of oxidised pan fibres”, Carbon, 12
(4), pp. 417-423, 1974.
[23] Kureha Chemical Industry Co., Fr. Pat 1,465,030, 1967.
[24] S. Ōtani. “On the carbon fiber from the molten pyrolysis products”, Carbon, 3
(1), pp. 31-34, 1965.
[25] D.D. Edie. “The effect of processing on the structure and properties of carbon
fibers”, Carbon, 36 (4), pp. 345-362, 1998.
[26] R.T.K Baker, P.S. Harris. “The Formation of Filamentous Carbon”, Chemistry
and Physics of Carbon, 14, p.83, 1978.
[27] A. Oberlin, M. Endo, T. Koyama. “High resolution electron microscope
observations of graphitized carbon fibers”, Carbon, 14 (2), pp. 133-135, 1976.
[28] A. Oberlin, M. Endo, T. Koyama. ”Filamentous growth of carbon through
benzene decomposition”, Journal of Crystal Growth, 32 (3), pp. 335-349, 1976.
[29] T. Koyama, M.T. Endo. “Method for Manufacturing Carbon Fibers by a Vapor
Phase Process,” Japanese Patent 1982-58, 966, 1983.
[30] M. Hatano, T. Ohsaki, K. Arakawa. “Graphite Whiskers by New Process and
Their Composites, Advancing technology in Materials and Processes”, Science of
Advanced Materials and Processes, 30, pp. 1467-1476, 1985.
[31] E. Hammel, X. Tang, M. Trampert, T. Schmitt, K. Mauthner, A. Eder, P.
Pötschke. ”Carbon nanofibers for composite applications”, Carbon, 42 (5-6), pp.
1153-1158, 2004.
[32] M. Minus, S. Kumar. “The processing, properties, and structure of carbon fibers”,
Journal of the Minerals, 57 (2), pp. 52–58, 2005.
[33] G.J. Capone. “Wet-spinning technology”, In: Acrylic Fiber Technology and
Applications, ed. J.C. Masson, Marcel Dekker, New York, pp. 69-103, 1995.
[34] D.D. Edie, R.J. Diefendorf. “Carbon fiber manufacturing”. In: Carbon-Carbon
Materials and Composites, eds. J. D. Buckley and D. D. Edie. Noyes
Publications. Park Ridge, NH, pp. 19-37, 1993.

49
[35] V.B. Gupta and V.K. Kothari. Manufactured Fibre Technology, Chapman & Hall,
London, 1997.
[36] M.J. Ram, J.P. Riggs. “Process for production acrylic filaments”, U.S. Patent 3
657 409, 1972.
[37] L.H. Peebles. Carbon Fiber – Formation, Structure, and Properties, CRC Press,
Boca Raton, LA, 1995.
[38] E. Fitzer, D.J. Müller. “The influence of oxygen on the chemical reactions during
stabilization of pan as carbon fiber precursor”, Carbon, 13 (1), pp.63-69, 1975.
[39] A.K. Fiedler, E. Fitzer, and F. Rozploch. Proceedings of 11th Biennial Conf. on
Carbon, p. 261, 1973.
[40] E. Fitzer, W. Frohs, M. Heine. “Optimization of stabilization and carbonization
treatment of PAN fibres and structural characterization of the resulting carbon
fibres”, Carbon, 24 (4), pp. 387-395, 1986.
[41 ] T. Matsumoto. “Mesophase pitch and its carbon fibers”, Pure Applied Chemistry,
57 (11), pp. 1553-1562, 1985.
[42] R. Moreton, W. Watt, W. Johnson. "Carbon fibres of high strength and high
breaking strain", Nature, 213, pp.690-691, 1967.
[43] E. Fitzer, W. Frohs. “The influence of carbonization and post treatment conditions
on the properties of PAN-based carbon fibers”. Proceedings of the International
Carbon Conference, Newcastle, U.K., pp. 18-23, 1988.
[44] S.C. Bennett, D.J. Johnson, W. Johnson. “Strength-structure relationships in
PAN-based carbon fibres”, 18 (11), pp. 3337-3347, 1983.
[45] D.J. Johnson. “Structure property relationships in carbon fibers”, Journal of
Physics D: Applied Physics, 20 (3), pp. 287-291, 1987.
[46] M.M. Treacy, T.W. Ebbesen, and J.M. Gibson. “Exceptionally high Young’s
modulus observed for individual carbon nanotubes”, Nature, 381, pp.678-680,
1996.
[47] B. Yakobson. "Mechanical properties of carbon nanotubes". Topics in Applied
Physics, 80, pp. 287-329, 2001.
[48] R.E. Smalley, et al. “Crystalline ropes of metallic carbon nanotubes”, Science,
273, pp. 483-487, 1996.
[49] J.W.G. Wildoer, L.C. Venema. A. G. Rinzler, R. E. Smalley, C. Dekker,
“Electronic structure of atomically resolved carbon nanotubes, Nature, 391, pp.
59–62, 1998.
[50] T. W. Odom, J. L. Huang, P. Kim, C. M. Lieber. “Atomic structure and electronic
properties of single-walled carbon nanotubes”, Nature, 391, pp. 62–64, 1998.

50
[51] M.S. Dresselhaus, P.C. Eklund. “Photons in carbon nanotubes”, Advances in
Physics, 49 (6), pp.705-814, 2000.
[52] J. Hone. "Phonons and Thermal Properties of Carbon Nanotubes", Topics in
Applied Physics, 80, pp. 273-287, 2001.
[53] M.S Dresselhaus, P. Avouris. "Introduction to Carbon Materials Research."
Topics in Applied Physics, 80, pp. 1-9, 2001.
[54] G.D. Li, Z.K. Tang, N. Wang, J.S. Chen. “Structural study of the 0.4-nm single-
walled carbon nanotubes aligned in channels of AlPO4-5 crystal”, Carbon, 40 (6),
pp. 917-921, 2002.
[55] D.A. Walters, et al. “Elastic strain of freely suspended single-wall carbon
nanotube ropes”, Appied Physics Letters, 74 (25), pp. 3803-3805, 1999.
[56] G. Gao, T. Cagin, W.A. Goddard III. “Energetics, Structure, mechanical and
vibrational properties of single-walled carbon nanotubes Nanotechnology, 9, pp.
184-191, 1998.
[57] J. Cumings, W. Mickelson, A. Zettl. “Simplified synthesis of double-wall carbon
nanotubes”, Solid State Communications, 126 (6), pp. 359-362, 2003.
[58] B. Yakobson. "Mechanical Properties of Carbon Nanotubes". Topics in Applied
Physics, 80, pp. 287-329, 2001.
[59] H. W. Kroto, J. R. Heath, S. C. O’Brien, R. F. Curl, R. E. Smalley. “C60:
Buckminsterfullerene”, Nature, 318, pp. 162–163, 1985.
[60] S. Iijima. “Helical microtubules of graphitic carbon”, Nature, 354, pp. 56-58,
1991.
[61] S. Iijima, T. Ichihashi, “Single-shell carbon nanotubes of 1-nm diameter”, Nature,
363, pp. 603-605, 1993.
[62] D. S. Bethune, C. H. Kiang, M. S. de Vries, G. Gorman, R. Savoy, J. Vazquez, R.
Beyers. “Cobalt-catalysed growth of carbon nanotubes with single-atomic-layer
walls”, Nature, 363, pp. 605-607, 1993.
[63] H.G. Chae, T.V. Sreekumar, T. Uchida, S. Kumar. “A comparison of
reinforcement efficiency of various types of carbon nanotubes in polyacrylonitrile
fiber”, Polymer, 46 (24), pp.10925–10935, 2005.
[64] H.G. Chae, M.L. Minus, A. Rasheed, S. Kumar. “Stabilization and carbonization
of gel spun polyacrylonitrile/single wall carbon nanotube composite fibers”,
Polymer, 48 (13), pp.3781–3789, 2007.
[65] H.H. Ye, H. Lam, N. Titchenal, Y. Gogotsi, F. Ko. “Reinforcement and rupture
behavior of carbon nanotubes-polymer nanofibers”, Applied Physics Letters,
85(10), pp. 1775-1777, 2004.

51
[66] S. Liu, L. Tan, D. Pan, Y. Chen. “Gel spinning of polyacrylonitrile fibers with
medium molecular weight”. Polymer International, 60, pp. 453–457, 2011.
[67] H.G. Chae, Y.H. Choi, M. L. Minus, S. Kumar. “Carbon nanotube reinforced
small diameter polyacrylonitrile based carbon fiber”, Composites Science and
Technology, 69 (3-4), pp.406-413, 2009.
[68] http://www.toraycfa.com/pdfs/T300DataSheet.pdf
[69] http://www.nist.gov/public_affairs/practiceguides/NIST%20SP960-19.pdf
[70] F. Inam. "Dimethylformamide: An effective dispersant for making ceramic-
carbonnanotube composites" Nanotechnology, 19, p. 195710, 2008.
[71] R. Poyato. "Aqueous colloidal processing of single-wall carbon nanotubes and
their composites with ceramics" Nanotechnology, 17, pp. 1770-1770, 2006.
[72] M. Naraghi, I. Chasiotis, Y. Dzenis, Y. Wen, H. Kahn. “Mechanical deformation
and failure of electrospun polyacrylonitrile nanofibers as a function of strain rate”,
Applied Physics Letters, 91, p. 151901, 2007.
[73] M. Naraghi, I. Chasiotis, Y. Dzenis, Y. Wen, and H. Kahn, “Novel Method for
Mechanical Characterization of Polymeric Nanofibers”, Review of Scientific
Instruments, 78, p. 085108, (2007)
[74] S.N. Arshad, M. Naraghi, I. Chasiotis. “Strong Carbon Nanofibers from
Electrospun Polyacrylonitrile”, Carbon, 49 (5), pp. 1710-1719, 2011.
[75] T. Ozkan, M. Naraghi, I. Chasiotis. “Mechanical Properties of Vapor Grown
Carbon Nanofibers”, Carbon 48 (1), pp. 239-244, 2010.
[76] M. Naraghi, S. Arshad, I. Chasiotis. “Molecular Orientation and Mechanical
Property Size Effects in Electrospun Polyacrylonitrile Nanofibers”, Polymer, 52,
pp. 1612-1618, 2011.
[77] M. Naraghi, I. Chasiotis, “Optimization of Comb-driven Devices for Mechanical
Testing of Polymeric Nanofibers Subjected to Large Deformations”, Journal of
Microelectromechanical Systems, 18 (5), pp. 1032-1046, 2009.
[78] W. Weibull. “A Statistical Theory of the Strength of Materials”, Royal Swedish
Institute for Engineering Research, Stockholm, Sweden, 1939.
[79] M.F. Ashby, D.R.H. Jones. Engineering materials 2: An Introduction to
Microstructures, Processing and Design, Pergamon Press, Oxford, England,
2005.
[80] B. Bergman. “On the estimation of the Weibull modulus”, Journal of Materials
Science Letters, 3 (8), pp. 689-692, 1984.
[81] M.R. Gurvich, A.T. DiBenedetto, A. Pegoretti. “Evaluation of the statistical
parameters of a Weibull distribution”, Journal of Materials Science, 32 (14), pp.
3711-3716, 1997.

52
[82] K. Trustrum, A.D.S. Jayatilaka. “On estimating the Weibull Modulus for a brittle
material”, Journal of Material Science, 14 (5), pp. 1080-1804, 1979.