Advancing Organics Management in Washington State
424
Advancing Organics Management in Washington State: The Waste to Fuels Technology Partnership 2015-2017 Biennium June 2018 Publication no. 18-07-010 Contract no. C1600095 and C1700123
-
Upload
khangminh22 -
Category
Documents
-
view
0 -
download
0
Transcript of Advancing Organics Management in Washington State

Advancing Organics Management in
Washington State:
The Waste to Fuels Technology Partnership 2015-2017 Biennium
June 2018 Publication no. 18-07-010 Contract no. C1600095 and C1700123

Publication and Contact Information
This report is available on the Department of Ecology’s website at https://fortress.wa.gov/ecy/publications/summarypages/1807010.html
For more information contact:
Waste 2 Resources P.O. Box 47600 Olympia, WA 98504-7600
Phone: 360-407-6900
Washington State Department of Ecology - www.ecy.wa.gov
o Headquarters, Olympia 360-407-6000
o Northwest Regional Office, Bellevue 425-649-7000
o Southwest Regional Office, Olympia 360-407-6300
o Central Regional Office, Yakima 509-575-2490
o Eastern Regional Office, Spokane 509-329-3400
If you need this document in a format for the visually impaired, call the Waste 2 Resources Program at 360-407-6900. Persons with hearing loss can call 711 for Washington Relay Service. Persons with a speech disability can call 877-833-6341.

Advancing Organics Management in
Washington State
The Waste to Fuels Technology Partnership 2015-2017 Biennium
By
Shulin Chen, Manuel Garcia-Pérez, Chad Kruger, Timothy Ewing, Jim Jensen, Georgine Yorgey, David R. Gang, Jim Amonette, Michael Ayiania, Anna Berim, Lucia Botella, Felix Martin Carbajal Gamarra, John Cleary, Alex Dunsmoor,
Richard W. Finch, Mark Fuchs, Sohrab Haghighi Mood, Sonia A. Hall, Yinglei Han, B. Thomas Jobson, Robert Long, Jingwei Ma, Kalidas Mainali,
Dusty Moller, Lars Neuenschwander, Ayca Seker, Dave Sjoding, Filip Stankovikj, Waled Suliman, Abid Tanzil, Evan Terrell, Chi-Cong Tran,
Xiaochao Xiong, and Liang Yu
Compiled and edited by
Karen Hills, Sonia A. Hall, Brooke Saari, and Tara Zimmerman
Waste 2 Resources Washington State Department of Ecology
Olympia, Washington


i
Table of Contents
Page
List of Figures and Tables ................................................................................................. viii
Figures ............................................................................................................................... viii
Tables ................................................................................................................................ xiii
List of Abbreviations ......................................................................................................... xvi
Acknowledgements ......................................................................................................... xviii
Executive Summary .......................................................................................................... xix
1. Producing a High-Value Food Additive, Polyphenols, from Fruit Pomace ..................1
1.1 Abstract ....................................................................................................................1
1.2 Background ..............................................................................................................2
1.3 Objectives ................................................................................................................3
1.4 Methods....................................................................................................................3
1.4.1 Preparation of adsorbents with surface functional groups ............................3
1.4.2 Preparation of grape pomace ........................................................................4
1.4.3 Preparation of the crude grape pomace extract.............................................4
1.4.4 Purification of crude extracts with adsorbents..............................................4
1.4.5 Determination of total polyphenols and subclasses ......................................5
1.5 Results and discussion .............................................................................................5
1.5.1 Recovery of polyphenols from grape pomace ..............................................5
1.5.2 Favorability of the adsorption of polyphenols onto functionalized adsorbents ..............................................................................................................7
1.5.3 Characterization of recovered polyphenols ..................................................9
1.5.4 Purity of recovered polyphenols with surface-functionalized adsorbents ..12
1.6 Conclusion .............................................................................................................13
1.7 References ..............................................................................................................14
2. Evaluation of Biorefinery Alternatives for the Production of Alternative Jet Fuel in a Composting Facility .....................................................................................................16
2.1 Abstract ..................................................................................................................16
2.2 Background ............................................................................................................16
2.3 Objectives ..............................................................................................................18
2.4 Methods ..................................................................................................................18
2.4.1 Methodology for evaluation of biorefinery alternatives .............................18
2.4.2 Composting baseline scenario ....................................................................19
2.4.3 Alternative jet fuel baseline scenarios ........................................................24
2.4.4 Biorefinery scenarios ..................................................................................30
2.4.5 Mass and energy balances ..........................................................................34
2.4.6 Techno-economic analysis .........................................................................34
2.5 Results and discussion ...........................................................................................36
2.5.1 Mass and energy balances ..........................................................................36
2.5.2 Techno-economic analysis .........................................................................41

ii
2.6 Conclusions ............................................................................................................47
2.7 References ..............................................................................................................48
3. Production and Characterization of Transportation Fuels from the Hydrotreatment and Distillation of Pyrolysis Oils .................................................................................52
3.1 Abstract ..................................................................................................................52
3.2 Background ............................................................................................................53
3.2.1 Characteristics of pyrolysis oils ..................................................................53
3.2.2 Evolution of functional groups during pyrolysis oil stabilization ..............54
3.2.3 Hydrotreating pyrolysis oils .......................................................................54
3.2.4 Co-hydrotreatment of vegetable oil and tire pyrolysis oil ..........................55
3.3 Objectives ..............................................................................................................55
3.4 Methods..................................................................................................................56
3.4.1 Evolution of functional groups during pyrolysis oil stabilization ..............56
3.4.2 Pyrolysis oil hydrotreatment for enhancing solubility in biodiesel and the fuel properties of resulting blends .......................................................................57
3.4.3 Co-hydrotreatment of tire pyrolysis oil and vegetable oil for the production of transportation fuel ...........................................................................................58
3.5 Results ....................................................................................................................59
3.5.1 Evolution of functional groups during pyrolysis oil stabilization ..............59
3.5.2 Pyrolysis oil hydrotreatment for enhancing solubility in biodiesel and the fuel properties of resulting blends .......................................................................65
3.5.3 Co-hydrotreatment of tire pyrolysis oil and vegetable oil for the production of transportation fuel ...........................................................................................70
3.6 Conclusions ............................................................................................................72
3.7 References ..............................................................................................................72
4. Producing Lipid-Based Biofuel and Chemicals as Options for an Integrated Biorefinery ...................................................................................................................78
4.1 Abstract ..................................................................................................................78
4.2 Background ............................................................................................................78
4.3 Methods..................................................................................................................81
4.3.1 Biofuel production by oleaginous yeast .....................................................81
4.3.2 Techno-economic assessment of lipid-based biofuel .................................83
4.4 Results and discussion ...........................................................................................84
4.4.1 Advanced biofuel production by oleaginous yeast .....................................84
4.4.2 Techno-economic assessment of lipid-based biofuel .................................87
4.5 Conclusions ............................................................................................................91
4.6 References ..............................................................................................................92
5. Quantification of Heavy Metals and Soluble Organic Pollutants in Biochar from Pyrolysis of Urban Wood Residuals and Compost Overs ...........................................95
5.1 Abstract ..................................................................................................................95
5.2 Background ............................................................................................................95
5.3 Objectives ..............................................................................................................96
5.4 Methods..................................................................................................................97
5.4.1 Sample preparation .....................................................................................97
5.4.2 Pyrolysis .....................................................................................................98

iii
5.4.3 Biochar characterization .............................................................................99
5.4.4 Washing experiment ...................................................................................99
5.5 Results and discussion .........................................................................................100
5.5.1 Biochar yield ............................................................................................100
5.5.2 Volatile matter, fixed carbon, and ash content .........................................100
5.5.3 Elemental analysis of biochar ...................................................................101
5.5.4 Surface properties .....................................................................................103
5.5.5 Polycyclic aromatic hydrocarbons ...........................................................104
5.5.6 Heavy metal analysis ................................................................................104
5.5.7 Washing experiment .................................................................................108
5.6 Conclusions ..........................................................................................................110
5.7 References ............................................................................................................111
6. Identification of Volatile Compounds from Pyrolysis of Urban Wood Residuals and Compost Overs...........................................................................................................113
6.1 Abstract ................................................................................................................113
6.2 Background ..........................................................................................................113
6.3 Objectives ............................................................................................................114
6.4 Methods................................................................................................................114
6.5 Results and discussion .........................................................................................116
6.6 Conclusions ..........................................................................................................124
6.7 References ............................................................................................................125
7. Identification of Condensed Liquid Products and Biochar Yields during Pyrolysis of Urban Wood Residuals and Compost Overs .............................................................126
7.1 Abstract ................................................................................................................126
7.2 Background ..........................................................................................................126
7.3 Objectives ............................................................................................................127
7.4 Methods................................................................................................................127
7.5 Results and discussion .........................................................................................129
7.5.1 Proximate analysis ....................................................................................129
7.5.2 Char quantification ...................................................................................130
7.5.3 GC-MS and HPLC ...................................................................................132
7.5.4 UV-Fluorescence ......................................................................................134
7.6 Conclusions ..........................................................................................................136
7.7 References ............................................................................................................136
8. Composting in the Presence of Biochar and Impact of the Resulting Product as a Soil Amendment: A Review..............................................................................................138
8.1 Abstract ................................................................................................................138
8.2 Introduction ..........................................................................................................138
8.2.1 Feedstock availability ...............................................................................139
8.2.2 Production of biochar ...............................................................................139
8.2.3 Pyrolysis ...................................................................................................141
8.3 Effect of biochar addition on soil properties........................................................152
8.3.1 Overview ..................................................................................................152
8.3.2 Biochar interaction with pollutants ..........................................................152
8.3.3 Mechanisms for removal of pollutants .....................................................153

iv
8.4. Introduction to compost ......................................................................................154
8.4.1 Composting phenomena ...........................................................................154
8.4.2 Parameters affecting the composting process ...........................................155
8.5 Addition of biochar during composting ...............................................................157
8.5.1 Impact of biochar addition on the composting process ............................157
8.5.2 Impacts of biochar on compost properties ................................................164
8.6 Use of biochar-enriched compost as a soil amendment .......................................165
8.7 Conclusions ..........................................................................................................167
8.8 References ............................................................................................................168
9. Impact of Biochar on Composition and Properties of Herbs: A Review ...................181
9.1 Abstract ................................................................................................................181
9.2 Background ..........................................................................................................181
9.3 Biochar and plant growth meta-analyses .............................................................185
9.4 Impact of biochar or co-composted biochar on soil health and soil microbiome 187
9.5 Impact of biochar on plant health and disease resistance ....................................189
9.6 Biochar improves resistance to specific abiotic stresses......................................190
9.7 Impact of biochar and co-composted biochar on plant productivity and crop yield ....................................................................................................................................192
9.8 Relationship between herb productivity and biochar...........................................195
9.9 Conclusions ..........................................................................................................197
9.10 References ..........................................................................................................197
10. Evaluation of Impact of Biochar-Amended Compost on Organic Herb Yield and Quality........................................................................................................................204
10.1 Abstract ..............................................................................................................204
10.2 Background ........................................................................................................204
10.3 Objectives ..........................................................................................................206
10.4 Methods..............................................................................................................207
10.4.1 Compost generation and gas emission sampling ....................................207
10.4.2 Plant growth and tissue collection ..........................................................209
10.4.3 Metabolite analysis .................................................................................210
10.5 Results and discussion .......................................................................................212
10.5.1 Compost generation and gas emissions ..................................................212
10.5.2 Impact of biochar amendment on sweet basil productivity ....................213
10.5.3 Impact of biochar amendment on sweet basil anti-oxidant compound production ..........................................................................................................215
10.5.4 Impact of biochar amendment on sweet basil flavor compound production ...........................................................................................................................216
10.6 Conclusions ........................................................................................................219
10.7 References ..........................................................................................................219
11. Wood Waste Boiler Survey .......................................................................................222
11.1 Abstract ..............................................................................................................222
11.2 Background ........................................................................................................222
11.3 Objectives ..........................................................................................................223
11.4 Methods..............................................................................................................224
11.4.1 Preparing contact list ..............................................................................224

v
11.4.2 Preparing survey questionnaire ..............................................................224
11.4.3 Survey implementation ...........................................................................225
11.4.4 Survey results compilation .....................................................................225
11.5 Results and discussion .......................................................................................225
11.6 Conclusions ........................................................................................................227
11.7 References ..........................................................................................................227
12. Changes to Boiler Operations to Produce High-Carbon Residuals or Biochar .........228
12.1 Abstract ..............................................................................................................228
12.2 Background ........................................................................................................228
12.3 Objectives ..........................................................................................................230
12.4 Methods..............................................................................................................230
12.5 Results ................................................................................................................230
12.5.1 Characteristics of high-carbon ash produced in biomass boilers ...........230
12.5.2 Greater recovery approach .....................................................................233
12.5.3 Greater production approach ..................................................................235
12.5.4 Developing the biochar industry – Challenges to using existing biomass boilers for biochar production ...........................................................................237
12.6 Conclusions ........................................................................................................239
12.7 References ..........................................................................................................240
13. Woody Biomass Inventory Methodology ..................................................................242
13.1 Abstract ..............................................................................................................242
13.2 Background ........................................................................................................242
13.2.1 Urban wood residuals .............................................................................243
13.2.2 Overgrown and overstocked forest biomass ...........................................244
13.3 Methods..............................................................................................................245
13.3.1 Urban wood residuals .............................................................................245
13.3.2 Overgrown and overstocked forest biomass ...........................................245
13.4 Results and discussion .......................................................................................246
13.4.1 Urban wood residuals .............................................................................246
13.4.2 Overgrown and overstocked forest woody biomass ...............................252
13.5 Conclusions and recommendations....................................................................268
13.6 References ..........................................................................................................268
14. Assessing Local Technical Potentials for CO2 Drawdown Using Biochar from Forestry Residues and Waste Wood in Washington State .........................................271
14.1 Abstract ..............................................................................................................271
14.2 Background ........................................................................................................271
14.3 Methods..............................................................................................................272
14.3.1 Site selection ...........................................................................................272
14.3.2 Dataset compilation ................................................................................272
14.3.3 Compilation of relevant scientific literature ...........................................272
14.3.4 Method development ..............................................................................272
14.4 Results and discussion .......................................................................................273
14.4.1 Site selection ...........................................................................................273
14.4.2 Datasets ...................................................................................................273
14.4.3 Biomass yield response to soil amendment with biochar .......................276

vi
14.4.4 Climate system response to CO2 drawdown ..........................................280
14.4.5 Estimates of available woody biomass ...................................................282
14.4.6 Location of available woody biomass ....................................................286
14.4.7 Estimates of biochar and bioenergy technical potential .........................287
14.5 Conclusions ........................................................................................................289
14.6 References ..........................................................................................................290
15. Bioelectrochemical Systems in a Sustainable Biorefinery ........................................294
15.1 Abstract ..............................................................................................................294
15.2 Introduction ........................................................................................................294
15.2.1 Biorefinery concept ................................................................................294
15.2.2 Bioelectrochemical systems ...................................................................295
15.3 Methods..............................................................................................................303
15.4 Discussion of BESs applications .......................................................................304
15.4.1 Organic waste treatment .........................................................................304
15.4.2 Nutrient recovery ....................................................................................305
15.4.3 Biofuel production ..................................................................................307
15.4.4 Biochemical production ..........................................................................308
15.4.5 Degradation and removal of environmental contaminants .....................309
15.4.6 Bioelectrochemical support components and additional applications ....312
15.5 Proposed biorefinery configuration and next steps ............................................313
15.6 References ..........................................................................................................315
16. A Review of Carbon Accounting Relevant to the Biorefinery Concept ....................337
16.1 Abstract ..............................................................................................................337
16.2 Introduction to carbon accounting .....................................................................337
16.2.1 Definition of carbon accounting .............................................................338
16.2.2 Categories of carbon accounting ............................................................339
16.2.3 Justification of carbon accounting ..........................................................341
16.3 Objectives ..........................................................................................................341
16.4 Background on relevance to biorefineries .........................................................341
16.4.1 Sustainable anaerobic biorefinery ..........................................................341
16.4.2 Baseline for comparing organic waste treatment technologies ..............343
16.5 Methods..............................................................................................................343
16.6 Literature Review...............................................................................................344
16.6.1 Biorefineries ...........................................................................................344
16.6.2 Feedstock ................................................................................................345
16.6.3 Pretreatment processes ...........................................................................346
16.6.4 Anaerobic digestion ................................................................................346
16.6.5 Fiber separation ......................................................................................348
16.6.6 Composting .............................................................................................348
16.6.7 Biogas stripping and upgrading ..............................................................349
16.6.8 Nutrient recovery ....................................................................................350
16.6.9 Wastewater treatment .............................................................................350
16.6.10 Thermochemical technologies for production and utilization of biochar ...........................................................................................................................350
16.6.11 Manure, fertilizer, and AD effluent field application ...........................351
16.6.12 Other innovative or potentially disruptive processes or technologies ..351

vii
16.7 Conclusions and next steps ................................................................................356
16.8 References ..........................................................................................................357
17. Commercialization, Technology Transfer, and Extension ........................................366
17.1 Abstract ..............................................................................................................366
17.2 Technology transfer, outreach, and extension activities ....................................366
17.2.1 Building relationships with clientele ......................................................367
17.2.2 Sharing research findings and providing technical support ...................368
17.2.3 Durable extension products ....................................................................369
17.3 Impacts of technology transfer, outreach and extension activities ....................370
18. Appendices .................................................................................................................372
Appendix A. Construction of the Anaerobic Digestion Jet Fuel Model ....................372
References .........................................................................................................378
Appendix B. Heavy Metals in Biochar – Supplemental Results and Thresholds in Related Regulations ...................................................................................................379
Appendix C. Results of Survey of Boiler Operators..................................................382

viii
List of Figures and Tables
Figures
Page Figure 1.1: (a) Fourier infrared transform reflectance (FTIR) of bare silica and mPEG-functionalized silica microparticles, (b) The chemical structure of mPEG .................................... 6
Figure 1.2: (a) Adsorption capacity; w: white grape pomace, r: red grape pomace and (b) Adsorption ratios and c) Recoveries of bare, mPEG- and amine-functionalized silica microparticles for total polyphenols ............................................................................................... 7
Figure 1.3: Adsorption isotherms of red grape pomace polyphenols (a) and white grape pomace polyphenols (b) on mPEG- and amine-functionalized silica microparticles at 30°C. (Qe is equilibrium adsorption capacity. Ce is equilibrium concentration of solute in bulk solution.) ...... 8
Figure 1.4: Freundlich adsorption equation constants of total polyphenols on mPEG- and amine-functionalized silica microparticles at 30°C ................................................................................. 10
Figure 1.5: Adsorption ratios of (a) total proanthocyanidins, (b) total flavanols, and (c) total anthocyanins for bare and mPEG-functionalized silica microparticles (w: white grape pomace, r: red grape pomace) ......................................................................................................................... 11
Figure 1.6: Recovery of (a) total proanthocyanidins, (b) total flavanols, and (c) total anthocyanins from bare and mPEG-functionalized silica microparticles (w: white grape pomace, r: red grape pomace) ..................................................................................................................... 12
Figure 1.7: Dry total polyphenols purity (%) for crude extracts and extracts purified by bare, mPEG-functionalized, and amine-functionalized (-NH2) silica microparticles ........................... 13
Figure 2.1: Proposed methodology for selecting biorefinery scenarios (biorefinery concepts) for composting facilities ..................................................................................................................... 19
Figure 2.2: Biorefinery scenarios for a composting facility ......................................................... 30
Figure 2.3: Schematics of proposed integrated pathways between a composting facility and anaerobic digestion ....................................................................................................................... 30
Figure 2.4: Schematics of proposed integrated pathways between a composting facility and slow pyrolysis ........................................................................................................................................ 31
Figure 2.5: Schematics of proposed integrated pathways between a composting facility and fast pyrolysis ........................................................................................................................................ 31
Figure 2.6: Schematics of proposed integrated pathways between a composting facility and ATJ technology ..................................................................................................................................... 32
Figure 2.7: Schematics of proposed integrated pathways between a composting facility and Virent BioForming technology ..................................................................................................... 32
Figure 2.8: Process block diagram of the composting facility base case (capacity 160,000 wet metric tons per year). Inputs and outputs are expressed in metric tons per day ........................... 37
Figure 2.9: Process block diagram of proposed integrated pathways between the composting facility and anaerobic digestion. Values are expressed in metric tons ......................................... 37
Figure 2.10: Process block diagram of proposed integrated pathways between the composting facility and slow pyrolysis. Values are expressed in metric tons ................................................. 38
Figure 2.11: Process block diagram of proposed integrated pathways between the composting facility and fast pyrolysis. Values are expressed in metric tons ................................................... 38

ix
Figure 2.12: Process block diagram of proposed integrated pathways between the composting facility and alcohol to jet. Values are expressed in metric tons .................................................... 39
Figure 2.13: Process block diagram of proposed integrated pathways between composting facility and Virent process. Values are expressed in metric tons ................................................. 39
Figure 2.14: Process block diagram for product base (standalone) cases. These cases utilize municipal solid waste as a feedstock and produce a varying range of products ........................... 41
Figure 2.15: Effect of tipping fee ($ per metric ton) and capacity (metric tons per day) on the minimum selling price for anaerobic digestion ............................................................................ 43
Figure 2.16: Effect of tipping fee ($ per metric ton) and capacity (metric tons per day) on the minimum selling price for slow pyrolysis .................................................................................... 44
Figure 2.17: The effect of tipping fee ($ per metric ton) and capacity (metric tons per day) on the minimum selling price for fast pyrolysis ...................................................................................... 45
Figure 2.18: Effect of tipping fee ($ per metric ton) and capacity (metric tons per day) on the minimum selling price for Virent’s BioForming .......................................................................... 46
Figure 2.19: Effect of tipping fee ($ per metric ton) and capacity (metric tons per day) on the minimum selling price of alcohol to jet ........................................................................................ 47
Figure 3.1: Experimental workflow of co-hydrotreatment of tire pyrolysis oil and vegetable (canola) oil .................................................................................................................................... 59
Figure 3.2: Yield of aqueous phase and bottom phase ................................................................. 60
Figure 3.3: Hydrogen consumption (in g g-1) of stabilized pyrolysis oil ...................................... 61
Figure 3.4: Production of CH4 and CO2 (in g g-1) of stabilized pyrolysis oil ............................... 61
Figure 3.5: Water content in the aqueous and bottom phases of the stabilized oils (left); cumulative water content in the system (right) ............................................................................. 62
Figure 3.6: Reaction temperature dependence of the content of carbonyl groups, aromatic compounds, and carboxylic acids in the aqueous and bottom phases of the stabilized pyrolysis oils (FTIR study comparison) ....................................................................................................... 64
Figure 3.7: Yield of biodiesel- and upgraded pyrolysis oil (bio-oil)-rich phases ......................... 66
Figure 3.8: Concentrations of upgraded pyrolysis oils (bio-oils) in the biodiesel-rich phase ...... 67
Figure 3.9: Yield of upgraded pyrolysis oil (bio-oil) extracted by the biodiesel .......................... 68
Figure 3.10: SEM micrographs for fresh and used CoMo/Al2O3 catalysts .................................. 71
Figure 4.1: An integrated biorefinery platform by using volatile fatty acids (VFA) generated from an anaerobic digestion (AD) process to produce lipid-based biofuel (drop-in hydrocarbon)....................................................................................................................................................... 80
Figure 4.2: Pathway for over-producing triacylglycerol (TAG) in Y. lipolytica .......................... 82
Figure 4.3: Pathway design for biosynthesis of fatty alcohol and wax ester in Y. lipolytica ....... 83
Figure 4.4: Lipid produced by the engineered strains (A) and lipid body in the recombinants (red portions of cells) (B) ..................................................................................................................... 85
Figure 4.5: GC-FID analysis of products of WEs produced by Y. lipolytica ............................... 85
Figure 4.6: (A) Growth of Y. lipolytica on 30 g L-1 of acetate, (B) Fatty alcohol produced, and (C) Fatty alcohol produced with supplementary dodecane, by two strains of engineered Y.
lipolytica, developed in our lab ..................................................................................................... 86
Figure 4.7: Effect of jet fuel production rate on profitability index for the AD Jet Fuel process 89
Figure 4.8: Effect of the tipping fee on the profitability index for the AD Jet Fuel process ........ 89
Figure 4.9: Effect of jet fuel price on the profitability index for the AD Jet Fuel process ........... 90
Figure 4.10: Effect of lipid titer on the profitability index for the AD Jet Fuel process .............. 91
Figure 5.1: Images of the woody biomass sources used in pyrolysis experiment ........................ 98

x
Figure 5.2: Spoon pyrolysis reactor used for biochar production ................................................. 98
Figure 5.3: Biochar yield at 400°C and 600°C ........................................................................... 100
Figure 5.4: Proximate analysis of biochar .................................................................................. 101
Figure 5.5: Elemental analysis of biochar................................................................................... 102
Figure 6.1: Chlorine, nitrogen, and sulfur abundance in samples .............................................. 124
Figure 7.1: Modified pyroprobe reactor set-up ........................................................................... 128
Figure 7.2: Raw chipped biomass (left) and ball-milled biomass flour (right) .......................... 129
Figure 7.3: Char yield at different reaction temperatures for A) Painted wood, B) Treated wood, C) Sawmill cut ends, D) OSB, E) Particle board, and F) Furniture (error bars represent standard error) ........................................................................................................................................... 130
Figure 7.4: Char yield at different reaction temperatures for G) Plywood, H) Molded pallet, I) Wood-derived fuel, J) Compost overs (1), and K) Compost overs (2) (error bars represent standard error) ............................................................................................................................. 131
Figure 7.5: UV-fluorescence spectra for A) Painted wood, B) Treated wood, C) Sawmill cut ends, D) OSB, E) Particle board, and F) Furniture ..................................................................... 134
Figure 7.6: UV-fluorescence spectra for G) Plywood, H) Molded pallet, I) Wood-derived fuel, J) Compost overs (1), and K) Compost overs (2) ........................................................................... 135
Figure 8.1: Mechanisms of pyrolysis (adapted from Vamvuka [2011]) ..................................... 142
Figure 8.2: Scanning electron microscope images of biochars derived from the pyrolysis of Douglas fir wood (a), Douglas fir bark (b), and hybrid poplar biochars (c) (Suliman et al., 2016)..................................................................................................................................................... 144
Figure 8.3: TEM images of a biochar derived from (a) Douglas fir wood (350°C) and (b) (600°C)..................................................................................................................................................... 145
Figure 8.4: Proposed superstructures for amorphous carbon (A) Franklin model 1951 (Franklin et al., 1951) and (B) Falling cards model 1995 (Dahn et al., 1997) ............................................... 145
Figure 8.5: Surface area (SA) and pore volume (PV) for biochar produced from Douglas fir wood (DFW), Douglas fir bark (DFB), and hybrid poplar (HP), as determined by CO2 (1&3) and N2 (2&4) adsorptions, using the Dubinin-Radushkevich method (Suliman, 2016) ................... 146
Figure 8.6: Detailed cluster representation of amorphous carbons (A) Harris model (2007) (Harris et al., 2008), (B) Shin model 1984 (Shinn et al., 1984) .................................................. 147
Figure 8.7: Model of a fragment of biochar surface, showing the most important types of surface functional groups, adapted from Bandosz (2006) ....................................................................... 147
Figure 8.8: Influence of pyrolysis temperature on the elemental composition of biochars derived from the pyrolysis of Douglas fir wood (DFW), Douglas fir bark (DFB), and hybrid poplar (HP) (Suliman et al., 2016) .................................................................................................................. 149
Figure 8.9: Variation in surface acidic and total basic functional groups as a function of pyrolysis temperature and feedstock source (Douglas fir wood: DFW, Douglas fir bark: DFB, hybrid poplar: HP) (Suliman et al., 2016) .............................................................................................. 150
Figure 8.10 Variation in zeta potential (surface charge) as a function of temperature for biochar from DFW (a), HP (b), and DFB (c) (Suliman et al., 2016) ....................................................... 151
Figure 8.11: Cumulative emissions of carbon dioxide (CO2), methane (CH4), and nitrous oxide (N2O) for compost and biochar blended with compost (Vandecasteele et al., 2016) ................. 161
Figure 8.12: Evolution of carbon dioxide (a), methane emissions (b), ammonia emission (c), nitrous oxide emissions (d), extractable ammonia (e), and total Kjeldahl nitrogen (f) during composting of DFSS + WS: Dewatered fresh sewage sludge + wheat straw (Control): DFSS +

xi
WS + L: Dewatered fresh sewage sludge + wheat straw + lime; DFSS + WS + L+ B: Dewatered fresh sewage fresh sewage sludge + wheat straw + lime + biochar (Awasthi et al., 2016b) ...... 162
Figure 9.1: The number of publications and literature citations (indicated above each graph) related to biochar and biochar in combination with other related topics. ................................... 183
Figure 9.2: Model of how biochar affects soil, plants, and soil-plant interactions under stressed conditions .................................................................................................................................... 191
Figure 10.1: Emissions in the early composting phase, up to day 14, either in the presence of compost alone or compost that was co-composted with ash or char amendments. (A) Mean flux of acetaldehyde, acetone, and dimethylsulfide (DMS) (B) Normalized area flux of α-pinene. . 212
Figure 10.2: Impact of biochar co-composting on biomass/yield of sweet basil cultivars Eleanora (a Genovese type of basil) and TSQ (Thai Siam Queen, a SE Asian basil cultivar). Different letters indicate significant differences between treatments. ....................................................... 214
Figure 10.3: The effect of biochar and ash amendments on antioxidant compound production (rosmarinic acid and chicoric acid) for (A) Eleanora and (B) TSQ basil cultivars. The only difference observed that was apparently truly significant was the higher level of rosmarinic acid in the Eleanora non-compost control plants compared to all other treatments, including the compost control. .......................................................................................................................... 216
Figure 10.4: GC-MS chromatograms for volatile compounds produced by TSQ (A-D) and Eleanora (E-H) demonstrate that treatments had little effect on flavor compound production .. 217
Figure 10.5: Relative levels of the major compounds produced by each cultivar across the different treatments. The y-axes are relative levels of compound areas from the GC-MS results, normalized relative to the compost control (set at 100%) .......................................................... 218
Figure 12.1: Sources of wood ash from biomass boilers. (Original illustration by Wellons, Inc., with notations by TR Miles Technical Consultants, Inc. Reprinted with permission.) .............. 231
Figure 12.2: Biochar tote up-flow filtration device installed under a roof downspout (with permission from Gray, et al. [2015]) .......................................................................................... 234
Figure 12.3: Rexius sells biochar and includes it in some of its Opus Grows soil blend products (with permission from Miles [2017]) .......................................................................................... 236
Figure 13.1: Data collection by LiDAR system (Washington DNR website, from a video by the National Ecological Observatory Network) ................................................................................ 256
Figure 13.2: Upper Tanana Valley Study Area. (Black lines show LiDAR flights. Used with permission from the Society of American Foresters. All rights reserved) ................................. 258
Figure 13.3: DNR LiDAR Portal - gray shading indicates areas for which LiDAR data is available (screenshot from July 2017) ........................................................................................ 260
Figure 13.4: Map of DNR LiDAR data priorities (DNR LiDAR Portal) ................................... 260
Figure 13.5: Spokane County LiDAR projects (Brenner, personal communication, 2017; used with permission from Quantum Spatial, Inc.) ............................................................................. 261
Figure 13.6: Turnbull study area in Spokane and Lincoln Counties (WSI, 2013; used with permission from Quantum Spatial, Inc.) ..................................................................................... 262
Figure 13.7: LiDAR point cloud RGB image from Turnbull Study Area. (WSI, 2013; used with permission from Quantum Spatial, Inc.) ..................................................................................... 263
Figure 13.8: Location of the Spokane County LiDAR project area (QSI Environmental, 2015; used with permission from Quantum Spatial, Inc.) .................................................................... 263
Figure 13.9: Illustration of LiDAR image available from Spokane County LiDAR project. (QSI Environmental, 2015; used with permission from Quantum Spatial, Inc.) ................................ 264

xii
Figure 13.10: LiDAR illustration of Upriver Dam from Spokane County LiDAR project (QSI Environmental, 2015; used with permission from Quantum Spatial, Inc.) ................................ 265
Figure 13.11: Community Wildfire Protection Plan treatment priorities (Spokane County, 2009)..................................................................................................................................................... 267
Figure 14.1: Low-scale (1:260,000) map of Spokane County (and the southeast corner of Stevens County) showing GIS datasets for vegetative structure, soil mapping units, roads, and urban boundaries ................................................................................................................................... 275
Figure 14.2: Medium-scale (1:40,000) map centered on the town of Cheney in Spokane County showing GIS datasets for vegetative structure, soil mapping units, roads, and the city limits ... 275
Figure 14.3: High-scale (1:10,000) map centered on the town of Cheney in Spokane County showing GIS datasets for vegetative structure, soil mapping units, roads, and the city limits ... 276
Figure 14.4: Model-simulated temporal evolution of atmospheric CO2 and change in surface air temperature (relative to pre-industrial) from year 1800 to year 2500 (Cao and Caldeira, 2010) 281
Figure 14.5: Map showing urban areas and roads, live woody biomass density (LEMMA data) and the wildland urban interface (dark grey shading) in Spokane County (the southwest corner of Stevens County is also shown at upper left). Yellow dot indicates location of proposed central biochar facility ............................................................................................................................ 284
Figure 14.6: Maps of woody biomass and agricultural soils in Spokane County. (a) woody biomass density from the LEMMA dataset, (b) maximum forest productivity (CMAI) from the soil survey database, (c) land capability classes (2, 3, and 4) from the soil survey database, and (d) woody biomass density and land capability classes. Blue lines indicate roads and highways...................................................................................................................................................... 286
Figure 14.7: Contributions of feedstocks and offset mechanisms to the total offset for biochar under the Aggressive biomass scenario with processing both at field sites and a centralized facility ......................................................................................................................................... 288
Figure 14.8: Contributions of feedstocks and offset mechanisms to the total offset for bioenergy under the Aggressive biomass harvest scenario with processing both at field sites and a centralized facility ....................................................................................................................... 289
Figure 15.1: Driving adoption of biorefinery technologies (adapted from U.S. DOE, n.d.) ...... 295
Figure 15.2: (A) Oxidation and reduction occurring in heterogeneous biofilm. (B) Oxidation occurring at bioanode with reduction occurring at cathode. (C) Oxidation occurring at bioanode and reduction occurring at biocathode ........................................................................................ 296
Figure 15.3: Types of bioelectrochemical systems (BESs) ........................................................ 297
Figure 15.4: Dual chamber microbial fuel cell (MFC) schematic diagram (adapted from Logan et al., 2006) ..................................................................................................................................... 298
Figure 15.5: Sediment microbial fuel cell (SMFC) schematic diagram (adapted from Ewing et al., 2014) ..................................................................................................................................... 299
Figure 15.6: Dual chamber microbial electrolysis cell (MEC) schematic diagram (adapted from Escapa et al., 2016) ..................................................................................................................... 300
Figure 15.7: Dual chamber microbial solar cell (MSC) schematic diagram (adapted from Strik et al., 2011) ..................................................................................................................................... 301
Figure 15.8: Three chamber microbial desalination cell (MDC) schematic diagram. (EM = exchange membrane) (adapted from Cao et al., 2009) ............................................................... 302
Figure 15.9: Conceptualized model of direct interspecies electron transfer (DIET) for enhancing methane production during anaerobic digestion (adapted from Liu et al., 2017) ....................... 303

xiii
Figure 15.10: Two channel power management system increasing the output voltage of generated electricity (adapted from Ewing et al., 2014) ............................................................. 312
Figure 15.11: Schematic diagram showing the concept of a sustainable biorefinery utilizing multiple bioelectrochemical systems .......................................................................................... 314
Figure 16.1: Types of organizational level carbon accounting (adapted from Ascui and Lovell, 2011; Bowen and Wittneben, 2011; Jones, 2012) ...................................................................... 340
Figure 16.2: Sustainable anaerobic biorefinery (adapted from Kennedy et al., 2013) ............... 342
Tables
Table 1.1: Freundlich adsorption equation constants of total polyphenols on mPEG- and amine-functionalized silica microparticles at 30°C ................................................................................... 8
Table 2.1: Technical and economic information used for building the baseline composting facility scenario (Chen et al., 2016) .............................................................................................. 21
Table 2.2: Primary equipment used in the composting facility .................................................... 23
Table 2.3: Composition of municipal solid waste (MSW) used for the baseline scenario ........... 24
Table 2.4: Techno-economic and environmental information from the Virent plant used to build the baseline scenario ..................................................................................................................... 25
Table 2.5: Techno-economic information from the ATJ plant used to build the baseline scenario....................................................................................................................................................... 26
Table 2.6: Techno-economic and environmental information for the fast pyrolysis process ....... 28
Table 2.7: Techno-economic and environmental information for the anaerobic digestion process....................................................................................................................................................... 29
Table 2.8: Techno-economic and environmental information for the slow pyrolysis process ..... 29
Table 2.9: Possible integration scenarios between composting facility and AJF technologies .... 33
Table 2.10: Integration cases studied ............................................................................................ 34
Table 2.11: Lang factor reductions for each of the design cases (as described in Table 2.10) .... 36
Table 2.12: Lang factor modifications and corresponding minimum selling prices (MSPs) of fuel for base (standalone) and co-location scenarios ........................................................................... 42
Table 3.1: Functional group in the volatile fraction of the aqueous and the bottom phases, measured by GC-MS. Results are presented in mmol g-1 sample, not multiplied by yield nor on an organic basis ............................................................................................................................. 63
Table 3.2: Phenol, carboxylic and aliphatic groups content in the stabilized pyrolysis oil phases, measured by 31P-NMR. Results are presented in mmol g-1 sample, not multiplied by yield nor on an organic basis ........................................................................................................................ 63
Table 3.3: Kinematic viscosity of blends of pyrolysis oils and upgraded pyrolysis oils with biodiesel ........................................................................................................................................ 69
Table 3.4: Calorific value of blends of pyrolysis oils and upgraded pyrolysis oils with biodiesel....................................................................................................................................................... 69
Table 3.5: PetroOXY stability of biodiesel blended with pyrolysis oils and upgraded pyrolysis oils ................................................................................................................................................. 69
Table 3.6: BET surface area analysis on fresh and used CoMo/Al2O3 catalysts .......................... 70
Table 3.7: Flash point determination of produced distillation cuts .............................................. 71
Table 3.8: Kinematic viscosity determination (at 40°C) of produced distillation cuts ................. 72

xiv
Table 4.1: Precursors for lipid-based biofuel and chemicals produced by engineered Y.
lipolytica* ..................................................................................................................................... 87
Table 4.2: Estimate of investment for 120 tons of food scraps and 120 tons of food scraps with 100 tons of compost leachate ........................................................................................................ 88
Table 5.1: Feedstock studied in this project.................................................................................. 97
Table 5.2: Hydrogen to carbon (H:C) and oxygen to carbon (O:C) ratios of biochar produced at 400°C and 600°C from different feedstocks. .............................................................................. 103
Table 5.3: Surface area and micropore volume of biochars ....................................................... 104
Table 5.4: Concentrations of metals (determined by ICP-MS) in biochar produced from compost overs and molded wood pallet feedstock. ................................................................................... 106
Table 5.5: Concentrations of metals (determined by ICP-MS) in biochar produced from treated wood, sawmill cut ends, wood-derived fuel, and furniture feedstock. ....................................... 107
Table 5.6: Concentrations of metals (determined by ICP-MS) in biochar produced from painted wood, plywood, oriented strand board, and particle board feedstock. ....................................... 107
Table 5.7: Heavy metal concentrations in biochar from treated wood after hydrochloric acid (HCl), acetic acid, and hot water wash treatments ...................................................................... 109
Table 5.8: Heavy metal concentrations in biochar from painted wood after hydrochloric acid (HCl), acetic acid, and hot water wash treatments ...................................................................... 110
Table 6.1: Compound names used when searching potential pollutants .................................... 116
Table 6.2: Numbers of compounds and potential pollutants identified in vapor resulting from pyrolysis of each material ........................................................................................................... 117
Table 6.3: Significant compounds identified in vapor from pyrolysis of Royal Organic compost overs* .......................................................................................................................................... 117
Table 6.4: Significant compounds identified in vapor from pyrolysis of Ellensburg compost overs* .......................................................................................................................................... 119
Table 6.5: Significant compounds identified in vapor from pyrolysis of furniture .................... 120
Table 6.6: Significant compounds identified in vapor from pyrolysis of molded wood pallet .. 120
Table 6.7: Significant compounds identified in vapor from pyrolysis of oriented strand board 121
Table 6.8: Significant compounds identified in vapor from pyrolysis of painted wood ............ 121
Table 6.9: Significant compounds identified in vapor from pyrolysis of plywood .................... 122
Table 6.10: Significant compounds identified in vapor from pyrolysis of saw mill cut ends .... 122
Table 6.11: Significant compounds identified in vapor from pyrolysis of treated wood ........... 123
Table 6.12: Significant compounds identified in vapor from pyrolysis of wood-derived fuel*. 123
Table 7.1: Proximate analysis ..................................................................................................... 129
Table 7.2: Guaiacol yields in pyrolysis oil ................................................................................. 132
Table 7.3: Furfural yields in pyrolysis oil ................................................................................... 133
Table 7.4: Levoglucosan yields in pyrolysis oil ......................................................................... 133
Table 9.1: Parameters evaluated for impact by biochar application relative to controls ............ 186
Table 10.1: Ash content of biochar used in this investigation .................................................... 207
Table 10.2: Surface area characterization of ash and biochar used in this investigation ............ 208
Table 10.3: Elemental composition of ash and biochar used in this investigation ..................... 208
Table 12.1: Comparison of boiler ash and biochars (Miles, 2015) ............................................. 232
Table 13.1: "Typical" construction waste estimated for a 2,000-square-foot home (Pollution Prevention Regional Information Center, n.d.) ........................................................................... 248
Table 13.2: Spokane County wood waste self-reported by recycling facilities (Ecology, 2015)249

xv
Table 13.3: Woody materials in the overall disposed waste stream for Spokane County (2015-2016) ........................................................................................................................................... 250
Table 13.4: Woody materials in the self-hauled C&D waste stream for Spokane County (2015-2016) ........................................................................................................................................... 251
Table 13.5: Estimated total tons of woody fractions, based on Moller (2009) study methods .. 251
Table 13.6: Illustrations of biomass available in Spokane County (DNR Biomass Calculator) 254
Table 13.7: Summary of different LiDAR systems (Chen, 2014) .............................................. 257
Table 13.8: LiDAR specifications and survey settings for Spokane County LiDAR project (QSI Environmental, 2015; used with permission from Quantum Spatial, Inc.) ................................ 264
Table 14.1: Biomass scenarios for input to the BGRAM program............................................. 285
Table 14.2: Biochar and bioenergy offset values calculated for ten biomass scenarios by BGRAM ...................................................................................................................................... 287
Table 16.1: "Pick and mix" definition of carbon accounting (adapted from Ascui and Lovell, 2011) ........................................................................................................................................... 339

xvi
List of Abbreviations
AD anaerobic digestion
AJF alternative jet fuel
ATJ alcohol to jet
BES bioelectrochemical system
BGRAM Biochar Global Response Assessment Model
BTG Biomass Technology Group
C&D construction and demolition
CMAI culmination mean annual increment
COD chemical oxygen demand
CR carbonization reactor
CSANR Center for Sustaining Agriculture and Natural Resources
DBH diameter at breast height
DIET direct interspecies electron transfer
DNR Department of Natural Resources
EPA Environmental Protection Agency
FFA free fatty acid
FIA Forest Inventory and Analysis
FP fast pyrolysis reactor
GC-MS Gas Chromatography-Mass Spectroscopy
GC-TOFMS Gas Chromatography Time-of-Flight Mass Spectrometer
GC-FID Gas Chromatography-Flame Ionization Detector
GHG greenhouse gas
GIS Geographic Information System
HPLC High-Performance Liquid Chromatography
ICP-MS Inductively coupled plasma mass spectrometry
LCD land clearing debris
LiDAR Light Detection and Ranging
MACT Maximum Achievable Control Technology
MAI mean annual increment
MDC microbial desalination cell
MEC Microbial electrolysis cell
MES microbial electrosynthesis
MFC microbial fuel cell
mPEG methoxy PEG Silane-5000
MSC microbial solar cell

xvii
MSP minimum selling price
MSW municipal solid waste
NAICS North American Industry Classification System
NARA Northwest Advanced Renewables Alliance
NUE nitrogen uptake efficiency
OSB oriented strand board
PAH polycyclic aromatic hydrocarbon
PDA photodiode array
PEM proton exchange membrane
PI profitability index
PMFC plant microbial fuel cell
PMS power management system
PSLC Puget Sound LiDAR Consortium
SMFC sediment microbial fuel cell
TAG Triacylglycerol
UPLC-MS ultra performance liquid chromatography mass spectrometry
USFS United States Forest Service
UV Ultraviolet
VFA volatile fatty acids
VOC volatile organic compound
WE wax ester
WGA waste generation area
WSU Washington State University

xviii
Acknowledgements
The authors would like to thank Sonia A. Hall, Karen Hills, Brooke Saari, and Tara Zimmerman for their time, effort, and skill in compiling and editing this report. The authors of Chapter 12 would also like to thank the following people for their contributions: • Tom Miles, T.R. Miles Technical Consultants • The Western Regional Boiler Operators Association, especially Lisa Harvey-Boyd • Gretchen Newman, Daniel Weston, and Shingo Yamazaki, Washington State Department of
Ecology • Dr. Andrew Brenner, Quantum Spatial • Abigail Gleason, Washington State Department of Natural Resources • Jonah Levine, Confluence Energy and Biochar Solutions

xix
Executive Summary
When organic “waste” materials are disposed of in landfills and wastewater treatment plants, they create a range of negative environmental impacts, including the use of landfill space, production of greenhouse gases, and release of nutrients. Alternatively, these materials can be recovered and used in anaerobic digestion, pyrolysis, composting, and other processes. These processes can support new industries, generate renewable energy, and produce other marketable products. Benefits from this include reduced demand for landfill space, and reduced greenhouse gas emissions. If organic products are land-applied, benefits also include improved soil quality and structure, reduced fertilizer and pesticide use, and increased amounts of carbon sequestered in the soil. Despite these benefits, organics still represent 28.5% of the municipal solid waste stream in Washington State1. Beyond these municipal sources, excess forestry biomass, crop residues, livestock and poultry manures, and food packing and processing wastes represent additional organic resources in Washington that could be more sustainably and productively managed. Significant remaining barriers that have prevented wider adoption of more advanced waste management technologies include project economics, the presence of inexpensive hydroelectric power in the Northwest, contamination of the waste stream, scale issues, opposition to new organic waste processing facilities from neighbors due to odors, and the need for additional technology development. To advance the management of organic materials in Washington State and address some of these barriers, researchers at Washington State University have conducted targeted applied research and extension on emerging technologies for managing residual organic materials. This work was funded through the Waste to Fuels Technology Partnership between Washington State University and the Washington Department of Ecology’s Waste 2 Resources Program. In the 2015-2017 biennium, work was carried out in a wide diversity of topic areas complementary to core composting, anaerobic digestion, and pyrolysis processes. The research this biennium ranged from exploration and development of technologies to produce various high-value co-products—polyphenols, fuel, and biochar—through evaluation of different feedstocks for biochar production and the impacts of biochar soil amendments on soils and on the overall carbon balance, to emerging bioelectrochemical technologies that could complement biorefinery approaches. A summary of that work, and the associated efforts to share the results, is provided here, with additional detail provided in the report that follows. Chapter 1: Producing a High-Value Food Additive, Polyphenols, from Fruit Pomace explores higher value uses for the large quantities of grape pomace—grape pulp, seed, and skins—that are by-products of the winemaking process. Grape pomace is a natural source of high-quality polyphenolic compounds, which have been of interest in recent years due to their potential health-promoting role. If an environmentally benign and economically feasible extraction and purification process can be developed, polyphenols from grape pomace could be used in 1 Washington Department of Ecology and Cascadia Consulting. 2016. 2015-2016 Washington Statewide Waste Characterization Study. Publication No. 16-07-032. Available online at https://fortress.wa.gov/ecy/publications/documents/1607032.pdf

xx
nutritional supplements or other products. Through the work carried out this biennium, a combined extraction and purification process with silica was developed to separate polyphenolic compounds at a high purity level from white and red grape pomace extracts. Bare silica, methoxy polyethylene glycol Silane-5000 (mPEG), and amine-functionalized silica microparticles were tested to determine their polyphenol binding characteristics. Results indicated that mPEG-functionalized silica particles had seven- and three-fold higher adsorption capacities for total polyphenols than bare and amine-functionalized silica microparticles, respectively. Approximately 35% of red pomace polyphenols and 41% of white pomace polyphenols were recovered by mPEG-functionalized silica particles, compared to less than 10% recovery by bare and amine-functionalized silica microparticles. The results of polyphenol subgroup analyses suggest that mPEG-functionalized silica particles preferentially adsorb proanthocyanidins over other tested polyphenol subgroups. When the crude extract polyphenols were purified with mPEG-functionalized silica particles, a purity level of approximately 95% was achieved for dry polyphenol, compared to a purity level of 40% for bare silica and amine-functionalized silica particles. Overall, these results are promising, suggesting an effective combined process of extraction and purification. Further work is needed to improve and scale up this combined process before it can be commercialized. Another important area of research was into the production of fuels within a biorefinery. Chapter
2: Evaluation of Biorefinery Alternatives for the Production of Alternative Jet Fuel in a
Composting Facility explores the integration of emerging technologies for the production of alternative jet fuel with a composting facility, a strategy that could lead to cost reductions, improved economics, and the generation of renewable fuels. A hypothetical composting facility with the capacity to process 160,000 wet metric tons per year was used to evaluate the feasibility of integrating emerging alternative jet fuel production technologies. Three alternative jet fuel technologies for processing of the dry fraction of the feedstock were studied: alcohol to jet, fast pyrolysis-hydrotreatment, and Virent’s BioForming Technology. Anaerobic digestion utilizing the wet fraction to produce methane gas was also studied. In addition, the production of biochar via slow pyrolysis of the dry fraction was examined. Eleven biorefinery scenarios for integrating the composting facility and various processing technologies were evaluated. Integrated compost-alternative jet fuel scenarios, with a tipping fee of $60 per metric ton of waste, had reduced capital and operational expenditures compared to stand-alone alternative jet fuel facilities. Based on this, the minimum selling price for fuel needed for the plant to break even was 29 to 46% lower for integrated facilities. Increasing the feedstock capacity also improved economics, with a minimum selling price of $0.93 to $4.37 per gallon at a feedstock capacity of 2,000 metric tons per day. Among the technologies examined, alcohol to jet was the most economically feasible for integration with a composting facility. The composting facilities studied are too small to support a competitive jet fuel industry, and thus regional strategies for dry waste aggregation (which could include blending with forest and agricultural wastes) that take advantage of existing infrastructure would be needed to achieve economies of scale resulting in competitive alternative fuel break-even prices. Current organic waste management strategies based on paying tipping fees per ton of organic waste processed favors conversion strategies that maximize the volumes of organics processed with little regard for adding value. This has resulted in the processing of large volumes of wastes in relatively

xxi
small areas with composting, a cheap but versatile technology. Next steps could include studies to identify organic waste aggregation strategies suitable for the conditions of Washington State, and to identify alternative economic structures that could catalyze the production of high-value fuels and chemicals from organic wastes. Chapter 3: Production and Characterization of Transportation Fuels from the Hydrotreatment
and Distillation of Pyrolysis Oils examines a major challenge for pyrolytic conversion: the poor quality of the resulting crude oils. Processing pyrolysis oils at high temperatures (200-400oC) with pressured hydrogen in the presence of suitable catalysts (a process called hydrotreatment) is the most viable way to stabilize these oils for subsequent conversion to hydrocarbon fuels. This chapter describes fundamental studies related to the hydrotreatment of pyrolysis oils, examining (1) the evolution of functional groups (groups of atoms within a molecule responsible for the characteristic reactions of a compound) during hydrotreatment, (2) the enhanced solubility in biodiesel after hydrotreatment, and (3) the co-hydrotreatment of tire pyrolysis oil and vegetable oil for the production of transportation fuel. In Part 1, the evolution of functional groups was examined during stabilization of two typical, wood-derived pyrolysis oils (from Amaron and BTG) in a batch reactor. The hydrogen consumption and the levels of deoxygenation were within the ranges reported in the literature, and it was not surprising that the hydrogenation was dominant in the total system, rather than the deoxygenation. Water formation increased from 3 to 10% as the temperature increased, which we speculate was predominantly the result of repolymerization (recombination) reactions instead of typical deoxygenation. In Part 2, hydrotreatment between 200 and 325°C in the presence of a Ru/C catalyst was examined, using the same wood-derived pyrolysis oils, in combination with extraction with biodiesel. This extraction could allow the direct utilization of some pyrolysis oil fractions as fuels. The hydrotreated oils generated three phases: top oil (light hydrocarbons), middle aqueous phase, and bottom heavy oil phase. Each of the phases was characterized, and the content of acetic acid, phenols, aromatic compounds, and linear alkane hydrocarbons was quantified. The upgraded pyrolysis oils were more soluble in biodiesel than the crude pyrolysis oils, obtaining blends with up to 48 and 29% by weight for the BTG and Amaron pyrolysis oils, respectively. Fuel properties of the resulting blends were also reported. In Part 3, the co-hydrotreatment of vegetable oil and tire pyrolysis oil in the presence of a CoMo/Al2O3 catalyst was examined, as a way of utilizing existing infrastructure created for vegetable oil processing to upgrade tire pyrolysis oil to obtain fuel cuts with aromatics. Hydrotreatment studies with different vegetable oil:tire pyrolysis oil blend ratios were conducted. The yield and composition of the resulting hydrotreated oils are reported. Aliphatic hydrocarbons ranging from C7 to C20 (derived from vegetable oils) and aromatics from C6 to C16 (derived from the tire pyrolysis oil) were identified as products. The resulting oils were then successfully distilled into naphtha, kerosene, diesel, and gas oil cuts. The yield, chemical composition, and fuel properties of the transportation fuel cuts obtained are reported and compared with commercial petroleum-derived fuels.

xxii
Although pyrolysis is an excellent alternative to convert polymeric underutilized resources such as biomass, tires, and plastics into oils that can be further refined, the lack of refining technologies to obtain high-value fuels and chemicals is limiting the viability of this promising path. This study demonstrated that stabilization of biomass-derived pyrolysis oils, followed by extraction with biodiesel can be a viable strategy for the production of transportation fuels from lignocellulosic materials. Next steps would include work to develop refining technologies to produce high-value products from pyrolysis oils obtained from these biomass sources. Chapter 4: Producing Lipid-Based Biofuel and Chemicals as Options for an Integrated
Biorefinery investigates a new avenue for combining anaerobic digestion with other technologies as part of an integrated biorefinery, a strategy that may improve the economic feasibility of anaerobic digestion by transforming low-value biomass into high-value, lipid-based fuels and chemicals. The study investigated aspects of an integrated biorefinery utilizing an engineered strain of yeast, Yarrowia lipolytica, to transform anaerobic digestion products into high-value lipids, which can be used for biofuel and lipid-based chemicals. The first part of the study focused on using Y. lipolytica to produce lipid-based biofuel and chemicals when feeding on volatile fatty acids generated from anaerobic digestion. First, researchers used metabolic engineering to produce a strain of Y. lipolytica that efficiently produces triacylglycerol and other lipid-based biofuel and chemicals such as free fatty acids, fatty alcohol, and wax ester. The engineered Y. lipolytica was successfully grown on acetate, a major component of the volatile fatty acids from anaerobic digestion. A techno-economic assessment analyzing the effect of various factors on the profitability of the production of jet fuel—one potential product from the integrated biorefinery—indicated that while current jet fuel price, feasible production rate, and tipping fees support profitable production, lipid titer (concentration) must be increased to 10 g L-
1 to achieve profitability in the model. These results provide crucial information for the further development and scaling up of an integrated biorefinery for the production of lipid-based biofuel and chemicals. This biennium’s research also pursued multiple objectives related to biochar production, including evaluation of different feedstocks, some initial exploration of the risk of producing contaminants in the process, and the potential benefits of biochar as a soil amendment, both to the soil itself, and to the overall carbon balance. Chapters 5 through 7 provide an exploration of the pyrolysis of wood-based fractions of municipal solid waste and compost overs. (Compost overs are large, woody and sometimes plastic materials that have not completely broken down during composting, which are removed by screening after composting is complete.) Chapter 5:
Quantification of Heavy Metals and Soluble Organic Pollutants in Biochar from Pyrolysis of
Urban Wood Residuals and Compost Overs investigates concerns about contaminants—such as heavy metals and soluble organic pollutants—that could be problematic when land applying biochar from these municipal sources to improve soil quality. The study examined whether heavy metals, polycyclic aromatic hydrocarbons, and volatile organic compounds were present in biochar from wood-based municipal solid waste and compost overs, and tested methods for removing heavy metals from biochar. Eleven biochar samples were produced from municipal solid waste and compost overs at two different temperatures (400°C and 600°C) in a laboratory scale spoon reactor. The mass fractions of volatiles, hydrogen, and oxygen decreased with an increase in temperature, with the best composition obtained in the biochar produced at 600°C. Concentrations of metals that exceeded thresholds established by the U.S. Environmental

xxiii
Protection Agency for biosolids were found in biochar made from painted wood (mercury) and treated wood (arsenic). No polycyclic aromatic hydrocarbons were found in the biochar. Of the different acid and hot water wash methods tested for the removal of heavy metals from biochar, an acid wash was found to be the most effective. This study confirms that it is possible to use some of the wood-based fractions of municipal solid waste and compost overs for biochar production. However, the resulting chars will have to be acid washed to remove some of the heavy metals. The viability of using these fractions to produce biochar will depend on our capacity to identify an appropriate scale and market for these chars (or engineered products). Chapter 6: Identification of Volatile Compounds from Pyrolysis of Urban Wood Residuals and
Compost Overs explores whether pyrolysis of these materials could contribute to air quality concerns by examining the vapors expelled during pyrolysis. Several hundred compounds were identified. Among these, 50 to 83 contained chlorine, nitrogen, or sulfur, representing potential pollutants. The main compound was carbon dioxide, except in one sample, used furniture, which primarily emitted acetic acid. On average, treated lumber had the greatest abundance of potential pollutants, as measured by peak areas in the chromatogram. Although compounds containing chlorine, nitrogen and sulfur were identified in small quantities from some of the waste fractions studied, we believe that it may be possible to create blends of these fractions with forest and agricultural wastes (with low contents of chlorine, nitrogen and sulfur) so that these fractions can be successfully converted to value-added products (pyrolysis oil or heat) without need to remove these contaminants. Studies are needed to develop standardization strategies for blending these fractions with other organic resources. Chapter 7: Identification of Condensed Liquid Products and Biochar Yields from Pyrolysis of
Urban Wood Residuals and Compost Overs builds on the work in Chapters 5 and 6 by condensing the pyrolysis products and analyzing yield and composition of liquid products, along with biochar yields. As in the above-described studies, 11 samples of wood scraps, furniture, and compost overs were pyrolyzed at temperatures between 350°C and 500°C under nitrogen. Analysis of the products with gas chromatography–mass spectrometry (GC-MS) showed that major constituents of the collected pyrolysis oil were levoglucosan, furfural, and guaiacol, which were derived from the cellulose, hemicellulose, and lignin fractions of the feedstocks, respectively. However, the yields were low, at less than 1%. The carbohydrate content of the pyrolysis oil was likely too low to be detected through high-performance liquid chromatography (HPLC) analysis. This is hypothesized to result from an inhibitory effect of the ash content in the biomass on thermal decomposition reactions. UV-fluorescence showed that the pyrolysis oil was primarily composed of single-ring and double-ring structures, with a small amount of three-ring polyaromatics. Biochar yields decreased in an approximately linear fashion as pyrolysis temperature increased. The samples pyrolyzed at 350°C had biochar yields as high as 60%, while at 500°C yields were roughly 20%. Despite low liquid yields in the experimental system, the results suggest that optimal liquid yields can be obtained by taking steps to mitigate the negative effect of the feedstock ash content and by operating the pyrolysis reactor at a sufficiently high temperature, near 500°C. Although the fractions studied are not ideal for pyrolysis oil production, they can be used as part of blend with other fractions. An initial washing step may be needed to remove some of the alkalines present. More studies are needed to understand the yield and composition of oils obtained from blends of these fractions with forest and agricultural wastes.

xxiv
Chapters 8 to 10 investigate biochar, biochar co-composted with other organic residuals, and their application to soil for plant growth. Chapter 8 provides a review of literature relating to Composting in the Presence of Biochar and Impact of the Resulting Product as a Soil
Amendment. The use of biochar as an additive for composting has received growing attention in the last ten years. Although the literature reports many beneficial effects of adding biochar, including reduction in greenhouse gas emissions and increases in microbial activity, the mechanisms by which these benefits are achieved are still poorly understood. The objectives of this literature review were to (1) report on the technologies and methods for composting organic wastes with biochar, (2) identify the potential interactions between biochar and the compost microbiome during composting, and (3) assess the synergistic merits of biochar and compost on soil properties. The technologies and methods for composting organic wastes with biochar and the phenomena involved were reviewed, and the potential interactions between biochar and the compost microbiome discussed. Most of the literature confirms a positive effect of biochar on soil cation exchange capacity, pH, surface area, porosity and water holding capacity. The literature reflecting on the capacity of biochar to adsorb pollutants, including Zn, Co, Cu, Mn, Cd, Cr, As, Pb, atrazine, catechol, carbaryl, diazinon, oxamyl, fluridone, pharmaceutical and personal care products, plasticizers, dyes, and polyaromatic compounds, is also summarized. The literature confirms not only that biochar impacts the composting process, but also that the composting process impacts the physicochemical properties of biochar. Biochar is fragmented into smaller particles, and the density and porosity of biochar are altered through the trapping of minerals, organic matter, or microbes, shifting biochar sorption capacity and water retention. Although the number of references reviewed indicates a high level of interest in this field, the literature review indicates that there is not yet a comprehensive understanding of how biochar structure and surface functionalities affect each of the composting steps. The picture of biochar co-composting is still fragmented and thus does not allow us to design engineered biochar to act in a target composting step. New studies are needed to understand how biochar characteristics (porosity, surface chemistry, ash content and composition) interact with critical phenomena of biomass composting and to engineer carbonaceous products for this application. Chapter 9 provides a literature review on the Impact of Biochar on Composition and Properties
of Herbs. This work aims to summarize the current state of knowledge related to biochar’s impact on plant growth, when used alone, in combination with compost, or when co-composted. Although some investigations have pointed to the potential for detrimental effects when biochar from particular sources is applied to certain crop species grown under specific conditions, mounting evidence points to a general, overall positive impact of biochar addition to soils, particularly when co-composted. Such evidence has been found in both tropical and temperate regions, and for staple grains, tree crops, herbaceous species, and other specialty crops. It is important to note, however, that not all biochars are equal, neither are all composts or soils, and potential permutations of specific biochar-compost-soil combinations need to be evaluated for each individual crop, perhaps even each cultivar, of interest. Chapter 10 describes a greenhouse study that evaluated a specific biochar-compost-crop combination, providing an Evaluation of Impact of Biochar-Amended Compost on Organic Herb
Yield and Quality. In this study, sweet basil was used to test the effects of co-composted biochar on crop productivity and quality. Soil health is a potentially critical component for basil

xxv
production, and soil amendments that enhance basil productivity would have important positive impacts on the herb industry. In this investigation, co-composted and non-co-composted biochar and ash were tested for their impact on basil growth and quality, measured by crop yield and production of both antioxidant and flavor compounds. In this pot-based study, with plants grown under organic management in a greenhouse, a strong positive impact on basil growth was observed when biochar was co-composted and added to soil that also contained field soil, but no impact was seen when biochar and compost were added together at the same ratios, but without being previously co-composted. The benefit was seen for 2.5% co-composted biochar, as well as for 5% co-composted biochar, and for both basil cultivars evaluated, but only when field soil was included in the pot soil mixtures. Additional work is needed to determine the mechanism of enhanced growth, but an impact on the soil microbe community is suspected as a possible contributing factor. This work indicates that co-composting of biochar has the potential to positively benefit both herb production and the products being generated by composting industries. Biochar can be produced using a variety of feedstocks, including woody residuals from either municipal solid waste streams or from managed trees. Chapter 11 describes a Wood Waste Boiler
Survey, used to explore the characteristics of commercial and industrial biomass boilers in Washington State, as such boilers use woody residuals to produce steam and power, and sometimes high-carbon ash with properties similar to biochar. Biomass boilers have been widely used at lumber mills and in pulp and paper plants, though recent economic impacts to these industries may have affected biomass boiler activity and functioning. This survey updates our knowledge of the biomass boilers in use by the industrial pulp and paper industry in Washington, with a particular focus on their potential for production of high-carbon ash. Currently, eight industrial boiler facilities are permitted in Washington State. Boiler engineers at these facilities were surveyed to update existing data about their boilers, including questions about fuel use and ash production. One plant is currently shut down for an overhaul after being purchased by a new owner. Of the remaining seven, five responded to the survey. Among these, none produce high-carbon ash as a saleable product. All those that answered questions regarding disposal of ash used landfill disposal. Only one facility had screening or ash reinjection equipment that would make harvesting high-carbon material possible. Given the prevailing view of ash as waste, and operators’ low awareness of biochar markets or opportunities, opportunities for high carbon ash production would likely require research on the ash and education of boiler facilities about potential markets. Chapter 12 follows up on the wood waste boiler survey described in Chapter 11, documenting the Changes to Boiler Operations to Produce High-Carbon Residuals or Biochar, necessary for large-scale biomass boiler operators to take advantage of market shifts in favor of biochar. Operations with boilers that collect and screen uncombusted fuels for reinjection into the boiler fire are well positioned for this purpose. Ash with a high carbon content and low risk of contamination, such as from wood boilers at lumber mills, is often given away for use as a valuable supplement in commercial-scale composting and soil blending operations. As described by boiler experts and operators, the primary challenge for any plan to harvest or increase production of high-carbon ash is the predominant drive for efficiency—getting maximum heat value per ton of fuel—in boiler operations. Further work would also be needed to explore whether biochar production would have an impact on the production of air pollutants.

xxvi
Finally, boiler operators have a low level of awareness about emerging biochar markets, and do not believe that adjusting boiler operations to produce more high-carbon ash makes economic sense. In addition to the operational aspects of producing biochar in existing biomass boilers, the existence of biomass to feed such production needs to be evaluated. Chapter 13: Woody Biomass
Inventory Methodology focuses on exploring existing methodologies for estimating the availability of two promising sources of wood for potential biochar production: urban wood residuals and woody biomass in overgrown and overstocked forests. Urban wood residuals at disposal and recycling facilities can include woody material from landscapes, pallets and crates, and lumber from construction and demolition activities. The disposed fraction is the subject of rigorous study through Washington State Department of Ecology’s Waste Composition Study program, while construction and demolition wastes have been estimated separately for some areas, including for the City of Seattle and the Portland Metro areas. Meanwhile, land-clearing debris, which includes the trees, brush, and other woody material removed from lots prior to development, is often not part of this waste stream. Some individual studies have estimated the amount of this material for certain areas, including Kitsap County. An alternate method for estimating land-clearing debris that could provide broader coverage involves identifying the number of acres cleared for construction per year using permitting information, and multiplying that acreage by an average per acre value for land-clearing debris. Meanwhile, overstocked and overgrown forest areas have received increased attention because resource management agencies are looking for ways to reduce the fire hazard associated with these areas. Traditional methods of estimating forest resources include biomass calculators developed by the Washington State Department of Natural Resources and the U.S. Forest Service. LiDAR technology is a newer, remote sensing method that has been used for estimating biomass resources, with both scientific literature and case studies that support its use. Using these types of woody biomass to produce biochar that is then land applied can also sequester carbon. Chapter 14: Assessing Local Technical Potentials for CO2 Drawdown Using
Biochar from Forestry Residues and Waste Wood in Washington State reports on the development of a high-resolution, scalable method to estimate the technical potential for CO2 drawdown by biochar in Washington State using forestry residues and waste wood. The analysis uses a geographic information system (GIS) approach to help determine the available biomass and the location of suitable land for biochar applications as a soil amendment, using Spokane County as a test case. The results show that over 100 years, Spokane County could sustainably offset atmospheric greenhouse gases totaling between 1.5 and 4.1 million metric tons carbon-equivalent (5.5 and 15.2 million metric tons CO2-equivalent), primarily through a combination of carbon storage in the form of biochar and the generation of renewable energy. Most of the biomass is derived from residual forest biomass as a by-product of timber harvest, but between 15 and 48% (depending on the timber harvest scenario) is obtained from the municipal waste stream. If the same biomass were instead combusted for renewable energy, the offsets decrease by an average of 42%. In addition to research into high-value by-products and biochar, we conducted a literature review on another suite of emerging technologies that could provide benefits when integrated into proposed regional biorefinery models. Chapter 15: Bioelectrochemical Systems in a Sustainable

xxvii
Biorefinery describes the potential for bioelectrochemical systems to be integrated into existing biorefineries or be used as the central technology for developing new concepts in organic waste treatment. The central principle of BESs is the use of microbial-driven redox reactions to produce electrical energy, fuels such as hydrogen and methane, or biologically-derived chemicals such as acetate or formate from organic wastes. Products from BESs include electricity, fuels such as hydrogen and methane, and bioderived chemicals such as acetate and formate. In the near term, electricity generation alone is not sufficient to promote widespread adoption of BESs, but the treatment of low-strength organic waste for production of value-added biofuels, biochemicals, and biomaterials is promising. Applications that could complement existing biorefinery concepts include integration with AD for improving energy capture, polishing treatment effluent for recovery of useful nutrients, and use to treat leachate from landfills and composting operations. BESs can also be used prior to the main waste conversion technology to capture a range of contaminants that may be problematic within existing waste streams, including complex petrochemicals, oil based solvents, heavy metals, chlorine or sulfur containing compounds, dyes, and pharmaceuticals. While these are some of the most promising first-generation integrations for BESs, ongoing advances in microelectronics and specialized low-energy harvesting components may make additional applications, including use as a primary energy source and for self-powered organic waste treatment, practical in the next generation. Using “waste” materials to produce useful products and fuel or energy that could replace fossil-fuel based production can impact the overall carbon balance of these activities. Chapter 16: A
Review of Carbon Accounting Relevant to the Biorefinery Concept identifies previous projects, topics, and themes related to carbon and CO2-equivalent emissions and reductions associated with the biorefinery concept in Washington State. A systematic review of the literature is presented, including relevant journal articles, factsheets, and project reports, focused on the topic of carbon accounting as related to anaerobic digestion systems. The results of these studies provide a valuable starting point for understanding how carbon and CO2-equivalents have been assessed and characterized. The goal of the Department of Ecology’s Waste 2 Resources Program—improving the economics and the environmental footprint of processing organic wastes in Washington—will only be achieved if the new and improved technologies, including those developed through funded research, are adopted by processors, industry, and commercial producers. Chapter 17:
Commercialization, Technology Transfer, and Extension describes activities to support improved decision making about emerging technologies for waste management. In the 2015-2017 biennium, the extension team provided technical support to regional stakeholders, participated in a federal advisory panel focused on furthering the adoption of technologies to recover nutrients and to control the production of greenhouse gases, delivered 12 presentations at national and regional conferences, published five formal extension publications (with one additional publication in progress), and produced blog articles and a five-part webinar series. Through these outreach activities, the team reached an estimated 20,600 scientists, producers, industry professionals, regulators, policy-makers, and other interested parties across the country. Taken together, this diverse body of work explores multiple avenues through which Washington State could successfully and profitably incorporate advanced waste treatment technologies such as pyrolysis and anaerobic digestion, and produce value-added products from organic waste. If

xxviii
adopted, these developments could contribute a wide range of economic, environmental, and social benefits for residents and communities of Washington State.

1
1. Producing a High-Value Food Additive, Polyphenols, from Fruit Pomace
Ayca Seker, Shulin Chen
1.1 Abstract
Large quantities of grape by-products result from the winemaking process, including pulp, seed, and skins. These by-products, also called grape pomace, could provide an inexpensive source of high-quality polyphenolic compounds. However, it is necessary to develop an environmentally benign and economically feasible separation process for the effective utilization of polyphenolic compounds from grape pomace. In this project, a combined extraction and purification process was developed to separate the polyphenolic compounds, at a high purity level, from grape pomace. Two different types of grape pomace, white and red, were used as initial sources of crude polyphenols. Three different types of adsorbents were tested to determine their polyphenol binding characteristics: bare silica, methoxy polyethylene glycol Silane-5000-(mPEG) and amine-functionalized silica microparticles. Polyphenol adsorption capacity, adsorption ratio, polyphenol recovery, and purity of recovered polyphenols were evaluated, and subgroups of adsorbed and recovered polyphenols were quantified. Our results indicate that the newly developed mPEG-functionalized silica particles have seven- and three-fold higher adsorption capacities for total polyphenols than bare (control) and amine-functionalized silica microparticles, respectively. Approximately 35% of red pomace polyphenols and 41% of white pomace polyphenols were recovered by mPEG-functionalized silica particles, whereas less than 10% of the polyphenols were recovered by bare and amine-functionalized silica microparticles for both red and white pomace extracts. The mPEG-functionalized silica particles are a preferable adsorbent for the selective recovery of proanthocyanidins than for other subgroups of polyphenols tested. Using the mPEG-functionalized silica particles, a purity level of approximately 95% was achieved for dry polyphenol, whereas bare silica and amine-functionalized silica particles achieved a purity level of approximately 40%. These overall results indicate that mPEG-modified microparticles are a promising purification platform for the recovery of high-purity polyphenols from grape pomace extract. Further work will be needed to improve and scale up this combined process. Once that has been accomplished, the method used in this study could be an effective starting point for scaling up the recovery of high-value polyphenols from by-products of the winemaking industry in Washington State and beyond.

2
1.2 Background
Grapes are one of the the world’s largest fruit crop with an annual production of more than 77 million tons (FAOSTAT, 2016). Almost fifty percent of worldwide grape production is used for winemaking (FAOSTAT, 2014). In 2016, Washington State’s wine grape production totaled 270,000 tons. Moreover, Washington State ranks second in the United States (behind California) in the production of wine grapes and wine (Wine, 2016). During winemaking from grapes, large quantities of residue including grape pulp, seeds, and skins —so called grape pomace—remain unused. Grape pomace makes up millions of tons of solid residue and results in additional costs for waste storage and disposal (Bucić-Kojić et al., 2007). These solid residues have the potential to create a waste management issue, but alternatively they can be used as an inexpensive source of high-quality polyphenolic compounds. For decades, scientists have been interested in plant polyphenols due to their health promoting effects. In recent years, interest has grown in extracting polyphenols from natural sources, especially from by-products of the food industry, due to the health promoting and nutritional effects of polyphenols (Bucić-Kojić et al., 2007; Fontana et al., 2013). Generally, utilization of grape pomace and other natural sources for the recovery of bioactive compounds—mostly polyphenols—requires two critical steps: the extraction–or isolation–of polyphenols from the plant matrix, and the purification of the crude extracts. In order to achieve sustainable recovery of valuable polyphenolic compounds from grape pomace, it is essential to develop cost-effective and high-yield extraction and purification methods. Extraction is the first important step in the separation, identification, and use of phenolic compounds. In the past few years, there have been many studies conducted on extraction of phenolic compounds from natural products. Because of the proliferation of research on new techniques, no single standard extraction method exists. The most commonly used are the traditional techniques: liquid-liquid extraction and solid-liquid extraction (Baydar et al., 2004; Fontana et al., 2013). Though more advanced extraction technologies have been developed, traditional solvent extraction methods were used in this study because they have the advantage of easy accessibility, applicability, and satisfactory results. Purification is an essential step in the recovery of polyphenols from grape pomace because other by-products from the pomace not only decrease the purity of polyphenols, but they may also affect their stability, and thus affect the final application of these polyphenolic compounds (Castañeda-Ovando et al., 2009). Polymeric resins have been widely used to separate phenolic compounds from crude plant extracts. The separation mechanism of these resins is based on hydrophobic interactions between the solutes (the polyphenols) and the adsorbent (the resin). Yet these resins have some drawbacks, such as generally low selectivity and low binding efficiencies of compounds of interest, limiting the amount of solutes that can be recovered from the crude extract (Leon-Gonzalez and Perez-Arribas, 2000). Surface modification approaches have been used to increase the selectivity and adsorption capacity of polymeric resins.

3
During the 2013-2015 biennium, a two-step technology was proposed based on magnetic particles with surface functional groups to separate high quantities of polyphenols from grape seeds, the main component of grape pomace. In the process described in the last biennium (Ecology, 2016), the goal was to complete the separation process in one step at the bench scale through extraction by aqueous ethanol solution from the grape pomace/seeds, and simultaneous adsorption of polyphenols by the magnetic beads. This one-step separation was difficult to achieve at the bench scale and presented challenges due to the complexity of the plant matrix and other interferences within the crude extract. Because an efficient separation was not easy to achieve in one step at the bench scale, we changed our research direction and developed an alternative and effective approach—separation in two steps by using aqueous ethanol solution for the extraction, followed by a two part purification step, involving both adsorption and desorption cycles . For this approach, a new type of adsorbent was used—silica microparticles with polyethylene glycol surface functionalization. Polyethylene glycol, which has been identified as a phenolic compound binder (Kim et al., 2003), was chosen due to its ability to accept protons and to bind polyphenols through a more specific type of interaction: hydrogen bonding.
1.3 Objectives
The overall objective of this project was to develop an environmentally benign process to recover the biologically active polyphenolic compounds from grape pomace. In order to achieve this goal, we aimed to determine the effectiveness of surface functionalized particles for purification of crude grape pomace extracts to obtain highly concentrated polyphenolic compounds. The specific objectives for this project were:
1) To recover polyphenols from grape pomace by using the proposed separation process and determine the adsorption capacity of adsorbents.
2) To evaluate the adsorption behavior of polyphenols onto functionalized adsorbents. 3) To determine the efficiency of the separation process and to identify and quantify the
resulting phenolic compounds by characterization using spectroscopic techniques before and after purification.
1.4 Methods
1.4.1 Preparation of adsorbents with surface functional groups Silica microparticles were selected as the support material for the surface modification. Surface modification of silica microparticles was performed using mPEG, a type of polyethylene glycol. Polyethylene glycol is a non-toxic compound that is widely used in pharmaceuticals, cosmetics, and animal feed. Polyethylene glycol can form a complex with polyphenols through hydrogen

4
bonding (Kim et al., 2003). For this reason, polyethylene glycol was used as the surface functional group to enhance the process for the separation of polyphenols. Briefly, silica microparticles were first washed with Piranha solution to remove all the organic impurities and to hydroxylate the surface of the silica microparticles. Then the surface of the silica particles was functionalized with mPEG on the basis of silanization chemistry to obtain hydrophilic hydroxyl-group-functionalized particles. The synthesized particles were characterized in terms of their surface chemical properties. The surface modification of the silica microparticles was confirmed based on the Fourier Transform Infrared Spectroscopy (Shimadzu FT-IR) spectra of the particles before and after the surface modification reaction. Another type of functional group capable of hydrogen bonding (amine) was identified to functionalize the silica microparticles. In this case the silica microparticles were functionalized with amine groups (-NH2) using (3-Aminopropyl) triethoxysilane.
1.4.2 Preparation of grape pomace Grape pomace (grape skin, seeds, and stems) from both red and white winemaking was provided by a local Washington winery (Chateau Ste. Michelle Winery, Woodinville, WA). Grape pomace was dried for 48 hours. Then the dried grape pomace was ground to powder using a coffee grinder (60 mesh) in order to increase the solvent-exposed surface area. After grinding, the samples were packed into plastic bags and stored at -20°C until use in further experiments.
1.4.3 Preparation of the crude grape pomace extract Polyphenolic compounds were extracted from grape pomace with traditional solvent extraction by using an aqueous ethanol solution. The extraction of polyphenolic compounds was performed at optimized conditions; in dark at a solid/liquid (sample/solvent) ratio of 1:10 (w/v) by using an ethanol:water solution (70:30; v/v) at 30°C in an orbital shaker for 24 hours. After the extraction process, the mixture was filtered through filter paper to separate the crude extract from the grape pomace. The crude extract was then dried to powder in a vacuum desiccator for 2 days. The resulting crude polyphenol extract was stored in a freezer at -20ºC until its use in the purification experiments.
1.4.4 Purification of crude extracts with adsorbents Batch adsorption experiments (binding of polyphenols to adsorbents) were performed with bare, mPEG-functionalized silica microparticles, and amine-functionalized silica microparticles in 100 mL glass-stoppered flasks, at 30°C. Due to stability and sensitivity issues, the flasks were equipped with a stopper and covered with aluminum foil to protect the crude extracts from light. Predetermined amounts of adsorbents (approx. 0.1 gram) were introduced into each flask together with crude grape pomace extracts. Each adsorption system was shaken in an incubator at 120 rpm for 24 hours in the dark. After 24 hours, aliquots were taken from each adsorption system and the crude grape pomace extract was removed. Subsequently, elution solvent was added to the adsorbents to release the adsorbed polyphenols (desorption) by shaking them at 120 rpm at 30°C for another 24 hours. The adsorption capacities, adsorption ratios of different adsorbents, and overall recovery were calculated by using equations described elsewhere (Sandhu and Gu, 2013).

5
1.4.5 Determination of total polyphenols and subclasses Various polyphenolic compounds exist in grape pomace extracts after the extraction and purification steps. It is difficult to detect each phenolic compound individually. Consequently, the polyphenols were measured in terms of total polyphenolic compounds. Since polyphenols include a wide spectrum of compounds, usually gallic acid is used as a standard unit for determining the total polyphenol content. Therefore, when spectrophotometric methods were used total phenolics are expressed as gallic acid equivalents (GAE) (Lapornik et al., 2005).
1.4.5.1 Determination of total polyphenols
The concentration of total phenolics in the standards, crude extracts, and purified extracts were determined by the Folin-Ciocalteu colorimetric method (Singleton and Rossi, 1965; Waterhouse, 2001). Total phenolics were expressed as GAE in mg L-1 of bulk solution or mg g-1 dry adsorbent.
1.4.5.2 Determination of subgroups of polyphenols
Total proanthocyanidins content
Proanthocyanidins were determined using vanillin-hydrochloric acid (HCl) methods (Sun et al., 1998). Catechin was used as a standard and results were expressed as mg catechin equivalents (CE) or mg CE g-1 dry adsorbent.
Total anthocyanin content
Total anthocyanin (TA) content of crude grape pomace extracts were determined using the pH differential method (Giusti and Wrolstad, 2001). Pigment content was calculated on the basis of cyanidin-3-glucoside. Results were expressed as mg TA or mg TA g-1 dry adsorbent.
Total flavanol content
Total flavanol content was estimated using the p-dimethylaminocinnamaldehyde (DMACA) colorimetric method (Arnous et al., 2001; Šamec et al., 2014). The total flavanol concentration of samples was calculated from a calibration curve prepared using catechin as the standard. Results were expressed as mg CE or mg CE g-1 dry adsorbent.
1.5 Results and discussion
1.5.1 Recovery of polyphenols from grape pomace
1.5.1.1 Characterization of adsorbents for surface modification
The surface functional groups of silica micro particles determine the behavior and effectiveness of these particles when used in the purification process. Polar surface functional groups were used in this study to enhance the binding of polyphenolic groups to the surface and, thus, improve the adsorption capacity of particles, increasing the overall recovery of polyphenols. The surface modification of silica microparticles was confirmed by comparing the Fourier transform infrared spectroscopy (FTIR) of bare silica and mPEG-functionalized silica

6
microparticles. The surface functional groups on the surfaces of silica particles were confirmed based on the presence of the characteristic peaks for different functional groups—carbonyl (C=O), amine, -CH2 groups (Figure 1.1).
Figure 1.1: (a) Fourier infrared transform reflectance (FTIR) of bare silica and mPEG-functionalized
silica microparticles, (b) The chemical structure of mPEG
1.5.1.2 Recovery of total polyphenols from white and red grape pomace
Bare silica, mPEG- and amine-functionalized silica microparticles were tested to determine their binding characteristics with polyphenols from both red and white grape pomace extracts. Binding/unbinding (adsorption/desorption) characteristics of surface-functionalized silica microparticles were expressed in terms of adsorption capacity, adsorption ratio, and recovery. Adsorption capacity is the quantity of polyphenols adsorbed on 1g of the particles, whereas adsorption ratio is the ratio of polyphenols adsorbed by the particles to the quantity of free polyphenols available in the solution. Total polyphenol adsorption capacities of bare silica, mPEG- and amine-functionalized silica microparticles were investigated (Figure 1.2). mPEG-functionalized silica particles have significantly greater adsorption capacities (7-fold) for total polyphenols compared to bare silica microparticles (control) (Figure 1.2a) which can be attributed to the introduction of more hydrogen bonding sites available for the interaction with polyphenols. The high adsorption capacity of mPEG-functionalized silica microparticles is likely due to hydrogen bonding interactions, since they are short-range, fairly strong, moderately directional and specific type of interactions. The adsorption studies also showed that the quantity of polyphenols adsorbed to mPEG-functionalized silica microparticles was three times greater than that adsorbed to the amine-functionalized silica microparticles. This suggests that an oxygen-based proton accepting mechanism could be more favorable for polyphenol adsorption than a nitrogen-based proton accepting mechanism. Similarly, higher adsorption ratios were obtained for mPEG-functionalized silica microparticles compared to the other types of adsorbents tested (Figure 1.2b). The highest adsorption ratio was observed for mPEG-functionalized silica particles where red grape pomace extracts were used, followed by mPEG-functionalized silica particles with white grape pomace extracts. This
a b

7
suggests that mPEG has a greater affinity towards polyphenolic compounds than either bare or amine-functionalized silica particles.
Figure 1.2: (a) Adsorption capacity; w: white grape pomace, r: red grape pomace and (b)
Adsorption ratios and c) Recoveries of bare, mPEG- and amine-functionalized silica microparticles for total polyphenols
Recovery is the percentage of polyphenols desorbed from the particles by an elution solvent and the initial amount of polyphenols. Approximately 35% of red pomace polyphenols and 41% of the white pomace polyphenols were recovered by mPEG-functionalized silica particles from red and white grape pomace extracts, respectively (Figure 1.2c). Furthermore, less than 10% of the polyphenols were recovered by bare and amine-functionalized silica microparticles for both red and white pomace extracts. This suggests that mPEG-functionalized silica particles are more effective than other types of adsorbents tested in terms of total polyphenol recovery.
1.5.2 Favorability of the adsorption of polyphenols onto functionalized adsorbents Surface physical and chemical properties of adsorbents are among the most important parameters that affect the adsorption performance. A common way to characterize the effectiveness of these properties on the adsorption performance is to utilize adsorption isotherms. Adsorption isotherms describe the distribution of compound of interest between liquid and solid phases at different equilibrium concentrations (Ng et al., 2002). In the case of the current process, the adsorption isotherms for the polyphenols on mPEG- and amine-functionalized silica particles were applied to show the relation between the adsorption capacity and the concentration of polyphenols within the solution at the equilibrium. A Freundlich isotherm was utilized to describe how efficiently
a b
c

8
these surface-functionalized particles would adsorb the polyphenols (Balasundram et al., 2006; Kuhnau, 1976). The adsorption isotherms of polyphenols on mPEG- and amine-functionalized silica particles were determined. The tested surface-functionalized adsorbents showed different adsorption behaviors (Figure 1.3).
Figure 1.3: Adsorption isotherms of red grape pomace polyphenols (a) and white grape pomace
polyphenols (b) on mPEG- and amine-functionalized silica microparticles at 30°C. (Qe is equilibrium adsorption capacity. Ce is equilibrium concentration of solute in bulk solution.)
The results showed that mPEG-functionalized silica particles had a greater adsorption capacity than amine-functionalized silica particles for each of the tested different polyphenol loadings. Greater affinity for both red and white pomace polyphenols was observed for mPEG-functionalized silica particles. The experimental isotherms were fitted to the Freundlich equation and the parameters of fitted curves were summarized in Table 1.1.
Table 1.1: Freundlich adsorption equation constants of total polyphenols on mPEG- and amine-functionalized silica microparticles at 30°C
Freundlich isotherm
mPEG-functionalized particles Amine-functionalized particles Kf
a 1/n nb R2 Kfa 1/n nb R2
Red grape pomace 0.391 0.993 1.007 0.954 9.021 0.339 2.951 0.905
White grape pomace 0.273 0.990 1.011 0.911 2.786 0.501 1.994 0.844 a Kf is an indicator of the relative adsorption capacity of adsorbent (mg g-1) (L mg-1) 1/n b n is indicator of adsorption intensity (dimensionless). The n values (indicator of adsorption intensity) for both mPEG- and amine-functionalized silica microparticles were greater than 1, suggesting that the adsorption process was a favorable process for all functionalized silica particles. The greater (1/n) value for mPEG-functionalized silica particles indicates that the adsorption process was greater in intensity, which coincides with the greater adsorption capacities of mPEG-functionalized silica particles than amine-functionalized silica particles. These results could be used as a starting point for designing an
b a

9
adsorption column in order to scale up the recovery process and thus utilize grape pomace at a large scale.
1.5.3 Characterization of recovered polyphenols In addition to the overall estimation of total polyphenols, we measured total flavanol, anthocyanin, and proanthocyanidin content of the purified extracts. These subgroups were selected due to their known high antioxidant and antiradical activities (Arnous et al., 2001; Heim et al., 2002). The adsorption capacities of bare and mPEG-functionalized silica microparticles were determined for total proanthocyanidins, flavanols, and anthocyanins. Irrespective of the type of adsorbents used, red grape pomace extracts showed a greater adsorption capacity compared to white grape pomace extracts for each of the tested polyphenolic subgroups (Figure 1.4). The mPEG-functionalized silica particles showed significantly greater adsorption capacity than bare silica particles for each of the tested polyphenolic subgroups. The greatest adsorption capacity of the mPEG system was observed for proanthocyanidins, followed by flavanols, and anthocyanins. Flavanols and proanthocyanidins are powerful antioxidants due to their high antiradical, reducing and hydroxyl-free radical scavenging capacity (Arnous et al., 2001). Like the results for total polyphenols, the adsorption capacity of mPEG-functionalized silica particles was significantly greater than that of bare silica particles for proanthocyanidins and flavanols (Figure 1.4a and b). Moreover, the adsorption capacity of mPEG-functionalized particles for total proanthocyanidins was three times greater than for total flavanols. Anthocyanins are colorful pigments which give dark color to fruits and vegetables, as well as being very efficient antioxidants (Castañeda-Ovando et al., 2009). The adsorption capacity of bare and mPEG-functionalized silica microparticles for total anthocyanin content was compared (Figure 1.4c). Since the white grapes do not have any colorful pigments, anthocyanins were not detected for the white grape pomace extracts. On the other hand, mPEG-functionalized silica particles had an adsorption capacity for red pomace anthocyanins that was seven times greater than that of bare silica particles.

10
Figure 1.4: Freundlich adsorption equation constants of total polyphenols on mPEG- and amine-
functionalized silica microparticles at 30°C
In addition to the adsorption capacity, adsorption ratios were determined for bare and mPEG-functionalized silica microparticles for total proanthocyanidins, total flavanols, and total anthocyanins. Adsorption ratios of bare and mPEG functionalized silica microparticles were measured for total proanthocyanidins, total flavanols and total anthocyanins (Figure 1.5). The mPEG-functionalized silica particles had a significantly greater adsorption ratio for each of the tested polyphenolic groups than bare silica particles. The highest adsorption ratio for white pomace extracts was observed for proanthocyanidins (~60%), followed by flavanols (~45%). For red pomace extracts, the highest adsorption ratio was observed for flavanols (~50%), followed by proanthocyanidins (~45%), and anthocyanins (~26%). The high adsorption ratio of mPEG-functionalized silica microparticles toward flavanols and proanthocyanidins can be attributed to the high affinity of mPEG to proanthocyanidins. Higher adsorption ratio of proanthocyanidins implies that greater amounts of proanthocyanidins can be adsorbed by mPEG-functionalized silica particles from the initial amount available in the crude extracts. This suggest that mPEG could be a good candidate for selective separation of proanthocyanidins from grape pomace extract.
a b
c

11
Figure 1.5: Adsorption ratios of (a) total proanthocyanidins, (b) total flavanols, and (c) total
anthocyanins for bare and mPEG-functionalized silica microparticles (w: white grape pomace, r: red grape pomace)
The recovery of bare and mPEG-functionalized silica microparticles for total proanthocyanidins, flavanols and anthocyanins was determined (Figure 1.6). mPEG-functionalized silica particles had a greater recovery than bare silica particles for each of the tested subgroups. In addition, red grape pomace polyphenols were recovered from mPEG-functionalized silica microparticles in higher quantities than white grape polyphenols for each of the tested polyphenolic subgroups. The greatest recovery using mPEG was observed for proanthocyanidins, followed by anthocyanins, and flavanols. Although mPEG showed comparable recovery values for both anthocyanins and proanthocyanidins (Figure 1.5), there were significantly lower amounts of adsorbed anthocyanins than proanthocyanidins (Figure 1.3). These results suggest that mPEG-functionalized silica particles are a more preferable adsorbent for the selective recovery of proanthocyanidins than for other subgroups of polyphenols tested.
a b
c

12
Figure 1.6: Recovery of (a) total proanthocyanidins, (b) total flavanols, and (c) total anthocyanins from bare and mPEG-functionalized silica microparticles (w: white grape pomace, r: red grape
pomace)
1.5.4 Purity of recovered polyphenols with surface-functionalized adsorbents Since the overall quality of the final product is dependent on the purity of the polyphenols, the percentage of the polyphenols in the recovered product was determined in the dry form. The polyphenol purity of red and white grape pomace crude extracts as well as the purity of extracts recovered by using bare, mPEG- and amine-functionalized silica microparticles was determined (Figure 1.7). For each of the adsorbents tested, the overall purity of polyphenols in the final dry product was significantly higher than the initial red and white grape pomace crude extract (Figure 1.7). This suggests that an extraction process followed by a separation process is required for the recovery of high-quality polyphenols. However, the efficiency of the selective recovery of polyphenol from crude grape pomace extract varied depending on the type of adsorbent used. After the extraction process, the red grape pomace crude extract had ~18% dry polyphenol purity whereas white grape pomace extracts had ~20%. Once these extracts were purified with mPEG-functionalized silica particles, the purity of dry polyphenol purity increased to ~95%, whereas bare silica and amine-functionalized silica particles had ~40% total polyphenol purity. This significant increase in the dry polyphenol purity is attributed to the selectivity of applied mPEG-
a b
c

13
functionalized silica microparticles toward polyphenolic compounds within the red and white grape pomace extracts. These overall results show that both white and red grape pomace polyphenols can be separated from the crude extract matrix and a high level of purity can be achieved with the use of mPEG-functionalized silica microparticles.
Figure 1.7: Dry total polyphenols purity (%) for crude extracts and extracts purified by bare,
mPEG-functionalized, and amine-functionalized (-NH2) silica microparticles
1.6 Conclusion
This project aimed to develop an effective and environmentally benign approach to recover a high-value product—polyphenols—from a by-product of winemaking—grape pomace. Recovery of polyphenols from grape pomace was achieved by combining a conventional solvent extraction method with a purification step using adsorbents functionalized with polyphenol-attracting functional groups. Silica microparticles coated with two types of functional groups capable of hydrogen bonding were developed. The performance of bare and coated silica microparticles in polyphenol recovery from red and white grape pomace extract was evaluated. Our results indicate that mPEG-functionalized silica microparticles are more effective for use in the recovery of polyphenolic compounds from grape pomace than other microparticles tested under the same conditions. The superior performance of the mPEG-functionalized silica microparticles was due to their high capacity for adsorption and recovery and their greater affinity toward polyphenolic compounds. As with total polyphenols, greater amounts of each

14
highly antioxidant subgroup of polyphenols were recovered with mPEG-functionalized silica microparticles than with the other adsorbents tested. Our results suggested that mPEG-functionalized silica microparticles are a preferable adsorbent for the recovery of proanthocyanidins among other subgroups and adsorbents tested. In addition to the selectivity, a remarkable polyphenol purity (~95%) was achieved by the use of mPEG-functionalized silica particles as an adsorbent. The high purity of the recovered polyphenols may provide unique antioxidant activities leading to an increase in health promoting effects. This technology is a promising candidate for the recovery of polyphenols from both red and white grape pomaces with comparable efficiencies. This proof-of-concept project suggests that agricultural residues such as grape pomace can be utilized to recover health promoting bioactive compounds at a high level of purity. It is anticipated that this project and further studies will significantly improve the sustainable utilization of grape pomace. Moreover, this work is especially significant for Washington State, which ranks second in the production of both white and red wines and, thus, produces large quantities of grape pomace. Washington State’s agriculture and related industries can benefit from these technologies by integrating them into current infrastructure to reduce the environmental impacts of winemaking by-products and improve the industry’s profitability through the production of additional, high-value products.
1.7 References
Arnous, A., Makris, D.P., Kefalas, P. 2001. Effect of principal polyphenolic components in relation to antioxidant characteristics of aged red wines. Journal of Agricultural and
Food Chemistry, 49(12), 5736-5742. Baydar, N.G., Ozkan, G., Sagdic, O. 2004. Total phenolic contents and antibacterial activities of
grape (Vitis vinifera L.) extracts. Food Control, 15(5), 335-339. Bucić-Kojić, A., Planinić, M., Tomas, S., Bilić, M., Velić, D. 2007. Study of solid–liquid
extraction kinetics of total polyphenols from grape seeds. Journal of Food Engineering, 81(1), 236-242.
Castañeda-Ovando, A., Pacheco-Hernández, M.d.L., Páez-Hernández, M.E., Rodríguez, J.A., Galán-Vidal, C.A. 2009. Chemical studies of anthocyanins: A review. Food Chemistry, 113(4), 859-871.
Ecology. 2016. Advancing Organics Management in Washington State: The Waste to Fuels Technology Partnership. Washington State Department of Ecology, Olympia, WA.
FAOSTAT. 2014. FAOSTAT-Food and Agriculture Organization of the United Nations Statistical Database. http://www.fao.org/faostat/.
FAOSTAT. 2016. FAOSTAT-Food and Agriculture Organization of the United Nations Statistical Database. http://www.fao.org/faostat/.
Fontana, A.R., Antoniolli, A., Bottini, R. 2013. Grape Pomace as a Sustainable Source of Bioactive Compounds: Extraction, Characterization, and Biotechnological Applications of Phenolics. Journal of Agricultural and Food Chemistry, 61(38), 8987-9003. Giusti, M.M., Wrolstad, R.E. 2001. Characterization and Measurement of Anthocyanins by UV-
Visible Spectroscopy. in: Current Protocols in Food Analytical Chemistry, John Wiley & Sons, Inc.

15
Heim, K.E., Tagliaferro, A.R., Bobilya, D.J. 2002. Flavonoid antioxidants: chemistry, metabolism and structure-activity relationships. The Journal of Nutritional Biochemistry, 13(10), 572-584.
Kim, Y.-J., Uyama, H., Kobayashi, S. 2003. Regioselective Synthesis of Poly(phenylene) as a Complex with Poly(ethylene glycol) by Template Polymerization of Phenol in Water. Macromolecules, 36(14), 5058-5060.
Kuhnau, J. 1976. The flavonoids. A class of semi-essential food components: their role in human nutrition. World review of nutrition and dietetics, 24, 117-91.
Lapornik, B., Prošek, M., Golc Wondra, A. 2005. Comparison of extracts prepared from plant by-products using different solvents and extraction time. Journal of Food Engineering, 71(2), 214-222.
Leon-Gonzalez, M., Perez-Arribas, L. 2000. Chemically modified polymeric sorbents for sample preconcentration. Journal of Chromatography A, 902(1), 3-16.
Šamec, D., Bogović, M., Vincek, D., Martinčić, J., Salopek-Sondi, B. 2014. Assessing the authenticity of the white cabbage (Brassica oleracea var. capitata f. alba) cv.‘Varaždinski’by molecular and phytochemical markers. Food research international, 60, 266-272.
Sandhu, A.K., Gu, L. 2013. Adsorption/Desorption Characteristics and Separation of Anthocyanins from Muscadine (Vitis rotundifolia) Juice Pomace by Use of Macroporous Adsorbent Resins. Journal of Agricultural and Food Chemistry, 61(7), 1441-1448.
Singleton, V.L., Rossi, J.A. 1965. Colorimetry of total phenolics with phosphomolybdic-phosphotungstic acid reagents. American journal of Enology and Viticulture, 16(3), 144-158.
Sun, B., Ricardo-da-Silva, J.M., Spranger, I. 1998. Critical Factors of Vanillin Assay for Catechins and Proanthocyanidins. Journal of Agricultural and Food Chemistry, 46(10), 4267-4274.
Waterhouse, A.L. 2001. Determination of Total Phenolics. in: Current Protocols in Food
Analytical Chemistry, John Wiley & Sons, Inc. Wine. 2016. Washington State Wine Facts. https://www.washingtonwine.org/wine/facts-and-
stats/state-facts.

16
2. Evaluation of Biorefinery Alternatives for the Production of Alternative Jet Fuel in a
Composting Facility
Sohrab Haghighi Mood, Abid Tanzil, Manuel Garcia-Pérez
2.1 Abstract
Municipal solid waste (MSW) has the potential to be used as a feedstock for the production of alternative fuels and chemicals, rather than being disposed of by composting or landfilling. Integration of emerging technologies for the production of alternative jet fuel (AJF) with a composting facility offer the potential for cost reduction. In this study, a hypothetical composting facility with a capacity to process 160,000 wet metric tons per year was used to evaluate the feasibility of integrating emerging AJF production technologies. Three AJF technologies (alcohol to jet [ATJ], fast pyrolysis, and Virent’s BioForming Technology [Virent]) were studied for processing of the dry fraction of the feedstock, and anaerobic digestion (AD) was studied for utilization of the wet fraction. Furthermore, the production of biochar from slow pyrolysis of the dry fraction was also studied. Eleven different biorefinery scenarios integrating the composting facility and AJF technologies were evaluated, with fuel production capacity ranging from 4.6 to 5.3 million gallons per year. For each of the scenarios, the minimum selling price (MSP) of the fuel was estimated. Integrated AJF scenarios with a tipping fee of $60 per metric ton resulted in cost reduction opportunities in capital expenditures and operational expenditures, leading to a reduction in MSPs of 29-46% compared to standalone AJF facilities. (The MSP of the standalone AJF facilities scenarios with feedstock costing $50 per metric ton ranged from $5.30 to $11.00 per gallon.) Scale was important for profitability; increasing the feedstock capacity of AJF plants to 2,000 metric tons per day allowed a reduction of the MSP in integrated scenarios to between $0.93 and $4.37 per gallon. Of the technologies examined, ATJ was the most economically feasible technology for integration with a composting facility.
2.2 Background
Municipal solid waste is a subset of solid waste which includes unsegregated garbage, refuse and similar solid waste material discarded from residential, commercial, institutional and industrial sources and community activities, including residue after recyclables have been separated (WACs, chapter 173-303). In 2014, 258 million tons of MSW was generated in the United States (EPA, 2016). Of this material, 34.6% was recycled. In 2013, in Washington State, 17 million tons of solid waste were generated and just under 8 million tons were recycled (Ecology, 2015). Due to the large quantities of waste that are generated in the U.S., the EPA has suggested three general strategies for reduction of the MSW heading to landfills and incineration units: (1) source reduction, (2) recycling, and (3) composting (EPA, 2011). In addition to these strategies, conversion of waste into high-value products is an approach that has generated considerable

17
interest. This project explores the feasibility of generating high-value products such as jet fuel, methane, and biochar from waste, thus improving the profitability of composting facilities. In Washington State, landfills receive 4.6 million tons of MSW per year. Organic materials, construction materials, paper, packaging, and wood waste represent the main waste sources, accounting for more than 68% of the total MSW generated in the state. Of the organic materials, food waste (vegetable and non-vegetable) compose 780,000 tons (Ecology, 2016). Composting of organic materials is extensively practiced in Washington with composting facilities of various sizes and types processing a variety of feedstocks, from manure to yard and food waste. However, as organic waste collection by businesses and governments increases, many existing composting facilities are exceeding their maximum capacity (Ecology, 2010). Furthermore, composting facilities have faced recent challenges due to odor problems and environmentally harmful leachate release. Since the type of waste received can vary widely by location, these facilities require efficient and effective management plans to handle the varying waste streams. Furthermore, the market for soil amendments produced by these facilities is rather limited (Thorneloe, 2005). These challenges highlight the need for composting facilities to use emerging technologies to produce alternative high-value products. At the same time, there is growing concern about the expected increase in greenhouse gas emissions associated with the growth of the aviation industry (IATA, 2011). By 2050 the International Air Transportation Association aims to reduce net carbon dioxide production to 50% of 2005 levels (Hileman et al., 2013). The U.S. aviation industry is studying the use of alternative jet fuels (or AJF) as a tool to reduce its greenhouse gas footprint (Davidson et al., 2014; U.S. Government Accountability Office, 2014). Several pathways for the production of AJF have been studied (Davis et al., 2015; Klein-Marcuschamer et al., 2013; Pearlson et al., 2013; Swanson et al., 2010a). The fuels produced from five of these pathways have received ASTM certification for up to 50 wt. % blends with commercial petroleum-based jet fuels (Zschocke et al., 2012):
• hydroprocessed synthesized paraffinic kerosene, • Fischer Tropsch synthetic kerosene containing aromatics (Henrich et al., 2009; Spath et
al., 2005; Swanson et al., 2010a), • synthesized paraffinic kerosene from hydroprocessed esters and fatty acids (Pearlson et
al., 2013; Seber et al., 2014), • direct sugars to hydrocarbons (Amyris and Total, 2012), and • alcohol to jet (Ryan et al., 2011).
The fuels produced by several other processes are currently under ASTM evaluation: ARA-catalytic hydrothermolysis, Virent synthesized kerosene (Zschocke et al., 2012), Virent synthesized aromatic kerosene (Zschocke et al., 2012), and hydrotreated depolymerized cellulosic jet (Ringer et al., 2006; Wildschut et al., 2009). One of the major challenges for the widespread adoption of AJFs is price competitiveness with conventional jet fuel. Therefore, it is critical to develop strategies to reduce production costs. Integration with existing industrial plants could provide cost reduction opportunities in terms of capital expenditures and operating costs.
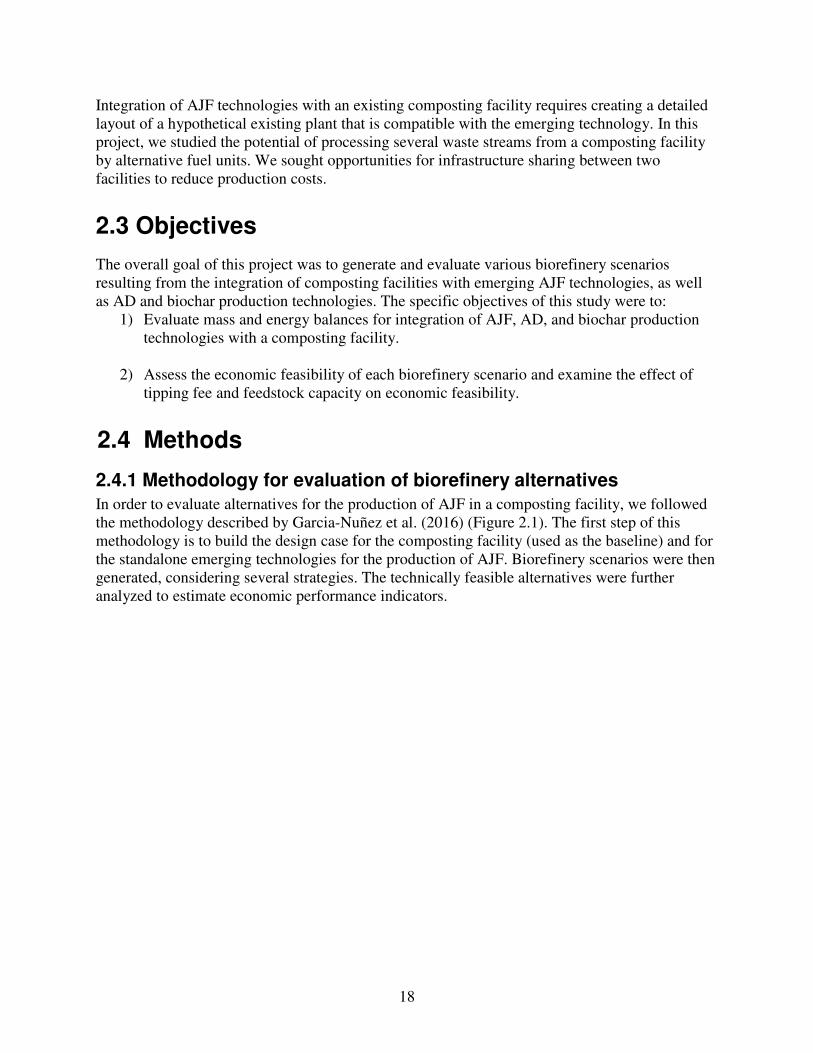
18
Integration of AJF technologies with an existing composting facility requires creating a detailed layout of a hypothetical existing plant that is compatible with the emerging technology. In this project, we studied the potential of processing several waste streams from a composting facility by alternative fuel units. We sought opportunities for infrastructure sharing between two facilities to reduce production costs.
2.3 Objectives
The overall goal of this project was to generate and evaluate various biorefinery scenarios resulting from the integration of composting facilities with emerging AJF technologies, as well as AD and biochar production technologies. The specific objectives of this study were to:
1) Evaluate mass and energy balances for integration of AJF, AD, and biochar production technologies with a composting facility.
2) Assess the economic feasibility of each biorefinery scenario and examine the effect of tipping fee and feedstock capacity on economic feasibility.
2.4 Methods
2.4.1 Methodology for evaluation of biorefinery alternatives In order to evaluate alternatives for the production of AJF in a composting facility, we followed the methodology described by Garcia-Nuñez et al. (2016) (Figure 2.1). The first step of this methodology is to build the design case for the composting facility (used as the baseline) and for the standalone emerging technologies for the production of AJF. Biorefinery scenarios were then generated, considering several strategies. The technically feasible alternatives were further analyzed to estimate economic performance indicators.

19
Figure 2.1: Proposed methodology for selecting biorefinery scenarios (biorefinery concepts) for
composting facilities
2.4.2 Composting baseline scenario To build the baseline scenario for this study, we created a hypothetical composting facility representative of a large-scale compost production system in Washington, with a capacity to process 160,000 wet metric tons per year. The technical information used to build this hypothetical composting facility was obtained through a literature review, surveys of compost facility operators in the state of Washington, and State laws that govern the construction of composting facilities (WAC 173-350-220 and WAC 173-350-040). Another important source for the creation of the baseline composting facility scenario was a Washington State Department of Ecology’s (2011) guide for siting and operating composting facilities. A summary of the information used to build the baseline scenario is shown in

20
Table 2.1.

21
Table 2.1: Technical and economic information used for building the baseline composting facility scenario (Chen et al., 2016)
Parameter Unit Value
Throughput capacity wet metric tons per year
160,000
Throughput capacity wet metric tons per day
666.7
Type of composting technology - Windrow- forced aeration with Gore system
Number of windrows 64 Dimension of windrows meters 50x8x3 Number of windrows in active composting 32 Number of windrows used for maturation 16 Number of windrows used for curing 16 Total active composting timea,b weeks 4 Total maturation timea weeks 2 Total curing timea weeks 2 C:N targeted at the beginning of active composting
kg C:kg N 30
Minimum initial water content wt. % 55 Moisture content after active composting wt. % 50 Moisture content after curing wt. % 50
a Source: Gore, W.L and Associates, 2008 b Source: Levis and Barlas, 2013 Our design case has the following systems: (1) scale house/office, (2) tipping building, (3) grinding/mixing area, (4) biofilter, (5) active composting area, (6) maturation area, (7) curing area, (8) screen/storage, (9) stormwater pond, and (10) leachate holding tank. Incoming feedstock is supplied by commercial waste collection companies and municipalities. The composting facility receives material 240 days per year (five days per week) at a rate of 667 wet metric tons per day. On average, the facility receives 167 metric tons (approximately 10 truckloads) per hour during the four hours per day that materials are received. This means that for four hours per day, there is a steady influx of dump trucks and industrial trucks dumping loads into a “negative air” tipping building, which moves air and odors through a biofilter (24,000 m3 per hour capacity) (Levis and Barlaz, 2013). The main equipment in the composting facility is shown in

22
Table 2.2.

23
Table 2.2: Primary equipment used in the composting facility
Equipment Number of Units
Function
Scale 1 Weighs the material received Front-end loaders 9 Mixes fractions, transports materials, and forms windrows Tube grinder 1 Reduces size of incoming feedstock Gore covering systems 2 Covers and uncovers windrows Aeration systems 64 Pushes/pulls air through the composting mass Bell conveyers 4 Transports materials inside the installation Miscellaneous truck 1 Transports materials inside the installation Water truck 1 Cleans the system and provides water when needed Excavator 1 Removes materials from large compacted piles Trommel screens 4 Separates materials by size
The bulking agent (wood chips) and the inoculant are mixed with feedstock received inside the tipping building, using a front-end loader. The goal is to achieve the proper mix of carbon-rich material (e.g., woody material) and nitrogen-rich material (e.g., food scraps, leaves). The mixture is moved into the mixer by two front-end loaders. The combined raw material (waste, wood, and inoculant) is removed from the tipping building by a front-end loader and placed directly onto a conveyor that leads to the grinder. Four front-end loaders work between the tipping building and the grinder and one front-end loader prepares the blend of waste materials, wood chips, and inoculant. Most waste received in the morning is processed and ground within a couple of hours. The waste received in the afternoon is mixed early the next day. An enclosed conveyor moves the material from the grinder to the middle of the active composting windrows with Gore cover system (Gore Company, U.S.). As needed, moisture in the form of leachate (collected from under the Gore cover pads and treated in a tank), stormwater, or fresh water is sprayed onto the material as it is moved on the conveyor. The moisture content of the mixed material before composting is kept between 40 and 60%. A front-end loader collects compostable waste mixtures at the end of the conveyor and moves them to a previously cleaned windrow location. A thin layer of wood chips or a blend of chips and coarse compost (between six inches and one-foot thick) is added to cover the entire top of the aerated windrow. After a windrow is constructed, the Gore cover is pulled over it to protect it from weather conditions, while still allowing release of carbon dioxide and moisture. Air is forced through the compost windrow through pressurized channels below the windrows. Oxygen levels in the aeration system are typically greater than 10%. The material spends its first 28 days in the 32 actively composting windrows, where the temperature should be 55oC or higher for three consecutive days. Each windrow is 50x8x3 meters and has an approximate capacity of 450 metric tons. After four weeks in active composting, the windrow is moved to the maturation area where it remains for two weeks. The maturation area is operated in a manner very similar to the active composting area and is composed of 16 covered windrows. After the compost has met pathogen reduction requirements and has started to cool down to mesophilic temperatures (below 55oC), it enters in the curing phase, which typically occurs in uncovered windrows to dry out the compost. In this phase, the level of biological activity in the

24
compost is measured. After the curing step, the compost is added to a 35-foot tall windrow, which holds the equivalent of 1,000 tractor-trailer loads. The windrows of finished compost are covered with a semi-permeable blanket that sheds water but allows air transfer. The finished windrows are turned every month to evenly distribute moisture. The final compost is screened by size in two separate steps and the materials resulting from the screening are used in different products (e.g., compost, mulch, soil blends). Contaminants are also removed in the screening steps. Oversized material (i.e., large pieces unable to pass through the first 3-inch screen) is returned to the beginning of the composting process and blended with unprocessed material in the tipping building. The composition of the feedstock used in our analysis is shown in Table 2.3.
Table 2.3: Composition of municipal solid waste (MSW) used for the baseline scenario
No Fraction Mass Fraction (wt. %) 1 Yard Trimmings – Leaves 30.4 2 Yard Trimmings – Grass 25.5 3 Yard Trimmings – Branches 21.0 4 Food Waste – Vegetable 5.2 5 Food Waste – Non-vegetable 14 6 Wood 3.0 7 Newsprint 0.1 8 Corrugated Cardboard 0.2 9 Bag and Sacks 0.2 10 Polyethylene Terephthalate (PET) –
Containers 0.2
11 Plastic Film 0.2 12 Ferrous Cans 0.05 13 Ferrous metal-other 0.05 Total 100
2.4.3 Alternative jet fuel baseline scenarios After building the composting facility base case, the next step was to create the design cases for AJF technologies. As product base cases, we examined five emerging technologies – Virent’s BioForming, ATJ, fast pyrolysis, slow pyrolysis, and AD. These design cases produce jet fuel, gasoline, diesel, methane (biogas), and biochar. These cases are called “product base cases” as they are integrated with a composting facility to develop scenarios that would produce AJF along with biochar. Each of the base cases followed either a catalytic, biochemical, or thermochemical process to generate hydrocarbon fuels. The input flow rate was set at 76 metric tons per day for the AD process, and at 320 metric tons per day for the fast pyrolysis, slow pyrolysis, ATJ, and Virent processes. These flow rates were based on the input of 60% of a specific fraction of the composting feedstock. For example, 60% of food and green waste in the composting facility

25
goes to the AD unit. The initial moisture content was assumed to be 45%. Our analyses we done for feedstock costs of -$60, $0, and $50 per metric ton. Below is a more detailed description of the assumptions and literature data that were used to construct these base design cases.
2.4.3.1 Virent’s BioForming
This process involves catalytic upgrading of a biomass-derived sugar stream to produce AJF. Pretreatment of lignocellulosic material is followed by purification of the sugar stream, which goes into a series of catalytic reactions: aqueous phase reforming, hydrogenation, condensation, and hydrotreatment (Davis et al., 2015). The catalytic upgrading yields long chain hydrocarbons which can be used as biofuel. The composition of the purified hydrolysate resulting from pretreatment was described by Davis et al. (2015). ASPEN Plus v.8.6 (Aspentech, Massachusetts, U.S.) was used to run a simulation of the catalytic upgrading of the hydrolysate to obtain a product stream of AJF. The techno-economic and environmental information used to build the Virent baseline scenario is described in Table 2.4. Table 2.4: Techno-economic and environmental information from the Virent plant used to build the
baseline scenario
Parameter Unit Value Reference Power Process requirement MW 35 Davis et al., 2015 Steam consumption kg hr-1 233,333 Makeup water kg hr-1 159,000 H2 requirement (stoichiometric) kg hr-1 1,509 This work Total purchased equipment cost Million(MM)$ 151.5 Davis et al., 2015 Delivery cost % of TPECa 10 Peters et al., 2004 Variable operational costb MM$ 106.4 Davis et al., 2015 Fuel yield gal dry kg-1 0.077 Total fuel productionc MGYd 50.6 Aviation MGY 46.7 Naphtha MGY 3.8 Year of cost analysis 2011 Operating hours hr year-1 7,880
a TPEC = total purchased equipment cost b The feedstock cost is included in this operational cost and is estimated on a dry biomass basis. Also, the total variable operational is lower than the source because of lower (stoichiometric) consumption of hydrogen. c This number slightly differs from the literature source as it was replicated in the ASPEN Plus v. 8.6 d MGY = million gallons per year
2.4.3.2 Alcohol to jet (ATJ)
In this process, MSW-derived ethanol is upgraded through a series of reactions—dehydration, oligomerization, and hydrotreatment—in order to obtain long chain fuel hydrocarbons (Atsonios et al., 2015). The mass and energy balances, as well as the economic parameters for the ethanol production scenario, were taken from the literature (Humbird et al., 2011). Though jet fuel is a mixture of a large number of different hydrocarbons, for this study a theoretical yield was estimated by assuming a single molecule of hexadecane jet fuel (C16H34) (Atsonios et al., 2015).

26
The purchased and operational cost for the upgrading process was taken from the literature (Atsonios et al., 2015) and scaled down. Electricity is a co-product of the ATJ pathway, however the electricity credit derived from this pathway was not considered. The techno-economic information used to build the ATJ baseline scenario is shown in Table 2.5.
Table 2.5: Techno-economic information from the ATJ plant used to build the baseline scenario
Parameter Unit Value Reference Power Efficiencya % of heating value 33 Process requirement MW 28 Humbird et al., 2011 Steam consumption kg hr-1 233,333 Humbird et al., 2011 Makeup water kg hr-1 147,000 Humbird et al., 2011 H2 requirement kg kg-1 ethanol 0.005 Atsonios et al., 2015 Ethanol yield kg kg-1 stover (dry) 0.263 Humbird et al., 2011 Total purchased equipment cost Ethanol production MM$ 79.3 Humbird et al., 2011 Ethanol upgrading MM$ 13.9 Atsonios et al., 2015 Delivery cost % of TPECb 10 Peters et al., 2004 Variable operational cost Ethanol productionc MM$ 68.7 Humbird et al., 2011 Ethanol upgrading MM$ 50.7 Atsonios et al., 2015 Operating labor MM$ 2.7 Humbird et al., 2011 Fuel yield kg kg-1 ethanol 0.614 Atsonios et al., 2015 Year of cost analysis 2011 Operating hours hr year-1 7,440 Atsonios et al., 2015
a The efficiency is estimated as the percentile of total higher heating value of lignin and unconverted sugar b TPEC = total purchased equipment cost c The feedstock cost is included in this operational cost and is estimated on a dry biomass basis
2.4.3.3 Fast pyrolysis
The scenario for the fast pyrolysis of MSW (45% moisture content) involves the purchase of hydrogen gas (H2). The steps for this scenario are grinding and drying wood, yard, and plastic waste, pyrolysis of waste in a fluidized bed reactor, syngas production, biochar combustion, and pyrolysis oil upgrading (Wright et al., 2010). The pyrolysis product distribution (pyrolysis oil: 0.64 kg kg-1, biochar: 0.15 kg kg-1, and gases: 0.21 kg kg-1) was obtained from the literature (Jones et al., 2013). The product distribution from pyrolysis oil upgrading was adopted from the pyrolysis model described by Jones et al. (2013). The techno-economic data used to build the fast pyrolysis baseline scenario are shown in

27
Table 2.6.

28
Table 2.6: Techno-economic and environmental information for the fast pyrolysis process
Parameter Unit Value Reference Moisture content after drying wt. % 10
Chopping energy kWh per dry metric
ton 46 Mani et al., 2004
Intermediate yield Mullen et al., 2010
Pyrolysis oil % of dry biomass 61.6 Biochar % of dry biomass 17 Non-condensable gas % of dry biomass 21.9 Pyrolysis oil composition Aqueous phase % of pyrolysis oil 38 Oily phase % of pyrolysis oil 62 Wright et al., 2010 Fuel conversion % of oily phase 42 Fuel gas (CH4) % of aqueous phase 16 Electricity requirement kWh per GGEa 1.45
Jones et al., 2013 H2 requirement for hydrotreatment % of pyrolysis oil 5.7 Total purchased equipment cost MM$ 50 Wright et al., 2010 Delivery cost % of TPECb 10 Peters et al., 2004 Variable operational cost MM$ 97.2 Wright et al., 2010 Operating labor MM$ 1.8 Fuel yield
Jones et al., 2013 Jet % of total fuel 42 Diesel % of total fuel 40 Gasoline % of total fuel 15 Light % of total fuel 3 Year of cost analysis 2007
Wright et al., 2010 Operating hours hr year-1 7,440
a GGE = gallon of gasoline equivalent b TPEC = total purchased equipment cost
2.4.3.4 Anaerobic digestion
Anaerobic digestion technology is a biological waste treatment process that occurs in an enclosed, oxygen-free environment. Feedstock is moved by front-end loaders into dedicated anaerobic bays for a 15 to 40-day batch treatment. The treatment typically involves the spraying of inoculum (i.e., AD effluent) into the windrow. Anaerobic digestion is capable of providing improved fertilizer quality from organic waste material while reducing odors, greenhouse gas emissions, and solids. Methane emissions from AD are entrapped and utilized for carbon offset, as well as for the production of renewable energy, either in the form of combined heat and power or compressed natural gas (Holm-Nielsen et al., 2009). The techno-economic data used to build the AD baseline scenario are shown in Table 2.7.

29
Table 2.7: Techno-economic and environmental information for the anaerobic digestion process
Parameter Unit Value Reference Food waste energy content Btu lb-1 1,500-3,000 Zhang et al., 2007 Density of food waste Pounds per cubic
yard 2,000 Zhang et al., 2007
Leachate moisture content % 95 Methane yield (10 days) mL g-1 VS 348 Zhang et al., 2007 Methane yield (28 days) mL g-1 VS 435 Zhang et al., 2007 Volatile solids to total solids (VS/TS)
% 87 Zhang et al., 2007
Methane content of biogas % 73 Zhang et al., 2007 Total purchased equipment cost MM$ 7 Chen et al., 2016 Capital cost $ per metric ton 561 Moriarty, 2013 Delivery cost $ 10 Peters et al., 2004 Variable operational and labor cost
$ 1.3 Chen et al., 2016
Operating hours hr 8,000 Chen et al., 2016
2.4.3.4 Slow pyrolysis
In our analysis, we assume that the feedstock consists of wood, yard, and plastic waste. After grinding, the feedstock is blended with the stockpile of bulking agents (wood chips). Following grinding, screening, and drying, the waste is pyrolyzed. The techno-economic data used to build the slow pyrolysis baseline scenario are shown in Table 2.8.
Table 2.8: Techno-economic and environmental information for the slow pyrolysis process
Parameter Unit Value Reference Yield of biochar % of the dry
biomass 25 Chen et al., 2016
Biomass for combustion % of dry biomass 11 Chen et al., 2016 Excess air for biomass combustion % 30 Fuel consumption for electricity generation
L kWh-1 0.25
Total purchased equipment cost MM$ 1.15 Delivery cost % of TPECa 10 Peters et al., 2004 Variable operational and labor cost MM$ 1.2 Year of cost analysis
2015
Operating hours hr year-1 7,200
a TPEC = total purchased equipment cost

30
2.4.4 Biorefinery scenarios The primary reason for integrating the emerging AJF production technologies with a compost facility to create a biorefinery is the potential for cost reduction. A successful integration requires a detailed understanding of the interactions between the existing infrastructure and the emerging AJF production technologies (BRDI, 2014). Compatibility issues may exist when attempting to utilize existing assets for the desired integration scenario. Biorefinery alternatives for a composting facility are shown in Figure 2.2. Schematics of proposed integrated pathways between a composting facility and the emerging technologies examined in this study are detailed in Figure 2.3 - Figure 2.7.
Figure 2.2: Biorefinery scenarios for a composting facility
Figure 2.3: Schematics of proposed integrated pathways between a composting facility and
anaerobic digestion

31
Figure 2.4: Schematics of proposed integrated pathways between a composting facility and slow
pyrolysis
Figure 2.5: Schematics of proposed integrated pathways between a composting facility and fast pyrolysis

32
Figure 2.6: Schematics of proposed integrated pathways between a composting facility and ATJ
technology
Figure 2.7: Schematics of proposed integrated pathways between a composting facility and Virent
BioForming technology

33
Not all of the possible integration scenarios (Table 2.9) were evaluated as part of the techno-economic analysis. Rather, each of the five emerging technologies were examined to evaluate the effect of feedstock price and tipping fee on minimum selling price (Table 2.10). Three different cases for each technology were evaluated:
1) Base case: standalone technology (not integrated with a composting facility so feedstock must be purchased, in this case at $50 per metric ton); no tipping fee
2) Co-location: technology integrated with a compost facility (no feedstock cost); no tipping fee
3) Co-location: technology integrated with a compost facility (no feedstock cost); $60 per metric ton tipping fee
Table 2.9: Possible integration scenarios between composting facility and AJF technologies
Case Description
Case 1 Composting Case 2 Production of biomethane through anaerobic digestion (standalone) Case 3 Electricity generation through anaerobic digestion (standalone) Case 4 Hydrogen production through anaerobic digestion (standalone) Case 5 Biochar production through slow pyrolysis (standalone) Case 6 Jet fuel production through fast pyrolysis (standalone) Case 7 Jet fuel production through Virent technology (standalone) Case 8 Jet fuel production through AJT technology (standalone) Case 9 Integration of composting facility and anaerobic digestion
Case 10 Integration of composting facility and fast pyrolysis
Case 11 Integration of composting facility and slow pyrolysis
Case 12 Integration of composting facility and Virent technology
Case 13 Integration of composting facility and ATJ technology
Case 14 Integration of fast pyrolysis and anaerobic digestion
Case 15 Integration of slow pyrolysis and anaerobic digestion
Case 16 Integration of Virent technology and anaerobic digestion
Case 17 Integration of ATJ technology and anaerobic digestion
Case 18 Integration of composting facility, fast pyrolysis, and anaerobic digestion
Case 19 Integration of composting facility, slow pyrolysis, and anaerobic digestion
Case 20 Integration of composting facility, Virent technology, and anaerobic digestion
Case 21 Integration of composting facility, ATJ technology, and anaerobic digestion
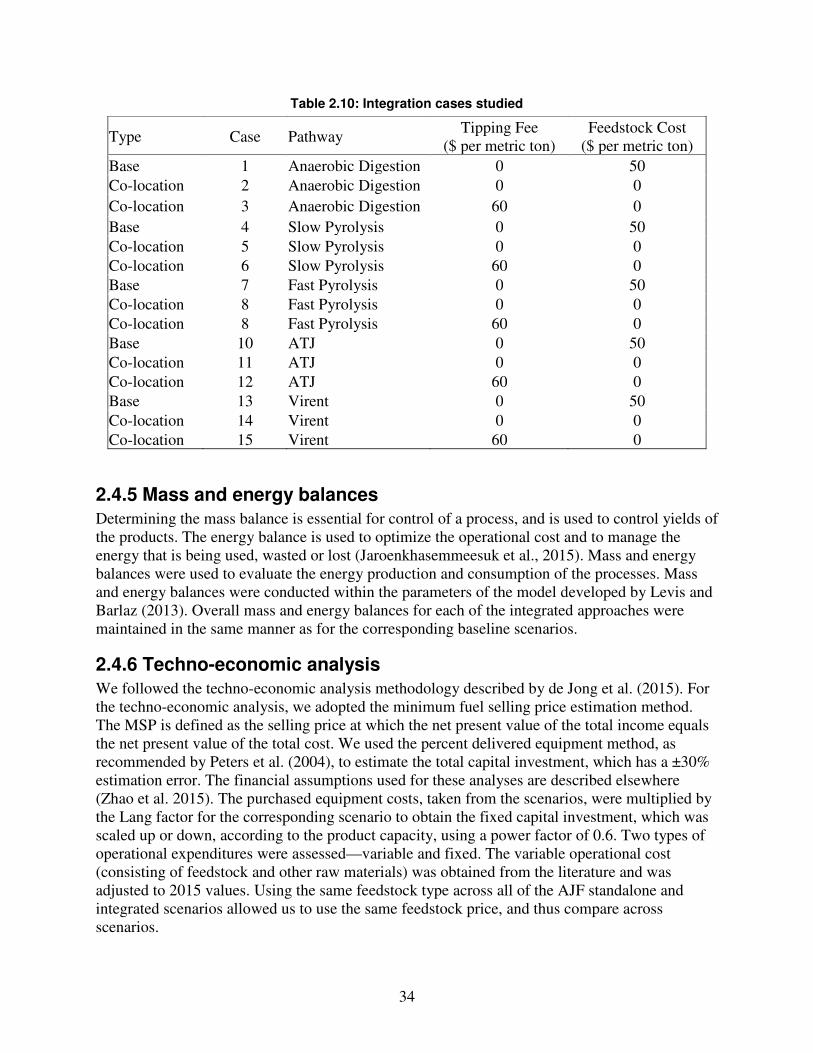
34
Table 2.10: Integration cases studied
Type Case Pathway Tipping Fee
($ per metric ton) Feedstock Cost
($ per metric ton) Base 1 Anaerobic Digestion 0 50 Co-location 2 Anaerobic Digestion 0 0 Co-location 3 Anaerobic Digestion 60 0 Base 4 Slow Pyrolysis 0 50 Co-location 5 Slow Pyrolysis 0 0 Co-location 6 Slow Pyrolysis 60 0 Base 7 Fast Pyrolysis 0 50 Co-location 8 Fast Pyrolysis 0 0 Co-location 8 Fast Pyrolysis 60 0 Base 10 ATJ 0 50 Co-location 11 ATJ 0 0 Co-location 12 ATJ 60 0 Base 13 Virent 0 50 Co-location 14 Virent 0 0 Co-location 15 Virent 60 0
2.4.5 Mass and energy balances Determining the mass balance is essential for control of a process, and is used to control yields of the products. The energy balance is used to optimize the operational cost and to manage the energy that is being used, wasted or lost (Jaroenkhasemmeesuk et al., 2015). Mass and energy balances were used to evaluate the energy production and consumption of the processes. Mass and energy balances were conducted within the parameters of the model developed by Levis and Barlaz (2013). Overall mass and energy balances for each of the integrated approaches were maintained in the same manner as for the corresponding baseline scenarios.
2.4.6 Techno-economic analysis We followed the techno-economic analysis methodology described by de Jong et al. (2015). For the techno-economic analysis, we adopted the minimum fuel selling price estimation method. The MSP is defined as the selling price at which the net present value of the total income equals the net present value of the total cost. We used the percent delivered equipment method, as recommended by Peters et al. (2004), to estimate the total capital investment, which has a ±30% estimation error. The financial assumptions used for these analyses are described elsewhere (Zhao et al. 2015). The purchased equipment costs, taken from the scenarios, were multiplied by the Lang factor for the corresponding scenario to obtain the fixed capital investment, which was scaled up or down, according to the product capacity, using a power factor of 0.6. Two types of operational expenditures were assessed—variable and fixed. The variable operational cost (consisting of feedstock and other raw materials) was obtained from the literature and was adjusted to 2015 values. Using the same feedstock type across all of the AJF standalone and integrated scenarios allowed us to use the same feedstock price, and thus compare across scenarios.

35
For fixed operational cost, we obtained the salary cost from the literature. The other constituents of fixed operational expenditures (property insurance, local taxes, maintenance and repairs, overhead cost) were estimated using assumptions from Peters et al., (2004). We used an “nth plant assumption,” meaning that all the scenarios were matured, and, thus, associated with fewer uncertainties and greater performance (Davis et al., 2015; de Jong et al., 2015; Humbird et al., 2011). In this analysis, we used the percent delivered method, which has been found to be useful for estimating the cost reduction opportunities in a co-locating strategy (de Jong et al., 2015). The capital cost reduction scopes for cases that would involve the sharing of infrastructure with an existing composting facility are presented in Table 2.11. Buildings cost includes labor, supplies, and materials needed for erecting all buildings inside a plant (Peters et al., 2004). In co-location cases, the building cost is considered to be an expansion corresponding to 7% (rather than 29%) of total delivered equipment cost (Peters et al., 2004), resulting in a 75% reduction in costs across all of the co-location scenarios. Setting up a new set of processes in an existing establishment allows for the reduction of some costs including roads, sidewalks, railroads, and other related work, collectively referred to as “yard improvement” (Peters et al., 2004).

36
Table 2.11: Lang factor reductions for each of the design cases (as described in Table 2.10)
Item Base factors (%)a
Reduction (%) Case 1 Case 2 Case 3 Case 4 Case 5
Buildings cost (including services)
29 29 29 7 29 29
Yard improvements 12 12 12 8 12 12 Service facilities cost (installed) b
55 55 55 28 55 55
Land cost c 6 6 6 0 6 6 Lang factor (FCI/TDEC) d 4.28 4.28 4.28 3.75 4.28 4.28 Item Base factors
(%) Case 6 Case 7 Case 8 Case 9 Case 10
Buildings cost (including services)
29 7 29 29 7 29
Yard improvements 12 8 12 12 8 12 Service facilities cost (installed)
55 28 55 55 28 55
Land cost 6 0 6 6 0 6 Lang factor (FCI/TDEC) 4.28 3.75 4.28 4.28 3.75 4.28 Item Base factors
(%) Case
11 Case
12 Case
13 Case
14 Case 15
Buildings (including services)
29 29 7 29 29 7
Yard improvements 12 12 8 12 12 8 Service facilities (installed) 55 55 28 55 55 28 Land 6 6 0 6 6 0 Lang factor (FCI/TDEC) 4.28 4.28 3.75 4.28 4.28 3.75
a Base factors proposed by Peters et al. 2004 b Service facilities: utilities for supplying steam, water, power, compressed air, and fuel are part of the service facilities of a chemical process plant. Waste disposal, fire protection, and miscellaneous service items c Land: the cost for land and the accompanying surveys and fees depends on the location of the property and may vary by a cost factor per acre as high as 30 to 50 between a rural district and high industrialized area. As rough average, land costs for industrial plants amount to 4-8% of purchased-equipment cost or 1-2% of total capital cost. d Lang Factor (fixed capital investment/total delivered equipment cost) is used to obtain order of magnitude cost estimates, and recognizes that the cost of a process plant may be obtained by multiplying the equipment cost by some factor to approximate the fixed or total capital investment.
2.5 Results and discussion
2.5.1 Mass and energy balances The material and energy flow for the composting facility base case scenario is shown in Figure 2.8. The process design data (

37
Table 2.1) resulted in the formation of a composting facility with a capacity to process 160,000 wet metric tons per year. In our study, we determined the mass balance of the composting facility with a known water content for each of the waste streams. Diesel was consumed by the tub grinder and front-end loaders. Electricity was used during material processing in screens, as well as for odor control and aeration using the Gore cover system.
2.5.1.1 Integrated scenarios
Process block diagrams show mass and energy balances for the composting baseline scenario (Figure 2.8) and for proposed integrated pathways of composting facility with emerging technologies (Figure 2.9 - Figure 2.13).
Figure 2.8: Process block diagram of the composting facility base case (capacity 160,000 wet
metric tons per year). Inputs and outputs are expressed in metric tons per day
Figure 2.9: Process block diagram of proposed integrated pathways between the composting
facility and anaerobic digestion. Values are expressed in metric tons

38
Figure 2.10: Process block diagram of proposed integrated pathways between the composting
facility and slow pyrolysis. Values are expressed in metric tons
Figure 2.11: Process block diagram of proposed integrated pathways between the composting
facility and fast pyrolysis. Values are expressed in metric tons
Input OutputProcess
Composting
Leachate
Foo
d &
gree
n
wa
ste
Anaerobic
Digestion
Biomethan
5.1 ton/day3
20 to
n/d
aySlow
Pyrolysis
Dryer
Biochar
Boiler
Vapor
Burner
Steam
Water
Electricity
1.107 MW
Water
Gas
76.8 ton/day100 ton/day
Effluent
24.6 ton/day
Solid Residues138.7 ton/day
Anaerobic
Digestion
CO2
7.37 ton/day
Wo
od
, yard
an
d
Plastic w
aste11872269 kJ/hr
176.5 ton/day
141.2 ton/day
water
39.71 ton/day
136.788 ton/day
Plastic Waste
Food/green waste
Wood Waste
Yard Waste
Newsprint
Corr. Cardboard
Ferros Cans & Metals
Bulking Agent
Inoculate
Water
2.668 (0.4%)
128.06 (19.2%)
20.01 (3%)
512.25 (76.8%)
0.667 (0.1%)
1.334 (0.2%)
0.667 (0.1%)
44
667 MSW ton/day
Compost
CH4
CO2
NH3
NO2
N2
VOC
Water
Ton/day
119.6
0.43
68.4
0.06
0.01
2.58
0.0001
102
Diesel
Electricity 8299 kW-h
1218 L/day
Input OutputProcess
Composting
Compost
CH4
CO2
NH3
NO2
N2
VOC
Water
Plastic Waste
Food/green waste
Wood Waste
Yard Waste
Newsprint
Corr. Cardboard
Ferros Cans & Metals
Bulking Agent
Inoculate
Water
Diesel
Electricity
2.668 (0.4%)
128.06 (19.2%)
20.01 (3%)
512.25(76.8%)
0.667 (0.1%)
1.334 (0.2%)
0.667 (0.1%)
44
667 MSW ton/day
Ton/day
8299 kW-h100 ton/day 1218 L/day
Ton/day
Leachate
Food & green
waste
Anaerobic
Digestion
Effluent
76.8 ton/day
Biogas
Mixing
Biogas
Purification
Solid-Liquid
separator
Solid Residues
176.8 ton/
day
12.5 ton/day
5.1 ton/dayBio-methane
CO27.37 ton/day
164.3 ton/day
138.7 ton/day
24.6 ton/day
Buffer Tank
Hydrotreatin
gFractionation
Light fraction 1.1 ton/
day
Gasoline 6.3 ton/day
Jet fuel 17.7
Diesel 11.8
Heavy fraction 4.9
Fuel gas
Fuel Gas/NG
reforming
DryerFast
Pyrolysis
Biooil
External NG
0.37 ton per day
H2
Wood, yard and
Plastic waste
320 ton/day
121 ton/day
Char
26 ton/day Water
131 ton/day
Dried feedstock
183 ton/daygas
36 ton/day
PSA
Off Gas
19.9 ton/day
119.6
0.43
68.4
0.06
0.01
2.58
0.0001
102

39
Figure 2.12: Process block diagram of proposed integrated pathways between the composting
facility and alcohol to jet. Values are expressed in metric tons
Input OutputProcess
Composting
Compost
CH4
CO2
NH3
NO2
N2
VOC
Water
Plastic Waste
Food/green waste
Wood Waste
Yard Waste
Newsprint
Corr. Cardboard
Ferros Cans & Metals
Bulking Agent
Inoculate
Water
Diesel
Electricity
2.668 (0.4%)
128.06 (19.2%)
20.01 (3%)
512.25(76.8%)
0.667 (0.1%)
1.334 (0.2%)
0.667 (0.1%)
97
667 MSW ton/day
Ton/day
9415.11 kW-h
100 ton/day
2968.39 L/day
Ton/day
Leachate
Foo
d &
gree
n w
aste
Anaerobic
Digestion
Effluent
76.8 ton/day
Biogas
Mixing
Biogas
Purification
Solid-Liquid
separator
Solid Residues
176.8 ton/day
12.5 ton/day
5.1 ton/day
Bio-methane
CO27.37 ton/day
164.3 ton/day
138.7 ton/day
24.6 ton/day
Buffer Tank
Fuel Gas/NG
reforming
Wo
od
, yard
and
waste
31
9 ton
/day
H2
11.56 ton/day
NG
32 ton/day
Deacetylation
Pretreatment
Conditioning
Hydrolysis
Concentration
Filtration
Ion Exchange
HydrogenationAPR
Condensation
Hydrotreatment
Separator
Fuel range
Hydrocarbons
30 ton/day
Water
254 ton/day
Water
279 ton/day
Water
530 ton/day
119.5
0.43
68.3
0.06
0.01
2.57
0.0001
102
Figure 2.13: Process block diagram of proposed integrated pathways between composting facility and Virent process. Values are expressed in metric tons
Input OutputProcess
Composting
Compost
CH4
CO2
NH3
NO2
N2
VOC
Water
Plastic Waste
Food/green waste
Wood Waste
Yard Waste
Newsprint
Corr. Cardboard
Ferros Cans & Metals
Bulking Agent
Inoculate
Water
Diesel
Electricity
2.668 (0.4%)
128.06 (19.2%)
20.01 (3%)
512.25(76.8%)
0.667 (0.1%)
1.334 (0.2%)
0.667 (0.1%)
44
667 MSW ton/day
Ton/day
8300 kW-h
100 ton/day
1218 L/day
Ton/day
Leachate
Food & green
waste
Anaerobic
Digestion
Effluent
76.8 ton/day
Biogas
Mixing
Biogas
Purification
Solid-Liquid
separator
Solid Residues
176.8 ton/
day
12.5 ton/day
5.1 ton/dayBio-methane
CO27.37 ton/day
164.3 ton/day
138.7 ton/day
24.6 ton/day
Buffer Tank
Fuel Gas/NG
reforming
PretreatmentHydrolysis
Fermentation
DistillationDehydration
Ethylen
Oligomerization
αOlefinesDistillation
C4-C8 Olefines
>C16 olefins
C9-C16 Olefins
Diesel & Jet Fuel
28.3 ton/day
Ethanol
28.3 ton/day
hydrogenation
Wood, and yard
waste
319 ton/day
H2
0.25 ton/day
H2
1.3 ton/day
119.5
0.43
68.3
0.06
0.01
2.57
0.0001
102
40
2.5.1.2 Standalone cases
Standalone AD case
It was assumed that 60 wt. % of the food and green waste in the composting facility went into the AD unit. The overall mass balance of standalone AD is shown in Figure 2.14. The product capacity of this process was estimated to be 16,057 ft3 hr-1 (or 129 million ft3 year-1) of methane, with an additional solid fertilizer production of 5,778 metric ton year-1. In the slow pyrolysis case, it was assumed that 60% by weight of wood, yard, and plastic waste in the composting facility went into the pyrolysis unit. Based on the information in Table 2.8, the product capacity of this process was estimated to be 1,636 kg hr-1 (or 11,783 metric ton year-1) of biochar.
Standalone Virent case
It was assumed in the Virent case that 60% by weight of wood and yard waste in the composting facility went to the Virent unit. The product capacity of this process was estimated to be 1,140 kg per hour (or 4.3 million gallons per year) of AJF, with an additional co-product production of 360,000 gallons per year (Figure 2.14). The jet fuel stream was modeled to consist of 17.34% dodecane (C12H26); 3.21% tetracosane (C24H50); 4.41% hexadecane (C16H34); 3.22% pentadecane (C15H32); 19.12% butylcyclopentane (C9H18); 16.96% propylcyclopentane (C8H18); 22.91% pentane (C5H12); and 12.83% hexane (C6H14). The co-product stream was modeled to consist of 86.22% pentane (C5H12); 6.85% hexane (C6H14); and 6.20% ethane (C2H6). A 33% efficiency assumption generated 4.78 MW of power from the burning of lignin and unconverted sugars, as well as from biogas derived from AD.
Standalone ATJ case
In the standalone ATJ case, it was assumed that 60% by weight of wood and yard waste in the composting facility went to the ATJ unit. In the standalone ATJ process, wood and yard waste was pretreated and fermented to produce ethanol at the rate of 1,927 kg hr-1 (Figure 2.14). This ethanol was then directed to a series of upgrading reactions to produce aviation fuel. The fuel production rate is 1,183 kg hr-1 or 5.3 million gallons per year. Based on the efficiency assumption, the total electricity generation was estimated to be 3.5 MW of electricity. The hydrogen (H2) requirement for the hydrotreatment reaction was estimated to be 10.5 kg hr-1, on a theoretical basis.
Standalone fast pyrolysis case
In the standalone fast pyrolysis unit, it was assumed that 60% by weight of wood, yard, and plastic waste in the composting facility went to the pyrolysis unit. Based on the information in

41
Table 2.6, the intermediate product distribution is 5,268 kg hr-1 pyrolysis oil; 1,081 kg hr-1 biochar; and 1,513 kg hr-1 non-condensable gas. The H2 requirement was calculated at the rate of 1,084 kg hr-1. The final product distribution from the hydrotreatment area was 277 kg hr-1 gasoline; 513 kg hr-1 diesel; 772 kg hr-1 jet fuel; and 215 kg hr-1 light gas (n-pentane) (Figure 2.10).
Figure 2.14: Process block diagram for product base (standalone) cases. These cases utilize
municipal solid waste as a feedstock and produce a varying range of products
2.5.2 Techno-economic analysis
2.5.2.1 Minimum fuel selling prices for base and integrated scenarios
The scope of the techno-economic analysis covered 15 scenarios (Table 2.12). Based on the standardization component, MSPs were estimated for AJF production both as standalone facilities and as part of a composting biorefinery. For each technology, the “base case” refers to a
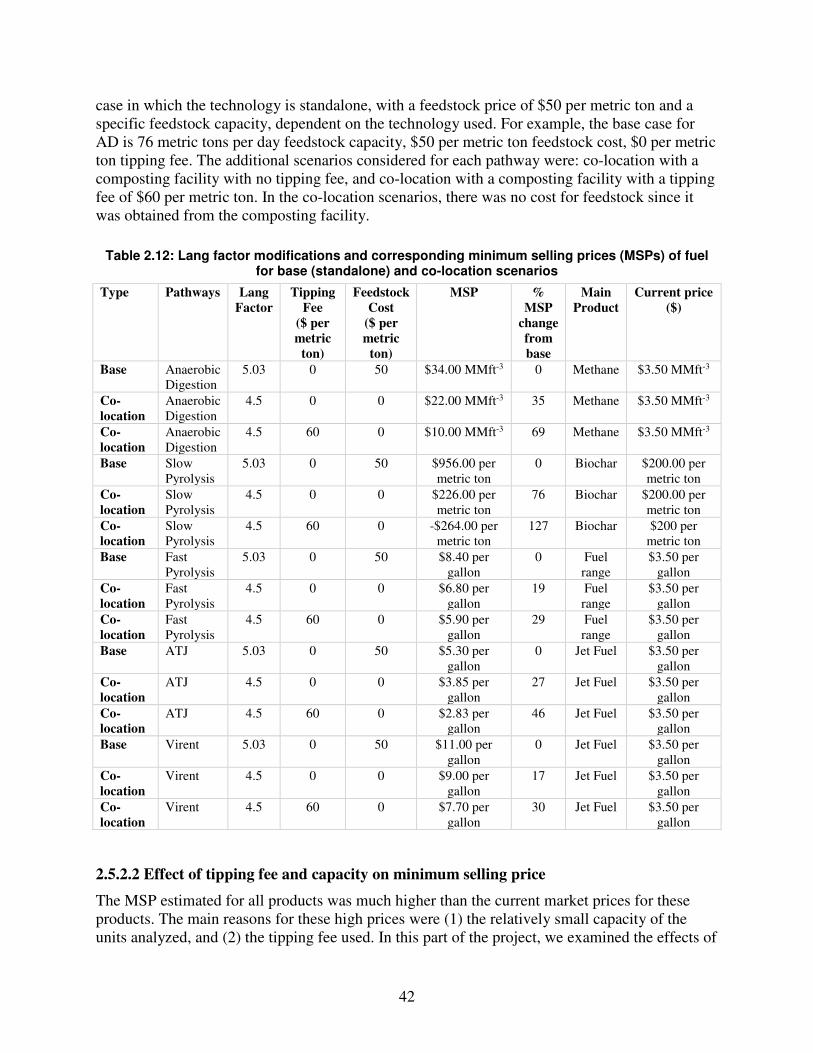
42
case in which the technology is standalone, with a feedstock price of $50 per metric ton and a specific feedstock capacity, dependent on the technology used. For example, the base case for AD is 76 metric tons per day feedstock capacity, $50 per metric ton feedstock cost, $0 per metric ton tipping fee. The additional scenarios considered for each pathway were: co-location with a composting facility with no tipping fee, and co-location with a composting facility with a tipping fee of $60 per metric ton. In the co-location scenarios, there was no cost for feedstock since it was obtained from the composting facility.
Table 2.12: Lang factor modifications and corresponding minimum selling prices (MSPs) of fuel for base (standalone) and co-location scenarios
Type Pathways Lang Factor
Tipping Fee
($ per metric
ton)
Feedstock Cost
($ per metric
ton)
MSP % MSP
change from base
Main Product
Current price ($)
Base Anaerobic Digestion
5.03 0 50 $34.00 MMft-3 0 Methane $3.50 MMft-3
Co-location
Anaerobic Digestion
4.5 0 0 $22.00 MMft-3 35 Methane $3.50 MMft-3
Co-location
Anaerobic Digestion
4.5 60 0 $10.00 MMft-3 69 Methane $3.50 MMft-3
Base Slow Pyrolysis
5.03 0 50 $956.00 per metric ton
0 Biochar $200.00 per metric ton
Co-location
Slow Pyrolysis
4.5 0 0 $226.00 per metric ton
76 Biochar $200.00 per metric ton
Co-location
Slow Pyrolysis
4.5 60 0 -$264.00 per metric ton
127 Biochar $200 per metric ton
Base Fast Pyrolysis
5.03 0 50 $8.40 per gallon
0 Fuel range
$3.50 per gallon
Co-location
Fast Pyrolysis
4.5 0 0 $6.80 per gallon
19 Fuel range
$3.50 per gallon
Co-location
Fast Pyrolysis
4.5 60 0 $5.90 per gallon
29 Fuel range
$3.50 per gallon
Base ATJ 5.03 0 50 $5.30 per gallon
0 Jet Fuel $3.50 per gallon
Co-location
ATJ 4.5 0 0 $3.85 per gallon
27 Jet Fuel $3.50 per gallon
Co-location
ATJ 4.5 60 0 $2.83 per gallon
46 Jet Fuel $3.50 per gallon
Base Virent 5.03 0 50 $11.00 per gallon
0 Jet Fuel $3.50 per gallon
Co-location
Virent 4.5 0 0 $9.00 per gallon
17 Jet Fuel $3.50 per gallon
Co-location
Virent 4.5 60 0 $7.70 per gallon
30 Jet Fuel $3.50 per gallon
2.5.2.2 Effect of tipping fee and capacity on minimum selling price
The MSP estimated for all products was much higher than the current market prices for these products. The main reasons for these high prices were (1) the relatively small capacity of the units analyzed, and (2) the tipping fee used. In this part of the project, we examined the effects of

43
co-location, tipping fee, and feedstock capacity on MSP. These results shown in Figure 2.15 - Figure 2.19, and are summarized below.
For AD (Figure 2.15), if the capacity was increased from 76 to 161 or 230 metric tons per day, the MSP decreased to below the current price (which was set based on the average price of methane in 2016, see https://www.eia.gov/dnav/ng/hist/n3035us3m.htm). Also, the minimum selling price was equal to the current price if the tipping fee increased to around $100 per day with a capacity of 76 metric tons per day. For slow pyrolysis (Figure 2.16), the price resulting from the base case capacity (320 metric tons per day) was equal to the MSP if the tipping fee was around $5 per metric ton. For fast pyrolysis (Figure 2.17), the base case MSP could not reach the current price at the base case capacity (320 metric tons per day) with a tipping fee in the range of $0 to $120 per metric ton. However, if the capacity were increased to either 1,000 or 2,000 metric tons per day, the MSP could equal the current price. For Virent’s BioForming (Figure 2.18), the base case (319 metric tons per day) had a high MSP. The MSP could equal the current price only if the capacity increased to 2,000 metric tons per day. For ATJ (Figure 2.19), the MSP was equal to the current price at the base case capacity (319 metric tons per day), if the tipping fees were around $25 and $50 per metric ton for co-location and standalone scenarios, respectively.
Figure 2.15: Effect of tipping fee ($ per metric ton) and capacity (metric tons per day) on the
minimum selling price for anaerobic digestion
-20
-10
0
10
20
30
40
50
-150 -100 -50 0 50 100 150 200
MSP
($/M
Mft
^3
)
Tipping Fee($/ton)
Co-location (76 Ton/day)
Standalone(76 ton/day)
Standalone(161 ton/day)
Co-location(161 ton/day)
Standalone (230 ton/day)
Co-location(230 ton/day)
Current Price 3.5$/Mft^3

44
Figure 2.16: Effect of tipping fee ($ per metric ton) and capacity (metric tons per day) on the
minimum selling price for slow pyrolysis
Current price 200 $/ton

45
Figure 2.17: The effect of tipping fee ($ per metric ton) and capacity (metric tons per day) on the
minimum selling price for fast pyrolysis
0
1
2
3
4
5
6
7
8
9
10
-120 -100 -80 -60 -40 -20 0 20 40 60 80 100 120 140 160
MSP
($)/
ga
l)
Tipping Fee($)/ton
Co-location (2000 ton/day)
Standalone(2000 ton/day)
Co-location (1000 ton/day)
Standalone(1000 ton/day)
Co-location(320 ton/day)
standalone (320 ton/day)
Current price (3.5 $/gal)

46
Figure 2.18: Effect of tipping fee ($ per metric ton) and capacity (metric tons per day) on the
minimum selling price for Virent’s BioForming
0
2
4
6
8
10
12
14
16
-150 -100 -50 0 50 100 150 200
MSP
($
/ga
l)
Tipping Fee($/ton)
Co-location (2000 ton/day)
standalone (2000 ton/day)
Co-location (1000 ton/day)
Standalone(1000 ton/day)
Co-location(319 ton/day)
Standalone(319 ton/day)
Current price(3.5 $/gal)

47
Figure 2.19: Effect of tipping fee ($ per metric ton) and capacity (metric tons per day) on the
minimum selling price of alcohol to jet
2.6 Conclusions
In this study, we generated and evaluated potential scenarios for the use of a composting facility as a platform for the production of AJFs, biochar, and methane. Minimum selling prices were evaluated for each scenario. The MSPs for each of the products generated by the AJF technologies studied was higher than current market prices. Anaerobic digestion, Virent’s BioForming, and fast pyrolysis standalone cases were not economically feasible (with feedstock capacities of 76, 319, and 320 metric tons per day, respectively, and with a tipping fee of $60 per metric ton). If the capacity and tipping fee were increased, however, they could become economically feasible. On the other hand, the slow pyrolysis and ATJ standalone cases (with feedstock capacities of 320 and 319 metric tons per day, respectively) could be economically feasible with a $60 per metric ton tipping fee. Integration with a composting facility and setting a tipping fee of $60 per metric ton resulted in cost reduction opportunities in capital expenditures and operational expenditures, leading to a reduction in MSPs of 29 to 46% compared to standalone AJF facilities. The results of this analysis suggest that through integration with emerging technologies, there is potential for composting facilities to be used as a platform for the production of a variety of
-1
0
1
2
3
4
5
6
7
-150 -100 -50 0 50 100 150 200
MSP
($/g
al)
Tipping Fee($/ton)
Co-location(2000 ton/day)
Standalone(2000 ton/day)
Co-location(1000 ton/day)
Standalone(1000 ton/day)
Co-location(319 ton/day)
Standalone(319 ton/day)
Current price(3.5 $/gal)
Current Price (3.5 $)

48
high-value products (fuel, methane, and biochar) in addition to compost. Furthermore, the results indicate that feedstock capacity plays an important role in determining the economic feasibility of these emerging technologies. In this study, we have shown that increasing feedstock capacity allows technologies to become economically feasible. The scope of this study only included techno-economic assessment of specific emerging technologies that could be integrated with a composting facility. Life cycle assessments were beyond the scope of this analysis. However, an analysis including a life cycle assessment could provide additional useful information for decision making and technology selection. Moreover, there are other technologies that could be evaluated using the techno-economic assessment and life cycle assessment methods, to evaluate the feasibility of their integration with a composting facility.
2.7 References
Amyris and Total. 2013. Breaking the Barrier with Breakthrough Jet Fuel Solutions, http://www.alternativefuelsworldwide.com/presentations/, Renewable Aviation Fuel Join Development Program.
Atsonios, K., Kougioumtzis, M.A., Panopoulos, K. D., and Kakaras, E. 2015. Alternative thermochemical routes for aviation biofuels via alcohols synthesis: Process modeling, techno-economic assessment and comparison. Applied Energy, 138, 346-366.
BRDI, 2014, Integrating the Biomass Supply Chain for Improved Efficiency, www. biomass board.gov/pdfs/isc_white_paper.pdf.
Chen, S., Frear, C., Garcia-Pérez, M., Jensen, J. Sjoding, D., Kruger, C., Abu-Lail, N.I., Astill, G., Dallmeyer, I., Dong, T., Flury, M., Fortuna, A., Garcia-Nunez, J., Hall, S.A., Harsh, J.B., Iqbal, H., Kennedy, N., Ma, J., Mitchell, S., Pecha, B., Pelaez-Samaniego, R., Seker, A., Smith, M., Suliman, W., Yorgey, G., Yu, L., and Zhao, Q. 2016. Advancing Organics Management in Washington State: The Waste to Fuels Technology Partnership. Publication 16-07-008. Washington Department of Ecology, Olympia, WA.
Davidson, C., E. Newes, A. Schwab, and L. Vimmerstedt. 2014. An Overview of Aviation Fuel Markets for Biofuels Stakeholders. National Renewable Energy Laboratory. Technical
Report: NREL/TP-6A20-60254. http://www.nrel.gov/docs/fy14osti/60254.pdf. Davis, R., Tao, L., Scarlata, C., Tan, E.C.D., Ross, J., Lukas, J., and Sexton, D. 2015. Process
Design and Economics for the Conversion of Lignocellulosic Biomass to Hydrocarbons: Dilute-Acid and Enzymatic Deconstruction of Biomass to Sugars and Catalytic Conversion of Sugars to Hydrocarbons. National Renewable Energy Laboratory. Technical Report: NREL/TP-5100-62498. http://www.nrel.gov/docs/fy15osti/62498.pdf.
De Jong, S., Hoefnagels, R., Faaij, A., Slade, R., Mawhood, R., & Junginger, M. 2015. The feasibility of short‐term production strategies for renewable jet fuels–a comprehensive techno‐economic comparison. Biofuels, Bioproducts and Biorefining, 9(6), 778-800.
Ecology. 2009. Washington Statewide Waste Characterization Study Area. p. 135. Washington State Department of Ecology. Olympia, WA. Retrieved from http://www.ecy.wa.gov/pubs/1007023.pdf
Ecology. 2010. Solid Waste in Washington State 19th Annual Status Report. p. 174. Washington State Department of Ecology. Olympia, WA.
Ecology. 2011. Siting and Operating Composting Facilities in Washington State. https://fortress.wa.gov/ecy/publications/publications/1107005.pdf Washington State Department of Ecology. Olympia, WA.

49
Ecology. 2015. The State Solid and Hazardous Waste Plan - Moving Washington Beyond Waste and Toxics. https://fortress.wa.gov/ecy/publications/documents/1504019.pdf Washington State Department of Ecology. Olympia, WA.
Ecology. 2016. Waste Characterization Study State of Washington Department of Ecology, https://fortress.wa.gov/ecy/publications/documents/1607032.pdf, Washington State Department of Ecology. Olympia, WA.
EPA. 2016. Advancing Sustainable Materials Management: 2014 Fact Sheet. https://www.epa.gov/sites/production/files/2016-11/documents/2014_smmfactsheet_508.pdf
Garcia-Nunez, J.A., Rodriguez, D.T., Fontanilla, C.A., Ramirez, N.E., Lora, E.E.S., Frear, C.S., Stockle, C., Amonette, J. and Garcia-Pérez, M. 2016. Evaluation of alternatives for the evolution of palm oil mills into biorefineries. Biomass and Bioenergy, 95, 310-329.
Gore, W.L. and Associates. 2008. The Gore Cover System: A Leading Compost Technology for Organic Waste Treatment. p.6.
Holm-Nielsen, J. B., Al Seadi, T., Oleskowicz-Popiel, P. 2009. The future of anaerobic digestion and biogas utilization. Bioresource Technology 100 (22), 5478-5484.
Henrich, E., N. Dahmen, and E. Dinjus, 2009, Cost estimate for biosynfuel production via biosyncrude gasification: Biofuels Bioproducts & Biorefining-Biofpr, 3(1), 28-41.
Hileman, J. I., De la Rosa Blanco, E., Bonnefoy, P. A., & Carter, N. A. 2013. The carbon dioxide challenge facing aviation. Progress in Aerospace Sciences, 63, 84-95.
Humbird, D., R. Davis, L. Tao, C. Kinchin, D. Hsu, D. Aden, P. Schoen, J. Lukas, B. Olthof, M. Worley, D. Sexton, and D. Dudgeon, 2011, Process Design and Economics for Biochemical Conversion of Lignocellulosic Biomass to Ethanol: Dilute-Acid Pretreatment and Enzymatic Hydrolysis of Corn Stover, Technical Report
NREL/TP-5100-47764. National Renewable Energy Laboratory. http://www.nrel.gov/docs/fy11osti/47764.pdf.
IATA(International Air Transport Association). 2011. Vision 2050. Report: Singapore. https://www.iata.org/pressroom/facts_figures/Documents/vision-2050.pdf
Levis, J.W. and Barlaz, M.A., 2013. Composting process model documentation. Retrieved May, 16, 2015. North Carolina State University. NC 27695-7908.
Jaroenkhasemmeesuk, C. and Tippayawong, N. 2015. Technical and economic analysis of a biomass pyrolysis plant. Energy Procedia, 79, 950-955.
Jones, S., Meyer, P., Snowden-Swan, L., Padmaperuma, A., Tan, E., Dutta, A., Jacobson, J., and Cafferty, K. 2013. Process Design and Economics for the Conversion of Lignocellulosic Biomass to Hydrocarbon Fuels: Fast Pyrolysis and Hydrotreating Bio-oil Pathway. National Renewable Energy Laboratory. PNNL-23053, NREL/TP-5100-61178. http://www.nrel.gov/docs/fy14osti/61178.pdf
Klein‐Marcuschamer, D., Turner, C., Allen, M., Gray, P., Dietzgen, R.G., Gresshoff, P.M., Hankamer, B., Heimann, K., Scott, P.T., Stephens, E. and Speight, R., 2013. Technoeconomic analysis of renewable aviation fuel from microalgae, Pongamia pinnata, and sugarcane. Biofuels, Bioproducts and Biorefining, 7(4), 416-428.
Levis, J.W. and M.A. Barlaz. 2013. Composting Process Model Documentation. North Carolina State University. November 2013. http://www4.ncsu.edu/~jwlevis/Composting.pdf
Mani, S., Tabil, L.G. and Sokhansanj, S., 2004. Grinding performance and physical properties of wheat and barley straws, corn stover and switchgrass. Biomass and bioenergy, 27(4), 339-352.

50
Moriarty, K. 2013. Feasibility Study of Anaerobic Digestion of Food Waste in St. Bernard, Louisiana. Technical Report NREL/TP-7A30-57082. http://www.nrel.gov/docs/fy13osti/57082.pdf
Mullen, C.A., Boateng, A.A., Goldberg, N.M., Lima, I.M., Laird, D.A. and Hicks, K.B., 2010. Bio-oil and bio-char production from corn cobs and stover by fast pyrolysis. Biomass and
bioenergy, 34(1), 67-74. Pearlson, M., Wollersheim, C. and Hileman, J., 2013. A techno‐economic review of
hydroprocessed renewable esters and fatty acids for jet fuel production. Biofuels,
Bioproducts and Biorefining, 7(1), 89-96. Peters, M.S., Timmerhaus, K.D., West, R.E., Timmerhaus, K. and West, R., 1968. Plant design
and economics for chemical engineers (Vol. 4). New York: McGraw-Hill. Ringer, M., Putsche, V., and Scahill, J. 2006. Large-Scale Pyrolysis Oil Production: A
Technology Assessment and Economic Analysis. National Renewable Energy Laboratory. Technical Report NREL/TP-510-37779 http://www.nrel.gov/docs/fy07osti/37779.pdf.
Ryan, C., Munz, D., Bevers, G. 2011. Isobutanol-A Renewable Solution for the Transportation Fuels Value Chain. Gevo® White Paper Transportation Fuels. http://gevo.com/wp-content/uploads/2011/05/GEVO-wp-iso-ftf.pdf
Seber, G., Malina, R., Pearlson, M.N., Olcay, H., Hileman, J.I. and Barrett, S.R., 2014. Environmental and economic assessment of producing hydroprocessed jet and diesel fuel from waste oils and tallow. Biomass and Bioenergy. 67, 108-118.
Spath, P., A. Aden, T. Eggeman, M. Ringer, B. Wallace, and J. Jechura, 2005. Biomass to Hydrogen Production detailed Design and Economic Utilizing the Battelle Columbus Laboratory Indirectly-Heated Gasifier. National Renewable Energy Laboratory. Technical Report NREL/TP-510-37408. http://www.nrel.gov/docs/fy05osti/37408.pdf,
Swanson, R.M., Platon, A., Satrio, J.A. and Brown, R.C., 2010. Techno-economic analysis of biomass-to-liquids production based on gasification. Fuel, 89, S11-S19.
Thorneloe, S., Weitz, K. and Jambeck, J., 2005. October. Moving from solid waste disposal to materials management in the United States. In Proceedings of the Sardinia ‘05,
International Solid and Hazardous Waste Symposium, published by CISA, University of Cagliari, Sardinia.
US Government Accountability Office. 2014. Alternative Jet Fuels: Federal Activities Support Development and Usage, but Long-term Commercial Viability Hinges on Market Factors, http://gao.gov/assets/670/663027.pdf.
Washington Administrative Code (WAC) 173-303, http://apps.leg.wa.gov/WAC/default.aspx?cite=173-303
Wildschut, J., Arentz, J., Rasrendra, C.B., Venderbosch, R.H. and Heeres, H.J., 2009. Catalytic hydrotreatment of fast pyrolysis oil: model studies on reaction pathways for the carbohydrate fraction. Environmental progress & sustainable energy, 28(3), 450-460.
Wright, M. M., J. A. Satrio, R. C. Brown, D. E. Dauggard, and D. D. Hsu. 2010. Techno-Economic Analysis of Biomass Fast Pyrolysis to Transportation Fuels, National Renewable Energy Laboratory. Technical Report NREL/TP-6A20-46586. http://www.nrel.gov/docs/fy11osti/46586.pdf.
Zhang, R., El-Mashad, H.M., Hartman, K., Wang, F., Liu, G., Choate, C. and Gamble, P., 2007. Characterization of food waste as feedstock for anaerobic digestion. Bioresource
technology, 98(4), 929-935.

51
Zhao, X., Brown, T.R. and Tyner, W.E., 2015. Stochastic techno-economic evaluation of cellulosic biofuel pathways. Bioresource technology, 198, 755-763.
Zschocke, A., S. Scheuermann, and J. Ortner, 2012, High Biofuel Blends in Aviation (HBBA) ENER/C2/2012/420-1, http://www.hbba.eu/study/HBBA_Study_Report_6.2.2015.pdf, Lufthansa & WiWEB.

52
3. Production and Characterization of Transportation Fuels from the
Hydrotreatment and Distillation of Pyrolysis Oils
Manuel Garcia-Pérez, Filip Stankovikj, Chi-Cong Tran, Yinglei Han, Lucia Botella
3.1 Abstract
The major challenge for the pyrolytic conversion of lignocellulosic materials and tires is the poor quality of the resulting crude oils. Processing pyrolysis oils at high temperatures (200-400oC) with pressured hydrogen in the presence of suitable catalysts (a process called hydrotreatment) is the most viable way to stabilize these oils for their conversion to hydrocarbon fuels. This study proposes an alternative path for the production of fuel additives from pyrolysis oils: stabilization of biomass-derived pyrolysis oils, followed by extraction with biodiesel. Fundamental studies were conducted related to the hydrotreatment of pyrolysis oils examining: (1) the evolution of functional groups during hydrotreatment, (2) the enhanced solubility in biodiesel after hydrotreatment, and (3) the co-hydrotreatment of tire pyrolysis oil and vegetable oil for the production of transportation fuel. For the first two parts of the study, two typical, wood-derived pyrolysis oils from BTG and Amaron were used. For the third part of the study, tire pyrolysis oil and vegetable oil were used. In Part 1 of the study, the evolution of functional groups was examined during stabilization of the pyrolysis oils in a batch reactor. Both aqueous and oily phases were analyzed by GC-MS, 31P-NMR, 1H-NMR, elemental analysis, KF titration, carbonyl groups by the Faix method, and phenols by the Folin–Ciocalteu method and UV-Fluorescence. The hydrogen consumption and the levels of deoxygenation were within the ranges reported in the literature, with no surprises that the hydrogenation in the total system was more dominant than the deoxygenation. Water formation increased from 3 to 10% as the temperature increased, and we speculate that this was predominantly the result of repolymerization reactions instead of typical deoxygenation. Moreover, most of the oxygen was reduced within the silent 31P-NMR oxygen (ester and ethers), that reduced their content from 5 to 1%, correlating well with the additional water produced. In Part 2 of the study, hydrotreatment was examined in combination with extraction with biodiesel, which can allow the direct utilization of some pyrolysis oil fractions as fuels. The BTG and Amaron oils were hydrotreated at temperatures between 200 and 325°C in the presence of a Ru/C catalyst. The hydrotreated oils generated three phases: top oil (light hydrocarbons), middle aqueous phase, and bottom heavy oil phase. Each of the phases was characterized and the content of acetic acid, phenols, aromatic compounds and linear alkane hydrocarbons quantified. The upgraded pyrolysis oils were more soluble in biodiesel than the crude pyrolysis oils, obtaining blends with up to 48 and 29 wt. % for the BTG and Amaron pyrolysis oils, respectively. Some of the fuel properties of the resulting blends are also reported here.

53
In Part 3 of the study, the co-hydrotreatment of vegetable oil and tire pyrolysis oil in the presence of a CoMo/Al2O3 catalyst was examined, as a way of utilizing existing infrastructure created for vegetable oil processing to upgrade tire pyrolysis oil to obtain fuel cuts with aromatics. Hydrotreatment studies with different vegetable oil:tire pyrolysis oil blend ratios were conducted. The yield and composition of the resulting hydrotreated oils are reported. Aliphatic hydrocarbons ranging from C7 to C20 derived from vegetable oils and aromatics from C6 to C16 derived from the tire pyrolysis oil were identified as products. The resulting oils were then successfully distilled into naphtha, kerosene, diesel and gas oil cuts. The yield, chemical composition and the fuel properties of the transportation fuel cuts obtained are reported and compared with commercial petroleum derived fuels. Through this three-part study, we demonstrated that stabilization of biomass-derived pyrolysis oils, followed by extraction with biodiesel can be a viable strategy for the production of transportation fuels from lignocellulosic materials.
3.2 Background
3.2.1 Characteristics of pyrolysis oils Fast pyrolysis is one of the most important routes for the production of biofuels and chemicals (Anex et al., 2010; Brown, 2015; Huber et al., 2006; Li et al., 2006; Zacher et al., 2014) . In this technology, small lignocellulosic particles are heated between 450-550°C in the absence of air, to produce vapors that will be rapidly removed from the reactor (residence time of vapors is less than 2 seconds) and to produce a liquid product called pyrolysis oil. Pyrolysis oil is a complex mixture with a volumetric energy density between 5 and 20 times higher than the original biomass. Yields of pyrolysis oil over 65 wt. % are typically achieved with fast pyrolysis (Bridgwater et al., 1999a, 1999b). Pyrolysis oil cannot be directly used as petroleum refinery feedstocks because of its high oxygen content, poor stability and high acidity (Diebold, 1999; Zacher et al., 2014). In addition, pyrolysis oil has high viscosity, is insoluble in commercial hydrocarbons, corrosive, thermally unstable, and has a heating value lower than petroleum. Pyrolysis oil is a complex organic mixture containing more than 400 oxygenated compounds such as aldehydes, ketones, and phenolic groups, which can react with each other in condensation or polymerization reactions that lead to high molecular weight and coke formation at high temperature (Branca et al., 2003; Diebold, 1999). The existence of these active species is a major reason for the deactivation of catalysts and reactor plugging during pyrolysis oil hydrotreatment. The water-insoluble phenolic fraction has been traditionally identified as a culprit for coking (Bu et al., 2012; Luo et al., 2016). However, recent studies show that the water soluble, high molecular weight fraction, which is present in higher concentration, has even greater influence on coke formation (Han et al., 2016; Kadarwati et al., 2016; Wang et al., 2013). Therefore, to carry out the hydrocracking and deoxygenation at high temperature, it is critical to stabilize the pyrolysis oil by converting these reactive compounds into stable molecules (Branca et al., 2003; Elliott, 2015; Zacher et al., 2014).
54
In order to address these limitations, pyrolysis oil can be treated in a number of ways: catalytic hydrotreatment (Elliot, 2007; Elliot, 2015; Zacher et al., 2014), addition of solvents (Oasmaa et al., 2004; Bouchera et al., 2000; Radlein, 1996), by the formation of micro-emulsions (Chiaramonti et al., 2003a, 2003b; Ikura et al., 2003; Jiang and Ellis, 2010), and by extracting some fractions with appropriate fuels (i.e., biodiesel) (Alcala and Bridgwater, 2013; Garcia-Pérez et al., 2007; Garcia-Pérez et al., 2010; Jiang et al., 2011).
3.2.2 Evolution of functional groups during pyrolysis oil stabilization Catalytic hydrotreatment involving the removal of S and O (heteroatoms), cleavage of molecules (hydrocracking), and reaction with double bonds (saturation of unsaturated bonds) has been developed, and now represents the most viable pathway for the conversion of highly oxygenated pyrolysis oils to hydrocarbon fuels (Elliott, 2007, 2015; Zacher et al., 2014). However, a deeper understanding of pyrolysis oil reactions with hydrogen at high temperature and pressure, in the presence of appropriate catalysts (hydrotreatment), has been limited by the availability of standardized analytical techniques (Weber et al., 2015), and the limitations on the analytical tools used to characterize these oils. Very few previous studies report on the changes in chemical composition of the aqueous phase (Ardiyanti et al., 2011, 2012a, 2012b; Elliott et al., 2015; Staš et al., 2014). None of them have studied separately the changes in composition of the volatile GC-MS detectable compounds and the heavy fractions in the whole pyrolysis oil in a batch hydrotreatment reactor, especially in terms of functional groups (e.g., carbonyl, carboxyl, phenol, ether, ester), which are the reactive parts of compounds. It is only recently that the changes in some of the functional groups in the whole oil have been studied in a continuous flow system under stabilization conditions (120 and 160°C) over Ru/TiO2 (Zacher et al., 2014).
3.2.3 Hydrotreating pyrolysis oils The strategy of hydrotreating pyrolysis oils involves reducing their molecular weight and oxygen content to convert them into fuel. A wide variety of catalysts (sulphided NiCu, CoMo on γ-Al2O3, Ru/C and Pd/C) have been used to hydrotreat pyrolysis oils (Elliott and Hart, 2009; Wildschut et al., 2009). The hydrotreatment method used, developed by the Pacific Northwest National Laboratory (PNNL), can be briefly described as follows: 100 g of raw pyrolysis oil were loaded with 5 g Ru/C into the reactor vessel. After closing the autoclave, hydrogen was flushed for 15 minutes to evacuate air. A leak test with pressurized H2 was performed at 18 MPa (2600 psi) for 1 hour (acceptable leaks <20 psi/h). Next, the pressure was adjusted to 15 MPa (2175 psi) and the reactor was heated to the set temperature (100, 125, 150, 175, 200°C) within 15 minutes. The stirring rate was held at 1200 rpm and the reaction time at constant temperature was 4 hours. The pressure and temperature were continuously monitored during the experiment. After 4 hours, the reactor was cooled to room temperature (within 45 minutes) using a supply of chilled water. Experiments with Amaron oil were done in triplicate to test for repeatability. Experiments with BTG oil were conducted as single experiments at each of the temperatures. This hydrotreatment method was designed to stabilize the pyrolysis oil under mild conditions, which largely impairs coke formation. Most of carbonyl-containing compounds in pyrolysis oil are stabilized after such hydrotreatment with a large hydrogen consumption. This is always

55
considered as a stabilization step followed by a subsequent high-temperature hydrodeoxygenation.
3.2.4 Co-hydrotreatment of vegetable oil and tire pyrolysis oil Tires are a readily available feedstock for pyrolysis. Co-hydrotreatment of vegetable oil and tire oil is an appropriate strategy to produce fuels simultaneously containing both aliphatic and aromatic hydrocarbons. In addition, the co-hydrotreatment of vegetable oil and tire pyrolysis oil offers an interesting opportunity to take advantage of existing infrastructure to process tire pyrolysis oil and to produce fuels with an aromatic content comparable with its fossil fuel competitors. Vegetable oil can be readily converted into biodiesel via transesterification with alcohols (methanol or ethanol). However, biodiesel suffers from drawbacks such as limited storage stability and poor cold flow properties (Morgan et al., 2012). The hydrocarbons resulting from the hydrotreatment (decarboxylation, decarbonylation and hydrodeoxygenation) and isomerization of vegetable oils (rapeseed, palm, soybean, sunflower, castor, jatropha, and cooking oil) have better fuel properties than the original oils (Kovács et al., 2011; Kubička and Kaluža, 2010; Liu et al., 2015; Hanafi et al., 2015; Studentschnig et al., 2013; Verma et al., 2015; Wang et al., 2012). The production of green diesel through hydrodeoxygenation technology by various catalysts (such as Pt/C, Pd/C, NiMo/Al2O3, and CoMo/Al2O3) has received considerable attention in the last 10 years (Bezergianni et al., 2012; Fu et al., 2010; Mäki-Arvela et al., 2008; Na et al., 2012; Snåre et al., 2007). CoMo/Al2O3 is another commercial catalyst for hydrocarbons production by hydrodeoxygenation of various triglycerides. This catalyst is a moderate acidic catalyst which favors hydrocracking of straight chain hydrocarbons and hydrogenation (Anand and Sinha, 2012; Kim et al., 2013).
3.3 Objectives
The objectives of this study were: 1) To expand the understanding of pyrolysis oil behavior during stabilization by using a
tandem of analytical techniques that will allow us to study in detail not only the oily phase but also the aqueous phase (De Miguel Mercader et al., 2011; Venderbosch et al., 2010). For the first time, we studied separately the evolution of functional groups in the volatile GC-MS-detectable fraction and the heavy fraction.
2) To study the stabilization and extraction steps and the fuel properties of the resulting blends. We stabilized and mildly deoxygenated oil at conditions typically used in the deoxygenation step and the resulting stabilized crude oil was extracted with biodiesel to produce a fuel.
3) To produce alternative fuels containing both aliphatic and aromatic hydrocarbons by conducting co-hydrotreatment on vegetable oil and pyrolysis oil derived from waste tires using commercial Co-Mo/Al2O3 catalysts. The information collected will also be useful to understand the challenges and opportunities of co-processing tire pyrolysis oil in facilities built for the hydrotreatment of vegetable oils.

56
3.4 Methods
3.4.1 Evolution of functional groups during pyrolysis oil stabilization
3.4.1.1 Pyrolysis oils
Two biomass pyrolysis oils produced by two distinct technologies were used for these studies: BTG-BTL pyrolysis oil from the Biomass Technology Group (The Netherlands) produced from pine wood using a rotating cone reactor (http://www.btg-btl.com/), and Amaron Energy pyrolysis oil (http://www.amaronenergy.com/; Utah, USA) produced from Arbor Pellets (www.arborpellet.com) in a rotating drum reactor. These oils were thoroughly characterized and their chemical makeup is given elsewhere (Stankovikj et al., 2016).
3.4.1.2 Reactor setup and hydrotreatment experiments
The hydrotreatment experiments were carried out in a stirred autoclave (PARR Instrument Company, USA). Hydrotreated products after the reaction were separated into two phases: a top aqueous phase and a bottom heavy oil phase. The catalyst was then separated from the bottom phase. The following analyses were completed:
Analyses of gas samples collected from the headspace of the reactor
• Gas chromatography (GC-FID/TCD) for H2, CO2, CO, CH4, C2H6 and C3H8. H2 consumption, as well as the production of the other gases was calculated.
Analyses of hydrotreated liquids
• Water content (Standard Test Method for Water Using Volumetric Karl Fischer Titration) • Gas Chromatography/Mass Spectroscopy (GC-MS) (Stankovikj et al., 2016, 2017) • Elemental Analysis: C, H, N on all samples (ASTM D5373 – 08). The O content was
calculated by difference.
Quantification of functional groups by titration
• Quantification of carbonyl groups by non-aqueous titration (based on modified oximation reaction; (Faix et al., 1998).
• Quantification of total phenols by the Folin-Ciocalteu Method (Rover and Brown, 2013; Singleton et al., 1999).
• Quantification of OH functional groups using 31P-NMR (Olarte et al., 2016).
Quantification of functional groups by spectroscopic techniques
• 1H-NMR studies: Oils were diluted in DMSO-d6 (10 wt. %) and 1H NMR spectra were acquired.
• ATR-FTIR • UV Florescence (aqueous and bottom phases)
57
3.4.2 Pyrolysis oil hydrotreatment for enhancing solubility in biodiesel and the fuel properties of resulting blends The same pyrolysis oils were used as described in Section 3.4.1. The biodiesel (supplied by University of Idaho) was produced by the transesterification of mustard vegetable oil with methanol. The following analysis was completed using the two pyrolysis oils and the biodiesel using standardized methods (Pelaez-Samaniego et al., 2014; Stankovikj et al., 2016).
• Water content • Elemental composition • Proximate analysis • Total acid number (TAN) • GC-MS analysis (34 compounds were quantified using standards, and other 54
compounds were semi-quantified with calibration from molecules of similar composition).
3.4.2.1 Hydrotreatment experiments
The hydrotreating experiments were carried out in a stirred autoclave (PARR Instrument Company, USA) with a Ru/C catalyst. As in the previous experiment, the hydrotreated products consisted of a top phase (mostly light deoxygenated hydrocarbons), an aqueous phase, and a bottom phase (lignin-derived products and the catalyst). The top and aqueous phases were separated, weighed, and sampled for further analysis. The bottom phase was filtered to separate the wet solids using a mixture of solvents and the solids were dried, sampled, and weighed. This information was used to calculate coke formation. The solvent used for the oil recovery was removed with a rotary evaporator and this oil was used for blending with biodiesel.
3.4.2.2 Preparation of hydrotreated pyrolysis oil and biodiesel blends
Both hydrotreated pyrolysis oils were used to prepare blends containing 15, 30, 40 and 50 wt. %. The vials containing pyrolysis oil and biodiesel blends were shaken and heated to 60oC in a water bath. Afterwards, the samples were left to cool down to room temperature overnight before separating the phases. The top phase consisted of the mixture of hydrotreated pyrolysis oil and biodiesel, while most of the heavy compounds from the hydrotreated pyrolysis oil remained in the bottom phase. The top phase was extracted, weighed, and sampled for subsequent analysis. The bottom phase weight was calculated as a difference between the initial total and the top phase weight. The following analyses were conducted:
Product analyses
• Water content (using methods described in Section 3.4.1) • Chemical composition (by GC-MS) (as described in Section 3.4.1) • Elemental composition (using LECO) (as described in Section 3.4.1) • Total acid number (TAN) of the raw pyrolysis oils (Agblevor, 2010) • Thermogravimetric analysis (as described in Section 3.4.1) • Composition of gases after hydrotreatment were determined by GC (as described in
Section 3.4.1)

58
Analyses of fuel properties of hydrotreated pyrolysis oil and biodiesel blends
• Oxidation stability was measured using PetroOXY (Petrotest) equipment (EN 16091:2012 and ASTM D7545-14)
• Viscosity (D445-15a) and kinematic viscosity (equation 2 in D445-15a) • Calorific value (DIN 51900-1,3)
Analyses of the catalyst
• Thermogravimetric analysis (as described in Section 3.4.1) • Elemental composition (as described in Section 3.4.1)
3.4.3 Co-hydrotreatment of tire pyrolysis oil and vegetable oil for the production of transportation fuel
3.4.3.1 Materials and reagents
The tire pyrolysis oil (CONRAD Industries, Inc, Chehalis, WA) was produced from shredded waste tires in a rotating kiln. The pyrolysis vapors were condensed using a spray condenser tower. The canola oil studied was a commercial oil (Walmart Great Value: Canola Oil. 53507-GRV). The chemical make-up of the vegetable oil studied was analyzed by transesterification with methanol and analysis of the resulting samples by GC-FID (FAMEWAX column, 30 m x 320 µm X 0.25 µm, Restek Corporation, Bellefonte, PA). The cobalt and molybdenum on gamma alumina (CoMo/γ-Al2O3) catalyst was used in this study because it performed better than Ru/C in preliminary tests. The CoMo/Al2O3 catalyst was purchased from Alfa Aesar (http://www.alfa.com/) and its properties are described elsewhere (Krar et al., 2010). The CoMo/Al2O3 catalyst was delivered as pellets, with particle length greater than 50 mm. The activity of such a catalyst was low in our system, and therefore the pellets were ground into fine powder (between 0.1 and 0.5 mm).
3.4.3.2 Co-hydrotreatment tests
Different tire pyrolysis oil:canola oil mass ratio (4:1, 1:1, and 1:4) were prepared before hydrotreating (Figure 3.1). 100 g of the prepared blends were fed into the reactor with 5 g of the CoMo/Al2O3 catalyst in each test. Hydrotreating tests were conducted in a 250 mL Parr reactor (Model# 4576A), with the stirring speed set at 250 rpm. Gaseous products were collected in gas sampling cylinders and analyzed by gas chromatography. The solid catalyst, liquid products and gases were separated and the yields were measured. The yield of coke was calculated by subtracting the initial mass of the catalyst added and the catalyst collected after filtering the oil and washing the catalyst with solvent.

59
Figure 3.1: Experimental workflow of co-hydrotreatment of tire pyrolysis oil and vegetable (canola) oil
3.5 Results
3.5.1 Evolution of functional groups during pyrolysis oil stabilization To carry out the hydrocracking and deoxygenation at high temperatures, it is critical to stabilize the pyrolysis oil by converting these reactive compounds into stable molecules. The fundamental underlying chemistry is to stabilize the reactive functional groups in the compounds. In this study, the behavior of functional groups in two typical wood-derived pyrolysis oils at characteristic stabilization conditions (hydrogenation in the range 100-200°C) over a Ru/C catalyst in a batch reactor was studied. Typical phase separation was observed, while the yields of the bottom and aqueous phases for one of the oils showed opposite trends to the yields from the other (Figure 3.2). The differences in the chemical composition of the initial oils are responsible for the differences observed in the oil yields. The BTG oil has a higher content of carbohydrates in the non-volatile fraction, while having similar content of phenols. The water content is higher in the BTG in comparison to the Amaron oil (26.2 to 18.6% respectively), and the amount of “co-solvent” compounds, especially the presence of glycol aldehyde, is higher in the BTG than in the Amaron oil (5.6 to 1.0 wt.% respectively). There is indication that the light reactive compounds get incorporated in the water insoluble fraction of the oil during aging, and, in our case, they have led to yields of the bottom phase increasing with increases in the stabilization temperature.
Tire Oil
Hydrocracking
100% Canola Oil
20 :80 %
Tire Oil :Canola Oil
50 :50 %
Tire Oil :Canola Oil
100 %
Tire Oil
80 :20 % Tire Oil :Canola Oil
Canola Oil
Naphtha (71 -182C)
Jet (182 -260 C)
Diesel (260-338C)
Gas oil (> 338 C )
Distillation
Lights (< 70C )
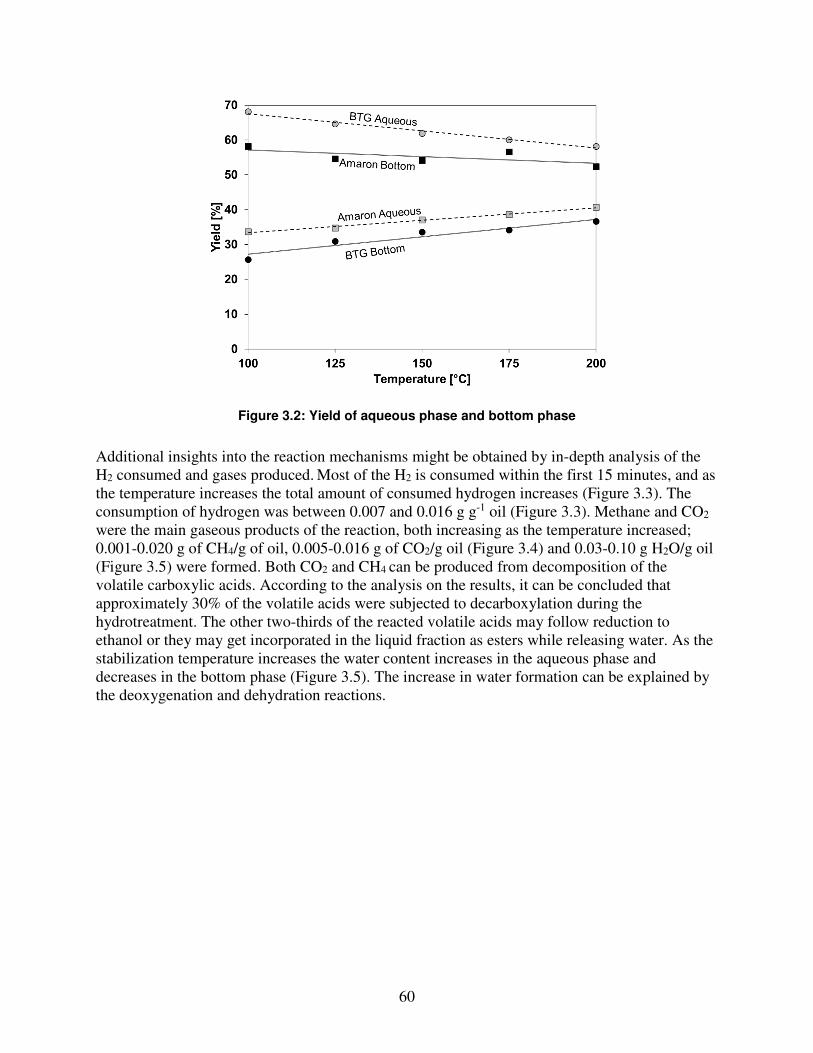
60
Figure 3.2: Yield of aqueous phase and bottom phase
Additional insights into the reaction mechanisms might be obtained by in-depth analysis of the H2 consumed and gases produced. Most of the H2 is consumed within the first 15 minutes, and as the temperature increases the total amount of consumed hydrogen increases (Figure 3.3). The consumption of hydrogen was between 0.007 and 0.016 g g-1 oil (Figure 3.3). Methane and CO2 were the main gaseous products of the reaction, both increasing as the temperature increased; 0.001-0.020 g of CH4/g of oil, 0.005-0.016 g of CO2/g oil (Figure 3.4) and 0.03-0.10 g H2O/g oil (Figure 3.5) were formed. Both CO2 and CH4 can be produced from decomposition of the volatile carboxylic acids. According to the analysis on the results, it can be concluded that approximately 30% of the volatile acids were subjected to decarboxylation during the hydrotreatment. The other two-thirds of the reacted volatile acids may follow reduction to ethanol or they may get incorporated in the liquid fraction as esters while releasing water. As the stabilization temperature increases the water content increases in the aqueous phase and decreases in the bottom phase (Figure 3.5). The increase in water formation can be explained by the deoxygenation and dehydration reactions.

61
Figure 3.3: Hydrogen consumption (in g g-1) of stabilized pyrolysis oil
Figure 3.4: Production of CH4 and CO2 (in g g-1) of stabilized pyrolysis oil

62
Figure 3.5: Water content in the aqueous and bottom phases of the stabilized oils (left); cumulative water content in the system (right)
Of all the functional groups followed, we observed a drastic decrease in hydroxyl groups that may be the result of dehydration, or a growth of repolymerization products in the bottom phase, which was clearly observable from the UV fluorescence results. The phenols were partially removed, which may be interpreted as some of them being included in the polymeric structure, while a smaller portion got hydrogenated. The amount of carboxylic acids in the volatile fraction decreased with increasing temperature (Table 3.1 and Table 3.2), and this is what one would expect in the total oil; the 31P-NMR was at the limit of its sensitivity for carboxylic groups to detect those changes. This was more obviously shown by the FTIR results which, as an analytical technique coupled with the deconvolution of the carbonyl region between 1490 and 1850 cm-1, can be a powerful tool for analyzing hydrotreated pyrolysis oils (Figure 3.6).

63
Table 3.1: Functional group in the volatile fraction of the aqueous and the bottom phases, measured by GC-MS. Results are presented in mmol g-1 sample, not multiplied by yield nor on an
organic basis
Aqueous Phase Bottom Phase
Sta
bili
zati
on
Tem
pera
ture
Car
bony
l
Car
boxy
lic
Phe
nol
Ali
phat
ic
Met
hoxy
l
Car
bony
l
Car
boxy
lic
Phe
nol
Ali
phat
ic
Met
hoxy
l
[°C] [mmol
g-1] [mmol
g-1] [mmol
g-1] [mmol
g-1] [mmol
g-1] [mmol
g-1] [mmol
g-1] [mmol
g-1] [mmol
g-1] [mmol
g-1] BTG
100 0.43 0.41 0.16 2.67 0.16 0.44 0.39 0.28 1.75 0.28 125 0.43 0.34 0.13 2.03 0.13 0.43 0.33 0.23 1.33 0.23 150 0.43 0.31 0.13 1.81 0.13 0.43 0.31 0.25 1.17 0.25 175 0.45 0.31 0.12 1.61 0.12 0.42 0.27 0.31 0.98 0.29 200 0.44 0.28 0.11 1.33 0.11 0.45 0.28 0.41 0.89 0.37
Amaron 100 0.74 0.56 0.19 2.39 0.18 0.62 0.46 0.37 1.06 0.33 125 0.38 0.43 0.16 1.25 0.14 0.37 0.40 0.32 1.03 0.34 150 0.34 0.44 0.14 1.05 0.12 0.41 0.37 0.35 0.78 0.37 175 0.39 0.32 0.12 0.87 0.11 0.40 0.35 0.35 0.73 0.38 200 0.41 0.34 0.11 1.14 0.10 0.38 0.30 0.37 0.63 0.37
Table 3.2: Phenol, carboxylic and aliphatic groups content in the stabilized pyrolysis oil phases, measured by 31P-NMR. Results are presented in mmol g-1 sample, not multiplied by yield nor on
an organic basis
Stabilization Temperature
Aqueous Phase Bottom Phase Phenol Carboxylic Aliphatic Phenol Carboxylic Aliphatic
[°C] [mmol g-1] [mmol g-1] [mmol g-1] [mmol g-1] [mmol g-1] [mmol g-1] BTG
100 0.50 0.81 8.52 2.18 0.77 5.23 125 0.55 0.78 8.80 1.83 0.72 5.56 150 0.38 0.82 8.24 2.02 0.70 5.11 175 0.38 0.80 7.71 2.20 0.75 4.43 200 0.34 0.80 6.62 2.39 0.80 3.44
Amaron 100 0.82 2.08 4.89 2.03 1.39 2.91 125 0.43 1.52 5.28 1.94 1.35 3.57 150 0.39 1.65 5.05 1.97 1.28 3.36 175 0.40 1.99 5.09 1.95 1.27 3.12 200 0.16 1.64 3.96 2.03 1.27 2.43

64
Figure 3.6: Reaction temperature dependence of the content of carbonyl groups, aromatic compounds, and carboxylic acids in the aqueous and bottom phases of the stabilized pyrolysis
oils (FTIR study comparison)

65
3.5.2 Pyrolysis oil hydrotreatment for enhancing solubility in biodiesel and the fuel properties of resulting blends Pyrolysis oil is poorly suited for direct input to the petroleum refinery infrastructure as a replacement or blend with conventional crude oils. In the previous section, we described the chemical changes that happen during pyrolysis oil stabilization. In this section, we will describe the impact of these changes on the solubilization of pyrolysis oil in biodiesel. The hydrotreatment of two lignocellulosic pyrolysis oils from fast and slow pyrolysis, respectively, using a noble metal catalyst, Ru/C, was studied in a batch reactor over the temperature range of 200-325oC. The reaction product consisted of three liquid phases (a top oil phase, an aqueous phase, and a bottom oil phase; this last one was the one mixed with biodiesel), gas, and solid char. The top oil phase was the least important in percentage, obtaining less than 1 wt. % for both pyrolysis oils, and was not further analyzed as there was not enough sample. The aqueous phase was more important for the BTG treated pyrolysis oil (between 42 and 50 wt. %) than for the treated Amaron pyrolysis oil (26 to 34 wt. %), as could be expected due to the higher water and oxygen content of the BTG pyrolysis oil. Char was not produced in all the experiments with BTG pyrolysis oil, only at the highest temperature (325oC), where 0.7 wt. % was produced. Char was produced from Amaron pyrolysis oil at a higher percentage (2.3 wt. % at 325°C), and was also detected at 200 and 275°C in smaller amounts. The bottom oil phase obtained (upgraded pyrolysis oil), which contained a very low amount of water, was blended with biodiesel to study the solubility of the mixtures. Neither BTG nor Amaron pyrolysis oils were soluble in biodiesel. However, the solubility of the upgraded oils in biodiesel improved considerably after hydrotreating. Under the same experimental conditions, BTG upgraded oil was more soluble in biodiesel than Amaron. The highest concentration of BTG upgraded oil phase in biodiesel was obtained at 325oC (approximately 50%), whereas for the Amaron upgraded oil phase the highest concentration was at 275oC (approximately 40%). Two phases were obtained in all blends, a biodiesel-rich phase (upper layer) and an upgraded pyrolysis oil-rich phase (bottom layer). Figure 3.7 shows the relationship between the ratio of biodiesel:bottom layer hydrotreated oils (upgraded pyrolysis oil) and the resulting ratio of the phases after equilibrium was achieved. The solubility of the upgraded pyrolysis oils in biodiesel was analyzed using the slope of the resulting straight line (K) as indicator. The upgraded pyrolysis oils were considerably more soluble in the biodiesel than the raw pyrolysis oils studied. The upgraded pyrolysis oil from BTG (fast pyrolysis oil) were more soluble than the oil from Amaron under the same reaction conditions (Figure 3.7).

66
0 1 2 3 4 5 6 70
10
20
30
40
50
BTG Bio-oil, BTG 200, BTG 250
BTG 275, BTG 325
Ratio
bio
die
se
l / b
io-o
il rich p
ha
se
s (
g/g
)
Biodiesel / bio-oil ratio (g/g)
0 1 2 3 4 5 6 70
10
20
30
40
50
Amaron Bio-oil, Amaron 200, Amaron 250
Amaron 275, Amaron 325
Ratio
bio
die
se
l / b
io-o
il rich p
ha
se
s (
g/g
)
Biodiesel / bio-oil ratio (g/g)
Figure 3.7: Yield of biodiesel- and upgraded pyrolysis oil (bio-oil)-rich phases
The concentration of upgraded pyrolysis oil in the biodiesel-rich phase was determined from the values of K and the mass of biodiesel and upgraded pyrolysis oil added to prepare each of the studied blends (Garcia-Pérez et al., 2010) (Figure 3.8). Biodiesel-rich phases with loads of up to 48 and 38 wt. % of BTG and Amaron upgraded oils, respectively, were obtained when blending equal amounts of bottom oils produced after hydrotreatment with biodiesel. These values are comparable to those reported in the literature (Garcia-Pérez et al., 2010) (up to 34 wt. %). The wt. % of upgraded pyrolysis oil extracted by the biodiesel was up to 93 and 70 wt. % for BTG and Amaron pyrolysis oil (Figure 3.9).

67
0 1 2 3 4 5 6 70
5
10
15
20
25
30
35
40
45
50
55
BTG 200, BTG 250, BTG 275, BTG 325
Co
nc. bio
-oil
in b
iod
iesel rich p
ha
se
(m
ass%
)
Biodiesel / bio-oil ratio (g/g)
0 1 2 3 4 5 6 70
5
10
15
20
25
30
35
40
45
50
55
Amaron 200, Amaron 250, Amaron 275, Amaron 325
Co
nc. bio
-oil
in b
iod
iesel rich p
ha
se
(m
ass%
)
Biodiesel / bio-oil ratio (g/g)
Figure 3.8: Concentrations of upgraded pyrolysis oils (bio-oils) in the biodiesel-rich phase

68
0 1 2 3 4 5 6 70
10
20
30
40
50
60
70
80
90
100
BTG 200, BTG 250, BTG 275, BTG 325
Bio
-oil
extr
acte
d (
ma
ss%
)
Biodiesel / bio-oil ratio (g/g)
0 1 2 3 4 5 6 70
10
20
30
40
50
60
70
80
90
100
Amaron 200, Amaron 250, Amaron 275, Amaron 325
Bio
-oil
extr
acte
d (
ma
ss%
)
Biodiesel / bio-oil ratio (g/g)
Figure 3.9: Yield of upgraded pyrolysis oil (bio-oil) extracted by the biodiesel
Regarding the fuel properties, viscosity did not show a clear tendency with the pyrolysis oil concentration, although it seems to increase, especially in the case of BTG bottom oil phase (Table 3.3). The calorific value of the blends was lower that the biodiesel’s, being related to the final concentration of pyrolysis oil in the biodiesel (Table 3.4). Oxidation stability of the biodiesel increased when both the raw pyrolysis oil and the upgraded pyrolysis oils were added to biodiesel in small amounts, but the behavior of the two bottom oil phases was different (Table 3.5). Whereas the Amaron bottom oil phase exerted the same effect than the raw Amaron

69
pyrolysis oil, the treated BTG pyrolysis oil at 200ºC was more beneficial in terms of increasing the oxidation stability than the raw BTG pyrolysis oil.
Table 3.3: Kinematic viscosity of blends of pyrolysis oils and upgraded pyrolysis oils with biodiesel
Sample Kinematic viscosity (mm2 s-1)
BTG and biodiesel blends Amaron and biodiesel blends 15% 30% 40% 50% 15% 30% 40% 50%
pyrolysis oil - 5.39 5.37 - 5.48 5.87 5.44 - 200°C - 4.78 5.03 - 5.24 - - - 250°C - 5.07 - - 5.39 5.93 5.76 - 275°C 5.59 - 7.27 8.21 5.61 8.30 7.51 5.24 325°C 5.15 5.00 - - 6.14 1.32 10.12 -
Table 3.4: Calorific value of blends of pyrolysis oils and upgraded pyrolysis oils with biodiesel
Sample Calorific value (MJ kg-1) BTG and biodiesel blends Amaron and biodiesel blends
15% 30% 40% 50% 15% 30% 40% 50% pyrolysis oil 40.0 39.7 39.7 38.5 40.3 39.8 39.8 39.7
200°C - 38.4 - 36.7 39.4 - 39.0 38.6 250°C - 38.3 - 38.7 38.7 38.0 - 37.4 275°C 39.1 42.4 36.3 33.1 38.4 38.0 37.4 35.9 325°C 39.1 38.6 37.8 38.3 39.5 38.1 - 36.7
Table 3.5: PetroOXY stability of biodiesel blended with pyrolysis oils and upgraded pyrolysis oils
Added
Concentration (wt. %)
Oxidation stability (min) Amaron
pyrolysis oil Amaron 200°C BTG pyrolysis
oil BTG 200°C
0 14±0.3 14.5±0.7 13.5±0.3 13.5±0.3 1 26.3±0.4 28.8±0.5 21.2±0.3 28.9±0.4
1.8 31.6±0.0 32.5±0.0 25.7±0.1 33.3±0.1 3 36.7±0.0 37.2±0.4 29.8±0.0 35.6±0.0 8 45.5±0.7 40.8±1.0 40.7±0.5 49.3±0.2

70
3.5.3 Co-hydrotreatment of tire pyrolysis oil and vegetable oil for the production of transportation fuel The yield of hydrotreated oils was very high (above 90 wt. %) with very low yields of coke. A small decrease in surface area due to the blockage of some pores was observed when used catalysts were analyzed (Table 3.6). The SEM micrographs on fresh and used CoMo/Al2O3 catalysts are shown in Figure 3.10. The Co and Mo oxides can be observed in white crystallized structures (Figure 3.10a). For used catalysts, although coke formation on the support or metal particles cannot be clearly observed, agglomeration of Co and/or Mo oxides indeed occurred to some extent when compared with the fresh catalyst (Zhang et al., 2014; Figure 3.10b through f). When the tire pyrolysis oil ratio in the blends was increased, however, the expected tendency of increasing pore blocking was not confirmed. The Brunauer-Emmett-Teller (BET) method was used to quantify the catalyst surface areas.
Table 3.6: BET surface area analysis on fresh and used CoMo/Al2O3 catalysts
Catalyst BET surface area
(m² g-1) a
Micropore volume
(cm³ g-1) b
Mesopore volume (cm³ g-1)
Total pore volume (cm³ g-1) c
Fresh 234 0.057 0.556 0.613
Canola100d 180 0.015 0.444 0.459
Canola80 171 0.016 0.412 0.428
Canola50 171 0.026 0.372 0.398
Canola20 172 0.033 0.374 0.407
Tire100 176 0.031 0.383 0.414
a BET surface area calculated from the adsorption of the N2 isotherm b Micropore volume calculated from CO2 adsorption using the Dubin-Radushkevich equation c Total pore volume calculated from N2 adsorption at p/p0=0.98 and the mesopore volume calculated by the difference between total and micropore volume (no macropore as shown in the pore distribution curves) d Canola100 = 100 wt. % of Canola, Canola80 = 80 wt. %, etc.

71
Figure 3.10: SEM micrographs for fresh and used CoMo/Al2O3 catalysts
Hydrotreated liquid products were distilled to obtain the following fractions: lights (<71°C), naphtha (71-182°C), kerosene (182-260°C), diesel (260-338°C), and gas oil (338-566°C). Naphtha, kerosene, and diesel cuts were isolated from the co-hydrocracked oils by simple distillation. These three cuts are the major components of gasoline, diesel and jet fuels, so blending these cuts in different ratios will result in different “drop-in” biofuels, or biofuels that are functionally equivalent to petroleum fuels and are fully compatible with existing petroleum infrastructure. Aliphatic C7-C12 and aromatic C6-C10 compounds were mainly collected in the naphtha cut, aliphatic C9-C18 and aromatic C7-C14 compounds in the kerosene cut, and aliphatic C15-C20 and aromatic C10-C16 compounds were collected in the diesel cut. For all the distillation cuts, carbon content increased, and hydrogen and oxygen contents decreased with the increase of tire pyrolysis oil portion in the blends. The produced distillation cuts had comparable flash points (Table 3.7) and kinematic viscosity (Table 3.8) to conventional petroleum fuels.
Table 3.7: Flash point determination of produced distillation cuts
Flash Point (°C)
Feeda Kerosene (182-260°C) Diesel (260-338°C) Hydrotreated-Canola oil-100 275 40 49 Hydrotreated-Canola oil-80 36 50 55 Hydrotreated-Canola oil-50 <20 50 55 Hydrotreated-Canola oil-20 <20 51 56 Hydrotreated-Tire oil-100 <20 49 54
a Feed refers to the oils before distillation

72
Table 3.8: Kinematic viscosity determination (at 40°C) of produced distillation cuts
Feed a
(mm2 s-1) Naphtha (mm2 s-1)
Kerosene (mm2 s-1)
Diesel (mm2 s-1)
Hydrotreated-Canola-100 36.351 0.849 1.995 3.551 Hydrotreated-Canola-80 23.952 0.717 2.150 4.217 Hydrotreated-Canola-50 15.405 0.705 2.005 4.095 Hydrotreated-Canola-20 5.707 0.679 1.646 4.601 Hydrotreated-Tire-100 3.743 0.685 1.937 6.820
a Feed refers to the oils before distillation
3.6 Conclusions
Several technologies have been proposed for the conversion of pyrolysis oil into transportation fuels. Although the two-step hydrotreatment concept proposed by PNNL has been studied for several decades, high fuel production costs and major challenges with the stability of catalysts are major hurdles for the deployment of this technology. This study proposes an alternative path for the production of fuel additives from pyrolysis oils. Here, we demonstrated that stabilization of biomass-derived pyrolysis oils, followed by extraction with biodiesel can be a viable strategy for the production of transportation fuels from lignocellulosic materials. In the stabilization step, functional groups including hydroxyl and carboxylic acid groups were substantially removed under mild conditions. The disappearance of these reactive groups indicated that the pyrolysis oil had been successfully stabilized. In the second part of the study, we demonstrated that hydrotreatment of pyrolysis oils increases their solubility in biodiesel. Blending hydrotreated pyrolysis oil with biodiesel for producing “drop-in” biofuel represents another viable pathway to utilize biomass-derived pyrolysis oils. In the third part of this study, tire pyrolysis oil and vegetable oil were introduced to the hydrotreatment system and we investigated their potential as alternative resources for producing transportation fuel. Unlike biomass-derived pyrolysis oil, tire pyrolysis oil does not have oxygenated compounds. The hydrotreated oils produced were readily distilled into different cuts, which were analogous to the major components of gasoline, jet fuel, or diesel. Our results showed that distillation cuts from the product resulting from co-hydrotreatment of tire pyrolysis oil and vegetable oil had flash points and kinematic viscosity levels similar to those of conventional petroleum fuels. Thus, the co-hydrotreatment of vegetable oil with tire pyrolysis oil is also a viable strategy to produce transportation fuels.
3.7 References
Agblevor, F. A. 2010. Rapid method for the determination of total acid number (TAN) of biooils. Paper presented at the Proceedings of the AIChE 2010 Annual Meeting, Salt Lake City, UT.
Alcala, A., Bridgwater, A. V. 2013. Upgrading fast pyrolysis liquids: Blends of biodiesel and pyrolysis oil. Fuel, 109, 417-426. doi: 10.1016/j.fuel.2013.02.058

73
Anand, M., Sinha, A.K., 2012. Temperature-dependent reaction pathways for the anomalous hydrocracking of triglycerides in the presence of sulfided Co–Mo-catalyst. Bioresource
technology, 126, 148-155. doi: 10.1016/j.biortech.2012.08.105 Anex, R.P., Aden, A., Kazi, F.K., Fortman, J., Swanson, R.M., Wright, M.M., Satrio, J.A.,
Brown, R.C., Daugaard, D.E., Platon, A., Kothandaraman, G., 2010. Techno-economic comparison of biomass-to-transportation fuels via pyrolysis, gasification, and biochemical pathways. Fuel, 89, S29-S35. doi: 10.1016/j.fuel.2010.07.015
Ardiyanti, A.R., Gutierrez, A., Honkela, M.L., Krause, A.O.I., Heeres, H.J., 2011. Hydrotreatment of wood-based pyrolysis oil using zirconia-supported mono-and bimetallic (Pt, Pd, Rh) catalysts. Applied Catalysis A: General, 407(1), 56-66. doi: 10.1016/j.apcata.2011.08.024
Ardiyanti, A.R., Khromova, S.A., Venderbosch, R.H., Yakovlev, V.A., Heeres, H.J., 2012a. Catalytic hydrotreatment of fast-pyrolysis oil using non-sulfided bimetallic Ni-Cu catalysts on a δ-Al 2 O 3 support. Applied Catalysis B: Environmental, 117, 105-117.doi: 10.1016/j.apcatb.2011.12.032
Ardiyanti, A.R., Khromova, S.A., Venderbosch, R.H., Yakovlev, V.A., Melián-Cabrera, I.V., Heeres, H.J., 2012b. Catalytic hydrotreatment of fast pyrolysis oil using bimetallic Ni–Cu catalysts on various supports. Applied Catalysis A: General, 449, 121-130. doi: 10.1016/j.apcata.2012.09.016
Bezergianni, S., Kalogianni, A., Dimitriadis, A., 2012. Catalyst evaluation for waste cooking oil hydroprocessing. Fuel, 93, 638-641. doi: 10.1016/j.fuel.2011.08.053
Bouchera, M. E., Chaalab, A., Roya, C., 2000. Bio-oils obtained by vacuum pyrolysis of softwood bark as a liquid fuel for gas turbines. Part I: Properties of bio-oil and its blends with methanol and a pyrolytic aqueous phase. Biomass and Bioenergy, 19, 337-350. doi: 961-9534/00
Branca, C., Giudicianni, P., Blasi, C. D., 2003. GC/MS Characterization of Liquids Generated from Low-Temperature Pyrolysis of Wood. Industrial & Engineering Chemistry
Research, 42, 3190-3202. Bridgwater, A. V., Meier, D., Radlein, D. 1999a. An overview of fast pyrolysis of biomass.
Organic Geochemistry, 30, 1479-1493. doi: S0146-6380(99)00120-5 Bridgwater, A. V., Meier, D., Radlein, D. 1999b. Principles and practice of biomass fast
pyrolysis processes for liquids. Journal of Analytical and Applied Pyrolysis, 51, 3-22. doi: 0165-2370:99
Brown, T. R., 2015. A techno-economic review of thermochemical cellulosic biofuel pathways. Bioresour Technol, 178, 166-176. doi: 10.1016/j.biortech.2014.09.053
Bu, Q., Lei, H., Zacher, A. H., Wang, L., Ren, S., Liang, J., Ruan, R., 2012. A review of catalytic hydrodeoxygenation of lignin-derived phenols from biomass pyrolysis. Bioresour
Technol, 124, 470-477. doi: 10.1016/j.biortech.2012.08.089 Chiaramonti, D., Bonini, M., Fratini, E., Tondi, G., Gartner, K., Bridgwater, A. V.,Baglioni, P.,
2003a. Development of emulsions from biomass pyrolysis liquid and diesel and their use in engines—Part 1 : emulsion production. Biomass and Bioenergy, 25(1), 85-99. doi: 10.1016/s0961-9534(02)00183-6
Chiaramonti, D., Bonini, M., Fratini, E., Tondi, G., Gartner, K., Bridgwater, A. V., Baglioni, P., 2003b. Development of emulsions from biomass pyrolysis liquid and diesel and their use in engines—Part 2: tests in diesel engines. Biomass and Bioenergy, 25(1), 101-111. doi: 10.1016/s0961-9534(02)00184-8

74
De Miguel Mercader, F., Koehorst, P. J. J., Heeres, H. J., Kersten, S. R. A., Hogendoorn, J. A., 2011. Competition between hydrotreating and polymerization reactions during pyrolysis oil hydrodeoxygenation. AIChE Journal, 57(11), 3160-3170. doi: 10.1002/aic.12503
Diebold, J.P., 1999. A review of the chemical and physical mechanisms of the storage stability of
fast pyrolysis bio-oils (No. NREL/SR-570-27613). National Renewable Energy Lab., Golden, CO.
Elliott, D. C., 2007. Historical Developments in Hydroprocessing Bio-oils. Energy & Fuels, 21, 1792-1815.
Elliott, D. C., 2015. Biofuel from fast pyrolysis and catalytic hydrodeoxygenation. Current
Opinion in Chemical Engineering, 9, 59-65. doi: 10.1016/j.coche.2015.08.008 Elliott, D. C., Hart, T. R., 2009. Catalytic Hydroprocessing of Chemical Models for Bio-oil.
Energy & Fuels, 23, 631–637. Elliott, D. C., Wang, H., Rover, M., Whitmer, L., Smith, R., Brown, R., 2015. Hydrocarbon
Liquid Production via Catalytic Hydroprocessing of Phenolic Oils Fractionated from Fast Pyrolysis of Red Oak and Corn Stover. ACS Sustainable Chemistry & Engineering, 3(5), 892-902. doi: 10.1021/acssuschemeng.5b00015
Faix, O., Andersons, B., Zakis, G., 1998. Determination of carbonyl groups of six round robin lignins by modified oximation and FTIR spectroscopy. Holzforschung-International
Journal of the Biology, Chemistry, Physics and Technology of Wood, 52(3), pp.268-274. doi: 10.1515/hfsg.1998.52.3.268
Fu, J., Lu, X., Savage, P. E., 2010. Catalytic hydrothermal deoxygenation of palmitic acid. Energy & Environmental Science, 3(3), 311-317. doi: 10.1039/c003390c
Garcia-Pérez, M., Adams, T. T., Goodrum, J. W., Geller, D. P., Das, K. C., 2007. Production and fuel properties of pine chip Bio-oil/Biodiesel blends. Energy & Fuels, 21(4), 2363-2372. doi: 10.1021/ef060533e
Garcia-Pérez, M., Shen, J., Wang, X. S., Li, C.-Z., 2010. Production and fuel properties of fast pyrolysis oil/bio-diesel blends. Fuel Processing Technology, 91(3), 296-305. doi: 10.1016/j.fuproc.2009.10.012
Han, Y., McIlroy, David N., McDonald, Armando G., 2016. Hydrodeoxygenation of pyrolysis oil for hydrocarbon production using nanospring based catalysts. Journal of Analytical
and Applied Pyrolysis, 117, 94-105. doi: 10.1016/j.jaap.2015.12.011 Hanafi, S.A., Elmelawy, M.S., El-Syed, H.A., Shalaby, N.H., 2015. Hydrocracking of Waste
Cooking Oil as Renewable Fuel on NiW/SiO2-Al2O3 Catalyst. Journal of Advanced
Catalysis Science and Technology, 2, pp.27-37. Huber, G. W., Iborra, S., Corma, A., 2006. Synthesis of Transportation Fuels from Biomass:
Chemistry, Catalysts, and Engineering. Chemical Reviews, 106, 4044-4098. Ikura, M., Stanciulescu, M., Hogan, E., 2003. Emulsification of pyrolysis derived bio-oil in
diesel fuel. Biomass and Bioenergy, 24, 221-232. doi: 0961-9534/03 Jiang, X., Ellis, N., 2010. Upgrading Bio-oil through Emulsification with Biodiesel: Mixture
Production. Energy & Fuels, 24(2), 1358-1364. doi: 10.1021/ef9010669 Jiang, X., Ellis, N., Zhong, Z., 2011. Fuel properties of bio-oil/bio-diesel mixture characterized
by TG, FTIR and 1H NMR. Korean Journal of Chemical Engineering, 28(1), 133-137. doi: 10.1007/s11814-010-0328-y
Kadarwati, S., Oudenhoven, S., Schagen, M., Hu, X., Garcia-Pérez, M., Kersten, S., Westerhof, R., 2016. Polymerization and cracking during the hydrotreatment of bio-oil and heavy fractions obtained by fractional condensation using Ru/C and NiMo/Al 2 O 3 catalyst.
75
Journal of Analytical and Applied Pyrolysis, 118, 136-143. doi: 10.1016/j.jaap.2016.01.011
Kim, S. K., Brand, S., Lee, H.-s., Kim, Y., Kim, J., 2013. Production of renewable diesel by hydrotreatment of soybean oil: Effect of reaction parameters. Chemical Engineering
Journal, 228, 114-123. doi: 10.1016/j.cej.2013.04.095 Kovács, S., Kasza, T., Thernesz, A., Horváth, I. W., Hancsók, J., 2011. Fuel production by
hydrotreating of triglycerides on NiMo/Al2O3/F catalyst. Chemical Engineering Journal, 176, 237-243. doi: 10.1016/j.cej.2011.05.110
Krar, M., Kovacs, S., Kallo, D., Hancsok, J., 2010. Fuel purpose hydrotreating of sunflower oil on CoMo/Al2O3 catalyst. Bioresour Technol, 101(23), 9287-9293. doi: 10.1016/j.biortech.2010.06.107
Kubička, D., Kaluža, L., 2010. Deoxygenation of vegetable oils over sulfided Ni, Mo and NiMo catalysts. Applied Catalysis A: General, 372(2), 199-208. doi: 10.1016/j.apcata.2009.10.034
Li, X., Hayashi, J., Li, C., 2006. FT-Raman spectroscopic study of the evolution of char structure during the pyrolysis of a Victorian brown coal. Fuel, 85(12-13), 1700-1707. doi: 10.1016/j.fuel.2006.03.008
Liu, S., Zhu, Q., Guan, Q., He, L., Li, W., 2015. Bio-aviation fuel production from hydroprocessing castor oil promoted by the nickel-based bifunctional catalysts. Bioresour
Technol, 183, 93-100. doi: 10.1016/j.biortech.2015.02.056 Luo, H., Klein, I. M., Jiang, Y., Zhu, H., Liu, B., Kenttämaa, H. I., Abu-Omar, M. M., 2016.
Total Utilization of Miscanthus Biomass, Lignin and Carbohydrates, Using Earth Abundant Nickel Catalyst. ACS Sustainable Chemistry & Engineering, 4(4), 2316-2322. doi: 10.1021/acssuschemeng.5b01776
Mäki-Arvela, P., Snåre, M., Eränen, K., Myllyoja, J., Murzin, D. Y., 2008. Continuous decarboxylation of lauric acid over Pd/C catalyst. Fuel, 87(17-18), 3543-3549. doi: 10.1016/j.fuel.2008.07.004
Morgan, T., Santillan-Jimenez, E., Harman-Ware, A. E., Ji, Y., Grubb, D., Crocker, M., 2012. Catalytic deoxygenation of triglycerides to hydrocarbons over supported nickel catalysts. Chemical Engineering Journal, 189, 346-355. doi: 10.1016/j.cej.2012.02.027
Na, J.-G., Yi, B. E., Han, J. K., Oh, Y.-K., Park, J.-H., Jung, T. S., Ko, C. H., 2012. Deoxygenation of microalgal oil into hydrocarbon with precious metal catalysts: Optimization of reaction conditions and supports. Energy, 47(1), 25-30. doi: 10.1016/j.energy.2012.07.004
Oasmaa, A., Kuoppala, E., Selin, J.F., Gust, S., Solantausta, Y., 2004. Fast pyrolysis of forestry residue and pine. 4. Improvement of the product quality by solvent addition. Energy &
Fuels, 18(5), pp.1578-1583. Olarte, M.V., Burton, S.D., Swita, M., Padmaperuma, A.B., Ferrell, J. and Ben, H., 2016.
Determination of Hydroxyl Groups in Pyrolysis Bio-oils using 31P NMR: Laboratory Analytical Procedure (LAP) (No. NREL/TP--5100-65887). National Renewable Energy Lab.(NREL), Golden, CO (United States).
Pelaez-Samaniego, M. R., Yadama, V., Garcia-Pérez, M., Lowell, E., McDonald, A. G., 2014. Effect of temperature during wood torrefaction on the formation of lignin liquid intermediates. Journal of Analytical and Applied Pyrolysis, 109, 222-233. doi: 10.1016/j.jaap.2014.06.008

76
Radlein, D., Piskorz, J. K., Majerski, P.A. 1996. Method of upgrading biomass pyrolysis liquids for use as fuels and as a source of chemicals by reaction with alcohol. European Patent Application 95309400.0..
Rover, M. R., Brown, R. C., 2013. Quantification of total phenols in bio-oil using the Folin–Ciocalteu method. Journal of Analytical and Applied Pyrolysis, 104, 366-371. doi: 10.1016/j.jaap.2013.06.011
Singleton, V. L., Orthofer, R., Lamuela-Raventos, R. M., 1999. Analysis of Total Phenols and Other Oxidation Substrates and Antioxidants by Means of Folin-Ciocalteu Reagent. Methods in Enzymology, 299, 152-178. doi: 0076-6879/9
Snåre, M., Kubičková, I., Mäki-Arvela, P., Eränen, K., Wärnå, J., Murzin, D. Y., 2007. Production of diesel fuel from renewable feeds: Kinetics of ethyl stearate decarboxylation. Chemical Engineering Journal, 134(1), 29-34. doi: 10.1016/j.cej.2007.03.064
Stankovikj, F., McDonald, A. G., Helms, G. L., Garcia-Pérez, M., 2016. Quantification of Bio-Oil Functional Groups and Evidences of the Presence of Pyrolytic Humins. Energy &
Fuels, 30(8), 6505-6524. doi: 10.1021/acs.energyfuels.6b01242 Stankovikj, F., McDonald, A. G., Helms, G. L., Olarte, M. V., & Garcia-Pérez, M., 2017.
Characterization of the Water-Soluble Fraction of Woody Biomass Pyrolysis Oils. Energy & Fuels, 31(2), 1650-1664. doi: 10.1021/acs.energyfuels.6b02950
Staš, M., Kubička, D., Chudoba, J., & Pospíšil, M., 2014. Overview of Analytical Methods Used for Chemical Characterization of Pyrolysis Bio-oil. Energy & Fuels, 28(1), 385-402. doi: 10.1021/ef402047y
Studentschnig, A. F. H., Schober, S., Mittelbach, M., 2013. Conversion of Crude Palm Oil into Hydrocarbons over Commercial Raney Nickel. Energy & Fuels, 27(12), 7480-7484. doi: 10.1021/ef401665x
Venderbosch, R. H., Ardiyanti, A. R., Wildschut, J., Oasmaa, A., Heeres, H. J., 2010. Stabilization of biomass-derived pyrolysis oils. Journal of Chemical Technology &
Biotechnology, 85(5), 674-686. doi: 10.1002/jctb.2354 Verma, D., Rana, B. S., Kumar, R., Sibi, M. G., Sinha, A. K., 2015. Diesel and aviation kerosene
with desired aromatics from hydroprocessing of jatropha oil over hydrogenation catalysts supported on hierarchical mesoporous SAPO-11. Applied Catalysis A: General, 490, 108-116. doi: 10.1016/j.apcata.2014.11.007
Wang, H. M., Male, J., Wang, Y., 2013. Recent Advances in Hydrotreating of Pyrolysis Bio-Oil and Its Oxygen-Containing Model Compounds. ACS Catalysis, 3(5), 1047-1070. doi: 10.1021/cs400069z
Wang, H., Yan, S., Salley, S. O., Ng, K. Y. S., 2012. Hydrocarbon Fuels Production from Hydrocracking of Soybean Oil Using Transition Metal Carbides and Nitrides Supported on ZSM-5. Industrial & Engineering Chemistry Research, 51(30), 10066-10073. doi: 10.1021/ie3000776
Weber, R. S., Olarte, M. V., Wang, H., 2015. Modeling the Kinetics of Deactivation of Catalysts during the Upgrading of Bio-oil. Energy & Fuels, 29(1), 273-277. doi: 10.1021/ef502483t
Wildschut, J., Mahfud, F. H., Venderbosch, R. H., Heeres, H. J., 2009. Hydrotreatment of Fast Pyrolysis Oil Using Heterogeneous Noble-Metal Catalysts. Industrial & Engineering
Chemistry Research, 48, 10324–10334.

77
Zacher, A. H., Olarte, M. V., Santosa, D. M., Elliott, D. C., Jones, S. B., 2014. A review and perspective of recent bio-oil hydrotreating research. Green Chem., 16(2), 491-515. doi: 10.1039/c3gc41382a
Zhang, H., Lin, H., Zheng, Y., 2014. The role of cobalt and nickel in deoxygenation of vegetable oils. Applied Catalysis B: Environmental, 160, 415-422. doi: 10.1016/j.apcatb.2014.05.043

78
4. Producing Lipid-Based Biofuel and Chemicals as Options for an Integrated
Biorefinery
Xiaochao Xiong, Liang Yu, Shulin Chen
4.1 Abstract
Anaerobic digestion (AD) is an established strategy for waste management. Anaerobic digestion has the benefit of producing renewable energy in the form of biogas, and has the potential to generate additional value-added products when combined with emerging technologies. Combining AD with other technologies as part of an integrated biorefinery appears to be critical to the economic feasibility of this approach to waste management. This two-part project investigated aspects of an integrated biorefinery that uses an engineered strain of yeast, Yarrowia
lipolytica, to transform products of AD into high-value lipids for biofuel and lipid-based chemicals. The first part of the project focused on the production of lipid-based biofuel and chemicals from volatile fatty acids (VFA) generated from AD using Y. lipolytica, a strain of yeast with a demonstrated ability to accumulate significant levels of triacylglycerol (TAG). First, we developed a robust Y. lipolytica production platform host by reprogramming the Y. lipolytica fatty acid biosynthetic circuitry through metabolic engineering. The Y. lipolytica platform host efficiently produced TAG and other lipid-based biofuel and chemicals (oleochemicals) such as free fatty acid (FFA), fatty alcohol, and wax ester (WE). We also demonstrated the ability to generate lipid-based biofuel by growing the Y. lipolytica on acetate, which is a major component of the VFA resulting from the AD process. In the second part of the project, we conducted a techno-economic assessment of lipid-based biofuel by analyzing the effect of various factors on profitability in the production of jet fuel. While current jet fuel price, feasible production rate, and tipping fees support profitable production, lipid titer must be increased to 10 g L-1 to achieve profitability in the model. These results provide crucial information for the further development and scaling-up of an integrated biorefinery for the production of lipid-based biofuel and chemicals. The integrated process is transformative in the way biomass is converted into fuels and chemicals, converting low-value waste into high-value, lipid-based products.
4.2 Background
Concerns over climate change, energy security, and the need for new economic development activities provide a great opportunity for industrial biotechnology companies to supply sustainable replacements for fuels and many chemicals currently produced by the petrochemical industry (Ohara, 2003). Lipids are among these chemicals, and consist of a fatty acid or fatty acid-based group. The process for production of many important building blocks for higher value chemicals, such as lactic (C3), succinic (C4), and citric (C6) acids from sugars by chemical or biological conversion is commercially available or close to commercialization. Compared with

79
these developed biotechnologies, the traditional and well-established oleochemical industry has been using fatty acids (ca. 52%), fatty alcohols (ca. 25%), methyl esters (ca. 11%), and amines (ca. 9%) as the basic materials to synthesize target chemicals such as surfactants, lubricants, and coatings (Salimon et al., 2012). In addition, some biodiesel and green diesel products are manufactured from plant oils or animal fats. Some biochemical transformations such as enzyme catalysis and fermentation have been introduced into the oleochemical and fuel industry. However, for these industries, access to fat oils such as tallow and palm oil or petroleum oil is usually still necessary. Therefore, an opportunity exists for the exploration of novel renewable oil supplies (Pfleger et al., 2015). Carbohydrates are the most abundant renewable feedstocks, and advances in hydrolysis technologies mean that microbial conversion of non-food carbohydrates to lipids is a promising option for sustainable lipid production. Usually, microbial cultivation results in very low lipid production. To maximize the capture of electrons generated from substrate catabolism and, thus, increase substrate-to-product yields, microbial strains with synthetic pathways have been engineered to convert glycolytic NADH into the lipid biosynthetic precursors NADPH or acetyl-CoA (Qiao et al., 2017). The production of lipids by microorganisms for use as an alternative to petroleum or fat oil feedstock has attracted much attention in the research community (Li et al., 2008). It has been established that lipids can be efficiently produced from diverse feedstocks such as pyrolysis sugars, food scraps (Chi et al., 2011), and AD effluent under optimized conditions. Various oleaginous (oil producing) yeast species can accumulate lipids, composing up to 20-70% of their cell dry weight. Among them, Y. lipolytica has been studied as the model organism for lipid accumulation (Beopoulos et al., 2009). This organism is particularly pertinent for industrial applications due to its nutritional versatility, robust growth properties, and genetic tractability. Although significant metabolic engineering for fatty acid production in Escherichia coli has occurred, the yields of these engineered strains are still much lower than those of native lipid-accumulating organisms like Y. lipolytica (Lennen and Pfleger, 2012). Furthermore, compared with lipid-producing microalgae, Y. lipolytica is more amenable for genetic manipulation and exhibits a faster growth rate when grown using organic carbon feedstock (Radakovits et al., 2010). Additionally, Y. lipolytica was classified as a Generally Recognized As Safe strain by the U.S. Food and Drug Administration (Nicaud et al., 2002). Metabolically engineered strains of Y.
lipolytica have been widely used for the production of citric acid, lipases, carotenoid, poly-3-hydroxybutyrate (PHB), and eicosapentaenoic acid-rich oil from sugars, glycerol and acetate under aerobic conditions in shaking flasks or fermentors (Bankar et al., 2009). Our previous work has demonstrated that Y. lipolytica strains can effectively produce TAG, a high energy density, high-value lipid, not only from sugars, but also from VFA generated from AD, thereby making this species an attractive target for further development. The economic competitiveness of biochemical transformation is strongly influenced by the cost of the carbon source, especially for fermentation aimed at producing commodity chemicals, including lipids. For example, it is estimated that sugar cost could account for up to 70% of the cost of bioethanol (Sauer et al., 2008). On the other hand, converting waste materials to high-value products and biofuel, such as lipid-based products, has long been a goal of the engineering
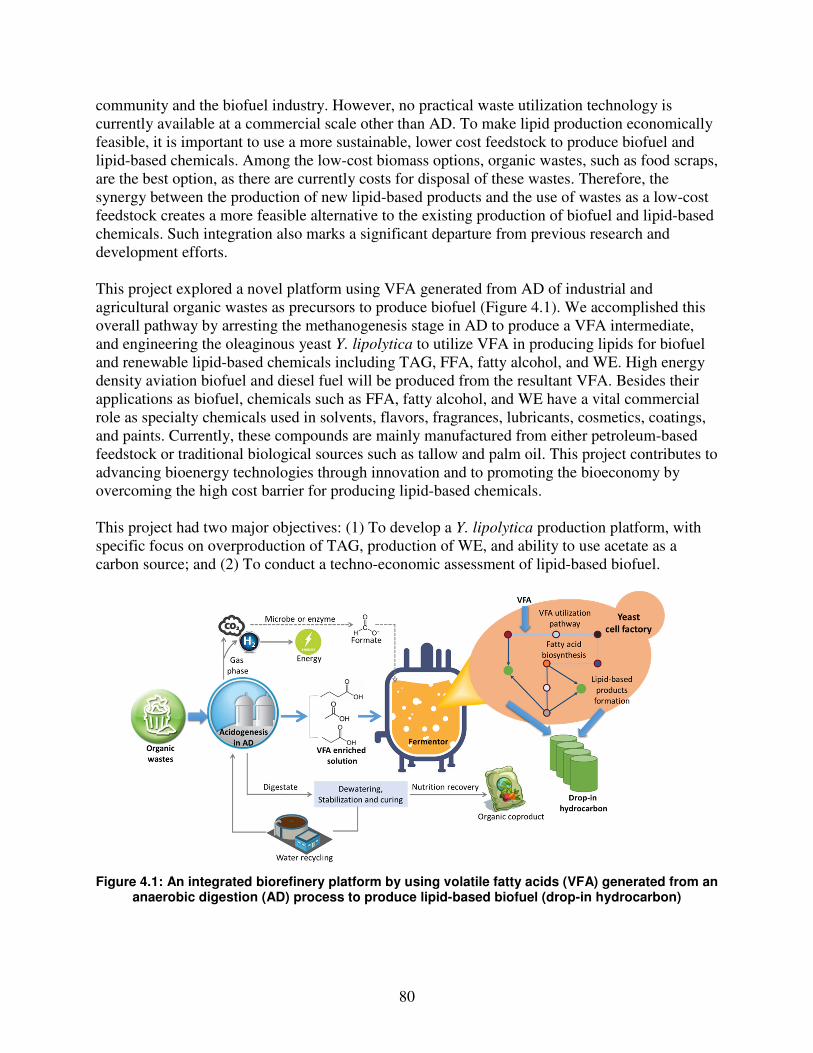
80
community and the biofuel industry. However, no practical waste utilization technology is currently available at a commercial scale other than AD. To make lipid production economically feasible, it is important to use a more sustainable, lower cost feedstock to produce biofuel and lipid-based chemicals. Among the low-cost biomass options, organic wastes, such as food scraps, are the best option, as there are currently costs for disposal of these wastes. Therefore, the synergy between the production of new lipid-based products and the use of wastes as a low-cost feedstock creates a more feasible alternative to the existing production of biofuel and lipid-based chemicals. Such integration also marks a significant departure from previous research and development efforts. This project explored a novel platform using VFA generated from AD of industrial and agricultural organic wastes as precursors to produce biofuel (Figure 4.1). We accomplished this overall pathway by arresting the methanogenesis stage in AD to produce a VFA intermediate, and engineering the oleaginous yeast Y. lipolytica to utilize VFA in producing lipids for biofuel and renewable lipid-based chemicals including TAG, FFA, fatty alcohol, and WE. High energy density aviation biofuel and diesel fuel will be produced from the resultant VFA. Besides their applications as biofuel, chemicals such as FFA, fatty alcohol, and WE have a vital commercial role as specialty chemicals used in solvents, flavors, fragrances, lubricants, cosmetics, coatings, and paints. Currently, these compounds are mainly manufactured from either petroleum-based feedstock or traditional biological sources such as tallow and palm oil. This project contributes to advancing bioenergy technologies through innovation and to promoting the bioeconomy by overcoming the high cost barrier for producing lipid-based chemicals. This project had two major objectives: (1) To develop a Y. lipolytica production platform, with specific focus on overproduction of TAG, production of WE, and ability to use acetate as a carbon source; and (2) To conduct a techno-economic assessment of lipid-based biofuel.
Figure 4.1: An integrated biorefinery platform by using volatile fatty acids (VFA) generated from an
anaerobic digestion (AD) process to produce lipid-based biofuel (drop-in hydrocarbon)

81
4.3 Methods
4.3.1 Biofuel production by oleaginous yeast
In the proposed integrated biorefinery platform, VFA-enriched solution from the AD process is treated in a fermentor. We focused on processes occurring during the fermentation step and specifically investigated three important aspects of using engineered strains of Y. lipolytica to manipulate the biochemical pathway: overproduction of TAG, production of WE, and production of lipid-based biofuel and chemicals from acetate.
4.3.1.1 Metabolic engineering of Y. lipolytica for overproduction of TAG
Metabolic engineering strategies for enhancing the production of lipid production include overexpressing gene(s) encoding acetyl-CoA carboxylase (ACC1) for the initial step of fatty acid biosynthesis (“push”), overexpressing gene DGA1 for tailored fatty acid formation (TAG) assembly (“pull”) (Tai and Stephanopoulos 2013), and deleting genes such as Gut2 for the reversible reaction that converts TAG back to its component parts (“block”) (Beopoulos, Mrozova et al. 2008) (Figure 4.2). More specifically, we developed the constructs for overproducing the native DGA1 and SCD encoding delta-9 stearoyl-CoA desaturase, another enzyme identified as a rate-limiting step for the lipid synthesis pathway in Y. lipolytica (Qiao et al., 2015) (Figure 4.2). The gene encoding oleosin, responsible for lipid body formation in oilseeds (Miquel et al., 2014), from Arabidopsis thaliana was synthesized by Integrated DNA Technologies, Inc. (Coralville, IA) with optimized codon for Y. lipolytica. The expression cassettes of these three genes (DGA1, SCD, and oleosin) were integrated into the locus of Gut2 in the genome of Y. lipolytica. Therefore, in addition to the overexpression of the selected genes, Gut2 was also disrupted (Figure 4.2). We further developed a new strategy to replace the native promoter of acc1 with a strong promoter, FBA, which enabled overexpression of acc1 in Y.
lipolytica. The combination of these efforts contributed to development of the TAG-overproducing strain.
4.3.1.2 Metabolic engineering of Y. lipolytica for production of wax ester
Acyl-CoA in the yeast plays an essential role in lipid metabolism. As a substrate, fatty acyl-CoA participates in the synthesis of non-polar lipid molecules such as sterol esters and TAG biosynthesis (Valle-Rodríguez et al., 2014). Acyl-CoA, which is also the precursor for lipid-based chemicals in our proposed pathway, is actively transported into the peroxisome, the compartment in which β-oxidation of fatty acids occurs (Hiltunen et al., 2003) (Figure 4.3). To decrease lipid accumulation, we have knocked out the genes dga1, dga2, and lor1. We further deleted the gene fao1 encoding fatty alcohol oxidase for degradation of fatty alcohol to fatty aldehyde. In our previous work, the resultant strain containing two copies of Tafar1 produced an enhanced level of hexadecanol, which led to increased accumulation inside the cells (Wang et al., 2016).
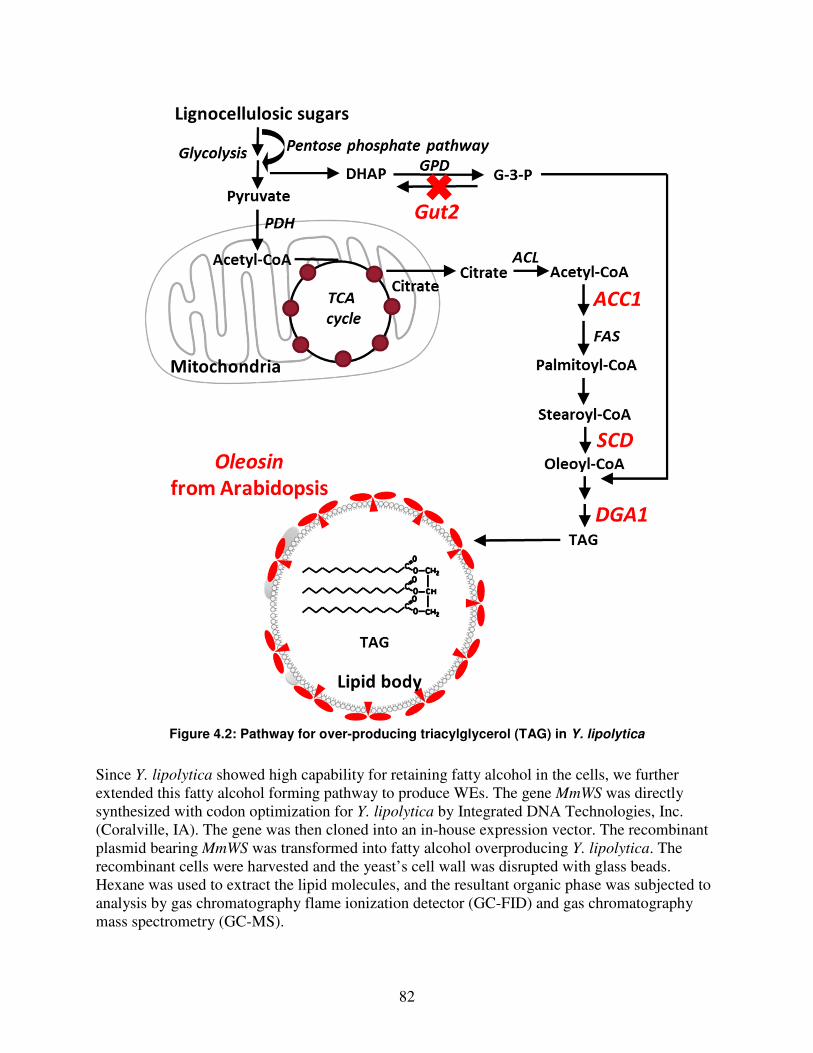
82
Figure 4.2: Pathway for over-producing triacylglycerol (TAG) in Y. lipolytica
Since Y. lipolytica showed high capability for retaining fatty alcohol in the cells, we further extended this fatty alcohol forming pathway to produce WEs. The gene MmWS was directly synthesized with codon optimization for Y. lipolytica by Integrated DNA Technologies, Inc. (Coralville, IA). The gene was then cloned into an in-house expression vector. The recombinant plasmid bearing MmWS was transformed into fatty alcohol overproducing Y. lipolytica. The recombinant cells were harvested and the yeast’s cell wall was disrupted with glass beads. Hexane was used to extract the lipid molecules, and the resultant organic phase was subjected to analysis by gas chromatography flame ionization detector (GC-FID) and gas chromatography mass spectrometry (GC-MS).

83
Figure 4.3: Pathway design for biosynthesis of fatty alcohol and wax ester in Y. lipolytica
4.3.1.3 Growth of Y. lipolytica on acetate for producing lipid-based biofuel and chemicals
Volatile fatty acids can be efficiently produced by the AD process without methanogenesis under optimal conditions. The resulting VFA is then used to synthesize the target products by the engineered strains of Y. lipolytica. Acetic acid and other organic acids derived from waste materials are considered inhibitory to many microorganisms, including E. coli and Saccharomyces cerevisiae. Consequently, it was necessary to first test the cell viability of Y.
lipolytica on the high acetic acid solution resulting from AD by using acetate for the cell growth. Next, the ability of Y. lipolytica to use acetate as a carbon source was tested by using 30 g L-1 of acetate as the sole carbon source to culture the strains in shaking flasks at 30°C. We further tested the engineered strains for production of various lipid-based chemicals including lipid, FFA, fatty alcohol, and WE from acetate.
Our previous work showed that the yeast Y. lipolytica was not able to secrete the fatty alcohol that it produced. To alleviate the potential toxicity conferred by the intracellularly accumulated fatty alcohol and, thus, reach higher yields, we developed an in situ extraction and fermentation process for fatty alcohol production. This was accomplished by the addition of dodecane to the culture media. The ratio of volumes of aqueous:organic fatty alcohol was 1:5. We determined the amount of the fatty alcohol produced in both the aqueous and organic phases.
4.3.2 Techno-economic assessment of lipid-based biofuel This section’s focus was to evaluate the economic feasibility of lipid-based biofuel as a major product of an integrated biorefinery. Here we use just one of the products of the integrated biorefinery, TAG, as a case study for the techno-economic assessment. This approach could be used for other products as well. To assess the effects of different factors on profitability, models were created for a recombinant strain of Y. lipolytica and a bioprocess for producing TAG from VFA. Volatile fatty acids are efficiently produced in the first step of the AD process under optimal conditions, but are difficult to separate from water. Our approach is to combine VFA produced from AD with the fatty acid

84
intermediates biosynthesized by the oleaginous strain of Y. lipolytica to generate TAG, while increasing carbon utilization efficiency by using a waste product, rather than glucose, as a carbon source. Unlike other types of carbon sources, such as glucose, VFA produced from AD was used to directly provide the carbon skeleton for the yeast to synthesize the esters for use as biofuel. By doing so, low value wastes can be transformed into long chain molecules with high energy density and high value. The lipid-based biofuel process model was constructed in the Aspen PlusTM process engineering software (Aspen Technologies, Inc.). In this project, several types of unit operations were linked to create a unique system based on input and process condition assumptions. A process consisted of components being mixed, separated, heated, cooled, and converted, with components transferred from unit to unit through process streams. A flow rate of 120 ton day-1 of source-separated food scraps from commercial venues (e.g., grocery stores) was assumed, with and without 100 ton day-1 of compost leachate. The AD lipid-based biofuel system would operate 8,000 hours year-1, with a daily production capacity of 120 or 220 ton day-1 of feedstock. The development of the lipid-based biofuel process model, including the parameters listed above, was based on the AD process model published in the previous Waste to Fuels Technology Partnership final report (Chen et al., 2016). More detail on the model is provided in Appendix A. Construction of the Anaerobic Digestion Jet Fuel Model.
4.4 Results and discussion
4.4.1 Advanced biofuel production by oleaginous yeast
4.4.1.1 Production of lipid by engineered Y. lipolytica
We measured the lipid content in the recombinant strains overexpressing the genes grown on 50 g L-1 glucose for 5 days, with the parent strain (Po4f) used as a control. Overexpression of acc1 improved the lipid content remarkably, although expression of oleosin increased the lipid yield even further (Figure 4.4A). The developed strain could accumulate more than 4 g L-1 of lipid, comprising more than 55% of cell dry weight. We further observed the lipid bodies under microscope, stained with Nile red stain. Lipid bodies were formed in the lipid-overproducing strain and took over most of the size in the cell (Figure 4.4B).

85
Figure 4.4: Lipid produced by the engineered strains (A) and lipid body in the recombinants (red
portions of cells) (B)
4.4.1.2 Production of wax ester by engineered Y. lipolytica
The strain expressing MmWS produced a metabolite whose retention time matches that of the standard palmityl palmitate (C16, C16) (Figure 4.5). We further confirmed the structure of products including the other minor product, cetyl oleate (C16, C18:1) by GC-MS. After simple optimization of expression of MmWS, the titer (concentration) of WEs produced by the recombinant grown for three days was up to 225 mg L-1. This is the first time the formation of long-chain WEs by engineering of an oleaginous yeast has been demonstrated.
Figure 4.5: GC-FID analysis of products of WEs produced by Y. lipolytica

86
At present, WEs are largely used for specialized and high-value markets such as personal cosmetics and pharmaceutical drugs (Wenning et al., 2016). Current practices for WE production rely on jojoba oil from the shrub Simmondsia chinensis, which yields 3,500 metric tons annually at an estimated cost of $26-62 per kg. Although WEs have many excellent performance properties that are commonly seen in renewable bioderived lubricants, this limited availability and high production cost prevent its use in widespread applications (i.e., high pressure, high temperature lubricants for gearboxes, differentials, cutting oils, etc.). Our project will contribute to the development of new technologies that overcome these obstacles and promote sustainable, low-cost, high-efficiency production of WEs.
4.4.1.3 Growth of Y. lipolytica on acetate for producing lipid-based biofuel and chemicals
Acetate (30 g L-1) was used as the sole carbon source to culture Y. lipolytica in shaking flasks at 30°C. Our results demonstrate that Y. lipolytica can readily convert acetic acid to cell biomass (Figure 4.6A). Furthermore, Y. lipolytica is capable of robust growth under stress conditions, such as low pH, and has been used to treat wastewater under non-sterile conditions.
Figure 4.6: (A) Growth of Y. lipolytica on 30 g L-1 of acetate, (B) Fatty alcohol produced, and (C)
Fatty alcohol produced with supplementary dodecane, by two strains of engineered Y. lipolytica, developed in our lab
We further developed a simultaneous extraction and fermentation process for fatty alcohol production using dodecane. Almost all of the fatty alcohol produced (Figure 4.6B) was extracted by the organic solvent, and only a very low content of fatty alcohol could be detected in the aqueous phase containing cell biomass (Figure 4.6C). Furthermore, cell growth was not inhibited by the additional dodecane. The demonstrated feasibility of extraction of the produced fatty alcohol by Y. lipolytica offers a new route to relieve product inhibition, increase yield, and simplify downstream separation.

87
We also tested the different strains for production of lipid-based products including TAG, FFA, fatty alcohol, and WE. The titer and yield varied between products (Table 4.1). These results clearly show that the engineered strains of Y. lipolytica can produce the targeted products from acetate. Both the yield and productivity of lipid can be further improved by using genetic engineering and cultivation approaches such as fed-batch culture, in which substrates are fed to the bioreactor during cultivation. Furthermore, integration of engineered yeast strains and the AD process is necessary in order to achieve a scaled-up biorefinery. Table 4.1: Precursors for lipid-based biofuel and chemicals produced by engineered Y. lipolytica*
Strain Product Titer (g L-1) Publications PO8 Lipid (Triglyceride or TAG) 2.89 ± 0.25 Developed in 6.3.1.1 YIRX TesA
Free fatty acid 2.31 ± 0.20 Paper submitted
KK2 Fatty alcohol (C16, C18) 1.03 ± 0.19 (Wang, Xiong et al. 2016)
WE2 Wax esters (C16-C16, C16-C18) 0.29 ± 0.16 Developed in 6.3.1.2 *Culture conditions: 5 days at 30°C, and 40 g L-1 acetate as carbon source using shaking flasks.
4.4.2 Techno-economic assessment of lipid-based biofuel
4.4.2.1 Comparison of anaerobic digestion of food scraps with and without compost leachate
In order to understand the effect of solid concentrations on profitability, estimates of investments were compared for two different scenarios: (1) 120 tons of food scraps and (2) 120 tons of food scraps with 100 tons of compost leachate (Table 4.2). The process model is described in detail in Appendix A. Construction of the Anaerobic Digestion Jet Fuel Model. In this study, the products were jet fuel, hydrogen, and solid organic fertilizer, respectively. Jet fuel is a complex mixture of hydrocarbons, containing alkanes, naphthenes, and aromatic hydrocarbons that weighs 6.8 pounds per U.S. gallon (0.81 kg L-1) and has a high flash point (min. 60°C or 140°F). In this model, jet fuel value was set at $5.21 per gallon, based on 2015 average prices for corporate jets (AviationWeekNetwork, 2015). The hydrogen was produced on site and the value was approximately $0.70 kg-1 (Wikipedia, 2017). The solid organic fertilizer was valued at $20 per ton (Levis and Barlaz, 2013). For food scraps, there is usually a tipping fee charged for treatment that was reported at $60 per ton (Chen et al., 2016). In comparison to the food scraps scenario, the food scraps with compost leachate scenario had to spend more money on capital, operating, and utility costs. Although product sales are slightly higher in the food scraps with compost leachate scenario, these revenues cannot offset the costs. Therefore, the payout period in the food scraps scenario was shorter than that in the food scraps with compost leachate scenario. This indicates that high solid concentration organic wastes could reduce reactor volume and system requirements, and thus lower costs. Compost leachate does not contain a high concentration of degradable materials that can be used to produce jet fuel, hydrogen, and solid organic fertilizer. More system and reactor space is wasted with the inclusion of compost leachate, and thus a greater investment is needed. To reduce costs, we recommend the development of high solid AD, integrating AD and composting strategies by composting solid AD digestate. Because composting facilities can break down materials that

88
resist degradation, composting solid AD digestate can reduce digester retention time and, thus, reduce cost.
Table 4.2: Estimate of investment for 120 tons of food scraps and 120 tons of food scraps with 100
tons of compost leachate
Item Food scraps Food scraps with compost leachate
Unit
Total Project Capital Cost 15,136,297.03 23,051,907.42 USD Total Operating Cost 2,044,541.93 2,608,033.03 USD Year-1 Total Raw Materials Cost 0.00 0.00 USD Year-1 Total Utilities Cost 241,594.38 373,345.40 USD Year-1 Total Product Sales 6,764,284.91 6,875,395.85 USD Year-1 Desired Rate of Return 10 10 Percent/Year-1 Payout Period 6.95 10.55 Year
4.4.2.2 Effect of jet fuel production rate on profitability of the Anaerobic Digestion Jet Fuel process
Since the scenario involving only food scraps was the more profitable scenario in this research, further analysis was conducted to reveal the effect of various parameters on this scenario, which will be referred to as the “AD Jet Fuel process.” In this process, organic wastes are converted to VFA by AD, VFA is fed to yeast to produce lipids, and lipids are separated to produce jet fuel (Appendix A). The profitability index (PI) is the ratio of payoff to investment of a proposed project and is also known as profit investment ratio (PIR) or value investment ratio (VIR). The profitability index was used in this economic valuation of the AD Jet Fuel process because it allows quantification of the amount of value created per unit of investment. The PI increased with an increase in jet fuel production rate (Figure 4.7). In this study, lipid directly separated from food scraps (rather than being converted to VFA by AD, then converted to lipid by yeast) was considered as a lipid source for jet fuel production. The rate of jet fuel production using this lipid source was much higher than that from microbial production (246 kg hour-1 vs. 45 kg hour-1). A PI greater than 1.0 indicates that a project can be profitable. Under the research conditions, a minimum jet fuel production rate of around 200 kg hour-1 is necessary for profitability.

89
Figure 4.7: Effect of jet fuel production rate on profitability index for the AD Jet Fuel process
4.4.2.3 Effect of tipping fee on profitability of the Anaerobic Digestion Jet Fuel process
A tipping fee (or gate fee) is very important for establishing a sustainable system of waste recycling and reuse. A tipping fee is the charge levied upon a given quantity of waste received at a waste processing facility. The PI of the AD Jet Fuel process increases with an increase of the tipping fee (Figure 4.8). A minimum tipping fee of around $25 per ton is crucial to the profitability of this project. If jet fuel production rate could be increased to over 291 kg hour-1, the minimum tipping fee needed for profitability decreases to zero.
Figure 4.8: Effect of the tipping fee on the profitability index for the AD Jet Fuel process
PI
(P
rofi
tab
ilit
y
Ind
ex)
Jet Fuel Production Rate (kg/hour)
0.8
0.85
0.9
0.95
1
1.05
1.1
1.15
1.2
0 10 20 30 40 50 60 66.139
PI
(P
rofi
tab
ilit
y
Ind
ex)
Tipping Fee ($/ton)

90
4.4.2.4 Effect of jet fuel price on profitability of the Anaerobic Digestion Jet Fuel process
The PI of the AD Jet Fuel process increases with an increase in jet fuel price (Figure 4.9). The price of jet fuel is dynamically changed with local markets. Like the price of any other commodity, the price of jet fuel reflects and responds to changes in supply and demand and can vary greatly. In a price survey of U.S. fuel suppliers, the price of jet fuel varied from $2.88 per gallon (minimum) to $9.30 per gallon (maximum) (AviationWeekNetwork, 2015). Under the research conditions, even if the price of jet fuel were reduced to around $2.80 per gallon, the PI remains greater than 1 (Figure 4.9), suggesting that it is possible to develop our technology to meet the goal of profitability.
Figure 4.9: Effect of jet fuel price on the profitability index for the AD Jet Fuel process
4.4.2.5 Effect of lipid titer on profitability of the Anaerobic Digestion Jet Fuel process
Lipid titer affects profitability because a higher lipid titer leads to more lipids produced and, thus, more jet fuel produced. The PI of the AD Jet Fuel process increases with an increase of lipid titer (Figure 4.10). In this study, engineered Y. lipolytica PO8 was used to enable the conversion of the fermentable carbon sources and VFA from the AD process to TAG. Currently, lipid titer using this process can reach 2.89 ± 0.25 g L-1. However, if we consider microbial production alone (and not the lipid separated directly from food waste), the lipid titer must be around 10 g L-1 to achieve profitability in this project. Therefore, more efforts are needed to enhance microbial lipid productivity for jet fuel production.
PI
(P
rofi
tab
ilit
y
Ind
ex)
Jet Fuel Price ($/Gallon)

91
Figure 4.10: Effect of lipid titer on the profitability index for the AD Jet Fuel process
4.5 Conclusions
The economic viability of AD as a waste management option can be enhanced by integration with a biorefinery for production of lipid-based biofuel and chemicals. Our approach (Figure 4.1) has unique elements, including (1) a hybrid biorefinery involving two major processes: VFA preparation from complex waste materials using AD, and conversion of VFA into chemicals and hydrocarbons through fermentation, and (2) design and engineering of the oleaginous yeast Y.
lipolytica as a versatile and efficient cell factory for producing lipid-based fuels and chemicals. Integrating these unique elements results in a transformative approach for developing renewable fuels and chemicals in a sustainable manner. In the first part of this project, we successfully engineered Y. lypolytica for overproduction of TAG and production of long chain WE. We showed that Y. lypolytica can use acetate as a sole carbon source, which is an important factor for its use in AD systems. We also demonstrated an in situ extraction and fermentation process for fatty alcohol production using dodecane. In the second part of this project, a techno-economic analysis was conducted to evaluate the feasibility of lipid-based biofuel as a major product of an integrated biorefinery. Results of the techno-economic analysis showed that digestion of organic wastes with a high solid concentration reduces capital, operating, and utility costs, thus increasing profitability. Lipid directly separated from food scraps can be a significant source for jet fuel production, making lipid concentration of food scraps an important consideration. The results of this analysis indicate that it is possible to make a profit with the parameters at levels used for the base case in the model (lipid titer: 2.89 g L-1 in addition to lipid that is directly separated from food waste; tipping fee: $60 ton-1; jet fuel: $5.21 gallon-1). Starting with the base case, each parameter was changed to evaluate its effect on profitability. A minimum jet fuel
PI
(P
rofi
tab
ilit
y
Ind
ex)
Lipid (Triglyceride) Titer (g/L)
92
production rate of 200 kg hour-1 was needed for profitability. Under the model conditions, a tipping fee of around $25 ton-1 or a jet fuel price of $2.80 gallon-1 resulted in profitability and thus allows the commercialization of this technology to be competitive with other jet fuel technologies. If we do not consider lipid that is directly separated from food scraps, but only microbial lipid, this changes the profitability of the model. Currently, the lipid titer from microbial production alone (2.89 g L-1) is not high enough to make a profitable project for jet fuel production. A lipid titer of around 10 g L-1 is necessary for establishing a sustainable program of lipid-based biofuel. The results of this project provide valuable information which will affect future scaling up of the biorefinery. Further development of this biorefinery process has the potential to advance enabling technologies, accelerate the development of a biofuel industry, and maximize bioenergy production from waste.
4.6 References
AviationWeekNetwork., 2015. "Jet-A and Avgas Fuel Prices: August 2015." from http://aviationweek.com/%5Bprimary-term%5D/jet-and-avgas-fuel-prices-august-2015.
Bankar, A.V., Kumar, A.R. and Zinjarde, S.S., 2009. "Environmental and industrial applications of Yarrowia lipolytica." Applied microbiology and biotechnology 84(5): 847-865.
Beopoulos, A., Chardot, T. and Nicaud, J.M., 2009. Yarrowia lipolytica: A model and a tool to understand the mechanisms implicated in lipid accumulation. Biochimie, 91(6), 692-696.
Beopoulos, A., Mrozova, Z., Thevenieau, F., Le Dall, M.T., Hapala, I., Papanikolaou, S., Chardot, T. and Nicaud, J.M., 2008. Control of lipid accumulation in the yeast Yarrowia lipolytica. Applied and environmental microbiology, 74(24), 7779-7789.
Chen, S., Frear, C., Garcia-Pérez, M., Jensen, J., Sjoding, D., Kruger, C., Abu-Lail, N.I., Astill, G., Dallmeyer, I., Dong, T., Flury, M., Fortuna, A.M., Garcia-Nunez, J., Hall, S.A., Harsh, J.B., Iqbal, H., Kennedy, N., Ma, J., Mitchell, S., Pecha, B., Pelaez-Samaniego, R., Seker, A., Smith, M., Suliman, W., Yorgey, G., Yu, L., and Zhao, Q. 2016. Advancing Organics Management in Washington State: The Waste to Fuels Technology Partnership. https://fortress.wa.gov/ecy/publications/SummaryPages/1607008.html, Department of Ecology, WA.
Chi, Z., Zheng, Y., Jiang, A. and Chen, S., 2011. Lipid production by culturing oleaginous yeast and algae with food waste and municipal wastewater in an integrated process. Applied
Biochemistry and Biotechnology, 165(2), 442-453. Heilmann, M., Iven, T., Ahmann, K., Hornung, E., Stymne, S. and Feussner, I., 2012. Production
of wax esters in plant seed oils by oleosomal cotargeting of biosynthetic enzymes. Journal of lipid research, 53(10), 2153-2161.
Hiltunen, J.K., Mursula, A.M., Rottensteiner, H., Wierenga, R.K., Kastaniotis, A.J. and Gurvitz, A., 2003. The biochemistry of peroxisomal β-oxidation in the yeast Saccharomyces cerevisiae. FEMS microbiology reviews, 27(1), 35-64.
Jinn, C.M., Ling, C.K., Wen, C.E., Tahir, P.M., Hua, L.S., Chen, L.W., Chuah, L. and Maminski, M., 2015. Empty Fruit Bunches in the Race for Energy, Biochemical, and Material Industry. In Agricultural Biomass Based Potential Materials (pp. 375-389). Springer International Publishing.

93
Lennen, R.M. and Pfleger, B.F., 2012. Engineering Escherichia coli to synthesize free fatty acids. Trends in biotechnology, 30(12), 659-667.
Levis, J.W. and Barlaz, M.A., 2013. Composting process model documentation. Retrieved
May, 16, p.2015. Li, Q., W. Du and D. Liu (2008). "Perspectives of microbial oils for biodiesel production."
Applied microbiology and biotechnology 80(5): 749-756. Miquel, M., Trigui, G., d’Andréa, S., Kelemen, Z., Baud, S., Berger, A., Deruyffelaere, C.,
Trubuil, A., Lepiniec, L. and Dubreucq, B., 2014. Specialization of oleosins in oil body dynamics during seed development in Arabidopsis seeds. Plant physiology, 164(4), 1866-1878.
Nicaud, J.M., Madzak, C., van den Broek, P., Gysler, C., Duboc, P., Niederberger, P. and Gaillardin, C., 2002. Protein expression and secretion in the yeast Yarrowia lipolytica. FEMS yeast research, 2(3), 371-379.
Ohara, H., 2003. Biorefinery. Applied microbiology and biotechnology, 62(5-6), 474-477. Peng, C.C., Chen, J.C., Shyu, D.J., Chen, M.J. and Tzen, J.T., 2004. A system for purification of
recombinant proteins in Escherichia coli via artificial oil bodies constituted with their oleosin-fused polypeptides. Journal of biotechnology, 111(1), 51-57.
Pfleger, B.F., Gossing, M. and Nielsen, J., 2015. Metabolic engineering strategies for microbial synthesis of oleochemicals. Metabolic engineering, 29, 1-11.
Qiao, K., Abidi, S.H.I., Liu, H., Zhang, H., Chakraborty, S., Watson, N., Ajikumar, P.K. and Stephanopoulos, G., 2015. Engineering lipid overproduction in the oleaginous yeast Yarrowia lipolytica. Metabolic engineering, 29, 56-65.
Qiao, K., Wasylenko, T.M., Zhou, K., Xu, P. and Stephanopoulos, G., 2017. Lipid production in Yarrowia lipolytica is maximized by engineering cytosolic redox metabolism. Nature
biotechnology, 35(2), 173-177. Radakovits, R., Jinkerson, R.E., Darzins, A. and Posewitz, M.C., 2010. Genetic engineering of
algae for enhanced biofuel production. Eukaryotic cell, 9(4), 486-501. Salimon, J., Salih, N. and Yousif, E., 2012. Industrial development and applications of plant oils
and their biobased oleochemicals. Arabian Journal of Chemistry, 5(2), 135-145. Sauer, M., Porro, D., Mattanovich, D. and Branduardi, P., 2008. Microbial production of organic
acids: expanding the markets. Trends in biotechnology, 26(2), 100-108. Tai, M. and Stephanopoulos, G., 2013. Engineering the push and pull of lipid biosynthesis in
oleaginous yeast Yarrowia lipolytica for biofuel production. Metabolic engineering, 15, 1-9.
Valle-Rodríguez, J.O., Shi, S., Siewers, V. and Nielsen, J., 2014. Metabolic engineering of Saccharomyces cerevisiae for production of fatty acid ethyl esters, an advanced biofuel, by eliminating non-essential fatty acid utilization pathways. Applied Energy, 115, 226-232.
Vargo, K.B., Parthasarathy, R. and Hammer, D.A., 2012. Self-assembly of tunable protein suprastructures from recombinant oleosin. Proceedings of the National Academy of
Sciences, 109(29), 11657-11662. Wang, G., Xiong, X., Ghogare, R., Wang, P., Meng, Y. and Chen, S., 2016. Exploring fatty
alcohol-producing capability of Yarrowia lipolytica. Biotechnology for biofuels, 9(1), 107.

94
Wenning, L., Yu, T., David, F., Nielsen, J. and Siewers, V., 2017. Establishing very long‐chain fatty alcohol and wax ester biosynthesis in Saccharomyces cerevisiae. Biotechnology and
bioengineering, 114(5), 1025-1035. Wikipedia. (2017). "Hydrogen economy." from
https://en.wikipedia.org/wiki/Hydrogen_economy. Xiong, X., Wang, X. and Chen, S., 2012. Engineering of a xylose metabolic pathway in Rhodococcus strains. Applied and environmental microbiology, 78(16), 5483-5491.

95
5. Quantification of Heavy Metals and Soluble Organic Pollutants in Biochar from Pyrolysis
of Urban Wood Residuals and Compost Overs
Michael Ayiania, Manuel Garcia-Pérez
5.1 Abstract
Fractions of municipal solid waste containing wood-based products have the potential to be used as feedstock for biochar production. One of the main limitations for the processing of organic waste fractions into biochar is the lack of understanding about environmental pollutants that may be present in the resulting biochar. Similarly, there is little information available on methods for removing heavy metals and soluble organic pollutants from biochar so that it can be used as a soil amendment. The objectives of this project were: (1) to examine the presence of three types of environmental pollutants—heavy metals, polycyclic aromatic hydrocarbons, and volatile organic compounds—in biochar, and (2) to test acid and hot water wash methods for removing heavy metals from biochar. Eleven biochar samples were produced from municipal solid waste and compost overs at two different temperatures (400°C and 600°C) in a laboratory scale spoon reactor. The composition of the biochar samples was determined by elemental and proximate analysis. The mass fractions of volatiles, hydrogen, and oxygen decreased with an increase in temperature. Concentrations of metals beyond thresholds established by the U.S. Environmental Protection Agency were found in biochar made from Of the different methods tested for the removal of heavy metals from biochar, acid wash was found to be the most effective. In conclusion, the composition of polycyclic aromatic hydrocarbons, volatile organic compounds, and heavy metals produced through various methods and from a range of feedstock materials must be thoroughly characterized before recommending the application of the resulting biochar for agricultural purposes.
5.2 Background
Environmental pollutants such as polycyclic aromatic hydrocarbons (PAHs), volatile organic compounds (VOCs), and heavy metals are formed during combustion and pyrolysis processes, and are frequently present in biochar (Freddo et al., 2012; Hilber et al., 2012; Keiluweit et al., 2012; Kloss et al., 2012; Schimmelpfennig and Glaser, 2012). These compounds are formed during biochar production, independent of operation conditions (Chouchene et al., 2010; Olsson et al., 2003; Olsson et al., 2004). These compounds can cause detrimental plant and microbial responses when present in soil (Hilber et al., 2012). Polycyclic aromatic hydrocarbons have been determined to possess carcinogenic properties (Wassenberg and Di Giulio, 2004; White and Claxton, 2004). The volatile organic compounds, such as ethylene, may trigger various microbial and plant growth processes, as they mimic plant hormones (Insam and Seewald, 2010). The levels of VOCs can also regulate seed germination rate, weed response, and nutrient uptake

96
(Simms and Rausher, 1987). Polycyclic aromatic hydrocarbons and VOCs are formed by thermal cracking of the biomass and tend to concentrate in the pyrolysis oil fraction (Dembiras, 2000). These compounds also become trapped inside the pores of biochar or deposited on the surface of biochar during the cooling process (Buss, 2015). Heavy metals present in biochar are toxic to living organisms. Soils polluted with these metals pose environmental problems, as they are persistent and not environmentally biodegradable, which threatens living organisms including plants and animals (Tian et al., 2014). These metals cause physiological, biochemical, and morphological alterations, leading to decreased growth and even mortality in plants (Farooq et al., 2015). Metal composition varies depending on the feedstock used for biochar production. Biochar (or charcoal) is a co-product from biomass pyrolysis that is targeted as a material with applications in environmental and agricultural management, as well as a vehicle for carbon sequestration (Hilber et al., 2012). Biochar is a carbon-rich, porous material prepared by thermochemical reactions of organic materials in an oxygen-limited environment (Ronsse et al., 2013; Suliman et al., 2016).The role of biochar has received much attention in political and academic arenas in recent years because of its potential to be used to sequester carbon, and can serve as a soil amendment, improving soil aggregation, water holding capacity, and organic matter content (Lehmann, 2007; Marris, 2006). Its application to soil can therefore improve crop yield, and can also reduce the loss of nutrients through leaching (Singh et al., 2010). Biochar can act as a carbon sink by remaining in the soil for more than 100 years (Lehmann, 2007), attracting attention as a strategy to withdraw carbon dioxide (CO2) from the atmosphere (Sohi et al., 2010). Biochar has also been recognized as an alternative sorbent to remove aqueous chemical contaminants, including heavy metals and organic compounds (Zhang et al., 2013; Zhang et al., 2012). The high surface area of biochar makes it a good candidate for various applications in our daily life. It is important to understand the physicochemical properties of this biochar, both accomplish the effective application of biochar and to inform research into methods of engineering biochar for specific applications. However, the existence of environmental pollutants such as heavy metals, polycyclic aromatic hydrocarbons (PAHs), and volatile organic compounds (VOCs) in biochar has a detrimental effect on soil quality and plant growth, and therefore on biochar’s ability to improve soil fertility and to mitigate climate change.
5.3 Objectives
One of the main limitations to processing organic waste fractions to produce biochar is the lack of information about the characteristics of the resulting biochar and the potential presence of heavy metals and soluble organic pollutants on the surface or within the structure of the biochar. The nature and quantities of the heavy metals in biochar is unknown, but most probably linked to the initial feedstock and to the production temperatures. Furthermore, there is little information on the methods that could be employed to remove the heavy metals so that the biochar can be used as a soil amendment, and to identify the presence of soluble organics pollutants (PAHs and VOCs). The objectives of this research were:
1. To document the characteristics of biochar derived from various fractions of municipal waste.
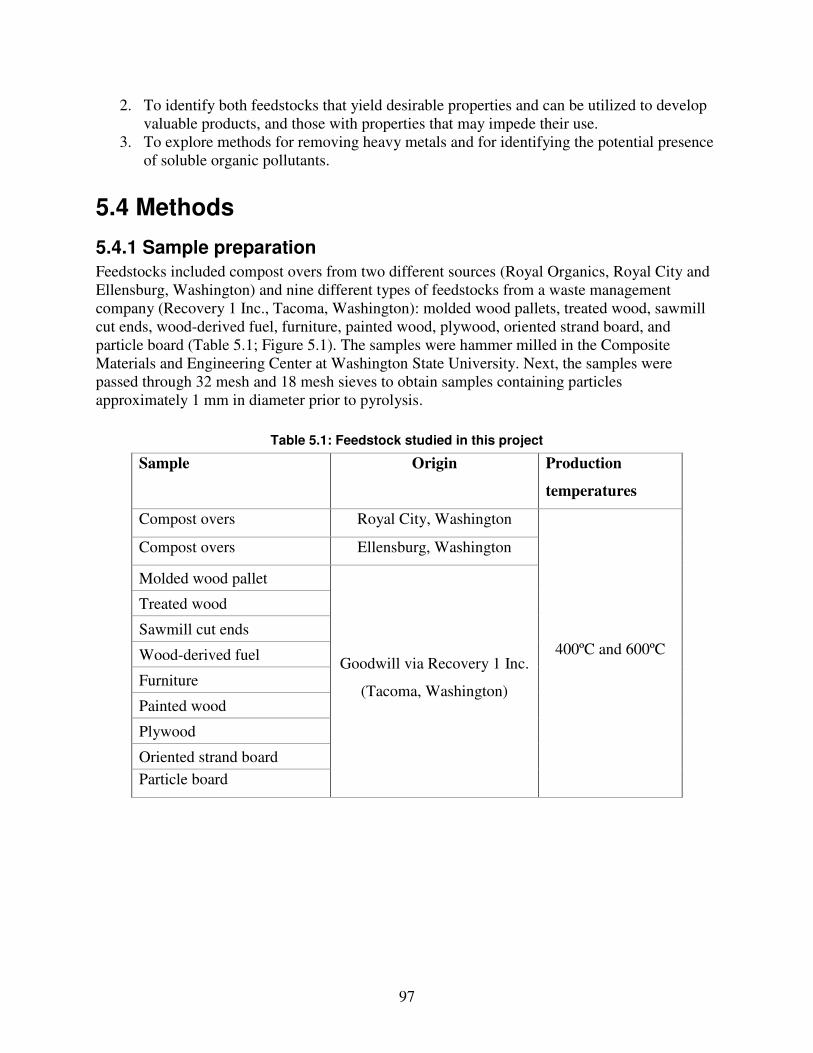
97
2. To identify both feedstocks that yield desirable properties and can be utilized to develop valuable products, and those with properties that may impede their use.
3. To explore methods for removing heavy metals and for identifying the potential presence of soluble organic pollutants.
5.4 Methods
5.4.1 Sample preparation
Feedstocks included compost overs from two different sources (Royal Organics, Royal City and Ellensburg, Washington) and nine different types of feedstocks from a waste management company (Recovery 1 Inc., Tacoma, Washington): molded wood pallets, treated wood, sawmill cut ends, wood-derived fuel, furniture, painted wood, plywood, oriented strand board, and particle board (Table 5.1; Figure 5.1). The samples were hammer milled in the Composite Materials and Engineering Center at Washington State University. Next, the samples were passed through 32 mesh and 18 mesh sieves to obtain samples containing particles approximately 1 mm in diameter prior to pyrolysis.
Table 5.1: Feedstock studied in this project
Sample Origin Production
temperatures
Compost overs Royal City, Washington
400ºC and 600ºC
Compost overs Ellensburg, Washington
Molded wood pallet
Goodwill via Recovery 1 Inc.
(Tacoma, Washington)
Treated wood
Sawmill cut ends
Wood-derived fuel
Furniture
Painted wood
Plywood
Oriented strand board
Particle board

98
Figure 5.1: Images of the woody biomass sources used in pyrolysis experiment
5.4.2 Pyrolysis Samples of each of the eleven feedstocks were pyrolyzed at two different temperatures (400°C and 600°C) in a spoon pyrolysis reactor following the same method described in Smith et al., (2016) and Wang et al. (2013a). Briefly, the samples were pyrolyzed for 30 minutes with a nitrogen flow rate of 300 mL min-1 (Figure 5.2). The resulting biochar was allowed to cool to room temperature under nitrogen flow.
Figure 5.2: Spoon pyrolysis reactor used for biochar production

99
5.4.3 Biochar characterization
5.4.3.1 Elemental analysis
Elemental analysis was performed using a TRUSPEC-CHN® elemental analyzer (LECO, U.S.). Briefly, 0.15 g of sample was used to determine total carbon (C), nitrogen (N), and hydrogen (H) contents. Oxygen (O) mass fraction was determined by subtracting the ash, carbon, nitrogen, and hydrogen contents from the total mass of the sample, under the assumption that these samples contained no sulfur.
5.4.3.2 Proximate analysis
Moisture, fixed carbon, volatile matter, and ash content of the biochars were determined using a thermogravimetric analyzer, SDTA851e (Mettler Toledo, U.S.), following a method described by Pecha et al. (2015). The percentage of fixed carbon was determined by subtracting the ash percentage from the volatile matter percentage, after assigning all weight loss up to 120°C to loss of free and non-structural water.
5.4.3.3 Gas physisorption analysis
Physisorption analysis was completed using both CO2 and nitrogen gas (N2) to characterize surface properties of the biochars. Adsorption isotherms were measured at 273 K on Micromeritics’ TriStar II PLUS Surface Area and Porosity Analyzer (Micromeritics, Norcross, Georgia, U.S.) following the method described by Suliman et al. (2016).
5.4.3.4 Analysis of polycyclic aromatic hydrocarbons
Biochar was soxhlet-extracted using 200 mL of ethyl acetate per 5 g of sample (glass fiber Soxhlet filter: Whatman 603 G, 10 371 055) for at least 18 hours. After the soxhlet extraction, the liquid was concentrated by evaporation. The remaining sample was then analyzed by gas chromatography mass spectrometry (GC-MS) to quantify PAHs.
5.4.3.5 Metal analysis
Samples were analyzed for arsenic (As), selenium (Se), cadmium (Cd), indium (In), tin (Sn), lead (Pb), platinum (Pt), mercury (Hg), molybdenum (Mo), and ruthenium (Ru) using the method described by Pecha et al. (2015), which used inductively coupled plasma mass spectrometry (ICP-MS; Agilent 7500cx).
5.4.4 Washing experiment A biochar washing experiment was conducted to determine the abilities of acid and hot water to remove heavy metals from the biochar. The methods are described in Pecha et al. (2015). Briefly, dried biochar was added in to an acid solution or hot water at 100°C. The acids used for this experiment were acetic acid (CH3COOH; JT Baker 100%) and hydrochloric acid (HCl; JT Baker 36.5-38%).
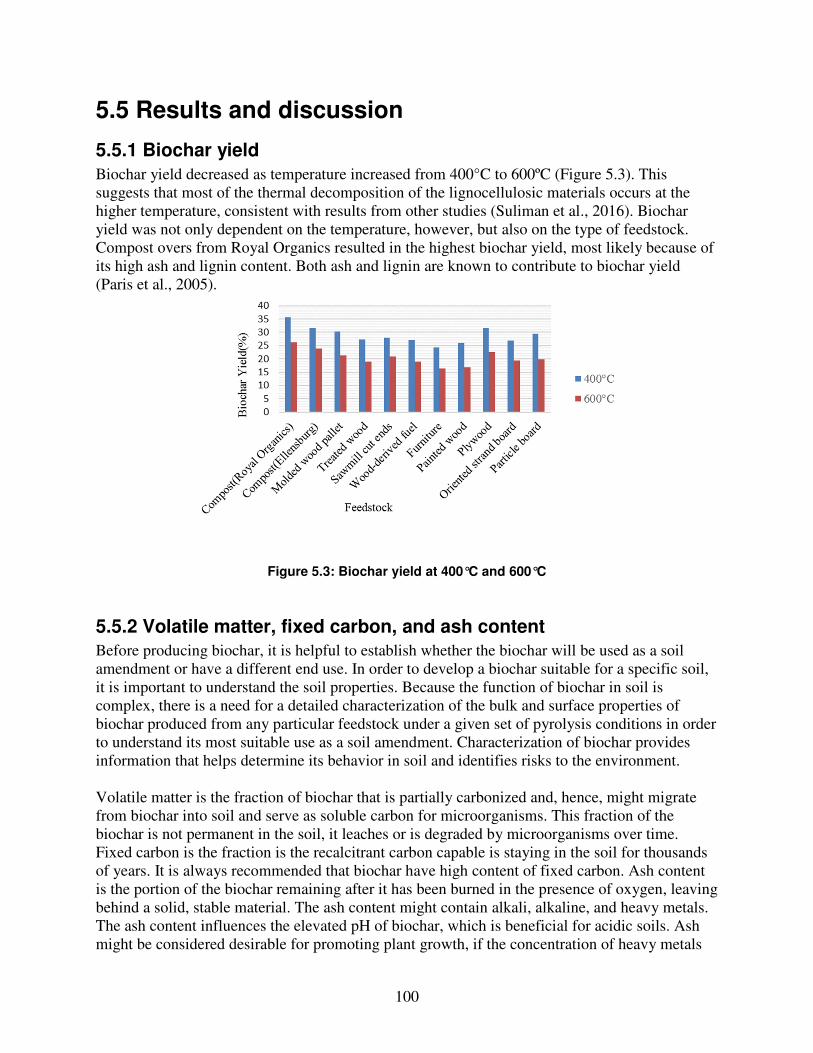
100
5.5 Results and discussion
5.5.1 Biochar yield
Biochar yield decreased as temperature increased from 400°C to 600ºC (Figure 5.3). This suggests that most of the thermal decomposition of the lignocellulosic materials occurs at the higher temperature, consistent with results from other studies (Suliman et al., 2016). Biochar yield was not only dependent on the temperature, however, but also on the type of feedstock. Compost overs from Royal Organics resulted in the highest biochar yield, most likely because of its high ash and lignin content. Both ash and lignin are known to contribute to biochar yield (Paris et al., 2005).
Figure 5.3: Biochar yield at 400°C and 600°C
5.5.2 Volatile matter, fixed carbon, and ash content Before producing biochar, it is helpful to establish whether the biochar will be used as a soil amendment or have a different end use. In order to develop a biochar suitable for a specific soil, it is important to understand the soil properties. Because the function of biochar in soil is complex, there is a need for a detailed characterization of the bulk and surface properties of biochar produced from any particular feedstock under a given set of pyrolysis conditions in order to understand its most suitable use as a soil amendment. Characterization of biochar provides information that helps determine its behavior in soil and identifies risks to the environment. Volatile matter is the fraction of biochar that is partially carbonized and, hence, might migrate from biochar into soil and serve as soluble carbon for microorganisms. This fraction of the biochar is not permanent in the soil, it leaches or is degraded by microorganisms over time. Fixed carbon is the fraction is the recalcitrant carbon capable is staying in the soil for thousands of years. It is always recommended that biochar have high content of fixed carbon. Ash content is the portion of the biochar remaining after it has been burned in the presence of oxygen, leaving behind a solid, stable material. The ash content might contain alkali, alkaline, and heavy metals. The ash content influences the elevated pH of biochar, which is beneficial for acidic soils. Ash might be considered desirable for promoting plant growth, if the concentration of heavy metals

101
does not exceed the threshold for land application. However, it is preferable for biochar designed for carbon sequestration to contain less ash and a high carbon content. These properties of biochar are dependent on pyrolysis temperature and origin of the feedstock. As the pyrolysis temperature increased, fixed carbon and ash content also increased, while volatile matter decreased (Figure 5.4). Compost overs from Royal Organics and molded wood pallets had the highest fixed carbon levels at 400°C and 600°C, respectively. The variation in these parameters was expected, because volatile matter, fixed carbon, and ash content are temperature- and feedstock-dependent.
Figure 5.4: Proximate analysis of biochar
5.5.3 Elemental analysis of biochar Elemental analysis is the most common type of analysis used to characterize biochar and involves the measurement of carbon, hydrogen, and nitrogen content of the resulting biochar. Elemental analysis is used for calculating the carbon to nitrogen ratio, which impacts nitrogen immobilization in the soil. The oxygen content of biochar is an indicator of oxygenated (carboxylic, phenolic, and lactonic) functional groups which affect cation exchange capacity, improving the ability to retain plants nutrients in soil (Suliman et al., 2015). The carbon, hydrogen, and nitrogen values (Figure 5.5) were corrected by subtracting the small amount of adsorbed water, as calculated in the thermogravimetric analyzer. Oxygen content was calculated by subtracting carbon, hydrogen, nitrogen, and ash from 100%. Water is 11.1% hydrogen and 88.9% oxygen, by weight. Elemental analysis showed a progressive decrease of the hydrogen to carbon (H:C) and oxygen to carbon (O:C) ratios with increasing pyrolysis temperature (Table 5.2), which was attributed to the thermal conversion of organic matter to carbonized organic

102
matter. This change in H:C and O:C ratios is also an indicator of the formation of structures containing condensed aromatic rings (Chen et al., 2008; Keiluweit et al., 2010; Wang et al., 2013b; Xu and Chen, 2013). We use the general term ‘aromatic rings’ because we don’t know the number of rings formed and further (NMR) analysis would be needed to estimate the number of rings. The elemental composition of biochar is dependent on pyrolysis temperature and feedstock. Our results showed that the H:C and O:C ratios decreased at the higher pyrolysis temperature, indicating the loss of some oxygenated functional groups, leading to cross-linking and rearrangement of the carbonized structure.
Figure 5.5: Elemental analysis of biochar

103
Table 5.2: Hydrogen to carbon (H:C) and oxygen to carbon (O:C) ratios of biochar produced at 400°C and 600°C from different feedstocks.
H:C O:C Feedstock 400°C 600°C 400°C 600°C Compost overs (Royal Organics) 0.043 0.015 0.136 0.034 Compost overs (Ellensburg) 0.045 0.015 0.135 0.039 Molded wood pallet 0.045 0.015 0.151 0.023 Treated wood 0.047 0.019 0.231 0.034 Sawmill cut ends 0.045 0.018 0.131 0.020 Wood-derived fuel 0.049 0.016 0.181 0.010 Furniture 0.042 0.017 0.126 -0.0611 Painted wood 0.046 0.022 0.147 0.040 Plywood 0.046 0.014 0.139 0.067 Oriented strand board 0.041 0.019 0.073 0.046 Particle board 0.048 0.018 0.134 -0.0131
1 Negative values are due to experimental error
5.5.4 Surface properties Surface area is an important indicator in biochar characterization as it gives information about the exchange, sorption, and reactivity of the biochar. The greater the surface area, the more chemical interaction biochar can participate in, on a per gram basis. Physisorption analysis was performed using both CO2 and N2 adsorption. N2 adsorption had a long equilibration time, indicating that most of the pores were micropores (less than 2 nm). Micropores contribute to the surface area of biochar and its ability to adsorb small molecules such as gases and other solvents (Robens et al., 1999). The surface area and micropore volume of biochar produced at 400°C and 600ºC (Table 5.3). As pyrolysis temperature increased, the surface area and micropore volume also increased, meaning that there were more active sites for adsorption. Micropore volume and surface area of biochar are also temperature and feedstock dependent.

104
Table 5.3: Surface area and micropore volume of biochars
Samples
Micropore volume
(cm3 g-1) Surface area1
(m2 g-1) 400°C 600°C 400°C 600°C
Compost overs (Royal Organics) 0.144 0.152 359.84 380.88
Compost overs (Ellensburg) 0.117 0.155 293.17 389.74
Molded wood pallet 0.086 0.164 214.99 410.09
Treated wood 0.098 0.196 245.65 489.86
Sawmill cut ends 0.094 0.179 235.01 446.82
Wood-derived fuel 0.103 0.119 259.04 298.43
Furniture 0.107 0.183 269.04 457.42
Painted wood 0.099 0.204 247.88 509.28
Plywood 0.102 0.108 255.07 451.15
Oriented strand board 0.095 0.1681 239.44 419.44
Particle board 0.095 0.1794 238.31 447.66 1Dubinin Radushkevich (DR) surface area (CO2)
5.5.5 Polycyclic aromatic hydrocarbons Gas chromatography (GC-MS) analysis was completed on the biochar to determine the possible presence of soluble PAHs, but no detectable compounds were found on the biochar produced from any of the studied feedstocks at either temperature.
5.5.6 Heavy metal analysis Metal concentrations in biochar varied considerably by feedstock ( Table 5.4-5.6). Treated wood feedstock had the greatest total metal concentration (363.22 mg kg-
1) and the greatest concentration of arsenic (As) (170.42 mg kg-1), antimony (Sb) (90.93 mg kg-
1), and lead (Pb) (61.67 mg kg-1). Biochar from furniture feedstock resulted in the highest concentration of indium (In) (26.00 mg kg-1) and tin (Sn) (11.40 mg kg-1), while biochar from painted wood showed the highest concentration of mercury (Hg) (62.99 mg kg-1) and molybdenum (Mo) (18.74 mg kg-1). Biosolids for land application must meet risk-based pollutant limits to protect public health and the environment. In 1993, the U.S. Environmental Protection Agency (EPA) implemented regulations for land application of biosolids through the code of Federal Regulations Title 40, part 503 (40 CFR, Part 503; https://www.ecfr.gov/cgi-bin/text-idx?tpl=/ecfrbrowse/Title40/40cfr503_main_02.tpl; for limits see

105
Appendix B. Heavy Metals in Biochar – Supplemental Results and Thresholds in Related Regulations). For example, comparing our data with the established regulations for metals, the biochar produced from painted wood and treated wood exceeded the acceptable threshold concentrations for land application for mercury (threshold limit 57 mg kg-1) and arsenic (threshold limit 75 mg kg-1). This suggests that before land applying these biochars produced from painted and treated wood, these metals should be removed, completely or partially, to meet the specifications established by the EPA.
Washington State also has standards for the maximum levels of metals permissible in fertilizers (http://www.ecy.wa.gov/programs/hwtr/dangermat/fert_standards.html; for additional information see

106
Appendix B. Heavy Metals in Biochar – Supplemental Results and Thresholds in Related Regulations). The biochar from furniture feedstock had an arsenic level of 6.63 ppm and a cadmium level of 5.09 ppm, in excess of the 5 ppm (As) and 1 ppm (Cd) state maximum levels. Only biochar from sawmill cut ends, Royal Organics compost overs, and painted wood exceeded the 5 ppm threshold for lead (Pb). The content of mercury (Hg) and selenium (Se) were in all the cases higher than the maximum levels allowed.
Table 5.4: Concentrations of metals (determined by ICP-MS) in biochar produced from compost overs and molded wood pallet feedstock.
Metals (mg kg-1)
Maximum allowable standard1
Compost overs
(Royal Organics)
Compost overs
(Ellensburg)
Molded wood pallet
Arsenic (As) 5.0 0.88 1.30 5.44 Selenium (Se) 1.0 nd2 2.03 nd Molybdenum (Mo) - 3.21 3.13 9.78 Cadmium (Cd) 1.0 nd nd nd Antimony (Sb) - 1.16 2.83 2.88 Lead (Pb) 5.0 9.26 1.96 9.29 Indium (In) - 1.52 2.26 12.48 Tin (Sn) - nd nd 2.12 Mercury (Hg) 0.2 nd 10.82 23.20 Ruthenium (Ru) - 0.55 5.23 1.03 Platinum (Pt) - 1.76 9.21 1.16 Total 18.34 38.77 67.39 1 source: http://www.ecy.wa.gov/programs/hwtr/dangermat/fert_standards.html; values are not presented when element is not listed as a metal of concern 2 nd = below detection limit

107
Table 5.5: Concentrations of metals (determined by ICP-MS) in biochar produced from treated wood, sawmill cut ends, wood-derived fuel, and furniture feedstock.
Metals (mg kg-1)
Maximum allowable standard1
Treated wood
Sawmill cuts ends
Wood-derived
fuel Furniture
Arsenic (As) 5.0 170.42 2.54 0.92 6.63 Selenium (Se) 1.0 nd2 10.18 nd 6.63 Molybdenum (Mo) - 15.69 8.63 2.28 5.93 Cadmium (Cd) 1.0 nd nd nd 5.09 Antimony (Sb) - 90.93 1.75 0.89 6.47 Lead (Pb) 5.0 61.67 7.23 8.10 4.62 Indium (In) - 8.41 8.90 17.26 26.00 Tin (Sn) - 11.25 nd 7.07 11.40 Mercury (Hg) 0.2 3.53 0.24 23.39 22.34 Ruthenium (Ru) - 1.12 1.90 0.10 1.08 Platinum (Pt) - 0.19 5.75 2.18 3.11 Total 363.22 47.12 62.18 99.30
1 source: http://www.ecy.wa.gov/programs/hwtr/dangermat/fert_standards.html; values are not presented when element is not listed as a metal of concern 2 nd = below detection limit
Table 5.6: Concentrations of metals (determined by ICP-MS) in biochar produced from painted
wood, plywood, oriented strand board, and particle board feedstock.
Metals (mg kg-1)
Maximum allowable standard1
Painted wood
Ply wood
Oriented strand board
Particle board
Arsenic (As) 5.0 0.29 0.47 0.36 0.19 Selenium (Se) 1.0 nd2 0.51 nd nd Molybdenum (Mo) - 18.74 1.11 0.79 1.97 Cadmium (Cd) 1.0 nd 1.49 nd nd Antimony (Sb) - 2.03 2.83 1.92 0.83 Lead (Pb) 5.0 7.02 4.85 2.98 1.32 Indium (In) - 8.73 13.41 11.03 15.61 Tin (Sn) - nd nd nd nd Mercury (Hg) 0.2 62.99 26.46 47.18 25.79 Ruthenium (Ru) - 2.21 0.31 0.66 0.36 Platinum (Pt) - 1.51 0.45 1.09 0.85 Total 103.52 51.91 66.01 46.92
1 source: http://www.ecy.wa.gov/programs/hwtr/dangermat/fert_standards.html; values are not presented when element is not listed as a metal of concern 2 nd = below detection limit

108
5.5.7 Washing experiment Biochar samples from painted wood and treated wood were used for this experiment because levels of mercury in biochar from painted wood and arsenic in biochar from treated wood exceeded the acceptable threshold concentrations for land application. For the treated wood biochar, all the three methods (hydrochloric acid, acetic acid, and hot water washes) were effective for the removal of arsenic, with the ICP-MS results showing that the concentration of arsenic was below the detection limit following treatment (
Table 5.7 and

109
Table 5.8). For the painted wood biochar, the hydrochloric and acetic acid methods were effective for the removal of mercury. Using the hot water wash lowered the concentration of mercury in painted wood biochar to below the EPA threshold, but this reduction was only 10% of the initial mercury concentration.
Table 5.7: Heavy metal concentrations in biochar from treated wood after hydrochloric acid (HCl), acetic acid, and hot water wash treatments
Treated Wood
Metals (mg kg-1)
Before wash HCl
Acetic acid
Hot water, 100°C
Arsenic (As) 170.42 nd1 nd nd Selenium (Se) nd 2.10 2.08 1.66 Molybdenum (Mo) 15.69 2.16 1.50 1.05 Cadmium (Cd) nd nd nd nd Antimony (Sb) 90.93 nd nd nd Lead (Pb) 61.67 8.48 5.15 5.55 Indium (In) 8.41 nd nd nd Tin (Sn) 11.25 nd nd nd Mercury (Hg) 3.53 nd nd nd Ruthenium (Ru) 1.12 nd nd nd Platinum (Pt) 0.19 nd nd nd Total 363.22 12.74 8.74 8.26
1 nd = below detection limit

110
Table 5.8: Heavy metal concentrations in biochar from painted wood after hydrochloric acid (HCl), acetic acid, and hot water wash treatments
Painted Wood
Metals (mg kg-1)
Before wash HCl
Acetic acid
Hot water, 100°C
Arsenic (As) 0.29 nd1 nd nd Selenium (Se) nd 1.72 3.35 1.81 Molybdenum (Mo) 18.74 0.95 6.11 3.93 Cadmium (Cd) nd nd nd nd Antimony (Sb) 2.03 nd nd nd Lead (Pb) 7.02 3.18 8.87 8.38 Indium (In) 8.73 nd nd nd Tin (Sn) nd nd nd nd Mercury (Hg) 62.99 nd nd 56.57 Ruthenium (Ru) 2.21 nd nd nd Platinum (Pt) 1.51 nd nd nd Total 103.52 5.86 18.34 70.69
1 nd = below detection limit
5.6 Conclusions
This work reports on the bulk and surface properties of biochars produced from different feedstocks at 400°C and 600°C, and explores the efficacy of three different wash methods for removing heavy metals from biochar. The results showed that carbon content, surface area, micropore volume, and ash content all depended on the production temperature and feedstock type. Regardless of the feedstock type used, biochar produced at 600°C had the best properties for use as a soil amendment. The results showed the presence of heavy metals in the biochars produced, at concentrations that varied depending on feedstock. The concentration of heavy metals was reduced by acid and hot water washing, in some cases to levels below the detection limit. Results suggest that acid washing is an effective way to remove or reduce the levels of some toxic metals present in biochar, particularly for mercury in painted wood. Acetic acid should be used, preferably, since it is an organic acid, and its weak acidity makes it a useful chemical for dissolving minerals. Even though hydrochloric acid was as effective, it may cause dulling and damage to the biochar. Biochar produced using each of the feedstock types studied—with the exception of painted and treated wood—had acceptable levels of metals for use in land application, if the existing EPA policies are used as reference. Biochar from painted and treated wood contained concentrations of arsenic (As) and mercury (Hg) exceeding these EPA specifications. Acid washing was effective for the removal of metals in biochar. No soluble PAHs were detected in the biochars produced in this study.

111
5.7 References
Chen, B., Zhou, D., Zhu, L. 2008. Transitional adsorption and partition of nonpolar and polar aromatic contaminants by biochars of pine needles with different pyrolytic temperatures. Environmental science & technology, 42(14), 5137-5143.
Chouchene, A., Jeguirim, M., Khiari, B., Trouvé, G., Zagrouba, F. 2010. Study on the emission mechanism during devolatilization/char oxidation and direct oxidation of olive solid waste in a fixed bed reactor. Journal of analytical and applied pyrolysis, 87(1), 168-174.
Farooq, M.A., Li, L., Ali, B., Gill, R.A., Wang, J., Ali, S., Gill, M.B., Zhou, W. 2015. Oxidative injury and antioxidant enzymes regulation in arsenic-exposed seedlings of four Brassica napus L. cultivars. Environmental Science and Pollution Research, 22(14), 10699-10712.
Freddo, A., Cai, C., Reid, B.J. 2012. Environmental contextualisation of potential toxic elements and polycyclic aromatic hydrocarbons in biochar. Environmental pollution, 171, 18-24.
Hilber, I., Blum, F., Leifeld, J., Schmidt, H.-P., Bucheli, T.D. 2012. Quantitative determination of PAHs in biochar: a prerequisite to ensure its quality and safe application. Journal of
agricultural and food chemistry, 60(12), 3042-3050. Insam, H., Seewald, M.S. 2010. Volatile organic compounds (VOCs) in soils. Biology and fertility
of soils, 46(3), 199-213. Keiluweit, M., Kleber, M., Sparrow, M.A., Simoneit, B.R., Prahl, F.G. 2012. Solvent-extractable
polycyclic aromatic hydrocarbons in biochar: influence of pyrolysis temperature and feedstock. Environmental science & technology, 46(17), 9333-9341.
Keiluweit, M., Nico, P.S., Johnson, M.G., Kleber, M. 2010. Dynamic molecular structure of plant biomass-derived black carbon (biochar). Environmental science & technology, 44(4), 1247-1253.
Kloss, S., Zehetner, F., Dellantonio, A., Hamid, R., Ottner, F., Liedtke, V., Schwanninger, M., Gerzabek, M.H., Soja, G. 2012. Characterization of slow pyrolysis biochars: effects of feedstocks and pyrolysis temperature on biochar properties. Journal of environmental
quality, 41(4), 990-1000. Lehmann, J. 2007. A handful of carbon. Nature, 447(7141), 143-144. Marris, E. 2006. Putting the carbon back: Black is the new green. Nature, 442(7103), 624-626. Olsson, M., Kjällstrand, J., Petersson, G. 2003. Oxidative pyrolysis of integral softwood pellets.
Journal of analytical and applied pyrolysis, 67(1), 135-141. Olsson, M., Ramnäs, O., Petersson, G. 2004. Specific volatile hydrocarbons in smoke from
oxidative pyrolysis of softwood pellets. Journal of analytical and applied pyrolysis, 71(2), 847-854.
Paris, O., Zollfrank, C., Zickler, G.A. 2005. Decomposition and carbonisation of wood biopolymers—a microstructural study of softwood pyrolysis. Carbon, 43(1), 53-66.
Pecha, B., Arauzo, P., Garcia-Pérez, M. 2015. Impact of combined acid washing and acid impregnation on the pyrolysis of Douglas fir wood. Journal of analytical and applied
pyrolysis, 114, 127-137. Robens, E., Rouquerol, F., Rouquerol, J., Sing, K. 1999. Adsorption by powders and porous solids,
Academic Press, London, UK. Ronsse, F., Van Hecke, S., Dickinson, D., Prins, W. 2013. Production and characterization of slow
pyrolysis biochar: influence of feedstock type and pyrolysis conditions. GCB Bioenergy, 5(2), 104-115.

112
Schimmelpfennig, S., Glaser, B. 2012. One step forward toward characterization: some important material properties to distinguish biochars. Journal of environmental quality, 41(4), 1001-1013.
Simms, E.L., Rausher, M.D. 1987. Costs and benefits of plant resistance to herbivory. The
American Naturalist, 130(4), 570-581. Singh, B.P., Hatton, B.J., Singh, B., Cowie, A.L., Kathuria, A. 2010. Influence of biochars on
nitrous oxide emission and nitrogen leaching from two contrasting soils. Journal of
environmental quality, 39(4), 1224-1235. Smith, M.W., Dallmeyer, I., Johnson, T.J., Brauer, C.S., McEwen, J.-S., Espinal, J.F., Garcia-
Pérez, M. 2016. Structural analysis of char by Raman spectroscopy: Improving band assignments through computational calculations from first principles. Carbon, 100, 678-692.
Sohi, S., Krull, E., Lopez-Capel, E., Bol, R. 2010. A review of biochar and its use and function in soil. Advances in agronomy, 105, 47-82.
Suliman, W., Harsh, J.B., Abu-Lail, N.I., Fortuna, A.-M., Dallmeyer, I., Garcia-Pérez, M. 2015. Understanding the effects of pyrolysis conditions and feedstock composition on the bulk and surface properties of biochars. Toward an understanding of the role of biochar as an agro-environmental tool: Potential for control water release, bacterial retention, and greenhouse gas emissions. Biomass and Bioenergy, 36, 1001.
Suliman, W., Harsh, J.B., Abu-Lail, N.I., Fortuna, A.-M., Dallmeyer, I., Garcia-Pérez, M. 2016. Influence of feedstock source and pyrolysis temperature on biochar bulk and surface properties. Biomass and Bioenergy, 84, 37-48.
Tian, T., Ali, B., Qin, Y., Malik, Z., Gill, R.A., Ali, S., Zhou, W. 2014. Alleviation of lead toxicity by 5-aminolevulinic acid is related to elevated growth, photosynthesis, and suppressed ultrastructural damages in oilseed rape. BioMed research international, 2014.
Wang, Z., McDonald, A.G., Westerhof, R.J., Kersten, S.R., Cuba-Torres, C.M., Ha, S., Pecha, B., Garcia-Pérez, M. 2013a. Effect of cellulose crystallinity on the formation of a liquid intermediate and on product distribution during pyrolysis. Journal of analytical and
applied pyrolysis, 100, 56-66. Wang, Z., Zheng, H., Luo, Y., Deng, X., Herbert, S., Xing, B. 2013b. Characterization and
influence of biochars on nitrous oxide emission from agricultural soil. Environmental
pollution, 174, 289-296. Wassenberg, D.M., Di Giulio, R.T. 2004. Synergistic embryotoxicity of polycyclic aromatic
hydrocarbon aryl hydrocarbon receptor agonists with cytochrome P4501A inhibitors in Fundulus heteroclitus. Environmental health perspectives, 1658-1664.
White, P., Claxton, L. 2004. Benzo [a] pyrene, polynuclear aromatic compounds, part 1. Mutation
Research, 567, 227-345. Xu, Y., Chen, B. 2013. Investigation of thermodynamic parameters in the pyrolysis conversion of
biomass and manure to biochars using thermogravimetric analysis. Bioresource
technology, 146, 485-493. Zhang, M., Gao, B., Varnoosfaderani, S., Hebard, A., Yao, Y., Inyang, M. 2013. Preparation and
characterization of a novel magnetic biochar for arsenic removal. Bioresource technology, 130, 457-462.
Zhang, M., Gao, B., Yao, Y., Xue, Y., Inyang, M. 2012. Synthesis of porous MgO-biochar nanocomposites for removal of phosphate and nitrate from aqueous solutions. Chemical
Engineering Journal, 210, 26-32.
113
6. Identification of Volatile Compounds from Pyrolysis of Urban Wood Residuals and
Compost Overs
Alex Dunsmoor, Manuel Garcia-Pérez
6.1 Abstract
The production of biochar from municipal solid waste and compost overs described in Chapter 5 also generates volatile compounds from pyrolysis. While potential contaminants in the biochar are a concern for land application, pollutants in the vapor phase are a concern for air quality, and this study addresses the lack of experimental information on the nature of volatile products derived from pyrolysis. Several hundred compounds were identified in the vapor phase, among which 50-83 contained chlorine, nitrogen, or sulfur (potential pollutants). The most prevalent compound identified in the pyrolysis vapor of these samples was carbon dioxide, with the exception of the furniture feedstock, for which the most prevalent compound was acetic acid. Treated lumber had the greatest abundance of potential pollutants as measured by peak areas of the chromatogram.
6.2 Background
One of the goals for Washington State’s solid and hazardous waste plan is to move beyond waste and toxics by developing a more diversified organics processing infrastructure (Ecology, 2015). Pyrolysis is among the processes studied in goal SWM 22 (Ecology, 2015), and evaluated in this chapter. While the Washington State University thermochemical conversion team has studied the biochar produced and pollutants from pyrolyzing municipal solid waste and compost overs, there is no information available on the vapors resulting from pyrolysis of these materials. Just as there are pollution concerns with land application of biochar derived from pyrolyzing municipal solid waste and compost overs, pollutants from the vapors produced from pyrolysis are a concern for air quality. Among the criteria air pollutants described by the U.S. Environmental Protection Agency are sulfur oxides and nitrogen oxides (USEPA, 2017). These compounds contribute to acid rain which damages infrastructure (Webster and Kukacka, 1986). While not a criteria air pollutant, chlorine contributes to ozone destruction in the stratosphere (NOAA, 2010). Ozone acts as a filter for ultraviolet radiation which, if allowed to reach earth’s surface, may contribute to increased rates of skin cancer (Henricksen et al., 1990). While pollutants may not be in the vapors from pyrolysis, processing of this gas, such as by combustion through a stack burn system, may lead to the emissions of criteria air pollutants. In this regard, we refer to any compound containing chlorine, nitrogen, or sulfur as a potential pollutant regardless of whether the particular compound’s characteristics are environmentally benign, or detrimental.

114
6.3 Objectives
The objective of this research is to identify compounds from the pyrolysis of municipal solid waste and compost overs. Specifically, this research sought to identify compounds containing chlorine, nitrogen, and sulfur, as these are of potential concern for air quality.
6.4 Methods
The sources and preparation of feedstock were previously described in Section 5.4.1. Approximately 0.05 mg of material was loaded into a quartz tube where each end was packed with quartz wool to retain contents. Volatile constituents in the vapor resulting from pyrolysis were identified using a gas chromatography-mass spectroscopy (GC-MS) system (6890N Network GC System, 5975B inert XL MSD, Agilent Technologies) coupled with a pyroprobe (CDS Analytical Inc. 5000 series), making the Py-GC-MS. A single quartz tube was placed in the pyroprobe and heated to 500°C at a rate of 10°C per millisecond making this fast pyrolysis; the sample remained heated for 13 seconds before pyrolysis ended. Each sample was analyzed in triplicate, and the first hit number of the highest quality was taken as the identity for the compound detected at each retention time. Significant constituents in vapor were defined as those with a peak area greater than 1% of the total peak area from all identified compounds in the chromatogram. Compounds containing chlorine, nitrogen, or sulfur were considered potential pollutants. Their presence was confirmed by searching the names of compounds containing these three elements using an algorithm in excel. A list of the compounds containing chlorine, nitrogen, and sulfur that were searched are shown in

115
Table 6.1.

116
Table 6.1: Compound names used when searching potential pollutants
Chlorine Nitrogen Sulfur
chloride nitrate sulfide
chlorate nitrite sulfate chloro amine sulfurous
cyanide thiol
cyanate sulfoxide
amide sulfone
imine sulfinic
imide sulfonic
azide thial
azo nitrile nitro nitroso oxime pyridine pyridyl nitrosooxy
6.5 Results and discussion
The total number of compounds identified, and the number of chlorine, nitrogen, and sulfur containing pollutants from the identified compounds are listed in Table 6.2. Among the potential pollutants, those containing nitrogen were the most prevalent. The total number of compounds identified ranged from 264 to 311 depending on the sample. Significant compounds identified from each sample are listed in Table 6.3 through Table 6.12.

117
Table 6.2: Numbers of compounds and potential pollutants identified in vapor resulting from pyrolysis of each material
Number of compounds
containing
Material Total number of
compounds Cl N S Royal Organics compost overs 282 ± 14 5 ± 2 47 ± 5 13 ± 1 Ellensburg compost overs 311 ± 17 6 ± 2 52 ± 3 12 ± 2 Furniture 288 ± 17 11 ± 2 54 ± 3 18 ± 5 Molded wood pallet 265 ± 34 7 ± 2 34 ± 9 14 ± 4 Oriented strand board 303 ± 12 8 ± 2 42 ± 7 14 ± 8 Painted wood 309 ± 18 6 ± 1 52 ± 7 15 ± 2 Plywood 264 ± 23 8 ± 3 39 ± 4 15 ± 4 Sawmill cut ends 265 ± 19 7 ± 1 38 ± 4 10 ± 1 Treated wood 267 ± 8 10 ± 3 48 ± 6 21 ± 2 Wood-derived fuel 264 ± 33 5 ± 2 42 ± 9 17 ± 4
Table 6.3: Significant compounds identified in vapor from pyrolysis of Royal Organic compost overs*
Compound % Composition Carbon dioxide 11.02 ± 1.17 2-Methoxy-4-vinylphenol 4.08 ± 0.23 n-Hexadecanoic acid 3.80 ± 1.54 Phenol, 2-methoxy- 3.73 ± 0.20 2-Propanone, 1-hydroxy- 3.38 ± 0.40 Phenol, 2-methoxy-4-(1-propenyl)-, (E)- 3.30 ± 0.17 Octadecanoic acid 2.88 ± 1.24 Phenol, 2-methoxy-4-methyl- 2.13 ± 0.07 4-((1E)-3-Hydroxy-1-propenyl)-2-methoxyphenol 2.04 ± 0.31 1,3-Propanediamine, N-methyl- 1.79 ± 0.09 2-Cyclopenten-1-one, 2-hydroxy- 1.79 ± 0.03 Acetic acid 1.78 ± 0.05 Furfural 1.19 ± 0.08 Vanillin 1.17 ± 0.05 Phenol, 2,6-dimethoxy- 1.14 ± 0.04
* Contained 4.85 wt. % plastic, balance was woody material

118
The most prevalent compound identified was carbon dioxide, ranging from 4.78 to 11% of the total peak area of the chromatogram. Furniture was the only feedstock for which carbon dioxide was not the most prevalent compound identified. For furniture, acetic acid constituted over 8.5% of the total chromatogram peak area, while carbon dioxide was less than 7% (

119
Table 6.5). Acetic acid was a significant compound identified in each of the feedstocks, but may have been the most significant constituent for furniture due to high amounts of hemicellulose, which is known to favor the formation of small carbonyl compounds during pyrolysis via deacetylation (Mohan et al., 2006). Alternatively, aluminum or copper (possibly present in the feedstock) may have acted as a catalyst to favor production of acetic acid. Catalytic pyrolysis using copper or aluminum has been shown to result in a strong reduction in levoglucosan and high molecular mass phenolic compounds while increasing acetic acid and furans production (Adam et al., 2005).
Table 6.4: Significant compounds identified in vapor from pyrolysis of Ellensburg compost overs*
Compound % Composition Carbon dioxide 10.58 ± 0.36 n-Hexadecanoic acid 5.37 ± 1.67 Octadecanoic acid 4.32 ± 1.36 2-Methoxy-4-vinylphenol 3.77 ± 0.14 Phenol, 2-methoxy- 3.52 ± 0.37 2-Propanone, 1-hydroxy- 3.07 ± 0.16 Phenol, 2-methoxy-4-(1-propenyl)-, (E)- 2.97 ± 0.44 Butane 2.62 ± 0.20 Acetic acid 1.90 ± 0.65 1,3-Propanediamine, N-methyl- 1.87 ± 0.25 Phenol, 2-methoxy-4-methyl- 1.77 ± 0.13 4-((1E)-3-Hydroxy-1-propenyl)-2-methoxyphenol 1.60 ± 0.13 2-Cyclopenten-1-one, 2-hydroxy- 1.58 ± 0.09 Phenol, 2,6-dimethoxy- 1.45 ± 0.06
* Contained 0.56 wt. % plastic, balance was woody material

120
Table 6.5: Significant compounds identified in vapor from pyrolysis of furniture
Compound % Composition Acetic acid 8.57 ± 0.32 Carbon dioxide 6.98 ± 0.25 n-Hexadecanoic acid 4.47 ± 0.13 Octadecanoic acid 3.45 ± 0.19 2-Propanone, 1-hydroxy- 2.04 ± 0.12 Phenol, 2,6-dimethoxy- 1.88 ± 0.12 2-Methoxy-4-vinylphenol 1.54 ± 0.03 Propanoic acid, 2-oxo-, methyl ester 1.38 ± 0.14 Phenol, 2-methoxy-4-methyl- 1.23 ± 0.20 3,5-Dimethoxy-4-hydroxycinnamaldehyde 1.06 ± 0.05 Benzaldehyde, 4-hydroxy-3,5-dimethoxy- 1.05 ± 0.03
Table 6.6: Significant compounds identified in vapor from pyrolysis of molded wood pallet
Compound % Composition Carbon dioxide 10.78 ± 1.08 Acetic acid 6.45 ± 3.49 n-Hexadecanoic acid 6.15 ± 1.78 Octadecanoic acid 4.88 ± 1.23 2,3,5,6-Tetrafluoroanisole 2.62 ± 0.27 2-Propanone, 1-hydroxy- 2.42 ± 0.16 2-Methoxy-4-vinylphenol 2.17 ± 0.12 Phenol, 2,6-dimethoxy- 2.02 ± 0.16 Phenol, 2-methoxy-4-(1-propenyl)-, (E)- 1.69 ± 0.19 Phenol, 2-methoxy- 1.55 ± 0.12 Phenol, 2-methoxy-4-methyl- 1.40 ± 0.31

121
Table 6.7: Significant compounds identified in vapor from pyrolysis of oriented strand board
Compound % Composition Carbon dioxide 9.00 ± 1.08 Acetic acid 8.88 ± 0.67 n-Hexadecanoic acid 4.73 ± 1.75 2,3,5,6-Tetrafluoroanisole 3.67 ± 0.11 Octadecanoic acid 3.60 ± 1.35 Phenol, 2,6-dimethoxy- 2.89 ± 0.37 2-Propanone, 1-hydroxy- 2.59 ± 0.32 Benzoic acid, 4-hydroxy-3-methoxy- 1.53 ± 0.66 2-Methoxy-4-vinylphenol 1.49 ± 0.12 2-Cyclopenten-1-one, 2-hydroxy- 1.43 ± 0.20 1,3-Propanediamine, N-methyl- 1.33 ± 0.26 Phenol 1.32 ± 0.02
Table 6.8: Significant compounds identified in vapor from pyrolysis of painted wood
Compound % Composition Carbon dioxide 6.02 ± 0.52 Acetic acid 3.06 ± 0.52 n-Hexadecanoic acid 2.92 ± 0.67 Phenol, 2-methoxy-4-methyl- 2.75 ± 0.17 Phenol, 2-methoxy-4-(1-propenyl)-, (E)- 2.68 ± 0.11 2-Methoxy-4-vinylphenol 2.25 ± 0.06 Octadecanoic acid 2.19 ± 0.45 2-Propanone, 1-hydroxy- 2.15 ± 0.15 1,6-Anhydro-.beta.-D-glucopyranose (levoglucosan) 1.83 ± 0.92 Phenol, 2-methoxy- 1.66 ± 0.23 Propanoic acid, 2-oxo-, methyl ester 1.50 ± 0.04 Furfural 1.24 ± 0.07 Vanillin 1.21 ± 0.18

122
Table 6.9: Significant compounds identified in vapor from pyrolysis of plywood
Compound % Composition Carbon dioxide 9.03 ± 0.47 n-Hexadecanoic acid 6.35 ± 1.99 Octadecanoic acid 4.92 ± 1.48 2-Methoxy-4-vinylphenol 4.25 ± 0.21 Phenol, 2-methoxy- 3.56 ± 0.29 2-Propanone, 1-hydroxy- 3.56 ± 0.15 Acetic acid 3.27 ± 0.32 Phenol, 2-methoxy-4-(1-propenyl)-, (E)- 3.01 ± 0.12 4-((1E)-3-Hydroxy-1-propenyl)-2-methoxyphenol 2.86 ± 0.22 Phenol, 2-methoxy-4-methyl- 2.39 ± 0.09 2-Cyclopenten-1-one, 2-hydroxy- 1.95 ± 0.06 1,3-Propanediamine, N-methyl- 1.74 ± 0.29 4-Hydroxy-2-methoxycinnamaldehyde 1.19 ± 0.14 Furfural 1.18 ± 0.01
Table 6.10: Significant compounds identified in vapor from pyrolysis of saw mill cut ends
Compound % Composition Carbon dioxide 9.93 ± 0.17 Acetic acid 5.30 ± 0.31 n-Hexadecanoic acid 5.28 ± 1.64 Octadecanoic acid 3.98 ± 1.29 Phenol, 2-methoxy-4-(1-propenyl)-, (E)- 2.93 ± 0.22 2-Propanone, 1-hydroxy- 2.71 ± 0.05 2-Propanone, 1-hydroxy- 2.71 ± 0.05 2-Methoxy-4-vinylphenol 2.62 ± 0.28 Phenol, 2-methoxy-4-methyl- 2.00 ± 0.67 4-((1E)-3-Hydroxy-1-propenyl)-2-methoxyphenol 1.99 ± 0.39 Phenol, 2-methoxy- 1.82 ± 0.14 Propanoic acid, 2-oxo-, methyl ester 1.45 ± 0.16 Furfural 1.16 ± 0.07

123
Table 6.11: Significant compounds identified in vapor from pyrolysis of treated wood
Compound % Composition Carbon dioxide 4.79 ± 1.89 Acetic acid 3.65 ± 0.52 n-Hexadecanoic acid 3.64 ± 0.32 Formic acid, chloro-, (3,4,4-trimethyl-1,2-dioxetan-3-yl) methyl ester 3.17 ± 0.49 Phenol, 2-methoxy-4-(1-propenyl)-, (E)- 3.06 ± 0.31 Phenol, 2-methoxy-4-methyl- 3.02 ± 0.17 Octadecanoic acid 2.83 ± 0.25 2-Methoxy-4-vinylphenol 2.83 ± 0.22 2-Propanone, 1-hydroxy- 2.47 ± 0.08 4-((1E)-3-Hydroxy-1-propenyl)-2-methoxyphenol 2.19 ± 0.35 Phenol, 2-methoxy- 2.03 ± 0.30 2-Cyclopenten-1-one, 2-hydroxy- 1.64 ± 0.13 4-Hydroxy-2-methoxycinnamaldehyde 1.58 ± 0.21 Propanoic acid, 2-oxo-, methyl ester 1.37 ± 0.30 12-Ethylsophoramine 1.32 ± 0.33 Vanillin 1.27 ± 0.13 1,6-Anhydro-.beta.-D-glucopyranose (levoglucosan) 1.15 ± 0.13
Table 6.12: Significant compounds identified in vapor from pyrolysis of wood-derived fuel*
Compound % Composition Carbon dioxide 8.16 ± 0.62 n-Hexadecanoic acid 4.67 ± 0.37 Acetic acid 4.13 ± 0.14 Octadecanoic acid 3.58 ± 0.27 Phenol, 2-methoxy-4-(1-propenyl)-, (E)- 3.03 ± 0.23 Phenol, 2-methoxy-4-methyl- 2.94 ± 0.19 2-Methoxy-4-vinylphenol 2.91 ± 0.27 2-Propanone, 1-hydroxy- 2.76 ± 0.07 4-((1E)-3-Hydroxy-1-propenyl)-2-methoxyphenol 1.96 ± 0.58 Phenol, 2-methoxy- 1.90 ± 0.09 2-Cyclopenten-1-one, 2-hydroxy- 1.76 ± 0.19 Propanoic acid, 2-oxo-, methyl ester 1.56 ± 0.12 Homovanillyl alcohol 1.32 ± 0.21 Furfural 1.23 ± 0.11
* Contained 0.87 wt. % plastic, balance was woody material

124
The abundance of chlorine, nitrogen, and sulfur in the samples are illustrated in Figure 6.1. Vapor from the pyrolysis of treated wood had the greatest average chlorine and nitrogen abundance of all the feedstocks, while furniture had the greatest average sulfur abundance. Overall, treated wood contained the greatest average abundance of all potential pollutants.
Figure 6.1: Chlorine, nitrogen, and sulfur abundance in samples
6.6 Conclusions
These first steps in characterizing the volatile fractions of vapor from pyrolyzing municipal solid waste and compost overs reveals the existence of potential pollutants containing chlorine, nitrogen, and sulfur. Further research is needed to determine how these compounds should be handled on a larger scale, whether it is by removing them prior to pyrolysis, scrubbing them in the gas phase, or, in the case of benign compounds, emitting them. This research focused on potential pollutants in the form of chlorine, nitrogen, or sulfur containing compounds, but organics such as acetic acid and phenols are also of concern when emitted into the air. These organic pollutants are also known as volatile organic compounds and can have similar negative effects on people and the environment as chlorine, sulfur, and nitrogen containing compounds. One way to treat these organics is to burn them, producing carbon dioxide and water which are relatively more benign than the original molecules. This can be done using an apparatus known as a burn stack system, more commonly referred to as a flare. When properly operated, flares can achieve a destruction efficiency of 98% or more of volatile organic compounds (USEPA, 1995). However, the presence of chlorine, sulfur and nitrogen
0
2
4
6
8
10
12
14
16
18
Royal
Organics
Compost
Overs
Ellensburg
Compost
Overs
Furniture Molded
Wood
Pallet
Oriented
Strand
Board
Painted
Wood
Plywood Sawmill
Cut Ends
Treated
Wood
Wood
Derived
Fuel
Co
ntr
ibu
tio
n t
o t
ota
l pe
ak
are
a (
%)
Sample
Chlorine Nitrogen Sulfur

125
containing compounds in the pyrolysis vapor to be treated may result in less efficient removal of the volatile organic compounds, warranting further studies into appropriate destruction methods.
6.7 References
Adam, A., Blazso, M., Mészáros, E., Stöcker, M., Nilsen, M.H., Bouzga, A., Hustad, J.E., Grønli, M., Øye, G., 2005. Pyrolysis of biomass in the presence of Al-MCM-41 type catalysts. Fuel. 84, 1494-1502. Ecology, 2015. The State Solid and Hazardous Waste Plan: Moving Beyond Waste and Toxics.
Washington State Department of Ecology publication number 15-04-019, 31. Henriksen, T., Dahlback, A., Larsen, S.H.H., Moan, J., 1990. Ultraviolet-Radiation and Skin Cancer. Effect of an Ozone Layer Depletion. Photochemistry and Photobiology. 51, 579- 582. Mohan, D., Pittman, C.U., Steele, P.H., 2006. Pyrolysis of Wood/Biomass for Bio-oil: A Critical Review. Energy & Fuels. 20, 848-889. National Oceanic and Atmospheric Administration, 2010. What are the chlorine and bromine reactions that destroy stratospheric ozone? https://www.esrl.noaa.gov/csd/assessments/ozone/2010/twentyquestions/Q9.pdf United States Environmental Protection Agency, 1995. Survey of Control Techniques Low Concentration Organic Vapor Gas Streams. U.S EPA, Office of Air Quality Planning and Standards. Publication EPA-456/R-95-003. United States Environmental Protection Agency, 2017. Criteria Air Pollutants. https://www.epa.gov/criteria-air-pollutants Webster, R.P., and Kukacka, L.E., 1986. Effects of Acid Deposition on Portland Cement
Concrete. ACS Symposium Series. 318, 239-249.

126
7. Identification of Condensed Liquid Products and Biochar Yields during Pyrolysis of
Urban Wood Residuals and Compost Overs
Evan Terrell, Kalidas Mainali, Lars Neuenschwander, and Manuel Garcia-Pérez
7.1 Abstract
Urban wood residuals and compost overs may be attractive feedstocks for pyrolysis. In this study, eleven types of organic wastes, including wood scraps, furniture, and compost overs, were pyrolyzed at 350, 400, 450 and 500°C under nitrogen. Analysis of the pyrolysis products with gas chromatography-mass spectroscopy (GC-MS) showed that major constituents of the collected pyrolysis oil were levoglucosan, furfural, and guaiacol, which are derived from the cellulose, hemicellulose, and lignin fractions of the feedstocks, respectively; however, the yields of each were low at less than 1%. The carbohydrate content of the pyrolysis oil was likely too low to be detected through high-performance liquid chromatography (HPLC) analysis. This could be due to an inhibitory effect of the biomass ash content on thermal decomposition reactions. Ultraviolet (UV)-fluorescence analysis shows that the pyrolysis oil is primarily composed of single-ring and double-ring structures, with a small quantity of polyaromatics consisting of three rings. Finally, char yields were analyzed through mass-balance, and showed an approximately linearly decreasing relationship with respect to temperature. The samples that were pyrolyzed at 350°C had char yields as high as 60%, while at 500°C char yields were approximately 20%. Despite low liquid yields in the experimental system, this study shows that biomass pyrolysis has significant potential in waste-to-energy applications. The results suggest that optimal liquid yields can be obtained by taking steps to mitigate the negative effect of the feedstock ash content and by operating the pyrolysis reactor at sufficiently high temperature, near 500°C.
7.2 Background
Pyrolysis is generally defined as the incomplete thermal degradation of carbonaceous solid materials in the complete absence of oxygen and oxidizing agents at relatively moderate temperatures of 300 to 600°C to yield pyrolysis oil, char, and gaseous products. An attractive feedstock for pyrolysis applications is dry organic waste fractions or woody municipal solid waste, as these resources are readily available and have properties very similar to wood, grass, and crop or logging residues (materials commonly proposed for pyrolysis). Utilization of these waste resources would also contribute to efficient, value-added solid waste management. Since biomass solid wastes also contain a higher percentage of volatile matter, they have potential for pyrolysis oil production. From the perspective of energy transformation, pyrolysis is an attractive thermochemical conversion process because of its simplicity and higher conversion capability into liquid product. Typical pyrolysis reactors operate at near-atmospheric pressure, and in the temperature range of 350 to 500°C.

127
Pyrolysis oil (or bio-oil) has moderate heating value, can be easily transported, and can be burned directly in thermal power plants. Alternatively, it can be upgraded to obtain light hydrocarbons for transportation fuel or other precursors for chemical production. Similarly, the solid char resulting from pyrolysis can be used for making activated carbon or solid fuel. Pyrolysis conversion appears to be a promising development among alternative renewable sources of energy. In this study, several biomass-derived wastes were analyzed following thermochemical conversion through pyrolysis. The most abundant chemical compounds that were identified in the pyrolysis oil were levoglucosan, furfural and guaiacol, which come from a feedstock’s cellulose, hemicellulose and lignin content, respectively. The oil also contains a non-negligible amount pyrolytic lignin, which is a broad category of high molecular-weight, poly-aromatic compounds also derived from lignin. Pyrolytic lignin is important because it is a major contributor to char formation, and poses unique challenges when upgrading pyrolysis oil into higher-value products.
7.3 Objectives
The goal of this research was to investigate the pyrolysis of 11 types of woody organic waste fractions at four reaction temperatures and determine:
1) feedstock characteristics, 2) biochar yield, and 3) the chemical composition and characteristics of the resulting pyrolysis oil, including
yields of three compounds of interest (furfural, guaiacol, and levoglucosan) and indications of the presence of pyrolytic lignin.
7.4 Methods
To study the pyrolysis of organic waste fractions, 11 feedstocks were tested using a modified pyroprobe reactor set up (Figure 7.1). These feedstocks were painted wood, treated wood, sawmill cut ends, oriented strand board (OSB), furniture, particle board, plywood, molded wood pallet, derived wood fuel, and overs from two types of compost. Compost overs were derived from compost sourced from Royal Organics in Royal City, Washington, and from Ellensburg, Washington, hereafter referred to as compost overs (1) and compost overs (2), respectively. Each sample was pyrolyzed at temperatures of 350, 400, 450 and 500°C. To determine the actual reaction temperature, an instrument calibration was carried out using cellulose as a surrogate material for the biomass. Thin films of approximately 2-3 mg of cellulose were applied to the inside of a small quartz tube (3 mm outside diameter), and the interior wall temperature was monitored using a type-K thermocouple for various temperature set-points. This process was carried out iteratively to identify the temperature set-points on the pyroprobe controller that would achieve the desired reaction temperature.

128
Figure 7.1: Modified pyroprobe reactor set-up
Prior to sample preparation, the feedstocks were ball milled for four hours to achieve an approximate particle size between 0.1-0.2 mm (Figure 7.2). Samples were prepared by applying a slurry of the biomass flour to the inside of small quartz tubes followed by overnight drying to remove water. Before reactions, all samples were further dried under vacuum (~3 mbarabsolute) for five minutes, and purged three times with nitrogen. Reactions took place at atmospheric pressure under nitrogen for one minute with a heating rate set-point of 20°C per millisecond. The reactor container was cooled externally using a chiller that continuously pumped a water/antifreeze mixture at -4°C through a copper coil wrapped around the outside of the container. Following reaction, the reactor and container were washed with approximately 2 mL of water to collect products for HPLC analysis. All experiments were then repeated, washing with methanol for GC-MS and UV-fluorescence analysis. Specific details about chemical analysis methodology for this study can be found in previous work from Pecha, et al. (2017). Char yields were quantified via mass balance. Additionally, prior to pyrolysis testing, each raw feedstock underwent proximate analysis using a Mettler-Toledo thermogravimetric analyzer with the following heating schedule: 25-120oC at 50oC per minute (N2), Hold 120oC for 3 minutes (N2), 120-950oC at 100oC per minute (N2), Hold 950oC for 5 minutes (N2), 950-450oC (N2) at -100oC per minute (N2), 450-600oC at 100oC per minute (O2), Hold 600oC 5 minutes (O2).
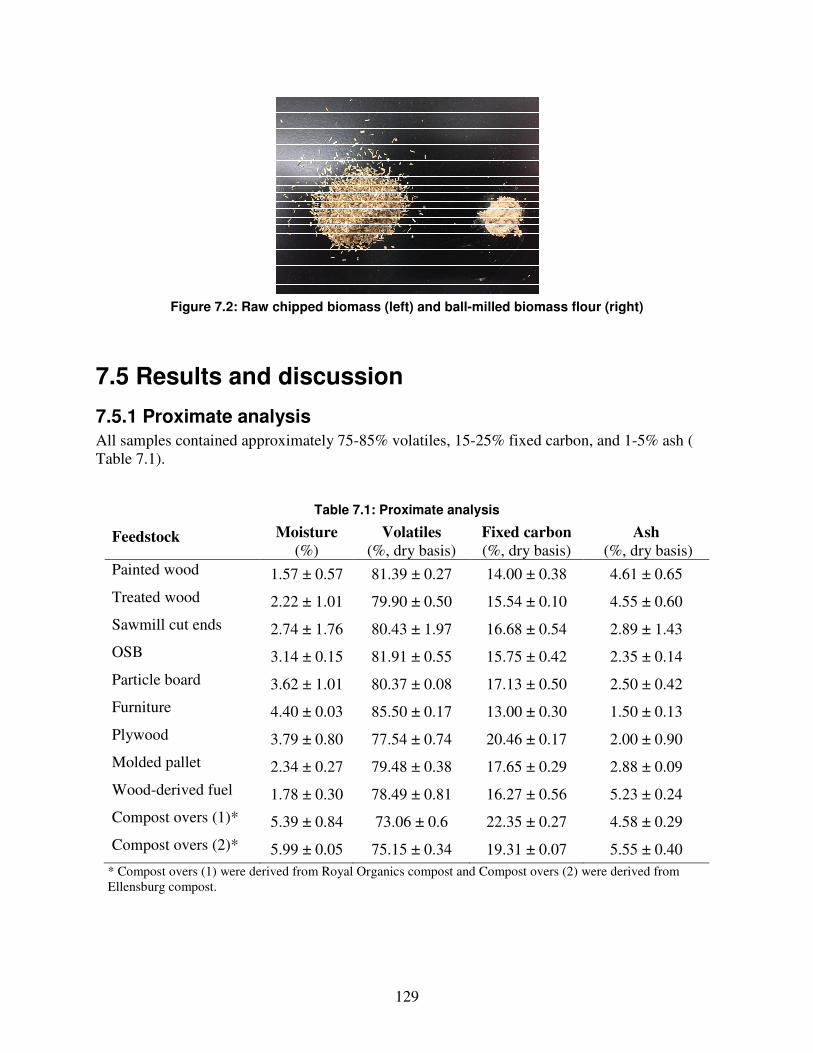
129
Figure 7.2: Raw chipped biomass (left) and ball-milled biomass flour (right)
7.5 Results and discussion
7.5.1 Proximate analysis All samples contained approximately 75-85% volatiles, 15-25% fixed carbon, and 1-5% ash ( Table 7.1).
Table 7.1: Proximate analysis
Feedstock Moisture (%)
Volatiles (%, dry basis)
Fixed carbon (%, dry basis)
Ash (%, dry basis)
Painted wood 1.57 ± 0.57 81.39 ± 0.27 14.00 ± 0.38 4.61 ± 0.65
Treated wood 2.22 ± 1.01 79.90 ± 0.50 15.54 ± 0.10 4.55 ± 0.60
Sawmill cut ends 2.74 ± 1.76 80.43 ± 1.97 16.68 ± 0.54 2.89 ± 1.43
OSB 3.14 ± 0.15 81.91 ± 0.55 15.75 ± 0.42 2.35 ± 0.14
Particle board 3.62 ± 1.01 80.37 ± 0.08 17.13 ± 0.50 2.50 ± 0.42
Furniture 4.40 ± 0.03 85.50 ± 0.17 13.00 ± 0.30 1.50 ± 0.13
Plywood 3.79 ± 0.80 77.54 ± 0.74 20.46 ± 0.17 2.00 ± 0.90
Molded pallet 2.34 ± 0.27 79.48 ± 0.38 17.65 ± 0.29 2.88 ± 0.09
Wood-derived fuel 1.78 ± 0.30 78.49 ± 0.81 16.27 ± 0.56 5.23 ± 0.24
Compost overs (1)* 5.39 ± 0.84 73.06 ± 0.6 22.35 ± 0.27 4.58 ± 0.29
Compost overs (2)* 5.99 ± 0.05 75.15 ± 0.34 19.31 ± 0.07 5.55 ± 0.40 * Compost overs (1) were derived from Royal Organics compost and Compost overs (2) were derived from Ellensburg compost.

130
7.5.2 Char quantification Char yields were determined by mass balance of the samples pre- and post-reaction. Figure 7.3 and Figure 7.4 show char yields with respect to reaction temperature. Each data point represents the average of four samples (two washed with water and two washed with methanol).
Figure 7.3: Char yield at different reaction temperatures for A) Painted wood, B) Treated wood, C) Sawmill cut ends, D) OSB, E) Particle board, and F) Furniture (error bars represent standard error)

131
Figure 7.4: Char yield at different reaction temperatures for G) Plywood, H) Molded pallet, I) Wood-derived fuel, J) Compost overs (1), and K) Compost overs (2) (error bars represent standard error)
In each case, the char yields decreased as temperature increased. This can possibly be explained by the fact that the biomass particles experienced a more severe temperature gradient at higher temperatures than at lower temperatures. Therefore, at higher temperatures, the effective rate of

132
heat transfer to the particle was faster, thereby producing less char. The relationship between reaction temperature and char yield appears to approximate a linear curve for most feedstocks.
7.5.3 GC-MS and HPLC Gas chromatography-mass spectrometry (GC-MS) and high-performance liquid chromatography (HPLC) are two analytical techniques that can be used to identify molecular constituents of a given sample. The former is useful for quantification of phenolic or aromatic components of pyrolysis oil and uses methanol as a solvent, while the latter is useful for carbohydrates in pyrolysis oil, and uses water as its solvent. The results from GC-MS analysis are presented for three of the major components identified in the collected pyrolysis oil: furfural, guaiacol, and levoglucosan (Table 7.2 through Table 7.4). Furfural is most likely derived from the 5-ring sugar hemicellulose content in the samples (Machado et al., 2016), guaiacol from lignin (Demirbas, 2000), and levoglucosan from cellulose (Zhang et al., 2013). The values presented are the yields of each compound relative to the total starting sample mass. For instances in which no value is given, the compound was not detected on GC-MS at any reaction temperature; for values of 0.00%, the compound was detected at higher reaction temperatures, but not at lower temperatures.
Table 7.2: Guaiacol yields in pyrolysis oil
350°C 400°C 450°C 500°C
Feedstock (%) (%) (%) (%) Painted wood --* 0.07 0.08 0.09 Treated wood -- 0.11 0.12 0.11 Sawmill cut ends -- 0.10 0.13 0.11 OSB -- -- -- -- Particle board 0.09 0.08 0.16 0.09 Furniture -- -- -- -- Plywood -- 0.08 0.25 0.18 Molded pallet 0.10 0.11 0.09 0.04 Wood-derived fuel -- 0.05 0.13 0.10 Compost overs (1) 0.07 0.32 0.38 0.18 Compost overs (2) 0.13 0.22 0.25 0.16 *-- denotes undetectable levels
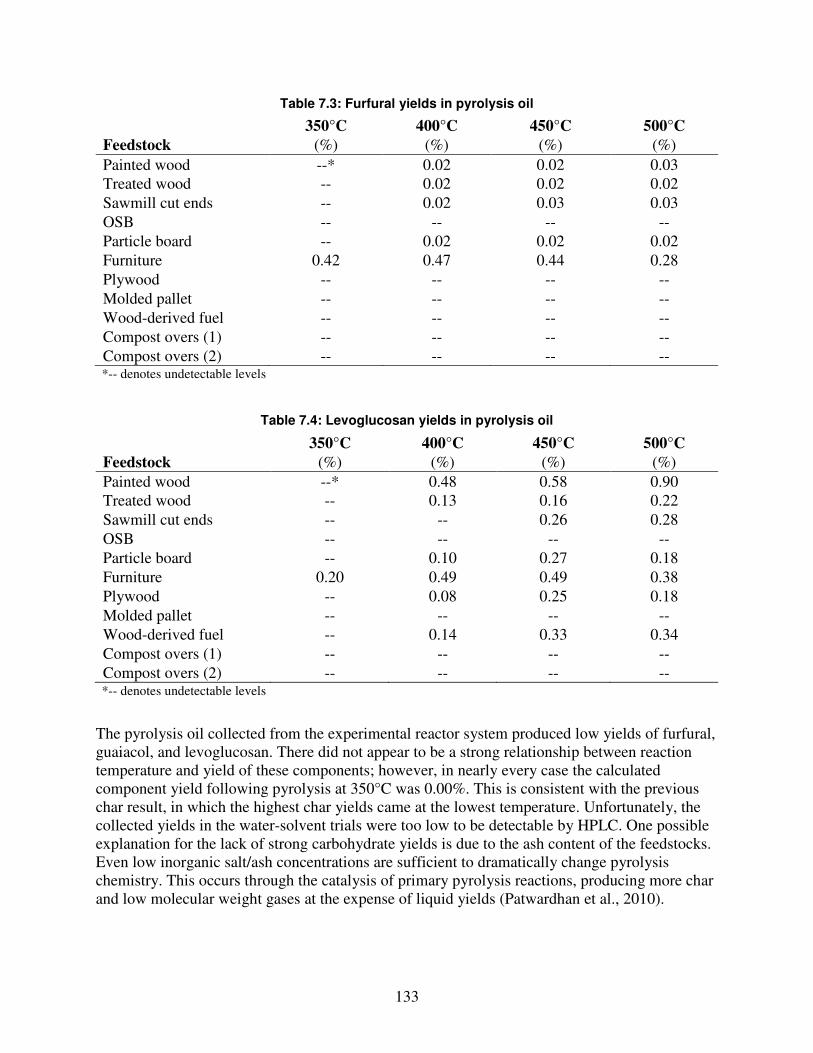
133
Table 7.3: Furfural yields in pyrolysis oil
350°C 400°C 450°C 500°C
Feedstock (%) (%) (%) (%) Painted wood --* 0.02 0.02 0.03 Treated wood -- 0.02 0.02 0.02 Sawmill cut ends -- 0.02 0.03 0.03 OSB -- -- -- -- Particle board -- 0.02 0.02 0.02 Furniture 0.42 0.47 0.44 0.28 Plywood -- -- -- -- Molded pallet -- -- -- -- Wood-derived fuel -- -- -- -- Compost overs (1) -- -- -- -- Compost overs (2) -- -- -- -- *-- denotes undetectable levels
Table 7.4: Levoglucosan yields in pyrolysis oil
350°C 400°C 450°C 500°C
Feedstock (%) (%) (%) (%) Painted wood --* 0.48 0.58 0.90 Treated wood -- 0.13 0.16 0.22 Sawmill cut ends -- -- 0.26 0.28 OSB -- -- -- -- Particle board -- 0.10 0.27 0.18 Furniture 0.20 0.49 0.49 0.38 Plywood -- 0.08 0.25 0.18 Molded pallet -- -- -- -- Wood-derived fuel -- 0.14 0.33 0.34 Compost overs (1) -- -- -- -- Compost overs (2) -- -- -- -- *-- denotes undetectable levels
The pyrolysis oil collected from the experimental reactor system produced low yields of furfural, guaiacol, and levoglucosan. There did not appear to be a strong relationship between reaction temperature and yield of these components; however, in nearly every case the calculated component yield following pyrolysis at 350°C was 0.00%. This is consistent with the previous char result, in which the highest char yields came at the lowest temperature. Unfortunately, the collected yields in the water-solvent trials were too low to be detectable by HPLC. One possible explanation for the lack of strong carbohydrate yields is due to the ash content of the feedstocks. Even low inorganic salt/ash concentrations are sufficient to dramatically change pyrolysis chemistry. This occurs through the catalysis of primary pyrolysis reactions, producing more char and low molecular weight gases at the expense of liquid yields (Patwardhan et al., 2010).

134
7.5.4 UV-Fluorescence Because GC-MS is limited to the detection of compounds with boiling points up to about 250oC, other techniques are needed for identification of pyrolysis oil constituents with higher molecular weights and a higher boiling point. These compounds tend to have polyaromatic structures and can broadly be classified as pyrolytic lignin. Previous work (Pecha et al., 2017) has identified pyrolytic lignin as having fluorescence peaks at 328 nm and 355 nm. The UV-fluorescence spectra for each feedstock are shown in Figure 7.5 and Figure 7.6.
Figure 7.5: UV-fluorescence spectra for A) Painted wood, B) Treated wood, C) Sawmill cut ends, D)
OSB, E) Particle board, and F) Furniture

135
Consistent with the GC-MS results, UV-fluorescence suggested that there were lower liquid yields from pyrolysis runs that were carried out at 350oC. In the combined spectra for each plot, the 350oC curve has a lower intensity/magnitude than those for higher temperatures. In general, it is difficult to make any strong conclusions about fluorescence intensity with respect to temperatures other than 350oC. All spectra do show peaks near 328 nm, and a shoulder in the
Figure 7.6: UV-fluorescence spectra for G) Plywood, H) Molded pallet, I) Wood-derived fuel, J) Compost overs (1), and K) Compost overs (2)

136
range of 350-360, indicating the likely presence of pyrolytic lignin. The magnitude of fluorescence intensity depends on several molecular characteristics, and typically single-ring compounds exhibit a peak between 250-290 nm, two-ring compounds have a peak between 310-330 nm, and three-ring compounds have a peak between 345-355 nm. The more condensed ring systems (larger size) continue to exhibit peaks at higher wavelengths. From these spectra, in all samples single-ring and polyaromatic structures with two rings appear to be present. In addition, there appear to be a few structures with three rings, as evidenced by the shoulder at 350-355 nm. A semi-quantitative measure of polyaromatic structures is useful because the larger molecular-weight compounds are most likely the ones that participate in char-forming reactions. Therefore, if it is desired to increase overall liquid yield from pyrolysis, fewer polyaromatic structures may be desired. These types of molecules can also be responsible for deactivating catalysts that are used for downstream pyrolysis oil upgrading processes.
7.6 Conclusions
The goal of this research was to identify the chemical composition and characteristics of pyrolysis oil, thereby directly contributing to foundational knowledge for future waste-to-energy processes using biomass pyrolysis. Eleven types of organic waste fractions were used as feedstocks for experimental pyrolysis, and the resulting volatile product was studied to identify some of its chemical characteristics. Feedstock characterization through proximate analysis showed that all feedstocks contained 75-85% volatile content, 15-25% fixed carbon, 1-5% ash, and up to 6% moisture content. The samples were pyrolyzed using a modified pyroprobe reactor at temperatures of 350, 400, 450 and 500oC. Following pyrolysis, char was quantified and the collected volatile fractions were analyzed with GC-MS, HPLC, and UV-fluorescence. The chemical analysis suggests that carbohydrate yields were very low, possibly due to a negative effect of the ash content in the samples. Ash can act as a type of negative catalyst within a pyrolysis reactor to inhibit the reactions that produce pyrolysis oil liquids from a feedstock. There were no strong trends in product yields with respect to increasing temperature above 350oC. However, at 350oC there were low yields of all GC-MS detected compounds, and lower UV-fluorescence intensity. This result is consistent with temperature trends seen in char quantification, which decreased linearly with temperature. Char yields at 350oC were as high as 60%. These results show that pyrolysis of organic waste samples needs to happen at sufficiently high temperature, with possible pretreatment to mitigate negative effects of ash content. High temperature is desirable because, based on results of the GC-MS analysis, the yields of the pyrolysis oil constituent compounds were typically lowest at 350oC. Ultimately, the feedstocks studied appear have significant potential to yield valuable products in waste-to-energy applications that utilize thermochemical conversion through pyrolysis.
7.7 References
Demirbas, A., 2000. Mechanisms of liquefaction and pyrolysis reactions of biomass. Energy
Convers. & Management, 41, 633-646. Machado, G., Leon, S., Santaos, F., Lourega, R., Dullius, J., Mollmann, M.E., Eichler, P., 2016.
Literature review on furfural production from lignocellulosic biomass. Nat. Resour., 7, 115-129.

137
Patwardhan, P.R., Satrio, J.A., Brown, R.C., Shanks, B.H., 2010. Influence of inorganic salts on the primary pyrolysis products of cellulose. Bioresour. Technol., 101(12), 4646-4655.
Pecha, M.B., Terrell, E., Montoya, J.I., Stankovikj, F., Broadbelt, L., Chejne, F., Garcia-Pérez, M., 2017. Effect of pressure on pyrolysis of milled wood lignin and acid washed hybrid poplar wood. Accepted in Industrial and Eng. Chem. Res.
Zhang, X., Yang, W., Dong, C., 2013. Levoglucosan formation mechanisms during cellulose pyrolysis. J. of Analytical and Appl. Pyrolysis, 104, 19-27.

138
8. Composting in the Presence of Biochar and Impact of the Resulting Product as a Soil
Amendment: A Review
Waled Suliman, Felix Martin Carbajal Gamarra, and Manuel Garcia-Pérez
8.1 Abstract
The use of biochar as an additive for composting has received increased attention in the last decade. Although, in general, the literature reports many beneficial effects of adding biochar, such as a reduction in greenhouse gases emission and an increase in soil microbial activity, the mechanisms by which these benefits are achieved are still poorly understood. This review addresses (1) the production technologies and the functional properties of biochar, (2) the potential interactions between biochar and the compost microbiome during composting, and (3) the synergistic effects of biochar and compost on soil properties. The technologies and methods for composting organic wastes with biochar, the phenomena involved during co-composting, the capacity of biochar to reduce pollutants and greenhouse gas emissions during co-composting, and the potential for co-composted biochar to improve soil properties and crop yields were also discussed. The literature suggests that not only does biochar impact the composting process, but the composting process also impacts the physicochemical properties of the biochar. The density and porosity of biochar are altered through the trapping of minerals, organic matter, or microbes, shifting biochar’s sorption capacity and water retention ability. Biochar is also fragmented into smaller particles during the composting process. The potential for adding nutrients and improving soil quality (e.g., cation exchange capacity [CEC], soil structure, and water holding capacity) could make co-composted biochar an attractive soil amendment for farming systems.
8.2 Introduction
Biochar is receiving growing attention as a soil amendment due to its potential to enhance soil fertility and sequester carbon (Song and Guo, 2012). It has the potential to provide environmental benefits by sequestering carbon dioxide (CO2) from the atmosphere while enhancing plant growth, which then consumes additional CO2 (Woolf et al., 2010). Biochar is also believed to reduce the leaching of nutrients, thus reducing the need for intensive uses of synthetic fertilizers and the associated deterioration of water quality (Laird et al., 2010). Historically, the use of biochar as a soil amendment dates back to the Amazonian Dark Earths (also known as terra preta) where charred organic materials appear to have been added purposefully to soil in the Amazon basin to enhance its fertility (Woolf et al., 2010). Some of these anthropogenically-modified soils date back 7,000 years and have long-lasting fertility resulting from the presence of biochar and its ability to resist biotic and abiotic degradation (Arroyo-Kalin, 2010).

139
Definitions of biochar and descriptions of its properties vary and are often imprecise. Biochar has been loosely defined as charred organic material (i.e., charcoal) that can be applied to soils to augment carbon sequestration and, concurrently, improve soil functions (Lehman et al., 2006). Its use as a soil amendment is the defining property that differentiates biochar from charcoal. The importance of feedstock types, pyrolysis conditions, and physicochemical properties of biochar should not be ignored when defining this material (Suliman et al., 2016). Therefore, biochar as a term is reserved for any organic-derived material that has been chemically and structurally altered through thermochemical decomposition in an oxygen-limited environment for agricultural uses (Forbes et al., 2006; Lehmann et al., 2006; Suliman et al., 2016). The aims of this review are to bring together literature on biochar-enriched compost to: (1) report the technologies and methods for composting organic wastes with biochar, (2) identify the potential interactions between biochar and the compost microbiome during composting, and (3) assess the synergistic merits of biochar and compost on soil properties.
8.2.1 Feedstock availability Feedstock is the term conventionally used for any type of biomass that is thermochemically turned into biochar (Suliman et al., 2016). A wide range of agricultural and forest wastes have been proposed for biochar production including wood chips, wood pellets, bark, field crop residues, and forest residues (e.g., dead wood, pole trees, and logging residues) (Suliman et al., 2016). Organic wastes, such as animal farm wastes, sewage sludge, urban wastes (e.g., yard trimmings, materials from site clearing, and wood packaging), and wastes from food, sugar, or juice processing are other potential available sources of biochar (Collison et al., 2009; Laird et al., 2011; Verheijen et al., 2010). The key point is that the suitability of any biomass feedstock, as a potential source for biochar, is absolutely dependent upon chemical, physical and environmental factors without ignoring economic, social, and logistical considerations (Collision et al., 2009). Woody biomass is the most important source for making charcoal worldwide. Woody biomass contains varying amounts of hemicellulose, cellulose, lignin, and slight quantities of other organic extractives (e.g., fats, phytosterols, and phenolics) and inorganic compounds (e.g., nitrogen, phosphorous, sulfur, silicon, alkali and alkaline earth metals, and various trace minerals). The structure of resulting biochar can vary significantly depending on botanical species, plant part, soil type, climate conditions, and time of harvest (Collison et al., 2009; Maia et al., 2011; McKendry, 2002). The idea of producing biochar from organic and agricultural wastes has the potential to alleviate problems related to the current high-volume waste disposal management. If agricultural wastes are left to decompose, they can increase greenhouse gas emissions by releasing nitrous oxide, methane, and CO2 (Lehman and Joseph, 2009).
8.2.2 Production of biochar According to a recent report, published by Stratistics MRC, titled “Biochar - Global Market Outlook (2016-2022),” revenue for the global biochar market is expected to reach $923.56 million by 2022 growing at a compound annual growth rate of 15.8%. This growth stems from a rise in the demand for biochar and composite materials containing biochar for agricultural and environmental applications due to the availability of cheaper feedstock, potential for waste management and environmental benefits, and the need for bio-based materials that have the potential to increase crop yield and reduce water demand. Technically, the feedstock source

140
along with the production technologies and conditions are considered the main factors affecting biochar quality and suitability for a target application. According to a recent studies (Suliman et al., 2016; Zhao et al., 2013), the peak temperature has a strong effect on surface area, pH, volatile matter (fraction that is removed at temperatures between 200 and 550°C), and recalcitrance (resistance to biotic and abiotic degradation) of biochar while CEC, ash content, total carbon, fixed carbon, and mineral concentrations were mainly affected by feedstock properties. The social and economic impact of wood carbonization in today’s world is significant (FAO, 2017). About half the wood extracted from forests worldwide is used as fuelwood and charcoal, generating income for 40 million people worldwide (FAO, 2017). The world’s top producers of charcoal are (in descending order): Brazil, Nigeria, Ethiopia, India, the Democratic Republic of Congo, Ghana, Tanzania, China, Madagascar, and Thailand (FAO, 2017). Today this industry contributes with an estimated $650 million to Tanzania’s economy, with 300,000 people involved in the production and trade of charcoal (FAO, 2017). The Food and Agriculture Organization (FAO) of the United Nations, estimated that 2.4 billion people in developing nations use charcoal as domestic fuel (FAO, 2017; Mangue 2000, 2005; Stassen, 2015). Approximately 3 billion people still lack access to clean fuels and technologies for cooking (FAO, 2017), and for these people charcoal is a common fuel. According to the FAO (2017) more than 52 megatons of charcoal were produced worldwide in 2015 (Africa: 62%, Americas: 19.6%, and Asia: 17%), an increase of close to 20% since 2005. Since char production generally yields a mere 20 wt. % of the original biomass, it can be estimated that more than 260 megatons of wood are currently processed worldwide to produce charcoal. Between 1 and 2.4 gigaton CO2 equivalents of greenhouse gases are emitted annually in the production and use of fuelwood and charcoal, representing 2-7% of global anthropogenic emissions (Chidumayo and Gumbo, 2013; FAO, 2017). Charcoal produced using sustainably managed resources and improved pyrolysis technologies has the potential to reduce emissions by 80% (FAO, 2017). Therefore, there are huge opportunities to improve the environmental performance of current carbonization units (Bailis et al., 2013; Kituyi, 2013; Norgate and Langberg, 2009). The potential use of char to fight global warming is also generating renewed interest in pyrolysis (Amonette, 2010). Char has the capacity to increase soil fertility and sequester carbon (Lehmann and Joseph, 2009; Ogawa and Okimori, 2010; Trossero et al., 2008; Woolf et al., 2010). Sustainable char technology could offset up to 130 gigaton CO2 equivalents of emissions during the first century of adoption (Woolf et al., 2010). Greening the pyrolysis value supply chain (with sustainable sourcing, production, transport, and distribution) is critical to supporting livelihoods and providing energy security in developing nations (FAO, 2017). The International Energy Agency forecasted that by 2030 charcoal will become a $12 billion industry (Stassen, 2015). Through our research in Scopus, the number of research papers with the keywords “carbonization reactors (CR)” and “fast pyrolysis reactors (FP)” have been steadily growing: 1980-1990 (CR:59 and FP:63 papers), 1990-2000 (CR:86 and FP:88 papers), 2000-2010 (CR:306 and FP:371 papers), 2010-2017 (CR:340 and FP:840 papers). Despite the growing interest in producing pyrolysis oil and biochar, the dispersed information on pyrolysis technologies and manufacturers hinders the development of this industry. Many different factors

141
affect the pyrolysis process (e.g., different feedstocks, scale, and capacity; use of mobile or stationary units), which makes it very difficult to find an exclusive design that is sustainable across all the potential feedstocks and applications.
8.2.3 Pyrolysis Generally speaking, thermochemical conversion of biomass feedstock can be divided into three main categories based on temperature and reaction time. These categories are: (1) Torrefaction (which takes place at temperatures of 200-300°C, generally in the absence of oxygen), (2) Pyrolysis (which takes place at 300-650°C in the absence of oxygen), and (3) Gasification (which takes place at 650-1300°C, with 15-30% of the stoichiometric oxygen for complete combustion). In this study, pyrolysis is the thermochemical process under investigation due to its adaptability to utilize multiple and seasonal sources of feedstock (Laird et al., 2011).
8.2.3.1 Introduction to pyrolysis
Pyrolysis is the thermo-chemical decomposition of carbon-based materials occurring in an oxygen deficient environment (though in auto-thermal processes a small amount of oxygen is present). Although the pyrolysis reaction is endothermic in nature, it is an exothermic process once the temperature reaches about 300°C (Mohan, Pittman, and Steele, 2006). This technology has been used for production of a range of compounds including activated carbon, methanol, syngas and some chemicals. The three main constituents of most feedstocks, hemicellulose, cellulose, and lignin, decompose in ranges of (200-260°C), (240-340°C), and (280-500°C), respectively (Bridgwater and Peacock, 2000). The extent of degradation of each of these components depend on the process parameters of reactor type, temperature, particle size, heating rate, and pressure. The final products are water, tars, polymers, gases, and charcoal (Vamvuka, 2011). The complexity of pyrolysis is illustrated in the simplified reaction scheme shown in Figure 8.1. Although hundreds of reactions happen when biomass is heated between 200 and 650°C (pyrolysis), sometimes these reactions are represented in term of very simplified pseudo-reactions. Three simplified pseudo-reaction steps for woody biomass pyrolysis and biochar formation were proposed by Demirbas (2004), as follows:
Biomass → Water + Dry biomass (1) Dry biomass → (Volatile + Gases)1 + Char1 (2) Char1→ (Volatile + Gases)2 + Char2 (3)
In the initial step, moisture and low molecular mass organic compounds are lost. In the second step, primary biochar (herein called “Char1”) is formed and predominately volatile products are yielded. Slow rate of Char1 decomposition occurred in the third step forming secondary biochar, a carbon-rich porous solid, (herein called “Char2”) by some chemical rearrangement of the primary biochar. Depending upon the operating conditions, pyrolysis processes can be divided into two classes: slow and fast (Demirbas 2004). In this review, only a brief description of each pyrolysis process is given:
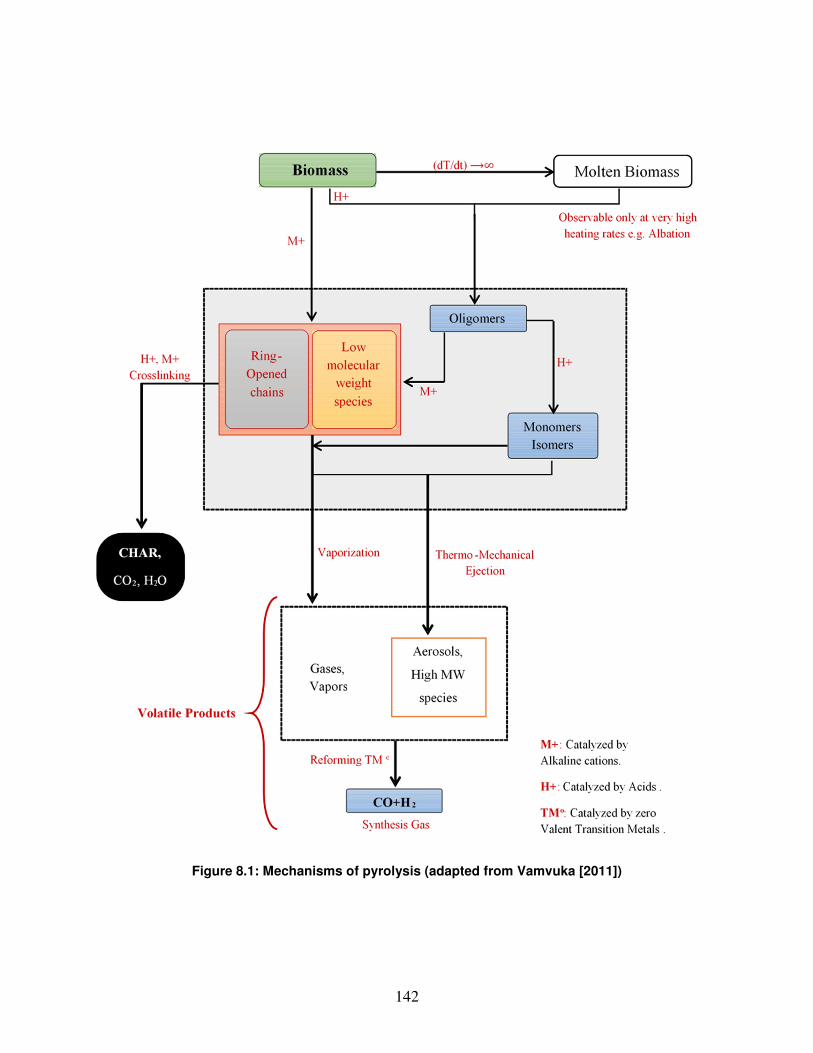
142
Figure 8.1: Mechanisms of pyrolysis (adapted from Vamvuka [2011])

143
8.2.3.2 Slow pyrolysis
Slow pyrolysis is an old method that has been used for thousands of years in traditional kilns built for the production of charcoal (Kobya et al., 2005; Lehmann and Joseph, 2009). It is characterized by slower heating rates (5-7°C per minute) and long residence time, along with low temperature (350-550°C). Traditionally, charcoal is produced in slow pyrolysis reactors known as kilns (pits or mounds), for use as a fuel for domestic cooking, heating, and metallurgical industry (Manuel, Lewis, and Kruger, 2011; Sohi et al., 2009). Slow pyrolysis units are often cheap, easy to operate, able to accept a range of feedstock sources, and do not require finely grounded feedstock (Laird et al., 2011). For these reasons, the slow pyrolysis technique is widely used in developing countries where charcoal is still sold and used as household fuel, with the largest global production in Africa and South America (21 and 14 megatons, respectively) (Lehmann and Joseph, 2009). Traditional charcoal production often harms the environment by polluting the air. With no recovery of liquid and gas products in traditional processes, they often escape into the atmosphere, causing environmental issues (Antal and Grønli, 2003; Laird et al., 2011). However, current configurations allow recirculation of gases to provide internal or external heat and, hence, slow pyrolyzers have become available for industrial scale processes that pose no serious risk of air pollution (Vamvuka, 2011). Moreover, while traditional methods convert about 10% of the feedstock into charcoal, controlled industrialized pyrolysis processes achieve about 35% (Sohi et al., 2009).
8.2.3.3 Fast pyrolysis
Fast pyrolysis is described as a rapid, high-temperature process with heating rates of over 300°C per minute) and short residence time which is carefully controlled to generate vapors and aerosols with less charcoal than slow pyrolysis (Bridgwater, 2012). According to Bridgwater and Peacocke (2000), the main product of fast pyrolysis is bio-oil (pyrolysis oil) which can be obtained in yields up to 80 wt. % of dry feedstock (typical yields are between 60 and 70 wt. %). Because of the low thermal conductivity of lignocellulosic material and the mass transfer limitations imposed by the biomass cell structure, it’s preferable to use small particles for fast pyrolysis. Ablative pyrolysis is a very special type of fast pyrolysis in which the biochar formed and the liquid intermediates are continuously removed from the reactor ( Jahirul et al., 2012; Mohan et al., 2006; Niels et al., 2007). The topic of fast pyrolysis has been extensively reviewed by Manuel et al. (2011), Bridgwater (2012), and Bridgwater and Peacock (2000).
8.2.3.4 Biochar formation
Lignocellulosic material is the most common form of biomass and the most important source for producing charcoal, worldwide. It consists mainly of cellulose, hemicellulose, and lignin. It also contains small quantities of other organic extractives (e.g., fats, phytosterols, and phenolics), and inorganic compounds (e.g., nitrogen, phosphorous, potassium, sulfur, silicon, alkaline metals, and various trace elements). The structure of lignocellulosic material can vary significantly depending upon factors relating to its origin: plant species, biomass type, soil type, climate conditions, and the time of harvest (Collision et al., 2009). During pyrolysis, cellulose and hemicellulose are mostly broken down into compounds of lower molecular weight, comprising mainly volatile products. A small fraction of the cellulose and hemicellulose is also subjected to

144
cross-linking, dehydration, aromatization, and polycondensation reactions. Figure 8.1 shows a suggested mechanism for cellulose pyrolysis, in which pyrolysis takes place through the initial de-polymerization of cellulose (between approximately 100 and -150°C). Cellulose decomposes into oligosaccharides and continues to complete chain breaks until it reaches the sugar level. The first resulting anhydro-monosaccharide is levoglucosan, followed by dehydration and isomerization reactions to form levoglucosenone, 1,4:3,6-dianhydro-Alpha-D-glucopyranose, and 1,6-anhydro-Beta-D-glucofuranose. These anhydro-monosaccharides may undergo competitive reactions (i.e., fragmentation/retroaldol condensation, dehydration, decarbonylation, or decarboxylation) resulting in char and gases. In the case of lignin, though the thermochemical reactions also result in the production of volatile products (products of cracking reactions), an important part of this material undergoes cross-linking and polycondensation to form a polycondensed aromatic macromolecule (charcoal) (Demirbas, 2004; Kersten and Garcia-Pérez, 2013; Wang et al., 2013a). Scanning electron microscope images of biochars produced from the pyrolysis of three lignocellulosic materials are shown in Figure 8.2. The pore structure observed is responsible for the capacity of biochar to hold water. These pores also serve as protection for soil microbes (Suliman et al., 2016).
Figure 8.2: Scanning electron microscope images of biochars derived from the pyrolysis of Douglas fir wood (a), Douglas fir bark (b), and hybrid poplar biochars (c) (Suliman et al., 2016)

145
Transmission electron microscope pictures of the surface of biochars are shown in Figure 8.3 (Suliman et al., 2016). Figure 8.3a corresponds to a biochar produced at low temperature. As the temperature increases, volatile matter is removed and cavities form on the surface of the char. These cavities in the nanometer range are responsible for gas adsorption.
Figure 8.3: TEM images of a biochar derived from (a) Douglas fir wood (350°°°°C) and (b) (600°°°°C)
Several models have been proposed to describe the superstructure of amorphous chars (Dahn et al., 1997; Franklin et al., 1951). Figure 8.4 shows two of these models. The cavities between the graphene layers form the volumes in which gases are adsorbed.
Figure 8.4: Proposed superstructures for amorphous carbon (A) Franklin model 1951 (Franklin et al., 1951) and (B) Falling cards model 1995 (Dahn et al., 1997)
As volatile matter is removed at high temperatures, pore volume increases, as shown in Figure 8.5. For biochar produced at temperatures below 500oC, it is very difficult to measure surface area with nitrogen due to the serious diffusion limitations at adsorption test temperatures. So, for biochars produced at low temperatures, it is necessary to measure the surface area with CO2 (Figure 8.5).

146
Figure 8.5: Surface area (SA) and pore volume (PV) for biochar produced from Douglas fir wood (DFW), Douglas fir bark (DFB), and hybrid poplar (HP), as determined by CO2 (1&3) and N2 (2&4)
adsorptions, using the Dubinin-Radushkevich method (Suliman, 2016)
8.2.3.5 Biochar composition
Biochar is a highly aromatic compound that contains random stacks of graphitic layers (Brewer et al., 2009; Spokas et al., 2010) (Figure 8.6). The aromaticity of biochar is a temperature-dependent parameter; as temperature increases, the carbon structure thermally transforms from amorphous to aromatic, and graphene sheets (Harvey et al. 2012; Paris, et al., 2005). The proportion of carbon, hydrogen, nitrogen and oxygen in biochar may change with pyrolysis temperature (Spokas et al., 2011). Typically, biochar has a diverse range of surface functional groups governing surface characteristics (i.e., acidic, basic, hydrophilic, and hydrophobic properties) and adsorption capability (Amonette, 2009; Farrell et al., 2013; Lehmann and Joseph, 2009). Based on production conditions, different functional groups could be observed on the biochar surface, such as hydroxyl, carbonyl and carboxyl groups. A model molecule of biochar with these functional groups is shown in Figure 8.7.

147
Figure 8.6: Detailed cluster representation of amorphous carbons (A) Harris model (2007) (Harris et al., 2008), (B) Shin model 1984 (Shinn et al., 1984)
Figure 8.7: Model of a fragment of biochar surface, showing the most important types of surface functional groups, adapted from Bandosz (2006)
8.2.3.6 Influence of feedstock source
The chemical and physical properties of the feedstock biomass are important in influencing the resulting biochar (Basso et al., 2013). For example, ash and mineral content of biochar vary considerably depending on the ash content and composition of the feedstock (Enders et al., 2012). The ash content of the biochar is about three to six times greater than in the original feedstock (Budai et al., 2014) due to concentration of the minerals of original feedstock during the thermal degradation process (Antal and Grønli, 2003). Woody feedstocks with low ash content generate biochars with low ash content, while herbaceous and manure feedstocks result in biochars with high ash content (Harris et al., 2007). Mineral composition, porosity, and yield of biochars also vary depending on feedstock. For example, crystalline silica was present in biochar produced from rice straw, while calcium carbonate was found in biochar of paper sludge (Verheijen et al., 2010). Some researchers have hypothesized that the inorganic materials from

148
high-ash feedstocks (e.g., manure) may somewhat block access to micropores, thereby reducing biochar surface area ( Bruun et al., 2011; Lee et al., 2010). Biochar yield is another feedstock-dependent parameter which is related to the lignin content of the biomass feedstock, regardless of pyrolysis type or conditions. Several studies have shown that high lignin content in the feedstock biomass increases the yield of biochar (Antal and Grønli, 2003; Collision et al., 2009; Sharma et al., 2004; Zhou et al., 2014). Proportions of cellulose, hemicellulose and lignin in feedstocks result into significant variation in yield and other properties of biochar. A low cellulose to lignin ratio in feedstock decreases yield of volatiles, but increases char yield (Hodgson et al., 2011).
8.2.3.7 Influence of pyrolysis temperature
The most influential pyrolysis parameter on biochar yield is temperature, followed by heating rate (Amonette, 2009; Cantrell et al., 2012; Song and Guo, 2012). Alterations in feedstock internal structure, elemental composition and surface characteristics depend on pyrolysis temperature. High pyrolysis temperatures lead to a decrease in surface functional groups and an increase in the aromaticity and, thus, recalcitrance of the biochar. Increasing pyrolysis temperature increases surface area and enlarges and increases the order of crystallites (Copeland et al., 2008; Lua et al., 2004). Increasing pyrolysis temperature also leads to a decrease in total nitrogen, oxygen, and hydrogen, while total carbon, pH, and surface area of biochar increase (Bruun et al., 2011; Song and Guo, 2012; Suliman et al., 2016) Figure 8.8 shows the influence of pyrolysis temperature on the elemental composition of biochar (Suliman et al., 2016). The relative quantity of biochar elements (e.g., O:C and H:C ratios) determines its stability, which in turn determines its suitability for environmental purposes (Cross and Sohi, 2013; Mašek et al., 2013). Biochar with low H:C ratio, for example, has higher aromaticity and is expected to be more recalcitrant (Hammes et al., 2006). An increase in pyrolysis temperature leads to a decrease in H:C and subsequently in the amount of biochar mineralized over an incubation period of 120 days (Farrell et al., 2013; Singh et al., 2012). Such findings are essential for the optimization of pyrolysis conditions for production of biochar with specific properties.

149
Figure 8.8: Influence of pyrolysis temperature on the elemental composition of biochars derived from the pyrolysis of Douglas fir wood (DFW), Douglas fir bark (DFB), and hybrid poplar (HP)
(Suliman et al., 2016)
As pyrolysis temperatures increases, there is a gradual reduction of oxygen content in biochar, and, thus, a reduction in oxygenated functional groups in biochar surface, which are responsible for many of its beneficial properties. Acidic functional groups tend to decrease as pyrolysis temperatures increase, while basic functional groups increase (Figure 8.9).

150
Figure 8.9: Variation in surface acidic and total basic functional groups as a function of pyrolysis temperature and feedstock source (Douglas fir wood: DFW, Douglas fir bark: DFB, hybrid poplar:
HP) (Suliman et al., 2016)
The gradual removal of oxygenated functional groups on the surface leads to a gradual change in surface charges. Biochar produced at higher temperatures tends to be more positively charged (Figure 8.10) (Suliman et al., 2016).

151
Figure 8.10 Variation in zeta potential (surface charge) as a function of temperature for biochar from DFW (a), HP (b), and DFB (c) (Suliman et al., 2016)
8.2.3.8 Influence of post-production treatments (i.e., wet and dry oxidation)
Surface oxygenated functional groups are the most important surface groups because they influence both surface characteristics (e.g., polarity, acidity, and wettability) and physicochemical properties (e.g., catalytic, electrical, and chemical reactivity of carbon materials) (Bansal and Goyal, 2005). While increasing pyrolysis temperature (in the range of 350-750oC) tends to decompose these surface groups, post-pyrolysis oxidation processes lead to significant increases in the number of surface oxygenated functional groups (Park and Kim, 2005; Valdés et al., 2002). Wet oxidation methods (using acids or bases) can be used to chemically modify biochar surface functionality for adsorption of specific compounds in aqueous or gas phases. However, the use of chemical oxidizers can result in the production of toxic wastes. Dry oxidation (i.e., oxidation by ozone, air, or cold plasma) can be used as an alternative to chemical treatments for surface modification (Vladimir et al., 2002; Wang et al., 2013b). Oxidation by hot air, for example, can be used to modify the density and composition of functional groups on surface of carbonaceous materials (i.e., biochar and activated carbon) (Osswald et al., 2009; Strelko et al., 2002).

152
Oxidation by air has some advantages over chemical treatments including lower energy cost, higher reactivity, and lower risk of damage and pollution. For this reason, it has been the subject of research more frequently than chemical treatments. Strelko et al. (2002) indicated that air oxidation of activated carbon increases the concentration of the acidic surface functional groups and results in a significant increase in pore volume and specific surface area. In a study conducted by Sakuma et al. (2011), an activated charcoal made from bamboo feedstock was oxidized with air at 350oC for two hours. Results of this study show that the surface carboxyl groups increased significantly from 0.02 mmol L-1 to 1.19 mmol L-1, suggesting that air oxidation following low temperature carbonization increased the number of acidic surface functional groups, greater surface area, and pore volume. Similarly, Yamashita and Machida (2010) studied the effect of air oxidation at 280oC for two hours on bamboo char porosity and found that both total pore volume and specific surface area were significantly increased from 0.14 to 0.24 mL g-1 and from 120 to 240 m2 g-1, respectively.
8.3 Effect of biochar addition on soil properties
8.3.1 Overview
Biochar can be used to ameliorate soil properties due to its specific characteristics (e.g., CEC, pH, surface area, porosity, and surface functionality) (Herath et al., 2013). These characteristics of biochar can produce changes in the soil’s chemical and physical properties including nutrient availability, CEC, pH, and water holding capacity. Recent studies have shown that the addition of biochar to soil increases pH, total carbon, CEC, water holding capacity, and exchangeable basic cations (Novak et al., 2009; Rondon et al., 2006; Sika, 2012; Uzoma, 2011). Improving soil properties through the application of biochar has been examined in recent publications. Herath et al. (2013) studied the effect of corn stove biochar on volumetric water content, bulk density, hydraulic conductivity, and aggregate stability of two different soils, and reported positive effects of biochar on these properties. Chan et al. (2007) found that addition of biochar from green waste to soil resulted in increased organic carbon, available sodium, potassium, and calcium, and extractable phosphorus. Similarly, Major et al. (2010) reported that biochar addition increased available calcium, magnesium, and pH in soil. The greater crop yield observed was attributed to nutrient uptake, primarily the 77–320% greater available calcium and magnesium. Generally, the changes in soil after biochar application reflect the properties of the biochar being applied. Since these changes are biochar type-, dose-, and soil-specific, more research is needed to better assess the profitability of biochar for agricultural use.
8.3.2 Biochar interaction with pollutants Soil pollution with trace elements (e.g., zinc, cobalt, copper, manganese, cadmium, chromium, arsenic, and lead, pesticides (e.g., atrazine, catechol, carbaryl, diazinon, oxamyl, fluridone), and other persistent organic pollutants (e.g., pharmaceutic and personal care products, plasticizers, dyes, polyaromatic compounds) poses a serious threat for the production of healthy food. Biochars have been extensively studied as a tool to remove these pollutants when used as a soil amendment (Bian et al., 2013; Cui et al., 2011; Inyang et al., 2015; Tan, 2015; Tan et al., 2016; Zhang et al., 2014; Zheng, 2012). The huge number of publications in this area has been summarized in excellent reviews published recently (Inyang and Dickenson, 2015; Pollard et al., 1992; Riswan et al., 2016; San Miguel, 2006; Tan, 2016). However, there remain concerns that

153
maintaining consistent quality in the production of biochar may be problematic due to the limited understanding of its chemical structure (McDonald-Wharry, 2016) and the extent to which production conditions affect that structure (Inyang and Dickenson, 2015).
8.3.3 Mechanisms for removal of pollutants The removal of pollutants with biochars is mediated by the following mechanisms: (1) pore filling, (2) diffusion and partitioning, (3) hydrophobic interactions, (4) aromatic π-π interactions, (5) hydrogen bonding, (6) electrostatic interactions, (7) cation exchange, (8) induced precipitation, (9) formation of surface complexes, (10) interaction with amine groups, (11) simultaneous adsorption and catalytic degradation, (12) microorganism mediated mechanisms, and (13) precipitation (Inyang and Dickenson, 2015; Riswan et al., 2016; Tan et al., 2016). Each of these mechanisms is discussed below. Pore filling is controlled by biochar pore volume. This is the primary mechanism responsible for the high adsorption capacity of activated carbons. Both micro-pores (< 2 nm) and small meso-pores (2-20 nm) contribute to adsorption (Inyang and Dickenson, 2015). Sorption kinetics for the pore filling process typically result in non-linear, Langmuir-like sorption isotherms. (Isotherms are special graphs used to describe pollutant adsorption equilibrium at constant temperature.) Diffusion and partitioning is a mechanism controlled by the diffusion and solubilization of pollutants into the noncarbonized organic matter of biochar. It is characterized by concentration-independent, linear isotherms. This mechanism is important for the adsorption of hydrophobic pollutants (e.g., atrazine, fluridone, 1-Naphthol) and is especially prominent in biochars produced at temperatures below 400oC. Hydrophobic interactions occur on sorbent surfaces with low hydration energies by direct competition between the sorbed apolar molecule and water. This mechanism is observed when hydrophobic molecules (e.g., perfluorooctane sulfonate, carbamazepine, diclofenac) are adsorbed on biochars with low surface polarity. Non-covalent π-electron donor–acceptor interactions are important for planar aromatic compounds (e.g., atrazine, carbaryl, sulfamethazine, sulfapyridine) on graphene-like surfaces. Aromatic-π systems in low-treatment temperature biochars (<500oC) containing electron-withdrawing entities may serve as electron-acceptors. Whereas, poly-condensed aromatic rings or electron-rich graphene like regions in high-treatment temperature biochars could serve as π-donors that bind electron withdrawing molecules. The ionic and ionizable organic compounds (e.g., methylene blue and methyl violet) can be removed by electrostatic interactions. Cationic organic compounds will tend to sorb on biochar surfaces which are typically negatively charged due to the presence of oxygenated functional groups, while, anionic sorbates will bind to positively charged sites such as those of mineral-rich biochars or biochars containing amine groups. The attractive or repulsive electrostatic forces between biochar sorbents and ionizable, organic sorbates will be affected by pH and ionic strength. Ion exchange capacity is another mechanism for the removal of cations and is important in biochars with high content of carboxylic acid on the surface. Polar pollutants (e.g., dibutyl phthalate, diazonon, oxamyl) may form hydrogen bonds with the oxygenated functional groups on biochar surface. The polar groups facilitate water sorption and promote hydrogen bonding with organic sorbates containing electronegative elements. Some pollutants are removed by

154
mechanisms mediated by microorganisms. There are abundant reports on the removal of polyaromatic hydrocarbons by bacteria that degrade these compounds in the presence of biochar. Surface complexation is another mechanism described in the literature for the removal and immobilization of some heavy metals (lead, copper, and zinc). Surface complexation happens in oxygen-containing functional groups via esterification reactions which depend on the pH of the solution. Some pollutants like copper, zinc, cadmium, and phosphate can also be removed by induced precipitation by counter ions often present within the ash fraction. For example, dairy manure-derived biochars increased copper, zinc, and cadmium sorption by precipitation with phosphate or with carbonate. In this case, zinc might be precipitated as zinc phosphate (Zn3(PO4)2).
8.4. Introduction to compost
The etymological meaning of word “compost” is originally derived from Latin, compositum, which means “to put together” or “mixture.” Compost can be defined as the stabilized and sanitized humus-like product of composting which is beneficial to both soil and plant, as a soil amelioration agent and as an organic fertilizer, respectively (Bonilla et al., 2012; Sunar et al., 2009). Composting is defined as the biological decomposition and stabilization of organic substrates derived from plants, animals, or humans, under controlled bio-oxidative conditions to allow the development of bio-thermophilic temperatures (Diaz et al. 2007; Epstein 1997; Sunar et al., 2009). This process involves the following stages: (1) incorporation of a heterogeneous organic substrate in the solid state, (2) transition through a thermophilic stage and a temporary release of phytotoxins, and (3) production of carbon dioxide, water, minerals and compost.
8.4.1 Composting phenomena Composting of agricultural wastes and municipal solid wastes has long been considered as an attractive waste management option for effective reduction of waste volume in urban communities and agricultural areas (Binh et al., 2015; Bonilla et al., 2012; Imbeah, 1998). Finished compost has undergone a rapid stage of decomposition, a longer stage of stabilization, and ultimately an incomplete process of humification (Insam and de Bertoldi, 2007). The general goals of composting range from sanitization to reduction of waste volume (Ma et al., 2013). According to Diaz et al. (2007) and Imbeah (1998), fresh organic matter is transformed into compost mainly for four essential reasons:
1) To overcome the phytotoxicity of fresh non-stabilized organic matter, 2) To reduce the presence of pathogens to a level that does not further constitute a health
risk for human, animal or plant, 3) To convert nitrogen from unstable ammonia to stable organic forms, and 4) To reduce the volume of wastes through recycling and conversion into soil amendments
or organic fertilizers. In their detailed report, Ma et al., (2013) have demonstrated that the successful development of organics recycling has had challenges, particularly when composting facilities are mainly designed to process green waste but not food scraps from residential and industrial food resource sectors. Odor emission from composting facilities, due to increased flows of highly putrescible food scraps, is still challenging several U.S cities, such as Seattle, Portland, and Philadelphia. This is because of the time lag between collection, transport, and composting. Food

155
scraps have often begun decomposing prior to arrival at the compost facility and their odor often increases with increasing fresh green waste flows in late spring through early summer. Ma et al. (2013) have also mentioned that combining partially decomposed food scraps with green wastes can lead to poor compost process control and inferior product stabilization due to acidification and inhibition of standard composting. This could lead to an increase in emission rate of volatile organic compounds (VOCs), methane, and ammonia. Such emissions are all potential sources of potent odors and harmful to the environment and human health.
8.4.2 Parameters affecting the composting process The effectiveness of the composting process is influenced by a broad range of interdependent interactions between biotic and abiotic factors that cause degradation of organic matter (Gajalakshmi and Abbasi, 2008; Pietronave et al., 2004). These factors are described below.
8.4.2.1 Biotic factors
The composition and magnitude of microorganisms are important components of the composting process. Representatives of the three major microbial groups (i.e., bacteria, fungi, and actinomycetes) are normally present when the process begins. Fungi and actinomycetes are the main decomposers of cellulose, hemicellulose, and lignin. Bacteria play the dominant role during the most active stages of the composting process (Lei and VanderGheynst, 2000; Sonoki et al., 2013; Tang et al., 2004). Measurements of microbial community structure have shown that enormous changes occur during composting as composting progresses from the mesophilic stage (approximately 20-40oC) into the thermophilic stage (40-80oC) and then through the stabilization stage. Strom (1985) used culture-dependent approaches to identify the thermophilic microbiota of solid waste composting with major emphasis on bacteria. Samples taken during the early thermophilic stages of composting contained 87% Bacillus spp. (e.g., B. circulans, B.
stearothermophilus, B. coagulans, B. licheniformis, B. brevis, B. sphaericus, and B. subtilis), some actinomycetes (e.g., Streptomyces spp. and Thermoactinomyces spp.), and fungi (e.g., Aspergillus fumigatus). Similar results were reported by Fujio and Kume (1991) who isolated 12 strains of thermophilic bacteria; nine of them were identified as belonging to B.
stearothermophilus, and two were identified as Thermus spp. However, the culturing techniques are not sufficient to measure the quantitative change in community structure, nor to identify a significant proportion of the microflora involved in thermophilic composting (Dees and Ghiorse, 2001; Tang et al., 2004). Culture-independent methods such as cell membrane phospholipids analysis, community metabolic capabilities analysis, and molecular genetic techniques are increasingly being used to detect the complex microbial community associated with composting (Dees and Ghiorse, 2001; Tang et al., 2004). These methods have revealed changes in community profile indicative of population succession during the different stages of composting and there is usually a degree of complementation in activities carried out by each of the microbial groups. For example, Herrmann and Shann (1997) used the ester-linked phospholipid fatty acid analysis technique to examine the changes in the total microbial community structure during municipal solid waste composting managed by an aerated-mixed method. They found that samples obtained from mesophilic, thermophilic, and curing stages had lipids characteristics of fungi, thermophilic bacteria and actinomycetes, and fungi and actinomycetes, respectively. Most fungi are eliminated

156
by high temperatures, but they commonly recover when temperatures are moderate (Tiquia, 2002). Actinomycetes are tolerant of higher temperatures and pH than fungi, but they tend to grow in numbers in the later stages of composting (Herrmann and Shann, 1997; Tiquia, 2002). Furthermore, Zhang et al. (2015) used integrated meta-omics to characterize microbial community structure during the composting of maize straw. They found that the fungal communities were primarily dominated by the phylum Ascomycota (>90%), and bacterial communities fluctuated between actinobacteria, proteobacteria, and bacteroidetes based on nitrogen source availability. They also found that Thermomyces lanuginosus was the dominant fungus in hemicellulose hydrolysis and that bacteria and fungi might synergistically degrade lignocellulose. The composting process is a combined activity of a wide succession of environment, in which one group of microorganisms can dominate over others and each group might get a chance to emerge gradually due to the continual change in temperature and progressive breakdown of complex compounds to simpler ones (Tiquia 2002).
8.4.2.2 Substrate source
Most organic wastes (e.g., agricultural wastes, sewage sludges, animal manures, poultry litter.) can be successfully composted, which allows the reuse for soil conditioning, fertilizing, and remediation (Zhang et al., 2017). The chemical composition of organic matter varies with its source. Food wastes, for example, contain lower cellulose and lignin content compared to woody wastes. Understanding substrate components is essential in the design of systems to improve the effectiveness of composting and to produce high quality compost. Six major components constitute organic material: (1) carbohydrates and sugars, (2) proteins, (3) fats, (4) hemicellulose, (5) lignin, and (6) minerals (Gajalakshmi and Abbasi, 2008; Komilis et al., 2004). In the beginning of this process, simple carbohydrates are converted to carbon dioxide and water (Bernal et al., 1998), and degradation of nitrogenous compounds results primarily in ammonia volatilization. In the later stages of composting, cellulose, hemicellulose, and finally lignin, are utilized by the compost microflora. Organic matter is mineralized and is converted to humic substances (Tuomela et al., 2000; Quagliotto et al., 2006).
8.4.2.3 Temperature
Temperature is an important factor affecting the abundance and community structure of microorganisms during composting. The metabolically generated heat in compost can elevate temperature from room temperature to approximately 70oC. While many composting organisms thrive at temperatures near 50oC, numerous organisms grow at temperatures exceeding 50oC. It is generally acknowledged that thermophilic bacteria can degrade organic materials more efficiently than mesophilic bacteria. In the initial stage of composting, the temperature of compost is almost the same as ambient temperature. After one or two days, the composting temperature will reach to 50-65oC. According to Stentiford (1996), a maximum temperature of 55-65°C is necessary to destroy pathogens, but mesophilic temperatures of 45-55°C must be maintained for maximum biodegradation. Golueke and Diaz (1996) recommended that compost temperatures not exceed 60-65°C as this would kill almost all microorganisms and cause the process to cease. The temperature attained by a compost pile is influenced by the amount of oxygen available to the microorganisms in the compost, and, hence, the aerobic nature of the composting process.

157
8.4.2.4 Aeration
With less than 18% oxygen, the microbial activity that drives the composting process will be limited. Aeration can be provided by turning the pile, using pumps to force air through the pile, or allowing air to passively flow through the pile. Forced aeration has been used by researchers for in-vessel composting of pig manure (Lau et al., 1992; Liao et al., 1993). In these studies, aeration rate affected the metabolic heat generated by aerobic microorganisms and, thus, the achievement and maintenance of thermophilic temperatures required to ensure pathogen reduction in the compost (Lau et al., 1992).
8.4.2.5 Carbon to nitrogen (C:N) ratio
The relative proportion of carbon and nitrogen in the substrate is also a major controlling factor in the composting process (Agnew and Leonard, 2003; Ekinci et al., 1999; Hansen et al., 1989; Richard, 1992). Carbon serves primarily as an energy source for the microorganisms, while a small fraction of the carbon is incorporated to the microbial cells. If the C:N ratio is high, growth of bacteria and other microorganisms will be limited, and decomposition rates and the fermentation process will be slowed. However, if the C:N ratio is too low, nitrogen is lost from the system as ammonia gas, lowering fertilizer efficiency. According to Golueke (1992), rapid and full humifaction of substrates by microorganisms requires an initial C:N ratio between 25 and 35.
8.4.2.6 Moisture and pH
Moisture provides a medium for the transport of dissolved nutrients required for the metabolic and physiological activities of microorganisms (Hamelers, 2004). For efficient composting, the moisture content of substrates need to be maintained in the range of 40–60% (Garg and Tothill, 2009). Microbial activity begins to decrease at moisture contents of about 40%. Moisture levels exceeding 60% restrict oxygen in the compost pile. This, in turn, affects the activity of aerobic microbial species (Agnew and Leonard, 2003; Iyengar and Bhave, 2006; Mohee and Mudhoo, 2005; Richard et al., 2002). The ranges of pH values suitable for bacterial and fungal development are 6.0-7.5 and 5.5-8.0, respectively. (Zorpas et al., 2003). pH also affects the loss of nitrogen, with a pH over 7.0 favoring volatilization of nitrogen in the form of ammonia.
8.5 Addition of biochar during composting
Biochar is a promising ingredient for compost with the potential to improve the composting process and reduce odor and GHG emissions. If biochar is used as a bulking agent in compost, it can also help with nutrient retention, aeration, leachate and moisture management, and can sorb odorous gases and in some cases prevent their formation. If biochar is used as cover layer on compost piles, it can not only reduce emissions, but also hold air and water, encouraging aerobic bacteria and reducing the number of anaerobic, methane-producing pockets (Ma et al., 2013).
8.5.1 Impact of biochar addition on the composting process The benefits of biochar co-composting have been investigated in the literature as a promising way to improve the growth-promoting effects of biochar. Historically, co-composting of biochar with organic materials dates back to the early Bokashi making in Eastern Asia, where biochar-

158
mineral blends were used to enhance both aerobic and anaerobic composting processes (Islam et al., 2012; Kammann et al., 2015). Biochar has a potential to create a quality compost with greater value as a soil amendment and fertilizer (Ma et al., 2013). However, several questions exist regarding the addition of biochar in the composting of organic materials including questions about how biochar impacts microbial populations and activity during composting, and how composting impacts biochar. In this section, we provide a review of studies aimed at answering these questions.
8.5.1.1 Effect of biochar on compost microbiome
A limited understanding exists of the interactions of biochar with soil microbial populations. There are very few published studies on the impact of soil fauna on biochar stability. Since biochar is not biologically inert, some degree of microbial decomposition is likely to occur (Ameloot et al., 2013). Applying biochar to a compost pile not only changes its bulk density, moisture content, and aeration but also effects microbial proliferation and activity. Several authors have recently reported enhanced microbial populations of bacteria, fungi, and actinomycetes, as well as changes in microbial community structure during co-composting of organic materials with biochar. Theeba et al. (2012) studied the changes of microbial population in a poultry manure pile co-composted with rice husk biochar. Both pile temperature and CO2 levels reflected changes in microbial activity and population, as also reported by Steiner et al. (2011) during composting of poultry litter with biochar produced from pine wood. The changes in compost pile amended with biochar include changes in the rates of decomposition, mineralization of slowly degradable organic matter, and loss of carbon and nitrogen (Insam and De Bertoldi, 2007; Larney et al., 2008). These changes may directly influence important functions within the compost pile, such as organic matter degradation, nutrient mineralization, and greenhouse gas emissions. Biochar provides suitable habitat for a range of microbial communities and can serve as a refuge from microbial grazers (Downie et al., 2009; Hockaday et al., 2006; Thies and Rillig, 2009; Warnock et al., 2007). Accordingly, porosity of biochar plays an important role in microbial colonization by providing favorable environmental conditions that stimulate microbial growth and biofilm formation. Thus, pore size to microbial cell size ratio is an important factor; Rivera-Utrilla et al. (2001) found that only biochar pores with a diameter greater than 3,000 nm would be available for bacterial attachment (cell size <1.3 micron). Biochar produced at a high temperature (>600oC) has larger pores, more accessible to microorganisms. Easier access to biochar pores in fresh (newly produced) biochars produced at high temperatures could partially explain the microbial colonization rate observed after their addition compared to pore accessibility of aging biochars or biochars produced at low temperatures (Cross and Sohi, 2011). However, biochar porosity is not always accessible for microbial inhabitation; pores in biochars produced at low temperature (<500oC), for instance, are not as accessible to microorganisms due to their small pore size and low surface area (Suliman et al., 2017). Biochar modifies microbial habitats by improving compost pile properties that are essential for microbial growth (such as aeration, moisture, and pH). These modifications would clearly be a mechanism of primary importance for microbial activity and abundance. Biochar with greater CEC promotes the adsorption of nutrients from solution in the compost pores, which, in turn, enhances microbial growth and increases the mineralization rate of organic compounds

159
(Taghizadeh-Toosi et al., 2012). The presence of oxygenated functional groups on the surface of biochar increases its affinity for water molecules. Suliman et al. (2016) found a marked increase in water retention capacity of soil after the addition of oxidized biochar compared to the addition of unoxidized biochar. Moreover, altering the pH can have a strong impact on the ratios of bacteria to fungi and on structures of bacterial and fungal communities. Aeration induced by the addition of biochar may alleviate limitations on microbial growth in oxygen-poor micro-environments located deeper inside compost piles (Cui et al., 2016). Biochar can participate in microbial intra- and inter-specific communication between microbial cells and the microbial decomposition processes of the organic matter. Cui et al. (2016) reported that biochar could accelerate degradation of organic matter and formation of ammonium during the thermophilic phase and enhance nitrification during the maturation phase (Sánchez-García et al., 2015). Persistent free radicals that are formed on biochar during pyrolysis play an important role in electron transfer between biochar and microbial cells. Therefore, biochar interrupts the direct interspecific electron transfer between microbial cells and the direct extracellular electron transfer between organic matter, biochar, and microbial cells via a combination of sorption and hydrolysis of signaling molecules (Chen et al., 2014; Khan et al., 2016; Zhu et al., 2017). Biochar may also contain some molecules that can act as signals for microbial communication, enhancing the degradation of organic matter (Gao et al., 2016; Masiello et al., 2013). The interactions between biochar and microorganisms during composting is an emerging research field that requires further experimental verification to clarify the linkage between biochar-microbe interaction mechanisms and the environmental effects of these interactions (Zhu et al., 2017). Studies investigating the composition and diversity of microbial communities during composting have initially utilized enzyme assays. However, enzyme-based assays might not be a realistic option in biochar co-composting process due to the complexity and synergistic actions of microbes, which presents a need for a much more comprehensive system for quantifying enzymes. Therefore, to clearly interpret the microbial responses to biochar addition, measurement of gene copy numbers is a more sensitive parameter than microbial biomass (Chen et al., 2013). With the development of quantitative real-time PCR (polymerase chain reaction) and RNA (ribonucleic acid)-sequence analysis techniques, studies based on microbial diversity approaches allow genes related to specific group of microorganisms to be easily defined. Integrated proteomic and metabolomic approaches have been used to attain a global overview of the response of microbes to biochar addition. These approaches enable the linking of microbial community structure and function and provide a comprehensive understanding of these intricate microcosms (Urich et al., 2013).
8.5.1.2 Effect of biochar on soil microbiome
During the production of biochar, a gradual change in chemical composition of the biomass feedstock occurs, creating molecular structures that are more resistant to breakdown (Ameloot et al., 2013). Although the nitrogen integrated into the biochar structure is recalcitrant, studies have reported assimilation and plant uptake of nitrogen from labelled biochars and increased soil respiration rates when biochar is added to soils (Ameloot et al., 2013). After mineralization of the labile biochar carbon in the short term, mineralization rates in amended soils decrease quickly to nearly the same level as treatments without biochar.

160
The incorporation of organic carbon from biochar into the microbial biomass is often measured by fumigation extraction methods in combination with biochar carbon-labelling experiments. After 624 days, 1.5-2.6 wt. % of the C incorporated into microbial biomass was from the biochar (Ameloot et al., 2013). The production of enzymes (e.g., manganese peroxidase, phenoloxidase, and lignine peroxidase) and of reactive phenoxy and peroxy radicals is the main mechanism for the degradation of char (Ameloot et al., 2013). While biochar is consumed and stabilized by soil microorganisms, it also interacts with and modifies the nature of soil microbial populations (Ameloot et al., 2013). The porous nature of biochar provides favorable microsites for microorganisms to thrive and shelter against predatory soil fauna and desiccation. Colonization of surfaces occur more quickly when biochar contains larger cracks that fungi can easily penetrate. The presence of nutrients (nitrogen, potassium, phosphorus) and sources of labile carbon also enhances the habitat conditions of biochar surfaces (Ameloot et al., 2013).
8.5.1.3 Effect of biochar on compost gas release
Vandecasteele et al. (2016) studied the effect of biochar to improve the composting process and composting quality and confirmed that the use of biochar, even in small amounts, changed the composting process and the properties of the end product. Biochar (10 wt. %) was added to the feedstock mixture or the mature compost. The results achieved depended on the time of application. Biochar added in the feedstock mixture reduced emissions of greenhouse gases (Figure 8.11). The feedstock used was a mixture of green waste and the organic fraction of municipal solid waste. Adding biochar to the compost did not affect the phosphorus fertilizer replacement value of the compost.

161
Figure 8.11: Cumulative emissions of carbon dioxide (CO2), methane (CH4), and nitrous oxide
(N2O) for compost and biochar blended with compost (Vandecasteele et al., 2016)
Similar results were reported by Awasthi et al. (2016a) in a study of compost amended with biochar and lime. The author found that biochar had a significant impact on CO2 emission during co-composting with sewage sludge. When lime was added as a co-composting agent, ammonia (NH3), methane (CH4), and nitrous oxide (N2O) emissions were also reduced (Figure 8.12). The presence of biochar and lime in the amendment also inhibited the bioavailability of heavy metals (Awasthi et al., 2016a). Wei et al. (2014) conducted a batch tomato stalk and chicken manure composting study in the presence of biochar, peat bog, and zeolite, and found that biochar was the material that most significantly affected composting. Biochar reduced the time required to enter in the thermophilic phase and resulted in a higher temperature and longer duration of this phase. Greater amounts of volatile fatty acids were obtained. The authors also observed more microbial activity, changes in individual chemical families, and changes in the properties of the final compost.
Czekala et al. (2016) also studied the impact of biochar addition on poultry manure composting dynamics. Like Wei et al. (2014), the authors observed an important impact on composting temperature. In contrast, Czekala et al. (2016) reported a shortening on the thermophilic phase period with biochar amendment. The authors also observed an increase in CO2 emissions.

162
Figure 8.12: Evolution of carbon dioxide (a), methane emissions (b), ammonia emission (c), nitrous oxide emissions (d), extractable ammonia (e), and total Kjeldahl nitrogen (f) during
composting of DFSS + WS: Dewatered fresh sewage sludge + wheat straw (Control): DFSS + WS + L: Dewatered fresh sewage sludge + wheat straw + lime; DFSS + WS + L+ B: Dewatered fresh
sewage fresh sewage sludge + wheat straw + lime + biochar (Awasthi et al., 2016b)

163
Dais et al. (2010) used biochar as a bulking agent for poultry manure composting, at a ratio of 1:1. The authors compared the behavior of biochar with coffee husk and sawdust. The addition of biochar reduced the loss of nitrogen in the mature compost. The use of biochar reduced odor emissions and nitrogen losses, and produced a composted material with a balanced C:N ratio. Steiner et al. (2010) found that when added during the composting of poultry litter, biochar adsorbed NH3 and water soluble NH4
+, reducing total N losses by 52%. Biochar did not influence mass losses but accelerated the poultry litter decomposition rate. Moisture content decreased, pH increased, and peak CO2 and temperature increased as a result of biochar addition. The same team (Steiner et al., 2011) reported the impact of biochar on the bulk density and aeration of the composting mixture. The authors also confirmed important increase in CO2 respiration rates when biochar was added. Albarune-Chowdhury et al. (2014) studied the effect of aeration flow rate in the co-composting of cattle slurry and straw with biochar. A lower flow rate reduced NH3 loss but increased methane losses from composting cattle slurry and straw. In the case of poultry manure, both ammonia and methane losses decreased when biochar was added. The aeration flow rate did not seem to affect N2O emissions from composting. Low flow could be an alternative strategy for reducing ammonia losses without any significant change in N2O emissions. These results confirm the need to carefully control the composting conditions. Iqbal et al. (2015) focused on the effect of biochar on leachates released during the composting of yard and food wastes. The authors found that biochar addition did not make any major difference in the leaching of nutrients (such as P and K) or on dissolved organic carbon. Jindo et al. (2012a) reported experimental data on the effect of hardwood-derived biochar on the microbial community structure during poultry and cow manure co-composting by phospholipid fatty acid analysis. The authors found interesting correlations between the phospholipid fatty acid profile and C:N ratio, temperature, and bulk density. In another manuscript, Jindo et al. (2012b) described the addition of biochar to enhance the organic matter quality of mature composts and found that the addition of biochar improved compost maturity as well as the activity of several enzymes: urease, phosphatase, and polyphenol oxidase. Zhang et al. (2014) described the co-composting of spent mushroom compost and biochar with green waste composting. The authors found that a combination of 35% spent mushroom compost and 20% biochar reduced the co-composting time significantly (24 hours instead of 90-270 hours for the traditional process). The effect of biochar addition on the maturity index during co-composting with chicken manure and sawdust was examined by Khan et al. (2014). Biochar decreased NH3 emission from finished compost and increased respiration rate. Sánchez-García et al. (2015) also studied how three biochars affected maturity indices (C:N ratio, dissolved organic carbon, seed germination, nitrate-nitrogen, ratio of nitrogen to ammonium-nitrogen, and the Solvita test) during co-composting with chicken manure and pine sawdust. The authors also found that biochar enhanced respiration and the decomposition of dissolved organic carbon (both indicative of
164
higher microbial activity) (Sánchez-García et al., 2015). The authors also found that biochar addition reduced ammonia emission and nitrate leaching. Bolan et al. (2012) compared the rate of decomposition of organic amendments in the presence of biochar. This study was conducted by comparing the CO2 released with several organic amendments (composts and biochars). The authors found that biochar increased the rate of decomposition, as measured by half-life.
Chen et al. (2010) studied the use of biochar during composting of pig manure to reduce nitrogen loss (through ammonia volatilization in the thermophilic phase) and immobilization of copper and zinc. Biochar addition resulted in a reduction in total Kjeldahl nitrogen and the immobilization of copper and zinc.
8.5.2 Impacts of biochar on compost properties As soon as biochar is mixed with compositing feedstock, its particles are subjected to a range of bio-physicochemical interactions over the composting period. Density and porosity of biochar can be altered through the trapping of minerals, organic matter, or microbes (Jaafar et al., 2014; Warnock et al., 2007), shifting biochar sorption capacity and water retention (Baronti et al., 2014; Masiello et al., 2015). Biochar can be fragmented into smaller particles which minimally alters the carbon speciation of the biochar (Spokas et al., 2014). However, fractures on the weathering particles may offer new opportunities for microbial colonization. Potential shifts in microbial colonization patterns as biochar ages during composting are expected due to changes in biochar surface chemistry, pore connectivity, and mineral content (Darmstadt et al., 2000; Purakayastha et al., 2015; Quin et al., 2014; Suliman et al., 2016, 2017). Several studies report changes in biochar properties as a consequence of aging (Cheng et al., 2008; Jones et al., 2012; LeCroy et al., 2013; Lin et al., 2012; Zimmerman, 2010). Biochar aging is a primarily abiotic process that can be enhanced when biochar is added to a compost pile, in which high temperatures enhance surface functionalities via abiotic and biotic oxidation. Khan et al. (2016) quantified the effects of composting on biochar properties in a poultry litter pile enriched with biochars made from macadamia nutshell, hardwood shavings, and chicken litter. Khan et al. found that composting increased the CEC of biochars through thermophilic oxidation. Biochar may sorb a broad range of organic and inorganic compounds from compost (Borchard et al., 2014; Hale et al., 2015). Prost et al. (2013) observed a considerable increase in the CEC of co-composted biochar due to sorption of organic leachates during the composting process. Levels of water-extractable organic carbon and nutrients were also changed in the biochar over time. Sorption of compost-derived organic materials on biochar may promote the clogging of micropores limiting its surface area and pore connectivity. The sum of these processes results in an alteration of the biochar, which in turn change its plant-growth promoting properties and its capacity for microbial colonization.

165
8.6 Use of biochar-enriched compost as a soil amendment
Several research studies have shown that biochar can ameliorate the interaction of soils with fertilizers and overall soil quality (Glaser et al., 2002; Jeffery et al., 2011). Biochar-soil interactions influence physical, chemical and biological properties of soil mixtures. Understanding biochar-soil interactions is very important because of its potential to decrease dependence of fertilizer and reduce the undesirable environmental impacts caused by excessive fertilizer usage (Fischer and Glaser, 2012; Foley et al., 2005). In addition, the composting of waste has attracted increasing interest because of its capacity to transform solid organic material in nutrients, enrich the quality of soil, and reduce fertilizer use (Fischer and Glaser, 2012). In this context, recent research has confirmed that biochar-enriched compost improves soil quality (Fischer and Glaser, 2012). However, previous research (Birk et al., 2009; Steiner et al., 2007, 2008) has shown that compost-chemical fertilizer-biochar interactions positively improves the soil biological community. Therefore, the main challenges in this area are to gain a better understanding of the complex interactions between biochar and compost and to maintain stability of biochar in the soil (Ameloot et al., 2013; Kammann et al., 2015). To understand the interaction between the soil and compost products with biochar, it is necessary to understand interactions that occur between biochar and soil organisms. Although there are few publications describing these interactions, biochar and mineral blending has been utilized for years, or possibly for centuries, to improve aerobic and anaerobic composting (Ogawa et al., 2010). The limited number of publications that exist on this topic (Kammann et al., 2015), are mostly from Asian-Pacific countries. In these papers, the authors researched the effect of biochar addition when composting wet, nutrient rich materials like manure and sewage sludge (Kammann et al., 2015). Biochar was typically added during composting, to adjust the C:N ratio and serve as a bulking agent (e.g., replacing wood chips) (Dias et al., 2010; Steiner et al., 2010; Steiner et al., 2011). The authors reported improvements in biochar’s capacity to retain N (Hua et al., 2009; Steiner et al., 2010; Prost et al., 2013); decrease the mobility of heavy metals (reduce toxicity) (Chen et al., 2010; Hua et al., 2009); augment the formation of stable humic compounds (Dias et al., 2010; Jindo et al., 2012b); suppress N2O emissions (Wang et al., 2013b); and modify the microbial composition during the composting process (Jindo et al., 2012a). According to Kammann et al. (2015) co-composting with biochar was responsible for the formation of ancient fertile black earth soil. Co-composting has an enormous impact in terms of modifying biochar and ameliorating its plant growth-promoting properties. Agegnehu et al. (2016), found satisfactory results of biochar-compost on soil fertility with a positive impact on maize growth, soil physicochemical properties, total soil organic carbon, total nitrogen, available phosphorus, nitrate-nitrogen, ammonium-nitrogen, exchangeable cations, and CEC. Kammann et al. (2015) suggested that composted biochar had more positive effects than untreated biochar. Although Khan et al. (2016) confirms that the composting had a positive influence on biochar surface properties, his studies did not show significant influence in elemental concentration in composted or incubated biochar. Khan et al. (2016) also observed that the C of composted and incubated biochars are equally recalcitrant.

166
Fischer and Glaser (2012) proposed a practical correlation, in which soil quality (measured in terms of soil fertility) increased as a function of available water holding capacity, soil organic matter level, root density, CEC, and clay content. In this context, effects of biochar on soil biota can be driven primarily by its physical and chemical properties (Lehmann et al., 2011). According to Fischer et al. (2012), one option is to combine the terra preta concept with biochar and composting. Additionally, this new concept could improve quality and properties of compost increase the capacity for C sequestration, and achieve long-term stability of biochar. However, the physical and chemical interactions of biochar and soil and the mechanisms by which these influence microbial abundance and community composition are still poorly understood (Lehmann et al., 2011). Nevertheless, pH, sorption phenomena, and physical properties of biochars (e.g., pore structure, surface area, and mineral matter) play important roles in determining how, and under which specific conditions, biochars affect soil biota (Lehmann et al., 2011). On this topic, several reports have shown that the effects of biochar on soil are driven by its physical and chemical properties. Also, the differences in physical structure between biochar and soil can be expected to have major impacts on soil (Lehmann et al., 2011). According to Downie et al. (2009) the effect of these interactions depends upon the biochar production conditions and source biomass, and effect on macro and micro structure of biochar particles. Lehmann et al. (2011) and Chan et al. (2007) found that tensile strength of biochar is less than of soil (like clay-rich soils), and soil tensile strength decreases significantly when biochar is added under specific conditions. This application of biochar to soil can change soil bulk density (Major et al., 2010), and consequently influence soil water and air levels, roots, and soil fauna. These alterations happen because the density of biochar is lower than soil (e.g., clay and some minerals), and because biochar has macro and micropores on the surface (Downie et al., 2009). Publications give various values for biochar densities (Brewer et al., 2009; Spokas et al., 2009). In addition, Bengough and Mullins (1990) found mechanical impedance as one of the main factors that influenced root elongation and expansion in soil from biochar. However, sorption phenomena interfere with the standard extraction procedures for soil microbial biomass (Lehmann et al., 2011). Khan et al. (2016) produced three biochars from macadamia nutshells, hardwood shavings, and chicken litter. These biochars were co-composted with chicken manure and sawdust. Composting increased the CEC of biochar 2.2-6.5 times due to the thermophilic oxidation. Some elements from biochar (e.g., boron, chlorine, magnesium, and sulfur) were lost during composting (Khan et al., 2016).
Beelsley et al. (2010) studied the effects of biochar and green waste compost amendments (applied separately) on mobility, bioavailability and toxicity of inorganic and organic contaminants in a multi-element polluted soil. The authors found that copper and arsenic concentrations in soil increased more than 30-fold after the compost was added. The organic carbon and pH increases and the zinc and cadmium increased. The concentration of polyaromatic hydrocarbons was reduced.

167
Agegnehu et al. (2016) studied the benefits of biochar, compost, and biochar-compost on soil quality, maize yield, and greenhouse gas emissions in a tropical agricultural soil. Maize grain yield was significantly increased by 10-29%. The content of leaf chlorophyll, nitrogen, and phosphorus in plant tissue increased with the addition of organic matter. The authors also found that organic amendments significantly improved soil water content, organic carbon, nitrogen, phosphorus, and CEC and decreased greenhouse gas emissions. Kammann et al. (2015) demonstrated that co-composting promoted biochar’s positive effects by nitrate capture. Quinoa (Chenopodium quinoa) biomass yield increased up to 305% in a sandy soil amended with 2 wt. % co-composted biochar. Schulz et al. (2013) studied the production of biochar/compost blends to maximize plant response and soil fertility. Oat (Avena sativa L.) biomass production was increased when biochar and compost were added. The addition of biochar increased total organic carbon and total nitrogen but did not affect levels of plant available ammonium and nitrate.
8.7 Conclusions
This literature review summarized relevant studies on biochar as a soil amendment and as a potential additive for composting, focusing on biochar-enriched compost. The technologies/methods for composting organic wastes with biochar were examined and the potential interactions between biochar and compost microbiome were discussed. Finally, there was a discussion of the synergistic merits of biochar and compost on soil properties. There are many published studies on the effects of the addition of biochar to soil. Most of the papers confirm the positive effect of biochar on CEC, pH, surface area, porosity, and water holding capacity of soil. Biochar addition is also a powerful instrument to fight soil pollution by heavy metals and contaminants (e.g., zinc, cobalt, copper, manganese, cadmium, chromium, arsenic, lead, atrazine, catechol, carbaryl, diazinon, oxamyl, fluridone, pharmaceutic and personal care products, plasticizers, dyes, and polyaromatic compounds). The capacity of biochar to adsorb these pollutants has been studied extensively. The understanding of the interactions between biochar and microorganisms in compost and how biochar interact with other components in the changing biologically-driven process was also reviewed. Biochar provides suitable habitat for a range of microbial communities and serves as a refuge from microbial grazers. Biochar porosity plays an important role in microbial colonization. The literature confirms the changes in biochar chemistry (likely surface oxidation, particle size reduction, and nutrient adsorption) during co-composting. Density and porosity of biochar are altered through the trapping of minerals, organic matter, or microbes, which shifts the sorption capacity and water retention ability of biochar. Biochar is also fragmented into smaller particles during the composting process. Fractures on the weathering particles offer opportunities for microbial colonization, contributing to changes in biochar surface chemistry, pore connectivity, and mineral content. These changes and the inherent adsorption capacity of biochar seem to justify the large numbers of reports on the greenhouse gases reductions observed during co-composting with biochar. Although several studies have been published on the impact of co-composting products on the soil amendment properties of resulting product, more research is needed to better understand biochar’s contribution. More information is needed to better match

168
the properties of biochar and its co-composted product and the properties of the soil where these products will be added to produce the desired functionality of the biochar.
8.8 References
Agegnehu, G., Bass, A.M., Nelson, P.N., Bird, M.I., 2016. Benefits of biochar, compost and biochar-compost for soil quality, maize yield and greenhouse gas emissions in a tropical agricultural soil. Science of the Total Environment, 543(1), pp.295-306.
Ameloot, N., Graber, E.R., Verheijen, F.G. and De Neve, S., 2013. Interactions between biochar stability and soil organisms: review and research needs. European Journal of Soil
Science, 64(4), pp.379-390. Amonette J. 2010. Biochar and Bioenergy: What Can They Do to Help Mitigate Climate
Change. Washington State Bioenergy Research Symposium, Seattle, WA. http://www.pacificbiomass.org/documents/Amonette%20(C1).pdf
Amonette, J., 2009. An Introduction to Biochar: Concept, Processes, Properties, and Applications. Presentation at Harvesting Clean Energy Workshop, Billings, MT.
Antal, M.J. and Grønli, M., 2003. The art, science, and technology of charcoal production. Industrial & Engineering Chemistry Research, 42(8), pp.1619-1640. doi:10.1021/ie0207919.
Arroyo-Kalin, M., 2010. The Amazonian formative: crop domestication and anthropogenic soils. Diversity, 2(4), pp.473-504.
Awasthi, M.K., Pandey, A.K., Bundela, P.S., Wong, J.W., Li, R. and Zhang, Z., 2016a. Co-composting of gelatin industry sludge combined with organic fraction of municipal solid waste and poultry waste employing zeolite mixed with enriched nitrifying bacterial consortium. Bioresource technology, 213, pp.181-189. doi:10.1016/j.biortech.2016.02.026
Awasthi, M.K., Wang, Q., Huang, H., Li, R., Shen, F., Lahori, A.H., Wang, P., Guo, D., Guo, Z., Jiang, S. and Zhang, Z., 2016b. Effect of biochar amendment on greenhouse gas emission and bio-availability of heavy metals during sewage sludge co-composting. Journal of
Cleaner Production, 135, pp.829-835. Bailis, R., Rujanavech, C., Dwivedi, P., de Oliveira Vilela, A., Chang, H. and de Miranda, R.C.,
2013. Innovation in charcoal production: A comparative life-cycle assessment of two kiln technologies in Brazil. Energy for sustainable development, 17(2), pp.189-200.
Bandosz, T.J., 2006. Activated carbon surfaces in environmental remediation (Vol. 7). Academic press. http://www.elsevier.com/books/activated-carbon-surfaces-in-environmental-remediation/bandosz/978-0-12-370536-5.
Bansal, R.C. and Goyal, M., 2005. Activated carbon adsorption. CRC press. https://www.crcpress.com/product/isbn/9780824753443.
Barnes, R.T., Gallagher, M.E., Masiello, C.A., Liu, Z. and Dugan, B., 2014. Biochar-induced changes in soil hydraulic conductivity and dissolved nutrient fluxes constrained by laboratory experiments. PloS one, 9(9), p.e108340. doi:10.1371/journal.pone.0108340.
Baronti, S., Vaccari, F.P., Miglietta, F., Calzolari, C., Lugato, E., Orlandini, S., Pini, R., Zulian, C. and Genesio, L., 2014. Impact of biochar application on plant water relations in Vitis vinifera (L.). European Journal of Agronomy, 53, pp.38-44. doi:10.1016/j.eja.2013.11.003.

169
Basso, A.S., Miguez, F.E., Laird, D.A., Horton, R. and Westgate, M., 2013. Assessing potential of biochar for increasing water‐holding capacity of sandy soils. Gcb Bioenergy, 5(2), pp.132-143. doi:10.1111/gcbb.12026.
Bech, N., Jensen, P.A. and Dam-Johansen, K., 2007, May. Ablative flash pyrolysis of straw and wood: bench-scale results. In Proc 15th European Biomass Conference and Exhibition,
Berlin (Vol. 7, No. 11). http://bech.nu/Ablative Flash Pyrolysis of Straw and Wood Bench-Scale Results.pdf.
Beesley, L., Moreno-Jiménez, E. and Gomez-Eyles, J.L., 2010. Effects of biochar and greenwaste compost amendments on mobility, bioavailability and toxicity of inorganic and organic contaminants in a multi-element polluted soil. Environmental
pollution, 158(6), pp.2282-2287. Bian, R., Chen, D., Liu, X., Cui, L., Li, L., Pan, G., Xie, D., Zheng, J., Zhang, X., Zheng, J. and
Chang, A., 2013. Biochar soil amendment as a solution to prevent Cd-tainted rice from China: results from a cross-site field experiment. Ecological engineering, 58, pp.378-383.
Biederman, L.A. and Harpole, W.S., 2013. Biochar and its effects on plant productivity and nutrient cycling: a meta‐analysis. GCB bioenergy, 5(2), pp.202-214. doi:10.1111/gcbb.12037.
Binh, N.T., Quynh, H.T. and Shima, K., 2015. Effect of Composts Combined with Chemical N Fertilizer on Nitrogen Uptake by Italian Ryegrass and N Transformation in Soil. Journal
of Agricultural Chemistry and Environment, 4(02), p.37. doi:10.4236/jacen.2015.42004. Bolan, N.S., Kunhikrishnan, A., Choppala, G.K., Thangarajan, R. and Chung, J.W., 2012.
Stabilization of carbon in composts and biochars in relation to carbon sequestration and soil fertility. Science of the Total Environment, 424, pp.264-270.
Bonilla, N., Gutiérrez-Barranquero, J.A., Vicente, A.D. and Cazorla, F.M., 2012. Enhancing soil quality and plant health through suppressive organic amendments. Diversity, 4(4), pp.475-491. doi:10.3390/d4040475.
Borchard, N., Siemens, J., Ladd, B., Möller, A. and Amelung, W., 2014. Application of biochars to sandy and silty soil failed to increase maize yield under common agricultural practice. Soil and Tillage Research, 144, pp.184-194. doi:10.1016/j.still.2014.07.016.
Brewer, C.E., Schmidt‐Rohr, K., Satrio, J.A. and Brown, R.C., 2009. Characterization of biochar from fast pyrolysis and gasification systems. Environmental Progress & Sustainable
Energy, 28(3), pp.386-396. doi:10.1002/ep. Bridgwater, A.V., 2012. Review of fast pyrolysis of biomass and product upgrading. Biomass
and bioenergy, 38, pp.68-94. doi:10.1016/j.biombioe.2011.01.048. Bridgwater, A.V. and Peacocke, G.V.C., 2000. Fast pyrolysis processes for biomass. Renewable
and sustainable energy reviews, 4(1), pp.1-73. doi:10.1016/S1364-0321(99)00007-6. Bruun, E.W., Müller‐Stöver, D., Ambus, P. and Hauggaard‐Nielsen, H., 2011. Application of
biochar to soil and N2O emissions: potential effects of blending fast‐pyrolysis biochar with anaerobically digested slurry. European Journal of Soil Science, 62(4), pp.581-589. doi:10.1016/j.biombioe.2010.12.008.
Budai, A., Wang, L., Gronli, M., Strand, L.T., Antal Jr, M.J., Abiven, S., Dieguez-Alonso, A., Anca-Couce, A. and Rasse, D.P., 2014. Surface properties and chemical composition of corncob and Miscanthus biochars: effects of production temperature and method. Journal
of agricultural and food chemistry, 62(17), pp.3791-3799. doi:10.1021/jf501139f.

170
Cantrell, K.B., Hunt, P.G., Uchimiya, M., Novak, J.M. and Ro, K.S., 2012. Impact of pyrolysis temperature and manure source on physicochemical characteristics of biochar. Bioresource technology, 107, pp.419-428.doi:10.1016/j.biortech.2011.11.084.
Chan, K.Y., Van Zwieten, L., Meszaros, I., Downie, A. and Joseph, S., 2008. Agronomic values of greenwaste biochar as a soil amendment. Soil Research, 45(8), pp.629-634. doi:10.1071/SR07109.
Chen, Y.X., Huang, X.D., Han, Z.Y., Huang, X., Hu, B., Shi, D.Z. and Wu, W.X., 2010. Effects of bamboo charcoal and bamboo vinegar on nitrogen conservation and heavy metals immobility during pig manure composting. Chemosphere, 78(9), pp.1177-1181.
Chen, J., Liu, X., Zheng, J., Zhang, B., Lu, H., Chi, Z., Pan, G., Li, L., Zheng, J., Zhang, X. and Wang, J., 2013. Biochar soil amendment increased bacterial but decreased fungal gene abundance with shifts in community structure in a slightly acid rice paddy from Southwest China. Applied Soil Ecology, 71, pp.33-44. doi:10.1016/j.apsoil.2013.05.003.
Chen, S., Rotaru, A.E., Shrestha, P.M., Malvankar, N.S., Liu, F., Fan, W., Nevin, K.P. and Lovley, D.R., 2014. Promoting interspecies electron transfer with biochar. Scientific
reports, 4. doi:10.1038/srep05019. Cheng, C.H., Lehmann, J. and Engelhard, M.H., 2008. Natural oxidation of black carbon in soils:
changes in molecular form and surface charge along a climosequence. Geochimica et
Cosmochimica Acta, 72(6), pp.1598-1610. doi:10.1016/j.gca.2008.01.010. Chidumayo, E.N. and Gumbo, D.J., 2013. The environmental impacts of charcoal production in
tropical ecosystems of the world: a synthesis. Energy for Sustainable
Development, 17(2), pp.86-94. Chowdhury, M.A., de Neergaard, A. and Jensen, L.S., 2014. Potential of aeration flow rate and
bio-char addition to reduce greenhouse gas and ammonia emissions during manure composting. Chemosphere, 97, pp.16-25.
Collison, M., Collison, L., Sakrabani, R., Tofield, B. and Wallage, Z., 2009. Biochar and carbon sequestration: a regional perspective. Norwich, UK: The Low Carbon Innovation Centre,
University of East Anglia.(A report prepared for East of England Development Agency
(EEDA), DA1 Carbon Reduction Ref. No: 7049). Copeland, C., Downie, A., Zwieten, L.V. and Kimber, S., 2008. The role of a scoping study in
directing and supporting the establishment of a slow pyrolysis plant in northern NSW. Australia Wollongbar Agricultural Institute is the Pasture Trial, pp.1-9.
Crombie, K., Mašek, O., Sohi, S.P., Brownsort, P. and Cross, A., 2013. The effect of pyrolysis conditions on biochar stability as determined by three methods. Gcb Bioenergy, 5(2), pp.122-131. doi:10.1111/gcbb.12030.
Cross, A. and Sohi, S.P., 2013. A method for screening the relative long‐term stability of biochar. Gcb Bioenergy, 5(2), pp.215-220. doi:10.1111/gcbb.12035.
Cross, A. and Sohi, S.P., 2011. The priming potential of biochar products in relation to labile carbon contents and soil organic matter status. Soil biology and biochemistry, 43(10), pp.2127-2134. doi:10.1016/j.soilbio.2011.06.016.
Cui, L., Li, L., Zhang, A., Pan, G., Bao, D. and Chang, A., 2011. Biochar amendment greatly reduces rice Cd uptake in a contaminated paddy soil: a two-year field experiment. BioResources, 6(3), pp.2605-2618.
Cui, E., Wu, Y., Zuo, Y. and Chen, H., 2016. Effect of different biochars on antibiotic resistance genes and bacterial community during chicken manure composting. Bioresource
technology, 203, pp.11-17. doi:10.1016/j.biortech.2015.12.030.

171
Czekała, W., Malińska, K., Cáceres, R., Janczak, D., Dach, J. and Lewicki, A., 2016. Co-composting of poultry manure mixtures amended with biochar–The effect of biochar on temperature and C-CO 2 emission. Bioresource technology, 200, pp.921-927.
Dahn, J.R., Xing, W. and Gao, Y., 1997. The “falling cards model” for the structure of microporous carbons. Carbon, 35(6), pp.825-830.
Darmstadt, H., Pantea, D., Sümmchen, L., Roland, U., Kaliaguine, S. and Roy, C., 2000. Surface and bulk chemistry of charcoal obtained by vacuum pyrolysis of bark: influence of feedstock moisture content. Journal of Analytical and Applied Pyrolysis, 53(1), pp.1-17.
Dees, P.M. and Ghiorse, W.C., 2001. Microbial diversity in hot synthetic compost as revealed by PCR-amplified rRNA sequences from cultivated isolates and extracted DNA. FEMS
Microbiology Ecology, 35(2), pp.207-216. Demirbas, A., 2004. Effects of temperature and particle size on bio-char yield from pyrolysis of
agricultural residues. Journal of analytical and applied pyrolysis, 72(2), pp.243-248. doi:10.1016/j.jaap.2004.07.003.
Dias, B.O., Silva, C.A., Higashikawa, F.S., Roig, A. and Sánchez-Monedero, M.A., 2010. Use of biochar as bulking agent for the composting of poultry manure: effect on organic matter degradation and humification. Bioresource technology, 101(4), pp.1239-1246.
De Bertoldi, M., Diaz, L.F., Bidlingmaier, W. and Stentiford, E. eds., 2007. Compost Science
and Technology. Elsevier. Enders, A., Hanley, K., Whitman, T., Joseph, S. and Lehmann, J., 2012. Characterization of
biochars to evaluate recalcitrance and agronomic performance. Bioresource
Technology, 114, pp.644-653. doi:10.1016/j.biortech.2012.03.022. Epstein, E., 1997. The Science of Composting, Technomic Pub. Co., Lancaster, PA, 487.
https://books.google.com/books/about/The_Science_of_Composting.html?id=dXNX4cOMqDUC.
FAO, 2017. The charcoal transition: greening the charcoal value chain to mitigate climate change and improve local livelihoods, by J. van Dam. Rome, Food and Agricultural Organization of the United Nations. http://www.fao.org/3/a-i6935e.pdf
FAO, 2017, FAOSTAT, Forestry Production and Trade, Retrieved February 17th, 2017, from: http://www.fao.org/faostat/en/#data/FO
Farrell, M., Kuhn, T.K., Macdonald, L.M., Maddern, T.M., Murphy, D.V., Hall, P.A., Singh, B.P., Baumann, K., Krull, E.S. and Baldock, J.A., 2013. Microbial utilisation of biochar-derived carbon. Science of the Total Environment, 465, pp.288-297. doi:10.1016/j.scitotenv.2013.03.090.
Fischer, D. and Glaser, B. 2012. Synergisms between compost and biochar for sustainable soil amelioration. In: Management of Organic Waste, Dr. Sunil Kumar (Ed.) https://cdn.intechopen.com/pdfs-wm/27163.pdf
Franklin, R.E., 1951, October. Crystallite growth in graphitizing and non-graphitizing carbons. In Proceedings of the Royal Society of London A: Mathematical, Physical and
Engineering Sciences, 209, No. 1097, pp. 196-218. Fu, P., Hu, S., Xinag, J., Sun, L., Yang, T., Zhang, A., Wang, Y. and Chen, G., 2009, October.
Effects of pyrolysis temperature on characteristics of porosity in biomass chars. In Energy and Environment Technology, 2009. ICEET'09. International Conference
on (Vol. 1, pp. 109-112). IEEE. doi:10.1109/ICEET.2009.33.

172
Fujio, Y. and Kume, S., 1991. Isolation and identification of thermophilic bacteria from sewage sludge compost. Journal of fermentation and bioengineering, 72(5), pp.334-337. doi:10.1016/0922-338X(91)90082-R.
Garcia-Pérez, M., Lewis, T., and Kruger, C. 2011. “Methods for Producing Biochar and Advanced Biofuels in Washington State. Part 1: Literature Review of Pyrolysis Reactors.” https://fortress.wa.gov/ecy/publications/summarypages/1107017.html.
Hale, L., Luth, M. and Crowley, D., 2015. Biochar characteristics relate to its utility as an alternative soil inoculum carrier to peat and vermiculite. Soil Biology and
Biochemistry, 81, pp.228-235. doi:10.1016/j.soilbio.2014.11.023. Hammes, K., Smernik, R.J., Skjemstad, J.O., Herzog, A., Vogt, U.F. and Schmidt, M.W., 2006.
Synthesis and characterisation of laboratory-charred grass straw (Oryza sativa) and chestnut wood (Castanea sativa) as reference materials for black carbon quantification. Organic Geochemistry, 37(11), pp.1629-1633. doi:10.1016/j.orggeochem.2006.07.003.
Harris, K., Gaskin, J., Bibens, B., Hilten, R., Das, K.C. and Chip, P., 2007, November. Effect of Feedstock and Production Method on Pyrolysis Char Properties for Use as an Agricultural Soil Amendment. In American Society Of Agronomy, Crop Science Society
Of America, And Soil Science Society Of America International Annual Meetings. New
Orleans, La. Nov (pp. 4-8). Harris, P.J., Liu, Z. and Suenaga, K., 2008. Imaging the atomic structure of activated
carbon. Journal of Physics: Condensed Matter, 20(36), p.362201. Harvey, O.R., Kuo, L.J., Zimmerman, A.R., Louchouarn, P., Amonette, J.E. and Herbert, B.E.,
2012. An index-based approach to assessing recalcitrance and soil carbon sequestration potential of engineered black carbons (biochars). Environmental science &
technology, 46(3), pp.1415-1421. doi:10.1021/es2040398. Hayden, H.L., Mele, P.M., Bougoure, D.S., Allan, C.Y., Norng, S., Piceno, Y.M., Brodie, E.L.,
DeSantis, T.Z., Andersen, G.L., Williams, A.L. and Hovenden, M.J., 2012. Changes in the microbial community structure of bacteria, archaea and fungi in response to elevated CO2 and warming in an Australian native grassland soil. Environmental
microbiology, 14(12), pp.3081-3096. doi:10.1111/j.1462-2920.2012.02855.x. Herath, H.M.S.K., Camps-Arbestain, M. and Hedley, M., 2013. Effect of biochar on soil
physical properties in two contrasting soils: an Alfisol and an Andisol. Geoderma, 209, pp.188-197. doi:10.1016/j.geoderma.2013.06.016.
Herrmann, R.F. and Shann, J.F., 1997. Microbial community changes during the composting of municipal solid waste. Microbial ecology, 33(1), pp.78-85. doi:10.1007/s002489900010.
Hockaday, W.C., Grannas, A.M., Kim, S. and Hatcher, P.G., 2006. Direct molecular evidence for the degradation and mobility of black carbon in soils from ultrahigh-resolution mass spectral analysis of dissolved organic matter from a fire-impacted forest soil. Organic
Geochemistry, 37(4), pp.501-510. doi:10.1016/j.orggeochem.2005.11.003. Hodgson, E.M., Nowakowski, D.J., Shield, I., Riche, A., Bridgwater, A.V., Clifton-Brown, J.C.
and Donnison, I.S., 2011. Variation in Miscanthus chemical composition and implications for conversion by pyrolysis and thermo-chemical bio-refining for fuels and chemicals. Bioresource technology, 102(3), pp.3411-3418. doi:10.1016/j.biortech.2010.10.017.
Imbeah, M., 1998. Composting piggery waste: a review. Bioresource Technology, 63(3), pp.197-203. http://www.prairieswine.com/pdf/3260.pdf.

173
Insam, H., and M. de Bertoldi. 2007. “Chapter 3 Microbiology of the Composting Process.” In Compost Science and Technology, edited by L.F. Diaz, M. De Bertoldi, W. Bidlingmaier, and E. Stentiford, 25–48. Amsterdam , The Netherlands: Elsevier. doi:10.1016/S1478-7482(07)80006-6.
Inyang, M. and Dickenson, E., 2015. The potential role of biochar in the removal of organic and microbial contaminants from potable and reuse water: a review. Chemosphere, 134, pp.232-240.
Iqbal, H., Garcia-Pérez, M. and Flury, M., 2015. Effect of biochar on leaching of organic carbon, nitrogen, and phosphorus from compost in bioretention systems. Science of the Total
Environment, 521, pp.37-45. Islam, M.K., Mondelli, D., Al Chami, Z., Mimiola, G. and Dumontet, S., 2012. Comparison of
maturity indices for composting different organic waste. Journal of Residuals Science &
Technology, 9(2). Jaafar, N.M., Clode, P.L. and Abbott, L.K., 2014. Microscopy observations of habitable space in
biochar for colonization by fungal hyphae from soil. Journal of Integrative
Agriculture, 13(3), pp.483-490. doi:10.1016/S2095-3119(13)60703-0. Jaafar, N.M., Clode, P.L. and Abbott, L.K., 2015. Biochar-soil interactions in four agricultural
soils. Pedosphere, 25(5), pp.729-736. doi:10.1016/S1002-0160(15)30054-0. Jahirul, M.I., Rasul, M.G., Chowdhury, A.A. and Ashwath, N., 2012. Biofuels production
through biomass pyrolysis—a technological review. Energies, 5(12), pp.4952-5001. doi:10.3390/en5124952.
Jindo, K., Sánchez-Monedero, M.A., Hernández, T., García, C., Furukawa, T., Matsumoto, K., Sonoki, T. and Bastida, F., 2012a. Biochar influences the microbial community structure during manure composting with agricultural wastes. Science of the total
environment, 416, pp.476-481. Jindo, K., Suto, K., Matsumoto, K., García, C., Sonoki, T. and Sanchez-Monedero, M.A., 2012b.
Chemical and biochemical characterisation of biochar-blended composts prepared from poultry manure. Bioresource technology, 110, pp.396-404.
Jones, D.L., Rousk, J., Edwards-Jones, G., DeLuca, T.H., Murphy, D.V., 2012. Biochar-mediated changes in soil quality and plant growth in a three year field trial. Soil Biology
and Biochemistry. 45, pp. 113-124. Joseph, S.D., Camps-Arbestain, M., Lin, Y., Munroe, P., Chia, C.H., Hook, J., Van Zwieten, L.,
Kimber, S., Cowie, A., Singh, B.P. and Lehmann, J., 2010. An investigation into the reactions of biochar in soil. Soil Research, 48(7), pp.501-515. doi:10.1071/SR10009.
Kammann, C.I., Schmidt, H.P., Messerschmidt, N., Linsel, S., Steffens, D., Müller, C., Koyro, H.W., Conte, P. and Joseph, S., 2015. Plant growth improvement mediated by nitrate capture in co-composted biochar. Scientific reports, 5, p.srep11080. doi:10.1038/srep11080.
Kersten, S. and Garcia-Pérez, M., 2013. Recent developments in fast pyrolysis of ligno-cellulosic materials. Current opinion in biotechnology, 24(3), pp.414-420. doi:10.1016/j.copbio.2013.04.003.
Khan, N., Clark, I., Sánchez-Monedero, M.A., Shea, S., Meier, S. and Bolan, N., 2014. Maturity indices in co-composting of chicken manure and sawdust with biochar. Bioresource
technology, 168, pp.245-251. Khan, N., Clark, I., Sánchez-Monedero, M.A., Shea, S., Meier, S., Qi, F., Kookana, R.S. and
Bolan, N., 2016. Physical and chemical properties of biochars co-composted with

174
biowastes and incubated with a chicken litter compost. Chemosphere, 142, pp.14-23. doi:10.1016/j.chemosphere.2015.05.065.
Khan, N., Clark, I., Sánchez-Monedero, M.A., Shea, S., Meier, S., Qi, F., Kookana, R.S. and Bolan, N., 2016. Physical and chemical properties of biochars co-composted with biowastes and incubated with a chicken litter compost. Chemosphere, 142, pp.14-23.
Kituyi, E., 2004. Towards sustainable production and use of charcoal in Kenya: exploring the potential in life cycle management approach. Journal of Cleaner Production, 12(8), pp.1047-1057.
Kobya, M., Demirbas, E., Senturk, E. and Ince, M., 2005. Adsorption of heavy metal ions from aqueous solutions by activated carbon prepared from apricot stone. Bioresource
technology, 96(13), pp.1518-1521. doi:10.1016/j.biortech.2004.12.005. Krishnan, Y., Bong, C.P.C., Azman, N.F., Zakaria, Z., Abdullah, N., Ho, C.S., Lee, C.T.,
Hansen, S.B. and Hara, H., 2017. Co-composting of palm empty fruit bunch and palm oil mill effluent: Microbial diversity and potential mitigation of greenhouse gas emission. Journal of Cleaner Production, 146, pp.94-100. doi:10.1016/j.jclepro.2016.08.118.
Laird, D., Fleming, P., Wang, B., Horton, R. and Karlen, D., 2010. Biochar impact on nutrient leaching from a Midwestern agricultural soil. Geoderma, 158(3), pp.436-442.
Laird, D.A., Rogovska, N.P., Garcia-Pérez, M., Collins, H.P., Streubel, J.D. and Smith, M., 2011. Pyrolysis and biochar–opportunities for distributed production and soil quality enhancement. In Sustainable Alternative Fuel Feedstock Opportunities, Challenges and
Roadmaps for Six US Regions, in Proceedings of the Sustainable Feedstocks for
Advanced Biofuels Workshop(pp. 257-281). edited by Braun Ross, L. Karlen Douglas, and Johnson Dewayne. Atlanta, GA: SWCS publisher. http://www.extension.org/pages/72947/recent-publications-about-biochar#.VYPACvlVikp.
Larney, F.J., Olson, A.F., DeMaere, P.R., Handerek, B.P. and Tovell, B.C., 2008. Nutrient and trace element changes during manure composting at four southern Alberta feedlots. Canadian journal of soil science, 88(1), pp.45-59. doi:10.4141/CJSS07044.
LeCroy, C., Masiello, C.A., Rudgers, J.A., Hockaday, W.C. and Silberg, J.J., 2013. Nitrogen, biochar, and mycorrhizae: alteration of the symbiosis and oxidation of the char surface. Soil Biology and Biochemistry, 58, pp.248-254.
Lee, J.W., Kidder, M., Evans, B.R., Paik, S., Buchanan Iii, A.C., Garten, C.T. and Brown, R.C., 2010. Characterization of biochars produced from cornstovers for soil amendment. Environmental Science & Technology, 44(20), pp.7970-7974. doi:10.1021/es101337x.
Lehmann, J., Gaunt, J. and Rondon, M., 2006. Bio-char sequestration in terrestrial ecosystems–a review. Mitigation and adaptation strategies for global change, 11(2), pp.395-419.
Lehmann, J., and Joseph, S. 2009. Biochar for Environmental Management: Science and
Technology | International Biochar Initiative. Earthscan, London, UK. http://www.biochar-international.org/projects/book.
Lei, F. and VanderGheynst, J.S., 2000. The effect of microbial inoculation and pH on microbial community structure changes during composting. Process Biochemistry, 35(9), pp.923-929. doi:10.1016/S0032-9592(99)00155-7.
Li, H., Duan, M., Gu, J., Zhang, Y., Qian, X., Ma, J., Zhang, R. and Wang, X., 2017. Effects of bamboo charcoal on antibiotic resistance genes during chicken manure

175
composting. Ecotoxicology and Environmental Safety, 140, pp.1-6. doi:10.1016/j.ecoenv.2017.01.007.
Lin, Y., Munroe, P., Joseph, S., Henderson, R. and Ziolkowski, A., 2012. Water extractable organic carbon in untreated and chemical treated biochars. Chemosphere, 87(2), pp.151-157. doi:10.1016/j.chemosphere.2011.12.007.
Lua, A.C., Yang, T. and Guo, J., 2004. Effects of pyrolysis conditions on the properties of activated carbons prepared from pistachio-nut shells. Journal of analytical and applied
pyrolysis, 72(2), pp.279-287. doi:10.1016/j.jaap.2004.08.001. Ma, J., Wilson, K., Zhao, Q., Yorgey, G., Frear, C., 2013. Odor in Commercial Scale Compost:
Literature Review and Critical Analysis, Washington State Department of Ecology. Maia, Claudia, Beata, Madaria, Etelvino, Novotny. 2011. Advances in Biochar Research in
Brazil. Dynamic Soil, Dynamic Plant. Major, J., Lehmann, J., Rondon, M. and Goodale, C., 2010. Fate of soil‐applied black carbon:
downward migration, leaching and soil respiration. Global Change Biology, 16(4), pp.1366-1379. doi:10.1111/j.1365-2486.2009.02044.x.
Mangue, P.D., 2000. Review of the existing studies related to fuelwood and/or charcoal in Mozambique. EC-FAO Partnership Programme (1998–2002), Project GCP/INT/679/EC.
Mašek, O., Brownsort, P., Cross, A. and Sohi, S., 2013. Influence of production conditions on the yield and environmental stability of biochar. Fuel, 103, pp.151-155. doi:10.1016/j.fuel.2011.08.044.
Masiello, C.A., Chen, Y., Gao, X., Liu, S., Cheng, H.Y., Bennett, M.R., Rudgers, J.A., Wagner, D.S., Zygourakis, K. and Silberg, J.J., 2013. Biochar and microbial signaling: production conditions determine effects on microbial communication. Environmental science &
technology, 47(20), pp.11496-11503. Masiello, C.A., Chen, Y., Gao, X., Liu, S., Cheng, H.Y., Bennett, M.R., Rudgers, J.A., Wagner,
D.S., Zygourakis, K. and Silberg, J.J., 2013. Biochar and microbial signaling: production conditions determine effects on microbial communication. Environmental science &
technology, 47(20), pp.11496-11503. doi:10.1021/es401458s. McDonald-Wharry, J.S., Manley-Harris, M. and Pickering, K.L., 2016. Reviewing, Combining,
and Updating the Models for the Nanostructure of Non-Graphitizing Carbons Produced from Oxygen-Containing Precursors. Energy & Fuels, 30(10), pp.7811-7826. doi:10.1021/acs.energyfuels.6b00917
McKendry, P., 2002. Energy production from biomass (part 1): overview of biomass. Bioresource technology, 83(1), pp.37-46. doi:10.1016/S0960-8524(01)00118-3.
Mohan, D., Pittman, C.U. and Steele, P.H., 2006. Pyrolysis of wood/biomass for bio-oil: a critical review. Energy & fuels, 20(3), pp.848-889. doi:10.1021/ef0502397.
Norgate, T. and Langberg, D., 2009. Environmental and economic aspects of charcoal use in steelmaking. ISIJ international, 49(4), pp.587-595.
Novak, J.M., Busscher, W.J., Laird, D.L., Ahmedna, M., Watts, D.W. and Niandou, M.A., 2009. Impact of biochar amendment on fertility of a southeastern coastal plain soil. Soil
science, 174(2), pp.105-112. doi:10.1097/SS.0b013e3181981d9a. Ogawa, M. and Okimori, Y., 2010. Pioneering works in biochar research, Japan. Soil
Research, 48(7), pp.489-500. Osswald, S., Portet, C., Gogotsi, Y., Laudisio, G., Singer, J.P., Fischer, J.E., Sokolov, V.V.,
Kukushkina, J.A. and Kravchik, A.E., 2009. Porosity control in nanoporous carbide-

176
derived carbon by oxidation in air and carbon dioxide. Journal of Solid State
Chemistry, 182(7), pp.1733-1741. doi:10.1016/j.jssc.2009.04.017. Paris, O., Zollfrank, C. and Zickler, G.A., 2005. Decomposition and carbonisation of wood
biopolymers—a microstructural study of softwood pyrolysis. Carbon, 43(1), pp.53-66. doi:10.1016/j.carbon.2004.08.034.
Park, S.J. and Kim, B.J., 2005. Ammonia removal of activated carbon fibers produced by oxyfluorination. Journal of colloid and interface science, 291(2), pp.597-599. doi:10.1016/j.jcis.2005.05.012.
Pollard, S.J.T., Fowler, G.D., Sollars, C.J. and Perry, R., 1992. Low-cost adsorbents for waste and wastewater treatment: a review. Science of the Total Environment, 116(1-2), pp.31-52.
Prost, K., Borchard, N., Siemens, J., Kautz, T., Séquaris, J.M., Möller, A. and Amelung, W., 2013. Biochar affected by composting with farmyard manure. Journal of environmental
quality, 42(1), pp.164-172. doi:10.2134/jeq2012.0064. Purakayastha, T.J., Kumari, S. and Pathak, H., 2015. Characterisation, stability, and microbial
effects of four biochars produced from crop residues. Geoderma, 239, pp.293-303. doi:10.1016/j.geoderma.2014.11.009.
Quilliam, R.S., Rangecroft, S., Emmett, B.A., Deluca, T.H. and Jones, D.L., 2013. Is biochar a source or sink for polycyclic aromatic hydrocarbon (PAH) compounds in agricultural soils?. Gcb Bioenergy, 5(2), pp.96-103. doi:10.1111/gcbb.12007.
Quin, P.R., Cowie, A.L., Flavel, R.J., Keen, B.P., Macdonald, L.M., Morris, S.G., Singh, B.P., Young, I.M. and Van Zwieten, L., 2014. Oil mallee biochar improves soil structural properties—a study with x-ray micro-CT. Agriculture, ecosystems & environment, 191, pp.142-149. doi:10.1016/j.agee.2014.03.022.
Rivera‐Utrilla, J., Bautista‐Toledo, I., Ferro‐García, M.A. and Moreno‐Castilla, C., 2001. Activated carbon surface modifications by adsorption of bacteria and their effect on aqueous lead adsorption. Journal of Chemical Technology and biotechnology, 76(12), pp.1209-1215. doi:10.1002/jctb.506.
Rizwan, M., Ali, S., Qayyum, M.F., Ibrahim, M., Zia-ur-Rehman, M., Abbas, T. and Ok, Y.S., 2016. Mechanisms of biochar-mediated alleviation of toxicity of trace elements in plants: a critical review. Environmental Science and Pollution Research, 23(3), pp.2230-2248.
Rondon, M.A., Lehmann, J., Ramírez, J. and Hurtado, M., 2007. Biological nitrogen fixation by common beans (Phaseolus vulgaris L.) increases with bio-char additions. Biology and
fertility of soils, 43(6), pp.699-708. doi:10.1007/s00374-006-0152-z. Ronsse, F., Van Hecke, S., Dickinson, D. and Prins, W., 2013. Production and characterization
of slow pyrolysis biochar: influence of feedstock type and pyrolysis conditions. Gcb
Bioenergy, 5(2), pp.104-115. doi:10.1111/gcbb.12018. Sakuma, M., Amano, Y. and Machida, M., 2011. Preparation of Bamboo Activated Carbon using
Low-temperature Carbonization and Air Oxidation. Journal of the Japan Society of
Material Cycles and Waste Management, 22(6), pp.337-343. doi:10.3985/jjsmcwm.22.337.
San Miguel, G., Lambert, S.D. and Graham, N.J., 2006. A practical review of the performance of organic and inorganic adsorbents for the treatment of contaminated waters. Journal of
Chemical Technology and Biotechnology, 81(10), pp.1685-1696. Sánchez-García, M., Alburquerque, J.A., Sánchez-Monedero, M.A., Roig, A. and Cayuela, M.L.,
2015. Biochar accelerates organic matter degradation and enhances N mineralisation

177
during composting of poultry manure without a relevant impact on gas emissions. Bioresource technology, 192, pp.272-279.
Schulz, H., Dunst, G. and Glaser, B., 2013. Positive effects of composted biochar on plant growth and soil fertility. Agronomy for sustainable development, 33(4), pp.817-827.
Schulz, H., Dunst, G. and Glaser, B., 2014. No effect level of co-composted biochar on plant growth and soil properties in a greenhouse experiment. Agronomy, 4(1), pp.34-51.
Sharma, R.K., Wooten, J.B., Baliga, V.L., Lin, X., Chan, W.G. and Hajaligol, M.R., 2004. Characterization of chars from pyrolysis of lignin. Fuel, 83(11), pp.1469-1482. doi:10.1016/j.fuel.2003.11.015.
Shinn, J.H., 1984. From coal to single-stage and two-stage products: a reactive model of coal structure. Fuel, 63(9), pp.1187-1196.
Sika, M.P., 2012. Effect of biochar on chemistry, nutrient uptake and fertilizer mobility in sandy
soil (Doctoral dissertation, Stellenbosch: Stellenbosch University). Singh, B.P., Cowie, A.L. and Smernik, R.J., 2012. Biochar carbon stability in a clayey soil as a
function of feedstock and pyrolysis temperature. Environmental Science &
Technology, 46(21), pp.11770-11778. doi:10.1021/es302545b. Sohi, S., Lopez-Capel, E., Krull, E. and Bol, R., 2009. Biochar, climate change and soil: A
review to guide future research. CSIRO Land and Water Science Report, 5(09), pp.17-31. Song, W. and Guo, M., 2012. Quality variations of poultry litter biochar generated at different
pyrolysis temperatures. Journal of analytical and applied pyrolysis, 94, pp.138-145. doi:10.1016/j.jaap.2011.11.018.
Sonoki, T., Furukawa, T., Jindo, K., Suto, K., Aoyama, M. and Sánchez‐Monedero, M.Á., 2013. Influence of biochar addition on methane metabolism during thermophilic phase of composting. Journal of basic microbiology, 53(7), pp.617-621. doi:10.1002/jobm.201200096.
Sorrenti, G., Masiello, C.A., Dugan, B. and Toselli, M., 2016. Biochar physico-chemical properties as affected by environmental exposure. Science of The Total
Environment, 563, pp.237-246. doi:10.1016/j.scitotenv.2016.03.245. Spokas, K.A., Baker, J.M. and Reicosky, D.C., 2010. Ethylene: potential key for biochar
amendment impacts. Plant and Soil, 333(1-2), pp.443-452. doi:10.1007/s11104-010-0359-5.
Spokas, K.A., Novak, J.M., Masiello, C.A., Johnson, M.G., Colosky, E.C., Ippolito, J.A. and Trigo, C., 2014. Physical disintegration of biochar: an overlooked process. Environmental Science & Technology Letters, 1(8), pp.326-332. doi:10.1021/ez500199t.
Stassen, H.E., 2015. Current Issues in Charcoal Production and Use. Biomass Power for the
World, p.425. Steiner, C., Das, K.C., Melear, N. and Lakly, D., 2010. Reducing nitrogen loss during poultry
litter composting using biochar. Journal of environmental quality, 39(4), pp.1236-1242. Steiner, C., Melear, N., Harris, K. and Das, K.C., 2011. Biochar as bulking agent for poultry
litter composting. Carbon Management, 2(3), pp.227-230. doi:10.4155/cmt.11.15. Strom, P.F., 1985. Identification of thermophilic bacteria in solid-waste composting. Applied and
environmental microbiology, 50(4), pp.906-913. http://www.ncbi.nlm.nih.gov/pubmed/4083886.
Strelko, V., Malik, D.J. and Streat, M., 2002. Characterisation of the surface of oxidised carbon adsorbents. Carbon, 40(1), pp.95-104.

178
Strelko, V. and Malik, D.J., 2002. Characterization and metal sorptive properties of oxidized active carbon. Journal of colloid and interface science, 250(1), pp.213-220. doi:10.1006/jcis.2002.8313.
Suliman, W., Harsh, J.B., Abu-Lail, N.I., Fortuna, A.M., Dallmeyer, I. and Garcia-Pérez, M., 2016. Influence of feedstock source and pyrolysis temperature on biochar bulk and surface properties. Biomass and Bioenergy, 84, pp.37-48. doi:10.1016/j.biombioe.2015.11.010.
Suliman, W., Harsh, J.B., Fortuna, A.M., Garcia-Pé rez, M. and Abu-Lail, N.I., 2017. Quantitative Effects of Biochar Oxidation and Pyrolysis
Temperature on the Transport of Pathogenic and Nonpathogenic Escherichia coli in Biochar-Amended Sand Columns. Environmental Science & Technology, 51(9), pp.5071-5081. doi:10.1021/acs.est.6b04535.
Sunar, N.M., Stentiford, E.I., Stewart, D.I. and Fletcher, L.A. 2009. The Process and Pathogen Behaviour in Composting: A Review. Proceeding UMT-MSD 2009 Post Graduate Seminar 2009. Universiti Malaysia Terengganu, Malaysian Student Department UK & Institute for Transport Studies University of Leeds. pp: 78-87.
Tan, X.F., Liu, Y.G., Gu, Y.L., Xu, Y., Zeng, G.M., Hu, X.J., Liu, S.B., Wang, X., Liu, S.M. and Li, J., 2016. Biochar-based nano-composites for the decontamination of wastewater: A review. Bioresource technology, 212, pp.318-333.
Tan, X., Liu, Y., Gu, Y., Zeng, G., Hu, X., Wang, X., Hu, X., Guo, Y., Zeng, X. and Sun, Z., 2015. Biochar amendment to lead‐contaminated soil: Effects on fluorescein diacetate hydrolytic activity and phytotoxicity to rice. Environmental Toxicology and
Chemistry, 34(9), pp.1962-1968. Taghizadeh-Toosi, A., Clough, T.J., Sherlock, R.R. and Condron, L.M., 2012. Biochar adsorbed
ammonia is bioavailable. Plant and soil, 350(1-2), pp.57-69. doi:10.1007/s11104-011-0870-3.
Tang, J.C., Kanamori, T., Inoue, Y., Yasuta, T., Yoshida, S. and Katayama, A., 2004. Changes in the microbial community structure during thermophilic composting of manure as detected by the quinone profile method. Process Biochemistry, 39(12), pp.1999-2006. doi:10.1016/j.procbio.2003.09.029.
Theeba, M., Bachmann, R.T., Illani, Z.I., Zulkefli, M., Husni, M.H.A. and Samsuri, A.W., 2012. Characterization of local mill Rice Husk Charcoal and its effect on compost properties. Malaysian Journal of Soil Science, 16, pp.89-102. http://www.biochar-international.org/node/4421.
Tiquia, S.M., 2002. Evolution of extracellular enzyme activities during manure composting. Journal of Applied Microbiology, 92(4), pp.764-775. http://www.ncbi.nlm.nih.gov/pubmed/11966919.
Trossero M., Domac J., Siemons R. 2008. Industrial Charcoal Production. TCP/CRO/3101 (A) Development of a sustainable char industry. FAO, Zagreb, Croatia.
Uzoma, K.C., Inoue, M., Andry, H., Zahoor, A. and Nishihara, E., 2011. Influence of biochar application on sandy soil hydraulic properties and nutrient retention. J. Food Agric.
Environ, 9(3-4), pp.1137-1143. Valdés, H., Sánchez-Polo, M., Rivera-Utrilla, J. and Zaror, C.A., 2002. Effect of ozone treatment
on surface properties of activated carbon. Langmuir, 18(6), pp.2111-2116. doi:10.1021/la010920a.

179
Vamvuka, D., 2011. Bio‐oil, solid and gaseous biofuels from biomass pyrolysis processes—An overview. International Journal of Energy Research, 35(10), pp.835-862. doi:10.1002/er.1804.
Vandecasteele, B., Sinicco, T., D'Hose, T., Nest, T.V. and Mondini, C., 2016. Biochar amendment before or after composting affects compost quality and N losses, but not P plant uptake. Journal of environmental management, 168, pp.200-209.
Verheijen, F., Jeffery, S., Bastos, A.C., Van der Velde, M. and Diafas, I., 2010. Biochar application to soils. A critical scientific review of effects on soil properties, processes,
and functions. EUR, 24099, p.162. doi:10.2788/472. Wang, R., Amano, Y. and Machida, M., 2013b. Surface properties and water vapor adsorption–
desorption characteristics of bamboo-based activated carbon. Journal of analytical and
applied pyrolysis, 104, pp.667-674. doi:10.1016/j.jaap.2013.04.013. Wang, Z., Cao, J. and Wang, J., 2009. Pyrolytic characteristics of pine wood in a slowly heating
and gas sweeping fixed-bed reactor. Journal of Analytical and Applied Pyrolysis, 84(2), pp.179-184. doi:10.1016/j.jaap.2009.02.001.
Wang, H., He, Z., Lu, Z., Zhou, J., Van Nostrand, J.D., Xu, X. and Zhang, Z., 2012. Genetic linkage of soil carbon pools and microbial functions in subtropical freshwater wetlands in response to experimental warming. Applied and environmental microbiology, 78(21), pp.7652-7661. doi:10.1128/AEM.01602-12.
Wang, Z., McDonald, A.G., Westerhof, R.J., Kersten, S.R., Cuba-Torres, C.M., Ha, S., Pecha, B. and Garcia-Pérez, M., 2013a. Effect of cellulose crystallinity on the formation of a liquid intermediate and on product distribution during pyrolysis. Journal of analytical and
applied pyrolysis, 100, pp.56-66. doi:10.1016/j.jaap.2012.11.017. Wang, J., Xiong, Z. and Kuzyakov, Y., 2016. Biochar stability in soil: meta‐analysis of
decomposition and priming effects. Gcb Bioenergy, 8(3), pp.512-523. doi:10.1111/gcbb.12266.
Warnock, D.D., Lehmann, J., Kuyper, T.W. and Rillig, M.C., 2007. Mycorrhizal responses to biochar in soil–concepts and mechanisms. Plant and soil, 300(1-2), pp.9-20. doi:10.1007/s11104-007-9391-5.
Wei, L., Shutao, W., Jin, Z. and Tong, X., 2014. Biochar influences the microbial community structure during tomato stalk composting with chicken manure. Bioresource
technology, 154, pp.148-154. Woolf, D., Amonette, J.E., Street-Perrott, F.A., Lehmann, J. and Joseph, S., 2010. Sustainable
biochar to mitigate global climate change. Nature communications, 1, p.1. OPEN ACCESS online at: www.nature.com/naturecommunications
Xu, H.J., Wang, X.H., Li, H., Yao, H.Y., Su, J.Q. and Zhu, Y.G., 2014. Biochar impacts soil microbial community composition and nitrogen cycling in an acidic soil planted with rape. Environmental science & technology, 48(16), pp.9391-9399. doi:10.1021/es5021058.
Yamashita, N. and Machida, M., 2011. Carbonization of bamboo and consecutive low temperature air activation. Wood science and technology, 45(4), pp.801-808. doi:10.1007/s00226-010-0372-0.
Yang, F., Zhao, L., Gao, B., Xu, X. and Cao, X., 2016. The interfacial behavior between biochar and soil minerals and its effect on biochar stability. Environmental science &
technology, 50(5), pp.2264-2271. doi:10.1021/acs.est.5b03656.

180
Zhang, L., Ma, H., Zhang, H., Xun, L., Chen, G. and Wang, L., 2015. Thermomyces lanuginosus is the dominant fungus in maize straw composts. Bioresource technology, 197, pp.266-275. doi:10.1016/j.biortech.2015.08.089.
Zhang, L. and Sun, X., 2014. Changes in physical, chemical, and microbiological properties during the two-stage co-composting of green waste with spent mushroom compost and biochar. Bioresource technology, 171, pp.274-284.
Zhang, L., Zeng, G., Dong, H., Chen, Y., Zhang, J., Yan, M., Zhu, Y., Yuan, Y., Xie, Y. and Huang, Z., 2017. The impact of silver nanoparticles on the co-composting of sewage sludge and agricultural waste: Evolutions of organic matter and nitrogen. Bioresource
Technology, 230, pp.132-139. doi:10.1016/j.biortech.2017.01.032. Zhang, Z.Y., Jun, M., Shu, D. and Chen, W.F., 2014. Effect of biochar on relieving cadmium
stress and reducing accumulation in super japonica rice. Journal of Integrative
Agriculture, 13(3), pp.547-553. Zhao, L., Cao, X., Mašek, O. and Zimmerman, A., 2013. Heterogeneity of biochar properties as
a function of feedstock sources and production temperatures. Journal of hazardous
materials, 256, pp.1-9. doi:10.1016/j.jhazmat.2013.04.015. Zheng, R.L., Cai, C., Liang, J.H., Huang, Q., Chen, Z., Huang, Y.Z., Arp, H.P.H. and Sun, G.X.,
2012. The effects of biochars from rice residue on the formation of iron plaque and the accumulation of Cd, Zn, Pb, As in rice (Oryza sativa L.) seedlings. Chemosphere, 89(7), pp.856-862.
Zhou, S., Pecha, B., van Kuppevelt, M., McDonald, A.G. and Garcia-Pérez, M., 2014. Slow and fast pyrolysis of Douglas-fir lignin: Importance of liquid-intermediate formation on the distribution of products. biomass and bioenergy, 66, pp.398-409. doi:10.1016/j.biombioe.2014.03.064.
Zhu, X., Chen, B., Zhu, L. and Xing, B., 2017. Effects and mechanisms of biochar-microbe interactions in soil improvement and pollution remediation: A review. Environmental
Pollution, 227, pp.98-115. doi:10.1016/j.envpol.2017.04.032. Zimmerman, A.R., 2010. Abiotic and Microbial Oxidation of Laboratory-Produced Black
Carbon (Biochar). Environ. Sci. Technol. 44 (4), pp. 1295-1301.

181
9. Impact of Biochar on Composition and Properties of Herbs: A Review
David R. Gang
9.1 Abstract
An important component of the Washington State Solid and Hazardous Waste Plan (June, 2015) is Goal SWM 24 “Diversified end-use markets will be in place for recycled organic products.” One approach to encourage diversified end-use markets for organic products is to increase adoption of more effective composts by a wider variety of organic farmers. This requires a clearer picture of the existing body of knowledge regarding compost utilization in specialty crops produced in Washington State. Moreover, it is clear that interest in the development of novel or designer composts is growing worldwide. Addition of biochar as an amendment either at the start or the end of the composting process is of particular interest, as it can have a significant impact on the composting process, dramatically altering emission profiles and volumes. However, the impact of such amendments on downstream agriculture is not yet well defined. In particular, a better understanding of how amendments like biochar affect compost quality and plant yield, when applied in either organic or conventional cropping systems, is critically needed. The purpose of this chapter is to outline the current state of knowledge, in general, related to biochar impact on plant growth, when used either alone or in combination with compost, or when co-composted. General trends reported in a growing series of review articles will be outlined, along with many specific examples that point out areas where further research is required. Although some investigations have pointed to potential detrimental effects of applying biochar from particular sources to certain crop species grown under specific conditions, mounting evidence points to a general overall positive impact of biochar addition to soils, particularly when co-composted. This positive impact has been observed in both tropical and temperate regions, for staple grains, tree crops, and herbaceous species and other specialty crops. The caveat that must be remembered, however, is that not all biochars are equal, neither are all composts or soils, and potential permutations of those three specific biochar:compost:soil combinations need to be evaluated for each individual plant species, perhaps even each cultivar, of interest.
9.2 Background
The term “biochar” was introduced about 20 years ago (mentioned perhaps first by Karaosmanoglu et al. [2000]) to describe charcoals that are derived from controlled pyrolysis of biological materials, such as wood, straw, or biowaste products. Although biochars or their equivalents have been used for millennia by humans in agriculture, much is still not understood about how they impact plant growth and productivity. Having typically very high carbon to nitrogen (C:N) ratios, biochars are not believed to be particularly good fertilizers, at least as far as their ability to supply nitrogen. However, they are believed to have strong plant growth-promoting properties, at least in some cases. In addition to their increasingly common use as a soil amendment to improve crop productivity, biochars have been used in a variety of

182
applications, as catalysts in fuel cells, as a contaminant adsorbent in gas storage, and as an activated carbon (Qian et al., 2015). Biochar is a broad category of products that are derived from a large variety of source materials. Biochar can have a large range of properties and, therefore, can have a large range of possible applications. The source materials can be agricultural waste (e.g., corn stover, wheat straw, old hay, orchard prunings, olive husks, leaf matter), forestry by-products (e.g., bark, wood chips, sawdust, small branches), pulp and paper waste, other organic waste materials (e.g., manure, water treatment solids), or municipal waste (Atkinson et al., 2010; Cha et al., 2016; Ekebafe et al., 2015; Gul et al., 2015; Ogawa and Okimori, 2010; Sohi et al., 2010). As described in Chapters 5, 6 & 7 of this report, biochars are produced by pyrolysis, i.e., heating biomass to a temperature between 400 and 800ºC, typically, to drive off water and other volatiles and leave a charred material. The specific temperature and other parameters (e.g., length of process, water content at start, temperature ramp time, pressure) of the charring process have a large impact on the particular biochar’s texture (fine vs. rough) and other properties. Biochars typically have a mildly alkaline pH, but can be slightly acidic, depending on source material and the exact production process (Fidel et al., 2017). Nitrogen content of biochar varies widely but is typically fairly low. Content of volatile organic compounds (VOCs) present in the biochar also varies widely, as do levels of potassium, phosphorus, and heavy metals (e.g., cadmium, chromium, zinc, nickel), among other properties (Buss et al., 2015; Buss et al., 2016a; Buss et al., 2016b; Buss and Mašek, 2014; Tsai et al., 2012; Xu et al., 2014; Xu et al., 2016a; Xu et al., 2016b). Biochars can be produced in large industrial-scale furnaces or in open pits within an orchard or on a family farm. Their diversity is potentially quite staggering. Thus, it is critical when drawing conclusions about the suitability of “biochar” for use in agriculture to not use results from just a few studies as the basis for grand conclusions. It’s also important to avoid using analysis methods that are inadequate to identify actual trends in benefits of biochar application. Unfortunately, that has been done quite often in the past few years (Jeffery et al., 2017; Jeffery et al., 2015a; Jeffery et al., 2015b; Jeffery et al., 2016; Jeffery et al., 2011). Biochars have been applied to a number of plants (typically crops or trees, although in some cases grassland grasses) in what is becoming a large and exponentially growing number of investigations. In those investigations, the biochar may or may not have been used in conjunction with compost. Thus, the biochar is usually applied either: (1) by itself as a single soil amendment; (2) in a combined amendment with synthetic or organic fertilizer; (3) mixed with cured compost; or (4) as part of cured compost after having been run through the composting process (co-composted). The biochar/compost is usually mixed into the soil (most often) or added to the soil surface as top dressing (less common). Some investigations have compared the impact of such treatments on plant properties, such as plant growth, biomass accumulation, or crop yield. Results of these studies have been mixed. In some cases, little or no positive benefit to the plants was reported. In other cases, significant positive impacts were seen. In rare cases, negative impacts were claimed. Despite the wide variety of results in these studies, interest in the application of biochar has grown exponentially over the past decade. Figure 9.1 illustrates this point by displaying the increase within the scientific literature of both publications and literature citations related to searches of the term biochar along with plant productivity, growth, compost, or co-composting. Data for each graph were generated using the Web of Science Citation Report tool (https://apps.webofknowledge.com/).
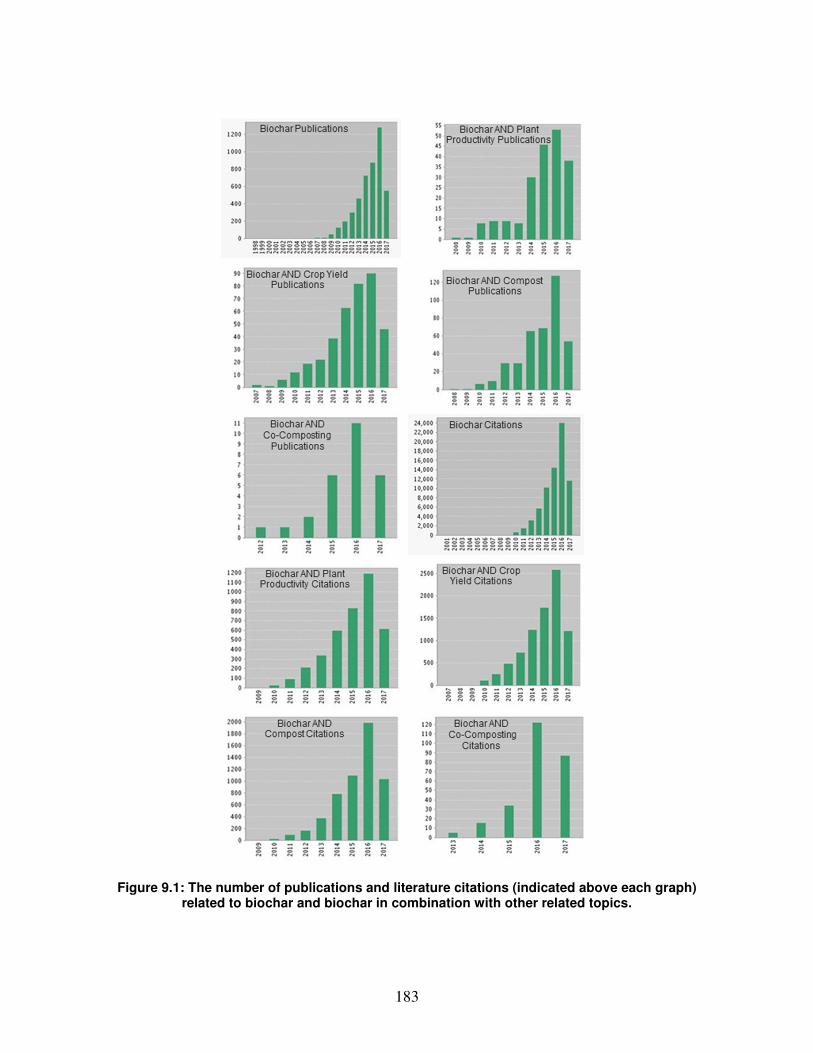
183
Figure 9.1: The number of publications and literature citations (indicated above each graph)
related to biochar and biochar in combination with other related topics.

184
It is certainly the case that not all biochars have the same properties; the same is true for composts. Feedstock source materials and specific parameters used in the processes of biochar production or composting can have significant impacts on the properties of the end products, as discussed elsewhere in this report. Much has been learned about many of these properties, from the physicochemical perspective. What is still lacking is a full understanding of the impacts of these specific properties or characteristics, in terms of plant productivity and growth, and the mechanisms that cause these impacts. Thus, it can be expected that different biochar-plant interactions lead to different outcomes. In some cases, significant, even quite large, increases in plant productivity and/or growth have been observed. In other cases, reduction in plant growth was reported when biochar was applied, either alone or in combination with certain composts. The goal of this review chapter is to provide a better understanding of the “big picture” of biochar application and its potential benefits for plants. Of particular interest, is the use of biochar during the composting process (co-composting). Some investigations have suggested that the resulting compost may have beneficial properties for plant growth, at least for certain compost types generated using certain biochar types and applied to specific plants. However, as will be explained below, that picture is not completely clear. Other reports have suggested that for other biochar:compost:plant combinations, either no clear benefits exist or a slight reduction in plant performance may occur. Examples of this will be outlined below, with the goal of pointing out why such differences may have been observed by different researchers. What is clear, however, is that co-composting biochar quite often (if not almost always) causes significant changes to the (bio)chemical processes that occur during the composting process. This usually leads to a significant reduction in emissions of noxious odors and greenhouse gases, which confers an important benefit to the composting industry. Thus, even if there is a net zero gain on plant performance when biochar is co-composted, there is a significant positive benefit for both the composting industry and the environment. The only real concern that should be considered with regards to co-composting biochar is whether negative impacts on plant performance might be produced using specific biochar:compost combinations. Despite the potential benefits that many investigations have suggested may result from the application of biochar and, particularly, co-composted biochar application in agriculture, parameters are lacking for the development of an industry standard for co-composted biochar for different applications in organic and non-organic agriculture. The development and implementation of such “designer biochar-amended composts” is a goal of research in Washington State, as such developments have the potential to enhance soil fertility, resilience, and overall quality of organic cropping systems, all while establishing a connection between three sustainable practices for the mutual benefit of multiple industries – waste from municipal, agricultural and the forest industries will be made available for conversion into biochar, which will enhance the quality of compost for higher yields in (organic) farming, all while reducing odor emissions and capturing greenhouse gases. The purpose of this chapter is to outline briefly what is known in general about the impacts of biochars on plant growth and how application of biochar in combination with compost (either mixed after composting or co-composted) affects plants in general, with particular emphasis on certain areas important for plant performance (e.g., crop yield, disease resistance, and abiotic stress resistance). A comprehensive review of all of the literature in this field is now impossible,

185
due to the very large number of publications available (Figure 9.1). Thus, each and every investigation that has been performed related to biochar application cannot be detailed in this chapter. Instead, general trends that have been observed, with specific examples, will be outlined, to give an accurate picture of the general state of knowledge in this area. The rest of the chapter will then focus specifically on biochars’ impacts on herbs, plants used not only for their flavor-imparting features, but also often because of their potential or real health promoting, even medicinal properties. Herbs are high-value crops and often grown under organic conditions, which make them particularly well suited to be recipients of high-value organic amendments. In addition, comparisons between the application of straight biochar to compost and to co-composted biochar will be discussed along the way where such information is available.
9.3 Biochar and plant growth meta-analyses
Six years ago, an initial meta-analysis was performed that compared all of the studies that had been published up until that time related to the effect of biochar on plant productivity or crop yield (Jeffery et al., 2011). At that time, only 23 such reports were available, of which only 15 provided sufficient information for inclusion in the meta-analysis (Asai et al., 2009; Blackwell et al., 2007; Chan et al., 2008; Chan et al., 2007; Chidumayo, 1994; Gaskin et al., 2010; Hossain et al., 2010; Ishii and Kadoya, 1994; Kimetu and Lehmann, 2010; Lehmann et al., 2003; Major et al., 2010; Nehls, 2002; Steiner et al., 2010; Van Zwieten et al., 2014; Yamato et al., 2006). Results from an additional unpublished study included in the meta-analysis have still not been published, and thus it is not cited here. In the meta-analysis, Jeffery et al. found that biochar amendment had a wide range of effects, some positive and some negative, depending on the type of biochar used and various soil parameters. This analysis was an admirable first attempt to evaluate the overall impact of biochar application on plant productivity. The researchers grouped all of these studies together, compared them across different parameters and came up with what they called a net 10% grand average positive effect of biochar amendment. However, due to the vast variation in biochar source materials (e.g., Acacia bark, paper pulp and wood chips or wood or pine chips, peanut hulls, green waste, poultry litter, and biosolids or wastewater sludge), soil properties (e.g., differing textures, range of pH), location of studies (e.g., tropical, subtropical, temperate), plants studied (e.g., staple grasses: maize, wheat, rice, sorghum; trees: bauhinia, satsuma mandarin; vegetables: radish, tomato, cowpea), of biochar application rates (ranging from 1 to 100 tons per hectare), and of other parameters (such as whether the study was a field trial or performed in pots in a greenhouse), it is quite frankly impossible to draw any real conclusions regarding efficacy of biochar in general from such a small sample size. For example, in that meta-analysis when biochar source materials were compared (Jeffery et al., 2011), the most positive impacts were seen with Acacia bark-based biochar (39% increase in productivity) and the most negative with biosolids-based biochar (10% reduction in productivity). But, due to so many other variables between all of the studies compared, it is hard to be convinced of what the real differences were both in response and mechanism. The best conclusion that can be drawn from that meta-analysis is that impacts vary by biochar type and plant type. Four years later, the authors updated their analysis (Jeffery et al., 2015a), and included data from 60 publications, including several from the “gray literature,” in other words non-peer reviewed reports or preliminary findings presented at conferences. In this analysis, the same grand average effect (10% positive) was determined as for the previous study by this group, although the range

186
of individual mean results was larger (from -28% to 39%). In addition, some specific soil and environmental parameters were more finely determined. As stated in the article: “The greatest (positive) effects with regard to soil analyses were seen in acidic (14%) and neutral pH soils (13%), and in soils with a coarse (10%) or medium texture (13%).” This suggested to the authors that biochar addition improved water holding capacity of the soil as well as nutrient availability. The porous nature of biochar could explain the first conclusion, but how exactly biochar improved the latter was not clear. More recently, Jeffery et al. (2017) used a similar meta-analysis approach and claimed that although biochar amendment had a positive impact on crops grown in the tropics, it had no positive (and, indeed, a slight negative) impact on crops grown in temperate regions. Based on a quick perusal of the scientific literature, it is hard to see how such a claim can be made (Atkinson et al., 2010). Biederman and Harpole (2013) performed a different meta-analysis, this time on 371 studies from 114 published manuscripts, and found a very different story compared to the work by Jeffery et al. Whereas Jeffery et al. (2017) continue to claim that biochar only impacts (and only slightly) plants grown in the tropics, Biederman and Harpole (2013) found that by and large plants benefited from biochar addition (regardless of whether they are grown in the tropics or in temperate regions), although the extent of those benefits varied depending on parameters considered, and there are indeed exceptions. They evaluated a large number of parameters impacting plant productivity that could potentially be affected by biochar addition. Table 9.1 lists the parameters that were evaluated and indicates whether a net positive or no benefit was observed for each parameter. Although this list is by no means exhaustive, it provides a good overall picture of how biochar may impact plant growth. None of these general parameters were impacted negatively. The general conclusion that Biederman and Harpole (2013) reached is that “biochar holds promise in being a win-win-win solution to energy, carbon storage, and ecosystem function.” The same has been concluded for the utilization of biochar composites, including co-composted biochar (Ekebafe et al., 2015).
Table 9.1: Parameters evaluated for impact by biochar application relative to controls
Positive Benefit No Benefit aboveground productivity belowground productivity
crop yield ratio of aboveground:belowground biomass
soil microbial biomass mycorrhizal colonization of roots
rhizobia nodulation plant tissue nitrogen (N)
plant potassium (K) tissue concentration soil phosphorus (P) concentration
soil phosphorus (P) soil inorganic nitrogen (N)
soil pH (increased in acid soils) soil potassium (K)
total soil nitrogen (N) total soil carbon (C)
An additional meta-analysis was performed by Liu et al. (2013) at about the same time as that by Biederman and Harpole (2013), and was conducted in a manner that was similar to that of Jeffery et al. (2011), but with a focus on different parameters. In Liu et al. (2013), 103 publications (published before April 2013) that contained data related to biochar’s impact on plant productivity were analyzed. Emphasis was placed on comparing pot experiments to field

187
experiments under different environmental conditions (e.g., rice paddy vs. dryland vs. field) and evaluating biomass and yield. This analysis evaluated mostly crop species (maize, wheat, rice, legumes, and vegetables) and grasses, in other words plants that matter the most for worldwide agriculture. Investigations from all over the globe were included (Africa, Americas, Asia, Europe, and Oceania). Most interesting was the inclusion of biochar source material type as an important parameter for comparison, where these were classified as being derived from either wood, crop residue, sludge, municipal waste, manure, or wood and sludge (the two combined). The overall conclusions of the Liu et al. (2013) meta-analysis were similar to those of Biederman and Harpole (2013), where a definite net benefit was observed across the board. There were nuanced differences between the impacts of biochar from different source material. Biochar derived from manure had a stronger positive benefit than biochar from wood and sludge, which was better than biochar from crop residue. Again, biochar from municipal waste appeared to potentially have a negative impact on crop productivity, which makes sense in terms of potential contaminants in the biochars (more nutrients in manure-based biochars would enhance plant productivity whereas more chemicals/heavy metals in municipal waste could potentially adversely affect crop productivity). The analyses of Biederman and Harpole (2013) and Liu et al. (2013) lead to conclusions that stand in stark contrast to the conclusions of Jeffery et al. (2011) outlined above. It is clear that significant controversy remains in this field. Therefore, if one seeks to understand how a particular plant species or group of species will respond to biochar amendment, a large number of factors must be considered and evaluated, and then the specific biochars of interest must be tested against those factors (e.g., soil type, pH, microbiome complement, additional fertilizer applied, organic content of soil, water holding capacity of the soil). Instead of attempting to draw large conclusions regarding average responses of plants in general, it is more useful to realize that specific plants or groups of plants must be evaluated for their specific responses to specific types of biochar applied to specific soil types. The rest of this chapter will take that caveat into consideration and then attempt to summarize some of the more recent findings related to biochar’s impact on plant productivity.
9.4 Impact of biochar or co-composted biochar on soil health and soil microbiome
Hundreds of research articles have been published over the last several decades related to biochar and compost (Figure 9.1), with a large focus on soil health impacts. Of particular interest has been the increase in carbon content that follows the addition of biochar to soils, both from a carbon sequestration perspective (Whitman and Lehmann, 2009), as well as from a crop productivity standpoint. Increases in carbon content often follow the terra preta or anthropogenic dark earth phenomenon (Glaser and Birk, 2012; Glaser et al., 2001; Wiedner et al., 2015). Soils from regions such as the Amazon Basin are often very poor, being nutrient deficient and having little capacity to retain nutrients when they are added. When charcoal (biochar) is added over time, such oxisol soils are converted to the dark earth, terra preta soils that support crop productivity (Glaser and Birk, 2012; Glaser et al., 2001; Wiedner et al., 2015). In the Amazon and other areas, such soils have been created by human activity, by the purposeful amendment of soil with charcoal and other organic matter over time, leading to

188
transformation of a poor soil into one that well supports sustainable cropping systems. The modern application of biochar very much follows this long tradition. It is clear that carbon content is obviously not the only feature of soils that make them productive. And although biochar does increase the carbon content of soils, it impacts soil health in other ways as well. Nitrogen dynamics are significantly impacted by biochar amendment, where nitrification is reduced (Schulz and Glaser, 2012). Studies of the impact of biochar on nitrogen availability have found that it either increases or decreases, depending on the particular system (Schulz and Glaser, 2012; Steiner et al., 2008). However, phosphate retention generally increases (Schulz and Glaser, 2012). A very recent article by Hussain et al. (2017), reviewed not only the impact of biochar on plant productivity but also focused attention on the impact of biochar on soil health, particularly the variation between soil types. They concluded that while it has been demonstrated that the largest improvements (in terms of crop productivity) are likely to occur in poor soils (low nutrient availability, low carbon content, arid conditions), much more modest gains may be observed in more nutrient rich soils. In general, biochar amendment increases soil nutrient supply, enhances soil microbe activity, and decreases nutrient leaching (Hussain et al., 2017; Sorrenti and Toselli, 2016). Biochar application generally (but not always) increases soil pH. It also increases soil porosity and water holding capacity. Several other chemical characteristics of soil are affected as well, including cation exchange capacity (Tan et al., 2017). Biochar not only increases soil organic matter (SOM), but it also stabilizes SOM by reducing soil bulk density and tensile strength, and increasing soil aggregation. Active SOM, or the labile fraction of SOM, is also increased by biochar. Active SOM influences dissolved organic carbon levels, microbial biomass, and the soil material cycle, thereby improving soil quality (Tan et al., 2017). Active SOM is also “an early indicator of changes in organic matter caused by soil management measures” (Tan et al., 2017). Active SOM provides nitrogen, phosphorus, sulfur, and other nutrients required by plants, stabilizes the soil and maintains the stability of the granular structure (Wang et al., 2005). The soil biome and microbiome are both impacted dramatically by biochar when it is added raw or after being co-composted, as reviewed by several investigators over the past half dozen years (Atkinson et al., 2010; Ekebafe et al., 2013; Fischer and Glaser, 2011; Glaser and Birk, 2012; Lehmann et al., 2011; Sohi et al., 2010). Biochar-amended soils have higher microorganism reproduction rates, but no increase in soil respiration (Steiner et al., 2004), which is a major characteristic of terra preta soil (Fischer and Glaser, 2011). Because biochar is degraded so slowly (on the order of centuries to millennia), and nutrient content is retained better in soils containing biochar, a more favorable and longer lasting environment for microbial growth exists in biochar-amended soils. Other factors that can positively influence microbial growth (and thus soil health) were summarized by Fischer and Glaser (2011), and include the following:
“high surface area and porous structure of biochar suitable for several kinds of microbes as habitat and retreats; enhanced ability to retain water and nutrients resulting in a stimulation of microbes; formation of ‘active’ surfaces covered by water film, dissolved nutrients and substances providing an optimal habitat for microorganisms; these specific surfaces serve as interaction matrix for storage and exchange processes of water and substances between soil fauna, microorganisms and root hairs; weak alkalinity; preserving character against decay probably resulting in the (partial) inhibition of certain
189
‘destructive’ and pathogenous organisms while simultaneously supporting beneficial microbes” (Fischer and Glaser, 2011).
The growth of free living bacteria in soil is supported by biochar, as is maintenance of endogenous arbuscular mycorrhizal fungi (Ogawa and Okimori, 2010). A final area of particular benefit to soil health has been the use of biochar in remediation of toxic/contaminated soils. Anawar et al. (2015) reviewed recently the impact of biochar in this arena. The remediation of mine tailings, heavy metal contaminated soils, organics contaminated soils (such as by polycyclic aromatic hydrocarbons (PAHs) or herbicides), and similar types of soils can be significantly improved when biochar is included in the remediation procedure. Results from such efforts included the following (as tabulated by Anawar et al. [2015]):
• Simultaneous reduction in heavy metal and PAH bioavailability; • Decreased toxic metal (e.g., copper and arsenic) uptake; • Increased pH in acidic soils associated with metal toxicity; • Enhanced nutrient availability, organic matter addition, pH buffering and microbial
stimulation; • Enhanced establishments of roots, including increased root mass, length and density; and • Improved grass growth and recovery of grasslands in severely degraded habitats.
Thus, when biochar is incorporated into bioremediation efforts of toxic or degraded soils, a significant enhancement is observed in the rate and extent of remediation and recovery of the soils and establishment of plants in these challenging environments.
9.5 Impact of biochar on plant health and disease resistance
Ample evidence now exists that biochar can have a significant impact on plant resistance to both bacterial and fungal (and other microbial) pathogens. Graber and Elad (2013) summarized this in their comprehensive review of the impact of biochar on plant disease resistance and plant health. Suggested mechanisms for biochar-induced disease resistance include: (1) improved nutrient supply and enhanced plant growth; (2) an increase in the levels of beneficial soil microorganisms, including mycorrhizal fungi, bacteria, and even earthworms; (3) the adsorption of pathogen-produced toxins by the biochar, thereby reducing the virulence of the pathogens; (4) suppression of soil-borne pathogens by biochar-produced toxins (such as breakdown products of the biochar); (5) adsorption of root exudates by the biochar, effectively cloaking the plant roots, making them less attractive to the pathogens; (6) mediation of redox processes in the soil that would therefore inhibit pathogen sustainability and growth outside of the plant; and (7) induction or priming of the systemic acquired immune system of plants, making them better prepared to fight off invaders. A few examples that are relevant to this chapter’s main topic illustrate this well. In one investigation, the first truly controlled experiment related to interaction of biochar with plant disease resistance, Elad et al. (2010), in a pot-based experiment, found that soil-applied

190
biochar was able to induce systemic resistance to the foliar fungal pathogens in tomato (Leveillula taurica, powdery mildew) and pepper (Botrytis cinerea, gray mold) and to the broad mite (Polyphagotarsonemus latus Banks) in pepper. Application rates of between 1% and 5% (w/w) biochar in a soil/coconut fiber-tuff potting medium were effective at suppressing the foliar fungal pathogens Botrytis cinerea (gray mold) and Leveillula taurica (powdery mildew) in both pepper and tomato. The investigators noticed longer term resistance to the powdery mildew in pepper as well, and proposed that induction of systemic acquired resistance may be the reason for this resistance. A similar set of experiments was carried out on strawberry, where significant resistance to foliar leaf infection by B. cinerea resulted from biochar addition to the soil (De Tender et al., 2016a; Harel et al., 2012). In particular, the soil microbiome was altered, as were other soil parameters, such as has been outlined above, which likely impacted plant resistance. Two conflicting studies have reported opposite effects of biochar on Pythium ultimum infection rates in tomato plants grown in pots with growth media containing a high percentage of biochar. In one case, it was reported that an increase in infection occurred when 50% (v/v) biochar was used (Gravel et al., 2013). In the other case, no increase in infection rate was observed (Dorais et al., 2016), and a reason for the difference was provided, which was that the study by Gravel et al. (2013) used growth media that was essentially sterile, whereas the study by Dorais et al. (2016) used media that contained multi-year old organic soil as a significant fraction, and thus would be expected to have significant colonization by beneficial microbes. Another consideration is that different types of biochar were used in the two investigations. In Gravel et al. (2013), the biochar was obtained from a commercial source (particle size of 0-150 mm; pyrolysis of balsam fir plus white and black spruces at 750°C; pH 7.1, EC 0.38; Biochar Engineering Inc. Colorado). In Dorais et al. (2016), the biochar was prepared from citrus wood in a traditional charcoal kiln (lump charcoal). Thus, as is becoming a common theme of this chapter, different soil compositions, different biochar types, and different experimental conditions lead to different results. Such differences often make direct comparisons across studies difficult, if not impossible to perform.
9.6 Biochar improves resistance to specific abiotic stresses
Plants experience a multitude of external abiotic stresses, including temperature extremes, salinity, drought, flooding, and heavy metal toxicity. By enhancing soil-root interactions, biochar may induce changes in plant physiology that enable plants to better deal with such stresses. Some of these abiotic stresses have been investigated to date, including heavy metals, drought stress, and temperature stress (Ali et al., 2017). A model of how biochar-amended soil and plants may interact and respond under these conditions is presented in Figure 9.2.

191
Figure 9.2: Model of how biochar affects soil, plants, and soil-plant interactions under stressed
conditions
Drought stress is one of the most significant and severe stresses that plants face currently, and will likely face with increasing frequency in the future. Biochar, by affecting soil water holding capacity and availability has the potential to improve crop productivity in drought-stressed regions of the world. Several investigations have begun to test this hypothesis. In a study by Kammann et al. (2011), quinoa (Chenopodium quinoa Willd cv. Hualhuas), an ancient grain from the Andes that has gained increasing popularity over the past two decades, was grown in sandy soil amended with three levels of biochar (0, 100, and 200 tons per hectare) and subjected to different levels of drought stress (control, 60%, and 20% of the water holding capacity of the control). The biochar application of 100 tons per hectare increased drought tolerance, plant growth, leaf nitrogen, and water-use efficiency of quinoa despite larger plant leaf areas. No additional benefit was observed in the higher biochar treatment (although no detrimental effect was seen either). Similar investigations with tomato grown in sandy soil in pots (Mulcahy et al., 2013), and with maize (Liu et al., 2012) and sunflower (Colmenero Flores et al., 2016) in sandy soil in the field also demonstrated clear positive impacts on water use efficiency, drought tolerance, stomatal conductance, and soil health. Herbaceous plants (Abutilon theophrasti and Prunella vulgaris) grown under high saline conditions also performed better (higher survival rate, increased biomass) when biochar was used as an amendment (Thomas et al., 2013). Spring wheat (Akhtar et al., 2015) and durum wheat (Vaccari et al., 2011) also responded well to biochar addition when faced with salinity stress. Heavy metals are common contaminants in wastewater effluents, often precluding the use of such water sources directly in plant production systems, such as in hydroponic crop production.

192
Many plants that are very suitable for growth in hydroponic systems, such as tomatoes, could benefit from the use of such effluent waters, if heavy metals could be either eliminated or reduced to levels that are no longer toxic. Nickel (Ni2+) is one such contaminant. A recent report outlines experiments that tested the ability of biochar to filter out and bind nickel from effluent water to be used in hydroponic tomato growth (Mosa et al., 2016). Previous reports suggested that biochar filters could perform better than activated carbon filters in removing heavy metals such as lead (Pb2+), copper (Cu2+), or cadmium (Cd2+) (Inyang et al., 2011; Regmi et al., 2012). In the study by Mosa et al. (2016), tomato plants grown in the presence of Ni2+ displayed significantly reduced plant growth and fruit yield, even when the effluent was passed through biochar-containing filters prior to introduction into a hydroponic growth system. However, when the biochar containing filters were used, the reduction in growth and yield was much lower, although deleterious effects were not completely eliminated. Thus, although biochar filtration in this case had a definite positive effect under this particular stress condition, the stress was not completely eliminated. The section above related to soil health discusses additional examples of reduction in toxic metal impact on plant growth in response to biochar amendment.
9.7 Impact of biochar and co-composted biochar on plant productivity and crop yield
As shown in Figure 9.1, over two hundred publications have addressed the question of whether biochar amendment can improve plant productivity and crop yield. Some of these articles have been referred to above. Several additional studies highlight some of the general conclusions that can be drawn in this particular area. Of particular interest are studies that address some of the concerns raised in the discussion of the meta-analyses or that include important information regarding the effects of co-composting biochar. One of the earlier field studies in the area of application of co-composted biochar was performed in a well-established grape vineyard in Switzerland (Schmidt et al., 2014). Biochar (8 t ha−1), compost (55 t ha−1), and co-composted biochar (55 t ha−1 + 8 t ha−1, mixed before composting) were applied as three separate treatments to the top soil around plants that had been established for over 3 decades, and the plants were then monitored for three years to evaluate impact on various green cover and vine growth, vine health, and grape quality parameters. The biochar-containing treatments induced “only small, economically irrelevant and mostly non-significant effects over the three years.” The investigators concluded that biochar amendment had no impact on vine growth in poor, alkaline, temperate soils. However, this was in a well-established vineyard, where the plants almost certainly had few roots in the zone where the biochar was added. A similar study should be conducted during vineyard establishment. In a second study, this time utilizing oat (Avena sativa L.) plants grown in pots in a glass house, in sandy or loam soils, with a large range of compost/biochar mixtures that were co-composted, the treatments of biochar and co-composted biochar had definite positive effects on plant growth (Schulz et al., 2013). Both plant height and seed mass increased with increasing amounts of biochar applied (the amount of compost had no impact). Improvements to soil properties, including total levels of soil carbon and nitrogen, were suggested as the reason for these growth improvements.

193
Several studies by Michael Bird’s group from Cairns, Australia, have also evaluated the impact of biochar and co-composted biochar relative to compost alone or fertilizer alone on crop yield. These studies provide additional indications that biochar can have a very positive impact on cropping systems, although in some cases deleterious effects were observed instead. Different types of biochar were evaluated as well. In one of the first of such studies, Bird et al. (2012) found that biochar produced from algae had significant positive impacts on sorghum growth in pots under controlled environmental conditions. In another study by this research group, Agegnehu et al. (2015a) evaluated the impact of biochar, biochar plus compost, and co-composted biochar on peanut yield on a Ferralsol soil in northern Australia. Significant improvements were found for soil parameters (soil organic carbon, soil water capacity, and cation exchange capacity) and plant nutrient availability, as well as plant parameters (leaf chlorophyll content, root nodulation number, and leaf nutrient content). A similar experiment was performed using maize as the plant evaluated, where again Agegnehu et al. (2015b) saw significant improvements to soil health and plant growth when biochar was applied. More recently, Bird’s group compared the yield and nitrogen uptake efficiencies (NUE) of barley (Hordeum vulgare) grown with either biochar alone or co-composted biochar to compost only and fertilizer only controls (Agegnehu et al., 2016). This experiment was carried out at two sites in Ethiopia (Holetta and Robgebeya) that had very similar deep clay soils but with different organic contents (1.44% and 2.32%, respectively) prior to amendment. Total nitrogen added varied by treatment to evaluate the impact on NUE. Biochar was added at a rate of 10 tons per hectare. Total nitrogen uptake increased in both the grain and straw more when compost was added than when biochar alone was added. However, when biochar was added along with the compost, either as a raw biochar amendment or when co-composted, nitrogen uptake was further enhanced and NUE was highest, suggesting that the biochar amendment either stimulated the plant to increase nitrogen uptake, or affected soil microbe-plant interactions in a way that increased nitrogen uptake, while also allowing the plant to obtain the same grain yield with less nitrogen. The actual mechanism causing these differences was not investigated, but soil health is a likely candidate. The impacts on grain yield and NUE were similar when biochar was present with compost (either raw or co-composted), suggesting that co-composting had no deleterious effects. Thus, the benefits to the composting process, as outlined in Chapter 8 of this report, can be gained with a very positive impact on crop yield relative to growth on standard fertilizer alone for staple crops such as barley in adverse environments. In another recent experiment, Seehausen et al. (2017) performed a very specific evaluation of the impact of spent mushroom substrate (compost) and biochar derived from mixed wood on the annual plant Abutilon theophrasti (velvetleaf, a food and medicinal plant in Asia, but a serious weed in North American corn fields, causing up to 34% reductions in yield) and the perennial Salix purpurea (a native tree species in eastern North America). The amendments were applied alone and in combination (but were not co-composted) and were evaluated for impact on maximum leaf area, aboveground biomass, belowground biomass, root mass fraction, reproductive allocation, maximum plant height, chlorophyll fluorescence, photosynthetic rate, and stomatal conductance. Like many such experiments, the plants were grown in a glass house,

194
which is not a typical environment for either species. Nevertheless, the results were interesting, if not complex. The plants were evaluated once during the middle of the experiment for physiological and photosynthesis parameters, and then monitored over several days at the end of the growth period for biomass, flower production, and fruit yield (as appropriate for the species). The effects of amendment application on S. purpurea appeared to be largely neutral for most parameters measured, neither benefiting nor adversely affecting them. However, aboveground biomass was reduced by approximately 25% in all treatments (biochar, compost, both biochar and compost) compared to the control, whereas belowground root mass increased approximately 17%. Both of these changes were statistically significant. The case of A. theophrasti, was confusing, where statements made in the abstract and the conclusion section of the paper did not match data presented. Contrary to what the authors stated, there was a positive impact on photosynthetic parameters (increased photosynthesis rate, increased stomatal conductance) and a definite increase in both aboveground (100%-150% increase, statistically significant) and belowground biomass (also 100%-150% increase, depending on treatment). Thus, biochar applied alone or in conjunction with compost had a net positive effect on plant growth for two temperate species grown under temperate environmental conditions. In a second investigation, Macil et al. (2017) evaluated the impact of biochar application (0, 5, 10, and 20 tons per hectare) in relation to phosphorus application (0 or 90 kg per hectare) on chickpea performance and productivity in subtropical South Africa and found that biochar increased stomatal conductance and chlorophyll content by 22%-49% and 57%-126%, respectively, depending on the time of year (summer vs. winter) and amount of biochar applied. Phosphorus application only increased chlorophyll content by up to 9%, and only in the winter. Both phosphorus and biochar application increased intercepted radiation, regardless of time of year. Biochar increased plant height only after 70 days post-emergence and phosphorus increased plant height at all plant growth stages. Because the greatest benefits were observed in the winter season, which is the dry season where the plants were grown, Macil et al. (2017) concluded that the use of biochar and inorganic phosphorus fertilizer in combination may be most beneficial to chickpea growing on poor soils or in arid environments. In contrast to the above findings, Wang et al. (2017) and Sun et al. (2017) provided warnings in their recent reports, where reduced plant growth was observed when excessive nutrients were applied (too much fertilizer) in their pot-based experiments and biochar was not able to ameliorate the problem, confirming results from early investigations. Wang et al. (2017) evaluated the growth of rape, lettuce, and pakchoi, grown in pots in four sequential growth seasons, and only found an improvement in growth in the fourth season, which they attributed a difference between the three species. Sun et al. (2017) found improved productivity at low co-composted biochar application rates (up to 5% biochar, w/w), but reduced growth when the co-composted mixture approached 30% (w/w) biochar in the soil. Similar results were found in evaluations of halophyte species, sesbania (Sesbania canabina [Retz.] Pers) and seashore mallow (Kosteletzkya virginica), in which lower levels of co-composted biochar (1%, w/w) increased yield up to >300%, but higher levels (10%, w/w) of co-composted biochar led to reduced growth (Luo et al., 2017). As a final example, a second investigation by Kammann et al. (2015) evaluated the growth of quinoa in response to biochar or co-composted biochar amendment. They found that the biochar

195
treatment that was not co-composted had a negative impact on quinoa growth, despite the fact that it contained no toxins, heavy metals, or anything expected to impede plant growth. However, when co-composted at a level of 20% (v/v) at the start of composting, the biochar instead had a significant positive impact on plant growth (3-fold higher biomass than the control, 5-fold higher than biochar alone). These results were quite striking. These are just a few representative studies that have been reported recently, but which greatly emphasize the need for further research in this area. There is a clear need for optimization of application levels (of either raw or co-composted biochar). This type of optimization will likely need to be determined for each different cropping system, just as standard nutrient levels must be optimized. Moreover, different biochars should be evaluated both alone and co-composted, and at different levels of application, in order to identify how a particular target crop species will respond.
9.8 Relationship between herb productivity and biochar
Much of the work related to biochar’s impact on plant growth and productivity has been performed on tree crops or staple crops, such as maize, wheat, or rice. While some plants such as tomatoes and lettuce have also been investigated (as outlined below) for their response to biochar application, few herb species have been evaluated, although sweet basil is one of those (Gravel et al., 2013; Pandey et al., 2016). Herbs are important specialty crops in Washington State, which is a leader in organic herb production within the United States, and one of the major producers of many other conventionally grown herbs, most notably peppermint, for which Washington is very well-known. Organic herb production occurs throughout Washington State, and each region within the state faces different challenges. Many of these challenges may be ameliorated, or at least reduced, by application of either biochar or co-composted biochar. One of the major herbs produced organically in Washington State is sweet basil, an herb crop that is in high demand and that is native to the Middle East and northeast Africa – climates that are markedly different than those in much of Washington State. Indeed, the major growing regions for Washington sweet basil are just east of Seattle and north of Spokane. Greenhouses are often used to increase the growing season east of the Cascade Range, which has a drier, but shorter growing season than the western part of the state. However, complications for basil production are prevalent in western Washington. High humidity and lower temperatures in the summer increase susceptibility to diseases (particularly downy mildew), which often leads to only a single annual harvest for outdoor production facilities such as are found at HerbCo (Andrews, 2016, personal communication), which is one of the largest organic herb producers in the nation, headquartered in Washington with growth facilities in several states. Improving plant resistance to downy mildew and other diseases, if only long enough to extend the growing season to one additional harvest, would tremendously benefit the industry. Organic producers of herbs have noted that management of soil fertility and overall soil health are primary horticultural concerns. Research that improves upon and extends the utility of organic amendments and practices, such as novel composting techniques, has the potential to

196
directly address these concerns. Such advances may ultimately translate into improving and sustaining yields for high-value organic crops that are nutritious and have high-quality appearance while providing significant environmental benefits in the process. As mentioned above, sweet basil has been a target for investigations related to the impact of biochar application on plant yield and properties (such as essential oil profiles). In a study by Pandey et al. (2016), basil plants were grown in pots with biochar, chemical fertilizer, or both added to the soil prior to planting. Significant improvements in soil quality and health, as outlined for many other species in previous sections of this chapter, were observed, including increases in total nitrogen, total organic matter, available phosphorus, and available nitrogen. In addition, soil microbial biomass carbon and microbial activity (as measured by specific enzyme activities) increased with biochar application, whether or not chemical fertilizer was present. Importantly, vegetative yield increased, with a decrease in chemical fertilizer requirement. Most importantly for plant quality, the basil aroma compounds were apparently not affected by biochar addition in this study, with the levels of the flavor compounds remaining the same across all treatments. This study did not evaluate co-composted biochar. In another study, biochar was evaluated as a potential replacement for peat as a major component in potting soil. Tomato, sweet pepper, geranium and basil were used as the test subjects (Dorais et al., 2016). Biochar was applied at rates of 0%, 10%, 20%, and 30% (all v/v) of the total soil mixture for sweet pepper, geranium and basil, and up to 50% (v/v) for tomato. Biochar addition of up to 30% (v/v) did not cause a reduction in plant growth, but 50% (v/v) biochar did negatively impact tomato plant height. No significant impact on disease sensitivity (inoculation with Pythium ultimum) was measured for tomato under those conditions. Lettuce is a plant with similar growth requirements to sweet basil. Trupiano et al. (2017) recently investigated the impact of biochar on lettuce growth and yield. They applied biochar alone (produced from orchard pruning remains), compost alone (produced from olive husks and leaves), or a combination of both biochar and compost (but not co-composted biochar), and found that biochar significantly improved soil health, lettuce growth, and lettuce yield. Combining biochar with compost had little effect in this study. In another study, both lettuce and strawberry growth were evaluated, with the lettuce being grown in field soil and the strawberry in peat-based growth substrate (De Tender et al., 2016b). The plant growth media properties changed when biochar was added, but the lettuce assay was not able to measure any impact on plant health, crop yield, or rhizosphere microbiology. On the other hand, the media supporting the strawberry plants that had biochar added to it displayed an increased bacterial diversity. These changes were less pronounced when synthetic (inorganic) fertilizer was added. These results led the authors to conclude that “in certain plant growth media, biochar amendment can result in chemical changes that induce multiple responses in the plant, including shifts in the rhizosphere microbiome. Biochar can be beneficial for plant growth, especially in conditions of limited nutrient availability” (De Tender et al., 2016b). Thus, herbaceous plants like lettuce, sweet basil and strawberry may respond differently to application of biochar, but again, those differences may be due to the specifics of the soil properties, the particular biochar source materials and biochar properties, and the compost properties (when applied with the biochar).

197
9.9 Conclusions
Plants experience a multitude of external abiotic stresses, including temperature extremes, drought, salinity, toxicity from heavy metals and organic toxins. They also face numerous biotic stresses such as competition for space and light, pathogen infestation, and predator attack. Soil types vary dramatically around the world, even in neighboring fields, leading to very different growth conditions depending on exactly where a plant resides. How plants respond to all of these factors can be significantly influenced by the presence of biochar in the soil, leading, in most cases, to improved plant growth performance when biochar is present, although some notable exceptions have been identified. It is also clear that the combination of such factors faced by a particular plant, plays a significant role in the response of that plant to biochar application, whether there is a positive benefit, a negative impact, or no impact at all. Most plants are, indeed, positively impacted by amendment of the soil with biochar, particularly when it has been co-composted. Indeed, co-composting appears to be a most promising avenue of research for the near-term as the positive impacts of biochar appear to be enhanced in most cases, while any negative impacts are quite often dampened or eliminated. Most of the research on the impact of biochar on plant growth, crop productivity, and yield has been performed on staple grains or tree/vine species. The few studies that have evaluated herbs or herbaceous plants (with sweet basil, lettuce, and strawberry the most studied to date) suggest that biochar holds great promise for use with the species studied. Finally, as has been pointed out above, in considering the application of biochar, care must be taken to evaluate different biochar source materials, different biochar production conditions, and interactions with different soil types (including co-composting with different types of compost) for any given plant species.
9.10 References
Agegnehu, G., Bass, A.M., Nelson, P.N., Bird, M.I. 2016. Benefits of biochar, compost and biochar–compost for soil quality, maize yield and greenhouse gas emissions in a tropical agricultural soil. Science of The Total Environment, 543, Part A, 295-306.
Agegnehu, G., Bass, A.M., Nelson, P.N., Muirhead, B., Wright, G., Bird, M.I. 2015a. Biochar and biochar-compost as soil amendments: Effects on peanut yield, soil properties and greenhouse gas emissions in tropical North Queensland, Australia. Agriculture,
Ecosystems & Environment, 213, 72-85. Agegnehu, G., Bird, M.I., Nelson, P.N., Bass, A.M. 2015b. The ameliorating effects of biochar
and compost on soil quality and plant growth on a Ferralsol. Soil Research, 53(1), 1-12. Akhtar, S.S., Andersen, M.N., Liu, F. 2015. Residual effects of biochar on improving growth,
physiology and yield of wheat under salt stress. Agricultural Water Management, 158, 61-68.
Ali, S., Rizwan, M., Qayyum, M.F., Ok, Y.S., Ibrahim, M., Riaz, M., Arif, M.S., Hafeez, F., Al-Wabel, M.I., Shahzad, A.N. 2017. Biochar soil amendment on alleviation of drought and salt stress in plants: a critical review. Environmental Science and Pollution Research, 24(14), 12700-12712.
Anawar, H.M., Akter, F., Solaiman, Z.M., Strezov, V. 2015. Biochar: An Emerging Panacea for Remediation of Soil Contaminants from Mining, Industry and Sewage Wastes. Pedosphere, 25(5), 654-665.

198
Andrews, T. (2016) Owner and CEO of HerbCo. Personal communication. Asai, H., Samson, B.K., Stephan, H.M., Songyikhangsuthor, K., Homma, K., Kiyono, Y., Inoue,
Y., Shiraiwa, T., Horie, T. 2009. Biochar amendment techniques for upland rice production in Northern Laos: 1. Soil physical properties, leaf SPAD and grain yield. Field Crops Research, 111(1–2), 81-84.
Atkinson, C.J., Fitzgerald, J.D., Hipps, N.A. 2010. Potential mechanisms for achieving agricultural benefits from biochar application to temperate soils: a review. Plant and Soil, 337(1), 1-18.
Biederman, L.A., Harpole, W.S. 2013. Biochar and its effects on plant productivity and nutrient cycling: a meta-analysis. GCB Bioenergy, 5(2), 202-214.
Bird, M.I., Wurster, C.M., Silva, P.H.D., Paul, N.A., de Nys, R. 2012. Algal biochar: effects and applications. Global Change Biology Bioenergy, 4(1), 61-69.
Blackwell, P., Shea, S., Storer, P., Solaiman, Z., Kerkmans, M., Stanley, I. 2007. Improving wheat production with deep banded oil mallee charcoal in Western Australia. First Asia
Pacific Biochar Conference, Terrigal, Australia. Buss, W., Graham, M.C., Shepherd, J.G., Mašek, O. 2016a. Risks and benefits of marginal
biomass-derived biochars for plant growth. Science of The Total Environment, 569–570, 496-506.
Buss, W., Graham, M.C., Shepherd, J.G., Mašek, O. 2016b. Suitability of marginal biomass-derived biochars for soil amendment. Science of The Total Environment, 547, 314-322.
Buss, W., Mašek, O. 2014. Mobile organic compounds in biochar – A potential source of contamination – Phytotoxic effects on cress seed (Lepidium sativum) germination. Journal of Environmental Management, 137, 111-119.
Buss, W., Mašek, O., Graham, M., Wüst, D. 2015. Inherent organic compounds in biochar–Their content, composition and potential toxic effects. Journal of Environmental Management, 156, 150-157.
Cha, J.S., Park, S.H., Jung, S.-C., Ryu, C., Jeon, J.-K., Shin, M.-C., Park, Y.-K. 2016. Production and utilization of biochar: A review. Journal of Industrial and Engineering Chemistry, 40, 1-15.
Chan, K., Van Zwieten, L., Meszaros, I., Downie, A., Joseph, S. 2008. Using poultry litter biochars as soil amendments. Soil Research, 46(5), 437-444.
Chan, K.Y., Van Zwieten, L., Meszaros, I., Downie, A., Joseph, S. 2007. Agronomic values of greenwaste biochar as a soil amendment. Soil Research, 45(8), 629-634.
Chidumayo, E. 1994. Effects of wood carbonization on soil and initial development of seedlings in miombo woodland, Zambia. Forest ecology and management, 70(1-3), 353-357.
Colmenero Flores, J.M., Franco-Navarro, J.D., Knicker, H., Paneque Carmona, M., Rosa Arranz, J.M.d.l. 2016. Effect of biochar amendment on morphology, productivity and water relations of sunflower plants under non-irrigation conditions. Catena, 287, 280-287.
De Tender, C., Haegeman, A., Vandecasteele, B., Ciement, L., Cremelie, P., Dawyndt, P., Maes, M., Debode, J. 2016a. Dynamics in the Strawberry Rhizosphere Microbiome in Response to Biochar and Botrytis cinerea Leaf Infection. Frontiers in Microbiology, 7.
De Tender, C.A., Debode, J., Vandecasteele, B., D'Hose, T., Cremelie, P., Haegeman, A., Ruttink, T., Dawyndt, P., Maes, M. 2016b. Biological, physicochemical and plant health responses in lettuce and strawberry in soil or peat amended with biochar. Applied Soil
Ecology, 107, 1-12.

199
Dorais, M., Martinez, C., Diop, M., Thériault, M., Ménard, C., Pepin, S. 2016. Assessing the potential of biochar as a growing media component for potted plants. International Society for Horticultural Science (ISHS), Leuven, Belgium. pp. 19-26.
Ekebafe, M.O., Ekebafe, L.O., Maliki, M. 2013. Utilisation of biochar and superabsorbent polymers for soil amendment. Science Progress, 96(1), 85-94.
Ekebafe, M.O., Ekebafe, L.O., Ugbesia, S.O. 2015. Biochar composts and composites. Science
Progress, 98(2), 169-176. Elad, Y., David, D.R., Harel, Y.M., Borenshtein, M., Kalifa, H.B., Silber, A., Graber, E.R. 2010.
Induction of Systemic Resistance in Plants by Biochar, a Soil-Applied Carbon Sequestering Agent. Phytopathology, 100(9), 913-921.
Fidel, R.B., Laird, D.A., Thompson, M.L., Lawrinenko, M. 2017. Characterization and quantification of biochar alkalinity. Chemosphere, 167, 367-373.
Fischer, D., Glaser, B. 2011. Synergisms between Compost and Biochar for Sustainable Soil Amelioration. Management of Organic Waste, 167-198.
Gaskin, J.W., Speir, R.A., Harris, K., Das, K.C., Lee, R.D., Morris, L.A., Fisher, D.S. 2010. Effect of Peanut Hull and Pine Chip Biochar on Soil Nutrients, Corn Nutrient Status, and Yield All rights reserved. No part of this periodical may be reproduced or transmitted in any form or by any means, electronic or mechanical, including photocopying, recording, or any information storage and retrieval system, without permission in writing from the publisher. Agronomy Journal, 102(2), 623-633.
Glaser, B., Birk, J.J. 2012. State of the scientific knowledge on properties and genesis of Anthropogenic Dark Earths in Central Amazonia (terra preta de Indio). Geochimica Et
Cosmochimica Acta, 82, 39-51. Glaser, B., Haumaier, L., Guggenberger, G., Zech, W. 2001. The 'Terra Preta' phenomenon: a
model for sustainable agriculture in the humid tropics. Naturwissenschaften, 88(1), 37-41.
Graber, E., Elad, Y. 2013. Biochar impact on plant resistance to disease. Biochar and Soil Biota, 278.
Gravel, V., Dorais, M., Ménard, C. 2013. Organic potted plants amended with biochar: its effect on growth and Pythium colonization. Canadian Journal of Plant Science, 93(6), 1217-1227.
Gul, S., Whalen, J.K., Thomas, B.W., Sachdeva, V., Deng, H. 2015. Physico-chemical properties and microbial responses in biochar-amended soils: Mechanisms and future directions. Agriculture, Ecosystems & Environment, 206, 46-59.
Harel, Y.M., Elad, Y., Rav-David, D., Borenstein, M., Shulchani, R., Lew, B., Graber, E.R. 2012. Biochar mediates systemic response of strawberry to foliar fungal pathogens. Plant
and Soil, 357(1-2), 245-257. Hossain, M.K., Strezov, V., Yin Chan, K., Nelson, P.F. 2010. Agronomic properties of
wastewater sludge biochar and bioavailability of metals in production of cherry tomato (Lycopersicon esculentum). Chemosphere, 78(9), 1167-1171.
Hussain, M., Farooq, M., Nawaz, A., Al-Sadi, A.M., Solaiman, Z.M., Alghamdi, S.S., Ammara, U., Ok, Y.S., Siddique, K.H.M. 2017. Biochar for crop production: potential benefits and risks. Journal of Soils and Sediments, 17(3), 685-716.
Inyang, M., Gao, B., Ding, W., Pullammanappallil, P., Zimmerman, A.R., Cao, X. 2011. Enhanced Lead Sorption by Biochar Derived from Anaerobically Digested Sugarcane Bagasse. Separation Science and Technology, 46(12), 1950-1956.

200
Ishii, T., Kadoya, K. 1994. Effects of charcoal as a soil conditioner on citrus growth and vesicular-arbuscular mycorrhizal development. Journal of the Japanese Society for
Horticultural Science, 63(3), 529-535. Jeffery, S., Abalos, D., Prodana, M., Bastos, A.C., van Groenigen, J.W., Hungate, B.A.,
Verheijen, F. 2017. Biochar boosts tropical but not temperate crop yields. Environmental
Research Letters, 12(5). Jeffery, S., Abalos, D., Spokas, K.A., Verheijen, F.G. 2015a. Biochar effects on crop yield.
Biochar for Environmental Management: Science, Technology and Implementation, 2. Jeffery, S., Meinders, M.B.J., Stoof, C.R., Bezemer, T.M., van de Voorde, T.F.J., Mommer, L.,
van Groenigen, J.W. 2015b. Biochar application does not improve the soil hydrological function of a sandy soil. Geoderma, 251–252, 47-54.
Jeffery, S., Verheijen, F.G.A., Kammann, C., Abalos, D. 2016. Biochar effects on methane emissions from soils: A meta-analysis. Soil Biology and Biochemistry, 101, 251-258.
Jeffery, S., Verheijen, F.G.A., van der Velde, M., Bastos, A.C. 2011. A quantitative review of the effects of biochar application to soils on crop productivity using meta-analysis. Agriculture, Ecosystems & Environment, 144(1), 175-187.
Kammann, C.I., Linsel, S., Gößling, J.W., Koyro, H.-W. 2011. Influence of biochar on drought tolerance of Chenopodium quinoa Willd and on soil–plant relations. Plant and Soil, 345(1), 195-210.
Kammann, C.I., Schmidt, H.-P., Messerschmidt, N., Linsel, S., Steffens, D., Müller, C., Koyro, H.-W., Conte, P., Joseph, S. 2015. Plant growth improvement mediated by nitrate capture in co-composted biochar. Scientific Reports, 5, 11080.
Karaosmanoglu, F., Isigigur-Ergundenler, A., Sever, A. 2000. Biochar from the straw-stalk of rapeseed plant. Energy & Fuels, 14(2), 336-339.
Kimetu, J.M., Lehmann, J. 2010. Stability and stabilisation of biochar and green manure in soil with different organic carbon contents. Soil Research, 48(7), 577-585.
Lehmann, J., Pereira da Silva, J., Steiner, C., Nehls, T., Zech, W., Glaser, B. 2003. Nutrient availability and leaching in an archaeological Anthrosol and a Ferralsol of the Central Amazon basin: fertilizer, manure and charcoal amendments. Plant and soil, 249(2), 343-357.
Lehmann, J., Rillig, M.C., Thies, J., Masiello, C.A., Hockaday, W.C., Crowley, D. 2011. Biochar effects on soil biota – A review. Soil Biology and Biochemistry, 43(9), 1812-1836.
Liu, J., Schulz, H., Brandl, S., Miehtke, H., Huwe, B., Glaser, B. 2012. Short-term effect of biochar and compost on soil fertility and water status of a Dystric Cambisol in NE Germany under field conditions. Journal of Plant Nutrition and Soil Science, 175(5), 698-707.
Liu, X., Zhang, A., Ji, C., Joseph, S., Bian, R., Li, L., Pan, G., Paz-Ferreiro, J. 2013. Biochar’s effect on crop productivity and the dependence on experimental conditions—a meta-analysis of literature data. Plant and Soil, 373(1), 583-594.
Luo, X., Liu, G., Xia, Y., Chen, L., Jiang, Z., Zheng, H., Wang, Z. 2017. Use of biochar-compost to improve properties and productivity of the degraded coastal soil in the Yellow River Delta, China. Journal of Soils and Sediments, 17(3), 780-789.
Macil, P.J., Ogola, J.B.O., Odhiambo, J.J.O., Lusiba, S.G. 2017. The response of some physiological traits of chickpea (Cicer arietinum L.) to biochar and phosphorus fertilizer application. Legume Research, 40(2), 299-305.
201
Major, J., Rondon, M., Molina, D., Riha, S.J., Lehmann, J. 2010. Maize yield and nutrition during 4 years after biochar application to a Colombian savanna oxisol. Plant and soil, 333(1-2), 117-128.
Mosa, A., El-Banna, M.F., Gao, B. 2016. Biochar filters reduced the toxic effects of nickel on tomato (Lycopersicon esculentum L.) grown in nutrient film technique hydroponic system. Chemosphere, 149, 254-262.
Mulcahy, D.N., Mulcahy, D.L., Dietz, D. 2013. Biochar soil amendment increases tomato seedling resistance to drought in sandy soils. Journal of Arid Environments, 88, 222-225.
Nehls, T. 2002. Fertility improvement of a Terra Firme Oxisol in Central Amazonia by charcoal applications. Final thesis in Geoecology, University of Bayreuth, Institute of Soil Science
and Soil Geography, 81. Ogawa, M., Okimori, Y. 2010. Pioneering works in biochar research, Japan. Soil Research,
48(7), 489-500. Pandey, V., Patel, A., Patra, D.D. 2016. Biochar ameliorates crop productivity, soil fertility,
essential oil yield and aroma profiling in basil (Ocimum basilicum L.). Ecological
Engineering, 90, 361-366. Qian, K., Kumar, A., Zhang, H., Bellmer, D., Huhnke, R. 2015. Recent advances in utilization of
biochar. Renewable and Sustainable Energy Reviews, 42, 1055-1064. Regmi, P., Garcia Moscoso, J.L., Kumar, S., Cao, X., Mao, J., Schafran, G. 2012. Removal of
copper and cadmium from aqueous solution using switchgrass biochar produced via hydrothermal carbonization process. Journal of Environmental Management, 109, 61-69.
Schmidt, H.-P., Kammann, C., Niggli, C., Evangelou, M.W.H., Mackie, K.A., Abiven, S. 2014.
Biochar and biochar-compost as soil amendments to a vineyard soil: Influences on plant growth, nutrient uptake, plant health and grape quality. Agriculture, Ecosystems &
Environment, 191, 117-123. Schulz, H., Dunst, G., Glaser, B. 2013. Positive effects of composted biochar on plant growth
and soil fertility. Agronomy for Sustainable Development, 33(4), 817-827. Schulz, H., Glaser, B. 2012. Effects of biochar compared to organic and inorganic fertilizers on
soil quality and plant growth in a greenhouse experiment. Journal of Plant Nutrition and
Soil Science, 175(3), 410-422. Seehausen M, Gale N, Dranga S, Hudson V, Liu N, Michener J, Thurston E, Williams C, Smith
S, Thomas S. 2017. Is There a Positive Synergistic Effect of Biochar and Compost Soil Amendments on Plant Growth and Physiological Performance? Agronomy 7, 13.
Sohi, S.P., Krull, E., Lopez-Capel, E., Bol, R. 2010. A review of biochar and its use and function in soil. in: Advances in Agronomy, Vol 105, (Ed.) D.L. Sparks, Vol. 105, Elsevier Academic Press Inc. San Diego, pp. 47-82.
Sorrenti, G., Toselli, M. 2016. Soil leaching as affected by the amendment with biochar and compost. Agriculture, Ecosystems & Environment, 226, 56-64.
Steiner, C., Das, K.C., Melear, N., Lakly, D. 2010. Reducing Nitrogen Loss during Poultry Litter Composting Using Biochar All rights reserved. No part of this periodical may be reproduced or transmitted in any form or by any means, electronic or mechanical, including photocopying, recording, or any information storage and retrieval system, without permission in writing from the publisher. Journal of Environmental Quality, 39, 1236-1242.

202
Steiner, C., Glaser, B., Teixeira, W.G., Lehmann, J., Blum, W.E.H., Zech, W. 2008. Nitrogen retention and plant uptake on a highly weathered central Amazonian Ferralsol amended with compost and charcoal. Journal of Plant Nutrition and Soil Science-Zeitschrift Fur
Pflanzenernahrung Und Bodenkunde, 171(6), 893-899. Steiner, C., Teixeira, W.G., Zech, W. 2004. Slash and char: An alternative to slash and burn
practiced in the Amazon basin. Springer-Verlag Berlin, Berlin. Sun, C.X., Chen, X., Cao, M.M., Li, M.Q., Zhang, Y.L. 2017. Growth and metabolic responses
of maize roots to straw biochar application at different rates. Plant and Soil, 1-16. Tan, Z.X., Lin, C.S.K., Ji, X.Y., Rainey, T.J. 2017. Returning biochar to fields: A review.
Applied Soil Ecology, 116, 1-11. Thomas, S.C., Frye, S., Gale, N., Garmon, M., Launchbury, R., Machado, N., Melamed, S.,
Murray, J., Petroff, A., Winsborough, C. 2013. Biochar mitigates negative effects of salt additions on two herbaceous plant species. Journal of Environmental Management, 129, 62-68.
Trupiano, D., Cocozza, C., Baronti, S., Amendola, C., Vaccari, F.P., Lustrato, G., Di Lonardo, S., Fantasma, F., Tognetti, R., Scippa, G.S. 2017. The Effects of Biochar and Its Combination with Compost on Lettuce (Lactuca sativa L.) Growth, Soil Properties, and Soil Microbial Activity and Abundance. International Journal of Agronomy, 2017, 12.
Tsai, W.T., Liu, S.C., Chen, H.R., Chang, Y.M., Tsai, Y.L. 2012. Textural and chemical properties of swine-manure-derived biochar pertinent to its potential use as a soil amendment. Chemosphere, 89(2), 198-203.
Vaccari, F.P., Baronti, S., Lugato, E., Genesio, L., Castaldi, S., Fornasier, F., Miglietta, F. 2011. Biochar as a strategy to sequester carbon and increase yield in durum wheat. European
Journal of Agronomy, 34(4), 231-238. Van Zwieten, L., Singh, B.P., Kimber, S.W.L., Murphy, D.V., Macdonald, L.M., Rust, J.,
Morris, S. 2014. An incubation study investigating the mechanisms that impact N2O flux from soil following biochar application. Agriculture, Ecosystems & Environment, 191, 53-62.
Wang, H., Zheng, H., Jiang, Z., Dai, Y., Liu, G., Chen, L., Luo, X., Liu, M., Wang, Z. 2017. Efficacies of biochar and biochar-based amendment on vegetable yield and nitrogen utilization in four consecutive planting seasons. Science of The Total Environment, 593–594, 124-133.
Wang Q-k, Wang S-l, Deng S-j. 2005. Comparative study on active soil organic matter in Chinese fir plantation and native broad-leaved forest in subtropical China. Journal of
Forestry Research, 16, 23-26. Whitman, T., Lehmann, J. 2009. Biochar—One way forward for soil carbon in offset
mechanisms in Africa? Environmental Science & Policy, 12(7), 1024-1027. Wiedner, K., Schneeweiss, J., Dippold, M.A., Glaser, B. 2015. Anthropogenic Dark Earth in
Northern Germany - The Nordic Analogue to terra preta de Indio in Amazonia. Catena, 132, 114-125.
Xu, G., Sun, J., Shao, H., Chang, S.X. 2014. Biochar had effects on phosphorus sorption and desorption in three soils with differing acidity. Ecological Engineering, 62, 54-60.
Xu, G., Zhang, Y., Shao, H., Sun, J. 2016a. Pyrolysis temperature affects phosphorus transformation in biochar: Chemical fractionation and 31P NMR analysis. Science of The
Total Environment, 569–570, 65-72.

203
Xu, G., Zhang, Y., Sun, J., Shao, H. 2016b. Negative interactive effects between biochar and phosphorus fertilization on phosphorus availability and plant yield in saline sodic soil. Science of The Total Environment, 568, 910-915.
Yamato, M., Okimori, Y., Wibowo, I.F., Anshori, S., Ogawa, M. 2006. Effects of the application of charred bark of Acacia mangium on the yield of maize, cowpea and peanut, and soil chemical properties in South Sumatra, Indonesia. Soil Science and Plant Nutrition, 52(4), 489-495.

204
10. Evaluation of Impact of Biochar-Amended Compost on Organic Herb Yield
and Quality
David R. Gang, Anna Berim, Robert Long, John Cleary, Mark Fuchs, Richard W. Finch,
Manuel Garcia-Pérez, and B. Thomas Jobson
10.1 Abstract
Sweet basil is an important specialty crop species in Washington State, which is a leader in organic herb production in the United States. Basil is grown both in the field and in greenhouses in Washington State, and is subject to drastically different environments across the state, including drought-susceptible soils in some areas, and high humidity conditions in others. Soil health is a potentially critical component of basil production, and soil amendments that enhance basil productivity would have important positive impacts on the herb industry. The addition of biochar to the composting process can reduce greenhouse gas emissions, and has the potential to change the resulting compost properties in ways that benefit plant health and productivity, and thereby crop quality. In this investigation, co-composted and non-co-composted biochar and ash were tested for their impact on basil growth and quality, measured as crop yield and production of antioxidants and flavor compounds. In this pot-based study, with plants grown under organic farming conditions in a glasshouse, a strong positive impact on basil growth was observed when biochar was co-composted and added to mixtures that contained field soil, but no impact was seen when biochar and compost were added together at the same ratios without being co-composted. This benefit was seen for 2.5% co-composted biochar, as well as for 5% co-composted biochar, and for both basil cultivars evaluated, but only when field soil was included in the pot soil mixtures. Additional work is needed to determine the actual mechanism of enhanced growth, but an impact on soil microbe balance is suspected as a potential cause or contributing factor. Thus, co-composting of biochar has the potential to positively benefit both the herb production and the composting industries.
10.2 Background
Compost is well-known for its value as a natural fertilizer. In addition, composting remains a reliable, inexpensive way to recycle organics. Additionally, composting may keep high nitrogen feedstocks out of landfills, while utilizing that nitrogen for crop production. However, there is a trend toward larger compost piles on smaller footprints as composters try to maximize material throughput, which poses challenges for keeping large piles aerobic (Ma et al., 2013). Large piles more frequently undergo anaerobic composting, releasing more odor compounds. Clearly, new innovations must be implemented if composted solid waste is to be increasingly produced for agricultural use. Because of this, there is significant interest for the introduction of amendments to the composting process that may reduce such emissions. As outlined elsewhere in this report, one such amendment is highly-porous biochar, which may be a low-cost solution to the problem of gas release during the composting process.

205
Biochar is produced commercially in the State of Washington, principally from the pyrolysis of forest industry wood waste and has the ability to provide clear positive benefits to both the composting industry and the environment in the following ways:
1) Directly absorb nitrous oxide (N2O), ammonia, hydrogen sulfide (H2S), and other odors that would otherwise be emitted during the composting process (Cheng et al., 2008; Dias et al., 2010; Hua et al., 2009; Kammann et al., 2012; Liang et al., 2006; Steiner et al., 2010; Wang et al., 2013) – this phenomenon has been recorded since the 19th century (Barry et al., 1853);
2) Alter physicochemical processes and the microbial community of the compost pile (Jindo et al., 2012; Steiner et al., 2010), which may lead to indirect sorption of odorous, compost-derived organic compounds through metabolites (Feng et al., 2013; Prost et al., 2013);
3) Provide nutrients such as potassium, phosphorus, calcium, magnesium, and iron, for later use as plant mineral nutrition when applied as a soil amendment (Dias et al., 2010; Wei et al., 2014; Zeng et al., 2013);
4) Increase organic carbon content of compost, improving water holding capacity, decreasing soil density thus improving tilth, increasing cation exchange capacity and holding plant nutrients, and neutralizing acidic soils (Trippe et al., 2015); and
5) Reduce the emission of greenhouse gases. Much of the work related to biochar impact on plant growth and productivity has been performed on tree crops or staple crops such as maize, wheat, or rice. While response to biochar application have also been investigated for some vegetable crops, such as tomatoes and lettuce (as outlined below), only a few herb species (including sweet basil) have been evaluated (Gravel et al., 2013; Pandey et al., 2016). This dearth of knowledge stimulated this investigation. Herbs are important specialty crops in Washington State, which is a leader in organic herb production within the United States, and one of the major producers of many other conventionally grown herbs. The most notable of these is peppermint, for which Washington is very well known. One of the other major herbs produced in Washington State is sweet basil. Sweet basil is consumed globally. While it is best known as a culinary herb, it also has medicinal uses. Basil, being native to the region spanning from eastern Greece to western India and from northeastern Africa to Azerbaijan, is a heat loving plant. While the native species and varieties tolerate dry/desert conditions well, many of the commercial varieties are more drought susceptible, though still quite heat tolerant. However, hot, dry conditions are not typical of most places where basil is now grown worldwide, including much of the United States and Washington State, in particular. Indeed, the major growing regions for Washington sweet basil are just east of Seattle and north of Spokane. Greenhouses are often used to increase the growing season east of the Cascade Range, which has a drier, but shorter growing season than the western part of the state. However, complications for basil production are prevalent in western Washington, where the high humidity and lower temperatures in the summer increase susceptibility to diseases (particularly downy mildew), which oftentimes leads to only a single annual harvest for outdoor production facilities such as are found at HerbCo (T. Andrews, personal communication), one of the largest organic herb

206
producers in the nation with growth facilities in several states, but headquartered in Washington. Improving plant resistance to downy mildew and other diseases, if only long enough to extend the growing season to one additional harvest, would provide tremendous benefit to the industry. Sweet basil has been used in investigations that tested the impact of biochar application on plant yield and somewhat on plant properties (such as levels of some essential oils). A recent study, in which basil plants were grown in pots in a glasshouse in soil containing mixed-in cured (non-composted) biochar, chemical fertilizer or both (Pandey et al., 2016), reported significant improvements in soil health and quality, as outlined in the previous chapter, including increases in total organic matter, total nitrogen, available phosphorus, and available nitrogen. Pandey et al. (2016) also reported improvements to soil microbial biomass carbon and microbial activity (including enhanced soil enzyme activity) with biochar application as well, regardless of the presence of chemical fertilizer. Importantly, vegetative yield increased, even when less chemical fertilizer was applied. And, setting the stage for this investigation, they also observed no change in the basil aroma compounds, with the levels of the flavor compounds remaining the same across all treatments. However, the Pandey et al. (2016) study did not include co-composted biochar. In different study, biochar was tested as a potential replacement for peat as a major soil component in potted plant growth. Basil, along with tomato, sweet pepper, and geranium were the plants used in the analysis (Dorais et al., 2016). In that study, biochar was applied at rates of 0%, 10%, 20%, 30%, and 50% of the soil mixture for tomato and up to 30% for geranium, sweet pepper and basil. Biochar addition of up to 30% did not impact plant growth, but 50% biochar reduced tomato plant height. No significant impact on disease sensitivity (after inoculation with Pythium ultimum) was measured for tomato under those conditions as well. Basil was not tested for disease resistance.
10.3 Objectives
The specific objectives were to evaluate the impact of co-composted and non-co-composted biochar and ash on sweet basil production and quality, including:
• Gas emissions during compost generation, • Productivity of sweet basil, • Production of antioxidant compounds in sweet basil, and • Production of flavor compounds in sweet basil.
The proximate composition of biochar is typically reported in terms of its content of moisture, volatiles, fixed carbon, and ash. Our team is interested in elucidating the relative impact of each of the biochar fractions on the performance observed. Typically, the ash fraction is responsible for the pH changes observed when biochar is used as a soil amendment. Thus, we decided to study the performance of a material rich in ash separate from biochar.

207
10.4 Methods
Different batches of compost were produced simultaneously from the same exact source materials, with some batches containing biochar or ash (co-composted) in addition to a control that contained no such amendments. Gas emissions were monitored to determine the impact of co-composting of ash or biochar on the composting process, and compost quality was measured. These composts were then used in a glass house-based experiment, where basil plants from two cultivars were grown in pots, in soil that contained non-sterilized field soil as a significant fraction of the soil volume, as well as compost from one of the generated batches. The plants were then evaluated for yield, and for chemical constituents associated with antioxidant properties and flavor/aroma. Methods for of each portion of this study are described below.
10.4.1 Compost generation and gas emission sampling
Five different types of co-compost were produced either using biochar from Amaron Energy (Salt Lake City, Utah) or wood ash from EnergyTricon Lumber, LLC (St Regis, Montana). The properties of the biochar and ash used are provided in
Table 10.1 through Table 10.3. All five compost piles contained: 3.5 yards of screened manure solids from the Washington State University (WSU) dairy, 3.5 yards of dairy bedding straw and manure, 6.5 yards of ground clean green (woody) yard trimmings, and 1.5 yards of food waste from the WSU dining commons. These components were mixed and stacked in separate 15-yard piles, beginning in mid-summer 2016. Four of the experimental piles contained either wood ash (ash) or biochar mixed at either 2.5% or 5% (by volume) at the initiation of the composting process. One pile contained no ash or biochar (compost control). The piles were turned on days 10 and 52 of the composting process. The piles were monitored for temperature (maintained >57°C) and bulk density throughout the composting process. By the end of the composting period, the piles had reduced to about 6 yards each.
Table 10.1: Ash content of biochar used in this investigation
Sample % Ash
Planer Wood Chip Char 8.6 Lumber Mill Boiler Ash* 73.2 Amaron Pyrolysis Char Bag 2386 9.6 Amaron Pyrolysis Char Bag 1406 10.3 Ag Energy Wheat Char 17.6 Amaron Pyrolysis Char Bag 2 11.3 Amaron Pyrolysis Char Bag 1 9.0 Ag Energy Paper Mill Rejects Char 13.5
*Soil mixed with char
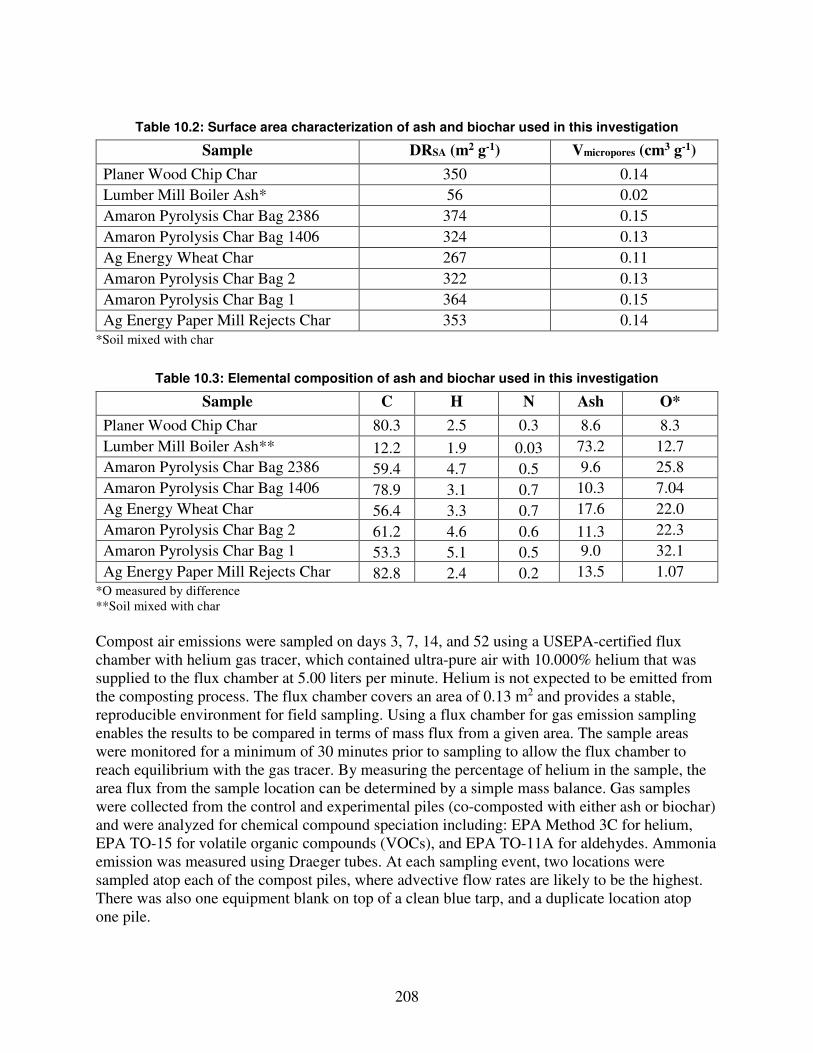
208
Table 10.2: Surface area characterization of ash and biochar used in this investigation
Sample DRSA (m2 g-1) Vmicropores (cm3 g-1)
Planer Wood Chip Char 350 0.14 Lumber Mill Boiler Ash* 56 0.02 Amaron Pyrolysis Char Bag 2386 374 0.15 Amaron Pyrolysis Char Bag 1406 324 0.13 Ag Energy Wheat Char 267 0.11 Amaron Pyrolysis Char Bag 2 322 0.13 Amaron Pyrolysis Char Bag 1 364 0.15 Ag Energy Paper Mill Rejects Char 353 0.14
*Soil mixed with char
Table 10.3: Elemental composition of ash and biochar used in this investigation
Sample C H N Ash O*
Planer Wood Chip Char 80.3 2.5 0.3 8.6 8.3 Lumber Mill Boiler Ash** 12.2 1.9 0.03 73.2 12.7 Amaron Pyrolysis Char Bag 2386 59.4 4.7 0.5 9.6 25.8 Amaron Pyrolysis Char Bag 1406 78.9 3.1 0.7 10.3 7.04 Ag Energy Wheat Char 56.4 3.3 0.7 17.6 22.0 Amaron Pyrolysis Char Bag 2 61.2 4.6 0.6 11.3 22.3 Amaron Pyrolysis Char Bag 1 53.3 5.1 0.5 9.0 32.1 Ag Energy Paper Mill Rejects Char 82.8 2.4 0.2 13.5 1.07
*O measured by difference **Soil mixed with char Compost air emissions were sampled on days 3, 7, 14, and 52 using a USEPA-certified flux chamber with helium gas tracer, which contained ultra-pure air with 10.000% helium that was supplied to the flux chamber at 5.00 liters per minute. Helium is not expected to be emitted from the composting process. The flux chamber covers an area of 0.13 m2 and provides a stable, reproducible environment for field sampling. Using a flux chamber for gas emission sampling enables the results to be compared in terms of mass flux from a given area. The sample areas were monitored for a minimum of 30 minutes prior to sampling to allow the flux chamber to reach equilibrium with the gas tracer. By measuring the percentage of helium in the sample, the area flux from the sample location can be determined by a simple mass balance. Gas samples were collected from the control and experimental piles (co-composted with either ash or biochar) and were analyzed for chemical compound speciation including: EPA Method 3C for helium, EPA TO-15 for volatile organic compounds (VOCs), and EPA TO-11A for aldehydes. Ammonia emission was measured using Draeger tubes. At each sampling event, two locations were sampled atop each of the compost piles, where advective flow rates are likely to be the highest. There was also one equipment blank on top of a clean blue tarp, and a duplicate location atop one pile.

209
10.4.2 Plant growth and tissue collection Two sweet basil cultivars were included in this investigation. Thai Siam Queen (TSQ), obtained from Territorial Seed Co. (Cottage Grove, Oregon), is a high methylchavicol producing cultivar used typically in Southeast Asian cuisine. Eleanora (Osborne International Seed Co., Mount Vernon, Washington) is an Italian/French sweet basil cultivar, rich in linalool and eugenol/methyleugenol. Both of these cultivars are grown commercially in the State of Washington using certified organic agricultural practices. On day 1 of this experiment, seeds were placed in open plastic germination trays containing vermiculite and kept wet with a fertilizer solution. Germination took place in a walk-in growth chamber under the following conditions: 16-hour day length light cycle using standard cool white fluorescent lighting, with temperature maintained between 18.5ºC and 22ºC, and relative humidity of 40-60%. All seeds germinated between days 4 and 6, with a germination rate of greater than 90%. On day 7 (one week after seeds were placed in the germination trays) and post radical emergence, the small emerging seedlings were transferred to cell packs containing standard greenhouse potting soil (sunshine mix #4), and were kept under the same growth conditions as above. On day 21 (two weeks after first seedling transfer), the young plants were transplanted to round, plastic 6" pots containing soil treatment mixtures. Each basil cultivar was divided into 10 treatment groups (based on soil mixture type), each containing 8 replicates, for a total of 80 plants per cultivar. Soil treatments were mixed by hand at the time of transplanting. The “standard” soil mixture contained one part each of vermiculite, peat, field topsoil and compost (if the treatment required, or no compost for the no-compost control). The compost used was generated at the WSU waste management composting facility during the Fall of 2016, as described above, and the field soil was topsoil collected from the HerbCo farm in Duvall, Washington, on February 21, 2017. HerbCo grows sweet basil each year on the farm that was the source of the top soil, but the soil taken for this experiment was from a field that was fallow in February 2017. Based on this soil mixture, the following treatments were generated and used for the soil in the pots:
Treatment 1: standard soil mixture, compost was co-composted with 5% biochar. Treatment 2: standard soil mixture, compost was co-composted with 2.5% biochar. Treatment 3: standard soil mixture, compost was co-composted with 5% ash. Treatment 4: standard soil mixture, compost was co-composted with 2.5% ash. Treatment 5: standard soil mixture, with standard non-co-composted compost (no biochar or ash added at the start of the composting process), and with addition of 12.5% raw biochar (i.e., the equal volume equivalent of biochar added at the start of the composting process after pile reduction from 15 to 6 yards by the end of the composting process). Treatment 6: standard soil mixture, with standard non-co-composted compost (no biochar or ash added at the start of the composting process), and with addition of 6.25% raw biochar (i.e., the equal volume equivalent of biochar added at the start of the composting process after pile reduction from 15 to 6 yards by the end of the composting process). Treatment 7: standard soil mixture, with standard non-co-composted compost (no biochar or ash added at the start of the composting process), and with addition of 12.5% raw ash (i.e.,

210
the equal volume equivalent of biochar added at the start of the composting process after pile reduction from 15 to 6 yards by the end of the composting process). Treatment 8: standard soil mixture, with standard non-co-composted compost (no biochar or ash added at the start of the composting process), and with addition of 6.25% raw ash (i.e., the equal volume equivalent of biochar added at the start of the composting process after pile reduction from 15 to 6 yards by the end of the composting process). Treatment 9: standard soil mixture, with standard non-co-composted compost (no biochar or ash added at the start of the composting process), and no fresh biochar or ash. Treatment 10: no compost control (i.e., soil mixture contained equal parts vermiculite, peat and field soil, but no compost, no biochar, no ash).
Potted plants were then placed in a greenhouse and grown under the following conditions: 16-hour day length with supplemental lighting (metal halide); light activation set to maintain minimum 200 µmol m−2 s−1 during the day cycle. Temperature was maintained between 24ºC and 26.5ºC at all times. Humidity was maintained in the range of 40-60% for the duration of the experiment. Plants were watered when needed to prevent onset of wilting (usually every other day) and were fertilized once weekly. No pesticides of any kind were used in this experiment. The fertilization was carried out via siphon-mixing with the house watering system at a rate of 1 ounce of liquid fertilizer per gallon of hose water. The fertilizer used in this study was a certified organic liquid concentrate rated 4-1-3 that is derived from “fish solubles, kelp extract, potassium sulfate and citric acid (for pH stabilization)” (Down To Earth Liquid All Purpose 4-1-3; Down To Earth Distributors, Inc., Eugene, Oregon). Emerging flowers were removed until all plants were harvested for analysis to prevent early termination of growth senescence. Flowering began roughly 20 days after transplanting to the 6” pots (about day 41), predominantly in the TSQ line. This corresponded roughly to emergence of the 5th to 6th leaf pairs. The Eleanora line began flowering later. At time of harvest, all plants were flowering. Pot positions were manually rotated every four days (i.e., each row was shifted laterally on the bench, with the row closest to the greenhouse wall brought back around to the position furthest from the wall). This was done to avoid environmental biasing from lighting irregularities and position, airflow, temperature, etc., within the greenhouse. On day 61 of the experiment, plant material was harvested for analysis. All replicates from all treatments were harvested. Harvest was carried out by cutting each plant at the soil line, determining the fresh weight of the cut plant (total weight of above-ground parts) and collecting the 5th, 6th, or 7th leaf pairs, depending on availability. The two uppermost leaf pairs that consisted of fully developed leaves were taken. The harvested leaves were placed immediately into 50 mL conical centrifuge tubes and submerged in liquid nitrogen. After all plants were harvested, the tubes were placed into a -80°C freezer until preparation for chemical/metabolite analysis.
10.4.3 Metabolite analysis The frozen leaf samples were ground by hand with a pestle in a mortar under liquid nitrogen (N2) and extracted in glass vials at room temperature as previously described (Gang et al., 2001). For analysis by gas chromatography-mass spectrometry (GC-MS), the accurately weighed fresh tissue aliquots were extracted with 1 mL tert-butyl methyl ether containing 50 µg 1,2,4-trimethylbenzene as an internal standard. The extracts were vortexed briefly, then incubated on an orbital shaker for 30 minutes at room temperature under mild shaking, and briefly vortexed

211
again. Tissue debris was removed by centrifugation at room temperature 21000 g for 15 minutes. An aliquot of the supernatants was dried over anhydrous sodium sulfate and used for GC-MS analysis. GC-MS analysis was performed using a Pegasus 4D time-of-flight mass spectrometer (LECO) equipped with a Gerstel MPS2 autosampler and an Agilent 7890A oven. The derivatization products were separated on a 30 m, 0.25 mm internal diameter, 0.25 μm df Rxi-5Sil® column (Restek) with an IntegraGuard® pre-column using ultrapure helium as carrier gas at a constant flow of 1 mL per minute. The linear thermal gradient started with a two-minute hold at 40°C, followed by a ramp to 100°C at 8°C per minute, and a second ramp to 150°C at 3°C per minute. The oven was then heated to 280°C at 25°C per minute. The final temperature was held for 5 minutes prior to returning to initial conditions. Mass spectra were collected at 17 spectra s-1. The transfer line was held at 250°C, the injection port at 220°C, and 1 μL of the sample was injected at an appropriate split ratio. Peak identification was conducted using NIST spectral library with an identity score cutoff of 700. Peak alignment and spectrum comparisons were carried out using the Statistical Compare feature of the ChromaTOF® software (LECO). The signal for the internal standard and the initial tissue weight were used for normalization. For the analysis by ultra-performance liquid chromatography-mass spectrometry (UPLC-MS), the accurately weighed frozen tissue aliquots were extracted using 1 mL aqueous ethanol (85% by volume) containing 7.15 µg internal standard kaempferol. The tissue was briefly vortexed, sonicated for 30 min in a Branson model 5510 sonication bath at room temperature, and briefly vortexed again. Debris was removed by centrifugation for 20 minutes at 21000 g and 4°C, and 2 µL of the clarified supernatants were used for analysis. The UPLC-MS analysis was performed using a Synapt G2-S high definition mass spectrometry quadrupole ion mobility time-of-flight mass spectrometer equipped with an Acquity ultra-performance liquid chromatography system with an Acquity photodiode array (PDA) detector (Waters, Milford, Massachusetts). The PDA detector was operated using a range from 210-500 nm and 20 scans per second. The separation of metabolites was achieved on an Acquity BEH C18 column (2.1 x 50 mm, 1.7 μm particle size, Waters) using LC-MS grade water with 0.1% formic acid as solvent A and acetonitrile with 0.1% formic acid as solvent B, at a flow rate of 400 μL per minute and the following linear gradient: 0 minutes, 97% A; 0.86 minutes, 97% A; 9.69 minutes, 1% A; 10.52 minutes, 1% A; 11.02 minutes, 97% A; 14 minutes, 97% A. The mass spectrometer was operated in the negative electrospray ionization mode with the following settings: capillary at 2.5kV, sampling cone at 40 V and source temperature of 100°C, source offset at 80 V, and 850 L per hour desolvation gas flow and 250°C desolvation temperature. Mass spectra were acquired for a mass range of 50-1000 m/z. Leucine enkephaline was infused as reference compound for accurate mass determination. Analysis of selected target metabolites was carried out using the TargetLynx module within MassLynx v. 4.1 (Waters, Milford, Massachusetts). The signal for the internal standard and the initial tissue weight were used for normalization.

212
10.5 Results and discussion
10.5.1 Compost generation and gas emissions
The compost generated for use in this experiment was typical of the compost routinely produced by WSU’s Waste Management facility, which is broadly used in the local community. When biochar was added to the mixture at the start of the composting process (co-composted), significant reduction in gas emissions was observed. For example, Figure 10.1A shows the mass flux of acetaldehyde, acetone, and dimethylsulfide, three of the more common and abundant compounds that were found in compost emissions from six major compost facilities in the State of Washington. It is clear that the addition of biochar led to significant reductions in the emission of these compounds throughout the composting process. However, much more comprehensive measurements are needed to draw strong conclusions regarding the actual impact of biochar amendment on the composting process. Volatile organic compounds (VOCs) from the developing compost piles were measured in WSU’s Atmospheric Chemistry Lab, where a variety of compounds can be detected and measured over time. A typical example of VOC profiles observed during the composting process is α-pinene, as shown in Figure 10.1B. A significant reduction in VOC occurred early on during the composting process when biochar was present. However, emission increased later in the composting process. The results are typical of the variability that has been measured for α-pinene at other compost facilities in Washington State Department of Ecology’s (Ecology’s) database. α-pinene is typically associated with pine tree woody materials used as compost bulking agents. WSU’s Atmospheric Chemistry Lab did not have a standard to convert the results to concentrations, so the results are presented here as normalized area flux for this experiment. Ammonia flux was also measured in the field at each sample location using Draeger tubes. The results were typical of the variability that is measured for ammonia at other composting facilities in Ecology’s database. While a few of the other sites in Ecology’s compost emission database accepted food waste, the experimental compost piles in this study were very nutrient rich with manure and had double the typical food waste to ensure emissions.
Figure 10.1: Emissions in the early composting phase, up to day 14, either in the presence of
compost alone or compost that was co-composted with ash or char amendments. (A) Mean flux of acetaldehyde, acetone, and dimethylsulfide (DMS) (B) Normalized area flux of α-pinene.
213
10.5.2 Impact of biochar amendment on sweet basil productivity Basil plants were grown for approximately two months after sowing and then harvested to determine biomass production (yield) and chemical composition (herb quality). Because plants were grown in pots in a greenhouse with supplemental lighting, they began flowering early compared to what would occur in the field. TSQ, in particular, began flowering early. The common horticultural practice under those circumstances is to pinch off the initiating inflorescences, which serves two purposes. First, it enables the plants to continue to grow (otherwise, many basil cultivars will, under long day conditions, switch to seed production at the cost of leaf production) and second, it causes lateral branch formation, which increases leaf (and, therefore, biomass) yield. Plants were pinched off as needed until about the 8th week, in preparation for harvest, at which time all initiating flowers (again, primarily on TSQ) were left on the plant. This led to significant branching of especially TSQ plants, but also of many of the Eleanora plants as well, especially those that were growing in more robustly. This branching can be seen in Figure 10.2A and B, for Eleanora and TSQ, respectively, where typical/representative plants from each treatment are shown. The plants displayed in Figure 10.2 are all shown at the same scale. The photographs were initially taken with both controls in each photograph with a pair of other treatments, and then cropped to display the controls just once. This enabled properly scaled photographs to be displayed, allowing direct comparison of plant size in response to each treatment. All photographs were taken on the same day, using plants from this study that were typical of each treatment type. The plants were then harvested and their fresh weights were determined. As shown in Figure 10.2C and D, there were significant differences between some of the treatments, not only in visual appearance, but also in measured fresh weight. The controls (treatments 9 and 10, see Methods) appeared to be the smallest on average, although statistical analysis suggested that they were in fact not significantly smaller than most of the other treatments. Interestingly, the 5% biochar co-composted treatment (treatment #1) produced the largest plants. The 2.5% biochar co-compost treatment appeared, based on the figure, to have a lower yield compared to the 5% biochar co-compost treatment. However, the difference was not significant based on ANOVA analysis (as indicated by letters above the bars in the figure). For cultivar TSQ, the 5% ash co-compost treatment was also not significantly different from the 5% biochar co-compost treatment.

214
Figure 10.2: Impact of biochar co-composting on biomass/yield of sweet basil cultivars Eleanora (a Genovese type of basil) and TSQ (Thai Siam Queen, a SE Asian basil cultivar). Different letters
indicate significant differences between treatments.
What was more impressive, however, was the clear distinction that the co-composting process had on the growth promoting properties of the soil compared to when non-co-composted

215
compost was used, such as in the other treatments or the compost control. The compost used for those treatments was generated at the same time as the co-composted compost, from the same starting materials, mixed in the same ratios and processed the same, just without addition of biochar or ash (see Methods). Yet, the plain compost had no growth promoting properties at all, even with the addition of non-co-composted biochar or ash. The only enhancement in yield (fresh weight increase) occurred when the biochar (or 5% ash) was co-composted. Thus, addition of biochar to the composting process not only led to significant reduction in gas emissions during the composting process, but also a significant increase in herb yield. Both cultivars showed this response. These experiments obviously need to be repeated with many additional cultivars, as well as in the field, but the results are very promising, indeed.
10.5.3 Impact of biochar amendment on sweet basil anti-oxidant compound production After fresh weight was determined for each plant, two leaf pairs, the most recently fully matured leaf pairs (see Methods), were collected and frozen immediately in liquid nitrogen. The leaves were then ground in the presence of liquid nitrogen with a mortar and pestle, and some of the resulting powder was extracted for either anti-oxidant compound or volatile metabolite levels. It is important to note that such analysis requires keeping the tissue at lower than -70ºC at all times up until the addition of solvent in order to prevent air-based oxidation of the compounds and their polymerization. Otherwise, compounds such as caffeic acid, which is present at very high levels in basil leaves, will non-enzymatically polymerize, leading to both browning of the tissue and confounding results with regards to the accumulation of other compound accumulation (such as rosmarinic acid or chicoric acid). In this investigation, we found very little impact of the treatments on production of the important antioxidant compounds: chicoric acid and rosmarinic acid (Figure 10.3). The only differences observed were seen in Eleanora, where the non-compost control had much higher levels (almost double) of rosmarinic acid than all other treatments (none of which were significantly different from each other) based on ANOVA analysis with p<0.05. For chicoric acid, only two treatments had statistically significant differences, which were 2.5% biochar + compost and 2.5% ash + compost. However, the difference was not that large, and appeared to be within the range of other treatments, so it is unclear how important that difference is. In cultivar TSQ there were no differences in chicoric acid or rosmarinic acid levels, regardless of treatment. Thus, it appears that the only important difference in antioxidant compound production was the higher level of rosmarinic acid in the Eleanora no-compost control relative to all other treatments. The reason for these differences may be a more water stressed condition that this cultivar may have experienced under this treatment compared to the other treatments. With no compost or biochar present in the soil, the water holding capacity of this treatment is expected to be the lowest, and Eleanora, being a Genovese-type sweet basil, is less drought tolerant that cultivars such as TSQ.
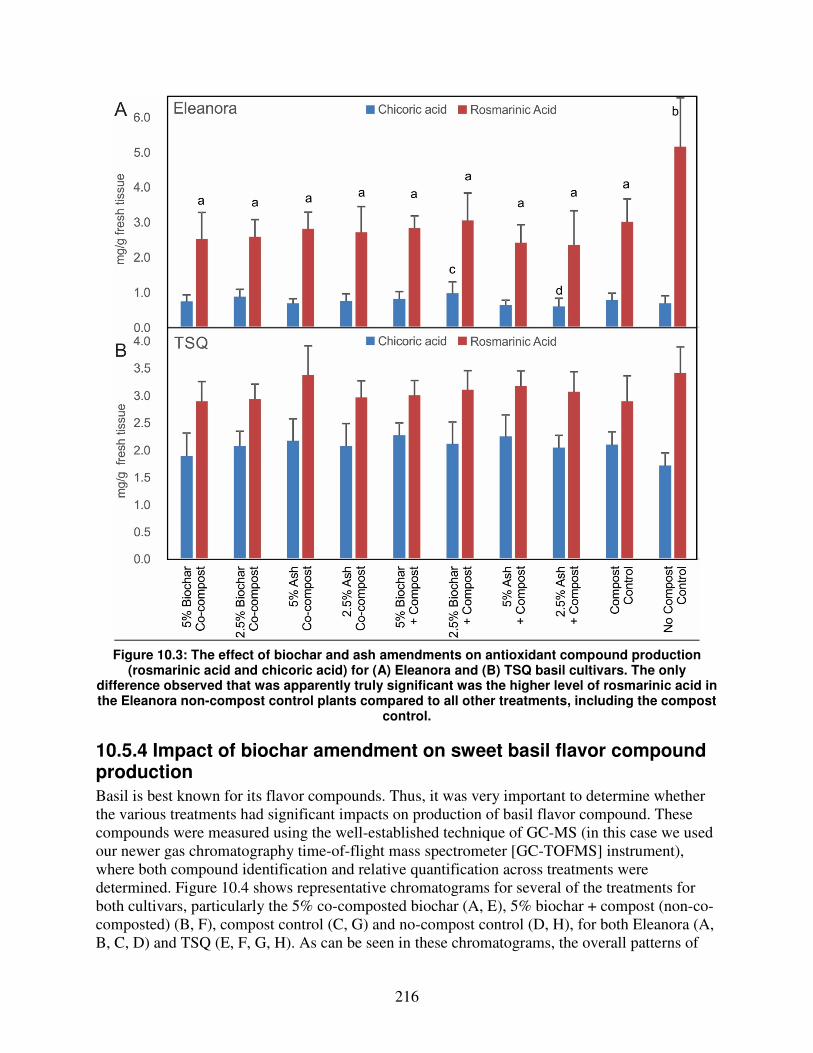
216
Figure 10.3: The effect of biochar and ash amendments on antioxidant compound production
(rosmarinic acid and chicoric acid) for (A) Eleanora and (B) TSQ basil cultivars. The only difference observed that was apparently truly significant was the higher level of rosmarinic acid in the Eleanora non-compost control plants compared to all other treatments, including the compost
control.
10.5.4 Impact of biochar amendment on sweet basil flavor compound production Basil is best known for its flavor compounds. Thus, it was very important to determine whether the various treatments had significant impacts on production of basil flavor compound. These compounds were measured using the well-established technique of GC-MS (in this case we used our newer gas chromatography time-of-flight mass spectrometer [GC-TOFMS] instrument), where both compound identification and relative quantification across treatments were determined. Figure 10.4 shows representative chromatograms for several of the treatments for both cultivars, particularly the 5% co-composted biochar (A, E), 5% biochar + compost (non-co-composted) (B, F), compost control (C, G) and no-compost control (D, H), for both Eleanora (A, B, C, D) and TSQ (E, F, G, H). As can be seen in these chromatograms, the overall patterns of

217
compound accumulation (the “fingerprints”) do not change much, at least at the qualitative level. There were no differences, for example, in presence or absence of specific compounds in each respective cultivar under the different conditions, and the compounds that were present at the highest level remained high, those at the lower levels remained low.
Figure 10.4: GC-MS chromatograms for volatile compounds produced by TSQ (A-D) and Eleanora
(E-H) demonstrate that treatments had little effect on flavor compound production
Some minor differences in relative abundance of specific compounds may have occurred in some of the treatments relative to the compost control, as data in Figure 10.5 may suggest. However, those differences were not typically statistically significant relative to the compost control. As is usually observed for species like basil, there was a large variation in compound production across plants within the same cultivar (the error bars in Figure 10.5 are standard deviations of the mean, with 8 replicates). The only potential major difference observed for Eleanora (Figure 10.5, left side), was the approximate 50% increase in eucalyptol and eugenol in the non-compost control. This may support the contention that these control plants could have experienced some drought stress due to the lower water holding capacity of that soil mixture compared to the compost-containing soils. Many basil varieties accumulate higher levels of volatiles in response to drought stress. For most of the other treatments with Eleanora, there was little change relative to the compost control. However, due to the high levels of variation among the individual plants, no statistically significant difference was present. These results suggest that biochar addition had little impact on the production of volatile flavor compounds in this cultivar under these conditions.
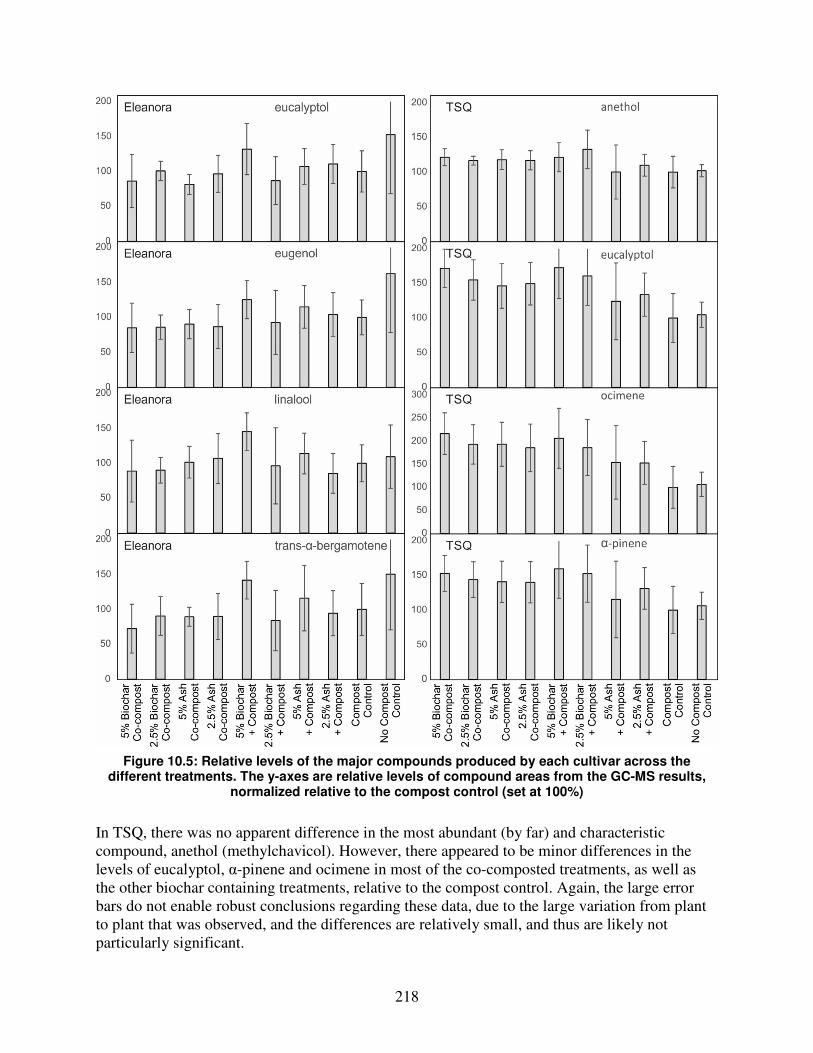
218
Figure 10.5: Relative levels of the major compounds produced by each cultivar across the
different treatments. The y-axes are relative levels of compound areas from the GC-MS results, normalized relative to the compost control (set at 100%)
In TSQ, there was no apparent difference in the most abundant (by far) and characteristic compound, anethol (methylchavicol). However, there appeared to be minor differences in the levels of eucalyptol, α-pinene and ocimene in most of the co-composted treatments, as well as the other biochar containing treatments, relative to the compost control. Again, the large error bars do not enable robust conclusions regarding these data, due to the large variation from plant to plant that was observed, and the differences are relatively small, and thus are likely not particularly significant.

219
In a previous investigation carried out by us last year, as a preliminary step to this investigation (data are unpublished), we grew TSQ basil and a breeding variety called SW. SW is somewhat similar to Eleanora, but also distinct in some of the compounds that it produces. The plants were grown in the greenhouse in late fall, in pots that contained standard greenhouse soil mixture (no field soil) and the same amount of compost as used in this investigation. Under those conditions, we again saw no difference in compound production, across the board, but we also saw no difference in growth enhancement. The fresh weight of all treatments was essentially identical to the control. Thus, biochar addition, either “raw” or co-composted, had no impact on the plants. In this follow-up investigation, we also saw essentially no difference in compound production, using both one of the same cultivars (TSQ) as well as a different cultivar (Eleanora). However, we observed an obvious and clearly dramatically significant impact on plant growth and crop yield when co-composted biochar was used in combination with soil that contained field soil. An impact on soil health, particularly on microbiome support/enhancement is an obvious potential reason for this difference and is something that needs to be followed up on.
10.6 Conclusions
The results of this investigation support the conclusion that sweet basil (including two very different cultivars) is a suitable crop species to be further evaluated for use of co-composted biochar in its soil health maintenance plan. The addition of biochar, particularly when co-composted, did not impact significantly either antioxidant compound levels or flavor compound production. Instead, enhanced growth was observed, leading to increased yield, with essentially identical chemical profiles per fresh weight leaf mass being retained. In addition, significant positive impacts on gas emissions were observed during the composting process when biochar was co-composted. Thus, co-composting of biochar and subsequent utilization of the resulting compost in sweet basil production appears to be a win-win-win situation, with regards to waste management, compost generation and crop production. This study raised questions about the mechanism whereby enhanced growth occurred. It is likely that positive impacts on soil health are involved, particularly related to the impact on soil microbe levels or composition, and especially when considering the fact that a previous investigation by our research team in fall 2016 using the same compost but mixed with essentially sterile greenhouse potting soil did not produce the same benefits to basil growth, but also did not impact herb quality. Future work to evaluate changes in the soil microbiome will help answer questions about the mechanisms involved.
10.7 References
Barry, P., Downing, A.J., J., S., Mead, P.B., Woodward, F.W., Williams, H.T. 1853. The
Horticulturist, And Journal Of Rural Art And Rural Taste #5. Cheng, C.-H., Lehmann, J., Engelhard, M.H. 2008. Natural oxidation of black carbon in soils:
changes in molecular form and surface charge along a climosequence. Geochimica et
Cosmochimica Acta, 72(6), 1598-1610.

220
Dias, B.O., Silva, C.A., Higashikawa, F.S., Roig, A., Sánchez-Monedero, M.A. 2010. Use of biochar as bulking agent for the composting of poultry manure: Effect on organic matter degradation and humification. Bioresource Technology, 101(4), 1239-1246.
Dorais, M., Martinez, C., Diop, M., Thériault, M., Ménard, C., Pepin, S. 2016. Assessing the potential of biochar as a growing media component for potted plants. International Society for Horticultural Science (ISHS), Leuven, Belgium. pp. 19-26.
Feng, L., Hu, C., Chen, X., Zhao, X. 2013. Dramatic inundation changes of China’s two largest freshwater lakes linked to the Three Gorges Dam. Environmental science & technology, 47(17), 9628-9634.
Gang, D.R., Wang, J., Dudareva, N., Nam, K.H., Simon, J., Lewinsohn, E., Pichersky, E. 2001. An investigation of the storage and biosynthesis of phenylpropenes in sweet basil (Ocimum basilicum L.). Plant Physiol., 125(2), 539-555.
Gravel, V., Dorais, M., Ménard, C. 2013. Organic potted plants amended with biochar: its effect on growth and Pythium colonization. Canadian Journal of Plant Science, 93(6), 1217-1227.
Hua, L., Wu, W., Liu, Y., McBride, M.B., Chen, Y. 2009. Reduction of nitrogen loss and Cu and Zn mobility during sludge composting with bamboo charcoal amendment. Environmental
Science and Pollution Research, 16(1), 1-9. Jindo, K., Sanchez-Monedero, M.A., Hernandez, T., Garcia, C., Furukawa, T., Matsumoto, K.,
Sonoki, T., Bastida, F. 2012. Biochar influences the microbial community structure during manure composting with agricultural wastes. Sci Total Environ, 416, 476-81.
Kammann, C., Ratering, S., Eckhard, C., Müller, C. 2012. Biochar and hydrochar effects on greenhouse gas (carbon dioxide, nitrous oxide, and methane) fluxes from soils. Journal of
environmental quality, 41(4), 1052-1066. Liang, B., Lehmann, J., Solomon, D., Kinyangi, J., Grossman, J., O'neill, B., Skjemstad, J.,
Thies, J., Luizao, F., Petersen, J. 2006. Black carbon increases cation exchange capacity in soils. Soil Science Society of America Journal, 70(5), 1719-1730.
Ma, J., Wilson, K., Zhao, Q., Yorgey, G., Frear, C. 2013. Odor in Commercial Scale Compost; Literature Review and Critical Analysis. Washington State Department of Ecology, 17.
Pandey, V., Patel, A., Patra, D.D. 2016. Biochar ameliorates crop productivity, soil fertility, essential oil yield and aroma profiling in basil (Ocimum basilicum L.). Ecological
Engineering, 90, 361-366. Prost, K., Borchard, N., Siemens, J., Kautz, T., Séquaris, J.-M., Möller, A., Amelung, W. 2013.
Biochar affected by composting with farmyard manure. Journal of environmental quality, 42(1), 164-172.
Steiner, C., Das, K.C., Melear, N., Lakly, D. 2010. Reducing nitrogen loss during poultry litter composting using biochar. Journal of Environmental Quality, 39, 1236-1242.
Trippe, K.M., Griffith, S.M., Banowetz, G.M., Whitaker, G.W. 2015. Changes in soil chemistry following wood and grass biochar amendments to an acidic agricultural production soil. Agronomy Journal, 107(4), 1440-1446.
Wang, C., Lu, H., Dong, D., Deng, H., Strong, P.J., Wang, H., Wu, W. 2013. Insight into the Effects of Biochar on Manure Composting: Evidence Supporting the Relationship between N2O Emission and Denitrifying Community. Environmental Science &
Technology, 47(13), 7341-7349.

221
Wei, L., Shutao, W., Jin, Z., Tong, X. 2014. Biochar influences the microbial community structure during tomato stalk composting with chicken manure. Bioresource Technology, 154, 148-154.
Zeng, G., Chen, M., Zeng, Z. 2013. Shale gas: surface water also at risk. Nature, 499(7457), 154-154.

222
11. Wood Waste Boiler Survey
Jim Jensen
11.1 Abstract
Commercial and industrial boilers use renewable fuels (i.e., woody residuals) to produce useful steam and power. They may also be a source of high-carbon ash with properties similar to biochar. Biomass boilers have been widely used at lumber mills and in pulp and paper plants. However, economic changes in recent decades have greatly affected these industries as well as the forestry sector that supplies them. This project updates our knowledge of the biomass boilers in use by the industrial pulp and paper industry in Washington, with a particular focus on their potential for production of high-carbon ash. Using public documents available from the industrial permit section of the Washington State Department of Ecology (Ecology), a contact list of industrial boiler operators was prepared. Currently, eight facilities have industrial boiler permits. The researchers prepared a series of questions designed to update existing data about each facility’s boilers, including questions about fuel use and ash production. The survey was conducted with boiler engineers at the targeted facilities. One plant is currently shut down for an overhaul after being purchased by a new owner. Of the remaining seven, completed surveys were submitted by five companies. Of the five facilities represented by survey respondents, none produce high-carbon ash. Only one facility had screening or ash reinjection equipment that would make harvesting high-carbon material possible. Those reporting on the disposal of ash all indicated that landfill disposal was the method used.
11.2 Background
This project was developed to update and expand upon previous work on the topic of wood-fueled biomass boilers in Washington State. In 1996, a Reasonable Available Control Technology (RACT) List and Schedule was published that listed wood waste boilers as a "Group Al" pollution source. This classification defined boilers using hog fuel (i.e., coarse wood waste chips) as "source categories" for which Ecology would begin a RACT review within the two years following its publication in December, 1996. This triggered the collection of substantial data on wood waste boilers in Washington. The data collection effort culminated in the publication of the "Wood Waste Boiler Survey" by Ecology’s Air Quality Program in April, 1997 (DeMay, 1997).
At the time of the 1997 survey, there were 85 wood waste boiler units operating in the state. It was estimated that they consumed 3.3 million tons of wood, defined as wood and bark or "hogged fuel." Hogged fuel (also called “hog fuel”), derives its name from the process to size the fuel for optimum combustion that uses a "hammer hog." Typically, the source of hogged fuel is a debarking system designed for removing the layers of bark from log segments. A sawmill could generate its own fuel, as could a pulp mill using "pulp" quality logs. Other facilities with wood-fueled boilers would have to purchase hogged fuel from mills with a surplus of fuel or without a wood-fired boiler. The 1997 survey did not address the purchase, collection, or use of forest

223
wood waste or "woody biomass" generated by logging activity (as opposed to sawmill processing), nor did it ask about use of urban wood waste, such as woody yard debris or woody waste from commercial businesses or construction activities.
In the 20 years since the publication of this survey, there have been sufficient changes in wood combustion and boiler control technology to warrant restudying wood waste boiler operations in Washington. Some of these changes include:
• revision of fine particle standards (namely, PM2.5) • revision of the U.S. industry classification system from Standard Industrial Classification
(SIC) to the North American Industry Classification System (NAICS) • contraction of the primary industries utilizing wood waste boilers • significant decreases in the price of natural gas as a competitive fuel • changes in the U.S. Environmental Protection Agency (EPA) regulations and policy with
regards to wood combustion emissions, especially with regards to painted, treated, or otherwise contaminated wood
• emergence of a category of new wood combustion devices—pyrolizers and gasifiers
From 2011 through 2013, the EPA went through a major rulemaking process to establish Boiler Maximum Achievable Control Technology (MACT) rules for major sources of any of several criteria pollutants: carbon monoxide, nitrogen dioxide, particulate matter, lead, ozone, and sulfur dioxide. Biomass boilers were included in these rules, which have had a significant impact on the operation of these boilers nationwide. The Boiler MACT rules have become a focus for establishing priorities for upgrades and investment at industrial boiler operations (Albright, personal communications, 2017).
An updated biomass boiler inventory is a critical first step for analyzing the potential to modify various types of wood boiler systems to produce residual ash with a higher carbon content. Reinjecting partially burned fuel is a standard practice to complete combustion, but can increase fine particle emissions. Reducing combustion rates could produce a more valuable residual, biochar, and simultaneously improve boiler emissions.
In a parallel project, we completed scoping of potential changes to biomass boilers, like the ones used in industrial settings, to produce biochar as a value-added product, and those results are presented in Chapter 12.
11.3 Objectives
The objective of this project was to generate up-to-date information about industrial biomass boilers in Washington State. Of specific interest, was information on boiler equipment, ash production, and fuel use, as this information is useful for assessing the potential for existing industrial boilers to produce high carbon content ash with characteristics similar to biochar.
224
11.4 Methods
11.4.1 Preparing contact list
In addition to the original Wood Waste Boiler Survey (DeMay, 1997), the project team identified and reviewed several other existing surveys and databases with valuable details about boilers in Washington, including the following:
• 1994 Washington State Directory of Biomass Energy Facilities. Washington State Energy Office, Olympia, Washington (Deshaye and Kerstetter, 1994).
• Hog Fuel Boiler/Wood Ash Action Plan, Technical Report. Washington Department of Ecology, Publication No. 01-04-008 (Ecology, 2004).
• Washington State Pulp and Paper Mill Boilers: Current and Potential Renewable Energy Production, Final Report. Washington Department of Ecology, Publication No. 09-07-048. Olympia, Washington (Gustafson and Raffaeli, 2009).
• Characterization of the U.S. Industrial/Commercial Boiler Population. Oak Ridge National Laboratory (Energy and Environmental Analysts, 2005).
Further, the project team consulted with Ecology staff and other air pollution control authorities regarding permit holders for biomass boilers. The project team, in consultation with Ecology staff, decided early in the project to focus on industrial-scale boilers—that is, those pulp and paper mills regulated by Ecology’s Industrial Section. A concern was expressed about the possibility of inadvertently exposing the proprietary technology of an existing Washington-based biochar company through the survey. The team resolved this issue by focusing on industrial boilers and avoiding questions that could shine light on which wood processing facility makes this particular biochar.
11.4.2 Preparing survey questionnaire
Using the 1997 survey as a starting point, questions were added about the purchase, collection, and use of (1) forest wood waste or woody biomass generated by logging activity, and (2) urban wood waste. Several new topic areas were added due to their relevance to the issues involved in modifying systems or operations to produce higher carbon content residuals or biochar products. These questions were informed by the initial scoping of the changes that could be made to different types of existing boiler systems to produce residual ash with higher carbon content or a specific biochar product (Chapter 12). The team considered changes such as the following:
• Equipment modifications • Additional feedstock requirements • Thermal energy implications • Potential cost • Engineering requirements
The survey instrument was developed with the support and input of experts at WSU as well as boiler engineers and private sector experts. Because of the relatively small number of boiler operators to be contacted, the survey instrument was developed as an interview-style questionnaire. However, to accommodate any operator who wished to respond to the survey via email, the survey instrument was also prepared for email delivery.

225
Drafts of survey topics and specific questions were discussed with experts and modifications made based on feedback received. In addition, the project team’s attendance at the spring 2017 meeting of the Western Regional Boiler Association provided additional opportunities to vet the survey and test the topics and questions with working boiler operators before sending it to the individuals targeted in Washington. The final draft of the survey was reviewed and approved by Ecology staff. This survey, though quite small, involved issues and methods that required approval from WSU’s Institutional Review Board (IRB) prior to implementation. The plans for the survey and all the relevant materials were packaged with the appropriate applications and submitted to the IRB for expedited review in late March 2017. Approval for the study was obtained in mid-May.
11.4.3 Survey implementation Upon receiving approval by the IRB, the survey began using the IRB-approved materials. Questionnaires were emailed to all the targeted participants on May 18, 2017. Follow-up phone calls or email reminders were made at weekly intervals, on or about May 25 and June 1. After June 1, more frequently calls were made to ensure we talked with as many representatives of the boiler facilities as possible.
11.4.4 Survey results compilation The contacts database was created with names and contact information for the representatives at the targeted facilities. These data came from public reports, conference presentations, and Ecology staff. In addition, any other relevant data from Ecology’s permit records for each facility was included, when possible. Finally, answers provided in the returned questionnaires by formal survey participants were included. All the facility-specific information is provided in Appendix C. Results of Survey of Boiler Operators. The project team extracted notable themes from the surveys, with an emphasis on boiler equipment, ash production, and fuel use information that can help assess the potential for existing industrial boilers to produce high carbon content ash with characteristics similar to biochar.
11.5 Results and discussion
As of 2017, there are eight pulp and paper facilities in Washington State that operate biomass boilers and are regulated by Ecology’s Industrial Section. These were the facilities targeted for participation in this study. The project team focused on contacting the primary environmental manager, boiler engineer, or other person with deep knowledge of the operation of the biomass boiler at the facility. Complete responses to the survey questionnaires returned are shown in Appendix C. Results of Survey of Boiler Operators During the survey period the project team received five completed questionnaires. Of the three remaining participants surveyed, one was reached by phone and email, but did not return a completed questionnaire. One did not respond to any phone or email message and was never reached by phone. The final participant worked at the Nippon Paper plant in Port Angeles. During the winter and spring of 2017, the Nippon Paper Industries USA facility (also known as the Ediz Hook factory), underwent a sales transaction. It was purchased by McKinley Paper, the

226
American subsidiary of the Mexican paper company BioPappel. McKinley Paper, based in New Mexico, took control of the facility on April 1. The facility was shuttered, including the boiler systems and the co-generation facility. The plant is expected to reopen in 12 to 18 months after a major retooling of the plant for manufacturing liner paper for cardboard boxes. The results of these surveys point to a long-established industrial sector still operating in Washington. All of these companies have biomass boilers as part of their industrial plants. The biomass boilers are stoker boilers installed from a variety of manufacturers, including Babcox & Wilcox, Kipper, Combustion Engineering, Foster Wheeler, and Riley. The grate types also vary, including two with pinhole grates, two with traveling grates, and one hydro grate. The oldest of these boilers was installed in the 1950s, three were made operational in the 1970s, and the most recent is from 1991. Through the years, the boilers have been upgraded with new systems, especially emissions controls. With proper maintenance, three respondents report these boilers can continue operating for long times (e.g., 25 years to indefinitely). The primary biomass fuel used at the responding facilities was described as hog fuel, such as bark and chips. Two respondents reported use of some construction and demolition debris. Three facilities also reported using wastewater treatment sludge. Two of them also mentioned paper recycling residuals and old corrugated cardboard rejects. Another indicated that “urban wood” was available in the area. This indicates some penetration of this biomass market by companies that collect, separate, and market urban wood waste materials. Two respondents indicated that they use biomass fuels from on-site resources, while others reported getting fuels mostly from off-site sources. None of the respondents reported any special issues or challenges getting fuel. In two cases, diesel fuel was used as a back-up fuel, while the rest use natural gas for back-up fuel. Ash is generated by all the boilers, with reported quantities ranging from a few thousand tons to tens of thousands of tons per year. Those who reported a percentage of carbon in ash said it was “likely low” or between 3% and 7%. With one exception, respondents reported no ash sorting or reinjection systems at their plants. As described in Chapter 12, these are features that support value-added marketing if there is high-carbon ash available. Four respondents reported that their ash is landfilled. One respondent reported working with a third-party broker to help manage ash disposal. Regarding the existing variability in boiler operations, one respondent described their boiler as a “swing boiler” with variable output on a daily basis. Another reported seasonal variation, making more steam in winter, “because the mill demand is higher in the winter.” Two respondents reported constant output without variation. These data addresses the ability existing facilities have to adjust their boiler operation toward production of higher carbon content ash. To that point, one respondent was clear that there was technical capacity to adjust boiler operations “as long as they stay within emission limits.” However, “it is not something Kapstone would consider. We use the boiler to make steam as efficiently as possible, not to generate char for re-sale.” Another respondent said they would not want to adjust boiler operation because “it’s running very efficiently now.” Making adjustments like this would be “too complicated/costly.” He also pointed to the “potential to impact pollution control” as another reason to avoid such

227
adjustments. The implications of the focus on boiler efficiency for biochar production are further discussed in Chapter 12.
11.6 Conclusions
This project provides valuable information for the discussion that follows in Chapter 12. The results provided by industrial boiler operators in Washington illustrate that the economics driving boiler operation put a premium on efficiency of fuel use over any added value that could be derived from boiler ash. Most of the ash generated is landfilled, which suggests that the ash is still viewed as a waste material with liabilities that justify the cost of landfill disposal. This view of ash as waste, combined with low awareness of biochar markets or opportunities, means that any opportunity will require research on the ash and education on potential markets.
11.7 References
Albright, E., 2017. Ramboll Environ. Personal communication. DeMay, J., 1997. Wood Waste Boiler Survey. Air Quality Program, Washington State
Department of Ecology, Publication No. 97-204. Olympia, WA. Deshaye, J., and Kerstetter, J. 1994. 1994 Washington State Directory of Biomass Energy
Facilities. Washington State Energy Office, Olympia, WA. Ecology, 2004. Hog Fuel Boiler/Wood Ash Action Plan, Technical Report. Hazardous Waste &
Toxics Reduction Program, Washington State Department of Ecology, Publication No.
01-04-008. Olympia, WA. Energy and Environmental Analysts, 2005. Characterization of the U.S. Industrial/Commercial
Boiler Population. Oak Ridge National Laboratory. Oak Ridge, TN. Gustafson, R., and Raffaeli, N. 2009. Washington State Pulp and Paper Mill Boilers: Current and
Potential Renewable Energy Production, Final Report. Washington State Department of Ecology, Publication No. 09-07-048. Olympia, WA.
La Fond, J., 2017. Jansen Combustion and Boiler Technologies, Inc. Personal communication.

228
12. Changes to Boiler Operations to Produce High-Carbon Residuals or Biochar
Jim Jensen and Dusty Moller
12.1 Abstract
Incomplete combustion of woody fuels in biomass boilers can result in the production of high-carbon ash particles with properties like those of commercial biochar. Producing significant volumes of high-carbon ash may occur as an inadvertent result of inefficiency or, under the right circumstances, could be encouraged in response to an increase in the value of biochar products. In this project, the technical potential and general modifications needed to increase production of high-carbon ash by existing biomass boilers were examined. In addition, the challenges to using existing biomass boilers for production of biochar-like materials were identified. Two general approaches are possible for recovering more high-carbon ash to markets: (1) greater recovery of biochar-like carbon already available in high-carbon ash residuals from biomass boilers, and (2) greater production of biochar-like carbon in ash residuals. Operations with boilers that collect and screen uncombusted fuels for reinjection into the boiler fire are well positioned for increased production of high-carbon ash. However, the primary challenge for any plan to harvest or increase production of high-carbon ash is the predominant drive for efficiency—getting maximum heat value per ton of fuel—in boiler operations. Further work would also be needed to explore whether biochar production would have an impact on the production of air pollutants. Finally, due to the emerging nature of existing markets for biochar, boiler operators have a low level of awareness about this potential market, and do not believe that adjusting boiler operations to produce more high-carbon ash makes economic sense.
12.2 Background
Biochar is a form of charcoal produced by gasification processes. It is stable, high in carbon, and has complex structure. Biochar has been used in a variety of applications, including soil enhancement, water filtration, and mining reclamation. Used in soils, biochar has several demonstrated benefits, including improved water and nutrient retention, and reduction of soil acidity (Ellyn, 2017). In the marketplace, biochar is sold both in bulk and in packaged forms as a soil amendment, and in soil mixes. Some biochars are mixed with other media for specialty products used for bioretention and stormwater filtration projects (Miles, 2015). Miles describes several toxic compounds sorbed by biochar, including heavy metals, explosives, herbicides, insecticides, fungicides, hydrocarbons, polychlorinated biphenyls (PCBs), and polycyclic aromatic hydrocarbons (PAHs) (Miles, 2015). Furthermore, new research suggests that using small quantities of biochar (less than 20%) in a composting process can speed the decomposition process and significantly improve the resulting compost and biochar. It helps reduce ammonia loss and odors, and supports moisture retention in compost products (Camps and Tomlinson, 2015).

229
With growing concern over climate change, the potential to use biochar as a carbon sink in agriculture has received greater attention. In addition to its use as a carbon sink, biochar use can reduce methane emissions in composting operations and cut emissions of nitrous oxide in soils. As a result, the production and use of biochar can be carbon negative, with more carbon stored or offset than the carbon emitted by its production and use (Amonette et al., 2015). Biochar is often produced directly through the processing of woody materials in dedicated gasification or pyrolysis units. These units produce both large volumes of biochar as well as synthetic “producer gas” that is used to fuel boilers or heaters, or to power generators for electricity. Biochar products can vary widely depending on the type of fuel or feedstock used, the type of gasifier, and other factors. Because of this variation, biochar may be considered a class of products rather than one specifically defined product. Among the widely used standards and classifications for biochar are those created by an industry organization called the International Biochar Initiative (IBI; see http://www.biochar-international.org/). In addition to its production in dedicated gasification units, biochar can also be a by-product of the combustion of woody biomass in boilers to produce steam or power. Depending on their efficacy for burning wood fuel completely, biomass boilers will generate forms of charcoal or biochar from woody materials that have not fully combusted. This is commonly measured according to the carbon content of the ash residuals, meaning that boiler ash (or “fly ash”) with high carbon percentages may contain char-like materials with marketable value. Research suggests these high-carbon materials are very similar to biochar produced by dedicated gasification processes. They can have total carbon levels and surface area characteristics similar to biochar products, and their greenhouse gas benefits are consistent with biochar (Spokas, 2012). Current end use or disposal pathways for boiler wood ash include uses as soil amendments, as components of cement production, in road construction, or as waste for landfill cover or disposal (Oregon DEQ, 2015). This project looks at issues related to improving the potential to add value to biomass boiler operations through greater production of biochar-like products from high-carbon ash obtained from existing wood boilers. Chapter 11 of this report documents industrial-scale biomass boilers operating in Washington State in 2017, complementing this discussion about the potential for biochar market activity. In a white paper prepared by Northwest biochar experts, Amonette et al. (2015) identified the need for a more rigorous review of waste biomass availability and boiler system capacity. After thorough inventories of the woody material biomass in current waste collection systems, and assessments of the large- and medium-scale boiler and gasifier systems in Washington State, the next steps proposed were: (1) to evaluate the technical potential for boilers and gasifiers to produce electrical power and biochar on a broad basis; and (2) to specify the general modifications required for boiler systems to produce quality biochar. These proposed next steps informed the objectives of this project.

230
12.3 Objectives
The objectives of this project were: 1) To review literature and consult industry experts to compile information on the topic of
high-carbon ash produced in biomass boilers and methods used to recover such material. 2) To examine the technical potential and general modifications needed to recover more
biochar-like products from the high-carbon ash at existing biomass boilers. Two different approaches were examined: (1) greater recovery of biochar-like carbon already available in high-carbon ash residuals from biomass boilers, and (2) greater production of biochar-like carbon in ash residuals.
3) To identify the primary challenges to using existing biomass boilers for production of biochar-like carbon in ash residuals.
12.4 Methods
The project scope was outlined during preparations for the biomass boiler inventory documented in Chapter 11 of this report. For compiling information on the topic of high-carbon ash production in biomass boilers and the methods used to recover this material, library and internet resources were searched for articles, reports and other documents. Several experts in the fields of biomass and biochar were contacted for information and ideas. Attending the spring 2017 meeting of the Western Regional Boiler Association provided an excellent opportunity to connect with boiler operators and vendors about the premise of this project and the specific issues, costs, and benefits of adjusting ash output. Informal communications were initiated with boiler operators and vendors to gain input regarding the production of more high-carbon ash residuals with characteristics like biochar. For the remainder of the chapter, information gleaned through literature review and communication with industry experts is synthesized and presented. For the section on the evaluation of technical potential and general modifications needed to increase production of biochar, we describe each of the two approaches (greater recovery and greater production), presenting real world examples of where such opportunities exist.
12.5 Results
12.5.1 Characteristics of high-carbon ash produced in biomass boilers
There are two major sources of wood ash from boilers—the boiler or bottom ash, which includes sand, grit, clinkers, and high-carbon materials left behind after the fuel is burned; and the fly ash, which includes ash particles and high-carbon materials that fly up through the boiler, through the superheater, and then over the top where it is collected in emission control systems, such a multicyclones and electrostatic precipitators (Figure 12.1). Biochar-like material may be present in both types of ash. Because of its light weight, a greater proportion may be found in the fly ash.

231
Figure 12.1: Sources of wood ash from biomass boilers. (Original illustration by Wellons, Inc., with notations by TR Miles Technical Consultants, Inc. Reprinted with permission.)
Carpenter (2013) looked for similarities between biochar and high-carbon boiler ash from New England biomass boiler plants. According to Carpenter (2013), the value of wood fly ash as a soil amendment is for pH adjustment. The ash helps neutralize soil acidity, reduce aluminum toxicity, and increase phosphorus availability. In recent years, high-carbon fly ash has found effective uses for odor control in composting facilities and landfills, and for sorption of volatile organic compounds when used for remediation of contaminated soils. When added to soils at a rate of 25 tons per acre, Carpenter (2013) found that high-carbon wood fly ash produced results similar to biochar, including:
• An additional 16 tons per acre of stable soil carbon, in this case increasing soil carbon from 1.2 to 2.7%
• An increase in cation exchange capacity of 6.4 milliequivalents per 100 g of sandy loam soil
• An increase in water-holding capacity • Increases in soil minerals (potassium, calcium, magnesium, and phosphorus) without
causing marked soil nutrient imbalances related to cation saturation and alkaline pH (Carpenter, 2013)

232
Tom Miles, a consultant who has worked on boilers for decades and has been researching biochar for nearly as long, prepared the data shown in Table 12.1 to show differences between high-carbon boiler ash and other similar materials (Miles, 2015).
Table 12.1: Comparison of boiler ash and biochars (Miles, 2015)
Material/Production Method
Ash (%)
Organic Carbon (%)
H:C Toxicity (mg kg-1)
pH
BBQ Charcoal ≤6%
IBI Biochar Standard
10% Min Class 1: ≥60% Class 2: ≥30% Class 3: ≥10%
<0.7 <13
Biochar (slow pyrolysis, hardwood, KARR method)
5.2% 83.8% 0.68 1.2 7.5
Gasification Ash (softwood tops)
18.3% 74.3% 0.41 0.74 12.0
Boiler Fly Ash (softwood hog fuel)
98.5% 1.6% 8.68 5.7 12.8
High-Carbon Boiler Fly Ash (softwood hog fuel)
8.4% 75.8% 0.48 9.8 9.5
As Table 12.1 illustrates, high-carbon fly ash can possess levels of organic carbon (75.8%) similar to Class 1 biochar (≥60%). The pH and H:C ratios of the high-carbon fly ash, which are used as measures of longevity in the soil, are similar to those of the biochar produced by slow pyrolysis produced by the KARR Group in Onalaska, Washington. As a carbon-enriched product, the high-carbon ash is comparable to biochars certified by IBI (Miles, 2015). Brian Coghlin operates Wood Ash Industries, a wood ash landfill in Ontario, Canada. The company receives combinations of bottom ash and fly ash that contain 38% carbon, with a pH of approximately 11.5. It contains micronutrients, minerals, and potash. The high carbon wood ash material has been approved by the Ontario Ministry of Environment for agricultural land application. Wood Ash Industries is developing technology to separate the biochar from the fly ash for product differentiation and added value. Their markets for biochar and fly ash include as an agriculture soil amendment, for mining reclamation and rehabilitation, groundwater remediation, odor control in wastewater and composting plants, and oil and acid spill cleanup (Coghlin, personal communication, 2017). The International Biochar Initiative (IBI; http://www.biochar-international.org/) has developed a biochar classification tool to evaluate the different properties of biochar products and to identify the best end uses for specific products. The tool considers four properties for classification:
• Carbon storage value • Fertilizer value (phosphorus, potassium, sulfur, and magnesium only) • Liming value • Particle size distribution

233
Use of this tool in coordination with product testing can help determine the best potential end uses for a specific product. The potential value of high-carbon wood ash from biomass boilers is heavily dependent on the types of wood used as fuel, minerals in the fiber, moisture content, soil contamination, and the combustion temperatures (Demeyer et al., 2001). Clean, low-contaminant fuels have a greater potential for producing ash products that will meet requirements for use as soil amendments or fertilizers. Burning urban-derived wood fuels, with painted lumber or treated with copper, chromium, or arsenic, can significantly increase heavy metal concentrations in the resulting ash. These fuels should be avoided (Oregon DEQ, 2015; Sustainable Forestry, 2017). Achieving consistency between batches is important in efforts to market any high-carbon ash material. Thorough and frequent testing to establish the level of consistency is required. Beyond basic soil amendment applications, developing markets for filtration, chemical or heavy metal mitigation requires that different batches from the same source perform consistently (Levine, personal communication, 2017).
12.5.2 Greater recovery approach The greater recovery approach assumes that biochar is already being produced, but is simply being disposed of with the ash residuals. In some cases, carbon is separated from ash and reinjected into the boiler to be more fully combusted. In contrast, another approach (presented in the Greater production approach section) considers proactive steps that can be taken by boiler operators to positively increase the volume of biochar that is present in ash piles.
12.5.2.1 Existing biomass boilers
Existing boilers with higher propensity to produce high-carbon ash provide an excellent first opportunity for harvesting high-carbon material or biochar from fly ash. For example, stoker boilers using grates, especially traveling grates, are more likely to produce ash with a greater unburned carbon content. This type of boiler can produce ash with carbon content in excess of 10%, sometimes as high as 40% to 50% (James et al., 2012). In a presentation to boiler operators, Tom Miles (2015) identified several conditions that slow combustion and result in higher carbon content in residual ash in a typical spreader stoker boiler with a moving grate. These include:
• High under-grate air plus poor over-fire air • Low under-grate air • Insufficient or poor over-fire air • Poor fuel distribution or deep fuel bed • High concentration of wet sawdust or bark
12.5.2.2 Ash collection and separation
In an effort to achieve greater fuel efficiency, boiler operators often install equipment designed to collect and reinject fly ash containing unburned fuel (James et al., 2012). The intent is to reintroduce the unburned fuel to release additional thermal units to the plant. Where plants have

234
high purchase costs for biomass fuel, this unburned, reinjected fuel is drier, so has a value equal to or greater than raw fuel. In larger or more advanced operations, complete ash handling systems go further in capturing unburned fuel. These systems separate the finer ash particles from the unburned fuel to keep abrasive, corrosive ash out of the boiler, while putting unburned fuel back through. Operators may use rotating trommel screens or water baths to capture only the unburned fuel for reinjection into the boiler. One industrial boiler operation in Washington, the Port Townsend Paper Company, has participated in research aimed at increasing the value of biochar produced from their boilers. This boiler operation installed equipment to separate charcoal-like residuals from their fly ash so that it could be reinjected into the boiler as fuel, and thus burned more completely. Beginning in 2014, the company began participating in a study to demonstrate the feasibility and benefits of using biochar from wood boilers as a key component of a mixed media designed to filter heavy metals from stormwater at the Port of Port Townsend. The project was conducted by researchers at Oregon State University and BioLogical Carbon, LLC. The team produced a high flow-rate, biochar-based filtration media that was packed in caged plastic totes (Figure 12.2). During a six-week pilot phase of testing in spring 2014, the biochar-packed up-flow filtration unit removed 99% of the zinc and 95% of the copper from stormwater that would otherwise have flowed into the Puget Sound. Results are similar to what could be expected from activated carbon filters, but at a fraction of the cost. Installation of a full project at the Port of Port Townsend occurred in 2015 (Gray, 2015; Gray, et al., 2015; Wilson, 2014).
Figure 12.2: Biochar tote up-flow filtration device installed under a roof downspout (with
permission from Gray, et al. [2015])
An important conclusion of the Port of Port Townsend research project was the requirement to rinse and screen the biochar to remove fine particles. Failure to rinse and remove fine particles

235
leaves them in the filter pack, where they can migrate during use and cause plugs or blockages, reducing stormwater flow rates and filtration effectiveness. Boiler operations that include water bath separation as part of their char fuel recovery methods already remove fine particles. These separation systems spread recovered ash into a water bath, which separates lightweight carbon material, which tends to float, from the heavier ash particles, which tend to sink. These systems can be very effective. They can be further designed to separate a particular size or type of biochar from the ash, separating out material that is too fine or too large from the rinsed, cleaned materials used to produce the filtration units. Considering the value that could be generated from well-separated and washed biochar, operations with water separation systems would be a high-priority target for market developers. With these systems, a boiler operator could more easily produce a separate pile of high-carbon material that could be marketed as a biochar-like material. For example, MP Combustion Process, Ltd. (North Vancouver, BC), is a company that supplies a wide range of material-handling equipment and systems (e.g., for fuel and ash) to companies with boiler operations, including companies in Washington State. Projects using this type of equipment demonstrate how biochar could be recovered. Designed with emissions control in mind, fly ash systems can include ash handling and conveying, with storage and conditioning systems. Conditioning may include adding and mixing water into ash to keep dust under control during handling and hauling. Carbon refeed or reinjection systems, as well as trommel and water bath separation systems, make up the heart of biochar recovery systems. In a typical water bath application, wet carbon is dragged to a flat plate that extracts it from the water. Typically, it is mixed with bark feed and added as fuel to the boiler. It could be separated as a washed and separated biochar product (Wanless, 2017).
12.5.3 Greater production approach At the current market value for biochar and high-carbon products, some operations may welcome the opportunity to produce greater volumes of high-carbon residuals, assuming they can do this while staying within boiler Maximum Achievable Control Technologies (MACT) restrictions, which are discussed in the Emissions Controls section, below. There are two general ways to achieve greater production: adjusting efficiency from energy toward carbon, and putting excess boiler capacity to use.
12.5.3.1 Adjusting efficiency from energy toward carbon
The first approach to consider involves running more fuel through the boiler, reducing its residence time in the hot zone. This produces more material with a higher carbon content in the ash residuals. In locations where biomass resources are readily available at little or no cost, the potential for producing new revenues through value-added marketing of high-carbon by-products becomes more practical. As a result of this change, the plant would receive a lower heat value (measured in British thermal units, or BTUs) per ton of wood fuel used. Conversely, it would receive a greater value for the carbon contained in, or recovered from, the ash residuals. Other benefits may include improved emissions and a lower carbon footprint, if the larger portion of carbon from the fuel that is subsequently sequestered as stable carbon in soils is accounted for as a sequestration benefit.

236
Biomass One (White City, Oregon) is an example of where such an opportunity exists. They currently operate a 30 MW biomass power plant using biomass fuels. The fuel is collected through a thriving organics recycling business. They accept a wide range of woody materials from yard and garden activity and from construction activity. They only accept clean material to keep out heavy metals and other contaminants. In addition to producing power, they also produce compost products and have developed a variety of soil and garden product blends. They produce fly ash with carbon that could be included as part of their garden soil mixes. It could be in Biomass One’s best interest to adjust their boiler operation and add necessary equipment to increase the production of high-carbon material in their ash. Since the company has already developed markets for its soil products, the opportunity to make additional value-added products with biochar as an ingredient could be very attractive. If Biomass One made such changes, they would be following in the footsteps of Rexius (Portland, Oregon), which manages large volumes of forest by-products and other organic residuals and produces a variety of composted and blended soil products. Biochar has become a feature of their soil products marketing (Figure 12.3).
Figure 12.3: Rexius sells biochar and includes it in some of its Opus Grows soil blend products
(with permission from Miles [2017])
12.5.3.2 Putting excess boiler capacity to use
Another approach to producing new volumes of biochar is to expand boiler capacity. In some cases this means operating existing boilers for more hours, even at times when the need for

237
energy is reduced and the boiler might otherwise be shut down. Boilers in some locations or for some uses may not be operated at the same capacity year round. They may have periods of slack energy production or in some cases may be shut down completely for weeks or months or years. Under the right circumstances and with the right value proposition, these boilers could be put back into production for energy if they can also generate a valuable by-product in the form of high-carbon residual biochar. The Willow Renewable Energy Project provides a valuable example of this type of new production. This project plans to refurbish and restart the 10megawatt biomass-fired power plant in Heppner, Oregon. A lumber mill operated on the site until the early 1990s. The boiler co-generation plant has been shut down since 1999. Precision Energy Systems, Inc., is an energy systems company located in Hayden, Idaho. They offer thermal fuel-based energy development, production, and utilization services to industrial-scale operations. They envisioned a successful restart of the Heppner, Oregon mill, and included biochar production in their plans from the beginning. Fuel for the 10 megawatt biomass power plant will come from low-grade forest residues, hog fuel, and other woody biomass harvested from private and federal forest lands. This will reduce fuel loads and mitigate forest fire risks in the area. Biochar is expected to be an important value-added by-product of the project, capturing upwards of $200 to $300 per ton in revenue. Consuming 100,000 to 120,000 tons of dry biomass per year, the plant is projected to produce roughly 15,000 tons per year of biochar product (Oswald, personal communication, 2017).
12.5.4 Developing the biochar industry – Challenges to using existing biomass boilers for biochar production
12.5.4.1 Drive toward efficiency
An important challenge to harvesting biochar-like products from existing biomass boilers is the drive toward efficiency. There is a widely held attitude in the industry that boilers producing ash with a carbon content greater than a few percent are inefficient, and that steps need to be taken to reduce the quantity of high-carbon residuals. Inefficient fuel use is not viewed favorably by boiler operators, who spend time, effort, and dollars to make their boiler systems as efficient as possible. Energy efficiency is important, especially if the operator must purchase their biomass feedstock from outside sources (LaFond, personal communication, 2017). For example, even as the Port Townsend Paper Company was participating in a pilot project to demonstrate the use and value of biochar—recovered from boilers—in stormwater filtration, the company was installing new equipment to increase steam production and fuel efficiency in their boilers, reduce carbon monoxide emissions, and minimize carryover and unburned carbon in the fly ash (LaFond, personal communication, 2017). This constant drive for more fuel efficiency is in conflict with the goal of harvesting more biochar from these boilers. Changing this strongly held viewpoint will require a cultural shift within the industry (Mussman, personal communication, 2017).
12.5.4.2 Emissions controls

238
Emission levels require careful study as the biochar industry develops. There are some indications (Albright, personal communication, 2017) that the production of high-carbon fly ash without modifying other operational parameters in boilers could lead to greater production of carbon monoxide. This needs to be carefully studied as it is an important issue for meeting boiler MACT regulations. At the 2017 Western Region Boiler Association conference in Idaho, boiler MACT regulations, especially for major sources, dominated the conversation. Presentations were on three topics: air quality and boiler MACT rules, water quality systems, and advanced controls, especially for assuring fuel is burned most efficiently. As a result, the goal most frequently described among boiler operators and consultants at this regional conference is to increase fuel use efficiency and decrease carbon content in ash. The issue may have different implications for biomass boilers used at commercial sites or lumber mills. While emissions issues can be as vexing for commercial boilers located at large industrial operations, these smaller operations often lack the level of capital resources required to make major efficiency upgrades (Oswald, personal communication, 2017). These operations often generate their own fuel resources from woody residuals that have little value except as fuel, so increasing fuel throughput (reducing fuel residence time) to increase the carbon content of the fly ash is more feasible. Rather than being viewed as an inefficiency, biochar separated and collected from these boilers would provide a value-added revenue stream for these operators.
12.5.4.3 Soft market development
U.S. biochar markets are still very much developing. Through the U.S. Biochar Initiative, it is estimated that the current production of biochar from 160 producers measures between 12,000 and 15,000 tons per year. The prices for these biochar products range from $300 to $3,000 per ton or $35 to $260 per cubic yard (Miles, 2017). This cannot be considered a large or mature product market, especially when considering that production from a single new project (e.g., the Willow Renewable Energy Project) would effectively match all the current production and double the size of the supply. Without corresponding increases in use and demand, it is difficult to see how the current high values for biochar would be sustained. More market development is required in order for biochar to maintain high values. Consider Hampton Lumber, which has several lumber mills in western states, including three in Washington. Their Washington mills have existing relationships with outside companies that collect, haul, and use or distribute their biomass wood ash for value-added uses. In one case the ash is incorporated into compost blends. In others, the ash is hauled and applied to agricultural lands. In both cases the ash is managed as having little or no value and any monetary exchange involves the hauling and transportation costs (Croneberger, personal communication, 2017). With more testing and research, a case might be made to separate high-value carbon from the other ash particles to gain revenue, or the mill might combine ash separation with increases in the volume of carbon produced by the boiler to gain even greater value. For now, the ash is considered low value. This view of wood ash having little to no value extends to Oregon as well, as was highlighted in the interview with Ron Vandeburgh of Freres Lumber Company in Lyons, Oregon. They use a

239
combination of bark and off-site hog fuel to operate their 10 megawatt Wellons boiler. Recently they installed ash separation equipment, including a trommel screen and a water bath separator to recover high-carbon material for reinjection into the boiler. They have relationships with third parties to take fine fly ash, which Vandeburgh estimates is 50% carbon. Looking at this from a biochar perspective, the company already has what is likely to be carbon-rich by-products with qualities similar to biochar. However, the existing market for biochar has not developed to a point that companies that produce such high-carbon material act to market this material at a higher value. Instead, other companies that may better understand the value as a soil amendment of the carbon-rich material in the ash, take it away for free.
12.6 Conclusions
Biomass boiler operations currently produce high-carbon ash residuals with biochar-like qualities. Operations with ash reinjection equipment that include some separation of unburned fuel from ash particles would be a good target for a company that wants to mine carbon from existing wood ash resources. Biochar separation through a water bath process simultaneously cleans and rinses fine particles from the material, enhancing its value. It is a common opinion among boiler operators and consultants that lumber mills operate with less fuel efficiency. Because of their low-cost fuel sources, lumber mills may be better placed than a company or broker to expand the biochar market potential by exploiting existing sources or finding new sources of high-carbon wood ash. The type of fuel used has a direct impact on the quality of the carbon or biochar produced. Market demand for clean soil amendment products, including some that are appropriate for use in organic production, affects the type of fuel used to produce the carbon or biochar product. As a result, fuels associated with heavy metals, plastics, or other contamination (e.g., urban demolition wastes) should be avoided. Economics and market development remain the overwhelming barriers to changing behavior. Asking boiler operators to accept less energy from their wood fuels in exchange for producing carbon-rich by-products in their ash that may have greater value is especially difficult when there are few markets established for biochar-like materials in agriculture (Crowe, 2011). The technology exists to harvest high-carbon by-products from biomass boilers. The obstacles to realizing greater use of this resource include long-held attitudes about maximizing fuel efficiency over other considerations, emissions control requirements, and the current markets for biochar, which are relatively shallow and underexploited. As a result of this evaluation, several priorities have been identified for market development of high-carbon wood ash residuals:
1) Quantifying marketable benefits of biochar alone, or of high-carbon wood ash products specifically marketed as agricultural soil amendments, compost ingredients, or filtration products.
2) Establishing cooperative, value-added, off-take agreements between potential end users or brokers for high-carbon ash materials produced at biomass boilers.

240
3) Establishing long-term markets for high-carbon wood ash residuals based on multiple years of experience marketing and using these products in the marketplace.
12.7 References
Albright, E.. 2017. Ramboll Environ. Lynnwood, WA. Personal communication. Amonette, J.E., Garcia-Pérez, M., Sjoding, D. and Fuchs, M.R., 2015. Biochar from Biomass
and its Potential Agronomic and Environmental Use in Washington: A Promising Alternative to Drawdown Carbon from the Atmosphere and Develop a New Industry. Pacific Northwest National Laboratory. Richland, WA.
Camps, M., and Tomlinson, T., 2015. The Use of Biochar in Composting. International Biochar
Initiative. http://www.biochar-international.org/compost Carpenter, A., 2014. Use of Wood Ash as a Soil Amendment. Northeast Biomass Heating Expo,
Portland, ME. http://nebiomassheat.com/pdfs/2014/1.b2.carpenter.pdf Carpenter, A., 2013. High Carbon Wood Ash from Biomass Plants: Similarities to Biochar and
Uses as a Soil Amendment. 2013 USBI North American Biochar Symposium. Amherst, MA. Available online at http://scholarworks.umass.edu/biochar/2013/Scale/7/
Coghlin, B., 2017. Wood Ash Industries. http://woodash.net Croneberger, T., 2017. Hampton Lumber. Personal communication. Crowe, R., 2011. Could Biomass Technology Help Commercialize Biochar. Renewable Energy
World, Nashua, NH. http://www.renewableenergyworld.com/articles/2011/10/could-biomass-technology-help-commercialize-biochar.html
Demeyer, A., Nkana, J.V. and Verloo, M.G., 2001. Characteristics of wood ash and influence on soil properties and nutrient uptake: an overview. Bioresource technology, 77(3), 287-295.
Ellyn, K., 2017. Wallowa County farmers part of biochar study. Wallowa County Chieftain. Enterprise, OR. http://www.wallowa.com/agriculture/20170418/wallowa-county-farmers-part-of-biochar-study
Gray, M., 2015. Port in a Storm. Storm Water Solutions, February 2015, pp. 24-25. https://www.estormwater.com/port-storm.
Gray, M., Cairns, A., Tortorici, F., Kalmar, J., Miedema, J., 2015. Port of Port Townsend Biochar Stormwater Filtration Feasibility Study. Final Report for Washington State Department of Commerce Grant #F14-52216-006. Sept. 17, 2015. Olympia, WA.
EPA, 2015. Industrial, Commercial, and Institutional Boilers and Process Heaters: National Emission Standards for Hazardous Air Pollutants (NESHAP) for Major Sources. https://www.epa.gov/stationary-sources-air-pollution/industrial-commercial-and-institutional-boilers-and-process-heaters
James, A., Thring, R.W., Helle, S., and Ghuman, H., 2012. Ash Management Review - Applications of Biomass Bottom Ash. Energies 2012. ISSN 1996-1073.
LaFond, J., 2017. Jansen Combustion and Boiler Technologies, Inc. Kirkland, WA. Personal communication.
Levine, J., 2017. Biochar Solutions. Personal communication. Miles, T., 2015. Biochar Products and Applications. Western Regional Boiler Association, Pasco,
WA. Available online at http://www.boiler-wrba.org/2015%20Presentations/7-Karr/03%2011%2015%20TRM%20WRBA%20Biochar%20Products%20and%20ApplicationsRev1.pdf

241
Miles, T., 2017. Biochar Products, Systems, and Processes for Organic Recycling and Compost Facilities. US Composting Council, Los Angeles, CA.
Mussman, M., 2017. Detroit Stoker Company. Monroe, MI. Personal communication. Oregon Department of Environmental Quality (DEQ), 2015. Management of Wood Ash
Generated from Biomass Combustion Facilities. Environmental Solutions Division, Materials Management Program, Portland, OR.
Oswald, M., 2017. Precision Energy Systems, Inc. Personal communication. Spokas, K., 2012. Could wood fired boiler ash be considered a biochar? USDA-ARS, Soil and
Water Management Unit, St. Paul, MN. Sustainable Forestry for Bioenergy and Bio-based Products, 2017. Ash Content, Fact Sheet 5.11.
http://www.forestbioenergy.net/training-materials/fact-sheets/module-5-fact-sheets/fact-sheet-5-11-ash-content/
Wanless, S., 2017. MP Combustion Process, Ltd. North Vancouver, B.C., Canada. Personal communication.
Wilson, S., 2014. Paper mill ‘biochar’ may help filter Port water. The Port Townsend Leader, Dec. 17, 2014. Port Townsend, WA. Available online at http://www.ptleader.com/news/paper-mill-biochar-may-help-filter-port-water/article_3b8e78f6-8583-11e4-8e37-eb4b861b936b.html

242
13. Woody Biomass Inventory Methodology
Jim Jensen and Dusty Moller
13.1 Abstract
Developing the Washington biochar industry depends on the availability of woody residuals that can be converted, in biomass boilers or gasifiers, into high quality biochar. Two areas of interest related to sourcing of woody residuals include: (1) urban wood residuals, and (2) woody biomass in overgrown and overstocked forests. This project investigated existing methodologies for estimating these two woody biomass resources, with a target focus on Spokane County. Urban wood residuals include woody materials in the municipal solid waste (MSW) stream, such as woody material from landscapes, pallets and crates, and lumber from construction and demolition (C&D) activities. Urban wood residuals may be sent to disposal and recycling facilities. The fraction disposed of through these facilities is the subject of rigorous study through the Washington State Department of Ecology (Ecology) Waste Composition Study Program. The recycled fraction is tallied through annual self-reporting by recycling facilities to Ecology. This self-reporting includes C&D materials, which are kept separate from MSW and recycled at specialized facilities. Another category of urban waste is land-clearing debris (LCD). Land-clearing debris includes trees, brush and other woody material removed from lots prior to development. Some of this material may be disposed of with yard and garden debris in the MSW system, delivered to compost facilities, or diverted to other properties and never fully accounted for. In this chapter, methods being used to estimate this source were investigated. Overstocked and overgrown forest areas have received increased attention because of massive forest fires in recent years. Resource management agencies at all levels of government are looking for ways to reduce the fire hazard associated with these areas. As markets for biochar develop, this material may gain use beyond the current practice of chip-in-place. Understanding the sources and available volume of this material is important for expanding this potential opportunity. More conventional methods of estimating forest resources were investigated, including biomass calculators developed by the Washington Department of Natural Resources (DNR) and the U.S. Forest Service (USFS). The team also examined literature and case studies detailing the use of LiDAR (Light Detection and Ranging) technology for estimating biomass resources. Two existing LiDAR studies completed in Spokane County within the past five years offer raw data resources that could be used for targeting biomass recovery activities, especially where those LiDAR data sets overlap with areas targeted by the Spokane community for fire hazard reduction activities.
13.2 Background
A major priority of the Waste to Fuels Technology (WTFT) Partnership is improving the techno-economic viability of converting biomass into energy and biochar. A first step toward this goal is quantifying and characterizing available sources of biomass suitable for energy production.

243
The goals of expanding pyrolysis and gasification technologies in Washington require the identification of woody biomass materials that can be used to produce energy and co-products, especially biochar. This project expands upon previous work to inventory Washington’s biomass resources. A Biomass Inventory and Bioenergy Assessment (Ecology, 2005) was completed in 2005, establishing a list of 44 biomass resources catalogued in seven categories, creating a framework for calculating biomass resources by county in Washington. An update to this inventory was completed during the 2011-2013 biennium by the Washington State University (WSU) Energy Program. This update used the same methodology, but included new data and an improved web-based interface (Jensen, 2013). While the current biomass inventory provides a starting point, there is a need for new, more complete and accurate methods of estimating woody biomass resources. These new methods can provide important data for project development, and will inform industry investment in economic conversion technologies. While the traditional approach used in woody biomass inventories has focused on mill residue, logging residue, forest thinnings, and debris from land clearing and orchards, two key sources of woody biomass may benefit from new attention and methodologies: (1) clean urban wood residuals in the municipal solid waste stream, and (2) woody biomass in overgrown and overstocked forests. This project addresses this information gap by reviewing existing methodologies used to inventory these materials, and by researching new methods for estimating these two important sources of woody biomass. Spokane County was the focus area for this project and was used to examine strengths and weaknesses of existing data sources for these two types of woody biomass.
13.2.1 Urban wood residuals Previous studies of urban wood residuals, including the Billion Ton Study for the Department of Energy (U.S. Dept. of Energy, 2016), include at least two major sources of woody material in the category of urban wood residuals: the woody components of MSW and of C&D waste. It may also be useful to investigate areas of overlap between another category of woody materials, LCD, and the MSW category. It is possible that where programs for recovering woody materials carry higher tipping costs, generators of LCD may find unregulated or unrecorded outlets for some fraction of this material. For the purpose of this project, we investigated all three of these major streams of woody materials that are generated and managed in urban areas.
13.2.1.1 Municipal solid waste
Municipal solid waste consists of all the materials collected from residential and commercial garbage collection accounts and contracts, and delivered to the appropriate receiving stations for ultimate recycling or disposal. The MSW stream also includes the separated organics collections that are sent to facilities for composting or other processing. The woody fraction of MSW and separated organics can be significant. This can include woody materials from yard and garden debris collections, as well as woody materials that are placed in garbage cans and dumpsters. Tree maintenance or removal by utility crews, arborists, or tree services comprises a significant portion of the woody materials in the MSW stream.
13.2.1.2 Construction and demolition debris
Construction and demolition debris is often collected separately from job sites and delivered directly to transfer stations or to facilities that receive and manage C&D debris. Woody materials

244
make up a significant portion of the materials sorted from this waste stream. However, it may be useful to look at C&D debris as two separate streams of materials – construction activities generating cleaner wood materials and demolition activities generating more painted or treated wood materials.
13.2.1.3 Land-clearing debris
Land-clearing debris is material generated from activities completed in anticipation of residential or commercial development, and from general maintenance or clearing activities around urban forests. These activities can generate significant quantities of woody material. Some of this material may be delivered to local disposal or recycling facilities, though some may not be measured as part of either MSW or C&D waste streams. For this reason, it is challenging to determine the total volume of LCD and the amount of overlap between LCD and other categories.
13.2.1.4 Factors affecting suitability of urban wood residuals for energy or biochar production
Urban wood residuals can vary significantly, both in their characteristics and in their levels of contamination. Materials separated or sorted at the source are cleanest. The cleanest materials include scrap lumber from new construction sites. If collected carefully, bulky wood and wood chips from utility and landscaping crews doing routine maintenance or land clearing can be mostly clean, with limited contamination from leafy material or dirt. The main problems with urban wood residuals are: contamination from painted or treated wood (from demolition), and contamination from plastics, glass, and other material collected by garbage trucks.
13.2.2 Overgrown and overstocked forest biomass Overgrown and overstocked forest biomass is another potential fuel source. This category includes woody material from forested areas that would benefit from thinning, has extensive slash piles, or would serve as a potential fuel source, increasing the risk or impact of wildfire. Estimates for overgrown and overstocked forest biomass in Washington are not typically separate from general estimates of forest biomass. Available estimates of forestry debris in Washington counties include the current Statewide Biomass Inventory (Jensen, 2013). The woody biomass inventory approach that was used historically focused on mill residue, logging residue, forest thinnings, and land-clearing and orchard debris. A more recent forest biomass calculator, developed and published by Washington DNR in 2012, incorporated several new features in the calculation, including such factors as level of forest harvesting, and value of forest by-product materials (DNR, 2012). Additional methods of estimating woody biomass resources, especially those that are even more sophisticated and accurate, could provide important new sources of data to support investment in economically viable conversion technologies for production of renewable energy and biochar. For this part of the study, WSU researchers looked at emerging remote sensing techniques, especially LiDAR technology, and its applicability for this purpose. The project team reviewed the scientific literature and various research papers related to LiDAR methods and capabilities. The team researched existing sources of LiDAR data for Washington, generally, and Spokane County, specifically, and determined the tools necessary for using LiDAR technology to estimate biomass resources.
245
13.3 Methods
This project focuses on exploring and developing new methodologies to estimate woody biomass inventories at a county level, including clean urban wood residuals and biomass from overstocked forest lands. The primary research methods used for this project included reviews of existing literature: (1) assessments from other states that included estimates of urban wood residuals, and (2) efforts in Washington aimed at assessing wood waste from rural forest resources. We collected data about urban wood from existing public sources. We also explored these topics through interactions with experts in biomass and wood energy, and through internet searches. To apply the existing methodologies to Spokane County, we identified appropriate data sources for the area and explored the strengths and weaknesses of each of these data sources. Next, we used existing methodologies and Spokane County data sources to make estimates for: (1) urban wood residuals, and (2) overgrown and overstocked forest biomass.
13.3.1 Urban wood residuals
Several methodologies exist for assessing the amounts of urban wood residuals available for bioenergy/biochar production. The first, most obvious method, is to use numbers reported to Ecology from known collection and recycling facilities in the area. In addition to the data from collection and recycling facilities, there are several ways to estimate the potential amounts of urban wood residuals, including use of the State’s Waste Composition Study for disposed waste, which has specific areas of analysis and includes the woody material in MSW and C&D waste. Other established methodologies examined include estimates based on per capita generation and estimates based on generation according to industrial classification categories.
13.3.2 Overgrown and overstocked forest biomass
Existing methodologies were identified by forestry experts and through literature research and were evaluated as potential data sources. LiDAR technologies and data were examined for the availability and quality of information for estimating overstocked forest biomass. Data sources each have strengths and weaknesses in terms of their usefulness for this type of estimation. For example, existing methodologies rely heavily on reported data about the production of forest products, but may leave out information related to the volume of undergrowth. LiDAR is expensive, but provides a high quality data. LiDAR methods were reviewed from research literature and from contacting forestry experts in Washington. Existing sources of LiDAR data for Washington were discussed with natural resource agency representatives and private LiDAR data companies.

246
13.4 Results and discussion
13.4.1 Urban wood residuals
13.4.1.1 Methods for estimating urban wood residuals
To inform the development of a methodology for estimating urban wood residuals, we reviewed the existing literature and methodologies in this area. Findings relevant to each of the categories of urban wood residuals are listed below.
Municipal solid waste
Municipal solid waste can be divided into the following categories as defined by the Washington State Waste Characterization Study (Cascadia, 2010; Cascadia, 2016):
• Yard and garden Waste (prunings): Materials including prunings six inches or less (branches with leaves OK). Food waste, leafy green waste, and grass were not included.
• Treated wood: Wood treated with preservatives such as creosote, CCA (chromated copper arsenate), and ACQ (alkaline copper quaternary). This includes dimensional lumber and posts if treated, but does not include painted or varnished wood. This material may also include some plywood (especially “marine plywood”), strandboard, and other wood.
• Painted wood: Wood painted, varnished, or coated in similar ways. • Dimensional lumber: Wood commonly used in construction for framing and related uses,
including 2x4s, 2x6s, and posts/headers (4x8s, etc.). • Engineered wood: Building materials that have been manufactured and generally include
adhesive as one or more layers. Examples include plywood (sheets of wood built up of two or more veneer sheets glued or cemented together under pressure), particle board (wood chips pressed together to form large sheets or boards), fiberboard (like particle board but with fibers), “glu-lam” beams and boards (built up from dimensional or smaller lumber), and similar products.
• Pallets and crates: Partial or whole pallets, crates and similar shipping containers. • Other untreated wood: Other types of wood products and materials that do not fit into the
above materials, excluding composite materials (see Remainder/Composites, below). • Wood by-products: Sawdust and shavings, not otherwise identifiable. • Remainder/composite wood debris: Items that consist primarily of wood but do not fit
into the above materials, including composite materials that consist primarily of (over 50%) wood. Examples of composites include wood with sheetrock nailed to it or with tiles glued to it (such that the materials cannot be easily separated).
• Natural wood: Wood that has not been processed, including stumps of trees and shrubs, with the adhering soil (if any), and other natural woods, such as logs and branches more than six inches in diameter.
Construction and demolition debris
David McKeever, a Research Forester with the Forest Products Laboratory in Madison, Wisconsin, has worked on broad inventories of woody residues and solid wood waste in the U.S. McKeever (2004) described an important issue with C&D waste, noting that construction and

247
demolition are distinctly different types of activities producing waste with very different characteristics, including ease of separation, recovery, and recyclability. Thus, they should be evaluated separately for inventories of wood waste. Construction waste is generally the cleaner of these two waste streams. Demolition debris is often contaminated with paints or other treatments, fasteners and adhesives, and other materials. Overall, McKeever (2004) calculated that 35.7 million metric tons of C&D wood waste was generated in the U.S., with about 30% originating from construction projects, and 70% generated from demolition activities. About 50% of this woody waste was considered of a size, quality, and condition available for recovery, with a larger percentage (43%) of the recoverable material coming from construction. Falk and McKeever (2012) provided updated figures for C&D wood waste in Biocycle magazine. Using similar methods and applying current economic, housing, and population information, they reported that 36.4 million tons of C&D wood wastes were generated in 2010, with the source split being closer to 80% to 20%, for demolition and construction, respectively. Nearly 17.3 million tons were considered recoverable. In 2008, Cascadia Consulting Group published the results of a Construction and Demolition Waste Composition Study completed the previous year for the City of Seattle. They collected data from three private transfer stations accepting C&D waste. An estimated total of 201,156 tons was collected at these facilities (which did not include public facilities) during the year of the study. Of this total, 83% was actual C&D debris; 17% was other recyclables or waste.
These results show that clean and recyclable wood materials made up 22.5% of the C&D waste stream, while treated, stained, or other contaminated wood materials made up 13.5% of the C&D waste stream (Cascadia, 2008). Portland Metro recently completed a Wood Waste Markets Alternatives Project. In the briefing paper for the Metro Solid Waste Alternatives Advisory Committee (Portland Metro, 2014), C&D waste was identified as a major component of the region’s overall waste stream, accounting for 80% of the 248,000 tons of urban wood waste generated in 2009. The remainder was from pallets and crating. Of this C&D waste, Metro estimated that 70% was from demolition/renovation activities and 30% was from new construction. They estimated that 60-70% was recovered, with about two-thirds of the recovered waste originating from separated loads. Other methodologies looked more closely at just construction materials. In their 1997 technical brief Residential Construction Waste: From Disposal to Management, the National Association of Homebuilders Research Center (1997) reported that wood waste makes up 40-50% of the waste from residential construction. Table 13.1 shows the weight of wood waste sorted from the construction of a 2,000-square-foot home. Up to half of jobsite wood waste can be engineered wood product waste (Pollution Prevention Regional Information Center, n.d.).

248
Table 13.1: "Typical" construction waste estimated for a 2,000-square-foot home (Pollution Prevention Regional Information Center, n.d.)
Material Weight (lbs) Volume (cubic
yards)a*
Solid Sawn Wood 1,600 6
Engineered Wood 1,400 5
Drywall 2,000 6
Cardboard (OCC) 600 20
Metals 150 1
Vinyl (PVC)b 150 1
Masonryc 1,000 1
Hazardous Materials 50 -
Other 1,050 11
Total 8000 50 a volumes are highly variable due to compressibility and captured air space in waste materials b assuming three sides of exterior clad in vinyl siding c assuming a brick veneer on home's front facade
Land-clearing debris
In a 2006 study of organic waste management for Kitsap County, Cascadia Consulting Group and LARK Consulting recognized the unique characteristics of land-clearing debris. For example, it is typically generated, collected and disposed of separately from the MSW or C&D waste streams. It is often generated from activities underway in the outskirts of urban areas. Land-clearing debris was identified in the study of organic waste management for Kitsap County as a large waste stream of special interest, because of the imposition of burn bans and the lack of information about the end-use disposition of this material (Cascadia and LARK, 2006). Based on average acres of land cleared, it was estimated that 120,000 to 380,000 tons of woody debris was generated annually in Kitsap County. At the time of this study, the consultants reported that contractors and developers burned or stockpiled much of this debris on site. The report identified only 70,000 tons that were processed for identified markets, such as hog fuel. The amount of LCD generated varies greatly by site and the density of the material can vary seasonally. The consultants reported quantities of woody debris generated at different locations as 95, 175, 280, and 380 tons per acre. When considering a possible burn ban in 2005, the Puget Sound Clean Air Agency estimated that Kitsap County would generate 120,000 tons of LCD, based on a generation estimate of 95 tons per acre. The consultants made their own estimate, based on varying land-clearing volumes per acre reported from Fort Lewis in Pierce County and varying densities. They estimated that LCD generation could range from 45 to 135 tons per acre, depending on the time of year (Cascadia and LARK, 2006). Another methodology that could offer more accurate results for LCD is to identify the number of acres cleared for construction per year, and use an average value for LCD per acre to estimate total LCD. Acres cleared may be obtained from permit data information in a county.

249
13.4.1.2 Estimating urban wood residuals in Spokane County
Methods used in this study for estimating urban wood waste for Spokane County generally involved one of three approaches: (1) using data specific to Spokane County such as self-reported data from recycling facilities, (2) using data from statewide waste characterization studies, or (3) using national data and applying it to a specific geographical area, such as Spokane County. The results from each of these approaches are examined below.
Self-reported data from Spokane County
Recycling facilities self-reporting to Ecology The first source of data that was collected was from recycling facilities in Spokane County that self-reported to Ecology (Table 13.2). The most recent data of this type is from 2015.
Table 13.2: Spokane County wood waste self-reported by recycling facilities (Ecology, 2015)
Material Type Tons Reported (2015)
Wood waste 338.00
Construction & demolition waste 125.00
Land-clearing debris 1,580.25
Wood – recycled 1,207.75
Wood – burned for energy 31,053.22
Total 34,304.22
Land-clearing debris National averages are available for amounts of land-clearing debris generated per acre of land cleared. (See “General estimate of land-clearing debris” below.) To obtain land-clearing information specific to Spokane County, contacts were initiated with Spokane County Building and Planning, Spokane Regional Clean Air Agency, and the local DNR office. There was no information available about acres of land cleared for development. According to the Spokane County Building and Planning Department, 346 permits were initiated during the first half of 2016 for the construction of buildings, including residences, duplexes, apartments, utility, commercial, and industrial. It is not known how much land clearing was completed in relation to this activity. Without such information, these alternative methodologies cannot currently be used to estimate amounts of LCD generated in Spokane County.
Washington State MSW characterization study
Another source of data that was examined to determine urban wood residuals from Spokane County was the Washington Statewide Waste Characterization Study (also referred to as a “composition study”). The most recent municipal solid waste characterization study was completed in 2016 by Ecology, working with Cascadia Consulting, and was an update of the 2009 and earlier characterization studies. The report, 2015-2016 Washington Statewide Waste Characterization Study (Cascadia, 2016), separates municipal solid waste by the commercial,

250
residential, and self-hauled categories. Self-hauled waste is divided into C&D and other waste streams. Data from the 2009 Washington Statewide Waste Characterization Study (Cascadia, 2010) was used in the most recent update of the Washington State Biomass Inventory (Jensen, 2013) to estimate biomass available in each county. As in previous characterization studies, Ecology picked 10 counties to study in detail, as proxies to represent Washington’s six Waste Generation Areas (WGAs). Spokane County was studied in detail and combined with Franklin County to represent the East WGA. Municipal solid waste stream For quantifying the broad availability of woody waste from the MSW stream disposed of in Spokane County, we looked at the categories of waste defined in the characterization study. The waste stream factors developed for the East WGA were applied to Spokane County, assuming that since Spokane County has approximately 61% of the East WGA’s population (Census Bureau), it would have 61% of the waste stream for each material. By this method, the total amount of urban woody material disposed of as MSW in Spokane County is estimated at 53,703 tons per year (Table 13.3). Treated and painted wood comprise 10.8% of the total woody materials in this waste stream. If the treated and painted categories of wood waste are removed (since they are not suitable for use in wood energy or biochar production plants), the total drops to 47,880 tons per year. Table 13.3: Woody materials in the overall disposed waste stream for Spokane County (2015-2016)
Material % of total
Error (+/-)
Spokane County estimate (tons)
Yard, garden waste (prunings) 1.6% 0.7% 7,261 Treated wood 0.1% 0.1% 418 Painted wood 1.2% 0.5% 5,405 Dimensional lumber 1.7% 0.9% 7,836 Engineered wood 1.9% 0.8% 8,539 Pallets and crates 3.1% 1.4% 14,064 Other untreated wood 0.3% 0.2% 1,208 Wood by-products 0.1% 0.1% 310 Remainder/composite wood 1.6% 0.7% 7,051 Natural wood 0.4% 0.5% 1,611 Total estimated urban wood 12.0% 53,703
Self-hauled C&D waste stream Looking solely at the self-hauled C&D disposed waste sector—a subset of the overall waste stream—can provide focus on a potential source of clean construction lumber. Once again, the waste stream factors for the East WGA can be applied to Spokane County. By this method the total amount of urban woody material self-hauled as C&D waste for disposal in Spokane County is estimated at 12,936 tons per year (Table 13.4). If the treated and painted categories of wood waste are removed, the total drops to 10,908 tons, or 84.3% of the total. This material could be a source for renewable energy and biochar production.

251
Table 13.4: Woody materials in the self-hauled C&D waste stream for Spokane County (2015-2016)
Material % of total
Error (+/-)
Spokane County estimate (tons)
Yard, garden waste (prunings) 2.0% 2.2% 535 Treated wood 0.6% 0.5% 165 Painted wood 6.9% 5.6% 1863 Dimensional lumber 5.2% 3.1% 1405 Engineered wood 11.7% 6.5% 3171 Pallets and crates 11.7% 7.4% 3171 Other untreated wood 2.2% 2.3% 606 Wood by-products 0.0% 0% 0 Remainder/composite wood 7.5% 5.8% 2020 Natural wood 0.0% 0% 0 Total estimated urban wood 47.8% 12,936
General estimation based on national data
A third approach for estimating urban woody materials in the waste stream is to use national data on waste generation based on population size or number and size of tree trimming and landscaping businesses. This follows the approach used by Moller (2009) to estimate urban woody materials in the waste stream in Henderson, Nevada. Using these methods, we looked at the same three general categories. Calculations for Spokane County using national data are summarized in Table 13.5 and described below.
Table 13.5: Estimated total tons of woody fractions, based on Moller (2009) study methods
Material type Estimated amount (tons per year)a
MSW – woody fraction 22,829 to 38,048b
LCD – woody fraction 180,000 c
C&D waste – woody fraction 44,185d
Total 247,014 to 262,233
a calculations are based on 2015 Spokane County population data (Tweedy, 2016) b based on 1.55 tons MSW per capita per year (Moller, 2009), woody fraction is 3 to 5% of the MSW stream (Wiltsee, 1998) c based on 0.12 dry tons of urban wood waste per person per year (Wiltsee, 1998) d based on 0.09 tons per capita per year (Moller, 2009), 2015 Spokane County population data (Tweedy, 2016)
Yet another method for estimating woody materials from national data focuses on landscaping and land-clearing activities. This method uses a tally of the business types responsible for most generation of woody materials and applies a common factor for material generation either on a per business or a per employee basis. The North American Industrial Classification System

252
(NAICS) attaches standard coding to various types of businesses in the economy. Woody materials generated on average by tree trimming and landscaping companies (Code 56173 = Landscaping Services) equals 1,000 tons per crew per business per year (Wiltsee, 1998). For this project, we sought information on the number of such businesses in Spokane County. The Employment Security Department in Washington keeps data on the number of firms and employees, but only to the three-digit NAICS code, which is a broader category called “Administrative and Support Services” (code 561). The U.S. Census Bureau reports that there were 180 businesses classified as landscaping services with 892 employees in Spokane County in 2013. According to this method, the total amount of woody material from land-clearing in Spokane County would equal approximately 180,000 tons per year. This method would likely include some overlap with the yard debris categories in estimates of MSW disposed or recycled. Those categories would include materials from these same companies, as well as material collected at the curb or self-hauled by residents.
13.4.2 Overgrown and overstocked forest woody biomass
13.4.2.1 DNR Forest Biomass Calculator
As described previously, the Washington DNR sponsored the University of Washington along with TSS Consultants to complete the Washington Forest Biomass Assessment project in 2012 (DNR, 2012). The study had a goal of establishing a sustainable volume of residual biomass that could be collected from working forests in the state. To avoid creating a simple snapshot in time of biomass availability, the project team created a model of biomass availability over time, with a calculator tool for use as a “first stop” in determining the appropriate location and scale for a bioenergy facility. The DNR calculator can be found online at http://wabiomass.cfr.washington.edu. The DNR biomass calculator gives users many options to choose from when developing a biomass estimate. Users can create estimates for different five-year periods ending in the years 2010, 2015, 2020, 2025, and 2030. Users can also choose from several different statewide harvest models (conservative, average, or aggressive), with different options for Eastside forest health treatments (baseline, increased, or aggressive) and different options for thinning intensity (light or heavy). Geographic area can be set to state or county level, or to “stumpage value area,” timbershed, watershed, or to the vicinity of one of over 40 existing or hypothetical biomass facilities located around the state. Biomass harvest costs can be set (low, medium, or high) and prices paid at the facility can be set from $27 to $100 per bone dry ton. The study team used the DNR Biomass Calculator to run many illustrative scenarios for Spokane County. The results of these scenarios are shown in Table 13.6. The results of the calculator show three different estimated volumes with increasing value, and a total potential residual value. The volume categories include Scattered Biomass (residual biomass left scattered on the forest floor after harvest activity), Roadside Biomass (residual biomass collected for market but

253
left at the roadside), and Market Biomass (residual biomass collected and available to the market at the modeled price). In these particular scenarios, the lowest volume of biomass brought to market was 25,395 tons, in a conservative harvest, where the cost to harvest was medium and the price paid was $40. The value of that biomass in the market was just over $34,000. The largest volume of biomass brought to market was 91,269 tons, in an aggressive harvest, where the cost to harvest was low and the maximum price ($100/ton) was used. Table 13.6 shows the practical value that this calculator can have for potential facility developers as an early step in feasibility analysis. The volume of biomass brought to market in these scenarios does not represent the full extent of the range. The results can vary greatly based on the parameters selected within the calculator. Using other parameters will generate different results with some higher or lower than those shown in Table 13.6.

254
Table 13.6: Illustrations of biomass available in Spokane County (DNR Biomass Calculator)
Note: This search was for the five-year period ending in 2020, only for Spokane County. All the existing and potential facilities were included, extending the potential hauling distance to 240 minutes. Other criteria were varied.
13.4.2.2 USFS Forest Inventory and Analysis (FIA) program
The Forest Inventory and Analysis (FIA) Program of the USFS provides web-based information for use in assessing the nation’s forests (USFS, n.d.). Like a kind of forest census, the program is designed to project what forests will be like in the future (during the next 10 to 50 years). FIA data sets are available on a county level and include information about forest ownership, location, and area; tree species, size, and health; products harvested, and unused residues. The

255
FIA data set includes information on roundwood products, slash piles, logging residue left in the forest, other timber products removed, and wood and bark residues at mills. While data for the FIA was once collected on a five-year rotation, the USFS has moved toward collecting data on an annual basis, a change that will help overcome one of its perceived weaknesses. The Northwest Advanced Renewables Alliance (NARA) project completed a comprehensive study of the multitude of challenges in establishing a biomass to biofuel industry to serve aviation in the Northwest. This multiyear, $40 million study investigated topics including woody residual biomass availability, storage, processing, facilities development and location, and transportation. The results include detailed studies of biomass availability, using GIS (Geographic Information System) and other methods. For example, the study supported development of a Land Use and Resource Analysis (LURA) model by Greg Latta at the University of Idaho. An important aspect of the NARA project was the evaluation of a wide range of supply chain considerations related to feedstocks for bioenergy development. Researchers at NARA used FIA compiled data sets for studies of biomass availability in the Northwest, specifically for an area they termed the Western Montana Corridor, which includes Spokane County. GIS software was used by the NARA team to analyze these biogeophysical resources. The team also made extensive use of data available through the USFS’s FIA program. To generate a long-term view of the resource, the NARA team averaged multi-year data sets from each state/county to reduce year-to-year variability in the data. The NARA researchers compiled data on biogeophysical assets, including data on the volume of unused forest residue and displayed results in a graphical format. Spokane County was projected to have 22.6 kilotons or between 18 and 36 kilotons of unused wood residue (dry matter) available. This equates to between 19,800 and 39,600 dry tons of biomass identified as forest residuals. This estimate refers to generally available forest residuals, and is not specific to overstocked forests subject to forest health thinning efforts (Martinkus, et al., 2014).
13.4.2.3 Light Detection and Ranging (LiDAR)
Light Detection and Ranging (LiDAR) technology uses measurements of time and reflections of laser pulses (light waves) to calculate distances, similar to the way that radar uses sound waves. LiDAR measurements are gathered by recording equipment used on the ground, or above ground in aerial vehicles or satellites. Used in combination with global positioning systems (GPS) and inertial navigation systems (INS), LiDAR systems in the air provide amazing accuracy in measuring vegetation structures (Chen, 2014). In forested areas, LiDAR systems installed in aerial vehicles scan the land surface, collecting millions of calculated data points to form three-dimensional “pictures” of the surface topography, as well as geologic and vegetative features on the surface (Figure 13.1). LiDAR has emerged as the premier remote sensing tool for making measurements in forested areas (Andersen et al., 2011b). LiDAR measurements of the forest structure can allow the accurate calculation of vegetation height, crown size, basal area, stem volume, and above ground biomass (Kumar, 2015). These are the types of data researchers use to estimate the effective volume of above ground vegetation or biomass. Sophisticated LiDAR programs can successfully identify different types of vegetation (e.g., trees versus understory and shrub material).

256
Figure 13.1: Data collection by LiDAR system (Washington DNR website, from a video by the
National Ecological Observatory Network)
LiDAR systems can be classified based on the location of data collection (satellite, airborne vehicle, or ground), the LiDAR technology used, and the size of the “footprint” (or area of pulse on the surface). There are two general types of LiDAR technology: discrete return LiDAR and full waveform LiDAR. They differ based on how they sample data vertically and horizontally. The number of range measurements taken per laser pulse establishes the quality of vertical sampling. Discrete return systems provide for one or a few light returns to be recorded per pulse, whereas waveform LiDAR measures amounts of energy returned to the sensor across equal time segments. These types of systems have different formats based on the size of the footprint. The quality of horizontal sampling depends on the number of footprints in a unit area (Table 13.7). Discrete return LiDAR is described as small footprint (less than one meter), compared to full waveform LiDAR, or large footprint (8 to 70 meters) (Lim et al., 2003). Discrete return LiDAR is used by researchers for fine-scale biomass mapping, even down to the scale of individual trees. Waveform LiDAR is more commonly used for broad-scale biomass mapping (Kumar, 2015). LiDAR has been used commercially for measuring gross merchantable timber volume (Lim et al., 2003), for carbon accounting (Melson et al., 2011), and for estimating biomass available for bioenergy production (Andersen et al., 2011b). LiDAR studies are expensive. To collect LiDAR data completely over a large area can cost as much as $2-3 per hectare (Andersen et al., 2011a).

257
Table 13.7: Summary of different LiDAR systems (Chen, 2014)
Ground truthing LiDAR measurements using predictive linear models was commonplace in early studies. Ground truthing continues as a method of calibrating systems or verifying that new systems are capable of matching previous results (Lim et al., 2003). As reported by Lim et al. (2003), researchers have demonstrated differences of three to six percent in the mean estimates of biomass and volume during discrete flights on the same flight line. Estimates of biomass and volume from two flight lines varied seven to eight percent from estimates using ground-based measurements (Lim et al., 2003). A project from the Upper Tanana Valley of interior Alaska (Anderson et al., 2011a) provides an example of the use of LiDAR for estimating forest biomass. In this project, researchers used LiDAR data to create detailed estimates of the biomass resource available to support development of combined heat and power systems for remote communities. Data was collected over a 201,226-hectare area, 163,913 hectares of which were forested. Figure 13.2 shows the distribution of flight lines across the research zone. Field plots were established at various locations along different flight lines. They were used to cross-check the LiDAR-collected data with field data. The researchers used three data sources (LiDAR data from strips of land, field data, and existing data sets from previous inventories) to project an estimate of biomass availability across the entire area that was more detailed and accurate than an estimate based on any one data source.
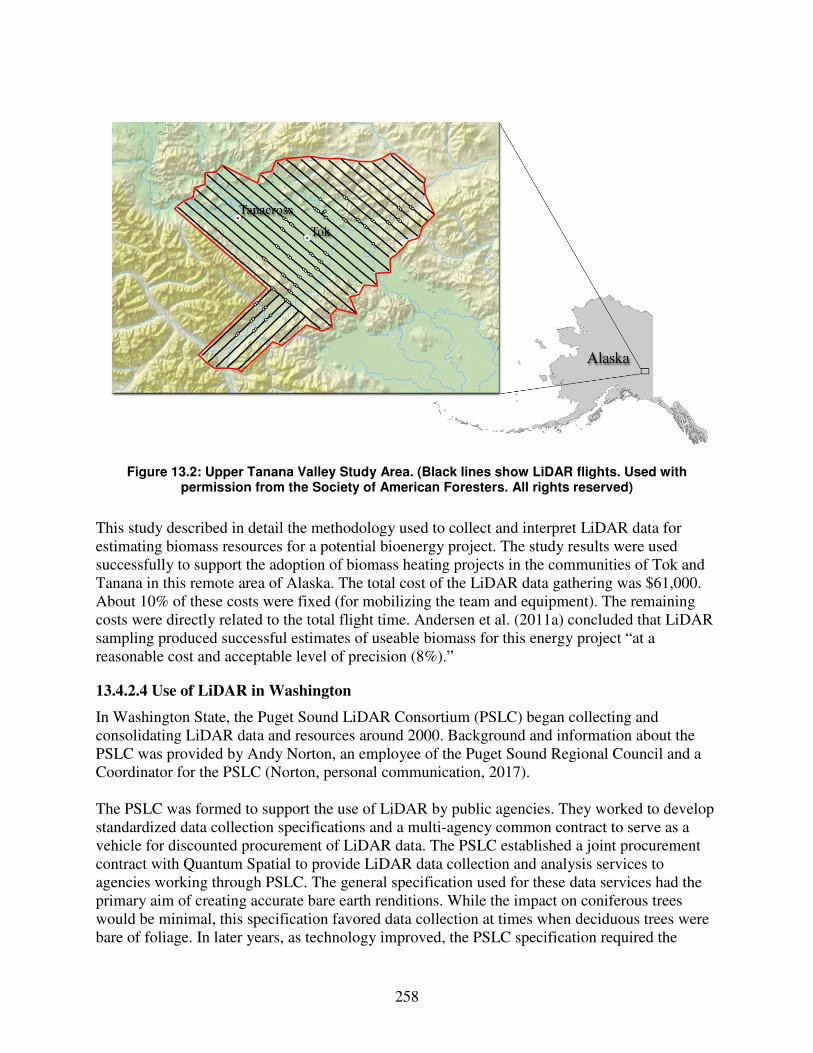
258
Figure 13.2: Upper Tanana Valley Study Area. (Black lines show LiDAR flights. Used with
permission from the Society of American Foresters. All rights reserved)
This study described in detail the methodology used to collect and interpret LiDAR data for estimating biomass resources for a potential bioenergy project. The study results were used successfully to support the adoption of biomass heating projects in the communities of Tok and Tanana in this remote area of Alaska. The total cost of the LiDAR data gathering was $61,000. About 10% of these costs were fixed (for mobilizing the team and equipment). The remaining costs were directly related to the total flight time. Andersen et al. (2011a) concluded that LiDAR sampling produced successful estimates of useable biomass for this energy project “at a reasonable cost and acceptable level of precision (8%).”
13.4.2.4 Use of LiDAR in Washington
In Washington State, the Puget Sound LiDAR Consortium (PSLC) began collecting and consolidating LiDAR data and resources around 2000. Background and information about the PSLC was provided by Andy Norton, an employee of the Puget Sound Regional Council and a Coordinator for the PSLC (Norton, personal communication, 2017). The PSLC was formed to support the use of LiDAR by public agencies. They worked to develop standardized data collection specifications and a multi-agency common contract to serve as a vehicle for discounted procurement of LiDAR data. The PSLC established a joint procurement contract with Quantum Spatial to provide LiDAR data collection and analysis services to agencies working through PSLC. The general specification used for these data services had the primary aim of creating accurate bare earth renditions. While the impact on coniferous trees would be minimal, this specification favored data collection at times when deciduous trees were bare of foliage. In later years, as technology improved, the PSLC specification required the

259
provider collect QL1 quality level of data (eight returns per square meter). This was an improvement for forest canopy work, for which researchers prefer eight or more pulses per square meter (Norton, personal communication, 2017). The PSLC contract required Quantum Spatial to provide specific deliverables for each project:
• Aircraft trajectories • All-return point cloud – list of all valid returns to the LiDAR receiver • Ground point list – X,Y,Z coordinates of all identified ground points • Ground surface model (or bare earth model) • First-return (highest-hit) surface model • Intensity image • Report of the survey
With a legislative appropriation in the past two years, Washington DNR has assumed the position as the lead State agency for developing and coordinating LiDAR data of interest to the State. The legislature provided resources to acquire new LiDAR data for Washington and to establish a repository of LiDAR data for public use. Based in the Division of Geology and Earth Resources, the DNR LiDAR Portal has begun to fill in the LiDAR picture of Washington. Abby Gleason leads the team working on the DNR LiDAR Portal, which is collecting LiDAR data resources from local and state agencies, research projects, and other sources. Many of the initial projects and data sets included in the DNR LiDAR Portal were collected through the contract with Quantum Spatial and according to the specification used by the PSLC. The LiDAR Portal is now available to the public in beta mode. Figure 13.3 shows a screenshot of the DNR LiDAR Portal and the areas for which previously collected LiDAR data is available. The portal currently offers public access to download first-return and bare earth Digital Elevation Models (DEMs), hillshade derivatives, and LAZ (compressed LAS) files of original point cloud data. These resources are available for about one third of DNR’s LiDAR data holdings. Over an extended time, starting with the key geologic hazards, DNR hopes to have LiDAR data for all land area in the State and has set priorities for collecting LiDAR data in Washington (Figure 13.4).

260
Figure 13.3: DNR LiDAR Portal - gray shading indicates areas for which LiDAR data is available
(screenshot from July 2017)
Figure 13.4: Map of DNR LiDAR data priorities (DNR LiDAR Portal)

261
13.4.2.5 Spokane County LiDAR projects
Spokane County has been the subject of two different LiDAR projects. Both projects were completed by Quantum Spatial using standard contracts and specifications. Figure 13.5 shows the relative locations of the two Spokane County LiDAR studies in Washington. The more recent one was completed in 2015 with the PSLC. The other was done in 2012 in coordination with the Oregon LiDAR Consortium (OLC), which operated very similarly to the PSLC.
Figure 13.5: Spokane County LiDAR projects (Brenner, personal communication, 2017; used with
permission from Quantum Spatial, Inc.)
The Turnbull LiDAR study, conducted in 2012 in conjunction with the OLC, covered 176,454 acres in Spokane and Lincoln Counties in Washington State. The project area covers area inside and around the Turnbull National Wildlife Refuge in Spokane County. The boundaries of the LiDAR study area are shown in Figure 13.6. Inside the blue shade of the study area, toward the east, the green shade of the wildlife refuge can be seen.

262
Figure 13.6: Turnbull study area in Spokane and Lincoln Counties (WSI, 2013; used with
permission from Quantum Spatial, Inc.)
Data was collected between October 2012 and July 2013 at a resolution of at least eight pulses per square meter. LiDAR data collection was coordinated with ground survey data collected at existing survey monuments with known coordinates. Field data collected on the ground was typically used to calibrate the accuracy of data collected from LiDAR instruments in the air. The final products included LiDAR point cloud data, plus bare earth and highest hits data sets, intensity rasters, three-inch orthophotos, study area vector shapes, and corresponding statistical data. The image generated from the LiDAR point cloud data with RGB extraction shows the landscape of trees against bare earth (Figure 13.7). Roads and other features are visible. This image comes from orthoimages of South Badger Lake Road in Spokane County. It is an example of the type of product available from these existing LiDAR resources. In 2015, the City of Spokane, Spokane County, U.S. Geological Survey, and other agencies worked together to sponsor a LiDAR data collection project in the county with a focus on the watersheds surrounding the City of Spokane. The data would be available to the participating agencies to make assessments of the topographic and geophysical properties of the study area. The project was completed by Quantum Spatial according to their specification and contract with the PSLC. The project covered an extensive area of Spokane County, roughly 300,000 acres (Figure 13.8). The LiDAR specifications and survey settings used for the Spokane County LiDAR project are detailed in Table 13.8. These settings are valuable information for anyone using the data for estimations of biomass or other biophysical resources in the study area.

263
Figure 13.7: LiDAR point cloud RGB image from Turnbull Study Area. (WSI, 2013; used with
permission from Quantum Spatial, Inc.)
Figure 13.8: Location of the Spokane County LiDAR project area (QSI Environmental, 2015; used
with permission from Quantum Spatial, Inc.)

264
Table 13.8: LiDAR specifications and survey settings for Spokane County LiDAR project (QSI Environmental, 2015; used with permission from Quantum Spatial, Inc.)
The Spokane County LiDAR Project yielded valuable data that could be used to accurately map the forests around the City of Spokane. Figure 13.9 and Figure 13.10 show illustrations from the project technical data report of LiDAR-generated images produced from the LiDAR data collected by Quantum Spatial. The first illustration is a view of a forested area near Antoine Peak generated from a three meter cross section of the 3-D LiDAR point cloud.
Figure 13.9: Illustration of LiDAR image available from Spokane County LiDAR project. (QSI
Environmental, 2015; used with permission from Quantum Spatial, Inc.)

265
The area around Upriver Dam is shown in Figure 13.10. According to the report, “The image was created from the gridded LiDAR surface colored by elevation and overlaid with the 3-D LiDAR point cloud in the top layer.” (Norton, 2015)
Figure 13.10: LiDAR illustration of Upriver Dam from Spokane County LiDAR project (QSI
Environmental, 2015; used with permission from Quantum Spatial, Inc.)
At the time of the project, the cost of data collection was $0.78 per acre. There were additional costs for mobilizing the aircraft and crew and for analyzing the data and reporting results. Data sets from this project are available to the public through the DNR LiDAR Portal. With appropriate software and training the data could be analyzed and interpreted by GIS and land surveying or forestry specialists for many purposes, including estimation of biomass resources in targeted areas. Software applications made for this purpose include ARC GIS, LASt Tools, and Fusion. The analysis would require additional classification of types of data according to their presence as structures, trees or other forms.
13.4.2.6 Spokane County Community Wildfire Protection Plan
In 2009, a countywide wildfire protection plan was prepared by the Spokane County Community Wildfire Protection Plan Planning Committee with support from Northwest Management, Inc. The planning committee included representatives from Spokane County, Washington DNR, Spokane County Extension Office, and a number of other agencies and cities. Completed in coordination with guidelines from the Federal Emergency Management Agency (FEMA), the Community Wildfire Protection Plan provides a detailed glimpse into the wildland-urban interface, showing concentrations of structures at the edges of urban areas, and where they intersect with more wild and wooded areas. In wildfire terms, these are areas where forest fuels

266
meet with urban fuels (i.e., houses and other buildings). According to the plan, “With treatment, a wildland-urban interface can provide firefighters a defensible area from which to suppress wildland fires or defend communities against other hazard risks. In addition, a wildland-urban interface that is properly thinned will be less likely to sustain a crown fire that enters or originates within it.” (Spokane County, 2009) The community protection plan describes how forest planners can use this and other data to evaluate the level of risk in these different areas, especially in intermix areas. This helps planners determine the types and priorities for expending resources on treatments in specific areas. The protection plan developed a detailed list of priorities for protection treatments throughout Spokane County. The areas identified in the protection plan as priorities to receive protection treatments, are shown in Figure 13.11 as pinkish colored areas scattered like bubbles across the county landscape. County planners and biomass energy developers working together could make effective use of available resources by comparing the county maps showing wildland-urban interface areas and priorities for wildfire protection treatments (Figure 13.11) with the maps showing the existing LiDAR data collection in Spokane County (Figure 13.6 and Figure 13.8). With the proper expertise and tools, LiDAR consultants, using existing data or data collected for this specific purpose, could develop valuable profiles of biomass resources available for renewable energy or biochar production in the areas planned for forest health treatments in coming years.

267
Figure 13.11: Community Wildfire Protection Plan treatment priorities (Spokane County, 2009)

268
13.5 Conclusions and recommendations
This project considered methodologies for estimating biomass availability for energy generation from two important sources: urban wood residuals and woody biomass from overstocked forests. The information and data available for urban woody biomass in the disposed waste stream is based on well-founded and well-established methodologies and statistical analyses. Data on recycled woody biomass, including recycled C&D resources, is currently self-reported by waste management facilities. A process could be developed to more accurately verify this data and divide it into more useful categories through data verification phone interviews with facility managers and staff. Methodologies for estimating land-clearing debris exist, but don’t appear to be used frequently in Washington State. For the most effective estimate, the project team endorses the methodology used by Kitsap County (or some easily adapted variation). This methodology is as follows: Through field observations of existing land-clearing operations, establish a predicted average recovery of biomass per acre, per employee, or per project that can be assessed in conjunction with publicly available data for a locality. The publicly available data could be the number of acres cleared per year, the level of employment for land-clearing companies based on NAICS code, or the number of permitted projects in the area. The study team found that NAICS-based data was more readily available for Spokane County than permit-based data. For woody biomass in overstocked forested areas, the DNR calculator developed in 2012 is still an excellent tool for developing biomass estimates, despite some limitations for overstocked forest areas. This calculator allows users to look at countywide data, or to focus on particular watersheds, timbersheds, or areas in proximity to potential facility locations. This calculator allows many other factors to be manipulated in order to target specific forecasts. The project team also found that LiDAR data is becoming more available for broad forested areas, or for areas at the urban-rural interface where development meets rural farms and ranches. Currently, LiDAR data exists for areas in Spokane County, especially watersheds around the City of Spokane. As the technology improves and the DNR LiDAR Portal adds more project data sets, data will become available for more parts of Spokane County.
13.6 References
Andersen, H-E., Strunk, J., and Temesgen, H. 2011a. Using Airborne Light Detection and Ranging as a Sampling Tool for Estimating Forest Biomass Resources in the Upper Tanana Valley of Interior Alaska. Western Journal of Applied Forestry, 26(4), 157-164.
Andersen, H.-E., Strunk, J., Temesgen, H., Atwood, D., and Winterberger, K. 2011b. Using multilevel remote sensing and ground data to estimate forest biomass resources in remote regions: a case study in the boreal forests of interior Alaska. Canadian Journal of Remote
Sensing, 37(6), 1-16. Brenner, A. Personal communication. April 2017. Cascadia Consulting Group, 2008. 2007 Construction & Demolition Waste Composition Study.
Seattle Public Utilities. Seattle, WA.

269
Cascadia Consulting Group, 2010. 2009 Washington Statewide Waste Characterization Study. Department of Ecology, publication no. 10-07-023, Olympia, WA.
Cascadia Consulting Group, 2016. 2015-2016 Washington Statewide Waste Characterization Study. Department of Ecology, publication no. 16-07-032, Olympia, WA.
Cascadia Consulting Group and LARK Environmental, 2006. 2006 Kitsap County Organic Waste Management Study. Kitsap County Public Works.
Chen, Q. 2014. LiDAR Remote Sensing of Vegetation Biomass, in Remote Sensing of Natural
Resources, Wang, G. and Weng, Q. (eds.), CRC Press, Boca Raton, FL Department of Natural Resources, 2012. Forest Biomass Calculator.
http://wabiomass.cfr.washington.edu/ Department of Natural Resources LiDAR portal, n.d. http://lidarportal.dnr.wa.gov/, accessed
August 31, 2017. Ecology, 2005. Biomass Inventory and Bioenergy Assessment: An Evaluation of Organic
Material Resources for Bioenergy Production in Washington State. Washington State Department of Ecology Publication No. 05-07-047.
Falk, B. and McKeever, D. 2012. Generation and recovery of solid wood waste in the U.S. Biocycle 53, 8, p. 30.
Jensen, J. 2013. Washington Biomass Inventory Update. (http://68.179.221.48/biomassinv.aspx) Kumar, L., Sinha, P., Taylor, S., and Alqurashi, A. 2015. Review of the use of remote sensing
for biomass estimation to support renewable energy generation. Journal of Applied
Remote Sensing, 9, 1-27. Lim, K., Treitz, P., Wulder, M., St-Onge, B., and Flood, M. 2003. LiDAR remote sensing of
forest structure. Progress in Physical Geography, 27(1), 88-106. Martinkus, N., Shi, W., Lovrich, N., Pierce, J., Smith, P. and Wolcott, M. 2014. Integrating
biogeophysical and social assets into biomass-to-biofuel supply chain siting decisions. Biomass and Bioenergy, 66, 410-418.
McKeever, D. B. 2004. Inventories of Woody Residues and Solid Wood Waste in the United
States, 2002. USDA Forest Service Forest Products Laboratory, Madison, WI. Melson, Susanna, Mark Harmon, Jeremy Fried, and James Domingo, 2011. Estimates of live-tree
carbon stores in the Pacific Northwest are sensitive to model selection. Carbon Balance
and Management, 6(2), 1-16. Moller, D. 2009. Estimating the Annual Wood Waste of Henderson, Nevada. Wood Utilization
Program—Business Environmental Program, Nevada Small Business Development Center, University of Nevada.
National Association of Homebuilders Research Center. 1997. Residential Construction Waste:
From Disposal to Management. NAHB Research Center Technical Brief. Norton, Andy. Personal communication. April 2017 Pollution Prevention Regional Information Center. n.d. Residential Construction Waste: From
Disposal to Management.
Portland Metro, 2014. Metro Wood Waste Markets Alternative Projects Briefing Paper. Portland, OR.
QSI Environmental, 2015. Spokane, Washington LiDAR Technical Data Report. Seattle, WA http://pugetsoundlidar.ess.washington.edu/lidardata/proj_reports/PSLC_Spokane_LiDAR_Report.pdf
Spokane County, 2009. Community Wildfire Protection Plan. Spokane, WA.

270
Tweedy, D., 2016. Spokane County Profile. Washington Employment Security Department. https://fortress.wa.gov/esd/employmentdata/reports-publications/regional-reports/county-profiles/spokane-county-profile
U.S. Dept. of Energy, 2016. 2016 Billion-Ton Report: Advancing Domestic Resources for a
Thriving Bioeconomy. vol. 1. Washington, D.C. U.S. Forest Service, n.d. Forest Inventory and Analysis National Program.
https://www.fia.fs.fed.us/ Accessed August 31, 2017. Wiltsee, G., 1998. Urban Wood Waste Resource Assessment. National Renewable Energy
Laboratory, Golden, CO. WSI Applied Remote Sensing and Analysis (now Quantum Spatial, Inc.), 2013. OLC Turnbull.
Portland, OR.

271
14. Assessing Local Technical Potentials for CO2 Drawdown Using Biochar from Forestry
Residues and Waste Wood in Washington State
James E. Amonette
Pacific Northwest National Laboratory and Washington State University
14.1 Abstract
This chapter reports on the development of a high-resolution scalable method to estimate the technical potential for atmospheric carbon (C) drawdown by biochar in Washington State using waste wood as the primary feedstock. The development is focused on Spokane County as a test case, and involves the use of a geographic information system (GIS) approach to help determine the available biomass and the location of suitable land for biochar amendment. The results show that over 100 years, Spokane County could sustainably offset atmospheric greenhouse gases totaling between 1.5 and 4.1 million metric tons (megatonnes; Mt) C-equivalent (5.5 and 15.2 Mt CO2-equivalent) primarily through a combination of C storage in the form of biochar and generation of renewable energy. Most of the biomass is derived from residual forest biomass as a by-product of timber harvest, but between 15 and 48%, depending on the timber harvest scenario, is obtained from the municipal waste stream. If the same biomass were instead combusted for renewable energy, the offsets decrease by an average of 42%.
14.2 Background
As outlined in Amonette et al. (2016a,b), production of biochar from waste wood in Washington State using modified biomass boilers has the potential to yield many benefits including improved biomass productivity, decreased irrigation costs, and, perhaps most importantly, drawdown of atmospheric CO2. Although Amonette et al. (2016a,b) used the results of an earlier global model (Woolf et el., 2010) to estimate that on the order of 500-600 Mt atmospheric CO2 could be offset in Washington State over the course of a century (before accounting for releases of C currently in the oceanic and terrestrial pools), they recommended further analysis be made to refine and solidify this estimate. The present work, therefore, focuses on developing and demonstrating a high-resolution scalable method for estimating the net 100-year CO2 drawdown technical potential of biochar for Spokane County with the aim to apply the method to the entire state in a separate, later effort. This method takes into account local, site-specific factors such as (1) the availability and distribution of waste-wood biomass, (2) the locations of existing biomass boilers, (3) the soil types and land-use categories receiving biochar amendments, and (4) the expected primary productivity responses to biochar amendments (a positive feedback loop). Global climate system responses to drawdown, such as net losses of soil C and the exsolvation of oceanic CO2, are also considered.

272
The work was organized into three sequential tasks. Task 1 focused on selection of the site for initial method application, compilation of the primary datasets needed as input to the method, and critical reviews of the literature pertaining to the responses of living biomass to soil amendments with biochar and of the global climate system to a large drawdown of atmospheric CO2. Task 2 focused on development and implementation of the method to the site selected using the datasets compiled in Task 1. Task 3 involved the preparation of this chapter, which will serve as the basis for a manuscript to be submitted to a peer-reviewed journal that describes the method, its application to Spokane County, and the manner by which this approach can be scaled to state or regional levels.
14.3 Methods
14.3.1 Site selection
Selection of the site for initial application of the method depended on the extent of available datasets having the qualities needed. These datasets include information about woody biomass (location, accessibility, type, quantity, and productivity), soil (native fertility status), and potential pyrolysis facilities (location and process conditions). In the ideal situation, the available datasets would consider the entirety of Spokane County and contain spatially identifiable data (i.e., data with geographic coordinates suitable for use in a GIS). The process for selecting the site, therefore, followed compilation and assessment of the available datasets.
14.3.2 Dataset compilation
As discussed in the previous section, the method is expected to require technical information about woody biomass, soil properties, and pyrolysis facilities. In the ideal situation, this information would be spatially identifiable. High priority was thus assigned to identifying and obtaining datasets that could be used in GIS, as well as the appropriate GIS software to manipulate them. Internet searches led to websites containing publicly available datasets from the State of Washington (http://geography.wa.gov/data-products-services/data/data-catalog ), the U.S. Department of Agriculture Natural Resources Conservation Service (https://websoilsurvey.sc.egov.usda.gov/App/HomePage.htm ), the LEMMA group (https://lemma.forestry.oregonstate.edu/data ), and an open-source GIS program (www.qgis.com). Information about potential pyrolysis facilities was based on Chapter 11 (this report), which presents the results of a recent statewide wood-waste boiler survey.
14.3.3 Compilation of relevant scientific literature Some of the data needed are not available in spatially identifiable datasets. This information includes the potential yield response of woody biomass to amendment of soils with biochar, as well as the potential climate system response to a drawdown of atmospheric C. Both types of information were synthesized from reviews of the relevant peer-reviewed literature, identified from internet searches using online library resources.
14.3.4 Method development The starting point for development of the algorithm was the Biochar Global Response Assessment Model (BGRAM) implemented in spreadsheet form by Woolf et al. (2010). This algorithm considers biomass composition, pyrolysis and combustion process parameters, energy

273
production, C intensity of energy being offset, rate of technology adoption, biochar properties, biomass growth response, biomass and biochar transport, biochar decomposition rates, and greenhouse gas emissions at every stage of the cycle from biomass harvest to 100 years after biochar has been added to the soil. The original version was developed for a global analysis based primarily on the use of agricultural biomass residues and required modest revisions to be able to work with smaller national, regional, and local datasets. Extensive details about the BGRAM program can be found in the online supplemental information file associated with the Woolf et al. (2010) publication. For the Spokane County study, the use of woody biomass from forested regions for biochar production, and the application of this biochar to non-forested agricultural regions, required special consideration with respect to carbon accounting. For example, biochar decomposition is typically associated with the feedstock type, but in this instance, the decomposition was occurring in a region that did not supply a feedstock (although wheat straw could be considered and added to the analysis, it was not the focus of the present study). Similarly, it was necessary to separate the changes in soil organic matter content resulting from biomass harvest from those resulting from biochar application when considering biomass growth response. Finally, the program was streamlined somewhat in order to decrease the processing time for each scenario. These efforts were consolidated in version 1.35 of BGRAM, which was able to process a scenario in less than a minute. Scenarios basically consisted of estimates of the amount and composition of sustainably available biomass for each feedstock being considered, coupled with information about whether the biomass is processed in the field by a mobile unit or at a central location, whether pyrolysis or combustion processes are to be used, and the travel distances required to get the biomass to the processor and the biochar to the land where it is to be applied. For this study, three feedstock streams were used: residual forest biomass from timber harvesting operations, wood reclaimed from municipal solid waste (MSW; dimensional lumber, engineered wood, pallets and crates, natural wood, and other non-treated wood), and green waste also reclaimed from the MSW stream. In addition, a fourth feedstock stream, based on the additional drawdown stemming from biomass response to biochar amendment, was considered in each scenario.
14.4 Results and discussion
14.4.1 Site selection All of the available spatially identifiable datasets contained information for the entirety of Spokane County, and as a result Spokane County (rather than a portion thereof) was selected as the site for initial implementation of the method.
14.4.2 Datasets The results of the wood-waste boiler survey (Chapter 11 of this report), indicated the existence of only five active boilers in the state, none of which are located in, or near, Spokane County. As a result, an assumption will be made, for the purpose of implementing the method used in this study, that a pyrolysis facility would be built adjacent to the municipal incinerator in Spokane

274
(located at 2900 S. Geiger Boulevard) to allow effluent gases from pyrolysis to be combusted for energy by the incinerator. Several types of GIS-compatible data were obtained. First, a gradient-nearest-neighbor raster dataset of vegetative structure at a 30x30 m scale was obtained from the LEMMA group at Oregon State University. This dataset is based on species-specific remote-sensing (Landsat) data for 2012 as validated by an extensive set of forestry plot surveys (Ohmann and Gregory, 2002; Ohmann et al., 2014) and covers Washington, Oregon, and California. In addition to the raster dataset, the data are arranged in a Microsoft Access® database on the basis of species (36,000), combinations of species (53,000), and 770 specific attributes (e.g., spatial area, volume, density, stem thickness) of the woody biomass present. Second, using the LEMMA dataset just described, the Washington State Department of Natural Resources (DNR) performed a very thorough biomass estimate for the state (Pérez-Garcia et al., 2013), and implemented a web-based platform for generating available biomass estimates on a county-wide basis (http://wabiomass.cfr.washington.edu/). The approach taken in the development of this dataset was similar to (and in more detail) than that originally envisioned for the current project and included detailed GIS modeling of factors affecting both physical and economic availability of the biomass. Third, a vector-based soil properties dataset for Spokane County was obtained from the U.S. Department of Agriculture’s Web Soil Survey. In addition to mapping units for different soil types, a Microsoft Access® database containing numerous soil chemical and physical properties, vegetative species present, and forest productivity estimates is provided. With the exception of federal lands, and an incomplete survey for Pierce County, similar datasets are available for the rest of the state. Finally, several GIS vector databases indicating the locations of roads, urban areas, county boundaries, and other jurisdictional features, as well as a raster digital elevation model base map of Washington State, were obtained to provide a spatial context for interpretation of the vegetation and soil data and aid in the interpretation of woody biomass accessibility. An example of a GIS map showing the vegetative structure, soil mapping units, and contextual features provided by combining the databases is given in the next several figures at three different scales. Figure 14.1 (scale: 1:260,000) depicts all of Spokane County, with the pinkish lines indicating roadways and the greenish areas indicating woody vegetation. Figure 14.2 (scale 1:40,000), and Figure 14.3 (scale: 1:10,000), are centered on Cheney, Washington. In these two figures, the soil mapping units are easily distinguished by the wavy bluish lines. In Figure 14.3, the individual vegetation cells are clearly evident. The variation in color of these cells is associated with different vegetative structures (i.e., combinations of woody species). Also evident are the Cheney city limits, shown as a light purple shade. Each of the features shown can be queried to identify properties associated with them such as species composition, annual biomass productivity, and stand density. Queries of these properties with respect to distance from public roads will likely be used in the method to refine the estimates of woody biomass available for biochar production.

275
Figure 14.1: Low-scale (1:260,000) map of Spokane County (and the southeast corner of Stevens
County) showing GIS datasets for vegetative structure, soil mapping units, roads, and urban boundaries
Figure 14.2: Medium-scale (1:40,000) map centered on the town of Cheney in Spokane County showing GIS datasets for vegetative structure, soil mapping units, roads, and the city limits

276
Figure 14.3: High-scale (1:10,000) map centered on the town of Cheney in Spokane County showing GIS datasets for vegetative structure, soil mapping units, roads, and the city limits
14.4.3 Biomass yield response to soil amendment with biochar In Spokane County, agronomic crops, principally wheat, as well as woody biomass offer opportunities for biochar applications. During the past decade, a significant body of knowledge has been gathered regarding the response of agronomic crops to amendment with biochar. In contrast, very little is known about the response of woody biomass, and, in particular, conifers, to biochar soil amendments. The key point to remember is that biochar is not a single substance, but rather a category of materials produced from different feedstocks by different processes and having a wide range of properties, some of which change after application to soil. Thus, yield responses (as well as greenhouse gas impacts) will vary significantly from biochar to biochar, and each biochar must be matched to the soil and biomass crop to ensure a beneficial outcome. According to several meta-analyses (Jeffery et al., 2011; Jeffery et al., 2017; Liu et al., 2013; Spokas et al., 2012), the response of agronomic crops to biochar soil amendments is generally positive, but not always so. Jeffery et al. (2017) reported that, in contrast to tropical soils where an average 25% increase in yield has been observed, biochar amendments in temperate soils resulted in a slight (3%) decrease in crop yield. However, they qualify this conclusion by noting that one of the main factors driving the response to biochar in tropical soils is its liming effect, as these soils are typically both nutrient poor and acidic in nature, and the published data available do not include any acidic temperate-zone soils. Results reported for wheat (Liu et al., 2013), based on 76 data pairs, showed a mean 10% increase in yield and a 13% increase in biomass for treatments receiving biochar relative to control treatments. Over all dryland crops, biochar amendments to acid soils (pH < 5, 135 data pairs) resulted in a mean 30% increase in yield whereas amendments to slightly acid soils (5.5 < pH < 6.5) resulted in a mean 15% yield increase (Liu et al., 2013). The liming effect of biochar thus could be a significant factor for

277
wheat responses in Spokane County. Other soil properties such as texture, organic C content, and carbon to nitrogen ratio seem to have an influence on the yield response of dryland crops to biochar amendments, with the largest response to biochar being in sandy soils (Liu et al., 2013). The meta-analytical results observed with wheat crops (Liu et al., 2013) are consistent with those obtained when wood-derived biochar was applied to a slightly acidic soil (pH = 5.5 in top 30 cm) near Pendleton, OR, in which the maximum mean increase in winter-wheat yield over three years was about 8% and pH increases on the order of 0.4 units were obtained (Machado et al., 2017). A much higher yield response of winter wheat to biochar (a 2.9-fold increase averaged over two years) was observed by Phillips et al. (2018) in Spokane County, WA following amendment of a highly acidic soil (pH = 4.0 in top 20 cm) with a high-ash (51%) biochar derived from Kentucky bluegrass seed screenings (Griffith et al., 2013). Although a liming effect of only about 0.4-0.9 pH units was observed with this biochar, the response of wheat to liming would be expected to be much larger than in the Machado et al. (2017) study due to the very low initial soil pH and high sensitivity of wheat to pH changes at this pH (McFarland et al., 2015). In a separate set of treatments, Phillips et al. (2018) added hydrated lime to the soil, and these resulted in pH increases of 0.6-1.3 units and an average 1.9-fold yield increase. The substantially larger yields seen with the biochar amendments relative to hydrated lime likely stemmed from the additional mineral nutrients (mainly K and P) present in the ash fraction of the biochar. In prescient work, Galinato et al. (2011) explored the potential yield response of dryland wheat grown in eastern Oregon to biochar amendments by assuming that the only factor driving the response was likely to be the liming effect. To estimate this response, they relied on unpublished work of Collins (2008) which supplied values for the liming potential of biochar for a Palouse silt loam soil similar to those soils on which wheat is grown in Spokane County. Decades of nitrogen (N) fertilization have resulted in low pH values in many of these soils (Mahler et al., 1985; Mahler, 1986; Mahler et al., 2015; Rasmussen and Rohde, 1989), and lime is needed to restore soil productivity to optimal levels. Galinato et al. (2011) used a value of 0.0196 pH unit increase for each metric ton of biochar added per hectare of Palouse soil. The pH responses to biochar amendments for two soils present in Spokane County, the Naff silt loam and Thatuna silt loam, were published by Granatstein et al. (2009). The soil pH response data for amendments with biochars prepared from softwood bark and wood pellets at a production temperature of 500ºC were pooled to simulate biochar prepared from residual forest biomass and recovered waste wood in the present study. This analysis yielded a value of a 0.012 pH unit increase for each metric ton of biochar C (about a 0.009 pH unit increase per metric ton of biochar) added per hectare of soil. A 50 metric ton per hectare biochar-C amendment, which is the maximum biochar application rate considered by Woolf et al. (2010), would be predicted to raise soil pH by 0.6 units. Galinato et al. (2011) used the following equation provided by Mahler (1986) to estimate the yield response of winter wheat to an increase in pH:
Yield = -2960.56 + 1530(Soil pH) where the units of yield are given in kg grain per hectare. Based on this equation, one can calculate that a 50 metric ton per hectare amendment with biochar C to a pH 4.45 soil (average

278
pH of the Naff and Thatuna soils tested by Collins) would result in a 24% increase in winter-wheat yield in the first year (i.e., from 3848 kg per hectare to 4766 kg per hectare). Liming of soil, however, is not a one-time operation, as every year’s addition of N fertilizer generates some acidity due to the oxidation of ammonium (NH4
+) to nitrate (NO3-) during
nitrification. In a long-term field study, Rasmussen and Rohde (1989) measured an average decrease in pH of 0.317 units for each metric ton of N added per hectare, and from this, one can calculate that application of 1.89 metric tons of N fertilizer would decrease soil pH by 0.6 units. Each kg of wheat requires on the order of 0.016 kg of N, suggesting that for the Naff and Thatuna soils, 62 kg of N would be removed in the grain prior to biochar amendment. Assuming an average N-use efficiency of 50%, a minimum of 123 kg N fertilizer would need to be applied to each hectare prior to biochar amendment in order to attain these yields. After amendment with biochar and adjusting N fertilizer rates upward for the pH-dependent yield increases, a return to the initial soil pH would occur about 15 years after amendment with biochar. The potential 918 kg per hectare increase in wheat yield following a 50 metric ton per hectare biochar-C addition would thus be temporary, and can be projected to decrease at a linear annual rate of 68 kg per hectare, or 7.4% of the initial increase each year (i.e., from 24% the first year to 0% in year 15). Obviously, a prudent farmer would continue to lime the soil to maintain optimal productivity, but this lime would have to come from other sources in order to avoid potential decreases in yield associated with higher application rates of biochar. The same approach can be applied to Spokane County as whole. The average wheat yields reported for Spokane County from the 2012 U.S. Department of Agriculture Census of Agriculture database (https://quickstats.nass.usda.gov/) are 62 bushels per acre (4200 kg per hectare). Back-calculating with the same equation by Mahler (1986) used earlier, the soil pH corresponding to this yield is 4.68. Assuming that Spokane County soils as a whole respond to biochar amendments in the same way as the Naff and Thatuna soils, a 30% increase in wheat yield would be obtained in the first year following a 50 metric ton of biochar-C per hectare amendment. After 19 years, the biochar-associated pH and yield increases would return to their initial values and the predicted net 100-year yield increase would be 2.8%. This yield increase was used to represent the yield response of Spokane County soils in the BGRAM algorithm. The recent field test results reported by Machado et al. (2017) can also be used to estimate the pH response of regional wheatland soils to amendment with wood-derived biochar. A value of 0.0174 pH units per metric ton of biochar C is obtained, which is 45% larger than the value obtained from analysis of the data presented by Granatstein et al. (2009) for two Spokane County soils. Application of this higher pH response value to Spokane County results in a predicted net 100-year yield increase of 4.6% and extends the length of time during which biochar-induced pH and yield increases would be expected from an application of 50 metric tons of biochar-C per hectare to 24 years. A very large increase in the pH and wheat-yield response of Spokane County soils would be predicted from the recent results of Phillips et al. (2018) using high-ash gasifier biochar prepared from grass-seed cleaning residues. For this biochar, a value of 0.082 pH units per metric ton of biochar C can be calculated, nearly 7 times larger than the value obtained from the Granatstein et al. (2009) data with wood biochar. Because of this high liming value, the biochar would need to

279
be applied in smaller increments to keep the soil pH in the optimum range for wheat production. Application in increments of 10 metric tons of biochar carbon would result in about 19 years of pH and yield increases for each application, and a total of 95 years out of the 100-year time window would be covered by a total application of 50 metric tons of biochar carbon. As a result, the predicted net 100-year yield increase for Spokane County using the high-ash biochar prepared from seed-cleaning residues would be 14.7%. It is clear that as a result not only of its high liming potential, but also its high concentration of mineral nutrients such as potassium and phosphate, the use of high-ash gasifier biochar prepared from straw and other agricultural residues would likely yield higher agronomic returns than the use of low-ash wood biochar that is the focus of the present report. The trade-off, however, is that biochars prepared from gasifiers typically have lower C yields (i.e., a larger proportion of the C originally present in the biomass is released as CO2 to the atmosphere) than biochars prepared by pyrolysis. The net carbon drawdown benefit, therefore, is likely to be smaller with the use of gasifier biochar. Other possible yield-enhancing benefits resulting from biochar amendment, such as increased moisture holding capacity, have been suggested. Unfortunately, a paucity of data exists to demonstrate the size of the benefit stemming from the increased moisture holding capacity. Lawes et al. (2009) modeled the yield response of wheat grown in Australia to the plant available water capacity (PAWC) of soil and obtained a value of 37 +/- 13 kg per hectare per millimeter of water in the rooting zone (1.8 m deep) for soils having PAWC values below 68 mm. Above this PAWC, no additional yield benefit was seen. The texture of the soils ranged from loamy sand to sandy loam. The texture of the primary wheat-growing soils in Spokane County is typically a silt loam. A rough estimate of PAWC for a representative silt loam soil from eastern Washington can be obtained from water holding capacity data provided by the U.S. Department of Agriculture Soil Survey Laboratory (https://ncsslabdatamart.sc.egov.usda.gov/, Pedon No. 05N0677, Warden silt loam). A simple calculation (difference in volumetric moisture contents measured at field capacity and the wilting point times the depth of the horizon for which data were measured) shows an estimated PAWC of about 506 mm, well above the ceiling (68 mm) where PAWC would be expected to have an impact on yield based on the results of Lawes et al. (2009). Thus one would not expect to see any impact of biochar on wheat yield in the typical soils of Spokane County stemming from improved water holding capacity. These results are consistent with the metastudy of Liu et al. (2013) showing that sandy soils had the greatest yield response to biochar (ca. 30%), whereas soils having silt or loam textures showed much smaller yield responses (ca. 8%) and most of the response in the finer textured soils may have been due to the liming effect. Consistent with the observations of Liu et al. (2013), recent work by Suliman et al. (2017) shows relative increases of 49 to 206% in plant available water capacity for a sandy soil amended with biochar prepared from woody biomass. Field trials with this combination of soil and biochar have not yet been reported that demonstrate a corresponding increase in plant yield.

280
Although application of biochar to forested lands is not considered in the present work, Thomas and Gale (2015) provided a review and meta-analysis of the growth response of trees to biochar amendments. Based on a total of 17 published studies, they found an overall robust positive response. Trees grown with biochar averaged about 40% more increase in biomass than those that did not receive biochar amendments. In contrast to hardwoods and trees in tropical or boreal zones, however, conifers, and trees in temperate zones showed a much lower response to biochar of about 10-15% relative to controls. Most of the experiments considered were small pot experiments using very young trees. Experiments with durations greater than one year trended to smaller growth responses than shorter duration experiments and suggests that age of the tree, or aging of the biochar in soil, may have had an impact. The authors speculated that the lower responses seen in temperate zones stem from limitations in N (this element is usually not limiting in boreal and tropical forests, and is not readily present in most biochars) and lower levels of phenolics and other growth-limiting substances in temperate soils. As noted previously in the discussion of yield responses by wheat, the liming effect of biochar also is believed to play an important role with the growth response of trees, and may account for much of the difference between the temperate and tropical zones. This brief overview gives insight to the key factors considered in the method when calculating the change in net primary productivity of the lands to which biochar is applied in Spokane County. In addition to properties of the biochar itself, these factors include type of living biomass being treated, and the key soil properties of pH and texture. Analysis of the available data suggests that the liming effect of biochar is likely the only factor of any importance in Spokane County soils, and this effect is relatively small. The 2.8% increase in yield identified for wheat was thus chosen to represent the change in net primary productivity over 100 years stemming from an application to croplands of 50 metric tons biochar C per hectare.
14.4.4 Climate system response to CO2 drawdown It has long been recognized that changes in atmospheric CO2 concentrations are buffered by reactions with the oceans, principally, and terrestrial ecosystems. The focus of most studies has been on the changes associated with increasing CO2, rather than decreasing CO2. Several studies (Dull et al. 2010; Joos et al., 1999; Nevle and Bird, 2008; Nevle et al., 2011), however, followed oceanic carbonate composition associated with the atmospheric drawdown between 1500 and 1650 A.D. caused, at least in part, by reforestation of the Americas following the post-colonization collapse of native populations. These studies give hints as to buffering capacity, and although based on scientific data, are not particularly precise nor instructive as to what factor to use to account for the buffering action of the oceanic and terrestrial climate systems. Due to the growing interest in climate geoengineering, of which CO2 removal is one of the two major approaches, Cao and Caldeira (2010) modeled the expected changes in planetary C pools that would be seen as atmospheric CO2 levels decreased. To establish boundaries to the problem, they tested three hypothetical extreme scenarios, each involving the instantaneous elimination of anthropogenic CO2 emissions in the year 2050. Two scenarios also involved complete and instantaneous removal of anthropogenic CO2 from the atmosphere (i.e., a return to pre-industrial levels of CO2), with one of these maintaining the pre-industrial levels by continued drawdown and the other (a one-time removal) allowing the atmospheric CO2 level to respond to the buffering actions provided by the ocean and terrestrial portions of the climate system.

281
Modeling by Cao and Caldeira (2010) predicted that, at the end of 2049 (immediately before the implementation of their scenarios), 54% of all anthropogenic emissions would have been taken up by the oceanic and terrestrial systems, and 46% would have remained in the atmosphere. With a simple halt to emissions, a very slow decrease in atmospheric CO2 levels was predicted due to uptake by the oceanic system (Figure 14.4). After 450 years, 27% of anthropogenic CO2 emissions remained in the atmosphere.
Figure 14.4: Model-simulated temporal evolution of atmospheric CO2 and change in surface air
temperature (relative to pre-industrial) from year 1800 to year 2500 (Cao and Caldeira, 2010)
One-time instantaneous removal of the 46% remaining in the atmosphere disrupted the balance between the atmospheric and oceanic/terrestrial C pools. Over the next 30 years the oceanic/terrestrial system released about one-third of the amount just removed from the atmosphere (Figure 14.4). Thereafter a slow decline in atmospheric CO2 levels was observed as the oceanic system took up C from the atmospheric and terrestrial pools. After 450 years, however, 12% of the anthropogenic CO2 remained in the atmosphere. In the third scenario, after cessation of emissions and removal of all anthropogenic CO2, maintenance of the atmospheric level at pre-industrial levels to account for the buffering by the oceanic and terrestrial climate systems was modeled. With this approach, continuation of
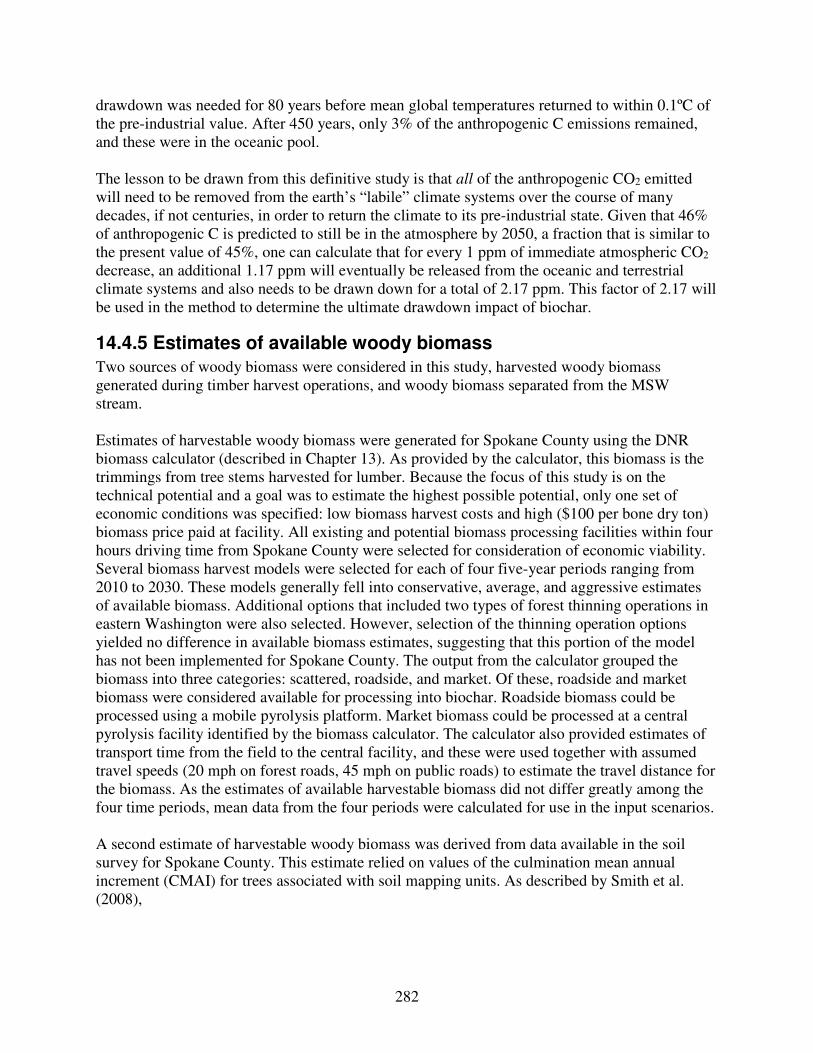
282
drawdown was needed for 80 years before mean global temperatures returned to within 0.1ºC of the pre-industrial value. After 450 years, only 3% of the anthropogenic C emissions remained, and these were in the oceanic pool. The lesson to be drawn from this definitive study is that all of the anthropogenic CO2 emitted will need to be removed from the earth’s “labile” climate systems over the course of many decades, if not centuries, in order to return the climate to its pre-industrial state. Given that 46% of anthropogenic C is predicted to still be in the atmosphere by 2050, a fraction that is similar to the present value of 45%, one can calculate that for every 1 ppm of immediate atmospheric CO2 decrease, an additional 1.17 ppm will eventually be released from the oceanic and terrestrial climate systems and also needs to be drawn down for a total of 2.17 ppm. This factor of 2.17 will be used in the method to determine the ultimate drawdown impact of biochar.
14.4.5 Estimates of available woody biomass Two sources of woody biomass were considered in this study, harvested woody biomass generated during timber harvest operations, and woody biomass separated from the MSW stream. Estimates of harvestable woody biomass were generated for Spokane County using the DNR biomass calculator (described in Chapter 13). As provided by the calculator, this biomass is the trimmings from tree stems harvested for lumber. Because the focus of this study is on the technical potential and a goal was to estimate the highest possible potential, only one set of economic conditions was specified: low biomass harvest costs and high ($100 per bone dry ton) biomass price paid at facility. All existing and potential biomass processing facilities within four hours driving time from Spokane County were selected for consideration of economic viability. Several biomass harvest models were selected for each of four five-year periods ranging from 2010 to 2030. These models generally fell into conservative, average, and aggressive estimates of available biomass. Additional options that included two types of forest thinning operations in eastern Washington were also selected. However, selection of the thinning operation options yielded no difference in available biomass estimates, suggesting that this portion of the model has not been implemented for Spokane County. The output from the calculator grouped the biomass into three categories: scattered, roadside, and market. Of these, roadside and market biomass were considered available for processing into biochar. Roadside biomass could be processed using a mobile pyrolysis platform. Market biomass could be processed at a central pyrolysis facility identified by the biomass calculator. The calculator also provided estimates of transport time from the field to the central facility, and these were used together with assumed travel speeds (20 mph on forest roads, 45 mph on public roads) to estimate the travel distance for the biomass. As the estimates of available harvestable biomass did not differ greatly among the four time periods, mean data from the four periods were calculated for use in the input scenarios. A second estimate of harvestable woody biomass was derived from data available in the soil survey for Spokane County. This estimate relied on values of the culmination mean annual increment (CMAI) for trees associated with soil mapping units. As described by Smith et al. (2008),
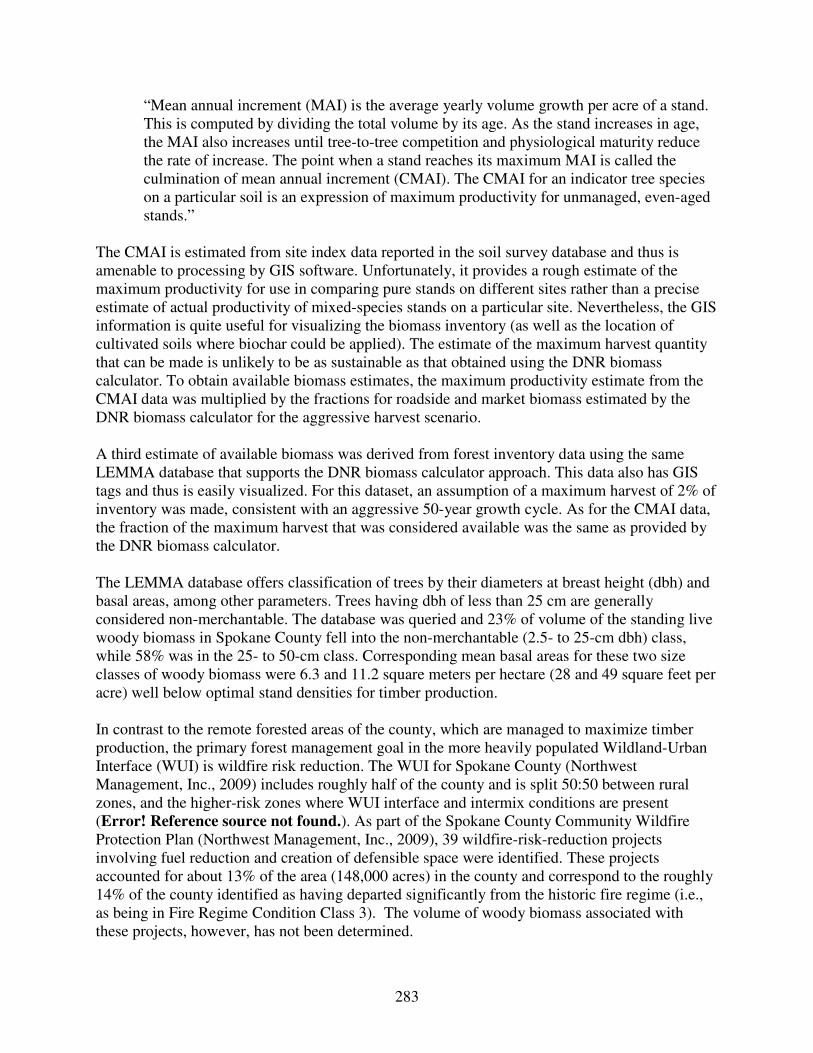
283
“Mean annual increment (MAI) is the average yearly volume growth per acre of a stand. This is computed by dividing the total volume by its age. As the stand increases in age, the MAI also increases until tree-to-tree competition and physiological maturity reduce the rate of increase. The point when a stand reaches its maximum MAI is called the culmination of mean annual increment (CMAI). The CMAI for an indicator tree species on a particular soil is an expression of maximum productivity for unmanaged, even-aged stands.”
The CMAI is estimated from site index data reported in the soil survey database and thus is amenable to processing by GIS software. Unfortunately, it provides a rough estimate of the maximum productivity for use in comparing pure stands on different sites rather than a precise estimate of actual productivity of mixed-species stands on a particular site. Nevertheless, the GIS information is quite useful for visualizing the biomass inventory (as well as the location of cultivated soils where biochar could be applied). The estimate of the maximum harvest quantity that can be made is unlikely to be as sustainable as that obtained using the DNR biomass calculator. To obtain available biomass estimates, the maximum productivity estimate from the CMAI data was multiplied by the fractions for roadside and market biomass estimated by the DNR biomass calculator for the aggressive harvest scenario. A third estimate of available biomass was derived from forest inventory data using the same LEMMA database that supports the DNR biomass calculator approach. This data also has GIS tags and thus is easily visualized. For this dataset, an assumption of a maximum harvest of 2% of inventory was made, consistent with an aggressive 50-year growth cycle. As for the CMAI data, the fraction of the maximum harvest that was considered available was the same as provided by the DNR biomass calculator. The LEMMA database offers classification of trees by their diameters at breast height (dbh) and basal areas, among other parameters. Trees having dbh of less than 25 cm are generally considered non-merchantable. The database was queried and 23% of volume of the standing live woody biomass in Spokane County fell into the non-merchantable (2.5- to 25-cm dbh) class, while 58% was in the 25- to 50-cm class. Corresponding mean basal areas for these two size classes of woody biomass were 6.3 and 11.2 square meters per hectare (28 and 49 square feet per acre) well below optimal stand densities for timber production. In contrast to the remote forested areas of the county, which are managed to maximize timber production, the primary forest management goal in the more heavily populated Wildland-Urban Interface (WUI) is wildfire risk reduction. The WUI for Spokane County (Northwest Management, Inc., 2009) includes roughly half of the county and is split 50:50 between rural zones, and the higher-risk zones where WUI interface and intermix conditions are present (Error! Reference source not found.). As part of the Spokane County Community Wildfire Protection Plan (Northwest Management, Inc., 2009), 39 wildfire-risk-reduction projects involving fuel reduction and creation of defensible space were identified. These projects accounted for about 13% of the area (148,000 acres) in the county and correspond to the roughly 14% of the county identified as having departed significantly from the historic fire regime (i.e., as being in Fire Regime Condition Class 3). The volume of woody biomass associated with these projects, however, has not been determined.

284
Figure 14.5: Map showing urban areas and roads, live woody biomass density (LEMMA data) and the wildland urban interface (dark grey shading) in Spokane County (the southwest corner of
Stevens County is also shown at upper left). Yellow dot indicates location of proposed central biochar facility

285
In areas were fire-hazard reduction is the primary forest management goal, periodic “low thinning” to remove some or all of the non-merchantable biomass is often recommended (Agee and Skinner, 2005; Scott and Reinhardt, 2001). This approach maintains the stand of older, more fire-resistant, trees and avoids catastrophic fires, but needs to be carefully applied in order to ensure that some young trees remain to replace the older trees when they die. Modeling of a severe-fire-weather wildfire in a ponderosa-pine/Douglas-fir/grand-fir stand similar to those in Spokane County after application of various fire-hazard reduction approaches suggests that a full low-thinning operation would preserve about 41% of the stand’s basal area, second only to a prescribed fire operation (50% survival), and was much better than several other options including selective thinning (2% survival), partial low thinning coupled with commercial harvest (6% survival), and no fire-hazard reduction (0% survival) (Agee and Skinner, 2005). Coupling of forest thinning operations with biochar production in Spokane County, therefore, might substantially increase the carbon drawdown potential while at the same time avoiding catastrophic fires that would work in the opposite direction to increase C emissions. Further analysis, by species and by wildfire-hazard-reduction project area, could identify additional areas where thinning operations would be recommended and determine the amounts of woody biomass potentially available for biochar production, but was not performed in the present study. Estimates of MSW biomass were obtained from the recent statewide waste characterization study published by the Washington Department of Ecology (Ecology, 2016). Because of the different biomass properties considered in the BGRAM algorithm, two feedstock types were selected: recovered wood waste (dimensional lumber, engineered wood, pallets and crates, natural wood, and other non-treated wood), and greenwaste (yard waste, garden waste, and prunings). These estimates of available biomass were consolidated to create ten input scenarios for the BGRAM program (Table 14.1).
Table 14.1: Biomass scenarios for input to the BGRAM program
Harvest scenario
Processing location
Biomass inputs
Facility Facility + Field
Harvested biomass
MSW wood MSW greenwaste
Total biomass pyrolyzed
Mean travel distance
-------------------------green metric tons -------------------- Km Aggressive X 83,200 29,900 6,540 120,000 47.9 Average X 63,300 29,900 6,540 99,800 53.1 Conservative X 40,000 29,900 6,540 76,500 53.4 Aggressive X 202,000 29,900 6,540 238,000 47.9 Average X 155,000 29,900 6,540 192,000 53.1 Conservative X 98,000 29,900 6,540 135,000 53.4 CMAI X 663,000 29,900 6,540 699,000 50.0 CMAI X 1,610,000 29,900 6,540 1,640,000 50.0 LEMMA X 30,000 29,900 6,540 66,500 50.0 MSW Only X n/a 29,900 6,540 36,500 50.0
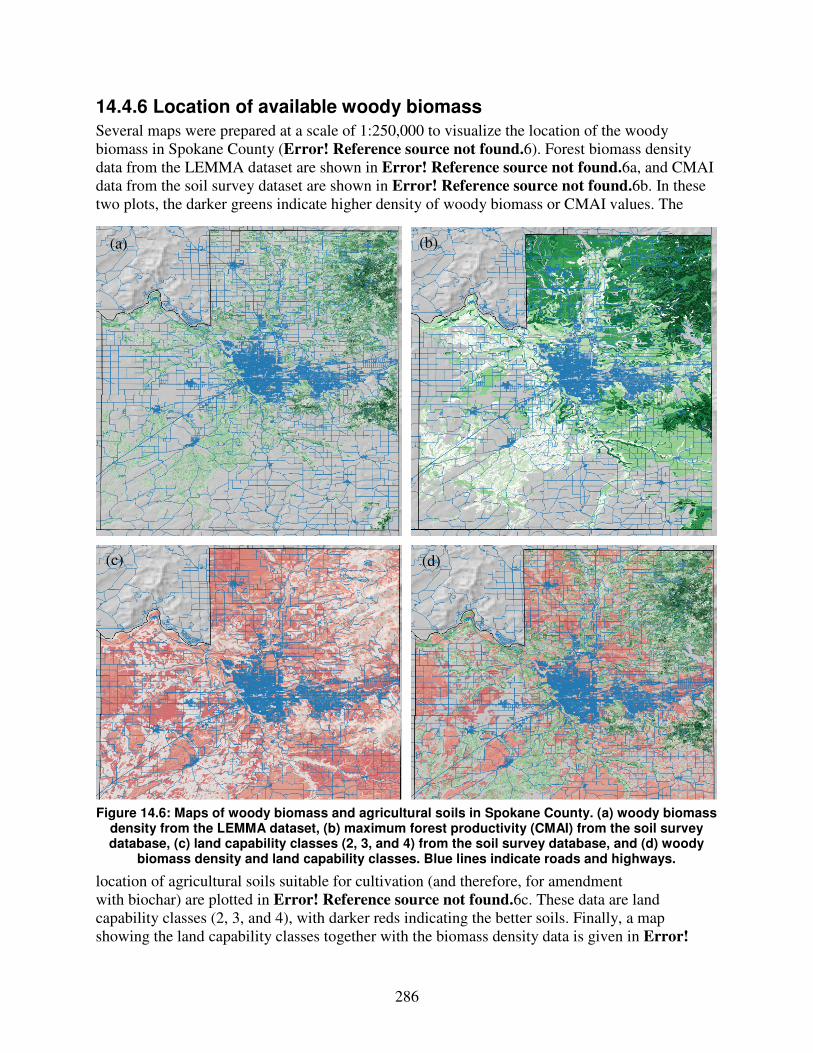
286
14.4.6 Location of available woody biomass Several maps were prepared at a scale of 1:250,000 to visualize the location of the woody biomass in Spokane County (Error! Reference source not found.6). Forest biomass density data from the LEMMA dataset are shown in Error! Reference source not found.6a, and CMAI data from the soil survey dataset are shown in Error! Reference source not found.6b. In these two plots, the darker greens indicate higher density of woody biomass or CMAI values. The
location of agricultural soils suitable for cultivation (and therefore, for amendment with biochar) are plotted in Error! Reference source not found.6c. These data are land capability classes (2, 3, and 4), with darker reds indicating the better soils. Finally, a map showing the land capability classes together with the biomass density data is given in Error!
(a)
(d) (c)
(b) (a)
Figure 14.6: Maps of woody biomass and agricultural soils in Spokane County. (a) woody biomass density from the LEMMA dataset, (b) maximum forest productivity (CMAI) from the soil survey database, (c) land capability classes (2, 3, and 4) from the soil survey database, and (d) woody
biomass density and land capability classes. Blue lines indicate roads and highways.

287
Reference source not found.6d. In each map, blue lines indicate roads and streets. Clearly, the highest density of woody biomass is in the mountains to the northeast and southeast of Spokane. The proposed site for the pyrolysis facility on the southwest edge of Spokane seems well situated to receive biomass from the northeast portion of Spokane County and to supply biochar to the agricultural lands located in the northwest and southern portions of the county.
14.4.7 Estimates of biochar and bioenergy technical potential Application of the BGRAM algorithm to the ten biomass harvest scenarios yielded a broad range of 100-year offset values for biochar and bioenergy production using the same amount of woody biomass (Table 14.2). The offsets are expressed using two different units—Mt of C-equivalent, and the equivalent amount of atmospheric CO2 that ultimately would be drawn down as a result of 100 years of biochar production (i.e., ppb CO2(eq) [ultimate]). Biochar offsets range from as low as 0.85 Mt Ceq for the MSW biomass alone, to a high of 25 Mt Ceq for the CMAI biomass scenario involving both facility and field production of biochar. The high results for the CMAI scenarios are not likely to be sustainable, given the high resolution and accuracy of the LEMMA dataset used to support the DNR biomass calculator and LEMMA biomass estimates. The most reliable estimates thus are the ones based on the DNR calculator. Table 14.2: Biochar and bioenergy offset values calculated for ten biomass scenarios by BGRAM
Harvest Scenario
Processing Location Total 100-year Offsets
Facility Facility + Field
Biochar Bioenergy Biochar Bioenergy
Mt Ceq (immediate) ppb CO2(eq) (ultimate) Aggressive X 2.17 1.14 0.47 0.25 Average X 1.85 0.99 0.40 0.21 Conservative X 1.48 0.81 0.32 0.18 Aggressive X 4.06 2.02 0.88 0.44 Average X 3.33 1.67 0.72 0.36 Conservative X 2.41 1.25 0.52 0.27 CMAI X 10.91 5.47 2.36 1.18 CMAI X 25.18 12.54 5.45 2.71 LEMMA X 1.31 0.74 0.28 0.16 MSW Only X 0.83 0.57 0.18 0.12
Bioenergy offsets for these scenarios typically ranged about 45% lower than those for biochar. This is due primarily to the low C intensity of the total primary energy supply in Washington state, which is about 9.0 kg C per gigajoule for the year 2014 (U.S. Energy Information Agency, 2017), well below those of natural gas (15.3 kg C GJ-1), oil (19.6 kg C GJ-1), and coal (26.2 kg C GJ-1) as estimated from data provided by the Intergovernmental Panel on Climate Change (2006) and International Energy Agency (2016a, 2016b). As a result, bioenergy is competing against
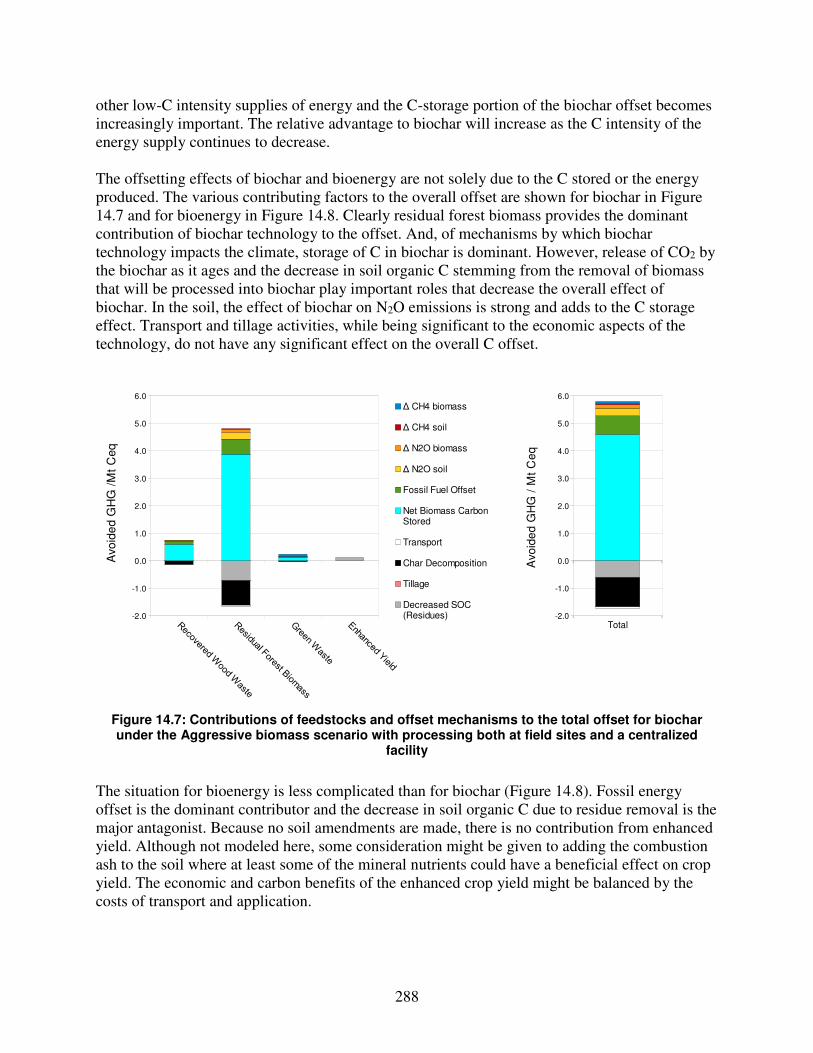
288
other low-C intensity supplies of energy and the C-storage portion of the biochar offset becomes increasingly important. The relative advantage to biochar will increase as the C intensity of the energy supply continues to decrease. The offsetting effects of biochar and bioenergy are not solely due to the C stored or the energy produced. The various contributing factors to the overall offset are shown for biochar in Figure 14.7 and for bioenergy in Figure 14.8. Clearly residual forest biomass provides the dominant contribution of biochar technology to the offset. And, of mechanisms by which biochar technology impacts the climate, storage of C in biochar is dominant. However, release of CO2 by the biochar as it ages and the decrease in soil organic C stemming from the removal of biomass that will be processed into biochar play important roles that decrease the overall effect of biochar. In the soil, the effect of biochar on N2O emissions is strong and adds to the C storage effect. Transport and tillage activities, while being significant to the economic aspects of the technology, do not have any significant effect on the overall C offset.
Figure 14.7: Contributions of feedstocks and offset mechanisms to the total offset for biochar under the Aggressive biomass scenario with processing both at field sites and a centralized
facility
The situation for bioenergy is less complicated than for biochar (Figure 14.8). Fossil energy offset is the dominant contributor and the decrease in soil organic C due to residue removal is the major antagonist. Because no soil amendments are made, there is no contribution from enhanced yield. Although not modeled here, some consideration might be given to adding the combustion ash to the soil where at least some of the mineral nutrients could have a beneficial effect on crop yield. The economic and carbon benefits of the enhanced crop yield might be balanced by the costs of transport and application.
-2.0
-1.0
0.0
1.0
2.0
3.0
4.0
5.0
6.0
Δ CH4 biomass
Δ CH4 soil
Δ N2O biomass
Δ N2O soil
Fossil Fuel Offset
Net Biomass Carbon Stored
Transport
Char Decomposition
Tillage
Decreased SOC (Residues)
Avo
ide
d G
HG
/M
t C
eq
Total-2.0
-1.0
0.0
1.0
2.0
3.0
4.0
5.0
6.0
Avoid
ed
GH
G /
Mt
Ce
q

289
Figure 14.8: Contributions of feedstocks and offset mechanisms to the total offset for bioenergy
under the Aggressive biomass harvest scenario with processing both at field sites and a centralized facility
14.5 Conclusions
This work has established the following:
1) With the availability of GIS datasets and the DNR biomass calculator, excellent county-level estimates of biomass availability can be made and used in BGRAM to predict technical potentials of C offsets from adoption of biochar and bioenergy technology.
2) Biochar prepared from local woody biomass feedstocks can draw down 1.5 to 4.1 Mt of atmospheric C over the course of the next 100 years.
3) On-site preparation of biochar from non-merchantable forest biomass generated during low-thinning operations for fire-hazard reduction has the potential to significantly increase the potential C offsets from biochar and to decrease C emissions associated with catastrophic wildfires. Work to better define the economics and overall fire-hazard reduction potential, and to improve technologies associated with thinning operations, onsite production, and on-site application of biochar is needed.
4) The proposed location of a pyrolysis facility on the southwest edge of Spokane is ideal from the standpoint of access to both biomass and soils for biochar disposal.
5) The biomass calculator developed by the DNR is an excellent source of available biomass data for use in biochar and bioenergy estimates in Washington State.
6) The growth response of wheat to wood biochar amendments is on the order of 3% when taken over the course of 100 years due to the steady diminution of the liming effect that is likely the primary benefit of biochar. amendments with high-ash biochar prepared from agricultural cropping residues can increase the growth response to as much as 15%.
-1.0
-0.5
0.0
0.5
1.0
1.5
2.0
2.5
3.0
Δ CH4 biomass
Δ CH4 soil
Δ N2O biomass
Δ N2O soil
Fossil Fuel Offset
Net Biomass Carbon Stored
Transport
Char Decomposition
Tillage
Decreased SOC (Residues)
Avo
ide
d G
HG
/M
t C
eq
Total-1.0
-0.5
0.0
0.5
1.0
1.5
2.0
2.5
3.0
Avo
ide
d G
HG
/ M
t C
eq

290
7) Although significant increases in plant available water holding capacities have been observed in sandy soils amended with biochar, the growth response of wheat to the increased plant available water provided by biochar amendments is likely to be insignificant in the silt-loam soils of Spokane County. Further work is needed to assess whether any significant increase in water infiltration rate or plant available water capacity occurs in silt-loam soils amended with wood biochar and whether these increases would translate favorably influence dryland wheat yields.
8) In Spokane County (and likely elsewhere in the state), biochar provides a significantly larger offset than bioenergy, assuming the same supply of biomass.
9) The ultimate drawdown potentials of biochar and bioenergy are 2.17 times smaller than the apparent immediate drawdown potentials because of the buffering capacity of the oceanic and terrestrial climate systems.
14.6 References
Agee, J.K., Skinner, C.N. 2005. Basic principles of forest fuel reduction treatments. Forest Ecol.
Manag., 211, 83-96. Amonette, J.E., Garcia-Pérez, M., Sjoding, D., Fuchs, M.R. 2016a. Biochar from biomass and its
potential agronomic and environmental use in Washington: A promising alternative to drawdown carbon from the atmosphere and develop a new industry. PNNL-25239. http://www.pnnl.gov/main/publications/external/technical_reports/PNNL-25239.pdf
Amonette, J.E., Garcia-Pérez, M., Sjoding, D., Fuchs, M.R. 2016b. Biochar from biomass and its potential agronomic and environmental use in Washington: A promising alternative to drawdown carbon from the atmosphere and develop a new industry. Invited Keynote Presentation by James E. Amonette at Biochar 2016, Corvallis, OR on 23 August 2016. http://biochar-us.org/sites/default/files/presentations/Amonette_USBI_Aug2016_finfinfin.pdf
Cao, L., Caldeira, K. 2010. Atmospheric carbon dioxide removal: long-term consequences and commitment. Environ. Res. Lett. 5, 024011.
Collins, H. December 2008. Use of biochar from the pyrolysis of waste organic material as a soil amendment: laboratory and greenhouse analyses. A Quarterly Progress Report Prepared for the Biochar Project.
Dull, R.A., Nevle, R.J., Woods, W.I., Bird, D.K., Avnery, S., Denevan, W.M. 2010. The Columbian encounter and the little Ice Age: Abrupt land use change, fire, and greenhouse forcing. Ann. Assoc. Amer. Geograph., 100, 755-771.
Ecology. 2016. 2015-2016 Washington statewide waste characterization study. Washington State Department of Ecology Publication Number 16-07-032.
https://fortress.wa.gov/ecy/publications/documents/1607032.pdf Galinato, S.P., Yoder, J.K., Granatstein, D. 2011. The economic value of biochar in crop
production and carbon sequestration. Ener. Policy 39, 6344-6350. Garg, A., Kazunari, K., Pulles, T. 2006. 2006 IPCC guidelines for national greenhouse gas
inventories. Volume 2. Energy. Chapter 1. Introduction. Available online at http://www.ipcc-nggip.iges.or.jp/public/2006gl/pdf/2_Volume2/V2_1_Ch1_Introduction.pdf. Accessed 28 August 2017

291
Granatstein, D., Kruger, C.E., Collins, H., Galinato, S., Garcia-Pérez, M., Yoder, J. 2009. Use of biochar from the pyrolysis of waste organic material as a soil amendment. Final project report. Center for Sustaining Agriculture and Natural Resources, Washington State University, Wenatchee, WA. State of Washington Department of Ecology Publication Number 09-07-062.
Griffith, S.M., Banowetz, G.M., Gady, D. 2013. Chemical characterization of chars developed from thermochemical treatment of Kentucky bluegrass seed screenings. Chemosphere 92, 1275-1279.
International Energy Agency. 2016a. Key world energy statistics. Available online at https://www.iea.org/publications/freepublications/publication/KeyWorld2016.pdf. Accessed 28 August 2017.
International Energy Agency. 2016b. Key coal trends. Available online at https://www.iea.org/publications/freepublications/publication/KeyCoalTrends.pdf. Accessed 28 August 2017.
Jeffery, S., Verheijen, F.G.A., van der Velde, M., Bastos, A.C. 2011. A quantitative review of the effects of biochar application to soils on crop productivity using meta-analysis. Agric.
Ecosys. Environ. 144, 175-187. Jeffery, S., Abalos, D., Prodana, M., Bastos, A.C., van Groenigen, J.W., Hungate, B.A.,
Verheijen, F. 2017. Biochar boosts tropical but not temperate crop yields. Environ. Res.
Lett. 12, 053001. Joos, F., Gerber, S., Prentice, I.C., Otto-Bliesner, B.L., Valdes, P.J. 2004. Transient simulations
of Holocene atmospheric carbon dioxide and terrestrial carbon since the Last Glacial Maximum. Glob. Biogeochem. Cycles 18, GB2002.
Lawes, R.A., Oliver, Y.M., Robertson, M.J. 2009. Integrating the effects of climate and plant available soil water holding capacity on wheat yield. Field Crops Res. 113, 297-305.
Liu, X.-Y., Zhang, A., Ji, C.-Y., Joseph, S., Bian, R.-J., Li, L.-Q., Pan, G.-X., Paz-Ferreiro, J. 2013. Biochar’s effect on crop productivity and the dependence on experimental conditions—a meta-analysis of literature data. Plant Soil 373, 583-594.
Machado, S., Awale, R., Pritchett, L., Rhinhart, K. 2017. Alkaline biochar amendment increased soil pH, carbon, and crop yield. Poster presented at 2017 Annual Meetings of the American Society of Agronomy, Crop Science Society of America, and Soil Science Society of America, Tampa, FL.
Mahler, R.L. 1986. Evaluation of soil pH manipulation on crop production in northern Idaho. Commun. Soil Sci. Plt. Anal. 17, 905-919.
Mahler, R.L., Halvorson, A.R., Koehler, F.E. 1985. Long-term acidification of farmland in northern Idaho and eastern Washington. Commun. Soil Sci. Plt. Anal. 16, 83-95.
Mahler R.L., Wilson, S., Shafii, B., Price, W. 2015. Long-term trends of nitrogen and phosphorous use and soil pH change in northern Idaho and eastern Washington. Commun. Soil Sci. Plt. Anal. 47, 414-424.
McFarland, C.R., Huggins, D.R., Koenig, R.T. 2015. Soil pH and implications for management: an introduction. Washington State University Extension Publication FS170E. Available online at http://cru.cahe.wsu.edu/CEPublications/FS170E/FS170E.pdf. Accessed 6 February 2018.
Military. 2014. Washington State Enhanced Hazard Mitigation Plan 2014 Annual Update. Wildland Urban Fire Profile. Emergency Management Division, Washington State Military Department. Available online at:
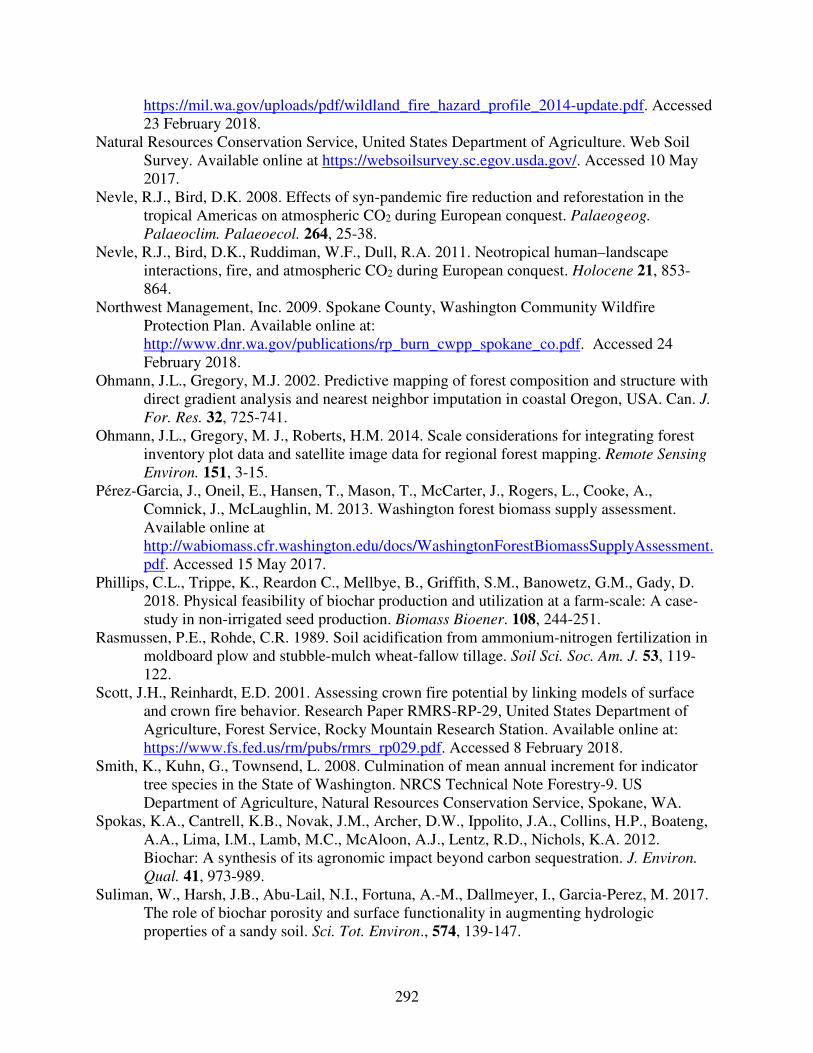
292
https://mil.wa.gov/uploads/pdf/wildland_fire_hazard_profile_2014-update.pdf. Accessed 23 February 2018.
Natural Resources Conservation Service, United States Department of Agriculture. Web Soil Survey. Available online at https://websoilsurvey.sc.egov.usda.gov/. Accessed 10 May 2017.
Nevle, R.J., Bird, D.K. 2008. Effects of syn-pandemic fire reduction and reforestation in the tropical Americas on atmospheric CO2 during European conquest. Palaeogeog.
Palaeoclim. Palaeoecol. 264, 25-38. Nevle, R.J., Bird, D.K., Ruddiman, W.F., Dull, R.A. 2011. Neotropical human–landscape
interactions, fire, and atmospheric CO2 during European conquest. Holocene 21, 853-864.
Northwest Management, Inc. 2009. Spokane County, Washington Community Wildfire Protection Plan. Available online at: http://www.dnr.wa.gov/publications/rp_burn_cwpp_spokane_co.pdf. Accessed 24 February 2018.
Ohmann, J.L., Gregory, M.J. 2002. Predictive mapping of forest composition and structure with direct gradient analysis and nearest neighbor imputation in coastal Oregon, USA. Can. J.
For. Res. 32, 725-741. Ohmann, J.L., Gregory, M. J., Roberts, H.M. 2014. Scale considerations for integrating forest
inventory plot data and satellite image data for regional forest mapping. Remote Sensing
Environ. 151, 3-15. Pérez-Garcia, J., Oneil, E., Hansen, T., Mason, T., McCarter, J., Rogers, L., Cooke, A.,
Comnick, J., McLaughlin, M. 2013. Washington forest biomass supply assessment. Available online at http://wabiomass.cfr.washington.edu/docs/WashingtonForestBiomassSupplyAssessment.pdf. Accessed 15 May 2017.
Phillips, C.L., Trippe, K., Reardon C., Mellbye, B., Griffith, S.M., Banowetz, G.M., Gady, D. 2018. Physical feasibility of biochar production and utilization at a farm-scale: A case-study in non-irrigated seed production. Biomass Bioener. 108, 244-251.
Rasmussen, P.E., Rohde, C.R. 1989. Soil acidification from ammonium-nitrogen fertilization in moldboard plow and stubble-mulch wheat-fallow tillage. Soil Sci. Soc. Am. J. 53, 119-122.
Scott, J.H., Reinhardt, E.D. 2001. Assessing crown fire potential by linking models of surface and crown fire behavior. Research Paper RMRS-RP-29, United States Department of Agriculture, Forest Service, Rocky Mountain Research Station. Available online at: https://www.fs.fed.us/rm/pubs/rmrs_rp029.pdf. Accessed 8 February 2018.
Smith, K., Kuhn, G., Townsend, L. 2008. Culmination of mean annual increment for indicator tree species in the State of Washington. NRCS Technical Note Forestry-9. US Department of Agriculture, Natural Resources Conservation Service, Spokane, WA.
Spokas, K.A., Cantrell, K.B., Novak, J.M., Archer, D.W., Ippolito, J.A., Collins, H.P., Boateng, A.A., Lima, I.M., Lamb, M.C., McAloon, A.J., Lentz, R.D., Nichols, K.A. 2012. Biochar: A synthesis of its agronomic impact beyond carbon sequestration. J. Environ.
Qual. 41, 973-989. Suliman, W., Harsh, J.B., Abu-Lail, N.I., Fortuna, A.-M., Dallmeyer, I., Garcia-Perez, M. 2017.
The role of biochar porosity and surface functionality in augmenting hydrologic properties of a sandy soil. Sci. Tot. Environ., 574, 139-147.

293
Thomas S.C., Gale, N. 2015. Biochar and forest restoration: a review and metaanalysis of tree growth responses. New Forests 46, 931-946.
Woolf, D., Amonette, J.E., Street-Perrott, F.A., Lehmann, J., Joseph, S. 2010. Sustainable biochar to mitigate global climate change. Nature Comms 1, 56. http://www.nature.com/articles/ncomms1053

294
15. Bioelectrochemical Systems in a Sustainable Biorefinery
Timothy Ewing
15.1 Abstract
Bioelectrochemical systems (BESs) are emerging technologies used to produce energy and value-added, bioderived products from the treatment of organic wastes. The central principle of BESs is the use of microbial-driven redox reactions to produce electrical energy, fuels such as hydrogen and methane, or biologically-derived chemicals such as acetate or formate from organic wastes. Organic waste sources suitable for treatment in BESs are almost unlimited. Industrial processing waste, municipal wastewater, and agricultural organic wastes have all been demonstrated to produce energy in BESs. In the near term, electricity generation alone is not sufficient to promote widespread adoption of BESs, but the treatment of low-strength organic waste for production of value-added biofuels, biochemicals, and biomaterials is promising. Applications that could complement existing biorefinery concepts include integration with anaerobic digestion (AD) for improving energy capture, polishing treatment effluent for recovery of useful nutrients, and use to treat leachate from landfills and composting operations. BESs can also be used prior to the main waste conversion technology to capture a range of contaminants that may be problematic within existing waste streams, including complex petrochemicals, oil based solvents, heavy metals, chlorine or sulfur containing compounds, dyes, and pharmaceuticals. While these are some of the most promising first-generation integrations for BESs, ongoing advances in microelectronics and specialized low-energy harvesting components may make additional applications, including use as a primary energy source and for self-powered organic waste treatment, practical in the next generation.
15.2 Introduction
15.2.1 Biorefinery concept The biorefinery concept provides a promising framework of sustainable organic waste treatment coupled with recovering bioenergy and producing multiple value-added bioproducts, and formalizes the integration of a suite of complementary technologies (Bell et al., 2014; Jungmeier et al., 2014; Mountraki et al., 2016). The biorefinery concept is founded on the principle of building cost effective and innovative systems to treat organic waste while providing a means to monetize the products (Bell et al., 2014; de Besi and McCormick, 2015). The concept of refining bioenergy, biofuels, and bioproducts from organic waste is continuing to gain more interest from governmental policy makers, researchers, and commercial and industrial entities (Bell et al., 2014; McCormick and Kautto, 2013; Schieb and Philp, 2014). A key aspect of this interest is the potential to develop a future sustainable bioeconomy (Lerner and Lerner, 2012; Ramcilovic-Suominen and Pülzl, n.d.). A bioeconomy is based on deriving materials, chemicals, and energy

295
from sustainable organic resources, such as animals, plants, and microorganisms (de Besi and McCormick, 2015; McCormick and Kautto, 2013). The adoption and deployment of biorefinery technologies at commercial and industrial scales has lagged behind the interest (Bacovsky et al., 2013). This has resulted in the suggestion that adoption of commercial and industrial scale facilities require additional policy development to overcome barriers such as “lock-in” with well-known solutions (Ragauskas et al., 2006; Schieb and Philp, 2014). Another possible catalyst could be the development of experimental, pilot-scale biorefineries to demonstrate environmental, economic, and social sustainability (Figure 15.1) (Bozell, 2008; Wellisch et al., 2010).
Figure 15.1: Driving adoption of biorefinery technologies (adapted from U.S. DOE, n.d.)
In a broader conversation about the development of a bioeconomy and various biorefineries, it is important that the fields of engineering and scientific research, technological advancement, environmental awareness, economic and other policies all play a role in driving the adoption of innovative organic waste treatment solutions (Sauvée and Viaggi, 2016). The development of biorefineries can be a directed, purposeful process or can be a dynamic realignment of existing facilities and technologies (Ersson et al., 2015). However, for the development to be successful, there needs to be a ready market for value-added bioproducts or an avenue by which to monetize bioenergy production (Ersson et al., 2015; Wield et al., 2013). Not all feedstocks treated in a biorefinery are completely depleted of energy, nutrients, or other potentially valuable elements at discharge. The use of BESs to capture this unrealized value through additional steps and continued waste treatment could provide an immediate pathway for technological development that could help biorefineries become more efficient and economically viable.
15.2.2 Bioelectrochemical systems The ability of select species of microorganisms to transfer electrons either directly to another species, to chemical electron mediators, or to solid electrodes, was first described in 1911 (Potter, 1911). Over the next ninety years, this phenomenon of electron transfer was studied as a curiosity, essentially, until it was shown that viable applications in organic waste treatment could be developed (Allen and Bennetto, 1993; Cohen, 1931; Kim et al., 2002; Lewis, 1966). Since
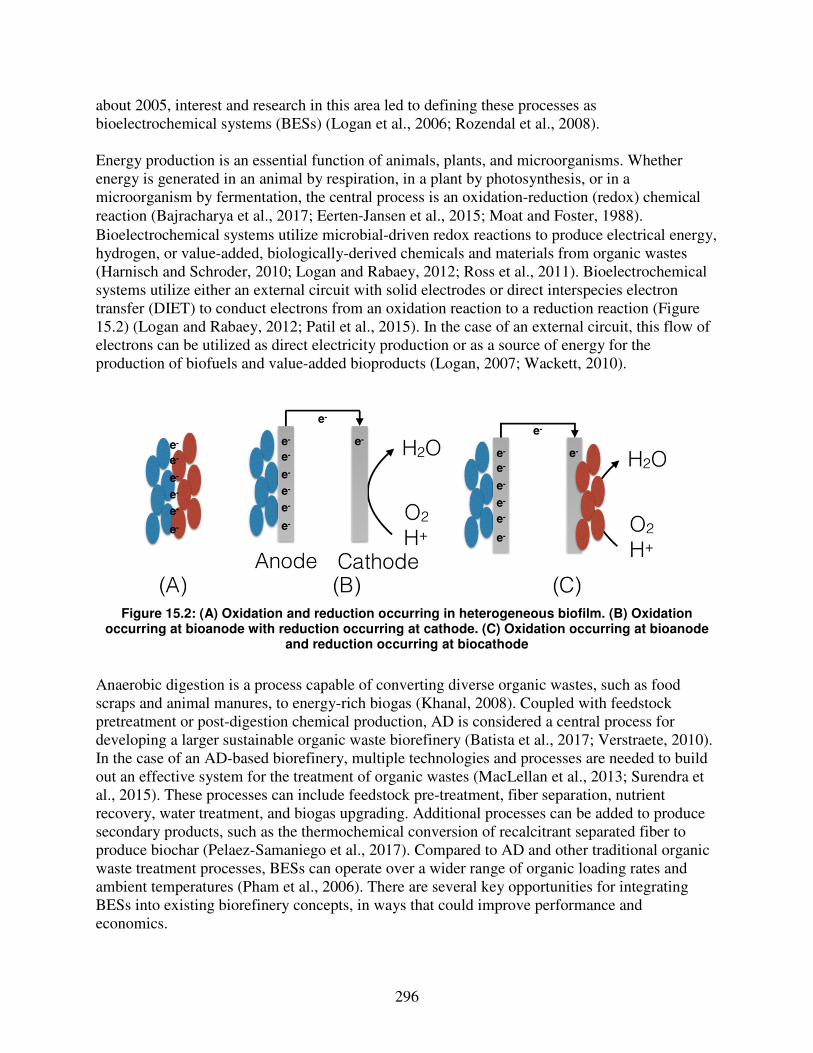
296
about 2005, interest and research in this area led to defining these processes as bioelectrochemical systems (BESs) (Logan et al., 2006; Rozendal et al., 2008). Energy production is an essential function of animals, plants, and microorganisms. Whether energy is generated in an animal by respiration, in a plant by photosynthesis, or in a microorganism by fermentation, the central process is an oxidation-reduction (redox) chemical reaction (Bajracharya et al., 2017; Eerten-Jansen et al., 2015; Moat and Foster, 1988). Bioelectrochemical systems utilize microbial-driven redox reactions to produce electrical energy, hydrogen, or value-added, biologically-derived chemicals and materials from organic wastes (Harnisch and Schroder, 2010; Logan and Rabaey, 2012; Ross et al., 2011). Bioelectrochemical systems utilize either an external circuit with solid electrodes or direct interspecies electron transfer (DIET) to conduct electrons from an oxidation reaction to a reduction reaction (Figure 15.2) (Logan and Rabaey, 2012; Patil et al., 2015). In the case of an external circuit, this flow of electrons can be utilized as direct electricity production or as a source of energy for the production of biofuels and value-added bioproducts (Logan, 2007; Wackett, 2010).
Figure 15.2: (A) Oxidation and reduction occurring in heterogeneous biofilm. (B) Oxidation
occurring at bioanode with reduction occurring at cathode. (C) Oxidation occurring at bioanode and reduction occurring at biocathode
Anaerobic digestion is a process capable of converting diverse organic wastes, such as food scraps and animal manures, to energy-rich biogas (Khanal, 2008). Coupled with feedstock pretreatment or post-digestion chemical production, AD is considered a central process for developing a larger sustainable organic waste biorefinery (Batista et al., 2017; Verstraete, 2010). In the case of an AD-based biorefinery, multiple technologies and processes are needed to build out an effective system for the treatment of organic wastes (MacLellan et al., 2013; Surendra et al., 2015). These processes can include feedstock pre-treatment, fiber separation, nutrient recovery, water treatment, and biogas upgrading. Additional processes can be added to produce secondary products, such as the thermochemical conversion of recalcitrant separated fiber to produce biochar (Pelaez-Samaniego et al., 2017). Compared to AD and other traditional organic waste treatment processes, BESs can operate over a wider range of organic loading rates and ambient temperatures (Pham et al., 2006). There are several key opportunities for integrating BESs into existing biorefinery concepts, in ways that could improve performance and economics.

297
The intent of this chapter is to describe the status of BESs as a relatively new but maturing organic waste treatment technology that could be integrated with existing treatment technologies such as AD and pyrolysis. To effectively put into context the potential of the technology to complement and disrupt existing organic waste treatment systems, it is first necessary to review the current state of BES systems. The remainder of this section will develop needed background on individual types of BESs (Figure 15.3). For each type, the reactor structure, operating principles, size, feedstocks, and product(s) will be briefly outlined.
Figure 15.3: Types of bioelectrochemical systems (BESs)
15.2.2.1 Microbial fuel cells
There are two general configurations of microbial fuel cells (MFCs): dual chamber with a proton exchange membrane (PEM) or single chamber with a PEM and an air cathode (Logan, 2007; Wen et al., 2010). In both cases, organic waste is oxidized by electrogenic microorganisms attached to the anode. In a dual chamber MFC, suspended oxygen transported to the cathode is reduced to water as the terminal electron acceptor. In a single chamber MFC, atmospheric oxygen is reduced forming water vapor, which is again the terminal electron acceptor. In both cases, an external circuit conducts the electrons from the anode to the cathode. To maintain charge balance within the MFC, protons generated during oxidation of organic waste and other cations present in the feedstock are transported across a PEM (or cation exchange membrane) from anode to cathode (Figure 15.4) (Logan, 2007).

298
Figure 15.4: Dual chamber microbial fuel cell (MFC) schematic diagram (adapted from Logan et al.,
2006)
The performance of the MFC is determined by the electrogenic microorganisms attached and growing as a biofilm on the anode. Microorganisms can be introduced to the anodic chamber as a pure culture or enriched from complex mixtures, such as those present in separated fiber and suspended solids of dairy manure or activated sludge from wastewater treatment (Ng et al., 2016). Two common genera that are known to produce electricity from oxidation of organic waste are Shewanella and Geobacter (Logan and Regan, 2006). Complex mixtures of microorganisms have also been shown to provide more stable performance and greater power (Kiely et al., 2011; Kiely et al., 2011; Logan, 2009). Operating on food waste leachate, an MFC has been reported to produce a current density of 66.75 A m-3 anode volume and power density of 15.14 W m-3 anode volume (Rikame et al., 2012). In another study, utilizing a specialty anode shaped like corrugated cardboard and operating on artificial wastewater, a current density of 390 A m-2 anode surface area was reported (Chen et al., 2012), which is among the highest reported in the literature. While a detailed discussion of electrode materials and fabrication is beyond the scope of this review, it is common for solid porous carbon and carbon felts and fabrics to be used for both the anode and cathode due to high surface area to volume ratio and relatively low cost (Chen et al., 2015; Krishnaraj et al., 2015). A greater surface area to volume ratio means that more surfaces are available for microorganism attachment per unit of volume. Likewise, at the cathode, a greater surface area to volume ratio provides more contact surface for oxygen. The physical size of MFCs can vary by intended application. Micro MFCs have been reported for powering portable devices (Choi, 2015). At the other end of the scale, a 200 L MFC was demonstrated for the treatment of municipal wastewater (Ge et al., 2015).
15.2.2.2 Sediment microbial fuel cells
Sedimentation occurs in both natural waterways, such as lakes, rivers, and oceans, and in constructed facilities, such as wastewater lagoons and stormwater holding ponds (Kayler, 2011). Organic matter from the decay of plants, animals, microorganisms, and the decomposition of animal manures, municipal wastewater, and the organic fraction of MSW make up much of the content of this sediment (Hong et al., 2010). Sediment microbial fuel cells (SMFCs) are unique

299
compared to MFCs as they are deployed in both natural waterways and constructed facilities without a physical reactor vessel (Ewing et al., 2014b). Yet as with MFCs, organic waste is oxidized in SMFCs by electrogenic microorganisms at the anode and oxygen is reduced to water as the terminal electron donor at the cathode to produce electricity (Figure 15.5).
Figure 15.5: Sediment microbial fuel cell (SMFC) schematic diagram (adapted from Ewing et al.,
2014)
Due to the natural sedimentation process, organic waste is continually refreshed at the sediment-water interface and defused to the electrode surface providing a potential long term supply of energy-rich material (Ewing et al., 2017; Hong et al., 2010). This provides for several potential applications of SMFCs. Remote monitoring of environmental conditions is difficult due to the need for a long-term power supply. It has been demonstrated that SMFCs can provide enough energy to periodically collect water quality measurements and wirelessly broadcast the results (Dewan et al., 2010; Donovan et al., 2011). To increase the amount of energy available for a given application, it has been shown that SMFCs can be scaled up when coupled with power management systems (Ewing et al., 2014b; Zhao et al., 2017). Another possible application is self-powered wastewater treatment systems (Ewing et al., 2014a). In a laboratory study, energy was collected from a simulated dairy lagoon and used to power an active aeration system to reduce chemical oxygen demand (COD) in the liquid wastewater (Ewing et al., 2014a). In the case of sediment or soil bioremediation, or constructed wetlands, SMFCs can provide energy to drive other remediation processes and mitigate methane release by oxidizing organic waste and producing electricity and carbon dioxide (M. Chen et al., 2015; Li and Yu, 2015a, 2015b).
15.2.2.3 Microbial electrolysis cells
Microbial electrolysis cells (MECs) operate in either dual chamber with PEM or single chamber without PEM configurations. As with MFCs, organic waste is oxidized by electrogenic microorganisms at the anode (Kadier et al., 2016). While the produced current would be identical to an MFC, in this case the external circuit is used to increase the energy conducted to the cathode. This energy is used to produce hydrogen gas as the terminal electron acceptor (Figure 15.6) (Jeremiasse et al., 2010a).
300
Figure 15.6: Dual chamber microbial electrolysis cell (MEC) schematic diagram (adapted from
Escapa et al., 2016)
The production of hydrogen gas is dependent on a reduced oxygen environment at the cathode, which is a difference compared to MFCs (Logan et al., 2008). To prevent methane production from consumption of hydrogen by anaerobic microorganisms, MECs can be cycled briefly to run in MFC configuration (Patrick D. Kiely et al., 2011). A possible system configuration is to run multiple reactors alternating between MFC and MEC configurations. This would provide the energy needed to produce hydrogen from the treatment of organic waste while maintaining operational parameters (Wang et al., 2011). Using a single chamber design, a MEC has been demonstrated to produce 3.9 moll H2 mol-1 acetate with 90.6% COD reduction (Tartakovsky et al., 2009). In another study, glycerol, milk, and starch fed to a single chamber MEC resulted in 91% hydrogen recovery in at the cathode (Montpart et al., 2015). The use of MECs to produce hydrogen at low temperatures has also been demonstrated (Xu et al., 2014). To reduce the use of exotic electrode materials and decrease the overall costs of MECs, microorganisms can be introduced to the cathode chamber to produce a biocathode. The microorganisms then utilize electrons and organic waste to reduce protons to hydrogen gas (Jeremiasse et al., 2010a). Similar to MFCs, MECs have been demonstrated at a laboratory scale and have been proposed at an industrial scale up to approximately 1000 m3 (Foley et al., 2010).
15.2.2.4 Microbial electrosynthesis
The production of non-hydrogen value-added biofuels and bioproducts is what differentiates microbial electrosynthesis (MES) from MECs (Desloover et al., 2012b; Marshall et al., 2012; Mohanakrishna et al., 2015). As with previously described BESs, organic waste is oxidized at the anode by electrogenic microorganisms. Then the current is increased by the input of external energy, as with MECs. While MECs can operate with or without a biocathode, MES operates exclusively with a targeted biocathode focused on the production of specific value-added biofuels or biochemicals (Bajracharya et al., 2015). Products can include methane gas, hydrogen peroxide, caustic soda, acetate, ethanol, butyrate, formate, and other bioderived polymer substances (Blasco-Gómez et al., 2017; Desloover et al., 2012b; Marshall et al., 2012).

301
15.2.2.5 Microbial solar cells
Photosynthetic microorganisms grown as a biofilm with electrogenic microorganisms form the basis of microbial solar cells (MSCs) (Mateo et al., 2014). Solar energy is converted to organic molecules which are then metabolized, either alone or as co-substrates with other organic wastes, by electrogenic microorganisms at the anode (Figure 15.7) (Strik et al., 2011).
Figure 15.7: Dual chamber microbial solar cell (MSC) schematic diagram (adapted from Strik et al.,
2011)
As with previously described BESs, MSCs can be operated in dual chamber mode with PEM or single chamber mode with PEM and air cathode. In addition, MSCs can be operated in MFC, MEC, or MES modes. This allows for the potential for completely self-contained electricity production or production of value-added biofuels and biochemicals from co-substrate organic wastes (Liu and Choi, 2017; Rosenbaum and Schröder, 2010; Strik et al., 2010). A unique application of MSCs has been demonstrated by the removal of algae from natural lakes (Wang et al., 2012). A similar study examined the use of MSCs for the removal of microcystins from blue-green algae systems (Yuan et al., 2011).
15.2.2.6 Plant microbial fuel cells
As compared to MSCs, plant microbial fuel cells (PMFCs) utilize higher level photosynthetic organisms to produce energy carriers to enhance electrogenic microorganism interaction near the root system of the host plant (Chen et al., 2012; Nitisoravut and Regmi, 2017). The anode is located near the root rhizosphere region and the cathode is located at or near the air-soil interface (Moqsud et al., 2015). Organic molecules excreted by the plant to the soil include sugars, organic acids, carbohydrates, and enzymes (Moqsud et al., 2015). Electricity production and generation of chemical compounds favorable to soil remediation are the primary uses for PMFCs (Timmers et al., 2012; Wise, 2000). The reduction of greenhouse gas emissions from constructed wetlands by the addition of PMFCs has also been demonstrated (Lu et al., 2015). Plants that have been shown to be applicable to use in PMFCs include reed manna grass, rice, Spartina anglica, and Pennisetum setaceum (Helder et al., 2012; Schamphelaire et al., 2010; Strik et al., 2008). Scale-up of electricity production considerations are directly related to types of organic molecules excreted by the plant and the availability of suitable, low-cost electrode materials for widespread deployment (Strik et al., 2008).

302
15.2.2.7 Microbial desalination cells
The three-chamber configuration of microbial desalination cells (MDCs) allows simultaneous treatment of organic wastes and salt water, or other salt containing wastewaters (Cao et al., 2009). The central chamber is divided from the anode by an anion exchange membrane and from the cathode by a cation exchange membrane, both of which contribute to maintaining overall cell charge balance (Figure 15.8).
Figure 15.8: Three chamber microbial desalination cell (MDC) schematic diagram. (EM = exchange
membrane) (adapted from Cao et al., 2009)
As with previously described BESs, MDCs utilize electrogenic microorganisms at the anode to oxidize organic waste. Additionally, MDCs can be operated in MFC, MEC, or MES modes to produce electricity, hydrogen, or value-added biofuels and biochemicals (Cao et al., 2009; Kim and Logan, 2013). While MDCs can be utilized as a standalone technology for the treatment of salt water, it has been demonstrated that coupling MDCs with traditional reverse-osmosis water filtering can reduce the energy input by 58% (Jacobson et al., 2011). It has also been estimated from laboratory data that operating MDC in MEC mode in combination with one or more MFCs could operate with net export of energy while simultaneously producing treated water (Luo et al., 2011; Mehanna et al., 2010). One current limitation with laboratory-scale systems is the longer retention time needed for salt water treatment by MDCs compared to reverse osmosis systems (Jacobson et al., 2011).
15.2.2.8 Direct interspecies electron transfer
In MES systems, electrogenic microorganisms on the anode are physically separated, either by distance or a PEM, from microorganisms making up the electron acceptor of the biocathode (Arends and Verstraete, 2012; Logan and Regan, 2006). With direct interspecies electron transfer (DIET), this physical separation is removed and heterogeneous mixtures of microorganisms interact directly (Rotaru et al., 2013). The concept of direct interspecies product exchange was first observed in the laboratory in 1967 (McInerney et al., 1981). Since then it has been demonstrated that electrogenic microorganisms can directly transfer electrons and metabolites to

303
methanogens to increase methane production (Figure 15.9) (Liu et al., 2017; Rosenbaum et al., 2011; Shen et al., 2016).
Figure 15.9: Conceptualized model of direct interspecies electron transfer (DIET) for enhancing
methane production during anaerobic digestion (adapted from Liu et al., 2017)
The enhancement of AD is an application of DIET that has been demonstrated in the laboratory and subsequently mathematically modeled. It was shown that with electron conduction by electrogenic microorganisms to methanogens, 50% more methane was produced from a given organic waste (Shen et al., 2016). While ongoing work is needed to optimize the integration of BESs with AD at scale, these results are promising for improving the economics of existing AD systems in both agricultural and municipal contexts. Another potential application for DIET is in the production of value-added biofuels and biochemicals. In a laboratory study utilizing a mixed culture, butyrate, propionate, and fumarate were produced using DIET (Wang et al., 2016).
15.3 Methods
This review used a combination of narrative (Green et al., 2006) and systematic (Petticrew and Roberts, 2006) approaches to provide relevant background information on concepts and technologies related to the development of sustainable biorefineries, and to provide more focused information on BESs as related to developing sustainable biorefineries. For the narrative portion of the review, the keywords “sustainable treatment of organic wastes,” “biorefinery,” and “bioelectrochemical systems” were searched using the Washington State University Library SEARCHIT service. Publications related to both agricultural and municipal biorefineries were retained in the pool. Articles and reports specific to incremental improvements of technologies, or related to differences in system performance based on materials or microorganisms were removed from the pool. To assemble a pool of primary research studies for the systematic review, the keywords “organic waste treatment,” “waste water treatment,” “nutrient recovery,” “nutrient removal,” and “bioproducts” were combined with “bioelectrochemical systems” and searched using the Washington State University Library SEARCHIT service. Based on these keywords, explicit inclusion and exclusion criteria were determined before the literature review and publication collection began. Studies were included if the BESs utilized as feedstock an identified renewable or relevant organic waste stream. In addition, studies were included if the overall
304
bioelectrochemical systems technology or process represented a unit operation that would support the development of sustainable biorefineries in the agriculture or municipal organics area. Studies were excluded if use of a feedstock or possible inclusion in a sustainable biorefinery was a secondary purpose. Examples of this scenario include studies that focused on improved electrode or membrane materials or specific microorganism effects on system performance.
15.4 Discussion of BESs applications
15.4.1 Organic waste treatment
Traditional biological treatments of organic wastes and wastewaters are energy intensive or do not scale effectively for varying waste concentrations (Metcalf and Eddy, 1972; Wiesmann et al., 2006). It has been reported that municipal wastewater treatment facilities utilize nearly 1 kWh m-
3 wastewater for aeration and transport (McCarty et al., 2011). Anaerobic digestion does scale up with higher strength organic waste and also returns a value-added product in the form of biogas, but it does not scale down to concentrations below about 3 kg m-3 organic loading rate or operate effectively at temperatures below 20℃ (Logan and Rabaey, 2012). The widespread adoption of BESs for organic waste treatment both in parallel with existing systems and as alternatives for edge cases has been suggested as a means to generate renewable energy, produce value-added, bioderived fuels and chemicals, and provide enhanced environmental protection by removing contaminants and heavy metals (Huang et al., 2011; Khosravanipour Mostafazadeh et al., 2017; Pandey et al., 2016). Bioelectrochemical systems generate electricity directly from the treatment of organic waste, which results in reduced sludge production compared to tradition treatment processes, which in turn reduces complexity and overall cost (Logan, 2007). Direct electricity production from organic waste in BESs can also provide higher energy efficiencies than combustion of the same materials because there are no thermal limitations when organic waste is metabolically converted to electricity (Logan and Rabaey, 2012). An MFC treating municipal wastewater was shown to produce approximately 0.07 kWh m-3 (Hays et al., 2011). This compares to the approximately 2 kWh m-3 that could be produced by biogas equivalents from AD (Batstone et al., 2015; Metcalf and Eddy, 1972). This shows that electricity generation alone is not sufficient to promote widespread adoption of BESs. An additional study suggested that the better use for BESs currently is treatment of low-strength organic waste for production of value-added biofuels, biochemicals, and biomaterials (Fornero et al., 2010; Logan and Rabaey, 2012).
15.4.1.1 Municipal organic waste
Current municipal wastewater treatment is expensive and does not handle contaminants or scale to varying influent rates. BESs have been shown to treat municipal wastewater in MFC, MEC, MES, and MSC configurations. Up to 80% COD removal has been shown using a single chamber MFC (Liu et al., 2004). Urine and human feces wastewater has also been shown to produce electricity and reduce COD using an MFC (Fangzhou et al., 2011; Santoro et al., 2013). Leachate from sanitary landfills and composting operations have been treated with BESs (Pocaznoi et al., 2012; Puig et al., 2011; Tugtas et al., 2013; Wu et al., 2015).

305
15.4.1.2 Agricultural organic waste
Animal manures and wastewater from agricultural processing and slaughterhouses are common sources of complex high-strength wastes in the agricultural sector. A single chamber MFC operating on field samples of dairy wastewater showed 95.49% COD removal (Venkata Mohan et al., 2010b). Simultaneous swine wastewater treatment and nitrogen removal was demonstrated in a dual chamber MFC (Kim et al., 2008). Treatment with BESs has been demonstrated for rice milling wastewater, cassava mill wastewater, and palm oil mill effluent, and meat industry and animal carcass wastewater (Baranitharan et al., 2015; Gurung and Oh, 2015; Kaewkannetra et al., 2011; Das, 2008; Heilmann and Logan, 2006; Katuri et al., 2012; Li et al., 2013).
15.4.1.3 Food industry organic waste
Food scraps are generated at each step of the process of moving food from field to table: harvesting, processing, retail sales, and final consumption (Parfitt et al., 2010). It has been estimated that approximately 30% of all food produced is wasted (Behera et al., 2010). A single chamber MFC operating on vegetable waste was shown to produce electricity and reduce COD by 63% (Venkata Mohan et al., 2010a). Food-processing wastewater was utilized as a feedstock in a dual chamber MFC, resulting in a power yield of 110 mW kg-1 and 99% COD removal (Sangeetha and Muthukumar, 2011). A starch-based wastewater containing 5 g L-1 COD was treated in an MFC and showed 98% reduction (Lu et al., 2009). Use of tomato pomace waste was demonstrated to produce electricity along with 95% COD reduction (Oh and Logan, 2005). Additional food industry organic wastes treated in MFCs to produce electricity include: beer brewery wastewater, winery wastewater and pomace, fermented apple juice, confectionary wastewater, and cheese whey (Cercado-Quezada et al., 2010; Cusick et al., 2010; Feng et al., 2008; Kassongo and Togo, 2011; Patil et al., 2009; Pepe Sciarria et al., 2015; Wang et al., 2008).
15.4.1.4 Biorefinery and petrochemical industries
The production of fuels and chemicals consumes large amounts of water and produces wastewater containing complex organic wastes. This is true for biorefineries as well as traditional petrochemical industries. Biodiesel production results in wastewater that contains sugars, phenolics, and various fermentation by-products. Clauwaert et al. (2008) reported a power density of 23 W m-3 using an MFC operating with a biocathode. Bioelectricity production was demonstrate on ethanol stillage wastewater using a dual chamber MFC (Sakdaronnarong et al., 2013). A BES utilizing petroleum sludge operated at 53 mW m-2 (Chandrasekhar and Venkata Mohan, 2012). Diesel degradation in an MFC, petroleum hydrocarbon treatment in an SMFC, and terephthalic acid utilization have also been demonstrated (Joung et al., 2009; Morris et al., 2009; Morris and Jin, 2012).
15.4.2 Nutrient recovery The need to remove nutrients from municipal wastewater is based on their potential for environmental impact on air, water, and soil quality after discharge (Staff, 2000), as well as the benefits to agriculture of generating more sustainable forms of nutrients, especially nitrogen and phosphorus (Drangert, 2012; US GAO, 2003). Various commercial nutrient removal systems are in operation that target nitrogen and phosphorus (Uludag-Demirer et al., 2008, 2005). These systems often need extensive and expensive pre-treatment of wastes to reach required removal efficiency. Bioelectrochemical systems have recently been demonstrated to be effective

306
approaches for the recovery of both nitrogen and phosphorus in various forms from organic waste (Ichihashi and Hirooka, 2012; Yuan et al., 2011; Zang et al., 2012).
15.4.2.1 Nitrogen
Traditional methods for removing or recovering nitrogen from organic waste include nitrification and denitrification, anaerobic ammonium oxidation (ANAMMOX), and ammonium sulfate production (Gerardi, 2002; J. Guo et al., 2016; Jetten et al., 2001; Jiang et al., 2014; Knowles, 1982). Each of these processes has been demonstrated at a commercial scale. The use of nitrification and denitrification and anaerobic ammonium oxidation (ANAMMOX) require a significant input of energy and result in atmospheric nitrogen gas as the product, which is not usable as a fertilizer (Stein and Klotz, 2016). Production of ammonium sulfate results in a usable product, but also necessitates large-scale chemical processing equipment and consumables in the form of sulfuric acid and chemical pH control (Metcalf and Eddy, 1972; Serna-Maza et al., 2015). The process of converting nitrite to atmospheric nitrogen gas has been demonstrated using an MES system (Virdis et al., 2010, 2008). A critical design consideration for this process is maintaining a sufficient concentration of dissolved oxygen at the biocathode (Virdis et al., 2010). Operating on synthetic wastewater, 94% total nitrogen removal was observed using an MES system (Virdis et al., 2010). To recover nitrogen rather than remove it, ammonium ions need to be managed within the BES (Cheng et al., 2013; Cord-Ruwisch et al., 2011). Utilizing a standard MFC treating synthetic wastewater that contained ammonium ions and utilizing a cation exchange membrane, it was demonstrated that ammonium ions would preferentially diffuse from the anode chamber to the cathode chamber (Villano et al., 2013). Recovery of ammonia from the cathode chamber is then accomplished by introducing a high-pH aerated catholyte (Kuntke et al., 2012). A laboratory study demonstrated that wastewater with approximately 1000 mg L-1 of ammonium could be treated with 96% nitrogen recovery (Wu and Modin, 2013). A study on AD effluent showed that nearly 100% ammonia recovery could be achieved (Desloover et al., 2012a). An alternative use of nitrogen in BESs is to grow algae biomass in an MSC (Leite et al., 2013). Any remaining nitrogen could then be sent to an MES or MFC for polishing treatment (Zhang et al., 2011).
15.4.2.2 Phosphorus
High phosphorus concentrations in industrial, municipal, and agricultural organic wastes, coupled with a potential global shortage of mineral deposits, has increased interest in phosphorus recovery technologies (Chowdhury et al., 2017; Rittmann et al., 2011). Phosphorus has traditionally been removed from organic waste by physical settling, chemical precipitation, or various biological processes (Lougheed, 2011; Mayer et al., 2016). Recovery of phosphorus by struvite precipitation is a relatively mature technology that is commonly utilized at a commercial scale (Corre et al., 2009). The use of BESs for phosphorus recovery has centered on systems operating in either MFC or MES modes (Cusick and Logan, 2012; Fischer et al., 2011). An MFC was demonstrated to recover 82% orthophosphate from pure ferric phosphate hydrate when operating on digester sludge (Fischer et al., 2011). In another study, recovery of 40% soluble phosphate as struvite occurred by precipitation at the cathode of an MES (Cusick and Logan, 2012). It was shown that

307
increased pH by oxygen reduction at the cathode helped precipitate struvite crystals in a single chamber MFC (Hirooka and Ichihashi, 2013; Ichihashi and Hirooka, 2012). In each of these cases, ammonia was utilized from wastewater recovery and magnesium was either added to the wastewater or dosed in the catholyte (Fischer et al., 2011). One possible limitation on phosphorus recovery relates to electrical current flow in the BES. It has been proposed that lower electrical currents could facilitate greater recovery of phosphorus (L. Zhang et al., 2012).
15.4.3 Biofuel production The energy contained in organic waste produced from industrial, municipal, and agricultural processes can be converted into fuels (Rozendal et al., 2007). A traditional biological process converts organic waste to biogas via AD (Paritosh et al., 2017). Other fuels, including hydrogen gas and ethanol, are sometimes produced from organic waste via a fermentation process (Bajracharya et al., 2015; Mohan et al., 2012; Venkata Mohan et al., 2009). A key problem with traditional biological conversion processes is low yields due to energy needs for conversion and limitations in microorganism metabolism (Vogel and Todaro, 2014). The use of BESs for biofuel production can reduce these issues.
15.4.3.1 Methane
The production of methane (CH4) by AD is well known and widely utilized at large-scale facilities treating industrial, municipal, and agricultural wastes (Budych-Gorzna et al., 2016; Koch et al., 2016; Nielfa et al., 2015; Qureshi et al., 2006). During combustion of biogas generated from AD, the CO2 is passed through the system and released to the atmosphere (Mordaunt and Pierce, 2014). If the biogas is upgraded then CO2 is stripped out and either released to the atmosphere or sequestered by some downstream process. A use for this waste CO2 product has been demonstrated at laboratory scale by conversion in an MES system to CH4 (Clauwaert and Verstraete, 2009; Wagner et al., 2009). This process of electromethanogenesis in the cathode chamber of an MES can result in improved CH4 yield from a given organic waste source (Clauwaert and Verstraete, 2009). One example of an electrogenic methanogen is Methanobacterium palustre (Cheng et al., 2009). This microorganism exhibited DIET properties and operated at -0.244 V potential (Cheng et al., 2011; Villano et al., 2011). Direct CH4 production in an MES treating organic waste has also been demonstrated (Cheng et al., 2011). A single chamber MES design showed an 86% conversion from acetate to CH4 given suitable external energy input to provide -0.8 V vs standard hydrogen electrode applied potential (Clauwaert and Verstraete, 2009). A similar single chamber MES study showed CH4 production at only -0.395 V vs standard hydrogen electrode given neutral pH (Sasaki et al., 2011). The scalability of these systems has been studied using multiple electrodes in a single MES (Rader and Logan, 2010). After approximately two weeks of operation treating AD effluent, the production of CH4 showed high substrate conversion efficiency at the biocathodes. Another study showed an overall efficiency of nearly 80% considering both electricity production and organic waste treatment. One of the highest reported efficiencies in the literature was 96%, which produced 4.5 L m-2 day-1 at a -0.8 V vs standard hydrogen electrode (Cheng et al., 2011).

308
15.4.3.2 Hydrogen
Hydrogen (H2) can also be produced by BESs and provide an alternative to CH4 production while treating organic waste (Logan, 2004; Pasupuleti et al., 2015; Rozendal et al., 2010). One reason this is of interest is that an analysis of common fuels has shown that H2 obtained from organic waste has a greater value than the CH4 from the same organic waste (Rozendal et al., 2007). Production of H2 is possible with BESs using both MEC and MES modes. In MEC mode, the theoretical hydrogen evolution potential is only about 0.2 V above the cell potential (Logan et al., 2008, 2006). This reduction in overpotential from 1.6 V to 0.2 V results in a significant reduction in energy demand leading to more efficient generation of H2 (Logan et al., 2008; Rozendal et al., 2006). One challenge in generating H2 from MECs is that the overpotential of the electrodes varies with the material used (Hu et al., 2009). Cathodes made with platinum have lower overpotentials than those made with porous carbon (Hu et al., 2009; Manuel et al., 2010). Other materials that have been tested include stainless steel, nickel, and nickel molybdenum alloys (Hu et al., 2010; Selembo et al., 2010, 2009). Of these alternatives, nickel has been demonstrated to reduce the overpotential while costing significantly less than platinum (Jeremiasse et al., 2010b). In one study using a stainless steel cathode, 4 L MEC, and operating on synthetic wastewater, 0.9 m3 m-
3 reactor volume per day was observed (Carmona-Martínez et al., 2015). An additional study showed that hydrogen production in an MEC from winery wastewater could drive the cost per kilogram below estimated market value (Cusick et al., 2010).
15.4.4 Biochemical production The production of value-added biochemicals such as hydrogen peroxide, caustic soda, acetate, butyrate, and formate have been demonstrated in BESs operating in MES mode (Cheng and Logan, 2011; Logan and Rabaey, 2012; Rabaey et al., 2010; Rabaey and Rozendal, 2010; Rozendal et al., 2009). While many of these products can be produced economically at scale, BESs provide an opportunity to couple organic waste treatment with energy production and value-added biochemical production. Both hydrogen peroxide and caustic soda production have been demonstrated at the cathode of MES systems (Cheng and Logan, 2011; Rabaey et al., 2010; Rozendal et al., 2009). In one health-related study, production of hydrogen peroxide at a cathode half-cell was shown to reduce pathogenic bacteria and reduce the potential for secondary infections in open wounds and burns (Sultana et al., 2015). In another study, butyrate production from CO2 reduction was shown to be a secondary product from a biocathode populated by lithoautotrophs (Bajracharya et al., 2015). The major microorganisms isolated from biocathodes that exhibit CO2 reduction include: Sporomusa ovata, Sporomusa silvacetica, Sporomusa sphaeroides, Clostridium lijungdahlii, Clostridium aceticum, and Moorella thermoacetica (Nevin et al., 2011, 2010). These microorganisms have been shown to produce acetate, 2-oxobuturate, and formate at the cathode (Rosenbaum et al., 2006). As with other BESs, improved performance has been shown using mixed cultures to pass both electrons and metabolites during the production of biochemicals (Marshall et al., 2013). In addition to pure culture and mixed culture biocathode development, engineered strains of microorganisms are being developed to target production of specific value-added biochemical

309
products (Li et al., 2012). It was shown that an engineered strain produced isobutanol from previously-formed formic acid (Li et al., 2012). Additional studies have shown the production of acetone and succinate (Ganigue et al., 2015; Sharma et al., 2013). It has been suggested that biochemical production from BESs should target high-value, low-volume products in order to prove and find a niche in the larger biorefinery concept (Nevin et al., 2010).
15.4.5 Degradation and removal of environmental contaminants There are almost limitless combinations of organic feedstocks that can be processed using the biorefinery concept. A consequence of this ability to accept organic waste from a variety of sources is that these sources can be contaminated with environmentally harmful substances. Complex petrochemicals, oil based solvents, heavy metals, reactive chemical species such as chlorine, sulfur, dyes, and pharmaceuticals are just a few examples. Any of these contaminants in sufficient concentration can severely reduce the effectiveness of traditional waste treatment systems. To combat these contaminants, current biorefineries may need expensive pre-treatment or screening of feedstocks or need to outright reject feedstocks from certain producers. By adopting BESs, some environmental contaminates can be targeted for treatment directly in the normal treatment screen. Since the BESs can operate in series, units targeting contaminants can be organized first in the stream, while energy, fuel, and value-added products can be extracted later in the stream.
15.4.5.1 Sulfur
Sulfur compounds are found in industrial, municipal, and agricultural organic wastes (Lens, 2000), and are problematic because the natural biological conversion of sulfur compounds to sulfides can potentially cause environmental concerns and result in corrosion in process and treatment facilities (Awad et al., 2014). Traditional biological sulfate reduction processes do not effectively treat all organic wastes and can cause the release of sulfides and sulfur-based gases (Huang, 2015). The use of BESs to oxidize sulfides to elemental sulfur has been demonstrated at laboratory scale (Habermann and Pommer, 1991; Rabaey et al., 2006). In one study, an MFC utilizing various anode materials demonstrated removal of 514 mg sulfide L-1 day-1 (Rabaey et al., 2006). The most effective anode material for sulfide removal has been reported to be activated carbon cloth (Zhao et al., 2008). Post-treatment analysis indicated that Paracoccus were the dominate sulfide-oxidizing microbes (Rabaey et al., 2006). It was also shown that elemental sulfur and other polysulfide species were the primary products from treatment with BESs (Zhao et al., 2008).
15.4.5.2 Petrochemical leachate
During normal operation, modern oil refineries produce wastewater containing hydrocarbons, sulfides, ammonia, nitrates, and heavy metals (Benyahia et al., 2005; Gary et al., 2007). Both the organic and inorganic components pose a serious potential for environmental contamination if released untreated (Chen et al., 2008). These contaminates also get into both municipal and agricultural waste streams and cause substantial problems for traditional treatment systems – as well as issues with disposal of contaminated effluents and solids. Traditional treatment processes utilize large volumes of water and are energy intensive. In addition, common aerobic and anaerobic biological systems can be inhibited by contaminant concentrations and do not

310
effectively address all of the components, even when coupled with physio-chemical add-on units (Misiti et al., 2013). To overcome biological inhibition, microorganisms can be acclimatized to the organic and inorganic waste environment (Ren et al., 2013). Development of an effective electrogenic biofilm for the treatment of petrochemical leachate in BESs has been demonstrated in the laboratory (Ren et al., 2013). In addition, petroleum sludge and oil-contaminated soil have also been shown to be degraded in BESs (Guo et al., 2016). Further studies of cultures isolated from BESs anodes have shown that Paenibacillus sp., Deinococcus sp., and Pseudomonas putida are among the dominant microbial species (Guo et al., 2014; Majumder et al., 2014). In contrast to utilizing startup cultures from the petrochemical industry, it was shown that an MFC started on municipal wastewater with a slowly increasing loading of petrochemical leachate gave 64% COD and 84% oil and grease reduction with simultaneous electricity production (Guo et al., 2016). Finally, it was shown that acclimated electrogenic microorganisms in a mixed culture were more effective in treating complex organic waste at the laboratory scale (Ren et al., 2013).
15.4.5.3 Synthetic dyes
Synthetic dyes are widely used in industrial processes, the food industry, and integrated into consumer goods (Chatwal, 2009; Venkataraman, 1952), and can end up in the waste stream. These dyes have been engineered to be both chemically and photo-stable (Mu et al., 2009; van der Zee et al., 2003). Release of synthetic dyes into the natural environment causes a number of problems including decreased light penetration in waterways, toxic effects on higher animals, and mutagenic effects on microorganisms (de Aragão Umbuzeiro et al., 2005; Selvam et al., 2003). Traditional treatment processes include chemical, physical, and biological systems. Chemical treatments can include ozone exposure and soaking in low pH solutions (Colindres et al., 2010). Physical treatments include adsorption, flocculation, photo degradation, and membrane filtration (Marcucci et al., 2002). Biological treatments are limited to dilute anaerobic systems with extremely long retention times (Naresh Kumar et al., 2015). Utilizing either or both the negative half-cell potential at the anode and the positive half-cell potential at the cathode, BESs have been shown to decolorize and remove synthetic dyes (Cui et al., 2011; Mu et al., 2009; Sun et al., 2009). One study showed that utilizing a co-substrate composed of glucose and confectionery waste mixed with a red synthetic dye in a single chamber MFC resulted in the dye being both decolorized and degraded to its base amine components (Sun et al., 2009). Another study on orange synthetic dye showed decolorization at the cathode with simultaneous electricity generation (Mu et al., 2009). Finally, a yellow synthetic dye was decolorized and degraded with an efficiency of 99.2% in 48 hours using an MFC with biocathode (Cui et al., 2011).
15.4.5.4 Chlorine containing compounds
Organic compounds that contain chlorine have been found to persist in the environment and are toxic to plants and animals (Sánchez-Osorio et al., 2017). These compounds are widely used in industrial solvents, pesticides, and various bleaching agents (Schmittinger, 2000). Discharge or disposal of untreated wastes containing these compounds can lead to soil and groundwater pollution and ecosystem-scale environmental problems (Qiao et al., 2016). As with synthetic

311
dyes, traditional chemical and physical treatment processes are expensive and not widely available (Oliveira et al., 2008). Compounds such as perchloroethene, trichloroethene, 4-chlorophenol, 1,2-dichloroethane, and 2-chlorophenal have been shown to degrade in BESs (Aulenta et al., 2011; Lovley, 2001; Oliveira et al., 2008). Treatment of chlorine-containing compounds is most effective using BESs in MES mode (Aulenta et al., 2009; Strycharz et al., 2008). Enriched dechlorinating bacteria at the cathode can outcompete methanogens and other anaerobic bacteria, given an ideal half-cell potential (Aulenta et al., 2011). In one study treating trichloroethene, it was shown that 94.7% of conducted electrons were utilized for dechlorination (Huang et al., 2011).
15.4.5.5 Pharmaceutical contaminants
Medications, hormones, steroids, and cosmetic products are of concern for causing contamination of air, water, and soil when passed through traditional wastewater treatment facilities (Stephenson, 2007). Using a single chamber MFC with air cathode, synthetic penicillin wastewater was shown to produce 101 W m-3 (Wen et al., 2011). Biologically toxic pharmaceutical effluent was shown to produce electricity when treated by MFC (Velvizhi and Venkata Mohan, 2012). Highly acidic steroidal drug production wastewater was shown to be treatable in an MFC with maximum of 82% COD reduction (Liu et al., 2012).
15.4.5.6 Metals
Industrial, municipal, and agricultural wastewater has been shown to contain a number of metals and heavy metals, such as iron, nickel, copper, arsenic, lead, zinc, gold, silver, cadmium, and chromium (Barakat, 2011; Wernick and Themelis, 1998). Even low concentrations of metals discharged to natural waterways can cause environmental degradation and disruptions in the local food chain, and can adversely affect human health (Miller, 2007). Traditional physicochemical metal removal processes (e.g., adsorption, filtration, precipitation, and electrocoagulation) are expensive, require extensive chemical pretreatment, and are limited in scope to specific systems (Barakat, 2011; Kaminari et al., 2007). Given the unique combination of biological organic waste treatment coupled with electrochemistry principles, BESs have been shown to be capable of removing and recovering metals from a variety of municipal leachates and mining effluents (Hamelers et al., 2010; Heijne et al., 2010). Removal and recovery of metals from BESs operating in either MFC or MES modes is accomplished by utilizing the target metal as the terminal electron acceptor either at the cathode or biocathode. This approach requires that the metal is in low enough concentration as to not cause an inhibitory effect on the electrogenic microorganisms on the anode. If this condition is met, organic waste can first be sent to the anode chamber, and then to the cathode chamber where aeration can take place (Abourached et al., 2014; Feng et al., 2013). Otherwise, metal removal can occur prior to treatment. Given that the redox potential of the cathode chamber is higher than the anode potential, metal precipitation will occur spontaneously (Modin et al., 2012; Qin et al., 2012; Tao et al., 2014, 2012; B. Zhang et al., 2012). A laboratory study using acetate as the organic waste fed to the anode chamber, found copper reduction and plating at the cathode under a current density of 3.2 A m-2 anode surface area (Heijne et al., 2010). Additional studies have been optimized for copper recovery, as well as

312
showing chromium and vanadium removal (Modin et al., 2012; B. Zhang et al., 2012). While these current studies have been sufficient to demonstrate metal removal and recovery by BESs, further work is needed in targeting specific opportunities to expand this technology to both pilot and industrial scales.
15.4.6 Bioelectrochemical support components and additional applications
15.4.6.1 Power management systems
There have been recent advancements in applications for and the utilization of BESs. These advancements have occurred in near lockstep with advances in microelectronics and specialized low-energy harvesting components. With power densities reported for MFCs in the range of 1 - 2000 mW m-2 anode surface area (Cheng et al., 2006; Liu et al., 2005; Manohar and Mansfeld, 2009; Simon et al., 2002), energy collection, storage, and distribution systems are needed for the development of impactful applications (Ewing et al., 2014b; Tang et al., 2015). As an example, MFC voltage output averages 0.3 V-0.9 V, with a corresponding 10 mW power output (Baranitharan et al., 2015; Cheng et al., 2006; Heilmann and Logan, 2006). Most low-energy electronic devices operate between 1.2 V-5 V with power needs of 100 mW-10000 mW. To bridge the disparity in electrical energy needs, power management systems (PMSs) have been developed to interface directly with BESs (Figure 15.10).
Figure 15.10: Two channel power management system increasing the output voltage of generated
electricity (adapted from Ewing et al., 2014)
Initially, PMSs were developed using combinations of charge pumps, DC/DC boost converters, and super capacitors as the base components (Donovan et al., 2011; Shantaram et al., 2005; Yang et al., 2012). Charge pumps can operate on the very low output power from MFCs to amplify the voltage to between 1.2 V and 5 V. This amplified voltage, though reduced in overall power, was conducted to a super capacitor for energy accumulation and storage. When sufficient energy was available, a DC/DC boost converter could again amplify the voltage, generally between 3.3 V and 12 V, again at the cost of overall power. Since MFCs do not output constant power, PMSs operate cyclically (Dewan et al., 2010). Over many charge cycles, energy is accumulated until there is sufficient power for the given application. Updated PMSs have started to utilize specialty energy harvesting chips. These chips
313
combine many of the previously separate components and provide built-in logic to ensure the maximum energy is being obtained from the BES (Boghani et al., 2014). Though beyond the scope of this chapter, it has been shown that BESs for electricity production do not scale up linearly with increasing anode surface area. This has limited the usefulness of large scale systems. To address this limitation, a PMS operating from multiple SMFCs was shown to scale up linearly (Tang et al., 2015). This opens the possibility of operating multiple optimized BESs in parallel to obtain more power than from a similarly sized single BES (Ewing et al., 2014b). Additional applications for PMSs have been shown for wireless transmission of water sampling data, self-powered wastewater treatment, and long-term operation of MFCs (Dewan et al., 2010; Donovan et al., 2011; Ewing et al., 2017, 2014a).
15.4.6.2 Biosensors
Monitoring the overall voltage output from BESs has been proposed as a means for assessing the strength of organic waste and detecting toxic compounds (Chang et al., 2005, 2004). This monitoring can take place in conjunction with the normal operation of the BES, or it can be a separate dedicated system, called a biosensor (Kim et al., 2003). The fundamental operating principle for biosensor design is that output electricity generated by a BES is related to the productivity of the electrogenic microorganism treating the influent organic waste (Patil et al., 2010). A change in electrical potential can be correlated to a change in microbial metabolism (Patil et al., 2010). Laboratory studies have shown that changes in pH, temperature, conductivity, water quality, and concentration of toxic compounds affect output voltage (Su et al., 2011). Biological oxygen demand is a common measure of the strength of organic waste. Monitoring biological oxygen demand has been demonstrated in BESs operating in MFC mode (Chang et al., 2005, 2004; Kim et al., 2003). One study showed that a biological oxygen demand of up to 100 mg L-1 could be differentiated using an MFC (Chang et al., 2004). Another study suggested that biological oxygen demand biosensors could operate continuously for up to five years (Chang et al., 2005). Additional applications have shown an ability to detect changes in concentrations of organophosphorus pesticides, polychlorinated biphenyls (PCBs), and heavy metals (D’Souza, 2001; Stein et al., 2012b, 2012a).
15.5 Proposed biorefinery configuration and next steps
Bioelectrochemical systems are an emerging suite of technologies capable of producing energy, fuel, and chemicals from organic waste. They utilize electrogenic microorganisms to oxidize biodegradable organic matter and transfer electrons to a solid electrode. Bioelectrochemical systems have the potential to treat nearly unlimited types of organic waste while producing value-added products, and integrating with existing biorefinery processes. Bioelectrochemical systems have been demonstrated to treat organic wastes from industrial, municipal, and agricultural processes. They have also been shown to treat otherwise recalcitrant or toxic organic wastes that contain synthetic dyes, chlorine-based compounds, and heavy metals.

314
A current limitation for the large-scale deployment of BESs is the relatively low value of electricity produced from organic wastes. In this case, electrical sales alone would not provide sufficient payback on the cost of the required energy collection components and power management system. Currently, the use of electricity production from BESs seems limited to specialty deployments of remote sensors. From an economic standpoint, the near-term utilization of BESs seems aimed at production of high-value, low-volume bioderived chemicals and specialty fuels. Another potential near-term use of BESs is the treatment of low strength organic wastes. Low strength organic wastes, such as manures and food scraps, would generally be thickened for treatment by AD, while others, like municipal wastewater, would be treated by aeration. For small-scale dilute liquid organic wastes, such as landfill or compost leachate or agricultural produce washwater, it would be impractical to thicken for sludge treatment or to input extensive energy to provide aeration. This is the type of dilute system where BESs could provide effective treatment. Anaerobic digestion-based biorefineries are operating at commercial scale in several industries. One possible path to drive adoption of BESs is their integration with existing facilities, as shown in Figure 15.11. In this concept, AD is the primary organic waste treatment technology. Influent organic waste is separated into both thickened solids and liquid streams. The high-strength thickened solids are anaerobically digested with an enhanced electrogenic population of microorganisms capable of DIET (Figure 15.9).
Figure 15.11: Schematic diagram showing the concept of a sustainable biorefinery utilizing
multiple bioelectrochemical systems
The low-strength liquid stream is sent to a bank of MFCs coupled electrically with MECs or MES systems to produce additional gaseous fuels. Though not shown, the biogas produced from AD could also be sent through the MECs and MES systems to strip CO2 and produce additional gaseous fuels. The effluent from AD is sent to a traditional solids separation process where the solids can be collected for further processing. The liquid effluent from primary solids separation is sent to a bank of MFCs coupled electrically with MES systems for nutrient recovery of phosphorous and nitrogen. Fine solids could be separated using traditional dissolved air floatation or centrifuge separators. The two remaining liquid effluent streams then converge on a

315
bank of MCDs coupled electrically with MES systems for salt and metal removal. While BESs would not produce sufficient energy to power all of the equipment for the entire biorefinery, the excess would reduce the overall parasitic energy load subtracted from biogas production and could provide an economic advantage to overall operations. Next steps for further development of BESs include: review and assessment of current process and economic models, developing a life cycle assessment of select BESs, and conducting a techno-economic assessment of BESs for select applications supporting organics recovery and utilization in Washington State. Collaborating with research faculty investigating the scale up of BESs and optimizing BESs’ operation parameters will be critical for informing advancement in this area. Finally, it will be important to work with industry to develop pilot-scale application demonstration systems for BESs.
15.6 References
Abourached, C., Catal, T., Liu, H., 2014. Efficacy of single-chamber microbial fuel cells for removal of cadmium and zinc with simultaneous electricity production. Water Res. 51, 228–233. doi:10.1016/j.watres.2013.10.062
Allen, R.M., Bennetto, H.P., 1993. Microbial fuel-cells. Appl. Biochem. Biotechnol. 39, 27–40. doi:10.1007/BF02918975
Arends, J.B.A., Verstraete, W., 2012. 100 years of microbial electricity production: three concepts for the future. Microb. Biotechnol. 5, 333–346. doi:10.1111/j.1751-7915.2011.00302.x
Aulenta, F., Canosa, A., Reale, P., Rossetti, S., Panero, S., Majone, M., 2009. Microbial reductive dechlorination of trichloroethene to ethene with electrodes serving as electron donors without the external addition of redox mediators. Biotechnol. Bioeng. 103, 85–91. doi:10.1002/bit.22234
Aulenta, F., Tocca, L., Verdini, R., Reale, P., Majone, M., 2011. Dechlorination of Trichloroethene in a Continuous-Flow Bioelectrochemical Reactor: Effect of Cathode Potential on Rate, Selectivity, and Electron Transfer Mechanisms. Environ. Sci. Technol. 45, 8444–8451. doi:10.1021/es202262y
Awad, N.K., Ashour, E.A., Fouda, A.S., Allam, N.K., 2014. Effect of alloying elements on the electrochemical behavior of Cu–Ni–Zn ternary system in sulfide-polluted saltwater. Appl. Surf. Sci. 307, 621–630. doi:10.1016/j.apsusc.2014.04.087
Bacovsky, D., Ludwiczek, N., Ognissanto, M., Worgetter, M., 2013. Status of Advanced Biofuels Demonstration Facilities in 2012 (IEA No. T39–P1b).
Bajracharya, S., ter Heijne, A., Dominguez Benetton, X., Vanbroekhoven, K., Buisman, C.J.N., Strik, D.P.B.T.B., Pant, D., 2015. Carbon dioxide reduction by mixed and pure cultures in microbial electrosynthesis using an assembly of graphite felt and stainless steel as a cathode. Bioresour. Technol. 195, 14–24. doi:10.1016/j.biortech.2015.05.081
Bajracharya, S., Yuliasni, R., Vanbroekhoven, K., Buisman, C.J.N., Strik, D.P.B.T.B., Pant, D., 2017. Long-term operation of microbial electrosynthesis cell reducing CO2 to multi-carbon chemicals with a mixed culture avoiding methanogenesis. Bioelectrochemistry 113, 26–34. doi:10.1016/j.bioelechem.2016.09.001
Barakat, M.A., 2011. New trends in removing heavy metals from industrial wastewater. Arab. J. Chem. 4, 361–377. doi:10.1016/j.arabjc.2010.07.019

316
Baranitharan, E., Khan, M.R., Yousuf, A., Teo, W.F.A., Tan, G.Y.A., Cheng, C.K., 2015. Enhanced power generation using controlled inoculum from palm oil mill effluent fed microbial fuel cell. Fuel 143, 72–79. doi:10.1016/j.fuel.2014.11.030
Batista, A.P., López, E.P., Dias, C., Lopes da Silva, T., Marques, I.P., 2017. Wastes valorization from Rhodosporidium toruloides NCYC 921 production and biorefinery by anaerobic digestion. Bioresour. Technol. 226, 108–117. doi:10.1016/j.biortech.2016.11.113
Batstone, D.J., Hülsen, T., Mehta, C.M., Keller, J., 2015. Platforms for energy and nutrient recovery from domestic wastewater: A review. Wastewater-Energy Nexus Sustain. Wastewater Reclam. 140, 2–11. doi:10.1016/j.chemosphere.2014.10.021
Behera, S.K., Park, J.M., Kim, K.H., Park, H.-S., 2010. Methane production from food waste leachate in laboratory-scale simulated landfill. Waste Manag. 30, 1502–1508. doi:10.1016/j.wasman.2010.02.028
Bell, G., Schuck, S., Jungmeier, G., Wellisch, M., Felby, C., Jorgensen, H., Spaeth, J., 2014. IEA Bioenergy Task42 Biorefining. Wageningen.
Benyahia, F., Abdulkarim, M., Zekri, A., Chaalal, O., Hasanain, H., 2005. Bioremediation of Crude Oil Contaminated Soils. Process Saf. Environ. Prot. 83, 364–370. doi:10.1205/psep.04388
Blasco-Gómez, R., Batlle-Vilanova, P., Villano, M., Balaguer, M.D., Colprim, J., Puig, S., 2017. On the Edge of Research and Technological Application: A Critical Review of Electromethanogenesis. Int. J. Mol. Sci. 18, 874. doi:10.3390/ijms18040874
Boghani, H.C., Papaharalabos, G., Michie, I., Fradler, K.R., Dinsdale, R.M., Guwy, A.J., Ieropoulos, I., Greenman, J., Premier, G.C., 2014. Controlling for peak power extraction from microbial fuel cells can increase stack voltage and avoid cell reversal. J. Power Sources 269, 363–369. doi:10.1016/j.jpowsour.2014.06.059
Bozell, J.J., 2008. Feedstocks for the Future – Biorefinery Production of Chemicals from Renewable Carbon. CLEAN – Soil Air Water 36, 641–647. doi:10.1002/clen.200800100
Bozell, J.J., Petersen, G.R., 2010. Technology development for the production of biobased products from biorefinery carbohydrates—the US Department of Energy’s “Top 10” revisited. Green Chem. 12, 539–554. doi:10.1039/B922014C
Brandt, R.C., Elliott, H.A., Adviento-Borbe, M.A.A., Wheeler, E.F., Kleinman, P.J.A., Beegle, D.B., 2011. Field Olfactometry Assessment of Dairy Manure Land Application Methods All rights reserved. No part of this periodical may be reproduced or transmitted in any form or by any means, electronic or mechanical, including photocopying, recording, or any information storage and retrieval system, without permission in writing from the publisher. J. Environ. Qual. 40, 431–437. doi:10.2134/jeq2010.0094
Budych-Gorzna, M., Smoczynski, M., Oleskowicz-Popiel, P., 2016. Enhancement of biogas production at the municipal wastewater treatment plant by co-digestion with poultry industry waste. Appl. Energy 161, 387–394. doi:10.1016/j.apenergy.2015.10.007
Cao, X., Huang, X., Liang, P., Xiao, K., Zhou, Y., Zhang, X., Logan, B.E., 2009. A New Method for Water Desalination Using Microbial Desalination Cells. Environ. Sci. Technol. 43, 7148–7152. doi:10.1021/es901950j
Carmona-Martínez, A.A., Trably, E., Milferstedt, K., Lacroix, R., Etcheverry, L., Bernet, N., 2015. Long-term continuous production of H2 in a microbial electrolysis cell (MEC) treating saline wastewater. Water Res. 81, 149–156. doi:10.1016/j.watres.2015.05.041

317
Castillo-Gonzalez, H.A., Bruns, M.A., 2005. Dissimilatory Iron Reduction and Odor Indicator Abatement by Biofilm Communities in Swine Manure Microcosms. Appl. Environ. Microbiol. 71, 4972–4978. doi:10.1128/AEM.71.9.4972-4978.2005
Cercado-Quezada, B., Delia, M.-L., Bergel, A., 2010. Testing various food-industry wastes for electricity production in microbial fuel cell. Bioresour. Technol. 101, 2748–2754. doi:10.1016/j.biortech.2009.11.076
Chandrasekhar, K., Venkata Mohan, S., 2012. Bio-electrochemical remediation of real field petroleum sludge as an electron donor with simultaneous power generation facilitates biotransformation of PAH: Effect of substrate concentration. Bioresour. Technol. 110, 517–525. doi:10.1016/j.biortech.2012.01.128
Chang, I.S., Jang, J.K., Gil, G.C., Kim, M., Kim, H.J., Cho, B.W., Kim, B.H., 2004. Continuous determination of biochemical oxygen demand using microbial fuel cell type biosensor. Biosens. Bioelectron. 19, 607–613. doi:10.1016/S0956-5663(03)00272-0
Chang, I.S., Moon, H., Jang, J.K., Kim, B.H., 2005. Improvement of a microbial fuel cell performance as a BOD sensor using respiratory inhibitors. Biosens. Bioelectron. 20, 1856–1859. doi:10.1016/j.bios.2004.06.003
Chatwal, G.R., 2009. Synthetic Dyes, 2nd ed. ed. Himalaya Publishing House, New Delhi. Chen, C., Yan, G., Guo, S., Yang, Y., 2008. Pretreatment of super viscous oil wastewater and its
application in refinery. Pet. Sci. 5, 269–274. doi:10.1007/s12182-008-0043-z Chen, M., Xu, P., Zeng, G., Yang, C., Huang, D., Zhang, J., 2015. Bioremediation of soils
contaminated with polycyclic aromatic hydrocarbons, petroleum, pesticides, chlorophenols and heavy metals by composting: Applications, microbes and future research needs. Biotechnol. Adv. 33, 745–755. doi:10.1016/j.biotechadv.2015.05.003
Chen, S., He, G., Liu, Q., Harnisch, F., Zhou, Y., Chen, Y., Hanif, M., Wang, S., Peng, X., Hou, H., Schröder, U., 2012. Layered corrugated electrode macrostructures boost microbial bioelectrocatalysis. Energy Environ. Sci. 5, 9769–9772. doi:10.1039/C2EE23344D
Chen, X., Cui, D., Wang, X., Wang, X., Li, W., 2015. Porous carbon with defined pore size as anode of microbial fuel cell. Biosens. Bioelectron. 69, 135–141. doi:10.1016/j.bios.2015.02.014
Chen, Z., Huang, Y., Liang, J., Zhao, F., Zhu, Y., 2012. A novel sediment microbial fuel cell with a biocathode in the rice rhizosphere. Bioresour. Technol. 108, 55–59. doi:10.1016/j.biortech.2011.10.040
Cheng, K.Y., Ho, G., Cord-Ruwisch, R., 2011. Novel Methanogenic Rotatable Bioelectrochemical System Operated with Polarity Inversion. Environ. Sci. Technol. 45, 796–802. doi:10.1021/es102482j
Cheng, K.Y., Kaksonen, A.H., Cord-Ruwisch, R., 2013. Ammonia recycling enables sustainable operation of bioelectrochemical systems. Bioresour. Technol. 143, 25–31. doi:10.1016/j.biortech.2013.05.108
Cheng, S., Liu, H., Logan, B.E., 2006. Increased Power Generation in a Continuous Flow MFC with Advective Flow through the Porous Anode and Reduced Electrode Spacing. Environ. Sci. Technol. 40, 2426–2432. doi:10.1021/es051652w
Cheng, S., Logan, B.E., 2011. High hydrogen production rate of microbial electrolysis cell (MEC) with reduced electrode spacing. Bioresour. Technol. 102, 3571–3574. doi:10.1016/j.biortech.2010.10.025

318
Cheng, S., Xing, D., Call, D.F., Logan, B.E., 2009. Direct Biological Conversion of Electrical Current into Methane by Electromethanogenesis. Environ. Sci. Technol. 43, 3953–3958. doi:10.1021/es803531g
Choi, S., 2015. Microscale microbial fuel cells: Advances and challenges. Biosens. Bioelectron. 69, 8–25. doi:10.1016/j.bios.2015.02.021
Chowdhury, R.B., Moore, G.A., Weatherley, A.J., Arora, M., 2017. Key sustainability challenges for the global phosphorus resource, their implications for global food security, and options for mitigation. J. Clean. Prod. 140, 945–963. doi:10.1016/j.jclepro.2016.07.012
Clark, J., Deswarte, F. (Eds.), 2008. Introduction to Chemicals from Biomass. Chichester, UK: John Wiley & Sons, Ltd, Chichester, UK. doi:10.1002/9780470697474.ch1
Clauwaert, P., Ha, D. van der, Verstraete, W., 2008. Energy recovery from energy rich vegetable products with microbial fuel cells. Biotechnol. Lett. 30, 1947–1951. doi:10.1007/s10529-008-9778-2
Clauwaert, P., Verstraete, W., 2009. Methanogenesis in membraneless microbial electrolysis cells. Appl. Microbiol. Biotechnol. 82, 829–836. doi:10.1007/s00253-008-1796-4
Cohen, B., 1931. The bacterial culture as an electrical half-cell. J. Bacteriol. 21, 18–19. Colindres, P., Yee-Madeira, H., Reguera, E., 2010. Removal of Reactive Black 5 from aqueous
solution by ozone for water reuse in textile dyeing processes. Desalination 258, 154–158. doi:10.1016/j.desal.2010.03.021
Cord-Ruwisch, R., Law, Y., Cheng, K.Y., 2011. Ammonium as a sustainable proton shuttle in bioelectrochemical systems. Bioresour. Technol. 102, 9691–9696. doi:10.1016/j.biortech.2011.07.100
Corre, K.S.L., Valsami-Jones, E., Hobbs, P., Parsons, S.A., 2009. Phosphorus Recovery from Wastewater by Struvite Crystallization: A Review. Crit. Rev. Environ. Sci. Technol. 39, 433–477. doi:10.1080/10643380701640573
Cui, D., Kong, F., Liang, B., Cheng, H., Liu, D., Sun, Q., Wang, A., 2011. Decolorization of azo dyes in dual-chamber biocatalyzed electrolysis systems seeding with enriched inoculum. J Env. Anal Toxicol S 3, 001.
Cusick, R.D., Kiely, P.D., Logan, B.E., 2010. A monetary comparison of energy recovered from microbial fuel cells and microbial electrolysis cells fed winery or domestic wastewaters. Int. J. Hydrog. Energy 35, 8855–8861. doi:10.1016/j.ijhydene.2010.06.077
Cusick, R.D., Logan, B.E., 2012. Phosphate recovery as struvite within a single chamber microbial electrolysis cell. Bioresour. Technol. 107, 110–115. doi:10.1016/j.biortech.2011.12.038
Das, K.C., 2008. Co-composting of alkaline tissue digester effluent with yard trimmings. Waste Manag. 28, 1785–1790. doi:10.1016/j.wasman.2007.08.027
de Aragão Umbuzeiro, G., Freeman, H.S., Warren, S.H., de Oliveira, D.P., Terao, Y., Watanabe, T., Claxton, L.D., 2005. The contribution of azo dyes to the mutagenic activity of the Cristais River. Chemosphere 60, 55–64. doi:10.1016/j.chemosphere.2004.11.100
de Besi, M., McCormick, K., 2015. Towards a Bioeconomy in Europe: National, Regional and Industrial Strategies. Sustainability 7, 10461–10478. doi:10.3390/su70810461
Desloover, J., Abate Woldeyohannis, A., Verstraete, W., Boon, N., Rabaey, K., 2012a. Electrochemical Resource Recovery from Digestate to Prevent Ammonia Toxicity during Anaerobic Digestion. Environ. Sci. Technol. 46, 12209–12216. doi:10.1021/es3028154

319
Desloover, J., Arends, J.B.A., Hennebel, T., Rabaey, K., 2012b. Operational and technical considerations for microbial electrosynthesis. Biochem. Soc. Trans. 40, 1233–1238. doi:10.1042/BST20120111
Dewan, A., Donovan, C., Heo, D., Beyenal, H., 2010. Evaluating the performance of microbial fuel cells powering electronic devices. J. Power Sources 195, 90–96. doi:10.1016/j.jpowsour.2009.07.001
Donovan, C., Dewan, A., Peng, H., Heo, D., Beyenal, H., 2011. Power management system for a 2.5 W remote sensor powered by a sediment microbial fuel cell. J. Power Sources 196, 1171–1177. doi:10.1016/j.jpowsour.2010.08.099
Drangert, J.-O., 2012. Phosphorus–a Limited Resource that Could be Made Limitless. Procedia Eng., SYMPHOS 2011 - 1st International Symposium on Innovation and Technology in the Phosphate Industry 46, 228–233. doi:10.1016/j.proeng.2012.09.469
D’Souza, S.F., 2001. Microbial biosensors. Biosens. Bioelectron. 16, 337–353. doi:10.1016/S0956-5663(01)00125-7
Eco-Cycle, 2011. Waste of Energy-Why Incineration Is Bad for Our Economy, Environment and Community. Boulder County, CO, USA.
Eerten-Jansen, V., A, M.C.A., Jansen, N.C., Plugge, C.M., de Wilde, V., Buisman, C.J.N., ter Heijne, A., 2015. Analysis of the mechanisms of bioelectrochemical methane production by mixed cultures. J. Chem. Technol. Biotechnol. 90, 963–970. doi:10.1002/jctb.4413
Enger, E.D., 2010. Environmental science: a study of interrelationships, 12th ed. ed. McGraw-Hill Higher Education, Boston.
Erickson, D., 2002. Effects of land application of dairy manure and wastewater on groundwater quality : pre- and post-animal waste holding pond monitoring. Olympia, WA : Washington State Department of Ecology, Olympia, WA.
Ersson, C., Ammenberg, J., Eklund, M., 2015. Connectedness and its dynamics in the Swedish biofuels for transport industry. Prog. Ind. Ecol. Int. J. 9, 269–295. doi:10.1504/PIE.2015.073416
Escapa, A., Mateos, R., Martínez, E.J., Blanes, J., 2016. Microbial electrolysis cells: An emerging technology for wastewater treatment and energy recovery. From laboratory to pilot plant and beyond. Renew. Sustain. Energy Rev. 55, 942–956. doi:10.1016/j.rser.2015.11.029
Ewing, T., Babauta, J.T., Atci, E., Tang, N., Orellana, J., Heo, D., Beyenal, H., 2014a. Self-powered wastewater treatment for the enhanced operation of a facultative lagoon. J. Power Sources 269, 284–292. doi:10.1016/j.jpowsour.2014.06.114
Ewing, T., Ha, P.T., Babauta, J.T., Tang, N.T., Heo, D., Beyenal, H., 2014b. Scale-up of sediment microbial fuel cells. J. Power Sources 272, 311–319. doi:10.1016/j.jpowsour.2014.08.070
Ewing, T., Ha, P.T., Beyenal, H., 2017. Evaluation of long-term performance of sediment microbial fuel cells and the role of natural resources. Appl. Energy 192, 490–497. doi:10.1016/j.apenergy.2016.08.177
Fahd, S., Fiorentino, G., Mellino, S., Ulgiati, S., 2012. Cropping bioenergy and biomaterials in marginal land: The added value of the biorefinery concept. 7th Bienn. Int. Workshop “Advances Energy Stud. 37, 79–93. doi:10.1016/j.energy.2011.08.023
Fan, J., Xiao, J., Liu, D., Ye, G., Luo, J., Houlbrooke, D., Laurenson, S., Yan, J., Chen, L., Tian, J., Ding, W., 2017. Effect of application of dairy manure, effluent and inorganic fertilizer

320
on nitrogen leaching in clayey fluvo-aquic soil: A lysimeter study. Sci. Total Environ. 592, 206–214. doi:10.1016/j.scitotenv.2017.03.060
Fangzhou, D., Zhenglong, L., Shaoqiang, Y., Beizhen, X., Hong, L., 2011. Electricity generation directly using human feces wastewater for life support system. Acta Astronaut., 17th IAA Humans in Space Symposium 68, 1537–1547. doi:10.1016/j.actaastro.2009.12.013
Feng, C., Hu, A., Chen, S., Yu, C.-P., 2013. A decentralized wastewater treatment system using microbial fuel cell techniques and its response to a copper shock load. Bioresour. Technol. 143, 76–82. doi:10.1016/j.biortech.2013.05.038
Feng, Y., Wang, X., Logan, B.E., Lee, H., 2008. Brewery wastewater treatment using air-cathode microbial fuel cells. Appl. Microbiol. Biotechnol. 78, 873–880. doi:10.1007/s00253-008-1360-2
Fischer, F., Bastian, C., Happe, M., Mabillard, E., Schmidt, N., 2011. Microbial fuel cell enables phosphate recovery from digested sewage sludge as struvite. Bioresour. Technol. 102, 5824–5830. doi:10.1016/j.biortech.2011.02.089
Foley, J.M., Rozendal, R.A., Hertle, C.K., Lant, P.A., Rabaey, K., 2010. Life Cycle Assessment of High-Rate Anaerobic Treatment, Microbial Fuel Cells, and Microbial Electrolysis Cells. Environ. Sci. Technol. 44, 3629–3637. doi:10.1021/es100125h
Fornero, J.J., Rosenbaum, M., Angenent, L.T., 2010. Electric Power Generation from Municipal, Food, and Animal Wastewaters Using Microbial Fuel Cells. Electroanalysis 22, 832–843. doi:10.1002/elan.200980011
Ganigue, R., Puig, S., Batlle-Vilanova, P., Balaguer, M.D., Colprim, J., 2015. Microbial electrosynthesis of butyrate from carbon dioxide. Chem. Commun. 51, 3235–3238. doi:10.1039/C4CC10121A
Gary, J.H., Handwerk, G.E., Kaiser, M.J., 2007. Petroleum Refining: Technology and Economics, Fifth Edition. CRC Press.
Ge, Z., Wu, L., Zhang, F., He, Z., 2015. Energy extraction from a large-scale microbial fuel cell system treating municipal wastewater. J. Power Sources 297, 260–264. doi:10.1016/j.jpowsour.2015.07.105
Gerardi, M.H., 2002. Nitrification and Denitrification in the Activated Sludge Process: Gerardi/Nitrification and Denitrification. John Wiley & Sons, Inc., Hoboken, NJ, USA. doi:10.1002/0471216682
Green, B.N., Johnson, C.D., Adams, A., 2006. Writing narrative literature reviews for peer-reviewed journals: secrets of the trade. J. Chiropr. Med. 5, 101–117. doi:10.1016/S0899-3467(07)60142-6
Guo, J., Wang, S., Lian, J., Ngo, H.H., Guo, W., Liu, Y., Song, Y., 2016. Rapid start-up of the anammox process: Effects of five different sludge extracellular polymeric substances on the activity of anammox bacteria. Bioresour. Technol. 220, 641–646. doi:10.1016/j.biortech.2016.08.084
Guo, X., Zhan, Y., Chen, C., Cai, B., Wang, Y., Guo, S., 2016. Influence of packing material characteristics on the performance of microbial fuel cells using petroleum refinery wastewater as fuel. Renew. Energy 87, Part 1, 437–444. doi:10.1016/j.renene.2015.10.041
Guo, X., Zhan, Y., Chen, C., Zhao, L., Guo, S., 2014. The influence of microbial synergistic and antagonistic effects on the performance of refinery wastewater microbial fuel cells. J. Power Sources 251, 229–236. doi:10.1016/j.jpowsour.2013.11.066

321
Gurung, A., Oh, S.-E., 2015. Rice Straw as a Potential Biomass for Generation of Bioelectrical Energy Using Microbial Fuel Cells (MFCs). Energy Sources Part Recovery Util. Environ. Eff. 37, 2625–2631. doi:10.1080/15567036.2012.728678
Habermann, W., Pommer, E.H., 1991. Biological fuel cells with sulphide storage capacity. Appl. Microbiol. Biotechnol. 35, 128–133. doi:10.1007/BF00180650
Hamelers, H.V.M., Ter Heijne, A., Sleutels, T.H.J.A., Jeremiasse, A.W., Strik, D.P.B.T.B., Buisman, C.J.N., 2010. New applications and performance of bioelectrochemical systems. Appl. Microbiol. Biotechnol. 85, 1673–1685. doi:10.1007/s00253-009-2357-1
Harnisch, F., Schroder, U., 2010. From MFC to MXC: chemical and biological cathodes and their potential for microbial bioelectrochemical systems. Chem. Soc. Rev. 39, 4433–4448. doi:10.1039/C003068F
Hays, S., Zhang, F., Logan, B.E., 2011. Performance of two different types of anodes in membrane electrode assembly microbial fuel cells for power generation from domestic wastewater. J. Power Sources 196, 8293–8300. doi:10.1016/j.jpowsour.2011.06.027
Heijne, A.T., Liu, F., Weijden, R. van der, Weijma, J., Buisman, C.J.N., Hamelers, H.V.M., 2010. Copper Recovery Combined with Electricity Production in a Microbial Fuel Cell. Environ. Sci. Technol. 44, 4376–4381. doi:10.1021/es100526g
Heilmann, J., Logan, B.E., 2006. Production of Electricity from Proteins Using a Microbial Fuel Cell. Water Environ. Res. 78, 531–537. doi:10.2175/106143005X73046
Helder, M., Strik, D.P., Hamelers, H.V., Buisman, C.J., 2012. The flat-plate plant-microbial fuel cell: the effect of a new design on internal resistances. Biotechnol. Biofuels 5, 70. doi:10.1186/1754-6834-5-70
Hirooka, K., Ichihashi, O., 2013. Phosphorus recovery from artificial wastewater by microbial fuel cell and its effect on power generation. Bioresour. Technol. 137, 368–375. doi:10.1016/j.biortech.2013.03.067
Hong, S.W., Kim, H.S., Chung, T.H., 2010. Alteration of sediment organic matter in sediment microbial fuel cells. Environ. Pollut. 158, 185–191. doi:10.1016/j.envpol.2009.07.022
Hu, H., Fan, Y., Liu, H., 2010. Optimization of NiMo catalyst for hydrogen production in microbial electrolysis cells. Int. J. Hydrog. Energy 35, 3227–3233. doi:10.1016/j.ijhydene.2010.01.131
Hu, H., Fan, Y., Liu, H., 2009. Hydrogen production in single-chamber tubular microbial electrolysis cells using non-precious-metal catalysts. Int. J. Hydrog. Energy 34, 8535–8542. doi:10.1016/j.ijhydene.2009.08.011
Huang, L., 2015. New progresses in safe, clean and efficient development technologies for high-sulfur gas reservoirs. Nat. Gas Ind. B 2, 360–367. doi:10.1016/j.ngib.2015.09.010
Huang, L., Cheng, S., Chen, G., 2011. Bioelectrochemical systems for efficient recalcitrant wastes treatment. J. Chem. Technol. Biotechnol. 86, 481–491. doi:10.1002/jctb.2551
Ichihashi, O., Hirooka, K., 2012. Removal and recovery of phosphorus as struvite from swine wastewater using microbial fuel cell. Bioresour. Technol. 114, 303–307. doi:10.1016/j.biortech.2012.02.124
Jacobson, K.S., Drew, D.M., He, Z., 2011. Use of a Liter-Scale Microbial Desalination Cell As a Platform to Study Bioelectrochemical Desalination with Salt Solution or Artificial Seawater. Environ. Sci. Technol. 45, 4652–4657. doi:10.1021/es200127p
Jeremiasse, A.W., Hamelers, H.V.M., Buisman, C.J.N., 2010a. Microbial electrolysis cell with a microbial biocathode. Fundam. Microb. Power Plants Electrochem. Act. Biofilms 78, 39–43. doi:10.1016/j.bioelechem.2009.05.005

322
Jeremiasse, A.W., Hamelers, H.V.M., Saakes, M., Buisman, C.J.N., 2010b. Ni foam cathode enables high volumetric H2 production in a microbial electrolysis cell. Int. J. Hydrog. Energy, Asian Hydrogen Energy Conference 2009 35, 12716–12723. doi:10.1016/j.ijhydene.2010.08.131
Jetten, M.S.M., Wagner, M., Fuerst, J., van Loosdrecht, M., Kuenen, G., Strous, M., 2001. Microbiology and application of the anaerobic ammonium oxidation (‘anammox’) process. Curr. Opin. Biotechnol. 12, 283–288. doi:10.1016/S0958-1669(00)00211-1
Jiang, A., Zhang, T., Zhao, Q.-B., Li, X., Chen, S., Frear, C.S., 2014. Evaluation of an integrated ammonia stripping, recovery, and biogas scrubbing system for use with anaerobically digested dairy manure. Biosyst. Eng. 119, 117–126. doi:10.1016/j.biosystemseng.2013.10.008
Jimenez, E., Cabanas, B., Lefebvre, G., 2015. Environment, energy and climate change: environmental chemistry of pollutants and wastes. Springer, Cham.
Jong, E., Higson, A., Walsh, P., Wellisch, M., 2012. Product developments in the bio-based chemicals arena. Biofuels Bioprod. Biorefining 6, 606–624. doi:10.1002/bbb.1360
Joung, J.Y., Lee, H.W., Choi, H., Lee, M.W., Park, J.M., 2009. Influences of organic loading disturbances on the performance of anaerobic filter process to treat purified terephthalic acid wastewater. Bioresour. Technol. 100, 2457–2461. doi:10.1016/j.biortech.2008.11.034
Jungmeier, G., van Ree, R., de Jong, E., Stichnothe, H., De Bari, I., Jorgensen, H., Wellisch, M., Walsh, P., Garnier, G., Spaeth, J., Torr, K., Habu, K., 2014. Facts, Figures and Integration of Biorefineries in a Future BioEconomy - Findings in IEA Bioenergy Task 42 “Biorefining.” doi:10.5071/22ndEUBCE2014-4DO.9.1
Kadier, A., Simayi, Y., Abdeshahian, P., Azman, N.F., Chandrasekhar, K., Kalil, M.S., 2016. A comprehensive review of microbial electrolysis cells (MEC) reactor designs and configurations for sustainable hydrogen gas production. Alex. Eng. J. 55, 427–443. doi:10.1016/j.aej.2015.10.008
Kaewkannetra, P., Chiwes, W., Chiu, T.Y., 2011. Treatment of cassava mill wastewater and production of electricity through microbial fuel cell technology. Fuel 90, 2746–2750. doi:10.1016/j.fuel.2011.03.031
Kaminari, N.M.S., Schultz, D.R., Ponte, M.J.J.S., Ponte, H.A., Marino, C.E.B., Neto, A.C., 2007. Heavy metals recovery from industrial wastewater using Taguchi method. Chem. Eng. J. 126, 139–146. doi:10.1016/j.cej.2006.08.024
Kassongo, J., Togo, C.A., 2011. Performance improvement of whey-driven microbial fuel cells by acclimation of indigenous anodophilic microbes. Afr. J. Biotechnol. 10, 7546–7852. doi:10.5897/AJB11.206
Katuri, K.P., Enright, A.-M., O’Flaherty, V., Leech, D., 2012. Microbial analysis of anodic biofilm in a microbial fuel cell using slaughterhouse wastewater. Bioelectrochemistry, International Symposium on Bioelectrochemistry and Bioenergetics, 21st BES 2011 87, 164–171. doi:10.1016/j.bioelechem.2011.12.002
Kayler, K.L., 2011. Sedimentation. Khalid, A., Arshad, M., Anjum, M., Mahmood, T., Dawson, L., 2011. The anaerobic digestion of
solid organic waste. Waste Manag. 31, 1737–1744. doi:10.1016/j.wasman.2011.03.021 Khan, M.A., Ngo, H.H., Guo, W.S., Liu, Y.W., Zhou, J.L., Zhang, J., Liang, S., Ni, B.J., Zhang,
X.B., Wang, J., 2016. Comparing the value of bioproducts from different stages of

323
anaerobic membrane bioreactors. Bioresour. Technol. 214, 816–825. doi:10.1016/j.biortech.2016.05.013
Khanal, S.K. (Ed.), 2008. Anaerobic Biotechnology for Bioenergy Production: Principles and Applications. Wiley-Blackwell.
Kiely, P.D., Cusick, R., Call, D.F., Selembo, P.A., Regan, J.M., Logan, B.E., 2011. Anode microbial communities produced by changing from microbial fuel cell to microbial electrolysis cell operation using two different wastewaters. Spec. Issue Biofuels - II Algal Biofuels Microb. Fuel Cells 102, 388–394. doi:10.1016/j.biortech.2010.05.019
Kiely, P.D., Regan, J.M., Logan, B.E., 2011. The electric picnic: synergistic requirements for exoelectrogenic microbial communities. Energy Biotechnol. – Environ. Biotechnol. 22, 378–385. doi:10.1016/j.copbio.2011.03.003
Kim, B.H., Chang, I.S., Gil, G.C., Park, H.S., Kim, H.J., 2003. Novel BOD (biological oxygen demand) sensor using mediator-less microbial fuel cell. Biotechnol. Lett. 25, 541–545. doi:10.1023/A:1022891231369
Kim, H.J., Park, H.S., Hyun, M.S., Chang, I.S., Kim, M., Kim, B.H., 2002. A mediator-less microbial fuel cell using a metal reducing bacterium, Shewanella putrefaciens. Enzyme Microb. Technol. 30, 145–152. doi:10.1016/S0141-0229(01)00478-1
Kim, J.R., Dec, J., Bruns, M.A., Logan, B.E., 2008. Removal of Odors from Swine Wastewater by Using Microbial Fuel Cells. Appl. Environ. Microbiol. 74, 2540–2543. doi:10.1128/AEM.02268-07
Kim, Y., Logan, B.E., 2013. Microbial desalination cells for energy production and desalination. Desalination 308, 122–130. doi:10.1016/j.desal.2012.07.022
Kircher, M., 2012. The transition to a bioeconomy: emerging from the oil age. Biofuels Bioprod. Biorefining 6, 369–375. doi:10.1002/bbb.1352
Kitchenham, B., 2004. Procedures for Performing Systematic Reviews: Joint Technical Report (Technical Report No. NICTA 0400011T.1).
Knowles, R., 1982. Denitrification. Microbiol. Rev. 46, 43–70. Koch, K., Plabst, M., Schmidt, A., Helmreich, B., Drewes, J.E., 2016. Co-digestion of food
waste in a municipal wastewater treatment plant: Comparison of batch tests and full-scale experiences. Waste Manag. 47, 28–33. doi:10.1016/j.wasman.2015.04.022
Krishnaraj, R.N., Berchmans, S., Pal, P., 2015. The three-compartment microbial fuel cell: a new sustainable approach to bioelectricity generation from lignocellulosic biomass. Cellulose 22, 655–662. doi:10.1007/s10570-014-0463-4
Kuntke, P., Śmiech, K.M., Bruning, H., Zeeman, G., Saakes, M., Sleutels, T.H.J.A., Hamelers, H.V.M., Buisman, C.J.N., 2012. Ammonium recovery and energy production from urine by a microbial fuel cell. Water Res. 46, 2627–2636. doi:10.1016/j.watres.2012.02.025
Lee, S.Y., Lim, H., Woo, H.C., 2014. Catalytic activity and characterizations of Ni/K2TixOy–Al2O3 catalyst for steam methane reforming. Int. J. Hydrog. Energy 39, 17645–17655. doi:10.1016/j.ijhydene.2014.08.014
Leite, G.B., Abdelaziz, A.E.M., Hallenbeck, P.C., 2013. Algal biofuels: Challenges and opportunities. Bioresour. Technol., Special Issue: IBS 2012 & Special Issue: IFIBiop 145, 134–141. doi:10.1016/j.biortech.2013.02.007
Lens, P., 2000. Environmental Technologies to Treat Sulfur Pollution Principles and Engineering, Integrated Environmental Technology Series. IWA Publishing, London.
Lerner, B.W., Lerner, K.L. (Eds.), 2012. Biotechnology: In Context, In Context Series. Gale, Detroit.

324
Levis, J.W., Barlaz, M.A., DeCarolis, J.F., Ranjithan, S.R., 2014. Systematic Exploration of Efficient Strategies to Manage Solid Waste in U.S. Municipalities: Perspectives from the Solid Waste Optimization Life-Cycle Framework (SWOLF). Environ. Sci. Technol. 48, 3625–3631. doi:10.1021/es500052h
Lewis, K., 1966. Symposium on bioelectrochemistry of microorganisms. IV. Biochemical fuel cells. Bacteriol. Rev. 30, 101–113.
Li, H., Opgenorth, P.H., Wernick, D.G., Rogers, S., Wu, T.-Y., Higashide, W., Malati, P., Huo, Y.-X., Cho, K.M., Liao, J.C., 2012. Integrated Electromicrobial Conversion of CO2 to Higher Alcohols. Science 335, 1596–1596. doi:10.1126/science.1217643
Li, W.-W., Yu, H.-Q., 2015a. Stimulating sediment bioremediation with benthic microbial fuel cells. Biotechnol. Adv. 33, 1–12. doi:10.1016/j.biotechadv.2014.12.011
Li, W.-W., Yu, H.-Q., 2015b. Electro-assisted groundwater bioremediation: Fundamentals, challenges and future perspectives. Bioresour. Technol. 196, 677–684. doi:10.1016/j.biortech.2015.07.074
Li, X., Zhu, N., Wang, Y., Li, P., Wu, P., Wu, J., 2013. Animal carcass wastewater treatment and bioelectricity generation in up-flow tubular microbial fuel cells: Effects of HRT and non-precious metallic catalyst. Bioresour. Technol. 128, 454–460. doi:10.1016/j.biortech.2012.10.053
Liao, W., Frear, C., Chen, S., 2007. Biomass inventory technology and economics assessment Report 1, Characteristics of biomass (Washington State Department of Ecology No. 07-7–25).
Liu, H., Cheng, S., Logan, B.E., 2005. Production of Electricity from Acetate or Butyrate Using a Single-Chamber Microbial Fuel Cell. Environ. Sci. Technol. 39, 658–662. doi:10.1021/es048927c
Liu, H., Ramnarayanan, R., Logan, B.E., 2004. Production of Electricity during Wastewater Treatment Using a Single Chamber Microbial Fuel Cell. Environ. Sci. Technol. 38, 2281–2285. doi:10.1021/es034923g
Liu, L., Choi, S., 2017. Self-sustaining, solar-driven bioelectricity generation in micro-sized microbial fuel cell using co-culture of heterotrophic and photosynthetic bacteria. J. Power Sources 348, 138–144. doi:10.1016/j.jpowsour.2017.03.014
Liu, R., Gao, C., Zhao, Y.-G., Wang, A., Lu, S., Wang, M., Maqbool, F., Huang, Q., 2012. Biological treatment of steroidal drug industrial effluent and electricity generation in the microbial fuel cells. Bioresour. Technol. 123, 86–91. doi:10.1016/j.biortech.2012.07.094
Liu, Y., Zhang, Y., Zhao, Z., Ngo, H.H., Guo, W., Zhou, J., Peng, L., Ni, B.-J., 2017. A modeling approach to direct interspecies electron transfer process in anaerobic transformation of ethanol to methane. Environ. Sci. Pollut. Res. 24, 855–863. doi:10.1007/s11356-016-7776-9
Logan, B., Rabaey, K., 2012. Conversion of Wastes into Bioelectricity and Chemicals by Using Microbial Electrochemical Technologies. Science 337, 686–690. doi:10.1126/science.1217412
Logan, B.E., 2009. Exoelectrogenic bacteria that power microbial fuel cells. Nat. Rev. Microbiol. 7, 375–381. doi:10.1038/nrmicro2113
Logan, B.E., 2007. Microbial Fuel Cells. John Wiley & Sons, Inc., Hoboken, NJ, USA. doi:10.1002/9780470258590
Logan, B.E., 2004. Peer Reviewed: Extracting Hydrogen and Electricity from Renewable Resources. Environ. Sci. Technol. 38, 160A–167A. doi:10.1021/es040468s

325
Logan, B.E., Call, D., Cheng, S., Hamelers, H.V.M., Sleutels, T.H.J.A., Jeremiasse, A.W., Rozendal, R.A., 2008. Microbial Electrolysis Cells for High Yield Hydrogen Gas Production from Organic Matter. Environ. Sci. Technol. 42, 8630–8640. doi:10.1021/es801553z
Logan, B.E., Hamelers, B., Rozendal, R., Schröder, U., Keller, J., Freguia, S., Aelterman, P., Verstraete, W., Rabaey, K., 2006. Microbial Fuel Cells: Methodology and Technology. Environ. Sci. Technol. 40, 5181–5192. doi:10.1021/es0605016
Logan, B.E., Regan, J.M., 2006. Electricity-producing bacterial communities in microbial fuel cells. Trends Microbiol. 14, 512–518. doi:10.1016/j.tim.2006.10.003
Lougheed, T., 2011. Phosphorus Recovery. Environ. Health Perspect. 119, A303–A305. Lovley, D.R., 2001. Anaerobes to the Rescue. Science 293, 1444–1446.
doi:10.1126/science.1063294 Lu, L., Xing, D., Ren, Z.J., 2015. Microbial community structure accompanied with electricity
production in a constructed wetland plant microbial fuel cell. Microb. Fuel Cells 195, 115–121. doi:10.1016/j.biortech.2015.05.098
Lu, N., Zhou, S.-G., Zhuang, L., Zhang, J.-T., Ni, J.-R., 2009. Electricity generation from starch processing wastewater using microbial fuel cell technology. Biochem. Eng. J. 43, 246–251. doi:10.1016/j.bej.2008.10.005
Luo, H., Jenkins, P.E., Ren, Z., 2011. Concurrent Desalination and Hydrogen Generation Using Microbial Electrolysis and Desalination Cells. Environ. Sci. Technol. 45, 340–344. doi:10.1021/es1022202
MacLellan, J., Chen, R., Kraemer, R., Zhong, Y., Liu, Y., Liao, W., 2013. Anaerobic treatment of lignocellulosic material to co-produce methane and digested fiber for ethanol biorefining. Bioresour. Technol. 130, 418–423. doi:10.1016/j.biortech.2012.12.032
Majumder, D., Maity, J.P., Tseng, M.-J., Nimje, V.R., Chen, H.-R., Chen, C.-C., Chang, Y.-F., Yang, T.-C., Chen, C.-Y., 2014. Electricity Generation and Wastewater Treatment of Oil Refinery in Microbial Fuel Cells Using Pseudomonas putida. Int. J. Mol. Sci. 15, 16772–16786. doi:10.3390/ijms150916772
Manohar, A.K., Mansfeld, F., 2009. The internal resistance of a microbial fuel cell and its dependence on cell design and operating conditions. Electrochimica Acta 54, 1664–1670. doi:10.1016/j.electacta.2008.06.047
Manuel, M.-F., Neburchilov, V., Wang, H., Guiot, S.R., Tartakovsky, B., 2010. Hydrogen production in a microbial electrolysis cell with nickel-based gas diffusion cathodes. J. Power Sources 195, 5514–5519. doi:10.1016/j.jpowsour.2010.03.061
Marcucci, M., Ciardelli, G., Matteucci, A., Ranieri, L., Russo, M., 2002. Experimental campaigns on textile wastewater for reuse by means of different membrane processes. Desalination 149, 137–143. doi:10.1016/S0011-9164(02)00745-2
Marshall, C.W., LaBelle, E.V., May, H.D., 2013. Production of fuels and chemicals from waste by microbiomes. Curr. Opin. Biotechnol., Energy biotechnology • Environmental biotechnology 24, 391–397. doi:10.1016/j.copbio.2013.03.016
Marshall, C.W., Ross, D.E., Fichot, E.B., Norman, R.S., May, H.D., 2012. Electrosynthesis of Commodity Chemicals by an Autotrophic Microbial Community. Appl. Environ. Microbiol. 78, 8412–8420. doi:10.1128/AEM.02401-12
Mateo, S., Gonzalez del Campo, A., Cañizares, P., Lobato, J., Rodrigo, M.A., Fernandez, F.J., 2014. Bioelectricity generation in a self-sustainable Microbial Solar Cell. Bioresour. Technol. 159, 451–454. doi:10.1016/j.biortech.2014.03.059

326
Mayer, B.K., Baker, L.A., Boyer, T.H., Drechsel, P., Gifford, M., Hanjra, M.A., Parameswaran, P., Stoltzfus, J., Westerhoff, P., Rittmann, B.E., 2016. Total Value of Phosphorus Recovery. Environ. Sci. Technol. 50, 6606–6620. doi:10.1021/acs.est.6b01239
McCarty, P.L., Bae, J., Kim, J., 2011. Domestic Wastewater Treatment as a Net Energy Producer–Can This be Achieved? Environ. Sci. Technol. 45, 7100–7106. doi:10.1021/es2014264
McCormick, K., Kautto, N., 2013. The Bioeconomy in Europe: An Overview. Sustainability 5, 2589–2608. doi:10.3390/su5062589
McDougall, F.R., White, P.R., Franke, M., Hindle, P., 2008. Integrated Solid Waste Management. John Wiley & Sons, Incorporated, Chichester, UNKNOWN.
McInerney, M.J., Mackie, R.I., Bryant, M.P., 1981. Syntrophic association of a butyrate-degrading bacterium and methanosarcina enriched from bovine rumen fluid. Appl. Environ. Microbiol. 41, 826–828.
Mehanna, M., Kiely, P.D., Call, D.F., Logan, B.E., 2010. Microbial Electrodialysis Cell for Simultaneous Water Desalination and Hydrogen Gas Production. Environ. Sci. Technol. 44, 9578–9583. doi:10.1021/es1025646
Metcalf & Eddy., 1972. Wastewater engineering: collection, treatment, disposal. New York, McGraw-Hill, New York.
Miller, J.R., 2007. Contaminated rivers: a geomorphological-geochemical approach to site assessment and remediation, Geomorphological-geochemical approach to site assessment and remediation. Springer, Dordrecht; London.
Misiti, T., Tezel, U., Pavlostathis, S.G., 2013. Fate and effect of naphthenic acids on oil refinery activated sludge wastewater treatment systems. Water Res. 47, 449–460. doi:10.1016/j.watres.2012.10.036
Moat, A.G., Foster, J.W., 1988. Microbial physiology, 2nd ed. ed. New York : Wiley, New York. Modin, O., Wang, X., Wu, X., Rauch, S., Fedje, K.K., 2012. Bioelectrochemical recovery of Cu,
Pb, Cd, and Zn from dilute solutions. J. Hazard. Mater. 235–236, 291–297. doi:10.1016/j.jhazmat.2012.07.058
Mohan, S.V., Chiranjeevi, P., Mohanakrishna, G., 2012. A rapid and simple protocol for evaluating biohydrogen production potential (BHP) of wastewater with simultaneous process optimization. Int. J. Hydrog. Energy, International Conference on Renewable Energy (ICRE 2011) 37, 3130–3141. doi:10.1016/j.ijhydene.2011.10.109
Mohanakrishna, G., Seelam, J.S., Vanbroekhoven, K., Pant, D., 2015. An enriched electroactive homoacetogenic biocathode for the microbial electrosynthesis of acetate through carbon dioxide reduction. Faraday Discuss. 183, 445–462. doi:10.1039/C5FD00041F
Montpart, N., Rago, L., Baeza, J.A., Guisasola, A., 2015. Hydrogen production in single chamber microbial electrolysis cells with different complex substrates. Water Res. 68, 601–615. doi:10.1016/j.watres.2014.10.026
Moqsud, M.A., Yoshitake, J., Bushra, Q.S., Hyodo, M., Omine, K., Strik, D., 2015. Compost in plant microbial fuel cell for bioelectricity generation. Waste Manag. 36, 63–69. doi:10.1016/j.wasman.2014.11.004
Mordaunt, C.J., Pierce, W.C., 2014. Design and preliminary results of an atmospheric-pressure model gas turbine combustor utilizing varying CO2 doping concentration in CH4 to emulate biogas combustion. Fuel 124, 258–268. doi:10.1016/j.fuel.2014.01.097

327
Morris, J.M., Jin, S., 2012. Enhanced biodegradation of hydrocarbon-contaminated sediments using microbial fuel cells. J. Hazard. Mater. 213–214, 474–477. doi:10.1016/j.jhazmat.2012.02.029
Morris, J.M., Jin, S., Crimi, B., Pruden, A., 2009. Microbial fuel cell in enhancing anaerobic biodegradation of diesel. Chem. Eng. J. 146, 161–167. doi:10.1016/j.cej.2008.05.028
Morrissey, A.., Browne, J., 2004. Waste management models and their application to sustainable waste management. Landfill Process Model. 24, 297–308. doi:10.1016/j.wasman.2003.09.005
Mostafazadeh, A.K., Drogui, P., Brar, S.K., Tyagi, R.D., Le Bihan, Y. and Buelna, G., 2017. Microbial electrosynthesis of solvents and alcoholic biofuels from nutrient waste: A review. Journal of Environmental Chemical Engineering.
Moulijn, J.A., 2001. Chemical process technology. New York : John Wiley & Sons, New York. Mountraki, A., Tsakalova, M., Panteli, A., Papoutsi, A.I., Kokossis, A.C., 2016. Integrated
Waste Management in Multiproduct Biorefineries: Systems Optimization and Analysis of a Real-Life Industrial Plant. Ind. Eng. Chem. Res. 55, 3478–3492. doi:10.1021/acs.iecr.5b03431
Mu, Y., Rabaey, K., Rozendal, R.A., Yuan, Z., Keller, J., 2009. Decolorization of Azo Dyes in Bioelectrochemical Systems. Environ. Sci. Technol. 43, 5137–5143. doi:10.1021/es900057f
Mulrow, C.D., 1994. Systematic Reviews: Rationale for systematic reviews. BMJ 309, 597–599. doi:10.1136/bmj.309.6954.597
Naresh Kumar, A., Nagendranatha Reddy, C., Venkata Mohan, S., 2015. Biomineralization of azo dye bearing wastewater in periodic discontinuous batch reactor: Effect of microaerophilic conditions on treatment efficiency. Bioresour. Technol., International Conference on Emerging Trends in Biotechnology 188, 56–64. doi:10.1016/j.biortech.2015.01.098
Nevin, K.P., Hensley, S.A., Franks, A.E., Summers, Z.M., Ou, J., Woodard, T.L., Snoeyenbos-West, O.L., Lovley, D.R., 2011. Electrosynthesis of Organic Compounds from Carbon Dioxide Is Catalyzed by a Diversity of Acetogenic Microorganisms. Appl. Environ. Microbiol. 77, 2882–2886. doi:10.1128/AEM.02642-10
Nevin, K.P., Woodard, T.L., Franks, A.E., Summers, Z.M., Lovley, D.R., 2010. Microbial Electrosynthesis: Feeding Microbes Electricity To Convert Carbon Dioxide and Water to Multicarbon Extracellular Organic Compounds. mBio 1, e00103-10. doi:10.1128/mBio.00103-10
Ng, D.H.P., Kumar, A., Cao, B., 2016. Microorganisms meet solid minerals: interactions and biotechnological applications. Appl. Microbiol. Biotechnol. 100, 6935–6946. doi:10.1007/s00253-016-7678-2
Nielfa, A., Cano, R., Fdz-Polanco, M., 2015. Theoretical methane production generated by the co-digestion of organic fraction municipal solid waste and biological sludge. Biotechnol. Rep. 5, 14–21. doi:10.1016/j.btre.2014.10.005
Nitisoravut, R., Regmi, R., 2017. Plant microbial fuel cells: A promising biosystems engineering. Renew. Sustain. Energy Rev. 76, 81–89. doi:10.1016/j.rser.2017.03.064
Oh, S., Logan, B.E., 2005. Hydrogen and electricity production from a food processing wastewater using fermentation and microbial fuel cell technologies. Water Res. 39, 4673–4682. doi:10.1016/j.watres.2005.09.019

328
Oliveira, J.L.M., Langenbach, T., Dezotti, M., 2008. Fate of organochlorine 14C-dicofol in a lab-scale wastewater treatment. Braz. J. Microbiol. 39, 311–313. doi:10.1590/S1517-838220080002000021
Pandey, P., Shinde, V.N., Deopurkar, R.L., Kale, S.P., Patil, S.A., Pant, D., 2016. Recent advances in the use of different substrates in microbial fuel cells toward wastewater treatment and simultaneous energy recovery. Appl. Energy 168, 706–723. doi:10.1016/j.apenergy.2016.01.056
Parfitt, J., Barthel, M., Macnaughton, S., 2010. Food waste within food supply chains: quantification and potential for change to 2050. Philos. Trans. R. Soc. Lond. B Biol. Sci. 365, 3065–3081. doi:10.1098/rstb.2010.0126
Paritosh, K., Kushwaha, S.K., Yadav, M., Pareek, N., Chawade, A., Vivekanand, V., 2017. Food Waste to Energy: An Overview of Sustainable Approaches for Food Waste Management and Nutrient Recycling. BioMed Res. Int. 2017, e2370927. doi:10.1155/2017/2370927
Pasupuleti, S.B., Srikanth, S., Venkata Mohan, S., Pant, D., 2015. Development of exoelectrogenic bioanode and study on feasibility of hydrogen production using abiotic VITO-CoRETM and VITO-CASETM electrodes in a single chamber microbial electrolysis cell (MEC) at low current densities. Bioresour. Technol., Microbial Fuel Cells 195, 131–138. doi:10.1016/j.biortech.2015.06.145
Patil, S.A., Gildemyn, S., Pant, D., Zengler, K., Logan, B.E., Rabaey, K., 2015. A logical data representation framework for electricity-driven bioproduction processes. Biotechnol. Adv. 33, 736–744. doi:10.1016/j.biotechadv.2015.03.002
Patil, S.A., Harnisch, F., Kapadnis, B., Schröder, U., 2010. Electroactive mixed culture biofilms in microbial bioelectrochemical systems: The role of temperature for biofilm formation and performance. Biosens. Bioelectron. 26, 803–808. doi:10.1016/j.bios.2010.06.019
Patil, S.A., Surakasi, V.P., Koul, S., Ijmulwar, S., Vivek, A., Shouche, Y.S., Kapadnis, B.P., 2009. Electricity generation using chocolate industry wastewater and its treatment in activated sludge based microbial fuel cell and analysis of developed microbial community in the anode chamber. Bioresour. Technol. 100, 5132–5139. doi:10.1016/j.biortech.2009.05.041
Pelaez-Samaniego, M.R., Hummel, R.L., Liao, W., Ma, J., Jensen, J., Kruger, C., Frear, C., 2017. Approaches for adding value to anaerobically digested dairy fiber. Renew. Sustain. Energy Rev. 72, 254–268. doi:10.1016/j.rser.2017.01.054
Pepe Sciarria, T., Merlino, G., Scaglia, B., D’Epifanio, A., Mecheri, B., Borin, S., Licoccia, S., Adani, F., 2015. Electricity generation using white and red wine lees in air cathode microbial fuel cells. J. Power Sources 274, 393–399. doi:10.1016/j.jpowsour.2014.10.050
Petticrew, M., Roberts, H. (Eds.), 2006. Systematic Reviews in the Social Sciences. Blackwell Publishing Ltd, Oxford, UK. doi:10.1002/9780470754887
Pham, T.H., Rabaey, K., Aelterman, P., Clauwaert, P., De Schamphelaire, L., Boon, N., Verstraete, W., 2006. Microbial Fuel Cells in Relation to Conventional Anaerobic Digestion Technology. Eng. Life Sci. 6, 285–292. doi:10.1002/elsc.200620121
Pocaznoi, D., Calmet, A., Etcheverry, L., Erable, B., Bergel, A., 2012. Stainless steel is a promising electrode material for anodes of microbial fuel cells. Energy Environ. Sci. 5, 9645–9652. doi:10.1039/C2EE22429A
Potter, M.C., 1911. Electrical Effects Accompanying the Decomposition of Organic Compounds. Proc. R. Soc. Lond. Ser. B Contain. Pap. Biol. Character 84, 260–276.

329
Puig, S., Serra, M., Coma, M., Cabré, M., Dolors Balaguer, M., Colprim, J., 2011. Microbial fuel cell application in landfill leachate treatment. J. Hazard. Mater. 185, 763–767. doi:10.1016/j.jhazmat.2010.09.086
Qiao, F., Gao, M., Yan, H., 2016. Molecularly imprinted ionic liquid magnetic microspheres for the rapid isolation of organochlorine pesticides in environmental water. J. Sep. Sci. 39, 1310–1315. doi:10.1002/jssc.201501165
Qin, B., Luo, H., Liu, G., Zhang, R., Chen, S., Hou, Y., Luo, Y., 2012. Nickel ion removal from wastewater using the microbial electrolysis cell. Bioresour. Technol. 121, 458–461. doi:10.1016/j.biortech.2012.06.068
Qureshi, A., Lo, K.V., Mavinic, D.S., Liao, P.H., Koch, F., Kelly, H., 2006. Dairy Manure Treatment, Digestion and Nutrient Recovery as a Phosphate Fertilizer. J. Environ. Sci. Health Part B 41, 1221–1235. doi:10.1080/03601230600857098
Rabaey, K., Bützer, S., Brown, S., Keller, J., Rozendal, R.A., 2010. High Current Generation Coupled to Caustic Production Using a Lamellar Bioelectrochemical System. Environ. Sci. Technol. 44, 4315–4321. doi:10.1021/es9037963
Rabaey, K., Rozendal, R.A., 2010. Microbial electrosynthesis — revisiting the electrical route for microbial production. Nat. Rev. Microbiol. 8, 706–716. doi:10.1038/nrmicro2422
Rabaey, K., Van de Sompel, K., Maignien, L., Boon, N., Aelterman, P., Clauwaert, P., De Schamphelaire, L., Pham, H.T., Vermeulen, J., Verhaege, M., Lens, P., Verstraete, W., 2006. Microbial Fuel Cells for Sulfide Removal. Environ. Sci. Technol. 40, 5218–5224. doi:10.1021/es060382u
Rader, G.K., Logan, B.E., 2010. Multi-electrode continuous flow microbial electrolysis cell for biogas production from acetate. Int. J. Hydrog. Energy, The 1st Iranian Conference On Hydrogen & Fuel Cell 35, 8848–8854. doi:10.1016/j.ijhydene.2010.06.033
Ragauskas, A.J., Williams, C.K., Davison, B.H., Britovsek, G., Cairney, J., Eckert, C.A., Frederick, W.J., Hallett, J.P., Leak, D.J., Liotta, C.L., Mielenz, J.R., Murphy, R., Templer, R., Tschaplinski, T., 2006. The Path Forward for Biofuels and Biomaterials. Science 311, 484–489.
Ramcilovic-Suominen, S., Pülzl, H., n.d. Sustainable development – A ‘selling point’ of the emerging EU bioeconomy policy framework? J. Clean. Prod. doi:10.1016/j.jclepro.2016.12.157
Ren, L., Siegert, M., Ivanov, I., Pisciotta, J.M., Logan, B.E., 2013. Treatability studies on different refinery wastewater samples using high-throughput microbial electrolysis cells (MECs). Bioresour. Technol. 136, 322–328. doi:10.1016/j.biortech.2013.03.060
Rikame, S.S., Mungray, A.A., Mungray, A.K., 2012. Electricity generation from acidogenic food waste leachate using dual chamber mediator less microbial fuel cell. Int. Biodeterior. Biodegrad. 75, 131–137. doi:10.1016/j.ibiod.2012.09.006
Rittmann, B.E., Mayer, B., Westerhoff, P., Edwards, M., 2011. Capturing the lost phosphorus. Chemosphere, The Phosphorus Cycle 84, 846–853. doi:10.1016/j.chemosphere.2011.02.001
Rosenbaum, M., Aulenta, F., Villano, M., Angenent, L.T., 2011. Cathodes as electron donors for microbial metabolism: Which extracellular electron transfer mechanisms are involved? Spec. Issue Biofuels - II Algal Biofuels Microb. Fuel Cells 102, 324–333. doi:10.1016/j.biortech.2010.07.008
Rosenbaum, M., Schröder, U., 2010. Photomicrobial Solar and Fuel Cells. Electroanalysis 22, 844–855. doi:10.1002/elan.200800005

330
Rosenbaum, M., Schröder, U., Scholz, F., 2006. Investigation of the electrocatalytic oxidation of formate and ethanol at platinum black under microbial fuel cell conditions. J. Solid State Electrochem. 10, 872–878. doi:10.1007/s10008-006-0167-2
Ross, D.E., Flynn, J.M., Baron, D.B., Gralnick, J.A., Bond, D.R., 2011. Towards Electrosynthesis in Shewanella: Energetics of Reversing the Mtr Pathway for Reductive Metabolism. PLoS ONE 6. doi:10.1371/journal.pone.0016649
Rotaru, A.-E., Shrestha, P.M., Liu, F., Shrestha, M., Shrestha, D., Embree, M., Zengler, K., Wardman, C., Nevin, K.P., Lovley, D.R., 2013. A new model for electron flow during anaerobic digestion: direct interspecies electron transfer to Methanosaeta for the reduction of carbon dioxide to methane. Energy Environ. Sci. 7, 408–415. doi:10.1039/C3EE42189A
Rozendal, R.A., Hamelers, H.V.M., Euverink, G.J.W., Metz, S.J., Buisman, C.J.N., 2006. Principle and perspectives of hydrogen production through biocatalyzed electrolysis. Int. J. Hydrog. Energy 31, 1632–1640. doi:10.1016/j.ijhydene.2005.12.006
Rozendal, R.A., Hamelers, H.V.M., Molenkamp, R.J., Buisman, C.J.N., 2007. Performance of single chamber biocatalyzed electrolysis with different types of ion exchange membranes. Water Res. 41, 1984–1994. doi:10.1016/j.watres.2007.01.019
Rozendal, R.A., Hamelers, H.V.M., Rabaey, K., Keller, J., Buisman, C.J.N., 2008. Towards practical implementation of bioelectrochemical wastewater treatment. Trends Biotechnol. 26, 450–459. doi:10.1016/j.tibtech.2008.04.008
Rozendal, R.A., Harnisch, F., Jeremiasse, A., Schroder, U., 2010. Chemically catalyzed cathodes in bioelectrochemical systems. IWA Publishing.
Rozendal, R.A., Leone, E., Keller, J., Rabaey, K., 2009. Efficient hydrogen peroxide generation from organic matter in a bioelectrochemical system. Electrochem. Commun. 11, 1752–1755. doi:10.1016/j.elecom.2009.07.008
Sakdaronnarong, C.K., Thanosawan, S., Chaithong, S., Sinbuathong, N., Jeraputra, C., 2013. Electricity production from ethanol stillage in two-compartment MFC. Fuel 107, 382–386. doi:10.1016/j.fuel.2012.10.030
Sánchez, A., Artola, A., Font, X., Gea, T., Barrena, R., Gabriel, D., Sánchez-Monedero, M.Á., Roig, A., Cayuela, M.L., Mondini, C., 2015. Greenhouse gas emissions from organic waste composting. Environ. Chem. Lett. 13, 223–238. doi:10.1007/s10311-015-0507-5
Sánchez-Osorio, J.L., Macías-Zamora, J.V., Ramírez-Álvarez, N., Bidleman, T.F., 2017. Organochlorine pesticides in residential soils and sediments within two main agricultural areas of northwest Mexico: Concentrations, enantiomer compositions and potential sources. Chemosphere 173, 275–287. doi:10.1016/j.chemosphere.2017.01.010
Sangeetha, T., Muthukumar, M., 2011. Catholyte Performance as an Influencing Factor on Electricity Production in a Dual-chambered Microbial Fuel Cell Employing Food Processing Wastewater. Energy Sources Part Recovery Util. Environ. Eff. 33, 1514–1522. doi:10.1080/15567030903397966
Santoro, C., Ieropoulos, I., Greenman, J., Cristiani, P., Vadas, T., Mackay, A., Li, B., 2013. Power generation and contaminant removal in single chamber microbial fuel cells (SCMFCs) treating human urine. Int. J. Hydrog. Energy 38, 11543–11551. doi:10.1016/j.ijhydene.2013.02.070
Sasaki, K., Hirano, S., Morita, M., Sasaki, D., Matsumoto, N., Ohmura, N., Igarashi, Y., 2011. Bioelectrochemical system accelerates microbial growth and degradation of filter paper. Appl. Microbiol. Biotechnol. 89, 449–455. doi:10.1007/s00253-010-2972-x

331
Sauvée, L., Viaggi, D., 2016. Biorefineries in the bio-based economy: opportunities and challenges for economic research. Bio-Based Appl. Econ. J. Volume 05, 1. doi:DOI: 10.13128/BAE-18336, ISSN 2280-6180 (print), ISSN 2280-6172 (online)
Scarlat, N., Dallemand, J.-F., Monforti-Ferrario, F., Nita, V., 2015. The role of biomass and bioenergy in a future bioeconomy: Policies and facts. Environ. Dev. 15, 3–34. doi:10.1016/j.envdev.2015.03.006
Schamphelaire, L.D., Cabezas, A., Marzorati, M., Friedrich, M.W., Boon, N., Verstraete, W., 2010. Microbial Community Analysis of Anodes from Sediment Microbial Fuel Cells Powered by Rhizodeposits of Living Rice Plants. Appl. Environ. Microbiol. 76, 2002–2008. doi:10.1128/AEM.02432-09
Schieb, P.-A., Philp, J.C., 2014. Biorefining policy needs to come of age. Trends Biotechnol. 32, 496–500. doi:10.1016/j.tibtech.2014.08.006
Schmittinger, P. (Ed.), 2000. Chlorine. Wiley-VCH Verlag GmbH, Weinheim, Germany. doi:10.1002/9783527613380
Selembo, P.A., Merrill, M.D., Logan, B.E., 2010. Hydrogen production with nickel powder cathode catalysts in microbial electrolysis cells. Int. J. Hydrog. Energy 35, 428–437. doi:10.1016/j.ijhydene.2009.11.014
Selembo, P.A., Merrill, M.D., Logan, B.E., 2009. The use of stainless steel and nickel alloys as low-cost cathodes in microbial electrolysis cells. J. Power Sources 190, 271–278. doi:10.1016/j.jpowsour.2008.12.144
Selvam, K., Swaminathan, K., Chae, K.-S., 2003. Microbial decolorization of azo dyes and dye industry effluent by Fomes lividus. World J. Microbiol. Biotechnol. 19, 591–593. doi:10.1023/A:1025128327853
Serna-Maza, A., Heaven, S., Banks, C.J., 2015. Biogas stripping of ammonia from fresh digestate from a food waste digester. Bioresour. Technol. 190, 66–75. doi:10.1016/j.biortech.2015.04.041
Shantaram, A., Beyenal, H., Veluchamy, R.R.A., Lewandowski, Z., 2005. Wireless Sensors Powered by Microbial Fuel Cells. Environ. Sci. Technol. 39, 5037–5042. doi:10.1021/es0480668
Sharma, M., Aryal, N., Sarma, P.M., Vanbroekhoven, K., Lal, B., Benetton, X.D., Pant, D., 2013. Bioelectrocatalyzed reduction of acetic and butyric acids via direct electron transfer using a mixed culture of sulfate-reducers drives electrosynthesis of alcohols and acetone. Chem. Commun. 49, 6495–6497. doi:10.1039/C3CC42570C
Shen, L., Worrell, E., Patel, M., 2010. Present and future development in plastics from biomass. Biofuels Bioprod. Biorefining 4, 25–40. doi:10.1002/bbb.189
Shen, L., Zhao, Q., Wu, X., Li, X., Li, Q., Wang, Y., 2016. Interspecies electron transfer in syntrophic methanogenic consortia: From cultures to bioreactors. Renew. Sustain. Energy Rev. 54, 1358–1367. doi:10.1016/j.rser.2015.10.102
Shen, M., Bennett, N., Ding, Y., Scott, K., 2011. A concise model for evaluating water electrolysis. Fuel Cell Technol. FUCETECH 2009 36, 14335–14341. doi:10.1016/j.ijhydene.2010.12.029
Simon, E., Halliwell, C.M., Toh, C.S., Cass, A.E.G., Bartlett, P.N., 2002. Oxidation of NADH produced by a lactate dehydrogenase immobilised on poly(aniline)–poly(anion) composite films. J. Electroanal. Chem. 538–539, 253–259. doi:10.1016/S0022-0728(02)00833-1

332
Slavin, R.E., 1995. Best evidence synthesis: An intelligent alternative to meta-analysis. Potsdam Int. Consult. Meta-Anal. 48, 9–18. doi:10.1016/0895-4356(94)00097-A
Solomon, S., Qin, M., Manning, Z., Chen, M., Marquis, K., Averyt, M., 2007. Climate Change 2007: The Physical Science Basis (IPCC No. AR4), Contribution of Working Group I to the Fourth Assessment Report of the Intergovernmental Panel on Climate Change. Cambridge University Press, Cambridge, United Kingdom and New York, NY, USA.
Staff, N.R.C., 2000. Clean Coastal Waters Understanding and Reducing the Effects of Nutrient Pollution. Washington : National Academies Press, Washington.
Staley, B.F., Xu, F., Cowie, S.J., Barlaz, M.A., Hater, G.R., 2006. Release of trace organic compounds during the decomposition of municipal solid waste components. Environ. Sci. Technol. 40, 5984.
Stein, L.Y., Klotz, M.G., 2016. The nitrogen cycle. Curr. Biol. 26, R94–R98. doi:10.1016/j.cub.2015.12.021
Stein, N.E., Hamelers, H.V.M., Buisman, C.N.J., 2012a. The effect of different control mechanisms on the sensitivity and recovery time of a microbial fuel cell based biosensor. Sens. Actuators B Chem. 171–172, 816–821. doi:10.1016/j.snb.2012.05.076
Stein, N.E., Hamelers, H.V.M., van Straten, G., Keesman, K.J., 2012b. Effect of Toxic Components on Microbial Fuel Cell-Polarization Curves and Estimation of the Type of Toxic Inhibition. Biosensors 2, 255–268. doi:10.3390/bios2030255
Stephenson, R., 2007. Fate of Pharmaceuticals and Personal Care Products Through Municipal Wastewater Treatment Processes, WERF Research Report Series. IWA Publishing, London.
Strik, D.P.B.T.B., (Bert), H., M, H.V., Snel, J.F.H., Buisman, C.J.N., 2008. Green electricity production with living plants and bacteria in a fuel cell. Int. J. Energy Res. 32, 870–876. doi:10.1002/er.1397
Strik, D.P.B.T.B., Hamelers, H.V.M., Buisman, C.J.N., 2010. Solar Energy Powered Microbial Fuel Cell with a Reversible Bioelectrode. Environ. Sci. Technol. 44, 532–537. doi:10.1021/es902435v
Strik, D.P.B.T.B., Timmers, R.A., Helder, M., Steinbusch, K.J.J., Hamelers, H.V.M., Buisman, C.J.N., 2011. Microbial solar cells: applying photosynthetic and electrochemically active organisms. Trends Biotechnol. 29, 41–49. doi:10.1016/j.tibtech.2010.10.001
Strycharz, S.M., Woodard, T.L., Johnson, J.P., Nevin, K.P., Sanford, R.A., Löffler, F.E., Lovley, D.R., 2008. Graphite Electrode as a Sole Electron Donor for Reductive Dechlorination of Tetrachlorethene by Geobacter lovleyi. Appl. Environ. Microbiol. 74, 5943–5947. doi:10.1128/AEM.00961-08
Su, L., Jia, W., Hou, C., Lei, Y., 2011. Microbial biosensors: A review. Biosens. Bioelectron. 26, 1788–1799. doi:10.1016/j.bios.2010.09.005
Sultana, S.T., Atci, E., Babauta, J.T., Falghoush, A.M., Snekvik, K.R., Call, D.R., Beyenal, H., 2015. Electrochemical scaffold generates localized, low concentration of hydrogen peroxide that inhibits bacterial pathogens and biofilms. Sci. Rep. 5, 14908. doi:10.1038/srep14908
Sun, J., Hu, Y., Bi, Z., Cao, Y., 2009. Simultaneous decolorization of azo dye and bioelectricity generation using a microfiltration membrane air-cathode single-chamber microbial fuel cell. Bioresour. Technol. 100, 3185–3192. doi:10.1016/j.biortech.2009.02.002

333
Surendra, K. c., Sawatdeenarunat, C., Shrestha, S., Sung, S., Khanal, S.K., 2015. Anaerobic Digestion-Based Biorefinery for Bioenergy and Biobased Products. Ind. Biotechnol. 11, 103–112. doi:10.1089/ind.2015.0001
Tang, N., Hong, W., Ewing, T., Beyenal, H., Kim, J.-H., Heo, D., 2015. A Self-Sustainable Power Management System for Reliable Power Scaling Up of Sediment Microbial Fuel Cells. IEEE Trans. Power Electron. 30, 4626–4632. doi:10.1109/TPEL.2015.2397931
Tao, H.-C., Gao, Z.-Y., Ding, H., Xu, N., Wu, W.-M., 2012. Recovery of silver from silver(I)-containing solutions in bioelectrochemical reactors. Bioresour. Technol. 111, 92–97. doi:10.1016/j.biortech.2012.02.029
Tao, H.-C., Lei, T., Shi, G., Sun, X.-N., Wei, X.-Y., Zhang, L.-J., Wu, W.-M., 2014. Removal of heavy metals from fly ash leachate using combined bioelectrochemical systems and electrolysis. J. Hazard. Mater. 264, 1–7. doi:10.1016/j.jhazmat.2013.10.057
Tartakovsky, B., Manuel, M.-F., Wang, H., Guiot, S.R., 2009. High rate membrane-less microbial electrolysis cell for continuous hydrogen production. Int. J. Hydrog. Energy 34, 672–677. doi:10.1016/j.ijhydene.2008.11.003
Timmers, R.A., Rothballer, M., Strik, D.P.B.T.B., Engel, M., Schulz, S., Schloter, M., Hartmann, A., Hamelers, B., Buisman, C., 2012. Microbial community structure elucidates performance of Glyceria maxima plant microbial fuel cell. Appl. Microbiol. Biotechnol. 94, 537–548. doi:10.1007/s00253-012-3894-6
Tugtas, A.E., Cavdar, P., Calli, B., 2013. Bio-electrochemical post-treatment of anaerobically treated landfill leachate. Bioresour. Technol. 128, 266–272. doi:10.1016/j.biortech.2012.10.035
Uludag-Demirer, S., Demirer, G.N., Chen, S., 2005. Ammonia removal from anaerobically digested dairy manure by struvite precipitation. Process Biochem. 40, 3667–3674. doi:10.1016/j.procbio.2005.02.028
Uludag-Demirer, S., Demirer, G.N., Frear, C., Chen, S., 2008. Anaerobic digestion of dairy manure with enhanced ammonia removal. J. Environ. Manage. 86, 193–200. doi:10.1016/j.jenvman.2006.12.002
US DOE, 2005. Roadmap on manufacturing R & D for the hydrogen economy: based on the results of the workshop on manufacturing R & D for the hydrogen economy, Roadmap on manufacturing research and development for the hydrogen economy. U.S. Dept. of Energy, Washington, D.C.
US DOE, n.d. Office of Energy Efficiency & Renewable Energy. Sustainability. US GAO, 2003. Natural gas: domestic nitrogen fertilizer production depends on natural gas
availability and prices., Domestic nitrogen fertilizer production depends on natural gas availability and prices. U.S. General Accounting Office, Washington, D.C.
van der Zee, F.P., Bisschops, I.A.E., Lettinga, G., Field, J.A., 2003. Activated Carbon as an Electron Acceptor and Redox Mediator during the Anaerobic Biotransformation of Azo Dyes. Environ. Sci. Technol. 37, 402–408. doi:10.1021/es025885o
van Wyk, J.P.., 2001. Biotechnology and the utilization of biowaste as a resource for bioproduct development. Trends Biotechnol. 19, 172–177. doi:10.1016/S0167-7799(01)01601-8
Velvizhi, G., Venkata Mohan, S., 2012. Electrogenic activity and electron losses under increasing organic load of recalcitrant pharmaceutical wastewater. Int. J. Hydrog. Energy, XII International Symposium on Polymer Electrolytes: New Materials for Application in Proton Exchange Membrane Fuel Cells 37, 5969–5978. doi:10.1016/j.ijhydene.2011.12.112

334
Venkata Mohan, S., Lenin Babu, M., Venkateswar Reddy, M., Mohanakrishna, G., Sarma, P.N., 2009. Harnessing of biohydrogen by acidogenic fermentation of Citrus limetta peelings: Effect of extraction procedure and pretreatment of biocatalyst. Int. J. Hydrog. Energy 34, 6149–6156. doi:10.1016/j.ijhydene.2009.05.056
Venkata Mohan, S., Mohanakrishna, G., Sarma, P.N., 2010a. Composite vegetable waste as renewable resource for bioelectricity generation through non-catalyzed open-air cathode microbial fuel cell. Bioresour. Technol. 101, 970–976. doi:10.1016/j.biortech.2009.09.005
Venkata Mohan, S., Mohanakrishna, G., Velvizhi, G., Babu, V.L., Sarma, P.N., 2010b. Bio-catalyzed electrochemical treatment of real field dairy wastewater with simultaneous power generation. Biochem. Eng. J. 51, 32–39. doi:10.1016/j.bej.2010.04.012
Venkataraman, K., 1952. The chemistry of synthetic dyes. Academic Press, New York. Verstraete, W., 2010. Anaerobic digestion in the biorefinery market economy. J. Biotechnol.
150, Supplement, 74. doi:10.1016/j.jbiotec.2010.08.192 Villano, M., Monaco, G., Aulenta, F., Majone, M., 2011. Electrochemically assisted methane
production in a biofilm reactor. J. Power Sources 196, 9467–9472. doi:10.1016/j.jpowsour.2011.07.016
Villano, M., Scardala, S., Aulenta, F., Majone, M., 2013. Carbon and nitrogen removal and enhanced methane production in a microbial electrolysis cell. Bioresour. Technol. 130, 366–371. doi:10.1016/j.biortech.2012.11.080
Virdis, B., Rabaey, K., Rozendal, R.A., Yuan, Z., Keller, J., 2010. Simultaneous nitrification, denitrification and carbon removal in microbial fuel cells. Water Res. 44, 2970–2980. doi:10.1016/j.watres.2010.02.022
Virdis, B., Rabaey, K., Yuan, Z., Keller, J., 2008. Microbial fuel cells for simultaneous carbon and nitrogen removal. Water Res. 42, 3013–3024. doi:10.1016/j.watres.2008.03.017
Vogel, H.C., Todaro, C.L., 2014. Fermentation and biochemical engineering handbook: principles, process design, and equipment., Third edition / edited by Henry C. Vogel, Chapel Hill, WC and Celeste M. Todaro, Celes Tech Inc., Haddonfield, New Jersey. ed. William Andrew, an imprint of Elsvier, Amsterdam.
Wackett, L.P., 2010. Microbial fuel cells. Microb. Biotechnol. 3, 235–236. doi:10.1111/j.1751-7915.2010.00168.x
Wagner, R.C., Regan, J.M., Oh, S.-E., Zuo, Y., Logan, B.E., 2009. Hydrogen and methane production from swine wastewater using microbial electrolysis cells. Water Res. 43, 1480–1488. doi:10.1016/j.watres.2008.12.037
Wang, A., Sun, D., Cao, G., Wang, H., Ren, N., Wu, W.-M., Logan, B.E., 2011. Integrated hydrogen production process from cellulose by combining dark fermentation, microbial fuel cells, and a microbial electrolysis cell. Bioresour. Technol. 102, 4137–4143. doi:10.1016/j.biortech.2010.10.137
Wang, H., Liu, D., Lu, L., Zhao, Z., Xu, Y., Cui, F., 2012. Degradation of algal organic matter using microbial fuel cells and its association with trihalomethane precursor removal. Bioresour. Technol. 116, 80–85. doi:10.1016/j.biortech.2012.04.021
Wang, L.-Y., Nevin, K.P., Woodard, T.L., Mu, B.-Z., Lovley, D.R., 2016. Expanding the Diet for DIET: Electron Donors Supporting Direct Interspecies Electron Transfer (DIET) in Defined Co-Cultures. Front. Microbiol. 7. doi:10.3389/fmicb.2016.00236

335
Wang, X., Feng, Y.J., Lee, H., 2008. Electricity production from beer brewery wastewater using single chamber microbial fuel cell. Water Sci. Technol. J. Int. Assoc. Water Pollut. Res. 57, 1117–1121. doi:10.2166/wst.2008.064
Webster, J., Watson, R.T., 2002. Analyzing the Past to Prepare for the Future: Writing a Literature Review. MIS Q. 26, xiii–xxiii.
Wellisch, M., Jungmeier, G., Karbowski, A., Patel, M.K., Rogulska, M., 2010. Biorefinery systems – potential contributors to sustainable innovation. Biofuels Bioprod. Biorefining 4, 275–286. doi:10.1002/bbb.217
Wen, Q., Kong, F., Zheng, H., Cao, D., Ren, Y., Yin, J., 2011. Electricity generation from synthetic penicillin wastewater in an air-cathode single chamber microbial fuel cell. Chem. Eng. J. 168, 572–576. doi:10.1016/j.cej.2011.01.025
Wen, Q., Wu, Y., Zhao, L., Sun, Q., 2010. Production of electricity from the treatment of continuous brewery wastewater using a microbial fuel cell. 17th Int. Symp. Alcohol Fuels 89, 1381–1385. doi:10.1016/j.fuel.2009.11.004
Wernick, I.K., Themelis, N.J., 1998. Recycling Metals for the Environment. Annu. Rev. Energy Environ. 23, 465.
Wield, D., Hanlin, R., Mittra, J., Smith, J., 2013. Twenty-first century bioeconomy: Global challenges of biological knowledge for health and agriculture. Sci. Public Policy SPP 40, 17–24. doi:10.1093/scipol/scs116
Wiesmann, U., Choi, I.S., Dombrowski, E.-M., 2006. Fundamentals of Biological Wastewater Treatment. Wiley-VCH Verlag GmbH & Co. KGaA, Weinheim, Germany. doi:10.1002/9783527609604
Wise, D.L., 2000. Bioremediation of contaminated soils. Marcel Dekker, New York. Wu, D., Wang, T., Huang, X., Dolfing, J., Xie, B., 2015. Perspective of harnessing energy from
landfill leachate via microbial fuel cells: novel biofuels and electrogenic physiologies. Appl. Microbiol. Biotechnol. 99, 7827–7836. doi:10.1007/s00253-015-6857-x
Wu, X., Modin, O., 2013. Ammonium recovery from reject water combined with hydrogen production in a bioelectrochemical reactor. Bioresour. Technol. 146, 530–536. doi:10.1016/j.biortech.2013.07.130
Xu, L., Liu, W., Wu, Y., Lee, P., Wang, A., Li, S., 2014. Trehalose enhancing microbial electrolysis cell for hydrogen generation in low temperature (0°C). Bioresour. Technol. 166, 458–463. doi:10.1016/j.biortech.2014.05.018
Yang, F., Zhang, D., Shimotori, T., Wang, K.-C., Huang, Y., 2012. Study of transformer-based power management system and its performance optimization for microbial fuel cells. J. Power Sources 205, 86–92. doi:10.1016/j.jpowsour.2012.01.025
Yuan, Y., Chen, Q., Zhou, S., Zhuang, L., Hu, P., 2011. Bioelectricity generation and microcystins removal in a blue-green algae powered microbial fuel cell. J. Hazard. Mater. 187, 591–595. doi:10.1016/j.jhazmat.2011.01.042
Zahn, J.A., Hatfield, J.L., Do, Y.S., DiSpirito, A.A., Laird, D.A., Pfeiffer, R.L., 1997. Characterization of Volatile Organic Emissions and Wastes from a Swine Production Facility. J. Environ. Qual. 26, 1687–1696. doi:10.2134/jeq1997.00472425002600060032x
Zang, G.-L., Sheng, G.-P., Li, W.-W., Tong, Z.-H., Zeng, R.J., Shi, C., Yu, H.-Q., 2012. Nutrient removal and energy production in a urine treatment process using magnesium ammonium phosphate precipitation and a microbial fuel cell technique. Phys. Chem. Chem. Phys. 14, 1978–1984. doi:10.1039/C2CP23402E

336
Zhang, B., Feng, C., Ni, J., Zhang, J., Huang, W., 2012. Simultaneous reduction of vanadium (V) and chromium (VI) with enhanced energy recovery based on microbial fuel cell technology. J. Power Sources 204, 34–39. doi:10.1016/j.jpowsour.2012.01.013
Zhang, L., Ma, J., Liu, Y., Li, D., Shi, H., Cai, L., 2012. Improvement of biological total phosphorus release and uptake by low electrical current application in lab-scale bio-electrochemical reactors. Bioelectrochemistry Amst. Neth. 88, 92–96. doi:10.1016/j.bioelechem.2012.06.005
Zhang, Y., Noori, J.S., Angelidaki, I., 2011. Simultaneous organic carbon, nutrients removal and energy production in a photomicrobial fuel cell (PFC). Energy Environ. Sci. 4, 4340–4346. doi:10.1039/C1EE02089G
Zhang, Y.-H.P., Ding, S.-Y., Mielenz, J.R., Cui, J.-B., Elander, R.T., Laser, M., Himmel, M.E., McMillan, J.R., Lynd, L.R., 2007. Fractionating recalcitrant lignocellulose at modest reaction conditions. Biotechnol. Bioeng. 97, 214–223. doi:10.1002/bit.21386
Zhao, F., Rahunen, N., Varcoe, J.R., Chandra, A., Avignone-Rossa, C., Thumser, A.E., Slade, R.C.T., 2008. Activated Carbon Cloth as Anode for Sulfate Removal in a Microbial Fuel Cell. Environ. Sci. Technol. 42, 4971–4976. doi:10.1021/es8003766
Zhao, Q., Ji, M., Li, R., Ren, Z.J., 2017. Long-term performance of sediment microbial fuel cells with multiple anodes. 1st Int. Conf. Bioresour. Technol. Bioenergy Bioprod. Environ. Sustain. BIORESTEC 237, 178–185. doi:10.1016/j.biortech.2017.03.002
Zhou, C., Gong, Z., Hu, J., Cao, A., Liang, H., 2015. A cost-benefit analysis of landfill mining and material recycling in China. Waste Manag. 35, 191–198. doi:10.1016/j.wasman.2014.09.029
Zimring, C.A., Rathje, W.L., 2012. Encyclopedia of consumption and waste: the social science of garbage. SAGE Reference, Thousand Oaks, Calif.

337
16. A Review of Carbon Accounting Relevant to the Biorefinery Concept
Timothy Ewing
16.1 Abstract
As part of the Extension efforts for the Waste to Fuels Technology Partnership, this report summarizes the current literature related to carbon utilization and CO2-equivalent emissions (carbon accounting) from processes, systems, and technologies related to the biorefinery concept. Specific topics of interest that were summarized—and organized based on their association with the different biorefinery unit operations—included: (1) form of the original organic material, (2) conversion or treatment process, (3) form of the carbon or CO2-equivalents material produced, and (4) utilization or final application or disposal of products and effluents. In total, 61 relevant studies from Washington State were reviewed as part of this effort. This summary provides a jumping-off point for developing a comprehensive carbon management framework, based on understanding the current state of carbon utilization at existing and future biorefineries. It also provides a basis for better articulating one of reasons for implementing biorefinery concepts in the state and region. To implement utilization of renewable carbon at an industrial scale, a full supply chain analysis needs to be completed, accounting for the relative sources and magnitudes of CO2-equivalent emissions. To support the development of this framework, work is needed in four areas: (a) quantifying sustainability in terms on the absolute CO2-equivalent emissions of all operating processes and systems, (b) developing rigorous quantitative models to predict CO2-equivalent emissions for all proposed processes and systems, (c) completing a technology review to identify process and system improvements, and (d) developing procedures to implement and continuously improve the carbon management framework.
16.2 Introduction to carbon accounting
According to the Intergovernmental Panel on Climate Change, there are six major global sustainability problems: climate change, deforestation, loss of biodiversity, lack of clean drinking water, population growth, and poverty (IPCC, 2007). Among these six global challenges, climate change interacts with the others based on both economic and social factors (Dawson et al., 2016; Linnerooth-Bayer and Hochrainer-Stigler, 2015; Stern, 2008). Transportation is an example that has both economic and social components, and accounts for up to one quarter of all fossil fuel use and associated carbon emissions worldwide (Akpan and Akpan, 2011). Climate change indicators in the United States include decreased sea ice in Alaska, sea level rise in Florida, decreased glaciers and ice sheets in the contiguous states, and reduced crop yields in the mid-west (U.S. Global Change Research Program, 2014). These indicators can be tied to potential future negative economic and social consequences, increasing frequency of severe

338
weather events, and show a need for sustainable utilization of resources (Banuri, 2009; Dawson et al., 2016; Letcher, 2009). Despite heightened awareness of these climate change indicators and the assessments of negative economic and social consequences, atmospheric carbon concentration continues to increase, stressing ecosystems already strained by population and industrial growth (Sanderson et al., 2016). Worldwide increases in greenhouse gas (GHG) emissions are currently being driven largely by economic and social progress in developing countries, such as China and India (Li, 2016; Spracklen, 2016). However, other large emitters of GHG, including the U.S. and the European Union, have not prioritized timely reductions to offset increased emissions from these emerging and modernizing cultures (Jonas et al., 2014). To complicate this assessment of current worldwide GHG emissions, industrial production has shifted from the U.S. and Europe to Asia (Weber and Matthews, 2007). Because greater transportation costs are associated with the global trade routes, more GHG emissions are associated with these goods (Ferng, 2003; Munksgaard and Pedersen, 2001). The determination of national carbon footprints and the associated responsibility for taking action is also hidden by this shift in trade routes (Bastianoni et al., 2004). Starting in the mid-1990s, carbon accounting transitioned from being a limited specialty to a widespread process conducted at the global, national, local, and even individual level (Ascui and Lovell, 2011). This move from specialty to generalized process was driven by the challenge of measuring, interpreting, and validating direct and indirect sources of past and present GHGs (Sommer and Kratena, 2017). To estimate these sources, atmospheric and economic models of human activity are needed to assess quantitative changes in GHGs on global and national scales (Arce et al., 2014; Singh and Bakshi, 2014). These models are laying the groundwork for developing opportunities for monetizing both elemental carbon and associated volatile compounds, and for the reduction of GHG emissions (Davidsdottir and Fisher, 2011). Carbon accounting, measurement, and disclosure has become a common practice at leading global companies (Schneider et al., 2010). This accounting, coupled with the development of detailed predictive models, have opened carbon markets in a number of countries, but have also introduced additional obligations and liabilities associated with carbon emissions (Bebbington and Larrinaga-Gonzalez, 2008; Cook, 2009).
16.2.1 Definition of carbon accounting The definition of “carbon accounting” has not been standardized and is often utilized interchangeably with environmental accounting, GHG accounting, carbon footprint analysis, and other general phrases related to environmental engineering and analysis (Brenton, 2010; Burritt and Schaltegger, 2000; Lomas and Giampietro, 2017). A scalable “pick and mix” definition was developed by Ascui and Lovell (2011) to create a description of carbon accounting that is applicable from a global scale down to an individual scale (Table 16.1). This definition is similar to the old “choose your own adventure” books, where the reader is assigned the duty of making decisions based on individual need.

339
Table 16.1: "Pick and mix" definition of carbon accounting (adapted from Ascui and Lovell, 2011)
estimation
Of
carbon emissions to the atmosphere
at
global
level, for
mandatory research
purposes
calculation carbon dioxide
removals from the atmosphere
national
voluntary
compliance
monitoring GHG
emission rights
civic reporting
reporting trades or transactions
corporate disclosure
validation
GHG equivalent
legal or financial instruments
project auditing
auditing
impacts on or from climate change
event marketing
16.2.2 Categories of carbon accounting
Carbon accounting can be divided into a number of organizational structures, including physical carbon accounting, monetary carbon accounting, and development of methodologies and systems for carbon accounting (Bowen and Wittneben, 2011; Jones, 2012). Additional carbon accounting categories can be framed around physical, political, market-enabling, financial, and social divisions (Ascui and Lovell, 2011). Another variation of this can relate internal vs. external (municipal, commercial, individual) categories to physical and monetary carbon accounting (Figure 16.1). While there is general agreement on the scientific validity and methodology of physical carbon accounting, political and monetary carbon accounting have yet to achieve widespread acceptance across regional, national, or international boundaries (Fogel, 2005; Miller, 2016; Rickels et al., 2012). When viewed from an international perspective, political carbon accounting uses existing statistics to estimate actual emissions and sinks, which can lead to wide variations from measured values, depending on the reliability and resolution of these national level statistics (Ascui and Lovell, 2011). While physical carbon accounting is driven by the scientific method, and political carbon accounting is driven by principles of accounting and economic modeling, market-enabling carbon accounting is driven by non-governmental organizations (NGO) developing projects and products that provide financial and social benefits (Hoffmann, 2011; Okereke et al., 2009; Supekar and Skerlos, 2014). In addition to NGOs, there is a growing awareness and interest in participation in voluntary carbon markets at the individual level across nations and geopolitical regions (Bayon et al., 2007; Merger and Pistorius, 2011).

340
Figure 16.1: Types of organizational level carbon accounting (adapted from Ascui and Lovell,
2011; Bowen and Wittneben, 2011; Jones, 2012)
Scientific carbon accounting is driven primarily by information obtained from physical measurement of carbon dioxide concentration and temperature increases in the atmosphere (IPCC, 2007). This accounting reports the baseline values needed to model future climate change, and also serves as the basis for political and corporate policy development (Prisley and Mortimer, 2004). The “hockey stick” shaped Keeling Curve is a presentation of fifty years of scientific monitoring of atmospheric carbon dioxide levels (Howe, 2015). Other GHGs include methane, ammonia, nitrous oxide, perfluorinated compounds, and, according to some sources, water vapor. This diversity of GHGs makes it necessary to frame carbon accounting in terms of carbon dioxide equivalents (CO2-equivalents) (Schnellnhuber and Cramer, 2006; U.S. EPA, 2005). Political and economic carbon accounting provide a high-level overview of specific national or geopolitical regions, based on statistics or on previous scientific carbon accounting. This method provides the basis for developing national and international programs and policies for guiding the reduction or reduced impact of climate change (Peters and Hertwich, 2008; Vink et al., 2013). A widely circulated target created using this method is to limit global average temperature increase to no more than 2℃ over the next century by reducing GHG emissions (Tollefson, 2015). Corporate carbon accounting can be based on top-down regulatory oversight from political entities or on bottom-up shareholder policies to promote projects and products that contribute to overall reductions in GHG emissions (Hopwood, 2009; Kolk et al., 2008). Carbon services such as financial and tax implication analysis, sustainability reporting, and GHG foot-printing are emerging in regions with carbon markets, as a service industry to support corporate decision making in this area (Dhanda and Hartman, 2011; Hopwood, 2009). The overlap and interaction between scientific, political, and corporate carbon accounting are still developing. Each of these components can contribute to an understanding of, and effort to reduce, climate change (IPCC, 2007).

341
16.2.3 Justification of carbon accounting A primary goal of carbon accounting is to identify and measure GHG emissions and determine if and by how much a particular system, project, or product varies from zero-sum sustainability (Moss et al., 2010). Information reported in CO2-equivalents provides a status assessment of GHG sources, drivers, and processes. This information can provide the basis for the development of policy and economic criteria (IPCC, 2007). Reporting at the project and product level can be based in relative terms—that is, comparing the CO2-equivalents produced to those of existing technologies or products—but overall sustainability should be based on absolute terms (Gray, 2010). Further evaluation of these reported values can be framed in terms of environmental relevance, monetary relevance, or related impact on industrial, municipal, or agricultural systems (Burritt and Schaltegger, 2000). Carbon reports without detailed methodology and framework transparency have the potential to be interpreted as evading core examination of the system without providing the justification for future policy or monetary development (Pellegrino and Lodhia, 2012). That is, for projects or technologies to be classified as reducing CO2-equivalents (relative to those of fossil fuel production, for example), their carbon reports must clearly detail how carbon is tracked, to ensure that all carbon released is accounted for, providing a true carbon footprint of the technology or product.
16.3 Objectives
The focus of this chapter is to summarize the existing literature by identifying projects, topics, and themes related to carbon and CO2-equivalent emissions and reductions (carbon accounting) associated with the biorefinery concept. Reports, journal articles, and factsheets were collected, reviewed, and analyzed for the identification of relevant topics and results, and the results were organized by relevant biorefinery unit operation. The specific goals of this report are to summarize topics of interest, including: (1) form of the original organic material, (2) conversion or treatment process, (3) form of the carbon or CO2-equivalents material produced, and (4) utilization or final application or disposal of products and effluents. This summary provides the basis for understanding the current state of carbon utilization at existing and future biorefineries, and can be used as the basis for developing quantitative carbon and financial analyses of specific processes or unit operations.
16.4 Background on relevance to biorefineries
16.4.1 Sustainable anaerobic biorefinery The development of biorefineries to convert organic wastes into bioenergy and bioderived, value-added products has been driven, in part, by concerns over the availability and cost of fossil fuels (Fiorentino et al., 2017). Organic wastes available for use in biorefineries include animal manures, food processing wastes, biosolids, and biodegradable industrial wastes (Aresta, 2012; Bergeron, 2012). Renewable products from biorefineries include: chemicals, polymers, fiber, agricultural-derived nutrients, and biofuels (Naik et al., 2010; Yang, 2013). Processes that utilize renewable biomass or organic wastes as feedstock are called “short-cycle” carbon systems and are considered more environmentally sustainable than fossil fuel feedstocks, or “long-cycle” carbon systems (Susmozas et al., 2016). The classification as a carbon neutral resource is only

342
appropriate when the carbon cycle is not just short but also local. Local cycles have lower transportation-related emissions, and include an accumulation and utilization of new organic matter during each iteration of the local, short cycle (Koponen et al., 2013). Biomass as a renewable carbon source has the potential to replace fossil fuels in many applications. Therefore, it is important to scrutinize the climate change impact of utilization of these organic materials as well as the economic and social costs (Sacramento-Rivero, 2012). A sustainable bioeconomy is developed from the marketability of both produced raw materials and finished products from the biorefinery (Cherubini and Ulgiati, 2010; Ramcilovic-Suominen and Pülzl, 2016; Sadhukhan et al., 2014). A mature and sustainable bioeconomy based on maximizing local resources and developing local, environmentally friendly jobs could be deployed region wide (Jenner, 2011; Low and Isserman, 2008). While a variety of technologies are available for converting organic wastes into useful products, AD has been identified as a core biorefinery technology (Sawatdeenarunat et al., 2015). Anaerobic digestion is a biological process that converts complex organic matter into organic compounds, biogas, and energetically stabilized effluent (Gerardi, 2003; Stams, 1994). The capture and utilization of methane from biogas reduces the emissions (in CO2-equivalents) from the AD biorefinery (Mohareb et al., 2011). Anaerobic digestion alone is not sufficient to create a sustainable biorefinery and extract all available resources from organic waste. Additional AD accessory unit operations may include: pretreatment processes, co-digestion with high strength wastes, fiber and solids separation from the effluent, nutrient recovery, water treatment, biogas scrubbing and upgrading, composting of separated fiber, thermochemical conversion of fiber solids to biochar, and combined heat and power from biogas (Figure 16.2).
Figure 16.2: Sustainable anaerobic biorefinery (adapted from Kennedy et al., 2013)

343
Biorefineries can be categorized by feedstock organics, resulting products, deployed technologies, or a combination of these factors (Nizami et al., 2017). Key feedstock categories include carbohydrates, lipids, proteins, and cellulosic and lignocellulosic materials (Bozell, 2008). Resulting product classes are biofuels, chemicals and precursor compounds, biogas, and combined heat and power (Bozell and Petersen, 2010). Driving technologies, in addition to AD, include fermentation by yeast, gasification, pyrolysis, liquefaction, oxidation, and combustion (Nizami et al., 2017). Other climate-related considerations in the utilization of biorefinery feedstock include converting from energy crops to field residues and reducing the logistics of collecting and transportation (You et al., 2012).
16.4.2 Baseline for comparing organic waste treatment technologies Composting is a well-established process that uses technology to ensure the effective and efficient treatment of biodegradable organic waste (Komilis and Ham, 2004). Of the 5,000 municipal and commercial composting operations in the U.S., 70% process yard trimmings, 8% are agriculture-based, 7% are industrial, 7% are focused on food scraps, and 8% treat mixed organics or biosolids (Platt and Goldstein, 2014). In terms of climate change, composting both contributes to emissions and “avoided emissions.” During the treatment of organic waste, GHG emissions result from both the biological processes and from the physical processes of turning and transporting the compost (Puyuelo et al., 2014). During the composting of animal manures and food scraps, the biological process prevents the release of methane, which is a much more potent GHG than carbon dioxide (Hrad et al., 2014). Finished compost can be land-applied for use as a soil amendment or used as a peat moss replacement (Tits et al., 2014). Emissions of GHGs from composting are categorized as direct and indirect. The primary direct GHGs are fossil carbon dioxide, biogenic carbon dioxide, methane, and various nitrogen compounds (Andersen et al., 2010). The primary indirect GHGs are continued carbon dioxide and nitrogen compound emissions based on conditions during the application of compost (Boldrin et al., 2010). In addition to the indirect emissions, compost can act as a short term carbon sink and can improve soil moisture content (Favoino and Hogg, 2008; Johnson et al., 2009). Estimates of overall GHG emissions from composting operations range from a significant net sink of CO2-equivalents to a slight net source, which are largely determined based on whether the facility operation is open versus closed, and factors related to the final application of finished compost (Andersen et al., 2010; Boldrin et al., 2010; Favoino and Hogg, 2008). Given composting’s status as a well-established process for managing organic wastes, composting can be used as a baseline for comparing GHG emissions of other waste treatment technologies (Mohareb et al., 2011).
16.5 Methods
The systematic review is a method used to collect and summarize literature focused on a specific research question or a previously narrowed topic (Petticrew and Roberts, 2006). To efficiently conduct the systematic review, five core steps were followed:
1) based on project development and topic selection, we determine keywords before conducting the literature review,

344
2) we selected and utilized one or more scientific or engineering databases to locate literature,
3) we reviewed resulting publications for timely and topical relevance to the project, 4) we determined the applicability of each study to the overall question to be answered, and 5) we applied a logical structure to the summarization of the literature (Mulrow, 1994).
To assemble a pool of primary research studies, the keywords “organic waste treatment,” “biomass utilization,” “nutrient recovery,” “nutrient removal,” “pretreatment,” and “bioproducts” were searched using the Washington State University Library SEARCHIT service. Based on these keywords, explicit inclusion and exclusion criteria were determined before the literature review and publication collection began. Studies were included if the topic included organic material utilization or the biorefinery concept, authors were associated with WSU, and the year of publication was between 2000-2017. In addition, reports were obtained from Washington State Department of Ecology (Ecology) and the Washington State Department of Agriculture online publications archives. Reports were included if the overall organic waste or biomass process represented a unit operation that would be relevant for the development of a sustainable biorefinery using agricultural or municipal organic wastes as feedstock. Studies were excluded if use of a feedstock or possible inclusion in a sustainable biorefinery was a secondary purpose (for examples, studies that focused on improved enzyme use for pretreatment or membrane materials or specific microorganism effects on system performance). Overall, 96 Washington State-based publications related to carbon conversion, utilization, or sequestration were identified and 61 were accepted and reviewed.
16.6 Literature Review
The organization of this section is based on generalized categories for an anaerobic biorefinery. Each reviewed publication is characterized by main topic and grouped by associated unit operation. Similar publications are grouped and listed in descending chronological order, unless noted as being a direct follow-up to a previously cited publication.
16.6.1 Biorefineries Traditional palm oil mills utilize open anaerobic and facultative lagoons for final treatment of waste products. Garcia-Nunez et al. (2016) conducted a literature review to determine available technologies for reducing waste and producing energy and value-added products. The products discussed include cellulosic ethanol, pyrolysis oil, biochar, biogas, compost, bioplastics, hydrogen, enzymes, and biodiesel. They concluded that contained AD could be utilized immediately, while other technologies should be assessed for economic feasibility. Due to concern about soil health in palm plantations, it was suggested that between 5.25 and 12.50 tons of biomass per hectare be left on the field to support retention of organic carbon in the soil. In a follow-up study, Garcia-Nunez et al. (2016b) evaluated six alternative palm oil biorefinery configurations. The option with the best environmental outcome was one that produced biochar and heat. The overall best option based on environmental, economic, and social factors was one based on production of pellets and biogas. Based on a field-to-gate analysis of produced fresh

345
fruit bunches, the palm oil biorefinery reduced GHG emissions and contributed to net carbon sequestration on the order of 1070 kg carbon per metric ton of fruit produced. A study reported to the Washington Department of Agriculture (WSDA, 2009) examined the potential for developing a sugar beet to ethanol industry in Washington State. This report detailed a specific biorefinery configuration to produce ethanol that slightly improved economic feasibility over existing technologies. While this report generally concluded that ethanol production from beets in Washington State is not feasible, it also highlighted the economic and technological changes needed in order to develop a future project for generating renewable carbon-neutral fuels from agricultural biomass. The development of a biorefinery to use softwood bark as a feedstock to produce transportation fuels was reported to Ecology (Ecology, 2009a) as part of the Beyond Waste initiative. The processes for generating biologically derived gasoline and diesel substitutes and ethanol were documented starting from fast pyrolysis of softwood bark. Based on 14.2 million tons of woody biomass produced statewide annually, this system could produce enough gasoline and diesel substitute to offset 15% of transportation fuel usage. In addition to transportation fuels, this system produces combustible gases and biochar. Analysis of the overall syngas showed that carbon dioxide, carbon monoxide, methane, and hydrogen make up the majority components with 94.1% at 250℃. A comprehensive literature review coupled with experimental testing of the produced biochar showed that dioxin and polyaromatic hydrocarbon components were below current environmental specifications.
16.6.2 Feedstock Greenhouse gas emissions from livestock operations contribute to air quality concerns. Khalil et al. (2016) developed a model for estimating GHG emissions from a dairy facility with an anaerobic digester and associated coarse fiber and fine solids removal systems. Laboratory analysis of total solids, volatile solids, total ammonia nitrogen, total Kjeldahl nitrogen, and total carbon were conducted. Based on laboratory digestion trials, single and three-pool empirical decomposition models were developed. Khalil et al. (2016) found that biochemical composition of manure can be used to estimate decomposition rates. The decomposition rate significantly decreased for AD-treated manure, which corresponds to reduced GHG emissions during subsequent storage. In a report to Ecology (Ecology, 2016), municipal solid waste was characterized in six waste generation areas to provide a baseline for future material recovery programs. Organic waste materials made up 28.5% of the overall total material generated in the state. Overall, paper packaging, paper products, organics, and wood wastes made up 55.7% of the statewide waste materials, which would all be of interest as potential feedstocks for processing in a biorefinery. During the collection period, these categories accounted for approximately 1.62 million tons of waste material. Volatile fatty acids (VFA) are produced during the decomposition of dairy manure. Page et al. (2014) examined dairy manure collected from four sources, pre- and post-digestion, to conduct VFA analysis. The flush dairy manure contained the highest VFA concentration with formic acid being the dominant component. Acetic acid was dominant in post-digestion effluent. During

346
storage of dairy manure, post-digestion effluent had the greatest stability, while pre-digestion manure showed a loss of VFA over time. Page et al. (2014) concluded that volatilization and GHG emissions can be reduced by utilizing AD before long-term storage. Hristov et al. (2009) estimated the loss of nitrogen from dairy manure. Given the potential negative impact on soil, water, and air quality from release of ammonia from animal manures, two methods of estimation were examined. The first method involved calculating the nitrogen to phosphorus (N:P) ratio and provided a statistically significant relationship to collective ammonia losses. The second method involved using N:K (nitrogen:potassium) ratios and did not account for all the ammonia losses. This study demonstrated that the N:P ratio can be used to rapidly estimate ammonia losses from dairy manure. In a technical report to Ecology (Ecology, 2007), the energy production potential of 42 feedstocks from agricultural and municipal sources was assessed. In the first part, chemical and physical composition including carbon, nitrogen, and phosphorus content and total solids, total volatile solids, and chemical oxygen demand (COD) content were determined. The summary in this report could be used to classify a given waste and estimate energy production potential, based on technology-specific modeling.
16.6.3 Pretreatment processes Yu et al. (2014) investigated pretreatment methods for AD of high carbon content lignocellulosic materials. Treatments included ozone contact, soaking in aqueous ammonia, combined ozone and ammonia, and grinding. The feedstock utilized was lawn trimmings. Soaking lawn trimmings in aqueous ammonia for 24 hours at 50℃ resulted in about 87% more sugar recovery than the control and produced the highest specific methane yield of any of the treatments. Yu et al. (2014) found that the ozone treatment produced more sugars and a higher VFA concentration than the aqueous ammonia treatment, but the inhibitory nature of the pretreatment reduced overall methane yield. This process has the potential to improve conversion of recalcitrant carbon from lignocellulosic materials into biogas.
16.6.4 Anaerobic digestion Anaerobic digestion of lignocellulosic biomass with high carbon content has traditionally been limited by hydrolytic retention time. For dairy digesters, a 20-30 day retention time is not sufficient for full hydrolysis and conversion of the fibrous material. Yao and Chen (2016) examined the use of solid-state AD coupled with an integrated hydrolysis treatment step. Using a feedstock of rape straw, the combined process reduced retention time by six days and improved methane yield by nearly 77%. The composition of the biogas was shifted significantly higher with 77.5-80.1% methane. This combined system was an improvement in the treatment of feedstocks with high carbon content and resulted in the conversion of more recalcitrant carbon into biogas. Ma et al. (2013) studied the AD of dairy manure to determine the rate-limiting step. When complex organic wastes with high carbon content are digested, a consortium of microorganisms metabolize different components to ultimately produce biogas. With sludge recycle feeding of dairy manure to a digester, the rate-limiting step was determined to be hydrolysis. This study showed that utilizing a ratio of hydrolytic and methanogenic bacteria at or above 24:1 would

347
shift the rate-limiting step towards methanogenesis. This shift corresponds to additional conversion of carbon compounds to biogas and a reduction of carbon in the liquid effluent, which could reduce GHG emissions during lagoon storage. Utilizing an innovative high-solids, two-stage dual digester design, Yu et al. (2012) developed a model for treating the organic fraction of municipal solid waste. The theory of this design is that the high-solids digester can be pH controlled by recycling leachate, effluent, and methanogenic bacteria to and from an upflow anaerobic sludge blanket reactor. This provides the possibility of producing methane-rich biogas from both digesters. Modeling results predicted that an organic loading rate of 5 kg COD per m3 per day could be maintained. It was also shown that optimizing the recycle rate was critical for balancing pH and maintaining the methanogenic population. According to a technical report to Ecology (Ecology, 2012), food scraps can be effectively treated at high solids concentration using a novel, multi-reactor, liquid recycle system. High solids AD operates in a total solids region above 20-25%. This total solids region makes for stackable piles of organic materials, such as food scraps. In this study, a leaching bed reactor was coupled with an upflow anaerobic sludge blanket reactor. Food scraps were mixed with a bulking agent (wheat straw) in a 70:30 ratio. Liquid was recycled from the leaching bed reactor to the upflow reactor, where high concentrations of volatile fatty acids were rapidly treated to produce biogas and a pH-stabilized effluent. This effluent was recycled to the leaching bed reactor to stabilize and buffer pH in the solids pile. The buffering capability of this effluent recycle was effective enough to allow biogas production from the leaching bed reactor. The benefits of this system include reduced use of external dilution water and the conversion of organics to biogas in both reactors. Treated solids from this system would be suitable for mixing with incoming compost as a carbon and nitrogen balancing agent. In a report by WSDA (2011), the profiles and general performance of six Washington State dairy anaerobic digesters were documented. Five of the reported digesters used a hybrid plug-flow complete mix design and the other used a complete mix design. Feedstocks included dairy manure and between 5-30% (by volume) pre-consumer organic waste. Biogas composition ranged from 55-70% methane and from 30-45% carbon dioxide. One facility was utilizing a full-scale nutrient recovery process for nitrogen and phosphorus. Future growth projections anticipated six to nine new digesters in operation by 2020. A follow-up factsheet from WSDA (2017) showed eight operating dairy anaerobic digesters in Washington State. There were 371 total dairies operating, comprised of 144 small (1-199 mature animals), 121 medium (200-699 mature animals), and 106 large (700+ mature animals) dairy facilities. Zaher et al. (2008) tested and modeled a new cold climate anaerobic digester design at the pilot scale for treatment of low-solids flush dairy manure. The physical digester was constructed underground and filled with discarded automobile tires to act as biomass carriers. Removal rates of 30-50% total volatile solids and 40-60% COD were reported, which was close to values reported from traditional designs. Zaher et al. (2008) concluded that this design increased solids retention time and enhanced biofilm development, but the modeling predicted that resulting methane production would be on the low end of traditional technologies. Based on the developed

348
model, effluent carbon concentration and subsequent GHG emissions could be estimated based on hydraulic retention time of the system. In a report submitted to Ecology (Ecology, 2007b) an extensive review of AD systems was framed in terms of producing energy and fertilizer from the organic fraction of municipal solid waste. Core materials covered include: biological and chemical background on the AD process, organic waste characterization, key parameters (pH, temperature, C:N ratio, retention time, organic loading rate, and inhibitors), digester types and classifications, economics, and current AD-related mathematical models. This report provides a basic introduction to AD and can be used as a basis for building a comprehensive sustainable anaerobic biorefinery.
16.6.5 Fiber separation Pelaez-Samaniego et al. (2017) conducted a literature review and critical analysis to investigate current technologies and processes capable of producing energy and value-added products from anaerobically digested dairy fiber. Most processes reviewed were still operating at the laboratory or pilot scale. These included processes that produce peat moss substitutes, fertilizers, charcoal, sugars, syngas, and pyrolysis oils. Thermal gasification was suggested to offer the best short-term opportunity for utilization of the fiber because many dairy operators were already familiar with biogas systems and because it was possible to use the product immediately in the existing infrastructure. These authors concluded that GHG emissions could be reduced by a factor of approximately 6.4 if manure from dry feedlots was utilized as feedstock for gasification instead of being land applied. Liao et al. (2010) processed dairy manure in an innovative two-stage leaching bed reactor to produce a peat moss-like plant growing medium. Separated fiber with a high carbon content was first washed at 50℃ with a leaching rate of 4 L hour-1 per kg of dry solids using a mixture of recycled and fresh water. A second wash step was used to finish the product. After optimal contact and washing time, coliform bacteria showed 1.6 log unit reduction, and the physical properties of the fiber more closely matched the desired peat moss characteristics. Liao et al. (2010) suggested that the leaching wastewater, which had a high COD, would be an effective feedstock for AD. Future work was suggested to compare the product from this four-hour process to compost taking 30-60 days to produce. Based on accumulated knowledge from operating and collaborating on AD-related projects, Kruger et al. (2008) summarized findings from a USDA NRCS Conservation Innovation Grant-funded project. A biophysical analysis of the Vander Haak Dairy digester showed that digested dairy fiber could be used as a horticultural media and add-on technologies could lead to nitrogen and phosphorus recovery from digested effluent.
16.6.6 Composting A report to Ecology (Ecology, 2013) provided a comprehensive review and analysis of odor from commercial scale composting facilities. More biodegradable food scraps and other organic materials are being diverted from landfill disposal in Washington State. These materials are responsible for approximately 873,000 metric tons of CO2equivalent emissions per year. This leads to the potential increase of GHG emissions and other volatile odor producing compounds around composting facilities. Four strategies were proposed for the reduction of odor from these

349
materials: (1) air quality control equipment, (2) optimization of compost pile composition and aeration, (3) utilization of AD as a pretreatment for these materials, and (4) mixing compost with biochar. The study concluded that current facilities should investigate upgraded air handling and air quality equipment to reduce GHG emissions, while future facilities should consider implementing all four strategies listed above. As part of the compost demonstration program, this report by Ecology (2007b) was targeted to help develop food scrap management programs at Washington State institutions and agencies. Composting is the primary method of disposal and treatment of food scraps. The report discusses carbon and nitrogen sources, odor control, and utilization of finished material. This document details on-site vermicomposting, in-vessel systems, and off-site composting, and discusses the necessity of education, motivation, monitoring, and communication in the development of a successful program. In a technical report from Ecology ( 2005a), the process of using above-ground burial to dispose of mortality livestock is detailed. While specifically written to address animal mortality, this document discusses common mortality composting feedstock and ratios, including applicable C:N ratios and typical moisture content. In this case, the finished product has limited marketability as a soil amendment, but can be used for on-farm application. This application shows that animal mortalities can be include in the local, carbon short-cycle to reduce GHG emissions and enhance soil composition. An Ecology factsheet (Ecology, 2005) describes background, fabrication, and operation of a small scale vermicomposting system. While targeted at the home user, this document details benefits of utilizing food scraps for conversion into value-added compost. Another Ecology factsheet, Solid Waste and Financial Assistance Program, gives the background and rational for small scale composting (Ecology, 2005c). Recommended feedstock includes food scraps and yard trimmings. Recommended uses for the resulting compost includes as a soil amendment, in a potting mixture, and as mulch.
16.6.7 Biogas stripping and upgrading Chi et al. (2011) demonstrated utilization of waste carbon dioxide to produce bicarbonate for algae growth. In a closed-loop system, carbonate can be utilized to capture carbon dioxide from a point source, resulting in the formation of bicarbonate. The bicarbonate solution is then circulated to an algal growth system, where it is metabolized back to carbonate and then recycled to capture more carbon dioxide. The authors caution that algae suitable for growth in harsh environments should be selected and optimized to take full advantage of this system. The local carbon short-cycle is demonstrated in this system. Following on their previous demonstration of using waste carbon dioxide to produce bicarbonate for algae growth, Chi et al. (2013) developed and tested a bicarbonate-based integrated carbon capture and algae production system (BICCAPS) using alkalihalophilic cyanobacteria. They measured 1.21 g L-1 day-1 biomass productivity with 1.0 M NaHCO3/Na2CO3. This system has potential as an alternative to traditional sparging for supplying carbon dioxide to algae growth systems.

350
Kennedy et al. (2015) developed a method for the selective removal of hydrogen sulfide from simulated as-produced biogas. Using a bubble column reactor and countercurrent flow of pretreated digester effluent and simulated biogas, a hydrogen sulfide removal efficiency of 84% was obtained at a biogas-to-effluent ratio of 20:1. This application demonstrates the removal and potential safe utilization of a highly corrosive biogas component that can detrimentally affect air, soil, and water quality if released to the environment.
16.6.8 Nutrient recovery Zhao et al. (2015) demonstrated ammonia recovery from anaerobically digested dairy manure using a direct aeration system. In this study, 90% total ammonia nitrogen removal was achieved using a micro air bubble diffuser operating at 55℃, with a six-hour aeration time. Zhao et al. (2015) concluded that bubble size, air flow rate, liquid to air ratio, and effluent pH all need to be optimized for best performance. Because this process does not use consumables, it was thought to be more economical compared to traditional ammonia stripping technologies, pending a life-cycle assessment. Ammonia released from dairy manure can cause negative soil, water, and air quality issues. Jiang et al. (2014) demonstrated an integrated ammonia stripping and recovery system. The pH of digested effluent was raised to promote the conversion of ammonium to ammonia. After stripping, carbon dioxide was bubbled through the liquid to decrease the pH of the discharged effluent. Jiang et al. (2014) determined that temperature and pH were the most sensitive parameters affecting overall ammonia removal. An overall ammonia removal of 90% was achieved, with an associated removal of hydrogen sulfide and carbon dioxide in the second step. Chen et al. (2012) developed a process for harvesting algae using captured ammonia and carbon dioxide. The use of ammonia as a flocculent achieved a 99% algae settling and removal rate with 12 hours of exposure. A subsequent step using heated carbon dioxide stripped ammonia from settled algae and provided a nutrient-rich recycle stream for growth of the next batch of algae. The recycled ammonia with carbon dioxide resulted in greater algae growth density than the control.
16.6.9 Wastewater treatment Aeration of low-strength dairy wastewater is an effective treatment to limit GHG emissions, especially methane emissions. To determine effective monitoring and control strategies, Ndegwa et al. (2007) determined that pH and oxygen-reduction potential measurements in aerated systems correlated well with total volatile solids and COD concentration. By utilizing these readily available sensors, waste stabilization can be estimated more effectively and control systems implemented more efficiently.
16.6.10 Thermochemical technologies for production and utilization of biochar
In Zhang et al. (2016), cellulosic biomass and waste plastics were treated by microwave-assisted pyrolysis followed by catalytic hydrogenation to produce jet fuel. High carbon content cellulose powder and common low-density polyethylene were utilized as the primary feedstocks. This

351
process was demonstrated to improve the carbon yield of renewable alkanes for jet fuel production and reduce the formation of char and coke during pyrolysis. Mitchell et al. (2015) tested various types of biochar produced from woody biomass and fiber separated from dairy manure for ability to sequester antibiotics. It was found that pinewood biochar was capable of sequestering antibiotic residues in a soil-urine-feces environment. It was suggested that adding biochar to livestock pen soil may be an effective method to limit the mobility and contamination from antibiotics. Liaw et al. (2012) utilized forestry wood waste from Washington State as a feedstock for an innovative auger pyrolysis reactor to determine temperature effects on yield and properties of pyrolysis oil (bio-oil) products. Yield and products compared favorably to traditional fluidized bed reactors. Acetic acid, glycolaldehyde, and methanol were each produced at a rate of about 5% of the total mass flow through the reactor. An unreported large fraction of the biomass was converted into a sugar-containing slurry. Liaw et al. (2012) reported that although pyrolysis oil yields were lower than traditional technologies, the auger pyrolysis reactor utilized fewer consumables and produce a cleaner biochar product. An Ecology factsheet (Ecology, 2002) gives general guidelines for using carbon for the adsorption of hazardous waste. The two main carbon sources listed are activated carbon and granular activated carbon. While not specifically related to biochar, this document discusses applications that are relevant to the utilization of these common carbon-based products.
16.6.11 Manure, fertilizer, and AD effluent field application Current methods of measuring or estimating GHG emissions from field applications of manure or fertilizer are expensive (measuring) or overly simplified (modeling). Wang et al. (2012) developed an empirical Unit Response curve method model for estimating carbon dioxide, methane, and nitrous oxide emissions from recent field application. Soil samples from five fields in Washington State were taken before and after the application of fiber separated from flush dairy manure and fiber separated from AD effluent. Standard methods were used to analyze the samples and the data was utilized in developing the model. The authors highlight that this study also examined the relationship between model parameters and site-specific background GHG fluxes to improve parameter estimation.
16.6.12 Other innovative or potentially disruptive processes or technologies
16.6.12.1 Modeling
In Adam et al. (2015), individual land, air, water, and economic models are coupled through the BioEarth initiative, which aims to provide a portal to support agricultural and natural resources managers in the Pacific Northwest region. This model examines the relationship between atmospheric, terrestrial, and aquatic carbon, nitrogen, and waste cycles, and further breaks out the economic implications of each. In 2015, the BioEarth initiative was halfway through the initial funding period. A stakeholder advisory process to generate feedback for initiative development was also described in this article.

352
Stöckle et al. (2014) reviewed and evaluated the CropSyst model for its ability to provide more functions to decision support systems. One highlight is that CropSyst has evolved from focusing on cropping systems alone to considering the whole farm, including dairy and crops. This larger combined model includes inputs such as animal feed, and tracks carbon, nitrogen, and phosphorus in liquid, solid, and gaseous forms throughout the process. This model has the potential to provide insight and guide the direction of future research in the area of GHG emissions. When developing a mathematical model, assumptions are made to reduce calculation time or focus on one specific parameter or system characteristic. These assumptions all result in uncertainty being introduced to the final estimates. Wang and Chen (2012) reviewed current models for estimating GHG emissions (carbon dioxide, methane, and nitrous oxide) from soil, to assess uncertainties related to specific model parameters. Wang and Chen (2012) concluded their review with several suggestions: given models should be calibrated using data from multiple locations, uncertainties should be expressly noted during model development and documentation, and the results from multiple competing models should be used to support the decision-making process. Wang and Chen (2013a) conducted a follow-up to their 2012 review of uncertainty. Specifically, the Bayesian inference and Markov chain Monte Carlo techniques were combined to determine uncertainty in soil GHG emission models. Findings included a suggestion to review all single gas simulation results and consider improved techniques to reduce uncertainty.
An additional study was conducted by Wang and Chen (2013b) to review and assess soil GHG emissions. In this study, the authors highlighted two main concepts: determine if model parameters for a given data set are unique (parameter identifiability) and determine if a set of model parameters are unique for a given data set (equifinality). They compared the covariance-inverse method to more traditional difference quotients and quasi-analytical methods. They concluded that while the covariance-inverse method provides similar diagnosis on model identifiability, it is a better option due to inherent advantages in implementation.
Although AD is a mature technology, phenomenological modeling of basic processes has not advanced at the same pace as physical digester design or feedstock assessment and optimization. Gas flow modeling is limited, as each component in biogas, methane, carbon dioxide, hydrogen, and other trace gases, must be either calculated individually, or oversimplifications must be made to account for non-linear calculations. Smith and Stöckle (2010) developed a new gas transfer model to reduce mathematical inconsistencies with current models and better estimate gas values to improve parallel thermodynamic modeling. This improved estimation of gas flow can lead to better understanding of biogas holdup and GHG emissions from post-digester effluent. Kemanian and Stöckle (2010) developed a simple carbon balance model to generate estimates of carbon in soil profiles. This model was validated by utilizing data from two long-term carbon storage and evolution experiments. Highlighting no-till cropping systems in Washington, they found that the factors affecting carbon storage potential are initial carbon level and residue input to the soil. To continue refining the model, inputs based on accurate initial carbon, crop yield, tillage operations, and crop rotation data are needed.

353
16.6.12.2 Cropping systems
Adewale et al. (2016) studied the carbon footprint and GHG emissions of an organic vegetable farm in Washington State. They found that the carbon footprint varied between crops, with cauliflower and chard at the high and low ends at 2.67 and 1.68 metric tons CO2-equivalent per hectare per year, respectively. Fuel use accounted for the largest portion of the carbon footprint at 38% of emissions, followed by fertilization, soil emission, and irrigation. It was estimated that switching to biodiesel for transportation fuel could reduce the whole farm carbon footprint by 32%. In Waldo et al. (2016), soil carbon dynamics were studied at both high and low rainfall sites. During the study, the net ecosystem exchange of carbon dioxide was monitored using the eddy covariance method. These two sites in the inland Pacific Northwest dryland wheat growing region both acted as net carbon sinks during the two-year project study. Results showed that wheat cropping years provided the highest carbon sink performance at the low rainfall site. During the fallow season, both sites were near neutral or slight carbon emitters. Chi et al. (2016) compared no-till and conventional tillage cropping systems to assess carbon and water dynamics. They found that no-till was nearly carbon neutral when adjusted for carbon losses at harvest, while conventional tillage was a net carbon source. In terms of water, both sites had similar evapotranspiration levels; however, the no-till site had less evaporation. Overall, no-till provided more net carbon uptake than conventional tillage. A literature review provided to Ecology (Ecology, 2015) described the current levels of carbon storage in Washington State soils and discussed strategies to increase carbon sequestration in these soils. From available data, it was estimated that increasing soil carbon levels by 5-15% could lead to significant reductions in atmospheric carbon dioxide levels. Available materials for increasing soil carbon composition include compost, municipal biosolids, and biochar. Agronomic application rates are estimated to be 5.0 dry tons of compost, 2.0 dry tons of biosolids, and 0.4 tons of biochar per acre per year. It was found that current production rates of these materials would not even provide coverage for 5% of the total statewide cropland. In addition, it was hypothesized that recovery and use of more available material would be constrained by transportation cost to distance fields.
16.6.12.3 Climate change adaptation and mitigation
A literature review on preparing Washington State for climate change was prepared by Whitely Binder et al. (2010). The focus of the study was the potential impacts of climate change on human and natural systems. The authors discuss both adaptation (the preparation for climate change) and mitigation (the reduction of current GHG emissions). The authors concluded that adaptation will require the systematic integration of government policy, scientific research, and economic changes to lessen the overall impact of climate change. In a parallel track with the literature review discussed above, Stöckle et al. (2010) utilized the CropSyst model to estimate future climate change impacts on agriculture in eastern Washington State. Results of the modeling showed that overall climate change should have little impact in the near term (20 years), but could result in reduced crop yields in the long term. Increasing carbon dioxide levels could act to mitigate the other adverse effects of climate change on agriculture, but

354
only if crop selection is modified to fit new growth conditions. In this analysis, assumptions were made about the frequency and persistence of maximum temperatures and the maintenance of sufficient irrigation sources.
16.6.12.4 Fuel and value-added chemical production
The production of carboxylic acids from microalgal biomass was demonstrated by Zhao et al. (2016). An anaerobic sequencing batch reactor was used with a mixed-culture seed obtained from dairy cow rumen to treat microalgal biomass. Hydraulic retention time was shown to impact the chain length of carboxylic acids, with 12 days being optimum for C5-C6 production. This process is suitable as a first stage in the production of downstream biofuels including biodiesel, biohydrogen, and biomethane. Lian et al. (2010) studied oils produced from pyrolysis as potential feedstock for yeast fermentation to produce ethanol and lipids. These oils contain high sugar content, which can detrimentally affect downstream processing. A multi-step process for neutralizing and adsorbing toxic compounds on activated carbon was developed to produce suitable fermentation feedstock. This process of removing impurities that can decrease efficacy of downstream oil processing results in the formation of valuable co-products. In a technical report to Ecology (Ecology, 2009b), food scraps were utilized as a feedstock for the production of hydrogen and a biodiesel precursor. This two-step process first utilized dark fermentation to treat food scraps to produce hydrogen and VFA, and then utilized yeast to metabolize VFA to produce an oil-rich biomass. Tracking of carbon showed that during the first step, 33% of the carbon was converted to carbon dioxide, while about 67% was converted to VFA. During the second step, this carbon was sequestered in the yeast biomass. This system has the potential to reduce GHG emissions from diversion of food scraps from landfilling in Washington State. As reported to Ecology (Ecology, 2009c), ethanol production from mixed waste paper, yard trimmings, and the organic fraction of MSW in Washington State was investigated. Utilizing pretreatments of dilute acid, steam, and enzymatic hydrolysis processes, a sugar-rich effluent was obtained from these organic and lignocellulosic materials. A yeast fermentation process resulted in ethanol conversions of 90 gallons per ton from mixed waste paper, 55 gallons per ton from yard trimmings, and 105 gallons per ton from the organic fraction of MSW. A life cycle assessment study estimated that conversion of the organic fraction of MSW could be economically viable immediately, whereas the other feedstocks need additional process optimizations. In a scenario where all of these materials are diverted to ethanol production, statewide energy consumption of the renewable fuel increased by a factor of 24, and 10.5 gigagrams of biogenic carbon dioxide are offset each year. The production of docosahexaenoic acid, a valuable nutraceutical, from waste crude glycerol was demonstrated by Chi et al. (2007). This process utilizes a waste carbon product from biodiesel production as feedstock for fermentation by microalgae. This study showed the potential for producing a low volume, high-value product from a low-value carbon containing waste product.

355
An Ecology report (Ecology, 2001) provides an overview of hog fuel boiler operation and wood ash disposal. In a hog fuel boiler, high carbon content wood is combusted to produce heat or combined heat and power. After combustion, the resulting wood ash is disposed of, either by landfilling or land application as a soil amendment. Concerns over dioxin production during combustion have resulted in a full review of hog fuel utilization and disposal methods.
16.6.12.5 Policy-related documents
According to a report to Ecology (Ecology, 2011), Washington State’s GHG emissions in 2008 were approximately 101.1 million metric tons of CO2-equivalents. This was projected to increase to 104.0 and 114.1 million metric tons of CO2-equivalents in 2020 and 2035, respectively. The majority of these emissions represent transportation and energy production, while approximately 6% occur in the agricultural sector. To address the need to reduce current emissions, six Washington State Departments (Ecology, Agriculture, Commerce, Fish and Wildlife, Natural Resources, and Transportation) were tasked with coordinating an integrated climate change response strategy. Stakeholder advisory groups were formed and the development of the response strategy is ongoing. An informational report by Ecology (Ecology, 2008) lists details about a proposed Western Climate Initiative carbon cap-and-trade program. Specific areas of interest include reduction of nitrogen fertilizer use and methane emissions in agriculture, reductions in methane emissions from municipal landfills and wastewater treatment facilities, and efforts to both mitigate the conversion of forested land and to increase carbon sequestration and storage through forest management practices. As part of the Beyond Waste program, a conceptual model for waste and material tracking was developed for Washington State (Ecology, 2003a). The largest category of waste production during the year 2000 was carbon dioxide and other GHGs. The annual emissions were estimated at 100 million tons. The majority of the emissions were from energy production and transportation. This estimate did not account for methane emissions or other volatile compounds. Additional material tracking showed that 14 million tons of animal manures were produced and 700,000 tons of fertilizers were utilized during that same year. This report detailed the initial steps to moving toward viewing waste as a valuable future resource. In a follow-up Beyond Waste program report to Ecology (Ecology, 2003b), there were three key recommendations to move toward utilizing all organic waste as a resource: (1) develop infrastructure, (2) strengthen markets, and (3) transform the system. Each of these three recommendations included 0-3 year, 3-10 year, and 10-30 year suggested actions. Development of a carbon trading market and communicating the importance of green energy and the carbon cycle education were listed as 3-10 year, near-term actions. The program development vision communicated in this report relies on each of the three key recommendations moving forward in parallel.
356
16.7 Conclusions and next steps
The sustainable use of carbon from biomass and organic waste and the reduction of CO2-equivalent emissions are critical for the development of a local bioeconomy to support regional employment through the production of bioenergy and value-added chemicals, fertilizers, and other products. This report summarized the current literature related to carbon utilization and CO2-equivalent emissions from processes, systems, and technologies related to the biorefinery concept. These summaries, organized by association with biorefinery unit operations, can provide a jumping-off point for developing a comprehensive carbon management framework. To implement utilization of renewable carbon at an industrial scale, a full supply chain analysis needs to be completed, accounting for the relative sources and magnitudes of CO2-equivalent emissions. Work in four general topic areas is needed to support the development of this framework:
• Review and quantify sustainability based on the absolute CO2-equivalent emissions of all operating processes and systems
o Quantify the carbon impact and GHG emissions o Determine magnitude of emissions related to scientific analysis and policy o Complete a parameter analysis to determine ranking of carbon sources for
targeted optimization o Determine economic values of processes and emissions
• Develop rigorous quantitative models to predict CO2-equivalent emissions for all proposed processes and systems
o Apply quantitative modeling as related to proposed future emission restrictions and policy
o Determine overall process goals and relate these to best-case through worst-case modeling forecasts
o Determine valuation of future products and markets to support technology development
• Complete a technology review to identify process and system improvements o Determine current alternative technologies with improved performance o Determine if existing fossil fuel reserves can be utilized with advanced
technologies for a lower cost during a short-term transition • Develop procedures to implement and continuously improve the carbon management
framework o Perform a life-cycle assessment on all proposed processes and systems
This report contributes to the overall understanding of carbon accounting by providing concise summaries of previous research. By clearly classifying each research project by its relevance to a particular biorefinery unit operation, the reader can gain a deeper understanding of the scope of work completed in Washington State.

357
16.8 References
Adam, J.C., Stephens, J.C., Chung, S.H., Brady, M.P., Evans, R.D., Kruger, C.E., Lamb, B.K., Liu, M., Stöckle, C.O., Vaughan, J.K., Rajagopalan, K., Harrison, J.A., Tague, C.L., Kalyanaraman, A., Chen, Y., Guenther, A., Leung, F.-Y., Leung, L.R., Perleberg, A.B., Yoder, J., Allen, E., Anderson, S., Chandrasekharan, B., Malek, K., Mullis, T., Miller, C., Nergui, T., Poinsatte, J., Reyes, J., Zhu, J., Choate, J.S., Jiang, X., Nelson, R., Yoon, J.-H., Yorgey, G.G., Johnson, K., Chinnayakanahalli, K.J., Hamlet, A.F., Nijssen, B., Walden, V., 2015. BioEarth: Envisioning and developing a new regional earth system model to inform natural and agricultural resource management. Clim. Change 129, 555–571. doi:10.1007/s10584-014-1115-2
Akpan, U.F., Akpan, G.E., 2011. The Contribution of Energy Consumption to Climate Change: A Feasible Policy Direction. Int. J. Energy Econ. Policy 2, 21–33.
Andersen, J.K., Boldrin, A., Samuelsson, J., Christensen, T.H., Scheutz, C., 2010. Quantification of Greenhouse Gas Emissions from Windrow Composting of Garden Waste. J. Environ.
Qual. 39, 713–724. doi:10.2134/jeq2009.0329 Arce, G.L.A.F., Carvalho, J.A., Nascimento, L.F.C., 2014. A time series sequestration and
storage model of atmospheric carbon dioxide. Ecol. Model. 272, 59–67. doi:10.1016/j.ecolmodel.2013.09.006
Aresta, M., 2012. Biorefinery From Biomass to Chemicals and Fuels, Biorefinery. De Gruyter, Berlin.
Ascui, F., Lovell, H., 2011. As frames collide: making sense of carbon accounting. Account.
Audit. Account. J. 24, 978–999. doi:10.1108/09513571111184724 Banuri, T., 2009. Climate change and sustainable development. Nat. Resour. Forum 33, 257–
258. doi:10.1111/j.1477-8947.2009.01270.x Bastianoni, S., Pulselli, F.M., Tiezzi, E., 2004. The problem of assigning responsibility for
greenhouse gas emissions. Ecol. Econ. 49, 253–257. doi:10.1016/j.ecolecon.2004.01.018 Bayon, R., Hawn, A., Hamilton, K., 2007. Voluntary carbon markets: an international business
guide to what they are and how they work. Earthscan, London ; Sterling, VA. Bebbington, J., Larrinaga-Gonzalez, C., 2008. Carbon Trading: Accounting and Reporting
Issues. Eur. Account. Rev. 17, 697–717. doi:10.1080/09638180802489162 Bergeron, C., 2012. Biorefinery Co-Products Phytochemicals, Primary Metabolites and Value-
Added Biomass Processing, Wiley Series in Renewable Resource Ser. Hoboken : Wiley, Hoboken.
Boldrin, A., Hartling, K.R., Laugen, M., Christensen, T.H., 2010. Environmental inventory modelling of the use of compost and peat in growth media preparation. Resour. Conserv.
Recycl. 54, 1250–1260. doi:10.1016/j.resconrec.2010.04.003 Bowen, F., Wittneben, B., 2011. Carbon accounting: Negotiating accuracy, consistency and
certainty across organisational fields. Account. Audit. Account. J. 24, 1022–1036. doi:10.1108/09513571111184742
Bozell, J.J., 2008. Feedstocks for the Future – Biorefinery Production of Chemicals from Renewable Carbon. CLEAN – Soil Air Water 36, 641–647. doi:10.1002/clen.200800100
Bozell, J.J., Petersen, G.R., 2010. Technology development for the production of biobased products from biorefinery carbohydrates—the US Department of Energy’s “Top 10” revisited. Green Chem. 12, 539–554. doi:10.1039/B922014C
358
Brenton, P., 2010. Carbon Footprints and Food Systems Do Current Accounting Methodologies Disadvantage Developing Countries? World Bank Publications, Washington, D.C.
Burritt, R., Schaltegger, S., 2000. Contemporary Environmental Accounting Issues, Concepts and Practice, Contemporary Environmental Accounting. Greenleaf Publishing, Sheffield.
Chen, F., Liu, Z., Li, D., Liu, C., Zheng, P., Chen, S., 2012. Using ammonia for algae harvesting and as nutrient in subsequent cultures. Bioresour. Technol. 121, 298–303. doi:10.1016/j.biortech.2012.06.076
Cherubini, F., Ulgiati, S., 2010. Crop residues as raw materials for biorefinery systems – A LCA case study. Appl. Energy 87, 47–57. doi:10.1016/j.apenergy.2009.08.024
Chi, J., Waldo, S., Pressley, S., O’Keeffe, P., Huggins, D., Stöckle, C., Pan, W.L., Brooks, E. and Lamb, B., 2016. Assessing carbon and water dynamics of no-till and conventional tillage cropping systems in the inland Pacific Northwest US using the eddy covariance method. Agricultural and Forest Meteorology, 218, 37-49. doi:10.1016/j.agrformet.2015.11.019
Chi, Z., O’Fallon, J.V., Chen, S., 2011. Bicarbonate produced from carbon capture for algae culture. Trends Biotechnol. 29, 537–541. doi:10.1016/j.tibtech.2011.06.006
Chi, Z., Pyle, D., Wen, Z., Frear, C., Chen, S., 2007. A laboratory study of producing docosahexaenoic acid from biodiesel-waste glycerol by microalgal fermentation. Process
Biochem. 42, 1537–1545. doi:10.1016/j.procbio.2007.08.008 Chi, Z., Xie, Y., Elloy, F., Zheng, Y., Hu, Y., Chen, S., 2013. Bicarbonate-based Integrated
Carbon Capture and Algae Production System with alkalihalophilic cyanobacterium. Bioresour. Technol. 133, 513–521. doi:10.1016/j.biortech.2013.01.150
Cook, A., 2009. Emission rights: From costless activity to market operations. Account. Organ.
Soc. 34, 456–468. doi:10.1016/j.aos.2007.12.001 Davidsdottir, B. and Fisher, M., 2011. The odd couple: The relationship between state economic
performance and carbon emissions economic intensity. Energy Policy, 39(8), 4551-4562. doi:10.1016/j.enpol.2011.04.030
Dawson, T.P., Perryman, A.H., Osborne, T.M., 2016. Modelling impacts of climate change on global food security. Clim. Change 134, 429–440. doi:10.1007/s10584-014-1277-y
Dhanda, K., Hartman, L., 2011. The Ethics of Carbon Neutrality: A Critical Examination of Voluntary Carbon Offset Providers. J. Bus. Ethics 100, 119–149. doi:10.1007/s10551-011-0766-4
Ecology, 2001. Hog Fuel Boiler/Wood Ash Action Plan: Technical Report (No. 01-04-008). Department of Ecology, Lacey, WA.
Ecology, 2002. Carbon Adsorption: Treatment Specific Guidance (No. 96–415). Department of Ecology, Lacey, WA.
Ecology, 2003a. Beyond Waste Consultant Team Issue Paper #1: Waste and Material Flows (No.
03-7–25). Department of Ecology, Lacey, WA. Ecology, 2003b. Beyond Waste Consultant Team Issue Paper #4 - Establishing the Organics
Cycle in Washington State (No. 03-4–31). Department of Ecology, Lacey, WA. Ecology, 2005a. On-Farm Composting of Livestock Mortalities (No. 05-7–34). Department of
Ecology, Lacey, WA. Ecology, 2005b. Focus on Vermicomposting (No. 05-7–21). Department of Ecology, Lacey,
WA. Ecology, 2005c. Why compost? (No. 05-7–17). Department of Ecology, Lacey, WA.

359
Ecology, 2007a. Biomass Inventory Technology and Economics Assessment -- Report 1. Characteristics of Biomass (No. 07-7–25). Department of Ecology, Lacey, WA.
Ecology, 2007b. Producing Energy and Fertilizer From Organic Municipal Solid Waste -- Project Deliverable #1 (No. 07-7–24). Department of Ecology, Lacey, WA.
Ecology, 2007c. Managing Food Scraps at Institutions and Agencies - A Guide for Washington State (No. 06-7–33). Department of Ecology, Lacey, WA.
Ecology, 2008. Forestry, Agriculture, and BioGas as Offsets (No. 08-1–33). Department of Ecology, Lacey, WA.
Ecology, 2009a. Organic Waste to Resources Research and Pilot Project Report: New Bio-refinery Concept to Convert Softwood Bark to Transportation Fuels Final Report to the Washington State Department of Ecology (No. 09-7–61). Department of Ecology, Lacey, WA.
Ecology, 2009b. Organic Waste to Resources Research and Pilot Project Report: Biodiesel and Biohydrogen Co-Production with Treatment of High Solid Food Waste (No. 09-7–65). Department of Ecology, Lacey, WA.
Ecology, 2009c. Organic Waste to Resources Research and Pilot Project Report: Converting Washington Lignocellulosic Rich Urban Waste to Ethanol (No. 09-7–60). Department of Ecology, Lacey, WA.
Ecology, 2011. Path to a Low-Carbon Economy (No. 10-1–11). Department of Ecology, Lacey, WA.
Ecology, 2012. Two Novel Floor-Scale Anaerobic Digester Systems for Processing Food Waste (No. 12-7–36). Department of Ecology, Lacey, WA.
Ecology, 2013. Odor in Commercial Scale Compost: Literature Review and Critical Analysis (No. 13-7–66). Department of Ecology, Lacey, WA.
Ecology, 2015. Soil Organic Carbon Storage (Sequestration) Principles and Management (No.
15-07-005). Department of Ecology, Lacey, WA. Ecology, 2016. 2015-2016 Washington Statewide Waste Characterization Study (No. 16-7–32).
Department of Ecology, Lacey, WA. Favoino, E. and Hogg, D., 2008. The potential role of compost in reducing greenhouse
gases. Waste Management & Research, 26(1), 61-69. doi:10.1177/0734242X08088584 Ferng, J.J., 2003. Allocating the responsibility of CO 2 over-emissions from the perspectives of
benefit principle and ecological deficit. Ecological Economics, 46(1), 121-141. doi:10.1016/S0921-8009(03)00104-6
Fiorentino, G., Ripa, M. and Ulgiati, S., 2016. Chemicals from biomass: technological versus environmental feasibility. A review. Biofuels, Bioproducts and Biorefining. doi:10.1002/bbb.1729
Fogel, C., 2005. Biotic carbon sequestration and the Kyoto Protocol: the construction of global knowledge by the Intergovernmental Panel on Climate Change. International
Environmental Agreements: Politics, Law and Economics, 5(2), 191-210. doi:10.1007/s10784-005-1749-7
Garcia-Nunez, J.A., Ramirez-Contreras, N.E., Rodriguez, D.T., Silva-Lora, E., Frear, C.S., Stockle, C., Garcia-Pérez, M., 2016a. Evolution of palm oil mills into bio-refineries: Literature review on current and potential uses of residual biomass and effluents. Resources, Conservation and Recycling, 110, 99-114. doi:10.1016/j.resconrec.2016.03.022

360
Garcia-Nunez, J.A., Rodriguez, D.T., Fontanilla, C.A., Ramirez, N.E., Silva Lora, E.E., Frear, C.S., Stockle, C., Amonette, J., Garcia-Pérez, M., 2016b. Evaluation of alternatives for the evolution of palm oil mills into biorefineries. Biomass and Bioenergy, 95, 310-329doi:10.1016/j.biombioe.2016.05.020
Gerardi, M.H., 2003. The Microbiology of Anaerobic Digesters. John Wiley & Sons. Gray, R., 2010. Is accounting for sustainability actually accounting for sustainability…and how
would we know? An exploration of narratives of organisations and the planet. Account.
Organ. Soc. 35, 47–62. doi:10.1016/j.aos.2009.04.006 Hoffmann, M.J., 2011. Climate governance at the crossroads : experimenting with a global
response after Kyoto. Oxford University Press, Oxford ; New York. Hopwood, A.G., 2009. Accounting and the environment. Account. Organ. Soc. 34, 433–439.
doi:10.1016/j.aos.2009.03.002 Howe, J.P., 2015. This Is Nature; This Is Un-Nature: Reading the Keeling Curve. Environ. Hist.
20, 286–293. doi:10.1093/envhis/emv005 Hrad, M., Binner, E., Piringer, M., Huber-Humer, M., 2014. Quantification of methane
emissions from full-scale open windrow composting of biowaste using an inverse dispersion technique. Waste Manag. 34, 2445–2453. doi:10.1016/j.wasman.2014.08.013
Hristov, A.N., Zaman, S., Vander Pol, M., Ndegwa, P., Campbell, L., Silva, S., 2009. Nitrogen Losses from Dairy Manure Estimated Through Nitrogen Mass Balance and Chemical Markers. J. Environ. Qual. 38, 2438. doi:10.2134/jeq2009.0057
IPCC, 2007. Climate Change 2007: The Physical Science Basis. Contribution of Working Group I to the Fourth Assessment Report of the Intergovernmental Panel on Climate Change. Cambridge University Press, Cambridge, United Kingdom and New York, NY, USA.
Jenner, M., 2011. Biomass energy outlook. BioCycle, 52(4), 61. Jiang, A., Zhang, T., Zhao, Q.-B., Li, X., Chen, S., Frear, C.S., 2014. Evaluation of an integrated
ammonia stripping, recovery, and biogas scrubbing system for use with anaerobically digested dairy manure. Biosyst. Eng. 119, 117–126. doi:10.1016/j.biosystemseng.2013.10.008
Johnson, G.A., Qian, Y.L., Davis, J.G., 2009. Topdressing Kentucky Bluegrass with Compost Increases Soil Water Content and Improves Turf Quality During Drought. Compost Sci.
Util. 17, 95–102. Jonas, M., Marland, G., Krey, V., Wagner, F., Nahorski, Z., 2014. Uncertainty in an emissions-
constrained world. Clim. Change 124, 459–476. doi:10.1007/s10584-014-1103-6 Jones, S., 2012. Contemporary Issues in Sustainability Accounting, Assurance and Reporting.
Emerald Group Publishing Limited, Bradford. Kemanian, A.R. and Stöckle, C.O., 2010. C-Farm: A simple model to evaluate the carbon
balance of soil profiles. European Journal of Agronomy, 32(1), 22-29. doi:10.1016/j.eja.2009.08.003
Kennedy, N., Frear, C., Garcia-Pérez, M., Kruger, C., Chen, S., 2013. Dairy Waste Biorefinery: Concept illustration and description (Extension). Washington State University.
Kennedy, N., Zhao, Q.-B., Ma, J., Chen, S., Frear, C., 2015. The selective removal of H2S over CO2 from biogas in a bubble column using pretreated digester effluent. Sep. Purif.
Technol. 144, 240–247. doi:10.1016/j.seppur.2015.02.046 Khalil, T.M., Higgins, S.S., Ndegwa, P.M., Frear, C.S., Stöckle, C.O., 2016. Assessing the effect
of different treatments on decomposition rate of dairy manure. J. Environ. Manage. 182, 230–237. doi:10.1016/j.jenvman.2016.07.056
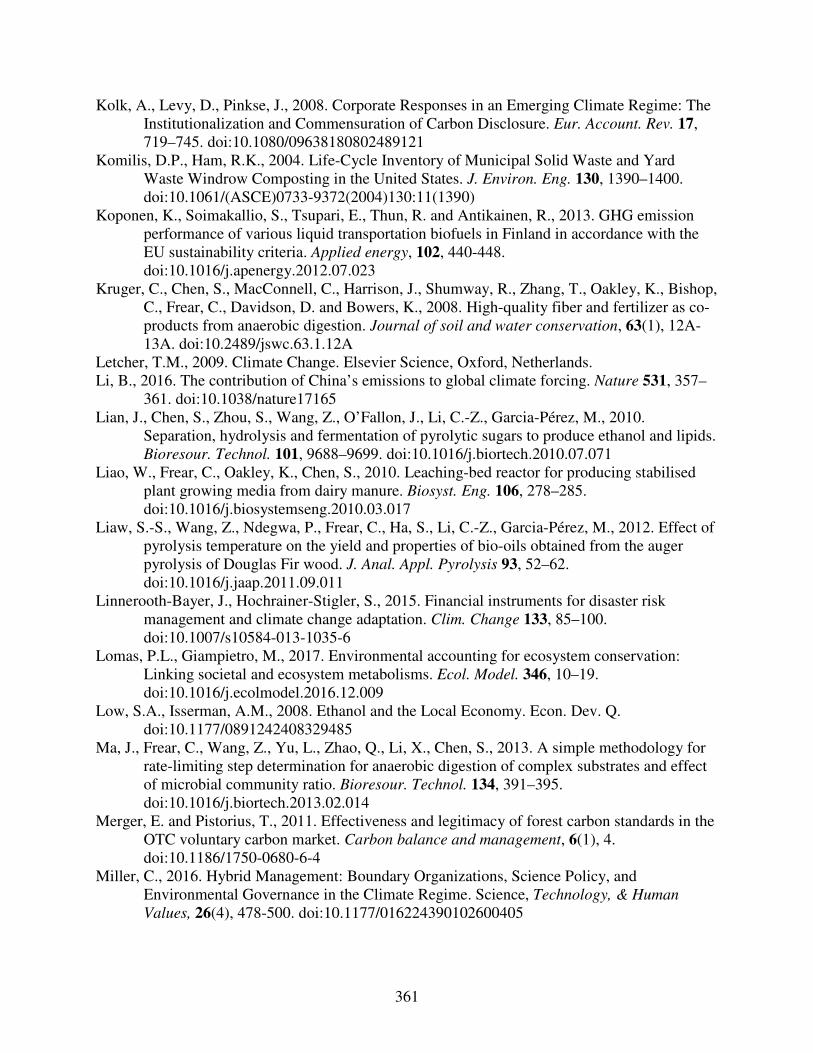
361
Kolk, A., Levy, D., Pinkse, J., 2008. Corporate Responses in an Emerging Climate Regime: The Institutionalization and Commensuration of Carbon Disclosure. Eur. Account. Rev. 17, 719–745. doi:10.1080/09638180802489121
Komilis, D.P., Ham, R.K., 2004. Life-Cycle Inventory of Municipal Solid Waste and Yard Waste Windrow Composting in the United States. J. Environ. Eng. 130, 1390–1400. doi:10.1061/(ASCE)0733-9372(2004)130:11(1390)
Koponen, K., Soimakallio, S., Tsupari, E., Thun, R. and Antikainen, R., 2013. GHG emission performance of various liquid transportation biofuels in Finland in accordance with the EU sustainability criteria. Applied energy, 102, 440-448. doi:10.1016/j.apenergy.2012.07.023
Kruger, C., Chen, S., MacConnell, C., Harrison, J., Shumway, R., Zhang, T., Oakley, K., Bishop, C., Frear, C., Davidson, D. and Bowers, K., 2008. High-quality fiber and fertilizer as co-products from anaerobic digestion. Journal of soil and water conservation, 63(1), 12A-13A. doi:10.2489/jswc.63.1.12A
Letcher, T.M., 2009. Climate Change. Elsevier Science, Oxford, Netherlands. Li, B., 2016. The contribution of China’s emissions to global climate forcing. Nature 531, 357–
361. doi:10.1038/nature17165 Lian, J., Chen, S., Zhou, S., Wang, Z., O’Fallon, J., Li, C.-Z., Garcia-Pérez, M., 2010.
Separation, hydrolysis and fermentation of pyrolytic sugars to produce ethanol and lipids. Bioresour. Technol. 101, 9688–9699. doi:10.1016/j.biortech.2010.07.071
Liao, W., Frear, C., Oakley, K., Chen, S., 2010. Leaching-bed reactor for producing stabilised plant growing media from dairy manure. Biosyst. Eng. 106, 278–285. doi:10.1016/j.biosystemseng.2010.03.017
Liaw, S.-S., Wang, Z., Ndegwa, P., Frear, C., Ha, S., Li, C.-Z., Garcia-Pérez, M., 2012. Effect of pyrolysis temperature on the yield and properties of bio-oils obtained from the auger pyrolysis of Douglas Fir wood. J. Anal. Appl. Pyrolysis 93, 52–62. doi:10.1016/j.jaap.2011.09.011
Linnerooth-Bayer, J., Hochrainer-Stigler, S., 2015. Financial instruments for disaster risk management and climate change adaptation. Clim. Change 133, 85–100. doi:10.1007/s10584-013-1035-6
Lomas, P.L., Giampietro, M., 2017. Environmental accounting for ecosystem conservation: Linking societal and ecosystem metabolisms. Ecol. Model. 346, 10–19. doi:10.1016/j.ecolmodel.2016.12.009
Low, S.A., Isserman, A.M., 2008. Ethanol and the Local Economy. Econ. Dev. Q. doi:10.1177/0891242408329485
Ma, J., Frear, C., Wang, Z., Yu, L., Zhao, Q., Li, X., Chen, S., 2013. A simple methodology for rate-limiting step determination for anaerobic digestion of complex substrates and effect of microbial community ratio. Bioresour. Technol. 134, 391–395. doi:10.1016/j.biortech.2013.02.014
Merger, E. and Pistorius, T., 2011. Effectiveness and legitimacy of forest carbon standards in the OTC voluntary carbon market. Carbon balance and management, 6(1), 4. doi:10.1186/1750-0680-6-4
Miller, C., 2016. Hybrid Management: Boundary Organizations, Science Policy, and Environmental Governance in the Climate Regime. Science, Technology, & Human
Values, 26(4), 478-500. doi:10.1177/016224390102600405

362
Mitchell, S.M., Subbiah, M., Ullman, J.L., Frear, C., Call, D.R., 2015. Evaluation of 27 different biochars for potential sequestration of antibiotic residues in food animal production environments. J. Environ. Chem. Eng. 3, 162–169. doi:10.1016/j.jece.2014.11.012
Mohareb, E.A., MacLean, H.L. and Kennedy, C.A., 2011. Greenhouse gas emissions from waste management—assessment of quantification methods. Journal of the Air & Waste
Management Association, 61(5), 480-493. doi:10.3155/1047-3289.61.5.480 Moss, R.H., Edmonds, J.A., Hibbard, K.A., Manning, M.R., Rose, S.K., van Vuuren, D.P.,
Carter, T.R., Emori, S., Kainuma, M., Kram, T., Meehl, G.A., Mitchell, J.F.B., Nakicenovic, N., Riahi, K., Smith, S.J., Stouffer, R.J., Thomson, A.M., Weyant, J.P., Wilbanks, T.J., 2010. The next generation of scenarios for climate change research and assessment. Nature 463, 747–756. doi:10.1038/nature08823
Mulrow, C.D., 1994. Rationale for systematic reviews. BMJ: British Medical Journal, 309(6954) 597. doi:10.1136/bmj.309.6954.597 Munksgaard, J., Pedersen, K.A., 2001. CO2 accounts for open economies: producer or consumer
responsibility? Energy Policy 29, 327–334. doi:10.1016/S0301-4215(00)00120-8 Naik, S.N., Goud, V.V., Rout, P.K., Dalai, A.K., 2010. Production of first and second generation
biofuels: A comprehensive review. Renew. Sustain. Energy Rev. 14, 578–597. doi:10.1016/j.rser.2009.10.003
Ndegwa, P.M., Wang, L., Vaddella, V.K., 2007. Potential strategies for process control and monitoring of stabilization of dairy wastewaters in batch aerobic treatment systems. Process Biochem. 42, 1272–1278. doi:10.1016/j.procbio.2007.06.001
Nizami, A.S., Rehan, M., Waqas, M., Naqvi, M., Ouda, O.K.M., Shahzad, K., Miandad, R., Khan, M.Z., Syamsiro, M., Ismail, I.M.I. and Pant, D., 2017. Waste biorefineries: Enabling circular economies in developing countries. Bioresource technology. doi:10.1016/j.biortech.2017.05.097
Okereke, C., Bulkeley, H. and Schroeder, H., 2009. Conceptualizing climate governance beyond the international regime. Global environmental politics, 9(1), 58-78.
Page, L.H., Ni, J.-Q., Heber, A.J., Mosier, N.S., Liu, X., Joo, H.-S., Ndegwa, P.M., Harrison, J.H., 2014. Characteristics of volatile fatty acids in stored dairy manure before and after anaerobic digestion. Biosyst. Eng. 118, 16–28. doi:10.1016/j.biosystemseng.2013.11.004
Pelaez-Samaniego, M.R., Hummel, R.L., Liao, W., Ma, J., Jensen, J., Kruger, C. and Frear, C., 2017. Approaches for adding value to anaerobically digested dairy fiber. Renewable and
Sustainable Energy Reviews, 72, 254-268. doi:10.1016/j.rser.2017.01.054 Pellegrino, C. and Lodhia, S., 2012. Climate change accounting and the Australian mining
industry: exploring the links between corporate disclosure and the generation of legitimacy. Journal of Cleaner Production, 36, pp.68-82. doi:10.1016/j.jclepro.2012.02.022
Peters, G.P., Hertwich, E.G., 2008. Post-Kyoto greenhouse gas inventories: production versus consumption. Clim. Change 86, 51–66. doi:10.1007/s10584-007-9280-1
Petticrew, M., Roberts, H. (Eds.), 2006. Systematic Reviews in the Social Sciences. Blackwell Publishing Ltd, Oxford, UK. doi:10.1002/9780470754887
Platt, B., Goldstein, N., 2014. State Of Compositing In The U.S. BioCycle 55, 19–27. Prisley, S.P., Mortimer, M.J., 2004. A synthesis of literature on evaluation of models for policy
applications, with implications for forest carbon accounting. For. Ecol. Manag. 198, 89–103. doi:10.1016/j.foreco.2004.03.038

363
Puyuelo, B., Gea, T., Sánchez, A., 2014. GHG emissions during the high-rate production of compost using standard and advanced aeration strategies. Chemosphere 109, 64–70. doi:10.1016/j.chemosphere.2014.02.060
Ramcilovic-Suominen, S. and Pülzl, H., 2016. Sustainable development–A ‘selling point’of the emerging EU bioeconomy policy framework? Journal of Cleaner Production. doi:10.1016/j.jclepro.2016.12.157
Rickels, W., Rehdanz, K., Oschlies, A., 2012. Economic prospects of ocean iron fertilization in an international carbon market. Resour. Energy Econ. 34, 129–150. doi:10.1016/j.reseneeco.2011.04.003
Sacramento-Rivero, J.C., 2012. A methodology for evaluating the sustainability of biorefineries: framework and indicators. Biofuels Bioprod. Biorefining 6, 32–44. doi:10.1002/bbb.335
Sadhukhan, J., Ng, K.S., Hernandez, E.M., 2014. Biorefineries and Chemical Processes: Design, Integration and Sustainability Analysis. John Wiley & Sons, Ltd.
Sanderson, B.M., O’Neill, B.C., Tebaldi, C., 2016. What would it take to achieve the Paris temperature targets? Geophys. Res. Lett. 43, 7133–7142. doi:10.1002/2016GL069563
Sawatdeenarunat, C., Surendra, K.C., Takara, D., Oechsner, H., Khanal, S.K., 2015. Anaerobic digestion of lignocellulosic biomass: Challenges and opportunities. Bioresour. Technol.
178, 178–186. doi:10.1016/j.biortech.2014.09.103 Schneider, M., Hendrichs, H., Hoffmann, V.H., 2010. Navigating the global carbon market.
Energy Policy 38, 277–287. doi:10.1016/j.enpol.2009.09.017 Schnellnhuber, H.J., Cramer, W.P., 2006. International Symposium on Stabilisation of
Greenhouse Gas Concentrations: Avoiding dangerous climate change. Cambridge University Press, Cambridge ; New York.
Singh, S., Bakshi, B.R., 2014. Accounting for Emissions and Sinks from the Biogeochemical Cycle of Carbon in the U.S. Economic Input-Output Model. J. Ind. Ecol. 18, 818–828. doi:10.1111/jiec.12156
Smith, S.A., Stöckle, C.O., 2010. Self-consistent liquid-to-gas mass transfer calculations. Bioresour. Technol. 101, 9361–9365. doi:10.1016/j.biortech.2010.07.025
Sommer, M., Kratena, K., 2017. The Carbon Footprint of European Households and Income Distribution. Ecol. Econ. 136, 62–72. doi:10.1016/j.ecolecon.2016.12.008
Spracklen, D.V., 2016. Global warming: China’s contribution to climate change. Nature 531, 310–312.
Stams, A.J., 1994. Metabolic interactions between anaerobic bacteria in methanogenic environments. Antonie van Leeuwenhoek, 66(1-3), 271-294. doi:10.1007/BF00871644
Stern, N., 2008. The Economics of Climate Change. Am. Econ. Rev. 98, 1–37. doi:10.1257/aer.98.2.1
Stöckle, C.O., Kemanian, A.R., Nelson, R.L., Adam, J.C., Sommer, R., Carlson, B., 2014. CropSyst model evolution: From field to regional to global scales and from research to decision support systems. Environ. Model. Softw. 62, 361–369. doi:10.1016/j.envsoft.2014.09.006
Stöckle, C.O., Nelson, R.L., Higgins, S., Brunner, J., Grove, G., Boydston, R., Whiting, M., Kruger, C., 2010. Assessment of climate change impact on Eastern Washington agriculture. Clim. Change 102, 77–102. doi:10.1007/s10584-010-9851-4
Supekar, S.D., Skerlos, S.J., 2014. Market-Driven Emissions from Recovery of Carbon Dioxide Gas. Environ. Sci. Technol. 48, 14615–14623. doi:10.1021/es503485z

364
Susmozas, A., Iribarren, D., Zapp, P., Linβen, J., Dufour, J., 2016. Life-cycle performance of hydrogen production via indirect biomass gasification with CO2 capture. Int. J. Hydrog.
Energy 41, 19484–19491. doi:10.1016/j.ijhydene.2016.02.053 Tits, M., Elsen, A., Bries, J., Vandendriessche, H., 2014. Short-term and long-term effects of
vegetable, fruit and garden waste compost applications in an arable crop rotation in Flanders. Plant Soil 376, 43–59. doi:10.1007/s11104-012-1318-0
Tollefson, J., 2015. Global-warming limit of 2 °C hangs in the balance. Nature 520, 14–15. doi:10.1038/nature.2015.17202
US EPA, 2005. Metrics for expressing greenhouse gas emissions: carbon equivalents and carbon dioxide equivalents, Emission facts. United States Environmental Protection Agency, Office of Transportation and Air Quality, Washington, D.C.
U.S. Global Change Research Program, 2014. Climate change impacts in the United States, Highlights: U.S. national climate assessment, U.S. national climate assessment. U.S. Global Change Research Program, Washington, DC.
Vink, M.J., Boezeman, D., Dewulf, A. and Termeer, C.J., 2013. Changing climate, changing frames: Dutch water policy frame developments in the context of a rise and fall of attention to climate change. Environmental Science & Policy, 30, 90-101. doi:10.1016/j.envsci.2012.10.010
Waldo, S., Chi, J., Pressley, S.N., O’Keeffe, P., Pan, W.L., Brooks, E.S., Huggins, D.R., Stöckle, C.O. and Lamb, B.K., 2016. Assessing carbon dynamics at high and low rainfall agricultural sites in the inland Pacific Northwest US using the eddy covariance method. Agricultural and Forest Meteorology, 218, pp.25-36. doi:10.1016/j.agrformet.2015.11.018
Wang, G., Chen, S., 2013a. Evaluation of a soil greenhouse gas emission model based on Bayesian inference and MCMC: Model uncertainty. Ecol. Model. 253, 97–106. doi:10.1016/j.ecolmodel.2012.09.010
Wang, G., Chen, S., 2013b. Evaluation of a soil greenhouse gas emission model based on Bayesian inference and MCMC: Parameter identifiability and equifinality. Ecol. Model.
253, 107–116. doi:10.1016/j.ecolmodel.2012.09.011 Wang, G., Chen, S., 2012. A review on parameterization and uncertainty in modeling greenhouse
gas emissions from soil. Geoderma 170, 206–216. doi:10.1016/j.geoderma.2011.11.009 Wang, G., Chen, S., Frear, C., 2012. Estimating greenhouse gas emissions from soil following
liquid manure applications using a unit response curve method. Geoderma 170, 295–304. doi:10.1016/j.geoderma.2011.12.001
Weber, C., Matthews, H., 2007. Embodied Environmental Emissions in U.S. International Trade, 1997-2004. Environ. Sci. Technol. 41, 4875. doi:10.1021/es0629110
Whitely Binder, L.C., Barcelos, J.K., Booth, D.B., Darzen, M., Elsner, M.M., Fenske, R., Graham, T.F., Hamlet, A.F., Hodges-Howell, J., Jackson, J.E., Karr, C., Keys, P.W., Littell, J.S., Mantua, N., Marlow, J., McKenzie, D., Robinson-Dorn, M., Rosenberg, E.A., Stöckle, C.O., Vano, J.A., 2010. Preparing for climate change in Washington State. Clim. Change 102, 351–376. doi:10.1007/s10584-010-9850-5
WSDA, 2017. Washington Cow Dairies and Digesters, 2017. Department of Agriculture, Olympia, WA.
WSDA, 2011. Washington Dairies and Digesters (No. 602–343). Department of Agriculture, Olympia, WA.

365
WSDA, 2009. Potential for a Sugar Beet Ethanol Industry in Washington State. Department of Agriculture, Olympia, WA.
Yang, S.-T., 2013. Bioprocessing Technologies in Biorefinery for Sustainable Production of Fuels, Chemicals, and Polymers, Bioprocessing Technologies. Wiley, Hoboken.
Yao, Y., Chen, S., 2016. A novel and simple approach to the good process performance of methane recovery from lignocellulosic biomass alone. Biotechnol. Biofuels 9. doi:10.1186/s13068-016-0530-1
You, F., Tao, L., Graziano, D.J. and Snyder, S.W., 2012. Optimal design of sustainable cellulosic biofuel supply chains: multiobjective optimization coupled with life cycle assessment and input–output analysis. AIChE Journal, 58(4), pp.1157-1180. doi:10.1002/aic.12637
Yu, L., Bule, M., Ma, J., Zhao, Q., Frear, C., Chen, S., 2014. Enhancing volatile fatty acid (VFA) and bio-methane production from lawn grass with pretreatment. Bioresour. Technol. 162, 243–249. doi:10.1016/j.biortech.2014.03.089
Yu, L., Zhao, Q., Ma, J., Frear, C., Chen, S., 2012. Experimental and modeling study of a two-stage pilot scale high solid anaerobic digester system. Bioresour. Technol. 124, 8–17. doi:10.1016/j.biortech.2012.08.088
Zaher, U., Frear, C., Pandey, P., Chen, S., 2008. Evaluation of a new fixed-bed digester design utilizing large media for flush dairy manure treatment. Bioresour. Technol. 99, 8619–8625. doi:10.1016/j.biortech.2008.04.034
Zhang, X., Lei, H., Zhu, L., Zhu, X., Qian, M., Yadavalli, G., Yan, D., Wu, J., Chen, S., 2016. Optimizing carbon efficiency of jet fuel range alkanes from cellulose co-fed with polyethylene via catalytically combined processes. Bioresour. Technol. 214, 45–54. doi:10.1016/j.biortech.2016.04.086
Zhao, B., Liu, J., Frear, C., Holtzapple, M., Chen, S., 2016. Consolidated bioprocessing of microalgal biomass to carboxylates by a mixed culture of cow rumen bacteria using anaerobic sequencing batch reactor (ASBR). Bioresour. Technol. 222, 517–522. doi:10.1016/j.biortech.2016.09.120
Zhao, Q.-B., Ma, J., Zeb, I., Yu, L., Chen, S., Zheng, Y.-M., Frear, C., 2015. Ammonia recovery from anaerobic digester effluent through direct aeration. Chem. Eng. J. 279, 31–37. doi:10.1016/j.cej.2015.04.113

366
17. Commercialization, Technology Transfer, and Extension
Georgine Yorgey, Chad Kruger, Timothy Ewing, Sonia A. Hall, Jingwei Ma, and Jim Jensen
17.1 Abstract
This chapter describes the commercialization, technology transfer, and extension work carried out with the support of the Department of Ecology’s (Ecology) Waste 2 Resources Program. This work focuses on supporting improved decision making about emerging technologies by waste processors, industry professionals, and others. In order to support the adoption and application of emerging technologies for waste management, the extension team carried out the following outreach activities:
• Delivered 12 presentations at national and regional conferences; • Provided technical support to regional stakeholders, including answering questions and
sharing resources, and participating in a federal advisory panel focused on furthering the adoption of technologies to recover nutrients and to control the production of greenhouse gases;
• Published five formal extension publications, with one additional peer-reviewed publication in progress, and seven other durable extension products, including webinars and blog posts.
This outreach work was aimed at (1) increasing awareness of the opportunities and potential surrounding biorefinery technologies; and (2) sharing tools, resources, and successful experiences that can help diverse groups further develop and implement these technologies in their professional fields. Building awareness and making resources available are critical early steps that contribute to improving the economic viability and the environmental footprint of facilities processing organic wastes in Washington State. Through these outreach activities, the team made an estimated 20,600 contacts with scientists, producers, industry professionals, regulators, policy-makers, and other interested parties across the country.
17.2 Technology transfer, outreach, and extension activities
The goal of the Department of Ecology’s Waste 2 Resources Program—improving the economics and the environmental footprint of processing organic wastes in Washington—will only be achieved if the new and improved technologies developed through funded research are adopted and applied by processors, industry, and commercial producers. For this reason, outreach and extension are critical for achieving the Waste 2 Resources Program’s objectives. The team responsible for the delivery of outreach and extension materials for the biennium included Ms. Georgine Yorgey (Assistant Director, Center for Sustaining Agriculture and

367
Natural Resources [CSANR]), Mr. Chad Kruger (Director, CSANR), Dr. Timothy Ewing (Research Engineer, CSANR), and Dr. Sonia A. Hall (Sustainable Systems Analyst, CSANR), with targeted support from several other individuals. Outreach and extension deliverables were in the form of conference presentations, technical support to multiple stakeholders, a field day, development of formal extension publications, and development of other durable extension products. These deliverables are outlined below.
17.2.1 Building relationships with clientele In collaboration with others, Ewing, Kruger, and others made numerous presentations during the biennium related to anaerobic digestion, pyrolysis, and nutrient recovery. These presentations included the following:
• Kruger, C.E., Yorgey, G., Ewing, T.W. (2016) Anaerobic Digestion Systems. MV REC Brownbag Series, Mount Vernon, Washington. 12/13/16. Followed by a question and answer session for Future Farmers of America students from Lynden Christian High School, chaperoned by Chris Clark from Whatcom Conservation District and accompanied by Washington State Representative Vincent Buys.
• Ewing, T.W. (2016) Panel discussion: where does biochar fit within the larger biorefinery concept? Biochar Workshop, Lopez Island, Washington. 10/28/16. Organized by the San Juan Islands Conservation District.
• Ewing, T.W., Kruger, C.E., Stöckle, C., Rajagopalan, K., Yorgey, G., Benedict, C.
(2016) Using emerging decision support tools to evaluate the water quality impacts of on-field application of AD systems nutrient products. Appendix A Workshop, Pullman, Washington. 10/20/16.
• Ewing, T.W. (2016) The Billion Ton Bioeconomy Initiative: Challenges and
Opportunities. The Pacific Northwest Bioeconomy Forum. Seattle, Washington. 10/3/16. Organized by U.S. Department of Agriculture (USDA). Ewing was an invited participant.
• Ewing, T.W., Kruger, C.E., Yorgey, G. (2016) From Dairy Farm to Bio-refinery:
developing technologies to produce environmentally friendly fuels, power, and value-added products. USBI Biochar 2016, Corvallis, Oregon. 8/24/16.
• Kruger, C.E. (2016) Saving the Planet with Soil Amendments? Skagit County Master Gardener’s Know and Grow. Mount Vernon, Washington. 8/16/16.
• Kruger, C.E., Hall, S.A. (2016) Advancing Organics Management in Washington State: The Waste to Fuels Technology Partnership. Washington State Recycling Association. Wenatchee, Washington. 5/17/16.
• Hall, S.A., Kruger, C.E. (2016) Renewable Energy Farm Walks (2 separate farm walks). Goldendale, Washington on 4/4/16, and Kennewick, Washington on 4/25/2016.

368
• Kruger, C.E. (2016) AD Technology and Small Farms. Small Farms and Community Food Systems Retreat. Mount Vernon, Washington. 3/21/16.
• Kruger, C.E. (2016) Extracting Value from Waste on a Small Farm: What’s Realistic & What’s Possible? San Juan Ag Summit. Camp Orkila, San Juan Islands, Washington. 2/13/16.
• Ewing, T.W., Kruger, C.E., Yorgey, G. (2016) Dairy Nutrient Recovery Technologies within an Anaerobic Digestion Bio-refinery. Anaerobic Digestion Webinar Series: Emerging Technologies to Improve Environmental and Economic Impact. 2/10/16.
In addition to these presentations, a small amount of Waste to Fuels Technology (WTFT) funding was used to complement various other funding sources (including from USDA’s National Institute of Food and Agriculture, the Environmental Protection Agency’s [EPA] Water Environment Research Foundation, Appendix A, and USDA’s Natural Resource Conservation Service [NRCS]) to host an anaerobic digestion field day for more than 80 participants at Edaleen Dairy (Lynden, Washington) on June 9, 2016. The morning included presentations on these topics: dairyman’s perspective, economic lessons learned, Renewable Natural Gas technologies, biochar and its integration with anaerobic digestion (AD) systems, fine solids separation, nutrient recovery approaches, water quality and application issues, and composition of nutrient recovery products. Additional lunchtime talks introduced the economic and environmental modeling tools that have recently been developed. The afternoon introduced participants to a new three-year effort looking at the application of dairy manure-derived fertilizers to red raspberries and blueberries (funded by USDA NRCS).
17.2.2 Sharing research findings and providing technical support Ewing and Kruger provided technical support to industry, academics, and various other stakeholders during the 2015-2017 biennium. Technical support aims to provide non-biased information and resources to specific individuals and support their decision-making around biorefinery-related issues. Kruger and Ewing provided support to the U.S. EPA’s Nutrient Recycling Challenge and arranged for Washington State University’s institutional partnership in the challenge. This competition, hosted by EPA with a variety of industry, non-profit, and academic partners, awarded prizes for the most promising technologies to recycle nutrients from livestock manure. In addition:
• Ewing has communicated with and provided technical support for approximately 10 consultants, companies, and community groups interested in developing anaerobic digestion or nutrient management projects.
• Ewing provided mentoring and technical support for a group of seven engineering
students completing their senior design project in anaerobic digestion at Gonzaga University.

369
• Ewing has collaborated with and provided technical support for project development ideas with crossover between biochar, the biorefinery concept, and composting to three faculty members at the WSU Puyallup Research and Extension Center.
Along with Chris Clark from Whatcom Conservation District, Ewing attended and provided technical support for a test of Janicki Bioenergy’s Omni Processor for treating dairy manure. Following this, Jensen, Ewing, and Yorgey collaborated with partners at the Stillaguamish Tribe and Janicki to submit an NRCS Conservation Innovation Grant proposal, in which WSU, led by Ewing, would provide independent evaluation of the Omni Processor on a dairy in Snohomish County. In June 2017, we had been notified that this proposal was awarded.
17.2.3 Durable extension products The following formal extension products were in progress or published during the 2015-2017 biennium:
• Ma, J., Frear, C.S., Yorgey. G.G. In review. Approaches to nutrient recovery from dairy manure. Washington State University Extension Publication, Pullman, Washington.
• Jensen, J., Frear, C., Ma, J., Kruger, C., Hummel, R., Yorgey, G. 2016. Digested fiber solids: Developing technologies for adding value. Washington State University Extension Publication FS235E, Pullman, Washington. http://pubs.wpdev.cahnrs.wsu.edu/pubs/fs235e/
• Kennedy, N.P., Yorgey, G.G., Frear, C.S., Kruger, C.E. 2016. Considerations for building, operating, and maintaining anaerobic co-digestion facilities on dairies. Washington State University Extension Publication EM088, Pullman, Washington. http://pubs.wpdev.cahnrs.wsu.edu/pubs/em088e/
• Mitchell, S.M., Kennedy, N.P., Ma, J., Yorgey, G.G., Kruger, C.E., Ullman, J.L., Frear. C.S. 2015. Anaerobic digestion effluents and processes: The basics. Washington State University Extension Publication FS171E, Pullman, Washington. http://pubs.wpdev.cahnrs.wsu.edu/pubs/fs171e/
• Kennedy, N.P., Yorgey, G.G., Frear, C.S., Kruger, C.E. 2015. On-farm co-digestion of dairy manure with high energy organics. Washington State University Extension Publication FS172E, Pullman, Washington. http://pubs.wpdev.cahnrs.wsu.edu/pubs/fs172e/
• Kennedy, N., Yorgey, G., Frear, C., Evans, D., Jensen, J., Kruger, C. 2015. Biogas upgrading on dairy digesters. Washington State University Extension Publication 180E, Pullman, Washington. http://pubs.wpdev.cahnrs.wsu.edu/pubs/fs180e/
In addition to these efforts, Ewing systematically identified and summarized projects, topics, and themes related to carbon and CO2-equivalent emissions and reductions (carbon accounting) associated with the biorefinery concept. The results are summarized in Chapter 16. This summary provides the basis for understanding the current state of carbon utilization at existing

370
and future biorefineries and can be used as the basis for developing quantitative carbon and financial analysis of specific processes or unit operations. It also provides a basis for better articulating one of reasons for implementing biorefinery concepts in the state and region. Two additional publications, produced with complementary funding, provide information relating to application of organic residuals to agricultural lands:
• Yorgey, G.G., W.L. Pan, R. Awale, S. Machado, and A. Bary. 2017. Soil Amendments. In Yorgey, G. and C. Kruger, eds. Advances in Dryland Farming in the Inland Pacific Northwest, Washington State University Extension Publication EM108, Pullman, Washington. http://extension.wsu.edu/publications/wp-content/uploads/sites/54/2017/06/em108-ch7.pdf
• Mitchell, S., G. G. Yorgey, and C.E. Kruger. 2016. Producer guide to biosolids quality. Washington State University Publication FS 192E, Pullman, Washington. http://extension.wsu.edu/publications/pubs/fs192e/?p-page=1
Finally, in early 2016, we produced a five-part Anaerobic Digestion Systems webinar series, “Emerging Technologies to Improve Economic and Environmental Impact.” Recordings from the series can be accessed at http://csanr.wsu.edu/webinars/anaerobic-digestion/. Though the coordination of the webinars was funded by other sources, the content of the presentations is relevant to this project and supported by the WTFT Partnership. In particular, the first webinar (given by Dr. Ewing) summarizes technologies for nutrient recovery in an agricultural context, and the second webinar (given by Dr. Manuel Garcia-Pérez) discussed the potential for biochar integration with AD.
17.3 Impacts of technology transfer, outreach and extension activities
The team estimated that we have had over 20,600 contacts with scientists, producers, industry, regulators, policy-makers, and other interested parties across the country. These parties were reached through the core outreach activities described above: conference presentations, technical support, and formal and other extension publications. These impacts include:
• 80 participants attended the AD Systems Field Day. • An estimated 550 professionals attended a live webinar presentation or one of our team’s
presentations. • An estimated 7,350 people viewed a video product on our website, including the video
“Anaerobic Digestion: Beyond Waste Management” and the five recordings in the AD Systems Series.
• The blog posts and resources on CSANR’s webpages on Waste to Fuels topics have been viewed more than 12,000 times cumulatively during the 2015-2017 biennium.
• Extension publications on Waste to Fuels topics, including those published during the current and previous biennia, were viewed or downloaded an estimated 630 times during the 2015-2017 biennium.

371
These statistics do not include views or downloads of the additional research products posted on webpages hosted by EPA, eXtension, and Ecology, so represent a conservative estimate of the impact of outreach activities. The project team has increased awareness around the potential and opportunities surrounding biorefinery technologies, and has shared tools, resources, and successful experiences that will help diverse groups further develop and implement these technologies.

372
18. Appendices
Appendix A. Construction of the Anaerobic Digestion Jet Fuel Model
This appendix details the information used to model the hypothetical Anaerobic Digestion (AD) Jet Fuel process described in Chapter 4. Building the model
The development of the anaerobic digestion process model was based on data on an anaerobic digester (AD) receiving food waste collected mainly from domestic kitchens (Banks et al., 2011). The industrial plant for the AD technology is assumed to operate 8000 hours per year with a daily production capacity of 220 ton of feedstock per day. The feedstocks include 120 ton of food scraps per day, with and without 100 ton of compost leachate per day. The flowsheet of the AD processes was constructed in the Aspen PlusTM process engineering software.
Scheme 1: Anaerobic digestion with food scraps and compost leachate
Figure A- 1: Block flow diagram of anaerobic digestion with food scraps and compost leachate
HIERARCHY
AD
36
557
RESIDUAL
25
5000
F2
25
4167
LEACHATE
36
19
H2
63
296
JET-FUEL
30
8058
WASTER
36
236
WGAS
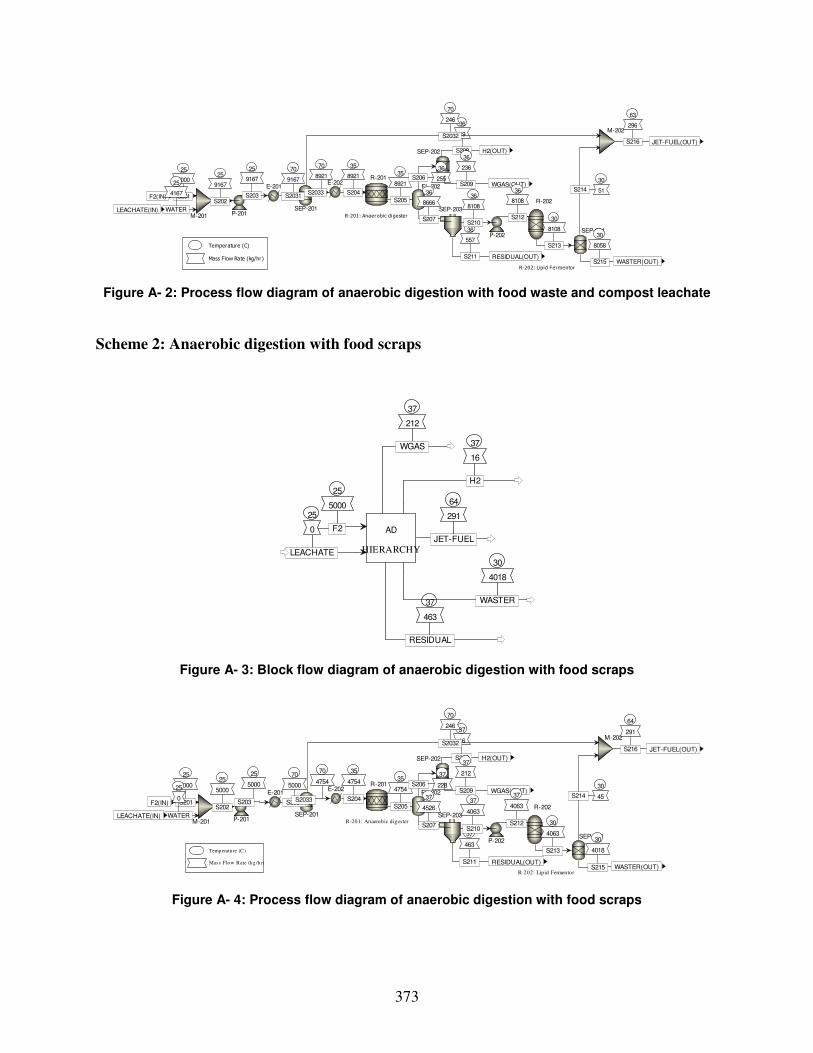
373
Figure A- 2: Process flow diagram of anaerobic digestion with food waste and compost leachate
Scheme 2: Anaerobic digestion with food scraps
Figure A- 3: Block flow diagram of anaerobic digestion with food scraps
Figure A- 4: Process flow diagram of anaerobic digestion with food scraps
R-201
M-201
E-202
SEP-203
FL-202
P-202
P-201
SEP-202
SEP-204
R-202
E-201
SEP-201
M-202
25
5000
S201F2(IN)
30
8058
S215 WASTER(OUT)
36
19
S208 H2(OUT)
36
557
S211 RESIDUAL(OUT)
35
8921
S204
35
8921
S205
36
8666
S207
36
255S206
36
8108
S210
25
9167
S202
25
9167
S203
36
236
S209 WGAS(OUT)25
4167
WATERLEACHATE(IN)
30
8108
S213
30
51S21436
8108
S212
70
9167
S2031
70
246
S2032
70
8921
S2033
63
296
S216 JET-FUEL(OUT)
Temperature (C)
Mass Flow Rate (kg/hr)
R-201: Anaerobic digester
R-202: Lipid Fermentor
HIERARCHY
AD
37
463
RESIDUAL
25
5000
F2
25
0
LEACHATE
37
16
H2
64
291
JET-FUEL
30
4018
WASTER
37
212
WGAS
R-201
M-201
E-202
SEP-203
FL-202
P-202
P-201
SEP-202
SEP-204
R-202
E-201
SEP-201
M-202
25
5000
S201F2(IN)
30
4018
S215 WASTER(OUT)
37
16
S208 H2(OUT)
37
463
S211 RESIDUAL(OUT)
35
4754
S204
35
4754
S205
37
4526
S207
37
228S206
37
4063
S210
25
5000
S202
25
5000
S203
37
212
S209 WGAS(OUT)25
0
WATERLEACHATE(IN)30
4063
S213
30
45S21437
4063
S212
70
5000
S2031
70
246
S2032
70
4754
S2033
64
291
S216 JET-FUEL(OUT)
Temperatu re (C)
Mass Flow Rate (kg /h r)
R-201: Anaerobic digester
R-202: Lipid Fermentor

374
Process description: Food scraps (F-2; note that all labels refer to Figure A- 1 through Figure A- 4 unless otherwise stated) including degradable organic wastes (such as carbohydrate, protein and lipid) are fed to a mixer (M-201), and diluted by compost leachate. The slurry stream (S202) is pumped to a heat exchanger (E-201), and then into a lipid separator (SEP-201). After separation, lipid is sent to M-202 for jet fuel production. The other components are sent to an anaerobic digester (R-201). After anaerobic digestion, the slurry is sent to a buffer tank (FL-202) to separate the biogas. The slurry is continually sent to a solid-liquid separator (SEP-203). After separation, the effluent is pumped to a lipid fermentor (R-202) and the residuals are removed. In the lipid fermentor (R-202), volatile fatty acids (VFA) are converted to lipid by Y. lipolytica PO8. Then the stream (S213) is sent to a lipid separator (SEP-204) that separates lipid to M-202 for jet fuel production. The wastewater (S215) will be reused by the AD system. The solid residuals (S211) will be used as organic fertilizer. The biogas is sent to buffer tank (FL-202) and then to a gas separator (SEP-202) to obtain hydrogen gas (H2). After gas separation, H2 and waste gases in biogas are sent out of the system. The compounds that are used in the holistic process model are shown in Table A- 1.
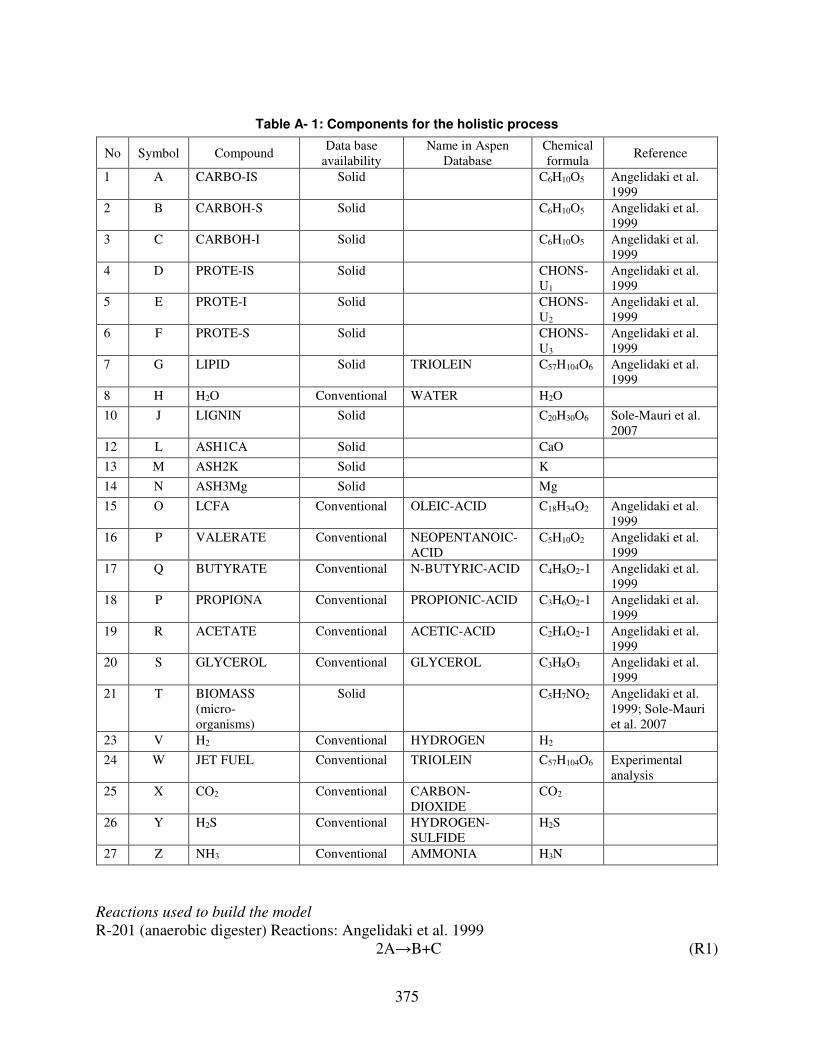
375
Table A- 1: Components for the holistic process
No Symbol Compound Data base
availability Name in Aspen
Database Chemical formula
Reference
1 A CARBO-IS Solid
C6H10O5 Angelidaki et al. 1999
2 B CARBOH-S Solid
C6H10O5 Angelidaki et al. 1999
3 C CARBOH-I Solid
C6H10O5 Angelidaki et al. 1999
4 D PROTE-IS Solid
CHONS-U1
Angelidaki et al. 1999
5 E PROTE-I Solid
CHONS-U2
Angelidaki et al. 1999
6 F PROTE-S Solid
CHONS-U3
Angelidaki et al. 1999
7 G LIPID Solid TRIOLEIN C57H104O6 Angelidaki et al. 1999
8 H H2O Conventional WATER H2O
10 J LIGNIN Solid
C20H30O6 Sole-Mauri et al. 2007
12 L ASH1CA Solid
CaO
13 M ASH2K Solid
K
14 N ASH3Mg Solid
Mg
15 O LCFA Conventional OLEIC-ACID C18H34O2 Angelidaki et al. 1999
16 P VALERATE Conventional NEOPENTANOIC-ACID
C5H10O2 Angelidaki et al. 1999
17 Q BUTYRATE Conventional N-BUTYRIC-ACID C4H8O2-1 Angelidaki et al. 1999
18 P PROPIONA Conventional PROPIONIC-ACID C3H6O2-1 Angelidaki et al. 1999
19 R ACETATE Conventional ACETIC-ACID C2H4O2-1 Angelidaki et al. 1999
20 S GLYCEROL Conventional GLYCEROL C3H8O3 Angelidaki et al. 1999
21 T BIOMASS (micro-organisms)
Solid C5H7NO2 Angelidaki et al. 1999; Sole-Mauri et al. 2007
23 V H2 Conventional HYDROGEN H2
24 W JET FUEL Conventional TRIOLEIN C57H104O6 Experimental analysis
25 X CO2 Conventional CARBON-DIOXIDE
CO2
26 Y H2S Conventional HYDROGEN-SULFIDE
H2S
27 Z NH3 Conventional AMMONIA H3N
Reactions used to build the model
R-201 (anaerobic digester) Reactions: Angelidaki et al. 1999 2A→B+C (R1)

376
xCONV, A: fractional conversion (range between 0 and 1: 1) 2D→E+F (R2)
xCONV, D: fractional conversion (range between 0 and 1: 1) G+3H→S+3O (R3)
xCONV, G: fractional conversion (range between 0 and 1: 1) F+0.30925H→0.017013 T + 0.29742 R + 0.02904 P + 0.022826 Q + 0.013202 P + 0.07527 X
+ 0.28298 Z + 0.001 Y (R4) xCONV, F: fractional conversion (range between 0 and 1: 1)
B + 0.1115Z → 0.1115T + 0.744R + 0.5P + 0.4409 Q + 0.6909X + 0.0254H (R5) xCONV, B: fractional conversion (range between 0 and 1: 1)
O + 15.2398 H + 0.1701 Z + 0.2500 X → 0.1701 T + 8.6998 R + 14.500 V (R6) xCONV, P: fractional conversion (range between 0 and 1: 1)
Q + 1.7818H + 0.0544Z + 0.0544X → 0.0544T + 1.8909R + 1.8909V (R7) xCONV, Q: fractional conversion (range between 0 and 1: 1)
S + 0.04071Z + 0.0291X → 0.04071T + 0.9418 P + 1.09305 H (R8) xCONV, S: fractional conversion (range between 0 and 1: 1)
P + 1.764H + 0.04643Z → 0.0458T + 0.9345R + 2.804V + 0.902X (R9) TR-201: Temperature (oC), value: 37 PR-201: Pressure (atm), value: 1 The aforementioned fractional conversions were estimated based on biogas yield of 642 mL g-1 VS and methane yield 402 mL g-1 VS (Banks et al., 2011).
0.07225R → W (R10) TR-202: Temperature (oC), value: 30 PR-201: Pressure (atm), value: 1 The aforementioned fractional conversions were estimated based on lipid (triglyceride) titer 2.89 ± 0.25 g L-1 in our experiments. Y. lipolytica PO8 culture conditions: 5 days at 30oC, 40 g L-1 acetate, nitrogen limited conditions using shaking flasks. Input variables used by ASPEN
Food waste (27.7% total solids [TS]) was used in this case (Banks et al., 2011). The total flow rate of the food waste was 120 ton per day. ṁF1: Mass flow rate (kg h-1) ṁF1 solid: Mass flow rate (kg h-1) (range between 0 and 10000: 1385) ṁF1 liquid: Mass flow rate (kg h-1) (range between 0 and 10000: 3615) TF1: Temperature (oC) (same for solid and liquid) (range between 10 and 40: 25) PF1: Pressure (atm) (same for solid and liquid) (range between 1 and 10: 1)

377
Table A- 2: For the solid (in F1)
No Symbol Compound Mass Fraction Range 1 A CARBO-IS xF1 A 0.484 4 D PROTE-IS xF1 D 0.308 7 G LIPID xF1 G 0.181 10 J LIGNIN xF1 J 0.019 12 L ASH1CA xF1 L 0.008 13 M ASH2K xF1 M 0 14 N ASH3Mg xF1 N 0 Total 1
Table A- 3: For the liquid (in F1)
No Symbol Compound Mass Fraction Range 8 H H2O (liquid) xF1 H 0.9999954 33 FF PO4
-3 xF1 FF 0.0000046 Total 1
Compost leachate (2.6% sugar) was sent to dilute the food scraps in the digester. The total flow rate of the food scraps was 100 ton per day. ṁL: Mass flow rate (kg h-1) ṁL solid: Mass flow rate (kg h-1) (range between 0 and 10000: 0) ṁL liquid: Mass flow rate (kg h-1) (range between 0 and 10000: 4166.7) TL: Temperature (oC) (same for solid and liquid) (range between 10 and 40: 25) PL: Pressure (atm) (same for solid and liquid) (range between 1 and 10: 1)
Table A- 4: For the solid (in leachate)
No Symbol Compound Mass Fraction Range 1 A CARBO-IS xF1 A 0 4 D PROTE-IS xF1 D 0 7 G LIPID xF1 G 0 10 J LIGNIN xF1 J 0 12 L ASH1CA xF1 L 0 13 M ASH2K xF1 M 0 14 N ASH3Mg xF1 N 0 Total 0
Table A- 5: For the liquid (in leachate)
No Symbol Compound Mass Fraction Range 2 B CARBOH-S xF1 B 0.026 8 H H2O (liquid) xF1 H 0.9999954 Total 1

378
Validation of mass balances
The aforementioned process model was validated by the study at the biogas plant with food scraps (Banks et al., 2011). The data of the food composition for model validation can be found in Table A- 6.
Table A- 6: Typical composition for food scraps used in anaerobic digestion
Composition Food scraps
(Bufierre et al., 2006)
Input in ASPEN Plus
Carbohydrate (mg g-1 DM) 302 – 735 399 Hemicellulose (mg g-1 DM) 85 – 295 85 Lignin (mg g-1 DM) 19 – 96 19 Crude protein (mg g-1 DM) 90 – 208 308 Lipid (mg g-1 DM) 35 – 81 181 Ash 0-10
ASH1Ca 8 ASH2K 0
ASH3Mg 0
References Angelidaki, I., Ellegaard, L., and Ahring, B.K. 1999. A Comprehensive Model of Anaerobic
Bioconversion of Complex Substrates to Biogas. Biotechnol. Bioeng., 63(3), 363‒372. Banks, C.J., Chesshire, M., Heaven, S., and Arnold, R. 2011. Anaerobic Digestion of Source-
Segregated Domestic Food Waste: Performance Assessment by Mass and Energy Balance. Bioresour. Technol., 102, 612–620.
Buffiere, P., Loisel, D., Bernet, N., and Delgenes, J.P. 2006. Towards New Indicators for the Prediction of Solid Waste Anaerobic Digestion Properties. Water Sci. Technol., 53(8), 233–241
Sole-Mauri, F., Illa, J., Margí, A., Prenafeta-Boldú, F.X., and Flotats, X. 2006. An Integrated Biochemical and Physical Model for the Composting Process. Bioresour. Technol., 98(17)3278–3293.

379
Appendix B. Heavy Metals in Biochar – Supplemental Results and Thresholds in Related Regulations
This appendix provides supplementary material for Chapter 5.
Table B- 1: U.S. Environmental Protection Agency’s pollutant limits and loading rates for land-applied biosolids. Values obtained from the code of Federal Regulations Title 40, part 503 (40 CFR,
Part 503; https://www.ecfr.gov/cgi-bin/text-idx?tpl=/ecfrbrowse/Title40/40cfr503_main_02.tpl)
* Source: EPA Guide to Part 503 Rule Chapter 2 1 Ceiling Concentration Limits (CCL) EPA Section 503.13 Table 1 2 Pollutant Concentration (PCL) EPA Section 503.13 Table 3 3 Cumulative Pollutant Loading Rate Limits for Biosolids (CPLR) EPA Section 503.13 Table 2 4 Annual Pollutant Loading Rate Limits for Biosolids (APLR) EPA Section 503.13 Table 4 5 Dry-weight basis: mg/kg - milligrams per kilogram; kg/ha - kilograms per hectare. 6 The February 25, 1994 Part 503 Rule Amendment deleted the molybdenum limits but retained the molybdenum
CCL.
Pollutant CCL1
mg kg-1 5 PCL2
mg kg-1 5 CPLR3
kg ha-1 5
APLR4 kg ha-1
(365 days)
Arsenic (As) 75 41 41 2.0 Cadmium (Cd)
85 39 39 1.9
Copper (Cu) 4,300 1,500 1,500 75 Lead (Pb) 840 300 300 15 Mercury (Hg)
57 17 17 0.85
Molybdenum (Mo)
75 —6 — —
Nickel (Ni) 420 420 420 21 Selenium (Se)
100 100 100 5.0
Zinc (Zn) 7,500 2,800 2,800 140
Applies to: All biosolids that are land applied Bulk biosolids
Regulatory status:
Biosolids that are land
applied cannot exceed
Biosolids below these do not need a permit if
other regulatory requirements are met
Cumulative metal concentrations cannot exceed
Biosolids above PCL
cannot exceed

380
Table B- 2: Standards for maximum allowable levels of metals in fertilizer in Washington State (obtained from http://www.ecy.wa.gov/programs/hwtr/dangermat/fert_standards.html)
Metal Maximum Allowable Concentrations by Toxicity
Characteristic Leaching Procedure (in ppm) Arsenic (As) 5.0 Barium (Ba) 100.0 Cadmium (Cd) 1.0 Chromium (Cr) 5.0 Cobalt (Co) - Lead (Pb) 5.0 Mercury (Hg) 0.2 Selenium (Se) 1.0 Silver (Ag) 5.0
Figure B- 1: ICP-MS results of biochar from treated wood, before and after acid and hot water
treatments.
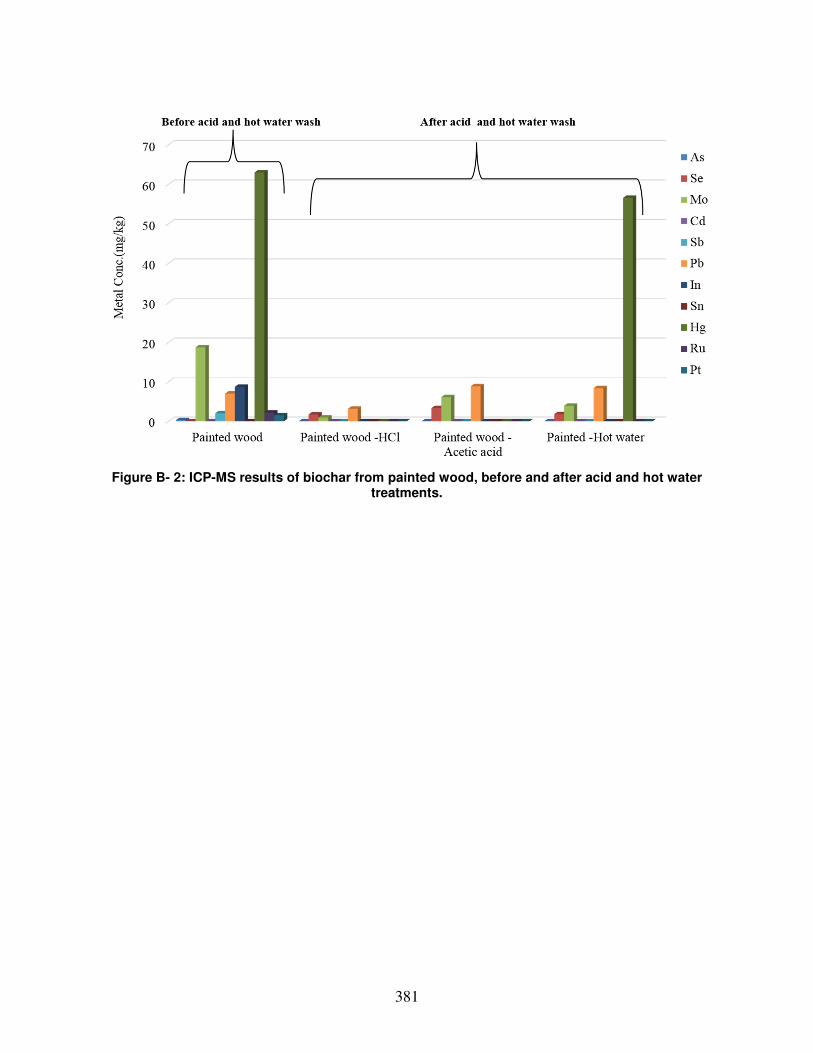
381
Figure B- 2: ICP-MS results of biochar from painted wood, before and after acid and hot water
treatments.

382
Appendix C. Results of Survey of Boiler Operators
This appendix shows results from the survey of boiler operators described in Chapter 11.

383
Table C-1: Boiler information from survey of current industrial facilities in Washington with biomass boilers (boiler questions)
Boiler Cosmo
Specialty Fibers
Boise White
Paper
Kapstone Paper
and Packaging
Corp
Nippon-
Dynawave
WestRock CP,
LLC
What type fuel
burner system is
used (e.g., large
watertube,
stoker, fluidized
bed)?
Two drum
Sterling Boiler
Sterling Hog
Fuel Boiler
CE VU40, stoker
boiler with
travelling grate
#11 Boiler Power Boiler
No. 7, stoker
designed to
burn wet
biomass/bio-
based solid
What type of
fuel delivery
system is used
(e.g., spreader or
underfeed
stoker, other)?
Stoker Stoker (4) Detroit
stoker 30”
wind-swept fuel
chutes fed via a
live bottom
wood bin.
Natural gas
through gas
piping
Spreader Stoker Overpile
reclaim to
Detroit Stoker
What type of
grate is used
(e.g., fixed,
chain, traveling,
vibrating,
rotating)?
Water-cooled
pinhole grate;
suspended air
Pinhole grate CE Traveling
grate
Traveling grate hydro grate
Boiler
Manufacturer
and Model?
Babcox &
Wilcox
Kipper Combustion
Engineering
VU40
Foster Wheeler Riley: 2 drum
natural
circulation
boiler
What year was it
put into
operation (age)?
1956-57 1979 1976 1974 1991
Has it been
through any
major upgrades
or remodels?
When was the
last?
1980s scrubber
systems
installed
Yes, over fire air
and WESP
added in 2007
Yes. New ID fan,
replacement of
the steam turbine
drives on the FD
& ID fans with
electric drives,
Re-tube gen, SH
& Econ in 2012.
MDC replaced in
2014. WESP’s
added for
pollution control
in 2007. New fuel
feed system
added in 2013.
TAH retube with
double-walled
tubes in 2016.
2005-2006
Upgrades to
overfire air
system &
particulate
emission
controls
2009 upgrade
to support
electrical
cogeneration
turbine
installation

384
Table C-2: Boiler information from survey of current industrial facilities in Washington with biomass boilers (boiler questions)
Boiler Cosmo
Specialty Fibers
Boise White
Paper
Kapstone Paper
and Packaging
Corp
Nippon-
Dynawave
WestRock CP,
LLC
What is its
remaining life
expectancy?
Maintain every
year to keep it
operating
indefinitely
25-35 years We expect to
keep the boiler
running as long
as we can, with
no end-date in
place.
What is the
boiler size, in
terms of fuel
input (million
BTU/hr
(MMBtu/hr)?
220 MMBtu/hr
design; average
is 140-150
MMBtu/hr
193 MMBtu/hr
design; average
is 172
MMBtu/hr
1,160
MMBtu/hr
design; average
= 491
MMBtu/hr
1,180
MMBtu/hr
design; average
= 1,000
MMBtu/hr
595 MMBtu/hr
design
What is the
designed boiler
output capacity,
pounds of
steam per hour
(pph)?
160K lbs
steam/hr
228K lbs
steam/hr
600K lbs
steam/hr
550K lbs
steam/hr
340K lbs
steam/hr
What is the
average boiler
output annually,
as pounds of
steam per hour
(pph) or as
percent of
capacity?
100K lbs
steam/hr
190K lbs
steam/hr
In the last year,
the average
steam flow was
341k#/hr.
std.dev was
123k#/hr
Roughly 400K
lbs steam/hr
280K lbs
steam/hr
Does this
change during
different
seasons?
It’s a swing
boiler, so it
varies up or
down on a day
to day basis
No Yes, the boiler
generally makes
more steam in
the winter
because the mill
demand is
higher in the
winter.
Yes No
What is the PSIG
of steam
produced?
850 psig 550 psig 800 psig 1,250 psig
design
875 psig design
Running normal
or typical level?
Yes Yes Yes Yes Yes
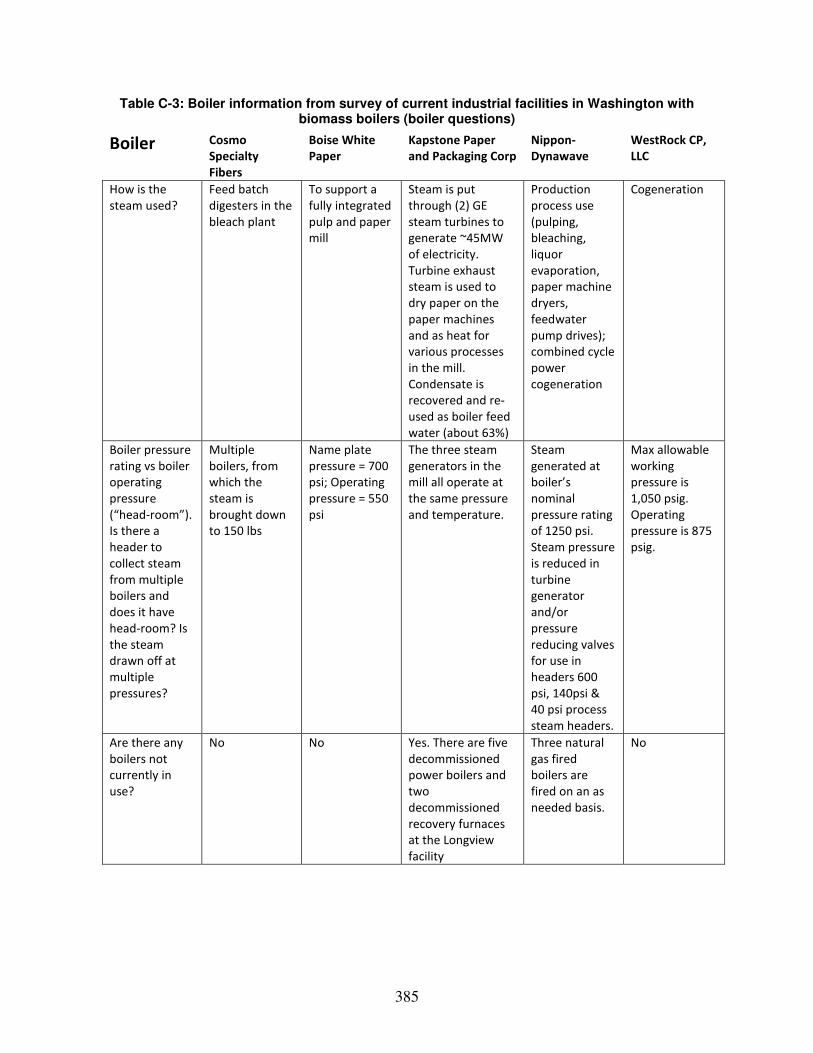
385
Table C-3: Boiler information from survey of current industrial facilities in Washington with biomass boilers (boiler questions)
Boiler Cosmo
Specialty
Fibers
Boise White
Paper
Kapstone Paper
and Packaging Corp
Nippon-
Dynawave
WestRock CP,
LLC
How is the
steam used?
Feed batch
digesters in the
bleach plant
To support a
fully integrated
pulp and paper
mill
Steam is put
through (2) GE
steam turbines to
generate ~45MW
of electricity.
Turbine exhaust
steam is used to
dry paper on the
paper machines
and as heat for
various processes
in the mill.
Condensate is
recovered and re-
used as boiler feed
water (about 63%)
Production
process use
(pulping,
bleaching,
liquor
evaporation,
paper machine
dryers,
feedwater
pump drives);
combined cycle
power
cogeneration
Cogeneration
Boiler pressure
rating vs boiler
operating
pressure
(“head-room”).
Is there a
header to
collect steam
from multiple
boilers and
does it have
head-room? Is
the steam
drawn off at
multiple
pressures?
Multiple
boilers, from
which the
steam is
brought down
to 150 lbs
Name plate
pressure = 700
psi; Operating
pressure = 550
psi
The three steam
generators in the
mill all operate at
the same pressure
and temperature.
Steam
generated at
boiler’s
nominal
pressure rating
of 1250 psi.
Steam pressure
is reduced in
turbine
generator
and/or
pressure
reducing valves
for use in
headers 600
psi, 140psi &
40 psi process
steam headers.
Max allowable
working
pressure is
1,050 psig.
Operating
pressure is 875
psig.
Are there any
boilers not
currently in
use?
No No Yes. There are five
decommissioned
power boilers and
two
decommissioned
recovery furnaces
at the Longview
facility
Three natural
gas fired
boilers are
fired on an as
needed basis.
No

386
Table C-4: Results of survey of current industrial facilities in Washington with biomass boilers (ash)
Ash Cosmo
Specialty
Fibers
Boise White
Paper
Kapstone Paper
and Packaging Corp
Nippon-
Dynawave
WestRock CP,
LLC
How much
residual ash is
generated by
the biomass
boiler now (lbs
or tons per
month or
year)?
2,388 tons per
year
2800 tons per
month
Roughly 60-80
tons/day
Roughly 50,000
tons per year
How much
residual ash is
generated by
the biomass
boiler now (lbs
or tons per
month or
year)?
What’s the
carbon content
of the biomass
ash?
Likely low
carbon
Not available 4-6% 3%-7% (2015
tests)
What’s the
carbon content
of the biomass
ash?
Where/How is
the ash
collected?
Cells are
cleaned twice
daily, ash
removed in
lugger buckets
Traveling grate
at the bottom
of the boiler
The ash is collected
off the multiclone
dust collector
hopper and the
tubular air heater
hopper. The TAH
hopper ash is
screened and
unburned carbon is
reinjected into the
boiler. The MDC
does not have a
reinjection system
Wet bottom
ash collection,
Dry fly ash
collection from
multiclones &
precipitator
into nitrogen
padded
enclosed
conveyors and
silo.
Where/How is
the ash
collected?
Does the boiler
have an ash
reinjection
system?
No No See above Not currently No
Is the ash
screened or
sorted prior to
reinjection?
No NA See above NA N/A

387
Table C-5: Results of survey of current industrial facilities in Washington with biomass boilers (ash)
Ash Cosmo
Specialty
Fibers
Boise White
Paper
Kapstone Paper and
Packaging Corp
Nippon-
Dynawave
WestRock CP,
LLC
End uses, how
is the ash
managed or
marketed now
(e.g., disposal,
reuse, sold)?
Landfill; Not
approved for
land
application
(WSDA)
Disposed in
on-site landfill
100% of the ash that is
not reinjected is
landfilled
Roughly
50,000 tons
per year
How much
residual ash is
generated by
the biomass
boiler now (lbs
or tons per
month or
year)?
What is the
cost or value to
the company
of ash
management?
$50,000 per
year in past
during start
up: volume
reductions are
getting that
down to about
half that.
Cost is $9,000
per month
Disposal cost is
roughly $40/ton
divided between
handling fees,
transportation costs,
and landfill costs
3%-7% (2015
tests)
What’s the
carbon content
of the biomass
ash?
Do you work
with a third-
party or broker
to market or
manage
residual ash?
No Yes No Wet bottom
ash collection,
Dry fly ash
collection from
multiclones &
precipitator
into nitrogen
padded
enclosed
conveyors and
silo.
Where/How is
the ash
collected?

388
Table C-6: Results of survey of current industrial facilities in Washington with biomass boilers (ash)
Ash Cosmo
Specialty
Fibers
Boise White
Paper
Kapstone Paper and
Packaging Corp
Nippon-
Dynawave
WestRock CP,
LLC
Ignoring the
economics for
now, would it be
possible as a
technical matter
to modify the
boiler operation
to generate
residual ash with
higher carbon
content? Do you
have flexibility to
change carbon
content? Some
examples:
reduce residence
time (dwell time)
of carbon in the
furnace/boiler,
excess fuel
available at low
cost, ability to
capture and/or
screen the
higher carbon
content ash. If
Yes, please
explain.
No flexibility to
control carbon
content.
Yes, but increasing the
carryover will increase
boiler tube erosion
and reduce efficiency.
It is not something
Kapstone would
consider. (We use the
boiler to make steam
as efficiently as
possible, not to
generate char for re-
sale). Adding a screen
to the Multiclone Dust
Collector hopper
discharge would
capture high carbon
content ash. Screens
were recently
removed from this
location to increase
the ash purge in the
boiler/scrubber/sludge
cycle.
Not currently No
Is the ash
screened or
sorted prior to
reinjection?
No NA See above NA N/A

389
Table C-7: Results of survey of current industrial facilities in Washington with biomass boilers (fuel)
Fuel Cosmo
Specialty
Fibers
Boise White
Paper
Kapstone Paper and
Packaging Corp
Nippon-
Dynawave
WestRock CP,
LLC
What form is
the primary
biomass fuel
(e.g., pulp,
chips, bark,
other)?
Hog fuel Bark, Chips,
Construction
and
Demolition
Debris
53% Hog fuel;
Wastewater treatment
sludge; Natural Gas;
OCC rejects that
contain a high
percentage of fiber
(>90%)
Hog fuel &
pulp & paper
mill
wastewater
treatment
solids (fossil
fuels: fuel oil,
coal)
Hog fuel,
Construction
and
Demolition
Debris (C&D),
Chip screening
fines,
Wastewater
treatment
plant sludges
(on-site
generated),
paper
recycling
residuals.
What type of
biomass fuel is
used (e.g., fir,
alder, brush,
pine,
hardwood,
slash)?
Mostly fir and
hemlock – no
cedar
Forest waste
material,
Construction
and
Demolition
Debris
Hog fuel from various
sources. Specifics are
unknown
Wide variety
What is the
source location
of the fuel?
(e.g., is the
source on-site
or off-site of
the facility)?
On-site
mostly; some
purchased
from nearby
mills
Off-site Offsite, but local
within about a 100
mile radius
Offsite Fines, sludge
and paper
recycling
residuals are
generated on-
site.
Are there any
special hauling
distance or
transportation
issues affecting
use of
biomass?
Not really;
paper
shutdown
freed up a lot
of supply
No Economical haul
distance is roughly 100
mile radius of the mill
No special
issues known

390
Table C-8: Results of survey of current industrial facilities in Washington with biomass boilers (fuel)
Fuel Cosmo
Specialty
Fibers
Boise White
Paper
Kapstone Paper and
Packaging Corp
Nippon-
Dynawave
WestRock CP,
LLC
What is the
annual
biomass fuel
consumed
(specify: BDT
vs. green tons
at what
moisture)?
80,000 bone
dry tons
(157,747
green tons,
dried to 40%)
63,000 bone
dry tons
303,432 bone dry
tons
About 150,000
bone dry tons per
year (+/- 30,000
bdt/yr) at annual
average moisture
of about 50%
230,000 bone
dry tons
What is the
current back-
up fuel for the
boiler?
RFO; ultra low
sulfur
Natural gas Natural Gas Diesel fuel used
for
startup/shutdown
and occasionally
for supplemental
steam during fuel
handling
problems. Coal is
a supplemental
fuel but not fired
without hog fuel.
Natural gas
(primary
backup),
option for
residual fuel
oil.
What other
sources of
woody
biomass are
available in the
area (forest
waste
material,
urban wood
waste, hog
fuel, etc.)?
No Forest waste
material
Urban wood. We already
purchase hog fuel
& mill residuals
from a wide
range of suppliers
over a wide
geographic area,
no other suitable
clean wood fuel
sources are
known.

391
Table C-9: Results of survey of current industrial facilities in Washington with biomass boilers (operations)
Operations Cosmo Specialty
Fibers
Boise White
Paper
Kapstone Paper
and Packaging
Corp
Nippon-
Dynawave
WestRock
CP, LLC
What is the
annual biomass
fuel consumed
(specify: BDT vs.
green tons at
what moisture)?
80,000 bone dry
tons (157,747
green tons, dried
to 40%)
63,000 bone
dry tons
303,432 bone dry
tons
About 150,000
bone dry tons per
year (+/- 30,000
bdt/yr) at annual
average moisture
of about 50%
230,000
bone dry
tons
What are your
calculated costs
for fuel,
including
hauling/storage?
$140/ton hemlock;
$60/ton for fir
currently; varies
widely by season
and logging
activity, etc.
Commodity market
variability
$3/MMBtu $35/ton
delivered
What are your
main reasons for
using biomass
fuel?
Renewable fuel,
Greenhouse gas
benefits
Cost Lowest cost Fuel cost
What are the
economics of
energy
production (e.g.,
internal cost of
energy) at the
facility now?
Always less than
cost to purchase
from the PUD at
BPA rate
NA $5/1000# of
steam on gas;
$3/1000# of
steam on
biomass
What technical
capacity or
ability do you
have to adjust
boiler
operation?
Wouldn’t want to
do this. It’s running
very efficiently
now. Too
complicated/costly.
Potential to impact
pollution control.
Adjust wood
to natural
gas ratio in
the boiler
We have the
ability to adjust
operations as
long as we stay
within emission
limits.

392
Table C-10: Results of survey of current industrial facilities in Washington with biomass boilers (regulatory)
Regulatory Cosmo Specialty
Fibers
Boise White
Paper
Kapstone Paper
and Packaging
Corp
Nippon-
Dynawave
WestRock
CP, LLC
What types of
emissions
control
equipment or
pollution control
device(s) are
installed.
Wet scrubber on
hog fuel boiler and
recovery stack.
Wet
Electrostatic
Precipitator
Ducon venturi-
style wet
scrubbers (4),
followed by
AHLundberg wet
electrostatic
precipitators for
particulate
control. Mobotek
urea injection
system for NoX
control.
Dry electrostatic
precipitator with
dry sorbent
injection for
partial control of
acid gas
emissions
Dry
electrostatic
precipitator
for PM
emissions
followed by
wet
scrubber for
HCl
emissions.
Is there anything
related to the
biomass boiler
or emissions
system that is
grandfathered
from pre-permit
days?
No No No No
For electricity
production (if
applicable),
what is the
utility/grid
connection?
How much
electricity is sold
to the utility
(percent and
kWh total)?
7.5 MW produced;
two turbine
generators; All
used internally
NA Kapstone sells
100% of its
generated power,
approximately
45W. Power from
the BPA enters
the mill through a
115KV feeder.
Turbines connect
to the mill busses
that run at
13.8KVA
Roughly 20 MW;
Buy all/sell all
agreement with
Cowlitz PUD